United States
Securities and Exchange Commission
Washington, D.C. 20549
Form N-CSR
Certified Shareholder Report of Registered Management Investment Companies
811-21904
(Investment Company Act File Number)
Federated MDT Series
_______________________________________________________________
(Exact Name of Registrant as Specified in Charter)
Federated Investors Funds
4000 Ericsson Drive
Warrendale, Pennsylvania 15086-7561
(Address of Principal Executive Offices)
(412) 288-1900
(Registrant's Telephone Number)
John W. McGonigle, Esquire
Federated Investors Tower
1001 Liberty Avenue
Pittsburgh, Pennsylvania 15222-3779
(Name and Address of Agent for Service)
(Notices should be sent to the Agent for Service)
Date of Fiscal Year End: 07/31/13
Date of Reporting Period: 07/31/13
Item 1. Reports to Stockholders

| Share Class | Ticker |
| A | QAACX |
| C | QCACX |
| R | QKACX |
| Institutional | QIACX |

| 1 | Please see the footnotes to the line graphs below for definitions of, and further information about, the Russell 3000® Index. |
| 2 | The Russell 2000® Index measures the performance of the small-cap segment of the U.S. equity universe. The Russell 2000® Index is a subset of the Russell 3000® Index representing approximately 10% of the total market capitalization of that index. It includes approximately 2000 of the smallest securities based on a combination of their market cap and current index membership. The Russell 2000® Index is constructed to provide a comprehensive and unbiased small-cap barometer and is completely reconstituted annually to ensure larger stocks do not distort the performance and characteristics of the true small-cap opportunity set. The Russell 2000 Index is unmanaged, and it is not possible to invest directly in an index. |
| 3 | The Russell Midcap® Index measures the performance of the mid-cap segment of the U.S. equity universe. The Russell Midcap® Index is a subset of the Russell 1000® Index. It includes approximately 800 of the smallest securities based on a combination of their market cap and current index membership. The Russell Midcap® Index represents approximately 31% of the total market capitalization of the Russell 1000® companies. The Russell Midcap® Index is constructed to provide a comprehensive and unbiased barometer for the mid-cap segment. The Russell Midcap Index is completely reconstituted annually to ensure larger stocks do not distort the performance and characteristics of the true mid-cap opportunity set. The Russell Midcap Index is unmanaged, and it is not possible to invest directly in an index. |
| 4 | The Russell Top 200® Index measures the performance of the largest cap segment of the U.S. equity universe. The Russell Top 200® Index is a subset of the Russell 3000® Index. It includes approximately 200 of the largest securities based on a combination of their market cap and current index membership and represents approximately 68% of the U.S. market. The Russell Top 200® Index is constructed to provide a comprehensive and unbiased barometer for this very large cap segment and is completely reconstituted annually to ensure new and growing equities are reflected. The Russell Top 200 Index is unmanaged, and it is not possible to invest directly in an index. |
| 5 | The Russell 3000® Value Index measures the performance of the broad value segment of U.S. equity value universe. It includes those Russell 3000® Index companies with lower price-to-book ratios and lower forecasted growth values. The Russell 3000® Value Index is constructed to provide a comprehensive, unbiased, and stable barometer of the broad value market. The Russell 3000® Value Index is completely reconstituted annually to ensure new and growing equities are included and that the represented companies continue to reflect value characteristics. The Russell 3000 Index is unmanaged, and it is not possible to invest directly in an index. |
| 6 | The Russell 3000® Growth Index measures the performance of the broad growth segment of the U.S. equity universe. It includes those Russell 3000® Index companies with higher price-to-book ratios and higher forecasted growth values. The Russell 3000® Growth Index is constructed to provide a comprehensive, unbiased, and stable barometer of the broad growth market. The Russell 3000® Growth Index is completely reconstituted annually to ensure new and growing equities are included and that the represented companies continue to reflect growth characteristics. The Russell 3000 Growth Index is unmanaged, and it is not possible to invest directly in an index. |
| Share Class | 1 Year | 5 Years | 10 Years |
| Class A Shares4 | 28.62% | 3.46% | 6.25% |
| Class C Shares4 | 33.99% | 3.81% | 6.02% |
| Class R Shares4 | 35.42% | 4.13% | 6.37% |
| Institutional Shares | 36.46% | 4.93% | 7.13% |
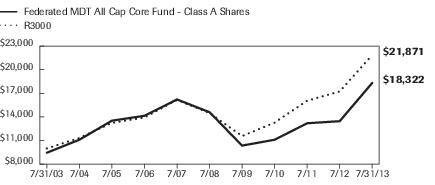
| Federated MDT All Cap Core Fund - | Class A Shares | R3000 |
| 7/31/2003 | 9,450 | 10,000 |
| 7/31/2004 | 11,107 | 11,331 |
| 7/31/2005 | 13,527 | 13,246 |
| 7/31/2006 | 14,147 | 13,928 |
| 7/31/2007 | 16,223 | 16,167 |
| 7/31/2008 | 14,604 | 14,498 |
| 7/31/2009 | 10,359 | 11,568 |
| 7/31/2010 | 11,103 | 13,282 |
| 7/31/2011 | 13,198 | 16,063 |
| 7/31/2012 | 13,462 | 17,240 |
| 7/31/2013 | 18,322 | 21,871 |
| ■ | Total returns shown include the maximum sales charge of 5.50% ($10,000 investment minus $550 sales charge = $9,450). |
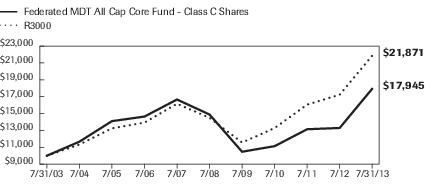
| Federated MDT All Cap Core Fund - | Class C Shares | R3000 |
| 7/31/2003 | 10,000 | 10,000 |
| 7/31/2004 | 11,667 | 11,331 |
| 7/31/2005 | 14,103 | 13,246 |
| 7/31/2006 | 14,645 | 13,928 |
| 7/31/2007 | 16,668 | 16,167 |
| 7/31/2008 | 14,885 | 14,498 |
| 7/31/2009 | 10,473 | 11,568 |
| 7/31/2010 | 11,136 | 13,282 |
| 7/31/2011 | 13,141 | 16,063 |
| 7/31/2012 | 13,293 | 17,240 |
| 7/31/2013 | 17,945 | 21,871 |
| ■ | Total returns shown include the maximum contingent deferred sales charge of 1.00%, as applicable. |
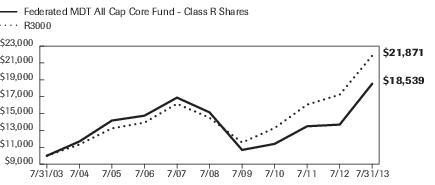
| Federated MDT All Cap Core Fund - | Class R Shares | R3000 |
| 7/31/2003 | 10,000 | 10,000 |
| 7/31/2004 | 11,691 | 11,331 |
| 7/31/2005 | 14,173 | 13,246 |
| 7/31/2006 | 14,750 | 13,928 |
| 7/31/2007 | 16,889 | 16,167 |
| 7/31/2008 | 15,143 | 14,498 |
| 7/31/2009 | 10,687 | 11,568 |
| 7/31/2010 | 11,404 | 13,282 |
| 7/31/2011 | 13,495 | 16,063 |
| 7/31/2012 | 13,690 | 17,240 |
| 7/31/2013 | 18,539 | 21,871 |
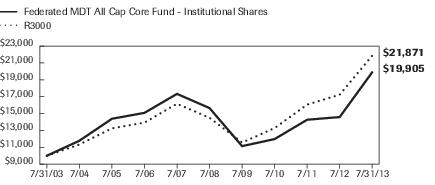
| Federated MDT All Cap Core Fund - | Institutional Shares | R3000 |
| 7/31/2003 | 10,000 | 10,000 |
| 7/31/2004 | 11,778 | 11,331 |
| 7/31/2005 | 14,385 | 13,246 |
| 7/31/2006 | 15,083 | 13,928 |
| 7/31/2007 | 17,334 | 16,167 |
| 7/31/2008 | 15,651 | 14,498 |
| 7/31/2009 | 11,137 | 11,568 |
| 7/31/2010 | 11,976 | 13,282 |
| 7/31/2011 | 14,267 | 16,063 |
| 7/31/2012 | 14,586 | 17,240 |
| 7/31/2013 | 19,905 | 21,871 |
| 1 | Represents a hypothetical investment of $10,000 in the Fund after deducting applicable sales charges: for Class A Shares, the maximum sales charge of 5.50% ($10,000 investment minus $550 sales charge = $9,450); for Class C Shares a 1.00% contingent deferred sales charge would be applied on any redemption less than one year from the purchase date. The Fund's performance assumes the reinvestment of all dividends and distributions. The R3000 has been adjusted to reflect reinvestment of dividends of securities. |
| 2 | The Fund is the successor to the MDT All Cap Core Fund pursuant to a reorganization that was completed on or about the close of business on December 8, 2006. Prior to that date, the Fund had no investment operations. Accordingly, the performance information shown for periods prior to that date for Class A Shares, Class C Shares and Class R Shares is historical information for the MDT All Cap Core Fund. The MDT All Cap Core Fund was managed by MDT Advisers and had similar investment objectives and strategies as the Fund. |
| 3 | The R3000 measures the performance of the largest 3,000 U.S. companies representing approximately 98% of the investable U.S. equity market. The R3000 is constructed to provide a comprehensive, unbiased, and stable barometer of the broad market and is completely reconstituted annually to ensure new and growing equities are reflected. The index is unmanaged and, unlike the Fund, is not affected by cash flows. It is not possible to invest directly in an index. The R3000 is not adjusted to reflect sales charges, expenses or other fees that the Securities and Exchange Commission requires to be reflected in the Fund's performance. |
| 4 | The start of performance date for the Fund's Class A Shares, Class C Shares and Class R Shares was October 1, 2002. Class A Shares, Class C Shares and Class R Shares commenced operations on February 12, 2003, September 15, 2005 and December 12, 2006, respectively. Performance results shown before those dates are for the Fund's Institutional Shares and have been adjusted for the maximum sales charge, maximum contingent deferred sales charge and total annual operating expenses applicable to each class. The Fund's Institutional Shares commenced operations on October 1, 2002. Subject to the expense adjustments described above, the Class A Shares, Class C Shares and Class R Shares annual returns would be substantially similar to those of the Institutional Shares because Shares of each class are invested in the same portfolio of securities. |
| Industry Composition | Percentage of Total Net Assets |
| Regional Banks | 4.8% |
| Money Center Bank | 4.4% |
| Services to Medical Professionals | 3.6% |
| Property Liability Insurance | 3.0% |
| Specialty Retailing | 3.0% |
| Integrated Domestic Oil | 2.7% |
| Oil Refiner | 2.6% |
| Software Packaged/Custom | 2.5% |
| Biotechnology | 2.3% |
| Computer Stores | 2.1% |
| Department Stores | 2.1% |
| Ethical Drugs | 2.1% |
| Defense Electronics | 2.0% |
| Defense Aerospace | 1.9% |
| Financial Services | 1.9% |
| AT&T Divestiture | 1.7% |
| Computers - Midrange | 1.7% |
| Electric Utility | 1.7% |
| Semiconductor Distribution | 1.6% |
| Computer Peripherals | 1.5% |
| Construction Machinery | 1.5% |
| Integrated International Oil | 1.5% |
| Telecommunication Equipment & Services | 1.5% |
| Grocery Chain | 1.4% |
| Medical Technology | 1.4% |
| Home Products | 1.3% |
| Broadcasting | 1.2% |
| Life Insurance | 1.2% |
| Multi-Line Insurance | 1.2% |
| Securities Brokerage | 1.2% |
| Soft Drinks | 1.2% |
| Cable TV | 1.1% |
| Industry Composition | Percentage of Total Net Assets |
| Agricultural Chemicals | 1.0% |
| Clothing Stores | 1.0% |
| Diversified Oil | 1.0% |
| Household Appliances | 1.0% |
| Other2 | 29.0% |
| Cash Equivalents3 | 2.1% |
| Other Assets and Liabilities—Net4 | 0.0% |
| TOTAL | 100.0% |
| 1 | Except for Cash Equivalents and Other Assets and Liabilities, industry classifications are based upon, and individual portfolio securities are assigned to, the classifications of the Global Industry Classification Standard (GICS) except that the Adviser assigns a classification to securities not classified by the GICS and to securities for which the Adviser does not have access to the classification made by the GICS. |
| 2 | For purposes of this table, industry classifications which constitute less than 1.0% of the Fund's total net assets have been aggregated under the designation “Other.” |
| 3 | Cash Equivalents include any investments in money market mutual funds and/or overnight repurchase agreements. |
| 4 | Assets, other than investments in securities, less liabilities. See Statement of Assets and Liabilities. |
| Shares | Value | ||
| COMMON STOCKS—97.9% | |||
| Agricultural Chemicals—1.0% | |||
| 3,000 | CF Industries Holdings, Inc. | $588,030 | |
| 3,700 | Monsanto Co. | 365,486 | |
| 2,500 | Scotts Miracle-Gro Co. | 125,625 | |
| TOTAL | 1,079,141 | ||
| Agricultural Machinery—0.9% | |||
| 5,400 | AGCO Corp. | 303,750 | |
| 8,200 | Deere & Co. | 681,174 | |
| TOTAL | 984,924 | ||
| Airline - National—0.6% | |||
| 17,100 | 1 | United Continental Holdings, Inc. | 595,935 |
| Airline - Regional—0.3% | |||
| 5,000 | Alaska Air Group, Inc. | 305,850 | |
| Apparel—0.5% | |||
| 2,000 | 1 | Ann, Inc. | 67,780 |
| 2,600 | Carter's, Inc. | 185,432 | |
| 2,300 | Guess ?, Inc. | 77,464 | |
| 900 | V.F. Corp. | 177,300 | |
| TOTAL | 507,976 | ||
| AT&T Divestiture—1.7% | |||
| 27,500 | AT&T, Inc. | 969,925 | |
| 17,400 | Verizon Communications, Inc. | 860,952 | |
| TOTAL | 1,830,877 | ||
| Auto Components—0.3% | |||
| 4,100 | Lear Corp. | 284,007 | |
| Auto Manufacturing—0.9% | |||
| 26,800 | Ford Motor Co. | 452,384 | |
| 12,800 | 1 | General Motors Co. | 459,136 |
| TOTAL | 911,520 | ||
| Auto Original Equipment Manufacturers—0.5% | |||
| 500 | 1 | AutoZone, Inc. | 224,290 |
| 1,800 | 1 | O'Reilly Automotive, Inc. | 225,468 |
| 2,200 | 1 | Tenneco Automotive, Inc. | 106,326 |
| TOTAL | 556,084 | ||
| Auto Rentals—0.3% | |||
| 5,000 | 1 | United Rentals, Inc. | 286,600 |
| Shares | Value | ||
| COMMON STOCKS—continued | |||
| Biotechnology—2.3% | |||
| 3,600 | 1 | Alexion Pharmaceuticals, Inc. | $418,428 |
| 5,800 | Amgen, Inc. | 628,082 | |
| 3,200 | 1 | Biogen Idec, Inc. | 698,016 |
| 4,400 | 1 | Celgene Corp. | 646,184 |
| TOTAL | 2,390,710 | ||
| Broadcasting—1.2% | |||
| 20,489 | 1 | DIRECTV Group, Inc. | 1,296,339 |
| Building Materials—0.4% | |||
| 4,200 | Fortune Brands Home & Security, Inc. | 173,502 | |
| 3,300 | Lennox International, Inc. | 237,006 | |
| TOTAL | 410,508 | ||
| Building Supply Stores—0.6% | |||
| 3,200 | Home Depot, Inc. | 252,896 | |
| 7,700 | Lowe's Cos., Inc. | 343,266 | |
| TOTAL | 596,162 | ||
| Cable & Wireless Television—0.4% | |||
| 4,000 | Time Warner Cable, Inc. | 456,280 | |
| Cable TV—1.1% | |||
| 5,200 | CBS Corp. (New), Class B | 274,768 | |
| 10,800 | Comcast Corp., Class A | 486,864 | |
| 4,900 | Viacom, Inc., Class B | 356,573 | |
| TOTAL | 1,118,205 | ||
| Capital Markets—0.3% | |||
| 6,600 | Franklin Resources, Inc. | 322,608 | |
| Carpets—0.4% | |||
| 3,400 | 1 | Mohawk Industries, Inc. | 404,566 |
| Closed End Fund—0.8% | |||
| 7,000 | 1 | Berkshire Hathaway, Inc. | 811,090 |
| Clothing Stores—1.0% | |||
| 1,700 | 1 | Children's Place Retail Stores, Inc. | 91,868 |
| 14,000 | Gap (The), Inc. | 642,600 | |
| 4,900 | Hanesbrands, Inc. | 310,954 | |
| TOTAL | 1,045,422 | ||
| Commodity Chemicals—0.9% | |||
| 1,900 | Du Pont (E.I.) de Nemours & Co. | 109,611 | |
| 7,800 | LyondellBasell Industries NV | 535,938 | |
| 3,000 | RPM International, Inc. | 105,720 |
| Shares | Value | ||
| COMMON STOCKS—continued | |||
| Commodity Chemicals—continued | |||
| 2,400 | Westlake Chemical Corp. | $249,648 | |
| TOTAL | 1,000,917 | ||
| Computer Peripherals—1.5% | |||
| 3,700 | Lexmark International, Inc., Class A | 138,713 | |
| 4,600 | NetApp, Inc. | 189,152 | |
| 8,100 | 1 | Sandisk Corp. | 446,472 |
| 12,000 | Western Digital Corp. | 772,560 | |
| TOTAL | 1,546,897 | ||
| Computer Services—0.6% | |||
| 1,300 | 1 | CACI International, Inc., Class A | 86,320 |
| 11,134 | 1 | Synnex Corp. | 551,356 |
| TOTAL | 637,676 | ||
| Computer Stores—2.1% | |||
| 10,800 | GameStop Corp. | 529,848 | |
| 42,649 | 1 | Ingram Micro, Inc., Class A | 973,677 |
| 2,100 | 1 | Insight Enterprises, Inc. | 44,919 |
| 13,862 | 1 | Tech Data Corp. | 711,675 |
| TOTAL | 2,260,119 | ||
| Computers - High End—0.7% | |||
| 3,600 | IBM Corp. | 702,144 | |
| Computers - Midrange—1.7% | |||
| 68,700 | Hewlett-Packard Co. | 1,764,216 | |
| Construction Machinery—1.5% | |||
| 7,300 | Caterpillar, Inc. | 605,243 | |
| 4,900 | Joy Global, Inc. | 242,550 | |
| 19,100 | Trinity Industries, Inc. | 751,967 | |
| TOTAL | 1,599,760 | ||
| Cosmetics & Toiletries—0.6% | |||
| 10,000 | Avon Products, Inc. | 228,600 | |
| 3,800 | Estee Lauder Cos., Inc., Class A | 249,470 | |
| 5,400 | 1 | Sally Beauty Holdings, Inc. | 164,754 |
| TOTAL | 642,824 | ||
| Crude Oil & Gas Production—0.5% | |||
| 8,400 | Chesapeake Energy Corp. | 195,720 | |
| 2,100 | EOG Resources, Inc. | 305,529 | |
| TOTAL | 501,249 | ||
| Defense Aerospace—1.9% | |||
| 3,200 | Alliant Techsystems, Inc. | 297,920 |
| Shares | Value | ||
| COMMON STOCKS—continued | |||
| Defense Aerospace—continued | |||
| 6,100 | General Dynamics Corp. | $520,574 | |
| 6,800 | Lockheed Martin Corp. | 816,816 | |
| 4,200 | Triumph Group, Inc. | 329,532 | |
| TOTAL | 1,964,842 | ||
| Defense Electronics—2.0% | |||
| 9,000 | 1 | First Solar, Inc. | 443,160 |
| 3,500 | L-3 Communications Holdings, Inc. | 326,025 | |
| 10,300 | Northrop Grumman Corp. | 948,218 | |
| 5,700 | Raytheon Co. | 409,488 | |
| TOTAL | 2,126,891 | ||
| Department Stores—2.1% | |||
| 2,600 | Dillards, Inc., Class A | 219,518 | |
| 14,900 | Kohl's Corp. | 789,402 | |
| 16,600 | Macy's, Inc. | 802,444 | |
| 2,200 | 1 | Penney (J.C.) Co., Inc. | 32,120 |
| 2,600 | 1 | Sears Holdings Corp. | 119,080 |
| 3,000 | Target Corp. | 213,750 | |
| TOTAL | 2,176,314 | ||
| Discount Department Stores—0.3% | |||
| 5,400 | Foot Locker, Inc. | 195,102 | |
| 1,800 | Wal-Mart Stores, Inc. | 140,292 | |
| TOTAL | 335,394 | ||
| Diversified Financial Services—0.2% | |||
| 4,100 | 1 | CIT Group, Inc. | 205,451 |
| Diversified Leisure—0.5% | |||
| 4,500 | 1 | Bally Technologies, Inc. | 322,560 |
| 4,700 | Las Vegas Sands Corp. | 261,179 | |
| TOTAL | 583,739 | ||
| Diversified Oil—1.0% | |||
| 9,000 | Murphy Oil Corp. | 609,480 | |
| 4,900 | Occidental Petroleum Corp. | 436,345 | |
| TOTAL | 1,045,825 | ||
| Education & Training Services—0.3% | |||
| 11,000 | 1 | Apollo Group, Inc., Class A | 200,420 |
| 2,100 | DeVRY, Inc. | 63,168 | |
| 1,500 | 1 | ITT Educational Services, Inc. | 39,345 |
| TOTAL | 302,933 |
| Shares | Value | ||
| COMMON STOCKS—continued | |||
| Electric Utility—1.7% | |||
| 24,600 | AES Corp. | $306,024 | |
| 5,200 | American Electric Power Co., Inc. | 241,020 | |
| 11,100 | Edison International | 553,335 | |
| 4,700 | Entergy Corp. | 317,250 | |
| 6,500 | Exelon Corp. | 198,835 | |
| 6,600 | PPL Corp. | 209,682 | |
| TOTAL | 1,826,146 | ||
| Electrical - Radio & TV—0.1% | |||
| 1,800 | Harman International Industries, Inc. | 108,954 | |
| Electrical Equipment—0.1% | |||
| 4,200 | 1 | Sanmina Corp. | 69,132 |
| Electronic Test/Measuring Equipment—0.1% | |||
| 1,800 | 1 | Itron, Inc. | 77,616 |
| Ethical Drugs—2.1% | |||
| 7,200 | Abbott Laboratories | 263,736 | |
| 11,400 | Eli Lilly & Co. | 605,454 | |
| 13,300 | Merck & Co., Inc. | 640,661 | |
| 14,700 | Pfizer, Inc. | 429,681 | |
| 3,700 | 1 | United Therapeutics Corp. | 276,908 |
| TOTAL | 2,216,440 | ||
| Financial Services—1.9% | |||
| 6,500 | Ameriprise Financial, Inc. | 578,500 | |
| 800 | BlackRock, Inc. | 225,568 | |
| 7,400 | Discover Financial Services | 366,374 | |
| 2,500 | Nelnet, Inc., Class A | 97,200 | |
| 2,300 | 1 | Outerwall, Inc. | 127,075 |
| 3,700 | Visa, Inc., Class A | 654,937 | |
| TOTAL | 2,049,654 | ||
| Food Wholesaling—0.6% | |||
| 3,800 | Ingredion, Inc. | 255,360 | |
| 11,500 | Sysco Corp. | 396,865 | |
| TOTAL | 652,225 | ||
| Gas Utilities—0.2% | |||
| 2,200 | EQT Corp. | 190,300 | |
| Generic Drugs—0.9% | |||
| 11,600 | 1 | Endo Health Solutions, Inc. | 446,136 |
| 14,600 | 1 | Mylan, Inc. | 489,976 |
| TOTAL | 936,112 |
| Shares | Value | ||
| COMMON STOCKS—continued | |||
| Grocery Chain—1.4% | |||
| 25,700 | Kroger Co. | $1,009,239 | |
| 17,900 | Safeway, Inc. | 461,641 | |
| TOTAL | 1,470,880 | ||
| Home Products—1.3% | |||
| 4,100 | Energizer Holdings, Inc. | 417,380 | |
| 5,850 | 1 | Jarden Corp. | 265,999 |
| 2,100 | Kimberly-Clark Corp. | 207,480 | |
| 5,200 | Newell Rubbermaid, Inc. | 140,504 | |
| 4,600 | Tupperware Brands Corp. | 387,688 | |
| TOTAL | 1,419,051 | ||
| Hospitals—0.1% | |||
| 2,700 | 1 | Community Health Systems, Inc. | 124,362 |
| Hotels—0.2% | |||
| 3,600 | Wyndham Worldwide Corp. | 224,280 | |
| Household Appliances—1.0% | |||
| 8,100 | Whirlpool Corp. | 1,084,914 | |
| Industrial Machinery—0.2% | |||
| 9,100 | 1 | Terex Corp. | 268,268 |
| Insurance Brokerage—0.4% | |||
| 11,100 | Aspen Insurance Holdings Ltd. | 416,139 | |
| Integrated Domestic Oil—2.7% | |||
| 22,800 | ConocoPhillips | 1,478,808 | |
| 8,200 | Hess Corp. | 610,572 | |
| 21,900 | Marathon Oil Corp. | 796,284 | |
| TOTAL | 2,885,664 | ||
| Integrated International Oil—1.5% | |||
| 6,700 | Chevron Corp. | 843,463 | |
| 7,900 | Exxon Mobil Corp. | 740,625 | |
| TOTAL | 1,584,088 | ||
| Internet Services—0.9% | |||
| 3,800 | IAC Interactive Corp. | 192,318 | |
| 1,200 | 1 | NetFlix, Inc. | 293,064 |
| 500 | 1 | Priceline.com, Inc. | 437,835 |
| TOTAL | 923,217 | ||
| Life Insurance—1.2% | |||
| 13,600 | Prudential Financial, Inc. | 1,073,992 | |
| 2,900 | StanCorp Financial Group, Inc. | 153,961 | |
| TOTAL | 1,227,953 |
| Shares | Value | ||
| COMMON STOCKS—continued | |||
| Mail Order—0.1% | |||
| 2,200 | HSN, Inc. | $132,132 | |
| Medical Supplies—0.8% | |||
| 7,400 | Cardinal Health, Inc. | 370,666 | |
| 4,300 | McKesson Corp. | 527,438 | |
| TOTAL | 898,104 | ||
| Medical Technology—1.4% | |||
| 4,600 | Medtronic, Inc. | 254,104 | |
| 3,900 | ResMed, Inc. | 185,835 | |
| 13,500 | St. Jude Medical, Inc. | 707,265 | |
| 4,700 | Zimmer Holdings, Inc. | 392,356 | |
| TOTAL | 1,539,560 | ||
| Metal Fabrication—0.3% | |||
| 1,500 | Reliance Steel & Aluminum Co. | 105,300 | |
| 4,200 | Timken Co. | 245,364 | |
| TOTAL | 350,664 | ||
| Miscellaneous Components—0.4% | |||
| 27,428 | 1 | Vishay Intertechnology, Inc. | 394,689 |
| Miscellaneous Food Products—0.4% | |||
| 7,200 | Archer-Daniels-Midland Co. | 262,584 | |
| 7,300 | Fresh Del Monte Produce, Inc. | 205,057 | |
| TOTAL | 467,641 | ||
| Money Center Bank—4.4% | |||
| 32,300 | Bank of America Corp. | 471,580 | |
| 10,700 | Bank of New York Mellon Corp. | 336,515 | |
| 17,300 | Citigroup, Inc. | 902,022 | |
| 26,700 | JP Morgan Chase & Co. | 1,487,991 | |
| 12,500 | State Street Corp. | 870,875 | |
| 14,700 | U.S. Bancorp | 548,604 | |
| TOTAL | 4,617,587 | ||
| Mortgage and Title—0.2% | |||
| 9,300 | 1 | CoreLogic, Inc. | 259,470 |
| Multi-Industry Capital Goods—0.7% | |||
| 16,300 | General Electric Co. | 397,231 | |
| 13,300 | Textron, Inc. | 364,154 | |
| TOTAL | 761,385 | ||
| Multi-Industry Transportation—0.2% | |||
| 2,100 | FedEx Corp. | 222,600 |
| Shares | Value | ||
| COMMON STOCKS—continued | |||
| Multi-Line Insurance—1.2% | |||
| 15,500 | 1 | American International Group, Inc. | $705,405 |
| 5,500 | CIGNA Corp. | 428,065 | |
| 2,500 | Cincinnati Financial Corp. | 122,500 | |
| 400 | Validus Holdings Ltd. | 14,172 | |
| TOTAL | 1,270,142 | ||
| Newspaper Publishing—0.1% | |||
| 200 | Washington Post Co., Class B | 107,472 | |
| Office Equipment—0.2% | |||
| 14,800 | Pitney Bowes, Inc. | 244,348 | |
| Office Supplies—0.2% | |||
| 4,500 | Avery Dennison Corp. | 201,285 | |
| Offshore Driller—0.1% | |||
| 1,700 | Bristow Group, Inc. | 115,617 | |
| Oil Gas & Consumable Fuels—0.8% | |||
| 13,700 | Phillips 66 | 842,550 | |
| Oil Refiner—2.6% | |||
| 11,600 | HollyFrontier Corp. | 528,380 | |
| 10,300 | Marathon Petroleum Corp. | 755,299 | |
| 8,700 | Tesoro Petroleum Corp. | 494,595 | |
| 28,400 | Valero Energy Corp. | 1,015,868 | |
| TOTAL | 2,794,142 | ||
| Oil Service, Explore & Drill—0.4% | |||
| 6,400 | Helmerich & Payne, Inc. | 404,480 | |
| Other Communications Equipment—0.4% | |||
| 7,600 | Harris Corp. | 433,732 | |
| Packaged Foods—0.2% | |||
| 5,300 | Mondelez International, Inc. | 165,731 | |
| Paper Products—0.7% | |||
| 5,700 | 1 | Boise, Inc. | 51,870 |
| 7,800 | International Paper Co. | 376,818 | |
| 2,600 | Rock-Tenn Co. | 297,310 | |
| TOTAL | 725,998 | ||
| Personal & Household—0.5% | |||
| 5,800 | Nu Skin Enterprises, Inc., Class A | 485,112 | |
| Personal Loans—0.3% | |||
| 4,200 | Capital One Financial Corp. | 289,884 | |
| Personnel Agency—0.4% | |||
| 4,500 | Manpower, Inc. | 300,915 |
| Shares | Value | ||
| COMMON STOCKS—continued | |||
| Personnel Agency—continued | |||
| 3,400 | Robert Half International, Inc. | $126,616 | |
| TOTAL | 427,531 | ||
| Poultry Products—0.4% | |||
| 14,500 | Tyson Foods, Inc., Class A | 400,490 | |
| Printing—0.1% | |||
| 4,800 | Donnelley (R.R.) & Sons Co. | 91,152 | |
| Property Liability Insurance—3.0% | |||
| 3,200 | Chubb Corp. | 276,800 | |
| 5,200 | Everest Re Group Ltd. | 694,356 | |
| 12,600 | HCC Insurance Holdings, Inc. | 561,078 | |
| 5,200 | PartnerRe Ltd. | 465,608 | |
| 3,900 | Platinum Underwriters Holdings Ltd. | 226,551 | |
| 11,200 | The Travelers Cos., Inc. | 935,760 | |
| TOTAL | 3,160,153 | ||
| Railroad—0.2% | |||
| 1,300 | Union Pacific Corp. | 206,167 | |
| Recreational Vehicles—0.1% | |||
| 1,400 | Polaris Industries, Inc., Class A | 156,996 | |
| Regional Banks—4.8% | |||
| 23,300 | BB&T Corp. | 831,577 | |
| 1,700 | City National Corp. | 118,201 | |
| 7,300 | Comerica, Inc. | 310,542 | |
| 29,600 | Fifth Third Bancorp | 569,208 | |
| 17,200 | Huntington Bancshares, Inc. | 147,060 | |
| 17,600 | KeyCorp | 216,304 | |
| 9,400 | PNC Financial Services Group | 714,870 | |
| 22,700 | SunTrust Banks, Inc. | 789,733 | |
| 29,100 | Wells Fargo & Co. | 1,265,850 | |
| 3,700 | Zions Bancorp | 109,668 | |
| TOTAL | 5,073,013 | ||
| Rental & Leasing Services—0.1% | |||
| 3,200 | Rent-A-Center, Inc. | 127,968 | |
| Restaurant—0.3% | |||
| 3,600 | 1 | Green Mountain Coffee, Inc. | 277,848 |
| Securities Brokerage—1.2% | |||
| 5,800 | Goldman Sachs Group, Inc. | 951,374 | |
| 10,700 | Morgan Stanley | 291,147 | |
| TOTAL | 1,242,521 |
| Shares | Value | ||
| COMMON STOCKS—continued | |||
| Semiconductor Distribution—1.6% | |||
| 25,913 | 1 | Arrow Electronics, Inc. | $1,182,928 |
| 14,515 | 1 | Avnet, Inc. | 546,780 |
| TOTAL | 1,729,708 | ||
| Semiconductor Manufacturing—0.7% | |||
| 27,100 | Intel Corp. | 631,430 | |
| 5,500 | 1 | Omnivision Technologies, Inc. | 89,430 |
| TOTAL | 720,860 | ||
| Semiconductors & Semiconductor Equipment—0.2% | |||
| 7,300 | Broadcom Corp. | 201,261 | |
| Services to Medical Professionals—3.6% | |||
| 15,400 | Aetna, Inc. | 988,218 | |
| 2,000 | 1 | Henry Schein, Inc. | 207,660 |
| 7,600 | Humana, Inc. | 693,576 | |
| 4,800 | Omnicare, Inc. | 253,392 | |
| 12,700 | UnitedHealth Group, Inc. | 925,195 | |
| 8,573 | Wellpoint, Inc. | 733,506 | |
| TOTAL | 3,801,547 | ||
| Soft Drinks—1.2% | |||
| 14,400 | Coca-Cola Enterprises, Inc. | 540,576 | |
| 13,800 | Dr. Pepper Snapple Group, Inc. | 645,012 | |
| 1,700 | PepsiCo, Inc. | 142,018 | |
| TOTAL | 1,327,606 | ||
| Software Packaged/Custom—2.5% | |||
| 19,200 | CA, Inc. | 571,008 | |
| 2,000 | 1 | Commvault Systems, Inc. | 168,860 |
| 7,300 | Computer Sciences Corp. | 347,918 | |
| 6,800 | 1 | Electronic Arts, Inc. | 177,616 |
| 9,300 | Microsoft Corp. | 296,019 | |
| 14,900 | Oracle Corp. | 482,015 | |
| 22,200 | Symantec Corp. | 592,296 | |
| TOTAL | 2,635,732 | ||
| Specialty Chemicals—0.9% | |||
| 3,300 | Airgas, Inc. | 340,593 | |
| 4,200 | Ashland, Inc. | 364,728 | |
| 12,400 | Huntsman Corp. | 223,448 | |
| TOTAL | 928,769 | ||
| Specialty Retailing—3.0% | |||
| 8,000 | Abercrombie & Fitch Co., Class A | 398,960 |
| Shares | Value | ||
| COMMON STOCKS—continued | |||
| Specialty Retailing—continued | |||
| 2,600 | 1 | AutoNation, Inc. | $124,540 |
| 2,900 | 1 | Big Lots, Inc. | 104,777 |
| 18,387 | CVS Caremark Corp. | 1,130,617 | |
| 800 | 1 | Cabela's, Inc., Class A | 54,912 |
| 500 | 1 | Dollar General Corp. | 27,335 |
| 1,400 | Expedia, Inc. | 65,982 | |
| 8,400 | GNC Acquisition Holdings, Inc. | 443,352 | |
| 2,700 | Nordstrom, Inc. | 165,348 | |
| 3,900 | Signet Jewelers Ltd. | 285,129 | |
| 16,300 | Staples, Inc. | 277,426 | |
| 1,400 | Williams-Sonoma, Inc. | 82,404 | |
| TOTAL | 3,160,782 | ||
| Technology Hardware & Equipment—0.2% | |||
| 9,500 | EMC Corp. | 248,425 | |
| Telecommunication Equipment & Services—1.5% | |||
| 2,400 | 1 | Anixter International, Inc. | 199,296 |
| 22,700 | Cisco Systems, Inc. | 579,985 | |
| 4,000 | Motorola, Inc. | 219,320 | |
| 8,500 | Qualcomm, Inc. | 548,675 | |
| TOTAL | 1,547,276 | ||
| Telephone Utility—0.9% | |||
| 26,200 | CenturyLink, Inc. | 939,270 | |
| Tobacco—0.2% | |||
| 5,000 | Lorillard, Inc. | 212,650 | |
| Toys & Games—0.6% | |||
| 9,500 | Hasbro, Inc. | 437,000 | |
| 6,000 | Mattel, Inc. | 252,180 | |
| TOTAL | 689,180 | ||
| Transportation—0.1% | |||
| 3,200 | 1 | Hertz Global Holdings, Inc. | 81,952 |
| Truck Manufacturing—0.1% | |||
| 1,200 | Cummins, Inc. | 145,428 | |
| Undesignated Consumer Cyclicals—0.6% | |||
| 8,300 | Herbalife Ltd. | 543,650 | |
| 2,100 | Weight Watchers International, Inc. | 99,645 | |
| TOTAL | 643,295 |
| Shares | Value | ||
| COMMON STOCKS—continued | |||
| Uniforms—0.3% | |||
| 6,500 | Cintas Corp. | $308,815 | |
| TOTAL COMMON STOCKS (IDENTIFIED COST $84,367,284) | 103,558,110 | ||
| MUTUAL FUND—2.1% | |||
| 2,182,008 | 2,3 | Federated Prime Value Obligations Fund, Institutional Shares, 0.06% (AT NET ASSET VALUE) | 2,182,008 |
| TOTAL INVESTMENTS—100.0% (IDENTIFIED COST $86,549,292)4 | 105,740,118 | ||
| OTHER ASSETS AND LIABILITIES - NET—0.0%5 | 46,726 | ||
| TOTAL NET ASSETS—100% | $105,786,844 |
| 1 | Non-income producing security. |
| 2 | Affiliated holding. |
| 3 | 7-day net yield. |
| 4 | The cost of investments for federal tax purposes amounts to $86,686,560. |
| 5 | Assets, other than investments in securities, less liabilities. See Statement of Assets and Liabilities. |
| Year Ended July 31 | 2013 | 2012 | 2011 | 2010 | 2009 |
| Net Asset Value, Beginning of Period | $12.73 | $12.48 | $10.54 | $9.91 | $14.05 |
| Income From Investment Operations: | |||||
| Net investment income | 0.091 | 0.061 | 0.031 | 0.051 | 0.061 |
| Net realized and unrealized gain (loss) on investments | 4.49 | 0.19 | 1.96 | 0.67 | (4.15) |
| TOTAL FROM INVESTMENT OPERATIONS | 4.58 | 0.25 | 1.99 | 0.72 | (4.09) |
| Less Distributions: | |||||
| Distributions from net investment income | (0.05) | — | (0.05) | (0.09) | (0.05) |
| Net Asset Value, End of Period | $17.26 | $12.73 | $12.48 | $10.54 | $9.91 |
| Total Return2 | 36.10% | 2.00% | 18.87% | 7.18% | (29.07)% |
| Ratios to Average Net Assets: | |||||
| Net expenses | 1.35% | 1.35% | 1.34% | 1.29% | 1.34% |
| Net investment income | 0.59% | 0.48% | 0.21% | 0.44% | 0.64% |
| Expense waiver/reimbursement3 | 0.16% | 0.40% | 0.31% | 0.25% | 0.14% |
| Supplemental Data: | |||||
| Net assets, end of period (000 omitted) | $34,092 | $29,365 | $40,227 | $54,437 | $81,898 |
| Portfolio turnover | 99% | 164% | 154% | 135% | 290% |
| 1 | Per share numbers have been calculated using the average shares method. |
| 2 | Based on net asset value, which does not reflect the sales charge, redemption fee or contingent deferred sales charge, if applicable. |
| 3 | This expense decrease is reflected in both the net expense and the net investment income ratios shown above. |
| Year Ended July 31 | 2013 | 2012 | 2011 | 2010 | 2009 |
| Net Asset Value, Beginning of Period | $12.26 | $12.12 | $10.27 | $9.66 | $13.73 |
| Income From Investment Operations: | |||||
| Net investment income (loss) | (0.03)1 | (0.04)1 | (0.07)1 | (0.04)1 | (0.02)1 |
| Net realized and unrealized gain (loss) on investments | 4.32 | 0.18 | 1.92 | 0.65 | (4.05) |
| TOTAL FROM INVESTMENT OPERATIONS | 4.29 | 0.14 | 1.85 | 0.61 | (4.07) |
| Less Distributions: | |||||
| Distributions from net investment income | — | — | — | (0.00)2 | — |
| Net Asset Value, End of Period | $16.55 | $12.26 | $12.12 | $10.27 | $9.66 |
| Total Return3 | 34.99% | 1.16% | 18.01% | 6.33% | (29.64)% |
| Ratios to Average Net Assets: | |||||
| Net expenses | 2.15% | 2.15% | 2.13% | 2.08% | 2.14% |
| Net investment income (loss) | (0.21)% | (0.32)% | (0.59)% | (0.36)% | (0.17)% |
| Expense waiver/reimbursement4 | 0.11% | 0.36% | 0.29% | 0.24% | 0.17% |
| Supplemental Data: | |||||
| Net assets, end of period (000 omitted) | $27,674 | $24,440 | $31,129 | $39,524 | $52,546 |
| Portfolio turnover | 99% | 164% | 154% | 135% | 290% |
| 1 | Per share numbers have been calculated using the average shares method. |
| 2 | Represents less than $0.01. |
| 3 | Based on net asset value, which does not reflect the sales charge, redemption fee or contingent deferred sales charge, if applicable. |
| 4 | This expense decrease is reflected in both the net expense and the net investment income (loss) ratios shown above. |
| Year Ended July 31 | 2013 | 2012 | 2011 | 2010 | 2009 |
| Net Asset Value, Beginning of Period | $12.62 | $12.44 | $10.52 | $9.91 | $14.10 |
| Income From Investment Operations: | |||||
| Net investment income (loss) | 0.021 | (0.00)1,2 | (0.04)1 | (0.01)1 | 0.011 |
| Net realized and unrealized gain (loss) on investments | 4.45 | 0.18 | 1.97 | 0.68 | (4.16) |
| TOTAL FROM INVESTMENT OPERATIONS | 4.47 | 0.18 | 1.93 | 0.67 | (4.15) |
| Less Distributions: | |||||
| Distributions from net investment income | — | — | (0.01) | (0.06) | (0.04) |
| Net Asset Value, End of Period | $17.09 | $12.62 | $12.44 | $10.52 | $9.91 |
| Total Return3 | 35.42% | 1.45% | 18.33% | 6.71% | (29.42)% |
| Ratios to Average Net Assets: | |||||
| Net expenses | 1.83% | 1.85% | 1.83% | 1.75% | 1.80% |
| Net investment income (loss) | 0.11% | (0.02)% | (0.31)% | (0.09)% | 0.15% |
| Expense waiver/reimbursement4 | 0.02% | 0.25% | 0.19% | 0.18% | 0.11% |
| Supplemental Data: | |||||
| Net assets, end of period (000 omitted) | $4,089 | $2,718 | $2,973 | $2,300 | $1,937 |
| Portfolio turnover | 99% | 164% | 154% | 135% | 290% |
| 1 | Per share numbers have been calculated using the average shares method. |
| 2 | Represents less than $0.01. |
| 3 | Based on net asset value. |
| 4 | This expense decrease is reflected in both the net expense and the net investment income (loss) ratios shown above. |
| Year Ended July 31 | 2013 | 2012 | 2011 | 2010 | 2009 |
| Net Asset Value, Beginning of Period | $12.87 | $12.61 | $10.66 | $10.02 | $14.22 |
| Income From Investment Operations: | |||||
| Net investment income | 0.121 | 0.091 | 0.051 | 0.081 | 0.091 |
| Net realized and unrealized gain (loss) on investments | 4.55 | 0.19 | 1.99 | 0.68 | (4.20) |
| TOTAL FROM INVESTMENT OPERATIONS | 4.67 | 0.28 | 2.04 | 0.76 | (4.11) |
| Less Distributions: | |||||
| Distributions from net investment income | (0.09) | (0.02) | (0.09) | (0.12) | (0.09) |
| Net Asset Value, End of Period | $17.45 | $12.87 | $12.61 | $10.66 | $10.02 |
| Total Return2 | 36.46% | 2.23% | 19.14% | 7.54% | (28.84)% |
| Ratios to Average Net Assets: | |||||
| Net expenses | 1.10% | 1.10% | 1.08% | 1.01% | 1.06% |
| Net investment income | 0.84% | 0.73% | 0.45% | 0.69% | 0.90% |
| Expense waiver/reimbursement3 | 0.05% | 0.27% | 0.19% | 0.20% | 0.12% |
| Supplemental Data: | |||||
| Net assets, end of period (000 omitted) | $39,932 | $39,101 | $43,197 | $41,958 | $50,031 |
| Portfolio turnover | 99% | 164% | 154% | 135% | 290% |
| 1 | Per share numbers have been calculated using the average shares method. |
| 2 | Based on net asset value. |
| 3 | This expense decrease is reflected in both the net expense and the net investment income ratios shown above. |
| Assets: | ||
| Total investment in securities, at value including $2,182,008 of investment in an affiliated holding (Note 5) (identified cost $86,549,292) | $105,740,118 | |
| Income receivable | 82,645 | |
| Receivable for investments sold | 420,908 | |
| Receivable for shares sold | 134,692 | |
| TOTAL ASSETS | 106,378,363 | |
| Liabilities: | ||
| Payable for investments purchased | $409,914 | |
| Payable for shares redeemed | 55,464 | |
| Payable for transfer agent fee | 29,735 | |
| Payable for Directors'/Trustees' fees (Note 5) | 187 | |
| Payable for auditing fees | 23,400 | |
| Payable for distribution services fee (Note 5) | 18,853 | |
| Payable for shareholder services fee (Note 5) | 9,598 | |
| Payable for share registration costs | 27,413 | |
| Accrued expenses (Note 5) | 16,955 | |
| TOTAL LIABILITIES | 591,519 | |
| Net assets for 6,175,593 shares outstanding | $105,786,844 | |
| Net Assets Consist of: | ||
| Paid-in capital | $197,721,904 | |
| Net unrealized appreciation of investments | 19,190,826 | |
| Accumulated net realized loss on investments | (111,612,209) | |
| Undistributed net investment income | 486,323 | |
| TOTAL NET ASSETS | $105,786,844 |
| Net Asset Value, Offering Price and Redemption Proceeds Per Share | ||
| Class A Shares: | ||
| Net asset value per share ($34,091,549 ÷ 1,975,593 shares outstanding), no par value, unlimited shares authorized | $17.26 | |
| Offering price per share (100/94.50 of $17.26) | $18.26 | |
| Redemption proceeds per share | $17.26 | |
| Class C Shares: | ||
| Net asset value per share ($27,673,669 ÷ 1,672,425 shares outstanding), no par value, unlimited shares authorized | $16.55 | |
| Offering price per share | $16.55 | |
| Redemption proceeds per share (99.00/100 of $16.55) | $16.38 | |
| Class R Shares: | ||
| Net asset value per share ($4,089,345 ÷ 239,282 shares outstanding), no par value, unlimited shares authorized | $17.09 | |
| Offering price per share | $17.09 | |
| Redemption proceeds per share | $17.09 | |
| Institutional Shares: | ||
| Net asset value per share ($39,932,281 ÷ 2,288,293 shares outstanding), no par value, unlimited shares authorized | $17.45 | |
| Offering price per share | $17.45 | |
| Redemption proceeds per share | $17.45 |
| Investment Income: | |||
| Dividends (including $2,284 received from an affiliated holding (Note 5) and net of foreign taxes withheld of $585) | $1,973,960 | ||
| Expenses: | |||
| Investment adviser fee (Note 5) | $761,160 | ||
| Administrative fee (Note 5) | 95,674 | ||
| Custodian fees | 15,521 | ||
| Transfer agent fee (Note 2) | 165,786 | ||
| Directors'/Trustees' fees (Note 5) | 1,650 | ||
| Auditing fees | 23,400 | ||
| Legal fees | 7,647 | ||
| Portfolio accounting fees | 79,518 | ||
| Distribution services fee (Note 5) | 206,619 | ||
| Shareholder services fee (Note 5) | 139,131 | ||
| Account administration fee (Note 2) | 242 | ||
| Share registration costs | 53,138 | ||
| Printing and postage | 23,347 | ||
| Insurance premiums (Note 5) | 4,079 | ||
| Miscellaneous (Note 5) | 7,469 | ||
| TOTAL EXPENSES | 1,584,381 | ||
| Waivers and Reimbursements: | |||
| Waiver/reimbursement of investment adviser fee (Note 5) | $(24,331) | ||
| Waiver of administrative fee (Note 5) | (4,588) | ||
| Reimbursement of transfer agent fee (Note 2) | (67,889) | ||
| TOTAL WAIVERS AND REIMBURSEMENTS | (96,808) | ||
| Net expenses | 1,487,573 | ||
| Net investment income | 486,387 | ||
| Realized and Unrealized Gain on Investments: | |||
| Net realized gain on investments | 16,243,619 | ||
| Net change in unrealized appreciation of investments | 14,544,294 | ||
| Net realized and unrealized gain on investments | 30,787,913 | ||
| Change in net assets resulting from operations | $31,274,300 |
| Year Ended July 31 | 2013 | 2012 |
| Increase (Decrease) in Net Assets | ||
| Operations: | ||
| Net investment income | $486,387 | $367,706 |
| Net realized gain on investments | 16,243,619 | 2,904,136 |
| Net change in unrealized appreciation/depreciation of investments | 14,544,294 | (2,143,917) |
| CHANGE IN NET ASSETS RESULTING FROM OPERATIONS | 31,274,300 | 1,127,925 |
| Distributions to Shareholders: | ||
| Distributions from net investment income | ||
| Class A Shares | (106,540) | — |
| Institutional Shares | (261,222) | (67,721) |
| CHANGE IN NET ASSETS RESULTING FROM DISTRIBUTIONS TO SHAREHOLDERS | (367,762) | (67,721) |
| Share Transactions: | ||
| Proceeds from sale of shares | 11,741,209 | 7,857,700 |
| Net asset value of shares issued to shareholders in payment of distributions declared | 356,920 | 65,854 |
| Cost of shares redeemed | (32,842,623) | (30,884,509) |
| CHANGE IN NET ASSETS RESULTING FROM SHARE TRANSACTIONS | (20,744,494) | (22,960,955) |
| Change in net assets | 10,162,044 | (21,900,751) |
| Net Assets: | ||
| Beginning of period | 95,624,800 | 117,525,551 |
| End of period (including undistributed net investment income of $486,323 and $367,698, respectively) | $105,786,844 | $95,624,800 |
| ■ | Equity securities listed on an exchange or traded through a regulated market system are valued at their last reported sale price or official closing price in their principal exchange or market. |
| ■ | Shares of other mutual funds are valued based upon their reported NAVs. |
| ■ | Fixed-income securities acquired with remaining maturities greater than 60 days are fair valued using price evaluations provided by a pricing service approved by the Board of Trustees (the “Trustees”). |
| ■ | Fixed-income securities and repurchase agreements acquired with remaining maturities of 60 days or less are valued at their amortized cost (adjusted for the accretion of any discount or amortization of any premium), unless the issuer's creditworthiness is impaired or other factors indicate that amortized cost is not an accurate estimate of the investment's fair value, in which case it would be valued in the same manner as a longer-term security. |
| ■ | Derivative contracts listed on exchanges are valued at their reported settlement or closing price. |
| ■ | Over-the-counter (OTC) derivative contracts are fair valued using price evaluations provided by a pricing service approved by the Trustees. |
| ■ | For securities that are fair valued in accordance with procedures established by and under the general supervision of the Trustees, certain factors may be considered such as: the purchase price of the security, information obtained by contacting the issuer, analysis of the issuer's financial statements or other available documents, fundamental analytical data, the nature and duration of restrictions on disposition, the movement of the market in which the security is normally traded and public trading in similar securities of the issuer or comparable issuers. |
| Transfer Agent Fees Incurred | Transfer Agent Fees Reimbursed | Account Administration Fees Incurred | |
| Class A Shares | $64,322 | $(40,425) | $141 |
| Class C Shares | 51,494 | (19,459) | 101 |
| Class R Shares | 9,752 | — | — |
| Institutional Shares | 40,218 | (8,005) | — |
| TOTAL | $165,786 | $(67,889) | $242 |
| Year Ended July 31 | 2013 | 2012 | ||
| Class A Shares: | Shares | Amount | Shares | Amount |
| Shares sold | 231,485 | $3,568,491 | 174,952 | $2,147,251 |
| Shares issued to shareholders in payment of distributions declared | 7,539 | 102,227 | — | — |
| Shares redeemed | (570,687) | (8,308,541) | (1,090,509) | (13,285,030) |
| NET CHANGE RESULTING FROM CLASS A SHARE TRANSACTIONS | (331,663) | $(4,637,823) | (915,557) | $(11,137,779) |
| Year Ended July 31 | 2013 | 2012 | ||
| Class C Shares: | Shares | Amount | Shares | Amount |
| Shares sold | 266,944 | $3,858,944 | 246,589 | $2,944,629 |
| Shares redeemed | (588,695) | (8,276,741) | (821,569) | (9,611,299) |
| NET CHANGE RESULTING FROM CLASS C SHARE TRANSACTIONS | (321,751) | $(4,417,797) | (574,980) | $(6,666,670) |
| Year Ended July 31 | 2013 | 2012 | ||
| Class R Shares: | Shares | Amount | Shares | Amount |
| Shares sold | 92,593 | $1,367,905 | 94,213 | $1,129,971 |
| Shares redeemed | (68,716) | (1,004,027) | (117,870) | (1,436,974) |
| NET CHANGE RESULTING FROM CLASS R SHARE TRANSACTIONS | 23,877 | $363,878 | (23,657) | $(307,003) |
| Year Ended July 31 | 2013 | 2012 | ||
| Institutional Shares: | Shares | Amount | Shares | Amount |
| Shares sold | 199,183 | $2,945,869 | 136,805 | $1,635,849 |
| Shares issued to shareholders in payment of distributions declared | 18,604 | 254,693 | 5,447 | 65,854 |
| Shares redeemed | (967,066) | (15,253,314) | (529,245) | (6,551,206) |
| NET CHANGE RESULTING FROM INSTITUTIONAL SHARE TRANSACTIONS | (749,279) | $(12,052,752) | (386,993) | $(4,849,503) |
| NET CHANGE RESULTING FROM TOTAL FUND SHARE TRANSACTIONS | (1,378,816) | $(20,744,494) | (1,901,187) | $(22,960,955) |
| 2013 | 2012 | |
| Ordinary income | $367,762 | $67,721 |
| Undistributed ordinary income | $486,323 |
| Net unrealized appreciation | $19,053,558 |
| Capital loss carryforwards | $(111,474,940) |
| Expiration Year | Short-Term | Long-Term | Total |
| 2017 | $41,884,059 | NA | $41,884,059 |
| 2018 | $69,590,881 | NA | $69,590,881 |
| Administrative Fee | Average Daily Net Assets of the Investment Complex |
| 0.150% | on the first $5 billion |
| 0.125% | on the next $5 billion |
| 0.100% | on the next $10 billion |
| 0.075% | on assets in excess of $20 billion |
| Share Class Name | Percentage of Average Daily Net Assets of Class |
| Class A Shares | 0.05% |
| Class C Shares | 0.75% |
| Class R Shares | 0.50% |
| Distribution Services Fees Incurred | |
| Class C Shares | $190,127 |
| Class R Shares | 16,492 |
| TOTAL | $206,619 |
| Service Fees Incurred | |
| Class A Shares | $75,857 |
| Class C Shares | 63,274 |
| TOTAL | $139,131 |
| Federated Prime Value Obligations Fund, Institutional Shares | |
| Balance of Shares Held 7/31/2012 | 1,319,746 |
| Purchases/Additions | 18,195,444 |
| Sales/Reductions | (17,333,182) |
| Balance of Shares Held 7/31/2013 | 2,182,008 |
| Value | $2,182,008 |
| Dividend Income | $2,284 |
| Purchases | $97,792,063 |
| Sales | $119,160,316 |
September 23, 2013
| Beginning Account Value 2/1/2013 | Ending Account Value 7/31/2013 | Expenses Paid During Period1 | |
| Actual: | |||
| Class A Shares | $1,000 | $1,175.70 | $7.28 |
| Class C Shares | $1,000 | $1,171.30 | $11.57 |
| Class R Shares | $1,000 | $1,173.00 | $9.97 |
| Institutional Shares | $1,000 | $1,176.70 | $5.94 |
| Hypothetical (assuming a 5% return before expenses): | |||
| Class A Shares | $1,000 | $1,018.10 | $6.76 |
| Class C Shares | $1,000 | $1,014.13 | $10.74 |
| Class R Shares | $1,000 | $1,015.62 | $9.25 |
| Institutional Shares | $1,000 | $1,019.34 | $5.51 |
| 1 | Expenses are equal to the Fund's annualized net expense ratios, multiplied by the average account value over the period, multiplied by 181/365 (to reflect the one-half-year period). The annualized net expense ratios are as follows: |
| Class A Shares | 1.35% |
| Class C Shares | 2.15% |
| Class R Shares | 1.85% |
| Institutional Shares | 1.10% |
| Name Birth Date Positions Held with Trust Date Service Began | Principal Occupation(s) for Past Five Years, Other Directorships Held and Previous Position(s) |
| John F. Donahue* Birth Date: July 28, 1924 Trustee Began serving: June 2006 | Principal Occupations: Director or Trustee of the Federated Fund Family; Chairman and Director, Federated Investors, Inc.; Chairman of the Federated Fund Family's Executive Committee. Previous Positions: Chairman of the Federated Fund Family; Trustee, Federated Investment Management Company; Chairman and Director, Federated Investment Counseling. |
| Name Birth Date Positions Held with Trust Date Service Began | Principal Occupation(s) for Past Five Years, Other Directorships Held and Previous Position(s) |
| J. Christopher Donahue* Birth Date: April 11, 1949 President and Trustee Began serving: May 2006 | Principal Occupations: Principal Executive Officer and President of certain of the Funds in the Federated Fund Family; Director or Trustee of certain of the Funds in the Federated Fund Family; President, Chief Executive Officer and Director, Federated Investors, Inc.; Chairman and Trustee, Federated Investment Management Company; Trustee, Federated Investment Counseling; Chairman and Director, Federated Global Investment Management Corp.; Chairman, Federated Equity Management Company of Pennsylvania and Passport Research, Ltd. (investment advisory subsidiary of Federated); Trustee, Federated Shareholder Services Company; Director, Federated Services Company. Previous Positions: President, Federated Investment Counseling; President and Chief Executive Officer, Federated Investment Management Company, Federated Global Investment Management Corp. and Passport Research, Ltd. |
| * | Family relationships and reasons for “interested” status: John F. Donahue is the father of J. Christopher Donahue; both are “interested” due to their beneficial ownership of shares of Federated Investors, Inc. and the positions they hold with Federated and its subsidiaries. |
| Name Birth Date Positions Held with Trust Date Service Began | Principal Occupation(s) for Past Five Years, Other Directorships Held, Previous Position(s) and Qualifications |
| Maureen Lally-Green Birth Date: July 5, 1949 Trustee Began serving: August 2009 | Principal Occupations: Director or Trustee of the Federated Fund Family; Director, Office of Church Relations, and Associate General Secretary, Diocese of Pittsburgh; Adjunct Professor of Law, Duquesne University School of Law. Other Directorships Held: Director, Auberle; Member, Pennsylvania State Board of Education; Director, Saint Vincent College; Director, Ireland Institute of Pittsburgh; Chair and Director, UPMC Mercy Hospital; Regent, St. Vincent Seminary; Director, Epilepsy Foundation of Western and Central Pennsylvania; Director, Saint Thomas More Society, Allegheny County; Director, Our Campaign for the Church Alive, Inc. Previous Position: Pennsylvania Superior Court Judge. Qualifications: Legal and director experience. |
| Name Birth Date Positions Held with Trust Date Service Began | Principal Occupation(s) for Past Five Years, Other Directorships Held, Previous Position(s) and Qualifications |
| Peter E. Madden Birth Date: March 16, 1942 Trustee Began serving: June 2006 | Principal Occupation: Director or Trustee, and Chairman of the Board of Directors or Trustees, of the Federated Fund Family. Previous Positions: Representative, Commonwealth of Massachusetts General Court; President, Chief Operating Officer and Director, State Street Bank and Trust Company and State Street Corporation (retired); Director, VISA USA and VISA International; Chairman and Director, Massachusetts Bankers Association; Director, Depository Trust Corporation; Director, The Boston Stock Exchange. Qualifications: Business management, mutual fund services and director experience. |
| Charles F. Mansfield, Jr. Birth Date: April 10, 1945 Trustee Began serving: June 2006 | Principal Occupations: Director or Trustee of the Federated Fund Family; Management Consultant. Previous Positions: Chief Executive Officer, PBTC International Bank; Partner, Arthur Young & Company (now Ernst & Young LLP); Chief Financial Officer of Retail Banking Sector, Chase Manhattan Bank; Senior Vice President, HSBC Bank USA (formerly Marine Midland Bank); Vice President, Citibank; Assistant Professor of Banking and Finance, Frank G. Zarb School of Business, Hofstra University; Executive Vice President, DVC Group, Inc. (marketing, communications and technology). Qualifications: Banking, business management, education and director experience. |
| Thomas M. O'Neill Birth Date: June 14, 1951 Trustee Began serving: October 2006 | Principal Occupations: Director or Trustee, Vice Chairman of the Audit Committee of the Federated Fund Family; Sole Proprietor, Navigator Management Company (investment and strategic consulting). Other Directorships Held: Board of Overseers, Children's Hospital of Boston; Visiting Committee on Athletics, Harvard College; Board of Directors, Medicines for Humanity; Board of Directors, The Golisano Children's Museum of Naples, Florida. Previous Positions: Chief Executive Officer and President, Managing Director and Chief Investment Officer, Fleet Investment Advisors; President and Chief Executive Officer, Aeltus Investment Management, Inc.; General Partner, Hellman, Jordan Management Co., Boston, MA; Chief Investment Officer, The Putnam Companies, Boston, MA; Credit Analyst and Lending Officer, Fleet Bank; Director and Consultant, EZE Castle Software (investment order management software); Director, Midway Pacific (lumber). Qualifications: Business management, mutual fund, director and investment experience. |
| Name Birth Date Positions Held with Trust Date Service Began | Principal Occupation(s) for Past Five Years, Other Directorships Held, Previous Position(s) and Qualifications |
| John S. Walsh Birth Date: November 28, 1957 Trustee Began serving: June 2006 | Principal Occupations: Director or Trustee, Chairman of the Audit Committee of the Federated Fund Family; President and Director, Heat Wagon, Inc. (manufacturer of construction temporary heaters); President and Director, Manufacturers Products, Inc. (distributor of portable construction heaters); President, Portable Heater Parts, a division of Manufacturers Products, Inc. Previous Position: Vice President, Walsh & Kelly, Inc. Qualifications: Business management and director experience. |
| Name Birth Date Address Positions Held with Trust Date Service Began | Principal Occupation(s) for Past Five Years and Previous Position(s) |
| John W. McGonigle Birth Date: October 26, 1938 Secretary Officer since: May 2006 | Principal Occupations: Executive Vice President and Secretary of the Federated Fund Family; Vice Chairman, Executive Vice President, Secretary and Director, Federated Investors, Inc. Previous Positions: Trustee, Federated Investment Management Company and Federated Investment Counseling; Director, Federated Global Investment Management Corp., Federated Services Company and Federated Securities Corp. |
| Lori A. Hensler, CPA Birth Date: January 6, 1967 TREASURER Officer since: April 2013 | Principal Occupations: Principal Financial Officer and Treasurer of the Federated Fund Family; Senior Vice President, Federated Administrative Services; Financial and Operations Principal for Federated Securities Corp. and Edgewood Services, Inc.; and Assistant Treasurer, Federated Investors Trust Company. Previous Positions: Controller of Federated Investors, Inc.; Senior Vice President and Assistant Treasurer, Federated Investors Management Company; Treasurer, Federated Investors Trust Company; Assistant Treasurer, Federated Administrative Services, Federated Administrative Services, Inc., Federated Securities Corp., Edgewood Services, Inc., Federated Advisory Services Company, Federated Equity Management Company of Pennsylvania, Federated Global Investment Management Corp., Federated Investment Counseling, Federated Investment Management Company, Passport Research, Ltd., and Federated MDTA, LLC; Financial and Operations Principal for Federated Securities Corp., Edgewood Services, Inc. and Southpointe Distribution Services, Inc. |
| Name Birth Date Address Positions Held with Trust Date Service Began | Principal Occupation(s) for Past Five Years and Previous Position(s) |
| Peter J. Germain Birth Date: September 3, 1959 CHIEF LEGAL OFFICER Officer since: June 2006 | Principal Occupations: Mr. Germain is Chief Legal Officer of the Federated Fund Family. He is General Counsel and Vice President, Federated Investors, Inc.; President, Federated Administrative Services and Federated Administrative Services, Inc.; Vice President, Federated Securities Corp.; Secretary, Federated Private Asset Management, Inc.; and Secretary, Retirement Plan Service Company of America. Mr. Germain joined Federated in 1984 and is a member of the Pennsylvania Bar Association. Previous Positions: Deputy General Counsel, Special Counsel, Managing Director of Mutual Fund Services, Federated Investors, Inc.; Senior Vice President, Federated Services Company; and Senior Corporate Counsel, Federated Investors, Inc. |
| Stephen F. Auth Birth Date: September 3, 1956 450 Lexington Avenue Suite 3700 New York, NY 10017-3943 CHIEF INVESTMENT OFFICER Began serving: June 2012 | Principal Occupations: Stephen F. Auth is Chief Investment Officer of various Funds in the Federated Fund Family; Executive Vice President, Federated Investment Counseling, Federated Global Investment Management Corp. and Federated Equity Management Company of Pennsylvania. Previous Positions: Executive Vice President, Federated Investment Management Company and Passport Research, Ltd. (investment advisory subsidiary of Federated); Senior Vice President, Global Portfolio Management Services Division; Senior Vice President, Federated Investment Management Company and Passport Research, Ltd.; Senior Managing Director and Portfolio Manager, Prudential Investments. |
| Brian P. Bouda Birth Date: February 28, 1947 CHIEF COMPLIANCE OFFICER AND SENIOR VICE PRESIDENT Officer since: June 2006 | Principal Occupations: Senior Vice President and Chief Compliance Officer of the Federated Fund Family; Vice President and Chief Compliance Officer of Federated Investors, Inc. and Chief Compliance Officer of certain of its subsidiaries. Mr. Bouda joined Federated in 1999 and is a member of the American Bar Association and the State Bar Association of Wisconsin. Previous Positions: Served in Senior Management positions with a large regional banking organization. |
| Daniel Mahr Birth Date: April 9, 1981 125 High Street Oliver Tower 21st Floor Boston, MA 02110-2704 Vice President Officer since: June 2012 Portfolio Manager since: August 2006 | Principal Occupations: Daniel Mahr has been the Fund's Portfolio Manager since August 2006. Mr. Mahr joined the MDT Advisers Investment Team in 2002. As Managing Director, Research, he is responsible for leading the Investment Team as it relates to the ongoing design, development and implementation of the Optimum Q Process. He is Vice President of the Trust with respect to the Fund. Mr. Mahr received his A.B., Computer Science from Harvard College and his S.M., Computer Science from Harvard University. |
The Board also received financial information about Federated, including information regarding the compensation and benefits Federated derived from its relationships with the Federated funds. This information covered not only the fees under the advisory contracts, but also fees received by Federated's subsidiaries for providing other services to the Federated funds under separate contracts (e.g., for serving as the Federated funds' administrator). The information also detailed any indirect benefit Federated may derive from its receipt of research services from brokers who execute Federated fund trades. In addition, the Board considered the fact that, in order for a fund to be competitive in the marketplace, Federated and its affiliates frequently waived fees and/or reimbursed expenses and have disclosed to fund investors and/or indicated to the Board their intention to do so in the future, where appropriate. Moreover, the Board receives regular reporting as to the institution, adjustment or elimination of these voluntary waivers.

Federated Investors Funds
4000 Ericsson Drive
Warrendale, PA 15086-7561
or call 1-800-341-7400.
CUSIP 31421R205
CUSIP 31421R718
CUSIP 31421R304
2013 ©Federated Investors, Inc.
| Share Class | Ticker |
| A | QABGX |
| C | QCBGX |
| R | QKBGX |
| Institutional | QIBGX |
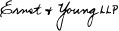
| 1 | The Fund's Blended Index, which reflects 60% of the S&P 500 and 40% of the BAB, is being used for comparison purposes because, although it is not the Fund's broad-based securities market index, the Fund's Adviser believes it is more reflective of the Fund's balanced investment style. |
| 2 | Please see the footnotes to the line graphs below for definitions of, and further information about, the S&P 500 Index, one of the Fund's broad-based securities market indices. The S&P 500's return for the 12-month reporting period was 24.98%. |
| 3 | Please see the footnotes to the line graphs below for definitions of, and further information about, the BAB, one of the Fund's broad-based securities market indices. The BAB's return for the 12-month reporting period was -1.90%. |
| 4 | Please see the footnotes to the line graphs below for definitions of, and further information about, the MMACA. |
| 5 | The Russell 3000® Index measures the performance of the largest 3,000 U.S. companies representing approximately 98% of the investable U.S. equity market. The Russell 3000® Index is constructed to provide a comprehensive, unbiased, and stable barometer of the broad market and is completely reconstituted annually to ensure new and growing equities are reflected. The index is unmanaged, and it is not possible to invest directly in an index. |
| 6 | The Russell 2000® Index measures the performance of the small-cap segment of the U.S. equity universe. The Russell 2000® Index is a subset of the Russell 3000® Index representing approximately 10% of the total market capitalization of that index. It includes approximately 2000 of the smallest securities based on a combination of their market cap and current index membership. The Russell 2000® Index is constructed to provide a comprehensive and unbiased small-cap barometer and is completely reconstituted annually to ensure larger stocks do not distort the performance and characteristics of the true small-cap opportunity set. The index is unmanaged, and it is not possible to invest directly in an index. |
| 7 | The Russell Midcap® Index measures the performance of the mid-cap segment of the U.S. equity universe. The Russell Midcap® Index is a subset of the Russell 1000® Index. It includes approximately 800 of the smallest securities based on a combination of their market cap and current index membership. The Russell Midcap® Index represents approximately 31% of the total market capitalization of the Russell 1000® companies. The Russell Midcap® Index is constructed to provide a comprehensive and unbiased barometer for the mid-cap segment. The Russell Midcap Index is completely reconstituted annually to ensure larger stocks do not distort the performance and characteristics of the true mid-cap opportunity set. The index is unmanaged, and it is not possible to invest directly in an index. |
| 8 | The Russell Top 200® Index measures the performance of the largest cap segment of the U.S. equity universe. The Russell Top 200® Index is a subset of the Russell 3000® Index. It includes approximately 200 of the largest securities based on a combination of their market cap and current index membership and represents approximately 68% of the U.S. market. The Russell Top 200® Index is constructed to provide a comprehensive and unbiased barometer for this very large cap segment and is completely reconstituted annually to ensure new and growing equities are reflected. The index is unmanaged, and it is not possible to invest directly in an index. |
| 9 | The Russell 3000® Value Index measures the performance of the broad value segment of U.S. equity value universe. It includes those Russell 3000® Index companies with lower price-to-book ratios and lower forecasted growth values. The Russell 3000® Value Index is constructed to provide a comprehensive, unbiased and stable barometer of the broad value market. The Russell 3000® Value Index is completely reconstituted annually to ensure new and growing equities are included and that the represented companies continue to reflect value characteristics. The index is unmanaged, and it is not possible to invest directly in an index. |
| 10 | The Russell 3000® Growth Index measures the performance of the broad growth segment of the U.S. equity universe. It includes those Russell 3000® Index companies with higher price-to-book ratios and higher forecasted growth values. The Russell 3000® Growth Index is constructed to provide a comprehensive, unbiased and stable barometer of the broad growth market. The Russell 3000® Growth Index is completely reconstituted annually to ensure new and growing equities are included and that the represented companies continue to reflect growth characteristics. The index is unmanaged, and it is not possible to invest directly in an index. |
| 11 | The Standard & Poor's BMI U.S. REIT Index is a float-adjusted market capitalization weighted index that tracks the market performance of U.S. Real Estate Investment Trusts, known as REITs. Investments in REITs involve special risks associated with an investment in real estate, such as limited liquidity and interest rate risks. The index is unmanaged, and it is not possible to invest directly in an index. |
| 12 | International investing involves special risks including currency risk, increased volatility of foreign securities, political risks and differences in auditing and other financial standards. |
| 13 | The MSCI EAFE Index measures international equity performance. It comprises 22 MSCI country indices, representing the developed markets outside of North America. The index is unmanaged, and it is not possible to invest directly in an index. |
| 14 | Prices of emerging markets securities can be significantly more volatile than the prices of securities in developed countries, and currency risks and political risks are accentuated in emerging markets. |
| 15 | The MSCI Emerging Markets Index is an unmanaged index consisting of 21 emerging market countries. The index is unmanaged, and it is not possible to invest directly in an index. |
| 16 | High-yield, lower-rated securities generally entail greater market, credit and liquidity risk than investment-grade securities and may include higher volatility and higher risk of default. Bond prices are sensitive to changes in interest rates, and a rise in interest rates can cause a decline in their prices. |
| 17 | The value of some mortgage-backed securities may be particularly sensitive to changes in prevailing interest rates, and although the securities are generally supported by some form of government or private insurance, there is no assurance that private guarantors or insurers will meet their obligations. |
| Share Class | 1 Year | 5 Years | 10 Years |
| Class A Shares6 | 12.72% | 3.40% | 5.70% |
| Class C Shares6 | 17.41% | 3.81% | 5.49% |
| Class R Shares6 | 18.84% | 4.10% | 5.83% |
| Institutional Shares | 19.63% | 4.84% | 6.56% |
| Federated MDT Balanced Fund - | Class A Shares | S&P 500 | BAB | Blended Index | Morningstar Moderate Allocation Category Average |
| 7/31/2003 | 9,450 | 10,000 | 10,000 | 10,000 | 10,000 |
| 7/31/2004 | 10,876 | 11,317 | 10,484 | 10,939 | 10,986 |
| 7/31/2005 | 12,673 | 12,907 | 10,986 | 10,950 | 12,321 |
| 7/31/2006 | 13,351 | 13,603 | 11,146 | 11,368 | 12,928 |
| 7/31/2007 | 14,738 | 15,798 | 11,769 | 12,722 | 14,498 |
| 7/31/2008 | 13,912 | 14,045 | 12,493 | 12,188 | 13,593 |
| 7/31/2009 | 11,638 | 11,242 | 13,473 | 11,111 | 12,008 |
| 7/31/2010 | 12,628 | 12,796 | 14,673 | 12,429 | 13,435 |
| 7/31/2011 | 14,355 | 15,311 | 15,324 | 14,115 | 15,244 |
| 7/31/2012 | 14,592 | 16,709 | 16,435 | 15,298 | 15,734 |
| 7/31/2013 | 17,406 | 20,886 | 16,122 | 17,476 | 17,969 |
| ■ | Total returns shown include the maximum sales charge of 5.50% ($10,000 investment minus $550 sales charge = $9,450). |
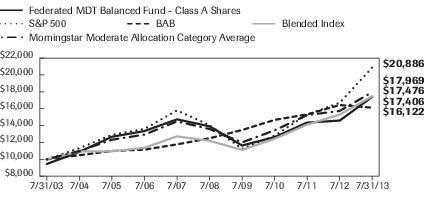
| Federated MDT Balanced Fund - | Class C Shares | S&P 500 | BAB | Blended Index | Morningstar Moderate Allocation Category Average |
| 7/31/2003 | 10,000 | 10,000 | 10,000 | 10,000 | 10,000 |
| 7/31/2004 | 11,424 | 11,317 | 10,484 | 10,939 | 10,986 |
| 7/31/2005 | 13,212 | 12,907 | 10,986 | 10,950 | 12,321 |
| 7/31/2006 | 13,799 | 13,603 | 11,146 | 11,368 | 12,928 |
| 7/31/2007 | 15,111 | 15,798 | 11,769 | 12,722 | 14,498 |
| 7/31/2008 | 14,161 | 14,045 | 12,493 | 12,188 | 13,593 |
| 7/31/2009 | 11,761 | 11,242 | 13,473 | 11,111 | 12,008 |
| 7/31/2010 | 12,659 | 12,796 | 14,673 | 12,429 | 13,435 |
| 7/31/2011 | 14,285 | 15,311 | 15,324 | 14,115 | 15,244 |
| 7/31/2012 | 14,418 | 16,709 | 16,435 | 15,298 | 15,734 |
| 7/31/2013 | 17,072 | 20,886 | 16,122 | 17,476 | 17,969 |
| ■ | Total returns shown include the maximum contingent deferred sales charge of 1.00%, as applicable. |
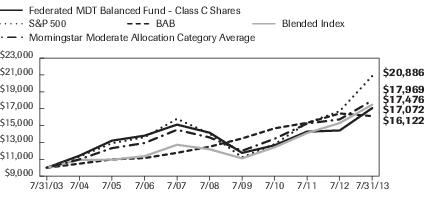
| Federated MDT Balanced Fund - | Class R Shares | S&P 500 | BAB | Blended Index | Morningstar Moderate Allocation Category Average |
| 7/31/2003 | 10,000 | 10,000 | 10,000 | 10,000 | 10,000 |
| 7/31/2004 | 11,452 | 11,317 | 10,484 | 10,939 | 10,986 |
| 7/31/2005 | 13,278 | 12,907 | 10,986 | 10,950 | 12,321 |
| 7/31/2006 | 13,918 | 13,603 | 11,146 | 11,368 | 12,928 |
| 7/31/2007 | 15,335 | 15,798 | 11,769 | 12,722 | 14,498 |
| 7/31/2008 | 14,413 | 14,045 | 12,493 | 12,188 | 13,593 |
| 7/31/2009 | 11,998 | 11,242 | 13,473 | 11,111 | 12,008 |
| 7/31/2010 | 12,960 | 12,796 | 14,673 | 12,429 | 13,435 |
| 7/31/2011 | 14,655 | 15,311 | 15,324 | 14,115 | 15,244 |
| 7/31/2012 | 14,830 | 16,709 | 16,435 | 15,298 | 15,734 |
| 7/31/2013 | 17,623 | 20,886 | 16,122 | 17,476 | 17,969 |

| Federated MDT Balanced Fund - | Institutional Shares | S&P 500 | BAB | Blended Index | Morningstar Moderate Allocation Category Average |
| 7/31/2003 | 10,000 | 10,000 | 10,000 | 10,000 | 10,000 |
| 7/31/2004 | 11,538 | 11,317 | 10,484 | 10,939 | 10,986 |
| 7/31/2005 | 13,477 | 12,907 | 10,986 | 10,950 | 12,321 |
| 7/31/2006 | 14,234 | 13,603 | 11,146 | 11,368 | 12,928 |
| 7/31/2007 | 15,744 | 15,798 | 11,769 | 12,722 | 14,498 |
| 7/31/2008 | 14,906 | 14,045 | 12,493 | 12,188 | 13,593 |
| 7/31/2009 | 12,501 | 11,242 | 13,473 | 11,111 | 12,008 |
| 7/31/2010 | 12,594 | 12,796 | 14,673 | 12,429 | 13,435 |
| 7/31/2011 | 15,495 | 15,311 | 15,324 | 14,115 | 15,244 |
| 7/31/2012 | 15,785 | 16,709 | 16,435 | 15,298 | 15,734 |
| 7/31/2013 | 18,884 | 20,886 | 16,122 | 17,476 | 17,969 |
| 1 | Represents a hypothetical investment of $10,000 in the Fund after deducting applicable sales charges: for Class A Shares, the maximum sales charge of 5.50% ($10,000 investment minus $550 sales charge = $9,450); for Class C Shares, a 1.00% contingent deferred sales charge would be applied on any redemption less than one year from the purchase date. The Fund's performance assumes the reinvestment of all dividends and distributions. The S&P 500 and BAB have been adjusted to reflect reinvestment of dividends on securities in the indexes. |
| 2 | The Fund is the successor to the MDT Balanced Fund pursuant to a reorganization that took place on December 8, 2006. Prior to that date, the Fund had no investment operations. Accordingly, the performance information shown for periods prior to that date is that of the MDT Balanced Fund. |
| 3 | The S&P 500 Index, a broad-based securities market index of the Fund, is an unmanaged capitalization-weighted index of 500 stocks designed to measure performance of the broad domestic economy through changes in the aggregate market value of 500 stocks representing all major industries. The S&P 500 is unmanaged and, unlike the Fund, is not affected by cash flows. It is not possible to invest |
| directly in an index. The S&P 500 is not adjusted to reflect sales charges, expenses or other fees that the Securities and Exchange Commission requires to be reflected in the Fund's performance. | |
| 4 | The BAB Index, a broad-based securities market index of the Fund, is an unmanaged index composed of securities from the Barclay's Government/Corporate Bond Index, Mortgage-Backed Securities Index and the Asset-Backed Securities Index. Total return comprises price appreciation/depreciation and income as a percentage of the original investment. Indices are rebalanced monthly by market capitalization. The BAB is unmanaged and, unlike the Fund, is not affected by cash flows. It is not possible to invest directly in an index. The BAB is not adjusted to reflect sales charges, expenses or other fees that the Securities and Exchange Commission requires to be reflected in the Fund's performance. |
| 5 | Morningstar figures represent the average of the total returns reported by all the mutual funds designated by Morningstar as falling into the respective category indicated. Morningstar figures do not reflect sales charges. It is not possible to invest directly in an average. |
| 6 | The start of performance date for the Fund's Class A Shares, Class C Shares and Class R Shares was October 1, 2002. Class A Shares and Class C Shares commenced operations on September 15, 2005, and Class R Shares commenced operations on December 12, 2006, respectively. Performance results shown before those dates are for the Fund's Institutional Shares and have been adjusted for the maximum sales charges, maximum contingent deferred sales charges and total annual operating expenses applicable to each class. The Fund's Institutional Shares commenced operations on October 1, 2002. Subject to the expense adjustments noted above, the Fund's Class A Shares, Class C Shares and Class R Shares annual returns would be substantially similar to those of the Institutional Shares because Shares of each class are invested in the same portfolio of securities. |
| Security Type | Percentage of Total Net Assets |
| Domestic Equity Securities | 57.7% |
| Corporate Debt Securities | 13.5% |
| International Equity Securities (including International Exchange-Traded Fund) | 8.6% |
| U.S. Treasury Securities2 | 4.9% |
| Mortgage-Backed Securities3 | 4.8% |
| Collateralized Mortgage Obligations | 2.0% |
| Trade Finance Agreements | 0.8% |
| Asset-Backed Securities | 0.7% |
| Foreign Debt Securities | 0.7% |
| Commercial Mortgage-Backed Securities | 0.2% |
| Municipal Security | 0.1% |
| Floating Rate Loan4 | 0.0% |
| Cash Equivalents5 | 7.1% |
| Derivative Contracts6 | (0.1)% |
| Other Assets and Liabilities—Net7 | (1.0)% |
| TOTAL | 100.0% |
| 1 | See the Fund's Prospectus for a description of the principal types of securities in which the Fund invests. As of the date specified above, the Fund owned shares of one or more affiliated investment companies. For purposes of this table, the affiliated investment company (other than an affiliated money market mutual fund) is not treated as a single portfolio security, but rather the Fund is treated as owning a pro rata portion of each security and each other asset and liability owned by the affiliated investment company. Accordingly, the percentages of total net assets shown in the table will differ from those presented on the Portfolio of Investments. |
| 2 | Also includes $90,330 held in U.S. Treasuries pledged as collateral to ensure the Fund is able to satisfy the obligations of its outstanding futures contracts. |
| 3 | For purposes of this table, Mortgage-Backed Securities include mortgage-backed securities guaranteed by Government Sponsored Entities. |
| 4 | Represents less than 0.1%. |
| 5 | Cash Equivalents include any investments in money market mutual funds and/or overnight repurchase agreements. |
| 6 | Based upon net unrealized appreciation (depreciation) or value of the derivative contracts as applicable. Derivative contracts may consist of futures, forwards, options and swaps. The impact of a derivative contract on the Fund's performance may be larger than its unrealized appreciation (depreciation) or value may indicate. In many cases, the notional value or amount of a derivative contract may provide a better indication of the contract's significance to the portfolio. More complete information regarding the Fund's direct investments in derivative contracts, including unrealized appreciation (depreciation), value and notional values or amounts of such contracts, can be found in the table at the end of the Portfolio of Investments included in this Report. |
| 7 | Assets, other than investments in securities and derivative contracts, less liabilities. See Statement of Assets and Liabilities. |
| Industry Composition | Percentage of Equity Securities |
| Regional Banks | 4.3% |
| Money Center Bank | 3.7% |
| Specialty Retailing | 3.7% |
| Services to Medical Professionals | 3.5% |
| Real Estate Investment Trusts | 3.3% |
| Software Packaged/Custom | 3.0% |
| Property Liability Insurance | 2.7% |
| Oil Refiner | 2.6% |
| Integrated Domestic Oil | 2.4% |
| Biotechnology | 2.3% |
| Financial Services | 2.1% |
| Defense Aerospace | 2.0% |
| Ethical Drugs | 2.0% |
| Oil Gas & Consumable Fuels | 2.0% |
| Telecommunication Equipment & Services | 2.0% |
| Defense Electronics | 1.8% |
| Department Stores | 1.7% |
| Construction Machinery | 1.6% |
| AT&T Divestiture | 1.5% |
| Computer Peripherals | 1.5% |
| Electric Utility | 1.5% |
| Grocery Chain | 1.5% |
| Broadcasting | 1.4% |
| Computers–Midrange | 1.4% |
| Medical Technology | 1.4% |
| Multi-Line Insurance | 1.4% |
| Semiconductor Distribution | 1.4% |
| Home Products | 1.3% |
| Integrated International Oil | 1.3% |
| Computer Stores | 1.2% |
| Generic Drugs | 1.2% |
| Life Insurance | 1.2% |
| Securities Brokerage | 1.1% |
| Clothing Stores | 1.0% |
| Household Appliances | 1.0% |
| Industry Composition | Percentage of Equity Securities |
| Medical Supplies | 1.0% |
| Soft Drinks | 1.0% |
| Other9 | 29.0% |
| TOTAL | 100.0% |
| 8 | Industry classifications are based upon, and individual portfolio securities are assigned to, the classifications of the Global Industry Classification Standard (GICS) except that the Adviser assigns a classification to securities not classified by the GICS and to securities for which the Adviser does not have access to the classification made by the GICS. |
| 9 | For purposes of this table, industry classifications which constitute less than 1.0% of the Fund's equity securities have been aggregated under the designation “Other.” |
| Shares or Principal Amount | Value | ||
| COMMON STOCKS—59.9% | |||
| Agricultural Chemicals—0.5% | |||
| 2,100 | CF Industries Holdings, Inc. | $411,621 | |
| 2,200 | Monsanto Co. | 217,316 | |
| 1,600 | Scotts Co. | 80,400 | |
| TOTAL | 709,337 | ||
| Agricultural Machinery—0.6% | |||
| 3,100 | AGCO Corp. | 174,375 | |
| 6,000 | Deere & Co. | 498,420 | |
| 691 | Lindsay Manufacturing Co. | 51,894 | |
| TOTAL | 724,689 | ||
| Air Freight & Logistics—0.1% | |||
| 800 | FedEx Corp. | 84,800 | |
| Airline - National—0.3% | |||
| 12,800 | 1 | United Continental Holdings, Inc. | 446,080 |
| Airline - Regional—0.2% | |||
| 4,185 | Alaska Air Group, Inc. | 255,996 | |
| 799 | 1 | Spirit Airlines, Inc. | 26,407 |
| TOTAL | 282,403 | ||
| Apparel—0.4% | |||
| 2,870 | 1 | Ann, Inc. | 97,264 |
| 1,700 | Carter's, Inc. | 121,244 | |
| 2,143 | 1 | Express, Inc. | 48,325 |
| 3,800 | Guess?, Inc. | 127,984 | |
| 400 | V.F. Corp. | 78,800 | |
| TOTAL | 473,617 | ||
| AT&T Divestiture—0.9% | |||
| 17,800 | AT&T, Inc. | 627,806 | |
| 10,900 | Verizon Communications | 539,332 | |
| TOTAL | 1,167,138 | ||
| Auto Components—0.3% | |||
| 3,300 | Lear Corp. | 228,591 | |
| 3,174 | 1 | Tenneco Automotive, Inc. | 153,399 |
| TOTAL | 381,990 | ||
| Auto Manufacturing—0.5% | |||
| 19,700 | Ford Motor Co. | 332,536 |
| Shares or Principal Amount | Value | ||
| COMMON STOCKS—continued | |||
| Auto Manufacturing—continued | |||
| 10,800 | 1 | General Motors Co. | $387,396 |
| TOTAL | 719,932 | ||
| Auto Part Replacement—0.0% | |||
| 1,030 | Standard Motor Products, Inc. | 35,422 | |
| Auto Rentals—0.2% | |||
| 3,400 | 1 | United Rentals, Inc. | 194,888 |
| Biotechnology—1.4% | |||
| 3,500 | Amgen, Inc. | 379,015 | |
| 1,251 | 1 | Air Methods Corp. | 42,021 |
| 2,400 | 1 | Alexion Pharmaceuticals, Inc. | 278,952 |
| 2,200 | 1 | Biogen Idec, Inc. | 479,886 |
| 3,000 | 1 | Celgene Corp. | 440,580 |
| 998 | Questcor Pharmaceuticals, Inc. | 66,686 | |
| 3,242 | 1 | Santarus, Inc. | 78,846 |
| 811 | 1 | Seattle Genetics, Inc. | 32,862 |
| TOTAL | 1,798,848 | ||
| Broadcasting—0.9% | |||
| 2,800 | American Tower Corp. | 198,212 | |
| 14,900 | 1 | DIRECTV | 942,723 |
| TOTAL | 1,140,935 | ||
| Building Materials—0.2% | |||
| 3,500 | Fortune Brands Home & Security, Inc. | 144,585 | |
| 2,200 | Lennox International, Inc. | 158,004 | |
| TOTAL | 302,589 | ||
| Building Supply Stores—0.4% | |||
| 3,200 | Home Depot, Inc. | 252,896 | |
| 6,100 | Lowe's Cos., Inc. | 271,938 | |
| TOTAL | 524,834 | ||
| Cable & Wireless Television—0.2% | |||
| 2,400 | Time Warner Cable, Inc. | 273,768 | |
| Cable TV—0.5% | |||
| 3,500 | CBS Corp., Class B | 184,940 | |
| 5,600 | Comcast Corp., Class A | 252,448 | |
| 2,300 | Viacom, Inc., Class B - New | 167,371 | |
| TOTAL | 604,759 | ||
| Capital Markets—0.1% | |||
| 3,300 | Franklin Resources, Inc. | 161,304 |
| Shares or Principal Amount | Value | ||
| COMMON STOCKS—continued | |||
| Carpets—0.1% | |||
| 1,300 | 1 | Mohawk Industries, Inc. | $154,687 |
| Chemicals—0.3% | |||
| 5,500 | LyondellBasell Industries NV - Class - A | 377,905 | |
| Closed End Fund—0.5% | |||
| 5,100 | 1 | Berkshire Hathaway, Inc., Class B | 590,937 |
| Clothing Stores—0.6% | |||
| 1,200 | 1 | Children's Place Retail Stores, Inc. | 64,848 |
| 8,200 | Gap (The), Inc. | 376,380 | |
| 5,300 | Hanesbrands, Inc. | 336,338 | |
| 1,074 | 1 | Jos A. Bank Clothiers, Inc. | 43,884 |
| TOTAL | 821,450 | ||
| Commercial Banks—0.2% | |||
| 6,300 | 1 | Popular, Inc. | 207,270 |
| Commodity Chemicals—0.2% | |||
| 2,100 | RPM International, Inc. | 74,004 | |
| 1,400 | Westlake Chemical Corp. | 145,628 | |
| TOTAL | 219,632 | ||
| Computer Peripherals—0.9% | |||
| 381 | 1 | Aruba Networks, Inc. | 6,774 |
| 6,300 | EMC Corp. Mass | 164,745 | |
| 2,800 | Lexmark International, Inc. | 104,972 | |
| 5,700 | 1 | Sandisk Corp. | 314,184 |
| 1,701 | 1 | Synaptics, Inc. | 68,040 |
| 8,600 | Western Digital Corp. | 553,668 | |
| TOTAL | 1,212,383 | ||
| Computer Services—0.2% | |||
| 900 | 1 | CACI International, Inc., Class A | 59,760 |
| 941 | Fair Isaac & Co., Inc. | 47,012 | |
| 809 | 1 | Manhattan Associates, Inc. | 71,467 |
| 1,009 | Syntel, Inc. | 72,426 | |
| TOTAL | 250,665 | ||
| Computer Stores—0.7% | |||
| 7,400 | GameStop Corp. | 363,044 | |
| 1,900 | 1 | Insight Enterprises, Inc. | 40,641 |
| 11,300 | 1 | Tech Data Corp. | 580,142 |
| TOTAL | 983,827 |
| Shares or Principal Amount | Value | ||
| COMMON STOCKS—continued | |||
| Computers - High End—0.4% | |||
| 2,500 | International Business Machines Corp. | $487,600 | |
| Computers - Midrange—0.8% | |||
| 43,400 | Hewlett-Packard Co. | 1,114,512 | |
| Construction Machinery—1.0% | |||
| 5,900 | Caterpillar, Inc. | 489,169 | |
| 4,300 | Joy Global, Inc. | 212,850 | |
| 14,400 | Trinity Industries, Inc. | 566,928 | |
| TOTAL | 1,268,947 | ||
| Consumer Goods—0.0% | |||
| 442 | Pool Corp. | 23,329 | |
| Cosmetics & Toiletries—0.4% | |||
| 9,700 | Avon Products, Inc. | 221,742 | |
| 2,000 | Estee Lauder Cos., Inc., Class A | 131,300 | |
| 1,365 | Inter Parfums, Inc. | 45,018 | |
| 5,332 | 1 | Sally Beauty Holdings, Inc. | 162,679 |
| TOTAL | 560,739 | ||
| Crude Oil & Gas Production—0.2% | |||
| 6,400 | Chesapeake Energy Corp. | 149,120 | |
| 2,271 | Energy XXI Bermuda | 60,976 | |
| 1,700 | 1 | Stone Energy Corp. | 41,412 |
| TOTAL | 251,508 | ||
| Defense Aerospace—1.2% | |||
| 2,200 | Alliant Techsystems, Inc. | 204,820 | |
| 2,300 | 1 | B/E Aerospace, Inc. | 160,333 |
| 3,400 | General Dynamics Corp. | 290,156 | |
| 866 | 1 | Hexcel Corp. | 30,492 |
| 3,900 | Lockheed Martin Corp. | 468,468 | |
| 728 | 1 | Teledyne Technologies, Inc. | 58,364 |
| 9,000 | Textron, Inc. | 246,420 | |
| 2,100 | Triumph Group, Inc. | 164,766 | |
| TOTAL | 1,623,819 | ||
| Defense Electronics—1.1% | |||
| 6,000 | 1 | First Solar, Inc. | 295,440 |
| 2,400 | L-3 Communications Holdings, Inc. | 223,560 | |
| 6,900 | Northrop Grumman Corp. | 635,214 | |
| 3,800 | Raytheon Co. | 272,992 | |
| TOTAL | 1,427,206 |
| Shares or Principal Amount | Value | ||
| COMMON STOCKS—continued | |||
| Department Stores—1.0% | |||
| 10,400 | Kohl's Corp. | $550,992 | |
| 11,000 | Macy's, Inc. | 531,740 | |
| 2,900 | 1 | Sears Holdings Corp. | 132,820 |
| 1,600 | Target Corp. | 114,000 | |
| TOTAL | 1,329,552 | ||
| Discount Department Stores—0.2% | |||
| 4,700 | Foot Locker, Inc. | 169,811 | |
| 800 | Wal-Mart Stores, Inc. | 62,352 | |
| TOTAL | 232,163 | ||
| Diversified Consumer Services—0.1% | |||
| 2,418 | 1 | Outerwall, Inc. | 133,594 |
| Diversified Leisure—0.3% | |||
| 3,300 | 1 | Bally Technologies, Inc. | 236,544 |
| 3,300 | Las Vegas Sand Corp. | 183,381 | |
| TOTAL | 419,925 | ||
| Education & Training Services—0.2% | |||
| 8,100 | 1 | Apollo Group, Inc., Class A | 147,582 |
| 1,500 | DeVry, Inc. | 45,120 | |
| 1,623 | 1 | Grand Canyon Education, Inc. | 54,890 |
| 1,200 | 1 | ITT Educational Services, Inc. | 31,476 |
| TOTAL | 279,068 | ||
| Electric & Electronic Original Equipment Manufacturers—0.1% | |||
| 1,742 | 1 | Generac Holdings, Inc. | 75,516 |
| Electric Utility—0.9% | |||
| 15,600 | AES Corp. | 194,064 | |
| 4,600 | Ameren Corp. | 164,726 | |
| 3,400 | American Electric Power Co., Inc. | 157,590 | |
| 7,000 | Edison International | 348,950 | |
| 3,200 | Entergy Corp. | 216,000 | |
| 4,300 | PPL Corp. | 136,611 | |
| TOTAL | 1,217,941 | ||
| Electrical - Radio & TV—0.1% | |||
| 1,400 | Harman International Industries, Inc. | 84,742 | |
| Electrical Equipment—0.1% | |||
| 1,216 | EnerSys, Inc. | 64,351 | |
| 448 | Littelfuse, Inc. | 35,835 | |
| TOTAL | 100,186 |
| Shares or Principal Amount | Value | ||
| COMMON STOCKS—continued | |||
| Electronic Equipment Instruments & Components—0.1% | |||
| 7,000 | 1 | Sanmina Corp. | $115,220 |
| Electronic Instruments—0.0% | |||
| 1,039 | 1 | IRobot Corp. | 36,323 |
| Electronic Test/Measuring Equipment—0.0% | |||
| 1,400 | 1 | Itron, Inc. | 60,368 |
| Ethical Drugs—1.2% | |||
| 5,400 | Abbott Laboratories | 197,802 | |
| 268 | 1 | Cubist Pharmaceuticals, Inc. | 16,704 |
| 994 | 1 | Ligand Pharmaceuticals, Inc., Class B | 47,096 |
| 8,600 | Lilly (Eli) & Co. | 456,746 | |
| 6,800 | Merck & Co., Inc. | 327,556 | |
| 11,300 | Pfizer, Inc. | 330,299 | |
| 3,300 | 1 | United Therapeutics Corp. | 246,972 |
| TOTAL | 1,623,175 | ||
| Financial Services—1.3% | |||
| 4,600 | Ameriprise Financial, Inc. | 409,400 | |
| 300 | Blackrock, Inc. | 84,588 | |
| 1,833 | Deluxe Corp. | 75,171 | |
| 4,200 | Discover Financial Services | 207,942 | |
| 1,700 | Dun & Bradstreet Corp. | 176,171 | |
| 1,423 | Financial Engines, Inc. | 67,934 | |
| 1,641 | Heartland Payment Systems, Inc. | 61,226 | |
| 1,600 | Nelnet, Inc., Class A | 62,208 | |
| 423 | 1 | Portfolio Recovery Associates, Inc. | 63,158 |
| 305 | 1 | Virtus Investment Partners, Inc. | 56,883 |
| 2,400 | Visa, Inc., Class A Shares | 424,824 | |
| TOTAL | 1,689,505 | ||
| Food Products—0.0% | |||
| 1,800 | Mondelez International, Inc. | 56,286 | |
| Food Wholesaling—0.3% | |||
| 2,600 | Ingredion, Inc. | 174,720 | |
| 7,500 | Sysco Corp. | 258,825 | |
| TOTAL | 433,545 | ||
| Furniture—0.0% | |||
| 1,564 | 1 | Select Comfort Corp. | 35,737 |
| Gas Utilities—0.1% | |||
| 1,700 | EQT Corp. | 147,050 |
| Shares or Principal Amount | Value | ||
| COMMON STOCKS—continued | |||
| Generic Drugs—0.7% | |||
| 7,900 | 1 | Endo Health Solutions, Inc. | $303,834 |
| 1,189 | 1 | Hi-Tech Pharmacal Co., Inc. | 42,733 |
| 2,800 | 1 | Impax Laboratories, Inc. | 58,072 |
| 12,400 | 1 | Mylan, Inc. | 416,144 |
| 900 | Perrigo Co. | 111,951 | |
| TOTAL | 932,734 | ||
| Grocery Chain—0.9% | |||
| 609 | Casey's General Stores, Inc. | 40,334 | |
| 20,000 | Kroger Co. | 785,400 | |
| 13,700 | Safeway, Inc. | 353,323 | |
| TOTAL | 1,179,057 | ||
| Home Building—0.0% | |||
| 1,161 | Ryland Group, Inc. | 46,951 | |
| Home Health Care—0.1% | |||
| 1,098 | 1 | Wellcare Health Plans, Inc. | 67,011 |
| Home Products—0.8% | |||
| 3,100 | Energizer Holdings, Inc. | 315,580 | |
| 4,800 | 1 | Jarden Corp. | 218,256 |
| 900 | Kimberly-Clark Corp. | 88,920 | |
| 3,800 | Newell Rubbermaid, Inc. | 102,676 | |
| 3,371 | Tupperware Brands Corp. | 284,108 | |
| TOTAL | 1,009,540 | ||
| Hospitals—0.1% | |||
| 1,900 | 1 | Community Health Systems, Inc. | 87,514 |
| Hotels—0.2% | |||
| 4,100 | Wyndham Worldwide Corp. | 255,430 | |
| Hotels and Motels—0.0% | |||
| 304 | Six Flags Entertainment Corp. | 11,184 | |
| Household Appliances—0.6% | |||
| 225 | 1 | Middleby Corp. | 40,261 |
| 5,400 | Whirlpool Corp. | 723,276 | |
| TOTAL | 763,537 | ||
| Industrial Conglomerates—0.2% | |||
| 11,100 | General Electric Co. | 270,507 | |
| Industrial Machinery—0.2% | |||
| 745 | Actuant Corp. | 26,306 |
| Shares or Principal Amount | Value | ||
| COMMON STOCKS—continued | |||
| Industrial Machinery—continued | |||
| 6,200 | 1 | Terex Corp. | $182,776 |
| TOTAL | 209,082 | ||
| Insurance Brokerage—0.3% | |||
| 8,400 | Aspen Insurance Holdings Ltd. | 314,916 | |
| 313 | 1 | Texas Capital Bancshares, Inc. | 14,238 |
| TOTAL | 329,154 | ||
| Integrated Domestic Oil—1.4% | |||
| 15,100 | ConocoPhillips | 979,386 | |
| 5,300 | Hess Corp. | 394,638 | |
| 14,900 | Marathon Oil Corp. | 541,764 | |
| TOTAL | 1,915,788 | ||
| Integrated International Oil—0.8% | |||
| 4,400 | Chevron Corp. | 553,916 | |
| 4,900 | Exxon Mobil Corp. | 459,375 | |
| TOTAL | 1,013,291 | ||
| Internet Services—0.5% | |||
| 2,476 | 1 | Angie's List, Inc. | 54,522 |
| 2,900 | IAC Interactive Corp. | 146,769 | |
| 400 | 1 | NetFlix, Inc. | 97,688 |
| 1,602 | 1 | Overstock.com, Inc. | 54,484 |
| 300 | 1 | Priceline.com, Inc. | 262,701 |
| 2,194 | 1 | Web.com Group, Inc. | 57,000 |
| TOTAL | 673,164 | ||
| Life Insurance—0.7% | |||
| 10,600 | Prudential Financial | 837,082 | |
| 1,900 | StanCorp Financial Group, Inc. | 100,871 | |
| TOTAL | 937,953 | ||
| Machined Parts Original Equipment Manufacturers—0.0% | |||
| 1,163 | Applied Industrial Technologies, Inc. | 60,662 | |
| Mail Order—0.1% | |||
| 1,980 | HSN, Inc. | 118,919 | |
| Maritime—0.0% | |||
| 503 | TAL International Group, Inc. | 20,246 | |
| Medical Supplies—0.6% | |||
| 3,300 | Cardinal Health, Inc. | 165,297 | |
| 355 | 1 | MWI Veterinary Supply, Inc. | 50,470 |
| 2,900 | McKesson Corp. | 355,714 |
| Shares or Principal Amount | Value | ||
| COMMON STOCKS—continued | |||
| Medical Supplies—continued | |||
| 629 | 1 | Medidata Solutions, Inc. | $58,201 |
| 1,490 | Owens & Minor, Inc. | 53,581 | |
| 1,419 | Steris Corp. | 63,884 | |
| 774 | West Pharmaceutical Services, Inc. | 57,090 | |
| TOTAL | 804,237 | ||
| Medical Technology—0.8% | |||
| 1,475 | Cantel Medical Corp. | 39,146 | |
| 1,279 | 1 | Cyberonics, Inc. | 66,495 |
| 940 | 1 | Integra Lifesciences Corp. | 37,027 |
| 1,900 | Medtronic, Inc. | 104,956 | |
| 1,800 | ResMed, Inc. | 85,770 | |
| 9,200 | St. Jude Medical, Inc. | 481,988 | |
| 3,200 | Zimmer Holdings, Inc. | 267,136 | |
| TOTAL | 1,082,518 | ||
| Metal Fabrication—0.2% | |||
| 1,100 | Reliance Steel & Aluminum Co. | 77,220 | |
| 2,800 | Timken Co. | 163,576 | |
| 2,188 | Worthington Industries, Inc. | 78,265 | |
| TOTAL | 319,061 | ||
| Miscellaneous Components—0.3% | |||
| 1,975 | 1 | Microsemi Corp. | 48,703 |
| 1,058 | 1 | Proto Labs, Inc. | 71,595 |
| 22,000 | 1 | Vishay Intertechnology, Inc. | 316,580 |
| TOTAL | 436,878 | ||
| Miscellaneous Food Products—0.2% | |||
| 5,400 | Archer-Daniels-Midland Co. | 196,938 | |
| 4,500 | Fresh Del Monte Produce, Inc. | 126,405 | |
| TOTAL | 323,343 | ||
| Money Center Bank—2.2% | |||
| 15,900 | Bank of America Corp. | 232,140 | |
| 10,500 | Citigroup, Inc. | 547,470 | |
| 17,700 | JPMorgan Chase & Co. | 986,421 | |
| 7,600 | State Street Corp. | 529,492 | |
| 7,900 | The Bank of New York Mellon Corp. | 248,455 | |
| 11,000 | U.S. Bancorp | 410,520 | |
| TOTAL | 2,954,498 |
| Shares or Principal Amount | Value | ||
| COMMON STOCKS—continued | |||
| Mortgage and Title—0.1% | |||
| 6,200 | 1 | CoreLogic, Inc. | $172,980 |
| Multi-Industry Basic—0.1% | |||
| 5,303 | 1 | Graphic Packaging Holding Co. | 45,606 |
| 2,290 | Olin Corp. | 55,876 | |
| TOTAL | 101,482 | ||
| Multi-Industry Capital Goods—0.0% | |||
| 640 | Acuity Brands, Inc. Holding Company | 55,360 | |
| Multi-Industry Transportation—0.0% | |||
| 1,473 | Brinks Co. (The) | 39,373 | |
| Multi-Line Insurance—0.8% | |||
| 11,300 | 1 | American International Group, Inc. | 514,263 |
| 5,900 | CIGNA Corp. | 459,197 | |
| 1,600 | Cincinnati Financial Corp. | 78,400 | |
| 1,300 | Validus Holdings Ltd. | 46,059 | |
| TOTAL | 1,097,919 | ||
| Newspaper Publishing—0.1% | |||
| 300 | Washington Post Co., Class B | 161,208 | |
| Office Equipment—0.1% | |||
| 10,000 | Pitney Bowes, Inc. | 165,100 | |
| Office Supplies—0.1% | |||
| 2,800 | Avery Dennison Corp. | 125,244 | |
| Offshore Driller—0.0% | |||
| 100 | Bristow Group, Inc. | 6,801 | |
| Oil Gas & Consumable Fuels—1.2% | |||
| 1,900 | EOG Resources, Inc. | 276,431 | |
| 5,400 | Murphy Oil Corp. | 365,688 | |
| 3,300 | Occidental Petroleum Corp. | 293,865 | |
| 4,500 | Peabody Energy Corp. | 74,520 | |
| 9,100 | Phillips 66 | 559,650 | |
| TOTAL | 1,570,154 | ||
| Oil Refiner—1.6% | |||
| 2,604 | Alon USA Energy, Inc. | 35,571 | |
| 1,581 | Delek US Holdings, Inc. | 47,825 | |
| 8,100 | HollyFrontier Corp. | 368,955 | |
| 6,900 | Marathon Petroleum Corp. | 505,977 | |
| 5,700 | Tesoro Petroleum Corp. | 324,045 | |
| 20,600 | Valero Energy Corp. | 736,862 |
| Shares or Principal Amount | Value | ||
| COMMON STOCKS—continued | |||
| Oil Refiner—continued | |||
| 2,401 | Western Refining, Inc. | $72,342 | |
| TOTAL | 2,091,577 | ||
| Oil Service, Explore & Drill—0.2% | |||
| 251 | 1 | Geospace Technologies Corp. | 18,677 |
| 4,200 | Helmerich & Payne, Inc. | 265,440 | |
| TOTAL | 284,117 | ||
| Oil Well Supply—0.0% | |||
| 256 | 1 | Dril-Quip, Inc. | 23,273 |
| Other Communications Equipment—0.3% | |||
| 6,800 | Harris Corp. | 388,076 | |
| 1,373 | 1 | Netgear, Inc. | 40,929 |
| TOTAL | 429,005 | ||
| Packaged Foods—0.1% | |||
| 959 | 1 | Hain Celestial Group, Inc. | 69,969 |
| Paper Products—0.4% | |||
| 5,800 | 1 | Boise, Inc. | 52,780 |
| 6,500 | International Paper Co. | 314,015 | |
| 1,800 | Rock-Tenn Co. | 205,830 | |
| TOTAL | 572,625 | ||
| Personal & Household—0.3% | |||
| 5,179 | Nu Skin Enterprises, Inc. | 433,172 | |
| Personal Loans—0.2% | |||
| 2,100 | Capital One Financial Corp. | 144,942 | |
| 1,055 | Cash America International, Inc. | 44,310 | |
| 402 | 1 | Credit Acceptance Corp. | 45,221 |
| TOTAL | 234,473 | ||
| Personnel Agency—0.3% | |||
| 3,500 | Manpower Group, Inc. | 234,045 | |
| 1,596 | Maximus, Inc. | 60,026 | |
| 3,000 | Robert Half International, Inc. | 111,720 | |
| TOTAL | 405,791 | ||
| Poultry Products—0.3% | |||
| 815 | Sanderson Farms, Inc. | 57,572 | |
| 10,300 | Tyson Foods, Inc., Class A | 284,486 | |
| TOTAL | 342,058 | ||
| Printing—0.1% | |||
| 3,500 | Donnelley (R.R.) & Sons Co. | 66,465 |
| Shares or Principal Amount | Value | ||
| COMMON STOCKS—continued | |||
| Printing—continued | |||
| 1,423 | Valassis Communications, Inc. | $40,740 | |
| TOTAL | 107,205 | ||
| Professional Services—0.0% | |||
| 223 | 1 | CoStar Group, Inc. | 34,911 |
| Property Liability Insurance—1.6% | |||
| 3,200 | Everest Re Group Ltd. | 427,296 | |
| 9,400 | HCC Insurance Holdings, Inc. | 418,582 | |
| 4,700 | PartnerRe Ltd. | 420,838 | |
| 3,600 | Platinum Underwriters Holdings Ltd. | 209,124 | |
| 7,500 | The Travelers Cos, Inc. | 626,625 | |
| TOTAL | 2,102,465 | ||
| Railroad—0.1% | |||
| 600 | Union Pacific Corp. | 95,154 | |
| Real Estate Investment Trusts—2.0% | |||
| 34,000 | DDR Corp. | 580,720 | |
| 7,000 | Extra Space Storage, Inc. | 294,350 | |
| 7,000 | Pebblebrook Hotel Trust | 186,550 | |
| 4,800 | ProLogis, Inc. | 184,128 | |
| 1,500 | SL Green Realty Corp. | 135,975 | |
| 3,691 | Simon Property Group, Inc. | 590,781 | |
| 53,000 | 1 | Strategic Hotels & Resorts, Inc. | 469,580 |
| 15,000 | 1 | Sunstone Hotel Investors, Inc. | 194,100 |
| TOTAL | 2,636,184 | ||
| Recreational Goods—0.1% | |||
| 1,305 | Sturm Ruger & Co., Inc. | 66,385 | |
| Recreational Vehicles—0.1% | |||
| 2,048 | Brunswick Corp. | 77,312 | |
| 700 | Polaris Industries, Inc. | 78,498 | |
| TOTAL | 155,810 | ||
| Regional Banks—2.6% | |||
| 12,700 | BB&T Corp. | 453,263 | |
| 863 | Bank of the Ozarks, Inc. | 41,234 | |
| 5,200 | Comerica, Inc. | 221,208 | |
| 20,900 | Fifth Third Bancorp | 401,907 | |
| 13,300 | Huntington Bancshares, Inc. | 113,715 | |
| 21,000 | KeyCorp | 258,090 | |
| 7,800 | PNC Financial Services Group | 593,190 |
| Shares or Principal Amount | Value | ||
| COMMON STOCKS—continued | |||
| Regional Banks—continued | |||
| 19,500 | SunTrust Banks, Inc. | $678,405 | |
| 13,800 | Wells Fargo & Co. | 600,300 | |
| 2,400 | Zions Bancorp | 71,136 | |
| TOTAL | 3,432,448 | ||
| Rental & Leasing Services—0.1% | |||
| 2,300 | Rent-A-Center, Inc. | 91,977 | |
| Restaurants—0.3% | |||
| 713 | Cracker Barrel Old Country Store, Inc. | 69,803 | |
| 938 | Domino's Pizza, Inc. | 58,700 | |
| 2,400 | 1 | Green Mountain Coffee, Inc. | 185,232 |
| 642 | 1 | Red Robin Gourmet Burgers | 36,517 |
| TOTAL | 350,252 | ||
| Road & Rail—0.0% | |||
| 2,003 | 1 | Swift Transportation Co. | 35,734 |
| Roofing & Wallboard—0.0% | |||
| 983 | 1 | Beacon Roofing Supply, Inc. | 40,097 |
| Securities Brokerage—0.6% | |||
| 3,900 | Goldman Sachs Group, Inc. | 639,717 | |
| 7,600 | Morgan Stanley | 206,796 | |
| TOTAL | 846,513 | ||
| Semiconductor Distribution—0.8% | |||
| 16,800 | 1 | Arrow Electronics, Inc. | 766,920 |
| 7,100 | 1 | Avnet, Inc. | 267,457 |
| 494 | 1 | Tyler Technologies, Inc. | 36,862 |
| TOTAL | 1,071,239 | ||
| Semiconductor Manufacturing—0.5% | |||
| 2,467 | 1 | Cirrus Logic, Inc. | 47,564 |
| 21,300 | Intel Corp. | 496,290 | |
| 1,865 | 1 | Semtech Corp. | 56,416 |
| TOTAL | 600,270 | ||
| Semiconductor Manufacturing Equipment—0.0% | |||
| 2,613 | Mentor Graphics Corp. | 53,645 | |
| Semiconductors & Semiconductor Equipment—0.1% | |||
| 3,800 | Broadcom Corp. | 104,766 | |
| Services to Medical Professionals—2.1% | |||
| 11,700 | Aetna, Inc. | 750,789 | |
| 1,276 | 1 | Bio-Reference Laboratories, Inc. | 34,133 |
| Shares or Principal Amount | Value | ||
| COMMON STOCKS—continued | |||
| Services to Medical Professionals—continued | |||
| 1,056 | 1 | Centene Corp. | $58,576 |
| 500 | 1 | Henry Schein, Inc. | 51,915 |
| 4,900 | Humana, Inc. | 447,174 | |
| 870 | 1 | Molina Healthcare, Inc. | 32,295 |
| 4,000 | Omnicare, Inc. | 211,160 | |
| 2,000 | Quest Diagnostics, Inc. | 116,620 | |
| 1,346 | 1 | Team Health Holdings, Inc. | 54,136 |
| 7,500 | UnitedHealth Group, Inc. | 546,375 | |
| 1,422 | 1 | WebMd Health Corp. | 46,940 |
| 4,800 | Wellpoint, Inc. | 410,688 | |
| TOTAL | 2,760,801 | ||
| Shoes—0.1% | |||
| 2,911 | 1 | CROCs, Inc. | 39,794 |
| 1,228 | 1 | Deckers Outdoor Corp. | 67,331 |
| 900 | 1 | Genesco, Inc. | 63,342 |
| TOTAL | 170,467 | ||
| Soft Drinks—0.6% | |||
| 10,400 | Coca-Cola Enterprises, Inc. | 390,416 | |
| 7,900 | Dr. Pepper Snapple Group, Inc. | 369,246 | |
| 700 | PepsiCo, Inc. | 58,478 | |
| TOTAL | 818,140 | ||
| Software—0.1% | |||
| 1,543 | 1 | Infoblox, Inc. | 50,456 |
| 1,804 | 1 | QLIK Technologies, Inc. | 56,501 |
| TOTAL | 106,957 | ||
| Software Packaged/Custom—1.8% | |||
| 2,207 | 1 | Aspen Technology, Inc. | 71,816 |
| 14,300 | CA, Inc. | 425,282 | |
| 2,456 | 1 | Commvault Systems, Inc. | 207,360 |
| 5,400 | Computer Sciences Corp. | 257,364 | |
| 4,500 | 1 | Electronic Arts, Inc. | 117,540 |
| 1,230 | 1 | Electronics for Imaging, Inc. | 36,937 |
| 168 | 1 | Guidewire Software, Inc. | 7,351 |
| 8,900 | Microsoft Corp. | 283,287 | |
| 11,600 | Oracle Corp. | 375,260 | |
| 1,581 | Pegasystems, Inc. | 56,758 | |
| 16,000 | Symantec Corp. | 426,880 |
| Shares or Principal Amount | Value | ||
| COMMON STOCKS—continued | |||
| Software Packaged/Custom—continued | |||
| 1,286 | 1 | Synchronoss Technologies, Inc. | $44,354 |
| 1,738 | 1 | ValueClick, Inc. | 42,477 |
| TOTAL | 2,352,666 | ||
| Specialty Chemicals—0.5% | |||
| 1,600 | Airgas, Inc. | 165,136 | |
| 1,641 | American Vanguard Corp. | 40,516 | |
| 3,300 | Ashland, Inc. | 286,572 | |
| 898 | Chemed Corp. | 63,390 | |
| 8,400 | Huntsman Corp. | 151,368 | |
| TOTAL | 706,982 | ||
| Specialty Retailing—2.2% | |||
| 5,200 | Abercrombie & Fitch Co., Class A | 259,324 | |
| 1,530 | 1 | Asbury Automotive Group, Inc. | 74,725 |
| 1,800 | 1 | AutoNation, Inc. | 86,220 |
| 300 | 1 | AutoZone, Inc. | 134,574 |
| 2,400 | 1 | Big Lots, Inc. | 86,712 |
| 12,000 | CVS Corp. | 737,880 | |
| 1,988 | 1 | Cabela's, Inc., Class A | 136,456 |
| 692 | 1 | Conn's, Inc. | 44,717 |
| 550 | Expedia, Inc. | 25,922 | |
| 7,271 | GNC Acquisition Holdings, Inc. | 383,763 | |
| 772 | 1 | Lumber Liquidators Holdings, Inc. | 74,745 |
| 2,500 | Nordstrom, Inc. | 153,100 | |
| 1,800 | 1 | O'Reilly Automotive, Inc. | 225,468 |
| 1,219 | Penske Automotive Group, Inc. | 45,323 | |
| 2,800 | Signet Jewelers Ltd. | 204,708 | |
| 13,300 | Staples, Inc. | 226,366 | |
| TOTAL | 2,900,003 | ||
| Surveillance-Detection—0.1% | |||
| 1,600 | Diebold, Inc. | 52,256 | |
| 736 | Mine Safety Appliances Co. | 39,104 | |
| TOTAL | 91,360 | ||
| Telecommunication Equipment & Services—1.2% | |||
| 2,773 | 1 | Anixter International, Inc. | 230,270 |
| 3,126 | 1 | CIENA Corp. | 68,959 |
| 21,300 | Cisco Systems, Inc. | 544,215 | |
| 752 | 1 | Mastec, Inc. | 24,816 |
| Shares or Principal Amount | Value | ||
| COMMON STOCKS—continued | |||
| Telecommunication Equipment & Services—continued | |||
| 3,200 | Motorola Solutions, Inc. | $175,456 | |
| 878 | Plantronics, Inc. | 40,818 | |
| 6,800 | Qualcomm, Inc. | 438,940 | |
| 2,134 | 1 | Ubiquiti Networks, Inc. | 44,857 |
| TOTAL | 1,568,331 | ||
| Telephone Utility—0.5% | |||
| 18,800 | CenturyLink, Inc. | 673,980 | |
| Toys & Games—0.3% | |||
| 6,900 | Hasbro, Inc. | 317,400 | |
| 2,200 | Mattel, Inc. | 92,466 | |
| TOTAL | 409,866 | ||
| Truck Manufacturing—0.1% | |||
| 1,300 | Cummins, Inc. | 157,547 | |
| Trucking—0.0% | |||
| 904 | 1 | Old Dominion Freight Lines, Inc. | 39,487 |
| Undesignated Consumer Cyclicals—0.5% | |||
| 8,200 | Herbalife Ltd. | 537,100 | |
| 1,216 | 1 | Parexel International Corp. | 60,131 |
| TOTAL | 597,231 | ||
| Undesignated Consumer Staples—0.1% | |||
| 1,513 | 1 | Medifast, Inc. | 41,365 |
| 875 | 1 | USANA, Inc. | 72,293 |
| TOTAL | 113,658 | ||
| Undesignated Health—0.0% | |||
| 1,499 | HealthSouth Corp. | 48,807 | |
| Uniforms—0.1% | |||
| 4,000 | Cintas Corp. | 190,040 | |
| TOTAL COMMON STOCKS (IDENTIFIED COST $66,794,908) | 79,408,963 | ||
| ASSET-BACKED SECURITIES—0.7% | |||
| $26,888 | CS First Boston Mortgage Securities Corp. 2002-HE4, AF, 5.510%, 08/25/2032 | 27,892 | |
| 300,000 | Discover Card Master Trust I 2012—B3, 0.641%, 05/15/2018 | 299,228 | |
| 200,000 | 2,3 | FREMF Mortgage Trust 2013-K25, B, 3.617%, 11/25/2045 | 176,935 |
| 400,000 | GE Dealer Floorplan Master Note Trust 2012-3, A, 0.681%, 06/20/2017 | 400,610 |
| Shares or Principal Amount | Value | ||
| ASSET-BACKED SECURITIES—continued | |||
| $25,000 | Santander Drive Auto Receivables Trust 2013-1, D, 2.270%, 01/15/2019 | $24,124 | |
| TOTAL ASSET-BACKED SECURITIES (IDENTIFIED COST $952,934) | 928,789 | ||
| COLLATERALIZED MORTGAGE OBLIGATIONS—1.1% | |||
| 1,473 | Bear Stearns Mortgage Securities, Inc. 1997-6 1A, 6.399%, 3/25/2031 | 1,527 | |
| 200,000 | Citigroup Commercial Mortgage Trust 2013-GC11 B, 3.732%, 4/10/2046 | 188,429 | |
| 200,000 | 2,3 | Commercial Mortgage Trust 2013-CR8 B, 3.971%, 6/10/2046 | 191,787 |
| 70,000 | Commercial Mortgage Pass-Through Certificates 2012-CR1 AM, 3.912%, 5/15/2045 | 69,534 | |
| 125,000 | Commercial Mortgage Pass-Through Certificates 2012-CR1 B, 4.612%, 5/15/2045 | 129,032 | |
| 4,700 | Federal Home Loan Mortgage Corp. REMIC 1311 K, 7.000%, 7/15/2022 | 5,192 | |
| 9,171 | Federal Home Loan Mortgage Corp. REMIC 1384 D, 7.000%, 9/15/2022 | 10,331 | |
| 79 | Federal Home Loan Mortgage Corp. REMIC 1595 D, 7.000%, 10/15/2013 | 79 | |
| 16,752 | Federal Home Loan Mortgage Corp. REMIC 2497 JH, 6.000%, 9/15/2032 | 18,526 | |
| 19,973 | Federal National Mortgage Association REMIC 1993-113 SB, 9.749%, 7/25/2023 | 22,413 | |
| 1,487 | Federal National Mortgage Association REMIC 2001-37 GA, 8.000%, 7/25/2016 | 1,582 | |
| 4,030 | Federal National Mortgage Association REMIC 2003-35 UC, 3.750%, 5/25/2033 | 4,221 | |
| 100,000 | GS Mortgage Securities Corp. II 2012-GCJ7 AS, 4.085%, 5/10/2045 | 100,784 | |
| 135,000 | GS Mortgage Securities Corp. II 2012-GCJ7 B, 4.74%, 5/10/2045 | 140,725 | |
| 14,602 | Government National Mortgage Association REMIC 2002-17 B, 6.000%, 3/20/2032 | 16,171 | |
| 100,000 | Merrill Lynch Mortgage Trust 2008-C1 AM, 6.252%, 2/12/2051 | 114,158 | |
| 50,000 | Morgan Stanley Capital I 2007-IQ16 AM, 6.093%, 12/12/2049 | 56,524 | |
| 100,000 | Morgan Stanley Capital I 2012-C4 AS, 3.773%, 3/15/2045 | 98,492 | |
| 150,000 | 2,3 | UBS-Barclays Commercial Mortgage Trust 2013-C6 B, 3.875%, 4/10/2046 | 142,131 |
| 105,000 | UBS-Citigroup Commercial Mortgage Trust 2011-C1 A3, 3.595%, 1/10/2045 | 106,367 | |
| 25,000 | WF-RBS Commercial Mortgage Trust 2012-C6 B, 4.697%, 4/15/2045 | 26,004 | |
| TOTAL COLLATERALIZED MORTGAGE OBLIGATIONS (IDENTIFIED COST $1,464,079) | 1,444,009 |
| Shares or Principal Amount | Value | ||
| CORPORATE BONDS—9.8% | |||
| Basic Industry - Chemicals—0.3% | |||
| $100,000 | Albemarle Corp., Sr. Note, 5.100%, 02/01/2015 | $105,986 | |
| 20,000 | 2,3 | Incitec Pivot Finance LLC, Company Guarantee, Series 144A, 4.000%, 12/07/2015 | 20,892 |
| 35,000 | 2,3 | Incitec Pivot Finance LLC, Company Guarantee, Series 144A, 6.000%, 12/10/2019 | 38,320 |
| 70,000 | RPM International, Inc., 6.500%, 02/15/2018 | 79,486 | |
| 20,000 | RPM International, Inc., Sr. Unsecd. Note, 6.125%, 10/15/2019 | 22,952 | |
| 75,000 | Rohm & Haas Co., 6.000%, 09/15/2017 | 86,344 | |
| 30,000 | Sherwin-Williams Co., 3.125%, 12/15/2014 | 30,972 | |
| TOTAL | 384,952 | ||
| Basic Industry - Metals & Mining—0.8% | |||
| 50,000 | Alcan, Inc., 5.000%, 06/01/2015 | 53,472 | |
| 100,000 | Alcoa, Inc., 5.870%, 02/23/2022 | 99,288 | |
| 80,000 | Allegheny Technologies, Inc., Sr. Note, 9.375%, 06/01/2019 | 96,332 | |
| 15,000 | Anglogold Ashanti Holdings PLC, Sr. Note, 6.500%, 04/15/2040 | 11,231 | |
| 100,000 | Anglogold Ashanti Holdings PLC, Sr. Unsecd. Note, 5.125%, 08/01/2022 | 79,852 | |
| 100,000 | Anglogold Ashanti Holdings PLC, Sr. Unsecd. Note, 8.500%, 07/30/2020 | 98,880 | |
| 30,000 | 2,3 | Barrick Gold Corp., Sr. Unsecd. Note, Series 144A, 2.500%, 05/01/2018 | 27,881 |
| 100,000 | 2,3 | Barrick Gold Corp., Sr. Unsecd. Note, Series 144A, 4.100%, 05/01/2023 | 85,290 |
| 40,000 | Carpenter Technology Corp., Sr. Unsecd. Note, 4.450%, 03/01/2023 | 39,184 | |
| 40,000 | Carpenter Technology Corp., Sr. Unsecd. Note, 5.200%, 07/15/2021 | 41,132 | |
| 50,000 | Goldcorp, Inc., Sr. Unsecd. Note, 3.700%, 03/15/2023 | 45,061 | |
| 20,000 | 2,3 | Newcrest Finance Property Ltd., Sr. Unsecd. Note, Series 144A, 4.200%, 10/01/2022 | 16,977 |
| 100,000 | Reliance Steel & Aluminum Co., Sr. Unsecd. Note, 4.500%, 04/15/2023 | 96,884 | |
| 85,000 | Rio Tinto Finance USA Ltd., Company Guarantee, 6.500%, 07/15/2018 | 99,827 | |
| 150,000 | Rio Tinto Finance USA Ltd., Sr. Unsecd. Note, 2.250%, 12/14/2018 | 146,678 | |
| 20,000 | Southern Copper Corp., Note, 6.750%, 04/16/2040 | 19,334 | |
| 60,000 | Worthington Industries, Inc., Sr. Unsecd. Note, 6.500%, 04/15/2020 | 64,262 | |
| TOTAL | 1,121,565 | ||
| Basic Industry - Paper—0.0% | |||
| 10,000 | Plum Creek Timberlands LP, Sr. Unsecd. Note, 3.250%, 03/15/2023 | 9,198 | |
| 20,000 | Plum Creek Timberlands LP, Sr. Unsecd. Note, 4.700%, 03/15/2021 | 20,834 | |
| TOTAL | 30,032 | ||
| Capital Goods - Aerospace & Defense—0.1% | |||
| 50,000 | 2,3 | BAE Systems Holdings, Inc, Series 144A, 5.200%, 8/15/2015 | 53,704 |
| Shares or Principal Amount | Value | ||
| CORPORATE BONDS—continued | |||
| Capital Goods - Aerospace & Defense—continued | |||
| $20,000 | Raytheon Co., Sr. Note, 4.400%, 02/15/2020 | $21,702 | |
| 10,000 | Rockwell Collins, Inc., Sr. Unsecd. Note, 3.100%, 11/15/2021 | 9,894 | |
| TOTAL | 85,300 | ||
| Capital Goods - Building Materials—0.0% | |||
| 40,000 | Valmont Industries, Inc., Sr. Unsecd. Note, 6.625%, 04/20/2020 | 45,349 | |
| Capital Goods - Construction Machinery—0.0% | |||
| 40,000 | AGCO Corp., Sr. Unsecd. Note, 5.875%, 12/01/2021 | 42,704 | |
| Capital Goods - Diversified Manufacturing—0.3% | |||
| 15,000 | ABB Finance USA, Inc., Sr. Unsecd. Note, 2.875%, 05/08/2022 | 14,477 | |
| 15,000 | Avery Dennison Corp., Sr. Unsecd. Note, 5.375%, 04/15/2020 | 15,744 | |
| 60,000 | Dover Corp., Note, 5.450%, 03/15/2018 | 68,855 | |
| 30,000 | Emerson Electric Co., 4.875%, 10/15/2019 | 34,312 | |
| 80,000 | Hubbell, Inc., 5.950%, 06/01/2018 | 92,712 | |
| 50,000 | Pentair, Ltd., Company Guarantee, 5.000%, 05/15/2021 | 52,866 | |
| 90,000 | Roper Industries, Inc., 6.625%, 08/15/2013 | 90,143 | |
| 40,000 | 2,3 | Textron Financial Corp., Jr. Sub. Note, Series 144A, 6.000%, 2/15/2067 | 35,600 |
| 15,000 | Thomas & Betts Corp., Sr. Unsecd. Note, 5.625%, 11/15/2021 | 17,160 | |
| TOTAL | 421,869 | ||
| Capital Goods - Environmental—0.1% | |||
| 85,000 | Republic Services, Inc., Company Guarantee, Series WI, 5.500%, 09/15/2019 | 96,851 | |
| 25,000 | Waste Management, Inc., 7.375%, 03/11/2019 | 30,273 | |
| TOTAL | 127,124 | ||
| Capital Goods - Packaging—0.0% | |||
| 45,000 | Packaging Corp. of America, Sr. Unsecd. Note, 3.900%, 06/15/2022 | 44,313 | |
| 10,000 | Rock-Tenn Co., Sr. Unsecd. Note, 4.000%, 03/01/2023 | 9,654 | |
| 10,000 | Rock-Tenn Co., Sr. Unsecd. Note, 4.450%, 03/01/2019 | 10,614 | |
| TOTAL | 64,581 | ||
| Communications - Media & Cable—0.0% | |||
| 24,000 | Cox Communications, Inc., Unsecd. Note, 5.450%, 12/15/2014 | 25,512 | |
| 30,000 | Time Warner Cable, Inc., Company Guarantee, 8.250%, 04/01/2019 | 34,979 | |
| TOTAL | 60,491 | ||
| Communications - Media Noncable—0.2% | |||
| 25,000 | Discovery Communications LLC, Company Guarantee, 5.050%, 06/01/2020 | 27,576 | |
| 30,000 | Interpublic Group of Cos., Inc., Sr. Unsecd. Note, 2.250%, 11/15/2017 | 29,569 | |
| 25,000 | Moody's Corp., Sr. Unsecd. Note, 5.500%, 09/01/2020 | 26,880 |
| Shares or Principal Amount | Value | ||
| CORPORATE BONDS—continued | |||
| Communications - Media Noncable—continued | |||
| $75,000 | News America Holdings, Inc., Company Guarantee, 8.000%, 10/17/2016 | $90,179 | |
| 20,000 | Omnicom Group, Inc., Sr. Unsecd. Note, 3.625%, 05/01/2022 | 19,731 | |
| 100,000 | 2,3 | Pearson Funding Two PLC, Sr. Unsecd. Note, Series 144A, 4.000%, 05/17/2016 | 106,428 |
| TOTAL | 300,363 | ||
| Communications - Telecom Wireless—0.3% | |||
| 50,000 | America Movil S.A.B. de C.V., 3.125%, 07/16/2022 | 46,747 | |
| 100,000 | America Movil S.A.B. de C.V., Note, 5.750%, 01/15/2015 | 107,051 | |
| 50,000 | American Tower Corp., Sr. Unsecd. Note, 4.500%, 01/15/2018 | 53,234 | |
| 100,000 | 2,3 | Crown Castle Towers LLC, Sr. Secd. Note, Series 144A, 5.495%, 01/15/2017 | 109,333 |
| 30,000 | 2,3 | SBA Tower Trust, Series 144A, 5.101%, 04/17/2017 | 32,950 |
| 90,000 | Telefonaktiebolaget LM Ericsson, Sr. Unsecd. Note, 4.125%, 05/15/2022 | 89,328 | |
| TOTAL | 438,643 | ||
| Communications - Telecom Wirelines—0.1% | |||
| 10,000 | CenturyLink, Inc., Sr. Unsecd. Note, 7.65%, 3/15/2042 | 9,500 | |
| 90,000 | Orange SA, Sr. Unsecd. Note, 5.375%, 07/08/2019 | 100,197 | |
| 60,000 | Verizon Communications, Inc., Sr. Unsecd. Note, 6.350%, 04/01/2019 | 71,459 | |
| TOTAL | 181,156 | ||
| Consumer Cyclical - Automotive—0.3% | |||
| 70,000 | 2,3 | Daimler Finance NA LLC, Company Guarantee, Series 144A, 1.950%, 03/28/2014 | 70,438 |
| 75,000 | DaimlerChrysler North America Holding Corp., 6.500%, 11/15/2013 | 76,219 | |
| 10,000 | DaimlerChrysler North America Holding Corp., Company Guarantee, 8.500%, 01/18/2031 | 14,555 | |
| 100,000 | Ford Motor Co., Sr. Unsecd. Note, 4.75%, 1/15/2043 | 91,199 | |
| 20,000 | 2,3 | Harley-Davidson Financial Services, Inc., Company Guarantee, Series 144A, 3.875%, 03/15/2016 | 21,234 |
| 10,000 | 2,3 | Harley-Davidson Financial Services, Inc., Sr. Unsecd. Note, Series 144A, 2.700%, 03/15/2017 | 10,132 |
| 80,000 | 2,3 | Nissan Motor Acceptance Corp., Note, Series 144A, 4.500%, 01/30/2015 | 84,209 |
| 10,000 | 2,3 | Nissan Motor Acceptance Corp., Sr. Unsecd. Note, Series 144A, 1.950%, 09/12/2017 | 9,939 |
| 65,000 | 2,3 | RCI Banque SA, Sr. Unsecd. Note, 3.500%, 04/03/2018 | 64,915 |
| 20,000 | 2,3 | RCI Banque SA, Sr. Unsecd. Note, Series 144A, 4.600%, 04/12/2016 | 20,985 |
| TOTAL | 463,825 |
| Shares or Principal Amount | Value | ||
| CORPORATE BONDS—continued | |||
| Consumer Cyclical - Entertainment—0.3% | |||
| $200,000 | 2 | Football Trust V, Pass Thru Cert., Series 144A, 5.35%, 10/05/2020 | $222,674 |
| 90,000 | NBC Universal, Inc., Sr. Unsecd. Note, 5.150%, 04/30/2020 | 102,916 | |
| 25,000 | Viacom, Inc., Sr. Unsecd. Note, 2.500%, 12/15/2016 | 25,835 | |
| TOTAL | 351,425 | ||
| Consumer Cyclical - Lodging—0.1% | |||
| 30,000 | Hyatt Hotels Corp., Sr. Unsecd. Note, 3.375%, 07/15/2023 | 28,148 | |
| 50,000 | Marriott International, Inc., Sr. Unsecd. Note, 3.000%, 03/01/2019 | 50,723 | |
| TOTAL | 78,871 | ||
| Consumer Cyclical - Retailers—0.0% | |||
| 15,000 | Advance Auto Parts, Inc., Company Guarantee, 4.500%, 01/15/2022 | 14,786 | |
| 10,000 | O'Reilly Automotive, Inc., Company Guarantee, 4.875%, 01/14/2021 | 10,589 | |
| TOTAL | 25,375 | ||
| Consumer Cyclical - Services—0.1% | |||
| 65,000 | Expedia, Inc., Company Guarantee, 5.950%, 08/15/2020 | 68,240 | |
| 10,000 | University of Southern California, Sr. Unsecd. Note, 5.250%, 10/01/2111 | 11,185 | |
| TOTAL | 79,425 | ||
| Consumer Non-Cyclical - Food/Beverage—0.5% | |||
| 100,000 | 2,3 | Bacardi Ltd., Sr. Note, Series 144A, 7.45%, 4/01/2014 | 104,287 |
| 100,000 | Bottling Group LLC, Note, 5.500%, 04/01/2016 | 111,405 | |
| 50,000 | ConAgra Foods, Inc., Sr. Unsecd. Note, 3.200%, 01/25/2023 | 47,991 | |
| 60,000 | Diageo Capital PLC, Company Guarantee, 7.375%, 01/15/2014 | 61,824 | |
| 200,000 | 2,3 | Kerry Group Financial Services, Sr. Unsecd. Note, Series 144A, 3.2%, 4/09/2023 | 185,627 |
| 20,000 | Sysco Corp., Sr. Note, 5.375%, 03/17/2019 | 23,330 | |
| 30,000 | The Coca-Cola Co., Sr. Unsecd. Note, Series WI, 1.800%, 09/01/2016 | 30,781 | |
| 50,000 | Tyson Foods, Inc., Sr. Unsecd. Note, 4.500%, 06/15/2022 | 51,596 | |
| TOTAL | 616,841 | ||
| Consumer Non-Cyclical - Health Care—0.2% | |||
| 40,000 | Baxter International, Inc., 6.250%, 12/01/2037 | 49,140 | |
| 50,000 | Boston Scientific Corp., 4.500%, 01/15/2015 | 52,401 | |
| 10,000 | Laboratory Corp. of America Holdings, Sr. Unsecd. Note, 3.750%, 08/23/2022 | 9,688 | |
| 90,000 | Quest Diagnostics, Inc., Sr. Unsecd. Note, 6.400%, 07/01/2017 | 102,418 | |
| 70,000 | Stryker Corp., Sr. Unsecd. Note, 1.300%, 04/01/2018 | 68,147 | |
| 10,000 | Zimmer Holdings, Inc., Sr. Note, 5.750%, 11/30/2039 | 11,414 | |
| TOTAL | 293,208 |
| Shares or Principal Amount | Value | ||
| CORPORATE BONDS—continued | |||
| Consumer Non-Cyclical - Pharmaceuticals—0.0% | |||
| $10,000 | Dentsply International, Inc., Sr. Unsecd. Note, 2.750%, 08/15/2016 | $10,282 | |
| 30,000 | Pfizer, Inc., Sr. Unsecd. Note, 6.200%, 03/15/2019 | 36,396 | |
| TOTAL | 46,678 | ||
| Consumer Non-Cyclical - Products—0.0% | |||
| 10,000 | Clorox Co., Sr. Unsecd. Note, 3.550%, 11/01/2015 | 10,554 | |
| Consumer Non-Cyclical - Tobacco—0.1% | |||
| 24,000 | Altria Group, Inc., 9.250%, 08/06/2019 | 32,018 | |
| 30,000 | Philip Morris International, Inc., 5.650%, 05/16/2018 | 35,032 | |
| TOTAL | 67,050 | ||
| Energy - Independent—0.2% | |||
| 50,000 | Canadian Natural Resources Ltd., 4.900%, 12/01/2014 | 52,549 | |
| 30,000 | EOG Resources, Inc., Note, 5.625%, 06/01/2019 | 35,502 | |
| 10,000 | Talisman Energy, Inc., Sr. Unsecd. Note, 3.750%, 02/01/2021 | 10,061 | |
| 10,000 | Talisman Energy, Inc., Sr. Unsecd. Note, 5.500%, 05/15/2042 | 10,103 | |
| 75,000 | XTO Energy, Inc., 6.375%, 06/15/2038 | 98,096 | |
| 60,000 | XTO Energy, Inc., 6.750%, 08/01/2037 | 81,224 | |
| TOTAL | 287,535 | ||
| Energy - Integrated—0.3% | |||
| 30,000 | BP Capital Markets America, Inc., Company Guarantee, 4.200%, 06/15/2018 | 32,225 | |
| 20,000 | BP Capital Markets PLC, Company Guarantee, 3.125%, 10/01/2015 | 20,975 | |
| 100,000 | Husky Oil Ltd., Deb., 7.550%, 11/15/2016 | 115,219 | |
| 90,000 | Petrobras Global Finance BV, Sr. Unsecd. Note, 4.375%, 05/20/2023 | 82,027 | |
| 20,000 | Petrobras International Finance Co., Sr. Unsecd. Note, 2.875%, 02/06/2015 | 20,364 | |
| 50,000 | Petrobras International Finance Co., Sr. Unsecd. Note, 5.375%, 01/27/2021 | 50,076 | |
| 20,000 | Phillips 66, Sr. Unsecd. Note, 1.950%, 03/05/2015 | 20,327 | |
| 50,000 | Phillips 66, Sr. Unsecd. Note, Series WI, 4.300%, 04/01/2022 | 51,615 | |
| TOTAL | 392,828 | ||
| Energy - Oil Field Services—0.1% | |||
| 15,000 | Nabors Industries, Inc., Company Guarantee, 5.000%, 09/15/2020 | 15,500 | |
| 15,000 | Nabors Industries, Inc., Company Guarantee, 9.250%, 01/15/2019 | 18,746 | |
| 20,000 | Nabors Industries, Inc., Sr. Unsecd. Note, 4.625%, 09/15/2021 | 20,050 | |
| 15,000 | Noble Holding International Ltd., Company Guarantee, 4.900%, 08/01/2020 | 16,014 |
| Shares or Principal Amount | Value | ||
| CORPORATE BONDS—continued | |||
| Energy - Oil Field Services—continued | |||
| $10,000 | 2,3 | Schlumberger Investment SA, Company Guarantee, 1.950%, 09/14/2016 | $10,232 |
| TOTAL | 80,542 | ||
| Energy - Refining—0.2% | |||
| 10,000 | Marathon Petroleum Corp., Sr. Unsecd. Note, 6.500%, 03/01/2041 | 11,402 | |
| 30,000 | Valero Energy Corp., 7.500%, 04/15/2032 | 36,322 | |
| 10,000 | Valero Energy Corp., 9.375%, 03/15/2019 | 13,114 | |
| 35,000 | Valero Energy Corp., Note, 4.750%, 04/01/2014 | 35,879 | |
| 95,000 | Valero Energy Corp., Sr. Unsecd. Note, 6.625%, 06/15/2037 | 106,670 | |
| TOTAL | 203,387 | ||
| Financial Institution - Banking—1.9% | |||
| 74,000 | American Express Co., 2.65%, 12/02/2022 | 69,442 | |
| 50,000 | American Express Credit Corp., Sr. Unsecd. Note, Series MTN, 2.800%, 09/19/2016 | 52,384 | |
| 40,000 | Associated Banc-Corp., Sr. Unsecd. Note, 5.125%, 03/28/2016 | 43,038 | |
| 60,000 | Bank of America Corp., Sr. Unsecd. Note, 4.500%, 04/01/2015 | 63,075 | |
| 100,000 | Bank of America Corp., Sr. Unsecd. Note, 5.000%, 05/13/2021 | 107,747 | |
| 50,000 | Bank of Montreal, Sr. Unsecd. Note, Series MTN, 1.450%, 04/09/2018 | 48,676 | |
| 125,000 | 2,3 | Barclays Bank PLC, Jr. Sub. Note, Series 144A, 5.926%, 09/29/2049 | 127,187 |
| 50,000 | Capital One Financial Corp., Sr. Note, 7.375%, 05/23/2014 | 52,662 | |
| 20,000 | Citigroup, Inc., Sr. Unsecd. Note, 4.450%, 01/10/2017 | 21,598 | |
| 100,000 | Citigroup, Inc., Sr. Unsecd. Note, 4.587%, 12/15/2015 | 107,187 | |
| 25,000 | City National Corp., Sr. Unsecd. Note, 5.25%, 9/15/2020 | 27,026 | |
| 40,000 | 2,3 | Commonwealth Bank of Australia, Sr. Unsecd. Note, Series 144A, 3.750%, 10/15/2014 | 41,532 |
| 40,000 | Deutsche Bank AG London, Sr. Unsecd. Note, 3.250%, 01/11/2016 | 41,992 | |
| 20,000 | Fifth Third Bancorp, Sr. Unsecd. Note, 3.625%, 01/25/2016 | 21,134 | |
| 75,000 | Goldman Sachs Group, Inc., Bond, 5.150%, 01/15/2014 | 76,516 | |
| 275,000 | Goldman Sachs Group, Inc., Sr. Unsecd. Note, 3.625%, 01/22/2023 | 264,064 | |
| 70,000 | Goldman Sachs Group, Inc., Sr. Unsecd. Note, 5.125%, 01/15/2015 | 73,956 | |
| 50,000 | Goldman Sachs Group, Inc., Sr. Unsecd. Note, 6.000%, 5/01/2014 | 51,972 | |
| 25,000 | Goldman Sachs Group, Inc., Sr. Unsecd. Note, 6.125%, 2/15/2033 | 27,788 | |
| 30,000 | Goldman Sachs Group, Inc., Sr. Unsecd. Note, 6.150%, 04/01/2018 | 34,235 | |
| 50,000 | HSBC Holdings PLC, Sr. Unsecd. Note, 5.100%, 04/05/2021 | 55,135 | |
| 150,000 | HSBC USA, Inc., Sr. Unsecd. Note, 2.375%, 02/13/2015 | 153,664 | |
| 400,000 | JPMorgan Chase & Co., Sub. Note, 3.375%, 05/01/2023 | 372,400 | |
| 65,000 | Morgan Stanley, Sr. Unsecd. Note, 4.750%, 03/22/2017 | 69,935 | |
| 175,000 | Morgan Stanley, Sub. Note, 4.100%, 05/22/2023 | 164,760 |
| Shares or Principal Amount | Value | ||
| CORPORATE BONDS—continued | |||
| Financial Institution - Banking—continued | |||
| $20,000 | Murray Street Investment Trust I, Sr. Unsecd. Note, 4.647%, 03/09/2017 | $21,413 | |
| 30,000 | Northern Trust Corp., Sr. Unsecd. Note, 4.625%, 5/01/2014 | 30,941 | |
| 100,000 | 2,3 | Santander US Debt SA Unipersonal, Bank Guarantee, Series 144A, 3.781%, 10/07/2015 | 101,759 |
| 30,000 | Wachovia Corp., Sr. Unsecd. Note, 5.75%, 2/01/2018 | 34,770 | |
| 70,000 | Westpac Banking Corp., Sr. Unsecd. Note, 4.875%, 11/19/2019 | 78,506 | |
| 100,000 | Wilmington Trust Corp., Sub. Note, 8.500%, 04/02/2018 | 121,282 | |
| TOTAL | 2,557,776 | ||
| Financial Institution - Brokerage—0.3% | |||
| 20,000 | 2,3 | CME Group Index Services LLC, Company Guarantee, Series 144A, 4.400%, 03/15/2018 | 21,730 |
| 80,000 | Janus Capital Group, Inc., Sr. Note, 6.700%, 06/15/2017 | 89,453 | |
| 125,000 | Jefferies Group LLC, Sr. Unsecd. Note, 6.875%, 04/15/2021 | 140,800 | |
| 40,000 | Jefferies Group, Inc., Sr. Unsecd. Note, 6.500%, 01/20/2043 | 40,113 | |
| 13,000 | Raymond James Financial, Inc., Sr. Unsecd. Note, 5.625%, 04/01/2024 | 13,602 | |
| 50,000 | TD Ameritrade Holding Corp., Company Guarantee, 4.150%, 12/01/2014 | 52,247 | |
| TOTAL | 357,945 | ||
| Financial Institution - Finance Noncaptive—0.2% | |||
| 30,000 | General Electric Capital Corp., Sr. Unsecd. Note, Series MTN, 3.100%, 01/09/2023 | 28,287 | |
| 200,000 | 2,3 | ILFC E-Capital Trust I, Floating Rate Note—Sr. Sub Note, Series 144A, 4.960%, 12/21/2065 | 172,000 |
| TOTAL | 200,287 | ||
| Financial Institution - Insurance - Health—0.1% | |||
| 50,000 | UnitedHealth Group, Inc., Sr. Unsecd. Note, 6.000%, 02/15/2018 | 58,790 | |
| 50,000 | Wellpoint, Inc., 5.850%, 01/15/2036 | 55,852 | |
| TOTAL | 114,642 | ||
| Financial Institution - Insurance - Life—0.3% | |||
| 200,000 | Aflac, Inc., Sr. Unsecd. Note, 3.625%, 06/15/2023 | 197,347 | |
| 10,000 | Aflac, Inc., Sr. Unsecd. Note, 6.900%, 12/17/2039 | 12,580 | |
| 10,000 | Lincoln National Corp., Sr. Unsecd. Note, 4.200%, 03/15/2022 | 10,286 | |
| 10,000 | MetLife, Inc., Jr. Sub. Note, 10.75%, 8/01/2039 | 15,250 | |
| 15,000 | 2,3 | Penn Mutual Life Insurance Co., Sr. Note, Series 144A, 7.625%, 06/15/2040 | 19,172 |
| 10,000 | Principal Financial Group, Inc., Sr. Unsecd. Note, 3.125%, 05/15/2023 | 9,566 | |
| 10,000 | Principal Financial Group, Inc., Sr. Unsecd. Note, 3.300%, 09/15/2022 | 9,763 |
| Shares or Principal Amount | Value | ||
| CORPORATE BONDS—continued | |||
| Financial Institution - Insurance - Life—continued | |||
| $50,000 | Prudential Financial, Inc., Sr. Unsecd. Note, Series MTN, 6.200%, 11/15/2040 | $58,809 | |
| TOTAL | 332,773 | ||
| Financial Institution - Insurance - P&C—0.4% | |||
| 90,000 | ACE INA Holdings, Inc., 5.600%, 05/15/2015 | 97,630 | |
| 1,000 | ACE INA Holdings, Inc., Sr. Note, 5.700%, 02/15/2017 | 1,131 | |
| 75,000 | CNA Financial Corp., 6.500%, 08/15/2016 | 85,299 | |
| 30,000 | CNA Financial Corp., Sr. Unsecd. Note, 7.350%, 11/15/2019 | 36,862 | |
| 20,000 | Chubb Corp., Sr. Note, 5.750%, 05/15/2018 | 23,344 | |
| 100,000 | 2,3 | Liberty Mutual Group, Inc., Unsecd. Note, Series 144A, 5.750%, 03/15/2014 | 102,466 |
| 65,000 | 2,3 | Nationwide Mutual Insurance Co., Sub. Note, Series 144A, 9.375%, 08/15/2039 | 91,132 |
| 50,000 | The Travelers Cos., Inc., Sr. Unsecd. Note, 5.500%, 12/01/2015 | 55,386 | |
| TOTAL | 493,250 | ||
| Financial Institution - REITs—0.4% | |||
| 50,000 | Alexandria Real Estate Equities, Inc., Sr. Unsecd. Note, 3.900%, 06/15/2023 | 48,182 | |
| 50,000 | Alexandria Real Estate Equities, Inc., Sr. Unsecd. Note, 4.600%, 04/01/2022 | 51,379 | |
| 15,000 | Avalonbay Communities, Inc., Sr. Unsecd. Note, Series MTN, 5.700%, 03/15/2017 | 16,892 | |
| 55,000 | Boston Properties LP, Sr. Unsecd. Note, 5.875%, 10/15/2019 | 63,853 | |
| 20,000 | Equity One, Inc., Bond, 6.000%, 09/15/2017 | 22,422 | |
| 40,000 | Health Care REIT, Inc., Sr. Unsecd. Note, 6.125%, 04/15/2020 | 45,813 | |
| 50,000 | 2,3 | Healthcare Trust of America, Series 144A, 3.700%, 04/15/2023 | 47,422 |
| 75,000 | Liberty Property LP, 6.625%, 10/01/2017 | 86,315 | |
| 20,000 | Post Apartment Homes LP, Sr. Unsecd. Note, 3.375%, 12/01/2022 | 18,801 | |
| 20,000 | Regency Centers LP, Company Guarantee, 4.800%, 04/15/2021 | 21,244 | |
| 35,000 | Simon Property Group LP, 6.750%, 05/15/2014 | 36,112 | |
| 30,000 | Tanger Properties LP, Sr. Unsecd. Note, 6.125%, 06/01/2020 | 35,224 | |
| 10,000 | UDR, Inc., Company Guarantee, 4.625%, 01/10/2022 | 10,392 | |
| TOTAL | 504,051 | ||
| Sovereign—0.0% | |||
| 30,000 | Corp Andina De Fomento, Sr. Unsecd. Note, 4.375%, 06/15/2022 | 30,485 | |
| Technology—0.4% | |||
| 15,000 | Agilent Technologies, Inc., Sr. Unsecd. Note, 3.200%, 10/01/2022 | 14,135 | |
| 45,000 | Apple, Inc., Sr. Unsecd. Note, 1.000%, 05/03/2018 | 43,356 |
| Shares or Principal Amount | Value | ||
| CORPORATE BONDS—continued | |||
| Technology—continued | |||
| $30,000 | Apple, Inc., Sr. Unsecd. Note, 2.400%, 05/03/2023 | $27,606 | |
| 60,000 | Cisco Systems, Inc., Sr. Unsecd. Note, 5.500%, 02/22/2016 | 67,148 | |
| 20,000 | Corning, Inc., Unsecd. Note, 4.750%, 03/15/2042 | 19,637 | |
| 100,000 | Fidelity National Information Services, Inc., Sr. Unsecd. Note, 3.500%, 04/15/2023 | 92,454 | |
| 20,000 | Hewlett-Packard Co., Sr. Unsecd. Note, 2.600%, 09/15/2017 | 20,268 | |
| 20,000 | Hewlett-Packard Co., Sr. Unsecd. Note, 3.300%, 12/09/2016 | 20,911 | |
| 100,000 | Hewlett-Packard Co., Sr. Unsecd. Note, 4.750%, 06/02/2014 | 103,026 | |
| 20,000 | Ingram Micro, Inc., Sr. Unsecd. Note, 5.000%, 08/10/2022 | 19,990 | |
| 10,000 | Juniper Networks, Inc., Sr. Unsecd. Note, 5.950%, 03/15/2041 | 9,988 | |
| 10,000 | Verisk Analytics, Inc., Sr. Unsecd. Note, 4.125%, 09/12/2022 | 10,059 | |
| 25,000 | Verisk Analytics, Inc., Sr. Unsecd. Note, 4.875%, 1/15/2019 | 27,727 | |
| 20,000 | Xerox Corp., Sr. Unsecd. Note, 2.950%, 03/15/2017 | 20,612 | |
| TOTAL | 496,917 | ||
| Transportation - Airlines—0.1% | |||
| 130,000 | Southwest Airlines Co., Sr. Unsecd. Note, 5.125%, 03/01/2017 | 139,945 | |
| Transportation - Railroads—0.1% | |||
| 75,000 | Burlington Northern Santa Fe Corp., 4.875%, 01/15/2015 | 79,438 | |
| 50,000 | Burlington Northern Santa Fe Corp., Deb., 5.750%, 05/01/2040 | 57,207 | |
| 30,000 | 2,3 | Kansas City Southern de Mexico SA de CV, Sr. Unsecd. Note, Series 144A, 3.000%, 05/15/2023 | 27,968 |
| TOTAL | 164,613 | ||
| Transportation - Services—0.1% | |||
| 90,000 | 2,3 | Enterprise Rent-A-Car USA, Series 144A, 6.375%, 10/15/2017 | 104,633 |
| 60,000 | Ryder System, Inc., Sr. Unsecd. Note, Series MTN, 3.15%, 3/02/2015 | 61,841 | |
| 30,000 | United Parcel Service, Inc., Sr. Unsecd. Note, 3.125%, 01/15/2021 | 30,435 | |
| TOTAL | 196,909 | ||
| Utility - Electric—0.6% | |||
| 70,000 | Appalachian Power Co., Sr. Unsecd. Note, 7.950%, 01/15/2020 | 88,956 | |
| 100,000 | Cleveland Electric Illuminating Co., Sr. Unsecd. Note, 5.950%, 12/15/2036 | 105,762 | |
| 5,000 | Consolidated Edison Co., Sr. Unsecd. Note, 6.650%, 04/01/2019 | 6,145 | |
| 70,000 | 2,3 | Electricite de France SA, Note, Series 144A, 5.600%, 01/27/2040 | 74,230 |
| 100,000 | Exelon Generation Co. LLC, Note, 5.350%, 01/15/2014 | 102,082 | |
| 25,000 | FirstEnergy Corp., Sr. Unsecd. Note, 4.250%, 03/15/2023 | 22,888 | |
| 10,000 | Great Plains Energy, Inc., Note, 4.850%, 06/01/2021 | 10,791 | |
| 19,641 | 2,3 | Great River Energy, 1st Mtg. Note, Series 144A, 5.829%, 7/01/2017 | 21,129 |
| Shares or Principal Amount | Value | ||
| CORPORATE BONDS—continued | |||
| Utility - Electric—continued | |||
| $25,000 | National Rural Utilities Cooperative Finance Corp., Sr. Unsecd. Note, 8.000%, 03/01/2032 | $34,728 | |
| 80,000 | Northern States Power Co., MN, 1st Mtg. Bond, 5.250%, 03/01/2018 | 92,036 | |
| 50,000 | PPL Energy Supply LLC, Sr. Unsecd. Note, 6.000%, 12/15/2036 | 49,636 | |
| 75,000 | PSI Energy, Inc., Bond, 6.050%, 06/15/2016 | 84,954 | |
| 50,000 | Progress Energy, Inc., 7.050%, 03/15/2019 | 60,971 | |
| 10,000 | TECO Finance, Inc., Company Guarantee, 5.150%, 03/15/2020 | 10,993 | |
| 40,000 | UIL Holdings Corp., Sr. Unsecd. Note, 4.625%, 10/01/2020 | 41,172 | |
| TOTAL | 806,473 | ||
| Utility - Natural Gas Distributor—0.1% | |||
| 20,000 | Atmos Energy Corp., 8.500%, 03/15/2019 | 26,066 | |
| 10,000 | 2,3 | Florida Gas Transmission Co. LLC, Sr. Unsecd. Note, Series 144A, 5.450%, 07/15/2020 | 11,031 |
| 65,000 | National Fuel Gas Co., Sr. Unsecd. Note, 3.750%, 03/01/2023 | 63,177 | |
| 55,000 | Sempra Energy, Sr. Unsecd. Note, 6.500%, 06/01/2016 | 62,952 | |
| TOTAL | 163,226 | ||
| Utility - Natural Gas Pipelines—0.2% | |||
| 50,000 | Enbridge Energy Partners LP, Sr. Unsecd. Note, 4.200%, 09/15/2021 | 51,183 | |
| 40,000 | Enbridge, Inc., Sr. Note, 5.600%, 04/01/2017 | 44,741 | |
| 65,000 | Enterprise Products Operating LLC, Company Guarantee, Series O, 9.750%, 01/31/2014 | 67,827 | |
| 50,000 | Kinder Morgan Energy Partners LP, Sr. Unsecd. Note, 5.000%, 12/15/2013 | 50,768 | |
| 20,000 | 2,3 | Texas Eastern Transmission LP, Sr. Unsecd. Note, Series 144A, 2.800%, 10/15/2022 | 18,494 |
| 40,000 | Williams Partners LP, 5.250%, 03/15/2020 | 43,223 | |
| 30,000 | Williams Partners LP, Sr. Unsecd. Note, 4.125%, 11/15/2020 | 30,315 | |
| TOTAL | 306,551 | ||
| TOTAL CORPORATE BONDS (IDENTIFIED COST $12,612,738) | 13,167,516 | ||
| FOREIGN GOVERNMENT/AGENCY—0.1% | |||
| Sovereign—0.1% | |||
| 75,000 | United Mexican States, 6.625%, 03/03/2015 (IDENTIFIED COST $76,682) | 81,750 | |
| MORTGAGE-BACKED SECURITIES—0.0% | |||
| Federal National Mortgage Association—0.0% | |||
| 1,762 | Federal National Mortgage Association Pool 512255, 7.500%, 9/1/2014 | 1,817 |
| Shares or Principal Amount | Value | ||
| MORTGAGE-BACKED SECURITIES—continued | |||
| Federal National Mortgage Association—continued | |||
| $4,952 | Federal National Mortgage Association Pool 609554, 7.500%, 10/1/2016 | $5,343 | |
| TOTAL MORTGAGE-BACKED SECURITIES (IDENTIFIED COST $6,957) | 7,160 | ||
| MUNICIPAL SECURITY—0.1% | |||
| Municipal Services—0.1% | |||
| 70,000 | Chicago, IL Metropolitan Water Reclamation District, Direct Payment Taxable Limited GO Build America Bonds, 5.720%, 12/01/2038 (IDENTIFIED COST $70,000) | 80,390 | |
| U.S. TREASURY—4.9% | |||
| 514,575 | U.S. Treasury Inflation-Protected Note, Series A-2022, 0.125%, 1/15/2022 | 510,000 | |
| 1,276,360 | U.S. Treasury Inflation-Protected Note, Series D-2021, 0.625%, 7/15/2021 | 1,332,899 | |
| 1,500,000 | United States Treasury Note, 0.500%, 7/31/2017 | 1,468,101 | |
| 750,000 | 4 | United States Treasury Note, 0.875%, 11/30/2016 | 752,725 |
| 950,000 | United States Treasury Note, 1.875%, 6/30/2020 | 943,223 | |
| 200,000 | United States Treasury Note, 3.375%, 11/15/2019 | 219,471 | |
| 1,100,000 | United States Treasury Note, 3.500%, 5/15/2020 | 1,212,650 | |
| TOTAL U.S. TREASURY (IDENTIFIED COST $6,648,194) | 6,439,069 | ||
| EXCHANGE-TRADED FUND—6.4% | |||
| 141,000 | iShares MSCI EAFE Index Fund (IDENTIFIED COST $7,994,496) | 8,512,170 | |
| INVESTMENT COMPANIES—17.0%5 | |||
| 55,577 | Emerging Markets Fixed Income Core Fund | 1,832,768 | |
| 821,021 | Federated Mortgage Core Portfolio | 8,062,428 | |
| 7,453,957 | 6 | Federated Prime Value Obligations Fund, Institutional Shares, 0.06% | 7,453,957 |
| 133,659 | Federated Project and Trade Finance Core Fund | 1,305,849 | |
| 576,194 | High Yield Bond Portfolio | 3,820,168 | |
| TOTAL INVESTMENT COMPANIES (IDENTIFIED COST $22,469,264) | 22,475,170 | ||
| TOTAL INVESTMENTS—100.0% (IDENTIFIED COST $119,090,252)7 | 132,544,986 | ||
| OTHER ASSETS AND LIABILITIES - NET—0.0%8 | 25,550 | ||
| TOTAL NET ASSETS—100% | $132,570,536 |
| Description | Number of Contracts | Notional Value | Expiration Date | Unrealized Appreciation/ (Depreciation) |
| 1United States Treasury Note 5-Year Long Futures | 66 | $8,010,234 | September 2013 | $(117,195) |
| 1United States Treasury Note 10-Year Long Futures | 55 | $6,954,063 | September 2013 | $(211,960) |
| 1United States Treasury Bond Ultra Long Short Futures | 10 | $1,442,500 | September 2013 | $52,321 |
| 1United States Treasury Long Bond Short Futures | 20 | $2,681,250 | September 2013 | $156,886 |
| 1United States Treasury Note 2-Year Short Futures | 100 | $22,031,250 | September 2013 | $7,587 |
| NET UNREALIZED DEPRECIATION ON FUTURES CONTRACTS | $(112,361) | |||
| 1 | Non-income producing security. |
| 2 | Denotes a restricted security that either: (a) cannot be offered for public sale without first being registered, or being able to take advantage of an exemption from registration, under the Securities Act of 1933; or (b) is subject to a contractual restriction on public sales. At July 31, 2013, these restricted securities amounted to $2,824,785, which represented 2.1% of total net assets. |
| 3 | Denotes a restricted security that may be resold without restriction to “qualified institutional buyers” as defined in Rule 144A under the Securities Act of 1933 and that the Fund has determined to be liquid under criteria established by the Fund's Board of Trustees (the “Trustees”). At July 31, 2013, these liquid restricted securities amounted to $2,602,111, which represented 2.0% of total net assets. |
| 4 | Pledged as collateral to ensure the Fund is able to satisfy the obligations of its outstanding futures contracts. |
| 5 | Affiliated holdings. |
| 6 | 7-day net yield. |
| 7 | The cost of investments for federal tax purposes amounts to $118,911,830. |
| 8 | Assets, other than investments in securities, less liabilities. See Statement of Assets and Liabilities. |
| Valuation Inputs | ||||
| Level 1— Quoted Prices and Investments in Certain Investment Companies | Level 2— Other Significant Observable Inputs | Level 3— Significant Unobservable Inputs | Total | |
| Equity Securities: | ||||
| Common Stocks | ||||
| Domestic | $76,476,366 | $— | $— | $76,476,366 |
| International | 2,932,597 | — | — | 2,932,597 |
| Debt Securities: | ||||
| Asset-Backed Securities | — | 928,789 | — | 928,789 |
| Collateralized Mortgage Obligations | — | 1,444,009 | — | 1,444,009 |
| Corporate Bonds | — | 13,167,516 | — | 13,167,516 |
| Foreign Government/Agency | — | 81,750 | — | 81,750 |
| Mortgage-Backed Securities | — | 7,160 | — | 7,160 |
| Municipal Security | — | 80,390 | — | 80,390 |
| U.S. Treasury | — | 6,439,069 | — | 6,439,069 |
| Exchange-Traded Fund | 8,512,170 | — | — | 8,512,170 |
| Investment Companies1 | 21,169,321 | 1,305,849 | — | 22,475,170 |
| TOTAL SECURITIES | $109,090,454 | $23,454,532 | $— | $132,544,986 |
| OTHER FINANCIAL INSTRUMENTS2 | $(112,361) | $— | $— | $(112,361) |
| 1 | Emerging Markets Fixed Income Core Fund, Federated Mortgage Core Portfolio, Federated Project and Trade Finance Core Fund and High Yield Bond Portfolio are affiliated holdings offered only to registered investment companies and other accredited investors. |
| 2 | Other financial instruments include futures contracts. |
| GO | —General Obligation |
| MTN | —Medium Term Note |
| REIT(s) | —Real Estate Investment Trust(s) |
| REMIC | —Real Estate Mortgage Investment Conduit |
| Year Ended July 31 | 2013 | 2012 | 2011 | 2010 | 2009 |
| Net Asset Value, Beginning of Period | $12.20 | $12.17 | $10.86 | $10.17 | $12.51 |
| Income From Investment Operations: | |||||
| Net investment income | 0.141 | 0.171 | 0.151 | 0.161 | 0.201 |
| Net realized and unrealized gain (loss) on investments, futures contracts, swap contracts and foreign currency transactions | 2.19 | 0.02 | 1.33 | 0.71 | (2.27) |
| TOTAL FROM INVESTMENT OPERATIONS | 2.33 | 0.19 | 1.48 | 0.87 | (2.07) |
| Less Distributions: | |||||
| Distributions from net investment income | (0.18) | (0.16) | (0.17) | (0.18) | (0.27) |
| Net Asset Value, End of Period | $14.35 | $12.20 | $12.17 | $10.86 | $10.17 |
| Total Return2 | 19.28% | 1.65% | 13.67% | 8.51% | (16.35)% |
| Ratios to Average Net Assets: | |||||
| Net expenses | 1.30% | 1.30% | 1.28% | 1.21% | 1.30% |
| Net investment income | 1.10% | 1.43% | 1.27% | 1.47% | 2.03% |
| Expense waiver/reimbursement3 | 0.11% | 0.28% | 0.23% | 0.25% | 0.14% |
| Supplemental Data: | |||||
| Net assets, end of period (000 omitted) | $50,340 | $48,774 | $57,358 | $86,018 | $105,635 |
| Portfolio turnover | 105% | 149% | 139% | 130% | 231% |
| 1 | Per share numbers have been calculated using the average shares method. |
| 2 | Based on net asset value, which does not reflect the sales charge, redemption fee or contingent deferred sales charge, if applicable. |
| 3 | This expense decrease is reflected in both the net expense and the net investment income ratios shown above. |
| Year Ended July 31 | 2013 | 2012 | 2011 | 2010 | 2009 |
| Net Asset Value, Beginning of Period | $12.03 | $11.99 | $10.70 | $10.03 | $12.30 |
| Income From Investment Operations: | |||||
| Net investment income | 0.041 | 0.081 | 0.061 | 0.081 | 0.131 |
| Net realized and unrealized gain (loss) on investments, futures contracts, swap contracts and foreign currency transactions | 2.16 | 0.03 | 1.31 | 0.69 | (2.23) |
| TOTAL FROM INVESTMENT OPERATIONS | 2.20 | 0.11 | 1.37 | 0.77 | (2.10) |
| Less Distributions: | |||||
| Distributions from net investment income | (0.07) | (0.07) | (0.08) | (0.10) | (0.17) |
| Net Asset Value, End of Period | $14.16 | $12.03 | $11.99 | $10.70 | $10.03 |
| Total Return2 | 18.41% | 0.93% | 12.85% | 7.63% | (16.95)% |
| Ratios to Average Net Assets: | |||||
| Net expenses | 2.05% | 2.05% | 2.04% | 1.96% | 2.05% |
| Net investment income | 0.36% | 0.68% | 0.52% | 0.71% | 1.28% |
| Expense waiver/reimbursement3 | 0.08% | 0.24% | 0.19% | 0.22% | 0.10% |
| Supplemental Data: | |||||
| Net assets, end of period (000 omitted) | $35,450 | $34,193 | $45,512 | $49,907 | $55,582 |
| Portfolio turnover | 105% | 149% | 139% | 130% | 231% |
| 1 | Per share numbers have been calculated using the average shares method. |
| 2 | Based on net asset value, which does not reflect the sales charge, redemption fee or contingent deferred sales charge, if applicable. |
| 3 | This expense decrease is reflected in both the net expense and the net investment income ratios shown above. |
| Year Ended July 31 | 2013 | 2012 | 2011 | 2010 | 2009 |
| Net Asset Value, Beginning of Period | $12.17 | $12.12 | $10.83 | $10.14 | $12.51 |
| Income From Investment Operations: | |||||
| Net investment income | 0.091 | 0.111 | 0.091 | 0.101 | 0.151 |
| Net realized and unrealized gain (loss) on investments, futures contracts, swap contracts and foreign currency transactions | 2.19 | 0.03 | 1.32 | 0.72 | (2.27) |
| TOTAL FROM INVESTMENT OPERATIONS | 2.28 | 0.14 | 1.41 | 0.82 | (2.12) |
| Less Distributions: | |||||
| Distributions from net investment income | (0.12) | (0.09) | (0.12) | (0.13) | (0.25) |
| Net Asset Value, End of Period | $14.33 | $12.17 | $12.12 | $10.83 | $10.14 |
| Total Return2 | 18.84% | 1.19% | 13.08% | 8.01% | (16.75)% |
| Ratios to Average Net Assets: | |||||
| Net expenses | 1.69% | 1.80% | 1.79% | 1.70% | 1.79% |
| Net investment income | 0.70% | 0.93% | 0.77% | 0.96% | 1.56% |
| Expense waiver/reimbursement3 | 0.06% | 0.22% | 0.17% | 0.21% | 0.09% |
| Supplemental Data: | |||||
| Net assets, end of period (000 omitted) | $417 | $526 | $665 | $673 | $597 |
| Portfolio turnover | 105% | 149% | 139% | 130% | 231% |
| 1 | Per share numbers have been calculated using the average shares method. |
| 2 | Based on net asset value. |
| 3 | This expense decrease is reflected in both the net expense and the net investment income ratios shown above. |
| Year Ended July 31 | 2013 | 2012 | 2011 | 2010 | 2009 |
| Net Asset Value, Beginning of Period | $12.23 | $12.21 | $10.90 | $10.21 | $12.57 |
| Income From Investment Operations: | |||||
| Net investment income | 0.181 | 0.201 | 0.181 | 0.191 | 0.231 |
| Net realized and unrealized gain (loss) on investments, futures contracts, swap contracts and foreign currency transactions | 2.19 | 0.02 | 1.34 | 0.71 | (2.28) |
| TOTAL FROM INVESTMENT OPERATIONS | 2.37 | 0.22 | 1.52 | 0.90 | (2.05) |
| Less Distributions: | |||||
| Distributions from net investment income | (0.21) | (0.20) | (0.21) | (0.21) | (0.31) |
| Net Asset Value, End of Period | $14.39 | $12.23 | $12.21 | $10.90 | $10.21 |
| Total Return2 | 19.63% | 1.87% | 13.99% | 8.74% | (16.13)% |
| Ratios to Average Net Assets: | |||||
| Net expenses | 1.05% | 1.05% | 1.04% | 0.96% | 1.05% |
| Net investment income | 1.35% | 1.69% | 1.52% | 1.71% | 2.29% |
| Expense waiver/reimbursement3 | 0.07% | 0.23% | 0.18% | 0.21% | 0.09% |
| Supplemental Data: | |||||
| Net assets, end of period (000 omitted) | $46,365 | $43,341 | $47,473 | $49,127 | $50,161 |
| Portfolio turnover | 105% | 149% | 139% | 130% | 231% |
| 1 | Per share numbers have been calculated using the average shares method. |
| 2 | Based on net asset value. |
| 3 | This expense decrease is reflected in both the net expense and the net investment income ratios shown above. |
| Assets: | ||
| Total investment in securities, at value including $22,475,170 of investment in affiliated holdings (Note 5) (identified cost $119,090,252) | $132,544,986 | |
| Income receivable | 237,124 | |
| Receivable for investments sold | 341,610 | |
| Receivable for shares sold | 95,857 | |
| TOTAL ASSETS | 133,219,577 | |
| Liabilities: | ||
| Payable for investments purchased | $320,845 | |
| Payable for shares redeemed | 135,917 | |
| Payable for daily variation margin | 10,297 | |
| Payable for transfer agent fee | 30,206 | |
| Payable for Directors'/Trustees' fees (Note 5) | 200 | |
| Payable for auditing fees | 28,000 | |
| Payable for portfolio accounting fees | 17,080 | |
| Payable for distribution services fee (Note 5) | 22,392 | |
| Payable for shareholder services fee (Note 5) | 35,237 | |
| Payable for share registration costs | 33,646 | |
| Accrued expenses (Note 5) | 15,221 | |
| TOTAL LIABILITIES | 649,041 | |
| Net assets for 9,261,349 shares outstanding | $132,570,536 | |
| Net Assets Consist of: | ||
| Paid-in capital | $159,656,974 | |
| Net unrealized appreciation of investments and futures contracts | 13,342,373 | |
| Accumulated net realized loss on investments and futures contracts | (41,162,835) | |
| Undistributed net investment income | 734,024 | |
| TOTAL NET ASSETS | $132,570,536 |
| Net Asset Value, Offering Price and Redemption Proceeds Per Share | ||
| Class A Shares: | ||
| Net asset value per share ($50,339,849 ÷ 3,507,177 shares outstanding), no par value, unlimited shares authorized | $14.35 | |
| Offering price per share (100/94.50 of $14.35) | $15.19 | |
| Redemption proceeds per share | $14.35 | |
| Class C Shares: | ||
| Net asset value per share ($35,449,564 ÷ 2,503,489 shares outstanding), no par value, unlimited shares authorized | $14.16 | |
| Offering price per share | $14.16 | |
| Redemption proceeds per share (99.00/100 of $14.16) | $14.02 | |
| Class R Shares: | ||
| Net asset value per share ($416,622 ÷ 29,068 shares outstanding), no par value, unlimited shares authorized | $14.33 | |
| Offering price per share | $14.33 | |
| Redemption proceeds per share | $14.33 | |
| Institutional Shares: | ||
| Net asset value per share ($46,364,501 ÷ 3,221,615 shares outstanding), no par value, unlimited shares authorized | $14.39 | |
| Offering price per share | $14.39 | |
| Redemption proceeds per share | $14.39 |
| Investment Income: | |||
| Dividends (including $532,755 received from affiliated holdings (Note 5) and net of foreign taxes withheld of $413) | $2,277,401 | ||
| Interest | 748,183 | ||
| Investment income allocated from affiliated partnership (Note 5) | 74,380 | ||
| TOTAL INCOME | 3,099,964 | ||
| Expenses: | |||
| Investment adviser fee (Note 5) | $968,018 | ||
| Administrative fee (Note 5) | 115,186 | ||
| Custodian fees | 22,423 | ||
| Transfer agent fee (Note 2) | 140,869 | ||
| Directors'/Trustees' fees (Note 5) | 1,766 | ||
| Auditing fees | 28,000 | ||
| Legal fees | 7,647 | ||
| Portfolio accounting fees | 107,508 | ||
| Distribution services fee (Note 5) | 260,222 | ||
| Shareholder services fee (Note 5) | 155,167 | ||
| Account administration fee (Note 2) | 43,186 | ||
| Share registration costs | 50,629 | ||
| Printing and postage | 32,130 | ||
| Insurance premiums (Note 5) | 4,150 | ||
| Miscellaneous (Note 5) | 9,400 | ||
| TOTAL EXPENSES | 1,946,301 |
| Waivers and Reimbursements: | |||
| Waiver/reimbursement of investment adviser fee (Note 5) | $(72,993) | ||
| Waiver of administrative fee (Note 5) | (4,563) | ||
| Reimbursement of transfer agent fee (Note 2) | (35,710) | ||
| TOTAL WAIVERS AND REIMBURSEMENTS | $(113,266) | ||
| Net expenses | $1,833,035 | ||
| Net investment income | 1,266,929 | ||
| Realized and Unrealized Gain (Loss) on Investments and Futures Contracts: | |||
| Net realized gain on investments (including realized gain of $1,278,677 on sales of investments in affiliated holdings) (Note 5) | 15,042,751 | ||
| Net realized gain on futures contracts | 41,408 | ||
| Net realized gain allocated from affiliated partnership (Note 5) | 10,664 | ||
| Realized gain distribution from affiliated investment company shares (Note 5) | 18,104 | ||
| Net change in unrealized appreciation of investments | 6,385,882 | ||
| Net change in unrealized appreciation of futures contracts | (126,623) | ||
| Net realized and unrealized gain on investments and futures contracts | 21,372,186 | ||
| Change in net assets resulting from operations | $22,639,115 |
| Year Ended July 31 | 2013 | 2012 |
| Increase (Decrease) in Net Assets | ||
| Operations: | ||
| Net investment income | $1,266,929 | $1,744,575 |
| Net realized gain on investments including allocations from partnership, futures contracts and swap contracts | 15,112,927 | 2,486,940 |
| Net change in unrealized appreciation/depreciation of investments and futures contracts | 6,259,259 | (2,836,562) |
| CHANGE IN NET ASSETS RESULTING FROM OPERATIONS | 22,639,115 | 1,394,953 |
| Distributions to Shareholders: | ||
| Distributions from net investment income | ||
| Class A Shares | (667,680) | (687,022) |
| Class C Shares | (196,512) | (236,475) |
| Class R Shares | (4,965) | (3,971) |
| Institutional Shares | (706,650) | (746,612) |
| CHANGE IN NET ASSETS RESULTING FROM DISTRIBUTIONS TO SHAREHOLDERS | (1,575,807) | (1,674,080) |
| Share Transactions: | ||
| Proceeds from sale of shares | 11,415,128 | 7,982,107 |
| Net asset value of shares issued to shareholders in payment of distributions declared | 1,433,859 | 1,539,146 |
| Cost of shares redeemed | (28,175,403) | (33,416,917) |
| CHANGE IN NET ASSETS RESULTING FROM SHARE TRANSACTIONS | (15,326,416) | (23,895,664) |
| Change in net assets | 5,736,892 | (24,174,791) |
| Net Assets: | ||
| Beginning of period | 126,833,644 | 151,008,435 |
| End of period (including undistributed net investment income of $734,024 and $1,040,803, respectively) | $132,570,536 | $126,833,644 |
| ■ | Equity securities listed on an exchange or traded through a regulated market system are valued at their last reported sale price or official closing price in their principal exchange or market. |
| ■ | Fixed-income securities acquired with remaining maturities greater than 60 days are fair valued using price evaluations provided by a pricing service approved by the Trustees. |
| ■ | Fixed-income securities and repurchase agreements acquired with remaining maturities of 60 days or less are valued at their amortized cost (adjusted for the accretion of any discount or amortization of any premium), unless the issuer's creditworthiness is impaired or other factors indicate that amortized cost is not an accurate estimate of the investment's fair value, in which case it would be valued in the same manner as a longer-term security. |
| ■ | Shares of other mutual funds or non-exchange-traded investment companies are valued based upon their reported NAVs. |
| ■ | Derivative contracts listed on exchanges are valued at their reported settlement or closing price. |
| ■ | Over-the-counter (OTC) derivative contracts are fair valued using price evaluations provided by a pricing service approved by the Trustees. |
| ■ | For securities that are fair valued in accordance with procedures established by and under the general supervision of the Trustees, certain factors may be considered such as: the purchase price of the security, information obtained by contacting the issuer, analysis of the issuer's financial statements or other available documents, fundamental analytical data, the nature and duration of restrictions on disposition, the movement of the market in which the security is normally traded and public trading in similar securities of the issuer or comparable issuers. |
| ■ | With respect to securities traded in foreign markets, significant trends in U.S. equity markets or in the trading of foreign securities index futures contracts; |
| ■ | Political or other developments affecting the economy or markets in which an issuer conducts its operations or its securities are traded; and |
| ■ | Announcements concerning matters such as acquisitions, recapitalizations, litigation developments, a natural disaster affecting the issuer's operations or regulatory changes or market developments affecting the issuer's industry. |
| Transfer Agent Fees Incurred | Transfer Agent Fees Reimbursed | Account Administration Fees Incurred | |
| Class A Shares | $70,996 | $(25,100) | $12,691 |
| Class C Shares | 33,158 | (6,473) | 30,495 |
| Class R Shares | 1,050 | — | — |
| Institutional Shares | 35,665 | (4,137) | — |
| TOTAL | $140,869 | $(35,710) | $43,186 |
| Security | Acquisition Date | Cost | Market Value |
| Football Trust V, Pass Thru Cert., Series 144A, 5.350%, 10/05/2020 | 3/24/2010 | $200,000 | $222,674 |
| Fair Value of Derivative Instruments | ||
| Liability | ||
| Statement of Assets and Liabilities Location | Fair Value | |
| Derivatives not accounted for as hedging instruments under ASC Topic 815 | ||
| Interest rate contracts | Payable for daily variation margin | $112,361* |
| * | Includes cumulative depreciation of futures contracts as reported in the footnotes to the Portfolio of Investments. Only the current day's variation margin is reported within the Statement of Assets and Liabilities. |
| Amount of Realized Gain or (Loss) on Derivatives Recognized in Income | |
| Futures | |
| Interest rate contracts | $41,408 |
| Change in Unrealized Appreciation or (Depreciation) on Derivatives Recognized in Income | |
| Futures | |
| Interest rate contracts | $(126,623) |
| Year Ended July 31 | 2013 | 2012 | ||
| Class A Shares: | Shares | Amount | Shares | Amount |
| Shares sold | 527,475 | $6,996,469 | 440,545 | $5,224,494 |
| Shares issued to shareholders in payment of distributions declared | 46,305 | 582,053 | 52,895 | 609,880 |
| Shares redeemed | (1,064,068) | (14,149,462) | (1,208,672) | (14,191,970) |
| NET CHANGE RESULTING FROM CLASS A SHARE TRANSACTIONS | (490,288) | $(6,570,940) | (715,232) | $(8,357,596) |
| Year Ended July 31 | 2013 | 2012 | ||
| Class C Shares: | Shares | Amount | Shares | Amount |
| Shares sold | 182,902 | $2,406,143 | 132,751 | $1,556,075 |
| Shares issued to shareholders in payment of distributions declared | 14,589 | 181,786 | 19,395 | 221,494 |
| Shares redeemed | (536,360) | (6,939,271) | (1,104,241) | (12,992,765) |
| NET CHANGE RESULTING FROM CLASS C SHARE TRANSACTIONS | (338,869) | $(4,351,342) | (952,095) | $(11,215,196) |
| Year Ended July 31 | 2013 | 2012 | ||
| Class R Shares: | Shares | Amount | Shares | Amount |
| Shares sold | 3,579 | $48,415 | 3,336 | $40,659 |
| Shares issued to shareholders in payment of distributions declared | 395 | 4,965 | 345 | 3,971 |
| Shares redeemed | (18,107) | (245,247) | (15,330) | (176,806) |
| NET CHANGE RESULTING FROM CLASS R SHARE TRANSACTIONS | (14,133) | $(191,867) | (11,649) | $(132,176) |
| Year Ended July 31 | 2013 | 2012 | ||
| Institutional Shares: | Shares | Amount | Shares | Amount |
| Shares sold | 146,925 | $1,964,101 | 96,867 | $1,160,879 |
| Shares issued to shareholders in payment of distributions declared | 52,824 | 665,055 | 60,988 | 703,801 |
| Shares redeemed | (520,558) | (6,841,423) | (503,403) | (6,055,376) |
| NET CHANGE RESULTING FROM INSTITUTIONAL SHARE TRANSACTIONS | (320,809) | $(4,212,267) | (345,548) | $(4,190,696) |
| NET CHANGE RESULTING FROM TOTAL FUND SHARE TRANSACTIONS | (1,164,099) | $(15,326,416) | (2,024,524) | $(23,895,664) |
| Increase (Decrease) | ||
| Paid-In Capital | Undistributed Net Investment Income (Loss) | Accumulated Net Realized Gain (Loss) |
| $(664) | $2,099 | $(1,435) |
| 2013 | 2012 | |
| Ordinary income | $1,575,807 | $1,674,080 |
| Undistributed ordinary income | $734,024 |
| Net unrealized appreciation | $13,633,156 |
| Capital loss carryforwards | $(41,453,618) |
| Expiration Year | Short-Term | Long-Term | Total |
| 2017 | $10,473,712 | NA | $10,473,712 |
| 2018 | $30,979,906 | NA | $30,979,906 |
| Administrative Fee | Average Daily Net Assets of the Investment Complex |
| 0.150% | on the first $5 billion |
| 0.125% | on the next $5 billion |
| 0.100% | on the next $10 billion |
| 0.075% | on assets in excess of $20 billion |
| Share Class Name | Percentage of Average Daily Net Assets of Class |
| Class A Shares | 0.05% |
| Class C Shares | 0.75% |
| Class R Shares | 0.50% |
| Distribution Services Fees Incurred | |
| Class C Shares | $257,680 |
| Class R Shares | 2,542 |
| TOTAL | $260,222 |
| Service Fees Incurred | |
| Class A Shares | $101,878 |
| Class C Shares | 53,289 |
| TOTAL | $155,167 |
| Emerging Markets Fixed Income Core Fund | Federated Mortgage Core Portfolio | Federated Prime Value Obligations Fund, Institutional Shares | Federated Project and Trade Finance Core Fund | High Yield Bond Portfolio | Total of Affiliated Transactions | |
| Balance of Shares Held 7/31/2012 | 43,041 | 1,111,788 | 3,699,581 | 95,499 | 368,556 | 5,318,465 |
| Purchases/Additions | 37,556 | 93,010 | 45,225,578 | 38,160 | 342,730 | 45,737,034 |
| Sales/Reductions | (25,020) | (383,777) | (41,471,202) | — | (135,092) | (42,015,091) |
| Balance of Shares Held 7/31/2013 | 55,577 | 821,021 | 7,453,957 | 133,659 | 576,194 | 9,040,408 |
| Value | $1,832,768 | $8,062,428 | $7,453,957 | $1,305,849 | $3,820,168 | $22,475,170 |
| Dividend Income/Allocated Investment Income | $74,380 | $251,069 | $7,227 | $55,720 | $218,739 | $607,135 |
| Capital Gain Distributions/Allocated Net Realized Gain | $10,664 | $— | $— | $2,935 | $15,169 | $28,768 |
| Purchases | $115,497,271 |
| Sales | $139,314,771 |
September 23, 2013
| Beginning Account Value 2/1/2013 | Ending Account Value 7/31/2013 | Expenses Paid During Period1 | |
| Actual: | |||
| Class A Shares | $1,000 | $1,092.10 | $6.74 |
| Class C Shares | $1,000 | $1,087.60 | $10.61 |
| Class R Shares | $1,000 | $1,090.60 | $8.03 |
| Institutional Shares | $1,000 | $1,093.50 | $5.45 |
| Hypothetical (assuming a 5% return before expenses): | |||
| Class A Shares | $1,000 | $1,018.35 | $6.51 |
| Class C Shares | $1,000 | $1,014.63 | $10.24 |
| Class R Shares | $1,000 | $1,017.11 | $7.75 |
| Institutional Shares | $1,000 | $1,019.59 | $5.26 |
| 1 | Expenses are equal to the Fund's annualized net expense ratios, multiplied by the average account value over the period, multiplied by 181/365 (to reflect the one-half-year period). The annualized net expense ratios are as follows: |
| Class A Shares | 1.30% |
| Class C Shares | 2.05% |
| Class R Shares | 1.55% |
| Institutional Shares | 1.05% |
| Name Birth Date Positions Held with Trust Date Service Began | Principal Occupation(s) for Past Five Years, Other Directorships Held and Previous Position(s) |
| John F. Donahue* Birth Date: July 28, 1924 Trustee Began serving: June 2006 | Principal Occupations: Director or Trustee of the Federated Fund Family; Chairman and Director, Federated Investors, Inc.; Chairman of the Federated Fund Family's Executive Committee. Previous Positions: Chairman of the Federated Fund Family; Trustee, Federated Investment Management Company; Chairman and Director, Federated Investment Counseling. |
| Name Birth Date Positions Held with Trust Date Service Began | Principal Occupation(s) for Past Five Years, Other Directorships Held and Previous Position(s) |
| J. Christopher Donahue* Birth Date: April 11, 1949 President and Trustee Began serving: May 2006 | Principal Occupations: Principal Executive Officer and President of certain of the Funds in the Federated Fund Family; Director or Trustee of certain of the Funds in the Federated Fund Family; President, Chief Executive Officer and Director, Federated Investors, Inc.; Chairman and Trustee, Federated Investment Management Company; Trustee, Federated Investment Counseling; Chairman and Director, Federated Global Investment Management Corp.; Chairman, Federated Equity Management Company of Pennsylvania and Passport Research, Ltd. (investment advisory subsidiary of Federated); Trustee, Federated Shareholder Services Company; Director, Federated Services Company. Previous Positions: President, Federated Investment Counseling; President and Chief Executive Officer, Federated Investment Management Company, Federated Global Investment Management Corp. and Passport Research, Ltd. |
| * | Family relationships and reasons for “interested” status: John F. Donahue is the father of J. Christopher Donahue; both are “interested” due to their beneficial ownership of shares of Federated Investors, Inc. and the positions they hold with Federated and its subsidiaries. |
| Name Birth Date Positions Held with Trust Date Service Began | Principal Occupation(s) for Past Five Years, Other Directorships Held, Previous Position(s) and Qualifications |
| Maureen Lally-Green Birth Date: July 5, 1949 Trustee Began serving: August 2009 | Principal Occupations: Director or Trustee of the Federated Fund Family; Director, Office of Church Relations, and Associate General Secretary, Diocese of Pittsburgh; Adjunct Professor of Law, Duquesne University School of Law. Other Directorships Held: Director, Auberle; Member, Pennsylvania State Board of Education; Director, Saint Vincent College; Director, Ireland Institute of Pittsburgh; Chair and Director, UPMC Mercy Hospital; Regent, St. Vincent Seminary; Director, Epilepsy Foundation of Western and Central Pennsylvania; Director, Saint Thomas More Society, Allegheny County; Director, Our Campaign for the Church Alive, Inc. Previous Position: Pennsylvania Superior Court Judge. Qualifications: Legal and director experience. |
| Name Birth Date Positions Held with Trust Date Service Began | Principal Occupation(s) for Past Five Years, Other Directorships Held, Previous Position(s) and Qualifications |
| Peter E. Madden Birth Date: March 16, 1942 Trustee Began serving: June 2006 | Principal Occupation: Director or Trustee, and Chairman of the Board of Directors or Trustees, of the Federated Fund Family. Previous Positions: Representative, Commonwealth of Massachusetts General Court; President, Chief Operating Officer and Director, State Street Bank and Trust Company and State Street Corporation (retired); Director, VISA USA and VISA International; Chairman and Director, Massachusetts Bankers Association; Director, Depository Trust Corporation; Director, The Boston Stock Exchange. Qualifications: Business management, mutual fund services and director experience. |
| Charles F. Mansfield, Jr. Birth Date: April 10, 1945 Trustee Began serving: June 2006 | Principal Occupations: Director or Trustee of the Federated Fund Family; Management Consultant. Previous Positions: Chief Executive Officer, PBTC International Bank; Partner, Arthur Young & Company (now Ernst & Young LLP); Chief Financial Officer of Retail Banking Sector, Chase Manhattan Bank; Senior Vice President, HSBC Bank USA (formerly Marine Midland Bank); Vice President, Citibank; Assistant Professor of Banking and Finance, Frank G. Zarb School of Business, Hofstra University; Executive Vice President, DVC Group, Inc. (marketing, communications and technology). Qualifications: Banking, business management, education and director experience. |
| Thomas M. O'Neill Birth Date: June 14, 1951 Trustee Began serving: October 2006 | Principal Occupations: Director or Trustee, Vice Chairman of the Audit Committee of the Federated Fund Family; Sole Proprietor, Navigator Management Company (investment and strategic consulting). Other Directorships Held: Board of Overseers, Children's Hospital of Boston; Visiting Committee on Athletics, Harvard College; Board of Directors, Medicines for Humanity; Board of Directors, The Golisano Children's Museum of Naples, Florida. Previous Positions: Chief Executive Officer and President, Managing Director and Chief Investment Officer, Fleet Investment Advisors; President and Chief Executive Officer, Aeltus Investment Management, Inc.; General Partner, Hellman, Jordan Management Co., Boston, MA; Chief Investment Officer, The Putnam Companies, Boston, MA; Credit Analyst and Lending Officer, Fleet Bank; Director and Consultant, EZE Castle Software (investment order management software); Director, Midway Pacific (lumber). Qualifications: Business management, mutual fund, director and investment experience. |
| Name Birth Date Positions Held with Trust Date Service Began | Principal Occupation(s) for Past Five Years, Other Directorships Held, Previous Position(s) and Qualifications |
| John S. Walsh Birth Date: November 28, 1957 Trustee Began serving: June 2006 | Principal Occupations: Director or Trustee, Chairman of the Audit Committee of the Federated Fund Family; President and Director, Heat Wagon, Inc. (manufacturer of construction temporary heaters); President and Director, Manufacturers Products, Inc. (distributor of portable construction heaters); President, Portable Heater Parts, a division of Manufacturers Products, Inc. Previous Position: Vice President, Walsh & Kelly, Inc. Qualifications: Business management and director experience. |
| Name Birth Date Address Positions Held with Trust Date Service Began | Principal Occupation(s) for Past Five Years and Previous Position(s) |
| John W. McGonigle Birth Date: October 26, 1938 Secretary Officer since: May 2006 | Principal Occupations: Executive Vice President and Secretary of the Federated Fund Family; Vice Chairman, Executive Vice President, Secretary and Director, Federated Investors, Inc. Previous Positions: Trustee, Federated Investment Management Company and Federated Investment Counseling; Director, Federated Global Investment Management Corp., Federated Services Company and Federated Securities Corp. |
| Lori A. Hensler, CPA Birth Date: January 6, 1967 TREASURER Officer since: April 2013 | Principal Occupations: Principal Financial Officer and Treasurer of the Federated Fund Family; Senior Vice President, Federated Administrative Services; Financial and Operations Principal for Federated Securities Corp. and Edgewood Services, Inc.; and Assistant Treasurer, Federated Investors Trust Company. Previous Positions: Controller of Federated Investors, Inc.; Senior Vice President and Assistant Treasurer, Federated Investors Management Company; Treasurer, Federated Investors Trust Company; Assistant Treasurer, Federated Administrative Services, Federated Administrative Services, Inc., Federated Securities Corp., Edgewood Services, Inc., Federated Advisory Services Company, Federated Equity Management Company of Pennsylvania, Federated Global Investment Management Corp., Federated Investment Counseling, Federated Investment Management Company, Passport Research, Ltd., and Federated MDTA, LLC; Financial and Operations Principal for Federated Securities Corp., Edgewood Services, Inc. and Southpointe Distribution Services, Inc. |
| Name Birth Date Address Positions Held with Trust Date Service Began | Principal Occupation(s) for Past Five Years and Previous Position(s) |
| Peter J. Germain Birth Date: September 3, 1959 CHIEF LEGAL OFFICER Officer since: June 2006 | Principal Occupations: Mr. Germain is Chief Legal Officer of the Federated Fund Family. He is General Counsel and Vice President, Federated Investors, Inc.; President, Federated Administrative Services and Federated Administrative Services, Inc.; Vice President, Federated Securities Corp.; Secretary, Federated Private Asset Management, Inc.; and Secretary, Retirement Plan Service Company of America. Mr. Germain joined Federated in 1984 and is a member of the Pennsylvania Bar Association. Previous Positions: Deputy General Counsel, Special Counsel, Managing Director of Mutual Fund Services, Federated Investors, Inc.; Senior Vice President, Federated Services Company; and Senior Corporate Counsel, Federated Investors, Inc. |
| Brian P. Bouda Birth Date: February 28, 1947 CHIEF COMPLIANCE OFFICER AND SENIOR VICE PRESIDENT Officer since: June 2006 | Principal Occupations: Senior Vice President and Chief Compliance Officer of the Federated Fund Family; Vice President and Chief Compliance Officer of Federated Investors, Inc. and Chief Compliance Officer of certain of its subsidiaries. Mr. Bouda joined Federated in 1999 and is a member of the American Bar Association and the State Bar Association of Wisconsin. Previous Positions: Served in Senior Management positions with a large regional banking organization. |
| Stephen F. Auth Birth Date: September 3, 1956 450 Lexington Avenue Suite 3700 New York, NY 10017-3943 CHIEF INVESTMENT OFFICER Began serving: June 2012 | Principal Occupations: Stephen F. Auth is Chief Investment Officer of various Funds in the Federated Fund Family; Executive Vice President, Federated Investment Counseling, Federated Global Investment Management Corp. and Federated Equity Management Company of Pennsylvania. Previous Positions: Executive Vice President, Federated Investment Management Company and Passport Research, Ltd. (investment advisory subsidiary of Federated); Senior Vice President, Global Portfolio Management Services Division; Senior Vice President, Federated Investment Management Company and Passport Research, Ltd.; Senior Managing Director and Portfolio Manager, Prudential Investments. |
| Robert J. Ostrowski Birth Date: April 26, 1963 Chief Investment Officer Officer since: May 2004 | Principal Occupations: Robert J. Ostrowski joined Federated in 1987 as an Investment Analyst and became a Portfolio Manager in 1990. He was named Chief Investment Officer of taxable fixed-income products in 2004 and also serves as a Senior Portfolio Manager. Mr. Ostrowski became an Executive Vice President of the Fund's Sub-Adviser in 2009 and served as a Senior Vice President of the Fund's Sub-Adviser from 1997 to 2009. Mr. Ostrowski has received the Chartered Financial Analyst designation. He received his M.S. in Industrial Administration from Carnegie Mellon University. |
| Name Birth Date Address Positions Held with Trust Date Service Began | Principal Occupation(s) for Past Five Years and Previous Position(s) |
| John F. Sherman Birth Date: August 28, 1967 125 High Street Oliver Tower 21st Floor Boston, MA 02110-2704 Vice President Officer since: June 2012 Portfolio Manager since: October 2002 | Principal Occupations: John F. Sherman has been the Fund's Portfolio Manager since October 2002. Mr. Sherman joined MDT Advisers Investment Team in 2000. He is Vice President of the Trust with respect to the Fund. Mr. Sherman is a member of the CFA Institute and the Boston Security Analysts Society. He received a B.S.B.A. from North Adams State College and an M.B.A. from Boston University Graduate School of Management. |
Federated Investors Funds
4000 Ericsson Drive
Warrendale, PA 15086-7561
or call 1-800-341-7400.
CUSIP 31421R833
CUSIP 31421R692
CUSIP 31421R825
2013 ©Federated Investors, Inc.
| Share Class | Ticker |
| A | QALGX |
| B | QBLGX |
| C | QCLGX |
| Institutional | QILGX |
| 1 | Please see the footnotes to the line graphs below for definitions of, and further information about, the Russell 1000® Growth Index. |
| 2 | The Russell 3000® Index measures the performance of the largest 3,000 U.S. companies representing approximately 98% of the investable U.S. equity market. The Russell 3000® Index is constructed to provide a comprehensive, unbiased, and stable barometer of the broad market and is completely reconstituted annually to ensure new and growing equities are reflected. The index is unmanaged, and it is not possible to invest directly in an index. |
| 3 | The Russell 2000® Index measures the performance of the small-cap segment of the U.S. equity universe. The Russell 2000® Index is a subset of the Russell 3000® Index representing approximately 10% of the total market capitalization of that index. It includes approximately 2000 of the smallest securities based on a combination of their market cap and current index membership. The Russell 2000® Index is constructed to provide a comprehensive and unbiased small-cap barometer and is completely reconstituted annually to ensure larger stocks do not distort the performance and characteristics of the true small-cap opportunity set. The index is unmanaged, and it is not possible to invest directly in an index. |
| 4 | The Russell Midcap® Index measures the performance of the mid-cap segment of the U.S. equity universe. The Russell Midcap® Index is a subset of the Russell 1000® Index. It includes approximately 800 of the smallest securities based on a combination of their market cap and current index membership. The Russell Midcap® Index represents approximately 31% of the total market capitalization of the Russell 1000® companies. The Russell Midcap® Index is constructed to provide a comprehensive and unbiased barometer for the mid-cap segment. The Russell Midcap Index is completely reconstituted annually to ensure larger stocks do not distort the performance and characteristics of the true mid-cap opportunity set. The index is unmanaged, and it is not possible to invest directly in an index. |
| 5 | The Russell Top 200® Index measures the performance of the largest cap segment of the U.S. equity universe. The Russell Top 200® Index is a subset of the Russell 3000® Index. It includes approximately 200 of the largest securities based on a combination of their market cap and current index membership and represents approximately 68% of the U.S. market. The Russell Top 200® Index is constructed to provide a comprehensive and unbiased barometer for this very large cap segment and is completely reconstituted annually to ensure new and growing equities are reflected. The index is unmanaged, and it is not possible to invest directly in an index. |
| 6 | The Russell 3000® Value Index measures the performance of the broad value segment of U.S. equity value universe. It includes those Russell 3000® Index companies with lower price-to-book ratios and lower forecasted growth values. The Russell 3000® Value Index is constructed to provide a comprehensive, unbiased, and stable barometer of the broad value market. The Russell 3000 Value Index is completely reconstituted annually to ensure new and growing equities are included and that the represented companies continue to reflect value characteristics. The index is unmanaged, and it is not possible to invest directly in an index. |
| 7 | The Russell 3000® Growth Index measures the performance of the broad growth segment of the U.S. equity universe. It includes those Russell 3000® Index companies with higher price-to-book ratios and higher forecasted growth values. The Russell 3000® Growth Index is constructed to provide a comprehensive, unbiased, and stable barometer of the broad growth market. The Russell 3000 Growth Index is completely reconstituted annually to ensure new and growing equities are included and that the represented companies continue to reflect growth characteristics. The index is unmanaged, and it is not possible to invest directly in an index. |
| Share Class | 1 Year | 5 Years | Start of Performance* |
| Class A Shares | 21.14% | 4.63% | 4.81% |
| Class B Shares4 | 21.82% | 4.70% | 4.82% |
| Class C Shares | 26.22% | 5.02% | 4.76% |
| Institutional Shares | 28.52% | 6.09% | 5.84% |
| * | The Fund's start of performance date was September 15, 2005. |

| Federated MDT Large Cap Growth Fund - | Class A Shares | R1000G |
| 9/15/2005 | 9,450 | 10,000 |
| 7/31/2006 | 9,620 | 10,029 |
| 7/31/2007 | 11,569 | 11,981 |
| 7/31/2008 | 10,903 | 11,228 |
| 7/31/2009 | 8,100 | 9,255 |
| 7/31/2010 | 9,006 | 10,518 |
| 7/31/2011 | 11,190 | 13,122 |
| 7/31/2012 | 11,286 | 14,206 |
| 7/31/2013 | 14,473 | 17,280 |
| ■ | Total returns shown include the maximum sales charge of 5.50% ($10,000 investment minus $550 sales charge = $9,450). |

| Federated MDT Large Cap Growth Fund - | Class B Shares | R1000G |
| 9/15/2005 | 10,000 | 10,000 |
| 7/31/2006 | 10,117 | 10,029 |
| 7/31/2007 | 12,111 | 11,981 |
| 7/31/2008 | 11,332 | 11,228 |
| 7/31/2009 | 8,357 | 9,255 |
| 7/31/2010 | 9,212 | 10,518 |
| 7/31/2011 | 11,365 | 13,122 |
| 7/31/2012 | 11,376 | 14,206 |
| 7/31/2013 | 14,484 | 17,280 |
| ■ | Total returns shown include the maximum contingent deferred sales charge of 5.50%, as applicable. |
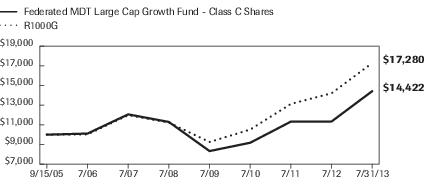
| Federated MDT Large Cap Growth Fund - | Class C Shares | R1000G |
| 9/15/2005 | 10,000 | 10,000 |
| 7/31/2006 | 10,110 | 10,029 |
| 7/31/2007 | 12,062 | 11,981 |
| 7/31/2008 | 11,291 | 11,228 |
| 7/31/2009 | 8,330 | 9,255 |
| 7/31/2010 | 9,178 | 10,518 |
| 7/31/2011 | 11,325 | 13,122 |
| 7/31/2012 | 11,336 | 14,206 |
| 7/31/2013 | 14,422 | 17,280 |
| ■ | Total returns shown include the maximum contingent deferred sales charge of 1.00%, as applicable. |
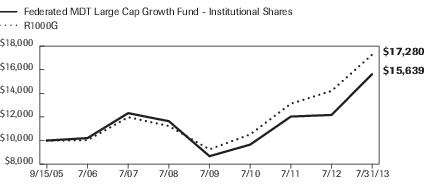
| Federated MDT Large Cap Growth Fund - | Institutional Shares | R1000G |
| 9/15/2005 | 10,000 | 10,000 |
| 7/31/2006 | 10,210 | 10,029 |
| 7/31/2007 | 12,322 | 11,981 |
| 7/31/2008 | 11,639 | 11,228 |
| 7/31/2009 | 8,676 | 9,255 |
| 7/31/2010 | 9,656 | 10,518 |
| 7/31/2011 | 12,033 | 13,122 |
| 7/31/2012 | 12,169 | 14,206 |
| 7/31/2013 | 15,639 | 17,280 |
| 1 | Represents a hypothetical investment of $10,000 in the Fund after deducting applicable sales charges: for Class A Shares, the maximum sales charge of 5.50% ($10,000 investment minus $550 sales charges = $9,450); for Class B Shares, the maximum contingent deferred sales charge is 5.50% on any redemption less than one year from the purchase date; for Class C Shares, a 1.00% contingent deferred sales charge would be applied to any redemption less than one year from the purchase date. The Fund's performance assumes the reinvestment of all dividends and distributions. The R1000G has been adjusted to reflect reinvestment of dividends on securities. |
| 2 | The Fund is the successor to the MDT Large Cap Growth Fund pursuant to a reorganization that took place on December 8, 2006. Prior to that date, the Fund had no investment operations. Accordingly, the performance information shown for the periods prior to that date is that of the MDT Large Cap Growth Fund. |
| 3 | The R1000G measures the performance of the large-cap growth segment of the U.S. equity universe. It includes those Russell 1000® Index companies with higher price-to-book ratios and higher forecasted growth values. The R1000G is constructed to provide a comprehensive and unbiased barometer for the large-cap growth segment. The R1000G is completely reconstituted annually to ensure new and growing equities are included and that the represented companies continue to reflect growth characteristics. The R1000G is unmanaged and, unlike the Fund, is not affected by cash flows. It is not possible to invest directly in an index. The R1000G is not adjusted to reflect sales charges, expenses or other fees that the Securities and Exchange Commission requires to be reflected in the Fund's performance. |
| 4 | The start of performance date for the Fund was September 15, 2005. Class B Shares of the Fund were offered beginning March 29, 2007. Performance results shown before that date are for the Fund's Institutional Shares and have been adjusted for the maximum contingent deferred sales charge and total annual operating expenses applicable to the Fund's Class B Shares. The Fund's Institutional Shares commenced operations on September 15, 2005. Subject to the expense adjustments described above, the Fund's Class B Shares annual returns would have been substantially similar to those of the Fund's Institutional Shares because Shares of each class are invested in the same portfolio of securities. |
| Industry Composition | Percentage of Total Net Assets |
| Software Packaged/Custom | 5.7% |
| Specialty Retailing | 4.6% |
| Biotechnology | 3.6% |
| Soft Drinks | 3.6% |
| Internet Services | 3.4% |
| Computer Peripherals | 3.3% |
| Financial Services | 3.0% |
| Medical Supplies | 2.7% |
| Crude Oil & Gas Production | 2.5% |
| Grocery Chain | 2.4% |
| Clothing Stores | 2.3% |
| Cable TV | 2.0% |
| Defense Aerospace | 2.0% |
| Construction Machinery | 1.9% |
| Semiconductor Manufacturing | 1.9% |
| Commodity Chemicals | 1.7% |
| Ethical Drugs | 1.7% |
| Discount Department Stores | 1.6% |
| Medical Technology | 1.6% |
| Other Communications Equipment | 1.6% |
| Telecommunication Equipment & Services | 1.6% |
| Toys & Games | 1.6% |
| AT&T Divestiture | 1.5% |
| Food Wholesaling | 1.5% |
| Computers—High End | 1.4% |
| Computers—Low End | 1.4% |
| Generic Drugs | 1.4% |
| Broadcasting | 1.3% |
| Cosmetics & Toiletries | 1.2% |
| Agricultural Chemicals | 1.1% |
| Cable & Wireless Television | 1.1% |
| Agricultural Machinery | 1.0% |
| Auto Part Replacement | 1.0% |
| Industry Composition | Percentage of Total Net Assets |
| Multi-Industry Capital Goods | 1.0% |
| Other2 | 26.7% |
| Cash Equivalents3 | 1.7% |
| Other Assets and Liabilities—Net4 | 0.4% |
| TOTAL | 100.0% |
| 1 | Except for Cash Equivalents and Other Assets and Liabilities, industry classifications are based upon, and individual portfolio securities are assigned to, the classifications of the Global Industry Classification Standard (GICS) except that the Adviser assigns a classification to securities not classified by the GICS and to securities for which the Adviser does not have access to the classification made by the GICS. |
| 2 | For purposes of this table, industry classifications which constitute less than 1.0% of the Fund's total net assets have been aggregated under the designation “Other.” |
| 3 | Cash Equivalents include any investments in money market mutual funds and/or overnight repurchase agreements. |
| 4 | Assets, other than investments in securities, less liabilities. See Statement of Assets and Liabilities. |
| Shares | Value | ||
| COMMON STOCKS—97.9% | |||
| Agricultural Chemicals—1.1% | |||
| 3,800 | Monsanto Co. | $375,364 | |
| 8,035 | Scotts Miracle-Gro Co. | 403,759 | |
| TOTAL | 779,123 | ||
| Agricultural Machinery—1.0% | |||
| 8,200 | Deere & Co. | 681,174 | |
| Airline - National—0.8% | |||
| 17,327 | 1 | United Continental Holdings, Inc. | 603,846 |
| Airline - Regional—0.3% | |||
| 3,700 | Alaska Air Group, Inc. | 226,329 | |
| Airlines—0.2% | |||
| 1,100 | Copa Holdings SA, Class A | 153,087 | |
| Apparel—0.7% | |||
| 4,800 | L Brands, Inc. | 267,696 | |
| 1,300 | V.F. Corp. | 256,100 | |
| TOTAL | 523,796 | ||
| AT&T Divestiture—1.5% | |||
| 21,936 | Verizon Communications, Inc. | 1,085,393 | |
| Auto Manufacturing—0.6% | |||
| 25,317 | Ford Motor Co. | 427,351 | |
| Auto Original Equipment Manufacturers—0.5% | |||
| 2,500 | Delphi Automotive PLC | 134,300 | |
| 1,500 | 1 | O'Reilly Automotive, Inc. | 187,890 |
| TOTAL | 322,190 | ||
| Auto Part Replacement—1.0% | |||
| 8,907 | Genuine Parts Co. | 730,285 | |
| Auto Rentals—0.3% | |||
| 4,200 | 1 | United Rentals, Inc. | 240,744 |
| Baking—0.4% | |||
| 12,348 | Flowers Foods, Inc. | 283,510 | |
| Biotechnology—3.6% | |||
| 4,300 | 1 | Alexion Pharmaceuticals, Inc. | 499,789 |
| 5,900 | Amgen, Inc. | 638,911 | |
| 3,100 | 1 | Biogen Idec, Inc. | 676,203 |
| 4,173 | 1 | Celgene Corp. | 612,847 |
| Shares | Value | ||
| COMMON STOCKS—continued | |||
| Biotechnology—continued | |||
| 1,400 | 1 | Illumina, Inc. | $111,748 |
| TOTAL | 2,539,498 | ||
| Broadcasting—1.3% | |||
| 14,653 | 1 | DIRECTV Group, Inc. | 927,095 |
| Building Materials—0.3% | |||
| 4,300 | Fortune Brands Home & Security, Inc. | 177,633 | |
| Building Supply Stores—0.7% | |||
| 6,700 | Home Depot, Inc. | 529,501 | |
| Cable & Wireless Television—1.1% | |||
| 6,900 | Time Warner Cable, Inc. | 787,083 | |
| Cable TV—2.0% | |||
| 5,793 | 1 | AMC Networks, Inc. | 395,430 |
| 2,600 | CBS Corp. (New), Class B | 137,384 | |
| 888 | 1 | Charter Communications, Inc. | 111,657 |
| 13,041 | Comcast Corp., Class A | 587,889 | |
| 2,400 | Viacom, Inc., Class B | 174,648 | |
| TOTAL | 1,407,008 | ||
| Capital Markets—0.6% | |||
| 8,700 | Franklin Resources, Inc. | 425,256 | |
| Cellular Communications—0.1% | |||
| 6,371 | 1 | NII Holdings, Inc. | 45,744 |
| Chemicals—0.5% | |||
| 4,800 | LyondellBasell Industries NV | 329,808 | |
| Clothing Stores—2.3% | |||
| 23,415 | Gap (The), Inc. | 1,074,749 | |
| 9,129 | Hanesbrands, Inc. | 579,326 | |
| TOTAL | 1,654,075 | ||
| Commercial Services—0.0% | |||
| 100 | 1 | Stericycle, Inc. | 11,594 |
| Commodity Chemicals—1.7% | |||
| 5,800 | Du Pont (E.I.) de Nemours & Co. | 334,602 | |
| 900 | PPG Industries, Inc. | 144,396 | |
| 15,925 | RPM International, Inc. | 561,197 | |
| 1,700 | Westlake Chemical Corp. | 176,834 | |
| TOTAL | 1,217,029 | ||
| Computer Peripherals—3.3% | |||
| 18,400 | EMC Corp. | 481,160 | |
| 14,000 | NetApp, Inc. | 575,680 |
| Shares | Value | ||
| COMMON STOCKS—continued | |||
| Computer Peripherals—continued | |||
| 6,800 | 1 | Sandisk Corp. | $374,816 |
| 13,800 | Western Digital Corp. | 888,444 | |
| TOTAL | 2,320,100 | ||
| Computer Services—0.6% | |||
| 4,054 | 1 | Cognizant Technology Solutions Corp. | 293,469 |
| 1,300 | 1 | Fiserv, Inc. | 125,112 |
| TOTAL | 418,581 | ||
| Computers - High End—1.4% | |||
| 5,200 | IBM Corp. | 1,014,208 | |
| Computers - Low End—1.4% | |||
| 2,195 | Apple, Inc. | 993,237 | |
| Construction Machinery—1.9% | |||
| 11,100 | Caterpillar, Inc. | 920,301 | |
| 8,900 | Joy Global, Inc. | 440,550 | |
| TOTAL | 1,360,851 | ||
| Cosmetics & Toiletries—1.2% | |||
| 15,906 | Avon Products, Inc. | 363,611 | |
| 4,800 | Estee Lauder Cos., Inc., Class A | 315,120 | |
| 3,500 | 1 | Sally Beauty Holdings, Inc. | 106,785 |
| 884 | 1 | Ulta Salon Cosmetics & Fragrance, Inc. | 89,196 |
| TOTAL | 874,712 | ||
| Crude Oil & Gas Production—2.5% | |||
| 4,900 | Cabot Oil & Gas Corp., Class A | 371,518 | |
| 6,700 | EOG Resources, Inc. | 974,783 | |
| 6,083 | 1 | Newfield Exploration Co. | 149,642 |
| 1,500 | Range Resources Corp. | 118,650 | |
| 4,700 | 1 | Southwestern Energy Co. | 182,313 |
| TOTAL | 1,796,906 | ||
| Defense Aerospace—2.0% | |||
| 4,008 | 1 | B/E Aerospace, Inc. | 279,398 |
| 1,800 | Boeing Co. | 189,180 | |
| 6,000 | Lockheed Martin Corp. | 720,720 | |
| 2,700 | Triumph Group, Inc. | 211,842 | |
| TOTAL | 1,401,140 | ||
| Department Stores—0.5% | |||
| 5,400 | Target Corp. | 384,750 | |
| Discount Department Stores—1.6% | |||
| 2,700 | Family Dollar Stores, Inc. | 185,652 |
| Shares | Value | ||
| COMMON STOCKS—continued | |||
| Discount Department Stores—continued | |||
| 12,632 | Wal-Mart Stores, Inc. | $984,538 | |
| TOTAL | 1,170,190 | ||
| Diversified Consumer Services—0.2% | |||
| 4,500 | Block (H&R), Inc. | 141,435 | |
| Diversified Leisure—0.2% | |||
| 2,500 | Las Vegas Sands Corp. | 138,925 | |
| Education & Training Services—0.3% | |||
| 5,400 | 1 | Apollo Group, Inc., Class A | 98,388 |
| 3,604 | 1 | ITT Educational Services, Inc. | 94,533 |
| TOTAL | 192,921 | ||
| Electrical Equipment—0.3% | |||
| 3,400 | Emerson Electric Co. | 208,658 | |
| Ethical Drugs—1.7% | |||
| 17,791 | Eli Lilly & Co. | 944,880 | |
| 3,600 | 1 | United Therapeutics Corp. | 269,424 |
| TOTAL | 1,214,304 | ||
| Financial Services—3.0% | |||
| 3,400 | American Express Co. | 250,818 | |
| 1,600 | BlackRock, Inc. | 451,136 | |
| 3,300 | 1 | FleetCor Technologies, Inc. | 296,241 |
| 6,700 | 1 | Verifone Systems, Inc. | 127,769 |
| 4,294 | Visa, Inc., Class A | 760,081 | |
| 12,400 | Western Union Co. | 222,704 | |
| TOTAL | 2,108,749 | ||
| Food Wholesaling—1.5% | |||
| 29,917 | Sysco Corp. | 1,032,436 | |
| Gas Utilities—0.2% | |||
| 1,400 | EQT Corp. | 121,100 | |
| Generic Drugs—1.4% | |||
| 9,000 | 1 | Endo Health Solutions, Inc. | 346,140 |
| 12,400 | 1 | Mylan, Inc. | 416,144 |
| 1,600 | Perrigo Co. | 199,024 | |
| TOTAL | 961,308 | ||
| Grocery Chain—2.4% | |||
| 37,977 | Kroger Co. | 1,491,357 | |
| 4,000 | Whole Foods Market, Inc. | 222,320 | |
| TOTAL | 1,713,677 |
| Shares | Value | ||
| COMMON STOCKS—continued | |||
| Health Care Equipment & Supplies—0.3% | |||
| 2,600 | Stryker Corp. | $183,196 | |
| Health Care Providers & Services—0.6% | |||
| 1,200 | 1 | Express Scripts Holding Co. | 78,660 |
| 5,000 | 1 | HCA, Inc. | 195,000 |
| 1,400 | 1 | Laboratory Corp. of America Holdings | 135,436 |
| TOTAL | 409,096 | ||
| Home Products—0.6% | |||
| 3,400 | 1 | Jarden Corp. | 154,598 |
| 3,600 | Tupperware Brands Corp. | 303,408 | |
| TOTAL | 458,006 | ||
| Hotels and Motels—0.5% | |||
| 100 | Marriott International, Inc., Class A | 4,157 | |
| 5,100 | Wyndham Worldwide Corp. | 317,730 | |
| TOTAL | 321,887 | ||
| Industrial Machinery—0.6% | |||
| 5,000 | Ingersoll-Rand PLC, Class A | 305,250 | |
| 1,100 | Valmont Industries, Inc. | 153,604 | |
| TOTAL | 458,854 | ||
| Internet Services—3.4% | |||
| 3,800 | 1 | eBay, Inc. | 196,422 |
| 300 | 1 | Google, Inc. | 266,280 |
| 3,400 | IAC Interactive Corp. | 172,074 | |
| 2,800 | 1 | NetFlix, Inc. | 683,816 |
| 1,246 | 1 | Priceline.com, Inc. | 1,091,085 |
| TOTAL | 2,409,677 | ||
| IT Services—0.7% | |||
| 3,000 | Accenture PLC | 221,430 | |
| 17,255 | SAIC, Inc. | 263,829 | |
| TOTAL | 485,259 | ||
| Life Insurance—0.7% | |||
| 6,100 | Prudential Financial, Inc. | 481,717 | |
| Medical Supplies—2.7% | |||
| 1,800 | Baxter International, Inc. | 131,472 | |
| 1,900 | Becton, Dickinson & Co. | 197,068 | |
| 22,448 | Cardinal Health, Inc. | 1,124,420 | |
| 4,100 | McKesson Corp. | 502,906 | |
| TOTAL | 1,955,866 |
| Shares | Value | ||
| COMMON STOCKS—continued | |||
| Medical Technology—1.6% | |||
| 22,232 | St. Jude Medical, Inc. | $1,164,734 | |
| Miscellaneous Components—0.4% | |||
| 3,600 | 1 | Cree, Inc. | 251,640 |
| Miscellaneous Machinery—0.2% | |||
| 1,800 | Illinois Tool Works, Inc. | 129,672 | |
| Multi-Industry Capital Goods—1.0% | |||
| 1,100 | 3M Co. | 129,173 | |
| 5,307 | Crane Co. | 323,196 | |
| 2,700 | Honeywell International, Inc. | 224,046 | |
| TOTAL | 676,415 | ||
| Multi-Line Insurance—0.8% | |||
| 6,000 | Allied World Assurance Holdings Ltd. | 567,900 | |
| Multiline Retail—0.4% | |||
| 6,300 | Macy's, Inc. | 304,542 | |
| Mutual Fund Adviser—0.1% | |||
| 200 | 1 | Affiliated Managers Group | 36,070 |
| Office Equipment—0.7% | |||
| 28,428 | Pitney Bowes, Inc. | 469,346 | |
| Office Supplies—0.7% | |||
| 11,485 | Avery Dennison Corp. | 513,724 | |
| Offshore Driller—0.2% | |||
| 1,900 | Oceaneering International, Inc. | 154,071 | |
| Oil Well Supply—0.5% | |||
| 3,600 | Halliburton Co. | 162,684 | |
| 2,300 | Schlumberger Ltd. | 187,059 | |
| TOTAL | 349,743 | ||
| Other Communications Equipment—1.6% | |||
| 18,017 | Harris Corp. | 1,028,230 | |
| 4,900 | 1 | Skyworks Solutions, Inc. | 117,698 |
| TOTAL | 1,145,928 | ||
| Packaged Foods—0.3% | |||
| 2,500 | Hershey Foods Corp. | 237,175 | |
| Paint & Related Materials—0.1% | |||
| 500 | Sherwin-Williams Co. | 87,085 | |
| Paper Products—0.4% | |||
| 2,600 | Rock-Tenn Co. | 297,310 | |
| Personal & Household—0.4% | |||
| 3,600 | Nu Skin Enterprises, Inc., Class A | 301,104 |
| Shares | Value | ||
| COMMON STOCKS—continued | |||
| Personal Products—0.4% | |||
| 2,900 | Kimberly-Clark Corp. | $286,520 | |
| Plastic Containers—0.6% | |||
| 15,128 | 1 | Owens-Illinois, Inc. | 450,058 |
| Pollution Control—0.1% | |||
| 1,500 | Danaher Corp. | 101,010 | |
| Printing—0.3% | |||
| 11,646 | Donnelley (R.R.) & Sons Co. | 221,158 | |
| Professional Services—0.3% | |||
| 2,200 | Dun & Bradstreet Corp. | 227,986 | |
| Property Liability Insurance—0.8% | |||
| 6,906 | The Travelers Cos., Inc. | 576,996 | |
| Railroad—0.9% | |||
| 2,800 | Union Pacific Corp. | 444,052 | |
| 3,000 | Wabtec Corp. | 174,180 | |
| TOTAL | 618,232 | ||
| Recreational Goods—0.3% | |||
| 11,642 | International Game Technology | 215,028 | |
| Recreational Vehicles—0.3% | |||
| 1,700 | Polaris Industries, Inc., Class A | 190,638 | |
| Restaurants—0.3% | |||
| 3,200 | 1 | Green Mountain Coffee, Inc. | 246,976 |
| Semiconductor Manufacturing—1.9% | |||
| 58,931 | Intel Corp. | 1,373,092 | |
| Semiconductors & Semiconductor Equipment—0.4% | |||
| 3,200 | Avago Technologies Ltd. | 117,376 | |
| 2,800 | Xilinx, Inc. | 130,732 | |
| TOTAL | 248,108 | ||
| Services to Medical Professionals—0.5% | |||
| 3,300 | 1 | Henry Schein, Inc. | 342,639 |
| Shoes—0.3% | |||
| 4,000 | 1 | Deckers Outdoor Corp. | 219,320 |
| Soft Drinks—3.6% | |||
| 26,094 | Coca-Cola Enterprises, Inc. | 979,569 | |
| 25,130 | Dr. Pepper Snapple Group, Inc. | 1,174,576 | |
| 5,310 | PepsiCo, Inc. | 443,597 | |
| TOTAL | 2,597,742 | ||
| Software Packaged/Custom—5.7% | |||
| 1,000 | 1 | Akamai Technologies, Inc. | 47,200 |
| Shares | Value | ||
| COMMON STOCKS—continued | |||
| Software Packaged/Custom—continued | |||
| 35,613 | CA, Inc. | $1,059,131 | |
| 2,300 | 1 | Commvault Systems, Inc. | 194,189 |
| 4,500 | 1 | Electronic Arts, Inc. | 117,540 |
| 1,400 | 1 | F5 Networks, Inc. | 122,864 |
| 4,300 | Intuit, Inc. | 274,856 | |
| 6,700 | Microsoft Corp. | 213,261 | |
| 10,400 | Oracle Corp. | 336,440 | |
| 60,308 | Symantec Corp. | 1,609,017 | |
| 1,088 | 1 | VMware, Inc., Class A | 89,423 |
| TOTAL | 4,063,921 | ||
| Specialty Chemicals—0.4% | |||
| 2,500 | Airgas, Inc. | 258,025 | |
| Specialty Retailing—4.6% | |||
| 7,089 | Advance Auto Parts, Inc. | 584,772 | |
| 800 | 1 | AutoZone, Inc. | 358,864 |
| 3,600 | 1 | Bed Bath & Beyond, Inc. | 275,292 |
| 5,900 | 1 | Big Lots, Inc. | 213,167 |
| 1,700 | Costco Wholesale Corp. | 199,393 | |
| 5,300 | 1 | Dollar General Corp. | 289,751 |
| 2,800 | Expedia, Inc. | 131,964 | |
| 13,016 | GNC Acquisition Holdings, Inc. | 686,984 | |
| 6,136 | Nordstrom, Inc. | 375,769 | |
| 2,600 | PetSmart, Inc. | 190,372 | |
| TOTAL | 3,306,328 | ||
| Telecommunication Equipment & Services—1.6% | |||
| 6,400 | Motorola, Inc. | 350,912 | |
| 12,300 | Qualcomm, Inc. | 793,965 | |
| TOTAL | 1,144,877 | ||
| Telephone Utility—0.3% | |||
| 28,204 | Windstream Corp. | 235,503 | |
| Textiles Apparel & Luxury Goods—0.2% | |||
| 2,100 | Coach, Inc. | 111,573 | |
| 300 | Ralph Lauren Corp. | 54,618 | |
| TOTAL | 166,191 | ||
| Toys & Games—1.6% | |||
| 21,165 | Hasbro, Inc. | 973,590 | |
| 4,600 | Mattel, Inc. | 193,338 | |
| TOTAL | 1,166,928 |
| Shares | Value | ||
| COMMON STOCKS—continued | |||
| Trading Companies & Distributors—0.2% | |||
| 500 | Grainger (W.W.), Inc. | $131,070 | |
| Transportation—0.5% | |||
| 12,800 | 1 | Hertz Global Holdings, Inc. | 327,808 |
| Truck Manufacturing—0.6% | |||
| 3,300 | Cummins, Inc. | 399,927 | |
| Undesignated Consumer Cyclicals—0.9% | |||
| 7,900 | Herbalife Ltd. | 517,450 | |
| 3,300 | Weight Watchers International, Inc. | 156,585 | |
| TOTAL | 674,035 | ||
| Uniforms—0.6% | |||
| 9,236 | Cintas Corp. | 438,802 | |
| TOTAL COMMON STOCKS (IDENTIFIED COST $59,558,047) | 69,755,275 | ||
| MUTUAL FUND—1.7% | |||
| 1,252,177 | 2,3 | Federated Prime Value Obligations Fund, Institutional Shares, 0.06% (AT NET ASSET VALUE) | 1,252,177 |
| TOTAL INVESTMENTS—99.6% (IDENTIFIED COST $60,810,224)4 | 71,007,452 | ||
| OTHER ASSETS AND LIABILITIES - NET—0.4%5 | 270,359 | ||
| TOTAL NET ASSETS—100% | $71,277,811 |
| 1 | Non-income producing security. |
| 2 | Affiliated holding. |
| 3 | 7-day net yield. |
| 4 | The cost of investments for federal tax purposes amounts to $60,824,908. |
| 5 | Assets, other than investments in securities, less liabilities. See Statement of Assets and Liabilities. |
| Year Ended July 31 | 2013 | 2012 | 2011 | 2010 | 2009 |
| Net Asset Value, Beginning of Period | $10.59 | $10.50 | $8.45 | $7.60 | $10.23 |
| Income From Investment Operations: | |||||
| Net investment income (loss)1 | 0.04 | (0.02) | (0.03) | (0.01) | 0.002 |
| Net realized and unrealized gain (loss) on investments | 2.95 | 0.11 | 2.08 | 0.86 | (2.63) |
| TOTAL FROM INVESTMENT OPERATIONS | 2.99 | 0.09 | 2.05 | 0.85 | (2.63) |
| Net Asset Value, End of Period | $13.58 | $10.59 | $10.50 | $8.45 | $7.60 |
| Total Return3 | 28.23% | 0.86% | 24.26% | 11.18% | (25.71)% |
| Ratios to Average Net Assets: | |||||
| Net expenses | 1.50% | 1.50% | 1.50% | 1.50% | 1.50% |
| Net investment income (loss) | 0.34% | (0.23)% | (0.28)% | (0.08)% | 0.04% |
| Expense waiver/reimbursement4 | 0.27% | 0.78% | 0.74% | 0.55% | 0.52% |
| Supplemental Data: | |||||
| Net assets, end of period (000 omitted) | $49,018 | $40,676 | $44,762 | $45,993 | $68,963 |
| Portfolio turnover | 135% | 258% | 208% | 217% | 380% |
| 1 | Per share numbers have been calculated using the average shares method. |
| 2 | Represents less than $0.01. |
| 3 | Based on net asset value, which does not reflect the sales charge, redemption fee or contingent deferred sales charge, if applicable. |
| 4 | This expense decrease is reflected in both the net expense and the net investment income (loss) ratios shown above. |
| Year Ended July 31 | 2013 | 2012 | 2011 | 2010 | 2009 |
| Net Asset Value, Beginning of Period | $10.25 | $10.24 | $8.30 | $7.53 | $10.21 |
| Income From Investment Operations: | |||||
| Net investment income (loss)1 | (0.05) | (0.10) | (0.10) | (0.07) | (0.05) |
| Net realized and unrealized gain (loss) on investments | 2.85 | 0.11 | 2.04 | 0.84 | (2.63) |
| TOTAL FROM INVESTMENT OPERATIONS | 2.80 | 0.01 | 1.94 | 0.77 | (2.68) |
| Net Asset Value, End of Period | $13.05 | $10.25 | $10.24 | $8.30 | $7.53 |
| Total Return2 | 27.32% | 0.10% | 23.37% | 10.23% | (26.25)% |
| Ratios to Average Net Assets: | |||||
| Net expenses | 2.25% | 2.25% | 2.25% | 2.25% | 2.25% |
| Net investment income (loss) | (0.44)% | (0.98)% | (1.04)% | (0.86)% | (0.72)% |
| Expense waiver/reimbursement3 | 0.26% | 0.78% | 0.74% | 0.56% | 0.52% |
| Supplemental Data: | |||||
| Net assets, end of period (000 omitted) | $7,428 | $4,932 | $6,680 | $7,506 | $8,532 |
| Portfolio turnover | 135% | 258% | 208% | 217% | 380% |
| 1 | Per share numbers have been calculated using the average shares method. |
| 2 | Based on net asset value, which does not reflect the sales charge, redemption fee or contingent deferred sales charge, if applicable. |
| 3 | This expense decrease is reflected in both the net expense and the net investment income (loss) ratios shown above. |
| Year Ended July 31 | 2013 | 2012 | 2011 | 2010 | 2009 |
| Net Asset Value, Beginning of Period | $10.03 | $10.02 | $8.12 | $7.37 | $9.99 |
| Income From Investment Operations: | |||||
| Net investment income (loss)1 | (0.05) | (0.09) | (0.10) | (0.07) | (0.05) |
| Net realized and unrealized gain (loss) on investments | 2.78 | 0.10 | 2.00 | 0.82 | (2.57) |
| TOTAL FROM INVESTMENT OPERATIONS | 2.73 | 0.01 | 1.90 | 0.75 | (2.62) |
| Net Asset Value, End of Period | $12.76 | $10.03 | $10.02 | $8.12 | $7.37 |
| Total Return2 | 27.22% | 0.10% | 23.40% | 10.18% | (26.23)% |
| Ratios to Average Net Assets: | |||||
| Net expenses | 2.25% | 2.25% | 2.25% | 2.25% | 2.25% |
| Net investment income (loss) | (0.43)% | (0.98)% | (1.05)% | (0.86)% | (0.71)% |
| Expense waiver/reimbursement3 | 0.27% | 0.78% | 0.74% | 0.56% | 0.52% |
| Supplemental Data: | |||||
| Net assets, end of period (000 omitted) | $9,830 | $7,001 | $7,564 | $6,816 | $7,333 |
| Portfolio turnover | 135% | 258% | 208% | 217% | 380% |
| 1 | Per share numbers have been calculated using the average shares method. |
| 2 | Based on net asset value, which does not reflect the sales charge, redemption fee or contingent deferred sales charge, if applicable. |
| 3 | This expense decrease is reflected in both the net expense and the net investment income (loss) ratios shown above. |
| Year Ended July 31 | 2013 | 2012 | 2011 | 2010 | 2009 |
| Net Asset Value, Beginning of Period | $10.80 | $10.68 | $8.57 | $7.70 | $10.33 |
| Income From Investment Operations: | |||||
| Net investment income (loss)1 | 0.07 | 0.002 | (0.00)2 | 0.01 | 0.02 |
| Net realized and unrealized gain (loss) on investments | 3.01 | 0.12 | 2.11 | 0.86 | (2.65) |
| TOTAL FROM INVESTMENT OPERATIONS | 3.08 | 0.12 | 2.11 | 0.87 | (2.63) |
| Net Asset Value, End of Period | $13.88 | $10.80 | $10.68 | $8.57 | $7.70 |
| Total Return3 | 28.52% | 1.12% | 24.62% | 11.30% | (25.46)% |
| Ratios to Average Net Assets: | |||||
| Net expenses | 1.25% | 1.25% | 1.25% | 1.25% | 1.25% |
| Net investment income (loss) | 0.58% | 0.02% | (0.05)% | 0.14% | 0.28% |
| Expense waiver/reimbursement4 | 0.27% | 0.78% | 0.74% | 0.56% | 0.52% |
| Supplemental Data: | |||||
| Net assets, end of period (000 omitted) | $5,002 | $3,774 | $4,565 | $4,179 | $4,769 |
| Portfolio turnover | 135% | 258% | 208% | 217% | 380% |
| 1 | Per share numbers have been calculated using the average shares method. |
| 2 | Represents less than $0.01. |
| 3 | Based on net asset value. |
| 4 | This expense decrease is reflected in both the net expense and the net investment income (loss) ratios shown above. |
| Assets: | ||
| Total investment in securities, at value including $1,252,177 of investment in an affiliated holding (Note 5) (identified cost $60,810,224) | $71,007,452 | |
| Income receivable | 35,941 | |
| Receivable for investments sold | 507,243 | |
| Receivable for shares sold | 227,900 | |
| TOTAL ASSETS | 71,778,536 | |
| Liabilities: | ||
| Payable for investments purchased | $272,195 | |
| Payable for shares redeemed | 86,555 | |
| Payable for transfer agent fee | 32,892 | |
| Payable for Directors'/Trustees' fees (Note 5) | 153 | |
| Payable for auditing fees | 23,400 | |
| Payable for distribution services fee (Note 5) | 10,642 | |
| Payable for shareholder services fee (Note 5) | 24,369 | |
| Payable for share registration costs | 32,504 | |
| Accrued expenses (Note 5) | 18,015 | |
| TOTAL LIABILITIES | 500,725 | |
| Net assets for 5,310,139 shares outstanding | $71,277,811 | |
| Net Assets Consist of: | ||
| Paid-in capital | $75,034,028 | |
| Net unrealized appreciation of investments | 10,197,228 | |
| Accumulated net realized loss on investments | (13,953,445) | |
| TOTAL NET ASSETS | $71,277,811 |
| Net Asset Value, Offering Price and Redemption Proceeds Per Share | ||
| Class A Shares: | ||
| Net asset value per share ($49,017,751 ÷ 3,610,321 shares outstanding), no par value, unlimited shares authorized | $13.58 | |
| Offering price per share (100/94.50 of $13.58) | $14.37 | |
| Redemption proceeds per share | $13.58 | |
| Class B Shares: | ||
| Net asset value per share ($7,428,044 ÷ 569,284 shares outstanding), no par value, unlimited shares authorized | $13.05 | |
| Offering price per share | $13.05 | |
| Redemption proceeds per share (94.50/100 of $13.05) | $12.33 | |
| Class C Shares: | ||
| Net asset value per share ($9,830,218 ÷ 770,118 shares outstanding), no par value, unlimited shares authorized | $12.76 | |
| Offering price per share | $12.76 | |
| Redemption proceeds per share (99.00/100 of $12.76) | $12.63 | |
| Institutional Shares: | ||
| Net asset value per share ($5,001,798 ÷ 360,416 shares outstanding), no par value, unlimited shares authorized | $13.88 | |
| Offering price per share | $13.88 | |
| Redemption proceeds per share | $13.88 |
| Investment Income: | |||
| Dividends (including $1,599 received from an affiliated holding (Note 5)) | $1,134,621 | ||
| Expenses: | |||
| Investment adviser fee (Note 5) | $463,929 | ||
| Administrative fee (Note 5) | 67,442 | ||
| Custodian fees | 12,478 | ||
| Transfer agent fee | 204,009 | ||
| Directors'/Trustees' fees (Note 5) | 1,476 | ||
| Auditing fees | 23,400 | ||
| Legal fees | 7,647 | ||
| Portfolio accounting fees | 77,898 | ||
| Distribution services fee (Note 5) | 105,236 | ||
| Shareholder services fee (Note 5) | 141,883 | ||
| Account administration fee (Note 2) | 1,243 | ||
| Share registration costs | 51,031 | ||
| Printing and postage | 24,378 | ||
| Insurance premiums (Note 5) | 4,020 | ||
| Miscellaneous (Note 5) | 7,222 | ||
| TOTAL EXPENSES | 1,193,292 | ||
| Waivers and Reimbursements (Note 5): | |||
| Waiver/reimbursement of investment adviser fee | $(164,063) | ||
| Waiver of administrative fee | (4,623) | ||
| Reimbursement of shareholder services fee | (115) | ||
| TOTAL WAIVERS AND REIMBURSEMENTS | (168,801) | ||
| Net expenses | 1,024,491 | ||
| Net investment income | 110,130 | ||
| Realized and Unrealized Gain on Investments: | |||
| Net realized gain on investments | 8,367,659 | ||
| Net change in unrealized appreciation of investments | 7,058,250 | ||
| Net realized and unrealized gain on investments | 15,425,909 | ||
| Change in net assets resulting from operations | $15,536,039 |
| Year Ended July 31 | 2013 | 2012 |
| Increase (Decrease) in Net Assets | ||
| Operations: | ||
| Net investment income (loss) | $110,130 | $(214,957) |
| Net realized gain on investments | 8,367,659 | 242,004 |
| Net change in unrealized appreciation/depreciation of investments | 7,058,250 | 160,615 |
| CHANGE IN NET ASSETS RESULTING FROM OPERATIONS | 15,536,039 | 187,662 |
| Share Transactions: | ||
| Proceeds from sale of shares | 12,798,303 | 7,568,065 |
| Cost of shares redeemed | (13,440,268) | (14,942,594) |
| CHANGE IN NET ASSETS RESULTING FROM SHARE TRANSACTIONS | (641,965) | (7,374,529) |
| Change in net assets | 14,894,074 | (7,186,867) |
| Net Assets: | ||
| Beginning of period | 56,383,737 | 63,570,604 |
| End of period (including accumulated net investment income (loss) of $0 and $(149,487), respectively) | $71,277,811 | $56,383,737 |
| ■ | Equity securities listed on an exchange or traded through a regulated market system are valued at their last reported sale price or official closing price in their principal exchange or market. |
| ■ | Shares of other mutual funds are valued based upon their reported NAVs. |
| ■ | Derivative contracts listed on exchanges are valued at their reported settlement or closing price. |
| ■ | Over-the-counter (OTC) derivative contracts are fair valued using price evaluations provided by a pricing service approved by the Board of Trustees (the “Trustees”). |
| ■ | Fixed-income securities acquired with remaining maturities greater than 60 days are fair valued using price evaluations provided by a pricing service approved by the Trustees. |
| ■ | Fixed-income securities and repurchase agreements acquired with remaining maturities of 60 days or less are valued at their amortized cost (adjusted for the accretion of any discount or amortization of any premium), unless the issuer's creditworthiness is impaired or other factors indicate that amortized cost is not an accurate estimate of the investment's fair value, in which case it would be valued in the same manner as a longer-term security. |
| ■ | For securities that are fair valued in accordance with procedures established by and under the general supervision of the Trustees, certain factors may be considered such as: the purchase price of the security, information obtained by contacting the issuer, analysis of the issuer's financial statements or other available documents, fundamental analytical data, the nature and duration of restrictions on disposition, the movement of the market in which the security is normally traded and public trading in similar securities of the issuer or comparable issuers. |
| Account Administration Fees Incurred | |
| Class A Shares | $1,094 |
| Class C Shares | 149 |
| TOTAL | $1,243 |
| Year Ended July 31 | 2013 | 2012 | ||
| Class A Shares: | Shares | Amount | Shares | Amount |
| Shares sold | 427,339 | $5,091,052 | 397,917 | $4,011,516 |
| Shares redeemed | (658,699) | (7,736,460) | (818,755) | (8,329,325) |
| NET CHANGE RESULTING FROM CLASS A SHARE TRANSACTIONS | (231,360) | $(2,645,408) | (420,838) | $(4,317,809) |
| Year Ended July 31 | 2013 | 2012 | ||
| Class B Shares: | Shares | Amount | Shares | Amount |
| Shares sold | 311,135 | $3,500,256 | 98,688 | $960,640 |
| Shares redeemed | (222,897) | (2,512,835) | (269,626) | (2,628,632) |
| NET CHANGE RESULTING FROM CLASS B SHARE TRANSACTIONS | 88,238 | $987,421 | (170,938) | $(1,667,992) |
| Year Ended July 31 | 2013 | 2012 | ||
| Class C Shares: | Shares | Amount | Shares | Amount |
| Shares sold | 280,843 | $3,155,642 | 209,412 | $2,012,624 |
| Shares redeemed | (208,807) | (2,310,108) | (265,950) | (2,580,209) |
| NET CHANGE RESULTING FROM CLASS C SHARE TRANSACTIONS | 72,036 | $845,534 | (56,538) | $(567,585) |
| Year Ended July 31 | 2013 | 2012 | ||
| Institutional Shares: | Shares | Amount | Shares | Amount |
| Shares sold | 85,726 | $1,051,353 | 56,279 | $583,285 |
| Shares redeemed | (74,931) | (880,865) | (134,119) | (1,404,428) |
| NET CHANGE RESULTING FROM INSTITUTIONAL SHARE TRANSACTIONS | 10,795 | $170,488 | (77,840) | $(821,143) |
| NET CHANGE RESULTING FROM TOTAL FUND SHARE TRANSACTIONS | (60,291) | $(641,965) | (726,154) | $(7,374,529) |
| Increase (Decrease) | ||
| Paid-In Capital | Undistributed Net Investment Income (Loss) | Accumulated Net Realized Gain (Loss) |
| $(57,027) | $39,357 | $17,670 |
| Net unrealized appreciation | $10,182,544 |
| Capital loss carryforwards | $(13,938,761) |
| Expiration Year | Short-Term | Long-Term | Total |
| 2017 | $12,338,134 | NA | $12,338,134 |
| 2018 | $1,600,627 | NA | $1,600,627 |
| Administrative Fee | Average Daily Net Assets of the Investment Complex |
| 0.150% | on the first $5 billion |
| 0.125% | on the next $5 billion |
| 0.100% | on the next $10 billion |
| 0.075% | on assets in excess of $20 billion |
| Share Class Name | Percentage of Average Daily Net Assets of Class |
| Class A Shares | 0.05% |
| Class B Shares | 0.75% |
| Class C Shares | 0.75% |
| Distribution Services Fees Incurred | |
| Class B Shares | $44,635 |
| Class C Shares | 60,601 |
| TOTAL | $105,236 |
| Service Fees Incurred | Service Fees Reimbursed | |
| Class A Shares | $106,942 | $— |
| Class B Shares | 15,027 | (115) |
| Class C Shares | 19,914 | — |
| TOTAL | $141,883 | $(115) |
| Federated Prime Value Obligations Fund, Institutional Shares | |
| Balance of Shares Held 7/31/2012 | 873,921 |
| Purchases/Additions | 10,927,543 |
| Sales/Reductions | (10,549,287) |
| Balance of Shares Held 7/31/2013 | 1,252,177 |
| Value | $1,252,177 |
| Dividend Income | $1,599 |
| Purchases | $81,518,429 |
| Sales | $82,628,241 |
September 23, 2013
| Beginning Account Value 2/1/2013 | Ending Account Value 7/31/2013 | Expenses Paid During Period1 | |
| Actual: | |||
| Class A Shares | $1,000 | $1,157.70 | $8.02 |
| Class B Shares | $1,000 | $1,152.80 | $12.01 |
| Class C Shares | $1,000 | $1,152.70 | $12.01 |
| Institutional Shares | $1,000 | $1,158.60 | $6.69 |
| Hypothetical (assuming a 5% return before expenses): | |||
| Class A Shares | $1,000 | $1,017.36 | $7.50 |
| Class B Shares | $1,000 | $1,013.64 | $11.23 |
| Class C Shares | $1,000 | $1,013.64 | $11.23 |
| Institutional Shares | $1,000 | $1,018.60 | $6.26 |
| 1 | Expenses are equal to the Fund's annualized net expense ratios, multiplied by the average account value over the period, multiplied by 181/365 (to reflect the one-half-year period). The annualized net expense ratios are as follows: |
| Class A Shares | 1.50% |
| Class B Shares | 2.25% |
| Class C Shares | 2.25% |
| Institutional Shares | 1.25% |
| Name Birth Date Positions Held with Trust Date Service Began | Principal Occupation(s) for Past Five Years, Other Directorships Held and Previous Position(s) |
| John F. Donahue* Birth Date: July 28, 1924 Trustee Began serving: June 2006 | Principal Occupations: Director or Trustee of the Federated Fund Family; Chairman and Director, Federated Investors, Inc.; Chairman of the Federated Fund Family's Executive Committee. Previous Positions: Chairman of the Federated Fund Family; Trustee, Federated Investment Management Company; Chairman and Director, Federated Investment Counseling. |
| Name Birth Date Positions Held with Trust Date Service Began | Principal Occupation(s) for Past Five Years, Other Directorships Held and Previous Position(s) |
| J. Christopher Donahue* Birth Date: April 11, 1949 President and Trustee Began serving: May 2006 | Principal Occupations: Principal Executive Officer and President of certain of the Funds in the Federated Fund Family; Director or Trustee of certain of the Funds in the Federated Fund Family; President, Chief Executive Officer and Director, Federated Investors, Inc.; Chairman and Trustee, Federated Investment Management Company; Trustee, Federated Investment Counseling; Chairman and Director, Federated Global Investment Management Corp.; Chairman, Federated Equity Management Company of Pennsylvania and Passport Research, Ltd. (investment advisory subsidiary of Federated); Trustee, Federated Shareholder Services Company; Director, Federated Services Company. Previous Positions: President, Federated Investment Counseling; President and Chief Executive Officer, Federated Investment Management Company, Federated Global Investment Management Corp. and Passport Research, Ltd. |
| * | Family relationships and reasons for “interested” status: John F. Donahue is the father of J. Christopher Donahue; both are “interested” due to their beneficial ownership of shares of Federated Investors, Inc. and the positions they hold with Federated and its subsidiaries. |
| Name Birth Date Positions Held with Trust Date Service Began | Principal Occupation(s) for Past Five Years, Other Directorships Held, Previous Position(s) and Qualifications |
| Maureen Lally-Green Birth Date: July 5, 1949 Trustee Began serving: August 2009 | Principal Occupations: Director or Trustee of the Federated Fund Family; Director, Office of Church Relations, and Associate General Secretary, Diocese of Pittsburgh; Adjunct Professor of Law, Duquesne University School of Law. Other Directorships Held: Director, Auberle; Member, Pennsylvania State Board of Education; Director, Saint Vincent College; Director, Ireland Institute of Pittsburgh; Chair and Director, UPMC Mercy Hospital; Regent, St. Vincent Seminary; Director, Epilepsy Foundation of Western and Central Pennsylvania; Director, Saint Thomas More Society, Allegheny County; Director, Our Campaign for the Church Alive, Inc. Previous Position: Pennsylvania Superior Court Judge. Qualifications: Legal and director experience. |
| Name Birth Date Positions Held with Trust Date Service Began | Principal Occupation(s) for Past Five Years, Other Directorships Held, Previous Position(s) and Qualifications |
| Peter E. Madden Birth Date: March 16, 1942 Trustee Began serving: June 2006 | Principal Occupation: Director or Trustee, and Chairman of the Board of Directors or Trustees, of the Federated Fund Family. Previous Positions: Representative, Commonwealth of Massachusetts General Court; President, Chief Operating Officer and Director, State Street Bank and Trust Company and State Street Corporation (retired); Director, VISA USA and VISA International; Chairman and Director, Massachusetts Bankers Association; Director, Depository Trust Corporation; Director, The Boston Stock Exchange. Qualifications: Business management, mutual fund services and director experience. |
| Charles F. Mansfield, Jr. Birth Date: April 10, 1945 Trustee Began serving: June 2006 | Principal Occupations: Director or Trustee of the Federated Fund Family; Management Consultant. Previous Positions: Chief Executive Officer, PBTC International Bank; Partner, Arthur Young & Company (now Ernst & Young LLP); Chief Financial Officer of Retail Banking Sector, Chase Manhattan Bank; Senior Vice President, HSBC Bank USA (formerly Marine Midland Bank); Vice President, Citibank; Assistant Professor of Banking and Finance, Frank G. Zarb School of Business, Hofstra University; Executive Vice President, DVC Group, Inc. (marketing, communications and technology). Qualifications: Banking, business management, education and director experience. |
| Thomas M. O'Neill Birth Date: June 14, 1951 Trustee Began serving: October 2006 | Principal Occupations: Director or Trustee, Vice Chairman of the Audit Committee of the Federated Fund Family; Sole Proprietor, Navigator Management Company (investment and strategic consulting). Other Directorships Held: Board of Overseers, Children's Hospital of Boston; Visiting Committee on Athletics, Harvard College; Board of Directors, Medicines for Humanity; Board of Directors, The Golisano Children's Museum of Naples, Florida. Previous Positions: Chief Executive Officer and President, Managing Director and Chief Investment Officer, Fleet Investment Advisors; President and Chief Executive Officer, Aeltus Investment Management, Inc.; General Partner, Hellman, Jordan Management Co., Boston, MA; Chief Investment Officer, The Putnam Companies, Boston, MA; Credit Analyst and Lending Officer, Fleet Bank; Director and Consultant, EZE Castle Software (investment order management software); Director, Midway Pacific (lumber). Qualifications: Business management, mutual fund, director and investment experience. |
| Name Birth Date Positions Held with Trust Date Service Began | Principal Occupation(s) for Past Five Years, Other Directorships Held, Previous Position(s) and Qualifications |
| John S. Walsh Birth Date: November 28, 1957 Trustee Began serving: June 2006 | Principal Occupations: Director or Trustee, Chairman of the Audit Committee of the Federated Fund Family; President and Director, Heat Wagon, Inc. (manufacturer of construction temporary heaters); President and Director, Manufacturers Products, Inc. (distributor of portable construction heaters); President, Portable Heater Parts, a division of Manufacturers Products, Inc. Previous Position: Vice President, Walsh & Kelly, Inc. Qualifications: Business management and director experience. |
| Name Birth Date Address Positions Held with Trust Date Service Began | Principal Occupation(s) for Past Five Years and Previous Position(s) |
| John W. McGonigle Birth Date: October 26, 1938 Secretary Officer since: May 2006 | Principal Occupations: Executive Vice President and Secretary of the Federated Fund Family; Vice Chairman, Executive Vice President, Secretary and Director, Federated Investors, Inc. Previous Positions: Trustee, Federated Investment Management Company and Federated Investment Counseling; Director, Federated Global Investment Management Corp., Federated Services Company and Federated Securities Corp. |
| Lori A. Hensler, CPA Birth Date: January 6, 1967 TREASURER Officer since: April 2013 | Principal Occupations: Principal Financial Officer and Treasurer of the Federated Fund Family; Senior Vice President, Federated Administrative Services; Financial and Operations Principal for Federated Securities Corp. and Edgewood Services, Inc.; and Assistant Treasurer, Federated Investors Trust Company. Previous Positions: Controller of Federated Investors, Inc.; Senior Vice President and Assistant Treasurer, Federated Investors Management Company; Treasurer, Federated Investors Trust Company; Assistant Treasurer, Federated Administrative Services, Federated Administrative Services, Inc., Federated Securities Corp., Edgewood Services, Inc., Federated Advisory Services Company, Federated Equity Management Company of Pennsylvania, Federated Global Investment Management Corp., Federated Investment Counseling, Federated Investment Management Company, Passport Research, Ltd., and Federated MDTA, LLC; Financial and Operations Principal for Federated Securities Corp., Edgewood Services, Inc. and Southpointe Distribution Services, Inc. |
| Name Birth Date Address Positions Held with Trust Date Service Began | Principal Occupation(s) for Past Five Years and Previous Position(s) |
| Peter J. Germain Birth Date: September 3, 1959 CHIEF LEGAL OFFICER Officer since: June 2006 | Principal Occupations: Mr. Germain is Chief Legal Officer of the Federated Fund Family. He is General Counsel and Vice President, Federated Investors, Inc.; President, Federated Administrative Services and Federated Administrative Services, Inc.; Vice President, Federated Securities Corp.; Secretary, Federated Private Asset Management, Inc.; and Secretary, Retirement Plan Service Company of America. Mr. Germain joined Federated in 1984 and is a member of the Pennsylvania Bar Association. Previous Positions: Deputy General Counsel, Special Counsel, Managing Director of Mutual Fund Services, Federated Investors, Inc.; Senior Vice President, Federated Services Company; and Senior Corporate Counsel, Federated Investors, Inc. |
| Stephen F. Auth Birth Date: September 3, 1956 450 Lexington Avenue Suite 3700 New York, NY 10017-3943 CHIEF INVESTMENT OFFICER Began serving: June 2012 | Principal Occupations: Stephen F. Auth is Chief Investment Officer of various Funds in the Federated Fund Family; Executive Vice President, Federated Investment Counseling, Federated Global Investment Management Corp. and Federated Equity Management Company of Pennsylvania. Previous Positions: Executive Vice President, Federated Investment Management Company and Passport Research, Ltd. (investment advisory subsidiary of Federated); Senior Vice President, Global Portfolio Management Services Division; Senior Vice President, Federated Investment Management Company and Passport Research, Ltd.; Senior Managing Director and Portfolio Manager, Prudential Investments. |
| Brian P. Bouda Birth Date: February 28, 1947 CHIEF COMPLIANCE OFFICER AND SENIOR VICE PRESIDENT Officer since: June 2006 | Principal Occupations: Senior Vice President and Chief Compliance Officer of the Federated Fund Family; Vice President and Chief Compliance Officer of Federated Investors, Inc. and Chief Compliance Officer of certain of its subsidiaries. Mr. Bouda joined Federated in 1999 and is a member of the American Bar Association and the State Bar Association of Wisconsin. Previous Positions: Served in Senior Management positions with a large regional banking organization. |
| Daniel Mahr Birth Date: April 9, 1981 125 High Street Oliver Tower 21st Floor Boston, MA 02110-2704 Vice President Officer since: June 2012 Portfolio Manager since: August 2006 | Principal Occupations: Daniel Mahr has been the Fund's Portfolio Manager since August 2006. Mr. Mahr joined the MDT Advisers Investment Team in 2002. As Managing Director, Research, he is responsible for leading the Investment Team as it relates to the ongoing design, development and implementation of the Optimum Q Process. He is Vice President of the Trust with respect to the Fund. Mr. Mahr received his A.B., Computer Science from Harvard College and his S.M., Computer Science from Harvard University. |
Federated Investors Funds
4000 Ericsson Drive
Warrendale, PA 15086-7561
or call 1-800-341-7400.
CUSIP 31421R684
CUSIP 31421R809
CUSIP 31421R882
2013 ©Federated Investors, Inc.
| Share Class | Ticker |
| A | QASCX |
| C | QCSCX |
| Institutional | QISCX |
| 1 | Please see the footnotes to the line graphs below for definitions of, and further information about, the Russell 2000® Index. |
| 2 | The Russell 3000® Index measures the performance of the largest 3,000 U.S. companies representing approximately 98% of the investable U.S. equity market. The Russell 3000® Index is constructed to provide a comprehensive, unbiased, and stable barometer of the broad market and is completely reconstituted annually to ensure new and growing equities are reflected. The index is unmanaged, and it is not possible to invest directly in an index. |
| 3 | Small company stocks may be less liquid and subject to greater price volatility than large company stocks. |
| 4 | The Russell Midcap® Index measures the performance of the mid-cap segment of the U.S. equity universe. The Russell Midcap® Index is a subset of the Russell 1000® Index. It includes approximately 800 of the smallest securities based on a combination of their market cap and current index membership. The Russell Midcap® Index represents approximately 31% of the total market capitalization of the Russell 1000® companies. The Russell Midcap® Index is constructed to provide a comprehensive and unbiased barometer for the mid-cap segment. The Russell Midcap® Index is completely reconstituted annually to ensure larger stocks do not distort the performance and characteristics of the true mid-cap opportunity set. The index is unmanaged, and it is not possible to invest directly in an index. |
| 5 | The Russell Top 200® Index measures the performance of the largest cap segment of the U.S. equity universe. The Russell Top 200® Index is a subset of the Russell 3000® Index. It includes approximately 200 of the largest securities based on a combination of their market cap and current index membership and represents approximately 68% of the U.S. market. The Russell Top 200® Index is constructed to provide a comprehensive and unbiased barometer for this very large cap segment and is completely reconstituted annually to ensure new and growing equities are reflected. The index is unmanaged, and it is not possible to invest directly in an index. |
| 6 | The Russell 3000® Value Index measures the performance of the broad value segment of U.S. equity value universe. It includes those Russell 3000® Index companies with lower price-to-book ratios and lower forecasted growth values. The Russell 3000® Value Index is constructed to provide a comprehensive, unbiased, and stable barometer of the broad value market. The Russell 3000® Value Index is completely reconstituted annually to ensure new and growing equities are included and that the represented companies continue to reflect value characteristics. The index is unmanaged, and it is not possible to invest directly in an index. |
| 7 | The Russell 3000® Growth Index measures the performance of the broad growth segment of the U.S. equity universe. It includes those Russell 3000® Index companies with higher price-to-book ratios and higher forecasted growth values. The Russell 3000® Growth Index is constructed to provide a comprehensive, unbiased, and stable barometer of the broad growth market. The Russell 3000® Growth Index is completely reconstituted annually to ensure new and growing equities are included and that the represented companies continue to reflect growth characteristics. The index is unmanaged, and it is not possible to invest directly in an index. |
| Share Class | 1 Year | 5 Years | Start of Performance* |
| Class A Shares | 36.05% | 4.87% | 4.11% |
| Class C Shares | 41.81% | 5.26% | 4.08% |
| Institutional Shares | 44.16% | 6.28% | 5.09% |
| * | The Fund's start of performance date was September 15, 2005. |
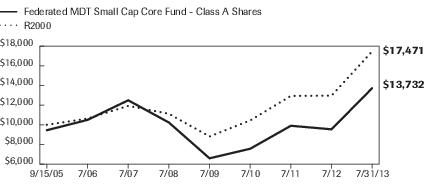
| Federated MDT Small Cap Core Fund - | Class A Shares | R2000 |
| 9/15/2005 | 9,450 | 10,000 |
| 7/31/2006 | 10,499 | 10,633 |
| 7/31/2007 | 12,493 | 11,922 |
| 7/31/2008 | 10,234 | 11,122 |
| 7/31/2009 | 6,595 | 8,817 |
| 7/31/2010 | 7,567 | 10,442 |
| 7/31/2011 | 9,903 | 12,940 |
| 7/31/2012 | 9,542 | 12,964 |
| 7/31/2013 | 13,732 | 17,471 |
| ■ | Total returns shown include the maximum sales charge of 5.50% ($10,000 investment minus $550 sales charge = $9,450). |
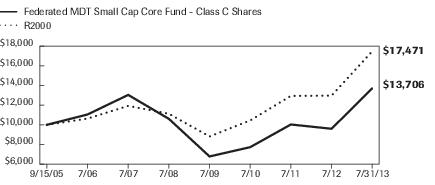
| Federated MDT Small Cap Core Fund - | Class C Shares | R2000 |
| 9/15/2005 | 10,000 | 10,000 |
| 7/31/2006 | 11,050 | 10,633 |
| 7/31/2007 | 13,040 | 11,922 |
| 7/31/2008 | 10,606 | 11,122 |
| 7/31/2009 | 6,784 | 8,817 |
| 7/31/2010 | 7,729 | 10,442 |
| 7/31/2011 | 10,033 | 12,940 |
| 7/31/2012 | 9,598 | 12,964 |
| 7/31/2013 | 13,706 | 17,471 |
| ■ | Total returns shown include the maximum contingent deferred sales charge of 1.00%, as applicable. |
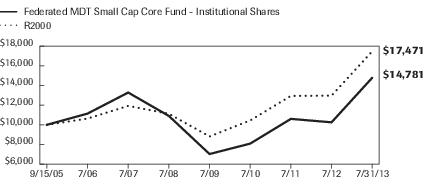
| Federated MDT Small Cap Core Fund - | Institutional Shares | R2000 |
| 9/15/2005 | 10,000 | 10,000 |
| 7/31/2006 | 11,140 | 10,633 |
| 7/31/2007 | 13,280 | 11,922 |
| 7/31/2008 | 10,900 | 11,122 |
| 7/31/2009 | 7,030 | 8,817 |
| 7/31/2010 | 8,090 | 10,442 |
| 7/31/2011 | 10,603 | 12,940 |
| 7/31/2012 | 10,253 | 12,964 |
| 7/31/2013 | 14,781 | 17,471 |
| 1 | Represents a hypothetical investment of $10,000 in the Fund after deducting applicable sales charges: for Class A Shares, the maximum sales charge of 5.50% ($10,000 investment minus $550 sales charge = $9,450); for Class C Shares, a 1.00% contingent deferred sales charge would be applied on any redemption less than one year from the purchase date. The Fund's performance assumes the reinvestment of all dividends and distributions. The R2000 has been adjusted to reflect reinvestment of dividends on securities. |
| 2 | The Fund is a successor to MDT Small Cap Core Fund pursuant to a reorganization that took place on December 8, 2006. Prior to that date, the Fund had no investment operations. Accordingly, the performance information shown for periods prior to that date is that of the MDT Small Cap Core Fund. |
| 3 | The R2000 measures the performance of the small-cap segment of the U.S. equity universe. The R2000 is a subset of the Russell 3000® Index representing approximately 10% of the total market capitalization of that index. It includes approximately 2000 of the smallest securities based on a combination of their market cap and current index membership. The R2000 is constructed to provide a comprehensive and unbiased small-cap barometer and is completely reconstituted annually to ensure larger stocks do not distort the performance and characteristics of the true small-cap opportunity set. The R2000 is unmanaged and, unlike the Fund, is not affected by cash flows. It is not possible to invest directly in an index. The R2000 is not adjusted to reflect sales charges, expenses or other fees that the Securities and Exchange Commission requires to be reflected in the Fund's performance. |
| Industry Composition | Percentage of Total Net Assets |
| Regional Banks | 7.9% |
| Financial Services | 5.2% |
| Specialty Retailing | 4.2% |
| Savings & Loan | 3.5% |
| Software Packaged/Custom | 3.2% |
| Multi-Line Insurance | 2.4% |
| Telecommunication Equipment & Services | 2.4% |
| Medical Supplies | 2.1% |
| Property Liability Insurance | 2.0% |
| Computer Services | 1.9% |
| Restaurant | 1.9% |
| Medical Technology | 1.8% |
| Shoes | 1.8% |
| Internet Services | 1.7% |
| Personnel Agency | 1.6% |
| Electric Utility | 1.5% |
| Semiconductor Manufacturing | 1.5% |
| Biotechnology | 1.4% |
| Defense Electronics | 1.4% |
| Furniture | 1.4% |
| Industry Composition | Percentage of Total Net Assets |
| Paper Products | 1.4% |
| Services to Medical Professionals | 1.4% |
| Airline – Regional | 1.3% |
| Electric & Electronic Original Equipment Manufacturers | 1.2% |
| Energy Equipment & Services | 1.2% |
| Printing | 1.1% |
| Specialty Chemicals | 1.1% |
| Computer Peripherals | 1.0% |
| Computer Stores | 1.0% |
| Electrical Equipment | 1.0% |
| Electronic Equipment Instruments & Components | 1.0% |
| Hospitals | 1.0% |
| Recreational Goods | 1.0% |
| Other2 | 32.9% |
| Cash Equivalents3 | 2.4% |
| Other Assets and Liabilities—Net4 | (0.8)% |
| TOTAL | 100.0% |
| 1 | Except for Cash Equivalents and Other Assets and Liabilities, industry classifications are based upon, and individual portfolio securities are assigned to, the classifications of the Global Industry Classification Standard (GICS) except that the Adviser assigns a classification to securities not classified by the GICS and to securities for which the Adviser does not have access to the classification made by the GICS. |
| 2 | For purposes of this table, industry classifications which constitute less than 1.0% of the Fund's total net assets have been aggregated under the designation “Other.” |
| 3 | Cash Equivalents include any investments in money market mutual funds and/or overnight repurchase agreements. |
| 4 | Assets, other than investments in securities, less liabilities. See Statement of Assets and Liabilities. |
| Shares | Value | ||
| COMMON STOCKS—98.4% | |||
| Accident & Health Insurance—0.2% | |||
| 2,087 | 1 | Triple-S Management Corp., Class B | $45,413 |
| Agricultural Machinery—0.2% | |||
| 505 | Lindsay Manufacturing Co. | 37,926 | |
| Airline - National—0.5% | |||
| 15,940 | 1 | Jet Blue Airways Corp. | 104,248 |
| Airline - Regional—1.3% | |||
| 556 | Alaska Air Group, Inc. | 34,011 | |
| 9,014 | 1 | Republic Airways Holdings, Inc. | 123,762 |
| 6,627 | SkyWest, Inc. | 100,200 | |
| TOTAL | 257,973 | ||
| Apparel—0.7% | |||
| 800 | 1 | Ann, Inc. | 27,112 |
| 2,737 | 1 | Express, Inc. | 61,719 |
| 1,100 | 1 | G-III Apparel Group Ltd. | 56,606 |
| TOTAL | 145,437 | ||
| Auto Original Equipment Manufacturers—0.6% | |||
| 3,000 | 1 | Stoneridge, Inc. | 36,240 |
| 1,654 | 1 | Tenneco Automotive, Inc. | 79,938 |
| TOTAL | 116,178 | ||
| Auto Part Replacement—0.7% | |||
| 4,385 | Standard Motor Products, Inc. | 150,800 | |
| Auto Rentals—0.1% | |||
| 109 | 1 | AMERCO | 18,129 |
| Automotive—0.3% | |||
| 2,800 | 1 | Tower International, Inc. | 62,468 |
| Biotechnology—1.4% | |||
| 1,300 | 1 | Anika Therapeutics, Inc. | 26,143 |
| 1,900 | 1 | Isis Pharmaceuticals, Inc. | 54,815 |
| 2,013 | PDL BioPharma, Inc. | 16,346 | |
| 360 | Questcor Pharmaceuticals, Inc. | 24,055 | |
| 3,900 | 1,2 | Repligen Corp. | 39,663 |
| 4,800 | 1 | Santarus, Inc. | 116,736 |
| TOTAL | 277,758 | ||
| Building Materials—0.0% | |||
| 250 | Aaon, Inc. | 5,393 |
| Shares | Value | ||
| COMMON STOCKS—continued | |||
| Business Services—0.6% | |||
| 3,341 | 1 | Euronet Worldwide, Inc. | $122,982 |
| Carpets—0.3% | |||
| 3,565 | Culp, Inc. | 68,591 | |
| Clothing Stores—0.4% | |||
| 1,192 | Mens Wearhouse, Inc. | 47,597 | |
| 2,800 | Stein Mart, Inc. | 39,116 | |
| TOTAL | 86,713 | ||
| Commercial Services—0.6% | |||
| 4,300 | Convergys Corp. | 81,399 | |
| 1,000 | 1 | Parexel International Corp. | 49,450 |
| TOTAL | 130,849 | ||
| Computer Networking—0.6% | |||
| 1,951 | Black Box Corp. | 52,794 | |
| 2,700 | 1 | Cray, Inc. | 62,559 |
| TOTAL | 115,353 | ||
| Computer Peripherals—1.0% | |||
| 4,900 | 1 | Synaptics, Inc. | 196,000 |
| Computer Services—1.9% | |||
| 1,505 | 1 | CACI International, Inc., Class A | 99,932 |
| 457 | 1 | Manhattan Associates, Inc. | 40,371 |
| 2,544 | 1 | Synnex Corp. | 125,979 |
| 1,700 | Syntel, Inc. | 122,026 | |
| TOTAL | 388,308 | ||
| Computer Stores—1.0% | |||
| 4,371 | 1 | Insight Enterprises, Inc. | 93,496 |
| 6,669 | 1 | PC Connections, Inc. | 113,106 |
| TOTAL | 206,602 | ||
| Construction & Engineering—0.6% | |||
| 3,100 | 1 | Pike Electric Corp. | 37,851 |
| 4,500 | 1 | Tutor Perini Corp. | 89,010 |
| TOTAL | 126,861 | ||
| Cosmetics & Toiletries—0.9% | |||
| 2,900 | Inter Parfums, Inc. | 95,642 | |
| 3,393 | 1 | Revlon, Inc. | 85,130 |
| TOTAL | 180,772 | ||
| Crude Oil & Gas Production—0.5% | |||
| 439 | CVR Energy, Inc. | 20,716 |
| Shares | Value | ||
| COMMON STOCKS—continued | |||
| Crude Oil & Gas Production—continued | |||
| 3,600 | 1 | Stone Energy Corp. | $87,696 |
| TOTAL | 108,412 | ||
| Dairy Products—0.2% | |||
| 900 | Cal-Maine Foods, Inc. | 45,612 | |
| Defense Aerospace—0.9% | |||
| 6,900 | AAR Corp. | 167,256 | |
| 100 | 1 | Esterline Technologies Corp. | 8,144 |
| TOTAL | 175,400 | ||
| Defense Electronics—1.4% | |||
| 1,300 | American Railcar Industries, Inc. | 46,709 | |
| 2,730 | 1 | First Solar, Inc. | 134,425 |
| 1,700 | Standex International Corp. | 100,351 | |
| TOTAL | 281,485 | ||
| Department Stores—0.1% | |||
| 1,000 | Bon-Ton Stores, Inc. | 18,860 | |
| Diversified Leisure—0.4% | |||
| 2,400 | 1 | Multimedia Games Holding Company, Inc. | 83,976 |
| Education & Training Services—0.6% | |||
| 123 | 1 | Capella Education Co. | 6,028 |
| 9,085 | 1 | Corinthian Colleges, Inc. | 20,351 |
| 400 | 1 | Grand Canyon Education, Inc. | 13,528 |
| 1,944 | 1 | ITT Educational Services, Inc. | 50,991 |
| 500 | Strayer Education, Inc. | 22,130 | |
| TOTAL | 113,028 | ||
| Electric & Electronic Original Equipment Manufacturers—1.2% | |||
| 1,800 | Altra Holdings, Inc. | 44,892 | |
| 4,371 | 1 | Generac Holdings, Inc. | 189,483 |
| TOTAL | 234,375 | ||
| Electric Utility—1.5% | |||
| 1,900 | El Paso Electric Co. | 71,763 | |
| 2,400 | Idacorp, Inc. | 126,648 | |
| 1,100 | MGE Energy, Inc. | 64,581 | |
| 800 | UniSource Energy Corp. | 40,680 | |
| TOTAL | 303,672 | ||
| Electrical Equipment—1.0% | |||
| 900 | Brady (W.H.) Co. | 29,943 | |
| 2,200 | Coleman Cable, Inc. | 47,806 | |
| 800 | Littelfuse, Inc. | 63,992 |
| Shares | Value | ||
| COMMON STOCKS—continued | |||
| Electrical Equipment—continued | |||
| 1,500 | Smith (A.O.) Corp. | $61,980 | |
| TOTAL | 203,721 | ||
| Electronic Equipment Instruments & Components—1.0% | |||
| 1,200 | 1 | Itron, Inc. | 51,744 |
| 6,767 | 1 | Sanmina Corp. | 111,385 |
| 4,900 | 1 | Taser International, Inc. | 43,512 |
| TOTAL | 206,641 | ||
| Electronic Instruments—0.5% | |||
| 2,700 | 1 | iRobot Corp. | 94,392 |
| Energy Equipment & Services—1.2% | |||
| 3,400 | 1 | Exterran Holdings, Inc. | 107,950 |
| 2,300 | 1 | PowerSecure International, Inc. | 37,444 |
| 6,100 | 1 | Renewable Energy Group, Inc. | 95,038 |
| TOTAL | 240,432 | ||
| Ethical Drugs—0.7% | |||
| 1,900 | 1 | Ligand Pharmaceuticals, Inc., Class B | 90,022 |
| 4,098 | 1 | PharMerica Corp. | 59,995 |
| TOTAL | 150,017 | ||
| Financial Services—5.2% | |||
| 5,035 | Deluxe Corp. | 206,486 | |
| 2,000 | Financial Engines, Inc. | 95,480 | |
| 700 | Heartland Payment Systems, Inc. | 26,117 | |
| 8,258 | MainSource Financial Group, Inc. | 119,411 | |
| 4,207 | Nelnet, Inc., Class A | 163,568 | |
| 1,100 | 1 | Outerwall, Inc. | 60,775 |
| 4,555 | 1 | PHH Corp. | 103,216 |
| 829 | 1 | Portfolio Recovery Associates, Inc. | 123,778 |
| 3,400 | 1 | Verifone Systems, Inc. | 64,838 |
| 100 | 1 | Virtus Investment Partners, Inc. | 18,650 |
| 2,400 | 1 | Xoom Corp. | 78,744 |
| TOTAL | 1,061,063 | ||
| Food Products—0.4% | |||
| 5,100 | 1 | Pilgrim's Pride Corp. | 84,762 |
| Food Wholesaling—0.2% | |||
| 5,200 | 1 | SUPERVALU, Inc. | 41,652 |
| Furniture—1.4% | |||
| 2,300 | 1 | American Woodmark Corp. | 79,787 |
| 4,300 | Haverty Furniture Cos., Inc. | 111,800 |
| Shares | Value | ||
| COMMON STOCKS—continued | |||
| Furniture—continued | |||
| 2,059 | Kimball International, Inc., Class B | $22,628 | |
| 3,900 | La-Z Boy Chair Co. | 80,847 | |
| TOTAL | 295,062 | ||
| Gas Distributor—0.2% | |||
| 700 | Southwest Gas Corp. | 34,748 | |
| Gas Utilities—0.2% | |||
| 800 | Chesapeake Utilities Corp. | 47,416 | |
| Generic Drugs—0.2% | |||
| 2,800 | 1 | Lannett Co., Inc. | 38,892 |
| Grocery Chain—0.2% | |||
| 1,300 | Ingles Markets, Inc., Class A | 36,998 | |
| Health Care—0.9% | |||
| 2,210 | 1 | USANA, Inc. | 182,590 |
| Home Building—0.3% | |||
| 446 | M.D.C. Holdings, Inc. | 14,112 | |
| 3,800 | 1 | PGT, Inc. | 38,000 |
| TOTAL | 52,112 | ||
| Home Health Care—0.9% | |||
| 2,900 | 1 | Addus Homecare Corp. | 56,956 |
| 4,016 | 1 | Gentiva Health Services, Inc. | 43,132 |
| 2,200 | 1 | Providence Service Corp. | 60,654 |
| 419 | 1 | Wellcare Health Plans, Inc. | 25,571 |
| TOTAL | 186,313 | ||
| Home Products—0.4% | |||
| 3,700 | 1 | Libbey, Inc. | 91,242 |
| Hospitals—1.0% | |||
| 2,000 | Ensign Group, Inc. | 76,480 | |
| 1,900 | HealthSouth Corp. | 61,864 | |
| 7,891 | Select Medical Holdings Corp. | 70,782 | |
| TOTAL | 209,126 | ||
| Hotels Restaurants & Leisure—0.3% | |||
| 1,600 | 1 | Marriott Vacations Worldwide Corp. | 70,400 |
| Household Appliances—0.1% | |||
| 1,642 | 1 | hhgregg, Inc. | 25,763 |
| Industrial Machinery—0.5% | |||
| 1,300 | Albany International Corp., Class A | 44,863 | |
| 2,800 | 1 | Columbus McKinnon Corp. | 61,936 |
| TOTAL | 106,799 |
| Shares | Value | ||
| COMMON STOCKS—continued | |||
| Industrial Services—0.1% | |||
| 974 | 1 | EnerNOC, Inc. | $15,214 |
| Insurance Brokerage—0.6% | |||
| 2,164 | AmTrust Financial Services, Inc. | 90,087 | |
| 5,200 | Crawford & Co., Class B | 40,872 | |
| TOTAL | 130,959 | ||
| Internet Services—1.7% | |||
| 4,000 | 1 | Angie's List, Inc. | 88,080 |
| 7,300 | 1 | Orbitz Worldwide, Inc. | 67,233 |
| 2,413 | 1 | Overstock.com, Inc. | 82,066 |
| 4,400 | 1 | Web.com Group, Inc. | 114,312 |
| TOTAL | 351,691 | ||
| Jewelry Stores—0.0% | |||
| 100 | Movado Group, Inc. | 3,648 | |
| Life Insurance—0.6% | |||
| 1,489 | Primerica, Inc. | 61,108 | |
| 3,668 | Symetra Financial Corp. | 65,951 | |
| TOTAL | 127,059 | ||
| Magazine Publishing—0.4% | |||
| 1,600 | Meredith Corp. | 76,032 | |
| Maritime—0.4% | |||
| 2,700 | Matson, Inc. | 76,464 | |
| Medical Supplies—2.1% | |||
| 3,400 | Invacare Corp. | 53,074 | |
| 1,000 | 1 | Medidata Solutions, Inc. | 92,530 |
| 3,500 | 1 | NuVasive, Inc. | 79,870 |
| 3,400 | 1 | Orthofix International NV | 77,214 |
| 1,600 | Steris Corp. | 72,032 | |
| 700 | West Pharmaceutical Services, Inc. | 51,632 | |
| TOTAL | 426,352 | ||
| Medical Technology—1.8% | |||
| 250 | Cantel Medical Corp. | 6,635 | |
| 3,000 | 1 | Cyberonics, Inc. | 155,970 |
| 1,100 | 1 | Greatbatch Technologies, Inc. | 41,580 |
| 3,300 | 1 | Hanger Orthopedic Group, Inc. | 121,836 |
| 1,100 | 1 | Integra Lifesciences Corp. | 43,329 |
| TOTAL | 369,350 | ||
| Metal Containers—0.1% | |||
| 500 | 1 | Mobile Mini, Inc. | 17,255 |
| Shares | Value | ||
| COMMON STOCKS—continued | |||
| Metal Fabrication—0.5% | |||
| 700 | Mueller Industries, Inc. | $38,423 | |
| 2,058 | NN, Inc. | 25,313 | |
| 1,200 | Worthington Industries, Inc. | 42,924 | |
| TOTAL | 106,660 | ||
| Metals & Mining—0.3% | |||
| 1,600 | Commercial Metals Corp. | 24,784 | |
| 1,400 | Schnitzer Steel Industries, Inc., Class A | 35,924 | |
| TOTAL | 60,708 | ||
| Miscellaneous Components—0.8% | |||
| 1,700 | 1 | Microsemi Corp. | 41,922 |
| 1,900 | 1 | Proto Labs, Inc. | 128,573 |
| TOTAL | 170,495 | ||
| Miscellaneous Machinery—0.2% | |||
| 1,700 | John Bean Technologies Corp. | 40,307 | |
| Miscellaneous Metals—0.5% | |||
| 2,400 | Matthews International Corp., Class A | 92,832 | |
| Money Center Bank—0.5% | |||
| 4,400 | International Bancshares Corp. | 106,524 | |
| 78 | MidWestOne Financial Group, Inc. | 2,035 | |
| TOTAL | 108,559 | ||
| Mortgage and Title—0.4% | |||
| 3,432 | First American Financial Corp. | 78,009 | |
| Multi-Industry Basic—0.4% | |||
| 4,300 | 1 | Graphic Packaging Holding Co. | 36,980 |
| 1,928 | Olin Corp. | 47,043 | |
| TOTAL | 84,023 | ||
| Multi-Line Insurance—2.4% | |||
| 1,100 | Amerisafe, Inc. | 39,303 | |
| 10,135 | CNO Financial Group, Inc. | 144,728 | |
| 2,675 | FBL Financial Group, Inc., Class A | 118,315 | |
| 5,225 | Montpelier Re Holdings Ltd. | 141,127 | |
| 700 | Safety Insurance Group, Inc. | 37,639 | |
| TOTAL | 481,112 | ||
| Natural Gas Production—0.2% | |||
| 6,663 | 1 | VAALCO Energy, Inc. | 41,311 |
| Office Supplies—0.7% | |||
| 3,326 | United Stationers, Inc. | 137,663 |
| Shares | Value | ||
| COMMON STOCKS—continued | |||
| Offshore Driller—0.4% | |||
| 6,200 | 1 | Newpark Resources, Inc. | $70,928 |
| Oil Refiner—0.9% | |||
| 272 | Alon USA Energy, Inc. | 3,716 | |
| 3,122 | Delek US Holdings, Inc. | 94,440 | |
| 2,972 | Western Refining, Inc. | 89,546 | |
| TOTAL | 187,702 | ||
| Oil Service, Explore & Drill—0.3% | |||
| 11,137 | 1 | Parker Drilling Co. | 67,602 |
| Oil Well Supply—0.4% | |||
| 2,200 | 1 | Park-Ohio Holdings Corp. | 77,286 |
| Optical Reading Equipment—0.4% | |||
| 2,400 | 1 | ScanSource, Inc. | 85,464 |
| Other Tobacco Products—0.6% | |||
| 2,000 | Universal Corp. | 122,600 | |
| Paper Products—1.4% | |||
| 9,207 | 1 | Boise, Inc. | 83,784 |
| 1,600 | Glatfelter (P.H.) Co. | 42,352 | |
| 2,500 | Kadant, Inc. | 81,850 | |
| 6,300 | 1 | Xerium Technologies, Inc. | 77,994 |
| TOTAL | 285,980 | ||
| Personal Loans—0.5% | |||
| 1,415 | Cash America International, Inc. | 59,430 | |
| 400 | 1 | Credit Acceptance Corp. | 44,996 |
| TOTAL | 104,426 | ||
| Personnel Agency—1.6% | |||
| 6,000 | 1 | AMN Healthcare Services, Inc. | 88,680 |
| 1,400 | Barrett Business Services, Inc. | 98,364 | |
| 3,035 | Kelly Services, Inc., Class A | 59,395 | |
| 4,000 | 1 | Korn/Ferry International | 78,120 |
| TOTAL | 324,559 | ||
| Pollution Control—0.3% | |||
| 1,800 | US Ecology, Inc. | 55,026 | |
| Poultry Products—0.6% | |||
| 1,800 | Sanderson Farms, Inc. | 127,152 | |
| Printed Circuit Boards—0.3% | |||
| 11,747 | 1 | Sigma Designs, Inc. | 61,319 |
| Printing—1.1% | |||
| 1,400 | 1 | Consolidated Graphics, Inc. | 75,026 |
| Shares | Value | ||
| COMMON STOCKS—continued | |||
| Printing—continued | |||
| 2,494 | Quad Graphics, Inc. | $69,932 | |
| 2,844 | Valassis Communications, Inc. | 81,424 | |
| TOTAL | 226,382 | ||
| Professional Services—0.9% | |||
| 300 | 1 | CoStar Group, Inc. | 46,965 |
| 2,300 | 1 | FTI Consulting, Inc. | 85,698 |
| 3,000 | 1,2 | RPX Corp. | 52,320 |
| TOTAL | 184,983 | ||
| Property Liability Insurance—2.0% | |||
| 1,870 | Argo Group International Holdings Ltd. | 83,495 | |
| 2,800 | Horace Mann Educators Corp. | 79,352 | |
| 1,974 | Platinum Underwriters Holdings Ltd. | 114,670 | |
| 1,508 | ProAssurance Corp. | 80,723 | |
| 1,600 | United Fire & Casualty Co. | 41,616 | |
| TOTAL | 399,856 | ||
| Railroad—0.4% | |||
| 3,200 | 1 | Greenbrier Cos., Inc. | 73,184 |
| Recreational Goods—1.0% | |||
| 9,000 | 1 | Smith & Wesson Holding Corp. | 106,560 |
| 1,300 | Sturm Ruger & Co., Inc. | 66,131 | |
| 3,800 | 1 | The Nautilus Group, Inc. | 33,364 |
| TOTAL | 206,055 | ||
| Recreational Vehicles—0.8% | |||
| 2,384 | Brunswick Corp. | 89,996 | |
| 3,300 | 1 | Winnebago Industries, Inc. | 78,936 |
| TOTAL | 168,932 | ||
| Regional Banks—7.9% | |||
| 1,200 | BBCN Bancorp, Inc. | 17,532 | |
| 800 | BancFirst Corp. | 41,824 | |
| 1,300 | Bancorpsouth, Inc. | 25,545 | |
| 5,464 | Cardinal Financial Corp. | 89,391 | |
| 1,600 | Community Trust Bancorp, Inc. | 63,760 | |
| 3,174 | Enterprise Financial Services Corp. | 58,814 | |
| 3,099 | Financial Institutions, Inc. | 62,383 | |
| 2,400 | First Interstate BancSystem, Inc., Class A | 56,568 | |
| 5,000 | First Merchants Corp. | 93,600 | |
| 900 | Great Southern Bancorp, Inc. | 26,280 | |
| 1,600 | Hancock Holding Co. | 52,416 |
| Shares | Value | ||
| COMMON STOCKS—continued | |||
| Regional Banks—continued | |||
| 5,480 | 1 | Hanmi Financial Corp. | $93,160 |
| 2,100 | Heartland Financial USA, Inc. | 58,800 | |
| 680 | Peoples Bancorp, Inc. | 15,293 | |
| 3,900 | 1 | Pinnacle Financial Partners, Inc. | 111,072 |
| 2,600 | PrivateBancorp, Inc. | 61,334 | |
| 1,600 | Renasant Corp. | 43,840 | |
| 1,700 | Sandy Spring Bancorp, Inc. | 41,548 | |
| 3,800 | Susquehanna Bankshares, Inc. | 50,540 | |
| 1,800 | TriCo Bancshares | 38,988 | |
| 800 | Trustmark Corp. | 21,576 | |
| 3,400 | Umpqua Holdings Corp. | 57,256 | |
| 1,200 | Washington Trust Bancorp | 38,808 | |
| 1,600 | Wesbanco, Inc. | 47,120 | |
| 6,000 | 1 | Western Alliance Bancorp | 106,380 |
| 18,457 | Wilshire Bancorp, Inc. | 162,237 | |
| 2,100 | Wintrust Financial Corp. | 85,911 | |
| TOTAL | 1,621,976 | ||
| Rental & Leasing Services—0.1% | |||
| 580 | Rent-A-Center, Inc. | 23,194 | |
| Restaurant—1.9% | |||
| 1,100 | 1 | AFC Enterprises, Inc. | 40,480 |
| 800 | CEC Entertainment, Inc. | 33,272 | |
| 1,100 | Cracker Barrel Old Country Store, Inc. | 107,690 | |
| 1,300 | Domino's Pizza, Inc. | 81,354 | |
| 4,100 | 1 | Krispy Kreme Doughnuts, Inc. | 86,182 |
| 500 | 1 | Papa Johns International, Inc. | 33,430 |
| TOTAL | 382,408 | ||
| Savings & Loan—3.5% | |||
| 2,537 | Banner Corp. | 94,072 | |
| 900 | 1 | BofI Holding, Inc. | 48,825 |
| 4,100 | 1 | Flagstar Bancorp, Inc. | 67,240 |
| 1,900 | Glacier Bancorp, Inc. | 46,246 | |
| 2,600 | MB Financial, Inc. | 74,828 | |
| 6,548 | Provident Financial Holdings, Inc. | 114,590 | |
| 3,400 | Sterling Financial Corp. WA | 90,202 | |
| 1,000 | WSFS Financial Corp. | 59,530 | |
| 4,100 | Webster Financial Corp. Waterbury | 111,684 | |
| TOTAL | 707,217 |
| Shares | Value | ||
| COMMON STOCKS—continued | |||
| Semiconductor Manufacturing—1.5% | |||
| 5,810 | 1 | Omnivision Technologies, Inc. | $94,470 |
| 1,300 | 1 | Plexus Corp. | 45,461 |
| 13,200 | 1 | RF Micro Devices, Inc. | 68,508 |
| 1,200 | 1 | Semtech Corp. | 36,300 |
| 5,751 | 1 | Spansion, Inc. | 67,862 |
| TOTAL | 312,601 | ||
| Semiconductor Manufacturing Equipment—0.6% | |||
| 1,700 | 1 | Advanced Energy Industries, Inc. | 36,822 |
| 4,253 | Mentor Graphics Corp. | 87,314 | |
| TOTAL | 124,136 | ||
| Services to Medical Professionals—1.4% | |||
| 1,700 | 1 | Bio-Reference Laboratories, Inc. | 45,475 |
| 5,200 | 1 | MedAssets, Inc. | 113,204 |
| 3,900 | 1 | WebMD Health Corp., Class A | 128,739 |
| TOTAL | 287,418 | ||
| Shoes—1.8% | |||
| 4,000 | Brown Shoe Co., Inc. | 95,080 | |
| 317 | 1 | CROCs, Inc. | 4,333 |
| 900 | 1 | Deckers Outdoor Corp. | 49,347 |
| 1,459 | 1 | Genesco, Inc. | 102,685 |
| 4,200 | 1 | Skechers USA, Inc., Class A | 114,576 |
| TOTAL | 366,021 | ||
| Software Packaged/Custom—3.2% | |||
| 4,032 | 1 | Aspen Technology, Inc. | 131,201 |
| 4,319 | CSG Systems International, Inc. | 102,274 | |
| 1,938 | 1 | Commvault Systems, Inc. | 163,625 |
| 1,800 | 1 | Electronics for Imaging, Inc. | 54,054 |
| 1,030 | 1 | ePlus, Inc. | 65,395 |
| 1,600 | Pegasystems, Inc. | 57,440 | |
| 2,700 | 1 | Take-Two Interactive Software, Inc. | 47,331 |
| 1,527 | 1 | ValueClick, Inc. | 37,320 |
| TOTAL | 658,640 | ||
| Specialty Chemicals—1.1% | |||
| 4,000 | American Vanguard Corp. | 98,760 | |
| 1,200 | Chemed Corp. | 84,708 | |
| 2,800 | FutureFuel Corp. | 44,212 | |
| 308 | 1 | Omnova Solutions, Inc. | 2,483 |
| TOTAL | 230,163 |
| Shares | Value | ||
| COMMON STOCKS—continued | |||
| Specialty Retailing—4.2% | |||
| 2,483 | 1 | Asbury Automotive Group, Inc. | $121,270 |
| 5,100 | Big 5 Sporting Goods Corp. | 103,377 | |
| 700 | 1 | Cabela's, Inc., Class A | 48,048 |
| 1,300 | 1 | Conn's, Inc. | 84,006 |
| 700 | Finish Line, Inc., Class A | 15,582 | |
| 1,000 | Lithia Motors, Inc., Class A | 65,240 | |
| 1,762 | 1 | Lumber Liquidators, Inc. | 170,597 |
| 3,820 | Natures Sunshine Products, Inc. | 69,524 | |
| 2,100 | Penske Automotive Group, Inc. | 78,078 | |
| 1,600 | Stage Stores, Inc. | 39,936 | |
| 1,600 | 1 | Stamps.com, Inc. | 63,776 |
| TOTAL | 859,434 | ||
| Telecommunication Equipment & Services—2.4% | |||
| 1,400 | Alliance Fiber Optic Products, Inc. | 44,534 | |
| 1,489 | 1 | Anixter International, Inc. | 123,647 |
| 2,700 | 1 | Arris Group, Inc. | 40,608 |
| 5,400 | 1 | CIENA Corp. | 119,124 |
| 1,500 | Plantronics, Inc. | 69,735 | |
| 4,600 | 1 | Ubiquiti Networks, Inc. | 96,692 |
| TOTAL | 494,340 | ||
| Telephone Utility—0.3% | |||
| 21,665 | 1 | Vonage Holdings Corp. | 69,761 |
| Truck Manufacturing—0.2% | |||
| 3,700 | 1 | Federal Signal Corp. | 35,890 |
| Trucking—0.3% | |||
| 3,665 | 1 | Swift Transportation Co. | 65,384 |
| Undesignated Consumer Cyclicals—0.4% | |||
| 1,500 | ABM Industries, Inc. | 38,850 | |
| 1,600 | 1 | TeleTech Holdings, Inc. | 40,080 |
| TOTAL | 78,930 | ||
| Undesignated Consumer Staples—0.7% | |||
| 5,000 | 1 | Medifast, Inc. | 136,700 |
| Uniforms—0.1% | |||
| 100 | Unifirst Corp. | 9,802 | |
| Water Utility—0.5% | |||
| 900 | American States Water Co. | 57,798 | |
| 4,800 | Mueller Water Products, Inc. | 37,152 | |
| TOTAL | 94,950 |
| Shares | Value | ||
| COMMON STOCKS—continued | |||
| Wireless Communications—0.2% | |||
| 800 | InterDigital, Inc. | $31,784 | |
| TOTAL COMMON STOCKS (IDENTIFIED COST $16,927,195) | 20,085,603 | ||
| MUTUAL FUND—2.4% | |||
| 485,617 | 2,3 | Federated Prime Value Obligations Fund, Institutional Shares, 0.06% (AT NET ASSET VALUE) | 485,617 |
| TOTAL INVESTMENTS—100.8% (IDENTIFIED COST $17,412,812)4 | 20,571,220 | ||
| OTHER ASSETS AND LIABILITIES - NET—(0.8)%5 | (157,153) | ||
| TOTAL NET ASSETS—100% | $20,414,067 |
| 1 | Non-income producing security. |
| 2 | Affiliated companies and holdings. |
| 3 | 7-day net yield. |
| 4 | The cost of investments for federal tax purposes amounts to $17,442,316. |
| 5 | Assets, other than investments in securities, less liabilities. See Statement of Assets and Liabilities. |
| Year Ended July 31 | 2013 | 2012 | 2011 | 2010 | 2009 |
| Net Asset Value, Beginning of Period | $9.52 | $9.88 | $7.55 | $6.58 | $10.21 |
| Income From Investment Operations: | |||||
| Net investment income (loss) | (0.01)1 | (0.06)1 | (0.09)1 | (0.06)1 | (0.04)1 |
| Net realized and unrealized gain (loss) on investments | 4.19 | (0.30) | 2.42 | 1.03 | (3.59) |
| TOTAL FROM INVESTMENT OPERATIONS | 4.18 | (0.36) | 2.33 | 0.97 | (3.63) |
| Net Asset Value, End of Period | $13.70 | $9.52 | $9.88 | $7.55 | $6.58 |
| Total Return2 | 43.91% | (3.64)% | 30.86% | 14.74% | (35.55)% |
| Ratios to Average Net Assets: | |||||
| Net expenses | 1.70% | 1.71% | 1.75% | 1.75% | 1.74% |
| Net investment income (loss) | (0.05)% | (0.65)% | (0.96)% | (0.77)% | (0.53)% |
| Expense waiver/reimbursement3 | 1.09% | 4.24% | 3.75% | 5.41% | 5.73% |
| Supplemental Data: | |||||
| Net assets, end of period (000 omitted) | $3,694 | $2,550 | $3,469 | $3,184 | $1,652 |
| Portfolio turnover | 184% | 200% | 210% | 192% | 222% |
| 1 | Per share numbers have been calculated using the average shares method. |
| 2 | Based on net asset value, which does not reflect the sales charge, redemption fee or contingent deferred sales charge, if applicable. |
| 3 | This expense decrease is reflected in both the net expense and the net investment income (loss) ratios shown above. |
| Year Ended July 31 | 2013 | 2012 | 2011 | 2010 | 2009 |
| Net Asset Value, Beginning of Period | $9.04 | $9.45 | $7.28 | $6.39 | $9.99 |
| Income From Investment Operations: | |||||
| Net investment income (loss) | (0.09)1 | (0.12)1 | (0.15)1 | (0.11)1 | (0.08)1 |
| Net realized and unrealized gain (loss) on investments | 3.96 | (0.29) | 2.32 | 1.00 | (3.52) |
| TOTAL FROM INVESTMENT OPERATIONS | 3.87 | (0.41) | 2.17 | 0.89 | (3.60) |
| Net Asset Value, End of Period | $12.91 | $9.04 | $9.45 | $7.28 | $6.39 |
| Total Return2 | 42.81% | (4.34)% | 29.81% | 13.93% | (36.04)% |
| Ratios to Average Net Assets: | |||||
| Net expenses | 2.45% | 2.46% | 2.50% | 2.50% | 2.49% |
| Net investment income (loss) | (0.81)% | (1.41)% | (1.70)% | (1.53)% | (1.29)% |
| Expense waiver/reimbursement3 | 1.11% | 4.24% | 3.78% | 5.13% | 5.61% |
| Supplemental Data: | |||||
| Net assets, end of period (000 omitted) | $2,636 | $2,358 | $2,978 | $3,258 | $1,366 |
| Portfolio turnover | 184% | 200% | 210% | 192% | 222% |
| 1 | Per share numbers have been calculated using the average shares method. |
| 2 | Based on net asset value, which does not reflect the sales charge, redemption fee or contingent deferred sales charge, if applicable. |
| 3 | This expense decrease is reflected in both the net expense and the net investment income (loss) ratios shown above. |
| Year Ended July 31 | 2013 | 2012 | 2011 | 2010 | 2009 |
| Net Asset Value, Beginning of Period | $9.67 | $10.00 | $7.63 | $6.63 | $10.28 |
| Income From Investment Operations: | |||||
| Net investment income (loss) | 0.031 | (0.04)1 | (0.06)1 | (0.04)1 | (0.02)1 |
| Net realized and unrealized gain (loss) on investments | 4.24 | (0.29) | 2.43 | 1.04 | (3.63) |
| TOTAL FROM INVESTMENT OPERATIONS | 4.27 | (0.33) | 2.37 | 1.00 | (3.65) |
| Net Asset Value, End of Period | $13.94 | $9.67 | $10.00 | $7.63 | $6.63 |
| Total Return2 | 44.16% | (3.30)% | 31.06% | 15.08% | (35.51)% |
| Ratios to Average Net Assets: | |||||
| Net expenses | 1.45% | 1.46% | 1.50% | 1.50% | 1.49% |
| Net investment income (loss) | 0.23% | (0.44)% | (0.71)% | (0.52)% | (0.30)% |
| Expense waiver/reimbursement3 | 1.10% | 3.77% | 3.79% | 5.56% | 5.22% |
| Supplemental Data: | |||||
| Net assets, end of period (000 omitted) | $14,084 | $11,650 | $4,836 | $5,727 | $3,319 |
| Portfolio turnover | 184% | 200% | 210% | 192% | 222% |
| 1 | Per share numbers have been calculated using the average shares method. |
| 2 | Based on net asset value. |
| 3 | This expense decrease is reflected in both the net expense and the net investment income (loss) ratios shown above. |
| Assets: | ||
| Total investment in securities, at value including $485,617 of investment in an affiliated holding and $91,983 of investment in affiliated companies (Note 5) (identified cost $17,412,812) | $20,571,220 | |
| Income receivable | 4,854 | |
| Receivable for investments sold | 314,357 | |
| Receivable for shares sold | 34,726 | |
| TOTAL ASSETS | 20,925,157 | |
| Liabilities: | ||
| Payable for investments purchased | $406,000 | |
| Payable for shares redeemed | 28,718 | |
| Payable for auditing fees | 23,400 | |
| Payable for distribution services fee (Note 5) | 1,635 | |
| Payable for shareholder services fee (Note 5) | 2,686 | |
| Payable for share registration costs | 27,970 | |
| Accrued expenses (Note 5) | 20,681 | |
| TOTAL LIABILITIES | 511,090 | |
| Net assets for 1,484,174 shares outstanding | $20,414,067 | |
| Net Assets Consist of: | ||
| Paid-in capital | $24,880,348 | |
| Net unrealized appreciation of investments | 3,158,408 | |
| Accumulated net realized loss on investments | (7,574,546) | |
| Accumulated net investment income (loss) | (50,143) | |
| TOTAL NET ASSETS | $20,414,067 | |
| Net Asset Value, Offering Price and Redemption Proceeds Per Share | ||
| Class A Shares: | ||
| Net asset value per share ($3,694,202 ÷ 269,711 shares outstanding), no par value, unlimited shares authorized | $13.70 | |
| Offering price per share (100/94.50 of $13.70) | $14.50 | |
| Redemption proceeds per share | $13.70 | |
| Class C Shares: | ||
| Net asset value per share ($2,635,677 ÷ 204,178 shares outstanding), no par value, unlimited shares authorized | $12.91 | |
| Offering price per share | $12.91 | |
| Redemption proceeds per share (99.00/100 of $12.91) | $12.78 | |
| Institutional Shares: | ||
| Net asset value per share ($14,084,188 ÷ 1,010,285 shares outstanding), no par value, unlimited shares authorized | $13.94 | |
| Offering price per share | $13.94 | |
| Redemption proceeds per share | $13.94 |
| Investment Income: | |||
| Dividends (including $395 received from an affiliated holding (Note 5)) | $291,397 | ||
| Expenses: | |||
| Investment adviser fee (Note 5) | $200,267 | ||
| Administrative fee (Note 5) | 32,012 | ||
| Custodian fees | 17,898 | ||
| Transfer agent fee | 28,950 | ||
| Directors'/Trustees' fees (Note 5) | 1,463 | ||
| Auditing fees | 23,400 | ||
| Legal fees | 8,838 | ||
| Portfolio accounting fees | 66,993 | ||
| Distribution services fee (Note 5) | 17,269 | ||
| Shareholder services fee (Note 5) | 13,043 | ||
| Share registration costs | 38,826 | ||
| Printing and postage | 18,564 | ||
| Insurance premiums (Note 5) | 3,945 | ||
| Miscellaneous (Note 5) | 4,378 | ||
| TOTAL EXPENSES | 475,846 | ||
| Waivers and Reimbursement (Note 5): | |||
| Waiver/reimbursement of investment adviser fee | $(188,362) | ||
| Waiver of administrative fee | (3,808) | ||
| TOTAL WAIVERS AND REIMBURSEMENT | (192,170) | ||
| Net expenses | 283,676 | ||
| Net investment income | 7,721 | ||
| Realized and Unrealized Gain on Investments: | |||
| Net realized gain on investments | 3,764,471 | ||
| Net change in unrealized appreciation of investments | 2,572,034 | ||
| Net realized and unrealized gain on investments | 6,336,505 | ||
| Change in net assets resulting from operations | $6,344,226 |
| Year Ended July 31 | 2013 | 2012 |
| Increase (Decrease) in Net Assets | ||
| Operations: | ||
| Net investment income (loss) | $7,721 | $(77,173) |
| Net realized gain (loss) on investments | 3,764,471 | (9,436) |
| Net change in unrealized appreciation/depreciation of investments | 2,572,034 | (74,338) |
| CHANGE IN NET ASSETS RESULTING FROM OPERATIONS | 6,344,226 | (160,947) |
| Share Transactions: | ||
| Proceeds from sale of shares | 2,885,582 | 8,745,470 |
| Cost of shares redeemed | (5,374,162) | (3,308,401) |
| CHANGE IN NET ASSETS RESULTING FROM SHARE TRANSACTIONS | (2,488,580) | 5,437,069 |
| Change in net assets | 3,855,646 | 5,276,122 |
| Net Assets: | ||
| Beginning of period | 16,558,421 | 11,282,299 |
| End of period (including accumulated net investment income (loss) of $(50,143) and $(56,440), respectively) | $20,414,067 | $16,558,421 |
| ■ | Equity securities listed on an exchange or traded through a regulated market system are valued at their last reported sale price or official closing price in their principal exchange or market. |
| ■ | Shares of other mutual funds are valued based upon their reported NAVs. |
| ■ | Fixed-income securities acquired with remaining maturities greater than 60 days are fair valued using price evaluations provided by a pricing service approved by the Fund's Board of Trustees (the “Trustees”). |
| ■ | Fixed-income securities and repurchase agreements acquired with remaining maturities of 60 days or less are valued at their amortized cost (adjusted for the accretion of any discount or amortization of any premium), unless the issuer's creditworthiness is impaired or other factors indicate that amortized cost is not an accurate estimate of the investment's fair value, in which case it would be valued in the same manner as a longer-term security. |
| ■ | Derivative contracts listed on exchanges are valued at their reported settlement or closing price. |
| ■ | Over-the-counter (OTC) derivative contracts are fair valued using price evaluations provided by a pricing service approved by the Trustees. |
| ■ | For securities that are fair valued in accordance with procedures established by and under the general supervision of the Trustees, certain factors may be considered such as: the purchase price of the security, information obtained by contacting the issuer, analysis of the issuer's financial statements or other available documents, fundamental analytical data, the nature and duration of restrictions on disposition, the movement of the market in which the security is normally traded and public trading in similar securities of the issuer or comparable issuers. |
| Year Ended July 31 | 2013 | 2012 | ||
| Class A Shares: | Shares | Amount | Shares | Amount |
| Shares sold | 58,995 | $721,385 | 37,994 | $344,850 |
| Shares redeemed | (57,089) | (645,446) | (121,394) | (1,100,407) |
| NET CHANGE RESULTING FROM CLASS A SHARE TRANSACTIONS | 1,906 | $75,939 | (83,400) | $(755,557) |
| Year Ended July 31 | 2013 | 2012 | ||
| Class C Shares: | Shares | Amount | Shares | Amount |
| Shares sold | 31,008 | $338,769 | 9,770 | $85,422 |
| Shares redeemed | (87,658) | (873,316) | (64,102) | (552,087) |
| NET CHANGE RESULTING FROM CLASS C SHARE TRANSACTIONS | (56,650) | $(534,547) | (54,332) | $(466,665) |
| Year Ended July 31 | 2013 | 2012 | ||
| Institutional Shares: | Shares | Amount | Shares | Amount |
| Shares sold | 154,932 | $1,825,428 | 898,001 | $8,315,198 |
| Shares redeemed | (349,832) | (3,855,400) | (176,188) | (1,655,907) |
| NET CHANGE RESULTING FROM INSTITUTIONAL SHARE TRANSACTIONS | (194,900) | $(2,029,972) | 721,813 | $6,659,291 |
| NET CHANGE RESULTING FROM TOTAL FUND SHARE TRANSACTIONS | (249,644) | $(2,488,580) | 584,081 | $5,437,069 |
| Increase (Decrease) | ||
| Paid-In Capital | Undistributed Net Investment Income (Loss) | Accumulated Net Realized Gain (Loss) |
| $(451,021) | $(1,424) | $452,445 |
| Net unrealized appreciation | $3,128,904 |
| Capital loss carryforwards and deferrals | $(7,595,185) |
| Expiration Year | Short-Term | Long-Term | Total |
| 2017 | $3,158,071 | NA | $3,158,071 |
| 2018 | $4,386,971 | NA | $4,386,971 |
| Administrative Fee | Average Daily Net Assets of the Investment Complex |
| 0.150% | on the first $5 billion |
| 0.125% | on the next $5 billion |
| 0.100% | on the next $10 billion |
| 0.075% | on assets in excess of $20 billion |
| Share Class Name | Percentage of Average Daily Net Assets of Class |
| Class A Shares | 0.05% |
| Class C Shares | 0.75% |
| Distribution Services Fees Incurred | |
| Class C Shares | $17,269 |
| Service Fees Incurred | |
| Class A Shares | $7,286 |
| Class C Shares | 5,757 |
| TOTAL | $13,043 |
| Affiliates | Balance of Shares Held 7/31/2012 | Purchases/ Additions | Sales/ Reductions | Balance of Shares Held 7/31/2013 | Value | |
| RPX Corp. | — | 3,000 | — | 3,000 | $52,320 | |
| Repligen Corp. | — | 3,900 | — | 3,900 | 39,663 | |
| TOTAL OF AFFILIATED COMPANIES | — | 6,900 | — | 6,900 | $91,983 |
| Federated Prime Value Obligations Fund, Institutional Shares | |
| Balance of Shares Held 7/31/2012 | 296,930 |
| Purchases/Additions | 4,671,001 |
| Sales/Reductions | (4,482,314) |
| Balance of Shares Held 7/31/2013 | 485,617 |
| Value | $485,617 |
| Dividend Income | $395 |
| Purchases | $31,603,001 |
| Sales | $34,150,176 |
September 23, 2013
| Beginning Account Value 2/1/2013 | Ending Account Value 7/31/2013 | Expenses Paid During Period1 | |
| Actual: | |||
| Class A Shares | $1,000 | $1,198.60 | $9.27 |
| Class C Shares | $1,000 | $1,194.30 | $13.33 |
| Institutional Shares | $1,000 | $1,200.70 | $7.91 |
| Hypothetical (assuming a 5% return before expenses): | |||
| Class A Shares | $1,000 | $1,016.36 | $8.50 |
| Class C Shares | $1,000 | $1,012.65 | $12.23 |
| Institutional Shares | $1,000 | $1,017.60 | $7.25 |
| 1 | Expenses are equal to the Fund's annualized net expense ratios, multiplied by the average account value over the period, multiplied by 181/365 (to reflect the one-half-year period). The annualized net expense ratios are as follows: |
| Class A Shares | 1.70% |
| Class C Shares | 2.45% |
| Institutional Shares | 1.45% |
| Name Birth Date Positions Held with Trust Date Service Began | Principal Occupation(s) for Past Five Years, Other Directorships Held and Previous Position(s) |
| John F. Donahue* Birth Date: July 28, 1924 Trustee Began serving: June 2006 | Principal Occupations: Director or Trustee of the Federated Fund Family; Chairman and Director, Federated Investors, Inc.; Chairman of the Federated Fund Family's Executive Committee. Previous Positions: Chairman of the Federated Fund Family; Trustee, Federated Investment Management Company; Chairman and Director, Federated Investment Counseling. |
| Name Birth Date Positions Held with Trust Date Service Began | Principal Occupation(s) for Past Five Years, Other Directorships Held and Previous Position(s) |
| J. Christopher Donahue* Birth Date: April 11, 1949 President and Trustee Began serving: May 2006 | Principal Occupations: Principal Executive Officer and President of certain of the Funds in the Federated Fund Family; Director or Trustee of certain of the Funds in the Federated Fund Family; President, Chief Executive Officer and Director, Federated Investors, Inc.; Chairman and Trustee, Federated Investment Management Company; Trustee, Federated Investment Counseling; Chairman and Director, Federated Global Investment Management Corp.; Chairman, Federated Equity Management Company of Pennsylvania and Passport Research, Ltd. (investment advisory subsidiary of Federated); Trustee, Federated Shareholder Services Company; Director, Federated Services Company. Previous Positions: President, Federated Investment Counseling; President and Chief Executive Officer, Federated Investment Management Company, Federated Global Investment Management Corp. and Passport Research, Ltd. |
| * | Family relationships and reasons for “interested” status: John F. Donahue is the father of J. Christopher Donahue; both are “interested” due to their beneficial ownership of shares of Federated Investors, Inc. and the positions they hold with Federated and its subsidiaries. |
| Name Birth Date Positions Held with Trust Date Service Began | Principal Occupation(s) for Past Five Years, Other Directorships Held, Previous Position(s) and Qualifications |
| Maureen Lally-Green Birth Date: July 5, 1949 Trustee Began serving: August 2009 | Principal Occupations: Director or Trustee of the Federated Fund Family; Director, Office of Church Relations, and Associate General Secretary, Diocese of Pittsburgh; Adjunct Professor of Law, Duquesne University School of Law. Other Directorships Held: Director, Auberle; Member, Pennsylvania State Board of Education; Director, Saint Vincent College; Director, Ireland Institute of Pittsburgh; Chair and Director, UPMC Mercy Hospital; Regent, St. Vincent Seminary; Director, Epilepsy Foundation of Western and Central Pennsylvania; Director, Saint Thomas More Society, Allegheny County; Director, Our Campaign for the Church Alive, Inc. Previous Position: Pennsylvania Superior Court Judge. Qualifications: Legal and director experience. |
| Name Birth Date Positions Held with Trust Date Service Began | Principal Occupation(s) for Past Five Years, Other Directorships Held, Previous Position(s) and Qualifications |
| Peter E. Madden Birth Date: March 16, 1942 Trustee Began serving: June 2006 | Principal Occupation: Director or Trustee, and Chairman of the Board of Directors or Trustees, of the Federated Fund Family. Previous Positions: Representative, Commonwealth of Massachusetts General Court; President, Chief Operating Officer and Director, State Street Bank and Trust Company and State Street Corporation (retired); Director, VISA USA and VISA International; Chairman and Director, Massachusetts Bankers Association; Director, Depository Trust Corporation; Director, The Boston Stock Exchange. Qualifications: Business management, mutual fund services and director experience. |
| Charles F. Mansfield, Jr. Birth Date: April 10, 1945 Trustee Began serving: June 2006 | Principal Occupations: Director or Trustee of the Federated Fund Family; Management Consultant. Previous Positions: Chief Executive Officer, PBTC International Bank; Partner, Arthur Young & Company (now Ernst & Young LLP); Chief Financial Officer of Retail Banking Sector, Chase Manhattan Bank; Senior Vice President, HSBC Bank USA (formerly Marine Midland Bank); Vice President, Citibank; Assistant Professor of Banking and Finance, Frank G. Zarb School of Business, Hofstra University; Executive Vice President, DVC Group, Inc. (marketing, communications and technology). Qualifications: Banking, business management, education and director experience. |
| Thomas M. O'Neill Birth Date: June 14, 1951 Trustee Began serving: October 2006 | Principal Occupations: Director or Trustee, Vice Chairman of the Audit Committee of the Federated Fund Family; Sole Proprietor, Navigator Management Company (investment and strategic consulting). Other Directorships Held: Board of Overseers, Children's Hospital of Boston; Visiting Committee on Athletics, Harvard College; Board of Directors, Medicines for Humanity; Board of Directors, The Golisano Children's Museum of Naples, Florida. Previous Positions: Chief Executive Officer and President, Managing Director and Chief Investment Officer, Fleet Investment Advisors; President and Chief Executive Officer, Aeltus Investment Management, Inc.; General Partner, Hellman, Jordan Management Co., Boston, MA; Chief Investment Officer, The Putnam Companies, Boston, MA; Credit Analyst and Lending Officer, Fleet Bank; Director and Consultant, EZE Castle Software (investment order management software); Director, Midway Pacific (lumber). Qualifications: Business management, mutual fund, director and investment experience. |
| Name Birth Date Positions Held with Trust Date Service Began | Principal Occupation(s) for Past Five Years, Other Directorships Held, Previous Position(s) and Qualifications |
| John S. Walsh Birth Date: November 28, 1957 Trustee Began serving: June 2006 | Principal Occupations: Director or Trustee, Chairman of the Audit Committee of the Federated Fund Family; President and Director, Heat Wagon, Inc. (manufacturer of construction temporary heaters); President and Director, Manufacturers Products, Inc. (distributor of portable construction heaters); President, Portable Heater Parts, a division of Manufacturers Products, Inc. Previous Position: Vice President, Walsh & Kelly, Inc. Qualifications: Business management and director experience. |
| Name Birth Date Address Positions Held with Trust Date Service Began | Principal Occupation(s) for Past Five Years and Previous Position(s) |
| John W. McGonigle Birth Date: October 26, 1938 Secretary Officer since: May 2006 | Principal Occupations: Executive Vice President and Secretary of the Federated Fund Family; Vice Chairman, Executive Vice President, Secretary and Director, Federated Investors, Inc. Previous Positions: Trustee, Federated Investment Management Company and Federated Investment Counseling; Director, Federated Global Investment Management Corp., Federated Services Company and Federated Securities Corp. |
| Lori A. Hensler, CPA Birth Date: January 6, 1967 TREASURER Officer since: April 2013 | Principal Occupations: Principal Financial Officer and Treasurer of the Federated Fund Family; Senior Vice President, Federated Administrative Services; Financial and Operations Principal for Federated Securities Corp. and Edgewood Services, Inc.; and Assistant Treasurer, Federated Investors Trust Company. Previous Positions: Controller of Federated Investors, Inc.; Senior Vice President and Assistant Treasurer, Federated Investors Management Company; Treasurer, Federated Investors Trust Company; Assistant Treasurer, Federated Administrative Services, Federated Administrative Services, Inc., Federated Securities Corp., Edgewood Services, Inc., Federated Advisory Services Company, Federated Equity Management Company of Pennsylvania, Federated Global Investment Management Corp., Federated Investment Counseling, Federated Investment Management Company, Passport Research, Ltd., and Federated MDTA, LLC; Financial and Operations Principal for Federated Securities Corp., Edgewood Services, Inc. and Southpointe Distribution Services, Inc. |
| Name Birth Date Address Positions Held with Trust Date Service Began | Principal Occupation(s) for Past Five Years and Previous Position(s) |
| Peter J. Germain Birth Date: September 3, 1959 CHIEF LEGAL OFFICER Officer since: June 2006 | Principal Occupations: Mr. Germain is Chief Legal Officer of the Federated Fund Family. He is General Counsel and Vice President, Federated Investors, Inc.; President, Federated Administrative Services and Federated Administrative Services, Inc.; Vice President, Federated Securities Corp.; Secretary, Federated Private Asset Management, Inc.; and Secretary, Retirement Plan Service Company of America. Mr. Germain joined Federated in 1984 and is a member of the Pennsylvania Bar Association. Previous Positions: Deputy General Counsel, Special Counsel, Managing Director of Mutual Fund Services, Federated Investors, Inc.; Senior Vice President, Federated Services Company; and Senior Corporate Counsel, Federated Investors, Inc. |
| Brian P. Bouda Birth Date: February 28, 1947 CHIEF COMPLIANCE OFFICER AND SENIOR VICE PRESIDENT Officer since: June 2006 | Principal Occupations: Senior Vice President and Chief Compliance Officer of the Federated Fund Family; Vice President and Chief Compliance Officer of Federated Investors, Inc. and Chief Compliance Officer of certain of its subsidiaries. Mr. Bouda joined Federated in 1999 and is a member of the American Bar Association and the State Bar Association of Wisconsin. Previous Positions: Served in Senior Management positions with a large regional banking organization. |
| Stephen F. Auth Birth Date: September 3, 1956 450 Lexington Avenue Suite 3700 New York, NY 10017-3943 CHIEF INVESTMENT OFFICER Began serving: June 2012 | Principal Occupations: Stephen F. Auth is Chief Investment Officer of various Funds in the Federated Fund Family; Executive Vice President, Federated Investment Counseling, Federated Global Investment Management Corp. and Federated Equity Management Company of Pennsylvania. Previous Positions: Executive Vice President, Federated Investment Management Company and Passport Research, Ltd. (investment advisory subsidiary of Federated); Senior Vice President, Global Portfolio Management Services Division; Senior Vice President, Federated Investment Management Company and Passport Research, Ltd.; Senior Managing Director and Portfolio Manager, Prudential Investments. |
| Daniel Mahr Birth Date: April 9, 1981 125 High Street Oliver Tower 21st Floor Boston, MA 02110-2704 Vice President Officer since: June 2012 Portfolio Manager since: August 2008 | Principal Occupations: Daniel Mahr has been the Fund's Portfolio Manager since August 2008. Mr. Mahr joined the MDT Advisers Investment Team in 2002. As Managing Director, Research, he is responsible for leading the Investment Team as it relates to the ongoing design, development and implementation of the Optimum Q Process. He is Vice President of the Trust with respect to the Fund. Mr. Mahr received his A.B., Computer Science from Harvard College and his S.M., Computer Science from Harvard University. |
Federated Investors Funds
4000 Ericsson Drive
Warrendale, PA 15086-7561
or call 1-800-341-7400.
CUSIP 31421R791
CUSIP 31421R783
2013 ©Federated Investors, Inc.
| Share Class | Ticker |
| A | QASGX |
| B | QBSGX |
| C | QCSGX |
| Institutional | QISGX |
| 1 | Please see the footnotes to the line graphs below for definitions of, and further information about, the Russell 2000® Growth Index. |
| 2 | The Russell 3000® Index measures the performance of the largest 3,000 U.S. companies representing approximately 98% of the investable U.S. equity market. The Russell 3000® Index is constructed to provide a comprehensive, unbiased, and stable barometer of the broad market and is completely reconstituted annually to ensure new and growing equities are reflected. The index is unmanaged, and it is not possible to invest directly in an index. |
| 3 | Small company stocks may be less liquid and subject to greater price volatility than large company stocks. |
| 4 | The Russell 2000® Index measures the performance of the small-cap segment of the U.S. equity universe. The Russell 2000® Index is a subset of the Russell 3000® Index representing approximately 10% of the total market capitalization of that index. It includes approximately 2000 of the smallest securities based on a combination of their market cap and current index membership. The Russell 2000® Index is constructed to provide a comprehensive and unbiased small-cap barometer and is completely reconstituted annually to ensure larger stocks do not distort the performance and characteristics of the true small-cap opportunity set. The index is unmanaged, and it is not possible to invest directly in an index. |
| 5 | The Russell Midcap® Index measures the performance of the mid-cap segment of the U.S. equity universe. The Russell Midcap® Index is a subset of the Russell 1000® Index. It includes approximately 800 of the smallest securities based on a combination of their market cap and current index membership. The Russell Midcap® Index represents approximately 31% of the total market capitalization of the Russell 1000® companies. The Russell Midcap® Index is constructed to provide a comprehensive and unbiased barometer for the mid-cap segment. The Russell Midcap® Index is completely reconstituted annually to ensure larger stocks do not distort the performance and characteristics of the true mid-cap opportunity set. The index is unmanaged, and it is not possible to invest directly in an index. |
| 6 | The Russell Top 200® Index measures the performance of the largest cap segment of the U.S. equity universe. The Russell Top 200® Index is a subset of the Russell 3000® Index. It includes approximately 200 of the largest securities based on a combination of their market cap and current index membership and represents approximately 68% of the U.S. market. The Russell Top 200® Index is constructed to provide a comprehensive and unbiased barometer for this very large cap segment and is completely reconstituted annually to ensure new and growing equities are reflected. The index is unmanaged, and it is not possible to invest directly in an index. |
| 7 | The Russell 3000® Value Index measures the performance of the broad value segment of the U.S. equity value universe. It includes those Russell 3000® Index companies with lower price-to-book ratios and lower forecasted growth values. The Russell 3000® Value Index is constructed to provide a comprehensive, unbiased and stable barometer of the broad value market. The Russell 3000® Value Index is completely reconstituted annually to ensure new and growing equities are included and that the represented companies continue to reflect value characteristics. The index is unmanaged, and it is not possible to invest directly in an index. |
| 8 | The Russell 3000® Growth Index measures the performance of the broad growth segment of the U.S. equity universe. It includes those Russell 3000® Index companies with higher price-to-book ratios and higher forecasted growth values. The Russell 3000® Growth Index is constructed to provide a comprehensive, unbiased, and stable barometer of the broad growth market. The Russell 3000® Growth Index is completely reconstituted annually to ensure new and growing equities are included and that the represented companies continue to reflect growth characteristics. The index is unmanaged, and it is not possible to invest directly in an index. |
| Share Class | 1 Year | 5 Years | Start of Performance* |
| Class A Shares | 27.73% | 5.66% | 5.56% |
| Class B Shares | 28.58% | 5.74% | 5.53% |
| Class C Shares | 33.07% | 6.06% | 5.52% |
| Institutional Shares | 35.42% | 7.11% | 6.58% |
| * | The Fund's start of performance date was September 15, 2005. |

| Federated MDT Small Cap Growth Fund - | Class A Shares | R2000G |
| 9/15/2005 | 9,450 | 10,000 |
| 7/31/2006 | 10,008 | 10,307 |
| 7/31/2007 | 12,238 | 12,042 |
| 7/31/2008 | 10,990 | 11,589 |
| 7/31/2009 | 7,456 | 9,172 |
| 7/31/2010 | 8,302 | 10,705 |
| 7/31/2011 | 11,512 | 13,843 |
| 7/31/2012 | 11,332 | 13,773 |
| 7/31/2013 | 15,312 | 18,647 |
| ■ | Total returns shown include the maximum sales charge of the 5.50% ($10,000 investment minus $550 sales charge = $9,450). |

| Federated MDT Small Cap Growth Fund - | Class B Shares | R2000G |
| 9/15/2005 | 10,000 | 10,000 |
| 7/31/2006 | 10,518 | 10,307 |
| 7/31/2007 | 12,780 | 12,042 |
| 7/31/2008 | 11,383 | 11,589 |
| 7/31/2009 | 7,657 | 9,172 |
| 7/31/2010 | 8,481 | 10,705 |
| 7/31/2011 | 11,667 | 13,843 |
| 7/31/2012 | 11,393 | 13,773 |
| 7/31/2013 | 15,275 | 18,647 |
| ■ | Total returns shown include the maximum contingent deferred sales charge of 5.50%, as applicable. |
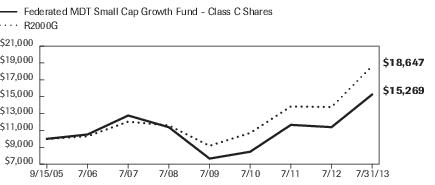
| Federated MDT Small Cap Growth Fund - | Class C Shares | R2000G |
| 9/15/2005 | 10,000 | 10,000 |
| 7/31/2006 | 10,520 | 10,307 |
| 7/31/2007 | 12,770 | 12,042 |
| 7/31/2008 | 11,379 | 11,589 |
| 7/31/2009 | 7,660 | 9,172 |
| 7/31/2010 | 8,474 | 10,705 |
| 7/31/2011 | 11,661 | 13,843 |
| 7/31/2012 | 11,389 | 13,773 |
| 7/31/2013 | 15,269 | 18,647 |
| ■ | Total returns shown include the maximum contingent deferred sales charge of 1.00%, as applicable. |
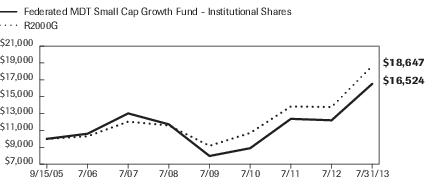
| Federated MDT Small Cap Growth Fund - | Institutional Shares | R2000G |
| 9/15/2005 | 10,000 | 10,000 |
| 7/31/2006 | 10,610 | 10,307 |
| 7/31/2007 | 13,020 | 12,042 |
| 7/31/2008 | 11,720 | 11,589 |
| 7/31/2009 | 7,970 | 9,172 |
| 7/31/2010 | 8,895 | 10,705 |
| 7/31/2011 | 12,373 | 13,843 |
| 7/31/2012 | 12,202 | 13,773 |
| 7/31/2013 | 16,524 | 18,647 |
| 1 | Represents a hypothetical investment of $10,000 in the Fund after deducting applicable sales charges: for Class A Shares, the maximum sales charge of 5.50% ($10,000 investment minus $550 sales charges = $9,450); for Class B Shares, the maximum contingent deferred sales charge is 5.50% on any redemption less than one year from the purchase date; for Class C Shares, a 1.00% contingent deferred sales charge would be applied to any redemption less than one year from the purchase date. The Fund's performance assumes the reinvestment of all dividends and distributions. The R2000G has been adjusted to reflect reinvestment of dividends on securities. |
| 2 | The Fund is the successor to the MDT Small Cap Growth Fund pursuant to a reorganization that took place on December 8, 2006. Prior to that date, the Fund had no investments operations. Accordingly, the performance information shown for periods prior to that date is that of the MDT Small Cap Growth Fund. |
| 3 | The R2000G measures the performance of the small-cap growth segment of the U.S. equity universe. It includes those Russell 2000® Index companies with higher price-to-value ratios and higher forecasted growth values. The R2000G is constructed to provide a comprehensive and unbiased barometer for the |
| small-cap growth segment. The R2000G is completely reconstituted annually to ensure larger stocks do not distort the performance and characteristics of the true small-cap opportunity set and that the represented companies continue to reflect growth characteristics. The R2000G is unmanaged and, unlike the Fund, is not affected by cash flows. It is not possible to invest directly in an index. The R2000G is not adjusted to reflect sales charges, expenses or other fees that the Securities and Exchange Commission requires to be reflected in the Fund's performance. | |
| 4 | The start of performance date for the Fund's Class A Shares, Class B Shares, Class C Shares and Institutional Shares was September 15, 2005. Class B Shares of the Fund were offered beginning March 17, 2008. Performance results shown before that date are for the Fund's Institutional Shares and have been adjusted for the total annual operating expenses applicable to the Fund's Class B Shares. The Fund's Institutional Shares commenced operations on September 15, 2005. Subject to the expense adjustments described above, the Class B Shares annual returns would have been substantially similar to those of the Fund's Institutional Shares because shares of each class are invested in the same portfolio of securities. |
| Industry Composition | Percentage of Total Net Assets |
| Software Packaged/Custom | 5.7% |
| Specialty Retailing | 5.3% |
| Financial Services | 5.1% |
| Biotechnology | 4.0% |
| Medical Supplies | 3.9% |
| Computer Services | 3.3% |
| Services to Medical Professionals | 3.2% |
| Apparel | 2.6% |
| Medical Technology | 2.6% |
| Restaurants | 2.5% |
| Telecommunication Equipment & Services | 2.5% |
| Education & Training Services | 2.2% |
| Oil Refiner | 2.1% |
| Semiconductor Manufacturing | 2.1% |
| Crude Oil & Gas Production | 2.0% |
| Specialty Chemicals | 2.0% |
| Undesignated Consumer Staples | 1.7% |
| Auto Original Equipment Manufacturers | 1.6% |
| Clothing Stores | 1.6% |
| Generic Drugs | 1.6% |
| Shoes | 1.6% |
| Electric & Electronic Original Equipment Manufacturers | 1.5% |
| Electrical Equipment | 1.5% |
| Miscellaneous Components | 1.5% |
| Computer Peripherals | 1.4% |
| Cosmetics & Toiletries | 1.4% |
| Personnel Agency | 1.3% |
| Recreational Vehicles | 1.3% |
| Packaged Foods | 1.2% |
| Multi-Industry Transportation | 1.1% |
| Office Furniture | 1.1% |
| Personal & Household | 1.1% |
| Personal Loans | 1.1% |
| Defense Aerospace | 1.0% |
| Home Health Care | 1.0% |
| Home Products | 1.0% |
| Machined Parts Original Equipment Manufacturers | 1.0% |
| Industry Composition | Percentage of Total Net Assets |
| Printing | 1.0% |
| Semiconductor Manufacturing Equipment | 1.0% |
| Other2 | 17.9% |
| Cash Equivalents3 | 1.5% |
| Other Assets and Liabilities—Net4 | (0.1)% |
| TOTAL | 100% |
| 1 | Except for Cash Equivalents and Other Assets and Liabilities, industry classifications are based upon, and individual portfolio securities are assigned to, the classifications of the Global Industry Classification Standard (GICS) except that the Adviser assigns a classification to securities not classified by the GICS and to securities for which the Adviser does not have access to the classification made by the GICS. |
| 2 | For purposes of this table, industry classifications which constitute less than 1.0% of the Fund's total net assets have been aggregated under the designation “Other.” |
| 3 | Cash Equivalents include any investments in money market mutual funds and/or overnight repurchase agreements. |
| 4 | Assets, other than investments in securities, less liabilities. See Statement of Assets and Liabilities. |
| Shares | Value | ||
| COMMON STOCKS—98.6% | |||
| Agricultural Machinery—0.8% | |||
| 7,353 | Lindsay Manufacturing Co. | $552,210 | |
| Airline - Regional—0.9% | |||
| 10,284 | Alaska Air Group, Inc. | 629,072 | |
| Apparel—2.6% | |||
| 15,864 | 1 | Ann, Inc. | 537,631 |
| 5,005 | Columbia Sportswear Co. | 322,923 | |
| 23,053 | 1 | Express, Inc. | 519,845 |
| 1,436 | Oxford Industries, Inc. | 97,174 | |
| 10,033 | 1 | Zumiez, Inc. | 276,610 |
| TOTAL | 1,754,183 | ||
| Auto Original Equipment Manufacturers—1.6% | |||
| 19,241 | Dana Holding Corp. | 420,416 | |
| 13,665 | 1 | Meritor, Inc. | 111,096 |
| 11,473 | 1 | Tenneco Automotive, Inc. | 554,490 |
| TOTAL | 1,086,002 | ||
| Beer—0.4% | |||
| 1,400 | 1 | The Boston Beer Co., Inc., Class A | 250,572 |
| Biotechnology—4.0% | |||
| 3,500 | 1 | Acorda Therapeutics, Inc. | 132,895 |
| 12,100 | 1 | Air Methods Corp. | 406,439 |
| 13,100 | 1 | Isis Pharmaceuticals, Inc. | 377,935 |
| 10,287 | Questcor Pharmaceuticals, Inc. | 687,377 | |
| 30,600 | 1 | Santarus, Inc. | 744,192 |
| 8,600 | 1 | Seattle Genetics, Inc. | 348,472 |
| TOTAL | 2,697,310 | ||
| Clothing Stores—1.6% | |||
| 8,187 | 1 | Aeropostale, Inc. | 123,869 |
| 3,308 | Cato Corp., Class A | 93,120 | |
| 7,598 | 1 | Children's Place Retail Stores, Inc. | 410,596 |
| 11,022 | 1 | Jos A. Bank Clothiers, Inc. | 450,359 |
| TOTAL | 1,077,944 | ||
| Commodity Chemicals—0.4% | |||
| 4,408 | Stepan Co. | 263,863 | |
| Computer Peripherals—1.4% | |||
| 10,234 | 1 | Silicon Graphics, Inc. | 192,604 |
| Shares | Value | ||
| COMMON STOCKS—continued | |||
| Computer Peripherals—continued | |||
| 18,217 | 1 | Synaptics, Inc. | $728,680 |
| TOTAL | 921,284 | ||
| Computer Services—3.3% | |||
| 9,955 | Fair Isaac & Co., Inc. | 497,352 | |
| 8,000 | 1 | Manhattan Associates, Inc. | 706,720 |
| 8,823 | Syntel, Inc. | 633,315 | |
| 14,941 | 1 | Unisys Corp. | 387,569 |
| TOTAL | 2,224,956 | ||
| Computer Stores—0.2% | |||
| 6,322 | 1 | Insight Enterprises, Inc. | 135,228 |
| Consumer Goods—0.0% | |||
| 622 | Pool Corp. | 32,829 | |
| Contracting—0.3% | |||
| 4,700 | 1 | Team, Inc. | 184,193 |
| Cosmetics & Toiletries—1.4% | |||
| 2,481 | 1 | Elizabeth Arden, Inc. | 101,870 |
| 16,427 | 1 | Revlon, Inc. | 412,154 |
| 14,034 | 1 | Sally Beauty Holdings, Inc. | 428,177 |
| TOTAL | 942,201 | ||
| Crude Oil & Gas Production—2.0% | |||
| 21,405 | Energy XXI (Bermuda) Ltd. | 574,724 | |
| 18,044 | 1 | Stone Energy Corp. | 439,552 |
| 19,484 | W&T Offshore, Inc. | 317,394 | |
| TOTAL | 1,331,670 | ||
| Defense Aerospace—1.0% | |||
| 5,600 | Kaman Corp., Class A | 212,016 | |
| 7,896 | 1 | Orbital Sciences Corp. | 146,392 |
| 4,300 | 1 | Teledyne Technologies, Inc. | 344,731 |
| TOTAL | 703,139 | ||
| Department Stores—0.1% | |||
| 6,256 | 1 | Saks, Inc. | 100,221 |
| Education & Training Services—2.2% | |||
| 3,960 | 1 | American Public Education, Inc. | 156,460 |
| 10,886 | 1 | Bridgepoint Education, Inc. | 175,482 |
| 5,528 | 1 | Capella Education Co. | 270,927 |
| 14,907 | 1 | Grand Canyon Education, Inc. | 504,155 |
| 5,300 | 1 | K12, Inc. | 164,830 |
| Shares | Value | ||
| COMMON STOCKS—continued | |||
| Education & Training Services—continued | |||
| 4,512 | Strayer Education, Inc. | $199,701 | |
| TOTAL | 1,471,555 | ||
| Electric & Electronic Original Equipment Manufacturers—1.5% | |||
| 10,200 | Altra Holdings, Inc. | 254,388 | |
| 17,586 | 1 | Generac Holdings, Inc. | 762,353 |
| TOTAL | 1,016,741 | ||
| Electrical Equipment—1.5% | |||
| 4,370 | Belden, Inc. | 256,126 | |
| 11,906 | EnerSys, Inc. | 630,066 | |
| 6,330 | 1 | Rofin-Sinar Technologies, Inc. | 146,286 |
| TOTAL | 1,032,478 | ||
| Electronic Instruments—0.5% | |||
| 10,389 | 1 | iRobot Corp. | 363,199 |
| Electronic Test/Measuring Equipment—0.6% | |||
| 6,434 | MTS Systems Corp. | 405,664 | |
| Ethical Drugs—0.2% | |||
| 1,900 | 1 | Cubist Pharmaceuticals, Inc. | 118,427 |
| Financial Services—5.1% | |||
| 18,568 | Deluxe Corp. | 761,474 | |
| 12,400 | Financial Engines, Inc. | 591,976 | |
| 15,305 | Heartland Payment Systems, Inc. | 571,029 | |
| 6,979 | 1 | Outerwall, Inc. | 385,590 |
| 4,400 | 1 | Portfolio Recovery Associates, Inc. | 656,964 |
| 2,600 | 1 | Virtus Investment Partners, Inc. | 484,900 |
| TOTAL | 3,451,933 | ||
| Furniture—0.7% | |||
| 7,783 | Ethan Allen Interiors, Inc. | 236,370 | |
| 12,014 | 1 | Select Comfort Corp. | 274,520 |
| TOTAL | 510,890 | ||
| Generic Drugs—1.6% | |||
| 12,700 | 1 | Hi-Tech Pharmacal Co., Inc. | 456,438 |
| 29,500 | 1 | Impax Laboratories, Inc. | 611,830 |
| TOTAL | 1,068,268 | ||
| Grocery Chain—0.3% | |||
| 3,150 | Casey's General Stores, Inc. | 208,625 | |
| Home Health Care—1.0% | |||
| 11,370 | 1 | Wellcare Health Plans, Inc. | 693,911 |
| Shares | Value | ||
| COMMON STOCKS—continued | |||
| Home Products—1.0% | |||
| 8,149 | Tupperware Brands Corp. | $686,798 | |
| Hotels and Motels—0.1% | |||
| 2,500 | Six Flags Entertainment Corp. | 91,975 | |
| Household Appliances—0.4% | |||
| 1,700 | 1 | Middleby Corp. | 304,198 |
| Industrial Machinery—0.8% | |||
| 4,145 | Tennant Co. | 213,882 | |
| 5,813 | Watts Industries, Inc., Class A | 303,904 | |
| TOTAL | 517,786 | ||
| Insurance Brokerage—0.1% | |||
| 1,600 | 1 | Texas Capital Bancshares, Inc. | 72,784 |
| Internet Services—0.8% | |||
| 4,661 | 1 | Travelzoo, Inc. | 133,631 |
| 16,700 | 1 | Web.com Group, Inc. | 433,866 |
| TOTAL | 567,497 | ||
| Machined Parts Original Equipment Manufacturers—1.0% | |||
| 13,078 | Applied Industrial Technologies, Inc. | 682,149 | |
| Mail Order—0.4% | |||
| 4,270 | HSN, Inc. | 256,456 | |
| Maritime—0.6% | |||
| 10,724 | TAL International Group, Inc. | 431,641 | |
| Medical Supplies—3.9% | |||
| 3,400 | 1 | MWI Veterinary Supply, Inc. | 483,378 |
| 1,400 | 1 | Medidata Solutions, Inc. | 129,542 |
| 9,360 | 1 | Orthofix International NV | 212,566 |
| 16,300 | Owens & Minor, Inc. | 586,148 | |
| 15,377 | Steris Corp. | 692,272 | |
| 7,450 | West Pharmaceutical Services, Inc. | 549,512 | |
| TOTAL | 2,653,418 | ||
| Medical Technology—2.6% | |||
| 17,400 | Cantel Medical Corp. | 461,796 | |
| 13,700 | 1 | Cyberonics, Inc. | 712,263 |
| 9,541 | 1 | Integra Lifesciences Corp. | 375,820 |
| 8,851 | 1 | MedAssets, Inc. | 192,686 |
| TOTAL | 1,742,565 | ||
| Metal Fabrication—0.9% | |||
| 17,038 | Worthington Industries, Inc. | 609,449 |
| Shares | Value | ||
| COMMON STOCKS—continued | |||
| Miscellaneous Components—1.5% | |||
| 8,600 | 1 | Proto Labs, Inc. | $581,962 |
| 12,410 | 1 | TriMas Corp. | 459,542 |
| TOTAL | 1,041,504 | ||
| Miscellaneous Metals—0.6% | |||
| 4,043 | AMCOL International Corp. | 141,828 | |
| 1,298 | Materion Corp. | 39,122 | |
| 6,365 | Matthews International Corp., Class A | 246,198 | |
| TOTAL | 427,148 | ||
| Multi-Industry Basic—0.5% | |||
| 13,714 | Olin Corp. | 334,622 | |
| Multi-Industry Capital Goods—0.3% | |||
| 2,680 | Acuity Brands, Inc. | 231,820 | |
| Multi-Industry Transportation—1.1% | |||
| 15,589 | Brinks Co. (The) | 416,694 | |
| 8,680 | 1 | Hub Group, Inc. | 332,010 |
| TOTAL | 748,704 | ||
| Office Furniture—1.1% | |||
| 7,940 | HNI Corp. | 302,593 | |
| 14,535 | Knoll, Inc. | 240,118 | |
| 7,135 | Miller Herman, Inc. | 200,565 | |
| TOTAL | 743,276 | ||
| Office Supplies—0.7% | |||
| 11,631 | United Stationers, Inc. | 481,407 | |
| Oil Gas & Consumable Fuels—0.2% | |||
| 3,325 | CVR Energy, Inc. | 156,907 | |
| Oil Refiner—2.1% | |||
| 26,400 | Alon USA Energy, Inc. | 360,624 | |
| 15,400 | Delek US Holdings, Inc. | 465,850 | |
| 20,850 | Western Refining, Inc. | 628,211 | |
| TOTAL | 1,454,685 | ||
| Other Communications Equipment—0.4% | |||
| 8,124 | 1 | Netgear, Inc. | 242,176 |
| Packaged Foods—1.2% | |||
| 6,000 | 1 | Hain Celestial Group, Inc. | 437,760 |
| 6,879 | 1 | United Natural Foods, Inc. | 403,109 |
| TOTAL | 840,869 | ||
| Paper Products—0.2% | |||
| 2,600 | 1 | Clearwater Paper Corp. | 127,192 |
| Shares | Value | ||
| COMMON STOCKS—continued | |||
| Personal & Household—1.1% | |||
| 9,200 | Nu Skin Enterprises, Inc., Class A | $769,488 | |
| Personal Loans—1.1% | |||
| 8,577 | Cash America International, Inc. | 360,234 | |
| 3,300 | 1 | Credit Acceptance Corp. | 371,217 |
| TOTAL | 731,451 | ||
| Personnel Agency—1.3% | |||
| 22,700 | 1 | AMN Healthcare Services, Inc. | 335,506 |
| 10,800 | Maximus, Inc. | 406,188 | |
| 6,592 | 1 | TrueBlue, Inc. | 176,006 |
| TOTAL | 917,700 | ||
| Photo-Optical Component-Equipment—0.3% | |||
| 2,997 | 1 | Coherent, Inc. | 169,870 |
| Poultry Products—0.6% | |||
| 5,800 | Sanderson Farms, Inc. | 409,712 | |
| Printing—1.0% | |||
| 3,401 | 1 | Consolidated Graphics, Inc. | 182,260 |
| 18,280 | Valassis Communications, Inc. | 523,356 | |
| TOTAL | 705,616 | ||
| Professional Services—0.5% | |||
| 2,200 | 1 | CoStar Group, Inc. | 344,410 |
| Recreational Vehicles—1.3% | |||
| 2,500 | Arctic Cat, Inc. | 137,600 | |
| 20,582 | Brunswick Corp. | 776,971 | |
| TOTAL | 914,571 | ||
| Regional Banks—0.4% | |||
| 6,400 | Bank of the Ozarks, Inc. | 305,792 | |
| Restaurants—2.5% | |||
| 5,605 | CEC Entertainment, Inc. | 233,112 | |
| 6,576 | Cracker Barrel Old Country Store, Inc. | 643,791 | |
| 6,700 | Domino's Pizza, Inc. | 419,286 | |
| 3,926 | 1 | Jack in the Box, Inc. | 157,393 |
| 4,316 | 1 | Red Robin Gourmet Burgers | 245,494 |
| TOTAL | 1,699,076 | ||
| Roofing & Wallboard—0.5% | |||
| 7,697 | 1 | Beacon Roofing Supply, Inc. | 313,961 |
| Semiconductor Distribution—0.3% | |||
| 2,500 | 1 | Tyler Technologies, Inc. | 186,550 |
| Shares | Value | ||
| COMMON STOCKS—continued | |||
| Semiconductor Manufacturing—2.1% | |||
| 6,412 | 1 | Cabot Microelectronics Corp. | $237,116 |
| 18,965 | 1 | Cirrus Logic, Inc. | 365,645 |
| 5,994 | 1 | Plexus Corp. | 209,610 |
| 16,900 | 1 | Semtech Corp. | 511,225 |
| 13,710 | 1 | Triquint Semiconductor, Inc. | 109,543 |
| TOTAL | 1,433,139 | ||
| Semiconductor Manufacturing Equipment—1.0% | |||
| 18,799 | Brooks Automation, Inc. | 184,606 | |
| 25,704 | Mentor Graphics Corp. | 527,703 | |
| TOTAL | 712,309 | ||
| Services to Medical Professionals—3.2% | |||
| 14,809 | 1 | Bio-Reference Laboratories, Inc. | 396,141 |
| 9,217 | 1 | Centene Corp. | 511,267 |
| 7,433 | 1 | Molina Healthcare, Inc. | 275,913 |
| 13,423 | 1 | Team Health Holdings, Inc. | 539,873 |
| 13,900 | 1 | WebMD Health Corp., Class A | 458,839 |
| TOTAL | 2,182,033 | ||
| Shoes—1.6% | |||
| 30,921 | 1 | CROCs, Inc. | 422,690 |
| 9,220 | 1 | Genesco, Inc. | 648,904 |
| TOTAL | 1,071,594 | ||
| Software Packaged/Custom—5.7% | |||
| 23,300 | 1 | Aspen Technology, Inc. | 758,182 |
| 16,472 | CSG Systems International, Inc. | 390,057 | |
| 8,800 | 1 | Commvault Systems, Inc. | 742,984 |
| 2,379 | 1 | MicroStrategy, Inc., Class A | 226,029 |
| 11,207 | 1 | PTC, Inc. | 303,485 |
| 15,930 | 1 | Progress Software Corp. | 407,649 |
| 17,800 | 1 | Qlik Technologies, Inc. | 557,496 |
| 16,803 | 1 | ValueClick, Inc. | 410,665 |
| 2,697 | 1 | Verint Systems, Inc. | 96,499 |
| TOTAL | 3,893,046 | ||
| Specialty Chemicals—2.0% | |||
| 15,500 | American Vanguard Corp. | 382,695 | |
| 8,333 | Chemed Corp. | 588,227 | |
| 12,934 | 1 | Chemtura Corp. | 289,204 |
| 1,638 | Quaker Chemical Corp. | 108,059 | |
| TOTAL | 1,368,185 |
| Shares | Value | ||
| COMMON STOCKS—continued | |||
| Specialty Retailing—5.3% | |||
| 2,114 | Aaron's, Inc. | $60,587 | |
| 10,500 | 1 | Asbury Automotive Group, Inc. | 512,820 |
| 8,951 | 1 | Cabela's, Inc., Class A | 614,397 |
| 10,402 | Finish Line, Inc., Class A | 231,549 | |
| 10,960 | GNC Acquisition Holdings, Inc. | 578,469 | |
| 3,445 | 1 | Kirkland's, Inc. | 60,563 |
| 7,851 | 1 | Lumber Liquidators, Inc. | 760,134 |
| 13,619 | Penske Automotive Group, Inc. | 506,354 | |
| 8,239 | Pier 1 Imports, Inc. | 193,616 | |
| 5,100 | 1 | Vera Bradley, Inc. | 123,624 |
| TOTAL | 3,642,113 | ||
| Surveillance-Detection—0.5% | |||
| 6,593 | Mine Safety Appliances Co. | 350,286 | |
| Telecommunication Equipment & Services—2.5% | |||
| 7,003 | Adtran, Inc. | 185,089 | |
| 8,931 | 1 | Anixter International, Inc. | 741,630 |
| 31,963 | 1 | CIENA Corp. | 705,104 |
| 1,858 | 1 | Mastec, Inc. | 61,314 |
| TOTAL | 1,693,137 | ||
| Trucking—0.6% | |||
| 9,900 | 1 | Old Dominion Freight Lines, Inc. | 432,432 |
| Undesignated Consumer Cyclicals—0.8% | |||
| 11,100 | 1 | Parexel International Corp. | 548,895 |
| Undesignated Consumer Staples—1.7% | |||
| 16,400 | 1 | Medifast, Inc. | 448,376 |
| 8,800 | 1 | USANA, Inc. | 727,056 |
| TOTAL | 1,175,432 | ||
| Undesignated Health—0.6% | |||
| 11,500 | HealthSouth Corp. | 374,440 | |
| Wireless Communications—0.4% | |||
| 7,600 | InterDigital, Inc. | 301,948 | |
| TOTAL COMMON STOCKS (IDENTIFIED COST $56,357,300) | 67,322,780 |
| Shares | Value | ||
| MUTUAL FUND—1.5% | |||
| 1,007,928 | 2,3 | Federated Prime Value Obligations Fund, Institutional Shares, 0.06% (AT NET ASSET VALUE) | $1,007,928 |
| TOTAL INVESTMENTS—100.1% (IDENTIFIED COST $57,365,228)4 | 68,330,708 | ||
| OTHER ASSETS AND LIABILITIES - NET—(0.1)%5 | (37,742) | ||
| TOTAL NET ASSETS—100% | $68,292,966 |
| 1 | Non-income producing security. |
| 2 | Affiliated holding. |
| 3 | 7-day net yield. |
| 4 | The cost of investments for federal tax purposes amounts to $57,384,982. |
| 5 | Assets, other than investments in securities, less liabilities. See Statement of Assets and Liabilities. |
| Year Ended July 31 | 2013 | 2012 | 2011 | 2010 | 2009 |
| Net Asset Value, Beginning of Period | $11.93 | $12.12 | $8.74 | $7.85 | $11.57 |
| Income From Investment Operations: | |||||
| Net investment income (loss) | (0.07)1 | (0.09)1 | (0.13)1 | (0.10)1 | (0.08)1 |
| Net realized and unrealized gain (loss) on investments and foreign currency transactions | 4.26 | (0.10) | 3.51 | 0.99 | (3.64) |
| TOTAL FROM INVESTMENT OPERATIONS | 4.19 | (0.19) | 3.38 | 0.89 | (3.72) |
| Regulatory Settlement Proceeds | — | — | — | — | 0.002 |
| Net Asset Value, End of Period | $16.12 | $11.93 | $12.12 | $8.74 | $7.85 |
| Total Return3 | 35.12% | (1.57)% | 38.67% | 11.34% | (32.15)%4 |
| Ratios to Average Net Assets: | |||||
| Net expenses | 1.75% | 1.75% | 1.75% | 1.75% | 1.75% |
| Net investment income (loss) | (0.49)% | (0.79)% | (1.18)% | (1.17)% | (1.04)% |
| Expense waiver/reimbursement5 | 0.59% | 1.04% | 1.14% | 1.22% | 1.02% |
| Supplemental Data: | |||||
| Net assets, end of period (000 omitted) | $30,187 | $22,718 | $25,634 | $19,822 | $21,682 |
| Portfolio turnover | 88% | 69% | 154% | 142% | 244% |
| 1 | Per share numbers have been calculated using the average shares method. |
| 2 | Represents less than $0.01. |
| 3 | Based on net asset value, which does not reflect the sales charge, redemption fee or contingent deferred sales charge, if applicable. |
| 4 | During the period, the Fund received a regulatory settlement from an unaffiliated third party, which had an impact of 0.09% on the total return. |
| 5 | This expense decrease is reflected in both the net expense and the net investment income (loss) ratios shown above. |
| Year Ended July 31 | 2013 | 2012 | 2011 | 2010 | 2009 |
| Net Asset Value, Beginning of Period | $11.62 | $11.90 | $8.65 | $7.81 | $11.61 |
| Income From Investment Operations: | |||||
| Net investment income (loss) | (0.17)1 | (0.17)1 | (0.21)1 | (0.16)1 | (0.14)1 |
| Net realized and unrealized gain (loss) on investments and foreign currency transactions | 4.13 | (0.11) | 3.46 | 1.00 | (3.66) |
| TOTAL FROM INVESTMENT OPERATIONS | 3.96 | (0.28) | 3.25 | 0.84 | (3.80) |
| Regulatory Settlement Proceeds | — | — | — | — | 0.002 |
| Net Asset Value, End of Period | $15.58 | $11.62 | $11.90 | $8.65 | $7.81 |
| Total Return3 | 34.08% | (2.35)% | 37.57% | 10.76% | (32.73)% |
| Ratios to Average Net Assets: | |||||
| Net expenses | 2.50% | 2.50% | 2.50% | 2.50% | 2.50% |
| Net investment income (loss) | (1.25)% | (1.55)% | (1.93)% | (1.92)% | (1.75)% |
| Expense waiver/reimbursement4 | 0.59% | 1.06% | 1.15% | 1.22% | 1.02% |
| Supplemental Data: | |||||
| Net assets, end of period (000 omitted) | $2,016 | $1,640 | $2,541 | $2,350 | $3,088 |
| Portfolio turnover | 88% | 69% | 154% | 142% | 244% |
| 1 | Per share numbers have been calculated using the average shares method. |
| 2 | Represents less than $0.01. |
| 3 | Based on net asset value, which does not reflect the sales charge, redemption fee or contingent deferred sales charge, if applicable. |
| 4 | This expense decrease is reflected in both the net expense and the net investment income (loss) ratios shown above. |
| Year Ended July 31 | 2013 | 2012 | 2011 | 2010 | 2009 |
| Net Asset Value, Beginning of Period | $11.33 | $11.60 | $8.43 | $7.62 | $11.32 |
| Income From Investment Operations: | |||||
| Net investment income (loss) | (0.16)1 | (0.17)1 | (0.21)1 | (0.16)1 | (0.14)1 |
| Net realized and unrealized gain (loss) on investments and foreign currency transactions | 4.02 | (0.10) | 3.38 | 0.97 | (3.56) |
| TOTAL FROM INVESTMENT OPERATIONS | 3.86 | (0.27) | 3.17 | 0.81 | (3.70) |
| Regulatory Settlement Proceeds | — | — | — | — | 0.002 |
| Net Asset Value, End of Period | $15.19 | $11.33 | $11.60 | $8.43 | $7.62 |
| Total Return3 | 34.07% | (2.33)% | 37.60% | 10.63% | (32.69)% |
| Ratios to Average Net Assets: | |||||
| Net expenses | 2.50% | 2.50% | 2.50% | 2.49% | 2.50% |
| Net investment income (loss) | (1.24)% | (1.54)% | (1.94)% | (1.91)% | (1.79)% |
| Expense waiver/reimbursement4 | 0.59% | 1.04% | 1.13% | 1.22% | 1.02% |
| Supplemental Data: | |||||
| Net assets, end of period (000 omitted) | $4,912 | $4,223 | $4,663 | $2,795 | $4,069 |
| Portfolio turnover | 88% | 69% | 154% | 142% | 244% |
| 1 | Per share numbers have been calculated using the average shares method. |
| 2 | Represents less than $0.01. |
| 3 | Based on net asset value, which does not reflect the sales charge, redemption fee or contingent deferred sales charge, if applicable. |
| 4 | This expense decrease is reflected in both the net expense and the net investment income (loss) ratios shown above. |
| Year Ended July 31 | 2013 | 2012 | 2011 | 2010 | 2009 |
| Net Asset Value, Beginning of Period | $12.14 | $12.31 | $8.85 | $7.93 | $11.66 |
| Income From Investment Operations: | |||||
| Net investment income (loss) | (0.03)1 | (0.06)1 | (0.10)1 | (0.08)1 | (0.06)1 |
| Net realized and unrealized gain (loss) on investments and foreign currency transactions | 4.33 | (0.11) | 3.56 | 1.00 | (3.67) |
| TOTAL FROM INVESTMENT OPERATIONS | 4.30 | (0.17) | 3.46 | 0.92 | (3.73) |
| Regulatory Settlement Proceeds | — | — | — | — | 0.002 |
| Net Asset Value, End of Period | $16.44 | $12.14 | $12.31 | $8.85 | $7.93 |
| Total Return3 | 35.42% | (1.38)% | 39.10% | 11.60% | (31.99)% |
| Ratios to Average Net Assets: | |||||
| Net expenses | 1.50% | 1.50% | 1.50% | 1.50% | 1.50% |
| Net investment income (loss) | (0.24)% | (0.54)% | (0.92)% | (0.92)% | (0.80)% |
| Expense waiver/reimbursement4 | 0.59% | 1.05% | 1.15% | 1.22% | 1.02% |
| Supplemental Data: | |||||
| Net assets, end of period (000 omitted) | $31,179 | $26,233 | $29,395 | $27,039 | $39,246 |
| Portfolio turnover | 88% | 69% | 154% | 142% | 244% |
| 1 | Per share numbers have been calculated using the average shares method. |
| 2 | Represents less than $0.01. |
| 3 | Based on net asset value. |
| 4 | This expense decrease is reflected in both the net expense and the net investment income (loss) ratios shown above. |
| Assets: | ||
| Total investment in securities, at value including $1,007,928 of investment in an affiliated holding (Note 5) (identified cost $57,365,228) | $68,330,708 | |
| Income receivable | 14,701 | |
| Receivable for investments sold | 617,537 | |
| Receivable for shares sold | 55,924 | |
| TOTAL ASSETS | 69,018,870 | |
| Liabilities: | ||
| Payable for investments purchased | $551,241 | |
| Payable for shares redeemed | 33,870 | |
| Payable for transfer agent fee | 46,807 | |
| Payable for Directors'/Trustees' fees (Note 5) | 159 | |
| Payable for auditing fees | 23,400 | |
| Payable for distribution services fee (Note 5) | 4,291 | |
| Payable for shareholder services fee (Note 5) | 17,638 | |
| Payable for share registration costs | 32,566 | |
| Accrued expenses (Note 5) | 15,932 | |
| TOTAL LIABILITIES | 725,904 | |
| Net assets for 4,221,925 shares outstanding | $68,292,966 | |
| Net Assets Consist of: | ||
| Paid-in capital | $69,731,586 | |
| Net unrealized appreciation of investments | 10,965,480 | |
| Accumulated net realized loss on investments and foreign currency transactions | (12,128,109) | |
| Accumulated net investment income (loss) | (275,991) | |
| TOTAL NET ASSETS | $68,292,966 |
| Net Asset Value, Ofering Price and Redemption Proceeds Per Share | ||
| Class A Shares: | ||
| Net asset value per share ($30,186,705 ÷ 1,872,938 shares outstanding), no par value, unlimited shares authorized | $16.12 | |
| Offering price per share (100/94.50 of $16.12) | $17.06 | |
| Redemption proceeds per share | $16.12 | |
| Class B Shares: | ||
| Net asset value per share ($2,015,565 ÷ 129,380 shares outstanding), no par value, unlimited shares authorized | $15.58 | |
| Offering price per share | $15.58 | |
| Redemption proceeds per share (94.50/100 of $15.58) | $14.72 | |
| Class C Shares: | ||
| Net asset value per share ($4,911,909 ÷ 323,363 shares outstanding), no par value, unlimited shares authorized | $15.19 | |
| Offering price per share | $15.19 | |
| Redemption proceeds per share (99.00/100 of $15.19) | $15.04 | |
| Institutional Shares: | ||
| Net asset value per share ($31,178,787 ÷ 1,896,244 shares outstanding), no par value, unlimited shares authorized | $16.44 | |
| Offering price per share | $16.44 | |
| Redemption proceeds per share | $16.44 |
| Investment Income: | |||
| Dividends (including $1,398 received from an affiliated holding (Note 5)) | $764,063 | ||
| Expenses: | |||
| Investment adviser fee (Note 5) | $695,502 | ||
| Administrative fee (Note 5) | 66,429 | ||
| Custodian fees | 12,404 | ||
| Transfer agent fee | 281,710 | ||
| Directors'/Trustees' fees (Note 5) | 1,499 | ||
| Auditing fees | 23,400 | ||
| Legal fees | 7,647 | ||
| Portfolio accounting fees | 78,822 | ||
| Distribution services fee (Note 5) | 46,983 | ||
| Shareholder services fee (Note 5) | 79,954 | ||
| Account administration fee (Note 2) | 620 | ||
| Share registration costs | 51,663 | ||
| Printing and postage | 36,433 | ||
| Insurance premiums (Note 5) | 4,020 | ||
| Miscellaneous (Note 5) | 5,985 | ||
| TOTAL EXPENSES | 1,393,071 | ||
| Waivers and Reimbursement (Note 5): | |||
| Waiver/reimbursement of investment adviser fee | $(350,750) | ||
| Waiver of administrative fee | (4,624) | ||
| TOTAL WAIVERS AND REIMBURSEMENT | (355,374) | ||
| Net expenses | 1,037,697 | ||
| Net investment income (loss) | (273,634) | ||
| Realized and Unrealized Gain on Investments: | |||
| Net realized gain on investments | 11,801,972 | ||
| Net change in unrealized appreciation of investments | 7,112,884 | ||
| Net realized and unrealized gain on investments | 18,914,856 | ||
| Change in net assets resulting from operations | $18,641,222 |
| Year Ended July 31 | 2013 | 2012 |
| Increase (Decrease) in Net Assets | ||
| Operations: | ||
| Net investment income (loss) | $(273,634) | $(422,764) |
| Net realized gain on investments | 11,801,972 | 4,915,672 |
| Net change in unrealized appreciation/depreciation of investments | 7,112,884 | (5,652,407) |
| CHANGE IN NET ASSETS RESULTING FROM OPERATIONS | 18,641,222 | (1,159,499) |
| Share Transactions: | ||
| Proceeds from sale of shares | 12,327,005 | 12,048,639 |
| Cost of shares redeemed | (17,490,091) | (18,308,002) |
| CHANGE IN NET ASSETS RESULTING FROM SHARE TRANSACTIONS | (5,163,086) | (6,259,363) |
| Change in net assets | 13,478,136 | (7,418,862) |
| Net Assets: | ||
| Beginning of period | 54,814,830 | 62,233,692 |
| End of period (including accumulated net investment income (loss) of $(275,991) and $(254,362), respectively) | $68,292,966 | $54,814,830 |
| ■ | Equity securities listed on an exchange or traded through a regulated market system are valued at their last reported sale price or official closing price in their principal exchange or market. |
| ■ | Shares of other mutual funds are valued based upon their reported NAVs. |
| ■ | Fixed-income securities acquired with remaining maturities greater than 60 days are fair valued using price evaluations provided by a pricing service approved by the Fund's Board of Trustees (the “Trustees”). |
| ■ | Fixed-income securities and repurchase agreements acquired with remaining maturities of 60 days or less are valued at their amortized cost (adjusted for the accretion of any discount or amortization of any premium), unless the issuer's creditworthiness is impaired or other factors indicate that amortized cost is not an accurate estimate of the investment's fair value, in which case it would be valued in the same manner as a longer-term security. |
| ■ | Derivative contracts listed on exchanges are valued at their reported settlement or closing price. |
| ■ | Over-the-counter (OTC) derivative contracts are fair valued using price evaluations provided by a pricing service approved by the Trustees. |
| ■ | For securities that are fair valued in accordance with procedures established by and under the general supervision of the Trustees, certain factors may be considered such as: the purchase price of the security, information obtained by contacting the issuer, analysis of the issuer's financial statements or other available documents, fundamental analytical data, the nature and duration of restrictions on disposition, the movement of the market in which the security is normally traded and public trading in similar securities of the issuer or comparable issuers. |
| Account Administration Fees Incurred | |
| Class A Shares | $206 |
| Class C Shares | 414 |
| TOTAL | $620 |
| Year Ended July 31 | 2013 | 2012 | ||
| Class A Shares: | Shares | Amount | Shares | Amount |
| Shares sold | 331,847 | $4,237,900 | 317,159 | $3,790,317 |
| Shares redeemed | (363,126) | (4,908,290) | (527,438) | (6,080,816) |
| NET CHANGE RESULTING FROM CLASS A SHARE TRANSACTIONS | (31,279) | $(670,390) | (210,279) | $(2,290,499) |
| Year Ended July 31 | 2013 | 2012 | ||
| Class B Shares: | Shares | Amount | Shares | Amount |
| Shares sold | 32,692 | $439,424 | 8,120 | $92,002 |
| Shares redeemed | (44,499) | (581,084) | (80,577) | (897,209) |
| NET CHANGE RESULTING FROM CLASS B SHARE TRANSACTIONS | (11,807) | $(141,660) | (72,457) | $(805,207) |
| Year Ended July 31 | 2013 | 2012 | ||
| Class C Shares: | Shares | Amount | Shares | Amount |
| Shares sold | 20,807 | $274,225 | 46,175 | $510,922 |
| Shares redeemed | (70,218) | (912,217) | (75,431) | (814,480) |
| NET CHANGE RESULTING FROM CLASS C SHARE TRANSACTIONS | (49,411) | $(637,992) | (29,256) | $(303,558) |
| Year Ended July 31 | 2013 | 2012 | ||
| Institutional Shares: | Shares | Amount | Shares | Amount |
| Shares sold | 523,422 | $7,375,456 | 680,052 | $7,655,398 |
| Shares redeemed | (787,972) | (11,088,500) | (907,921) | (10,515,497) |
| NET CHANGE RESULTING FROM INSTITUTIONAL SHARE TRANSACTIONS | (264,550) | $(3,713,044) | (227,869) | $(2,860,099) |
| NET CHANGE RESULTING FROM TOTAL FUND SHARE TRANSACTIONS | (357,047) | $(5,163,086) | (539,861) | $(6,259,363) |
| Increase (Decrease) | ||
| Paid-In Capital | Undistributed Net Investment Income (Loss) | Accumulated Net Realized Gain (Loss) |
| $(260,824) | $252,005 | $8,819 |
| Net unrealized appreciation | $10,945,726 |
| Capital loss carryforwards and deferrals | $(12,384,346) |
| Expiration Year | Short-Term | Long-Term | Total |
| 2018 | $12,108,355 | NA | $12,108,355 |
| Administrative Fee | Average Daily Net Assets of the Investment Complex |
| 0.150% | on the first $5 billion |
| 0.125% | on the next $5 billion |
| 0.100% | on the next $10 billion |
| 0.075% | on assets in excess of $20 billion |
| Share Class Name | Percentage of Average Daily Net Assets of Class |
| Class A Shares | 0.05% |
| Class B Shares | 0.75% |
| Class C Shares | 0.75% |
| Distribution Services Fees Incurred | |
| Class B Shares | $13,171 |
| Class C Shares | 33,812 |
| TOTAL | $46,983 |
| Service Fees Incurred | |
| Class A Shares | $64,706 |
| Class B Shares | 4,391 |
| Class C Shares | 10,857 |
| TOTAL | $79,954 |
| Federated Prime Value Obligations Fund, Institutional Shares | |
| Balance of Shares Held 7/31/2012 | 839,624 |
| Purchases/Additions | 14,062,010 |
| Sales/Reductions | (13,893,706) |
| Balance of Shares Held 7/31/2013 | 1,007,928 |
| Value | $1,007,928 |
| Dividend Income | $1,398 |
| Purchases | $52,302,907 |
| Sales | $57,736,101 |
September 23, 2013
| Beginning Account Value 2/1/2013 | Ending Account Value 7/31/2013 | Expenses Paid During Period1 | |
| Actual: | |||
| Class A Shares | $1,000 | $1,172.40 | $9.43 |
| Class B Shares | $1,000 | $1,167.90 | $13.44 |
| Class C Shares | $1,000 | $1,166.70 | $13.43 |
| Institutional Shares | $1,000 | $1,173.40 | $8.08 |
| Hypothetical (assuming a 5% return before expenses): | |||
| Class A Shares | $1,000 | $1,016.12 | $8.75 |
| Class B Shares | $1,000 | $1,012.40 | $12.47 |
| Class C Shares | $1,000 | $1,012.40 | $12.47 |
| Institutional Shares | $1,000 | $1,017.36 | $7.50 |
| 1 | Expenses are equal to the Fund's annualized net expense ratios, multiplied by the average account value over the period, multiplied by 181/365 (to reflect the one-half-year period). The annualized net expense ratios are as follows: |
| Class A Shares | 1.75% |
| Class B Shares | 2.50% |
| Class C Shares | 2.50% |
| Institutional Shares | 1.50% |
| Name Birth Date Positions Held with Trust Date Service Began | Principal Occupation(s) for Past Five Years, Other Directorships Held and Previous Position(s) |
| John F. Donahue* Birth Date: July 28, 1924 Trustee Began serving: June 2006 | Principal Occupations: Director or Trustee of the Federated Fund Family; Chairman and Director, Federated Investors, Inc.; Chairman of the Federated Fund Family's Executive Committee. Previous Positions: Chairman of the Federated Fund Family; Trustee, Federated Investment Management Company; Chairman and Director, Federated Investment Counseling. |
| Name Birth Date Positions Held with Trust Date Service Began | Principal Occupation(s) for Past Five Years, Other Directorships Held and Previous Position(s) |
| J. Christopher Donahue* Birth Date: April 11, 1949 President and Trustee Began serving: June 2006 | Principal Occupations: Principal Executive Officer and President of certain of the Funds in the Federated Fund Family; Director or Trustee of certain of the Funds in the Federated Fund Family; President, Chief Executive Officer and Director, Federated Investors, Inc.; Chairman and Trustee, Federated Investment Management Company; Trustee, Federated Investment Counseling; Chairman and Director, Federated Global Investment Management Corp.; Chairman, Federated Equity Management Company of Pennsylvania and Passport Research, Ltd. (investment advisory subsidiary of Federated); Trustee, Federated Shareholder Services Company; Director, Federated Services Company. Previous Positions: President, Federated Investment Counseling; President and Chief Executive Officer, Federated Investment Management Company, Federated Global Investment Management Corp. and Passport Research, Ltd. |
| * | Family relationships and reasons for “interested” status: John F. Donahue is the father of J. Christopher Donahue; both are “interested” due to their beneficial ownership of shares of Federated Investors, Inc. and the positions they hold with Federated and its subsidiaries. |
| Name Birth Date Positions Held with Trust Date Service Began | Principal Occupation(s) for Past Five Years, Other Directorships Held, Previous Position(s) and Qualifications |
| Maureen Lally-Green Birth Date: July 5, 1949 Trustee Began serving: August 2009 | Principal Occupations: Director or Trustee of the Federated Fund Family; Director, Office of Church Relations, and Associate General Secretary, Diocese of Pittsburgh; Adjunct Professor of Law, Duquesne University School of Law. Other Directorships Held: Director, Auberle; Member, Pennsylvania State Board of Education; Director, Saint Vincent College; Director, Ireland Institute of Pittsburgh; Chair and Director, UPMC Mercy Hospital; Regent, St. Vincent Seminary; Director, Epilepsy Foundation of Western and Central Pennsylvania; Director, Saint Thomas More Society, Allegheny County; Director, Our Campaign for the Church Alive, Inc. Previous Position: Pennsylvania Superior Court Judge. Qualifications: Legal and director experience. |
| Name Birth Date Positions Held with Trust Date Service Began | Principal Occupation(s) for Past Five Years, Other Directorships Held, Previous Position(s) and Qualifications |
| Peter E. Madden Birth Date: March 16, 1942 Trustee Began serving: June 2006 | Principal Occupation: Director or Trustee, and Chairman of the Board of Directors or Trustees, of the Federated Fund Family. Previous Positions: Representative, Commonwealth of Massachusetts General Court; President, Chief Operating Officer and Director, State Street Bank and Trust Company and State Street Corporation (retired); Director, VISA USA and VISA International; Chairman and Director, Massachusetts Bankers Association; Director, Depository Trust Corporation; Director, The Boston Stock Exchange. Qualifications: Business management, mutual fund services and director experience. |
| Charles F. Mansfield, Jr. Birth Date: April 10, 1945 Trustee Began serving: June 2006 | Principal Occupations: Director or Trustee of the Federated Fund Family; Management Consultant. Previous Positions: Chief Executive Officer, PBTC International Bank; Partner, Arthur Young & Company (now Ernst & Young LLP); Chief Financial Officer of Retail Banking Sector, Chase Manhattan Bank; Senior Vice President, HSBC Bank USA (formerly Marine Midland Bank); Vice President, Citibank; Assistant Professor of Banking and Finance, Frank G. Zarb School of Business, Hofstra University; Executive Vice President, DVC Group, Inc. (marketing, communications and technology). Qualifications: Banking, business management, education and director experience. |
| Thomas M. O'Neill Birth Date: June 14, 1951 Trustee Began serving: October 2006 | Principal Occupations: Director or Trustee, Vice Chairman of the Audit Committee of the Federated Fund Family; Sole Proprietor, Navigator Management Company (investment and strategic consulting). Other Directorships Held: Board of Overseers, Children's Hospital of Boston; Visiting Committee on Athletics, Harvard College; Board of Directors, Medicines for Humanity; Board of Directors, The Golisano Children's Museum of Naples, Florida. Previous Positions: Chief Executive Officer and President, Managing Director and Chief Investment Officer, Fleet Investment Advisors; President and Chief Executive Officer, Aeltus Investment Management, Inc.; General Partner, Hellman, Jordan Management Co., Boston, MA; Chief Investment Officer, The Putnam Companies, Boston, MA; Credit Analyst and Lending Officer, Fleet Bank; Director and Consultant, EZE Castle Software (investment order management software); Director, Midway Pacific (lumber). Qualifications: Business management, mutual fund, director and investment experience. |
| Name Birth Date Positions Held with Trust Date Service Began | Principal Occupation(s) for Past Five Years, Other Directorships Held, Previous Position(s) and Qualifications |
| John S. Walsh Birth Date: November 28, 1957 Trustee Began serving: June 2006 | Principal Occupations: Director or Trustee, Chairman of the Audit Committee of the Federated Fund Family; President and Director, Heat Wagon, Inc. (manufacturer of construction temporary heaters); President and Director, Manufacturers Products, Inc. (distributor of portable construction heaters); President, Portable Heater Parts, a division of Manufacturers Products, Inc. Previous Position: Vice President, Walsh & Kelly, Inc. Qualifications: Business management and director experience. |
| Name Birth Date Address Positions Held with Trust Date Service Began | Principal Occupation(s) for Past Five Years and Previous Position(s) |
| John W. McGonigle Birth Date: October 26, 1938 Secretary Officer since: May 2006 | Principal Occupations: Executive Vice President and Secretary of the Federated Fund Family; Vice Chairman, Executive Vice President, Secretary and Director, Federated Investors, Inc. Previous Positions: Trustee, Federated Investment Management Company and Federated Investment Counseling; Director, Federated Global Investment Management Corp., Federated Services Company and Federated Securities Corp. |
| Lori A. Hensler, CPA Birth Date: January 6, 1967 TREASURER Officer since: April 2013 | Principal Occupations: Principal Financial Officer and Treasurer of the Federated Fund Family; Senior Vice President, Federated Administrative Services; Financial and Operations Principal for Federated Securities Corp. and Edgewood Services, Inc.; and Assistant Treasurer, Federated Investors Trust Company. Previous Positions: Controller of Federated Investors, Inc.; Senior Vice President and Assistant Treasurer, Federated Investors Management Company; Treasurer, Federated Investors Trust Company; Assistant Treasurer, Federated Administrative Services, Federated Administrative Services, Inc., Federated Securities Corp., Edgewood Services, Inc., Federated Advisory Services Company, Federated Equity Management Company of Pennsylvania, Federated Global Investment Management Corp., Federated Investment Counseling, Federated Investment Management Company, Passport Research, Ltd., and Federated MDTA, LLC; Financial and Operations Principal for Federated Securities Corp., Edgewood Services, Inc. and Southpointe Distribution Services, Inc. |
| Name Birth Date Address Positions Held with Trust Date Service Began | Principal Occupation(s) for Past Five Years and Previous Position(s) |
| Peter J. Germain Birth Date: September 3, 1959 CHIEF LEGAL OFFICER Officer since: June 2006 | Principal Occupations: Mr. Germain is Chief Legal Officer of the Federated Fund Family. He is General Counsel and Vice President, Federated Investors, Inc.; President, Federated Administrative Services and Federated Administrative Services, Inc.; Vice President, Federated Securities Corp.; Secretary, Federated Private Asset Management, Inc.; and Secretary, Retirement Plan Service Company of America. Mr. Germain joined Federated in 1984 and is a member of the Pennsylvania Bar Association. Previous Positions: Deputy General Counsel, Special Counsel, Managing Director of Mutual Fund Services, Federated Investors, Inc.; Senior Vice President, Federated Services Company; and Senior Corporate Counsel, Federated Investors, Inc. |
| Brian P. Bouda Birth Date: February 28, 1947 CHIEF COMPLIANCE OFFICER AND SENIOR VICE PRESIDENT Officer since: June 2006 | Principal Occupations: Senior Vice President and Chief Compliance Officer of the Federated Fund Family; Vice President and Chief Compliance Officer of Federated Investors, Inc. and Chief Compliance Officer of certain of its subsidiaries. Mr. Bouda joined Federated in 1999 and is a member of the American Bar Association and the State Bar Association of Wisconsin. Previous Positions: Served in Senior Management positions with a large regional banking organization. |
| Stephen F. Auth Birth Date: September 3, 1956 450 Lexington Avenue Suite 3700 New York, NY 10017-3943 CHIEF INVESTMENT OFFICER Began serving: June 2012 | Principal Occupations: Stephen F. Auth is Chief Investment Officer of various Funds in the Federated Fund Family; Executive Vice President, Federated Investment Counseling, Federated Global Investment Management Corp. and Federated Equity Management Company of Pennsylvania. Previous Positions: Executive Vice President, Federated Investment Management Company and Passport Research, Ltd. (investment advisory subsidiary of Federated); Senior Vice President, Global Portfolio Management Services Division; Senior Vice President, Federated Investment Management Company and Passport Research, Ltd.; Senior Managing Director and Portfolio Manager, Prudential Investments. |
| Daniel Mahr Birth Date: April 9, 1981 125 High Street Oliver Tower 21st Floor Boston, MA 02110-2704 Vice President Officer since: June 2012 Portfolio Manager since: August 2008 | Principal Occupations: Daniel Mahr has been the Fund's Portfolio Manager since August 2008. Mr. Mahr joined the MDT Advisers Investment Team in 2002. As Managing Director, Research, he is responsible for leading the Investment Team as it relates to the ongoing design, development and implementation of the Optimum Q Process. He is Vice President of the Trust with respect to the Fund. Mr. Mahr received his A.B., Computer Science from Harvard College and his S.M., Computer Science from Harvard University. |
Federated Investors Funds
4000 Ericsson Drive
Warrendale, PA 15086-7561
or call 1-800-341-7400.
CUSIP 31421R676
CUSIP 31421R767
CUSIP 31421R759
2013 ©Federated Investors, Inc.
Item 2. Code of Ethics
(a) As of the end of the period covered by this report, the registrant has adopted a code of ethics (the "Section 406 Standards for Investment Companies - Ethical Standards for Principal Executive and Financial Officers") that applies to the registrant's Principal Executive Officer and Principal Financial Officer; the registrant's Principal Financial Officer also serves as the Principal Accounting Officer.
(c) Not Applicable
(d) Not Applicable
(e) Not Applicable
(f)(3) The registrant hereby undertakes to provide any person, without charge, upon request, a copy of the code of ethics. To request a copy of the code of ethics, contact the registrant at 1-800-341-7400, and ask for a copy of the Section 406 Standards for Investment Companies - Ethical Standards for Principal Executive and Financial Officers.
Item 3. Audit Committee Financial Expert
The registrant's Board has determined that each of the following members of the Board's Audit Committee is an “audit committee financial expert,” and is "independent," for purposes of this Item: Charles F. Mansfield, Jr., Thomas M. O'Neill and John S. Walsh.
Item 4. Principal Accountant Fees and Services
(a) Audit Fees billed to the registrant for the two most recent fiscal years:
Fiscal year ended 2013 - $121,600
Fiscal year ended 2012 – $120,100
(b) Audit-Related Fees billed to the registrant for the two most recent fiscal years:
Fiscal year ended 2013 - $182
Fiscal year ended 2012 – $0
Travel to Audit Committee Meeting.
Amount requiring approval of the registrant’s audit committee pursuant to paragraph (c)(7)(ii) of Rule 2-01 of Regulation S-X, $0 and $0, respectively.
(c) Tax Fees billed to the registrant for the two most recent fiscal years:
Fiscal year ended 2013 - $0
Fiscal year ended 2012 - $0
Amount requiring approval of the registrant’s audit committee pursuant to paragraph (c)(7)(ii) of Rule 2-01 of Regulation S-X, $0 and $0, respectively.
(d) All Other Fees billed to the registrant for the two most recent fiscal years:
Fiscal year ended 2013 - $0
Fiscal year ended 2012 - $0
Amount requiring approval of the registrant’s audit committee pursuant to paragraph (c)(7)(ii) of Rule 2-01 of Regulation S-X, $12,280 and $14,619, respectively. Fiscal year ended 2013- Service fee for analysis of potential Passive Foreign Investment Company holdings. Fiscal year ended 2012- Service fee for analysis of potential Passive Foreign Investment Company holdings.
(e)(1) Audit Committee Policies regarding Pre-approval of Services.
The Audit Committee is required to pre-approve audit and non-audit services performed by the independent auditor in order to assure that the provision of such services do not impair the auditor’s independence. Unless a type of service to be provided by the independent auditor has received general pre-approval, it will require specific pre-approval by the Audit Committee. Any proposed services exceeding pre-approved cost levels will require specific pre-approval by the Audit Committee.
Certain services have the general pre-approval of the Audit Committee. The term of the general pre-approval is 12 months from the date of pre-approval, unless the Audit Committee specifically provides for a different period. The Audit Committee will annually review the services that may be provided by the independent auditor without obtaining specific pre-approval from the Audit Committee and may grant general pre-approval for such services. The Audit Committee will revise the list of general pre-approved services from time to time, based on subsequent determinations. The Audit Committee will not delegate its responsibilities to pre-approve services performed by the independent auditor to management.
The Audit Committee has delegated pre-approval authority to its Chairman. The Chairman will report any pre-approval decisions to the Audit Committee at its next scheduled meeting. The Committee will designate another member with such pre-approval authority when the Chairman is unavailable.
AUDIT SERVICES
The annual Audit services engagement terms and fees will be subject to the specific pre-approval of the Audit Committee. The Audit Committee must approve any changes in terms, conditions and fees resulting from changes in audit scope, registered investment company (RIC) structure or other matters.
In addition to the annual Audit services engagement specifically approved by the Audit Committee, the Audit Committee may grant general pre-approval for other Audit Services, which are those services that only the independent auditor reasonably can provide. The Audit Committee has pre-approved certain Audit services, all other Audit services must be specifically pre-approved by the Audit Committee.
AUDIT-RELATED SERVICES
Audit-related services are assurance and related services that are reasonably related to the performance of the audit or review of the Company’s financial statements or that are traditionally performed by the independent auditor. The Audit Committee believes that the provision of Audit-related services does not impair the independence of the auditor, and has pre-approved certain Audit-related services, all other Audit-related services must be specifically pre-approved by the Audit Committee.
TAX SERVICES
The Audit Committee believes that the independent auditor can provide Tax services to the Company such as tax compliance, tax planning and tax advice without impairing the auditor’s independence. However, the Audit Committee will not permit the retention of the independent auditor in connection with a transaction initially recommended by the independent auditor, the purpose of which may be tax avoidance and the tax treatment of which may not be supported in the Internal Revenue Code and related regulations. The Audit Committee has pre-approved certain Tax services, all Tax services involving large and complex transactions must be specifically pre-approved by the Audit Committee.
ALL OTHER SERVICES
With respect to the provision of services other than audit, review or attest services the pre-approval requirement is waived if:
| (1) | The aggregate amount of all such services provided constitutes no more than five percent of the total amount of revenues paid by the registrant, the registrant’s adviser (not including any sub-adviser whose role is primarily portfolio management and is subcontracted with or overseen by another investment adviser), and any entity controlling, controlled by, or under common control with the investment adviser that provides ongoing services to the registrant to its accountant during the fiscal year in which the services are provided; |
| (2) | Such services were not recognized by the registrant, the registrant’s adviser (not including any sub-adviser whose role is primarily portfolio management and is subcontracted with or overseen by another investment adviser), and any entity controlling, controlled by, or under common control with the investment adviser that provides ongoing services to the registrant at the time of the engagement to be non-audit services; and |
| (3) | Such services are promptly brought to the attention of the Audit Committee of the issuer and approved prior to the completion of the audit by the Audit Committee or by one or more members of the Audit Committee who are members of the board of directors to whom authority to grant such approvals has been delegated by the Audit Committee. |
The Audit Committee may grant general pre-approval to those permissible non-audit services classified as All Other services that it believes are routine and recurring services, and would not impair the independence of the auditor.
The SEC’s rules and relevant guidance should be consulted to determine the precise definitions of prohibited non-audit services and the applicability of exceptions to certain of the prohibitions.
PRE-APPROVAL FEE LEVELS
Pre-approval fee levels for all services to be provided by the independent auditor will be established annually by the Audit Committee. Any proposed services exceeding these levels will require specific pre-approval by the Audit Committee.
PROCEDURES
Requests or applications to provide services that require specific approval by the Audit Committee will be submitted to the Audit Committee by both the independent auditor and the Principal Accounting Officer and/or Internal Auditor, and must include a joint statement as to whether, in their view, the request or application is consistent with the SEC’s rules on auditor independence.
(e)(2) Percentage of services identified in items 4(b) through 4(d) that were approved by the registrants audit committee pursuant to paragraph (c)(7)(i)(C) of Rule 2-01 of Regulation S-X:
4(b)
Fiscal year ended 2013 – 0%
Fiscal year ended 2012 – 0%
Percentage of services provided to the registrants investment adviser and any entity controlling, controlled by, or under common control with the investment adviser that provides ongoing services to the registrant that were approved by the registrants audit committee pursuant to paragraph (c)(7)(i)(C) of Rule 2-01 of Regulation S-X, 0% and 0% respectively.
4(c)
Fiscal year ended 2013 – 0%
Fiscal year ended 2012 – 0%
Percentage of services provided to the registrants investment adviser and any entity controlling, controlled by, or under common control with the investment adviser that provides ongoing services to the registrant that were approved by the registrants audit committee pursuant to paragraph (c)(7)(i)(C) of Rule 2-01 of Regulation S-X, 0% and 0% respectively.
4(d)
Fiscal year ended 2013 – 0%
Fiscal year ended 2012 – 0%
Percentage of services provided to the registrants investment adviser and any entity controlling, controlled by, or under common control with the investment adviser that provides ongoing services to the registrant that were approved by the registrants audit committee pursuant to paragraph (c)(7)(i)(C) of Rule 2-01 of Regulation S-X, 0% and 0% respectively.
| (f) | NA |
| (g) | Non-Audit Fees billed to the registrant, the registrant’s investment adviser, and certain entities controlling, controlled by or under common control with the investment adviser: |
Fiscal year ended 2013 - $126,877
Fiscal year ended 2012 - $350,676
(h) The registrant’s Audit Committee has considered that the provision of non-audit services that were rendered to the registrant’s adviser (not including any sub-adviser whose role is primarily portfolio management and is subcontracted with or overseen by another investment adviser), and any entity controlling, controlled by, or under common control with the investment adviser that provides ongoing services to the registrant that were not pre-approved pursuant to paragraph (c)(7)(ii) of Rule 2-01 of Regulation S-X is compatible with maintaining the principal accountant’s independence.
Item 5. Audit Committee of Listed Registrants
Not Applicable
Item 6. Schedule of Investments
(a) The registrant’s Schedule of Investments is included as part of the Report to Stockholders filed under Item 1 of this form.
(b) Not Applicable; Fund had no divestments during the reporting period covered since the previous Form N-CSR filing.
Item 7. Disclosure of Proxy Voting Policies and Procedures for Closed-End Management Investment Companies
| Not Applicable |
Item 8. Portfolio Managers of Closed-End Management Investment Companies
| Not Applicable |
Item 9. Purchases of Equity Securities by Closed-End Management Investment Company and Affiliated Purchasers
| Not Applicable |
Item 10. Submission of Matters to a Vote of Security Holders
No changes to report.
Item 11. Controls and Procedures
(a) The registrant’s President and Treasurer have concluded that the
registrant’s disclosure controls and procedures (as defined in rule 30a-3(c) under the Act) are effective in design and operation and are sufficient to form the basis of the certifications required by Rule 30a-(2) under the Act, based on their evaluation of these disclosure controls and procedures within 90 days of the filing date of this report on Form N-CSR.
(b) There were no changes in the registrant’s internal control over financial reporting (as defined in rule 30a-3(d) under the Act) during the second fiscal quarter of the period covered by this report that have materially affected, or are reasonably likely to materially affect, the registrant’s internal control over financial reporting.
Item 12. Exhibits
(a)(1) Code of Ethics- Not Applicable to this Report.
(a)(2) Certifications of Principal Executive Officer and Principal Financial Officer.
(a)(3) Not Applicable.
(b) Certifications pursuant to 18 U.S.C. Section 1350.
SIGNATURES
Pursuant to the requirements of the Securities Exchange Act of 1934 and the Investment Company Act of 1940, the registrant has duly caused this report to be signed on its behalf by the undersigned, thereunto duly authorized.
Registrant Federated MDT Series
By /S/ Lori A. Hensler
Lori A. Hensler, Principal Financial Officer
Date September 20, 2013
Pursuant to the requirements of the Securities Exchange Act of 1934 and the Investment Company Act of 1940, this report has been signed below by the following persons on behalf of the registrant and in the capacities and on the dates indicated.
By /S/ J. Christopher Donahue
J. Christopher Donahue, Principal Executive Officer
Date September 20, 2013
By /S/ Lori A. Hensler
Lori A. Hensler, Principal Financial Officer
Date September 20, 2013