UNITED STATES
SECURITIES AND EXCHANGE COMMISSION
Washington, D.C. 20549
FORM N-CSR
CERTIFIED SHAREHOLDER REPORT OF REGISTERED
MANAGEMENT INVESTMENT COMPANIES
Investment Company Act file number 811-22435
Kayne Anderson Energy Development Company
(Exact name of registrant as specified in charter)
| | |
| 811 Main Street, 14th Floor, Houston, Texas | | 77002 |
| (Address of principal executive offices) | | (Zip code) |
David Shladovsky, Esq.
KA Fund Advisors, LLC, 811 Main Street, 14th Floor, Houston, Texas 77002
(Name and address of agent for service)
Registrant’s telephone number, including area code: (713) 493-2020
Date of fiscal year end: November 30, 2014
Date of reporting period: May 31, 2014
Form N-CSR is to be used by management investment companies to file reports with the Commission not later than 10 days after the transmission to stockholders of any report that is required to be transmitted to stockholders under Rule 30e-1 under the Investment Company Act of 1940 (17 CFR 270.30e-1). The Commission may use the information provided on Form N-CSR in its regulatory, disclosure review, inspection, and policymaking roles.
A registrant is required to disclose the information specified by Form N-CSR, and the Commission will make this information public. A registrant is not required to respond to the collection of information contained in Form N-CSR unless the Form displays a currently valid Office of Management and Budget (“OMB”) control number. Please direct comments concerning the accuracy of the information collection burden estimate and any suggestions for reducing the burden to Secretary, Securities and Exchange Commission, 450 Fifth Street, NW, Washington, DC 20549-0609. The OMB has reviewed this collection of information under the clearance requirements of 44 U.S.C. § 3507.
Item 1. Reports to Stockholders.
The report of Kayne Anderson Energy Development Company (the “Registrant”) to stockholders for the semi-annual period ended May 31, 2014 is attached below.

Energy Development Company

KED Semi-Annual Report
May 31, 2014
CONTENTS
CAUTIONARY NOTE REGARDING FORWARD-LOOKING STATEMENTS: This report of Kayne Anderson Energy Development Company (the “Company”) contains “forward-looking statements” as defined under the U.S. federal securities laws. Generally, the words “believe,” “expect,” “intend,” “estimate,” “anticipate,” “project,” “will” and similar expressions identify forward-looking statements, which generally are not historical in nature. Forward-looking statements are subject to certain risks and uncertainties that could cause actual results to materially differ from the Company’s historical experience and its present expectations or projections indicated in any forward-looking statements. These risks include, but are not limited to, changes in economic and political conditions; regulatory and legal changes; master limited partnership (“MLP”) industry risk; leverage risk; valuation risk; interest rate risk; tax risk; and other risks discussed in the Company’s filings with the Securities and Exchange Commission (“SEC”). You should not place undue reliance on forward-looking statements, which speak only as of the date they are made. The Company undertakes no obligation to update or revise any forward-looking statements made herein. There is no assurance that the Company’s investment objectives will be attained.
KAYNE ANDERSON ENERGY DEVELOPMENT COMPANY
MANAGEMENT DISCUSSION
(UNAUDITED)
Company Overview
Kayne Anderson Energy Development Company is a non-diversified, closed-end management investment company organized under the laws of the State of Maryland. We are a taxable corporation, paying federal and applicable state taxes on our taxable income. Our operations are externally managed and advised by our investment adviser, KA Fund Advisors, LLC (“KAFA” or the “Adviser”), pursuant to an investment management agreement. Our investment objective is to generate both current income and capital appreciation primarily through equity and debt investments. We seek to achieve this objective by investing at least 80% of our total assets in securities of Energy Companies. A key focus area for our investments is equity and debt investments in private and public entities structured as limited partnerships (“MLPs”). We also own equity and debt investments in Upstream, Midstream and Other Energy Companies (as such terms are defined in Note 1 — Organization).
As of May 31, 2014, we had total assets of $576 million, net assets of $362 million (net asset value of $34.49 per share), and 10.5 million shares of common stock outstanding. As of May 31, 2014, we held $566 million in equity investments and no debt investments.
Results of Operations — For the Three Months Ended May 31, 2014
Investment Income. Investment income totaled $2.3 million for the quarter. We received $8.6 million of dividends and distributions during the quarter, of which $6.3 million was treated as a return of capital. We received $0.4 million of paid-in-kind dividends, which are not included in investment income but are reflected as an unrealized gain.
Operating Expenses. Operating expenses totaled $2.9 million, including $2.0 million of investment management fees (net of fee waiver of $0.3 million), $0.6 million of interest expense (including non-cash amortization of debt issuance costs of $0.1 million) and $0.3 million of other operating expenses. KAFA agreed to waive 0.25% of its 1.75% management fee for a one-year period effective October 3, 2013.
Net Investment Loss. Our net investment loss totaled $0.4 million and included a current tax benefit of $0.2 million and a deferred tax benefit of $0.01 million.
Net Realized Gains. We had net realized gains from investments of $16.1 million after taking into account a current tax expense of $9.6 million and a deferred tax expense of $0.2 million.
Net Change in Unrealized Gains. We had a net increase in unrealized gains of $26.1 million. The net increase consisted of $41.7 million of unrealized gains from investments and a deferred tax expense of $15.6 million.
Net Increase in Net Assets Resulting from Operations. We had an increase in net assets resulting from operations of $41.8 million. This increase was comprised of net investment loss of $0.4 million, net realized gains of $16.1 million and net unrealized gains of $26.1 million, as noted above.
Distributions to Common Stockholders
We pay quarterly distributions to our common stockholders, funded generally by net distributable income (“NDI”) generated from our portfolio investments. NDI is the amount of income received by us from our portfolio investments less operating expenses, subject to certain adjustments as described below. NDI is not a financial measure under the accounting principles generally accepted in the United States of America (“GAAP”). Refer to the “Reconciliation of NDI to GAAP” section below for a reconciliation of this measure to our results reported under GAAP.
1
KAYNE ANDERSON ENERGY DEVELOPMENT COMPANY
MANAGEMENT DISCUSSION
(UNAUDITED)
Income from portfolio investments includes (a) cash dividends and distributions, (b) paid-in-kind dividends or non-cash distributions received, and (c) interest income from debt securities and commitment fees from private investments in public equity (“PIPE investments”).
Operating expenses include (a) investment management fees paid to KAFA, (b) other expenses (mostly comprised of fees paid to other service providers) and (c) interest expense.
Net Distributable Income (NDI)
(amounts in millions, except for per share amounts)
| | | | |
| | | Three Months
Ended
May 31,
2014 | |
Distributions and Other Income from Investments | | | | |
Dividends and Distributions(1) | | $ | 8.6 | |
Paid-In-Kind Dividends(1) | | | 0.4 | |
| | | | |
Total Distributions from Investments | | | 9.0 | |
Expenses | | | | |
Investment Management Fee | | | (2.0 | ) |
Other Expenses | | | (0.4 | ) |
Interest Expense | | | (0.4 | ) |
| | | | |
Net Distributable Income (NDI) | | $ | 6.2 | |
| | | | |
Weighted Average Shares Outstanding | | | 10.48 | |
NDI per Weighted Average Share Outstanding | | $ | 0.589 | |
| | | | |
Adjusted NDI per Weighted Average Share Outstanding(2) | | $ | 0.499 | |
| | | | |
Distribution paid per Common Share(3) | | $ | 0.515 | |
| (1) | See Note 2 — Significant Accounting Policies to the Financial Statements for additional information regarding paid-in-kind and non-cash dividends and distributions. |
| (2) | Adjusted NDI excludes $0.9 million of non-cash distributions from Common and Preferred A units of VantaCore Partners LP received during the three months ended May 31, 2014. |
| (3) | The distribution of $0.515 per share for the second quarter of fiscal 2014 was paid on July 18, 2014. |
Payment of future distributions is subject to Board of Directors approval, as well as meeting the covenants of our credit facility. In determining our quarterly distribution to common stockholders, our Board of Directors considers a number of factors which include, but are not limited to:
| | • | | NDI and Adjusted NDI generated in the current quarter; |
| | • | | Expected NDI and Adjusted NDI over the next twelve months; |
| | • | | The extent to which NDI and Adjusted NDI are comprised of non-cash interest and distributions; |
| | • | | Seasonality of cash distributions of VantaCore Partners LP; |
| | • | | The impact of potential liquidity events at our portfolio companies; and |
| | • | | Realized and unrealized gains generated by the portfolio. |
On June 26, 2014, we declared a quarterly distribution of $0.515 per share for the second quarter of fiscal 2014 (a total distribution of $5.4 million). The distribution represents an increase of 1.0% from the prior quarter’s distribution and an increase of 17.0% from the distribution for the quarter ended May 31, 2013. The distribution was paid on July 18, 2014.
2
KAYNE ANDERSON ENERGY DEVELOPMENT COMPANY
MANAGEMENT DISCUSSION
(UNAUDITED)
Reconciliation of NDI to GAAP
The difference between distributions and other income from investments in the NDI calculation and total investment income as reported in our Statement of Operations is reconciled as follows:
| | • | | GAAP recognizes that a significant portion of the cash distributions received from MLPs is characterized as a return of capital and therefore excluded from investment income, whereas the NDI calculation includes the return of capital portion of such distributions. |
| | • | | NDI includes the value of paid-in-kind dividends and distributions, whereas such amounts are not included as investment income for GAAP purposes during the period received, but rather are recorded as unrealized gains upon receipt. |
| | • | | NDI includes commitment fees from PIPE investments, whereas such amounts are generally not included in investment income for GAAP purposes, but rather are recorded as a reduction to the cost of the investment. |
| | • | | Certain of our investments in debt securities were purchased at a discount or premium to the par value of such security. When making such investments, we consider the security’s yield to maturity, which factors in the impact of such discount (or premium). Interest income reported under GAAP includes the non-cash accretion of the discount (or amortization of the premium) based on the effective interest method. When we calculate interest income for purposes of determining NDI, in order to better reflect the yield to maturity, the accretion of the discount (or amortization of the premium) is calculated on a straight-line basis to the earlier of the expected call date or the maturity date of the debt security. |
The treatment of expenses included in NDI also differs from what is reported in the Statement of Operations as follows:
| | • | | The non-cash amortization or write-offs of capitalized debt issuance costs related to our debt financings is included in interest expense for GAAP purposes, but is excluded from our calculation of NDI. |
Liquidity and Capital Resources
On January 28, 2014, we renewed our amended and restated senior secured revolving credit facility (“Credit Facility”), which was scheduled to mature on March 30, 2014, with a syndicate of lenders. The Credit Facility has a three-year commitment, maturing on January 28, 2017, and a total commitment amount of $120 million. Under the Credit Facility, the interest rate is LIBOR plus 1.60% based on current borrowings and current borrowing base. If borrowings exceed the borrowing base attributable to “quoted” securities (generally defined as equity investments in public MLPs and midstream companies and investments in bank debt and high yield bonds that are traded), the interest rate will increase to LIBOR plus 3.00%. We pay a commitment fee of 0.30% per annum on any unused amounts of the Credit Facility.
The maximum amount that we can borrow under our new Credit Facility is limited to the lesser of our commitment amount of $120 million and our borrowing base. Our borrowing base, subject to certain limitations, is generally calculated by multiplying the fair value of each of our investments by an advance rate. The total contribution to our borrowing base from private MLPs is limited to no more than 25% of the total borrowing base, and there is a limit of 10% of the total commitment amount on the borrowing base contribution from any single issuer.
As of May 31, 2014, we had $105 million of borrowings under our Credit Facility (at an interest rate of 1.78%), which represented 46.6% of our borrowing base of $225.2 million (47.4% of our borrowing base of $221.6 million attributable to quoted securities). At May 31, 2014, our asset coverage ratio under the Investment Company Act of 1940, as amended (the “1940 Act”), was 445%.
3
KAYNE ANDERSON ENERGY DEVELOPMENT COMPANY
MANAGEMENT DISCUSSION
(UNAUDITED)
As of July 24, 2014, we had $102.0 million borrowed under our Credit Facility (at an interest rate of 1.75%), and we had $3.3 million of cash. Our borrowings represented 42.8% of our borrowing base of $238.1 million (43.5% of our borrowing base of $234.3 million attributable to quoted securities).
4
KAYNE ANDERSON ENERGY DEVELOPMENT COMPANY
PORTFOLIO SUMMARY
(UNAUDITED)
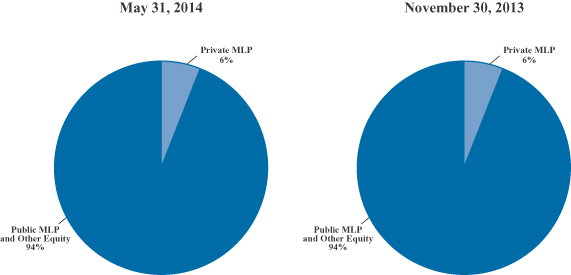
Portfolio of Long-Term Investments by Category
Top 10 Holdings by Issuer
| | | | | | | | | | | | | | | | | | | | | | |
| | | Public/ Private | | Equity/
Debt | | Sector | | Percent of Long-Term
Investments as of
|
| Holding | | | | | May 31,
2014 | | November 30,
2013 |
1. Emerge Energy Services LP | | Public | | | | Equity | | | Frac Sand | | | | 8.6 | % | | | | 14.0 | % |
2. Regency Energy Partners LP(1) | | Public | | | | Equity | | | Midstream | | | | 7.8 | | | | | 4.9 | |
3. VantaCore Partners LP | | Private | | | | Equity | | | Aggregates | | | | 5.6 | | | | | 6.2 | |
4. Enterprise Products Partners L.P. | | Public | | | | Equity | | | Midstream | | | | 5.5 | | | | | 5.1 | |
5. Williams Partners L.P. | | Public | | | | Equity | | | Midstream | | | | 5.3 | | | | | 4.7 | |
6. Energy Transfer Partners, L.P. | | Public | | | | Equity | | | Midstream | | | | 4.7 | | | | | 4.9 | |
7. DCP Midstream Partners, LP | | Public | | | | Equity | | | Midstream | | | | 4.5 | | | | | 3.6 | |
8. Plains GP Holdings, L.P.(2) | | Public | | | | Equity | | | Midstream | | | | 4.2 | | | | | 4.2 | |
9. ONEOK Partners, L.P. | | Public | | | | Equity | | | Midstream | | | | 4.2 | | | | | 3.2 | |
10. MarkWest Energy Partners, L.P. | | Public | | | | Equity | | | Midstream | | | | 3.7 | | | | | 3.9 | |
| (1) | As of November 30, 2013, our investments in Regency Energy Partners LP (“Regency”) and PVR Partners, L.P. (“PVR”) represented 4.9% of total investments. On March 21, 2014, PVR completed its merger with Regency. |
| (2) | We hold an interest in Plains AAP, L.P. (“PAA GP”), which controls the general partner of Plains All American, L.P. Our ownership of PAA GP is exchangeable into shares of Plains GP Holdings, L.P. (which trades on the NYSE under the ticker “PAGP”) on a one-for-one basis at our option. See Note 3 — Fair Value. |
5
KAYNE ANDERSON ENERGY DEVELOPMENT COMPANY
SCHEDULE OF INVESTMENTS
MAY 31, 2014
(amounts in 000’s, except number of option contracts)
(UNAUDITED)
| | | | | | | | |
Description | | No. of
Shares/Units | | | Value | |
Long-Term Investments — 156.4% | | | | | | | | |
Equity Investments(1) — 156.4% | | | | | | | | |
Public MLP and Other Equity — 147.6% | | | | | | | | |
Access Midstream Partners, L.P. | | | 232 | | | $ | 14,610 | |
Alliance Holdings GP, L.P. | | | 71 | | | | 4,565 | |
Arc Logistics Partners LP | | | 237 | | | | 5,593 | |
Atlas Pipeline Partners, L.P. | | | 105 | | | | 3,423 | |
Buckeye Partners, L.P.(2) | | | 177 | | | | 13,871 | |
Capital Product Partners L.P. | | | 352 | | | | 3,775 | |
Capital Product Partners L.P. — Class B Units(3)(4) | | | 606 | | | | 6,503 | |
Crestwood Equity Partners LP | | | 105 | | | | 1,479 | |
Crestwood Midstream Partners LP | | | 902 | | | | 19,667 | |
DCP Midstream Partners, LP | | | 475 | | | | 25,537 | |
Dynagas LNG Partners LP | | | 108 | | | | 2,600 | |
El Paso Pipeline Partners, L.P. | | | 352 | | | | 12,038 | |
Emerge Energy Services LP(5) | | | 516 | | | | 49,024 | |
Enable Midstream Partners, LP(6) | | | 67 | | | | 1,694 | |
Enbridge Energy Management, L.L.C.(7) | | | 85 | | | | 2,527 | |
Enbridge Energy Partners, L.P. | | | 306 | | | | 9,481 | |
EnLink Midstream Partners, LP | | | 287 | | | | 8,741 | |
Enduro Royalty Trust | | | 188 | | | | 2,370 | |
Energy Transfer Partners, L.P.(8) | | | 475 | | | | 26,732 | |
Enterprise Products Partners L.P.(8) | | | 416 | | | | 31,098 | |
EV Energy Partners, L.P. | | | 337 | | | | 12,442 | |
Exterran Partners, L.P. | | | 210 | | | | 5,888 | |
GasLog Partners LP(6) | | | 4 | | | | 111 | |
Global Partners LP | | | 205 | | | | 8,385 | |
Golar LNG Partners LP | | | 96 | | | | 3,147 | |
Holly Energy Partners, L.P. | | | 77 | | | | 2,725 | |
Kinder Morgan, Inc. | | | 48 | | | | 1,603 | |
Kinder Morgan Energy Partners, L.P. | | | 46 | | | | 3,524 | |
Kinder Morgan Management, LLC(7) | | | 254 | | | | 18,288 | |
Legacy Reserves LP | | | 69 | | | | 2,040 | |
LRR Energy, L.P. | | | 19 | | | | 327 | |
Magellan Midstream Partners, L.P. | | | 43 | | | | 3,529 | |
MarkWest Energy Partners, L.P.(5) | | | 343 | | | | 21,268 | |
Mid-Con Energy Partners, LP | | | 171 | | | | 3,809 | |
Midcoast Energy Partners, L.P. | | | 311 | | | | 6,850 | |
NuStar Energy L.P. | | | 39 | | | | 2,274 | |
ONEOK Partners, L.P. | | | 433 | | | | 23,843 | |
PBF Logistics LP(6) | | | 17 | | | | 460 | |
Plains All American Pipeline, L.P.(5) | | | 206 | | | | 11,606 | |
Plains GP Holdings, L.P.—Unregistered(3)(5)(9) | | | 918 | | | | 24,048 | |
QEP Midstream Partners, LP | | | 62 | | | | 1,509 | |
Regency Energy Partners LP | | | 1,596 | | | | 44,364 | |
SandRidge Permian Trust | | | 115 | | | | 1,396 | |
Sprague Resources LP | | | 207 | | | | 5,119 | |
Summit Midstream Partners, LP | | | 272 | | | | 12,252 | |
See accompanying notes to financial statements.
6
KAYNE ANDERSON ENERGY DEVELOPMENT COMPANY
SCHEDULE OF INVESTMENTS
MAY 31, 2014
(amounts in 000’s, except number of option contracts)
(UNAUDITED)
| | | | | | | | |
Description | | No. of
Shares/Units | | | Value | |
Public MLP and Other Equity (continued) | | | | | | | | |
| | |
SunCoke Energy Partners, L.P. | | | 258 | | | $ | 7,389 | |
Sunoco Logistics Partners L.P. | | | 18 | | | | 1,647 | |
Tallgrass Energy Partners, LP | | | 69 | | | | 2,528 | |
Targa Resources Corp. | | | 18 | | | | 2,012 | |
Targa Resources Partners LP | | | 130 | | | | 8,858 | |
USA Compression Partners, LP | | | 91 | | | | 2,275 | |
Western Gas Partners, LP | | | 183 | | | | 13,189 | |
Williams Partners L.P. | | | 565 | | | | 30,023 | |
| | | | | | | | |
| | | | | | | 534,056 | |
| | | | | | | | |
Private MLP(3)(5) — 8.8% | | | | | | | | |
VantaCore Partners LP — Common Units(7) | | | 2,187 | | | | 20,775 | |
VantaCore Partners LP — Class A Preferred Units(7)(10) | | | 456 | | | | 7,642 | |
VantaCore Partners LP — Class B Preferred Units(11) | | | 202 | | | | 3,368 | |
| | | | | | | | |
| | | | | | | 31,785 | |
| | | | | | | | |
Total Long-Term Investments — 156.4% (Cost — $360,574) | | | | 565,841 | |
| | | | | | | | |
| | | | | | | | | | | | | | | | |
| | | | | | | | | | | | | | | | |
| | | Strike
Price | | | Expiration
Date | | | No. of
Contracts | | | Value | |
Liabilities | | | | | | | | | | | | | | | | |
Call Option Contracts Written(12) | | | | | | | | | | | | | | | | |
Public MLP | | | | | | | | | | | | | | | | |
Buckeye Partners, L.P. (Premium Received — $23) | | $ | 80.00 | | | | 7/18/14 | | | | 200 | | | | (19 | ) |
Credit Facility | | | | (105,000 | ) |
Deferred Tax Liability | | | | (98,256 | ) |
Other Liabilities in Excess of Other Assets | | | | (754 | ) |
| | | | | | | | | | | | | | | | |
Net Assets | | | $ | 361,812 | |
| | | | | | | | | | | | | | | | |
| (1) | Unless otherwise noted, equity investments are common units/common shares. |
| (2) | Security or a portion thereof is segregated as collateral on option contracts written. |
| (3) | Fair valued security, restricted from public sale. See Notes 2, 3 and 9 in Notes to Financial Statements. |
| (4) | Class B Units are convertible on a one-for-one basis into common units of Capital Product Partners L.P. (“CPLP”) and are senior to the common units in terms of liquidation preference and priority of distributions. The Class B Units pay quarterly cash distributions of $0.21375 per unit and are convertible at any time at the option of the holder. If CPLP increases the quarterly cash distribution per common unit, the distribution per Class B Unit will increase by an equal amount. If CPLP does not redeem the Class B Units by May 2022, then the distribution increases by 25% per quarter to a maximum of $0.33345 per unit. CPLP may require that the Class B Units convert into common units after May 2015 if the common unit price exceeds $11.70 per unit, and the Class B Units are callable after May 2017 at a price of $9.27 per unit and after May 2019 at $9.00 per unit. |
| (5) | The Company believes that it is an affiliate of Emerge Energy Services LP, MarkWest Energy Partners, L.P., Plains GP Holdings, L.P. (“Plains GP”), Plains All American Pipeline, L.P. and VantaCore Partners LP (“VantaCore”). See Note 5 — Agreements and Affiliations. |
| (6) | Security is not currently paying cash distributions, but is expected to pay cash distributions within the next 12 months. |
See accompanying notes to financial statements.
7
KAYNE ANDERSON ENERGY DEVELOPMENT COMPANY
SCHEDULE OF INVESTMENTS
MAY 31, 2014
(amounts in 000’s, except number of option contracts)
(UNAUDITED)
| (7) | All or a portion of dividends or distributions are paid-in-kind. |
| (8) | In lieu of cash distributions, the Company has elected to receive distributions in additional units through the partnership’s dividend reinvestment program. |
| (9) | The Company holds an interest in Plains AAP, L.P. (“PAA GP”), which controls the general partner of Plains All American, L.P. The Company’s ownership of PAA GP is exchangeable into shares of Plains GP (which trades on the NYSE under the ticker “PAGP”) on a one-for-one basis at the Company’s option. See Note 3 — Fair Value. |
| (10) | The Class A Preferred Units have a liquidation preference of $17.50 per unit and were issued by VantaCore to holders of the Common and Class A Preferred Units to the extent that such units did not receive full cash distributions. The Class A Preferred Units have a minimum quarterly distribution of $0.475 per unit and are senior to VantaCore’s Common Units in liquidation preference. See Note 9 — Restricted Securities. |
| (11) | The Class B Preferred Units have a liquidation preference of $17.50 per unit and a minimum quarterly distribution of $0.3825 per unit and are senior to all other equity classes of VantaCore in distributions and liquidation preference. See Note 9 — Restricted Securities. |
| (12) | Security is non-income producing. |
See accompanying notes to financial statements.
8
KAYNE ANDERSON ENERGY DEVELOPMENT COMPANY
STATEMENT OF ASSETS AND LIABILITIES
MAY 31, 2014
(amounts in 000’s, except share and per share amounts)
(UNAUDITED)
| | | | |
ASSETS | | | | |
Investments, at fair value: | | | | |
Non-affiliated (Cost — $305,355) | | $ | 428,110 | |
Affiliated (Cost — $55,219) | | | 137,731 | |
| | | | |
Total investments (Cost — $360,574) | | | 565,841 | |
Cash | | | 1,355 | |
Deposits with broker | | | 17 | |
Receivable for securities sold | | | 6,485 | |
Dividends and distributions receivable | | | 818 | |
Debt offering costs, prepaid expenses and other assets | | | 1,583 | |
| | | | |
Total Assets | | | 576,099 | |
| | | | |
| |
LIABILITIES | | | | |
Payable for securities purchased | | | 3,994 | |
Investment management fee payable | | | 2,003 | |
Call option contracts written (Premiums received — $23) | | | 19 | |
Accrued directors’ fees and expenses | | | 82 | |
Accrued expenses and other liabilities | | | 492 | |
Current income tax liability | | | 4,441 | |
Deferred income tax liability | | | 98,256 | |
Credit facility | | | 105,000 | |
| | | | |
Total Liabilities | | | 214,287 | |
| | | | |
NET ASSETS | | $ | 361,812 | |
| | | | |
NET ASSETS CONSIST OF | | | | |
Common stock, $0.001 par value (200,000,000 shares authorized; 10,491,483 shares issued and outstanding) | | $ | 10 | |
Paid-in capital | | | 203,209 | |
Accumulated net investment loss, net of income taxes, less dividends | | | (67,152 | ) |
Accumulated net realized gains on investments, net of income taxes | | | 96,765 | |
Net unrealized gains on investments, net of income taxes | | | 128,980 | |
| | | | |
NET ASSETS | | $ | 361,812 | |
| | | | |
NET ASSET VALUE PER SHARE | | $ | 34.49 | |
| | | | |
See accompanying notes to financial statements.
9
KAYNE ANDERSON ENERGY DEVELOPMENT COMPANY
STATEMENT OF OPERATIONS
(amounts in 000’s)
(UNAUDITED)
| | | | | | | | |
| | | For the Three
Months Ended
May 31, 2014 | | | For the Six
Months Ended
May 31, 2014 | |
INVESTMENT INCOME | | | | | | | | |
Income | | | | | | | | |
Dividends and distributions: | | | | | | | | |
Non-affiliated investments | | $ | 6,068 | | | $ | 11,531 | |
Affiliated investments | | | 2,520 | | | | 5,334 | |
| | | | | | | | |
Total dividends and distributions | | | 8,588 | | | | 16,865 | |
Return of capital | | | (6,326 | ) | | | (12,275 | ) |
| | | | | | | | |
Total Investment Income | | | 2,262 | | | | 4,590 | |
| | | | | | | | |
Expenses | | | | | | | | |
Investment management fees, before investment management fee waiver | | | 2,337 | | | | 4,412 | |
Professional fees | | | 141 | | | | 300 | |
Directors’ fees and expenses | | | 78 | | | | 150 | |
Administration fees | | | 26 | | | | 63 | |
Insurance | | | 15 | | | | 36 | |
Other expenses | | | 87 | | | | 187 | |
| | | | | | | | |
Total Expenses — before fee waiver and interest expense | | | 2,684 | | | | 5,148 | |
Investment management fee waiver | | | (334 | ) | | | (630 | ) |
Interest expense and amortization of offering costs | | | 565 | | | | 1,207 | |
| | | | | | | | |
Total Expenses | | | 2,915 | | | | 5,725 | |
| | | | | | | | |
Net Investment Loss — Before Income Taxes | | | (653 | ) | | | (1,135 | ) |
Current income tax benefit | | | 249 | | | | 278 | |
Deferred income tax benefit | | | 8 | | | | 174 | |
| | | | | | | | |
Net Investment Loss | | | (396 | ) | | | (683 | ) |
| | | | | | | | |
REALIZED AND UNREALIZED GAINS (LOSSES) | | | | | | | | |
Net Realized Gains | | | | | | | | |
Investments — non-affiliated | | | 2,878 | | | | 6,209 | |
Investments — affiliated | | | 23,025 | | | | 40,627 | |
Current income tax expense | | | (9,627 | ) | | | (10,782 | ) |
Deferred income tax expense | | | (203 | ) | | | (6,751 | ) |
| | | | | | | | |
Net Realized Gains | | | 16,073 | | | | 29,303 | |
| | | | | | | | |
Net Change in Unrealized Gains | | | | | | | | |
Investments — non-affiliated | | | 30,774 | | | | 40,722 | |
Investments — affiliated | | | 10,960 | | | | 6,375 | |
Options | | | 4 | | | | 4 | |
Deferred income tax expense | | | (15,657 | ) | | | (17,631 | ) |
| | | | | | | | |
Net Change in Unrealized Gains | | | 26,081 | | | | 29,470 | |
| | | | | | | | |
Net Realized and Unrealized Gains | | | 42,154 | | | | 58,773 | |
| | | | | | | | |
NET INCREASE IN NET ASSETS RESULTING FROM OPERATIONS | | $ | 41,758 | | | $ | 58,090 | |
| | | | | | | | |
See accompanying notes to financial statements.
10
KAYNE ANDERSON ENERGY DEVELOPMENT COMPANY
STATEMENT OF CHANGES IN NET ASSETS
(amounts in 000’s, except share amounts)
| | | | | | | | |
| | | For the Six
Months Ended
May 31,
2014
(Unaudited) | | | For the Fiscal
Year Ended
November 30,
2013 | |
OPERATIONS | | | | | | | | |
Net investment loss, net of tax | | $ | (683 | ) | | $ | (1,504 | ) |
Net realized gains, net of tax | | | 29,303 | | | | 3,891 | |
Net change in unrealized gains, net of tax | | | 29,470 | | | | 80,935 | |
| | | | | | | | |
Net Increase in Net Assets Resulting from Operations | | | 58,090 | | | | 83,322 | |
| | | | | | | | |
DIVIDENDS AND DISTRIBUTIONS | | | | | | | | |
Dividends | | | (10,575 | )(1) | | | (18,348 | )(2) |
Distributions — return of capital | | | — | (1) | | | — | (2) |
| | | | | | | | |
Dividends and Distributions | | | (10,575 | ) | | | (18,348 | ) |
| | | | | | | | |
CAPITAL STOCK TRANSACTIONS | | | | | | | | |
Issuance of 31,572 and 54,781 shares of common stock from reinvestment of dividends and distributions | | | 893 | | | | 1,413 | |
| | | | | | | | |
Total Increase in Net Assets | | | 48,408 | | | | 66,387 | |
| | | | | | | | |
NET ASSETS | | | | | | | | |
Beginning of period | | | 313,404 | | | | 247,017 | |
| | | | | | | | |
End of period | | $ | 361,812 | | | $ | 313,404 | |
| | | | | | | | |
| (1) | The characterization of the distributions paid to common stockholders for the six months ended May 31, 2014 as either a dividend (eligible to be treated as qualified dividend income) or distribution (return of capital) is based solely on the Company’s operating results during the period and does not reflect the expected results during the remainder of the fiscal year. The actual characterization of the common stock distributions made during the current year will not be determinable until after the end of the fiscal year when the Company can determine earnings and profits. Therefore, the characterization may differ from the preliminary estimates. |
| (2) | Distributions paid to common stockholders for the fiscal year ended November 30, 2013 are characterized as dividends (eligible to be treated as qualified dividend income). This characterization is based on the Company’s earnings and profits. |
See accompanying notes to financial statements.
11
KAYNE ANDERSON ENERGY DEVELOPMENT COMPANY
STATEMENT OF CASH FLOWS
FOR THE SIX MONTHS ENDED MAY 31, 2014
(amounts in 000’s)
(UNAUDITED)
| | | | |
CASH FLOWS FROM OPERATING ACTIVITIES | | | | |
Net increase in net assets resulting from operations | | $ | 58,090 | |
Adjustments to reconcile net increase in net assets resulting from operations to net cash used in operating activities: | | | | |
Return of capital distributions | | | 12,275 | |
Net realized gains on investments | | | (46,836 | ) |
Net unrealized gains on investments | | | (47,101 | ) |
Purchase of long-term investments | | | (102,119 | ) |
Proceeds from sale of long-term investments | | | 88,517 | |
Increase in deposits with brokers | | | (17 | ) |
Increase in receivable for securities sold | | | (4,552 | ) |
Increase in interest, dividends and distributions receivable | | | (525 | ) |
Amortization of deferred debt offering costs | | | 323 | |
Decrease in prepaid expenses and other assets | | | 20 | |
Decrease in deferred income tax asset | | | 1,971 | |
Decrease in income tax receivable | | | 594 | |
Increase in payable for securities purchased | | | 3,612 | |
Increase in investment management fee payable | | | 213 | |
Increase in call options written | | | 23 | |
Decrease in accrued directors’ fees and expenses | | | (2 | ) |
Decrease in accrued expenses and other liabilities | | | (65 | ) |
Increase in current income tax liability | | | 4,441 | |
Increase in deferred income tax liability | | | 22,236 | |
| | | | |
Net Cash Used in Operating Activities | | | (8,902 | ) |
| | | | |
CASH FLOWS FROM FINANCING ACTIVITIES | | | | |
Increase in borrowings under credit facility | | | 20,000 | |
Costs associated with issuance of credit facility | | | (1,529 | ) |
Cash distributions paid to stockholders | | | (9,682 | ) |
| | | | |
Net Cash Provided by Financing Activities | | | 8,789 | |
| | | | |
NET DECREASE IN CASH | | | (113 | ) |
CASH — BEGINNING OF PERIOD | | | 1,468 | |
| | | | |
CASH — END OF PERIOD | | $ | 1,355 | |
| | | | |
Supplemental disclosure of cash flow information:
Non-cash financing activities not included herein consisted of reinvestment of distributions pursuant to the Company’s dividend reinvestment plan of $893.
During the six months ended May 31, 2014, there were $5,200 of federal income taxes paid and $269 of state income taxes paid, net of income tax refunds. Interest paid was $907.
During the six months ended May 31, 2014, the Company received $3,647 of paid-in-kind and non-cash dividends and distributions. See Note 2 — Significant Accounting Policies.
See accompanying notes to financial statements.
12
KAYNE ANDERSON ENERGY DEVELOPMENT COMPANY
FINANCIAL HIGHLIGHTS
(amounts in 000’s, except share and per share amounts)
| | | | | | | | | | | | | | | | | | | | | | | | | | | | | | | | | | | | |
| | | For the Six
Months Ended
May 31,
2014
(Unaudited) | | | For the Fiscal Year Ended
November 30, | | | For the
Period
September 21,
2006
through
November 30,
2006 | |
| | | | 2013 | | | 2012 | | | 2011 | | | 2010 | | | 2009 | | | 2008 | | | 2007 | | |
| | | | | | | | | | | | | | | | | | | | | | | | | | | | | | | | | | | | |
Per Share of Common Stock(1) | | | | | | | | | | | | | | | | | | | | | | | | | | | | | | | | | | | | |
Net asset value, beginning of period | | $ | 29.96 | | | $ | 23.74 | | | $ | 23.01 | | | $ | 20.56 | | | $ | 16.58 | | | $ | 16.10 | | | $ | 23.95 | | | $ | 24.03 | | | $ | 23.32 | |
Net investment income (loss) | | | (0.07 | ) | | | (0.14 | ) | | | 0.08 | | | | 0.25 | | | | (0.18 | ) | | | 0.10 | | | | 0.09 | | | | 0.08 | | | | (0.07 | ) |
Net realized and unrealized gain (loss) on investments | | | 5.61 | | | | 8.13 | | | | 2.27 | | | | 3.60 | | | | 5.39 | | | | 1.68 | | | | (5.89 | ) | | | 1.18 | | | | 0.78 | |
Net change in unrealized losses — conversion to taxable corporation | | | — | | | | — | | | | — | | | | — | | | | — | | | | — | | | | (0.38 | ) | | | — | | | | — | |
| | | | | | | | | | | | | | | | | | | | | | | | | | | | | | | | | | | | |
Total income (loss) from investment operations | | | 5.54 | | | | 7.99 | | | | 2.35 | | | | 3.85 | | | | 5.21 | | | | 1.78 | | | | (6.18 | ) | | | 1.26 | | | | 0.71 | |
| | | | | | | | | | | | | | | | | | | | | | | | | | | | | | | | | | | | |
Dividends(2) | | | (1.01 | ) | | | (1.76 | ) | | | (1.62 | ) | | | (1.37 | ) | | | (0.51 | ) | | | — | | | | — | | | | (0.95 | ) | | | — | |
Distributions from net realized long-term capital gains(2)(3) | | | — | | | | — | | | | — | | | | — | | | | — | | | | — | | | | — | | | | (0.15 | ) | | | — | |
Distributions — return of capital(2) | | | — | | | | — | | | | — | | | | — | | | | (0.69 | ) | | | (1.30 | ) | | | (1.67 | ) | | | (0.24 | ) | | | — | |
| | | | | | | | | | | | | | | | | | | | | | | | | | | | | | | | | | | | |
Total dividends and distributions | | | (1.01 | ) | | | (1.76 | ) | | | (1.62 | ) | | | (1.37 | ) | | | (1.20 | ) | | | (1.30 | ) | | | (1.67 | ) | | | (1.34 | ) | | | — | |
| | | | | | | | | | | | | | | | | | | | | | | | | | | | | | | | | | | | |
Effect of shares issued in reinvestment of distributions | | | — | | | | (0.01 | ) | | | — | | | | (0.03 | ) | | | (0.03 | ) | | | — | | | | — | | | | — | | | | — | |
| | | | | | | | | | | | | | | | | | | | | | | | | | | | | | | | | | | | |
Net asset value, end of period | | $ | 34.49 | | | $ | 29.96 | | | $ | 23.74 | | | $ | 23.01 | | | $ | 20.56 | | | $ | 16.58 | | | $ | 16.10 | | | $ | 23.95 | | | $ | 24.03 | |
| | | | | | | | | | | | | | | | | | | | | | | | | | | | | | | | | | | | |
Market value per share, end of period | | $ | 34.31 | | | $ | 28.70 | | | $ | 26.01 | | | $ | 20.21 | | | $ | 18.21 | | | $ | 13.53 | | | $ | 9.63 | | | $ | 23.14 | | | $ | 22.32 | |
| | | | | | | | | | | | | | | | | | | | | | | | | | | | | | | | | | | | |
Total investment return based on market value(4) | | | 23.8 | %(5) | | | 18.1 | % | | | 37.8 | % | | | 19.3 | % | | | 45.8 | % | | | 56.0 | % | | | (54.8 | )% | | | 9.3 | % | | | (10.7 | )%(5) |
See accompanying notes to financial statements.
13
KAYNE ANDERSON ENERGY DEVELOPMENT COMPANY
FINANCIAL HIGHLIGHTS
(amounts in 000’s, except share and per share amounts)
| | | | | | | | | | | | | | | | | | | | | | | | | | | | | | | | | | | | |
| | | For the Six
Months Ended
May 31,
2014
(Unaudited) | | | For the Fiscal Year Ended
November 30, | | | For the
Period
September 21,
2006
through
November 30,
2006 | |
| | | | 2013 | | | 2012 | | | 2011 | | | 2010 | | | 2009 | | | 2008 | | | 2007 | | |
| | | | | | | | | | | | | | | | | | | | | | | | | | | | | | | | | | | | |
Supplemental Data and Ratios(6) | | | | | | | | | | | | | | | | | | | | | | | | | | | | | | | | | | | | |
Net assets, end of period | | $ | 361,812 | | | $ | 313,404 | | | $ | 247,017 | | | $ | 238,030 | | | $ | 211,041 | | | $ | 168,539 | | | $ | 162,687 | | | $ | 240,758 | | | $ | 240,349 | |
Ratio of expenses to average net assets: | | | | | | | | | | | | | | | | | | | | | | | | | | | | | | | | | | | | |
Management fees | | | 2.6 | % | | | 2.5 | % | | | 2.4 | % | | | 2.4 | % | | | 2.1 | % | | | 2.0 | % | | | 0.4 | % | | | 3.1 | % | | | 2.4 | % |
Other expenses | | | 0.4 | | | | 0.5 | | | | 0.6 | | | | 0.7 | | | | 1.0 | | | | 1.3 | | | | 1.1 | | | | 0.9 | | | | 1.3 | |
| | | | | | | | | | | | | | | | | | | | | | | | | | | | | | | | | | | | |
Subtotal | | | 3.0 | | | | 3.0 | | | | 3.0 | | | | 3.1 | | | | 3.1 | | | | 3.3 | | | | 1.5 | | | | 4.0 | | | | 3.7 | |
Interest expense | | | 0.7 | | | | 0.8 | | | | 0.9 | | | | 0.8 | | | | 0.9 | | | | 0.8 | | | | 2.0 | | | | 1.0 | | | | — | |
Management fee waivers | | | (0.4 | ) | | | (0.1 | ) | | | — | | | | — | | | | — | | | | — | | | | — | | | | (0.4 | ) | | | (0.5 | ) |
| | | | | | | | | | | | | | | | | | | | | | | | | | | | | | | | | | | | |
Expenses (excluding tax expense) | | | 3.3 | | | | 3.7 | | | | 3.9 | | | | 3.9 | | | | 4.0 | | | | 4.1 | | | | 3.5 | | | | 4.6 | | | | 3.2 | |
Tax expense | | | 20.3 | | | | 17.1 | | | | 5.6 | | | | 10.0 | | | | 16.3 | | | | 6.9 | | | | — | (7) | | | 0.8 | | | | — | |
| | | | | | | | | | | | | | | | | | | | | | | | | | | | | | | | | | | | |
Total expenses(8) | | | 23.6 | % | | | 20.8 | % | | | 9.5 | % | | | 13.9 | % | | | 20.3 | % | | | 11.0 | % | | | 3.5 | % | | | 5.4 | % | | | 3.2 | % |
| | | | | | | | | | | | | | | | | | | | | | | | | | | | | | | | | | | | |
Ratio of net investment income (loss) to average net assets | | | (0.4 | )% | | | (0.5 | )% | | | 0.3 | % | | | 1.1 | % | | | (1.0 | )% | | | 0.7 | % | | | 0.4 | % | | | 0.3 | % | | | (0.3 | )% |
Net increase (decrease) in net assets resulting from operations to average net assets | | | 16.9 | %(5) | | | 29.2 | % | | | 9.9 | % | | | 17.1 | % | | | 28.3 | % | | | 11.3 | % | | | (29.5 | )% | | | 5.1 | % | | | 3.0 | %(5) |
Portfolio turnover rate | | | 17.4 | %(5) | | | 38.4 | % | | | 34.6 | % | | | 68.1 | % | | | 33.4 | % | | | 20.9 | % | | | 27.0 | % | | | 28.8 | % | | | 5.6 | %(5) |
Average net assets | | $ | 343,615 | | | $ | 284,880 | | | $ | 246,183 | | | $ | 231,455 | | | $ | 188,307 | | | $ | 160,847 | | | $ | 211,531 | | | $ | 246,468 | | | $ | 234,537 | |
Average shares of common stock outstanding | | | 10,475,066 | | | | 10,430,618 | | | | 10,372,215 | | | | 10,301,878 | | | | 10,212,289 | | | | 10,116,071 | | | | 10,073,398 | | | | 10,014,496 | | | | 10,000,060 | |
Average amount of borrowings outstanding under the credit facility | | $ | 87,665 | | | $ | 77,786 | | | $ | 78,180 | | | $ | 62,559 | | | $ | 54,956 | | | $ | 53,422 | | | $ | 75,563 | | | $ | 32,584 | | | | — | |
Asset coverage of total debt(9) | | | 444.6 | % | | | 468.7 | % | | | 443.1 | % | | | 409.1 | % | | | 470.2 | % | | | n/a | | | | n/a | | | | n/a | | | | n/a | |
Average amount of borrowings per share of common stock during the period | | $ | 8.37 | | | $ | 7.46 | | | $ | 7.54 | | | $ | 6.07 | | | $ | 5.38 | | | $ | 5.28 | | | $ | 7.50 | | | $ | 3.25 | | | | — | |
See accompanying notes to financial statements.
14
KAYNE ANDERSON ENERGY DEVELOPMENT COMPANY
FINANCIAL HIGHLIGHTS
(amounts in 000’s, except share and per share amounts)
| (1) | Based on average shares of common stock outstanding. |
| (2) | The characterization of the distribution paid during the six months ended May 31, 2014 is based solely on the Company’s operating results during the period and does not reflect the expected results during the remainder of the fiscal year. The information presented in each of the other periods is a characterization of the total distributions paid to common stockholders as either a dividend (eligible to be treated as qualified dividend income) or a distribution (long-term capital gains or return of capital) and is based on the Company’s earnings and profits. |
| (3) | For the fiscal year ended November 30, 2007 and prior periods, the Company was treated as a regulated investment company under the U.S. Internal Revenue Code of 1986, as amended. Since December 1, 2007, the Company has been taxed as a corporation, and, as a result, the categorization of distributions from net realized long-term capital gains is no longer applicable. |
| (4) | Total investment return is calculated assuming a purchase of common stock at the market price on the first day and a sale at the current market price on the last day of the period reported. The calculation also assumes reinvestment of distributions, if any, at actual prices pursuant to the Company’s dividend reinvestment plan. |
| (6) | Unless otherwise noted, ratios are annualized. |
| (7) | For the fiscal year ended November 30, 2008, the Company accrued deferred income tax benefits of $33,264 (15.5% of average net assets) primarily related to unrealized losses on investments. Realization of the deferred tax benefit was dependent on whether there was sufficient taxable income of the appropriate character within the carryforward periods to realize a portion or all of the deferred tax benefit. Because it could not have been predicted whether the Company would incur a benefit in the future, a deferred income tax expense of 0% was assumed. |
| (8) | For the fiscal year ended November 30, 2008, total expenses exclude 0.4% relating to bad debt expense for the ratio of expenses to average net assets. |
| (9) | Calculated pursuant to section 18(a)(1)(A) of the 1940 Act. Represents the value of total assets less all liabilities not represented by senior securities representing indebtedness divided by senior securities representing indebtedness. Under the 1940 Act, the Company may not declare or make any distribution on its common stock nor can it incur additional indebtedness if at the time of such declaration or incurrence its asset coverage with respect to senior securities representing indebtedness would be less than 300%. For purposes of this test, the Credit Facility is considered a senior security representing indebtedness. Prior to July 7, 2010, the Company was a business development company under the 1940 Act and not subject to the requirements of section 18(a)(1)(A) for the asset coverage of total debt disclosure. |
See accompanying notes to financial statements.
15
KAYNE ANDERSON ENERGY DEVELOPMENT COMPANY
NOTES TO FINANCIAL STATEMENTS
(amounts in 000’s, except number of option contracts, share and per share amounts)
(UNAUDITED)
Kayne Anderson Energy Development Company (the “Company”) was organized as a Maryland corporation on May 24, 2006. The Company is an externally managed, non-diversified closed-end management investment company. The Company commenced investment operations on September 21, 2006. The Company’s shares of common stock are listed on the New York Stock Exchange (“NYSE”) under the symbol “KED.” Prior to November 30, 2007, the Company was treated as a regulated investment company (“RIC”) under the U.S. Internal Revenue Code of 1986, as amended. Since December 1, 2007, the Company has been taxed as a corporation. See Note 6 — Income Taxes.
The Company’s investment objective is to generate both current income and capital appreciation primarily through equity and debt investments. The Company seeks to achieve this objective by investing at least 80% of its total assets in securities of companies that derive the majority of their revenue from activities in the energy industry (“Energy Companies”), including: (a) Midstream Energy Companies, which are businesses that operate assets used to gather, transport, process, treat, terminal and store natural gas, natural gas liquids, propane, crude oil or refined petroleum products; (b) Upstream Energy Companies, which are businesses engaged in the exploration, extraction and production of natural resources, including natural gas, natural gas liquids and crude oil, from onshore and offshore geological reservoirs; and (c) Other Energy Companies, which are businesses engaged in owning, leasing, managing, producing, processing and selling of coal and coal reserves; the marine transportation of crude oil, refined petroleum products, liquefied natural gas, as well as other energy-related natural resources using tank vessels and bulk carriers; and refining, marketing and distributing refined energy products, such as motor gasoline and propane, to retail customers and industrial end-users. A majority of the Company’s investments are in entities structured as master limited partnerships (“MLPs”), including both publicly-traded MLPs and private MLPs, which are structured much like publicly-traded MLPs.
| 2. | Significant Accounting Policies |
A. Use of Estimates — The preparation of financial statements in conformity with accounting principles generally accepted in the United States of America (“GAAP”) requires management to make estimates and assumptions that affect the reported amount of assets and liabilities and disclosure of contingent assets and liabilities at the date of the financial statements and the reported amounts of revenue and expenses during the period. Actual results could differ materially from those estimates.
B. Cash and Cash Equivalents — Cash and cash equivalents include short-term, liquid investments with an original maturity of three months or less and include money market fund accounts.
C. Calculation of Net Asset Value — The Company determines its net asset value no less frequently than as of the last day of each quarter based on the most recent close of regular session trading on the NYSE, and makes its net asset value available for publication quarterly. Net asset value is computed by dividing the value of the Company’s assets (including accrued interest and distributions and current and deferred income tax assets), less all of its liabilities (including accrued expenses, distributions payable, current and deferred accrued income taxes, and any borrowings) by the total number of common shares outstanding.
As of June 30, 2013, the Company began providing adjusted net asset value on a monthly basis for those months that do not constitute the end of a fiscal quarter. The Company’s adjusted net asset value is a non-GAAP measure and is intended to provide investors with a monthly update on the impact of price changes for the public securities in the Company’s portfolio. Adjusted net asset value is calculated based on the same methodology as net asset value and incorporates updated values for the publicly-traded equity securities (including PIPE investments) and quoted debt investments in the Company’s portfolio, including any related income tax impact. The Company’s adjusted net asset value calculation incorporates the Company’s month-end balance sheet but does not update the value of the non-traded securities in its portfolio.
16
KAYNE ANDERSON ENERGY DEVELOPMENT COMPANY
NOTES TO FINANCIAL STATEMENTS
(amounts in 000’s, except number of option contracts, share and per share amounts)
(UNAUDITED)
D. Investment Valuation — Readily marketable portfolio securities listed on any exchange other than the NASDAQ Stock Market, Inc. (“NASDAQ”) are valued, except as indicated below, at the last sale price on the business day as of which such value is being determined. If there has been no sale on such day, the securities are valued at the mean of the most recent bid and ask prices on such day. Securities admitted to trade on the NASDAQ are valued at the NASDAQ official closing price. Portfolio securities traded on more than one securities exchange are valued at the last sale price on the business day as of which such value is being determined at the close of the exchange representing the principal market for such securities.
Equity securities traded in the over-the-counter market, but excluding securities admitted to trading on the NASDAQ, are valued at the closing bid prices. Debt securities that are considered bonds are valued by using the mean of the bid and ask prices provided by an independent pricing service. For debt securities that are considered bank loans, the fair market value is determined by using the mean of the bid and ask prices provided by the agent or syndicate bank or principal market maker. When price quotes are not available, fair market value will be based on prices of comparable securities. In certain cases, the Company may not be able to purchase or sell debt securities at the quoted prices due to the lack of liquidity for these securities.
Exchange-traded options and futures contracts are valued at the last sale price at the close of trading in the market where such contracts are principally traded or, if there was no sale on the applicable exchange on such day, at the mean between the quoted bid and ask price as of the close of trading on such exchange.
The Company holds securities that are privately issued or otherwise restricted as to resale. For these securities, as well as any other portfolio security held by the Company for which reliable market quotations are not readily available, valuations are determined in a manner that most accurately reflects fair value of the security on the valuation date. Unless otherwise determined by the Board of Directors, the following valuation process is used for such securities:
| | • | | Investment Team Valuation. The applicable investments are valued by senior professionals of KA Fund Advisors, LLC (“KAFA” or the “Adviser”) who are responsible for the portfolio investments. |
| | • | | Investment Team Valuation Documentation. Preliminary valuation conclusions will be determined by senior management of KAFA. Such valuations are submitted to the Valuation Committee (a committee of the Company’s Board of Directors) and the Board of Directors on a quarterly basis. New private investments made during a quarter will be valued by senior management of KAFA. |
| | • | | Valuation Committee. The Valuation Committee meets to consider valuations presented by KAFA at the end of each quarter. The Valuation Committee’s valuation determinations are subject to ratification by the Board of Directors at its next regular meeting. |
| | • | | Valuation Firm. Quarterly, a third-party valuation firm engaged by the Board of Directors reviews the valuation methodologies and calculations employed for these securities, unless the aggregate fair value of such security is less than 0.1% of total assets. |
| | • | | Board of Directors Determination. The Board of Directors meets quarterly to consider the valuations provided by KAFA and the Valuation Committee and ratify valuations for the applicable securities. The Board of Directors considers the report provided by the third-party valuation firm in reviewing and determining in good faith the fair value of the applicable portfolio securities. |
At May 31, 2014, the Company held 17.2% of its net assets applicable to common stockholders (10.8% of total assets) in securities that were fair valued pursuant to the procedures adopted by the Board of Directors. The aggregate fair value of these securities at May 31, 2014 was $62,336. See Note 3 — Fair Value and Note 9 — Restricted Securities.
E. Repurchase Agreements — From time to time, the Company has agreed to purchase securities from financial institutions subject to the seller’s agreement to repurchase them at an agreed-upon time and price
17
KAYNE ANDERSON ENERGY DEVELOPMENT COMPANY
NOTES TO FINANCIAL STATEMENTS
(amounts in 000’s, except number of option contracts, share and per share amounts)
(UNAUDITED)
(“repurchase agreements”). The financial institutions with whom the Company enters into repurchase agreements are banks and broker/dealers which KAFA considers creditworthy. The seller under a repurchase agreement is required to maintain the value of the securities as collateral, subject to the agreement, at not less than the repurchase price plus accrued interest. KAFA monitors daily the mark-to-market of the value of the collateral, and, if necessary, requires the seller to maintain additional securities, so that the value of the collateral is not less than the repurchase price. Default by or bankruptcy of the seller would, however, expose the Company to possible loss because of adverse market action or delays in connection with the disposition of the underlying securities. As of May 31, 2014, the Company did not have any repurchase agreements.
F. Security Transactions — Security transactions are accounted for on the date the securities are purchased or sold (trade date). Realized gains and losses are reported on an identified cost basis.
G. Derivative Financial Instruments — The Company may utilize derivative financial instruments in its operations.
Interest rate swap contracts. The Company may use hedging techniques such as interest rate swaps to mitigate potential interest rate risk on a portion of the Company’s leverage. Such interest rate swaps would principally be used to protect the Company against higher costs on its leverage resulting from increases in interest rates. The Company does not hedge any interest rate risk associated with portfolio holdings. Interest rate transactions the Company may use for hedging purposes may expose it to certain risks that differ from the risks associated with its portfolio holdings. A decline in interest rates may result in a decline in the value of the swap contracts, which, everything else being held constant, would result in a decline in the net assets of the Company. In addition, if the counterparty to an interest rate swap or cap defaults, the Company would not be able to use the anticipated net receipts under the interest rate swap or cap to offset its cost of financial leverage.
Interest rate swap contracts are recorded at fair value with changes in value during the reporting period, and amounts accrued under the agreements, included as unrealized gains or losses in the Statement of Operations. Monthly cash settlements under the terms of interest rate swap agreements are recorded as realized gains or losses in the Statement of Operations. The Company generally values interest rate swap contracts based on dealer quotations, if available, or by discounting the future cash flows from the stated terms of the interest rate swap agreement by using interest rates currently available in the market.
Option contracts. The Company is exposed to financial market risks including changes in the valuations of its investment portfolio. The Company may purchase or write (sell) call options. A call option on a security is a contract that gives the holder of the option, in return for a premium, the right to buy from the writer of the option the security underlying the option at a specified exercise price at any time during the term of the option.
The Company would realize a gain on a purchased call option if, during the option period, the value of such securities exceeded the sum of the exercise price, the premium paid and transaction costs; otherwise the Company would realize either no gain or a loss on the purchased call option. The Company may also purchase put option contracts. If a purchased put option is exercised, the premium paid increases the cost basis of the securities sold by the Company.
The Company may also write (sell) call options with the purpose of generating income or reducing its ownership of certain securities. If the Company writes a call option on a security, the Company has the obligation upon exercise of the option to deliver the underlying security upon payment of the exercise price. The Company will only write call options on securities that the Company holds in its portfolio (i.e., covered calls).
When the Company writes a call option, an amount equal to the premium received by the Company is recorded as a liability and is subsequently adjusted to the current fair value of the option written. Premiums received from writing options that expire unexercised are treated by the Company on the expiration date as realized gains from investments. If the Company repurchases a written call option prior to its exercise, the difference between the premium received and the amount paid to repurchase the option is treated as a realized
18
KAYNE ANDERSON ENERGY DEVELOPMENT COMPANY
NOTES TO FINANCIAL STATEMENTS
(amounts in 000’s, except number of option contracts, share and per share amounts)
(UNAUDITED)
gain or loss. If a call option is exercised, the premium is added to the proceeds from the sale of the underlying security in determining whether the Company has realized a gain or loss. The Company, as the writer of an option, bears the market risk of an unfavorable change in the price of the security underlying the written option. See Note 7 — Derivative Financial Instruments.
H. Return of Capital Estimates — Dividends and distributions received from the Company’s investments are comprised of income and return of capital. The payments made by MLPs (and other entities treated as partnerships for federal income tax purposes) are categorized as “distributions” and payments made by corporations are categorized as “dividends.” At the time such dividends and distributions are received, the Company estimates the amount of such payments that is considered investment income and the amount that is considered a return of capital. The Company estimates that 90% of the distributions received from Public MLPs will be treated as a return of capital. Such estimates for Public or Private MLPs and other investments are based on historical information available from each investment and other industry sources. These estimates may subsequently be revised based on information received from investments after their tax reporting periods are concluded.
The following table sets forth (i) the components of total dividends and distributions from the Company’s private and public investments, (ii) the percentage of return of capital attributable to each category and (iii) the estimated total return of capital portion of the dividends and distributions received that are attributable to net realized gains (losses) and net change in unrealized gains (losses). The return of capital portion of the dividends and distributions received is a reduction to investment income, results in an equivalent reduction in the cost basis of the associated investments, and increases net realized gains (losses) and net change in unrealized gains (losses). In accordance with GAAP, the return of capital cost basis reductions are limited to the total amount of the cash distributions received, but for income tax purposes, the cost basis reductions typically exceed cash distributions received due to allocated losses from MLP investments. See Note 6 — Income Taxes.
| | | | | | | | |
| | | For the
Three Months
Ended
May 31,
2014 | | | For the
Six Months
Ended
May 31,
2014 | |
Distributions from private MLPs | | $ | 1,445 | | | $ | 2,860 | |
Distributions from public MLPs and dividends from other public equity investments | | | 7,143 | | | | 14,005 | |
| | | | | | | | |
Total dividends and distributions from investments | | $ | 8,588 | | | | 16,865 | |
| | | | | | | | |
Distributions from private MLPs — % return of capital | | | 51 | % | | | 58 | % |
Distributions from public MLPs and dividends from other public equity investments — % return of capital | | | 78 | % | | | 76 | % |
Total dividends and distributions — % return of capital | | | 74 | % | | | 73 | % |
Return of capital — attributable to net realized gains (losses) | | $ | 675 | | | $ | 1,510 | |
Return of capital — attributable to net change in unrealized gains (losses) | | | 5,651 | | | | 10,765 | |
| | | | | | | | |
Total return of capital | | $ | 6,326 | | | $ | 12,275 | |
| | | | | | | | |
I. Investment Income — The Company records dividends and distributions on the ex-dividend date. Interest income is recognized on the accrual basis, including amortization of premiums and accretion of discounts to the extent that such amounts are expected to be collected. When investing in securities with payment in-kind interest, the Company will accrue interest income during the life of the security even though it will not be receiving cash as the interest is accrued. To the extent that interest income to be received is not expected to be realized, a reserve against income is established. During the three and six months ended May 31, 2014, the Company did not hold any debt securities and did not earn any interest income.
Certain of the Company’s debt securities may be purchased at a discount or premium to the par value of the security. The non-cash accretion of a discount to par value increases interest income while the non-cash amortization of a premium to par value decreases interest income. The accretion of a discount and amortization
19
KAYNE ANDERSON ENERGY DEVELOPMENT COMPANY
NOTES TO FINANCIAL STATEMENTS
(amounts in 000’s, except number of option contracts, share and per share amounts)
(UNAUDITED)
of a premium are based on the effective interest method. The amount of these non-cash adjustments can be found in the Company’s Statement of Cash Flows. The non-cash accretion of a discount increases the cost basis of the debt security, which results in an offsetting unrealized loss. The non-cash amortization of a premium decreases the cost basis of the debt security which results in an offsetting unrealized gain. To the extent that par value is not expected to be realized, the Company discontinues accruing the non-cash accretion of the discount to par value of the debt security.
The Company receives paid-in-kind and non-cash dividends and distributions in the form of additional units or shares from the investments listed in the table below. For paid-in-kind dividends, the additional units are not reflected in investment income during the period received but are recorded as unrealized gains upon receipt. Non-cash distributions are reflected in investment income, and the Company estimates return of capital on these non-cash distributions. During the three and six months ended May 31, 2014, the Company received the following paid-in-kind and non-cash dividends and distributions.
| | | | | | | | |
| | | For the
Three Months
Ended
May 31,
2014 | | | For the
Six Months
Ended
May 31,
2014 | |
Paid-in-kind dividends | | | | | | | | |
Enbridge Energy Management, L.L.C. | | $ | 45 | | | $ | 89 | |
Kinder Morgan Management, LLC | | | 325 | | | | 648 | |
| | | | | | | | |
| | | 370 | | | | 737 | |
| | | | | | | | |
Non-cash distributions | | | | | | | | |
Energy Transfer Partners, L.P. | | | 404 | | | | 795 | |
Enterprise Products Partners L.P. | | | 292 | | | | 562 | |
VantaCore Partners LP | | | 944 | | | | 1,553 | |
| | | | | | | | |
| | | 1,640 | | | | 2,910 | |
| | | | | | | | |
Total paid-in-kind and non-cash dividends and distributions | | $ | 2,010 | | | $ | 3,647 | |
| | | | | | | | |
J. Distributions to Stockholders — Distributions to common stockholders are recorded on the ex-dividend date. The characterization of the distributions paid to common stockholders as either a dividend (ordinary income) or a distribution (return of capital) is based solely on the Company’s operating results during the period and does not reflect the expected results during the remainder of the fiscal year. The actual characterization of the common stock distributions made during the current year will not be determinable until after the end of the fiscal year when the Company can determine earnings and profits and, therefore, the characterization may differ from the preliminary estimates.
K. Income Taxes — The Company is taxed as a corporation and pays federal and applicable state corporate taxes on its taxable income. The Company invests its assets primarily in MLPs, which generally are treated as partnerships for federal income tax purposes. As a limited partner in the MLPs, the Company includes its allocable share of the MLPs’ taxable income in computing its own taxable income. Current income taxes reflect the amount of income taxes that the Company expects to be payable as of a measurement date applying the provisions of the enacted tax laws. Deferred income taxes reflect (i) taxes on unrealized gains (losses), which are attributable to the difference between fair market value and tax basis, (ii) the net tax effects of temporary differences between the carrying amounts of assets and liabilities for financial reporting purposes and the amounts used for income tax purposes and (iii) the net tax benefit of accumulated net operating and capital losses. To the extent the Company has a deferred tax asset, consideration is given as to whether or not a valuation allowance is required. The need to establish a valuation allowance for deferred tax assets is assessed periodically by the Company based on the Income Tax Topic of the Financial Accounting Standards Board (“FASB”)
20
KAYNE ANDERSON ENERGY DEVELOPMENT COMPANY
NOTES TO FINANCIAL STATEMENTS
(amounts in 000’s, except number of option contracts, share and per share amounts)
(UNAUDITED)
Accounting Standards Codification (ASC 740), that it is more likely than not that some portion or all of the deferred tax asset will not be realized. In the assessment for a valuation allowance, consideration is given to all positive and negative evidence related to the realization of the deferred tax asset. This assessment considers, among other matters, the nature, frequency and severity of current and cumulative losses, forecasts of future profitability (which are highly dependent on future cash distributions from the Company’s MLP holdings), the duration of statutory carryforward periods and the associated risk that operating and capital loss carryforwards may expire unused.
The Company may rely to some extent on information provided by MLPs, which may not necessarily be timely, to estimate taxable income allocable to the MLP units held in the portfolio and to estimate the associated current or deferred tax liability. Such estimates are made in good faith. From time to time, as new information becomes available, the Company modifies its estimates or assumptions regarding the current or deferred tax liability.
The Company’s policy is to classify interest and penalties associated with underpayment of federal and state income taxes, if any, as income tax expense on its Statement of Operations. As of May 31, 2014, the Company did not have any outstanding interest or penalties associated with the underpayment of any income taxes. Tax years subsequent to the fiscal year end November 30, 2009 remain open and subject to examination by the federal and state tax authorities.
L. Indemnifications — Under the Company’s organizational documents, its officers and directors are indemnified against certain liabilities arising out of the performance of their duties to the Company. In addition, in the normal course of business, the Company enters into contracts that provide general indemnification to other parties. The Company’s maximum exposure under these arrangements is unknown, as this would involve future claims that may be made against the Company that have not yet occurred, and may not occur. However, the Company has not had prior claims or losses pursuant to these contracts and expects the risk of loss to be remote.
M. Foreign Currency Translations — The books and records of the Company are maintained in U.S. dollars. Foreign currency amounts are translated into U.S. dollars on the following basis: (i) market value of investment securities, assets and liabilities at the rate of exchange as of the valuation date; and (ii) purchases and sales of investment securities, income and expenses at the relevant rates of exchange prevailing on the respective dates of such transactions.
The Company does not isolate that portion of gains and losses on investments in equity and debt securities which is due to changes in the foreign exchange rates from that which is due to changes in market prices of equity and debt securities. Accordingly, realized and unrealized foreign currency gains and losses with respect to such securities are included in the reported net realized and unrealized gains and losses on investment transactions balances.
Net realized foreign exchange gains or losses represent gains and losses from transactions in foreign currencies and foreign currency contracts, foreign exchange gains or losses realized between the trade date and settlement date on security transactions, and the difference between the amounts of interest and dividends recorded on the Company’s books and the U.S. dollar equivalent of such amounts on the payment date.
Net unrealized foreign exchange gains or losses represent the difference between the cost of assets and liabilities (other than investments) recorded on the Company’s books from the value of the assets and liabilities (other than investments) on the valuation date.
The Fair Value Measurement Topic of the FASB Accounting Standards Codification (“ASC 820”) defines fair value as the price at which an orderly transaction to sell an asset or to transfer a liability would take place
21
KAYNE ANDERSON ENERGY DEVELOPMENT COMPANY
NOTES TO FINANCIAL STATEMENTS
(amounts in 000’s, except number of option contracts, share and per share amounts)
(UNAUDITED)
between market participants under current market conditions at the measurement date. As required by ASC 820, the Company has performed an analysis of all assets and liabilities (other than deferred taxes) measured at fair value to determine the significance and character of all inputs to their fair value determination. Inputs are the assumptions, along with considerations of risk, that a market participant would use to value an asset or a liability. In general, observable inputs are based on market data that is readily available, regularly distributed and verifiable that the Company obtains from independent, third-party sources. Unobservable inputs are developed by the Company based on its own assumptions of how market participants would value an asset or a liability.
Accounting Standards Update (“ASU”) No. 2011-04 “Amendments to Achieve Common Fair Value Measurement and Disclosure Requirements in U.S. GAAP and IFRSs” amends ASC 820. The amended guidance clarifies the wording used to describe many requirements in accounting literature for fair value measurement and disclosure to establish consistency between U.S. GAAP and International Financial Reporting Standards (“IFRSs”).
ASU No. 2011-04 requires the inclusion of additional disclosures on assumptions used by the Company to determine fair value. Specifically, for assets measured at fair value using significant unobservable inputs (Level 3), ASU No. 2011-04 requires that the Company (i) describe the valuation process, (ii) disclose quantitative information about unobservable inputs and (iii) provide a qualitative discussion about the sensitivity of the fair value measurement to changes in the unobservable inputs and inter-relationships between the inputs.
The fair value hierarchy prioritizes the inputs to valuation techniques used to measure fair value into the following three broad categories.
| | • | | Level 1 — Valuations based on quoted unadjusted prices for identical instruments in active markets traded on a national exchange to which the Company has access at the date of measurement. |
| | • | | Level 2 — Valuations based on quoted prices for similar instruments in active markets; quoted prices for identical or similar instruments in markets that are not active; and model-derived valuations in which all significant inputs and significant value drivers are observable in active markets. Level 2 inputs are those in markets for which there are few transactions, the prices are not current, little public information exists or instances where prices vary substantially over time or among brokered market makers. |
| | • | | Level 3 — Model derived valuations in which one or more significant inputs or significant value drivers are unobservable. Unobservable inputs are those inputs that reflect the Company’s own assumptions that market participants would use to price the asset or liability based on the best available information. |
The following table presents the Company’s assets and liabilities measured at fair value on a recurring basis at May 31, 2014, and the Company presents these assets and liabilities by security type and description on its Schedule of Investments or on its Statement of Assets and Liabilities. Note that the valuation levels below are not necessarily an indication of the risk or liquidity associated with the underlying investment.
| | | | | | | | | | | | | | | | |
| | | Total | | | Quoted Prices in
Active Markets
(Level 1) | | | Prices with Other
Observable Inputs
(Level 2) | | | One or More
Unobservable Inputs
(Level 3) | |
Assets at Fair Value | | | | | | | | | | | | | | | | |
Equity investments | | $ | 565,841 | | | $ | 503,505 | | | $ | — | | | $ | 62,336 | |
| | | | | | | | | | | | | | | | |
Liabilities at Fair Value | | | | | | | | | | | | | | | | |
Call option contracts written | | $ | 19 | | | $ | — | | | $ | 19 | | | $ | — | |
For the six months ended May 31, 2014, there were no transfers between Level 1 and Level 2.
22
KAYNE ANDERSON ENERGY DEVELOPMENT COMPANY
NOTES TO FINANCIAL STATEMENTS
(amounts in 000’s, except number of option contracts, share and per share amounts)
(UNAUDITED)
The following tables present the Company’s assets measured at fair value on a recurring basis using significant unobservable inputs (Level 3) for the three and six months ended May 31, 2014.
| | | | |
Three Months Ended May 31, 2014 | | Equity
Investments | |
Balance — February 28, 2014 | | $ | 62,173 | |
Realized gains (losses) | | | — | |
Unrealized gains (losses), net | | | (781 | ) |
Purchase | | | — | |
Issuance | | | 944 | |
Transfers out to Level 1 and 2 | | | — | |
| | | | |
Balance — May 31, 2014 | | $ | 62,336 | |
| | | | |
| | | | |
Six Months Ended May 31, 2014 | | Equity
Investments | |
Balance — November 30, 2013 | | $ | 54,811 | |
Realized gains (losses) | | | — | |
Unrealized gains (losses), net | | | 5,331 | |
Purchase | | | 641 | |
Issuances | | | 1,553 | |
Transfers out to Level 1 and 2 | | | — | |
| | | | |
Balance — May 31, 2014 | | $ | 62,336 | |
| | | | |
The $781 of unrealized losses and $5,331 of unrealized gains for the three and six months ended May 31, 2014 relate to investments that are still held at May 31, 2014, and the Company includes these unrealized gains (losses) on the Statement of Operations — Net Change in Unrealized Gains.
The purchase of $641 for the six months ended May 31, 2014 relates to the Company's additional investment in VantaCore Partners LP ("VantaCore") (Class B Preferred Units), which was made in February 2014. The issuances of $944 and $1,553 for the three and six months ended May 31, 2014 relate to additional units received from VantaCore (Class A Preferred Units) as non-cash distributions.
| Valuation | Techniques and Unobservable Inputs |
Unless otherwise determined by the Board of Directors, the Company values its PIPE investments that are convertible into or otherwise will become publicly tradeable (e.g., through subsequent registration or expiration of a restriction on trading) based on the market value of the publicly-traded security less a discount. This discount is initially equal to the discount negotiated at the time the Company agrees to a purchase price. To the extent that such securities are convertible or otherwise become publicly traded within a time frame that may be reasonably determined, this discount will be amortized on a straight line basis over such estimated time frame.
The Company’s investment in Plains AAP, L.P. (“PAA GP”), which controls the general partner of Plains All American, L.P., is valued as a PIPE investment. The Company’s ownership of PAA GP is exchangeable into shares of Plains GP Holdings, L.P. (“Plains GP”) on a one-for-one basis at the Company’s option. Plains GP completed its initial public offering in October 2013 and in connection with the offering, the Company agreed to a 15-month lock-up on any Plains GP shares it receives in exchange for its ownership in PAA GP (lock-up expires in January 2015). During the 15-month lock-up period, the Company is valuing its investment in PAA GP on an “as exchanged” basis based on the public market value of Plains GP less a discount because of the lack of liquidity.
23
KAYNE ANDERSON ENERGY DEVELOPMENT COMPANY
NOTES TO FINANCIAL STATEMENTS
(amounts in 000’s, except number of option contracts, share and per share amounts)
(UNAUDITED)
One of the Company’s private investments is Class B Units of Capital Product Partners L.P. (“CPLP”). The Class B Units are convertible units (convertible on a one-for-one basis into common units) and are senior to CPLP’s common units in terms of liquidation preference and priority of distributions. The Company’s Board of Directors has determined that it is appropriate to value the Class B Units using a convertible pricing model. This model takes into account the attributes of the Class B Units, including the preferred dividend, conversion ratio and call features, to determine the estimated value of such units. In using this model, the Company estimates (i) the credit spread for CPLP’s Class B Units, which is based on credit spreads for companies in a similar line of business as CPLP and (ii) the expected volatility for CPLP’s common units, which is based on CPLP’s historical volatility. The Company applies a discount to the value derived from the convertible pricing model to account for an expected discount in market prices for convertible securities relative to the values calculated using pricing models. To the extent this resulting price per Class B Unit is less than the public market price for CPLP’s common units at such time, the public market price is used for the Class B Units.
The Company’s investments in private companies are typically valued using one of or a combination of the following valuation techniques: (i) analysis of valuations for publicly-traded companies in a similar line of business (“public company analysis”); (ii) analysis of valuations for comparable M&A transactions (“M&A analysis”); and (iii) discounted cash flow analysis. The table entitled “Quantitative Table for Valuation Techniques” outlines the valuation technique(s) used for each asset category.
The public company analysis utilizes valuation ratios for publicly-traded companies in a similar line of business as the portfolio company to estimate the fair value of such portfolio company. The Company typically focuses on the following valuation ratios: (a) distribution yields (“yield analysis”), which are calculated by dividing the company’s annual distribution by its stock price and (b) trading multiples (“trading multiple analysis”), which are the ratio of certain measures of cash flow to the company’s enterprise value and equity value (as described below in more detail).
For both the yield analysis and the trading multiple analysis, the Company utilizes projections provided by external sources (i.e., third party equity research estimates) as well as internally developed estimates, and the Company focuses on EBITDA and distribution projections for the current calendar year and next calendar year. Based on this data, the Company selects a range of yields given the yields of similar publicly-traded companies and applies such yields to the portfolio company’s projected distributions to estimate the portfolio company’s equity value. For the trading multiple analysis, the Company focuses on the ratio of enterprise value (“EV”) to earnings before interest expense, income tax expense, depreciation and amortization (“EBITDA”), which is referred to as an EV/EBITDA multiple. The Company selects a range of EV/EBITDA multiples given the trading multiples of similar publicly-traded companies and applies such multiples to the portfolio company’s projected EBITDA to estimate the portfolio company’s enterprise value and resulting equity value. When calculating these values, the Company applies a discount to the portfolio company’s estimated equity value for the size of the company and the lack of marketability in the portfolio company’s securities.
The M&A analysis utilizes valuation multiples for historical M&A transactions for companies or assets in a similar line of business as the portfolio company to estimate the fair value of such portfolio company. Typically, the Company’s analysis focuses on EV/EBITDA multiples. The Company selects a range of multiples based on EV/EBITDA multiples for similar M&A transactions and applies such ranges to the portfolio company’s EBITDA to estimate the portfolio company’s enterprise value. The Company utilizes projections provided by external sources as well as internally developed estimates to calculate the valuation multiples of the comparable M&A transactions.
For the Company’s preferred equity investments, a discounted cash flow analysis is utilized to estimate the value of such security by calculating the present value of the security’s preferred distributions. In this calculation, the discount rates used are based on the Company’s assessment of the expected return market participants would require on such security. This assessment is based in part on prevailing yields of similar preferred stock and debt securities.
24
KAYNE ANDERSON ENERGY DEVELOPMENT COMPANY
NOTES TO FINANCIAL STATEMENTS
(amounts in 000’s, except number of option contracts, share and per share amounts)
(UNAUDITED)
Under these valuation techniques, the Company estimates operating results of its portfolio companies (including EBITDA and distributions). These estimates utilize unobservable inputs such as historical operating results, which may not be publicly available, and projected operating results, which will be based on operating assumptions for such portfolio company. The Company also consults with management of the portfolio companies to develop these financial projections. These estimates will be sensitive to changes in assumptions specific to such portfolio company as well as general assumptions for the industry. Other unobservable inputs utilized in the valuation techniques outlined above include: discounts for lack of marketability, selection of publicly-traded companies, selection of similar M&A transactions, selected ranges for valuation multiples, selected range of yields and expected required rates of return (discount rates).
Changes in EBITDA multiples, market yields or discount rates, each in isolation, may change the fair value of the Company’s portfolio investments. Generally, a decrease in EBITDA multiples or an increase in market yields or discount rates will result in a decrease in the fair value of the Company’s portfolio investments.
Due to the inherent uncertainty of determining the fair value of investments that do not have a readily available market value, the fair value of the Company’s investments may fluctuate from period to period. Additionally, the fair value of the Company’s investments may differ from the values that would have been used had a ready market existed for such investments and may differ materially from the values that the Company may ultimately realize.
The following table summarizes the significant unobservable inputs that the Company used to value its portfolio investments categorized as Level 3 as of May 31, 2014:
Quantitative Table for Valuation Techniques
| | | | | | | | | | | | | | | | | | | | | | |
| | | | | | | | | | Range | | | Weighted
Average | |
Assets at Fair Value | | Fair Value | | | Valuation Technique | | Unobservable Inputs | | Low | | | | | High | | |
Equity securities of | | $ | 24,048 | | | - Discount to publicly-traded | | - Current discount | | | 5.1% | | | | | | 5.1% | | | | 5.1% | |
public companies (PIPE) — valued based on a discount to market value | | | | | | securities | | | | | | | | | | | | | | | | |
| | | | | | | | | | | | | | | | | | | | | | |
Equity securities of | | | 6,503 | | | - Convertible pricing model | | - Credit spread | | | 6.3% | | | | | | 6.8% | | | | 6.5% | |
public companies — | | | | | | | | - Volatility | | | 25.0% | | | | | | 30.0% | | | | 27.5% | |
not valued based on a discount to market value | | | | | | | | - Discount for marketability | | | 8.0% | | | | | | 8.0% | | | | 8.0% | |
| | | | | | | | | | | | | | | | | | | | | | |
Equity securities of | | | 20,775 | | | - Public company analysis | | | | | | | | | | | | | | | | |
private companies — common units | | | | | | • Yield analysis | | - Valuation yield for IPO analysis | | | 9.5% | | | | | | 11.0% | | | | 10.3% | |
| | | | | | | | | | | | | | | | | | | | | | |
| | | | | | • Trading multiple analysis | | - EV / 2014E EBITDA | | | 10.0x | | | | | | 12.0x | | | | 11.0x | |
| | | | | | | | - EV / 2015E EBITDA | | | 9.0x | | | | | | 11.0x | | | | 10.0x | |
| | | | | | | | - Discount for marketability | | | 20.0% | | | | | | 20.0% | | | | 20.0% | |
| | | | | | | | | | | | | | | | | | | | | | |
| | | | | | - M&A analysis | | - Selected EV / EBITDA multiples | | | 8.0x | | | | | | 9.0x | | | | 8.5x | |
| | | | | | | | | | | | | | | | | | | | | | |
Equity securities of | | | 11,010 | | | - Discounted cash flow | | - Selected rates of return | | | 11.0% | | | | | | 15.0% | | | | 13.4% | |
private companies — | | | | | | | | | | | | | | | | | | | | | | |
preferred units | | | | | | | | | | | | | | | | | | | | | | |
| | | | | | | | | | | | | | | | | | | | | | |
| | | | | | | | | | | | | | | | | | | | | | |
Total | | $ | 62,336 | | | | | | | | | | | | | | | | | | | |
| | | | | | | | | | | | | | | | | | | | | | |
25
KAYNE ANDERSON ENERGY DEVELOPMENT COMPANY
NOTES TO FINANCIAL STATEMENTS
(amounts in 000’s, except number of option contracts, share and per share amounts)
(UNAUDITED)
The Company’s investments are concentrated in the energy sector. The focus of the Company’s portfolio within the energy sector may present more risks than if the Company’s portfolio were broadly diversified across numerous sectors of the economy. A downturn in the energy sector would have a larger impact on the Company than on an investment company that does not concentrate in energy. The performance of securities in the energy sector may lag the performance of other industries or the broader market as a whole. Additionally, to the extent that the Company invests a relatively high percentage of its assets in the securities of a limited number of issuers, the Company may be more susceptible than a more widely diversified investment company to any single economic, political or regulatory occurrence. At May 31, 2014, the Company had the following investment concentrations.
| | | | |
Category | | Percent of
Long-Term
Investments | |
Securities of energy companies | | | 100.0 | % |
Equity securities | | | 100.0 | % |
MLP securities(1) | | | 98.7 | % |
Largest single issuer | | | 8.7 | % |
Restricted securities | | | 11.0 | % |
| (1) | MLP securities consist of preferred and common units of private entities structured as limited partnerships and publicly traded energy-related master limited partnerships and limited liability companies that are treated as partnerships for federal income tax purposes and their affiliates (including affiliates of MLPs that own general partner interests or, in some cases subordinated units, registered or unregistered common units, or other limited partner units in an MLP). |
| 5. | Agreements and Affiliations |
A. Administration Agreement — The Company has an administration and accounting agreement with Ultimus Fund Solutions, LLC (“Ultimus”) that may be amended from time to time. Pursuant to the agreement, Ultimus will provide certain administrative and accounting services for the Company. The agreement has an initial term of two years (expiring on November 14, 2015) and has automatic one-year renewals unless earlier terminated by either party as provided under the terms of the agreement.
B. Investment Management Agreement — The Company has entered into an investment management agreement with KAFA under which KAFA, subject to the overall supervision of the Company’s Board of Directors, manages the day-to-day operations of, and provides investment advisory services to, the Company. For providing these services, KAFA receives an investment management fee from the Company. On September 26, 2013, the Company renewed its agreement with KAFA for a period of one year. The agreement will expire on October 2, 2014 and may be renewed annually thereafter upon the approval of the Company’s Board of Directors (including a majority of the Company’s directors who are not “interested persons” of the Company, as such term is defined in the 1940 Act). In conjunction with this renewal, the Company entered into a new one-year agreement with KAFA to waive a portion of its management fee, which agreement may be renewed annually. For a one-year period effective October 3, 2013, KAFA agreed to waive 0.25% of its 1.75% management fee, thereby reducing the management fee to 1.50% on average total assets. This decision was based, in part, on the portion of securities in the Company’s portfolio which were publicly traded vs. the portion that were privately held (i.e., private companies).
For purposes of calculating the management fee, the “average total assets” for each quarterly period are determined by averaging the total assets at the last day of that quarter with the total assets at the last day of the prior quarter. Total assets (excluding deferred taxes) shall equal gross asset value (which includes assets attributable to the use of leverage instruments), minus the sum of accrued and unpaid dividends and distributions
26
KAYNE ANDERSON ENERGY DEVELOPMENT COMPANY
NOTES TO FINANCIAL STATEMENTS
(amounts in 000’s, except number of option contracts, share and per share amounts)
(UNAUDITED)
on common and preferred stock and accrued liabilities (other than liabilities associated with leverage and deferred taxes). Liabilities associated with leverage include the principal amount of any borrowings, commercial paper or notes that the Company may issue, the liquidation preference of outstanding preferred stock, and other liabilities from other forms of leverage such as short positions and put or call options held or written by the Company. The Company’s management fees for the three and six months ended May 31, 2014 were $2,003 and $3,782, net of management fee waivers of $334 and $630.
C. Portfolio Companies — From time to time, the Company may “control” or may be an “affiliate” of one or more of its portfolio companies, as each of these terms is defined in the 1940 Act. In general, under the 1940 Act, the Company would be presumed to “control” a portfolio company if the Company and its affiliates owned 25% or more of its outstanding voting securities and would be an “affiliate” of a portfolio company if the Company and its affiliates owned 5% or more of its outstanding voting securities. The 1940 Act contains prohibitions and restrictions relating to transactions between investment companies and their affiliates (including the Company’s investment adviser), principal underwriters and affiliates of those affiliates or underwriters.
The Company believes that there are several factors that determine whether or not a security should be considered a “voting security” in complex structures such as limited partnerships of the kind in which the Company invests. The Company also notes that the SEC staff has issued guidance on the circumstances under which it would consider a limited partnership interest to constitute a voting security. Under most partnership agreements, the management of the partnership is vested in the general partner, and the limited partners, individually or collectively, have no rights to manage or influence management of the partnership through such activities as participating in the selection of the managers or the board of the limited partnership or the general partner. As a result, the Company believes that many of the limited partnership interests in which it invests should not be considered voting securities. However, it is possible that the SEC staff may consider the limited partner interests the Company holds in certain limited partnerships to be voting securities. If such a determination were made, the Company may be regarded as a person affiliated with and controlling the issuer(s) of those securities for purposes of Section 17 of the 1940 Act.
In making such a determination as to whether to treat any class of limited partnership interests the Company holds as a voting security, the Company considers, among other factors, whether or not the holders of such limited partnership interests have the right to elect the board of directors of the limited partnership or the general partner. If the holders of such limited partnership interests do not have the right to elect the board of directors, the Company generally has not treated such security as a voting security. In other circumstances, based on the facts and circumstances of those partnership agreements, including the right to elect the directors of the general partner, the Company has treated those securities as voting securities. If the Company does not consider the security to be a voting security, it will not consider such partnership to be an “affiliate” unless the Company and its affiliates own more than 25% of the outstanding securities of such partnership. Additionally, certain partnership agreements give common unitholders the right to elect the partnership’s board of directors, but limit the amount of voting securities any limited partner can hold to no more than 4.9% of the partnership’s outstanding voting securities (i.e., any amounts held in excess of such limit by a limited partner do not have voting rights). In such instances, the Company does not consider itself to be an affiliate if it owns more than 5% of such partnership’s common units.
There is no assurance that the SEC staff will not consider that other limited partnership securities that the Company owns and does not treat as voting securities are, in fact, voting securities for the purposes of Section 17 of the 1940 Act. If such determination were made, the Company will be required to abide by the restrictions on “control” or “affiliate” transactions as proscribed in the 1940 Act. The Company or any portfolio company that it controls, and its affiliates, may from time to time engage in certain of such joint transactions, purchases, sales and loans in reliance upon and in compliance with the conditions of certain exemptive rules promulgated by the SEC. The Company cannot make assurances, however, that it would be able to satisfy the conditions of these rules with respect to any particular eligible transaction, or even if the Company were allowed to engage in such a transaction,
27
KAYNE ANDERSON ENERGY DEVELOPMENT COMPANY
NOTES TO FINANCIAL STATEMENTS
(amounts in 000’s, except number of option contracts, share and per share amounts)
(UNAUDITED)
that the terms would be more or as favorable to the Company or any company that it controls as those that could be obtained in arm’s length transaction. As a result of these prohibitions, restrictions may be imposed on the size of positions that may be taken for the Company or on the type of investments that it could make.
As of May 31, 2014, the Company believes that MarkWest Energy Partners, L.P. meets the criteria described above and is therefore considered an affiliate of the Company.
Emerge Energy Services LP — Kevin S. McCarthy is Chairman of the Board of Directors and President and Chief Executive Officer of the Company. Mr. McCarthy also serves as a director on the board of Emerge Energy Services GP LLC (“Emerge GP”), the general partner of Emerge Energy Services LP (“Emerge”). Various affiliated funds managed by KAFA, including the Company, own units of Emerge. The Company believes that it is an affiliate of Emerge under the 1940 Act by virtue of Mr. McCarthy’s participation on the board of Emerge GP.
Plains GP Holdings, L.P., Plains AAP, L.P. and Plains All American Pipeline, L.P. — Robert V. Sinnott is Chief Executive Officer of Kayne Anderson Capital Advisors, L.P. (“KACALP”), the managing member of KAFA. Mr. Sinnott also serves as a director of (i) PAA GP Holdings LLC, which is the general partner of Plains GP Holdings, L.P. (“Plains GP”) and (ii) Plains All American GP LLC (“Plains All American GP”), which controls the general partner of Plains All American Pipeline, L.P. (“PAA”). Members of senior management of KACALP and KAFA and various affiliated funds managed by KACALP, including the Company, own shares of Plains GP as well as interests in Plains AAP, L.P. (“PAA GP”) (which are exchangeable into shares of Plains GP as described in Note 3 — Fair Value). The Company believes that it is an affiliate of Plains GP and PAA under the 1940 Act by virtue of (i) the Company’s and other affiliated Kayne Anderson funds’ ownership interest in Plains GP and PAA GP and (ii) Mr. Sinnott’s participation on the boards of Plains GP and Plains All American GP.
VantaCore Partners LP — At May 31, 2014, the Company held a 23.5% limited partnership interest in VantaCore Partners LP (“VantaCore”). The Company believes that the limited partnership interests of VantaCore should not be considered voting securities for purposes of the 1940 Act because of the limited scope and character of the rights of such securities. One of the Company’s Senior Vice Presidents serves as Chairman of the board of directors of the general partner for VantaCore. Although the Company does not own any interest in the general partner of VantaCore, it believes it is an affiliate of VantaCore under the 1940 Act by virtue of its participation on the board of the general partner.
The Company’s taxes include current and deferred income taxes. Current income taxes reflect the estimated income tax liability of the Company as of a measurement date. Deferred income taxes reflect (i) taxes on unrealized gains (losses), which are attributable to the difference between fair market value and tax basis, (ii) the net tax effects of temporary differences between the carrying amounts of assets and liabilities for financial reporting purposes and the amounts used for income tax purposes and (iii) the net tax benefit of accumulated net operating and capital losses, if any.
During the six months ended May 31, 2014, the Company paid $5,200 of federal income taxes and $269 of state income taxes, net of refunds. At May 31, 2014, the Company had a current income tax liability of $4,441. The liability is the result of the Company’s current year to date estimated income tax expense ($10,504) exceeding its estimated income tax payments of $5,469 and its receivable related to the capital loss carryforward ($594) at November 30, 2013. During second quarter 2014, the Company changed its state tax rate from 1.8% to 2.0% (net of federal benefit), based on updated apportionment data.
28
KAYNE ANDERSON ENERGY DEVELOPMENT COMPANY
NOTES TO FINANCIAL STATEMENTS
(amounts in 000’s, except number of option contracts, share and per share amounts)
(UNAUDITED)
Components of the Company’s current and deferred tax assets and liabilities are as follows:
| | | | |
| | | As of
May 31, 2014 | |
Current income tax liability | | $ | (4,441 | ) |
| |
Deferred tax asset: | | | | |
Organizational costs | | $ | 12 | |
Deferred tax liabilities: | | | | |
Net unrealized gains on investment securities | | | (98,268 | ) |
| | | | |
Total net deferred tax liability | | $ | (98,256 | ) |
| | | | |
The Company utilized all of its estimated federal and state net operating loss carryforwards of $5,358 and $5,328, respectively (amounts as of November 30, 2013), during first quarter 2014.
The Company primarily invests in equity securities issued by MLPs, which generally are treated as partnerships for federal income tax purposes. As a limited partner of MLPs, the Company includes its allocable share of such MLPs’ income or loss in computing its own taxable income or loss. Additionally, for income tax purposes, the Company reduces the cost basis of its MLP investments by the cash distributions received, and increases or decreases the cost basis of its MLP investments by its allocable share of the MLP’s income or loss.
As of May 31, 2014, the identified cost of investments for federal income tax purposes was $310,071. The cost basis for federal income tax purposes is $50,503 lower than the cost basis for GAAP reporting purposes primarily due to the additional basis adjustments attributable to the Company’s share of the allocated losses from its MLP investments. Gross unrealized appreciation and depreciation of investments and options for federal income tax purposes were as follows:
| | | | |
| | | As of
May 31, 2014 | |
Gross unrealized appreciation of investments (including options) | | $ | 256,316 | |
Gross unrealized depreciation of investments (including options) | | | (542 | ) |
| | | | |
Net unrealized appreciation of investments (including options) | | $ | 255,774 | |
| | | | |
Components of the Company’s income tax benefit (expense) were as follows:
| | | | | | | | |
| | | For the
Three Months
Ended
May 31, 2014 | | | For the
Six Months
Ended
May 31, 2014 | |
Current income tax benefit — net investment loss | | | 249 | | | | 278 | |
Deferred income tax benefit — net investment loss | | | 8 | | | | 174 | |
Current income tax expense — net realized gains | | | (9,627 | ) | | | (10,782 | ) |
Deferred income tax expense — net realized gains | | | (203 | ) | | | (6,751 | ) |
Deferred income tax expense — net unrealized gains | | | (15,657 | ) | | | (17,631 | ) |
| | | | | | | | |
Total income tax expense | | $ | (25,230 | ) | | $ | (34,712 | ) |
| | | | | | | | |
29
KAYNE ANDERSON ENERGY DEVELOPMENT COMPANY
NOTES TO FINANCIAL STATEMENTS
(amounts in 000’s, except number of option contracts, share and per share amounts)
(UNAUDITED)
Total income taxes were different from the amount computed by applying the federal statutory income tax rate of 35% to the net investment income and realized and unrealized gains (losses) on investments before taxes as follows:
| | | | | | | | |
| | | For the
Three Months
Ended
May 31, 2014 | | | For the
Six Months
Ended
May 31, 2014 | |
Computed federal income tax at 35% | | $ | (23,444 | ) | | $ | (32,479 | ) |
State income tax, net of federal tax | | | (1,391 | ) | | | (1,855 | ) |
Effect of change in state tax rate (0.2%) | | | (402 | ) | | | (402 | ) |
Other, net | | | 7 | | | | 24 | |
| | | | | | | | |
Total income tax expense | | $ | (25,230 | ) | | $ | (34,712 | ) |
| | | | | | | | |
The Company’s policy is to classify interest and penalties associated with underpayment of federal and state income taxes, if any, as income tax expense on its Statement of Operations. As of May 31, 2014, the Company did not have any interest or penalties associated with the underpayment of any income taxes. Tax years subsequent to the fiscal year end November 30, 2009 remain open and subject to examination by the federal and state tax authorities.
| 7. | Derivative Financial Instruments |
As required by the Derivatives and Hedging Topic of the FASB Accounting Standards Codification (ASC 815), the following are the derivative instruments and hedging activities of the Company. See Note 2 — Significant Accounting Policies.
Option Contracts — Transactions in option contracts for the three and six months ended May 31, 2014 were as follows:
| | | | | | | | |
Three Months Ended May 31, 2014 | | Number of
Contracts | | | Premium | |
Call Options Written | | | | | | | | |
Options outstanding at February 28, 2014 | | | — | | | $ | — | |
Options written | | | 200 | | | | 23 | |
Options exercised | | | — | | | | — | |
Options expired | | | — | | | | — | |
| | | | | | | | |
Options outstanding at May 31, 2014(1) | | | 200 | | | $ | 23 | |
| | | | | | | | |
| | | | | | | | |
Six Months Ended May 31, 2014 | | Number of
Contracts | | | Premium | |
Call Options Written | | | | | | | | |
Options outstanding at November 30, 2013 | | | — | | | $ | — | |
Options written | | | 220 | | | | 29 | |
Options exercised | | | (20 | ) | | | (6 | ) |
Options expired | | | — | | | | — | |
| | | | | | | | |
Options outstanding at May 31, 2014(1) | | | 200 | | | $ | 23 | |
| | | | | | | | |
| (1) | The percentage of total investments subject to call options written was 0.3% at May 31, 2014. |
30
KAYNE ANDERSON ENERGY DEVELOPMENT COMPANY
NOTES TO FINANCIAL STATEMENTS
(amounts in 000’s, except number of option contracts, share and per share amounts)
(UNAUDITED)
The following table sets forth the fair value of the Company's derivative instruments on the Statement of Assets and Liabilities:
| | | | | | |
Derivatives Not Accounted for as
Hedging Instruments | | Statement of Assets and Liabilities Location | | Fair Value as of
May 31, 2014 | |
Call options | | Call option contracts written | | $ | (19 | ) |
The following table sets forth the effect of the Company's derivative instruments on the Statement of Operations:
| | | | | | | | | | |
| | | | | For the Three and Six Months
Ended May 31, 2014 | |
Derivatives Not Accounted for as
Hedging Instruments | | Location of Gains (Losses) on
Derivatives Recognized in Income | | Net Realized
Gains (Losses) on
Derivatives
Recognized in
Income | | | Change in
Unrealized
Gains (Losses) on
Derivatives
Recognized in
Income | |
Call options | | Options | | $ | — | | | $ | 4 | |
| | | | | | | | | | |
| 8. | Investment Transactions |
For the six months ended May 31, 2014, the Company purchased and sold securities in the amount of $102,199 and $88,517 (excluding short-term investments).
From time to time, certain of the Company’s investments may be restricted as to resale. For instance, private investments that are not registered under the Securities Act of 1933, as amended, cannot be offered for public sale in a non-exempt transaction without first being registered. In other cases, certain of the Company’s investments have restrictions such as lock-up agreements that preclude the Company from offering these securities for public sale.
At May 31, 2014, the Company held the following restricted investments:
| | | | | | | | | | | | | | | | | | | | | | | | | | | | |
Investment | | Acquisition
Date | | Type of
Restriction | | Number of
Units
(in 000s) | | | Cost
Basis
(GAAP) | | | Fair
Value | | | Fair Value
Per Unit | | | Percent
of Net
Assets | | | Percent
of Total
Assets | |
Level 3 Investments(1) | | | | | | | | | | | | | | | | | | | | | | | | | | | | |
Capital Product Partners L.P. | | | | | | | | | | | | | | | | | | | | | | | | | | | | |
Class B Units | | (2) | | (3) | | | 606 | | | $ | 4,402 | | | $ | 6,503 | | | $ | 10.73 | | | | 1.8 | % | | | 1.1 | % |
Plains GP Holdings, L.P. | | | | | | | | | | | | | | | | | | | | | | | | | | | | |
Common Units | | (2) | | (4) | | | 918 | | | | 3,377 | | | | 24,048 | | | | 26.20 | | | | 6.7 | | | | 4.2 | |
VantaCore Partners LP(5)(6)(7) | | | | | | | | | | | | | | | | | | | | | | | | | | | | |
Class A Common Units | | (2) | | (8) | | | 2,187 | | | | 18,351 | | | | 20,775 | | | | 9.50 | | | | 5.7 | | | | 3.6 | |
Class A Preferred Units | | (2) | | (8) | | | 456 | | | | 4,905 | | | | 7,642 | | | | 16.75 | | | | 2.1 | | | | 1.3 | |
Class B Preferred Units | | (2) | | (8) | | | 202 | | | | 2,897 | | | | 3,368 | | | | 16.65 | | | | 0.9 | | | | 0.6 | |
| | | | | | | | | | | | | | | | | | | | | | | | | | | | |
Total | | | $ | 33,932 | | | $ | 62,336 | | | | | | | | 17.2 | % | | | 10.8 | % |
| | | | | | | | | | | | | | | | | | | | | | | | | | | | |
| (1) | Securities are valued using inputs reflecting the Company’s own assumptions as more fully described in Note 2 — Significant Accounting Policies and Note 3 — Fair Value. |
| (2) | Security was acquired at various dates during the six months ended May 31, 2014 and/or in prior fiscal years. |
| (3) | Unregistered or restricted security of a publicly-traded company. |
31
KAYNE ANDERSON ENERGY DEVELOPMENT COMPANY
NOTES TO FINANCIAL STATEMENTS
(amounts in 000’s, except number of option contracts, share and per share amounts)
(UNAUDITED)
| (4) | The Company holds an interest in PAA GP, which controls the general partner of Plains All American, L.P. The Company’s ownership of PAA GP is exchangeable into shares of Plains GP (which trades on the NYSE under the ticker “PAGP”) on a one-for-one basis at the Company’s option. The Company agreed to a 15-month lock-up on any Plains GP shares it receives in exchange for its ownership in PAA GP (lock-up expires in January 2015). See Note 3 — Fair Value. |
| (5) | The Company’s investment in VantaCore includes 1,823 incentive distribution rights (18% of total outstanding incentive distribution rights) for which the Company assigns a value of zero. |
| (6) | The Class A Preferred Units are senior to the VantaCore Common Units in liquidation preference. The Class A Preferred Units have a liquidation preference of $17.50 per unit and were issued by VantaCore to holders of the common and preferred units to the extent that such units did not receive full cash distributions. |
| (7) | The Class B Preferred Units have a liquidation preference of $17.50 per unit and a minimum quarterly distribution of $0.3825 per unit and are senior to all other equity classes of VantaCore in distributions and liquidation preference. |
| (8) | Unregistered security of a private company. |
On January 28, 2014, the Company renewed its amended and restated senior secured revolving credit facility (“Credit Facility”), which was scheduled to mature on March 30, 2014, with a syndicate of lenders. The Credit Facility has a three-year commitment, maturing on January 28, 2017 and total commitments of $120,000. Under the Credit Facility, the interest rate is LIBOR plus 1.60% based on current borrowings and the current borrowing base. If borrowings exceed the borrowing base attributable to “quoted” securities (generally defined as equity investments in public MLPs and midstream companies and investments in bank debt and high yield bonds which are traded), the interest rate will increase to LIBOR plus 3.00%. The Company pays a commitment fee of 0.30% per annum on any unused amounts of the new Credit Facility.
The obligations under the Credit Facility are collateralized by substantially all of the Company’s assets. The Credit Facility contains affirmative and reporting covenants and certain financial ratio and restrictive covenants, including: (a) maintaining a ratio, of total assets less liabilities (other than indebtedness and preferred stock) to aggregate indebtedness of the Company of not less than 3.0:1.0, (b) maintaining a ratio, of total assets less liabilities (other than indebtedness and preferred stock) to aggregate indebtedness and preferred stock of the Company of not less than 2:25:1.0 and (c) maintaining the value of the portion of the Company’s portfolio that can be converted into cash within specified time periods and valuations at no less than 10% of the principal amount outstanding under the Credit Facility during any period when adjusted outstanding principal amounts exceed a specified threshold percentage of the Company’s adjusted borrowing base. The Credit Facility also contains customary representations and warranties and events of default.
Under the terms of the Credit Facility, if an investment becomes non-performing, it will reduce the Company’s borrowing base and could cause the Company to be in default under the terms of its loans under the Credit Facility. Debt investments are generally characterized as non-performing if such investments are in default of any payment obligations, and private MLP equity investments are generally characterized as non-performing if such investments fail to pay cash distributions, in their most recent fiscal quarter, that are greater than 80% of their minimum quarterly distribution amount.
Under the terms of the Credit Facility, the Company is restricted from paying distributions to stockholders if, after giving effect to the distribution, the Company would be in default of the Credit Facility. As of May 31, 2014, the Company had $105,000 borrowed under its Credit Facility (at an interest rate of 1.78%), which represented 46.6% and 47.4% of its borrowing base and quoted borrowing base of $225,217 and $221,617, respectively. The maximum amount that the Company can borrow under its Credit Facility is limited to the lesser of the commitment amount of $120,000 and its borrowing base.
32
KAYNE ANDERSON ENERGY DEVELOPMENT COMPANY
NOTES TO FINANCIAL STATEMENTS
(amounts in 000’s, except number of option contracts, share and per share amounts)
(UNAUDITED)
As of May 31, 2014, the Company was in compliance with all financial and operational covenants required by the Credit Facility.
The Company has 200,000,000 shares of common stock authorized. Transactions in common shares for the six months ended May 31, 2014 were as follows:
| | | | |
Shares outstanding at November 30, 2013 | | | 10,459,911 | |
Shares issued through reinvestment of distributions | | | 31,572 | |
| | | | |
Shares outstanding at May 31, 2014 | | | 10,491,483 | |
| | | | |
On June 26, 2014, the Company declared its quarterly distribution of $0.515 per common share for the second quarter of fiscal 2014 for a total of $5,403. The distribution was paid on July 18, 2014. Of this total, pursuant to the Company’s dividend reinvestment plan, $410 was reinvested into the Company through the issuance of shares of common stock.
The Company has performed an evaluation of subsequent events through the date the financial statements were issued and has determined that no additional items require recognition or disclosure.
33
KAYNE ANDERSON ENERGY DEVELOPMENT COMPANY
PRIVACY POLICY NOTICE
(UNAUDITED)
Rev. 01/2011
| | |
FACTS | | WHAT DOES KAYNE ANDERSON ENERGY DEVELOPMENT COMPANY (“KED”) DO WITH YOUR PERSONAL INFORMATION? |
| | |
Why? | | Financial companies choose how they share your personal information. Federal law gives consumers the right to limit some but not all sharing. Federal law also requires us to tell you how we collect, share, and protect your personal information. Please read this notice carefully to understand what we do. |
| | |
What? | | The types of personal information we collect and share depend on the product or service you have with us. This information can include: n Social Security number and account balances n Payment history and transaction history n Account transactions and wire transfer instructions When you are no longer our customer, we continue to share your information as described in this notice. |
| | |
How? | | All financial companies need to share customers’ personal information to run their everyday business. In the section below, we list the reasons financial companies can share their customers’ personal information; the reasons KED chooses to share; and whether you can limit this sharing. |
| | | | |
| Reasons we can share your personal information | | Does KED share? | | Can you limit
this sharing? |
For our everyday business purposes — such as to process your transactions, maintain your account(s), respond to court orders and legal investigations, or report to credit bureaus | | Yes | | No |
For our marketing purposes — to offer our products and services to you | | No | | No |
| For joint marketing with other financial companies | | No | | We don’t share |
For our affiliates’ everyday business purposes — information about your transactions and experiences | | No | | We don’t share |
For our affiliates’ everyday business purposes — information about your creditworthiness | | No | | We don’t share |
| For nonaffiliates to market to you | | No | | We don’t share |
| | |
Questions? | | Call 877-657-3863 or go to http://www.kaynefunds.com |
34
KAYNE ANDERSON ENERGY DEVELOPMENT COMPANY
PRIVACY POLICY NOTICE
(UNAUDITED)
| | |
| Who we are |
| Who is providing this notice? | | KED |
| | |
| What we do |
How does KED protect my personal information? | | To protect your personal information from unauthorized access and use, we use security measures that comply with federal law. These measures include computer safeguards and secured files and buildings. Access to your personal information is on a need-to-know basis. KED has adopted internal policies to protect your non-public personal information. |
How does KED collect my personal information? | | We collect your personal information, for example, when you n Open an account or provide account information n Buy securities from us or make a wire transfer n Give us your contact information We also collect your personal information from other companies. |
| Why can’t I limit all sharing? | | Federal law gives you the right to limit only n sharing for affiliates’ everyday business purposes — information about your creditworthiness n affiliates from using your information to market to you n sharing for nonaffiliates to market to you State laws and individual companies may give you additional rights to limit sharing. |
| | |
| Definitions |
| Affiliates | | Companies related by common ownership or control. They can be financial and nonfinancial companies. n KED does not share with our affiliates. |
| Nonaffiliates | | Companies not related by common ownership or control. They can be financial and nonfinancial companies. n KED does not share with nonaffiliates so they can market to you. |
| Joint marketing | | A formal agreement between nonaffiliated financial companies that together market financial products or services to you. n KED doesn’t jointly market. |
| | |
| Other important information |
| None. |
35
KAYNE ANDERSON ENERGY DEVELOPMENT COMPANY
DIVIDEND REINVESTMENT PLAN
(UNAUDITED)
Kayne Anderson Energy Development Company, a Maryland corporation (the “Company”), has adopted the following plan (the “Plan”) with respect to distributions declared by its Board of Directors (the “Board”) on shares of its Common Stock:
1. Unless a stockholder specifically elects to receive cash as set forth below, all distributions hereafter declared by the Board shall be payable in shares of the Common Stock of the Company, and no action shall be required on such stockholder’s part to receive a distribution in stock.
2. Such distributions shall be payable on such date or dates as may be fixed from time to time by the Board to stockholders of record at the close of business on the record date(s) established by the Board for the distribution involved.
3. The Company may use newly-issued shares of its Common Stock or purchase shares in the open market in connection with the implementation of the plan. The number of shares to be issued to a stockholder shall be based on share price equal to 95% of the closing price of the Company’s Common Stock one day prior to the dividend payment date.
4. The Board may, in its sole discretion, instruct the Company to purchase shares of its Common Stock in the open market in connection with the implementation of the Plan as follows: If the Company’s Common Stock is trading below net asset value at the time of valuation, upon notice from the Company, the Plan Administrator (as defined below) will receive the dividend or distribution in cash and will purchase Common Stock in the open market, on the New York Stock Exchange or elsewhere, for the Participants’ accounts, except that the Plan Administrator will endeavor to terminate purchases in the open market and cause the Company to issue the remaining shares if, following the commencement of the purchases, the market value of the shares, including brokerage commissions, exceeds the net asset value at the time of valuation. These remaining shares will be issued by the Company at a price equal to the greater of (i) the net asset value at the time of valuation or (ii) 95% of the then current market price.
5. In a case where the Plan Administrator has terminated open market purchases and caused the issuance of remaining shares by the Company, the number of shares received by the participant in respect of the cash dividend or distribution will be based on the weighted average of prices paid for shares purchased in the open market, including brokerage commissions, and the price at which the Company issues the remaining shares. To the extent that the Plan Administrator is unable to terminate purchases in the open market before the Plan Administrator has completed its purchases, or remaining shares cannot be issued by the Company because the Company declared a dividend or distribution payable only in cash, and the market price exceeds the net asset value of the shares, the average share purchase price paid by the Plan Administrator may exceed the net asset value of the shares, resulting in the acquisition of fewer shares than if the dividend or distribution had been paid in shares issued by the Company.
6. A stockholder may, however, elect to receive his or its distributions in cash. To exercise this option, such stockholder shall notify American Stock Transfer & Trust Company, the plan administrator and the Company’s transfer agent and registrar (collectively the “Plan Administrator”), in writing so that such notice is received by the Plan Administrator no later than the record date fixed by the Board for the distribution involved.
7. The Plan Administrator will set up an account for shares acquired pursuant to the Plan for each stockholder who has not so elected to receive dividends and distributions in cash (each, a “Participant”). The Plan Administrator may hold each Participant’s shares, together with the shares of other Participants, in non-certificated form in the Plan Administrator’s name or that of its nominee. Upon request by a Participant, received no later than three (3) days prior to the payable date, the Plan Administrator will, instead of crediting shares to and/or carrying shares in a Participant’s account, issue, without charge to the Participant, a certificate registered in the Participant’s name for the number of whole shares payable to the Participant
36
KAYNE ANDERSON ENERGY DEVELOPMENT COMPANY
DIVIDEND REINVESTMENT PLAN
(UNAUDITED)
and a check for any fractional share less a broker commission on the sale of such fractional shares. If a request to terminate a Participant’s participation in the Plan is received less than three (3) days before the payable date, dividends and distributions for that payable date will be reinvested. However, subsequent dividends and distributions will be paid to the Participant in cash.
8. The Plan Administrator will confirm to each Participant each acquisition made pursuant to the Plan as soon as practicable but not later than ten (10) business days after the date thereof. Although each Participant may from time to time have an undivided fractional interest (computed to three decimal places) in a share of Common Stock of the Company, no certificates for a fractional share will be issued. However, dividends and distributions on fractional shares will be credited to each Participant’s account. In the event of termination of a Participant’s account under the Plan, the Plan Administrator will adjust for any such undivided fractional interest in cash at the market value of the Company’s shares at the time of termination.
9. The Plan Administrator will forward to each Participant any Company related proxy solicitation materials and each Company report or other communication to stockholders, and will vote any shares held by it under the Plan in accordance with the instructions set forth on proxies returned by Participants to the Company.
10. In the event that the Company makes available to its stockholders rights to purchase additional shares or other securities, the shares held by the Plan Administrator for each Participant under the Plan will be added to any other shares held by the Participant in certificated form in calculating the number of rights to be issued to the Participant.
11. The Plan Administrator’s service fee, if any, and expenses for administering the Plan will be paid for by the Company.
12. Each Participant may terminate his or its account under the Plan by so notifying the Plan Administrator via the Plan Administrator’s website at www.amstock.com, by filling out the transaction request form located at the bottom of the Participant’s Statement and sending it to American Stock Transfer and Trust Company, P.O. Box 922, Wall Street Station, New York, NY 10269-0560 or by calling the Plan Administrator at (866) 627-2675. Such termination will be effective immediately. The Plan may be terminated by the Company upon notice in writing mailed to each Participant at least 30 days prior to any record date for the payment of any dividend or distribution by the Company. Upon any termination, the Plan Administrator will cause a certificate or certificates to be issued for the full shares held for the Participant under the Plan and a cash adjustment for any fractional share to be delivered to the Participant without charge to the Participant. If a Participant elects by his or its written notice to the Plan Administrator in advance of termination to have the Plan Administrator sell part or all of his or its shares and remit the proceeds to the Participant, the Plan Administrator is authorized to deduct a $15.00 transaction fee plus a $0.10 per share brokerage commission from the proceeds.
13. These terms and conditions may be amended or supplemented by the Company at any time but, except when necessary or appropriate to comply with applicable law or the rules or policies of the Securities and Exchange Commission or any other regulatory authority, only by mailing to each Participant appropriate written notice at least 30 days prior to the effective date thereof. The amendment or supplement shall be deemed to be accepted by each Participant unless, prior to the effective date thereof, the Plan Administrator receives written notice of the termination of his or its account under the Plan. Any such amendment may include an appointment by the Plan Administrator in its place and stead of a successor agent under these terms and conditions, with full power and authority to perform all or any of the acts to be performed by the Plan Administrator under these terms and conditions. Upon any such appointment of any agent for the purpose of receiving dividends and distributions, the Company will be authorized to pay to such successor agent, for each Participant’s account, all dividends and distributions payable on shares of the
37
KAYNE ANDERSON ENERGY DEVELOPMENT COMPANY
DIVIDEND REINVESTMENT PLAN
(UNAUDITED)
Company held in the Participant’s name or under the Plan for retention or application by such successor agent as provided in these terms and conditions.
14. The Plan Administrator will at all times act in good faith and use its best efforts within reasonable limits to ensure its full and timely performance of all services to be performed by it under this Plan and to comply with applicable law, but assumes no responsibility and shall not be liable for loss or damage due to errors unless such error is caused by the Plan Administrator’s negligence, bad faith, or willful misconduct or that of its employees or agents.
15. These terms and conditions shall be governed by the laws of the State of Maryland.
Adopted: September 5, 2006
Amended: July 9, 2007
Amended: April 2, 2009
38
KAYNE ANDERSON ENERGY DEVELOPMENT COMPANY
PROXY VOTING AND PORTFOLIO HOLDINGS INFORMATION
(UNAUDITED)
The policies and procedures that the Company uses to determine how to vote proxies relating to its portfolio securities are available:
| | • | | without charge, upon request, by calling (877) 657-3863; |
| | • | | on the Company’s website, http://www.kaynefunds.com; and |
| | • | | on the SEC’s website, http://www.sec.gov. |
Information regarding how the Company voted proxies relating to portfolio securities during the most recent 12-month period ended June 30 is available without charge, upon request, by calling (877) 657-3863, and on the SEC’s website at http://www.sec.gov (see Form N-PX).
The Company files a complete schedule of its portfolio holdings for the first and third quarters of its fiscal year with the SEC on Form N-Q and Form N-30B-2. The Company’s Form N-Q and Form N-30B-2 are available on the SEC’s website at http://www.sec.gov and may be reviewed and copied at the SEC’s Public Reference Room in Washington, DC. Information on the operation of the SEC’s Public Reference Room may be obtained by calling 1-800-SEC-0330. The Company also makes its Form N-Q and Form N-30B-2 available on its website at http://www.kaynefunds.com.
REPURCHASE DISCLOSURE
(UNAUDITED)
Notice is hereby given in accordance with Section 23(c) of the 1940 Act, that the Company may from time to time purchase shares of its common stock in the open market or in privately negotiated transactions.
39
KAYNE ANDERSON ENERGY DEVELOPMENT COMPANY
RESULTS OF ANNUAL MEETING OF STOCKHOLDERS
(UNAUDITED)
On June 26, 2014, the Company held its annual meeting of stockholders where the following matters were approved by stockholders. As of the record date of May 7, 2014 (the “Record Date”), the Company had 10,491,483 outstanding shares of common stock, each of which was entitled to cast one vote. Represented in person or by proxy at this meeting were a total of 8,488,445 shares of common stock, constituting a quorum.
| | (i) | The election of William R. Cordes and Barry R. Pearl as Class II directors, each to serve for a term of three years until the Company’s 2017 annual meeting of stockholders and until his successor is duly elected and qualified. |
The election of each of Mr. Cordes and Mr. Pearl required the affirmative vote of the holders of a majority of the Company’s common stock outstanding as of the Record Date.
| | a. | In the election of Mr. Cordes, 8,352,073 shares were cast in favor, 58,102 shares were cast against, and 78,267 shares withheld authority. |
| | b. | In the election of Mr. Pearl, 8,298,166 shares were cast in favor, 117,223 shares were cast against, and 73,052 shares withheld authority. |
As a result of the vote on this matter, Mr. Cordes and Mr. Pearl were each elected to serve as a director of the Company for a 3-year term.
Albert L. Richey and James C. Baker continued as directors with terms expiring on the date of the Company’s 2016 annual meeting of stockholders. Kevin S. McCarthy and William L. Thacker continued as directors with terms expiring on the date of the Company’s 2015 annual meeting of stockholders.
| | (ii) | The ratification of PricewaterhouseCoopers LLP as the Company’s independent registered public accounting firm for its fiscal year ending November 30, 2014. |
The approval of this proposal required the affirmative vote of a majority of the votes cast by the holders of the Company’s common stock outstanding as of the Record Date. For purposes of this proposal, each share of common stock is entitled to one vote. For purposes of the vote on this proposal, abstentions and broker non-votes will not be counted as votes cast and will have no effect on the result of the vote.
On this matter, 8,398,783 shares were cast in favor, 44,308 shares were cast against, 45,354 shares abstained, and there were no broker non-votes.
As a result of the vote on this matter, the proposal was approved.
40
| | |
| Directors and Corporate Officers | | |
| |
| Kevin S. McCarthy | | Chairman of the Board of Directors,
President and Chief Executive Officer |
| |
| William R. Cordes | | Director |
| |
| Barry R. Pearl | | Director |
| |
| Albert L. Richey | | Director |
| |
| William L. Thacker | | Director |
| |
| James C. Baker | | Director, Executive Vice President |
| |
| Terry A. Hart | | Chief Financial Officer and Treasurer |
| |
| David J. Shladovsky | | Secretary |
| |
| Michael O’Neil | | Chief Compliance Officer |
| |
| J.C. Frey | | Executive Vice President,
Assistant Secretary and Assistant Treasurer |
| |
| Ron M. Logan, Jr. | | Senior Vice President |
| |
| Jody C. Meraz | | Vice President |
| |
Investment Adviser
KA Fund Advisors, LLC
811 Main Street, 14th Floor
Houston, TX 77002 | | Administrator
Ultimus Fund Solutions, LLC
225 Pictoria Drive, Suite 450
Cincinnati, OH 45246 |
| |
1800 Avenue of the Stars, Third Floor
Los Angeles, CA 90067 | | Stock Transfer Agent and Registrar
American Stock Transfer & Trust Company, LLC 6201 15th Avenue
Brooklyn, NY 11219
(888) 888-0317 |
| |
Custodian
JPMorgan Chase Bank, N.A.
14201 North Dallas Parkway, Second Floor
Dallas, TX 75254 | | Independent Registered Public Accounting Firm
PricewaterhouseCoopers LLP
601 S. Figueroa Street, Suite 900
Los Angeles, CA 90017 |
| |
| | Legal Counsel
Paul Hastings LLP
55 Second Street, 24th Floor
San Francisco, CA 94105 |
Please visit us on the web at http://www.kaynefunds.com or call us toll-free at 1-877-657-3863.

This report, including the financial statements herein, is made available to stockholders of the Company for their information. It is not a prospectus, circular or representation intended for use in the purchase or sale of shares of the Company or of any securities mentioned in this report.
Item 2. Code of Ethics.
Not applicable.
Item 3. Audit Committee Financial Expert.
Not applicable.
Item 4. Principal Accountant Fees and Services.
Not applicable.
Item 5. Audit Committee of Listed Registrants.
Not applicable.
Item 6. Investments.
(a) Please see the schedule of investments contained in the Report to Stockholders included under Item 1 of this Form N-CSR.
(b) Not applicable.
Item 7. Disclosure of Proxy Voting Policies and Procedures for Closed-End Management Investment Companies.
Not applicable.
Item 8. Portfolio Managers of Closed-End Management Investment Companies.
Not applicable.
Item 9. Purchases of Equity Securities by Closed-End Management Investment Company and Affiliated Purchasers.
None.
Item 10. Submission of Matters to a Vote of Security Holders.
None.
Item 11. Controls and Procedures.
(a) The Registrant’s principal executive officer and principal financial officer have evaluated the Registrant’s disclosure controls and procedures (as defined in Rule 30a-3(c) under the Investment Company Act of 1940, as amended (the “1940 Act”)) as of a date within 90 days of this filing and have concluded that the Registrant’s disclosure controls and procedures are effective, as of such date, based on the evaluation of these controls and procedures required by Rule 30a-3(b) under the 1940 Act and Rule 13a-15(b) under the Securities Exchange Act of 1934, as amended.
(b) There were no changes in the Registrant’s internal control over financial reporting (as defined in Rule 30a-3(d) under the 1940 Act) that occurred during the second fiscal quarter of the period covered by this report that have materially affected, or are reasonably likely to materially affect, the Registrant’s internal control over financial reporting.
Item 12. Exhibits.
| | |
| (a)(1) | | Not applicable for semi-annual reports. |
| |
| (a)(2) | | Separate certifications of Principal Executive Officer and Principal Financial Officer of the Registrant pursuant to Section 302 of the Sarbanes-Oxley Act of 2002 attached hereto as EX-99.CERT. |
| |
| (b) | | Certification of Principal Executive Officer and Principal Financial Officer of the Registrant pursuant to Section 906 of the Sarbanes-Oxley Act of 2002 attached hereto as EX-99.906 CERT. |
SIGNATURES
Pursuant to the requirements of the Securities Exchange Act of 1934 and the Investment Company Act of 1940, the Registrant has duly caused this report to be signed on its behalf by the undersigned, thereunto duly authorized.
| | | | | | | | |
| | | | KAYNE ANDERSON ENERGY DEVELOPMENT COMPANY |
| | | | |
| Date: July 30, 2014 | | | | By: | | /s/ KEVIN S. MCCARTHY | | |
| | | | | | Kevin S. McCarthy | | |
| | | | | | Chairman of the Board of Directors, President and Chief Executive Officer | | |
Pursuant to the requirements of the Securities Exchange Act of 1934 and the Investment Company Act of 1940, this report has been signed below by the following persons on behalf of the Registrant and in the capacities and on the dates indicated.
| | | | | | | | |
| Date: July 30, 2014 | | | | By: | | /S/ KEVIN S. MCCARTHY | | |
| | | | | | Kevin S. McCarthy | | |
| | | | | | Chairman of the Board of Directors, President and Chief Executive Officer | | |
| | | | |
| Date: July 30, 2014 | | | | By: | | /s/ TERRY A. HART | | |
| | | | | | Terry A. Hart | | |
| | | | | | Chief Financial Officer and Treasurer | | |
Exhibit Index
| | |
| (a)(1) | | Not applicable for semi-annual reports. |
| |
| (a)(2) | | Separate certifications of Principal Executive Officer and Principal Financial Officer of the Registrant pursuant to Section 302 of the Sarbanes-Oxley Act of 2002 attached hereto as EX-99.CERT. |
| |
| (b) | | Certification of Principal Executive Officer and Principal Financial Officer of the Registrant pursuant to Section 906 of the Sarbanes-Oxley Act of 2002 attached hereto as EX-99.906 CERT. |