 Q2 2013 Earnings Press Release Supplement July 18, 2013 |
 1 Important Notes This presentation, and other statements that BlackRock may make, may contain forward-looking statements within the meaning of the Private Securities Litigation Reform Act, with respect to BlackRock’s future financial or business performance, strategies or expectations. Forward-looking statements are typically identified by words or phrases such as “trend,” “potential,” “opportunity,” “pipeline,” “believe,” “comfortable,” “expect,” “anticipate,” “current,” “intention,” “estimate,” “position,” “assume,” “outlook,” “continue,” “remain,” “maintain,” “sustain,” “seek,” “achieve,” and similar expressions, or future or conditional verbs such as “will,” “would,” “should,” “could,” “may” and similar expressions. BlackRock cautions that forward-looking statements are subject to numerous assumptions, risks and uncertainties, which change over time. Forward- looking statements speak only as of the date they are made, and BlackRock assumes no duty to and does not undertake to update forward-looking statements. Actual results could differ materially from those anticipated in forward-looking statements and future results could differ materially from historical performance. In addition to risk factors previously disclosed in BlackRock’s Securities and Exchange Commission (“SEC”) reports and those identified elsewhere in this presentation the following factors, among others, could cause actual results to differ materially from forward-looking statements or historical performance: (1) the introduction, withdrawal, success and timing of business initiatives and strategies; (2) changes and volatility in political, economic or industry conditions, the interest rate environment, foreign exchange rates or financial and capital markets, which could result in changes in demand for products or services or in the value of assets under management; (3) the relative and absolute investment performance of BlackRock’s investment products; (4) the impact of increased competition; (5) the impact of future acquisitions or divestitures; (6) the unfavorable resolution of legal proceedings; (7) the extent and timing of any share repurchases; (8) the impact, extent and timing of technological changes and the adequacy of intellectual property, information and cyber security protection; (9) the impact of legislative and regulatory actions and reforms, including the Dodd-Frank Wall Street Reform and Consumer Protection Act, and regulatory, supervisory or enforcement actions of government agencies relating to BlackRock or The PNC Financial Services Group, Inc. (“PNC”); (10) terrorist activities, international hostilities and natural disasters, which may adversely affect the general economy, domestic and local financial and capital markets, specific industries or BlackRock; (11) the ability to attract and retain highly talented professionals; (12) fluctuations in the carrying value of BlackRock’s economic investments; (13) the impact of changes to tax legislation, including income, payroll and transaction taxes, and taxation on products or transactions, which could affect the value proposition to clients and, generally, the tax position of BlackRock; (14) BlackRock’s success in maintaining the distribution of its products; (15) the impact of BlackRock electing to provide support to its products from time to time and any potential liabilities related to securities lending or other indemnification obligations; and (16) the impact of problems at other financial institutions or the failure or negative performance of products at other financial institutions. This presentation also includes non-GAAP financial measures. You can find our presentations on the most directly comparable GAAP financial measures calculated in accordance with GAAP and our reconciliations in the appendix to this earnings release supplement, our current earnings release dated July 18, 2013, and BlackRock’s other periodic reports, which are available on BlackRock’s web site at www.blackrock.com. |
 2 Table of Contents Operating and Net Income/Diluted EPS, as adjusted Page 3 Operating Margin, as adjusted Page 4 Q2 2013 Mix by Product, Client Type, Style and Region Page 5 Major Market Indices and Exchange Rates Page 6 Year-over-Year: Q2 2013 vs. Q2 2012 Pages 7-12 Sequential Quarters: Q2 2013 vs. Q1 2013 Pages 13-18 Non-operating and Capital Management Pages 19-21 Appendix Pages 22-29 |
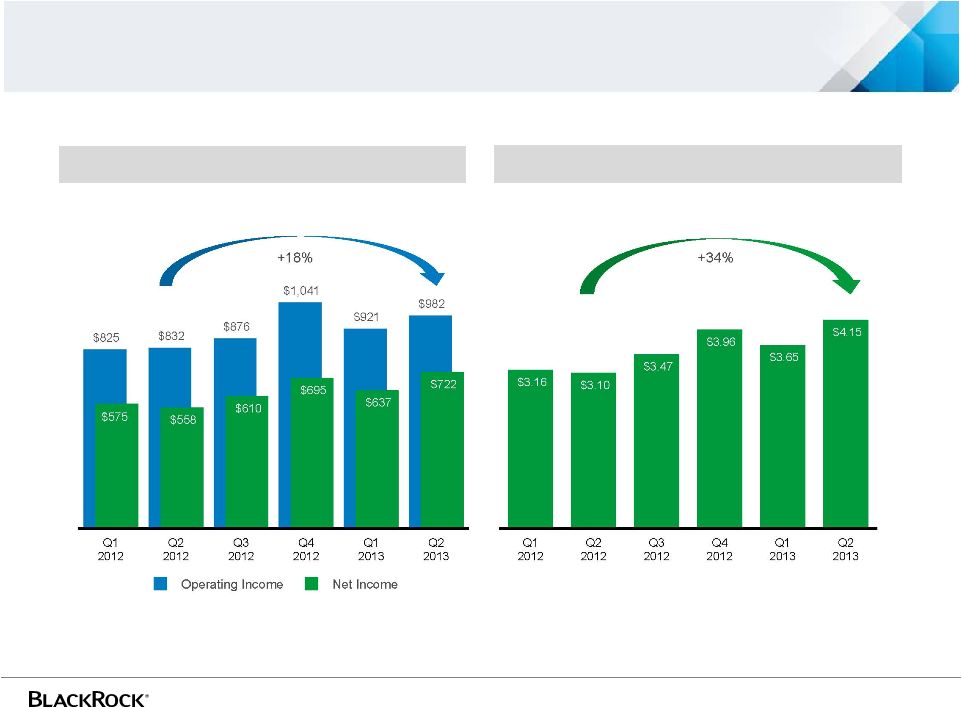 3 EPS up 34% and operating income up 18% year-over-year Operating and Net Income, as adjusted ($ in millions) Diluted Earnings Per Share, as adjusted For further information and reconciliation between GAAP and as adjusted, see the appendix, notes (a) through (f) in the current earnings release as well as previously filed Form 10-Ks, 10-Qs and 8-Ks. • Q2 2013 EPS reflects a $39 million non-cash, non-operating pre-tax gain related to the PennyMac IPO • Amounts related to the PennyMac Charitable Contribution have been excluded from as adjusted results, among other items |
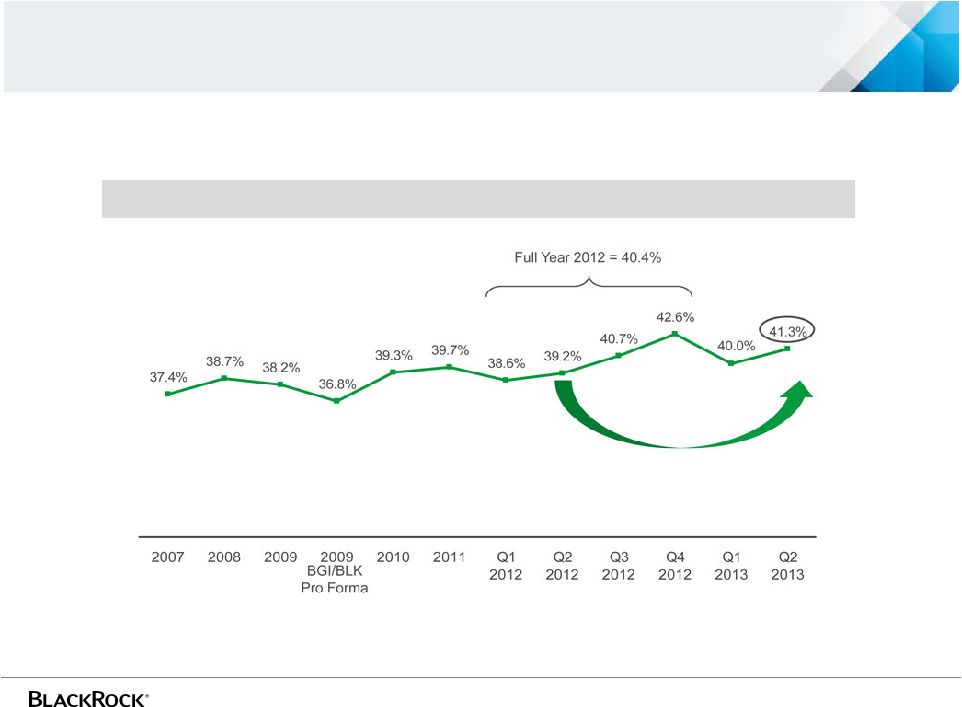 4 Continued margin improvement Operating Margin, as adjusted For further information and reconciliation between GAAP and as adjusted, see the appendix, notes (a) through (f) in the current earnings release as well as previously filed Form 10-Ks, 10-Qs and 8-Ks. • Sequential results reflect seasonal factors primarily related to higher securities lending fees, lower payroll taxes and lower performance fees • Q2 2013 and Q1 2013 include $9 million and $33 million of organizational alignment costs, respectively • Amounts related to the PennyMac Charitable Contribution have been excluded from as adjusted results, among other items |
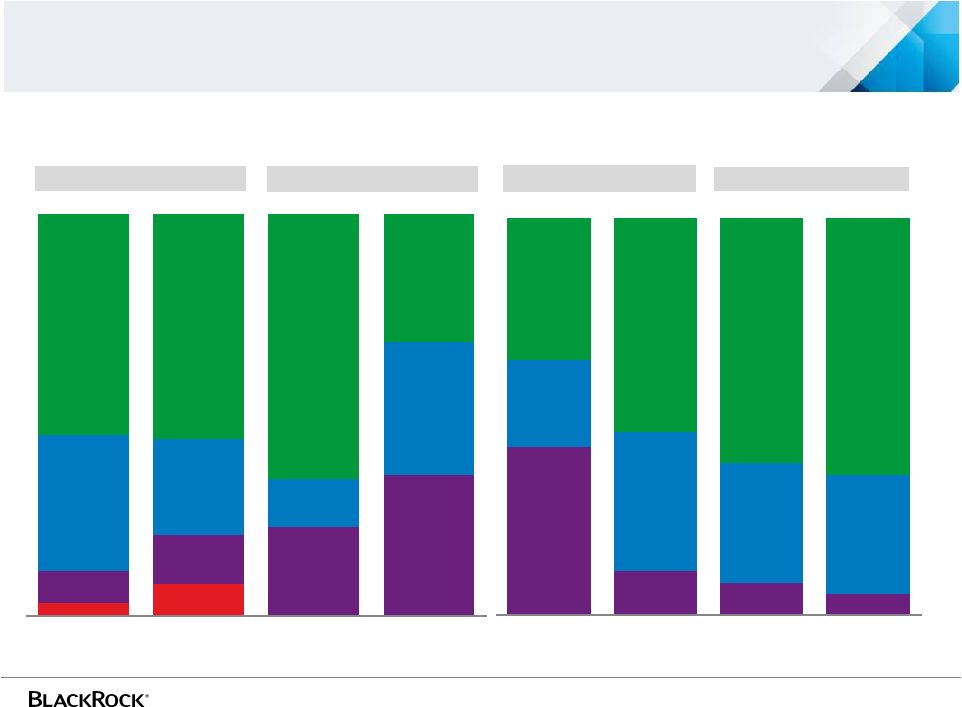 5 A broadly diversified business across clients, products and geographies Q2 2013 Long-term Base Fees of $2.094 billion Long-term Assets Under Management of $3.564 trillion at June 30, 2013 Product Type Client Type Style Region Alternatives 3% Alternatives 8% Multi-asset 8% Multi-asset 12% Fixed Income 34% Fixed Income 24% Equity 55% Equity 56% iShares 22% iShares 35% Retail 12% Retail 33% Institutional 66% Institutional 32% AUM Base Fees AUM Base Fees Index 42% Index 11% iShares 22% iShares 35% Asia-Pacific 8% Asia - Pacific 5% EMEA 31% EMEA 30% Americas 61% Americas 65% Active 36% Active 54% AUM Base Fees AUM Base Fees |
 6 Major market indices and exchange rates Spot Spot June 30, 2013 vs. Average Level Average Q2 2013 vs. June 30, 2013 March 31, 2013 March 31, 2013 Q2 2013 Q2 2012 Q1 2013 Q2 2012 Q1 2013 Equity Indices: Domestic S&P 500 1,606 1,569 2.4% 1,610 1,350 1,513 19.3% 6.4% Global MSCI Barra World Index 1,434 1,435 (0.1%) 1,463 1,233 1,405 18.7% 4.1% MSCI Europe Index 98 101 (3.0%) 101 86 100 17.4% 1.0% MSCI AC Asia Pacific Index 131 136 (3.7%) 136 118 133 15.3% 2.0% MSCI Emerging Markets Index 940 1,035 (9.1%) 1,004 963 1,059 4.2% (5.2%) S&P Global Natural Resources 3,083 3,415 (9.7%) 3,295 3,209 3,524 2.7% (6.5%) Fixed Income Index: Barclays U.S. Aggregate Bond Index 1,799 1,842 (2.3%) 1,839 1,800 1,837 2.2% 0.1% Foreign Exchange Rates: GBP to USD 1.52 1.52 0.1% 1.54 1.58 1.55 (3.0%) (1.0%) EUR to USD 1.30 1.28 1.5% 1.31 1.28 1.32 1.8% (1.1%) Source: Bloomberg |
Year-over-year Q2 2013 vs. Q2 2012 * * * * * * * * * * * |
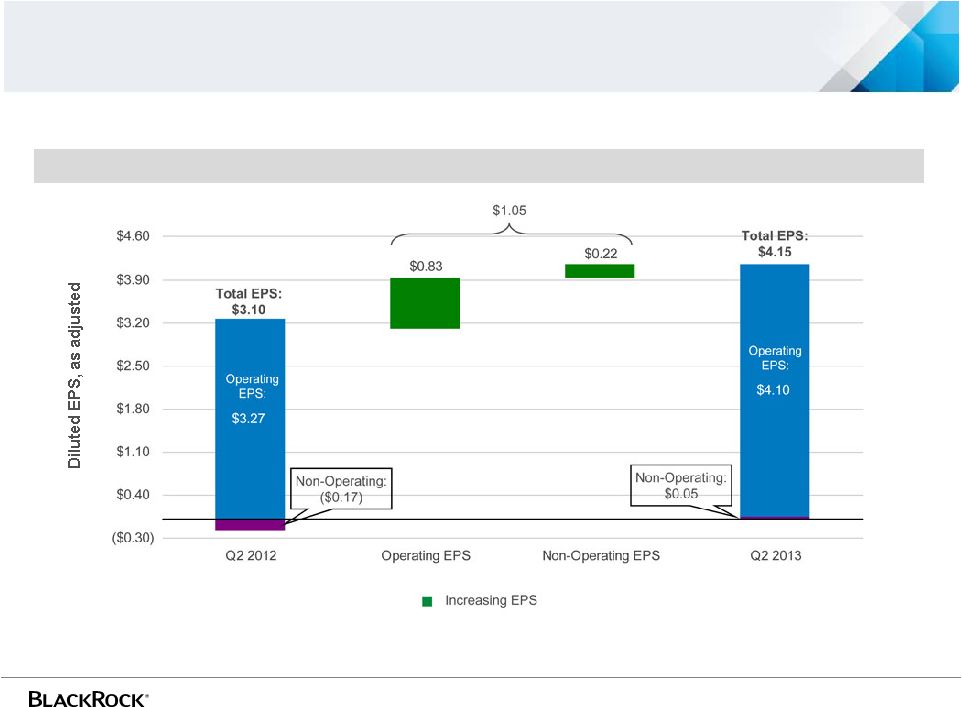 8 Q2 2013 Compared to Q2 2012, as adjusted EPS up 34% year-over-year driven by an increase in operating income of 18% For further information and reconciliation between GAAP and as adjusted, see the appendix and notes (a) through (f) in the current earnings release. • Q2 2013 EPS reflects a $39 million non-cash, non-operating pre-tax gain related to the PennyMac IPO • Amounts related to the PennyMac Charitable Contribution have been excluded from as adjusted results, among other items |
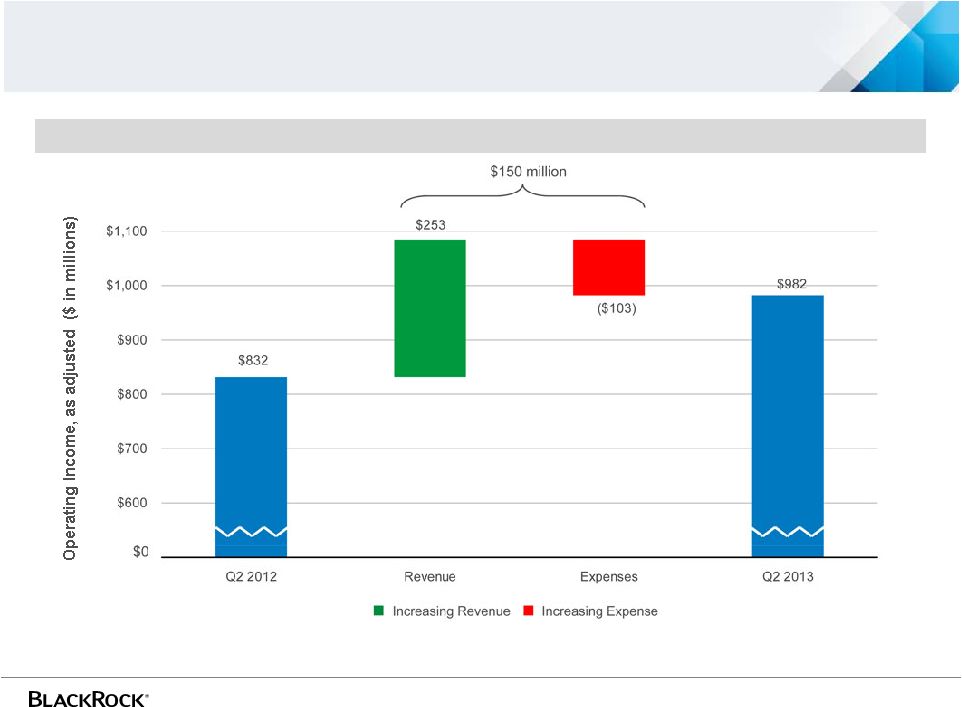 9 Q2 2013 Compared to Q2 2012, as adjusted Operating results reflect record base fees and margin expansion For further information and reconciliation between GAAP and as adjusted, see the appendix and notes (a) through (f) in the current earnings release. • Amounts related to the PennyMac Charitable Contribution have been excluded from as adjusted results, among other items |
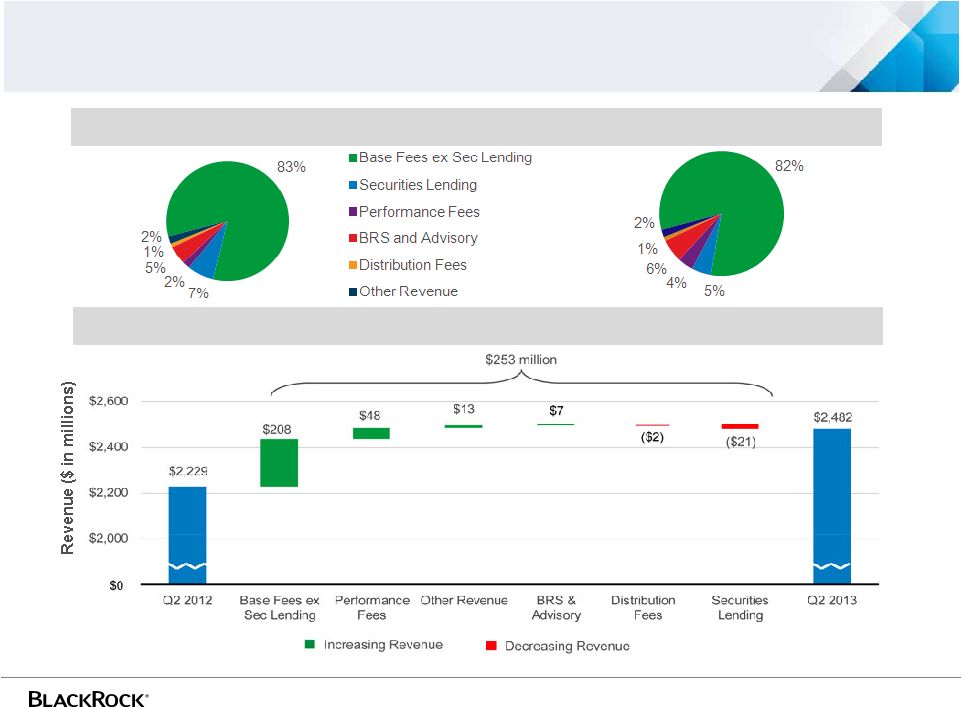 10 Revenue reflects record base fees and higher performance fees Q2 2013 Compared to Q2 2012 Total Revenue Q2 2012 $2.23 billion Q2 2013 $2.48 billion |
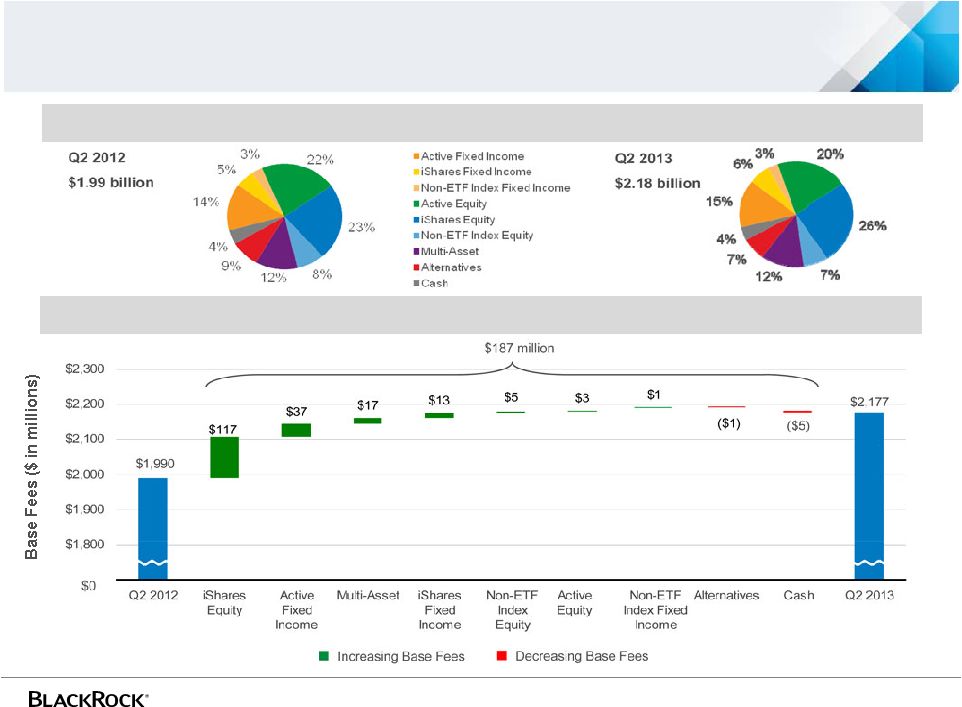 11 Base fees (including securities lending) reflect growth across all traditional long-term asset classes Q2 2013 Compared to Q2 2012 Base fees |
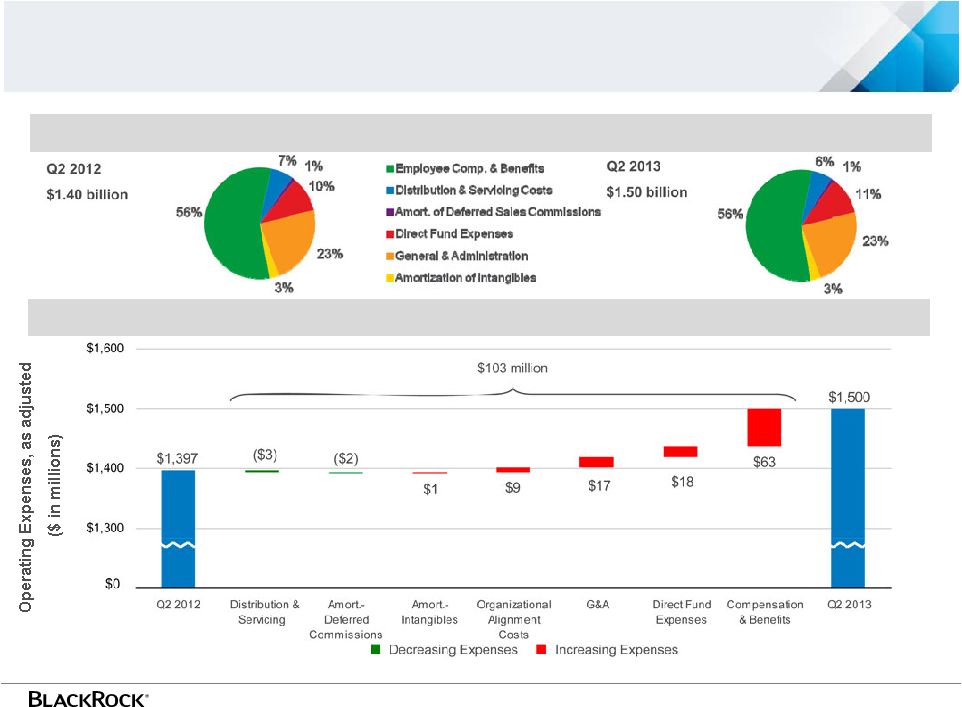 12 Expenses driven by higher revenue-related expenses Expenses, as adjusted, by Category Q2 2013 Compared to Q2 2012, as adjusted For further information and reconciliation between GAAP and as adjusted, see the appendix and notes (a) through (f) in the current earnings release. • Amounts related to the PennyMac Charitable Contribution have been excluded from as adjusted results, among other items (1) Compensation & benefits expense excludes organizational alignment costs incurred in Q2 2013, which is presented separately above. (1) |
Sequential Quarters Q2 2013 vs. Q1 2013 ************************ ************************ ************************ ************************ ************************ ************************ ************************ ************************ ************************ ************************ ************************ *********************** |
 14 Results reflect base fee growth and seasonal factors For further information and reconciliation between GAAP and as adjusted, see the appendix and notes (a) through (f) in the current earnings release. Q2 2013 Compared to Q1 2013, as adjusted • Sequential results reflect seasonal factors primarily related to higher securities lending fees, lower payroll taxes and lower performance fees • Q2 2013 and Q1 2013 include $9 million and $33 million of organizational alignment costs, respectively • Q1 2013 included $18 million of pre-tax fund launch costs • Q2 2013 EPS reflects a $39 million non-cash, non-operating pre-tax gain related to the PennyMac IPO • Amounts related to the PennyMac Charitable Contribution have been excluded from as adjusted results, among other items |
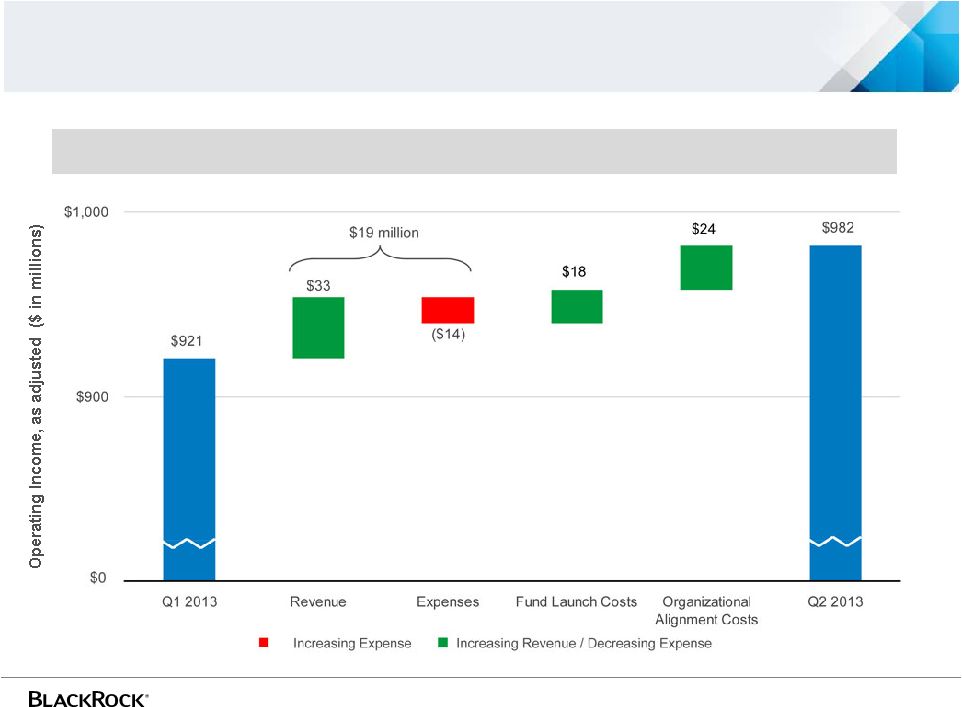 15 Operating income reflects record base fees, margin expansion and seasonal factors Q2 2013 Compared to Q1 2013 , as adjusted For further information and reconciliation between GAAP and as adjusted, see the appendix and notes (a) through (f) in the current earnings release. • Sequential results reflect seasonal factors primarily related to higher securities lending fees, lower payroll taxes and lower performance fees • Amounts related to the PennyMac Charitable Contribution have been excluded from as adjusted results, among other items |
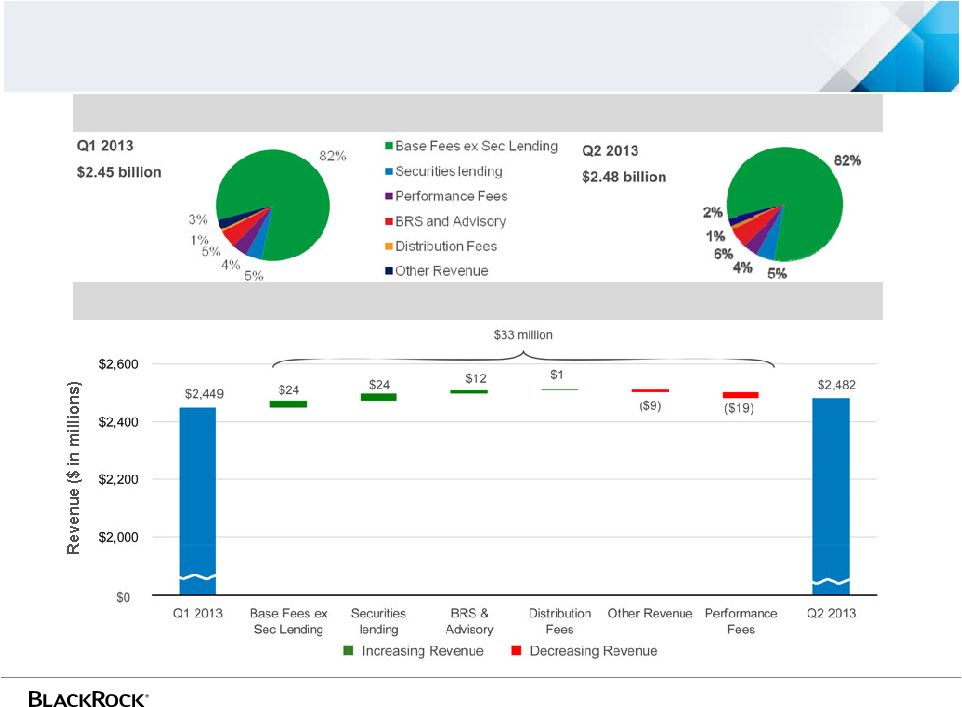 16 Higher revenue driven by record base fees and seasonally higher securities lending Q2 2013 Compared to Q1 2013 Total Revenue |
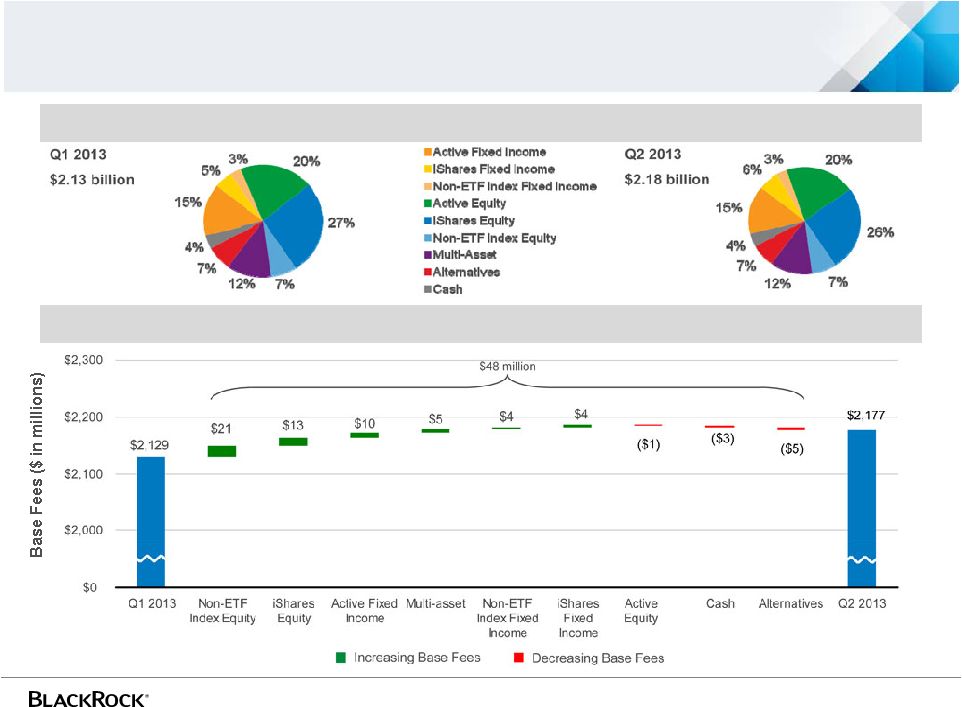 17 Base fees (including securities lending) reflects growth from higher average AUM Base Fees Q2 2013 Compared to Q1 2013 |
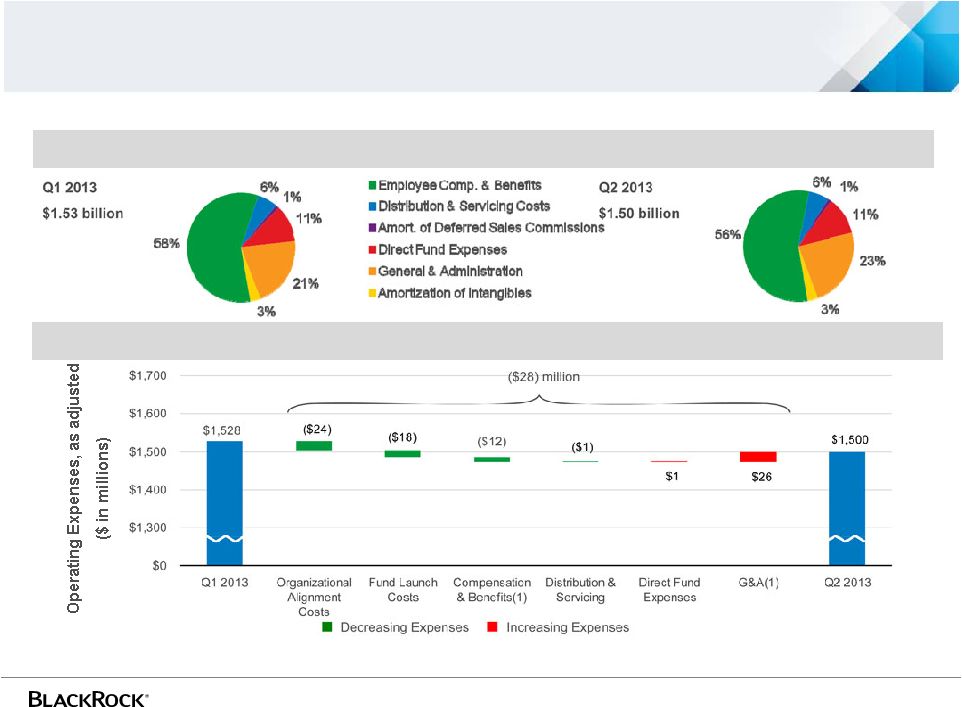 18 Expenses reflects seasonal factors (1) Compensation & benefits expense excludes organizational alignment costs incurred in Q1 2013 and Q2 2013, which are presented separately above. G&A expense excludes Q1 2013 fund launch costs, which are also presented separately above. For further information and reconciliation between GAAP and as adjusted, see the appendix and notes (a) through (f) in the current earnings release. Expenses, as adjusted, by Category Q2 2013 Compared to Q1 2013, as adjusted • Sequential results reflect seasonal factors primarily related to lower payroll taxes • Amounts related to the PennyMac Charitable Contribution have been excluded from as adjusted results, among other items |
Non-operating and Capital Management ****** ****** ****** ****** ****** ****** ****** ****** ****** ****** ****** ***** |
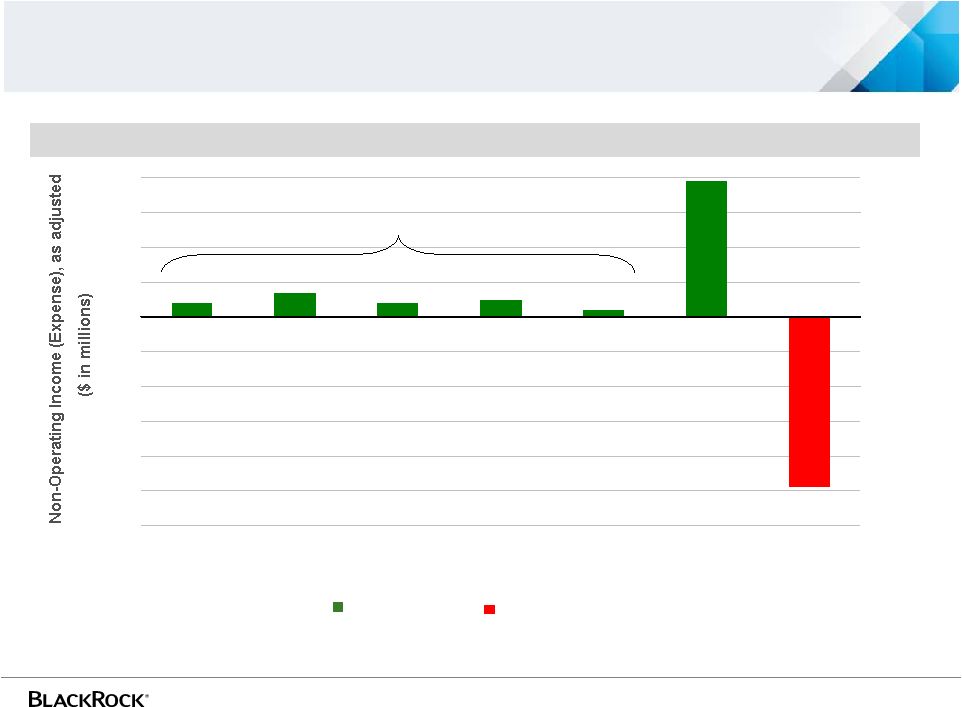 20 Q2 2013 $12 million Non-Operating Income by Category, as adjusted Q2 2013 non-operating income $4 $4 $7 $5 $2 $39 ($49) ($60) ($50) ($40) ($30) ($20) ($10) $0 $10 $20 $30 $40 Private Equity Real Estate Distressed Credit/ Mortgage Funds Hedge Funds/ Funds of Hedge Funds Other Investments Non-cash Gain Related to PennyMac IPO Net Interest Expense For further information and reconciliation between GAAP and as adjusted, see the appendix and notes (a) through (f) in the current earnings release. Net Interest Expense Investment Gains $22 million Net Investment Gain • Amounts related to the PennyMac Charitable Contribution have been excluded from as adjusted results, among other items |
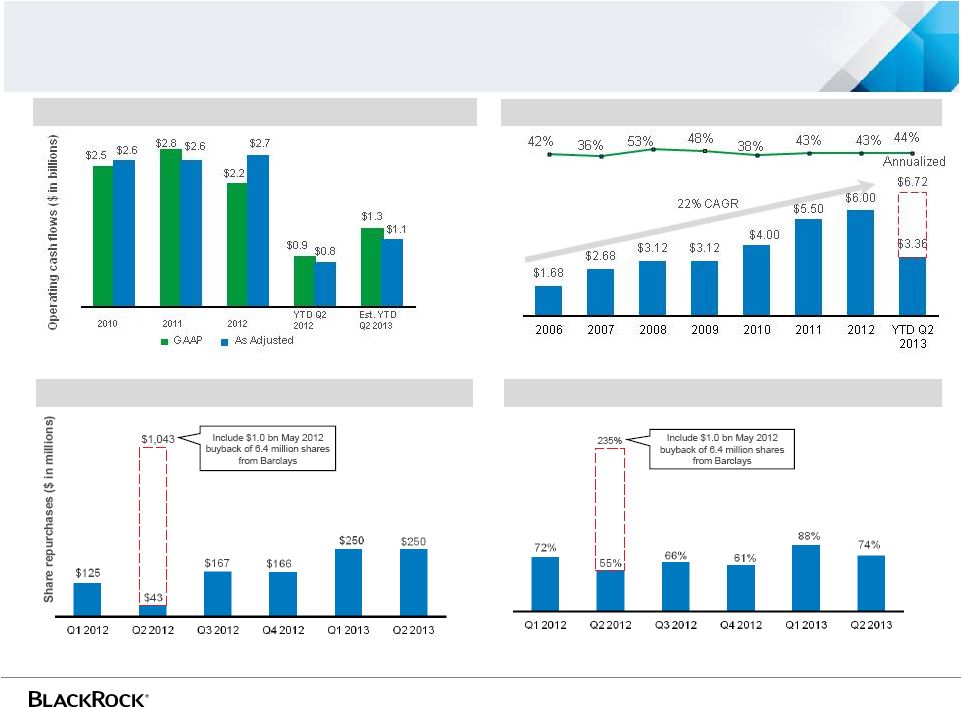 21 Continued commitment to sound capital management Operating cash flow Share repurchases Amounts above exclude repurchases of employee tax withholdings related to employee stock transactions. Total payout ratio Dividends and Dividend Payout Ratio Payout ratio = (Dividends declared + shares repurchases) / GAAP Net income. For further information and reconciliation between GAAP and as adjusted, see the previously filed Form 10-Ks, Form 10-Qs and 8-Ks and the appendix to this earnings release supplement. Dividend payout ratio = Dividends declared / GAAP Net income. |
Appendix * * * * * * * * * * * * |
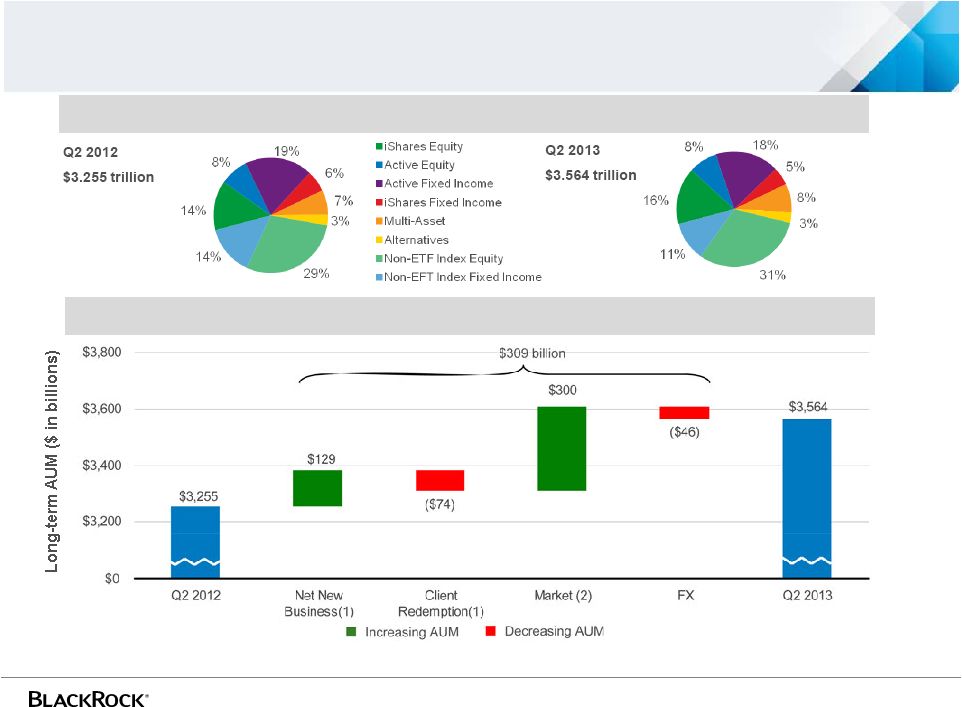 23 Q2 2013 long-term AUM up 9% from Q2 2012 Q2 2013 Compared to Q2 2012 Long-term AUM (1) Net new business excludes the effect of a single low-fee non-ETP index fixed income outflow of $74.2 billion in the third quarter 2012, which is shown separately above. (2) Market includes $6.1 billion of AUM acquired from Swiss Re Private Equity Partners in September 2012. |
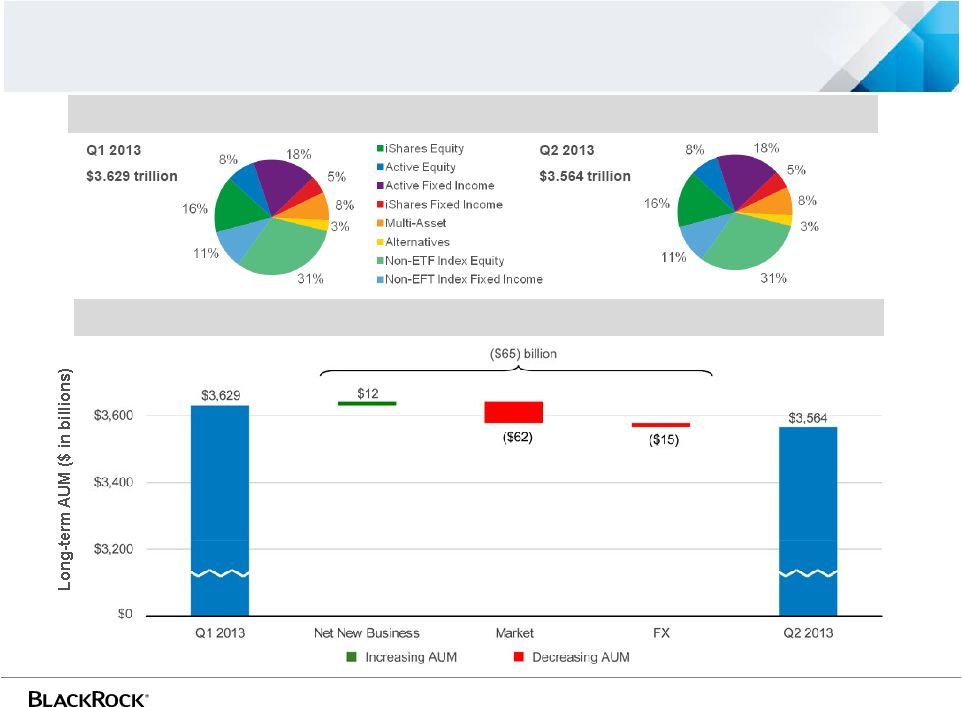 24 Q2 2013 long-term AUM down 2% from Q1 2013 Q2 2013 Compared to Q1 2013 Long-term AUM |
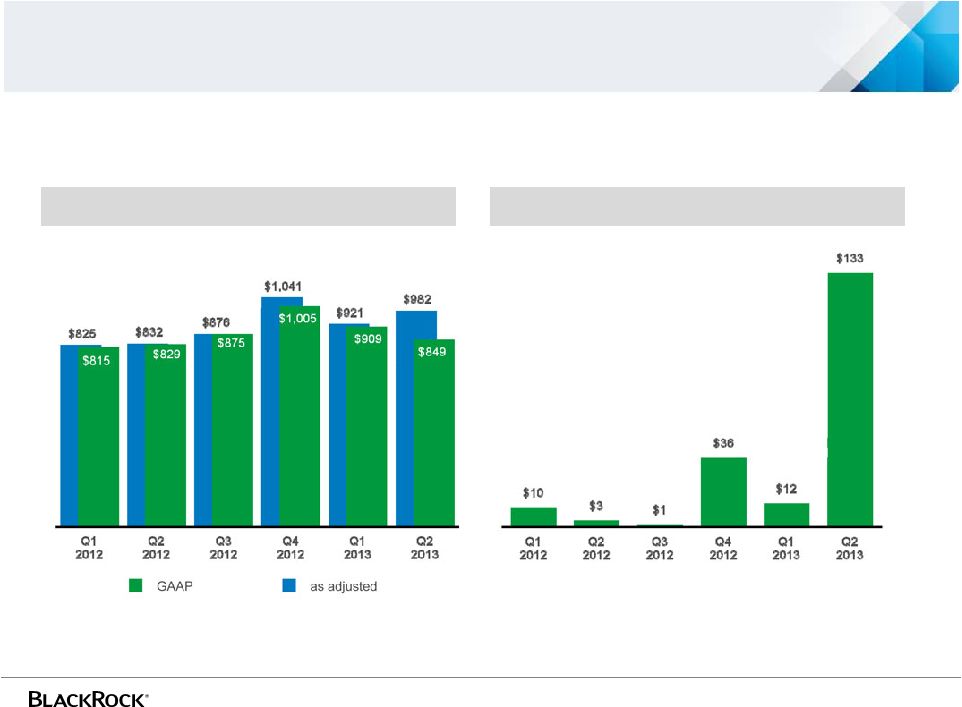 25 Quarterly operating income – GAAP and as adjusted Operating Income ($ in millions) Non-GAAP Adjustments ($ in millions) Non-GAAP adjustments include amounts related to the PennyMac Charitable Contribution, a contribution to short-term investment funds (“STIFs”), PNC LTIP funding obligation and compensation related to appreciation (depreciation) on certain deferred compensation plans. For further information and reconciliation between GAAP and as adjusted, see notes (a) through (f) in the current earnings release as well as previously filed Form 10-Ks, 10-Qs and 8-Ks. |
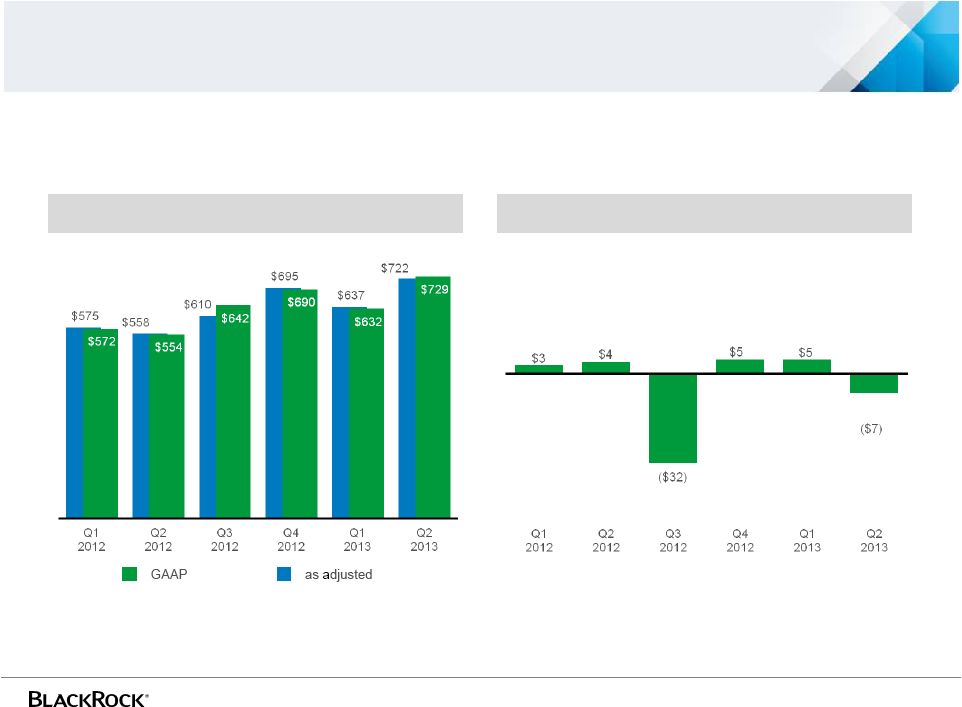 26 Quarterly net income – GAAP and as adjusted Net Income ($ in millions) Non-GAAP Adjustments ($ in millions) Non-GAAP adjustments include amounts related to the PennyMac Charitable Contribution, a contribution to STIFs, PNC LTIP funding obligation and income tax changes. For further information and reconciliation between GAAP and as adjusted, see notes (a) through (f) in the current earnings release as well as previously filed Form 10-Ks, 10-Qs and 8-Ks. |
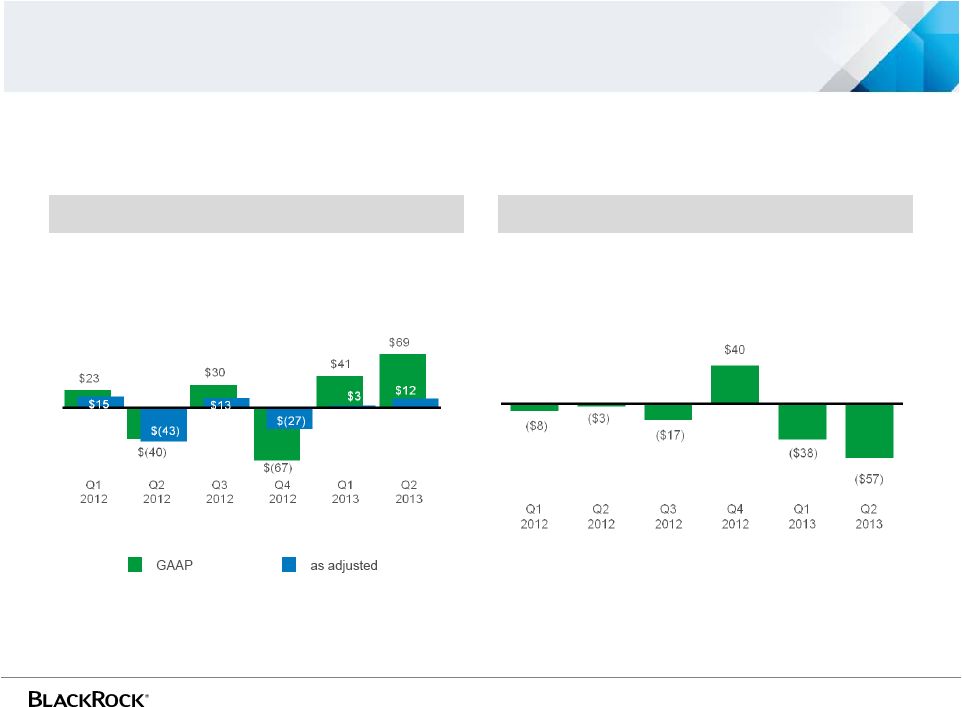 27 Quarterly non-operating income (expense) – GAAP and as adjusted Non-Operating Income (Expense) ($ in millions) Non-GAAP Adjustments ($ in millions) Non-GAAP adjustments include net income (loss) attributable to non-controlling interests, a gain associated with the PennyMac Charitable Contribution and compensation expense related to (appreciation) depreciation on certain deferred compensation plans. For further information and reconciliation between GAAP and as adjusted, see notes (a) through (f) in the current earnings release as well as previously filed Form 10-Ks, 10-Qs and 8-Ks. |
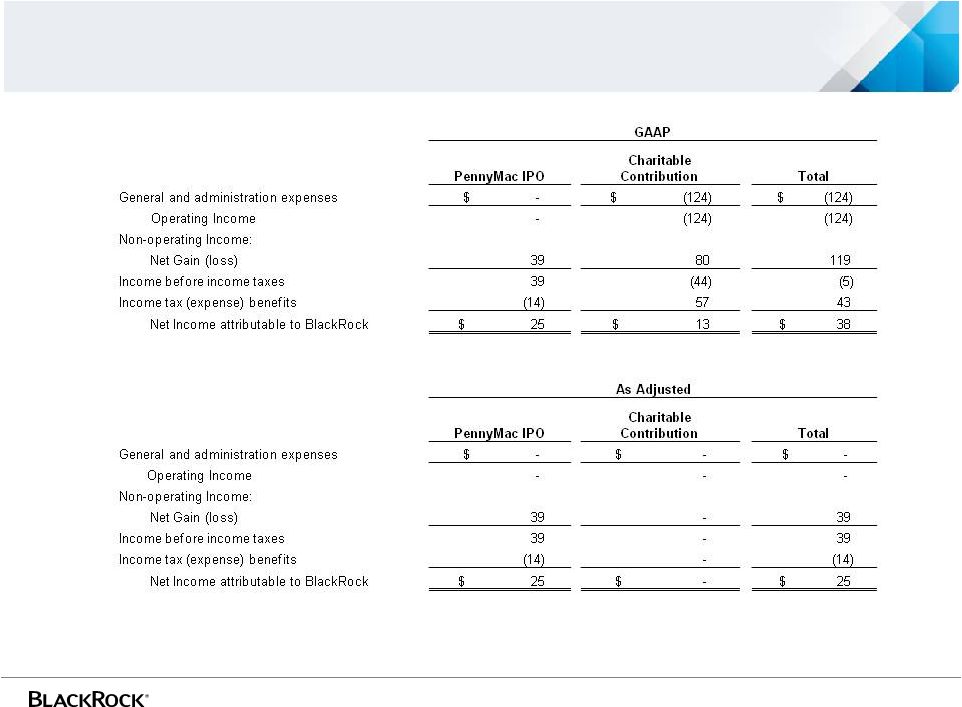 28 Q2 2013 PennyMac Financial Impact Both GAAP and as adjusted results include a $39 million non-cash, pre-tax gain related to the carrying value of the Company’s equity method investment in PennyMac in connection with PennyMac’s initial public offering. |
 29 Cash Flow GAAP and As Adjusted (in millions) 2010 2011 2012 YTD Q2 2012 EST YTD Q2 2013 Operating Cash Flows Operating Cash flows, GAAP basis $2,488 $2,826 $2,240 $865 $1,300 Less: Non-GAAP adjustments (1) (77) 178 (483) 51 200 Operating Cash flows, as Adjusted $2,565 $2,648 $2,723 $814 $1,100 Investing Cash Flows Investing Cash flows, GAAP basis ($627) ($204) ($266) ($547) $- Less: Non-GAAP adjustments (1) (52) 24 (211) (184) - Investing Cash flows, as Adjusted ($575) ($228) ($55) ($363) $- Financing Cash Flows Financing Cash flows, GAAP basis ($3,170) ($2,485) ($944) ($235) ($2,200) Less: Non-GAAP adjustments (1) 110 (71) 631 (3) (100) Financing Cash flows, as Adjusted ($3,280) ($2,414) ($1,575) ($232) ($2,100) (1) Non-GAAP adjustments include the impact on cash flows of consolidated sponsored investment funds and consolidated VIEs . |
 * * * * * * * * * * * * * * * * * * * * * |