UNITED STATES
SECURITIES AND EXCHANGE COMMISSION
Washington, D.C. 20549
FORM N-CSR
CERTIFIED SHAREHOLDER REPORT OF REGISTERED
MANAGEMENT INVESTMENT COMPANIES
Investment Company Act file number 811-21990
Fidelity Commonwealth Trust II
(Exact name of registrant as specified in charter)
245 Summer St., Boston, Massachusetts 02210
(Address of principal executive offices) (Zip code)
Margaret Carey, Secretary
245 Summer St.
Boston, Massachusetts 02210
(Name and address of agent for service)
Registrant's telephone number, including area code:
617-563-7000
Date of fiscal year end: | August 31 |
Date of reporting period: | August 31, 2023 |
Item 1.
Reports to Stockholders


Contents
| Average Annual Total Returns | |||
Periods ended August 31, 2023 | Past 1 year | Past 5 years | Past 10 years |
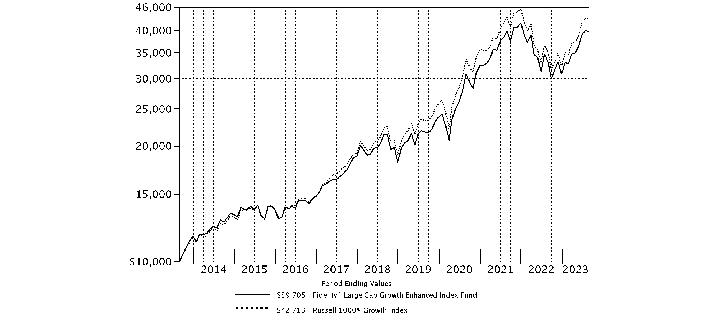
| Fidelity® Large Cap Growth Enhanced Index Fund | 19.85% | 13.09% | 14.78% |
| $10,000 Over 10 Years |
Let's say hypothetically that $10,000 was invested in Fidelity® Large Cap Growth Enhanced Index Fund on August 31, 2013. The chart shows how the value of your investment would have changed, and also shows how the Russell 1000 Growth Index performed over the same period. |
 |
Top Holdings (% of Fund's net assets) | ||
| Apple, Inc. | 13.1 | |
| Microsoft Corp. | 10.5 | |
| NVIDIA Corp. | 5.4 | |
| Amazon.com, Inc. | 5.3 | |
| Tesla, Inc. | 3.8 | |
| Alphabet, Inc. Class C | 3.7 | |
| Alphabet, Inc. Class A | 3.7 | |
| Meta Platforms, Inc. Class A | 3.4 | |
| Eli Lilly & Co. | 2.5 | |
| Broadcom, Inc. | 2.2 | |
| 53.6 | ||
| Market Sectors (% of Fund's net assets) | ||
| Information Technology | 44.5 | |
| Consumer Discretionary | 14.4 | |
| Communication Services | 12.7 | |
| Health Care | 11.3 | |
| Industrials | 6.3 | |
| Financials | 5.4 | |
| Consumer Staples | 2.4 | |
| Energy | 1.4 | |
| Materials | 0.9 | |
| Real Estate | 0.6 | |
Asset Allocation (% of Fund's net assets) |
 |
Futures - 0.1% |
| Common Stocks - 99.9% | |||
| Shares | Value ($) | ||
| COMMUNICATION SERVICES - 12.7% | |||
| Entertainment - 1.9% | |||
| Electronic Arts, Inc. | 96,234 | 11,546,155 | |
| Netflix, Inc. (a) | 74,101 | 32,136,122 | |
| 43,682,277 | |||
| Interactive Media & Services - 10.8% | |||
| Alphabet, Inc.: | |||
| Class A (a) | 634,845 | 86,446,844 | |
| Class C (a) | 645,403 | 88,646,102 | |
| Meta Platforms, Inc. Class A (a) | 275,371 | 81,479,525 | |
| 256,572,471 | |||
TOTAL COMMUNICATION SERVICES | 300,254,748 | ||
| CONSUMER DISCRETIONARY - 14.4% | |||
| Automobiles - 3.8% | |||
| Tesla, Inc. (a) | 344,570 | 88,926,626 | |
| Broadline Retail - 5.6% | |||
| Amazon.com, Inc. (a) | 910,506 | 125,658,933 | |
| Etsy, Inc. (a) | 83,439 | 6,138,607 | |
| 131,797,540 | |||
| Diversified Consumer Services - 0.2% | |||
| Duolingo, Inc. (a) | 26,858 | 3,952,423 | |
| H&R Block, Inc. | 23,740 | 949,125 | |
| 4,901,548 | |||
| Hotels, Restaurants & Leisure - 1.8% | |||
| Airbnb, Inc. Class A (a) | 134,369 | 17,676,242 | |
| Booking Holdings, Inc. (a) | 7,935 | 24,638,413 | |
| Starbucks Corp. | 1,680 | 163,699 | |
| 42,478,354 | |||
| Household Durables - 0.1% | |||
| NVR, Inc. (a) | 563 | 3,590,437 | |
| Specialty Retail - 2.9% | |||
| AutoZone, Inc. (a) | 577 | 1,460,577 | |
| O'Reilly Automotive, Inc. (a) | 8,555 | 8,039,134 | |
| The Home Depot, Inc. | 143,686 | 47,459,486 | |
| TJX Companies, Inc. | 11,478 | 1,061,485 | |
| Ulta Beauty, Inc. (a) | 26,868 | 11,151,026 | |
| 69,171,708 | |||
TOTAL CONSUMER DISCRETIONARY | 340,866,213 | ||
| CONSUMER STAPLES - 2.4% | |||
| Beverages - 1.3% | |||
| PepsiCo, Inc. | 36,218 | 6,443,907 | |
| The Coca-Cola Co. | 400,156 | 23,941,333 | |
| 30,385,240 | |||
| Consumer Staples Distribution & Retail - 0.6% | |||
| Costco Wholesale Corp. | 25,065 | 13,767,703 | |
| Household Products - 0.5% | |||
| Kimberly-Clark Corp. | 87,463 | 11,267,858 | |
| Personal Care Products - 0.0% | |||
| elf Beauty, Inc. (a) | 2,801 | 388,527 | |
TOTAL CONSUMER STAPLES | 55,809,328 | ||
| ENERGY - 1.4% | |||
| Oil, Gas & Consumable Fuels - 1.4% | |||
| Cheniere Energy, Inc. | 98,873 | 16,136,074 | |
| EOG Resources, Inc. | 95,271 | 12,253,756 | |
| Texas Pacific Land Corp. (b) | 3,201 | 6,033,085 | |
| 34,422,915 | |||
| FINANCIALS - 5.4% | |||
| Capital Markets - 1.2% | |||
| Charles Schwab Corp. | 203,921 | 12,061,927 | |
| LPL Financial | 15,712 | 3,623,030 | |
| NASDAQ, Inc. | 235,136 | 12,339,937 | |
| 28,024,894 | |||
| Financial Services - 4.0% | |||
| Apollo Global Management, Inc. | 193,813 | 16,927,627 | |
| MasterCard, Inc. Class A | 118,928 | 49,074,450 | |
| Visa, Inc. Class A | 121,792 | 29,921,859 | |
| 95,923,936 | |||
| Insurance - 0.2% | |||
| Brown & Brown, Inc. | 26,961 | 1,997,810 | |
| Kinsale Capital Group, Inc. | 4,859 | 1,936,943 | |
| 3,934,753 | |||
TOTAL FINANCIALS | 127,883,583 | ||
| HEALTH CARE - 11.3% | |||
| Biotechnology - 2.5% | |||
| AbbVie, Inc. | 140,646 | 20,669,336 | |
| Amgen, Inc. | 7,749 | 1,986,379 | |
| Exelixis, Inc. (a) | 24,891 | 557,309 | |
| Gilead Sciences, Inc. | 150,829 | 11,535,402 | |
| Incyte Corp. (a) | 205,886 | 13,285,824 | |
| Sarepta Therapeutics, Inc. (a) | 5,644 | 682,980 | |
| Seagen, Inc. (a) | 2,022 | 416,674 | |
| United Therapeutics Corp. (a) | 46,605 | 10,456,298 | |
| 59,590,202 | |||
| Health Care Equipment & Supplies - 1.3% | |||
| Align Technology, Inc. (a) | 22,594 | 8,362,943 | |
| Inspire Medical Systems, Inc. (a) | 33,486 | 7,597,304 | |
| Insulet Corp. (a) | 15,610 | 2,992,593 | |
| Intuitive Surgical, Inc. (a) | 751 | 234,823 | |
| Lantheus Holdings, Inc. (a) | 176,060 | 12,049,546 | |
| 31,237,209 | |||
| Health Care Providers & Services - 3.9% | |||
| Elevance Health, Inc. | 30,283 | 13,385,389 | |
| HCA Holdings, Inc. | 43,233 | 11,988,511 | |
| Humana, Inc. | 31,084 | 14,349,307 | |
| UnitedHealth Group, Inc. | 108,137 | 51,535,931 | |
| 91,259,138 | |||
| Life Sciences Tools & Services - 0.2% | |||
| Medpace Holdings, Inc. (a) | 15,879 | 4,291,617 | |
| Thermo Fisher Scientific, Inc. | 2,750 | 1,532,025 | |
| 5,823,642 | |||
| Pharmaceuticals - 3.4% | |||
| Eli Lilly & Co. | 104,399 | 57,857,926 | |
| Merck & Co., Inc. | 114,166 | 12,441,811 | |
| Pfizer, Inc. | 253,230 | 8,959,277 | |
| 79,259,014 | |||
TOTAL HEALTH CARE | 267,169,205 | ||
| INDUSTRIALS - 6.3% | |||
| Aerospace & Defense - 1.2% | |||
| Axon Enterprise, Inc. (a) | 67,114 | 14,289,242 | |
| Lockheed Martin Corp. | 29,709 | 13,320,030 | |
| 27,609,272 | |||
| Building Products - 0.1% | |||
| Allegion PLC | 15,440 | 1,757,226 | |
| Commercial Services & Supplies - 1.1% | |||
| Cintas Corp. | 31,775 | 16,020,002 | |
| Republic Services, Inc. | 75,726 | 10,914,388 | |
| 26,934,390 | |||
| Construction & Engineering - 0.5% | |||
| Valmont Industries, Inc. | 47,956 | 12,156,846 | |
| Ground Transportation - 2.2% | |||
| CSX Corp. | 382,838 | 11,561,708 | |
| Uber Technologies, Inc. (a) | 465,431 | 21,982,306 | |
| Union Pacific Corp. | 78,996 | 17,424,148 | |
| 50,968,162 | |||
| Machinery - 1.1% | |||
| Caterpillar, Inc. | 85,614 | 24,068,664 | |
| Deere & Co. | 4,006 | 1,646,226 | |
| Illinois Tool Works, Inc. | 5,393 | 1,333,959 | |
| 27,048,849 | |||
| Passenger Airlines - 0.1% | |||
| American Airlines Group, Inc. (a) | 151,790 | 2,235,867 | |
| Trading Companies & Distributors - 0.0% | |||
| Applied Industrial Technologies, Inc. | 1,715 | 264,745 | |
TOTAL INDUSTRIALS | 148,975,357 | ||
| INFORMATION TECHNOLOGY - 44.5% | |||
| Communications Equipment - 0.1% | |||
| Extreme Networks, Inc. (a) | 51,805 | 1,422,047 | |
| IT Services - 1.7% | |||
| Accenture PLC Class A | 28,364 | 9,183,412 | |
| Gartner, Inc. (a) | 42,477 | 14,853,357 | |
| GoDaddy, Inc. (a) | 127,069 | 9,213,773 | |
| MongoDB, Inc. Class A (a) | 17,128 | 6,530,906 | |
| 39,781,448 | |||
| Semiconductors & Semiconductor Equipment - 11.0% | |||
| Applied Materials, Inc. | 86,829 | 13,263,998 | |
| Broadcom, Inc. | 57,925 | 53,458,403 | |
| Enphase Energy, Inc. (a) | 78,256 | 9,901,732 | |
| KLA Corp. | 38,941 | 19,543,320 | |
| Lattice Semiconductor Corp. (a) | 142,025 | 13,813,352 | |
| NVIDIA Corp. | 259,248 | 127,951,850 | |
| Qualcomm, Inc. | 206,965 | 23,703,701 | |
| 261,636,356 | |||
| Software - 18.4% | |||
| Adobe, Inc. (a) | 70,750 | 39,573,305 | |
| Autodesk, Inc. (a) | 77,322 | 17,160,845 | |
| Cadence Design Systems, Inc. (a) | 77,939 | 18,739,653 | |
| Fortinet, Inc. (a) | 120,374 | 7,247,719 | |
| HubSpot, Inc. (a) | 28,472 | 15,560,517 | |
| Intuit, Inc. | 5,072 | 2,748,060 | |
| Manhattan Associates, Inc. (a) | 68,004 | 13,778,970 | |
| Microsoft Corp. | 760,875 | 249,384,390 | |
| Palo Alto Networks, Inc. (a) | 81,235 | 19,764,476 | |
| Salesforce, Inc. (a) | 85,268 | 18,883,451 | |
| ServiceNow, Inc. (a) | 458 | 269,684 | |
| Synopsys, Inc. (a) | 42,125 | 19,330,741 | |
| Teradata Corp. (a) | 239,125 | 11,064,314 | |
| VMware, Inc. Class A (a) | 6,872 | 1,159,856 | |
| 434,665,981 | |||
| Technology Hardware, Storage & Peripherals - 13.3% | |||
| Apple, Inc. | 1,655,880 | 311,090,177 | |
| Pure Storage, Inc. Class A (a) | 126,429 | 4,626,037 | |
| 315,716,214 | |||
TOTAL INFORMATION TECHNOLOGY | 1,053,222,046 | ||
| MATERIALS - 0.9% | |||
| Chemicals - 0.4% | |||
| CF Industries Holdings, Inc. | 77,088 | 5,941,172 | |
| Linde PLC | 10,896 | 4,217,188 | |
| 10,158,360 | |||
| Metals & Mining - 0.5% | |||
| Nucor Corp. | 70,964 | 12,212,904 | |
TOTAL MATERIALS | 22,371,264 | ||
| REAL ESTATE - 0.6% | |||
| Equity Real Estate Investment Trusts (REITs) - 0.6% | |||
| Public Storage | 50,947 | 14,080,732 | |
| Ryman Hospitality Properties, Inc. | 7,318 | 622,250 | |
| 14,702,982 | |||
| TOTAL COMMON STOCKS (Cost $1,467,566,491) | 2,365,677,641 | ||
| Money Market Funds - 0.2% | |||
| Shares | Value ($) | ||
| Fidelity Cash Central Fund 5.43% (c) | 80,122 | 80,138 | |
| Fidelity Securities Lending Cash Central Fund 5.44% (c)(d) | 6,142,036 | 6,142,650 | |
| TOTAL MONEY MARKET FUNDS (Cost $6,222,788) | 6,222,788 | ||
| TOTAL INVESTMENT IN SECURITIES - 100.1% (Cost $1,473,789,279) | 2,371,900,429 |
NET OTHER ASSETS (LIABILITIES) - (0.1)% | (3,455,878) |
| NET ASSETS - 100.0% | 2,368,444,551 |
| Futures Contracts | |||||
Number of contracts | Expiration Date | Notional Amount ($) | Value ($) | Unrealized Appreciation/ (Depreciation) ($) | |
| Purchased | |||||
| Equity Index Contracts | |||||
| CME E-mini S&P 500 Index Contracts (United States) | 8 | Sep 2023 | 1,806,400 | 210 | 210 |
| The notional amount of futures purchased as a percentage of Net Assets is 0.1% | |||||
| (a) | Non-income producing |
| (b) | Security or a portion of the security is on loan at period end. |
| (c) | Affiliated fund that is generally available only to investment companies and other accounts managed by Fidelity Investments. The rate quoted is the annualized seven-day yield of the fund at period end. A complete unaudited listing of the fund's holdings as of its most recent quarter end is available upon request. In addition, each Fidelity Central Fund's financial statements, which are not covered by the Fund's Report of Independent Registered Public Accounting Firm, are available on the SEC's website or upon request. |
| (d) | Investment made with cash collateral received from securities on loan. |
| Affiliate | Value, beginning of period ($) | Purchases ($) | Sales Proceeds ($) | Dividend Income ($) | Realized Gain (loss) ($) | Change in Unrealized appreciation (depreciation) ($) | Value, end of period ($) | % ownership, end of period |
| Fidelity Cash Central Fund 5.43% | 33,751,495 | 788,905,048 | 822,576,405 | 2,052,081 | - | - | 80,138 | 0.0% |
| Fidelity Securities Lending Cash Central Fund 5.44% | 831,850 | 88,755,290 | 83,444,490 | 2,853 | - | - | 6,142,650 | 0.0% |
| Total | 34,583,345 | 877,660,338 | 906,020,895 | 2,054,934 | - | - | 6,222,788 | |
| Valuation Inputs at Reporting Date: | ||||
| Description | Total ($) | Level 1 ($) | Level 2 ($) | Level 3 ($) |
Investments in Securities: | ||||
| Equities: | ||||
Communication Services | 300,254,748 | 300,254,748 | - | - |
Consumer Discretionary | 340,866,213 | 340,866,213 | - | - |
Consumer Staples | 55,809,328 | 55,809,328 | - | - |
Energy | 34,422,915 | 34,422,915 | - | - |
Financials | 127,883,583 | 127,883,583 | - | - |
Health Care | 267,169,205 | 267,169,205 | - | - |
Industrials | 148,975,357 | 148,975,357 | - | - |
Information Technology | 1,053,222,046 | 1,053,222,046 | - | - |
Materials | 22,371,264 | 22,371,264 | - | - |
Real Estate | 14,702,982 | 14,702,982 | - | - |
| Money Market Funds | 6,222,788 | 6,222,788 | - | - |
| Total Investments in Securities: | 2,371,900,429 | 2,371,900,429 | - | - |
Derivative Instruments: | ||||
| Assets | ||||
Futures Contracts | 210 | 210 | - | - |
| Total Assets | 210 | 210 | - | - |
| Total Derivative Instruments: | 210 | 210 | - | - |
Primary Risk Exposure / Derivative Type | Value | |
| Asset ($) | Liability ($) | |
| Equity Risk | ||
Futures Contracts (a) | 210 | 0 |
| Total Equity Risk | 210 | 0 |
| Total Value of Derivatives | 210 | 0 |
| Statement of Assets and Liabilities | ||||
| August 31, 2023 | ||||
| Assets | ||||
| Investment in securities, at value (including securities loaned of $5,842,725) - See accompanying schedule: | ||||
Unaffiliated issuers (cost $1,467,566,491) | $ | 2,365,677,641 | ||
Fidelity Central Funds (cost $6,222,788) | 6,222,788 | |||
| Total Investment in Securities (cost $1,473,789,279) | $ | 2,371,900,429 | ||
| Receivable for investments sold | 57,100,454 | |||
| Receivable for fund shares sold | 3,029,404 | |||
| Dividends receivable | 1,834,696 | |||
| Distributions receivable from Fidelity Central Funds | 70,437 | |||
| Receivable for daily variation margin on futures contracts | 210 | |||
| Other receivables | 10,899 | |||
Total assets | 2,433,946,529 | |||
| Liabilities | ||||
| Payable for investments purchased | $ | 33,477,191 | ||
| Payable for fund shares redeemed | 8,205,019 | |||
| Accrued management fee | 829,229 | |||
| Notes payable to affiliates | 16,816,000 | |||
| Other payables and accrued expenses | 31,889 | |||
| Collateral on securities loaned | 6,142,650 | |||
| Total Liabilities | 65,501,978 | |||
| Net Assets | $ | 2,368,444,551 | ||
| Net Assets consist of: | ||||
| Paid in capital | $ | 1,470,381,057 | ||
| Total accumulated earnings (loss) | 898,063,494 | |||
| Net Assets | $ | 2,368,444,551 | ||
Net Asset Value, offering price and redemption price per share ($2,368,444,551 ÷ 80,081,427 shares) | $ | 29.58 | ||
| Statement of Operations | ||||
Year ended August 31, 2023 | ||||
| Investment Income | ||||
| Dividends | $ | 20,177,977 | ||
| Interest | 93,311 | |||
| Income from Fidelity Central Funds (including $2,853 from security lending) | 2,054,934 | |||
| Total Income | 22,326,222 | |||
| Expenses | ||||
| Management fee | $ | 7,896,319 | ||
| Independent trustees' fees and expenses | 10,270 | |||
| Interest | 41,394 | |||
| Miscellaneous | 35,374 | |||
| Total expenses before reductions | 7,983,357 | |||
| Expense reductions | (2,918) | |||
| Total expenses after reductions | 7,980,439 | |||
| Net Investment income (loss) | 14,345,783 | |||
| Realized and Unrealized Gain (Loss) | ||||
| Net realized gain (loss) on: | ||||
| Investment Securities: | ||||
| Unaffiliated issuers | 29,491,248 | |||
| Redemptions in-kind | 14,287,867 | |||
| Futures contracts | 2,639,291 | |||
| Total net realized gain (loss) | 46,418,406 | |||
| Change in net unrealized appreciation (depreciation) on: | ||||
| Investment Securities: | ||||
| Unaffiliated issuers | 358,359,152 | |||
| Futures contracts | 380,401 | |||
| Total change in net unrealized appreciation (depreciation) | 358,739,553 | |||
| Net gain (loss) | 405,157,959 | |||
| Net increase (decrease) in net assets resulting from operations | $ | 419,503,742 | ||
| Statement of Changes in Net Assets | ||||
Year ended August 31, 2023 | Year ended August 31, 2022 | |||
| Increase (Decrease) in Net Assets | ||||
| Operations | ||||
| Net investment income (loss) | $ | 14,345,783 | $ | 8,691,799 |
| Net realized gain (loss) | 46,418,406 | (8,165,601) | ||
| Change in net unrealized appreciation (depreciation) | 358,739,553 | (299,422,252) | ||
| Net increase (decrease) in net assets resulting from operations | 419,503,742 | (298,896,054) | ||
| Distributions to shareholders | (10,050,462) | (234,756,175) | ||
| Share transactions | ||||
| Proceeds from sales of shares | 1,206,466,982 | 431,325,162 | ||
| Reinvestment of distributions | 8,894,596 | 220,826,073 | ||
| Cost of shares redeemed | (882,002,420) | (277,612,906) | ||
Net increase (decrease) in net assets resulting from share transactions | 333,359,158 | 374,538,329 | ||
| Total increase (decrease) in net assets | 742,812,438 | (159,113,900) | ||
| Net Assets | ||||
| Beginning of period | 1,625,632,113 | 1,784,746,013 | ||
| End of period | $ | 2,368,444,551 | $ | 1,625,632,113 |
| Other Information | ||||
| Shares | ||||
| Sold | 46,876,724 | 15,823,152 | ||
| Issued in reinvestment of distributions | 388,750 | 7,278,381 | ||
| Redeemed | (32,666,545) | (9,733,327) | ||
| Net increase (decrease) | 14,598,929 | 13,368,206 | ||
| Fidelity® Large Cap Growth Enhanced Index Fund |
| Years ended August 31, | 2023 | 2022 | 2021 | 2020 | 2019 | |||||
Selected Per-Share Data | ||||||||||
| Net asset value, beginning of period | $ | 24.83 | $ | 34.25 | $ | 27.80 | $ | 20.24 | $ | 21.58 |
| Income from Investment Operations | ||||||||||
Net investment income (loss) A,B | .18 | .15 | .14 | .16 | .21 | |||||
| Net realized and unrealized gain (loss) | 4.71 | (5.05) | 7.63 | 8.08 | (.15) | |||||
| Total from investment operations | 4.89 | (4.90) | 7.77 | 8.24 | .06 | |||||
| Distributions from net investment income | (.14) | (.14) | (.16) | (.18) | (.24) C | |||||
| Distributions from net realized gain | - | (4.38) | (1.16) | (.51) | (1.16) C | |||||
| Total distributions | (.14) | (4.52) | (1.32) | (.68) D | (1.40) | |||||
| Net asset value, end of period | $ | 29.58 | $ | 24.83 | $ | 34.25 | $ | 27.80 | $ | 20.24 |
Total Return E | 19.85% | (16.70)% | 29.08% | 41.73% | 1.28% | |||||
Ratios to Average Net Assets B,F,G | ||||||||||
| Expenses before reductions | .39% | .39% | .39% | .39% | .39% | |||||
| Expenses net of fee waivers, if any | .39% | .39% | .39% | .39% | .39% | |||||
| Expenses net of all reductions | .39% | .39% | .39% | .39% | .39% | |||||
| Net investment income (loss) | .71% | .52% | .47% | .74% | 1.07% | |||||
| Supplemental Data | ||||||||||
| Net assets, end of period (000 omitted) | $ | 2,368,445 | $ | 1,625,632 | $ | 1,784,746 | $ | 1,417,537 | $ | 1,106,497 |
Portfolio turnover rate H | 108% I | 101% | 84% | 69% | 85% |
| Average Annual Total Returns | |||
Periods ended August 31, 2023 | Past 1 year | Past 5 years | Past 10 years |
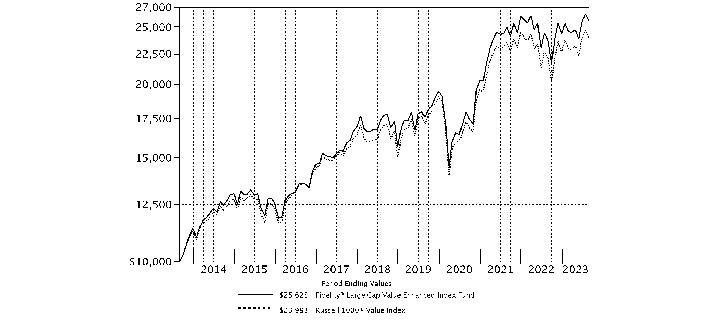
| Fidelity® Large Cap Value Enhanced Index Fund | 8.30% | 7.64% | 9.87% |
| $10,000 Over 10 Years |
Let's say hypothetically that $10,000 was invested in Fidelity® Large Cap Value Enhanced Index Fund on August 31, 2013. The chart shows how the value of your investment would have changed, and also shows how the Russell 1000® Value Index performed over the same period. |
 |
Top Holdings (% of Fund's net assets) | ||
| Berkshire Hathaway, Inc. Class B | 3.9 | |
| JPMorgan Chase & Co. | 2.6 | |
| Exxon Mobil Corp. | 2.4 | |
| Johnson & Johnson | 2.1 | |
| Chevron Corp. | 1.8 | |
| Cisco Systems, Inc. | 1.5 | |
| Comcast Corp. Class A | 1.5 | |
| Pfizer, Inc. | 1.4 | |
| Bank of America Corp. | 1.4 | |
| Walmart, Inc. | 1.4 | |
| 20.0 | ||
| Market Sectors (% of Fund's net assets) | ||
| Financials | 20.6 | |
| Health Care | 16.0 | |
| Industrials | 15.0 | |
| Information Technology | 9.9 | |
| Energy | 7.9 | |
| Consumer Staples | 7.5 | |
| Consumer Discretionary | 6.6 | |
| Real Estate | 4.8 | |
| Materials | 4.5 | |
| Communication Services | 4.1 | |
| Utilities | 2.6 | |
Asset Allocation (% of Fund's net assets) |
 |
Futures - 0.3% |
| Common Stocks - 99.5% | |||
| Shares | Value ($) | ||
| COMMUNICATION SERVICES - 4.1% | |||
| Diversified Telecommunication Services - 0.7% | |||
| AT&T, Inc. | 1,641,680 | 24,280,447 | |
| Lumen Technologies, Inc. (a) | 465,449 | 740,064 | |
| Verizon Communications, Inc. | 308,626 | 10,795,737 | |
| 35,816,248 | |||
| Entertainment - 1.4% | |||
| Activision Blizzard, Inc. | 153,264 | 14,098,755 | |
| Electronic Arts, Inc. | 299,687 | 35,956,446 | |
| Liberty Media Corp. Liberty Formula One Class A | 23,593 | 1,430,915 | |
| Liberty Media Corp. Liberty Live Class A | 28,594 | 952,466 | |
| Netflix, Inc. (b) | 13,462 | 5,838,200 | |
| Playtika Holding Corp. (b) | 26,164 | 255,361 | |
| Spotify Technology SA (b) | 26,585 | 4,093,292 | |
| The Walt Disney Co. (b) | 200,311 | 16,762,024 | |
| 79,387,459 | |||
| Interactive Media & Services - 0.4% | |||
| Alphabet, Inc.: | |||
| Class A (b) | 2,241 | 305,157 | |
| Class C (b) | 145,770 | 20,021,510 | |
| 20,326,667 | |||
| Media - 1.6% | |||
| Comcast Corp. Class A | 1,726,638 | 80,737,593 | |
| Liberty Media Corp. Liberty SiriusXM | 347,223 | 8,486,130 | |
| Liberty Media Corp. Liberty SiriusXM Class A | 47,081 | 1,131,356 | |
| TEGNA, Inc. | 31,996 | 528,894 | |
| 90,883,973 | |||
TOTAL COMMUNICATION SERVICES | 226,414,347 | ||
| CONSUMER DISCRETIONARY - 6.6% | |||
| Automobiles - 1.0% | |||
| Ford Motor Co. | 3,206,252 | 38,891,837 | |
| General Motors Co. | 439,809 | 14,738,000 | |
| 53,629,837 | |||
| Broadline Retail - 0.9% | |||
| Amazon.com, Inc. (b) | 112,009 | 15,458,362 | |
| eBay, Inc. | 616,453 | 27,604,765 | |
| Macy's, Inc. (a) | 632,711 | 7,738,056 | |
| 50,801,183 | |||
| Distributors - 0.7% | |||
| Genuine Parts Co. | 212,313 | 32,638,877 | |
| LKQ Corp. | 78,451 | 4,121,031 | |
| 36,759,908 | |||
| Diversified Consumer Services - 0.0% | |||
| ADT, Inc. | 133,845 | 859,285 | |
| H&R Block, Inc. | 23,740 | 949,125 | |
| 1,808,410 | |||
| Hotels, Restaurants & Leisure - 1.6% | |||
| Airbnb, Inc. Class A (b) | 120,387 | 15,836,910 | |
| Caesars Entertainment, Inc. (b) | 46,492 | 2,569,148 | |
| Draftkings Holdings, Inc. (b) | 62,600 | 1,856,090 | |
| Expedia, Inc. (b) | 9,648 | 1,045,747 | |
| Hilton Grand Vacations, Inc. (b) | 45,120 | 1,972,646 | |
| International Game Technology PLC | 25,136 | 804,855 | |
| Marriott Vacations Worldwide Corp. | 19,842 | 2,156,627 | |
| McDonald's Corp. | 165,512 | 46,533,699 | |
| MGM Resorts International | 288,609 | 12,693,024 | |
| Wendy's Co. | 93,249 | 1,845,398 | |
| Wynn Resorts Ltd. | 20,039 | 2,031,554 | |
| 89,345,698 | |||
| Household Durables - 1.4% | |||
| D.R. Horton, Inc. | 109,627 | 13,047,806 | |
| Lennar Corp. Class A | 53,092 | 6,322,726 | |
| NVR, Inc. (b) | 1,313 | 8,373,434 | |
| Toll Brothers, Inc. | 327,651 | 26,844,446 | |
| TopBuild Corp. (b) | 69,546 | 20,173,904 | |
| 74,762,316 | |||
| Leisure Products - 0.1% | |||
| Peloton Interactive, Inc. Class A (a)(b) | 454,655 | 2,900,699 | |
| Polaris, Inc. | 7,624 | 854,574 | |
| 3,755,273 | |||
| Specialty Retail - 0.9% | |||
| AutoNation, Inc. (b) | 68,762 | 10,801,823 | |
| AutoZone, Inc. (b) | 4,125 | 10,441,736 | |
| Murphy U.S.A., Inc. | 10,863 | 3,450,523 | |
| Petco Health & Wellness Co., Inc. (b) | 104,363 | 531,208 | |
| The Home Depot, Inc. | 36,558 | 12,075,107 | |
| TJX Companies, Inc. | 101,556 | 9,391,899 | |
| Ulta Beauty, Inc. (b) | 5,399 | 2,240,747 | |
| Victoria's Secret & Co. (b) | 55,778 | 1,069,822 | |
| 50,002,865 | |||
| Textiles, Apparel & Luxury Goods - 0.0% | |||
| Crocs, Inc. (b) | 27,358 | 2,663,028 | |
TOTAL CONSUMER DISCRETIONARY | 363,528,518 | ||
| CONSUMER STAPLES - 7.5% | |||
| Beverages - 1.2% | |||
| Coca-Cola Bottling Co. Consolidated | 706 | 493,423 | |
| Keurig Dr. Pepper, Inc. | 133,625 | 4,496,481 | |
| Molson Coors Beverage Co. Class B | 47,330 | 3,004,982 | |
| PepsiCo, Inc. | 13,753 | 2,446,934 | |
| The Coca-Cola Co. | 960,473 | 57,465,100 | |
| 67,906,920 | |||
| Consumer Staples Distribution & Retail - 1.6% | |||
| Casey's General Stores, Inc. | 22,877 | 5,591,368 | |
| Grocery Outlet Holding Corp. (b) | 16,651 | 513,683 | |
| Kroger Co. | 135,227 | 6,273,181 | |
| Walmart, Inc. | 482,312 | 78,428,754 | |
| 90,806,986 | |||
| Food Products - 2.3% | |||
| Archer Daniels Midland Co. | 390,057 | 30,931,520 | |
| Cal-Maine Foods, Inc. | 32,196 | 1,538,647 | |
| Flowers Foods, Inc. | 41,416 | 975,761 | |
| Lamb Weston Holdings, Inc. | 22,127 | 2,155,391 | |
| Mondelez International, Inc. | 761,652 | 54,275,322 | |
| Post Holdings, Inc. (b) | 29,146 | 2,614,688 | |
| The J.M. Smucker Co. | 781 | 113,206 | |
| The Kraft Heinz Co. | 1,033,358 | 34,193,816 | |
| 126,798,351 | |||
| Household Products - 1.7% | |||
| Colgate-Palmolive Co. | 78,681 | 5,780,693 | |
| Kimberly-Clark Corp. | 109,273 | 14,077,641 | |
| Procter & Gamble Co. | 473,192 | 73,032,453 | |
| 92,890,787 | |||
| Tobacco - 0.7% | |||
| Philip Morris International, Inc. | 409,460 | 39,332,728 | |
TOTAL CONSUMER STAPLES | 417,735,772 | ||
| ENERGY - 7.9% | |||
| Energy Equipment & Services - 0.7% | |||
| Baker Hughes Co. Class A | 339,155 | 12,274,019 | |
| Schlumberger Ltd. | 413,236 | 24,364,395 | |
| Weatherford International PLC (b) | 59,646 | 5,279,864 | |
| 41,918,278 | |||
| Oil, Gas & Consumable Fuels - 7.2% | |||
| Chevron Corp. | 616,913 | 99,384,684 | |
| Civitas Resources, Inc. | 34,336 | 2,823,106 | |
| ConocoPhillips Co. | 423,838 | 50,449,437 | |
| Devon Energy Corp. | 201,627 | 10,301,123 | |
| Diamondback Energy, Inc. | 47,620 | 7,227,764 | |
| EOG Resources, Inc. | 272,717 | 35,076,861 | |
| Exxon Mobil Corp. | 1,175,777 | 130,734,645 | |
| Marathon Oil Corp. | 400,746 | 10,559,657 | |
| Marathon Petroleum Corp. | 89,977 | 12,846,016 | |
| Murphy Oil Corp. | 215,650 | 9,790,510 | |
| ONEOK, Inc. | 8,757 | 570,956 | |
| Phillips 66 Co. | 144,735 | 16,522,948 | |
| Pioneer Natural Resources Co. | 18,567 | 4,417,646 | |
| Texas Pacific Land Corp. | 500 | 942,375 | |
| Valero Energy Corp. | 38,856 | 5,047,394 | |
| Vitesse Energy, Inc. (a) | 32,656 | 758,925 | |
| 397,454,047 | |||
TOTAL ENERGY | 439,372,325 | ||
| FINANCIALS - 20.6% | |||
| Banks - 6.1% | |||
| Bank of America Corp. | 2,752,231 | 78,906,463 | |
| Citigroup, Inc. | 504,394 | 20,826,428 | |
| Citizens Financial Group, Inc. | 34,882 | 981,231 | |
| Columbia Banking Systems, Inc. | 343,171 | 7,028,142 | |
| East West Bancorp, Inc. | 216,062 | 11,956,871 | |
| Eastern Bankshares, Inc. | 146,664 | 1,974,097 | |
| Fifth Third Bancorp | 296,290 | 7,866,500 | |
| JPMorgan Chase & Co. | 971,847 | 142,210,372 | |
| KeyCorp | 442,085 | 5,008,823 | |
| Signature Bank | 47,175 | 2,595 | |
| U.S. Bancorp | 293,066 | 10,705,701 | |
| Wells Fargo & Co. | 1,255,662 | 51,846,284 | |
| 339,313,507 | |||
| Capital Markets - 4.7% | |||
| Affiliated Managers Group, Inc. | 5,794 | 776,454 | |
| Bank of New York Mellon Corp. | 818,593 | 36,730,268 | |
| BlackRock, Inc. Class A | 1,830 | 1,281,988 | |
| Cboe Global Markets, Inc. | 48,659 | 7,284,739 | |
| Charles Schwab Corp. | 746,329 | 44,145,360 | |
| CME Group, Inc. | 140,199 | 28,415,533 | |
| Federated Hermes, Inc. | 370,356 | 12,873,575 | |
| Goldman Sachs Group, Inc. | 127,118 | 41,657,840 | |
| Intercontinental Exchange, Inc. | 51,893 | 6,122,855 | |
| Morgan Stanley | 139,053 | 11,840,363 | |
| NASDAQ, Inc. | 655,725 | 34,412,448 | |
| Robinhood Markets, Inc. (b) | 394,757 | 4,298,904 | |
| S&P Global, Inc. | 47,908 | 18,725,321 | |
| SEI Investments Co. | 9,610 | 596,397 | |
| State Street Corp. | 4,640 | 318,954 | |
| Stifel Financial Corp. | 160,577 | 10,440,717 | |
| Virtu Financial, Inc. Class A | 34,634 | 649,041 | |
| 260,570,757 | |||
| Consumer Finance - 0.6% | |||
| Discover Financial Services | 88,354 | 7,958,045 | |
| Synchrony Financial | 814,040 | 26,277,211 | |
| 34,235,256 | |||
| Financial Services - 5.7% | |||
| Berkshire Hathaway, Inc. Class B (b) | 600,480 | 216,292,888 | |
| Corebridge Financial, Inc. | 80,156 | 1,429,181 | |
| Essent Group Ltd. | 58,007 | 2,913,112 | |
| Fidelity National Information Services, Inc. | 660,302 | 36,884,470 | |
| MasterCard, Inc. Class A | 43,101 | 17,785,197 | |
| MGIC Investment Corp. | 689,998 | 12,130,165 | |
| PayPal Holdings, Inc. (b) | 395,546 | 24,725,580 | |
| The Western Union Co. | 32,407 | 400,226 | |
| 312,560,819 | |||
| Insurance - 3.5% | |||
| American Financial Group, Inc. | 19,942 | 2,311,677 | |
| American International Group, Inc. | 241,581 | 14,137,320 | |
| Axis Capital Holdings Ltd. | 36,410 | 1,997,453 | |
| Brown & Brown, Inc. | 395,013 | 29,270,463 | |
| Chubb Ltd. | 102,854 | 20,660,283 | |
| Cincinnati Financial Corp. | 33,963 | 3,592,946 | |
| F&G Annuities & Life, Inc. (a) | 22,751 | 644,081 | |
| Globe Life, Inc. | 41,019 | 4,576,490 | |
| Hartford Financial Services Group, Inc. | 236,523 | 16,987,082 | |
| Loews Corp. | 193,897 | 12,039,065 | |
| MetLife, Inc. | 468,336 | 29,664,402 | |
| Prudential Financial, Inc. | 167,150 | 15,824,091 | |
| Reinsurance Group of America, Inc. | 50,831 | 7,046,193 | |
| The Travelers Companies, Inc. | 93,709 | 15,108,702 | |
| Unum Group | 257,884 | 12,685,314 | |
| W.R. Berkley Corp. | 120,460 | 7,451,656 | |
| 193,997,218 | |||
TOTAL FINANCIALS | 1,140,677,557 | ||
| HEALTH CARE - 16.0% | |||
| Biotechnology - 2.4% | |||
| Alkermes PLC (b) | 56,027 | 1,635,428 | |
| Amgen, Inc. | 51,407 | 13,177,670 | |
| Biogen, Inc. (b) | 48,610 | 12,996,370 | |
| Exelixis, Inc. (b) | 567,210 | 12,699,832 | |
| Gilead Sciences, Inc. | 701,604 | 53,658,674 | |
| Incyte Corp. (b) | 295,839 | 19,090,491 | |
| PTC Therapeutics, Inc. (b) | 134,767 | 5,323,297 | |
| United Therapeutics Corp. (b) | 40,267 | 9,034,304 | |
| Vir Biotechnology, Inc. (b) | 207,130 | 2,622,266 | |
| 130,238,332 | |||
| Health Care Equipment & Supplies - 3.4% | |||
| Abbott Laboratories | 539,867 | 55,552,314 | |
| Align Technology, Inc. (b) | 8,696 | 3,218,737 | |
| Becton, Dickinson & Co. | 90,389 | 25,259,206 | |
| Boston Scientific Corp. (b) | 409,817 | 22,105,529 | |
| GE Healthcare Holding LLC | 73,743 | 5,195,194 | |
| Integra LifeSciences Holdings Corp. (b) | 163,200 | 6,942,528 | |
| Lantheus Holdings, Inc. (b) | 47,055 | 3,220,444 | |
| Medtronic PLC | 317,744 | 25,896,136 | |
| The Cooper Companies, Inc. | 10,163 | 3,760,208 | |
| Zimmer Biomet Holdings, Inc. | 295,663 | 35,219,377 | |
| 186,369,673 | |||
| Health Care Providers & Services - 3.4% | |||
| Centene Corp. (b) | 385,920 | 23,791,968 | |
| Cigna Group | 94,724 | 26,168,452 | |
| CVS Health Corp. | 590,171 | 38,461,444 | |
| Elevance Health, Inc. | 69,973 | 30,928,766 | |
| Humana, Inc. | 53,480 | 24,687,972 | |
| McKesson Corp. | 43,167 | 17,798,617 | |
| UnitedHealth Group, Inc. | 52,192 | 24,873,663 | |
| 186,710,882 | |||
| Health Care Technology - 0.0% | |||
| Teladoc Health, Inc. (b) | 63,395 | 1,435,263 | |
| Life Sciences Tools & Services - 1.4% | |||
| Bio-Rad Laboratories, Inc. Class A (b) | 53,114 | 21,256,223 | |
| Danaher Corp. | 96,706 | 25,627,090 | |
| Syneos Health, Inc. (b) | 695,527 | 29,719,869 | |
| 76,603,182 | |||
| Pharmaceuticals - 5.4% | |||
| Bristol-Myers Squibb Co. | 379,210 | 23,378,297 | |
| Elanco Animal Health, Inc. (b) | 267,414 | 3,262,451 | |
| Johnson & Johnson | 723,567 | 116,986,313 | |
| Merck & Co., Inc. | 596,818 | 65,041,226 | |
| Organon & Co. | 256,292 | 5,628,172 | |
| Pfizer, Inc. | 2,261,301 | 80,004,829 | |
| Royalty Pharma PLC | 76,111 | 2,269,630 | |
| Viatris, Inc. | 417,673 | 4,489,985 | |
| 301,060,903 | |||
TOTAL HEALTH CARE | 882,418,235 | ||
| INDUSTRIALS - 15.0% | |||
| Aerospace & Defense - 2.8% | |||
| General Dynamics Corp. | 60,691 | 13,755,008 | |
| Hexcel Corp. | 5,647 | 413,925 | |
| L3Harris Technologies, Inc. | 128,833 | 22,943,869 | |
| Lockheed Martin Corp. | 39,734 | 17,814,739 | |
| Moog, Inc. Class A | 78,131 | 9,075,697 | |
| Northrop Grumman Corp. | 17,863 | 7,736,287 | |
| Parsons Corp. (b) | 245,565 | 14,002,116 | |
| RTX Corp. | 221,994 | 19,100,364 | |
| Textron, Inc. | 437,907 | 34,029,753 | |
| The Boeing Co. (b) | 49,013 | 10,980,382 | |
| Woodward, Inc. | 30,739 | 3,976,704 | |
| 153,828,844 | |||
| Air Freight & Logistics - 0.6% | |||
| FedEx Corp. | 130,367 | 34,028,394 | |
| Building Products - 1.0% | |||
| A.O. Smith Corp. | 8,653 | 627,343 | |
| Allegion PLC | 70,694 | 8,045,684 | |
| Johnson Controls International PLC | 636,181 | 37,572,850 | |
| Owens Corning | 2,887 | 415,468 | |
| Simpson Manufacturing Co. Ltd. | 460 | 73,490 | |
| Trane Technologies PLC | 41,613 | 8,541,484 | |
| 55,276,319 | |||
| Commercial Services & Supplies - 1.2% | |||
| Cintas Corp. | 59,835 | 30,167,012 | |
| Republic Services, Inc. | 252,630 | 36,411,562 | |
| Tetra Tech, Inc. | 6,078 | 956,373 | |
| 67,534,947 | |||
| Construction & Engineering - 0.4% | |||
| Arcosa, Inc. | 51,498 | 4,028,174 | |
| EMCOR Group, Inc. | 32,191 | 7,218,832 | |
| Valmont Industries, Inc. | 44,265 | 11,221,178 | |
| 22,468,184 | |||
| Electrical Equipment - 2.0% | |||
| Acuity Brands, Inc. | 16,094 | 2,595,640 | |
| AMETEK, Inc. | 152,050 | 24,253,496 | |
| Atkore, Inc. (b) | 7,610 | 1,171,712 | |
| Eaton Corp. PLC | 91,891 | 21,168,930 | |
| Emerson Electric Co. | 470,150 | 46,192,238 | |
| EnerSys | 33,110 | 3,475,888 | |
| nVent Electric PLC | 235,806 | 13,332,471 | |
| 112,190,375 | |||
| Ground Transportation - 1.6% | |||
| CSX Corp. | 996,857 | 30,105,081 | |
| Norfolk Southern Corp. | 46,408 | 9,514,104 | |
| RXO, Inc. | 25,603 | 462,902 | |
| Uber Technologies, Inc. (b) | 80,961 | 3,823,788 | |
| Union Pacific Corp. | 200,985 | 44,331,261 | |
| 88,237,136 | |||
| Industrial Conglomerates - 1.4% | |||
| 3M Co. | 423,642 | 45,189,892 | |
| General Electric Co. | 220,167 | 25,200,315 | |
| Honeywell International, Inc. | 37,580 | 7,062,785 | |
| 77,452,992 | |||
| Machinery - 2.7% | |||
| AGCO Corp. | 209,240 | 27,102,857 | |
| Allison Transmission Holdings, Inc. | 206,995 | 12,512,848 | |
| Caterpillar, Inc. | 82,247 | 23,122,099 | |
| CNH Industrial NV | 656,219 | 9,042,698 | |
| Cummins, Inc. | 40,963 | 9,423,129 | |
| Deere & Co. | 42,798 | 17,587,410 | |
| Fortive Corp. | 167,955 | 13,243,252 | |
| Gates Industrial Corp. PLC (b) | 135,217 | 1,660,465 | |
| Oshkosh Corp. | 167,579 | 17,399,728 | |
| PACCAR, Inc. | 192,818 | 15,866,993 | |
| SPX Technologies, Inc. (b) | 23,041 | 1,820,700 | |
| Westinghouse Air Brake Tech Co. | 15,306 | 1,722,231 | |
| 150,504,410 | |||
| Marine Transportation - 0.0% | |||
| Kirby Corp. (b) | 11,108 | 920,076 | |
| Passenger Airlines - 0.7% | |||
| American Airlines Group, Inc. (b) | 635,848 | 9,366,041 | |
| United Airlines Holdings, Inc. (b) | 575,425 | 28,661,919 | |
| 38,027,960 | |||
| Professional Services - 0.3% | |||
| Korn Ferry | 50,426 | 2,570,717 | |
| Leidos Holdings, Inc. | 137,129 | 13,371,449 | |
| 15,942,166 | |||
| Trading Companies & Distributors - 0.3% | |||
| Applied Industrial Technologies, Inc. | 4,451 | 687,101 | |
| Beacon Roofing Supply, Inc. (b) | 101,837 | 8,131,684 | |
| Boise Cascade Co. | 13,770 | 1,506,025 | |
| Core & Main, Inc. (b) | 33,685 | 1,106,215 | |
| MSC Industrial Direct Co., Inc. Class A (a) | 22,128 | 2,258,384 | |
| 13,689,409 | |||
TOTAL INDUSTRIALS | 830,101,212 | ||
| INFORMATION TECHNOLOGY - 9.9% | |||
| Communications Equipment - 1.7% | |||
| Cisco Systems, Inc. | 1,422,216 | 81,564,088 | |
| Juniper Networks, Inc. | 397,108 | 11,563,785 | |
| 93,127,873 | |||
| Electronic Equipment, Instruments & Components - 0.3% | |||
| Avnet, Inc. | 19,865 | 1,008,149 | |
| Belden, Inc. | 47,921 | 4,499,782 | |
| Coherent Corp. (b) | 68,048 | 2,560,646 | |
| Keysight Technologies, Inc. (b) | 51,615 | 6,880,280 | |
| Vontier Corp. | 128,232 | 4,027,767 | |
| 18,976,624 | |||
| IT Services - 1.5% | |||
| Akamai Technologies, Inc. (b) | 8,778 | 922,480 | |
| Amdocs Ltd. | 90,858 | 8,104,534 | |
| Gartner, Inc. (b) | 30,382 | 10,623,978 | |
| GoDaddy, Inc. (b) | 149,805 | 10,862,361 | |
| IBM Corp. | 48,545 | 7,127,862 | |
| Kyndryl Holdings, Inc. (b) | 76,197 | 1,286,205 | |
| Twilio, Inc. Class A (b) | 322,274 | 20,532,077 | |
| Wix.com Ltd. (b) | 233,938 | 23,106,056 | |
| 82,565,553 | |||
| Semiconductors & Semiconductor Equipment - 3.6% | |||
| Advanced Micro Devices, Inc. (b) | 293,882 | 31,069,205 | |
| Broadcom, Inc. | 28,458 | 26,263,604 | |
| Cirrus Logic, Inc. (b) | 34,372 | 2,819,879 | |
| Intel Corp. | 2,016,194 | 70,849,057 | |
| NVIDIA Corp. | 7,504 | 3,703,599 | |
| NXP Semiconductors NV | 4,284 | 881,304 | |
| Qorvo, Inc. (b) | 288,458 | 30,977,505 | |
| Qualcomm, Inc. | 258,637 | 29,621,696 | |
| 196,185,849 | |||
| Software - 2.4% | |||
| Adobe, Inc. (b) | 20,413 | 11,417,807 | |
| Blackbaud, Inc. (b) | 2,955 | 224,905 | |
| Box, Inc. Class A (b) | 100,968 | 2,673,633 | |
| DocuSign, Inc. (b) | 56,767 | 2,855,380 | |
| Dropbox, Inc. Class A (b) | 468,621 | 13,022,978 | |
| NCR Corp. (b) | 13,867 | 426,549 | |
| Oracle Corp. | 5,998 | 722,099 | |
| Salesforce, Inc. (b) | 197,919 | 43,831,142 | |
| SolarWinds, Inc. (b) | 82,880 | 882,672 | |
| Synopsys, Inc. (b) | 35,090 | 16,102,450 | |
| Teradata Corp. (b) | 541,936 | 25,075,379 | |
| Unity Software, Inc. (b) | 48,853 | 1,810,981 | |
| Workday, Inc. Class A (b) | 18,735 | 4,580,708 | |
| Zoom Video Communications, Inc. Class A (b) | 139,842 | 9,932,977 | |
| 133,559,660 | |||
| Technology Hardware, Storage & Peripherals - 0.4% | |||
| NetApp, Inc. | 240,940 | 18,480,098 | |
| Pure Storage, Inc. Class A (b) | 117,993 | 4,317,364 | |
| 22,797,462 | |||
TOTAL INFORMATION TECHNOLOGY | 547,213,021 | ||
| MATERIALS - 4.5% | |||
| Chemicals - 2.1% | |||
| Air Products & Chemicals, Inc. | 59,265 | 17,512,215 | |
| Avient Corp. | 24,154 | 968,817 | |
| CF Industries Holdings, Inc. | 131,420 | 10,128,539 | |
| Corteva, Inc. | 307,574 | 15,535,563 | |
| Eastman Chemical Co. | 214,920 | 18,270,349 | |
| Ecolab, Inc. | 69,725 | 12,816,152 | |
| Ginkgo Bioworks Holdings, Inc. Class A (a)(b) | 758,826 | 1,775,653 | |
| Linde PLC | 72,884 | 28,209,023 | |
| PPG Industries, Inc. | 35,663 | 5,055,587 | |
| Sherwin-Williams Co. | 22,947 | 6,235,159 | |
| The Chemours Co. LLC | 53,733 | 1,827,997 | |
| 118,335,054 | |||
| Construction Materials - 0.7% | |||
| Eagle Materials, Inc. | 24,985 | 4,730,160 | |
| Martin Marietta Materials, Inc. | 25,052 | 11,183,463 | |
| Vulcan Materials Co. | 89,920 | 19,625,040 | |
| 35,538,663 | |||
| Containers & Packaging - 0.7% | |||
| Graphic Packaging Holding Co. | 133,310 | 2,964,814 | |
| Sealed Air Corp. | 199,207 | 7,382,611 | |
| WestRock Co. | 798,830 | 26,129,729 | |
| 36,477,154 | |||
| Metals & Mining - 1.0% | |||
| Commercial Metals Co. | 59,344 | 3,340,474 | |
| Newmont Corp. | 108,296 | 4,269,028 | |
| Nucor Corp. | 247,159 | 42,536,064 | |
| Steel Dynamics, Inc. | 36,859 | 3,928,801 | |
| Worthington Industries, Inc. | 31,758 | 2,390,425 | |
| 56,464,792 | |||
TOTAL MATERIALS | 246,815,663 | ||
| REAL ESTATE - 4.8% | |||
| Equity Real Estate Investment Trusts (REITs) - 4.5% | |||
| American Homes 4 Rent Class A | 366,710 | 13,216,228 | |
| American Tower Corp. | 82,683 | 14,992,082 | |
| Apartment Income (REIT) Corp. | 225,095 | 7,666,736 | |
| AvalonBay Communities, Inc. | 15,815 | 2,907,113 | |
| Crown Castle International Corp. | 317,043 | 31,862,822 | |
| EastGroup Properties, Inc. | 2,650 | 476,020 | |
| EPR Properties | 34,114 | 1,527,625 | |
| Equity Residential (SBI) | 85,917 | 5,569,999 | |
| Extra Space Storage, Inc. | 5,217 | 671,324 | |
| Federal Realty Investment Trust (SBI) | 67,214 | 6,582,939 | |
| Gaming & Leisure Properties | 63,028 | 2,987,527 | |
| Healthpeak Properties, Inc. | 266,978 | 5,494,407 | |
| Highwoods Properties, Inc. (SBI) | 308,491 | 7,351,341 | |
| Invitation Homes, Inc. | 975,778 | 33,264,272 | |
| Kilroy Realty Corp. | 29,803 | 1,101,221 | |
| Mid-America Apartment Communities, Inc. | 75,408 | 10,951,504 | |
| NNN (REIT), Inc. | 237,692 | 9,362,688 | |
| Park Hotels & Resorts, Inc. | 559,577 | 7,179,373 | |
| Prologis (REIT), Inc. | 33,866 | 4,206,157 | |
| Public Storage | 92,132 | 25,463,442 | |
| Rexford Industrial Realty, Inc. | 91,945 | 4,916,299 | |
| SBA Communications Corp. Class A | 61,481 | 13,804,329 | |
| Simon Property Group, Inc. | 130,973 | 14,864,126 | |
| Spirit Realty Capital, Inc. | 84,672 | 3,269,186 | |
| Terreno Realty Corp. | 145,502 | 8,859,617 | |
| UDR, Inc. | 112,288 | 4,480,291 | |
| VICI Properties, Inc. | 132,636 | 4,090,494 | |
| Weyerhaeuser Co. | 79,005 | 2,587,414 | |
| 249,706,576 | |||
| Real Estate Management & Development - 0.3% | |||
| Zillow Group, Inc.: | |||
| Class A (b) | 73,238 | 3,729,279 | |
| Class C (b) | 218,106 | 11,376,409 | |
| 15,105,688 | |||
TOTAL REAL ESTATE | 264,812,264 | ||
| UTILITIES - 2.6% | |||
| Electric Utilities - 1.5% | |||
| Allete, Inc. | 54,586 | 2,996,771 | |
| Duke Energy Corp. | 124,245 | 11,032,956 | |
| Entergy Corp. | 29,107 | 2,772,442 | |
| Evergy, Inc. | 22,115 | 1,215,662 | |
| Hawaiian Electric Industries, Inc. | 42,785 | 599,846 | |
| NextEra Energy, Inc. | 580,504 | 38,777,667 | |
| OGE Energy Corp. | 104,576 | 3,560,813 | |
| Pinnacle West Capital Corp. | 14,337 | 1,107,820 | |
| Xcel Energy, Inc. | 391,431 | 22,362,453 | |
| 84,426,430 | |||
| Gas Utilities - 0.2% | |||
| National Fuel Gas Co. | 75,023 | 4,031,736 | |
| UGI Corp. | 118,269 | 2,978,013 | |
| 7,009,749 | |||
| Independent Power and Renewable Electricity Producers - 0.2% | |||
| Brookfield Renewable Corp. | 53,386 | 1,492,139 | |
| Clearway Energy, Inc.: | |||
| Class A | 46,164 | 1,082,084 | |
| Class C | 152,172 | 3,769,300 | |
| Vistra Corp. | 192,513 | 6,048,758 | |
| 12,392,281 | |||
| Multi-Utilities - 0.7% | |||
| Black Hills Corp. | 67,890 | 3,733,950 | |
| Consolidated Edison, Inc. | 98,222 | 8,737,829 | |
| NiSource, Inc. | 425,254 | 11,379,797 | |
| Public Service Enterprise Group, Inc. | 235,570 | 14,388,616 | |
| 38,240,192 | |||
TOTAL UTILITIES | 142,068,652 | ||
| TOTAL COMMON STOCKS (Cost $4,777,819,942) | 5,501,157,566 | ||
| Money Market Funds - 3.0% | |||
| Shares | Value ($) | ||
| Fidelity Cash Central Fund 5.43% (c) | 155,185,077 | 155,216,114 | |
| Fidelity Securities Lending Cash Central Fund 5.44% (c)(d) | 13,095,079 | 13,096,389 | |
| TOTAL MONEY MARKET FUNDS (Cost $168,312,503) | 168,312,503 | ||
| TOTAL INVESTMENT IN SECURITIES - 102.5% (Cost $4,946,132,445) | 5,669,470,069 |
NET OTHER ASSETS (LIABILITIES) - (2.5)% | (137,705,741) |
| NET ASSETS - 100.0% | 5,531,764,328 |
| Futures Contracts | |||||
Number of contracts | Expiration Date | Notional Amount ($) | Value ($) | Unrealized Appreciation/ (Depreciation) ($) | |
| Purchased | |||||
| Equity Index Contracts | |||||
| CME E-mini S&P 500 Index Contracts (United States) | 65 | Sep 2023 | 14,677,000 | 540,701 | 540,701 |
| The notional amount of futures purchased as a percentage of Net Assets is 0.3% | |||||
| (a) | Security or a portion of the security is on loan at period end. |
| (b) | Non-income producing |
| (c) | Affiliated fund that is generally available only to investment companies and other accounts managed by Fidelity Investments. The rate quoted is the annualized seven-day yield of the fund at period end. A complete unaudited listing of the fund's holdings as of its most recent quarter end is available upon request. In addition, each Fidelity Central Fund's financial statements, which are not covered by the Fund's Report of Independent Registered Public Accounting Firm, are available on the SEC's website or upon request. |
| (d) | Investment made with cash collateral received from securities on loan. |
| Affiliate | Value, beginning of period ($) | Purchases ($) | Sales Proceeds ($) | Dividend Income ($) | Realized Gain (loss) ($) | Change in Unrealized appreciation (depreciation) ($) | Value, end of period ($) | % ownership, end of period |
| Fidelity Cash Central Fund 5.43% | 8,770,543 | 839,840,159 | 693,394,588 | 1,677,853 | - | - | 155,216,114 | 0.4% |
| Fidelity Securities Lending Cash Central Fund 5.44% | 51,168,351 | 615,567,234 | 653,639,196 | 193,813 | - | - | 13,096,389 | 0.0% |
| Total | 59,938,894 | 1,455,407,393 | 1,347,033,784 | 1,871,666 | - | - | 168,312,503 | |
| Valuation Inputs at Reporting Date: | ||||
| Description | Total ($) | Level 1 ($) | Level 2 ($) | Level 3 ($) |
Investments in Securities: | ||||
| Equities: | ||||
Communication Services | 226,414,347 | 226,414,347 | - | - |
Consumer Discretionary | 363,528,518 | 363,528,518 | - | - |
Consumer Staples | 417,735,772 | 417,735,772 | - | - |
Energy | 439,372,325 | 439,372,325 | - | - |
Financials | 1,140,677,557 | 1,140,677,557 | - | - |
Health Care | 882,418,235 | 882,418,235 | - | - |
Industrials | 830,101,212 | 830,101,212 | - | - |
Information Technology | 547,213,021 | 547,213,021 | - | - |
Materials | 246,815,663 | 246,815,663 | - | - |
Real Estate | 264,812,264 | 264,812,264 | - | - |
Utilities | 142,068,652 | 142,068,652 | - | - |
| Money Market Funds | 168,312,503 | 168,312,503 | - | - |
| Total Investments in Securities: | 5,669,470,069 | 5,669,470,069 | - | - |
Derivative Instruments: | ||||
| Assets | ||||
Futures Contracts | 540,701 | 540,701 | - | - |
| Total Assets | 540,701 | 540,701 | - | - |
| Total Derivative Instruments: | 540,701 | 540,701 | - | - |
Primary Risk Exposure / Derivative Type | Value | |
| Asset ($) | Liability ($) | |
| Equity Risk | ||
Futures Contracts (a) | 540,701 | 0 |
| Total Equity Risk | 540,701 | 0 |
| Total Value of Derivatives | 540,701 | 0 |
| Statement of Assets and Liabilities | ||||
| August 31, 2023 | ||||
| Assets | ||||
| Investment in securities, at value (including securities loaned of $12,549,124) - See accompanying schedule: | ||||
Unaffiliated issuers (cost $4,777,819,942) | $ | 5,501,157,566 | ||
Fidelity Central Funds (cost $168,312,503) | 168,312,503 | |||
| Total Investment in Securities (cost $4,946,132,445) | $ | 5,669,470,069 | ||
| Segregated cash with brokers for derivative instruments | 7,705,600 | |||
| Receivable for investments sold | 163,221,367 | |||
| Receivable for fund shares sold | 2,261,245 | |||
| Dividends receivable | 12,520,764 | |||
| Distributions receivable from Fidelity Central Funds | 177,877 | |||
| Receivable for daily variation margin on futures contracts | 63,335 | |||
| Other receivables | 67,580 | |||
Total assets | 5,855,487,837 | |||
| Liabilities | ||||
| Payable for investments purchased | $ | 170,401,828 | ||
| Payable for fund shares redeemed | 138,424,457 | |||
| Accrued management fee | 1,803,836 | |||
| Collateral on securities loaned | 13,093,388 | |||
| Total Liabilities | 323,723,509 | |||
| Net Assets | $ | 5,531,764,328 | ||
| Net Assets consist of: | ||||
| Paid in capital | $ | 4,690,660,336 | ||
| Total accumulated earnings (loss) | 841,103,992 | |||
| Net Assets | $ | 5,531,764,328 | ||
Net Asset Value, offering price and redemption price per share ($5,531,764,328 ÷ 367,307,367 shares) | $ | 15.06 | ||
| Statement of Operations | ||||
Year ended August 31, 2023 | ||||
| Investment Income | ||||
| Dividends | $ | 123,931,441 | ||
| Interest | 78,834 | |||
| Income from Fidelity Central Funds (including $193,813 from security lending) | 1,871,666 | |||
| Total Income | 125,881,941 | |||
| Expenses | ||||
| Management fee | $ | 21,604,951 | ||
| Independent trustees' fees and expenses | 30,662 | |||
| Interest | 29,724 | |||
| Total expenses before reductions | 21,665,337 | |||
| Expense reductions | (1,773) | |||
| Total expenses after reductions | 21,663,564 | |||
| Net Investment income (loss) | 104,218,377 | |||
| Realized and Unrealized Gain (Loss) | ||||
| Net realized gain (loss) on: | ||||
| Investment Securities: | ||||
| Unaffiliated issuers | 87,781,805 | |||
| Redemptions in-kind | 117,706,408 | |||
| Futures contracts | 3,530,011 | |||
| Total net realized gain (loss) | 209,018,224 | |||
| Change in net unrealized appreciation (depreciation) on: | ||||
| Investment Securities: | ||||
| Unaffiliated issuers | 129,900,340 | |||
| Futures contracts | 513,598 | |||
| Total change in net unrealized appreciation (depreciation) | 130,413,938 | |||
| Net gain (loss) | 339,432,162 | |||
| Net increase (decrease) in net assets resulting from operations | $ | 443,650,539 | ||
| Statement of Changes in Net Assets | ||||
Year ended August 31, 2023 | Year ended August 31, 2022 | |||
| Increase (Decrease) in Net Assets | ||||
| Operations | ||||
| Net investment income (loss) | $ | 104,218,377 | $ | 109,310,484 |
| Net realized gain (loss) | 209,018,224 | 269,166,406 | ||
| Change in net unrealized appreciation (depreciation) | 130,413,938 | (702,930,899) | ||
| Net increase (decrease) in net assets resulting from operations | 443,650,539 | (324,454,009) | ||
| Distributions to shareholders | (257,200,574) | (697,082,541) | ||
| Share transactions | ||||
| Proceeds from sales of shares | 817,757,697 | 1,055,115,905 | ||
| Reinvestment of distributions | 243,302,994 | 669,849,842 | ||
| Cost of shares redeemed | (1,407,138,550) | (1,199,545,360) | ||
Net increase (decrease) in net assets resulting from share transactions | (346,077,859) | 525,420,387 | ||
| Total increase (decrease) in net assets | (159,627,894) | (496,116,163) | ||
| Net Assets | ||||
| Beginning of period | 5,691,392,222 | 6,187,508,385 | ||
| End of period | $ | 5,531,764,328 | $ | 5,691,392,222 |
| Other Information | ||||
| Shares | ||||
| Sold | 56,058,366 | 67,688,693 | ||
| Issued in reinvestment of distributions | 16,907,783 | 42,939,093 | ||
| Redeemed | (96,852,853) | (77,436,714) | ||
| Net increase (decrease) | (23,886,704) | 33,191,072 | ||
| Fidelity® Large Cap Value Enhanced Index Fund |
| Years ended August 31, | 2023 | 2022 | 2021 | 2020 | 2019 | |||||
Selected Per-Share Data | ||||||||||
| Net asset value, beginning of period | $ | 14.55 | $ | 17.28 | $ | 12.63 | $ | 12.81 | $ | 13.81 |
| Income from Investment Operations | ||||||||||
Net investment income (loss) A,B | .27 | .28 | .25 | .28 | .30 | |||||
| Net realized and unrealized gain (loss) | .91 | (1.04) | 4.63 | - C | (.46) | |||||
| Total from investment operations | 1.18 | (.76) | 4.88 | .28 | (.16) | |||||
| Distributions from net investment income | (.22) | (.33) D | (.23) | (.29) | (.31) | |||||
| Distributions from net realized gain | (.45) | (1.64) D | - | (.17) | (.54) | |||||
| Total distributions | (.67) | (1.97) | (.23) | (.46) | (.84) E | |||||
| Net asset value, end of period | $ | 15.06 | $ | 14.55 | $ | 17.28 | $ | 12.63 | $ | 12.81 |
Total Return F | 8.30% | (5.18)% | 39.12% | 1.95% | (.77)% | |||||
Ratios to Average Net Assets B,G,H | ||||||||||
| Expenses before reductions | .39% | .39% | .39% | .39% | .39% | |||||
| Expenses net of fee waivers, if any | .39% | .39% | .39% | .39% | .39% | |||||
| Expenses net of all reductions | .39% | .39% | .39% | .39% | .39% | |||||
| Net investment income (loss) | 1.88% | 1.76% | 1.65% | 2.21% | 2.37% | |||||
| Supplemental Data | ||||||||||
| Net assets, end of period (000 omitted) | $ | 5,531,764 | $ | 5,691,392 | $ | 6,187,508 | $ | 3,887,139 | $ | 3,757,353 |
Portfolio turnover rate I | 88% J | 112% | 75% | 81% | 94% |
| Average Annual Total Returns | |||
Periods ended August 31, 2023 | Past 1 year | Past 5 years | Past 10 years |
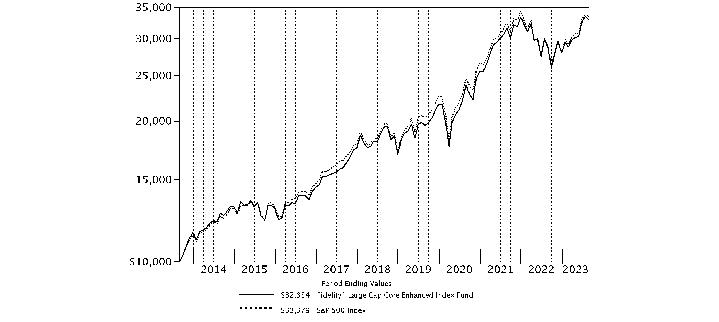
| Fidelity® Large Cap Core Enhanced Index Fund | 15.01% | 11.07% | 12.62% |
| $10,000 Over 10 Years |
Let's say hypothetically that $10,000 was invested in Fidelity® Large Cap Core Enhanced Index Fund on August 31, 2013. The chart shows how the value of your investment would have changed, and also shows how the S&P 500® Index performed over the same period. |
 |
Top Holdings (% of Fund's net assets) | ||
| Apple, Inc. | 7.5 | |
| Microsoft Corp. | 6.1 | |
| NVIDIA Corp. | 3.3 | |
| Amazon.com, Inc. | 2.8 | |
| Alphabet, Inc. Class C | 2.4 | |
| Tesla, Inc. | 2.4 | |
| Berkshire Hathaway, Inc. Class B | 2.2 | |
| Alphabet, Inc. Class A | 2.1 | |
| Meta Platforms, Inc. Class A | 1.9 | |
| UnitedHealth Group, Inc. | 1.7 | |
| 32.4 | ||
| Market Sectors (% of Fund's net assets) | ||
| Information Technology | 28.1 | |
| Health Care | 14.1 | |
| Financials | 12.4 | |
| Consumer Discretionary | 11.2 | |
| Industrials | 10.1 | |
| Communication Services | 9.3 | |
| Consumer Staples | 5.2 | |
| Energy | 4.2 | |
| Materials | 1.8 | |
| Real Estate | 1.7 | |
| Utilities | 0.2 | |
Asset Allocation (% of Fund's net assets) |
 |
Futures - 1.3% |
| Common Stocks - 98.3% | |||
| Shares | Value ($) | ||
| COMMUNICATION SERVICES - 9.3% | |||
| Diversified Telecommunication Services - 0.1% | |||
| AT&T, Inc. | 178,286 | 2,636,850 | |
| Entertainment - 1.4% | |||
| Activision Blizzard, Inc. | 12,777 | 1,175,356 | |
| Electronic Arts, Inc. | 96,692 | 11,601,106 | |
| Netflix, Inc. (a) | 33,754 | 14,638,435 | |
| Spotify Technology SA (a) | 11,500 | 1,770,655 | |
| 29,185,552 | |||
| Interactive Media & Services - 6.4% | |||
| Alphabet, Inc.: | |||
| Class A (a) | 318,804 | 43,411,541 | |
| Class C (a) | 355,679 | 48,852,511 | |
| Meta Platforms, Inc. Class A (a) | 128,009 | 37,876,583 | |
| 130,140,635 | |||
| Media - 1.4% | |||
| Charter Communications, Inc. Class A (a) | 15,513 | 6,796,556 | |
| Comcast Corp. Class A | 451,482 | 21,111,298 | |
| TEGNA, Inc. | 68,607 | 1,134,074 | |
| 29,041,928 | |||
TOTAL COMMUNICATION SERVICES | 191,004,965 | ||
| CONSUMER DISCRETIONARY - 11.2% | |||
| Automobiles - 3.2% | |||
| Ford Motor Co. | 1,044,739 | 12,672,684 | |
| General Motors Co. | 147,345 | 4,937,531 | |
| Tesla, Inc. (a) | 186,294 | 48,078,756 | |
| 65,688,971 | |||
| Broadline Retail - 2.9% | |||
| Amazon.com, Inc. (a) | 418,109 | 57,703,223 | |
| Etsy, Inc. (a) | 27,194 | 2,000,663 | |
| 59,703,886 | |||
| Distributors - 0.1% | |||
| Genuine Parts Co. | 12,202 | 1,875,813 | |
| Diversified Consumer Services - 0.0% | |||
| H&R Block, Inc. | 23,740 | 949,125 | |
| Hotels, Restaurants & Leisure - 1.7% | |||
| Airbnb, Inc. Class A (a) | 71,194 | 9,365,571 | |
| Booking Holdings, Inc. (a) | 1,993 | 6,188,325 | |
| Chipotle Mexican Grill, Inc. (a) | 1,208 | 2,327,381 | |
| McDonald's Corp. | 43,010 | 12,092,262 | |
| Starbucks Corp. | 44,230 | 4,309,771 | |
| 34,283,310 | |||
| Household Durables - 0.8% | |||
| D.R. Horton, Inc. | 3,323 | 395,503 | |
| NVR, Inc. (a) | 800 | 5,101,864 | |
| Toll Brothers, Inc. | 16,619 | 1,361,595 | |
| TopBuild Corp. (a) | 29,534 | 8,567,223 | |
| 15,426,185 | |||
| Specialty Retail - 2.4% | |||
| Murphy U.S.A., Inc. | 4,684 | 1,487,826 | |
| O'Reilly Automotive, Inc. (a) | 6,026 | 5,662,632 | |
| The Home Depot, Inc. | 84,723 | 27,984,007 | |
| TJX Companies, Inc. | 50,780 | 4,696,134 | |
| Ulta Beauty, Inc. (a) | 21,422 | 8,890,773 | |
| 48,721,372 | |||
| Textiles, Apparel & Luxury Goods - 0.1% | |||
| Crocs, Inc. (a) | 25,792 | 2,510,593 | |
TOTAL CONSUMER DISCRETIONARY | 229,159,255 | ||
| CONSUMER STAPLES - 5.2% | |||
| Beverages - 1.3% | |||
| PepsiCo, Inc. | 24,577 | 4,372,740 | |
| The Coca-Cola Co. | 381,541 | 22,827,598 | |
| 27,200,338 | |||
| Consumer Staples Distribution & Retail - 1.0% | |||
| Costco Wholesale Corp. | 7,577 | 4,161,895 | |
| Walmart, Inc. | 99,913 | 16,246,853 | |
| 20,408,748 | |||
| Food Products - 1.5% | |||
| Archer Daniels Midland Co. | 44,946 | 3,564,218 | |
| Mondelez International, Inc. | 216,618 | 15,436,199 | |
| The Kraft Heinz Co. | 340,521 | 11,267,840 | |
| 30,268,257 | |||
| Household Products - 1.4% | |||
| Colgate-Palmolive Co. | 97,903 | 7,192,933 | |
| Kimberly-Clark Corp. | 65,252 | 8,406,415 | |
| Procter & Gamble Co. | 86,473 | 13,346,243 | |
| 28,945,591 | |||
TOTAL CONSUMER STAPLES | 106,822,934 | ||
| ENERGY - 4.2% | |||
| Energy Equipment & Services - 0.0% | |||
| Weatherford International PLC (a) | 1,568 | 138,799 | |
| Oil, Gas & Consumable Fuels - 4.2% | |||
| Chevron Corp. | 158,120 | 25,473,132 | |
| ConocoPhillips Co. | 103,528 | 12,322,938 | |
| EOG Resources, Inc. | 108,399 | 13,942,279 | |
| Exxon Mobil Corp. | 269,844 | 30,003,954 | |
| Occidental Petroleum Corp. warrants 8/3/27 (a) | 9,120 | 372,552 | |
| ONEOK, Inc. | 16,146 | 1,052,719 | |
| Pioneer Natural Resources Co. | 2,681 | 637,890 | |
| Texas Pacific Land Corp. (b) | 1,000 | 1,884,750 | |
| 85,690,214 | |||
TOTAL ENERGY | 85,829,013 | ||
| FINANCIALS - 12.4% | |||
| Banks - 2.9% | |||
| Bank of America Corp. | 693,889 | 19,893,798 | |
| East West Bancorp, Inc. | 31,771 | 1,758,207 | |
| JPMorgan Chase & Co. | 225,755 | 33,034,729 | |
| U.S. Bancorp | 24,716 | 902,875 | |
| Wells Fargo & Co. | 118,849 | 4,907,275 | |
| 60,496,884 | |||
| Capital Markets - 2.1% | |||
| Bank of New York Mellon Corp. | 34,764 | 1,559,861 | |
| Charles Schwab Corp. | 253,308 | 14,983,168 | |
| Goldman Sachs Group, Inc. | 21,892 | 7,174,227 | |
| LPL Financial | 13,149 | 3,032,028 | |
| NASDAQ, Inc. | 224,612 | 11,787,638 | |
| SEI Investments Co. | 56,949 | 3,534,255 | |
| Stifel Financial Corp. | 19,073 | 1,240,126 | |
| 43,311,303 | |||
| Consumer Finance - 0.2% | |||
| Synchrony Financial | 148,526 | 4,794,419 | |
| Financial Services - 5.4% | |||
| Berkshire Hathaway, Inc. Class B (a) | 125,620 | 45,248,324 | |
| Essent Group Ltd. | 5,500 | 276,210 | |
| Fidelity National Information Services, Inc. | 150,883 | 8,428,324 | |
| MasterCard, Inc. Class A | 71,246 | 29,398,949 | |
| MGIC Investment Corp. | 188,916 | 3,321,143 | |
| PayPal Holdings, Inc. (a) | 198,492 | 12,407,735 | |
| Visa, Inc. Class A | 43,160 | 10,603,549 | |
| 109,684,234 | |||
| Insurance - 1.8% | |||
| Brown & Brown, Inc. | 135,631 | 10,050,257 | |
| Hartford Financial Services Group, Inc. | 82,671 | 5,937,431 | |
| MetLife, Inc. | 157,169 | 9,955,084 | |
| Progressive Corp. | 10,246 | 1,367,534 | |
| The Travelers Companies, Inc. | 57,189 | 9,220,582 | |
| 36,530,888 | |||
TOTAL FINANCIALS | 254,817,728 | ||
| HEALTH CARE - 14.1% | |||
| Biotechnology - 2.4% | |||
| AbbVie, Inc. | 32,062 | 4,711,832 | |
| Amgen, Inc. | 33,345 | 8,547,657 | |
| Exelixis, Inc. (a) | 364,124 | 8,152,736 | |
| Gilead Sciences, Inc. | 200,512 | 15,335,158 | |
| Incyte Corp. (a) | 162,110 | 10,460,958 | |
| United Therapeutics Corp. (a) | 5,902 | 1,324,173 | |
| 48,532,514 | |||
| Health Care Equipment & Supplies - 1.9% | |||
| Abbott Laboratories | 192,093 | 19,766,370 | |
| Align Technology, Inc. (a) | 7,858 | 2,908,560 | |
| Hologic, Inc. (a) | 25,756 | 1,925,003 | |
| Lantheus Holdings, Inc. (a) | 38,965 | 2,666,765 | |
| Zimmer Biomet Holdings, Inc. | 95,918 | 11,425,752 | |
| Zimvie, Inc. (a) | 18,157 | 214,253 | |
| 38,906,703 | |||
| Health Care Providers & Services - 4.7% | |||
| Centene Corp. (a) | 188,035 | 11,592,358 | |
| Cigna Group | 20,227 | 5,587,911 | |
| CVS Health Corp. | 180,582 | 11,768,529 | |
| Elevance Health, Inc. | 34,556 | 15,274,098 | |
| HCA Holdings, Inc. | 18,843 | 5,225,164 | |
| Humana, Inc. | 28,762 | 13,277,402 | |
| McKesson Corp. | 2,093 | 862,986 | |
| UnitedHealth Group, Inc. | 71,475 | 34,063,556 | |
| 97,652,004 | |||
| Life Sciences Tools & Services - 0.3% | |||
| Danaher Corp. | 10,493 | 2,780,645 | |
| Syneos Health, Inc. (a) | 62,895 | 2,687,503 | |
| Thermo Fisher Scientific, Inc. | 1,395 | 777,155 | |
| 6,245,303 | |||
| Pharmaceuticals - 4.8% | |||
| Bristol-Myers Squibb Co. | 101,462 | 6,255,132 | |
| Eli Lilly & Co. | 28,681 | 15,895,010 | |
| Johnson & Johnson | 186,705 | 30,186,464 | |
| Merck & Co., Inc. | 228,711 | 24,924,925 | |
| Pfizer, Inc. | 580,266 | 20,529,811 | |
| 97,791,342 | |||
TOTAL HEALTH CARE | 289,127,866 | ||
| INDUSTRIALS - 10.1% | |||
| Aerospace & Defense - 1.7% | |||
| General Dynamics Corp. | 33,891 | 7,681,056 | |
| L3Harris Technologies, Inc. | 23,106 | 4,114,948 | |
| Lockheed Martin Corp. | 25,428 | 11,400,644 | |
| Textron, Inc. | 109,069 | 8,475,752 | |
| The Boeing Co. (a) | 14,228 | 3,187,499 | |
| 34,859,899 | |||
| Building Products - 0.1% | |||
| Johnson Controls International PLC | 22,574 | 1,333,220 | |
| Trane Technologies PLC | 3,668 | 752,894 | |
| 2,086,114 | |||
| Commercial Services & Supplies - 1.2% | |||
| Cintas Corp. | 25,338 | 12,774,659 | |
| Republic Services, Inc. | 80,895 | 11,659,396 | |
| 24,434,055 | |||
| Construction & Engineering - 0.3% | |||
| Valmont Industries, Inc. | 24,878 | 6,306,573 | |
| Electrical Equipment - 1.3% | |||
| AMETEK, Inc. | 76,977 | 12,278,601 | |
| Emerson Electric Co. | 143,445 | 14,093,471 | |
| EnerSys | 14,654 | 1,538,377 | |
| 27,910,449 | |||
| Ground Transportation - 2.2% | |||
| CSX Corp. | 429,024 | 12,956,525 | |
| Norfolk Southern Corp. | 25,536 | 5,235,135 | |
| Uber Technologies, Inc. (a) | 179,412 | 8,473,629 | |
| Union Pacific Corp. | 80,907 | 17,845,657 | |
| 44,510,946 | |||
| Industrial Conglomerates - 0.5% | |||
| 3M Co. | 90,770 | 9,682,436 | |
| Machinery - 1.9% | |||
| AGCO Corp. | 19,937 | 2,582,440 | |
| Allison Transmission Holdings, Inc. | 58,127 | 3,513,777 | |
| Caterpillar, Inc. | 63,677 | 17,901,515 | |
| Deere & Co. | 16,741 | 6,879,547 | |
| PACCAR, Inc. | 98,683 | 8,120,624 | |
| 38,997,903 | |||
| Passenger Airlines - 0.7% | |||
| American Airlines Group, Inc. (a) | 466,162 | 6,866,566 | |
| United Airlines Holdings, Inc. (a) | 157,557 | 7,847,914 | |
| 14,714,480 | |||
| Professional Services - 0.1% | |||
| Leidos Holdings, Inc. | 21,855 | 2,131,081 | |
| Trading Companies & Distributors - 0.1% | |||
| W.W. Grainger, Inc. | 2,098 | 1,498,266 | |
TOTAL INDUSTRIALS | 207,132,202 | ||
| INFORMATION TECHNOLOGY - 28.1% | |||
| Communications Equipment - 1.3% | |||
| Cisco Systems, Inc. | 413,840 | 23,733,724 | |
| Juniper Networks, Inc. | 80,785 | 2,352,459 | |
| 26,086,183 | |||
| Electronic Equipment, Instruments & Components - 0.1% | |||
| Belden, Inc. | 2,900 | 272,310 | |
| Keysight Technologies, Inc. (a) | 17,534 | 2,337,282 | |
| 2,609,592 | |||
| IT Services - 1.3% | |||
| Accenture PLC Class A | 360 | 116,557 | |
| Gartner, Inc. (a) | 18,755 | 6,558,248 | |
| GoDaddy, Inc. (a) | 143,234 | 10,385,897 | |
| Wix.com Ltd. (a) | 98,865 | 9,764,896 | |
| 26,825,598 | |||
| Semiconductors & Semiconductor Equipment - 7.4% | |||
| Applied Materials, Inc. | 65,599 | 10,020,903 | |
| Broadcom, Inc. | 34,695 | 32,019,669 | |
| Enphase Energy, Inc. (a) | 3,081 | 389,839 | |
| Intel Corp. | 534,486 | 18,781,838 | |
| KLA Corp. | 3,421 | 1,716,897 | |
| Lam Research Corp. | 2,704 | 1,899,290 | |
| Lattice Semiconductor Corp. (a) | 12,885 | 1,253,195 | |
| NVIDIA Corp. | 138,541 | 68,376,911 | |
| Qualcomm, Inc. | 149,251 | 17,093,717 | |
| 151,552,259 | |||
| Software - 10.1% | |||
| Adobe, Inc. (a) | 45,139 | 25,248,048 | |
| Autodesk, Inc. (a) | 50,905 | 11,297,856 | |
| Microsoft Corp. | 378,197 | 123,957,849 | |
| Palo Alto Networks, Inc. (a) | 3,191 | 776,370 | |
| RingCentral, Inc. (a) | 92,581 | 2,863,530 | |
| Salesforce, Inc. (a) | 93,892 | 20,793,322 | |
| Synopsys, Inc. (a) | 31,400 | 14,409,146 | |
| Teradata Corp. (a) | 130,207 | 6,024,678 | |
| Zoom Video Communications, Inc. Class A (a) | 11,779 | 836,662 | |
| 206,207,461 | |||
| Technology Hardware, Storage & Peripherals - 7.9% | |||
| Apple, Inc. | 812,246 | 152,596,659 | |
| NetApp, Inc. | 58,102 | 4,456,423 | |
| Pure Storage, Inc. Class A (a) | 126,000 | 4,610,340 | |
| 161,663,422 | |||
TOTAL INFORMATION TECHNOLOGY | 574,944,515 | ||
| MATERIALS - 1.8% | |||
| Chemicals - 0.8% | |||
| CF Industries Holdings, Inc. | 67,619 | 5,211,396 | |
| Ecolab, Inc. | 29,374 | 5,399,235 | |
| Linde PLC | 16,034 | 6,205,799 | |
| 16,816,430 | |||
| Construction Materials - 0.1% | |||
| Vulcan Materials Co. | 13,002 | 2,837,687 | |
| Containers & Packaging - 0.2% | |||
| Sealed Air Corp. | 77,861 | 2,885,529 | |
| WestRock Co. | 7,682 | 251,278 | |
| 3,136,807 | |||
| Metals & Mining - 0.7% | |||
| Nucor Corp. | 77,601 | 13,355,132 | |
| Worthington Industries, Inc. | 4,965 | 373,716 | |
| 13,728,848 | |||
TOTAL MATERIALS | 36,519,772 | ||
| REAL ESTATE - 1.7% | |||
| Equity Real Estate Investment Trusts (REITs) - 1.7% | |||
| American Tower Corp. | 16,925 | 3,068,841 | |
| Invitation Homes, Inc. | 176,493 | 6,016,646 | |
| Public Storage | 36,680 | 10,137,618 | |
| Ryman Hospitality Properties, Inc. | 91,947 | 7,818,253 | |
| SBA Communications Corp. Class A | 13,030 | 2,925,626 | |
| Simon Property Group, Inc. | 33,994 | 3,857,979 | |
| 33,824,963 | |||
| UTILITIES - 0.2% | |||
| Electric Utilities - 0.2% | |||
| NextEra Energy, Inc. | 21,881 | 1,461,651 | |
| Xcel Energy, Inc. | 43,416 | 2,480,356 | |
| 3,942,007 | |||
| Independent Power and Renewable Electricity Producers - 0.0% | |||
| Brookfield Renewable Corp. | 10,080 | 281,736 | |
TOTAL UTILITIES | 4,223,743 | ||
| TOTAL COMMON STOCKS (Cost $1,491,304,661) | 2,013,406,956 | ||
| Money Market Funds - 3.5% | |||
| Shares | Value ($) | ||
| Fidelity Cash Central Fund 5.43% (c) | 70,512,957 | 70,527,060 | |
| Fidelity Securities Lending Cash Central Fund 5.44% (c)(d) | 1,386,911 | 1,387,050 | |
| TOTAL MONEY MARKET FUNDS (Cost $71,914,110) | 71,914,110 | ||
| TOTAL INVESTMENT IN SECURITIES - 101.8% (Cost $1,563,218,771) | 2,085,321,066 |
NET OTHER ASSETS (LIABILITIES) - (1.8)% | (37,006,198) |
| NET ASSETS - 100.0% | 2,048,314,868 |
| Futures Contracts | |||||
Number of contracts | Expiration Date | Notional Amount ($) | Value ($) | Unrealized Appreciation/ (Depreciation) ($) | |
| Purchased | |||||
| Equity Index Contracts | |||||
| CME E-mini S&P 500 Index Contracts (United States) | 119 | Sep 2023 | 26,870,200 | 510,449 | 510,449 |
| The notional amount of futures purchased as a percentage of Net Assets is 1.3% | |||||
| (a) | Non-income producing |
| (b) | Security or a portion of the security is on loan at period end. |
| (c) | Affiliated fund that is generally available only to investment companies and other accounts managed by Fidelity Investments. The rate quoted is the annualized seven-day yield of the fund at period end. A complete unaudited listing of the fund's holdings as of its most recent quarter end is available upon request. In addition, each Fidelity Central Fund's financial statements, which are not covered by the Fund's Report of Independent Registered Public Accounting Firm, are available on the SEC's website or upon request. |
| (d) | Investment made with cash collateral received from securities on loan. |
| Affiliate | Value, beginning of period ($) | Purchases ($) | Sales Proceeds ($) | Dividend Income ($) | Realized Gain (loss) ($) | Change in Unrealized appreciation (depreciation) ($) | Value, end of period ($) | % ownership, end of period |
| Fidelity Cash Central Fund 5.43% | 91,438,262 | 398,663,485 | 419,574,687 | 1,185,153 | 35 | (35) | 70,527,060 | 0.2% |
| Fidelity Securities Lending Cash Central Fund 5.44% | - | 74,944,767 | 73,557,717 | 43,997 | - | - | 1,387,050 | 0.0% |
| Total | 91,438,262 | 473,608,252 | 493,132,404 | 1,229,150 | 35 | (35) | 71,914,110 | |
| Valuation Inputs at Reporting Date: | ||||
| Description | Total ($) | Level 1 ($) | Level 2 ($) | Level 3 ($) |
Investments in Securities: | ||||
| Equities: | ||||
Communication Services | 191,004,965 | 191,004,965 | - | - |
Consumer Discretionary | 229,159,255 | 229,159,255 | - | - |
Consumer Staples | 106,822,934 | 106,822,934 | - | - |
Energy | 85,829,013 | 85,829,013 | - | - |
Financials | 254,817,728 | 254,817,728 | - | - |
Health Care | 289,127,866 | 289,127,866 | - | - |
Industrials | 207,132,202 | 207,132,202 | - | - |
Information Technology | 574,944,515 | 574,944,515 | - | - |
Materials | 36,519,772 | 36,519,772 | - | - |
Real Estate | 33,824,963 | 33,824,963 | - | - |
Utilities | 4,223,743 | 4,223,743 | - | - |
| Money Market Funds | 71,914,110 | 71,914,110 | - | - |
| Total Investments in Securities: | 2,085,321,066 | 2,085,321,066 | - | - |
Derivative Instruments: | ||||
| Assets | ||||
Futures Contracts | 510,449 | 510,449 | - | - |
| Total Assets | 510,449 | 510,449 | - | - |
| Total Derivative Instruments: | 510,449 | 510,449 | - | - |
Primary Risk Exposure / Derivative Type | Value | |
| Asset ($) | Liability ($) | |
| Equity Risk | ||
Futures Contracts (a) | 510,449 | 0 |
| Total Equity Risk | 510,449 | 0 |
| Total Value of Derivatives | 510,449 | 0 |
| Statement of Assets and Liabilities | ||||
| August 31, 2023 | ||||
| Assets | ||||
| Investment in securities, at value (including securities loaned of $1,319,325) - See accompanying schedule: | ||||
Unaffiliated issuers (cost $1,491,304,661) | $ | 2,013,406,956 | ||
Fidelity Central Funds (cost $71,914,110) | 71,914,110 | |||
| Total Investment in Securities (cost $1,563,218,771) | $ | 2,085,321,066 | ||
| Segregated cash with brokers for derivative instruments | 3,483,200 | |||
| Receivable for investments sold | 59,240,198 | |||
| Receivable for fund shares sold | 1,248,507 | |||
| Dividends receivable | 2,787,561 | |||
| Distributions receivable from Fidelity Central Funds | 120,993 | |||
| Other receivables | 19,663 | |||
Total assets | 2,152,221,188 | |||
| Liabilities | ||||
| Payable for investments purchased | $ | 58,436,495 | ||
| Payable for fund shares redeemed | 43,413,766 | |||
| Accrued management fee | 658,421 | |||
| Payable for daily variation margin on futures contracts | 10,588 | |||
| Collateral on securities loaned | 1,387,050 | |||
| Total Liabilities | 103,906,320 | |||
| Net Assets | $ | 2,048,314,868 | ||
| Net Assets consist of: | ||||
| Paid in capital | $ | 1,561,358,411 | ||
| Total accumulated earnings (loss) | 486,956,457 | |||
| Net Assets | $ | 2,048,314,868 | ||
Net Asset Value, offering price and redemption price per share ($2,048,314,868 ÷ 97,590,726 shares) | $ | 20.99 | ||
| Statement of Operations | ||||
Year ended August 31, 2023 | ||||
| Investment Income | ||||
| Dividends | $ | 31,203,225 | ||
| Interest | 62,568 | |||
| Income from Fidelity Central Funds (including $43,997 from security lending) | 1,229,150 | |||
| Total Income | 32,494,943 | |||
| Expenses | ||||
| Management fee | $ | 7,651,709 | ||
| Independent trustees' fees and expenses | 10,392 | |||
| Interest | 27,922 | |||
| Total expenses before reductions | 7,690,023 | |||
| Expense reductions | (2,087) | |||
| Total expenses after reductions | 7,687,936 | |||
| Net Investment income (loss) | 24,807,007 | |||
| Realized and Unrealized Gain (Loss) | ||||
| Net realized gain (loss) on: | ||||
| Investment Securities: | ||||
| Unaffiliated issuers | (34,334,099) | |||
| Redemptions in-kind | 23,998,066 | |||
| Fidelity Central Funds | 35 | |||
| Futures contracts | 6,711,576 | |||
| Total net realized gain (loss) | (3,624,422) | |||
| Change in net unrealized appreciation (depreciation) on: | ||||
| Investment Securities: | ||||
| Unaffiliated issuers | 223,701,589 | |||
| Fidelity Central Funds | (35) | |||
| Futures contracts | (443,168) | |||
| Total change in net unrealized appreciation (depreciation) | 223,258,386 | |||
| Net gain (loss) | 219,633,964 | |||
| Net increase (decrease) in net assets resulting from operations | $ | 244,440,971 | ||
| Statement of Changes in Net Assets | ||||
Year ended August 31, 2023 | Year ended August 31, 2022 | |||
| Increase (Decrease) in Net Assets | ||||
| Operations | ||||
| Net investment income (loss) | $ | 24,807,007 | $ | 19,467,302 |
| Net realized gain (loss) | (3,624,422) | 12,825,524 | ||
| Change in net unrealized appreciation (depreciation) | 223,258,386 | (204,549,067) | ||
| Net increase (decrease) in net assets resulting from operations | 244,440,971 | (172,256,241) | ||
| Distributions to shareholders | (22,292,999) | (204,215,644) | ||
| Share transactions | ||||
| Proceeds from sales of shares | 629,039,473 | 1,542,789,506 | ||
| Reinvestment of distributions | 18,530,259 | 176,281,500 | ||
| Cost of shares redeemed | (1,283,514,169) | (389,268,600) | ||
Net increase (decrease) in net assets resulting from share transactions | (635,944,437) | 1,329,802,406 | ||
| Total increase (decrease) in net assets | (413,796,465) | 953,330,521 | ||
| Net Assets | ||||
| Beginning of period | 2,462,111,333 | 1,508,780,812 | ||
| End of period | $ | 2,048,314,868 | $ | 2,462,111,333 |
| Other Information | ||||
| Shares | ||||
| Sold | 33,210,795 | 79,739,464 | ||
| Issued in reinvestment of distributions | 1,043,371 | 8,430,488 | ||
| Redeemed | (69,893,397) | (19,431,162) | ||
| Net increase (decrease) | (35,639,231) | 68,738,790 | ||
| Fidelity® Large Cap Core Enhanced Index Fund |
| Years ended August 31, | 2023 | 2022 | 2021 | 2020 | 2019 | |||||
Selected Per-Share Data | ||||||||||
| Net asset value, beginning of period | $ | 18.48 | $ | 23.40 | $ | 18.12 | $ | 15.21 | $ | 16.22 |
| Income from Investment Operations | ||||||||||
Net investment income (loss) A,B | .24 | .24 | .22 | .24 | .27 | |||||
| Net realized and unrealized gain (loss) | 2.49 | (2.08) | 5.50 | 3.06 | (.27) | |||||
| Total from investment operations | 2.73 | (1.84) | 5.72 | 3.30 | - | |||||
| Distributions from net investment income | (.15) | (.36) C | (.22) | (.26) | (.24) | |||||
| Distributions from net realized gain | (.08) | (2.72) C | (.22) | (.13) | (.78) | |||||
| Total distributions | (.22) D | (3.08) | (.44) | (.39) | (1.01) D | |||||
| Net asset value, end of period | $ | 20.99 | $ | 18.48 | $ | 23.40 | $ | 18.12 | $ | 15.21 |
Total Return E | 15.01% | (9.41)% | 32.14% | 21.97% | .65% | |||||
Ratios to Average Net Assets B,F,G | ||||||||||
| Expenses before reductions | .39% | .39% | .39% | .39% | .39% | |||||
| Expenses net of fee waivers, if any | .39% | .39% | .39% | .39% | .39% | |||||
| Expenses net of all reductions | .39% | .39% | .39% | .39% | .39% | |||||
| Net investment income (loss) | 1.26% | 1.18% | 1.09% | 1.49% | 1.81% | |||||
| Supplemental Data | ||||||||||
| Net assets, end of period (000 omitted) | $ | 2,048,315 | $ | 2,462,111 | $ | 1,508,781 | $ | 1,087,245 | $ | 834,635 |
Portfolio turnover rate H | 105% I | 104% | 83% | 63% | 77% |
| Average Annual Total Returns | |||
Periods ended August 31, 2023 | Past 1 year | Past 5 years | Past 10 years |
| Fidelity® Mid Cap Enhanced Index Fund | 8.19% | 7.25% | 9.86% |
| $10,000 Over 10 Years |
Let's say hypothetically that $10,000 was invested in Fidelity® Mid Cap Enhanced Index Fund on August 31, 2013. The chart shows how the value of your investment would have changed, and also shows how the Russell Midcap® Index performed over the same period. |
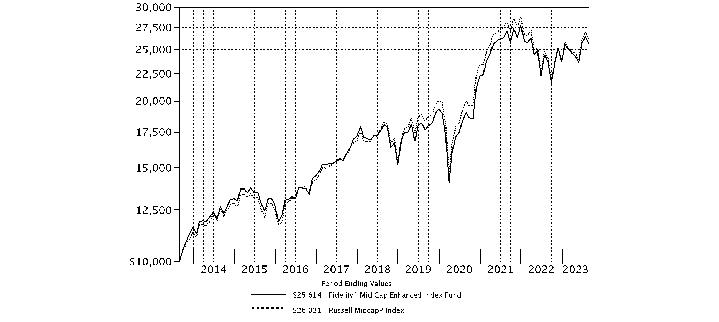 |
Top Holdings (% of Fund's net assets) | ||
| Trane Technologies PLC | 1.0 | |
| Apollo Global Management, Inc. | 1.0 | |
| Nucor Corp. | 1.0 | |
| Cintas Corp. | 1.0 | |
| PACCAR, Inc. | 0.9 | |
| AMETEK, Inc. | 0.9 | |
| D.R. Horton, Inc. | 0.9 | |
| Simon Property Group, Inc. | 0.9 | |
| Bank of New York Mellon Corp. | 0.9 | |
| Align Technology, Inc. | 0.8 | |
| 9.3 | ||
| Market Sectors (% of Fund's net assets) | ||
| Industrials | 20.2 | |
| Information Technology | 15.0 | |
| Financials | 14.1 | |
| Health Care | 12.3 | |
| Consumer Discretionary | 11.9 | |
| Real Estate | 6.8 | |
| Materials | 6.3 | |
| Utilities | 4.0 | |
| Energy | 3.6 | |
| Communication Services | 2.9 | |
| Consumer Staples | 1.9 | |
Asset Allocation (% of Fund's net assets) |
 |
Futures - 0.9% |
| Common Stocks - 99.0% | |||
| Shares | Value ($) | ||
| COMMUNICATION SERVICES - 2.9% | |||
| Entertainment - 1.8% | |||
| Electronic Arts, Inc. | 104,029 | 12,481,399 | |
| Playtika Holding Corp. (a) | 374,728 | 3,657,345 | |
| Spotify Technology SA (a) | 79,430 | 12,229,837 | |
| 28,368,581 | |||
| Interactive Media & Services - 0.1% | |||
| Pinterest, Inc. Class A (a) | 8,054 | 221,404 | |
| Vimeo, Inc. (a) | 382,509 | 1,522,386 | |
| 1,743,790 | |||
| Media - 1.0% | |||
| Liberty Media Corp. Liberty SiriusXM | 55,002 | 1,344,249 | |
| Liberty Media Corp. Liberty SiriusXM Class A | 71,839 | 1,726,291 | |
| News Corp.: | |||
| Class A | 109,779 | 2,359,151 | |
| Class B | 118,384 | 2,604,448 | |
| The New York Times Co. Class A | 30,827 | 1,364,711 | |
| The Trade Desk, Inc. (a) | 86,629 | 6,932,919 | |
| 16,331,769 | |||
TOTAL COMMUNICATION SERVICES | 46,444,140 | ||
| CONSUMER DISCRETIONARY - 11.9% | |||
| Automobile Components - 0.2% | |||
| Aptiv PLC (a) | 36,789 | 3,732,244 | |
| Automobiles - 0.5% | |||
| Ford Motor Co. | 596,780 | 7,238,941 | |
| Broadline Retail - 0.9% | |||
| eBay, Inc. | 228,181 | 10,217,945 | |
| Etsy, Inc. (a) | 68,465 | 5,036,970 | |
| 15,254,915 | |||
| Distributors - 0.8% | |||
| Genuine Parts Co. | 76,043 | 11,690,090 | |
| LKQ Corp. | 18,753 | 985,095 | |
| 12,675,185 | |||
| Diversified Consumer Services - 0.2% | |||
| ADT, Inc. | 124,854 | 801,563 | |
| H&R Block, Inc. | 69,335 | 2,772,013 | |
| 3,573,576 | |||
| Hotels, Restaurants & Leisure - 2.8% | |||
| Airbnb, Inc. Class A (a) | 14,374 | 1,890,900 | |
| Booking Holdings, Inc. (a) | 2,785 | 8,647,509 | |
| Caesars Entertainment, Inc. (a) | 191,948 | 10,607,046 | |
| Chipotle Mexican Grill, Inc. (a) | 4,240 | 8,168,954 | |
| Draftkings Holdings, Inc. (a) | 50,350 | 1,492,878 | |
| MGM Resorts International | 217,895 | 9,583,022 | |
| Norwegian Cruise Line Holdings Ltd. (a) | 159,787 | 2,647,671 | |
| Yum! Brands, Inc. | 20,259 | 2,621,109 | |
| 45,659,089 | |||
| Household Durables - 3.3% | |||
| D.R. Horton, Inc. | 121,062 | 14,408,799 | |
| Lennar Corp. Class A | 36,026 | 4,290,336 | |
| NVR, Inc. (a) | 1,891 | 12,059,531 | |
| PulteGroup, Inc. | 29,847 | 2,449,245 | |
| Toll Brothers, Inc. | 128,043 | 10,490,563 | |
| TopBuild Corp. (a) | 34,854 | 10,110,448 | |
| Whirlpool Corp. | 5,861 | 820,306 | |
| 54,629,228 | |||
| Leisure Products - 0.1% | |||
| Peloton Interactive, Inc. Class A (a) | 300,386 | 1,916,463 | |
| Specialty Retail - 2.2% | |||
| AutoNation, Inc. (a) | 6,162 | 967,989 | |
| AutoZone, Inc. (a) | 2,829 | 7,161,133 | |
| GameStop Corp. Class A (a)(b) | 24,356 | 451,804 | |
| O'Reilly Automotive, Inc. (a) | 7,237 | 6,800,609 | |
| Petco Health & Wellness Co., Inc. (a)(b) | 189,702 | 965,583 | |
| Ross Stores, Inc. | 43,499 | 5,298,613 | |
| Ulta Beauty, Inc. (a) | 21,051 | 8,736,797 | |
| Williams-Sonoma, Inc. (b) | 42,181 | 5,955,957 | |
| 36,338,485 | |||
| Textiles, Apparel & Luxury Goods - 0.9% | |||
| Crocs, Inc. (a) | 38,976 | 3,793,924 | |
| Tapestry, Inc. | 238,352 | 7,941,889 | |
| Under Armour, Inc.: | |||
| Class A (sub. vtg.) (a) | 169,791 | 1,297,203 | |
| Class C (non-vtg.) (a) | 106,887 | 736,451 | |
| 13,769,467 | |||
TOTAL CONSUMER DISCRETIONARY | 194,787,593 | ||
| CONSUMER STAPLES - 1.9% | |||
| Consumer Staples Distribution & Retail - 0.3% | |||
| Casey's General Stores, Inc. | 15,565 | 3,804,242 | |
| Grocery Outlet Holding Corp. (a) | 66,060 | 2,037,951 | |
| 5,842,193 | |||
| Food Products - 0.7% | |||
| Lamb Weston Holdings, Inc. | 94,157 | 9,171,833 | |
| McCormick & Co., Inc. (non-vtg.) | 25,181 | 2,066,856 | |
| 11,238,689 | |||
| Household Products - 0.5% | |||
| Church & Dwight Co., Inc. | 11,717 | 1,133,854 | |
| Kimberly-Clark Corp. | 41,513 | 5,348,120 | |
| The Clorox Co. | 8,084 | 1,264,742 | |
| 7,746,716 | |||
| Personal Care Products - 0.4% | |||
| Coty, Inc. Class A (a) | 569,926 | 6,588,345 | |
TOTAL CONSUMER STAPLES | 31,415,943 | ||
| ENERGY - 3.6% | |||
| Energy Equipment & Services - 0.8% | |||
| Baker Hughes Co. Class A | 66,841 | 2,418,976 | |
| Halliburton Co. | 280,443 | 10,830,709 | |
| 13,249,685 | |||
| Oil, Gas & Consumable Fuels - 2.8% | |||
| Cheniere Energy, Inc. | 80,315 | 13,107,408 | |
| Chesapeake Energy Corp. | 1,099 | 96,943 | |
| Coterra Energy, Inc. | 113,280 | 3,193,363 | |
| Devon Energy Corp. | 169,008 | 8,634,619 | |
| Diamondback Energy, Inc. | 29,455 | 4,470,680 | |
| Marathon Oil Corp. | 302,938 | 7,982,416 | |
| ONEOK, Inc. | 103,720 | 6,762,544 | |
| Phillips 66 Co. | 3,176 | 362,572 | |
| The Williams Companies, Inc. | 27,466 | 948,401 | |
| 45,558,946 | |||
TOTAL ENERGY | 58,808,631 | ||
| FINANCIALS - 14.1% | |||
| Banks - 1.5% | |||
| BOK Financial Corp. | 16,369 | 1,360,428 | |
| Citizens Financial Group, Inc. | 198,467 | 5,582,877 | |
| Columbia Banking Systems, Inc. | 158,295 | 3,241,882 | |
| East West Bancorp, Inc. | 96,175 | 5,322,325 | |
| Fifth Third Bancorp | 293,420 | 7,790,301 | |
| First Hawaiian, Inc. | 33,875 | 640,576 | |
| 23,938,389 | |||
| Capital Markets - 5.8% | |||
| Ameriprise Financial, Inc. | 14,652 | 4,946,222 | |
| Bank of New York Mellon Corp. | 315,834 | 14,171,472 | |
| Cboe Global Markets, Inc. | 29,145 | 4,363,298 | |
| Interactive Brokers Group, Inc. | 94,568 | 8,613,253 | |
| Janus Henderson Group PLC | 27,887 | 766,056 | |
| LPL Financial | 41,684 | 9,611,914 | |
| MSCI, Inc. | 2,826 | 1,536,270 | |
| NASDAQ, Inc. | 219,667 | 11,528,124 | |
| Raymond James Financial, Inc. | 87,888 | 9,192,206 | |
| Robinhood Markets, Inc. (a) | 741,315 | 8,072,920 | |
| SEI Investments Co. | 18,203 | 1,129,678 | |
| State Street Corp. | 107,672 | 7,401,373 | |
| Stifel Financial Corp. | 145,440 | 9,456,509 | |
| Tradeweb Markets, Inc. Class A | 37,271 | 3,221,333 | |
| Virtu Financial, Inc. Class A | 42,940 | 804,696 | |
| 94,815,324 | |||
| Consumer Finance - 0.6% | |||
| Synchrony Financial | 303,723 | 9,804,178 | |
| Financial Services - 2.7% | |||
| Apollo Global Management, Inc. | 184,154 | 16,084,010 | |
| Corebridge Financial, Inc. | 105,209 | 1,875,876 | |
| Essent Group Ltd. | 15,181 | 762,390 | |
| Fidelity National Information Services, Inc. | 132,704 | 7,412,845 | |
| FleetCor Technologies, Inc. (a) | 9,940 | 2,700,996 | |
| MGIC Investment Corp. | 50,694 | 891,201 | |
| The Western Union Co. | 666,464 | 8,230,830 | |
| WEX, Inc. (a) | 32,846 | 6,443,728 | |
| 44,401,876 | |||
| Insurance - 3.5% | |||
| Arch Capital Group Ltd. (a) | 41,514 | 3,190,766 | |
| Axis Capital Holdings Ltd. | 28,104 | 1,541,785 | |
| Brown & Brown, Inc. | 157,738 | 11,688,386 | |
| Everest Re Group Ltd. | 29,816 | 10,754,035 | |
| Hartford Financial Services Group, Inc. | 46,996 | 3,375,253 | |
| Kinsale Capital Group, Inc. | 1,116 | 444,871 | |
| Prudential Financial, Inc. | 107,060 | 10,135,370 | |
| Reinsurance Group of America, Inc. | 43,209 | 5,989,632 | |
| Unum Group | 209,652 | 10,312,782 | |
| 57,432,880 | |||
| Mortgage Real Estate Investment Trusts - 0.0% | |||
| Rithm Capital Corp. | 25,959 | 267,637 | |
TOTAL FINANCIALS | 230,660,284 | ||
| HEALTH CARE - 12.3% | |||
| Biotechnology - 3.7% | |||
| Biogen, Inc. (a) | 50,342 | 13,459,437 | |
| Exact Sciences Corp. (a) | 112,709 | 9,430,362 | |
| Exelixis, Inc. (a) | 437,568 | 9,797,148 | |
| Gilead Sciences, Inc. | 40,773 | 3,118,319 | |
| Horizon Therapeutics PLC (a) | 19,367 | 2,183,436 | |
| Incyte Corp. (a) | 154,156 | 9,947,687 | |
| Sarepta Therapeutics, Inc. (a) | 45,922 | 5,557,021 | |
| Seagen, Inc. (a) | 9,425 | 1,942,210 | |
| United Therapeutics Corp. (a) | 24,913 | 5,589,481 | |
| 61,025,101 | |||
| Health Care Equipment & Supplies - 3.5% | |||
| Abiomed, Inc. (c) | 3,289 | 9,176 | |
| Align Technology, Inc. (a) | 36,499 | 13,509,740 | |
| Dentsply Sirona, Inc. | 109,447 | 4,059,389 | |
| DexCom, Inc. (a) | 831 | 83,914 | |
| Hologic, Inc. (a) | 77,369 | 5,782,559 | |
| IDEXX Laboratories, Inc. (a) | 17,077 | 8,733,349 | |
| Insulet Corp. (a) | 38,603 | 7,400,581 | |
| The Cooper Companies, Inc. | 12,852 | 4,755,111 | |
| Zimmer Biomet Holdings, Inc. | 101,530 | 12,094,254 | |
| Zimvie, Inc. (a) | 17,678 | 208,600 | |
| 56,636,673 | |||
| Health Care Providers & Services - 1.9% | |||
| Cardinal Health, Inc. | 18,772 | 1,639,359 | |
| Cencora, Inc. | 54,395 | 9,572,432 | |
| Cigna Group | 6,474 | 1,788,507 | |
| Elevance Health, Inc. | 14,090 | 6,227,921 | |
| Molina Healthcare, Inc. (a) | 36,021 | 11,170,833 | |
| Premier, Inc. | 35,006 | 753,679 | |
| 31,152,731 | |||
| Health Care Technology - 0.5% | |||
| Teladoc Health, Inc. (a) | 132,407 | 2,997,694 | |
| Veeva Systems, Inc. Class A (a) | 24,803 | 5,176,386 | |
| 8,174,080 | |||
| Life Sciences Tools & Services - 1.6% | |||
| 10X Genomics, Inc. (a) | 138,696 | 7,191,388 | |
| Mettler-Toledo International, Inc. (a) | 8,356 | 10,139,839 | |
| Syneos Health, Inc. (a) | 215,347 | 9,201,777 | |
| 26,533,004 | |||
| Pharmaceuticals - 1.1% | |||
| Elanco Animal Health, Inc. (a) | 2,164 | 26,401 | |
| Jazz Pharmaceuticals PLC (a) | 41,470 | 5,945,139 | |
| Royalty Pharma PLC | 160,721 | 4,792,700 | |
| Viatris, Inc. | 618,367 | 6,647,445 | |
| 17,411,685 | |||
TOTAL HEALTH CARE | 200,933,274 | ||
| INDUSTRIALS - 20.2% | |||
| Aerospace & Defense - 2.8% | |||
| Axon Enterprise, Inc. (a) | 54,825 | 11,672,791 | |
| General Dynamics Corp. | 13,612 | 3,085,024 | |
| Howmet Aerospace, Inc. | 156,380 | 7,736,119 | |
| Parsons Corp. (a) | 125,077 | 7,131,891 | |
| Textron, Inc. | 147,309 | 11,447,382 | |
| Woodward, Inc. | 36,068 | 4,666,117 | |
| 45,739,324 | |||
| Building Products - 2.9% | |||
| Allegion PLC | 56,120 | 6,387,017 | |
| Builders FirstSource, Inc. (a) | 59,258 | 8,594,780 | |
| Carrier Global Corp. | 198,022 | 11,376,364 | |
| Fortune Brands Home & Security, Inc. | 22,579 | 1,558,403 | |
| Owens Corning | 21,510 | 3,095,504 | |
| Trane Technologies PLC | 79,653 | 16,349,563 | |
| 47,361,631 | |||
| Commercial Services & Supplies - 1.9% | |||
| Cintas Corp. | 31,489 | 15,875,809 | |
| MSA Safety, Inc. | 1,564 | 285,712 | |
| Republic Services, Inc. | 91,291 | 13,157,772 | |
| Tetra Tech, Inc. | 6,385 | 1,004,680 | |
| 30,323,973 | |||
| Construction & Engineering - 0.4% | |||
| AECOM | 44,455 | 3,900,926 | |
| EMCOR Group, Inc. | 4,776 | 1,071,018 | |
| Valmont Industries, Inc. | 7,609 | 1,928,882 | |
| 6,900,826 | |||
| Electrical Equipment - 2.6% | |||
| Acuity Brands, Inc. | 14,942 | 2,409,846 | |
| AMETEK, Inc. | 91,616 | 14,613,668 | |
| Hubbell, Inc. Class B | 16,852 | 5,494,595 | |
| nVent Electric PLC | 188,766 | 10,672,830 | |
| Rockwell Automation, Inc. | 25,819 | 8,057,594 | |
| Vertiv Holdings Co. | 50,684 | 1,996,443 | |
| 43,244,976 | |||
| Ground Transportation - 0.9% | |||
| Hertz Global Holdings, Inc. (a)(b) | 88,827 | 1,505,618 | |
| Old Dominion Freight Lines, Inc. | 3,981 | 1,701,360 | |
| Uber Technologies, Inc. (a) | 25,568 | 1,207,577 | |
| XPO, Inc. (a) | 140,904 | 10,515,666 | |
| 14,930,221 | |||
| Machinery - 5.1% | |||
| AGCO Corp. | 76,043 | 9,849,850 | |
| Allison Transmission Holdings, Inc. | 162,253 | 9,808,194 | |
| CNH Industrial NV | 21,340 | 294,065 | |
| Cummins, Inc. | 57,665 | 13,265,257 | |
| Donaldson Co., Inc. | 26,289 | 1,679,078 | |
| Fortive Corp. | 156,608 | 12,348,541 | |
| Gates Industrial Corp. PLC (a) | 27,862 | 342,145 | |
| Graco, Inc. | 65,754 | 5,190,621 | |
| ITT, Inc. | 8,402 | 859,357 | |
| Oshkosh Corp. | 21,555 | 2,238,056 | |
| Otis Worldwide Corp. | 16,385 | 1,401,737 | |
| PACCAR, Inc. | 185,316 | 15,249,654 | |
| Parker Hannifin Corp. | 16,948 | 7,065,621 | |
| Westinghouse Air Brake Tech Co. | 17,548 | 1,974,501 | |
| Xylem, Inc. | 23,904 | 2,475,020 | |
| 84,041,697 | |||
| Marine Transportation - 0.1% | |||
| Kirby Corp. (a) | 28,508 | 2,361,318 | |
| Passenger Airlines - 1.6% | |||
| American Airlines Group, Inc. (a) | 203,022 | 2,990,514 | |
| Delta Air Lines, Inc. | 289,522 | 12,414,703 | |
| United Airlines Holdings, Inc. (a) | 214,593 | 10,688,877 | |
| 26,094,094 | |||
| Professional Services - 0.9% | |||
| Booz Allen Hamilton Holding Corp. Class A | 85,683 | 9,708,741 | |
| Leidos Holdings, Inc. | 42,767 | 4,170,210 | |
| 13,878,951 | |||
| Trading Companies & Distributors - 1.0% | |||
| MSC Industrial Direct Co., Inc. Class A | 10,134 | 1,034,276 | |
| United Rentals, Inc. | 3,305 | 1,574,965 | |
| W.W. Grainger, Inc. | 18,735 | 13,379,413 | |
| 15,988,654 | |||
TOTAL INDUSTRIALS | 330,865,665 | ||
| INFORMATION TECHNOLOGY - 15.0% | |||
| Communications Equipment - 0.7% | |||
| Juniper Networks, Inc. | 280,879 | 8,179,196 | |
| Motorola Solutions, Inc. | 6,157 | 1,745,940 | |
| ViaSat, Inc. (a) | 46,823 | 1,298,870 | |
| 11,224,006 | |||
| Electronic Equipment, Instruments & Components - 1.0% | |||
| Amphenol Corp. Class A | 57,173 | 5,052,950 | |
| Keysight Technologies, Inc. (a) | 79,205 | 10,558,027 | |
| Vontier Corp. | 10,200 | 320,382 | |
| 15,931,359 | |||
| IT Services - 3.5% | |||
| Amdocs Ltd. | 69,510 | 6,200,292 | |
| Gartner, Inc. (a) | 36,635 | 12,810,527 | |
| GoDaddy, Inc. (a) | 104,535 | 7,579,833 | |
| Kyndryl Holdings, Inc. (a) | 71,553 | 1,207,815 | |
| MongoDB, Inc. Class A (a) | 31,073 | 11,848,135 | |
| Twilio, Inc. Class A (a) | 162,651 | 10,362,495 | |
| Wix.com Ltd. (a) | 83,133 | 8,211,046 | |
| 58,220,143 | |||
| Semiconductors & Semiconductor Equipment - 2.6% | |||
| Allegro MicroSystems LLC (a) | 70,502 | 2,696,702 | |
| Cirrus Logic, Inc. (a) | 40,272 | 3,303,915 | |
| Enphase Energy, Inc. (a) | 41,991 | 5,313,121 | |
| KLA Corp. | 5,960 | 2,991,145 | |
| Lattice Semiconductor Corp. (a) | 112,763 | 10,967,329 | |
| Monolithic Power Systems, Inc. | 14,657 | 7,639,375 | |
| ON Semiconductor Corp. (a) | 32,880 | 3,237,365 | |
| Qorvo, Inc. (a) | 65,830 | 7,069,484 | |
| 43,218,436 | |||
| Software - 6.8% | |||
| AppLovin Corp. (a)(b) | 118,786 | 5,133,931 | |
| Autodesk, Inc. (a) | 8,425 | 1,869,845 | |
| Black Knight, Inc. (a) | 2,756 | 208,795 | |
| Cadence Design Systems, Inc. (a) | 32,239 | 7,751,545 | |
| DocuSign, Inc. (a) | 196,877 | 9,902,913 | |
| Dropbox, Inc. Class A (a) | 358,974 | 9,975,887 | |
| HubSpot, Inc. (a) | 24,228 | 13,241,087 | |
| Manhattan Associates, Inc. (a) | 8,917 | 1,806,763 | |
| Nutanix, Inc. Class A (a) | 108,285 | 3,367,664 | |
| Palo Alto Networks, Inc. (a) | 34,802 | 8,467,327 | |
| RingCentral, Inc. (a) | 215,289 | 6,658,889 | |
| Splunk, Inc. (a) | 100,651 | 12,204,940 | |
| Synopsys, Inc. (a) | 19,741 | 9,058,947 | |
| Teradata Corp. (a) | 197,009 | 9,115,606 | |
| Unity Software, Inc. (a)(b) | 23,380 | 866,697 | |
| Workday, Inc. Class A (a) | 15,541 | 3,799,775 | |
| Zoom Video Communications, Inc. Class A (a) | 103,623 | 7,360,342 | |
| 110,790,953 | |||
| Technology Hardware, Storage & Peripherals - 0.4% | |||
| Pure Storage, Inc. Class A (a) | 183,356 | 6,708,996 | |
TOTAL INFORMATION TECHNOLOGY | 246,093,893 | ||
| MATERIALS - 6.3% | |||
| Chemicals - 2.5% | |||
| CF Industries Holdings, Inc. | 41,690 | 3,213,048 | |
| Corteva, Inc. | 187,027 | 9,446,734 | |
| Eastman Chemical Co. | 23,573 | 2,003,941 | |
| Element Solutions, Inc. | 418,840 | 8,636,481 | |
| Ginkgo Bioworks Holdings, Inc. Class A (a)(b) | 1,145,816 | 2,681,209 | |
| The Chemours Co. LLC | 208,954 | 7,108,615 | |
| Westlake Corp. | 59,315 | 7,769,079 | |
| 40,859,107 | |||
| Construction Materials - 1.6% | |||
| Martin Marietta Materials, Inc. | 29,522 | 13,178,916 | |
| Vulcan Materials Co. | 61,369 | 13,393,784 | |
| 26,572,700 | |||
| Containers & Packaging - 0.3% | |||
| Berry Global Group, Inc. | 27,678 | 1,808,481 | |
| Graphic Packaging Holding Co. | 78,286 | 1,741,081 | |
| WestRock Co. | 18,923 | 618,971 | |
| 4,168,533 | |||
| Metals & Mining - 1.9% | |||
| Nucor Corp. | 92,817 | 15,973,806 | |
| Reliance Steel & Aluminum Co. | 10,511 | 2,995,215 | |
| Steel Dynamics, Inc. | 106,087 | 11,307,813 | |
| 30,276,834 | |||
| Paper & Forest Products - 0.0% | |||
| Louisiana-Pacific Corp. | 3,356 | 209,683 | |
TOTAL MATERIALS | 102,086,857 | ||
| REAL ESTATE - 6.8% | |||
| Equity Real Estate Investment Trusts (REITs) - 6.1% | |||
| American Homes 4 Rent Class A | 99,835 | 3,598,053 | |
| Apartment Income (REIT) Corp. | 48,265 | 1,643,906 | |
| EastGroup Properties, Inc. | 6,236 | 1,120,173 | |
| EPR Properties | 37,400 | 1,674,772 | |
| Federal Realty Investment Trust (SBI) | 62,036 | 6,075,806 | |
| First Industrial Realty Trust, Inc. | 18,487 | 960,215 | |
| Gaming & Leisure Properties | 159,860 | 7,577,364 | |
| Highwoods Properties, Inc. (SBI) | 156,066 | 3,719,053 | |
| Invitation Homes, Inc. | 156,784 | 5,344,767 | |
| Kilroy Realty Corp. | 54,362 | 2,008,676 | |
| National Storage Affiliates Trust | 202,655 | 6,809,208 | |
| NNN (REIT), Inc. | 219,185 | 8,633,697 | |
| Park Hotels & Resorts, Inc. | 366,722 | 4,705,043 | |
| Public Storage | 18,221 | 5,035,920 | |
| Regency Centers Corp. | 119,102 | 7,408,144 | |
| Ryman Hospitality Properties, Inc. | 19,089 | 1,623,138 | |
| SBA Communications Corp. Class A | 23,897 | 5,365,593 | |
| Simon Property Group, Inc. | 126,559 | 14,363,181 | |
| Spirit Realty Capital, Inc. | 119,120 | 4,599,223 | |
| Terreno Realty Corp. | 12,410 | 755,645 | |
| VICI Properties, Inc. | 230,463 | 7,107,479 | |
| 100,129,056 | |||
| Real Estate Management & Development - 0.7% | |||
| CoStar Group, Inc. (a) | 31,838 | 2,610,398 | |
| Zillow Group, Inc.: | |||
| Class A (a) | 78,985 | 4,021,916 | |
| Class C (a) | 92,735 | 4,837,058 | |
| 11,469,372 | |||
TOTAL REAL ESTATE | 111,598,428 | ||
| UTILITIES - 4.0% | |||
| Electric Utilities - 0.7% | |||
| Entergy Corp. | 9,636 | 917,829 | |
| FirstEnergy Corp. | 166,055 | 5,989,604 | |
| Hawaiian Electric Industries, Inc. | 33,591 | 470,946 | |
| OGE Energy Corp. | 5,798 | 197,422 | |
| Xcel Energy, Inc. | 59,258 | 3,385,410 | |
| 10,961,211 | |||
| Gas Utilities - 0.5% | |||
| National Fuel Gas Co. | 144,134 | 7,745,761 | |
| UGI Corp. | 46,934 | 1,181,798 | |
| 8,927,559 | |||
| Independent Power and Renewable Electricity Producers - 1.1% | |||
| Brookfield Renewable Corp. | 104,692 | 2,926,141 | |
| Clearway Energy, Inc.: | |||
| Class A | 35,290 | 827,198 | |
| Class C | 66,822 | 1,655,181 | |
| The AES Corp. | 117,976 | 2,115,310 | |
| Vistra Corp. | 326,042 | 10,244,240 | |
| 17,768,070 | |||
| Multi-Utilities - 1.7% | |||
| Consolidated Edison, Inc. | 112,816 | 10,036,111 | |
| DTE Energy Co. | 4,914 | 508,009 | |
| NiSource, Inc. | 248,397 | 6,647,104 | |
| WEC Energy Group, Inc. | 133,168 | 11,202,092 | |
| 28,393,316 | |||
TOTAL UTILITIES | 66,050,156 | ||
| TOTAL COMMON STOCKS (Cost $1,444,514,740) | 1,619,744,864 | ||
| Money Market Funds - 3.8% | |||
| Shares | Value ($) | ||
| Fidelity Cash Central Fund 5.43% (d) | 49,711,612 | 49,721,554 | |
| Fidelity Securities Lending Cash Central Fund 5.44% (d)(e) | 13,169,428 | 13,170,745 | |
| TOTAL MONEY MARKET FUNDS (Cost $62,892,299) | 62,892,299 | ||
| TOTAL INVESTMENT IN SECURITIES - 102.8% (Cost $1,507,407,039) | 1,682,637,163 |
NET OTHER ASSETS (LIABILITIES) - (2.8)% | (46,121,487) |
| NET ASSETS - 100.0% | 1,636,515,676 |
| Futures Contracts | |||||
Number of contracts | Expiration Date | Notional Amount ($) | Value ($) | Unrealized Appreciation/ (Depreciation) ($) | |
| Purchased | |||||
| Equity Index Contracts | |||||
| CME E-mini S&P MidCap 400 Index Contracts (United States) | 55 | Sep 2023 | 14,567,850 | 351,793 | 351,793 |
| The notional amount of futures purchased as a percentage of Net Assets is 0.9% | |||||
| (a) | Non-income producing |
| (b) | Security or a portion of the security is on loan at period end. |
| (c) | Level 3 security |
| (d) | Affiliated fund that is generally available only to investment companies and other accounts managed by Fidelity Investments. The rate quoted is the annualized seven-day yield of the fund at period end. A complete unaudited listing of the fund's holdings as of its most recent quarter end is available upon request. In addition, each Fidelity Central Fund's financial statements, which are not covered by the Fund's Report of Independent Registered Public Accounting Firm, are available on the SEC's website or upon request. |
| (e) | Investment made with cash collateral received from securities on loan. |
| Affiliate | Value, beginning of period ($) | Purchases ($) | Sales Proceeds ($) | Dividend Income ($) | Realized Gain (loss) ($) | Change in Unrealized appreciation (depreciation) ($) | Value, end of period ($) | % ownership, end of period |
| Fidelity Cash Central Fund 5.43% | 21,467,918 | 449,495,105 | 421,241,469 | 886,716 | - | - | 49,721,554 | 0.1% |
| Fidelity Securities Lending Cash Central Fund 5.44% | 41,395,337 | 203,207,243 | 231,431,835 | 126,747 | - | - | 13,170,745 | 0.0% |
| Total | 62,863,255 | 652,702,348 | 652,673,304 | 1,013,463 | - | - | 62,892,299 | |
| Valuation Inputs at Reporting Date: | ||||
| Description | Total ($) | Level 1 ($) | Level 2 ($) | Level 3 ($) |
Investments in Securities: | ||||
| Equities: | ||||
Communication Services | 46,444,140 | 46,444,140 | - | - |
Consumer Discretionary | 194,787,593 | 194,787,593 | - | - |
Consumer Staples | 31,415,943 | 31,415,943 | - | - |
Energy | 58,808,631 | 58,808,631 | - | - |
Financials | 230,660,284 | 230,660,284 | - | - |
Health Care | 200,933,274 | 200,924,098 | - | 9,176 |
Industrials | 330,865,665 | 330,865,665 | - | - |
Information Technology | 246,093,893 | 246,093,893 | - | - |
Materials | 102,086,857 | 102,086,857 | - | - |
Real Estate | 111,598,428 | 111,598,428 | - | - |
Utilities | 66,050,156 | 66,050,156 | - | - |
| Money Market Funds | 62,892,299 | 62,892,299 | - | - |
| Total Investments in Securities: | 1,682,637,163 | 1,682,627,987 | - | 9,176 |
Derivative Instruments: | ||||
| Assets | ||||
Futures Contracts | 351,793 | 351,793 | - | - |
| Total Assets | 351,793 | 351,793 | - | - |
| Total Derivative Instruments: | 351,793 | 351,793 | - | - |
Primary Risk Exposure / Derivative Type | Value | |
| Asset ($) | Liability ($) | |
| Equity Risk | ||
Futures Contracts (a) | 351,793 | 0 |
| Total Equity Risk | 351,793 | 0 |
| Total Value of Derivatives | 351,793 | 0 |
| Statement of Assets and Liabilities | ||||
| August 31, 2023 | ||||
| Assets | ||||
| Investment in securities, at value (including securities loaned of $12,727,027) - See accompanying schedule: | ||||
Unaffiliated issuers (cost $1,444,514,740) | $ | 1,619,744,864 | ||
Fidelity Central Funds (cost $62,892,299) | 62,892,299 | |||
| Total Investment in Securities (cost $1,507,407,039) | $ | 1,682,637,163 | ||
| Segregated cash with brokers for derivative instruments | 820,800 | |||
| Receivable for investments sold | 20,673,244 | |||
| Receivable for fund shares sold | 296,876 | |||
| Dividends receivable | 1,859,342 | |||
| Distributions receivable from Fidelity Central Funds | 94,824 | |||
| Other receivables | 28,848 | |||
Total assets | 1,706,411,097 | |||
| Liabilities | ||||
| Payable for investments purchased | $ | 55,106,796 | ||
| Payable for fund shares redeemed | 1,000,364 | |||
| Accrued management fee | 613,995 | |||
| Payable for daily variation margin on futures contracts | 2,434 | |||
| Collateral on securities loaned | 13,171,832 | |||
| Total Liabilities | 69,895,421 | |||
| Net Assets | $ | 1,636,515,676 | ||
| Net Assets consist of: | ||||
| Paid in capital | $ | 1,521,342,289 | ||
| Total accumulated earnings (loss) | 115,173,387 | |||
| Net Assets | $ | 1,636,515,676 | ||
Net Asset Value, offering price and redemption price per share ($1,636,515,676 ÷ 98,249,094 shares) | $ | 16.66 | ||
| Statement of Operations | ||||
Year ended August 31, 2023 | ||||
| Investment Income | ||||
| Dividends | $ | 26,198,952 | ||
| Interest | 43,267 | |||
| Income from Fidelity Central Funds (including $126,747 from security lending) | 1,013,463 | |||
| Total Income | 27,255,682 | |||
| Expenses | ||||
| Management fee | $ | 7,794,857 | ||
| Independent trustees' fees and expenses | 9,500 | |||
| Interest | 2,322 | |||
| Total expenses before reductions | 7,806,679 | |||
| Expense reductions | (1,764) | |||
| Total expenses after reductions | 7,804,915 | |||
| Net Investment income (loss) | 19,450,767 | |||
| Realized and Unrealized Gain (Loss) | ||||
| Net realized gain (loss) on: | ||||
| Investment Securities: | ||||
| Unaffiliated issuers | (62,536,880) | |||
| Redemptions in-kind | 69,766,859 | |||
| Futures contracts | 1,494,441 | |||
| Total net realized gain (loss) | 8,724,420 | |||
| Change in net unrealized appreciation (depreciation) on: | ||||
| Investment Securities: | ||||
| Unaffiliated issuers | 112,237,090 | |||
| Futures contracts | (773,128) | |||
| Total change in net unrealized appreciation (depreciation) | 111,463,962 | |||
| Net gain (loss) | 120,188,382 | |||
| Net increase (decrease) in net assets resulting from operations | $ | 139,639,149 | ||
| Statement of Changes in Net Assets | ||||
Year ended August 31, 2023 | Year ended August 31, 2022 | |||
| Increase (Decrease) in Net Assets | ||||
| Operations | ||||
| Net investment income (loss) | $ | 19,450,767 | $ | 19,011,742 |
| Net realized gain (loss) | 8,724,420 | 101,845,182 | ||
| Change in net unrealized appreciation (depreciation) | 111,463,962 | (369,508,755) | ||
| Net increase (decrease) in net assets resulting from operations | 139,639,149 | (248,651,831) | ||
| Distributions to shareholders | (57,460,804) | (258,245,278) | ||
| Share transactions | ||||
| Proceeds from sales of shares | 531,911,323 | 330,859,667 | ||
| Reinvestment of distributions | 54,197,269 | 243,001,334 | ||
| Cost of shares redeemed | (686,633,472) | (454,449,105) | ||
Net increase (decrease) in net assets resulting from share transactions | (100,524,880) | 119,411,896 | ||
| Total increase (decrease) in net assets | (18,346,535) | (387,485,213) | ||
| Net Assets | ||||
| Beginning of period | 1,654,862,211 | 2,042,347,424 | ||
| End of period | $ | 1,636,515,676 | $ | 1,654,862,211 |
| Other Information | ||||
| Shares | ||||
| Sold | 32,689,184 | 17,822,532 | ||
| Issued in reinvestment of distributions | 3,496,598 | 13,560,343 | ||
| Redeemed | (41,895,245) | (25,723,746) | ||
| Net increase (decrease) | (5,709,463) | 5,659,129 | ||
| Fidelity® Mid Cap Enhanced Index Fund |
| Years ended August 31, | 2023 | 2022 | 2021 | 2020 | 2019 | |||||
Selected Per-Share Data | ||||||||||
| Net asset value, beginning of period | $ | 15.92 | $ | 20.78 | $ | 15.16 | $ | 14.59 | $ | 16.42 |
| Income from Investment Operations | ||||||||||
Net investment income (loss) A,B | .18 | .18 | .14 | .19 | .21 | |||||
| Net realized and unrealized gain (loss) | 1.09 | (2.46) | 6.07 | .97 | (.71) | |||||
| Total from investment operations | 1.27 | (2.28) | 6.21 | 1.16 | (.50) | |||||
| Distributions from net investment income | (.15) | (.15) C | (.16) | (.22) | (.25) | |||||
| Distributions from net realized gain | (.37) | (2.43) C | (.43) | (.38) | (1.09) | |||||
| Total distributions | (.53) D | (2.58) | (.59) | (.59) D | (1.33) D | |||||
| Net asset value, end of period | $ | 16.66 | $ | 15.92 | $ | 20.78 | $ | 15.16 | $ | 14.59 |
Total Return E | 8.19% | (12.36)% | 41.82% | 7.91% | (2.19)% | |||||
Ratios to Average Net Assets B,F,G | ||||||||||
| Expenses before reductions | .45% | .51% | .59% | .59% | .59% | |||||
| Expenses net of fee waivers, if any | .45% | .51% | .59% | .59% | .59% | |||||
| Expenses net of all reductions | .45% | .51% | .59% | .59% | .59% | |||||
| Net investment income (loss) | 1.12% | 1.00% | .77% | 1.33% | 1.46% | |||||
| Supplemental Data | ||||||||||
| Net assets, end of period (000 omitted) | $ | 1,636,516 | $ | 1,654,862 | $ | 2,042,347 | $ | 1,182,253 | $ | 1,263,319 |
Portfolio turnover rate H | 104% I | 116% | 70% | 73% | 90% |
| Average Annual Total Returns | |||
Periods ended August 31, 2023 | Past 1 year | Past 5 years | Past 10 years |
| Fidelity® International Enhanced Index Fund | 19.29% | 3.68% | 5.37% |
| $10,000 Over 10 Years |
Let's say hypothetically that $10,000 was invested in Fidelity® International Enhanced Index Fund on August 31, 2013. The chart shows how the value of your investment would have changed, and also shows how the MSCI EAFE Index performed over the same period. |
 |
Top Holdings (% of Fund's net assets) | ||
| Novo Nordisk A/S Series B (Denmark, Pharmaceuticals) | 2.5 | |
| ASML Holding NV (Netherlands) (Netherlands, Semiconductors & Semiconductor Equipment) | 2.2 | |
| LVMH Moet Hennessy Louis Vuitton SE (France, Textiles, Apparel & Luxury Goods) | 2.0 | |
| Shell PLC (London) (Netherlands, Oil, Gas & Consumable Fuels) | 1.9 | |
| Novartis AG (Switzerland, Pharmaceuticals) | 1.9 | |
| Nestle SA (Reg. S) (United States of America, Food Products) | 1.6 | |
| HSBC Holdings PLC (United Kingdom, Banks) | 1.4 | |
| TotalEnergies SE (France, Oil, Gas & Consumable Fuels) | 1.3 | |
| Unilever PLC (United Kingdom, Personal Care Products) | 1.3 | |
| BP PLC (United Kingdom, Oil, Gas & Consumable Fuels) | 1.2 | |
| 17.3 | ||
| Market Sectors (% of Fund's net assets) | ||
| Industrials | 17.5 | |
| Financials | 16.0 | |
| Consumer Discretionary | 14.5 | |
| Health Care | 12.5 | |
| Consumer Staples | 8.9 | |
| Information Technology | 8.5 | |
| Materials | 8.0 | |
| Energy | 4.9 | |
| Utilities | 4.0 | |
| Communication Services | 2.8 | |
| Real Estate | 0.8 | |
Asset Allocation (% of Fund's net assets) |
 |
Futures - 1.2% |
Geographic Diversification (% of Fund's net assets) |
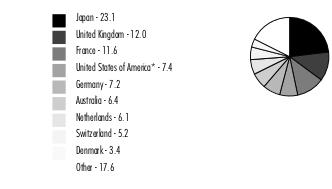 |
* Includes Short-Term investments and Net Other Assets (Liabilities). Percentages are adjusted for the effect of derivatives, if applicable. |
| Common Stocks - 97.3% | |||
| Shares | Value ($) | ||
| Australia - 6.4% | |||
| ANZ Group Holdings Ltd. | 330,247 | 5,391,980 | |
| APA Group unit | 428,602 | 2,496,637 | |
| Aristocrat Leisure Ltd. | 205,555 | 5,447,445 | |
| BHP Group Ltd. | 248,164 | 7,211,784 | |
| Brambles Ltd. | 472,091 | 4,579,194 | |
| Commonwealth Bank of Australia | 50,741 | 3,359,436 | |
| Computershare Ltd. | 87,768 | 1,431,968 | |
| Fortescue Metals Group Ltd. | 740,264 | 10,278,986 | |
| Glencore PLC | 599,020 | 3,198,125 | |
| Macquarie Group Ltd. | 69,289 | 7,970,353 | |
| Medibank Private Ltd. | 1,272,136 | 3,016,867 | |
| National Australia Bank Ltd. | 94,559 | 1,762,247 | |
| Pilbara Minerals Ltd. | 2,310,120 | 6,990,253 | |
| Qantas Airways Ltd. (a) | 1,203,743 | 4,609,595 | |
| Rio Tinto Ltd. | 52,641 | 3,850,876 | |
| Scentre Group unit | 2,060,126 | 3,670,861 | |
| Sonic Healthcare Ltd. | 109,740 | 2,286,770 | |
| South32 Ltd. | 472,179 | 1,029,585 | |
| Suncorp Group Ltd. | 382,439 | 3,377,532 | |
| Telstra Group Ltd. | 3,181,565 | 8,266,595 | |
| Wesfarmers Ltd. | 182,116 | 6,356,771 | |
| Woodside Energy Group Ltd. | 65,734 | 1,576,769 | |
| Woolworths Group Ltd. | 56,501 | 1,395,933 | |
TOTAL AUSTRALIA | 99,556,562 | ||
| Austria - 0.1% | |||
| Verbund AG | 18,883 | 1,547,969 | |
| Belgium - 0.9% | |||
| Ageas | 164,858 | 6,557,055 | |
| Solvay SA Class A | 63,264 | 7,333,374 | |
TOTAL BELGIUM | 13,890,429 | ||
| China - 0.7% | |||
| BOC Hong Kong (Holdings) Ltd. | 3,176,000 | 8,828,578 | |
| Budweiser Brewing Co. APAC Ltd. (b) | 443,700 | 961,816 | |
| SITC International Holdings Co. Ltd. | 164,000 | 305,735 | |
| Wilmar International Ltd. | 472,700 | 1,322,140 | |
TOTAL CHINA | 11,418,269 | ||
| Denmark - 3.4% | |||
| A.P. Moller - Maersk A/S Series A | 801 | 1,435,789 | |
| Carlsberg A/S Series B | 5,851 | 847,885 | |
| DSV A/S | 4,326 | 822,954 | |
| Genmab A/S (a) | 26,650 | 10,210,559 | |
| Novo Nordisk A/S: | |||
| Series B | 187,803 | 34,640,963 | |
| Series B sponsored ADR | 22,821 | 4,236,034 | |
| Pandora A/S | 9,316 | 967,505 | |
TOTAL DENMARK | 53,161,689 | ||
| Finland - 1.8% | |||
| Elisa Corp. (A Shares) | 73,178 | 3,592,200 | |
| Kesko Oyj | 209,319 | 4,090,091 | |
| Kone OYJ (B Shares) | 194,331 | 8,850,358 | |
| Nordea Bank Abp | 1,021,494 | 11,212,782 | |
TOTAL FINLAND | 27,745,431 | ||
| France - 11.6% | |||
| Aeroports de Paris SA | 17,043 | 2,247,238 | |
| Air Liquide SA | 92,937 | 16,791,503 | |
| Airbus Group NV | 937 | 137,090 | |
| bioMerieux SA | 3,381 | 350,488 | |
| BNP Paribas SA | 32,941 | 2,130,217 | |
| Capgemini SA | 6,072 | 1,133,164 | |
| Carrefour SA | 54,877 | 1,048,904 | |
| Compagnie de St.-Gobain | 177,156 | 11,556,682 | |
| Dassault Aviation SA | 293 | 57,697 | |
| Edenred SA | 99,659 | 6,358,559 | |
| Eiffage SA | 67,974 | 6,730,979 | |
| Engie SA | 472,819 | 7,614,389 | |
| Eurazeo SA | 5,181 | 305,901 | |
| Hermes International SCA | 6,906 | 14,234,181 | |
| L'Oreal SA | 40,986 | 18,035,038 | |
| La Francaise des Jeux SAEM (b) | 84,813 | 3,071,697 | |
| Legrand SA | 71,944 | 7,106,937 | |
| LVMH Moet Hennessy Louis Vuitton SE | 36,072 | 30,504,562 | |
| Orange SA ADR | 55,037 | 615,314 | |
| Pernod Ricard SA | 3,555 | 698,501 | |
| Publicis Groupe SA | 26,340 | 2,055,257 | |
| Safran SA | 59,294 | 9,502,765 | |
| Societe Generale Series A | 34,834 | 986,887 | |
| TotalEnergies SE | 320,768 | 20,121,420 | |
| Ubisoft Entertainment SA (a) | 151,145 | 4,582,479 | |
| Valeo SA | 55,667 | 1,086,525 | |
| VINCI SA | 100,034 | 11,142,596 | |
| Wendel SA | 6,516 | 596,692 | |
TOTAL FRANCE | 180,803,662 | ||
| Germany - 6.1% | |||
| Allianz SE | 6,361 | 1,546,226 | |
| Bayerische Motoren Werke AG (BMW) | 23,710 | 2,498,235 | |
| Beiersdorf AG | 4,651 | 608,980 | |
| Continental AG | 19,558 | 1,450,778 | |
| Deutsche Bank AG | 441,567 | 4,813,030 | |
| Deutsche Borse AG | 61,794 | 10,969,916 | |
| Deutsche Lufthansa AG (a) | 586,545 | 5,245,258 | |
| Evonik Industries AG | 20,167 | 387,174 | |
| Fresenius Medical Care AG & Co. KGaA | 23,886 | 1,150,050 | |
| Fresenius SE & Co. KGaA | 97,398 | 3,127,216 | |
| GEA Group AG | 18,860 | 744,411 | |
| Infineon Technologies AG | 130,669 | 4,669,544 | |
| Knorr-Bremse AG | 39,490 | 2,702,004 | |
| Mercedes-Benz Group AG: | |||
| ADR | 50,266 | 917,857 | |
| (Germany) | 923 | 67,540 | |
| Muenchener Rueckversicherungs-Gesellschaft AG in Muenchen | 16,589 | 6,443,403 | |
| Rational AG | 1,024 | 781,148 | |
| RWE AG | 243,640 | 10,055,111 | |
| SAP SE | 125,332 | 17,484,368 | |
| Scout24 AG (b) | 4,047 | 279,188 | |
| Siemens AG | 96,565 | 14,507,040 | |
| Siemens AG sponsored ADR | 43,439 | 3,264,006 | |
| Telefonica Deutschland Holding AG | 951,319 | 1,809,361 | |
TOTAL GERMANY | 95,521,844 | ||
| Hong Kong - 1.6% | |||
| AIA Group Ltd. | 374,632 | 3,389,768 | |
| ASMPT Ltd. | 108,800 | 1,089,755 | |
| Hang Seng Bank Ltd. | 42,800 | 545,755 | |
| Henderson Land Development Co. Ltd. | 3,000 | 8,238 | |
| Hong Kong & China Gas Co. Ltd. | 367,000 | 270,020 | |
| Hong Kong Exchanges and Clearing Ltd. | 121,300 | 4,702,060 | |
| Hongkong Land Holdings Ltd. | 81,900 | 290,745 | |
| Jardine Matheson Holdings Ltd. | 119,400 | 5,678,664 | |
| New World Development Co. Ltd. | 1,557,000 | 3,307,634 | |
| Sino Land Ltd. | 708,000 | 811,609 | |
| Swire Pacific Ltd. (A Shares) | 46,500 | 383,629 | |
| WH Group Ltd. (b) | 7,588,955 | 3,908,276 | |
| Xinyi Glass Holdings Ltd. | 268,000 | 395,728 | |
TOTAL HONG KONG | 24,781,881 | ||
| Ireland - 0.7% | |||
| CRH PLC | 58,300 | 3,354,213 | |
| CRH PLC sponsored ADR | 142,934 | 8,228,710 | |
TOTAL IRELAND | 11,582,923 | ||
| Israel - 0.6% | |||
| Bank Hapoalim BM (Reg.) | 37,648 | 312,228 | |
| Wix.com Ltd. (a) | 91,672 | 9,054,443 | |
TOTAL ISRAEL | 9,366,671 | ||
| Italy - 1.8% | |||
| Assicurazioni Generali SpA | 462,523 | 9,594,399 | |
| Coca-Cola HBC AG | 102,185 | 2,948,824 | |
| Eni SpA | 186,320 | 2,880,880 | |
| Intesa Sanpaolo SpA | 2,951,016 | 7,880,396 | |
| Terna - Rete Elettrica Nazionale | 53,820 | 444,701 | |
| UniCredit SpA | 177,885 | 4,333,833 | |
TOTAL ITALY | 28,083,033 | ||
| Japan - 23.1% | |||
| Ajinomoto Co., Inc. | 255,800 | 10,852,974 | |
| ASAHI INTECC Co. Ltd. | 38,000 | 774,913 | |
| Astellas Pharma, Inc. | 169,200 | 2,560,058 | |
| BayCurrent Consulting, Inc. | 11,800 | 406,567 | |
| Bridgestone Corp. | 248,800 | 9,680,448 | |
| Canon, Inc. | 270,700 | 6,663,028 | |
| Central Japan Railway Co. | 16,600 | 2,132,403 | |
| Chubu Electric Power Co., Inc. | 685,000 | 9,157,188 | |
| Dai Nippon Printing Co. Ltd. | 42,500 | 1,163,459 | |
| Daiichi Sankyo Kabushiki Kaisha | 44,800 | 1,319,524 | |
| Daiwa Securities Group, Inc. | 309,800 | 1,765,175 | |
| DENSO Corp. | 95,100 | 6,509,508 | |
| Disco Corp. | 45,000 | 8,893,999 | |
| FANUC Corp. | 6,700 | 190,557 | |
| Fast Retailing Co. Ltd. | 49,700 | 11,436,517 | |
| FUJIFILM Holdings Corp. | 62,000 | 3,670,697 | |
| Hamamatsu Photonics K.K. | 48,400 | 2,244,107 | |
| Hirose Electric Co. Ltd. | 19,800 | 2,402,619 | |
| Hitachi Construction Machinery Co. Ltd. | 34,700 | 1,083,011 | |
| Hitachi Ltd. | 222,600 | 14,831,330 | |
| Honda Motor Co. Ltd. | 410,700 | 13,272,343 | |
| Hoya Corp. | 84,184 | 9,347,349 | |
| Itochu Corp. | 160,300 | 6,028,809 | |
| Japan Post Bank Co. Ltd. | 803,400 | 6,452,269 | |
| JFE Holdings, Inc. | 296,700 | 4,697,402 | |
| Kansai Electric Power Co., Inc. | 218,200 | 3,110,394 | |
| Keisei Electric Railway Co. | 800 | 30,670 | |
| Keyence Corp. | 2,400 | 998,302 | |
| Kikkoman Corp. | 10,300 | 596,500 | |
| Kintetsu Group Holdings Co. Ltd. | 58,200 | 1,843,663 | |
| Kirin Holdings Co. Ltd. | 124,300 | 1,747,949 | |
| Komatsu Ltd. | 149,800 | 4,263,039 | |
| Lawson, Inc. (c) | 57,900 | 2,766,163 | |
| Marubeni Corp. | 123,550 | 2,024,846 | |
| Mazda Motor Corp. | 449,500 | 4,683,303 | |
| Mitsubishi Chemical Holdings Corp. | 884,300 | 5,289,572 | |
| Mitsubishi Corp. | 290,500 | 14,367,765 | |
| Mitsubishi Electric Corp. | 160,258 | 2,091,687 | |
| Mitsubishi UFJ Financial Group, Inc. | 162,200 | 1,293,980 | |
| Mitsubishi UFJ Lease & Finance Co. Ltd. | 171,300 | 1,114,842 | |
| Mitsui & Co. Ltd. | 198,500 | 7,410,921 | |
| Nidec Corp. | 102,400 | 5,328,328 | |
| Nintendo Co. Ltd. | 55,100 | 2,362,517 | |
| Nippon Express Holdings, Inc. | 40,100 | 2,086,098 | |
| Nippon Paint Holdings Co. Ltd. | 276,000 | 2,135,991 | |
| Nissan Chemical Corp. | 7,900 | 339,250 | |
| Nissan Motor Co. Ltd. | 1,896,400 | 8,063,906 | |
| Nissan Motor Co. Ltd. sponsored ADR (c) | 87,636 | 747,535 | |
| Nisshin Seifun Group, Inc. | 40,600 | 535,911 | |
| Nitto Denko Corp. | 119,300 | 8,157,777 | |
| OBIC Co. Ltd. | 21,000 | 3,656,002 | |
| Olympus Corp. | 651,400 | 8,822,184 | |
| Ono Pharmaceutical Co. Ltd. | 245,500 | 4,637,970 | |
| Open House Group Co. Ltd. | 15,600 | 528,167 | |
| Otsuka Holdings Co. Ltd. | 110,000 | 4,192,996 | |
| Panasonic Holdings Corp. | 923,400 | 10,628,387 | |
| Recruit Holdings Co. Ltd. | 146,000 | 5,200,885 | |
| Renesas Electronics Corp. (a) | 562,500 | 9,371,064 | |
| Ricoh Co. Ltd. | 268,300 | 2,190,731 | |
| Shin-Etsu Chemical Co. Ltd. | 420,100 | 13,390,169 | |
| Shin-Etsu Chemical Co. Ltd. ADR (c) | 30,225 | 480,880 | |
| Shiseido Co. Ltd. | 24,300 | 988,067 | |
| SoftBank Corp. | 991,700 | 11,373,520 | |
| Sompo Holdings, Inc. | 86,300 | 3,764,707 | |
| Sony Group Corp. | 34,500 | 2,870,142 | |
| Subaru Corp. | 237,800 | 4,591,904 | |
| Sumitomo Chemical Co. Ltd. | 15,100 | 41,866 | |
| Sumitomo Corp. | 223,100 | 4,598,625 | |
| Suntory Beverage & Food Ltd. | 16,200 | 524,876 | |
| Tokio Marine Holdings, Inc. | 396,200 | 8,743,541 | |
| Tokyo Electric Power Co., Inc. (a) | 668,000 | 2,938,383 | |
| Tokyo Electron Ltd. | 27,700 | 4,114,161 | |
| Tokyo Gas Co. Ltd. | 45,000 | 1,044,469 | |
| Toppan, Inc. | 108,000 | 2,613,616 | |
| Toyota Motor Corp. | 592,095 | 10,201,272 | |
| Toyota Tsusho Corp. | 166,800 | 9,968,219 | |
| USS Co. Ltd. | 36,700 | 641,831 | |
| Yokogawa Electric Corp. | 89,200 | 1,770,880 | |
| Z Holdings Corp. | 539,800 | 1,624,279 | |
| ZOZO, Inc. | 273,300 | 5,465,249 | |
TOTAL JAPAN | 361,906,205 | ||
| Luxembourg - 0.2% | |||
| ArcelorMittal SA (Netherlands) | 113,703 | 3,024,398 | |
| Eurofins Scientific SA | 11,448 | 705,591 | |
TOTAL LUXEMBOURG | 3,729,989 | ||
| Netherlands - 6.1% | |||
| ASML Holding NV: | |||
| (depository receipt) | 5,791 | 3,825,129 | |
| (Netherlands) | 46,492 | 30,569,799 | |
| ING Groep NV (Certificaten Van Aandelen) | 433,534 | 6,158,344 | |
| Koninklijke Ahold Delhaize NV | 185,938 | 6,082,031 | |
| Koninklijke Philips Electronics NV | 460,326 | 10,344,255 | |
| NN Group NV | 27,142 | 1,046,582 | |
| NN Group NV rights (a)(d) | 27,142 | 32,963 | |
| Shell PLC: | |||
| (London) | 957,815 | 29,285,458 | |
| rights (a)(d) | 957,815 | 317,037 | |
| Wolters Kluwer NV | 57,209 | 6,898,245 | |
| Wolters Kluwer NV rights (a)(d) | 57,209 | 44,665 | |
TOTAL NETHERLANDS | 94,604,508 | ||
| New Zealand - 0.2% | |||
| Meridian Energy Ltd. | 630,970 | 2,018,567 | |
| Xero Ltd. (a) | 10,758 | 872,028 | |
TOTAL NEW ZEALAND | 2,890,595 | ||
| Norway - 0.6% | |||
| DNB Bank ASA | 355,638 | 7,029,739 | |
| Gjensidige Forsikring ASA | 192,374 | 2,994,620 | |
TOTAL NORWAY | 10,024,359 | ||
| Singapore - 1.9% | |||
| Oversea-Chinese Banking Corp. Ltd. | 865,200 | 8,034,526 | |
| STMicroelectronics NV (France) | 240,579 | 11,354,060 | |
| United Overseas Bank Ltd. | 483,255 | 10,169,649 | |
TOTAL SINGAPORE | 29,558,235 | ||
| Spain - 3.2% | |||
| ACS Actividades de Construccion y Servicios SA | 121,081 | 4,252,619 | |
| Aena SME SA (b) | 25,407 | 3,994,762 | |
| Banco Bilbao Vizcaya Argentaria SA | 606,184 | 4,782,723 | |
| Banco Santander SA (Spain) | 921,266 | 3,596,263 | |
| Iberdrola SA | 1,219,110 | 14,461,977 | |
| Industria de Diseno Textil SA | 335,325 | 12,846,754 | |
| Naturgy Energy Group SA | 17,587 | 509,944 | |
| Redeia Corp. SA | 182,648 | 2,971,806 | |
| Telefonica SA | 761,230 | 3,154,287 | |
TOTAL SPAIN | 50,571,135 | ||
| Sweden - 3.3% | |||
| ASSA ABLOY AB (B Shares) | 159,102 | 3,580,740 | |
| Atlas Copco AB: | |||
| (A Shares) | 202,645 | 2,679,214 | |
| (B Shares) | 131,256 | 1,514,746 | |
| Epiroc AB (A Shares) | 148,412 | 2,847,342 | |
| Essity AB (B Shares) | 125,514 | 2,931,354 | |
| Evolution AB (b) | 42,378 | 4,591,385 | |
| Fastighets AB Balder (a) | 878,696 | 4,213,503 | |
| Industrivarden AB (A Shares) | 81,720 | 2,132,475 | |
| Kinnevik AB (B Shares) (a) | 64,062 | 754,514 | |
| Securitas AB (B Shares) | 61,458 | 501,050 | |
| Skandinaviska Enskilda Banken AB (A Shares) | 365,643 | 4,246,381 | |
| Svenska Handelsbanken AB (A Shares) | 741,575 | 6,187,745 | |
| Swedbank AB (A Shares) | 79,632 | 1,412,116 | |
| Swedish Orphan Biovitrum AB (a) | 175,358 | 3,389,117 | |
| Swedish Orphan Biovitrum AB rights 9/14/23 (a)(c) | 175,358 | 158,404 | |
| Volvo AB (B Shares) | 548,444 | 11,080,588 | |
TOTAL SWEDEN | 52,220,674 | ||
| Switzerland - 5.2% | |||
| ABB Ltd.: | |||
| (Reg.) | 278,749 | 10,600,334 | |
| sponsored ADR | 82,416 | 3,124,391 | |
| Alcon, Inc. (Switzerland) | 35,848 | 2,999,812 | |
| Baloise Holdings AG | 9,006 | 1,408,988 | |
| Compagnie Financiere Richemont SA | 8,645 | 1,230,474 | |
| Compagnie Financiere Richemont SA Series A | 93,167 | 13,214,957 | |
| Givaudan SA | 2,436 | 8,129,652 | |
| Kuehne & Nagel International AG | 5,826 | 1,753,703 | |
| Novartis AG | 288,260 | 29,010,996 | |
| Schindler Holding AG (participation certificate) | 3,854 | 860,153 | |
| Swiss Life Holding AG | 11,187 | 7,023,615 | |
| Zurich Insurance Group Ltd. | 2,580 | 1,212,090 | |
TOTAL SWITZERLAND | 80,569,165 | ||
| United Kingdom - 12.0% | |||
| 3i Group PLC | 159,401 | 4,025,458 | |
| AstraZeneca PLC (United Kingdom) | 96,556 | 12,969,666 | |
| Aviva PLC | 705,160 | 3,351,649 | |
| BAE Systems PLC | 885,223 | 11,266,916 | |
| Barclays PLC | 1,388,514 | 2,586,329 | |
| Barclays PLC sponsored ADR | 61,806 | 464,163 | |
| BP PLC | 2,011,159 | 12,427,530 | |
| BP PLC sponsored ADR | 169,657 | 6,307,847 | |
| British American Tobacco PLC (United Kingdom) | 86,376 | 2,861,152 | |
| BT Group PLC | 431,540 | 631,956 | |
| Bunzl PLC | 5,175 | 185,526 | |
| Burberry Group PLC | 190,055 | 5,258,235 | |
| Centrica PLC | 2,715,168 | 5,219,555 | |
| CK Hutchison Holdings Ltd. | 907,000 | 4,943,146 | |
| CNH Industrial NV | 3,733 | 51,732 | |
| Coca-Cola European Partners PLC | 42,150 | 2,702,237 | |
| Diageo PLC | 42,697 | 1,748,571 | |
| Hargreaves Lansdown PLC | 227,339 | 2,192,203 | |
| HSBC Holdings PLC: | |||
| (United Kingdom) | 1,985,785 | 14,649,568 | |
| sponsored ADR (c) | 203,948 | 7,611,339 | |
| Imperial Brands PLC | 186,001 | 4,211,359 | |
| InterContinental Hotel Group PLC | 73,442 | 5,539,383 | |
| InterContinental Hotel Group PLC ADR | 53,632 | 4,074,423 | |
| Legal & General Group PLC | 1,110,637 | 3,077,010 | |
| Lloyds Banking Group PLC | 4,825,139 | 2,577,895 | |
| Pearson PLC | 78,764 | 834,798 | |
| Phoenix Group Holdings PLC | 45,785 | 302,182 | |
| Reckitt Benckiser Group PLC | 119,763 | 8,642,786 | |
| Reckitt Benckiser Group PLC ADR | 13,198 | 190,183 | |
| Rolls-Royce Holdings PLC (a) | 4,062,722 | 11,397,253 | |
| Sage Group PLC | 518,510 | 6,377,999 | |
| Schroders PLC | 793,672 | 4,140,335 | |
| Standard Chartered PLC (United Kingdom) | 42,679 | 384,732 | |
| Tesco PLC | 2,204,505 | 7,416,582 | |
| Unilever PLC | 390,704 | 19,952,967 | |
| Vodafone Group PLC | 6,337,778 | 5,875,463 | |
| Wise PLC (a) | 173,764 | 1,409,235 | |
TOTAL UNITED KINGDOM | 187,859,363 | ||
| United States of America - 5.8% | |||
| CSL Ltd. | 4,049 | 715,049 | |
| GSK PLC | 395,124 | 6,920,971 | |
| GSK PLC sponsored ADR | 144,115 | 5,062,760 | |
| Holcim AG | 172,696 | 11,448,551 | |
| Monday.com Ltd. (a) | 3,728 | 661,496 | |
| Nestle SA (Reg. S) | 209,510 | 25,191,361 | |
| QIAGEN NV (Germany) (a) | 143,146 | 6,548,747 | |
| Roche Holding AG: | |||
| (Bearer) | 3,652 | 1,141,883 | |
| (participation certificate) | 46,315 | 13,592,916 | |
| Sanofi SA | 114,899 | 12,237,200 | |
| Schneider Electric SA | 22,455 | 3,848,975 | |
| Tenaris SA sponsored ADR | 106,000 | 3,384,580 | |
TOTAL UNITED STATES OF AMERICA | 90,754,489 | ||
| TOTAL COMMON STOCKS (Cost $1,305,694,931) | 1,522,149,080 | ||
| Nonconvertible Preferred Stocks - 1.1% | |||
| Shares | Value ($) | ||
| Germany - 1.1% | |||
| Dr. Ing. h.c. F. Porsche AG Series F (b) | 61,157 | 6,754,243 | |
| Volkswagen AG | 82,993 | 10,156,881 | |
| TOTAL NONCONVERTIBLE PREFERRED STOCKS (Cost $18,785,051) | 16,911,124 | ||
| Money Market Funds - 1.9% | |||
| Shares | Value ($) | ||
| Fidelity Cash Central Fund 5.43% (e) | 19,921,998 | 19,925,982 | |
| Fidelity Securities Lending Cash Central Fund 5.44% (e)(f) | 10,180,920 | 10,181,938 | |
| TOTAL MONEY MARKET FUNDS (Cost $30,107,920) | 30,107,920 | ||
| TOTAL INVESTMENT IN SECURITIES - 100.3% (Cost $1,354,587,902) | 1,569,168,124 |
NET OTHER ASSETS (LIABILITIES) - (0.3)% | (4,055,580) |
| NET ASSETS - 100.0% | 1,565,112,544 |
| Futures Contracts | |||||
Number of contracts | Expiration Date | Notional Amount ($) | Value ($) | Unrealized Appreciation/ (Depreciation) ($) | |
| Purchased | |||||
| Equity Index Contracts | |||||
| ICE MSCI EAFE Index Contracts (United States) | 179 | Sep 2023 | 18,878,235 | (13,230) | (13,230) |
| The notional amount of futures purchased as a percentage of Net Assets is 1.2% | |||||
| (a) | Non-income producing |
| (b) | Security exempt from registration under Rule 144A of the Securities Act of 1933. These securities may be resold in transactions exempt from registration, normally to qualified institutional buyers. At the end of the period, the value of these securities amounted to $23,561,367 or 1.5% of net assets. |
| (c) | Security or a portion of the security is on loan at period end. |
| (d) | Security or a portion of the security purchased on a delayed delivery or when-issued basis. |
| (e) | Affiliated fund that is generally available only to investment companies and other accounts managed by Fidelity Investments. The rate quoted is the annualized seven-day yield of the fund at period end. A complete unaudited listing of the fund's holdings as of its most recent quarter end is available upon request. In addition, each Fidelity Central Fund's financial statements, which are not covered by the Fund's Report of Independent Registered Public Accounting Firm, are available on the SEC's website or upon request. |
| (f) | Investment made with cash collateral received from securities on loan. |
| Affiliate | Value, beginning of period ($) | Purchases ($) | Sales Proceeds ($) | Dividend Income ($) | Realized Gain (loss) ($) | Change in Unrealized appreciation (depreciation) ($) | Value, end of period ($) | % ownership, end of period |
| Fidelity Cash Central Fund 5.43% | 18,255,010 | 376,399,359 | 374,728,387 | 864,826 | - | - | 19,925,982 | 0.1% |
| Fidelity Securities Lending Cash Central Fund 5.44% | 5,934,742 | 212,621,667 | 208,374,471 | 307,137 | - | - | 10,181,938 | 0.0% |
| Total | 24,189,752 | 589,021,026 | 583,102,858 | 1,171,963 | - | - | 30,107,920 | |
| Valuation Inputs at Reporting Date: | ||||
| Description | Total ($) | Level 1 ($) | Level 2 ($) | Level 3 ($) |
Investments in Securities: | ||||
| Equities: | ||||
Communication Services | 46,222,416 | 21,401,372 | 24,821,044 | - |
Consumer Discretionary | 220,425,141 | 101,629,518 | 118,795,623 | - |
Consumer Staples | 135,809,411 | 54,136,442 | 81,672,969 | - |
Energy | 76,301,521 | 11,269,196 | 65,032,325 | - |
Financials | 254,516,045 | 164,643,829 | 89,872,216 | - |
Health Care | 193,454,441 | 53,144,264 | 140,310,177 | - |
Industrials | 276,926,434 | 175,445,549 | 101,480,885 | - |
Information Technology | 133,067,375 | 38,814,188 | 94,253,187 | - |
Materials | 125,790,091 | 91,224,621 | 34,565,470 | - |
Real Estate | 12,686,219 | 12,677,981 | 8,238 | - |
Utilities | 63,861,110 | 41,784,744 | 22,076,366 | - |
| Money Market Funds | 30,107,920 | 30,107,920 | - | - |
| Total Investments in Securities: | 1,569,168,124 | 796,279,624 | 772,888,500 | - |
Derivative Instruments: | ||||
| Liabilities | ||||
Futures Contracts | (13,230) | (13,230) | - | - |
| Total Liabilities | (13,230) | (13,230) | - | - |
| Total Derivative Instruments: | (13,230) | (13,230) | - | - |
Primary Risk Exposure / Derivative Type | Value | |
| Asset ($) | Liability ($) | |
| Equity Risk | ||
Futures Contracts (a) | 0 | (13,230) |
| Total Equity Risk | 0 | (13,230) |
| Total Value of Derivatives | 0 | (13,230) |
| Statement of Assets and Liabilities | ||||
| August 31, 2023 | ||||
| Assets | ||||
| Investment in securities, at value (including securities loaned of $9,804,200) - See accompanying schedule: | ||||
Unaffiliated issuers (cost $1,324,479,982) | $ | 1,539,060,204 | ||
Fidelity Central Funds (cost $30,107,920) | 30,107,920 | |||
| Total Investment in Securities (cost $1,354,587,902) | $ | 1,569,168,124 | ||
| Segregated cash with brokers for derivative instruments | 622,599 | |||
| Cash | 14,257 | |||
| Foreign currency held at value (cost $461,070) | 461,451 | |||
| Receivable for fund shares sold | 304,102 | |||
| Dividends receivable | 3,317,973 | |||
| Reclaims receivable | 3,361,308 | |||
| Interest receivable | 631 | |||
| Distributions receivable from Fidelity Central Funds | 56,763 | |||
| Other receivables | 66,163 | |||
Total assets | 1,577,373,371 | |||
| Liabilities | ||||
| Payable for investments purchased on a delayed delivery basis | $ | 394,665 | ||
| Payable for fund shares redeemed | 869,557 | |||
| Accrued management fee | 712,707 | |||
| Payable for daily variation margin on futures contracts | 98,513 | |||
| Other payables and accrued expenses | 3,360 | |||
| Collateral on securities loaned | 10,182,025 | |||
| Total Liabilities | 12,260,827 | |||
| Net Assets | $ | 1,565,112,544 | ||
| Net Assets consist of: | ||||
| Paid in capital | $ | 1,516,313,074 | ||
| Total accumulated earnings (loss) | 48,799,470 | |||
| Net Assets | $ | 1,565,112,544 | ||
Net Asset Value, offering price and redemption price per share ($1,565,112,544 ÷ 149,918,343 shares) | $ | 10.44 | ||
| Statement of Operations | ||||
Year ended August 31, 2023 | ||||
| Investment Income | ||||
| Dividends | $ | 52,511,526 | ||
| Interest | 45,321 | |||
| Income from Fidelity Central Funds (including $307,137 from security lending) | 1,171,963 | |||
| Income before foreign taxes withheld | $ | 53,728,810 | ||
| Less foreign taxes withheld | (4,648,683) | |||
| Total Income | 49,080,127 | |||
| Expenses | ||||
| Management fee | $ | 8,333,434 | ||
| Independent trustees' fees and expenses | 8,052 | |||
| Interest | 16,731 | |||
| Total expenses before reductions | 8,358,217 | |||
| Expense reductions | (441) | |||
| Total expenses after reductions | 8,357,776 | |||
| Net Investment income (loss) | 40,722,351 | |||
| Realized and Unrealized Gain (Loss) | ||||
| Net realized gain (loss) on: | ||||
| Investment Securities: | ||||
| Unaffiliated issuers | (34,624,969) | |||
| Foreign currency transactions | (599,124) | |||
| Futures contracts | 3,144,313 | |||
| Total net realized gain (loss) | (32,079,780) | |||
| Change in net unrealized appreciation (depreciation) on: | ||||
| Investment Securities: | ||||
| Unaffiliated issuers | 261,104,444 | |||
| Assets and liabilities in foreign currencies | 281,786 | |||
| Futures contracts | (176,537) | |||
| Total change in net unrealized appreciation (depreciation) | 261,209,693 | |||
| Net gain (loss) | 229,129,913 | |||
| Net increase (decrease) in net assets resulting from operations | $ | 269,852,264 | ||
| Statement of Changes in Net Assets | ||||
Year ended August 31, 2023 | Year ended August 31, 2022 | |||
| Increase (Decrease) in Net Assets | ||||
| Operations | ||||
| Net investment income (loss) | $ | 40,722,351 | $ | 44,150,052 |
| Net realized gain (loss) | (32,079,780) | (40,880,584) | ||
| Change in net unrealized appreciation (depreciation) | 261,209,693 | (317,751,294) | ||
| Net increase (decrease) in net assets resulting from operations | 269,852,264 | (314,481,826) | ||
| Distributions to shareholders | (33,763,256) | (40,640,601) | ||
| Share transactions | ||||
| Proceeds from sales of shares | 600,539,896 | 742,204,628 | ||
| Reinvestment of distributions | 24,033,209 | 33,150,295 | ||
| Cost of shares redeemed | (600,353,896) | (794,518,975) | ||
Net increase (decrease) in net assets resulting from share transactions | 24,219,209 | (19,164,052) | ||
| Total increase (decrease) in net assets | 260,308,217 | (374,286,479) | ||
| Net Assets | ||||
| Beginning of period | 1,304,804,327 | 1,679,090,806 | ||
| End of period | $ | 1,565,112,544 | $ | 1,304,804,327 |
| Other Information | ||||
| Shares | ||||
| Sold | 64,929,566 | 72,917,785 | ||
| Issued in reinvestment of distributions | 2,529,811 | 3,024,662 | ||
| Redeemed | (63,195,426) | (75,511,518) | ||
| Net increase (decrease) | 4,263,951 | 430,929 | ||
| Fidelity® International Enhanced Index Fund |
| Years ended August 31, | 2023 | 2022 | 2021 | 2020 | 2019 | |||||
Selected Per-Share Data | ||||||||||
| Net asset value, beginning of period | $ | 8.96 | $ | 11.56 | $ | 9.20 | $ | 8.98 | $ | 9.83 |
| Income from Investment Operations | ||||||||||
Net investment income (loss) A,B | .26 | .31 | .25 | .19 | .30 | |||||
| Net realized and unrealized gain (loss) | 1.45 | (2.61) | 2.28 | .32 | (.95) | |||||
| Total from investment operations | 1.71 | (2.30) | 2.53 | .51 | (.65) | |||||
| Distributions from net investment income | (.23) | (.30) | (.17) | (.29) | (.20) | |||||
| Total distributions | (.23) | (.30) | (.17) | (.29) | (.20) | |||||
| Net asset value, end of period | $ | 10.44 | $ | 8.96 | $ | 11.56 | $ | 9.20 | $ | 8.98 |
Total Return C | 19.29% | (20.35)% | 27.77% | 5.55% | (6.51)% | |||||
Ratios to Average Net Assets B,D,E | ||||||||||
| Expenses before reductions | .55% | .57% | .59% | .59% | .59% | |||||
| Expenses net of fee waivers, if any | .55% | .57% | .59% | .59% | .59% | |||||
| Expenses net of all reductions | .55% | .57% | .59% | .59% | .59% | |||||
| Net investment income (loss) | 2.69% | 2.99% | 2.32% | 2.13% | 3.27% | |||||
| Supplemental Data | ||||||||||
| Net assets, end of period (000 omitted) | $ | 1,565,113 | $ | 1,304,804 | $ | 1,679,091 | $ | 1,182,923 | $ | 1,505,889 |
Portfolio turnover rate F | 105% | 114% | 82% | 75% | 103% |
| Tax cost | Gross unrealized appreciation | Gross unrealized depreciation | Net unrealized appreciation (depreciation) | |
Fidelity Large Cap Growth Enhanced Index Fund | $1,484,081,191 | $924,087,127 | (36,267,889) | $887,819,238 |
Fidelity Large Cap Value Enhanced Index Fund | 4,968,089,772 | 900,399,523 | (199,019,226) | 701,380,297 |
Fidelity Large Cap Core Enhanced Index Fund | 1,573,456,548 | 559,776,679 | (47,912,161) | 511,864,518 |
| Fidelity Mid Cap Enhanced Index Fund | 1,514,019,808 | 240,629,125 | (72,011,770) | 168,617,355 |
Fidelity International Enhanced Index Fund | 1,364,093,111 | 244,125,749 | (39,050,736) | 205,075,013 |
| Undistributed ordinary income | Undistributed long-term capital gain | Capital loss carryforward | Net unrealized appreciation (depreciation) on securities and other investments | |
Fidelity Large Cap Growth Enhanced Index Fund | $9,738,781 | $505,476 | $- | $887,819,238 |
Fidelity Large Cap Value Enhanced Index Fund | 66,952,451 | 72,771,244 | - | 701,380,297 |
Fidelity Large Cap Core Enhanced Index Fund | 13,332,534 | - | (38,240,595) | 511,864,518 |
| Fidelity Mid Cap Enhanced Index Fund | 9,469,584 | - | (62,913,553) | 168,617,355 |
Fidelity International Enhanced Index Fund | 35,960,056 | - | (192,178,322) | 205,017,734 |
| Short-term | Long-term | Total capital loss carryforward | |
Fidelity Large Cap Core Enhanced Index Fund | (38,240,595) | - | (38,240,595) |
| Fidelity Mid Cap Enhanced Index Fund | (58,232,433) | (4,681,120) | (62,913,553) |
Fidelity International Enhanced Index Fund | (174,393,866) | (17,784,456) | (192,178,322) |
| August 31, 2023 | |||
| Ordinary Income | Long-term Capital Gains | Total | |
Fidelity Large Cap Growth Enhanced Index Fund | $10,050,462 | $- | $10,050,462 |
Fidelity Large Cap Value Enhanced Index Fund | 84,574,965 | 172,625,609 | 257,200,574 |
Fidelity Large Cap Core Enhanced Index Fund | 14,695,385 | 7,597,614 | 22,292,999 |
| Fidelity Mid Cap Enhanced Index Fund | 16,855,170 | 40,605,634 | 57,460,804 |
Fidelity International Enhanced Index Fund | 33,763,256 | - | 33,763,256 |
| August 31, 2022 | |||
| Ordinary Income | Long-term Capital Gains | Total | |
Fidelity Large Cap Growth Enhanced Index Fund | $84,709,586 | $150,046,589 | $234,756,175 |
Fidelity Large Cap Value Enhanced Index Fund | 298,040,890 | 399,041,651 | 697,082,541 |
Fidelity Large Cap Core Enhanced Index Fund | 93,609,903 | 110,605,741 | 204,215,644 |
| Fidelity Mid Cap Enhanced Index Fund | 40,554,225 | 217,691,053 | 258,245,278 |
Fidelity International Enhanced Index Fund | 40,640,601 | - | 40,640,601 |
| Equity Risk | Equity risk relates to the fluctuations in the value of financial instruments as a result of changes in market prices (other than those arising from interest rate risk or foreign exchange risk), whether caused by factors specific to an individual investment, its issuer, or all factors affecting all instruments traded in a market or market segment. |
| Purchases ($) | Sales ($) | |
| Fidelity Large Cap Growth Enhanced Index Fund | 2,589,884,949 | 2,152,923,266 |
| Fidelity Large Cap Value Enhanced Index Fund | 4,868,646,569 | 4,982,369,127 |
| Fidelity Large Cap Core Enhanced Index Fund | 2,034,084,638 | 2,571,143,089 |
| Fidelity Mid Cap Enhanced Index Fund | 1,832,229,584 | 1,765,707,575 |
| Fidelity International Enhanced Index Fund | 1,589,729,821 | 1,556,745,579 |
| Shares | Total net realized gain or loss ($) | Total Proceeds ($) | |
| Fidelity Large Cap Growth Enhanced Index Fund | 2,957,746 | 14,287,867 | 83,970,422 |
| Fidelity Large Cap Value Enhanced Index Fund | 25,502,664 | 117,706,408 | 375,867,257 |
| Fidelity Large Cap Core Enhanced Index Fund | 1,958,911 | 23,998,066 | 41,117,535 |
| Fidelity Mid Cap Enhanced Index Fund | 12,107,173 | 69,766,859 | 200,533,885 |
| Fidelity Large Cap Growth Enhanced Index Fund | .39% |
| Fidelity Large Cap Value Enhanced Index Fund | .39% |
| Fidelity Large Cap Core Enhanced Index Fund | .39% |
| Fidelity Mid Cap Enhanced Index Fund | .45% |
| Fidelity International Enhanced Index Fund | .55% |
| Amount | |
| Fidelity Large Cap Growth Enhanced Index Fund | $4,259 |
| Fidelity Large Cap Value Enhanced Index Fund | 3,848 |
| Fidelity Large Cap Core Enhanced Index Fund | 1,974 |
| Fidelity Mid Cap Enhanced Index Fund | 1,614 |
| Fidelity International Enhanced Index Fund | 579 |
| Borrower or Lender | Average Loan Balance | Weighted Average Interest Rate | Interest Expense | |
Fidelity Large Cap Growth Enhanced Index Fund | Borrower | $54,770,800 | 5.44% | $41,394 |
Fidelity Large Cap Value Enhanced Index Fund | Borrower | $61,479,000 | 4.35% | $29,724 |
Fidelity Large Cap Core Enhanced Index Fund | Borrower | $22,101,250 | 3.68% | $27,112 |
| Fidelity Mid Cap Enhanced Index Fund | Borrower | $4,314,500 | 4.84% | $2,322 |
Fidelity International Enhanced Index Fund | Borrower | $12,807,600 | 4.70% | $16,731 |
| Purchases ($) | Sales ($) | Realized Gain (Loss) ($) | |
| Fidelity Large Cap Growth Enhanced Index Fund | 98,630,928 | 59,443,059 | 3,980,573 |
| Fidelity Large Cap Value Enhanced Index Fund | 202,835,859 | 125,091,754 | 12,994,217 |
| Fidelity Large Cap Core Enhanced Index Fund | 78,182,956 | 64,476,701 | 726,303 |
| Fidelity Mid Cap Enhanced Index Fund | 65,914,545 | 39,218,370 | (2,777,171) |
| Fidelity International Enhanced Index Fund | 19,322,590 | 2,972,597 | (142,908) |
| Amount ($) | |
| Fidelity Large Cap Value Enhanced Index Fund | 3,045 |
| Fidelity Large Cap Core Enhanced Index Fund | 1,353 |
| Fidelity Central Fund | Investment Manager | Investment Objective | Investment Practices | Expense RatioA |
| Fidelity Money Market Central Funds | Fidelity Management & Research Company LLC (FMR) | Each fund seeks to obtain a high level of current income consistent with the preservation of capital and liquidity. | Short-term Investments | Less than .005% |
| Total Security Lending Fees Paid to NFS | Security Lending Income From Securities Loaned to NFS | Value of Securities Loaned to NFS at Period End | |
| Fidelity Large Cap Growth Enhanced Index Fund | $310 | $- | $- |
| Fidelity Large Cap Value Enhanced Index Fund | $17,561 | $374 | $- |
| Fidelity Large Cap Core Enhanced Index Fund | $3,721 | $- | $- |
| Fidelity Mid Cap Enhanced Index Fund | $13,555 | $3,917 | $- |
| Fidelity International Enhanced Index Fund | $33,238 | $9 | $- |
| Average Loan Balance | Weighted Average Interest Rate | Interest Expense | |
| Fidelity Large Cap Core Enhanced Index Fund | $8,149,000 | 3.58% | $810 |
| Custodian credits | |
Fidelity Large Cap Growth Enhanced Index Fund | $2,918 |
Fidelity Large Cap Value Enhanced Index Fund | 1,773 |
Fidelity Large Cap Core Enhanced Index Fund | 2,087 |
Fidelity Mid Cap Enhanced Index Fund | 1,764 |
Fidelity International Enhanced Index Fund | 441 |
| Fund | Strategic Advisers Fidelity U.S. Total Stock Fund |
Fidelity Large Cap Value Enhanced Index Fund | 59% |
| Fund | % of shares held |
Fidelity Large Cap Value Enhanced Index Fund | 61% |
| Current Mutual Funds (Target and Predecessor Funds) | New ETFs |
| Fidelity International Enhanced Index Fund | Fidelity Enhanced International ETF |
| Fidelity Large Cap Core Enhanced Index Fund | Fidelity Enhanced Large Cap Core ETF |
| Fidelity Large Cap Growth Enhanced Index Fund | Fidelity Enhanced Large Cap Growth ETF |
| Fidelity Large Cap Value Enhanced Index Fund | Fidelity Enhanced Large Cap Value ETF |
| Fidelity Mid Cap Enhanced Index Fund | Fidelity Enhanced Mid Cap ETF |
| The Example is based on an investment of $1,000 invested at the beginning of the period and held for the entire period (March 1, 2023 to August 31, 2023). |
Annualized Expense Ratio- A | Beginning Account Value March 1, 2023 | Ending Account Value August 31, 2023 | Expenses Paid During Period- C March 1, 2023 to August 31, 2023 | |||||||
| Fidelity® Large Cap Growth Enhanced Index Fund | .39% | |||||||||
| Actual | $ 1,000 | $ 1,212.30 | $ 2.17 | |||||||
Hypothetical-B | $ 1,000 | $ 1,023.24 | $ 1.99 | |||||||
| Fidelity® Large Cap Value Enhanced Index Fund | .39% | |||||||||
| Actual | $ 1,000 | $ 1,042.20 | $ 2.01 | |||||||
Hypothetical-B | $ 1,000 | $ 1,023.24 | $ 1.99 | |||||||
| Fidelity® Large Cap Core Enhanced Index Fund | .39% | |||||||||
| Actual | $ 1,000 | $ 1,140.10 | $ 2.10 | |||||||
Hypothetical-B | $ 1,000 | $ 1,023.24 | $ 1.99 | |||||||
| Fidelity® Mid Cap Enhanced Index Fund | .45% | |||||||||
| Actual | $ 1,000 | $ 1,021.50 | $ 2.29 | |||||||
Hypothetical-B | $ 1,000 | $ 1,022.94 | $ 2.29 | |||||||
| Fidelity® International Enhanced Index Fund | .55% | |||||||||
| Actual | $ 1,000 | $ 1,061.00 | $ 2.86 | |||||||
Hypothetical-B | $ 1,000 | $ 1,022.43 | $ 2.80 | |||||||
| Fidelity Large Cap Value Enhanced Index Fund | $89,603,673 |
| Fidelity Large Cap Growth Enhanced Index Fund | $3,583,892 |
| Fidelity Large Cap Core Enhanced Index Fund | |
| December 2022 | 100% |
| Fidelity Large Cap Value Enhanced Index Fund | |
| December 2022 | 100% |
| Fidelity Large Cap Growth Enhanced Index Fund | |
| December 2022 | 100% |
| Fidelity Mid Cap Enhanced Index Fund | |
| December 2022 | 98% |
| Fidelity Large Cap Core Enhanced Index Fund | |
| December 2022 | 100% |
| Fidelity Large Cap Value Enhanced Index Fund | |
| December 2022 | 100% |
| Fidelity Large Cap Growth Enhanced Index Fund | |
| December 2022 | 100% |
| Fidelity International Enhanced Index Fund | |
| December 2022 | 99.83% |
| Fidelity Mid Cap Enhanced Index Fund | |
| December 2022 | 100% |
| Fidelity International Enhanced Index Fund | $322,285 |
| Fidelity Mid Cap Enhanced Index Fund | $287,007 |
| Pay Date | Income | Taxes | |
| Fidelity International Enhanced Index Fund | 12/12/2022 | $0.2431 | $0.0171 |
| A special meeting of shareholders was held on April 19, 2023. The results of votes taken among shareholders on the proposal before them are reported below. Each vote reported represents one dollar of net asset value held on the record date for the meeting. | ||
| Proposal 1 | ||
| To reclassify the diversification status of the fund from diversified to non-diversified by eliminating the following fundamental policy: The fund may not with respect to 75% of fund's total assets, purchase the securities of any issuer (other than securities issued or guaranteed by the U.S. Government or any of its agencies or instrumentalities, or securities of other investment companies) if as a result, (a) more than 5% of fund's total assets would be invested in the securities of that issuer, or (b) the fund would hold more than 10% of outstanding voting securities of issuer. | ||
# of Votes | % of Votes | |
| Affirmative | 1,212,959,725.500 | 85.392 |
| Against | 164,063,927.240 | 11.550 |
| Abstain | 43,439,041.970 | 3.058 |
| TOTAL | 1,420,462,694.710 | 100.000 |
 |
Item 2.
Code of Ethics
As of the end of the period, August 31, 2023, Fidelity Commonwealth Trust II (the trust) has adopted a code of ethics, as defined in Item 2 of Form N-CSR, that applies to its President and Treasurer and its Chief Financial Officer. A copy of the code of ethics is filed as an exhibit to this Form N-CSR.
Item 3.
Audit Committee Financial Expert
The Board of Trustees of the trust has determined that Donald F. Donahue is an audit committee financial expert, as defined in Item 3 of Form N-CSR. Mr. Donahue is independent for purposes of Item 3 of Form N-CSR.
Item 4.
Principal Accountant Fees and Services
Fees and Services
The following table presents fees billed by PricewaterhouseCoopers LLP (“PwC”) in each of the last two fiscal years for services rendered to Fidelity International Enhanced Index Fund, Fidelity Large Cap Core Enhanced Index Fund, Fidelity Large Cap Growth Enhanced Index Fund, Fidelity Large Cap Value Enhanced Index Fund and Fidelity Mid Cap Enhanced Index Fund (the “Funds”):
Services Billed by PwC
August 31, 2023 FeesA
Audit Fees | Audit-Related Fees | Tax Fees | All Other Fees | |
Fidelity International Enhanced Index Fund | $39,900 | $3,700 | $9,800 | $1,200 |
Fidelity Large Cap Core Enhanced Index Fund | $39,500 | $3,700 | $9,800 | $1,200 |
Fidelity Large Cap Growth Enhanced Index Fund | $39,500 | $3,700 | $9,800 | $1,200 |
Fidelity Large Cap Value Enhanced Index Fund | $39,600 | $3,700 | $9,800 | $1,200 |
Fidelity Mid Cap Enhanced Index Fund | $39,500 | $3,700 | $9,800 | $1,200 |
August 31, 2022 FeesA
Audit Fees | Audit-Related Fees | Tax Fees | All Other Fees | |
Fidelity International Enhanced Index Fund | $38,100 | $3,600 | $9,300 | $1,200 |
Fidelity Large Cap Core Enhanced Index Fund | $37,700 | $3,600 | $10,200 | $1,200 |
Fidelity Large Cap Growth Enhanced Index Fund | $37,700 | $3,600 | $10,200 | $1,200 |
Fidelity Large Cap Value Enhanced Index Fund | $37,700 | $3,600 | $9,300 | $1,200 |
Fidelity Mid Cap Enhanced Index Fund | $37,700 | $3,600 | $10,200 | $1,200 |
A Amounts may reflect rounding.
The following table(s) present(s) fees billed by PwC that were required to be approved by the Audit Committee for services that relate directly to the operations and financial reporting of the Fund(s) and that are rendered on behalf of Fidelity Management & Research Company LLC ("FMR") and entities controlling, controlled by, or under common control with FMR (not including any sub-adviser whose role is primarily portfolio management and is subcontracted with or overseen by another investment adviser) that provide ongoing services to the Fund(s) (“Fund Service Providers”):
Services Billed by PwC
August 31, 2023A | August 31, 2022A | |
Audit-Related Fees | $8,284,200 | $7,914,600 |
Tax Fees | $1,000 | $353,200 |
All Other Fees | $- | $- |
A Amounts may reflect rounding.
“Audit-Related Fees” represent fees billed for assurance and related services that are reasonably related to the performance of the fund audit or the review of the fund's financial statements and that are not reported under Audit Fees.
“Tax Fees” represent fees billed for tax compliance, tax advice or tax planning that relate directly to the operations and financial reporting of the fund.
“All Other Fees” represent fees billed for services provided to the fund or Fund Service Provider, a significant portion of which are assurance related, that relate directly to the operations and financial reporting of the fund, excluding those services that are reported under Audit Fees, Audit-Related Fees or Tax Fees.
Assurance services must be performed by an independent public accountant.
* * *
The aggregate non-audit fees billed by PwC for services rendered to the Fund(s), FMR (not including any sub-adviser whose role is primarily portfolio management and is subcontracted with or overseen by another investment adviser), and any Fund Service Provider for each of the last two fiscal years of the Fund(s) are as follows:
Billed By | August 31, 2023A | August 31, 2022A |
| |
PwC | $13,661,300 | $13,308,400 |
| |
| ||||
A Amounts may reflect rounding.
The trust's Audit Committee has considered non-audit services that were not pre-approved that were provided by PwC to Fund Service Providers to be compatible with maintaining the independence of PwC in its(their) audit of the Fund(s), taking into account representations from PwC, in accordance with Public Company Accounting Oversight Board rules, regarding its independence from the Fund(s) and its(their) related entities and FMR’s review of the appropriateness and permissibility under applicable law of such non-audit services prior to their provision to the Fund(s) Service Providers.
Audit Committee Pre-Approval Policies and Procedures
The trust’s Audit Committee must pre-approve all audit and non-audit services provided by a fund’s independent registered public accounting firm relating to the operations or financial reporting of the fund. Prior to the commencement of any audit or non-audit services to a fund, the Audit Committee reviews the services to determine whether they are appropriate and permissible under applicable law.
The Audit Committee has adopted policies and procedures to, among other purposes, provide a framework for the Committee’s consideration of non-audit services by the audit firms that audit the Fidelity funds. The policies and procedures require that any non-audit service provided by a fund audit firm to a Fidelity fund and any non-audit service provided by a fund auditor to a Fund Service Provider that relates directly to the operations and financial reporting of a Fidelity fund (“Covered Service”) are subject to approval by the Audit Committee before such service is provided.
All Covered Services must be approved in advance of provision of the service either: (i) by formal resolution of the Audit Committee, or (ii) by oral or written approval of the service by the Chair of the Audit Committee (or if the Chair is unavailable, such other member of the Audit Committee as may be designated by the Chair to act in the Chair’s absence). The approval contemplated by (ii) above is permitted where the Treasurer determines that action on such an engagement is necessary before the next meeting of the Audit Committee.
Non-audit services provided by a fund audit firm to a Fund Service Provider that do not relate directly to the operations and financial reporting of a Fidelity fund are reported to the Audit Committee periodically.
Non-Audit Services Approved Pursuant to Rule 2-01(c)(7)(i)(C) and (ii) of Regulation S-X (“De Minimis Exception”)
There were no non-audit services approved or required to be approved by the Audit Committee pursuant to the De Minimis Exception during the Fund’s(s’) last two fiscal
years relating to services provided to (i) the Fund(s) or (ii) any Fund Service Provider that relate directly to the operations and financial reporting of the Fund(s).
The Registrant has not retained, for the preparation of the audit report on the financial statements included in the Form N-CSR, a registered public accounting firm that has a branch or office that is located in a foreign jurisdiction and that the Public Company Accounting Oversight Board (the “PCAOB”) has determined that the PCAOB is unable to inspect or investigate completely because of a position taken by an authority in the foreign jurisdiction.
The Registrant is not a “foreign issuer,” as defined in 17 CFR 240.3b-4.
Item 5.
Audit Committee of Listed Registrants
Not applicable.
Item 6.
Investments
(a)
Not applicable.
(b)
Not applicable.
Item 7.
Disclosure of Proxy Voting Policies and Procedures for Closed-End Management Investment Companies
Not applicable.
Item 8.
Portfolio Managers of Closed-End Management Investment Companies
Not applicable.
Item 9.
Purchase of Equity Securities by Closed-End Management Investment Company and Affiliated Purchasers
Not applicable.
Item 10.
Submission of Matters to a Vote of Security Holders
There were no material changes to the procedures by which shareholders may recommend nominees to the trust’s Board of Trustees.
Item 11.
Controls and Procedures
(a)(i) The President and Treasurer and the Chief Financial Officer have concluded that the trust’s disclosure controls and procedures (as defined in Rule 30a-3(c) under the Investment Company Act) provide reasonable assurances that material information
relating to the trust is made known to them by the appropriate persons, based on their evaluation of these controls and procedures as of a date within 90 days of the filing date of this report.
(a)(ii) There was no change in the trust’s internal control over financial reporting (as defined in Rule 30a-3(d) under the Investment Company Act) that occurred during the period covered by this report that has materially affected, or is reasonably likely to materially affect, the trust’s internal control over financial reporting.
Item 12.
Disclosure of Securities Lending Activities for Closed-End Management
Investment Companies
Not applicable.
Item 13.
Exhibits
(a) | (1) | Code of Ethics pursuant to Item 2 of Form N-CSR is filed and attached hereto as EX-99.CODE ETH. |
(a) | (2) | |
(a) | (3) | Not applicable. |
(b) |
SIGNATURES
Pursuant to the requirements of the Securities Exchange Act of 1934 and the Investment Company Act of 1940, the registrant has duly caused this report to be signed on its behalf by the undersigned, thereunto duly authorized.
Fidelity Commonwealth Trust II
By: | /s/Stacie M. Smith |
Stacie M. Smith | |
President and Treasurer | |
Date: | October 23, 2023 |
Pursuant to the requirements of the Securities Exchange Act of 1934 and the Investment Company Act of 1940, this report has been signed below by the following persons on behalf of the registrant and in the capacities and on the dates indicated.
By: | /s/Stacie M. Smith |
Stacie M. Smith | |
President and Treasurer | |
Date: | October 23, 2023 |
By: | /s/John J. Burke III |
John J. Burke III | |
Chief Financial Officer | |
Date: | October 23, 2023 |