UNITED STATES
SECURITIES AND EXCHANGE COMMISSION
Washington, D.C. 20549
FORM N-CSR
CERTIFIED SHAREHOLDER REPORT OF REGISTERED
MANAGEMENT INVESTMENT COMPANIES
Investment Company Act file number 811-21990
Fidelity Commonwealth Trust II
(Exact name of registrant as specified in charter)
245 Summer St., Boston, Massachusetts 02210
(Address of principal executive offices) (Zip code)
Margaret Carey, Secretary
245 Summer St.
Boston, Massachusetts 02210
(Name and address of agent for service)
Registrant's telephone number, including area code:
617-563-7000
Date of fiscal year end: | February 28 |
Date of reporting period: | February 28, 2023 |
Item 1.
Reports to Stockholders


Contents
| Average Annual Total Returns | |||
Periods ended February 28, 2023 | Past 1 year | Past 5 years | Past 10 years |
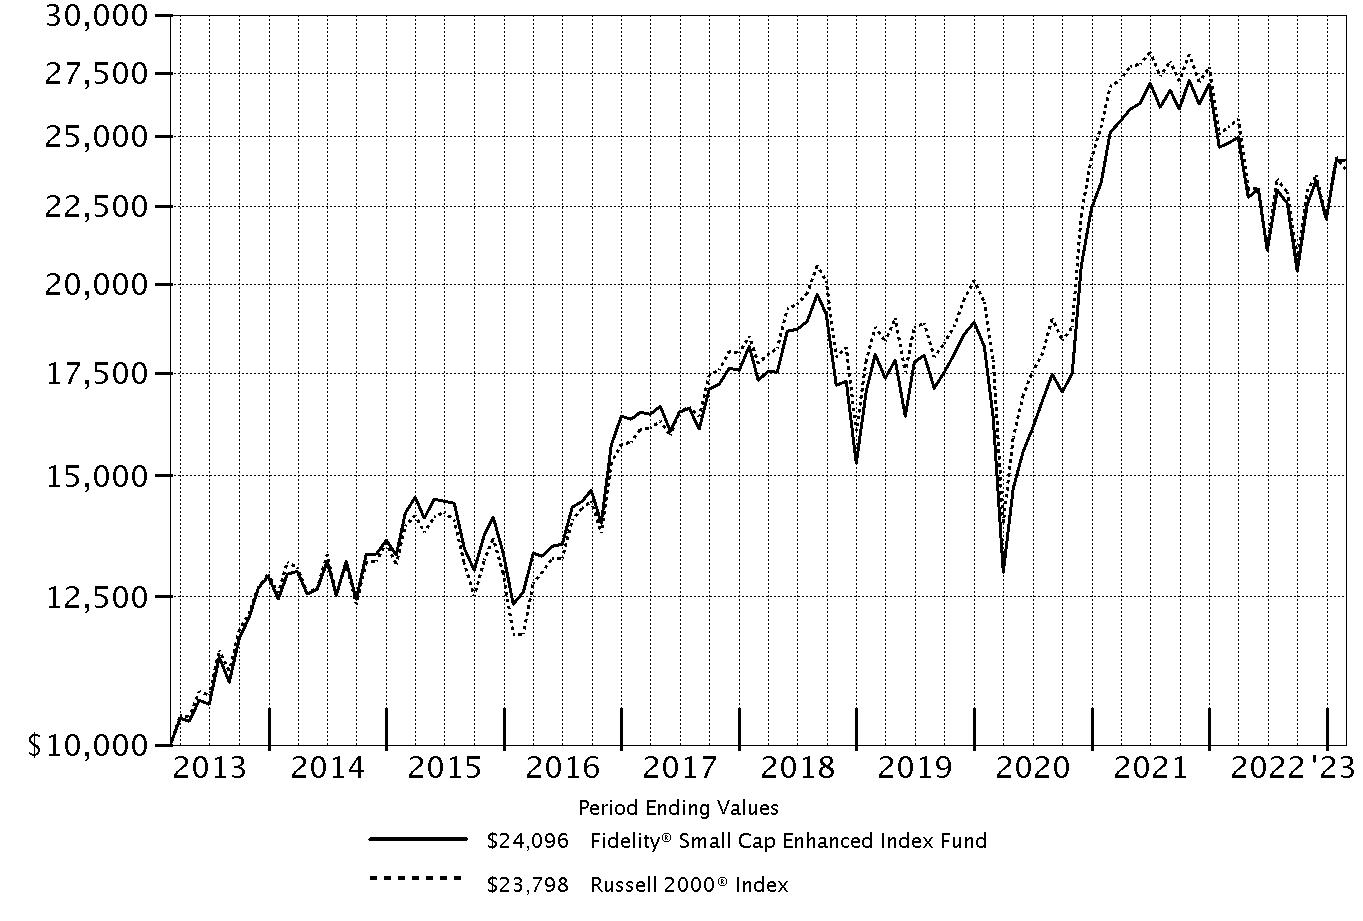
| Fidelity® Small Cap Enhanced Index Fund | -2.62% | 6.83% | 9.19% |
| $10,000 Over 10 Years |
Let's say hypothetically that $10,000 was invested in Fidelity® Small Cap Enhanced Index Fund on February 28, 2013. The chart shows how the value of your investment would have changed, and also shows how the Russell 2000® Index performed over the same period. |
 |
Top Holdings (% of Fund's net assets) | ||
| EMCOR Group, Inc. | 0.8 | |
| Atkore, Inc. | 0.8 | |
| Comfort Systems U.S.A., Inc. | 0.8 | |
| Texas Roadhouse, Inc. Class A | 0.8 | |
| Visteon Corp. | 0.8 | |
| SPS Commerce, Inc. | 0.7 | |
| Commercial Metals Co. | 0.7 | |
| Watts Water Technologies, Inc. Class A | 0.7 | |
| Option Care Health, Inc. | 0.7 | |
| Wingstop, Inc. | 0.7 | |
| 7.5 | ||
| Market Sectors (% of Fund's net assets) | ||
| Industrials | 16.4 | |
| Financials | 15.3 | |
| Health Care | 14.8 | |
| Information Technology | 14.6 | |
| Consumer Discretionary | 11.5 | |
| Energy | 6.6 | |
| Materials | 5.0 | |
| Real Estate | 4.9 | |
| Consumer Staples | 3.6 | |
| Communication Services | 3.6 | |
| Utilities | 1.8 | |
Asset Allocation (% of Fund's net assets) |
 |
Foreign investments - 4.3% |
Futures - 1.8% |
| Common Stocks - 98.1% | |||
| Shares | Value ($) | ||
| COMMUNICATION SERVICES - 3.6% | |||
| Diversified Telecommunication Services - 1.5% | |||
| Bandwidth, Inc. (a) | 82,677 | 1,314,564 | |
| Cogent Communications Group, Inc. (b) | 55,571 | 3,597,667 | |
| EchoStar Holding Corp. Class A (a)(b) | 53,925 | 1,076,343 | |
| Iridium Communications, Inc. | 30,251 | 1,856,504 | |
| Ooma, Inc. (a) | 83,256 | 1,089,821 | |
| 8,934,899 | |||
| Entertainment - 0.1% | |||
| Lions Gate Entertainment Corp.: | |||
| Class A (a) | 13,744 | 145,824 | |
| Class B (a) | 20,755 | 206,512 | |
| Madison Square Garden Entertainment Corp. (a) | 3,573 | 216,274 | |
| 568,610 | |||
| Interactive Media & Services - 1.3% | |||
| Eventbrite, Inc. (a) | 88,233 | 772,921 | |
| Shutterstock, Inc. (b) | 30,398 | 2,286,538 | |
| TrueCar, Inc. (a) | 216,791 | 505,123 | |
| Vimeo, Inc. (a) | 117,709 | 450,825 | |
| Yelp, Inc. (a) | 115,722 | 3,473,974 | |
| Zedge, Inc. (a)(b) | 20,492 | 56,353 | |
| 7,545,734 | |||
| Media - 0.4% | |||
| Quotient Technology, Inc. (a) | 289,424 | 1,094,023 | |
| TechTarget, Inc. (a) | 14,489 | 546,670 | |
| TEGNA, Inc. | 23,373 | 406,690 | |
| 2,047,383 | |||
| Wireless Telecommunication Services - 0.3% | |||
| Telephone & Data Systems, Inc. | 140,947 | 1,788,617 | |
TOTAL COMMUNICATION SERVICES | 20,885,243 | ||
| CONSUMER DISCRETIONARY - 11.5% | |||
| Auto Components - 1.2% | |||
| Luminar Technologies, Inc. (a)(b) | 20,546 | 183,887 | |
| Modine Manufacturing Co. (a) | 55,283 | 1,349,458 | |
| The Goodyear Tire & Rubber Co. (a) | 107,810 | 1,224,722 | |
| Visteon Corp. (a) | 25,970 | 4,338,029 | |
| 7,096,096 | |||
| Automobiles - 0.6% | |||
| Winnebago Industries, Inc. (b) | 51,490 | 3,272,704 | |
| Diversified Consumer Services - 0.7% | |||
| 2U, Inc. (a) | 110,918 | 993,825 | |
| Duolingo, Inc. (a) | 32,313 | 2,933,697 | |
| Perdoceo Education Corp. (a) | 15,895 | 219,113 | |
| 4,146,635 | |||
| Hotels, Restaurants & Leisure - 2.8% | |||
| Bloomin' Brands, Inc. | 108,686 | 2,836,705 | |
| Chuy's Holdings, Inc. (a) | 8,191 | 292,828 | |
| Denny's Corp. (a) | 45,661 | 532,864 | |
| Dine Brands Global, Inc. | 6,350 | 486,855 | |
| Everi Holdings, Inc. (a) | 12,100 | 229,779 | |
| Hilton Grand Vacations, Inc. (a) | 8,021 | 382,923 | |
| International Game Technology PLC (b) | 111,768 | 2,968,558 | |
| Texas Roadhouse, Inc. Class A | 43,547 | 4,421,762 | |
| Wingstop, Inc. | 24,993 | 4,257,558 | |
| 16,409,832 | |||
| Household Durables - 1.6% | |||
| Beazer Homes U.S.A., Inc. (a) | 13,558 | 202,150 | |
| Cavco Industries, Inc. (a) | 3,502 | 998,070 | |
| Ethan Allen Interiors, Inc. (b) | 5,730 | 169,322 | |
| Flexsteel Industries, Inc. (b) | 18,297 | 383,871 | |
| Green Brick Partners, Inc. (a) | 51,037 | 1,592,354 | |
| Installed Building Products, Inc. | 34,140 | 3,939,073 | |
| Meritage Homes Corp. (b) | 1,916 | 209,285 | |
| Skyline Champion Corp. (a) | 30,334 | 2,075,149 | |
| 9,569,274 | |||
| Internet & Direct Marketing Retail - 0.3% | |||
| CarParts.com, Inc. (a) | 193,340 | 1,212,242 | |
| Revolve Group, Inc. (a) | 25,196 | 682,308 | |
| 1,894,550 | |||
| Leisure Products - 0.2% | |||
| Johnson Outdoors, Inc. Class A | 14,563 | 944,556 | |
| Nautilus, Inc. (a) | 101,906 | 165,088 | |
| 1,109,644 | |||
| Multiline Retail - 0.5% | |||
| Dillard's, Inc. Class A (b) | 7,398 | 2,636,721 | |
| Specialty Retail - 2.9% | |||
| Academy Sports & Outdoors, Inc. | 8,190 | 484,439 | |
| American Eagle Outfitters, Inc. | 70,527 | 1,013,473 | |
| Asbury Automotive Group, Inc. (a) | 8,330 | 1,891,743 | |
| Boot Barn Holdings, Inc. (a) | 18,625 | 1,442,506 | |
| Group 1 Automotive, Inc. (b) | 10,766 | 2,380,040 | |
| Lithia Motors, Inc. Class A (sub. vtg.) | 6,161 | 1,572,164 | |
| MarineMax, Inc. (a)(b) | 15,090 | 506,722 | |
| Monro, Inc. (b) | 5,600 | 282,464 | |
| Murphy U.S.A., Inc. | 5,159 | 1,316,009 | |
| National Vision Holdings, Inc. (a) | 78,138 | 2,919,236 | |
| OneWater Marine, Inc. Class A (a)(b) | 2,400 | 66,768 | |
| Sonic Automotive, Inc. Class A (sub. vtg.) (b) | 18,071 | 1,028,059 | |
| The Buckle, Inc. (b) | 11,626 | 474,225 | |
| The Container Store Group, Inc. (a) | 73,231 | 318,555 | |
| The ODP Corp. (a) | 14,873 | 673,449 | |
| Winmark Corp. | 1,520 | 443,840 | |
| 16,813,692 | |||
| Textiles, Apparel & Luxury Goods - 0.7% | |||
| Crocs, Inc. (a) | 13,381 | 1,628,602 | |
| G-III Apparel Group Ltd. (a) | 39,346 | 653,734 | |
| Lakeland Industries, Inc. (b) | 23,640 | 358,619 | |
| Oxford Industries, Inc. (b) | 9,901 | 1,164,457 | |
| Rocky Brands, Inc. | 7,381 | 196,482 | |
| Wolverine World Wide, Inc. | 22,449 | 376,021 | |
| 4,377,915 | |||
TOTAL CONSUMER DISCRETIONARY | 67,327,063 | ||
| CONSUMER STAPLES - 3.6% | |||
| Beverages - 1.0% | |||
| Coca-Cola Bottling Co. Consolidated | 5,994 | 3,337,759 | |
| Primo Water Corp. | 153,884 | 2,382,124 | |
| 5,719,883 | |||
| Food & Staples Retailing - 0.9% | |||
| Ingles Markets, Inc. Class A | 19,255 | 1,721,397 | |
| Natural Grocers by Vitamin Cottage, Inc. (b) | 22,015 | 241,725 | |
| PriceSmart, Inc. | 2,153 | 150,107 | |
| Sprouts Farmers Market LLC (a) | 95,573 | 2,894,906 | |
| Weis Markets, Inc. | 6,106 | 466,743 | |
| 5,474,878 | |||
| Food Products - 1.0% | |||
| Cal-Maine Foods, Inc. (b) | 41,032 | 2,330,618 | |
| Hostess Brands, Inc. Class A (a) | 137,352 | 3,392,594 | |
| John B. Sanfilippo & Son, Inc. | 3,362 | 301,807 | |
| 6,025,019 | |||
| Personal Products - 0.6% | |||
| elf Beauty, Inc. (a) | 43,936 | 3,284,216 | |
| Herbalife Nutrition Ltd. (a) | 11,098 | 214,746 | |
| 3,498,962 | |||
| Tobacco - 0.1% | |||
| Vector Group Ltd. | 30,153 | 400,130 | |
TOTAL CONSUMER STAPLES | 21,118,872 | ||
| ENERGY - 6.6% | |||
| Energy Equipment & Services - 1.9% | |||
| Bristow Group, Inc. (a)(b) | 14,184 | 386,372 | |
| Cactus, Inc. | 11,235 | 516,248 | |
| DMC Global, Inc. (a) | 8,192 | 219,300 | |
| Dril-Quip, Inc. (a) | 23,314 | 798,505 | |
| Helix Energy Solutions Group, Inc. (a) | 49,378 | 408,850 | |
| Helmerich & Payne, Inc. (b) | 21,497 | 904,594 | |
| Nabors Industries Ltd. (a) | 15,481 | 2,326,949 | |
| Nabors Industries Ltd. warrants 6/11/26 (a) | 10,764 | 300,316 | |
| Oceaneering International, Inc. (a) | 120,572 | 2,518,749 | |
| Tidewater, Inc. (a) | 35,674 | 1,742,318 | |
| Weatherford International PLC (a) | 16,266 | 1,083,641 | |
| 11,205,842 | |||
| Oil, Gas & Consumable Fuels - 4.7% | |||
| Arch Resources, Inc. | 6,804 | 1,070,609 | |
| Chord Energy Corp. | 17,088 | 2,300,387 | |
| Civitas Resources, Inc. | 15,180 | 1,065,181 | |
| CONSOL Energy, Inc. | 25,521 | 1,396,764 | |
| Delek U.S. Holdings, Inc. | 96,073 | 2,418,157 | |
| DHT Holdings, Inc. | 16,894 | 195,464 | |
| Golar LNG Ltd. (a) | 89,145 | 2,035,180 | |
| Kosmos Energy Ltd. (a) | 139,151 | 1,095,118 | |
| Magnolia Oil & Gas Corp. Class A | 65,479 | 1,430,716 | |
| Matador Resources Co. (b) | 11,155 | 600,027 | |
| Murphy Oil Corp. | 89,427 | 3,489,442 | |
| Par Pacific Holdings, Inc. (a) | 51,146 | 1,420,836 | |
| PBF Energy, Inc. Class A | 36,759 | 1,606,736 | |
| Peabody Energy Corp. (a)(b) | 25,629 | 699,672 | |
| Permian Resource Corp. Class A (b) | 150,964 | 1,631,921 | |
| Ranger Oil Corp. (b) | 13,522 | 561,163 | |
| Scorpio Tankers, Inc. | 16,755 | 1,011,332 | |
| SM Energy Co. | 31,523 | 930,244 | |
| Southwestern Energy Co. (a) | 159,701 | 846,415 | |
| Talos Energy, Inc. (a) | 36,178 | 644,330 | |
| World Fuel Services Corp. | 44,040 | 1,208,898 | |
| 27,658,592 | |||
TOTAL ENERGY | 38,864,434 | ||
| FINANCIALS - 15.3% | |||
| Banks - 8.0% | |||
| 1st Source Corp. | 14,701 | 732,404 | |
| Atlantic Union Bankshares Corp. | 72,397 | 2,711,992 | |
| Banc of California, Inc. | 29,503 | 517,778 | |
| BancFirst Corp. | 25,796 | 2,328,089 | |
| Bancorp, Inc., Delaware (a) | 61,036 | 2,111,235 | |
| Banner Corp. | 17,447 | 1,098,812 | |
| Capital City Bank Group, Inc. | 2,442 | 87,106 | |
| Cathay General Bancorp | 19,020 | 816,338 | |
| Central Pacific Financial Corp. | 15,802 | 354,439 | |
| Columbia Banking Systems, Inc. (b) | 46,177 | 1,372,842 | |
| Community Bank System, Inc. (b) | 23,154 | 1,413,552 | |
| Community Trust Bancorp, Inc. | 8,634 | 369,104 | |
| ConnectOne Bancorp, Inc. | 6,461 | 156,679 | |
| Eastern Bankshares, Inc. | 57,601 | 903,184 | |
| FB Financial Corp. | 10,293 | 387,943 | |
| Financial Institutions, Inc. | 18,529 | 462,484 | |
| First Bancorp, Puerto Rico | 164,659 | 2,389,202 | |
| First Busey Corp. | 17,313 | 417,936 | |
| First Commonwealth Financial Corp. | 189,851 | 3,039,515 | |
| First Financial Bankshares, Inc. (b) | 8,144 | 298,722 | |
| Fulton Financial Corp. | 178,264 | 3,066,141 | |
| Great Southern Bancorp, Inc. | 27,687 | 1,611,107 | |
| Heartland Financial U.S.A., Inc. | 32,652 | 1,614,315 | |
| Lakeland Financial Corp. | 3,267 | 233,983 | |
| Mercantile Bank Corp. | 3,473 | 120,131 | |
| Midland States Bancorp, Inc. | 11,254 | 293,054 | |
| NBT Bancorp, Inc. | 25,272 | 1,025,790 | |
| Northwest Bancshares, Inc. (b) | 55,824 | 771,488 | |
| OFG Bancorp | 9,857 | 299,850 | |
| Old National Bancorp, Indiana | 179,731 | 3,175,847 | |
| Park National Corp. (b) | 3,633 | 464,188 | |
| Peapack-Gladstone Financial Corp. | 13,620 | 505,983 | |
| Renasant Corp. | 11,076 | 398,514 | |
| S&T Bancorp, Inc. (b) | 7,775 | 289,697 | |
| ServisFirst Bancshares, Inc. | 18,931 | 1,399,947 | |
| Sierra Bancorp | 17,630 | 356,302 | |
| Southstate Corp. | 18,062 | 1,457,242 | |
| Tompkins Financial Corp. | 5,096 | 381,130 | |
| TowneBank | 9,277 | 281,371 | |
| Trico Bancshares | 9,000 | 454,590 | |
| Triumph Bancorp, Inc. (a) | 3,651 | 222,163 | |
| Trustmark Corp. | 17,356 | 510,266 | |
| UMB Financial Corp. | 13,144 | 1,191,635 | |
| United Bankshares, Inc., West Virginia | 10,910 | 444,801 | |
| Univest Corp. of Pennsylvania | 15,294 | 431,291 | |
| Washington Federal, Inc. | 96,035 | 3,367,947 | |
| Westamerica Bancorp. | 14,011 | 772,286 | |
| 47,110,415 | |||
| Capital Markets - 2.2% | |||
| Cohen & Steers, Inc. | 7,777 | 562,744 | |
| Federated Hermes, Inc. | 76,247 | 3,000,319 | |
| Focus Financial Partners, Inc. Class A (a) | 1,889 | 97,964 | |
| Open Lending Corp. (a) | 42,920 | 303,874 | |
| Oppenheimer Holdings, Inc. Class A (non-vtg.) | 32,816 | 1,446,857 | |
| Stifel Financial Corp. | 46,897 | 3,134,127 | |
| StoneX Group, Inc. (a) | 9,381 | 945,886 | |
| Virtus Investment Partners, Inc. | 15,466 | 3,254,510 | |
| WisdomTree Investments, Inc. | 32,075 | 191,488 | |
| 12,937,769 | |||
| Consumer Finance - 1.1% | |||
| Bread Financial Holdings, Inc. (b) | 62,745 | 2,576,937 | |
| PROG Holdings, Inc. (a) | 125,616 | 3,105,228 | |
| Regional Management Corp. | 14,475 | 456,252 | |
| 6,138,417 | |||
| Diversified Financial Services - 0.1% | |||
| Compass Diversified Holdings | 29,117 | 633,877 | |
| Insurance - 2.0% | |||
| American Equity Investment Life Holding Co. | 3,151 | 131,239 | |
| Amerisafe, Inc. | 19,463 | 1,061,512 | |
| CNO Financial Group, Inc. | 138,737 | 3,554,442 | |
| Employers Holdings, Inc. | 18,141 | 805,642 | |
| Genworth Financial, Inc. Class A (a) | 29,508 | 183,835 | |
| Hippo Holdings, Inc. (a)(b) | 5,200 | 89,492 | |
| Kinsale Capital Group, Inc. | 3,683 | 1,173,772 | |
| Oscar Health, Inc. (a) | 257,548 | 1,426,816 | |
| Selective Insurance Group, Inc. | 2,456 | 249,358 | |
| Trupanion, Inc. (a)(b) | 50,240 | 2,983,251 | |
| 11,659,359 | |||
| Mortgage Real Estate Investment Trusts - 0.8% | |||
| Apollo Commercial Real Estate Finance, Inc. | 15,524 | 178,371 | |
| Ares Commercial Real Estate Corp. | 15,471 | 174,977 | |
| Blackstone Mortgage Trust, Inc. (b) | 166,492 | 3,524,636 | |
| KKR Real Estate Finance Trust, Inc. | 27,863 | 404,014 | |
| TPG RE Finance Trust, Inc. | 57,204 | 485,662 | |
| 4,767,660 | |||
| Thrifts & Mortgage Finance - 1.1% | |||
| Axos Financial, Inc. (a) | 35,165 | 1,666,469 | |
| Federal Agricultural Mortgage Corp. Class C (non-vtg.) | 11,771 | 1,669,834 | |
| NMI Holdings, Inc. (a) | 53,432 | 1,247,103 | |
| Provident Financial Services, Inc. | 44,409 | 1,036,950 | |
| Radian Group, Inc. | 18,804 | 401,465 | |
| Waterstone Financial, Inc. | 34,548 | 556,223 | |
| 6,578,044 | |||
TOTAL FINANCIALS | 89,825,541 | ||
| HEALTH CARE - 14.8% | |||
| Biotechnology - 6.4% | |||
| 2seventy bio, Inc. (a) | 30,403 | 410,136 | |
| Adverum Biotechnologies, Inc. (a) | 173,968 | 125,257 | |
| Affimed NV (a) | 81,785 | 74,359 | |
| Agios Pharmaceuticals, Inc. (a) | 2,210 | 55,935 | |
| Akebia Therapeutics, Inc. (a)(b) | 396,648 | 334,255 | |
| Akero Therapeutics, Inc. (a) | 12,050 | 548,396 | |
| Alector, Inc. (a) | 44,330 | 378,578 | |
| Alkermes PLC (a) | 50,492 | 1,350,156 | |
| Allakos, Inc. (a) | 66,875 | 397,906 | |
| Amicus Therapeutics, Inc. (a) | 89,229 | 1,176,931 | |
| Anika Therapeutics, Inc. (a) | 8,145 | 258,197 | |
| Apellis Pharmaceuticals, Inc. (a) | 16,999 | 1,113,095 | |
| Arbutus Biopharma Corp. (a)(b) | 105,053 | 292,047 | |
| Arcellx, Inc. | 6,556 | 183,634 | |
| Arcturus Therapeutics Holdings, Inc. (a) | 21,431 | 348,254 | |
| Arrowhead Pharmaceuticals, Inc. (a) | 15,148 | 489,280 | |
| Ars Pharmaceuticals, Inc. (a) | 20,944 | 186,820 | |
| Assembly Biosciences, Inc. (a) | 88,168 | 119,908 | |
| Atara Biotherapeutics, Inc. (a) | 82,150 | 332,708 | |
| Atreca, Inc. (a)(b) | 71,252 | 101,890 | |
| Beam Therapeutics, Inc. (a)(b) | 9,923 | 399,302 | |
| BioCryst Pharmaceuticals, Inc. (a) | 16,022 | 141,795 | |
| Biohaven Ltd. (a) | 32,503 | 496,646 | |
| bluebird bio, Inc. (a) | 67,273 | 349,820 | |
| Blueprint Medicines Corp. (a) | 9,609 | 407,133 | |
| Bolt Biotherapeutics, Inc. (a)(b) | 50,695 | 81,619 | |
| BridgeBio Pharma, Inc. (a)(b) | 54,734 | 625,062 | |
| C4 Therapeutics, Inc. (a)(b) | 33,508 | 176,587 | |
| CareDx, Inc. (a) | 26,390 | 443,880 | |
| Catalyst Pharmaceutical Partners, Inc. (a) | 6,844 | 104,439 | |
| Cogent Biosciences, Inc. (a) | 28,494 | 376,976 | |
| Coherus BioSciences, Inc. (a) | 43,895 | 297,169 | |
| Corbus Pharmaceuticals Holdings, Inc. (a)(b) | 6,577 | 19,665 | |
| Cytokinetics, Inc. (a) | 13,958 | 605,219 | |
| CytomX Therapeutics, Inc. (a)(b) | 106,678 | 229,358 | |
| Deciphera Pharmaceuticals, Inc. (a) | 37,045 | 537,153 | |
| Denali Therapeutics, Inc. (a) | 14,563 | 395,385 | |
| Editas Medicine, Inc. (a)(b) | 33,919 | 306,628 | |
| Emergent BioSolutions, Inc. (a) | 24,533 | 303,719 | |
| Fate Therapeutics, Inc. (a) | 71,015 | 434,612 | |
| FibroGen, Inc. (a) | 5,235 | 116,217 | |
| Fortress Biotech, Inc. (a) | 54,189 | 41,726 | |
| Gritstone Bio, Inc. (a)(b) | 76,699 | 187,913 | |
| Gt Biopharma, Inc. (a)(b) | 32,905 | 22,573 | |
| Halozyme Therapeutics, Inc. (a) | 25,584 | 1,227,776 | |
| Heron Therapeutics, Inc. (a)(b) | 86,711 | 205,505 | |
| Homology Medicines, Inc. (a)(b) | 41,073 | 62,431 | |
| ImmunoGen, Inc. (a) | 126,027 | 488,985 | |
| Infinity Pharmaceuticals, Inc. (a) | 169,523 | 36,278 | |
| Inhibrx, Inc. (a)(b) | 15,259 | 367,132 | |
| Insmed, Inc. (a) | 43,896 | 894,600 | |
| Intellia Therapeutics, Inc. (a) | 22,312 | 896,273 | |
| Intercept Pharmaceuticals, Inc. (a) | 28,209 | 569,258 | |
| Ironwood Pharmaceuticals, Inc. Class A (a) | 7,869 | 88,684 | |
| Iveric Bio, Inc. (a) | 39,826 | 827,584 | |
| Kalvista Pharmaceuticals, Inc. (a) | 41,259 | 302,428 | |
| Karuna Therapeutics, Inc. (a) | 5,555 | 1,107,778 | |
| Karyopharm Therapeutics, Inc. (a)(b) | 71,616 | 216,280 | |
| Kezar Life Sciences, Inc. (a) | 23,776 | 149,551 | |
| Kiniksa Pharmaceuticals Ltd. (a) | 25,979 | 334,090 | |
| Kodiak Sciences, Inc. (a) | 36,969 | 240,299 | |
| Krystal Biotech, Inc. (a) | 1,634 | 133,841 | |
| Kura Oncology, Inc. (a) | 24,446 | 291,396 | |
| Madrigal Pharmaceuticals, Inc. (a) | 4,832 | 1,309,520 | |
| MiMedx Group, Inc. (a) | 35,812 | 172,256 | |
| Mustang Bio, Inc. (a)(b) | 69,880 | 38,434 | |
| Myriad Genetics, Inc. (a) | 1,942 | 36,743 | |
| Nurix Therapeutics, Inc. (a) | 19,137 | 180,462 | |
| Oncternal Therapeutics, Inc. rights (a)(c) | 1,148 | 0 | |
| ORIC Pharmaceuticals, Inc. (a)(b) | 88,202 | 390,735 | |
| Ovid Therapeutics, Inc. (a)(b) | 59,108 | 145,997 | |
| Passage Bio, Inc. (a) | 38,538 | 47,402 | |
| Pieris Pharmaceuticals, Inc. (a)(b) | 81,145 | 121,718 | |
| Precigen, Inc. (a) | 127,294 | 160,390 | |
| Prometheus Biosciences, Inc. (a)(b) | 12,854 | 1,573,201 | |
| Protagonist Therapeutics, Inc. (a) | 39,500 | 640,690 | |
| Prothena Corp. PLC (a) | 3,001 | 167,336 | |
| PTC Therapeutics, Inc. (a) | 24,489 | 1,069,435 | |
| Puma Biotechnology, Inc. (a) | 41,309 | 159,453 | |
| RAPT Therapeutics, Inc. (a) | 3,987 | 117,417 | |
| REGENXBIO, Inc. (a) | 19,724 | 438,859 | |
| Relay Therapeutics, Inc. (a)(b) | 4,306 | 69,542 | |
| Replimune Group, Inc. (a) | 19,374 | 424,291 | |
| Revolution Medicines, Inc. (a) | 5,316 | 142,256 | |
| Rigel Pharmaceuticals, Inc. (a) | 123,558 | 186,573 | |
| Rocket Pharmaceuticals, Inc. (a) | 4,942 | 94,936 | |
| Sage Therapeutics, Inc. (a) | 4,561 | 189,920 | |
| Sangamo Therapeutics, Inc. (a) | 75,179 | 229,296 | |
| Selecta Biosciences, Inc. (a)(b) | 85,524 | 139,404 | |
| Seres Therapeutics, Inc. (a) | 45,431 | 229,427 | |
| Sesen Bio, Inc. | 304,482 | 176,600 | |
| Surface Oncology, Inc. (a)(b) | 60,289 | 39,791 | |
| Sutro Biopharma, Inc. (a) | 49,542 | 279,417 | |
| Syndax Pharmaceuticals, Inc. (a) | 25,782 | 653,574 | |
| TCR2 Therapeutics, Inc. (a) | 66,033 | 82,541 | |
| TG Therapeutics, Inc. (a) | 15,750 | 252,315 | |
| Travere Therapeutics, Inc. (a) | 22,459 | 497,691 | |
| Twist Bioscience Corp. (a) | 19,351 | 376,570 | |
| Vanda Pharmaceuticals, Inc. (a) | 46,697 | 300,729 | |
| Vaxcyte, Inc. (a) | 19,188 | 786,132 | |
| Veracyte, Inc. (a) | 28,260 | 695,479 | |
| Vir Biotechnology, Inc. (a) | 9,576 | 218,333 | |
| Voyager Therapeutics, Inc. (a)(b) | 45,215 | 324,644 | |
| Xbiotech, Inc. (a) | 12,960 | 43,546 | |
| Xencor, Inc. (a) | 5,090 | 163,542 | |
| Zentalis Pharmaceuticals, Inc. (a) | 19,677 | 372,486 | |
| 37,557,590 | |||
| Health Care Equipment & Supplies - 3.4% | |||
| Accuray, Inc. (a)(b) | 343,316 | 995,616 | |
| Artivion, Inc. (a) | 47,507 | 628,993 | |
| Atricure, Inc. (a) | 36,029 | 1,387,117 | |
| Avanos Medical, Inc. (a) | 74,237 | 2,083,833 | |
| Cerus Corp. (a) | 243,112 | 695,300 | |
| Embecta Corp. | 6,166 | 197,004 | |
| Figs, Inc. Class A (a)(b) | 215,287 | 1,982,793 | |
| Inari Medical, Inc. (a)(b) | 9,448 | 531,544 | |
| Inspire Medical Systems, Inc. (a) | 10,637 | 2,764,875 | |
| Integer Holdings Corp. (a) | 24,811 | 1,860,329 | |
| IRadimed Corp. | 5,532 | 209,995 | |
| Lantheus Holdings, Inc. (a) | 3,905 | 288,814 | |
| LivaNova PLC (a)(b) | 1,905 | 90,145 | |
| Merit Medical Systems, Inc. (a) | 2,502 | 176,591 | |
| Novocure Ltd. (a)(b) | 5,161 | 397,242 | |
| Orthofix International NV (a) | 21,398 | 440,799 | |
| Shockwave Medical, Inc. (a) | 15,678 | 2,982,583 | |
| SurModics, Inc. (a) | 44,575 | 973,518 | |
| Tactile Systems Technology, Inc. (a)(b) | 26,277 | 379,703 | |
| Zimvie, Inc. (a) | 45,303 | 515,548 | |
| 19,582,342 | |||
| Health Care Providers & Services - 2.2% | |||
| 23andMe Holding Co. Class A (a)(b) | 96,489 | 242,187 | |
| Addus HomeCare Corp. (a) | 4,911 | 533,531 | |
| AMN Healthcare Services, Inc. (a) | 12,341 | 1,110,813 | |
| DocGo, Inc. Class A (a)(b) | 70,757 | 647,427 | |
| Hims & Hers Health, Inc. (a)(b) | 192,044 | 2,164,336 | |
| Invitae Corp. (a)(b) | 173,555 | 373,143 | |
| National Healthcare Corp. | 25,059 | 1,396,287 | |
| Option Care Health, Inc. (a) | 139,174 | 4,268,467 | |
| Privia Health Group, Inc. (a) | 8,419 | 235,143 | |
| The Ensign Group, Inc. | 17,916 | 1,603,124 | |
| 12,574,458 | |||
| Health Care Technology - 1.0% | |||
| Computer Programs & Systems, Inc. (a) | 14,296 | 429,023 | |
| Health Catalyst, Inc. (a) | 146,012 | 2,038,328 | |
| HealthStream, Inc. | 27,317 | 700,681 | |
| Nextgen Healthcare, Inc. (a) | 93,489 | 1,693,086 | |
| Phreesia, Inc. (a) | 31,284 | 1,151,251 | |
| 6,012,369 | |||
| Life Sciences Tools & Services - 0.7% | |||
| AbCellera Biologics, Inc. (a)(b) | 26,096 | 219,206 | |
| Adaptive Biotechnologies Corp. (a) | 51,611 | 441,274 | |
| Berkeley Lights, Inc. (a)(b) | 57,506 | 100,636 | |
| Codexis, Inc. (a) | 52,093 | 251,870 | |
| Cytek Biosciences, Inc. (a) | 10,055 | 103,567 | |
| Medpace Holdings, Inc. (a) | 8,357 | 1,620,255 | |
| Nanostring Technologies, Inc. (a) | 33,876 | 330,630 | |
| Pacific Biosciences of California, Inc. (a)(b) | 76,297 | 692,777 | |
| Quanterix Corp. (a) | 43,055 | 473,605 | |
| 4,233,820 | |||
| Pharmaceuticals - 1.1% | |||
| Aclaris Therapeutics, Inc. (a) | 19,383 | 241,512 | |
| Amneal Pharmaceuticals, Inc. (a) | 77,432 | 159,510 | |
| Amphastar Pharmaceuticals, Inc. (a) | 17,943 | 571,664 | |
| Amylyx Pharmaceuticals, Inc. (a) | 4,282 | 149,099 | |
| Arvinas Holding Co. LLC (a) | 11,736 | 359,708 | |
| Atea Pharmaceuticals, Inc. (a) | 39,227 | 138,864 | |
| Axsome Therapeutics, Inc. (a) | 4,075 | 277,874 | |
| Corcept Therapeutics, Inc. (a)(b) | 10,013 | 208,571 | |
| Esperion Therapeutics, Inc. (a)(b) | 55,957 | 345,814 | |
| Intra-Cellular Therapies, Inc. (a) | 16,524 | 810,172 | |
| Nektar Therapeutics (a) | 69,233 | 95,542 | |
| NGM Biopharmaceuticals, Inc. (a) | 28,902 | 136,995 | |
| Odonate Therapeutics, Inc. (a)(b) | 72,556 | 135,680 | |
| Pacira Biosciences, Inc. (a) | 6,696 | 285,049 | |
| Prestige Brands Holdings, Inc. (a) | 18,756 | 1,130,049 | |
| Relmada Therapeutics, Inc. (a) | 52,182 | 187,855 | |
| Revance Therapeutics, Inc. (a) | 9,915 | 344,051 | |
| Supernus Pharmaceuticals, Inc. (a) | 8,208 | 308,539 | |
| Theravance Biopharma, Inc. (a)(b) | 47,439 | 512,341 | |
| WAVE Life Sciences (a) | 41,740 | 175,308 | |
| 6,574,197 | |||
TOTAL HEALTH CARE | 86,534,776 | ||
| INDUSTRIALS - 16.4% | |||
| Aerospace & Defense - 0.8% | |||
| Aerojet Rocketdyne Holdings, Inc. (a) | 3,867 | 217,867 | |
| Astronics Corp. (a) | 39,961 | 609,006 | |
| Maxar Technologies, Inc. | 6,883 | 354,475 | |
| Parsons Corp. (a) | 73,340 | 3,302,500 | |
| Triumph Group, Inc. (a) | 18,689 | 235,855 | |
| 4,719,703 | |||
| Air Freight & Logistics - 0.6% | |||
| Atlas Air Worldwide Holdings, Inc. (a) | 1,270 | 128,029 | |
| Forward Air Corp. | 19,704 | 2,033,650 | |
| Hub Group, Inc. Class A (a) | 14,394 | 1,320,362 | |
| 3,482,041 | |||
| Airlines - 0.1% | |||
| Frontier Group Holdings, Inc. (a) | 14,900 | 175,224 | |
| Mesa Air Group, Inc. (a) | 87,564 | 265,319 | |
| SkyWest, Inc. (a) | 10,007 | 190,833 | |
| 631,376 | |||
| Building Products - 1.3% | |||
| Apogee Enterprises, Inc. | 34,653 | 1,585,721 | |
| AZZ, Inc. | 35,958 | 1,461,693 | |
| Janus International Group, Inc. (a) | 20,110 | 208,943 | |
| Jeld-Wen Holding, Inc. (a) | 38,143 | 501,580 | |
| Masonite International Corp. (a) | 14,525 | 1,289,820 | |
| PGT Innovations, Inc. (a) | 43,549 | 921,061 | |
| Resideo Technologies, Inc. (a) | 71,708 | 1,315,125 | |
| UFP Industries, Inc. | 3,020 | 258,301 | |
| 7,542,244 | |||
| Commercial Services & Supplies - 1.6% | |||
| ABM Industries, Inc. | 42,830 | 2,073,400 | |
| Brady Corp. Class A | 7,403 | 408,349 | |
| Cimpress PLC (a) | 28,953 | 1,016,829 | |
| HNI Corp. | 3,438 | 107,438 | |
| Kimball International, Inc. Class B | 61,035 | 421,752 | |
| Liquidity Services, Inc. (a) | 4,801 | 60,781 | |
| The Brink's Co. | 56,295 | 3,673,249 | |
| The GEO Group, Inc. (a)(b) | 150,817 | 1,321,157 | |
| 9,082,955 | |||
| Construction & Engineering - 2.6% | |||
| API Group Corp. (a) | 91,636 | 2,152,530 | |
| Arcosa, Inc. | 6,824 | 413,534 | |
| Comfort Systems U.S.A., Inc. | 31,782 | 4,622,374 | |
| EMCOR Group, Inc. | 29,746 | 4,974,106 | |
| MYR Group, Inc. (a) | 27,708 | 3,341,862 | |
| 15,504,406 | |||
| Electrical Equipment - 2.1% | |||
| Atkore, Inc. (a) | 32,075 | 4,683,592 | |
| Encore Wire Corp. | 11,500 | 2,219,615 | |
| EnerSys (b) | 15,623 | 1,416,850 | |
| Enovix Corp. (a)(b) | 55,132 | 508,317 | |
| Preformed Line Products Co. | 12,841 | 1,144,968 | |
| Regal Rexnord Corp. | 10,646 | 1,678,235 | |
| SunPower Corp. (a)(b) | 15,013 | 225,495 | |
| Thermon Group Holdings, Inc. (a) | 1,200 | 31,740 | |
| Vicor Corp. (a) | 10,820 | 508,540 | |
| 12,417,352 | |||
| Machinery - 3.2% | |||
| Alamo Group, Inc. | 1,128 | 205,736 | |
| Altra Industrial Motion Corp. | 5,839 | 359,274 | |
| Barnes Group, Inc. | 76,261 | 3,213,639 | |
| Energy Recovery, Inc. (a) | 4,560 | 100,639 | |
| Enerpac Tool Group Corp. Class A | 11,944 | 321,652 | |
| Evoqua Water Technologies Corp. (a) | 15,386 | 747,144 | |
| Gorman-Rupp Co. | 6,777 | 188,807 | |
| Helios Technologies, Inc. | 2,333 | 158,037 | |
| Hillenbrand, Inc. | 16,462 | 776,019 | |
| Hurco Companies, Inc. | 20,022 | 587,245 | |
| Hyster-Yale Materials Handling, Inc. Class A (b) | 16,836 | 655,089 | |
| Kadant, Inc. | 1,745 | 374,582 | |
| L.B. Foster Co. Class A (a) | 6,670 | 83,842 | |
| Lindsay Corp. (b) | 12,838 | 1,931,991 | |
| Mueller Industries, Inc. | 25,705 | 1,901,399 | |
| Mueller Water Products, Inc. Class A (b) | 69,486 | 963,771 | |
| Proto Labs, Inc. (a) | 34,047 | 1,070,438 | |
| Standex International Corp. | 1,577 | 182,427 | |
| Tennant Co. (b) | 4,980 | 352,684 | |
| Wabash National Corp. | 19,004 | 520,710 | |
| Watts Water Technologies, Inc. Class A | 24,432 | 4,281,219 | |
| 18,976,344 | |||
| Marine - 0.1% | |||
| Safe Bulkers, Inc. | 126,812 | 475,545 | |
| Professional Services - 1.6% | |||
| Barrett Business Services, Inc. | 13,827 | 1,327,115 | |
| CRA International, Inc. | 10,167 | 1,265,486 | |
| Heidrick & Struggles International, Inc. | 29,980 | 1,029,213 | |
| Kforce, Inc. | 25,862 | 1,616,116 | |
| Resources Connection, Inc. | 5,890 | 106,373 | |
| TriNet Group, Inc. (a) | 26,780 | 2,219,259 | |
| TrueBlue, Inc. (a) | 26,785 | 500,880 | |
| Upwork, Inc. (a) | 103,437 | 1,172,976 | |
| 9,237,418 | |||
| Road & Rail - 0.4% | |||
| Marten Transport Ltd. | 79,285 | 1,749,820 | |
| Werner Enterprises, Inc. | 13,284 | 617,042 | |
| 2,366,862 | |||
| Trading Companies & Distributors - 2.0% | |||
| Applied Industrial Technologies, Inc. | 16,757 | 2,393,905 | |
| Global Industrial Co. | 38,077 | 1,071,106 | |
| GMS, Inc. (a) | 44,640 | 2,710,094 | |
| Rush Enterprises, Inc. Class A | 30,746 | 1,742,683 | |
| Titan Machinery, Inc. (a) | 64,380 | 2,947,960 | |
| Transcat, Inc. (a) | 2,850 | 256,472 | |
| Veritiv Corp. (b) | 2,184 | 330,745 | |
| 11,452,965 | |||
TOTAL INDUSTRIALS | 95,889,211 | ||
| INFORMATION TECHNOLOGY - 14.6% | |||
| Communications Equipment - 1.1% | |||
| CommScope Holding Co., Inc. (a) | 246,596 | 1,785,355 | |
| Digi International, Inc. (a) | 9,634 | 321,487 | |
| Extreme Networks, Inc. (a) | 156,559 | 2,930,784 | |
| Harmonic, Inc. (a) | 93,126 | 1,228,332 | |
| 6,265,958 | |||
| Electronic Equipment & Components - 2.7% | |||
| Badger Meter, Inc. | 10,877 | 1,322,861 | |
| Belden, Inc. | 46,300 | 3,906,794 | |
| Benchmark Electronics, Inc. | 66,269 | 1,576,540 | |
| Daktronics, Inc. (a) | 21,956 | 89,141 | |
| Fabrinet (a) | 31,204 | 3,802,831 | |
| Kimball Electronics, Inc. (a) | 68,148 | 1,704,381 | |
| PC Connection, Inc. | 18,741 | 820,856 | |
| Sanmina Corp. (a) | 34,632 | 2,093,851 | |
| ScanSource, Inc. (a) | 19,047 | 593,885 | |
| 15,911,140 | |||
| IT Services - 1.8% | |||
| AvidXchange Holdings, Inc. (a) | 53,532 | 532,643 | |
| Conduent, Inc. (a) | 137,549 | 547,445 | |
| CSG Systems International, Inc. | 51,598 | 2,899,808 | |
| ExlService Holdings, Inc. (a) | 23,286 | 3,830,780 | |
| Grid Dynamics Holdings, Inc. (a) | 15,364 | 178,991 | |
| Marqeta, Inc. Class A (a) | 216,059 | 1,253,142 | |
| Paysafe Ltd. (a)(b) | 43,629 | 869,962 | |
| Perficient, Inc. (a) | 2,613 | 185,000 | |
| Ttec Holdings, Inc. | 7,850 | 316,041 | |
| 10,613,812 | |||
| Semiconductors & Semiconductor Equipment - 2.2% | |||
| ACM Research, Inc. | 66,409 | 689,325 | |
| Axcelis Technologies, Inc. (a) | 7,751 | 996,314 | |
| Diodes, Inc. (a) | 31,916 | 2,926,378 | |
| Impinj, Inc. (a) | 15,269 | 2,024,975 | |
| Lattice Semiconductor Corp. (a) | 41,266 | 3,505,959 | |
| MACOM Technology Solutions Holdings, Inc. (a) | 5,584 | 382,727 | |
| MaxLinear, Inc. Class A (a) | 5,970 | 204,234 | |
| PDF Solutions, Inc. (a) | 3,978 | 148,936 | |
| Photronics, Inc. (a) | 26,536 | 467,564 | |
| Semtech Corp. (a) | 47,644 | 1,467,912 | |
| 12,814,324 | |||
| Software - 6.1% | |||
| 8x8, Inc. (a)(b) | 146,364 | 778,656 | |
| Agilysys, Inc. (a) | 23,466 | 1,875,168 | |
| Box, Inc. Class A (a) | 110,495 | 3,685,008 | |
| CommVault Systems, Inc. (a) | 51,084 | 3,007,826 | |
| Couchbase, Inc. (a) | 16,670 | 271,054 | |
| Domo, Inc. Class B (a) | 186,413 | 2,865,168 | |
| Liveramp Holdings, Inc. (a) | 134,975 | 3,189,459 | |
| Momentive Global, Inc. (a) | 103,856 | 716,606 | |
| Pagerduty, Inc. (a) | 18,095 | 540,317 | |
| Progress Software Corp. (b) | 27,377 | 1,572,535 | |
| PROS Holdings, Inc. (a) | 28,205 | 735,868 | |
| Q2 Holdings, Inc. (a) | 85,888 | 2,772,465 | |
| Qualys, Inc. (a) | 10,526 | 1,243,647 | |
| SecureWorks Corp. (a) | 33,777 | 255,692 | |
| Sprout Social, Inc. (a) | 26,175 | 1,596,152 | |
| SPS Commerce, Inc. (a) | 28,775 | 4,334,666 | |
| Tenable Holdings, Inc. (a) | 61,681 | 2,728,151 | |
| Upland Software, Inc. (a) | 36,104 | 209,042 | |
| Varonis Systems, Inc. (a) | 27,303 | 739,365 | |
| Yext, Inc. (a) | 248,178 | 1,821,627 | |
| Zuora, Inc. (a) | 113,288 | 959,549 | |
| 35,898,021 | |||
| Technology Hardware, Storage & Peripherals - 0.7% | |||
| Diebold Nixdorf, Inc. (a)(b) | 78,684 | 253,362 | |
| Super Micro Computer, Inc. (a) | 31,537 | 3,089,680 | |
| Xerox Holdings Corp. | 41,434 | 683,247 | |
| 4,026,289 | |||
TOTAL INFORMATION TECHNOLOGY | 85,529,544 | ||
| MATERIALS - 5.0% | |||
| Chemicals - 1.8% | |||
| AdvanSix, Inc. (b) | 26,793 | 1,102,532 | |
| American Vanguard Corp. | 53,841 | 1,123,662 | |
| Avient Corp. | 17,863 | 779,363 | |
| Balchem Corp. | 1,593 | 207,090 | |
| Cabot Corp. | 8,353 | 664,314 | |
| Ecovyst, Inc. (a) | 145,977 | 1,465,609 | |
| FutureFuel Corp. (b) | 47,346 | 414,278 | |
| Hawkins, Inc. | 2,118 | 86,139 | |
| Innospec, Inc. | 8,229 | 900,746 | |
| Rayonier Advanced Materials, Inc. (a) | 35,794 | 293,511 | |
| Sensient Technologies Corp. | 20,663 | 1,557,784 | |
| Stepan Co. | 16,499 | 1,717,381 | |
| 10,312,409 | |||
| Construction Materials - 0.1% | |||
| Summit Materials, Inc. | 20,739 | 612,630 | |
| Containers & Packaging - 0.6% | |||
| Greif, Inc. Class A | 4,661 | 331,164 | |
| Myers Industries, Inc. (b) | 123,140 | 3,181,938 | |
| O-I Glass, Inc. (a) | 9,005 | 200,091 | |
| 3,713,193 | |||
| Metals & Mining - 2.0% | |||
| ATI, Inc. (a) | 31,164 | 1,266,817 | |
| Commercial Metals Co. | 82,788 | 4,284,279 | |
| Hecla Mining Co. | 89,941 | 463,196 | |
| Materion Corp. | 8,134 | 908,405 | |
| Novagold Resources, Inc. (a) | 16,389 | 91,615 | |
| Olympic Steel, Inc. | 17,824 | 935,760 | |
| Ryerson Holding Corp. | 23,858 | 857,218 | |
| SunCoke Energy, Inc. | 304,721 | 2,897,897 | |
| 11,705,187 | |||
| Paper & Forest Products - 0.5% | |||
| Clearwater Paper Corp. (a) | 13,311 | 513,671 | |
| Sylvamo Corp. | 44,778 | 2,208,899 | |
| 2,722,570 | |||
TOTAL MATERIALS | 29,065,989 | ||
| REAL ESTATE - 4.9% | |||
| Equity Real Estate Investment Trusts (REITs) - 4.7% | |||
| Alexanders, Inc. | 1,922 | 420,745 | |
| American Assets Trust, Inc. | 109,480 | 2,762,180 | |
| Apple Hospitality (REIT), Inc. | 16,926 | 279,448 | |
| Ashford Hospitality Trust, Inc. (a) | 103,577 | 512,706 | |
| Brandywine Realty Trust (SBI) | 76,478 | 450,455 | |
| CareTrust (REIT), Inc. | 79,554 | 1,564,827 | |
| Chatham Lodging Trust | 14,547 | 177,619 | |
| Community Healthcare Trust, Inc. | 3,300 | 127,842 | |
| Corporate Office Properties Trust (SBI) | 36,657 | 932,188 | |
| EastGroup Properties, Inc. | 9,287 | 1,516,288 | |
| Empire State Realty Trust, Inc. | 93,665 | 682,818 | |
| Equity Commonwealth | 15,224 | 323,206 | |
| Essential Properties Realty Trust, Inc. | 72,015 | 1,855,106 | |
| Global Medical REIT, Inc. | 107,050 | 1,076,923 | |
| Global Net Lease, Inc. | 134,457 | 1,898,533 | |
| National Storage Affiliates Trust | 71,757 | 3,035,321 | |
| Necessity Retail (REIT), Inc./The | 124,263 | 852,444 | |
| Outfront Media, Inc. | 99,249 | 1,731,895 | |
| Phillips Edison & Co., Inc. | 17,756 | 605,302 | |
| Piedmont Office Realty Trust, Inc. Class A | 97,170 | 889,106 | |
| Retail Opportunity Investments Corp. | 52,261 | 743,674 | |
| RLJ Lodging Trust | 37,538 | 425,681 | |
| RPT Realty | 12,300 | 131,856 | |
| Ryman Hospitality Properties, Inc. | 4,529 | 420,155 | |
| SITE Centers Corp. | 31,657 | 423,254 | |
| Summit Hotel Properties, Inc. | 36,328 | 268,827 | |
| Terreno Realty Corp. | 37,100 | 2,307,991 | |
| Universal Health Realty Income Trust (SBI) | 15,526 | 823,189 | |
| 27,239,579 | |||
| Real Estate Management & Development - 0.2% | |||
| Anywhere Real Estate, Inc. (a) | 102,083 | 591,061 | |
| eXp World Holdings, Inc. (b) | 20,538 | 248,099 | |
| Marcus & Millichap, Inc. | 10,918 | 375,252 | |
| 1,214,412 | |||
TOTAL REAL ESTATE | 28,453,991 | ||
| UTILITIES - 1.8% | |||
| Electric Utilities - 1.0% | |||
| Allete, Inc. | 24,465 | 1,497,013 | |
| MGE Energy, Inc. | 14,835 | 1,050,021 | |
| Otter Tail Corp. (b) | 10,910 | 773,410 | |
| PNM Resources, Inc. | 5,638 | 276,262 | |
| Portland General Electric Co. | 42,902 | 2,050,716 | |
| 5,647,422 | |||
| Gas Utilities - 0.0% | |||
| Chesapeake Utilities Corp. | 1,158 | 148,328 | |
| Independent Power and Renewable Electricity Producers - 0.6% | |||
| Altus Power, Inc. Class A (a)(b) | 48,558 | 328,738 | |
| Clearway Energy, Inc.: | |||
| Class A | 62,450 | 1,855,390 | |
| Class C | 52,711 | 1,655,653 | |
| 3,839,781 | |||
| Water Utilities - 0.2% | |||
| American States Water Co. (b) | 12,429 | 1,109,910 | |
TOTAL UTILITIES | 10,745,441 | ||
| TOTAL COMMON STOCKS (Cost $519,324,152) | 574,240,105 | ||
| Money Market Funds - 9.1% | |||
| Shares | Value ($) | ||
| Fidelity Cash Central Fund 4.63% (d) | 8,571,750 | 8,573,464 | |
| Fidelity Securities Lending Cash Central Fund 4.63% (d)(e) | 44,522,288 | 44,526,740 | |
| TOTAL MONEY MARKET FUNDS (Cost $53,097,959) | 53,100,204 | ||
| TOTAL INVESTMENT IN SECURITIES - 107.2% (Cost $572,422,111) | 627,340,309 |
NET OTHER ASSETS (LIABILITIES) - (7.2)% | (41,867,662) |
| NET ASSETS - 100.0% | 585,472,647 |
| Futures Contracts | |||||
Number of contracts | Expiration Date | Notional Amount ($) | Value ($) | Unrealized Appreciation/ (Depreciation) ($) | |
| Purchased | |||||
| Equity Index Contracts | |||||
| CME E-mini Russell 2000 Index Contracts (United States) | 108 | Mar 2023 | 10,255,140 | 217,565 | 217,565 |
| The notional amount of futures purchased as a percentage of Net Assets is 1.8% | |||||
| (a) | Non-income producing |
| (b) | Security or a portion of the security is on loan at period end. |
| (c) | Level 3 security |
| (d) | Affiliated fund that is generally available only to investment companies and other accounts managed by Fidelity Investments. The rate quoted is the annualized seven-day yield of the fund at period end. A complete unaudited listing of the fund's holdings as of its most recent quarter end is available upon request. In addition, each Fidelity Central Fund's financial statements, which are not covered by the Fund's Report of Independent Registered Public Accounting Firm, are available on the SEC's website or upon request. |
| (e) | Investment made with cash collateral received from securities on loan. |
| Affiliate | Value, beginning of period ($) | Purchases ($) | Sales Proceeds ($) | Dividend Income ($) | Realized Gain (loss) ($) | Change in Unrealized appreciation (depreciation) ($) | Value, end of period ($) | % ownership, end of period |
| Fidelity Cash Central Fund 4.63% | 7,208,320 | 70,605,212 | 69,240,068 | 184,008 | - | - | 8,573,464 | 0.0% |
| Fidelity Securities Lending Cash Central Fund 4.63% | 111,488,782 | 241,082,111 | 308,044,153 | 117,646 | - | - | 44,526,740 | 0.1% |
| Total | 118,697,102 | 311,687,323 | 377,284,221 | 301,654 | - | - | 53,100,204 | |
| Valuation Inputs at Reporting Date: | ||||
| Description | Total ($) | Level 1 ($) | Level 2 ($) | Level 3 ($) |
Investments in Securities: | ||||
| Equities: | ||||
Communication Services | 20,885,243 | 20,885,243 | - | - |
Consumer Discretionary | 67,327,063 | 67,327,063 | - | - |
Consumer Staples | 21,118,872 | 21,118,872 | - | - |
Energy | 38,864,434 | 38,864,434 | - | - |
Financials | 89,825,541 | 89,825,541 | - | - |
Health Care | 86,534,776 | 86,534,776 | - | - |
Industrials | 95,889,211 | 95,889,211 | - | - |
Information Technology | 85,529,544 | 85,529,544 | - | - |
Materials | 29,065,989 | 29,065,989 | - | - |
Real Estate | 28,453,991 | 28,453,991 | - | - |
Utilities | 10,745,441 | 10,745,441 | - | - |
| Money Market Funds | 53,100,204 | 53,100,204 | - | - |
| Total Investments in Securities: | 627,340,309 | 627,340,309 | - | - |
Derivative Instruments: | ||||
| Assets | ||||
Futures Contracts | 217,565 | 217,565 | - | - |
| Total Assets | 217,565 | 217,565 | - | - |
| Total Derivative Instruments: | 217,565 | 217,565 | - | - |
Primary Risk Exposure / Derivative Type | Value | |
| Asset ($) | Liability ($) | |
| Equity Risk | ||
Futures Contracts (a) | 217,565 | 0 |
| Total Equity Risk | 217,565 | 0 |
| Total Value of Derivatives | 217,565 | 0 |
| Statement of Assets and Liabilities | ||||
| February 28, 2023 | ||||
| Assets | ||||
| Investment in securities, at value (including securities loaned of $43,695,485) - See accompanying schedule: | ||||
Unaffiliated issuers (cost $519,324,152) | $ | 574,240,105 | ||
Fidelity Central Funds (cost $53,097,959) | 53,100,204 | |||
| Total Investment in Securities (cost $572,422,111) | $ | 627,340,309 | ||
| Segregated cash with brokers for derivative instruments | 591,600 | |||
| Receivable for investments sold | 5,557,456 | |||
| Receivable for fund shares sold | 309,469 | |||
| Dividends receivable | 515,806 | |||
| Distributions receivable from Fidelity Central Funds | 26,495 | |||
| Receivable for daily variation margin on futures contracts | 1,431 | |||
| Other receivables | 15,088 | |||
Total assets | 634,357,654 | |||
| Liabilities | ||||
| Payable for investments purchased | $ | 3,779,843 | ||
| Payable for fund shares redeemed | 297,121 | |||
| Accrued management fee | 272,359 | |||
| Other payables and accrued expenses | 15,089 | |||
| Collateral on securities loaned | 44,520,595 | |||
| Total Liabilities | 48,885,007 | |||
| Net Assets | $ | 585,472,647 | ||
| Net Assets consist of: | ||||
| Paid in capital | $ | 563,568,143 | ||
| Total accumulated earnings (loss) | 21,904,504 | |||
| Net Assets | $ | 585,472,647 | ||
Net Asset Value , offering price and redemption price per share ($585,472,647 ÷ 45,061,324 shares) | $ | 12.99 | ||
| Statement of Operations | ||||
Year ended February 28, 2023 | ||||
| Investment Income | ||||
| Dividends | $ | 8,322,936 | ||
| Interest | 9,702 | |||
| Income from Fidelity Central Funds (including $117,646 from security lending) | 301,654 | |||
| Total Income | 8,634,292 | |||
| Expenses | ||||
| Management fee | $ | 3,183,680 | ||
| Independent trustees' fees and expenses | 1,981 | |||
| Total expenses before reductions | 3,185,661 | |||
| Expense reductions | (1,046) | |||
| Total expenses after reductions | 3,184,615 | |||
| Net Investment income (loss) | 5,449,677 | |||
| Realized and Unrealized Gain (Loss) | ||||
| Net realized gain (loss) on: | ||||
| Investment Securities: | ||||
| Unaffiliated issuers | (25,671,089) | |||
| Futures contracts | (783,238) | |||
| Total net realized gain (loss) | (26,454,327) | |||
| Change in net unrealized appreciation (depreciation) on: | ||||
| Investment Securities: | ||||
| Unaffiliated issuers | 817,537 | |||
| Futures contracts | 47,494 | |||
| Total change in net unrealized appreciation (depreciation) | 865,031 | |||
| Net gain (loss) | (25,589,296) | |||
| Net increase (decrease) in net assets resulting from operations | $ | (20,139,619) | ||
| Statement of Changes in Net Assets | ||||
Year ended February 28, 2023 | Year ended February 28, 2022 | |||
| Increase (Decrease) in Net Assets | ||||
| Operations | ||||
| Net investment income (loss) | $ | 5,449,677 | $ | 3,022,029 |
| Net realized gain (loss) | (26,454,327) | 147,858,610 | ||
| Change in net unrealized appreciation (depreciation) | 865,031 | (162,304,136) | ||
| Net increase (decrease) in net assets resulting from operations | (20,139,619) | (11,423,497) | ||
| Distributions to shareholders | (28,460,527) | (128,801,439) | ||
| Share transactions | ||||
| Proceeds from sales of shares | 54,476,948 | 162,033,486 | ||
| Reinvestment of distributions | 26,941,979 | 121,633,024 | ||
| Cost of shares redeemed | (102,513,711) | (177,404,543) | ||
Net increase (decrease) in net assets resulting from share transactions | (21,094,784) | 106,261,967 | ||
| Total increase (decrease) in net assets | (69,694,930) | (33,962,969) | ||
| Net Assets | ||||
| Beginning of period | 655,167,577 | 689,130,546 | ||
| End of period | $ | 585,472,647 | $ | 655,167,577 |
| Other Information | ||||
| Shares | ||||
| Sold | 4,367,027 | 9,267,659 | ||
| Issued in reinvestment of distributions | 2,089,264 | 8,198,504 | ||
| Redeemed | (8,275,075) | (10,434,032) | ||
| Net increase (decrease) | (1,818,784) | 7,032,131 | ||
| Fidelity® Small Cap Enhanced Index Fund |
| Years ended February 28, | 2023 | 2022 | 2021 | 2020 A | 2019 | |||||
Selected Per-Share Data | ||||||||||
| Net asset value, beginning of period | $ | 13.98 | $ | 17.29 | $ | 11.31 | $ | 12.57 | $ | 13.81 |
| Income from Investment Operations | ||||||||||
Net investment income (loss) B,C | .12 | .07 | .08 | .12 | .11 | |||||
| Net realized and unrealized gain (loss) | (.50) | (.20) | 5.99 | (1.26) | .31 | |||||
| Total from investment operations | (.38) | (.13) | 6.07 | (1.14) | .42 | |||||
| Distributions from net investment income | (.11) | (.07) | (.09) | (.12) | (.12) | |||||
| Distributions from net realized gain | (.51) | (3.11) | - | - | (1.54) | |||||
| Total distributions | (.61) D | (3.18) | (.09) | (.12) | (1.66) | |||||
| Net asset value, end of period | $ | 12.99 | $ | 13.98 | $ | 17.29 | $ | 11.31 | $ | 12.57 |
Total Return E | (2.62)% | (1.64)% | 53.78% | (9.18)% | 4.01% | |||||
Ratios to Average Net Assets C,F,G | ||||||||||
| Expenses before reductions | .55% | .63% | .64% | .64% | .64% | |||||
| Expenses net of fee waivers, if any | .55% | .63% | .64% | .64% | .64% | |||||
| Expenses net of all reductions | .55% | .63% | .64% | .64% | .64% | |||||
| Net investment income (loss) | .94% | .41% | .62% | .94% | .84% | |||||
| Supplemental Data | ||||||||||
| Net assets, end of period (000 omitted) | $ | 585,473 | $ | 655,168 | $ | 689,131 | $ | 515,960 | $ | 701,171 |
Portfolio turnover rate H | 98% | 96% | 44% | 79% | 88% |
| Gross unrealized appreciation | $113,832,736 |
| Gross unrealized depreciation | (63,495,188) |
| Net unrealized appreciation (depreciation) | $50,337,548 |
| Tax Cost | $577,002,761 |
| Capital loss carryforward | $(28,433,044) |
| Net unrealized appreciation (depreciation) on securities and other investments | $50,337,548 |
| Short-term | $(28,433,044) |
| Total capital loss carryforward | $(28,433,044) |
| February 28, 2023 | February 28, 2022 | |
| Ordinary Income | $4,900,302 | $ 11,438,963 |
| Long-term Capital Gains | 23,560,225 | 117,362,476 |
| Total | $28,460,527 | $ 128,801,439 |
| Equity Risk | Equity risk relates to the fluctuations in the value of financial instruments as a result of changes in market prices (other than those arising from interest rate risk or foreign exchange risk), whether caused by factors specific to an individual investment, its issuer, or all factors affecting all instruments traded in a market or market segment. |
| Purchases ($) | Sales ($) | |
| Fidelity Small Cap Enhanced Index Fund | 560,659,564 | 599,219,594 |
| Amount | |
| Fidelity Small Cap Enhanced Index Fund | $1,839 |
| Purchases ($) | Sales ($) | Realized Gain (Loss) ($) | |
| Fidelity Small Cap Enhanced Index Fund | 11,491,247 | 11,280,493 | (411,306) |
| Fidelity Central Fund | Investment Manager | Investment Objective | Investment Practices | Expense Ratio A |
| Fidelity Money Market Central Funds | Fidelity Management & Research Company LLC (FMR) | Each fund seeks to obtain a high level of current income consistent with the preservation of capital and liquidity. | Short-term Investments | Less than .005% |
| Total Security Lending Fees Paid to NFS | Security Lending Income From Securities Loaned to NFS | Value of Securities Loaned to NFS at Period End | |
| Fidelity Small Cap Enhanced Index Fund | $11,447 | $4,417 | $83,246 |
| The Example is based on an investment of $1,000 invested at the beginning of the period and held for the entire period (September 1, 2022 to February 28, 2023). |
Annualized Expense Ratio- A | Beginning Account Value September 1, 2022 | Ending Account Value February 28, 2023 | Expenses Paid During Period- C September 1, 2022 to February 28, 2023 | |||||||
| Fidelity® Small Cap Enhanced Index Fund | .55% | |||||||||
| Actual | $ 1,000 | $ 1,066.60 | $ 2.82 | |||||||
Hypothetical- B | $ 1,000 | $ 1,022.07 | $ 2.76 | |||||||
- Highly liquid investments - cash or convertible to cash within three business days or less
- Moderately liquid investments - convertible to cash in three to seven calendar days
- Less liquid investments - can be sold or disposed of, but not settled, within seven calendar days
- Illiquid investments - cannot be sold or disposed of within seven calendar days
 |
Item 2.
Code of Ethics
As of the end of the period, February 28, 2023, Fidelity Commonwealth Trust II (the trust) has adopted a code of ethics, as defined in Item 2 of Form N-CSR, that applies to its President and Treasurer and its Chief Financial Officer. A copy of the code of ethics is filed as an exhibit to this Form N-CSR.
Item 3.
Audit Committee Financial Expert
The Board of Trustees of the trust has determined that Donald F. Donahue is an audit committee financial expert, as defined in Item 3 of Form N-CSR. Mr. Donahue is independent for purposes of Item 3 of Form N-CSR.
Item 4.
Principal Accountant Fees and Services
Fees and Services
The following table presents fees billed by PricewaterhouseCoopers LLP (“PwC”) in each of the last two fiscal years for services rendered to Fidelity Small Cap Enhanced Index Fund (the “Fund”):
Services Billed by PwC
February 28, 2023 FeesA
Audit Fees | Audit-Related Fees | Tax Fees | All Other Fees | |
Fidelity Small Cap Enhanced Index Fund | $39,400 | $3,500 | $10,000 | $1,200 |
February 28, 2022 FeesA
Audit Fees | Audit-Related Fees | Tax Fees | All Other Fees | |
Fidelity Small Cap Enhanced Index Fund | $37,700 | $3,700 | $10,200 | $1,200 |
The following table(s) present(s) fees billed by PwC that were required to be approved by the Audit Committee for services that relate directly to the operations and financial reporting of the Fund(s) and that are rendered on behalf of Fidelity Management & Research Company LLC ("FMR") and entities controlling, controlled by, or under common control with FMR (not including any sub-adviser whose role is primarily portfolio management and is subcontracted with or overseen by another investment adviser) that provide ongoing services to the Fund(s) (“Fund Service Providers”):
Services Billed by PwC
February 28, 2023A | February 28, 2022A | |
Audit-Related Fees | $7,914,600 | $8,239,800 |
Tax Fees | $1,000 | $354,200 |
All Other Fees | $- | $- |
A Amounts may reflect rounding.
“Audit-Related Fees” represent fees billed for assurance and related services that are reasonably related to the performance of the fund audit or the review of the fund's financial statements and that are not reported under Audit Fees.
“Tax Fees” represent fees billed for tax compliance, tax advice or tax planning that relate directly to the operations and financial reporting of the fund.
“All Other Fees” represent fees billed for services provided to the fund or Fund Service Provider, a significant portion of which are assurance related, that relate directly to the operations and financial reporting of the fund, excluding those services that are reported under Audit Fees, Audit-Related Fees or Tax Fees.
Assurance services must be performed by an independent public accountant.
* * *
The aggregate non-audit fees billed by PwC for services rendered to the Fund(s), FMR (not including any sub-adviser whose role is primarily portfolio management and is subcontracted with or overseen by another investment adviser), and any Fund Service Provider for each of the last two fiscal years of the Fund(s) are as follows:
Billed By | February 28, 2023A | February 28, 2022A |
PwC | $12,897,700 | $13,851,800 |
A Amounts may reflect rounding.
The trust's Audit Committee has considered non-audit services that were not pre-approved that were provided by PwC to Fund Service Providers to be compatible with maintaining the independence of PwC in its(their) audit of the Fund(s), taking into account representations from PwC, in accordance with Public Company Accounting Oversight Board rules, regarding its independence from the Fund(s) and its(their) related entities and FMR’s review of the appropriateness and permissibility under applicable law of such non-audit services prior to their provision to the Fund(s) Service Providers.
Audit Committee Pre-Approval Policies and Procedures
The trust’s Audit Committee must pre-approve all audit and non-audit services provided by a fund’s independent registered public accounting firm relating to the operations or financial reporting of the fund. Prior to the commencement of any audit or non-audit services to a fund, the Audit Committee reviews the services to determine whether they are appropriate and permissible under applicable law.
The Audit Committee has adopted policies and procedures to, among other purposes, provide a framework for the Committee’s consideration of non-audit services by the audit firms that audit the Fidelity funds. The policies and procedures require that any non-audit service provided by a fund audit firm to a Fidelity fund and any non-audit service provided by a fund auditor to a Fund Service Provider that relates directly to the operations and financial reporting of a Fidelity fund (“Covered Service”) are subject to approval by the Audit Committee before such service is provided.
All Covered Services must be approved in advance of provision of the service either: (i) by formal resolution of the Audit Committee, or (ii) by oral or written approval of the service by the Chair of the Audit Committee (or if the Chair is unavailable, such other member of the Audit Committee as may be designated by the Chair to act in the Chair’s absence). The approval contemplated by (ii) above is permitted where the Treasurer determines that action on such an engagement is necessary before the next meeting of the Audit Committee.
Non-audit services provided by a fund audit firm to a Fund Service Provider that do not relate directly to the operations and financial reporting of a Fidelity fund are reported to the Audit Committee periodically.
Non-Audit Services Approved Pursuant to Rule 2-01(c)(7)(i)(C) and (ii) of Regulation S-X (“De Minimis Exception”)
There were no non-audit services approved or required to be approved by the Audit Committee pursuant to the De Minimis Exception during the Fund’s(s’) last two fiscal years relating to services provided to (i) the Fund(s) or (ii) any Fund Service Provider that relate directly to the operations and financial reporting of the Fund(s).
Item 5.
Audit Committee of Listed Registrants
Not applicable.
Item 6.
Investments
(a)
Not applicable.
(b)
Not applicable.
Item 7.
Disclosure of Proxy Voting Policies and Procedures for Closed-End Management Investment Companies
Not applicable.
Item 8.
Portfolio Managers of Closed-End Management Investment Companies
Not applicable.
Item 9.
Purchase of Equity Securities by Closed-End Management Investment Company and Affiliated Purchasers
Not applicable.
Item 10.
Submission of Matters to a Vote of Security Holders
There were no material changes to the procedures by which shareholders may recommend nominees to the trust’s Board of Trustees.
Item 11.
Controls and Procedures
(a)(i) The President and Treasurer and the Chief Financial Officer have concluded that the trust’s disclosure controls and procedures (as defined in Rule 30a-3(c) under the Investment Company Act) provide reasonable assurances that material information relating to the trust is made known to them by the appropriate persons, based on their evaluation of these controls and procedures as of a date within 90 days of the filing date of this report.
(a)(ii) There was no change in the trust’s internal control over financial reporting (as defined in Rule 30a-3(d) under the Investment Company Act) that occurred during the period covered by this report that has materially affected, or is reasonably likely to materially affect, the trust’s internal control over financial reporting.
Item 12.
Disclosure of Securities Lending Activities for Closed-End Management
Investment Companies
Not applicable.
Item 13.
Exhibits
(a) | (1) | Code of Ethics pursuant to Item 2 of Form N-CSR is filed and attached hereto as EX-99.CODE ETH. |
(a) | (2) | |
(a) | (3) | Not applicable. |
(b) |
SIGNATURES
Pursuant to the requirements of the Securities Exchange Act of 1934 and the Investment Company Act of 1940, the registrant has duly caused this report to be signed on its behalf by the undersigned, thereunto duly authorized.
Fidelity Commonwealth Trust II
By: | /s/Stacie M. Smith |
Stacie M. Smith | |
President and Treasurer | |
Date: | April 20, 2023 |
Pursuant to the requirements of the Securities Exchange Act of 1934 and the Investment Company Act of 1940, this report has been signed below by the following persons on behalf of the registrant and in the capacities and on the dates indicated.
By: | /s/Stacie M. Smith |
Stacie M. Smith | |
President and Treasurer | |
Date: | April 20, 2023 |
By: | /s/John J. Burke III |
John J. Burke III | |
Chief Financial Officer | |
Date: | April 20, 2023 |