UNITED STATES
SECURITIES AND EXCHANGE COMMISSION
Washington, D.C. 20549
FORM N-CSR
CERTIFIED SHAREHOLDER REPORT OF REGISTERED
MANAGEMENT INVESTMENT COMPANIES
Investment Company Act file number 811-21990
Fidelity Commonwealth Trust II
(Exact name of registrant as specified in charter)
245 Summer St., Boston, Massachusetts 02210
(Address of principal executive offices) (Zip code)
Cynthia Lo Bessette, Secretary
245 Summer St.
Boston, Massachusetts 02210
(Name and address of agent for service)
Registrant's telephone number, including area code:
617-563-7000
Date of fiscal year end: | August 31 |
|
|
Date of reporting period: | August 31, 2021 |
Item 1.
Reports to Stockholders
Fidelity® Large Cap Growth Enhanced Index Fund
Fidelity® Large Cap Value Enhanced Index Fund
Fidelity® Large Cap Core Enhanced Index Fund
Fidelity® Mid Cap Enhanced Index Fund
Fidelity® International Enhanced Index Fund
August 31, 2021

Contents
Fidelity® Large Cap Growth Enhanced Index Fund | |
Fidelity® Large Cap Value Enhanced Index Fund | |
Fidelity® Large Cap Core Enhanced Index Fund | |
Fidelity® Mid Cap Enhanced Index Fund | |
Fidelity® International Enhanced Index Fund | |
Board Approval of Investment Advisory Contracts and Management Fees |
To view a fund's proxy voting guidelines and proxy voting record for the 12-month period ended June 30, visit http://www.fidelity.com/proxyvotingresults or visit the Securities and Exchange Commission's (SEC) web site at http://www.sec.gov.
You may also call 1-800-544-8544 to request a free copy of the proxy voting guidelines.
The funds or securities referred to herein are not sponsored, endorsed, or promoted by MSCI, and MSCI bears no liability with respect to any such funds or securities or any index on which such funds or securities are based. The prospectus contains a more detailed description of the limited relationship MSCI has with Fidelity and any related funds.
A fund is not in any way connected to or sponsored, endorsed, sold or promoted by the London Stock Exchange Group plc and its group undertakings (collectively, the “LSE Group”). The LSE Group does not accept any liability whatsoever to any person arising out of the use of a fund or the underlying data.
Standard & Poor’s® and S&P® are registered trademarks of Standard & Poor’s Financial Services LLC (“S&P”) and Dow Jones® is a registered trademark of Dow Jones Trademark Holdings LLC (“Dow Jones”). A fund is not sponsored, endorsed, sold or promoted by SPDJI, Dow Jones, S&P, or their respective affiliates and none of such parties make any representation regarding the advisability of investing in such product(s) nor do they have any liability for any errors, omissions, or interruptions of the index or indices.
Standard & Poor's, S&P and S&P 500 are registered service marks of The McGraw-Hill Companies, Inc. and have been licensed for use by Fidelity Distributors Corporation.
Other third-party marks appearing herein are the property of their respective owners.
All other marks appearing herein are registered or unregistered trademarks or service marks of FMR LLC or an affiliated company. © 2021 FMR LLC. All rights reserved.
This report and the financial statements contained herein are submitted for the general information of the shareholders of the Funds. This report is not authorized for distribution to prospective investors in the Funds unless preceded or accompanied by an effective prospectus.
A fund files its complete schedule of portfolio holdings with the SEC for the first and third quarters of each fiscal year on Form N-PORT. Forms N-PORT are available on the SEC’s web site at http://www.sec.gov. A fund's Forms N-PORT may be reviewed and copied at the SEC’s Public Reference Room in Washington, DC. Information regarding the operation of the SEC's Public Reference Room may be obtained by calling 1-800-SEC-0330.
For a complete list of a fund's portfolio holdings, view the most recent holdings listing, semiannual report, or annual report on Fidelity's web site at http://www.fidelity.com, http://www.institutional.fidelity.com, or http://www.401k.com, as applicable.
NOT FDIC INSURED •MAY LOSE VALUE •NO BANK GUARANTEE
Neither the Funds nor Fidelity Distributors Corporation is a bank.
Note to Shareholders:
Early in 2020, the outbreak and spread of COVID-19 emerged as a public health emergency that had a major influence on financial markets, primarily based on its impact on the global economy and corporate earnings. On March 11, 2020, the World Health Organization declared the COVID-19 outbreak a pandemic, citing sustained risk of further global spread. The pandemic prompted a number of measures to limit the spread of COVID-19, including travel and border restrictions, quarantines, and restrictions on large gatherings. In turn, these resulted in lower consumer activity, diminished demand for a wide range of products and services, disruption in manufacturing and supply chains, and – given the wide variability in outcomes regarding the outbreak – significant market uncertainty and volatility. To help stem the turmoil, the U.S. government took unprecedented action – in concert with the U.S. Federal Reserve and central banks around the world – to help support consumers, businesses, and the broader economy, and to limit disruption to the financial system.
In general, the overall impact of the pandemic lessened in 2021, amid a resilient economy and widespread distribution of three COVID-19 vaccines granted emergency use authorization from the U.S. Food and Drug Administration (FDA) early in the year. Still, the situation remains dynamic, and the extent and duration of its influence on financial markets and the economy is highly uncertain, due in part to a recent spike in cases based on highly contagious variants of the coronavirus.
Extreme events such as the COVID-19 crisis are exogenous shocks that can have significant adverse effects on mutual funds and their investments. Although multiple asset classes may be affected by market disruption, the duration and impact may not be the same for all types of assets. Fidelity is committed to helping you stay informed amid news about COVID-19 and during increased market volatility, and we continue to take extra steps to be responsive to customer needs. We encourage you to visit us online, where we offer ongoing updates, commentary, and analysis on the markets and our funds.
Fidelity® Large Cap Growth Enhanced Index Fund
Performance: The Bottom Line
Average annual total return reflects the change in the value of an investment, assuming reinvestment of distributions from dividend income and capital gains (the profits earned upon the sale of securities that have grown in value, if any) and assuming a constant rate of performance each year. The hypothetical investment and the average annual total returns do not reflect the deduction of taxes that a shareholder would pay on fund distributions or the redemption of fund shares. During periods of reimbursement by Fidelity, a fund’s total return will be greater than it would be had the reimbursement not occurred. How a fund did yesterday is no guarantee of how it will do tomorrow.
Average Annual Total Returns
| For the periods ended August 31, 2021 | Past 1 year | Past 5 years | Past 10 years |
| Fidelity® Large Cap Growth Enhanced Index Fund | 29.08% | 22.53% | 18.42% |
$10,000 Over 10 Years
Let's say hypothetically that $10,000 was invested in Fidelity® Large Cap Growth Enhanced Index Fund on August 31, 2011.
The chart shows how the value of your investment would have changed, and also shows how the Russell 1000® Growth Index performed over the same period.
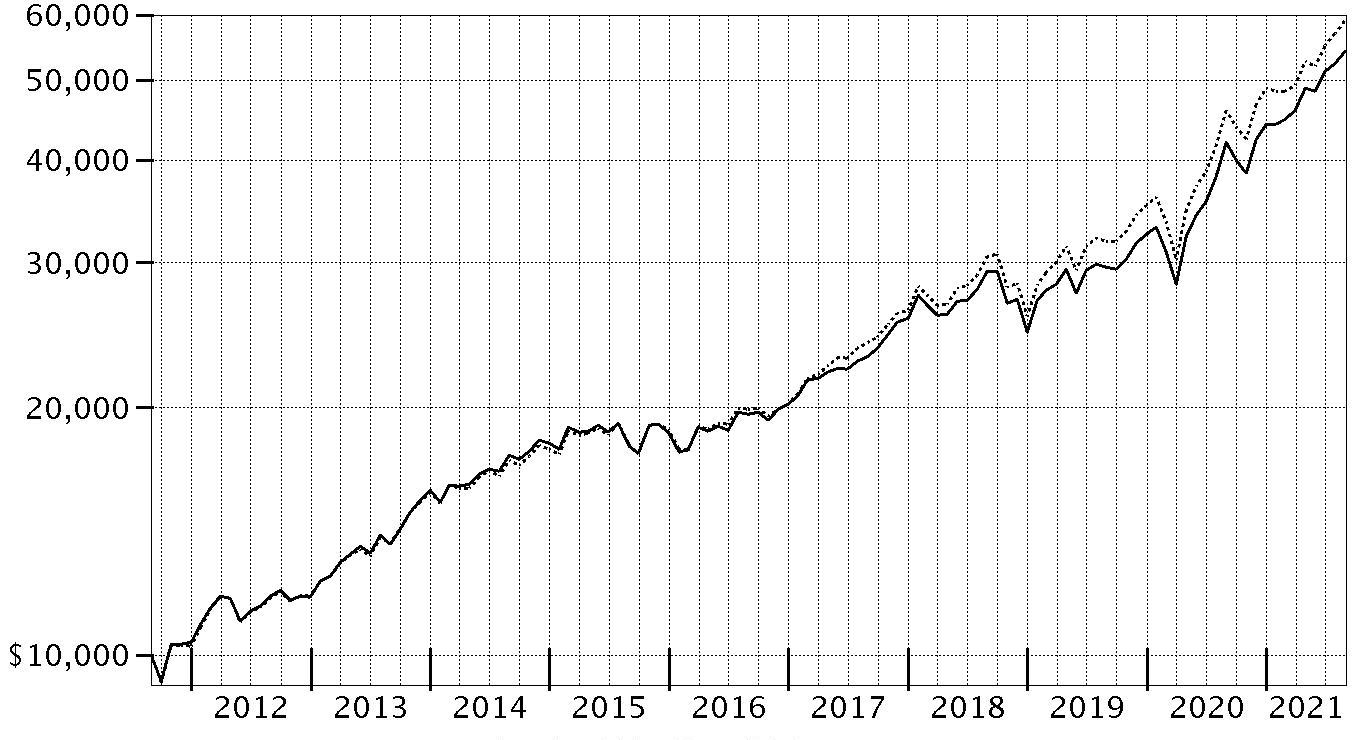
| Period Ending Values | ||
| $54,254 | Fidelity® Large Cap Growth Enhanced Index Fund | |
| $59,135 | Russell 1000® Growth Index | |
Fidelity® Large Cap Growth Enhanced Index Fund
Management's Discussion of Fund Performance
Market Recap: The S&P 500® index gained 31.17% for the 12 months ending August 31, 2021, as U.S. equities continued a historic rebound following a steep but brief decline due to the early-2020 outbreak and spread of COVID-19. The rally slowed in September 2020, when stocks began a two-month retreat amid Congress’s inability to reach a deal on additional fiscal stimulus, as well as uncertainty about the election. But as the calendar turned, investors grew hopeful. The rollout of three COVID-19 vaccines was underway, the U.S. Federal Reserve pledged to hold interest rates near zero until the economy recovered, and the federal government planned to deploy trillions of dollars to boost consumers and the economy. This backdrop fueled a sharp rotation, with small-cap value usurping leadership from large growth. As part of the “reopening” theme, investors moved out of tech-driven mega-caps that had thrived due to the work-from-home trend in favor of cheap smaller companies that stood to benefit from a broad cyclical recovery. A flattish May reflected concerns about inflation and jobs, but the uptrend resumed through August, driven by corporate earnings and a rebounding economy. Notably, this leg saw momentum shift back to large growth, as easing rates and a hawkish Fed stymied the reflation trade. By sector, financials (+56%) led, driven by banks, which rose 67% as the economy brightened. Energy (+43%) also stood out. In contrast, notable “laggards” included consumer staples (+14%) and consumer discretionary (+18%).Comments from Senior Portfolio Manager Maximilian Kaufmann, of the Geode Capital Management, LLC, investment management team: For the fiscal year ending August 31, 2021, the fund gained 29.08%, outperforming the 28.53% result of the benchmark Russell 1000® Growth Index. Versus the benchmark, security selection was the primary contributor, especially in the consumer discretionary sector. Security selection and an underweighting in industrials and stock selection in real estate also helped. Applied Materials, the fund's top individual relative contributor, increased 121% this period and we reduced our stake in the company. Also helping performance was our overweighting in Fortinet, which gained roughly 139%. The fund's non-benchmark stake in Park Hotels & Resorts, a position not held at period end, gained approximately 133%. Conversely, the primary detractor from performance versus the benchmark was our stock picks in health care. Also hurting the fund's relative result was an overweighting in consumer discretionary. Stock picking and an underweighting in the communication services sector, especially within the media & entertainment industry, also hindered the fund's relative performance. The biggest individual relative detractor was an overweight position in Pinterest (-23%), which was a position we established the past 12 months. Another notable relative detractor was our lighter-than-benchmark stake in Moderna (+481%). This period we increased our stake. Another notable relative detractor was our overweighting in Quidel (-49%), a position that was sold the past year. Notable changes in positioning include decreased exposure to the health care sector and a higher allocation to communication services.The views expressed above reflect those of the portfolio manager(s) only through the end of the period as stated on the cover of this report and do not necessarily represent the views of Fidelity or any other person in the Fidelity organization. Any such views are subject to change at any time based upon market or other conditions and Fidelity disclaims any responsibility to update such views. These views may not be relied on as investment advice and, because investment decisions for a Fidelity fund are based on numerous factors, may not be relied on as an indication of trading intent on behalf of any Fidelity fund.
Fidelity® Large Cap Growth Enhanced Index Fund
Investment Summary (Unaudited)
Top Ten Stocks as of August 31, 2021
| % of fund's net assets | |
| Apple, Inc. | 11.0 |
| Microsoft Corp. | 9.5 |
| Amazon.com, Inc. | 6.5 |
| Facebook, Inc. Class A | 4.0 |
| Alphabet, Inc. Class A | 3.4 |
| Alphabet, Inc. Class C | 2.9 |
| Tesla, Inc. | 2.4 |
| NVIDIA Corp. | 2.3 |
| Adobe, Inc. | 1.9 |
| MasterCard, Inc. Class A | 1.7 |
| 45.6 |
Top Market Sectors as of August 31, 2021
| % of fund's net assets | |
| Information Technology | 44.8 |
| Consumer Discretionary | 18.9 |
| Communication Services | 12.4 |
| Health Care | 10.2 |
| Industrials | 4.0 |
| Consumer Staples | 2.3 |
| Financials | 2.0 |
| Real Estate | 1.8 |
| Energy | 1.4 |
| Materials | 1.2 |
Asset Allocation (% of fund's net assets)
| As of August 31, 2021* | ||
| Stocks and Equity Futures | 100.0% | |

* Foreign investments - 1.5%
Fidelity® Large Cap Growth Enhanced Index Fund
Schedule of Investments August 31, 2021
Showing Percentage of Net Assets
| Common Stocks - 99.0% | |||
| Shares | Value | ||
| COMMUNICATION SERVICES - 12.4% | |||
| Entertainment - 1.6% | |||
| Activision Blizzard, Inc. | 103,364 | $8,514,093 | |
| Electronic Arts, Inc. | 1,199 | 174,107 | |
| Netflix, Inc. (a) | 18,181 | 10,348,443 | |
| Roku, Inc. Class A (a) | 19,540 | 6,885,896 | |
| Spotify Technology SA (a) | 10,105 | 2,368,006 | |
| 28,290,545 | |||
| Interactive Media & Services - 10.8% | |||
| Alphabet, Inc.: | |||
| Class A (a) | 21,175 | 61,279,391 | |
| Class C (a) | 17,761 | 51,671,012 | |
| Facebook, Inc. Class A (a) | 187,920 | 71,293,090 | |
| Pinterest, Inc. Class A (a) | 148,074 | 8,228,472 | |
| 192,471,965 | |||
| TOTAL COMMUNICATION SERVICES | 220,762,510 | ||
| CONSUMER DISCRETIONARY - 18.9% | |||
| Automobiles - 2.4% | |||
| Tesla, Inc. (a) | 58,960 | 43,378,051 | |
| Hotels, Restaurants & Leisure - 2.9% | |||
| International Game Technology PLC (a) | 263,573 | 5,664,184 | |
| McDonald's Corp. | 35,811 | 8,503,680 | |
| Scientific Games Corp. Class A (a) | 134,252 | 9,713,132 | |
| Starbucks Corp. | 132,619 | 15,581,406 | |
| Travel+Leisure Co. | 95,377 | 5,222,845 | |
| Wendy's Co. (b) | 223,750 | 5,150,725 | |
| Yum! Brands, Inc. | 12,389 | 1,623,331 | |
| 51,459,303 | |||
| Household Durables - 1.2% | |||
| D.R. Horton, Inc. | 29,589 | 2,829,300 | |
| NVR, Inc. (a) | 1,411 | 7,308,895 | |
| PulteGroup, Inc. | 131,802 | 7,098,856 | |
| TopBuild Corp. (a)(b) | 15,826 | 3,462,571 | |
| 20,699,622 | |||
| Internet & Direct Marketing Retail - 6.9% | |||
| Amazon.com, Inc. (a) | 33,197 | 115,219,816 | |
| eBay, Inc. | 53,937 | 4,139,125 | |
| Etsy, Inc. (a) | 14,652 | 3,168,642 | |
| 122,527,583 | |||
| Leisure Products - 0.3% | |||
| Brunswick Corp. (b) | 12,156 | 1,177,552 | |
| Mattel, Inc. (a)(b) | 99,514 | 2,124,624 | |
| Polaris, Inc. | 23,127 | 2,769,690 | |
| 6,071,866 | |||
| Multiline Retail - 0.2% | |||
| Target Corp. | 15,021 | 3,709,887 | |
| Specialty Retail - 3.5% | |||
| Bath & Body Works, Inc. | 44,564 | 3,007,179 | |
| Best Buy Co., Inc. | 12,712 | 1,481,075 | |
| Lowe's Companies, Inc. | 66,047 | 13,466,323 | |
| O'Reilly Automotive, Inc. (a) | 15,928 | 9,462,506 | |
| The Home Depot, Inc. | 74,819 | 24,404,461 | |
| TJX Companies, Inc. | 32,576 | 2,368,927 | |
| Ulta Beauty, Inc. (a) | 17,175 | 6,652,049 | |
| Williams-Sonoma, Inc. (b) | 9,947 | 1,857,105 | |
| 62,699,625 | |||
| Textiles, Apparel & Luxury Goods - 1.5% | |||
| Crocs, Inc. (a) | 7,455 | 1,064,723 | |
| Deckers Outdoor Corp. (a) | 3,113 | 1,302,635 | |
| NIKE, Inc. Class B | 149,354 | 24,604,578 | |
| 26,971,936 | |||
| TOTAL CONSUMER DISCRETIONARY | 337,517,873 | ||
| CONSUMER STAPLES - 2.3% | |||
| Beverages - 1.2% | |||
| Monster Beverage Corp. (a) | 45,163 | 4,406,554 | |
| PepsiCo, Inc. | 29,842 | 4,666,990 | |
| The Coca-Cola Co. | 210,681 | 11,863,447 | |
| 20,936,991 | |||
| Food & Staples Retailing - 1.0% | |||
| Costco Wholesale Corp. | 19,319 | 8,799,611 | |
| Walmart, Inc. | 59,993 | 8,884,963 | |
| 17,684,574 | |||
| Personal Products - 0.1% | |||
| MediFast, Inc. | 10,709 | 2,440,581 | |
| TOTAL CONSUMER STAPLES | 41,062,146 | ||
| ENERGY - 1.4% | |||
| Energy Equipment & Services - 0.1% | |||
| Halliburton Co. | 67,871 | 1,356,063 | |
| Schlumberger Ltd. | 17,499 | 490,672 | |
| 1,846,735 | |||
| Oil, Gas & Consumable Fuels - 1.3% | |||
| Continental Resources, Inc. | 22,659 | 890,046 | |
| EOG Resources, Inc. | 136,825 | 9,238,424 | |
| Hess Corp. | 27,524 | 1,892,275 | |
| Pioneer Natural Resources Co. | 46,895 | 7,018,775 | |
| Texas Pacific Land Corp. (b) | 2,337 | 3,177,712 | |
| 22,217,232 | |||
| TOTAL ENERGY | 24,063,967 | ||
| FINANCIALS - 2.0% | |||
| Capital Markets - 1.5% | |||
| Artisan Partners Asset Management, Inc. (b) | 168,213 | 8,740,347 | |
| Cohen & Steers, Inc. (b) | 3,837 | 336,543 | |
| S&P Global, Inc. | 27,675 | 12,282,719 | |
| SEI Investments Co. | 17,801 | 1,118,081 | |
| The Blackstone Group LP | 36,424 | 4,579,590 | |
| 27,057,280 | |||
| Consumer Finance - 0.4% | |||
| SLM Corp. (b) | 338,881 | 6,354,019 | |
| Insurance - 0.1% | |||
| Trupanion, Inc. (a)(b) | 25,127 | 2,301,131 | |
| TOTAL FINANCIALS | 35,712,430 | ||
| HEALTH CARE - 10.2% | |||
| Biotechnology - 3.4% | |||
| AbbVie, Inc. | 64,979 | 7,848,164 | |
| Alkermes PLC (a) | 3,948 | 123,414 | |
| Alnylam Pharmaceuticals, Inc. (a) | 4,437 | 893,745 | |
| Amgen, Inc. | 76,544 | 17,262,968 | |
| Biogen, Inc. (a) | 6,053 | 2,051,422 | |
| Gilead Sciences, Inc. | 39,907 | 2,904,431 | |
| Incyte Corp. (a) | 80,205 | 6,134,880 | |
| Moderna, Inc. (a) | 19,020 | 7,164,644 | |
| Novavax, Inc. (a) | 8,747 | 2,086,509 | |
| Regeneron Pharmaceuticals, Inc. (a) | 7,370 | 4,962,958 | |
| Vertex Pharmaceuticals, Inc. (a) | 49,949 | 10,004,285 | |
| 61,437,420 | |||
| Health Care Equipment & Supplies - 1.4% | |||
| Abbott Laboratories | 24,052 | 3,039,451 | |
| IDEXX Laboratories, Inc. (a) | 19,506 | 13,142,363 | |
| Insulet Corp. (a) | 2,562 | 762,989 | |
| Intuitive Surgical, Inc. (a) | 204 | 214,926 | |
| Novocure Ltd. (a)(b) | 29,635 | 3,977,313 | |
| Ortho Clinical Diagnostics Holdings PLC | 22,555 | 461,024 | |
| Shockwave Medical, Inc. (a) | 7,681 | 1,645,347 | |
| Stryker Corp. | 6,962 | 1,929,170 | |
| 25,172,583 | |||
| Health Care Providers & Services - 0.7% | |||
| Amedisys, Inc. (a) | 13,567 | 2,488,866 | |
| Anthem, Inc. | 23,891 | 8,962,231 | |
| Select Medical Holdings Corp. (b) | 7,081 | 244,790 | |
| 11,695,887 | |||
| Health Care Technology - 0.6% | |||
| Cerner Corp. | 68,576 | 5,235,778 | |
| Veeva Systems, Inc. Class A (a) | 19,457 | 6,459,335 | |
| 11,695,113 | |||
| Life Sciences Tools & Services - 2.5% | |||
| 10X Genomics, Inc. (a) | 4,438 | 780,733 | |
| Agilent Technologies, Inc. | 48,067 | 8,434,316 | |
| Illumina, Inc. (a) | 23,872 | 10,913,324 | |
| Mettler-Toledo International, Inc. (a) | 6,506 | 10,102,712 | |
| Pacific Biosciences of California, Inc. (a) | 53,410 | 1,672,267 | |
| Thermo Fisher Scientific, Inc. | 14,419 | 8,001,824 | |
| Waters Corp. (a) | 11,902 | 4,927,666 | |
| 44,832,842 | |||
| Pharmaceuticals - 1.6% | |||
| Bristol-Myers Squibb Co. | 134,879 | 9,018,010 | |
| Eli Lilly & Co. | 20,688 | 5,343,504 | |
| Jazz Pharmaceuticals PLC (a) | 4,996 | 658,023 | |
| Johnson & Johnson | 52,742 | 9,131,222 | |
| Merck & Co., Inc. | 48,925 | 3,732,488 | |
| 27,883,247 | |||
| TOTAL HEALTH CARE | 182,717,092 | ||
| INDUSTRIALS - 4.0% | |||
| Aerospace & Defense - 1.1% | |||
| Lockheed Martin Corp. | 38,921 | 14,003,776 | |
| Moog, Inc. Class A | 34,749 | 2,760,461 | |
| Northrop Grumman Corp. | 3,459 | 1,271,874 | |
| Teledyne Technologies, Inc. (a) | 2,977 | 1,379,482 | |
| 19,415,593 | |||
| Air Freight & Logistics - 0.1% | |||
| Expeditors International of Washington, Inc. | 5,032 | 627,188 | |
| United Parcel Service, Inc. Class B | 11,762 | 2,301,000 | |
| 2,928,188 | |||
| Building Products - 0.2% | |||
| Simpson Manufacturing Co. Ltd. (b) | 28,835 | 3,262,680 | |
| Commercial Services & Supplies - 0.1% | |||
| Clean Harbors, Inc. (a) | 17,107 | 1,755,520 | |
| Construction & Engineering - 0.3% | |||
| EMCOR Group, Inc. | 39,533 | 4,803,260 | |
| Electrical Equipment - 0.1% | |||
| Atkore, Inc. (a) | 10,377 | 962,674 | |
| Plug Power, Inc. (a)(b) | 6,944 | 180,961 | |
| 1,143,635 | |||
| Machinery - 1.0% | |||
| AGCO Corp. | 45,442 | 6,253,728 | |
| Caterpillar, Inc. | 36,147 | 7,622,318 | |
| Cummins, Inc. | 3,625 | 855,428 | |
| Deere & Co. | 10,306 | 3,895,977 | |
| 18,627,451 | |||
| Professional Services - 0.2% | |||
| Upwork, Inc. (a) | 67,559 | 3,020,563 | |
| Road & Rail - 0.9% | |||
| Old Dominion Freight Lines, Inc. | 25,359 | 7,321,650 | |
| Union Pacific Corp. | 42,394 | 9,192,715 | |
| 16,514,365 | |||
| TOTAL INDUSTRIALS | 71,471,255 | ||
| INFORMATION TECHNOLOGY - 44.8% | |||
| Electronic Equipment & Components - 0.6% | |||
| National Instruments Corp. | 162,541 | 6,797,465 | |
| Vontier Corp. | 116,478 | 4,236,305 | |
| 11,033,770 | |||
| IT Services - 6.7% | |||
| Accenture PLC Class A | 12,427 | 4,182,431 | |
| Amdocs Ltd. | 56,696 | 4,367,293 | |
| EPAM Systems, Inc. (a) | 18,125 | 11,469,681 | |
| Gartner, Inc. (a) | 35,462 | 10,948,538 | |
| MasterCard, Inc. Class A | 87,601 | 30,330,094 | |
| MongoDB, Inc. Class A (a) | 1,863 | 729,979 | |
| Okta, Inc. (a) | 4,517 | 1,190,681 | |
| PayPal Holdings, Inc. (a) | 60,903 | 17,580,260 | |
| Snowflake Computing, Inc. | 5,466 | 1,663,577 | |
| Square, Inc. (a) | 27,986 | 7,502,207 | |
| The Western Union Co. | 130,327 | 2,820,276 | |
| Visa, Inc. Class A | 117,664 | 26,956,822 | |
| 119,741,839 | |||
| Semiconductors & Semiconductor Equipment - 7.0% | |||
| Advanced Micro Devices, Inc. (a) | 56,842 | 6,293,546 | |
| Applied Materials, Inc. | 66,343 | 8,964,930 | |
| Broadcom, Inc. | 19,262 | 9,577,259 | |
| Cirrus Logic, Inc. (a) | 21,182 | 1,772,298 | |
| Intel Corp. | 162,785 | 8,800,157 | |
| Lam Research Corp. | 9,848 | 5,956,267 | |
| NVIDIA Corp. | 184,448 | 41,288,685 | |
| Qualcomm, Inc. | 151,618 | 22,240,844 | |
| Semtech Corp. (a) | 37,582 | 2,627,733 | |
| Texas Instruments, Inc. | 86,910 | 16,591,988 | |
| Xilinx, Inc. | 6,191 | 963,258 | |
| 125,076,965 | |||
| Software - 19.2% | |||
| Adobe, Inc. (a) | 51,802 | 34,380,987 | |
| Atlassian Corp. PLC (a) | 15,374 | 5,643,180 | |
| Bill.Com Holdings, Inc. (a) | 973 | 266,981 | |
| Box, Inc. Class A (a)(b) | 301,144 | 7,763,492 | |
| Cadence Design Systems, Inc. (a) | 15,425 | 2,521,679 | |
| Cloudflare, Inc. (a) | 4,897 | 591,264 | |
| Crowdstrike Holdings, Inc. (a) | 12,741 | 3,580,221 | |
| Datadog, Inc. Class A (a) | 4,975 | 685,555 | |
| DocuSign, Inc. (a) | 9,055 | 2,682,453 | |
| Dropbox, Inc. Class A (a) | 315,562 | 10,006,471 | |
| Fair Isaac Corp. (a) | 5,704 | 2,622,357 | |
| Fortinet, Inc. (a) | 40,972 | 12,911,916 | |
| HubSpot, Inc. (a)(b) | 16,781 | 11,486,091 | |
| Intuit, Inc. | 15,026 | 8,506,369 | |
| Manhattan Associates, Inc. (a) | 30,209 | 4,923,765 | |
| Microsoft Corp. | 559,143 | 168,794,089 | |
| Nutanix, Inc. Class A (a) | 112,748 | 4,161,529 | |
| Oracle Corp. | 141,071 | 12,573,658 | |
| Palantir Technologies, Inc. (a)(b) | 147,943 | 3,896,819 | |
| Qualys, Inc. (a) | 23,264 | 2,730,728 | |
| ServiceNow, Inc. (a) | 13,524 | 8,704,587 | |
| Synopsys, Inc. (a) | 36,781 | 12,220,119 | |
| Teradata Corp. (a)(b) | 43,558 | 2,382,187 | |
| The Trade Desk, Inc. (a) | 22,451 | 1,797,203 | |
| Unity Software, Inc. (b) | 4,340 | 550,095 | |
| Workday, Inc. Class A (a) | 50,342 | 13,751,421 | |
| Zoom Video Communications, Inc. Class A (a) | 8,474 | 2,453,223 | |
| Zscaler, Inc. (a) | 1,658 | 461,488 | |
| 343,049,927 | |||
| Technology Hardware, Storage & Peripherals - 11.3% | |||
| Apple, Inc. | 1,284,604 | 195,041,428 | |
| NetApp, Inc. | 61,763 | 5,492,584 | |
| 200,534,012 | |||
| TOTAL INFORMATION TECHNOLOGY | 799,436,513 | ||
| MATERIALS - 1.2% | |||
| Chemicals - 0.0% | |||
| Amyris, Inc. (a)(b) | 67,726 | 1,019,276 | |
| Construction Materials - 0.5% | |||
| Vulcan Materials Co. | 46,364 | 8,620,459 | |
| Metals & Mining - 0.7% | |||
| Alcoa Corp. (a) | 120,000 | 5,324,400 | |
| Freeport-McMoRan, Inc. | 177,461 | 6,457,806 | |
| 11,782,206 | |||
| TOTAL MATERIALS | 21,421,941 | ||
| REAL ESTATE - 1.8% | |||
| Equity Real Estate Investment Trusts (REITs) - 1.6% | |||
| American Tower Corp. | 4,240 | 1,238,801 | |
| Crown Castle International Corp. | 4,370 | 850,795 | |
| National Storage Affiliates Trust | 162,980 | 9,330,605 | |
| Potlatch Corp. | 10,534 | 547,241 | |
| Public Storage | 36,299 | 11,746,719 | |
| SBA Communications Corp. Class A | 14,346 | 5,149,784 | |
| 28,863,945 | |||
| Real Estate Management & Development - 0.2% | |||
| eXp World Holdings, Inc. (b) | 82,957 | 3,803,578 | |
| TOTAL REAL ESTATE | 32,667,523 | ||
| TOTAL COMMON STOCKS | |||
| (Cost $928,811,472) | 1,766,833,250 | ||
| Money Market Funds - 2.7% | |||
| Fidelity Cash Central Fund 0.06% (c) | 12,518,057 | 12,520,561 | |
| Fidelity Securities Lending Cash Central Fund 0.06% (c)(d) | 35,682,357 | 35,685,925 | |
| TOTAL MONEY MARKET FUNDS | |||
| (Cost $48,206,486) | 48,206,486 | ||
| TOTAL INVESTMENT IN SECURITIES - 101.7% | |||
| (Cost $977,017,958) | 1,815,039,736 | ||
| NET OTHER ASSETS (LIABILITIES) - (1.7)% | (30,293,723) | ||
| NET ASSETS - 100% | $1,784,746,013 |
| Futures Contracts | |||||
| Number of contracts | Expiration Date | Notional Amount | Value | Unrealized Appreciation/(Depreciation) | |
| Purchased | |||||
| Equity Index Contracts | |||||
| CME E-mini S&P 500 Index Contracts (United States) | 81 | Sept. 2021 | $18,308,025 | $772,281 | $772,281 |
The notional amount of futures purchased as a percentage of Net Assets is 1.0%
Legend
(a) Non-income producing
(b) Security or a portion of the security is on loan at period end.
(c) Affiliated fund that is generally available only to investment companies and other accounts managed by Fidelity Investments. The rate quoted is the annualized seven-day yield of the fund at period end. A complete unaudited listing of the fund's holdings as of its most recent quarter end is available upon request. In addition, each Fidelity Central Fund's financial statements, which are not covered by the Fund's Report of Independent Registered Public Accounting Firm, are available on the SEC's website or upon request.
(d) Investment made with cash collateral received from securities on loan.
Affiliated Central Funds
Fiscal year to date information regarding the Fund's investments in Fidelity Central Funds, including the ownership percentage, is presented below.
| Fund | Value, beginning of period | Purchases | Sales Proceeds | Dividend Income | Realized Gain/Loss | Change in Unrealized appreciation (depreciation) | Value, end of period | % ownership, end of period |
| Fidelity Cash Central Fund 0.06% | $14,026,888 | $155,863,085 | $157,369,039 | $9,566 | $(373) | $-- | $12,520,561 | 0.0% |
| Fidelity Securities Lending Cash Central Fund 0.06% | 7,426,400 | 303,015,808 | 274,756,283 | 11,306 | -- | -- | 35,685,925 | 0.1% |
| Total | $21,453,288 | $458,878,893 | $432,125,322 | $20,872 | $(373) | $-- | $48,206,486 |
Amounts in the income column in the above table include any capital gain distributions from underlying funds, which are presented in the corresponding line-item in the Statement of Operations, if applicable. Amount for Fidelity Securities Lending Cash Central Fund represents the income earned on investing cash collateral, less rebates paid to borrowers and any lending agent fees associated with the loan, plus any premium payments received for lending certain types of securities.
Investment Valuation
The following is a summary of the inputs used, as of August 31, 2021, involving the Fund's assets and liabilities carried at fair value. The inputs or methodology used for valuing securities may not be an indication of the risk associated with investing in those securities. For more information on valuation inputs, and their aggregation into the levels used below, please refer to the Investment Valuation section in the accompanying Notes to Financial Statements.
| Valuation Inputs at Reporting Date: | ||||
| Description | Total | Level 1 | Level 2 | Level 3 |
| Investments in Securities: | ||||
| Equities: | ||||
| Communication Services | $220,762,510 | $220,762,510 | $-- | $-- |
| Consumer Discretionary | 337,517,873 | 337,517,873 | -- | -- |
| Consumer Staples | 41,062,146 | 41,062,146 | -- | -- |
| Energy | 24,063,967 | 24,063,967 | -- | -- |
| Financials | 35,712,430 | 35,712,430 | -- | -- |
| Health Care | 182,717,092 | 182,717,092 | -- | -- |
| Industrials | 71,471,255 | 71,471,255 | -- | -- |
| Information Technology | 799,436,513 | 799,436,513 | -- | -- |
| Materials | 21,421,941 | 21,421,941 | -- | -- |
| Real Estate | 32,667,523 | 32,667,523 | -- | -- |
| Money Market Funds | 48,206,486 | 48,206,486 | -- | -- |
| Total Investments in Securities: | $1,815,039,736 | $1,815,039,736 | $-- | $-- |
| Derivative Instruments: | ||||
| Assets | ||||
| Futures Contracts | $772,281 | $772,281 | $-- | $-- |
| Total Assets | $772,281 | $772,281 | $-- | $-- |
| Total Derivative Instruments: | $772,281 | $772,281 | $-- | $-- |
Value of Derivative Instruments
The following table is a summary of the Fund's value of derivative instruments by primary risk exposure as of August 31, 2021. For additional information on derivative instruments, please refer to the Derivative Instruments section in the accompanying Notes to Financial Statements.
| Primary Risk Exposure / Derivative Type | Value | |
| Asset | Liability | |
| Equity Risk | ||
| Futures Contracts(a) | $772,281 | $0 |
| Total Equity Risk | 772,281 | 0 |
| Total Value of Derivatives | $772,281 | $0 |
(a) Reflects gross cumulative appreciation (depreciation) on futures contracts as presented in the Schedule of Investments. In the Statement of Assets and Liabilities, the period end daily variation margin is included in receivable or payable for daily variation margin on futures contracts, and the net cumulative appreciation (depreciation) is included in Total accumulated earnings (loss).
See accompanying notes which are an integral part of the financial statements.
Fidelity® Large Cap Growth Enhanced Index Fund
Financial Statements
Statement of Assets and Liabilities
| August 31, 2021 | ||
| Assets | ||
| Investment in securities, at value (including securities loaned of $34,788,073) — See accompanying schedule: Unaffiliated issuers (cost $928,811,472) | $1,766,833,250 | |
| Fidelity Central Funds (cost $48,206,486) | 48,206,486 | |
| Total Investment in Securities (cost $977,017,958) | $1,815,039,736 | |
| Segregated cash with brokers for derivative instruments | 701,500 | |
| Receivable for investments sold | 57,043,583 | |
| Receivable for fund shares sold | 887,839 | |
| Dividends receivable | 1,081,527 | |
| Distributions receivable from Fidelity Central Funds | 1,822 | |
| Total assets | 1,874,756,007 | |
| Liabilities | ||
| Payable for investments purchased | $52,884,491 | |
| Payable for fund shares redeemed | 856,720 | |
| Accrued management fee | 567,222 | |
| Payable for daily variation margin on futures contracts | 15,636 | |
| Collateral on securities loaned | 35,685,925 | |
| Total liabilities | 90,009,994 | |
| Net Assets | $1,784,746,013 | |
| Net Assets consist of: | ||
| Paid in capital | $744,319,880 | |
| Total accumulated earnings (loss) | 1,040,426,133 | |
| Net Assets | $1,784,746,013 | |
| Net Asset Value, offering price and redemption price per share ($1,784,746,013 ÷ 52,114,292 shares) | $34.25 |
See accompanying notes which are an integral part of the financial statements.
Statement of Operations
| Year ended August 31, 2021 | ||
| Investment Income | ||
| Dividends | $13,101,943 | |
| Interest | 1,152 | |
| Income from Fidelity Central Funds (including $11,306 from security lending) | 20,872 | |
| Total income | 13,123,967 | |
| Expenses | ||
| Management fee | $5,920,987 | |
| Independent trustees' fees and expenses | 6,206 | |
| Miscellaneous | 688 | |
| Total expenses before reductions | 5,927,881 | |
| Expense reductions | (24) | |
| Total expenses after reductions | 5,927,857 | |
| Net investment income (loss) | 7,196,110 | |
| Realized and Unrealized Gain (Loss) | ||
| Net realized gain (loss) on: | ||
| Investment securities: | ||
| Unaffiliated issuers | 231,849,223 | |
| Fidelity Central Funds | (373) | |
| Futures contracts | 5,187,516 | |
| Total net realized gain (loss) | 237,036,366 | |
| Change in net unrealized appreciation (depreciation) on: | ||
| Investment securities: | ||
| Unaffiliated issuers | 158,018,521 | |
| Futures contracts | (1,184,846) | |
| Total change in net unrealized appreciation (depreciation) | 156,833,675 | |
| Net gain (loss) | 393,870,041 | |
| Net increase (decrease) in net assets resulting from operations | $401,066,151 |
See accompanying notes which are an integral part of the financial statements.
Statement of Changes in Net Assets
| Year ended August 31, 2021 | Year ended August 31, 2020 | |
| Increase (Decrease) in Net Assets | ||
| Operations | ||
| Net investment income (loss) | $7,196,110 | $8,626,118 |
| Net realized gain (loss) | 237,036,366 | 45,068,155 |
| Change in net unrealized appreciation (depreciation) | 156,833,675 | 364,720,084 |
| Net increase (decrease) in net assets resulting from operations | 401,066,151 | 418,414,357 |
| Distributions to shareholders | (66,348,989) | (36,697,344) |
| Share transactions | ||
| Proceeds from sales of shares | 241,985,557 | 209,522,448 |
| Reinvestment of distributions | 62,980,686 | 34,711,004 |
| Cost of shares redeemed | (272,474,096) | (314,911,009) |
| Net increase (decrease) in net assets resulting from share transactions | 32,492,147 | (70,677,557) |
| Total increase (decrease) in net assets | 367,209,309 | 311,039,456 |
| Net Assets | ||
| Beginning of period | 1,417,536,704 | 1,106,497,248 |
| End of period | $1,784,746,013 | $1,417,536,704 |
| Other Information | ||
| Shares | ||
| Sold | 8,233,862 | 9,623,803 |
| Issued in reinvestment of distributions | 2,273,671 | 1,619,739 |
| Redeemed | (9,387,317) | (14,928,782) |
| Net increase (decrease) | 1,120,216 | (3,685,240) |
See accompanying notes which are an integral part of the financial statements.
Financial Highlights
Fidelity Large Cap Growth Enhanced Index Fund
| Years ended August 31, | 2021 | 2020 | 2019 | 2018 | 2017 A | 2017 B |
| Selected Per–Share Data | ||||||
| Net asset value, beginning of period | $27.80 | $20.24 | $21.58 | $17.61 | $16.65 | $13.86 |
| Income from Investment Operations | ||||||
| Net investment income (loss)C | .14 | .16 | .21 | .23 | .12 | .22 |
| Net realized and unrealized gain (loss) | 7.63 | 8.08 | (.15) | 4.40 | 1.04 | 2.73 |
| Total from investment operations | 7.77 | 8.24 | .06 | 4.63 | 1.16 | 2.95 |
| Distributions from net investment income | (.16) | (.18) | (.24)D | (.18) | (.04) | (.16) |
| Distributions from net realized gain | (1.16) | (.51) | (1.16)D | (.48) | (.16) | – |
| Total distributions | (1.32) | (.68)E | (1.40) | (.66) | (.20) | (.16) |
| Net asset value, end of period | $34.25 | $27.80 | $20.24 | $21.58 | $17.61 | $16.65 |
| Total ReturnF,G | 29.08% | 41.73% | 1.28% | 26.86% | 7.04% | 21.33% |
| Ratios to Average Net AssetsH,I | ||||||
| Expenses before reductions | .39% | .39% | .39% | .39% | .40%J | .45% |
| Expenses net of fee waivers, if any | .39% | .39% | .39% | .39% | .40%J | .45% |
| Expenses net of all reductions | .39% | .39% | .39% | .39% | .40%J | .45% |
| Net investment income (loss) | .47% | .74% | 1.07% | 1.18% | 1.44%J | 1.43% |
| Supplemental Data | ||||||
| Net assets, end of period (000 omitted) | $1,784,746 | $1,417,537 | $1,106,497 | $1,181,986 | $924,332 | $825,463 |
| Portfolio turnover rateK | 84% | 69% | 85% | 100% | 110%J | 86% |
A For the six month period ended August 31. The Fund changed its fiscal year end from February 28 to August 31, effective August 31, 2017.
B For the year ended February 28.
C Calculated based on average shares outstanding during the period.
D The amounts shown reflect certain reclassifications related to book to tax differences that were made in the year shown.
E Total distributions per share do not sum due to rounding.
F Total returns for periods of less than one year are not annualized.
G Total returns would have been lower if certain expenses had not been reduced during the applicable periods shown.
H Fees and expenses of any underlying mutual funds or exchange-traded funds (ETFs) are not included in the Fund's expense ratio. The Fund indirectly bears its proportionate share of these expenses. For additional expense information related to investments in Fidelity Central Funds, please refer to the "Investments in Fidelity Central Funds" note found in the Notes to Financial Statements section of the most recent Annual or Semi-Annual report.
I Expense ratios reflect operating expenses of the class. Expenses before reductions do not reflect amounts reimbursed, waived, or reduced through arrangements with the investment advisor, brokerage services, or other offset arrangements, if applicable, and do not represent the amount paid by the class during periods when reimbursements, waivers or reductions occur.
J Annualized
K Amount does not include the portfolio activity of any underlying mutual funds or exchange-traded funds (ETFs).
See accompanying notes which are an integral part of the financial statements.
Fidelity® Large Cap Value Enhanced Index Fund
Performance: The Bottom Line
Average annual total return reflects the change in the value of an investment, assuming reinvestment of distributions from dividend income and capital gains (the profits earned upon the sale of securities that have grown in value, if any) and assuming a constant rate of performance each year. The hypothetical investment and the average annual total returns do not reflect the deduction of taxes that a shareholder would pay on fund distributions or the redemption of fund shares. During periods of reimbursement by Fidelity, a fund’s total return will be greater than it would be had the reimbursement not occurred. How a fund did yesterday is no guarantee of how it will do tomorrow.
Average Annual Total Returns
| For the periods ended August 31, 2021 | Past 1 year | Past 5 years | Past 10 years |
| Fidelity® Large Cap Value Enhanced Index Fund | 39.12% | 12.90% | 13.72% |
$10,000 Over 10 Years
Let's say hypothetically that $10,000 was invested in Fidelity® Large Cap Value Enhanced Index Fund on August 31, 2011.
The chart shows how the value of your investment would have changed, and also shows how the Russell 1000® Value Index performed over the same period.
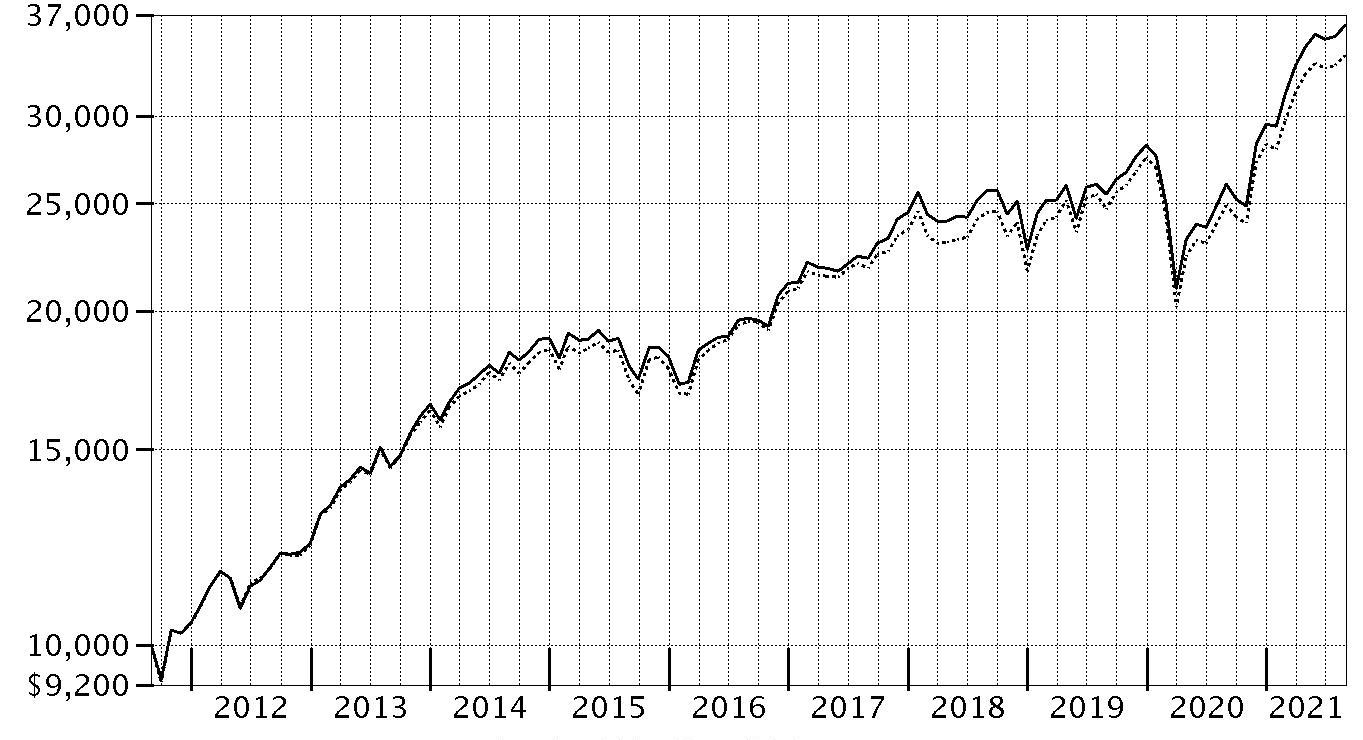
| Period Ending Values | ||
| $36,183 | Fidelity® Large Cap Value Enhanced Index Fund | |
| $34,022 | Russell 1000® Value Index | |
Fidelity® Large Cap Value Enhanced Index Fund
Management's Discussion of Fund Performance
Market Recap: The S&P 500® index gained 31.17% for the 12 months ending August 31, 2021, as U.S. equities continued a historic rebound following a steep but brief decline due to the early-2020 outbreak and spread of COVID-19. The rally slowed in September 2020, when stocks began a two-month retreat amid Congress’s inability to reach a deal on additional fiscal stimulus, as well as uncertainty about the election. But as the calendar turned, investors grew hopeful. The rollout of three COVID-19 vaccines was underway, the U.S. Federal Reserve pledged to hold interest rates near zero until the economy recovered, and the federal government planned to deploy trillions of dollars to boost consumers and the economy. This backdrop fueled a sharp rotation, with small-cap value usurping leadership from large growth. As part of the “reopening” theme, investors moved out of tech-driven mega-caps that had thrived due to the work-from-home trend in favor of cheap smaller companies that stood to benefit from a broad cyclical recovery. A flattish May reflected concerns about inflation and jobs, but the uptrend resumed through August, driven by corporate earnings and a rebounding economy. Notably, this leg saw momentum shift back to large growth, as easing rates and a hawkish Fed stymied the reflation trade. By sector, financials (+56%) led, driven by banks, which rose 67% as the economy brightened. Energy (+43%) also stood out. In contrast, notable “laggards” included consumer staples (+14%) and consumer discretionary (+18%).Comments from Senior Portfolio Manager Maximilian Kaufmann, of the Geode Capital Management, LLC, investment management team: For the fiscal year ending August 31, 2021, the fund gained 39.12%, outperforming the 36.44% result of the benchmark Russell 1000® Value Index. Versus the benchmark, security selection was the primary contributor, especially in the consumer discretionary sector. Strong picks in the industrials sector, especially within the capital goods industry, also helped. Also helping was stock selection in the financials sector, primarily driven by the diversified financials industry. General Electric, the fund's top individual relative contributor, increased 107% this period. Also boosting value was our overweighting in AGCO, which gained 99%. The fund's non-benchmark stake in Applied Materials, a position not held at period end, gained approximately 118%. Conversely, the primary detractors from performance versus the benchmark were stock picks and an overweighting in health care. Stock picking and an underweighting in materials also hampered relative performance. Also detracting from the fund's relative result was an underweighting in the information technology sector, especially within the technology hardware & equipment industry. The biggest individual relative detractor was an overweight position in Royal Gold (-7%), which was a stake that was not held at the end of this period. Our second-largest detractor this period was Procter & Gamble. The company is among the fund's biggest holdings and gained about 5% the past 12 months and detracted from relative performance. Another notable relative detractor was an outsized stake in Chevron (+23%), which was among the fund's largest holdings the past 12 months. Notable changes in positioning include a higher allocation to the energy and health care sectors.The views expressed above reflect those of the portfolio manager(s) only through the end of the period as stated on the cover of this report and do not necessarily represent the views of Fidelity or any other person in the Fidelity organization. Any such views are subject to change at any time based upon market or other conditions and Fidelity disclaims any responsibility to update such views. These views may not be relied on as investment advice and, because investment decisions for a Fidelity fund are based on numerous factors, may not be relied on as an indication of trading intent on behalf of any Fidelity fund.
Fidelity® Large Cap Value Enhanced Index Fund
Investment Summary (Unaudited)
Top Ten Stocks as of August 31, 2021
| % of fund's net assets | |
| Berkshire Hathaway, Inc. Class B | 2.9 |
| Johnson & Johnson | 2.6 |
| JPMorgan Chase & Co. | 2.0 |
| UnitedHealth Group, Inc. | 1.8 |
| Procter & Gamble Co. | 1.6 |
| Walmart, Inc. | 1.5 |
| Intel Corp. | 1.5 |
| Bank of America Corp. | 1.4 |
| Cisco Systems, Inc. | 1.3 |
| Verizon Communications, Inc. | 1.2 |
| 17.8 |
Top Market Sectors as of August 31, 2021
| % of fund's net assets | |
| Financials | 19.7 |
| Health Care | 18.8 |
| Information Technology | 11.5 |
| Industrials | 10.7 |
| Consumer Discretionary | 7.4 |
| Consumer Staples | 6.9 |
| Communication Services | 6.7 |
| Energy | 5.7 |
| Real Estate | 4.9 |
| Materials | 3.8 |
Asset Allocation (% of fund's net assets)
| As of August 31, 2021* | ||
| Stocks and Equity Futures | 100.0% | |

* Foreign investments - 5.4%
Fidelity® Large Cap Value Enhanced Index Fund
Schedule of Investments August 31, 2021
Showing Percentage of Net Assets
| Common Stocks - 99.4% | |||
| Shares | Value | ||
| COMMUNICATION SERVICES - 6.7% | |||
| Diversified Telecommunication Services - 2.0% | |||
| AT&T, Inc. | 1,839,015 | $50,425,791 | |
| Lumen Technologies, Inc. (a) | 157,570 | 1,938,111 | |
| Verizon Communications, Inc. | 1,314,486 | 72,296,730 | |
| 124,660,632 | |||
| Entertainment - 1.9% | |||
| Activision Blizzard, Inc. | 239,820 | 19,753,973 | |
| Electronic Arts, Inc. | 251,176 | 36,473,267 | |
| The Walt Disney Co. (b) | 342,334 | 62,065,154 | |
| 118,292,394 | |||
| Interactive Media & Services - 1.4% | |||
| Alphabet, Inc.: | |||
| Class A (b) | 12,567 | 36,368,270 | |
| Class C (b) | 16,806 | 48,892,687 | |
| 85,260,957 | |||
| Media - 1.3% | |||
| Comcast Corp. Class A | 1,180,926 | 71,658,590 | |
| Liberty Media Corp.: | |||
| Liberty SiriusXM Series A (b) | 88,544 | 4,382,928 | |
| Liberty SiriusXM Series C (b) | 32,568 | 1,607,231 | |
| News Corp. Class A | 193,460 | 4,347,046 | |
| 81,995,795 | |||
| Wireless Telecommunication Services - 0.1% | |||
| Telephone & Data Systems, Inc. | 175,507 | 3,566,302 | |
| TOTAL COMMUNICATION SERVICES | 413,776,080 | ||
| CONSUMER DISCRETIONARY - 7.4% | |||
| Automobiles - 0.2% | |||
| Ford Motor Co. (b) | 1,201,810 | 15,659,584 | |
| Distributors - 0.4% | |||
| Genuine Parts Co. | 79,474 | 9,710,928 | |
| LKQ Corp. (b) | 274,871 | 14,482,953 | |
| 24,193,881 | |||
| Diversified Consumer Services - 0.1% | |||
| Graham Holdings Co. | 2,108 | 1,300,235 | |
| Service Corp. International | 39,171 | 2,458,372 | |
| 3,758,607 | |||
| Hotels, Restaurants & Leisure - 3.0% | |||
| Carnival Corp. (a)(b) | 999,247 | 24,121,823 | |
| Hilton Worldwide Holdings, Inc. (b) | 107,646 | 13,440,680 | |
| Hyatt Hotels Corp. Class A (b) | 195,968 | 14,421,285 | |
| International Game Technology PLC (b) | 431,933 | 9,282,240 | |
| McDonald's Corp. | 276,434 | 65,642,018 | |
| Norwegian Cruise Line Holdings Ltd. (a)(b) | 305,005 | 7,881,329 | |
| Royal Caribbean Cruises Ltd. (a)(b) | 330,042 | 27,304,375 | |
| Travel+Leisure Co. | 231,960 | 12,702,130 | |
| Wendy's Co. | 456,455 | 10,507,594 | |
| 185,303,474 | |||
| Household Durables - 1.6% | |||
| D.R. Horton, Inc. | 234,774 | 22,449,090 | |
| Lennar Corp. Class A | 72,708 | 7,802,295 | |
| Meritage Homes Corp. (b) | 177,327 | 19,779,054 | |
| PulteGroup, Inc. | 467,460 | 25,177,396 | |
| Toll Brothers, Inc. | 138,094 | 8,846,302 | |
| TopBuild Corp. (b) | 21,003 | 4,595,246 | |
| Whirlpool Corp. (a) | 35,507 | 7,865,866 | |
| 96,515,249 | |||
| Internet & Direct Marketing Retail - 0.1% | |||
| eBay, Inc. | 76,499 | 5,870,533 | |
| Leisure Products - 0.2% | |||
| Brunswick Corp. | 71,872 | 6,962,241 | |
| Polaris, Inc. | 64,848 | 7,766,196 | |
| 14,728,437 | |||
| Multiline Retail - 0.8% | |||
| Dollar General Corp. | 101,553 | 22,637,179 | |
| Kohl's Corp. | 69,740 | 4,003,076 | |
| Target Corp. | 81,463 | 20,119,732 | |
| 46,759,987 | |||
| Specialty Retail - 0.9% | |||
| AutoNation, Inc. (a)(b) | 119,854 | 13,074,873 | |
| Best Buy Co., Inc. | 53,131 | 6,190,293 | |
| CarMax, Inc. (b) | 13,007 | 1,628,606 | |
| Dick's Sporting Goods, Inc. | 43,272 | 6,093,130 | |
| Foot Locker, Inc. | 210,040 | 11,907,168 | |
| O'Reilly Automotive, Inc. (b) | 12,898 | 7,662,444 | |
| Ulta Beauty, Inc. (b) | 24,429 | 9,461,596 | |
| 56,018,110 | |||
| Textiles, Apparel & Luxury Goods - 0.1% | |||
| Carter's, Inc. | 21,010 | 2,151,004 | |
| Deckers Outdoor Corp. (b) | 8,939 | 3,740,525 | |
| 5,891,529 | |||
| TOTAL CONSUMER DISCRETIONARY | 454,699,391 | ||
| CONSUMER STAPLES - 6.9% | |||
| Beverages - 0.9% | |||
| Keurig Dr. Pepper, Inc. | 31,791 | 1,133,985 | |
| Molson Coors Beverage Co. Class B | 17,590 | 836,053 | |
| PepsiCo, Inc. | 17,825 | 2,787,652 | |
| The Coca-Cola Co. | 847,620 | 47,729,482 | |
| 52,487,172 | |||
| Food & Staples Retailing - 1.6% | |||
| Costco Wholesale Corp. | 12,656 | 5,764,681 | |
| Kroger Co. | 29,138 | 1,341,222 | |
| Walmart, Inc. | 634,732 | 94,003,809 | |
| 101,109,712 | |||
| Food Products - 1.7% | |||
| Archer Daniels Midland Co. | 84,011 | 5,040,660 | |
| Bunge Ltd. | 108,241 | 8,194,926 | |
| Conagra Brands, Inc. | 61,030 | 2,021,314 | |
| Ingredion, Inc. | 15,238 | 1,338,811 | |
| Mondelez International, Inc. | 441,092 | 27,378,580 | |
| The J.M. Smucker Co. | 70,504 | 8,719,230 | |
| The Kraft Heinz Co. | 515,625 | 18,557,344 | |
| Tyson Foods, Inc. Class A | 457,828 | 35,948,655 | |
| 107,199,520 | |||
| Household Products - 1.8% | |||
| Colgate-Palmolive Co. | 206,895 | 16,127,465 | |
| Procter & Gamble Co. | 686,584 | 97,762,696 | |
| 113,890,161 | |||
| Tobacco - 0.9% | |||
| Altria Group, Inc. | 285,490 | 14,340,163 | |
| Philip Morris International, Inc. | 380,805 | 39,222,915 | |
| 53,563,078 | |||
| TOTAL CONSUMER STAPLES | 428,249,643 | ||
| ENERGY - 5.7% | |||
| Energy Equipment & Services - 0.9% | |||
| Baker Hughes Co. Class A | 15,143 | 344,958 | |
| Halliburton Co. | 1,068,714 | 21,352,906 | |
| Schlumberger Ltd. | 1,144,729 | 32,098,201 | |
| 53,796,065 | |||
| Oil, Gas & Consumable Fuels - 4.8% | |||
| Antero Resources Corp. (b) | 187,333 | 2,570,209 | |
| Cabot Oil & Gas Corp. | 65,612 | 1,042,575 | |
| Chevron Corp. | 741,068 | 71,713,150 | |
| ConocoPhillips Co. | 824,027 | 45,758,219 | |
| Continental Resources, Inc. | 126,450 | 4,966,956 | |
| Devon Energy Corp. | 176,632 | 5,219,476 | |
| Diamondback Energy, Inc. | 79,589 | 6,139,495 | |
| EOG Resources, Inc. | 578,455 | 39,057,282 | |
| EQT Corp. (b) | 151,452 | 2,776,115 | |
| Exxon Mobil Corp. | 1,294,075 | 70,552,969 | |
| Hess Corp. | 143,990 | 9,899,313 | |
| Kinder Morgan, Inc. | 216,199 | 3,517,558 | |
| Marathon Oil Corp. | 1,665,630 | 19,571,153 | |
| Ovintiv, Inc. | 85,842 | 2,340,053 | |
| Pioneer Natural Resources Co. | 103,304 | 15,461,510 | |
| 300,586,033 | |||
| TOTAL ENERGY | 354,382,098 | ||
| FINANCIALS - 19.7% | |||
| Banks - 8.3% | |||
| Associated Banc-Corp. (a) | 53,309 | 1,099,232 | |
| Bank of America Corp. | 2,082,197 | 86,931,725 | |
| Citigroup, Inc. | 862,883 | 62,049,917 | |
| Citizens Financial Group, Inc. | 516,111 | 22,600,501 | |
| Comerica, Inc. | 151,823 | 11,221,238 | |
| East West Bancorp, Inc. | 48,208 | 3,535,575 | |
| Eastern Bankshares, Inc. (a) | 173,434 | 3,430,525 | |
| First Republic Bank | 58,879 | 11,713,388 | |
| FNB Corp., Pennsylvania | 168,943 | 1,973,254 | |
| Hancock Whitney Corp. | 126,818 | 5,828,555 | |
| Huntington Bancshares, Inc. | 628,121 | 9,754,719 | |
| JPMorgan Chase & Co. | 782,306 | 125,129,845 | |
| KeyCorp | 435,767 | 8,854,785 | |
| M&T Bank Corp. | 20,236 | 2,833,242 | |
| PacWest Bancorp | 86,847 | 3,695,340 | |
| PNC Financial Services Group, Inc. | 164,204 | 31,379,384 | |
| Popular, Inc. | 112,715 | 8,559,577 | |
| Regions Financial Corp. | 1,373,477 | 28,060,135 | |
| SVB Financial Group (b) | 12,703 | 7,107,329 | |
| Synovus Financial Corp. | 43,439 | 1,872,221 | |
| Truist Financial Corp. | 71,690 | 4,090,631 | |
| U.S. Bancorp | 45,111 | 2,588,920 | |
| Umpqua Holdings Corp. | 132,204 | 2,574,012 | |
| Wells Fargo & Co. | 1,360,630 | 62,180,791 | |
| Wintrust Financial Corp. | 35,398 | 2,649,186 | |
| 511,714,027 | |||
| Capital Markets - 4.2% | |||
| Ameriprise Financial, Inc. | 66,530 | 18,156,702 | |
| Artisan Partners Asset Management, Inc. | 19,572 | 1,016,961 | |
| Bank of New York Mellon Corp. | 176,897 | 9,768,252 | |
| BlackRock, Inc. Class A | 8,537 | 8,052,867 | |
| Charles Schwab Corp. | 63,355 | 4,615,412 | |
| CME Group, Inc. | 10,001 | 2,017,402 | |
| Goldman Sachs Group, Inc. | 130,881 | 54,120,602 | |
| Intercontinental Exchange, Inc. | 79,994 | 9,561,683 | |
| Jefferies Financial Group, Inc. | 487,383 | 18,013,676 | |
| Morgan Stanley | 691,522 | 72,215,642 | |
| NASDAQ, Inc. | 50,330 | 9,853,607 | |
| Raymond James Financial, Inc. | 118,589 | 16,590,601 | |
| SEI Investments Co. | 8,896 | 558,758 | |
| State Street Corp. | 335,690 | 31,188,958 | |
| Stifel Financial Corp. | 120,252 | 8,309,413 | |
| 264,040,536 | |||
| Consumer Finance - 1.3% | |||
| Capital One Financial Corp. | 264,285 | 43,863,381 | |
| OneMain Holdings, Inc. | 61,860 | 3,577,364 | |
| SLM Corp. | 820,472 | 15,383,850 | |
| Synchrony Financial | 352,084 | 17,516,179 | |
| 80,340,774 | |||
| Diversified Financial Services - 2.9% | |||
| Berkshire Hathaway, Inc. Class B (b) | 624,972 | 178,598,242 | |
| Insurance - 2.9% | |||
| Allstate Corp. | 33,898 | 4,585,721 | |
| American International Group, Inc. | 236,672 | 12,912,824 | |
| Aon PLC | 21,388 | 6,135,362 | |
| Arthur J. Gallagher & Co. | 9,204 | 1,321,878 | |
| Assurant, Inc. | 15,909 | 2,706,280 | |
| Chubb Ltd. | 96,190 | 17,691,265 | |
| Everest Re Group Ltd. | 9,795 | 2,594,696 | |
| Fidelity National Financial, Inc. | 364,614 | 17,804,102 | |
| First American Financial Corp. | 379,193 | 26,744,482 | |
| Hartford Financial Services Group, Inc. | 10,152 | 682,417 | |
| MetLife, Inc. | 655,668 | 40,651,416 | |
| Primerica, Inc. | 34,162 | 5,224,736 | |
| Reinsurance Group of America, Inc. | 68,804 | 7,968,879 | |
| Selective Insurance Group, Inc. | 47,129 | 3,938,571 | |
| The Travelers Companies, Inc. | 64,853 | 10,357,673 | |
| W.R. Berkley Corp. | 226,345 | 17,046,042 | |
| Willis Towers Watson PLC | 11,936 | 2,634,514 | |
| 181,000,858 | |||
| Thrifts & Mortgage Finance - 0.1% | |||
| New York Community Bancorp, Inc. | 460,914 | 5,770,643 | |
| TOTAL FINANCIALS | 1,221,465,080 | ||
| HEALTH CARE - 18.8% | |||
| Biotechnology - 2.2% | |||
| Amgen, Inc. | 104,977 | 23,675,463 | |
| Biogen, Inc. (b) | 71,934 | 24,379,152 | |
| Gilead Sciences, Inc. | 817,828 | 59,521,522 | |
| Incyte Corp. (b) | 53,532 | 4,094,663 | |
| Regeneron Pharmaceuticals, Inc. (b) | 25,892 | 17,435,673 | |
| United Therapeutics Corp. (b) | 33,573 | 7,214,166 | |
| 136,320,639 | |||
| Health Care Equipment & Supplies - 3.6% | |||
| Abbott Laboratories | 216,466 | 27,354,808 | |
| Baxter International, Inc. | 364,207 | 27,759,858 | |
| Boston Scientific Corp. (b) | 293,271 | 13,241,186 | |
| Danaher Corp. | 197,463 | 64,009,606 | |
| Envista Holdings Corp. (b) | 155,075 | 6,635,659 | |
| Hologic, Inc. (b) | 33,083 | 2,618,519 | |
| Medtronic PLC | 437,314 | 58,372,673 | |
| Ortho Clinical Diagnostics Holdings PLC | 103,559 | 2,116,746 | |
| Quidel Corp. (a)(b) | 6,914 | 891,560 | |
| STERIS PLC | 27,899 | 5,998,564 | |
| Stryker Corp. | 30,877 | 8,556,017 | |
| Zimmer Biomet Holdings, Inc. | 49,288 | 7,415,380 | |
| 224,970,576 | |||
| Health Care Providers & Services - 4.1% | |||
| Amedisys, Inc. (b) | 5,773 | 1,059,057 | |
| Anthem, Inc. | 153,508 | 57,585,456 | |
| CVS Health Corp. | 680,207 | 58,763,083 | |
| Encompass Health Corp. | 23,272 | 1,825,688 | |
| Laboratory Corp. of America Holdings (b) | 41,394 | 12,558,112 | |
| Quest Diagnostics, Inc. | 15,977 | 2,441,765 | |
| Select Medical Holdings Corp. (a) | 204,748 | 7,078,138 | |
| UnitedHealth Group, Inc. | 268,629 | 111,822,194 | |
| 253,133,493 | |||
| Health Care Technology - 0.5% | |||
| Cerner Corp. | 221,318 | 16,897,629 | |
| Veeva Systems, Inc. Class A (b) | 34,447 | 11,435,715 | |
| 28,333,344 | |||
| Life Sciences Tools & Services - 2.2% | |||
| Agilent Technologies, Inc. | 179,950 | 31,575,827 | |
| Bio-Rad Laboratories, Inc. Class A (b) | 27,997 | 22,532,546 | |
| Illumina, Inc. (b) | 18,785 | 8,587,751 | |
| PerkinElmer, Inc. | 22,320 | 4,124,736 | |
| QIAGEN NV (b) | 28,528 | 1,592,433 | |
| Syneos Health, Inc. (b) | 26,517 | 2,460,247 | |
| Thermo Fisher Scientific, Inc. | 109,410 | 60,717,080 | |
| Waters Corp. (b) | 13,556 | 5,612,455 | |
| 137,203,075 | |||
| Pharmaceuticals - 6.2% | |||
| AstraZeneca PLC sponsored ADR | 49,980 | 2,912,834 | |
| Bristol-Myers Squibb Co. | 1,076,447 | 71,971,246 | |
| Johnson & Johnson | 924,259 | 160,016,961 | |
| Merck & Co., Inc. | 788,339 | 60,142,382 | |
| Organon & Co. | 247,888 | 8,400,924 | |
| Pfizer, Inc. | 1,525,035 | 70,258,362 | |
| Viatris, Inc. | 548,748 | 8,028,183 | |
| 381,730,892 | |||
| TOTAL HEALTH CARE | 1,161,692,019 | ||
| INDUSTRIALS - 10.7% | |||
| Aerospace & Defense - 2.2% | |||
| Curtiss-Wright Corp. | 98,173 | 11,955,508 | |
| General Dynamics Corp. | 25,773 | 5,162,590 | |
| Lockheed Martin Corp. | 13,166 | 4,737,127 | |
| Mercury Systems, Inc. (b) | 54,282 | 2,734,727 | |
| Moog, Inc. Class A | 165,336 | 13,134,292 | |
| Northrop Grumman Corp. | 69,363 | 25,504,775 | |
| Parsons Corp. (a)(b) | 95,017 | 3,366,452 | |
| Raytheon Technologies Corp. | 300,152 | 25,440,884 | |
| Teledyne Technologies, Inc. (b) | 66,779 | 30,944,053 | |
| Textron, Inc. | 130,842 | 9,508,288 | |
| The Boeing Co. (b) | 23,219 | 5,096,571 | |
| 137,585,267 | |||
| Air Freight & Logistics - 0.1% | |||
| FedEx Corp. | 27,945 | 7,424,707 | |
| Airlines - 0.2% | |||
| Alaska Air Group, Inc. (b) | 52,563 | 3,013,962 | |
| Southwest Airlines Co. (b) | 215,605 | 10,732,817 | |
| 13,746,779 | |||
| Building Products - 0.5% | |||
| Johnson Controls International PLC | 265,804 | 19,882,139 | |
| Simpson Manufacturing Co. Ltd. | 23,212 | 2,626,438 | |
| UFP Industries, Inc. | 81,860 | 6,146,049 | |
| 28,654,626 | |||
| Commercial Services & Supplies - 0.9% | |||
| Clean Harbors, Inc. (b) | 92,052 | 9,446,376 | |
| Republic Services, Inc. | 326,374 | 40,512,805 | |
| Waste Management, Inc. | 26,037 | 4,038,599 | |
| 53,997,780 | |||
| Construction & Engineering - 0.6% | |||
| EMCOR Group, Inc. | 166,552 | 20,236,068 | |
| Quanta Services, Inc. | 155,334 | 15,859,601 | |
| 36,095,669 | |||
| Electrical Equipment - 1.6% | |||
| AMETEK, Inc. | 99,623 | 13,545,739 | |
| Atkore, Inc. (b) | 12,232 | 1,134,763 | |
| Eaton Corp. PLC | 240,795 | 40,540,246 | |
| Emerson Electric Co. | 157,236 | 16,588,398 | |
| Hubbell, Inc. Class B | 30,540 | 6,294,599 | |
| nVent Electric PLC | 480,630 | 16,514,447 | |
| Regal Beloit Corp. | 16,520 | 2,468,418 | |
| 97,086,610 | |||
| Industrial Conglomerates - 1.5% | |||
| 3M Co. | 17,364 | 3,381,465 | |
| General Electric Co. | 313,749 | 33,072,282 | |
| Honeywell International, Inc. | 138,111 | 32,029,322 | |
| Roper Technologies, Inc. | 48,893 | 23,629,009 | |
| 92,112,078 | |||
| Machinery - 1.6% | |||
| AGCO Corp. | 174,037 | 23,950,972 | |
| Caterpillar, Inc. | 140,780 | 29,686,279 | |
| Cummins, Inc. | 64,249 | 15,161,479 | |
| Deere & Co. | 66,230 | 25,036,927 | |
| Gates Industrial Corp. PLC (b) | 320,296 | 5,246,448 | |
| 99,082,105 | |||
| Professional Services - 0.5% | |||
| CACI International, Inc. Class A (b) | 67,396 | 17,357,166 | |
| IHS Markit Ltd. | 58,396 | 7,042,558 | |
| Manpower, Inc. | 55,769 | 6,771,472 | |
| 31,171,196 | |||
| Road & Rail - 1.0% | |||
| CSX Corp. | 492,262 | 16,013,283 | |
| Norfolk Southern Corp. | 35,935 | 9,110,960 | |
| Old Dominion Freight Lines, Inc. | 4,053 | 1,170,182 | |
| Ryder System, Inc. | 62,300 | 4,952,227 | |
| Schneider National, Inc. Class B | 312,448 | 7,042,578 | |
| Union Pacific Corp. | 81,070 | 17,579,219 | |
| Werner Enterprises, Inc. | 174,443 | 8,226,732 | |
| 64,095,181 | |||
| Trading Companies & Distributors - 0.0% | |||
| MSC Industrial Direct Co., Inc. Class A | 13,408 | 1,129,088 | |
| TOTAL INDUSTRIALS | 662,181,086 | ||
| INFORMATION TECHNOLOGY - 11.5% | |||
| Communications Equipment - 1.7% | |||
| Ciena Corp. (b) | 218,375 | 12,475,764 | |
| Cisco Systems, Inc. | 1,388,017 | 81,920,763 | |
| Juniper Networks, Inc. | 325,296 | 9,427,078 | |
| 103,823,605 | |||
| Electronic Equipment & Components - 0.4% | |||
| Avnet, Inc. | 27,476 | 1,111,679 | |
| National Instruments Corp. | 380,345 | 15,906,028 | |
| Vontier Corp. | 242,671 | 8,825,944 | |
| 25,843,651 | |||
| IT Services - 2.8% | |||
| Alliance Data Systems Corp. | 35,715 | 3,503,999 | |
| Amdocs Ltd. | 335,379 | 25,834,244 | |
| Automatic Data Processing, Inc. | 75,354 | 15,752,000 | |
| Cognizant Technology Solutions Corp. Class A | 71,802 | 5,479,211 | |
| DXC Technology Co. (b) | 138,513 | 5,086,197 | |
| EPAM Systems, Inc. (b) | 11,187 | 7,079,245 | |
| Fidelity National Information Services, Inc. | 67,680 | 8,647,474 | |
| FleetCor Technologies, Inc. (b) | 90,760 | 23,895,293 | |
| Gartner, Inc. (b) | 39,585 | 12,221,473 | |
| Global Payments, Inc. | 83,968 | 13,656,556 | |
| IBM Corp. | 340,101 | 47,729,774 | |
| SolarWinds, Inc. (a) | 41,690 | 711,648 | |
| The Western Union Co. | 290,515 | 6,286,745 | |
| 175,883,859 | |||
| Semiconductors & Semiconductor Equipment - 3.2% | |||
| Broadcom, Inc. | 11,661 | 5,797,966 | |
| Cirrus Logic, Inc. (b) | 156,200 | 13,069,254 | |
| Intel Corp. | 1,702,547 | 92,039,691 | |
| Micron Technology, Inc. | 29,633 | 2,183,952 | |
| NVIDIA Corp. | 47,916 | 10,725,997 | |
| NXP Semiconductors NV | 27,552 | 5,927,262 | |
| Qualcomm, Inc. | 211,209 | 30,982,248 | |
| Synaptics, Inc. (b) | 16,923 | 3,211,647 | |
| Texas Instruments, Inc. | 165,955 | 31,682,469 | |
| 195,620,486 | |||
| Software - 3.1% | |||
| Adobe, Inc. (b) | 15,316 | 10,165,229 | |
| Black Knight, Inc. (b) | 280,239 | 21,205,685 | |
| Box, Inc. Class A (b) | 657,239 | 16,943,621 | |
| Dropbox, Inc. Class A (b) | 1,023,105 | 32,442,660 | |
| FireEye, Inc. (b) | 209,830 | 3,816,808 | |
| Qualys, Inc. (b) | 18,821 | 2,209,209 | |
| Salesforce.com, Inc. (b) | 97,560 | 25,879,741 | |
| SS&C Technologies Holdings, Inc. | 303,103 | 22,932,773 | |
| Synopsys, Inc. (b) | 98,515 | 32,730,624 | |
| Teradata Corp. (b) | 65,499 | 3,582,140 | |
| Workday, Inc. Class A (b) | 77,953 | 21,293,641 | |
| 193,202,131 | |||
| Technology Hardware, Storage & Peripherals - 0.3% | |||
| NetApp, Inc. | 117,911 | 10,485,825 | |
| Western Digital Corp. (b) | 100,398 | 6,345,154 | |
| 16,830,979 | |||
| TOTAL INFORMATION TECHNOLOGY | 711,204,711 | ||
| MATERIALS - 3.8% | |||
| Chemicals - 1.9% | |||
| CF Industries Holdings, Inc. | 286,317 | 13,004,518 | |
| Corteva, Inc. | 814,142 | 35,797,824 | |
| Dow, Inc. | 93,914 | 5,907,191 | |
| DuPont de Nemours, Inc. | 347,139 | 25,695,229 | |
| Eastman Chemical Co. | 130,587 | 14,777,225 | |
| NewMarket Corp. | 11,028 | 3,856,822 | |
| Olin Corp. | 330,024 | 16,448,396 | |
| 115,487,205 | |||
| Construction Materials - 0.2% | |||
| Vulcan Materials Co. | 81,873 | 15,222,647 | |
| Containers & Packaging - 0.2% | |||
| International Paper Co. | 77,809 | 4,675,543 | |
| WestRock Co. | 206,959 | 10,770,146 | |
| 15,445,689 | |||
| Metals & Mining - 1.5% | |||
| Alcoa Corp. (b) | 489,332 | 21,711,661 | |
| Freeport-McMoRan, Inc. | 1,043,982 | 37,990,505 | |
| Hecla Mining Co. (a) | 1,318,954 | 8,111,567 | |
| Reliance Steel & Aluminum Co. | 154,894 | 23,240,296 | |
| 91,054,029 | |||
| TOTAL MATERIALS | 237,209,570 | ||
| REAL ESTATE - 4.9% | |||
| Equity Real Estate Investment Trusts (REITs) - 4.7% | |||
| American Homes 4 Rent Class A | 469,021 | 19,670,741 | |
| American Tower Corp. | 33,633 | 9,826,554 | |
| Apartment Income (REIT) Corp. | 340,118 | 17,284,797 | |
| Brixmor Property Group, Inc. | 68,129 | 1,597,625 | |
| Camden Property Trust (SBI) | 41,729 | 6,261,019 | |
| Crown Castle International Corp. | 75,850 | 14,767,237 | |
| CubeSmart | 29,608 | 1,584,028 | |
| Equity Commonwealth | 229,213 | 6,037,470 | |
| Extra Space Storage, Inc. | 27,106 | 5,066,382 | |
| First Industrial Realty Trust, Inc. | 84,387 | 4,724,828 | |
| Gaming & Leisure Properties | 63,332 | 3,122,268 | |
| Healthcare Realty Trust, Inc. | 211,165 | 6,341,285 | |
| Hudson Pacific Properties, Inc. | 80,891 | 2,133,905 | |
| Invitation Homes, Inc. | 273,023 | 11,243,087 | |
| JBG SMITH Properties | 163,538 | 4,927,400 | |
| Kilroy Realty Corp. | 98,815 | 6,487,205 | |
| Life Storage, Inc. | 112,871 | 14,045,667 | |
| National Storage Affiliates Trust | 286,763 | 16,417,182 | |
| Potlatch Corp. | 87,203 | 4,530,196 | |
| Prologis (REIT), Inc. | 220,467 | 29,688,086 | |
| PS Business Parks, Inc. | 42,494 | 6,681,332 | |
| Public Storage | 73,187 | 23,684,045 | |
| Realty Income Corp. | 231,817 | 16,741,824 | |
| Rexford Industrial Realty, Inc. | 34,032 | 2,107,602 | |
| SBA Communications Corp. Class A | 50,234 | 18,032,499 | |
| Stag Industrial, Inc. | 190,833 | 8,062,694 | |
| Terreno Realty Corp. | 40,881 | 2,731,260 | |
| Ventas, Inc. | 87,161 | 4,875,786 | |
| Weyerhaeuser Co. | 674,593 | 24,285,348 | |
| 292,959,352 | |||
| Real Estate Management & Development - 0.2% | |||
| eXp World Holdings, Inc. (a) | 73,982 | 3,392,075 | |
| Jones Lang LaSalle, Inc. (b) | 7,633 | 1,850,468 | |
| Opendoor Technologies, Inc. (a)(b) | 342,036 | 6,064,298 | |
| 11,306,841 | |||
| TOTAL REAL ESTATE | 304,266,193 | ||
| UTILITIES - 3.3% | |||
| Electric Utilities - 2.2% | |||
| American Electric Power Co., Inc. | 25,104 | 2,248,565 | |
| Duke Energy Corp. | 224,103 | 23,454,620 | |
| Entergy Corp. | 16,864 | 1,865,327 | |
| Hawaiian Electric Industries, Inc. | 293,426 | 12,793,374 | |
| IDACORP, Inc. | 97,868 | 10,310,394 | |
| NextEra Energy, Inc. | 627,905 | 52,737,741 | |
| NRG Energy, Inc. | 129,896 | 5,932,350 | |
| OGE Energy Corp. | 150,793 | 5,339,580 | |
| Portland General Electric Co. | 201,046 | 10,323,712 | |
| PPL Corp. | 106,643 | 3,129,972 | |
| Southern Co. | 83,785 | 5,507,188 | |
| 133,642,823 | |||
| Gas Utilities - 0.0% | |||
| UGI Corp. | 21,281 | 985,523 | |
| Independent Power and Renewable Electricity Producers - 0.0% | |||
| Clearway Energy, Inc. Class C (a) | 26,368 | 827,692 | |
| Multi-Utilities - 1.1% | |||
| Ameren Corp. | 36,766 | 3,225,114 | |
| DTE Energy Co. | 13,433 | 1,616,527 | |
| MDU Resources Group, Inc. | 463,822 | 14,921,154 | |
| NiSource, Inc. | 80,486 | 1,983,980 | |
| Public Service Enterprise Group, Inc. | 239,060 | 15,285,496 | |
| Sempra Energy | 107,537 | 14,233,597 | |
| WEC Energy Group, Inc. | 161,041 | 15,215,154 | |
| 66,481,022 | |||
| TOTAL UTILITIES | 201,937,060 | ||
| TOTAL COMMON STOCKS | |||
| (Cost $4,857,048,510) | 6,151,062,931 | ||
| Money Market Funds - 1.3% | |||
| Fidelity Cash Central Fund 0.06% (c) | 25,800,511 | 25,805,671 | |
| Fidelity Securities Lending Cash Central Fund 0.06% (c)(d) | 54,818,544 | 54,824,025 | |
| TOTAL MONEY MARKET FUNDS | |||
| (Cost $80,629,696) | 80,629,696 | ||
| TOTAL INVESTMENT IN SECURITIES - 100.7% | |||
| (Cost $4,937,678,206) | 6,231,692,627 | ||
| NET OTHER ASSETS (LIABILITIES) - (0.7)% | (44,184,242) | ||
| NET ASSETS - 100% | $6,187,508,385 |
| Futures Contracts | |||||
| Number of contracts | Expiration Date | Notional Amount | Value | Unrealized Appreciation/(Depreciation) | |
| Purchased | |||||
| Equity Index Contracts | |||||
| CME E-mini S&P 500 Index Contracts (United States) | 159 | Sept. 2021 | $35,937,975 | $2,380,865 | $2,380,865 |
The notional amount of futures purchased as a percentage of Net Assets is 0.6%
Legend
(a) Security or a portion of the security is on loan at period end.
(b) Non-income producing
(c) Affiliated fund that is generally available only to investment companies and other accounts managed by Fidelity Investments. The rate quoted is the annualized seven-day yield of the fund at period end. A complete unaudited listing of the fund's holdings as of its most recent quarter end is available upon request. In addition, each Fidelity Central Fund's financial statements, which are not covered by the Fund's Report of Independent Registered Public Accounting Firm, are available on the SEC's website or upon request.
(d) Investment made with cash collateral received from securities on loan.
Affiliated Central Funds
Fiscal year to date information regarding the Fund's investments in Fidelity Central Funds, including the ownership percentage, is presented below.
| Fund | Value, beginning of period | Purchases | Sales Proceeds | Dividend Income | Realized Gain/Loss | Change in Unrealized appreciation (depreciation) | Value, end of period | % ownership, end of period |
| Fidelity Cash Central Fund 0.06% | $94,657,997 | $1,028,009,413 | $1,096,846,949 | $42,533 | $(14,790) | $-- | $25,805,671 | 0.0% |
| Fidelity Securities Lending Cash Central Fund 0.06% | 38,880,593 | 558,052,310 | 542,108,878 | 45,315 | -- | -- | 54,824,025 | 0.2% |
| Total | $133,538,590 | $1,586,061,723 | $1,638,955,827 | $87,848 | $(14,790) | $-- | $80,629,696 |
Amounts in the income column in the above table include any capital gain distributions from underlying funds, which are presented in the corresponding line-item in the Statement of Operations, if applicable. Amount for Fidelity Securities Lending Cash Central Fund represents the income earned on investing cash collateral, less rebates paid to borrowers and any lending agent fees associated with the loan, plus any premium payments received for lending certain types of securities.
Investment Valuation
The following is a summary of the inputs used, as of August 31, 2021, involving the Fund's assets and liabilities carried at fair value. The inputs or methodology used for valuing securities may not be an indication of the risk associated with investing in those securities. For more information on valuation inputs, and their aggregation into the levels used below, please refer to the Investment Valuation section in the accompanying Notes to Financial Statements.
| Valuation Inputs at Reporting Date: | ||||
| Description | Total | Level 1 | Level 2 | Level 3 |
| Investments in Securities: | ||||
| Equities: | ||||
| Communication Services | $413,776,080 | $413,776,080 | $-- | $-- |
| Consumer Discretionary | 454,699,391 | 454,699,391 | -- | -- |
| Consumer Staples | 428,249,643 | 428,249,643 | -- | -- |
| Energy | 354,382,098 | 354,382,098 | -- | -- |
| Financials | 1,221,465,080 | 1,221,465,080 | -- | -- |
| Health Care | 1,161,692,019 | 1,161,692,019 | -- | -- |
| Industrials | 662,181,086 | 662,181,086 | -- | -- |
| Information Technology | 711,204,711 | 711,204,711 | -- | -- |
| Materials | 237,209,570 | 237,209,570 | -- | -- |
| Real Estate | 304,266,193 | 304,266,193 | -- | -- |
| Utilities | 201,937,060 | 201,937,060 | -- | -- |
| Money Market Funds | 80,629,696 | 80,629,696 | -- | -- |
| Total Investments in Securities: | $6,231,692,627 | $6,231,692,627 | $-- | $-- |
| Derivative Instruments: | ||||
| Assets | ||||
| Futures Contracts | $2,380,865 | $2,380,865 | $-- | $-- |
| Total Assets | $2,380,865 | $2,380,865 | $-- | $-- |
| Total Derivative Instruments: | $2,380,865 | $2,380,865 | $-- | $-- |
Value of Derivative Instruments
The following table is a summary of the Fund's value of derivative instruments by primary risk exposure as of August 31, 2021. For additional information on derivative instruments, please refer to the Derivative Instruments section in the accompanying Notes to Financial Statements.
| Primary Risk Exposure / Derivative Type | Value | |
| Asset | Liability | |
| Equity Risk | ||
| Futures Contracts(a) | $2,380,865 | $0 |
| Total Equity Risk | 2,380,865 | 0 |
| Total Value of Derivatives | $2,380,865 | $0 |
(a) Reflects gross cumulative appreciation (depreciation) on futures contracts as presented in the Schedule of Investments. In the Statement of Assets and Liabilities, the period end daily variation margin is included in receivable or payable for daily variation margin on futures contracts, and the net cumulative appreciation (depreciation) is included in Total accumulated earnings (loss).
See accompanying notes which are an integral part of the financial statements.
Fidelity® Large Cap Value Enhanced Index Fund
Financial Statements
Statement of Assets and Liabilities
| August 31, 2021 | ||
| Assets | ||
| Investment in securities, at value (including securities loaned of $53,995,264) — See accompanying schedule: Unaffiliated issuers (cost $4,857,048,510) | $6,151,062,931 | |
| Fidelity Central Funds (cost $80,629,696) | 80,629,696 | |
| Total Investment in Securities (cost $4,937,678,206) | $6,231,692,627 | |
| Segregated cash with brokers for derivative instruments | 1,794,000 | |
| Receivable for fund shares sold | 3,543,058 | |
| Dividends receivable | 10,707,599 | |
| Distributions receivable from Fidelity Central Funds | 4,672 | |
| Other receivables | 53 | |
| Total assets | 6,247,742,009 | |
| Liabilities | ||
| Payable for fund shares redeemed | $3,378,010 | |
| Accrued management fee | 1,998,148 | |
| Payable for daily variation margin on futures contracts | 36,442 | |
| Collateral on securities loaned | 54,821,024 | |
| Total liabilities | 60,233,624 | |
| Net Assets | $6,187,508,385 | |
| Net Assets consist of: | ||
| Paid in capital | $4,341,580,017 | |
| Total accumulated earnings (loss) | 1,845,928,368 | |
| Net Assets | $6,187,508,385 | |
| Net Asset Value, offering price and redemption price per share ($6,187,508,385 ÷ 358,002,999 shares) | $17.28 |
See accompanying notes which are an integral part of the financial statements.
Statement of Operations
| Year ended August 31, 2021 | ||
| Investment Income | ||
| Dividends | $102,221,104 | |
| Interest | 7,213 | |
| Income from Fidelity Central Funds (including $45,315 from security lending) | 87,848 | |
| Total income | 102,316,165 | |
| Expenses | ||
| Management fee | $19,494,567 | |
| Independent trustees' fees and expenses | 19,662 | |
| Miscellaneous | 1,946 | |
| Total expenses before reductions | 19,516,175 | |
| Expense reductions | (17) | |
| Total expenses after reductions | 19,516,158 | |
| Net investment income (loss) | 82,800,007 | |
| Realized and Unrealized Gain (Loss) | ||
| Net realized gain (loss) on: | ||
| Investment securities: | ||
| Unaffiliated issuers | 582,433,416 | |
| Fidelity Central Funds | (14,790) | |
| Futures contracts | 30,205,612 | |
| Total net realized gain (loss) | 612,624,238 | |
| Change in net unrealized appreciation (depreciation) on: | ||
| Investment securities: | ||
| Unaffiliated issuers | 891,530,679 | |
| Futures contracts | (7,084,942) | |
| Total change in net unrealized appreciation (depreciation) | 884,445,737 | |
| Net gain (loss) | 1,497,069,975 | |
| Net increase (decrease) in net assets resulting from operations | $1,579,869,982 |
See accompanying notes which are an integral part of the financial statements.
Statement of Changes in Net Assets
| Year ended August 31, 2021 | Year ended August 31, 2020 | |
| Increase (Decrease) in Net Assets | ||
| Operations | ||
| Net investment income (loss) | $82,800,007 | $82,780,635 |
| Net realized gain (loss) | 612,624,238 | (74,800,031) |
| Change in net unrealized appreciation (depreciation) | 884,445,737 | 57,205,902 |
| Net increase (decrease) in net assets resulting from operations | 1,579,869,982 | 65,186,506 |
| Distributions to shareholders | (72,050,354) | (133,328,253) |
| Share transactions | ||
| Proceeds from sales of shares | 1,305,285,422 | 1,109,158,059 |
| Reinvestment of distributions | 69,423,163 | 129,596,262 |
| Cost of shares redeemed | (582,158,495) | (1,040,826,463) |
| Net increase (decrease) in net assets resulting from share transactions | 792,550,090 | 197,927,858 |
| Total increase (decrease) in net assets | 2,300,369,718 | 129,786,111 |
| Net Assets | ||
| Beginning of period | 3,887,138,667 | 3,757,352,556 |
| End of period | $6,187,508,385 | $3,887,138,667 |
| Other Information | ||
| Shares | ||
| Sold | 83,825,151 | 90,730,727 |
| Issued in reinvestment of distributions | 5,016,125 | 9,571,363 |
| Redeemed | (38,515,307) | (86,005,764) |
| Net increase (decrease) | 50,325,969 | 14,296,326 |
See accompanying notes which are an integral part of the financial statements.
Financial Highlights
Fidelity Large Cap Value Enhanced Index Fund
| Years ended August 31, | 2021 | 2020 | 2019 | 2018 | 2017 A | 2017 B |
| Selected Per–Share Data | ||||||
| Net asset value, beginning of period | $12.63 | $12.81 | $13.81 | $12.50 | $12.53 | $9.94 |
| Income from Investment Operations | ||||||
| Net investment income (loss)C | .25 | .28 | .30 | .30 | .14 | .25 |
| Net realized and unrealized gain (loss) | 4.63 | –D | (.46) | 1.57 | (.04) | 2.55 |
| Total from investment operations | 4.88 | .28 | (.16) | 1.87 | .10 | 2.80 |
| Distributions from net investment income | (.23) | (.29) | (.31) | (.22) | (.04) | (.21) |
| Distributions from net realized gain | – | (.17) | (.54) | (.34) | (.09) | – |
| Total distributions | (.23) | (.46) | (.84)E | (.56) | (.13) | (.21) |
| Net asset value, end of period | $17.28 | $12.63 | $12.81 | $13.81 | $12.50 | $12.53 |
| Total ReturnF,G | 39.12% | 1.95% | (.77)% | 15.20% | .79% | 28.30% |
| Ratios to Average Net AssetsH,I | ||||||
| Expenses before reductions | .39% | .39% | .39% | .39% | .40%J | .45% |
| Expenses net of fee waivers, if any | .39% | .39% | .39% | .39% | .40%J | .45% |
| Expenses net of all reductions | .39% | .39% | .39% | .39% | .40%J | .45% |
| Net investment income (loss) | 1.65% | 2.21% | 2.37% | 2.27% | 2.27%J | 2.23% |
| Supplemental Data | ||||||
| Net assets, end of period (000 omitted) | $6,187,508 | $3,887,139 | $3,757,353 | $3,925,278 | $3,062,841 | $2,889,227 |
| Portfolio turnover rateK | 75% | 81% | 94% | 99% | 93%J | 81% |
A For the six month period ended August 31. The Fund changed its fiscal year end from February 28 to August 31, effective August 31, 2017.
B For the year ended February 28.
C Calculated based on average shares outstanding during the period.
D Amount represents less than $.005 per share.
E Total distributions per share do not sum due to rounding.
F Total returns for periods of less than one year are not annualized.
G Total returns would have been lower if certain expenses had not been reduced during the applicable periods shown.
H Fees and expenses of any underlying mutual funds or exchange-traded funds (ETFs) are not included in the Fund's expense ratio. The Fund indirectly bears its proportionate share of these expenses. For additional expense information related to investments in Fidelity Central Funds, please refer to the "Investments in Fidelity Central Funds" note found in the Notes to Financial Statements section of the most recent Annual or Semi-Annual report.
I Expense ratios reflect operating expenses of the class. Expenses before reductions do not reflect amounts reimbursed, waived, or reduced through arrangements with the investment advisor, brokerage services, or other offset arrangements, if applicable, and do not represent the amount paid by the class during periods when reimbursements, waivers or reductions occur.
J Annualized
K Amount does not include the portfolio activity of any underlying mutual funds or exchange-traded funds (ETFs).
See accompanying notes which are an integral part of the financial statements.
Fidelity® Large Cap Core Enhanced Index Fund
Performance: The Bottom Line
Average annual total return reflects the change in the value of an investment, assuming reinvestment of distributions from dividend income and capital gains (the profits earned upon the sale of securities that have grown in value, if any) and assuming a constant rate of performance each year. The hypothetical investment and the average annual total returns do not reflect the deduction of taxes that a shareholder would pay on fund distributions or the redemption of fund shares. During periods of reimbursement by Fidelity, a fund’s total return will be greater than it would be had the reimbursement not occurred. How a fund did yesterday is no guarantee of how it will do tomorrow.
Average Annual Total Returns
| For the periods ended August 31, 2021 | Past 1 year | Past 5 years | Past 10 years |
| Fidelity® Large Cap Core Enhanced Index Fund | 32.14% | 17.88% | 16.01% |
$10,000 Over 10 Years
Let's say hypothetically that $10,000 was invested in Fidelity® Large Cap Core Enhanced Index Fund on August 31, 2011.
The chart shows how the value of your investment would have changed, and also shows how the S&P 500® Index performed over the same period.
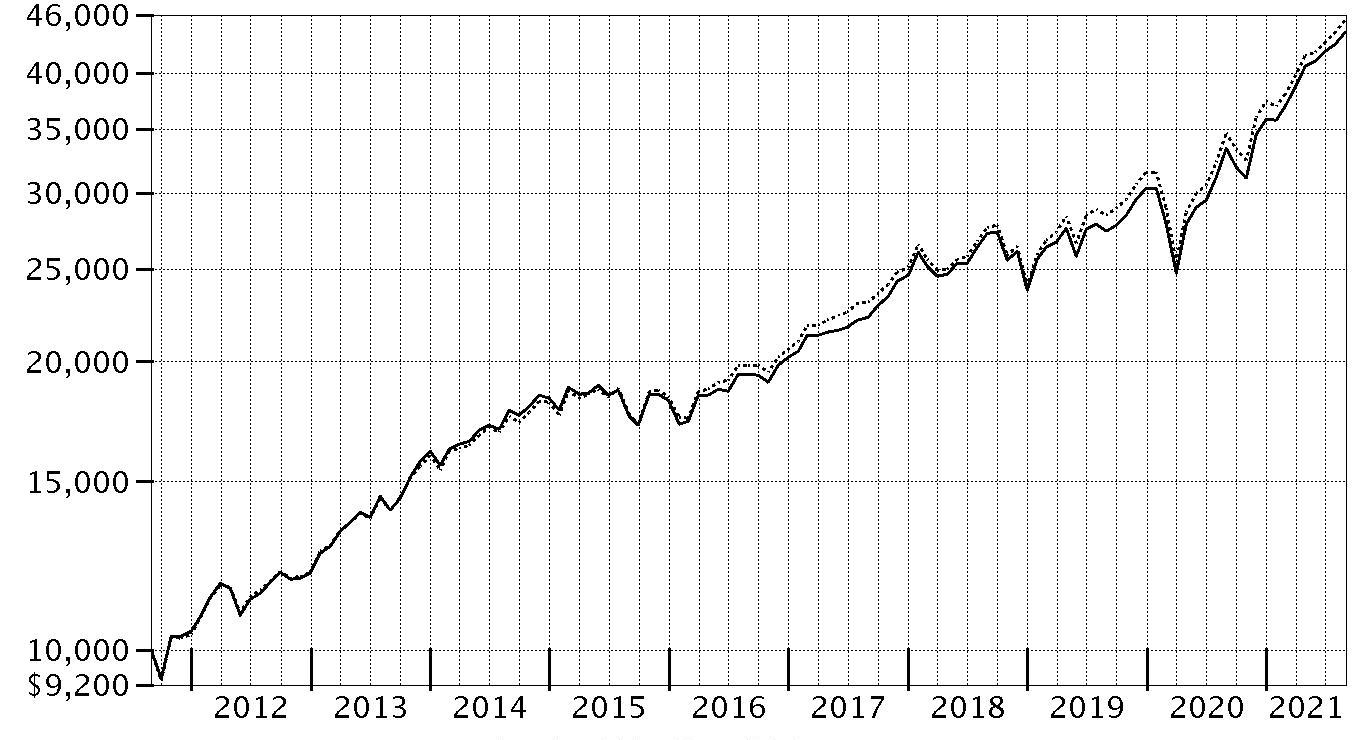
| Period Ending Values | ||
| $44,133 | Fidelity® Large Cap Core Enhanced Index Fund | |
| $45,424 | S&P 500® Index | |
Fidelity® Large Cap Core Enhanced Index Fund
Management's Discussion of Fund Performance
Market Recap: The S&P 500® index gained 31.17% for the 12 months ending August 31, 2021, as U.S. equities continued a historic rebound following a steep but brief decline due to the early-2020 outbreak and spread of COVID-19. The rally slowed in September 2020, when stocks began a two-month retreat amid Congress’s inability to reach a deal on additional fiscal stimulus, as well as uncertainty about the election. But as the calendar turned, investors grew hopeful. The rollout of three COVID-19 vaccines was underway, the U.S. Federal Reserve pledged to hold interest rates near zero until the economy recovered, and the federal government planned to deploy trillions of dollars to boost consumers and the economy. This backdrop fueled a sharp rotation, with small-cap value usurping leadership from large growth. As part of the “reopening” theme, investors moved out of tech-driven mega-caps that had thrived due to the work-from-home trend in favor of cheap smaller companies that stood to benefit from a broad cyclical recovery. A flattish May reflected concerns about inflation and jobs, but the uptrend resumed through August, driven by corporate earnings and a rebounding economy. Notably, this leg saw momentum shift back to large growth, as easing rates and a hawkish Fed stymied the reflation trade. By sector, financials (+56%) led, driven by banks, which rose 67% as the economy brightened. Energy (+43%) also stood out. In contrast, notable “laggards” included consumer staples (+14%) and consumer discretionary (+18%).Comments from Senior Portfolio Manager Maximilian Kaufmann, of the Geode Capital Management, LLC, investment management team: For the fiscal year ending August 31, 2021, the fund gained 32.14%, outperforming the 31.17% result of the benchmark S&P 500® index. Versus the benchmark, security selection was the primary contributor, especially in the industrials sector. Strong picks in the consumer discretionary sector, especially within the consumer services industry, also helped. Also bolstering the fund's relative result was security selection and an underweighting in consumer staples. Scientific Games, the fund's largest individual contributor, increased about 120% this period. This was a position we established the past 12 months. Our second-largest contributor was Park Hotels & Resorts, which gained roughly 139% the past year. Park Hotels & Resorts was sold in the past 12 months. Another contributor this period was AGCO. The stock gained approximately 99% the past 12 months. All of these contributors were non-benchmark positions. In contrast, the biggest detractors from performance versus the benchmark were stock picks and an overweighting in the health care sector, especially within the health care equipment & services industry. Stock selection and an underweighting in materials and an overweighting in consumer discretionary also hindered the fund's relative performance. The biggest individual relative detractor was an underweight position in Salesforce.com (-3%). This period we reduced our stake. Another notable relative detractor was an underweighting in Exxon Mobil (+46%). This period we increased our stake. Another notable relative detractor was an outsized stake in Intel (+11%). Notable changes in positioning include increased exposure to the financials sector.The views expressed above reflect those of the portfolio manager(s) only through the end of the period as stated on the cover of this report and do not necessarily represent the views of Fidelity or any other person in the Fidelity organization. Any such views are subject to change at any time based upon market or other conditions and Fidelity disclaims any responsibility to update such views. These views may not be relied on as investment advice and, because investment decisions for a Fidelity fund are based on numerous factors, may not be relied on as an indication of trading intent on behalf of any Fidelity fund.
Fidelity® Large Cap Core Enhanced Index Fund
Investment Summary (Unaudited)
Top Ten Stocks as of August 31, 2021
| % of fund's net assets | |
| Microsoft Corp. | 5.9 |
| Apple, Inc. | 5.9 |
| Amazon.com, Inc. | 3.7 |
| Facebook, Inc. Class A | 2.7 |
| Alphabet, Inc. Class A | 2.2 |
| Alphabet, Inc. Class C | 2.1 |
| Berkshire Hathaway, Inc. Class B | 1.9 |
| NVIDIA Corp. | 1.8 |
| Johnson & Johnson | 1.5 |
| UnitedHealth Group, Inc. | 1.3 |
| 29.0 |
Top Market Sectors as of August 31, 2021
| % of fund's net assets | |
| Information Technology | 28.5 |
| Health Care | 14.1 |
| Consumer Discretionary | 12.3 |
| Financials | 10.4 |
| Communication Services | 10.1 |
| Industrials | 6.9 |
| Consumer Staples | 5.3 |
| Energy | 3.9 |
| Real Estate | 2.5 |
| Materials | 2.4 |
Asset Allocation (% of fund's net assets)
| As of August 31, 2021* | ||
| Stocks and Equity Futures | 100.0% | |

* Foreign investments - 2.1%
Fidelity® Large Cap Core Enhanced Index Fund
Schedule of Investments August 31, 2021
Showing Percentage of Net Assets
| Common Stocks - 97.5% | |||
| Shares | Value | ||
| COMMUNICATION SERVICES - 10.1% | |||
| Diversified Telecommunication Services - 1.0% | |||
| AT&T, Inc. | 69,610 | $1,908,706 | |
| Verizon Communications, Inc. | 242,585 | 13,342,175 | |
| 15,250,881 | |||
| Entertainment - 1.5% | |||
| Activision Blizzard, Inc. | 92,117 | 7,587,677 | |
| Electronic Arts, Inc. | 52,356 | 7,602,615 | |
| Netflix, Inc. (a) | 3,715 | 2,114,541 | |
| The Walt Disney Co. (a) | 28,166 | 5,106,496 | |
| 22,411,329 | |||
| Interactive Media & Services - 7.0% | |||
| Alphabet, Inc.: | |||
| Class A (a) | 11,568 | 33,477,214 | |
| Class C (a) | 11,058 | 32,170,376 | |
| Facebook, Inc. Class A (a) | 107,059 | 40,616,043 | |
| 106,263,633 | |||
| Media - 0.6% | |||
| Comcast Corp. Class A | 149,202 | 9,053,577 | |
| TOTAL COMMUNICATION SERVICES | 152,979,420 | ||
| CONSUMER DISCRETIONARY - 12.3% | |||
| Automobiles - 1.4% | |||
| Ford Motor Co. (a) | 236,804 | 3,085,556 | |
| Tesla, Inc. (a) | 24,559 | 18,068,547 | |
| 21,154,103 | |||
| Hotels, Restaurants & Leisure - 2.3% | |||
| International Game Technology PLC (a) | 41,438 | 890,503 | |
| McDonald's Corp. | 57,741 | 13,711,178 | |
| Scientific Games Corp. Class A (a) | 40,004 | 2,894,289 | |
| Starbucks Corp. | 68,991 | 8,105,753 | |
| Travel+Leisure Co. | 74,155 | 4,060,728 | |
| Wendy's Co. | 129,631 | 2,984,106 | |
| Yum! Brands, Inc. | 13,297 | 1,742,306 | |
| 34,388,863 | |||
| Household Durables - 1.3% | |||
| D.R. Horton, Inc. | 38,461 | 3,677,641 | |
| Meritage Homes Corp. (a)(b) | 41,678 | 4,648,764 | |
| NVR, Inc. (a) | 823 | 4,263,091 | |
| PulteGroup, Inc. | 94,462 | 5,087,723 | |
| Toll Brothers, Inc. (b) | 32,287 | 2,068,305 | |
| 19,745,524 | |||
| Internet & Direct Marketing Retail - 3.8% | |||
| Amazon.com, Inc. (a) | 16,059 | 55,737,417 | |
| eBay, Inc. | 19,927 | 1,529,198 | |
| 57,266,615 | |||
| Leisure Products - 0.0% | |||
| Brunswick Corp. | 5,016 | 485,900 | |
| Polaris, Inc. | 1,615 | 193,412 | |
| 679,312 | |||
| Multiline Retail - 0.9% | |||
| Dollar General Corp. | 23,277 | 5,188,676 | |
| Dollar Tree, Inc. (a) | 8,682 | 786,068 | |
| Target Corp. | 29,681 | 7,330,613 | |
| 13,305,357 | |||
| Specialty Retail - 2.0% | |||
| AutoNation, Inc. (a)(b) | 12,672 | 1,382,388 | |
| Foot Locker, Inc. | 25,683 | 1,455,969 | |
| Lowe's Companies, Inc. | 44,290 | 9,030,288 | |
| O'Reilly Automotive, Inc. (a) | 5,650 | 3,356,552 | |
| The Home Depot, Inc. | 31,557 | 10,293,262 | |
| TJX Companies, Inc. | 5,368 | 390,361 | |
| Ulta Beauty, Inc. (a) | 10,243 | 3,967,216 | |
| 29,876,036 | |||
| Textiles, Apparel & Luxury Goods - 0.6% | |||
| Deckers Outdoor Corp. (a) | 1,153 | 482,473 | |
| NIKE, Inc. Class B | 52,060 | 8,576,364 | |
| 9,058,837 | |||
| TOTAL CONSUMER DISCRETIONARY | 185,474,647 | ||
| CONSUMER STAPLES - 5.3% | |||
| Beverages - 1.2% | |||
| PepsiCo, Inc. | 15,305 | 2,393,549 | |
| The Coca-Cola Co. | 273,268 | 15,387,721 | |
| 17,781,270 | |||
| Food & Staples Retailing - 1.7% | |||
| Costco Wholesale Corp. | 21,899 | 9,974,776 | |
| Walmart, Inc. | 102,542 | 15,186,470 | |
| 25,161,246 | |||
| Food Products - 1.0% | |||
| Archer Daniels Midland Co. | 47,091 | 2,825,460 | |
| Mondelez International, Inc. | 109,144 | 6,774,568 | |
| The Kraft Heinz Co. | 54,290 | 1,953,897 | |
| Tyson Foods, Inc. Class A | 55,437 | 4,352,913 | |
| 15,906,838 | |||
| Household Products - 1.0% | |||
| Colgate-Palmolive Co. | 27,380 | 2,134,271 | |
| Procter & Gamble Co. | 90,394 | 12,871,202 | |
| 15,005,473 | |||
| Tobacco - 0.4% | |||
| Altria Group, Inc. | 19,502 | 979,585 | |
| Philip Morris International, Inc. | 54,117 | 5,574,051 | |
| 6,553,636 | |||
| TOTAL CONSUMER STAPLES | 80,408,463 | ||
| ENERGY - 3.9% | |||
| Energy Equipment & Services - 0.7% | |||
| Halliburton Co. | 185,414 | 3,704,572 | |
| Schlumberger Ltd. | 235,709 | 6,609,280 | |
| 10,313,852 | |||
| Oil, Gas & Consumable Fuels - 3.2% | |||
| Antero Resources Corp. (a)(b) | 15,381 | 211,027 | |
| Chevron Corp. | 54,102 | 5,235,451 | |
| ConocoPhillips Co. | 140,545 | 7,804,464 | |
| Continental Resources, Inc. | 13,740 | 539,707 | |
| Diamondback Energy, Inc. | 3,294 | 254,099 | |
| EOG Resources, Inc. | 133,616 | 9,021,752 | |
| Exxon Mobil Corp. | 241,049 | 13,141,991 | |
| Hess Corp. | 14,238 | 978,863 | |
| Marathon Oil Corp. | 319,895 | 3,758,766 | |
| Occidental Petroleum Corp. warrants 8/3/27 (a) | 9,120 | 92,294 | |
| Ovintiv, Inc. | 25,583 | 697,393 | |
| PDC Energy, Inc. | 21,261 | 887,647 | |
| Pioneer Natural Resources Co. | 25,096 | 3,756,118 | |
| Texas Pacific Land Corp. (b) | 948 | 1,289,034 | |
| 47,668,606 | |||
| TOTAL ENERGY | 57,982,458 | ||
| FINANCIALS - 10.4% | |||
| Banks - 3.9% | |||
| Bank of America Corp. | 174,123 | 7,269,635 | |
| Citigroup, Inc. | 100,698 | 7,241,193 | |
| Citizens Financial Group, Inc. | 55,515 | 2,431,002 | |
| Comerica, Inc. | 9,522 | 703,771 | |
| First Republic Bank | 16,690 | 3,320,309 | |
| Glacier Bancorp, Inc. | 3,270 | 174,160 | |
| Hancock Whitney Corp. | 42,179 | 1,938,547 | |
| Huntington Bancshares, Inc. | 40,303 | 625,906 | |
| JPMorgan Chase & Co. | 108,542 | 17,361,293 | |
| KeyCorp | 56,945 | 1,157,122 | |
| PNC Financial Services Group, Inc. | 22,210 | 4,244,331 | |
| Regions Financial Corp. | 222,030 | 4,536,073 | |
| SVB Financial Group (a) | 371 | 207,575 | |
| Truist Financial Corp. | 19,753 | 1,127,106 | |
| U.S. Bancorp | 12,573 | 721,564 | |
| Wells Fargo & Co. | 114,737 | 5,243,481 | |
| 58,303,068 | |||
| Capital Markets - 2.5% | |||
| Ameriprise Financial, Inc. | 19,634 | 5,358,315 | |
| Artisan Partners Asset Management, Inc. | 31,420 | 1,632,583 | |
| Goldman Sachs Group, Inc. | 29,891 | 12,360,227 | |
| Jefferies Financial Group, Inc. (b) | 59,168 | 2,186,849 | |
| LPL Financial | 1,744 | 257,850 | |
| Morgan Stanley | 78,428 | 8,190,236 | |
| NASDAQ, Inc. | 2,497 | 488,863 | |
| Raymond James Financial, Inc. | 21,248 | 2,972,595 | |
| S&P Global, Inc. | 2,686 | 1,192,101 | |
| SEI Investments Co. | 17,985 | 1,129,638 | |
| State Street Corp. | 27,603 | 2,564,595 | |
| Stifel Financial Corp. | 4,235 | 292,639 | |
| 38,626,491 | |||
| Consumer Finance - 1.0% | |||
| Capital One Financial Corp. | 45,506 | 7,552,631 | |
| OneMain Holdings, Inc. | 55,103 | 3,186,606 | |
| SLM Corp. | 69,616 | 1,305,300 | |
| Synchrony Financial | 75,807 | 3,771,398 | |
| 15,815,935 | |||
| Diversified Financial Services - 1.9% | |||
| Berkshire Hathaway, Inc. Class B (a) | 98,481 | 28,142,915 | |
| Insurance - 1.1% | |||
| Aon PLC | 5,384 | 1,544,454 | |
| Arthur J. Gallagher & Co. | 1,869 | 268,426 | |
| First American Financial Corp. | 36,414 | 2,568,279 | |
| MetLife, Inc. | 90,004 | 5,580,248 | |
| Primerica, Inc. | 7,824 | 1,196,603 | |
| Reinsurance Group of America, Inc. | 3,164 | 366,454 | |
| Selective Insurance Group, Inc. | 12,574 | 1,050,809 | |
| The Travelers Companies, Inc. | 3,396 | 542,375 | |
| Trupanion, Inc. (a)(b) | 7,952 | 728,244 | |
| W.R. Berkley Corp. | 32,875 | 2,475,816 | |
| 16,321,708 | |||
| TOTAL FINANCIALS | 157,210,117 | ||
| HEALTH CARE - 14.1% | |||
| Biotechnology - 2.6% | |||
| AbbVie, Inc. | 12,316 | 1,487,526 | |
| Amgen, Inc. | 32,328 | 7,290,934 | |
| Biogen, Inc. (a) | 11,280 | 3,822,905 | |
| Gilead Sciences, Inc. | 151,332 | 11,013,943 | |
| Incyte Corp. (a) | 65,078 | 4,977,816 | |
| Moderna, Inc. (a) | 7,226 | 2,721,962 | |
| Regeneron Pharmaceuticals, Inc. (a) | 2,596 | 1,748,146 | |
| United Therapeutics Corp. (a) | 8,930 | 1,918,878 | |
| Vertex Pharmaceuticals, Inc. (a) | 19,038 | 3,813,121 | |
| 38,795,231 | |||
| Health Care Equipment & Supplies - 2.4% | |||
| Abbott Laboratories | 79,540 | 10,051,470 | |
| Baxter International, Inc. | 63,069 | 4,807,119 | |
| Danaher Corp. | 5,322 | 1,725,180 | |
| Edwards Lifesciences Corp. (a) | 20,295 | 2,378,168 | |
| IDEXX Laboratories, Inc. (a) | 4,401 | 2,965,218 | |
| Intuitive Surgical, Inc. (a) | 3,347 | 3,526,265 | |
| Medtronic PLC | 34,652 | 4,625,349 | |
| Stryker Corp. | 12,918 | 3,579,578 | |
| West Pharmaceutical Services, Inc. | 5,612 | 2,534,491 | |
| Zimmer Biomet Holdings, Inc. | 4,289 | 645,280 | |
| 36,838,118 | |||
| Health Care Providers & Services - 2.6% | |||
| Anthem, Inc. | 29,107 | 10,918,909 | |
| CVS Health Corp. | 73,555 | 6,354,416 | |
| Laboratory Corp. of America Holdings (a) | 7,133 | 2,164,010 | |
| Molina Healthcare, Inc. (a) | 1,883 | 506,094 | |
| UnitedHealth Group, Inc. | 47,440 | 19,747,849 | |
| 39,691,278 | |||
| Health Care Technology - 0.5% | |||
| Cerner Corp. | 65,750 | 5,020,013 | |
| Veeva Systems, Inc. Class A (a) | 8,578 | 2,847,724 | |
| 7,867,737 | |||
| Life Sciences Tools & Services - 1.9% | |||
| Agilent Technologies, Inc. | 22,534 | 3,954,041 | |
| Bio-Rad Laboratories, Inc. Class A (a) | 2,199 | 1,769,799 | |
| Illumina, Inc. (a) | 14,520 | 6,637,963 | |
| Thermo Fisher Scientific, Inc. | 21,687 | 12,035,201 | |
| Waters Corp. (a) | 8,480 | 3,510,890 | |
| 27,907,894 | |||
| Pharmaceuticals - 4.1% | |||
| AstraZeneca PLC sponsored ADR | 24,520 | 1,429,026 | |
| Bristol-Myers Squibb Co. | 192,874 | 12,895,556 | |
| Eli Lilly & Co. | 3,193 | 824,720 | |
| Johnson & Johnson | 135,420 | 23,445,265 | |
| Merck & Co., Inc. | 124,045 | 9,463,393 | |
| Pfizer, Inc. | 292,482 | 13,474,646 | |
| 61,532,606 | |||
| TOTAL HEALTH CARE | 212,632,864 | ||
| INDUSTRIALS - 6.9% | |||
| Aerospace & Defense - 1.2% | |||
| Lockheed Martin Corp. | 21,006 | 7,557,959 | |
| Mercury Systems, Inc. (a) | 18,849 | 949,613 | |
| Moog, Inc. Class A | 41,730 | 3,315,031 | |
| Northrop Grumman Corp. | 10,954 | 4,027,786 | |
| Teledyne Technologies, Inc. (a) | 3,803 | 1,762,234 | |
| 17,612,623 | |||
| Air Freight & Logistics - 0.2% | |||
| FedEx Corp. | 1,221 | 324,407 | |
| United Parcel Service, Inc. Class B | 13,146 | 2,571,752 | |
| 2,896,159 | |||
| Airlines - 0.2% | |||
| Alaska Air Group, Inc. (a) | 18,304 | 1,049,551 | |
| Southwest Airlines Co. (a) | 45,146 | 2,247,368 | |
| 3,296,919 | |||
| Building Products - 0.3% | |||
| Simpson Manufacturing Co. Ltd. | 5,664 | 640,882 | |
| UFP Industries, Inc. (b) | 45,937 | 3,448,950 | |
| 4,089,832 | |||
| Commercial Services & Supplies - 0.4% | |||
| Clean Harbors, Inc. (a) | 14,837 | 1,522,573 | |
| Republic Services, Inc. | 36,117 | 4,483,203 | |
| 6,005,776 | |||
| Construction & Engineering - 0.4% | |||
| EMCOR Group, Inc. | 48,781 | 5,926,892 | |
| Electrical Equipment - 1.1% | |||
| AMETEK, Inc. | 21,454 | 2,917,100 | |
| Atkore, Inc. (a) | 11,716 | 1,086,893 | |
| Eaton Corp. PLC | 17,715 | 2,982,497 | |
| Emerson Electric Co. | 84,250 | 8,888,375 | |
| nVent Electric PLC | 36,366 | 1,249,536 | |
| 17,124,401 | |||
| Industrial Conglomerates - 0.6% | |||
| 3M Co. | 27,234 | 5,303,549 | |
| Roper Technologies, Inc. | 6,776 | 3,274,705 | |
| 8,578,254 | |||
| Machinery - 1.6% | |||
| AGCO Corp. | 47,615 | 6,552,776 | |
| Caterpillar, Inc. | 40,161 | 8,468,750 | |
| Cummins, Inc. | 1,361 | 321,169 | |
| Deere & Co. | 24,830 | 9,386,485 | |
| 24,729,180 | |||
| Professional Services - 0.1% | |||
| CACI International, Inc. Class A (a) | 3,759 | 968,093 | |
| IHS Markit Ltd. | 169 | 20,381 | |
| TriNet Group, Inc. (a) | 11,689 | 1,076,323 | |
| 2,064,797 | |||
| Road & Rail - 0.8% | |||
| Old Dominion Freight Lines, Inc. | 13,181 | 3,805,618 | |
| Union Pacific Corp. | 34,730 | 7,530,853 | |
| 11,336,471 | |||
| TOTAL INDUSTRIALS | 103,661,304 | ||
| INFORMATION TECHNOLOGY - 28.5% | |||
| Communications Equipment - 0.9% | |||
| Cisco Systems, Inc. | 225,332 | 13,299,095 | |
| Juniper Networks, Inc. | 9,365 | 271,398 | |
| 13,570,493 | |||
| Electronic Equipment & Components - 0.5% | |||
| National Instruments Corp. | 84,089 | 3,516,602 | |
| Vontier Corp. | 106,303 | 3,866,240 | |
| 7,382,842 | |||
| IT Services - 4.9% | |||
| Accenture PLC Class A | 17,675 | 5,948,698 | |
| Alliance Data Systems Corp. | 1,182 | 115,966 | |
| Amdocs Ltd. | 86,334 | 6,650,308 | |
| Automatic Data Processing, Inc. | 7,643 | 1,597,693 | |
| Cognizant Technology Solutions Corp. Class A | 39,771 | 3,034,925 | |
| EPAM Systems, Inc. (a) | 11,830 | 7,486,142 | |
| Fidelity National Information Services, Inc. | 2,631 | 336,163 | |
| FleetCor Technologies, Inc. (a) | 15,941 | 4,196,946 | |
| Gartner, Inc. (a) | 20,181 | 6,230,682 | |
| IBM Corp. | 51,826 | 7,273,261 | |
| MasterCard, Inc. Class A | 35,604 | 12,327,173 | |
| PayPal Holdings, Inc. (a) | 18,977 | 5,477,901 | |
| SolarWinds, Inc. (b) | 7,141 | 121,897 | |
| The Western Union Co. | 50,643 | 1,095,915 | |
| Visa, Inc. Class A | 51,800 | 11,867,380 | |
| 73,761,050 | |||
| Semiconductors & Semiconductor Equipment - 5.5% | |||
| Applied Materials, Inc. | 27,397 | 3,702,157 | |
| Broadcom, Inc. | 14,607 | 7,262,746 | |
| Cirrus Logic, Inc. (a) | 18,143 | 1,518,025 | |
| Intel Corp. | 292,861 | 15,832,066 | |
| Lam Research Corp. | 1,183 | 715,502 | |
| NVIDIA Corp. | 119,116 | 26,664,117 | |
| NXP Semiconductors NV | 3,420 | 735,745 | |
| Qualcomm, Inc. | 93,738 | 13,750,427 | |
| Semtech Corp. (a) | 5,855 | 409,382 | |
| Texas Instruments, Inc. | 70,424 | 13,444,646 | |
| 84,034,813 | |||
| Software - 10.4% | |||
| Adobe, Inc. (a) | 27,175 | 18,036,048 | |
| Black Knight, Inc. (a) | 51,203 | 3,874,531 | |
| Box, Inc. Class A (a) | 161,297 | 4,158,237 | |
| Cadence Design Systems, Inc. (a) | 1,790 | 292,629 | |
| Dropbox, Inc. Class A (a) | 238,594 | 7,565,816 | |
| HubSpot, Inc. (a) | 673 | 460,648 | |
| Microsoft Corp. | 294,445 | 88,887,056 | |
| Nutanix, Inc. Class A (a) | 831 | 30,672 | |
| Oracle Corp. | 89,978 | 8,019,739 | |
| Qualys, Inc. (a) | 4,849 | 569,176 | |
| Salesforce.com, Inc. (a) | 9,192 | 2,438,362 | |
| ServiceNow, Inc. (a) | 5,501 | 3,540,664 | |
| SS&C Technologies Holdings, Inc. | 56,869 | 4,302,709 | |
| Synopsys, Inc. (a) | 30,081 | 9,994,111 | |
| Workday, Inc. Class A (a) | 16,352 | 4,466,712 | |
| 156,637,110 | |||
| Technology Hardware, Storage & Peripherals - 6.3% | |||
| Apple, Inc. | 579,242 | 87,946,313 | |
| NetApp, Inc. | 55,615 | 4,945,842 | |
| Western Digital Corp. (a) | 30,720 | 1,941,504 | |
| 94,833,659 | |||
| TOTAL INFORMATION TECHNOLOGY | 430,219,967 | ||
| MATERIALS - 2.4% | |||
| Chemicals - 0.8% | |||
| CF Industries Holdings, Inc. | 75,988 | 3,451,375 | |
| Corteva, Inc. | 93,352 | 4,104,687 | |
| DuPont de Nemours, Inc. | 31,139 | 2,304,909 | |
| NewMarket Corp. | 4,089 | 1,430,046 | |
| Olin Corp. | 27,044 | 1,347,873 | |
| 12,638,890 | |||
| Construction Materials - 0.2% | |||
| Vulcan Materials Co. | 11,917 | 2,215,728 | |
| Metals & Mining - 1.4% | |||
| Alcoa Corp. (a) | 143,690 | 6,375,525 | |
| Freeport-McMoRan, Inc. | 208,858 | 7,600,343 | |
| Nucor Corp. | 12,610 | 1,482,432 | |
| Reliance Steel & Aluminum Co. | 33,713 | 5,058,299 | |
| 20,516,599 | |||
| TOTAL MATERIALS | 35,371,217 | ||
| REAL ESTATE - 2.5% | |||
| Equity Real Estate Investment Trusts (REITs) - 2.5% | |||
| American Tower Corp. | 18,685 | 5,459,196 | |
| Apartment Income (REIT) Corp. | 44,591 | 2,266,115 | |
| Camden Property Trust (SBI) | 4,264 | 639,771 | |
| Crown Castle International Corp. | 8,507 | 1,656,228 | |
| Extra Space Storage, Inc. | 2,564 | 479,237 | |
| Healthcare Realty Trust, Inc. | 18,107 | 543,753 | |
| Kilroy Realty Corp. | 4,105 | 269,493 | |
| National Storage Affiliates Trust | 94,060 | 5,384,935 | |
| Prologis (REIT), Inc. | 12,556 | 1,690,791 | |
| PS Business Parks, Inc. | 15,256 | 2,398,701 | |
| Public Storage | 24,525 | 7,936,535 | |
| Realty Income Corp. | 33,018 | 2,384,560 | |
| SBA Communications Corp. Class A | 5,088 | 1,826,439 | |
| Simon Property Group, Inc. | 1,438 | 193,339 | |
| Stag Industrial, Inc. | 6,590 | 278,428 | |
| Terreno Realty Corp. | 1,631 | 108,967 | |
| Weyerhaeuser Co. | 113,549 | 4,087,764 | |
| 37,604,252 | |||
| Real Estate Management & Development - 0.0% | |||
| Opendoor Technologies, Inc. (a)(b) | 31,342 | 555,694 | |
| TOTAL REAL ESTATE | 38,159,946 | ||
| UTILITIES - 1.1% | |||
| Electric Utilities - 0.7% | |||
| Hawaiian Electric Industries, Inc. | 34,391 | 1,499,448 | |
| IDACORP, Inc. | 18,877 | 1,988,692 | |
| NextEra Energy, Inc. | 88,658 | 7,446,385 | |
| Portland General Electric Co. | 3,163 | 162,420 | |
| 11,096,945 | |||
| Multi-Utilities - 0.4% | |||
| MDU Resources Group, Inc. | 89,402 | 2,876,062 | |
| Public Service Enterprise Group, Inc. | 14,125 | 903,153 | |
| WEC Energy Group, Inc. | 20,508 | 1,937,596 | |
| 5,716,811 | |||
| TOTAL UTILITIES | 16,813,756 | ||
| TOTAL COMMON STOCKS | |||
| (Cost $968,564,451) | 1,470,914,159 | ||
| Money Market Funds - 2.8% | |||
| Fidelity Cash Central Fund 0.06% (c) | 28,714,272 | 28,720,015 | |
| Fidelity Securities Lending Cash Central Fund 0.06% (c)(d) | 13,968,174 | 13,969,571 | |
| TOTAL MONEY MARKET FUNDS | |||
| (Cost $42,689,552) | 42,689,586 | ||
| TOTAL INVESTMENT IN SECURITIES - 100.3% | |||
| (Cost $1,011,254,003) | 1,513,603,745 | ||
| NET OTHER ASSETS (LIABILITIES) - (0.3)% | (4,822,933) | ||
| NET ASSETS - 100% | $1,508,780,812 |
| Futures Contracts | |||||
| Number of contracts | Expiration Date | Notional Amount | Value | Unrealized Appreciation/(Depreciation) | |
| Purchased | |||||
| Equity Index Contracts | |||||
| CME E-mini S&P 500 Index Contracts (United States) | 165 | Sept. 2021 | $37,294,125 | $1,553,683 | $1,553,683 |
The notional amount of futures purchased as a percentage of Net Assets is 2.5%
Legend
(a) Non-income producing
(b) Security or a portion of the security is on loan at period end.
(c) Affiliated fund that is generally available only to investment companies and other accounts managed by Fidelity Investments. The rate quoted is the annualized seven-day yield of the fund at period end. A complete unaudited listing of the fund's holdings as of its most recent quarter end is available upon request. In addition, each Fidelity Central Fund's financial statements, which are not covered by the Fund's Report of Independent Registered Public Accounting Firm, are available on the SEC's website or upon request.
(d) Investment made with cash collateral received from securities on loan.
Affiliated Central Funds
Fiscal year to date information regarding the Fund's investments in Fidelity Central Funds, including the ownership percentage, is presented below.
| Fund | Value, beginning of period | Purchases | Sales Proceeds | Dividend Income | Realized Gain/Loss | Change in Unrealized appreciation (depreciation) | Value, end of period | % ownership, end of period |
| Fidelity Cash Central Fund 0.06% | $17,304,753 | $169,996,666 | $158,581,405 | $14,062 | $2 | $(1) | $28,720,015 | 0.0% |
| Fidelity Securities Lending Cash Central Fund 0.06% | 7,391,679 | 130,086,136 | 123,508,244 | 8,136 | -- | -- | 13,969,571 | 0.0% |
| Total | $24,696,432 | $300,082,802 | $282,089,649 | $22,198 | $2 | $(1) | $42,689,586 |
Amounts in the income column in the above table include any capital gain distributions from underlying funds, which are presented in the corresponding line-item in the Statement of Operations, if applicable. Amount for Fidelity Securities Lending Cash Central Fund represents the income earned on investing cash collateral, less rebates paid to borrowers and any lending agent fees associated with the loan, plus any premium payments received for lending certain types of securities.
Investment Valuation
The following is a summary of the inputs used, as of August 31, 2021, involving the Fund's assets and liabilities carried at fair value. The inputs or methodology used for valuing securities may not be an indication of the risk associated with investing in those securities. For more information on valuation inputs, and their aggregation into the levels used below, please refer to the Investment Valuation section in the accompanying Notes to Financial Statements.
| Valuation Inputs at Reporting Date: | ||||
| Description | Total | Level 1 | Level 2 | Level 3 |
| Investments in Securities: | ||||
| Equities: | ||||
| Communication Services | $152,979,420 | $152,979,420 | $-- | $-- |
| Consumer Discretionary | 185,474,647 | 185,474,647 | -- | -- |
| Consumer Staples | 80,408,463 | 80,408,463 | -- | -- |
| Energy | 57,982,458 | 57,982,458 | -- | -- |
| Financials | 157,210,117 | 157,210,117 | -- | -- |
| Health Care | 212,632,864 | 212,632,864 | -- | -- |
| Industrials | 103,661,304 | 103,661,304 | -- | -- |
| Information Technology | 430,219,967 | 430,219,967 | -- | -- |
| Materials | 35,371,217 | 35,371,217 | -- | -- |
| Real Estate | 38,159,946 | 38,159,946 | -- | -- |
| Utilities | 16,813,756 | 16,813,756 | -- | -- |
| Money Market Funds | 42,689,586 | 42,689,586 | -- | -- |
| Total Investments in Securities: | $1,513,603,745 | $1,513,603,745 | $-- | $-- |
| Derivative Instruments: | ||||
| Assets | ||||
| Futures Contracts | $1,553,683 | $1,553,683 | $-- | $-- |
| Total Assets | $1,553,683 | $1,553,683 | $-- | $-- |
| Total Derivative Instruments: | $1,553,683 | $1,553,683 | $-- | $-- |
Value of Derivative Instruments
The following table is a summary of the Fund's value of derivative instruments by primary risk exposure as of August 31, 2021. For additional information on derivative instruments, please refer to the Derivative Instruments section in the accompanying Notes to Financial Statements.
| Primary Risk Exposure / Derivative Type | Value | |
| Asset | Liability | |
| Equity Risk | ||
| Futures Contracts(a) | $1,553,683 | $0 |
| Total Equity Risk | 1,553,683 | 0 |
| Total Value of Derivatives | $1,553,683 | $0 |
(a) Reflects gross cumulative appreciation (depreciation) on futures contracts as presented in the Schedule of Investments. In the Statement of Assets and Liabilities, the period end daily variation margin is included in receivable or payable for daily variation margin on futures contracts, and the net cumulative appreciation (depreciation) is included in Total accumulated earnings (loss).
See accompanying notes which are an integral part of the financial statements.
Fidelity® Large Cap Core Enhanced Index Fund
Financial Statements
Statement of Assets and Liabilities
| August 31, 2021 | ||
| Assets | ||
| Investment in securities, at value (including securities loaned of $13,659,416) — See accompanying schedule: Unaffiliated issuers (cost $968,564,451) | $1,470,914,159 | |
| Fidelity Central Funds (cost $42,689,552) | 42,689,586 | |
| Total Investment in Securities (cost $1,011,254,003) | $1,513,603,745 | |
| Segregated cash with brokers for derivative instruments | 1,587,000 | |
| Receivable for investments sold | 50,214,224 | |
| Receivable for fund shares sold | 1,476,783 | |
| Dividends receivable | 1,799,007 | |
| Distributions receivable from Fidelity Central Funds | 1,840 | |
| Total assets | 1,568,682,599 | |
| Liabilities | ||
| Payable for investments purchased | $44,039,518 | |
| Payable for fund shares redeemed | 1,378,964 | |
| Accrued management fee | 479,221 | |
| Payable for daily variation margin on futures contracts | 34,513 | |
| Collateral on securities loaned | 13,969,571 | |
| Total liabilities | 59,901,787 | |
| Net Assets | $1,508,780,812 | |
| Net Assets consist of: | ||
| Paid in capital | $837,561,052 | |
| Total accumulated earnings (loss) | 671,219,760 | |
| Net Assets | $1,508,780,812 | |
| Net Asset Value, offering price and redemption price per share ($1,508,780,812 ÷ 64,491,167 shares) | $23.40 |
See accompanying notes which are an integral part of the financial statements.
Statement of Operations
| Year ended August 31, 2021 | ||
| Investment Income | ||
| Dividends | $18,497,126 | |
| Interest | 1,549 | |
| Income from Fidelity Central Funds (including $8,136 from security lending) | 22,198 | |
| Total income | 18,520,873 | |
| Expenses | ||
| Management fee | $4,855,579 | |
| Independent trustees' fees and expenses | 5,031 | |
| Miscellaneous | 541 | |
| Total expenses before reductions | 4,861,151 | |
| Expense reductions | (17) | |
| Total expenses after reductions | 4,861,134 | |
| Net investment income (loss) | 13,659,739 | |
| Realized and Unrealized Gain (Loss) | ||
| Net realized gain (loss) on: | ||
| Investment securities: | ||
| Unaffiliated issuers | 166,670,567 | |
| Fidelity Central Funds | 2 | |
| Futures contracts | 6,259,170 | |
| Total net realized gain (loss) | 172,929,739 | |
| Change in net unrealized appreciation (depreciation) on: | ||
| Investment securities: | ||
| Unaffiliated issuers | 167,482,479 | |
| Affiliated issuers | (1) | |
| Futures contracts | (979,386) | |
| Total change in net unrealized appreciation (depreciation) | 166,503,092 | |
| Net gain (loss) | 339,432,831 | |
| Net increase (decrease) in net assets resulting from operations | $353,092,570 |
See accompanying notes which are an integral part of the financial statements.
Statement of Changes in Net Assets
| Year ended August 31, 2021 | Year ended August 31, 2020 | |
| Increase (Decrease) in Net Assets | ||
| Operations | ||
| Net investment income (loss) | $13,659,739 | $13,556,685 |
| Net realized gain (loss) | 172,929,739 | 17,283,529 |
| Change in net unrealized appreciation (depreciation) | 166,503,092 | 169,250,395 |
| Net increase (decrease) in net assets resulting from operations | 353,092,570 | 200,090,609 |
| Distributions to shareholders | (26,171,279) | (21,489,954) |
| Share transactions | ||
| Proceeds from sales of shares | 285,679,244 | 336,476,475 |
| Reinvestment of distributions | 22,676,269 | 20,156,350 |
| Cost of shares redeemed | (213,740,918) | (282,623,722) |
| Net increase (decrease) in net assets resulting from share transactions | 94,614,595 | 74,009,103 |
| Total increase (decrease) in net assets | 421,535,886 | 252,609,758 |
| Net Assets | ||
| Beginning of period | 1,087,244,926 | 834,635,168 |
| End of period | $1,508,780,812 | $1,087,244,926 |
| Other Information | ||
| Shares | ||
| Sold | 14,046,394 | 22,284,606 |
| Issued in reinvestment of distributions | 1,209,401 | 1,226,055 |
| Redeemed | (10,775,930) | (18,390,267) |
| Net increase (decrease) | 4,479,865 | 5,120,394 |
See accompanying notes which are an integral part of the financial statements.
Financial Highlights
Fidelity Large Cap Core Enhanced Index Fund
| Years ended August 31, | 2021 | 2020 | 2019 | 2018 | 2017 A | 2017 B |
| Selected Per–Share Data | ||||||
| Net asset value, beginning of period | $18.12 | $15.21 | $16.22 | $13.74 | $13.21 | $10.90 |
| Income from Investment Operations | ||||||
| Net investment income (loss)C | .22 | .24 | .27 | .27 | .12 | .22 |
| Net realized and unrealized gain (loss) | 5.50 | 3.06 | (.27) | 2.74 | .45 | 2.29 |
| Total from investment operations | 5.72 | 3.30 | – | 3.01 | .57 | 2.51 |
| Distributions from net investment income | (.22) | (.26) | (.24) | (.19) | (.04) | (.20) |
| Distributions from net realized gain | (.22) | (.13) | (.78) | (.33) | – | – |
| Total distributions | (.44) | (.39) | (1.01)D | (.53)D | (.04) | (.20) |
| Net asset value, end of period | $23.40 | $18.12 | $15.21 | $16.22 | $13.74 | $13.21 |
| Total ReturnE,F | 32.14% | 21.97% | .65% | 22.32% | 4.29% | 23.09% |
| Ratios to Average Net AssetsG,H | ||||||
| Expenses before reductions | .39% | .39% | .39% | .39% | .40%I | .45% |
| Expenses net of fee waivers, if any | .39% | .39% | .39% | .39% | .40%I | .45% |
| Expenses net of all reductions | .39% | .39% | .39% | .39% | .40%I | .45% |
| Net investment income (loss) | 1.09% | 1.49% | 1.81% | 1.78% | 1.85%I | 1.82% |
| Supplemental Data | ||||||
| Net assets, end of period (000 omitted) | $1,508,781 | $1,087,245 | $834,635 | $758,736 | $534,236 | $524,986 |
| Portfolio turnover rateJ | 83% | 63% | 77% | 92% | 88%I | 82% |
A For the six month period ended August 31. The Fund changed its fiscal year end from February 28 to August 31, effective August 31, 2017.
B For the year ended February 28.
C Calculated based on average shares outstanding during the period.
D Total distributions per share do not sum due to rounding.
E Total returns for periods of less than one year are not annualized.
F Total returns would have been lower if certain expenses had not been reduced during the applicable periods shown.
G Fees and expenses of any underlying mutual funds or exchange-traded funds (ETFs) are not included in the Fund's expense ratio. The Fund indirectly bears its proportionate share of these expenses. For additional expense information related to investments in Fidelity Central Funds, please refer to the "Investments in Fidelity Central Funds" note found in the Notes to Financial Statements section of the most recent Annual or Semi-Annual report.
H Expense ratios reflect operating expenses of the class. Expenses before reductions do not reflect amounts reimbursed, waived, or reduced through arrangements with the investment advisor, brokerage services, or other offset arrangements, if applicable, and do not represent the amount paid by the class during periods when reimbursements, waivers or reductions occur.
I Annualized
J Amount does not include the portfolio activity of any underlying mutual funds or exchange-traded funds (ETFs).
See accompanying notes which are an integral part of the financial statements.
Fidelity® Mid Cap Enhanced Index Fund
Performance: The Bottom Line
Average annual total return reflects the change in the value of an investment, assuming reinvestment of distributions from dividend income and capital gains (the profits earned upon the sale of securities that have grown in value, if any) and assuming a constant rate of performance each year. The hypothetical investment and the average annual total returns do not reflect the deduction of taxes that a shareholder would pay on fund distributions or the redemption of fund shares. During periods of reimbursement by Fidelity, a fund’s total return will be greater than it would be had the reimbursement not occurred. How a fund did yesterday is no guarantee of how it will do tomorrow.
Average Annual Total Returns
| For the periods ended August 31, 2021 | Past 1 year | Past 5 years | Past 10 years |
| Fidelity® Mid Cap Enhanced Index Fund | 41.82% | 14.50% | 14.36% |
$10,000 Over 10 Years
Let's say hypothetically that $10,000 was invested in Fidelity® Mid Cap Enhanced Index Fund on August 31, 2011.
The chart shows how the value of your investment would have changed, and also shows how the Russell Midcap® Index performed over the same period.
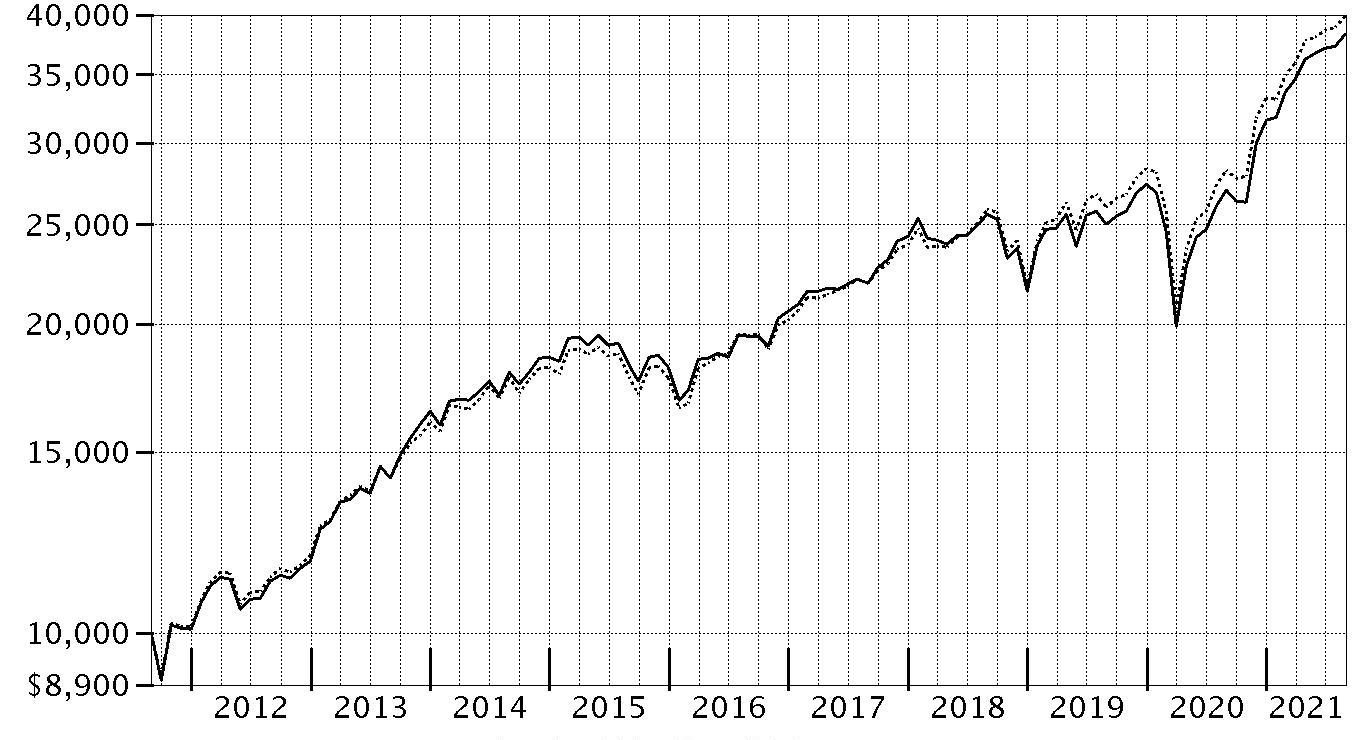
| Period Ending Values | ||
| $38,267 | Fidelity® Mid Cap Enhanced Index Fund | |
| $39,906 | Russell Midcap® Index | |
Fidelity® Mid Cap Enhanced Index Fund
Management's Discussion of Fund Performance
Market Recap: The S&P 500® index gained 31.17% for the 12 months ending August 31, 2021, as U.S. equities continued a historic rebound following a steep but brief decline due to the early-2020 outbreak and spread of COVID-19. The rally slowed in September 2020, when stocks began a two-month retreat amid Congress’s inability to reach a deal on additional fiscal stimulus, as well as uncertainty about the election. But as the calendar turned, investors grew hopeful. The rollout of three COVID-19 vaccines was underway, the U.S. Federal Reserve pledged to hold interest rates near zero until the economy recovered, and the federal government planned to deploy trillions of dollars to boost consumers and the economy. This backdrop fueled a sharp rotation, with small-cap value usurping leadership from large growth. As part of the “reopening” theme, investors moved out of tech-driven mega-caps that had thrived due to the work-from-home trend in favor of cheap smaller companies that stood to benefit from a broad cyclical recovery. A flattish May reflected concerns about inflation and jobs, but the uptrend resumed through August, driven by corporate earnings and a rebounding economy. Notably, this leg saw momentum shift back to large growth, as easing rates and a hawkish Fed stymied the reflation trade. By sector, financials (+56%) led, driven by banks, which rose 67% as the economy brightened. Energy (+43%) also stood out. In contrast, notable “laggards” included consumer staples (+14%) and consumer discretionary (+18%).Comments from Senior Portfolio Manager Maximilian Kaufmann, of the Geode Capital Management, LLC, investment management team: For the fiscal year ending August 31, 2021, the fund gained 41.82%, outperforming the 41.24% result of the benchmark Russell MidCap® Index. Versus the benchmark, market selection was the primary contributor, especially in the consumer staples sector. Security selection in industrials and information technology also helped. The fund's biggest individual relative contributor was an overweighting in Freeport-McMoRan, which gained 139% the past year. The company was among the fund's largest holdings this period. Also boosting value was our outsized stake in Generac Holdings, which gained 130%. Another notable relative contributor was our overweighting in Peloton Interactive (+47%), a position not held at period end. Conversely, the largest detractor from performance versus the benchmark was stock picks in health care. Weak picks in the communication services sector, primarily within the media & entertainment industry, also hurt the fund's relative performance. Also hurting the fund's relative performance was security selection and an overweighting in energy. The fund's biggest individual relative detractor was an overweighting in Citrix Systems, which returned about -31% the past 12 months. Also hurting performance was our outsized stake in Quidel, which returned roughly -27%. We added to our position the past year. Also holding back performance was our overweighting in Incyte, which returned roughly -21%. Notable changes in positioning include increased exposure to the real estate sector.The views expressed above reflect those of the portfolio manager(s) only through the end of the period as stated on the cover of this report and do not necessarily represent the views of Fidelity or any other person in the Fidelity organization. Any such views are subject to change at any time based upon market or other conditions and Fidelity disclaims any responsibility to update such views. These views may not be relied on as investment advice and, because investment decisions for a Fidelity fund are based on numerous factors, may not be relied on as an indication of trading intent on behalf of any Fidelity fund.
Fidelity® Mid Cap Enhanced Index Fund
Investment Summary (Unaudited)
Top Ten Stocks as of August 31, 2021
| % of fund's net assets | |
| Synopsys, Inc. | 1.0 |
| Agilent Technologies, Inc. | 1.0 |
| Fortinet, Inc. | 0.9 |
| Veeva Systems, Inc. Class A | 0.9 |
| Chipotle Mexican Grill, Inc. | 0.9 |
| Simon Property Group, Inc. | 0.9 |
| SBA Communications Corp. Class A | 0.8 |
| EPAM Systems, Inc. | 0.8 |
| Cadence Design Systems, Inc. | 0.8 |
| HubSpot, Inc. | 0.8 |
| 8.8 |
Top Market Sectors as of August 31, 2021
| % of fund's net assets | |
| Information Technology | 20.3 |
| Industrials | 14.5 |
| Consumer Discretionary | 13.8 |
| Health Care | 13.6 |
| Financials | 10.4 |
| Real Estate | 8.3 |
| Materials | 4.5 |
| Communication Services | 3.8 |
| Energy | 3.5 |
| Utilities | 3.4 |
Asset Allocation (% of fund's net assets)
| As of August 31, 2021* | ||
| Stocks and Equity Futures | 100.0% | |

* Foreign investments - 4.8%
Fidelity® Mid Cap Enhanced Index Fund
Schedule of Investments August 31, 2021
Showing Percentage of Net Assets
| Common Stocks - 97.7% | |||
| Shares | Value | ||
| COMMUNICATION SERVICES - 3.8% | |||
| Diversified Telecommunication Services - 0.1% | |||
| Lumen Technologies, Inc. (a) | 240,676 | $2,960,315 | |
| Entertainment - 1.5% | |||
| Activision Blizzard, Inc. | 54,415 | 4,482,164 | |
| Roku, Inc. Class A (b) | 30,393 | 10,710,493 | |
| Spotify Technology SA (b) | 63,202 | 14,810,757 | |
| 30,003,414 | |||
| Interactive Media & Services - 1.2% | |||
| Match Group, Inc. (b) | 2,562 | 352,121 | |
| Pinterest, Inc. Class A (b) | 152,973 | 8,500,710 | |
| Twitter, Inc. (b) | 66,114 | 4,264,353 | |
| Zillow Group, Inc.: | |||
| Class A (b) | 38,591 | 3,689,300 | |
| Class C (b) | 74,969 | 7,179,781 | |
| 23,986,265 | |||
| Media - 1.0% | |||
| DISH Network Corp. Class A (b) | 130,779 | 5,700,657 | |
| Liberty Media Corp.: | |||
| Liberty SiriusXM Series A (b) | 29,800 | 1,475,100 | |
| Liberty SiriusXM Series C (b) | 33,713 | 1,663,737 | |
| News Corp.: | |||
| Class A | 259,847 | 5,838,762 | |
| Class B | 57,484 | 1,266,373 | |
| The New York Times Co. Class A | 25,212 | 1,280,265 | |
| ViacomCBS, Inc. Class B | 68,038 | 2,820,175 | |
| 20,045,069 | |||
| TOTAL COMMUNICATION SERVICES | 76,995,063 | ||
| CONSUMER DISCRETIONARY - 13.8% | |||
| Automobiles - 0.4% | |||
| Ford Motor Co. (b) | 676,552 | 8,815,473 | |
| Distributors - 1.0% | |||
| Genuine Parts Co. | 58,027 | 7,090,319 | |
| LKQ Corp. (b) | 235,204 | 12,392,899 | |
| 19,483,218 | |||
| Hotels, Restaurants & Leisure - 3.7% | |||
| Carnival Corp. (b) | 76,792 | 1,853,759 | |
| Chipotle Mexican Grill, Inc. (b) | 9,346 | 17,788,522 | |
| Darden Restaurants, Inc. | 49,838 | 7,508,095 | |
| Domino's Pizza, Inc. | 4,593 | 2,374,076 | |
| International Game Technology PLC (b) | 382,316 | 8,215,971 | |
| MGM Resorts International | 96,099 | 4,095,739 | |
| Norwegian Cruise Line Holdings Ltd. (a)(b) | 20,845 | 538,635 | |
| Royal Caribbean Cruises Ltd. (a)(b) | 22,951 | 1,898,736 | |
| Scientific Games Corp. Class A (b) | 120,617 | 8,726,640 | |
| Wendy's Co. | 469,652 | 10,811,389 | |
| Yum China Holdings, Inc. | 69,196 | 4,259,706 | |
| Yum! Brands, Inc. | 50,984 | 6,680,434 | |
| 74,751,702 | |||
| Household Durables - 2.0% | |||
| D.R. Horton, Inc. | 55,397 | 5,297,061 | |
| Lennar Corp. Class A | 105,266 | 11,296,094 | |
| NVR, Inc. (b) | 1,778 | 9,209,933 | |
| PulteGroup, Inc. | 70,777 | 3,812,049 | |
| Whirlpool Corp. (a) | 54,243 | 12,016,452 | |
| 41,631,589 | |||
| Internet & Direct Marketing Retail - 0.6% | |||
| eBay, Inc. | 96,537 | 7,408,249 | |
| Etsy, Inc. (b) | 16,229 | 3,509,684 | |
| Qurate Retail, Inc. Series A | 80,913 | 892,470 | |
| 11,810,403 | |||
| Leisure Products - 0.9% | |||
| Brunswick Corp. | 92,266 | 8,937,807 | |
| Mattel, Inc. (b) | 18,751 | 400,334 | |
| Polaris, Inc. | 81,957 | 9,815,170 | |
| 19,153,311 | |||
| Multiline Retail - 0.7% | |||
| Dollar General Corp. | 5,032 | 1,121,683 | |
| Dollar Tree, Inc. (b) | 49,889 | 4,516,950 | |
| Target Corp. | 31,881 | 7,873,969 | |
| 13,512,602 | |||
| Specialty Retail - 3.2% | |||
| AutoNation, Inc. (a)(b) | 75,261 | 8,210,222 | |
| AutoZone, Inc. (b) | 2,754 | 4,266,359 | |
| Bath & Body Works, Inc. | 149,565 | 10,092,646 | |
| Best Buy Co., Inc. | 37,270 | 4,342,328 | |
| Dick's Sporting Goods, Inc. | 52,837 | 7,439,978 | |
| Foot Locker, Inc. | 67,475 | 3,825,158 | |
| GameStop Corp. Class A (a)(b) | 6,089 | 1,328,863 | |
| O'Reilly Automotive, Inc. (b) | 17,638 | 10,478,383 | |
| Ulta Beauty, Inc. (b) | 30,279 | 11,727,359 | |
| Williams-Sonoma, Inc. | 22,760 | 4,249,292 | |
| 65,960,588 | |||
| Textiles, Apparel & Luxury Goods - 1.3% | |||
| Carter's, Inc. | 9,369 | 959,198 | |
| Deckers Outdoor Corp. (b) | 25,060 | 10,486,357 | |
| lululemon athletica, Inc. (b) | 37,248 | 14,905,532 | |
| 26,351,087 | |||
| TOTAL CONSUMER DISCRETIONARY | 281,469,973 | ||
| CONSUMER STAPLES - 1.6% | |||
| Beverages - 0.1% | |||
| Molson Coors Beverage Co. Class B | 51,011 | 2,424,553 | |
| Food & Staples Retailing - 0.1% | |||
| Kroger Co. | 16,182 | 744,857 | |
| Food Products - 1.4% | |||
| Archer Daniels Midland Co. | 263,762 | 15,825,720 | |
| Conagra Brands, Inc. | 37,432 | 1,239,748 | |
| Ingredion, Inc. | 20,943 | 1,840,052 | |
| The J.M. Smucker Co. | 11,304 | 1,397,966 | |
| Tyson Foods, Inc. Class A | 106,973 | 8,399,520 | |
| 28,703,006 | |||
| Personal Products - 0.0% | |||
| Nu Skin Enterprises, Inc. Class A (a) | 12,331 | 624,195 | |
| TOTAL CONSUMER STAPLES | 32,496,611 | ||
| ENERGY - 3.5% | |||
| Energy Equipment & Services - 0.3% | |||
| Halliburton Co. | 365,778 | 7,308,244 | |
| Oil, Gas & Consumable Fuels - 3.2% | |||
| Cabot Oil & Gas Corp. | 8,173 | 129,869 | |
| EOG Resources, Inc. | 70,625 | 4,768,600 | |
| HollyFrontier Corp. | 170,268 | 5,504,764 | |
| Kinder Morgan, Inc. | 318,004 | 5,173,925 | |
| Marathon Oil Corp. | 460,828 | 5,414,729 | |
| Marathon Petroleum Corp. | 166,756 | 9,883,628 | |
| Occidental Petroleum Corp. | 334,667 | 8,597,595 | |
| Pioneer Natural Resources Co. | 96,416 | 14,430,583 | |
| Targa Resources Corp. | 53,721 | 2,359,426 | |
| Texas Pacific Land Corp. | 355 | 482,708 | |
| The Williams Companies, Inc. | 318,355 | 7,860,185 | |
| 64,606,012 | |||
| TOTAL ENERGY | 71,914,256 | ||
| FINANCIALS - 10.4% | |||
| Banks - 2.2% | |||
| Citizens Financial Group, Inc. | 268,311 | 11,749,339 | |
| East West Bancorp, Inc. | 85,169 | 6,246,294 | |
| First Republic Bank | 2,838 | 564,592 | |
| Huntington Bancshares, Inc. | 73,495 | 1,141,377 | |
| KeyCorp | 51,190 | 1,040,181 | |
| Popular, Inc. | 24,758 | 1,880,123 | |
| Regions Financial Corp. | 595,986 | 12,175,994 | |
| SVB Financial Group (b) | 17,054 | 9,541,713 | |
| Wintrust Financial Corp. | 7,553 | 565,267 | |
| 44,904,880 | |||
| Capital Markets - 4.5% | |||
| Affiliated Managers Group, Inc. | 52,048 | 8,853,885 | |
| Ameriprise Financial, Inc. | 57,359 | 15,653,845 | |
| Cboe Global Markets, Inc. | 2,432 | 306,797 | |
| Jefferies Financial Group, Inc. | 303,382 | 11,212,999 | |
| LPL Financial | 48,300 | 7,141,155 | |
| Morgan Stanley | 42,367 | 4,424,386 | |
| MSCI, Inc. | 11,278 | 7,156,793 | |
| NASDAQ, Inc. | 66,247 | 12,969,838 | |
| Northern Trust Corp. | 10,054 | 1,191,600 | |
| Raymond James Financial, Inc. | 60,135 | 8,412,887 | |
| SEI Investments Co. | 56,099 | 3,523,578 | |
| State Street Corp. | 97,757 | 9,082,603 | |
| Stifel Financial Corp. | 18,269 | 1,262,388 | |
| 91,192,754 | |||
| Consumer Finance - 1.2% | |||
| Ally Financial, Inc. | 114,523 | 6,058,267 | |
| Discover Financial Services | 9,922 | 1,272,199 | |
| OneMain Holdings, Inc. | 151,800 | 8,778,594 | |
| Synchrony Financial | 182,528 | 9,080,768 | |
| 25,189,828 | |||
| Insurance - 2.4% | |||
| American Financial Group, Inc. | 35,751 | 4,931,493 | |
| Arch Capital Group Ltd. (b) | 35,179 | 1,445,857 | |
| Arthur J. Gallagher & Co. | 38,289 | 5,499,066 | |
| Assurant, Inc. | 4,115 | 700,003 | |
| CNA Financial Corp. | 18,944 | 840,166 | |
| Fidelity National Financial, Inc. | 85,466 | 4,173,305 | |
| First American Financial Corp. | 126,139 | 8,896,584 | |
| Hartford Financial Services Group, Inc. | 29,954 | 2,013,508 | |
| Primerica, Inc. | 14,757 | 2,256,936 | |
| Prudential Financial, Inc. | 25,232 | 2,671,564 | |
| Reinsurance Group of America, Inc. | 22,310 | 2,583,944 | |
| W.R. Berkley Corp. | 139,856 | 10,532,555 | |
| Willis Towers Watson PLC | 13,327 | 2,941,535 | |
| 49,486,516 | |||
| Mortgage Real Estate Investment Trusts - 0.1% | |||
| Annaly Capital Management, Inc. | 312,482 | 2,715,469 | |
| TOTAL FINANCIALS | 213,489,447 | ||
| HEALTH CARE - 13.6% | |||
| Biotechnology - 2.9% | |||
| Acceleron Pharma, Inc. (b) | 815 | 109,112 | |
| Alnylam Pharmaceuticals, Inc. (b) | 10,807 | 2,176,854 | |
| Biogen, Inc. (b) | 22,277 | 7,549,898 | |
| Gilead Sciences, Inc. | 102,679 | 7,472,978 | |
| Incyte Corp. (b) | 165,080 | 12,626,969 | |
| Regeneron Pharmaceuticals, Inc. (b) | 12,162 | 8,189,891 | |
| Sage Therapeutics, Inc. (b) | 180,864 | 8,357,725 | |
| Sarepta Therapeutics, Inc. (a)(b) | 19,418 | 1,516,934 | |
| Seagen, Inc. (b) | 3,900 | 653,640 | |
| United Therapeutics Corp. (b) | 45,120 | 9,695,386 | |
| Vertex Pharmaceuticals, Inc. (b) | 7,001 | 1,402,230 | |
| 59,751,617 | |||
| Health Care Equipment & Supplies - 3.3% | |||
| Abiomed, Inc. (b) | 7,720 | 2,809,771 | |
| Dentsply Sirona, Inc. | 41,522 | 2,561,907 | |
| Hologic, Inc. (b) | 147,037 | 11,637,979 | |
| IDEXX Laboratories, Inc. (b) | 8,662 | 5,836,109 | |
| Insulet Corp. (b) | 35,407 | 10,544,559 | |
| Integra LifeSciences Holdings Corp. (b) | 9,336 | 702,347 | |
| Novocure Ltd. (b) | 51,179 | 6,868,734 | |
| Quidel Corp. (a)(b) | 28,068 | 3,619,369 | |
| ResMed, Inc. | 9,024 | 2,621,743 | |
| West Pharmaceutical Services, Inc. | 21,318 | 9,627,635 | |
| Zimmer Biomet Holdings, Inc. | 64,429 | 9,693,343 | |
| 66,523,496 | |||
| Health Care Providers & Services - 1.6% | |||
| Amedisys, Inc. (b) | 24,870 | 4,562,402 | |
| DaVita HealthCare Partners, Inc. (b) | 37,801 | 4,943,237 | |
| Guardant Health, Inc. (b) | 7,748 | 986,088 | |
| Laboratory Corp. of America Holdings (b) | 23,553 | 7,145,509 | |
| McKesson Corp. | 27,620 | 5,638,347 | |
| Molina Healthcare, Inc. (b) | 26,551 | 7,136,112 | |
| Quest Diagnostics, Inc. | 18,410 | 2,813,600 | |
| 33,225,295 | |||
| Health Care Technology - 1.5% | |||
| Cerner Corp. | 178,898 | 13,658,862 | |
| Veeva Systems, Inc. Class A (b) | 53,877 | 17,886,086 | |
| 31,544,948 | |||
| Life Sciences Tools & Services - 3.1% | |||
| 10X Genomics, Inc. (b) | 15,942 | 2,804,517 | |
| Agilent Technologies, Inc. | 110,649 | 19,415,580 | |
| Bruker Corp. | 33,866 | 2,990,706 | |
| Charles River Laboratories International, Inc. (b) | 11,553 | 5,127,915 | |
| Illumina, Inc. (b) | 19,166 | 8,761,929 | |
| Mettler-Toledo International, Inc. (b) | 2,384 | 3,701,947 | |
| PerkinElmer, Inc. | 26,460 | 4,889,808 | |
| QIAGEN NV (b) | 25,398 | 1,417,716 | |
| Waters Corp. (b) | 34,892 | 14,445,986 | |
| 63,556,104 | |||
| Pharmaceuticals - 1.2% | |||
| Jazz Pharmaceuticals PLC (b) | 64,084 | 8,440,504 | |
| Organon & Co. | 60,263 | 2,042,313 | |
| Viatris, Inc. | 905,203 | 13,243,120 | |
| 23,725,937 | |||
| TOTAL HEALTH CARE | 278,327,397 | ||
| INDUSTRIALS - 14.5% | |||
| Aerospace & Defense - 1.9% | |||
| HEICO Corp. | 4,663 | 591,362 | |
| Mercury Systems, Inc. (b) | 155,962 | 7,857,366 | |
| Northrop Grumman Corp. | 7,506 | 2,759,956 | |
| Teledyne Technologies, Inc. (b) | 30,384 | 14,079,338 | |
| Textron, Inc. | 184,531 | 13,409,868 | |
| 38,697,890 | |||
| Air Freight & Logistics - 0.2% | |||
| Expeditors International of Washington, Inc. | 36,254 | 4,518,699 | |
| Airlines - 1.0% | |||
| Alaska Air Group, Inc. (b) | 115,182 | 6,604,536 | |
| American Airlines Group, Inc. (a)(b) | 216,177 | 4,310,569 | |
| Southwest Airlines Co. (b) | 74,458 | 3,706,519 | |
| United Airlines Holdings, Inc. (b) | 124,113 | 5,772,496 | |
| 20,394,120 | |||
| Building Products - 1.4% | |||
| A.O. Smith Corp. | 24,257 | 1,763,969 | |
| Fortune Brands Home & Security, Inc. | 78,527 | 7,646,174 | |
| Johnson Controls International PLC | 76,978 | 5,757,954 | |
| Owens Corning | 43,463 | 4,152,890 | |
| Simpson Manufacturing Co. Ltd. | 3,393 | 383,918 | |
| Trane Technologies PLC | 41,685 | 8,274,473 | |
| 27,979,378 | |||
| Commercial Services & Supplies - 1.2% | |||
| Cintas Corp. | 22,309 | 8,829,233 | |
| Driven Brands Holdings, Inc. | 12,576 | 375,771 | |
| IAA, Inc. (b) | 11,095 | 589,366 | |
| Republic Services, Inc. | 119,732 | 14,862,333 | |
| 24,656,703 | |||
| Electrical Equipment - 2.1% | |||
| Acuity Brands, Inc. | 2,996 | 552,852 | |
| AMETEK, Inc. | 19,545 | 2,657,534 | |
| Eaton Corp. PLC | 5,642 | 949,887 | |
| Generac Holdings, Inc. (b) | 33,931 | 14,827,168 | |
| nVent Electric PLC | 160,043 | 5,499,077 | |
| Plug Power, Inc. (a)(b) | 47,167 | 1,229,172 | |
| Regal Beloit Corp. | 26,440 | 3,950,665 | |
| Rockwell Automation, Inc. | 39,262 | 12,777,818 | |
| 42,444,173 | |||
| Machinery - 2.6% | |||
| AGCO Corp. | 83,538 | 11,496,500 | |
| Allison Transmission Holdings, Inc. | 98,531 | 3,643,676 | |
| Crane Co. | 8,715 | 886,926 | |
| Cummins, Inc. | 66,617 | 15,720,280 | |
| Dover Corp. | 7,015 | 1,223,135 | |
| Ingersoll Rand, Inc. (b) | 130,197 | 6,903,045 | |
| Oshkosh Corp. | 10,617 | 1,216,496 | |
| PACCAR, Inc. | 32,713 | 2,678,213 | |
| Parker Hannifin Corp. | 15,378 | 4,562,191 | |
| Pentair PLC | 18,368 | 1,417,275 | |
| Snap-On, Inc. (a) | 7,697 | 1,731,440 | |
| Stanley Black & Decker, Inc. | 9,768 | 1,887,861 | |
| 53,367,038 | |||
| Professional Services - 2.2% | |||
| Booz Allen Hamilton Holding Corp. Class A | 90,220 | 7,389,920 | |
| CACI International, Inc. Class A (b) | 42,853 | 11,036,362 | |
| CoStar Group, Inc. (b) | 65,044 | 5,511,829 | |
| IHS Markit Ltd. | 46,461 | 5,603,197 | |
| Jacobs Engineering Group, Inc. | 41,777 | 5,638,224 | |
| Robert Half International, Inc. | 80,761 | 8,350,687 | |
| Upwork, Inc. (b) | 37,306 | 1,667,951 | |
| 45,198,170 | |||
| Road & Rail - 1.3% | |||
| Kansas City Southern | 7,323 | 2,055,346 | |
| Old Dominion Freight Lines, Inc. | 54,958 | 15,867,474 | |
| Ryder System, Inc. | 78,337 | 6,227,008 | |
| XPO Logistics, Inc. (b) | 35,624 | 3,096,082 | |
| 27,245,910 | |||
| Trading Companies & Distributors - 0.6% | |||
| W.W. Grainger, Inc. | 27,313 | 11,845,648 | |
| TOTAL INDUSTRIALS | 296,347,729 | ||
| INFORMATION TECHNOLOGY - 20.3% | |||
| Communications Equipment - 1.0% | |||
| Arista Networks, Inc. (b) | 2,905 | 1,073,485 | |
| Ciena Corp. (b) | 183,080 | 10,459,360 | |
| Juniper Networks, Inc. | 320,450 | 9,286,641 | |
| 20,819,486 | |||
| Electronic Equipment & Components - 1.7% | |||
| Amphenol Corp. Class A | 4,711 | 361,004 | |
| Corning, Inc. | 28,703 | 1,147,833 | |
| Keysight Technologies, Inc. (b) | 72,373 | 12,982,269 | |
| National Instruments Corp. | 178,336 | 7,458,012 | |
| SYNNEX Corp. | 7,932 | 1,007,919 | |
| Vontier Corp. | 127,763 | 4,646,740 | |
| Zebra Technologies Corp. Class A (b) | 13,223 | 7,764,149 | |
| 35,367,926 | |||
| IT Services - 3.4% | |||
| Akamai Technologies, Inc. (b) | 28,488 | 3,226,266 | |
| Alliance Data Systems Corp. | 20,456 | 2,006,938 | |
| Amdocs Ltd. | 152,949 | 11,781,661 | |
| EPAM Systems, Inc. (b) | 26,345 | 16,671,379 | |
| FleetCor Technologies, Inc. (b) | 31,737 | 8,355,717 | |
| Gartner, Inc. (b) | 19,360 | 5,977,206 | |
| Genpact Ltd. | 19,323 | 1,002,477 | |
| GoDaddy, Inc. (b) | 84,154 | 6,169,330 | |
| MongoDB, Inc. Class A (b) | 6,511 | 2,551,205 | |
| Okta, Inc. (b) | 17,171 | 4,526,276 | |
| The Western Union Co. | 285,680 | 6,182,115 | |
| VeriSign, Inc. (b) | 3,388 | 732,689 | |
| 69,183,259 | |||
| Semiconductors & Semiconductor Equipment - 2.7% | |||
| Allegro MicroSystems LLC (b) | 34,405 | 1,033,870 | |
| Analog Devices, Inc. | 9,742 | 1,587,459 | |
| Applied Materials, Inc. | 72,700 | 9,823,951 | |
| Cirrus Logic, Inc. (b) | 132,541 | 11,089,705 | |
| Microchip Technology, Inc. | 25,380 | 3,993,797 | |
| Monolithic Power Systems, Inc. | 3,354 | 1,659,995 | |
| ON Semiconductor Corp. (b) | 157,165 | 6,971,839 | |
| Qorvo, Inc. (b) | 50,121 | 9,424,252 | |
| Synaptics, Inc. (b) | 27,379 | 5,195,987 | |
| Xilinx, Inc. | 27,042 | 4,207,465 | |
| 54,988,320 | |||
| Software - 10.9% | |||
| Atlassian Corp. PLC (b) | 7,351 | 2,698,258 | |
| Bill.Com Holdings, Inc. (b) | 6,800 | 1,865,852 | |
| Black Knight, Inc. (b) | 147,951 | 11,195,452 | |
| Cadence Design Systems, Inc. (b) | 101,004 | 16,512,134 | |
| Citrix Systems, Inc. | 105,625 | 10,865,644 | |
| Cloudflare, Inc. (b) | 27,715 | 3,346,309 | |
| Crowdstrike Holdings, Inc. (b) | 35,500 | 9,975,500 | |
| Datadog, Inc. Class A (b) | 24,649 | 3,396,632 | |
| DocuSign, Inc. (b) | 35,494 | 10,514,743 | |
| Dolby Laboratories, Inc. Class A | 18,224 | 1,806,181 | |
| Dropbox, Inc. Class A (b) | 382,575 | 12,131,453 | |
| Fair Isaac Corp. (b) | 19,305 | 8,875,281 | |
| FireEye, Inc. (b) | 609,216 | 11,081,639 | |
| Five9, Inc. (b) | 601 | 95,096 | |
| Fortinet, Inc. (b) | 57,712 | 18,187,360 | |
| HubSpot, Inc. (b) | 23,464 | 16,060,404 | |
| Manhattan Associates, Inc. (b) | 9,514 | 1,550,687 | |
| NortonLifeLock, Inc. | 7,760 | 206,106 | |
| Nuance Communications, Inc. (b) | 13,342 | 734,477 | |
| Nutanix, Inc. Class A (b) | 257,349 | 9,498,752 | |
| Palantir Technologies, Inc. (b) | 246,721 | 6,498,631 | |
| Palo Alto Networks, Inc. (b) | 4,366 | 2,012,901 | |
| SS&C Technologies Holdings, Inc. | 162,393 | 12,286,654 | |
| Synopsys, Inc. (b) | 59,412 | 19,739,040 | |
| Teradata Corp. (b) | 214,058 | 11,706,832 | |
| The Trade Desk, Inc. (b) | 60,010 | 4,803,801 | |
| Unity Software, Inc. (a) | 16,571 | 2,100,374 | |
| Workday, Inc. Class A (b) | 32,634 | 8,914,303 | |
| Zscaler, Inc. (b) | 9,342 | 2,600,252 | |
| 221,260,748 | |||
| Technology Hardware, Storage & Peripherals - 0.6% | |||
| NetApp, Inc. | 120,227 | 10,691,787 | |
| Western Digital Corp. (b) | 24,382 | 1,540,942 | |
| 12,232,729 | |||
| TOTAL INFORMATION TECHNOLOGY | 413,852,468 | ||
| MATERIALS - 4.5% | |||
| Chemicals - 1.9% | |||
| CF Industries Holdings, Inc. | 229,793 | 10,437,198 | |
| Corteva, Inc. | 357,486 | 15,718,659 | |
| DuPont de Nemours, Inc. | 13,568 | 1,004,303 | |
| Eastman Chemical Co. | 80,004 | 9,053,253 | |
| NewMarket Corp. | 7,138 | 2,496,373 | |
| 38,709,786 | |||
| Construction Materials - 0.4% | |||
| Vulcan Materials Co. | 43,624 | 8,111,010 | |
| Containers & Packaging - 0.7% | |||
| Ball Corp. | 29,330 | 2,814,507 | |
| Berry Global Group, Inc. (b) | 39,918 | 2,681,292 | |
| Sealed Air Corp. | 55,293 | 3,374,532 | |
| WestRock Co. | 109,121 | 5,678,657 | |
| 14,548,988 | |||
| Metals & Mining - 1.5% | |||
| Nucor Corp. | 95,454 | 11,221,572 | |
| Reliance Steel & Aluminum Co. | 67,478 | 10,124,399 | |
| Royal Gold, Inc. | 17,347 | 1,931,242 | |
| United States Steel Corp. | 243,454 | 6,512,395 | |
| 29,789,608 | |||
| TOTAL MATERIALS | 91,159,392 | ||
| REAL ESTATE - 8.3% | |||
| Equity Real Estate Investment Trusts (REITs) - 7.5% | |||
| American Homes 4 Rent Class A | 240,953 | 10,105,569 | |
| Apartment Income (REIT) Corp. | 109,103 | 5,544,614 | |
| Brixmor Property Group, Inc. | 327,001 | 7,668,173 | |
| Camden Property Trust (SBI) | 41,373 | 6,207,605 | |
| CubeSmart | 37,806 | 2,022,621 | |
| CyrusOne, Inc. | 8,568 | 659,565 | |
| Equity Lifestyle Properties, Inc. | 66,826 | 5,684,888 | |
| Essex Property Trust, Inc. | 27,452 | 9,079,474 | |
| Extra Space Storage, Inc. | 23,101 | 4,317,808 | |
| First Industrial Realty Trust, Inc. | 85,304 | 4,776,171 | |
| Gaming & Leisure Properties | 190,806 | 9,406,736 | |
| Highwoods Properties, Inc. (SBI) | 6,007 | 274,460 | |
| Hudson Pacific Properties, Inc. | 44,977 | 1,186,493 | |
| Invitation Homes, Inc. | 304,532 | 12,540,628 | |
| JBG SMITH Properties | 35,741 | 1,076,876 | |
| Kilroy Realty Corp. | 63,432 | 4,164,311 | |
| Kimco Realty Corp. | 51,545 | 1,123,166 | |
| Life Storage, Inc. | 48,569 | 6,043,926 | |
| National Retail Properties, Inc. | 9,844 | 468,673 | |
| National Storage Affiliates Trust | 32,470 | 1,858,908 | |
| Public Storage | 5,782 | 1,871,113 | |
| Realty Income Corp. | 201,541 | 14,555,291 | |
| Rexford Industrial Realty, Inc. | 32,817 | 2,032,357 | |
| SBA Communications Corp. Class A | 48,047 | 17,247,432 | |
| Simon Property Group, Inc. | 130,692 | 17,571,539 | |
| Sun Communities, Inc. | 20,362 | 4,102,739 | |
| VICI Properties, Inc. (a) | 37,314 | 1,153,376 | |
| 152,744,512 | |||
| Real Estate Management & Development - 0.8% | |||
| CBRE Group, Inc. (b) | 57,631 | 5,549,865 | |
| Opendoor Technologies, Inc. (a)(b) | 626,587 | 11,109,388 | |
| 16,659,253 | |||
| TOTAL REAL ESTATE | 169,403,765 | ||
| UTILITIES - 3.4% | |||
| Electric Utilities - 1.9% | |||
| Entergy Corp. | 3,308 | 365,898 | |
| Evergy, Inc. | 7,022 | 480,656 | |
| Hawaiian Electric Industries, Inc. | 80,716 | 3,519,218 | |
| IDACORP, Inc. | 29,632 | 3,121,731 | |
| NRG Energy, Inc. | 229,339 | 10,473,912 | |
| OGE Energy Corp. | 134,542 | 4,764,132 | |
| PPL Corp. | 218,495 | 6,412,828 | |
| Xcel Energy, Inc. | 129,263 | 8,886,831 | |
| 38,025,206 | |||
| Gas Utilities - 0.2% | |||
| UGI Corp. | 86,613 | 4,011,048 | |
| Independent Power and Renewable Electricity Producers - 0.1% | |||
| The AES Corp. | 121,358 | 2,896,815 | |
| Multi-Utilities - 1.0% | |||
| CMS Energy Corp. | 13,204 | 846,773 | |
| Consolidated Edison, Inc. | 15,812 | 1,193,015 | |
| DTE Energy Co. | 67,761 | 8,154,359 | |
| MDU Resources Group, Inc. | 153,333 | 4,932,723 | |
| Public Service Enterprise Group, Inc. | 47,392 | 3,030,244 | |
| WEC Energy Group, Inc. | 22,601 | 2,135,342 | |
| 20,292,456 | |||
| Water Utilities - 0.2% | |||
| American Water Works Co., Inc. | 24,620 | 4,486,995 | |
| TOTAL UTILITIES | 69,712,520 | ||
| TOTAL COMMON STOCKS | |||
| (Cost $1,563,721,885) | 1,995,168,621 | ||
| Nonconvertible Preferred Stocks - 0.0% | |||
| CONSUMER DISCRETIONARY - 0.0% | |||
| Internet & Direct Marketing Retail - 0.0% | |||
| Qurate Retail, Inc. 8.00% | |||
| (Cost $322,102) | 5,207 | 562,851 | |
| Money Market Funds - 4.8% | |||
| Fidelity Cash Central Fund 0.06% (c) | 46,698,554 | 46,707,893 | |
| Fidelity Securities Lending Cash Central Fund 0.06% (c)(d) | 51,098,199 | 51,103,309 | |
| TOTAL MONEY MARKET FUNDS | |||
| (Cost $97,811,201) | 97,811,202 | ||
| TOTAL INVESTMENT IN SECURITIES - 102.5% | |||
| (Cost $1,661,855,188) | 2,093,542,674 | ||
| NET OTHER ASSETS (LIABILITIES) - (2.5)% | (51,195,250) | ||
| NET ASSETS - 100% | $2,042,347,424 |
| Futures Contracts | |||||
| Number of contracts | Expiration Date | Notional Amount | Value | Unrealized Appreciation/(Depreciation) | |
| Purchased | |||||
| Equity Index Contracts | |||||
| CME E-mini S&P MidCap 400 Index Contracts (United States) | 168 | Sept. 2021 | $46,233,600 | $1,939,224 | $1,939,224 |
The notional amount of futures purchased as a percentage of Net Assets is 2.3%
Legend
(a) Security or a portion of the security is on loan at period end.
(b) Non-income producing
(c) Affiliated fund that is generally available only to investment companies and other accounts managed by Fidelity Investments. The rate quoted is the annualized seven-day yield of the fund at period end. A complete unaudited listing of the fund's holdings as of its most recent quarter end is available upon request. In addition, each Fidelity Central Fund's financial statements, which are not covered by the Fund's Report of Independent Registered Public Accounting Firm, are available on the SEC's website or upon request.
(d) Investment made with cash collateral received from securities on loan.
Affiliated Central Funds
Fiscal year to date information regarding the Fund's investments in Fidelity Central Funds, including the ownership percentage, is presented below.
| Fund | Value, beginning of period | Purchases | Sales Proceeds | Dividend Income | Realized Gain/Loss | Change in Unrealized appreciation (depreciation) | Value, end of period | % ownership, end of period |
| Fidelity Cash Central Fund 0.06% | $12,473,951 | $466,649,906 | $432,417,350 | $26,491 | $1,385 | $1 | $46,707,893 | 0.1% |
| Fidelity Securities Lending Cash Central Fund 0.06% | 24,853,964 | 265,372,480 | 239,123,135 | 39,442 | -- | -- | 51,103,309 | 0.2% |
| Total | $37,327,915 | $732,022,386 | $671,540,485 | $65,933 | $1,385 | $1 | $97,811,202 |
Amounts in the income column in the above table include any capital gain distributions from underlying funds, which are presented in the corresponding line-item in the Statement of Operations, if applicable. Amount for Fidelity Securities Lending Cash Central Fund represents the income earned on investing cash collateral, less rebates paid to borrowers and any lending agent fees associated with the loan, plus any premium payments received for lending certain types of securities.
Investment Valuation
The following is a summary of the inputs used, as of August 31, 2021, involving the Fund's assets and liabilities carried at fair value. The inputs or methodology used for valuing securities may not be an indication of the risk associated with investing in those securities. For more information on valuation inputs, and their aggregation into the levels used below, please refer to the Investment Valuation section in the accompanying Notes to Financial Statements.
| Valuation Inputs at Reporting Date: | ||||
| Description | Total | Level 1 | Level 2 | Level 3 |
| Investments in Securities: | ||||
| Equities: | ||||
| Communication Services | $76,995,063 | $76,995,063 | $-- | $-- |
| Consumer Discretionary | 282,032,824 | 282,032,824 | -- | -- |
| Consumer Staples | 32,496,611 | 32,496,611 | -- | -- |
| Energy | 71,914,256 | 71,914,256 | -- | -- |
| Financials | 213,489,447 | 213,489,447 | -- | -- |
| Health Care | 278,327,397 | 278,327,397 | -- | -- |
| Industrials | 296,347,729 | 296,347,729 | -- | -- |
| Information Technology | 413,852,468 | 413,852,468 | -- | -- |
| Materials | 91,159,392 | 91,159,392 | -- | -- |
| Real Estate | 169,403,765 | 169,403,765 | -- | -- |
| Utilities | 69,712,520 | 69,712,520 | -- | -- |
| Money Market Funds | 97,811,202 | 97,811,202 | -- | -- |
| Total Investments in Securities: | $2,093,542,674 | $2,093,542,674 | $-- | $-- |
| Derivative Instruments: | ||||
| Assets | ||||
| Futures Contracts | $1,939,224 | $1,939,224 | $-- | $-- |
| Total Assets | $1,939,224 | $1,939,224 | $-- | $-- |
| Total Derivative Instruments: | $1,939,224 | $1,939,224 | $-- | $-- |
Value of Derivative Instruments
The following table is a summary of the Fund's value of derivative instruments by primary risk exposure as of August 31, 2021. For additional information on derivative instruments, please refer to the Derivative Instruments section in the accompanying Notes to Financial Statements.
| Primary Risk Exposure / Derivative Type | Value | |
| Asset | Liability | |
| Equity Risk | ||
| Futures Contracts(a) | $1,939,224 | $0 |
| Total Equity Risk | 1,939,224 | 0 |
| Total Value of Derivatives | $1,939,224 | $0 |
(a) Reflects gross cumulative appreciation (depreciation) on futures contracts as presented in the Schedule of Investments. In the Statement of Assets and Liabilities, the period end daily variation margin is included in receivable or payable for daily variation margin on futures contracts, and the net cumulative appreciation (depreciation) is included in Total accumulated earnings (loss).
See accompanying notes which are an integral part of the financial statements.
Fidelity® Mid Cap Enhanced Index Fund
Financial Statements
Statement of Assets and Liabilities
| August 31, 2021 | ||
| Assets | ||
| Investment in securities, at value (including securities loaned of $50,068,075) — See accompanying schedule: Unaffiliated issuers (cost $1,564,043,987) | $1,995,731,472 | |
| Fidelity Central Funds (cost $97,811,201) | 97,811,202 | |
| Total Investment in Securities (cost $1,661,855,188) | $2,093,542,674 | |
| Segregated cash with brokers for derivative instruments | 2,403,000 | |
| Cash | 44 | |
| Receivable for investments sold | 29,640,477 | |
| Receivable for fund shares sold | 4,302,767 | |
| Dividends receivable | 1,707,788 | |
| Distributions receivable from Fidelity Central Funds | 4,431 | |
| Total assets | 2,131,601,181 | |
| Liabilities | ||
| Payable for investments purchased | $35,417,137 | |
| Payable for fund shares redeemed | 1,632,780 | |
| Accrued management fee | 976,372 | |
| Payable for daily variation margin on futures contracts | 123,072 | |
| Collateral on securities loaned | 51,104,396 | |
| Total liabilities | 89,253,757 | |
| Net Assets | $2,042,347,424 | |
| Net Assets consist of: | ||
| Paid in capital | $1,419,784,734 | |
| Total accumulated earnings (loss) | 622,562,690 | |
| Net Assets | $2,042,347,424 | |
| Net Asset Value, offering price and redemption price per share ($2,042,347,424 ÷ 98,299,428 shares) | $20.78 |
See accompanying notes which are an integral part of the financial statements.
Statement of Operations
| Year ended August 31, 2021 | ||
| Investment Income | ||
| Dividends | $22,071,886 | |
| Interest | 8,724 | |
| Income from Fidelity Central Funds (including $39,442 from security lending) | 65,933 | |
| Total income | 22,146,543 | |
| Expenses | ||
| Management fee | $9,565,764 | |
| Independent trustees' fees and expenses | 6,328 | |
| Miscellaneous | 606 | |
| Total expenses before reductions | 9,572,698 | |
| Expense reductions | (11) | |
| Total expenses after reductions | 9,572,687 | |
| Net investment income (loss) | 12,573,856 | |
| Realized and Unrealized Gain (Loss) | ||
| Net realized gain (loss) on: | ||
| Investment securities: | ||
| Unaffiliated issuers | 209,133,097 | |
| Fidelity Central Funds | 1,385 | |
| Foreign currency transactions | 56 | |
| Futures contracts | 12,967,718 | |
| Total net realized gain (loss) | 222,102,256 | |
| Change in net unrealized appreciation (depreciation) on: | ||
| Investment securities: | ||
| Unaffiliated issuers | 301,576,678 | |
| Affiliated issuers | 1 | |
| Futures contracts | 920,223 | |
| Total change in net unrealized appreciation (depreciation) | 302,496,902 | |
| Net gain (loss) | 524,599,158 | |
| Net increase (decrease) in net assets resulting from operations | $537,173,014 |
See accompanying notes which are an integral part of the financial statements.
Statement of Changes in Net Assets
| Year ended August 31, 2021 | Year ended August 31, 2020 | |
| Increase (Decrease) in Net Assets | ||
| Operations | ||
| Net investment income (loss) | $12,573,856 | $15,836,494 |
| Net realized gain (loss) | 222,102,256 | 23,994,791 |
| Change in net unrealized appreciation (depreciation) | 302,496,902 | 37,141,842 |
| Net increase (decrease) in net assets resulting from operations | 537,173,014 | 76,973,127 |
| Distributions to shareholders | (48,113,370) | (49,106,870) |
| Share transactions | ||
| Proceeds from sales of shares | 767,695,434 | 356,099,125 |
| Reinvestment of distributions | 45,996,344 | 46,674,152 |
| Cost of shares redeemed | (442,657,003) | (511,705,893) |
| Net increase (decrease) in net assets resulting from share transactions | 371,034,775 | (108,932,616) |
| Total increase (decrease) in net assets | 860,094,419 | (81,066,359) |
| Net Assets | ||
| Beginning of period | 1,182,253,005 | 1,263,319,364 |
| End of period | $2,042,347,424 | $1,182,253,005 |
| Other Information | ||
| Shares | ||
| Sold | 41,621,085 | 25,241,616 |
| Issued in reinvestment of distributions | 2,692,994 | 3,028,822 |
| Redeemed | (24,018,015) | (36,862,521) |
| Net increase (decrease) | 20,296,064 | (8,592,083) |
See accompanying notes which are an integral part of the financial statements.
Financial Highlights
Fidelity Mid Cap Enhanced Index Fund
| Years ended August 31, | 2021 | 2020 | 2019 | 2018 | 2017 A | 2017 B |
| Selected Per–Share Data | ||||||
| Net asset value, beginning of period | $15.16 | $14.59 | $16.42 | $14.93 | $14.77 | $11.98 |
| Income from Investment Operations | ||||||
| Net investment income (loss)C | .14 | .19 | .21 | .26 | .12 | .21 |
| Net realized and unrealized gain (loss) | 6.07 | .97 | (.71) | 2.17 | .13 | 2.76 |
| Total from investment operations | 6.21 | 1.16 | (.50) | 2.43 | .25 | 2.97 |
| Distributions from net investment income | (.16) | (.22) | (.25) | (.21) | (.02) | (.18) |
| Distributions from net realized gain | (.43) | (.38) | (1.09) | (.73) | (.07) | – |
| Total distributions | (.59) | (.59)D | (1.33)D | (.94) | (.09) | (.18) |
| Redemption fees added to paid in capitalC | – | – | – | – | –E | –E |
| Net asset value, end of period | $20.78 | $15.16 | $14.59 | $16.42 | $14.93 | $14.77 |
| Total ReturnF,G | 41.82% | 7.91% | (2.19)% | 16.67% | 1.72% | 24.85% |
| Ratios to Average Net AssetsH,I | ||||||
| Expenses before reductions | .59% | .59% | .59% | .59% | .59%J | .60% |
| Expenses net of fee waivers, if any | .59% | .59% | .59% | .59% | .59%J | .60% |
| Expenses net of all reductions | .59% | .59% | .59% | .59% | .59%J | .60% |
| Net investment income (loss) | .77% | 1.33% | 1.46% | 1.64% | 1.62%J | 1.53% |
| Supplemental Data | ||||||
| Net assets, end of period (000 omitted) | $2,042,347 | $1,182,253 | $1,263,319 | $1,289,418 | $1,183,861 | $1,176,023 |
| Portfolio turnover rateK | 70% | 73% | 90% | 108% | 94%J | 87% |
A For the six month period ended August 31. The Fund changed its fiscal year end from February 28 to August 31, effective August 31, 2017.
B For the year ended February 28.
C Calculated based on average shares outstanding during the period.
D Total distributions per share do not sum due to rounding.
E Amount represents less than $.005 per share.
F Total returns for periods of less than one year are not annualized.
G Total returns would have been lower if certain expenses had not been reduced during the applicable periods shown.
H Fees and expenses of any underlying mutual funds or exchange-traded funds (ETFs) are not included in the Fund's expense ratio. The Fund indirectly bears its proportionate share of these expenses. For additional expense information related to investments in Fidelity Central Funds, please refer to the "Investments in Fidelity Central Funds" note found in the Notes to Financial Statements section of the most recent Annual or Semi-Annual report.
I Expense ratios reflect operating expenses of the class. Expenses before reductions do not reflect amounts reimbursed, waived, or reduced through arrangements with the investment advisor, brokerage services, or other offset arrangements, if applicable, and do not represent the amount paid by the class during periods when reimbursements, waivers or reductions occur.
J Annualized
K Amount does not include the portfolio activity of any underlying mutual funds or exchange-traded funds (ETFs).
See accompanying notes which are an integral part of the financial statements.
Fidelity® International Enhanced Index Fund
Performance: The Bottom Line
Average annual total return reflects the change in the value of an investment, assuming reinvestment of distributions from dividend income and capital gains (the profits earned upon the sale of securities that have grown in value, if any) and assuming a constant rate of performance each year. The hypothetical investment and the average annual total returns do not reflect the deduction of taxes that a shareholder would pay on fund distributions or the redemption of fund shares. During periods of reimbursement by Fidelity, a fund’s total return will be greater than it would be had the reimbursement not occurred. How a fund did yesterday is no guarantee of how it will do tomorrow.
Average Annual Total Returns
| For the periods ended August 31, 2021 | Past 1 year | Past 5 years | Past 10 years |
| Fidelity® International Enhanced Index Fund | 27.77% | 9.50% | 7.75% |
$10,000 Over 10 Years
Let's say hypothetically that $10,000 was invested in Fidelity® International Enhanced Index Fund on August 31, 2011.
The chart shows how the value of your investment would have changed, and also shows how the MSCI EAFE Index performed over the same period.
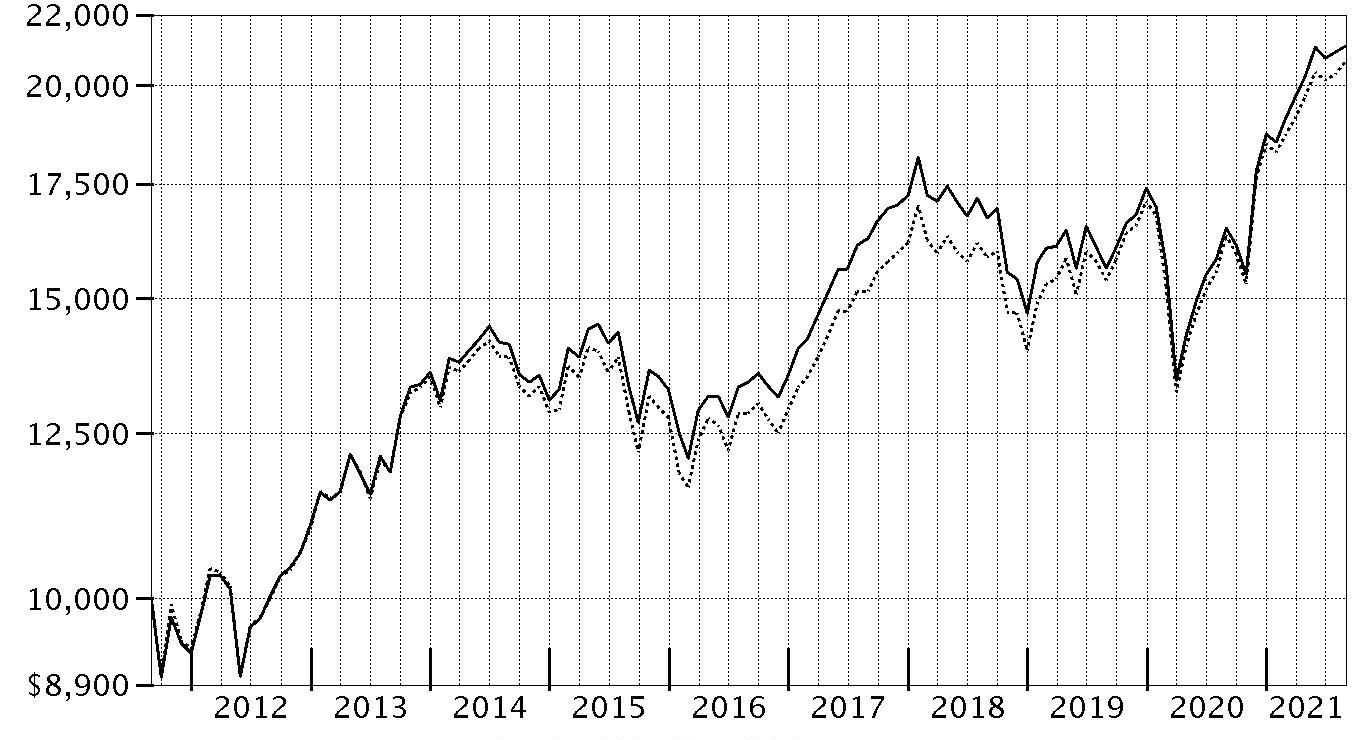
| Period Ending Values | ||
| $21,086 | Fidelity® International Enhanced Index Fund | |
| $20,653 | MSCI EAFE Index | |
Fidelity® International Enhanced Index Fund
Management's Discussion of Fund Performance
Market Recap: The MSCI ACWI (All Country World Index) ex USA Index gained 25.04% for the 12 months ending August 31, 2021, with international equities rising amid an improved outlook for global economic growth, widespread COVID-19 vaccinations, fiscal stimulus in the U.S. and abroad, and government spending programs. As 2021 began, investors saw reasons to be hopeful. The index recorded steady monthly gains before a modest two-month decline in June and July that coincided with slower-than-expected vaccinations in some countries and an uptick in COVID-19 cases in others, such as Japan. However, the index rebounded by gaining1.90% in August. As part of the “reopening” trade, investors generally moved out of tech-driven mega-caps that had thrived due to the work-from-home trend in favor of cheap smaller companies they believed stood to benefit from a broad cyclical recovery. Overall, foreign stocks faced the headwind of a modestly stronger U.S. dollar. By region, Canada (+32%) led the way, followed by Europe ex U.K. (+31%) and the U.K. (+27%). Conversely, Japan (+20%), Asia Pacific ex Japan (+23%) and emerging markets (+21%) lagged. Looking at sectors, information technology (+47%) fared best, followed by financials (+35%), materials (+34%) and industrials (+32%). In contrast, communication services (+10%) was a notable laggard. Real estate (+12%), consumer staples (+13%) and health care (+14%) also underperformed the broader index, as did consumer discretionary and utilities (+15% each).Comments from Senior Portfolio Manager Maximilian Kaufmann, of the Geode Capital Management, LLC, investment management team: For the fiscal year ending August 31, 2021, the fund gained 27.77%, outperforming the 26.35% result of the benchmark MSCI EAFE Index (Net MA). From a regional standpoint, an underweighting and stock picks in Europe ex U.K. and security selection in the U.K. contributed most to the fund's relative result. Versus the benchmark, security selection was the primary contributor, especially in the consumer discretionary sector. Stock picking and an underweighting in consumer staples also lifted the fund's relative result. Also boosting performance were stock picks in industrials, primarily driven by the transportation industry. (The fund's relative performance can be affected by Fidelity's methodologies for valuing certain foreign stocks and for incorporating foreign exchange rates, which differ from those used by the index, as well as by local tax laws or regulations, which vary by country.) The fund's biggest individual relative contributor was an overweighting in Nippon Yusen, which gained 347% the past 12 months. Also adding value was our outsized stake in Stellantis, which gained about 126%. Another notable relative contributor was our overweighting in Evolution (+85%), a position not held at period end. In contrast, an overweighting in Asia Pacific ex Japan and emerging markets, primarily driven by China, hurt the fund's relative result. By sector, the largest detractors from performance versus the benchmark were security selection and an underweighting in information technology. Weak picks in the health care sector, primarily within the health care equipment & services industry, also hampered the fund's relative result. Also hampering the fund's relative result was an underweighting in financials, especially within the banks industry. In addition, a modestly stronger U.S. dollar provided a headwind to the fund's non-U.S. holdings. The fund's largest individual relative detractor was an underweighting in M3, which gained about 17% the past year. M3 was not held at period end. Also hurting performance was our lighter-than-benchmark stake in Compagnie Financiere Richemont, which gained roughly 69%. This was a position we established the past 12 months. Also hindering performance was an underweighting in Adyen, which gained 91%. This was a stake we established the past year. Notable changes in positioning include a higher allocation to Australia and France. By sector, meaningful changes in positioning include a lower allocation to consumer staples and communication services.The views expressed above reflect those of the portfolio manager(s) only through the end of the period as stated on the cover of this report and do not necessarily represent the views of Fidelity or any other person in the Fidelity organization. Any such views are subject to change at any time based upon market or other conditions and Fidelity disclaims any responsibility to update such views. These views may not be relied on as investment advice and, because investment decisions for a Fidelity fund are based on numerous factors, may not be relied on as an indication of trading intent on behalf of any Fidelity fund.
Fidelity® International Enhanced Index Fund
Investment Summary (Unaudited)
Geographic Diversification (% of fund's net assets)
| As of August 31, 2021 | ||
| Japan | 23.1% | |
| United Kingdom | 12.6% | |
| France | 12.1% | |
| Switzerland | 9.4% | |
| Germany | 8.2% | |
| Australia | 7.8% | |
| Netherlands | 6.6% | |
| Denmark | 3.2% | |
| Sweden | 2.9% | |
| Other* | 14.1% | |
* Includes Short-Term investments and Net Other Assets (Liabilities).
Percentages are based on country or territory of incorporation and are adjusted for the effect of futures contracts, if applicable.
Asset Allocation as of August 31, 2021
| % of fund's net assets | |
| Stocks and Equity Futures | 100.0 |
Top Ten Stocks as of August 31, 2021
| % of fund's net assets | |
| ASML Holding NV (Netherlands) (Netherlands, Semiconductors & Semiconductor Equipment) | 2.5 |
| LVMH Moet Hennessy Louis Vuitton SE (France, Textiles, Apparel & Luxury Goods) | 1.6 |
| Nestle SA (Reg. S) (Switzerland, Food Products) | 1.6 |
| Roche Holding AG (participation certificate) (Switzerland, Pharmaceuticals) | 1.6 |
| Novartis AG (Switzerland, Pharmaceuticals) | 1.3 |
| SAP SE (Germany, Software) | 1.1 |
| Total SA (France, Oil, Gas & Consumable Fuels) | 1.1 |
| Novo Nordisk A/S Series B (Denmark, Pharmaceuticals) | 1.1 |
| AstraZeneca PLC (United Kingdom) (United Kingdom, Pharmaceuticals) | 1.0 |
| L'Oreal SA (France, Personal Products) | 1.0 |
| 13.9 |
Top Market Sectors as of August 31, 2021
| % of fund's net assets | |
| Industrials | 16.4 |
| Financials | 15.4 |
| Health Care | 14.9 |
| Consumer Discretionary | 13.5 |
| Information Technology | 10.2 |
| Consumer Staples | 8.2 |
| Materials | 8.0 |
| Communication Services | 4.6 |
| Energy | 3.8 |
| Real Estate | 2.5 |
Fidelity® International Enhanced Index Fund
Schedule of Investments August 31, 2021
Showing Percentage of Net Assets
| Common Stocks - 98.9% | |||
| Shares | Value | ||
| Australia - 7.8% | |||
| Afterpay Ltd. (a) | 3,969 | $390,785 | |
| APA Group unit | 356,028 | 2,390,952 | |
| Aristocrat Leisure Ltd. | 127,737 | 4,267,679 | |
| ASX Ltd. | 15,022 | 964,535 | |
| Aurizon Holdings Ltd. | 2,979,236 | 8,238,359 | |
| Australia & New Zealand Banking Group Ltd. | 500,366 | 10,194,291 | |
| BHP Group Ltd. | 404,343 | 13,378,347 | |
| BlueScope Steel Ltd. | 139,696 | 2,575,304 | |
| Commonwealth Bank of Australia | 80,183 | 5,872,826 | |
| CSL Ltd. | 6,965 | 1,589,411 | |
| Dexus unit | 632,922 | 4,926,470 | |
| Dominos Pizza Enterprises Ltd. | 42,923 | 4,921,686 | |
| Fortescue Metals Group Ltd. | 441,835 | 6,787,712 | |
| Goodman Group unit | 616,336 | 10,428,868 | |
| Medibank Private Ltd. | 2,522,141 | 6,550,007 | |
| National Australia Bank Ltd. | 317,922 | 6,409,676 | |
| QBE Insurance Group Ltd. | 458,020 | 3,941,393 | |
| Rio Tinto Ltd. | 74,085 | 6,073,303 | |
| SEEK Ltd. | 182,259 | 4,338,609 | |
| Sonic Healthcare Ltd. | 187,003 | 5,937,209 | |
| Suncorp Group Ltd. | 843,504 | 7,700,976 | |
| Tabcorp Holdings Ltd. | 373,047 | 1,307,203 | |
| Telstra Corp. Ltd. | 1,217,366 | 3,419,766 | |
| Wesfarmers Ltd. | 77,504 | 3,399,048 | |
| Westpac Banking Corp. | 104,878 | 1,973,127 | |
| WiseTech Global Ltd. | 7,376 | 260,838 | |
| Woodside Petroleum Ltd. | 31,000 | 441,995 | |
| Woolworths Group Ltd. | 64,607 | 1,973,241 | |
| TOTAL AUSTRALIA | 130,653,616 | ||
| Austria - 0.3% | |||
| Voestalpine AG | 96,661 | 4,382,687 | |
| Bailiwick of Jersey - 0.4% | |||
| Experian PLC | 47,560 | 2,097,878 | |
| Ferguson PLC | 12,561 | 1,814,160 | |
| Glencore Xstrata PLC | 483,895 | 2,181,271 | |
| TOTAL BAILIWICK OF JERSEY | 6,093,309 | ||
| Belgium - 0.4% | |||
| KBC Groep NV | 35,603 | 2,999,008 | |
| UCB SA | 27,901 | 3,191,625 | |
| TOTAL BELGIUM | 6,190,633 | ||
| Bermuda - 0.1% | |||
| Kerry Properties Ltd. | 433,923 | 1,478,500 | |
| Cayman Islands - 1.2% | |||
| ASM Pacific Technology Ltd. | 330,500 | 3,935,004 | |
| Chow Tai Fook Jewellery Group Ltd. | 315,000 | 638,307 | |
| CK Asset Holdings Ltd. | 1,324,328 | 8,633,090 | |
| CK Hutchison Holdings Ltd. | 332,500 | 2,426,165 | |
| WH Group Ltd. (b) | 2,086,500 | 1,810,860 | |
| Xinyi Glass Holdings Ltd. | 638,000 | 2,682,447 | |
| TOTAL CAYMAN ISLANDS | 20,125,873 | ||
| Denmark - 3.2% | |||
| A.P. Moller - Maersk A/S: | |||
| Series A | 943 | 2,552,817 | |
| Series B | 2,859 | 8,144,606 | |
| Carlsberg A/S Series B | 18,371 | 3,207,093 | |
| Genmab A/S (a) | 22,504 | 10,654,938 | |
| GN Store Nord A/S | 28,103 | 2,114,574 | |
| Novo Nordisk A/S Series B | 181,681 | 18,188,079 | |
| Novozymes A/S Series B | 54,864 | 4,432,187 | |
| Pandora A/S | 27,213 | 3,257,852 | |
| Tryg A/S | 16,539 | 409,523 | |
| TOTAL DENMARK | 52,961,669 | ||
| Finland - 2.4% | |||
| Kesko Oyj | 213,901 | 8,829,624 | |
| Kone OYJ (B Shares) | 104,923 | 8,701,881 | |
| Nokia Corp. (a) | 752,175 | 4,511,704 | |
| Nokia Corp. sponsored ADR (a) | 481,000 | 2,866,760 | |
| Nordea Bank ABP (Stockholm Stock Exchange) | 984,944 | 11,568,210 | |
| Orion Oyj (B Shares) | 51,331 | 2,092,831 | |
| Stora Enso Oyj (R Shares) | 64,216 | 1,256,767 | |
| TOTAL FINLAND | 39,827,777 | ||
| France - 12.1% | |||
| Accor SA (a) | 62,614 | 2,155,842 | |
| Air Liquide SA | 29,983 | 5,374,223 | |
| Arkema SA | 31,879 | 4,230,863 | |
| bioMerieux SA | 9,821 | 1,204,260 | |
| BNP Paribas SA | 233,065 | 14,764,639 | |
| Capgemini SA | 11,978 | 2,689,296 | |
| Carrefour SA | 315,278 | 6,272,657 | |
| Compagnie de St. Gobain | 160,048 | 11,602,351 | |
| Dassault Systemes SA | 121,436 | 6,926,239 | |
| EDF SA | 283,476 | 3,840,846 | |
| Eiffage SA | 47,894 | 4,977,605 | |
| Essilor International SA | 6,988 | 1,371,825 | |
| Eutelsat Communications | 179,393 | 2,072,006 | |
| Hermes International SCA | 5,773 | 8,483,097 | |
| Ipsen SA | 8,282 | 828,083 | |
| Kering SA | 5,831 | 4,640,459 | |
| L'Oreal SA | 36,510 | 17,084,169 | |
| La Francaise des Jeux SAEM (b) | 75,513 | 3,906,186 | |
| Legrand SA | 79,171 | 9,083,624 | |
| LVMH Moet Hennessy Louis Vuitton SE | 36,455 | 27,006,242 | |
| Orange SA | 325,179 | 3,697,025 | |
| Sanofi SA | 70,079 | 7,262,890 | |
| Sanofi SA sponsored ADR (c) | 50,057 | 2,591,951 | |
| Sartorius Stedim Biotech | 10,485 | 6,358,452 | |
| Schneider Electric SA | 65,926 | 11,778,768 | |
| Societe Generale Series A | 273,848 | 8,619,124 | |
| Sodexo SA (a) | 12,000 | 992,113 | |
| Thales SA | 45,857 | 4,653,277 | |
| Total SA | 424,197 | 18,763,348 | |
| TOTAL FRANCE | 203,231,460 | ||
| Germany - 8.2% | |||
| Allianz SE | 67,680 | 15,901,121 | |
| BASF AG | 86,758 | 6,711,531 | |
| Bayerische Motoren Werke AG (BMW) | 105,040 | 9,967,968 | |
| Beiersdorf AG | 6,935 | 841,369 | |
| Brenntag AG | 78,714 | 7,940,927 | |
| Carl Zeiss Meditec AG | 12,124 | 2,678,414 | |
| Daimler AG: | |||
| ADR | 43,299 | 910,145 | |
| (Germany) | 161,683 | 13,634,592 | |
| Deutsche Bank AG (a) | 661,884 | 8,227,838 | |
| Deutsche Post AG | 27,529 | 1,936,640 | |
| Deutsche Wohnen SE (Bearer) | 5,975 | 370,810 | |
| Fresenius SE & Co. KGaA | 14,341 | 745,905 | |
| HeidelbergCement AG | 26,292 | 2,284,859 | |
| HelloFresh AG (a) | 57,068 | 6,150,724 | |
| LEG Immobilien AG | 10,627 | 1,693,957 | |
| Muenchener Rueckversicherungs-Gesellschaft AG in Muenchen | 33,609 | 9,819,763 | |
| Nemetschek Se | 34,541 | 3,385,911 | |
| SAP SE | 127,159 | 19,100,557 | |
| SAP SE sponsored ADR (c) | 22,823 | 3,426,645 | |
| Siemens AG | 71,495 | 11,860,650 | |
| Siemens AG sponsored ADR | 6,906 | 571,541 | |
| Telefonica Deutschland Holding AG | 885,426 | 2,485,074 | |
| Uniper SE | 28,880 | 1,146,785 | |
| Vonovia SE | 9,826 | 663,173 | |
| Zalando SE (a)(b) | 51,413 | 5,694,213 | |
| TOTAL GERMANY | 138,151,112 | ||
| Hong Kong - 1.3% | |||
| AIA Group Ltd. | 795,832 | 9,502,813 | |
| CLP Holdings Ltd. | 131,000 | 1,309,587 | |
| Henderson Land Development Co. Ltd. | 732,584 | 3,315,606 | |
| Sun Hung Kai Properties Ltd. | 512,000 | 7,215,115 | |
| Swire Pacific Ltd. (A Shares) | 76,500 | 518,364 | |
| TOTAL HONG KONG | 21,861,485 | ||
| Ireland - 0.7% | |||
| DCC PLC (United Kingdom) | 58,100 | 4,936,509 | |
| James Hardie Industries PLC CDI | 90,500 | 3,511,528 | |
| Kingspan Group PLC (Ireland) | 19,688 | 2,249,807 | |
| Smurfit Kappa Group PLC | 28,904 | 1,657,958 | |
| TOTAL IRELAND | 12,355,802 | ||
| Israel - 0.1% | |||
| NICE Systems Ltd. (a) | 7,601 | 2,217,412 | |
| Italy - 0.7% | |||
| Amplifon SpA | 45,448 | 2,376,186 | |
| Enel SpA | 109,052 | 993,512 | |
| Eni SpA | 417,805 | 5,154,710 | |
| Poste Italiane SpA (b) | 238,423 | 3,233,234 | |
| TOTAL ITALY | 11,757,642 | ||
| Japan - 23.1% | |||
| AGC, Inc. | 175,000 | 8,462,482 | |
| Aisin Seiki Co. Ltd. | 23,500 | 898,218 | |
| Ajinomoto Co., Inc. | 200,600 | 5,915,070 | |
| Amada Co. Ltd. | 197,700 | 2,005,483 | |
| Asahi Kasei Corp. | 268,630 | 2,773,837 | |
| Astellas Pharma, Inc. | 357,625 | 6,036,537 | |
| Bridgestone Corp. | 99,300 | 4,570,788 | |
| Canon, Inc. | 365,100 | 8,686,506 | |
| Capcom Co. Ltd. | 25,100 | 700,423 | |
| Chugai Pharmaceutical Co. Ltd. | 115,100 | 4,507,120 | |
| CyberAgent, Inc. | 174,300 | 3,201,930 | |
| Dai Nippon Printing Co. Ltd. | 193,180 | 4,593,545 | |
| Dai-ichi Mutual Life Insurance Co. | 185,267 | 3,653,472 | |
| Daiichi Sankyo Kabushiki Kaisha | 115,400 | 2,742,474 | |
| Daikin Industries Ltd. | 22,000 | 5,490,025 | |
| Daito Trust Construction Co. Ltd. | 200 | 21,961 | |
| Dentsu Group, Inc. | 113,500 | 4,209,244 | |
| Disco Corp. | 4,200 | 1,223,560 | |
| FANUC Corp. | 31,800 | 6,927,982 | |
| Fujitsu Ltd. | 53,255 | 9,826,628 | |
| Hirose Electric Co. Ltd. | 11,500 | 1,916,057 | |
| Hitachi Ltd. | 25,800 | 1,427,015 | |
| Honda Motor Co. Ltd. | 183,900 | 5,566,036 | |
| Hoya Corp. | 86,984 | 14,057,860 | |
| Iida Group Holdings Co. Ltd. | 126,500 | 3,214,962 | |
| INPEX Corp. | 1,023,000 | 7,048,439 | |
| Isuzu Motors Ltd. | 126,500 | 1,600,582 | |
| Itochu Corp. | 33,400 | 1,005,203 | |
| Japan Post Bank Co. Ltd. | 920,500 | 8,057,460 | |
| Japan Post Holdings Co. Ltd. | 622,177 | 5,340,379 | |
| Japan Post Insurance Co. Ltd. | 88,700 | 1,608,476 | |
| Japan Real Estate Investment Corp. | 529 | 3,274,544 | |
| JTEKT Corp. | 218,000 | 1,971,640 | |
| Kamigumi Co. Ltd. | 239,000 | 5,166,041 | |
| KDDI Corp. | 108,520 | 3,316,957 | |
| Keyence Corp. | 4,500 | 2,704,949 | |
| Kyocera Corp. | 23,900 | 1,487,246 | |
| Lawson, Inc. | 66,500 | 3,203,654 | |
| LIXIL Group Corp. | 290,400 | 8,460,046 | |
| Marubeni Corp. | 700,350 | 5,574,026 | |
| Mazda Motor Corp. (a) | 658,200 | 5,713,594 | |
| McDonald's Holdings Co. (Japan) Ltd. | 76,000 | 3,626,778 | |
| Medipal Holdings Corp. | 262,857 | 5,024,663 | |
| Mitsubishi Electric Corp. | 402,158 | 5,503,330 | |
| Mitsubishi Estate Co. Ltd. | 6,700 | 104,810 | |
| Mitsubishi Gas Chemical Co., Inc. | 123,100 | 2,321,797 | |
| Mitsui & Co. Ltd. | 60,000 | 1,324,728 | |
| Mitsui Chemicals, Inc. | 112,000 | 3,868,563 | |
| MS&AD Insurance Group Holdings, Inc. | 79,600 | 2,572,177 | |
| NEC Corp. | 37,700 | 1,980,694 | |
| NGK Insulators Ltd. | 79,300 | 1,315,480 | |
| Nidec Corp. | 25,600 | 2,924,257 | |
| Nintendo Co. Ltd. | 17,900 | 8,599,866 | |
| Nippon Express Co. Ltd. | 57,100 | 3,887,461 | |
| Nippon Telegraph & Telephone Corp. | 345,300 | 9,199,756 | |
| Nippon Yusen KK | 42,600 | 3,434,641 | |
| Nissan Motor Co. Ltd. (a) | 1,599,000 | 8,388,505 | |
| Nissan Motor Co. Ltd. sponsored ADR (a)(c) | 87,636 | 921,054 | |
| Nitto Denko Corp. | 86,800 | 6,595,901 | |
| Nomura Holdings, Inc. | 7,200 | 34,771 | |
| Nomura Research Institute Ltd. | 154,200 | 5,795,728 | |
| OBIC Co. Ltd. | 6,700 | 1,275,871 | |
| Olympus Corp. | 503,800 | 10,585,227 | |
| ORIX Corp. | 75,300 | 1,404,154 | |
| Otsuka Holdings Co. Ltd. | 71,600 | 3,046,490 | |
| Panasonic Corp. | 605,000 | 7,232,820 | |
| Recruit Holdings Co. Ltd. | 48,600 | 2,861,675 | |
| Renesas Electronics Corp. (a) | 726,700 | 7,781,432 | |
| ROHM Co. Ltd. | 17,100 | 1,650,702 | |
| Santen Pharmaceutical Co. Ltd. | 70,800 | 1,055,420 | |
| SCSK Corp. | 28,200 | 1,781,484 | |
| Seiko Epson Corp. | 172,600 | 3,216,198 | |
| SHIMANO, Inc. | 9,500 | 2,789,165 | |
| Shin-Etsu Chemical Co. Ltd. | 49,500 | 8,175,808 | |
| SoftBank Corp. | 174,300 | 2,332,628 | |
| SoftBank Group Corp. | 91,400 | 5,150,735 | |
| Sony Group Corp. | 27,400 | 2,833,033 | |
| Sony Group Corp. sponsored ADR | 11,770 | 1,217,724 | |
| Sumitomo Chemical Co. Ltd. | 1,823,700 | 9,249,871 | |
| Sumitomo Corp. | 544,700 | 7,696,552 | |
| Sumitomo Dainippon Pharma Co., Ltd. | 66,200 | 1,186,624 | |
| Sumitomo Rubber Industries Ltd. | 149,800 | 1,795,993 | |
| Suntory Beverage & Food Ltd. | 14,200 | 568,568 | |
| Sysmex Corp. | 15,800 | 1,798,082 | |
| Takeda Pharmaceutical Co. Ltd. | 245,800 | 8,181,580 | |
| Tokyo Electron Ltd. | 11,800 | 5,066,873 | |
| Tokyo Gas Co. Ltd. | 113,400 | 2,181,106 | |
| Tosoh Corp. | 97,900 | 1,777,978 | |
| Toyo Suisan Kaisha Ltd. | 39,900 | 1,651,997 | |
| Toyota Motor Corp. | 103,059 | 8,975,753 | |
| Toyota Motor Corp. sponsored ADR (c) | 1,843 | 321,106 | |
| Trend Micro, Inc. | 103,900 | 5,694,833 | |
| Yamaha Corp. | 16,400 | 967,468 | |
| Yamaha Motor Co. Ltd. | 142,300 | 3,621,688 | |
| Yamato Holdings Co. Ltd. | 197,300 | 5,021,497 | |
| ZOZO, Inc. | 64,000 | 2,440,394 | |
| TOTAL JAPAN | 388,175,940 | ||
| Luxembourg - 0.8% | |||
| Eurofins Scientific SA | 71,667 | 10,161,267 | |
| InPost SA | 70,727 | 1,377,930 | |
| Tenaris SA | 204,708 | 2,060,448 | |
| TOTAL LUXEMBOURG | 13,599,645 | ||
| Multi-National - 0.1% | |||
| HKT Trust/HKT Ltd. unit | 1,082,000 | 1,474,674 | |
| Netherlands - 6.6% | |||
| Adyen BV (a)(b) | 3,458 | 11,165,055 | |
| ASML Holding NV (Netherlands) | 49,928 | 41,639,336 | |
| CNH Industrial NV | 126,130 | 2,084,992 | |
| EXOR NV | 11,103 | 925,557 | |
| Heineken Holding NV | 33,049 | 3,063,275 | |
| Koninklijke Ahold Delhaize NV | 343,583 | 11,590,438 | |
| Koninklijke Philips Electronics NV | 269,514 | 12,420,051 | |
| QIAGEN NV (Germany) (a) | 23,713 | 1,312,319 | |
| Randstad NV | 18,609 | 1,368,892 | |
| Stellantis NV (Italy) | 446,927 | 8,935,170 | |
| STMicroelectronics NV (France) | 100,838 | 4,492,000 | |
| Wolters Kluwer NV | 97,267 | 11,188,493 | |
| Wolters Kluwer NV rights (a)(d) | 97,267 | 62,018 | |
| TOTAL NETHERLANDS | 110,247,596 | ||
| Norway - 0.5% | |||
| DNB Bank ASA | 128,113 | 2,705,414 | |
| Equinor ASA | 63,825 | 1,356,187 | |
| Gjensidige Forsikring ASA | 94,519 | 2,210,163 | |
| Norsk Hydro ASA | 214,000 | 1,477,330 | |
| Yara International ASA | 24,033 | 1,206,868 | |
| TOTAL NORWAY | 8,955,962 | ||
| Singapore - 1.3% | |||
| ComfortDelgro Corp. Ltd. | 1,540,467 | 1,856,191 | |
| DBS Group Holdings Ltd. | 304,267 | 6,782,611 | |
| Genting Singapore Ltd. | 5,503,260 | 3,131,387 | |
| Oversea-Chinese Banking Corp. Ltd. | 146,300 | 1,243,787 | |
| Singapore Technologies Engineering Ltd. | 259,100 | 728,475 | |
| Singapore Telecommunications Ltd. | 633,300 | 1,092,831 | |
| United Overseas Bank Ltd. | 352,555 | 6,707,841 | |
| TOTAL SINGAPORE | 21,543,123 | ||
| Spain - 2.7% | |||
| Banco Bilbao Vizcaya Argentaria SA | 1,101,178 | 7,207,204 | |
| Banco Santander SA (Spain) | 3,125,768 | 11,525,499 | |
| CaixaBank SA | 1,165,521 | 3,620,629 | |
| Grifols SA | 116,174 | 2,838,098 | |
| Iberdrola SA | 308,843 | 3,827,020 | |
| Red Electrica Corporacion SA | 373,072 | 7,440,125 | |
| Telefonica SA | 1,899,443 | 9,398,626 | |
| TOTAL SPAIN | 45,857,201 | ||
| Sweden - 2.9% | |||
| ASSA ABLOY AB (B Shares) | 56,153 | 1,796,936 | |
| Atlas Copco AB: | |||
| (A Shares) | 89,807 | 6,165,128 | |
| (B Shares) | 65,608 | 3,795,319 | |
| Electrolux AB (B Shares) | 82,058 | 2,078,682 | |
| Embracer Group AB (a) | 69,643 | 1,580,182 | |
| EQT AB | 43,497 | 2,216,321 | |
| Hexagon AB (B Shares) | 63,490 | 1,100,960 | |
| Husqvarna AB (B Shares) | 19,432 | 260,649 | |
| ICA Gruppen AB | 57,110 | 2,841,122 | |
| Industrivarden AB: | |||
| (A Shares) | 35,076 | 1,290,944 | |
| (C Shares) | 37,550 | 1,308,895 | |
| Kinnevik AB (B Shares) | 54,945 | 2,152,733 | |
| Nibe Industrier AB (B Shares) | 149,984 | 2,090,872 | |
| Sandvik AB | 201,097 | 5,131,815 | |
| Securitas AB (B Shares) | 71,337 | 1,184,204 | |
| Skandinaviska Enskilda Banken AB (A Shares) | 144,696 | 1,943,376 | |
| SKF AB (B Shares) | 145,027 | 3,697,332 | |
| Svenska Handelsbanken AB (A Shares) | 336,418 | 3,780,230 | |
| Swedish Match Co. AB | 537,556 | 4,963,522 | |
| TOTAL SWEDEN | 49,379,222 | ||
| Switzerland - 9.4% | |||
| ABB Ltd. (Reg.) | 381,170 | 14,101,258 | |
| Coca-Cola HBC AG | 247,895 | 8,960,117 | |
| Compagnie Financiere Richemont SA: | |||
| warrants 11/22/23 (a) | 12,618 | 6,476 | |
| Series A | 72,057 | 7,953,020 | |
| Geberit AG (Reg.) | 7,038 | 5,880,947 | |
| Holcim Ltd. | 98,741 | 5,628,480 | |
| Julius Baer Group Ltd. | 33,606 | 2,293,731 | |
| Kuehne & Nagel International AG | 4,160 | 1,522,267 | |
| Logitech International SA (Reg.) | 20,836 | 2,130,585 | |
| Nestle SA (Reg. S) | 209,827 | 26,498,811 | |
| Novartis AG | 239,688 | 22,168,955 | |
| Partners Group Holding AG | 6,809 | 12,075,147 | |
| Roche Holding AG (participation certificate) | 65,226 | 26,191,838 | |
| SGS SA (Reg.) | 993 | 3,120,780 | |
| Sonova Holding AG Class B | 9,392 | 3,620,394 | |
| Straumann Holding AG | 1,296 | 2,504,963 | |
| Swatch Group AG (Bearer) | 17,037 | 4,803,662 | |
| Swiss Prime Site AG | 17,410 | 1,862,200 | |
| UBS Group AG | 392,163 | 6,543,544 | |
| TOTAL SWITZERLAND | 157,867,175 | ||
| United Kingdom - 12.6% | |||
| Admiral Group PLC | 67,785 | 3,365,243 | |
| AstraZeneca PLC: | |||
| (United Kingdom) | 146,517 | 17,134,203 | |
| sponsored ADR | 142,673 | 8,314,982 | |
| Auto Trader Group PLC (b) | 280,492 | 2,425,589 | |
| BAE Systems PLC | 1,346,598 | 10,520,459 | |
| Barclays PLC | 2,378,720 | 6,031,034 | |
| Barratt Developments PLC | 481,346 | 4,890,544 | |
| Berkeley Group Holdings PLC | 38,610 | 2,562,314 | |
| BHP Group PLC | 301,827 | 9,385,599 | |
| BP PLC | 1,718,038 | 6,989,486 | |
| BP PLC sponsored ADR | 366,475 | 8,963,979 | |
| British American Tobacco PLC (United Kingdom) | 223,955 | 8,401,308 | |
| Bunzl PLC | 55,076 | 1,996,012 | |
| Burberry Group PLC | 253,319 | 6,476,185 | |
| Compass Group PLC (a) | 47,000 | 971,018 | |
| Diageo PLC | 81,404 | 3,913,308 | |
| Direct Line Insurance Group PLC | 706,046 | 2,999,486 | |
| Evraz PLC | 413,421 | 3,355,786 | |
| GlaxoSmithKline PLC | 327,000 | 6,577,804 | |
| GlaxoSmithKline PLC sponsored ADR (c) | 107,945 | 4,397,679 | |
| HSBC Holdings PLC: | |||
| (United Kingdom) | 620,286 | 3,275,642 | |
| sponsored ADR (c) | 345,731 | 9,141,128 | |
| Imperial Brands PLC | 263,446 | 5,583,294 | |
| InterContinental Hotel Group PLC (a) | 126,247 | 8,066,441 | |
| InterContinental Hotel Group PLC ADR (a) | 14,813 | 946,403 | |
| J Sainsbury PLC | 241,591 | 1,009,740 | |
| Lloyds Banking Group PLC | 3,541,813 | 2,120,326 | |
| London Stock Exchange Group PLC ADR (c) | 34,272 | 950,020 | |
| Persimmon PLC | 38,484 | 1,555,546 | |
| Prudential PLC ADR (c) | 64,866 | 2,701,669 | |
| RELX PLC: | |||
| (London Stock Exchange) | 81,773 | 2,453,127 | |
| sponsored ADR | 46,306 | 1,396,589 | |
| Rio Tinto PLC | 163,550 | 12,100,126 | |
| Royal Dutch Shell PLC: | |||
| Class A (United Kingdom) | 352,264 | 6,981,679 | |
| Class B (United Kingdom) | 392,929 | 7,731,907 | |
| rights (a)(d) | 392,929 | 93,876 | |
| rights (a)(d) | 352,264 | 84,161 | |
| Schroders PLC | 23,775 | 1,235,571 | |
| Smith & Nephew PLC | 150,225 | 2,876,663 | |
| Tate & Lyle PLC | 304,477 | 2,953,714 | |
| Unilever PLC | 106,386 | 5,923,566 | |
| United Utilities Group PLC | 130,456 | 1,896,705 | |
| Vodafone Group PLC | 6,056,570 | 10,172,444 | |
| Whitbread PLC (a) | 22,050 | 972,519 | |
| TOTAL UNITED KINGDOM | 211,894,874 | ||
| TOTAL COMMON STOCKS | |||
| (Cost $1,389,743,712) | 1,660,284,389 | ||
| Nonconvertible Preferred Stocks - 0.0% | |||
| Germany - 0.0% | |||
| Bayerische Motoren Werke AG (BMW) (non-vtg.) | |||
| (Cost $1,072,798) | 12,064 | 1,009,940 | |
| Money Market Funds - 1.3% | |||
| Fidelity Cash Central Fund 0.06% (e) | 8,913,090 | 8,914,873 | |
| Fidelity Securities Lending Cash Central Fund 0.06% (e)(f) | 12,448,474 | 12,449,719 | |
| TOTAL MONEY MARKET FUNDS | |||
| (Cost $21,364,592) | 21,364,592 | ||
| TOTAL INVESTMENT IN SECURITIES - 100.2% | |||
| (Cost $1,412,181,102) | 1,682,658,921 | ||
| NET OTHER ASSETS (LIABILITIES) - (0.2)% | (3,568,115) | ||
| NET ASSETS - 100% | $1,679,090,806 |
| Futures Contracts | |||||
| Number of contracts | Expiration Date | Notional Amount | Value | Unrealized Appreciation/(Depreciation) | |
| Purchased | |||||
| Equity Index Contracts | |||||
| ICE E-mini MSCI EAFE Index Contracts (United States) | 151 | Sept. 2021 | $17,753,825 | $408,528 | $408,528 |
The notional amount of futures purchased as a percentage of Net Assets is 1.1%
Categorizations in the Schedule of Investments are based on country or territory of incorporation.
Legend
(a) Non-income producing
(b) Security exempt from registration under Rule 144A of the Securities Act of 1933. These securities may be resold in transactions exempt from registration, normally to qualified institutional buyers. At the end of the period, the value of these securities amounted to $28,235,137 or 1.7% of net assets.
(c) Security or a portion of the security is on loan at period end.
(d) Security or a portion of the security purchased on a delayed delivery or when-issued basis.
(e) Affiliated fund that is generally available only to investment companies and other accounts managed by Fidelity Investments. The rate quoted is the annualized seven-day yield of the fund at period end. A complete unaudited listing of the fund's holdings as of its most recent quarter end is available upon request. In addition, each Fidelity Central Fund's financial statements, which are not covered by the Fund's Report of Independent Registered Public Accounting Firm, are available on the SEC's website or upon request.
(f) Investment made with cash collateral received from securities on loan.
Affiliated Central Funds
Fiscal year to date information regarding the Fund's investments in Fidelity Central Funds, including the ownership percentage, is presented below.
| Fund | Value, beginning of period | Purchases | Sales Proceeds | Dividend Income | Realized Gain/Loss | Change in Unrealized appreciation (depreciation) | Value, end of period | % ownership, end of period |
| Fidelity Cash Central Fund 0.06% | $11,483,578 | $258,547,872 | $261,116,517 | $10,657 | $(60) | $-- | $8,914,873 | 0.0% |
| Fidelity Securities Lending Cash Central Fund 0.06% | 11,298,852 | 274,399,459 | 273,248,592 | 236,844 | -- | -- | 12,449,719 | 0.0% |
| Total | $22,782,430 | $532,947,331 | $534,365,109 | $247,501 | $(60) | $-- | $21,364,592 |
Amounts in the income column in the above table include any capital gain distributions from underlying funds, which are presented in the corresponding line-item in the Statement of Operations, if applicable. Amount for Fidelity Securities Lending Cash Central Fund represents the income earned on investing cash collateral, less rebates paid to borrowers and any lending agent fees associated with the loan, plus any premium payments received for lending certain types of securities.
Investment Valuation
The following is a summary of the inputs used, as of August 31, 2021, involving the Fund's assets and liabilities carried at fair value. The inputs or methodology used for valuing securities may not be an indication of the risk associated with investing in those securities. For more information on valuation inputs, and their aggregation into the levels used below, please refer to the Investment Valuation section in the accompanying Notes to Financial Statements.
| Valuation Inputs at Reporting Date: | ||||
| Description | Total | Level 1 | Level 2 | Level 3 |
| Investments in Securities: | ||||
| Equities: | ||||
| Communication Services | $78,868,365 | $24,574,739 | $54,293,626 | $-- |
| Consumer Discretionary | 225,992,438 | 148,999,570 | 76,992,868 | -- |
| Consumer Staples | 137,060,517 | 92,323,524 | 44,736,993 | -- |
| Energy | 65,670,215 | 17,810,600 | 47,859,615 | -- |
| Financials | 259,676,738 | 163,008,690 | 96,668,048 | -- |
| Health Care | 246,556,101 | 125,554,038 | 121,002,063 | -- |
| Industrials | 274,851,517 | 170,467,215 | 104,384,302 | -- |
| Information Technology | 170,327,848 | 87,527,057 | 82,800,791 | -- |
| Materials | 132,756,484 | 75,449,579 | 57,306,905 | -- |
| Real Estate | 44,507,468 | 44,507,468 | -- | -- |
| Utilities | 25,026,638 | 20,206,106 | 4,820,532 | -- |
| Money Market Funds | 21,364,592 | 21,364,592 | -- | -- |
| Total Investments in Securities: | $1,682,658,921 | $991,793,178 | $690,865,743 | $-- |
| Derivative Instruments: | ||||
| Assets | ||||
| Futures Contracts | $408,528 | $408,528 | $-- | $-- |
| Total Assets | $408,528 | $408,528 | $-- | $-- |
| Total Derivative Instruments: | $408,528 | $408,528 | $-- | $-- |
Value of Derivative Instruments
The following table is a summary of the Fund's value of derivative instruments by primary risk exposure as of August 31, 2021. For additional information on derivative instruments, please refer to the Derivative Instruments section in the accompanying Notes to Financial Statements.
| Primary Risk Exposure / Derivative Type | Value | |
| Asset | Liability | |
| Equity Risk | ||
| Futures Contracts(a) | $408,528 | $0 |
| Total Equity Risk | 408,528 | 0 |
| Total Value of Derivatives | $408,528 | $0 |
(a) Reflects gross cumulative appreciation (depreciation) on futures contracts as presented in the Schedule of Investments. In the Statement of Assets and Liabilities, the period end daily variation margin is included in receivable or payable for daily variation margin on futures contracts, and the net cumulative appreciation (depreciation) is included in Total accumulated earnings (loss).
See accompanying notes which are an integral part of the financial statements.
Fidelity® International Enhanced Index Fund
Financial Statements
Statement of Assets and Liabilities
| August 31, 2021 | ||
| Assets | ||
| Investment in securities, at value (including securities loaned of $12,104,241) — See accompanying schedule: Unaffiliated issuers (cost $1,390,816,510) | $1,661,294,329 | |
| Fidelity Central Funds (cost $21,364,592) | 21,364,592 | |
| Total Investment in Securities (cost $1,412,181,102) | $1,682,658,921 | |
| Segregated cash with brokers for derivative instruments | 896,732 | |
| Cash | 736 | |
| Foreign currency held at value (cost $2,577,345) | 2,588,161 | |
| Receivable for investments sold | 49,072,065 | |
| Receivable for fund shares sold | 1,079,748 | |
| Dividends receivable | 4,468,293 | |
| Reclaim receivable | 3,616,121 | |
| Distributions receivable from Fidelity Central Funds | 10,773 | |
| Total assets | 1,744,391,550 | |
| Liabilities | ||
| Payable for investments purchased | ||
| Regular delivery | $51,264,449 | |
| Delayed delivery | 240,055 | |
| Payable for fund shares redeemed | 507,105 | |
| Accrued management fee | 823,309 | |
| Payable for daily variation margin on futures contracts | 15,890 | |
| Other payables and accrued expenses | 130 | |
| Collateral on securities loaned | 12,449,806 | |
| Total liabilities | 65,300,744 | |
| Net Assets | $1,679,090,806 | |
| Net Assets consist of: | ||
| Paid in capital | $1,502,447,366 | |
| Total accumulated earnings (loss) | 176,643,440 | |
| Net Assets | $1,679,090,806 | |
| Net Asset Value, offering price and redemption price per share ($1,679,090,806 ÷ 145,223,463 shares) | $11.56 |
See accompanying notes which are an integral part of the financial statements.
Statement of Operations
| Year ended August 31, 2021 | ||
| Investment Income | ||
| Dividends | $41,967,037 | |
| Non-Cash dividends | 3,080,428 | |
| Income from Fidelity Central Funds (including $236,844 from security lending) | 247,501 | |
| Income before foreign taxes withheld | 45,294,966 | |
| Less foreign taxes withheld | (3,704,628) | |
| Total income | 41,590,338 | |
| Expenses | ||
| Management fee | $8,408,354 | |
| Independent trustees' fees and expenses | 5,771 | |
| Miscellaneous | 615 | |
| Total expenses before reductions | 8,414,740 | |
| Expense reductions | (13) | |
| Total expenses after reductions | 8,414,727 | |
| Net investment income (loss) | 33,175,611 | |
| Realized and Unrealized Gain (Loss) | ||
| Net realized gain (loss) on: | ||
| Investment securities: | ||
| Unaffiliated issuers | 122,560,384 | |
| Fidelity Central Funds | (60) | |
| Foreign currency transactions | (290,722) | |
| Futures contracts | 4,267,239 | |
| Total net realized gain (loss) | 126,536,841 | |
| Change in net unrealized appreciation (depreciation) on: | ||
| Investment securities: | ||
| Unaffiliated issuers | 176,173,156 | |
| Assets and liabilities in foreign currencies | (113,613) | |
| Futures contracts | (207,774) | |
| Total change in net unrealized appreciation (depreciation) | 175,851,769 | |
| Net gain (loss) | 302,388,610 | |
| Net increase (decrease) in net assets resulting from operations | $335,564,221 |
See accompanying notes which are an integral part of the financial statements.
Statement of Changes in Net Assets
| Year ended August 31, 2021 | Year ended August 31, 2020 | |
| Increase (Decrease) in Net Assets | ||
| Operations | ||
| Net investment income (loss) | $33,175,611 | $29,712,952 |
| Net realized gain (loss) | 126,536,841 | (84,803,987) |
| Change in net unrealized appreciation (depreciation) | 175,851,769 | 95,864,718 |
| Net increase (decrease) in net assets resulting from operations | 335,564,221 | 40,773,683 |
| Distributions to shareholders | (21,705,885) | (47,815,176) |
| Share transactions | ||
| Proceeds from sales of shares | 468,950,811 | 465,032,067 |
| Reinvestment of distributions | 18,920,477 | 42,797,410 |
| Cost of shares redeemed | (305,561,888) | (823,753,671) |
| Net increase (decrease) in net assets resulting from share transactions | 182,309,400 | (315,924,194) |
| Total increase (decrease) in net assets | 496,167,736 | (322,965,687) |
| Net Assets | ||
| Beginning of period | 1,182,923,070 | 1,505,888,757 |
| End of period | $1,679,090,806 | $1,182,923,070 |
| Other Information | ||
| Shares | ||
| Sold | 43,722,143 | 54,187,748 |
| Issued in reinvestment of distributions | 1,899,646 | 4,453,424 |
| Redeemed | (29,034,687) | (97,743,672) |
| Net increase (decrease) | 16,587,102 | (39,102,500) |
See accompanying notes which are an integral part of the financial statements.
Financial Highlights
Fidelity International Enhanced Index Fund
| Years ended August 31, | 2021 | 2020 | 2019 | 2018 | 2017 A | 2017 B |
| Selected Per–Share Data | ||||||
| Net asset value, beginning of period | $9.20 | $8.98 | $9.83 | $9.73 | $8.48 | $7.42 |
| Income from Investment Operations | ||||||
| Net investment income (loss)C | .25 | .19 | .30 | .27 | .18 | .20 |
| Net realized and unrealized gain (loss) | 2.28 | .32 | (.95) | –D | 1.07 | 1.08 |
| Total from investment operations | 2.53 | .51 | (.65) | .27 | 1.25 | 1.28 |
| Distributions from net investment income | (.17) | (.29) | (.20) | (.14)E | – | (.20) |
| Distributions from net realized gain | – | – | – | (.03)E | – | (.02) |
| Total distributions | (.17) | (.29) | (.20) | (.17) | – | (.22) |
| Redemption fees added to paid in capitalC | – | – | – | –D | –D | –D |
| Net asset value, end of period | $11.56 | $9.20 | $8.98 | $9.83 | $9.73 | $8.48 |
| Total ReturnF,G | 27.77% | 5.55% | (6.51)% | 2.71% | 14.74% | 17.31% |
| Ratios to Average Net AssetsH,I | ||||||
| Expenses before reductions | .59% | .59% | .59% | .59% | .59%J | .62% |
| Expenses net of fee waivers, if any | .59% | .59% | .59% | .59% | .59%J | .62% |
| Expenses net of all reductions | .59% | .59% | .59% | .59% | .59%J | .62% |
| Net investment income (loss) | 2.32% | 2.13% | 3.27% | 2.69% | 3.86%J | 2.53% |
| Supplemental Data | ||||||
| Net assets, end of period (000 omitted) | $1,679,091 | $1,182,923 | $1,505,889 | $1,691,151 | $576,386 | $271,576 |
| Portfolio turnover rateK | 82% | 75% | 103% | 66% | 70%J | 75% |
A For the six month period ended August 31. The Fund changed its fiscal year end from February 28 to August 31, effective August 31, 2017.
B For the year ended February 28.
C Calculated based on average shares outstanding during the period.
D Amount represents less than $.005 per share.
E The amounts shown reflect certain reclassifications related to book to tax differences that were made in the year shown.
F Total returns for periods of less than one year are not annualized.
G Total returns would have been lower if certain expenses had not been reduced during the applicable periods shown.
H Fees and expenses of any underlying mutual funds or exchange-traded funds (ETFs) are not included in the Fund's expense ratio. The Fund indirectly bears its proportionate share of these expenses. For additional expense information related to investments in Fidelity Central Funds, please refer to the "Investments in Fidelity Central Funds" note found in the Notes to Financial Statements section of the most recent Annual or Semi-Annual report.
I Expense ratios reflect operating expenses of the class. Expenses before reductions do not reflect amounts reimbursed, waived, or reduced through arrangements with the investment advisor, brokerage services, or other offset arrangements, if applicable, and do not represent the amount paid by the class during periods when reimbursements, waivers or reductions occur.
J Annualized
K Amount does not include the portfolio activity of any underlying mutual funds or exchange-traded funds (ETFs).
See accompanying notes which are an integral part of the financial statements.
Notes to Financial Statements
For the period ended August 31, 2021
1. Organization.
Fidelity Large Cap Growth Enhanced Index Fund, Fidelity Large Cap Value Enhanced Index Fund, Fidelity Large Cap Core Enhanced Index Fund, Fidelity Mid Cap Enhanced Index Fund and Fidelity International Enhanced Index Fund (the Funds) are funds of Fidelity Commonwealth Trust II (the Trust) and are authorized to issue an unlimited number of shares. Share transactions on the Statement of Changes in Net Assets may contain exchanges between affiliated funds. The Trust is registered under the Investment Company Act of 1940, as amended (the 1940 Act), as an open-end management investment company organized as a Delaware statutory trust.
2. Significant Accounting Policies.
Each Fund is an investment company and applies the accounting and reporting guidance of the Financial Accounting Standards Board (FASB) Accounting Standards Codification Topic 946 Financial Services - Investment Companies. The financial statements have been prepared in conformity with accounting principles generally accepted in the United States of America (GAAP), which require management to make certain estimates and assumptions at the date of the financial statements. Actual results could differ from those estimates. Subsequent events, if any, through the date that the financial statements were issued have been evaluated in the preparation of the financial statements. Each Fund's Schedule of Investments lists any underlying mutual funds or exchange-traded funds (ETFs) but does not include the underlying holdings of these funds. The following summarizes the significant accounting policies of each Fund:
Investment Valuation. Investments are valued as of 4:00 p.m. Eastern time on the last calendar day of the period. The Board of Trustees (the Board) has delegated the day to day responsibility for the valuation of each Fund's investments to the Fair Value Committee (the Committee) established by each Fund's investment adviser. In accordance with valuation policies and procedures approved by the Board, each Fund attempts to obtain prices from one or more third party pricing vendors or brokers to value its investments. When current market prices, quotations or currency exchange rates are not readily available or reliable, investments will be fair valued in good faith by the Committee, in accordance with procedures adopted by the Board. Factors used in determining fair value vary by investment type and may include market or investment specific events. The frequency with which these procedures are used cannot be predicted and they may be utilized to a significant extent. The Committee oversees each Fund's valuation policies and procedures and reports to the Board on the Committee's activities and fair value determinations. The Board monitors the appropriateness of the procedures used in valuing each Fund's investments and ratifies the fair value determinations of the Committee.
Each Fund categorizes the inputs to valuation techniques used to value its investments into a disclosure hierarchy consisting of three levels as shown below:
- Level 1 – quoted prices in active markets for identical investments
- Level 2 – other significant observable inputs (including quoted prices for similar investments, interest rates, prepayment speeds, etc.)
- Level 3 – unobservable inputs (including the Fund's own assumptions based on the best information available)
Valuation techniques used to value each Fund's investments by major category are as follows:
Equity securities, including restricted securities, for which market quotations are readily available, are valued at the last reported sale price or official closing price as reported by a third party pricing vendor on the primary market or exchange on which they are traded and are categorized as Level 1 in the hierarchy. In the event there were no sales during the day or closing prices are not available, securities are valued at the last quoted bid price or may be valued using the last available price and are generally categorized as Level 2 in the hierarchy. For foreign equity securities, when market or security specific events arise, comparisons to the valuation of American Depositary Receipts (ADRs), futures contracts, Exchange-Traded Funds (ETFs) and certain indexes as well as quoted prices for similar securities may be used and would be categorized as Level 2 in the hierarchy. For equity securities, including restricted securities, where observable inputs are limited, assumptions about market activity and risk are used and these securities may be categorized as Level 3 in the hierarchy.
Futures contracts are valued at the settlement price established each day by the board of trade or exchange on which they are traded and are categorized as Level 1 in the hierarchy. Investments in open-end mutual funds, including the Fidelity Central Funds, are valued at their closing net asset value (NAV) each business day and are categorized as Level 1 in the hierarchy.
Changes in valuation techniques may result in transfers in or out of an assigned level within the disclosure hierarchy. The aggregate value of investments by input level as of August 31, 2021 is included at the end of each Fund's Schedule of Investments.
Foreign Currency. Certain Funds may use foreign currency contracts to facilitate transactions in foreign-denominated securities. Gains and losses from these transactions may arise from changes in the value of the foreign currency or if the counterparties do not perform under the contracts' terms.
Foreign-denominated assets, including investment securities, and liabilities are translated into U.S. dollars at the exchange rates at period end. Purchases and sales of investment securities, income and dividends received, and expenses denominated in foreign currencies are translated into U.S. dollars at the exchange rate in effect on the transaction date.
The effects of exchange rate fluctuations on investments are included with the net realized and unrealized gain (loss) on investment securities. Other foreign currency transactions resulting in realized and unrealized gain (loss) are disclosed separately.
Investment Transactions and Income. For financial reporting purposes, the Funds' investment holdings and NAV include trades executed through the end of the last business day of the period. The NAV per share for processing shareholder transactions is calculated as of the close of business of the New York Stock Exchange (NYSE), normally 4:00 p.m. Eastern time and includes trades executed through the end of the prior business day. Gains and losses on securities sold are determined on the basis of identified cost and for certain Funds include proceeds received from litigation. Dividend income is recorded on the ex-dividend date, except for certain dividends from foreign securities where the ex-dividend date may have passed, which are recorded as soon as the Funds are informed of the ex-dividend date. Non-cash dividends included in dividend income, if any, are recorded at the fair market value of the securities received. Income and capital gain distributions from Fidelity Central Funds, if any, are recorded on the ex-dividend date. Certain distributions received by the Funds represent a return of capital or capital gain. The Funds determine the components of these distributions subsequent to the ex-dividend date, based upon receipt of tax filings or other correspondence relating to the underlying investment. These distributions are recorded as a reduction of cost of investments and/or as a realized gain. Interest income is accrued as earned and includes coupon interest and amortization of premium and accretion of discount on debt securities as applicable. Investment income is recorded net of foreign taxes withheld where recovery of such taxes is uncertain. Funds may file withholding tax reclaims in certain jurisdictions to recover a portion of amounts previously withheld. Any withholding tax reclaims income is included in the Statement of Operations in foreign taxes withheld. Any receivables for withholding tax reclaims are included in the Statement of Assets and Liabilities in reclaims receivable.
Expenses. Expenses directly attributable to a fund are charged to that fund. Expenses attributable to more than one fund are allocated among the respective funds on the basis of relative net assets or other appropriate methods. Expenses included in the accompanying financial statements reflect the expenses of that fund and do not include any expenses associated with any underlying mutual funds or exchange-traded funds. Although not included in a fund's expenses, a fund indirectly bears its proportionate share of these expenses through the net asset value of each underlying mutual fund or exchange-traded fund. Expense estimates are accrued in the period to which they relate and adjustments are made when actual amounts are known.
Income Tax Information and Distributions to Shareholders. Each year, each Fund intends to qualify as a regulated investment company under Subchapter M of the Internal Revenue Code, including distributing substantially all of its taxable income and realized gains. As a result, no provision for U.S. Federal income taxes is required. As of August 31, 2021, each Fund did not have any unrecognized tax benefits in the financial statements; nor is each Fund aware of any tax positions for which it is reasonably possible that the total amounts of unrecognized tax benefits will significantly change in the next twelve months. Each Fund files a U.S. federal tax return, in addition to state and local tax returns as required. Each Fund's federal income tax returns are subject to examination by the Internal Revenue Service (IRS) for a period of three fiscal years after they are filed. State and local tax returns may be subject to examination for an additional fiscal year depending on the jurisdiction. Foreign taxes are provided for based on each Fund's understanding of the tax rules and rates that exist in the foreign markets in which it invests.
Distributions are declared and recorded on the ex-dividend date. Income and capital gain distributions are determined in accordance with income tax regulations, which may differ from GAAP. In addition, certain Funds claimed a portion of the payment made to redeeming shareholders as a distribution for income tax purposes.
Capital accounts within the financial statements are adjusted for permanent book-tax differences. These adjustments have no impact on net assets or the results of operations. Capital accounts are not adjusted for temporary book-tax differences which will reverse in a subsequent period.
Book-tax differences are primarily due to futures contracts, foreign currency transactions, capital loss carryforward, passive foreign investment companies (PFIC), partnerships and losses deferred due to wash sales and excise tax regulations.
As of period end, the cost and unrealized appreciation (depreciation) in securities, and derivatives if applicable, for federal income tax purposes were as follows for each Fund:
| Tax cost | Gross unrealized appreciation | Gross unrealized depreciation | Net unrealized appreciation (depreciation) | |
| Fidelity Large Cap Growth Enhanced Index Fund | $979,622,581 | $ 851,035,021 | $(15,617,866) | $ 835,417,155 |
| Fidelity Large Cap Value Enhanced Index Fund | 4,948,900,807 | 1,366,186,696 | (83,394,876) | 1,282,791,820 |
| Fidelity Large Cap Core Enhanced Index Fund | 1,012,577,475 | 510,848,761 | (9,822,491) | 501,026,270 |
| Fidelity Mid Cap Enhanced Index Fund | 1,665,322,487 | 463,915,703 | (35,695,516) | 428,220,187 |
| Fidelity International Enhanced Index Fund | 1,416,724,983 | 304,599,502 | (38,665,564) | 265,933,938 |
The tax-based components of distributable earnings as of period end were as follows for each Fund:
| Undistributed ordinary income | Undistributed long-term capital gain | Capital loss carryforward | Net unrealized appreciation (depreciation) on securities and other investments | |
| Fidelity Large Cap Growth Enhanced Index Fund | $69,246,101 | $135,762,877 | $– | $ 835,417,155 |
| Fidelity Large Cap Value Enhanced Index Fund | 238,194,945 | 324,941,603 | – | 1,282,791,820 |
| Fidelity Large Cap Core Enhanced Index Fund | 79,849,376 | 90,344,115 | – | 501,026,270 |
| Fidelity Mid Cap Enhanced Index Fund | 31,961,638 | 162,380,867 | – | 428,220,187 |
| Fidelity International Enhanced Index Fund | 26,994,140 | – | (116,449,606) | 266,096,992 |
Capital loss carryforwards are only available to offset future capital gains of the Funds to the extent provided by regulations and may be limited. The capital loss carryforward information presented below, including any applicable limitation, is estimated as of fiscal period end and is subject to adjustment.
| No expiration | ||
| Short-term | Total capital loss carryfoward | |
| Fidelity International Enhanced Index Fund | $(116,449,606) | $(116,449,606) |
The tax character of distributions paid was as follows:
| August 31, 2021 | |||
| Ordinary Income | Long-term Capital Gains | Total | |
| Fidelity Large Cap Growth Enhanced Index Fund | $9,736,538 | $56,612,451 | $66,348,989 |
| Fidelity Large Cap Value Enhanced Index Fund | 72,050,354 | – | 72,050,354 |
| Fidelity Large Cap Core Enhanced Index Fund | 16,123,915 | 10,047,364 | 26,171,279 |
| Fidelity Mid Cap Enhanced Index Fund | 12,841,068 | 35,272,302 | 48,113,370 |
| Fidelity International Enhanced Index Fund | 21,705,885 | – | 21,705,885 |
| August 31, 2020 | |||
| Ordinary Income | Long-term Capital Gains | Total | |
| Fidelity Large Cap Growth Enhanced Index Fund | $9,510,147 | $27,187,197 | $36,697,344 |
| Fidelity Large Cap Value Enhanced Index Fund | 90,813,605 | 42,514,648 | 133,328,253 |
| Fidelity Large Cap Core Enhanced Index Fund | 14,454,879 | 7,035,075 | 21,489,954 |
| Fidelity Mid Cap Enhanced Index Fund | 21,282,405 | 27,824,465 | 49,106,870 |
| Fidelity International Enhanced Index Fund | 47,815,176 | – | 47,815,176 |
Delayed Delivery Transactions and When-Issued Securities. During the period, certain Funds transacted in securities on a delayed delivery or when-issued basis. Payment and delivery may take place after the customary settlement period for that security. The price of the underlying securities and the date when the securities will be delivered and paid for are fixed at the time the transaction is negotiated. Securities purchased on a delayed delivery or when-issued basis are identified as such in the Schedule of Investments. Compensation for interest forgone in the purchase of a delayed delivery or when-issued debt security may be received. With respect to purchase commitments, each applicable Fund identifies securities as segregated in its records with a value at least equal to the amount of the commitment. Payables and receivables associated with the purchases and sales of delayed delivery securities having the same coupon, settlement date and broker are offset. Delayed delivery or when-issued securities that have been purchased from and sold to different brokers are reflected as both payables and receivables in the Statement of Assets and Liabilities under the caption "Delayed delivery", as applicable. Losses may arise due to changes in the value of the underlying securities or if the counterparty does not perform under the contract's terms, or if the issuer does not issue the securities due to political, economic, or other factors.
Restricted Securities (including Private Placements). Funds may invest in securities that are subject to legal or contractual restrictions on resale. These securities generally may be resold in transactions exempt from registration or to the public if the securities are registered. Disposal of these securities may involve time-consuming negotiations and expense, and prompt sale at an acceptable price may be difficult. Information regarding restricted securities held at period end is included at the end of the Schedule of Investments, if applicable.
3. Derivative Instruments.
Risk Exposures and the Use of Derivative Instruments. The Funds' investment objective allows the Funds to enter into various types of derivative contracts, including futures contracts. Derivatives are investments whose value is primarily derived from underlying assets, indices or reference rates and may be transacted on an exchange or over-the-counter (OTC). Derivatives may involve a future commitment to buy or sell a specified asset based on specified terms, to exchange future cash flows at periodic intervals based on a notional principal amount, or for one party to make one or more payments upon the occurrence of specified events in exchange for periodic payments from the other party.
The Funds used derivatives to increase returns and to manage exposure to certain risks as defined below. The success of any strategy involving derivatives depends on analysis of numerous economic factors, and if the strategies for investment do not work as intended, the Funds may not achieve their objectives.
The Funds' use of derivatives increased or decreased their exposure to the following risk:
| Equity Risk | Equity risk relates to the fluctuations in the value of financial instruments as a result of changes in market prices (other than those arising from interest rate risk or foreign exchange risk), whether caused by factors specific to an individual investment, its issuer, or all factors affecting all instruments traded in a market or market segment. |
The Funds are also exposed to additional risks from investing in derivatives, such as liquidity risk and counterparty credit risk. Liquidity risk is the risk that the Funds will be unable to close out the derivative in the open market in a timely manner. Counterparty credit risk is the risk that the counterparty will not be able to fulfill its obligation to the Funds. Counterparty credit risk related to exchange-traded futures contracts may be mitigated by the protection provided by the exchange on which they trade.
Investing in derivatives may involve greater risks than investing in the underlying assets directly and, to varying degrees, may involve risk of loss in excess of any initial investment and collateral received and amounts recognized in the Statement of Assets and Liabilities. In addition, there may be the risk that the change in value of the derivative contract does not correspond to the change in value of the underlying instrument.
Futures Contracts. A futures contract is an agreement between two parties to buy or sell a specified underlying instrument for a fixed price at a specified future date. The Funds used futures contracts to manage their exposure to the stock market.
Upon entering into a futures contract, a fund is required to deposit either cash or securities (initial margin) with a clearing broker in an amount equal to a certain percentage of the face value of the contract. Futures contracts are marked-to-market daily and subsequent daily payments (variation margin) are made or received by a fund depending on the daily fluctuations in the value of the futures contracts and are recorded as unrealized appreciation or (depreciation). This receivable and/or payable, if any, is included in daily variation margin on futures contracts in the Statement of Assets and Liabilities. Realized gain or (loss) is recorded upon the expiration or closing of a futures contract. The net realized gain (loss) and change in net unrealized appreciation (depreciation) on futures contracts during the period is presented in the Statement of Operations.
Any open futures contracts at period end are presented in the Schedule of Investments under the caption "Futures Contracts". The notional amount at value reflects each contract's exposure to the underlying instrument or index at period end and is representative of volume of activity during the period. Cash deposited to meet initial margin requirements is presented as segregated cash with brokers for derivative instruments in the Statement of Assets and Liabilities.
4. Purchases and Sales of Investments.
Purchases and sales of securities, other than short-term securities and in-kind transactions, as applicable, are noted in the table below.
| Purchases ($) | Sales ($) | |
| Fidelity Large Cap Growth Enhanced Index Fund | 1,265,553,908 | 1,290,525,506 |
| Fidelity Large Cap Value Enhanced Index Fund | 4,536,266,724 | 3,647,548,849 |
| Fidelity Large Cap Core Enhanced Index Fund | 1,085,505,175 | 1,014,861,888 |
| Fidelity Mid Cap Enhanced Index Fund | 1,416,682,121 | 1,095,981,947 |
| Fidelity International Enhanced Index Fund | 1,330,576,799 | 1,134,088,747 |
5. Fees and Other Transactions with Affiliates.
Management Fee. Fidelity Management & Research Company LLC (the investment adviser) and its affiliates provide the Funds with investment management related services for which the Funds pay a monthly management fee. Each Fund pays an all-inclusive management fee based on the annual rates noted in the following table; and the investment adviser pays all ordinary operating expenses of each Fund, except fees and expenses of the independent Trustees and certain miscellaneous expenses such as proxy and shareholder meeting expenses. The management fees are reduced by an amount equal to the fees and expenses paid by the Funds to the independent Trustees.
| Fidelity Large Cap Growth Enhanced Index Fund | .39% |
| Fidelity Large Cap Value Enhanced Index Fund | .39% |
| Fidelity Large Cap Core Enhanced Index Fund | .39% |
| Fidelity Mid Cap Enhanced Index Fund | .59% |
| Fidelity International Enhanced Index Fund | .59% |
Sub-Adviser. Geode Capital Management, LLC (Geode), serves as sub-adviser for the Funds. Geode provides discretionary investment advisory services to the Funds and is paid by the investment adviser for providing these services.
Interfund Trades. Funds may purchase from or sell securities to other Fidelity Funds under procedures adopted by the Board. The procedures have been designed to ensure these interfund trades are executed in accordance with Rule 17a-7 of the 1940 Act. Any interfund trades are included within the respective purchases and sales amounts shown in the Purchases and Sales of Investments note.
6. Investments in Fidelity Central Funds.
Funds may invest in Fidelity Central Funds, which are open-end investment companies generally available only to other investment companies and accounts managed by the investment adviser and its affiliates. The Schedule of Investments lists any Fidelity Central Funds held as an investment as of period end, but does not include the underlying holdings of each Fidelity Central Fund. An investing fund indirectly bears its proportionate share of the expenses of the underlying Fidelity Central Funds.
Based on its investment objective, each Fidelity Central Fund may invest or participate in various investment vehicles or strategies that are similar to those of the investing fund. These strategies are consistent with the investment objectives of the investing fund and may involve certain economic risks which may cause a decline in value of each of the Fidelity Central Funds and thus a decline in the value of the investing fund.
| Fidelity Central Fund | Investment Manager | Investment Objective | Investment Practices | Expense Ratio(a) |
| Fidelity Money Market Central Funds | Fidelity Management & Research Company LLC (FMR) | Each fund seeks to obtain a high level of current income consistent with the preservation of capital and liquidity. | Short-term Investments | Less than .005% to .01% |
(a) Expenses expressed as a percentage of average net assets and are as of each underlying Central Fund's most recent annual or semi-annual shareholder report.
A complete unaudited list of holdings for each Fidelity Central Fund is available upon request or at the Securities and Exchange Commission website at www.sec.gov. In addition, the financial statements of the Fidelity Central Funds, which are not covered by the Report of Independent Registered Public Accounting Firm, are available on the Securities and Exchange Commission website or upon request.
7. Committed Line of Credit.
Certain Funds participate with other funds managed by the investment adviser or an affiliate in a $4.25 billion credit facility (the "line of credit") to be utilized for temporary or emergency purposes to fund shareholder redemptions or for other short-term liquidity purposes. The participating funds have agreed to pay commitment fees on their pro-rata portion of the line of credit, which are reflected in Miscellaneous expenses on the Statement of Operations, and are listed below. Effective during January 2021, commitment fees are borne by the investment adviser. During the period, there were no borrowings on this line of credit.
| Amount | |
| Fidelity Large Cap Growth Enhanced Index Fund | $688 |
| Fidelity Large Cap Value Enhanced Index Fund | 1,946 |
| Fidelity Large Cap Core Enhanced Index Fund | 541 |
| Fidelity Mid Cap Enhanced Index Fund | 606 |
| Fidelity International Enhanced Index Fund | 615 |
8. Security Lending.
Funds lend portfolio securities from time to time in order to earn additional income. Lending agents are used, including National Financial Services (NFS), an affiliate of the investment adviser. Pursuant to a securities lending agreement, NFS will receive a fee, which is capped at 9.9% of a fund's daily lending revenue, for its services as lending agent. A fund may lend securities to certain qualified borrowers, including NFS. On the settlement date of the loan, a fund receives collateral (in the form of U.S. Treasury obligations, letters of credit and/or cash) against the loaned securities and maintains collateral in an amount not less than 100% of the market value of the loaned securities during the period of the loan. The market value of the loaned securities is determined at the close of business of a fund and any additional required collateral is delivered to a fund on the next business day. A fund or borrower may terminate the loan at any time, and if the borrower defaults on its obligation to return the securities loaned because of insolvency or other reasons, a fund may apply collateral received from the borrower against the obligation. A fund may experience delays and costs in recovering the securities loaned. Any cash collateral received is invested in the Fidelity Securities Lending Cash Central Fund. Any loaned securities are identified as such in the Schedule of Investments, and the value of loaned securities and cash collateral at period end, as applicable, are presented in the Statement of Assets and Liabilities. Security lending income represents the income earned on investing cash collateral, less rebates paid to borrowers and any lending agent fees associated with the loan, plus any premium payments received for lending certain types of securities. Security lending income is presented in the Statement of Operations as a component of income from Fidelity Central Funds. Affiliated security lending activity, if any, was as follows:
| Total Security Lending Fees Paid to NFS | Security Lending Income From Securities Loaned to NFS | Value of Securities Loaned to NFS at Period End | |
| Fidelity Large Cap Growth Enhanced Index Fund | $1,193 | $1 | $– |
| Fidelity Large Cap Value Enhanced Index Fund | $5,144 | $2 | $– |
| Fidelity Large Cap Core Enhanced Index Fund | $898 | $1 | $– |
| Fidelity Mid Cap Enhanced Index Fund | $4,935 | $– | $– |
| Fidelity International Enhanced Index Fund | $19,029 | $– | $– |
9. Expense Reductions.
Through arrangements with each applicable Fund's custodian, credits realized as a result of certain uninvested cash balances were used to reduce each applicable Fund's expenses. All of the applicable expense reductions are noted in the table below.
| Custodian credits | |
| Fidelity Large Cap Growth Enhanced Index Fund | $24 |
| Fidelity Large Cap Value Enhanced Index Fund | 17 |
| Fidelity Large Cap Core Enhanced Index Fund | 17 |
| Fidelity Mid Cap Enhanced Index Fund | 11 |
| Fidelity International Enhanced Index Fund | 13 |
10. Other.
Fund's organizational documents provide former and current trustees and officers with a limited indemnification against liabilities arising in connection with the performance of their duties to the fund. In the normal course of business, the fund may also enter into contracts that provide general indemnifications. The fund's maximum exposure under these arrangements is unknown as this would be dependent on future claims that may be made against the fund. The risk of material loss from such claims is considered remote.
At the end of the period, the following mutual funds managed by the investment adviser or its affiliates were the owners of record of 10% or more of the total outstanding shares.
| Strategic Advisers Fidelity U.S. Total Stock Fund | |
| Fidelity Large Cap Value Enhanced Index Fund | 51% |
Mutual funds managed by the investment adviser or its affiliates, in aggregate, were the owners of record of more than 20% of the total outstanding shares.
| Fund | % of shares held |
| Fidelity Large Cap Value Enhanced Index Fund | 54% |
11. Coronavirus (COVID-19) Pandemic.
An outbreak of COVID-19 first detected in China during December 2019 has since spread globally and was declared a pandemic by the World Health Organization during March 2020. Developments that disrupt global economies and financial markets, such as the COVID-19 pandemic, may magnify factors that affect the Funds' performance.
Report of Independent Registered Public Accounting Firm
To the Board of Trustees of Fidelity Commonwealth Trust II and the Shareholders of Fidelity Large Cap Growth Enhanced Index Fund, Fidelity Large Cap Value Enhanced Index Fund, Fidelity Large Cap Core Enhanced Index Fund, Fidelity Mid Cap Enhanced Index Fund and Fidelity International Enhanced Index Fund
Opinions on the Financial Statements
We have audited the accompanying statements of assets and liabilities, including the schedules of investments, of Fidelity Large Cap Growth Enhanced Index Fund, Fidelity Large Cap Value Enhanced Index Fund, Fidelity Large Cap Core Enhanced Index Fund, Fidelity Mid Cap Enhanced Index Fund, and Fidelity International Enhanced Index Fund (five of the funds constituting Fidelity Commonwealth Trust II, hereafter collectively referred to as the “Funds”) as of August 31, 2021, the related statements of operations for the year ended August 31, 2021, the statements of changes in net assets for each of the two years in the period ended August 31, 2021, including the related notes, and the financial highlights for each of the four years in the period ended August 31, 2021, for the six month period ended August 31, 2017 and for the year ended February 28, 2017 (collectively referred to as the “financial statements”). In our opinion, the financial statements present fairly, in all material respects, the financial position of each of the Funds as of August 31, 2021, the results of each of their operations for the year then ended, the changes in each of their net assets for each of the two years in the period ended August 31, 2021 and each of the financial highlights for each of the four years in the period ended August 31, 2021, for the six month period ended August 31, 2017 and for the year ended February 28, 2017 in conformity with accounting principles generally accepted in the United States of America.
Basis for Opinions
These financial statements are the responsibility of the Funds’ management. Our responsibility is to express an opinion on the Funds’ financial statements based on our audits. We are a public accounting firm registered with the Public Company Accounting Oversight Board (United States) (PCAOB) and are required to be independent with respect to the Funds in accordance with the U.S. federal securities laws and the applicable rules and regulations of the Securities and Exchange Commission and the PCAOB.
We conducted our audits of these financial statements in accordance with the standards of the PCAOB. Those standards require that we plan and perform the audit to obtain reasonable assurance about whether the financial statements are free of material misstatement, whether due to error or fraud.
Our audits included performing procedures to assess the risks of material misstatement of the financial statements, whether due to error or fraud, and performing procedures that respond to those risks. Such procedures included examining, on a test basis, evidence regarding the amounts and disclosures in the financial statements. Our audits also included evaluating the accounting principles used and significant estimates made by management, as well as evaluating the overall presentation of the financial statements. Our procedures included confirmation of securities owned as of August 31, 2021 by correspondence with the custodian and brokers; when replies were not received from brokers, we performed other auditing procedures. We believe that our audits provide a reasonable basis for our opinions.
/s/ PricewaterhouseCoopers LLP
Boston, Massachusetts
October 13, 2021
We have served as the auditor of one or more investment companies in the Fidelity group of funds since 1932.
Trustees and Officers
The Trustees, Members of the Advisory Board (if any), and officers of the trust and funds, as applicable, are listed below. The Board of Trustees governs each fund and is responsible for protecting the interests of shareholders. The Trustees are experienced executives who meet periodically throughout the year to oversee each fund's activities, review contractual arrangements with companies that provide services to each fund, oversee management of the risks associated with such activities and contractual arrangements, and review each fund's performance. Each of the Trustees oversees 313 funds.
The Trustees hold office without limit in time except that (a) any Trustee may resign; (b) any Trustee may be removed by written instrument, signed by at least two-thirds of the number of Trustees prior to such removal; (c) any Trustee who requests to be retired or who has become incapacitated by illness or injury may be retired by written instrument signed by a majority of the other Trustees; and (d) any Trustee may be removed at any special meeting of shareholders by a two-thirds vote of the outstanding voting securities of the trust. Each Trustee who is not an interested person (as defined in the 1940 Act) of the trust and the funds is referred to herein as an Independent Trustee. Each Independent Trustee shall retire not later than the last day of the calendar year in which his or her 75th birthday occurs. The Independent Trustees may waive this mandatory retirement age policy with respect to individual Trustees. Officers and Advisory Board Members hold office without limit in time, except that any officer or Advisory Board Member may resign or may be removed by a vote of a majority of the Trustees at any regular meeting or any special meeting of the Trustees. Except as indicated, each individual has held the office shown or other offices in the same company for the past five years.
Each fund’s Statement of Additional Information (SAI) includes more information about the Trustees. To request a free copy, call Fidelity at 1-800-544-8544.
Experience, Skills, Attributes, and Qualifications of the Trustees. The Governance and Nominating Committee has adopted a statement of policy that describes the experience, qualifications, attributes, and skills that are necessary and desirable for potential Independent Trustee candidates (Statement of Policy). The Board believes that each Trustee satisfied at the time he or she was initially elected or appointed a Trustee, and continues to satisfy, the standards contemplated by the Statement of Policy. The Governance and Nominating Committee also engages professional search firms to help identify potential Independent Trustee candidates who have the experience, qualifications, attributes, and skills consistent with the Statement of Policy. From time to time, additional criteria based on the composition and skills of the current Independent Trustees, as well as experience or skills that may be appropriate in light of future changes to board composition, business conditions, and regulatory or other developments, have also been considered by the professional search firms and the Governance and Nominating Committee. In addition, the Board takes into account the Trustees' commitment and participation in Board and committee meetings, as well as their leadership of standing and ad hoc committees throughout their tenure.
In determining that a particular Trustee was and continues to be qualified to serve as a Trustee, the Board has considered a variety of criteria, none of which, in isolation, was controlling. The Board believes that, collectively, the Trustees have balanced and diverse experience, qualifications, attributes, and skills, which allow the Board to operate effectively in governing each fund and protecting the interests of shareholders. Information about the specific experience, skills, attributes, and qualifications of each Trustee, which in each case led to the Board's conclusion that the Trustee should serve (or continue to serve) as a trustee of the funds, is provided below.
Board Structure and Oversight Function. Robert A. Lawrence is an interested person and currently serves as Acting Chairman. The Trustees have determined that an interested Chairman is appropriate and benefits shareholders because an interested Chairman has a personal and professional stake in the quality and continuity of services provided to the funds. Independent Trustees exercise their informed business judgment to appoint an individual of their choosing to serve as Chairman, regardless of whether the Trustee happens to be independent or a member of management. The Independent Trustees have determined that they can act independently and effectively without having an Independent Trustee serve as Chairman and that a key structural component for assuring that they are in a position to do so is for the Independent Trustees to constitute a substantial majority for the Board. The Independent Trustees also regularly meet in executive session. David M. Thomas serves as Lead Independent Trustee and as such (i) acts as a liaison between the Independent Trustees and management with respect to matters important to the Independent Trustees and (ii) with management prepares agendas for Board meetings.
Fidelity® funds are overseen by different Boards of Trustees. The funds' Board oversees Fidelity's high income and certain equity funds, and other Boards oversee Fidelity's investment-grade bond, money market, asset allocation, and other equity funds. The asset allocation funds may invest in Fidelity® funds overseen by the funds' Board. The use of separate Boards, each with its own committee structure, allows the Trustees of each group of Fidelity® funds to focus on the unique issues of the funds they oversee, including common research, investment, and operational issues. On occasion, the separate Boards establish joint committees to address issues of overlapping consequences for the Fidelity® funds overseen by each Board.
The Trustees operate using a system of committees to facilitate the timely and efficient consideration of all matters of importance to the Trustees, each fund, and fund shareholders and to facilitate compliance with legal and regulatory requirements and oversight of the funds' activities and associated risks. The Board, acting through its committees, has charged FMR and its affiliates with (i) identifying events or circumstances the occurrence of which could have demonstrably adverse effects on the funds' business and/or reputation; (ii) implementing processes and controls to lessen the possibility that such events or circumstances occur or to mitigate the effects of such events or circumstances if they do occur; and (iii) creating and maintaining a system designed to evaluate continuously business and market conditions in order to facilitate the identification and implementation processes described in (i) and (ii) above. Because the day-to-day operations and activities of the funds are carried out by or through FMR, its affiliates, and other service providers, the funds' exposure to risks is mitigated but not eliminated by the processes overseen by the Trustees. While each of the Board's committees has responsibility for overseeing different aspects of the funds' activities, oversight is exercised primarily through the Operations, Audit, and Compliance Committees. Appropriate personnel, including but not limited to the funds' Chief Compliance Officer (CCO), FMR's internal auditor, the independent accountants, the funds' Treasurer and portfolio management personnel, make periodic reports to the Board's committees, as appropriate, including an annual review of Fidelity's risk management program for the Fidelity® funds. The responsibilities of each standing committee, including their oversight responsibilities, are described further under "Standing Committees of the Trustees."
Interested Trustees*:
Correspondence intended for a Trustee who is an interested person may be sent to Fidelity Investments, 245 Summer Street, Boston, Massachusetts 02210.
Name, Year of Birth; Principal Occupations and Other Relevant Experience+
Bettina Doulton (1964)
Year of Election or Appointment: 2020
Trustee
Ms. Doulton also serves as Trustee of other Fidelity® funds. Prior to her retirement, Ms. Doulton served in a variety of positions at Fidelity Investments, including as a managing director of research (2006-2007), portfolio manager to certain Fidelity® funds (1993-2005), equity analyst and portfolio assistant (1990-1993), and research assistant (1987-1990). Ms. Doulton currently owns and operates Phi Builders + Architects and Cellardoor Winery. Previously, Ms. Doulton served as a member of the Board of Brown Capital Management, LLC (2014-2018).
Robert A. Lawrence (1952)
Year of Election or Appointment: 2020
Trustee
Acting Chairman of the Board of Trustees
Mr. Lawrence also serves as Trustee of other funds. Previously, Mr. Lawrence served as a Member of the Advisory Board of certain funds. Prior to his retirement in 2008, Mr. Lawrence served as Vice President of certain Fidelity® funds (2006-2008), Senior Vice President, Head of High Income Division of Fidelity Management & Research Company (investment adviser firm, 2006-2008), and President of Fidelity Strategic Investments (investment adviser firm, 2002-2005).
* Determined to be an “Interested Trustee” by virtue of, among other things, his or her affiliation with the trust or various entities under common control with FMR.
+ The information includes the Trustee's principal occupation during the last five years and other information relating to the experience, attributes, and skills relevant to the Trustee's qualifications to serve as a Trustee, which led to the conclusion that the Trustee should serve as a Trustee for each fund.
Independent Trustees:
Correspondence intended for an Independent Trustee may be sent to Fidelity Investments, P.O. Box 55235, Boston, Massachusetts 02205-5235.
Name, Year of Birth; Principal Occupations and Other Relevant Experience+
Thomas P. Bostick (1956)
Year of Election or Appointment: 2021
Trustee
Lieutenant General Bostick also serves as Trustee of other Fidelity® funds. Prior to his retirement, General Bostick (United States Army, Retired) held a variety of positions within the U.S. Army, including Commanding General and Chief of Engineers, U.S. Army Corps of Engineers (2012-2016) and Deputy Chief of Staff and Director of Human Resources, U.S. Army (2009-2012). General Bostick currently serves as a member of the Board and Finance and Governance Committees of CSX Corporation (transportation, 2020-present) and a member of the Board and Corporate Governance and Nominating Committee of Perma-Fix Environmental Services, Inc. (nuclear waste management, 2020-present). General Bostick serves as Chief Executive Officer of Bostick Global Strategies, LLC (consulting, 2016-present) and Managing Partner, Sustainability, of Ridge-Lane Limited Partners (strategic advisory and venture development, 2016-present). Previously, General Bostick served as a Member of the Advisory Board of certain Fidelity® funds (2021), President, Intrexon Bioengineering (2018-2020) and Chief Operating Officer (2017-2020) and Senior Vice President of the Environment Sector (2016-2017) of Intrexon Corporation (biopharmaceutical company).
Dennis J. Dirks (1948)
Year of Election or Appointment: 2018
Trustee
Mr. Dirks also serves as Trustee of other Fidelity® funds. Prior to his retirement in May 2003, Mr. Dirks served as Chief Operating Officer and as a member of the Board of The Depository Trust & Clearing Corporation (financial markets infrastructure), President, Chief Operating Officer and a member of the Board of The Depository Trust Company (DTC), President and a member of the Board of the National Securities Clearing Corporation (NSCC), Chief Executive Officer and a member of the Board of the Government Securities Clearing Corporation and Chief Executive Officer and a member of the Board of the Mortgage-Backed Securities Clearing Corporation. Mr. Dirks currently serves as a member of the Finance Committee (2016-present) and Board (2017-present) and is Treasurer (2018-present) of the Asolo Repertory Theatre.
Donald F. Donahue (1950)
Year of Election or Appointment: 2017
Trustee
Mr. Donahue also serves as Trustee of other Fidelity® funds. Mr. Donahue serves as President and Chief Executive Officer of Miranda Partners, LLC (risk consulting for the financial services industry, 2012-present). Previously, Mr. Donahue served as Chief Executive Officer (2006-2012), Chief Operating Officer (2003-2006) and Managing Director, Customer Marketing and Development (1999-2003) of The Depository Trust & Clearing Corporation (financial markets infrastructure). Mr. Donahue currently serves as a member (2007-present) and Co-Chairman (2016-present) of the Board of United Way of New York and a member of the Board of NYC Leadership Academy (2012-present). Mr. Donahue previously served as a member of the Advisory Board of certain Fidelity® funds (2015-2018).
Vicki L. Fuller (1957)
Year of Election or Appointment: 2020
Trustee
Ms. Fuller also serves as Trustee of other Fidelity® funds. Previously, Ms. Fuller served as a member of the Advisory Board of certain Fidelity® funds (2018-2020), Chief Investment Officer of the New York State Common Retirement Fund (2012-2018) and held a variety of positions at AllianceBernstein L.P. (global asset management, 1985-2012), including Managing Director (2006-2012) and Senior Vice President and Senior Portfolio Manager (2001-2006). Ms. Fuller currently serves as a member of the Board, Audit Committee and Nominating and Governance Committee of The Williams Companies, Inc. (natural gas infrastructure, 2018-present), as a member of the Board, Audit Committee and Nominating and Governance Committee of two Blackstone business development companies (2020-present) and as a member of the Board of Treliant, LLC (consulting, 2019-present).
Patricia L. Kampling (1959)
Year of Election or Appointment: 2020
Trustee
Ms. Kampling also serves as Trustee of other Fidelity® funds. Prior to her retirement, Ms. Kampling served as Chairman of the Board and Chief Executive Officer (2012-2019), President and Chief Operating Officer (2011-2012) and Executive Vice President and Chief Financial Officer (2010-2011) of Alliant Energy Corporation. Ms. Kampling currently serves as a member of the Board, Finance Committee and Governance, Compensation and Nominating Committee of Xcel Energy Inc. (utilities company, 2020-present) and as a member of the Board, Audit, Finance and Risk Committee and Safety, Environmental, Technology and Operations Committee of American Water Works Company, Inc. (utilities company, 2019-present). In addition, Ms. Kampling currently serves as a member of the Board of the Nature Conservancy, Wisconsin Chapter (2019-present). Previously, Ms. Kampling served as a Member of the Advisory Board of certain Fidelity® funds (2020), a member of the Board, Compensation Committee and Executive Committee and Chair of the Audit Committee of Briggs & Stratton Corporation (manufacturing, 2011-2021), a member of the Board of Interstate Power and Light Company (2012-2019) and Wisconsin Power and Light Company (2012-2019) (each a subsidiary of Alliant Energy Corporation) and as a member of the Board and Workforce Development Committee of the Business Roundtable (2018-2019).
Thomas A. Kennedy (1955)
Year of Election or Appointment: 2021
Trustee
Mr. Kennedy also serves as Trustee of other Fidelity® funds. Previously, Mr. Kennedy served as a Member of the Advisory Board of certain Fidelity® funds (2020) and held a variety of positions at Raytheon Company (aerospace and defense, 1983-2020), including Chairman and Chief Executive Officer (2014-2020) and Executive Vice President and Chief Operating Officer (2013-2014). Mr. Kennedy currently serves as Executive Chairman of the Board of Directors of Raytheon Technologies Corporation (aerospace and defense, 2020-present). He is also a member of the Rutgers School of Engineering Industry Advisory Board (2011-present) and a member of the UCLA Engineering Dean’s Executive Board (2016-present).
Oscar Munoz (1959)
Year of Election or Appointment: 2021
Trustee
Mr. Munoz also serves as Trustee of other Fidelity® funds. Prior to his retirement, Mr. Munoz served as Executive Chairman (2020-2021), Chief Executive Officer (2015-2020), President (2015-2016) and a member of the Board (2010-2021) of United Airlines Holdings, Inc. Mr. Munoz currently serves as a member of the Board of CBRE Group, Inc. (commercial real estate, 2020-present), a member of the Board of Univision Communications, Inc. (Hispanic media, 2020-present) and a member of the Advisory Board of Salesforce.com, Inc. (cloud-based software, 2020-present). Previously, Mr. Munoz served as a Member of the Advisory Board of certain Fidelity® funds (2021).
Garnett A. Smith (1947)
Year of Election or Appointment: 2017
Trustee
Mr. Smith also serves as Trustee of other Fidelity® funds. Prior to his retirement, Mr. Smith served as Chairman and Chief Executive Officer (1990-1997) and President (1986-1990) of Inbrand Corp. (manufacturer of personal absorbent products). Prior to his employment with Inbrand Corp., he was employed by a retail fabric chain and North Carolina National Bank (now Bank of America). Mr. Smith previously served as a member of the Advisory Board of certain Fidelity® funds (2012-2013).
David M. Thomas (1949)
Year of Election or Appointment: 2018
Trustee
Lead Independent Trustee
Mr. Thomas also serves as Trustee of other Fidelity® funds. Previously, Mr. Thomas served as Executive Chairman (2005-2006) and Chairman and Chief Executive Officer (2000-2005) of IMS Health, Inc. (pharmaceutical and healthcare information solutions). Mr. Thomas currently serves as a member of the Board of Fortune Brands Home and Security (home and security products, 2004-present) and Presiding Director (2013-present) of Interpublic Group of Companies, Inc. (marketing communication).
Susan Tomasky (1953)
Year of Election or Appointment: 2020
Trustee
Ms. Tomasky also serves as Trustee of other Fidelity® funds. Prior to her retirement, Ms. Tomasky served in various executive officer positions at American Electric Power Company, Inc. (1998-2011), including most recently as President of AEP Transmission (2007-2011). Ms. Tomasky currently serves as a member of the Board and Sustainability Committee and as Chair of the Audit Committee of Marathon Petroleum Corporation (2018-present) and as a member of the Board, Corporate Governance Committee and Organization and Compensation Committee and as Chair of the Audit Committee of Public Service Enterprise Group, Inc. (utilities company, 2012-present). In addition, Ms. Tomasky currently serves as a member (2009-present) and President (2020-present) of the Board of the Royal Shakespeare Company – America (2009-present), as a member of the Board of the Columbus Association for the Performing Arts (2011-present) and as a member of the Board and Investment Committee of Kenyon College (2016-present). Previously, Ms. Tomasky served as a Member of the Advisory Board of certain Fidelity® funds (2020), as a member of the Board of the Columbus Regional Airport Authority (2007-2020), as a member of the Board (2011-2018) and Lead Independent Director (2015-2018) of Andeavor Corporation (previously Tesoro Corporation) (independent oil refiner and marketer) and as a member of the Board of Summit Midstream Partners LP (energy, 2012-2018).
Michael E. Wiley (1950)
Year of Election or Appointment: 2017
Trustee
Mr. Wiley also serves as Trustee of other Fidelity® funds. Previously, Mr. Wiley served as a member of the Advisory Board of certain Fidelity® funds (2018-2020), Chairman, President and CEO of Baker Hughes, Inc. (oilfield services, 2000-2004). Mr. Wiley also previously served as a member of the Board of Andeavor Corporation (independent oil refiner and marketer, 2005-2018), a member of the Board of Andeavor Logistics LP (natural resources logistics, 2015-2018) and a member of the Board of High Point Resources (exploration and production, 2005-2020).
+ The information includes the Trustee's principal occupation during the last five years and other information relating to the experience, attributes, and skills relevant to the Trustee's qualifications to serve as a Trustee, which led to the conclusion that the Trustee should serve as a Trustee for each fund.
Advisory Board Members and Officers:
Correspondence intended for a Member of the Advisory Board (if any) may be sent to Fidelity Investments, P.O. Box 55235, Boston, Massachusetts 02205-5235. Correspondence intended for an officer or Peter S. Lynch may be sent to Fidelity Investments, 245 Summer Street, Boston, Massachusetts 02210. Officers appear below in alphabetical order.
Name, Year of Birth; Principal Occupation
Peter S. Lynch (1944)
Year of Election or Appointment: 2018
Member of the Advisory Board
Mr. Lynch also serves as a Member of the Advisory Board of other Fidelity® funds. Mr. Lynch is Vice Chairman and a Director of Fidelity Management & Research Company LLC (investment adviser firm). In addition, Mr. Lynch serves as a Trustee of Boston College and as the Chairman of the Inner-City Scholarship Fund. Previously, Mr. Lynch served as Vice Chairman and a Director of FMR Co., Inc. (investment adviser firm) and on the Special Olympics International Board of Directors (1997-2006).
Craig S. Brown (1977)
Year of Election or Appointment: 2019
Assistant Treasurer
Mr. Brown also serves as an officer of other funds. Mr. Brown serves as Assistant Treasurer of FIMM, LLC (2021-present) and is an employee of Fidelity Investments (2013-present).
John J. Burke III (1964)
Year of Election or Appointment: 2018
Chief Financial Officer
Mr. Burke also serves as Chief Financial Officer of other funds. Mr. Burke serves as Head of Investment Operations for Fidelity Fund and Investment Operations (2018-present) and is an employee of Fidelity Investments (1998-present). Previously Mr. Burke served as head of Asset Management Investment Operations (2012-2018).
William C. Coffey (1969)
Year of Election or Appointment: 2019
Assistant Secretary
Mr. Coffey also serves as Assistant Secretary of other funds. He is Senior Vice President and Deputy General Counsel of FMR LLC (diversified financial services company, 2010-present), and is an employee of Fidelity Investments. Previously, Mr. Coffey served as Secretary and CLO of certain funds (2018-2019); CLO, Secretary, and Senior Vice President of Fidelity Management & Research Company and FMR Co., Inc. (investment adviser firms, 2018-2019); Secretary of Fidelity SelectCo, LLC and Fidelity Investments Money Management, Inc. (investment adviser firms, 2018-2019); CLO of Fidelity Management & Research (Hong Kong) Limited, FMR Investment Management (UK) Limited, and Fidelity Management & Research (Japan) Limited (investment adviser firms, 2018-2019); and Assistant Secretary of certain funds (2009-2018).
Timothy M. Cohen (1969)
Year of Election or Appointment: 2018
Vice President
Mr. Cohen also serves as Vice President of other funds. Mr. Cohen serves as Co-Head of Equity (2018-present), a Director of Fidelity Management & Research (Japan) Limited (investment adviser firm, 2016-present), and is an employee of Fidelity Investments. Previously, Mr. Cohen served as Executive Vice President of Fidelity SelectCo, LLC (2019), Head of Global Equity Research (2016-2018), Chief Investment Officer - Equity and a Director of Fidelity Management & Research (U.K.) Inc. (investment adviser firm, 2013-2015) and as a Director of Fidelity Management & Research (Hong Kong) Limited (investment adviser firm, 2017).
Jonathan Davis (1968)
Year of Election or Appointment: 2017
Assistant Treasurer
Mr. Davis also serves as an officer of other funds. Mr. Davis serves as Assistant Treasurer of FIMM, LLC (2021-present) and FMR Capital, Inc. (2017-present) and is an employee of Fidelity Investments. Previously, Mr. Davis served as Vice President and Associate General Counsel of FMR LLC (diversified financial services company, 2003-2010).
Laura M. Del Prato (1964)
Year of Election or Appointment: 2018
Assistant Treasurer
Ms. Del Prato also serves as an officer of other funds. Ms. Del Prato serves as Assistant Treasurer of FIMM, LLC (2021-present) and is an employee of Fidelity Investments (2017-present). Previously, Ms. Del Prato served as President and Treasurer of The North Carolina Capital Management Trust: Cash Portfolio and Term Portfolio (2018-2020). Prior to joining Fidelity Investments, Ms. Del Prato served as a Managing Director and Treasurer of the JPMorgan Mutual Funds (2014-2017). Prior to JPMorgan, Ms. Del Prato served as a partner at Cohen Fund Audit Services (accounting firm, 2012-2013) and KPMG LLP (accounting firm, 2004-2012).
Colm A. Hogan (1973)
Year of Election or Appointment: 2020
Assistant Treasurer
Mr. Hogan also serves as an officer of other funds. Mr. Hogan serves as Assistant Treasurer of FIMM, LLC (2021-present) and FMR Capital, Inc. (2017-present) and is an employee of Fidelity Investments (2005-present). Previously, Mr. Hogan served as Deputy Treasurer of certain Fidelity® funds (2016-2020) and Assistant Treasurer of certain Fidelity® funds (2016-2018).
Pamela R. Holding (1964)
Year of Election or Appointment: 2018
Vice President
Ms. Holding also serves as Vice President of other funds. Ms. Holding serves as Co-Head of Equity (2018-present) and is an employee of Fidelity Investments (2013-present). Previously, Ms. Holding served as Executive Vice President of Fidelity SelectCo, LLC (2019) and as Chief Investment Officer of Fidelity Institutional Asset Management (2013-2018).
Cynthia Lo Bessette (1969)
Year of Election or Appointment: 2019
Secretary and Chief Legal Officer (CLO)
Ms. Lo Bessette also serves as an officer of other funds. Ms. Lo Bessette serves as CLO, Secretary, and Senior Vice President of Fidelity Management & Research Company LLC (investment adviser firm, 2019-present); and CLO of Fidelity Management & Research (Hong Kong) Limited, FMR Investment Management (UK) Limited, and Fidelity Management & Research (Japan) Limited (investment adviser firms, 2019-present). She is a Senior Vice President and Deputy General Counsel of FMR LLC (diversified financial services company, 2019-present), and is an employee of Fidelity Investments. Previously, Ms. Lo Bessette served as CLO, Secretary, and Senior Vice President of FMR Co., Inc. (investment adviser firm, 2019); Secretary of Fidelity SelectCo, LLC and Fidelity Investments Money Management, Inc. (investment adviser firms, 2019). Prior to joining Fidelity Investments, Ms. Lo Bessette was Executive Vice President, General Counsel (2016-2019) and Senior Vice President, Deputy General Counsel (2015-2016) of OppenheimerFunds (investment management company) and Deputy Chief Legal Officer (2013-2015) of Jennison Associates LLC (investment adviser firm).
Chris Maher (1972)
Year of Election or Appointment: 2020
Deputy Treasurer
Mr. Maher also serves as an officer of other funds. Mr. Maher serves as Assistant Treasurer of FIMM, LLC (2021-present) and FMR Capital, Inc. (2017-present), and is an employee of Fidelity Investments (2008-present). Previously, Mr. Maher served as Assistant Treasurer of certain funds (2013-2020); Vice President of Asset Management Compliance (2013), Vice President of the Program Management Group of FMR (investment adviser firm, 2010-2013), and Vice President of Valuation Oversight (2008-2010).
Jason P. Pogorelec (1975)
Year of Election or Appointment: 2020
Chief Compliance Officer
Mr. Pogorelec also serves as Chief Compliance Officer of other funds. Mr. Pogorelec is a senior Vice President of Asset Management Compliance for Fidelity Investments and is an employee of Fidelity Investments (2006-present). Previously, Mr. Pogorelec served as Vice President, Associate General Counsel for Fidelity Investments (2010-2020) and Assistant Secretary of certain Fidelity funds (2015-2020).
Brett Segaloff (1972)
Year of Election or Appointment: 2021
Anti-Money Laundering (AML) Officer
Mr. Segaloff also serves as an AML Officer of other funds and other related entities. He is Director, Anti-Money Laundering (2007-present) of FMR LLC (diversified financial services company) and is an employee of Fidelity Investments (1996-present).
Stacie M. Smith (1974)
Year of Election or Appointment: 2018
President and Treasurer
Ms. Smith also serves as an officer of other funds. Ms. Smith serves as Assistant Treasurer of FIMM, LLC (2021-present) and FMR Capital, Inc. (2017-present), is an employee of Fidelity Investments (2009-present), and has served in other fund officer roles. Prior to joining Fidelity Investments, Ms. Smith served as Senior Audit Manager of Ernst & Young LLP (accounting firm, 1996-2009). Previously, Ms. Smith served as Assistant Treasurer (2013-2019) and Deputy Treasurer (2013-2016) of certain Fidelity® funds.
Marc L. Spector (1972)
Year of Election or Appointment: 2017
Assistant Treasurer
Mr. Spector also serves as an officer of other funds. Mr. Spector serves as Assistant Treasurer of FIMM, LLC (2021-present) and FMR Capital, Inc. (2017-present) and is an employee of Fidelity Investments (2016-present). Prior to joining Fidelity Investments, Mr. Spector served as Director at the Siegfried Group (accounting firm, 2013-2016), and prior to Siegfried Group as audit senior manager at Deloitte & Touche LLP (accounting firm, 2005-2013).
Jim Wegmann (1979)
Year of Election or Appointment: 2019
Assistant Treasurer
Mr. Wegmann also serves as an officer of other funds. Mr. Wegmann serves as Assistant Treasurer of FIMM, LLC (2021-present) and is an employee of Fidelity Investments (2011-present).
Shareholder Expense Example
As a shareholder, you incur two types of costs: (1) transaction costs, which may include sales charges (loads) on purchase payments or redemption proceeds, as applicable and (2) ongoing costs, which generally include management fees, distribution and/or service (12b-1) fees and other Fund expenses. This Example is intended to help you understand your ongoing costs (in dollars) of investing in a fund and to compare these costs with the ongoing costs of investing in other mutual funds.
The Example is based on an investment of $1,000 invested at the beginning of the period and held for the entire period (March 1, 2021 to August 31, 2021).
Actual Expenses
The first line of the accompanying table provides information about actual account values and actual expenses. You may use the information in this line, together with the amount you invested, to estimate the expenses that you paid over the period. Simply divide your account value by $1,000.00 (for example, an $8,600 account value divided by $1,000.00 = 8.6), then multiply the result by the number in the first line for a class/Fund under the heading entitled "Expenses Paid During Period" to estimate the expenses you paid on your account during this period. If any fund is a shareholder of any underlying mutual funds or exchange-traded funds (ETFs) (the Underlying Funds), such fund indirectly bears its proportional share of the expenses of the Underlying Funds in addition to the direct expenses incurred presented in the table. These fees and expenses are not included in the annualized expense ratio used to calculate the expense estimate in the table below.
Hypothetical Example for Comparison Purposes
The second line of the accompanying table provides information about hypothetical account values and hypothetical expenses based on the actual expense ratio and an assumed rate of return of 5% per year before expenses, which is not the actual return. The hypothetical account values and expenses may not be used to estimate the actual ending account balance or expenses you paid for the period. You may use this information to compare the ongoing costs of investing in the Fund and other funds. To do so, compare this 5% hypothetical example with the 5% hypothetical examples that appear in the shareholder reports of the other funds. If any fund is a shareholder of any Underlying Funds, such fund indirectly bears its proportional share of the expenses of the Underlying Funds in addition to the direct expenses as presented in the table. These fees and expenses are not included in the annualized expense ratio used to calculate the expense estimate in the table below.
Please note that the expenses shown in the table are meant to highlight your ongoing costs only and do not reflect any transaction costs. Therefore, the second line of the table is useful in comparing ongoing costs only, and will not help you determine the relative total costs of owning different funds.
| Annualized Expense Ratio-A | Beginning Account Value March 1, 2021 | Ending Account Value August 31, 2021 | Expenses Paid During Period-B March 1, 2021 to August 31, 2021 | |
| Fidelity Large Cap Growth Enhanced Index Fund | .39% | |||
| Actual | $1,000.00 | $1,210.20 | $2.17 | |
| Hypothetical-C | $1,000.00 | $1,023.24 | $1.99 | |
| Fidelity Large Cap Value Enhanced Index Fund | .39% | |||
| Actual | $1,000.00 | $1,152.80 | $2.12 | |
| Hypothetical-C | $1,000.00 | $1,023.24 | $1.99 | |
| Fidelity Large Cap Core Enhanced Index Fund | .39% | |||
| Actual | $1,000.00 | $1,193.30 | $2.16 | |
| Hypothetical-C | $1,000.00 | $1,023.24 | $1.99 | |
| Fidelity Mid Cap Enhanced Index Fund | .59% | |||
| Actual | $1,000.00 | $1,138.00 | $3.18 | |
| Hypothetical-C | $1,000.00 | $1,022.23 | $3.01 | |
| Fidelity International Enhanced Index Fund | .59% | |||
| Actual | $1,000.00 | $1,104.10 | $3.13 | |
| Hypothetical-C | $1,000.00 | $1,022.23 | $3.01 |
A Annualized expense ratio reflects expenses net of applicable fee waivers.
B Expenses are equal to the annualized expense ratio, multiplied by the average account value over the period, multiplied by 184/ 365 (to reflect the one-half year period). The fees and expenses of any Underlying Funds are not included in each annualized expense ratio.
C 5% return per year before expenses
Distributions (Unaudited)
The funds hereby designate as capital gain dividend the amounts noted below for the taxable year ended August 31, 2021, or, if subsequently determined to be different, the net capital gain of such year.
| Fidelity Large Cap Growth Enhanced Index Fund | $159,823,443 |
| Fidelity Large Cap Value Enhanced Index Fund | $324,941,602 |
| Fidelity Large Cap Core Enhanced Index Fund | $90,936,269 |
| Fidelity Mid Cap Enhanced Index Fund | $162,462,081 |
| Fidelity International Enhanced Index Fund | $0 |
A percentage of the dividends distributed during the fiscal year for the following funds qualify for the dividends–received deduction for corporate shareholders:
| Fidelity Large Cap Growth Enhanced Index Fund | |
| December 2020 | 97% |
| Fidelity Large Cap Value Enhanced Index Fund | |
| December 2020 | 100% |
| Fidelity Large Cap Core Enhanced Index Fund | |
| December 2020 | 88% |
| Fidelity Mid Cap Enhanced Index Fund | |
| December 2020 | 95% |
| Fidelity International Enhanced Index Fund | |
| December 2020 | 1% |
A percentage of the dividends distributed during the fiscal year for the following funds may be taken into account as a dividend for purposes of the maximum rate under section 1(h)(11) of the Internal Revenue Code.
| Fidelity Large Cap Growth Enhanced Index Fund | |
| December 2020 | 97% |
| Fidelity Large Cap Value Enhanced Index Fund | |
| December 2020 | 100% |
| Fidelity Large Cap Core Enhanced Index Fund | |
| December 2020 | 89% |
| Fidelity Mid Cap Enhanced Index Fund | |
| December 2020 | 100% |
| Fidelity International Enhanced Index Fund | |
| December 2020 | 100% |
A percentage of the dividends distributed during the fiscal year for the following funds qualify as a section 199A dividend:
| Fidelity Large Cap Growth Enhanced Index Fund | |
| December 2020 | 2% |
| Fidelity Large Cap Core Enhanced Index Fund | |
| December 2020 | 2% |
| Fidelity Mid Cap Enhanced Index Fund | |
| December 2020 | 1% |
The funds hereby designate the percentages noted below of the short-term capital gain dividends distributed during the fiscal year as qualifying to be taxed as short-term capital gain dividends for nonresident alien shareholders:
| December, 2020 | |
| Fidelity Large Cap Growth Enhanced Index Fund | 100% |
| Fidelity Large Cap Core Enhanced Index Fund | 100% |
The amounts per share which represent income derived from sources within, and taxes paid to, foreign countries or possessions of the United States are as follows:
| Pay Date | Income | Taxes | |
| Fidelity International Enhanced Index Fund | 12/14/2020 | $0.1894 | $0.0214 |
The funds will notify shareholders in January 2022 of amounts for use in preparing 2021 income tax returns.
Board Approval of Investment Advisory Contracts and Management Fees
Fidelity International Enhanced Index Fund
Fidelity Large Cap Core Enhanced Index Fund
Fidelity Large Cap Growth Enhanced Index Fund
Fidelity Large Cap Value Enhanced Index Fund
Fidelity Mid Cap Enhanced Index Fund
Fidelity International Enhanced Index Fund

Fidelity Large Cap Core Enhanced Index Fund
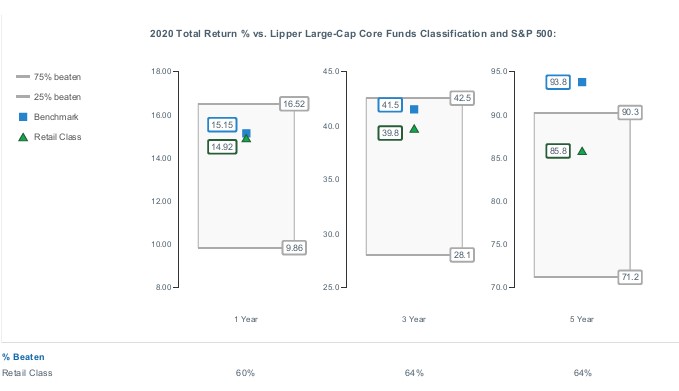
Fidelity Large Cap Growth Enhanced Index Fund
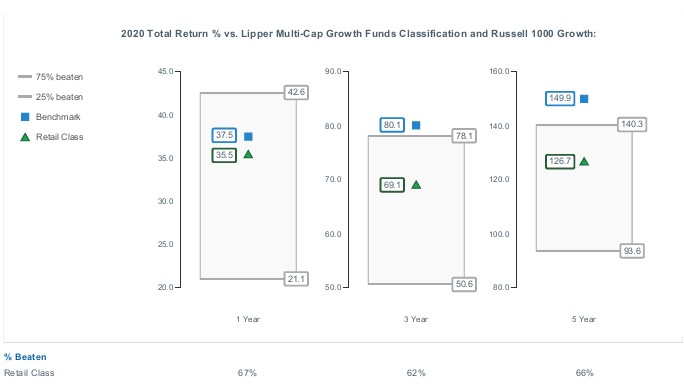
Fidelity Large Cap Value Enhanced Index Fund
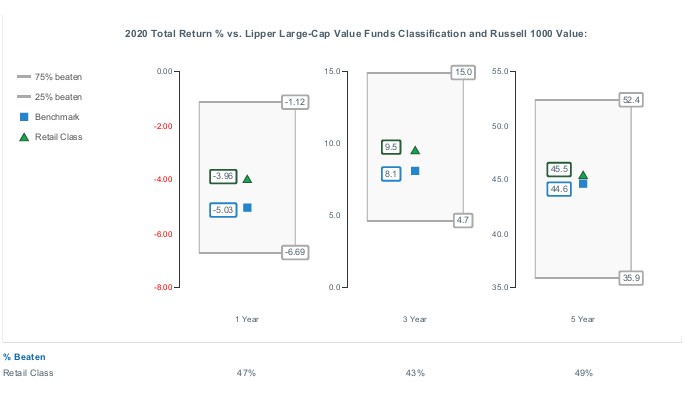
Fidelity Mid Cap Enhanced Index Fund

Fidelity International Enhanced Index Fund
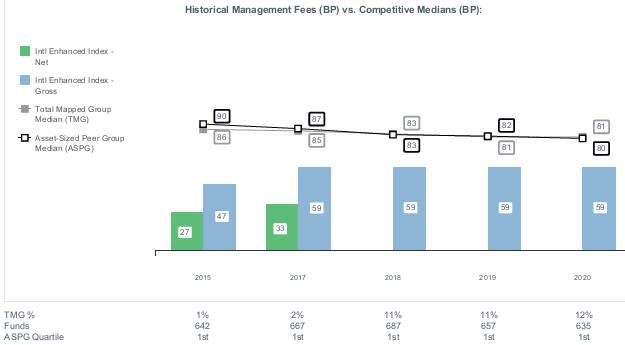
Fidelity Large Cap Core Enhanced Index Fund
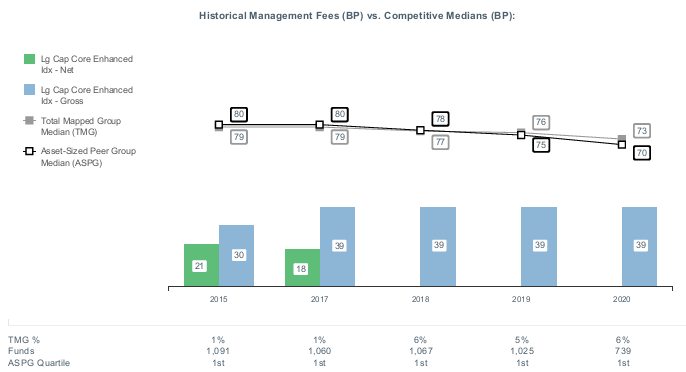
Fidelity Large Cap Growth Enhanced Index Fund
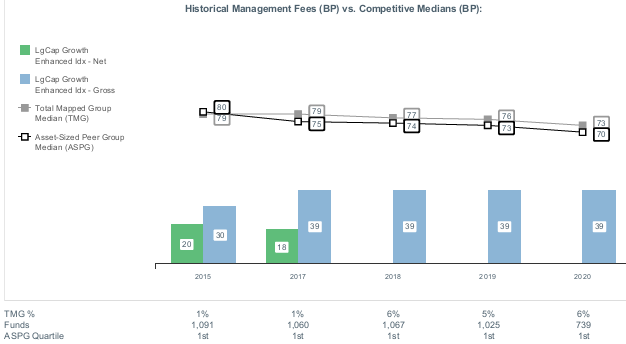
Fidelity Large Cap Value Enhanced Index Fund
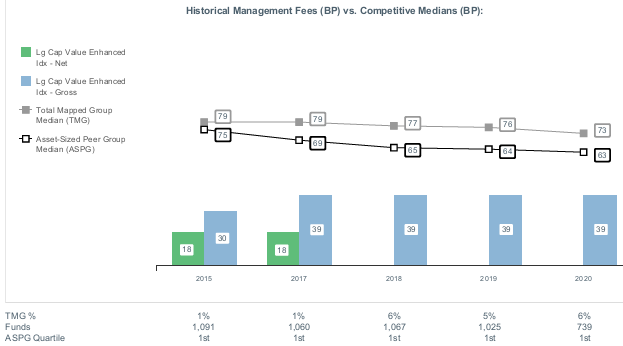
Fidelity Mid Cap Enhanced Index Fund

![]()
GEI-ANN-1021
1.855140.115
Item 2.
Code of Ethics
As of the end of the period, August 31, 2021, Fidelity Commonwealth Trust II (the trust) has adopted a code of ethics, as defined in Item 2 of Form N-CSR, that applies to its President and Treasurer and its Chief Financial Officer. A copy of the code of ethics is filed as an exhibit to this Form N-CSR.
Item 3.
Audit Committee Financial Expert
The Board of Trustees of the trust has determined that Donald F. Donahue is an audit committee financial expert, as defined in Item 3 of Form N-CSR. Mr. Donahue is independent for purposes of Item 3 of Form N-CSR.
Item 4.
Principal Accountant Fees and Services
Fees and Services
The following table presents fees billed by PricewaterhouseCoopers LLP (“PwC”) in each of the last two fiscal years for services rendered to Fidelity International Enhanced Index Fund, Fidelity Large Cap Core Enhanced Index Fund, Fidelity Large Cap Growth Enhanced Index Fund, Fidelity Large Cap Value Enhanced Index Fund and Fidelity Mid Cap Enhanced Index Fund (the “Funds”):
Services Billed by PwC
August 31, 2021 FeesA
| Audit Fees | Audit-Related Fees | Tax Fees | All Other Fees |
Fidelity International Enhanced Index Fund | $37,000 | $3,400 | $9,000 | $1,200 |
Fidelity Large Cap Core Enhanced Index Fund | $36,600 | $3,400 | $9,000 | $1,200 |
Fidelity Large Cap Growth Enhanced Index Fund | $36,600 | $3,400 | $9,000 | $1,200 |
Fidelity Large Cap Value Enhanced Index Fund | $36,600 | $3,400 | $9,000 | $1,200 |
Fidelity Mid Cap Enhanced Index Fund | $36,600 | $3,400 | $9,000 | $1,200 |
|
|
|
|
|
August 31, 2020 FeesA
| Audit Fees | Audit-Related Fees | Tax Fees | All Other Fees |
Fidelity International Enhanced Index Fund | $37,800 | $3,600 | $9,000 | $1,500 |
Fidelity Large Cap Core Enhanced Index Fund | $37,300 | $3,600 | $9,000 | $1,500 |
Fidelity Large Cap Growth Enhanced Index Fund | $37,300 | $3,600 | $9,000 | $1,500 |
Fidelity Large Cap Value Enhanced Index Fund | $37,300 | $3,600 | $9,000 | $1,500 |
Fidelity Mid Cap Enhanced Index Fund | $37,300 | $3,600 | $9,200 | $1,500 |
A Amounts may reflect rounding.
The following table(s) present(s) fees billed by PwC that were required to be approved by the Audit Committee for services that relate directly to the operations and financial reporting of the Fund(s) and that are rendered on behalf of Fidelity Management & Research Company LLC ("FMR") and entities controlling, controlled by, or under common control with FMR (not including any sub-adviser whose role is primarily portfolio management and is subcontracted with or overseen by another investment adviser) that provide ongoing services to the Fund(s) (“Fund Service Providers”):
Services Billed by PwC
| August 31, 2021A | August 31, 2020A |
Audit-Related Fees | $8,959,700 | $8,940,200 |
Tax Fees | $11,200 | $20,800 |
All Other Fees | $- | $- |
A Amounts may reflect rounding.
“Audit-Related Fees” represent fees billed for assurance and related services that are reasonably related to the performance of the fund audit or the review of the fund's financial statements and that are not reported under Audit Fees.
“Tax Fees” represent fees billed for tax compliance, tax advice or tax planning that relate directly to the operations and financial reporting of the fund.
“All Other Fees” represent fees billed for services provided to the fund or Fund Service Provider, a significant portion of which are assurance related, that relate directly to the operations and financial reporting of the fund, excluding those services that are reported under Audit Fees, Audit-Related Fees or Tax Fees.
Assurance services must be performed by an independent public accountant.
* * *
The aggregate non-audit fees billed by PwC for services rendered to the Fund(s), FMR (not including any sub-adviser whose role is primarily portfolio management and is subcontracted with or overseen by another investment adviser), and any Fund Service Provider for each of the last two fiscal years of the Fund(s) are as follows:
Billed By | August 31, 2021A | August 31, 2020A | ||
PwC | $14,341,600 | $14,112,900 | ||
|
|
|
| |
A Amounts may reflect rounding.
The trust's Audit Committee has considered non-audit services that were not pre-approved that were provided by PwC to Fund Service Providers to be compatible with maintaining the independence of PwC in its(their) audit of the Fund(s), taking into account representations from PwC, in accordance with Public Company Accounting Oversight Board rules, regarding its independence from the Fund(s) and its(their) related entities and FMR’s review of the appropriateness and permissibility under applicable law of such non-audit services prior to their provision to the Fund(s) Service Providers.
Audit Committee Pre-Approval Policies and Procedures
The trust’s Audit Committee must pre-approve all audit and non-audit services provided by a fund’s independent registered public accounting firm relating to the operations or financial reporting of the fund. Prior to the commencement of any audit or non-audit services to a fund, the Audit Committee reviews the services to determine whether they are appropriate and permissible under applicable law.
The Audit Committee has adopted policies and procedures to, among other purposes, provide a framework for the Committee’s consideration of non-audit services by the audit firms that audit the Fidelity funds. The policies and procedures require that any non-audit service provided by a fund audit firm to a Fidelity fund and any non-audit service provided by a fund auditor to a Fund Service Provider that relates directly to the operations and financial reporting of a Fidelity fund (“Covered Service”) are subject to approval by the Audit Committee before such service is provided.
All Covered Services must be approved in advance of provision of the service either: (i) by formal resolution of the Audit Committee, or (ii) by oral or written approval of the service by the Chair of the Audit Committee (or if the Chair is unavailable, such other member of the Audit Committee as may be designated by the Chair to act in the Chair’s absence). The approval contemplated by (ii) above is permitted where the Treasurer determines that action on such an engagement is necessary before the next meeting of the Audit Committee.
Non-audit services provided by a fund audit firm to a Fund Service Provider that do not relate directly to the operations and financial reporting of a Fidelity fund are reported to the Audit Committee periodically.
Non-Audit Services Approved Pursuant to Rule 2-01(c)(7)(i)(C) and (ii) of Regulation S-X (“De Minimis Exception”)
There were no non-audit services approved or required to be approved by the Audit Committee pursuant to the De Minimis Exception during the Fund’s(s’) last two fiscal years relating to services provided to (i) the Fund(s) or (ii) any Fund Service Provider that relate directly to the operations and financial reporting of the Fund(s).
Item 5.
Audit Committee of Listed Registrants
Not applicable.
Item 6.
Investments
(a)
Not applicable.
(b)
Not applicable.
Item 7.
Disclosure of Proxy Voting Policies and Procedures for Closed-End Management Investment Companies
Not applicable.
Item 8.
Portfolio Managers of Closed-End Management Investment Companies
Not applicable.
Item 9.
Purchase of Equity Securities by Closed-End Management Investment Company and Affiliated Purchasers
Not applicable.
Item 10.
Submission of Matters to a Vote of Security Holders
There were no material changes to the procedures by which shareholders may recommend nominees to the trust’s Board of Trustees.
Item 11.
Controls and Procedures
(a)(i) The President and Treasurer and the Chief Financial Officer have concluded that the trust’s disclosure controls and procedures (as defined in Rule 30a-3(c) under the Investment Company Act) provide reasonable assurances that material information relating to the trust is made known to them by the appropriate persons, based on their evaluation of these controls and procedures as of a date within 90 days of the filing date of this report.
(a)(ii) There was no change in the trust’s internal control over financial reporting (as defined in Rule 30a-3(d) under the Investment Company Act) that occurred during the period covered by this report that has materially affected, or is reasonably likely to materially affect, the trust’s internal control over financial reporting.
Item 12.
Disclosure of Securities Lending Activities for Closed-End Management
Investment Companies
Not applicable.
Item 13.
Exhibits
(a) | (1) | Code of Ethics pursuant to Item 2 of Form N-CSR is filed and attached hereto as EX-99.CODE ETH. |
(a) | (2) | |
(a) | (3) | Not applicable. |
(b) |
|
SIGNATURES
Pursuant to the requirements of the Securities Exchange Act of 1934 and the Investment Company Act of 1940, the registrant has duly caused this report to be signed on its behalf by the undersigned, thereunto duly authorized.
Fidelity Commonwealth Trust II
By: | /s/Stacie M. Smith |
| Stacie M. Smith |
| President and Treasurer |
|
|
Date: | October 21, 2021 |
Pursuant to the requirements of the Securities Exchange Act of 1934 and the Investment Company Act of 1940, this report has been signed below by the following persons on behalf of the registrant and in the capacities and on the dates indicated.
By: | /s/Stacie M. Smith |
| Stacie M. Smith |
| President and Treasurer |
|
|
Date: | October 21, 2021 |
By: | /s/John J. Burke III |
| John J. Burke III |
| Chief Financial Officer |
|
|
Date: | October 21, 2021 |