UNITED STATES
SECURITIES AND EXCHANGE COMMISSION
Washington, D.C. 20549
FORM N-CSR
CERTIFIED SHAREHOLDER REPORT OF REGISTERED
MANAGEMENT INVESTMENT COMPANIES
Investment Company Act file number 811-21990
Fidelity Commonwealth Trust II
(Exact name of registrant as specified in charter)
245 Summer St., Boston, Massachusetts 02210
(Address of principal executive offices) (Zip code)
Marc Bryant, Secretary
245 Summer St.
Boston, Massachusetts 02210
(Name and address of agent for service)
Registrant's telephone number, including area code:
617-563-7000
Date of fiscal year end: | August 31 |
|
|
Date of reporting period: | August 31, 2017 |
Item 1.
Reports to Stockholders
Fidelity® Large Cap Growth Enhanced Index Fund Fidelity® Large Cap Value Enhanced Index Fund Fidelity® Large Cap Core Enhanced Index Fund Fidelity® Mid Cap Enhanced Index Fund Fidelity® International Enhanced Index Fund Annual Report August 31, 2017 |
 |
Contents
To view a fund's proxy voting guidelines and proxy voting record for the 12-month period ended June 30, visit http://www.fidelity.com/proxyvotingresults or visit the Securities and Exchange Commission's (SEC) web site at http://www.sec.gov.
You may also call 1-800-544-8544 to request a free copy of the proxy voting guidelines.
The funds or securities referred to herein are not sponsored, endorsed, or promoted by MSCI, and MSCI bears no liability with respect to any such funds or securities or any index on which such funds or securities are based. The prospectus contains a more detailed description of the limited relationship MSCI has with Fidelity and any related funds.
Standard & Poor's, S&P and S&P 500 are registered service marks of The McGraw-Hill Companies, Inc. and have been licensed for use by Fidelity Distributors Corporation.
Other third-party marks appearing herein are the property of their respective owners.
All other marks appearing herein are registered or unregistered trademarks or service marks of FMR LLC or an affiliated company. © 2017 FMR LLC. All rights reserved.
This report and the financial statements contained herein are submitted for the general information of the shareholders of the Funds. This report is not authorized for distribution to prospective investors in the Funds unless preceded or accompanied by an effective prospectus.
A fund files its complete schedule of portfolio holdings with the SEC for the first and third quarters of each fiscal year on Form N-Q. Forms N-Q are available on the SEC’s web site at http://www.sec.gov. A fund's Forms N-Q may be reviewed and copied at the SEC’s Public Reference Room in Washington, DC. Information regarding the operation of the SEC's Public Reference Room may be obtained by calling 1-800-SEC-0330.
For a complete list of a fund's portfolio holdings, view the most recent holdings listing, semiannual report, or annual report on Fidelity's web site at http://www.fidelity.com, http://www.institutional.fidelity.com, or http://www.401k.com, as applicable.
NOT FDIC INSURED •MAY LOSE VALUE •NO BANK GUARANTEE
Neither the Funds nor Fidelity Distributors Corporation is a bank.
Note to shareholders:
During 2018, Fidelity’s Large-Cap, Mid-Cap and International Enhanced Index Funds will begin investing all or substantially all of their assets in a “master portfolio.” The master portfolio will be an affiliated mutual fund with an investment objective and investment strategies substantially the same as the existing enhanced index mutual funds. This is commonly referred to as a master-feeder structure. In this structure, a fund does not invest in securities directly and instead invests in a master portfolio that, in turn, invests directly in securities. Fidelity will file preliminary registration statements for five multi-factor, enhanced index exchange-traded funds (ETFs) with the Securities and Exchange Commission (SEC) that, if approved, also will invest in the master portfolio.
In order to facilitate the conversion of the Large-Cap, Mid-Cap and International Enhanced Index Funds to a master-feeder structure, the following changes were made: the fiscal year-end of each fund changed to August 31 from February 28; and each fund is now allowed to pay dividends quarterly instead of semiannually, and capital gains once a year instead of twice. In addition, pursuant with the conversion, the funds will disclose the full holdings of the underlying master portfolios daily with no lag, rather than the current monthly disclosure with a 30-day lag.
Fidelity® Large Cap Growth Enhanced Index Fund
Performance: The Bottom Line
Average annual total return reflects the change in the value of an investment, assuming reinvestment of distributions from dividend income and capital gains (the profits earned upon the sale of securities that have grown in value, if any) and assuming a constant rate of performance each year. The hypothetical investment and the average annual total returns do not reflect the deduction of taxes that a shareholder would pay on fund distributions or the redemption of fund shares. During periods of reimbursement by Fidelity, a fund’s total return will be greater than it would be had the reimbursement not occurred. How a fund did yesterday is no guarantee of how it will do tomorrow.
Average Annual Total Returns
| For the periods ended August 31, 2017 | Past 1 year | Past 5 years | Past 10 years |
| Fidelity® Large Cap Growth Enhanced Index Fund | 17.49% | 14.40% | 8.65% |
$10,000 Over 10 Years
Let's say hypothetically that $10,000 was invested in Fidelity® Large Cap Growth Enhanced Index Fund on August 31, 2007.
The chart shows how the value of your investment would have changed, and also shows how the Russell 1000® Growth Index performed over the same period.

| Period Ending Values | ||
| $22,930 | Fidelity® Large Cap Growth Enhanced Index Fund | |
| $24,535 | Russell 1000® Growth Index | |
Fidelity® Large Cap Growth Enhanced Index Fund
Management's Discussion of Fund Performance
Market Recap: The U.S. equity bellwether S&P 500® index returned 5.65% for the six months ending August 31, 2017. Following a strong start to 2017, equity markets leveled off in March amid fading optimism for President Trump’s pro-business agenda and stalled efforts by Congress to repeal and replace the Affordable Care Act (ACA). Upward momentum soon returned and continued until the index cooled off in August, when geopolitical tension escalated and uncertainty grew regarding the future of health care, tax reform and the debt ceiling. In a stark reversal from 2016, growth-oriented stocks handily topped their value counterparts. Among sectors, information technology (+15%) was a standout, surging as a handful of major index constituents posted strong returns. Health care (+9%) also topped the broader market, climbing from April to period end following renewed efforts to reconsider the ACA. Conversely, financials (+1%) lagged because sentiment regarding the potential for reduced regulation and lower taxes faded as the White House turned its attention to other initiatives. Rising interest rates held back real estate (+4%). Investors’ general preference for risk assets, coupled with increased competition, hampered consumer staples (+1%) and telecommunication services (-5%). Lastly, lower oil prices sent energy (-10%) to the bottom of the sector performance rankings.Comments from Maximilian Kaufmann, Senior Portfolio Manager of the Geode Capital Management, LLC, investment management team: For the six months ending August 31, 2017 – the period since our previous annual report – the fund gained 7.04%, trailing the 10.69% return of the benchmark Russell 1000® Growth Index. Within the broad large-cap growth stock universe, the fund was somewhat more exposed to lower-valuation stocks, which detracted from results. At the same time, growth and momentum were desirable characteristics these past six months, but our generally low exposure to these factors muted the positive impact on the fund. Looking more closely at the portfolio, stock picking in the information technology sector was by far the biggest source of difficulty. In this category, Seagate Technology, a maker of hard disk drives that twice reported weaker-than-expected financial results this period, especially hurt results. Other information technology detractors included our underweighting in graphics-processing company NVIDIA, a strong performer, and diversified technology firm IBM, which we overweighted for the stock’s valuation characteristics but which nevertheless struggled. Stock picking in consumer discretionary was a secondary detractor. In this group, an overweight in home products retailer Bed Bath & Beyond – which we maintained largely due to the company’s attractive valuation and profitability factors – hampered results, as the company disappointed in an increasingly competitive retail environment. We ultimately sold the fund’s stake in Bed Bath & Beyond in July. On the positive side, two of our top individual contributors of the period were aircraft manufacturer Boeing and industrial conglomerate General Electric. Boeing’s stock rose throughout the period and especially sharply in July on stronger-than-expected earnings. Meanwhile, our models led us to mostly avoid GE. This positioning was helpful in light of the stock’s struggles. We did not hold a GE position at period end.The views expressed above reflect those of the portfolio manager(s) only through the end of the period as stated on the cover of this report and do not necessarily represent the views of Fidelity or any other person in the Fidelity organization. Any such views are subject to change at any time based upon market or other conditions and Fidelity disclaims any responsibility to update such views. These views may not be relied on as investment advice and, because investment decisions for a Fidelity fund are based on numerous factors, may not be relied on as an indication of trading intent on behalf of any Fidelity fund.
Fidelity® Large Cap Growth Enhanced Index Fund
Investment Summary (Unaudited)
Top Ten Stocks as of August 31, 2017
| % of fund's net assets | % of fund's net assets 6 months ago | |
| Apple, Inc. | 7.7 | 6.4 |
| Microsoft Corp. | 4.3 | 3.7 |
| Facebook, Inc. Class A | 3.9 | 3.1 |
| Amazon.com, Inc. | 3.3 | 3.4 |
| Alphabet, Inc. Class C | 2.7 | 1.6 |
| Alphabet, Inc. Class A | 2.4 | 2.2 |
| UnitedHealth Group, Inc. | 2.1 | 1.7 |
| Comcast Corp. Class A | 2.0 | 1.1 |
| Home Depot, Inc. | 2.0 | 1.2 |
| PepsiCo, Inc. | 1.7 | 1.7 |
| 32.1 |
Market Sectors as of August 31, 2017
| % of fund's net assets | % of fund's net assets 6 months ago | |
| Information Technology | 39.3 | 33.6 |
| Consumer Discretionary | 19.9 | 21.1 |
| Health Care | 15.5 | 17.7 |
| Industrials | 10.2 | 9.6 |
| Consumer Staples | 6.8 | 8.2 |
| Materials | 2.9 | 2.6 |
| Financials | 2.6 | 1.4 |
| Telecommunication Services | 1.0 | 1.8 |
| Real Estate | 0.6 | 0.9 |
| Energy | 0.2 | 1.3 |
Asset Allocation (% of fund's net assets)
| As of August 31, 2017* | ||
| Stocks and Equity Futures | 100.0% | |

* Foreign investments - 3.6%
| As of February 28, 2017* | ||
| Stocks and Equity Futures | 99.9% | |
| Short-Term Investments and Net Other Assets (Liabilities) | 0.1% | |

* Foreign investments - 3.6%
Fidelity® Large Cap Growth Enhanced Index Fund
Investments August 31, 2017
Showing Percentage of Net Assets
| Common Stocks - 99.0% | |||
| Shares | Value | ||
| CONSUMER DISCRETIONARY - 19.9% | |||
| Auto Components - 1.4% | |||
| BorgWarner, Inc. | 22,237 | $1,032,019 | |
| Delphi Automotive PLC | 14,763 | 1,423,153 | |
| Gentex Corp. | 273,610 | 4,998,855 | |
| Lear Corp. | 37,389 | 5,591,151 | |
| 13,045,178 | |||
| Diversified Consumer Services - 0.5% | |||
| H&R Block, Inc. | 171,853 | 4,595,349 | |
| Hotels, Restaurants & Leisure - 2.1% | |||
| Darden Restaurants, Inc. | 12,754 | 1,046,976 | |
| Extended Stay America, Inc. unit | 11,354 | 222,425 | |
| Las Vegas Sands Corp. | 37,702 | 2,345,441 | |
| McDonald's Corp. | 32,914 | 5,265,253 | |
| Park Hotels & Resorts, Inc. | 176,471 | 4,710,011 | |
| Royal Caribbean Cruises Ltd. | 37,837 | 4,709,193 | |
| Starbucks Corp. | 24,739 | 1,357,182 | |
| 19,656,481 | |||
| Household Durables - 1.5% | |||
| D.R. Horton, Inc. | 149,229 | 5,394,628 | |
| PulteGroup, Inc. | 58,059 | 1,499,083 | |
| Taylor Morrison Home Corp. (a) | 199,502 | 4,033,930 | |
| Toll Brothers, Inc. | 78,574 | 3,061,243 | |
| Whirlpool Corp. | 181 | 31,063 | |
| 14,019,947 | |||
| Internet & Direct Marketing Retail - 4.2% | |||
| Amazon.com, Inc. (a) | 31,572 | 30,959,503 | |
| Liberty Interactive Corp. QVC Group Series A (a) | 219,293 | 4,850,761 | |
| Netflix, Inc. (a) | 5,024 | 877,743 | |
| Priceline Group, Inc. (a) | 1,296 | 2,400,296 | |
| 39,088,303 | |||
| Media - 3.9% | |||
| AMC Networks, Inc. Class A (a) | 4,222 | 256,613 | |
| Charter Communications, Inc. Class A (a) | 5,951 | 2,371,712 | |
| Comcast Corp. Class A | 460,038 | 18,682,143 | |
| Discovery Communications, Inc.: | |||
| Class A (a)(b) | 18,934 | 420,524 | |
| Class C (non-vtg.) (a) | 1,289 | 27,082 | |
| Sinclair Broadcast Group, Inc. Class A | 34,125 | 1,032,281 | |
| The Walt Disney Co. | 129,821 | 13,137,885 | |
| 35,928,240 | |||
| Multiline Retail - 0.8% | |||
| Dollar Tree, Inc. (a) | 34,855 | 2,775,852 | |
| Target Corp. | 84,166 | 4,589,572 | |
| 7,365,424 | |||
| Specialty Retail - 4.6% | |||
| Best Buy Co., Inc. | 65,977 | 3,579,912 | |
| Dick's Sporting Goods, Inc. | 33,167 | 874,282 | |
| Foot Locker, Inc. | 58,343 | 2,055,424 | |
| Gap, Inc. | 205,062 | 4,843,564 | |
| Home Depot, Inc. | 119,748 | 17,946,633 | |
| Lowe's Companies, Inc. | 59,931 | 4,428,302 | |
| Ross Stores, Inc. | 61,012 | 3,566,151 | |
| Williams-Sonoma, Inc. (b) | 99,316 | 4,568,536 | |
| 41,862,804 | |||
| Textiles, Apparel & Luxury Goods - 0.9% | |||
| Carter's, Inc. | 30,774 | 2,668,414 | |
| Columbia Sportswear Co. | 2,040 | 116,872 | |
| Michael Kors Holdings Ltd. (a) | 111,174 | 4,693,766 | |
| NIKE, Inc. Class B | 19,794 | 1,045,321 | |
| 8,524,373 | |||
| TOTAL CONSUMER DISCRETIONARY | 184,086,099 | ||
| CONSUMER STAPLES - 6.8% | |||
| Beverages - 2.3% | |||
| PepsiCo, Inc. | 137,955 | 15,965,532 | |
| The Coca-Cola Co. | 123,700 | 5,634,535 | |
| 21,600,067 | |||
| Food & Staples Retailing - 2.4% | |||
| Costco Wholesale Corp. | 5,515 | 864,421 | |
| CVS Health Corp. | 61,436 | 4,751,460 | |
| Kroger Co. | 245,636 | 5,372,059 | |
| Wal-Mart Stores, Inc. | 61,685 | 4,815,748 | |
| Walgreens Boots Alliance, Inc. | 73,295 | 5,973,543 | |
| 21,777,231 | |||
| Food Products - 0.7% | |||
| Campbell Soup Co. | 44,413 | 2,051,881 | |
| Tyson Foods, Inc. Class A | 76,025 | 4,812,383 | |
| 6,864,264 | |||
| Household Products - 0.2% | |||
| Procter & Gamble Co. | 14,770 | 1,362,828 | |
| Personal Products - 0.0% | |||
| Nu Skin Enterprises, Inc. Class A | 4,712 | 286,631 | |
| Tobacco - 1.2% | |||
| Altria Group, Inc. | 160,546 | 10,178,616 | |
| Philip Morris International, Inc. | 5,704 | 666,969 | |
| 10,845,585 | |||
| TOTAL CONSUMER STAPLES | 62,736,606 | ||
| ENERGY - 0.2% | |||
| Oil, Gas & Consumable Fuels - 0.2% | |||
| Devon Energy Corp. | 62,784 | 1,971,418 | |
| FINANCIALS - 2.6% | |||
| Capital Markets - 1.9% | |||
| BGC Partners, Inc. Class A | 66,708 | 866,537 | |
| Evercore, Inc. Class A | 47,241 | 3,564,333 | |
| Federated Investors, Inc. Class B (non-vtg.) (b) | 140,623 | 3,840,414 | |
| Lazard Ltd. Class A | 6,224 | 266,947 | |
| LPL Financial | 61,473 | 2,879,395 | |
| Moelis & Co. Class A | 10,861 | 427,923 | |
| Morningstar, Inc. | 27,665 | 2,287,896 | |
| Raymond James Financial, Inc. | 5,165 | 404,523 | |
| T. Rowe Price Group, Inc. | 32,272 | 2,722,466 | |
| 17,260,434 | |||
| Consumer Finance - 0.4% | |||
| Capital One Financial Corp. | 40,243 | 3,203,745 | |
| Diversified Financial Services - 0.0% | |||
| Leucadia National Corp. | 7,551 | 178,808 | |
| Insurance - 0.3% | |||
| Allstate Corp. | 32,778 | 2,966,409 | |
| FNF Group | 1,479 | 71,347 | |
| 3,037,756 | |||
| TOTAL FINANCIALS | 23,680,743 | ||
| HEALTH CARE - 15.5% | |||
| Biotechnology - 6.1% | |||
| AbbVie, Inc. | 190,525 | 14,346,533 | |
| Amgen, Inc. | 44,821 | 7,967,829 | |
| Biogen, Inc. (a) | 31,899 | 10,097,947 | |
| Bioverativ, Inc. | 3,335 | 189,061 | |
| Celgene Corp. (a) | 59,478 | 8,263,279 | |
| Gilead Sciences, Inc. | 133,620 | 11,185,330 | |
| United Therapeutics Corp. (a)(b) | 36,931 | 4,830,575 | |
| 56,880,554 | |||
| Health Care Equipment & Supplies - 1.1% | |||
| Baxter International, Inc. | 84,200 | 5,223,768 | |
| C.R. Bard, Inc. | 2,695 | 864,583 | |
| Masimo Corp. (a) | 44,117 | 3,722,592 | |
| Medtronic PLC | 8,314 | 670,275 | |
| 10,481,218 | |||
| Health Care Providers & Services - 4.8% | |||
| Aetna, Inc. | 15,694 | 2,474,944 | |
| Centene Corp. (a) | 59,508 | 5,287,286 | |
| Cigna Corp. | 13,652 | 2,485,483 | |
| Express Scripts Holding Co. (a) | 80,087 | 5,031,065 | |
| Humana, Inc. | 30,119 | 7,759,257 | |
| UnitedHealth Group, Inc. | 99,519 | 19,794,329 | |
| Wellcare Health Plans, Inc. (a) | 6,819 | 1,191,143 | |
| 44,023,507 | |||
| Pharmaceuticals - 3.5% | |||
| Bristol-Myers Squibb Co. | 146,981 | 8,889,411 | |
| Eli Lilly & Co. | 103,794 | 8,437,414 | |
| Johnson & Johnson | 66,263 | 8,771,233 | |
| Merck & Co., Inc. | 85,987 | 5,491,130 | |
| Pfizer, Inc. | 22,649 | 768,254 | |
| 32,357,442 | |||
| TOTAL HEALTH CARE | 143,742,721 | ||
| INDUSTRIALS - 10.2% | |||
| Aerospace & Defense - 3.0% | |||
| Lockheed Martin Corp. | 5,941 | 1,814,322 | |
| Northrop Grumman Corp. | 13,478 | 3,668,846 | |
| Raytheon Co. | 28,088 | 5,112,297 | |
| Spirit AeroSystems Holdings, Inc. Class A | 21,000 | 1,564,500 | |
| The Boeing Co. | 64,800 | 15,529,968 | |
| 27,689,933 | |||
| Air Freight & Logistics - 0.3% | |||
| FedEx Corp. | 6,229 | 1,335,373 | |
| United Parcel Service, Inc. Class B | 10,131 | 1,158,581 | |
| 2,493,954 | |||
| Airlines - 0.9% | |||
| Alaska Air Group, Inc. | 14,013 | 1,046,211 | |
| Copa Holdings SA Class A | 2,181 | 270,597 | |
| Southwest Airlines Co. | 130,655 | 6,812,352 | |
| 8,129,160 | |||
| Commercial Services & Supplies - 0.2% | |||
| KAR Auction Services, Inc. | 31,864 | 1,436,748 | |
| LSC Communications, Inc. | 50,220 | 809,044 | |
| 2,245,792 | |||
| Construction & Engineering - 0.1% | |||
| EMCOR Group, Inc. | 18,518 | 1,222,929 | |
| Industrial Conglomerates - 1.6% | |||
| 3M Co. | 54,355 | 11,105,814 | |
| Honeywell International, Inc. | 22,856 | 3,160,299 | |
| 14,266,113 | |||
| Machinery - 2.2% | |||
| Allison Transmission Holdings, Inc. | 141,923 | 4,928,986 | |
| Caterpillar, Inc. | 596 | 70,024 | |
| Cummins, Inc. | 33,720 | 5,374,294 | |
| Deere & Co. | 61,878 | 7,173,517 | |
| Illinois Tool Works, Inc. | 1,074 | 147,686 | |
| Ingersoll-Rand PLC | 20,511 | 1,751,434 | |
| Snap-On, Inc. (b) | 954 | 140,782 | |
| Toro Co. | 17,581 | 1,084,396 | |
| 20,671,119 | |||
| Professional Services - 0.7% | |||
| Manpower, Inc. | 11,428 | 1,274,336 | |
| Robert Half International, Inc. | 114,652 | 5,193,736 | |
| 6,468,072 | |||
| Road & Rail - 1.2% | |||
| Union Pacific Corp. | 101,635 | 10,702,166 | |
| TOTAL INDUSTRIALS | 93,889,238 | ||
| INFORMATION TECHNOLOGY - 39.3% | |||
| Communications Equipment - 1.1% | |||
| Cisco Systems, Inc. | 146,140 | 4,707,169 | |
| F5 Networks, Inc. (a) | 43,220 | 5,159,604 | |
| Motorola Solutions, Inc. | 2,373 | 209,109 | |
| 10,075,882 | |||
| Electronic Equipment & Components - 0.6% | |||
| CDW Corp. | 17,510 | 1,110,484 | |
| Corning, Inc. | 120,232 | 3,457,872 | |
| TE Connectivity Ltd. | 9,637 | 767,105 | |
| 5,335,461 | |||
| Internet Software & Services - 9.0% | |||
| Alphabet, Inc.: | |||
| Class A (a) | 23,184 | 22,146,284 | |
| Class C (a) | 26,576 | 24,963,634 | |
| Facebook, Inc. Class A (a) | 210,444 | 36,190,055 | |
| 83,299,973 | |||
| IT Services - 5.3% | |||
| Accenture PLC Class A | 55,423 | 7,247,111 | |
| Alliance Data Systems Corp. | 23,995 | 5,410,873 | |
| Automatic Data Processing, Inc. | 3,251 | 346,134 | |
| Booz Allen Hamilton Holding Corp. Class A | 46,633 | 1,590,652 | |
| Broadridge Financial Solutions, Inc. | 9,517 | 743,563 | |
| Cognizant Technology Solutions Corp. Class A | 50,948 | 3,605,590 | |
| CSRA, Inc. | 7,263 | 228,857 | |
| First Data Corp. Class A (a) | 16,317 | 300,396 | |
| Genpact Ltd. | 4,608 | 131,098 | |
| IBM Corp. | 78,614 | 11,244,160 | |
| MasterCard, Inc. Class A | 36,128 | 4,815,862 | |
| Maximus, Inc. | 12,296 | 747,351 | |
| PayPal Holdings, Inc. (a) | 6,914 | 426,456 | |
| Total System Services, Inc. | 26,001 | 1,797,189 | |
| Vantiv, Inc. (a) | 3,222 | 227,763 | |
| Visa, Inc. Class A | 97,530 | 10,096,306 | |
| 48,959,361 | |||
| Semiconductors & Semiconductor Equipment - 5.9% | |||
| Applied Materials, Inc. | 190,370 | 8,589,494 | |
| Broadcom Ltd. | 12,625 | 3,182,384 | |
| Intel Corp. | 137,622 | 4,826,404 | |
| KLA-Tencor Corp. | 62,433 | 5,849,348 | |
| Lam Research Corp. | 41,583 | 6,901,946 | |
| Maxim Integrated Products, Inc. | 55,164 | 2,573,952 | |
| Micron Technology, Inc. (a) | 143,374 | 4,583,667 | |
| MKS Instruments, Inc. | 8,298 | 683,340 | |
| NVIDIA Corp. | 20,991 | 3,556,715 | |
| NXP Semiconductors NV (a) | 6,594 | 744,858 | |
| ON Semiconductor Corp. (a) | 91,736 | 1,566,851 | |
| Skyworks Solutions, Inc. | 12,552 | 1,322,479 | |
| Texas Instruments, Inc. | 127,455 | 10,555,823 | |
| 54,937,261 | |||
| Software - 8.1% | |||
| Activision Blizzard, Inc. | 26,562 | 1,741,405 | |
| Adobe Systems, Inc. (a) | 57,341 | 8,897,030 | |
| Cadence Design Systems, Inc. (a) | 9,638 | 378,677 | |
| Citrix Systems, Inc. (a) | 70,491 | 5,513,101 | |
| Electronic Arts, Inc. (a) | 64,192 | 7,799,328 | |
| Intuit, Inc. | 54,816 | 7,753,723 | |
| Microsoft Corp. | 525,919 | 39,322,964 | |
| Red Hat, Inc. (a) | 33,837 | 3,637,478 | |
| Salesforce.com, Inc. (a) | 1,448 | 138,270 | |
| 75,181,976 | |||
| Technology Hardware, Storage & Peripherals - 9.3% | |||
| Apple, Inc. | 435,314 | 71,391,494 | |
| HP, Inc. | 234,887 | 4,481,644 | |
| NetApp, Inc. | 70,212 | 2,714,396 | |
| Seagate Technology LLC (b) | 57,746 | 1,820,731 | |
| Western Digital Corp. | 58,424 | 5,157,086 | |
| 85,565,351 | |||
| TOTAL INFORMATION TECHNOLOGY | 363,355,265 | ||
| MATERIALS - 2.9% | |||
| Chemicals - 1.8% | |||
| E.I. du Pont de Nemours & Co. | 47,140 | 3,956,460 | |
| LyondellBasell Industries NV Class A | 65,915 | 5,971,240 | |
| Monsanto Co. | 19,484 | 2,283,525 | |
| The Chemours Co. LLC | 93,893 | 4,607,330 | |
| 16,818,555 | |||
| Metals & Mining - 0.7% | |||
| Freeport-McMoRan, Inc. (a) | 94,967 | 1,403,612 | |
| Steel Dynamics, Inc. | 135,320 | 4,661,774 | |
| 6,065,386 | |||
| Paper & Forest Products - 0.4% | |||
| Louisiana-Pacific Corp. (a) | 149,723 | 3,814,942 | |
| TOTAL MATERIALS | 26,698,883 | ||
| REAL ESTATE - 0.6% | |||
| Equity Real Estate Investment Trusts (REITs) - 0.6% | |||
| American Tower Corp. | 416 | 61,589 | |
| Gaming & Leisure Properties | 26,076 | 1,021,918 | |
| Weyerhaeuser Co. | 144,003 | 4,695,938 | |
| 5,779,445 | |||
| TELECOMMUNICATION SERVICES - 1.0% | |||
| Diversified Telecommunication Services - 1.0% | |||
| Verizon Communications, Inc. | 185,590 | 8,902,752 | |
| TOTAL COMMON STOCKS | |||
| (Cost $730,070,832) | 914,843,170 | ||
| Principal Amount | Value | ||
| U.S. Treasury Obligations - 0.1% | |||
| U.S. Treasury Bills, yield at date of purchase 1.18% 6/21/18 (c) | |||
| (Cost $1,188,573) | 1,200,000 | 1,188,634 | |
| Shares | Value | ||
| Money Market Funds - 2.3% | |||
| Fidelity Cash Central Fund, 1.11% (d) | 7,830,661 | $7,832,227 | |
| Fidelity Securities Lending Cash Central Fund 1.11% (d)(e) | 13,303,878 | 13,305,208 | |
| TOTAL MONEY MARKET FUNDS | |||
| (Cost $21,136,394) | 21,137,435 | ||
| TOTAL INVESTMENT IN SECURITIES - 101.4% | |||
| (Cost $752,395,799) | 937,169,239 | ||
| NET OTHER ASSETS (LIABILITIES) - (1.4)% | (12,837,641) | ||
| NET ASSETS - 100% | $924,331,598 |
| Futures Contracts | |||||
| Number of contracts | Expiration Date | Notional amount | Value | Unrealized Appreciation/(Depreciation) | |
| Purchased | |||||
| Equity Index Contracts | |||||
| CME E-mini S&P 500 Index Contracts (United States) | 74 | Sept. 2017 | $9,139,370 | $154,545 | $154,545 |
The notional amount of futures purchased as a percentage of Net Assets is 1.0%
Legend
(a) Non-income producing
(b) Security or a portion of the security is on loan at period end.
(c) Security or a portion of the security was pledged to cover margin requirements for futures contracts. At period end, the value of securities pledged amounted to $400,173.
(d) Affiliated fund that is generally available only to investment companies and other accounts managed by Fidelity Investments. The rate quoted is the annualized seven-day yield of the fund at period end. A complete unaudited listing of the fund's holdings as of its most recent quarter end is available upon request. In addition, each Fidelity Central Fund's financial statements, which are not covered by the Fund's Report of Independent Registered Public Accounting Firm, are available on the SEC's website or upon request.
(e) Investment made with cash collateral received from securities on loan.
Affiliated Central Funds
Information regarding fiscal year to date income earned by the Fund from investments in Fidelity Central Funds is as follows:
| Fund | Six months ended August 31, 2017 | Year ended February 28, 2017 |
| Fidelity Cash Central Fund | $49,578 | $29,341 |
| Fidelity Securities Lending Cash Central Fund | 9,351 | 81,478 |
| Total | $58,929 | $110,819 |
Investment Valuation
The following is a summary of the inputs used, as of August 31, 2017, involving the Fund's assets and liabilities carried at fair value. The inputs or methodology used for valuing securities may not be an indication of the risk associated with investing in those securities. For more information on valuation inputs, and their aggregation into the levels used below, please refer to the Investment Valuation section in the accompanying Notes to Financial Statements.
| Valuation Inputs at Reporting Date: | ||||
| Description | Total | Level 1 | Level 2 | Level 3 |
| Investments in Securities: | ||||
| Equities: | ||||
| Consumer Discretionary | $184,086,099 | $184,086,099 | $-- | $-- |
| Consumer Staples | 62,736,606 | 62,736,606 | -- | -- |
| Energy | 1,971,418 | 1,971,418 | -- | -- |
| Financials | 23,680,743 | 23,680,743 | -- | -- |
| Health Care | 143,742,721 | 143,742,721 | -- | -- |
| Industrials | 93,889,238 | 93,889,238 | -- | -- |
| Information Technology | 363,355,265 | 363,355,265 | -- | -- |
| Materials | 26,698,883 | 26,698,883 | -- | -- |
| Real Estate | 5,779,445 | 5,779,445 | -- | -- |
| Telecommunication Services | 8,902,752 | 8,902,752 | -- | -- |
| U.S. Government and Government Agency Obligations | 1,188,634 | -- | 1,188,634 | -- |
| Money Market Funds | 21,137,435 | 21,137,435 | -- | -- |
| Total Investments in Securities: | $937,169,239 | $935,980,605 | $1,188,634 | $-- |
| Derivative Instruments: | ||||
| Assets | ||||
| Futures Contracts | $154,545 | $154,545 | $-- | $-- |
| Total Assets | $154,545 | $154,545 | $-- | $-- |
| Total Derivative Instruments: | $154,545 | $154,545 | $-- | $-- |
Value of Derivative Instruments
The following table is a summary of the Fund's value of derivative instruments by primary risk exposure as of August 31, 2017. For additional information on derivative instruments, please refer to the Derivative Instruments section in the accompanying Notes to Financial Statements.
| Primary Risk Exposure / Derivative Type | Value | |
| Asset | Liability | |
| Equity Risk | ||
| Futures Contracts(a) | $154,545 | $0 |
| Total Equity Risk | 154,545 | 0 |
| Total Value of Derivatives | $154,545 | $0 |
(a) Reflects gross cumulative appreciation (depreciation) on futures contracts as presented in the Schedule of Investments. In the Statement of Assets and Liabilities, the period end daily variation margin is included in receivable or payable for daily variation margin on futures contracts, and the net cumulative appreciation (depreciation) is included in net unrealized appreciation (depreciation).
See accompanying notes which are an integral part of the financial statements.
Fidelity® Large Cap Growth Enhanced Index Fund
Financial Statements
Statement of Assets and Liabilities
| August 31, 2017 | ||
| Assets | ||
| Investment in securities, at value (including securities loaned of $13,129,943) — See accompanying schedule: Unaffiliated issuers (cost $731,259,405) | $916,031,804 | |
| Fidelity Central Funds (cost $21,136,394) | 21,137,435 | |
| Total Investment in Securities (cost $752,395,799) | $937,169,239 | |
| Receivable for investments sold | 13,670,917 | |
| Receivable for fund shares sold | 644,746 | |
| Dividends receivable | 1,542,929 | |
| Distributions receivable from Fidelity Central Funds | 7,630 | |
| Receivable for daily variation margin for on futures contracts | 52,507 | |
| Total assets | 953,087,968 | |
| Liabilities | ||
| Payable for investments purchased | $12,867,175 | |
| Payable for fund shares redeemed | 2,290,031 | |
| Accrued management fee | 298,719 | |
| Collateral on securities loaned | 13,300,445 | |
| Total liabilities | 28,756,370 | |
| Net Assets | $924,331,598 | |
| Net Assets consist of: | ||
| Paid in capital | $720,882,599 | |
| Undistributed net investment income | 6,064,111 | |
| Accumulated undistributed net realized gain (loss) on investments and foreign currency transactions | 12,456,903 | |
| Net unrealized appreciation (depreciation) on investments | 184,927,985 | |
| Net Assets, for 52,485,566 shares outstanding | $924,331,598 | |
| Net Asset Value, offering price and redemption price per share ($924,331,598 ÷ 52,485,566 shares) | $17.61 |
See accompanying notes which are an integral part of the financial statements.
Statement of Operations
| Six months ended August 31, 2017 | Year ended February 28, 2017 | |
| Investment Income | ||
| Dividends | $8,216,288 | $12,051,939 |
| Interest | 3,632 | 26,155 |
| Income from Fidelity Central Funds (including $9,351 and $81,478, respectively, from security lending) | 58,929 | 110,819 |
| Total income | 8,278,849 | 12,188,913 |
| Expenses | ||
| Management fee | $1,680,849 | $1,942,461 |
| Transfer agent fees | 105,657 | 972,530 |
| Independent trustees' fees and expenses | 8,622 | 2,693 |
| Miscellaneous | 1,364 | 1,829 |
| Total expenses before reductions | 1,796,492 | 2,919,513 |
| Expense reductions | (138) | (217) |
| Total expenses | 1,796,354 | 2,919,296 |
| Net investment income (loss) | 6,482,495 | 9,269,617 |
| Realized and Unrealized Gain (Loss) | ||
| Net realized gain (loss) on: | ||
| Investment securities: | ||
| Unaffiliated issuers | 15,512,419 | 9,159,061 |
| Fidelity Central Funds | 275 | 2,866 |
| Foreign currency transactions | 11 | 9 |
| Futures contracts | 1,022,906 | 1,863,288 |
| Total net realized gain (loss) | 16,535,611 | 11,025,224 |
| Change in net unrealized appreciation (depreciation) on: | ||
| Investment securities: | ||
| Unaffiliated issuers | 38,753,818 | 101,591,221 |
| Fidelity Central Funds | (2,068) | – |
| Futures contracts | (459,998) | 444,062 |
| Total change in net unrealized appreciation (depreciation) | 38,291,752 | 102,035,283 |
| Net gain (loss) | 54,827,363 | 113,060,507 |
| Net increase (decrease) in net assets resulting from operations | $61,309,858 | $122,330,124 |
See accompanying notes which are an integral part of the financial statements.
Statement of Changes in Net Assets
| Six months ended August 31, 2017 | Year ended February 28, 2017 | Year ended February 29, 2016 | |
| Increase (Decrease) in Net Assets | |||
| Operations | |||
| Net investment income (loss) | $6,482,495 | $9,269,617 | $5,942,877 |
| Net realized gain (loss) | 16,535,611 | 11,025,224 | 4,493,035 |
| Change in net unrealized appreciation (depreciation) | 38,291,752 | 102,035,283 | (38,693,142) |
| Net increase (decrease) in net assets resulting from operations | 61,309,858 | 122,330,124 | (28,257,230) |
| Distributions to shareholders from net investment income | (2,076,402) | (7,111,776) | (5,276,402) |
| Distributions to shareholders from net realized gain | (8,201,785) | – | (14,162,511) |
| Total distributions | (10,278,187) | (7,111,776) | (19,438,913) |
| Share transactions | |||
| Proceeds from sales of shares | 148,068,388 | 438,141,867 | 205,196,525 |
| Reinvestment of distributions | 9,882,890 | 6,777,223 | 18,634,238 |
| Cost of shares redeemed | (110,113,958) | (183,763,026) | (131,133,765) |
| Net increase (decrease) in net assets resulting from share transactions | 47,837,320 | 261,156,064 | 92,696,998 |
| Total increase (decrease) in net assets | 98,868,991 | 376,374,412 | 45,000,855 |
| Net Assets | |||
| Beginning of period | 825,462,607 | 449,088,195 | 404,087,340 |
| End of period | $924,331,598 | $825,462,607 | $449,088,195 |
| Other Information | |||
| Undistributed net investment income end of period | $6,064,111 | $2,048,261 | $284 |
| Shares | |||
| Sold | 8,778,514 | 28,762,124 | 13,841,828 |
| Issued in reinvestment of distributions | 600,784 | 429,482 | 1,270,101 |
| Redeemed | (6,458,191) | (12,024,884) | (8,915,319) |
| Net increase (decrease) | 2,921,107 | 17,166,722 | 6,196,610 |
See accompanying notes which are an integral part of the financial statements.
Financial Highlights — Fidelity Large Cap Growth Enhanced Index Fund
| Year ended August 31, | 2017 A | 2017 B | 2016 C | 2015 B | 2014 B | 2013 B |
| Selected Per–Share Data | ||||||
| Net asset value, beginning of period | $16.65 | $13.86 | $15.42 | $14.22 | $11.77 | $10.93 |
| Income from Investment Operations | ||||||
| Net investment income (loss)D | .12 | .22 | .20 | .20 | .18 | .20 |
| Net realized and unrealized gain (loss) | 1.04 | 2.73 | (1.09) | 2.15 | 3.15 | .81 |
| Total from investment operations | 1.16 | 2.95 | (.89) | 2.35 | 3.33 | 1.01 |
| Distributions from net investment income | (.04) | (.16) | (.18) | (.15) | (.17) | (.17) |
| Distributions from net realized gain | (.16) | – | (.49) | (1.00) | (.71) | – |
| Total distributions | (.20) | (.16) | (.67) | (1.15) | (.88) | (.17) |
| Net asset value, end of period | $17.61 | $16.65 | $13.86 | $15.42 | $14.22 | $11.77 |
| Total ReturnE,F | 7.04% | 21.33% | (6.01)% | 17.46% | 29.08% | 9.36% |
| Ratios to Average Net AssetsG,H | ||||||
| Expenses before reductions | .40%I | .45% | .45% | .45% | .45% | .45% |
| Expenses net of fee waivers, if any | .40%I | .45% | .45% | .45% | .45% | .45% |
| Expenses net of all reductions | .40%I | .45% | .45% | .45% | .45% | .45% |
| Net investment income (loss) | 1.44%I | 1.43% | 1.38% | 1.37% | 1.41% | 1.80% |
| Supplemental Data | ||||||
| Net assets, end of period (000 omitted) | $924,332 | $825,463 | $449,088 | $404,087 | $248,855 | $171,392 |
| Portfolio turnover rateJ | 110%I | 86% | 89% | 69% | 83% | 87% |
A For the six month period ended August 31. The Fund changed its fiscal year end from February 28 to August 31, effective August 31, 2017.
B For the year ended February 28.
C For the year ended February 29.
D Calculated based on average shares outstanding during the period.
E Total returns for periods of less than one year are not annualized.
F Total returns would have been lower if certain expenses had not been reduced during the applicable periods shown.
G Fees and expenses of any underlying Fidelity Central Funds are not included in the Fund's expense ratio. The Fund indirectly bears its proportionate share of the expenses of any underlying Fidelity Central Funds.
H Expense ratios reflect operating expenses of the Fund. Expenses before reductions do not reflect amounts reimbursed by the investment adviser or reductions from expense offset arrangements and do not represent the amount paid by the Fund during periods when reimbursements or reductions occur. Expenses net of fee waivers reflect expenses after reimbursement by the investment adviser but prior to reductions from expense offset arrangements. Expenses net of all reductions represent the net expenses paid by the Fund.
I Annualized
J Amount does not include the portfolio activity of any underlying Fidelity Central Funds.
See accompanying notes which are an integral part of the financial statements.
Fidelity® Large Cap Value Enhanced Index Fund
Performance: The Bottom Line
Average annual total return reflects the change in the value of an investment, assuming reinvestment of distributions from dividend income and capital gains (the profits earned upon the sale of securities that have grown in value, if any) and assuming a constant rate of performance each year. The hypothetical investment and the average annual total returns do not reflect the deduction of taxes that a shareholder would pay on fund distributions or the redemption of fund shares. During periods of reimbursement by Fidelity, a fund’s total return will be greater than it would be had the reimbursement not occurred. How a fund did yesterday is no guarantee of how it will do tomorrow.
Average Annual Total Returns
| For the periods ended August 31, 2017 | Past 1 year | Past 5 years | Past 10 years |
| Fidelity® Large Cap Value Enhanced Index Fund | 13.15% | 13.67% | 5.96% |
$10,000 Over 10 Years
Let's say hypothetically that $10,000 was invested in Fidelity® Large Cap Value Enhanced Index Fund on August 31, 2007.
The chart shows how the value of your investment would have changed, and also shows how the Russell 1000® Value Index performed over the same period.

| Period Ending Values | ||
| $17,846 | Fidelity® Large Cap Value Enhanced Index Fund | |
| $17,847 | Russell 1000® Value Index | |
Fidelity® Large Cap Value Enhanced Index Fund
Management's Discussion of Fund Performance
Market Recap: The U.S. equity bellwether S&P 500® index returned 5.65% for the six months ending August 31, 2017. Following a strong start to 2017, equity markets leveled off in March amid fading optimism for President Trump’s pro-business agenda and stalled efforts by Congress to repeal and replace the Affordable Care Act (ACA). Upward momentum soon returned and continued until the index cooled off in August, when geopolitical tension escalated and uncertainty grew regarding the future of health care, tax reform and the debt ceiling. In a stark reversal from 2016, growth-oriented stocks handily topped their value counterparts. Among sectors, information technology (+15%) was a standout, surging as a handful of major index constituents posted strong returns. Health care (+9%) also topped the broader market, climbing from April to period end following renewed efforts to reconsider the ACA. Conversely, financials (+1%) lagged because sentiment regarding the potential for reduced regulation and lower taxes faded as the White House turned its attention to other initiatives. Rising interest rates held back real estate (+4%). Investors’ general preference for risk assets, coupled with increased competition, hampered consumer staples (+1%) and telecommunication services (-5%). Lastly, lower oil prices sent energy (-10%) to the bottom of the sector performance rankings.Comments from Maximilian Kaufmann, Senior Portfolio Manager of the Geode Capital Management, LLC, investment management team: For the six months ending August 31, 2017 – the period since our previous annual report – the fund gained 0.79%, outperforming the 0.46% return of the benchmark Russell 1000® Value Index. Within the broad large-cap value stock universe, the fund was somewhat more exposed to stocks with momentum and growth characteristics, while being somewhat less exposed to lower-valuation stocks. We’d also point out that stocks selected by our models in the consumer discretionary, information technology and health care sectors created the biggest drag. These three sectors combined to make up a much larger portion of the fund than they did in the benchmark. The fund was well positioned in the energy sector. Good stock picking here added value, along with an underweighting in this lagging category, which was a byproduct of our bottom-up process. Among individual names, the fund especially was helped by its modest exposure to oil-field services giant Schlumberger and by avoiding exploration and production company Anadarko Petroleum, two benchmark components hampered by continued weakness in oil prices. Elsewhere, the fund’s overweighting in electronics retailer Best Buy was helpful. Best Buy’s shares rose in the first half of the period on a solid earnings report, while our subsequent decision to gradually scale back the fund’s position proved timely in light of weaker share-price performance late in the period. On the negative side, hard-disk drive maker Seagate Technology twice reported weaker-than-expected financial results this period, hurting the fund’s performance. Also detracting was grocery chain Kroger, which we first purchased in March and, due largely to its attractive valuation characteristics, added to the position over time.The views expressed above reflect those of the portfolio manager(s) only through the end of the period as stated on the cover of this report and do not necessarily represent the views of Fidelity or any other person in the Fidelity organization. Any such views are subject to change at any time based upon market or other conditions and Fidelity disclaims any responsibility to update such views. These views may not be relied on as investment advice and, because investment decisions for a Fidelity fund are based on numerous factors, may not be relied on as an indication of trading intent on behalf of any Fidelity fund.
Fidelity® Large Cap Value Enhanced Index Fund
Investment Summary (Unaudited)
Top Ten Stocks as of August 31, 2017
| % of fund's net assets | % of fund's net assets 6 months ago | |
| Exxon Mobil Corp. | 3.2 | 3.3 |
| JPMorgan Chase & Co. | 3.2 | 3.4 |
| Johnson & Johnson | 2.7 | 2.9 |
| Bank of America Corp. | 2.5 | 2.7 |
| Wells Fargo & Co. | 2.4 | 2.8 |
| Berkshire Hathaway, Inc. Class B | 2.4 | 2.3 |
| AT&T, Inc. | 2.3 | 2.7 |
| Procter & Gamble Co. | 2.3 | 2.5 |
| Pfizer, Inc. | 2.2 | 2.1 |
| Citigroup, Inc. | 2.0 | 1.0 |
| 25.2 |
Top Market Sectors as of August 31, 2017
| % of fund's net assets | % of fund's net assets 6 months ago | |
| Financials | 23.3 | 25.0 |
| Health Care | 15.8 | 12.5 |
| Consumer Staples | 10.7 | 8.5 |
| Information Technology | 9.9 | 11.5 |
| Consumer Discretionary | 9.1 | 6.2 |
| Energy | 8.1 | 10.4 |
| Industrials | 8.0 | 8.7 |
| Utilities | 5.2 | 4.9 |
| Materials | 3.0 | 4.7 |
| Real Estate | 2.7 | 2.8 |
Asset Allocation (% of fund's net assets)
| As of August 31, 2017* | ||
| Stocks and Equity Futures | 100.0% | |

* Foreign investments - 6.5%
| As of February 28, 2017* | ||
| Stocks and Equity Futures | 100.0% | |

* Foreign investments - 5.1%
Fidelity® Large Cap Value Enhanced Index Fund
Investments August 31, 2017
Showing Percentage of Net Assets
| Common Stocks - 98.5% | |||
| Shares | Value | ||
| CONSUMER DISCRETIONARY - 9.1% | |||
| Auto Components - 0.8% | |||
| Gentex Corp. | 351,850 | $6,428,300 | |
| Lear Corp. | 108,920 | 16,287,897 | |
| Tenneco, Inc. | 53,042 | 2,874,876 | |
| 25,591,073 | |||
| Automobiles - 0.9% | |||
| Ford Motor Co. | 255,125 | 2,814,029 | |
| General Motors Co. | 708,654 | 25,894,217 | |
| 28,708,246 | |||
| Diversified Consumer Services - 0.0% | |||
| H&R Block, Inc. | 18,688 | 499,717 | |
| Hotels, Restaurants & Leisure - 0.9% | |||
| Carnival Corp. | 121,827 | 8,464,540 | |
| Darden Restaurants, Inc. | 2,511 | 206,128 | |
| Park Hotels & Resorts, Inc. | 484,955 | 12,943,449 | |
| Royal Caribbean Cruises Ltd. | 43,358 | 5,396,337 | |
| 27,010,454 | |||
| Household Durables - 0.6% | |||
| CalAtlantic Group, Inc. | 42,261 | 1,468,570 | |
| D.R. Horton, Inc. | 286,876 | 10,370,567 | |
| PulteGroup, Inc. | 62,860 | 1,623,045 | |
| Taylor Morrison Home Corp. (a) | 94,976 | 1,920,415 | |
| Toll Brothers, Inc. | 41,997 | 1,636,203 | |
| 17,018,800 | |||
| Internet & Direct Marketing Retail - 0.3% | |||
| Liberty Interactive Corp. QVC Group Series A (a) | 338,434 | 7,486,160 | |
| Media - 1.4% | |||
| Charter Communications, Inc. Class A (a) | 8,334 | 3,321,432 | |
| MSG Network, Inc. Class A (a) | 132,859 | 2,849,826 | |
| Tegna, Inc. | 549,084 | 6,929,440 | |
| The Walt Disney Co. | 142,536 | 14,424,643 | |
| Time Warner, Inc. | 138,532 | 14,005,585 | |
| 41,530,926 | |||
| Multiline Retail - 1.7% | |||
| Dollar Tree, Inc. (a) | 18,536 | 1,476,207 | |
| Kohl's Corp. | 224,988 | 8,950,023 | |
| Macy's, Inc. | 831,258 | 17,265,229 | |
| Target Corp. | 426,606 | 23,262,825 | |
| 50,954,284 | |||
| Specialty Retail - 2.0% | |||
| Bed Bath & Beyond, Inc. | 404,743 | 11,166,859 | |
| Best Buy Co., Inc. | 107,819 | 5,850,259 | |
| Dick's Sporting Goods, Inc. | 149,323 | 3,936,154 | |
| Foot Locker, Inc. | 333,771 | 11,758,752 | |
| GameStop Corp. Class A | 331,993 | 6,141,871 | |
| Gap, Inc. (b) | 702,689 | 16,597,514 | |
| Office Depot, Inc. | 300,538 | 1,289,308 | |
| Signet Jewelers Ltd. | 74,805 | 4,717,951 | |
| 61,458,668 | |||
| Textiles, Apparel & Luxury Goods - 0.5% | |||
| Michael Kors Holdings Ltd. (a) | 394,712 | 16,664,741 | |
| TOTAL CONSUMER DISCRETIONARY | 276,923,069 | ||
| CONSUMER STAPLES - 10.7% | |||
| Beverages - 0.4% | |||
| PepsiCo, Inc. | 101,013 | 11,690,234 | |
| Food & Staples Retailing - 4.2% | |||
| CVS Health Corp. | 457,372 | 35,373,150 | |
| Kroger Co. | 793,843 | 17,361,346 | |
| Wal-Mart Stores, Inc. | 577,977 | 45,122,664 | |
| Walgreens Boots Alliance, Inc. | 380,253 | 30,990,620 | |
| 128,847,780 | |||
| Food Products - 2.7% | |||
| Archer Daniels Midland Co. | 427,311 | 17,656,491 | |
| Bunge Ltd. | 210,986 | 15,745,885 | |
| ConAgra Foods, Inc. | 79,230 | 2,571,806 | |
| Fresh Del Monte Produce, Inc. | 9,807 | 460,831 | |
| Ingredion, Inc. | 40,030 | 4,956,515 | |
| Mondelez International, Inc. | 13,174 | 535,655 | |
| Pilgrim's Pride Corp. (a)(b) | 21,642 | 637,357 | |
| Sanderson Farms, Inc. (b) | 12,755 | 1,881,618 | |
| The J.M. Smucker Co. | 172,764 | 18,098,757 | |
| Tyson Foods, Inc. Class A | 311,556 | 19,721,495 | |
| 82,266,410 | |||
| Household Products - 2.6% | |||
| Colgate-Palmolive Co. | 107,837 | 7,725,443 | |
| Procter & Gamble Co. | 765,754 | 70,656,122 | |
| 78,381,565 | |||
| Personal Products - 0.0% | |||
| Nu Skin Enterprises, Inc. Class A | 21,490 | 1,307,237 | |
| Tobacco - 0.8% | |||
| Philip Morris International, Inc. | 220,026 | 25,727,640 | |
| TOTAL CONSUMER STAPLES | 328,220,866 | ||
| ENERGY - 8.1% | |||
| Energy Equipment & Services - 0.4% | |||
| Baker Hughes, a GE Co. Class A | 11,334 | 384,223 | |
| Dril-Quip, Inc. (a)(b) | 139,382 | 5,233,794 | |
| Schlumberger Ltd. | 116,981 | 7,429,463 | |
| 13,047,480 | |||
| Oil, Gas & Consumable Fuels - 7.7% | |||
| Andeavor | 37,708 | 3,776,456 | |
| Chevron Corp. | 479,797 | 51,635,753 | |
| ConocoPhillips Co. | 660,489 | 28,836,950 | |
| Devon Energy Corp. | 617,554 | 19,391,196 | |
| Exxon Mobil Corp. | 1,282,846 | 97,919,631 | |
| Marathon Oil Corp. | 57,446 | 638,800 | |
| Marathon Petroleum Corp. | 165,448 | 8,677,748 | |
| Southwestern Energy Co. (a) | 224,273 | 1,222,288 | |
| Valero Energy Corp. | 343,198 | 23,371,784 | |
| World Fuel Services Corp. | 21,413 | 739,605 | |
| 236,210,211 | |||
| TOTAL ENERGY | 249,257,691 | ||
| FINANCIALS - 23.3% | |||
| Banks - 11.3% | |||
| Bank of America Corp. | 3,174,787 | 75,845,661 | |
| Citigroup, Inc. | 923,962 | 62,857,135 | |
| Citizens Financial Group, Inc. | 55,548 | 1,840,305 | |
| Fifth Third Bancorp | 232,650 | 6,079,145 | |
| JPMorgan Chase & Co. | 1,068,418 | 97,108,512 | |
| PNC Financial Services Group, Inc. | 27,737 | 3,478,497 | |
| Regions Financial Corp. | 1,311,109 | 18,499,748 | |
| TCF Financial Corp. | 62,482 | 970,345 | |
| U.S. Bancorp | 118,157 | 6,055,546 | |
| Wells Fargo & Co. | 1,442,302 | 73,658,363 | |
| 346,393,257 | |||
| Capital Markets - 3.0% | |||
| Bank of New York Mellon Corp. | 351,561 | 18,379,609 | |
| Federated Investors, Inc. Class B (non-vtg.) (b) | 88,225 | 2,409,425 | |
| Goldman Sachs Group, Inc. | 161,550 | 36,145,197 | |
| LPL Financial | 20,874 | 977,738 | |
| Morgan Stanley | 662,623 | 30,149,347 | |
| Thomson Reuters Corp. | 67,469 | 3,085,069 | |
| 91,146,385 | |||
| Consumer Finance - 1.5% | |||
| American Express Co. | 9,886 | 851,185 | |
| Capital One Financial Corp. | 46,083 | 3,668,668 | |
| Discover Financial Services | 316,034 | 18,630,204 | |
| Navient Corp. | 100,476 | 1,326,283 | |
| Synchrony Financial | 711,485 | 21,906,623 | |
| 46,382,963 | |||
| Diversified Financial Services - 2.9% | |||
| Berkshire Hathaway, Inc. Class B (a) | 401,084 | 72,660,377 | |
| Donnelley Financial Solutions, Inc. | 35,799 | 766,457 | |
| Leucadia National Corp. | 686,237 | 16,250,092 | |
| 89,676,926 | |||
| Insurance - 2.9% | |||
| AFLAC, Inc. | 291,463 | 24,060,271 | |
| Allstate Corp. | 34,441 | 3,116,911 | |
| American National Insurance Co. | 4,789 | 554,135 | |
| Aspen Insurance Holdings Ltd. | 111,746 | 5,050,919 | |
| Assured Guaranty Ltd. | 278,775 | 11,859,089 | |
| Chubb Ltd. | 9,894 | 1,399,209 | |
| CNA Financial Corp. | 6,489 | 318,350 | |
| Everest Re Group Ltd. | 32,020 | 8,084,410 | |
| First American Financial Corp. | 31,090 | 1,525,275 | |
| FNF Group | 100,533 | 4,849,712 | |
| Loews Corp. | 37,887 | 1,764,776 | |
| Old Republic International Corp. | 210,812 | 4,024,401 | |
| Prudential Financial, Inc. | 118,852 | 12,132,412 | |
| The Travelers Companies, Inc. | 61,664 | 7,472,444 | |
| Unum Group | 9,429 | 454,289 | |
| 86,666,603 | |||
| Mortgage Real Estate Investment Trusts - 1.7% | |||
| AGNC Investment Corp. | 482,733 | 10,398,069 | |
| Annaly Capital Management, Inc. | 1,509,188 | 18,864,850 | |
| Chimera Investment Corp. | 672,243 | 12,819,674 | |
| MFA Financial, Inc. | 1,184,321 | 10,398,338 | |
| 52,480,931 | |||
| Thrifts & Mortgage Finance - 0.0% | |||
| Essent Group Ltd. (a) | 12,258 | 479,043 | |
| TOTAL FINANCIALS | 713,226,108 | ||
| HEALTH CARE - 15.8% | |||
| Biotechnology - 2.3% | |||
| Amgen, Inc. | 158,502 | 28,176,901 | |
| Gilead Sciences, Inc. | 298,095 | 24,953,532 | |
| United Therapeutics Corp. (a)(b) | 125,900 | 16,467,720 | |
| 69,598,153 | |||
| Health Care Equipment & Supplies - 2.3% | |||
| Abbott Laboratories | 104,708 | 5,333,826 | |
| Baxter International, Inc. | 368,639 | 22,870,364 | |
| Danaher Corp. | 104,630 | 8,728,235 | |
| Medtronic PLC | 416,441 | 33,573,473 | |
| 70,505,898 | |||
| Health Care Providers & Services - 3.8% | |||
| Aetna, Inc. | 25,837 | 4,074,495 | |
| Anthem, Inc. | 146,248 | 28,670,458 | |
| Centene Corp. (a) | 222,159 | 19,738,827 | |
| Cigna Corp. | 22,075 | 4,018,975 | |
| DaVita HealthCare Partners, Inc. (a) | 13,585 | 795,538 | |
| Express Scripts Holding Co. (a) | 392,032 | 24,627,450 | |
| Humana, Inc. | 65,032 | 16,753,544 | |
| McKesson Corp. | 48,851 | 7,293,943 | |
| UnitedHealth Group, Inc. | 56,997 | 11,336,703 | |
| 117,309,933 | |||
| Life Sciences Tools & Services - 0.1% | |||
| Bruker Corp. | 149,013 | 4,334,788 | |
| Pharmaceuticals - 7.3% | |||
| Allergan PLC | 59,718 | 13,704,087 | |
| Johnson & Johnson | 627,377 | 83,045,893 | |
| Merck & Co., Inc. | 905,974 | 57,855,500 | |
| Mylan N.V. (a) | 47,386 | 1,491,711 | |
| Pfizer, Inc. | 1,970,114 | 66,826,267 | |
| 222,923,458 | |||
| TOTAL HEALTH CARE | 484,672,230 | ||
| INDUSTRIALS - 8.0% | |||
| Aerospace & Defense - 2.6% | |||
| Huntington Ingalls Industries, Inc. | 44,833 | 9,592,469 | |
| Northrop Grumman Corp. | 16,185 | 4,405,719 | |
| Raytheon Co. | 137,091 | 24,951,933 | |
| Spirit AeroSystems Holdings, Inc. Class A | 243,302 | 18,125,999 | |
| Textron, Inc. | 26,373 | 1,294,651 | |
| United Technologies Corp. | 175,134 | 20,967,042 | |
| 79,337,813 | |||
| Airlines - 0.1% | |||
| Copa Holdings SA Class A | 6,861 | 851,244 | |
| Hawaiian Holdings, Inc. (a) | 50,746 | 2,174,466 | |
| 3,025,710 | |||
| Building Products - 0.6% | |||
| Owens Corning | 251,763 | 18,663,191 | |
| Commercial Services & Supplies - 0.2% | |||
| Deluxe Corp. | 44,018 | 3,052,648 | |
| KAR Auction Services, Inc. | 33,377 | 1,504,969 | |
| LSC Communications, Inc. | 62,128 | 1,000,882 | |
| 5,558,499 | |||
| Construction & Engineering - 0.0% | |||
| EMCOR Group, Inc. | 9,565 | 631,673 | |
| Electrical Equipment - 0.7% | |||
| Eaton Corp. PLC | 322,965 | 23,175,968 | |
| Industrial Conglomerates - 1.2% | |||
| General Electric Co. | 1,209,797 | 29,700,516 | |
| Honeywell International, Inc. | 41,984 | 5,805,128 | |
| 35,505,644 | |||
| Machinery - 1.6% | |||
| Allison Transmission Holdings, Inc. | 382,758 | 13,293,185 | |
| Cummins, Inc. | 125,422 | 19,989,758 | |
| Deere & Co. | 129,186 | 14,976,533 | |
| Snap-On, Inc. (b) | 5,865 | 865,498 | |
| 49,124,974 | |||
| Professional Services - 0.4% | |||
| Manpower, Inc. | 73,548 | 8,201,337 | |
| Robert Half International, Inc. | 88,625 | 4,014,713 | |
| 12,216,050 | |||
| Road & Rail - 0.6% | |||
| Union Pacific Corp. | 166,075 | 17,487,698 | |
| Trading Companies & Distributors - 0.0% | |||
| W.W. Grainger, Inc. (b) | 8,795 | 1,429,803 | |
| TOTAL INDUSTRIALS | 246,157,023 | ||
| INFORMATION TECHNOLOGY - 9.9% | |||
| Communications Equipment - 2.4% | |||
| Cisco Systems, Inc. | 1,752,099 | 56,435,109 | |
| Juniper Networks, Inc. | 642,920 | 17,828,172 | |
| 74,263,281 | |||
| Electronic Equipment & Components - 0.3% | |||
| Anixter International, Inc. (a) | 1,675 | 123,615 | |
| Corning, Inc. | 231,674 | 6,662,944 | |
| Tech Data Corp. (a) | 24,212 | 2,670,341 | |
| 9,456,900 | |||
| Internet Software & Services - 0.0% | |||
| eBay, Inc. (a) | 12,562 | 453,865 | |
| IT Services - 0.2% | |||
| Amdocs Ltd. | 3,032 | 196,443 | |
| IBM Corp. | 32,739 | 4,682,659 | |
| 4,879,102 | |||
| Semiconductors & Semiconductor Equipment - 4.0% | |||
| Applied Materials, Inc. | 328,342 | 14,814,791 | |
| Cirrus Logic, Inc. (a) | 112,782 | 6,539,100 | |
| Intel Corp. | 1,635,636 | 57,361,755 | |
| KLA-Tencor Corp. | 102,590 | 9,611,657 | |
| Lam Research Corp. | 1,960 | 325,321 | |
| Marvell Technology Group Ltd. | 303,435 | 5,434,521 | |
| Micron Technology, Inc. (a) | 494,381 | 15,805,361 | |
| NXP Semiconductors NV (a) | 8,974 | 1,013,703 | |
| Qualcomm, Inc. | 114,494 | 5,984,601 | |
| Texas Instruments, Inc. | 68,656 | 5,686,090 | |
| 122,576,900 | |||
| Software - 0.7% | |||
| CA Technologies, Inc. | 88,240 | 2,927,803 | |
| Oracle Corp. | 345,108 | 17,369,286 | |
| 20,297,089 | |||
| Technology Hardware, Storage & Peripherals - 2.3% | |||
| Apple, Inc. | 84,661 | 13,884,404 | |
| HP, Inc. | 744,014 | 14,195,787 | |
| Seagate Technology LLC (b) | 181,920 | 5,735,938 | |
| Western Digital Corp. | 239,909 | 21,176,767 | |
| Xerox Corp. | 533,834 | 17,226,823 | |
| 72,219,719 | |||
| TOTAL INFORMATION TECHNOLOGY | 304,146,856 | ||
| MATERIALS - 3.0% | |||
| Chemicals - 1.6% | |||
| Ashland Global Holdings, Inc. | 24,058 | 1,492,799 | |
| Cabot Corp. | 8,934 | 470,643 | |
| Eastman Chemical Co. | 170,409 | 14,689,256 | |
| LyondellBasell Industries NV Class A | 223,292 | 20,228,022 | |
| The Dow Chemical Co. | 72,231 | 4,814,196 | |
| Trinseo SA | 100,862 | 6,747,668 | |
| 48,442,584 | |||
| Containers & Packaging - 0.0% | |||
| WestRock Co. | 5,274 | 300,143 | |
| Metals & Mining - 1.1% | |||
| Nucor Corp. | 236,543 | 13,035,885 | |
| Reliance Steel & Aluminum Co. | 136,557 | 9,889,458 | |
| Steel Dynamics, Inc. | 301,648 | 10,391,774 | |
| Tahoe Resources, Inc. | 56,760 | 270,903 | |
| 33,588,020 | |||
| Paper & Forest Products - 0.3% | |||
| Louisiana-Pacific Corp. (a) | 319,336 | 8,136,681 | |
| TOTAL MATERIALS | 90,467,428 | ||
| REAL ESTATE - 2.7% | |||
| Equity Real Estate Investment Trusts (REITs) - 2.6% | |||
| Brixmor Property Group, Inc. | 583,017 | 10,914,078 | |
| Corrections Corp. of America | 410,043 | 10,989,152 | |
| Equity Commonwealth (a) | 6,087 | 188,332 | |
| Host Hotels & Resorts, Inc. (b) | 688,058 | 12,467,611 | |
| LaSalle Hotel Properties (SBI) (b) | 85,676 | 2,431,485 | |
| Liberty Property Trust (SBI) | 58,986 | 2,512,804 | |
| Outfront Media, Inc. | 24,763 | 544,786 | |
| Prologis, Inc. | 36,247 | 2,296,610 | |
| PS Business Parks, Inc. | 4,022 | 543,412 | |
| Quality Care Properties, Inc. | 180,220 | 2,472,618 | |
| RLJ Lodging Trust | 221,729 | 4,474,491 | |
| Senior Housing Properties Trust (SBI) | 71,751 | 1,414,930 | |
| Spirit Realty Capital, Inc. | 356,070 | 3,097,809 | |
| Sunstone Hotel Investors, Inc. | 291,229 | 4,601,418 | |
| Weyerhaeuser Co. | 666,158 | 21,723,412 | |
| 80,672,948 | |||
| Real Estate Management & Development - 0.1% | |||
| Realogy Holdings Corp. | 51,888 | 1,759,003 | |
| TOTAL REAL ESTATE | 82,431,951 | ||
| TELECOMMUNICATION SERVICES - 2.7% | |||
| Diversified Telecommunication Services - 2.7% | |||
| AT&T, Inc. | 1,904,653 | 71,348,301 | |
| Level 3 Communications, Inc. (a) | 18,865 | 1,026,822 | |
| Verizon Communications, Inc. | 180,619 | 8,664,293 | |
| 81,039,416 | |||
| UTILITIES - 5.2% | |||
| Electric Utilities - 4.0% | |||
| Duke Energy Corp. | 341,649 | 29,825,958 | |
| Eversource Energy | 156,138 | 9,836,694 | |
| Exelon Corp. | 642,015 | 24,313,108 | |
| FirstEnergy Corp. | 593,961 | 19,351,249 | |
| NextEra Energy, Inc. | 85,458 | 12,862,284 | |
| PG&E Corp. | 50,596 | 3,560,946 | |
| PPL Corp. | 562,925 | 22,089,177 | |
| 121,839,416 | |||
| Gas Utilities - 0.6% | |||
| National Fuel Gas Co. | 35,118 | 2,036,142 | |
| UGI Corp. | 332,331 | 16,420,475 | |
| 18,456,617 | |||
| Independent Power and Renewable Electricity Producers - 0.0% | |||
| The AES Corp. | 111,067 | 1,226,180 | |
| Multi-Utilities - 0.6% | |||
| Avangrid, Inc. | 6,708 | 327,485 | |
| CenterPoint Energy, Inc. | 92,088 | 2,727,647 | |
| MDU Resources Group, Inc. | 119,148 | 3,221,762 | |
| Public Service Enterprise Group, Inc. | 161,170 | 7,549,203 | |
| SCANA Corp. | 44,071 | 2,661,007 | |
| WEC Energy Group, Inc. | 20,898 | 1,362,968 | |
| 17,850,072 | |||
| TOTAL UTILITIES | 159,372,285 | ||
| TOTAL COMMON STOCKS | |||
| (Cost $2,728,184,544) | 3,015,914,923 | ||
| Principal Amount | Value | ||
| U.S. Treasury Obligations - 0.2% | |||
| U.S. Treasury Bills, yield at date of purchase 1.18% 6/21/18 (c) | |||
| (Cost $5,744,770) | 5,800,000 | 5,745,065 | |
| Shares | Value | ||
| Money Market Funds - 2.8% | |||
| Fidelity Cash Central Fund, 1.11% (d) | 36,736,641 | $36,743,988 | |
| Fidelity Securities Lending Cash Central Fund 1.11% (d)(e) | 50,195,498 | 50,200,517 | |
| TOTAL MONEY MARKET FUNDS | |||
| (Cost $86,941,295) | 86,944,505 | ||
| TOTAL INVESTMENT IN SECURITIES - 101.5% | |||
| (Cost $2,820,870,609) | 3,108,604,493 | ||
| NET OTHER ASSETS (LIABILITIES) - (1.5)% | (45,763,539) | ||
| NET ASSETS - 100% | $3,062,840,954 |
| Futures Contracts | |||||
| Number of contracts | Expiration Date | Notional amount | Value | Unrealized Appreciation/(Depreciation) | |
| Purchased | |||||
| Equity Index Contracts | |||||
| CME E-mini S&P 500 Index Contracts (United States) | 373 | Sept. 2017 | $46,067,365 | $643,014 | $643,014 |
The notional amount of futures purchased as a percentage of Net Assets is 1.5%
Legend
(a) Non-income producing
(b) Security or a portion of the security is on loan at period end.
(c) Security or a portion of the security was pledged to cover margin requirements for futures contracts. At period end, the value of securities pledged amounted to $1,732,434.
(d) Affiliated fund that is generally available only to investment companies and other accounts managed by Fidelity Investments. The rate quoted is the annualized seven-day yield of the fund at period end. A complete unaudited listing of the fund's holdings as of its most recent quarter end is available upon request. In addition, each Fidelity Central Fund's financial statements, which are not covered by the Fund's Report of Independent Registered Public Accounting Firm, are available on the SEC's website or upon request.
(e) Investment made with cash collateral received from securities on loan.
Affiliated Central Funds
Information regarding fiscal year to date income earned by the Fund from investments in Fidelity Central Funds is as follows:
| Fund | Six months ended August 31, 2017 | Year ended February 28, 2017 |
| Fidelity Cash Central Fund | $135,841 | $124,556 |
| Fidelity Securities Lending Cash Central Fund | 26,689 | 238,171 |
| Total | $162,530 | $362,727 |
Investment Valuation
The following is a summary of the inputs used, as of August 31, 2017, involving the Fund's assets and liabilities carried at fair value. The inputs or methodology used for valuing securities may not be an indication of the risk associated with investing in those securities. For more information on valuation inputs, and their aggregation into the levels used below, please refer to the Investment Valuation section in the accompanying Notes to Financial Statements.
| Valuation Inputs at Reporting Date: | ||||
| Description | Total | Level 1 | Level 2 | Level 3 |
| Investments in Securities: | ||||
| Equities: | ||||
| Consumer Discretionary | $276,923,069 | $276,923,069 | $-- | $-- |
| Consumer Staples | 328,220,866 | 328,220,866 | -- | -- |
| Energy | 249,257,691 | 249,257,691 | -- | -- |
| Financials | 713,226,108 | 713,226,108 | -- | -- |
| Health Care | 484,672,230 | 484,672,230 | -- | -- |
| Industrials | 246,157,023 | 246,157,023 | -- | -- |
| Information Technology | 304,146,856 | 304,146,856 | -- | -- |
| Materials | 90,467,428 | 90,467,428 | -- | -- |
| Real Estate | 82,431,951 | 82,431,951 | -- | -- |
| Telecommunication Services | 81,039,416 | 81,039,416 | -- | -- |
| Utilities | 159,372,285 | 159,372,285 | -- | -- |
| U.S. Government and Government Agency Obligations | 5,745,065 | -- | 5,745,065 | -- |
| Money Market Funds | 86,944,505 | 86,944,505 | -- | -- |
| Total Investments in Securities: | $3,108,604,493 | $3,102,859,428 | $5,745,065 | $-- |
| Derivative Instruments: | ||||
| Assets | ||||
| Futures Contracts | $643,014 | $643,014 | $-- | $-- |
| Total Assets | $643,014 | $643,014 | $-- | $-- |
| Total Derivative Instruments: | $643,014 | $643,014 | $-- | $-- |
Value of Derivative Instruments
The following table is a summary of the Fund's value of derivative instruments by primary risk exposure as of August 31, 2017. For additional information on derivative instruments, please refer to the Derivative Instruments section in the accompanying Notes to Financial Statements.
| Primary Risk Exposure / Derivative Type | Value | |
| Asset | Liability | |
| Equity Risk | ||
| Futures Contracts(a) | $643,014 | $0 |
| Total Equity Risk | 643,014 | 0 |
| Total Value of Derivatives | $643,014 | $0 |
(a) Reflects gross cumulative appreciation (depreciation) on futures contracts as presented in the Schedule of Investments. In the Statement of Assets and Liabilities, the period end daily variation margin is included in receivable or payable for daily variation margin on futures contracts, and the net cumulative appreciation (depreciation) is included in net unrealized appreciation (depreciation).
See accompanying notes which are an integral part of the financial statements.
Fidelity® Large Cap Value Enhanced Index Fund
Financial Statements
Statement of Assets and Liabilities
| August 31, 2017 | ||
| Assets | ||
| Investment in securities, at value (including securities loaned of $49,463,197) — See accompanying schedule: Unaffiliated issuers (cost $2,733,929,314) | $3,021,659,988 | |
| Fidelity Central Funds (cost $86,941,295) | 86,944,505 | |
| Total Investment in Securities (cost $2,820,870,609) | $3,108,604,493 | |
| Receivable for investments sold | 37,810,271 | |
| Receivable for fund shares sold | 2,477,462 | |
| Dividends receivable | 8,672,062 | |
| Distributions receivable from Fidelity Central Funds | 46,215 | |
| Receivable for daily variation margin for on futures contracts | 270,158 | |
| Total assets | 3,157,880,661 | |
| Liabilities | ||
| Payable to custodian bank | $580,463 | |
| Payable for investments purchased | 40,198,472 | |
| Payable for fund shares redeemed | 3,084,576 | |
| Accrued management fee | 979,283 | |
| Collateral on securities loaned | 50,196,913 | |
| Total liabilities | 95,039,707 | |
| Net Assets | $3,062,840,954 | |
| Net Assets consist of: | ||
| Paid in capital | $2,707,296,287 | |
| Undistributed net investment income | 31,818,640 | |
| Accumulated undistributed net realized gain (loss) on investments and foreign currency transactions | 35,348,781 | |
| Net unrealized appreciation (depreciation) on investments and assets and liabilities in foreign currencies | 288,377,246 | |
| Net Assets, for 245,123,239 shares outstanding | $3,062,840,954 | |
| Net Asset Value, offering price and redemption price per share ($3,062,840,954 ÷ 245,123,239 shares) | $12.50 |
See accompanying notes which are an integral part of the financial statements.
Statement of Operations
| Six months ended August 31, 2017 | Year ended February 28, 2017 | |
| Investment Income | ||
| Dividends | $39,025,011 | $54,861,789 |
| Interest | 19,248 | 50,227 |
| Income from Fidelity Central Funds (including $26,689 and $238,171, respectively, from security lending) | 162,530 | 362,727 |
| Total income | 39,206,789 | 55,274,743 |
| Expenses | ||
| Management fee | $5,484,091 | $6,216,249 |
| Transfer agent fees | 364,020 | 3,112,230 |
| Independent trustees' fees and expenses | 28,271 | 8,555 |
| Miscellaneous | 4,622 | 5,737 |
| Total expenses before reductions | 5,881,004 | 9,342,771 |
| Expense reductions | (1,243) | (362) |
| Total expenses | 5,879,761 | 9,342,409 |
| Net investment income (loss) | 33,327,028 | 45,932,334 |
| Realized and Unrealized Gain (Loss) | ||
| Net realized gain (loss) on: | ||
| Investment securities: | ||
| Unaffiliated issuers | 50,609,630 | 40,239,557 |
| Fidelity Central Funds | 2,820 | (4,956) |
| Foreign currency transactions | (639) | 27 |
| Futures contracts | 2,260,045 | 5,199,649 |
| Total net realized gain (loss) | 52,871,856 | 45,434,277 |
| Change in net unrealized appreciation (depreciation) on: | ||
| Investment securities: | ||
| Unaffiliated issuers | (64,279,294) | 415,177,382 |
| Fidelity Central Funds | (8,187) | – |
| Assets and liabilities in foreign currencies | 348 | – |
| Futures contracts | (759,288) | 899,649 |
| Total change in net unrealized appreciation (depreciation) | (65,046,421) | 416,077,031 |
| Net gain (loss) | (12,174,565) | 461,511,308 |
| Net increase (decrease) in net assets resulting from operations | $21,152,463 | $507,443,642 |
See accompanying notes which are an integral part of the financial statements.
Statement of Changes in Net Assets
| Six months ended August 31, 2017 | Year ended February 28, 2017 | Year ended February 29, 2016 | |
| Increase (Decrease) in Net Assets | |||
| Operations | |||
| Net investment income (loss) | $33,327,028 | $45,932,334 | $29,451,038 |
| Net realized gain (loss) | 52,871,856 | 45,434,277 | (21,752,912) |
| Change in net unrealized appreciation (depreciation) | (65,046,421) | 416,077,031 | (148,264,686) |
| Net increase (decrease) in net assets resulting from operations | 21,152,463 | 507,443,642 | (140,566,560) |
| Distributions to shareholders from net investment income | (9,524,832) | (38,789,221) | (27,330,027) |
| Distributions to shareholders from net realized gain | (20,240,257) | – | (19,261,829) |
| Total distributions | (29,765,089) | (38,789,221) | (46,591,856) |
| Share transactions | |||
| Proceeds from sales of shares | 585,123,239 | 1,358,650,321 | 973,573,154 |
| Reinvestment of distributions | 28,992,659 | 37,834,856 | 45,246,065 |
| Cost of shares redeemed | (431,889,605) | (544,200,825) | (368,721,721) |
| Net increase (decrease) in net assets resulting from share transactions | 182,226,293 | 852,284,352 | 650,097,498 |
| Total increase (decrease) in net assets | 173,613,667 | 1,320,938,773 | 462,939,082 |
| Net Assets | |||
| Beginning of period | 2,889,227,287 | 1,568,288,514 | 1,105,349,432 |
| End of period | $3,062,840,954 | $2,889,227,287 | $1,568,288,514 |
| Other Information | |||
| Undistributed net investment income end of period | $31,818,640 | $9,477,261 | $2,921,629 |
| Shares | |||
| Sold | 47,098,344 | 117,663,726 | 90,741,261 |
| Issued in reinvestment of distributions | 2,384,267 | 3,143,198 | 4,311,676 |
| Redeemed | (34,998,563) | (47,915,162) | (34,436,496) |
| Net increase (decrease) | 14,484,048 | 72,891,762 | 60,616,441 |
See accompanying notes which are an integral part of the financial statements.
Financial Highlights — Fidelity Large Cap Value Enhanced Index Fund
| Year ended August 31, | 2017 A | 2017 B | 2016 C | 2015 B | 2014 B | 2013 B |
| Selected Per–Share Data | ||||||
| Net asset value, beginning of period | $12.53 | $9.94 | $11.38 | $10.21 | $8.89 | $7.78 |
| Income from Investment Operations | ||||||
| Net investment income (loss)D | .14 | .25 | .24 | .26E | .20 | .18 |
| Net realized and unrealized gain (loss) | (.04) | 2.55 | (1.32) | 1.28 | 1.87 | 1.21 |
| Total from investment operations | .10 | 2.80 | (1.08) | 1.54 | 2.07 | 1.39 |
| Distributions from net investment income | (.04) | (.21) | (.21) | (.12) | (.16) | (.15) |
| Distributions from net realized gain | (.09) | – | (.15) | (.24) | (.59) | (.13) |
| Total distributions | (.13) | (.21) | (.36) | (.37)F | (.75) | (.28) |
| Net asset value, end of period | $12.50 | $12.53 | $9.94 | $11.38 | $10.21 | $8.89 |
| Total ReturnG,H | .79% | 28.30% | (9.69)% | 15.37% | 23.92% | 18.38% |
| Ratios to Average Net AssetsI,J | ||||||
| Expenses before reductions | .40%K | .45% | .45% | .45% | .45% | .45% |
| Expenses net of fee waivers, if any | .40%K | .45% | .45% | .45% | .45% | .45% |
| Expenses net of all reductions | .40%K | .45% | .45% | .45% | .45% | .45% |
| Net investment income (loss) | 2.27%K | 2.23% | 2.20% | 2.34%E | 2.01% | 2.27% |
| Supplemental Data | ||||||
| Net assets, end of period (000 omitted) | $3,062,841 | $2,889,227 | $1,568,289 | $1,105,349 | $180,081 | $106,740 |
| Portfolio turnover rateL | 93%K | 81% | 88% | 76%M | 85% | 76% |
A For the six month period ended August 31. The Fund changed its fiscal year end from February 28 to August 31, effective August 31, 2017.
B For the year ended February 28.
C For the year ended February 29.
D Calculated based on average shares outstanding during the period.
E Net Investment income per share reflects a large, non-recurring dividend which amounted to $.04 per share. Excluding this non-recurring dividend, the ratio of net investment income (loss) to average net assets would have been 2.00%.
F Total distributions of $.37 per share is comprised of distributions from net investment income of $.124 and distributions from net realized gain of $.243 per share.
G Total returns for periods of less than one year are not annualized.
H Total returns would have been lower if certain expenses had not been reduced during the applicable periods shown.
I Fees and expenses of any underlying Fidelity Central Funds are not included in the Fund's expense ratio. The Fund indirectly bears its proportionate share of the expenses of any underlying Fidelity Central Funds.
J Expense ratios reflect operating expenses of the Fund. Expenses before reductions do not reflect amounts reimbursed by the investment adviser or reductions from expense offset arrangements and do not represent the amount paid by the Fund during periods when reimbursements or reductions occur. Expenses net of fee waivers reflect expenses after reimbursement by the investment adviser but prior to reductions from expense offset arrangements. Expenses net of all reductions represent the net expenses paid by the Fund.
K Annualized
L Amount does not include the portfolio activity of any underlying Fidelity Central Funds.
M Portfolio turnover rate excludes securities received or delivered in-kind.
See accompanying notes which are an integral part of the financial statements.
Fidelity® Large Cap Core Enhanced Index Fund
Performance: The Bottom Line
Average annual total return reflects the change in the value of an investment, assuming reinvestment of distributions from dividend income and capital gains (the profits earned upon the sale of securities that have grown in value, if any) and assuming a constant rate of performance each year. The hypothetical investment and the average annual total returns do not reflect the deduction of taxes that a shareholder would pay on fund distributions or the redemption of fund shares. During periods of reimbursement by Fidelity, a fund’s total return will be greater than it would be had the reimbursement not occurred. How a fund did yesterday is no guarantee of how it will do tomorrow.
Average Annual Total Returns
| For the periods ended August 31, 2017 | Past 1 year | Past 5 years | Past 10 years |
| Fidelity® Large Cap Core Enhanced Index Fund | 14.71% | 13.57% | 7.24% |
$10,000 Over 10 Years
Let's say hypothetically that $10,000 was invested in Fidelity® Large Cap Core Enhanced Index Fund on August 31, 2007.
The chart shows how the value of your investment would have changed, and also shows how the S&P 500® Index performed over the same period.

| Period Ending Values | ||
| $20,121 | Fidelity® Large Cap Core Enhanced Index Fund | |
| $20,825 | S&P 500® Index | |
Fidelity® Large Cap Core Enhanced Index Fund
Management's Discussion of Fund Performance
Market Recap: The U.S. equity bellwether S&P 500® index returned 5.65% for the six months ending August 31, 2017. Following a strong start to 2017, equity markets leveled off in March amid fading optimism for President Trump’s pro-business agenda and stalled efforts by Congress to repeal and replace the Affordable Care Act (ACA). Upward momentum soon returned and continued until the index cooled off in August, when geopolitical tension escalated and uncertainty grew regarding the future of health care, tax reform and the debt ceiling. In a stark reversal from 2016, growth-oriented stocks handily topped their value counterparts. Among sectors, information technology (+15%) was a standout, surging as a handful of major index constituents posted strong returns. Health care (+9%) also topped the broader market, climbing from April to period end following renewed efforts to reconsider the ACA. Conversely, financials (+1%) lagged because sentiment regarding the potential for reduced regulation and lower taxes faded as the White House turned its attention to other initiatives. Rising interest rates held back real estate (+4%). Investors’ general preference for risk assets, coupled with increased competition, hampered consumer staples (+1%) and telecommunication services (-5%). Lastly, lower oil prices sent energy (-10%) to the bottom of the sector performance rankings.Comments from Maximilian Kaufmann, Senior Portfolio Manager of the Geode Capital Management, LLC, investment management team: For the six months ending August 31, 2017 – the period since our previous annual report – the fund gained 4.29%, trailing the 5.65% return of the benchmark S&P 500® index. Stock picking in the information technology sector was by far the biggest source of difficulty, led by an overweighting in Seagate Technology, a maker of hard disk drives that twice reported weaker-than-expected financial results this period. Other information technology detractors included graphics-processing company NVIDIA, a strong performer that, unfortunately, we significantly underweighted, and diversified technology firm IBM, which we overweighted due to the stock’s attractive valuation characteristics but which nevertheless struggled this period. Elsewhere, an overweight in home products retailer Bed Bath & Beyond – which we maintained largely due to the company’s valuation and profitability factors – hampered results, as the company struggled in an increasingly competitive retail environment. On the positive side, the fund was well positioned in the energy sector. Good stock picking here added value, along with an underweighting in this lagging category, which was a byproduct of our bottom-up process. Among individual names, the fund especially was helped by having minimal exposure – and none at period end – to oil-field services giant Schlumberger, hampered by continued weakness in oil prices. Other notable relative contributors included aircraft manufacturer Boeing and industrial conglomerate General Electric. Boeing’s stock, which we found attractive for its growth and price momentum characteristics, among other reasons, rose throughout the period and especially sharply in July on stronger-than-expected earnings. Meanwhile, our models led us to underweight GE largely because it exhibited poor price momentum and earnings quality. This positioning was helpful in light of the stock’s struggles.The views expressed above reflect those of the portfolio manager(s) only through the end of the period as stated on the cover of this report and do not necessarily represent the views of Fidelity or any other person in the Fidelity organization. Any such views are subject to change at any time based upon market or other conditions and Fidelity disclaims any responsibility to update such views. These views may not be relied on as investment advice and, because investment decisions for a Fidelity fund are based on numerous factors, may not be relied on as an indication of trading intent on behalf of any Fidelity fund.
Fidelity® Large Cap Core Enhanced Index Fund
Investment Summary (Unaudited)
Top Ten Stocks as of August 31, 2017
| % of fund's net assets | % of fund's net assets 6 months ago | |
| Apple, Inc. | 4.5 | 4.1 |
| Microsoft Corp. | 3.2 | 2.9 |
| Johnson & Johnson | 2.2 | 2.2 |
| Facebook, Inc. Class A | 2.2 | 1.5 |
| JPMorgan Chase & Co. | 2.0 | 2.1 |
| Exxon Mobil Corp. | 2.0 | 1.8 |
| Amazon.com, Inc. | 1.8 | 1.9 |
| Procter & Gamble Co. | 1.6 | 1.7 |
| Bank of America Corp. | 1.6 | 1.8 |
| AT&T, Inc. | 1.6 | 1.8 |
| 22.7 |
Top Market Sectors as of August 31, 2017
| % of fund's net assets | % of fund's net assets 6 months ago | |
| Information Technology | 25.1 | 23.0 |
| Health Care | 16.3 | 15.7 |
| Consumer Discretionary | 14.2 | 13.4 |
| Financials | 12.2 | 12.8 |
| Industrials | 10.8 | 8.2 |
| Consumer Staples | 10.2 | 10.2 |
| Energy | 3.8 | 4.9 |
| Telecommunication Services | 2.0 | 3.5 |
| Utilities | 2.0 | 1.7 |
| Materials | 1.6 | 3.9 |
Asset Allocation (% of fund's net assets)
| As of August 31, 2017* | ||
| Stocks and Equity Futures | 100.0% | |

* Foreign investments - 5.8%
| As of February 28, 2017* | ||
| Stocks and Equity Futures | 100.0% | |

* Foreign investments - 4.7%
Fidelity® Large Cap Core Enhanced Index Fund
Investments August 31, 2017
Showing Percentage of Net Assets
| Common Stocks - 98.8% | |||
| Shares | Value | ||
| CONSUMER DISCRETIONARY - 14.2% | |||
| Auto Components - 0.7% | |||
| Gentex Corp. | 31,003 | $566,425 | |
| Lear Corp. | 19,043 | 2,847,690 | |
| 3,414,115 | |||
| Diversified Consumer Services - 0.5% | |||
| H&R Block, Inc. | 103,013 | 2,754,568 | |
| Hotels, Restaurants & Leisure - 1.8% | |||
| Carnival Corp. | 38,511 | 2,675,744 | |
| Las Vegas Sands Corp. | 21,012 | 1,307,157 | |
| McDonald's Corp. | 2,281 | 364,892 | |
| Park Hotels & Resorts, Inc. | 102,093 | 2,724,862 | |
| Royal Caribbean Cruises Ltd. | 21,597 | 2,687,963 | |
| 9,760,618 | |||
| Household Durables - 1.1% | |||
| PulteGroup, Inc. | 37,323 | 963,680 | |
| Taylor Morrison Home Corp. (a) | 121,718 | 2,461,138 | |
| Toll Brothers, Inc. | 62,094 | 2,419,182 | |
| 5,844,000 | |||
| Internet & Direct Marketing Retail - 1.8% | |||
| Amazon.com, Inc. (a) | 9,806 | 9,615,764 | |
| Media - 3.8% | |||
| Charter Communications, Inc. Class A (a) | 4,040 | 1,610,102 | |
| Comcast Corp. Class A | 186,213 | 7,562,110 | |
| Discovery Communications, Inc. Class C (non-vtg.) (a) | 67,161 | 1,411,053 | |
| Tegna, Inc. | 161,181 | 2,034,104 | |
| The Walt Disney Co. | 62,614 | 6,336,537 | |
| Time Warner, Inc. | 14,195 | 1,435,115 | |
| 20,389,021 | |||
| Multiline Retail - 1.0% | |||
| Dollar Tree, Inc. (a) | 21,110 | 1,681,200 | |
| Target Corp. | 64,498 | 3,517,076 | |
| 5,198,276 | |||
| Specialty Retail - 3.0% | |||
| Bed Bath & Beyond, Inc. | 65,328 | 1,802,400 | |
| Best Buy Co., Inc. | 53,036 | 2,877,733 | |
| GameStop Corp. Class A | 13,419 | 248,252 | |
| Gap, Inc. | 117,213 | 2,768,571 | |
| Home Depot, Inc. | 41,481 | 6,216,757 | |
| Signet Jewelers Ltd. | 35,216 | 2,221,073 | |
| 16,134,786 | |||
| Textiles, Apparel & Luxury Goods - 0.5% | |||
| Michael Kors Holdings Ltd. (a) | 66,520 | 2,808,474 | |
| TOTAL CONSUMER DISCRETIONARY | 75,919,622 | ||
| CONSUMER STAPLES - 10.2% | |||
| Beverages - 1.9% | |||
| PepsiCo, Inc. | 59,953 | 6,938,361 | |
| The Coca-Cola Co. | 75,520 | 3,439,936 | |
| 10,378,297 | |||
| Food & Staples Retailing - 3.4% | |||
| CVS Health Corp. | 60,219 | 4,657,337 | |
| Kroger Co. | 140,985 | 3,083,342 | |
| Wal-Mart Stores, Inc. | 72,887 | 5,690,288 | |
| Walgreens Boots Alliance, Inc. | 55,040 | 4,485,760 | |
| 17,916,727 | |||
| Food Products - 1.7% | |||
| Archer Daniels Midland Co. | 67,874 | 2,804,554 | |
| Campbell Soup Co. | 11,132 | 514,298 | |
| The J.M. Smucker Co. | 23,794 | 2,492,659 | |
| Tyson Foods, Inc. Class A | 50,994 | 3,227,920 | |
| 9,039,431 | |||
| Household Products - 1.8% | |||
| Colgate-Palmolive Co. | 14,853 | 1,064,069 | |
| Procter & Gamble Co. | 94,922 | 8,758,453 | |
| 9,822,522 | |||
| Tobacco - 1.4% | |||
| Altria Group, Inc. | 85,759 | 5,437,121 | |
| Philip Morris International, Inc. | 15,679 | 1,833,345 | |
| 7,270,466 | |||
| TOTAL CONSUMER STAPLES | 54,427,443 | ||
| ENERGY - 3.8% | |||
| Energy Equipment& Services - 0.0% | |||
| Baker Hughes, a GE Co. Class A | 1,505 | 51,020 | |
| Oil, Gas & Consumable Fuels - 3.8% | |||
| Chevron Corp. | 22,135 | 2,382,169 | |
| ConocoPhillips Co. | 57,469 | 2,509,097 | |
| Devon Energy Corp. | 27,961 | 877,975 | |
| Exxon Mobil Corp. | 140,159 | 10,698,336 | |
| Valero Energy Corp. | 52,497 | 3,575,046 | |
| 20,042,623 | |||
| TOTAL ENERGY | 20,093,643 | ||
| FINANCIALS - 12.2% | |||
| Banks - 6.8% | |||
| Bank of America Corp. | 364,732 | 8,713,447 | |
| Citigroup, Inc. | 109,197 | 7,428,672 | |
| Citizens Financial Group, Inc. | 9,987 | 330,869 | |
| JPMorgan Chase & Co. | 119,502 | 10,861,537 | |
| PNC Financial Services Group, Inc. | 4,337 | 543,903 | |
| U.S. Bancorp | 4,231 | 216,839 | |
| Wells Fargo & Co. | 162,776 | 8,312,970 | |
| 36,408,237 | |||
| Capital Markets - 2.1% | |||
| BGC Partners, Inc. Class A | 1,382 | 17,952 | |
| Goldman Sachs Group, Inc. | 21,627 | 4,838,825 | |
| LPL Financial | 7,586 | 355,328 | |
| Morgan Stanley | 92,819 | 4,223,265 | |
| Thomson Reuters Corp. | 41,306 | 1,888,747 | |
| 11,324,117 | |||
| Consumer Finance - 0.6% | |||
| American Express Co. | 7,912 | 681,223 | |
| Discover Financial Services | 46,328 | 2,731,036 | |
| 3,412,259 | |||
| Diversified Financial Services - 1.2% | |||
| Berkshire Hathaway, Inc. Class B (a) | 34,201 | 6,195,853 | |
| Leucadia National Corp. | 14,404 | 341,087 | |
| 6,536,940 | |||
| Insurance - 0.8% | |||
| AFLAC, Inc. | 17,750 | 1,465,263 | |
| Allstate Corp. | 1,849 | 167,335 | |
| Erie Indemnity Co. Class A | 258 | 31,164 | |
| First American Financial Corp. | 2,025 | 99,347 | |
| FNF Group | 4,540 | 219,010 | |
| Prudential Financial, Inc. | 19,409 | 1,981,271 | |
| 3,963,390 | |||
| Mortgage Real Estate Investment Trusts - 0.7% | |||
| AGNC Investment Corp. | 43,165 | 929,774 | |
| Annaly Capital Management, Inc. | 226,353 | 2,829,413 | |
| 3,759,187 | |||
| TOTAL FINANCIALS | 65,404,130 | ||
| HEALTH CARE - 16.3% | |||
| Biotechnology - 4.2% | |||
| AbbVie, Inc. | 69,017 | 5,196,980 | |
| Amgen, Inc. | 34,527 | 6,137,865 | |
| Biogen, Inc. (a) | 8,982 | 2,843,342 | |
| Gilead Sciences, Inc. | 68,112 | 5,701,656 | |
| United Therapeutics Corp. (a)(b) | 20,406 | 2,669,105 | |
| 22,548,948 | |||
| Health Care Equipment & Supplies - 1.4% | |||
| Baxter International, Inc. | 58,889 | 3,653,474 | |
| C.R. Bard, Inc. | 118 | 37,856 | |
| Danaher Corp. | 2,339 | 195,119 | |
| Masimo Corp. (a) | 24,327 | 2,052,712 | |
| Medtronic PLC | 18,877 | 1,521,864 | |
| 7,461,025 | |||
| Health Care Providers & Services - 4.8% | |||
| Aetna, Inc. | 18,835 | 2,970,280 | |
| Anthem, Inc. | 21,391 | 4,193,492 | |
| Centene Corp. (a) | 36,313 | 3,226,410 | |
| Express Scripts Holding Co. (a) | 58,825 | 3,695,387 | |
| Humana, Inc. | 14,852 | 3,826,172 | |
| McKesson Corp. | 355 | 53,005 | |
| UnitedHealth Group, Inc. | 38,647 | 7,686,888 | |
| 25,651,634 | |||
| Pharmaceuticals - 5.9% | |||
| Allergan PLC | 6,067 | 1,392,255 | |
| Bristol-Myers Squibb Co. | 55,791 | 3,374,240 | |
| Eli Lilly & Co. | 970 | 78,851 | |
| Johnson & Johnson | 88,786 | 11,752,603 | |
| Merck & Co., Inc. | 112,283 | 7,170,392 | |
| Pfizer, Inc. | 233,546 | 7,921,880 | |
| 31,690,221 | |||
| TOTAL HEALTH CARE | 87,351,828 | ||
| INDUSTRIALS - 10.8% | |||
| Aerospace & Defense - 4.0% | |||
| General Dynamics Corp. | 5,058 | 1,018,428 | |
| Lockheed Martin Corp. | 3,844 | 1,173,919 | |
| Moog, Inc. Class A (a) | 9,603 | 737,126 | |
| Northrop Grumman Corp. | 8,464 | 2,303,985 | |
| Raytheon Co. | 22,965 | 4,179,860 | |
| Spirit AeroSystems Holdings, Inc. Class A | 39,552 | 2,946,624 | |
| The Boeing Co. | 25,952 | 6,219,656 | |
| United Technologies Corp. | 23,646 | 2,830,899 | |
| 21,410,497 | |||
| Airlines - 0.2% | |||
| Hawaiian Holdings, Inc. (a) | 4,977 | 213,264 | |
| Southwest Airlines Co. | 15,172 | 791,068 | |
| 1,004,332 | |||
| Building Products - 0.4% | |||
| Owens Corning | 26,933 | 1,996,543 | |
| Commercial Services & Supplies - 0.1% | |||
| KAR Auction Services, Inc. | 11,933 | 538,059 | |
| LSC Communications, Inc. | 14,164 | 228,182 | |
| 766,241 | |||
| Construction & Engineering - 0.1% | |||
| EMCOR Group, Inc. | 7,910 | 522,376 | |
| Electrical Equipment - 0.6% | |||
| Eaton Corp. PLC | 38,846 | 2,787,589 | |
| Fortive Corp. | 3,954 | 256,891 | |
| 3,044,480 | |||
| Industrial Conglomerates - 1.8% | |||
| 3M Co. | 28,507 | 5,824,550 | |
| General Electric Co. | 109,143 | 2,679,461 | |
| Honeywell International, Inc. | 6,300 | 871,101 | |
| 9,375,112 | |||
| Machinery - 2.3% | |||
| Allison Transmission Holdings, Inc. | 76,015 | 2,640,001 | |
| Cummins, Inc. | 21,201 | 3,379,015 | |
| Deere & Co. | 29,956 | 3,472,799 | |
| Illinois Tool Works, Inc. | 3,581 | 492,423 | |
| Ingersoll-Rand PLC | 28,236 | 2,411,072 | |
| Toro Co. | 1,569 | 96,776 | |
| 12,492,086 | |||
| Professional Services - 0.4% | |||
| Manpower, Inc. | 9,163 | 1,021,766 | |
| Robert Half International, Inc. | 26,394 | 1,195,648 | |
| 2,217,414 | |||
| Road & Rail - 0.9% | |||
| Union Pacific Corp. | 45,718 | 4,814,105 | |
| Trading Companies & Distributors - 0.0% | |||
| W.W. Grainger, Inc. (b) | 710 | 115,425 | |
| TOTAL INDUSTRIALS | 57,758,611 | ||
| INFORMATION TECHNOLOGY - 25.1% | |||
| Communications Equipment - 1.9% | |||
| Cisco Systems, Inc. | 210,700 | 6,786,647 | |
| F5 Networks, Inc. (a) | 2,050 | 244,729 | |
| Juniper Networks, Inc. | 105,669 | 2,930,201 | |
| 9,961,577 | |||
| Electronic Equipment & Components - 0.5% | |||
| Corning, Inc. | 69,260 | 1,991,918 | |
| TE Connectivity Ltd. | 9,637 | 767,105 | |
| 2,759,023 | |||
| Internet Software & Services - 5.3% | |||
| Alphabet, Inc.: | |||
| Class A (a) | 7,452 | 7,118,448 | |
| Class C (a) | 6,338 | 5,953,474 | |
| eBay, Inc. (a) | 103,445 | 3,737,468 | |
| Facebook, Inc. Class A (a) | 68,023 | 11,697,915 | |
| 28,507,305 | |||
| IT Services - 2.0% | |||
| Accenture PLC Class A | 12,640 | 1,652,806 | |
| IBM Corp. | 39,998 | 5,720,914 | |
| MasterCard, Inc. Class A | 1,878 | 250,337 | |
| Maximus, Inc. | 617 | 37,501 | |
| Total System Services, Inc. | 11,739 | 811,400 | |
| Visa, Inc. Class A | 18,324 | 1,896,900 | |
| 10,369,858 | |||
| Semiconductors & Semiconductor Equipment - 4.9% | |||
| Applied Materials, Inc. | 86,452 | 3,900,714 | |
| Intel Corp. | 195,903 | 6,870,318 | |
| KLA-Tencor Corp. | 32,894 | 3,081,839 | |
| Lam Research Corp. | 828 | 137,431 | |
| Marvell Technology Group Ltd. | 152,234 | 2,726,511 | |
| Micron Technology, Inc. (a) | 111,674 | 3,570,218 | |
| MKS Instruments, Inc. | 5,174 | 426,079 | |
| NVIDIA Corp. | 518 | 87,770 | |
| Qualcomm, Inc. | 2,957 | 154,562 | |
| Skyworks Solutions, Inc. | 3,557 | 374,766 | |
| Texas Instruments, Inc. | 59,438 | 4,922,655 | |
| 26,252,863 | |||
| Software - 4.0% | |||
| Citrix Systems, Inc. (a) | 3,909 | 305,723 | |
| Electronic Arts, Inc. (a) | 11,457 | 1,392,026 | |
| Intuit, Inc. | 11,218 | 1,586,786 | |
| Microsoft Corp. | 228,114 | 17,056,084 | |
| Oracle Corp. | 18,800 | 946,204 | |
| 21,286,823 | |||
| Technology Hardware, Storage & Peripherals - 6.5% | |||
| Apple, Inc. | 147,809 | 24,240,672 | |
| HP, Inc. | 189,936 | 3,623,979 | |
| NetApp, Inc. | 12,016 | 464,539 | |
| Seagate Technology LLC (b) | 67,474 | 2,127,455 | |
| Western Digital Corp. | 36,950 | 3,261,577 | |
| Xerox Corp. | 32,430 | 1,046,516 | |
| 34,764,738 | |||
| TOTAL INFORMATION TECHNOLOGY | 133,902,187 | ||
| MATERIALS - 1.6% | |||
| Chemicals - 1.0% | |||
| E.I. du Pont de Nemours & Co. | 13,015 | 1,092,349 | |
| LyondellBasell Industries NV Class A | 40,028 | 3,626,137 | |
| Monsanto Co. | 6,341 | 743,165 | |
| 5,461,651 | |||
| Paper & Forest Products - 0.6% | |||
| Louisiana-Pacific Corp. (a) | 111,691 | 2,845,887 | |
| TOTAL MATERIALS | 8,307,538 | ||
| REAL ESTATE - 0.6% | |||
| Equity Real Estate Investment Trusts (REITs) - 0.6% | |||
| Weyerhaeuser Co. | 102,641 | 3,347,123 | |
| TELECOMMUNICATION SERVICES - 2.0% | |||
| Diversified Telecommunication Services - 2.0% | |||
| AT&T, Inc. | 224,605 | 8,413,703 | |
| Verizon Communications, Inc. | 47,803 | 2,293,110 | |
| 10,706,813 | |||
| UTILITIES - 2.0% | |||
| Electric Utilities - 1.9% | |||
| Duke Energy Corp. | 5,935 | 518,126 | |
| Eversource Energy | 5,472 | 344,736 | |
| Exelon Corp. | 42,455 | 1,607,771 | |
| NextEra Energy, Inc. | 30,053 | 4,523,277 | |
| PPL Corp. | 79,015 | 3,100,549 | |
| 10,094,459 | |||
| Gas Utilities - 0.1% | |||
| UGI Corp. | 8,194 | 404,866 | |
| TOTAL UTILITIES | 10,499,325 | ||
| TOTAL COMMON STOCKS | |||
| (Cost $416,522,503) | 527,718,263 | ||
| Principal Amount | Value | ||
| U.S. Treasury Obligations - 0.2% | |||
| U.S. Treasury Bills, yield at date of purchase 1.18% 6/21/18 (c) | |||
| (Cost $841,906) | 850,000 | 841,949 | |
| Shares | Value | ||
| Money Market Funds - 1.2% | |||
| Fidelity Cash Central Fund, 1.11% (d) | 3,737,336 | $3,738,084 | |
| Fidelity Securities Lending Cash Central Fund 1.11% (d)(e) | 2,776,720 | 2,776,998 | |
| TOTAL MONEY MARKET FUNDS | |||
| (Cost $6,514,806) | 6,515,082 | ||
| TOTAL INVESTMENT IN SECURITIES - 100.2% | |||
| (Cost $423,879,215) | 535,075,294 | ||
| NET OTHER ASSETS (LIABILITIES) - (0.2)% | (838,973) | ||
| NET ASSETS - 100% | $534,236,321 |
| Futures Contracts | |||||
| Number of contracts | Expiration Date | Notional amount | Value | Unrealized Appreciation/(Depreciation) | |
| Purchased | |||||
| Equity Index Contracts | |||||
| CME E-mini S&P 500 Index Contracts (United States) | 50 | Sept. 2017 | $6,175,250 | $104,609 | $104,609 |
The notional amount of futures sold as a percentage of Net Assets is 1.2%
Legend
(a) Non-income producing
(b) Security or a portion of the security is on loan at period end.
(c) Security or a portion of the security was pledged to cover margin requirements for futures contracts. At period end, the value of securities pledged amounted to $217,916.
(d) Affiliated fund that is generally available only to investment companies and other accounts managed by Fidelity Investments. The rate quoted is the annualized seven-day yield of the fund at period end. A complete unaudited listing of the fund's holdings as of its most recent quarter end is available upon request. In addition, each Fidelity Central Fund's financial statements, which are not covered by the Fund's Report of Independent Registered Public Accounting Firm, are available on the SEC's website or upon request.
(e) Investment made with cash collateral received from securities on loan.
Affiliated Central Funds
Information regarding fiscal year to date income earned by the Fund from investments in Fidelity Central Funds is as follows:
| Fund | Six months ended August 31, 2017 | Year ended February 28, 2017 |
| Fidelity Cash Central Fund | $48,593 | $10,401 |
| Fidelity Securities Lending Cash Central Fund | 4,252 | 41,080 |
| Total | $52,845 | $51,481 |
Investment Valuation
The following is a summary of the inputs used, as of August 31, 2017, involving the Fund's assets and liabilities carried at fair value. The inputs or methodology used for valuing securities may not be an indication of the risk associated with investing in those securities. For more information on valuation inputs, and their aggregation into the levels used below, please refer to the Investment Valuation section in the accompanying Notes to Financial Statements.
| Valuation Inputs at Reporting Date: | ||||
| Description | Total | Level 1 | Level 2 | Level 3 |
| Investments in Securities: | ||||
| Equities: | ||||
| Consumer Discretionary | $75,919,622 | $75,919,622 | $-- | $-- |
| Consumer Staples | 54,427,443 | 54,427,443 | -- | -- |
| Energy | 20,093,643 | 20,093,643 | -- | -- |
| Financials | 65,404,130 | 65,404,130 | -- | -- |
| Health Care | 87,351,828 | 87,351,828 | -- | -- |
| Industrials | 57,758,611 | 57,758,611 | -- | -- |
| Information Technology | 133,902,187 | 133,902,187 | -- | -- |
| Materials | 8,307,538 | 8,307,538 | -- | -- |
| Real Estate | 3,347,123 | 3,347,123 | -- | -- |
| Telecommunication Services | 10,706,813 | 10,706,813 | -- | -- |
| Utilities | 10,499,325 | 10,499,325 | -- | -- |
| U.S. Government and Government Agency Obligations | 841,949 | -- | 841,949 | -- |
| Money Market Funds | 6,515,082 | 6,515,082 | -- | -- |
| Total Investments in Securities: | $535,075,294 | $534,233,345 | $841,949 | $-- |
| Derivative Instruments: | ||||
| Assets | ||||
| Futures Contracts | $104,609 | $104,609 | $-- | $-- |
| Total Assets | $104,609 | $104,609 | $-- | $-- |
| Total Derivative Instruments: | $104,609 | $104,609 | $-- | $-- |
Value of Derivative Instruments
The following table is a summary of the Fund's value of derivative instruments by primary risk exposure as of August 31, 2017. For additional information on derivative instruments, please refer to the Derivative Instruments section in the accompanying Notes to Financial Statements.
| Primary Risk Exposure / Derivative Type | Value | |
| Asset | Liability | |
| Equity Risk | ||
| Futures Contracts(a) | $104,609 | $0 |
| Total Equity Risk | 104,609 | 0 |
| Total Value of Derivatives | $104,609 | $0 |
(a) Reflects gross cumulative appreciation (depreciation) on futures contracts as presented in the Schedule of Investments. In the Statement of Assets and Liabilities, the period end daily variation margin is included in receivable or payable for daily variation margin on futures contracts, and the net cumulative appreciation (depreciation) is included in net unrealized appreciation (depreciation).
See accompanying notes which are an integral part of the financial statements.
Fidelity® Large Cap Core Enhanced Index Fund
Financial Statements
Statement of Assets and Liabilities
| August 31, 2017 | ||
| Assets | ||
| Investment in securities, at value (including securities loaned of $2,744,802) — See accompanying schedule: Unaffiliated issuers (cost $417,364,409) | $528,560,212 | |
| Fidelity Central Funds (cost $6,514,806) | 6,515,082 | |
| Total Investment in Securities (cost $423,879,215) | $535,075,294 | |
| Receivable for investments sold | 8,122,880 | |
| Receivable for fund shares sold | 503,036 | |
| Dividends receivable | 1,324,730 | |
| Distributions receivable from Fidelity Central Funds | 5,156 | |
| Receivable for daily variation margin for on futures contracts | 35,750 | |
| Total assets | 545,066,846 | |
| Liabilities | ||
| Payable for investments purchased | $7,581,256 | |
| Payable for fund shares redeemed | 298,775 | |
| Accrued management fee | 173,394 | |
| Collateral on securities loaned | 2,777,100 | |
| Total liabilities | 10,830,525 | |
| Net Assets | $534,236,321 | |
| Net Assets consist of: | ||
| Paid in capital | $415,741,679 | |
| Undistributed net investment income | 4,538,723 | |
| Accumulated undistributed net realized gain (loss) on investments and foreign currency transactions | 2,655,231 | |
| Net unrealized appreciation (depreciation) on investments | 111,300,688 | |
| Net Assets, for 38,880,412 shares outstanding | $534,236,321 | |
| Net Asset Value, offering price and redemption price per share ($534,236,321 ÷ 38,880,412 shares) | $13.74 |
See accompanying notes which are an integral part of the financial statements.
Statement of Operations
| Six months ended August 31, 2017 | Year ended February 28, 2017 | |
| Investment Income | ||
| Dividends | $5,955,802 | $10,922,487 |
| Interest | 2,543 | 10,170 |
| Income from Fidelity Central Funds (including $4,252 and $41,080, respectively, from security lending) | 52,845 | 51,481 |
| Total income | 6,011,190 | 10,984,138 |
| Expenses | ||
| Management fee | $997,299 | $1,448,099 |
| Transfer agent fees | 65,933 | 725,073 |
| Independent trustees' fees and expenses | 5,168 | 2,079 |
| Miscellaneous | 858 | 1,418 |
| Total expenses before reductions | 1,069,258 | 2,176,669 |
| Expense reductions | (166) | (97) |
| Total expenses | 1,069,092 | 2,176,572 |
| Net investment income (loss) | 4,942,098 | 8,807,566 |
| Realized and Unrealized Gain (Loss) | ||
| Net realized gain (loss) on: | ||
| Investment securities: | ||
| Unaffiliated issuers | 8,898,279 | 7,265,790 |
| Fidelity Central Funds | 134 | (866) |
| Foreign currency transactions | (12) | 6 |
| Futures contracts | 854,554 | 1,026,856 |
| Total net realized gain (loss) | 9,752,955 | 8,291,786 |
| Change in net unrealized appreciation (depreciation) on: | ||
| Investment securities: | ||
| Unaffiliated issuers | 7,858,170 | 81,763,619 |
| Fidelity Central Funds | (1,348) | – |
| Futures contracts | (156,184) | 137,056 |
| Total change in net unrealized appreciation (depreciation) | 7,700,638 | 81,900,675 |
| Net gain (loss) | 17,453,593 | 90,192,461 |
| Net increase (decrease) in net assets resulting from operations | $22,395,691 | $99,000,027 |
See accompanying notes which are an integral part of the financial statements.
Statement of Changes in Net Assets
| Six months ended August 31, 2017 | Year ended February 28, 2017 | Year ended February 29, 2016 | |
| Increase (Decrease) in Net Assets | |||
| Operations | |||
| Net investment income (loss) | $4,942,098 | $8,807,566 | $7,402,916 |
| Net realized gain (loss) | 9,752,955 | 8,291,786 | 1,390,162 |
| Change in net unrealized appreciation (depreciation) | 7,700,638 | 81,900,675 | (41,711,760) |
| Net increase (decrease) in net assets resulting from operations | 22,395,691 | 99,000,027 | (32,918,682) |
| Distributions to shareholders from net investment income | (1,405,265) | (7,861,211) | (6,567,904) |
| Distributions to shareholders from net realized gain | – | – | (8,297,616) |
| Total distributions | (1,405,265) | (7,861,211) | (14,865,520) |
| Share transactions | |||
| Proceeds from sales of shares | 56,911,888 | 166,579,819 | 207,509,960 |
| Reinvestment of distributions | 1,332,680 | 7,444,746 | 14,075,999 |
| Cost of shares redeemed | (69,984,446) | (151,876,457) | (143,985,591) |
| Net increase (decrease) in net assets resulting from share transactions | (11,739,878) | 22,148,108 | 77,600,368 |
| Total increase (decrease) in net assets | 9,250,548 | 113,286,924 | 29,816,166 |
| Net Assets | |||
| Beginning of period | 524,985,773 | 411,698,849 | 381,882,683 |
| End of period | $534,236,321 | $524,985,773 | $411,698,849 |
| Other Information | |||
| Undistributed net investment income end of period | $4,538,723 | $1,335,391 | $603,436 |
| Shares | |||
| Sold | 4,273,941 | 13,918,048 | 17,838,199 |
| Issued in reinvestment of distributions | 102,121 | 591,010 | 1,214,811 |
| Redeemed | (5,222,228) | (12,563,272) | (12,333,931) |
| Net increase (decrease) | (846,166) | 1,945,786 | 6,719,079 |
See accompanying notes which are an integral part of the financial statements.
Financial Highlights — Fidelity Large Cap Core Enhanced Index Fund
| Year ended August 31, | 2017 A | 2017 B | 2016 C | 2015 B | 2014 B | 2013 B |
| Selected Per–Share Data | ||||||
| Net asset value, beginning of period | $13.21 | $10.90 | $12.29 | $11.30 | $10.70 | $9.68 |
| Income from Investment Operations | ||||||
| Net investment income (loss)D | .12 | .22 | .22 | .20 | .19 | .21 |
| Net realized and unrealized gain (loss) | .45 | 2.29 | (1.17) | 1.55 | 2.45 | 1.03 |
| Total from investment operations | .57 | 2.51 | (.95) | 1.75 | 2.64 | 1.24 |
| Distributions from net investment income | (.04) | (.20) | (.19) | (.16) | (.27) | (.18) |
| Distributions from net realized gain | – | – | (.25) | (.60) | (1.77) | (.05) |
| Total distributions | (.04) | (.20) | (.44) | (.76) | (2.04) | (.22)E |
| Net asset value, end of period | $13.74 | $13.21 | $10.90 | $12.29 | $11.30 | $10.70 |
| Total ReturnF,G | 4.29% | 23.09% | (7.94)% | 16.04% | 26.44% | 13.03% |
| Ratios to Average Net AssetsH,I | ||||||
| Expenses before reductions | .40%J | .45% | .45% | .45% | .45% | .45% |
| Expenses net of fee waivers, if any | .40%J | .45% | .45% | .45% | .45% | .45% |
| Expenses net of all reductions | .40%J | .45% | .45% | .45% | .45% | .45% |
| Net investment income (loss) | 1.85%J | 1.82% | 1.86% | 1.69% | 1.67% | 2.08% |
| Supplemental Data | ||||||
| Net assets, end of period (000 omitted) | $534,236 | $524,986 | $411,699 | $381,883 | $441,773 | $208,675 |
| Portfolio turnover rateK | 88%J | 82% | 84% | 101% | 125% | 85% |
A For the six month period ended August 31 . The Fund changed its fiscal year end from February 28 to August 31, effective August 31, 2017.
B For the year ended February 28.
C For the year ended February 29.
D Calculated based on average shares outstanding during the period.
E Total distributions of $.22 per share is comprised of distributions from net investment income of $.175 and distributions from net realized gain of $.049 per share.
F Total returns for periods of less than one year are not annualized.
G Total returns would have been lower if certain expenses had not been reduced during the applicable periods shown.
H Fees and expenses of any underlying Fidelity Central Funds are not included in the Fund's expense ratio. The Fund indirectly bears its proportionate share of the expenses of any underlying Fidelity Central Funds.
I Expense ratios reflect operating expenses of the Fund. Expenses before reductions do not reflect amounts reimbursed by the investment adviser or reductions from expense offset arrangements and do not represent the amount paid by the Fund during periods when reimbursements or reductions occur. Expenses net of fee waivers reflect expenses after reimbursement by the investment adviser but prior to reductions from expense offset arrangements. Expenses net of all reductions represent the net expenses paid by the Fund.
J Annualized
K Amount does not include the portfolio activity of any underlying Fidelity Central Funds.
See accompanying notes which are an integral part of the financial statements.
Fidelity® Mid Cap Enhanced Index Fund
Performance: The Bottom Line
Average annual total return reflects the change in the value of an investment, assuming reinvestment of distributions from dividend income and capital gains (the profits earned upon the sale of securities that have grown in value, if any) and assuming a constant rate of performance each year. The hypothetical investment and the average annual total returns do not reflect the deduction of taxes that a shareholder would pay on fund distributions or the redemption of fund shares. During periods of reimbursement by Fidelity, a fund’s total return will be greater than it would be had the reimbursement not occurred. How a fund did yesterday is no guarantee of how it will do tomorrow.
Average Annual Total Returns
| For the periods ended August 31, 2017 | Past 1 year | Past 5 years | Life of fundA |
| Fidelity® Mid Cap Enhanced Index Fund | 12.70% | 14.30% | 8.54% |
A From December 20, 2007
$10,000 Over Life of Fund
Let's say hypothetically that $10,000 was invested in Fidelity® Mid Cap Enhanced Index Fund on December 20, 2007, when the fund started.
The chart shows how the value of your investment would have changed, and also shows how the Russell Midcap® Index performed over the same period.

| Period Ending Values | ||
| $22,153 | Fidelity® Mid Cap Enhanced Index Fund | |
| $22,077 | Russell Midcap® Index | |
Fidelity® Mid Cap Enhanced Index Fund
Management's Discussion of Fund Performance
Market Recap: The U.S. equity bellwether S&P 500® index returned 5.65% for the six months ending August 31, 2017. Following a strong start to 2017, equity markets leveled off in March amid fading optimism for President Trump’s pro-business agenda and stalled efforts by Congress to repeal and replace the Affordable Care Act (ACA). Upward momentum soon returned and continued until the index cooled off in August, when geopolitical tension escalated and uncertainty grew regarding the future of health care, tax reform and the debt ceiling. In a stark reversal from 2016, growth-oriented stocks handily topped their value counterparts. Among sectors, information technology (+15%) was a standout, surging as a handful of major index constituents posted strong returns. Health care (+9%) also topped the broader market, climbing from April to period end following renewed efforts to reconsider the ACA. Conversely, financials (+1%) lagged because sentiment regarding the potential for reduced regulation and lower taxes faded as the White House turned its attention to other initiatives. Rising interest rates held back real estate (+4%). Investors’ general preference for risk assets, coupled with increased competition, hampered consumer staples (+1%) and telecommunication services (-5%). Lastly, lower oil prices sent energy (-10%) to the bottom of the sector performance rankings.Comments from Maximilian Kaufmann, Senior Portfolio Manager of the Geode Capital Management, LLC, investment management team: For the six months ending August 31, 2017 – the period since our previous annual report – the fund gained 1.72%, trailing the 3.24% return of the benchmark Russell Midcap® Index. Within the mid-cap growth stock universe, the fund’s relatively high exposure to lower-valuation stocks detracted from results. At the same time, growth and momentum were desirable characteristics these past six months, but our generally low exposure to these factors muted the positive impact on the fund. Looking more closely at the portfolio, stock picking in the consumer discretionary sector proved the biggest drag on relative performance this period, with exposure to several brick-and-mortar retailers hurting most. An increasingly competitive business environment weighed on footwear retailer Foot Locker, home products retailer Bed Bath & Beyond and department store Macy’s. The fund was well positioned in the energy sector. Modestly favorable stock picking here added value, along with an underweighting in this lagging category, which was a byproduct of our bottom-up process. That said, because persistently sluggish oil prices hindered the financial results of many energy stocks this period, our relative overweighting in exploration and production company Southwestern Energy detracted from the fund’s performance. On the flip side, our top individual contributor was NVIDIA, a graphics-processing company that produced strong earnings and revenue. As the period progressed, our models continued to like certain aspects of NVIDIA’s business but found the company’s stock less attractively valued. We ultimately sold the fund’s stake in late June. Also contributing was our stake in chicken producer Pilgrim’s Pride, which gained about 44%. For much of the period, our models found the stock attractively valued – albeit somewhat less so over time – while also noting its improving price momentum.The views expressed above reflect those of the portfolio manager(s) only through the end of the period as stated on the cover of this report and do not necessarily represent the views of Fidelity or any other person in the Fidelity organization. Any such views are subject to change at any time based upon market or other conditions and Fidelity disclaims any responsibility to update such views. These views may not be relied on as investment advice and, because investment decisions for a Fidelity fund are based on numerous factors, may not be relied on as an indication of trading intent on behalf of any Fidelity fund.
Fidelity® Mid Cap Enhanced Index Fund
Investment Summary (Unaudited)
Top Ten Stocks as of August 31, 2017
| % of fund's net assets | % of fund's net assets 6 months ago | |
| Prologis, Inc. | 1.1 | 0.2 |
| Lam Research Corp. | 1.0 | 0.8 |
| PPL Corp. | 1.0 | 0.9 |
| Delphi Automotive PLC | 0.9 | 0.5 |
| Synchrony Financial | 0.9 | 1.0 |
| Western Digital Corp. | 0.9 | 0.3 |
| Cummins, Inc. | 0.9 | 0.9 |
| Weyerhaeuser Co. | 0.9 | 0.9 |
| Agilent Technologies, Inc. | 0.8 | 0.7 |
| T. Rowe Price Group, Inc. | 0.8 | 0.8 |
| 9.2 |
Top Market Sectors as of August 31, 2017
| % of fund's net assets | % of fund's net assets 6 months ago | |
| Information Technology | 17.4 | 16.8 |
| Consumer Discretionary | 16.4 | 17.0 |
| Financials | 13.4 | 11.7 |
| Industrials | 12.7 | 12.2 |
| Health Care | 12.1 | 10.5 |
| Real Estate | 7.5 | 7.5 |
| Consumer Staples | 5.8 | 6.4 |
| Materials | 5.3 | 6.2 |
| Utilities | 5.2 | 4.8 |
| Energy | 3.2 | 5.0 |
Asset Allocation (% of fund's net assets)
| As of August 31, 2017* | ||
| Stocks and Equity Futures | 99.9% | |
| Short-Term Investments and Net Other Assets (Liabilities) | 0.1% | |

* Foreign investments - 8.0%
| As of February 28, 2017* | ||
| Stocks and Equity Futures | 99.9% | |
| Short-Term Investments and Net Other Assets (Liabilities) | 0.1% | |

* Foreign investments - 5.3%
Fidelity® Mid Cap Enhanced Index Fund
Investments August 31, 2017
Showing Percentage of Net Assets
| Common Stocks - 99.1% | |||
| Shares | Value | ||
| CONSUMER DISCRETIONARY - 16.4% | |||
| Auto Components - 2.8% | |||
| BorgWarner, Inc. | 153,806 | $7,138,136 | |
| Delphi Automotive PLC | 114,976 | 11,083,686 | |
| Gentex Corp. | 383,010 | 6,997,593 | |
| Lear Corp. | 55,412 | 8,286,310 | |
| 33,505,725 | |||
| Diversified Consumer Services - 0.6% | |||
| H&R Block, Inc. | 239,636 | 6,407,867 | |
| Hotels, Restaurants & Leisure - 1.7% | |||
| Darden Restaurants, Inc. | 48,026 | 3,942,454 | |
| Park Hotels & Resorts, Inc. | 255,638 | 6,822,978 | |
| Royal Caribbean Cruises Ltd. | 78,653 | 9,789,152 | |
| 20,554,584 | |||
| Household Durables - 2.3% | |||
| CalAtlantic Group, Inc. | 92,961 | 3,230,395 | |
| D.R. Horton, Inc. | 234,643 | 8,482,344 | |
| Garmin Ltd. | 20,400 | 1,050,600 | |
| NVR, Inc. (a) | 1,921 | 5,226,753 | |
| PulteGroup, Inc. | 140,787 | 3,635,120 | |
| Toll Brothers, Inc. | 78,406 | 3,054,698 | |
| Whirlpool Corp. | 13,556 | 2,326,481 | |
| 27,006,391 | |||
| Internet & Direct Marketing Retail - 0.6% | |||
| Liberty Interactive Corp. QVC Group Series A (a) | 337,973 | 7,475,963 | |
| Leisure Products - 0.3% | |||
| Hasbro, Inc. | 36,473 | 3,583,472 | |
| Media - 1.4% | |||
| AMC Networks, Inc. Class A (a) | 2,772 | 168,482 | |
| Discovery Communications, Inc.: | |||
| Class A (a)(b) | 268,476 | 5,962,852 | |
| Class C (non-vtg.) (a)(b) | 75,071 | 1,577,242 | |
| Liberty Media Corp. Liberty SiriusXM Series A (a) | 18,934 | 846,350 | |
| Omnicom Group, Inc. (b) | 23,196 | 1,678,926 | |
| Scripps Networks Interactive, Inc. Class A | 1,850 | 158,453 | |
| Tegna, Inc. | 497,853 | 6,282,905 | |
| 16,675,210 | |||
| Multiline Retail - 1.5% | |||
| Dollar Tree, Inc. (a) | 35,608 | 2,835,821 | |
| Kohl's Corp. | 185,806 | 7,391,363 | |
| Macy's, Inc. | 346,400 | 7,194,728 | |
| Target Corp. | 14,636 | 798,101 | |
| 18,220,013 | |||
| Specialty Retail - 4.2% | |||
| Bed Bath & Beyond, Inc. | 208,190 | 5,743,962 | |
| Best Buy Co., Inc. | 150,224 | 8,151,154 | |
| Dick's Sporting Goods, Inc. | 73,859 | 1,946,923 | |
| Foot Locker, Inc. | 187,954 | 6,621,619 | |
| GameStop Corp. Class A | 162,424 | 3,004,844 | |
| Gap, Inc. (b) | 311,602 | 7,360,039 | |
| Ross Stores, Inc. | 167,830 | 9,809,664 | |
| Signet Jewelers Ltd. | 74,805 | 4,717,951 | |
| Williams-Sonoma, Inc. (b) | 39,326 | 1,808,996 | |
| 49,165,152 | |||
| Textiles, Apparel & Luxury Goods - 1.0% | |||
| Carter's, Inc. | 34,803 | 3,017,768 | |
| Michael Kors Holdings Ltd. (a)(b) | 169,155 | 7,141,724 | |
| PVH Corp. | 15,345 | 1,931,782 | |
| 12,091,274 | |||
| TOTAL CONSUMER DISCRETIONARY | 194,685,651 | ||
| CONSUMER STAPLES - 5.8% | |||
| Beverages - 0.3% | |||
| Dr. Pepper Snapple Group, Inc. | 34,079 | 3,102,893 | |
| Food & Staples Retailing - 0.1% | |||
| Kroger Co. | 34,562 | 755,871 | |
| Food Products - 4.8% | |||
| Archer Daniels Midland Co. | 96,343 | 3,980,893 | |
| Bunge Ltd. | 96,483 | 7,200,526 | |
| Campbell Soup Co. (b) | 134,529 | 6,215,240 | |
| ConAgra Foods, Inc. | 250,794 | 8,140,773 | |
| Ingredion, Inc. | 60,877 | 7,537,790 | |
| Pilgrim's Pride Corp. (a)(b) | 211,470 | 6,227,792 | |
| The J.M. Smucker Co. (b) | 75,892 | 7,950,446 | |
| Tyson Foods, Inc. Class A | 147,383 | 9,329,344 | |
| 56,582,804 | |||
| Household Products - 0.4% | |||
| Church & Dwight Co., Inc. | 95,284 | 4,780,398 | |
| Spectrum Brands Holdings, Inc. (b) | 5,330 | 586,087 | |
| 5,366,485 | |||
| Personal Products - 0.2% | |||
| Nu Skin Enterprises, Inc. Class A | 37,384 | 2,274,069 | |
| TOTAL CONSUMER STAPLES | 68,082,122 | ||
| ENERGY - 3.2% | |||
| Energy Equipment & Services - 0.1% | |||
| Baker Hughes, a GE Co. Class A | 30,400 | 1,030,560 | |
| Oil, Gas & Consumable Fuels - 3.1% | |||
| Andeavor | 10,106 | 1,012,116 | |
| Cimarex Energy Co. | 10,125 | 1,009,361 | |
| Devon Energy Corp. | 288,719 | 9,065,777 | |
| Marathon Oil Corp. | 285,077 | 3,170,056 | |
| Marathon Petroleum Corp. | 28,427 | 1,490,996 | |
| Noble Energy, Inc. | 173,990 | 4,135,742 | |
| Southwestern Energy Co. (a) | 1,147,936 | 6,256,251 | |
| The Williams Companies, Inc. | 146,072 | 4,342,721 | |
| Valero Energy Corp. | 88,245 | 6,009,485 | |
| World Fuel Services Corp. | 21,891 | 756,115 | |
| 37,248,620 | |||
| TOTAL ENERGY | 38,279,180 | ||
| FINANCIALS - 13.4% | |||
| Banks - 3.9% | |||
| Associated Banc-Corp. | 3,154 | 69,073 | |
| Citizens Financial Group, Inc. | 266,158 | 8,817,815 | |
| Comerica, Inc. | 60,117 | 4,102,985 | |
| East West Bancorp, Inc. | 72,282 | 4,002,254 | |
| Fifth Third Bancorp | 371,000 | 9,694,230 | |
| KeyCorp | 49,635 | 854,218 | |
| Regions Financial Corp. | 652,647 | 9,208,849 | |
| SunTrust Banks, Inc. | 143,968 | 7,932,637 | |
| TCF Financial Corp. | 127,658 | 1,982,529 | |
| 46,664,590 | |||
| Capital Markets - 2.3% | |||
| Ameriprise Financial, Inc. | 4,716 | 653,213 | |
| BGC Partners, Inc. Class A | 103,722 | 1,347,349 | |
| Federated Investors, Inc. Class B (non-vtg.) (b) | 238,467 | 6,512,534 | |
| Lazard Ltd. Class A | 48,207 | 2,067,598 | |
| LPL Financial | 39,530 | 1,851,585 | |
| Morningstar, Inc. | 41,138 | 3,402,113 | |
| MSCI, Inc. | 3,813 | 437,008 | |
| Raymond James Financial, Inc. | 8,191 | 641,519 | |
| T. Rowe Price Group, Inc. | 118,168 | 9,968,652 | |
| 26,881,571 | |||
| Consumer Finance - 2.2% | |||
| Discover Financial Services | 165,894 | 9,779,451 | |
| Navient Corp. | 418,636 | 5,525,995 | |
| Synchrony Financial | 353,500 | 10,884,265 | |
| 26,189,711 | |||
| Diversified Financial Services - 0.7% | |||
| Donnelley Financial Solutions, Inc. | 40,159 | 859,804 | |
| Leucadia National Corp. | 302,110 | 7,153,965 | |
| 8,013,769 | |||
| Insurance - 1.9% | |||
| American International Group, Inc. warrants 1/19/21 (a) | 574 | 10,533 | |
| Assured Guaranty Ltd. | 75,072 | 3,193,563 | |
| CNA Financial Corp. | 4,957 | 243,190 | |
| Everest Re Group Ltd. | 24,268 | 6,127,185 | |
| First American Financial Corp. | 15,190 | 745,221 | |
| FNF Group | 51,223 | 2,470,998 | |
| Lincoln National Corp. | 43,864 | 2,976,611 | |
| Loews Corp. | 4,691 | 218,507 | |
| Old Republic International Corp. | 87,747 | 1,675,090 | |
| Progressive Corp. | 12,703 | 590,435 | |
| Unum Group | 79,535 | 3,831,996 | |
| 22,083,329 | |||
| Mortgage Real Estate Investment Trusts - 2.4% | |||
| AGNC Investment Corp. | 345,307 | 7,437,913 | |
| Annaly Capital Management, Inc. | 694,200 | 8,677,500 | |
| Chimera Investment Corp. | 318,558 | 6,074,901 | |
| MFA Financial, Inc. | 788,450 | 6,922,591 | |
| 29,112,905 | |||
| TOTAL FINANCIALS | 158,945,875 | ||
| HEALTH CARE - 12.1% | |||
| Biotechnology - 1.0% | |||
| Bioverativ, Inc. | 79,443 | 4,503,624 | |
| United Therapeutics Corp. (a)(b) | 55,557 | 7,266,856 | |
| 11,770,480 | |||
| Health Care Equipment & Supplies - 2.9% | |||
| Baxter International, Inc. | 103,628 | 6,429,081 | |
| C.R. Bard, Inc. | 9,138 | 2,931,562 | |
| Hill-Rom Holdings, Inc. | 10,080 | 775,757 | |
| Hologic, Inc. (a) | 124,844 | 4,818,978 | |
| Masimo Corp. (a) | 68,514 | 5,781,211 | |
| The Cooper Companies, Inc. | 24,163 | 6,060,805 | |
| Varian Medical Systems, Inc. (a)(b) | 75,189 | 7,988,831 | |
| 34,786,225 | |||
| Health Care Providers & Services - 5.3% | |||
| Aetna, Inc. | 17,575 | 2,771,578 | |
| Anthem, Inc. | 32,817 | 6,433,445 | |
| Cardinal Health, Inc. | 55,135 | 3,719,407 | |
| Centene Corp. (a) | 104,222 | 9,260,125 | |
| DaVita HealthCare Partners, Inc. (a) | 22,137 | 1,296,343 | |
| Express Scripts Holding Co. (a) | 97,475 | 6,123,380 | |
| Humana, Inc. | 25,033 | 6,449,001 | |
| Laboratory Corp. of America Holdings (a) | 9,294 | 1,457,950 | |
| McKesson Corp. | 14,207 | 2,121,247 | |
| Quest Diagnostics, Inc. | 76,346 | 8,272,089 | |
| Universal Health Services, Inc. Class B | 65,867 | 7,122,199 | |
| VCA, Inc. (a) | 1,532 | 142,415 | |
| Wellcare Health Plans, Inc. (a) | 42,918 | 7,496,916 | |
| 62,666,095 | |||
| Health Care Technology - 0.5% | |||
| Cerner Corp. (a) | 80,981 | 5,488,892 | |
| Veeva Systems, Inc. Class A (a) | 6,164 | 366,758 | |
| 5,855,650 | |||
| Life Sciences Tools & Services - 1.6% | |||
| Agilent Technologies, Inc. | 156,854 | 10,151,591 | |
| Bruker Corp. | 157,334 | 4,576,846 | |
| Charles River Laboratories International, Inc. (a) | 29,245 | 3,181,856 | |
| PerkinElmer, Inc. | 16,568 | 1,109,890 | |
| 19,020,183 | |||
| Pharmaceuticals - 0.8% | |||
| Mallinckrodt PLC (a) | 72,211 | 2,966,428 | |
| Mylan N.V. (a) | 186,725 | 5,878,103 | |
| 8,844,531 | |||
| TOTAL HEALTH CARE | 142,943,164 | ||
| INDUSTRIALS - 12.7% | |||
| Aerospace & Defense - 1.7% | |||
| Huntington Ingalls Industries, Inc. | 38,017 | 8,134,117 | |
| L3 Technologies, Inc. | 13,689 | 2,484,280 | |
| Northrop Grumman Corp. | 2,429 | 661,198 | |
| Spirit AeroSystems Holdings, Inc. Class A | 109,213 | 8,136,369 | |
| Textron, Inc. | 19,686 | 966,386 | |
| 20,382,350 | |||
| Airlines - 1.6% | |||
| Alaska Air Group, Inc. | 29,208 | 2,180,669 | |
| Copa Holdings SA Class A | 19,753 | 2,450,755 | |
| JetBlue Airways Corp. (a) | 317,261 | 6,284,940 | |
| United Continental Holdings, Inc. (a) | 130,818 | 8,105,483 | |
| 19,021,847 | |||
| Building Products - 0.7% | |||
| Owens Corning | 109,370 | 8,107,598 | |
| Commercial Services & Supplies - 0.6% | |||
| KAR Auction Services, Inc. | 64,065 | 2,888,691 | |
| LSC Communications, Inc. | 99,452 | 1,602,172 | |
| Pitney Bowes, Inc. | 143,909 | 1,849,231 | |
| Republic Services, Inc. | 7,545 | 492,236 | |
| 6,832,330 | |||
| Electrical Equipment - 1.2% | |||
| Fortive Corp. | 25,708 | 1,670,249 | |
| Regal Beloit Corp. | 28,857 | 2,175,818 | |
| Rockwell Automation, Inc. | 59,716 | 9,797,007 | |
| Sensata Technologies Holding BV (a) | 5,527 | 246,836 | |
| 13,889,910 | |||
| Industrial Conglomerates - 0.0% | |||
| ITT, Inc. | 5,437 | 219,437 | |
| Machinery - 4.8% | |||
| AGCO Corp. | 20,229 | 1,384,675 | |
| Allison Transmission Holdings, Inc. | 192,453 | 6,683,893 | |
| Crane Co. | 7,733 | 574,021 | |
| Cummins, Inc. | 67,439 | 10,748,428 | |
| Deere & Co. | 18,681 | 2,165,688 | |
| Donaldson Co., Inc. | 71,152 | 3,361,932 | |
| Graco, Inc. | 4,799 | 554,332 | |
| Ingersoll-Rand PLC | 114,220 | 9,753,246 | |
| Oshkosh Corp. | 20,454 | 1,525,868 | |
| PACCAR, Inc. | 12,664 | 840,003 | |
| Parker Hannifin Corp. | 29,951 | 4,818,816 | |
| Snap-On, Inc. (b) | 25,522 | 3,766,282 | |
| Stanley Black & Decker, Inc. | 42,764 | 6,158,016 | |
| Timken Co. | 37,994 | 1,704,031 | |
| Toro Co. | 41,877 | 2,582,973 | |
| 56,622,204 | |||
| Professional Services - 1.2% | |||
| Manpower, Inc. | 67,318 | 7,506,630 | |
| Robert Half International, Inc. | 156,929 | 7,108,884 | |
| 14,615,514 | |||
| Road & Rail - 0.1% | |||
| Kansas City Southern | 7,193 | 743,972 | |
| Trading Companies & Distributors - 0.8% | |||
| United Rentals, Inc. (a) | 19,406 | 2,291,072 | |
| W.W. Grainger, Inc. (b) | 44,460 | 7,227,862 | |
| 9,518,934 | |||
| TOTAL INDUSTRIALS | 149,954,096 | ||
| INFORMATION TECHNOLOGY - 17.4% | |||
| Communications Equipment - 1.6% | |||
| Arris International PLC (a) | 1,943 | 54,132 | |
| F5 Networks, Inc. (a) | 61,601 | 7,353,927 | |
| Juniper Networks, Inc. | 281,058 | 7,793,738 | |
| Motorola Solutions, Inc. | 37,319 | 3,288,550 | |
| 18,490,347 | |||
| Electronic Equipment & Components - 0.7% | |||
| Amphenol Corp. Class A | 454 | 36,747 | |
| CDW Corp. | 58,846 | 3,732,013 | |
| Corning, Inc. | 19,049 | 547,849 | |
| Dolby Laboratories, Inc. Class A | 33,257 | 1,678,148 | |
| FLIR Systems, Inc. | 53,606 | 2,037,028 | |
| 8,031,785 | |||
| Internet Software & Services - 0.5% | |||
| eBay, Inc. (a) | 171,431 | 6,193,802 | |
| IT Services - 2.4% | |||
| Alliance Data Systems Corp. | 28,968 | 6,532,284 | |
| Amdocs Ltd. | 116,721 | 7,562,354 | |
| Booz Allen Hamilton Holding Corp. Class A | 97,390 | 3,321,973 | |
| Broadridge Financial Solutions, Inc. | 6,720 | 525,034 | |
| CSRA, Inc. | 21,903 | 690,164 | |
| Fidelity National Information Services, Inc. | 29,807 | 2,769,666 | |
| First Data Corp. Class A (a) | 12,722 | 234,212 | |
| Fiserv, Inc. (a) | 5,259 | 650,591 | |
| The Western Union Co. | 187,040 | 3,538,797 | |
| Total System Services, Inc. | 43,139 | 2,981,768 | |
| 28,806,843 | |||
| Semiconductors & Semiconductor Equipment - 5.5% | |||
| Applied Materials, Inc. | 134,220 | 6,056,006 | |
| KLA-Tencor Corp. | 94,620 | 8,864,948 | |
| Lam Research Corp. | 67,735 | 11,242,655 | |
| Marvell Technology Group Ltd. | 432,230 | 7,741,239 | |
| Maxim Integrated Products, Inc. | 183,877 | 8,579,701 | |
| Microchip Technology, Inc. (b) | 8,635 | 749,518 | |
| Micron Technology, Inc. (a) | 110,172 | 3,522,199 | |
| Microsemi Corp. (a) | 5,154 | 259,659 | |
| ON Semiconductor Corp. (a) | 155,629 | 2,658,143 | |
| Skyworks Solutions, Inc. | 92,378 | 9,732,946 | |
| Xilinx, Inc. | 82,544 | 5,452,857 | |
| 64,859,871 | |||
| Software - 3.8% | |||
| CA Technologies, Inc. | 237,204 | 7,870,429 | |
| Cadence Design Systems, Inc. (a) | 216,201 | 8,494,537 | |
| CDK Global, Inc. | 47,546 | 3,066,717 | |
| Citrix Systems, Inc. (a) | 103,244 | 8,074,713 | |
| Electronic Arts, Inc. (a) | 17,924 | 2,177,766 | |
| Intuit, Inc. | 10,090 | 1,427,231 | |
| Red Hat, Inc. (a) | 51,993 | 5,589,248 | |
| Synopsys, Inc. (a) | 107,074 | 8,610,891 | |
| 45,311,532 | |||
| Technology Hardware, Storage & Peripherals - 2.9% | |||
| HP, Inc. | 329,044 | 6,278,160 | |
| NCR Corp. (a) | 46,604 | 1,702,444 | |
| NetApp, Inc. | 199,689 | 7,719,977 | |
| Western Digital Corp. | 122,638 | 10,825,256 | |
| Xerox Corp. | 238,910 | 7,709,626 | |
| 34,235,463 | |||
| TOTAL INFORMATION TECHNOLOGY | 205,929,643 | ||
| MATERIALS - 5.3% | |||
| Chemicals - 2.1% | |||
| Ashland Global Holdings, Inc. | 1,427 | 88,545 | |
| Cabot Corp. | 74,549 | 3,927,241 | |
| Celanese Corp. Class A | 46,980 | 4,558,000 | |
| Eastman Chemical Co. | 101,245 | 8,727,319 | |
| LyondellBasell Industries NV Class A | 67,083 | 6,077,049 | |
| The Chemours Co. LLC | 33,746 | 1,655,916 | |
| 25,034,070 | |||
| Containers & Packaging - 0.6% | |||
| Avery Dennison Corp. | 14,861 | 1,400,798 | |
| Bemis Co., Inc. | 7,053 | 300,528 | |
| Owens-Illinois, Inc. (a) | 9,504 | 234,179 | |
| Packaging Corp. of America | 41,107 | 4,620,838 | |
| WestRock Co. | 8,794 | 500,467 | |
| 7,056,810 | |||
| Metals & Mining - 2.5% | |||
| Alcoa Corp. | 39,013 | 1,711,890 | |
| Freeport-McMoRan, Inc. (a) | 336,369 | 4,971,534 | |
| Nucor Corp. | 163,791 | 9,026,522 | |
| Reliance Steel & Aluminum Co. | 86,188 | 6,241,735 | |
| Steel Dynamics, Inc. | 212,288 | 7,313,322 | |
| Tahoe Resources, Inc. | 20,466 | 97,680 | |
| 29,362,683 | |||
| Paper & Forest Products - 0.1% | |||
| Domtar Corp. | 2,951 | 119,338 | |
| Louisiana-Pacific Corp. (a) | 57,712 | 1,470,502 | |
| 1,589,840 | |||
| TOTAL MATERIALS | 63,043,403 | ||
| REAL ESTATE - 7.5% | |||
| Equity Real Estate Investment Trusts (REITs) - 7.3% | |||
| Apple Hospitality (REIT), Inc. | 8,619 | 156,693 | |
| Brixmor Property Group, Inc. | 372,915 | 6,980,969 | |
| Camden Property Trust (SBI) | 49,062 | 4,390,068 | |
| Corrections Corp. of America | 245,648 | 6,583,366 | |
| Equity Lifestyle Properties, Inc. | 68,007 | 6,062,824 | |
| Essex Property Trust, Inc. | 1,031 | 274,215 | |
| Gaming & Leisure Properties | 11,264 | 441,436 | |
| HCP, Inc. | 9,131 | 272,195 | |
| Hospitality Properties Trust (SBI) | 181,906 | 4,976,948 | |
| Host Hotels & Resorts, Inc. | 459,700 | 8,329,764 | |
| Lamar Advertising Co. Class A (b) | 60,941 | 4,056,233 | |
| Liberty Property Trust (SBI) | 118,422 | 5,044,777 | |
| Omega Healthcare Investors, Inc. (b) | 197,638 | 6,298,723 | |
| Outfront Media, Inc. | 67,884 | 1,493,448 | |
| Prologis, Inc. | 195,540 | 12,389,414 | |
| Quality Care Properties, Inc. | 102,346 | 1,404,187 | |
| Senior Housing Properties Trust (SBI) | 152,491 | 3,007,123 | |
| Ventas, Inc. | 31,119 | 2,129,784 | |
| Welltower, Inc. | 24,691 | 1,807,875 | |
| Weyerhaeuser Co. | 316,836 | 10,332,022 | |
| WP Carey, Inc. | 4,850 | 333,923 | |
| 86,765,987 | |||
| Real Estate Management & Development - 0.2% | |||
| CBRE Group, Inc. (a) | 6,673 | 240,762 | |
| Realogy Holdings Corp. | 51,007 | 1,729,137 | |
| 1,969,899 | |||
| TOTAL REAL ESTATE | 88,735,886 | ||
| TELECOMMUNICATION SERVICES - 0.1% | |||
| Diversified Telecommunication Services - 0.1% | |||
| Level 3 Communications, Inc. (a) | 29,973 | 1,631,430 | |
| UTILITIES - 5.2% | |||
| Electric Utilities - 2.4% | |||
| Edison International | 1,927 | 154,507 | |
| Entergy Corp. | 38,863 | 3,076,784 | |
| Eversource Energy | 71,292 | 4,491,396 | |
| FirstEnergy Corp. | 263,277 | 8,577,565 | |
| PPL Corp. | 283,108 | 11,109,158 | |
| Westar Energy, Inc. | 2,006 | 102,928 | |
| Xcel Energy, Inc. | 3,713 | 183,794 | |
| 27,696,132 | |||
| Gas Utilities - 0.8% | |||
| National Fuel Gas Co. | 28,292 | 1,640,370 | |
| UGI Corp. | 152,506 | 7,535,321 | |
| 9,175,691 | |||
| Independent Power and Renewable Electricity Producers - 0.2% | |||
| The AES Corp. | 225,785 | 2,492,666 | |
| Multi-Utilities - 1.8% | |||
| CenterPoint Energy, Inc. | 179,052 | 5,303,520 | |
| DTE Energy Co. | 23,978 | 2,693,209 | |
| MDU Resources Group, Inc. | 149,532 | 4,043,345 | |
| Public Service Enterprise Group, Inc. | 126,168 | 5,909,709 | |
| SCANA Corp. | 6,178 | 373,028 | |
| Vectren Corp. | 3,898 | 255,748 | |
| WEC Energy Group, Inc. | 46,256 | 3,016,816 | |
| 21,595,375 | |||
| TOTAL UTILITIES | 60,959,864 | ||
| TOTAL COMMON STOCKS | |||
| (Cost $1,070,378,648) | 1,173,190,314 | ||
| Principal Amount | Value | ||
| U.S. Treasury Obligations - 0.1% | |||
| U.S. Treasury Bills, yield at date of purchase 1.18% 6/21/18 (c) | |||
| (Cost $1,188,573) | 1,200,000 | 1,188,634 | |
| Shares | Value | ||
| Money Market Funds - 6.8% | |||
| Fidelity Cash Central Fund, 1.11% (d) | 9,365,653 | $9,367,526 | |
| Fidelity Securities Lending Cash Central Fund 1.11% (d)(e) | 71,690,484 | 71,697,654 | |
| TOTAL MONEY MARKET FUNDS | |||
| (Cost $81,058,136) | 81,065,180 | ||
| TOTAL INVESTMENT IN SECURITIES - 106.0% | |||
| (Cost $1,152,625,357) | 1,255,444,128 | ||
| NET OTHER ASSETS (LIABILITIES) - (6.0)% | (71,583,216) | ||
| NET ASSETS - 100% | $1,183,860,912 |
| Futures Contracts | |||||
| Number of contracts | Expiration Date | Notional amount | Value | Unrealized Appreciation/(Depreciation) | |
| Purchased | |||||
| Equity Index Contracts | |||||
| CME E-mini S&P MidCap 400 Index Contracts (United States) | 58 | Sept. 2017 | $10,036,320 | $112,947 | $112,947 |
The notional amount of futures purchased as a percentage of Net Assets is 0.8%
Legend
(a) Non-income producing
(b) Security or a portion of the security is on loan at period end.
(c) Security or a portion of the security was pledged to cover margin requirements for futures contracts. At period end, the value of securities pledged amounted to $421,965.
(d) Affiliated fund that is generally available only to investment companies and other accounts managed by Fidelity Investments. The rate quoted is the annualized seven-day yield of the fund at period end. A complete unaudited listing of the fund's holdings as of its most recent quarter end is available upon request. In addition, each Fidelity Central Fund's financial statements, which are not covered by the Fund's Report of Independent Registered Public Accounting Firm, are available on the SEC's website or upon request.
(e) Investment made with cash collateral received from securities on loan.
Affiliated Central Funds
Information regarding fiscal year to date income earned by the Fund from investments in Fidelity Central Funds is as follows:
| Fund | Six months ended August 31, 2017 | Year ended February 28, 2017 |
| Fidelity Cash Central Fund | $48,468 | $34,345 |
| Fidelity Securities Lending Cash Central Fund | 38,693 | 213,374 |
| Total | $87,161 | $247,719 |
Investment Valuation
The following is a summary of the inputs used, as of August 31, 2017, involving the Fund's assets and liabilities carried at fair value. The inputs or methodology used for valuing securities may not be an indication of the risk associated with investing in those securities. For more information on valuation inputs, and their aggregation into the levels used below, please refer to the Investment Valuation section in the accompanying Notes to Financial Statements.
| Valuation Inputs at Reporting Date: | ||||
| Description | Total | Level 1 | Level 2 | Level 3 |
| Investments in Securities: | ||||
| Equities: | ||||
| Consumer Discretionary | $194,685,651 | $194,685,651 | $-- | $-- |
| Consumer Staples | 68,082,122 | 68,082,122 | -- | -- |
| Energy | 38,279,180 | 38,279,180 | -- | -- |
| Financials | 158,945,875 | 158,945,875 | -- | -- |
| Health Care | 142,943,164 | 142,943,164 | -- | -- |
| Industrials | 149,954,096 | 149,954,096 | -- | -- |
| Information Technology | 205,929,643 | 205,929,643 | -- | -- |
| Materials | 63,043,403 | 63,043,403 | -- | -- |
| Real Estate | 88,735,886 | 88,735,886 | -- | -- |
| Telecommunication Services | 1,631,430 | 1,631,430 | -- | -- |
| Utilities | 60,959,864 | 60,959,864 | -- | -- |
| U.S. Government and Government Agency Obligations | 1,188,634 | -- | 1,188,634 | -- |
| Money Market Funds | 81,065,180 | 81,065,180 | -- | -- |
| Total Investments in Securities: | $1,255,444,128 | $1,254,255,494 | $1,188,634 | $-- |
| Derivative Instruments: | ||||
| Assets | ||||
| Futures Contracts | $112,947 | $112,947 | $-- | $-- |
| Total Assets | $112,947 | $112,947 | $-- | $-- |
| Total Derivative Instruments: | $112,947 | $112,947 | $-- | $-- |
Value of Derivative Instruments
The following table is a summary of the Fund's value of derivative instruments by primary risk exposure as of August 31, 2017. For additional information on derivative instruments, please refer to the Derivative Instruments section in the accompanying Notes to Financial Statements.
| Primary Risk Exposure / Derivative Type | Value | |
| Asset | Liability | |
| Equity Risk | ||
| Futures Contracts(a) | $112,947 | $0 |
| Total Equity Risk | 112,947 | 0 |
| Total Value of Derivatives | $112,947 | $0 |
(a) Reflects gross cumulative appreciation (depreciation) on futures contracts as presented in the Schedule of Investments. In the Statement of Assets and Liabilities, the period end daily variation margin is included in receivable or payable for daily variation margin on futures contracts, and the net cumulative appreciation (depreciation) is included in net unrealized appreciation (depreciation).
See accompanying notes which are an integral part of the financial statements.
Fidelity® Mid Cap Enhanced Index Fund
Financial Statements
Statement of Assets and Liabilities
| August 31, 2017 | ||
| Assets | ||
| Investment in securities, at value (including securities loaned of $70,075,887) — See accompanying schedule: Unaffiliated issuers (cost $1,071,567,221) | $1,174,378,948 | |
| Fidelity Central Funds (cost $81,058,136) | 81,065,180 | |
| Total Investment in Securities (cost $1,152,625,357) | $1,255,444,128 | |
| Cash | 323,584 | |
| Receivable for investments sold | 15,816,475 | |
| Receivable for fund shares sold | 865,664 | |
| Dividends receivable | 1,639,243 | |
| Distributions receivable from Fidelity Central Funds | 17,295 | |
| Receivable for daily variation margin for on futures contracts | 91,543 | |
| Total assets | 1,274,197,932 | |
| Liabilities | ||
| Payable for investments purchased | $16,795,307 | |
| Payable for fund shares redeemed | 1,282,545 | |
| Accrued management fee | 581,258 | |
| Collateral on securities loaned | 71,677,910 | |
| Total liabilities | 90,337,020 | |
| Net Assets | $1,183,860,912 | |
| Net Assets consist of: | ||
| Paid in capital | $1,028,727,680 | |
| Undistributed net investment income | 9,061,191 | |
| Accumulated undistributed net realized gain (loss) on investments and foreign currency transactions | 43,140,479 | |
| Net unrealized appreciation (depreciation) on investments and assets and liabilities in foreign currencies | 102,931,562 | |
| Net Assets, for 79,305,224 shares outstanding | $1,183,860,912 | |
| Net Asset Value, offering price and redemption price per share ($1,183,860,912 ÷ 79,305,224 shares) | $14.93 |
See accompanying notes which are an integral part of the financial statements.
Statement of Operations
| Six months ended August 31, 2017 | Year ended February 28, 2017 | |
| Investment Income | ||
| Dividends | $12,985,123 | $20,541,971 |
| Interest | 3,617 | 23,488 |
| Income from Fidelity Central Funds (including $38,693 and $213,374, respectively, from security lending) | 87,161 | 247,719 |
| Total income | 13,075,901 | 20,813,178 |
| Expenses | ||
| Management fee | $3,347,684 | $4,408,062 |
| Transfer agent fees | 146,740 | 1,470,706 |
| Independent trustees' fees and expenses | 11,472 | 4,153 |
| Miscellaneous | 1,892 | 2,821 |
| Total expenses before reductions | 3,507,788 | 5,885,742 |
| Expense reductions | (641) | (194) |
| Total expenses | 3,507,147 | 5,885,548 |
| Net investment income (loss) | 9,568,754 | 14,927,630 |
| Realized and Unrealized Gain (Loss) | ||
| Net realized gain (loss) on: | ||
| Investment securities: | ||
| Unaffiliated issuers | 49,638,460 | 20,792,140 |
| Fidelity Central Funds | 4,325 | 7,767 |
| Foreign currency transactions | 45 | (22,467) |
| Futures contracts | 256,437 | 3,073,364 |
| Total net realized gain (loss) | 49,899,267 | 23,850,804 |
| Change in net unrealized appreciation (depreciation) on: | ||
| Investment securities: | ||
| Unaffiliated issuers | (39,202,655) | 174,574,859 |
| Fidelity Central Funds | (9,437) | – |
| Assets and liabilities in foreign currencies | (156) | – |
| Futures contracts | (316,963) | 108,038 |
| Total change in net unrealized appreciation (depreciation) | (39,529,211) | 174,682,897 |
| Net gain (loss) | 10,370,056 | 198,533,701 |
| Net increase (decrease) in net assets resulting from operations | $19,938,810 | $213,461,331 |
See accompanying notes which are an integral part of the financial statements.
Statement of Changes in Net Assets
| Six months ended August 31, 2017 | Year ended February 28, 2017 | Year ended February 29, 2016 | |
| Increase (Decrease) in Net Assets | |||
| Operations | |||
| Net investment income (loss) | $9,568,754 | $14,927,630 | $10,379,153 |
| Net realized gain (loss) | 49,899,267 | 23,850,804 | 5,509,202 |
| Change in net unrealized appreciation (depreciation) | (39,529,211) | 174,682,897 | (109,303,196) |
| Net increase (decrease) in net assets resulting from operations | 19,938,810 | 213,461,331 | (93,414,841) |
| Distributions to shareholders from net investment income | (1,441,547) | (13,411,857) | (8,742,049) |
| Distributions to shareholders from net realized gain | (5,846,277) | – | (30,376,224) |
| Total distributions | (7,287,824) | (13,411,857) | (39,118,273) |
| Share transactions | |||
| Proceeds from sales of shares | 127,094,477 | 426,253,089 | 510,890,785 |
| Reinvestment of distributions | 6,841,106 | 12,561,998 | 37,487,590 |
| Cost of shares redeemed | (138,749,134) | (268,090,456) | (219,096,797) |
| Net increase (decrease) in net assets resulting from share transactions | (4,813,551) | 170,724,631 | 329,281,578 |
| Redemption fees | – | 7,663 | 18,422 |
| Total increase (decrease) in net assets | 7,837,435 | 370,781,768 | 196,766,886 |
| Net Assets | |||
| Beginning of period | 1,176,023,477 | 805,241,709 | 608,474,823 |
| End of period | $1,183,860,912 | $1,176,023,477 | $805,241,709 |
| Other Information | |||
| Undistributed net investment income end of period | $9,061,191 | $1,439,172 | $285 |
| Shares | |||
| Sold | 8,574,869 | 31,499,548 | 37,966,163 |
| Issued in reinvestment of distributions | 471,151 | 869,944 | 2,951,931 |
| Redeemed | (9,371,828) | (19,978,229) | (16,655,539) |
| Net increase (decrease) | (325,808) | 12,391,263 | 24,262,555 |
See accompanying notes which are an integral part of the financial statements.
Financial Highlights — Fidelity Mid Cap Enhanced Index Fund
| Year ended August 31, | 2017 A | 2017 B | 2016 C | 2015 B | 2014 B | 2013 B |
| Selected Per–Share Data | ||||||
| Net asset value, beginning of period | $14.77 | $11.98 | $14.16 | $13.60 | $10.97 | $9.79 |
| Income from Investment Operations | ||||||
| Net investment income (loss)D | .12 | .21 | .18 | .15 | .15 | .18 |
| Net realized and unrealized gain (loss) | .13 | 2.76 | (1.70) | 1.73 | 3.17 | 1.30 |
| Total from investment operations | .25 | 2.97 | (1.52) | 1.88 | 3.32 | 1.48 |
| Distributions from net investment income | (.02) | (.18) | (.14) | (.10) | (.12) | (.17) |
| Distributions from net realized gain | (.07) | – | (.51) | (1.22) | (.57) | (.13) |
| Total distributions | (.09) | (.18) | (.66)E | (1.32) | (.69) | (.30) |
| Redemption fees added to paid in capitalD | – | –F | –F | –F | –F | –F |
| Net asset value, end of period | $14.93 | $14.77 | $11.98 | $14.16 | $13.60 | $10.97 |
| Total ReturnG,H | 1.72% | 24.85% | (11.02)% | 15.22% | 30.97% | 15.57% |
| Ratios to Average Net AssetsI,J | ||||||
| Expenses before reductions | .59%K | .60% | .60% | .60% | .60% | .60% |
| Expenses net of fee waivers, if any | .59%K | .60% | .60% | .60% | .60% | .60% |
| Expenses net of all reductions | .59%K | .60% | .60% | .60% | .60% | .60% |
| Net investment income (loss) | 1.62%K | 1.53% | 1.34% | 1.08% | 1.24% | 1.80% |
| Supplemental Data | ||||||
| Net assets, end of period (000 omitted) | $1,183,861 | $1,176,023 | $805,242 | $608,475 | $271,674 | $128,130 |
| Portfolio turnover rateL | 94%K | 87% | 88% | 89% | 128% | 99% |
A For the six month period ended August 31. The Fund changed its fiscal year end from February 28 to August 31, effective August 31, 2017.
B For the year ended February 28.
C For the year ended February 29.
D Calculated based on average shares outstanding during the period.
E Total distributions of $.66 per share is comprised of distributions from net investment income of $.144 and distributions from net realized gain of $.511 per share.
F Amount represents less than $.005 per share.
G Total returns for periods of less than one year are not annualized.
H Total returns would have been lower if certain expenses had not been reduced during the applicable periods shown.
I Fees and expenses of any underlying Fidelity Central Funds are not included in the Fund's expense ratio. The Fund indirectly bears its proportionate share of the expenses of any underlying Fidelity Central Funds.
J Expense ratios reflect operating expenses of the Fund. Expenses before reductions do not reflect amounts reimbursed by the investment adviser or reductions from expense offset arrangements and do not represent the amount paid by the Fund during periods when reimbursements or reductions occur. Expenses net of fee waivers reflect expenses after reimbursement by the investment adviser but prior to reductions from expense offset arrangements. Expenses net of all reductions represent the net expenses paid by the Fund.
K Annualized
L Amount does not include the portfolio activity of any underlying Fidelity Central Funds.
See accompanying notes which are an integral part of the financial statements.
Fidelity® International Enhanced Index Fund
Performance: The Bottom Line
Average annual total return reflects the change in the value of an investment, assuming reinvestment of distributions from dividend income and capital gains (the profits earned upon the sale of securities that have grown in value, if any) and assuming a constant rate of performance each year. The hypothetical investment and the average annual total returns do not reflect the deduction of taxes that a shareholder would pay on fund distributions or the redemption of fund shares. During periods of reimbursement by Fidelity, a fund’s total return will be greater than it would be had the reimbursement not occurred. How a fund did yesterday is no guarantee of how it will do tomorrow.
Average Annual Total Returns
| For the periods ended August 31, 2017 | Past 1 year | Past 5 years | Life of fundA |
| Fidelity® International Enhanced Index Fund | 21.58% | 10.18% | 2.03% |
A From December 20, 2007
$10,000 Over Life of Fund
Let's say hypothetically that $10,000 was invested in Fidelity® International Enhanced Index Fund on December 20, 2007, when the fund started.
The chart shows how the value of your investment would have changed, and also shows how the MSCI EAFE Index performed over the same period.
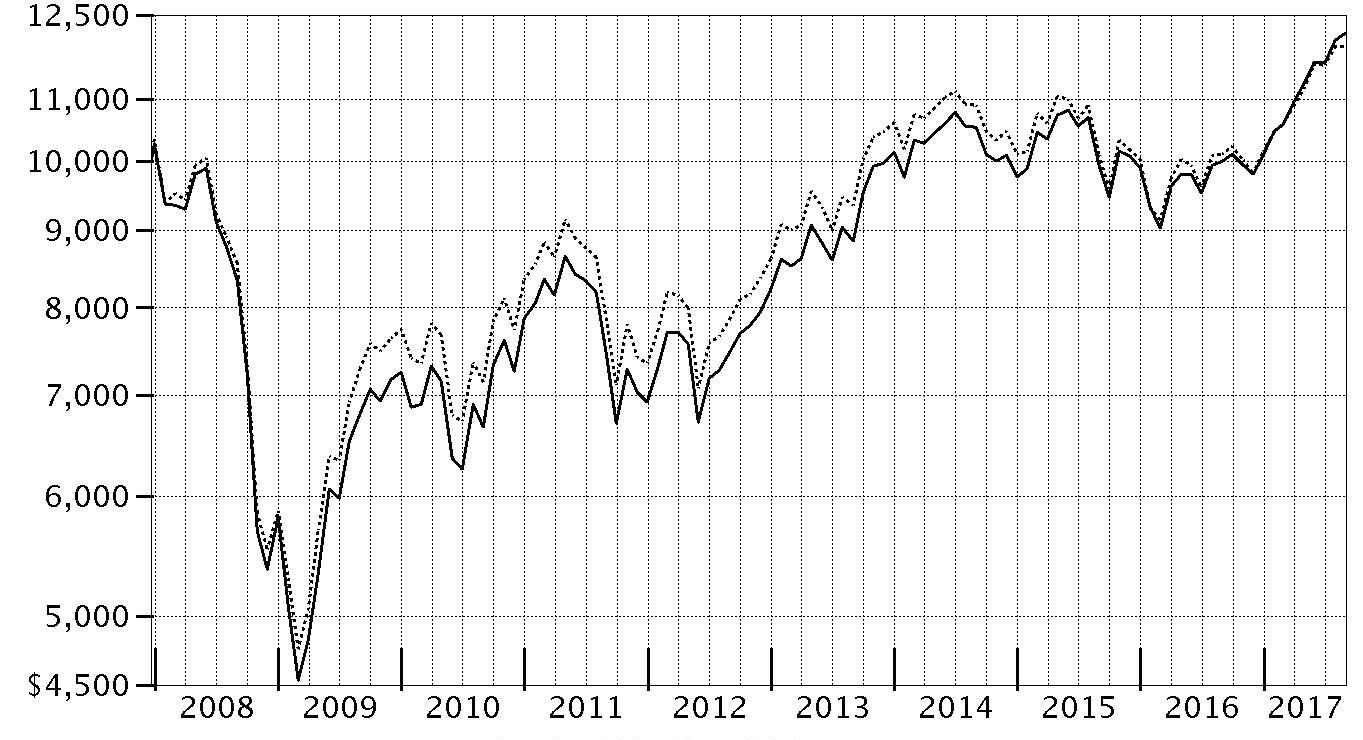
| Period Ending Values | ||
| $12,150 | Fidelity® International Enhanced Index Fund | |
| $11,909 | MSCI EAFE Index | |
Fidelity® International Enhanced Index Fund
Management's Discussion of Fund Performance
Market Recap: For the six months ending August 31, 2017, synchronized global economic expansion lent support to equities, while mostly flagging commodity prices helped mitigate concern about potential overheating. Assisted by a generally weaker U.S. dollar, international equities spearhead the global market rally. In this environment, the MSCI ACWI (All Country World Index) ex USA Index returned 13.19% for the period, well ahead of U.S. counterparts. Favorable election results in France and elsewhere suggested ebbing political uncertainty and near-term risk in the eurozone; Europe (+18%) far outpaced the U.K. (+8%), which faced more-mixed conditions ahead of its expected exit from the European Union. Among other factors, “saber rattling” from North Korea bolstered the “safe haven” yen, which resulted in export-heavy Japan (+7%) lagging the rest of the Asia-Pacific group (+12%). Commodity-price sluggishness slowed resource-rich Canada (+6%), but the emerging-markets group (+17%) sped ahead. Among sectors, information technology (+27%) fared best atop a surge led by major Chinese internet names, with utilities (+17%) a distant second. Bottom-performing energy (+5%) at least got its head back above water, with health care (+8%) and telecom services (+11%) the next-closest laggards. The remaining sectors were clustered closer to the index return.Comments from Maximilian Kaufmann, Senior Portfolio Manager of the Geode Capital Management, LLC, investment management team: For the six months ending August 31, 2017 – the period since our previous annual report – the fund gained 14.74%, significantly outpacing the 12.32% return of the benchmark MSCI EAFE Index. During the period, international equities significantly outpaced their U.S. counterparts, lifted by various factors, including more optimism about the influential Chinese economy, less concern about political risks in Europe and continued supportive monetary policy from global central banks. A generally weaker U.S. dollar also boosted returns for U.S. investors in international stocks. Unlike in the U.S., where low-valuation stocks significantly lagged their growth- and momentum-oriented counterparts this period, investors in international stocks encountered much more uniformly positive conditions. Value-oriented stocks fared particularly well, especially in Japan, but growth and momentum factors also were popular with investors. Exposure to all these factors – especially valuation – were positives for the fund. Our stock picking, which derives from our quantitative investment approach, was strongest in the U.K. and Japan. In the latter, the fund benefited from its investment in semiconductor-equipment company Tokyo Electron, which in May reported healthy earnings. Japanese civil engineering company Taisei also contributed to results. Despite the fund’s overall strength in Japan, it was also the source of several notable relative detractors, including manufacturing company JTEKT and automobile maker Honda Motor. Lack of exposure to video game company Nintendo, a strong-performing benchmark component that our models disfavored, also hampered relative results. Among U.K.-listed stocks, the fund benefited from its position in homebuilder Persimmon and a lack of exposure to Ireland-based biotechnology company and benchmark component Shire, whose shares returned -18%. Our top individual contributor was German aviation company Lufthansa, which, at the recommendation of our models, we increased exposure to over the course of the period. China-based Yangzijiang Shipbuilding was another meaningful contributor, while a position in Coca-Cola Amatil hurt results.The views expressed above reflect those of the portfolio manager(s) only through the end of the period as stated on the cover of this report and do not necessarily represent the views of Fidelity or any other person in the Fidelity organization. Any such views are subject to change at any time based upon market or other conditions and Fidelity disclaims any responsibility to update such views. These views may not be relied on as investment advice and, because investment decisions for a Fidelity fund are based on numerous factors, may not be relied on as an indication of trading intent on behalf of any Fidelity fund.
Fidelity® International Enhanced Index Fund
Investment Summary (Unaudited)
Geographic Diversification (% of fund's net assets)
| As of August 31, 2017 | ||
| Japan | 23.4% | |
| United Kingdom | 16.1% | |
| France | 9.0% | |
| Germany | 8.6% | |
| Switzerland | 7.6% | |
| Australia | 6.1% | |
| Netherlands | 5.5% | |
| United States of America* | 4.0% | |
| Spain | 3.8% | |
| Other | 15.9% | |

* Includes Short-Term investments and Net Other Assets (Liabilities).
| As of February 28, 2017 | ||
| Japan | 23.2% | |
| United Kingdom | 15.8% | |
| France | 9.6% | |
| Switzerland | 8.9% | |
| Germany | 8.2% | |
| Australia | 7.0% | |
| United States of America* | 4.3% | |
| Netherlands | 4.3% | |
| Spain | 3.2% | |
| Other | 15.5% | |
* Includes Short-Term investments and Net Other Assets (Liabilities).
Percentages are based on country or territory of incorporation and include the effect of futures contracts, if applicable.
Asset Allocation as of August 31, 2017
| % of fund's net assets | % of fund's net assets 6 months ago | |
| Stocks and Equity Futures | 100.0 | 99.8 |
| Short-Term Investments and Net Other Assets (Liabilities) | 0.0 | 0.2 |
Top Ten Stocks as of August 31, 2017
| % of fund's net assets | % of fund's net assets 6 months ago | |
| Nestle SA (Reg. S) (Switzerland, Food Products) | 1.9 | 2.2 |
| Novartis AG (Switzerland, Pharmaceuticals) | 1.8 | 1.5 |
| Roche Holding AG (participation certificate) (Switzerland, Pharmaceuticals) | 1.7 | 1.8 |
| Total SA (France, Oil, Gas & Consumable Fuels) | 1.3 | 0.8 |
| Sanofi SA (France, Pharmaceuticals) | 1.3 | 1.1 |
| GlaxoSmithKline PLC sponsored ADR (United Kingdom, Pharmaceuticals) | 1.2 | 0.9 |
| Allianz SE (Germany, Insurance) | 1.1 | 0.7 |
| Unilever NV (Certificaten Van Aandelen) (Bearer) (Netherlands, Personal Products) | 1.1 | 1.0 |
| Commonwealth Bank of Australia (Australia, Banks) | 1.1 | 1.3 |
| BASF AG (Germany, Chemicals) | 1.1 | 0.5 |
| 13.6 |
Top Market Sectors as of August 31, 2017
| % of fund's net assets | % of fund's net assets 6 months ago | |
| Financials | 20.3 | 18.7 |
| Industrials | 13.7 | 13.3 |
| Consumer Discretionary | 13.2 | 13.6 |
| Health Care | 10.2 | 11.2 |
| Consumer Staples | 9.2 | 10.1 |
| Materials | 9.2 | 9.2 |
| Information Technology | 6.3 | 5.6 |
| Telecommunication Services | 5.6 | 4.0 |
| Real Estate | 3.4 | 4.1 |
| Energy | 2.8 | 3.4 |
Percentages shown as 0.0% may reflect amounts less than 0.05%.
Fidelity® International Enhanced Index Fund
Investments August 31, 2017
Showing Percentage of Net Assets
| Common Stocks - 96.0% | |||
| Shares | Value | ||
| Australia - 6.1% | |||
| Aristocrat Leisure Ltd. | 71,439 | $1,202,253 | |
| Australia & New Zealand Banking Group Ltd. | 48,948 | 1,143,990 | |
| BHP Billiton Ltd. | 119,826 | 2,608,512 | |
| Cimic Group Ltd. | 4,606 | 153,968 | |
| Coca-Cola Amatil Ltd. | 217,351 | 1,390,905 | |
| Commonwealth Bank of Australia | 107,504 | 6,477,891 | |
| Computershare Ltd. | 20,242 | 226,084 | |
| Fortescue Metals Group Ltd. | 648,306 | 3,097,379 | |
| Harvey Norman Holdings Ltd. (a) | 14,849 | 48,161 | |
| Macquarie Group Ltd. | 40,128 | 2,768,899 | |
| Mirvac Group unit | 178,987 | 330,103 | |
| National Australia Bank Ltd. | 199,253 | 4,783,564 | |
| Qantas Airways Ltd. | 88,336 | 401,674 | |
| Rio Tinto Ltd. | 70,192 | 3,785,413 | |
| South32 Ltd. | 141,140 | 327,622 | |
| Stockland Corp. Ltd. unit | 92,611 | 326,142 | |
| Telstra Corp. Ltd. | 214,745 | 626,511 | |
| Wesfarmers Ltd. | 124,960 | 4,233,741 | |
| Westpac Banking Corp. | 24,665 | 613,851 | |
| Woolworths Ltd. | 24,897 | 514,589 | |
| TOTAL AUSTRALIA | 35,061,252 | ||
| Austria - 0.1% | |||
| OMV AG | 8,812 | 506,574 | |
| Bailiwick of Jersey - 0.4% | |||
| Glencore Xstrata PLC | 295,329 | 1,372,894 | |
| WPP PLC | 67,526 | 1,231,479 | |
| TOTAL BAILIWICK OF JERSEY | 2,604,373 | ||
| Belgium - 0.6% | |||
| Ageas | 29,778 | 1,382,874 | |
| Anheuser-Busch InBev SA NV | 6,379 | 755,471 | |
| UCB SA | 15,639 | 1,077,764 | |
| TOTAL BELGIUM | 3,216,109 | ||
| Bermuda - 0.4% | |||
| Hongkong Land Holdings Ltd. | 49,000 | 363,090 | |
| Kerry Properties Ltd. | 439,000 | 1,739,003 | |
| TOTAL BERMUDA | 2,102,093 | ||
| Cayman Islands - 2.3% | |||
| Cheung Kong Property Holdings Ltd. | 422,000 | 3,704,616 | |
| CK Hutchison Holdings Ltd. | 283,500 | 3,709,600 | |
| Melco Crown Entertainment Ltd. sponsored ADR | 140,753 | 3,089,528 | |
| WH Group Ltd. | 2,570,000 | 2,686,337 | |
| TOTAL CAYMAN ISLANDS | 13,190,081 | ||
| Denmark - 2.5% | |||
| Danske Bank A/S | 97,927 | 3,805,882 | |
| H Lundbeck A/S | 11,992 | 763,783 | |
| Novo Nordisk A/S Series B | 130,659 | 6,225,878 | |
| Vestas Wind Systems A/S | 36,304 | 3,306,518 | |
| William Demant Holding A/S (b) | 9,472 | 250,622 | |
| TOTAL DENMARK | 14,352,683 | ||
| Finland - 0.6% | |||
| Sampo Oyj (A Shares) | 36,152 | 1,908,267 | |
| Stora Enso Oyj (R Shares) | 7,454 | 97,965 | |
| UPM-Kymmene Corp. | 58,375 | 1,519,106 | |
| TOTAL FINLAND | 3,525,338 | ||
| France - 9.0% | |||
| BNP Paribas SA | 79,659 | 6,060,589 | |
| Bouygues SA | 64,584 | 2,928,897 | |
| Capgemini SA | 12,618 | 1,398,915 | |
| Casino Guichard Perrachon SA | 5,590 | 317,858 | |
| CNP Assurances | 9,616 | 223,224 | |
| Compagnie de St. Gobain | 20,877 | 1,145,103 | |
| Credit Agricole SA | 120,501 | 2,126,802 | |
| ENGIE | 122,531 | 2,045,056 | |
| Eurazeo SA | 16,717 | 1,382,903 | |
| Eutelsat Communications | 5,912 | 171,831 | |
| Klepierre SA | 5,848 | 235,655 | |
| LVMH Moet Hennessy - Louis Vuitton SA | 19,644 | 5,159,883 | |
| Natixis SA | 124,973 | 938,467 | |
| Orange SA (b) | 191,870 | 3,257,692 | |
| Peugeot Citroen SA | 148,122 | 3,127,245 | |
| Renault SA | 37,754 | 3,341,605 | |
| Safran SA | 539 | 52,352 | |
| Sanofi SA | 73,793 | 7,194,843 | |
| Societe Generale Series A | 21,165 | 1,184,011 | |
| Total SA | 145,439 | 7,546,444 | |
| Unibail-Rodamco | 7,827 | 1,989,785 | |
| Valeo SA | 3,720 | 248,792 | |
| TOTAL FRANCE | 52,077,952 | ||
| Germany - 8.6% | |||
| Allianz SE | 30,634 | 6,565,672 | |
| BASF AG | 64,679 | 6,265,255 | |
| Bayer AG | 48,519 | 6,209,140 | |
| Bayerische Motoren Werke AG (BMW) | 19,888 | 1,846,702 | |
| Continental AG | 11,476 | 2,589,557 | |
| Covestro AG | 39,137 | 3,075,448 | |
| Daimler AG (Germany) | 56,877 | 4,145,836 | |
| Deutsche Borse AG | 10,832 | 1,157,838 | |
| Deutsche Lufthansa AG | 119,931 | 3,008,203 | |
| Hannover Reuck SE | 2,119 | 256,797 | |
| Hochtief AG | 3,657 | 644,532 | |
| Hugo Boss AG | 11,620 | 983,667 | |
| Infineon Technologies AG | 3,871 | 89,397 | |
| Innogy SE | 28,604 | 1,260,762 | |
| Linde AG | 4,450 | 854,424 | |
| Metro AG | 36,076 | 395,195 | |
| Metro Wholesale & Food Specialist AG | 78,776 | 1,539,849 | |
| Muenchener Rueckversicherungs AG | 19,345 | 3,993,273 | |
| SAP SE | 12,411 | 1,302,557 | |
| Siemens AG | 26,268 | 3,438,718 | |
| TOTAL GERMANY | 49,622,822 | ||
| Hong Kong - 1.9% | |||
| AIA Group Ltd. | 104,200 | 799,567 | |
| Henderson Land Development Co. Ltd. | 401,760 | 2,489,903 | |
| i-CABLE Communications Ltd. (b) | 195,559 | 7,247 | |
| New World Development Co. Ltd. | 87,816 | 120,069 | |
| Sun Hung Kai Properties Ltd. | 231,000 | 3,855,043 | |
| Wharf Holdings Ltd. | 187,000 | 1,781,408 | |
| Wheelock and Co. Ltd. | 266,000 | 1,990,135 | |
| TOTAL HONG KONG | 11,043,372 | ||
| Isle of Man - 0.3% | |||
| Genting Singapore PLC | 1,848,300 | 1,615,277 | |
| Israel - 0.4% | |||
| Check Point Software Technologies Ltd. (a)(b) | 20,977 | 2,346,697 | |
| Italy - 0.7% | |||
| Assicurazioni Generali SpA | 18,767 | 336,011 | |
| Telecom Italia SpA (b) | 2,700,764 | 2,591,628 | |
| Terna SpA | 201,299 | 1,188,597 | |
| Unipolsai SpA | 102,093 | 231,770 | |
| TOTAL ITALY | 4,348,006 | ||
| Japan - 23.4% | |||
| Aisin Seiki Co. Ltd. | 18,200 | 915,505 | |
| All Nippon Airways Ltd. | 223,000 | 827,211 | |
| Asahi Glass Co. Ltd. | 56,600 | 2,208,705 | |
| Asahi Kasei Corp. | 51,000 | 610,970 | |
| Astellas Pharma, Inc. | 282,700 | 3,570,889 | |
| Bridgestone Corp. | 89,300 | 3,833,235 | |
| Brother Industries Ltd. | 95,600 | 2,266,190 | |
| Canon, Inc. | 22,200 | 778,149 | |
| Central Japan Railway Co. | 10,600 | 1,796,316 | |
| Fujifilm Holdings Corp. | 86,800 | 3,412,467 | |
| Fujitsu Ltd. | 395,000 | 2,928,681 | |
| Hitachi High-Technologies Corp. | 33,500 | 1,196,048 | |
| Hitachi Ltd. | 606,000 | 4,172,848 | |
| Honda Motor Co. Ltd. | 166,900 | 4,674,874 | |
| Hoya Corp. | 61,600 | 3,527,284 | |
| Itochu Corp. | 225,700 | 3,687,244 | |
| Japan Post Bank Co. Ltd. | 63,700 | 811,207 | |
| JTEKT Corp. | 91,900 | 1,229,680 | |
| Kajima Corp. | 333,000 | 3,056,324 | |
| Kansai Electric Power Co., Inc. | 163,700 | 2,293,155 | |
| Kao Corp. | 15,800 | 986,215 | |
| KDDI Corp. | 172,800 | 4,661,858 | |
| Kirin Holdings Co. Ltd. | 154,700 | 3,513,063 | |
| Kuraray Co. Ltd. | 14,800 | 281,097 | |
| Kyocera Corp. | 8,700 | 522,309 | |
| Marubeni Corp. | 465,800 | 3,031,185 | |
| Mitsubishi Chemical Holdings Corp. | 361,700 | 3,365,799 | |
| Mitsubishi Corp. | 173,100 | 4,004,911 | |
| Mitsubishi Electric Corp. | 43,700 | 646,745 | |
| Mitsubishi Gas Chemical Co., Inc. | 6,800 | 168,802 | |
| Mitsubishi Tanabe Pharma Corp. | 13,500 | 331,560 | |
| Mitsubishi UFJ Financial Group, Inc. | 212,900 | 1,297,317 | |
| Mitsui & Co. Ltd. | 46,400 | 694,090 | |
| Mitsui Chemicals, Inc. | 497,000 | 2,974,721 | |
| mixi, Inc. | 37,700 | 2,009,569 | |
| Mizuho Financial Group, Inc. | 1,793,600 | 3,077,778 | |
| MS&AD Insurance Group Holdings, Inc. | 98,300 | 3,244,924 | |
| Nexon Co. Ltd. | 69,900 | 1,744,082 | |
| Nippon Electric Glass Co. Ltd. | 12,200 | 463,874 | |
| Nippon Telegraph & Telephone Corp. | 83,200 | 4,142,061 | |
| NKSJ Holdings, Inc. | 39,900 | 1,500,764 | |
| Nomura Holdings, Inc. | 625,100 | 3,478,025 | |
| NTT DOCOMO, Inc. | 155,500 | 3,607,336 | |
| Obayashi Corp. | 253,800 | 2,994,302 | |
| OMRON Corp. | 10,000 | 502,115 | |
| Oracle Corp. Japan | 4,600 | 340,183 | |
| ORIX Corp. | 220,000 | 3,521,081 | |
| Pola Orbis Holdings, Inc. | 43,500 | 1,398,758 | |
| Sega Sammy Holdings, Inc. | 78,100 | 1,122,463 | |
| Sekisui House Ltd. | 14,200 | 245,934 | |
| SHIMIZU Corp. | 190,900 | 1,972,642 | |
| Shionogi & Co. Ltd. | 23,000 | 1,212,398 | |
| Sumitomo Chemical Co. Ltd. | 310,000 | 1,858,280 | |
| Sumitomo Corp. | 243,200 | 3,443,315 | |
| Sumitomo Mitsui Financial Group, Inc. | 44,300 | 1,649,435 | |
| Sumitomo Rubber Industries Ltd. | 22,000 | 364,816 | |
| Suntory Beverage & Food Ltd. | 16,800 | 776,313 | |
| Suzuki Motor Corp. | 54,800 | 2,754,580 | |
| Taisei Corp. | 317,000 | 3,180,525 | |
| Tokyo Electron Ltd. | 26,200 | 3,684,468 | |
| Toppan Printing Co. Ltd. | 40,000 | 400,600 | |
| Tosoh Corp. | 239,000 | 2,804,475 | |
| Toyota Motor Corp. | 54,200 | 3,051,687 | |
| TOTAL JAPAN | 134,823,437 | ||
| Luxembourg - 0.6% | |||
| ArcelorMittal SA (Netherlands) (b) | 130,163 | 3,477,135 | |
| Netherlands - 5.5% | |||
| ABN AMRO Group NV GDR | 19,195 | 537,905 | |
| EXOR NV | 32,981 | 2,116,234 | |
| Ferrari NV | 11,183 | 1,279,360 | |
| Fiat Chrysler Automobiles NV (b) | 243,838 | 3,672,003 | |
| Heineken Holding NV | 11,529 | 1,138,326 | |
| ING Groep NV (Certificaten Van Aandelen) | 305,737 | 5,427,074 | |
| Koninklijke Ahold Delhaize NV | 27,851 | 500,644 | |
| Koninklijke Philips Electronics NV | 73,913 | 2,803,072 | |
| NN Group NV | 80,358 | 3,188,899 | |
| NXP Semiconductors NV (b) | 8,682 | 980,719 | |
| STMicroelectronics NV (France) | 188,977 | 3,286,742 | |
| Unilever NV (Certificaten Van Aandelen) (Bearer) | 110,220 | 6,561,864 | |
| TOTAL NETHERLANDS | 31,492,842 | ||
| Norway - 0.5% | |||
| Marine Harvest ASA | 151,733 | 3,013,948 | |
| Portugal - 0.4% | |||
| Energias de Portugal SA | 558,290 | 2,143,388 | |
| Singapore - 1.5% | |||
| CapitaLand Ltd. | 132,000 | 367,978 | |
| ComfortDelgro Corp. Ltd. | 166,900 | 281,870 | |
| DBS Group Holdings Ltd. | 119,976 | 1,824,481 | |
| Oversea-Chinese Banking Corp. Ltd. | 458,400 | 3,776,192 | |
| Yangzijiang Shipbuilding Holdings Ltd. | 2,334,500 | 2,573,898 | |
| TOTAL SINGAPORE | 8,824,419 | ||
| Spain - 3.8% | |||
| Aena SA | 10,514 | 2,053,314 | |
| Amadeus IT Holding SA Class A | 49,210 | 3,050,367 | |
| Banco Bilbao Vizcaya Argentaria SA | 305,428 | 2,702,673 | |
| Banco Santander SA (Spain) | 570,950 | 3,721,154 | |
| Endesa SA | 84,755 | 2,044,669 | |
| International Consolidated Airlines Group SA | 59,538 | 471,120 | |
| MAPFRE SA (Reg.) | 582,848 | 2,062,820 | |
| Red Electrica Corporacion SA | 41,816 | 939,097 | |
| Telefonica SA | 431,216 | 4,652,258 | |
| TOTAL SPAIN | 21,697,472 | ||
| Sweden - 2.7% | |||
| Atlas Copco AB (A Shares) | 59,918 | 2,348,232 | |
| Electrolux AB (B Shares) | 55,559 | 2,020,073 | |
| Industrivarden AB (C Shares) | 56,464 | 1,337,385 | |
| Lundbergfoeretagen AB | 9,288 | 719,474 | |
| Sandvik AB | 219,474 | 3,626,711 | |
| SKF AB (B Shares) | 8,819 | 176,252 | |
| Swedbank AB (A Shares) | 51,428 | 1,391,074 | |
| Volvo AB (B Shares) | 222,027 | 3,791,846 | |
| TOTAL SWEDEN | 15,411,047 | ||
| Switzerland - 7.6% | |||
| ABB Ltd. (Reg.) | 119,299 | 2,760,389 | |
| Actelion Ltd. (b) | 1,855 | 519,872 | |
| Adecco SA (Reg.) | 40,518 | 2,936,546 | |
| Coca-Cola HBC AG | 22,228 | 759,966 | |
| Nestle SA (Reg. S) | 130,503 | 11,063,512 | |
| Novartis AG | 120,475 | 10,156,905 | |
| Partners Group Holding AG | 316 | 204,966 | |
| Roche Holding AG (participation certificate) | 38,497 | 9,780,963 | |
| Swiss Re Ltd. | 1,968 | 178,237 | |
| UBS Group AG | 72,054 | 1,187,187 | |
| Zurich Insurance Group AG | 14,903 | 4,458,700 | |
| TOTAL SWITZERLAND | 44,007,243 | ||
| United Kingdom - 16.1% | |||
| 3i Group PLC | 212,428 | 2,663,126 | |
| Anglo American PLC (United Kingdom) | 215,544 | 3,909,047 | |
| Associated British Foods PLC | 1,605 | 68,946 | |
| AstraZeneca PLC (United Kingdom) | 1,659 | 97,264 | |
| BAE Systems PLC | 224,950 | 1,767,759 | |
| Barratt Developments PLC | 383,235 | 3,094,780 | |
| Berkeley Group Holdings PLC | 62,167 | 3,007,321 | |
| BHP Billiton PLC | 237,295 | 4,517,545 | |
| BP PLC | 285,411 | 1,648,641 | |
| British American Tobacco PLC (United Kingdom) | 45,728 | 2,852,747 | |
| BT Group PLC | 921,236 | 3,479,799 | |
| Burberry Group PLC | 85,190 | 1,979,561 | |
| Carnival PLC | 47,208 | 3,284,690 | |
| Carphone Warehouse Group PLC | 41,763 | 93,642 | |
| Diageo PLC | 38,560 | 1,289,755 | |
| Direct Line Insurance Group PLC | 107,976 | 530,710 | |
| G4S PLC (United Kingdom) | 107,490 | 394,052 | |
| GlaxoSmithKline PLC | 1,524 | 30,236 | |
| GlaxoSmithKline PLC sponsored ADR | 164,637 | 6,623,347 | |
| HSBC Holdings PLC: | |||
| (United Kingdom) | 46,231 | 448,198 | |
| sponsored ADR | 108,153 | 5,234,605 | |
| Imperial Tobacco Group PLC | 26,823 | 1,110,088 | |
| Investec PLC | 14,918 | 113,814 | |
| Kingfisher PLC | 440,939 | 1,703,800 | |
| Legal & General Group PLC | 849,655 | 2,858,788 | |
| Marks & Spencer Group PLC | 698,703 | 2,887,563 | |
| Persimmon PLC | 94,859 | 3,261,587 | |
| Prudential PLC | 51,504 | 1,209,020 | |
| Rio Tinto PLC | 109,575 | 5,322,235 | |
| Royal Dutch Shell PLC: | |||
| Class A (United Kingdom) | 176,013 | 4,850,717 | |
| Class B (United Kingdom) | 63,686 | 1,777,514 | |
| Royal Mail PLC | 214,613 | 1,093,968 | |
| Schroders PLC | 13,645 | 594,262 | |
| Scottish & Southern Energy PLC | 76,791 | 1,415,003 | |
| Smith & Nephew PLC | 16,608 | 300,443 | |
| Standard Life PLC | 92,623 | 514,535 | |
| Tate & Lyle PLC | 138,960 | 1,228,176 | |
| Taylor Wimpey PLC | 1,213,099 | 3,145,160 | |
| Unilever PLC | 97,571 | 5,692,745 | |
| Vodafone Group PLC | 2,007,652 | 5,745,315 | |
| William Hill PLC | 226,848 | 726,303 | |
| WM Morrison Supermarkets PLC | 17,424 | 55,426 | |
| TOTAL UNITED KINGDOM | 92,622,233 | ||
| TOTAL COMMON STOCKS | |||
| (Cost $502,580,148) | 553,125,793 | ||
| Principal Amount | Value | ||
| Government Obligations - 0.2% | |||
| United States of America - 0.2% | |||
| U.S. Treasury Bills, yield at date of purchase 1.18% 6/21/18(c) | |||
| (Cost $1,386,669) | $1,400,000 | 1,386,740 | |
| Shares | Value | ||
| Money Market Funds - 3.1% | |||
| Fidelity Cash Central Fund, 1.11% (d) | 17,472,742 | 17,476,236 | |
| Fidelity Securities Lending Cash Central Fund 1.11% (d)(e) | 486,213 | 486,262 | |
| TOTAL MONEY MARKET FUNDS | |||
| (Cost $17,962,456) | 17,962,498 | ||
| TOTAL INVESTMENT IN SECURITIES - 99.3% | |||
| (Cost $521,929,273) | 572,475,031 | ||
| NET OTHER ASSETS (LIABILITIES) - 0.7% | 3,910,626 | ||
| NET ASSETS - 100% | $576,385,657 |
| Futures Contracts | |||||
| Number of contracts | Expiration Date | Notional amount | Value | Unrealized Appreciation/(Depreciation) | |
| Purchased | |||||
| Equity Index Contracts | |||||
| ICE E-mini MSCI EAFE Index Contracts (United States) | 237 | Sept. 2017 | $22,927,380 | $239,306 | $239,306 |
The notional amount of futures purchased as a percentage of Net Assets is 4.0%
Legend
(a) Security or a portion of the security is on loan at period end.
(b) Non-income producing
(c) Security or a portion of the security was pledged to cover margin requirements for futures contracts. At period end, the value of securities pledged amounted to $801,337.
(d) Affiliated fund that is generally available only to investment companies and other accounts managed by Fidelity Investments. The rate quoted is the annualized seven-day yield of the fund at period end. A complete unaudited listing of the fund's holdings as of its most recent quarter end is available upon request. In addition, each Fidelity Central Fund's financial statements, which are not covered by the Fund's Report of Independent Registered Public Accounting Firm, are available on the SEC's website or upon request.
(e) Investment made with cash collateral received from securities on loan.
Affiliated Central Funds
Information regarding fiscal year to date income earned by the Fund from investments in Fidelity Central Funds is as follows:
| Fund | Six Months ended August 31, 2017 | Year ended February 28, 2017 |
| Fidelity Cash Central Fund | $73,228 | $15,778 |
| Fidelity Securities Lending Cash Central Fund | 8,150 | 10,621 |
| Total | $81,378 | $26,399 |
Investment Valuation
The following is a summary of the inputs used, as of August 31, 2017, involving the Fund's assets and liabilities carried at fair value. The inputs or methodology used for valuing securities may not be an indication of the risk associated with investing in those securities. For more information on valuation inputs, and their aggregation into the levels used below, please refer to the Investment Valuation section in the accompanying Notes to Financial Statements.
| Valuation Inputs at Reporting Date: | ||||
| Description | Total | Level 1 | Level 2 | Level 3 |
| Investments in Securities: | ||||
| Equities: | ||||
| Consumer Discretionary | $76,323,195 | $57,216,782 | $19,106,413 | $-- |
| Consumer Staples | 53,449,242 | 25,233,148 | 28,216,094 | -- |
| Energy | 16,329,890 | 506,574 | 15,823,316 | -- |
| Financials | 116,984,948 | 82,092,864 | 34,892,084 | -- |
| Health Care | 57,873,191 | 20,515,770 | 37,357,421 | -- |
| Industrials | 79,042,389 | 68,272,451 | 10,769,938 | -- |
| Information Technology | 36,702,461 | 31,245,616 | 5,456,845 | -- |
| Materials | 52,294,124 | 38,991,408 | 13,302,716 | -- |
| Real Estate | 19,292,930 | 19,292,930 | -- | -- |
| Telecommunication Services | 32,764,458 | 626,511 | 32,137,947 | -- |
| Utilities | 12,068,965 | 12,068,965 | -- | -- |
| Government Obligations | 1,386,740 | -- | 1,386,740 | -- |
| Money Market Funds | 17,962,498 | 17,962,498 | -- | -- |
| Total Investments in Securities: | $572,475,031 | $374,025,517 | $198,449,514 | $-- |
| Derivative Instruments: | ||||
| Assets | ||||
| Futures Contracts | $239,306 | $239,306 | $-- | $-- |
| Total Assets | $239,306 | $239,306 | $-- | $-- |
| Total Derivative Instruments: | $239,306 | $239,306 | $-- | $-- |
The following is a summary of transfers between Level 1 and Level 2 for the period ended August 31, 2017. Transfers are assumed to have occurred at the beginning of the period, and are primarily attributable to the valuation techniques used for foreign equity securities, as discussed in the accompanying Notes to Financial Statements:
| Transfers | Total |
| Level 1 to Level 2 | $84,526 |
| Level 2 to Level 1 | $8,368,975 |
Value of Derivative Instruments
The following table is a summary of the Fund's value of derivative instruments by primary risk exposure as of August 31, 2017. For additional information on derivative instruments, please refer to the Derivative Instruments section in the accompanying Notes to Financial Statements.
| Primary Risk Exposure / Derivative Type | Value | |
| Asset | Liability | |
| Equity Risk | ||
| Futures Contracts(a) | $239,306 | $0 |
| Total Equity Risk | 239,306 | 0 |
| Total Value of Derivatives | $239,306 | $0 |
(a) Reflects gross cumulative appreciation (depreciation) on futures contracts as presented in the Schedule of Investments. In the Statement of Assets and Liabilities, the period end daily variation margin is included in receivable or payable for daily variation margin on futures contracts, and the net cumulative appreciation (depreciation) is included in net unrealized appreciation (depreciation).
See accompanying notes which are an integral part of the financial statements.
Fidelity® International Enhanced Index Fund
Financial Statements
Statement of Assets and Liabilities
| August 31, 2017 | ||
| Assets | ||
| Investment in securities, at value (including securities loaned of $480,964) — See accompanying schedule: Unaffiliated issuers (cost $503,966,817) | $554,512,533 | |
| Fidelity Central Funds (cost $17,962,456) | 17,962,498 | |
| Total Investment in Securities (cost $521,929,273) | $572,475,031 | |
| Foreign currency held at value (cost $111,595) | 112,482 | |
| Receivable for fund shares sold | 3,003,928 | |
| Dividends receivable | 2,192,255 | |
| Distributions receivable from Fidelity Central Funds | 15,930 | |
| Receivable for daily variation margin for on futures contracts | 165,377 | |
| Other receivables | 48 | |
| Total assets | 577,965,051 | |
| Liabilities | ||
| Payable to custodian bank | $53 | |
| Payable for fund shares redeemed | 825,667 | |
| Accrued management fee | 267,962 | |
| Collateral on securities loaned | 485,712 | |
| Total liabilities | 1,579,394 | |
| Net Assets | $576,385,657 | |
| Net Assets consist of: | ||
| Paid in capital | $523,222,754 | |
| Undistributed net investment income | 7,649,198 | |
| Accumulated undistributed net realized gain (loss) on investments and foreign currency transactions | (5,301,697) | |
| Net unrealized appreciation (depreciation) on investments and assets and liabilities in foreign currencies | 50,815,402 | |
| Net Assets, for 59,222,217 shares outstanding | $576,385,657 | |
| Net Asset Value, offering price and redemption price per share ($576,385,657 ÷ 59,222,217 shares) | $9.73 |
See accompanying notes which are an integral part of the financial statements.
Statement of Operations
| Six months ended August 31, 2017 | Year ended February 28, 2017 | |
| Investment Income | ||
| Dividends | $8,437,769 | $6,183,945 |
| Non-Cash dividends | 1,531,729 | – |
| Interest | 1,906 | 1,566 |
| Income from Fidelity Central Funds (including $8,150 and $10,621, respectively, from security lending) | 81,378 | 26,399 |
| Income before foreign taxes withheld | 10,052,782 | 6,211,910 |
| Less foreign taxes withheld | (907,580) | (449,758) |
| Total income | 9,145,202 | 5,762,152 |
| Expenses | ||
| Management fee | $1,177,353 | $863,342 |
| Transfer agent fees | 36,556 | 275,772 |
| Independent trustees' fees and expenses | 3,654 | 765 |
| Miscellaneous | 508 | 512 |
| Total expenses before reductions | 1,218,071 | 1,140,391 |
| Expense reductions | (78) | (23) |
| Total expenses | 1,217,993 | 1,140,368 |
| Net investment income (loss) | 7,927,209 | 4,621,784 |
| Realized and Unrealized Gain (Loss) | ||
| Net realized gain (loss) on: | ||
| Investment securities: | ||
| Unaffiliated issuers | 7,464,187 | (4,504,641) |
| Fidelity Central Funds | (35) | 116 |
| Foreign currency transactions | (331,151) | (117,011) |
| Futures contracts | 1,598,503 | 326,015 |
| Total net realized gain (loss) | 8,731,504 | (4,295,521) |
| Change in net unrealized appreciation (depreciation) on: | ||
| Investment securities: | ||
| Unaffiliated issuers | 35,803,071 | 28,662,209 |
| Fidelity Central Funds | (167) | – |
| Assets and liabilities in foreign currencies | 46,423 | 36 |
| Futures contracts | 73,908 | 151,387 |
| Total change in net unrealized appreciation (depreciation) | 35,923,235 | 28,813,632 |
| Net gain (loss) | 44,654,739 | 24,518,111 |
| Net increase (decrease) in net assets resulting from operations | $52,581,948 | $29,139,895 |
See accompanying notes which are an integral part of the financial statements.
Statement of Changes in Net Assets
| Six months ended August 31, 2017�� | Year ended February 28, 2017 | Year ended February 29, 2016 | |
| Increase (Decrease) in Net Assets | |||
| Operations | |||
| Net investment income (loss) | $7,927,209 | $4,621,784 | $3,232,456 |
| Net realized gain (loss) | 8,731,504 | (4,295,521) | (8,202,367) |
| Change in net unrealized appreciation (depreciation) | 35,923,235 | 28,813,632 | (18,846,011) |
| Net increase (decrease) in net assets resulting from operations | 52,581,948 | 29,139,895 | (23,815,922) |
| Distributions to shareholders from net investment income | – | (4,288,268) | (2,909,905) |
| Distributions to shareholders from net realized gain | – | (392,264) | (40,835) |
| Total distributions | – | (4,680,532) | (2,950,740) |
| Share transactions | |||
| Proceeds from sales of shares | 290,120,502 | 151,532,441 | 120,458,928 |
| Reinvestment of distributions | – | 4,408,489 | 2,774,693 |
| Cost of shares redeemed | (37,899,931) | (61,528,135) | (49,141,729) |
| Net increase (decrease) in net assets resulting from share transactions | 252,220,571 | 94,412,795 | 74,091,892 |
| Redemption fees | 7,280 | 5,161 | 12,817 |
| Total increase (decrease) in net assets | 304,809,799 | 118,877,319 | 47,338,047 |
| Net Assets | |||
| Beginning of period | 271,575,858 | 152,698,539 | 105,360,492 |
| End of period | $576,385,657 | $271,575,858 | $152,698,539 |
| Other Information | |||
| Undistributed net investment income end of period | $7,649,198 | $1,283 | $97,784 |
| Shares | |||
| Sold | 31,303,660 | 18,467,381 | 14,156,866 |
| Issued in reinvestment of distributions | – | 542,369 | 343,487 |
| Redeemed | (4,088,208) | (7,586,650) | (5,937,186) |
| Net increase (decrease) | 27,215,452 | 11,423,100 | 8,563,167 |
See accompanying notes which are an integral part of the financial statements.
Financial Highlights — Fidelity International Enhanced Index Fund
| Year ended August 31, | 2017 A | 2017 B | 2016 C | 2015 B | 2014 B | 2013 B |
| Selected Per–Share Data | ||||||
| Net asset value, beginning of period | $8.48 | $7.42 | $8.77 | $8.85 | $7.45 | $6.95 |
| Income from Investment Operations | ||||||
| Net investment income (loss)D | .18 | .20 | .19 | .20 | .28E | .21 |
| Net realized and unrealized gain (loss) | 1.07 | 1.08 | (1.38) | (.10) | 1.29 | .52 |
| Total from investment operations | 1.25 | 1.28 | (1.19) | .10 | 1.57 | .73 |
| Distributions from net investment income | – | (.20) | (.16) | (.16) | (.15) | (.21) |
| Distributions from net realized gain | – | (.02) | –F | (.02) | (.01) | (.02) |
| Total distributions | – | (.22) | (.16) | (.18) | (.17)G | (.23) |
| Redemption fees added to paid in capitalD,F | – | – | – | – | – | – |
| Net asset value, end of period | $9.73 | $8.48 | $7.42 | $8.77 | $8.85 | $7.45 |
| Total ReturnH,I | 14.74% | 17.31% | (13.71)% | 1.25% | 21.21% | 10.64% |
| Ratios to Average Net AssetsJ,K | ||||||
| Expenses before reductions | .59%L | .62% | .62% | .62% | .62% | .62% |
| Expenses net of fee waivers, if any | .59%L | .62% | .62% | .62% | .62% | .62% |
| Expenses net of all reductions | .59%L | .62% | .62% | .62% | .62% | .62% |
| Net investment income (loss) | 3.86%L | 2.53% | 2.27% | 2.31% | 3.40%E | 3.04% |
| Supplemental Data | ||||||
| Net assets, end of period (000 omitted) | $576,386 | $271,576 | $152,699 | $105,360 | $44,828 | $30,412 |
| Portfolio turnover rateM | 70%L | 75% | 77% | 75% | 63% | 56% |
A For the six month period ended August 31. The Fund changed its fiscal year end from February 28 to August 31, effective August 31, 2017.
B For the year ended February 28.
C For the year ended February 29.
D Calculated based on average shares outstanding during the period.
E Net Investment income per share reflects a large, non-recurring dividend which amounted to $.06 per share. Excluding this non-recurring dividend, the ratio of net investment income (loss) to average net assets would have been 2.64%.
F Amount represents less than $.005 per share.
G Total distributions of $.17 per share is comprised of distributions from net investment income of $.153 and distributions from net realized gain of $.013 per share.
H Total returns for periods of less than one year are not annualized.
I Total returns would have been lower if certain expenses had not been reduced during the applicable periods shown.
J Fees and expenses of any underlying Fidelity Central Funds are not included in the Fund's expense ratio. The Fund indirectly bears its proportionate share of the expenses of any underlying Fidelity Central Funds.
K Expense ratios reflect operating expenses of the Fund. Expenses before reductions do not reflect amounts reimbursed by the investment adviser or reductions from expense offset arrangements and do not represent the amount paid by the Fund during periods when reimbursements or reductions occur. Expenses net of fee waivers reflect expenses after reimbursement by the investment adviser but prior to reductions from expense offset arrangements. Expenses net of all reductions represent the net expenses paid by the Fund.
L Annualized
M Amount does not include the portfolio activity of any underlying Fidelity Central Funds.
See accompanying notes which are an integral part of the financial statements.
Notes to Financial Statements
For the period ended August 31, 2017
1. Organization.
Fidelity Large Cap Growth Enhanced Index Fund, Fidelity Large Cap Value Enhanced Index Fund, Fidelity Large Cap Core Enhanced Index Fund, Fidelity Mid Cap Enhanced Index Fund and Fidelity International Enhanced Index Fund (the Funds) are funds of Fidelity Commonwealth Trust II (the Trust) and are authorized to issue an unlimited number of shares. Share transactions on the Statement of Changes in Net Assets may contain exchanges between affiliated funds. The Trust is registered under the Investment Company Act of 1940, as amended (the 1940 Act), as an open-end management investment company organized as a Delaware statutory trust.
In April, 2017, the Board of Trustees approved a change in the fiscal year-end of the Funds from February 28 to August 31. Accordingly, the Funds' financial statements and related notes include information as of the six month period ended August 31, 2017 and the one year periods ended February 28, 2017 and February 29, 2016, as applicable.
2. Significant Accounting Policies.
Each Fund is an investment company and applies the accounting and reporting guidance of the Financial Accounting Standards Board (FASB) Accounting Standards Codification Topic 946 Financial Services – Investments Companies. The financial statements have been prepared in conformity with accounting principles generally accepted in the United States of America (GAAP), which require management to make certain estimates and assumptions at the date of the financial statements. Actual results could differ from those estimates. Subsequent events, if any, through the date that the financial statements were issued have been evaluated in the preparation of the financial statements. The following summarizes the significant accounting policies of the Funds:
Investment Valuation. Investments are valued as of 4:00 p.m. Eastern time on the last calendar day of the period. The Board of Trustees (the Board) has delegated the day to day responsibility for the valuation of each Fund's investments to the Fair Value Committee (the Committee) established by each Fund's investment adviser. In accordance with valuation policies and procedures approved by the Board, each Fund attempts to obtain prices from one or more third party pricing vendors or brokers to value its investments. When current market prices, quotations or currency exchange rates are not readily available or reliable, investments will be fair valued in good faith by the Committee, in accordance with procedures adopted by the Board. Factors used in determining fair value vary by investment type and may include market or investment specific events, changes in interest rates and credit quality. The frequency with which these procedures are used cannot be predicted and they may be utilized to a significant extent. The Committee oversees each Fund's valuation policies and procedures and reports to the Board on the Committee's activities and fair value determinations. The Board monitors the appropriateness of the procedures used in valuing each Fund's investments and ratifies the fair value determinations of the Committee.
Each Fund categorizes the inputs to valuation techniques used to value its investments into a disclosure hierarchy consisting of three levels as shown below:
- Level 1 – quoted prices in active markets for identical investments
- Level 2 – other significant observable inputs (including quoted prices for similar investments, interest rates, prepayment speeds, etc.)
- Level 3 – unobservable inputs (including the Fund's own assumptions based on the best information available)
Valuation techniques used to value each Fund's investments by major category are as follows:
Equity securities, including restricted securities, for which market quotations are readily available, are valued at the last reported sale price or official closing price as reported by a third party pricing vendor on the primary market or exchange on which they are traded and are categorized as Level 1 in the hierarchy. In the event there were no sales during the day or closing prices are not available, securities are valued at the last quoted bid price or may be valued using the last available price and are generally categorized as Level 2 in the hierarchy. For foreign equity securities, when market or security specific events arise, comparisons to the valuation of American Depositary Receipts (ADRs), futures contracts, Exchange-Traded Funds (ETFs) and certain indexes as well as quoted prices for similar securities may be used and would be categorized as Level 2 in the hierarchy. Utilizing these techniques may result in transfers between Level 1 and Level 2. For equity securities, including restricted securities, where observable inputs are limited, assumptions about market activity and risk are used and these securities may be categorized as Level 3 in the hierarchy.
Debt securities, including restricted securities, are valued based on evaluated prices received from third party pricing vendors or from brokers who make markets in such securities. U.S. government and government agency obligations are valued by pricing vendors who utilize matrix pricing which considers yield or price of bonds of comparable quality, coupon, maturity and type or by broker-supplied prices. When independent prices are unavailable or unreliable, debt securities may be valued utilizing pricing methodologies which consider similar factors that would be used by third party pricing vendors. Debt securities are generally categorized as Level 2 in the hierarchy but may be Level 3 depending on the circumstances.
Futures contracts are valued at the settlement price established each day by the board of trade or exchange on which they are traded and are categorized as Level 1 in the hierarchy. Investments in open-end mutual funds, including the Fidelity Central Funds, are valued at their closing net asset value (NAV) each business day and are categorized as Level 1 in the hierarchy.
Changes in valuation techniques may result in transfers in or out of an assigned level within the disclosure hierarchy. The aggregate value of investments by input level as of August 31, 2017, including information on transfers between Levels 1 and 2 is included at the end of each applicable Fund's Schedule of Investments.
Foreign Currency. The Funds may use foreign currency contracts to facilitate transactions in foreign-denominated securities. Gains and losses from these transactions may arise from changes in the value of the foreign currency or if the counterparties do not perform under the contracts' terms.
Foreign-denominated assets, including investment securities, and liabilities are translated into U.S. dollars at the exchange rates at period end. Purchases and sales of investment securities, income and dividends received and expenses denominated in foreign currencies are translated into U.S. dollars at the exchange rate in effect on the transaction date.
The effects of exchange rate fluctuations on investments are included with the net realized and unrealized gain (loss) on investment securities. Other foreign currency transactions resulting in realized and unrealized gain (loss) are disclosed separately.
Investment Transactions and Income. For financial reporting purposes, the Funds' investment holdings and NAV include trades executed through the end of the last business day of the period. The NAV per share for processing shareholder transactions is calculated as of the close of business of the New York Stock Exchange (NYSE), normally 4:00 p.m. Eastern time and includes trades executed through the end of the prior business day. Gains and losses on securities sold are determined on the basis of identified cost and may include proceeds received from litigation. Dividend income is recorded on the ex-dividend date, except for certain dividends from foreign securities where the ex-dividend date may have passed, which are recorded as soon as the Funds are informed of the ex-dividend date. Non-cash dividends included in dividend income, if any, are recorded at the fair market value of the securities received. Income and capital gain distributions from Fidelity Central Funds, if any, are recorded on the ex-dividend date. Certain distributions received by the Funds represent a return of capital or capital gain. The Funds determine the components of these distributions subsequent to the ex-dividend date, based upon receipt of tax filings or other correspondence relating to the underlying investment. These distributions are recorded as a reduction of cost of investments and/or as a realized gain. Interest income is accrued as earned and includes coupon interest and amortization of premium and accretion of discount on debt securities as applicable. Investment income is recorded net of foreign taxes withheld where recovery of such taxes is uncertain.
Expenses. Expenses directly attributable to a fund are charged to that fund. Expenses attributable to more than one fund are allocated among the respective funds on the basis of relative net assets or other appropriate methods. Expense estimates are accrued in the period to which they relate and adjustments are made when actual amounts are known.
Income Tax Information and Distributions to Shareholders. Each year, each Fund intends to qualify as a regulated investment company under Subchapter M of the Internal Revenue Code, including distributing substantially all of its taxable income and realized gains. As a result, no provision for U.S. Federal income taxes is required. As of August 31, 2017, each Fund did not have any unrecognized tax benefits in the financial statements; nor is each Fund aware of any tax positions for which it is reasonably possible that the total amounts of unrecognized tax benefits will significantly change in the next twelve months. Each Fund files a U.S. federal tax return, in addition to state and local tax returns as required. Each Fund's federal income tax returns are subject to examination by the Internal Revenue Service (IRS) for a period of three fiscal years after they are filed. State and local tax returns may be subject to examination for an additional fiscal year depending on the jurisdiction. Foreign taxes are provided for based on each Fund's understanding of the tax rules and rates that exist in the foreign markets in which it invests.
Distributions are declared and recorded on the ex-dividend date. Income and capital gain distributions are determined in accordance with income tax regulations, which may differ from GAAP. In addition, certain Funds claimed a portion of the payment made to redeeming shareholders as a distribution for income tax purposes.
Capital accounts within the financial statements are adjusted for permanent book-tax differences. These adjustments have no impact on net assets or the results of operations. Capital accounts are not adjusted for temporary book-tax differences which will reverse in a subsequent period.
Book-tax differences are primarily due to futures contracts, foreign currency transactions, passive foreign investment companies (PFIC), partnerships, market discount, capital loss carryforwards and losses deferred due to wash sales.
As of period end, the cost and unrealized appreciation (depreciation) in securities, and derivatives if applicable, for federal income tax purposes were as follows for each Fund:
| Tax cost | Gross unrealized appreciation | Gross unrealized depreciation | Net unrealized appreciation (depreciation) on securities | |
| Fidelity Large Cap Growth Enhanced Index Fund | $754,596,701 | $198,313,361 | $(15,740,823) | $182,572,538 |
| Fidelity Large Cap Value Enhanced Index Fund | 2,833,738,095 | 355,346,588 | (80,480,190) | 274,866,398 |
| Fidelity Large Cap Core Enhanced Index Fund | 425,506,789 | 121,014,515 | (11,446,010) | 109,568,505 |
| Fidelity Mid Cap Enhanced Index Fund | 1,157,200,490 | 158,304,601 | (60,060,963) | 98,243,638 |
| Fidelity International Enhanced Index Fund | 524,849,354 | 57,147,390 | (9,521,713) | 47,625,677 |
The tax-based components of distributable earnings as of period end were as follows for each Fund:
| Undistributed ordinary income | Undistributed long-term capital gain | Capital loss carryforward | Net unrealized appreciation (depreciation) on securities and other investments | |
| Fidelity Large Cap Growth Enhanced Index Fund | $8,842,282 | $12,034,179 | $– | $182,572,538 |
| Fidelity Large Cap Value Enhanced Index Fund | 42,009,910 | 38,668,009 | – | 274,866,746 |
| Fidelity Large Cap Core Enhanced Index Fund | 4,538,308 | 4,387,829 | – | 109,568,505 |
| Fidelity Mid Cap Enhanced Index Fund | 9,060,606 | 47,829,144 | – | 98,243,482 |
| Fidelity International Enhanced Index Fund | 8,598,033 | – | (3,091,747) | 47,656,015 |
Capital loss carryforwards are only available to offset future capital gains of the Funds to the extent provided by regulations and may be limited. Under the Regulated Investment Company Modernization Act of 2010 (the Act), the Funds are permitted to carry forward capital losses incurred in taxable years beginning after December 22, 2010 for an unlimited period and such capital losses are required to be used prior to any losses that expire. The capital loss carryforward information presented below, including any applicable limitation, is estimated as of fiscal period end and is subject to adjustment.
| Fiscal year of expiration | |||
| 2018 | 2019 | Total with expiration | |
| Fidelity International Enhanced Index Fund | $(545,048) | $– | $(545,048) |
| No expiration | ||||
| Short-term | Long-term | Total no expiration | Total capital loss carryfoward | |
| Fidelity International Enhanced Index Fund | $(1,268,901) | $(1,277,798) | $(2,546,699) | $(3,091,747) |
The tax character of distributions paid was as follows:
| August 31, 2017 | ||||
| Ordinary Income | Long-term Capital Gains | Total | ||
| Fidelity Large Cap Growth Enhanced Index Fund | $2,232,132 | $8,046,055 | $10,278,187 | |
| Fidelity Large Cap Value Enhanced Index Fund | 18,573,418 | 11,191,671 | 29,765,089 | |
| Fidelity Large Cap Core Enhanced Index Fund | 1,405,265 | – | 1,405,265 | |
| Fidelity Mid Cap Enhanced Index Fund | 1,441,547 | 5,846,277 | 7,287,824 |
| February 28, 2017 | ||
| Ordinary Income | Total | |
| Fidelity Large Cap Growth Enhanced Index Fund | $7,111,776 | $7,111,776 |
| Fidelity Large Cap Value Enhanced Index Fund | 38,789,221 | 38,789,221 |
| Fidelity Large Cap Core Enhanced Index Fund | 7,861,211 | 7,861,211 |
| Fidelity Mid Cap Enhanced Index Fund | 13,411,857 | 13,411,857 |
| Fidelity International Enhanced Index Fund | 4,680,532 | 4,680,532 |
| February 29, 2016 | |||
| Ordinary Income | Long-term Capital Gains | Total | |
| Fidelity Large Cap Growth Enhanced Index Fund | $6,275,758 | $13,163,155 | $19,438,913 |
| Fidelity Large Cap Value Enhanced Index Fund | 27,330,027 | 19,261,829 | 46,591,856 |
| Fidelity Large Cap Core Enhanced Index Fund | 9,163,862 | 5,701,658 | 14,865,520 |
| Fidelity Mid Cap Enhanced Index Fund | 13,914,554 | 25,203,719 | 39,118,273 |
| Fidelity International Enhanced Index Fund | 2,950,740 | – | 2,950,740 |
Short Term Trading (Redemption) Fees. Shares held by investors of Fidelity International Enhanced Index Fund less than 30 days may be subject to a redemption fee equal to 1.00%, of the net asset value of shares redeemed. All redemption fees, which reduce the proceeds of the shareholder redemption, are retained by the Funds and accounted for as an addition to paid in capital.
3. Derivative Instruments.
Risk Exposures and the Use of Derivative Instruments. The Funds' investment objective allows the Funds to enter into various types of derivative contracts, including futures contracts. Derivatives are investments whose value is primarily derived from underlying assets, indices or reference rates and may be transacted on an exchange or over-the-counter (OTC). Derivatives may involve a future commitment to buy or sell a specified asset based on specified terms, to exchange future cash flows at periodic intervals based on a notional principal amount, or for one party to make one or more payments upon the occurrence of specified events in exchange for periodic payments from the other party.
The Funds used derivatives to increase returns and to manage exposure to certain risks as defined below. The success of any strategy involving derivatives depends on analysis of numerous economic factors, and if the strategies for investment do not work as intended, the Funds may not achieve their objectives.
The Funds' use of derivatives increased or decreased their exposure to the following risk:
| Equity Risk | Equity risk relates to the fluctuations in the value of financial instruments as a result of changes in market prices (other than those arising from interest rate risk or foreign exchange risk), whether caused by factors specific to an individual investment, its issuer, or all factors affecting all instruments traded in a market or market segment. |
The Funds are also exposed to additional risks from investing in derivatives, such as liquidity risk and counterparty credit risk. Liquidity risk is the risk that the Funds will be unable to close out the derivative in the open market in a timely manner. Counterparty credit risk is the risk that the counterparty will not be able to fulfill its obligation to the Funds. Counterparty credit risk related to exchange-traded futures contracts may be mitigated by the protection provided by the exchange on which they trade.
Investing in derivatives may involve greater risks than investing in the underlying assets directly and, to varying degrees, may involve risk of loss in excess of any initial investment and collateral received and amounts recognized in the Statement of Assets and Liabilities. In addition, there may be the risk that the change in value of the derivative contract does not correspond to the change in value of the underlying instrument.
Net Realized Gain (Loss) and Change in Net Unrealized Appreciation (Depreciation) on Derivatives. The table below, which reflects the impacts of derivatives on the financial performance of the Funds, summarizes the net realized gain (loss) and change in net unrealized appreciation (depreciation) for derivatives as presented in the Statement of Operations.
| Six months ended August 31, 2017 | Six months ended August 31, 2017 | Year ended February 28, 2017 | Year ended February 28, 2017 | |
| Primary Risk Exposure / Derivative Type | Net Realized Gain (Loss) | Change in Net Unrealized Appreciation (Depreciation) | Net Realized Gain (Loss) | Change in Net Unrealized Appreciation (Depreciation) |
| Fidelity Large Cap Growth Enhanced Index Fund | ||||
| Equity Risk | ||||
| Futures Contracts | $1,022,906 | $(459,998) | $1,863,288 | $444,062 |
| Fidelity Large Cap Value Enhanced Index Fund | ||||
| Equity Risk | ||||
| Futures Contracts | $2,260,045 | $(759,288) | $5,199,649 | $899,649 |
| Fidelity Large Cap Core Enhanced Index Fund | ||||
| Equity Risk | ||||
| Futures Contracts | 854,554 | (156,184) | 1,026,856 | 137,056 |
| Fidelity Mid Cap Enhanced Index Fund | ||||
| Equity Risk | ||||
| Futures Contracts | 256,437 | (316,963) | 3,073,364 | 108,038 |
| Fidelity International Enhanced Index Fund | ||||
| Equity Risk | ||||
| Futures Contracts | 1,598,503 | 73,908 | 326,015 | 151,387 |
A summary of the value of derivatives by primary risk exposure as of period end is included at the end of the Schedule of Investments.
Futures Contracts. A futures contract is an agreement between two parties to buy or sell a specified underlying instrument for a fixed price at a specified future date. The Funds used futures contracts to manage their exposure to the stock market.
Upon entering into a futures contract, a fund is required to deposit either cash or securities (initial margin) with a clearing broker in an amount equal to a certain percentage of the face value of the contract. Futures contracts are marked-to-market daily and subsequent daily payments (variation margin) are made or received by a fund depending on the daily fluctuations in the value of the futures contracts and are recorded as unrealized appreciation or (depreciation). This receivable and/or payable, if any, is included in daily variation margin on futures contracts in the Statement of Assets and Liabilities. Realized gain or (loss) is recorded upon the expiration or closing of a futures contract.
Any open futures contracts at period end are presented in the Schedule of Investments under the caption "Futures Contracts". The underlying face amount at value reflects each contract's exposure to the underlying instrument or index at period end and is representative of volume of activity during the period. Securities deposited to meet initial margin requirements are identified in the Schedule of Investments.
4. Purchases and Sales of Investments.
Purchases and sales of securities, other than short-term securities, for the six month period ended August 31, 2017, are noted in the table below.
| Purchases ($) | Sales ($) | |
| Fidelity Large Cap Growth Enhanced Index Fund | 536,306,465 | 486,468,710 |
| Fidelity Large Cap Value Enhanced Index Fund | 1,519,494,761 | 1,351,469,092 |
| Fidelity Large Cap Core Enhanced Index Fund | 230,518,907 | 237,642,041 |
| Fidelity Mid Cap Enhanced Index Fund | 558,144,718 | 553,973,681 |
| Fidelity International Enhanced Index Fund | 389,242,245 | 139,393,148 |
5. Fees and Other Transactions with Affiliates.
Management Fee. FMR Co., Inc. (the investment adviser) and its affiliates provides the Funds with investment management related services for which the Funds pay a monthly management fee. In March 2017, the shareholders approved an amendment to the management fee contract and the termination of the expense contract for each Fund. Effective April 1, 2017, each Fund pays an all-inclusive management fee based on the annual rates noted in the following table; and the investment adviser pays all ordinary operating expenses of each Fund, except fees and expenses of the independent Trustees and certain miscellaneous expenses such as proxy and shareholder meeting expenses. The management fees are reduced by an amount equal to the fees and expenses paid by the Funds to the independent Trustees.
| Fidelity Large Cap Growth Enhanced Index Fund | .39% |
| Fidelity Large Cap Value Enhanced Index Fund | .39% |
| Fidelity Large Cap Core Enhanced Index Fund | .39% |
| Fidelity Mid Cap Enhanced Index Fund | .59% |
| Fidelity International Enhanced Index Fund | .59% |
For the period March 1 through March 31, 2017 and the period ended February 28, 2017, the Funds paid a monthly management fee to the investment adviser. The management fee was based on an annual rate of 0.30% of average net assets for Fidelity Large Cap Growth Enhanced Index, Fidelity Large Cap Value Enhanced Index and Fidelity Large Cap Core Enhanced Index, 0.45% of average net assets for Fidelity Mid Cap Enhanced Index and 0.47% of average net assets for Fidelity International Enhanced Index. Under the management contract, the investment adviser paid all other ordinary fund-wide operating expenses (such as custody, audit, legal and pricing and bookkeeping fees), except the compensation of the independent Trustees and certain other expenses such as interest expense. The management fee was reduced by an amount equal to the fees and expenses paid by the Funds to the independent Trustees.
In addition, under the expense contract, the investment adviser paid other expenses such as those listed above for each of the Funds so that the total expenses did not exceed certain amounts of each Fund's average net assets with certain exceptions, as noted in the following table:
| Fidelity Large Cap Growth Enhanced Index Fund | .45% |
| Fidelity Large Cap Value Enhanced Index Fund | .45% |
| Fidelity Large Cap Core Enhanced Index Fund | .45% |
| Fidelity Mid Cap Enhanced Index Fund | .60% |
| Fidelity International Enhanced Index Fund | .62% |
For the reporting period March 1, 2017 through August 31, 2017, each Fund's annualized management fee rate expressed as a percentage of each Fund's average net assets was as follows:
| Fidelity Large Cap Growth Enhanced Index Fund | .37% |
| Fidelity Large Cap Value Enhanced Index Fund | .37% |
| Fidelity Large Cap Core Enhanced Index Fund | .37% |
| Fidelity Mid Cap Enhanced Index Fund | .57% |
| Fidelity International Enhanced Index Fund | .57% |
Sub-Adviser. Geode Capital Management, LLC (Geode), serves as sub-adviser for the Funds. Geode provides discretionary investment advisory services to the Funds and is paid by the investment adviser for providing these services.
Transfer Agent Fees. Fidelity Investments Institutional Operations Company, Inc. (FIIOC), an affiliate of the investment adviser, is the Funds' transfer, dividend disbursing and shareholder servicing agent. FIIOC receives account fees and asset-based fees that vary according to type of account. FIIOC pays for typesetting, printing and mailing of shareholder reports, except proxy statements. Effective April 1, 2017, the transfer agent fees are paid by the investment adviser, not each Fund.
Prior to April 1, 2017, under the expense contract, each Fund paid transfer agent fees at the annual rate of .15%. For the reporting period March 1, 2017 through August 31, 2017, each Fund's annualized transfer agent rate expressed as a percentage of each Fund's average net assets was .02%.
Interfund Trades. The Funds may purchase from or sell securities to other Fidelity Funds under procedures adopted by the Board. The procedures have been designed to ensure these interfund trades are executed in accordance with Rule 17a-7 of the 1940 Act. Interfund trades are included within the respective purchases and sales amounts shown in the Purchases and Sales of Investments note.
6. Investments in Fidelity Central Funds.
The Funds invest in Fidelity Central Funds, which are open-end investment companies available only to other investment companies and accounts managed by the investment adviser and its affiliates. The Funds' Schedules of Investments list each of the Fidelity Central Funds held as of period end, if any, as an investment of each Fund, but does not include the underlying holdings of each Fidelity Central Fund. As an Investing Fund, each Fund indirectly bears its proportionate share of the expenses of the underlying Fidelity Central Funds.
The Fidelity Money Market Central Funds are managed by Fidelity Investments Money Management, Inc. (FIMM), an affiliate of the investment adviser. Annualized expenses of the Money Market Central Funds as of their most recent shareholder report date are less than .005%.
A complete unaudited list of holdings for each Fidelity Central Fund is available upon request or at the Securities and Exchange Commission (the SEC) website at www.sec.gov. In addition, the financial statements of the Fidelity Central Funds, which are not covered by the Funds' Report of Independent Registered Public Accounting Firm, are available on the SEC website or upon request.
7. Committed Line of Credit.
Certain Funds participate with other funds managed by the investment adviser or an affiliate in a $4.25 billion credit facility (the "line of credit") to be utilized for temporary or emergency purposes to fund shareholder redemptions or for other short-term liquidity purposes. The participating funds have agreed to pay commitment fees on their pro-rata portion of the line of credit, which are reflected in Miscellaneous expenses on the Statement of Operations, and are as follows:
| Six months ended August 31, 2017 | Year ended February 28, 2017 | |
| Fidelity Large Cap Growth Enhanced Index Fund | $1,364 | $1,829 |
| Fidelity Large Cap Value Enhanced Index Fund | 4,622 | 5,737 |
| Fidelity Large Cap Core Enhanced Index Fund | 858 | 1,418 |
| Fidelity Mid Cap Enhanced Index Fund | 1,892 | 2,821 |
| Fidelity International Enhanced Index Fund | 508 | 512 |
During the period, the Funds did not borrow on this line of credit.
8. Security Lending.
Certain Funds lend portfolio securities through a lending agent from time to time in order to earn additional income. On the settlement date of the loan, each applicable Fund receives collateral (in the form of U.S. Treasury obligations, letters of credit and/or cash) against the loaned securities and maintains collateral in an amount not less than 100% of the market value of the loaned securities during the period of the loan. The market value of the loaned securities is determined at the close of business of the Funds and any additional required collateral is delivered to the Funds on the next business day. The Funds or borrower may terminate the loan at any time, and if the borrower defaults on its obligation to return the securities loaned because of insolvency or other reasons, the Funds may apply collateral received from the borrower against the obligation. The Funds may experience delays and costs in recovering the securities loaned. Any cash collateral received is invested in the Fidelity Securities Lending Cash Central Fund. The value of loaned securities and cash collateral at period end are disclosed on each applicable Fund's Statement of Assets and Liabilities. Security lending income represents the income earned on investing cash collateral, less rebates paid to borrowers and any lending agent fees associated with the loan, plus any premium payments received for lending certain types of securities. Security lending income is presented on each applicable Fund's Statement of Operations as a component of income from Fidelity Central Funds.
9. Expense Reductions.
Through arrangements with each applicable Fund's custodian, credits realized as a result of certain uninvested cash balances were used to reduce each applicable Fund's expenses. All of the applicable expense reductions are noted in the table below.
| Six months ended August 31, 2017 | Year ended February 28, 2017 | |
| Fidelity Large Cap Growth Enhanced Index Fund | $138 | $217 |
| Fidelity Large Cap Value Enhanced Index Fund | 1,243 | 362 |
| Fidelity Large Cap Core Enhanced Index Fund | 166 | 97 |
| Fidelity Mid Cap Enhanced Index Fund | 641 | 194 |
| Fidelity International Enhanced Index Fund | 78 | 23 |
10. Other.
The Funds' organizational documents provide former and current trustees and officers with a limited indemnification against liabilities arising in connection with the performance of their duties to the Funds. In the normal course of business, the Funds may also enter into contracts that provide general indemnifications. The Funds' maximum exposure under these arrangements is unknown as this would be dependent on future claims that may be made against the Funds. The risk of material loss from such claims is considered remote.
Report of Independent Registered Public Accounting Firm
To the Trustees of Fidelity Commonwealth Trust II and the Shareholders of Fidelity Large Cap Growth Enhanced Index Fund, Fidelity Large Cap Value Enhanced Index Fund, Fidelity Large Cap Core Enhanced Index Fund, Fidelity Mid Cap Enhanced Index Fund and Fidelity International Enhanced Index Fund:
In our opinion, the accompanying statement of assets and liabilities, including the schedule of investments in securities, and the related statements of operations and of changes in net assets and the financial highlights present fairly, in all material respects, the financial position of the Fidelity Large Cap Growth Enhanced Index Fund, Fidelity Large Cap Value Enhanced Index Fund, Fidelity Large Cap Core Enhanced Index Fund, Fidelity MidCap Enhanced Index Fund and Fidelity International Enhanced Index Fund (each a fund of Fidelity Commonwealth Trust II) (the "Funds") as of August 31, 2017, the results of their operations, the changes in their net assets and the financial highlights for each of the periods indicated, in conformity with accounting principles generally accepted in the United States of America. These financial statements and financial highlights (hereafter referred to as “financial statements”) are the responsibility of the Funds' management. Our responsibility is to express an opinion on these financial statements based on our audits. We conducted our audits of these financial statements in accordance with the standards of the Public Company Accounting Oversight Board (United States). Those standards require that we plan and perform the audit to obtain reasonable assurance about whether the financial statements are free of material misstatement. An audit includes examining, on a test basis, evidence supporting the amounts and disclosures in the financial statements, assessing the accounting principles used and significant estimates made by management, and evaluating the overall financial statement presentation. Our procedures included confirmation of securities owned as of August 31, 2017 by correspondence with the custodian and brokers; when replies were not received from brokers, we performed other auditing procedures. We believe that our audits provide a reasonable basis for our opinion.
PricewaterhouseCoopers LLP
Boston, Massachusetts
October 20, 2017
Trustees and Officers
The Trustees, Members of the Advisory Board (if any), and officers of the trust and funds, as applicable, are listed below. The Board of Trustees governs each fund and is responsible for protecting the interests of shareholders. The Trustees are experienced executives who meet periodically throughout the year to oversee each fund's activities, review contractual arrangements with companies that provide services to each fund, oversee management of the risks associated with such activities and contractual arrangements, and review each fund's performance. Except for Donald F. Donahue and Carol B. Tomé, each of the Trustees oversees 90 funds. Mr. Donahue and Ms. Tomé each oversees 7 funds.
The Trustees hold office without limit in time except that (a) any Trustee may resign; (b) any Trustee may be removed by written instrument, signed by at least two-thirds of the number of Trustees prior to such removal; (c) any Trustee who requests to be retired or who has become incapacitated by illness or injury may be retired by written instrument signed by a majority of the other Trustees; and (d) any Trustee may be removed at any special meeting of shareholders by a two-thirds vote of the outstanding voting securities of the trust. Each Trustee who is not an interested person (as defined in the 1940 Act) of the trust and the funds is referred to herein as an Independent Trustee. Each Independent Trustee shall retire not later than the last day of the calendar year in which his or her 75th birthday occurs. The Independent Trustees may waive this mandatory retirement age policy with respect to individual Trustees. Officers and Advisory Board Members hold office without limit in time, except that any officer or Advisory Board Member may resign or may be removed by a vote of a majority of the Trustees at any regular meeting or any special meeting of the Trustees. Except as indicated, each individual has held the office shown or other offices in the same company for the past five years.
Each fund’s Statement of Additional Information (SAI) includes more information about the Trustees. To request a free copy, call Fidelity at 1-800-544-8544.
Experience, Skills, Attributes, and Qualifications of the Trustees. The Governance and Nominating Committee has adopted a statement of policy that describes the experience, qualifications, attributes, and skills that are necessary and desirable for potential Independent Trustee candidates (Statement of Policy). The Board believes that each Trustee satisfied at the time he or she was initially elected or appointed a Trustee, and continues to satisfy, the standards contemplated by the Statement of Policy. The Governance and Nominating Committee also engages professional search firms to help identify potential Independent Trustee candidates who have the experience, qualifications, attributes, and skills consistent with the Statement of Policy. From time to time, additional criteria based on the composition and skills of the current Independent Trustees, as well as experience or skills that may be appropriate in light of future changes to board composition, business conditions, and regulatory or other developments, have also been considered by the professional search firms and the Governance and Nominating Committee. In addition, the Board takes into account the Trustees' commitment and participation in Board and committee meetings, as well as their leadership of standing and ad hoc committees throughout their tenure.
In determining that a particular Trustee was and continues to be qualified to serve as a Trustee, the Board has considered a variety of criteria, none of which, in isolation, was controlling. The Board believes that, collectively, the Trustees have balanced and diverse experience, qualifications, attributes, and skills, which allow the Board to operate effectively in governing each fund and protecting the interests of shareholders. Information about the specific experience, skills, attributes, and qualifications of each Trustee, which in each case led to the Board's conclusion that the Trustee should serve (or continue to serve) as a trustee of the funds, is provided below.
Board Structure and Oversight Function. Brian B. Hogan is an interested person and currently serves as Chairman. The Trustees have determined that an interested Chairman is appropriate and benefits shareholders because an interested Chairman has a personal and professional stake in the quality and continuity of services provided to the funds. Independent Trustees exercise their informed business judgment to appoint an individual of their choosing to serve as Chairman, regardless of whether the Trustee happens to be independent or a member of management. The Independent Trustees have determined that they can act independently and effectively without having an Independent Trustee serve as Chairman and that a key structural component for assuring that they are in a position to do so is for the Independent Trustees to constitute a substantial majority for the Board. The Independent Trustees also regularly meet in executive session. Michael E. Wiley serves as Chairman of the Independent Trustees and as such (i) acts as a liaison between the Independent Trustees and management with respect to matters important to the Independent Trustees and (ii) with management prepares agendas for Board meetings.
Fidelity® funds are overseen by different Boards of Trustees. The funds' Board oversees Fidelity's sector portfolios. Other Boards oversee Fidelity's equity and high income funds, and Fidelity's investment grade bond, money market, and asset allocation funds. The use of separate Boards, each with its own committee structure, allows the Trustees of each group of Fidelity® funds to focus on the unique issues of the funds they oversee, including common research, investment, and operational issues. On occasion, the separate Boards establish joint committees to address issues of overlapping consequences for the Fidelity® funds overseen by each Board.
The Trustees operate using a system of committees to facilitate the timely and efficient consideration of all matters of importance to the Trustees, each fund, and fund shareholders and to facilitate compliance with legal and regulatory requirements and oversight of the funds' activities and associated risks. The Board, acting through its committees, has charged FMR and its affiliates with (i) identifying events or circumstances the occurrence of which could have demonstrably adverse effects on the funds' business and/or reputation; (ii) implementing processes and controls to lessen the possibility that such events or circumstances occur or to mitigate the effects of such events or circumstances if they do occur; and (iii) creating and maintaining a system designed to evaluate continuously business and market conditions in order to facilitate the identification and implementation processes described in (i) and (ii) above. Because the day-to-day operations and activities of the funds are carried out by or through FMR, its affiliates, and other service providers, the funds' exposure to risks is mitigated but not eliminated by the processes overseen by the Trustees. While each of the Board's committees has responsibility for overseeing different aspects of the funds' activities, oversight is exercised primarily through the Operations and Audit Committees. Appropriate personnel, including but not limited to the funds' Chief Compliance Officer (CCO), FMR's internal auditor, the independent accountants, the funds' Treasurer and portfolio management personnel, make periodic reports to the Board's committees, as appropriate. The responsibilities of each standing committee, including their oversight responsibilities, are described further under "Standing Committees of the Trustees."
Interested Trustees*:
Correspondence intended for a Trustee who is an interested person may be sent to Fidelity Investments, 245 Summer Street, Boston, Massachusetts 02210.
Name, Year of Birth; Principal Occupations and Other Relevant Experience+
Brian B. Hogan (1964)
Year of Election or Appointment: 2017
Trustee
Chairman of the Board of Trustees
Mr. Hogan also serves as Trustee or Vice President of other funds. Mr. Hogan serves as a Director of FMR Investment Management (UK) Limited (investment adviser firm, 2015-present) and Fidelity SelectCo, LLC (investment adviser firm, 2014-present) and President of the Equity Division of FMR (investment adviser firm, 2009-present). Previously, Mr. Hogan served as Senior Vice President, Equity Research of FMR (2006-2009) and as a portfolio manager. Mr. Brian B. Hogan is not related to Mr. Colm A. Hogan.
* Determined to be an "Interested Trustee" by virtue of, among other things, his or her affiliation with the trust or various entities under common control with FMR.
+ The information includes the Trustee's principal occupation during the last five years and other information relating to the experience, attributes, and skills relevant to the Trustee's qualifications to serve as a Trustee, which led to the conclusion that the Trustee should serve as a Trustee for each fund.
Independent Trustees:
Correspondence intended for an Independent Trustee may be sent to Fidelity Investments, P.O. Box 55235, Boston, Massachusetts 02205-5235.
Name, Year of Birth; Principal Occupations and Other Relevant Experience+
Donald F. Donahue (1950)
Year of Election or Appointment: 2017
Trustee
Mr. Donahue also serves as a Trustee or Member of the Advisory Board of other Fidelity® funds. Mr. Donahue is President and Chief Executive Officer of Miranda Partners, LLC (risk consulting for the financial services industry, 2012-present) and a consultant for the Institute for Defense Analyses (national security, 2012-present). Previously, Mr. Donahue served as Chief Executive Officer (2006-2012), Chief Operating Officer (2003-2006), and Managing Director, Customer Marketing and Development (1999-2003) of The Depository Trust & Clearing Corporation (financial markets infrastructure). Mr. Donahue serves as a Member (2012-present) and Co-Chairman (2016-present) of the Board of Directors of United Way of New York, Member of the Board of Directors of NYC Leadership Academy (2012-present) and Member of the Board of Advisors of Ripple Labs, Inc. (financial services, 2015-present). He also served as Chairman (2010-2012) and Member of the Board of Directors (2012-2013) of Omgeo, LLC (financial services), Treasurer of United Way of New York (2012-2016), and Member of the Board of Directors of XBRL US (financial services non-profit, 2009-2012) and the International Securities Services Association (2009-2012).
David A. Rosow (1942)
Year of Election or Appointment: 2017
Trustee
Mr. Rosow also serves as Trustee of other Fidelity® funds. Prior to his retirement in 2006, Mr. Rosow was the Chief Executive Officer, owner and operator of a number of private companies, which encompassed the oil refining, drilling and marketing of petroleum products (including specialty petroleum products), recreation industry, and real estate development. Mr. Rosow currently serves as a Director of Oxbow Carbon LLC (upgraders, marketers, and distributors of petroleum byproducts of the oil refining process, 2015-present) and Oxbridge Academy of the Palm Beaches (2015-present) and serves as its President and CEO. Previously, Mr. Rosow served on the Fairfield Country Day School Board for 27 years, including as its President for 3 years, stepping down in 2006. Mr. Rosow served as Lead Director and Chairman of the Audit Committee of Hudson United Bancorp (1996-2006), Chairman of the Board of Westport Bank and Trust (1992-1996), and as a Director of TD Banknorth (2006-2007). In addition, Mr. Rosow served as a member (2008-2014) and President (2009-2014) of the Town Council of Palm Beach, Florida. Mr. Rosow also served as a Member of the Advisory Board of certain Fidelity® funds (2012-2013).
Garnett A. Smith (1947)
Year of Election or Appointment: 2017
Trustee
Mr. Smith also serves as Trustee of other Fidelity® funds. Prior to Mr. Smith's retirement, he served as Chairman and Chief Executive Officer of Inbrand Corp. (manufacturer of personal absorbent products, 1990-1997). He also served as President (1986-1990) of Inbrand Corp. Prior to his employment with Inbrand Corp., he was employed by a retail fabric chain and North Carolina National Bank. In addition, Mr. Smith served as a Member of the Advisory Board of certain Fidelity® funds (2012-2013) and as a board member of the Jackson Hole Land Trust (2009-2012).
Carol B. Tomé (1957)
Year of Election or Appointment: 2017
Trustee
Ms. Tomé also serves as Trustee or Member of the Advisory Board of other Fidelity® funds. Ms. Tomé is Chief Financial Officer (2001-present) and Executive Vice President of Corporate Services (2007-present) of The Home Depot, Inc. (home improvement retailer) and a Director (2003-present) and Chair of the Audit Committee (2004-present) of United Parcel Service, Inc. (package delivery and supply chain management). Previously, Ms. Tomé served as Senior Vice President of Finance and Accounting/Treasurer (2000-2007) and Vice President and Treasurer (1995-2000) of The Home Depot, Inc. and Chair of the Board (2010-2012), Vice Chair of the Board (2009 and 2013), and a Director (2008-2013) of the Federal Reserve Bank of Atlanta. Ms. Tomé is also a director or trustee of many community and professional organizations.
Michael E. Wiley (1950)
Year of Election or Appointment: 2017
Trustee
Chairman of the Independent Trustees
Mr. Wiley also serves as Trustee of other Fidelity® funds. Mr. Wiley serves as a Director of Tesoro Corporation (independent oil refiner and marketer, 2005-present), a Director of Tesoro Logistics LP (natural resources logistics, 2015-present), and a Director of Bill Barrett Corporation (exploration and production, 2005-present). In addition, Mr. Wiley also serves as a Director of Post Oak Bank (privately-held bank, 2004-present). Previously, Mr. Wiley served as a Trustee of other Fidelity® funds (2008-2013), as a Director of Asia Pacific Exploration Consolidated (international oil and gas exploration and production, 2008-2013), as a member of the Board of Trustees of the University of Tulsa (2000-2006; 2007-2010), as a Senior Energy Advisor of Katzenbach Partners, LLC (consulting, 2006-2007), as an Advisory Director of Riverstone Holdings (private investment), Chairman, President, and CEO of Baker Hughes, Inc. (oilfield services, 2000-2004), and as Director of Spinnaker Exploration Company (exploration and production, 2001-2005).
+ The information includes the Trustee's principal occupation during the last five years and other information relating to the experience, attributes, and skills relevant to the Trustee's qualifications to serve as a Trustee, which led to the conclusion that the Trustee should serve as a Trustee for each fund.
Advisory Board Members and Officers:
Correspondence intended for a Member of the Advisory Board (if any) may be sent to Fidelity Investments, P.O. Box 55235, Boston, Massachusetts 02205-5235. Except for Anthony R. Rochte, correspondence intended for an officer may be sent to Fidelity Investments, 245 Summer Street, Boston, Massachusetts 02210. Correspondence intended for Mr. Rochte may be sent to Fidelity SelectCo, LLC (SelectCo), 1225 17th Street, Denver, Colorado 80202-5541. Officers appear below in alphabetical order.
Name, Year of Birth; Principal Occupation
Elizabeth Paige Baumann (1968)
Year of Election or Appointment: 2017
Anti-Money Laundering (AML) Officer
Ms. Baumann also serves as AML Officer of other funds. She is Chief AML Officer (2012-present) and Senior Vice President (2014-present) of FMR LLC (diversified financial services company) and is an employee of Fidelity Investments. Previously, Ms. Baumann served as AML Officer of the funds (2012-2016), and Vice President (2007-2014) and Deputy Anti-Money Laundering Officer (2007-2012) of FMR LLC.
Marc R. Bryant (1966)
Year of Election or Appointment: 2017
Secretary and Chief Legal Officer (CLO)
Mr. Bryant also serves as Secretary and CLO of other funds. Mr. Bryant serves as CLO, Secretary, and Senior Vice President of Fidelity Management & Research Company (investment adviser firm, 2015-present) and FMR Co., Inc. (investment adviser firm, 2015-present); Secretary of Fidelity SelectCo, LLC (investment adviser firm, 2015-present) and Fidelity Investments Money Management, Inc. (investment adviser firm, 2015-present); and CLO of Fidelity Management & Research (Hong Kong) Limited and FMR Investment Management (UK) Limited (investment adviser firms, 2015-present) and Fidelity Management & Research (Japan) Limited (investment adviser firm, 2016-present). He is Senior Vice President and Deputy General Counsel of FMR LLC (diversified financial services company). Previously, Mr. Bryant served as Secretary and CLO of Fidelity Rutland Square Trust II (2010-2014) and Assistant Secretary of Fidelity's Fixed Income and Asset Allocation Funds (2013-2015). Prior to joining Fidelity Investments, Mr. Bryant served as a Senior Vice President and the Head of Global Retail Legal for AllianceBernstein L.P. (2006-2010), and as the General Counsel for ProFund Advisors LLC (2001-2006).
William C. Coffey (1969)
Year of Election or Appointment: 2017
Assistant Secretary
Mr. Coffey also serves as Assistant Secretary of other funds. He is Senior Vice President and Deputy General Counsel of FMR LLC (diversified financial services company, 2010-present), and is an employee of Fidelity Investments. Previously, Mr. Coffey served as Vice President and Associate General Counsel of FMR LLC (2005-2009).
Jonathan Davis (1968)
Year of Election or Appointment: 2017
Assistant Treasurer
Mr. Davis also serves as Assistant Treasurer of other funds, and is an employee of Fidelity Investments. Previously, Mr. Davis served as Vice President and Associate General Counsel of FMR LLC (diversified financial services company, 2003-2010).
Adrien E. Deberghes (1967)
Year of Election or Appointment: 2017
President and Treasurer
Mr. Deberghes also serves as an officer of other funds. He serves as Executive Vice President of Fidelity Investments Money Management, Inc. (FIMM) (investment adviser firm, 2016-present) and is an employee of Fidelity Investments (2008-present). Prior to joining Fidelity Investments, Mr. Deberghes was Senior Vice President of Mutual Fund Administration at State Street Corporation (2007-2008), Senior Director of Mutual Fund Administration at Investors Bank & Trust (2005-2007), and Director of Finance for Dunkin' Brands (2000-2005). Previously, Mr. Deberghes served in other fund officer roles.
Joseph DeSantis (1959)
Year of Election or Appointment: 2017
Vice President
Mr. DeSantis also serves as Vice President of other funds. Mr. DeSantis serves as a Director of Fidelity Management & Research (Japan) Limited (investment adviser firm, 2016-present), Chief Investment Officer, Equities (2010-present) and is an employee of Fidelity Investments.
Stephanie J. Dorsey (1969)
Year of Election or Appointment: 2017
Assistant Treasurer
Ms. Dorsey also serves as an officer of other funds. She is an employee of Fidelity Investments (2008-present) and has served in other fund officer roles. Prior to joining Fidelity Investments, Ms. Dorsey served as Treasurer (2004-2008) of the JPMorgan Mutual Funds and Vice President (2004-2008) of JPMorgan Chase Bank.
Howard J. Galligan III (1966)
Year of Election or Appointment: 2017
Chief Financial Officer
Mr. Galligan also serves as Chief Financial Officer of other funds. Mr. Galligan serves as President of Fidelity Pricing and Cash Management Services (FPCMS) (2014-present) and as a Director of Strategic Advisers, Inc. (investment adviser firm, 2008-present). Previously, Mr. Galligan served as Chief Administrative Officer of Asset Management (2011-2014) and Chief Operating Officer and Senior Vice President of Investment Support for Strategic Advisers, Inc. (2003-2011).
James D. Gryglewicz (1972)
Year of Election or Appointment: 2017
Chief Compliance Officer
Mr. Gryglewicz also serves as Chief Compliance Officer of other funds. Mr. Gryglewicz serves as Compliance Officer of Strategic Advisers, Inc. (investment adviser firm, 2015-present) and Fidelity SelectCo, LLC (investment adviser firm, 2014-present), Senior Vice President of Asset Management Compliance (2009-present), and is an employee of Fidelity Investments (2004-present).
Brian B. Hogan (1964)
Year of Election or Appointment: 2017
Vice President
Mr. Hogan also serves as Trustee or Vice President of other funds. Mr. Hogan serves as a Director of FMR Investment Management (UK) Limited (investment adviser firm, 2015-present) and Fidelity SelectCo, LLC (investment adviser firm, 2014-present) and President of the Equity Division of FMR (investment adviser firm, 2009-present). Previously, Mr. Hogan served as Senior Vice President, Equity Research of FMR (2006-2009) and as a portfolio manager. Mr. Brian B. Hogan is not related to Mr. Colm A. Hogan.
Colm A. Hogan (1973)
Year of Election or Appointment: 2017
Assistant Treasurer
Mr. Hogan also serves as an officer of other funds. Mr. Hogan is an employee of Fidelity Investments (2005-present). Mr. Colm A. Hogan is not related to Mr. Brian B. Hogan.
Chris Maher (1972)
Year of Election or Appointment: 2017
Assistant Treasurer
Mr. Maher serves as Assistant Treasurer of other funds. Mr. Maher is Vice President of Valuation Oversight and is an employee of Fidelity Investments. Previously, Mr. Maher served as Vice President of Asset Management Compliance (2013), Vice President of the Program Management Group of FMR (investment adviser firm, 2010-2013), and Vice President of Valuation Oversight (2008-2010).
Rieco E. Mello (1969)
Year of Election or Appointment: 2017
Assistant Treasurer
Mr. Mello also serves as Assistant Treasurer of other funds. Mr. Mello is an employee of Fidelity Investments (1995-present).
Anthony R. Rochte (1968)
Year of Election or Appointment: 2017
Vice President
Mr. Rochte also serves as Vice President of other funds. Mr. Rochte serves as President of Fidelity SelectCo, LLC (investment adviser firm, 2012-present) and is an employee of Fidelity Investments (2012-present). Prior to joining Fidelity Investments, Mr. Rochte served as Senior Managing Director and head of State Street Global Advisors' North American Intermediary Business Group (2006-2012).
Stacie M. Smith (1974)
Year of Election or Appointment: 2017
Assistant Treasurer
Ms. Smith also serves as an officer of other funds. She is an employee of Fidelity Investments (2009-present) and has served in other fund officer roles. Prior to joining Fidelity Investments, Ms. Smith served as Senior Audit Manager of Ernst & Young LLP (accounting firm, 1996-2009). Previously, Ms. Smith served as Deputy Treasurer of certain Fidelity® funds (2013-2016).
Marc L. Spector (1972)
Year of Election or Appointment: 2017
Assistant Treasurer
Mr. Spector also serves as an officer of other funds. Mr. Spector is an employee of Fidelity Investments (2016-present). Prior to joining Fidelity Investments, Mr. Spector served as Director at the Siegfried Group (accounting firm, 2013-2016), and prior to Siegfried Group as audit senior manager at Deloitte & Touche (accounting firm, 2005-2013).
Renee Stagnone (1975)
Year of Election or Appointment: 2017
Assistant Treasurer
Ms. Stagnone also serves as an officer of other funds. Ms. Stagnone is an employee of Fidelity Investments (1997-present). Previously, Ms. Stagnone served as Deputy Treasurer of certain Fidelity® funds (2013-2016).
Shareholder Expense Example
As a shareholder of a Fund, you incur two types of costs: (1) transaction costs, including redemption fees and (2) ongoing costs, including management fees and other Fund expenses. This Example is intended to help you understand your ongoing costs (in dollars) of investing in the Funds and to compare these costs with the ongoing costs of investing in other mutual funds.
The Example is based on an investment of $1,000 invested at the beginning of the period and held for the entire period (March 1, 2017 to August 31, 2017).
Actual Expenses
The first line of the accompanying table for each fund provides information about actual account values and actual expenses. You may use the information in this line, together with the amount you invested, to estimate the expenses that you paid over the period. Simply divide your account value by $1,000.00 (for example, an $8,600 account value divided by $1,000.00 = 8.6), then multiply the result by the number in the first line for a fund under the heading entitled "Expenses Paid During Period" to estimate the expenses you paid on your account during this period. A small balance maintenance fee of $12.00 that is charged once a year may apply for certain accounts with a value of less than $2,000. This fee is not included in the table below. If it was, the estimate of expenses you paid during the period would be higher, and your ending account value lower, by this amount. In addition, each Fund, as a shareholder in the underlying Fidelity Central Funds, will indirectly bear its pro-rata share of the fees and expenses incurred by the underlying Fidelity Central Funds. These fees and expenses are not included in the Fund's annualized expense ratio used to calculate the expense estimate in the table below.
Hypothetical Example for Comparison Purposes
The second line of the accompanying table for each fund provides information about hypothetical account values and hypothetical expenses based on a fund's actual expense ratio and an assumed rate of return of 5% per year before expenses, which is not the Fund's actual return. The hypothetical account values and expenses may not be used to estimate the actual ending account balance or expenses you paid for the period. You may use this information to compare the ongoing costs of investing in the Fund and other funds. To do so, compare this 5% hypothetical example with the 5% hypothetical examples that appear in the shareholder reports of the other funds. A small balance maintenance fee of $12.00 that is charged once a year may apply for certain accounts with a value of less than $2,000. This fee is not included in the table below. If it was, the estimate of expenses you paid during the period would be higher, and your ending account value lower, by this amount. In addition, each Fund, as a shareholder in the underlying Fidelity Central Funds, will indirectly bear its pro-rata share of the fees and expenses incurred by the underlying Fidelity Central Funds. These fees and expenses are not included in the Fund's annualized expense ratio used to calculate the expense estimate in the table below.
Please note that the expenses shown in the table are meant to highlight your ongoing costs only and do not reflect any transaction costs. Therefore, the second line of the table is useful in comparing ongoing costs only, and will not help you determine the relative total costs of owning different funds. In addition, if these transactional costs were included, your costs would have been higher.
| Annualized Expense Ratio-A | Beginning Account Value March 1, 2017 | Ending Account Value August 31, 2017 | Expenses Paid During Period-B March 1, 2017 to August 31, 2017 | |
| Fidelity Large Cap Growth Enhanced Index Fund | .40% | |||
| Actual | $1,000.00 | $1,070.40 | $4.14 | |
| Hypothetical-C | $1,000.00 | $1,046.00 | $4.09 | |
| Fidelity Large Cap Value Enhanced Index Fund | .40% | |||
| Actual | $1,000.00 | $1,007.90 | $4.02 | |
| Hypothetical-C | $1,000.00 | $1,046.00 | $4.09 | |
| Fidelity Large Cap Core Enhanced Index Fund | .40% | |||
| Actual | $1,000.00 | $1,042.90 | $4.09 | |
| Hypothetical-C | $1,000.00 | $1,046.00 | $4.09 | |
| Fidelity Mid Cap Enhanced Index Fund | .59% | |||
| Actual | $1,000.00 | $1,017.20 | $5.95 | |
| Hypothetical-C | $1,000.00 | $1,044.10 | $6.03 | |
| Fidelity International Enhanced Index Fund | .59% | |||
| Actual | $1,000.00 | $1,147.40 | $6.33 | |
| Hypothetical-C | $1,000.00 | $1,044.10 | $6.03 |
A Annualized expense ratio reflects expenses net of applicable fee waivers.
B Expenses are equal to each Fund's annualized expense ratio, multiplied by the average account value over the period, multiplied by 184/ 184 (to reflect the one-half year period).
C 5% return per year before expenses
Distributions (Unaudited)
The funds hereby designate as capital gain dividend the amounts noted below for the taxable year ended August 31, 2017, or, if subsequently determined to be different, the net capital gain of such year.
| Fidelity Large Cap Growth Enhanced Index Fund | $12,077,937 |
| Fidelity Large Cap Value Enhanced Index Fund | $38,674,818 |
| Fidelity Large Cap Core Enhanced Index Fund | $4,710,260 |
| Fidelity Mid Cap Enhanced Index Fund | $50,011,036 |
A percentage of the dividends distributed during the fiscal year for the following funds qualify for the dividends–received deduction for corporate shareholders:
| April 2017 | |
| Fidelity Large Cap Growth Enhanced Index Fund | 100% |
| Fidelity Large Cap Value Enhanced Index Fund | 66% |
| Fidelity Large Cap Core Enhanced Index Fund | 100% |
| Fidelity Mid Cap Enhanced Index Fund | 100% |
| Fidelity International Enhanced Index Fund | – |
A percentage of the dividends distributed during the fiscal year for the following funds may be taken into account as a dividend for purposes of the maximum rate under section 1(h)(11) of the Internal Revenue Code.
| April 2017 | |
| Fidelity Large Cap Growth Enhanced Index Fund | 100% |
| Fidelity Large Cap Value Enhanced Index Fund | 73% |
| Fidelity Large Cap Core Enhanced Index Fund | 100% |
| Fidelity Mid Cap Enhanced Index Fund | 100% |
| Fidelity International Enhanced Index Fund | – |
The funds will notify shareholders in January 2018 of amounts for use in preparing 2017 income tax returns.
Board Approval of Investment Advisory Contracts
International Enhanced Index FundLarge Cap Core Enhanced Index FundLarge Cap Growth Enhanced Index FundLarge Cap Value Enhanced Index FundMid Cap Enhanced Index FundAt its April 2017 meeting, the Board of Trustees, including the Independent Trustees (together, the Board), voted to continue the sub-advisory agreement with Geode Capital Management, LLC (Geode) for each fund (the Sub-Advisory Agreement) for four months through January 31, 2018, in connection with the change in oversight of the funds from another Fidelity Funds Board of Trustees to the Sector Portfolios Board of Trustees.The Board considered that the approval of the Sub-Advisory Agreement will not result in any changes in (i) the investment process or strategies employed in the management of the funds' assets; (ii) the fees and expenses paid by shareholders; (iii) the nature, extent or quality of services provided under the Sub-Advisory Agreement; or (iv) the day-to-day management of each fund or the persons primarily responsible for such management. The Board concluded that the Sub-Advisory Agreement is fair and reasonable, and that the Sub-Advisory Agreement should be renewed, without modification, through January 31, 2018, with the understanding that the Board will consider the annual renewal for a full one year period in January 2018.In connection with its consideration of future renewals of the Sub-Advisory Agreement, the Board will consider: (i) the nature, extent and quality of services provided to the fund, including shareholder and administrative services and investment performance; (ii) the competitiveness of the management fee and total expenses; (iii) the costs of the services and profitability, including the revenues earned and the expenses incurred in conducting the business of developing, marketing, distributing, managing, administering, and servicing the fund and its shareholders, to the extent applicable; and (iv) whether there have been economies of scale in respect of the Fidelity funds, whether the Fidelity funds (including the fund) have appropriately benefited from any such economies of scale, and whether there is the potential for realization of any further economies.Based on its evaluation of all of the conclusions noted above, and after considering all factors it believed relevant, the Board ultimately concluded that the management fee structures are fair and reasonable, and that the amendment to the New Advisory Contracts for the funds should be approved.Board Approval of Investment Advisory ContractsInternational Enhanced Index FundLarge Cap Core Enhanced Index FundLarge Cap Growth Enhanced Index FundLarge Cap Value Enhanced Index FundMid Cap Enhanced Index FundAt its July 2017 meeting, the Board of Trustees, including the Independent Trustees (together, the Board), voted to approve an amended and restated sub-advisory agreement with Geode Capital Management, LLC (Geode) for each fund (the Sub-Advisory Agreement) in connection with the conversion of each fund to a master-feeder structure. The Sub-Advisory Agreement permits each fund to aggregate its assets with those of a related exchange-traded fund feeder for purposes of calculating the effective sub-advisory fee rate to be paid to Geode.The Board considered that the approval of the Sub-Advisory Agreement will not result in any changes in (i) the investment process or strategies employed in the management of the funds' assets; (ii) the fees and expenses paid by shareholders; (iii) the nature, extent or quality of services provided under the Sub-Advisory Agreement; or (iv) the day-to-day management of each fund or the persons primarily responsible for such management. The Board concluded that the Sub-Advisory Agreement is fair and reasonable and should be approved.In connection with its consideration of future renewals of the Sub-Advisory Agreement, the Board will consider: (i) the nature, extent and quality of services provided to the fund, including shareholder and administrative services and investment performance; (ii) the competitiveness of the management fee and total expenses; (iii) the costs of the services and profitability, including the revenues earned and the expenses incurred in conducting the business of developing, marketing, distributing, managing, administering, and servicing the fund and its shareholders, to the extent applicable; and (iv) whether there have been economies of scale in respect of the Fidelity funds, whether the Fidelity funds (including the fund) have appropriately benefited from any such economies of scale, and whether there is the potential for realization of any further economies.Based on its evaluation of all of the conclusions noted above, and after considering all factors it believed relevant, the Board ultimately concluded that the management fee structures are fair and reasonable, and that the Sub-Advisory Agreements for the funds should be approved.
Proxy Voting Results
A special meeting of shareholders was held on March 8, 2017. The results of votes taken among shareholders on the proposals before them are reported below. Each vote reported represents one dollar of net asset value held on the record date for the meeting.
PROPOSAL 1
To elect a Board of Trustees.
| # of Votes | % of Votes | |
| Donald F. Donahue | ||
| Affirmative | 4,251,161,311.78 | 96.580 |
| Withheld | 150,560,345.58 | 3.420 |
| TOTAL | 4,401,721,657.36 | 100.000 |
| Brian B. Hogan | ||
| Affirmative | 4,241,813,790.79 | 96.368 |
| Withheld | 159,907,866.57 | 3.632 |
| TOTAL | 4,401,721,657.36 | 100.000 |
| David A. Rosow | ||
| Affirmative | 4,227,521,324.31 | 96.043 |
| Withheld | 174,200,333.05 | 3.957 |
| TOTAL | 4,401,721,657.36 | 100.000 |
| Garnett A. Smith | ||
| Affirmative | 4,247,477,480.79 | 96.496 |
| Withheld | 154,244,176.57 | 3.504 |
| TOTAL | 4,401,721,657.36 | 100.000 |
| Carol B. Tomé | ||
| Affirmative | 4,260,535,339.06 | 96.793 |
| Withheld | 141,186,318.30 | 3.207 |
| TOTAL | 4,401,721,657.36 | 100.000 |
| Michael E. Wiley | ||
| Affirmative | 4,245,954,069.99 | 96.462 |
| Withheld | 155,767,587.37 | 3.538 |
| TOTAL | 4,401,721,657.36 | 100.000 |
PROPOSAL 2A
To approve an amended and restated management contract between Fidelity® Large Cap Core Enhanced Index Fund and FMRC.
| # of Votes | % of Votes | |
| Affirmative | 298,098,053.26 | 89.664 |
| Against | 7,395,552.66 | 2.225 |
| Abstain | 19,599,665.57 | 5.895 |
| Broker Non-Vote | 7,370,166.53 | 2.216 |
| TOTAL | 332,463,438.02 | 100.000 |
PROPOSAL 2B
To terminate the expense contract between Fidelity® Large Cap Core Enhanced Index Fund and FMRC.
| # of Votes | % of Votes | |
| Affirmative | 296,860,006.02 | 89.292 |
| Against | 6,802,624.42 | 2.046 |
| Abstain | 21,430,641.05 | 6.446 |
| Broker Non-Vote | 7,370,166.53 | 2.216 |
| TOTAL | 332,463,438.02 | 100.000 |
PROPOSAL 2A
To approve an amended and restated management contract between Fidelity® Large Cap Value Enhanced Index Fund and FMRC.
| # of Votes | % of Votes | |
| Affirmative | 1,854,799,753.44 | 91.848 |
| Against | 41,880,774.05 | 2.074 |
| Abstain | 100,243,472.75 | 4.964 |
| Broker Non-Vote | 22,504,618.53 | 1.114 |
| TOTAL | 2,019,428,618.77 | 100.000 |
PROPOSAL 2B
To terminate the expense contract between Fidelity ® Large Cap Value Enhanced Index Fund and FMRC.
| # of Votes | % of Votes | |
| Affirmative | 1,849,364,932.16 | 91.579 |
| Against | 30,374,181.50 | 1.505 |
| Abstain | 117,184,886.58 | 5.802 |
| Broker Non-Vote | 22,504,618.53 | 1.114 |
| TOTAL | 2,019,428,618.77 | 100.000 |
PROPOSAL 2A
To approve an amended and restated management contract between Fidelity® Large Cap Growth Enhanced Index Fund and FMRC.
| # of Votes | % of Votes | |
| Affirmative | 425,999,249.29 | 86.024 |
| Against | 18,965,399.25 | 3.830 |
| Abstain | 19,498,485.44 | 3.937 |
| Broker Non-Vote | 30,749,496.45 | 6.209 |
| TOTAL | 495,212,630.43 | 100.000 |
PROPOSAL 2B
To terminate the expense contract between Fidelity ® Large Cap Growth Enhanced Index Fund and FMRC.
| # of Votes | % of Votes | |
| Affirmative | 420,416,782.72 | 84.897 |
| Against | 20,182,182.67 | 4.076 |
| Abstain | 23,864,168.59 | 4.818 |
| Broker Non-Vote | 30,749,496.45 | 6.209 |
| TOTAL | 495,212,630.43 | 100.000 |
PROPOSAL 2A
To approve an amended and restated management contract between Fidelity® International Enhanced Index Fund and FMRC.
| # of Votes | % of Votes | |
| Affirmative | 135,725,380.55 | 89.584 |
| Against | 4,673,601.15 | 3.085 |
| Abstain | 3,581,810.78 | 2.364 |
| Broker Non-Vote | 7,526,154.30 | 4.967 |
| TOTAL | 151,506,946.78 | 100.000 |
PROPOSAL 2B
To terminate the expense contract between Fidelity ® International Enhanced Index Fund and FMRC.
| # of Votes | % of Votes | |
| Affirmative | 135,139,099.01 | 89.197 |
| Against | 4,930,694.79 | 3.255 |
| Abstain | 3,910,998.68 | 2.581 |
| Broker Non-Vote | 7,526,154.30 | 4.967 |
| TOTAL | 151,506,946.78 | 100.000 |
PROPOSAL 2A
To approve an amended and restated management contract between Fidelity® Mid Cap Enhanced Index Fund and FMRC.
| # of Votes | % of Votes | |
| Affirmative | 620,692,966.41 | 88.541 |
| Against | 17,513,295.54 | 2.498 |
| Abstain | 38,237,103.30 | 5.454 |
| Broker Non-Vote | 24,586,315.20 | 3.507 |
| TOTAL | 701,029,680.45 | 100.000 |
PROPOSAL 2B
To terminate the expense contract between Fidelity ® Mid Cap Enhanced Index Fund and FMRC.
| # of Votes | % of Votes | |
| Affirmative | 619,802,288.49 | 88.414 |
| Against | 13,260,499.66 | 1.891 |
| Abstain | 43,380,577.10 | 6.188 |
| Broker Non-Vote | 24,586,315.20 | 3.507 |
| TOTAL | 701,029,680.45 | 100.000 |
| Proposal 1 reflects trust wide proposal and voting results. |
![]()
GEI-ANN-1017
1.855140.111
Item 2.
Code of Ethics
As of the end of the period, August 31, 2017, Fidelity Commonwealth Trust II (the “trust”) has adopted a code of ethics, as defined in Item 2 of Form N-CSR, that applies to its President and Treasurer and its Chief Financial Officer. A copy of the code of ethics is filed as an exhibit to this Form N-CSR.
Item 3.
Audit Committee Financial Expert
The Board of Trustees of the trust has determined that David A. Rosow is an audit committee financial expert, as defined in Item 3 of Form N-CSR. Mr. Rosow is independent for purposes of Item 3 of Form N-CSR.
Item 4.
Principal Accountant Fees and Services
Fees and Services
The following table presents fees billed by PricewaterhouseCoopers LLP (“PwC”) for the 6 month period ended August 31, 2017 and for the fiscal years ended February 28, 2017 and February 29, 2016 for services rendered to Fidelity International Enhanced Index Fund, Fidelity Large Cap Core Enhanced Index Fund, Fidelity Large Cap Growth Enhanced Index Fund, Fidelity Large Cap Value Enhanced Index Fund and Fidelity Mid Cap Enhanced Index Fund (the “Funds”):
Services Billed by PwC
August 31, 2017 FeesA,B
| Audit Fees | Audit-Related Fees | Tax Fees | All Other Fees |
Fidelity International Enhanced Index Fund | $32,000 | $4,400 | $3,700 | $2,100 |
Fidelity Large Cap Core Enhanced Index Fund | $32,000 | $4,300 | $5,400 | $2,100 |
Fidelity Large Cap Growth Enhanced Index Fund | $32,000 | $4,300 | $3,700 | $2,100 |
Fidelity Large Cap Value Enhanced Index Fund | $32,000 | $4,300 | $3,700 | $2,100 |
Fidelity Mid Cap Enhanced Index Fund | $32,000 | $4,300 | $3,700 | $2,100 |
|
|
|
|
|
February 28, 2017 FeesA,C
| Audit Fees | Audit-Related Fees | Tax Fees | All Other Fees |
Fidelity International Enhanced Index Fund | $45,000 | $4,700 | $3,700 | $2,300 |
Fidelity Large Cap Core Enhanced Index Fund | $46,000 | $4,600 | $5,400 | $2,200 |
Fidelity Large Cap Growth Enhanced Index Fund | $45,000 | $4,600 | $3,700 | $2,200 |
Fidelity Large Cap Value Enhanced Index Fund | $45,000 | $4,600 | $3,700 | $2,200 |
Fidelity Mid Cap Enhanced Index Fund | $45,000 | $4,600 | $3,700 | $2,200 |
|
|
|
|
|
February 29, 2016 FeesA
| Audit Fees | Audit-Related Fees | Tax Fees | All Other Fees |
Fidelity International Enhanced Index Fund | $49,000 | $- | $6,500 | $1,900 |
Fidelity Large Cap Core Enhanced Index Fund | $49,000 | $- | $6,500 | $1,900 |
Fidelity Large Cap Growth Enhanced Index Fund | $49,000 | $- | $3,700 | $1,900 |
Fidelity Large Cap Value Enhanced Index Fund | $52,000 | $- | $3,700 | $2,200 |
Fidelity Mid Cap Enhanced Index Fund | $49,000 | $- | $4,700 | $2,000 |
A Amounts may reflect rounding.
B For the six month period ended August 31, 2017.
C Certain amounts have been reclassified to align with current period presentation.
The following table presents fees billed by PwC that were required to be approved by the Audit Committee for services that relate directly to the operations and financial reporting of the Funds and that are rendered on behalf of Fidelity Management & Research Company (“FMR”) and entities controlling, controlled by, or under common control with FMR (not including any sub-adviser whose role is primarily portfolio management and is subcontracted with or overseen by another investment adviser) that provide ongoing services to the Funds (“Fund Service Providers”):
Services Billed by PwC
| August 31, 2017A,B | February 28, 2017A | February 29, 2016A,C |
Audit-Related Fees | $9,815,000 | $5,985,000 | $5,470,000 |
Tax Fees | $105,000 | $105,000 | $- |
All Other Fees | $- | $- | $- |
A Amounts may reflect rounding.
B For the 6 month period ended August 31, 2017.
C Certain amounts have been reclassified to align with current period presentation.
“Audit-Related Fees” represent fees billed for assurance and related services that are reasonably related to the performance of the fund audit or the review of the fund's financial statements and that are not reported under Audit Fees.
“Tax Fees” represent fees billed for tax compliance, tax advice or tax planning that relate directly to the operations and financial reporting of the fund.
“All Other Fees” represent fees billed for services provided to the fund or Fund Service Provider, a significant portion of which are assurance related, that relate directly to the operations and financial reporting of the fund, excluding those services that are reported under Audit Fees, Audit-Related Fees or Tax Fees.
Assurance services must be performed by an independent public accountant.
* * *
The aggregate non-audit fees billed by PwC for services rendered to the Funds, FMR (not including any sub-adviser whose role is primarily portfolio management and is subcontracted with or overseen by another investment adviser), and any Fund Service Provider relating to Covered Services and Non-Covered Services (each as defined below) for the six month period ended August 31, 2017 and for the fiscal years ended February 28, 2017 and February 29, 2016 are as follows:
Billed By | August 31, 2017A,B | February 28, 2017A,C | February 29, 2016A | |
PwC | $13,015,000 | $8,025,000 | $6,130,000 | |
|
|
|
| |
A Amounts may reflect rounding.
B For the six month period ended August 31, 2017.
C Certain amounts have been reclassified to align with current period presentation.
The trust's Audit Committee has considered non-audit services that were not pre-approved that were provided by PwC to Fund Service Providers to be compatible with maintaining the independence of PwC in its audit of the Funds, taking into account representations from PwC, in accordance with Public Company Accounting Oversight Board rules, regarding its independence from the Funds and their related entities and FMR’s review of the appropriateness and permissibility under applicable law of such non-audit services prior to their provision to the Fund Service Providers.
Audit Committee Pre-Approval Policies and Procedures
The trust’s Audit Committee must pre-approve all audit and non-audit services provided by a fund’s independent registered public accounting firm relating to the operations or financial reporting of the fund. Prior to the commencement of any audit or non-audit services to a fund, the Audit Committee reviews the services to determine whether they are appropriate and permissible under applicable law.
The Audit Committee has adopted policies and procedures to, among other purposes, provide a framework for the Committee’s consideration of non-audit services by the audit firms that audit the Fidelity funds. The policies and procedures require that any non-audit service provided by a fund audit firm to a Fidelity fund and any non-audit service provided by a fund auditor to a Fund Service Provider that relates directly to the operations and financial reporting of a Fidelity fund (“Covered Service”) are subject to approval by the Audit Committee before such service is provided.
All Covered Services must be approved in advance of provision of the service either: (i) by formal resolution of the Audit Committee, or (ii) by oral or written approval of the service by the Chair of the Audit Committee (or if the Chair is unavailable, such other member of the Audit Committee as may be designated by the Chair to act in the Chair’s absence). The approval contemplated by (ii) above is permitted where the Treasurer determines that action on such an engagement is necessary before the next meeting of the Audit Committee.
Non-audit services provided by a fund audit firm to a Fund Service Provider that do not relate directly to the operations and financial reporting of a Fidelity fund are reported to the Audit Committee on a periodic basis.
Non-Audit Services Approved Pursuant to Rule 2-01(c)(7)(i)(C) and (ii) of Regulation S-X (“De Minimis Exception”)
There were no non-audit services approved or required to be approved by the Audit Committee pursuant to the De Minimis Exception during the periods ended August 31, 2017, February 28, 2017 and February 29, 2016, relating to services provided to (i) the Funds or (ii) any Fund Service Provider that relate directly to the operations and financial reporting of the Funds.
Item 5.
Audit Committee of Listed Registrants
Not applicable.
Item 6.
Investments
(a)
Not applicable.
(b)
Not applicable
Item 7.
Disclosure of Proxy Voting Policies and Procedures for Closed-End Management Investment Companies
Not applicable.
Item 8.
Portfolio Managers of Closed-End Management Investment Companies
Not applicable.
Item 9.
Purchase of Equity Securities by Closed-End Management Investment Company and Affiliated Purchasers
Not applicable.
Item 10.
Submission of Matters to a Vote of Security Holders
There were no material changes to the procedures by which shareholders may recommend nominees to the trust’s Board of Trustees.
Item 11.
Controls and Procedures
(a)(i) The President and Treasurer and the Chief Financial Officer have concluded that the trust’s disclosure controls and procedures (as defined in Rule 30a-3(c) under the Investment Company Act) provide reasonable assurances that material information relating to the trust is made known to them by the appropriate persons, based on their evaluation of these controls and procedures as of a date within 90 days of the filing date of this report.
(a)(ii) There was no change in the trust’s internal control over financial reporting (as defined in Rule 30a-3(d) under the Investment Company Act) that occurred during the second fiscal quarter of the period covered by this report that has materially affected, or is reasonably likely to materially affect, the trust’s internal control over financial reporting.
Item 12.
Exhibits
(a) | (1) | Code of Ethics pursuant to Item 2 of Form N-CSR is filed and attached hereto as EX-99.CODE ETH. |
(a) | (2) | Certification pursuant to Rule 30a-2(a) under the Investment Company Act of 1940 (17 CFR 270.30a-2(a)) is filed and attached hereto as Exhibit 99.CERT. |
(a) | (3) | Not applicable. |
(b) |
| Certification pursuant to Rule 30a-2(b) under the Investment Company Act of 1940 (17 CFR 270.30a-2(b)) is furnished and attached hereto as Exhibit 99.906CERT. |
SIGNATURES
Pursuant to the requirements of the Securities Exchange Act of 1934 and the Investment Company Act of 1940, the registrant has duly caused this report to be signed on its behalf by the undersigned, thereunto duly authorized.
Fidelity Commonwealth Trust II
By: | /s/ Adrien E. Deberghes |
| Adrien E. Deberghes |
| President and Treasurer |
|
|
Date: | October 26, 2017 |
Pursuant to the requirements of the Securities Exchange Act of 1934 and the Investment Company Act of 1940, this report has been signed below by the following persons on behalf of the registrant and in the capacities and on the dates indicated.
By: | /s/Adrien E. Deberghes |
| Adrien E. Deberghes |
| President and Treasurer |
|
|
Date: | October 26, 2017 |
By: | /s/Howard J. Galligan III |
| Howard J. Galligan III |
| Chief Financial Officer |
|
|
Date: | October 26, 2017 |