UNITED STATES
SECURITIES AND EXCHANGE COMMISSION
Washington, D.C. 20549
FORM N-CSR
CERTIFIED SHAREHOLDER REPORT OF REGISTERED
MANAGEMENT INVESTMENT COMPANIES
Investment Company Act file number 811-21990
Fidelity Commonwealth Trust II
(Exact name of registrant as specified in charter)
245 Summer St., Boston, Massachusetts 02210
(Address of principal executive offices) (Zip code)
Marc Bryant, Secretary
245 Summer St.
Boston, Massachusetts 02210
(Name and address of agent for service)
Registrant's telephone number, including area code:
617-563-7000
Date of fiscal year end: | February 29 |
|
|
Date of reporting period: | February 29, 2016 |
Item 1.
Reports to Stockholders
Fidelity® Large Cap Growth Enhanced Index Fund Fidelity® Large Cap Value Enhanced Index Fund Fidelity® Large Cap Core Enhanced Index Fund Fidelity® Mid Cap Enhanced Index Fund Fidelity® Small Cap Enhanced Index Fund Fidelity® International Enhanced Index Fund Annual Report February 29, 2016 |
 |
Contents
Fidelity® Large Cap Growth Enhanced Index Fund | |
Fidelity® Large Cap Value Enhanced Index Fund | |
Fidelity® Large Cap Core Enhanced Index Fund | |
Fidelity® Mid Cap Enhanced Index Fund | |
Fidelity® Small Cap Enhanced Index Fund | |
Fidelity® International Enhanced Index Fund | |
Board Approval of Investment Advisory Contracts and Management Fees | |
To view a fund's proxy voting guidelines and proxy voting record for the 12-month period ended June 30, visit http://www.fidelity.com/proxyvotingresults or visit the Securities and Exchange Commission's (SEC) web site at http://www.sec.gov.
You may also call 1-800-544-8544 to request a free copy of the proxy voting guidelines.
The funds or securities referred to herein are not sponsored, endorsed, or promoted by MSCI, and MSCI bears no liability with respect to any such funds or securities or any index on which such funds or securities are based. The prospectus contains a more detailed description of the limited relationship MSCI has with Fidelity and any related funds.
Standard & Poor's, S&P and S&P 500 are registered service marks of The McGraw-Hill Companies, Inc. and have been licensed for use by Fidelity Distributors Corporation.
Other third-party marks appearing herein are the property of their respective owners.
All other marks appearing herein are registered or unregistered trademarks or service marks of FMR LLC or an affiliated company. © 2016 FMR LLC. All rights reserved.
This report and the financial statements contained herein are submitted for the general information of the shareholders of the Funds. This report is not authorized for distribution to prospective investors in the Funds unless preceded or accompanied by an effective prospectus.
A fund files its complete schedule of portfolio holdings with the SEC for the first and third quarters of each fiscal year on Form N-Q. Forms N-Q are available on the SEC’s web site at http://www.sec.gov. A fund's Forms N-Q may be reviewed and copied at the SEC’s Public Reference Room in Washington, DC. Information regarding the operation of the SEC's Public Reference Room may be obtained by calling 1-800-SEC-0330.
For a complete list of a fund's portfolio holdings, view the most recent holdings listing, semiannual report, or annual report on Fidelity's web site at http://www.fidelity.com, http://www.advisor.fidelity.com, or http://www.401k.com, as applicable.
NOT FDIC INSURED •MAY LOSE VALUE •NO BANK GUARANTEE
Neither the Funds nor Fidelity Distributors Corporation is a bank.
Fidelity® Large Cap Growth Enhanced Index Fund
Performance: The Bottom Line
Average annual total return reflects the change in the value of an investment, assuming reinvestment of distributions from dividend income and capital gains (the profits earned upon the sale of securities that have grown in value, if any) and assuming a constant rate of performance each year. The hypothetical investment and the average annual total returns do not reflect the deduction of taxes that a shareholder would pay on fund distributions or the redemption of fund shares. During periods of reimbursement by Fidelity, a fund’s total return will be greater than it would be had the reimbursement not occurred. How a fund did yesterday is no guarantee of how it will do tomorrow.
Average Annual Total Returns
| For the periods ended February 29, 2016 | Past 1 year | Past 5 years | Life of fundA |
| Fidelity® Large Cap Growth Enhanced Index Fund | (6.01)% | 11.06% | 6.82% |
A From April 19, 2007
$10,000 Over Life of Fund
Let's say hypothetically that $10,000 was invested in Fidelity® Large Cap Growth Enhanced Index Fund on April 19, 2007, when the fund started.
The chart shows how the value of your investment would have changed, and also shows how the Russell 1000® Growth Index performed over the same period.
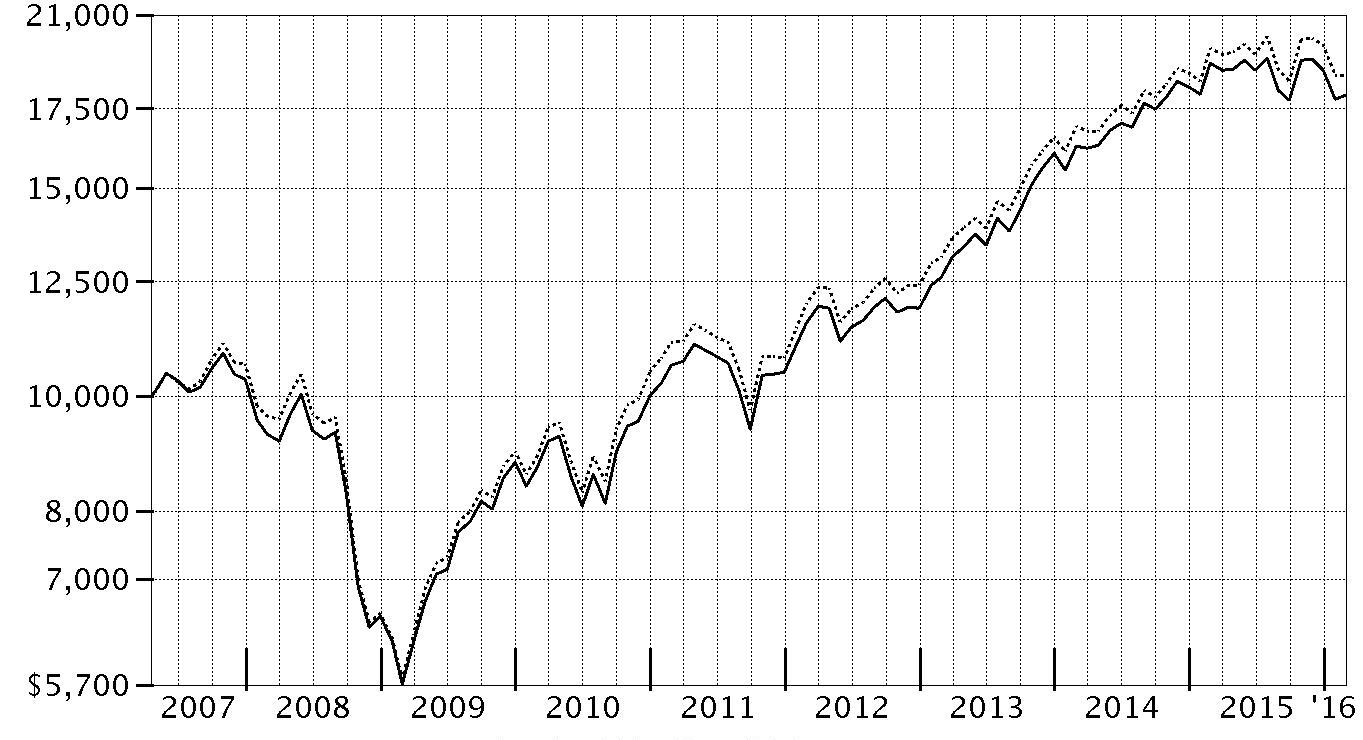
| Period Ending Values | ||
| $17,957 | Fidelity® Large Cap Growth Enhanced Index Fund | |
| $18,680 | Russell 1000® Growth Index | |
Fidelity® Large Cap Growth Enhanced Index Fund
Management's Discussion of Fund Performance
Market Recap: The S&P 500® index returned -6.19% for the year ending February 29, 2016. Largely range-bound for the first half of the period, U.S. stocks suffered a steep, late-summer decline on concern about an economic slowdown in China. The market recovered in October, lifted by the U.S. Federal Reserve’s decision to delay raising near-term interest rates until mid-December. Investors also drew courage from a rate cut in China and economic stimulus in Europe. But continued oil-price weakness and U.S.-dollar strength, plus fresh worries about China and the Middle East, pushed the S&P 500® to its worst January since 2009, followed by a volatile but ultimately flattish February. Overall, growth-oriented and larger-cap stocks fared better than value and smaller-cap complements. In this environment, the tech-heavy Nasdaq Composite Index® returned -7.07% for the 12 months; the Russell 2000® Index, -14.97%. Few sectors within the broad-market S&P 500® gained ground, with a wide gap separating leaders from laggards. Despite increased competition among wireless carriers, telecommunication services (+8%) led the way, followed by the more defensive utilities sector (+6%). Rising wages and low inflation buoyed consumer staples (+4%), less so consumer discretionary (0%). Meanwhile, energy (-24%) foundered amid commodity weakness that also hurt materials (-17%). The financials sector (-12%) struggled as well.Comments from Maximilian Kaufmann, Senior Portfolio Manager of the Geode Capital Management, LLC, investment management team: In a challenging environment, the fund returned -6.01%, lagging the -5.05% result of the Russell 1000® Growth Index. Versus the index, the fund was hurt most by weak stock picks in the consumer discretionary sector. An overweighting in the struggling energy group also hurt, although the impact was mostly offset by favorable stock picking there. The fund’s top individual detractor was asset manager Waddell & Reed Financial, whose shares lost roughly half their value for the period. Although Waddell & Reed struggled along with financial markets, our models continued to find the stock compelling, as the company displayed favorable credit, profitability and cash-flow characteristics. As Waddell & Reed’s valuation declined, we gradually added shares to the portfolio to maintain a consistent weighting. Also hampering results was Fossil Group, a maker of watches and other accessories. Weaker-than-expected revenue, resulting from disappointing sales and unfavorable foreign-exchange effects, weighed on results. We ultimately sold the fund’s position, due partly to the stock’s poor price and earnings momentum qualities. Further detracting was a position in semiconductor manufacturer Micron Technology, also due to worsening price and earnings momentum characteristics. Last July, the company reported weaker-than-expected financial results, and we eliminated our position shortly afterwards. On the positive side, Public Storage was a meaningful contributor. Shares of this self-storage real estate investment trust (REIT) rose about 31% for the period. Our models led us to invest in Public Storage, based most notably on the stock’s price and earnings momentum characteristics. Also adding value was timely positioning in Keurig Green Mountain, a coffee retailer and maker of single-serve beverage systems. Late in 2015 and soon after we established a position in Keurig, its shares soared when the company agreed to be acquired at a substantial premium. We sold most of our stake shortly afterwards.The views expressed above reflect those of the portfolio manager(s) only through the end of the period as stated on the cover of this report and do not necessarily represent the views of Fidelity or any other person in the Fidelity organization. Any such views are subject to change at any time based upon market or other conditions and Fidelity disclaims any responsibility to update such views. These views may not be relied on as investment advice and, because investment decisions for a Fidelity fund are based on numerous factors, may not be relied on as an indication of trading intent on behalf of any Fidelity fund.
Fidelity® Large Cap Growth Enhanced Index Fund
Investment Summary (Unaudited)
Top Ten Stocks as of February 29, 2016
| % of fund's net assets | % of fund's net assets 6 months ago | |
| Apple, Inc. | 6.0 | 6.8 |
| Facebook, Inc. Class A | 2.6 | 1.4 |
| Microsoft Corp. | 2.6 | 2.5 |
| Amazon.com, Inc. | 2.6 | 2.4 |
| Verizon Communications, Inc. | 2.4 | 2.2 |
| The Walt Disney Co. | 2.1 | 1.2 |
| Alphabet, Inc. Class A | 2.1 | 1.8 |
| PepsiCo, Inc. | 1.9 | 1.8 |
| Home Depot, Inc. | 1.9 | 2.0 |
| Gilead Sciences, Inc. | 1.8 | 2.0 |
| 26.0 |
Market Sectors as of February 29, 2016
| % of fund's net assets | % of fund's net assets 6 months ago | |
| Information Technology | 28.5 | 28.7 |
| Consumer Discretionary | 22.2 | 20.5 |
| Health Care | 17.7 | 19.3 |
| Consumer Staples | 10.1 | 9.2 |
| Industrials | 9.1 | 9.1 |
| Financials | 4.9 | 5.1 |
| Telecommunication Services | 3.4 | 3.0 |
| Materials | 1.6 | 1.8 |
| Energy | 1.2 | 2.4 |
Fidelity® Large Cap Growth Enhanced Index Fund
Investments February 29, 2016
Showing Percentage of Net Assets
| Common Stocks - 98.7% | |||
| Shares | Value | ||
| CONSUMER DISCRETIONARY - 22.2% | |||
| Auto Components - 2.2% | |||
| BorgWarner, Inc. | 58,297 | $1,905,146 | |
| Gentex Corp. (a) | 160,819 | 2,341,525 | |
| Lear Corp. | 23,528 | 2,384,563 | |
| Tenneco, Inc. (b) | 14,761 | 671,921 | |
| The Goodyear Tire & Rubber Co. | 32,052 | 965,406 | |
| Visteon Corp. | 23,512 | 1,643,959 | |
| 9,912,520 | |||
| Automobiles - 0.5% | |||
| Ford Motor Co. | 181,636 | 2,272,266 | |
| Hotels, Restaurants & Leisure - 2.0% | |||
| Carnival Corp. unit | 41,937 | 2,011,299 | |
| Darden Restaurants, Inc. (a) | 35,944 | 2,296,103 | |
| McDonald's Corp. | 24,960 | 2,925,062 | |
| Starbucks Corp. | 29,706 | 1,729,186 | |
| Starwood Hotels & Resorts Worldwide, Inc. | 583 | 40,291 | |
| 9,001,941 | |||
| Household Durables - 0.6% | |||
| D.R. Horton, Inc. | 21,979 | 587,279 | |
| Jarden Corp. (b) | 919 | 48,597 | |
| Tempur Sealy International, Inc. (a)(b) | 38,850 | 2,240,480 | |
| 2,876,356 | |||
| Internet & Catalog Retail - 2.7% | |||
| Amazon.com, Inc. (b) | 21,022 | 11,615,075 | |
| Priceline Group, Inc. (b) | 563 | 712,313 | |
| 12,327,388 | |||
| Leisure Products - 0.5% | |||
| Brunswick Corp. | 10,207 | 434,206 | |
| Hasbro, Inc. | 427 | 32,396 | |
| Polaris Industries, Inc. | 19,157 | 1,684,092 | |
| 2,150,694 | |||
| Media - 6.3% | |||
| Comcast Corp. Class A | 136,356 | 7,871,832 | |
| Discovery Communications, Inc. Class C (non-vtg.) (b) | 91,213 | 2,248,400 | |
| DISH Network Corp. Class A (b) | 10,184 | 479,972 | |
| MSG Network, Inc. Class A (b) | 143,990 | 2,364,316 | |
| Scripps Networks Interactive, Inc. Class A | 29,685 | 1,758,539 | |
| Sinclair Broadcast Group, Inc. Class A | 10,666 | 329,259 | |
| The Walt Disney Co. | 98,664 | 9,424,385 | |
| Time Warner Cable, Inc. | 8,361 | 1,595,780 | |
| Viacom, Inc. Class B (non-vtg.) | 57,815 | 2,130,483 | |
| 28,202,966 | |||
| Multiline Retail - 0.6% | |||
| Target Corp. | 33,837 | 2,654,513 | |
| Specialty Retail - 5.0% | |||
| American Eagle Outfitters, Inc. (a) | 148,377 | 2,264,233 | |
| Bed Bath & Beyond, Inc. (b) | 1,220 | 58,499 | |
| Best Buy Co., Inc. (a) | 43,049 | 1,394,357 | |
| Dick's Sporting Goods, Inc. | 29,188 | 1,239,614 | |
| Foot Locker, Inc. (a) | 18,637 | 1,164,813 | |
| Gap, Inc. (a) | 28,347 | 783,795 | |
| GNC Holdings, Inc. | 84,130 | 2,396,022 | |
| Home Depot, Inc. | 67,219 | 8,343,222 | |
| Lithia Motors, Inc. Class A (sub. vtg.) | 498 | 46,175�� | |
| Lowe's Companies, Inc. | 65,125 | 4,397,891 | |
| Penske Automotive Group, Inc. | 4,985 | 188,034 | |
| TJX Companies, Inc. | 346 | 25,639 | |
| Urban Outfitters, Inc. (b) | 5,271 | 139,629 | |
| 22,441,923 | |||
| Textiles, Apparel & Luxury Goods - 1.8% | |||
| Michael Kors Holdings Ltd. (b) | 51,791 | 2,933,960 | |
| NIKE, Inc. Class B | 83,968 | 5,171,589 | |
| 8,105,549 | |||
| TOTAL CONSUMER DISCRETIONARY | 99,946,116 | ||
| CONSUMER STAPLES - 10.1% | |||
| Beverages - 3.6% | |||
| Dr. Pepper Snapple Group, Inc. | 26,478 | 2,423,531 | |
| PepsiCo, Inc. | 87,488 | 8,558,076 | |
| The Coca-Cola Co. | 119,403 | 5,149,851 | |
| 16,131,458 | |||
| Food & Staples Retailing - 2.0% | |||
| Costco Wholesale Corp. | 3,840 | 576,115 | |
| CVS Health Corp. | 43,515 | 4,228,353 | |
| Kroger Co. | 7,557 | 301,600 | |
| Wal-Mart Stores, Inc. | 34,262 | 2,272,941 | |
| Walgreens Boots Alliance, Inc. | 20,446 | 1,614,007 | |
| 8,993,016 | |||
| Food Products - 1.7% | |||
| Campbell Soup Co. (a) | 43,824 | 2,706,132 | |
| General Mills, Inc. | 3,152 | 185,495 | |
| Keurig Green Mountain, Inc. | 400 | 36,776 | |
| Pilgrim's Pride Corp. (a) | 96,109 | 2,349,865 | |
| Tyson Foods, Inc. Class A | 37,627 | 2,436,348 | |
| 7,714,616 | |||
| Household Products - 1.0% | |||
| Church & Dwight Co., Inc. | 1,429 | 129,696 | |
| Clorox Co. | 22,362 | 2,827,004 | |
| Colgate-Palmolive Co. | 402 | 26,387 | |
| Procter & Gamble Co. | 14,717 | 1,181,628 | |
| 4,164,715 | |||
| Personal Products - 0.0% | |||
| Nu Skin Enterprises, Inc. Class A | 1,408 | 42,930 | |
| Tobacco - 1.8% | |||
| Altria Group, Inc. | 118,918 | 7,321,781 | |
| Philip Morris International, Inc. | 8,703 | 792,234 | |
| 8,114,015 | |||
| TOTAL CONSUMER STAPLES | 45,160,750 | ||
| ENERGY - 1.2% | |||
| Energy Equipment & Services - 0.4% | |||
| Dril-Quip, Inc. (b) | 28,445 | 1,543,141 | |
| Oil, Gas & Consumable Fuels - 0.8% | |||
| Marathon Petroleum Corp. | 20,124 | 689,247 | |
| Tesoro Corp. | 28,056 | 2,263,558 | |
| The Williams Companies, Inc. | 1,999 | 31,964 | |
| Western Refining, Inc. | 29,090 | 775,830 | |
| 3,760,599 | |||
| TOTAL ENERGY | 5,303,740 | ||
| FINANCIALS - 4.9% | |||
| Capital Markets - 0.9% | |||
| T. Rowe Price Group, Inc. | 28,848 | 1,993,685 | |
| Waddell & Reed Financial, Inc. Class A (a) | 82,361 | 1,928,895 | |
| 3,922,580 | |||
| Consumer Finance - 0.6% | |||
| American Express Co. (a) | 47,917 | 2,663,227 | |
| Discover Financial Services | 1,667 | 77,382 | |
| Synchrony Financial (b) | 1,294 | 34,873 | |
| 2,775,482 | |||
| Diversified Financial Services - 1.4% | |||
| Berkshire Hathaway, Inc. Class B (a)(b) | 15,595 | 2,092,381 | |
| Broadcom Ltd. | 10,709 | 1,434,685 | |
| Leucadia National Corp. | 49,600 | 716,720 | |
| Morningstar, Inc. | 24,444 | 1,940,609 | |
| 6,184,395 | |||
| Insurance - 0.2% | |||
| Progressive Corp. | 33,350 | 1,064,532 | |
| Real Estate Investment Trusts - 1.8% | |||
| Lamar Advertising Co. Class A | 29,510 | 1,685,906 | |
| Public Storage | 14,946 | 3,728,878 | |
| Simon Property Group, Inc. | 1,235 | 234,317 | |
| Weyerhaeuser Co. | 102,259 | 2,656,689 | |
| 8,305,790 | |||
| TOTAL FINANCIALS | 22,252,779 | ||
| HEALTH CARE - 17.7% | |||
| Biotechnology - 6.6% | |||
| AbbVie, Inc. | 113,919 | 6,221,117 | |
| Amgen, Inc. | 49,000 | 6,971,720 | |
| Baxalta, Inc. | 435 | 16,756 | |
| Biogen, Inc. (b) | 18,440 | 4,783,705 | |
| Celgene Corp. (b) | 12,740 | 1,284,574 | |
| Gilead Sciences, Inc. | 90,414 | 7,888,622 | |
| United Therapeutics Corp. (b) | 19,897 | 2,426,240 | |
| 29,592,734 | |||
| Health Care Equipment & Supplies - 1.3% | |||
| C.R. Bard, Inc. | 4,575 | 880,139 | |
| Edwards Lifesciences Corp. (b) | 18,701 | 1,626,987 | |
| ResMed, Inc. (a) | 12,709 | 723,269 | |
| St. Jude Medical, Inc. | 44,555 | 2,392,158 | |
| 5,622,553 | |||
| Health Care Providers & Services - 5.4% | |||
| Aetna, Inc. (a) | 24,566 | 2,668,605 | |
| Anthem, Inc. | 19,946 | 2,606,743 | |
| Cardinal Health, Inc. | 36,437 | 2,976,903 | |
| Cigna Corp. | 7,143 | 997,234 | |
| Express Scripts Holding Co. (b) | 41,550 | 2,924,289 | |
| Humana, Inc. | 3,123 | 552,677 | |
| McKesson Corp. | 24,577 | 3,824,673 | |
| Molina Healthcare, Inc. (a)(b) | 13,018 | 807,637 | |
| UnitedHealth Group, Inc. | 59,163 | 7,046,313 | |
| 24,405,074 | |||
| Life Sciences Tools & Services - 0.4% | |||
| Bruker Corp. | 31,915 | 829,152 | |
| INC Research Holdings, Inc. Class A (b) | 18,729 | 743,167 | |
| PRA Health Sciences, Inc. (b) | 1,817 | 78,440 | |
| 1,650,759 | |||
| Pharmaceuticals - 4.0% | |||
| Allergan PLC (b) | 6,018 | 1,745,882 | |
| Bristol-Myers Squibb Co. | 73,248 | 4,536,249 | |
| Eli Lilly & Co. | 24,692 | 1,777,824 | |
| Jazz Pharmaceuticals PLC (b) | 1,001 | 121,702 | |
| Johnson & Johnson | 38,081 | 4,006,502 | |
| Merck & Co., Inc. | 58,358 | 2,930,155 | |
| Mylan N.V. (a) | 65,497 | 2,951,950 | |
| 18,070,264 | |||
| TOTAL HEALTH CARE | 79,341,384 | ||
| INDUSTRIALS - 9.1% | |||
| Aerospace & Defense - 3.6% | |||
| BE Aerospace, Inc. | 32,908 | 1,435,447 | |
| General Dynamics Corp. | 6,785 | 924,592 | |
| Honeywell International, Inc. | 13,024 | 1,319,982 | |
| Huntington Ingalls Industries, Inc. | 17,576 | 2,303,511 | |
| Moog, Inc. Class A (b) | 12,033 | 519,585 | |
| Spirit AeroSystems Holdings, Inc. Class A (a)(b) | 53,902 | 2,479,492 | |
| The Boeing Co. (a) | 50,024 | 5,911,836 | |
| United Technologies Corp. | 11,950 | 1,154,609 | |
| 16,049,054 | |||
| Air Freight & Logistics - 0.2% | |||
| United Parcel Service, Inc. Class B | 7,499 | 724,028 | |
| Airlines - 1.8% | |||
| Alaska Air Group, Inc. | 10,139 | 749,272 | |
| Delta Air Lines, Inc. | 21,123 | 1,018,974 | |
| JetBlue Airways Corp. (a)(b) | 31,024 | 682,528 | |
| Southwest Airlines Co. | 81,232 | 3,407,682 | |
| United Continental Holdings, Inc. (b) | 35,174 | 2,014,063 | |
| 7,872,519 | |||
| Commercial Services & Supplies - 0.2% | |||
| Deluxe Corp. | 9,620 | 552,284 | |
| KAR Auction Services, Inc. | 9,223 | 326,586 | |
| 878,870 | |||
| Construction & Engineering - 0.2% | |||
| Quanta Services, Inc. (b) | 38,655 | 784,310 | |
| Industrial Conglomerates - 1.2% | |||
| 3M Co. | 35,448 | 5,560,728 | |
| Machinery - 1.1% | |||
| Caterpillar, Inc. (a) | 16,632 | 1,125,986 | |
| Cummins, Inc. | 27,301 | 2,663,759 | |
| Illinois Tool Works, Inc. | 7,158 | 674,642 | |
| Toro Co. | 3,793 | 302,302 | |
| 4,766,689 | |||
| Professional Services - 0.1% | |||
| Robert Half International, Inc. | 16,693 | 657,537 | |
| Road & Rail - 0.7% | |||
| Union Pacific Corp. | 40,749 | 3,213,466 | |
| Trading Companies & Distributors - 0.0% | |||
| United Rentals, Inc. (b) | 4,192 | 216,181 | |
| TOTAL INDUSTRIALS | 40,723,382 | ||
| INFORMATION TECHNOLOGY - 28.5% | |||
| Communications Equipment - 2.6% | |||
| Brocade Communications Systems, Inc. | 243,896 | 2,421,887 | |
| Cisco Systems, Inc. | 82,103 | 2,149,457 | |
| F5 Networks, Inc. (b) | 4,476 | 430,457 | |
| Juniper Networks, Inc. | 78,405 | 1,936,604 | |
| Motorola Solutions, Inc. | 36,306 | 2,668,128 | |
| Qualcomm, Inc. | 36,423 | 1,849,924 | |
| 11,456,457 | |||
| Electronic Equipment & Components - 0.5% | |||
| Dolby Laboratories, Inc. Class A | 18,109 | 715,306 | |
| Jabil Circuit, Inc. | 26,484 | 552,191 | |
| SYNNEX Corp. | 4,598 | 432,350 | |
| TE Connectivity Ltd. | 9,408 | 535,503 | |
| 2,235,350 | |||
| Internet Software & Services - 7.0% | |||
| Alphabet, Inc.: | |||
| Class A | 12,911 | 9,260,027 | |
| Class C | 9,730 | 6,789,302 | |
| eBay, Inc. (b) | 139,879 | 3,329,120 | |
| Facebook, Inc. Class A (b) | 110,720 | 11,838,182 | |
| 31,216,631 | |||
| IT Services - 4.1% | |||
| Accenture PLC Class A | 9,069 | 909,258 | |
| Amdocs Ltd. | 38,163 | 2,166,132 | |
| CSRA, Inc. | 20,074 | 520,920 | |
| DST Systems, Inc. | 6,965 | 728,400 | |
| Global Payments, Inc. | 5,827 | 355,156 | |
| IBM Corp. (a) | 25,159 | 3,296,584 | |
| MasterCard, Inc. Class A | 17,835 | 1,550,218 | |
| Paychex, Inc. (a) | 57,116 | 2,935,191 | |
| Total System Services, Inc. | 37,131 | 1,618,169 | |
| Vantiv, Inc. (b) | 6,525 | 339,561 | |
| Visa, Inc. Class A | 54,754 | 3,963,642 | |
| 18,383,231 | |||
| Semiconductors & Semiconductor Equipment - 2.3% | |||
| Applied Materials, Inc. | 149,622 | 2,823,367 | |
| Integrated Device Technology, Inc. (b) | 2,195 | 42,627 | |
| Intel Corp. | 90,542 | 2,679,138 | |
| KLA-Tencor Corp. | 387 | 26,215 | |
| Lam Research Corp. | 1,422 | 104,233 | |
| Linear Technology Corp. (a) | 16,949 | 739,315 | |
| NVIDIA Corp. | 32,560 | 1,021,082 | |
| Skyworks Solutions, Inc. | 20,542 | 1,365,016 | |
| Texas Instruments, Inc. | 32,785 | 1,738,261 | |
| 10,539,254 | |||
| Software - 6.0% | |||
| Activision Blizzard, Inc. | 3,870 | 122,563 | |
| Aspen Technology, Inc. (b) | 60,857 | 2,006,455 | |
| CA Technologies, Inc. | 59,210 | 1,734,261 | |
| Citrix Systems, Inc. (b) | 36,689 | 2,592,078 | |
| Electronic Arts, Inc. (b) | 48,758 | 3,132,214 | |
| Microsoft Corp. | 231,274 | 11,767,221 | |
| Oracle Corp. | 80,253 | 2,951,705 | |
| Synopsys, Inc. (b) | 45,034 | 2,015,272 | |
| VMware, Inc. Class A (a)(b) | 11,315 | 571,294 | |
| 26,893,063 | |||
| Technology Hardware, Storage & Peripherals - 6.0% | |||
| Apple, Inc. | 280,482 | 27,119,807 | |
| NetApp, Inc. | 1,435 | 35,645 | |
| 27,155,452 | |||
| TOTAL INFORMATION TECHNOLOGY | 127,879,438 | ||
| MATERIALS - 1.6% | |||
| Chemicals - 1.6% | |||
| E.I. du Pont de Nemours & Co. (a) | 10,238 | 623,187 | |
| LyondellBasell Industries NV Class A | 44,699 | 3,585,307 | |
| The Dow Chemical Co. | 21,960 | 1,067,476 | |
| Westlake Chemical Corp. | 45,560 | 1,964,547 | |
| 7,240,517 | |||
| TELECOMMUNICATION SERVICES - 3.4% | |||
| Diversified Telecommunication Services - 3.4% | |||
| AT&T, Inc. | 101,031 | 3,733,095 | |
| Level 3 Communications, Inc. (b) | 19,975 | 969,786 | |
| Verizon Communications, Inc. | 212,616 | 10,786,010 | |
| 15,488,891 | |||
| TOTAL COMMON STOCKS | |||
| (Cost $398,906,636) | 443,336,997 | ||
| Principal Amount | Value | ||
| U.S. Treasury Obligations - 0.2% | |||
| U.S. Treasury Bills, yield at date of purchase 0.37% 5/26/16 (c) | |||
| (Cost $999,122) | 1,000,000 | 999,230 | |
| Shares | Value | ||
| Money Market Funds - 9.4% | |||
| Dreyfus Cash Management Institutional Shares, 0.10% (d) | 3,870,686 | $3,870,686 | |
| Fidelity Securities Lending Cash Central Fund, 0.44% (e)(f) | 38,296,671 | 38,296,671 | |
| TOTAL MONEY MARKET FUNDS | |||
| (Cost $42,167,357) | 42,167,357 | ||
| TOTAL INVESTMENT PORTFOLIO - 108.3% | |||
| (Cost $442,073,115) | 486,503,584 | ||
| NET OTHER ASSETS (LIABILITIES) - (8.3)% | (37,415,389) | ||
| NET ASSETS - 100% | $449,088,195 |
| Futures Contracts | |||
| Expiration Date | Underlying Face Amount at Value | Unrealized Appreciation/(Depreciation) | |
| Purchased | |||
| Equity Index Contracts | |||
| 59 CME E-mini S&P 500 Index Contracts (United States) | March 2016 | 5,692,025 | $170,481 |
The face value of futures purchased as a percentage of Net Assets is 1.3%
Legend
(a) Security or a portion of the security is on loan at period end.
(b) Non-income producing
(c) Security or a portion of the security was pledged to cover margin requirements for futures contracts. At period end, the value of securities pledged amounted to $259,800.
(d) The rate quoted is the annualized seven-day yield of the fund at period end.
(e) Affiliated fund that is generally available only to investment companies and other accounts managed by Fidelity Investments. The rate quoted is the annualized seven-day yield of the fund at period end. A complete unaudited listing of the fund's holdings as of its most recent quarter end is available upon request. In addition, each Fidelity Central Fund's financial statements, which are not covered by the Fund's Report of Independent Registered Public Accounting Firm, are available on the SEC's website or upon request.
(f) Investment made with cash collateral received from securities on loan.
Affiliated Central Funds
Information regarding fiscal year to date income earned by the Fund from investments in Fidelity Central Funds is as follows:
| Fund | Income earned |
| Fidelity Securities Lending Cash Central Fund | $85,669 |
Investment Valuation
The following is a summary of the inputs used, as of February 29, 2016, involving the Fund's assets and liabilities carried at fair value. The inputs or methodology used for valuing securities may not be an indication of the risk associated with investing in those securities. For more information on valuation inputs, and their aggregation into the levels used below, please refer to the Investment Valuation section in the accompanying Notes to Financial Statements.
| Valuation Inputs at Reporting Date: | ||||
| Description | Total | Level 1 | Level 2 | Level 3 |
| Investments in Securities: | ||||
| Equities: | ||||
| Consumer Discretionary | $99,946,116 | $99,946,116 | $-- | $-- |
| Consumer Staples | 45,160,750 | 45,160,750 | -- | -- |
| Energy | 5,303,740 | 5,303,740 | -- | -- |
| Financials | 22,252,779 | 22,252,779 | -- | -- |
| Health Care | 79,341,384 | 79,341,384 | -- | -- |
| Industrials | 40,723,382 | 40,723,382 | -- | -- |
| Information Technology | 127,879,438 | 127,879,438 | -- | -- |
| Materials | 7,240,517 | 7,240,517 | -- | -- |
| Telecommunication Services | 15,488,891 | 15,488,891 | -- | -- |
| U.S. Government and Government Agency Obligations | 999,230 | -- | 999,230 | -- |
| Money Market Funds | 42,167,357 | 42,167,357 | -- | -- |
| Total Investments in Securities: | $486,503,584 | $485,504,354 | $999,230 | $-- |
| Derivative Instruments: | ||||
| Assets | ||||
| Futures Contracts | $170,481 | $170,481 | $-- | $-- |
| Total Assets | $170,481 | $170,481 | $-- | $-- |
| Total Derivative Instruments: | $170,481 | $170,481 | $-- | $-- |
Value of Derivative Instruments
The following table is a summary of the Fund's value of derivative instruments by primary risk exposure as of February 29, 2016. For additional information on derivative instruments, please refer to the Derivative Instruments section in the accompanying Notes to Financial Statements.
| Primary Risk Exposure / Derivative Type | Value | |
| Asset | Liability | |
| Equity Risk | ||
| Futures Contracts(a) | $170,481 | $0 |
| Total Equity Risk | 170,481 | 0 |
| Total Value of Derivatives | $170,481 | $0 |
(a) Reflects gross cumulative appreciation (depreciation) on futures contracts as presented in the Schedule of Investments. Only the period end receivable or payable for daily variation margin and net unrealized appreciation (depreciation) are presented in the Statement of Assets and Liabilities.
See accompanying notes which are an integral part of the financial statements.
Fidelity® Large Cap Growth Enhanced Index Fund
Financial Statements
Statement of Assets and Liabilities
| February 29, 2016 | ||
| Assets | ||
| Investment in securities, at value (including securities loaned of $37,253,422) — See accompanying schedule: Unaffiliated issuers (cost $403,776,444) | $448,206,913 | |
| Fidelity Central Funds (cost $38,296,671) | 38,296,671 | |
| Total Investments (cost $442,073,115) | $486,503,584 | |
| Receivable for investments sold | 3,528,592 | |
| Receivable for fund shares sold | 1,194,234 | |
| Dividends receivable | 738,523 | |
| Interest receivable | 1,085 | |
| Distributions receivable from Fidelity Central Funds | 6,474 | |
| Total assets | 491,972,492 | |
| Liabilities | ||
| Payable for investments purchased | $4,246,126 | |
| Payable for fund shares redeemed | 146,943 | |
| Accrued management fee | 108,201 | |
| Payable for daily variation margin for derivative instruments | 32,256 | |
| Other affiliated payables | 54,100 | |
| Collateral on securities loaned, at value | 38,296,671 | |
| Total liabilities | 42,884,297 | |
| Net Assets | $449,088,195 | |
| Net Assets consist of: | ||
| Paid in capital | $410,020,005 | |
| Undistributed net investment income | 284 | |
| Accumulated undistributed net realized gain (loss) on investments | (5,533,044) | |
| Net unrealized appreciation (depreciation) on investments | 44,600,950 | |
| Net Assets, for 32,397,737 shares outstanding | $449,088,195 | |
| Net Asset Value, offering price and redemption price per share ($449,088,195 ÷ 32,397,737 shares) | $13.86 |
See accompanying notes which are an integral part of the financial statements.
Statement of Operations
| Year ended February 29, 2016 | ||
| Investment Income | ||
| Dividends | $7,789,456 | |
| Interest | 4,979 | |
| Income from Fidelity Central Funds (includng $85,669 from security lending) | 85,669 | |
| Total income | 7,880,104 | |
| Expenses | ||
| Management fee | $1,289,353 | |
| Transfer agent fees | 645,475 | |
| Independent trustees' compensation | 1,733 | |
| Interest | 147 | |
| Miscellaneous | 592 | |
| Total expenses before reductions | 1,937,300 | |
| Expense reductions | (73) | 1,937,227 |
| Net investment income (loss) | 5,942,877 | |
| Realized and Unrealized Gain (Loss) | ||
| Net realized gain (loss) on: | ||
| Investment securities: | ||
| Unaffiliated issuers | 4,703,296 | |
| Futures contracts | (210,261) | |
| Total net realized gain (loss) | 4,493,035 | |
| Change in net unrealized appreciation (depreciation) on: Investment securities | (38,637,124) | |
| Futures contracts | (56,018) | |
| Total change in net unrealized appreciation (depreciation) | (38,693,142) | |
| Net gain (loss) | (34,200,107) | |
| Net increase (decrease) in net assets resulting from operations | $(28,257,230) |
See accompanying notes which are an integral part of the financial statements.
Statement of Changes in Net Assets
| Year ended February 29, 2016 | Year ended February 28, 2015 | |
| Increase (Decrease) in Net Assets | ||
| Operations | ||
| Net investment income (loss) | $5,942,877 | $4,021,094 |
| Net realized gain (loss) | 4,493,035 | 21,360,706 |
| Change in net unrealized appreciation (depreciation) | (38,693,142) | 24,829,492 |
| Net increase (decrease) in net assets resulting from operations | (28,257,230) | 50,211,292 |
| Distributions to shareholders from net investment income | (5,276,402) | (3,179,099) |
| Distributions to shareholders from net realized gain | (14,162,511) | (20,420,531) |
| Total distributions | (19,438,913) | (23,599,630) |
| Share transactions | ||
| Proceeds from sales of shares | 205,196,525 | 171,920,676 |
| Reinvestment of distributions | 18,634,238 | 22,608,233 |
| Cost of shares redeemed | (131,133,765) | (65,908,703) |
| Net increase (decrease) in net assets resulting from share transactions | 92,696,998 | 128,620,206 |
| Total increase (decrease) in net assets | 45,000,855 | 155,231,868 |
| Net Assets | ||
| Beginning of period | 404,087,340 | 248,855,472 |
| End of period (including undistributed net investment income of $284 and undistributed net investment income of $1,083,176, respectively) | $449,088,195 | $404,087,340 |
| Other Information | ||
| Shares | ||
| Sold | 13,841,828 | 11,603,829 |
| Issued in reinvestment of distributions | 1,270,101 | 1,602,974 |
| Redeemed | (8,915,319) | (4,501,955) |
| Net increase (decrease) | 6,196,610 | 8,704,848 |
See accompanying notes which are an integral part of the financial statements.
Financial Highlights — Fidelity Large Cap Growth Enhanced Index Fund
| Years ended February 28, | 2016A | 2015 | 2014 | 2013 | 2012A |
| Selected Per–Share Data | |||||
| Net asset value, beginning of period | $15.42 | $14.22 | $11.77 | $10.93 | $10.19 |
| Income from Investment Operations | |||||
| Net investment income (loss)B | .20 | .20 | .18 | .20 | .13 |
| Net realized and unrealized gain (loss) | (1.09) | 2.15 | 3.15 | .81 | .72 |
| Total from investment operations | (.89) | 2.35 | 3.33 | 1.01 | .85 |
| Distributions from net investment income | (.18) | (.15) | (.17) | (.17) | (.11) |
| Distributions from net realized gain | (.49) | (1.00) | (.71) | – | – |
| Total distributions | (.67) | (1.15) | (.88) | (.17) | (.11) |
| Net asset value, end of period | $13.86 | $15.42 | $14.22 | $11.77 | $10.93 |
| Total ReturnC | (6.01)% | 17.46% | 29.08% | 9.36% | 8.40% |
| Ratios to Average Net AssetsD,E | |||||
| Expenses before reductions | .45% | .45% | .45% | .45% | .45% |
| Expenses net of fee waivers, if any | .45% | .45% | .45% | .45% | .45% |
| Expenses net of all reductions | .45% | .45% | .45% | .45% | .45% |
| Net investment income (loss) | 1.38% | 1.37% | 1.41% | 1.80% | 1.30% |
| Supplemental Data | |||||
| Net assets, end of period (000 omitted) | $449,088 | $404,087 | $248,855 | $171,392 | $141,826 |
| Portfolio turnover rateF | 89% | 69% | 83% | 87% | 77% |
A For the year ended February 29.
B Calculated based on average shares outstanding during the period.
C Total returns would have been lower if certain expenses had not been reduced during the applicable periods shown.
D Fees and expenses of any underlying Fidelity Central Funds are not included in the Fund's expense ratio. The Fund indirectly bears its proportionate share of the expenses of any underlying Fidelity Central Funds.
E Expense ratios reflect operating expenses of the Fund. Expenses before reductions do not reflect amounts reimbursed by the investment adviser or reductions from expense offset arrangements and do not represent the amount paid by the Fund during periods when reimbursements or reductions occur. Expenses net of fee waivers reflect expenses after reimbursement by the investment adviser but prior to reductions from expense offset arrangements. Expenses net of all reductions represent the net expenses paid by the Fund.
F Amount does not include the portfolio activity of any underlying Fidelity Central Funds.
See accompanying notes which are an integral part of the financial statements.
Fidelity® Large Cap Value Enhanced Index Fund
Performance: The Bottom Line
Average annual total return reflects the change in the value of an investment, assuming reinvestment of distributions from dividend income and capital gains (the profits earned upon the sale of securities that have grown in value, if any) and assuming a constant rate of performance each year. The hypothetical investment and the average annual total returns do not reflect the deduction of taxes that a shareholder would pay on fund distributions or the redemption of fund shares. During periods of reimbursement by Fidelity, a fund’s total return will be greater than it would be had the reimbursement not occurred. How a fund did yesterday is no guarantee of how it will do tomorrow.
Average Annual Total Returns
| For the periods ended February 29, 2016 | Past 1 year | Past 5 years | Life of fundA |
| Fidelity® Large Cap Value Enhanced Index Fund | (9.69)% | 9.62% | 3.44% |
A From April 19, 2007
$10,000 Over Life of Fund
Let's say hypothetically that $10,000 was invested in Fidelity® Large Cap Value Enhanced Index Fund on April 19, 2007, when the fund started.
The chart shows how the value of your investment would have changed, and also shows how the Russell 1000® Value Index performed over the same period.
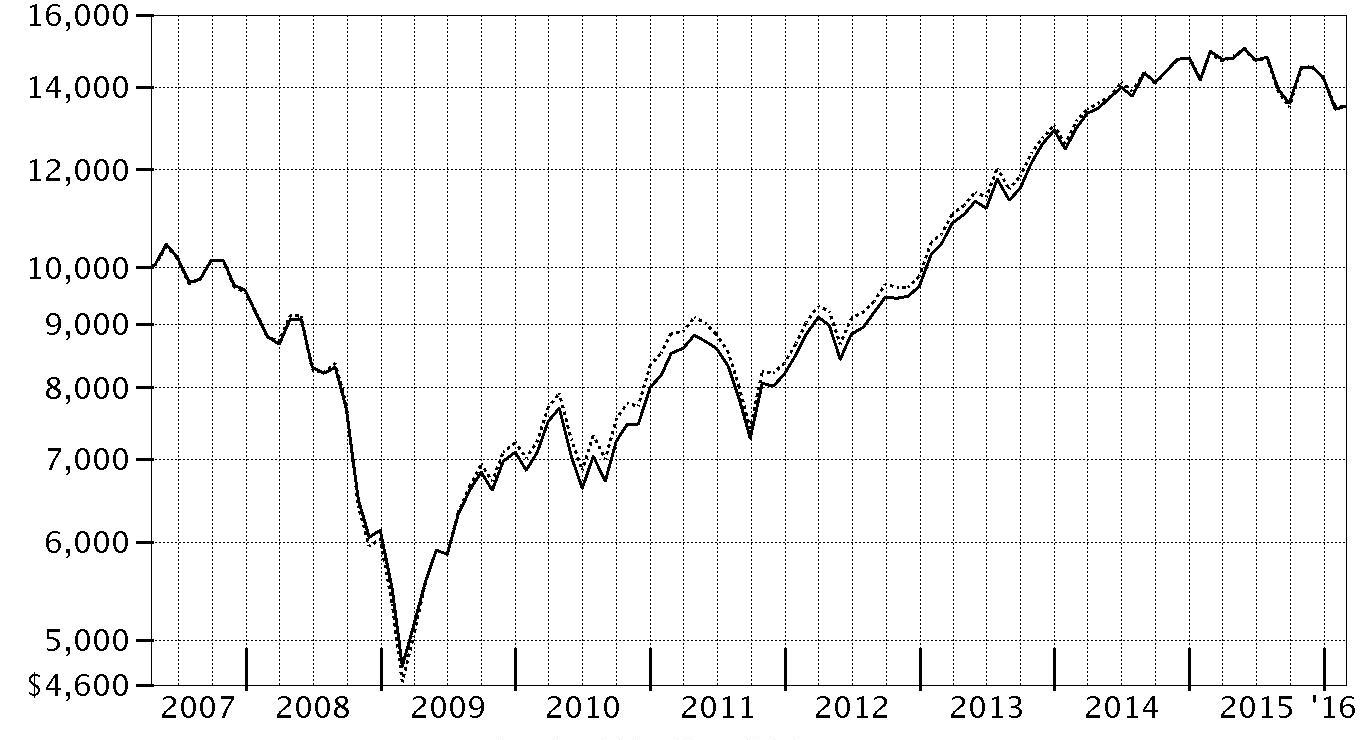
| Period Ending Values | ||
| $13,497 | Fidelity® Large Cap Value Enhanced Index Fund | |
| $13,493 | Russell 1000® Value Index | |
Fidelity® Large Cap Value Enhanced Index Fund
Management's Discussion of Fund Performance
Market Recap: The S&P 500® index returned -6.19% for the year ending February 29, 2016. Largely range-bound for the first half of the period, U.S. stocks suffered a steep, late-summer decline on concern about an economic slowdown in China. The market recovered in October, lifted by the U.S. Federal Reserve’s decision to delay raising near-term interest rates until mid-December. Investors also drew courage from a rate cut in China and economic stimulus in Europe. But continued oil-price weakness and U.S.-dollar strength, plus fresh worries about China and the Middle East, pushed the S&P 500® to its worst January since 2009, followed by a volatile but ultimately flattish February. Overall, growth-oriented and larger-cap stocks fared better than value and smaller-cap complements. In this environment, the tech-heavy Nasdaq Composite Index® returned -7.07% for the 12 months; the Russell 2000® Index, -14.97%. Few sectors within the broad-market S&P 500® gained ground, with a wide gap separating leaders from laggards. Despite increased competition among wireless carriers, telecommunication services (+8%) led the way, followed by the more defensive utilities sector (+6%). Rising wages and low inflation buoyed consumer staples (+4%), less so consumer discretionary (0%). Meanwhile, energy (-24%) foundered amid commodity weakness that also hurt materials (-17%). The financials sector (-12%) struggled as well.Comments from Maximilian Kaufmann, Senior Portfolio Manager of the Geode Capital Management, LLC, investment management team: In a challenging stock market environment, the fund returned -9.69%, slightly lagging the -9.41% result of its benchmark, the Russell 1000® Value Index. Relative to the index, the fund was hurt most by weak stock picking in the information technology sector. We also struggled in the diversified financials industry within the broader financials sector. In contrast, stock picks in energy contributed to results, as did a modest underweighting in this, the index’s weakest-performing category by far. Within this group, a small stake in Atwood Oceanics meaningfully detracted, as this and other energy stocks continued to suffer amid declines in the price of oil. As of the end of February 2016 – at the recommendation of our models – we held steady our position in Atwood. Another meaningful individual detractor was Navient, a provider of education loan-management and asset-recovery services. Through our models, we were attracted to Navient’s valuation and earnings-quality characteristics. Shares of Navient were down sharply for the period, as the company forecasted weaker-than-expected earnings and higher anticipated losses from student-loan borrowers. We steadily increased the fund’s exposure to the stock, as Navient’s valuation and earnings characteristics, among others, remained attractive to our models. On the positive side, the fund’s top relative contributor was timely positioning in Keurig Green Mountain, a coffee retailer and maker of single-serve beverage systems. Late in 2015, soon after we established a position. Keurig shares soared when the company agreed to be acquired at a substantial premium. We sold our stake shortly thereafter. Public Storage also added value. Shares of this self-storage real estate investment trust (REIT) rose about 31% for the period. Our models led us to invest in Public Storage based most notably on the stock’s price and earnings momentum characteristics.The views expressed above reflect those of the portfolio manager(s) only through the end of the period as stated on the cover of this report and do not necessarily represent the views of Fidelity or any other person in the Fidelity organization. Any such views are subject to change at any time based upon market or other conditions and Fidelity disclaims any responsibility to update such views. These views may not be relied on as investment advice and, because investment decisions for a Fidelity fund are based on numerous factors, may not be relied on as an indication of trading intent on behalf of any Fidelity fund.
Fidelity® Large Cap Value Enhanced Index Fund
Investment Summary (Unaudited)
Top Ten Stocks as of February 29, 2016
| % of fund's net assets | % of fund's net assets 6 months ago | |
| Exxon Mobil Corp. | 3.9 | 3.7 |
| Johnson & Johnson | 3.2 | 2.8 |
| JPMorgan Chase & Co. | 2.7 | 2.6 |
| Berkshire Hathaway, Inc. Class B | 2.7 | 2.4 |
| Wells Fargo & Co. | 2.6 | 2.0 |
| Procter & Gamble Co. | 2.5 | 2.4 |
| AT&T, Inc. | 2.4 | 1.7 |
| General Electric Co. | 2.4 | 2.0 |
| Cisco Systems, Inc. | 1.9 | 1.8 |
| Bank of America Corp.�� | 1.9 | 2.1 |
| 26.2 |
Market Sectors as of February 29, 2016
| % of fund's net assets | % of fund's net assets 6 months ago | |
| Financials | 26.3 | 28.1 |
| Health Care | 13.7 | 13.5 |
| Information Technology | 12.8 | 12.2 |
| Energy | 11.3 | 12.9 |
| Consumer Staples | 8.6 | 7.8 |
| Industrials | 8.4 | 8.0 |
| Consumer Discretionary | 7.0 | 6.6 |
| Utilities | 5.1 | 4.3 |
| Telecommunication Services | 3.8 | 2.8 |
| Materials | 2.0 | 2.3 |
Fidelity® Large Cap Value Enhanced Index Fund
Investments February 29, 2016
Showing Percentage of Net Assets
| Common Stocks - 99.0% | |||
| Shares | Value | ||
| CONSUMER DISCRETIONARY - 7.0% | |||
| Auto Components - 1.4% | |||
| BorgWarner, Inc. | 88,311 | $2,886,003 | |
| Gentex Corp. (a) | 568,124 | 8,271,885 | |
| Johnson Controls, Inc. | 40,310 | 1,469,703 | |
| Lear Corp. | 6,987 | 708,132 | |
| Tenneco, Inc. (b) | 23,909 | 1,088,338 | |
| The Goodyear Tire & Rubber Co. | 228,012 | 6,867,721 | |
| 21,291,782 | |||
| Automobiles - 2.0% | |||
| Ford Motor Co. | 1,278,462 | 15,993,560 | |
| General Motors Co. | 519,706 | 15,300,145 | |
| 31,293,705 | |||
| Hotels, Restaurants & Leisure - 0.6% | |||
| Carnival Corp. unit | 126,070 | 6,046,317 | |
| Darden Restaurants, Inc. (a) | 41,455 | 2,648,145 | |
| Texas Roadhouse, Inc. Class A | 6,346 | 264,692 | |
| 8,959,154 | |||
| Leisure Products - 0.3% | |||
| Brunswick Corp. | 92,632 | 3,940,565 | |
| Hasbro, Inc. | 16,860 | 1,279,168 | |
| 5,219,733 | |||
| Media - 0.9% | |||
| Comcast Corp. Class A | 70,428 | 4,065,808 | |
| Discovery Communications, Inc. Class C (non-vtg.) (b) | 50,650 | 1,248,523 | |
| Gannett Co., Inc. | 126,467 | 1,929,886 | |
| MSG Network, Inc. Class A (b) | 285,372 | 4,685,808 | |
| The Walt Disney Co. | 15,499 | 1,480,464 | |
| 13,410,489 | |||
| Multiline Retail - 1.0% | |||
| Dillard's, Inc. Class A | 9,131 | 764,173 | |
| Target Corp. | 198,157 | 15,545,417 | |
| 16,309,590 | |||
| Specialty Retail - 0.8% | |||
| Best Buy Co., Inc. | 130,211 | 4,217,534 | |
| GNC Holdings, Inc. | 271,216 | 7,724,232 | |
| 11,941,766 | |||
| Textiles, Apparel & Luxury Goods - 0.0% | |||
| PVH Corp. | 4,950 | 391,793 | |
| Skechers U.S.A., Inc. Class A (sub. vtg.) (b) | 7,691 | 253,188 | |
| 644,981 | |||
| TOTAL CONSUMER DISCRETIONARY | 109,071,200 | ||
| CONSUMER STAPLES - 8.6% | |||
| Beverages - 0.1% | |||
| PepsiCo, Inc. | 20,288 | 1,984,572 | |
| Food & Staples Retailing - 2.3% | |||
| CVS Health Corp. | 16,680 | 1,620,796 | |
| Sysco Corp. | 47,496 | 2,095,998 | |
| Wal-Mart Stores, Inc. | 381,248 | 25,291,992 | |
| Walgreens Boots Alliance, Inc. | 83,830 | 6,617,540 | |
| 35,626,326 | |||
| Food Products - 2.8% | |||
| Archer Daniels Midland Co. | 329,523 | 11,520,124 | |
| Bunge Ltd. | 48,409 | 2,406,895 | |
| Campbell Soup Co. (a) | 92,638 | 5,720,397 | |
| Mondelez International, Inc. (a) | 68,417 | 2,772,941 | |
| Pilgrim's Pride Corp. (a) | 344,570 | 8,424,737 | |
| Sanderson Farms, Inc. (a) | 12,236 | 1,116,657 | |
| Tyson Foods, Inc. Class A | 175,960 | 11,393,410 | |
| 43,355,161 | |||
| Household Products - 2.6% | |||
| Church & Dwight Co., Inc. (a) | 8,851 | 803,317 | |
| Clorox Co. | 4,232 | 535,009 | |
| Procter & Gamble Co. | 492,601 | 39,550,934 | |
| 40,889,260 | |||
| Personal Products - 0.0% | |||
| Nu Skin Enterprises, Inc. Class A | 13,474 | 410,822 | |
| Tobacco - 0.8% | |||
| Altria Group, Inc. | 150,148 | 9,244,612 | |
| Philip Morris International, Inc. | 38,636 | 3,517,035 | |
| 12,761,647 | |||
| TOTAL CONSUMER STAPLES | 135,027,788 | ||
| ENERGY - 11.3% | |||
| Energy Equipment & Services - 2.1% | |||
| Atwood Oceanics, Inc. (a) | 643,764 | 4,429,096 | |
| Baker Hughes, Inc. | 41,777 | 1,790,980 | |
| Cameron International Corp. (b) | 10,139 | 664,713 | |
| Dril-Quip, Inc. (b) | 157,259 | 8,531,301 | |
| FMC Technologies, Inc. (b) | 284,847 | 6,987,297 | |
| Oceaneering International, Inc. | 179,513 | 4,958,149 | |
| Schlumberger Ltd. | 85,720 | 6,147,838 | |
| 33,509,374 | |||
| Oil, Gas & Consumable Fuels - 9.2% | |||
| Antero Resources Corp. (a)(b) | 93,234 | 2,130,397 | |
| Chevron Corp. | 266,827 | 22,264,045 | |
| Columbia Pipeline Group, Inc. | 7,767 | 140,971 | |
| ConocoPhillips Co. | 207,992 | 7,036,369 | |
| EOG Resources, Inc. (a) | 161,182 | 10,434,923 | |
| EQT Corp. | 99,759 | 5,560,567 | |
| Exxon Mobil Corp. | 759,060 | 60,838,660 | |
| HollyFrontier Corp. | 31,597 | 1,068,611 | |
| Marathon Petroleum Corp. | 65,315 | 2,237,039 | |
| Memorial Resource Development Corp. (b) | 57,438 | 555,425 | |
| Occidental Petroleum Corp. | 26,754 | 1,841,210 | |
| ONEOK, Inc. (a) | 83,737 | 2,009,688 | |
| Spectra Energy Corp. | 24,037 | 701,880 | |
| Teekay Corp. (a) | 29,513 | 236,104 | |
| Tesoro Corp. | 122,496 | 9,882,977 | |
| Valero Energy Corp. | 209,766 | 12,602,741 | |
| Western Refining, Inc. | 156,607 | 4,176,709 | |
| World Fuel Services Corp. | 16,236 | 760,007 | |
| 144,478,323 | |||
| TOTAL ENERGY | 177,987,697 | ||
| FINANCIALS - 26.3% | |||
| Banks - 9.3% | |||
| Bank of America Corp. | 2,382,659 | 29,830,891 | |
| Bank of the Ozarks, Inc. | 12,303 | 465,546 | |
| CIT Group, Inc. | 71,673 | 2,136,572 | |
| Citigroup, Inc. | 419,243 | 16,287,591 | |
| Citizens Financial Group, Inc. | 116,381 | 2,238,007 | |
| JPMorgan Chase & Co. | 750,683 | 42,263,453 | |
| KeyCorp | 194,950 | 2,056,723 | |
| Pinnacle Financial Partners, Inc. | 4,552 | 211,076 | |
| Regions Financial Corp. | 544,437 | 4,094,166 | |
| SunTrust Banks, Inc. | 76,908 | 2,551,807 | |
| TCF Financial Corp. | 7,453 | 84,517 | |
| U.S. Bancorp | 98,272 | 3,785,437 | |
| Umpqua Holdings Corp. | 12,884 | 193,775 | |
| Wells Fargo & Co. | 854,726 | 40,103,744 | |
| 146,303,305 | |||
| Capital Markets - 2.5% | |||
| Franklin Resources, Inc. | 175,672 | 6,297,841 | |
| Goldman Sachs Group, Inc. | 124,950 | 18,683,774 | |
| Morgan Stanley | 514,350 | 12,704,445 | |
| Waddell & Reed Financial, Inc. Class A | 95,916 | 2,246,353 | |
| 39,932,413 | |||
| Consumer Finance - 3.2% | |||
| American Express Co. | 181,181 | 10,070,040 | |
| Capital One Financial Corp. | 195,772 | 12,868,094 | |
| Discover Financial Services | 185,638 | 8,617,316 | |
| Navient Corp. | 580,506 | 6,286,880 | |
| Synchrony Financial (b) | 434,353 | 11,705,813 | |
| 49,548,143 | |||
| Diversified Financial Services - 3.8% | |||
| Berkshire Hathaway, Inc. Class B (a)(b) | 308,845 | 41,437,734 | |
| CME Group, Inc. | 64,741 | 5,919,917 | |
| IntercontinentalExchange, Inc. | 14,619 | 3,486,047 | |
| Leucadia National Corp. | 574,739 | 8,304,979 | |
| 59,148,677 | |||
| Insurance - 3.6% | |||
| AFLAC, Inc. (a) | 174,046 | 10,359,218 | |
| American International Group, Inc. | 64,672 | 3,246,534 | |
| American National Insurance Co. | 4,643 | 472,054 | |
| Aspen Insurance Holdings Ltd. | 113,402 | 5,067,935 | |
| Assured Guaranty Ltd. | 200,134 | 4,965,325 | |
| Chubb Ltd. | 10,911 | 1,260,548 | |
| CNA Financial Corp. | 5,928 | 171,734 | |
| Endurance Specialty Holdings Ltd. | 42,415 | 2,641,182 | |
| FNF Group | 60,306 | 1,988,892 | |
| Lincoln National Corp. | 70,327 | 2,569,045 | |
| MetLife, Inc. | 2,921 | 115,555 | |
| Old Republic International Corp. | 127,120 | 2,262,736 | |
| Pricoa Global Funding I (a) | 26,639 | 1,760,572 | |
| Progressive Corp. | 257,621 | 8,223,262 | |
| Reinsurance Group of America, Inc. | 9,661 | 870,456 | |
| The Travelers Companies, Inc. | 95,706 | 10,290,309 | |
| 56,265,357 | |||
| Real Estate Investment Trusts - 3.9% | |||
| American Campus Communities, Inc. | 5,029 | 220,119 | |
| American Capital Agency Corp. | 50,288 | 908,704 | |
| Care Capital Properties, Inc. | 71,108 | 1,885,073 | |
| CBL & Associates Properties, Inc. (a) | 235,811 | 2,718,901 | |
| Chimera Investment Corp. | 494,101 | 6,438,136 | |
| Corrections Corp. of America | 52,765 | 1,526,491 | |
| Host Hotels & Resorts, Inc. | 8,934 | 136,780 | |
| Lamar Advertising Co. Class A (a) | 128,902 | 7,364,171 | |
| Liberty Property Trust (SBI) | 10,328 | 298,273 | |
| MFA Financial, Inc. (a) | 1,125,648 | 7,665,663 | |
| Mid-America Apartment Communities, Inc. | 3,419 | 307,505 | |
| New Residential Investment Corp. | 242,386 | 2,838,340 | |
| Public Storage (a) | 33,922 | 8,463,200 | |
| RLJ Lodging Trust | 10,123 | 212,279 | |
| Ryman Hospitality Properties, Inc. | 2,071 | 99,139 | |
| Senior Housing Properties Trust (SBI) (a) | 122,900 | 1,918,469 | |
| Simon Property Group, Inc. | 2,742 | 520,240 | |
| Starwood Property Trust, Inc. (a) | 249,387 | 4,374,248 | |
| Two Harbors Investment Corp. | 187,789 | 1,455,365 | |
| Weyerhaeuser Co. | 439,162 | 11,409,429 | |
| 60,760,525 | |||
| Real Estate Management & Development - 0.0% | |||
| The RMR Group, Inc. (b) | 1,869 | 42,165 | |
| TOTAL FINANCIALS | 412,000,585 | ||
| HEALTH CARE - 13.7% | |||
| Biotechnology - 1.0% | |||
| Amgen, Inc. | 50,890 | 7,240,629 | |
| Biogen, Inc. (b) | 10,645 | 2,761,526 | |
| United Therapeutics Corp. (b) | 51,919 | 6,331,003 | |
| 16,333,158 | |||
| Health Care Equipment & Supplies - 1.4% | |||
| Abbott Laboratories | 62,703 | 2,429,114 | |
| Baxter International, Inc. | 36,209 | 1,430,618 | |
| Hologic, Inc. (b) | 12,882 | 446,104 | |
| Medtronic PLC | 127,558 | 9,871,714 | |
| St. Jude Medical, Inc. | 152,277 | 8,175,752 | |
| 22,353,302 | |||
| Health Care Providers & Services - 3.2% | |||
| Aetna, Inc. (a) | 71,305 | 7,745,862 | |
| Anthem, Inc. | 96,739 | 12,642,820 | |
| Cardinal Health, Inc. | 52,909 | 4,322,665 | |
| Express Scripts Holding Co. (b) | 100,951 | 7,104,931 | |
| McKesson Corp. | 42,415 | 6,600,622 | |
| Molina Healthcare, Inc. (a)(b) | 42,019 | 2,606,859 | |
| UnitedHealth Group, Inc. | 74,536 | 8,877,238 | |
| 49,900,997 | |||
| Life Sciences Tools & Services - 0.1% | |||
| Agilent Technologies, Inc. | 14,787 | 552,294 | |
| Bruker Corp. | 58,580 | 1,521,908 | |
| 2,074,202 | |||
| Pharmaceuticals - 8.0% | |||
| Allergan PLC (b) | 25,504 | 7,398,965 | |
| Bristol-Myers Squibb Co. | 3,498 | 216,631 | |
| Eli Lilly & Co. | 37,598 | 2,707,056 | |
| Johnson & Johnson | 477,635 | 50,251,978 | |
| Merck & Co., Inc. | 568,128 | 28,525,707 | |
| Mylan N.V. (a) | 184,334 | 8,307,933 | |
| Pfizer, Inc. | 929,911 | 27,590,459 | |
| 124,998,729 | |||
| TOTAL HEALTH CARE | 215,660,388 | ||
| INDUSTRIALS - 8.4% | |||
| Aerospace & Defense - 3.0% | |||
| General Dynamics Corp. | 63,824 | 8,697,296 | |
| Huntington Ingalls Industries, Inc. | 59,970 | 7,859,668 | |
| Moog, Inc. Class A (b) | 9,385 | 405,244 | |
| Spirit AeroSystems Holdings, Inc. Class A (b) | 101,064 | 4,648,944 | |
| The Boeing Co. (a) | 67,727 | 8,003,977 | |
| United Technologies Corp. | 179,710 | 17,363,580 | |
| Vectrus, Inc. (b) | 4,131 | 79,522 | |
| 47,058,231 | |||
| Airlines - 0.5% | |||
| Delta Air Lines, Inc. | 65,209 | 3,145,682 | |
| Hawaiian Holdings, Inc. (b) | 5,458 | 234,803 | |
| JetBlue Airways Corp. (a)(b) | 111,879 | 2,461,338 | |
| Southwest Airlines Co. | 27,966 | 1,173,174 | |
| United Continental Holdings, Inc. (b) | 8,112 | 464,493 | |
| 7,479,490 | |||
| Building Products - 0.2% | |||
| Owens Corning | 85,478 | 3,668,716 | |
| Commercial Services & Supplies - 0.1% | |||
| Deluxe Corp. | 37,630 | 2,160,338 | |
| Construction & Engineering - 0.3% | |||
| Quanta Services, Inc. (b) | 187,563 | 3,805,653 | |
| Electrical Equipment - 0.3% | |||
| Eaton Corp. PLC | 93,552 | 5,305,334 | |
| Industrial Conglomerates - 2.7% | |||
| 3M Co. | 24,904 | 3,906,690 | |
| General Electric Co. | 1,288,848 | 37,557,031 | |
| 41,463,721 | |||
| Machinery - 1.2% | |||
| Allison Transmission Holdings, Inc. | 93,938 | 2,224,452 | |
| Caterpillar, Inc. (a) | 33,106 | 2,241,276 | |
| Cummins, Inc. | 89,584 | 8,740,711 | |
| SPX Flow, Inc. (b) | 17,589 | 329,442 | |
| Trinity Industries, Inc. (a) | 328,809 | 5,208,335 | |
| 18,744,216 | |||
| Road & Rail - 0.1% | |||
| Norfolk Southern Corp. | 24,409 | 1,786,007 | |
| TOTAL INDUSTRIALS | 131,471,706 | ||
| INFORMATION TECHNOLOGY - 12.8% | |||
| Communications Equipment - 4.4% | |||
| Brocade Communications Systems, Inc. | 896,732 | 8,904,549 | |
| Cisco Systems, Inc. | 1,158,197 | 30,321,597 | |
| Juniper Networks, Inc. | 291,893 | 7,209,757 | |
| Motorola Solutions, Inc. | 42,989 | 3,159,262 | |
| Qualcomm, Inc. | 371,736 | 18,880,471 | |
| 68,475,636 | |||
| Electronic Equipment & Components - 0.3% | |||
| Dolby Laboratories, Inc. Class A | 16,794 | 663,363 | |
| Jabil Circuit, Inc. | 28,971 | 604,045 | |
| SYNNEX Corp. | 3,561 | 334,841 | |
| TE Connectivity Ltd. | 29,489 | 1,678,514 | |
| Tech Data Corp. (a)(b) | 27,736 | 1,952,892 | |
| 5,233,655 | |||
| Internet Software & Services - 0.4% | |||
| eBay, Inc. (b) | 290,759 | 6,920,064 | |
| IT Services - 1.3% | |||
| Amdocs Ltd. | 38,231 | 2,169,992 | |
| CACI International, Inc. Class A (b) | 3,908 | 377,591 | |
| CSRA, Inc. | 42,281 | 1,097,192 | |
| IBM Corp. (a) | 53,968 | 7,071,427 | |
| Xerox Corp. | 986,032 | 9,475,768 | |
| 20,191,970 | |||
| Semiconductors & Semiconductor Equipment - 2.4% | |||
| Applied Materials, Inc. | 98,213 | 1,853,279 | |
| Integrated Device Technology, Inc. (b) | 38,371 | 745,165 | |
| Intel Corp. | 911,914 | 26,983,535 | |
| Lam Research Corp. | 25,829 | 1,893,266 | |
| Marvell Technology Group Ltd. | 298,483 | 2,850,513 | |
| Micron Technology, Inc. (b) | 18,332 | 194,869 | |
| NVIDIA Corp. | 70,712 | 2,217,528 | |
| Teradyne, Inc. | 12,737 | 243,022 | |
| 36,981,177 | |||
| Software - 2.2% | |||
| Activision Blizzard, Inc. | 13,504 | 427,672 | |
| Citrix Systems, Inc. (b) | 11,210 | 791,987 | |
| Electronic Arts, Inc. (b) | 94,639 | 6,079,609 | |
| Microsoft Corp. | 443,102 | 22,545,030 | |
| Oracle Corp. | 77,061 | 2,834,304 | |
| Synopsys, Inc. (b) | 17,223 | 770,729 | |
| VMware, Inc. Class A (a)(b) | 5,053 | 255,126 | |
| 33,704,457 | |||
| Technology Hardware, Storage & Peripherals - 1.8% | |||
| Apple, Inc. | 67,542 | 6,530,636 | |
| EMC Corp. | 178,341 | 4,660,050 | |
| HP, Inc. | 482,314 | 5,155,937 | |
| NetApp, Inc. (a) | 127,656 | 3,170,975 | |
| SanDisk Corp. | 10,482 | 757,429 | |
| Western Digital Corp. | 191,458 | 8,334,167 | |
| 28,609,194 | |||
| TOTAL INFORMATION TECHNOLOGY | 200,116,153 | ||
| MATERIALS - 2.0% | |||
| Chemicals - 1.7% | |||
| Cabot Corp. | 3,322 | 147,929 | |
| E.I. du Pont de Nemours & Co. (a) | 50,804 | 3,092,439 | |
| LyondellBasell Industries NV Class A | 96,168 | 7,713,635 | |
| The Dow Chemical Co. | 127,829 | 6,213,768 | |
| The Mosaic Co. | 198,217 | 5,282,483 | |
| Westlake Chemical Corp. | 104,507 | 4,506,342 | |
| 26,956,596 | |||
| Metals & Mining - 0.3% | |||
| Nucor Corp. | 12,980 | 510,633 | |
| Reliance Steel & Aluminum Co. | 53,097 | 3,233,076 | |
| 3,743,709 | |||
| TOTAL MATERIALS | 30,700,305 | ||
| TELECOMMUNICATION SERVICES - 3.8% | |||
| Diversified Telecommunication Services - 3.8% | |||
| AT&T, Inc. | 1,043,190 | 38,545,871 | |
| CenturyLink, Inc. | 301,774 | 9,231,267 | |
| Level 3 Communications, Inc. (b) | 42,061 | 2,042,062 | |
| Verizon Communications, Inc. | 207,196 | 10,511,053 | |
| 60,330,253 | |||
| UTILITIES - 5.1% | |||
| Electric Utilities - 3.3% | |||
| American Electric Power Co., Inc. | 40,978 | 2,530,392 | |
| Duke Energy Corp. | 131,976 | 9,803,177 | |
| Edison International | 6,043 | 411,891 | |
| Entergy Corp. | 116,906 | 8,441,782 | |
| Exelon Corp. (a) | 396,786 | 12,494,791 | |
| FirstEnergy Corp. | 167,417 | 5,603,447 | |
| NextEra Energy, Inc. | 6,170 | 696,099 | |
| OGE Energy Corp. | 77,176 | 1,920,139 | |
| PPL Corp. | 286,772 | 10,034,152 | |
| 51,935,870 | |||
| Gas Utilities - 0.5% | |||
| ONE Gas, Inc. | 4,760 | 275,985 | |
| UGI Corp. | 217,294 | 8,031,186 | |
| 8,307,171 | |||
| Independent Power and Renewable Electricity Producers - 0.0% | |||
| Talen Energy Corp. (b) | 48,203 | 306,571 | |
| Multi-Utilities - 1.2% | |||
| CenterPoint Energy, Inc. | 36,552 | 680,964 | |
| NiSource, Inc. | 257,548 | 5,532,131 | |
| Public Service Enterprise Group, Inc. | 271,733 | 11,592,130 | |
| Sempra Energy | 3,250 | 313,658 | |
| 18,118,883 | |||
| Water Utilities - 0.1% | |||
| American Water Works Co., Inc. | 32,148 | 2,083,833 | |
| TOTAL UTILITIES | 80,752,328 | ||
| TOTAL COMMON STOCKS | |||
| (Cost $1,616,274,594) | 1,553,118,403 | ||
| Principal Amount�� | Value | ||
| U.S. Treasury Obligations - 0.2% | |||
| U.S. Treasury Bills, yield at date of purchase 0.35% to 0.37% 5/26/16 (c) | |||
| (Cost $2,098,209) | 2,100,000 | 2,098,383 | |
| Shares | Value | ||
| Money Market Funds - 8.7% | |||
| Dreyfus Cash Management Institutional Shares, 0.10% (d) | 13,761,357 | $13,761,357 | |
| Fidelity Securities Lending Cash Central Fund, 0.44% (e)(f) | 122,445,806 | 122,445,806 | |
| TOTAL MONEY MARKET FUNDS | |||
| (Cost $136,207,163) | 136,207,163 | ||
| TOTAL INVESTMENT PORTFOLIO - 107.9% | |||
| (Cost $1,754,579,966) | 1,691,423,949 | ||
| NET OTHER ASSETS (LIABILITIES) - (7.9)% | (123,135,435) | ||
| NET ASSETS - 100% | $1,568,288,514 |
| Futures Contracts | |||
| Expiration Date | Underlying Face Amount at Value | Unrealized Appreciation/(Depreciation) | |
| Purchased | |||
| Equity Index Contracts | |||
| 145 CME E-mini S&P 500 Index Contracts (United States) | March 2016 | 13,988,875 | $502,653 |
The face value of futures purchased as a percentage of Net Assets is 0.9%
Legend
(a) Security or a portion of the security is on loan at period end.
(b) Non-income producing
(c) Security or a portion of the security was pledged to cover margin requirements for futures contracts. At period end, the value of securities pledged amounted to $821,367.
(d) The rate quoted is the annualized seven-day yield of the fund at period end.
(e) Investment made with cash collateral received from securities on loan.
(f) Affiliated fund that is generally available only to investment companies and other accounts managed by Fidelity Investments. The rate quoted is the annualized seven-day yield of the fund at period end. A complete unaudited listing of the fund's holdings as of its most recent quarter end is available upon request. In addition, each Fidelity Central Fund's financial statements, which are not covered by the Fund's Report of Independent Registered Public Accounting Firm, are available on the SEC's website or upon request.
Affiliated Central Funds
Information regarding fiscal year to date income earned by the Fund from investments in Fidelity Central Funds is as follows:
| Fund | Income earned |
| Fidelity Securities Lending Cash Central Fund | $327,538 |
Investment Valuation
The following is a summary of the inputs used, as of February 29, 2016, involving the Fund's assets and liabilities carried at fair value. The inputs or methodology used for valuing securities may not be an indication of the risk associated with investing in those securities. For more information on valuation inputs, and their aggregation into the levels used below, please refer to the Investment Valuation section in the accompanying Notes to Financial Statements.
| Valuation Inputs at Reporting Date: | ||||
| Description | Total | Level 1 | Level 2 | Level 3 |
| Investments in Securities: | ||||
| Equities: | ||||
| Consumer Discretionary | $109,071,200 | $109,071,200 | $-- | $-- |
| Consumer Staples | 135,027,788 | 135,027,788 | -- | -- |
| Energy | 177,987,697 | 177,987,697 | -- | -- |
| Financials | 412,000,585 | 412,000,585 | -- | -- |
| Health Care | 215,660,388 | 215,660,388 | -- | -- |
| Industrials | 131,471,706 | 131,471,706 | -- | -- |
| Information Technology | 200,116,153 | 200,116,153 | -- | -- |
| Materials | 30,700,305 | 30,700,305 | -- | -- |
| Telecommunication Services | 60,330,253 | 60,330,253 | -- | -- |
| Utilities | 80,752,328 | 80,752,328 | -- | -- |
| U.S. Government and Government Agency Obligations | 2,098,383 | -- | 2,098,383 | -- |
| Money Market Funds | 136,207,163 | 136,207,163 | -- | -- |
| Total Investments in Securities: | $1,691,423,949 | $1,689,325,566 | $2,098,383 | $-- |
| Derivative Instruments: | ||||
| Assets | ||||
| Futures Contracts | $502,653 | $502,653 | $-- | $-- |
| Total Assets | $502,653 | $502,653 | $-- | $-- |
| Total Derivative Instruments: | $502,653 | $502,653 | $-- | $-- |
Value of Derivative Instruments
The following table is a summary of the Fund's value of derivative instruments by primary risk exposure as of February 29, 2016. For additional information on derivative instruments, please refer to the Derivative Instruments section in the accompanying Notes to Financial Statements.
| Primary Risk Exposure / Derivative Type | Value | |
| Asset | Liability | |
| Equity Risk | ||
| Futures Contracts(a) | $502,653 | $0 |
| Total Equity Risk | 502,653 | 0 |
| Total Value of Derivatives | $502,653 | $0 |
(a) Reflects gross cumulative appreciation (depreciation) on futures contracts as presented in the Schedule of Investments. Only the period end receivable or payable for daily variation margin and net unrealized appreciation (depreciation) are presented in the Statement of Assets and Liabilities.
See accompanying notes which are an integral part of the financial statements.
Fidelity® Large Cap Value Enhanced Index Fund
Financial Statements
Statement of Assets and Liabilities
| February 29, 2016 | ||
| Assets | ||
| Investment in securities, at value (including securities loaned of $119,049,506) — See accompanying schedule: Unaffiliated issuers (cost $1,632,134,160) | $1,568,978,143 | |
| Fidelity Central Funds (cost $122,445,806) | 122,445,806 | |
| Total Investments (cost $1,754,579,966) | $1,691,423,949 | |
| Receivable for investments sold | 19,164,079 | |
| Receivable for fund shares sold | 4,256,310 | |
| Dividends receivable | 5,075,897 | |
| Interest receivable | 3,414 | |
| Distributions receivable from Fidelity Central Funds | 29,616 | |
| Total assets | 1,719,953,265 | |
| Liabilities | ||
| Payable for investments purchased | $27,468,364 | |
| Payable for fund shares redeemed | 1,092,520 | |
| Accrued management fee | 377,334 | |
| Payable for daily variation margin for derivative instruments | 92,058 | |
| Other affiliated payables | 188,669 | |
| Collateral on securities loaned, at value | 122,445,806 | |
| Total liabilities | 151,664,751 | |
| Net Assets | $1,568,288,514 | |
| Net Assets consist of: | ||
| Paid in capital | $1,667,270,374 | |
| Undistributed net investment income | 2,921,629 | |
| Accumulated undistributed net realized gain (loss) on investments | (39,250,125) | |
| Net unrealized appreciation (depreciation) on investments | (62,653,364) | |
| Net Assets, for 157,747,429 shares outstanding | $1,568,288,514 | |
| Net Asset Value, offering price and redemption price per share ($1,568,288,514 ÷ 157,747,429 shares) | $9.94 |
See accompanying notes which are an integral part of the financial statements.
Statement of Operations
| Year ended February 29, 2016 | ||
| Investment Income | ||
| Dividends | $35,150,808 | |
| Interest | 19,721 | |
| Income from Fidelity Central Funds (including $327,538 from security lending) | 327,538 | |
| Total income | 35,498,067 | |
| Expenses | ||
| Management fee | $4,025,394 | |
| Transfer agent fees | 2,015,120 | |
| Independent trustees' compensation | 5,311 | |
| Miscellaneous | 1,767 | |
| Total expenses before reductions | 6,047,592 | |
| Expense reductions | (563) | 6,047,029 |
| Net investment income (loss) | 29,451,038 | |
| Realized and Unrealized Gain (Loss) | ||
| Net realized gain (loss) on: | ||
| Investment securities: | ||
| Unaffiliated issuers | (21,348,253) | |
| Futures contracts | (404,659) | |
| Total net realized gain (loss) | (21,752,912) | |
| Change in net unrealized appreciation (depreciation) on: Investment securities | (147,964,530) | |
| Futures contracts | (300,156) | |
| Total change in net unrealized appreciation (depreciation) | (148,264,686) | |
| Net gain (loss) | (170,017,598) | |
| Net increase (decrease) in net assets resulting from operations | $(140,566,560) |
See accompanying notes which are an integral part of the financial statements.
Statement of Changes in Net Assets
| Year ended February 29, 2016 | Year ended February 28, 2015 | |
| Increase (Decrease) in Net Assets | ||
| Operations | ||
| Net investment income (loss) | $29,451,038 | $14,440,271 |
| Net realized gain (loss) | (21,752,912) | 12,112,668 |
| Change in net unrealized appreciation (depreciation) | (148,264,686) | 50,678,738 |
| Net increase (decrease) in net assets resulting from operations | (140,566,560) | 77,231,677 |
| Distributions to shareholders from net investment income | (27,330,027) | (7,996,305) |
| Distributions to shareholders from net realized gain | (19,261,829) | (12,351,234) |
| Total distributions | (46,591,856) | (20,347,539) |
| Share transactions | ||
| Proceeds from sales of shares | 973,573,154 | 1,280,586,314 |
| Reinvestment of distributions | 45,246,065 | 19,714,665 |
| Cost of shares redeemed | (368,721,721) | (431,917,050) |
| Net increase (decrease) in net assets resulting from share transactions | 650,097,498 | 868,383,929 |
| Total increase (decrease) in net assets | 462,939,082 | 925,268,067 |
| Net Assets | ||
| Beginning of period | 1,105,349,432 | 180,081,365 |
| End of period (including undistributed net investment income of $2,921,629 and undistributed net investment income of $5,226,405, respectively) | $1,568,288,514 | $1,105,349,432 |
| Other Information | ||
| Shares | ||
| Sold | 90,741,261 | 117,800,508 |
| Issued in reinvestment of distributions | 4,311,676 | 1,828,662 |
| Redeemed | (34,436,496) | (40,129,282) |
| Net increase (decrease) | 60,616,441 | 79,499,888 |
See accompanying notes which are an integral part of the financial statements.
Financial Highlights — Fidelity Large Cap Value Enhanced Index Fund
| Years ended February 28, | 2016A | 2015 | 2014 | 2013 | 2012A |
| Selected Per–Share Data | |||||
| Net asset value, beginning of period | $11.38 | $10.21 | $8.89 | $7.78 | $7.92 |
| Income from Investment Operations | |||||
| Net investment income (loss)B | .24 | .26C | .20 | .18 | .15 |
| Net realized and unrealized gain (loss) | (1.32) | 1.28 | 1.87 | 1.21 | .10 |
| Total from investment operations | (1.08) | 1.54 | 2.07 | 1.39 | .25 |
| Distributions from net investment income | (.21) | (.12) | (.16) | (.15) | (.13) |
| Distributions from net realized gain | (.15) | (.24) | (.59) | (.13) | (.26) |
| Total distributions | (.36) | (.37)D | (.75) | (.28) | (.39) |
| Net asset value, end of period | $9.94 | $11.38 | $10.21 | $8.89 | $7.78 |
| Total ReturnE | (9.69)% | 15.37% | 23.92% | 18.38% | 3.58% |
| Ratios to Average Net AssetsF,G | |||||
| Expenses before reductions | .45% | .45% | .45% | .45% | .45% |
| Expenses net of fee waivers, if any | .45% | .45% | .45% | .45% | .45% |
| Expenses net of all reductions | .45% | .45% | .45% | .45% | .45% |
| Net investment income (loss) | 2.20% | 2.34%C | 2.01% | 2.27% | 2.04% |
| Supplemental Data | |||||
| Net assets, end of period (000 omitted) | $1,568,289 | $1,105,349 | $180,081 | $106,740 | $71,354 |
| Portfolio turnover rateH | 88% | 76%I | 85% | 76% | 85% |
A For the year ended February 29.
B Calculated based on average shares outstanding during the period.
C Net Investment income per share reflects a large, non-recurring dividend which amounted to $.04 per share. Excluding this non-recurring dividend, the ratio of net investment income (loss) to average net assets would have been 2.00%.
D Total distributions of $.37 per share is comprised of distributions from net investment income of $.124 and distributions from net realized gain of $.243 per share.
E Total returns would have been lower if certain expenses had not been reduced during the applicable periods shown.
F Fees and expenses of any underlying Fidelity Central Funds are not included in the Fund's expense ratio. The Fund indirectly bears its proportionate share of the expenses of any underlying Fidelity Central Funds.
G Expense ratios reflect operating expenses of the Fund. Expenses before reductions do not reflect amounts reimbursed by the investment adviser or reductions from expense offset arrangements and do not represent the amount paid by the Fund during periods when reimbursements or reductions occur. Expenses net of fee waivers reflect expenses after reimbursement by the investment adviser but prior to reductions from expense offset arrangements. Expenses net of all reductions represent the net expenses paid by the Fund.
H Amount does not include the portfolio activity of any underlying Fidelity Central Funds.
I Portfolio turnover rate excludes securities received or delivered in-kind.
See accompanying notes which are an integral part of the financial statements.
Fidelity® Large Cap Core Enhanced Index Fund
Performance: The Bottom Line
Average annual total return reflects the change in the value of an investment, assuming reinvestment of distributions from dividend income and capital gains (the profits earned upon the sale of securities that have grown in value, if any) and assuming a constant rate of performance each year. The hypothetical investment and the average annual total returns do not reflect the deduction of taxes that a shareholder would pay on fund distributions or the redemption of fund shares. During periods of reimbursement by Fidelity, a fund’s total return will be greater than it would be had the reimbursement not occurred. How a fund did yesterday is no guarantee of how it will do tomorrow.
Average Annual Total Returns
| For the periods ended February 29, 2016 | Past 1 year | Past 5 years | Life of fundA |
| Fidelity® Large Cap Core Enhanced Index Fund | (7.94)% | 10.27% | 5.24% |
A From April 19, 2007
$10,000 Over Life of Fund
Let's say hypothetically that $10,000 was invested in Fidelity® Large Cap Core Enhanced Index Fund on April 19, 2007, when the fund started.
The chart shows how the value of your investment would have changed, and also shows how the S&P 500® Index performed over the same period.
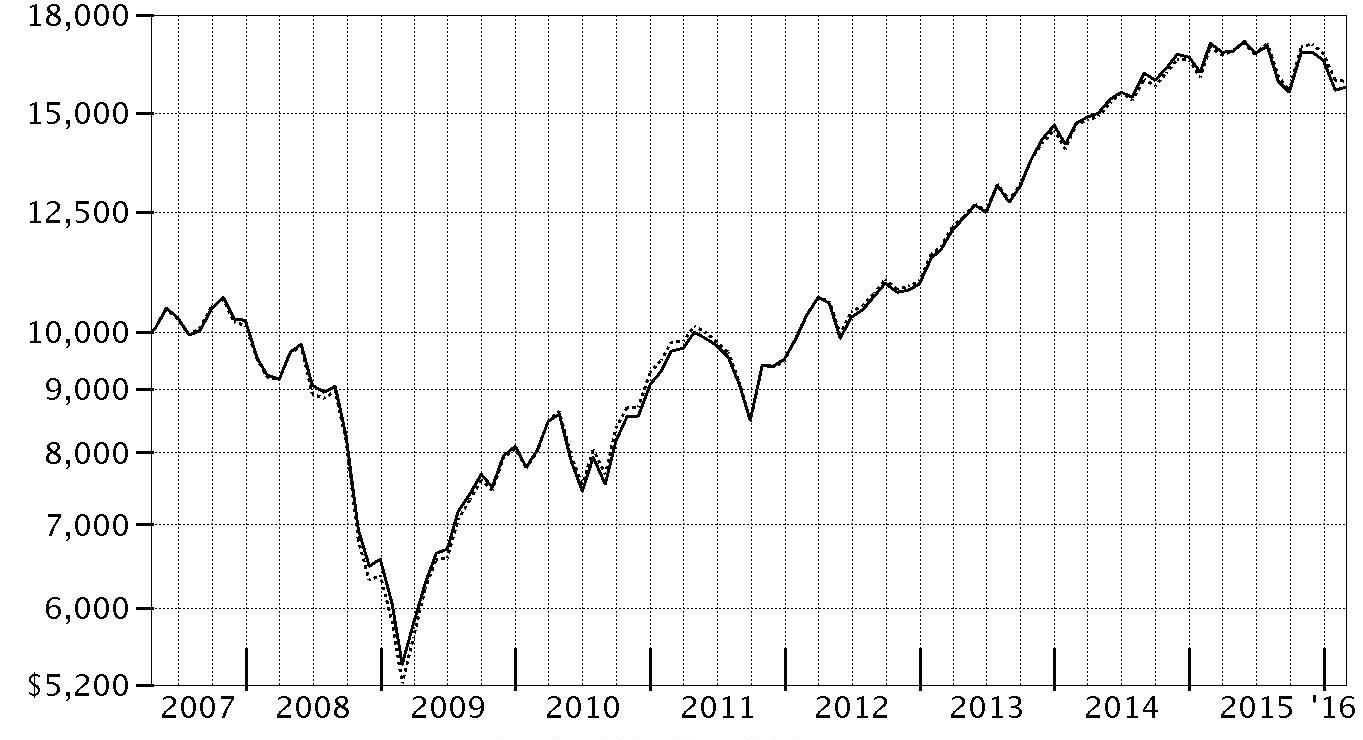
| Period Ending Values | ||
| $15,737 | Fidelity® Large Cap Core Enhanced Index Fund | |
| $15,916 | S&P 500® Index | |
Fidelity® Large Cap Core Enhanced Index Fund
Management's Discussion of Fund Performance
Market Recap: The S&P 500® index returned -6.19% for the year ending February 29, 2016. Largely range-bound for the first half of the period, U.S. stocks suffered a steep, late-summer decline on concern about an economic slowdown in China. The market recovered in October, lifted by the U.S. Federal Reserve’s decision to delay raising near-term interest rates until mid-December. Investors also drew courage from a rate cut in China and economic stimulus in Europe. But continued oil-price weakness and U.S.-dollar strength, plus fresh worries about China and the Middle East, pushed the S&P 500® to its worst January since 2009, followed by a volatile but ultimately flattish February. Overall, growth-oriented and larger-cap stocks fared better than value and smaller-cap complements. In this environment, the tech-heavy Nasdaq Composite Index® returned -7.07% for the 12 months; the Russell 2000® Index, -14.97%. Few sectors within the broad-market S&P 500® gained ground, with a wide gap separating leaders from laggards. Despite increased competition among wireless carriers, telecommunication services (+8%) led the way, followed by the more defensive utilities sector (+6%). Rising wages and low inflation buoyed consumer staples (+4%), less so consumer discretionary (0%). Meanwhile, energy (-24%) foundered amid commodity weakness that also hurt materials (-17%). The financials sector (-12%) struggled as well.Comments from Maximilian Kaufmann, Senior Portfolio Manager of the Geode Capital Management, LLC, investment management team: In a challenging environment, the fund returned -7.94%, lagging the -6.19% return of its S&P 500® benchmark. Relative to the index, the fund was hurt most by weak stock picking in the information technology sector. We also struggled in the retailing industry within consumer discretionary and the diversified financials group in the broader financials sector. In contrast, stock picking in energy contributed positively to relative results in this, the index’s weakest-performing category by far. In consumer staples, our picks in the food, beverage & tobacco industry also added value. The fund’s biggest individual detractor was Navient, a provider of education loan-management and asset recovery services. Through our models, we were attracted to Navient’s valuation and earnings-quality characteristics. Shares of Navient were down sharply for the period, as the company forecasted weaker-than-expected earnings and higher anticipated losses from student-loan borrowers. We ultimately sold the vast majority of the fund’s position in the final months of the period. In the beleaguered energy sector, a small out-of-index position in Atwood Oceanics meaningfully detracted, as this and other energy stocks continued to suffer amid declines in the price of oil. As of period end – at the recommendation of our models – we held steady our stake in Atwood. The fund’s top relative contributor was timely positioning in Keurig Green Mountain, a coffee retailer and maker of single-serve beverage systems. Late in 2015 and soon after we established a position in the Keurig, its shares soared when the company agreed to be acquired at a substantial premium. We sold our stake shortly thereafter. Public Storage also added value. Shares of this self-storage real estate investment trust (REIT) were up about 31% for the period. Our models led us to invest in Public Storage based most notably on the stock’s price and earnings momentum characteristics.The views expressed above reflect those of the portfolio manager(s) only through the end of the period as stated on the cover of this report and do not necessarily represent the views of Fidelity or any other person in the Fidelity organization. Any such views are subject to change at any time based upon market or other conditions and Fidelity disclaims any responsibility to update such views. These views may not be relied on as investment advice and, because investment decisions for a Fidelity fund are based on numerous factors, may not be relied on as an indication of trading intent on behalf of any Fidelity fund.
Fidelity® Large Cap Core Enhanced Index Fund
Investment Summary (Unaudited)
Top Ten Stocks as of February 29, 2016
| % of fund's net assets | % of fund's net assets 6 months ago | |
| Apple, Inc. | 3.6 | 4.2 |
| Microsoft Corp. | 2.6 | 2.5 |
| Johnson & Johnson | 2.2 | 2.0 |
| Exxon Mobil Corp. | 2.1 | 2.2 |
| AT&T, Inc. | 1.8 | 1.7 |
| Amazon.com, Inc. | 1.7 | 0.7 |
| Procter & Gamble Co. | 1.7 | 1.6 |
| Verizon Communications, Inc. | 1.7 | 1.6 |
| Wells Fargo & Co. | 1.7 | 1.5 |
| JPMorgan Chase & Co. | 1.7 | 1.8 |
| 20.8 |
Market Sectors as of February 29, 2016
| % of fund's net assets | % of fund's net assets 6 months ago | |
| Information Technology | 21.7 | 21.4 |
| Health Care | 16.2 | 16.8 |
| Consumer Discretionary | 14.2 | 13.2 |
| Financials | 13.8 | 14.7 |
| Consumer Staples | 11.3 | 10.2 |
| Industrials | 8.2 | 8.0 |
| Energy | 5.6 | 7.9 |
| Telecommunication Services | 4.5 | 3.3 |
| Materials | 1.7 | 2.0 |
| Utilities | 1.5 | 1.1 |
Fidelity® Large Cap Core Enhanced Index Fund
Investments February 29, 2016
Showing Percentage of Net Assets
| Common Stocks - 98.7% | |||
| Shares | Value | ||
| CONSUMER DISCRETIONARY - 14.2% | |||
| Auto Components - 1.6% | |||
| BorgWarner, Inc. | 65,028 | $2,125,115 | |
| Gentex Corp. | 127,770 | 1,860,331 | |
| Johnson Controls, Inc. | 3,900 | 142,194 | |
| Tenneco, Inc. (a) | 5,955 | 271,072 | |
| The Goodyear Tire & Rubber Co. | 66,510 | 2,003,281 | |
| 6,401,993 | |||
| Automobiles - 1.0% | |||
| Ford Motor Co. | 261,066 | 3,265,936 | |
| General Motors Co. | 29,502 | 868,539 | |
| 4,134,475 | |||
| Hotels, Restaurants & Leisure - 0.8% | |||
| Carnival Corp. unit | 48,689 | 2,335,124 | |
| McDonald's Corp. | 4,195 | 491,612 | |
| Starbucks Corp. | 8,372 | 487,334 | |
| 3,314,070 | |||
| Household Durables - 0.3% | |||
| D.R. Horton, Inc. | 2,111 | 56,406 | |
| Tempur Sealy International, Inc. (a)(b) | 21,427 | 1,235,695 | |
| 1,292,101 | |||
| Internet & Catalog Retail - 1.8% | |||
| Amazon.com, Inc. (a) | 12,911 | 7,133,586 | |
| Priceline Group, Inc. (a) | 168 | 212,555 | |
| 7,346,141 | |||
| Leisure Products - 0.3% | |||
| Brunswick Corp. | 10,871 | 462,452 | |
| Hasbro, Inc. | 8,415 | 638,446 | |
| Polaris Industries, Inc. | 3,668 | 322,454 | |
| 1,423,352 | |||
| Media - 3.6% | |||
| Comcast Corp. Class A | 85,986 | 4,963,972 | |
| Discovery Communications, Inc. Class C (non-vtg.) (a) | 15,980 | 393,907 | |
| MSG Network, Inc. Class A (a) | 92,522 | 1,519,211 | |
| The Walt Disney Co. | 57,271 | 5,470,526 | |
| Time Warner Cable, Inc. | 3,762 | 718,015 | |
| Viacom, Inc. Class B (non-vtg.) | 51,683 | 1,904,519 | |
| 14,970,150 | |||
| Multiline Retail - 0.8% | |||
| Target Corp. | 42,650 | 3,345,893 | |
| Specialty Retail - 3.0% | |||
| American Eagle Outfitters, Inc. (b) | 75,105 | 1,146,102 | |
| Bed Bath & Beyond, Inc. (a) | 8,649 | 414,720 | |
| Best Buy Co., Inc. | 30,211 | 978,534 | |
| Gap, Inc. (b) | 72,972 | 2,017,676 | |
| GNC Holdings, Inc. | 37,310 | 1,062,589 | |
| Home Depot, Inc. | 25,226 | 3,131,051 | |
| Lowe's Companies, Inc. | 45,537 | 3,075,114 | |
| Urban Outfitters, Inc. (a)(b) | 14,394 | 381,297 | |
| 12,207,083 | |||
| Textiles, Apparel & Luxury Goods - 1.0% | |||
| Michael Kors Holdings Ltd. (a) | 44,244 | 2,506,423 | |
| NIKE, Inc. Class B | 25,210 | 1,552,684 | |
| 4,059,107 | |||
| TOTAL CONSUMER DISCRETIONARY | 58,494,365 | ||
| CONSUMER STAPLES - 11.3% | |||
| Beverages - 2.4% | |||
| Dr. Pepper Snapple Group, Inc. | 21,811 | 1,996,361 | |
| PepsiCo, Inc. | 54,419 | 5,323,267 | |
| The Coca-Cola Co. | 66,456 | 2,866,247 | |
| 10,185,875 | |||
| Food & Staples Retailing - 2.5% | |||
| CVS Health Corp. | 40,022 | 3,888,938 | |
| Wal-Mart Stores, Inc. | 68,682 | 4,556,364 | |
| Walgreens Boots Alliance, Inc. | 23,777 | 1,876,956 | |
| 10,322,258 | |||
| Food Products - 2.6% | |||
| Archer Daniels Midland Co. | 73,490 | 2,569,210 | |
| Campbell Soup Co. (b) | 37,405 | 2,309,759 | |
| Hormel Foods Corp. | 21,320 | 906,313 | |
| Mead Johnson Nutrition Co. Class A | 2,613 | 192,735 | |
| Pilgrim's Pride Corp. (b) | 84,665 | 2,070,059 | |
| Tyson Foods, Inc. Class A | 41,041 | 2,657,405 | |
| 10,705,481 | |||
| Household Products - 2.3% | |||
| Clorox Co. | 17,855 | 2,257,229 | |
| Procter & Gamble Co. | 88,528 | 7,107,913 | |
| 9,365,142 | |||
| Tobacco - 1.5% | |||
| Altria Group, Inc. | 80,857 | 4,978,365 | |
| Philip Morris International, Inc. | 13,088 | 1,191,401 | |
| 6,169,766 | |||
| TOTAL CONSUMER STAPLES | 46,748,522 | ||
| ENERGY - 5.6% | |||
| Energy Equipment & Services - 1.0% | |||
| Atwood Oceanics, Inc. | 54,357 | 373,976 | |
| Baker Hughes, Inc. | 472 | 20,235 | |
| Dril-Quip, Inc. (a) | 10,174 | 551,940 | |
| FMC Technologies, Inc. (a) | 40,736 | 999,254 | |
| Oceaneering International, Inc. | 3,974 | 109,762 | |
| Schlumberger Ltd. | 26,047 | 1,868,091 | |
| 3,923,258 | |||
| Oil, Gas & Consumable Fuels - 4.6% | |||
| Chevron Corp. | 25,264 | 2,108,028 | |
| ConocoPhillips Co. | 4,952 | 167,526 | |
| EOG Resources, Inc. (b) | 25,250 | 1,634,685 | |
| EQT Corp. | 2,336 | 130,209 | |
| Exxon Mobil Corp. | 105,616 | 8,465,122 | |
| Marathon Petroleum Corp. | 32,051 | 1,097,747 | |
| Memorial Resource Development Corp. (a) | 16,525 | 159,797 | |
| Occidental Petroleum Corp. | 9,719 | 668,862 | |
| ONEOK, Inc. | 5,029 | 120,696 | |
| Spectra Energy Corp. | 854 | 24,937 | |
| Tesoro Corp. | 24,064 | 1,941,484 | |
| Valero Energy Corp. | 31,680 | 1,903,334 | |
| Western Refining, Inc. | 21,721 | 579,299 | |
| 19,001,726 | |||
| TOTAL ENERGY | 22,924,984 | ||
| FINANCIALS - 13.8% | |||
| Banks - 5.0% | |||
| Bank of America Corp. | 409,392 | 5,125,588 | |
| Citigroup, Inc. | 26,256 | 1,020,046 | |
| JPMorgan Chase & Co. | 122,492 | 6,896,300 | |
| SunTrust Banks, Inc. | 16,180 | 536,852 | |
| Wells Fargo & Co. | 147,312 | 6,911,879 | |
| 20,490,665 | |||
| Capital Markets - 1.7% | |||
| Goldman Sachs Group, Inc. | 22,642 | 3,385,658 | |
| Morgan Stanley | 84,423 | 2,085,248 | |
| T. Rowe Price Group, Inc. | 19,495 | 1,347,299 | |
| 6,818,205 | |||
| Consumer Finance - 2.0% | |||
| American Express Co. | 51,517 | 2,863,315 | |
| Capital One Financial Corp. | 14,792 | 972,278 | |
| Discover Financial Services | 45,665 | 2,119,769 | |
| Navient Corp. | 4,140 | 44,836 | |
| Synchrony Financial (a) | 87,313 | 2,353,085 | |
| 8,353,283 | |||
| Diversified Financial Services - 2.6% | |||
| Berkshire Hathaway, Inc. Class B (a) | 47,811 | 6,414,802 | |
| Broadcom Ltd. | 1,317 | 176,438 | |
| CME Group, Inc. | 2,867 | 262,158 | |
| Leucadia National Corp. | 144,547 | 2,088,704 | |
| Morningstar, Inc. | 24,288 | 1,928,224 | |
| 10,870,326 | |||
| Insurance - 0.7% | |||
| AFLAC, Inc. | 112 | 6,666 | |
| FNF Group | 8,055 | 265,654 | |
| Lincoln National Corp. | 943 | 34,448 | |
| MetLife, Inc. | 1,525 | 60,329 | |
| Progressive Corp. | 52,523 | 1,676,534 | |
| The Travelers Companies, Inc. | 8,064 | 867,041 | |
| 2,910,672 | |||
| Real Estate Investment Trusts - 1.8% | |||
| Care Capital Properties, Inc. | 5,428 | 143,896 | |
| CBL & Associates Properties, Inc. | 11,078 | 127,729 | |
| Equity Lifestyle Properties, Inc. | 879 | 61,671 | |
| Host Hotels & Resorts, Inc. | 2,602 | 39,837 | |
| Lamar Advertising Co. Class A | 6,342 | 362,318 | |
| Liberty Property Trust (SBI) | 439 | 12,678 | |
| MFA Financial, Inc. | 121,104 | 824,718 | |
| Public Storage | 11,861 | 2,959,201 | |
| Ryman Hospitality Properties, Inc. | 2,071 | 99,139 | |
| Simon Property Group, Inc. | 397 | 75,323 | |
| Two Harbors Investment Corp. | 6,565 | 50,879 | |
| Weyerhaeuser Co. | 106,384 | 2,763,856 | |
| 7,521,245 | |||
| TOTAL FINANCIALS | 56,964,396 | ||
| HEALTH CARE - 16.2% | |||
| Biotechnology - 4.2% | |||
| AbbVie, Inc. | 54,400 | 2,970,784 | |
| Amgen, Inc. | 31,418 | 4,470,153 | |
| Baxalta, Inc. | 604 | 23,266 | |
| Biogen, Inc. (a) | 12,559 | 3,258,056 | |
| Gilead Sciences, Inc. | 55,840 | 4,872,040 | |
| United Therapeutics Corp. (a) | 13,323 | 1,624,607 | |
| 17,218,906 | |||
| Health Care Equipment & Supplies - 0.7% | |||
| Abbott Laboratories | 25,077 | 971,483 | |
| Edwards Lifesciences Corp. (a) | 214 | 18,618 | |
| Medtronic PLC | 4,928 | 381,378 | |
| St. Jude Medical, Inc. | 26,391 | 1,416,933 | |
| 2,788,412 | |||
| Health Care Providers & Services - 4.3% | |||
| Aetna, Inc. (b) | 27,111 | 2,945,068 | |
| Anthem, Inc. | 21,141 | 2,762,917 | |
| Cardinal Health, Inc. | 16,650 | 1,360,305 | |
| Centene Corp. (a) | 326 | 18,569 | |
| Cigna Corp. | 2,548 | 355,726 | |
| Express Scripts Holding Co. (a) | 39,404 | 2,773,254 | |
| Humana, Inc. | 845 | 149,540 | |
| McKesson Corp. | 17,455 | 2,716,347 | |
| Owens & Minor, Inc. | 1,390 | 54,780 | |
| UnitedHealth Group, Inc. | 40,282 | 4,797,586 | |
| 17,934,092 | |||
| Life Sciences Tools & Services - 0.2% | |||
| Bruker Corp. | 22,622 | 587,720 | |
| INC Research Holdings, Inc. Class A (a) | 3,443 | 136,618 | |
| PRA Health Sciences, Inc. (a) | 1,817 | 78,440 | |
| 802,778 | |||
| Pharmaceuticals - 6.8% | |||
| Allergan PLC (a) | 6,714 | 1,947,799 | |
| Bristol-Myers Squibb Co. | 67,087 | 4,154,698 | |
| Eli Lilly & Co. | 18,051 | 1,299,672 | |
| Johnson & Johnson | 85,639 | 9,010,079 | |
| Merck & Co., Inc. | 106,471 | 5,345,909 | |
| Mylan N.V. (b) | 55,825 | 2,516,033 | |
| Pfizer, Inc. | 125,519 | 3,724,149 | |
| 27,998,339 | |||
| TOTAL HEALTH CARE | 66,742,527 | ||
| INDUSTRIALS - 8.2% | |||
| Aerospace & Defense - 3.4% | |||
| BE Aerospace, Inc. | 30,299 | 1,321,642 | |
| General Dynamics Corp. | 17,691 | 2,410,753 | |
| Huntington Ingalls Industries, Inc. | 3,024 | 396,325 | |
| Moog, Inc. Class A (a) | 3,129 | 135,110 | |
| Raytheon Co. | 14,030 | 1,737,616 | |
| Rockwell Collins, Inc. | 8,010 | 701,436 | |
| Spirit AeroSystems Holdings, Inc. Class A (a) | 4,572 | 210,312 | |
| The Boeing Co. (b) | 32,413 | 3,830,568 | |
| United Technologies Corp. | 35,981 | 3,476,484 | |
| 14,220,246 | |||
| Airlines - 1.4% | |||
| Delta Air Lines, Inc. | 26,601 | 1,283,232 | |
| Southwest Airlines Co. | 62,520 | 2,622,714 | |
| United Continental Holdings, Inc. (a) | 31,181 | 1,785,424 | |
| 5,691,370 | |||
| Commercial Services & Supplies - 0.0% | |||
| Rollins, Inc. | 2,159 | 59,437 | |
| Electrical Equipment - 0.6% | |||
| Eaton Corp. PLC | 42,246 | 2,395,771 | |
| Industrial Conglomerates - 2.2% | |||
| 3M Co. | 26,080 | 4,091,170 | |
| General Electric Co. | 164,904 | 4,805,303 | |
| 8,896,473 | |||
| Machinery - 0.4% | |||
| Cummins, Inc. | 15,998 | 1,560,925 | |
| Toro Co. | 2,383 | 189,925 | |
| 1,750,850 | |||
| Road & Rail - 0.1% | |||
| Norfolk Southern Corp. | 1,135 | 83,048 | |
| Union Pacific Corp. | 2,073 | 163,477 | |
| 246,525 | |||
| Trading Companies & Distributors - 0.1% | |||
| Fastenal Co. | 10,730 | 485,962 | |
| TOTAL INDUSTRIALS | 33,746,634 | ||
| INFORMATION TECHNOLOGY - 21.7% | |||
| Communications Equipment - 3.5% | |||
| Arista Networks, Inc. (a) | 9,427 | 646,127 | |
| Brocade Communications Systems, Inc. | 223,699 | 2,221,331 | |
| Cisco Systems, Inc. | 203,968 | 5,339,882 | |
| Juniper Networks, Inc. | 25,260 | 623,922 | |
| Motorola Solutions, Inc. | 23,180 | 1,703,498 | |
| Qualcomm, Inc. | 74,014 | 3,759,171 | |
| 14,293,931 | |||
| Electronic Equipment & Components - 1.1% | |||
| Corning, Inc. | 20,958 | 383,531 | |
| TE Connectivity Ltd. | 43,185 | 2,458,090 | |
| Tech Data Corp. (a) | 23,204 | 1,633,794 | |
| 4,475,415 | |||
| Internet Software & Services - 4.1% | |||
| Alphabet, Inc.: | |||
| Class A | 6,966 | 4,996,155 | |
| Class C | 4,156 | 2,899,932 | |
| eBay, Inc. (a) | 104,010 | 2,475,438 | |
| Facebook, Inc. Class A (a) | 61,063 | 6,528,856 | |
| 16,900,381 | |||
| IT Services - 1.6% | |||
| Accenture PLC Class A | 9,058 | 908,155 | |
| Genpact Ltd. (a) | 206 | 5,445 | |
| IBM Corp. | 9,970 | 1,306,369 | |
| MasterCard, Inc. Class A | 413 | 35,898 | |
| Paychex, Inc. (b) | 20,671 | 1,062,283 | |
| The Western Union Co. | 18,339 | 334,870 | |
| Visa, Inc. Class A | 18,707 | 1,354,200 | |
| Xerox Corp. | 184,579 | 1,773,804 | |
| 6,781,024 | |||
| Semiconductors & Semiconductor Equipment - 1.9% | |||
| Applied Materials, Inc. | 58,213 | 1,098,479 | |
| Intel Corp. | 182,306 | 5,394,435 | |
| Lam Research Corp. | 11,679 | 856,071 | |
| Texas Instruments, Inc. | 10,365 | 549,552 | |
| 7,898,537 | |||
| Software - 4.7% | |||
| Aspen Technology, Inc. (a) | 8,990 | 296,400 | |
| Citrix Systems, Inc. (a) | 17,393 | 1,228,815 | |
| Electronic Arts, Inc. (a) | 39,484 | 2,536,452 | |
| Microsoft Corp. | 213,289 | 10,852,144 | |
| Oracle Corp. | 122,736 | 4,514,230 | |
| 19,428,041 | |||
| Technology Hardware, Storage & Peripherals - 4.8% | |||
| Apple, Inc. | 153,726 | 14,863,765 | |
| EMC Corp. | 30,492 | 796,756 | |
| HP, Inc. | 241,466 | 2,581,272 | |
| NetApp, Inc. | 16,320 | 405,389 | |
| Western Digital Corp. | 23,048 | 1,003,279 | |
| 19,650,461 | |||
| TOTAL INFORMATION TECHNOLOGY | 89,427,790 | ||
| MATERIALS - 1.7% | |||
| Chemicals - 1.7% | |||
| E.I. du Pont de Nemours & Co. (b) | 13,015 | 792,223 | |
| LyondellBasell Industries NV Class A | 34,633 | 2,777,913 | |
| The Dow Chemical Co. | 21,369 | 1,038,747 | |
| The Mosaic Co. | 60,019 | 1,599,506 | |
| Westlake Chemical Corp. | 14,081 | 607,173 | |
| 6,815,562 | |||
| TELECOMMUNICATION SERVICES - 4.5% | |||
| Diversified Telecommunication Services - 4.5% | |||
| AT&T, Inc. | 202,010 | 7,464,270 | |
| CenturyLink, Inc. | 85,865 | 2,626,610 | |
| Level 3 Communications, Inc. (a) | 26,310 | 1,277,351 | |
| Verizon Communications, Inc. | 137,559 | 6,978,368 | |
| 18,346,599 | |||
| UTILITIES - 1.5% | |||
| Electric Utilities - 0.9% | |||
| Exelon Corp. (b) | 86,568 | 2,726,026 | |
| FirstEnergy Corp. | 5,561 | 186,127 | |
| NextEra Energy, Inc. | 4,907 | 553,608 | |
| OGE Energy Corp. | 8,011 | 199,314 | |
| PPL Corp. | 1,757 | 61,477 | |
| 3,726,552 | |||
| Multi-Utilities - 0.6% | |||
| Public Service Enterprise Group, Inc. | 61,131 | 2,607,848 | |
| TOTAL UTILITIES | 6,334,400 | ||
| TOTAL COMMON STOCKS | |||
| (Cost $384,970,227) | 406,545,779 | ||
| Principal Amount | Value | ||
| U.S. Treasury Obligations - 0.1% | |||
| U.S. Treasury Bills, yield at date of purchase 0.39% 5/26/16 (c) | |||
| (Cost $499,529) | 500,000 | 499,615 | |
| Shares | Value | ||
| Money Market Funds - 6.8% | |||
| Dreyfus Cash Management Institutional Shares, 0.10% (d) | 3,858,348 | $3,858,348 | |
| Fidelity Securities Lending Cash Central Fund, 0.44% (e)(f) | 23,943,595 | 23,943,595 | |
| TOTAL MONEY MARKET FUNDS | |||
| (Cost $27,801,943) | 27,801,943 | ||
| TOTAL INVESTMENT PORTFOLIO - 105.6% | |||
| (Cost $413,271,699) | 434,847,337 | ||
| NET OTHER ASSETS (LIABILITIES) - (5.6)% | (23,148,488) | ||
| NET ASSETS - 100% | $411,698,849 |
| Futures Contracts | |||
| Expiration Date | Underlying Face Amount at Value | Unrealized Appreciation/(Depreciation) | |
| Purchased | |||
| Equity Index Contracts | |||
| 53 CME E-mini S&P 500 Index Contracts (United States) | March 2016 | 5,113,175 | $123,737 |
The face value of futures purchased as a percentage of Net Assets is 1.2%
Legend
(a) Non-income producing
(b) Security or a portion of the security is on loan at period end.
(c) Security or a portion of the security was pledged to cover margin requirements for futures contracts. At period end, the value of securities pledged amounted to $236,818.
(d) The rate quoted is the annualized seven-day yield of the fund at period end.
(e) Investment made with cash collateral received from securities on loan.
(f) Affiliated fund that is generally available only to investment companies and other accounts managed by Fidelity Investments. The rate quoted is the annualized seven-day yield of the fund at period end. A complete unaudited listing of the fund's holdings as of its most recent quarter end is available upon request. In addition, each Fidelity Central Fund's financial statements, which are not covered by the Fund's Report of Independent Registered Public Accounting Firm, are available on the SEC's website or upon request.
Affiliated Central Funds
Information regarding fiscal year to date income earned by the Fund from investments in Fidelity Central Funds is as follows:
| Fund | Income earned |
| Fidelity Securities Lending Cash Central Fund | $82,379 |
Investment Valuation
The following is a summary of the inputs used, as of February 29, 2016, involving the Fund's assets and liabilities carried at fair value. The inputs or methodology used for valuing securities may not be an indication of the risk associated with investing in those securities. For more information on valuation inputs, and their aggregation into the levels used below, please refer to the Investment Valuation section in the accompanying Notes to Financial Statements.
| Valuation Inputs at Reporting Date: | ||||
| Description | Total | Level 1 | Level 2 | Level 3 |
| Investments in Securities: | ||||
| Equities: | ||||
| Consumer Discretionary | $58,494,365 | $58,494,365 | $-- | $-- |
| Consumer Staples | 46,748,522 | 46,748,522 | -- | -- |
| Energy | 22,924,984 | 22,924,984 | -- | -- |
| Financials | 56,964,396 | 56,964,396 | -- | -- |
| Health Care | 66,742,527 | 66,742,527 | -- | -- |
| Industrials | 33,746,634 | 33,746,634 | -- | -- |
| Information Technology | 89,427,790 | 89,427,790 | -- | -- |
| Materials | 6,815,562 | 6,815,562 | -- | -- |
| Telecommunication Services | 18,346,599 | 18,346,599 | -- | -- |
| Utilities | 6,334,400 | 6,334,400 | -- | -- |
| U.S. Government and Government Agency Obligations | 499,615 | -- | 499,615 | -- |
| Money Market Funds | 27,801,943 | 27,801,943 | -- | -- |
| Total Investments in Securities: | $434,847,337 | $434,347,722 | $499,615 | $-- |
| Derivative Instruments: | ||||
| Assets | ||||
| Futures Contracts | $123,737 | $123,737 | $-- | $-- |
| Total Assets | $123,737 | $123,737 | $-- | $-- |
| Total Derivative Instruments: | $123,737 | $123,737 | $-- | $-- |
Value of Derivative Instruments
The following table is a summary of the Fund's value of derivative instruments by primary risk exposure as of February 29, 2016. For additional information on derivative instruments, please refer to the Derivative Instruments section in the accompanying Notes to Financial Statements.
| Primary Risk Exposure / Derivative Type | Value | |
| Asset | Liability | |
| Equity Risk | ||
| Futures Contracts(a) | $123,737 | $0 |
| Total Equity Risk | 123,737 | 0 |
| Total Value of Derivatives | $123,737 | $0 |
(a) Reflects gross cumulative appreciation (depreciation) on futures contracts as presented in the Schedule of Investments. Only the period end receivable or payable for daily variation margin and net unrealized appreciation (depreciation) are presented in the Statement of Assets and Liabilities.
See accompanying notes which are an integral part of the financial statements.
Fidelity® Large Cap Core Enhanced Index Fund
Financial Statements
Statement of Assets and Liabilities
| February 29, 2016 | ||
| Assets | ||
| Investment in securities, at value (including securities loaned of $23,231,705) — See accompanying schedule: Unaffiliated issuers (cost $389,328,104) | $410,903,742 | |
| Fidelity Central Funds (cost $23,943,595) | 23,943,595 | |
| Total Investments (cost $413,271,699) | $434,847,337 | |
| Receivable for investments sold | 4,891,069 | |
| Receivable for fund shares sold | 1,582,340 | |
| Dividends receivable | 963,714 | |
| Interest receivable | 1,064 | |
| Distributions receivable from Fidelity Central Funds | 6,007 | |
| Total assets | 442,291,531 | |
| Liabilities | ||
| Payable for investments purchased | $5,558,356 | |
| Payable for fund shares redeemed | 914,274 | |
| Accrued management fee | 99,673 | |
| Payable for daily variation margin for derivative instruments | 26,947 | |
| Other affiliated payables | 49,837 | |
| Collateral on securities loaned, at value | 23,943,595 | |
| Total liabilities | 30,592,682 | |
| Net Assets | $411,698,849 | |
| Net Assets consist of: | ||
| Paid in capital | $406,685,675 | |
| Undistributed net investment income | 603,436 | |
| Accumulated undistributed net realized gain (loss) on investments | (17,289,637) | |
| Net unrealized appreciation (depreciation) on investments | 21,699,375 | |
| Net Assets, for 37,780,792 shares outstanding | $411,698,849 | |
| Net Asset Value, offering price and redemption price per share ($411,698,849 ÷ 37,780,792 shares) | $10.90 |
See accompanying notes which are an integral part of the financial statements.
Statement of Operations
| Year ended February 29, 2016 | ||
| Investment Income | ||
| Dividends | $9,103,640 | |
| Interest | 4,775 | |
| Income from Fidelity Central Funds (including $82,379 from security lending) | 82,379 | |
| Total income | 9,190,794 | |
| Expenses | ||
| Management fee | $1,190,063 | |
| Transfer agent fees | 595,771 | |
| Independent trustees' compensation | 1,605 | |
| Miscellaneous | 555 | |
| Total expenses before reductions | 1,787,994 | |
| Expense reductions | (116) | 1,787,878 |
| Net investment income (loss) | 7,402,916 | |
| Realized and Unrealized Gain (Loss) | ||
| Net realized gain (loss) on: | ||
| Investment securities: | ||
| Unaffiliated issuers | 1,681,350 | |
| Futures contracts | (291,188) | |
| Total net realized gain (loss) | 1,390,162 | |
| Change in net unrealized appreciation (depreciation) on: Investment securities | (41,717,835) | |
| Futures contracts | 6,075 | |
| Total change in net unrealized appreciation (depreciation) | (41,711,760) | |
| Net gain (loss) | (40,321,598) | |
| Net increase (decrease) in net assets resulting from operations | $(32,918,682) |
See accompanying notes which are an integral part of the financial statements.
Statement of Changes in Net Assets
| Year ended February 29, 2016 | Year ended February 28, 2015 | |
| Increase (Decrease) in Net Assets | ||
| Operations | ||
| Net investment income (loss) | $7,402,916 | $6,332,829 |
| Net realized gain (loss) | 1,390,162 | 24,806,942 |
| Change in net unrealized appreciation (depreciation) | (41,711,760) | 26,871,253 |
| Net increase (decrease) in net assets resulting from operations | (32,918,682) | 58,011,024 |
| Distributions to shareholders from net investment income | (6,567,904) | (4,804,434) |
| Distributions to shareholders from net realized gain | (8,297,616) | (18,865,721) |
| Total distributions | (14,865,520) | (23,670,155) |
| Share transactions | ||
| Proceeds from sales of shares | 207,509,960 | 229,544,332 |
| Reinvestment of distributions | 14,075,999 | 22,379,464 |
| Cost of shares redeemed | (143,985,591) | (346,155,181) |
| Net increase (decrease) in net assets resulting from share transactions | 77,600,368 | (94,231,385) |
| Total increase (decrease) in net assets | 29,816,166 | (59,890,516) |
| Net Assets | ||
| Beginning of period | 381,882,683 | 441,773,199 |
| End of period (including undistributed net investment income of $603,436 and undistributed net investment income of $1,386,171, respectively) | $411,698,849 | $381,882,683 |
| Other Information | ||
| Shares | ||
| Sold | 17,838,199 | 19,268,068 |
| Issued in reinvestment of distributions | 1,214,811 | 1,960,142 |
| Redeemed | (12,333,931) | (29,262,135) |
| Net increase (decrease) | 6,719,079 | (8,033,925) |
See accompanying notes which are an integral part of the financial statements.
Financial Highlights — Fidelity Large Cap Core Enhanced Index Fund
| Years ended February 28, | 2016A | 2015 | 2014 | 2013 | 2012A |
| Selected Per–Share Data | |||||
| Net asset value, beginning of period | $12.29 | $11.30 | $10.70 | $9.68 | $9.09 |
| Income from Investment Operations | |||||
| Net investment income (loss)B | .22 | .20 | .19 | .21 | .14 |
| Net realized and unrealized gain (loss) | (1.17) | 1.55 | 2.45 | 1.03 | .48 |
| Total from investment operations | (.95) | 1.75 | 2.64 | 1.24 | .62 |
| Distributions from net investment income | (.19) | (.16) | (.27) | (.18) | (.03) |
| Distributions from net realized gain | (.25) | (.60) | (1.77) | (.05) | – |
| Total distributions | (.44) | (.76) | (2.04) | (.22)C | (.03) |
| Net asset value, end of period | $10.90 | $12.29 | $11.30 | $10.70 | $9.68 |
| Total ReturnD | (7.94)% | 16.04% | 26.44% | 13.03% | 6.78% |
| Ratios to Average Net AssetsE,F | |||||
| Expenses before reductions | .45% | .45% | .45% | .45% | .45% |
| Expenses net of fee waivers, if any | .45% | .45% | .45% | .45% | .45% |
| Expenses net of all reductions | .45% | .45% | .45% | .45% | .45% |
| Net investment income (loss) | 1.86% | 1.69% | 1.67% | 2.08% | 1.53% |
| Supplemental Data | |||||
| Net assets, end of period (000 omitted) | $411,699 | $381,883 | $441,773 | $208,675 | $262,225 |
| Portfolio turnover rateG | 84% | 101% | 125% | 85% | 104% |
A For the year ended February 29.
B Calculated based on average shares outstanding during the period.
C Total distributions of $.22 per share is comprised of distributions from net investment income of $.175 and distributions from net realized gain of $.049 per share.
D Total returns would have been lower if certain expenses had not been reduced during the applicable periods shown.
E Fees and expenses of any underlying Fidelity Central Funds are not included in the Fund's expense ratio. The Fund indirectly bears its proportionate share of the expenses of any underlying Fidelity Central Funds.
F Expense ratios reflect operating expenses of the Fund. Expenses before reductions do not reflect amounts reimbursed by the investment adviser or reductions from expense offset arrangements and do not represent the amount paid by the Fund during periods when reimbursements or reductions occur. Expenses net of fee waivers reflect expenses after reimbursement by the investment adviser but prior to reductions from expense offset arrangements. Expenses net of all reductions represent the net expenses paid by the Fund.
G Amount does not include the portfolio activity of any underlying Fidelity Central Funds.
See accompanying notes which are an integral part of the financial statements.
Fidelity® Mid Cap Enhanced Index Fund
Performance: The Bottom Line
Average annual total return reflects the change in the value of an investment, assuming reinvestment of distributions from dividend income and capital gains (the profits earned upon the sale of securities that have grown in value, if any) and assuming a constant rate of performance each year. The hypothetical investment and the average annual total returns do not reflect the deduction of taxes that a shareholder would pay on fund distributions or the redemption of fund shares. During periods of reimbursement by Fidelity, a fund’s total return will be greater than it would be had the reimbursement not occurred. How a fund did yesterday is no guarantee of how it will do tomorrow.
Average Annual Total Returns
| For the periods ended February 29, 2016 | Past 1 year | Past 5 years | Life of fundA |
| Fidelity® Mid Cap Enhanced Index Fund | (11.02)% | 9.60% | 7.02% |
A From December 20, 2007
$10,000 Over Life of Fund
Let's say hypothetically that $10,000 was invested in Fidelity® Mid Cap Enhanced Index Fund on December 20, 2007, when the fund started.
The chart shows how the value of your investment would have changed, and also shows how the Russell Midcap® Index performed over the same period.
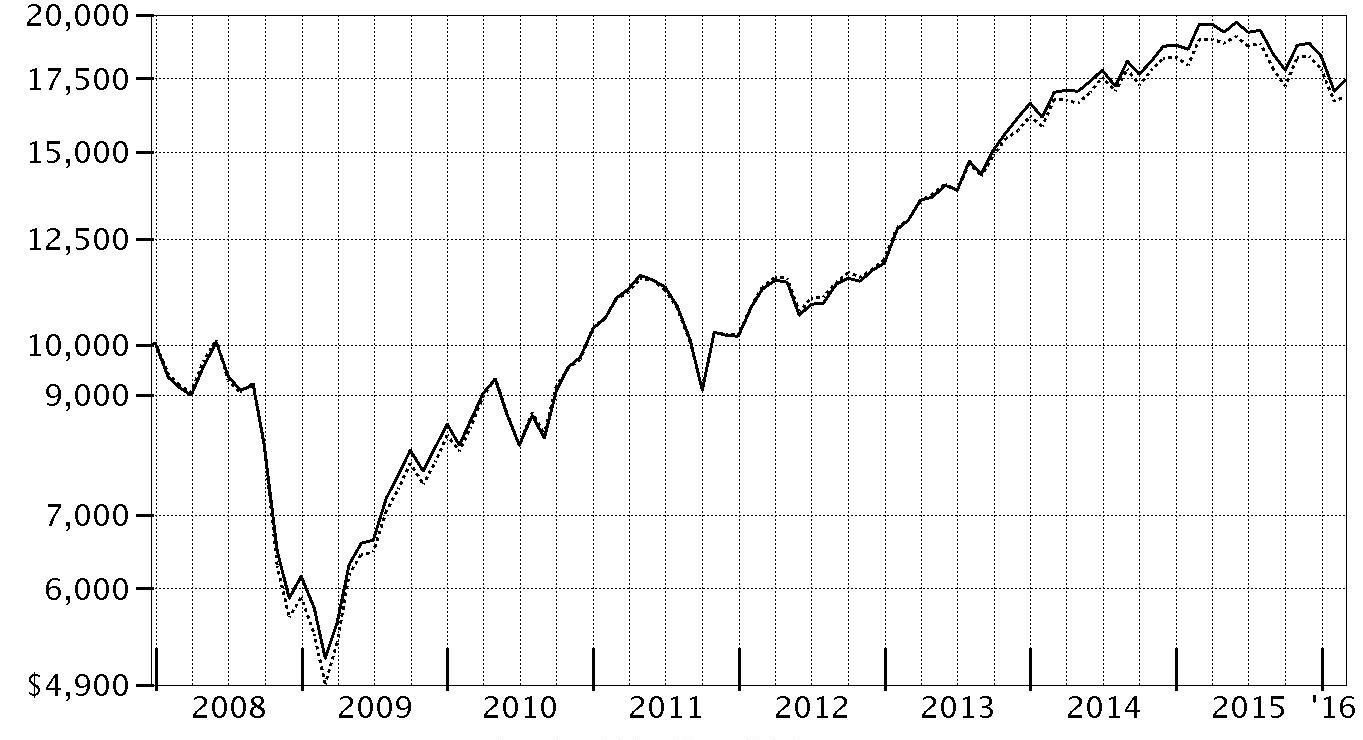
| Period Ending Values | ||
| $17,444 | Fidelity® Mid Cap Enhanced Index Fund | |
| $16,863 | Russell Midcap® Index | |
Fidelity® Mid Cap Enhanced Index Fund
Management's Discussion of Fund Performance
Market Recap: The S&P 500® index returned -6.19% for the year ending February 29, 2016. Largely range-bound for the first half of the period, U.S. stocks suffered a steep, late-summer decline on concern about an economic slowdown in China. The market recovered in October, lifted by the U.S. Federal Reserve’s decision to delay raising near-term interest rates until mid-December. Investors also drew courage from a rate cut in China and economic stimulus in Europe. But continued oil-price weakness and U.S.-dollar strength, plus fresh worries about China and the Middle East, pushed the S&P 500® to its worst January since 2009, followed by a volatile but ultimately flattish February. Overall, growth-oriented and larger-cap stocks fared better than value and smaller-cap complements. In this environment, the tech-heavy Nasdaq Composite Index® returned -7.07% for the 12 months; the Russell 2000® Index, -14.97%. Few sectors within the broad-market S&P 500® gained ground, with a wide gap separating leaders from laggards. Despite increased competition among wireless carriers, telecommunication services (+8%) led the way, followed by the more defensive utilities sector (+6%). Rising wages and low inflation buoyed consumer staples (+4%), less so consumer discretionary (0%). Meanwhile, energy (-24%) foundered amid commodity weakness that also hurt materials (-17%). The financials sector (-12%) struggled as well.Comments from Maximilian Kaufmann, Senior Portfolio Manager of the Geode Capital Management, LLC, investment management team: In a challenging market environment, the fund returned -11.02%, slightly outpacing the -11.25% return of its benchmark, the Russell Midcap® Index. Relative to the index, the fund was helped most by strong security selection in the weak-performing energy sector; however, a modest overweighting there slightly tempered this strong result. Good stock picking in the information technology sector’s software & services industry – as well as picks in the health care sector – further added value. In contrast, the fund was hurt by subpar security selection in the consumer discretionary sector – especially among retailers – as well as in the financials group. Within this group, however, the fund’s top relative contributor was timely positioning in Keurig Green Mountain, a coffee retailer and maker of single-serve beverage systems. Late in 2015, several months after we established a position, its share price soared when Keurig agreed to be acquired at a substantial premium. We sold much of our holdings shortly thereafter, maintaining just a small allocation at period end. An out-of-benchmark position in Public Storage was another meaningful contributor. Shares of this self-storage real estate investment trust (REIT) rose about 31% for the period. Our models led us to invest in Public Storage based most notably on the stock’s price momentum, earnings momentum and cash flow characteristics. In contrast, our biggest detractor was Western Digital, a maker of computer data storage systems. Shares of Western Digital fell sharply this period – returning -61% for the fund – reflecting declining sales amid a slowdown in the market for PCs. We maintained a position in Western Digital at period end because the stock remained appealing to our models. Also, fund holdings in Waddell & Reed Financial lost roughly half their value for the period. Although Waddell & Reed struggled along with financial markets, our models continued to find the stock compelling, as the company displayed favorable credit, profitability, cash flow and valuation characteristics. As Waddell & Reed’s valuation declined, we gradually added shares to the portfolio to maintain a relatively consistent overweighting.The views expressed above reflect those of the portfolio manager(s) only through the end of the period as stated on the cover of this report and do not necessarily represent the views of Fidelity or any other person in the Fidelity organization. Any such views are subject to change at any time based upon market or other conditions and Fidelity disclaims any responsibility to update such views. These views may not be relied on as investment advice and, because investment decisions for a Fidelity fund are based on numerous factors, may not be relied on as an indication of trading intent on behalf of any Fidelity fund.
Fidelity® Mid Cap Enhanced Index Fund
Investment Summary (Unaudited)
Top Ten Stocks as of February 29, 2016
| % of fund's net assets | % of fund's net assets 6 months ago | |
| Southwest Airlines Co. | 1.0 | 0.9 |
| United Continental Holdings, Inc. | 0.9 | 0.9 |
| IntercontinentalExchange, Inc. | 0.9 | 0.0 |
| Applied Materials, Inc. | 0.9 | 0.7 |
| Synchrony Financial | 0.9 | 0.6 |
| PPL Corp. | 0.9 | 0.0 |
| Public Service Enterprise Group, Inc. | 0.9 | 0.8 |
| Tyson Foods, Inc. Class A | 0.9 | 0.5 |
| Edwards Lifesciences Corp. | 0.9 | 0.8 |
| Electronic Arts, Inc. | 0.8 | 0.8 |
| 9.0 |
Market Sectors as of February 29, 2016
| % of fund's net assets | % of fund's net assets 6 months ago | |
| Financials | 22.5 | 20.9 |
| Consumer Discretionary | 18.3 | 18.4 |
| Information Technology | 15.8 | 15.9 |
| Industrials | 11.7 | 10.7 |
| Health Care | 10.9 | 11.8 |
| Consumer Staples | 5.8 | 5.5 |
| Utilities | 5.3 | 4.0 |
| Energy | 3.9 | 5.6 |
| Materials | 3.5 | 5.3 |
| Telecommunication Services | 1.0 | 0.0 |
Percentages shown as 0.0% may reflect amounts less than 0.05%.
Fidelity® Mid Cap Enhanced Index Fund
Investments February 29, 2016
Showing Percentage of Net Assets
| Common Stocks - 98.7% | |||
| Shares | Value | ||
| CONSUMER DISCRETIONARY - 18.3% | |||
| Auto Components - 3.0% | |||
| BorgWarner, Inc. | 104,084 | $3,401,465 | |
| Delphi Automotive PLC | 79,374 | 5,292,658 | |
| Gentex Corp. (a) | 324,391 | 4,723,133 | |
| Lear Corp. | 48,469 | 4,912,333 | |
| The Goodyear Tire & Rubber Co. | 173,049 | 5,212,236 | |
| Visteon Corp. | 3,621 | 253,180 | |
| 23,795,005 | |||
| Automobiles - 0.7% | |||
| Harley-Davidson, Inc. | 93,481 | 4,035,575 | |
| Thor Industries, Inc. | 31,188 | 1,727,191 | |
| 5,762,766 | |||
| Distributors - 0.1% | |||
| Genuine Parts Co. | 11,444 | 1,031,677 | |
| Diversified Consumer Services - 0.5% | |||
| ServiceMaster Global Holdings, Inc. (b) | 101,991 | 3,868,519 | |
| Hotels, Restaurants & Leisure - 0.7% | |||
| Carnival Corp. unit | 31,342 | 1,503,162 | |
| Darden Restaurants, Inc. (a) | 10,719 | 684,730 | |
| Starwood Hotels & Resorts Worldwide, Inc. | 11,506 | 795,180 | |
| Texas Roadhouse, Inc. Class A | 1,910 | 79,666 | |
| Wyndham Worldwide Corp. (a) | 34,798 | 2,534,686 | |
| 5,597,424 | |||
| Household Durables - 0.6% | |||
| D.R. Horton, Inc. | 42,279 | 1,129,695 | |
| Jarden Corp. (b) | 15,006 | 793,517 | |
| NVR, Inc. (b) | 193 | 315,941 | |
| Tempur Sealy International, Inc. (a)(b) | 38,850 | 2,240,480 | |
| Toll Brothers, Inc. (b) | 12,377 | 339,749 | |
| 4,819,382 | |||
| Internet & Catalog Retail - 0.7% | |||
| Liberty Interactive Corp. QVC Group Series A (b) | 225,459 | 5,722,149 | |
| Leisure Products - 1.2% | |||
| Brunswick Corp. | 105,287 | 4,478,909 | |
| Hasbro, Inc. | 12,042 | 913,627 | |
| Polaris Industries, Inc. | 48,004 | 4,220,032 | |
| 9,612,568 | |||
| Media - 2.8% | |||
| Cablevision Systems Corp. - NY Group Class A | 2,376 | 77,291 | |
| Discovery Communications, Inc.: | |||
| Class A (a)(b) | 174,099 | 4,352,475 | |
| Class C (non-vtg.) (b) | 193,228 | 4,763,070 | |
| Gannett Co., Inc. | 220,208 | 3,360,374 | |
| John Wiley & Sons, Inc. Class A | 6,054 | 263,531 | |
| MSG Network, Inc. Class A (b) | 261,210 | 4,289,068 | |
| Scripps Networks Interactive, Inc. Class A | 80,431 | 4,764,732 | |
| Starz Series A (b) | 10,415 | 262,354 | |
| Tegna, Inc. | 10,326 | 254,433 | |
| 22,387,328 | |||
| Multiline Retail - 1.7% | |||
| Dollar General Corp. | 36,456 | 2,706,858 | |
| Kohl's Corp. (a) | 8,008 | 373,733 | |
| Macy's, Inc. | 145,173 | 6,272,925 | |
| Target Corp. | 55,172 | 4,328,243 | |
| 13,681,759 | |||
| Specialty Retail - 5.0% | |||
| American Eagle Outfitters, Inc. (a) | 40,470 | 617,572 | |
| AutoNation, Inc. (a)(b) | 51,664 | 2,659,146 | |
| Bed Bath & Beyond, Inc. (b) | 106,577 | 5,110,367 | |
| Best Buy Co., Inc. (a) | 175,153 | 5,673,206 | |
| CST Brands, Inc. | 7,017 | 227,631 | |
| Dick's Sporting Goods, Inc. | 103,902 | 4,412,718 | |
| Foot Locker, Inc. (a) | 80,395 | 5,024,688 | |
| Gap, Inc. (a) | 154,033 | 4,259,012 | |
| GNC Holdings, Inc. | 160,699 | 4,576,708 | |
| Murphy U.S.A., Inc. (a)(b) | 3,265 | 207,948 | |
| O'Reilly Automotive, Inc. (a)(b) | 5,932 | 1,544,218 | |
| Penske Automotive Group, Inc. | 14,712 | 554,937 | |
| Ross Stores, Inc. | 39,580 | 2,176,108 | |
| Staples, Inc. | 348,266 | 3,291,114 | |
| 40,335,373 | |||
| Textiles, Apparel & Luxury Goods - 1.3% | |||
| Carter's, Inc. | 2,271 | 230,802 | |
| Fossil Group, Inc. (a)(b) | 80,552 | 3,778,694 | |
| Michael Kors Holdings Ltd. (b) | 104,093 | 5,896,868 | |
| PVH Corp. | 3,468 | 274,492 | |
| Skechers U.S.A., Inc. Class A (sub. vtg.) (b) | 19,624 | 646,022 | |
| 10,826,878 | |||
| TOTAL CONSUMER DISCRETIONARY | 147,440,828 | ||
| CONSUMER STAPLES - 5.8% | |||
| Beverages - 1.1% | |||
| Coca-Cola Enterprises, Inc. | 43,932 | 2,131,141 | |
| Constellation Brands, Inc. Class A (sub. vtg.) | 1,395 | 197,295 | |
| Dr. Pepper Snapple Group, Inc. | 70,819 | 6,482,063 | |
| 8,810,499 | |||
| Food & Staples Retailing - 0.4% | |||
| Rite Aid Corp. (b) | 26,991 | 214,578 | |
| Sysco Corp. | 73,847 | 3,258,868 | |
| 3,473,446 | |||
| Food Products - 3.4% | |||
| Archer Daniels Midland Co. | 53,476 | 1,869,521 | |
| Bunge Ltd. | 78,604 | 3,908,191 | |
| Campbell Soup Co. (a) | 94,811 | 5,854,579 | |
| Hormel Foods Corp. (a) | 33,534 | 1,425,530 | |
| Ingredion, Inc. | 12,458 | 1,260,999 | |
| Keurig Green Mountain, Inc. | 8,283 | 761,539 | |
| Mead Johnson Nutrition Co. Class A | 10,609 | 782,520 | |
| Pilgrim's Pride Corp. (a) | 186,056 | 4,549,069 | |
| Tyson Foods, Inc. Class A | 107,612 | 6,967,877 | |
| 27,379,825 | |||
| Household Products - 0.9% | |||
| Church & Dwight Co., Inc. (a) | 7,284 | 661,096 | |
| Clorox Co. | 50,019 | 6,323,402 | |
| 6,984,498 | |||
| TOTAL CONSUMER STAPLES | 46,648,268 | ||
| ENERGY - 3.9% | |||
| Energy Equipment & Services - 1.3% | |||
| Cameron International Corp. (b) | 12,519 | 820,746 | |
| Dril-Quip, Inc. (b) | 82,798 | 4,491,792 | |
| FMC Technologies, Inc. (b) | 130,040 | 3,189,881 | |
| Oceaneering International, Inc. | 81,552 | 2,252,466 | |
| 10,754,885 | |||
| Oil, Gas & Consumable Fuels - 2.6% | |||
| Antero Resources Corp. (b) | 42,144 | 962,990 | |
| EOG Resources, Inc. (a) | 43,146 | 2,793,272 | |
| EQT Corp. | 57,258 | 3,191,561 | |
| HollyFrontier Corp. | 40,808 | 1,380,127 | |
| Memorial Resource Development Corp. (b) | 144,095 | 1,393,399 | |
| Pioneer Natural Resources Co. | 21,328 | 2,570,664 | |
| Tesoro Corp. | 69,674 | 5,621,298 | |
| Valero Energy Corp. | 13,482 | 809,999 | |
| Western Refining, Inc. | 67,412 | 1,797,878 | |
| 20,521,188 | |||
| TOTAL ENERGY | 31,276,073 | ||
| FINANCIALS - 22.5% | |||
| Banks - 3.2% | |||
| CIT Group, Inc. | 72,143 | 2,150,583 | |
| Citizens Financial Group, Inc. | 207,843 | 3,996,821 | |
| East West Bancorp, Inc. | 19,092 | 572,187 | |
| Fifth Third Bancorp | 281,994 | 4,303,228 | |
| KeyCorp | 427,036 | 4,505,230 | |
| Regions Financial Corp. | 496,942 | 3,737,004 | |
| SunTrust Banks, Inc. | 191,850 | 6,365,583 | |
| 25,630,636 | |||
| Capital Markets - 2.1% | |||
| Affiliated Managers Group, Inc. (b) | 10,982 | 1,523,094 | |
| Federated Investors, Inc. Class B (non-vtg.) (a) | 34,986 | 915,584 | |
| Lazard Ltd. Class A | 14,850 | 522,423 | |
| Legg Mason, Inc. | 31,446 | 898,098 | |
| LPL Financial (a) | 16,531 | 334,422 | |
| NorthStar Asset Management Group, Inc. | 203,768 | 2,227,184 | |
| SEI Investments Co. | 12,869 | 491,210 | |
| T. Rowe Price Group, Inc. | 95,883 | 6,626,474 | |
| Waddell & Reed Financial, Inc. Class A (a) | 148,513 | 3,478,174 | |
| 17,016,663 | |||
| Consumer Finance - 2.4% | |||
| Ally Financial, Inc. (b) | 156,055 | 2,743,447 | |
| Capital One Financial Corp. | 5,631 | 370,126 | |
| Discover Financial Services | 71,179 | 3,304,129 | |
| Navient Corp. | 463,457 | 5,019,239 | |
| Santander Consumer U.S.A. Holdings, Inc. (a)(b) | 89,354 | 915,879 | |
| Synchrony Financial (b) | 268,525 | 7,236,749 | |
| 19,589,569 | |||
| Diversified Financial Services - 3.6% | |||
| CBOE Holdings, Inc. | 62,696 | 3,918,500 | |
| FactSet Research Systems, Inc. | 25,825 | 3,886,404 | |
| IntercontinentalExchange, Inc. | 31,555 | 7,524,605 | |
| Leucadia National Corp. | 304,997 | 4,407,207 | |
| Moody's Corp. (a) | 47,958 | 4,258,670 | |
| Morningstar, Inc. | 29,776 | 2,363,917 | |
| MSCI, Inc. Class A | 35,633 | 2,512,839 | |
| 28,872,142 | |||
| Insurance - 2.6% | |||
| American International Group, Inc. warrants 1/19/21 (b) | 574 | 9,345 | |
| Aon PLC | 396 | 37,735 | |
| Aspen Insurance Holdings Ltd. | 49,023 | 2,190,838 | |
| Assured Guaranty Ltd. | 128,997 | 3,200,416 | |
| FNF Group | 969 | 31,958 | |
| Lincoln National Corp. | 99,134 | 3,621,365 | |
| Loews Corp. | 17,074 | 620,640 | |
| Old Republic International Corp. | 59,661 | 1,061,966 | |
| PartnerRe Ltd. | 1,228 | 172,252 | |
| Progressive Corp. | 212,149 | 6,771,796 | |
| The Travelers Companies, Inc. | 31,679 | 3,406,126 | |
| 21,124,437 | |||
| Real Estate Investment Trusts - 8.3% | |||
| American Capital Agency Corp. | 24,292 | 438,956 | |
| Apartment Investment & Management Co. Class A | 2,212 | 80,981 | |
| AvalonBay Communities, Inc. (a) | 8,973 | 1,540,126 | |
| Care Capital Properties, Inc. | 67,223 | 1,782,082 | |
| CBL & Associates Properties, Inc. | 371,133 | 4,279,163 | |
| Chimera Investment Corp. | 241,224 | 3,143,149 | |
| Corrections Corp. of America | 155,870 | 4,509,319 | |
| Crown Castle International Corp. | 10,836 | 937,314 | |
| Equity Lifestyle Properties, Inc. | 73,056 | 5,125,609 | |
| Extra Space Storage, Inc. | 21,194 | 1,741,087 | |
| Hospitality Properties Trust (SBI) (a) | 156,707 | 3,804,846 | |
| Host Hotels & Resorts, Inc. (a) | 292,313 | 4,475,312 | |
| Iron Mountain, Inc. | 15,632 | 459,268 | |
| Kimco Realty Corp. | 50,109 | 1,340,416 | |
| Lamar Advertising Co. Class A (a) | 84,631 | 4,834,969 | |
| Liberty Property Trust (SBI) | 2,171 | 62,698 | |
| MFA Financial, Inc. | 638,348 | 4,347,150 | |
| Mid-America Apartment Communities, Inc. | 547 | 49,197 | |
| Post Properties, Inc. | 13,728 | 765,061 | |
| Public Storage | 16,352 | 4,079,660 | |
| Retail Properties America, Inc. | 9,350 | 137,352 | |
| Senior Housing Properties Trust (SBI) | 32,047 | 500,254 | |
| Starwood Property Trust, Inc. | 92,580 | 1,623,853 | |
| Taubman Centers, Inc. | 49,733 | 3,522,091 | |
| The Macerich Co. (a) | 66,172 | 5,232,882 | |
| Welltower, Inc. | 24,102 | 1,537,226 | |
| Weyerhaeuser Co. | 245,849 | 6,387,157 | |
| 66,737,178 | |||
| Real Estate Management & Development - 0.2% | |||
| CBRE Group, Inc. (b) | 42,259 | 1,073,801 | |
| Thrifts & Mortgage Finance - 0.1% | |||
| New York Community Bancorp, Inc. (a) | 69,947 | 1,058,298 | |
| TOTAL FINANCIALS | 181,102,724 | ||
| HEALTH CARE - 10.9% | |||
| Biotechnology - 1.0% | |||
| Medivation, Inc. (b) | 85,491 | 3,058,013 | |
| United Therapeutics Corp. (a)(b) | 38,413 | 4,684,081 | |
| 7,742,094 | |||
| Health Care Equipment & Supplies - 3.2% | |||
| C.R. Bard, Inc. | 31,938 | 6,144,232 | |
| Edwards Lifesciences Corp. (b) | 79,844 | 6,946,428 | |
| Dentsply Sirona, Inc.(b) | 398 | 44,016 | |
| Intuitive Surgical, Inc. (b) | 152 | 85,585 | |
| ResMed, Inc. (a) | 89,984 | 5,120,989 | |
| St. Jude Medical, Inc. | 108,954 | 5,849,740 | |
| Varian Medical Systems, Inc. (a)(b) | 20,202 | 1,580,200 | |
| 25,771,190 | |||
| Health Care Providers & Services - 4.0% | |||
| Aetna, Inc. | 893 | 97,007 | |
| AmerisourceBergen Corp. | 72,880 | 6,312,866 | |
| Anthem, Inc. | 30,439 | 3,978,073 | |
| Cardinal Health, Inc. | 47,557 | 3,885,407 | |
| Centene Corp. (a)(b) | 86,570 | 4,931,027 | |
| HCA Holdings, Inc. (b) | 828 | 57,306 | |
| LifePoint Hospitals, Inc. (a)(b) | 11,978 | 746,948 | |
| McKesson Corp. | 25,535 | 3,973,757 | |
| Molina Healthcare, Inc. (a)(b) | 16,145 | 1,001,636 | |
| Quest Diagnostics, Inc. | 75,791 | 5,042,375 | |
| Universal Health Services, Inc. Class B | 20,520 | 2,264,792 | |
| VCA, Inc. (b) | 3,784 | 193,098 | |
| 32,484,292 | |||
| Health Care Technology - 0.7% | |||
| Cerner Corp. (b) | 35,488 | 1,812,017 | |
| IMS Health Holdings, Inc. (b) | 131,335 | 3,385,816 | |
| 5,197,833 | |||
| Life Sciences Tools & Services - 1.2% | |||
| Agilent Technologies, Inc. | 154,956 | 5,787,607 | |
| Bruker Corp. | 73,448 | 1,908,179 | |
| Charles River Laboratories International, Inc. (b) | 26,959 | 1,979,599 | |
| 9,675,385 | |||
| Pharmaceuticals - 0.8% | |||
| Jazz Pharmaceuticals PLC (b) | 9,005 | 1,094,828 | |
| Mylan N.V. (a) | 42,309 | 1,906,867 | |
| Perrigo Co. PLC | 2,937 | 370,796 | |
| Zoetis, Inc. Class A | 79,840 | 3,278,230 | |
| 6,650,721 | |||
| TOTAL HEALTH CARE | 87,521,515 | ||
| INDUSTRIALS - 11.7% | |||
| Aerospace & Defense - 2.2% | |||
| BE Aerospace, Inc. | 61,116 | 2,665,880 | |
| General Dynamics Corp. | 2,924 | 398,453 | |
| Huntington Ingalls Industries, Inc. | 38,280 | 5,016,977 | |
| Rockwell Collins, Inc. | 32,253 | 2,824,395 | |
| Spirit AeroSystems Holdings, Inc. Class A (a)(b) | 106,109 | 4,881,014 | |
| Textron, Inc. | 41,041 | 1,401,550 | |
| Triumph Group, Inc. | 11,983 | 365,002 | |
| 17,553,271 | |||
| Air Freight & Logistics - 0.3% | |||
| Expeditors International of Washington, Inc. (a) | 47,871 | 2,191,534 | |
| Airlines - 3.5% | |||
| Alaska Air Group, Inc. | 71,669 | 5,296,339 | |
| Delta Air Lines, Inc. | 42,376 | 2,044,218 | |
| JetBlue Airways Corp. (a)(b) | 230,571 | 5,072,562 | |
| Southwest Airlines Co. | 196,315 | 8,235,414 | |
| United Continental Holdings, Inc. (b) | 132,178 | 7,568,512 | |
| 28,217,045 | |||
| Building Products - 0.1% | |||
| GCP Applied Technologies, Inc. (b) | 23,603 | 418,481 | |
| Owens Corning | 14,937 | 641,096 | |
| 1,059,577 | |||
| Commercial Services & Supplies - 1.0% | |||
| ADT Corp. | 4,795 | 193,574 | |
| Cintas Corp. | 54,504 | 4,577,791 | |
| Deluxe Corp. | 8,168 | 468,925 | |
| KAR Auction Services, Inc. | 74,000 | 2,620,340 | |
| Waste Connections, Inc. | 4,433 | 273,383 | |
| 8,134,013 | |||
| Construction & Engineering - 0.3% | |||
| Quanta Services, Inc. (b) | 147,151 | 2,985,694 | |
| Electrical Equipment - 0.5% | |||
| Acuity Brands, Inc. | 4,948 | 1,036,260 | |
| Rockwell Automation, Inc. | 27,761 | 2,889,642 | |
| 3,925,902 | |||
| Machinery - 2.4% | |||
| Allison Transmission Holdings, Inc. | 163,017 | 3,860,243 | |
| Caterpillar, Inc. (a) | 32,863 | 2,224,825 | |
| Cummins, Inc. | 8,229 | 802,904 | |
| Lincoln Electric Holdings, Inc. | 10,103 | 551,321 | |
| PACCAR, Inc. (a) | 131,513 | 6,772,920 | |
| Parker Hannifin Corp. | 17,010 | 1,721,412 | |
| SPX Flow, Inc. (b) | 27,497 | 515,019 | |
| Toro Co. | 4,077 | 324,937 | |
| Trinity Industries, Inc. (a) | 157,617 | 2,496,653 | |
| 19,270,234 | |||
| Professional Services - 1.3% | |||
| Equifax, Inc. | 55,377 | 5,807,940 | |
| Manpower, Inc. | 9,917 | 767,972 | |
| Robert Half International, Inc. | 93,326 | 3,676,111 | |
| 10,252,023 | |||
| Trading Companies & Distributors - 0.1% | |||
| United Rentals, Inc. (a)(b) | 14,310 | 737,967 | |
| TOTAL INDUSTRIALS | 94,327,260 | ||
| INFORMATION TECHNOLOGY - 15.8% | |||
| Communications Equipment - 2.7% | |||
| Arista Networks, Inc. (b) | 25,107 | 1,720,834 | |
| Arris International PLC (b) | 68,532 | 1,637,229 | |
| Brocade Communications Systems, Inc. | 496,434 | 4,929,590 | |
| F5 Networks, Inc. (b) | 51,428 | 4,945,831 | |
| Juniper Networks, Inc. | 223,076 | 5,509,977 | |
| Motorola Solutions, Inc. | 41,410 | 3,043,221 | |
| 21,786,682 | |||
| Electronic Equipment & Components - 0.7% | |||
| Avnet, Inc. | 41,325 | 1,700,524 | |
| Dolby Laboratories, Inc. Class A | 28,095 | 1,109,753 | |
| Jabil Circuit, Inc. | 135,855 | 2,832,577 | |
| 5,642,854 | |||
| Internet Software & Services - 0.4% | |||
| eBay, Inc. (b) | 143,818 | 3,422,868 | |
| IT Services - 4.6% | |||
| Amdocs Ltd. | 94,659 | 5,372,845 | |
| Computer Sciences Corp. | 9,984 | 287,639 | |
| CSRA, Inc. | 146,114 | 3,791,658 | |
| DST Systems, Inc. | 39,980 | 4,181,108 | |
| Fiserv, Inc. (b) | 34,194 | 3,269,972 | |
| Paychex, Inc. (a) | 126,878 | 6,520,260 | |
| Teradata Corp. (a)(b) | 87,191 | 2,175,415 | |
| The Western Union Co. | 231,688 | 4,230,623 | |
| Total System Services, Inc. | 61,541 | 2,681,957 | |
| Xerox Corp. | 460,024 | 4,420,831 | |
| 36,932,308 | |||
| Semiconductors & Semiconductor Equipment - 2.8% | |||
| Analog Devices, Inc. | 52,295 | 2,771,112 | |
| Applied Materials, Inc. | 391,467 | 7,386,982 | |
| KLA-Tencor Corp. | 8,760 | 593,402 | |
| Lam Research Corp. | 6,412 | 470,000 | |
| Marvell Technology Group Ltd. | 180,937 | 1,727,948 | |
| NVIDIA Corp. | 210,676 | 6,606,799 | |
| Skyworks Solutions, Inc. | 37,359 | 2,482,506 | |
| Xilinx, Inc. | 15,978 | 754,481 | |
| 22,793,230 | |||
| Software - 3.3% | |||
| Activision Blizzard, Inc. | 10,555 | 334,277 | |
| Aspen Technology, Inc. (b) | 13,562 | 447,139 | |
| CA Technologies, Inc. | 185,301 | 5,427,466 | |
| CDK Global, Inc. | 3,572 | 160,347 | |
| Citrix Systems, Inc. (b) | 79,766 | 5,635,468 | |
| Electronic Arts, Inc. (b) | 106,476 | 6,840,018 | |
| Intuit, Inc. | 31,063 | 3,001,928 | |
| Synopsys, Inc. (b) | 100,625 | 4,502,969 | |
| 26,349,612 | |||
| Technology Hardware, Storage & Peripherals - 1.3% | |||
| NetApp, Inc. (a) | 170,379 | 4,232,214 | |
| SanDisk Corp. | 17,055 | 1,232,394 | |
| Western Digital Corp. | 123,594 | 5,380,047 | |
| 10,844,655 | |||
| TOTAL INFORMATION TECHNOLOGY | 127,772,209 | ||
| MATERIALS - 3.5% | |||
| Chemicals - 2.4% | |||
| Air Products & Chemicals, Inc. | 2,442 | 323,492 | |
| Airgas, Inc. | 3,128 | 442,675 | |
| Cabot Corp. | 47,967 | 2,135,971 | |
| Eastman Chemical Co. | 36,131 | 2,317,804 | |
| LyondellBasell Industries NV Class A | 51,410 | 4,123,596 | |
| The Mosaic Co. | 211,249 | 5,629,786 | |
| Westlake Chemical Corp. | 92,919 | 4,006,667 | |
| 18,979,991 | |||
| Construction Materials - 0.1% | |||
| Eagle Materials, Inc. | 16,997 | 1,026,959 | |
| Containers & Packaging - 0.4% | |||
| Avery Dennison Corp. | 40,813 | 2,657,743 | |
| Packaging Corp. of America | 11,318 | 548,923 | |
| Sealed Air Corp. | 8,255 | 377,501 | |
| 3,584,167 | |||
| Metals & Mining - 0.4% | |||
| Reliance Steel & Aluminum Co. | 51,672 | 3,146,308 | |
| Paper & Forest Products - 0.2% | |||
| Domtar Corp. (a) | 36,144 | 1,271,907 | |
| TOTAL MATERIALS | 28,009,332 | ||
| TELECOMMUNICATION SERVICES - 1.0% | |||
| Diversified Telecommunication Services - 1.0% | |||
| CenturyLink, Inc. | 222,798 | 6,815,391 | |
| Level 3 Communications, Inc. (b) | 23,251 | 1,128,836 | |
| 7,944,227 | |||
| UTILITIES - 5.3% | |||
| Electric Utilities - 2.7% | |||
| Allete, Inc. | 6,976 | 369,868 | |
| American Electric Power Co., Inc. | 4,102 | 253,299 | |
| Edison International | 15,601 | 1,063,364 | |
| Entergy Corp. | 79,372 | 5,731,452 | |
| Exelon Corp. (a) | 126,374 | 3,979,517 | |
| FirstEnergy Corp. | 84,368 | 2,823,797 | |
| ITC Holdings Corp. | 2,873 | 116,730 | |
| OGE Energy Corp. | 17,680 | 439,878 | |
| PPL Corp. | 206,351 | 7,220,221 | |
| 21,998,126 | |||
| Gas Utilities - 0.6% | |||
| AGL Resources, Inc. | 4,817 | 311,419 | |
| ONE Gas, Inc. | 4,587 | 265,954 | |
| UGI Corp. | 110,387 | 4,079,904 | |
| 4,657,277 | |||
| Multi-Utilities - 1.5% | |||
| Ameren Corp. | 28,883 | 1,356,057 | |
| Avangrid, Inc. | 12,067 | 468,079 | |
| Black Hills Corp. | 6,445 | 360,984 | |
| CenterPoint Energy, Inc. | 41,079 | 765,302 | |
| Consolidated Edison, Inc. | 661 | 46,277 | |
| DTE Energy Co. | 11,059 | 930,283 | |
| Public Service Enterprise Group, Inc. | 166,720 | 7,112,275 | |
| Sempra Energy | 11,599 | 1,119,419 | |
| TECO Energy, Inc. | 2,286 | 62,796 | |
| 12,221,472 | |||
| Water Utilities - 0.5% | |||
| American Water Works Co., Inc. | 62,470 | 4,049,305 | |
| TOTAL UTILITIES | 42,926,180 | ||
| TOTAL COMMON STOCKS | |||
| (Cost $827,512,724) | 794,968,616 | ||
| Principal Amount | Value | ||
| U.S. Treasury Obligations - 0.1% | |||
| U.S. Treasury Bills, yield at date of purchase 0.37% 5/26/16 (c) | |||
| (Cost $999,122) | 1,000,000 | 999,230 | |
| Shares | Value | ||
| Money Market Funds - 16.7% | |||
| Dreyfus Cash Management Institutional Shares, 0.10% (d) | 8,249,780 | $8,249,784 | |
| Fidelity Securities Lending Cash Central Fund, 0.44% (e)(f) | 126,169,484 | 126,169,484 | |
| TOTAL MONEY MARKET FUNDS | |||
| (Cost $134,419,264) | 134,419,268 | ||
| TOTAL INVESTMENT PORTFOLIO - 115.5% | |||
| (Cost $962,931,110) | 930,387,114 | ||
| NET OTHER ASSETS (LIABILITIES) - (15.5)% | (125,145,405) | ||
| NET ASSETS - 100% | $805,241,709 |
| Futures Contracts | |||
| Expiration Date | Underlying Face Amount at Value | Unrealized Appreciation/(Depreciation) | |
| Purchased | |||
| Equity Index Contracts | |||
| 75 CME E-mini S&P MidCap 400 Index Contracts (United States) | March 2016 | 9,995,250 | $321,872 |
The face value of futures purchased as a percentage of Net Assets is 1.2%
Legend
(a) Security or a portion of the security is on loan at period end.
(b) Non-income producing
(c) Security or a portion of the security was pledged to cover margin requirements for futures contracts. At period end, the value of securities pledged amounted to $458,647.
(d) The rate quoted is the annualized seven-day yield of the fund at period end.
(e) Investment made with cash collateral received from securities on loan.
(f) Affiliated fund that is generally available only to investment companies and other accounts managed by Fidelity Investments. The rate quoted is the annualized seven-day yield of the fund at period end. A complete unaudited listing of the fund's holdings as of its most recent quarter end is available upon request. In addition, each Fidelity Central Fund's financial statements, which are not covered by the Fund's Report of Independent Registered Public Accounting Firm, are available on the SEC's website or upon request.
Affiliated Central Funds
Information regarding fiscal year to date income earned by the Fund from investments in Fidelity Central Funds is as follows:
| Fund | Income earned |
| Fidelity Securities Lending Cash Central Fund | $197,423 |
Investment Valuation
The following is a summary of the inputs used, as of February 29, 2016, involving the Fund's assets and liabilities carried at fair value. The inputs or methodology used for valuing securities may not be an indication of the risk associated with investing in those securities. For more information on valuation inputs, and their aggregation into the levels used below, please refer to the Investment Valuation section in the accompanying Notes to Financial Statements.
| Valuation Inputs at Reporting Date: | ||||
| Description | Total | Level 1 | Level 2 | Level 3 |
| Investments in Securities: | ||||
| Equities: | ||||
| Consumer Discretionary | $147,440,828 | $147,440,828 | $-- | $-- |
| Consumer Staples | 46,648,268 | 46,648,268 | -- | -- |
| Energy | 31,276,073 | 31,276,073 | -- | -- |
| Financials | 181,102,724 | 181,102,724 | -- | -- |
| Health Care | 87,521,515 | 87,521,515 | -- | -- |
| Industrials | 94,327,260 | 94,327,260 | -- | -- |
| Information Technology | 127,772,209 | 127,772,209 | -- | -- |
| Materials | 28,009,332 | 28,009,332 | -- | -- |
| Telecommunication Services | 7,944,227 | 7,944,227 | -- | -- |
| Utilities | 42,926,180 | 42,926,180 | -- | -- |
| U.S. Government and Government Agency Obligations | 999,230 | -- | 999,230 | -- |
| Money Market Funds | 134,419,268 | 134,419,268 | -- | -- |
| Total Investments in Securities: | $930,387,114 | $929,387,884 | $999,230 | $-- |
| Derivative Instruments: | ||||
| Assets | ||||
| Futures Contracts | $321,872 | $321,872 | $-- | $-- |
| Total Assets | $321,872 | $321,872 | $-- | $-- |
| Total Derivative Instruments: | $321,872 | $321,872 | $-- | $-- |
Value of Derivative Instruments
The following table is a summary of the Fund's value of derivative instruments by primary risk exposure as of February 29, 2016. For additional information on derivative instruments, please refer to the Derivative Instruments section in the accompanying Notes to Financial Statements.
| Primary Risk Exposure / Derivative Type | Value | |
| Asset | Liability | |
| Equity Risk | ||
| Futures Contracts(a) | $321,872 | $0 |
| Total Equity Risk | 321,872 | 0 |
| Total Value of Derivatives | $321,872 | $0 |
(a) Reflects gross cumulative appreciation (depreciation) on futures contracts as presented in the Schedule of Investments. Only the period end receivable or payable for daily variation margin and net unrealized appreciation (depreciation) are presented in the Statement of Assets and Liabilities.
See accompanying notes which are an integral part of the financial statements.
Fidelity® Mid Cap Enhanced Index Fund
Financial Statements
Statement of Assets and Liabilities
| February 29, 2016 | ||
| Assets | ||
| Investment in securities, at value (including securities loaned of $122,595,457) — See accompanying schedule: Unaffiliated issuers (cost $836,761,626) | $804,217,630 | |
| Fidelity Central Funds (cost $126,169,484) | 126,169,484 | |
| Total Investments (cost $962,931,110) | $930,387,114 | |
| Receivable for investments sold | 6,200,043 | |
| Receivable for fund shares sold | 2,605,424 | |
| Dividends receivable | 1,194,798 | |
| Interest receivable | 1,565 | |
| Distributions receivable from Fidelity Central Funds | 19,542 | |
| Total assets | 940,408,486 | |
| Liabilities | ||
| Payable for investments purchased | $7,828,128 | |
| Payable for fund shares redeemed | 751,095 | |
| Accrued management fee | 290,380 | |
| Payable for daily variation margin for derivative instruments | 30,879 | |
| Other affiliated payables | 96,793 | |
| Other payables and accrued expenses | 18 | |
| Collateral on securities loaned, at value | 126,169,484 | |
| Total liabilities | 135,166,777 | |
| Net Assets | $805,241,709 | |
| Net Assets consist of: | ||
| Paid in capital | $859,768,617 | |
| Undistributed net investment income | 285 | |
| Accumulated undistributed net realized gain (loss) on investments and foreign currency transactions | (22,305,069) | |
| Net unrealized appreciation (depreciation) on investments | (32,222,124) | |
| Net Assets, for 67,239,769 shares outstanding | $805,241,709 | |
| Net Asset Value, offering price and redemption price per share ($805,241,709 ÷ 67,239,769 shares) | $11.98 |
See accompanying notes which are an integral part of the financial statements.
Statement of Operations
| Year ended February 29, 2016 | ||
| Investment Income | ||
| Dividends | $14,809,767 | |
| Interest | 10,168 | |
| Income from Fidelity Central Funds (including $197,423 from security lending) | 197,423 | |
| Total income | 15,017,358 | |
| Expenses | ||
| Management fee | $3,474,998 | |
| Transfer agent fees | 1,159,273 | |
| Independent trustees' compensation | 3,067 | |
| Miscellaneous | 1,009 | |
| Total expenses before reductions | 4,638,347 | |
| Expense reductions | (142) | 4,638,205 |
| Net investment income (loss) | 10,379,153 | |
| Realized and Unrealized Gain (Loss) | ||
| Net realized gain (loss) on: | ||
| Investment securities: | ||
| Unaffiliated issuers | 6,540,935 | |
| Foreign currency transactions | (2,113) | |
| Futures contracts | (1,029,620) | |
| Total net realized gain (loss) | 5,509,202 | |
| Change in net unrealized appreciation (depreciation) on: Investment securities | (109,042,407) | |
| Futures contracts | (260,789) | |
| Total change in net unrealized appreciation (depreciation) | (109,303,196) | |
| Net gain (loss) | (103,793,994) | |
| Net increase (decrease) in net assets resulting from operations | $(93,414,841) |
See accompanying notes which are an integral part of the financial statements.
Statement of Changes in Net Assets
| Year ended February 29, 2016 | Year ended February 28, 2015 | |
| Increase (Decrease) in Net Assets | ||
| Operations | ||
| Net investment income (loss) | $10,379,153 | $3,975,433 |
| Net realized gain (loss) | 5,509,202 | 23,080,386 |
| Change in net unrealized appreciation (depreciation) | (109,303,196) | 31,483,026 |
| Net increase (decrease) in net assets resulting from operations | (93,414,841) | 58,538,845 |
| Distributions to shareholders from net investment income | (8,742,049) | (2,992,974) |
| Distributions to shareholders from net realized gain | (30,376,224) | (29,582,652) |
| Total distributions | (39,118,273) | (32,575,626) |
| Share transactions | ||
| Proceeds from sales of shares | 510,890,785 | 395,167,108 |
| Reinvestment of distributions | 37,487,590 | 31,124,764 |
| Cost of shares redeemed | (219,096,797) | (115,467,866) |
| Net increase (decrease) in net assets resulting from share transactions | 329,281,578 | 310,824,006 |
| Redemption fees | 18,422 | 13,246 |
| Total increase (decrease) in net assets | 196,766,886 | 336,800,471 |
| Net Assets | ||
| Beginning of period | 608,474,823 | 271,674,352 |
| End of period (including undistributed net investment income of $285 and undistributed net investment income of $840,505, respectively) | $805,241,709 | $608,474,823 |
| Other Information | ||
| Shares | ||
| Sold | 37,966,163 | 29,171,712 |
| Issued in reinvestment of distributions | 2,951,931 | 2,437,242 |
| Redeemed | (16,655,539) | (8,607,909) |
| Net increase (decrease) | 24,262,555 | 23,001,045 |
See accompanying notes which are an integral part of the financial statements.
Financial Highlights — Fidelity Mid Cap Enhanced Index Fund
| Years ended February 28, | 2016A | 2015 | 2014 | 2013 | 2012A |
| Selected Per–Share Data | |||||
| Net asset value, beginning of period | $14.16 | $13.60 | $10.97 | $9.79 | $10.28 |
| Income from Investment Operations | |||||
| Net investment income (loss)B | .18 | .15 | .15 | .18 | .10 |
| Net realized and unrealized gain (loss) | (1.70) | 1.73 | 3.17 | 1.30 | .05 |
| Total from investment operations | (1.52) | 1.88 | 3.32 | 1.48 | .15 |
| Distributions from net investment income | (.14) | (.10) | (.12) | (.17) | (.07) |
| Distributions from net realized gain | (.51) | (1.22) | (.57) | (.13) | (.58) |
| Total distributions | (.66)C | (1.32) | (.69) | (.30) | (.64)D |
| Redemption fees added to paid in capitalB,E | – | – | – | – | – |
| Net asset value, end of period | $11.98 | $14.16 | $13.60 | $10.97 | $9.79 |
| Total ReturnF | (11.02)% | 15.22% | 30.97% | 15.57% | 1.91% |
| Ratios to Average Net AssetsG,H | |||||
| Expenses before reductions | .60% | .60% | .60% | .60% | .60% |
| Expenses net of fee waivers, if any | .60% | .60% | .60% | .60% | .60% |
| Expenses net of all reductions | .60% | .60% | .60% | .60% | .60% |
| Net investment income (loss) | 1.34% | 1.08% | 1.24% | 1.80% | 1.03% |
| Supplemental Data | |||||
| Net assets, end of period (000 omitted) | $805,242 | $608,475 | $271,674 | $128,130 | $79,061 |
| Portfolio turnover rateI | 88% | 89% | 128% | 99% | 92% |
A For the year ended February 29.
B Calculated based on average shares outstanding during the period.
C Total distributions of $.66 per share is comprised of distributions from net investment income of $.144 and distributions from net realized gain of $.511 per share.
D Total distributions of $.64 per share is comprised of distributions from net investment income of $.069 and distributions from net realized gain of $.575 per share.
E Amount represents less than $.005 per share.
F Total returns would have been lower if certain expenses had not been reduced during the applicable periods shown.
G Fees and expenses of any underlying Fidelity Central Funds are not included in the Fund's expense ratio. The Fund indirectly bears its proportionate share of the expenses of any underlying Fidelity Central Funds.
H Expense ratios reflect operating expenses of the Fund. Expenses before reductions do not reflect amounts reimbursed by the investment adviser or reductions from expense offset arrangements and do not represent the amount paid by the Fund during periods when reimbursements or reductions occur. Expenses net of fee waivers reflect expenses after reimbursement by the investment adviser but prior to reductions from expense offset arrangements. Expenses net of all reductions represent the net expenses paid by the Fund.
I Amount does not include the portfolio activity of any underlying Fidelity Central Funds.
See accompanying notes which are an integral part of the financial statements.
Fidelity® Small Cap Enhanced Index Fund
Performance: The Bottom Line
Average annual total return reflects the change in the value of an investment, assuming reinvestment of distributions from dividend income and capital gains (the profits earned upon the sale of securities that have grown in value, if any) and assuming a constant rate of performance each year. The hypothetical investment and the average annual total returns do not reflect the deduction of taxes that a shareholder would pay on fund distributions or the redemption of fund shares. During periods of reimbursement by Fidelity, a fund’s total return will be greater than it would be had the reimbursement not occurred. How a fund did yesterday is no guarantee of how it will do tomorrow.
Average Annual Total Returns
| For the periods ended February 29, 2016 | Past 1 year | Past 5 years | Life of fundA |
| Fidelity® Small Cap Enhanced Index Fund | (11.20)% | 8.49% | 6.27% |
A From December 20, 2007
$10,000 Over Life of Fund
Let's say hypothetically that $10,000 was invested in Fidelity® Small Cap Enhanced Index Fund on December 20, 2007, when the fund started.
The chart shows how the value of your investment would have changed, and also shows how the Russell 2000® Index performed over the same period.
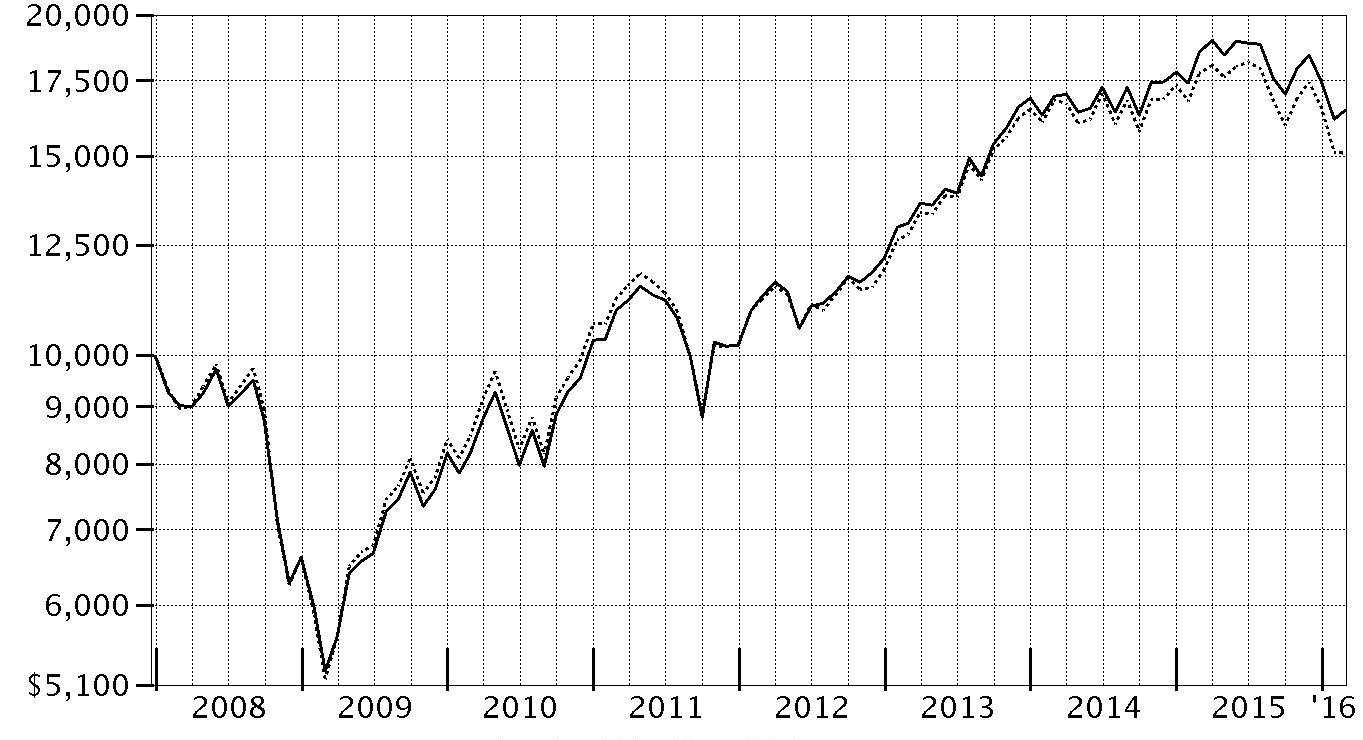
| Period Ending Values | ||
| $16,468 | Fidelity® Small Cap Enhanced Index Fund | |
| $15,101 | Russell 2000® Index | |
Fidelity® Small Cap Enhanced Index Fund
Management's Discussion of Fund Performance
Market Recap: The S&P 500® index returned -6.19% for the year ending February 29, 2016. Largely range-bound for the first half of the period, U.S. stocks suffered a steep, late-summer decline on concern about an economic slowdown in China. The market recovered in October, lifted by the U.S. Federal Reserve’s decision to delay raising near-term interest rates until mid-December. Investors also drew courage from a rate cut in China and economic stimulus in Europe. But continued oil-price weakness and U.S.-dollar strength, plus fresh worries about China and the Middle East, pushed the S&P 500® to its worst January since 2009, followed by a volatile but ultimately flattish February. Overall, growth-oriented and larger-cap stocks fared better than value and smaller-cap complements. In this environment, the tech-heavy Nasdaq Composite Index® returned -7.07% for the 12 months; the Russell 2000® Index, -14.97%. Few sectors within the broad-market S&P 500® gained ground, with a wide gap separating leaders from laggards. Despite increased competition among wireless carriers, telecommunication services (+8%) led the way, followed by the more defensive utilities sector (+6%). Rising wages and low inflation buoyed consumer staples (+4%), less so consumer discretionary (0%). Meanwhile, energy (-24%) foundered amid commodity weakness that also hurt materials (-17%). The financials sector (-12%) struggled as well.Comments from Maximilian Kaufmann, Senior Portfolio Manager of the Geode Capital Management, LLC, investment management team: In a challenging stock market environment, the fund returned -11.20%, although it significantly outpaced the -14.97% return of its benchmark, the Russell 2000® Index. Versus the index, the fund was helped most by strong security selection in the health care sector. Favorable stock picking in energy, which at -53% was the Russell® index’s weakest-performing sector by far, also contributed; however, a modest overweighting there tempered this strong result. The fund was hurt to a limited extent by subpar security selection in the financials and consumer discretionary sectors. In individual terms, the fund’s biggest contributor was an overweighting in Omega Protein, a maker of nutritional products. As Omega’s valuation rose, we sold some shares but maintained a relatively consistent weighting in the stock. Also adding value was a timely overweighting in lifestyle footwear company Skechers USA. We exited our position in October, and Skechers finished the period as the fund’s top contributor. In contrast, our biggest detractor by far was Century Aluminum Company, a global producer of primary aluminum. The company struggled amid low prices for the commodity, and the fund’s overweighted position in the stock, which we carried in the early half of the period, lost nearly three-quarters of its value. Amid poor price and earnings momentum, we had exited our Century Aluminum position entirely by autumn 2015. Fund holdings in World Acceptance posed another performance challenge, due partly to the threat of legal action against the company from the Consumer Financial Protection Bureau, which was inquiring into its lending practices. We steadily reduced our position in the stock and maintained only a small position at period end.The views expressed above reflect those of the portfolio manager(s) only through the end of the period as stated on the cover of this report and do not necessarily represent the views of Fidelity or any other person in the Fidelity organization. Any such views are subject to change at any time based upon market or other conditions and Fidelity disclaims any responsibility to update such views. These views may not be relied on as investment advice and, because investment decisions for a Fidelity fund are based on numerous factors, may not be relied on as an indication of trading intent on behalf of any Fidelity fund.
Fidelity® Small Cap Enhanced Index Fund
Investment Summary (Unaudited)
Top Ten Stocks as of February 29, 2016
| % of fund's net assets | % of fund's net assets 6 months ago | |
| Sovran Self Storage, Inc. | 0.7 | 0.7 |
| Integrated Device Technology, Inc. | 0.7 | 0.7 |
| SYNNEX Corp. | 0.7 | 0.6 |
| Deluxe Corp. | 0.7 | 0.6 |
| Tenneco, Inc. | 0.7 | 0.6 |
| Tech Data Corp. | 0.7 | 0.6 |
| Wellcare Health Plans, Inc. | 0.7 | 0.0 |
| Molina Healthcare, Inc. | 0.7 | 0.7 |
| RLJ Lodging Trust | 0.7 | 0.1 |
| Aspen Technology, Inc. | 0.7 | 0.7 |
| 7.0 |
Market Sectors as of February 29, 2016
| % of fund's net assets | % of fund's net assets 6 months ago | |
| Financials | 24.3 | 22.2 |
| Information Technology | 19.2 | 17.8 |
| Health Care | 15.5 | 17.5 |
| Consumer Discretionary | 14.2 | 14.3 |
| Industrials | 10.5 | 10.5 |
| Consumer Staples | 5.4 | 4.2 |
| Energy | 2.8 | 4.8 |
| Utilities | 2.7 | 1.6 |
| Materials | 1.9 | 1.9 |
| Telecommunication Services | 1.3 | 1.0 |
Percentages shown as 0.0% may reflect amounts less than 0.05%.
Fidelity® Small Cap Enhanced Index Fund
Investments February 29, 2016
Showing Percentage of Net Assets
| Common Stocks - 97.8% | |||
| Shares | Value | ||
| CONSUMER DISCRETIONARY - 14.2% | |||
| Auto Components - 2.9% | |||
| American Axle & Manufacturing Holdings, Inc. (a) | 208,962 | $3,055,024 | |
| Cooper Tire & Rubber Co. | 90,173 | 3,543,799 | |
| Cooper-Standard Holding, Inc. (a) | 15,888 | 1,163,796 | |
| Dana Holding Corp. | 247,059 | 3,073,414 | |
| Drew Industries, Inc. | 2,047 | 123,209 | |
| Horizon Global Corp. (a) | 8,753 | 77,289 | |
| Metaldyne Performance Group, Inc. (b) | 34,347 | 490,475 | |
| Modine Manufacturing Co. (a) | 2,920 | 27,682 | |
| Tenneco, Inc. (a) | 80,353 | 3,657,669 | |
| Tower International, Inc. | 10,547 | 226,339 | |
| 15,438,696 | |||
| Diversified Consumer Services - 0.4% | |||
| American Public Education, Inc. (a) | 3,179 | 49,052 | |
| Capella Education Co. | 23,503 | 1,086,779 | |
| Grand Canyon Education, Inc. (a) | 6,078 | 236,920 | |
| K12, Inc. (a) | 87,326 | 854,922 | |
| 2,227,673 | |||
| Hotels, Restaurants & Leisure - 2.3% | |||
| BJ's Restaurants, Inc. (a) | 12,536 | 552,587 | |
| Bloomin' Brands, Inc. | 110,382 | 1,908,505 | |
| Boyd Gaming Corp. (a) | 57,618 | 997,944 | |
| Cracker Barrel Old Country Store, Inc. (b) | 11,884 | 1,759,426 | |
| Interval Leisure Group, Inc. (b) | 83,394 | 1,079,952 | |
| Isle of Capri Casinos, Inc. (a) | 217,511 | 2,468,750 | |
| Marriott Vacations Worldwide Corp. | 39,576 | 2,396,327 | |
| Pinnacle Entertainment, Inc. (a) | 1,997 | 57,733 | |
| Ruth's Hospitality Group, Inc. | 41,594 | 730,807 | |
| Texas Roadhouse, Inc. Class A | 8,249 | 344,066 | |
| 12,296,097 | |||
| Household Durables - 1.3% | |||
| Bassett Furniture Industries, Inc. | 12,363 | 383,006 | |
| CSS Industries, Inc. | 849 | 22,982 | |
| Ethan Allen Interiors, Inc. (b) | 27,733 | 791,222 | |
| Flexsteel Industries, Inc. | 47,301 | 1,931,300 | |
| KB Home (b) | 39,134 | 477,435 | |
| La-Z-Boy, Inc. | 106,016 | 2,581,490 | |
| Zagg, Inc. (a) | 73,212 | 762,869 | |
| 6,950,304 | |||
| Leisure Products - 1.7% | |||
| Brunswick Corp. | 63,975 | 2,721,497 | |
| Nautilus, Inc. (a) | 144,577 | 2,441,906 | |
| Smith & Wesson Holding Corp. (a) | 133,185 | 3,377,572 | |
| Sturm, Ruger & Co., Inc. (b) | 6,348 | 446,328 | |
| 8,987,303 | |||
| Media - 1.2% | |||
| A.H. Belo Corp. Class A | 12,118 | 72,466 | |
| Gray Television, Inc. (a) | 101,378 | 1,169,902 | |
| Media General, Inc. (a)(b) | 312 | 5,185 | |
| Meredith Corp. | 9,602 | 417,591 | |
| Nexstar Broadcasting Group, Inc. Class A | 25,076 | 1,120,396 | |
| Saga Communications, Inc. Class A | 896 | 33,627 | |
| Sinclair Broadcast Group, Inc. Class A | 108,391 | 3,346,030 | |
| The McClatchy Co. Class A (a)(b) | 53,866 | 57,637 | |
| The New York Times Co. Class A | 14,531 | 182,655 | |
| Time, Inc. | 14,272 | 201,235 | |
| 6,606,724 | |||
| Multiline Retail - 0.4% | |||
| Big Lots, Inc. (b) | 45,849 | 1,854,592 | |
| Specialty Retail - 3.0% | |||
| American Eagle Outfitters, Inc. (b) | 182,884 | 2,790,810 | |
| Big 5 Sporting Goods Corp. | 128,965 | 1,766,821 | |
| Caleres, Inc. | 72,515 | 2,055,075 | |
| Chico's FAS, Inc. | 81 | 1,034 | |
| Express, Inc. (a) | 187,939 | 3,238,189 | |
| Group 1 Automotive, Inc. | 19,381 | 1,080,685 | |
| Outerwall, Inc. (b) | 24,544 | 765,527 | |
| Pier 1 Imports, Inc. | 2,653 | 13,106 | |
| Rent-A-Center, Inc. | 48,844 | 623,738 | |
| Select Comfort Corp. (a) | 58,430 | 1,045,897 | |
| Shoe Carnival, Inc. | 45,387 | 1,069,772 | |
| Stein Mart, Inc. | 11,346 | 84,074 | |
| Tailored Brands, Inc. | 8,214 | 126,824 | |
| The Cato Corp. Class A (sub. vtg.) | 19,500 | 705,900 | |
| The Children's Place Retail Stores, Inc. | 6,013 | 409,726 | |
| 15,777,178 | |||
| Textiles, Apparel & Luxury Goods - 1.0% | |||
| Deckers Outdoor Corp. (a) | 20,019 | 1,132,275 | |
| Movado Group, Inc. | 103,722 | 3,029,720 | |
| Unifi, Inc. (a) | 43,890 | 983,575 | |
| 5,145,570 | |||
| TOTAL CONSUMER DISCRETIONARY | 75,284,137 | ||
| CONSUMER STAPLES - 5.4% | |||
| Beverages - 0.1% | |||
| National Beverage Corp. (a) | 15,805 | 600,906 | |
| Food & Staples Retailing - 0.8% | |||
| Casey's General Stores, Inc. | 8,127 | 857,967 | |
| Ingles Markets, Inc. Class A | 54,258 | 1,830,122 | |
| SpartanNash Co. | 40,519 | 1,112,247 | |
| United Natural Foods, Inc. (a) | 16,180 | 499,315 | |
| Weis Markets, Inc. | 2,702 | 112,484 | |
| 4,412,135 | |||
| Food Products - 2.6% | |||
| Cal-Maine Foods, Inc. (b) | 15,905 | 849,009 | |
| Darling International, Inc. (a) | 15,397 | 138,727 | |
| Dean Foods Co. | 5,776 | 111,419 | |
| John B. Sanfilippo & Son, Inc. | 3,614 | 251,534 | |
| Omega Protein Corp. (a) | 127,271 | 3,022,686 | |
| Post Holdings, Inc. (a) | 50,472 | 3,505,785 | |
| Sanderson Farms, Inc. (b) | 38,945 | 3,554,121 | |
| Seaboard Corp. (a) | 145 | 424,125 | |
| Seneca Foods Corp. Class A (a) | 8,874 | 295,149 | |
| TreeHouse Foods, Inc. (a)(b) | 19,245 | 1,624,663 | |
| 13,777,218 | |||
| Household Products - 0.5% | |||
| Central Garden & Pet Co. Class A (non-vtg.) (a) | 72,684 | 983,415 | |
| WD-40 Co. | 12,643 | 1,365,444 | |
| 2,348,859 | |||
| Personal Products - 0.8% | |||
| MediFast, Inc. | 1,966 | 59,668 | |
| Natural Health Trends Corp. (b) | 76,095 | 2,371,881 | |
| Nutraceutical International Corp. (a) | 4,575 | 112,271 | |
| USANA Health Sciences, Inc. (a) | 16,790 | 1,892,569 | |
| 4,436,389 | |||
| Tobacco - 0.6% | |||
| Universal Corp. (b) | 56,139 | 3,058,453 | |
| TOTAL CONSUMER STAPLES | 28,633,960 | ||
| ENERGY - 2.8% | |||
| Energy Equipment & Services - 1.1% | |||
| Atwood Oceanics, Inc. (b) | 114,648 | 788,778 | |
| Dril-Quip, Inc. (a) | 50,038 | 2,714,562 | |
| Gulf Island Fabrication, Inc. | 3,339 | 29,750 | |
| Matrix Service Co. (a) | 110,892 | 2,039,304 | |
| Natural Gas Services Group, Inc. (a) | 378 | 6,827 | |
| 5,579,221 | |||
| Oil, Gas & Consumable Fuels - 1.7% | |||
| Adams Resources & Energy, Inc. | 601 | 19,665 | |
| Alon U.S.A. Energy, Inc. (b) | 113,742 | 1,121,496 | |
| DHT Holdings, Inc. | 482,848 | 2,815,004 | |
| Hallador Energy Co. | 1,196 | 5,777 | |
| Navios Maritime Acquisition Corp. (b) | 6,749 | 11,473 | |
| Nordic American Tanker Shipping Ltd. (b) | 50,952 | 704,157 | |
| Rex American Resources Corp. (a)(b) | 34,257 | 1,729,979 | |
| Ship Finance International Ltd. (NY Shares) (b) | 6,090 | 79,353 | |
| Western Refining, Inc. | 96,973 | 2,586,270 | |
| 9,073,174 | |||
| TOTAL ENERGY | 14,652,395 | ||
| FINANCIALS - 24.3% | |||
| Banks - 6.2% | |||
| Arrow Financial Corp. | 1,358 | 35,539 | |
| Banc of California, Inc. | 2,829 | 43,369 | |
| BancFirst Corp. | 10,690 | 603,985 | |
| Banco Latinoamericano de Comercio Exterior SA Series E | 7,186 | 153,565 | |
| BancorpSouth, Inc. | 12,326 | 245,534 | |
| Banner Corp. | 12,350 | 490,419 | |
| BB&T Corp. | 79,952 | 2,571,256 | |
| Brookline Bancorp, Inc., Delaware | 9,175 | 96,429 | |
| Centerstate Banks of Florida, Inc. | 17,441 | 244,174 | |
| Central Pacific Financial Corp. | 1,393 | 27,762 | |
| Chemical Financial Corp. | 49,955 | 1,689,978 | |
| Community Trust Bancorp, Inc. | 3,609 | 121,695 | |
| Fidelity Southern Corp. | 22,998 | 344,740 | |
| First Bancorp, North Carolina | 9,751 | 180,296 | |
| First Bancorp, Puerto Rico (a)(b) | 152,663 | 409,137 | |
| First Busey Corp. | 17,008 | 322,302 | |
| First Citizen Bancshares, Inc. | 201 | 47,060 | |
| First Financial Corp., Indiana | 631 | 20,791 | |
| First Interstate Bancsystem, Inc. | 41,737 | 1,118,552 | |
| First Merchants Corp. | 23,936 | 531,140 | |
| First Midwest Bancorp, Inc., Delaware | 33,082 | 552,469 | |
| FirstMerit Corp. | 28,313 | 555,784 | |
| Fulton Financial Corp. | 266,127 | 3,355,861 | |
| German American Bancorp, Inc. | 193 | 6,162 | |
| Great Southern Bancorp, Inc. | 16,093 | 604,614 | |
| Great Western Bancorp, Inc. | 58,664 | 1,443,721 | |
| Guaranty Bancorp | 18,082 | 269,241 | |
| Heritage Commerce Corp. | 5,031 | 46,939 | |
| Hilltop Holdings, Inc. (a) | 131,432 | 2,192,286 | |
| IBERIABANK Corp. | 13,718 | 654,074 | |
| International Bancshares Corp. | 20,436 | 460,832 | |
| MainSource Financial Group, Inc. | 3,178 | 65,785 | |
| Merchants Bancshares, Inc. | 18,218 | 526,500 | |
| National Penn Bancshares, Inc. | 948 | 10,551 | |
| Opus Bank | 52,392 | 1,690,166 | |
| Peapack-Gladstone Financial Corp. | 1,299 | 21,537 | |
| People's Utah Bancorp | 762 | 11,582 | |
| Preferred Bank, Los Angeles | 2,933 | 83,737 | |
| PrivateBancorp, Inc. | 91,927 | 3,158,612 | |
| ServisFirst Bancshares, Inc. | 12,297 | 449,455 | |
| Stonegate Bank | 3,041 | 87,307 | |
| Texas Capital Bancshares, Inc. (a) | 3,981 | 128,706 | |
| UMB Financial Corp. | 12,057 | 592,119 | |
| Umpqua Holdings Corp. | 217,077 | 3,264,838 | |
| Univest Corp. of Pennsylvania | 8,042 | 153,522 | |
| Washington Trust Bancorp, Inc. | 7,895 | 292,905 | |
| Wintrust Financial Corp. | 64,796 | 2,753,830 | |
| 32,730,858 | |||
| Capital Markets - 1.8% | |||
| Diamond Hill Investment Group, Inc. | 3,461 | 584,909 | |
| Financial Engines, Inc. (b) | 113,575 | 2,771,230 | |
| Greenhill & Co., Inc. | 3,587 | 82,716 | |
| INTL FCStone, Inc. (a) | 84,255 | 2,151,030 | |
| KCG Holdings, Inc. Class A (a) | 54,993 | 581,276 | |
| Manning & Napier, Inc. Class A | 13,456 | 92,308 | |
| Oppenheimer Holdings, Inc. Class A (non-vtg.) | 18,923 | 267,950 | |
| Piper Jaffray Companies (a) | 69,879 | 2,959,376 | |
| Vector Capital Corp. rights (a) | 8,300 | 0 | |
| 9,490,795 | |||
| Consumer Finance - 0.8% | |||
| Enova International, Inc. (a) | 96,585 | 558,261 | |
| Nelnet, Inc. Class A | 85,642 | 3,220,139 | |
| Regional Management Corp. (a) | 11,981 | 183,309 | |
| World Acceptance Corp. (a)(b) | 15,663 | 575,302 | |
| 4,537,011 | |||
| Diversified Financial Services - 0.2% | |||
| Gain Capital Holdings, Inc. | 52,323 | 378,295 | |
| Marlin Business Services Corp. | 34,086 | 470,728 | |
| 849,023 | |||
| Insurance - 3.9% | |||
| AMBAC Financial Group, Inc. (a) | 1,169 | 17,851 | |
| Amerisafe, Inc. | 31,307 | 1,612,311 | |
| EMC Insurance Group | 5,364 | 129,165 | |
| Employers Holdings, Inc. | 41,165 | 1,142,740 | |
| Federated National Holding Co. | 97,690 | 2,334,791 | |
| HCI Group, Inc. (b) | 55,517 | 1,950,867 | |
| Heritage Insurance Holdings, Inc. | 137,740 | 2,688,685 | |
| Horace Mann Educators Corp. | 62,198 | 1,916,320 | |
| Infinity Property & Casualty Corp. | 4,334 | 324,010 | |
| James River Group Holdings Ltd. | 15,491 | 452,802 | |
| National General Holdings Corp. | 2,068 | 41,215 | |
| Navigators Group, Inc. (a) | 7,408 | 599,900 | |
| Selective Insurance Group, Inc. | 98,965 | 3,323,245 | |
| Stewart Information Services Corp. | 3,943 | 133,076 | |
| United Insurance Holdings Corp. | 97,119 | 1,894,792 | |
| Universal Insurance Holdings, Inc. (b) | 110,913 | 2,165,022 | |
| 20,726,792 | |||
| Real Estate Investment Trusts - 8.1% | |||
| American Capital Mortgage Investment Corp. | 8,277 | 114,388 | |
| Anworth Mortgage Asset Corp. | 175,283 | 823,830 | |
| Apollo Commercial Real Estate Finance, Inc. | 131,471 | 2,031,227 | |
| Apollo Residential Mortgage, Inc. | 39,760 | 512,904 | |
| Ashford Hospitality Trust, Inc. | 293,701 | 1,624,167 | |
| Capstead Mortgage Corp. (b) | 271,825 | 2,639,421 | |
| Colony Financial, Inc. | 9,256 | 151,798 | |
| Colony Starwood Homes | 13,013 | 285,765 | |
| Coresite Realty Corp. (b) | 49,855 | 3,213,653 | |
| CubeSmart | 28,792 | 860,881 | |
| DCT Industrial Trust, Inc. | 6,588 | 238,420 | |
| Easterly Government Properties, Inc. | 2,368 | 40,493 | |
| Extra Space Storage, Inc. | 30,363 | 2,494,320 | |
| First Industrial Realty Trust, Inc. | 21,169 | 455,557 | |
| Gyrodyne LLC (a) | 340 | 9,846 | |
| Hatteras Financial Corp. | 11,808 | 162,360 | |
| InfraReit, Inc. | 13,530 | 285,754 | |
| iStar Financial, Inc. (a) | 25,213 | 213,302 | |
| LTC Properties, Inc. | 2,476 | 110,033 | |
| Mack-Cali Realty Corp. | 6,050 | 120,395 | |
| MFA Financial, Inc. | 413,248 | 2,814,219 | |
| Monogram Residential Trust, Inc. (b) | 62,737 | 569,652 | |
| New Residential Investment Corp. | 266,543 | 3,121,219 | |
| New York (REIT), Inc. | 19,445 | 186,672 | |
| PS Business Parks, Inc. | 26,640 | 2,445,818 | |
| Redwood Trust, Inc. (b) | 30,115 | 358,067 | |
| RLJ Lodging Trust | 170,828 | 3,582,263 | |
| Ryman Hospitality Properties, Inc. | 69,537 | 3,328,736 | |
| Sabra Health Care REIT, Inc. | 14,646 | 291,675 | |
| Sovran Self Storage, Inc. (b) | 35,759 | 3,806,188 | |
| Sunstone Hotel Investors, Inc. | 149,076 | 1,923,080 | |
| The GEO Group, Inc. | 105,083 | 3,051,610 | |
| Xenia Hotels & Resorts, Inc. | 80,839 | 1,238,453 | |
| 43,106,166 | |||
| Real Estate Management & Development - 0.4% | |||
| Altisource Portfolio Solutions SA (a)(b) | 34,064 | 911,553 | |
| Marcus & Millichap, Inc. (a) | 29,909 | 666,672 | |
| RE/MAX Holdings, Inc. | 8,276 | 265,329 | |
| The RMR Group, Inc. (a) | 10,613 | 239,429 | |
| 2,082,983 | |||
| Thrifts & Mortgage Finance - 2.9% | |||
| BofI Holding, Inc. (a)(b) | 153,037 | 2,835,776 | |
| Charter Financial Corp. | 629 | 8,624 | |
| Dime Community Bancshares, Inc. | 52,829 | 899,678 | |
| Essent Group Ltd. (a) | 78,379 | 1,508,796 | |
| EverBank Financial Corp. | 32,539 | 423,658 | |
| Farmer Mac Class C (non-vtg.) | 954 | 30,957 | |
| First Defiance Financial Corp. | 9,760 | 382,494 | |
| Flagstar Bancorp, Inc. (a) | 2,213 | 42,490 | |
| Hingham Institution for Savings | 918 | 107,819 | |
| Lendingtree, Inc. (a)(b) | 35,428 | 3,130,772 | |
| Northwest Bancshares, Inc. | 196,887 | 2,478,807 | |
| OceanFirst Financial Corp. | 1,517 | 25,774 | |
| Walker & Dunlop, Inc. (a) | 42,390 | 980,057 | |
| Waterstone Financial, Inc. | 23,568 | 332,780 | |
| WSFS Financial Corp. | 65,840 | 1,994,952 | |
| 15,183,434 | |||
| TOTAL FINANCIALS | 128,707,062 | ||
| HEALTH CARE - 15.5% | |||
| Biotechnology - 2.9% | |||
| ACADIA Pharmaceuticals, Inc. (a)(b) | 14,816 | 255,724 | |
| Achillion Pharmaceuticals, Inc. (a) | 4,804 | 35,502 | |
| Acorda Therapeutics, Inc. (a)(b) | 21,931 | 717,363 | |
| Alexion Pharmaceuticals, Inc. (a) | 2,737 | 385,370 | |
| AMAG Pharmaceuticals, Inc. (a) | 22,833 | 600,051 | |
| Anacor Pharmaceuticals, Inc. (a) | 10,098 | 644,050 | |
| Applied Genetic Technologies Corp. (a) | 21,501 | 285,318 | |
| ARIAD Pharmaceuticals, Inc. (a) | 8,253 | 45,061 | |
| Cepheid, Inc. (a) | 25,714 | 763,192 | |
| Concert Pharmaceuticals, Inc. (a) | 22,901 | 294,507 | |
| Cytokinetics, Inc. (a)(b) | 38,929 | 245,253 | |
| CytomX Therapeutics, Inc. (a)(b) | 5,184 | 66,874 | |
| Dyax Corp. rights 12/31/19 (a) | 29,085 | 67,768 | |
| Eagle Pharmaceuticals, Inc. (a)(b) | 7,322 | 464,142 | |
| Emergent BioSolutions, Inc. (a)(b) | 17,920 | 606,234 | |
| Enanta Pharmaceuticals, Inc. (a)(b) | 16,571 | 470,451 | |
| Exelixis, Inc. (a)(b) | 9,375 | 34,125 | |
| FibroGen, Inc. (a) | 19,224 | 333,152 | |
| Five Prime Therapeutics, Inc. (a) | 15,642 | 509,460 | |
| Genomic Health, Inc. (a) | 10,159 | 258,343 | |
| Halozyme Therapeutics, Inc. (a) | 4,734 | 38,487 | |
| Ironwood Pharmaceuticals, Inc. Class A (a) | 15,878 | 153,223 | |
| Kite Pharma, Inc. (a)(b) | 5,569 | 249,046 | |
| Ligand Pharmaceuticals, Inc. Class B (a)(b) | 8,743 | 806,804 | |
| MiMedx Group, Inc. (a)(b) | 71,749 | 590,494 | |
| Myriad Genetics, Inc. (a)(b) | 30,925 | 1,082,375 | |
| Neurocrine Biosciences, Inc. (a) | 22,313 | 820,672 | |
| NewLink Genetics Corp. (a)(b) | 19,183 | 403,610 | |
| Novavax, Inc. (a)(b) | 35,306 | 153,934 | |
| Ophthotech Corp. (a)(b) | 11,658 | 525,076 | |
| PDL BioPharma, Inc. | 142,906 | 430,147 | |
| Pfenex, Inc. (a) | 14,404 | 102,845 | |
| Portola Pharmaceuticals, Inc. (a)(b) | 7,692 | 216,684 | |
| Progenics Pharmaceuticals, Inc. (a)(b) | 21,743 | 95,887 | |
| Prothena Corp. PLC (a) | 4,057 | 129,175 | |
| Repligen Corp. (a)(b) | 13,882 | 357,184 | |
| Retrophin, Inc. (a) | 29,644 | 421,834 | |
| Rigel Pharmaceuticals, Inc. (a) | 106,572 | 241,918 | |
| TESARO, Inc. (a) | 1,732 | 70,077 | |
| Tobira Therapeutics, Inc. (a)(b) | 8,463 | 59,918 | |
| Trevena, Inc. (a) | 37,575 | 314,503 | |
| Ultragenyx Pharmaceutical, Inc. (a) | 8,893 | 542,384 | |
| Vanda Pharmaceuticals, Inc. (a)(b) | 27,277 | 214,124 | |
| Voyager Therapeutics, Inc. (a)(b) | 3,928 | 37,591 | |
| ZIOPHARM Oncology, Inc. (a) | 6,031 | 47,404 | |
| 15,187,336 | |||
| Health Care Equipment & Supplies - 4.2% | |||
| Abiomed, Inc. (a) | 13,012 | 1,041,090 | |
| Atrion Corp. | 185 | 69,514 | |
| Cantel Medical Corp. | 53,908 | 3,430,166 | |
| Cryolife, Inc. | 7,314 | 78,333 | |
| Exactech, Inc. (a) | 20,973 | 391,146 | |
| Greatbatch, Inc. (a) | 66,073 | 2,497,559 | |
| ICU Medical, Inc. (a) | 8,561 | 786,756 | |
| Inogen, Inc. (a)(b) | 24,760 | 846,297 | |
| LivaNova PLC (a)(b) | 51,575 | 2,910,893 | |
| Masimo Corp. (a) | 82,211 | 3,110,864 | |
| Meridian Bioscience, Inc. | 37,428 | 754,174 | |
| Merit Medical Systems, Inc. (a) | 102,709 | 1,931,956 | |
| Natus Medical, Inc. (a) | 38,578 | 1,401,153 | |
| NuVasive, Inc. (a) | 11,471 | 479,488 | |
| OraSure Technologies, Inc. (a) | 5,485 | 36,804 | |
| Steris PLC | 20,711 | 1,332,132 | |
| SurModics, Inc. (a) | 32,583 | 607,999 | |
| Symmetry Surgical, Inc. (a) | 9,315 | 88,865 | |
| Vascular Solutions, Inc. (a) | 7,253 | 218,025 | |
| West Pharmaceutical Services, Inc. | 265 | 16,435 | |
| 22,029,649 | |||
| Health Care Providers & Services - 5.7% | |||
| Air Methods Corp. (a) | 5,004 | 181,795 | |
| Alliance Healthcare Services, Inc. (a) | 60,188 | 430,344 | |
| AMN Healthcare Services, Inc. (a) | 3,128 | 88,929 | |
| AmSurg Corp. (a) | 12,826 | 872,809 | |
| Centene Corp. (a)(b) | 45,509 | 2,592,193 | |
| Chemed Corp. | 22,156 | 2,847,046 | |
| Corvel Corp. (a) | 20,449 | 848,429 | |
| HealthSouth Corp. | 16,410 | 578,124 | |
| Magellan Health Services, Inc. (a) | 54,036 | 3,403,457 | |
| Molina Healthcare, Inc. (a)(b) | 58,264 | 3,614,699 | |
| National Healthcare Corp. | 12,786 | 819,966 | |
| Owens & Minor, Inc. | 42,831 | 1,687,970 | |
| PharMerica Corp. (a) | 70,938 | 1,639,377 | |
| Select Medical Holdings Corp. (b) | 109,218 | 1,069,244 | |
| Surgical Care Affiliates, Inc. (a) | 68,295 | 2,767,996 | |
| Team Health Holdings, Inc. (a) | 37,648 | 1,677,971 | |
| Triple-S Management Corp. (a)(b) | 64,328 | 1,686,680 | |
| Wellcare Health Plans, Inc. (a) | 40,292 | 3,621,042 | |
| 30,428,071 | |||
| Health Care Technology - 1.3% | |||
| Computer Programs & Systems, Inc. (b) | 20,791 | 1,178,018 | |
| HMS Holdings Corp. (a) | 47,386 | 624,074 | |
| Omnicell, Inc. (a) | 65,724 | 1,798,866 | |
| Quality Systems, Inc. | 194,900 | 3,030,695 | |
| 6,631,653 | |||
| Life Sciences Tools & Services - 0.6% | |||
| Cambrex Corp. (a) | 17,537 | 676,402 | |
| INC Research Holdings, Inc. Class A (a) | 11,311 | 448,820 | |
| Luminex Corp. (a)(b) | 28,623 | 534,678 | |
| PAREXEL International Corp. (a) | 23,100 | 1,355,739 | |
| PRA Health Sciences, Inc. (a)(b) | 9,452 | 408,043 | |
| 3,423,682 | |||
| Pharmaceuticals - 0.8% | |||
| Catalent, Inc. (a) | 18,261 | 443,194 | |
| DepoMed, Inc. (a) | 4,587 | 70,089 | |
| Impax Laboratories, Inc. (a) | 17,291 | 565,243 | |
| Innoviva, Inc. (b) | 1,685 | 19,748 | |
| Intra-Cellular Therapies, Inc. (a) | 563 | 15,832 | |
| Lannett Co., Inc. (a)(b) | 18,550 | 466,718 | |
| Nektar Therapeutics (a)(b) | 21,845 | 244,009 | |
| Pacira Pharmaceuticals, Inc. (a)(b) | 7,800 | 405,678 | |
| Prestige Brands Holdings, Inc. (a) | 23,000 | 1,124,700 | |
| Sucampo Pharmaceuticals, Inc. Class A (a) | 29,754 | 391,265 | |
| The Medicines Company (a)(b) | 14,560 | 468,250 | |
| TherapeuticsMD, Inc. (a)(b) | 6,066 | 37,063 | |
| 4,251,789 | |||
| TOTAL HEALTH CARE | 81,952,180 | ||
| INDUSTRIALS - 10.5% | |||
| Aerospace & Defense - 1.7% | |||
| Astronics Corp. (a) | 69,111 | 2,198,421 | |
| Astronics Corp. Class B | 8,594 | 266,414 | |
| Curtiss-Wright Corp. | 44,632 | 3,150,573 | |
| Moog, Inc. Class A (a) | 61,719 | 2,665,026 | |
| Teledyne Technologies, Inc. (a) | 8,955 | 762,787 | |
| 9,043,221 | |||
| Air Freight & Logistics - 0.4% | |||
| Atlas Air Worldwide Holdings, Inc. (a)(b) | 65,791 | 2,382,292 | |
| Airlines - 1.1% | |||
| Hawaiian Holdings, Inc. (a) | 82,317 | 3,541,277 | |
| JetBlue Airways Corp. (a) | 114,273 | 2,514,006 | |
| 6,055,283 | |||
| Building Products - 0.4% | |||
| American Woodmark Corp. (a) | 16,913 | 1,154,989 | |
| Insteel Industries, Inc. | 2,319 | 60,711 | |
| Universal Forest Products, Inc. | 9,226 | 707,819 | |
| 1,923,519 | |||
| Commercial Services & Supplies - 2.1% | |||
| ACCO Brands Corp. (a) | 18,094 | 132,267 | |
| ARC Document Solutions, Inc. (a) | 24,813 | 86,846 | |
| Deluxe Corp. | 64,150 | 3,682,852 | |
| Ennis, Inc. | 26,038 | 513,990 | |
| G&K Services, Inc. Class A | 4,635 | 307,301 | |
| Herman Miller, Inc. | 47,340 | 1,235,101 | |
| Kimball International, Inc. Class B | 130,462 | 1,373,765 | |
| Steelcase, Inc. Class A | 60,712 | 758,293 | |
| Tetra Tech, Inc. | 7,264 | 199,978 | |
| UniFirst Corp. | 24,894 | 2,624,077 | |
| 10,914,470 | |||
| Construction & Engineering - 0.5% | |||
| Argan, Inc. | 87,853 | 2,835,016 | |
| EMCOR Group, Inc. | 2,118 | 97,153 | |
| 2,932,169 | |||
| Electrical Equipment - 0.1% | |||
| Allied Motion Technologies, Inc. | 12,121 | 223,754 | |
| EnerSys | 4,213 | 216,380 | |
| 440,134 | |||
| Machinery - 1.4% | |||
| Alamo Group, Inc. | 7,951 | 412,577 | |
| Briggs & Stratton Corp. | 6,752 | 143,615 | |
| Federal Signal Corp. | 30,779 | 365,039 | |
| FreightCar America, Inc. | 2,647 | 39,361 | |
| Global Brass & Copper Holdings, Inc. | 25,384 | 559,463 | |
| Hurco Companies, Inc. | 15,053 | 390,625 | |
| Hyster-Yale Materials Handling Class A | 24,892 | 1,471,615 | |
| Kadant, Inc. | 23,785 | 907,873 | |
| TriMas Corp. (a) | 3,078 | 50,910 | |
| Wabash National Corp. (a)(b) | 251,825 | 2,953,907 | |
| 7,294,985 | |||
| Marine - 0.6% | |||
| Matson, Inc. | 75,445 | 3,024,590 | |
| Professional Services - 1.9% | |||
| Acacia Research Corp. | 2,531 | 7,998 | |
| CRA International, Inc. (a) | 2,114 | 41,688 | |
| Heidrick & Struggles International, Inc. | 2,079 | 48,836 | |
| Insperity, Inc. (b) | 63,681 | 3,024,211 | |
| Kforce, Inc. | 11,254 | 179,389 | |
| Korn/Ferry International | 100,879 | 2,866,981 | |
| Resources Connection, Inc. | 91,997 | 1,275,998 | |
| RPX Corp. (a) | 265,688 | 2,632,968 | |
| TrueBlue, Inc. (a) | 4,010 | 92,030 | |
| 10,170,099 | |||
| Road & Rail - 0.3% | |||
| ArcBest Corp. | 69,577 | 1,361,622 | |
| Saia, Inc. (a) | 3,595 | 94,369 | |
| 1,455,991 | |||
| Trading Companies & Distributors - 0.0% | |||
| Kaman Corp. | 1,681 | 73,863 | |
| TOTAL INDUSTRIALS | 55,710,616 | ||
| INFORMATION TECHNOLOGY - 19.2% | |||
| Communications Equipment - 1.6% | |||
| Bel Fuse, Inc. Class B (non-vtg.) | 3,822 | 56,757 | |
| Black Box Corp. | 38,159 | 505,607 | |
| Communications Systems, Inc. | 7,450 | 50,362 | |
| Comtech Telecommunications Corp. | 31,754 | 652,545 | |
| Digi International, Inc. (a) | 32,705 | 277,665 | |
| Extreme Networks, Inc. (a) | 36,746 | 103,624 | |
| InterDigital, Inc. | 12,518 | 622,520 | |
| Ixia (a) | 787 | 8,980 | |
| NETGEAR, Inc. (a) | 55,411 | 2,189,289 | |
| Plantronics, Inc. | 35,124 | 1,317,150 | |
| Polycom, Inc. (a) | 245,485 | 2,555,499 | |
| 8,339,998 | |||
| Electronic Equipment & Components - 5.7% | |||
| Anixter International, Inc. (a) | 7,485 | 320,583 | |
| Belden, Inc. | 4,519 | 247,506 | |
| Benchmark Electronics, Inc. (a) | 140,860 | 3,049,619 | |
| Coherent, Inc. (a) | 34,477 | 2,916,754 | |
| ePlus, Inc. (a) | 8,206 | 616,189 | |
| II-VI, Inc. (a) | 12,393 | 272,026 | |
| Insight Enterprises, Inc. (a) | 8,577 | 223,860 | |
| KEMET Corp. (a) | 9,724 | 17,892 | |
| Kimball Electronics, Inc. (a) | 113,264 | 1,293,475 | |
| Mercury Systems, Inc. (a) | 11,273 | 184,201 | |
| Methode Electronics, Inc. Class A | 90,763 | 2,593,099 | |
| MTS Systems Corp. | 880 | 48,356 | |
| Multi-Fineline Electronix, Inc. (a) | 4,190 | 94,568 | |
| PC Connection, Inc. | 8,616 | 213,418 | |
| Plexus Corp. (a) | 23,746 | 864,117 | |
| QLogic Corp. (a) | 245,007 | 3,158,140 | |
| Rofin-Sinar Technologies, Inc. (a)(b) | 13,037 | 291,247 | |
| Sanmina Corp. (a) | 160,394 | 3,304,116 | |
| ScanSource, Inc. (a) | 77,117 | 2,883,405 | |
| SYNNEX Corp. | 39,661 | 3,729,324 | |
| Tech Data Corp. (a) | 51,533 | 3,628,439 | |
| 29,950,334 | |||
| Internet Software & Services - 1.0% | |||
| Bankrate, Inc. (a) | 18,940 | 145,080 | |
| DHI Group, Inc. (a) | 4,507 | 35,064 | |
| EarthLink Holdings Corp. | 68,763 | 387,823 | |
| Global Sources Ltd. (a)(b) | 57,052 | 425,608 | |
| RetailMeNot, Inc. (a) | 185,452 | 1,498,452 | |
| United Online, Inc. (a) | 89,386 | 1,100,342 | |
| WebMD Health Corp. (a) | 29,338 | 1,627,085 | |
| 5,219,454 | |||
| IT Services - 4.2% | |||
| CACI International, Inc. Class A (a) | 10,356 | 1,000,597 | |
| Cardtronics, Inc. (a)(b) | 50,670 | 1,708,592 | |
| Computer Task Group, Inc. | 15,595 | 73,764 | |
| Convergys Corp. (b) | 55,577 | 1,432,775 | |
| CSG Systems International, Inc. | 80,327 | 3,049,213 | |
| EVERTEC, Inc. | 19,063 | 226,850 | |
| ExlService Holdings, Inc. (a) | 15,975 | 752,263 | |
| Hackett Group, Inc. | 12,048 | 167,467 | |
| Heartland Payment Systems, Inc. | 5,380 | 503,138 | |
| Higher One Holdings, Inc. (a) | 57,178 | 245,865 | |
| Jack Henry & Associates, Inc. | 33,295 | 2,738,181 | |
| ManTech International Corp. Class A | 4,546 | 132,425 | |
| Maximus, Inc. | 56,246 | 2,765,616 | |
| NCI, Inc. Class A | 18,628 | 278,302 | |
| Neustar, Inc. Class A (a)(b) | 128,893 | 3,205,569 | |
| Science Applications International Corp. | 11,452 | 511,332 | |
| Sykes Enterprises, Inc. (a) | 77,640 | 2,365,691 | |
| Syntel, Inc. (a) | 28,310 | 1,294,333 | |
| 22,451,973 | |||
| Semiconductors & Semiconductor Equipment - 4.3% | |||
| Alpha & Omega Semiconductor Ltd. (a) | 2,177 | 25,754 | |
| Cabot Microelectronics Corp. | 69,930 | 2,689,508 | |
| Cirrus Logic, Inc. (a) | 99,804 | 3,516,095 | |
| Fairchild Semiconductor International, Inc. (a) | 7,773 | 155,926 | |
| FormFactor, Inc. (a) | 18,266 | 138,822 | |
| Integrated Device Technology, Inc. (a) | 192,205 | 3,732,621 | |
| IXYS Corp. | 66,420 | 749,218 | |
| MaxLinear, Inc. Class A (a) | 23,685 | 381,092 | |
| Microsemi Corp. (a)(b) | 19,563 | 677,467 | |
| MKS Instruments, Inc. | 86,543 | 2,847,265 | |
| NeoPhotonics Corp. (a) | 150,322 | 1,647,529 | |
| Photronics, Inc. (a) | 237,026 | 2,410,554 | |
| Rudolph Technologies, Inc. (a) | 21,074 | 273,119 | |
| Silicon Laboratories, Inc. (a) | 2,382 | 98,258 | |
| Synaptics, Inc. (a) | 4,038 | 327,926 | |
| Tessera Technologies, Inc. | 109,213 | 3,219,599 | |
| 22,890,753 | |||
| Software - 1.9% | |||
| Aspen Technology, Inc. (a) | 108,630 | 3,581,531 | |
| Fleetmatics Group PLC (a)(b) | 2,400 | 86,664 | |
| Gigamon, Inc. (a) | 16,184 | 442,956 | |
| MicroStrategy, Inc. Class A (a) | 9,170 | 1,475,361 | |
| Monotype Imaging Holdings, Inc. | 34,294 | 814,140 | |
| Pegasystems, Inc. | 19,896 | 484,468 | |
| Progress Software Corp. (a) | 68,840 | 1,736,145 | |
| QAD, Inc. Class B | 4,123 | 67,988 | |
| Qualys, Inc. (a) | 5,595 | 139,707 | |
| RealPage, Inc. (a) | 4,612 | 92,471 | |
| Synchronoss Technologies, Inc. (a) | 45,216 | 1,266,500 | |
| Zix Corp. (a) | 6,899 | 27,527 | |
| 10,215,458 | |||
| Technology Hardware, Storage & Peripherals - 0.5% | |||
| Super Micro Computer, Inc. (a)(b) | 79,368 | 2,577,079 | |
| TOTAL INFORMATION TECHNOLOGY | 101,645,049 | ||
| MATERIALS - 1.9% | |||
| Chemicals - 0.9% | |||
| Chemtura Corp. (a) | 11,728 | 295,897 | |
| FutureFuel Corp. | 145,782 | 1,868,925 | |
| Innophos Holdings, Inc. | 15,572 | 451,277 | |
| Kraton Performance Polymers, Inc. (a) | 23,826 | 409,092 | |
| Minerals Technologies, Inc. | 34,900 | 1,773,618 | |
| 4,798,809 | |||
| Construction Materials - 0.0% | |||
| United States Lime & Minerals, Inc. | 1,710 | 90,938 | |
| Containers & Packaging - 0.3% | |||
| AEP Industries, Inc. | 22,694 | 1,786,245 | |
| Metals & Mining - 0.3% | |||
| Commercial Metals Co. | 79,253 | 1,164,227 | |
| SunCoke Energy, Inc. | 7,905 | 37,391 | |
| Worthington Industries, Inc. | 2,219 | 69,033 | |
| 1,270,651 | |||
| Paper & Forest Products - 0.4% | |||
| Schweitzer-Mauduit International, Inc. | 74,493 | 2,251,178 | |
| TOTAL MATERIALS | 10,197,821 | ||
| TELECOMMUNICATION SERVICES - 1.3% | |||
| Diversified Telecommunication Services - 1.2% | |||
| Atlantic Tele-Network, Inc. | 24,575 | 1,767,926 | |
| FairPoint Communications, Inc. (a) | 1,223 | 18,382 | |
| IDT Corp. Class B | 77,773 | 1,013,382 | |
| Inteliquent, Inc. | 159,827 | 2,720,256 | |
| Vonage Holdings Corp. (a) | 128,383 | 689,417 | |
| 6,209,363 | |||
| Wireless Telecommunication Services - 0.1% | |||
| Shenandoah Telecommunications Co. | 13,518 | 326,595 | |
| Spok Holdings, Inc. | 14,103 | 249,905 | |
| 576,500 | |||
| TOTAL TELECOMMUNICATION SERVICES | 6,785,863 | ||
| UTILITIES - 2.7% | |||
| Electric Utilities - 0.6% | |||
| Allete, Inc. | 24,216 | 1,283,932 | |
| Cleco Corp. | 7,302 | 335,235 | |
| IDACORP, Inc. | 15,957 | 1,132,309 | |
| PNM Resources, Inc. | 4,756 | 151,812 | |
| Portland General Electric Co. | 5,798 | 220,614 | |
| 3,123,902 | |||
| Gas Utilities - 1.1% | |||
| New Jersey Resources Corp. | 21,983 | 761,051 | |
| ONE Gas, Inc. | 61,018 | 3,537,824 | |
| Piedmont Natural Gas Co., Inc. | 17,266 | 1,025,773 | |
| Southwest Gas Corp. | 5,820 | 355,020 | |
| 5,679,668 | |||
| Multi-Utilities - 0.4% | |||
| Avangrid, Inc. | 55,306 | 2,145,320 | |
| Water Utilities - 0.6% | |||
| American States Water Co. | 68,323 | 2,897,578 | |
| Middlesex Water Co. | 4,365 | 122,307 | |
| 3,019,885 | |||
| TOTAL UTILITIES | 13,968,775 | ||
| TOTAL COMMON STOCKS | |||
| (Cost $514,969,504) | 517,537,858 | ||
| Principal Amount | Value | ||
| U.S. Treasury Obligations - 0.3% | |||
| U.S. Treasury Bills, yield at date of purchase 0.37% to 0.39% 5/26/16 (c) | |||
| (Cost $1,498,651) | 1,500,000 | 1,498,845 | |
| Shares | Value | ||
| Money Market Funds - 17.1% | |||
| Dreyfus Cash Management Institutional Shares, 0.10% (d) | 8,704,912 | $8,704,900 | |
| Fidelity Securities Lending Cash Central Fund, 0.44% (e)(f) | 81,571,882 | 81,571,882 | |
| TOTAL MONEY MARKET FUNDS | |||
| (Cost $90,276,789) | 90,276,782 | ||
| TOTAL INVESTMENT PORTFOLIO - 115.2% | |||
| (Cost $606,744,944) | 609,313,485 | ||
| NET OTHER ASSETS (LIABILITIES) - (15.2)% | (80,304,183) | ||
| NET ASSETS - 100% | $529,009,302 |
| Futures Contracts | |||
| Expiration Date | Underlying Face Amount at Value | Unrealized Appreciation/(Depreciation) | |
| Purchased | |||
| Equity Index Contracts | |||
| 109 ICE Russell 2000 Index Contracts (United States) | March 2016 | 11,245,530 | $(81,721) |
The face value of futures purchased as a percentage of Net Assets is 2.1%
Legend
(a) Non-income producing
(b) Security or a portion of the security is on loan at period end.
(c) Security or a portion of the security was pledged to cover margin requirements for futures contracts. At period end, the value of securities pledged amounted to $567,563.
(d) The rate quoted is the annualized seven-day yield of the fund at period end.
(e) Investment made with cash collateral received from securities on loan.
(f) Affiliated fund that is generally available only to investment companies and other accounts managed by Fidelity Investments. The rate quoted is the annualized seven-day yield of the fund at period end. A complete unaudited listing of the fund's holdings as of its most recent quarter end is available upon request. In addition, each Fidelity Central Fund's financial statements, which are not covered by the Fund's Report of Independent Registered Public Accounting Firm, are available on the SEC's website or upon request.
Affiliated Central Funds
Information regarding fiscal year to date income earned by the Fund from investments in Fidelity Central Funds is as follows:
| Fund | Income earned |
| Fidelity Securities Lending Cash Central Fund | $782,021 |
Investment Valuation
The following is a summary of the inputs used, as of February 29, 2016, involving the Fund's assets and liabilities carried at fair value. The inputs or methodology used for valuing securities may not be an indication of the risk associated with investing in those securities. For more information on valuation inputs, and their aggregation into the levels used below, please refer to the Investment Valuation section in the accompanying Notes to Financial Statements.
| Valuation Inputs at Reporting Date: | ||||
| Description | Total | Level 1 | Level 2 | Level 3 |
| Investments in Securities: | ||||
| Equities: | ||||
| Consumer Discretionary | $75,284,137 | $75,284,137 | $-- | $-- |
| Consumer Staples | 28,633,960 | 28,633,960 | -- | -- |
| Energy | 14,652,395 | 14,652,395 | -- | -- |
| Financials | 128,707,062 | 128,707,062 | -- | -- |
| Health Care | 81,952,180 | 81,884,412 | -- | 67,768 |
| Industrials | 55,710,616 | 55,710,616 | -- | -- |
| Information Technology | 101,645,049 | 101,645,049 | -- | -- |
| Materials | 10,197,821 | 10,197,821 | -- | -- |
| Telecommunication Services | 6,785,863 | 6,785,863 | -- | -- |
| Utilities | 13,968,775 | 13,968,775 | -- | -- |
| U.S. Government and Government Agency Obligations | 1,498,845 | -- | 1,498,845 | -- |
| Money Market Funds | 90,276,782 | 90,276,782 | -- | -- |
| Total Investments in Securities: | $609,313,485 | $607,746,872 | $1,498,845 | $67,768 |
| Derivative Instruments: | ||||
| Liabilities | ||||
| Futures Contracts | $(81,721) | $(81,721) | $-- | $-- |
| Total Liabilities | $(81,721) | $(81,721) | $-- | $-- |
| Total Derivative Instruments: | $(81,721) | $(81,721) | $-- | $-- |
Value of Derivative Instruments
The following table is a summary of the Fund's value of derivative instruments by primary risk exposure as of February 29, 2016. For additional information on derivative instruments, please refer to the Derivative Instruments section in the accompanying Notes to Financial Statements.
| Primary Risk Exposure / Derivative Type | Value | |
| Asset | Liability | |
| Equity Risk | ||
| Futures Contracts(a) | $0 | $(81,721) |
| Total Equity Risk | 0 | (81,721) |
| Total Value of Derivatives | $0 | $(81,721) |
(a) Reflects gross cumulative appreciation (depreciation) on futures contracts as presented in the Schedule of Investments. Only the period end receivable or payable for daily variation margin and net unrealized appreciation (depreciation) are presented in the Statement of Assets and Liabilities.
See accompanying notes which are an integral part of the financial statements.
Fidelity® Small Cap Enhanced Index Fund
Financial Statements
Statement of Assets and Liabilities
| February 29, 2016 | ||
| Assets | ||
| Investment in securities, at value (including securities loaned of $78,984,871) — See accompanying schedule: Unaffiliated issuers (cost $525,173,062) | $527,741,603 | |
| Fidelity Central Funds (cost $81,571,882) | 81,571,882 | |
| Total Investments (cost $606,744,944) | $609,313,485 | |
| Cash | 334,594 | |
| Receivable for investments sold | 6,972,797 | |
| Receivable for fund shares sold | 668,450 | |
| Dividends receivable | 417,798 | |
| Interest receivable | 2,516 | |
| Distributions receivable from Fidelity Central Funds | 102,151 | |
| Other receivables | 289 | |
| Total assets | 617,812,080 | |
| Liabilities | ||
| Payable for investments purchased | $6,338,182 | |
| Payable for fund shares redeemed | 571,889 | |
| Accrued management fee | 219,891 | |
| Payable for daily variation margin for derivative instruments | 37,504 | |
| Other affiliated payables | 63,430 | |
| Collateral on securities loaned, at value | 81,571,882 | |
| Total liabilities | 88,802,778 | |
| Net Assets | $529,009,302 | |
| Net Assets consist of: | ||
| Paid in capital | $543,406,781 | |
| Undistributed net investment income | 454 | |
| Accumulated undistributed net realized gain (loss) on investments | (16,884,753) | |
| Net unrealized appreciation (depreciation) on investments | 2,486,820 | |
| Net Assets, for 48,142,482 shares outstanding | $529,009,302 | |
| Net Asset Value, offering price and redemption price per share ($529,009,302 ÷ 48,142,482 shares) | $10.99 |
See accompanying notes which are an integral part of the financial statements.
Statement of Operations
| Year ended February 29, 2016 | ||
| Investment Income | ||
| Dividends | $7,663,066 | |
| Interest | 15,718 | |
| Income from Fidelity Central Funds (including $782,021 from security lending) | 782,021 | |
| Total income | 8,460,805 | |
| Expenses | ||
| Management fee | $2,801,067 | |
| Transfer agent fees | 808,581 | |
| Independent trustees' compensation | 2,178 | |
| Miscellaneous | 744 | |
| Total expenses before reductions | 3,612,570 | |
| Expense reductions | (213) | 3,612,357 |
| Net investment income (loss) | 4,848,448 | |
| Realized and Unrealized Gain (Loss) | ||
| Net realized gain (loss) on: | ||
| Investment securities: | ||
| Unaffiliated issuers | 6,672,421 | |
| Futures contracts | (2,289,456) | |
| Total net realized gain (loss) | 4,382,965 | |
| Change in net unrealized appreciation (depreciation) on: Investment securities | (75,597,446) | |
| Futures contracts | (1,222,722) | |
| Total change in net unrealized appreciation (depreciation) | (76,820,168) | |
| Net gain (loss) | (72,437,203) | |
| Net increase (decrease) in net assets resulting from operations | $(67,588,755) |
See accompanying notes which are an integral part of the financial statements.
Statement of Changes in Net Assets
| Year ended February 29, 2016 | Year ended February 28, 2015 | |
| Increase (Decrease) in Net Assets | ||
| Operations | ||
| Net investment income (loss) | $4,848,448 | $2,600,051 |
| Net realized gain (loss) | 4,382,965 | 18,844,826 |
| Change in net unrealized appreciation (depreciation) | (76,820,168) | 17,743,442 |
| Net increase (decrease) in net assets resulting from operations | (67,588,755) | 39,188,319 |
| Distributions to shareholders from net investment income | (4,016,522) | (1,928,427) |
| Distributions to shareholders from net realized gain | (24,264,444) | (24,849,514) |
| Total distributions | (28,280,966) | (26,777,941) |
| Share transactions | ||
| Proceeds from sales of shares | 247,736,855 | 152,765,894 |
| Reinvestment of distributions | 27,163,046 | 25,817,637 |
| Cost of shares redeemed | (123,045,531) | (133,500,842) |
| Net increase (decrease) in net assets resulting from share transactions | 151,854,370 | 45,082,689 |
| Redemption fees | 109,416 | 77,956 |
| Total increase (decrease) in net assets | 56,094,065 | 57,571,023 |
| Net Assets | ||
| Beginning of period | 472,915,237 | 415,344,214 |
| End of period (including undistributed net investment income of $454 and undistributed net investment income of $553,011, respectively) | $529,009,302 | $472,915,237 |
| Other Information | ||
| Shares | ||
| Sold | 19,800,031 | 12,334,842 |
| Issued in reinvestment of distributions | 2,244,291 | 2,171,867 |
| Redeemed | (10,146,784) | (10,864,622) |
| Net increase (decrease) | 11,897,538 | 3,642,087 |
See accompanying notes which are an integral part of the financial statements.
Financial Highlights — Fidelity Small Cap Enhanced Index Fund
| Years ended February 28, | 2016A | 2015 | 2014 | 2013 | 2012A |
| Selected Per–Share Data | |||||
| Net asset value, beginning of period | $13.05 | $12.74 | $10.56 | $9.81 | $10.72 |
| Income from Investment Operations | |||||
| Net investment income (loss)B | .11 | .08 | .08 | .20 | .07 |
| Net realized and unrealized gain (loss) | (1.52) | 1.04 | 2.91 | 1.30 | .14 |
| Total from investment operations | (1.41) | 1.12 | 2.99 | 1.50 | .21 |
| Distributions from net investment income | (.09) | (.06) | (.07) | (.20) | (.06) |
| Distributions from net realized gain | (.56) | (.75) | (.75) | (.55) | (1.08) |
| Total distributions | (.65) | (.81) | (.82) | (.75) | (1.13)C |
| Redemption fees added to paid in capitalB | –D | –D | .01 | –D | .01 |
| Net asset value, end of period | $10.99 | $13.05 | $12.74 | $10.56 | $9.81 |
| Total ReturnE | (11.20)% | 9.53% | 29.35% | 16.15% | 2.87% |
| Ratios to Average Net AssetsF,G | |||||
| Expenses before reductions | .67% | .67% | .67% | .67% | .67% |
| Expenses net of fee waivers, if any | .67% | .67% | .67% | .67% | .67% |
| Expenses net of all reductions | .67% | .67% | .67% | .67% | .67% |
| Net investment income (loss) | .90% | .63% | .70% | 2.02% | .69% |
| Supplemental Data | |||||
| Net assets, end of period (000 omitted) | $529,009 | $472,915 | $415,344 | $157,567 | $121,874 |
| Portfolio turnover rateH | 87% | 99% | 107% | 106% | 79% |
A For the year ended February 29.
B Calculated based on average shares outstanding during the period.
C Total distributions of $1.13 per share is comprised of distributions from net investment income of $.056 and distributions from net realized gain of $1.075 per share.
D Amount represents less than $.005 per share.
E Total returns would have been lower if certain expenses had not been reduced during the applicable periods shown.
F Fees and expenses of any underlying Fidelity Central Funds are not included in the Fund's expense ratio. The Fund indirectly bears its proportionate share of the expenses of any underlying Fidelity Central Funds.
G Expense ratios reflect operating expenses of the Fund. Expenses before reductions do not reflect amounts reimbursed by the investment adviser or reductions from expense offset arrangements and do not represent the amount paid by the Fund during periods when reimbursements or reductions occur. Expenses net of fee waivers reflect expenses after reimbursement by the investment adviser but prior to reductions from expense offset arrangements. Expenses net of all reductions represent the net expenses paid by the Fund.
H Amount does not include the portfolio activity of any underlying Fidelity Central Funds.
See accompanying notes which are an integral part of the financial statements.
Fidelity® International Enhanced Index Fund
Performance: The Bottom Line
Average annual total return reflects the change in the value of an investment, assuming reinvestment of distributions from dividend income and capital gains (the profits earned upon the sale of securities that have grown in value, if any) and assuming a constant rate of performance each year. The hypothetical investment and the average annual total returns do not reflect the deduction of taxes that a shareholder would pay on fund distributions or the redemption of fund shares. During periods of reimbursement by Fidelity, a fund’s total return will be greater than it would be had the reimbursement not occurred. How a fund did yesterday is no guarantee of how it will do tomorrow.
Average Annual Total Returns
| For the periods ended February 29, 2016 | Past 1 year | Past 5 years | Life of fundA |
| Fidelity® International Enhanced Index Fund | (13.71)% | 1.55% | (1.24)% |
A From December 20, 2007
$10,000 Over Life of Fund
Let's say hypothetically that $10,000 was invested in Fidelity® International Enhanced Index Fund on December 20, 2007, when the fund started.
The chart shows how the value of your investment would have changed, and also shows how the MSCI EAFE Index performed over the same period.
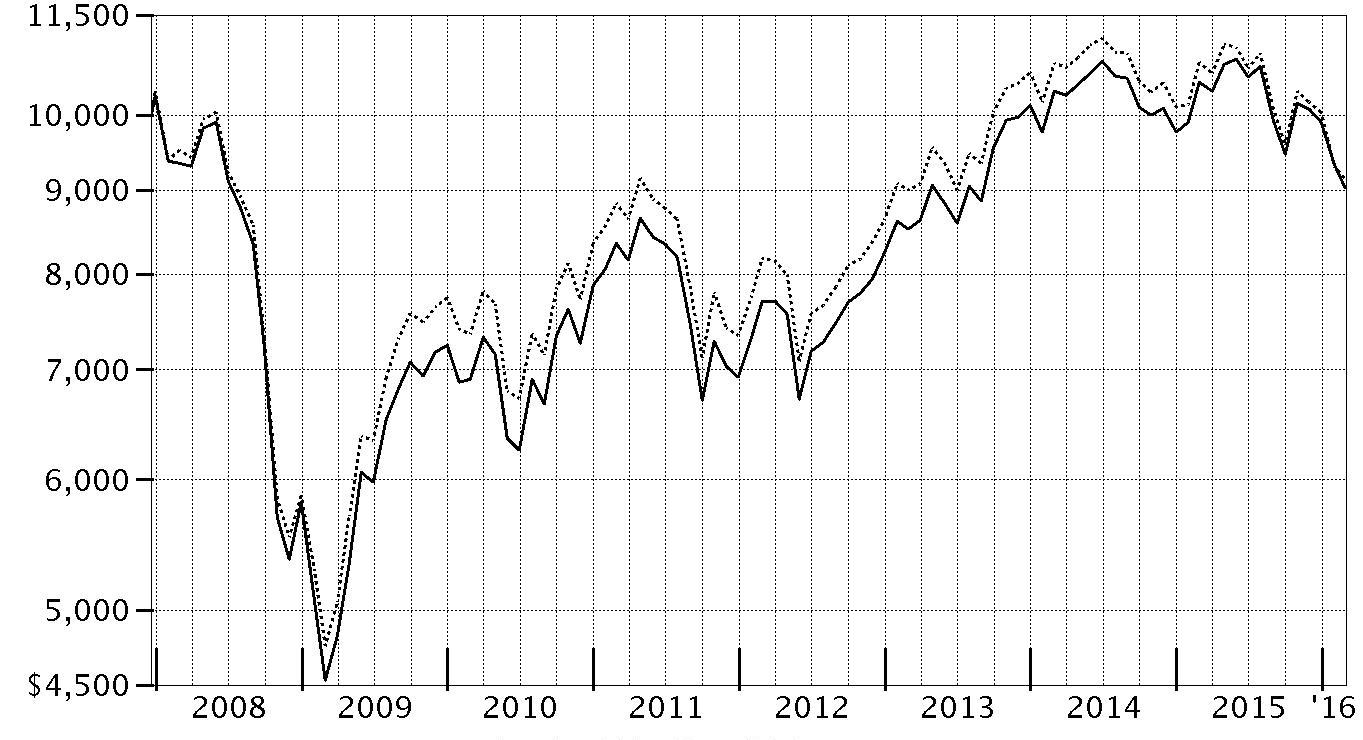
| Period Ending Values | ||
| $9,027 | Fidelity® International Enhanced Index Fund | |
| $9,142 | MSCI EAFE Index | |
Fidelity® International Enhanced Index Fund
Management's Discussion of Fund Performance
Market Recap: International equities suffered a setback for the year ending February 29, 2016, held back by a collapse in commodity prices that affected resources-related sectors and geographies in particular. The non-U.S. developed-markets MSCI EAFE Index returned -15.04% for the 12 months, hurt also by concerns about global economic growth. Stocks in developing markets fell further, with the MSCI Emerging Markets Index returning -23.13%. Commodity producers were pressured for much of the year, largely related to economic deceleration in China, the world’s second-largest economy and a leading consumer of raw materials. Effects were exacerbated by U.S. dollar strength relative to global currencies, weighing on commodities priced in dollars and acutely affecting the equity returns of resources-related areas. Among regions within the MSCI EAFE Index, net energy consumer Japan (-10%) fared best; Asia Pacific ex Japan (-19%), worst. At the country level, only Denmark (+5%) and Israel (+3%) managed a gain, with several notching declines of greater than 20%. As for sectors, consumer staples (-2%) and telecommunication services (-6%) lost the least, whereas materials (-29%), financials (-22%) and energy (-21%) lost the most. Among emerging-markets countries, Hungary (+27%) proved the sole gainer. Meanwhile, Greece (-68%), Brazil (-40%), China (-29%) and India (-26%) headed the market’s broad-based decline.Comments from Maximilian Kaufmann, Senior Portfolio Manager of the Geode Capital Management, LLC, investment management team: In a challenging environment for global stocks, the fund returned -13.71%, outpacing the -15.04% return of the MSCI EAFE Index. Relative to the index, the fund was helped the most by good security selection, especially in the consumer discretionary sector. Positioning in the materials and financials sectors also added value. In contrast, stock picking in information technology detracted from results. By region, stock picking was strongest in continental Europe. The fund also benefited from a small average overweighting to stocks from the Europe ex U.K. region, the index’s largest allocation. Security selection also was favorable in the U.K. and, to a lesser extent, Japan. Selection effects also proved modestly positive in the Asia Pacific ex Japan region, although Hong Kong detracted from performance there, as did unfavorable currency movements that weighed on results for U.S. investors in foreign securities. (The fund may use fair-value pricing techniques to better reflect the value of foreign securities whose prices may be stale due to differences in market-closure times and dates around the world. Fair-value pricing is an adjustment process that attempts to best represent the value of fund holdings as of the close of trading in U.S. markets, accounting for any major changes occurring after the close of foreign markets. The MSCI EAFE does not engage in fair-value pricing; differences between fund and index pricing methodologies may cause short-term discrepancies in performance, which tend to smooth out over time.) On an individual basis, the biggest relative contributor was Vestas Wind Systems, a Danish provider of wind power systems. Strong demand for its products enabled Vestas to produce record earnings and revenue in 2015 and announce a dividend increase for shareholders, benefiting its share price. Tokyo Electric Power was another source of strength. This Japanese utility company benefited from favorable regulatory changes in its home market and higher earnings resulting from low commodity prices. Our investment in French electric utility Electricite de France, however, returned roughly -55%. Investors were worried about the financial impact of the company’s plans to build two new nuclear reactors amid collapsing electricity prices in Europe. Our models continued to find the stock attractive, however, leading us to increase our stake in the stock for the period. Other detractors included overweightings in Danish shipping and transportation company AP Moller-Maersk and London-based Fiat Chrysler Automobiles, as well as our investment in U.K.-based bank Barclays. We also were hurt by underweighting Germany-based business software provider SAP.The views expressed above reflect those of the portfolio manager(s) only through the end of the period as stated on the cover of this report and do not necessarily represent the views of Fidelity or any other person in the Fidelity organization. Any such views are subject to change at any time based upon market or other conditions and Fidelity disclaims any responsibility to update such views. These views may not be relied on as investment advice and, because investment decisions for a Fidelity fund are based on numerous factors, may not be relied on as an indication of trading intent on behalf of any Fidelity fund.
Fidelity® International Enhanced Index Fund
Investment Summary (Unaudited)
Geographic Diversification (% of fund's net assets)
| As of February 29, 2016 | ||
| Japan | 23.5% | |
| United Kingdom | 17.5% | |
| Switzerland | 9.7% | |
| France | 8.9% | |
| Germany | 8.0% | |
| Australia | 5.9% | |
| Netherlands | 5.5% | |
| Hong Kong | 2.9% | |
| Sweden | 2.4% | |
| Other* | 15.7% | |
* Includes Short-Term investments and Net Other Assets (Liabilities).
Percentages are based on country or territory of incorporation and are adjusted for the effect of futures contracts, if applicable.
| As of August 31, 2015 | ||
| Japan | 23.4% | |
| United Kingdom | 18.3% | |
| France | 10.1% | |
| Switzerland | 9.4% | |
| Germany | 7.6% | |
| Netherlands | 5.6% | |
| Australia | 5.1% | |
| Hong Kong | 3.0% | |
| Spain | 2.9% | |
| Other* | 14.6% | |

* Includes Short-Term investments and Net Other Assets (Liabilities).
Percentages are based on country or territory of incorporation and are adjusted for the effect of futures contracts, if applicable.
Asset Allocation as of February 29, 2016
| % of fund's net assets | % of fund's net assets 6 months ago | |
| Stocks and Equity Futures | 99.9 | 99.9 |
| Short-Term Investments and Net Other Assets (Liabilities) | 0.1 | 0.1 |
Top Ten Stocks as of February 29, 2016
| % of fund's net assets | % of fund's net assets 6 months ago | |
| Nestle SA (Switzerland, Food Products) | 2.4 | 1.9 |
| Roche Holding AG (participation certificate) (Switzerland, Pharmaceuticals) | 2.1 | 2.0 |
| Novartis AG (Switzerland, Pharmaceuticals) | 1.9 | 2.3 |
| Novo Nordisk A/S Series B (Denmark, Pharmaceuticals) | 1.4 | 1.3 |
| Sanofi SA (France, Pharmaceuticals) | 1.3 | 1.4 |
| Siemens AG (Germany, Industrial Conglomerates) | 1.1 | 0.8 |
| GlaxoSmithKline PLC sponsored ADR (United Kingdom, Pharmaceuticals) | 1.1 | 1.2 |
| HSBC Holdings PLC (United Kingdom, Banks) | 1.1 | 1.4 |
| Unilever NV (Certification Van Aandelen) (Bearer) (Netherlands, Personal Products) | 1.0 | 1.0 |
| Reckitt Benckiser Group PLC (United Kingdom, Household Products) | 1.0 | 0.0 |
| 14.4 |
Market Sectors as of February 29, 2016
| % of fund's net assets | % of fund's net assets 6 months ago | |
| Financials | 21.6 | 23.8 |
| Health Care | 13.4 | 13.5 |
| Consumer Discretionary | 12.8 | 14.4 |
| Consumer Staples | 12.8 | 10.7 |
| Industrials | 11.9 | 11.7 |
| Information Technology | 6.4 | 4.7 |
| Telecommunication Services | 6.2 | 6.1 |
| Utilities | 4.6 | 4.7 |
| Materials | 4.4 | 4.9 |
| Energy | 3.5 | 3.7 |
Percentages shown as 0.0% may reflect amounts less than 0.05%.
Fidelity® International Enhanced Index Fund
Investments February 29, 2016
Showing Percentage of Net Assets
| Common Stocks - 96.8% | |||
| Shares | Value | ||
| Australia - 5.9% | |||
| Aurizon Holdings Ltd. | 61,899 | $179,814 | |
| Australia & New Zealand Banking Group Ltd. | 82,628 | 1,318,190 | |
| BHP Billiton Ltd. | 9,080 | 102,381 | |
| Cimic Group Ltd. | 11,301 | 254,566 | |
| Cochlear Ltd. | 1,372 | 100,365 | |
| Commonwealth Bank of Australia | 9,131 | 457,120 | |
| CSL Ltd. | 16,005 | 1,173,429 | |
| Flight Centre Travel Group Ltd. | 6,976 | 206,136 | |
| Goodman Group unit | 97,869 | 453,352 | |
| Harvey Norman Holdings Ltd. | 218,205 | 744,455 | |
| Mirvac Group unit | 116,119 | 151,670 | |
| National Australia Bank Ltd. | 12,550 | 215,863 | |
| Qantas Airways Ltd. | 272,179 | 749,874 | |
| Rio Tinto Ltd. | 12,645 | 363,542 | |
| Sonic Healthcare Ltd. | 35,169 | 462,035 | |
| Telstra Corp. Ltd. | 233,453 | 872,672 | |
| The Star Entertainment Group Ltd. | 19,062 | 71,021 | |
| Westpac Banking Corp. | 8,362 | 171,026 | |
| Woodside Petroleum Ltd. | 44,334 | 802,160 | |
| Woolworths Ltd. | 7,763 | 126,885 | |
| TOTAL AUSTRALIA | 8,976,556 | ||
| Bailiwick of Jersey - 0.3% | |||
| WPP PLC | 23,871 | 502,781 | |
| Belgium - 0.9% | |||
| Anheuser-Busch InBev SA NV | 11,199 | 1,252,907 | |
| Groupe Bruxelles Lambert SA | 2,244 | 171,905 | |
| TOTAL BELGIUM | 1,424,812 | ||
| Bermuda - 0.4% | |||
| Kerry Properties Ltd. | 256,000 | 600,994 | |
| Cayman Islands - 0.9% | |||
| Cheung Kong Property Holdings Ltd. | 83,500 | 427,266 | |
| CK Hutchison Holdings Ltd. | 73,024 | 882,047 | |
| TOTAL CAYMAN ISLANDS | 1,309,313 | ||
| Denmark - 2.2% | |||
| A.P. Moller - Maersk A/S Series B | 175 | 229,986 | |
| Danske Bank A/S | 1,484 | 40,602 | |
| Novo Nordisk A/S Series B | 40,980 | 2,109,842 | |
| Vestas Wind Systems A/S | 14,480 | 981,333 | |
| TOTAL DENMARK | 3,361,763 | ||
| Finland - 1.0% | |||
| Neste Oyj | 21,000 | 660,445 | |
| Orion Oyj (B Shares) | 24,140 | 819,334 | |
| Sampo Oyj (A Shares) | 987 | 44,537 | |
| TOTAL FINLAND | 1,524,316 | ||
| France - 8.9% | |||
| AXA SA | 36,020 | 791,955 | |
| BNP Paribas SA | 9,277 | 433,955 | |
| Christian Dior SA | 3,855 | 680,841 | |
| CNP Assurances | 6,319 | 93,763 | |
| Credit Agricole SA | 37,962 | 396,741 | |
| EDF SA | 55,950 | 591,914 | |
| Engie | 5,669 | 88,096 | |
| Eurazeo SA | 4,437 | 260,357 | |
| L'Oreal SA | 7,618 | 1,282,186 | |
| LVMH Moet Hennessy - Louis Vuitton SA | 2,216 | 368,160 | |
| Orange SA | 3,240 | 56,118 | |
| Peugeot Citroen SA (a) | 57,506 | 868,304 | |
| Renault SA | 11,436 | 1,046,757 | |
| Safran SA | 4,741 | 295,576 | |
| Sanofi SA | 25,233 | 1,999,419 | |
| Societe Generale Series A | 2,927 | 102,799 | |
| Total SA | 33,665 | 1,508,880 | |
| Unibail-Rodamco | 2,181 | 545,105 | |
| Valeo SA | 6,861 | 953,866 | |
| VINCI SA | 17,176 | 1,192,471 | |
| TOTAL FRANCE | 13,557,263 | ||
| Germany - 7.2% | |||
| Allianz SE | 7,598 | 1,126,989 | |
| BASF AG | 18,879 | 1,224,076 | |
| Bayer AG | 5,580 | 578,467 | |
| Commerzbank AG | 30,353 | 247,613 | |
| Continental AG | 2,732 | 548,632 | |
| Daimler AG (Germany) | 8,956 | 614,770 | |
| Deutsche Bank AG | 5,423 | 94,302 | |
| Deutsche Boerse AG | 1,722 | 141,581 | |
| Deutsche Telekom AG | 11,294 | 188,915 | |
| Fresenius SE & Co. KGaA | 13,062 | 865,074 | |
| Merck KGaA | 1,229 | 104,832 | |
| Metro AG | 26,939 | 665,090 | |
| Muenchener Rueckversicherungs AG | 3,071 | 606,520 | |
| OSRAM Licht AG | 16,709 | 784,514 | |
| ProSiebenSat.1 Media AG | 17,851 | 918,043 | |
| RWE AG | 25,789 | 292,231 | |
| SAP AG | 3,562 | 268,587 | |
| Siemens AG | 18,589 | 1,718,454 | |
| TOTAL GERMANY | 10,988,690 | ||
| Hong Kong - 2.9% | |||
| AIA Group Ltd. | 16,800 | 85,749 | |
| Hang Lung Properties Ltd. | 97,000 | 170,104 | |
| Hysan Development Co. Ltd. | 111,005 | 439,564 | |
| Link (REIT) | 164,000 | 924,576 | |
| New World Development Co. Ltd. | 177,466 | 148,762 | |
| PCCW Ltd. | 621,000 | 394,410 | |
| Sino Land Ltd. | 208,111 | 288,967 | |
| Sun Hung Kai Properties Ltd. | 24,000 | 269,048 | |
| Wharf Holdings Ltd. | 171,000 | 858,512 | |
| Wheelock and Co. Ltd. | 209,000 | 824,924 | |
| TOTAL HONG KONG | 4,404,616 | ||
| Israel - 0.5% | |||
| Check Point Software Technologies Ltd. (a)(b) | 10,094 | 838,509 | |
| Italy - 2.4% | |||
| Atlantia SpA | 33,946 | 842,331 | |
| Enel SpA | 275,885 | 1,102,557 | |
| EXOR SpA | 6,241 | 207,141 | |
| Intesa Sanpaolo SpA | 98,574 | 248,985 | |
| Mediobanca SpA | 37,435 | 254,930 | |
| Snam Rete Gas SpA | 114,186 | 618,353 | |
| Terna SpA | 69,342 | 362,383 | |
| UniCredit SpA | 5,569 | 20,816 | |
| TOTAL ITALY | 3,657,496 | ||
| Japan - 23.5% | |||
| Alps Electric Co. Ltd. | 9,200 | 150,977 | |
| Amada Holdings Co. Ltd. | 80,600 | 747,226 | |
| Asahi Kasei Corp. | 124,000 | 701,705 | |
| Astellas Pharma, Inc. | 65,900 | 948,161 | |
| Canon, Inc. | 34,000 | 958,275 | |
| Central Japan Railway Co. | 5,900 | 1,055,609 | |
| Chubu Electric Power Co., Inc. | 58,100 | 765,904 | |
| Dai-ichi Mutual Life Insurance Co. | 29,700 | 359,494 | |
| Dainippon Sumitomo Pharma Co. Ltd. | 6,400 | 72,588 | |
| Fuji Heavy Industries Ltd. | 27,200 | 889,898 | |
| Fujifilm Holdings Corp. | 2,400 | 89,953 | |
| Fujitsu Ltd. | 156,000 | 570,729 | |
| Hitachi Chemical Co. Ltd. | 5,500 | 89,506 | |
| Hitachi High-Technologies Corp. | 18,600 | 494,133 | |
| Honda Motor Co. Ltd. | 11,700 | 300,911 | |
| Hoya Corp. | 25,300 | 914,261 | |
| Iida Group Holdings Co. Ltd. | 45,400 | 830,975 | |
| Isuzu Motors Ltd. | 44,800 | 448,207 | |
| Itochu Corp. | 64,900 | 765,119 | |
| Japan Tobacco, Inc. | 900 | 35,788 | |
| JTEKT Corp. | 30,700 | 419,123 | |
| Kao Corp. | 21,300 | 1,074,634 | |
| KDDI Corp. | 46,100 | 1,177,763 | |
| Konami Holdings Corp. | 20,500 | 497,485 | |
| Konica Minolta, Inc. | 68,400 | 573,489 | |
| Medipal Holdings Corp. | 22,700 | 347,881 | |
| Mitsubishi Chemical Holdings Corp. | 132,400 | 668,057 | |
| Mitsubishi Electric Corp. | 90,000 | 911,147 | |
| Mitsubishi Motors Corp. of Japan | 15,300 | 108,989 | |
| Mitsubishi Tanabe Pharma Corp. | 45,400 | 815,291 | |
| Mitsubishi UFJ Financial Group, Inc. | 268,500 | 1,158,661 | |
| Mitsubishi UFJ Lease & Finance Co. Ltd. | 19,400 | 83,678 | |
| Mitsui Chemicals, Inc. | 115,000 | 375,749 | |
| mixi, Inc. | 23,100 | 774,370 | |
| Mizuho Financial Group, Inc. | 802,000 | 1,183,141 | |
| Murata Manufacturing Co. Ltd. | 5,600 | 671,992 | |
| Nexon Co. Ltd. | 26,300 | 395,050 | |
| Nippon Electric Glass Co. Ltd. | 60,000 | 285,358 | |
| Nippon Telegraph & Telephone Corp. | 27,600 | 1,168,786 | |
| Nissan Motor Co. Ltd. | 54,500 | 494,297 | |
| NKSJ Holdings, Inc. | 12,300 | 353,853 | |
| Nomura Holdings, Inc. | 191,200 | 807,966 | |
| NTT DOCOMO, Inc. | 51,100 | 1,189,440 | |
| ORIX Corp. | 78,400 | 1,026,328 | |
| Panasonic Corp. | 79,700 | 670,783 | |
| Resona Holdings, Inc. | 87,200 | 305,820 | |
| ROHM Co. Ltd. | 6,300 | 268,837 | |
| Sekisui Chemical Co. Ltd. | 34,400 | 381,005 | |
| Sekisui House Ltd. | 5,400 | 87,885 | |
| Shionogi & Co. Ltd. | 2,600 | 111,483 | |
| Sumitomo Chemical Co. Ltd. | 192,000 | 840,742 | |
| Sumitomo Mitsui Financial Group, Inc. | 43,400 | 1,217,812 | |
| TDK Corp. | 9,600 | 500,441 | |
| Teijin Ltd. | 234,000 | 753,855 | |
| Tokyo Electric Power Co., Inc. (a) | 156,800 | 794,257 | |
| Tokyo Electron Ltd. | 13,400 | 807,718 | |
| Toppan Printing Co. Ltd. | 17,000 | 143,559 | |
| Toyota Motor Corp. | 24,100 | 1,256,516 | |
| Yokogawa Electric Corp. | 7,800 | 75,272 | |
| TOTAL JAPAN | 35,967,932 | ||
| Luxembourg - 0.0% | |||
| RTL Group SA | 929 | 78,009 | |
| Netherlands - 5.5% | |||
| AerCap Holdings NV (a) | 21,333 | 762,228 | |
| Airbus Group NV | 11,835 | 763,792 | |
| CNH Industrial NV | 54,317 | 362,509 | |
| Fiat Chrysler Automobiles NV | 129,771 | 895,732 | |
| Heineken Holding NV | 11,255 | 818,617 | |
| Heineken NV (Bearer) | 3,531 | 284,863 | |
| ING Groep NV (Certificaten Van Aandelen) | 71,193 | 848,716 | |
| Koninklijke Ahold NV | 44,740 | 984,116 | |
| Koninklijke Boskalis Westminster NV | 7,063 | 257,935 | |
| NN Group NV | 10,212 | 315,499 | |
| QIAGEN NV (Germany) (a)�� | 2,471 | 52,928 | |
| STMicroelectronics NV | 96,209 | 550,614 | |
| Unilever NV (Certificaten Van Aandelen) (Bearer) | 35,800 | 1,543,976 | |
| TOTAL NETHERLANDS | 8,441,525 | ||
| Norway - 0.9% | |||
| DNB ASA | 21,523 | 248,556 | |
| Norsk Hydro ASA | 26,253 | 104,236 | |
| Telenor ASA | 63,030 | 940,969 | |
| Yara International ASA | 450 | 17,509 | |
| TOTAL NORWAY | 1,311,270 | ||
| Portugal - 0.1% | |||
| Energias de Portugal SA | 39,763 | 123,583 | |
| Singapore - 1.6% | |||
| Jardine Cycle & Carriage Ltd. | 2,000 | 54,836 | |
| Keppel Corp. Ltd. | 33,200 | 122,316 | |
| Singapore Telecommunications Ltd. | 99,100 | 262,485 | |
| United Overseas Bank Ltd. | 34,600 | 421,188 | |
| Wilmar International Ltd. | 360,800 | 798,071 | |
| Yangzijiang Shipbuilding Holdings Ltd. | 1,113,500 | 716,727 | |
| TOTAL SINGAPORE | 2,375,623 | ||
| Spain - 2.1% | |||
| Banco Bilbao Vizcaya Argentaria SA | 48,676 | 307,719 | |
| Banco Santander SA (Spain) | 246,763 | 998,154 | |
| Endesa SA | 45,406 | 823,907 | |
| Gas Natural SDG SA | 11,514 | 201,974 | |
| Inditex SA | 26,130 | 806,240 | |
| TOTAL SPAIN | 3,137,994 | ||
| Sweden - 2.4% | |||
| Investor AB (B Shares) | 12,963 | 431,653 | |
| Nordea Bank AB | 20,163 | 201,704 | |
| Skandinaviska Enskilda Banken AB (A Shares) | 18,316 | 179,912 | |
| Skanska AB (B Shares) | 23,010 | 491,813 | |
| Svenska Handelsbanken AB (A Shares) | 2,725 | 34,847 | |
| Swedbank AB (A Shares) | 937 | 18,927 | |
| Swedish Match Co. AB | 16,038 | 518,313 | |
| Telefonaktiebolaget LM Ericsson (B Shares) | 122,063 | 1,121,061 | |
| TeliaSonera AB | 148,749 | 683,045 | |
| TOTAL SWEDEN | 3,681,275 | ||
| Switzerland - 9.7% | |||
| ABB Ltd. (Reg.) | 53,106 | 947,095 | |
| Actelion Ltd. | 278 | 38,811 | |
| Adecco SA (Reg.) | 4,076 | 237,784 | |
| Coca-Cola HBC AG | 15,798 | 302,341 | |
| Compagnie Financiere Richemont SA Series A | 2,185 | 138,749 | |
| Credit Suisse Group AG | 7,379 | 98,762 | |
| Lonza Group AG | 68 | 10,352 | |
| Nestle SA | 52,371 | 3,662,361 | |
| Novartis AG | 40,401 | 2,899,080 | |
| Partners Group Holding AG | 618 | 224,516 | |
| Roche Holding AG (participation certificate) | 12,264 | 3,144,678 | |
| SGS SA (Reg.) | 71 | 143,493 | |
| Swatch Group AG (Bearer) | 976 | 337,972 | |
| Swiss Re Ltd. | 7,141 | 632,949 | |
| Syngenta AG (Switzerland) | 872 | 349,218 | |
| UBS Group AG | 63,262 | 971,897 | |
| Zurich Insurance Group AG | 3,046 | 645,176 | |
| TOTAL SWITZERLAND | 14,785,234 | ||
| United Kingdom - 17.5% | |||
| 3i Group PLC | 42,873 | 261,426 | |
| Aggreko PLC | 4,639 | 57,110 | |
| AstraZeneca PLC: | |||
| (United Kingdom) | 1,546 | 87,900 | |
| sponsored ADR (b) | 32,380 | 928,335 | |
| Aviva PLC | 17,893 | 108,568 | |
| Barclays PLC | 312,272 | 741,869 | |
| Barratt Developments PLC | 21,375 | 175,530 | |
| BP PLC | 90,857 | 440,947 | |
| British American Tobacco PLC (United Kingdom) | 11,301 | 614,822 | |
| British Land Co. PLC | 35,841 | 328,744 | |
| BT Group PLC | 205,687 | 1,385,129 | |
| Burberry Group PLC | 9,003 | 165,407 | |
| Carnival PLC | 18,530 | 915,404 | |
| CYBG PLC | 3,137 | 8,252 | |
| Diageo PLC | 5,507 | 142,491 | |
| GlaxoSmithKline PLC | 1,351 | 26,182 | |
| GlaxoSmithKline PLC sponsored ADR | 43,131 | 1,667,876 | |
| Hammerson PLC | 38,292 | 292,865 | |
| HSBC Holdings PLC: | |||
| (United Kingdom) | 38,442 | 244,466 | |
| sponsored ADR | 44,792 | 1,423,042 | |
| Imperial Tobacco Group PLC | 26,720 | 1,384,406 | |
| ITV PLC | 8,855 | 30,640 | |
| J Sainsbury PLC | 57,961 | 204,007 | |
| Johnson Matthey PLC | 7,044 | 250,693 | |
| Kingfisher PLC | 134,701 | 622,224 | |
| Land Securities Group PLC | 25,739 | 361,473 | |
| Legal & General Group PLC | 12,393 | 39,156 | |
| Lloyds Banking Group PLC | 1,016,483 | 1,020,066 | |
| Marks & Spencer Group PLC | 141,955 | 834,820 | |
| Meggitt PLC | 21,512 | 124,447 | |
| National Grid PLC | 92,659 | 1,237,535 | |
| Next PLC | 2,256 | 212,422 | |
| Old Mutual PLC | 158,337 | 375,309 | |
| Persimmon PLC | 30,468 | 926,166 | |
| Prudential PLC | 22,209 | 386,752 | |
| Reckitt Benckiser Group PLC | 16,585 | 1,510,724 | |
| Rio Tinto PLC | 27,311 | 723,764 | |
| Royal Dutch Shell PLC: | |||
| Class A (United Kingdom) | 56,715 | 1,291,982 | |
| Class B (United Kingdom) | 34,035 | 772,784 | |
| Royal Mail PLC | 127,394 | 806,244 | |
| SABMiller PLC | 10,468 | 608,730 | |
| Segro PLC | 46,924 | 271,368 | |
| Standard Chartered PLC (United Kingdom) | 8,759 | 52,477 | |
| Unilever PLC | 31,452 | 1,343,710 | |
| Vodafone Group PLC | 310,132 | 940,599 | |
| William Hill PLC | 76,761 | 436,566 | |
| TOTAL UNITED KINGDOM | 26,785,429 | ||
| TOTAL COMMON STOCKS | |||
| (Cost $161,661,539) | 147,834,983 | ||
| Nonconvertible Preferred Stocks - 0.8% | |||
| Germany - 0.8% | |||
| Henkel AG & Co. KGaA | 6,276 | 633,851 | |
| Volkswagen AG | 4,941 | 578,895 | |
| TOTAL GERMANY | |||
| (Cost $1,305,599) | 1,212,746 | ||
| Principal Amount | Value | ||
| Government Obligations - 0.3% | |||
| United States of America - 0.3% | |||
| U.S. Treasury Bills, yield at date of purchase 0.37% 5/26/16 (Cost $499,561)(c) | 500,000 | 499,615 | |
| Shares | Value | ||
| Money Market Funds - 2.8% | |||
| Dreyfus Cash Management Institutional Shares, 0.10% (d) | 2,487,934 | 2,487,934 | |
| Fidelity Securities Lending Cash Central Fund, 0.44% (e)(f) | 1,803,943 | 1,803,943 | |
| TOTAL MONEY MARKET FUNDS | |||
| (Cost $4,291,877) | 4,291,877 | ||
| TOTAL INVESTMENT PORTFOLIO - 100.7% | |||
| (Cost $167,758,576) | 153,839,221 | ||
| NET OTHER ASSETS (LIABILITIES) - (0.7)% | (1,140,682) | ||
| NET ASSETS - 100% | $152,698,539 |
| Futures Contracts | |||
| Expiration Date | Underlying Face Amount at Value | Unrealized Appreciation/(Depreciation) | |
| Purchased | |||
| Equity Index Contracts | |||
| 46 ICE E-mini MSCI EAFE Index Contracts (United States) | March 2016 | 3,553,500 | $14,011 |
The face value of futures purchased as a percentage of Net Assets is 2.3%
Categorizations in the Schedule of Investments are based on country or territory of incorporation.
Legend
(a) Non-income producing
(b) Security or a portion of the security is on loan at period end.
(c) Security or a portion of the security was pledged to cover margin requirements for futures contracts. At period end, the value of securities pledged amounted to $162,874.
(d) The rate quoted is the annualized seven-day yield of the fund at period end.
(e) Investment made with cash collateral received from securities on loan.
(f) Affiliated fund that is generally available only to investment companies and other accounts managed by Fidelity Investments. The rate quoted is the annualized seven-day yield of the fund at period end. A complete unaudited listing of the fund's holdings as of its most recent quarter end is available upon request. In addition, each Fidelity Central Fund's financial statements, which are not covered by the Fund's Report of Independent Registered Public Accounting Firm, are available on the SEC's website or upon request.
Affiliated Central Funds
Information regarding fiscal year to date income earned by the Fund from investments in Fidelity Central Funds is as follows:
| Fund | Income earned |
| Fidelity Securities Lending Cash Central Fund | $9,673 |
Investment Valuation
The following is a summary of the inputs used, as of February 29, 2016, involving the Fund's assets and liabilities carried at fair value. The inputs or methodology used for valuing securities may not be an indication of the risk associated with investing in those securities. For more information on valuation inputs, and their aggregation into the levels used below, please refer to the Investment Valuation section in the accompanying Notes to Financial Statements.
| Valuation Inputs at Reporting Date: | ||||
| Description | Total | Level 1 | Level 2 | Level 3 |
| Investments in Securities: | ||||
| Equities: | ||||
| Consumer Discretionary | $20,202,844 | $9,770,462 | $10,432,382 | $-- |
| Consumer Staples | 19,792,889 | 8,811,750 | 10,981,139 | -- |
| Energy | 5,477,198 | 1,462,605 | 4,014,593 | -- |
| Financials | 32,629,044 | 14,840,955 | 17,788,089 | -- |
| Health Care | 20,278,604 | 8,660,416 | 11,618,188 | -- |
| Industrials | 17,946,242 | 10,120,685 | 7,825,557 | -- |
| Information Technology | 9,892,850 | 838,509 | 9,054,341 | -- |
| Materials | 6,565,033 | 1,355,508 | 5,209,525 | -- |
| Telecommunication Services | 9,260,331 | 394,410 | 8,865,921 | -- |
| Utilities | 7,002,694 | 2,810,210 | 4,192,484 | -- |
| Government Obligations | 499,615 | -- | 499,615 | -- |
| Money Market Funds | 4,291,877 | 4,291,877 | -- | -- |
| Total Investments in Securities: | $153,839,221 | $63,357,387 | $90,481,834 | $-- |
| Derivative Instruments: | ||||
| Assets | ||||
| Futures Contracts | $14,011 | $14,011 | $-- | $-- |
| Total Assets | $14,011 | $14,011 | $-- | $-- |
| Total Derivative Instruments: | $14,011 | $14,011 | $-- | $-- |
The following is a summary of transfers between Level 1 and Level 2 for the period ended February 29, 2016. Transfers are assumed to have occurred at the beginning of the period, and are primarily attributable to the valuation techniques used for foreign equity securities, as discussed in the accompanying Notes to Financial Statements:
| Transfers | Total |
| Level 1 to Level 2 | $18,197,836 |
| Level 2 to Level 1 | $4,521,480 |
Value of Derivative Instruments
The following table is a summary of the Fund's value of derivative instruments by primary risk exposure as of February 29, 2016. For additional information on derivative instruments, please refer to the Derivative Instruments section in the accompanying Notes to Financial Statements.
| Primary Risk Exposure / Derivative Type | Value | |
| Asset | Liability | |
| Equity Risk | ||
| Futures Contracts(a) | $14,011 | $0 |
| Total Equity Risk | 14,011 | 0 |
| Total Value of Derivatives | $14,011 | $0 |
(a) Reflects gross cumulative appreciation (depreciation) on futures contracts as presented in the Schedule of Investments. Only the period end receivable or payable for daily variation margin and net unrealized appreciation (depreciation) are presented in the Statement of Assets and Liabilities.
See accompanying notes which are an integral part of the financial statements.
Fidelity® International Enhanced Index Fund
Financial Statements
Statement of Assets and Liabilities
| February 29, 2016 | ||
| Assets | ||
| Investment in securities, at value (including securities loaned of $1,747,348) — See accompanying schedule: Unaffiliated issuers (cost $165,954,633) | $152,035,278 | |
| Fidelity Central Funds (cost $1,803,943) | 1,803,943 | |
| Total Investments (cost $167,758,576) | $153,839,221 | |
| Foreign currency held at value (cost $371,951) | 364,414 | |
| Receivable for fund shares sold | 255,620 | |
| Dividends receivable | 459,244 | |
| Interest receivable | 427 | |
| Distributions receivable from Fidelity Central Funds | 520 | |
| Other receivables | 718 | |
| Total assets | 154,920,164 | |
| Liabilities | ||
| Payable for investments purchased | $7,990 | |
| Payable for fund shares redeemed | 305,930 | |
| Accrued management fee | 59,263 | |
| Payable for daily variation margin for derivative instruments | 24,369 | |
| Other affiliated payables | 18,914 | |
| Other payables and accrued expenses | 1,216 | |
| Collateral on securities loaned, at value | 1,803,943 | |
| Total liabilities | 2,221,625 | |
| Net Assets | $152,698,539 | |
| Net Assets consist of: | ||
| Paid in capital | $175,888,200 | |
| Undistributed net investment income | 97,784 | |
| Accumulated undistributed net realized gain (loss) on investments and foreign currency transactions | (9,365,980) | |
| Net unrealized appreciation (depreciation) on investments and assets and liabilities in foreign currencies | (13,921,465) | |
| Net Assets, for 20,583,665 shares outstanding | $152,698,539 | |
| Net Asset Value, offering price and redemption price per share ($152,698,539 ÷ 20,583,665 shares) | $7.42 |
See accompanying notes which are an integral part of the financial statements.
Statement of Operations
| Year ended February 29, 2016 | ||
| Investment Income | ||
| Dividends | $4,457,528 | |
| Interest | 2,337 | |
| Income from Fidelity Central Funds (including $9,673 from security lending) | 9,673 | |
| Income before foreign taxes withheld | 4,469,538 | |
| Less foreign taxes withheld | (351,490) | |
| Total income | 4,118,048 | |
| Expenses | ||
| Management fee | $670,648 | |
| Transfer agent fees | 214,201 | |
| Independent trustees' compensation | 563 | |
| Miscellaneous | 184 | |
| Total expenses before reductions | 885,596 | |
| Expense reductions | (4) | 885,592 |
| Net investment income (loss) | 3,232,456 | |
| Realized and Unrealized Gain (Loss) | ||
| Net realized gain (loss) on: | ||
| Investment securities: | ||
| Unaffiliated issuers | (7,344,107) | |
| Foreign currency transactions | (50,361) | |
| Futures contracts | (807,899) | |
| Total net realized gain (loss) | (8,202,367) | |
| Change in net unrealized appreciation (depreciation) on: Investment securities | (18,694,623) | |
| Assets and liabilities in foreign currencies | (9,148) | |
| Futures contracts | (142,240) | |
| Total change in net unrealized appreciation (depreciation) | (18,846,011) | |
| Net gain (loss) | (27,048,378) | |
| Net increase (decrease) in net assets resulting from operations | $(23,815,922) |
See accompanying notes which are an integral part of the financial statements.
Statement of Changes in Net Assets
| Year ended February 29, 2016 | Year ended February 28, 2015 | |
| Increase (Decrease) in Net Assets | ||
| Operations | ||
| Net investment income (loss) | $3,232,456 | $1,633,296 |
| Net realized gain (loss) | (8,202,367) | 19,527 |
| Change in net unrealized appreciation (depreciation) | (18,846,011) | (200,062) |
| Net increase (decrease) in net assets resulting from operations | (23,815,922) | 1,452,761 |
| Distributions to shareholders from net investment income | (2,909,905) | (1,364,791) |
| Distributions to shareholders from net realized gain | (40,835) | (142,751) |
| Total distributions | (2,950,740) | (1,507,542) |
| Share transactions | ||
| Proceeds from sales of shares | 120,458,928 | 84,284,947 |
| Reinvestment of distributions | 2,774,693 | 1,449,038 |
| Cost of shares redeemed | (49,141,729) | (25,152,806) |
| Net increase (decrease) in net assets resulting from share transactions | 74,091,892 | 60,581,179 |
| Redemption fees | 12,817 | 6,191 |
| Total increase (decrease) in net assets | 47,338,047 | 60,532,589 |
| Net Assets | ||
| Beginning of period | 105,360,492 | 44,827,903 |
| End of period (including undistributed net investment income of $97,784 and undistributed net investment income of $212,190, respectively) | $152,698,539 | $105,360,492 |
| Other Information | ||
| Shares | ||
| Sold | 14,156,866 | 9,723,983 |
| Issued in reinvestment of distributions | 343,487 | 175,962 |
| Redeemed | (5,937,186) | (2,942,195) |
| Net increase (decrease) | 8,563,167 | 6,957,750 |
See accompanying notes which are an integral part of the financial statements.
Financial Highlights — Fidelity International Enhanced Index Fund
| Years ended February 28, | 2016A | 2015 | 2014 | 2013 | 2012A |
| Selected Per–Share Data | |||||
| Net asset value, beginning of period | $8.77 | $8.85 | $7.45 | $6.95 | $7.77 |
| Income from Investment Operations | |||||
| Net investment income (loss)B | .19 | .20 | .28C | .21 | .20 |
| Net realized and unrealized gain (loss) | (1.38) | (.10) | 1.29 | .52 | (.82) |
| Total from investment operations | (1.19) | .10 | 1.57 | .73 | (.62) |
| Distributions from net investment income | (.16) | (.16) | (.15) | (.21) | (.19) |
| Distributions from net realized gain | –D | (.02) | (.01) | (.02) | (.01) |
| Total distributions | (.16) | (.18) | (.17)E | (.23) | (.20) |
| Redemption fees added to paid in capitalB,D | – | – | – | – | – |
| Net asset value, end of period | $7.42 | $8.77 | $8.85 | $7.45 | $6.95 |
| Total ReturnF | (13.71)% | 1.25% | 21.21% | 10.64% | (7.81)% |
| Ratios to Average Net AssetsG,H | |||||
| Expenses before reductions | .62% | .62% | .62% | .62% | .62% |
| Expenses net of fee waivers, if any | .62% | .62% | .62% | .62% | .62% |
| Expenses net of all reductions | .62% | .62% | .62% | .62% | .62% |
| Net investment income (loss) | 2.27% | 2.31% | 3.40%C | 3.04% | 2.84% |
| Supplemental Data | |||||
| Net assets, end of period (000 omitted) | $152,699 | $105,360 | $44,828 | $30,412 | $26,066 |
| Portfolio turnover rateI | 77% | 75% | 63% | 56% | 49% |
A For the year ended February 29.
B Calculated based on average shares outstanding during the period.
C Net Investment income per share reflects a large, non-recurring dividend which amounted to $.06 per share. Excluding this non-recurring dividend, the ratio of net investment income (loss) to average net assets would have been 2.64%.
D Amount represents less than $.005 per share.
E Total distributions of $.17 per share is comprised of distributions from net investment income of $.153 and distributions from net realized gain of $.013 per share.
F Total returns would have been lower if certain expenses had not been reduced during the applicable periods shown.
G Fees and expenses of any underlying Fidelity Central Funds are not included in the Fund's expense ratio. The Fund indirectly bears its proportionate share of the expenses of any underlying Fidelity Central Funds.
H Expense ratios reflect operating expenses of the Fund. Expenses before reductions do not reflect amounts reimbursed by the investment adviser or reductions from expense offset arrangements and do not represent the amount paid by the Fund during periods when reimbursements or reductions occur. Expenses net of fee waivers reflect expenses after reimbursement by the investment adviser but prior to reductions from expense offset arrangements. Expenses net of all reductions represent the net expenses paid by the Fund.
I Amount does not include the portfolio activity of any underlying Fidelity Central Funds.
See accompanying notes which are an integral part of the financial statements.
Notes to Financial Statements
For the period ended February 29, 2016
1. Organization.
Fidelity Large Cap Growth Enhanced Index Fund, Fidelity Large Cap Value Enhanced Index Fund, Fidelity Large Cap Core Enhanced Index Fund, Fidelity Mid Cap Enhanced Index Fund, Fidelity Small Cap Enhanced Index Fund and Fidelity International Enhanced Index Fund (the Funds) are funds of Fidelity Commonwealth Trust II (the Trust) and are authorized to issue an unlimited number of shares. Share transactions on the Statement of Changes in Net Assets may contain exchanges between affiliated funds. The Trust is registered under the Investment Company Act of 1940, as amended (the 1940 Act), as an open-end management investment company organized as a Delaware statutory trust.
2. Significant Accounting Policies.
The financial statements have been prepared in conformity with accounting principles generally accepted in the United States of America (GAAP), which require management to make certain estimates and assumptions at the date of the financial statements. Actual results could differ from those estimates. Subsequent events, if any, through the date that the financial statements were issued have been evaluated in the preparation of the financial statements. The following summarizes the significant accounting policies of the Funds:
Investment Valuation. Investments are valued as of 4:00 p.m. Eastern time on the last calendar day of the period. The Board of Trustees (the Board) has delegated the day to day responsibility for the valuation of each Fund's investments to the Strategic Advisers, Inc. (Strategic Advisers) Fair Value Committee (the Committee). In accordance with valuation policies and procedures approved by the Board, each Fund attempts to obtain prices from one or more third party pricing vendors or brokers to value its investments. When current market prices, quotations or currency exchange rates are not readily available or reliable, investments will be fair valued in good faith by the Committee, in accordance with procedures adopted by the Board. Factors used in determining fair value vary by investment type and may include market or investment specific events. The frequency with which these procedures are used cannot be predicted and they may be utilized to a significant extent. The Committee oversees each Fund's valuation policies and procedures and reports to the Board on the Committee's activities and fair value determinations. The Board monitors the appropriateness of the procedures used in valuing each Fund's investments and ratifies the fair value determinations of the Committee.
Each Fund categorizes the inputs to valuation techniques used to value its investments into a disclosure hierarchy consisting of three levels as shown below:
- Level 1 – quoted prices in active markets for identical investments
- Level 2 – other significant observable inputs (including quoted prices for similar investments, interest rates, prepayment speeds, etc.)
- Level 3 – unobservable inputs (including the Fund's own assumptions based on the best information available)
Valuation techniques used to value each Fund's investments by major category are as follows:
Equity securities, including restricted securities, for which market quotations are readily available, are valued at the last reported sale price or official closing price as reported by a third party pricing vendor on the primary market or exchange on which they are traded and are categorized as Level 1 in the hierarchy. In the event there were no sales during the day or closing prices are not available, securities are valued at the last quoted bid price or may be valued using the last available price and are generally categorized as Level 2 in the hierarchy. For foreign equity securities, when market or security specific events arise, comparisons to the valuation of American Depositary Receipts (ADRs), futures contracts, Exchange-Traded Funds (ETFs) and certain indexes as well as quoted prices for similar securities may be used and would be categorized as Level 2 in the hierarchy. Utilizing these techniques may result in transfers between Level 1 and Level 2. For equity securities, including restricted securities, where observable inputs are limited, assumptions about market activity and risk are used and these securities may be categorized as Level 3 in the hierarchy.
Futures contracts are valued at the settlement price established each day by the board of trade or exchange on which they are traded and are categorized as Level 1 in the hierarchy. Investments in open-end mutual funds, including the Fidelity Central Funds, are valued at their closing net asset value (NAV) each business day and are categorized as Level 1 in the hierarchy. If an unaffiliated open-end mutual fund's NAV is unavailable, shares of that fund may be valued by another method that the Board believes reflects fair value in accordance with the Board's fair value pricing policies and is categorized as Level 2 in the hierarchy.
Changes in valuation techniques may result in transfers in or out of an assigned level within the disclosure hierarchy. The aggregate value of investments by input level as of February 29, 2016, including information on transfers between Levels 1 and 2 is included at the end of each Fund's Schedule of Investments.
Foreign Currency. The Funds may use foreign currency contracts to facilitate transactions in foreign-denominated securities. Gains and losses from these transactions may arise from changes in the value of the foreign currency or if the counterparties do not perform under the contracts' terms.
Foreign-denominated assets, including investment securities, and liabilities are translated into U.S. dollars at the exchange rates at period end. Purchases and sales of investment securities, income and dividends received and expenses denominated in foreign currencies are translated into U.S. dollars at the exchange rate in effect on the transaction date.
The effects of exchange rate fluctuations on investments are included with the net realized and unrealized gain (loss) on investment securities. Other foreign currency transactions resulting in realized and unrealized gain (loss) are disclosed separately.
Investment Transactions and Income. For financial reporting purposes, the Funds' investment holdings and NAV include trades executed through the end of the last business day of the period. The NAV per share for processing shareholder transactions is calculated as of the close of business of the New York Stock Exchange (NYSE), normally 4:00 p.m. Eastern time and includes trades executed through the end of the prior business day. Gains and losses on securities sold are determined on the basis of identified cost and may include proceeds received from litigation. Dividend income is recorded on the ex-dividend date, except for certain dividends from foreign securities where the ex-dividend date may have passed, which are recorded as soon as the Funds are informed of the ex-dividend date. Non-cash dividends included in dividend income, if any, are recorded at the fair market value of the securities received. Income and capital gain distributions from Fidelity Central Funds, if any, are recorded on the ex-dividend date. Distributions received on securities that represent a return of capital or capital gain are recorded as a reduction of cost of investments and/or as a realized gain. Subsequent to ex-dividend date the Funds determine the components of these distributions, based upon receipt of tax filings or other correspondence relating to the underlying investment. Interest income is accrued as earned and includes coupon interest and amortization of premium and accretion of discount on debt securities as applicable. Investment income is recorded net of foreign taxes withheld where recovery of such taxes is uncertain.
Expenses. Expenses directly attributable to a fund are charged to that fund. Expenses attributable to more than one fund are allocated among the respective funds on the basis of relative net assets or other appropriate methods. Expense estimates are accrued in the period to which they relate and adjustments are made when actual amounts are known.
Income Tax Information and Distributions to Shareholders. Each year, each Fund intends to qualify as a regulated investment company under Subchapter M of the Internal Revenue Code, including distributing substantially all of its taxable income and realized gains. As a result, no provision for U.S. Federal income taxes is required. As of February 29, 2016, each Fund did not have any unrecognized tax benefits in the financial statements; nor is each Fund aware of any tax positions for which it is reasonably possible that the total amounts of unrecognized tax benefits will significantly change in the next twelve months. Each Fund files a U.S. federal tax return, in addition to state and local tax returns as required. Each Fund's federal income tax returns are subject to examination by the Internal Revenue Service (IRS) for a period of three fiscal years after they are filed. State and local tax returns may be subject to examination for an additional fiscal year depending on the jurisdiction. Foreign taxes are provided for based on each Fund's understanding of the tax rules and rates that exist in the foreign markets in which it invests.
Distributions are declared and recorded on the ex-dividend date. Income and capital gain distributions are determined in accordance with income tax regulations, which may differ from GAAP. In addition, certain Funds claimed a portion of the payment made to redeeming shareholders as a distribution for income tax purposes.
Capital accounts within the financial statements are adjusted for permanent book-tax differences. These adjustments have no impact on net assets or the results of operations. Capital accounts are not adjusted for temporary book-tax differences which will reverse in a subsequent period.
Book-tax differences are primarily due to foreign currency transactions, futures contracts, partnerships, market discount, passive foreign investment companies (PFIC), capital loss carryforwards and losses deferred due to wash sales and excise tax regulations.
The federal tax cost of investment securities and unrealized appreciation (depreciation) as of period end were as follows for each Fund:
| Tax cost | Gross unrealized appreciation | Gross unrealized depreciation | Net unrealized appreciation (depreciation) on securities | |
| Fidelity Large Cap Growth Enhanced Index Fund | $443,434,540 | $67,836,720 | $(24,767,676) | $43,069,044 |
| Fidelity Large Cap Value Enhanced Index Fund | 1,769,152,679 | 70,130,891 | (147,859,621) | (77,728,730) |
| Fidelity Large Cap Core Enhanced Index Fund | 414,889,604 | 47,624,617 | (27,666,884) | 19,957,733 |
| Fidelity Mid Cap Enhanced Index Fund | 967,223,881 | 56,541,850 | (93,378,617) | (36,836,767) |
| Fidelity Small Cap Enhanced Index Fund | 612,358,314 | 56,145,459 | (59,190,288) | (3,044,829) |
| Fidelity International Enhanced Index Fund | 169,308,860 | 5,820,681 | (21,290,320) | (15,469,639) |
The tax-based components of distributable earnings as of period end were as follows for each Fund:
| Undistributed ordinary income | Capital loss carryforward | Net unrealized appreciation (depreciation) on securities and other investments | |
| Fidelity Large Cap Growth Enhanced Index Fund | $– | $– | $43,069,044 |
| Fidelity Large Cap Value Enhanced Index Fund | 2,921,187 | – | (77,728,730) |
| Fidelity Large Cap Core Enhanced Index Fund | 603,266 | (8,806,234) | 19,957,733 |
| Fidelity Mid Cap Enhanced Index Fund | – | – | (36,836,767) |
| Fidelity Small Cap Enhanced Index Fund | – | – | (3,044,829) |
| Fidelity International Enhanced Index Fund | 63,043 | (7,801,543) | (15,485,760) |
Capital loss carryforwards are only available to offset future capital gains of the Funds to the extent provided by regulations and may be limited. Under the Regulated Investment Company Modernization Act of 2010 (the Act), the Funds are permitted to carry forward capital losses incurred in taxable years beginning after December 22, 2010 for an unlimited period and such capital losses are required to be used prior to any losses that expire. The capital loss carryforward information presented below, including any applicable limitation, is estimated as of fiscal period end and is subject to adjustment.
| Fiscal year of expiration | |||
| 2018 | 2019 | Total with expiration | |
| Fidelity Large Cap Core Enhanced Index Fund | $(8,806,234) | $-– | $(8,806,234) |
| Fidelity International Enhanced Index Fund | -– | (545,047) | (545,047) |
| No expiration | ||||
| Short-term | Long-term | Total no expiration | Total capital loss carryfoward | |
| Fidelity International Enhanced Index Fund | $(5,592,435) | $(1,664,060) | $(7,256,495) | $(7,801,543) |
Due to large redemptions in prior period, capital losses that will be available to offset future capital gains of Fidelity Large Cap Core Enhanced Index Fund will be limited to approximately $4,403,117 per year.
Certain of the Funds intend to elect to defer to the next fiscal year capital losses recognized during the period November 1, 2015 to February 29, 2016. Loss deferrals were as follows:
| Capital losses | |
| Fidelity Large Cap Growth Enhanced Index Fund | $(4,000,854) |
| Fidelity Large Cap Value Enhanced Index Fund | (24,174,317) |
| Fidelity Large Cap Core Enhanced Index Fund | (6,741,590) |
| Fidelity Mid Cap Enhanced Index Fund | (17,690,140) |
| Fidelity Small Cap Enhanced Index Fund | (11,352,650) |
The tax character of distributions paid was as follows:
| February 29, 2016 | |||
| Ordinary Income | Long-term Capital Gains | Total | |
| Fidelity Large Cap Growth Enhanced Index Fund | $6,275,758 | $13,163,155 | $19,438,913 |
| Fidelity Large Cap Value Enhanced Index Fund | 27,330,027 | 19,261,829 | 46,591,856 |
| Fidelity Large Cap Core Enhanced Index Fund | 9,163,862 | 5,701,658 | 14,865,520 |
| Fidelity Mid Cap Enhanced Index Fund | 13,914,554 | 25,203,719 | 39,118,273 |
| Fidelity Small Cap Enhanced Index Fund | 4,016,522 | 24,264,444 | 28,280,966 |
| Fidelity International Enhanced Index Fund | 2,950,740 | – | 2,950,740 |
| February 28, 2015 | |||
| Ordinary Income | Long-term Capital Gains | Total | |
| Fidelity Large Cap Growth Enhanced Index Fund | $6,719,799 | $16,879,831 | $23,599,630 |
| Fidelity Large Cap Value Enhanced Index Fund | 13,782,591 | 6,564,948 | 20,347,539 |
| Fidelity Large Cap Core Enhanced Index Fund | 16,551,782 | 7,118,373 | 23,670,155 |
| Fidelity Mid Cap Enhanced Index Fund | 16,185,129 | 16,390,497 | 32,575,626 |
| Fidelity Small Cap Enhanced Index Fund | 8,761,565 | 18,016,376 | 26,777,941 |
| Fidelity International Enhanced Index Fund | 1,507,542 | – | 1,507,542 |
Short Term Trading (Redemption) Fees. Shares held by investors of Fidelity Small Cap Enhanced Index Fund less than 90 days may be subject to a redemption fee equal to 1.50% of the NAV of shares redeemed. Shares held by investors of Fidelity Mid Cap Enhanced Index Fund and Fidelity International Enhanced Index Fund less than 30 days may be subject to a redemption fee equal to 0.75% and 1.00%, respectively, of the net asset value of shares redeemed. All redemption fees, which reduce the proceeds of the shareholder redemption, are retained by the Funds and accounted for as an addition to paid in capital.
3. Derivative Instruments.
Risk Exposures and the Use of Derivative Instruments. The Funds' investment objective allows the Funds to enter into various types of derivative contracts, including futures contracts. Derivatives are investments whose value is primarily derived from underlying assets, indices or reference rates and may be transacted on an exchange or over-the-counter (OTC). Derivatives may involve a future commitment to buy or sell a specified asset based on specified terms, to exchange future cash flows at periodic intervals based on a notional principal amount, or for one party to make one or more payments upon the occurrence of specified events in exchange for periodic payments from the other party.
The Funds used derivatives to increase returns and to manage exposure to certain risks as defined below. The success of any strategy involving derivatives depends on analysis of numerous economic factors, and if the strategies for investment do not work as intended, the Funds may not achieve their objectives.
The Funds' use of derivatives increased or decreased their exposure to the following risk:
| Equity Risk | Equity risk relates to the fluctuations in the value of financial instruments as a result of changes in market prices (other than those arising from interest rate risk or foreign exchange risk), whether caused by factors specific to an individual investment, its issuer, or all factors affecting all instruments traded in a market or market segment. |
The Funds are also exposed to additional risks from investing in derivatives, such as liquidity risk and counterparty credit risk. Liquidity risk is the risk that the Funds will be unable to close out the derivative in the open market in a timely manner. Counterparty credit risk is the risk that the counterparty will not be able to fulfill its obligation to the Funds. Counterparty credit risk related to exchange-traded futures contracts may be mitigated by the protection provided by the exchange on which they trade.
Investing in derivatives may involve greater risks than investing in the underlying assets directly and, to varying degrees, may involve risk of loss in excess of any initial investment and collateral received and amounts recognized in the Statement of Assets and Liabilities. In addition, there may be the risk that the change in value of the derivative contract does not correspond to the change in value of the underlying instrument.
Net Realized Gain (Loss) and Change in Net Unrealized Appreciation (Depreciation) on Derivatives. The table below, which reflects the impacts of derivatives on the financial performance of the Funds, summarizes the net realized gain (loss) and change in net unrealized appreciation (depreciation) for derivatives during the period as presented in the Statement of Operations.
| Primary Risk Exposure / Derivative Type | Net Realized Gain (Loss) | Change in Net Unrealized Appreciation (Depreciation) |
| Fidelity Large Cap Growth Enhanced Index Fund | ||
| Equity Risk | ||
| Futures Contracts(a) | $(210,261) | $(56,018) |
| Fidelity Large Cap Value Enhanced Index Fund | ||
| Equity Risk | ||
| Futures Contracts(a) | (404,659) | (300,156) |
| Fidelity Large Cap Core Enhanced Index Fund | ||
| Equity Risk | ||
| Futures Contracts(a) | (291,188) | 6,075 |
| Fidelity Mid Cap Enhanced Index Fund | ||
| Equity Risk | ||
| Futures Contracts(a) | (1,029,620) | (260,789) |
| Fidelity Small Cap Enhanced Index Fund | ||
| Equity Risk | ||
| Futures Contracts(a) | (2,289,456) | (1,222,722) |
| Fidelity International Enhanced Index Fund | ||
| Equity Risk | ||
| Futures Contracts(a) | (807,899) | (142,240) |
(a) A summary of the value of derivatives by primary risk exposure as of period end, is included at the end of the Schedule of Investments.
Futures Contracts. A futures contract is an agreement between two parties to buy or sell a specified underlying instrument for a fixed price at a specified future date. The Funds used futures contracts to manage their exposure to the stock market.
Upon entering into a futures contract, a fund is required to deposit either cash or securities (initial margin) with a clearing broker in an amount equal to a certain percentage of the face value of the contract. Futures contracts are marked-to-market daily and subsequent daily payments (variation margin) are made or received by a fund depending on the daily fluctuations in the value of the futures contracts and are recorded as unrealized appreciation or (depreciation). This receivable and/or payable, if any, is included in daily variation margin for derivative instruments in the Statement of Assets and Liabilities. Realized gain or (loss) is recorded upon the expiration or closing of a futures contract.
Any open futures contracts at period end are presented in the Schedule of Investments under the caption "Futures Contracts". The underlying face amount at value reflects each contract's exposure to the underlying instrument or index at period end and is representative of volume of activity during the period. Securities deposited to meet initial margin requirements are identified in the Schedule of Investments.
4. Purchases and Sales of Investments.
Purchases and sales of securities, other than short-term securities, are noted in the table below.
| Purchases ($) | Sales ($) | |
| Fidelity Large Cap Growth Enhanced Index Fund | 461,577,119 | 379,406,755 |
| Fidelity Large Cap Value Enhanced Index Fund | 1,817,143,165 | 1,171,911,962 |
| Fidelity Large Cap Core Enhanced Index Fund | 412,437,267 | 327,221,014 |
| Fidelity Mid Cap Enhanced Index Fund | 978,462,572 | 664,182,480 |
| Fidelity Small Cap Enhanced Index Fund | 594,646,603 | 452,402,813 |
| Fidelity International Enhanced Index Fund | 180,995,054 | 106,991,509 |
5. Fees and Other Transactions with Affiliates.
Management Fee and Expense Contract. Effective October 1, 2015 FMR Co., Inc., an affiliate of Strategic Advisers, Inc. (SAI), replaced SAI as an investment adviser to the Funds pursuant to a management contract between the Funds and FMR Co., Inc. The new contract does not impact the Funds' investment process, strategies or management fees. For investment management related services, the Funds pay a monthly management fee to the investment adviser. The management fee is based on an annual rate of 0.30% of average net assets for Fidelity Large Cap Growth Enhanced Index, Fidelity Large Cap Value Enhanced Index and Fidelity Large Cap Core Enhanced Index, 0.45% of average net assets for Fidelity Mid Cap Enhanced Index, 0.52% of average net assets for Fidelity Small Cap Enhanced Index and 0.47% of average net assets for Fidelity International Enhanced Index. Under the management contract, the investment adviser pays all other ordinary fund-wide operating expenses (such as custody, audit, legal and pricing and bookkeeping fees), except the compensation of the independent Trustees and certain other expenses such as interest expense. The management fee is reduced by an amount equal to the fees and expenses paid by the Funds to the independent Trustees.
In addition, under the expense contract, the investment adviser pays other expenses such as those listed above for each of the Funds so that the total expenses do not exceed certain amounts of each Fund's average net assets with certain exceptions, as noted in the following table:
| Fidelity Large Cap Growth Enhanced Index Fund | .45% |
| Fidelity Large Cap Value Enhanced Index Fund | .45% |
| Fidelity Large Cap Core Enhanced Index Fund | .45% |
| Fidelity Mid Cap Enhanced Index Fund | .60% |
| Fidelity Small Cap Enhanced Index Fund | .67% |
| Fidelity International Enhanced Index Fund | .62% |
Sub-Adviser. Geode Capital Management, LLC (Geode), serves as sub-adviser for the Funds. Geode provides discretionary investment advisory services to the Funds and is paid by the investment adviser for providing these services.
Interfund Lending Program. Pursuant to an Exemptive Order issued by the SEC, the Fund, along with other registered investment companies having management contracts with Fidelity Management & Research Company (FMR) or other affiliated entities of FMR, may participate in an interfund lending program. This program provides an alternative credit facility allowing the funds to borrow from, or lend money to, other participating affiliated funds. At period end, there were no interfund loans outstanding. The Fund's activity in this program during the period for which loans were outstanding was as follows:
| Borrower or Lender | Average Loan Balance | Weighted Average Interest Rate | Interest Expense | |
| Fidelity Large Cap Growth Enhanced Index Fund | Borrower | $4,816,333 | .37% | $147 |
Transfer Agent Fees. Fidelity Investments Institutional Operations Company, Inc. (FIIOC), an affiliate of the investment adviser, is the Funds' transfer, dividend disbursing and shareholder servicing agent. FIIOC receives account fees and asset-based fees that vary according to type of account. FIIOC pays for typesetting, printing and mailing of shareholder reports, except proxy statements. Under the expense contract, each fund paid transfer agent fees at the annual rate of .15% of average net assets.
6. Investments in Fidelity Central Funds.
The Funds invest in Fidelity Central Funds, which are open-end investment companies available only to other investment companies and accounts managed by the investment adviser and its affiliates. The Funds' Schedules of Investments list each of the Fidelity Central Funds held as of period end, if any, as an investment of each Fund, but do not include the underlying holdings of each Fidelity Central Fund. As an Investing Fund, each Fund indirectly bears its proportionate share of the expenses of the underlying Fidelity Central Funds.
The Fidelity Securities Lending Cash Central Fund seeks preservation of capital and current income and is managed by Fidelity Investments Money Management, Inc. (FIMM), an affiliate of the investment adviser. Annualized expenses of the Money Market Central Funds as of their most recent shareholder report date are less than .005%.
A complete unaudited list of holdings for each Fidelity Central Fund is available upon request or at the Securities and Exchange Commission (the SEC) website at www.sec.gov. In addition, the financial statements of the Fidelity Central Funds, which are not covered by the Funds' Report of Independent Registered Public Accounting Firm, are available on the SEC website or upon request.
Interfund Trades. The Funds may purchase from or sell securities to other Fidelity Funds under procedures adopted by the Board. The procedures have been designed to ensure these interfund trades are executed in accordance with Rule 17a-7 of the 1940 Act. Interfund trades are included within the respective purchases and sales amounts shown in the Purchases and Sales of Investments note.
7. Committed Line of Credit.
Certain Funds participate with other funds managed by the investment adviser or an affiliate in a $4.25 billion credit facility (the "line of credit") to be utilized for temporary or emergency purposes to fund shareholder redemptions or for other short-term liquidity purposes. The participating funds have agreed to pay commitment fees on their pro-rata portion of the line of credit, which are reflected in Miscellaneous expenses on the Statement of Operations, and are as follows:
| Fidelity Large Cap Growth Enhanced Index Fund | $592 |
| Fidelity Large Cap Value Enhanced Index Fund | 1,767 |
| Fidelity Large Cap Core Enhanced Index Fund | 555 |
| Fidelity Mid Cap Enhanced Index Fund | 1,009 |
| Fidelity Small Cap Enhanced Index Fund | 744 |
| Fidelity International Enhanced Index Fund | 184 |
During the period, the Funds did not borrow on this line of credit.
8. Security Lending.
Certain Funds lend portfolio securities through a lending agent from time to time in order to earn additional income. On the settlement date of the loan, each applicable Fund receives collateral (in the form of U.S. Treasury obligations, letters of credit and/or cash) against the loaned securities and maintains collateral in an amount not less than 100% of the market value of the loaned securities during the period of the loan. The market value of the loaned securities is determined at the close of business of the Funds and any additional required collateral is delivered to the Funds on the next business day. The Funds or borrower may terminate the loan at any time, and if the borrower defaults on its obligation to return the securities loaned because of insolvency or other reasons, the Funds may apply collateral received from the borrower against the obligation. The Funds may experience delays and costs in recovering the securities loaned. Any cash collateral received is invested in the Fidelity Securities Lending Cash Central Fund. The value of loaned securities and cash collateral at period end are disclosed on each applicable Fund's Statement of Assets and Liabilities. Security lending income represents the income earned on investing cash collateral, less rebates paid to borrowers and any lending agent fees associated with the loan, plus any premium payments received for lending certain types of securities. Security lending income is presented on each applicable Fund's Statement of Operations as a component of income from Fidelity Central Funds.
9. Expense Reductions.
Through arrangements with each applicable Fund's custodian, credits realized as a result of certain uninvested cash balances were used to reduce each applicable Fund's expenses. All of the applicable expense reductions are noted in the table below.
| Expense reduction | |
| Fidelity Large Cap Growth Enhanced Index Fund | $73 |
| Fidelity Large Cap Value Enhanced Index Fund | 563 |
| Fidelity Large Cap Core Enhanced Index Fund | 116 |
| Fidelity Mid Cap Enhanced Index Fund | 142 |
| Fidelity Small Cap Enhanced Index Fund | 213 |
| Fidelity International Enhanced Index Fund | 4 |
10. Other.
The Funds' organizational documents provide former and current trustees and officers with a limited indemnification against liabilities arising in connection with the performance of their duties to the Funds. In the normal course of business, the Funds may also enter into contracts that provide general indemnifications. The Funds' maximum exposure under these arrangements is unknown as this would be dependent on future claims that may be made against the Funds. The risk of material loss from such claims is considered remote.
Report of Independent Registered Public Accounting Firm
To the Trustees of Fidelity Commonwealth Trust II and the Shareholders of Fidelity Large Cap Growth Enhanced Index Fund, Fidelity Large Cap Value Enhanced Index Fund, Fidelity Large Cap Core Enhanced Index Fund, Fidelity Mid Cap Enhanced Index Fund, Fidelity Small Cap Enhanced Index Fund and Fidelity International Enhanced Index Fund:
In our opinion, the accompanying statements of assets and liabilities, including the schedules of investments, and the related statements of operations and of changes in net assets and the financial highlights present fairly, in all material respects, the financial position of Fidelity Large Cap Growth Enhanced Index Fund, Fidelity Large Cap Value Enhanced Index Fund, Fidelity Large Cap Core Enhanced Index Fund, Fidelity Mid Cap Enhanced Index Fund, Fidelity Small Cap Enhanced Index Fund and Fidelity International Enhanced Index Fund (each a fund of Fidelity Commonwealth Trust II) (the "Funds") at February 29, 2016, the results of each of their operations for the year then ended, the changes in each of their net assets for each of the two years in the period then ended and the financial highlights for each of the five years in the period then ended, in conformity with accounting principles generally accepted in the United States of America. These financial statements and financial highlights (hereafter referred to as “financial statements”) are the responsibility of the Funds' management. Our responsibility is to express an opinion on these financial statements based on our audits. We conducted our audits of these financial statements in accordance with the standards of the Public Company Accounting Oversight Board (United States). Those standards require that we plan and perform the audit to obtain reasonable assurance about whether the financial statements are free of material misstatement. An audit includes examining, on a test basis, evidence supporting the amounts and disclosures in the financial statements, assessing the accounting principles used and significant estimates made by management, and evaluating the overall financial statement presentation. We believe that our audits, which included confirmation of securities at February 29, 2016 by correspondence with the custodian and brokers, provide a reasonable basis for our opinion.
PricewaterhouseCoopers LLP
Boston, Massachusetts
April 19, 2016
Trustees and Officers
The Trustees, Members of the Advisory Board (if any), and officers of the trust and funds, as applicable, are listed below. The Board of Trustees governs each fund and is responsible for protecting the interests of shareholders. The Trustees are experienced executives who meet periodically throughout the year to oversee each fund's activities, review contractual arrangements with companies that provide services to each fund, oversee management of the risks associated with such activities and contractual arrangements, and review each fund's performance. Except for Elizabeth S. Acton, John Engler, and Geoffrey A. von Kuhn, each of the Trustees oversees 239 funds. Ms. Acton and Mr. Engler each oversees 234 funds. Mr. von Kuhn oversees 163 funds.
The Trustees hold office without limit in time except that (a) any Trustee may resign; (b) any Trustee may be removed by written instrument, signed by at least two-thirds of the number of Trustees prior to such removal; (c) any Trustee who requests to be retired or who has become incapacitated by illness or injury may be retired by written instrument signed by a majority of the other Trustees; and (d) any Trustee may be removed at any special meeting of shareholders by a two-thirds vote of the outstanding voting securities of the trust. Each Trustee who is not an interested person (as defined in the 1940 Act) of the trust and the funds is referred to herein as an Independent Trustee. Each Independent Trustee shall retire not later than the last day of the calendar year in which his or her 75th birthday occurs. The Independent Trustees may waive this mandatory retirement age policy with respect to individual Trustees. Officers and Advisory Board Members hold office without limit in time, except that any officer or Advisory Board Member may resign or may be removed by a vote of a majority of the Trustees at any regular meeting or any special meeting of the Trustees. Except as indicated, each individual has held the office shown or other offices in the same company for the past five years.
Each fund’s Statement of Additional Information (SAI) includes more information about the Trustees. To request a free copy, call Fidelity at 1-800-544-8544.
Experience, Skills, Attributes, and Qualifications of the Trustees. The Governance and Nominating Committee has adopted a statement of policy that describes the experience, qualifications, attributes, and skills that are necessary and desirable for potential Independent Trustee candidates (Statement of Policy). The Board believes that each Trustee satisfied at the time he or she was initially elected or appointed a Trustee, and continues to satisfy, the standards contemplated by the Statement of Policy. The Governance and Nominating Committee also engages professional search firms to help identify potential Independent Trustee candidates who have the experience, qualifications, attributes, and skills consistent with the Statement of Policy. From time to time, additional criteria based on the composition and skills of the current Independent Trustees, as well as experience or skills that may be appropriate in light of future changes to board composition, business conditions, and regulatory or other developments, have also been considered by the professional search firms and the Governance and Nominating Committee. In addition, the Board takes into account the Trustees' commitment and participation in Board and committee meetings, as well as their leadership of standing and ad hoc committees throughout their tenure.
In determining that a particular Trustee was and continues to be qualified to serve as a Trustee, the Board has considered a variety of criteria, none of which, in isolation, was controlling. The Board believes that, collectively, the Trustees have balanced and diverse experience, qualifications, attributes, and skills, which allow the Board to operate effectively in governing each fund and protecting the interests of shareholders. Information about the specific experience, skills, attributes, and qualifications of each Trustee, which in each case led to the Board's conclusion that the Trustee should serve (or continue to serve) as a trustee of the funds, is provided below.
Board Structure and Oversight Function. Abigail P. Johnson is an interested person and currently serves as Chairman. The Trustees have determined that an interested Chairman is appropriate and benefits shareholders because an interested Chairman has a personal and professional stake in the quality and continuity of services provided to the funds. Independent Trustees exercise their informed business judgment to appoint an individual of their choosing to serve as Chairman, regardless of whether the Trustee happens to be independent or a member of management. The Independent Trustees have determined that they can act independently and effectively without having an Independent Trustee serve as Chairman and that a key structural component for assuring that they are in a position to do so is for the Independent Trustees to constitute a substantial majority for the Board. The Independent Trustees also regularly meet in executive session. Marie L. Knowles serves as Chairman of the Independent Trustees and as such (i) acts as a liaison between the Independent Trustees and management with respect to matters important to the Independent Trustees and (ii) with management prepares agendas for Board meetings.
Fidelity® funds are overseen by different Boards of Trustees. The funds' Board oversees Fidelity's investment-grade bond, money market, asset allocation and certain equity funds, and other Boards oversee Fidelity's high income, sector and other equity funds. The asset allocation funds may invest in Fidelity® funds that are overseen by such other Boards. The use of separate Boards, each with its own committee structure, allows the Trustees of each group of Fidelity® funds to focus on the unique issues of the funds they oversee, including common research, investment, and operational issues. On occasion, the separate Boards establish joint committees to address issues of overlapping consequences for the Fidelity® funds overseen by each Board.
The Trustees operate using a system of committees to facilitate the timely and efficient consideration of all matters of importance to the Trustees, each fund, and fund shareholders and to facilitate compliance with legal and regulatory requirements and oversight of the funds' activities and associated risks. The Board, acting through its committees, has charged FMR and its affiliates with (i) identifying events or circumstances the occurrence of which could have demonstrably adverse effects on the funds' business and/or reputation; (ii) implementing processes and controls to lessen the possibility that such events or circumstances occur or to mitigate the effects of such events or circumstances if they do occur; and (iii) creating and maintaining a system designed to evaluate continuously business and market conditions in order to facilitate the identification and implementation processes described in (i) and (ii) above. Because the day-to-day operations and activities of the funds are carried out by or through FMR, its affiliates, and other service providers, the funds' exposure to risks is mitigated but not eliminated by the processes overseen by the Trustees. While each of the Board's committees has responsibility for overseeing different aspects of the funds' activities, oversight is exercised primarily through the Operations and Audit Committees. In addition, an ad hoc Board committee of Independent Trustees has worked with FMR to enhance the Board's oversight of investment and financial risks, legal and regulatory risks, technology risks, and operational risks, including the development of additional risk reporting to the Board. Appropriate personnel, including but not limited to the funds' Chief Compliance Officer (CCO), FMR's internal auditor, the independent accountants, the funds' Treasurer and portfolio management personnel, make periodic reports to the Board's committees, as appropriate, including an annual review of Fidelity's risk management program for the Fidelity® funds. The responsibilities of each standing committee, including their oversight responsibilities, are described further under "Standing Committees of the Trustees."
Interested Trustees*:
Correspondence intended for a Trustee who is an interested person may be sent to Fidelity Investments, 245 Summer Street, Boston, Massachusetts 02210.
Name, Year of Birth; Principal Occupations and Other Relevant Experience+
Abigail P. Johnson (1961)
Year of Election or Appointment: 2014
Trustee
Chairman of the Board of Trustees
Ms. Johnson also serves as Trustee of other Fidelity® funds. Ms. Johnson serves as President (2013-present) and Chief Executive Officer (2014-present) of FMR LLC (diversified financial services company), President of Fidelity Financial Services (2012-present) and President of Personal, Workplace and Institutional Services (2005-present). Ms. Johnson is Chairman and Director of FMR Co., Inc. (investment adviser firm, 2011-present), Chairman and Director of FMR (investment adviser firm, 2011-present), and the Vice Chairman and Director (2007-present) of FMR LLC. Previously, Ms. Johnson served as President and a Director of FMR (2001-2005), a Trustee of other investment companies advised by FMR, Fidelity Investments Money Management, Inc. (investment adviser firm), and FMR Co., Inc. (2001-2005), Senior Vice President of the Fidelity® funds (2001-2005), and managed a number of Fidelity® funds. Ms. Abigail P. Johnson and Mr. Arthur E. Johnson are not related.
Geoffrey A. von Kuhn (1951)
Year of Election or Appointment: 2015
Trustee
Mr. von Kuhn also serves as Trustee or Member of the Advisory Board of other Fidelity funds. Mr. von Kuhn is Chief Administrative Officer for FMR LLC (diversified financial services company, 2013-present), a Director of Pembroke Real Estate, Inc. (2009-present), and a Director of Discovery Natural Resources LLC (2012-present). Previously, Mr. von Kuhn was a managing director of Crosby Group (private wealth management company, 2007-2013), a member of the management committee and senior executive in the Wealth Management Group of AmSouth Bank (2001-2006), and head of the U.S. private bank at Citigroup (2000-2001).
* Determined to be an “Interested Trustee” by virtue of, among other things, his or her affiliation with the trust or various entities under common control with FMR.
+ The information includes the Trustee's principal occupation during the last five years and other information relating to the experience, attributes, and skills relevant to the Trustee's qualifications to serve as a Trustee, which led to the conclusion that the Trustee should serve as a Trustee for each fund.
Independent Trustees:
Correspondence intended for an Independent Trustee may be sent to Fidelity Investments, P.O. Box 55235, Boston, Massachusetts 02205-5235.
Name, Year of Birth; Principal Occupations and Other Relevant Experience+
Elizabeth S. Acton (1951)
Year of Election or Appointment: 2014
Trustee
Ms. Acton also serves as Trustee or Member of the Advisory Board of other Fidelity® funds. Prior to her retirement in April 2012, Ms. Acton was Executive Vice President, Finance (2011-2012), Executive Vice President, Chief Financial Officer (2002-2011), and Treasurer (2004-2005) of Comerica Incorporated (financial services). Prior to joining Comerica, Ms. Acton held a variety of positions at Ford Motor Company (1983-2002), including Vice President and Treasurer (2000-2002) and Executive Vice President and Chief Financial Officer of Ford Motor Credit Company (1998-2000). Ms. Acton currently serves as a member of the Board of Directors and Audit and Finance Committees of Beazer Homes USA, Inc. (homebuilding, 2012-present).
John Engler (1948)
Year of Election or Appointment: 2014
Trustee
Mr. Engler also serves as Trustee or Member of the Advisory Board of other Fidelity® funds. He serves as president of the Business Roundtable (2011-present), and on the board of directors for Universal Forest Products (manufacturer and distributor of wood and wood-alternative products, 2003-present) and K12 Inc. (technology-based education company, 2012-present). Previously, Mr. Engler served as a trustee of The Munder Funds (2003-2014), president and CEO of the National Association of Manufacturers (2004-2011), member of the Board of Trustees of the Annie E. Casey Foundation (2004-2015), and as governor of Michigan (1991-2003). He is a past chairman of the National Governors Association.
Albert R. Gamper, Jr. (1942)
Year of Election or Appointment: 2014
Trustee
Mr. Gamper also serves as Trustee of other Fidelity® funds. Prior to his retirement in December 2004, Mr. Gamper served as Chairman of the Board of CIT Group Inc. (commercial finance). During his tenure with CIT Group Inc. Mr. Gamper served in numerous senior management positions, including Chairman (1987-1989; 1999-2001; 2002-2004), Chief Executive Officer (1987-2004), and President (2002-2003). Mr. Gamper currently serves as a member of the Board of Directors of Public Service Enterprise Group (utilities, 2000-present), and Member of the Board of Trustees of Barnabas Health Care System (1997-present). Previously, Mr. Gamper served as Chairman (2012-2015) and Vice Chairman (2011-2012) of the Independent Trustees of certain Fidelity® funds and as Chairman of the Board of Governors, Rutgers University (2004-2007).
Robert F. Gartland (1951)
Year of Election or Appointment: 2014
Trustee
Mr. Gartland also serves as Trustee of other Fidelity® funds. Mr. Gartland is Chairman and an investor in Gartland and Mellina Group Corp. (consulting, 2009-present). Previously, Mr. Gartland served as a partner and investor of Vietnam Partners LLC (investments and consulting, 2008-2011). Prior to his retirement, Mr. Gartland held a variety of positions at Morgan Stanley (financial services, 1979-2007) including Managing Director (1987-2007).
Arthur E. Johnson (1947)
Year of Election or Appointment: 2014
Trustee
Vice Chairman of the Independent Trustees
Mr. Johnson also serves as Trustee of other Fidelity® funds. Mr. Johnson serves as a member of the Board of Directors of Eaton Corporation plc (diversified power management, 2009-present), AGL Resources, Inc. (holding company, 2002-present) and Booz Allen Hamilton (management consulting, 2011-present). Prior to his retirement, Mr. Johnson served as Senior Vice President of Corporate Strategic Development of Lockheed Martin Corporation (defense contractor, 1999-2009). He previously served on the Board of Directors of IKON Office Solutions, Inc. (1999-2008) and Delta Airlines (2005-2007). Mr. Arthur E. Johnson is not related to Ms. Abigail P. Johnson.
Michael E. Kenneally (1954)
Year of Election or Appointment: 2014
Trustee
Mr. Kenneally also serves as Trustee of other Fidelity® funds. Prior to his retirement, Mr. Kenneally served as Chairman and Global Chief Executive Officer of Credit Suisse Asset Management. Before joining Credit Suisse, he was an Executive Vice President and Chief Investment Officer for Bank of America Corporation. Earlier roles at Bank of America included Director of Research, Senior Portfolio Manager and Research Analyst, and Mr. Kenneally was awarded the Chartered Financial Analyst (CFA) designation in 1991.
James H. Keyes (1940)
Year of Election or Appointment: 2014
Trustee
Mr. Keyes also serves as Trustee of other Fidelity® funds. Mr. Keyes serves as a member of the Board and Non-Executive Chairman of Navistar International Corporation (manufacture and sale of trucks, buses, and diesel engines, since 2002). Previously, Mr. Keyes served as a member of the Board of Pitney Bowes, Inc. (integrated mail, messaging, and document management solutions, 1998-2013). Prior to his retirement, Mr. Keyes served as Chairman (1993-2002) and Chief Executive Officer (1988-2002) of Johnson Controls (automotive, building, and energy) and as a member of the Board of LSI Logic Corporation (semiconductor technologies, 1984-2008).
Marie L. Knowles (1946)
Year of Election or Appointment: 2014
Trustee
Chairman of the Independent Trustees
Ms. Knowles also serves as Trustee of other Fidelity® funds. Prior to Ms. Knowles' retirement in June 2000, she served as Executive Vice President and Chief Financial Officer of Atlantic Richfield Company (ARCO) (diversified energy, 1996-2000). From 1993 to 1996, she was a Senior Vice President of ARCO and President of ARCO Transportation Company (pipeline and tanker operations). Ms. Knowles currently serves as a Director and Chairman of the Audit Committee of McKesson Corporation (healthcare service, since 2002). Ms. Knowles is a member of the Board of the Santa Catalina Island Company (real estate, 2009-present). Ms. Knowles is a Member of the Investment Company Institute Board of Governors and a Member of the Governing Council of the Independent Directors Council (2014-present). She also serves as a member of the Advisory Board for the School of Engineering of the University of Southern California. Previously, Ms. Knowles served as a Director of Phelps Dodge Corporation (copper mining and manufacturing, 1994-2007), URS Corporation (engineering and construction, 2000-2003) and America West (airline, 1999-2002). Ms. Knowles previously served as Vice Chairman of the Independent Trustees of certain Fidelity® funds (2012-2015).
+ The information includes the Trustee's principal occupation during the last five years and other information relating to the experience, attributes, and skills relevant to the Trustee's qualifications to serve as a Trustee, which led to the conclusion that the Trustee should serve as a Trustee for each fund.
Advisory Board Members and Officers:
Correspondence intended for an officer may be sent to Fidelity Investments, 245 Summer Street, Boston, Massachusetts 02210. Officers appear below in alphabetical order.
Name, Year of Birth; Principal Occupation
Marc R. Bryant (1966)
Year of Election or Appointment: 2015
Secretary and Chief Legal Officer (CLO)
Mr. Bryant also serves as Secretary and CLO of other funds. Mr. Bryant serves as CLO, Secretary, and Senior Vice President of Fidelity Management & Research Company (investment adviser firm, 2015-present) and FMR Co., Inc. (investment adviser firm, 2015-present); Secretary of Fidelity SelectCo, LLC (investment adviser firm, 2015-present) and Fidelity Investments Money Management, Inc. (investment adviser firm, 2015-present); and CLO of Fidelity Management & Research (Hong Kong) Limited and FMR Investment Management (U.K.) Limited (investment adviser firms, 2015-present) and Fidelity Management & Research (Japan) Limited (investment adviser firm, 2016-present). He is Senior Vice President and Deputy General Counsel of FMR LLC (diversified financial services company). Previously, Mr. Bryant served as Secretary and CLO of Fidelity Rutland Square Trust II (2010-2014) and Assistant Secretary of Fidelity's Fixed Income and Asset Allocation Funds (2013-2015). Prior to joining Fidelity Investments, Mr. Bryant served as a Senior Vice President and the Head of Global Retail Legal for AllianceBernstein L.P. (2006-2010), and as the General Counsel for ProFund Advisors LLC (2001-2006).
Jeffrey S. Christian (1961)
Year of Election or Appointment: 2016
Assistant Treasurer
Mr. Christian also serves as Assistant Treasurer of other funds. Mr. Christian is an employee of Fidelity Investments (2003-present).
Jonathan Davis (1968)
Year of Election or Appointment: 2010
Assistant Treasurer
Mr. Davis also serves as Assistant Treasurer of other funds, and is an employee of Fidelity Investments. Previously, Mr. Davis served as Vice President and Associate General Counsel of FMR LLC (diversified financial services company, 2003-2010).
Adrien E. Deberghes (1967)
Year of Election or Appointment: 2010
Assistant Treasurer
Mr. Deberghes also serves as an officer of other funds. He is an employee of Fidelity Investments (2008-present). Prior to joining Fidelity Investments, Mr. Deberghes was Senior Vice President of Mutual Fund Administration at State Street Corporation (2007-2008), Senior Director of Mutual Fund Administration at Investors Bank & Trust (2005-2007), and Director of Finance for Dunkin' Brands (2000-2005). Previously, Mr. Deberghes served in other fund officer roles.
Stephanie J. Dorsey (1969)
Year of Election or Appointment: 2013
President and Treasurer
Ms. Dorsey also serves as an officer of other funds. She is an employee of Fidelity Investments (2008-present) and has served in other fund officer roles. Prior to joining Fidelity Investments, Ms. Dorsey served as Treasurer (2004-2008) of the JPMorgan Mutual Funds and Vice President (2004-2008) of JPMorgan Chase Bank.
Howard J. Galligan III (1966)
Year of Election or Appointment: 2014
Chief Financial Officer
Mr. Galligan also serves as Chief Financial Officer of other funds. Mr. Galligan serves as President of Fidelity Pricing and Cash Management Services (FPCMS) (2014-present) and as a Director of Strategic Advisers, Inc. (investment adviser firm, 2008-present). Previously, Mr. Galligan served as Chief Administrative Officer of Asset Management (2011-2014) and Chief Operating Officer and Senior Vice President of Investment Support for Strategic Advisers, Inc. (2003-2011).
Scott C. Goebel (1968)
Year of Election or Appointment: 2015
Vice President
Mr. Goebel serves as Vice President of other funds and is an employee of Fidelity Investments (2001-present). Previously, Mr. Goebel served as Secretary of Fidelity SelectCo, LLC (investment adviser firm, 2013-2015), Fidelity Investments Money Management, Inc. (FIMM) (investment adviser firm, 2010-2015), and Fidelity Research and Analysis Company (FRAC) (investment adviser firm, 2010-2015); General Counsel, Secretary, and Senior Vice President of Fidelity Management & Research Company (investment adviser firm, 2008-2015) and FMR Co., Inc. (investment adviser firm, 2008-2015); Assistant Secretary of Fidelity Management & Research (Japan) Limited (investment adviser firm, 2008-2015) and Fidelity Management & Research (U.K.) Inc. (investment adviser firm, 2008-2015); Chief Legal Officer (CLO) of Fidelity Management & Research (Hong Kong) Limited (investment adviser firm, 2008-2015); Secretary and CLO of certain Fidelity® funds (2008-2015); Assistant Secretary of FIMM (2008-2010), FRAC (2008-2010), and certain funds (2007-2008); and as Vice President and Secretary of Fidelity Distributors Corporation (FDC) (2005-2007).
Colm A. Hogan (1973)
Year of Election or Appointment: 2016
Assistant Treasurer
Mr. Hogan also serves as an officer of other funds. Mr. Hogan is an employee of Fidelity Investments (2005-present).
Chris Maher (1972)
Year of Election or Appointment: 2013
Assistant Treasurer
Mr. Maher serves as Assistant Treasurer of other funds. Mr. Maher is Vice President of Valuation Oversight and is an employee of Fidelity Investments. Previously, Mr. Maher served as Vice President of Asset Management Compliance (2013), Vice President of the Program Management Group of FMR (investment adviser firm, 2010-2013), and Vice President of Valuation Oversight (2008-2010).
John F. Papandrea (1972)
Year of Election or Appointment: 2016
Anti-Money Laundering (AML) Officer
Mr. Papandrea also serves as AML Officer of other funds. Mr. Papandrea is Vice President of FMR LLC (diversified financial services company, 2008-present) and is an employee of Fidelity Investments (2005-present).
Jason P. Pogorelec (1975)
Year of Election or Appointment: 2015
Assistant Secretary
Mr. Pogorelec also serves as Assistant Secretary of other funds. Mr. Pogorelec serves as Vice President, Associate General Counsel (2010-present) and is an employee of Fidelity Investments (2006-present).
Nancy D. Prior (1967)
Year of Election or Appointment: 2014
Vice President
Ms. Prior also serves as Vice President of other funds. Ms. Prior serves as a Director of FMR Investment Management (U.K.) Limited (investment adviser firm, 2015-present) and Fidelity Investments Money Management, Inc. (FIMM) (investment adviser firm, 2014-present), President, Fixed Income (2014-present), Vice Chairman of FIAM LLC (investment adviser firm, 2014-present), and is an employee of Fidelity Investments (2002-present). Previously, Ms. Prior served as Vice President of Fidelity's Money Market Funds (2012-2014), President, Money Market and Short Duration Bond Group of Fidelity Management & Research (FMR) (investment adviser firm, 2013-2014), President, Money Market Group of FMR (2011-2013), Managing Director of Research (2009-2011), Senior Vice President and Deputy General Counsel (2007-2009), and Assistant Secretary of other Fidelity® funds (2008-2009).
Stacie M. Smith (1974)
Year of Election or Appointment: 2013
Assistant Treasurer
Ms. Smith also serves as an officer of other funds. She is an employee of Fidelity Investments (2009-present) and has served in other fund officer roles. Prior to joining Fidelity Investments, Ms. Smith served as Senior Audit Manager of Ernst & Young LLP (1996-2009). Previously, Ms. Smith served as Deputy Treasurer of certain Fidelity funds (2013-2016).
Renee Stagnone (1975)
Year of Election or Appointment: 2016
Assistant Treasurer
Ms. Stagnone also serves as an officer of other funds. Ms. Stagnone is an employee of Fidelity Investments (1997-present). Previously, Ms. Stagnone served as Deputy Treasurer of certain Fidelity funds (2013-2016).
Michael H. Whitaker (1967)
Year of Election or Appointment: 2008
Chief Compliance Officer
Mr. Whitaker also serves as Chief Compliance Officer of other funds. Mr. Whitaker also serves as Compliance Officer of FMR Co., Inc. (investment adviser firm, 2014-present), FMR (investment adviser firm, 2014-present), and Fidelity Investments Money Management, Inc. (investment adviser firm, 2014-present) and is an employee of Fidelity Investments (2007-present). Prior to joining Fidelity Investments, Mr. Whitaker worked at MFS Investment Management where he served as Senior Vice President and Chief Compliance Officer (2004-2006), and Assistant General Counsel.
Derek L. Young (1964)
Year of Election or Appointment: 2009
Vice President of Fidelity's Asset Allocation Funds
Mr. Young also serves as an officer of other funds. He is a Director of Strategic Advisers, Inc. (investment adviser firm, 2011-present), President of Fidelity Global Asset Allocation (GAA) (2011-present), and Vice Chairman of FIAM LLC (investment adviser firm, 2011-present). Previously, Mr. Young served as Trustee of certain funds (2012-2015), President of Strategic Advisers, Inc. (2011-2015), Chief Investment Officer of GAA (2009-2011), and as a portfolio manager.
Shareholder Expense Example
As a shareholder of the Fund, you incur two types of costs: (1) transaction costs, including redemption fees and (2) ongoing costs, including management fees and other Fund expenses. This Example is intended to help you understand your ongoing costs (in dollars) of investing in the Fund and to compare these costs with the ongoing costs of investing in other mutual funds.
The Example is based on an investment of $1,000 invested at the beginning of the period and held for the entire period (September 1, 2015 to February 29, 2016).
Actual Expenses
The first line of the accompanying table for each fund provides information about actual account values and actual expenses. You may use the information in this line, together with the amount you invested, to estimate the expenses that you paid over the period. Simply divide your account value by $1,000.00 (for example, an $8,600 account value divided by $1,000.00 = 8.6), then multiply the result by the number in the first line under the heading entitled "Expenses Paid During Period" to estimate the expenses you paid on your account during this period. In addition to the direct expenses incurred by each Fund presented in the table, as a shareholder of the underlying non-affiliated funds (the Underlying Funds), each Fund also indirectly bears its proportionate share of the expenses of the Underlying Funds. These fees and expenses are not included in each Fund's annualized expense ratio used to calculate the expense estimate in the table below. A small balance maintenance fee of $12.00 that is charged once a year may apply for certain accounts with a value of less than $2,000. This fee is not included in the table below. If it was, the estimate of expenses you paid during the period would be higher, and your ending account value lower, by this amount. In addition, the Fund, as a shareholder in the underlying Fidelity Central Funds, will indirectly bear its pro-rata share of the fees and expenses incurred by the underlying Fidelity Central Funds. These fees and expenses are not included in the Fund's annualized expense ratio used to calculate the expense estimate in the table below.
Hypothetical Example for Comparison Purposes
The second line of the accompanying table for each fund provides information about hypothetical account values and hypothetical expenses based on a fund's actual expense ratio and an assumed rate of return of 5% per year before expenses, which is not the Fund's actual return. The hypothetical account values and expenses may not be used to estimate the actual ending account balance or expenses you paid for the period. You may use this information to compare the ongoing costs of investing in the Fund and other funds. To do so, compare this 5% hypothetical example with the 5% hypothetical examples that appear in the shareholder reports of the other funds. In addition to the direct expenses incurred by each Fund presented in the table, as a shareholder of the underlying non-affiliated funds (the Underlying Funds), each Fund also indirectly bears its proportionate share of the expenses of the Underlying Funds. These fees and expenses are not included in each Fund's annualized expense ratio used to calculate the expense estimate in the table below. A small balance maintenance fee of $12.00 that is charged once a year may apply for certain accounts with a value of less than $2,000. This fee is not included in the table below. If it was, the estimate of expenses you paid during the period would be higher, and your ending account value lower, by this amount. In addition, each Fund, as a shareholder in the underlying Fidelity Central Funds, will indirectly bear its pro-rata share of the fees and expenses incurred by the underlying Fidelity Central Funds. These fees and expenses are not included in the Fund's annualized expense ratio used to calculate the expense estimate in the table below.
Please note that the expenses shown in the table are meant to highlight your ongoing costs only and do not reflect any transaction costs. Therefore, the second line of the table is useful in comparing ongoing costs only, and will not help you determine the relative total costs of owning different funds. In addition, if these transactional costs were included, your costs would have been higher.
| Annualized Expense Ratio-A | Beginning Account Value September 1, 2015 | Ending Account Value February 29, 2016 | Expenses Paid During Period-B September 1, 2015 to February 29, 2016 | |
| Fidelity Large Cap Growth Enhanced Index Fund | .45% | |||
| Actual | $1,000.00 | $989.30 | $2.23 | |
| Hypothetical-C | $1,000.00 | $1,022.63 | $2.26 | |
| Fidelity Large Cap Value Enhanced Index Fund | .45% | |||
| Actual | $1,000.00 | $967.90 | $2.20 | |
| Hypothetical-C | $1,000.00 | $1,022.63 | $2.26 | |
| Fidelity Large Cap Core Enhanced Index Fund | .45% | |||
| Actual | $1,000.00 | $987.90 | $2.22 | |
| Hypothetical-C | $1,000.00 | $1,022.63 | $2.26 | |
| Fidelity Mid Cap Enhanced Index Fund | .60% | |||
| Actual | $1,000.00 | $947.20 | $2.90 | |
| Hypothetical-C | $1,000.00 | $1,021.88 | $3.02 | |
| Fidelity Small Cap Enhanced Index Fund | .67% | |||
| Actual | $1,000.00 | $936.00 | $3.23 | |
| Hypothetical-C | $1,000.00 | $1,021.53 | $3.37 | |
| Fidelity International Enhanced Index Fund | .62% | |||
| Actual | $1,000.00 | $909.70 | $2.94 | |
| Hypothetical-C | $1,000.00 | $1,021.78 | $3.12 |
A Annualized expense ratio reflects expenses net of applicable fee waivers.
B Expenses are equal to each Fund's annualized expense ratio, multiplied by the average account value over the period, multiplied by 182/366 (to reflect the one-half year period).
C 5% return per year before expenses
Distributions (Unaudited)
The funds hereby designate as capital gain dividend the amounts noted below for the taxable year ended February 29, 2016, or, if subsequently determined to be different, the net capital gain of such year.
| Fidelity Large Cap Growth Enhanced Index Fund | $9,348,641 |
| Fidelity Large Cap Value Enhanced Index Fund | $15,850,766 |
| Fidelity Large Cap Core Enhanced Index Fund | $4,433,464 |
| Fidelity Mid Cap Enhanced Index Fund | $19,566,962 |
| Fidelity Small Cap Enhanced Index Fund | $16,311,786 |
A percentage of the dividends distributed during the fiscal year for the following funds qualify for the dividends–received deduction for corporate shareholders:
| April 2015 | December 2015 | |
| Fidelity Large Cap Growth Enhanced Index Fund | 68% | 100% |
| Fidelity Large Cap Value Enhanced Index Fund | 90% | 100% |
| Fidelity Large Cap Core Enhanced Index Fund | 43% | 100% |
| Fidelity Mid Cap Enhanced Index Fund | 99% | 76% |
| Fidelity Small Cap Enhanced Index Fund | 100% | 100% |
A percentage of the dividends distributed during the fiscal year for the following funds may be taken into account as a dividend for purposes of the maximum rate under section 1(h)(11) of the Internal Revenue Code.
| April 2015 | December 2015 | |
| Fidelity Large Cap Growth Enhanced Index Fund | 69% | 100% |
| Fidelity Large Cap Value Enhanced Index Fund | 93% | 100% |
| Fidelity Large Cap Core Enhanced Index Fund | 43% | 100% |
| Fidelity Mid Cap Enhanced Index Fund | 99% | 77% |
| Fidelity Small Cap Enhanced Index Fund | 100% | 100% |
| Fidelity International Enhanced Index Fund | 95% | 100% |
The amounts per share which represent income derived from sources within, and taxes paid to, foreign countries or possessions of the United States are as follows:
| Pay Date | Income | Taxes | |
| Fidelity International Enhanced Index Fund | 04/13/15 | $0.0216 | $0.0016 |
| Fidelity International Enhanced Index Fund | 12/14/15 | $0.1563 | $0.0153 |
The funds will notify shareholders in January 2017 of amounts for use in preparing 2016 income tax returns.
Board Approval of Investment Advisory Contracts and Management Fees
Fidelity International Enhanced Index Fund, Fidelity Large Cap Core Enhanced Index Fund, Fidelity Large Cap Growth Enhanced Index Fund, Fidelity Large Cap Value Enhanced Index Fund, Fidelity Mid Cap Enhanced Index Fund, and Fidelity Small Cap Enhanced Index Fund
Each year, the Board of Trustees, including the Independent Trustees (together, the Board), votes on the management and sub-advisory arrangements for each fund. The Board, assisted by the advice of fund counsel and Independent Trustees' counsel, requests and considers a broad range of information relevant to the contract arrangements throughout the year.
The Board meets regularly and, at each of its meetings, covers an extensive agenda of topics and materials and considers factors that are relevant to its annual consideration of each fund's management and sub-advisory arrangements, including the services and support provided to each fund and its shareholders. The Board has established four standing committees (Committees) — Operations, Audit, Fair Valuation, and Governance and Nominating — each composed of and chaired by Independent Trustees with varying backgrounds, to which the Board has assigned specific subject matter responsibilities in order to enhance effective decision-making by the Board. The Operations Committee, of which all of the Independent Trustees are members, meets regularly throughout the year and considers, among other matters, information specifically related to the annual consideration of each fund's management and sub-advisory arrangements. The Board, acting directly and through its Committees, requests and receives information concerning the annual consideration of each fund's management and sub-advisory arrangements. The Board also meets as needed to consider matters specifically related to the Board's annual consideration of the management and sub-advisory arrangements. Members of the Board may also meet with trustees of other Fidelity funds through ad hoc joint committees to discuss certain matters relevant to all of the Fidelity funds.
At its September 2015 meeting, the Board unanimously determined to approve an amended and restated management contract and sub-advisory agreement (Advisory Contracts) for each fund to reflect the fact that, effective October 1, 2015, FMR Co., Inc. (FMRC), an affiliate of Strategic Advisers, Inc. (Strategic Advisers) and Fidelity Management & Research Company (FMR), would assume the duties and rights of Strategic Advisers under the fund's then current management contract and sub-advisory agreement. The Board noted that, with the exception of the date, term, and entity name, the terms of each fund's management contract and sub-advisory agreement, including the fees payable thereunder, would not change as a result of the approval of the Advisory Contracts. The Board considered that FMRC would render the same services to the funds under the Advisory Contracts that Strategic Advisers rendered to the funds under the then current management contracts and sub-advisory agreements. The Board also considered that approval of the Advisory Contracts would not result in any changes to (i) the investment process or strategies employed in the management of the funds' assets; or (ii) the day-to-day management of the funds or the persons primarily responsible for such management. As a result, the Board considered that its prior experience with Strategic Advisers as investment adviser for the funds was relevant to its consideration of the Advisory Contracts. In reaching its determination, the Board considered all factors it believed relevant, including (i) the nature, extent, and quality of the services to be provided to each fund and its shareholders (including the investment performance of each fund); (ii) the competitiveness of each fund's management fee and total expense ratio relative to peer funds; (iii) the total costs of the services to be provided by and the profits to be realized by Fidelity from its relationship with each fund; and (iv) the extent to which (if any) economies of scale exist and would be realized as each fund grows, and whether any economies of scale are appropriately shared with fund shareholders.
In considering whether to approve the Advisory Contracts for each fund, the Board reached a determination, with the assistance of fund counsel and Independent Trustees' counsel and through the exercise of its business judgment, that the approval of the Advisory Contracts was in the best interests of each fund and its shareholders and that the compensation payable under the Advisory Contracts was fair and reasonable. The Board's decision to approve the Advisory Contracts was not based on any single factor, but rather was based on a comprehensive consideration of all the information provided to the Board at its meetings throughout the year. The Board, in reaching its determination to approve the Advisory Contracts, was aware that shareholders of each fund have a broad range of investment choices available to them, including a wide choice among funds offered by Fidelity's competitors, and that each fund's shareholders, who have the opportunity to review and weigh the disclosure provided by the fund in its prospectus and other public disclosures, have chosen to invest in that fund, which is part of the Fidelity family of funds.
Nature, Extent, and Quality of Services Provided. The Board considered Fidelity's and Geode's staffing as it relates to the funds, including the backgrounds of investment personnel that provide services to the funds, and also considered the funds' investment objectives, strategies, and related investment philosophies. The Independent Trustees also had discussions with senior management of Fidelity's investment operations and investment groups and with representatives of Geode. The Board considered the portfolio managers' investments, if any, in the funds that they manage.Resources Dedicated to Investment Management and Support Services. The Board reviewed the general qualifications and capabilities of Fidelity's and Geode's investment staff, including their size, education, experience, and resources, as well as Fidelity's approach to recruiting, training, managing, and compensating investment personnel. The Board noted that Fidelity has continued to increase the resources devoted to non-U.S. offices, including expansion of Fidelity's global investment organization. The Board also noted that Fidelity's and Geode's analysts have extensive resources, tools and capabilities that allow them to conduct sophisticated quantitative and fundamental analysis, as well as credit analysis of issuers, counterparties and guarantors. Further, the Board considered that Fidelity's and Geode's investment professionals have sufficient access to information and data so as to provide competitive investment results over time, and that those professionals also have access to sophisticated tools that permit them to assess portfolio construction and risk and performance attribution characteristics continuously. Additionally, in its deliberations, the Board considered Fidelity's and Geode's trading, risk management, compliance, and technology and operations capabilities and resources, which are integral parts of the investment management process.Shareholder and Administrative Services. The Board considered (i) the nature, extent, quality, and cost of advisory, administrative, and shareholder services performed by Fidelity, Geode, and their affiliates under the then current management contract and sub-advisory agreement (and to be performed under the Advisory Contracts) and under separate agreements covering transfer agency, pricing and bookkeeping, and securities lending services for each fund; (ii) the nature and extent of the supervision of third party service providers, principally custodians, subcustodians, and pricing vendors; and (iii) the resources devoted to, and the record of compliance with, each fund's compliance policies and procedures. The Board also reviewed the allocation of fund brokerage, including allocations to brokers affiliated with the investment advisers.The Board noted that the growth of fund assets over time across the complex allows Fidelity to reinvest in the development of services designed to enhance the value or convenience of the Fidelity funds as investment vehicles. These services include 24-hour access to account information and market information through telephone representatives and over the Internet, investor education materials and asset allocation tools, and the expanded availability of Fidelity Investor Centers.Investment in a Large Fund Family. The Board considered the benefits to shareholders of investing in a Fidelity fund, including the benefits of investing in a fund that is part of a large family of funds offering a variety of investment disciplines and providing a large variety of mutual fund investor services. The Board noted that Fidelity had taken, or had made recommendations that resulted in the Fidelity funds taking, a number of actions over the previous year that benefited particular funds, including (i) continuing to dedicate additional resources to investment research and to the support of the senior management team that oversees asset management; (ii) continuing efforts to enhance Fidelity's global research capabilities; (iii) launching new funds and making other enhancements to meet client needs; (iv) reducing management fees and total expenses for certain index funds and diversified international funds; (v) continuing to launch dedicated lower cost underlying funds to meet portfolio construction needs related to expanding underlying fund options for Fidelity funds of funds, specifically for the Freedom Fund product lines; (vi) rationalizing product lines and gaining increased efficiencies through fund mergers; (vii) launching active fixed-income exchange-traded funds; (viii) continuing to develop, acquire and implement systems and technology to improve services to the funds and shareholders, strengthen information security, and increase efficiency; (ix) implementing investment enhancements to further strengthen Fidelity's target date product line to increase investors' probability of success in achieving their goals; (x) modifying the eligibility criteria for certain share classes to accommodate roll-over assets from employer-sponsored retirement plans; (xi) launching a new Class W of the Freedom Index Funds to attract and retain Fidelity record-kept retirement plan assets; and (xii) implementing changes to Fidelity's money market product line in response to recent money market regulatory reforms.Investment Performance. The Board considered whether each fund has operated in accordance with its investment objective, as well as its record of compliance with its investment restrictions and its performance history, and noted that the approval of the Advisory Contracts for each fund would not result in any changes to the fund's investment strategy or the personnel responsible for providing advisory services to the fund.The Board took into account discussions with representatives of the investment advisers about fund investment performance that occur at Board meetings throughout the year. In this regard the Board noted that as part of regularly scheduled fund reviews and other reports to the Board on fund performance, the Board considers annualized return information for each fund for different time periods, measured against a securities market index ("benchmark index") and a peer group of funds with similar objectives ("peer group"), if any. In its evaluation of fund investment performance at meetings throughout the year, the Board gave particular attention to information indicating underperformance of certain Fidelity funds for specific time periods and discussed with the investment advisers the reasons for such underperformance.In addition to reviewing absolute and relative fund performance, the Independent Trustees periodically consider the appropriateness of fund performance metrics in evaluating the results achieved. In general, the Independent Trustees believe that fund performance should be evaluated based on gross performance (before fees and expenses but after transaction costs) compared to appropriate benchmark indices, over appropriate time periods that may include full market cycles, and on net performance (after fees and expenses) compared to peer groups, as applicable, over the same periods, taking into account relevant factors including the following: general market conditions; issuer-specific information; and fund cash flows and other factors. Depending on the circumstances, the Independent Trustees may be satisfied with a fund's performance notwithstanding that it lags its benchmark index or peer group for certain periods.The Independent Trustees recognize that shareholders evaluate performance on a net basis over their own holding periods, for which one-, three-, and five-year periods are often used as a proxy. For this reason, the performance information reviewed by the Board also included net cumulative calendar year total return information for each fund and an appropriate benchmark index and peer group for the most recent one-, three-, and five-year periods.Based on its review, the Board concluded that the nature, extent, and quality of services provided to each fund under the Advisory Contracts should benefit the shareholders of each fund.Competitiveness of Management Fee and Total Expense Ratio. The Board considered each fund's management fee and total expense ratio compared to "mapped groups" of competitive funds and classes created for the purpose of facilitating the Trustees' competitive analysis of management fees and total expenses. Fidelity creates "mapped groups" by combining similar Lipper investment objective categories that have comparable investment mandates. Combining Lipper investment objective categories aids the Board's management fee and total expense ratio comparisons by broadening the competitive group used for comparison.Management Fee. The Board considered two proprietary management fee comparisons for the 12-month periods shown in basis points (BP) in the charts below. The group of Lipper funds used by the Board for management fee comparisons is referred to below as the "Total Mapped Group" and, for the reasons explained above, is broader than the Lipper peer group used by the Board for performance comparisons. The Total Mapped Group comparison focuses on a fund's standing in terms of gross management fees before expense reimbursements or caps relative to the total universe of funds with comparable investment mandates, regardless of whether their management fee structures also are comparable. Funds with comparable investment mandates offer exposure to similar types of securities. Funds with comparable management fee structures have similar management fee contractual arrangements (e.g., flat rate charged for advisory services, all-inclusive fee rate, etc.). "TMG %" represents the percentage of funds in the Total Mapped Group that had management fees that were lower than a fund's. For example, a hypothetical TMG % of 20% would mean that 80% of the funds in the Total Mapped Group had higher, and 20% had lower, management fees than a fund. The funds' actual TMG %s and the number of funds in the Total Mapped Group are in the charts below. The "Asset-Size Peer Group" (ASPG) comparison focuses on a fund's standing relative to a subset of non-Fidelity funds within the Total Mapped Group that are similar in size and management fee structure. For example, if a fund is in the first quartile of the ASPG, the fund's management fee ranks in the least expensive or lowest 25% of funds in the ASPG. The ASPG represents at least 15% of the funds in the Total Mapped Group with comparable asset size and management fee structures, subject to a minimum of 50 funds (or all funds in the Total Mapped Group if fewer than 50). Additional information, such as the ASPG quartile in which a fund's management fee rate ranked, is also included in the charts and considered by the Board. Because the vast majority of competitor funds' management fees do not cover non-management expenses, for a more meaningful comparison of management fees, each fund is compared on the basis of a hypothetical "net management fee," which is derived by subtracting payments made by the investment adviser for "fund-level" non-management expenses (including pricing and bookkeeping fees and fees paid to non-affiliated custodians) from the fund's management fee. In this regard, the Board considered that net management fees can vary from year to year because of differences in "fund-level" non-management expenses. The Board noted that, although the investment adviser does not pay transfer agent fees or other "class-level" expenses under each fund's management contract, such expenses may be paid by the investment adviser pursuant to expense limitation arrangements in effect for the fund and, as a result, are also subtracted from the management fee for purposes of calculating the hypothetical "net management fee." The Board considered that "fund-level" non-management expenses and "class-level" expenses paid by the investment adviser may exceed the fund's management fee and result in a negative net management fee.Fidelity International Enhanced Index Fund

Fidelity Large Cap Core Enhanced Index Fund
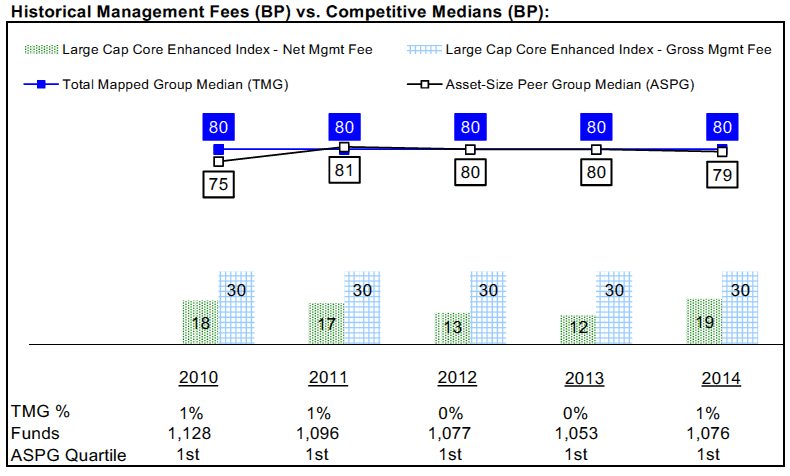
Fidelity Large Cap Growth Enhanced Index Fund
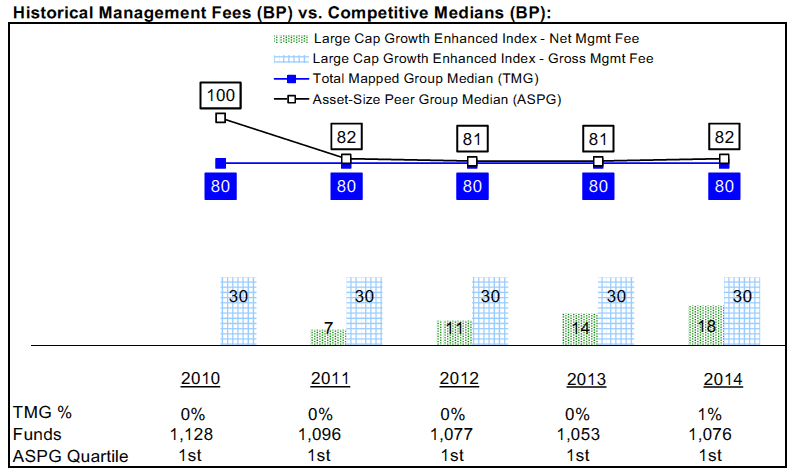
Fidelity Large Cap Value Enhanced Index Fund
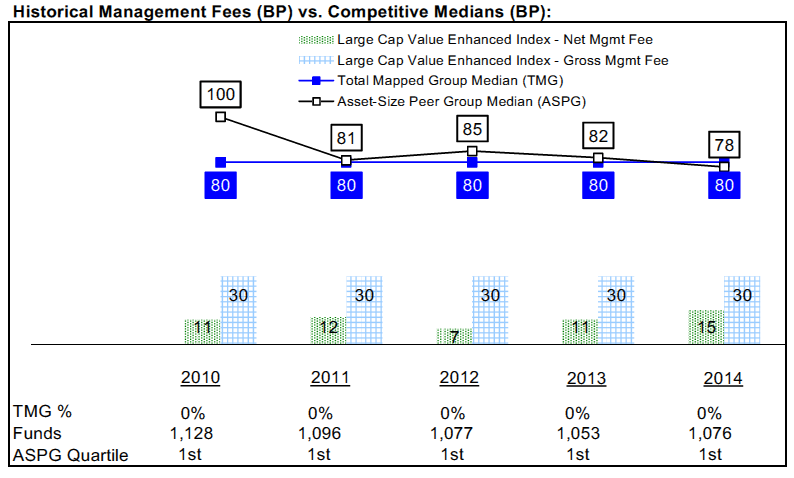
Fidelity Mid Cap Enhanced Index Fund
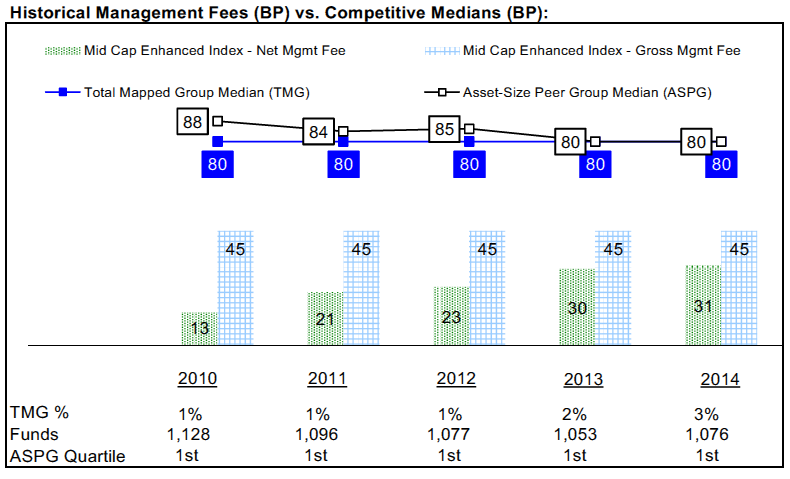
Fidelity Small Cap Enhanced Index Fund
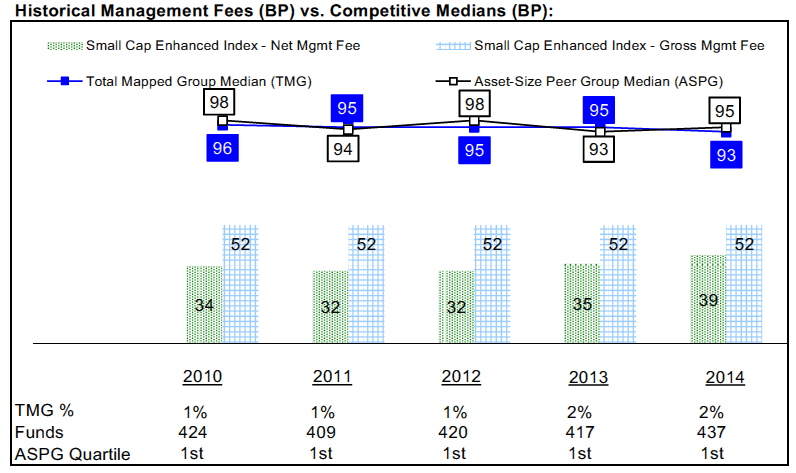
Proxy Voting Results
A special meeting of shareholders was held on November 18, 2015. The results of votes taken among shareholders on the proposal before them are reported below. Each vote reported represents one dollar of net asset value held on the record date for the meeting.
PROPOSAL 1
| To elect a Board of Trustees. | ||
| # of Votes | % of Votes | |
| Elizabeth S. Acton | ||
| Affirmative | 2,248,712,794.82 | 95.745 |
| Withheld | 99,953,779.74 | 4.255 |
| TOTAL | 2,348,666,574.56 | 100.000 |
| John Engler | ||
| Affirmative | 2,236,225,540.43 | 95.213 |
| Withheld | 112,441,034.13 | 4.787 |
| TOTAL | 2,348,666,574.56 | 100.000 |
| Albert R. Gamper, Jr. | ||
| Affirmative | 2,233,282,894.72 | 95.088 |
| Withheld | 115,383,679.84 | 4.912 |
| TOTAL | 2,348,666,574.56 | 100.000 |
| Robert F. Gartland | ||
| Affirmative | 2,252,098,679.82 | 95.889 |
| Withheld | 96,567,894.74 | 4.111 |
| TOTAL | 2,348,666,574.56 | 100.000 |
| Abigail P. Johnson | ||
| Affirmative | 2,228,175,540.30 | 94.870 |
| Withheld | 120,491,034.26 | 5.130 |
| TOTAL | 2,348,666,574.56 | 100.000 |
| Arthur E. Johnson | ||
| Affirmative | 2,242,705,495.85 | 95.489 |
| Withheld | 105,961,078.71 | 4.511 |
| TOTAL | 2,348,666,574.56 | 100.000 |
| Michael E. Kenneally | ||
| Affirmative | 2,252,717,800.35 | 95.915 |
| Withheld | 95,948,774.21 | 4.085 |
| TOTAL | 2,348,666,574.56 | 100.000 |
| James H. Keyes | ||
| Affirmative | 2,240,251,778.43 | 95.384 |
| Withheld | 108,414,796.13 | 4.616 |
| TOTAL | 2,348,666,574.56 | 100.000 |
| Marie L. Knowles | ||
| Affirmative | 2,228,451,562.38 | 94.882 |
| Withheld | 120,215,012.18 | 5.118 |
| TOTAL | 2,348,666,574.56 | 100.000 |
| Geoffrey A. von Kuhn | ||
| Affirmative | 2,240,960,103.36 | 95.415 |
| Withheld | 107,706,471.20 | 4.585 |
| TOTAL | 2,348,666,574.56 | 100.000 |
| Proposal 1 reflects trust wide proposal and voting results. |
![]()
GEI-ANN-0416
1.855140.109
Item 2.
Code of Ethics
As of the end of the period, February 29, 2016, Fidelity Commonwealth Trust II (the “trust”) has adopted a code of ethics, as defined in Item 2 of Form N-CSR, that applies to its President and Treasurer and its Chief Financial Officer. A copy of the code of ethics is filed as an exhibit to this Form N-CSR.
Item 3.
Audit Committee Financial Expert
The Board of Trustees of the trust has determined that Elizabeth S. Acton is an audit committee financial expert, as defined in Item 3 of Form N-CSR. Ms. Acton is independent for purposes of Item 3 of Form N-CSR.
Item 4.
Principal Accountant Fees and Services
Fees and Services
The following table presents fees billed by PricewaterhouseCoopers LLP (“PwC”) in each of the last two fiscal years for services rendered to Fidelity International Enhanced Index Fund, Fidelity Large Cap Core Enhanced Index Fund, Fidelity Large Cap Growth Enhanced Index Fund, Fidelity Large Cap Value Enhanced Index Fund, Fidelity Mid Cap Enhanced Index Fund, and Fidelity Small Cap Enhanced Index Fund (the “Funds”):
Services Billed by PwC
February 29, 2016 FeesA
| Audit Fees | Audit-Related Fees | Tax Fees | All Other Fees |
Fidelity International Enhanced Index Fund | $49,000 | $- | $6,500 | $1,900 |
Fidelity Large Cap Core Enhanced Index Fund | $49,000 | $- | $6,500 | $1,900 |
Fidelity Large Cap Growth Enhanced Index Fund | $49,000 | $- | $3,700 | $1,900 |
Fidelity Large Cap Value Enhanced Index Fund | $52,000 | $- | $3,700 | $2,200 |
Fidelity Mid Cap Enhanced Index Fund | $49,000 | $- | $4,700 | $2,000 |
Fidelity Small Cap Enhanced Index Fund | $49,000 | $- | $3,700 | $2,000 |
February 28, 2015 FeesA
| Audit Fees | Audit-Related Fees | Tax Fees | All Other Fees |
Fidelity International Enhanced Index Fund | $45,000 | $- | $6,400 | $2,100 |
Fidelity Large Cap Core Enhanced Index Fund | $45,000 | $- | $8,200 | $2,200 |
Fidelity Large Cap Growth Enhanced Index Fund | $45,000 | $- | $3,600 | $2,200 |
Fidelity Large Cap Value Enhanced Index Fund | $45,000 | $- | $3,600 | $2,300 |
Fidelity Mid Cap Enhanced Index Fund | $45,000 | $- | $4,700 | $2,200 |
Fidelity Small Cap Enhanced Index Fund | $45,000 | $- | $3,600 | $2,300 |
A Amounts may reflect rounding.
The following table presents fees billed by PwC that were required to be approved by the Audit Committee for services that relate directly to the operations and financial reporting of the Funds and that are rendered on behalf of Fidelity Management & Research Company (“FMR”) and entities controlling, controlled by, or under common control with FMR (not including any sub-adviser whose role is primarily portfolio management and is subcontracted with or overseen by another investment adviser) that provide ongoing services to the Funds (“Fund Service Providers”):
Services Billed by PwC
| February 29, 2016A | February 28, 2015A |
Audit-Related Fees | $5,695,000 | $5,900,000 |
Tax Fees | $- | $- |
All Other Fees | $- | $- |
A Amounts may reflect rounding.
“Audit-Related Fees” represent fees billed for assurance and related services that are reasonably related to the performance of the Fund audit or the review of the Fund's financial statements and that are not reported under Audit Fees.
“Tax Fees” represent fees billed for tax compliance, tax advice or tax planning that relate directly to the operations and financial reporting of the Fund.
“All Other Fees” represent fees billed for services provided to the fund or Fund Service Provider, a significant portion of which are assurance related, that relate directly to the operations and financial reporting of the fund, excluding those services that are reported under Audit Fees, Audit-Related Fees or Tax Fees.
Assurance services must be performed by an independent public accountant.
* * *
The aggregate non-audit fees billed by PwC for services rendered to the Funds, FMR (not including any sub-adviser whose role is primarily portfolio management and is subcontracted with or overseen by another investment adviser), and any Fund Service Provider relating to Covered Services and Non-Covered Services (each as defined below) for each of the last two fiscal years of the Funds are as follows:
Billed By | February 29, 2016 A | February 28, 2015 A |
PwC | $6,130,000 | $8,145,000 |
A Amounts may reflect rounding.
The trust's Audit Committee has considered non-audit services that were not pre-approved that were provided by PwC to Fund Service Providers to be compatible with maintaining the independence of PwC in its audit of the Funds, taking into account representations from PwC, in accordance with Public Company Accounting Oversight Board rules, regarding its independence from the Funds and their related entities and FMR’s review of the appropriateness and permissibility under applicable law of such non-audit services prior to their provision to the Fund Service Providers.
Audit Committee Pre-Approval Policies and Procedures
The trust’s Audit Committee must pre-approve all audit and non-audit services provided by the independent registered public accounting firm relating to the operations or financial reporting of the funds. Prior to the commencement of any audit or non-audit services to a fund, the Audit Committee reviews the services to determine whether they are appropriate and permissible under applicable law.
The trust’s Audit Committee has adopted policies and procedures to, among other purposes, provide a framework for the Committee’s consideration of non-audit services by the audit firms that audit the Fidelity funds. The policies and procedures require that any non-audit service provided by a fund audit firm to the trust and any non-audit service provided by a fund auditor to a Fund Service Provider that relates directly to the operations and financial reporting of the trust (“Covered Service”) are subject to approval by the Audit Committee before such service is provided.
All Covered Services must be approved in advance of provision of the service either: (i) by formal resolution of the Audit Committee, or (ii) by oral or written approval of the service by the Chair of the Audit Committee (or if the Chair is unavailable, such other member of the Audit Committee as may be designated by the Chair to act in the Chair’s absence). The approval contemplated by (ii) above is permitted where the Treasurer determines that action on such an engagement is necessary before the next meeting of the Audit Committee.
Non-audit services provided by a fund audit firm to a Fund Service Provider that do not relate directly to the operations and financial reporting of the trust (“Non-Covered Service”) are not required to be approved, but are reported to the Audit Committee annually.
Non-Audit Services Approved Pursuant to Rule 2-01(c)(7)(i)(C) and (ii) of Regulation S-X (“De Minimis Exception”)
There were no non-audit services approved or required to be approved by the Audit Committee pursuant to the De Minimis Exception during the Funds’ last two fiscal years relating to services provided to (i) the Funds or (ii) any Fund Service Provider that relate directly to the operations and financial reporting of the Funds.
Item 5.
Audit Committee of Listed Registrants
Not applicable.
Item 6.
Investments
(a)
Not applicable.
(b)
Not applicable
Item 7.
Disclosure of Proxy Voting Policies and Procedures for Closed-End Management Investment Companies
Not applicable.
Item 8.
Portfolio Managers of Closed-End Management Investment Companies
Not applicable.
Item 9.
Purchase of Equity Securities by Closed-End Management Investment Company and Affiliated Purchasers
Not applicable.
Item 10.
Submission of Matters to a Vote of Security Holders
There were no material changes to the procedures by which shareholders may recommend nominees to the Fund’s Board of Trustees.
Item 11.
Controls and Procedures
(a)(i) The President and Treasurer and the Chief Financial Officer have concluded that the trust’s disclosure controls and procedures (as defined in Rule 30a-3(c) under the Investment Company Act) provide reasonable assurances that material information relating to the trust is made known to them by the appropriate persons, based on their evaluation of these controls and procedures as of a date within 90 days of the filing date of this report.
(a)(ii) There was no change in the trust’s internal control over financial reporting (as defined in Rule 30a-3(d) under the Investment Company Act) that occurred during the second fiscal quarter of the period covered by this report that has materially affected, or is reasonably likely to materially affect, the trust’s internal control over financial reporting.
Item 12.
Exhibits
(a) | (1) | Code of Ethics pursuant to Item 2 of Form N-CSR is filed and attached hereto as EX-99.CODE ETH. |
(a) | (2) | Certification pursuant to Rule 30a-2(a) under the Investment Company Act of 1940 (17 CFR 270.30a-2(a)) is filed and attached hereto as Exhibit 99.CERT. |
(a) | (3) | Not applicable. |
(b) |
| Certification pursuant to Rule 30a-2(b) under the Investment Company Act of 1940 (17 CFR 270.30a-2(b)) is furnished and attached hereto as Exhibit 99.906CERT. |
SIGNATURES
Pursuant to the requirements of the Securities Exchange Act of 1934 and the Investment Company Act of 1940, the registrant has duly caused this report to be signed on its behalf by the undersigned, thereunto duly authorized.
Fidelity Commonwealth Trust II
By: | /s/Stephanie J. Dorsey |
| Stephanie J. Dorsey |
| President and Treasurer |
|
|
Date: | April 26, 2016 |
Pursuant to the requirements of the Securities Exchange Act of 1934 and the Investment Company Act of 1940, this report has been signed below by the following persons on behalf of the registrant and in the capacities and on the dates indicated.
By: | /s/ Stephanie J. Dorsey |
| Stephanie J. Dorsey |
| President and Treasurer |
|
|
Date: | April 26, 2016 |
By: | /s/Howard J. Galligan III |
| Howard J. Galligan III |
| Chief Financial Officer |
|
|
Date: | April 26, 2016 |