UNITED STATES
SECURITIES AND EXCHANGE COMMISSION
Washington, D.C. 20549
FORM N-CSR
CERTIFIED SHAREHOLDER REPORT OF REGISTERED
MANAGEMENT INVESTMENT COMPANIES
Investment Company Act file number 811-21990
Fidelity Commonwealth Trust II
(Exact name of registrant as specified in charter)
245 Summer St., Boston, Massachusetts 02210
(Address of principal executive offices) (Zip code)
Marc Bryant, Secretary
245 Summer St.
Boston, Massachusetts 02210
(Name and address of agent for service)
Registrant's telephone number, including area code: 617-563-7000
Date of fiscal year end: | February 28 |
|
|
Date of reporting period: | February 28, 2013 |
Item 1. Reports to Stockholders
Fidelity® Large Cap Growth Enhanced Index Fund
Fidelity Large Cap Value Enhanced Index Fund
Fidelity Large Cap Core Enhanced Index Fund
Fidelity Mid Cap Enhanced Index Fund
Fidelity Small Cap Enhanced Index Fund
Fidelity International Enhanced Index Fund
Annual Report
(Fidelity Cover Art)
February 28, 2013
Contents
Shareholder Expense Example | An example of shareholder expenses | |
| ||
Fidelity® Large Cap Growth Enhanced Index Fund | Performance | |
| Management's Discussion | |
| Investment Changes | |
| Investments | |
| Financial Statements | |
| ||
Fidelity Large Cap Value Enhanced Index Fund | Performance | |
| Management's Discussion | |
| Investment Changes | |
| Investments | |
| Financial Statements | |
| ||
Fidelity Large Cap Core Enhanced Index Fund | Performance | |
| Management's Discussion | |
| Investment Changes | |
| Investments | |
| Financial Statements | |
|
|
|
Fidelity Mid Cap Enhanced Index Fund | Performance | |
| Management's Discussion | |
| Investment Changes | |
| Investments | |
| Financial Statements | |
| ||
Fidelity Small Cap Enhanced Index Fund | Performance | |
| Management's Discussion | |
| Investment Changes | |
| Investments | |
| Financial Statements | |
| ||
Fidelity International Enhanced Index Fund | Performance | |
| Management's Discussion | |
| Investment Changes | |
| Investments | |
| Financial Statements | |
| ||
Notes | Notes to the Financial Statements | |
Report of Independent Registered Public Accounting Firm |
| |
Trustees and Officers |
| |
Distributions |
| |
Board Approval of Investment Advisory Contracts and Management Fees |
| |
Annual Report
To view a fund's proxy voting guidelines and proxy voting record for the 12-month period ended June 30, visit http://www.fidelity.com/proxyvotingresults or visit the Securities and Exchange Commission's (SEC) web site at http://www.sec.gov. You may also call 1-800-544-8544 to request a free copy of the proxy voting guidelines.
Standard & Poor's, S&P and S&P 500 are registered service marks of The McGraw-Hill Companies, Inc. and have been licensed for use by Fidelity Distributors Corporation.
Other third-party marks appearing herein are the property of their respective owners.
All other marks appearing herein are registered or unregistered trademarks or service marks of FMR LLC or an affiliated company. © 2013 FMR LLC. All rights reserved.
This report and the financial statements contained herein are submitted for the general information of the shareholders of the funds. This report is not authorized for distribution to prospective investors in the funds unless preceded or accompanied by an effective prospectus.
A fund files its complete schedule of portfolio holdings with the SEC for the first and third quarters of each fiscal year on Form N-Q. Forms N-Q are available on the SEC's web site at http://www.sec.gov. A fund's Forms N-Q may be reviewed and copied at the SEC's Public Reference Room in Washington, DC. Information regarding the operation of the SEC's Public Reference Room may be obtained by calling 1-800-SEC-0330. For a complete list of a fund's portfolio holdings, view the most recent holdings listing, semiannual report, or annual report on Fidelity's web site at http://www.fidelity.com, http://www.advisor.fidelity.com, or http://www.401k.com, as applicable.
NOT FDIC INSURED • MAY LOSE VALUE • NO BANK GUARANTEE
Neither the funds nor Fidelity Distributors Corporation is a bank.
Annual Report
Shareholder Expense Example
As a shareholder of a Fund, you incur two types of costs: (1) transaction costs, including redemption fees and (2) ongoing costs, including management fees and other Fund expenses. This Example is intended to help you understand your ongoing costs (in dollars) of investing in the Funds and to compare these costs with the ongoing costs of investing in other mutual funds.
The Example is based on an investment of $1,000 invested at the beginning of the period and held for the entire period (September 1, 2012 to February 28, 2013).
Actual Expenses
The first line of the accompanying table for each fund provides information about actual account values and actual expenses. You may use the information in this line, together with the amount you invested, to estimate the expenses that you paid over the period. Simply divide your account value by $1,000.00 (for example, an $8,600 account value divided by $1,000.00 = 8.6), then multiply the result by the number in the first line for a fund under the heading entitled "Expenses Paid During Period" to estimate the expenses you paid on your account during this period. In addition to the direct expenses incurred by each Fund presented in the table, as a shareholder of the underlying non-affiliated funds (the Underlying Funds), each Fund also indirectly bears its proportionate share of the expenses of the Underlying Funds. These fees and expenses are not included in each Fund's annualized expense ratio used to calculate the expense estimate in the table below. A small balance maintenance fee of $12.00 that is charged once a year may apply for certain accounts with a value of less than $2,000. This fee is not included in the table below. If it was, the estimate of expenses you paid during the period would be higher, and your ending account value lower, by this amount. In addition, each Fund, as a shareholder in the underlying Fidelity Central Funds, will indirectly bear its pro-rata share of the fees and expenses incurred by the underlying Fidelity Central Funds. These fees and expenses are not included in the Fund's annualized expense ratio used to calculate the expense estimate in the table below.
Hypothetical Example for Comparison Purposes
The second line of the accompanying table for each fund provides information about hypothetical account values and hypothetical expenses based on a fund's actual expense ratio and an assumed rate of return of 5% per year before expenses, which is not the Fund's actual return. The hypothetical account values and expenses may not be used to estimate the actual ending account balance or expenses you paid for the period. You may use this information to compare the ongoing costs of investing in the Fund and other funds. To do so, compare this 5% hypothetical example with the 5% hypothetical examples that appear in the shareholder reports of the other funds. In addition to the direct expenses incurred by each Fund presented in the table, as a shareholder of the underlying non-affiliated funds (the Underlying Funds), each Fund also indirectly bears its proportionate share of the expenses of the Underlying Funds. These fees and expenses are not included in each Fund's annualized expense ratio used to calculate the expense estimate in the table below. A small balance maintenance fee of $12.00 that is charged once a year may apply for certain accounts with a value of less than $2,000. This fee is not included in the table below. If it was, the estimate of expenses you paid during the period would be higher, and your ending account value lower, by this amount. In addition, each Fund, as a shareholder in the underlying Fidelity Central Funds, will indirectly bear its pro-rata share of the fees and expenses incurred by the underlying Fidelity Central Funds. These fees and expenses are not included in the Fund's annualized expense ratio used to calculate the expense estimate in the table below.
Please note that the expenses shown in the table are meant to highlight your ongoing costs only and do not reflect any transaction costs. Therefore, the second line of the table is useful in comparing ongoing costs only, and will not help you determine the relative total costs of owning different funds. In addition, if these transactional costs were included, your costs would have been higher.
| Annualized | Beginning | Ending | Expenses Paid |
Fidelity Large Cap Growth Enhanced Index Fund | .45% |
|
|
|
Actual |
| $ 1,000.00 | $ 1,058.80 | $ 2.30 |
HypotheticalA |
| $ 1,000.00 | $ 1,022.56 | $ 2.26 |
Fidelity Large Cap Value Enhanced Index Fund | .45% |
|
|
|
Actual |
| $ 1,000.00 | $ 1,136.60 | $ 2.38 |
HypotheticalA |
| $ 1,000.00 | $ 1,022.56 | $ 2.26 |
Fidelity Large Cap Core Enhanced Index Fund | .45% |
|
|
|
Actual |
| $ 1,000.00 | $ 1,089.80 | $ 2.33 |
HypotheticalA |
| $ 1,000.00 | $ 1,022.56 | $ 2.26 |
Fidelity Mid Cap Enhanced Index Fund | .60% |
|
|
|
Actual |
| $ 1,000.00 | $ 1,144.10 | $ 3.19 |
HypotheticalA |
| $ 1,000.00 | $ 1,021.82 | $ 3.01 |
Fidelity Small Cap Enhanced Index Fund | .67% |
|
|
|
Actual |
| $ 1,000.00 | $ 1,148.90 | $ 3.57 |
HypotheticalA |
| $ 1,000.00 | $ 1,021.47 | $ 3.36 |
Fidelity International Enhanced Index Fund | .62% |
|
|
|
Actual |
| $ 1,000.00 | $ 1,139.00 | $ 3.29 |
HypotheticalA |
| $ 1,000.00 | $ 1,021.72 | $ 3.11 |
A 5% return per year before expenses
* Expenses are equal to each Fund's annualized expense ratio, multiplied by the average account value over the period, multiplied by 181/365 (to reflect the one-half year period).
Annual Report
Fidelity® Large Cap Growth Enhanced Index Fund
Performance: The Bottom Line
Average annual total return reflects the change in the value of an investment, assuming reinvestment of the fund's distributions from dividend income and capital gains (the profits earned upon the sale of securities that have grown in value, if any) and assuming a constant rate of performance each year. The $10,000 table and the fund's returns do not reflect the deduction of taxes that a shareholder would pay on fund distributions or the redemption of fund shares. During periods of reimbursement by Fidelity a fund's total returns will be greater than it would be had the reimbursement not occurred. How a fund did yesterday is no guarantee of how it will do tomorrow.
Average Annual Total Returns
Periods ended February 28, 2013 | Past 1 | Past 5 | Life of |
Fidelity Large Cap Growth Enhanced Index Fund | 9.36% | 6.27% | 4.02% |
A From April 19, 2007.
$10,000 Over Life of Fund
Let's say hypothetically that $10,000 was invested in Fidelity Large Cap Growth Enhanced Index Fund on April 19, 2007, when the fund started. The chart shows how the value of your investment would have changed, and also shows how the Russell 1000® Growth Index performed over the same period.

Annual Report
Fidelity Large Cap Growth Enhanced Index Fund
Management's Discussion of Fund Performance
Market Recap: U.S. stock markets posted solid gains for the year ending February 28, 2013, sparked by a late-period rally that pushed major equity benchmarks to multiyear highs. Improvement in the global economy and more monetary stimulus from the U.S. Federal Reserve kept markets on the upswing for much of the year, shrugging off an early decline brought on by debt woes in Europe, and another dip later in the period amid Congressional gridlock on the federal budget. Renewed optimism over employment, the housing market, corporate earnings and record dividends made stocks a favorite with investors during the 12 months, which helped push the broad-based S&P 500® Index across the milestone 1,500 mark at the end of January. The S&P 500® finished the period up 13.46%, with the blue-chip-laden Dow Jones Industrial AverageSM following suit, rising 11.51% and nearing an all-time high by period end. The technology-heavy Nasdaq Composite Index® also hit a multiyear high, despite adding a more modest 7.96%. Elsewhere, gains were broad-based, with seven of the 10 sectors in the S&P 500® posting a double-digit advance, led by telecommunication services and health care, while materials, tech and energy showed single-digit returns. Outside the U.S., foreign developed-markets stocks rose strongly, despite the headwind of a stronger U.S. dollar, with the MSCI® EAFE® Index adding 9.99%.
Comments from Maximilian Kaufmann, Senior Portfolio Manager of the Geode Capital Management, LLC, investment management team for Fidelity® Large Cap Growth Enhanced Index Fund: For the year, the fund returned 9.36%, modestly trailing the benchmark Russell 1000® Growth Index, which added 9.60%. Relative to the benchmark, the fund experienced subpar security selection in the consumer discretionary and industrials sectors. On the positive side, however, very strong stock picking in the energy and, to a lesser extent, materials sectors helped. The biggest individual detractor of the period was Dell, a poor-performing personal computer manufacturer in which the fund was overweighted. We were also hurt by exposure to for-profit higher education provider Apollo Group, whose shares were down sharply, and untimely ownership of Marvell Technology Group, a semiconductor company and out-of-benchmark position. Other disappointments included several stocks the fund owned at relatively unfavorable times, including casino gaming operator Las Vegas Sands; Cummins, a maker of power-generation equipment; and oil-field services company Halliburton. On the positive side, five of the fund's top-six individual contributors were energy stocks, led by Marathon Petroleum, an oil refiner and non-index holding whose shares were up by triple digits during the year. Various other oil-refining companies added significant value, including HollyFrontier, Phillips 66 and Western Refining - the latter two of which were not in the benchmark. Elsewhere, the fund benefited from an out-of-index allocation to PulteGroup, a homebuilder whose shares soared in response to improved conditions in the U.S. housing market. Most of the stocks I've mentioned were not in the portfolio at period end.
The views expressed above reflect those of the portfolio manager(s) only through the end of the period as stated on the cover of this report and do not necessarily represent the views of Fidelity or any other person in the Fidelity organization. Any such views are subject to change at any time based upon market or other conditions and Fidelity disclaims any responsibility to update such views. These views may not be relied on as investment advice and, because investment decisions for a Fidelity fund are based on numerous factors, may not be relied on as an indication of trading intent on behalf of any Fidelity fund.
Annual Report
Fidelity Large Cap Growth Enhanced Index Fund
Investment Changes (Unaudited)
Top Ten Stocks as of February 28, 2013 | ||
| % of fund's | % of fund's net assets |
Apple, Inc. | 5.6 | 8.5 |
Microsoft Corp. | 3.1 | 3.4 |
IBM Corp. | 3.1 | 2.7 |
Google, Inc. Class A | 2.9 | 2.6 |
Oracle Corp. | 2.1 | 2.0 |
QUALCOMM, Inc. | 1.8 | 1.1 |
Home Depot, Inc. | 1.7 | 1.0 |
PepsiCo, Inc. | 1.7 | 1.2 |
The Coca-Cola Co. | 1.7 | 1.6 |
Philip Morris International, Inc. | 1.6 | 2.2 |
| 25.3 | |
Market Sectors as of February 28, 2013 | ||
| % of fund's | % of fund's net assets |
Information Technology | 28.1 | 30.6 |
Consumer Discretionary | 15.5 | 14.7 |
Consumer Staples | 13.8 | 12.8 |
Industrials | 13.6 | 10.3 |
Health Care | 11.9 | 11.6 |
Financials | 5.7 | 3.9 |
Energy | 4.4 | 4.3 |
Materials | 3.5 | 3.7 |
Telecommunication Services | 1.4 | 2.2 |
Utilities | 0.7 | 0.9 |
Annual Report
Fidelity Large Cap Growth Enhanced Index Fund
Investments February 28, 2013
Showing Percentage of Net Assets
Common Stocks - 98.6% | |||
Shares | Value | ||
CONSUMER DISCRETIONARY - 15.5% | |||
Auto Components - 1.2% | |||
Delphi Automotive PLC | 23,450 | $ 981,383 | |
Gentex Corp. (d) | 33,714 | 632,138 | |
Visteon Corp. (a)(d) | 7,930 | 462,160 | |
| 2,075,681 | ||
Automobiles - 0.4% | |||
Ford Motor Co. | 47,112 | 594,082 | |
Distributors - 0.4% | |||
Genuine Parts Co. | 8,862 | 629,468 | |
Hotels, Restaurants & Leisure - 2.2% | |||
Bally Technologies, Inc. (a)(d) | 8,322 | 397,376 | |
International Game Technology | 37,617 | 599,615 | |
McDonald's Corp. | 17,995 | 1,725,721 | |
Starbucks Corp. | 17,749 | 973,000 | |
Yum! Brands, Inc. (d) | 1,964 | 128,603 | |
| 3,824,315 | ||
Household Durables - 0.7% | |||
Newell Rubbermaid, Inc. | 23,478 | 547,977 | |
Tupperware Brands Corp. | 8,111 | 634,524 | |
| 1,182,501 | ||
Internet & Catalog Retail - 1.5% | |||
Amazon.com, Inc. (a) | 6,164 | 1,628,960 | |
Expedia, Inc. | 1,321 | 84,333 | |
Liberty Media Corp. Interactive Series A (a) | 28,295 | 590,800 | |
priceline.com, Inc. (a) | 346 | 237,903 | |
| 2,541,996 | ||
Leisure Equipment & Products - 0.4% | |||
Polaris Industries, Inc. | 7,554 | 659,993 | |
Media - 4.1% | |||
Cinemark Holdings, Inc. | 21,187 | 588,999 | |
Comcast Corp. Class A | 42,920 | 1,707,787 | |
DIRECTV (a) | 24,859 | 1,197,458 | |
DISH Network Corp. Class A | 17,889 | 622,537 | |
Morningstar, Inc. | 2,678 | 183,657 | |
News Corp. Class A | 12,817 | 369,130 | |
The Walt Disney Co. | 5,066 | 276,553 | |
Time Warner Cable, Inc. | 13,955 | 1,205,572 | |
Viacom, Inc. Class B (non-vtg.) | 15,957 | 932,846 | |
| 7,084,539 | ||
Multiline Retail - 0.0% | |||
Target Corp. | 80 | 5,037 | |
Specialty Retail - 4.2% | |||
American Eagle Outfitters, Inc. | 29,338 | 606,710 | |
Foot Locker, Inc. | 5,896 | 201,584 | |
Gap, Inc. (d) | 23,017 | 757,720 | |
Home Depot, Inc. | 43,423 | 2,974,476 | |
Lowe's Companies, Inc. | 17,588 | 670,982 | |
O'Reilly Automotive, Inc. (a) | 100 | 10,174 | |
| |||
Shares | Value | ||
PetSmart, Inc. (d) | 11,047 | $ 719,270 | |
TJX Companies, Inc. | 29,142 | 1,310,516 | |
| 7,251,432 | ||
Textiles, Apparel & Luxury Goods - 0.4% | |||
Coach, Inc. | 7,459 | 360,493 | |
NIKE, Inc. Class B | 7,045 | 383,671 | |
| 744,164 | ||
TOTAL CONSUMER DISCRETIONARY | 26,593,208 | ||
CONSUMER STAPLES - 13.8% | |||
Beverages - 3.4% | |||
PepsiCo, Inc. | 38,841 | 2,942,983 | |
The Coca-Cola Co. | 72,431 | 2,804,528 | |
| 5,747,511 | ||
Food & Staples Retailing - 2.9% | |||
Costco Wholesale Corp. | 4,583 | 464,212 | |
CVS Caremark Corp. | 16,757 | 856,618 | |
Kroger Co. | 31,599 | 923,007 | |
Wal-Mart Stores, Inc. | 38,066 | 2,694,311 | |
| 4,938,148 | ||
Food Products - 2.4% | |||
Campbell Soup Co. (d) | 15,546 | 639,873 | |
Hillshire Brands Co. | 14,720 | 476,928 | |
Hormel Foods Corp. (d) | 17,256 | 645,547 | |
Ingredion, Inc. | 8,062 | 533,704 | |
Kraft Foods Group, Inc. | 13,286 | 643,972 | |
Mondelez International, Inc. | 13,826 | 382,289 | |
The Hershey Co. (d) | 10,321 | 860,152 | |
| 4,182,465 | ||
Household Products - 2.6% | |||
Church & Dwight Co., Inc. | 11,499 | 712,478 | |
Colgate-Palmolive Co. (d) | 13,149 | 1,504,640 | |
Kimberly-Clark Corp. | 13,838 | 1,304,647 | |
Procter & Gamble Co. | 12,064 | 919,036 | |
| 4,440,801 | ||
Tobacco - 2.5% | |||
Altria Group, Inc. | 46,195 | 1,549,842 | |
Philip Morris International, Inc. | 29,687 | 2,723,782 | |
| 4,273,624 | ||
TOTAL CONSUMER STAPLES | 23,582,549 | ||
ENERGY - 4.4% | |||
Energy Equipment & Services - 1.7% | |||
Diamond Offshore Drilling, Inc. (d) | 6,955 | 484,624 | |
Helmerich & Payne, Inc. | 9,280 | 614,893 | |
Schlumberger Ltd. | 23,188 | 1,805,186 | |
| 2,904,703 | ||
Oil, Gas & Consumable Fuels - 2.7% | |||
Chevron Corp. | 5,045 | 591,022 | |
Common Stocks - continued | |||
Shares | Value | ||
ENERGY - continued | |||
Oil, Gas & Consumable Fuels - continued | |||
CVR Energy, Inc. | 10,774 | $ 605,283 | |
Delek US Holdings, Inc. | 17,579 | 656,751 | |
EOG Resources, Inc. | 2,124 | 267,008 | |
Exxon Mobil Corp. | 6,241 | 558,882 | |
HollyFrontier Corp. | 11,399 | 640,624 | |
Marathon Petroleum Corp. | 8,961 | 742,688 | |
Phillips 66 | 9,647 | 607,375 | |
Western Refining, Inc. | 582 | 20,888 | |
| 4,690,521 | ||
TOTAL ENERGY | 7,595,224 | ||
FINANCIALS - 5.7% | |||
Capital Markets - 1.7% | |||
Franklin Resources, Inc. | 4,705 | 664,581 | |
Goldman Sachs Group, Inc. | 4,059 | 607,876 | |
LPL Financial | 8,559 | 269,865 | |
Raymond James Financial, Inc. (d) | 2,083 | 91,402 | |
SEI Investments Co. | 22,927 | 648,146 | |
Waddell & Reed Financial, Inc. Class A (d) | 14,961 | 613,700 | |
| 2,895,570 | ||
Commercial Banks - 0.5% | |||
Fifth Third Bancorp | 18,694 | 296,113 | |
Wells Fargo & Co. | 15,343 | 538,232 | |
| 834,345 | ||
Consumer Finance - 1.2% | |||
American Express Co. (d) | 23,765 | 1,476,995 | |
Discover Financial Services | 14,742 | 568,009 | |
| 2,045,004 | ||
Diversified Financial Services - 0.4% | |||
CBOE Holdings, Inc. | 18,950 | 680,684 | |
Insurance - 1.0% | |||
Allied World Assurance Co. Holdings Ltd. | 6,691 | 587,537 | |
The Travelers Companies, Inc. | 6,318 | 508,094 | |
Validus Holdings Ltd. | 17,435 | 621,209 | |
| 1,716,840 | ||
Real Estate Investment Trusts - 0.9% | |||
American Tower Corp. | 2,102 | 163,115 | |
Extra Space Storage, Inc. | 15,248 | 570,885 | |
Public Storage | 3,278 | 495,666 | |
Simon Property Group, Inc. | 2,520 | 400,327 | |
| 1,629,993 | ||
TOTAL FINANCIALS | 9,802,436 | ||
| |||
Shares | Value | ||
HEALTH CARE - 11.9% | |||
Biotechnology - 2.7% | |||
Amgen, Inc. | 24,335 | $ 2,224,462 | |
Biogen Idec, Inc. (a) | 2,086 | 346,985 | |
Celgene Corp. (a) | 4,677 | 482,573 | |
Gilead Sciences, Inc. (a) | 21,334 | 911,175 | |
Myriad Genetics, Inc. (a) | 6,406 | 162,841 | |
United Therapeutics Corp. (a)(d) | 8,017 | 479,497 | |
| 4,607,533 | ||
Health Care Equipment & Supplies - 3.2% | |||
Abbott Laboratories | 51,245 | 1,731,569 | |
Baxter International, Inc. | 19,380 | 1,310,088 | |
Medtronic, Inc. | 13,304 | 598,148 | |
St. Jude Medical, Inc. (d) | 18,818 | 771,538 | |
Thoratec Corp. (a) | 15,991 | 563,043 | |
Zimmer Holdings, Inc. (d) | 7,516 | 563,399 | |
| 5,537,785 | ||
Health Care Providers & Services - 2.6% | |||
Aetna, Inc. | 10,485 | 494,787 | |
AmerisourceBergen Corp. | 17,504 | 826,189 | |
Cardinal Health, Inc. | 16,446 | 759,970 | |
Express Scripts Holding Co. (a) | 8,445 | 480,605 | |
McKesson Corp. | 10,554 | 1,120,096 | |
UnitedHealth Group, Inc. | 2,723 | 145,544 | |
WellPoint, Inc. | 9,364 | 582,254 | |
| 4,409,445 | ||
Life Sciences Tools & Services - 0.0% | |||
Charles River Laboratories International, Inc. (a) | 200 | 8,148 | |
Pharmaceuticals - 3.4% | |||
AbbVie, Inc. | 44,286 | 1,635,039 | |
Allergan, Inc. | 1,731 | 187,675 | |
Bristol-Myers Squibb Co. (d) | 19,970 | 738,291 | |
Eli Lilly & Co. | 18,800 | 1,027,608 | |
Johnson & Johnson | 21,795 | 1,658,817 | |
Warner Chilcott PLC | 42,582 | 575,283 | |
| 5,822,713 | ||
TOTAL HEALTH CARE | 20,385,624 | ||
INDUSTRIALS - 13.6% | |||
Aerospace & Defense - 3.5% | |||
Honeywell International, Inc. | 10,363 | 726,446 | |
Lockheed Martin Corp. | 10,816 | 951,808 | |
Northrop Grumman Corp. | 8,549 | 561,498 | |
Precision Castparts Corp. | 472 | 88,070 | |
Raytheon Co. | 8,514 | 464,609 | |
The Boeing Co. | 23,355 | 1,796,000 | |
United Technologies Corp. | 14,908 | 1,349,919 | |
| 5,938,350 | ||
Air Freight & Logistics - 0.4% | |||
United Parcel Service, Inc. Class B | 9,424 | 778,894 | |
Common Stocks - continued | |||
Shares | Value | ||
INDUSTRIALS - continued | |||
Airlines - 0.7% | |||
Copa Holdings SA Class A | 5,634 | $ 588,302 | |
Southwest Airlines Co. | 50,141 | 586,650 | |
| 1,174,952 | ||
Commercial Services & Supplies - 0.5% | |||
Avery Dennison Corp. | 5,870 | 239,790 | |
Cintas Corp. (d) | 13,580 | 596,162 | |
| 835,952 | ||
Electrical Equipment - 1.4% | |||
Emerson Electric Co. | 23,988 | 1,360,120 | |
Hubbell, Inc. Class B | 6,718 | 624,169 | |
Rockwell Automation, Inc. | 5,170 | 467,058 | |
| 2,451,347 | ||
Industrial Conglomerates - 1.4% | |||
3M Co. | 19,299 | 2,007,096 | |
General Electric Co. | 15,186 | 352,619 | |
| 2,359,715 | ||
Machinery - 3.4% | |||
Caterpillar, Inc. (d) | 8,871 | 819,414 | |
Deere & Co. | 15,634 | 1,373,134 | |
Illinois Tool Works, Inc. (d) | 18,367 | 1,129,571 | |
Lincoln Electric Holdings, Inc. | 11,694 | 655,449 | |
Toro Co. | 14,261 | 643,171 | |
WABCO Holdings, Inc. (a) | 8,609 | 591,610 | |
Wabtec Corp. | 6,679 | 653,139 | |
| 5,865,488 | ||
Marine - 0.3% | |||
Matson, Inc. | 20,713 | 532,531 | |
Professional Services - 0.8% | |||
Equifax, Inc. | 12,358 | 681,173 | |
Robert Half International, Inc. | 18,154 | 645,375 | |
| 1,326,548 | ||
Road & Rail - 1.2% | |||
Union Pacific Corp. | 14,593 | 2,000,846 | |
TOTAL INDUSTRIALS | 23,264,623 | ||
INFORMATION TECHNOLOGY - 28.1% | |||
Communications Equipment - 3.0% | |||
Arris Group, Inc. (a) | 284 | 4,927 | |
Cisco Systems, Inc. | 26,175 | 545,749 | |
Harris Corp. | 12,382 | 595,203 | |
Motorola Solutions, Inc. | 13,775 | 856,943 | |
QUALCOMM, Inc. | 47,032 | 3,086,710 | |
| 5,089,532 | ||
Computers & Peripherals - 6.4% | |||
Apple, Inc. | 21,897 | 9,665,335 | |
| |||
Shares | Value | ||
EMC Corp. (a) | 27,357 | $ 629,485 | |
Western Digital Corp. | 14,319 | 675,284 | |
| 10,970,104 | ||
Internet Software & Services - 3.7% | |||
AOL, Inc. (d) | 15,921 | 587,485 | |
eBay, Inc. (a) | 16,420 | 897,846 | |
Google, Inc. Class A (a) | 6,115 | 4,899,338 | |
| 6,384,669 | ||
IT Services - 7.3% | |||
Accenture PLC Class A | 6,720 | 499,699 | |
Amdocs Ltd. | 14,791 | 539,428 | |
Automatic Data Processing, Inc. | 2,599 | 159,475 | |
Booz Allen Hamilton Holding Corp. Class A (d) | 33,289 | 426,099 | |
Broadridge Financial Solutions, Inc. | 27,293 | 626,374 | |
DST Systems, Inc. | 100 | 6,792 | |
Fidelity National Information Services, Inc. | 7,404 | 278,761 | |
Genpact Ltd. | 1,823 | 32,103 | |
IBM Corp. | 26,197 | 5,261,144 | |
Jack Henry & Associates, Inc. | 14,069 | 615,097 | |
MasterCard, Inc. Class A | 3,444 | 1,783,372 | |
Total System Services, Inc. | 25,963 | 616,881 | |
Visa, Inc. Class A | 10,168 | 1,613,052 | |
| 12,458,277 | ||
Office Electronics - 0.1% | |||
Zebra Technologies Corp. Class A (a) | 3,706 | 165,732 | |
Semiconductors & Semiconductor Equipment - 2.1% | |||
Avago Technologies Ltd. | 20,492 | 701,236 | |
Intel Corp. | 110,198 | 2,297,628 | |
Maxim Integrated Products, Inc. | 19,812 | 617,738 | |
| 3,616,602 | ||
Software - 5.5% | |||
CA Technologies, Inc. | 23,854 | 584,184 | |
Microsoft Corp. | 191,057 | 5,311,385 | |
Oracle Corp. | 102,720 | 3,519,187 | |
| 9,414,756 | ||
TOTAL INFORMATION TECHNOLOGY | 48,099,672 | ||
MATERIALS - 3.5% | |||
Chemicals - 3.3% | |||
CF Industries Holdings, Inc. | 2,786 | 559,512 | |
E.I. du Pont de Nemours & Co. (d) | 32,550 | 1,559,145 | |
LyondellBasell Industries NV Class A | 8,933 | 523,652 | |
Monsanto Co. | 17,315 | 1,749,334 | |
NewMarket Corp. (d) | 2,148 | 540,587 | |
Praxair, Inc. | 1,889 | 213,551 | |
Westlake Chemical Corp. | 5,964 | 514,216 | |
| 5,659,997 | ||
Common Stocks - continued | |||
Shares | Value | ||
MATERIALS - continued | |||
Containers & Packaging - 0.2% | |||
Silgan Holdings, Inc. | 7,924 | $ 340,177 | |
TOTAL MATERIALS | 6,000,174 | ||
TELECOMMUNICATION SERVICES - 1.4% | |||
Diversified Telecommunication Services - 1.4% | |||
Verizon Communications, Inc. | 52,425 | 2,439,335 | |
UTILITIES - 0.7% | |||
Electric Utilities - 0.3% | |||
Cleco Corp. (d) | 12,259 | 543,074 | |
Independent Power Producers & Energy Traders - 0.2% | |||
Black Hills Corp. | 9,777 | 406,625 | |
Multi-Utilities - 0.2% | |||
CenterPoint Energy, Inc. | 12,874 | 275,890 | |
TOTAL UTILITIES | 1,225,589 | ||
TOTAL COMMON STOCKS (Cost $145,345,571) |
| ||
U.S. Treasury Obligations - 0.1% | ||||
| Principal |
| ||
U.S. Treasury Bills, yield at date of purchase 0.12% to 0.12% 6/27/13 to 8/22/13 (e) | $ 200,000 |
| ||
Money Market Funds - 11.0% | |||
Shares |
| ||
Dreyfus Cash Management Institutional Shares, 0.10% (f) | 2,156,245 | 2,156,245 | |
Fidelity Securities Lending Cash Central Fund, 0.16% (b)(c) | 16,614,250 | 16,614,250 | |
TOTAL MONEY MARKET FUNDS (Cost $18,770,495) |
| ||
TOTAL INVESTMENT PORTFOLIO - 109.7% (Cost $164,315,970) | 187,958,833 | ||
NET OTHER ASSETS (LIABILITIES) - (9.7)% | (16,566,873) | ||
NET ASSETS - 100% | $ 171,391,960 | ||
Futures Contracts | |||||
Expiration | Underlying | Unrealized | |||
Purchased | |||||
Equity Index Contracts | |||||
31 CME E-mini S&P 500 Index Contracts | March 2013 | $ 2,345,615 | $ 21,731 | ||
|
The face value of futures purchased as a percentage of net assets is 1.4% |
Legend |
(a) Non-income producing |
(b) Affiliated fund that is generally available only to investment companies and other accounts managed by Fidelity Investments. The rate quoted is the annualized seven-day yield of the fund at period end. A complete unaudited listing of the fund's holdings as of its most recent quarter end is available upon request. In addition, each Fidelity Central Fund's financial statements, which are not covered by the Fund's Report of Independent Registered Public Accounting Firm, are available on the SEC's website or upon request. |
(c) Investment made with cash collateral received from securities on loan. |
(d) Security or a portion of the security is on loan at period end. |
(e) Security or a portion of the security was pledged to cover margin requirements for futures contracts. At the period end, the value of securities pledged amounted to $159,928. |
(f) The rate quoted is the annualized seven-day yield at period end. |
Affiliated Central Funds |
Information regarding fiscal year to date income earned by the Fund from investments in Fidelity Central Funds is as follows: |
Fund | Income earned |
Fidelity Securities Lending Cash Central Fund | $ 27,021 |
Other Information |
The following is a summary of the inputs used, as of February 28, 2013, involving the Fund's assets and liabilities carried at fair value. The inputs or methodology used for valuing securities may not be an indication of the risk associated with investing in those securities. For more information on valuation inputs, and their aggregation into the levels used in the table below, please refer to the Investment Valuation section in the accompanying Notes to Financial Statements. |
Valuation Inputs at Reporting Date: | ||||
Description | Total | Level 1 | Level 2 | Level 3 |
Investments in Securities: | ||||
Equities: | ||||
Consumer Discretionary | $ 26,593,208 | $ 26,593,208 | $ - | $ - |
Consumer Staples | 23,582,549 | 23,582,549 | - | - |
Energy | 7,595,224 | 7,595,224 | - | - |
Financials | 9,802,436 | 9,802,436 | - | - |
Health Care | 20,385,624 | 20,385,624 | - | - |
Industrials | 23,264,623 | 23,264,623 | - | - |
Information Technology | 48,099,672 | 48,099,672 | - | - |
Materials | 6,000,174 | 6,000,174 | - | - |
Telecommunication Services | 2,439,335 | 2,439,335 | - | - |
Utilities | 1,225,589 | 1,225,589 | - | - |
U.S. Government and Government Agency Obligations | 199,904 | - | 199,904 | - |
Money Market Funds | 18,770,495 | 18,770,495 | - | - |
Total Investments in Securities: | $ 187,958,833 | $ 187,758,929 | $ 199,904 | $ - |
Derivative Instruments: | ||||
Assets | ||||
Futures Contracts | $ 21,731 | $ 21,731 | $ - | $ - |
Value of Derivative Instruments |
The following table is a summary of the Fund's value of derivative instruments by primary risk exposure as of February 28, 2013. For additional information on derivative instruments, please refer to the Derivative Instruments section in the accompanying Notes to Financial Statements. |
Primary Risk Exposure / | Value | |
| Asset | Liability |
Equity Risk | ||
Futures Contracts (a) | $ 21,731 | $ - |
Total Value of Derivatives | $ 21,731 | $ - |
(a) Reflects cumulative appreciation/(depreciation) on futures contracts as disclosed on the Schedule of Investments. Only the period end variation margin is separately disclosed on the Statement of Assets and Liabilities. |
See accompanying notes which are an integral part of the financial statements.
Annual Report
Fidelity Large Cap Growth Enhanced Index Fund
Financial Statements
Statement of Assets and Liabilities
| February 28, 2013 | |
|
|
|
Assets | ||
Investment in securities, at value (including securities loaned of $16,288,005) - See accompanying schedule: Unaffiliated issuers (cost $147,701,720) | $ 171,344,583 |
|
Fidelity Central Funds (cost $16,614,250) | 16,614,250 |
|
Total Investments (cost $164,315,970) |
| $ 187,958,833 |
Receivable for fund shares sold | 86,984 | |
Dividends receivable | 380,503 | |
Interest receivable | 64 | |
Distributions receivable from Fidelity Central Funds | 1,224 | |
Total assets | 188,427,608 | |
|
|
|
Liabilities | ||
Payable for fund shares redeemed | 352,445 | |
Accrued management fee | 42,840 | |
Payable for daily variation margin on futures contracts | 4,693 | |
Other affiliated payables | 21,420 | |
Collateral on securities loaned, at value | 16,614,250 | |
Total liabilities | 17,035,648 | |
|
|
|
Net Assets | $ 171,391,960 | |
Net Assets consist of: |
| |
Paid in capital | $ 144,586,623 | |
Undistributed net investment income | 553,491 | |
Accumulated undistributed net realized gain (loss) on investments | 2,587,252 | |
Net unrealized appreciation (depreciation) on investments | 23,664,594 | |
Net Assets, for 14,566,604 shares outstanding | $ 171,391,960 | |
Net Asset Value, offering price and redemption price per share ($171,391,960 ÷ 14,566,604 shares) | $ 11.77 | |
Statement of Operations
| Year ended February 28, 2013 | |
|
|
|
Investment Income |
|
|
Dividends |
| $ 3,602,571 |
Interest |
| 3,070 |
Income from Fidelity Central Funds |
| 27,021 |
Total income |
| 3,632,662 |
|
|
|
Expenses | ||
Management fee | $ 483,759 | |
Transfer agent fees | 242,868 | |
Independent trustees' compensation | 1,906 | |
Miscellaneous | 402 | |
Total expenses before reductions | 728,935 | |
Expense reductions | (33) | 728,902 |
Net investment income (loss) | 2,903,760 | |
Realized and Unrealized Gain (Loss) Net realized gain (loss) on: | ||
Investment securities: |
|
|
Unaffiliated issuers | 6,127,050 | |
Futures contracts | 348,303 | |
Total net realized gain (loss) |
| 6,475,353 |
Change in net unrealized appreciation (depreciation) on: Investment securities | 4,989,871 | |
Futures contracts | 19,727 | |
Total change in net unrealized appreciation (depreciation) |
| 5,009,598 |
Net gain (loss) | 11,484,951 | |
Net increase (decrease) in net assets resulting from operations | $ 14,388,711 | |
See accompanying notes which are an integral part of the financial statements.
Annual Report
Statement of Changes in Net Assets
| Year ended | Year ended |
Increase (Decrease) in Net Assets |
|
|
Operations |
|
|
Net investment income (loss) | $ 2,903,760 | $ 1,142,947 |
Net realized gain (loss) | 6,475,353 | 3,448,006 |
Change in net unrealized appreciation (depreciation) | 5,009,598 | 6,196,939 |
Net increase (decrease) in net assets resulting from operations | 14,388,711 | 10,787,892 |
Distributions to shareholders from net investment income | (2,493,084) | (1,003,885) |
Share transactions | 80,543,311 | 100,274,570 |
Reinvestment of distributions | 2,387,285 | 950,430 |
Cost of shares redeemed | (65,260,416) | (37,297,717) |
Net increase (decrease) in net assets resulting from share transactions | 17,670,180 | 63,927,283 |
Total increase (decrease) in net assets | 29,565,807 | 73,711,290 |
|
|
|
Net Assets | ||
Beginning of period | 141,826,153 | 68,114,863 |
End of period (including undistributed net investment income of $553,491 and undistributed net investment income of $247,352, respectively) | $ 171,391,960 | $ 141,826,153 |
Other Information Shares | ||
Sold | 7,227,786 | 9,925,533 |
Issued in reinvestment of distributions | 217,076 | 95,150 |
Redeemed | (5,855,594) | (3,727,897) |
Net increase (decrease) | 1,589,268 | 6,292,786 |
Financial Highlights
Years ended February 28, | 2013 | 2012 F | 2011 | 2010 | 2009 |
Selected Per-Share Data |
|
|
|
|
|
Net asset value, beginning of period | $ 10.93 | $ 10.19 | $ 8.44 | $ 5.60 | $ 9.25 |
Income from Investment Operations |
|
|
|
|
|
Net investment income (loss) B | .20 | .13 | .11 | .11 | .09 |
Net realized and unrealized gain (loss) | .81 | .72 | 1.75 | 2.83 | (3.65) |
Total from investment operations | 1.01 | .85 | 1.86 | 2.94 | (3.56) |
Distributions from net investment income | (.17) | (.11) | (.11) | (.10) | (.09) |
Net asset value, end of period | $ 11.77 | $ 10.93 | $ 10.19 | $ 8.44 | $ 5.60 |
Total Return A | 9.36% | 8.40% | 22.14% | 52.50% | (38.61)% |
Ratios to Average Net Assets C, E |
|
|
|
|
|
Expenses before reductions | .45% | .45% | .45% | .45% | .45% |
Expenses net of fee waivers, if any | .45% | .45% | .45% | .45% | .45% |
Expenses net of all reductions | .45% | .45% | .45% | .45% | .45% |
Net investment income (loss) | 1.80% | 1.30% | 1.25% | 1.42% | 1.14% |
Supplemental Data |
|
|
|
|
|
Net assets, end of period (000 omitted) | $ 171,392 | $ 141,826 | $ 68,115 | $ 49,812 | $ 22,104 |
Portfolio turnover rate D | 87% | 77% | 80% | 35% G | 58% G |
A Total returns would have been lower if certain expenses had not been reduced during the applicable periods shown.
B Calculated based on average shares outstanding during the period.
C Fees and expenses of any underlying funds and Fidelity Central Funds are not included in the Fund's expense ratio. The Fund indirectly bears its proportionate share of the expenses of any underlying funds and Fidelity Central Funds.
D Amount does not include the portfolio activity of any underlying funds and Fidelity Central Funds.
E Expense ratios reflect operating expenses of the Fund. Expenses before reductions do not reflect amounts reimbursed by the investment adviser or reductions from expense offset arrangements and do not represent the amount paid by the Fund during periods when reimbursements or reductions occur. Expenses net of fee waivers reflect expenses after reimbursement by the investment adviser but prior to reductions from expense offset arrangements. Expenses net of all reductions represent the net expenses paid by the Fund.
F For the year ended February 29.
G Reflects adjustments to exclude transactions in money market mutual funds.
See accompanying notes which are an integral part of the financial statements.
Annual Report
Fidelity Large Cap Value Enhanced Index Fund
Performance: The Bottom Line
Average annual total return reflects the change in the value of an investment, assuming reinvestment of the fund's distributions from dividend income and capital gains (the profits earned upon the sale of securities that have grown in value, if any) and assuming a constant rate of performance each year. The $10,000 table and the fund's returns do not reflect the deduction of taxes that a shareholder would pay on fund distributions or the redemption of fund shares. During periods of reimbursement by Fidelity a fund's total returns will be greater than it would be had the reimbursement not occurred. How a fund did yesterday is no guarantee of how it will do tomorrow.
Average Annual Total Returns
Periods ended February 28, 2013 | Past 1 | Past 5 | Life of |
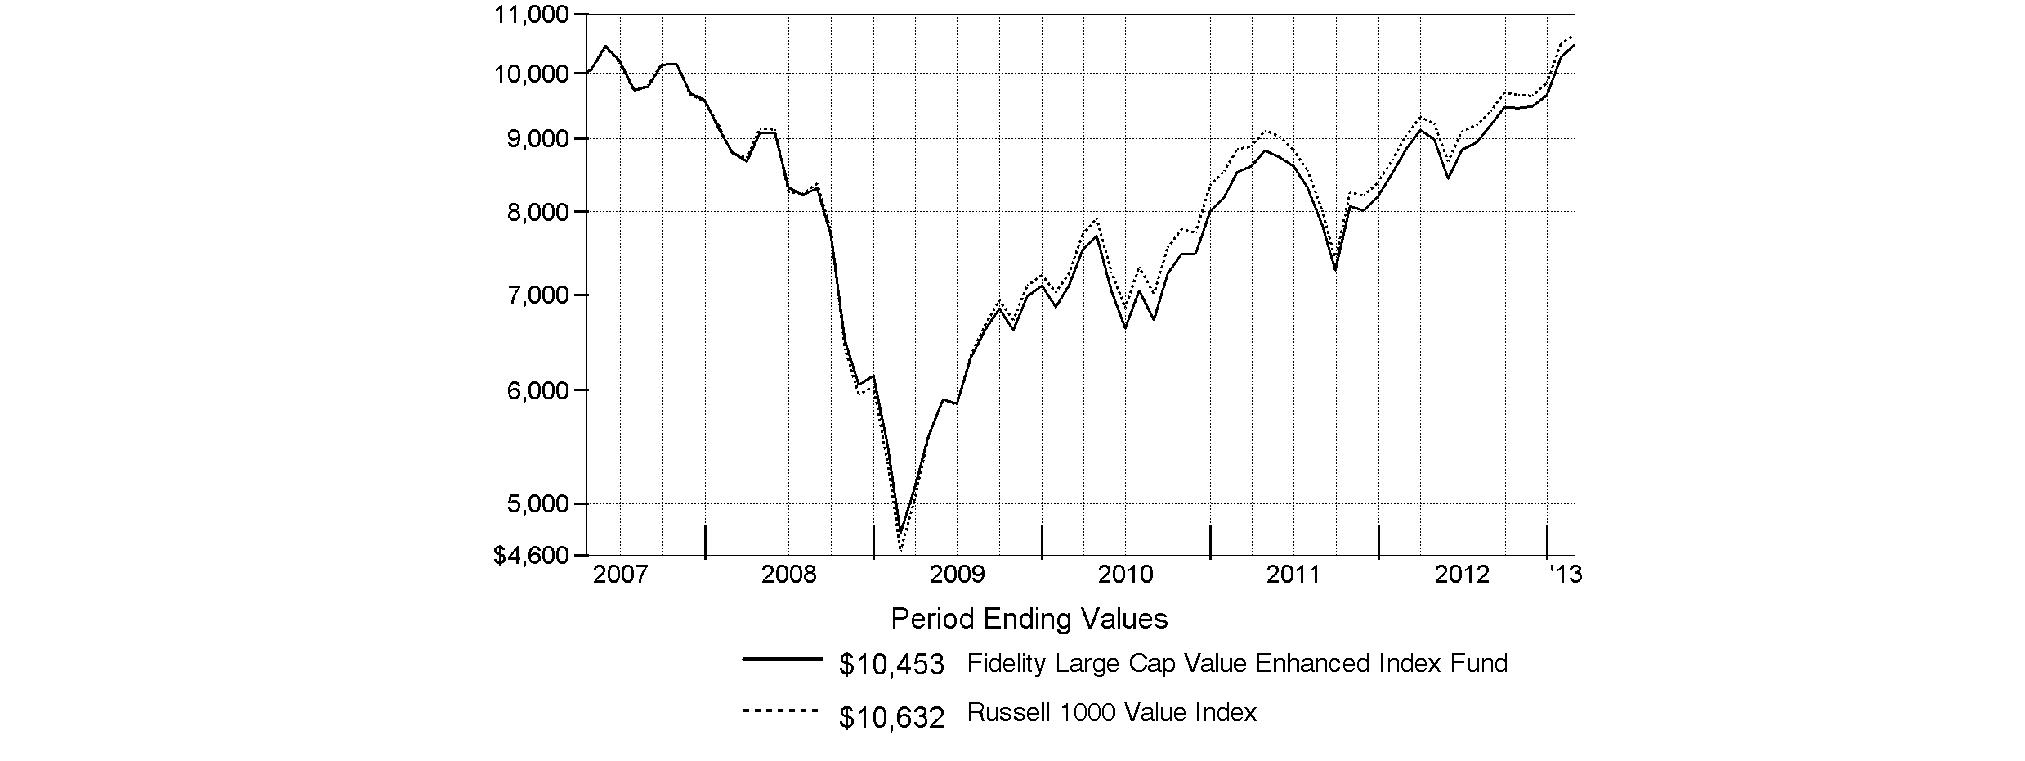
Fidelity Large Cap Value Enhanced Index Fund | 18.38% | 3.50% | 0.76% |
A From April 19, 2007.
$10,000 Over Life of Fund
Let's say hypothetically that $10,000 was invested in Fidelity Large Cap Value Enhanced Index Fund on April 19, 2007, when the fund started. The chart shows how the value of your investment would have changed, and also shows how the Russell 1000 Value Index performed over the same period.
Annual Report
Fidelity Large Cap Value Enhanced Index Fund
Management's Discussion of Fund Performance
Market Recap: U.S. stock markets posted solid gains for the year ending February 28, 2013, sparked by a late-period rally that pushed major equity benchmarks to multiyear highs. Improvement in the global economy and more monetary stimulus from the U.S. Federal Reserve kept markets on the upswing for much of the year, shrugging off an early decline brought on by debt woes in Europe, and another dip later in the period amid Congressional gridlock on the federal budget. Renewed optimism over employment, the housing market, corporate earnings and record dividends made stocks a favorite with investors during the 12 months, which helped push the broad-based S&P 500® Index across the milestone 1,500 mark at the end of January. The S&P 500® finished the period up 13.46%, with the blue-chip-laden Dow Jones Industrial AverageSM following suit, rising 11.51% and nearing an all-time high by period end. The technology-heavy Nasdaq Composite Index® also hit a multiyear high, despite adding a more modest 7.96%. Elsewhere, gains were broad-based, with seven of the 10 sectors in the S&P 500® posting a double-digit advance, led by telecommunication services and health care, while materials, tech and energy showed single-digit returns. Outside the U.S., foreign developed-markets stocks rose strongly, despite the headwind of a stronger U.S. dollar, with the MSCI® EAFE® Index adding 9.99%.
Comments from Maximilian Kaufmann, Senior Portfolio Manager of the Geode Capital Management, LLC, investment management team for Fidelity® Large Cap Value Enhanced Index Fund: For the year, the fund returned 18.38%, outpacing the benchmark Russell 1000® Value Index, which added 17.63%. Relative to the benchmark, the fund had very strong stock picking in the energy sector and, to a somewhat lesser extent, in financials and materials. In contrast, security selection was subpar in health care, information technology - especially the software/services industry - and industrials. The fund's top-six individual contributors were all energy stocks, led by Marathon Petroleum, an oil refiner whose shares were up by triple digits during the year. Various other oil-refining companies added significant value, including Phillips 66, Tesoro, Valero Energy and HollyFrontier. Further contributing were significant underweightings in two energy stocks that performed relatively poorly - Apache and Devon Energy. Elsewhere, the fund's significant underweighting in Newmont Mining, one of the world's largest gold producers, also helped, given the stock's poor showing. In contrast, the biggest individual detractor was untimely positioning in diversified financials firm Morgan Stanley. With Sprint Nextel, a telecommunication services provider, we did not own the stock until September and therefore missed out on its strong advance during the first seven months of the period. Other detractors were overweightings in poor-performing Marvell Technology Group, a semiconductor company, and health insurance provider Humana. Newmont and Devon were not held at period end.
The views expressed above reflect those of the portfolio manager(s) only through the end of the period as stated on the cover of this report and do not necessarily represent the views of Fidelity or any other person in the Fidelity organization. Any such views are subject to change at any time based upon market or other conditions and Fidelity disclaims any responsibility to update such views. These views may not be relied on as investment advice and, because investment decisions for a Fidelity fund are based on numerous factors, may not be relied on as an indication of trading intent on behalf of any Fidelity fund.
Annual Report
Fidelity Large Cap Value Enhanced Index Fund
Investment Changes (Unaudited)
Top Ten Stocks as of February 28, 2013 | ||
| % of fund's | % of fund's net assets |
Exxon Mobil Corp. | 5.3 | 5.2 |
General Electric Co. | 3.3 | 3.4 |
Chevron Corp. | 3.1 | 3.4 |
Procter & Gamble Co. | 2.6 | 2.0 |
JPMorgan Chase & Co. | 2.6 | 2.4 |
Pfizer, Inc. | 2.4 | 2.4 |
Wells Fargo & Co. | 2.3 | 2.6 |
AT&T, Inc. | 2.2 | 2.6 |
Johnson & Johnson | 2.1 | 1.7 |
Berkshire Hathaway, Inc. Class B | 1.8 | 1.7 |
| 27.7 | |
Market Sectors as of February 28, 2013 | ||
| % of fund's | % of fund's net assets |
Financials | 27.3 | 24.6 |
Energy | 15.0 | 16.7 |
Health Care | 11.1 | 11.9 |
Industrials | 9.8 | 8.0 |
Consumer Staples | 7.9 | 8.0 |
Consumer Discretionary | 7.0 | 7.1 |
Utilities | 6.8 | 7.6 |
Information Technology | 6.2 | 7.5 |
Materials | 2.6 | 2.8 |
Telecommunication Services | 2.4 | 3.1 |
Annual Report
Fidelity Large Cap Value Enhanced Index Fund
Investments February 28, 2013
Showing Percentage of Net Assets
Common Stocks - 96.1% | |||
Shares | Value | ||
CONSUMER DISCRETIONARY - 7.0% | |||
Auto Components - 1.2% | |||
Delphi Automotive PLC | 10,310 | $ 431,474 | |
Gentex Corp. (e) | 2,855 | 53,531 | |
Lear Corp. | 8,195 | 437,777 | |
Visteon Corp. (a) | 6,478 | 377,538 | |
| 1,300,320 | ||
Automobiles - 0.9% | |||
Ford Motor Co. | 74,477 | 939,155 | |
Diversified Consumer Services - 0.1% | |||
Service Corp. International | 8,675 | 134,810 | |
Household Durables - 0.8% | |||
Leggett & Platt, Inc. (e) | 13,467 | 411,821 | |
Newell Rubbermaid, Inc. | 18,009 | 420,330 | |
| 832,151 | ||
Internet & Catalog Retail - 0.4% | |||
Liberty Media Corp. Interactive Series A (a) | 21,488 | 448,669 | |
Media - 2.5% | |||
Comcast Corp. Class A | 25,732 | 1,023,876 | |
DISH Network Corp. Class A | 1,438 | 50,042 | |
News Corp. Class A | 15,315 | 441,072 | |
The Walt Disney Co. | 8,707 | 475,315 | |
Time Warner Cable, Inc. | 4,177 | 360,851 | |
Time Warner, Inc. | 6,046 | 321,466 | |
| 2,672,622 | ||
Multiline Retail - 0.2% | |||
Target Corp. (e) | 2,763 | 173,958 | |
Specialty Retail - 0.9% | |||
Foot Locker, Inc. | 843 | 28,822 | |
Home Depot, Inc. | 5,858 | 401,273 | |
Lowe's Companies, Inc. | 10,946 | 417,590 | |
PetSmart, Inc. | 1,543 | 100,465 | |
| 948,150 | ||
TOTAL CONSUMER DISCRETIONARY | 7,449,835 | ||
CONSUMER STAPLES - 7.9% | |||
Beverages - 0.5% | |||
PepsiCo, Inc. | 4,251 | 322,098 | |
The Coca-Cola Co. | 4,074 | 157,745 | |
| 479,843 | ||
Food & Staples Retailing - 1.6% | |||
CVS Caremark Corp. | 19,927 | 1,018,668 | |
Kroger Co. | 7,400 | 216,154 | |
Wal-Mart Stores, Inc. | 5,487 | 388,370 | |
Walgreen Co. | 3,230 | 132,236 | |
| 1,755,428 | ||
Food Products - 2.6% | |||
Archer Daniels Midland Co. | 18,431 | 587,212 | |
ConAgra Foods, Inc. | 13,990 | 477,199 | |
| |||
Shares | Value | ||
Ingredion, Inc. | 6,201 | $ 410,506 | |
Mondelez International, Inc. | 32,741 | 905,289 | |
Tyson Foods, Inc. Class A | 18,903 | 428,531 | |
| 2,808,737 | ||
Household Products - 2.7% | |||
Colgate-Palmolive Co. (e) | 508 | 58,130 | |
Procter & Gamble Co. | 37,056 | 2,822,926 | |
| 2,881,056 | ||
Tobacco - 0.5% | |||
Altria Group, Inc. | 15,675 | 525,896 | |
Reynolds American, Inc. | 10 | 437 | |
| 526,333 | ||
TOTAL CONSUMER STAPLES | 8,451,397 | ||
ENERGY - 15.0% | |||
Energy Equipment & Services - 0.7% | |||
Bristow Group, Inc. | 5,996 | 349,327 | |
Diamond Offshore Drilling, Inc. (e) | 5,617 | 391,393 | |
National Oilwell Varco, Inc. | 698 | 47,555 | |
| 788,275 | ||
Oil, Gas & Consumable Fuels - 14.3% | |||
Anadarko Petroleum Corp. | 2,163 | 172,132 | |
Apache Corp. | 817 | 60,679 | |
Chevron Corp. | 28,266 | 3,311,362 | |
ConocoPhillips (e) | 21,573 | 1,250,155 | |
CVR Energy, Inc. | 5,567 | 312,754 | |
Exxon Mobil Corp. | 63,643 | 5,699,231 | |
HollyFrontier Corp. | 10,489 | 589,482 | |
Marathon Petroleum Corp. | 9,400 | 779,072 | |
Murphy Oil Corp. | 7,919 | 482,109 | |
Occidental Petroleum Corp. | 6,193 | 509,870 | |
Phillips 66 | 14,129 | 889,562 | |
Tesoro Corp. | 7,948 | 446,996 | |
Valero Energy Corp. | 15,930 | 726,249 | |
| 15,229,653 | ||
TOTAL ENERGY | 16,017,928 | ||
FINANCIALS - 27.3% | |||
Capital Markets - 3.9% | |||
American Capital Ltd. (a) | 28,776 | 402,288 | |
Bank of New York Mellon Corp. | 3,635 | 98,654 | |
Franklin Resources, Inc. | 3,800 | 536,750 | |
Goldman Sachs Group, Inc. | 8,317 | 1,245,554 | |
Invesco Ltd. | 12,309 | 329,758 | |
Morgan Stanley | 33,876 | 763,904 | |
Raymond James Financial, Inc. (e) | 9,292 | 407,733 | |
SEI Investments Co. | 14,595 | 412,601 | |
| 4,197,242 | ||
Commercial Banks - 4.7% | |||
CapitalSource, Inc. | 43,355 | 390,195 | |
Common Stocks - continued | |||
Shares | Value | ||
FINANCIALS - continued | |||
Commercial Banks - continued | |||
CIT Group, Inc. (a) | 8,187 | $ 342,708 | |
Fifth Third Bancorp | 31,655 | 501,415 | |
KeyCorp | 629 | 5,906 | |
PNC Financial Services Group, Inc. | 1,551 | 96,767 | |
Popular, Inc. (a) | 9,658 | 269,651 | |
Regions Financial Corp. | 62,111 | 475,149 | |
U.S. Bancorp | 13,750 | 467,225 | |
Wells Fargo & Co. | 69,388 | 2,434,131 | |
| 4,983,147 | ||
Consumer Finance - 1.1% | |||
American Express Co. (e) | 9,702 | 602,979 | |
Capital One Financial Corp. | 555 | 28,322 | |
Discover Financial Services | 14,945 | 575,831 | |
| 1,207,132 | ||
Diversified Financial Services - 6.7% | |||
Bank of America Corp. | 165,831 | 1,862,282 | |
CBOE Holdings, Inc. | 10,510 | 377,519 | |
Citigroup, Inc. | 44,273 | 1,858,138 | |
Interactive Brokers Group, Inc. | 200 | 2,942 | |
JPMorgan Chase & Co. | 55,845 | 2,731,937 | |
McGraw-Hill Companies, Inc. (e) | 6,030 | 280,697 | |
| 7,113,515 | ||
Insurance - 8.1% | |||
ACE Ltd. | 3,428 | 292,717 | |
Allied World Assurance Co. Holdings Ltd. | 3,821 | 335,522 | |
Allstate Corp. | 13,750 | 632,775 | |
American Financial Group, Inc. | 8,809 | 387,244 | |
American International Group, Inc. (a) | 12,516 | 475,733 | |
American National Insurance Co. | 3,840 | 308,621 | |
Arthur J. Gallagher & Co. | 9,518 | 366,253 | |
Aspen Insurance Holdings Ltd. | 10,185 | 365,234 | |
Axis Capital Holdings Ltd. | 9,659 | 393,411 | |
Berkshire Hathaway, Inc. Class B (a) | 19,241 | 1,965,661 | |
CNA Financial Corp. | 4,000 | 126,160 | |
Everest Re Group Ltd. | 3,631 | 452,459 | |
Fidelity National Financial, Inc. Class A | 8,334 | 207,850 | |
HCC Insurance Holdings, Inc. | 9,205 | 368,200 | |
Loews Corp. | 6,952 | 299,701 | |
Marsh & McLennan Companies, Inc. | 9,838 | 365,383 | |
MetLife, Inc. | 1,543 | 54,684 | |
PartnerRe Ltd. | 4,429 | 395,244 | |
ProAssurance Corp. | 2,014 | 94,436 | |
Reinsurance Group of America, Inc. | 6,828 | 392,610 | |
Torchmark Corp. | 43 | 2,416 | |
Validus Holdings Ltd. | 10,494 | 373,901 | |
| 8,656,215 | ||
| |||
Shares | Value | ||
Real Estate Investment Trusts - 2.8% | |||
American Capital Agency Corp. | 15,482 | $ 491,089 | |
BRE Properties, Inc. | 5,725 | 278,292 | |
Camden Property Trust (SBI) | 35 | 2,420 | |
CommonWealth REIT (e) | 8,003 | 202,076 | |
Extra Space Storage, Inc. | 8,551 | 320,149 | |
General Growth Properties, Inc. (e) | 24,819 | 475,036 | |
Liberty Property Trust (SBI) | 406 | 15,749 | |
MFA Financial, Inc. | 45,183 | 401,225 | |
Public Storage | 1,661 | 251,160 | |
Retail Properties America, Inc. (e) | 6,769 | 100,181 | |
RLJ Lodging Trust | 8,296 | 177,451 | |
Weyerhaeuser Co. | 10,159 | 298,776 | |
| 3,013,604 | ||
TOTAL FINANCIALS | 29,170,855 | ||
HEALTH CARE - 11.1% | |||
Health Care Equipment & Supplies - 2.1% | |||
Abbott Laboratories | 11,229 | 379,428 | |
CareFusion Corp. (a) | 13,870 | 454,104 | |
Covidien PLC | 657 | 41,765 | |
Medtronic, Inc. | 19,183 | 862,468 | |
St. Jude Medical, Inc. (e) | 5,046 | 206,886 | |
Thoratec Corp. (a) | 6,130 | 215,837 | |
Zimmer Holdings, Inc. | 664 | 49,773 | |
| 2,210,261 | ||
Health Care Providers & Services - 2.0% | |||
Cardinal Health, Inc. | 9,160 | 423,284 | |
Humana, Inc. | 5,415 | 369,628 | |
UnitedHealth Group, Inc. | 15,837 | 846,488 | |
WellPoint, Inc. | 8,324 | 517,586 | |
| 2,156,986 | ||
Pharmaceuticals - 7.0% | |||
AbbVie, Inc. | 5,027 | 185,597 | |
Eli Lilly & Co. | 14,309 | 782,130 | |
Johnson & Johnson | 28,905 | 2,199,960 | |
Merck & Co., Inc. | 41,302 | 1,764,834 | |
Pfizer, Inc. | 92,406 | 2,529,152 | |
| 7,461,673 | ||
TOTAL HEALTH CARE | 11,828,920 | ||
INDUSTRIALS - 9.8% | |||
Aerospace & Defense - 2.3% | |||
Alliant Techsystems, Inc. | 5,286 | 347,819 | |
General Dynamics Corp. | 7,368 | 500,803 | |
L-3 Communications Holdings, Inc. | 1,320 | 100,676 | |
Lockheed Martin Corp. | 1,424 | 125,312 | |
Northrop Grumman Corp. | 8,450 | 554,996 | |
Common Stocks - continued | |||
Shares | Value | ||
INDUSTRIALS - continued | |||
Aerospace & Defense - continued | |||
Raytheon Co. | 9,017 | $ 492,058 | |
The Boeing Co. | 3,678 | 282,838 | |
| 2,404,502 | ||
Air Freight & Logistics - 0.0% | |||
FedEx Corp. | 460 | 48,498 | |
Airlines - 0.7% | |||
Copa Holdings SA Class A | 3,027 | 316,079 | |
Southwest Airlines Co. | 36,853 | 431,180 | |
| 747,259 | ||
Commercial Services & Supplies - 0.0% | |||
Avery Dennison Corp. | 1,295 | 52,901 | |
Construction & Engineering - 0.7% | |||
AECOM Technology Corp. (a) | 14,620 | 443,132 | |
EMCOR Group, Inc. | 9,185 | 354,265 | |
| 797,397 | ||
Electrical Equipment - 0.2% | |||
Brady Corp. Class A | 6,792 | 231,268 | |
Industrial Conglomerates - 3.7% | |||
3M Co. | 4,062 | 422,448 | |
General Electric Co. | 150,284 | 3,489,594 | |
| 3,912,042 | ||
Machinery - 1.5% | |||
Deere & Co. (e) | 3,530 | 310,040 | |
Dover Corp. | 5,142 | 377,166 | |
Illinois Tool Works, Inc. (e) | 5,094 | 313,281 | |
Mueller Industries, Inc. | 5,814 | 309,189 | |
WABCO Holdings, Inc. (a) | 4,046 | 278,041 | |
| 1,587,717 | ||
Professional Services - 0.4% | |||
Equifax, Inc. | 5,866 | 323,334 | |
Robert Half International, Inc. | 1,413 | 50,232 | |
| 373,566 | ||
Road & Rail - 0.3% | |||
Union Pacific Corp. | 2,559 | 350,864 | |
TOTAL INDUSTRIALS | 10,506,014 | ||
INFORMATION TECHNOLOGY - 6.2% | |||
Communications Equipment - 2.2% | |||
Brocade Communications Systems, Inc. (a) | 54,120 | 303,613 | |
Cisco Systems, Inc. | 85,177 | 1,775,940 | |
QUALCOMM, Inc. | 4,429 | 290,675 | |
| 2,370,228 | ||
Computers & Peripherals - 0.1% | |||
Hewlett-Packard Co. | 4,892 | 98,525 | |
| |||
Shares | Value | ||
Electronic Equipment & Components - 0.7% | |||
Avnet, Inc. (a) | 11,745 | $ 414,716 | |
Tech Data Corp. (a) | 6,178 | 327,805 | |
| 742,521 | ||
IT Services - 1.5% | |||
Amdocs Ltd. | 9,968 | 363,533 | |
Booz Allen Hamilton Holding Corp. Class A (e) | 21,252 | 272,026 | |
Computer Sciences Corp. | 4,918 | 236,212 | |
Fidelity National Information Services, Inc. | 9,759 | 367,426 | |
Total System Services, Inc. | 14,114 | 335,349 | |
| 1,574,546 | ||
Office Electronics - 0.4% | |||
Xerox Corp. | 61,622 | 499,754 | |
Semiconductors & Semiconductor Equipment - 0.9% | |||
Intel Corp. | 32,241 | 672,225 | |
Marvell Technology Group Ltd. | 25,360 | 256,136 | |
| 928,361 | ||
Software - 0.4% | |||
CA Technologies, Inc. | 2,077 | 50,866 | |
Microsoft Corp. | 12,526 | 348,223 | |
| 399,089 | ||
TOTAL INFORMATION TECHNOLOGY | 6,613,024 | ||
MATERIALS - 2.6% | |||
Chemicals - 1.7% | |||
CF Industries Holdings, Inc. | 2,040 | 409,693 | |
E.I. du Pont de Nemours & Co. (e) | 6,179 | 295,974 | |
Huntsman Corp. | 3,989 | 68,730 | |
LyondellBasell Industries NV Class A | 9,732 | 570,490 | |
Monsanto Co. | 3,314 | 334,813 | |
The Dow Chemical Co. | 4,783 | 151,717 | |
| 1,831,417 | ||
Containers & Packaging - 0.8% | |||
Bemis Co., Inc. (e) | 10,983 | 410,105 | |
Graphic Packaging Holding Co. (a) | 41,227 | 305,904 | |
Packaging Corp. of America | 1,741 | 72,739 | |
| 788,748 | ||
Metals & Mining - 0.1% | |||
Freeport-McMoRan Copper & Gold, Inc. | 2,560 | 81,715 | |
Reliance Steel & Aluminum Co. | 763 | 50,808 | |
| 132,523 | ||
TOTAL MATERIALS | 2,752,688 | ||
TELECOMMUNICATION SERVICES - 2.4% | |||
Diversified Telecommunication Services - 2.2% | |||
AT&T, Inc. | 65,150 | 2,339,537 | |
Common Stocks - continued | |||
Shares | Value | ||
TELECOMMUNICATION SERVICES - continued | |||
Wireless Telecommunication Services - 0.2% | |||
Sprint Nextel Corp. (a) | 36,553 | $ 212,007 | |
TOTAL TELECOMMUNICATION SERVICES | 2,551,544 | ||
UTILITIES - 6.8% | |||
Electric Utilities - 3.2% | |||
American Electric Power Co., Inc. | 14,144 | 661,798 | |
Cleco Corp. (e) | 4,719 | 209,052 | |
Duke Energy Corp. (e) | 4,280 | 296,390 | |
Entergy Corp. (e) | 6,253 | 389,312 | |
NextEra Energy, Inc. | 700 | 50,309 | |
NV Energy, Inc. | 21,100 | 416,936 | |
Pinnacle West Capital Corp. | 7,298 | 408,250 | |
Portland General Electric Co. | 10,267 | 304,827 | |
Southern Co. | 3,743 | 168,472 | |
Xcel Energy, Inc. | 18,413 | 528,453 | |
| 3,433,799 | ||
Gas Utilities - 0.2% | |||
Atmos Energy Corp. | 1,431 | 54,621 | |
Southwest Gas Corp. | 2,193 | 99,343 | |
| 153,964 | ||
Multi-Utilities - 3.0% | |||
Alliant Energy Corp. | 8,979 | 428,209 | |
Ameren Corp. | 13,150 | 444,339 | |
CenterPoint Energy, Inc. | 22,025 | 471,996 | |
Consolidated Edison, Inc. | 9,970 | 588,230 | |
Dominion Resources, Inc. | 1,374 | 76,944 | |
DTE Energy Co. | 7,504 | 501,267 | |
Public Service Enterprise Group, Inc. | 17,292 | 563,546 | |
SCANA Corp. | 2,415 | 117,949 | |
| 3,192,480 | ||
Water Utilities - 0.4% | |||
American Water Works Co., Inc. | 11,001 | 433,989 | |
TOTAL UTILITIES | 7,214,232 | ||
TOTAL COMMON STOCKS (Cost $83,912,850) |
| ||
U.S. Treasury Obligations - 0.2% | ||||
| Principal Amount |
| ||
U.S. Treasury Bills, yield at date of purchase 0.12% 6/27/13 (f) | $ 200,000 |
| ||
Money Market Funds - 9.4% | |||
Shares | Value | ||
Dreyfus Cash Management Institutional Shares, 0.10% (c) | 3,225,013 | $ 3,225,013 | |
Fidelity Securities Lending Cash Central Fund, 0.16% (b)(d) | 6,852,975 | 6,852,975 | |
TOTAL MONEY MARKET FUNDS (Cost $10,077,988) |
| ||
TOTAL INVESTMENT PORTFOLIO - 105.7% (Cost $94,190,757) | 112,834,351 | ||
NET OTHER ASSETS (LIABILITIES) - (5.7)% | (6,094,281) | ||
NET ASSETS - 100% | $ 106,740,070 | ||
Futures Contracts | |||||
Expiration | Underlying | Unrealized | |||
Purchased | |||||
Equity Index Contracts | |||||
55 CME E-mini S&P 500 Index Contracts | March 2013 | $ 4,161,575 | $ 148,393 | ||
|
The face value of futures purchased as a percentage of net assets is 3.9% |
Legend |
(a) Non-income producing |
(b) Affiliated fund that is generally available only to investment companies and other accounts managed by Fidelity Investments. The rate quoted is the annualized seven-day yield of the fund at period end. A complete unaudited listing of the fund's holdings as of its most recent quarter end is available upon request. In addition, each Fidelity Central Fund's financial statements, which are not covered by the Fund's Report of Independent Registered Public Accounting Firm, are available on the SEC's website or upon request. |
(c) The rate quoted is the annualized seven-day yield of the fund at period end. |
(d) Investment made with cash collateral received from securities on loan. |
(e) Security or a portion of the security is on loan at period end. |
(f) Security or a portion of the security was pledged to cover margin requirements for futures contracts. At the period end, the value of securities pledged amounted to $199,926. |
Affiliated Central Funds |
Information regarding fiscal year to date income earned by the Fund from investments in Fidelity Central Funds is as follows: |
Fund | Income earned |
Fidelity Securities Lending Cash Central Fund | $ 9,260 |
Other Information |
The following is a summary of the inputs used, as of February 28, 2013, involving the Fund's assets and liabilities carried at fair value. The inputs or methodology used for valuing securities may not be an indication of the risk associated with investing in those securities. For more information on valuation inputs, and their aggregation into the levels used in the table below, please refer to the Investment Valuation section in the accompanying Notes to Financial Statements. |
Valuation Inputs at Reporting Date: | ||||
Description | Total | Level 1 | Level 2 | Level 3 |
Investments in Securities: | ||||
Equities: | ||||
Consumer Discretionary | $ 7,449,835 | $ 7,449,835 | $ - | $ - |
Consumer Staples | 8,451,397 | 8,451,397 | - | - |
Energy | 16,017,928 | 16,017,928 | - | - |
Financials | 29,170,855 | 29,170,855 | - | - |
Health Care | 11,828,920 | 11,828,920 | - | - |
Industrials | 10,506,014 | 10,506,014 | - | - |
Information Technology | 6,613,024 | 6,613,024 | - | - |
Materials | 2,752,688 | 2,752,688 | - | - |
Telecommunication Services | 2,551,544 | 2,551,544 | - | - |
Utilities | 7,214,232 | 7,214,232 | - | - |
U.S. Government and Government Agency Obligations | 199,926 | - | 199,926 | - |
Money Market Funds | 10,077,988 | 10,077,988 | - | - |
Total Investments in Securities: | $ 112,834,351 | $ 112,634,425 | $ 199,926 | $ - |
Derivative Instruments: | ||||
Assets | ||||
Futures Contracts | $ 148,393 | $ 148,393 | $ - | $ - |
Value of Derivative Instruments |
The following table is a summary of the Fund's value of derivative instruments by primary risk exposure as of February 28, 2013. For additional information on derivative instruments, please refer to the Derivative Instruments section in the accompanying Notes to Financial Statements. |
Primary Risk Exposure / | Value | |
| Asset | Liability |
Equity Risk | ||
Futures Contracts (a) | $ 148,393 | $ - |
Total Value of Derivatives | $ 148,393 | $ - |
(a) Reflects cumulative appreciation/(depreciation) on futures contracts as disclosed on the Schedule of Investments. Only the period end variation margin is separately disclosed on the Statement of Assets and Liabilities. |
See accompanying notes which are an integral part of the financial statements.
Annual Report
Fidelity Large Cap Value Enhanced Index Fund
Financial Statements
Statement of Assets and Liabilities
| February 28, 2013 | |
|
|
|
Assets | ||
Investment in securities, at value (including securities loaned of $6,701,611) - See accompanying schedule: Unaffiliated issuers (cost $87,337,782) | $ 105,981,376 |
|
Fidelity Central Funds (cost $6,852,975) | 6,852,975 |
|
Total Investments (cost $94,190,757) |
| $ 112,834,351 |
Receivable for fund shares sold | 577,669 | |
Dividends receivable | 304,495 | |
Interest receivable | 133 | |
Distributions receivable from Fidelity Central Funds | 383 | |
Total assets | 113,717,031 | |
|
|
|
Liabilities | ||
Payable for fund shares redeemed | $ 79,669 | |
Accrued management fee | 25,914 | |
Payable for daily variation margin on futures contracts | 5,447 | |
Other affiliated payables | 12,956 | |
Collateral on securities loaned, at value | 6,852,975 | |
Total liabilities | 6,976,961 | |
|
|
|
Net Assets | $ 106,740,070 | |
Net Assets consist of: |
| |
Paid in capital | $ 85,719,176 | |
Undistributed net investment income | 440,579 | |
Accumulated undistributed net realized gain (loss) on investments | 1,788,328 | |
Net unrealized appreciation (depreciation) on investments | 18,791,987 | |
Net Assets, for 12,009,239 shares outstanding | $ 106,740,070 | |
Net Asset Value, offering price and redemption price per share ($106,740,070 ÷ 12,009,239 shares) | $ 8.89 | |
Statement of Operations
| Year ended February 28, 2013 | |
|
|
|
Investment Income |
|
|
Dividends |
| $ 2,222,251 |
Interest |
| 1,647 |
Income from Fidelity Central Funds |
| 9,260 |
Total income |
| 2,233,158 |
|
|
|
Expenses | ||
Management fee | $ 245,956 | |
Transfer agent fees | 123,500 | |
Independent trustees' compensation | 974 | |
Miscellaneous | 214 | |
Total expenses | 370,644 | |
Net investment income (loss) | 1,862,514 | |
Realized and Unrealized Gain (Loss) Net realized gain (loss) on: | ||
Investment securities: |
|
|
Unaffiliated issuers | 3,967,673 | |
Futures contracts | 160,394 | |
Total net realized gain (loss) |
| 4,128,067 |
Change in net unrealized appreciation (depreciation) on: Investment securities | 8,686,956 | |
Futures contracts | 44,116 | |
Total change in net unrealized appreciation (depreciation) |
| 8,731,072 |
Net gain (loss) | 12,859,139 | |
Net increase (decrease) in net assets resulting from operations | $ 14,721,653 | |
See accompanying notes which are an integral part of the financial statements.
Annual Report
Statement of Changes in Net Assets
| Year ended | Year ended |
Increase (Decrease) in Net Assets |
|
|
Operations |
|
|
Net investment income (loss) | $ 1,862,514 | $ 1,687,945 |
Net realized gain (loss) | 4,128,067 | 3,313,626 |
Change in net unrealized appreciation (depreciation) | 8,731,072 | (3,513,996) |
Net increase (decrease) in net assets resulting from operations | 14,721,653 | 1,487,575 |
Distributions to shareholders from net investment income | (1,610,247) | (1,395,578) |
Distributions to shareholders from net realized gain | (1,265,614) | (2,874,041) |
Total distributions | (2,875,861) | (4,269,619) |
Share transactions | 49,477,878 | 44,771,312 |
Reinvestment of distributions | 2,776,149 | 4,155,117 |
Cost of shares redeemed | (28,713,291) | (59,913,933) |
Net increase (decrease) in net assets resulting from share transactions | 23,540,736 | (10,987,504) |
Total increase (decrease) in net assets | 35,386,528 | (13,769,548) |
|
|
|
Net Assets | ||
Beginning of period | 71,353,542 | 85,123,090 |
End of period (including undistributed net investment income of $440,579 and undistributed net investment income of $226,847, respectively) | $ 106,740,070 | $ 71,353,542 |
Other Information Shares | ||
Sold | 6,067,936 | 6,042,322 |
Issued in reinvestment of distributions | 349,249 | 580,129 |
Redeemed | (3,584,294) | (8,189,565) |
Net increase (decrease) | 2,832,891 | (1,567,114) |
Financial Highlights
Years ended February 28, | 2013 | 2012 G | 2011 | 2010 | 2009 |
Selected Per-Share Data |
|
|
|
|
|
Net asset value, beginning of period | $ 7.78 | $ 7.92 | $ 6.70 | $ 4.59 | $ 8.68 |
Income from Investment Operations |
|
|
|
|
|
Net investment income (loss) B | .18 | .15 | .12 | .13 | .20 |
Net realized and unrealized gain (loss) | 1.21 | .10 E | 1.22 | 2.11 | (4.14) |
Total from investment operations | 1.39 | .25 | 1.34 | 2.24 | (3.94) |
Distributions from net investment income | (.15) | (.13) | (.12) | (.13) | (.15) |
Distributions from net realized gain | (.13) | (.26) | - | - | - |
Total distributions | (.28) | (.39) | (.12) | (.13) | (.15) |
Net asset value, end of period | $ 8.89 | $ 7.78 | $ 7.92 | $ 6.70 | $ 4.59 |
Total Return A | 18.38% | 3.58% | 20.15% | 48.83% | (45.82)% |
Ratios to Average Net Assets C, F |
|
|
|
|
|
Expenses before reductions | .45% | .45% | .45% | .45% | .45% |
Expenses net of fee waivers, if any | .45% | .45% | .45% | .45% | .45% |
Expenses net of all reductions | .45% | .45% | .45% | .45% | .45% |
Net investment income (loss) | 2.27% | 2.04% | 1.76% | 2.11% | 2.81% |
Supplemental Data |
|
|
|
|
|
Net assets, end of period (000 omitted) | $ 106,740 | $ 71,354 | $ 85,123 | $ 69,024 | $ 20,162 |
Portfolio turnover rate D | 76% | 85% | 83% | 89% H | 72% H |
A Total returns would have been lower if certain expenses had not been reduced during the applicable periods shown.
B Calculated based on average shares outstanding during the period.
C Fees and expenses of any underlying funds and Fidelity Central Funds are not included in the Fund's expense ratio. The Fund indirectly bears its proportionate share of the expenses of any underlying funds and Fidelity Central Funds.
D Amount does not include the portfolio activity of any underlying funds and Fidelity Central Funds.
E The amount shown for a share outstanding does not correspond with the aggregate net gain (loss) on investments for the period due to the timing of sales and repurchases of shares in relation to fluctuating market values of the investments of the Fund.
F Expense ratios reflect operating expenses of the Fund. Expenses before reductions do not reflect amounts reimbursed by the investment adviser or reductions from expense offset arrangements and do not represent the amount paid by the Fund during periods when reimbursements or reductions occur. Expenses net of fee waivers reflect expenses after reimbursement by the investment adviser but prior to reductions from expense offset arrangements. Expenses net of all reductions represent the net expenses paid by the Fund.
G For the year ended February 29.
H Reflects adjustments to exclude transactions in money market mutual funds.
See accompanying notes which are an integral part of the financial statements.
Annual Report
Fidelity Large Cap Core Enhanced Index Fund
Performance: The Bottom Line
Average annual total return reflects the change in the value of an investment, assuming reinvestment of the fund's distributions from dividend income and capital gains (the profits earned upon the sale of securities that have grown in value, if any) and assuming a constant rate of performance each year. The $10,000 table and the fund's returns do not reflect the deduction of taxes that a shareholder would pay on fund distributions or the redemption of fund shares. During periods of reimbursement by Fidelity a fund's total returns will be greater than it would be had the reimbursement not occurred. How a fund did yesterday is no guarantee of how it will do tomorrow.
Average Annual Total Returns
Periods ended February 28, 2013 | Past 1 | Past 5 | Life of |
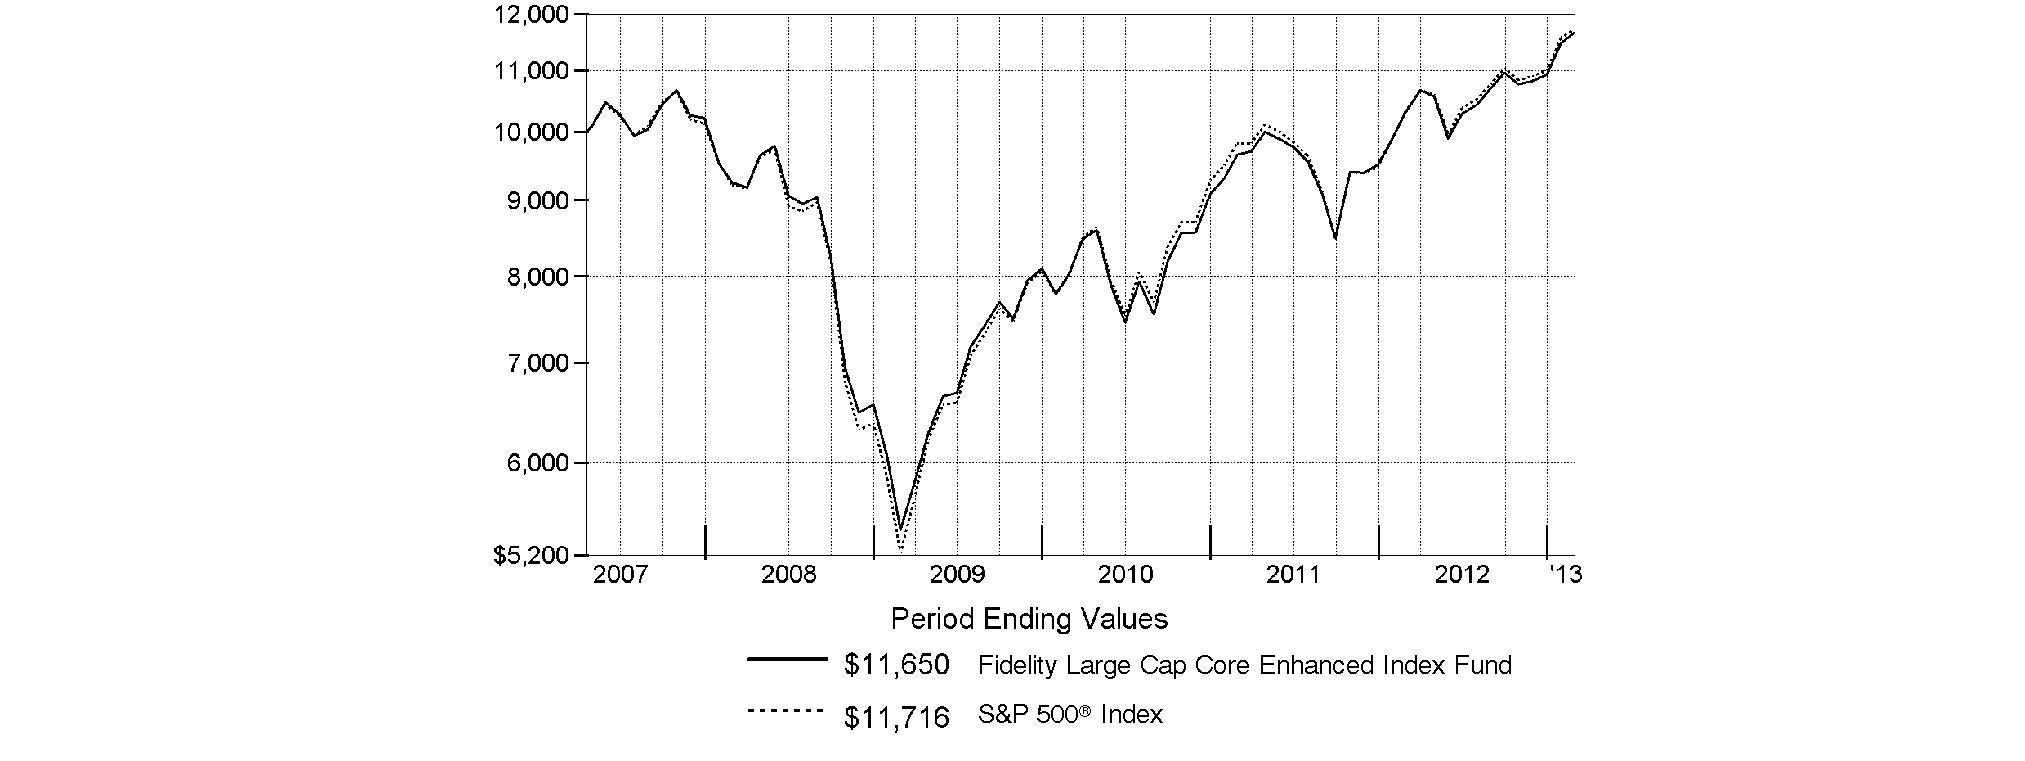
Fidelity Large Cap Core Enhanced Index Fund | 13.03% | 4.74% | 2.64% |
A From April 19, 2007.
$10,000 Over Life of Fund
Let's say hypothetically that $10,000 was invested in Fidelity Large Cap Core Enhanced Index Fund on April 19, 2007, when the fund started. The chart shows how the value of your investment would have changed, and also shows how the S&P 500® Index performed over the same period.
Annual Report
Fidelity Large Cap Core Enhanced Index Fund
Management's Discussion of Fund Performance
Market Recap: U.S. stock markets posted solid gains for the year ending February 28, 2013, sparked by a late-period rally that pushed major equity benchmarks to multiyear highs. Improvement in the global economy and more monetary stimulus from the U.S. Federal Reserve kept markets on the upswing for much of the year, shrugging off an early decline brought on by debt woes in Europe, and another dip later in the period amid Congressional gridlock on the federal budget. Renewed optimism over employment, the housing market, corporate earnings and record dividends made stocks a favorite with investors during the 12 months, which helped push the broad-based S&P 500® Index across the milestone 1,500 mark at the end of January. The S&P 500® finished the period up 13.46%, with the blue-chip-laden Dow Jones Industrial AverageSM following suit, rising 11.51% and nearing an all-time high by period end. The technology-heavy Nasdaq Composite Index® also hit a multiyear high, despite adding a more modest 7.96%. Elsewhere, gains were broad-based, with seven of the 10 sectors in the S&P 500® posting a double-digit advance, led by telecommunication services and health care, while materials, tech and energy showed single-digit returns. Outside the U.S., foreign developed-markets stocks rose strongly, despite the headwind of a stronger U.S. dollar, with the MSCI® EAFE® Index adding 9.99%.
Comments from Maximilian Kaufmann, Senior Portfolio Manager of the Geode Capital Management, LLC, investment management team for Fidelity® Large Cap Core Enhanced Index Fund: For the year, the fund gained 13.03%, modestly trailing the fund's benchmark, the S&P 500® Index. Relative to the benchmark, the fund had subpar security selection in the health care, consumer staples and consumer discretionary sectors. On the positive side, very strong stock picking in the energy and, to a lesser extent, materials sectors helped. The biggest individual detractor was untimely ownership of diversified financials firm Morgan Stanley. It hurt to overweight the stock during the first three months of the period, when it declined, as did our lack of a stake later in the period, when it rebounded. Similarly, the timing of our ownership of in oil-field services company Halliburton hampered the fund's result. Elsewhere, the stocks of biotechnology firm Gilead Sciences and online retailer eBay both had strong performance, but we missed out because we did not have enough exposure during the period. Other notable detractors included Marvell Technology Group, a semiconductor company and out-of-benchmark position; Cummins, a maker of power generation equipment; health insurance provider Humana; and microprocessor manufacturer Intel. On the positive side, the fund's top-six contributors were all energy stocks, led by Marathon Petroleum, an oil refiner whose shares were up by triple digits during the year. Various other oil-refining companies added significant value, including Valero Energy, Phillips 66, HollyFrontier - an out-of-benchmark position - and Tesoro. Further contributing was a lack of a position in Apache, an independent energy company and index component whose shares were down about 31%. Our positioning in two materials stocks also provided a boost - PPG Industries, a supplier of decorative coatings, and international mining company Freeport McMoRan Copper & Gold. Some of the stocks I've mentioned were not in the portfolio at period end.
The views expressed above reflect those of the portfolio manager(s) only through the end of the period as stated on the cover of this report and do not necessarily represent the views of Fidelity or any other person in the Fidelity organization. Any such views are subject to change at any time based upon market or other conditions and Fidelity disclaims any responsibility to update such views. These views may not be relied on as investment advice and, because investment decisions for a Fidelity fund are based on numerous factors, may not be relied on as an indication of trading intent on behalf of any Fidelity fund.
Annual Report
Fidelity Large Cap Core Enhanced Index Fund
Investment Changes (Unaudited)
Top Ten Stocks as of February 28, 2013 | ||
| % of fund's | % of fund's net assets |
Apple, Inc. | 3.3 | 4.7 |
Exxon Mobil Corp. | 3.3 | 2.9 |
General Electric Co. | 2.1 | 2.1 |
Chevron Corp. | 2.0 | 2.2 |
Johnson & Johnson | 1.8 | 1.8 |
Procter & Gamble Co. | 1.8 | 1.1 |
Microsoft Corp. | 1.8 | 2.1 |
IBM Corp. | 1.8 | 1.7 |
Pfizer, Inc. | 1.8 | 1.7 |
JPMorgan Chase & Co. | 1.7 | 1.5 |
| 21.4 | |
Market Sectors as of February 28, 2013 | ||
| % of fund's | % of fund's net assets |
Information Technology | 18.6 | 19.7 |
Financials | 16.4 | 13.4 |
Consumer Staples | 11.7 | 11.8 |
Health Care | 11.2 | 12.5 |
Industrials | 11.1 | 8.8 |
Consumer Discretionary | 10.3 | 10.1 |
Energy | 10.3 | 11.6 |
Utilities | 4.2 | 4.4 |
Materials | 2.6 | 2.8 |
Telecommunication Services | 1.9 | 3.3 |
Annual Report
Fidelity Large Cap Core Enhanced Index Fund
Investments February 28, 2013
Showing Percentage of Net Assets
Common Stocks - 98.3% | |||
Shares | Value | ||
CONSUMER DISCRETIONARY - 10.3% | |||
Auto Components - 0.7% | |||
Delphi Automotive PLC | 21,600 | $ 903,960 | |
Lear Corp. | 9,923 | 530,087 | |
| 1,434,047 | ||
Automobiles - 0.7% | |||
Ford Motor Co. | 113,270 | 1,428,335 | |
Diversified Consumer Services - 0.0% | |||
Apollo Group, Inc. Class A (non-vtg.) (a)(e) | 246 | 4,150 | |
Hotels, Restaurants & Leisure - 1.4% | |||
International Game Technology | 39,703 | 632,866 | |
McDonald's Corp. | 19,114 | 1,833,033 | |
Wynn Resorts Ltd. (e) | 2,989 | 349,414 | |
| 2,815,313 | ||
Household Durables - 0.5% | |||
Newell Rubbermaid, Inc. | 30,593 | 714,041 | |
Whirlpool Corp. | 2,284 | 257,978 | |
| 972,019 | ||
Internet & Catalog Retail - 0.7% | |||
Amazon.com, Inc. (a) | 3,162 | 835,622 | |
Liberty Media Corp. Interactive Series A (a) | 32,617 | 681,043 | |
| 1,516,665 | ||
Media - 3.8% | |||
Comcast Corp. Class A | 57,759 | 2,298,231 | |
DIRECTV (a) | 17,318 | 834,208 | |
News Corp. Class A | 58,608 | 1,687,910 | |
The Walt Disney Co. | 15,652 | 854,443 | |
Time Warner Cable, Inc. | 11,889 | 1,027,091 | |
Time Warner, Inc. | 2,228 | 118,463 | |
Viacom, Inc. Class B (non-vtg.) | 19,509 | 1,140,496 | |
| 7,960,842 | ||
Specialty Retail - 2.5% | |||
Home Depot, Inc. | 33,213 | 2,275,091 | |
Lowe's Companies, Inc. | 27,836 | 1,061,943 | |
PetSmart, Inc. | 11,786 | 767,386 | |
TJX Companies, Inc. | 26,830 | 1,206,545 | |
| 5,310,965 | ||
TOTAL CONSUMER DISCRETIONARY | 21,442,336 | ||
CONSUMER STAPLES - 11.7% | |||
Beverages - 2.1% | |||
PepsiCo, Inc. | 31,998 | 2,424,488 | |
The Coca-Cola Co. | 50,330 | 1,948,778 | |
| 4,373,266 | ||
Food & Staples Retailing - 2.4% | |||
CVS Caremark Corp. | 30,961 | 1,582,726 | |
| |||
Shares | Value | ||
Kroger Co. | 30,726 | $ 897,506 | |
Wal-Mart Stores, Inc. | 35,678 | 2,525,289 | |
| 5,005,521 | ||
Food Products - 2.7% | |||
Campbell Soup Co. (e) | 13,942 | 573,853 | |
ConAgra Foods, Inc. | 28,187 | 961,459 | |
Hormel Foods Corp. (e) | 19,074 | 713,558 | |
Ingredion, Inc. | 9,333 | 617,845 | |
Mondelez International, Inc. | 37,562 | 1,038,589 | |
The Hershey Co. (e) | 10,463 | 871,986 | |
Tyson Foods, Inc. Class A | 35,295 | 800,138 | |
| 5,577,428 | ||
Household Products - 2.9% | |||
Colgate-Palmolive Co. (e) | 9,061 | 1,036,850 | |
Kimberly-Clark Corp. | 12,914 | 1,217,532 | |
Procter & Gamble Co. | 50,202 | 3,824,388 | |
| 6,078,770 | ||
Tobacco - 1.6% | |||
Altria Group, Inc. | 34,323 | 1,151,537 | |
Philip Morris International, Inc. | 23,551 | 2,160,804 | |
| 3,312,341 | ||
TOTAL CONSUMER STAPLES | 24,347,326 | ||
ENERGY - 10.3% | |||
Energy Equipment & Services - 0.8% | |||
Diamond Offshore Drilling, Inc. (e) | 9,591 | 668,301 | |
Halliburton Co. | 4,349 | 180,527 | |
Schlumberger Ltd. | 11,248 | 875,657 | |
| 1,724,485 | ||
Oil, Gas & Consumable Fuels - 9.5% | |||
Chevron Corp. | 35,175 | 4,120,751 | |
ConocoPhillips (e) | 30,739 | 1,781,325 | |
CVR Energy, Inc. | 9,588 | 538,654 | |
Delek US Holdings, Inc. | 12,423 | 464,123 | |
Exxon Mobil Corp. | 76,215 | 6,825,053 | |
HollyFrontier Corp. | 15,395 | 865,199 | |
Marathon Petroleum Corp. | 15,845 | 1,313,234 | |
Occidental Petroleum Corp. | 13,898 | 1,144,222 | |
Phillips 66 | 22,871 | 1,439,958 | |
Valero Energy Corp. | 26,633 | 1,214,198 | |
| 19,706,717 | ||
TOTAL ENERGY | 21,431,202 | ||
FINANCIALS - 16.4% | |||
Capital Markets - 2.9% | |||
American Capital Ltd. (a) | 45,833 | 640,745 | |
Franklin Resources, Inc. | 6,609 | 933,521 | |
Goldman Sachs Group, Inc. | 12,273 | 1,838,004 | |
Invesco Ltd. | 15,322 | 410,476 | |
LPL Financial | 7,244 | 228,403 | |
Common Stocks - continued | |||
Shares | Value | ||
FINANCIALS - continued | |||
Capital Markets - continued | |||
Morgan Stanley | 50,769 | $ 1,144,841 | |
SEI Investments Co. | 28,650 | 809,936 | |
| 6,005,926 | ||
Commercial Banks - 2.2% | |||
Fifth Third Bancorp | 56,246 | 890,937 | |
U.S. Bancorp | 12,232 | 415,643 | |
Wells Fargo & Co. | 95,419 | 3,347,299 | |
| 4,653,879 | ||
Consumer Finance - 1.6% | |||
American Express Co. (e) | 24,944 | 1,550,270 | |
Discover Financial Services | 24,686 | 951,152 | |
SLM Corp. | 41,217 | 781,886 | |
| 3,283,308 | ||
Diversified Financial Services - 4.6% | |||
Bank of America Corp. | 224,355 | 2,519,507 | |
CBOE Holdings, Inc. | 19,357 | 695,303 | |
Citigroup, Inc. | 60,253 | 2,528,818 | |
JPMorgan Chase & Co. | 73,530 | 3,597,088 | |
McGraw-Hill Companies, Inc. (e) | 6,626 | 308,440 | |
| 9,649,156 | ||
Insurance - 4.2% | |||
Allied World Assurance Co. Holdings Ltd. | 1,560 | 136,984 | |
American International Group, Inc. (a) | 3,774 | 143,450 | |
Arthur J. Gallagher & Co. | 16,209 | 623,722 | |
Axis Capital Holdings Ltd. | 16,969 | 691,147 | |
Berkshire Hathaway, Inc. Class B (a) | 20,611 | 2,105,620 | |
CNA Financial Corp. | 17,992 | 567,468 | |
Fidelity National Financial, Inc. Class A | 21,501 | 536,235 | |
HCC Insurance Holdings, Inc. | 15,931 | 637,240 | |
Loews Corp. | 18,991 | 818,702 | |
Marsh & McLennan Companies, Inc. | 28,173 | 1,046,345 | |
ProAssurance Corp. | 4,770 | 223,665 | |
Reinsurance Group of America, Inc. | 10,515 | 604,613 | |
Validus Holdings Ltd. | 18,445 | 657,195 | |
| 8,792,386 | ||
Real Estate Investment Trusts - 0.9% | |||
American Capital Agency Corp. | 3,518 | 111,591 | |
Extra Space Storage, Inc. | 16,928 | 633,784 | |
General Growth Properties, Inc. (e) | 32,407 | 620,270 | |
Public Storage | 2,421 | 366,079 | |
Simon Property Group, Inc. | 1,003 | 159,337 | |
| 1,891,061 | ||
TOTAL FINANCIALS | 34,275,716 | ||
| |||
Shares | Value | ||
HEALTH CARE - 11.2% | |||
Biotechnology - 1.0% | |||
Amgen, Inc. | 19,080 | $ 1,744,103 | |
Gilead Sciences, Inc. (a) | 7,537 | 321,905 | |
| 2,066,008 | ||
Health Care Equipment & Supplies - 1.8% | |||
Abbott Laboratories | 42,324 | 1,430,128 | |
CareFusion Corp. (a) | 5,775 | 189,074 | |
Medtronic, Inc. | 29,778 | 1,338,819 | |
St. Jude Medical, Inc. (e) | 20,820 | 853,620 | |
| 3,811,641 | ||
Health Care Providers & Services - 2.7% | |||
AmerisourceBergen Corp. | 17,168 | 810,330 | |
Cardinal Health, Inc. | 19,309 | 892,269 | |
Humana, Inc. | 12,013 | 820,007 | |
McKesson Corp. | 7,570 | 803,404 | |
UnitedHealth Group, Inc. | 27,094 | 1,448,174 | |
WellPoint, Inc. | 14,844 | 923,000 | |
| 5,697,184 | ||
Pharmaceuticals - 5.7% | |||
AbbVie, Inc. | 4,967 | 183,382 | |
Bristol-Myers Squibb Co. | 5,636 | 208,363 | |
Eli Lilly & Co. | 22,988 | 1,256,524 | |
Johnson & Johnson | 50,434 | 3,838,532 | |
Merck & Co., Inc. | 63,241 | 2,702,288 | |
Pfizer, Inc. | 136,630 | 3,739,563 | |
| 11,928,652 | ||
TOTAL HEALTH CARE | 23,503,485 | ||
INDUSTRIALS - 11.1% | |||
Aerospace & Defense - 3.5% | |||
Alliant Techsystems, Inc. | 1,523 | 100,213 | |
General Dynamics Corp. | 15,204 | 1,033,416 | |
Honeywell International, Inc. | 6,619 | 463,992 | |
L-3 Communications Holdings, Inc. | 10,536 | 803,581 | |
Lockheed Martin Corp. | 11,721 | 1,031,448 | |
Northrop Grumman Corp. | 13,224 | 868,552 | |
Raytheon Co. | 17,321 | 945,207 | |
The Boeing Co. | 19,792 | 1,522,005 | |
United Technologies Corp. | 4,885 | 442,337 | |
| 7,210,751 | ||
Air Freight & Logistics - 0.8% | |||
United Parcel Service, Inc. Class B | 18,699 | 1,545,472 | |
Airlines - 0.6% | |||
Copa Holdings SA Class A | 4,629 | 483,360 | |
Southwest Airlines Co. | 66,289 | 775,581 | |
| 1,258,941 | ||
Commercial Services & Supplies - 0.3% | |||
Cintas Corp. (e) | 16,000 | 702,400 | |
Common Stocks - continued | |||
Shares | Value | ||
INDUSTRIALS - continued | |||
Electrical Equipment - 0.3% | |||
Emerson Electric Co. | 400 | $ 22,680 | |
Rockwell Automation, Inc. | 6,987 | 631,206 | |
| 653,886 | ||
Industrial Conglomerates - 2.9% | |||
3M Co. | 16,704 | 1,737,216 | |
General Electric Co. | 189,267 | 4,394,780 | |
| 6,131,996 | ||
Machinery - 1.2% | |||
Caterpillar, Inc. (e) | 2,781 | 256,881 | |
Illinois Tool Works, Inc. (e) | 16,262 | 1,000,113 | |
Mueller Industries, Inc. | 12,127 | 644,914 | |
WABCO Holdings, Inc. (a) | 9,580 | 658,338 | |
| 2,560,246 | ||
Marine - 0.1% | |||
Matson, Inc. | 9,437 | 242,625 | |
Professional Services - 0.6% | |||
Equifax, Inc. | 14,572 | 803,209 | |
Robert Half International, Inc. | 11,573 | 411,420 | |
| 1,214,629 | ||
Road & Rail - 0.8% | |||
Union Pacific Corp. | 11,838 | 1,623,108 | |
TOTAL INDUSTRIALS | 23,144,054 | ||
INFORMATION TECHNOLOGY - 18.6% | |||
Communications Equipment - 3.0% | |||
Brocade Communications Systems, Inc. (a) | 111,539 | 625,734 | |
Cisco Systems, Inc. | 112,897 | 2,353,902 | |
Harris Corp. | 15,992 | 768,735 | |
Motorola Solutions, Inc. | 3,319 | 206,475 | |
QUALCOMM, Inc. | 36,777 | 2,413,675 | |
| 6,368,521 | ||
Computers & Peripherals - 3.3% | |||
Apple, Inc. | 15,508 | 6,845,228 | |
EMC Corp. (a) | 3,121 | 71,814 | |
| 6,917,042 | ||
Electronic Equipment & Components - 1.0% | |||
Amphenol Corp. Class A | 12,646 | 896,096 | |
Avnet, Inc. (a) | 9,616 | 339,541 | |
FLIR Systems, Inc. | 29,945 | 788,751 | |
| 2,024,388 | ||
Internet Software & Services - 1.8% | |||
eBay, Inc. (a) | 4,945 | 270,393 | |
Google, Inc. Class A (a) | 4,313 | 3,455,576 | |
| 3,725,969 | ||
IT Services - 4.9% | |||
Accenture PLC Class A (e) | 18,794 | 1,397,522 | |
| |||
Shares | Value | ||
Computer Sciences Corp. | 6,352 | $ 305,087 | |
Fidelity National Information Services, Inc. | 23,332 | 878,450 | |
IBM Corp. | 18,709 | 3,757,328 | |
MasterCard, Inc. Class A | 3,003 | 1,555,013 | |
Total System Services, Inc. | 29,083 | 691,012 | |
Visa, Inc. Class A | 9,984 | 1,583,862 | |
| 10,168,274 | ||
Office Electronics - 0.4% | |||
Xerox Corp. | 104,019 | 843,594 | |
Semiconductors & Semiconductor Equipment - 1.1% | |||
Intel Corp. | 109,366 | 2,280,281 | |
Software - 3.1% | |||
Microsoft Corp. | 137,536 | 3,823,501 | |
Oracle Corp. | 78,535 | 2,690,609 | |
| 6,514,110 | ||
TOTAL INFORMATION TECHNOLOGY | 38,842,179 | ||
MATERIALS - 2.6% | |||
Chemicals - 2.3% | |||
CF Industries Holdings, Inc. | 4,071 | 817,579 | |
E.I. du Pont de Nemours & Co. (e) | 29,194 | 1,398,393 | |
LyondellBasell Industries NV Class A | 16,755 | 982,178 | |
Monsanto Co. | 15,509 | 1,566,874 | |
| 4,765,024 | ||
Containers & Packaging - 0.3% | |||
Graphic Packaging Holding Co. (a) | 84,117 | 624,148 | |
TOTAL MATERIALS | 5,389,172 | ||
TELECOMMUNICATION SERVICES - 1.9% | |||
Diversified Telecommunication Services - 1.8% | |||
AT&T, Inc. | 68,146 | 2,447,123 | |
Verizon Communications, Inc. | 30,241 | 1,407,114 | |
| 3,854,237 | ||
Wireless Telecommunication Services - 0.1% | |||
Sprint Nextel Corp. (a) | 38,185 | 221,473 | |
TOTAL TELECOMMUNICATION SERVICES | 4,075,710 | ||
UTILITIES - 4.2% | |||
Electric Utilities - 1.9% | |||
American Electric Power Co., Inc. | 21,982 | 1,028,538 | |
Duke Energy Corp. (e) | 306 | 21,191 | |
Entergy Corp. (e) | 13,657 | 850,285 | |
NV Energy, Inc. | 32,391 | 640,046 | |
Portland General Electric Co. | 22,988 | 682,514 | |
Southern Co. | 10,930 | 491,959 | |
Xcel Energy, Inc. | 10,684 | 306,631 | |
| 4,021,164 | ||
Multi-Utilities - 2.0% | |||
Alliant Energy Corp. | 10,231 | 487,916 | |
Common Stocks - continued | |||
Shares | Value | ||
UTILITIES - continued | |||
Multi-Utilities - continued | |||
Ameren Corp. | 25,422 | $ 859,009 | |
CenterPoint Energy, Inc. | 41,820 | 896,203 | |
DTE Energy Co. | 12,289 | 820,905 | |
Public Service Enterprise Group, Inc. | 30,543 | 995,396 | |
| 4,059,429 | ||
Water Utilities - 0.3% | |||
American Water Works Co., Inc. | 16,108 | 635,461 | |
TOTAL UTILITIES | 8,716,054 | ||
TOTAL COMMON STOCKS (Cost $193,471,564) |
| ||
U.S. Treasury Obligations - 0.2% | ||||
| Principal |
| ||
U.S. Treasury Bills, yield at date of purchase 0.11% to 0.12% 4/11/13 to 4/25/13 (f) | $ 450,000 |
| ||
Money Market Funds - 6.9% | |||
Shares |
| ||
Dreyfus Cash Management Institutional Shares, 0.10% (c) | 2,548,027 | 2,548,027 | |
Fidelity Securities Lending Cash Central Fund, 0.16% (b)(d) | 11,820,850 | 11,820,850 | |
TOTAL MONEY MARKET FUNDS (Cost $14,368,877) |
| ||
TOTAL INVESTMENT PORTFOLIO - 105.4% (Cost $208,290,372) | 219,986,056 | ||
NET OTHER ASSETS (LIABILITIES) - (5.4)% | (11,310,827) | ||
NET ASSETS - 100% | $ 208,675,229 | ||
Futures Contracts | |||||
Expiration | Underlying | Unrealized | |||
Purchased | |||||
Equity Index Contracts | |||||
45 CME E-mini S&P 500 Index Contracts | March 2013 | $ 3,404,925 | $ (6,565) | ||
|
The face value of futures purchased as a percentage of net assets is 1.6% |
Legend |
(a) Non-income producing |
(b) Affiliated fund that is generally available only to investment companies and other accounts managed by Fidelity Investments. The rate quoted is the annualized seven-day yield of the fund at period end. A complete unaudited listing of the fund's holdings as of its most recent quarter end is available upon request. In addition, each Fidelity Central Fund's financial statements, which are not covered by the Fund's Report of Independent Registered Public Accounting Firm, are available on the SEC's website or upon request. |
(c) The rate quoted is the annualized seven-day yield of the fund at period end. |
(d) Investment made with cash collateral received from securities on loan. |
(e) Security or a portion of the security is on loan at period end. |
(f) Security or a portion of the security was pledged to cover margin requirements for futures contracts. At the period end, the value of securities pledged amounted to $179,982. |
Affiliated Central Funds |
Information regarding fiscal year to date income earned by the Fund from investments in Fidelity Central Funds is as follows: |
Fund | Income earned |
Fidelity Securities Lending Cash Central Fund | $ 17,712 |
Other Information |
The following is a summary of the inputs used, as of February 28, 2013, involving the Fund's assets and liabilities carried at fair value. The inputs or methodology used for valuing securities may not be an indication of the risk associated with investing in those securities. For more information on valuation inputs, and their aggregation into the levels used in the table below, please refer to the Investment Valuation section in the accompanying Notes to Financial Statements. |
Valuation Inputs at Reporting Date: | ||||
Description | Total | Level 1 | Level 2 | Level 3 |
Investments in Securities: | ||||
Equities: | ||||
Consumer Discretionary | $ 21,442,336 | $ 21,442,336 | $ - | $ - |
Consumer Staples | 24,347,326 | 24,347,326 | - | - |
Energy | 21,431,202 | 21,431,202 | - | - |
Financials | 34,275,716 | 34,275,716 | - | - |
Health Care | 23,503,485 | 23,503,485 | - | - |
Industrials | 23,144,054 | 23,144,054 | - | - |
Information Technology | 38,842,179 | 38,842,179 | - | - |
Materials | 5,389,172 | 5,389,172 | - | - |
Telecommunication Services | 4,075,710 | 4,075,710 | - | - |
Utilities | 8,716,054 | 8,716,054 | - | - |
U.S. Government and Government Agency Obligations | 449,945 | - | 449,945 | - |
Money Market Funds | 14,368,877 | 14,368,877 | - | - |
Total Investments in Securities: | $ 219,986,056 | $ 219,536,111 | $ 449,945 | $ - |
Derivative Instruments: | ||||
Liabilities | ||||
Futures Contracts | $ (6,565) | $ (6,565) | $ - | $ - |
Value of Derivative Instruments |
The following table is a summary of the Fund's value of derivative instruments by primary risk exposure as of February 28, 2013. For additional information on derivative instruments, please refer to the Derivative Instruments section in the accompanying Notes to Financial Statements. |
Primary Risk Exposure / | Value | |
| Asset | Liability |
Equity Risk | ||
Futures Contracts (a) | $ - | $ (6,565) |
Total Value of Derivatives | $ - | $ (6,565) |
(a) Reflects cumulative appreciation/(depreciation) on futures contracts as disclosed on the Schedule of Investments. Only the period end variation margin is separately disclosed on the Statement of Assets and Liabilities. |
See accompanying notes which are an integral part of the financial statements.
Annual Report
Fidelity Large Cap Core Enhanced Index Fund
Financial Statements
Statement of Assets and Liabilities
| February 28, 2013 | |
|
|
|
Assets | ||
Investment in securities, at value (including securities loaned of $11,578,433) - See accompanying schedule: Unaffiliated issuers (cost $196,469,522) | $ 208,165,206 |
|
Fidelity Central Funds (cost $11,820,850) | 11,820,850 |
|
Total Investments (cost $208,290,372) |
| $ 219,986,056 |
Receivable for fund shares sold | 149,471 | |
Dividends receivable | 608,373 | |
Interest receivable | 18 | |
Distributions receivable from Fidelity Central Funds | 678 | |
Total assets | 220,744,596 | |
|
|
|
Liabilities | ||
Payable for fund shares redeemed | $ 164,508 | |
Accrued management fee | 52,112 | |
Payable for daily variation margin on futures contracts | 5,842 | |
Other affiliated payables | 26,055 | |
Collateral on securities loaned, at value | 11,820,850 | |
Total liabilities | 12,069,367 | |
|
|
|
Net Assets | $ 208,675,229 | |
Net Assets consist of: |
| |
Paid in capital | $ 201,363,530 | |
Undistributed net investment income | 1,427,838 | |
Accumulated undistributed net realized gain (loss) on investments | (5,805,258) | |
Net unrealized appreciation (depreciation) on investments | 11,689,119 | |
Net Assets, for 19,503,515 shares outstanding | $ 208,675,229 | |
Net Asset Value, offering price and redemption price per share ($208,675,229 ÷ 19,503,515 shares) | $ 10.70 | |
Statement of Operations
| Year ended February 28, 2013 | |
|
|
|
Investment Income |
|
|
Dividends |
| $ 5,992,149 |
Interest |
| 2,958 |
Income from Fidelity Central Funds |
| 17,712 |
Total income |
| 6,012,819 |
|
|
|
Expenses | ||
Management fee | $ 710,378 | |
Transfer agent fees | 356,611 | |
Independent trustees' compensation | 2,772 | |
Interest | 842 | |
Miscellaneous | 639 | |
Total expenses before reductions | 1,071,242 | |
Expense reductions | (2) | 1,071,240 |
Net investment income (loss) | 4,941,579 | |
Realized and Unrealized Gain (Loss) Net realized gain (loss) on: | ||
Investment securities: |
|
|
Unaffiliated issuers | 11,726,761 | |
Futures contracts | 224,224 | |
Total net realized gain (loss) |
| 11,950,985 |
Change in net unrealized appreciation (depreciation) on: Investment securities | 9,871,900 | |
Futures contracts | (240,186) | |
Total change in net unrealized appreciation (depreciation) |
| 9,631,714 |
Net gain (loss) | 21,582,699 | |
Net increase (decrease) in net assets resulting from operations | $ 26,524,278 | |
See accompanying notes which are an integral part of the financial statements.
Annual Report
Fidelity Large Cap Core Enhanced Index Fund
Financial Statements - continued
Statement of Changes in Net Assets
| Year ended | Year ended |
Increase (Decrease) in Net Assets |
|
|
Operations |
|
|
Net investment income (loss) | $ 4,941,579 | $ 5,034,728 |
Net realized gain (loss) | 11,950,985 | 18,244,681 |
Change in net unrealized appreciation (depreciation) | 9,631,714 | (28,944,074) |
Net increase (decrease) in net assets resulting from operations | 26,524,278 | (5,664,665) |
Distributions to shareholders from net investment income | (4,152,614) | (2,264,397) |
Distributions to shareholders from net realized gain | (1,162,732) | - |
Total distributions | (5,315,346) | (2,264,397) |
Share transactions | 52,970,505 | 212,282,081 |
Reinvestment of distributions | 5,061,436 | 2,249,226 |
Cost of shares redeemed | (132,790,409) | (913,023,187) |
Net increase (decrease) in net assets resulting from share transactions | (74,758,468) | (698,491,880) |
Total increase (decrease) in net assets | (53,549,536) | (706,420,942) |
|
|
|
Net Assets | ||
Beginning of period | 262,224,765 | 968,645,707 |
End of period (including undistributed net investment income of $1,427,838 and undistributed net investment income of $8, respectively) | $ 208,675,229 | $ 262,224,765 |
Other Information Shares | ||
Sold | 5,322,241 | 23,586,792 |
Issued in reinvestment of distributions | 509,712 | 247,985 |
Redeemed | (13,418,567) | (103,303,937) |
Net increase (decrease) | (7,586,614) | (79,469,160) |
Financial Highlights
Years ended February 28, | 2013 | 2012 G | 2011 | 2010 | 2009 |
Selected Per-Share Data |
|
|
|
|
|
Net asset value, beginning of period | $ 9.68 | $ 9.09 | $ 7.69 | $ 5.27 | $ 9.20 |
Income from Investment Operations |
|
|
|
|
|
Net investment income (loss) B | .21 | .14 | .13 | .12 | .16 |
Net realized and unrealized gain (loss) | 1.03 | .48 E | 1.42 | 2.43 | (3.95) |
Total from investment operations | 1.24 | .62 | 1.55 | 2.55 | (3.79) |
Distributions from net investment income | (.18) | (.03) | (.15) | (.13) | (.14) |
Distributions from net realized gain | (.05) | - | - | - | - |
Total distributions | (.22) H | (.03) | (.15) | (.13) | (.14) |
Net asset value, end of period | $ 10.70 | $ 9.68 | $ 9.09 | $ 7.69 | $ 5.27 |
Total Return A | 13.03% | 6.78% | 20.25% | 48.52% | (41.51)% |
Ratios to Average Net Assets C, F |
|
|
|
|
|
Expenses before reductions | .45% | .45% | .45% | .45% | .45% |
Expenses net of fee waivers, if any | .45% | .45% | .45% | .45% | .45% |
Expenses net of all reductions | .45% | .45% | .45% | .45% | .45% |
Net investment income (loss) | 2.08% | 1.53% | 1.58% | 1.76% | 2.05% |
Supplemental Data |
|
|
|
|
|
Net assets, end of period (000 omitted) | $ 208,675 | $ 262,225 | $ 968,646 | $ 1,006,185 | $ 723,548 |
Portfolio turnover rate D | 85% | 104% | 64% | 60% I | 45% I |
A Total returns would have been lower if certain expenses had not been reduced during the applicable periods shown.
B Calculated based on average shares outstanding during the period.
C Fees and expenses of any underlying funds and Fidelity Central Funds are not included in the Fund's expense ratio. The Fund indirectly bears its proportionate share of the expenses of any underlying funds and Fidelity Central Funds.
D Amount does not include the portfolio activity of any underlying funds and Fidelity Central Funds.
E The amount shown for a share outstanding does not correspond with the aggregate net gain (loss) on investments for the period due to the timing of sales and repurchases of shares in relation to fluctuating market values of the investments of the Fund.
F Expense ratios reflect operating expenses of the Fund. Expenses before reductions do not reflect amounts reimbursed by the investment adviser or reductions from expense offset arrangements and do not represent the amount paid by the Fund during periods when reimbursements or reductions occur. Expenses net of fee waivers reflect expenses after reimbursement by the investment adviser but prior to reductions from expense offset arrangements. Expenses net of all reductions represent the net expenses paid by the Fund.
G For the year ended February 29.
H Total distributions of $0.22 per share is comprised of distributions from net investment income of $0.175 and distributions from net realized gain of $.049 per share.
I Reflects adjustments to exclude transactions in money market mutual funds.
See accompanying notes which are an integral part of the financial statements.
Annual Report
Fidelity Mid Cap Enhanced Index Fund
Performance: The Bottom Line
Average annual total return reflects the change in the value of an investment, assuming reinvestment of the fund's distributions from dividend income and capital gains (the profits earned upon the sale of securities that have grown in value, if any) and assuming a constant rate of performance each year. The $10,000 table and the fund's returns do not reflect the deduction of taxes that a shareholder would pay on fund distributions or the redemption of fund shares. During periods of reimbursement by Fidelity a fund's total returns will be greater than it would be had the reimbursement not occurred. How a fund did yesterday is no guarantee of how it will do tomorrow.
Average Annual Total Returns
Periods ended February 28, 2013 | Past 1 | Past 5 | Life of |
Fidelity Mid Cap Enhanced Index Fund | 15.57% | 7.24% | 5.16% |
A From December 20, 2007.
$10,000 Over Life of Fund
Let's say hypothetically that $10,000 was invested in Fidelity Mid Cap Enhanced Index Fund on December 20, 2007, when the fund started. The chart shows how the value of your investment would have changed, and also shows how the Russell Midcap® Index performed over the same period.

Annual Report
Fidelity Mid Cap Enhanced Index Fund
Management's Discussion of Fund Performance
Market Recap: U.S. stock markets posted solid gains for the year ending February 28, 2013, sparked by a late-period rally that pushed major equity benchmarks to multiyear highs. Improvement in the global economy and more monetary stimulus from the U.S. Federal Reserve kept markets on the upswing for much of the year, shrugging off an early decline brought on by debt woes in Europe, and another dip later in the period amid Congressional gridlock on the federal budget. Renewed optimism over employment, the housing market, corporate earnings and record dividends made stocks a favorite with investors during the 12 months, which helped push the broad-based S&P 500® Index across the milestone 1,500 mark at the end of January. The S&P 500® finished the period up 13.46%, with the blue-chip-laden Dow Jones Industrial AverageSM following suit, rising 11.51% and nearing an all-time high by period end. The technology-heavy Nasdaq Composite Index® also hit a multiyear high, despite adding a more modest 7.96%. Elsewhere, gains were broad-based, with seven of the 10 sectors in the S&P 500® posting a double-digit advance, led by telecommunication services and health care, while materials, tech and energy showed single-digit returns. Outside the U.S., foreign developed-markets stocks rose strongly, despite the headwind of a stronger U.S. dollar, with the MSCI® EAFE® Index adding 9.99%.
Comments from Maximilian Kaufmann, Senior Portfolio Manager of the Geode Capital Management, LLC, investment management team for Fidelity® Mid Cap Enhanced Index Fund: For the year, the fund returned 15.57%, outpacing the benchmark Russell Midcap® Index, which added 15.04%. Relative to the Russell index, the fund had very strong stock picking in the energy and financials sectors, while, to a lesser extent, security selection in health care was subpar, as was the fund's positioning in industrials and utilities. Six of the fund's top-seven contributors were oil refining stocks - Tesoro, Western Refining, Valero Energy, HollyFrontier, Marathon Petroleum and Delek US Holdings - with shares of each turning in an extremely strong gain during the period. Thanks to lower energy prices, oil-refining companies experienced reduced raw material costs and, therefore, higher profits. Western Refining and Delek were out-of-benchmark positions. PulteGroup, a homebuilder whose shares were up in response to improved conditions in the U.S. housing market, also added value, as did timely ownership of wireless service provider MetroPCS Communications. In contrast, the fund's biggest detractor was Health Net, whose shares fell sharply in both May and August after the company announced weaker-than-expected financial forecasts. In the case of Sprint Nextel, another underperforming telecommunication services provider for the fund, we did not own the stock until September, and therefore missed out on its strong advance during the first seven months of the period. The fund's allocation to poor-performing semiconductor producer Marvell Technology Group, health-benefits provider Humana and luxury accessories manufacturer Coach also hampered results. Some of the stocks I've mentioned were not in the portfolio at period end.
The views expressed above reflect those of the portfolio manager(s) only through the end of the period as stated on the cover of this report and do not necessarily represent the views of Fidelity or any other person in the Fidelity organization. Any such views are subject to change at any time based upon market or other conditions and Fidelity disclaims any responsibility to update such views. These views may not be relied on as investment advice and, because investment decisions for a Fidelity fund are based on numerous factors, may not be relied on as an indication of trading intent on behalf of any Fidelity fund.
Annual Report
Fidelity Mid Cap Enhanced Index Fund
Investment Changes (Unaudited)
Top Ten Stocks as of February 28, 2013 | ||
| % of fund's | % of fund's net assets |
Marathon Petroleum Corp. | 1.1 | 0.9 |
Valero Energy Corp. | 1.0 | 1.0 |
Intuit, Inc. | 0.9 | 0.9 |
Liberty Global, Inc. Class A | 0.8 | 0.0 |
Macy's, Inc. | 0.8 | 0.9 |
Symantec Corp. | 0.8 | 0.8 |
Applied Materials, Inc. | 0.8 | 0.0 |
CIGNA Corp. | 0.8 | 0.4 |
Edison International | 0.8 | 0.0 |
Ingersoll-Rand PLC | 0.8 | 0.0 |
| 8.6 | |
Market Sectors as of February 28, 2013 | ||
| % of fund's | % of fund's net assets |
Financials | 21.4 | 17.7 |
Information Technology | 14.9 | 14.3 |
Industrials | 14.5 | 10.4 |
Consumer Discretionary | 14.3 | 16.4 |
Consumer Staples | 7.9 | 7.4 |
Health Care | 7.6 | 11.6 |
Energy | 6.7 | 6.9 |
Utilities | 6.2 | 7.5 |
Materials | 3.9 | 4.4 |
Telecommunication Services | 0.2 | 1.6 |
Annual Report
Fidelity Mid Cap Enhanced Index Fund
Investments February 28, 2013
Showing Percentage of Net Assets
Common Stocks - 97.6% | |||
Shares | Value | ||
CONSUMER DISCRETIONARY - 14.3% | |||
Auto Components - 2.1% | |||
BorgWarner, Inc. (a) | 843 | $ 62,728 | |
Dana Holding Corp. (e) | 2,663 | 44,552 | |
Delphi Automotive PLC | 23,187 | 970,376 | |
Gentex Corp. (e) | 21,985 | 412,219 | |
Lear Corp. | 12,946 | 691,575 | |
Visteon Corp. (a)(e) | 7,741 | 451,145 | |
| 2,632,595 | ||
Automobiles - 0.3% | |||
Harley-Davidson, Inc. | 7,120 | 374,726 | |
Hotels, Restaurants & Leisure - 0.9% | |||
International Game Technology | 41,644 | 663,805 | |
Wyndham Worldwide Corp. | 8,816 | 531,076 | |
| 1,194,881 | ||
Household Durables - 2.2% | |||
Newell Rubbermaid, Inc. | 26,212 | 611,788 | |
NVR, Inc. (a) | 456 | 460,195 | |
PulteGroup, Inc. (a) | 24,674 | 473,247 | |
Tupperware Brands Corp. | 6,421 | 502,315 | |
Whirlpool Corp. | 7,264 | 820,469 | |
| 2,868,014 | ||
Internet & Catalog Retail - 1.5% | |||
Expedia, Inc. | 11,234 | 717,179 | |
Liberty Media Corp. Interactive Series A (a) | 38,738 | 808,849 | |
Netflix, Inc. (a)(e) | 1,741 | 327,447 | |
| 1,853,475 | ||
Media - 1.8% | |||
Cinemark Holdings, Inc. | 12,866 | 357,675 | |
DISH Network Corp. Class A | 21,077 | 733,480 | |
Liberty Global, Inc. Class A (a) | 15,669 | 1,079,437 | |
Starz - Liberty Capital Series A (a)(e) | 5,067 | 94,044 | |
| 2,264,636 | ||
Multiline Retail - 0.8% | |||
Macy's, Inc. | 25,230 | 1,036,953 | |
Specialty Retail - 4.3% | |||
Advance Auto Parts, Inc. | 8,565 | 653,852 | |
Bed Bath & Beyond, Inc. (a)(e) | 9,460 | 536,855 | |
Foot Locker, Inc. | 1,520 | 51,969 | |
Gap, Inc. (e) | 20,305 | 668,441 | |
Limited Brands, Inc. | 4,775 | 217,358 | |
O'Reilly Automotive, Inc. (a) | 7,426 | 755,521 | |
PetSmart, Inc. | 10,775 | 701,560 | |
Ross Stores, Inc. | 12,983 | 752,495 | |
Signet Jewelers Ltd. | 3,078 | 188,435 | |
Staples, Inc. | 30,003 | 395,440 | |
TJX Companies, Inc. | 12,629 | 567,926 | |
| 5,489,852 | ||
| |||
Shares | Value | ||
Textiles, Apparel & Luxury Goods - 0.4% | |||
Coach, Inc. | 11,624 | $ 561,788 | |
TOTAL CONSUMER DISCRETIONARY | 18,276,920 | ||
CONSUMER STAPLES - 7.9% | |||
Beverages - 0.4% | |||
Coca-Cola Enterprises, Inc. | 14,019 | 501,600 | |
Food & Staples Retailing - 0.7% | |||
Kroger Co. | 31,830 | 929,754 | |
Food Products - 4.4% | |||
Campbell Soup Co. (e) | 12,079 | 497,172 | |
ConAgra Foods, Inc. | 26,190 | 893,341 | |
Hillshire Brands Co. | 19,337 | 626,519 | |
Hormel Foods Corp. (e) | 16,921 | 633,015 | |
Ingredion, Inc. | 9,984 | 660,941 | |
The Hershey Co. (e) | 10,313 | 859,485 | |
The J.M. Smucker Co. | 8,743 | 833,208 | |
Tyson Foods, Inc. Class A | 31,020 | 703,223 | |
| 5,706,904 | ||
Household Products - 1.8% | |||
Church & Dwight Co., Inc. (e) | 12,330 | 763,967 | |
Clorox Co. (e) | 9,803 | 823,550 | |
Energizer Holdings, Inc. | 7,524 | 691,681 | |
| 2,279,198 | ||
Personal Products - 0.6% | |||
Avon Products, Inc. | 33,016 | 645,463 | |
Nu Skin Enterprises, Inc. Class A | 1,738 | 71,606 | |
| 717,069 | ||
TOTAL CONSUMER STAPLES | 10,134,525 | ||
ENERGY - 6.7% | |||
Energy Equipment & Services - 2.0% | |||
Bristow Group, Inc. | 9,323 | 543,158 | |
Diamond Offshore Drilling, Inc. (e) | 9,496 | 661,681 | |
Helmerich & Payne, Inc. (e) | 10,528 | 697,585 | |
Oceaneering International, Inc. | 11,920 | 757,993 | |
| 2,660,417 | ||
Oil, Gas & Consumable Fuels - 4.7% | |||
CVR Energy, Inc. | 8,752 | 491,687 | |
Delek US Holdings, Inc. | 11,798 | 440,773 | |
HollyFrontier Corp. | 16,284 | 915,161 | |
Marathon Petroleum Corp. | 16,358 | 1,355,751 | |
Murphy Oil Corp. (e) | 8,532 | 519,428 | |
Tesoro Corp. | 10,831 | 609,135 | |
Valero Energy Corp. (e) | 27,264 | 1,242,966 | |
Western Refining, Inc. | 11,718 | 420,559 | |
| 5,995,460 | ||
TOTAL ENERGY | 8,655,877 | ||
Common Stocks - continued | |||
Shares | Value | ||
FINANCIALS - 21.4% | |||
Capital Markets - 3.9% | |||
American Capital Ltd. (a) | 47,569 | $ 665,015 | |
Ameriprise Financial, Inc. (e) | 3,900 | 267,657 | |
Invesco Ltd. | 20,339 | 544,882 | |
Jefferies Group, Inc. (e) | 382 | 8,297 | |
Lazard Ltd. Class A | 7,177 | 257,654 | |
LPL Financial | 11,795 | 371,896 | |
Raymond James Financial, Inc. (e) | 15,361 | 674,041 | |
SEI Investments Co. | 22,136 | 625,785 | |
Solar Capital Ltd. | 8,897 | 217,977 | |
T. Rowe Price Group, Inc. | 9,499 | 676,234 | |
TD Ameritrade Holding Corp. (e) | 32,578 | 619,308 | |
Waddell & Reed Financial, Inc. Class A (e) | 2,900 | 118,958 | |
| 5,047,704 | ||
Commercial Banks - 3.3% | |||
CapitalSource, Inc. | 29,500 | 265,500 | |
CIT Group, Inc. (a) | 17,455 | 730,666 | |
Fifth Third Bancorp | 37,476 | 593,620 | |
Huntington Bancshares, Inc. | 63,027 | 443,080 | |
KeyCorp | 56,566 | 531,155 | |
Popular, Inc. (a) | 13,646 | 380,996 | |
Regions Financial Corp. | 91,476 | 699,791 | |
SunTrust Banks, Inc. | 22,031 | 607,835 | |
| 4,252,643 | ||
Consumer Finance - 1.1% | |||
Discover Financial Services | 14,371 | 553,715 | |
SLM Corp. | 41,585 | 788,867 | |
| 1,342,582 | ||
Diversified Financial Services - 1.1% | |||
McGraw-Hill Companies, Inc. (e) | 18,917 | 880,586 | |
Moody's Corp. (e) | 12,032 | 578,258 | |
| 1,458,844 | ||
Insurance - 6.3% | |||
Allied World Assurance Co. Holdings Ltd. | 7,333 | 643,911 | |
American Financial Group, Inc. | 14,874 | 653,861 | |
American International Group, Inc. (a) | 13,415 | 509,904 | |
American International Group, Inc. warrants 1/19/21 (a) | 574 | 7,944 | |
Arch Capital Group Ltd. (a)(e) | 2,757 | 135,424 | |
Arthur J. Gallagher & Co. | 13,466 | 518,172 | |
Aspen Insurance Holdings Ltd. | 8,670 | 310,906 | |
Axis Capital Holdings Ltd. | 15,797 | 643,412 | |
CNA Financial Corp. | 179 | 5,646 | |
Everest Re Group Ltd. | 5,702 | 710,526 | |
Fidelity National Financial, Inc. Class A | 16,964 | 423,082 | |
HCC Insurance Holdings, Inc. | 16,734 | 669,360 | |
Marsh & McLennan Companies, Inc. | 9,198 | 341,614 | |
PartnerRe Ltd. | 7,247 | 646,722 | |
| |||
Shares | Value | ||
ProAssurance Corp. | 8,776 | $ 411,507 | |
Progressive Corp. | 13,079 | 318,604 | |
Reinsurance Group of America, Inc. | 10,795 | 620,713 | |
Validus Holdings Ltd. | 15,253 | 543,464 | |
| 8,114,772 | ||
Real Estate Investment Trusts - 5.4% | |||
American Campus Communities, Inc. | 4,702 | 212,530 | |
American Capital Agency Corp. | 25,286 | 802,072 | |
Apollo Residential Mortgage, Inc. | 8,705 | 194,818 | |
Camden Property Trust (SBI) | 6,337 | 438,140 | |
Chimera Investment Corp. | 216,431 | 644,964 | |
Equity Lifestyle Properties, Inc. | 26 | 1,916 | |
Extra Space Storage, Inc. | 17,762 | 665,009 | |
General Growth Properties, Inc. (e) | 42,952 | 822,101 | |
HCP, Inc. | 788 | 38,517 | |
MFA Financial, Inc. | 72,531 | 644,075 | |
Public Storage | 3,669 | 554,789 | |
The Geo Group, Inc. | 3,451 | 119,198 | |
Ventas, Inc. | 1,999 | 141,489 | |
Vornado Realty Trust | 3,488 | 279,772 | |
Western Asset Mortgage Capital Corp. | 16,470 | 353,940 | |
Weyerhaeuser Co. | 33,137 | 974,559 | |
| 6,887,889 | ||
Thrifts & Mortgage Finance - 0.3% | |||
Ocwen Financial Corp. (a) | 5,462 | 215,312 | |
Washington Federal, Inc. | 8,185 | 143,647 | |
| 358,959 | ||
TOTAL FINANCIALS | 27,463,393 | ||
HEALTH CARE - 7.6% | |||
Biotechnology - 0.5% | |||
Biogen Idec, Inc. (a) | 3,395 | 564,724 | |
Health Care Equipment & Supplies - 2.3% | |||
Boston Scientific Corp. (a) | 84,498 | 624,440 | |
CareFusion Corp. (a) | 23,406 | 766,312 | |
St. Jude Medical, Inc. (e) | 18,324 | 751,284 | |
Thoratec Corp. (a) | 3,795 | 133,622 | |
Zimmer Holdings, Inc. (e) | 9,176 | 687,833 | |
| 2,963,491 | ||
Health Care Providers & Services - 3.0% | |||
AmerisourceBergen Corp. | 15,538 | 733,394 | |
CIGNA Corp. | 17,137 | 1,001,829 | |
Humana, Inc. | 12,063 | 823,420 | |
Omnicare, Inc. | 18,040 | 672,170 | |
Quest Diagnostics, Inc. | 11,662 | 655,055 | |
| 3,885,868 | ||
Life Sciences Tools & Services - 0.4% | |||
Charles River Laboratories International, Inc. (a) | 8,041 | 327,590 | |
Life Technologies Corp. (a) | 2,678 | 155,672 | |
| 483,262 | ||
Common Stocks - continued | |||
Shares | Value | ||
HEALTH CARE - continued | |||
Pharmaceuticals - 1.4% | |||
Actavis, Inc. (a) | 5,971 | $ 508,490 | |
Forest Laboratories, Inc. (a) | 19,365 | 712,632 | |
Warner Chilcott PLC | 44,957 | 607,369 | |
| 1,828,491 | ||
TOTAL HEALTH CARE | 9,725,836 | ||
INDUSTRIALS - 14.5% | |||
Aerospace & Defense - 1.7% | |||
Alliant Techsystems, Inc. | 7,056 | 464,285 | |
Exelis, Inc. | 36,828 | 380,065 | |
L-3 Communications Holdings, Inc. | 9,223 | 703,438 | |
Textron, Inc. | 20,220 | 583,347 | |
| 2,131,135 | ||
Airlines - 0.6% | |||
Copa Holdings SA Class A | 4,234 | 442,114 | |
Southwest Airlines Co. | 29,094 | 340,400 | |
| 782,514 | ||
Building Products - 0.3% | |||
Lennox International, Inc. | 6,453 | 381,179 | |
Commercial Services & Supplies - 1.8% | |||
Avery Dennison Corp. | 16,039 | 655,193 | |
Cintas Corp. (e) | 10,130 | 444,707 | |
Republic Services, Inc. | 21,741 | 683,537 | |
Unifirst Corp. Massachusetts | 6,262 | 523,127 | |
| 2,306,564 | ||
Construction & Engineering - 1.0% | |||
AECOM Technology Corp. (a)(e) | 19,322 | 585,650 | |
Chicago Bridge & Iron Co. NV unit | 12,344 | 661,515 | |
EMCOR Group, Inc. | 1,855 | 71,547 | |
| 1,318,712 | ||
Electrical Equipment - 1.8% | |||
AMETEK, Inc. | 18,177 | 760,344 | |
Eaton Corp. PLC | 3,204 | 198,552 | |
Hubbell, Inc. Class B | 4,921 | 457,210 | |
Rockwell Automation, Inc. | 9,368 | 846,305 | |
| 2,262,411 | ||
Machinery - 5.2% | |||
CNH Global NV | 10,604 | 469,757 | |
Crane Co. | 11,305 | 607,983 | |
Dover Corp. | 8,500 | 623,475 | |
Ingersoll-Rand PLC | 18,713 | 985,239 | |
Lincoln Electric Holdings, Inc. | 6,300 | 353,115 | |
Parker Hannifin Corp. (e) | 8,468 | 800,057 | |
Snap-On, Inc. | 4,346 | 348,853 | |
Timken Co. | 8,452 | 459,113 | |
Trinity Industries, Inc. (e) | 5,700 | 246,468 | |
Valmont Industries, Inc. | 4,246 | 668,957 | |
| |||
Shares | Value | ||
WABCO Holdings, Inc. (a) | 6,867 | $ 471,900 | |
Wabtec Corp. | 6,691 | 654,313 | |
| 6,689,230 | ||
Marine - 0.1% | |||
Matson, Inc. | 4,446 | 114,307 | |
Professional Services - 2.0% | |||
Equifax, Inc. | 8,533 | 470,339 | |
Manpower, Inc. | 1,144 | 62,462 | |
Nielsen Holdings B.V. | 20,593 | 693,778 | |
Robert Half International, Inc. | 18,487 | 657,213 | |
Towers Watson & Co. | 10,046 | 668,762 | |
| 2,552,554 | ||
TOTAL INDUSTRIALS | 18,538,606 | ||
INFORMATION TECHNOLOGY - 14.9% | |||
Communications Equipment - 0.8% | |||
Brocade Communications Systems, Inc. (a) | 70,924 | 397,884 | |
Harris Corp. | 12,758 | 613,277 | |
| 1,011,161 | ||
Computers & Peripherals - 1.3% | |||
NetApp, Inc. (a) | 21,534 | 728,495 | |
Western Digital Corp. | 17,997 | 848,739 | |
| 1,577,234 | ||
Electronic Equipment & Components - 1.4% | |||
Amphenol Corp. Class A | 11,541 | 817,795 | |
Avnet, Inc. (a) | 17,985 | 635,050 | |
Tech Data Corp. (a) | 7,000 | 371,420 | |
| 1,824,265 | ||
IT Services - 3.0% | |||
Amdocs Ltd. | 20,145 | 734,688 | |
Computer Sciences Corp. | 15,331 | 736,348 | |
CoreLogic, Inc. (a) | 6,661 | 172,587 | |
Fidelity National Information Services, Inc. | 18,454 | 694,793 | |
Fiserv, Inc. (a) | 4,078 | 334,845 | |
Genpact Ltd. | 20,646 | 363,576 | |
The Western Union Co. | 26,211 | 367,740 | |
Total System Services, Inc. (e) | 17,212 | 408,957 | |
| 3,813,534 | ||
Office Electronics - 0.6% | |||
Xerox Corp. | 98,004 | 794,812 | |
Semiconductors & Semiconductor Equipment - 4.7% | |||
Analog Devices, Inc. | 20,343 | 919,910 | |
Applied Materials, Inc. | 73,145 | 1,002,087 | |
Avago Technologies Ltd. | 22,649 | 775,049 | |
KLA-Tencor Corp. | 14,908 | 816,362 | |
Linear Technology Corp. (e) | 1,424 | 54,454 | |
Marvell Technology Group Ltd. | 67,304 | 679,770 | |
Maxim Integrated Products, Inc. | 23,889 | 744,859 | |
Common Stocks - continued | |||
Shares | Value | ||
INFORMATION TECHNOLOGY - continued | |||
Semiconductors & Semiconductor Equipment - continued | |||
NVIDIA Corp. | 57,995 | $ 734,217 | |
PMC-Sierra, Inc. (a) | 45,049 | 292,368 | |
| 6,019,076 | ||
Software - 3.1% | |||
Activision Blizzard, Inc. | 48,875 | 698,913 | |
CA Technologies, Inc. | 32,170 | 787,843 | |
Intuit, Inc. | 16,956 | 1,093,323 | |
Symantec Corp. (a) | 43,967 | 1,030,586 | |
Synopsys, Inc. (a) | 11,258 | 394,368 | |
| 4,005,033 | ||
TOTAL INFORMATION TECHNOLOGY | 19,045,115 | ||
MATERIALS - 3.9% | |||
Chemicals - 2.3% | |||
A. Schulman, Inc. | 183 | 5,737 | |
Albemarle Corp. | 6,901 | 449,117 | |
CF Industries Holdings, Inc. | 4,562 | 916,186 | |
Eastman Chemical Co. | 8,394 | 585,314 | |
Huntsman Corp. | 23,791 | 409,919 | |
Valspar Corp. | 400 | 24,644 | |
Westlake Chemical Corp. | 6,960 | 600,091 | |
| 2,991,008 | ||
Containers & Packaging - 1.3% | |||
Bemis Co., Inc. (e) | 16,929 | 632,129 | |
Graphic Packaging Holding Co. (a) | 41,621 | 308,828 | |
Packaging Corp. of America | 1,493 | 62,378 | |
Silgan Holdings, Inc. | 14,171 | 608,361 | |
| 1,611,696 | ||
Paper & Forest Products - 0.3% | |||
International Paper Co. | 8,100 | 356,481 | |
TOTAL MATERIALS | 4,959,185 | ||
TELECOMMUNICATION SERVICES - 0.2% | |||
Wireless Telecommunication Services - 0.2% | |||
Sprint Nextel Corp. (a) | 53,561 | 310,654 | |
UTILITIES - 6.2% | |||
Electric Utilities - 2.9% | |||
Cleco Corp. (e) | 2,738 | 121,293 | |
Edison International | 20,710 | 994,701 | |
Entergy Corp. (e) | 7,557 | 470,499 | |
NV Energy, Inc. | 34,888 | 689,387 | |
Pinnacle West Capital Corp. | 9,479 | 530,255 | |
Xcel Energy, Inc. | 32,840 | 942,508 | |
| 3,748,643 | ||
| |||
Shares | Value | ||
Gas Utilities - 0.2% | |||
Atmos Energy Corp. | 7,903 | $ 301,658 | |
Multi-Utilities - 2.5% | |||
Alliant Energy Corp. | 14,111 | 672,954 | |
Ameren Corp. | 19,962 | 674,516 | |
CenterPoint Energy, Inc. | 38,436 | 823,683 | |
CMS Energy Corp. | 1,400 | 37,254 | |
DTE Energy Co. | 13,168 | 879,622 | |
Wisconsin Energy Corp. (e) | 2,531 | 104,530 | |
| 3,192,559 | ||
Water Utilities - 0.6% | |||
American Water Works Co., Inc. | 18,858 | 743,948 | |
TOTAL UTILITIES | 7,986,808 | ||
TOTAL COMMON STOCKS (Cost $110,994,515) |
| ||
U.S. Treasury Obligations - 0.1% | ||||
| Principal |
| ||
U.S. Treasury Bills, yield at date of purchase 0.12% 6/27/13 (f) | $ 100,000 |
| ||
Money Market Funds - 14.2% | |||
Shares |
| ||
Dreyfus Cash Management Institutional Shares, 0.10% (c) | 2,950,146 | 2,950,146 | |
Fidelity Securities Lending Cash Central Fund, 0.16% (b)(d) | 15,177,325 | 15,177,325 | |
TOTAL MONEY MARKET FUNDS (Cost $18,127,471) |
| ||
TOTAL INVESTMENT PORTFOLIO - 111.9% (Cost $129,221,945) | 143,324,353 | ||
NET OTHER ASSETS (LIABILITIES) - (11.9)% | (15,194,185) | ||
NET ASSETS - 100% | $ 128,130,168 | ||
Futures Contracts | |||||
Expiration Date | Underlying Face Amount at Value | Unrealized Appreciation/(Depreciation) | |||
Purchased | |||||
Equity Index Contracts | |||||
26 CME E-mini S&P MidCap 400 Index Contracts | March 2013 | $ 2,864,420 | $ 142,598 | ||
|
The face value of futures purchased as a percentage of net assets is 2.2% |
Legend |
(a) Non-income producing |
(b) Affiliated fund that is generally available only to investment companies and other accounts managed by Fidelity Investments. The rate quoted is the annualized seven-day yield of the fund at period end. A complete unaudited listing of the fund's holdings as of its most recent quarter end is available upon request. In addition, each Fidelity Central Fund's financial statements, which are not covered by the Fund's Report of Independent Registered Public Accounting Firm, are available on the SEC's website or upon request. |
(c) The rate quoted is the annualized seven-day yield of the fund at period end. |
(d) Investment made with cash collateral received from securities on loan. |
(e) Security or a portion of the security is on loan at period end. |
(f) Security or a portion of the security was pledged to cover margin requirements for futures contracts. At the period end, the value of securities pledged amounted to $99,963. |
Affiliated Central Funds |
Information regarding fiscal year to date income earned by the Fund from investments in Fidelity Central Funds is as follows: |
Fund | Income earned |
Fidelity Securities Lending Cash Central Fund | $ 11,130 |
Other Information |
The following is a summary of the inputs used, as of February 28, 2013, involving the Fund's assets and liabilities carried at fair value. The inputs or methodology used for valuing securities may not be an indication of the risk associated with investing in those securities. For more information on valuation inputs, and their aggregation into the levels used in the table below, please refer to the Investment Valuation section in the accompanying Notes to Financial Statements. |
Valuation Inputs at Reporting Date: | ||||
Description | Total | Level 1 | Level 2 | Level 3 |
Investments in Securities: | ||||
Equities: | ||||
Consumer Discretionary | $ 18,276,920 | $ 18,276,920 | $ - | $ - |
Consumer Staples | 10,134,525 | 10,134,525 | - | - |
Energy | 8,655,877 | 8,655,877 | - | - |
Financials | 27,463,393 | 27,463,393 | - | - |
Health Care | 9,725,836 | 9,725,836 | - | - |
Industrials | 18,538,606 | 18,538,606 | - | - |
Information Technology | 19,045,115 | 19,045,115 | - | - |
Materials | 4,959,185 | 4,959,185 | - | - |
Telecommunication Services | 310,654 | 310,654 | - | - |
Utilities | 7,986,808 | 7,986,808 | - | - |
U.S. Government and Government Agency Obligations | 99,963 | - | 99,963 | - |
Money Market Funds | 18,127,471 | 18,127,471 | - | - |
Total Investments in Securities: | $ 143,324,353 | $ 143,224,390 | $ 99,963 | $ - |
Derivative Instruments: | ||||
Assets | ||||
Futures Contracts | $ 142,598 | $ 142,598 | $ - | $ - |
Value of Derivative Instruments |
The following table is a summary of the Fund's value of derivative instruments by primary risk exposure as of February 28, 2013. For additional information on derivative instruments, please refer to the Derivative Instruments section in the accompanying Notes to Financial Statements. |
Primary Risk Exposure / | Value | |
| Asset | Liability |
Equity Risk | ||
Futures Contracts (a) | $ 142,598 | $ - |
Total Value of Derivatives | $ 142,598 | $ - |
(a) Reflects cumulative appreciation/(depreciation) on futures contracts as disclosed on the Schedule of Investments. Only the period end variation margin is separately disclosed on the Statement of Assets and Liabilities. |
See accompanying notes which are an integral part of the financial statements.
Annual Report
Fidelity Mid Cap Enhanced Index Fund
Financial Statements
Statement of Assets and Liabilities
| February 28, 2013 | |
|
|
|
Assets | ||
Investment in securities, at value (including securities loaned of $14,842,382) - See accompanying schedule: Unaffiliated issuers (cost $114,044,620) | $ 128,147,028 |
|
Fidelity Central Funds (cost $15,177,325) | 15,177,325 |
|
Total Investments (cost $129,221,945) |
| $ 143,324,353 |
Segregated cash with broker for futures contracts | 1,100 | |
Receivable for investments sold | 3,170,379 | |
Receivable for fund shares sold | 487,942 | |
Dividends receivable | 219,319 | |
Interest receivable | 150 | |
Distributions receivable from Fidelity Central Funds | 1,680 | |
Total assets | 147,204,923 | |
|
|
|
Liabilities | ||
Payable for investments purchased | $ 3,752,183 | |
Payable for fund shares redeemed | 87,099 | |
Accrued management fee | 41,569 | |
Payable for daily variation margin on futures contracts | 2,722 | |
Other affiliated payables | 13,857 | |
Collateral on securities loaned, at value | 15,177,325 | |
Total liabilities | 19,074,755 | |
|
|
|
Net Assets | $ 128,130,168 | |
Net Assets consist of: |
| |
Paid in capital | $ 112,337,730 | |
Undistributed net investment income | 209,469 | |
Accumulated undistributed net realized gain (loss) on investments | 1,337,963 | |
Net unrealized appreciation (depreciation) on investments | 14,245,006 | |
Net Assets, for 11,677,583 shares outstanding | $ 128,130,168 | |
Net Asset Value, offering price and redemption price per share ($128,130,168 ÷ 11,677,583 shares) | $ 10.97 | |
Statement of Operations
| Year ended February 28, 2013 | |
|
|
|
Investment Income |
|
|
Dividends |
| $ 1,906,252 |
Interest |
| 1,014 |
Income from Fidelity Central Funds |
| 11,130 |
Total income |
| 1,918,396 |
|
|
|
Expenses | ||
Management fee | $ 359,010 | |
Transfer agent fees | 119,980 | |
Independent trustees' compensation | 930 | |
Miscellaneous | 203 | |
Total expenses before reductions | 480,123 | |
Expense reductions | (3) | 480,120 |
Net investment income (loss) | 1,438,276 | |
Realized and Unrealized Gain (Loss) Net realized gain (loss) on: | ||
Investment securities: |
|
|
Unaffiliated issuers | 3,565,047 | |
Futures contracts | 241,282 | |
Total net realized gain (loss) |
| 3,806,329 |
Change in net unrealized appreciation (depreciation) on: Investment securities | 6,527,948 | |
Futures contracts | (75,506) | |
Total change in net unrealized appreciation (depreciation) |
| 6,452,442 |
Net gain (loss) | 10,258,771 | |
Net increase (decrease) in net assets resulting from operations | $ 11,697,047 | |
See accompanying notes which are an integral part of the financial statements.
Annual Report
Fidelity Mid Cap Enhanced Index Fund
Financial Statements - continued
Statement of Changes in Net Assets
| Year ended | Year ended |
Increase (Decrease) in Net Assets |
|
|
Operations |
|
|
Net investment income (loss) | $ 1,438,276 | $ 724,409 |
Net realized gain (loss) | 3,806,329 | 4,738,420 |
Change in net unrealized appreciation (depreciation) | 6,452,442 | (4,487,136) |
Net increase (decrease) in net assets resulting from operations | 11,697,047 | 975,693 |
Distributions to shareholders from net investment income | (1,338,905) | (511,180) |
Distributions to shareholders from net realized gain | (1,032,505) | (4,128,001) |
Total distributions | (2,371,410) | (4,639,181) |
Share transactions | 62,334,770 | 48,633,295 |
Reinvestment of distributions | 2,289,379 | 4,485,129 |
Cost of shares redeemed | (24,883,399) | (32,503,734) |
Net increase (decrease) in net assets resulting from share transactions | 39,740,750 | 20,614,690 |
Redemption fees | 2,311 | 6,307 |
Total increase (decrease) in net assets | 49,068,698 | 16,957,509 |
|
|
|
Net Assets | ||
Beginning of period | 79,061,470 | 62,103,961 |
End of period (including undistributed net investment income of $209,469 and undistributed net investment income of $118,757, respectively) | $ 128,130,168 | $ 79,061,470 |
Other Information Shares | ||
Sold | 5,905,950 | 5,003,022 |
Issued in reinvestment of distributions | 235,166 | 482,205 |
Redeemed | (2,543,261) | (3,448,788) |
Net increase (decrease) | 3,597,855 | 2,036,439 |
Financial Highlights
Years ended February 28, | 2013 | 2012 F | 2011 | 2010 | 2009 |
Selected Per-Share Data |
|
|
|
|
|
Net asset value, beginning of period | $ 9.79 | $ 10.28 | $ 8.33 | $ 5.12 | $ 9.16 |
Income from Investment Operations |
|
|
|
|
|
Net investment income (loss) B | .18 | .10 | .10 | .09 | .10 |
Net realized and unrealized gain (loss) | 1.30 | .05 | 2.30 | 3.20 | (4.07) |
Total from investment operations | 1.48 | .15 | 2.40 | 3.29 | (3.97) |
Distributions from net investment income | (.17) | (.07) | (.10) | (.08) | (.08) |
Distributions from net realized gain | (.13) | (.58) | (.35) | - | - |
Total distributions | (.30) | (.64) H | (.45) | (.08) | (.08) |
Redemption fees added to paid in capital B | - G | - G | - G | - G | .01 |
Net asset value, end of period | $ 10.97 | $ 9.79 | $ 10.28 | $ 8.33 | $ 5.12 |
Total Return A | 15.57% | 1.91% | 29.44% | 64.37% | (43.40)% |
Ratios to Average Net Assets C, E |
|
|
|
|
|
Expenses before reductions | .60% | .60% | .60% | .60% | .60% |
Expenses net of fee waivers, if any | .60% | .60% | .60% | .60% | .60% |
Expenses net of all reductions | .60% | .60% | .60% | .60% | .60% |
Net investment income (loss) | 1.80% | 1.03% | 1.16% | 1.21% | 1.39% |
Supplemental Data |
|
|
|
|
|
Net assets, end of period (000 omitted) | $ 128,130 | $ 79,061 | $ 62,104 | $ 33,617 | $ 14,235 |
Portfolio turnover rate D | 99% | 92% | 59% | 80% I | 58% I |
A Total returns would have been lower if certain expenses had not been reduced during the applicable periods shown.
B Calculated based on average shares outstanding during the period.
C Fees and expenses of any underlying funds and Fidelity Central Funds are not included in the Fund's expense ratio. The Fund indirectly bears its proportionate share of the expenses of any underlying funds and Fidelity Central Funds.
D Amount does not include the portfolio activity of any underlying funds and Fidelity Central Funds.
E Expense ratios reflect operating expenses of the Fund. Expenses before reductions do not reflect amounts reimbursed by the investment adviser or reductions from expense offset arrangements and do not represent the amount paid by the Fund during periods when reimbursements or reductions occur. Expenses net of fee waivers reflect expenses after reimbursement by the investment adviser but prior to reductions from expense offset arrangements. Expenses net of all reductions represent the net expenses paid by the Fund.
F For the year ended February 29.
G Amount represents less than $.01 per share.
H Total distributions of $.64 per share is comprised of distributions from net investment income of $.069 and distributions from net realized gain of $.575 per share.
I Reflects adjustments to exclude transactions in money market funds.
See accompanying notes which are an integral part of the financial statements.
Annual Report
Fidelity Small Cap Enhanced Index Fund
Performance: The Bottom Line
Average annual total return reflects the change in the value of an investment, assuming reinvestment of the fund's distributions from dividend income and capital gains (the profits earned upon the sale of securities that have grown in value, if any) and assuming a constant rate of performance each year. The $10,000 table and the fund's returns do not reflect the deduction of taxes that a shareholder would pay on fund distributions or the redemption of fund shares. During periods of reimbursement by Fidelity a fund's total returns will be greater than it would be had the reimbursement not occurred. How a fund did yesterday is no guarantee of how it will do tomorrow.
Average Annual Total Returns
Periods ended February 28, 2013 | Past 1 | Past 5 | Life of |
Fidelity Small Cap Enhanced Index Fund | 16.15% | 7.71% | 5.32% |
A From December 20, 2007.
$10,000 Over Life of Fund
Let's say hypothetically that $10,000 was invested in Fidelity Small Cap Enhanced Index Fund on December 20, 2007, when the fund started. The chart shows how the value of your investment would have changed, and also shows how the Russell 2000® Index performed over the same period.
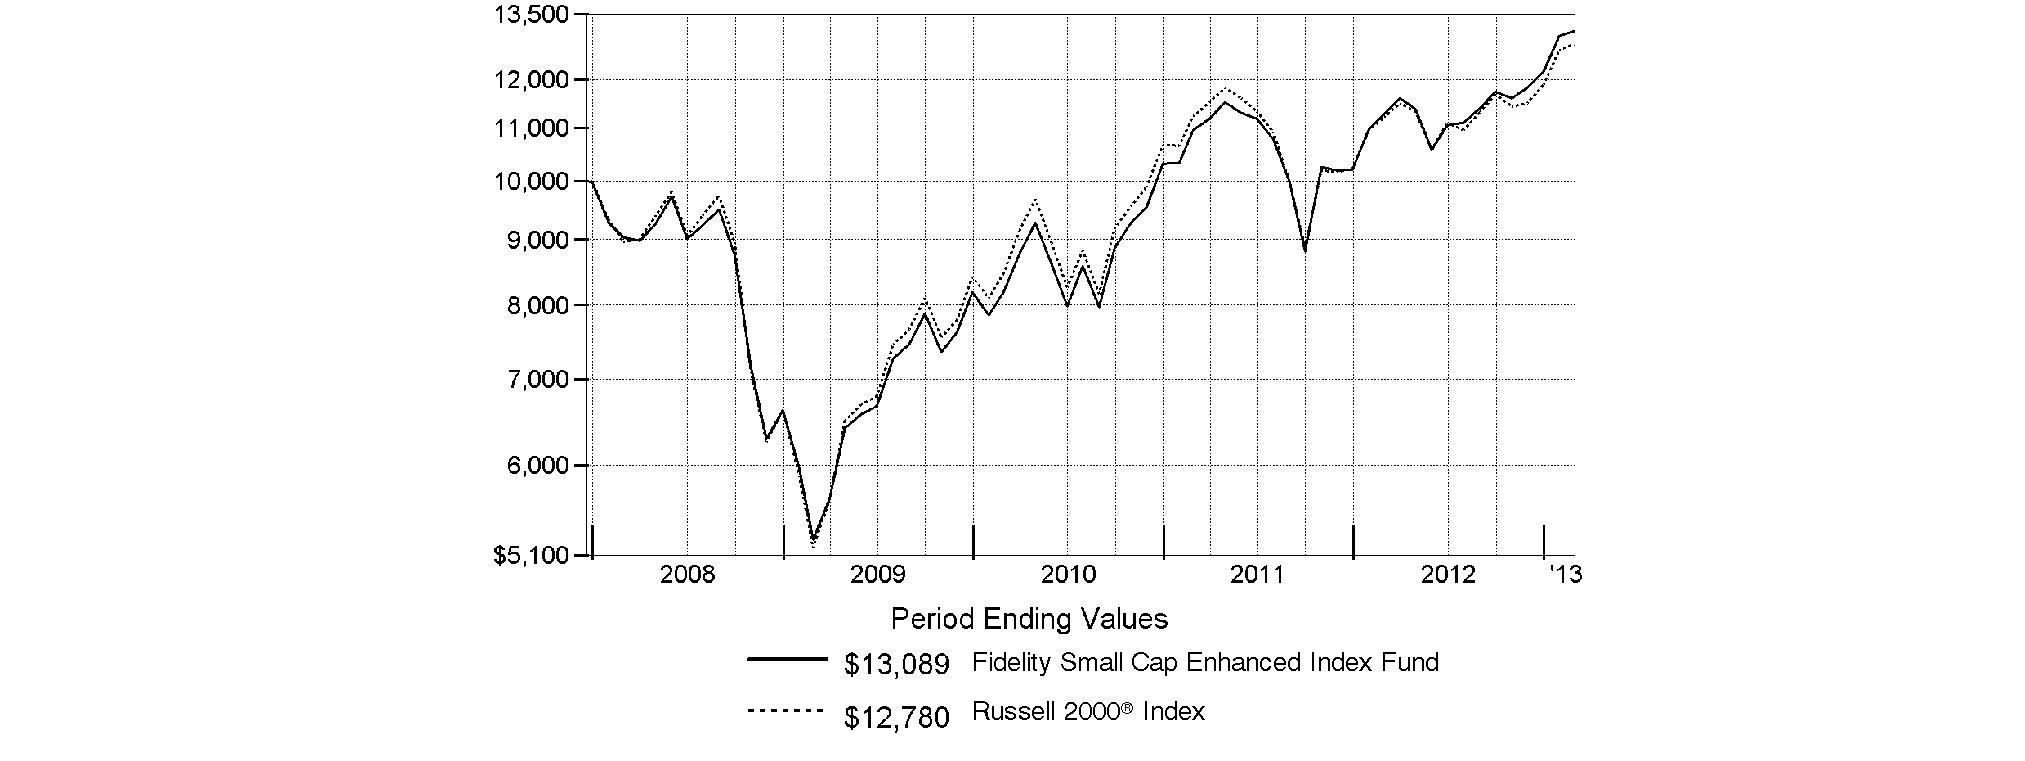
Annual Report
Fidelity Small Cap Enhanced Index Fund
Management's Discussion of Fund Performance
Market Recap: U.S. stock markets posted solid gains for the year ending February 28, 2013, sparked by a late-period rally that pushed major equity benchmarks to multiyear highs. Improvement in the global economy and more monetary stimulus from the U.S. Federal Reserve kept markets on the upswing for much of the year, shrugging off an early decline brought on by debt woes in Europe, and another dip later in the period amid Congressional gridlock on the federal budget. Renewed optimism over employment, the housing market, corporate earnings and record dividends made stocks a favorite with investors during the 12 months, which helped push the broad-based S&P 500® Index across the milestone 1,500 mark at the end of January. The S&P 500® finished the period up 13.46%, with the blue-chip-laden Dow Jones Industrial AverageSM following suit, rising 11.51% and nearing an all-time high by period end. The technology-heavy Nasdaq Composite Index® also hit a multiyear high, despite adding a more modest 7.96%. Elsewhere, gains were broad-based, with seven of the 10 sectors in the S&P 500® posting a double-digit advance, led by telecommunication services and health care, while materials, tech and energy showed single-digit returns. Outside the U.S., foreign developed-markets stocks rose strongly, despite the headwind of a stronger U.S. dollar, with the MSCI® EAFE® Index adding 9.99%.
Comments from Maximilian Kaufmann, Senior Portfolio Manager of the Geode Capital Management, LLC, investment management team for Fidelity® Small Cap Enhanced Index Fund: For the year, the fund returned 16.15%, outpacing the 14.02% advance of the benchmark Russell 2000® Index. Relative to the index, the fund had very strong stock picking in the energy sector and, to a lesser extent, in financials and information technology. In contrast, security selection was subpar in the retailing industry within consumer discretionary, as well as in the consumer staples sector. The fund's top-three individual contributors were oil refining stocks - Western Refining, Alon USA Energy and Delek US Holdings - with shares of each rising by triple digits during the year. Thanks to lower energy prices, oil refining companies experienced reduced raw material costs and, therefore, higher profits. In the financials sector, Hanmi Financial, a Los Angeles-based community bank whose target market is the Korean-American community, enjoyed very good results. Another Southern California-based bank holding company, Pacific Capital Bancorp, rose sharply in March on news that the company would be acquired. The stock was sold from the fund shortly afterwards. In materials, the fund benefited from timely ownership of Coeur d'Alene Mines, a silver and gold producer whose shares fell overall during the period. In contrast, the fund's biggest detractor was Xyratex, a provider of data-storage technology whose shares performed poorly. An out-of-benchmark stake in premium-mattress manufacturer and retailer Tempur-Pedic International detracted, as did the fund's overweighting in freight transportation provider Arkansas Best and untimely ownership of strong-performing airline and index component US Airways Group. Several of the stocks I've mentioned were not in the portfolio at period end.
The views expressed above reflect those of the portfolio manager(s) only through the end of the period as stated on the cover of this report and do not necessarily represent the views of Fidelity or any other person in the Fidelity organization. Any such views are subject to change at any time based upon market or other conditions and Fidelity disclaims any responsibility to update such views. These views may not be relied on as investment advice and, because investment decisions for a Fidelity fund are based on numerous factors, may not be relied on as an indication of trading intent on behalf of any Fidelity fund.
Annual Report
Fidelity Small Cap Enhanced Index Fund
Investment Changes (Unaudited)
Top Ten Stocks as of February 28, 2013 | ||
| % of fund's | % of fund's net assets |
Ocwen Financial Corp. | 0.8 | 0.1 |
Western Refining, Inc. | 0.7 | 0.7 |
Helix Energy Solutions Group, Inc. | 0.7 | 0.6 |
EMCOR Group, Inc. | 0.6 | 0.0 |
Cleco Corp. | 0.6 | 0.7 |
Bristow Group, Inc. | 0.6 | 0.2 |
RLJ Lodging Trust | 0.6 | 0.2 |
Brunswick Corp. | 0.6 | 0.6 |
CommVault Systems, Inc. | 0.6 | 0.1 |
Nelnet, Inc. Class A | 0.6 | 0.6 |
| 6.4 | |
Market Sectors as of February 28, 2013 | ||
| % of fund's | % of fund's net assets |
Financials | 23.7 | 21.7 |
Industrials | 15.7 | 13.5 |
Information Technology | 15.4 | 14.8 |
Consumer Discretionary | 11.4 | 14.3 |
Health Care | 9.8 | 12.2 |
Energy | 6.3 | 4.2 |
Materials | 5.1 | 6.5 |
Consumer Staples | 4.5 | 2.7 |
Utilities | 4.3 | 4.8 |
Telecommunication Services | 0.0* | 0.5 |
* Amount represents less than 0.1% |
Annual Report
Fidelity Small Cap Enhanced Index Fund
Investments February 28, 2013
Showing Percentage of Net Assets
Common Stocks - 96.2% | |||
Shares | Value | ||
CONSUMER DISCRETIONARY - 11.4% | |||
Auto Components - 1.0% | |||
Cooper Tire & Rubber Co. | 6,439 | $ 162,778 | |
Dana Holding Corp. (e) | 16,212 | 271,227 | |
Dorman Products, Inc. (e) | 1,152 | 40,274 | |
Drew Industries, Inc. | 5,091 | 185,211 | |
Standard Motor Products, Inc. | 16,916 | 418,333 | |
Superior Industries International, Inc. | 4,732 | 102,921 | |
Tenneco, Inc. (a) | 8,944 | 316,886 | |
| 1,497,630 | ||
Distributors - 0.3% | |||
Core-Mark Holding Co., Inc. | 1,749 | 83,812 | |
Pool Corp. | 6,488 | 296,631 | |
VOXX International Corp. (a) | 14,209 | 141,380 | |
| 521,823 | ||
Diversified Consumer Services - 0.4% | |||
Hillenbrand, Inc. | 28,223 | 696,826 | |
Hotels, Restaurants & Leisure - 3.7% | |||
AFC Enterprises, Inc. (a) | 2,776 | 83,280 | |
Ameristar Casinos, Inc. | 3,742 | 98,040 | |
Bob Evans Farms, Inc. | 15,705 | 639,194 | |
Churchill Downs, Inc. | 1,090 | 71,918 | |
Cracker Barrel Old Country Store, Inc. | 12,420 | 934,978 | |
Domino's Pizza, Inc. | 2,081 | 99,097 | |
Einstein Noah Restaurant Group, Inc. | 3,451 | 46,381 | |
Jack in the Box, Inc. (a) | 17,222 | 545,249 | |
Marcus Corp. | 4,945 | 60,378 | |
Marriott Vacations Worldwide Corp. (a) | 19,674 | 811,749 | |
Multimedia Games Holding Co., Inc. (a) | 17,860 | 333,982 | |
Papa John's International, Inc. (a) | 16,416 | 853,796 | |
Sonic Corp. (a) | 30,082 | 339,626 | |
Texas Roadhouse, Inc. Class A | 42,984 | 831,311 | |
Town Sports International Holdings, Inc. | 4,057 | 37,608 | |
| 5,786,587 | ||
Household Durables - 1.9% | |||
Flexsteel Industries, Inc. | 25,123 | 577,829 | |
M.D.C. Holdings, Inc. (e) | 23,548 | 904,950 | |
NACCO Industries, Inc. Class A | 11,627 | 675,412 | |
Tupperware Brands Corp. | 10,404 | 813,905 | |
| 2,972,096 | ||
Internet & Catalog Retail - 0.0% | |||
PetMed Express, Inc. (e) | 1,862 | 23,554 | |
Leisure Equipment & Products - 0.8% | |||
Arctic Cat, Inc. (a)(e) | 8,404 | 305,317 | |
Brunswick Corp. (e) | 26,131 | 952,214 | |
| 1,257,531 | ||
Media - 0.9% | |||
Belo Corp. Series A (e) | 12,623 | 109,063 | |
Fisher Communications, Inc. | 13,232 | 486,541 | |
Global Sources Ltd. (a) | 46,398 | 359,585 | |
Harte-Hanks, Inc. | 7,699 | 55,972 | |
| |||
Shares | Value | ||
LIN TV Corp. Class A (a) | 6,368 | $ 72,404 | |
Nexstar Broadcasting Group, Inc. Class A | 14,670 | 217,996 | |
Scholastic Corp. (e) | 746 | 22,455 | |
Shutterstock, Inc. | 1,017 | 33,154 | |
| 1,357,170 | ||
Specialty Retail - 1.4% | |||
Big 5 Sporting Goods Corp. | 40,672 | 634,076 | |
Brown Shoe Co., Inc. | 22,569 | 370,132 | |
Destination Maternity Corp. | 7,700 | 172,403 | |
Express, Inc. (a) | 17,044 | 315,314 | |
Haverty Furniture Companies, Inc. | 4,483 | 82,263 | |
Penske Automotive Group, Inc. | 2,947 | 87,703 | |
Stage Stores, Inc. | 3,793 | 93,649 | |
The Cato Corp. Class A (sub. vtg.) (e) | 18,498 | 474,659 | |
| 2,230,199 | ||
Textiles, Apparel & Luxury Goods - 1.0% | |||
Iconix Brand Group, Inc. (a) | 15,366 | 362,945 | |
Movado Group, Inc. | 16,975 | 611,779 | |
Perry Ellis International, Inc. | 6,136 | 99,526 | |
Skechers U.S.A., Inc. Class A (sub. vtg.) (a) | 3,627 | 75,804 | |
True Religion Apparel, Inc. | 18,711 | 499,397 | |
| 1,649,451 | ||
TOTAL CONSUMER DISCRETIONARY | 17,992,867 | ||
CONSUMER STAPLES - 4.5% | |||
Beverages - 0.1% | |||
Coca-Cola Bottling Co. CONSOLIDATED | 1,236 | 80,871 | |
Food & Staples Retailing - 0.8% | |||
Casey's General Stores, Inc. | 1,369 | 77,472 | |
Harris Teeter Supermarkets, Inc. | 4,472 | 192,296 | |
Rite Aid Corp. (a) | 497,433 | 815,790 | |
United Natural Foods, Inc. (a) | 3,375 | 170,843 | |
| 1,256,401 | ||
Food Products - 2.7% | |||
Cal-Maine Foods, Inc. (e) | 15,878 | 642,900 | |
Fresh Del Monte Produce, Inc. | 26,487 | 691,046 | |
J&J Snack Foods Corp. | 9,324 | 645,407 | |
Lancaster Colony Corp. | 1,726 | 126,291 | |
Omega Protein Corp. (a) | 14,888 | 123,273 | |
Pilgrims Pride Corp. (a)(e) | 63,305 | 557,717 | |
Post Holdings, Inc. (a) | 8,235 | 318,365 | |
Sanderson Farms, Inc. (e) | 16,165 | 820,050 | |
Seneca Foods Corp. Class A (a) | 4,575 | 139,629 | |
TreeHouse Foods, Inc. (a) | 4,474 | 261,237 | |
| 4,325,915 | ||
Household Products - 0.2% | |||
Orchids Paper Products Co. | 12,647 | 277,222 | |
WD-40 Co. | 2,030 | 110,046 | |
| 387,268 | ||
Common Stocks - continued | |||
Shares | Value | ||
CONSUMER STAPLES - continued | |||
Personal Products - 0.7% | |||
Inter Parfums, Inc. | 1,645 | $ 41,224 | |
MediFast, Inc. (a)(e) | 13,960 | 323,593 | |
Nature's Sunshine Products, Inc. | 4,461 | 64,506 | |
Nu Skin Enterprises, Inc. Class A | 15,508 | 638,930 | |
Nutraceutical International Corp. | 1,351 | 22,143 | |
| 1,090,396 | ||
TOTAL CONSUMER STAPLES | 7,140,851 | ||
ENERGY - 6.3% | |||
Energy Equipment & Services - 3.3% | |||
Basic Energy Services, Inc. (a)(e) | 15,566 | 227,731 | |
Bristow Group, Inc. | 16,441 | 957,853 | |
Dawson Geophysical Co. (a) | 1,073 | 33,156 | |
Exterran Holdings, Inc. (a) | 9,089 | 229,315 | |
Geospace Technologies Corp. (a)(e) | 8,757 | 852,231 | |
Gulf Island Fabrication, Inc. | 5,391 | 128,360 | |
Helix Energy Solutions Group, Inc. (a) | 44,055 | 1,031,328 | |
Hercules Offshore, Inc. (a) | 100,788 | 683,343 | |
Hornbeck Offshore Services, Inc. (a)(e) | 4,281 | 181,943 | |
ION Geophysical Corp. (a)(e) | 15,155 | 100,629 | |
Key Energy Services, Inc. (a) | 11,328 | 97,194 | |
Matrix Service Co. (a) | 14,423 | 224,422 | |
Parker Drilling Co. (a) | 30,502 | 145,190 | |
Pioneer Energy Services Corp. (a) | 15,560 | 135,839 | |
RigNet, Inc. (a) | 7,778 | 152,604 | |
| 5,181,138 | ||
Oil, Gas & Consumable Fuels - 3.0% | |||
Adams Resources & Energy, Inc. | 838 | 33,361 | |
Alon USA Energy, Inc. | 42,567 | 829,631 | |
CVR Energy, Inc. | 15,090 | 847,756 | |
Delek US Holdings, Inc. | 23,938 | 894,324 | |
DHT Holdings, Inc. | 11,548 | 49,656 | |
Rex American Resources Corp. (a) | 10,809 | 249,688 | |
SemGroup Corp. Class A (a) | 7,609 | 350,699 | |
VAALCO Energy, Inc. (a)(e) | 43,773 | 354,999 | |
Warren Resources, Inc. (a) | 8,357 | 21,895 | |
Western Refining, Inc. | 29,592 | 1,062,057 | |
| 4,694,066 | ||
TOTAL ENERGY | 9,875,204 | ||
FINANCIALS - 23.7% | |||
Capital Markets - 3.2% | |||
American Capital Ltd. (a) | 50,053 | 699,741 | |
Apollo Investment Corp. | 88,359 | 767,840 | |
Artio Global Investors, Inc. Class A | 32,916 | 89,532 | |
BGC Partners, Inc. Class A | 20,561 | 87,795 | |
| |||
Shares | Value | ||
Calamos Asset Management, Inc. Class A | 6,197 | $ 69,282 | |
Evercore Partners, Inc. Class A | 18,700 | 761,090 | |
FBR Capital Markets Corp. (a) | 2,325 | 41,060 | |
FXCM, Inc. Class A (e) | 4,645 | 61,082 | |
Golub Capital BDC, Inc. | 1,943 | 31,923 | |
Investment Technology Group, Inc. (a) | 10,728 | 129,916 | |
MCG Capital Corp. | 25,457 | 114,557 | |
Medallion Financial Corp. | 2,647 | 34,411 | |
Piper Jaffray Companies (a)(e) | 10,806 | 416,787 | |
Solar Capital Ltd. (e) | 31,812 | 779,394 | |
Stellus Capital Investment Corp. | 3,355 | 51,164 | |
TCP Capital Corp. | 43,258 | 678,285 | |
TICC Capital Corp. | 19,744 | 203,956 | |
| 5,017,815 | ||
Commercial Banks - 4.5% | |||
1st Source Corp. | 1,340 | 31,570 | |
Alliance Financial Corp. | 1,654 | 73,520 | |
Banco Latinoamericano de Exporaciones SA (BLADEX) Series E | 25,054 | 605,806 | |
Bank of Marin Bancorp | 1,915 | 71,985 | |
Banner Bank | 22,573 | 670,644 | |
Central Pacific Financial Corp. (a)(e) | 23,191 | 359,229 | |
Citizens & Northern Corp. | 3,943 | 76,889 | |
Eagle Bancorp, Inc., Maryland (a) | 5,939 | 128,876 | |
First Bancorp, Puerto Rico (a)(e) | 54,345 | 297,267 | |
First Community Bancshares, Inc. | 5,013 | 78,303 | |
First Interstate Bancsystem, Inc. | 1,730 | 31,607 | |
First Merchants Corp. | 25,248 | 375,438 | |
Hanmi Financial Corp. (a) | 49,050 | 833,360 | |
MainSource Financial Group, Inc. | 3,046 | 42,644 | |
MB Financial, Inc. | 35,420 | 839,808 | |
Mercantile Bank Corp. | 1,545 | 25,740 | |
Merchants Bancshares, Inc. | 12,568 | 362,461 | |
PacWest Bancorp (e) | 4,630 | 126,538 | |
Peoples Bancorp, Inc. | 3,500 | 75,845 | |
PrivateBancorp, Inc. | 22,764 | 407,703 | |
Republic Bancorp, Inc., Kentucky Class A | 3,233 | 69,962 | |
SCBT Financial Corp. | 1,918 | 91,335 | |
State Bank Financial Corp. | 2,987 | 47,493 | |
StellarOne Corp. | 2,115 | 32,550 | |
Sterling Financial Corp. | 10,823 | 229,231 | |
Susquehanna Bancshares, Inc. (e) | 7,299 | 84,887 | |
Union/First Market Bankshares Corp. | 3,725 | 67,609 | |
Washington Trust Bancorp, Inc. | 6,484 | 171,437 | |
Webster Financial Corp. | 7,044 | 155,109 | |
WesBanco, Inc. | 6,077 | 142,141 | |
Wilshire Bancorp, Inc. (a) | 88,033 | 516,754 | |
| 7,123,741 | ||
Consumer Finance - 0.9% | |||
Cash America International, Inc. (e) | 5,734 | 290,370 | |
Common Stocks - continued | |||
Shares | Value | ||
FINANCIALS - continued | |||
Consumer Finance - continued | |||
Green Dot Corp. Class A (a) | 10,338 | $ 144,939 | |
Nelnet, Inc. Class A | 28,318 | 939,591 | |
| 1,374,900 | ||
Diversified Financial Services - 0.5% | |||
MarketAxess Holdings, Inc. (e) | 13,060 | 510,124 | |
Marlin Business Services Corp. | 17,943 | 340,020 | |
Vector Capital Corp. rights (a) | 8,300 | 0 | |
| 850,144 | ||
Insurance - 3.5% | |||
Argo Group International Holdings, Ltd. | 14,885 | 565,332 | |
Enstar Group Ltd. (a) | 2,049 | 256,822 | |
FBL Financial Group, Inc. Class A | 8,270 | 300,532 | |
First American Financial Corp. | 37,966 | 922,194 | |
Horace Mann Educators Corp. | 29,034 | 594,036 | |
Maiden Holdings Ltd. | 24,912 | 251,113 | |
Montpelier Re Holdings Ltd. | 10,645 | 263,144 | |
Platinum Underwriters Holdings Ltd. | 15,595 | 824,664 | |
Primerica, Inc. | 23,455 | 738,129 | |
ProAssurance Corp. | 14,953 | 701,146 | |
Symetra Financial Corp. | 5,756 | 75,807 | |
| 5,492,919 | ||
Real Estate Investment Trusts - 8.1% | |||
AG Mortgage Investment Trust, Inc. | 28,971 | 759,909 | |
American Capital Mortgage Investment Corp. | 31,149 | 800,529 | |
Anworth Mortgage Asset Corp. | 105,277 | 642,190 | |
Apollo Commercial Real Estate Finance, Inc. | 35,660 | 615,135 | |
Apollo Residential Mortgage, Inc. | 26,765 | 599,001 | |
Capstead Mortgage Corp. | 63,849 | 800,666 | |
Chatham Lodging Trust | 1,422 | 23,406 | |
Crexus Investment Corp. | 6,923 | 92,145 | |
Extra Space Storage, Inc. | 16,838 | 630,415 | |
Gyrodyne Co. of America, Inc. | 573 | 42,643 | |
JAVELIN Mortgage Investment Corp. | 4,776 | 91,604 | |
LTC Properties, Inc. | 5,231 | 201,760 | |
MFA Financial, Inc. | 78,270 | 695,038 | |
NorthStar Realty Finance Corp. | 34,076 | 304,980 | |
PennyMac Mortgage Investment Trust | 3,577 | 90,927 | |
Potlatch Corp. | 18,221 | 801,906 | |
PS Business Parks, Inc. | 7,251 | 536,501 | |
Resource Capital Corp. | 40,792 | 277,386 | |
RLJ Lodging Trust | 44,666 | 955,406 | |
Ryman Hospitality Properties, Inc. (e) | 1,189 | 53,208 | |
Select Income (REIT) | 7,149 | 198,814 | |
Sovran Self Storage, Inc. | 11,321 | 688,770 | |
Spirit Realty Capital, Inc. (e) | 2,602 | 51,832 | |
Starwood Property Trust, Inc. (e) | 30,267 | 845,963 | |
Strategic Hotel & Resorts, Inc. (a) | 45,509 | 331,306 | |
| |||
Shares | Value | ||
The Geo Group, Inc. | 27,095 | $ 935,861 | |
Western Asset Mortgage Capital Corp. | 34,352 | 738,224 | |
| 12,805,525 | ||
Thrifts & Mortgage Finance - 3.0% | |||
Dime Community Bancshares, Inc. | 39,485 | 561,082 | |
Doral Financial Corp. (a) | 199,665 | 113,709 | |
EverBank Financial Corp. | 29,167 | 440,422 | |
Farmer Mac Class C (non-vtg.) | 4,130 | 139,388 | |
First Financial Holdings, Inc. | 2,621 | 52,315 | |
Flagstar Bancorp, Inc. (a)(e) | 32,711 | 444,542 | |
Flushing Financial Corp. | 10,407 | 164,431 | |
Fox Chase Bancorp, Inc. | 3,507 | 58,637 | |
Home Loan Servicing Solutions Ltd. | 4,099 | 92,473 | |
HomeStreet, Inc. (e) | 22,921 | 572,567 | |
Ocwen Financial Corp. (a) | 31,213 | 1,230,416 | |
Provident Financial Holdings, Inc. | 4,615 | 78,917 | |
Simplicity Bancorp, Inc. | 4,191 | 63,871 | |
WSFS Financial Corp. | 13,994 | 664,715 | |
| 4,677,485 | ||
TOTAL FINANCIALS | 37,342,529 | ||
HEALTH CARE - 9.8% | |||
Biotechnology - 1.2% | |||
Alkermes PLC (a)(e) | 5,677 | 123,248 | |
Allos Therapeutics, Inc. rights | 8,044 | 0 | |
Cepheid, Inc. (a)(e) | 3,231 | 117,705 | |
Cubist Pharmaceuticals, Inc. (a) | 9,762 | 414,202 | |
Emergent BioSolutions, Inc. (a) | 16,208 | 251,062 | |
Geron Corp. (a)(e) | 19,107 | 27,896 | |
Maxygen, Inc. | 11,400 | 27,816 | |
PDL BioPharma, Inc. (e) | 17,255 | 123,201 | |
Pharmacyclics, Inc. (a)(e) | 7,181 | 630,348 | |
Seattle Genetics, Inc. (a)(e) | 5,591 | 157,331 | |
| 1,872,809 | ||
Health Care Equipment & Supplies - 2.0% | |||
CONMED Corp. | 5,566 | 173,158 | |
Cyberonics, Inc. (a) | 6,136 | 280,722 | |
Greatbatch, Inc. (a) | 11,916 | 322,566 | |
Invacare Corp. (e) | 14,863 | 215,662 | |
Natus Medical, Inc. (a) | 4,384 | 55,677 | |
RTI Biologics, Inc. (a) | 61,061 | 221,651 | |
Sirona Dental Systems, Inc. (a) | 9,565 | 679,306 | |
SurModics, Inc. (a) | 12,421 | 314,997 | |
Thoratec Corp. (a)(e) | 8,973 | 315,939 | |
Vascular Solutions, Inc. (a) | 5,200 | 78,936 | |
West Pharmaceutical Services, Inc. | 9,345 | 564,625 | |
| 3,223,239 | ||
Health Care Providers & Services - 5.5% | |||
Alliance Healthcare Services, Inc. (a) | 74,399 | 523,769 | |
Amedisys, Inc. (a)(e) | 14,527 | 164,155 | |
AMN Healthcare Services, Inc. (a) | 9,298 | 131,102 | |
Common Stocks - continued | |||
Shares | Value | ||
HEALTH CARE - continued | |||
Health Care Providers & Services - continued | |||
AmSurg Corp. (a) | 12,207 | $ 368,651 | |
Centene Corp. (a)(e) | 13,920 | 626,678 | |
Chemed Corp. | 5,026 | 387,957 | |
Corvel Corp. (a) | 1,628 | 78,209 | |
Five Star Quality Care, Inc. (a) | 67,808 | 429,903 | |
Gentiva Health Services, Inc. (a) | 19,666 | 206,886 | |
Hanger, Inc. (a) | 21,281 | 631,194 | |
Magellan Health Services, Inc. (a) | 14,794 | 762,779 | |
Molina Healthcare, Inc. (a)(e) | 24,762 | 790,155 | |
National Healthcare Corp. | 6,768 | 313,832 | |
PharMerica Corp. (a) | 2,788 | 39,952 | |
Providence Service Corp. (a) | 18,084 | 308,875 | |
Select Medical Holdings Corp. (e) | 70,044 | 647,207 | |
Team Health Holdings, Inc. (a) | 23,127 | 774,523 | |
The Ensign Group, Inc. | 1,275 | 39,933 | |
Triple-S Management Corp. (a) | 1,856 | 33,334 | |
Universal American Spin Corp. | 23,843 | 198,851 | |
Vanguard Health Systems, Inc. (a) | 46,606 | 693,031 | |
Wellcare Health Plans, Inc. (a) | 8,403 | 480,568 | |
| 8,631,544 | ||
Health Care Technology - 0.5% | |||
Computer Programs & Systems, Inc. (e) | 1,173 | 61,160 | |
Omnicell, Inc. (a) | 41,918 | 755,362 | |
| 816,522 | ||
Life Sciences Tools & Services - 0.4% | |||
Cambrex Corp. (a) | 10,075 | 115,963 | |
Luminex Corp. (a)(e) | 1,724 | 29,101 | |
PAREXEL International Corp. (a) | 14,325 | 496,934 | |
| 641,998 | ||
Pharmaceuticals - 0.2% | |||
Jazz Pharmaceuticals PLC (a) | 2,230 | 129,741 | |
Pozen, Inc. (a) | 28,497 | 176,396 | |
| 306,137 | ||
TOTAL HEALTH CARE | 15,492,249 | ||
INDUSTRIALS - 15.7% | |||
Aerospace & Defense - 2.5% | |||
AAR Corp. | 34,145 | 599,928 | |
American Science & Engineering, Inc. | 10,220 | 639,159 | |
Cubic Corp. | 8,418 | 351,367 | |
Curtiss-Wright Corp. | 19,340 | 671,291 | |
Esterline Technologies Corp. (a)(e) | 9,236 | 636,637 | |
LMI Aerospace, Inc. (a) | 2,490 | 55,154 | |
Moog, Inc. Class A (a) | 11,160 | 501,754 | |
Taser International, Inc. (a) | 51,563 | 384,144 | |
Teledyne Technologies, Inc. (a) | 1,052 | 77,406 | |
| 3,916,840 | ||
| |||
Shares | Value | ||
Air Freight & Logistics - 0.1% | |||
Forward Air Corp. | 1,672 | $ 63,068 | |
Park-Ohio Holdings Corp. (a) | 1,937 | 39,399 | |
| 102,467 | ||
Airlines - 1.1% | |||
Alaska Air Group, Inc. (a)(e) | 15,325 | 790,004 | |
Republic Airways Holdings, Inc. (a) | 12,895 | 121,342 | |
SkyWest, Inc. | 57,199 | 800,786 | |
| 1,712,132 | ||
Building Products - 1.0% | |||
A.O. Smith Corp. (e) | 9,625 | 688,476 | |
American Woodmark Corp. (a)(e) | 1,780 | 57,138 | |
Apogee Enterprises, Inc. | 30,475 | 785,950 | |
Gibraltar Industries, Inc. (a) | 5,298 | 90,861 | |
Insteel Industries, Inc. | 1,552 | 24,661 | |
| 1,647,086 | ||
Commercial Services & Supplies - 2.5% | |||
Consolidated Graphics, Inc. (a) | 4,809 | 185,627 | |
Deluxe Corp. (e) | 3,751 | 148,840 | |
G&K Services, Inc. Class A | 20,024 | 834,400 | |
Intersections, Inc. | 24,700 | 259,103 | |
Kimball International, Inc. Class B | 32,817 | 302,245 | |
Mine Safety Appliances Co. | 3,134 | 146,828 | |
Performant Financial Corp. | 6,680 | 88,510 | |
Steelcase, Inc. Class A | 33,730 | 477,280 | |
The Brink's Co. | 13,280 | 351,256 | |
Unifirst Corp. Massachusetts | 10,248 | 856,118 | |
Viad Corp. | 9,453 | 259,579 | |
| 3,909,786 | ||
Construction & Engineering - 1.9% | |||
Argan, Inc. | 33,452 | 559,652 | |
Dycom Industries, Inc. (a) | 17,053 | 357,260 | |
EMCOR Group, Inc. | 26,592 | 1,025,653 | |
Granite Construction, Inc. | 23,794 | 739,755 | |
MYR Group, Inc. (a) | 3,731 | 86,597 | |
Primoris Services Corp. | 6,206 | 116,363 | |
Sterling Construction Co., Inc. (a) | 2,867 | 32,397 | |
Tutor Perini Corp. (a) | 8,457 | 143,854 | |
| 3,061,531 | ||
Electrical Equipment - 0.2% | |||
Brady Corp. Class A | 5,803 | 197,592 | |
Powell Industries, Inc. (a) | 1,641 | 95,523 | |
| 293,115 | ||
Machinery - 2.6% | |||
Alamo Group, Inc. | 1,243 | 44,475 | |
Albany International Corp. Class A | 3,384 | 96,647 | |
American Railcar Industries, Inc. | 3,616 | 157,802 | |
Cascade Corp. | 52 | 3,341 | |
CLARCOR, Inc. (e) | 2,940 | 149,911 | |
ESCO Technologies, Inc. | 926 | 37,559 | |
Hurco Companies, Inc. (a) | 2,129 | 59,867 | |
Common Stocks - continued | |||
Shares | Value | ||
INDUSTRIALS - continued | |||
Machinery - continued | |||
Hyster-Yale Materials Handling Class A | 17,221 | $ 882,232 | |
John Bean Technologies Corp. | 3,756 | 69,223 | |
Kadant, Inc. | 18,134 | 445,190 | |
Kaydon Corp. | 4,872 | 121,849 | |
L.B. Foster Co. Class A | 3,193 | 141,003 | |
Lindsay Corp. | 872 | 74,512 | |
Lydall, Inc. (a) | 1,952 | 29,397 | |
Mueller Industries, Inc. | 15,746 | 837,372 | |
RBC Bearings, Inc. (a) | 2,204 | 109,847 | |
Standex International Corp. (e) | 2,950 | 158,769 | |
Tennant Co. | 5,351 | 249,731 | |
Twin Disc, Inc. (e) | 1,046 | 24,999 | |
Watts Water Technologies, Inc. Class A | 9,381 | 440,344 | |
| 4,134,070 | ||
Professional Services - 1.1% | |||
Barrett Business Services, Inc. | 12,317 | 538,007 | |
GP Strategies Corp. (a) | 1,204 | 25,994 | |
Insperity, Inc. | 15,396 | 436,477 | |
Kelly Services, Inc. Class A (non-vtg.) | 14,503 | 256,123 | |
Korn/Ferry International (a) | 9,576 | 177,252 | |
Navigant Consulting, Inc. (a) | 2,751 | 35,020 | |
Resources Connection, Inc. | 12,801 | 156,300 | |
TrueBlue, Inc. (a) | 2,368 | 45,916 | |
WageWorks, Inc. (a) | 3,915 | 92,433 | |
| 1,763,522 | ||
Road & Rail - 1.5% | |||
AMERCO | 2,146 | 323,424 | |
Celadon Group, Inc. (e) | 9,505 | 189,435 | |
Heartland Express, Inc. | 5,709 | 77,471 | |
Knight Transportation, Inc. | 9,120 | 142,819 | |
Old Dominion Freight Lines, Inc. (a) | 4,202 | 151,062 | |
Roadrunner Transportation Systems, Inc. (a) | 4,273 | 97,339 | |
Saia, Inc. (a) | 8,824 | 283,515 | |
Swift Transporation Co. (a)(e) | 60,788 | 822,462 | |
Universal Truckload Services, Inc. | 4,182 | 76,280 | |
Werner Enterprises, Inc. (e) | 11,591 | 266,825 | |
| 2,430,632 | ||
Trading Companies & Distributors - 1.2% | |||
Aceto Corp. | 7,093 | 73,838 | |
Aircastle Ltd. | 52,335 | 704,952 | |
Applied Industrial Technologies, Inc. | 13,519 | 586,860 | |
DXP Enterprises, Inc. (a) | 2,399 | 149,218 | |
H&E Equipment Services, Inc. (e) | 15,431 | 300,287 | |
| 1,815,155 | ||
TOTAL INDUSTRIALS | 24,786,336 | ||
| |||
Shares | Value | ||
INFORMATION TECHNOLOGY - 15.4% | |||
Communications Equipment - 2.8% | |||
Anaren, Inc. (a) | 17,812 | $ 344,662 | |
Arris Group, Inc. (a)(e) | 54,117 | 938,930 | |
Black Box Corp. (e) | 23,544 | 571,177 | |
Communications Systems, Inc. | 5,701 | 61,001 | |
Comtech Telecommunications Corp. | 19,782 | 529,762 | |
Emulex Corp. (a) | 33,343 | 215,062 | |
Harmonic, Inc. (a) | 21,327 | 121,351 | |
InterDigital, Inc. | 6,148 | 272,971 | |
Loral Space & Communications Ltd. | 10,894 | 634,467 | |
Oplink Communications, Inc. (a) | 2,734 | 41,994 | |
Plantronics, Inc. | 7,309 | 294,991 | |
Tellabs, Inc. (e) | 53,841 | 109,297 | |
Tessco Technologies, Inc. | 14,265 | 324,814 | |
| 4,460,479 | ||
Computers & Peripherals - 1.5% | |||
Cray, Inc. (a) | 5,424 | 104,954 | |
Electronics for Imaging, Inc. (a) | 23,857 | 550,142 | |
QLogic Corp. (a) | 71,515 | 813,841 | |
Super Micro Computer, Inc. (a)(e) | 6,000 | 70,200 | |
Synaptics, Inc. (a) | 24,311 | 845,050 | |
| 2,384,187 | ||
Electronic Equipment & Components - 2.3% | |||
Anixter International, Inc. (e) | 13,246 | 912,914 | |
Audience, Inc. (e) | 1,507 | 20,555 | |
Benchmark Electronics, Inc. (a) | 35,523 | 618,811 | |
Checkpoint Systems, Inc. (a) | 5,966 | 70,757 | |
Coherent, Inc. | 2,097 | 121,123 | |
Daktronics, Inc. | 5,456 | 55,706 | |
Electro Scientific Industries, Inc. | 39,490 | 434,785 | |
Newport Corp. (a) | 8,589 | 140,430 | |
OSI Systems, Inc. (a) | 1,983 | 114,280 | |
PC Connection, Inc. | 3,202 | 45,917 | |
Plexus Corp. (a) | 6,821 | 166,160 | |
Sanmina Corp. (a) | 5,887 | 60,283 | |
ScanSource, Inc. (a) | 1,837 | 55,128 | |
SYNNEX Corp. (a)(e) | 18,403 | 701,706 | |
Vishay Precision Group, Inc. (a) | 1,939 | 27,243 | |
| 3,545,798 | ||
Internet Software & Services - 0.1% | |||
XO Group, Inc. (a) | 14,271 | 130,580 | |
IT Services - 2.5% | |||
Acxiom Corp. (a) | 38,498 | 701,049 | |
CACI International, Inc. Class A (a)(e) | 15,973 | 810,630 | |
Convergys Corp. (e) | 17,284 | 286,742 | |
CSG Systems International, Inc. (a) | 4,707 | 91,363 | |
Global Cash Access Holdings, Inc. (a) | 70,469 | 500,330 | |
Heartland Payment Systems, Inc. | 2,147 | 66,772 | |
Jack Henry & Associates, Inc. | 13,661 | 597,259 | |
Maximus, Inc. | 2,589 | 188,427 | |
NCI, Inc. Class A (a) | 8,882 | 44,676 | |
Common Stocks - continued | |||
Shares | Value | ||
INFORMATION TECHNOLOGY - continued | |||
IT Services - continued | |||
Sykes Enterprises, Inc. (a) | 2,387 | $ 35,471 | |
Teletech Holdings, Inc. (a) | 25,799 | 482,699 | |
Unisys Corp. (a) | 5,338 | 122,667 | |
| 3,928,085 | ||
Semiconductors & Semiconductor Equipment - 1.9% | |||
Advanced Energy Industries, Inc. (a)(e) | 11,426 | 206,125 | |
Ambarella, Inc. (a) | 3,054 | 30,418 | |
Cabot Microelectronics Corp. (e) | 5,419 | 185,167 | |
Exar Corp. (a) | 4,289 | 50,396 | |
First Solar, Inc. (a)(e) | 7,850 | 202,923 | |
Intersil Corp. Class A | 17,178 | 145,841 | |
Kulicke & Soffa Industries, Inc. (a) | 60,956 | 659,544 | |
MEMC Electronic Materials, Inc. (a)(e) | 16,630 | 82,319 | |
Omnivision Technologies, Inc. (a)(e) | 16,319 | 251,476 | |
Rambus, Inc. (a) | 9,897 | 55,819 | |
RF Micro Devices, Inc. (a)(e) | 166,170 | 766,044 | |
Semtech Corp. (a) | 2,723 | 83,242 | |
Spansion, Inc. Class A | 4,782 | 56,236 | |
Tessera Technologies, Inc. | 11,029 | 196,757 | |
| 2,972,307 | ||
Software - 4.3% | |||
Actuate Corp. (a) | 19,810 | 119,058 | |
Aspen Technology, Inc. (a) | 30,190 | 928,644 | |
AVG Technologies NV (e) | 28,710 | 450,747 | |
CommVault Systems, Inc. (a)(e) | 12,865 | 951,367 | |
Comverse, Inc. | 1,225 | 33,712 | |
Fair Isaac Corp. | 7,877 | 349,266 | |
Infoblox, Inc. (e) | 7,618 | 160,664 | |
Manhattan Associates, Inc. (a) | 12,292 | 858,719 | |
Monotype Imaging Holdings, Inc. (e) | 33,442 | 702,282 | |
NetScout Systems, Inc. (a) | 24,154 | 614,236 | |
Pegasystems, Inc. | 3,860 | 105,725 | |
Progress Software Corp. (a)(e) | 29,758 | 670,150 | |
QAD, Inc.: | |||
Class A | 4,628 | 60,395 | |
Class B | 3,690 | 44,391 | |
TeleCommunication Systems, Inc. Class A (a) | 144,131 | 332,943 | |
TeleNav, Inc. (a) | 50,844 | 361,501 | |
| 6,743,800 | ||
TOTAL INFORMATION TECHNOLOGY | 24,165,236 | ||
MATERIALS - 5.1% | |||
Chemicals - 2.3% | |||
A. Schulman, Inc. | 4,988 | 156,374 | |
Axiall Corp. | 10,966 | 620,456 | |
Balchem Corp. | 1,108 | 44,686 | |
FutureFuel Corp. | 40,064 | 525,239 | |
Innospec, Inc. | 11,551 | 464,928 | |
| |||
Shares | Value | ||
Kraton Performance Polymers, Inc. (a) | 1,872 | $ 45,003 | |
Landec Corp. (a) | 8,500 | 93,585 | |
LSB Industries, Inc. (a) | 4,793 | 185,729 | |
Minerals Technologies, Inc. | 17,323 | 697,078 | |
OM Group, Inc. (a)(e) | 6,043 | 148,295 | |
Quaker Chemical Corp. | 2,016 | 115,739 | |
Sensient Technologies Corp. | 7,900 | 291,589 | |
Stepan Co. | 2,521 | 154,386 | |
| 3,543,087 | ||
Construction Materials - 0.3% | |||
Headwaters, Inc. (a) | 50,139 | 471,808 | |
Containers & Packaging - 1.7% | |||
AEP Industries, Inc. (a) | 8,323 | 587,021 | |
Boise, Inc. | 68,992 | 592,641 | |
Graphic Packaging Holding Co. (a) | 119,999 | 890,393 | |
Myers Industries, Inc. | 36,273 | 533,939 | |
| 2,603,994 | ||
Metals & Mining - 0.2% | |||
Metals USA Holdings Corp. | 1,353 | 28,061 | |
Worthington Industries, Inc. (e) | 12,559 | 355,922 | |
| 383,983 | ||
Paper & Forest Products - 0.6% | |||
Buckeye Technologies, Inc. | 2,571 | 71,294 | |
Clearwater Paper Corp. (a) | 2,310 | 111,781 | |
Domtar Corp. | 1,682 | 125,410 | |
Neenah Paper, Inc. | 4,881 | 142,525 | |
Schweitzer-Mauduit International, Inc. | 13,150 | 484,578 | |
| 935,588 | ||
TOTAL MATERIALS | 7,938,460 | ||
TELECOMMUNICATION SERVICES - 0.0% | |||
Diversified Telecommunication Services - 0.0% | |||
Premiere Global Services, Inc. (a) | 3,188 | 34,016 | |
UTILITIES - 4.3% | |||
Electric Utilities - 2.5% | |||
Cleco Corp. (e) | 22,610 | 1,001,623 | |
El Paso Electric Co. | 24,389 | 813,373 | |
IDACORP, Inc. | 15,700 | 733,033 | |
PNM Resources, Inc. | 23,189 | 520,825 | |
Portland General Electric Co. (e) | 31,641 | 939,421 | |
| 4,008,275 | ||
Gas Utilities - 0.1% | |||
Southwest Gas Corp. | 1,598 | 72,389 | |
Independent Power Producers & Energy Traders - 0.6% | |||
Black Hills Corp. | 20,034 | 833,214 | |
Genie Energy Ltd. Class B | 13,296 | 93,338 | |
| 926,552 | ||
Common Stocks - continued | |||
Shares | Value | ||
UTILITIES - continued | |||
Multi-Utilities - 0.6% | |||
Avista Corp. | 13,872 | $ 363,308 | |
NorthWestern Energy Corp. | 15,222 | 593,354 | |
| 956,662 | ||
Water Utilities - 0.5% | |||
American States Water Co. (e) | 15,050 | 797,048 | |
TOTAL UTILITIES | 6,760,926 | ||
TOTAL COMMON STOCKS (Cost $130,806,840) |
| ||
U.S. Treasury Obligations - 0.4% | ||||
| Principal |
| ||
U.S. Treasury Bills, yield at date of purchase 0.1% to 0.12% 6/27/13 (f) | $ 700,000 |
| ||
Money Market Funds - 17.3% | |||
Shares |
| ||
Dreyfus Cash Management Institutional Shares, 0.10% (c) | 4,549,244 | 4,549,244 | |
Fidelity Securities Lending Cash Central Fund, 0.16% (b)(d) | 22,662,157 | 22,662,157 | |
TOTAL MONEY MARKET FUNDS (Cost $27,211,401) |
| ||
TOTAL INVESTMENT PORTFOLIO - 113.9% (Cost $158,717,996) | 179,439,817 | ||
NET OTHER ASSETS (LIABILITIES) - (13.9)% | (21,872,414) | ||
NET ASSETS - 100% | $ 157,567,403 | ||
Futures Contracts | |||||
Expiration | Underlying | Unrealized | |||
Purchased | |||||
Equity Index Contracts | |||||
65 NYFE Russell 2000 Mini Index Contracts | March 2013 | $ 5,916,300 | $ 147,491 | ||
|
The face value of futures purchased as a percentage of net assets is 3.8% |
Legend |
(a) Non-income producing |
(b) Affiliated fund that is generally available only to investment companies and other accounts managed by Fidelity Investments. The rate quoted is the annualized seven-day yield of the fund at period end. A complete unaudited listing of the fund's holdings as of its most recent quarter end is available upon request. In addition, each Fidelity Central Fund's financial statements, which are not covered by the Fund's Report of Independent Registered Public Accounting Firm, are available on the SEC's website or upon request. |
(c) The rate quoted is the annualized seven-day yield of the fund at period end. |
(d) Investment made with cash collateral received from securities on loan. |
(e) Security or a portion of the security is on loan at period end. |
(f) Security or a portion of the security was pledged to cover margin requirements for futures contracts. At the period end, the value of securities pledged amounted to $269,900. |
Affiliated Central Funds |
Information regarding fiscal year to date income earned by the Fund from investments in Fidelity Central Funds is as follows: |
Fund | Income earned |
Fidelity Securities Lending Cash Central Fund | $ 47,988 |
Other Information |
The following is a summary of the inputs used, as of February 28, 2013, involving the Fund's assets and liabilities carried at fair value. The inputs or methodology used for valuing securities may not be an indication of the risk associated with investing in those securities. For more information on valuation inputs, and their aggregation into the levels used in the table below, please refer to the Investment Valuation section in the accompanying Notes to Financial Statements. |
Valuation Inputs at Reporting Date: | ||||
Description | Total | Level 1 | Level 2 | Level 3 |
Investments in Securities: | ||||
Equities: | ||||
Consumer Discretionary | $ 17,992,867 | $ 17,992,867 | $ - | $ - |
Consumer Staples | 7,140,851 | 7,140,851 | - | - |
Energy | 9,875,204 | 9,875,204 | - | - |
Financials | 37,342,529 | 37,342,529 | - | - |
Health Care | 15,492,249 | 15,492,249 | - | - |
Industrials | 24,786,336 | 24,786,336 | - | - |
Information Technology | 24,165,236 | 24,165,236 | - | - |
Materials | 7,938,460 | 7,938,460 | - | - |
Telecommunication Services | 34,016 | 34,016 | - | - |
Utilities | 6,760,926 | 6,760,926 | - | - |
U.S. Government and Government Agency Obligations | 699,742 | - | 699,742 | - |
Money Market Funds | 27,211,401 | 27,211,401 | - | - |
Total Investments in Securities: | $ 179,439,817 | $ 178,740,075 | $ 699,742 | $ - |
Derivative Instruments: | ||||
Assets | ||||
Futures Contracts | $ 147,491 | $ 147,491 | $ - | $ - |
Value of Derivative Instruments |
The following table is a summary of the Fund's value of derivative instruments by primary risk exposure as of February 28, 2013. For additional information on derivative instruments, please refer to the Derivative Instruments section in the accompanying Notes to Financial Statements. |
Primary Risk Exposure / | Value | |
| Asset | Liability |
Equity Risk | ||
Futures Contracts (a) | $ 147,491 | $ - |
Total Value of Derivatives | $ 147,491 | $ - |
(a) Reflects cumulative appreciation/(depreciation) on futures contracts as disclosed on the Schedule of Investments. Only the period end variation margin is separately disclosed on the Statement of Assets and Liabilities. |
See accompanying notes which are an integral part of the financial statements.
Annual Report
Fidelity Small Cap Enhanced Index Fund
Financial Statements
Statement of Assets and Liabilities
| February 28, 2013 | |
|
|
|
Assets | ||
Investment in securities, at value (including securities loaned of $22,088,073) - See accompanying schedule: Unaffiliated issuers (cost $136,055,839) | $ 156,777,660 |
|
Fidelity Central Funds (cost $22,662,157) | 22,662,157 |
|
Total Investments (cost $158,717,996) |
| $ 179,439,817 |
Receivable for investments sold | 5,197,066 | |
Receivable for fund shares sold | 746,382 | |
Dividends receivable | 140,126 | |
Interest receivable | 147 | |
Distributions receivable from Fidelity Central Funds | 2,752 | |
Receivable for daily variation margin on futures contracts | 7,296 | |
Other receivables | 95 | |
Total assets | 185,533,681 | |
|
|
|
Liabilities | ||
Payable for investments purchased | $ 4,886,263 | |
Payable for fund shares redeemed | 332,183 | |
Accrued management fee | 66,494 | |
Other affiliated payables | 19,181 | |
Collateral on securities loaned, at value | 22,662,157 | |
Total liabilities | 27,966,278 | |
|
|
|
Net Assets | $ 157,567,403 | |
Net Assets consist of: |
| |
Paid in capital | $ 132,697,371 | |
Undistributed net investment income | 72,543 | |
Accumulated undistributed net realized gain (loss) on investments | 3,928,176 | |
Net unrealized appreciation (depreciation) on investments | 20,869,313 | |
Net Assets, for 14,919,053 shares outstanding | $ 157,567,403 | |
Net Asset Value, offering price and redemption price per share ($157,567,403 ÷ 14,919,053 shares) | $ 10.56 | |
Statement of Operations
| Year ended February 28, 2013 | |
|
|
|
Investment Income |
|
|
Dividends |
| $ 3,376,674 |
Interest |
| 3,333 |
Income from Fidelity Central Funds |
| 47,988 |
Total income |
| 3,427,995 |
|
|
|
Expenses | ||
Management fee | $ 662,265 | |
Transfer agent fees | 191,479 | |
Independent trustees' compensation | 1,528 | |
Miscellaneous | 324 | |
Total expenses before reductions | 855,596 | |
Expense reductions | (5) | 855,591 |
Net investment income (loss) | 2,572,404 | |
Realized and Unrealized Gain (Loss) Net realized gain (loss) on: | ||
Investment securities: |
|
|
Unaffiliated issuers | 10,277,350 | |
Futures contracts | 828,829 | |
Total net realized gain (loss) |
| 11,106,179 |
Change in net unrealized appreciation (depreciation) on: Investment securities | 6,236,255 | |
Futures contracts | 95,726 | |
Total change in net unrealized appreciation (depreciation) |
| 6,331,981 |
Net gain (loss) | 17,438,160 | |
Net increase (decrease) in net assets resulting from operations | $ 20,010,564 | |
See accompanying notes which are an integral part of the financial statements.
Annual Report
Statement of Changes in Net Assets
| Year ended | Year ended |
Increase (Decrease) in Net Assets |
|
|
Operations |
|
|
Net investment income (loss) | $ 2,572,404 | $ 794,412 |
Net realized gain (loss) | 11,106,179 | 11,860,259 |
Change in net unrealized appreciation (depreciation) | 6,331,981 | (10,947,206) |
Net increase (decrease) in net assets resulting from operations | 20,010,564 | 1,707,465 |
Distributions to shareholders from net investment income | (2,545,839) | (628,524) |
Distributions to shareholders from net realized gain | (6,901,191) | (12,048,896) |
Total distributions | (9,447,030) | (12,677,420) |
Share transactions | 52,452,774 | 56,252,048 |
Reinvestment of distributions | 9,101,641 | 12,118,854 |
Cost of shares redeemed | (36,450,246) | (49,441,411) |
Net increase (decrease) in net assets resulting from share transactions | 25,104,169 | 18,929,491 |
Redemption fees | 26,146 | 84,849 |
Total increase (decrease) in net assets | 35,693,849 | 8,044,385 |
|
|
|
Net Assets | ||
Beginning of period | 121,873,554 | 113,829,169 |
End of period (including undistributed net investment income of $72,543 and undistributed net investment income of $59,138, respectively) | $ 157,567,403 | $ 121,873,554 |
Other Information Shares | ||
Sold | 5,233,611 | 5,595,208 |
Issued in reinvestment of distributions | 954,511 | 1,301,330 |
Redeemed | (3,697,266) | (5,089,964) |
Net increase (decrease) | 2,490,856 | 1,806,574 |
Financial Highlights
Years ended February 28, | 2013 | 2012 F | 2011 | 2010 | 2009 |
Selected Per-Share Data |
|
|
|
|
|
Net asset value, beginning of period | $ 9.81 | $ 10.72 | $ 8.05 | $ 5.20 | $ 9.03 |
Income from Investment Operations |
|
|
|
|
|
Net investment income (loss) B | .20 | .07 | .06 | .05 | .09 |
Net realized and unrealized gain (loss) | 1.30 | .14 | 2.67 | 2.86 | (3.87) |
Total from investment operations | 1.50 | .21 | 2.73 | 2.91 | (3.78) |
Distributions from net investment income | (.20) | (.06) | (.06) | (.06) | (.06) |
Distributions from net realized gain | (.55) | (1.08) | - | - | - |
Total distributions | (.75) | (1.13) H | (.06) | (.06) | (.06) |
Redemption fees added to paid in capital B | - G | .01 | - G | - G | .01 |
Net asset value, end of period | $ 10.56 | $ 9.81 | $ 10.72 | $ 8.05 | $ 5.20 |
Total Return A | 16.15% | 2.87% | 34.01% | 55.93% | (41.94)% |
Ratios to Average Net Assets C, E |
|
|
|
|
|
Expenses before reductions | .67% | .67% | .67% | .67% | .67% |
Expenses net of fee waivers, if any | .67% | .67% | .67% | .67% | .67% |
Expenses net of all reductions | .67% | .67% | .67% | .67% | .67% |
Net investment income (loss) | 2.02% | .69% | .63% | .77% | 1.29% |
Supplemental Data |
|
|
|
|
|
Net assets, end of period (000 omitted) | $ 157,567 | $ 121,874 | $ 113,829 | $ 85,243 | $ 57,443 |
Portfolio turnover rate D | 106% | 79% | 90% | 98% I | 36% I |
A Total returns would have been lower if certain expenses had not been reduced during the applicable periods shown.
B Calculated based on average shares outstanding during the period.
C Fees and expenses of any underlying funds and Fidelity Central Funds are not included in the Fund's expense ratio. The Fund indirectly bears its proportionate share of the expenses of any underlying funds and Fidelity Central Funds.
D Amount does not include the portfolio activity of any underlying funds and Fidelity Central Funds.
E Expense ratios reflect operating expenses of the Fund. Expenses before reductions do not reflect amounts reimbursed by the investment adviser or reductions from expense offset arrangements and do not represent the amount paid by the Fund during periods when reimbursements or reductions occur. Expenses net of fee waivers reflect expenses after reimbursement by the investment adviser but prior to reductions from expense offset arrangements. Expenses net of all reductions represent the net expenses paid by the Fund.
F For the year ended February 29.
G Amount represents less than $.01 per share.
H Total distributions of $1.13 per share is comprised of distributions from net investment income of $.056 and distributions from net realized gain of $1.075 per share.
I Reflects adjustments to exclude transactions in money market funds.
See accompanying notes which are an integral part of the financial statements.
Annual Report
Fidelity International Enhanced Index Fund
Performance: The Bottom Line
Average annual total return reflects the change in the value of an investment, assuming reinvestment of the fund's distributions from dividend income and capital gains (the profits earned upon the sale of securities that have grown in value, if any) and assuming a constant rate of performance each year. The $10,000 table and the fund's returns do not reflect the deduction of taxes that a shareholder would pay on fund distributions or the redemption of fund shares. During periods of reimbursement by Fidelity a fund's total returns will be greater than it would be had the reimbursement not occurred. How a fund did yesterday is no guarantee of how it will do tomorrow.
Average Annual Total Returns
Periods ended February 28, 2013 | Past 1 | Past 5 | Life of |
Fidelity International Enhanced Index Fund | 10.64% | -1.83% | -3.03% |
A From December 20, 2007.
$10,000 Over Life of Fund
Let's say hypothetically that $10,000 was invested in Fidelity International Enhanced Index Fund on December 20, 2007, when the fund started. The chart shows how the value of your investment would have changed, and also shows how the MSCI® EAFE® Index performed over the same period.
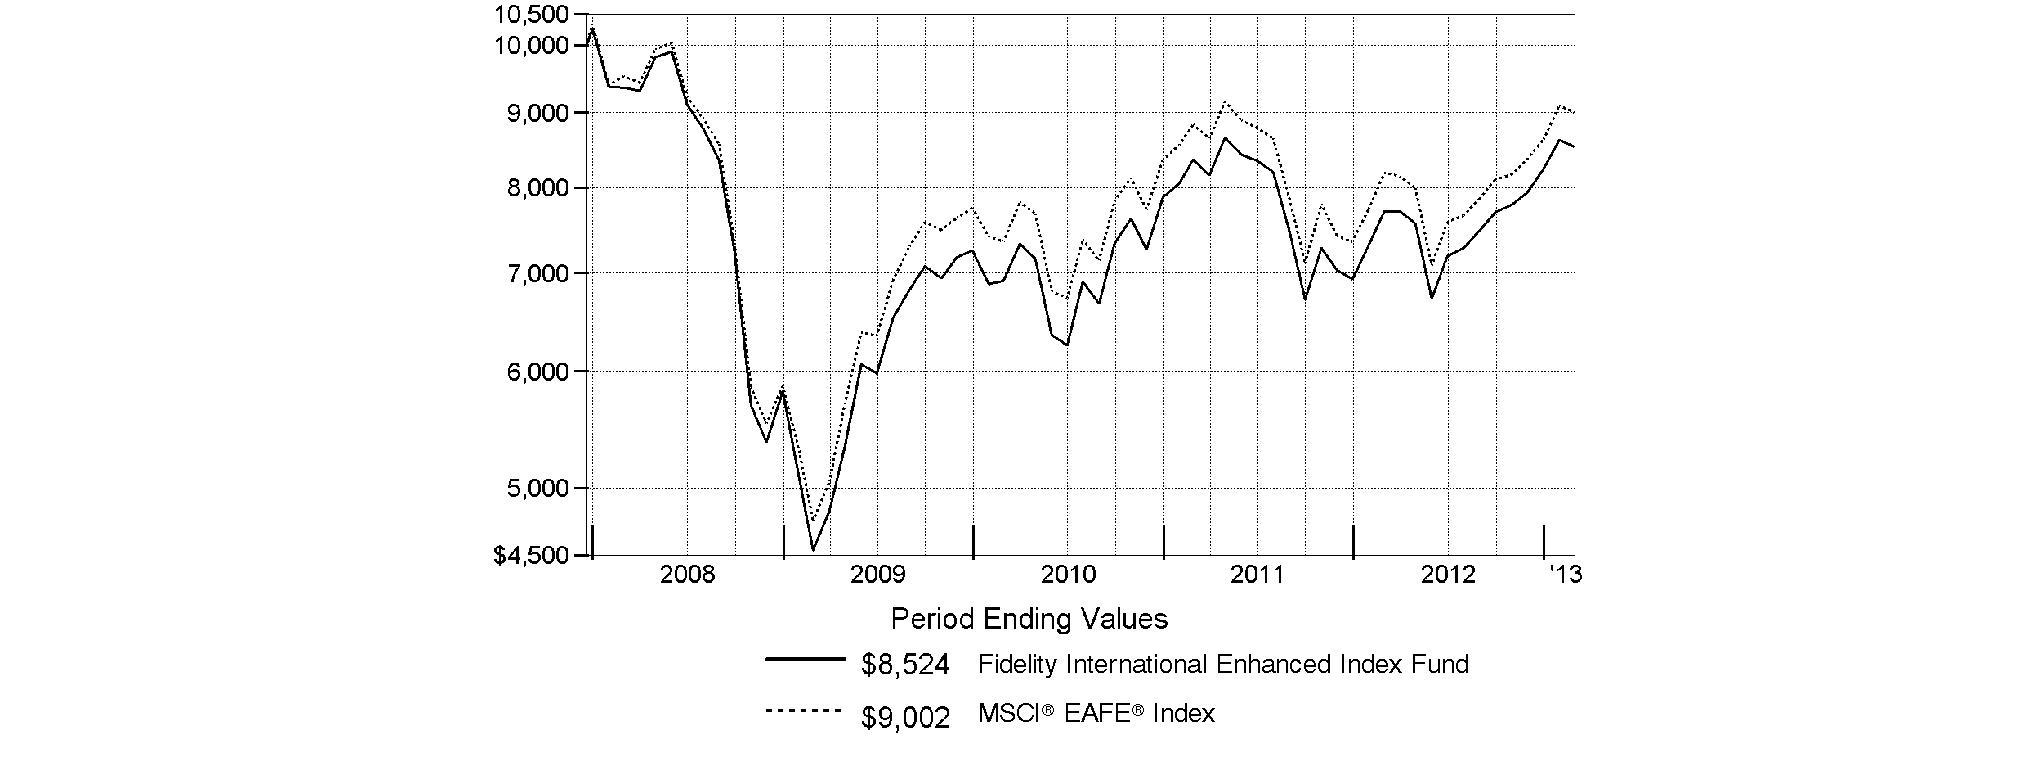
Annual Report
Fidelity International Enhanced Index Fund
Management's Discussion of Fund Performance
Market Recap: For the 12 months ending February 28, 2013, international equities cast off an early-period drubbing and rebounded to finish in positive territory, as debt woes in the eurozone subsided and central banks around the world continued with monetary easing. Foreign developed- and emerging-markets stocks, as measured by the MSCI® ACWI® (All Country World Index) ex USA Index, rose 6.80% for the year, fueled in part by stabilization in the eurozone and improving U.S. economic data, but held back by a stronger U.S. dollar. International stocks were hard hit through May, amid fear of global debt contagion and an economic slowdown in China. Markets reversed course in the summer and never looked back, fueled by news that European Central Bank officials would do "whatever it takes" to save the euro. Within the MSCI index, several European countries had double-digit gains, with Switzerland (+23%) and Sweden (+15%) posting strong returns, while larger economies such as Germany (+11%), France (+10%) and the U.K. (+7%) - the biggest market weighting in the index - also fared well. Countries plagued by slowing or stagnant economies had mixed results, including Greece (+9%), Spain (+2%) and Italy (-3%). Asia-Pacific ex Japan (+15%) outpaced the index, while Japan (+5%) was especially hurt by currency fluctuations. Canada and the more-volatile emerging markets saw only modest to flat gains.
Comments from Maximilian Kaufmann, Senior Portfolio Manager of the Geode Capital Management, LLC, investment management team for Fidelity® International Enhanced Index Fund: For the year, the fund gained 10.64%, outpacing the benchmark MSCI® EAFE® Index, which added 9.99%. Relative to the MSCI® EAFE®, stock selection in the financials sector was especially helpful and more than made up for the modest negative impact of underweighting one of its underlying industries, diversified financials. Stock picking also was favorable in the energy and materials sectors. In contrast, security selection in consumer services within the consumer discretionary sector hurt, as did our positioning in information technology. On a country basis, stock selection was very strong in Japan, but unfavorable in France and the United Kingdom. (The fund's performance relative to the index can be affected by Fidelity's methodologies for valuing certain foreign stocks and for incorporating foreign exchange rates, which differ from those used by the index.) Looking at individual stocks, Hong Kong-based investment holding company Wheelock and Spanish food retailer Distribuidora Internacional de Alimentacion each enjoyed a very favorable result, with both firms' shares gaining more than 60%. In Japan, Fuji Heavy Industries, a manufacturer of vehicles and industrial machinery, also added value, as did Germany's Suedzucker, a maker of sugar-based food products. Underweighting a couple of poor-performing U.K.-based companies - mining firm Anglo American and natural gas company BG Group - also proved helpful. On the negative side, the fund's position in Finnish mobile phone manufacturer Nokia proved detrimental, as the company was unsuccessful in managing a highly competitive business environment. Similarly, an increasingly competitive business environment weighed on the shares of France's leading telecommunication services provider, France Telecom. Elsewhere, our investments in OZ Minerals, an Australian mining company, and Showa Denko, a Japanese materials firm, detracted from the fund's results. Nokia and Showa Denko were not held at period end.
The views expressed above reflect those of the portfolio manager(s) only through the end of the period as stated on the cover of this report and do not necessarily represent the views of Fidelity or any other person in the Fidelity organization. Any such views are subject to change at any time based upon market or other conditions and Fidelity disclaims any responsibility to update such views. These views may not be relied on as investment advice and, because investment decisions for a Fidelity fund are based on numerous factors, may not be relied on as an indication of trading intent on behalf of any Fidelity fund.
Annual Report
Fidelity International Enhanced Index Fund
Investment Changes (Unaudited)
Geographic Diversification (% of fund's net assets) | |||
As of February 28, 2013 | |||
 | United Kingdom | 21.0% |
|
 | Japan | 20.9% |
|
 | France | 8.1% |
|
 | Switzerland | 8.0% |
|
 | Australia | 8.0% |
|
 | Germany | 7.8% |
|
 | Hong Kong | 3.2% |
|
 | Sweden | 2.8% |
|
 | Spain | 2.7% |
|
 | Other | 17.5% |
|

Percentages are based on country or territory of incorporation and are adjusted for the effect of futures contracts, if applicable. |
As of August 31, 2012 | |||
| United Kingdom | 21.0% |
|
| Japan | 20.6% |
|
| Australia | 7.7% |
|
| Germany | 7.5% |
|
| Switzerland | 7.4% |
|
| France | 7.4% |
|
| United States of America | 4.1% |
|
| Netherlands | 3.5% |
|
| Hong Kong | 3.1% |
|
| Other | 17.7% |
|

Percentages are based on country or territory of incorporation and are adjusted for the effect of futures contracts, if applicable. |
Asset Allocation as of February 28, 2013 | ||
| % of fund's | % of fund's net assets |
Stocks and Equity Futures | 99.3 | 98.6 |
Short-Term Investments and Net Other Assets (Liabilities) | 0.7 | 1.4 |
Top Ten Stocks as of February 28, 2013 | ||
| % of fund's | % of fund's net assets |
Nestle SA (Switzerland, Food Products) | 1.9 | 2.3 |
Roche Holding AG (participation certificate) (Switzerland, Pharmaceuticals) | 1.7 | 1.6 |
HSBC Holdings PLC (United Kingdom) (United Kingdom, Commercial Banks) | 1.7 | 1.7 |
Novartis AG (Switzerland, Pharmaceuticals) | 1.5 | 1.5 |
Royal Dutch Shell PLC Class B (United Kingdom) (United Kingdom, Oil, Gas & Consumable Fuels) | 1.3 | 1.5 |
Sanofi SA (France, Pharmaceuticals) | 1.3 | 0.6 |
Vodafone Group PLC (United Kingdom, Wireless Telecommunication Services) | 1.3 | 1.1 |
BP PLC (United Kingdom, Oil, Gas & Consumable Fuels) | 1.3 | 1.6 |
Total SA (France, Oil, Gas & Consumable Fuels) | 1.2 | 1.4 |
Commonwealth Bank of Australia (Australia, Commercial Banks) | 1.2 | 1.2 |
| 14.4 | |
Market Sectors as of February 28, 2013 | ||
| % of fund's | % of fund's net assets |
Financials | 25.6 | 22.9 |
Consumer Staples | 11.8 | 13.0 |
Consumer Discretionary | 11.5 | 10.1 |
Industrials | 11.2 | 11.2 |
Health Care | 10.2 | 10.1 |
Materials | 8.5 | 7.8 |
Energy | 7.4 | 8.7 |
Information Technology | 4.3 | 3.5 |
Telecommunication Services | 3.9 | 5.1 |
Utilities | 3.3 | 3.5 |
Annual Report
Fidelity International Enhanced Index Fund
Investments February 28, 2013
Showing Percentage of Net Assets
Common Stocks - 96.2% | |||
Shares | Value | ||
Australia - 8.0% | |||
Amcor Ltd. | 4,062 | $ 38,172 | |
Australia & New Zealand Banking Group Ltd. | 10,757 | 315,568 | |
BHP Billiton Ltd. | 5,913 | 221,372 | |
Commonwealth Bank of Australia | 5,484 | 376,822 | |
DEXUS Property Group unit | 47,022 | 52,353 | |
Flight Centre Ltd. | 3,298 | 109,484 | |
Macquarie Group Ltd. | 3,152 | 121,444 | |
National Australia Bank Ltd. | 8,544 | 263,564 | |
OZ Minerals Ltd. | 13,064 | 84,869 | |
Ramsay Health Care Ltd. | 1,974 | 64,765 | |
Rio Tinto Ltd. | 925 | 63,352 | |
Suncorp-Metway Ltd. | 12,251 | 141,030 | |
Telstra Corp. Ltd. | 31,221 | 146,378 | |
Wesfarmers Ltd. | 358 | 15,004 | |
Westfield Group unit | 12,003 | 137,317 | |
Westfield Retail Trust unit | 7,479 | 24,293 | |
Westpac Banking Corp. | 7,908 | 248,549 | |
Woolworths Ltd. | 416 | 14,843 | |
TOTAL AUSTRALIA | 2,439,179 | ||
Austria - 0.8% | |||
OMV AG | 2,933 | 127,665 | |
Raiffeisen International Bank-Holding AG | 5 | 189 | |
Voestalpine AG | 3,033 | 102,399 | |
TOTAL AUSTRIA | 230,253 | ||
Belgium - 1.6% | |||
Ageas | 1,167 | 39,743 | |
Anheuser-Busch InBev SA NV | 2,768 | 259,403 | |
Groupe Bruxelles Lambert SA | 694 | 55,441 | |
Solvay SA Class A | 831 | 118,744 | |
TOTAL BELGIUM | 473,331 | ||
Bermuda - 0.4% | |||
Noble Group Ltd. | 112,000 | 107,171 | |
Yue Yuen Industrial (Holdings) Ltd. | 2,000 | 6,756 | |
TOTAL BERMUDA | 113,927 | ||
Cayman Islands - 0.8% | |||
MGM China Holdings Ltd. | 46,800 | 113,084 | |
Sands China Ltd. | 4,000 | 19,057 | |
Wynn Macau Ltd. (a) | 40,400 | 106,527 | |
TOTAL CAYMAN ISLANDS | 238,668 | ||
Denmark - 1.4% | |||
A.P. Moller - Maersk A/S Series B | 17 | 135,961 | |
Novo Nordisk A/S Series B | 1,678 | 293,372 | |
TOTAL DENMARK | 429,333 | ||
Finland - 1.2% | |||
Metso Corp. | 2,482 | 106,608 | |
Orion Oyj (B Shares) | 4,959 | 146,965 | |
| |||
Shares | Value | ||
Sampo Oyj (A Shares) | 1,809 | $ 66,861 | |
Stora Enso Oyj (R Shares) | 8,332 | 56,021 | |
TOTAL FINLAND | 376,455 | ||
France - 8.1% | |||
AXA SA | 7,080 | 122,982 | |
BNP Paribas SA | 3,033 | 170,684 | |
Bouygues SA | 4,346 | 122,784 | |
Christian Dior SA | 269 | 44,935 | |
Compagnie de St. Gobain | 3,666 | 146,241 | |
Danone SA | 207 | 14,375 | |
EDF SA | 5,526 | 104,502 | |
France Telecom SA | 14,755 | 142,311 | |
GDF Suez | 6,610 | 124,958 | |
Imerys | 1,526 | 102,841 | |
LVMH Moet Hennessy - Louis Vuitton SA | 78 | 13,432 | |
Michelin CGDE Series B | 1,529 | 136,619 | |
PPR SA | 267 | 59,852 | |
Renault SA | 2,311 | 146,678 | |
Sanofi SA | 4,182 | 394,939 | |
Schneider Electric SA | 498 | 38,308 | |
Societe Generale Series A | 1,125 | 43,196 | |
Total SA | 7,584 | 378,637 | |
Unibail-Rodamco | 88 | 19,991 | |
VINCI SA | 3,086 | 142,825 | |
TOTAL FRANCE | 2,471,090 | ||
Germany - 6.3% | |||
Allianz AG | 922 | 126,029 | |
BASF AG | 3,479 | 327,842 | |
Bayer AG | 3,124 | 309,398 | |
Bayerische Motoren Werke AG (BMW) | 991 | 91,472 | |
Continental AG | 1,144 | 134,285 | |
Daimler AG (Germany) | 748 | 44,594 | |
Deutsche Bank AG | 1,692 | 77,248 | |
Deutsche Post AG | 6,243 | 140,067 | |
Kabel Deutschland Holding AG | 10 | 867 | |
Metro AG | 1,512 | 46,784 | |
Muenchener Rueckversicherungs AG | 582 | 104,629 | |
SAP AG | 1,207 | 94,255 | |
Siemens AG | 3,144 | 326,319 | |
Suedzucker AG (Bearer) | 2,317 | 101,487 | |
TOTAL GERMANY | 1,925,276 | ||
Hong Kong - 3.2% | |||
AIA Group Ltd. | 3,200 | 13,864 | |
Cheung Kong Holdings Ltd. | 9,000 | 139,950 | |
Hang Seng Bank Ltd. | 8,200 | 132,585 | |
Hopewell Holdings Ltd. | 19,500 | 85,235 | |
Hysan Development Co. Ltd. | 13,005 | 66,906 | |
Sino Land Ltd. | 22,000 | 39,997 | |
SJM Holdings Ltd. | 39,000 | 97,455 | |
Sun Hung Kai Properties Ltd. | 9,788 | 151,447 | |
Common Stocks - continued | |||
Shares | Value | ||
Hong Kong - continued | |||
Wharf Holdings Ltd. | 16,000 | $ 139,873 | |
Wheelock and Co. Ltd. | 21,000 | 114,672 | |
TOTAL HONG KONG | 981,984 | ||
Ireland - 0.1% | |||
CRH PLC | 1,075 | 23,373 | |
Italy - 2.3% | |||
Assicurazioni Generali SpA | 851 | 13,799 | |
Enel SpA | 43,158 | 156,188 | |
ENI SpA | 9,093 | 206,955 | |
EXOR SpA | 1,263 | 35,386 | |
Fiat Industrial SpA | 10,425 | 126,780 | |
Fiat SpA | 15,937 | 85,515 | |
Intesa Sanpaolo SpA | 7,634 | 12,388 | |
Telecom Italia SpA | 51,389 | 37,791 | |
UniCredit SpA (a) | 5,235 | 26,600 | |
TOTAL ITALY | 701,402 | ||
Japan - 20.9% | |||
Aisin Seiki Co. Ltd. | 3,200 | 115,827 | |
Ajinomoto Co., Inc. | 7,000 | 92,815 | |
Aozora Bank Ltd. | 39,000 | 118,233 | |
Asahi Kasei Corp. | 17,000 | 100,507 | |
Brother Industries Ltd. | 10,200 | 106,743 | |
Canon, Inc. | 5,700 | 206,279 | |
Central Japan Railway Co. | 1,300 | 126,367 | |
Daicel Chemical Industries Ltd. | 14,000 | 107,692 | |
Daihatsu Motor Co. Ltd. | 6,000 | 121,890 | |
Daito Trust Construction Co. Ltd. | 500 | 44,773 | |
Daiwa House Industry Co. Ltd. | 6,000 | 110,174 | |
Daiwa Securities Group, Inc. | 21,000 | 129,820 | |
Denso Corp. | 3,700 | 155,281 | |
East Japan Railway Co. | 1,100 | 81,174 | |
Fuji Heavy Industries Ltd. | 8,000 | 119,625 | |
Fujifilm Holdings Corp. | 2,000 | 38,408 | |
Fujitsu Ltd. | 25,000 | 114,899 | |
Hitachi Ltd. | 24,000 | 134,642 | |
Honda Motor Co. Ltd. | 1,600 | 59,838 | |
Hoya Corp. | 5,600 | 107,420 | |
Idemitsu Kosan Co. Ltd. | 1,300 | 118,233 | |
INPEX Corp. | 21 | 111,695 | |
Isuzu Motors Ltd. | 18,000 | 110,692 | |
Itochu Corp. | 11,300 | 130,446 | |
Japan Tobacco, Inc. | 2,200 | 69,425 | |
JGC Corp. | 4,000 | 110,389 | |
Jupiter Telecommunications Co. | 5 | 6,635 | |
Kao Corp. | 4,000 | 127,910 | |
Konica Minolta Holdings, Inc. | 10,000 | 76,384 | |
Kurita Water Industries Ltd. | 3,900 | 77,924 | |
Marubeni Corp. | 1,000 | 7,304 | |
Mitsubishi UFJ Financial Group, Inc. | 32,900 | 182,346 | |
Mitsui & Co. Ltd. | 5,900 | 87,459 | |
| |||
Shares | Value | ||
Mizuho Financial Group, Inc. | 98,700 | $ 217,083 | |
Namco Bandai Holdings, Inc. | 6,700 | 106,547 | |
NEC Corp. (a) | 35,000 | 86,471 | |
Nippon Telegraph & Telephone Corp. | 3,000 | 137,078 | |
Nissan Motor Co. Ltd. | 7,300 | 73,959 | |
Nitto Denko Corp. | 1,900 | 111,716 | |
Nomura Holdings, Inc. | 25,000 | 143,423 | |
NTT DoCoMo, Inc. | 52 | 80,391 | |
ORIX Corp. | 1,090 | 121,359 | |
Osaka Gas Co. Ltd. | 27,000 | 104,866 | |
Otsuka Holdings Co. Ltd. | 4,200 | 134,487 | |
Resona Holdings, Inc. | 24,800 | 113,712 | |
Seven & i Holdings Co., Ltd. | 4,300 | 125,535 | |
Seven Bank Ltd. | 36,800 | 96,873 | |
Shionogi & Co. Ltd. | 5,800 | 118,203 | |
Softbank Corp. | 200 | 7,412 | |
Sojitz Corp. | 62,900 | 96,362 | |
Sumitomo Corp. | 11,300 | 138,248 | |
Sumitomo Mitsui Financial Group, Inc. | 5,800 | 231,473 | |
Sumitomo Mitsui Trust Holdings, Inc. | 7,000 | 27,187 | |
Suzuki Motor Corp. | 5,200 | 124,376 | |
Tokyo Gas Co. Ltd. | 23,000 | 111,166 | |
Toyoda Gosei Co. Ltd. | 4,600 | 106,253 | |
Toyota Motor Corp. | 6,200 | 318,429 | |
TOTAL JAPAN | 6,341,858 | ||
Netherlands - 2.5% | |||
Heineken Holding NV (A Shares) | 1,823 | 114,241 | |
Heineken NV (Bearer) | 1,860 | 138,876 | |
ING Groep NV (Certificaten Van Aandelen) (a) | 5,524 | 44,224 | |
Koninklijke Ahold NV | 8,934 | 128,302 | |
Koninklijke Philips Electronics NV | 5,859 | 165,525 | |
Royal DSM NV | 1,880 | 110,057 | |
Unilever NV (Certificaten Van Aandelen) (Bearer) | 1,870 | 72,521 | |
TOTAL NETHERLANDS | 773,746 | ||
New Zealand - 0.3% | |||
Telecom Corp. of New Zealand Ltd. | 42,784 | 85,594 | |
Norway - 1.4% | |||
DnB NOR ASA | 5,322 | 79,264 | |
Gjensidige Forsikring ASA | 2,422 | 38,709 | |
Orkla ASA (A Shares) | 4,763 | 38,987 | |
StatoilHydro ASA | 6,594 | 163,694 | |
Yara International ASA | 2,111 | 100,904 | |
TOTAL NORWAY | 421,558 | ||
Portugal - 0.0% | |||
Energias de Portugal SA | 586 | 1,758 | |
Portugal Telecom SGPS SA (Reg.) | 18 | 91 | |
TOTAL PORTUGAL | 1,849 | ||
Common Stocks - continued | |||
Shares | Value | ||
Singapore - 2.4% | |||
ComfortDelgro Corp. Ltd. | 65,000 | $ 100,775 | |
DBS Group Holdings Ltd. | 13,106 | 159,909 | |
Keppel Ld Ltd. | 31,000 | 104,134 | |
Oversea-Chinese Banking Corp. Ltd. | 506 | 4,127 | |
Singapore Technologies Engineering Ltd. | 33,000 | 113,251 | |
United Overseas Bank Ltd. | 10,000 | 154,070 | |
Yangzijiang Shipbuilding Holdings Ltd. | 122,000 | 95,066 | |
TOTAL SINGAPORE | 731,332 | ||
Spain - 2.7% | |||
Amadeus IT Holding SA Class A | 4,803 | 122,903 | |
Banco Bilbao Vizcaya Argentaria SA | 9,874 | 95,653 | |
Banco Santander SA (Spain) | 22,514 | 170,473 | |
Distribuidora Internacional de Alimentacion SA | 9,116 | 71,206 | |
Gas Natural SDG SA | 5,530 | 109,703 | |
Iberdrola SA | 26,912 | 133,162 | |
MAPFRE SA (Reg.) | 13,338 | 43,412 | |
Repsol YPF SA | 1,076 | 22,912 | |
Telefonica SA | 4,065 | 53,058 | |
TOTAL SPAIN | 822,482 | ||
Sweden - 2.8% | |||
Industrivarden AB Series C | 5,565 | 99,298 | |
Investor AB (B Shares) | 2,744 | 80,401 | |
Nordea Bank AB | 3,829 | 44,315 | |
Sandvik AB | 8,686 | 141,154 | |
Scania AB (B Shares) | 4,426 | 92,114 | |
Skandinaviska Enskilda Banken AB (A Shares) | 8,016 | 83,477 | |
Svenska Cellulosa AB (SCA) (B Shares) | 199 | 4,865 | |
Svenska Handelsbanken AB (A Shares) | 542 | 23,558 | |
Swedbank AB (A Shares) | 3,956 | 95,117 | |
Telefonaktiebolaget LM Ericsson (B Shares) | 15,637 | 190,093 | |
TOTAL SWEDEN | 854,392 | ||
Switzerland - 8.0% | |||
ABB Ltd. (Reg.) | 1,152 | 26,209 | |
Actelion Ltd. | 2,046 | 105,563 | |
Compagnie Financiere Richemont SA Series A | 216 | 17,364 | |
Credit Suisse Group | 1,860 | 49,583 | |
Ems-Chemie Holding AG | 395 | 111,361 | |
Givaudan SA | 15 | 17,924 | |
Nestle SA | 8,479 | 591,917 | |
Novartis AG | 6,889 | 466,510 | |
Pargesa Holding SA | 662 | 47,286 | |
Roche Holding AG (participation certificate) | 2,306 | 528,217 | |
Schindler Holding AG (Reg.) | 831 | 125,009 | |
Swiss Re Ltd. | 1,463 | 116,987 | |
| |||
Shares | Value | ||
UBS AG | 7,103 | $ 112,230 | |
Zurich Insurance Group AG | 453 | 123,967 | |
TOTAL SWITZERLAND | 2,440,127 | ||
United Kingdom - 21.0% | |||
Aberdeen Asset Management PLC | 9,187 | 59,916 | |
Anglo American PLC (United Kingdom) | 1,003 | 29,245 | |
Antofagasta PLC | 6,980 | 115,738 | |
AstraZeneca PLC: | |||
(United Kingdom) | 1,546 | 70,104 | |
sponsored ADR (d) | 3,588 | 163,039 | |
BAE Systems PLC | 7,610 | 40,995 | |
Barclays PLC | 35,080 | 162,768 | |
BG Group PLC | 3,664 | 64,784 | |
BHP Billiton PLC | 2,833 | 89,398 | |
BP PLC | 57,959 | 388,646 | |
British American Tobacco PLC (United Kingdom) | 6,695 | 348,297 | |
British Land Co. PLC | 1 | 9 | |
British Sky Broadcasting Group PLC | 10,787 | 139,179 | |
BT Group PLC | 25,000 | 101,468 | |
Centrica PLC | 60 | 320 | |
Cobham PLC | 32,936 | 115,620 | |
Diageo PLC | 3,141 | 94,187 | |
GlaxoSmithKline PLC | 1,351 | 29,772 | |
GlaxoSmithKline PLC sponsored ADR | 7,029 | 309,487 | |
HSBC Holdings PLC: | |||
(United Kingdom) | 35,397 | 392,046 | |
sponsored ADR (d) | 2,293 | 127,124 | |
Imperial Tobacco Group PLC | 5,090 | 184,551 | |
ITV PLC | 61,891 | 116,614 | |
J Sainsbury PLC | 23,107 | 121,218 | |
Johnson Matthey PLC | 2,715 | 94,732 | |
Lloyds Banking Group PLC (a) | 64,962 | 53,399 | |
Marks & Spencer Group PLC | 20,814 | 117,241 | |
National Grid PLC | 15,728 | 173,767 | |
Next PLC | 2,055 | 130,905 | |
Pearson PLC | 50 | 875 | |
Prudential PLC | 3,990 | 59,223 | |
Reckitt Benckiser Group PLC | 2,221 | 149,229 | |
Rexam PLC | 16,826 | 131,331 | |
Rio Tinto PLC | 5,100 | 272,709 | |
Royal Dutch Shell PLC: | |||
Class A (United Kingdom) | 7,450 | 244,692 | |
Class B (United Kingdom) | 12,040 | 405,155 | |
SABMiller PLC | 701 | 34,849 | |
Standard Chartered PLC (United Kingdom) | 7,177 | 195,546 | |
Tate & Lyle PLC | 8,200 | 101,073 | |
Tesco PLC | 38,898 | 218,102 | |
TUI Travel PLC | 20,150 | 96,994 | |
Common Stocks - continued | |||
Shares | Value | ||
United Kingdom - continued | |||
Unilever PLC | 6,019 | $ 239,698 | |
Vodafone Group PLC | 155,104 | 389,031 | |
TOTAL UNITED KINGDOM | 6,373,076 | ||
TOTAL COMMON STOCKS (Cost $27,149,004) |
| ||
Nonconvertible Preferred Stocks - 1.5% | |||
|
|
|
|
Germany - 1.5% | |||
Henkel AG & Co. KGaA | 1,939 | 170,899 | |
ProSiebenSat.1 Media AG | 2,783 | 95,920 | |
Volkswagen AG | 824 | 179,923 | |
TOTAL NONCONVERTIBLE PREFERRED STOCKS (Cost $370,536) |
| ||
Government Obligations - 0.2% | ||||
| Principal |
| ||
United States of America - 0.2% | ||||
U.S. Treasury Bills, yield at date of purchase 0.15% 4/11/13 (e) | $ 60,000 |
| ||
Money Market Funds - 1.8% | |||
Shares |
| ||
Dreyfus Cash Management Institutional Shares, 0.10% (f) | 268,254 | 268,254 | |
Fidelity Securities Lending Cash Central Fund, 0.16% (b)(c) | 287,925 | 287,925 | |
TOTAL MONEY MARKET FUNDS (Cost $556,179) |
| ||
TOTAL INVESTMENT PORTFOLIO - 99.7% (Cost $28,135,709) | 30,313,200 | ||
NET OTHER ASSETS (LIABILITIES) - 0.3% | 98,448 | ||
NET ASSETS - 100% | $ 30,411,648 | ||
Futures Contracts | |||||
Expiration | Underlying | Unrealized | |||
Purchased | |||||
Equity Index Contracts | |||||
6 NYSE E-mini MSCI EAFE Index Contracts | March 2013 | $ 497,670 | $ (1,994) | ||
|
The face value of futures purchased as a percentage of net assets is 1.6% |
Legend |
(a) Non-income producing |
(b) Affiliated fund that is generally available only to investment companies and other accounts managed by Fidelity Investments. The rate quoted is the annualized seven-day yield of the fund at period end. A complete unaudited listing of the fund's holdings as of its most recent quarter end is available upon request. In addition, each Fidelity Central Fund's financial statements, which are not covered by the Fund's Report of Independent Registered Public Accounting Firm, are available on the SEC's websiteor upon request. |
(c) Investment made with cash collateral received from securities on loan. |
(d) Security or a portion of the security is on loan at period end. |
(e) Security or a portion of the security was pledged to cover margin requirements for futures contracts. At the period end, the value of securities pledged amounted to $59,994. |
(f) The rate quoted is the annualized seven-day yield of the fund at period end. |
Affiliated Central Funds |
Information regarding fiscal year to date income earned by the Fund from investments in Fidelity Central Funds is as follows: |
Fund | Income earned |
Fidelity Securities Lending Cash Central Fund | $ 813 |
Other Information |
Categorizations in the Schedule of Investments are based on country or territory of incorporation. |
The following is a summary of the inputs used, as of February 28, 2013, involving the Fund's assets and liabilities carried at fair value. The inputs or methodology used for valuing securities may not be an indication of the risk associated with investing in those securities. For more information on valuation inputs, and their aggregation into the levels used in the tables below, please refer to the Investment Valuation section in the accompanying Notes to Financial Statements. |
Valuation Inputs at Reporting Date: | ||||
Description | Total | Level 1 | Level 2 | Level 3 |
Investments in Securities: | ||||
Equities: | ||||
Consumer Discretionary | $ 3,524,979 | $ 3,071,878 | $ 453,101 | $ - |
Consumer Staples | 3,651,612 | 2,045,589 | 1,606,023 | - |
Energy | 2,233,068 | 445,289 | 1,787,779 | - |
Financials | 7,752,081 | 5,760,909 | 1,991,172 | - |
Health Care | 3,134,821 | 1,880,124 | 1,254,697 | - |
Industrials | 3,388,677 | 2,870,624 | 518,053 | - |
Information Technology | 1,278,497 | 787,870 | 490,627 | - |
Materials | 2,532,299 | 1,925,447 | 606,852 | - |
Telecommunication Services | 1,180,603 | 239,384 | 941,219 | - |
Utilities | 1,020,390 | 846,623 | 173,767 | - |
Government Obligations | 59,994 | - | 59,994 | - |
Money Market Funds | 556,179 | 556,179 | - | - |
Total Investments in Securities: | $ 30,313,200 | $ 20,429,916 | $ 9,883,284 | $ - |
Derivative Instruments: | ||||
Liabilities | ||||
Futures Contracts | $ (1,994) | $ (1,994) | $ - | $ - |
The following is a summary of transfers between Level 1 and Level 2 for the period ended February 28, 2013. Transfers are assumed to have occurred at the beginning of the period, and are primarily attributable to the valuation techniques used for foreign equity securities, as discussed in the accompanying Notes to Financial Statements: |
Transfers | Total |
Level 1 to Level 2 | $ 985,186 |
Level 2 to Level 1 | $ 217,115 |
Value of Derivative Instruments |
The following table is a summary of the Fund's value of derivative instruments by primary risk exposure as of February 28, 2013. For additional information on derivative instruments, please refer to the Derivative Instruments section in the accompanying Notes to Financial Statements. |
Primary Risk Exposure / | Value | |
| Asset | Liability |
Equity Risk | ||
Futures Contracts (a) | $ - | $ (1,994) |
Total Value of Derivatives | $ - | $ (1,994) |
(a) Reflects cumulative appreciation/(depreciation) on futures contracts as disclosed on the Schedule of Investments. Only the period end variation margin is separately disclosed on the Statement of Assets and Liabilities. |
See accompanying notes which are an integral part of the financial statements.
Annual Report
Fidelity International Enhanced Index Fund
Financial Statements
Statement of Assets and Liabilities
| February 28, 2013 | |
|
|
|
Assets | ||
Investment in securities, at value (including securities loaned of $281,008) - See accompanying schedule: Unaffiliated issuers (cost $27,847,784) | $ 30,025,275 |
|
Fidelity Central Funds (cost $287,925) | 287,925 |
|
Total Investments (cost $28,135,709) |
| $ 30,313,200 |
Foreign currency held at value (cost $328,339) | 325,047 | |
Receivable for fund shares sold | 5,307 | |
Dividends receivable | 95,549 | |
Interest receivable | 25 | |
Distributions receivable from Fidelity Central Funds | 29 | |
Total assets | 30,739,157 | |
|
|
|
Liabilities | ||
Payable for fund shares redeemed | $ 23,248 | |
Accrued management fee | 11,793 | |
Payable for daily variation margin on futures contracts | 780 | |
Other affiliated payables | 3,763 | |
Collateral on securities loaned, at value | 287,925 | |
Total liabilities | 327,509 | |
|
|
|
Net Assets | $ 30,411,648 | |
Net Assets consist of: |
| |
Paid in capital | $ 31,717,526 | |
Undistributed net investment income | 68,799 | |
Accumulated undistributed net realized gain (loss) on investments and foreign currency transactions | (3,545,101) | |
Net unrealized appreciation (depreciation) on investments and assets and liabilities in foreign currencies | 2,170,424 | |
Net Assets, for 4,081,528 shares outstanding | $ 30,411,648 | |
Net Asset Value, offering price and redemption price per share ($30,411,648 ÷ 4,081,528 shares) | $ 7.45 | |
Statement of Operations
| Year ended February 28, 2013 | |
|
|
|
Investment Income |
|
|
Dividends |
| $ 1,010,925 |
Interest |
| 714 |
Income from Fidelity Central Funds |
| 813 |
Income before foreign taxes withheld |
| 1,012,452 |
Less foreign taxes withheld |
| (73,910) |
Total income |
| 938,542 |
|
|
|
Expenses | ||
Management fee | $ 120,457 | |
Transfer agent fees | 38,542 | |
Independent trustees' compensation | 308 | |
Miscellaneous | 66 | |
Total expenses | 159,373 | |
Net investment income (loss) | 779,169 | |
Realized and Unrealized Gain (Loss) Net realized gain (loss) on: | ||
Investment securities: |
|
|
Unaffiliated issuers | 160,772 | |
Foreign currency transactions | 8,627 | |
Futures contracts | 175,060 | |
Total net realized gain (loss) |
| 344,459 |
Change in net unrealized appreciation (depreciation) on: Investment securities | 1,600,673 | |
Assets and liabilities in foreign currencies | (5,506) | |
Futures contracts | (95,604) | |
Total change in net unrealized appreciation (depreciation) |
| 1,499,563 |
Net gain (loss) | 1,844,022 | |
Net increase (decrease) in net assets resulting from operations | $ 2,623,191 | |
See accompanying notes which are an integral part of the financial statements.
Annual Report
Fidelity International Enhanced Index Fund
Financial Statements - continued
Statement of Changes in Net Assets
| Year ended | Year ended |
Increase (Decrease) in Net Assets |
|
|
Operations |
|
|
Net investment income (loss) | $ 779,169 | $ 711,725 |
Net realized gain (loss) | 344,459 | (17,937) |
Change in net unrealized appreciation (depreciation) | 1,499,563 | (2,857,591) |
Net increase (decrease) in net assets resulting from operations | 2,623,191 | (2,163,803) |
Distributions to shareholders from net investment income | (774,163) | (697,868) |
Distributions to shareholders from net realized gain | (63,148) | (17,836) |
Total distributions | (837,311) | (715,704) |
Share transactions | 9,411,727 | 12,780,368 |
Reinvestment of distributions | 807,297 | 678,145 |
Cost of shares redeemed | (7,659,451) | (9,990,460) |
Net increase (decrease) in net assets resulting from share transactions | 2,559,573 | 3,468,053 |
Redemption fees | 229 | 2,353 |
Total increase (decrease) in net assets | 4,345,682 | 590,899 |
|
|
|
Net Assets | ||
Beginning of period | 26,065,966 | 25,475,067 |
End of period (including undistributed net investment income of $68,799 and undistributed net investment income of $63,793, respectively) | $ 30,411,648 | $ 26,065,966 |
Other Information Shares | ||
Sold | 1,352,694 | 1,810,888 |
Issued in reinvestment of distributions | 114,634 | 105,259 |
Redeemed | (1,136,991) | (1,444,919) |
Net increase (decrease) | 330,337 | 471,228 |
Financial Highlights
Years ended February 28, | 2013 | 2012 F | 2011 | 2010 | 2009 |
Selected Per-Share Data |
|
|
|
|
|
Net asset value, beginning of period | $ 6.95 | $ 7.77 | $ 6.58 | $ 4.42 | $ 9.35 |
Income from Investment Operations |
|
|
|
|
|
Net investment income (loss) B | .21 | .20 | .17 | .15 | .18 |
Net realized and unrealized gain (loss) | .52 | (.82) | 1.19 | 2.17 | (4.96) |
Total from investment operations | .73 | (.62) | 1.36 | 2.32 | (4.78) |
Distributions from net investment income | (.21) | (.19) | (.17) | (.14) | (.14) |
Distributions from net realized gain | (.02) | (.01) | - | (.02) | (.01) |
Total distributions | (.23) | (.20) | (.17) | (.16) | (.15) |
Redemption fees added to paid in capital B, G | - | - | - | - | - |
Net asset value, end of period | $ 7.45 | $ 6.95 | $ 7.77 | $ 6.58 | $ 4.42 |
Total Return A | 10.64% | (7.81)% | 20.95% | 52.44% | (51.52)% |
Ratios to Average Net Assets C, E |
|
|
|
|
|
Expenses before reductions | .62% | .62% | .62% | .62% | .62% |
Expenses net of fee waivers, if any | .62% | .62% | .62% | .62% | .62% |
Expenses net of all reductions | .62% | .62% | .62% | .62% | .62% |
Net investment income (loss) | 3.04% | 2.84% | 2.50% | 2.39% | 2.69% |
Supplemental Data |
|
|
|
|
|
Net assets, end of period (000 omitted) | $ 30,412 | $ 26,066 | $ 25,475 | $ 19,958 | $ 12,950 |
Portfolio turnover rate D | 56% | 49% | 32% | 22% H | 42% H |
A Total returns would have been lower if certain expenses had not been reduced during the applicable periods shown.
B Calculated based on average shares outstanding during the period.
C Fees and expenses of any underlying funds and Fidelity Central Funds are not included in the Fund's expense ratio. The Fund indirectly bears its proportionate share of the expenses of any underlying funds and Fidelity Central Funds.
D Amount does not include the portfolio activity of any underlying funds and Fidelity Central Funds.
E Expense ratios reflect operating expenses of the Fund. Expenses before reductions do not reflect amounts reimbursed by the investment adviser or reductions from expense offset arrangements and do not represent the amount paid by the Fund during periods when reimbursements or reductions occur. Expenses net of fee waivers reflect expenses after reimbursement by the investment adviser but prior to reductions from expense offset arrangements. Expenses net of all reductions represent the net expenses paid by the Fund.
F For the year ended February 29.
G Amount represents less than $.01 per share.
H Reflects adjustments to exclude transactions in money market mutual funds.
See accompanying notes which are an integral part of the financial statements.
Annual Report
Notes to Financial Statements
For the period ended February 28, 2013
1. Organization.
Fidelity Large Cap Growth Enhanced Index Fund, Fidelity Large Cap Value Enhanced Index Fund, Fidelity Large Cap Core Enhanced Index Fund, Fidelity Mid Cap Enhanced Index Fund, Fidelity Small Cap Enhanced Index Fund and Fidelity International Enhanced Index Fund (the Funds) are funds of Fidelity Commonwealth Trust II (the Trust) and are authorized to issue an unlimited number of shares. The Trust is registered under the Investment Company Act of 1940, as amended (the 1940 Act), as an open-end management investment company organized as a Delaware statutory trust.
2. Significant Accounting Policies.
The financial statements have been prepared in conformity with accounting principles generally accepted in the United States of America (GAAP), which require management to make certain estimates and assumptions at the date of the financial statements. Actual results could differ from those estimates. Subsequent events, if any, through the date that the financial statements were issued have been evaluated in the preparation of the financial statements. The following summarizes the significant accounting policies of the Funds:
Investment Valuation. Investments are valued as of 4:00 p.m. Eastern time on the last calendar day of the period. In accordance with valuation policies and procedures approved by the Board of Trustees (the Board), each Fund attempts to obtain prices from one or more third party pricing vendors or brokers to value its investments. When current market prices, quotations or currency exchange rates are not readily available or reliable, investments will be fair valued in good faith by the Strategic Advisers Fair Value Committee (the Committee), in accordance with procedures adopted by each Fund's Board. Factors used in determining fair value vary by investment type and may include market or investment specific events, changes in interest rates and credit quality. The frequency with which these procedures are used cannot be predicted and they may be utilized to a significant extent. The Committee oversees each Fund's valuation policies and procedures and is responsible for approving and reporting to the Board all fair value determinations.
Each Fund categorizes the inputs to valuation techniques used to value their investments into a disclosure hierarchy consisting of three levels as shown below:
Level 1 - quoted prices in active markets for identical investments
Level 2 - other significant observable inputs (including quoted prices for similar investments, interest rates, prepayment speeds, etc.)
Level 3 - unobservable inputs (including the Fund's own assumptions based on the best information available)
Valuation techniques used to value each Fund's investments by major category are as follows:
Equity securities, including restricted securities, for which market quotations are readily available, are valued at the last reported sale price or official closing price as reported by a third party pricing vendor on the primary market or exchange on which they are traded and are categorized as Level 1 in the hierarchy. In the event there were no sales during the day or closing prices are not available, securities are valued at the last quoted bid price or may be valued using the last available price and are generally categorized as Level 2 in the hierarchy. For foreign equity securities, when significant market or security specific events arise, comparisons to the valuation of American Depositary Receipts (ADRs), futures contracts, Exchange-Traded Funds (ETFs) and certain indexes as well as quoted prices for similar securities are used and are categorized as Level 2 in the hierarchy. Utilizing these techniques may result in transfers between Level 1 and Level 2.
Debt securities, including restricted securities, are valued based on evaluated prices received from third party pricing vendors or from brokers who make markets in such securities. For U.S. government and government agency obligations, pricing vendors utilize matrix pricing which considers prepayment speed assumptions, attributes of the collateral, yield or price of bonds of comparable quality, coupon, maturity and type as well as broker-supplied prices. When independent prices are unavailable or unreliable, debt securities may be valued utilizing pricing methodologies which consider similar factors that would be used by third party pricing vendors. Debt securities are generally categorized as Level 2 in the hierarchy but may be Level 3 depending on the circumstances.
Futures contracts are valued at the settlement price or official closing price established each day by the board of trade or exchange on which they are traded and are categorized as Level 1 in the hierarchy. Investments in open-end mutual funds, including the Fidelity Central Funds, are valued at their closing net asset value (NAV) each business day and are categorized as Level 1 in the hierarchy.
Changes in valuation techniques may result in transfers in or out of an assigned level within the disclosure hierarchy. The aggregate value of investments by input level, as of February 28, 2013, including information on transfers between Levels 1 and 2, is included at the end of each applicable Fund's Schedule of Investments.
Foreign Currency. The Funds may use foreign currency contracts to facilitate transactions in foreign-denominated securities. Gains and losses from these transactions may arise from changes in the value of the foreign currency or if the counterparties do not perform under the contracts' terms.
Annual Report
Notes to Financial Statements - continued
2. Significant Accounting Policies - continued
Foreign Currency - continued
Foreign-denominated assets, including investment securities, and liabilities are translated into U.S. dollars at the exchange rates at period end. Purchases and sales of investment securities, income and dividends received and expenses denominated in foreign currencies are translated into U.S. dollars at the exchange rate in effect on the transaction date.
The effects of exchange rate fluctuations on investments are included with the net realized and unrealized gain (loss) on investment securities. Other foreign currency transactions resulting in realized and unrealized gain (loss) are disclosed separately.
Investment Transactions and Income. For financial reporting purposes, the Funds' investment holdings and NAV include trades executed through the end of the last business day of the period. The NAV per share for processing shareholder transactions is calculated as of the close of business of the New York Stock Exchange (NYSE), normally 4:00 p.m. Eastern time and includes trades executed through the end of the prior business day. Gains and losses on securities sold are determined on the basis of identified cost and may include proceeds received from litigation. Dividend income is recorded on the ex-dividend date, except for certain dividends from foreign securities where the ex-dividend date may have passed, which are recorded as soon as the Funds are informed of the ex-dividend date. Non-cash dividends included in dividend income, if any, are recorded at the fair market value of the securities received. Distributions received on securities that represent a return of capital or capital gain are recorded as a reduction of cost of investments and/or as a realized gain. The Funds estimate the components of distributions received that may be considered return of capital distributions or capital gain distributions. Interest income and distributions from the Fidelity Central Funds are accrued as earned. Interest income includes coupon interest and amortization of premium and accretion of discount on debt securities. Investment income is recorded net of foreign taxes withheld where recovery of such taxes is uncertain.
Expenses. Expenses directly attributable to a fund are charged to that fund. Expenses attributable to more than one fund are allocated among the respective funds on the basis of relative net assets or other appropriate methods. Expense estimates are accrued in the period to which they relate and adjustments are made when actual amounts are known.
Income Tax Information and Distributions to Shareholders. Each year, each Fund intends to qualify as a regulated investment company under Subchapter M of the Internal Revenue Code, including distributing substantially all of its taxable income and realized gains. As a result, no provision for income taxes is required. As of February 28, 2013, each Fund did not have any unrecognized tax benefits in the financial statements; nor is each Fund aware of any tax positions for which it is reasonably possible that the total amounts of unrecognized tax benefits will significantly change in the next twelve months. Each Fund files a U.S. federal tax return, in addition to state and local tax returns as required. A fund's federal income tax returns are subject to examination by the Internal Revenue Service (IRS) for a period of three fiscal years after they are filed. State and local tax returns may be subject to examination for an additional fiscal year depending on the jurisdiction. Foreign taxes are provided for based on each Fund's understanding of the tax rules and rates that exist in the foreign markets in which it invests.
Distributions are declared and recorded on the ex-dividend date. Income and capital gain distributions are determined in accordance with income tax regulations, which may differ from GAAP. In addition, certain Funds claimed a portion of the payment made to redeeming shareholders as a distribution for income tax purposes.
Capital accounts within the financial statements are adjusted for permanent book-tax differences. These adjustments have no impact on net assets or the results of operations. Temporary book-tax differences will reverse in a subsequent period.
Book-tax differences are primarily due to the short-term gain distributions from the Underlying Funds, futures contracts, foreign currency transactions, passive foreign investment companies (PFIC), market discount, partnerships, capital loss carryforwards and losses deferred due to wash sales and excise tax regulations.
The federal tax cost of investment securities and unrealized appreciation (depreciation) as of period end were as follows for each Fund:
| Tax cost | Gross unrealized | Gross unrealized | Net unrealized |
Fidelity Large Cap Growth Enhanced Index Fund | $ 164,355,384 | $ 25,874,823 | $ (2,271,374) | $ 23,603,449 |
Fidelity Large Cap Value Enhanced Index Fund | 94,315,575 | 19,199,479 | (680,703) | 18,518,776 |
Fidelity Large Cap Core Enhanced Index Fund | 210,791,709 | 22,681,909 | (13,487,562) | 9,194,347 |
Fidelity Mid Cap Enhanced Index Fund | 129,235,185 | 15,484,551 | (1,395,383) | 14,089,168 |
Fidelity Small Cap Enhanced Index Fund | 158,891,936 | 23,823,873 | (3,275,992) | 20,547,881 |
Fidelity International Enhanced Index Fund | 28,194,125 | 4,005,627 | (1,886,552) | 2,119,075 |
Annual Report
2. Significant Accounting Policies - continued
Income Tax Information and Distributions to Shareholders - continued
The tax-based components of distributable earnings as of period end were as follows for each Fund:
| Undistributed | Undistributed | Capital loss | Net unrealized |
Fidelity Large Cap Growth Enhanced Index Fund | $ 553,491 | $ 2,648,398 | $ - | $ 23,603,449 |
Fidelity Large Cap Value Enhanced Index Fund | 440,579 | 2,061,542 | - | 18,518,776 |
Fidelity Large Cap Core Enhanced Index Fund | 7,712,404 | 4,526,264 | (14,121,317) | 9,187,782 |
Fidelity Mid Cap Enhanced Index Fund | 209,468 | 2,656,588 | (1,162,787) | 14,231,766 |
Fidelity Small Cap Enhanced Index Fund | 72,543 | 4,249,608 | - | 20,547,881 |
Fidelity International Enhanced Index Fund | 87,595 | - | (3,391,976) | 2,114,002 |
Capital loss carryforwards are only available to offset future capital gains of the Funds to the extent provided by regulations and may be limited. Under the Regulated Investment Company Modernization Act of 2010 (the Act), the Funds are permitted to carry forward capital losses incurred in taxable years beginning after December 22, 2010 for an unlimited period and such capital losses are required to be used prior to any losses that expire. The capital loss carryforward information presented below, including any applicable limitation, is estimated as of fiscal period end and is subject to adjustment.
| Fiscal year of expiration | Total with | |||
| 2017 | 2018 | 2019 |
| |
Fidelity Large Cap Core Enhanced Index Fund | $ - | $ (13,309,569) | $ - | $ (13,309,569) | |
Fidelity Mid Cap Enhanced Index Fund | - | (654,342) | (508,445) | (1,162,787) | |
Fidelity International Enhanced Index Fund | (730,243) | (1,890,764) | (754,234) | (3,375,241) | |
| No expiration |
|
| |
| Short-term | Long-term | Total no expiration | Total capital loss |
Fidelity Large Cap Core Enhanced Index Fund | $ - | $ (811,748) | $ (811,748) | $ (14,121,317) |
Fidelity Mid Cap Enhanced Index Fund | - | - | - | (1,162,787) |
Fidelity International Enhanced Index Fund | (16,735) | - | (16,735) | (3,391,976) |
Due to large redemptions or subscriptions in a prior period, capital losses that will be available to offset future capital gains of Fidelity Large Cap Core Enhanced Index Fund, Fidelity Mid Cap Enhanced Index Fund and Fidelity International Enhanced Index Fund will be limited to approximately $2,804,338, $541,266 and $706,051 per year, respectively.
The tax character of distributions paid was as follows:
February 28, 2013 |
|
|
|
| Ordinary Income | Long-term | Total |
Fidelity Large Cap Growth Enhanced Index Fund | $ 2,493,084 | $ - | $ 2,493,084 |
Fidelity Large Cap Value Enhanced Index Fund | 1,610,247 | 1,265,614 | 2,875,861 |
Fidelity Large Cap Core Enhanced Index Fund | 4,152,614 | 1,162,732 | 5,315,346 |
Fidelity Mid Cap Enhanced Index Fund | 1,338,905 | 1,032,505 | 2,371,410 |
Fidelity Small Cap Enhanced Index Fund | 2,545,839 | 6,901,191 | 9,447,030 |
Fidelity International Enhanced Index Fund | 837,311 | - | 837,311 |
February 29, 2012 |
|
|
|
| Ordinary Income | Long-term | Total |
Fidelity Large Cap Growth Enhanced Index Fund | $ 1,003,885 | $ - | $ 1,003,885 |
Fidelity Large Cap Value Enhanced Index Fund | 1,691,757 | 2,577,862 | 4,269,619 |
Fidelity Large Cap Core Enhanced Index Fund | 2,264,397 | - | 2,264,397 |
Fidelity Mid Cap Enhanced Index Fund | 880,930 | 3,758,251 | 4,639,181 |
Fidelity Small Cap Enhanced Index Fund | 628,524 | 12,048,896 | 12,677,420 |
Fidelity International Enhanced Index Fund | 715,704 | - | 715,704 |
Short Term Trading (Redemption) Fees. Shares held by investors of Fidelity Small Cap Enhanced Index Fund less than 90 days are subject to a redemption fee equal to 1.50% of the net asset value of shares redeemed. Shares held by investors of Fidelity Mid Cap Enhanced Index Fund and Fidelity International Enhanced Index Fund less than 30 days are subject to a redemption fee equal to 0.75% and 1.00%, respectively, of the net asset
Annual Report
Notes to Financial Statements - continued
2. Significant Accounting Policies - continued
Short Term Trading (Redemption) Fees - continued
value of shares redeemed. All redemption fees, which reduce the proceeds of the shareholder redemption, are retained by the Funds and accounted for as an addition to paid in capital.
New Accounting Pronouncement. The Financial Accounting Standards Board issued in December 2011, Accounting Standard Update No. 2011-11, Disclosures about Offsetting Assets and Liabilities, and in January 2013, Accounting Standards Update No. 2013-1 Clarifying the Scope of Disclosures about Offsetting Assets and Liabilities. These updates create new disclosure requirements requiring entities to disclose both gross and net information for derivatives and other financial instruments that are either offset in the Statement of Assets and Liabilities or subject to an enforceable master netting arrangement or similar agreement. The disclosure requirements are effective for annual reporting periods beginning on or after January 1, 2013, and interim periods within those annual periods. Management is currently evaluating the impact of the update's adoption on the Funds' financial statement disclosures.
3. Derivative Instruments.
Risk Exposures and the Use of Derivative Instruments. The Funds' investment objective allows the Funds to enter into various types of derivative contracts, including futures contracts. Derivatives are investments whose value is primarily derived from underlying assets, indices or reference rates and may be transacted on an exchange or over-the-counter (OTC). Derivatives may involve a future commitment to buy or sell a specified asset based on specified terms, to exchange future cash flows at periodic intervals based on a notional principal amount, or for one party to make one or more payments upon the occurrence of specified events in exchange for periodic payments from the other party.
The Funds used derivatives to increase returns and to manage exposure to certain risks as defined below. The success of any strategy involving derivatives depends on analysis of numerous economic factors, and if the strategies for investment do not work as intended, the Funds may not achieve their objectives.
The Funds' use of derivatives increased or decreased their exposure to the following risk:
Equity Risk | Equity risk relates to the fluctuations in the value of financial instruments as a result of changes in market prices (other than those arising from interest rate risk or foreign exchange risk), whether caused by factors specific to an individual investment, its issuer, or all factors affecting all instruments traded in a market or market segment. |
The Funds are also exposed to additional risks from investing in derivatives, such as liquidity risk and counterparty credit risk. Liquidity risk is the risk that the Funds will be unable to close out the derivative in the open market in a timely manner. Counterparty credit risk is the risk that the counterparty will not be able to fulfill its obligation to the Funds. Counterparty credit risk related to exchange-traded futures contracts is mitigated by the protection provided by the exchange on which they trade.
Investing in derivatives may involve greater risks than investing in the underlying assets directly and, to varying degrees, may involve risk of loss in excess of any initial investment and collateral received and amounts recognized in the Statement of Assets and Liabilities. In addition, there may be the risk that the change in value of the derivative contract does not correspond to the change in value of the underlying instrument.
Net Realized Gain (Loss) and Change in Net Unrealized Appreciation (Depreciation) on Derivatives. The table below, which reflects the impacts of derivatives on the financial performance of the Funds, summarizes the net realized gain (loss) and change in net unrealized appreciation (depreciation) for derivatives during the period as presented in the Statement of Operations.
Primary Risk Exposure / Derivative Type | Net Realized Gain | Change in Net |
Fidelity Large Cap Growth Enhanced Index Fund |
|
|
Equity Risk |
|
|
Futures Contracts (a) | $ 348,303 | $ 19,727 |
Fidelity Large Cap Value Enhanced Index Fund |
|
|
Equity Risk |
|
|
Futures Contracts (a) | $ 160,394 | $ 44,116 |
Fidelity Large Cap Core Enhanced Index Fund |
|
|
Equity Risk |
|
|
Futures Contracts (a) | $ 224,224 | $ (240,186) |
Fidelity Mid Cap Enhanced Index Fund |
|
|
Equity Risk |
|
|
Futures Contracts (a) | $ 241,282 | $ (75,506) |
Annual Report
3. Derivative Instruments - continued
Net Realized Gain (Loss) and Change in Net Unrealized Appreciation (Depreciation) on Derivatives - continued
Primary Risk Exposure / Derivative Type | Net Realized Gain | Change in Net |
Fidelity Small Cap Enhanced Index Fund |
|
|
Equity Risk |
|
|
Futures Contracts (a) | $ 828,829 | $ 95,726 |
Fidelity International Enhanced Index Fund |
|
|
Equity Risk |
|
|
Futures Contracts (a) | $ 175,060 | $ (95,604) |
(a) A summary of the value of derivatives by primary risk exposure as of period end, is included at the end of the Schedule of Investments and is representative of activity for the period.
Futures Contracts. A futures contract is an agreement between two parties to buy or sell a specified underlying instrument for a fixed price at a specified future date. The Funds used futures contracts to manage their exposure to the stock market.
Upon entering into a futures contract, a fund is required to deposit either cash or securities (initial margin) with a clearing broker in an amount equal to a certain percentage of the face value of the contract. Futures contracts are marked-to-market daily and subsequent payments (variation margin) are made or received by a fund depending on the daily fluctuations in the value of the futures contracts and are recorded as unrealized appreciation or (depreciation). This receivable and/or payable, if any, is included in daily variation margin on futures contracts in the Statement of Assets and Liabilities. Realized gain or (loss) is recorded upon the expiration or closing of a futures contract.
Any open futures contracts at period end are presented in the Schedule of Investments under the caption "Futures Contracts." The underlying face amount at value reflects each contract's exposure to the underlying instrument or index at period end and is representative of activity for the period. Securities deposited to meet initial margin requirements are identified in the Schedule of Investments. Cash deposited to meet initial margin requirements is presented as segregated cash in the Statement of Assets and Liabilities.
4. Purchases and Sales of Investments.
Purchases and sales of securities, other than short-term securities, are noted in the table below.
| Purchases ($) | Sales ($) |
Fidelity Large Cap Growth Enhanced Index Fund | 158,134,669 | 138,352,728 |
Fidelity Large Cap Value Enhanced Index Fund | 81,349,492 | 61,112,523 |
Fidelity Large Cap Core Enhanced Index Fund | 199,159,824 | 267,109,739 |
Fidelity Mid Cap Enhanced Index Fund | 117,625,276 | 79,703,439 |
Fidelity Small Cap Enhanced Index Fund | 148,176,521 | 131,591,188 |
Fidelity International Enhanced Index Fund | 17,059,353 | 14,040,106 |
5. Fees and Other Transactions with Affiliates.
Management Fee and Expense Contract. Strategic Advisers, Inc. (Strategic Advisers), an affiliate of Fidelity Management & Research Company (FMR), provides the Funds with investment management related services. For these services, the Funds pay a monthly management fee to Strategic Advisers. The management fee is based on an annual rate of 0.30% of average net assets for Fidelity Large Cap Growth Enhanced Index, Fidelity Large Cap Value Enhanced Index and Fidelity Large Cap Core Enhanced Index, 0.45% of average net assets for Fidelity Mid Cap Enhanced Index, 0.52% of average net assets for Fidelity Small Cap Enhanced Index and 0.47% of average net assets for Fidelity International Enhanced Index. Under the management contract, Strategic Advisers pays all other ordinary fund-wide operating expenses (such as custody, audit, legal and pricing and bookkeeping fees), except the compensation of the independent Trustees and certain other expenses such as interest expense. The management fee paid to Strategic Advisers by the Funds is reduced by an amount equal to the fees and expenses paid by the Funds to the independent Trustees.
Annual Report
Notes to Financial Statements - continued
5. Fees and Other Transactions with Affiliates - continued
Management Fee and Expense Contract - continued
In addition, under the expense contract, Strategic Advisers pays other expenses such as those listed above for each of the Funds so that the total expenses do not exceed certain amounts of each Fund's average net assets with certain exceptions, as noted in the following table:
Fidelity Large Cap Growth Enhanced Index Fund | .45% |
Fidelity Large Cap Value Enhanced Index Fund | .45% |
Fidelity Large Cap Core Enhanced Index Fund | .45% |
Fidelity Mid Cap Enhanced Index Fund | .60% |
Fidelity Small Cap Enhanced Index Fund | .67% |
Fidelity International Enhanced Index Fund | .62% |
Sub-Adviser. Geode Capital Management, LLC (Geode), serves as sub-adviser for the Funds. Geode provides discretionary investment advisory services to the Funds and is paid by Strategic Advisers for providing these services.
Transfer Agent Fees. Fidelity Investments Institutional Operations Company, Inc. (FIIOC), an affiliate of FMR, is the Funds' transfer, dividend disbursing and shareholder servicing agent. FIIOC receives account fees and asset-based fees that vary according to type of account. FIIOC pays for typesetting, printing and mailing of shareholder reports, except proxy statements. Under the expense contract, each fund paid transfer agent fees at the annual rate of 0.15% of average net assets.
Interfund Lending Program. Pursuant to an Exemptive Order issued by the SEC, the Funds, along with other registered investment companies having management contracts with FMR, may participate in an interfund lending program. This program provides an alternative credit facility allowing the funds to borrow from, or lend money to, other participating affiliated funds. At period end, there were no interfund loans outstanding. Each applicable fund's activity in this program during the period for which loans were outstanding was as follows:
| Borrower or | Average Loan | Weighted | Interest Expense |
Fidelity Large Cap Core Enhanced Index Fund | Borrower | $ 5,201,000 | .42% | $ 842 |
6. Investments in Fidelity Central Funds.
The Funds invest in Fidelity Central Funds, which are open-end investment companies available only to other investment companies and accounts managed by FMR and its affiliates. The Funds' Schedules of Investments list each of the Fidelity Central Funds held as of period end, if any, as an investment of each Fund, but do not include the underlying holdings of each Fidelity Central Fund. As an Investing Fund, each Fund indirectly bears its proportionate share of the expenses of the underlying Fidelity Central Funds.
The Fidelity Securities Lending Cash Central Fund seeks preservation of capital and current income and is managed by Fidelity Investments Money Management, Inc. (FIMM), an affiliate of FMR.
A complete unaudited list of holdings for each Fidelity Central Fund is available upon request or at the Securities and Exchange Commission (the SEC) website at www.sec.gov. In addition, the financial statements of the Fidelity Central Funds, which are not covered by the Funds' Report of Independent Registered Public Accounting Firm, are available on the SEC website or upon request.
7. Committed Line of Credit.
Certain Funds participate with other funds managed by FMR or an affiliate in a $4.25 billion credit facility (the "line of credit") to be utilized for temporary or emergency purposes to fund shareholder redemptions or for other short-term liquidity purposes. The participating funds have agreed to pay commitment fees on their pro-rata portion of the line of credit, which are reflected in Miscellaneous expenses on the Statement of Operations, and are as follows:
Fidelity Large Cap Growth Enhanced Index Fund | $ 402 |
Fidelity Large Cap Value Enhanced Index Fund | 206 |
Fidelity Large Cap Core Enhanced Index Fund | 639 |
Fidelity Mid Cap Enhanced Index Fund | 203 |
Fidelity Small Cap Enhanced Index Fund | 324 |
Fidelity International Enhanced Index Fund | 66 |
During the period, there were no borrowings on this line of credit.
Annual Report
8. Security Lending.
Certain Funds lend portfolio securities through a lending agent from time to time in order to earn additional income. On the settlement date of the loan, each applicable Fund receives collateral (in the form of U.S. Treasury obligations, letters of credit and/or cash) against the loaned securities and maintains collateral in an amount not less than 100% of the market value of the loaned securities during the period of the loan. The market value of the loaned securities is determined at the close of business of the Funds and any additional required collateral is delivered to the Funds on the next business day. If the borrower defaults on its obligation to return the securities loaned because of insolvency or other reasons, a fund could experience delays and costs in recovering the securities loaned or in gaining access to the collateral. Any cash collateral received is invested in the Fidelity Securities Lending Cash Central Fund. The value of loaned securities and cash collateral at period end are disclosed on each applicable Fund's Statement of Assets and Liabilities. Security lending income represents the income earned on investing cash collateral, less rebates paid to borrowers and any lending agent fees associated with the loan, plus any premium payments received for lending certain types of securities. Security lending income is presented on each applicable Fund's Statement of Operations as a component of income from Fidelity Central Funds.
9. Expense Reductions.
Through arrangements with each applicable Fund's custodian, credits realized as a result of uninvested cash balances were used to reduce each applicable Fund's expenses. All of the applicable expense reductions are noted in the table below.
| Expense |
Fidelity Large Cap Growth Enhanced Index Fund | $ 33 |
Fidelity Large Cap Core Enhanced Index Fund | 2 |
Fidelity Mid Cap Enhanced Index Fund | 3 |
Fidelity Small Cap Enhanced Index Fund | 5 |
10. Other.
The Funds' organizational documents provide former and current trustees and officers with a limited indemnification against liabilities arising in connection with the performance of their duties to the Funds. In the normal course of business, the Funds may also enter into contracts that provide general indemnifications. The Funds' maximum exposure under these arrangements is unknown as this would be dependent on future claims that may be made against the Funds. The risk of material loss from such claims is considered remote.
At the end of the period, Strategic Advisers U.S. Opportunity Fund and Strategic Advisers U.S. Opportunity II Fund were the owners of record of approximately 35% and 11% of the total outstanding shares of the Fidelity Large Cap Core Enhanced Index Fund, respectively. Mutual funds managed by FMR or its affiliates were the owners of record, in the aggregate, of approximately 46% of the total outstanding shares of Fidelity Large Cap Core Enhanced Index Fund.
Annual Report
Report of Independent Registered Public Accounting Firm
To the Trustees of Fidelity Commonwealth Trust II and the Shareholders of Fidelity Large Cap Growth Enhanced Index Fund, Fidelity Large Cap Value Enhanced Index Fund, Fidelity Large Cap Core Enhanced Index Fund, Fidelity Mid Cap Enhanced Index Fund, Fidelity Small Cap Enhanced Index Fund and Fidelity International Enhanced Index Fund:
In our opinion, the accompanying statements of assets and liabilities, including the schedules of investments, and the related statements of operations and of changes in net assets and the financial highlights present fairly, in all material respects, the financial positions of Fidelity Large Cap Growth Enhanced Index Fund, Fidelity Large Cap Value Enhanced Index Fund, Fidelity Large Cap Core Enhanced Index Fund, Fidelity Mid Cap Enhanced Index Fund, Fidelity Small Cap Enhanced Index Fund and Fidelity International Enhanced Index Fund (funds of Fidelity Commonwealth Trust II) at February 28, 2013, the results of each of their operations for the year then ended, the changes in each of their net assets for each of the two years in the period then ended and their financial highlights for each of the five years in the period then ended, in conformity with accounting principles generally accepted in the United States of America. These financial statements and financial highlights (hereafter referred to as "financial statements") are the responsibility of the Fidelity Commonwealth Trust II's management. Our responsibility is to express an opinion on these financial statements based on our audits. We conducted our audits of these financial statements in accordance with the standards of the Public Company Accounting Oversight Board (United States). Those standards require that we plan and perform the audit to obtain reasonable assurance about whether the financial statements are free of material misstatement. An audit includes examining, on a test basis, evidence supporting the amounts and disclosures in the financial statements, assessing the accounting principles used and significant estimates made by management, and evaluating the overall financial statement presentation. We believe that our audits, which included confirmation of securities at February 28, 2013 by correspondence with the custodian and brokers, provide a reasonable basis for our opinion.
PricewaterhouseCoopers LLP
Boston, Massachusetts
April 23, 2013
Annual Report
Trustees and Officers
The Trustees, Members of the Advisory Board, and executive officers of the trust and funds, as applicable, are listed below. The Board of Trustees governs each fund and is responsible for protecting the interests of shareholders. The Trustees are experienced executives who meet periodically throughout the year to oversee each fund's activities, review contractual arrangements with companies that provide services to each fund, oversee management of the risks associated with such activities and contractual arrangements, and review each fund's performance. Each of the Trustees oversees 26 funds advised by Strategic Advisers or an affiliate.
The Trustees hold office without limit in time except that (a) any Trustee may resign; (b) any Trustee may be removed by written instrument, signed by at least two-thirds of the number of Trustees prior to such removal; (c) any Trustee who requests to be retired or who has become incapacitated by illness or injury may be retired by written instrument signed by a majority of the other Trustees; and (d) any Trustee may be removed at any special meeting of shareholders by a two-thirds vote of the outstanding voting securities of the trust. The executive officers and Advisory Board Members hold office without limit in time, except that any officer and Advisory Board Member may resign or may be removed by a vote of a majority of the Trustees at any regular meeting or any special meeting of the Trustees. Except as indicated, each individual has held the office shown or other offices in the same company for the past five years.
Experience, Skills, Attributes, and Qualifications of the Funds' Trustees. The Governance and Nominating Committee has adopted a statement of policy that describes the experience, qualifications, attributes, and skills that are necessary and desirable for potential Independent Trustee candidates (Statement of Policy). The Board believes that each Trustee satisfied at the time he or she was initially elected or appointed a Trustee, and continues to satisfy, the standards contemplated by the Statement of Policy. The Governance and Nominating Committee may also engage professional search firms to help identify potential Independent Trustee candidates with experience, qualifications, attributes, and skills consistent with the Statement of Policy. Additional criteria based on the composition and skills of the current Independent Trustees, as well as experience or skills that may be appropriate in light of future changes to board composition, business conditions, and regulatory or other developments, may be considered by the professional search firms and the Governance and Nominating Committee. In addition, the Board takes into account the Trustees' commitment and participation in Board and committee meetings, as well as their leadership of standing and ad hoc committees throughout their tenure.
In determining that a particular Trustee was and continues to be qualified to serve as a Trustee, the Board has considered a variety of criteria, none of which, in isolation, was controlling. The Board believes that, collectively, the Trustees have balanced and diverse experience, qualifications, attributes, and skills, which allow the Board to operate effectively in governing each fund and protecting the interests of shareholders. Information about the specific experience, skills, attributes, and qualifications of each Trustee, which in each case led to the Board's conclusion that the Trustee should serve (or continue to serve) as a trustee of the funds, is provided below.
Board Structure and Oversight Function. Roger T. Servison is an interested person (as defined in the 1940 Act) and currently serves as Chairman. The Trustees have determined that an interested Chairman is appropriate and benefits shareholders because an interested Chairman has a personal and professional stake in the quality and continuity of services provided to the funds. Independent Trustees exercise their informed business judgment to appoint an individual of their choosing to serve as Chairman, regardless of whether the Trustee happens to be independent or a member of management. The Independent Trustees have determined that they can act independently and effectively without having an Independent Trustee serve as Chairman and that a key structural component for assuring that they are in a position to do so is for the Independent Trustees to constitute a substantial majority for the Board. The Independent Trustees also regularly meet in executive session. Ralph F. Cox serves as the lead Independent Trustee and as such (i) acts as a liaison between the Independent Trustees and management with respect to matters important to the Independent Trustees and (ii) with management prepares agendas for Board meetings.
Fidelity funds are overseen by different Boards of Trustees. The funds' Board oversees asset allocation funds as well as the Fidelity enhanced index funds. Other boards oversee Fidelity's investment-grade bond, money market, and asset allocation funds and Fidelity's equity and high income funds. The funds may invest in Fidelity funds overseen by such other Boards. The use of separate Boards, each with its own committee structure, allows the Trustees of each group of Fidelity funds to focus on the unique issues of the funds they oversee, including common research, investment, and operational issues.
The Trustees primarily operate as a full Board, but also operate in committees, to facilitate the timely and efficient consideration of all matters of importance to the Trustees, each fund, and fund shareholders and to facilitate compliance with legal and regulatory requirements and oversight of the funds' activities and associated risks. The Board has charged Strategic Advisers and its affiliates with (i) identifying events or circumstances the occurrence of which could have demonstrably adverse effects on the funds' business and/or reputation; (ii) implementing processes and controls to lessen the possibility that such events or circumstances occur or to mitigate the effects of such events or circumstances if they do occur; and (iii) creating and maintaining a system designed to evaluate continuously business and market conditions in order to facilitate the identification and implementation processes described in (i) and (ii) above. Because the day-to-day operations and activities of the funds are carried out by or through Strategic Advisers, its affiliates and other service providers, the funds' exposure to risks is mitigated but not eliminated by the processes overseen by the Trustees. Board oversight of different aspects of the funds' activities is exercised primarily through the full Board, but also through the Audit and Compliance Committee. Appropriate personnel, including but not limited to the funds' Chief Compliance Officer (CCO), FMR's internal auditor, the independent accountants, the funds' Treasurer and portfolio management personnel, make periodic reports to the Board's committees, as appropriate. The responsibilities of each committee, including their oversight responsibilities, are described further under "Standing Committees of the Funds' Trustees."
Annual Report
The funds' Statement of Additional Information (SAI) includes more information about the Trustees. To request a free copy, call Fidelity at 1-800-544-8544.
Interested Trustees*:
Correspondence intended for each Trustee who is an interested person may be sent to Fidelity Investments, 245 Summer Street, Boston, Massachusetts 02210.
Name, Year of Birth; Principal Occupations and Other Relevant Experience+ | |
Roger T. Servison (1945) | |
| Year of Election or Appointment: 2006 Mr. Servison is Chairman of the Board of Trustees. Mr. Servison serves as President of Strategic New Business Development for Fidelity Investments and serves as a Director of Strategic Advisers. Previously, Mr. Servison oversaw Fidelity Investments Life Insurance Company (2005-2006) and Strategic Advisers (2005-2007). Mr. Servison also served as President and a Director of Fidelity Brokerage Services (Japan), LLC (1994-2004). |
Derek L. Young (1964) | |
| Year of Election or Appointment: 2012 Mr. Young is Vice President of Fidelity's Asset Allocation Funds (2009-present), President and a Director of Strategic Advisers, Inc. (2011-present), President of Fidelity Global Asset Allocation (GAA) (2011-present), and Vice Chairman of Pyramis Global Advisors, LLC (2011-present). Previously, Mr. Young served as Chief Investment Officer of GAA (2009-2011) and as a portfolio manager. |
* Trustees have been determined to be "Interested Trustees" by virtue of, among other things, their affiliation with the trust or various entities under common control with Strategic Advisers.
+ The information above includes each Trustee's principal occupation during the last five years and other information relating to the experience, attributes, and skills relevant to each Trustee's qualifications to serve as a Trustee, which led to the conclusion that each Trustee should serve as a Trustee for each fund.
Independent Trustees:
Correspondence intended for each Independent Trustee (that is, the Trustees other than the Interested Trustees) may be sent to Fidelity Investments, P.O. Box 55235, Boston, Massachusetts 02205-5235.
Name, Year of Birth; Principal Occupations and Other Relevant Experience+ | |
Peter C. Aldrich (1944) | |
| Year of Election or Appointment: 2006 Mr. Aldrich is a Director of the National Bureau of Economic Research and a Director of the funds of BlackRock Realty Group (2006-present). Previously, Mr. Aldrich served as a Trustee for the Fidelity Rutland Square Trust (2005-2010), a Managing Member of Poseidon, LLC (foreign private investment, 1998-2004), and Chairman and Managing Member of AEGIS, LLC (foreign private investment, 1997-2004). Mr. Aldrich also served as Faculty Chairman of The Research Council on Global Investment of The Conference Board (business and professional education non-profit, 1999-2004). Mr. Aldrich is a Member of the Boards of Trustees of the Museum of Fine Arts Boston and Massachusetts Eye and Ear Infirmary and an Overseer of the Longy School of Music. |
Amy Butte Liebowitz (1968) | |
| Year of Election or Appointment: 2011 Ms. Butte Liebowitz was the founder and Chief Executive Officer of TILE Financial (financial internet service, 2008-2012). Previously, Ms. Butte Liebowitz served as the Chief Financial Officer and member of the Board of Directors of MF Global (broker-dealer, 2006-2008), and Chief Financial Officer and Executive Vice President of the New York Stock Exchange (2004-2006). Ms. Butte Liebowitz is a member of the Boards of Directors of Accion International and the New York Women's Forum, as well as an alumna of the World Economic Forum's Young Global Leader program. |
Ralph F. Cox (1932) | |
| Year of Election or Appointment: 2006 Mr. Cox is President of RABAR Enterprises (management consulting for the petroleum industry). Mr. Cox is a Director of Abraxas Petroleum (exploration and production). Mr. Cox is a member of the Advisory Boards of the Business and Engineering Schools of Texas A&M University and the Engineering School of University of Texas at Austin. Previously, Mr. Cox served as a Trustee for the Fidelity Rutland Square Trust (2005-2010) and as an Advisory Director of CH2M Hill Companies (engineering, 1981-2011). Mr. Ralph F. Cox and Mr. Howard E. Cox, Jr. are not related. |
Karen Kaplan (1960) | |
| Year of Election or Appointment: 2006 Ms. Kaplan is President of Hill Holliday (advertising and specialized marketing, 2007-present). Ms. Kaplan is a Director of DSM (dba Delta Dental and DentaQuest) (2004-present), Director of Vera Bradley (2012-present), Member of the Board of Governors of the Chief Executives' Club of Boston (2010-present), Member of the Board of Directors of the Massachusetts Conference for Women (2008-present), Chairman of the Executive Committee of the Greater Boston Chamber of Commerce (2006-present), Board of Directors of Jobs for Massachusetts (2012-present), National Association of Corporate Directors Chapter (2012-present), and Board of Directors of the Post Office Square Trust (2012-present). She is also a member of the Clinton Global Initiative, an action oriented community of the most effective CEOs, heads of state, Nobel Prize winners, and non-governmental leaders in the world. Previously, Ms. Kaplan served as an Advisory Board Member of Fidelity Rutland Square Trust (2006-2010), President of the Massachusetts Women's Forum (2008-2010), Treasurer of the Massachusetts Women's Forum (2002-2006), Vice Chair of the Board of the Massachusetts Society for the Prevention of Cruelty to Children (2003-2010), Director of United Way of Massachusetts Bay (2004-2006), Director of ADVO (direct mail marketing, 2003-2007), and Director of Tweeter Home Entertainment Group (2006-2007). |
+ The information above includes each Trustee's principal occupation during the last five years and other information relating to the experience, attributes, and skills relevant to each Trustee's qualifications to serve as a Trustee, which led to the conclusion that each Trustee should serve as a Trustee for each fund.
Advisory Board Members and Executive Officers:
Correspondence intended for Mary C. Farrell may be sent to Fidelity Investments, P.O. Box 55235, Boston, Massachusetts 02205-5235. Correspondence intended for each executive officer and Howard E. Cox, Jr. may be sent to Fidelity Investments, 245 Summer Street, Boston, Massachusetts 02210.
Name, Year of Birth; Principal Occupation | |
Howard E. Cox, Jr. (1944) | |
| Year of Election or Appointment: 2009 Member of the Advisory Board of Fidelity Commonwealth Trust II. Mr. Cox is a Member of the Advisory Board of Devonshire Investors (2009-present). Mr. Cox serves as an Advisory Partner of Greylock (venture capital) and a Director of Stryker Corporation (medical products and services). Previously, Mr. Cox served as an Advisory Board Member of Fidelity Rutland Square Trust (2006-2010) and a Member of the Secretary of Defense's Business Board of Directors (2008-2010). Mr. Howard E. Cox, Jr. and Mr. Ralph F. Cox are not related. |
Mary C. Farrell (1949) | |
| Year of Election or Appointment: 2013 Member of the Advisory Board of Fidelity Commonwealth Trust II. Ms. Farrell is a Director of the W.R. Berkley Corporation (insurance provider) and President (2009-present) and Director (2006-present) of the Howard Gilman Foundation (charitable organization). Previously, Ms. Farrell was Managing Director and Chief Investment Strategist at UBS Wealth Management USA and Co-Head of UBS Wealth Management Investment Strategy & Research Group (2003-2005). Ms. Farrell also served as Investment Strategist at PaineWebber (1982-2000) and UBS PaineWebber (2000-2002). Ms. Farrell also serves as Trustee on the Board of Overseers of the New York University Stern School of Business, the Board of Trustees of Yale-New Haven Hospital and the Board of Trustees of Fidelity Rutland Square Trust II. |
Kenneth B. Robins (1969) | |
| Year of Election or Appointment: 2010 President and Treasurer of each fund. Mr. Robins also serves as President and Treasurer of other Fidelity Equity and High Income Funds (2008-present) and Assistant Treasurer of other Fidelity Fixed Income and Asset Allocation Funds (2009-present). Mr. Robins is an employee of Fidelity Investments (2004-present). Previously, Mr. Robins served as Deputy Treasurer of the Fidelity funds (2005-2008) and Treasurer and Chief Financial Officer of The North Carolina Capital Management Trust: Cash and Term Portfolios (2006-2008). |
Marc Bryant (1966) | |
| Year of Election or Appointment: 2010 Secretary and Chief Legal Officer of each fund. Senior Vice President and Deputy General Counsel of Fidelity Investments. Prior to joining Fidelity Investments, Mr. Bryant served as a Senior Vice President and the Head of Global Retail Legal for AllianceBernstein L.P. (2006-2010), and as the General Counsel for ProFund Advisors LLC (2001-2006). |
Elizabeth Paige Baumann (1968) | |
| Year of Election or Appointment: 2012 Anti-Money Laundering (AML) Officer of each fund. Ms. Baumann also serves as AML Officer of the Fidelity funds (2012-present) and The North Carolina Capital Management Trust: Cash and Term Portfolios (2012-present), Chief AML Officer of FMR LLC (2012-present), and is an employee of Fidelity Investments. Previously, Ms. Baumann served as Vice President and Deputy Anti-Money Laundering Officer (2007-2012). |
Nicholas E. Steck (1964) | |
| Year of Election or Appointment: 2009 Chief Financial Officer of each fund. Mr. Steck serves as Senior Vice President of Fidelity Pricing and Cash Management Services (2008-present) and is an employee of Fidelity Investments. During the period 2002 to 2009, Mr. Steck served as a Compliance Officer of FMR, Fidelity Investments Money Management, Inc., FMR LLC, Fidelity Research & Analysis (U.K.) Inc., Fidelity Management & Research (Hong Kong) Limited, and Fidelity Management & Research (Japan) Inc. |
Laura M. Doherty (1969) | |
| Year of Election or Appointment: 2009 Chief Compliance Officer of each fund. Ms. Doherty also serves as Senior Vice President of the Office of the Chief Compliance Officer (2008-present). Previously, Ms. Doherty served as a Vice President in Fidelity's Corporate Audit department (1998-2008). |
Adrien E. Deberghes (1967) | |
| Year of Election or Appointment: 2011 Vice President and Assistant Treasurer of each fund. Mr. Deberghes also serves as Assistant Treasurer (2010-present) and Deputy Treasurer (2008-present) of other Fidelity funds and is an employee of Fidelity Investments (2008-present). Previously, Mr. Deberghes served as Senior Vice President of Mutual Fund Administration at State Street Corporation (2007-2008), Senior Director of Mutual Fund Administration at Investors Bank & Trust (2005-2007), and Director of Finance for Dunkin' Brands (2000-2005). |
Stephanie J. Dorsey (1969) | |
| Year of Election or Appointment: 2012 Assistant Treasurer of each fund. Ms. Dorsey also serves as President and Treasurer (2013-present) and Assistant Treasurer (2010-present) of other Fidelity funds and is an employee of Fidelity Investments (2008-present). Previously, Ms. Dorsey served as Deputy Treasurer of the Fidelity funds (2008-2013), Treasurer (2004-2008) of the JPMorgan Mutual Funds and Vice President (2004-2008) of JPMorgan Chase Bank. |
Jonathan Davis (1968) | |
| Year of Election or Appointment: 2010 Assistant Treasurer of each fund. Mr. Davis is also Assistant Treasurer of certain Fidelity funds. Mr. Davis is an employee of Fidelity Investments. Previously, Mr. Davis served as Vice President and Associate General Counsel of FMR LLC (2003-2010). |
Margaret A. Carey (1973) | |
| Year of Election or Appointment: 2009 Assistant Secretary of each fund. Ms. Carey also serves as Assistant Secretary of The North Carolina Capital Management Trust: Cash and Term Portfolios (2008-present), Vice President, Associate General Counsel (2007-present), and is an employee of Fidelity Investments (2004-present). |
Annual Report
Distributions (Unaudited)
The Board of Trustees of each fund voted to pay to shareholders of record at the opening of business on record date, the following distributions per share derived from capital gains realized from sales of portfolio securities and dividends derived from net investment income:
| Pay Date | Record Date | Dividends | Capital Gains |
Fidelity Large Cap Growth Enhanced Index Fund | 04/15/13 | 04/12/13 | $0.039 | $0.186 |
Fidelity Large Cap Value Enhanced Index Fund | 04/15/13 | 04/12/13 | $0.035 | $0.163 |
Fidelity Large Cap Core Enhanced Index Fund | 04/15/13 | 04/12/13 | $0.041 | $0.587 |
Fidelity Mid Cap Enhanced Index Fund | 04/15/13 | 04/12/13 | $0.014 | $0.170 |
Fidelity Small Cap Enhanced Index Fund | 04/15/13 | 04/12/13 | $0.005 | $0.254 |
Fidelity International Enhanced Index Fund | 04/15/13 | 04/12/13 | $0.017 | $0.005 |
The funds hereby designate as capital gain dividend the amounts noted below for the taxable year ended February 28, 2013, or, if subsequently determined to be different, the net capital gain of such year.
Fidelity Large Cap Growth Enhanced Index Fund | $3,148,651 |
Fidelity Large Cap Value Enhanced Index Fund | $2,749,874 |
Fidelity Large Cap Core Enhanced Index Fund | $5,688,997 |
Fidelity Mid Cap Enhanced Index Fund | $2,782,280 |
Fidelity Small Cap Enhanced Index Fund | $10,435,241 |
A percentage of the dividends distributed during the fiscal year for the following funds qualify for the dividends-received deduction for corporate shareholders:
| April 2012 | December 2012 |
Fidelity Large Cap Growth Enhanced Index Fund | 100% | 100% |
Fidelity Large Cap Value Enhanced Index Fund | 100% | 100% |
Fidelity Large Cap Core Enhanced Index Fund | 0% | 100% |
Fidelity Mid Cap Enhanced Index Fund | 100% | 100% |
Fidelity Small Cap Enhanced Index Fund | 100% | 98% |
A percentage of the dividends distributed during the fiscal year for the following funds may be taken into account as a dividend for purposes of the maximum rate under section 1(h)(11) of the Internal Revenue Code.
| April 2012 | December 2012 |
Fidelity Large Cap Growth Enhanced Index Fund | 100% | 100% |
Fidelity Large Cap Value Enhanced Index Fund | 100% | 100% |
Fidelity Large Cap Core Enhanced Index Fund | 0% | 100% |
Fidelity Mid Cap Enhanced Index Fund | 100% | 100% |
Fidelity Small Cap Enhanced Index Fund | 100% | 100% |
Fidelity International Enhanced Index Fund | 100% | 100% |
The amounts per share which represent income derived from sources within, and taxes paid to, foreign countries or possession of the United States are as follows:
| Pay Date | Income | Taxes |
Fidelity International Enhanced Index Fund | 04/16/2012 | $0.0160 | $0.0015 |
Fidelity International Enhanced Index Fund | 12/17/2012 | $0.1000 | $0.0172 |
The funds will notify shareholders in January 2014 of amounts for use in preparing 2013 income tax returns.
Annual Report
Board Approval of Investment Advisory Contracts and Management Fees
Fidelity Large Cap Core Enhanced Index Fund, Fidelity Large Cap Growth Enhanced Index Fund, Fidelity Large Cap Value Enhanced Index Fund, Fidelity Mid Cap Enhanced Index Fund, Fidelity Small Cap Enhanced Index Fund, and Fidelity International Enhanced Index Fund
Each year the Board of Trustees, including the Independent Trustees (together, the Board), votes at an in-person meeting on the renewal of the management contract with Strategic Advisers, Inc. (Strategic Advisers) and the sub-advisory agreements with Geode Capital Management, LLC (Geode) (the Sub-Advisory Agreements and, together with the management contract, the Advisory Contracts) for each fund. The Board, assisted by the advice of fund counsel and Independent Trustees' counsel, requests and considers a broad range of information relevant to the renewal of the Advisory Contracts throughout the year.
The Board meets at least four times per year and, at each of its meetings, considers factors that are relevant to its annual consideration of the renewal of each fund's Advisory Contracts, including the services and support provided to each fund and its shareholders. The Board has established standing committees, each composed of Independent Trustees with varying backgrounds, to which the Board has assigned specific subject matter responsibilities in order to enhance effective decision-making by the Board. While the full Board or the Independent Trustees, as appropriate, act on all major matters, a portion of the activities of the Board (including certain of those described herein) may be conducted through these committees.
At its September 2012 meeting, the Board of Trustees, including the Independent Trustees, unanimously determined to renew each fund's Advisory Contracts. In reaching its determination, the Board considered all factors it believed relevant, including, (i) the nature, extent, and quality of the services to be provided to each fund and its shareholders (including the investment performance of each fund); (ii) the competitiveness of each fund's management fee and total expenses relative to peer funds; (iii) the total costs of the services to be provided by and the profits, if any, to be realized by Strategic Advisers from its relationship with the funds; (iv) the extent to which economies of scale exist and would be realized as each fund grows; and (v) whether fee levels reflect these economies of scale, if any, for the benefit of each fund's shareholders.
In considering whether to renew the Advisory Contracts for each fund, the Board reached a determination, with the assistance of fund counsel and Independent Trustees' counsel and through the exercise of its business judgment, that the renewal of the Advisory Contracts is in the best interests of each fund and its shareholders. In addition, with respect to the Sub-Advisory Agreements, the Board also concluded that the renewal of such agreements does not involve a conflict of interest from which Strategic Advisers or its affiliates derive an inappropriate advantage. Also, the Board found that the advisory fees to be charged under the Advisory Contracts bear a reasonable relationship to the services rendered and are based on services provided that are in addition to, rather than duplicative of, services provided under the advisory contract of any underlying fund in which each fund may invest. The Board's decision to renew the Advisory Contracts was not based on any single factor, but rather was based on a comprehensive consideration of all the information provided to the Board throughout the year.
Nature, Extent, and Quality of Services Provided. The Board considered the staffing within the investment adviser, Strategic Advisers, and the sub-adviser, Geode (collectively, the Investment Advisers), including the backgrounds of each fund's investment personnel and each fund's investment objective, strategies and related investment philosophy. The Independent Trustees also had discussions with senior management of Strategic Advisers' investment operations and investment groups. The Board considered the structure of each Investment Adviser's portfolio manager compensation program and whether such structures provide appropriate incentives to act in the best interests of each fund.
Resources Dedicated to Investment Management and Support Services. The Board reviewed the general qualifications and capabilities of the Investment Advisers' investment staff, their use of technology, and the Investment Advisers' approach to recruiting, managing and compensating investment personnel. The Board noted that the Investment Advisers' analysts have extensive resources, tools, and capabilities that allow them to conduct sophisticated quantitative and fundamental analysis. Additionally, in its deliberations, the Board considered the Investment Advisers' trading capabilities and resources, which are an integral part of the investment management process.
Shareholder and Administrative Services. The Board considered (i) the nature, extent, quality, and cost of advisory, administrative, and shareholder services performed by the Investment Advisers and their affiliates under the Advisory Contracts and under separate agreements covering transfer agency and pricing and bookkeeping, and securities lending services for each fund; (ii) the nature and extent of Strategic Advisers' supervision of third party service providers, including the sub-adviser, custodians and subcustodians; and (iii) the resources devoted to, and the record of compliance with, each fund's compliance policies and procedures.
Investment Performance. The Board considered whether each fund has operated in accordance with its investment objective, as well as its record of compliance with its investment restrictions. It also reviewed each fund's absolute investment performance, as well as each fund's relative investment performance over multiple periods measured against (i) a broad-based securities market index, and (ii) a peer group of mutual funds deemed appropriate by Strategic Advisers and reviewed by the Board. Because each fund had been in existence less than five years, the following charts considered by the Board show for each fund, over the one- and three-year periods ended December 31, 2011, the cumulative total returns of each fund, the cumulative total returns of a broad-based securities market index ("benchmark"), and a range of cumulative total returns of a peer group of mutual funds identified by Lipper Inc. as having an investment style similar to the respective fund based on underlying portfolio holdings. The box within each chart shows the 25th percentile return (top of box) and the 75th percentile return (bottom of box) of the peer group. Returns shown above the box are in the first quartile and returns shown below the box are in the fourth quartile. The percentage beaten numbers noted below each chart correspond to the percentile box and represent the percentage of funds in the peer group whose performance was equal to or lower than that of each fund.
Annual Report
Board Approval of Investment Advisory Contracts and Management Fees - continued
Fidelity International Enhanced Index Fund
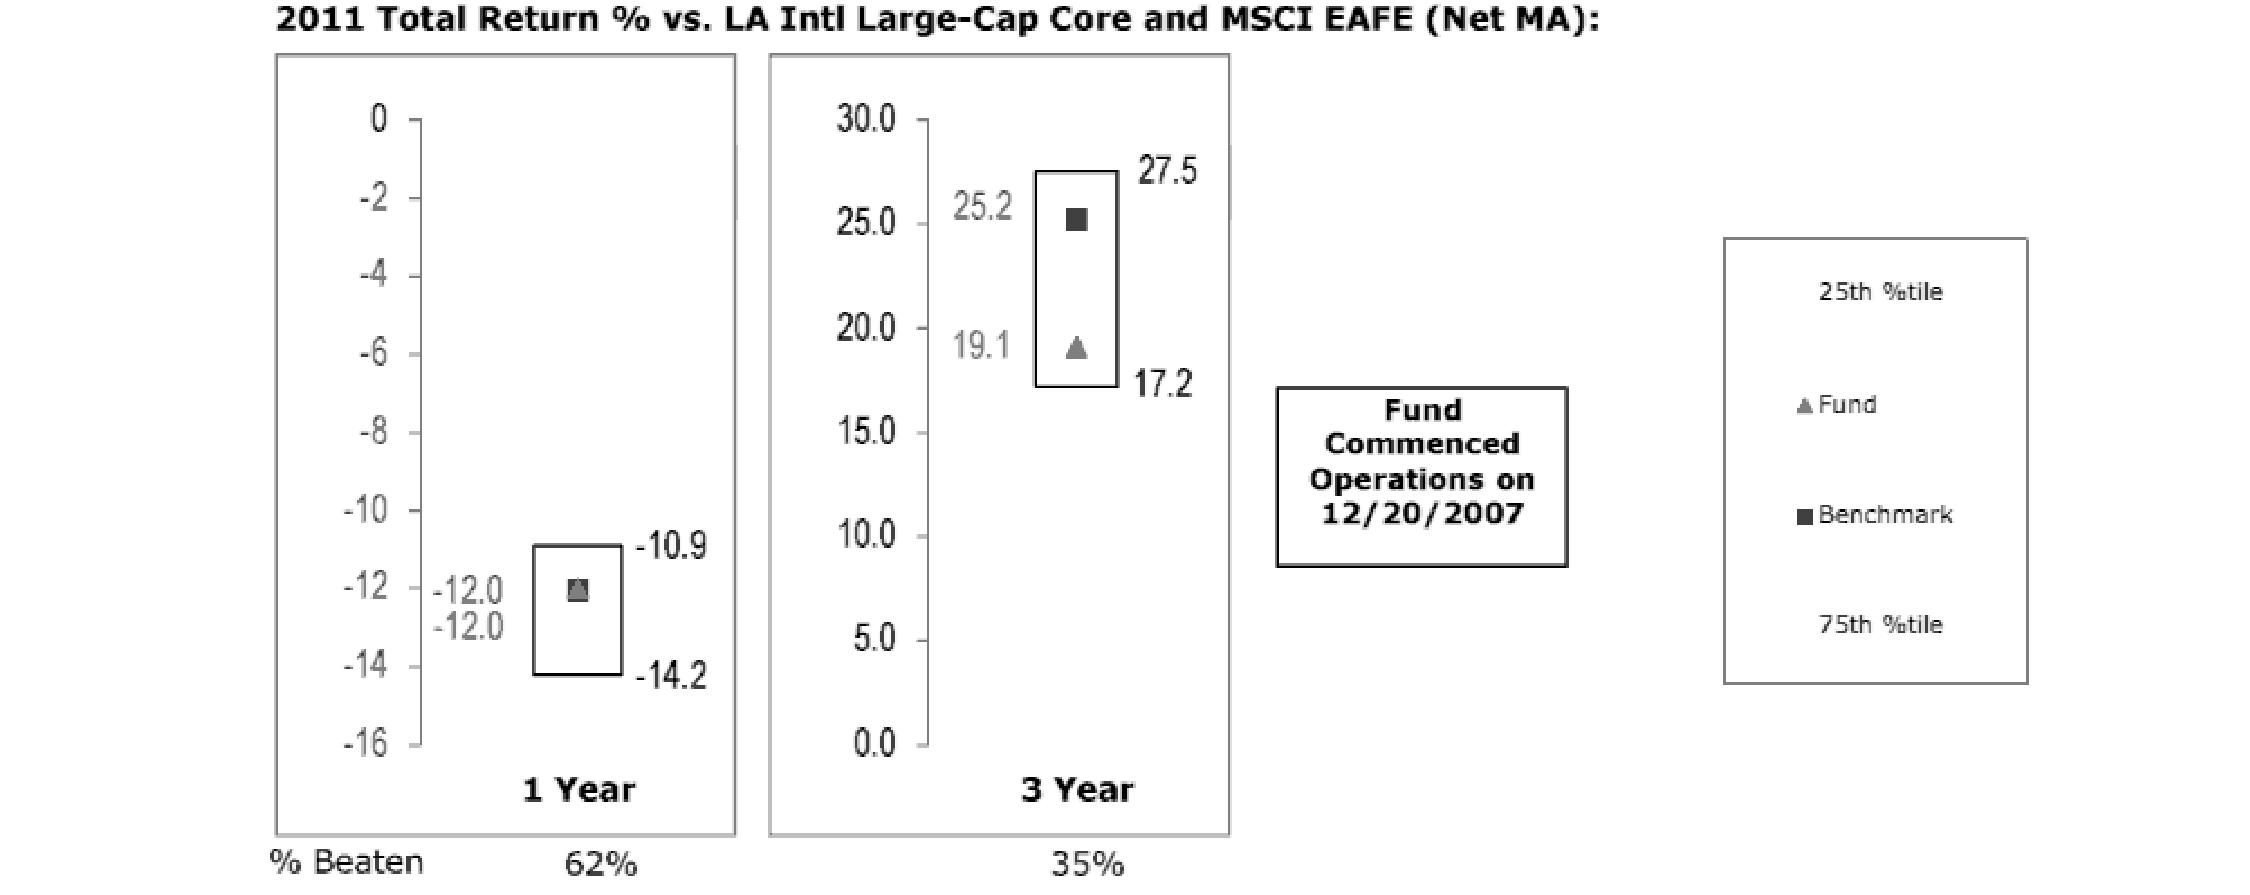
The Board reviewed the fund's relative investment performance against its peer group and noted that the performance of the fund was in the second quartile for the one-year period and in the third quartile for the three-year period and that the fund had out-performed 62% and under-performed 65% of its peers for the one- and three-year periods, respectively, ended December 31, 2011. The Board also noted that the investment performance of the fund was equal to its benchmark for the one-year period and lower than its benchmark for the three-year period shown.
Fidelity Large Cap Core Enhanced Index Fund

The Board reviewed the fund's relative investment performance against its peer group and noted that the performance of the fund was in the first quartile for the one-year period and in the second quartile for the three-year period and that the fund had out-performed 90% and 56% of its peers for the one- and three-year periods, respectively, ended December 31, 2011. The Board also noted that the investment performance of the fund was higher than its benchmark for the one-year period and lower than its benchmark for the three-year period shown.
Annual Report
Fidelity Large Cap Growth Enhanced Index Fund

The Board reviewed the fund's relative investment performance against its peer group and noted that the performance of the fund was in the first quartile for the one-year period and in the second quartile for the three-year period and that the fund had out-performed 95% and 53% of its peers for the one- and three-year periods, respectively, ended December 31, 2011. The Board also noted that the investment performance of the fund was higher than its benchmark for the one-year period and lower than its benchmark for the three-year period shown.
Fidelity Large Cap Value Enhanced Index Fund

The Board reviewed the fund's relative investment performance against its peer group and noted that the performance of the fund was in the first quartile for the one-year period and in the third quartile for the three-year period and that the fund had out-performed 90% and under-performed 64% of its peers for the one- and three-year periods, respectively, ended December 31, 2011. The Board also noted that the investment performance of the fund was higher than its benchmark for the one-year period and lower than its benchmark for the three-year period shown.
Annual Report
Board Approval of Investment Advisory Contracts and Management Fees - continued
Fidelity Mid Cap Enhanced Index Fund
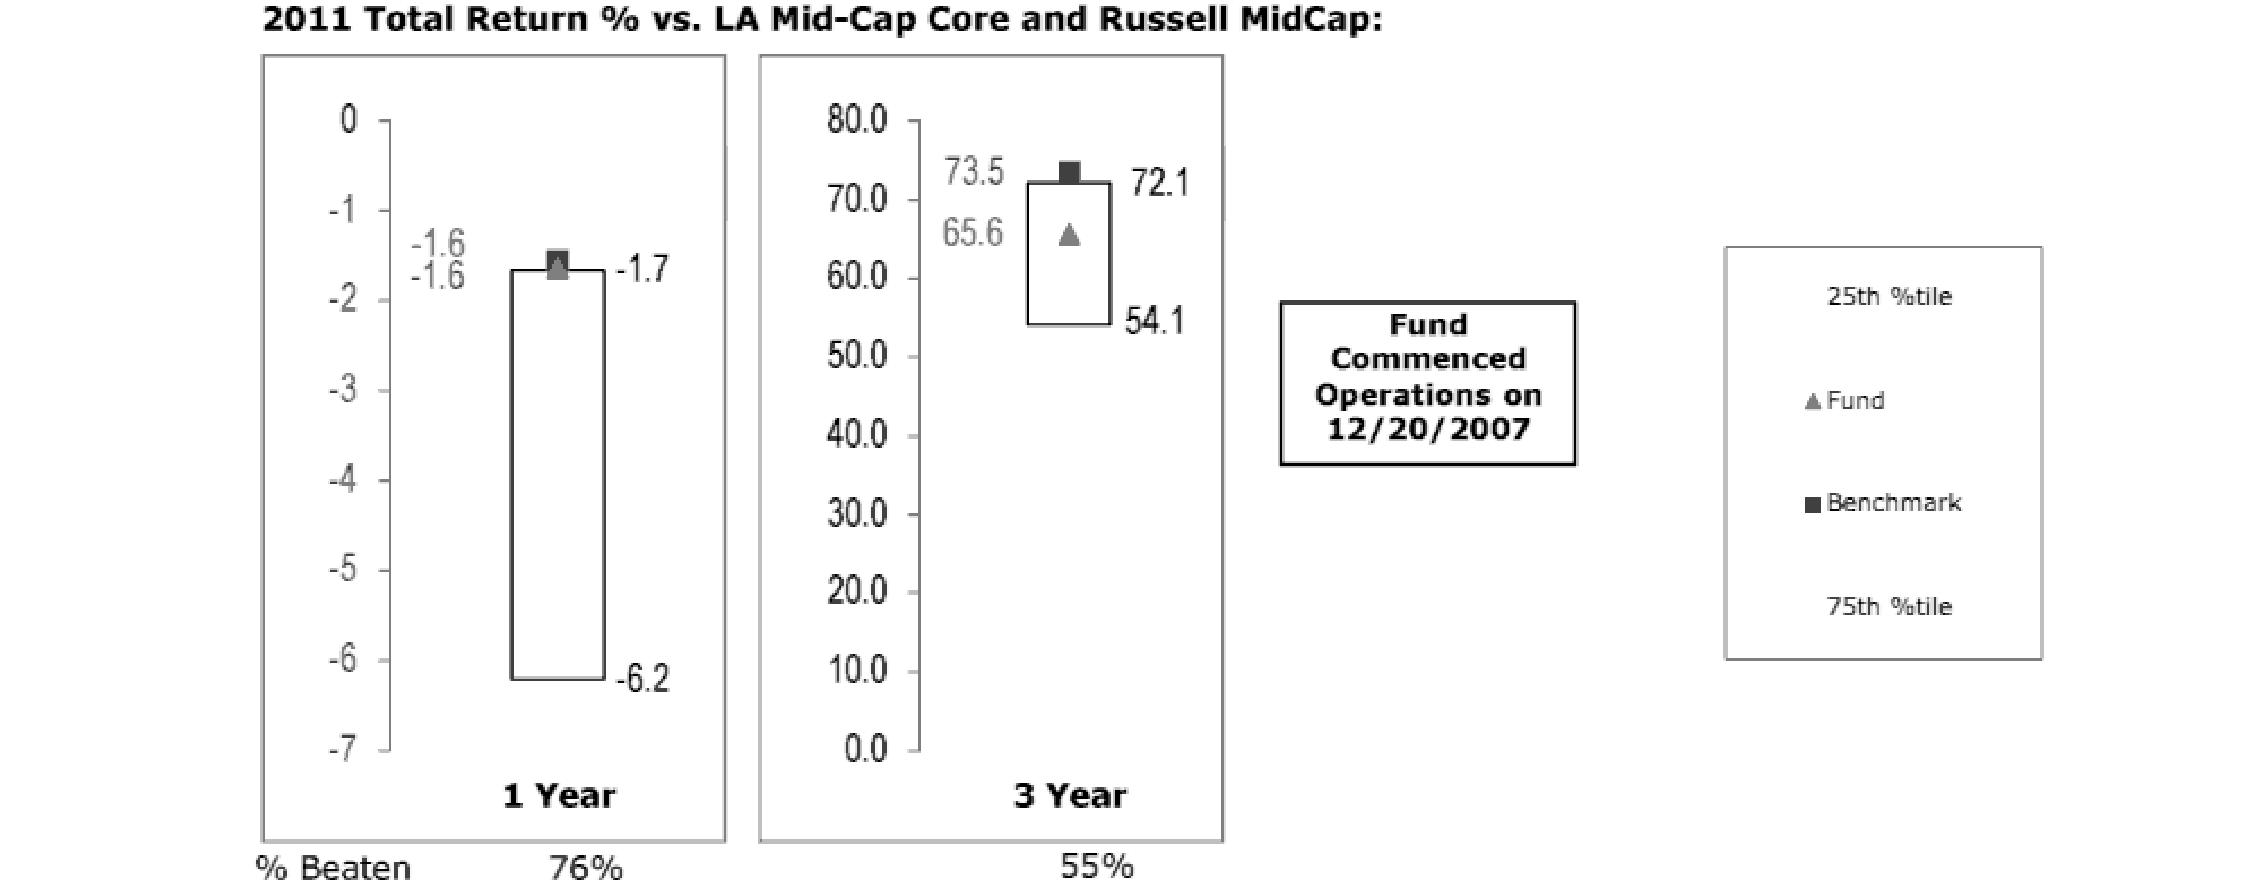
The Board reviewed the fund's relative investment performance against its peer group and noted that the performance of the fund was in the first quartile for the one-year period and in the second quartile for the three-year period and that the fund had out-performed 76% and 55% of its peers for the one- and three-year periods, respectively, ended December 31, 2011. The Board also noted that the investment performance of the fund was equal to its benchmark for the one-year period and lower than its benchmark for the three-year period shown.
Fidelity Small Cap Enhanced Index Fund

The Board reviewed the fund's relative investment performance against its peer group and noted that the performance of the fund was in the second quartile for the one-year period and in the third quartile for the three-year period and that the fund had out-performed 73% and under-performed 62% of its peers for the one- and three-year periods, respectively, ended December 31, 2011. The Board also noted that the investment performance of the fund was higher than its benchmark for the one-year period and lower than its benchmark for the three-year period shown.
Based on its review, the Board concluded that the nature, extent, and quality of services provided to each fund under the Advisory Contracts should benefit each fund's shareholders.
Competitiveness of Management Fee and Total Fund Expenses. The Board considered the amount and nature of fees paid to the Investment Advisers. The Board also considered information comparing the management fees and total expenses of each fund to those of other registered investment companies with investment objectives similar to those of the funds. The Board also considered expense contracts currently in effect between the funds and Strategic Advisers, which limit each fund's total annual operating expenses (excluding interest, taxes, securities lending costs, brokerage commissions and certain other expenses) to the following:
Annual Report
Fidelity Large Cap Core Enhanced Index Fund | 0.45% |
Fidelity Large Cap Growth Enhanced Index Fund | 0.45% |
Fidelity Large Cap Value Enhanced Index Fund | 0.45% |
Fidelity Mid Cap Enhanced Index Fund | 0.60% |
Fidelity Small Cap Enhanced Index Fund | 0.67% |
Fidelity International Enhanced Index Fund | 0.62% |
The Board considered each fund's management fee and total expenses compared to "mapped groups" of competitive funds. Strategic Advisers uses "mapped groups," which are created by Fidelity by combining similar Lipper investment objective categories that it believes have comparable management fee characteristics. Combining Lipper investment objective categories aids the Board's management fee and total expense comparisons by broadening the competitive group used for comparison and by reducing the number of universes to which Strategic Advisers' funds are compared.
Management Fee. The Board considered two proprietary management fee comparisons. The group of Lipper funds used by the Board for management fee comparisons is referred to as the "Total Mapped Group." The Total Mapped Group comparison focuses on a fund's standing relative to the total universe of comparable funds available to investors, in terms of gross management fees before expense reimbursements or caps. "TMG %" represents the percentage of funds in the Total Mapped Group that had management fees that were lower than the fund's. For example, a TMG % of 5% would mean that 95% of the funds in the Total Mapped Group had higher management fees than the fund. The Board also compared each fund's management fee to an "Asset-Size Peer Group" (ASPG), which is a sub-set of the competitive funds in the Total Mapped Group. The ASPG comparison focuses on a fund's standing relative to non-Fidelity funds similar in size to the fund within the Total Mapped Group. The ASPG represents at least 15% of the funds in the Total Mapped Group with comparable asset size and management fee characteristics, subject to a minimum of 50 funds (or all funds in the Total Mapped Group if fewer than 50). Additional information, such as the ASPG quartile in which each fund's management fee ranked, is also included in the chart and considered by the Board.
Fidelity International Enhanced Index Fund

Annual Report
Board Approval of Investment Advisory Contracts and Management Fees - continued
Fidelity Large Cap Core Enhanced Index Fund
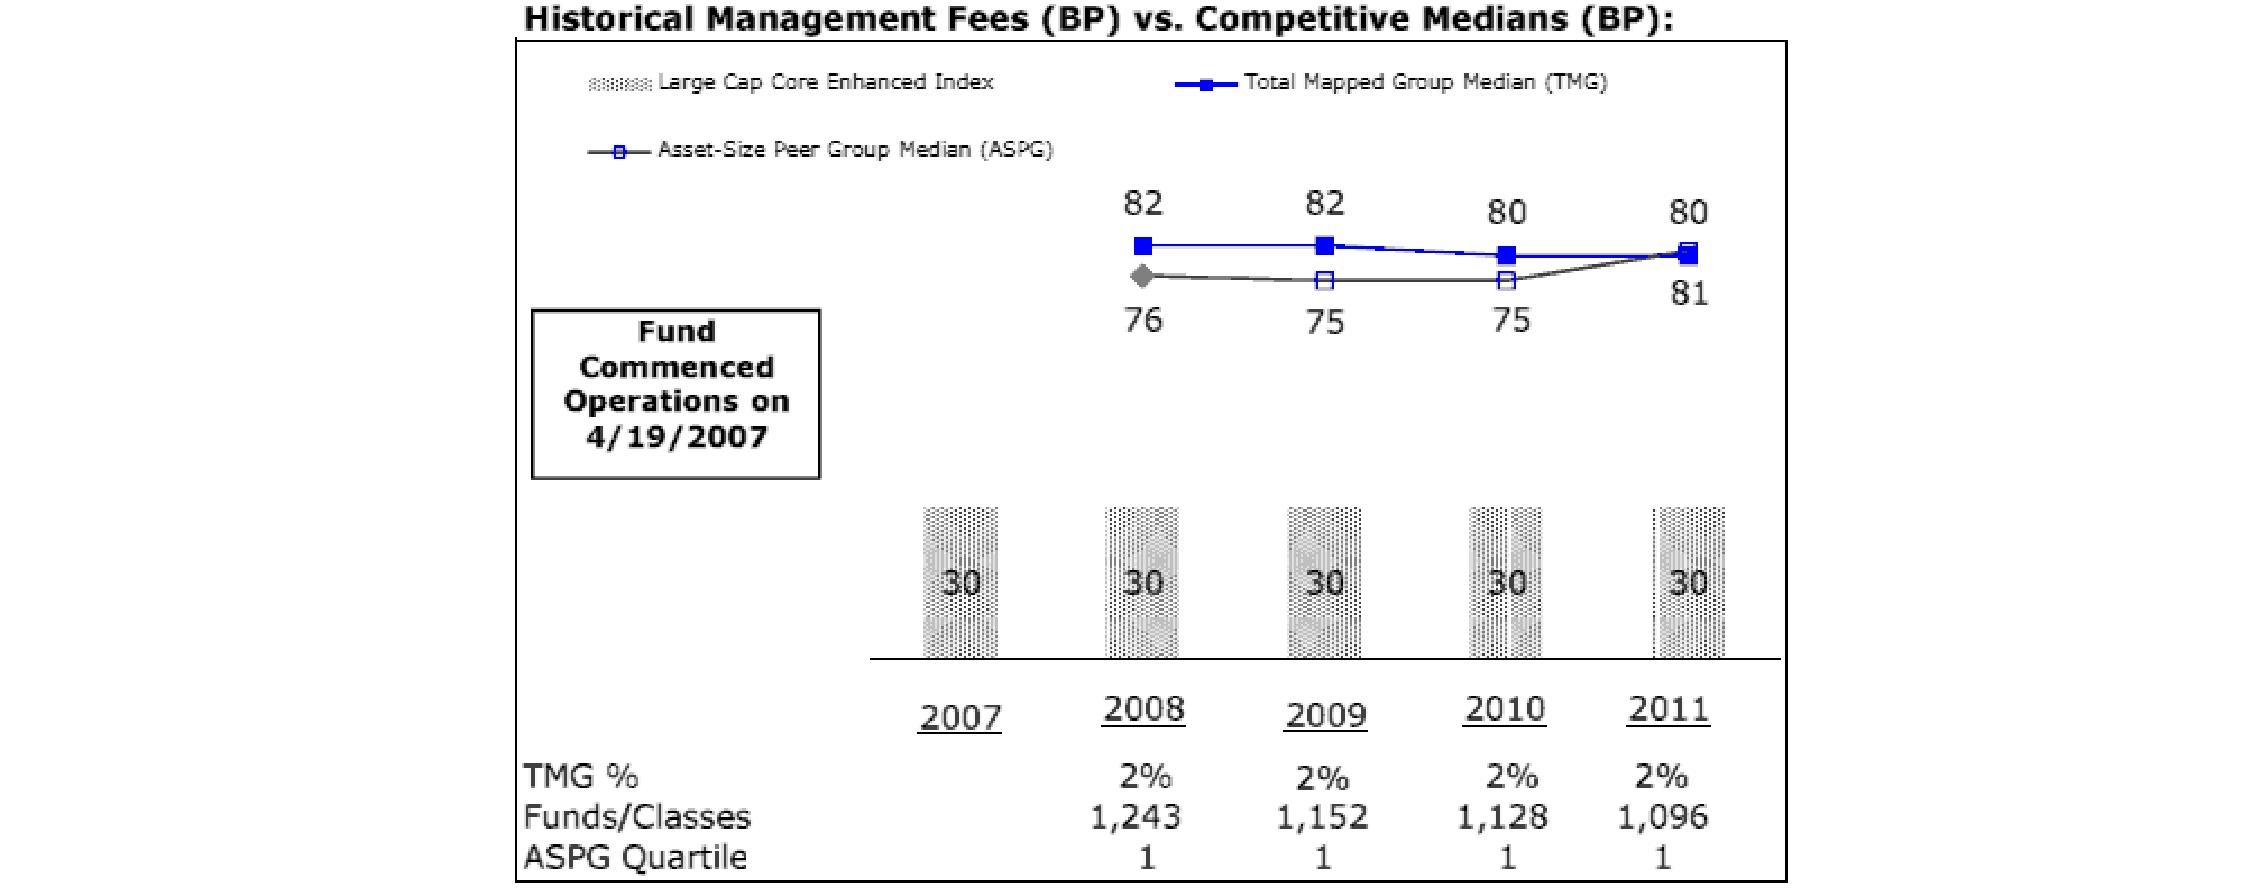
Fidelity Large Cap Growth Enhanced Index Fund
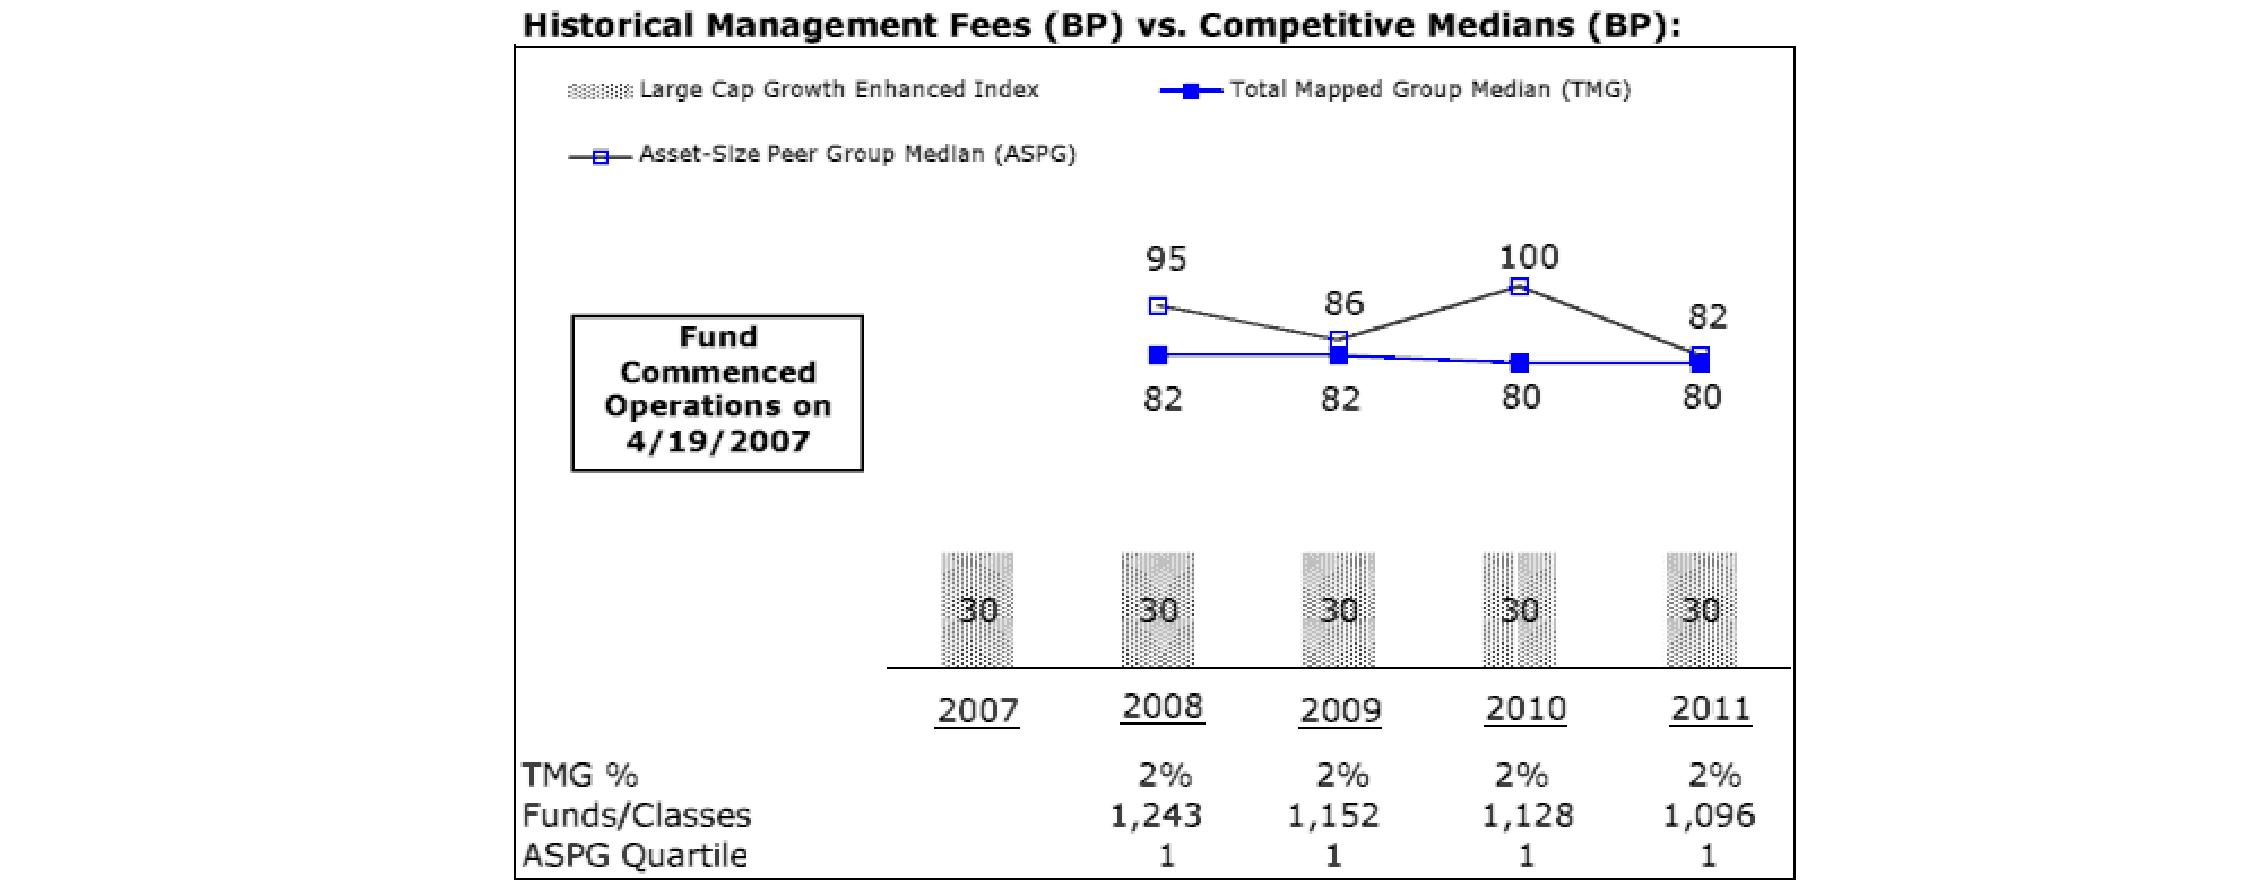
Annual Report
Fidelity Large Cap Value Enhanced Index Fund

Fidelity Mid Cap Enhanced Index Fund
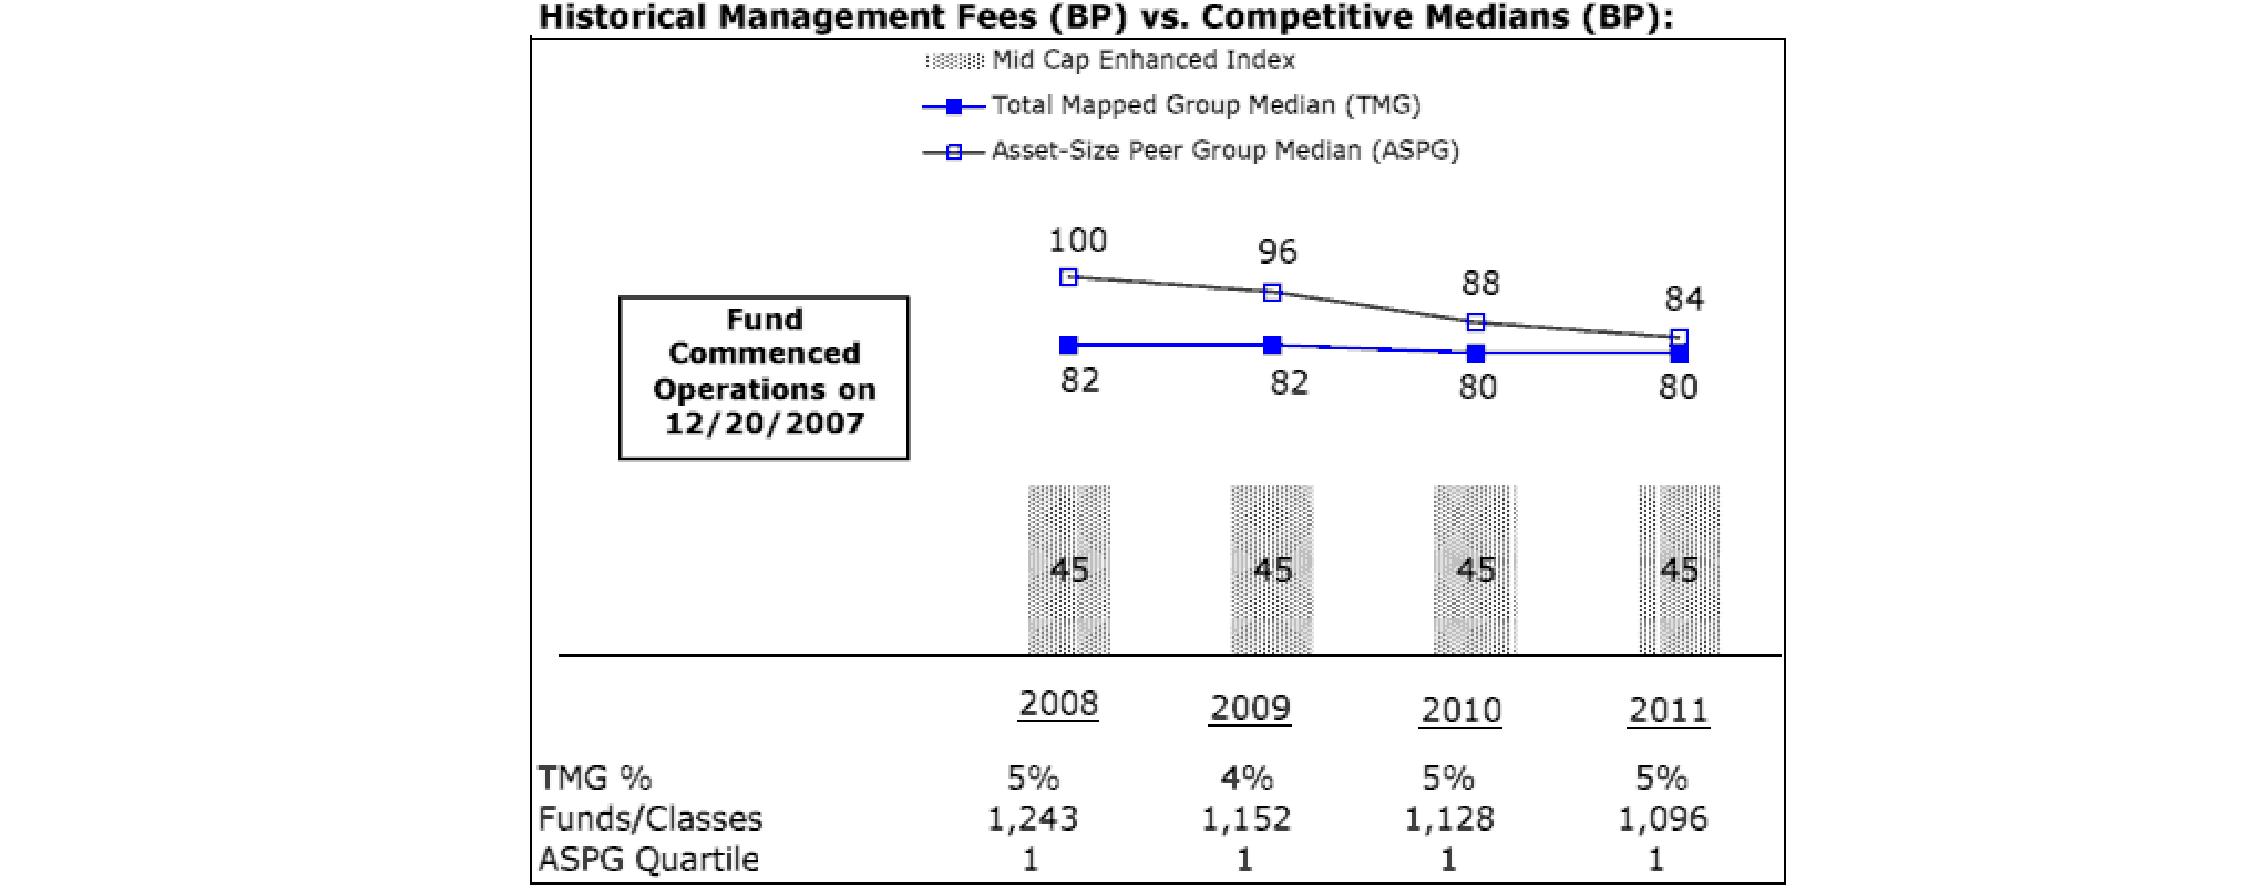
Annual Report
Board Approval of Investment Advisory Contracts and Management Fees - continued
Fidelity Small Cap Enhanced Index Fund
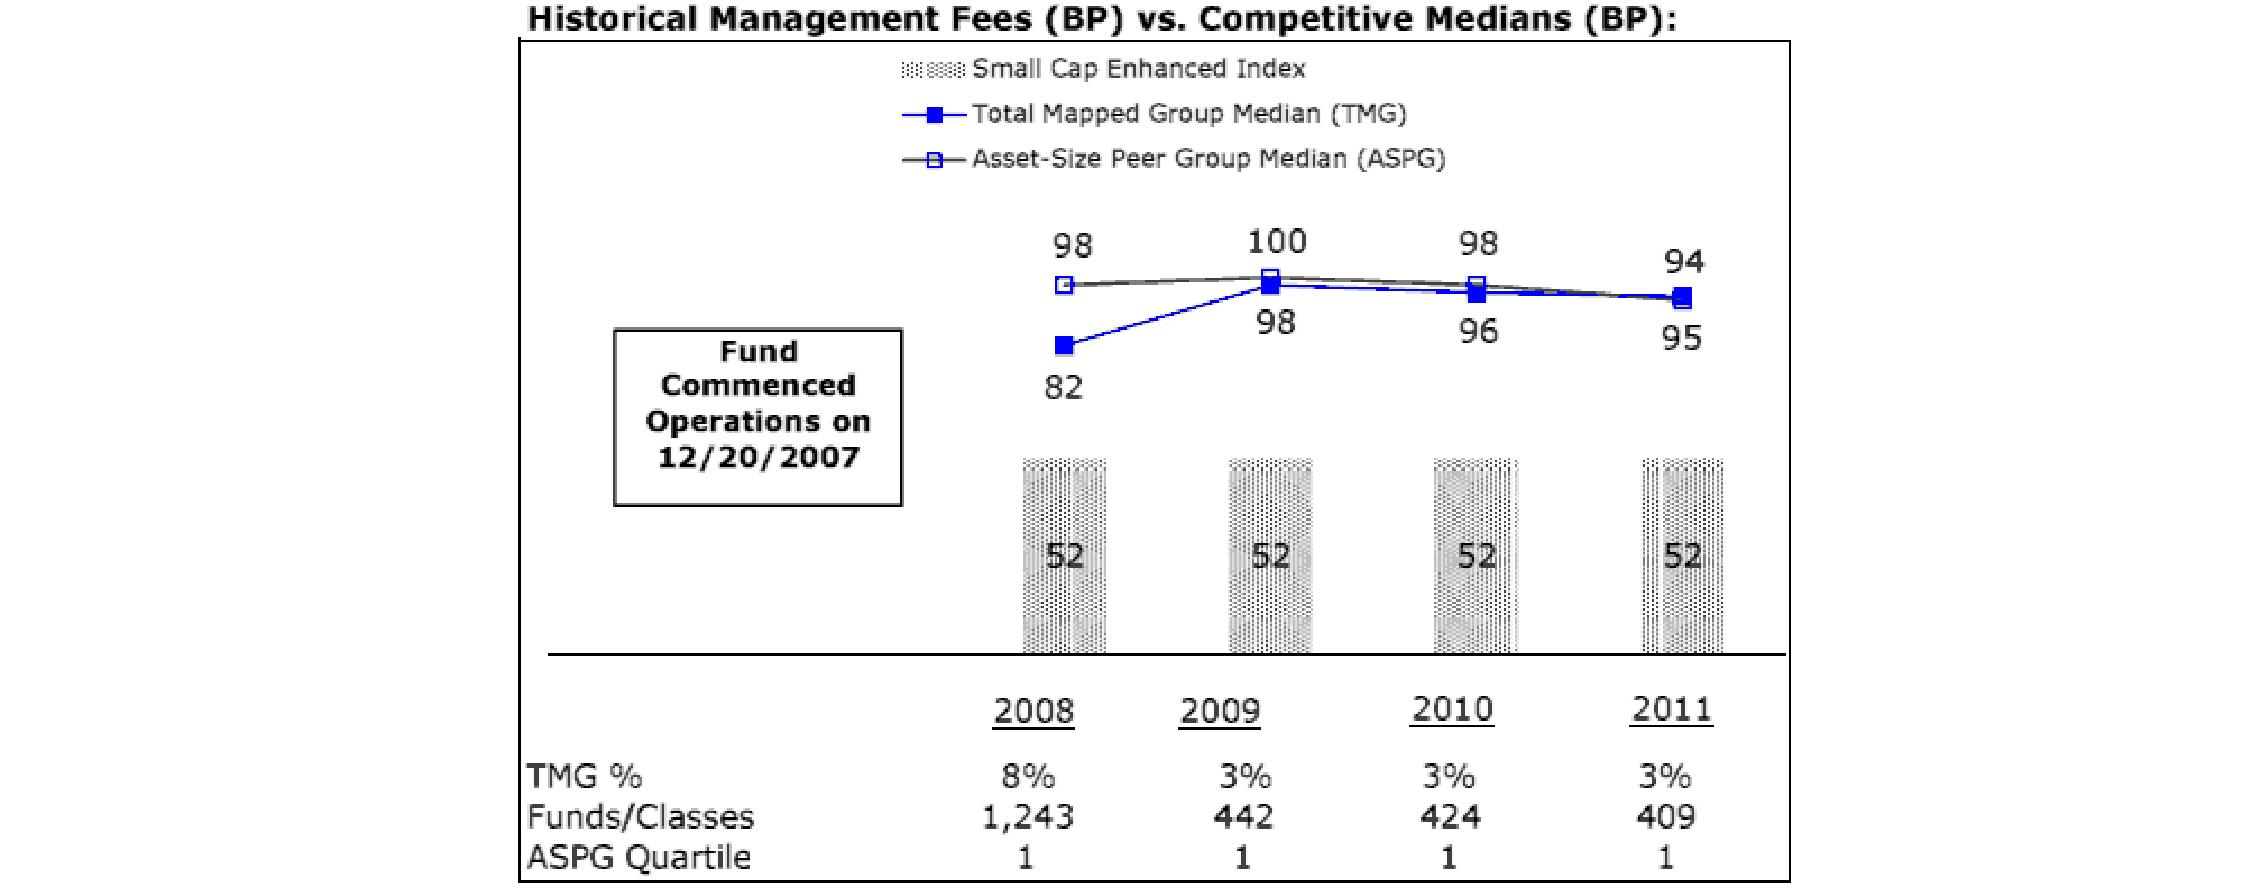
The Board noted that each fund's management fee was ranked below the median of its Total Mapped Group and below the median of its ASPG for the year ended February 29, 2012.
Based on its review, the Board concluded that each fund's management fee bears a reasonable relationship to the services rendered.
Total Expenses. In its review of each fund's total expenses, the Board considered each fund's management fee as well as other fund expenses, as applicable, such as transfer agent fees, pricing and bookkeeping fees, and custodial, legal, and audit fees. The Board also noted the effects of any waivers and reimbursements on fees and expenses. The Board further noted that each fund's total expenses were compared to classes of competitive funds having similar load types. This comparison, which is a proxy for comparing funds by distribution channel, showed each fund's position relative to competitive funds with the same load type. The Board noted that each fund's total expenses (giving effect to each fund's expense contract with Strategic Advisers) were below the median of each fund's Total Mapped Group for the year ended February 29, 2012.
Based on its review, the Board concluded that the total expenses of each fund were reasonable in light of the services that each fund and its shareholders receive and the other factors considered.
Costs of the Services and Profitability. The Board considered information regarding the revenues earned and expenses incurred by Strategic Advisers and its affiliates in conducting the business of developing, marketing, distributing, managing, administering and servicing each fund and its shareholders.
On an annual basis, Strategic Advisers presents information to the Board on its profitability for managing each fund. Strategic Advisers calculates the profitability for each fund using a series of detailed revenue and cost allocation methodologies. The Board reviews any significant changes from the prior year's methodologies. Strategic Advisers noted that, to the extent possible, it employs the same corporate reporting of revenues and expenses as those used by other Fidelity funds.
The Board also reviewed Strategic Advisers' and its affiliates' non-fund businesses and fall-out benefits related to the mutual fund business, as well as cases where Strategic Advisers' affiliates may benefit from or be related to each fund's business.
The Board considered the costs of the services provided by and the profits realized, if any, by Strategic Advisers and its affiliates in connection with the operation of each fund and was satisfied that the profitability was not excessive in the circumstances.
Possible Economies of Scale. The Board considered whether economies of scale have been realized in respect of the management of the Strategic Advisers funds. The Board considered that each fund's sub-advisory contract provides for breakpoints as the fund's assets grow and noted that any potential decline in sub-advisory fees would accrue directly to Strategic Advisers. The Board also considered expense contracts currently in effect between the funds and Strategic Advisers, which limit the total annual operating expenses (excluding interest, taxes, securities lending costs, brokerage commissions and certain other expenses) for each fund to the amounts described above. The Board noted that each fund has not generated sufficient revenue to cover its expenses. The Board also noted that as each fund's assets increase, it will continue to monitor whether management fee breakpoints are appropriate.
Annual Report
Conclusion. Based on its evaluation of all of the conclusions noted above, and after considering all factors it believed relevant, the Board ultimately concluded that the advisory fee structures bear a reasonable relationship to the services rendered and that each fund's Advisory Contracts should be renewed because each agreement is in the best interests of that fund and its shareholders. The Board also concluded that the advisory fees charged thereunder are based on services provided that are in addition to, rather than duplicative of, services provided under the advisory contract of any underlying fund in which each fund may invest. In addition, with respect to each Sub-Advisory Agreement, the Board concluded that the renewal of each agreement does not involve a conflict of interest from which Strategic Advisers or its affiliates derive an inappropriate advantage.
Annual Report
Investment Adviser
Strategic Advisers, Inc.
Boston, MA
Investment Sub-Adviser
Geode Capital Management, LLC
Boston, MA
General Distributor
Fidelity Distributors Corporation
Smithfield, RI
Transfer and Service Agents
Fidelity Investments Institutional Operations Company, Inc.
Boston, MA
Fidelity Service Company, Inc.
Boston, MA
Custodian
The Bank of New York Mellon
New York, NY
The Fidelity Telephone Connection
Mutual Fund 24-Hour Service
Exchanges/Redemptions
and Account Assistance 1-800-544-6666
Product Information 1-800-544-6666
Retirement Accounts 1-800-544-4774
(8 a.m. - 9 p.m.)
TDD Service 1-800-544-0118
for the deaf and hearing impaired
(9 a.m. - 9 p.m. Eastern time)
Fidelity Automated Service
Telephone (FAST®)
1-800-544-5555

Automated line for quickest service
(Fidelity Investment logo)(registered trademark)
Corporate Headquarters
245 Summer St., Boston, MA 02210
www.fidelity.com
GEI-UANN-0413
1.855137.105
Item 2. Code of Ethics
As of the end of the period, February 28, 2013, Fidelity Commonwealth Trust II (the "trust") has adopted a code of ethics, as defined in Item 2 of Form N-CSR, that applies to its President and Treasurer and its Chief Financial Officer. A copy of the code of ethics is filed as an exhibit to this Form N-CSR.
Item 3. Audit Committee Financial Expert
The Board of Trustees of the trust has determined that Amy Butte Liebowitz is an audit committee financial expert, as defined in Item 3 of Form N-CSR. Ms. Butte Liebowitz is independent for purposes of Item 3 of Form N-CSR.
Item 4. Principal Accountant Fees and Services
Fees and Services
The following table presents fees billed by PricewaterhouseCoopers LLP ("PwC") in each of the last two fiscal years for services rendered to Fidelity International Enhanced Index Fund, Fidelity Large Cap Core Enhanced Index Fund, Fidelity Large Cap Growth Enhanced Index Fund, Fidelity Large Cap Value Enhanced Index Fund, Fidelity Mid Cap Enhanced Index Fund, and Fidelity Small Cap Enhanced Index Fund (the "Funds"):
Services Billed by PwC
February 28, 2013 FeesA
| Audit Fees | Audit-Related Fees | Tax Fees | All Other Fees |
Fidelity International Enhanced Index Fund | $47,000 | $- | $4,000 | $500 |
Fidelity Large Cap Core Enhanced Index Fund | $49,000 | $- | $4,000 | $500 |
Fidelity Large Cap Growth Enhanced Index Fund | $44,000 | $- | $4,000 | $500 |
Fidelity Large Cap Value Enhanced Index Fund | $44,000 | $- | $4,000 | $500 |
Fidelity Mid Cap Enhanced Index Fund | $47,000 | $- | $4,000 | $500 |
Fidelity Small Cap Enhanced Index Fund | $45,000 | $- | $4,000 | $500 |
February 29, 2012 FeesA
| Audit Fees | Audit-Related Fees | Tax Fees | All Other Fees |
Fidelity International Enhanced Index Fund | $43,000 | $- | $4,000 | $- |
Fidelity Large Cap Core Enhanced Index Fund | $44,000 | $- | $4,000 | $- |
Fidelity Large Cap Growth Enhanced Index Fund | $43,000 | $- | $4,000 | $- |
Fidelity Large Cap Value Enhanced Index Fund | $44,000 | $- | $4,000 | $- |
Fidelity Mid Cap Enhanced Index Fund | $44,000 | $- | $4,000 | $- |
Fidelity Small Cap Enhanced Index Fund | $44,000 | $- | $4,000 | $- |
A Amounts may reflect rounding.
The following table presents fees billed by PwC that were required to be approved by the Audit Committee for services that relate directly to the operations and financial reporting of the Funds and that are rendered on behalf of Strategic Advisers, Inc. ("Strategic Advisers") and entities controlling, controlled by, or under common control with Strategic Advisers (not including any sub-adviser whose role is primarily portfolio management and is subcontracted with or overseen by another investment adviser) that provide ongoing services to the Funds ("Fund Service Providers"):
Services Billed by PwC
| February 28, 2013A | February 29, 2012A |
Audit-Related Fees | $4,755,000 | $3,795,000 |
Tax Fees | $- | $- |
All Other Fees | $- | $- |
A Amounts may reflect rounding.
"Audit-Related Fees" represent fees billed for assurance and related services that are reasonably related to the performance of the Fund audit or the review of the Fund's financial statements and that are not reported under Audit Fees.
"Tax Fees" represent fees billed for tax compliance, tax advice or tax planning that relate directly to the operations and financial reporting of the Fund.
"All Other Fees" represent fees billed for services provided to the fund or Fund Service Provider, a significant portion of which are assurance related, that relate directly to the operations and financial reporting of the fund, excluding those services that are reported under Audit Fees, Audit-Related Fees or Tax Fees.
Assurance services must be performed by an independent public accountant.
* * *
The aggregate non-audit fees billed by PwC for services rendered to the Funds, Strategic Advisers (not including any sub-adviser whose role is primarily portfolio management and is subcontracted with or overseen by another investment adviser), and any Fund Service Provider relating to Covered Services and Non-Covered Services (each as defined below) for each of the last two fiscal years of the Funds are as follows:
Billed By | February 28, 2013 A | February 29, 2012 A |
PwC | $5,430,000 | $5,145,000 |
A Amounts may reflect rounding.
The trust's Audit Committee has considered non-audit services that were not pre-approved that were provided by PwC to Fund Service Providers to be compatible with maintaining the independence of PwC in its audit of the Funds, taking into account representations from PwC, in accordance with Public Company Accounting Oversight Board rules, regarding its independence from the Funds and their related entities and Strategic Advisers' review of the appropriateness and permissibility under applicable law of such non-audit services prior to their provision to the Fund Service Providers.
Audit Committee Pre-Approval Policies and Procedures
The trust's Audit Committee must pre-approve all audit and non-audit services provided by the independent registered public accounting firm relating to the operations or financial reporting of the funds. Prior to the commencement of any audit or non-audit services to a fund, the Audit Committee reviews the services to determine whether they are appropriate and permissible under applicable law.
The trust's Audit Committee has adopted policies and procedures to, among other purposes, provide a framework for the Committee's consideration of non-audit services by the audit firms that audit the Fidelity funds. The policies and procedures require that any non-audit service provided by a fund audit firm to the trust and any non-audit service provided by a fund auditor to a Fund Service Provider that relates directly to the operations and financial reporting of the trust ("Covered Service") are subject to approval by the Audit Committee before such service is provided.
All Covered Services must be approved in advance of provision of the service either: (i) by formal resolution of the Audit Committee, or (ii) by oral or written approval of the service by the Chair of the Audit Committee (or if the Chair is unavailable, such other member of the Audit Committee as may be designated by the Chair to act in the Chair's absence). The approval contemplated by (ii) above is permitted where the Treasurer determines that action on such an engagement is necessary before the next meeting of the Audit Committee.
Non-audit services provided by a fund audit firm to a Fund Service Provider that do not relate directly to the operations and financial reporting of the trust ("Non-Covered Service") are not required to be approved, but are reported to the Audit Committee annually.
Non-Audit Services Approved Pursuant to Rule 2-01(c)(7)(i)(C) and (ii) of Regulation S-X ("De Minimis Exception")
There were no non-audit services approved or required to be approved by the Audit Committee pursuant to the De Minimis Exception during the Funds' last two fiscal years relating to services provided to (i) the Funds or (ii) any Fund Service Provider that relate directly to the operations and financial reporting of the Funds.
Item 5. Audit Committee of Listed Registrants
Not applicable.
Item 6. Investments
(a) Not applicable.
(b) Not applicable
Item 7. Disclosure of Proxy Voting Policies and Procedures for Closed-End Management Investment Companies
Not applicable.
Item 8. Portfolio Managers of Closed-End Management Investment Companies
Not applicable.
Item 9. Purchase of Equity Securities by Closed-End Management Investment Company and Affiliated Purchasers
Not applicable.
Item 10. Submission of Matters to a Vote of Security Holders
Not applicable.
Item 11. Controls and Procedures
(a)(i) The President and Treasurer and the Chief Financial Officer have concluded that the trust's disclosure controls and procedures (as defined in Rule 30a-3(c) under the Investment Company Act) provide reasonable assurances that material information relating to the trust is made known to them by the appropriate persons, based on their evaluation of these controls and procedures as of a date within 90 days of the filing date of this report.
(a)(ii) There was no change in the trust's internal control over financial reporting (as defined in Rule 30a-3(d) under the Investment Company Act) that occurred during the second fiscal quarter of the period covered by this report that has materially affected, or is reasonably likely to materially affect, the trust's internal control over financial reporting.
Item 12. Exhibits
(a) | (1) | Code of Ethics pursuant to Item 2 of Form N-CSR is filed and attached hereto as EX-99.CODE ETH. |
(a) | (2) | Certification pursuant to Rule 30a-2(a) under the Investment Company Act of 1940 (17 CFR 270.30a-2(a)) is filed and attached hereto as Exhibit 99.CERT. |
(a) | (3) | Not applicable. |
(b) |
| Certification pursuant to Rule 30a-2(b) under the Investment Company Act of 1940 (17 CFR 270.30a-2(b)) is furnished and attached hereto as Exhibit 99.906CERT. |
SIGNATURES
Pursuant to the requirements of the Securities Exchange Act of 1934 and the Investment Company Act of 1940, the registrant has duly caused this report to be signed on its behalf by the undersigned, thereunto duly authorized.
Fidelity Commonwealth Trust II
By: | /s/Kenneth B. Robins |
| Kenneth B. Robins |
| President and Treasurer |
|
|
Date: | April 25, 2013 |
Pursuant to the requirements of the Securities Exchange Act of 1934 and the Investment Company Act of 1940, this report has been signed below by the following persons on behalf of the registrant and in the capacities and on the dates indicated.
By: | /s/Kenneth B. Robins |
| Kenneth B. Robins |
| President and Treasurer |
|
|
Date: | April 25, 2013 |
By: | /s/Nicholas E. Steck |
| Nicholas E. Steck |
| Chief Financial Officer |
|
|
Date: | April 25, 2013 |