UNITED STATES
SECURITIES AND EXCHANGE COMMISSION
Washington, D.C. 20549
FORM N-CSR
CERTIFIED SHAREHOLDER REPORT OF REGISTERED
MANAGEMENT INVESTMENT COMPANIES
Investment Company Act file number 811-21990
Fidelity Commonwealth Trust II
(Exact name of registrant as specified in charter)
82 Devonshire St., Boston, Massachusetts 02109
(Address of principal executive offices) (Zip code)
Marc Bryant, Secretary
82 Devonshire St.
Boston, Massachusetts 02109
(Name and address of agent for service)
Registrant's telephone number, including area code: 617-563-7000
Date of fiscal year end: | February 28 |
|
|
Date of reporting period: | February 28, 2011 |
Item 1. Reports to Stockholders
Fidelity® Large Cap Growth Enhanced Index Fund
Fidelity Large Cap Value Enhanced Index Fund
Fidelity Large Cap Core Enhanced Index Fund
Fidelity Mid Cap Enhanced Index Fund
Fidelity Small Cap Enhanced Index Fund
Fidelity International Enhanced Index Fund
Annual Report
(2_fidelity_logos) (Registered_Trademark)
February 28, 2011
Contents
Shareholder Expense Example | An example of shareholder expenses | |
| ||
Fidelity® Large Cap Growth Enhanced Index Fund | Performance | |
| Management's Discussion | |
| Investment Changes | |
| Investments | |
| Financial Statements | |
| ||
Fidelity Large Cap Value Enhanced Index Fund | Performance | |
| Management's Discussion | |
| Investment Changes | |
| Investments | |
| Financial Statements | |
| ||
Fidelity Large Cap Core Enhanced Index Fund | Performance | |
| Management's Discussion | |
| Investment Changes | |
| Investments | |
| Financial Statements | |
|
|
|
Fidelity Mid Cap Enhanced Index Fund | Performance | |
| Management's Discussion | |
| Investment Changes | |
| Investments | |
| Financial Statements | |
| ||
Fidelity Small Cap Enhanced Index Fund | Performance | |
| Management's Discussion | |
| Investment Changes | |
| Investments | |
| Financial Statements | |
| ||
Fidelity International Enhanced Index Fund | Performance | |
| Management's Discussion | |
| Investment Changes | |
| Investments | |
| Financial Statements | |
| ||
Notes | Notes to the Financial Statements | |
Report of Independent Registered Public Accounting Firm |
| |
Trustees and Officers |
| |
Distributions |
| |
Board Approval of Investment Advisory Contracts |
| |
Annual Report
To view a fund's proxy voting guidelines and proxy voting record for the 12-month period ended June 30, visit http://www.fidelity.com/proxyvotingresults or visit the Securities and Exchange Commission's (SEC) web site at http://www.sec.gov. You may also call 1-800-544-8544 to request a free copy of the proxy voting guidelines.
Geode is a registered trademark of Geode Capital Management, LLC.
Standard & Poor's, S&P and S&P 500 are registered service marks of The McGraw-Hill Companies, Inc. and have been licensed for use by Fidelity Distributors Corporation.
Other third party marks appearing herein are the property of their respective owners.
All other marks appearing herein are registered or unregistered trademarks or service marks of FMR LLC or an affiliated company.
This report and the financial statements contained herein are submitted for the general information of the shareholders of the funds. This report is not authorized for distribution to prospective investors in the funds unless preceded or accompanied by an effective prospectus.
A fund files its complete schedule of portfolio holdings with the SEC for the first and third quarters of each fiscal year on Form N-Q. Forms N-Q are available on the SEC's web site at http://www.sec.gov. A fund's Forms N-Q may be reviewed and copied at the SEC's Public Reference Room in Washington, DC. Information regarding the operation of the SEC's Public Reference Room may be obtained by calling 1-800-SEC-0330. For a complete list of a fund's portfolio holdings, view the most recent holdings listing, semiannual report, or annual report on Fidelity's web site at http://www.fidelity.com, http://www.advisor.fidelity.com, or http://www.401k.com, as applicable.
NOT FDIC INSURED • MAY LOSE VALUE • NO BANK GUARANTEE
Neither the funds nor Fidelity Distributors Corporation is a bank.
Annual Report
Shareholder Expense Example
As a shareholder of a Fund, you incur two types of costs: (1) transaction costs, including redemption fees, and (2) ongoing costs, including management fees and other Fund expenses. This Example is intended to help you understand your ongoing costs (in dollars) of investing in the Funds and to compare these costs with the ongoing costs of investing in other mutual funds.
The Example is based on an investment of $1,000 invested at the beginning of the period and held for the entire period (September 1, 2010 to February 28, 2011).
Actual Expenses
The first line of the accompanying table for each fund provides information about actual account values and actual expenses. You may use the information in this line, together with the amount you invested, to estimate the expenses that you paid over the period. Simply divide your account value by $1,000.00 (for example, an $8,600 account value divided by $1,000.00 = 8.6), then multiply the result by the number in the first line for a fund under the heading entitled "Expenses Paid During Period" to estimate the expenses you paid on your account during this period. An annual index fund fee of $10 that is charged once a year may apply for certain accounts with a value of less than $10,000. This fee is not included in the table below. If it was, the estimate of expenses you paid during the period would be higher, and your ending account value lower, by this amount. In addition, each Fund, as a shareholder in the underlying Fidelity Central Funds, will indirectly bear its pro-rata share of the fees and expenses incurred by the underlying Fidelity Central Funds. These fees and expenses are not included in the Fund's annualized expense ratio used to calculate the expense estimate in the table below.
Hypothetical Example for Comparison Purposes
The second line of the accompanying table for each fund provides information about hypothetical account values and hypothetical expenses based on a fund's actual expense ratio and an assumed rate of return of 5% per year before expenses, which is not the Fund's actual return. The hypothetical account values and expenses may not be used to estimate the actual ending account balance or expenses you paid for the period. You may use this information to compare the ongoing costs of investing in the Fund and other funds. To do so, compare this 5% hypothetical example with the 5% hypothetical examples that appear in the shareholder reports of the other funds. An annual index fund fee of $10 that is charged once a year may apply for certain accounts with a value of less than $10,000. This fee is not included in the table below. If it was, the estimate of expenses you paid during the period would be higher, and your ending account value lower, by this amount. In addition, each Fund, as a shareholder in the underlying Fidelity Central Funds, will indirectly bear its pro-rata share of the fees and expenses incurred by the underlying Fidelity Central Funds. These fees and expenses are not included in the Fund's annualized expense ratio used to calculate the expense estimate in the table below.
Please note that the expenses shown in the table are meant to highlight your ongoing costs only and do not reflect any transaction costs. Therefore, the second line of the table is useful in comparing ongoing costs only, and will not help you determine the relative total costs of owning different funds. In addition, if these transactional costs were included, your costs would have been higher.
| Annualized Expense Ratio | Beginning | Ending | Expenses Paid |
Fidelity Large Cap Growth Enhanced Index Fund | .45% |
|
|
|
Actual |
| $ 1,000.00 | $ 1,308.70 | $ 2.58 |
HypotheticalA |
| $ 1,000.00 | $ 1,022.56 | $ 2.26 |
Fidelity Large Cap Value Enhanced Index Fund | .45% |
|
|
|
Actual |
| $ 1,000.00 | $ 1,269.40 | $ 2.53 |
HypotheticalA |
| $ 1,000.00 | $ 1,022.56 | $ 2.26 |
Fidelity Large Cap Core Enhanced Index Fund | .45% |
|
|
|
Actual |
| $ 1,000.00 | $ 1,280.40 | $ 2.54 |
HypotheticalA |
| $ 1,000.00 | $ 1,022.56 | $ 2.26 |
Fidelity Mid Cap Enhanced Index Fund | .60% |
|
|
|
Actual |
| $ 1,000.00 | $ 1,341.30 | $ 3.48 |
HypotheticalA |
| $ 1,000.00 | $ 1,021.82 | $ 3.01 |
Fidelity Small Cap Enhanced Index Fund | .67% |
|
|
|
Actual |
| $ 1,000.00 | $ 1,375.20 | $ 3.95 |
HypotheticalA |
| $ 1,000.00 | $ 1,021.47 | $ 3.36 |
Fidelity International Enhanced Index Fund | .62% |
|
|
|
Actual |
| $ 1,000.00 | $ 1,252.90 | $ 3.46 |
HypotheticalA |
| $ 1,000.00 | $ 1,021.72 | $ 3.11 |
A 5% return per year before expenses
* Expenses are equal to each Fund's annualized expense ratio, multiplied by the average account value over the period, multiplied by 181/365 (to reflect the one-half year period).
Annual Report
Fidelity Large Cap Growth Enhanced Index Fund
Performance: The Bottom Line
Average annual total return reflects the change in the value of an investment, assuming reinvestment of the fund's distributions from dividend income and capital gains (the profits earned upon the sale of securities that have grown in value, if any) and assuming a constant rate of performance each year. The $10,000 table and the fund's returns do not reflect the deduction of taxes that a shareholder would pay on fund distributions or the redemption of fund shares. During periods of reimbursement by Fidelity a fund's total returns will be greater than it would be had the reimbursement not occurred. How a fund did yesterday is no guarantee of how it will do tomorrow.
Average Annual Total Returns
Periods ended February 28, 2011 | Past 1 | Life of |
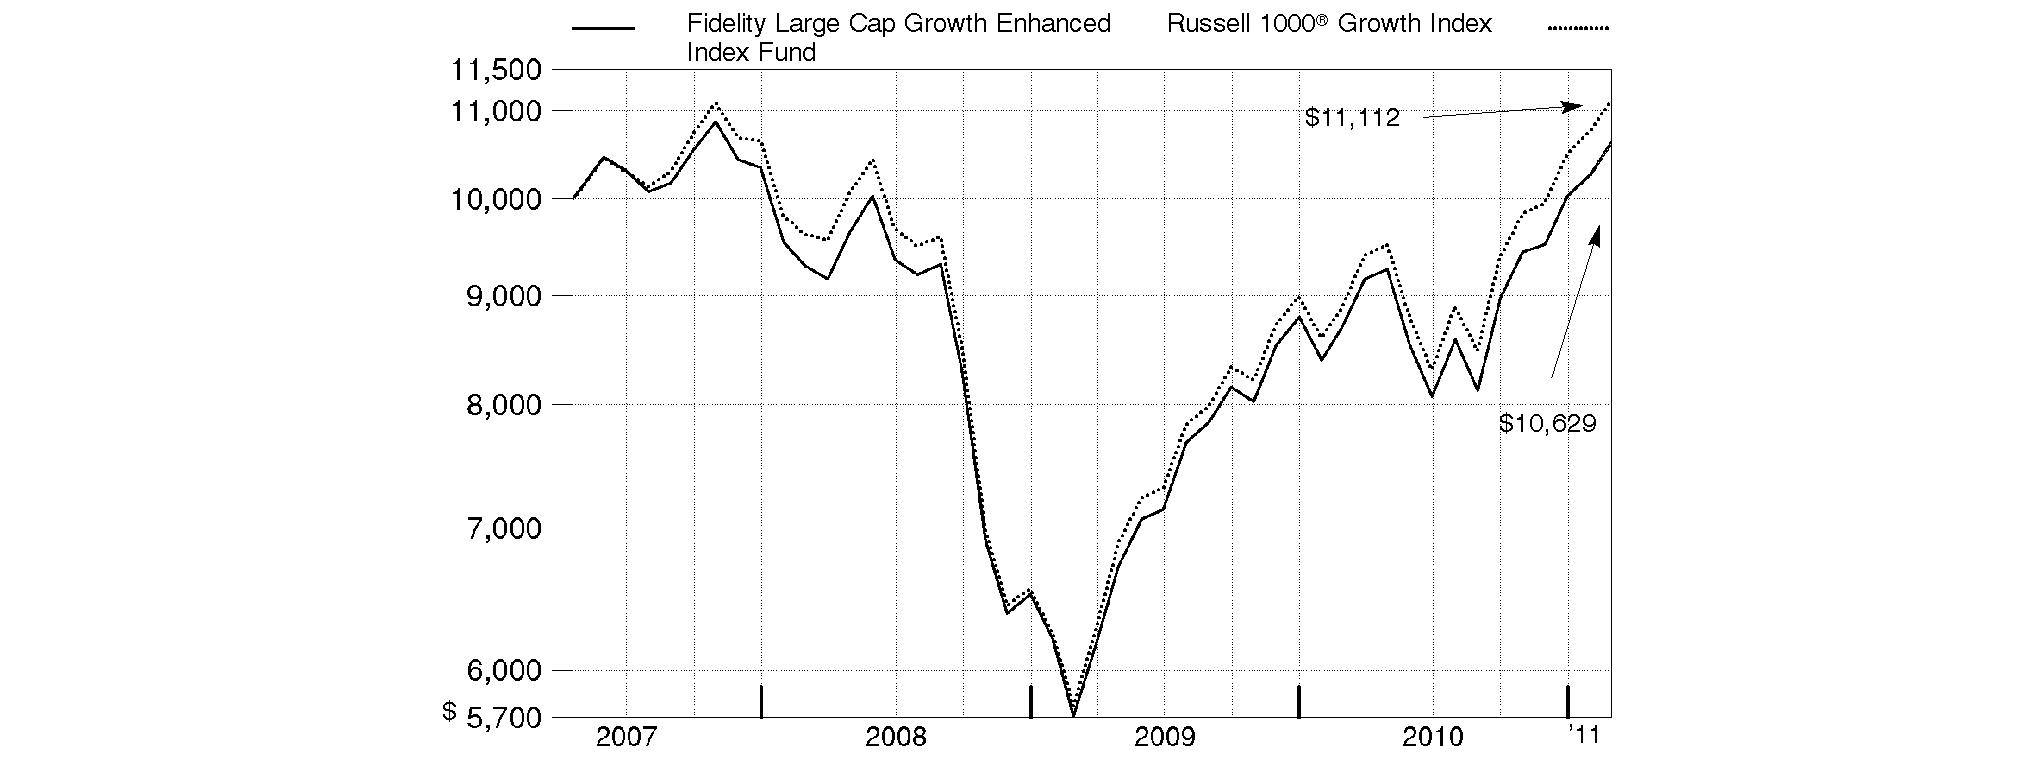
Fidelity Large Cap Growth Enhanced Index Fund | 22.14% | 1.59% |
A From April 19, 2007.
$10,000 Over Life of Fund
Let's say hypothetically that $10,000 was invested in Fidelity Large Cap Growth Enhanced Index Fund on April 19, 2007, when the fund started. The chart shows how the value of your investment would have changed, and also shows how the Russell 1000® Growth Index performed over the same period.
Annual Report
Fidelity Large Cap Growth Enhanced Index Fund
Management's Discussion of Fund Performance
Market Recap: Steady economic growth, encouraging monetary policy, improving credit-market conditions, an uptick in merger-and-acquisition activity and better-than-expected corporate earnings propelled U.S. stock markets forward during the 12-month period ending February 28, 2011. Uncertainty over the global effects of the debt crisis in Europe and China's attempt to rein in its economy plagued equities during the spring, but markets reacted positively to the Federal Reserve's second round of stimulative quantitative easing and the Congressional midterm elections in November, followed in December by the extension of Bush-era tax policies. For the full year, the S&P 500® Index advanced 22.57%, with all but one of the 10 major sectors tracked by MSCI® U.S. Investable Market classifications delivering a double-digit gain. While cyclically oriented sectors benefited from an overall improving economy, less economically sensitive sectors fell short of the broad market. Energy and materials stocks performed best, while the health care and consumer staples groups struggled the most.
Comments from Maximilian Kaufmann, member of the Geode Capital Management, LLC, investment management team for Fidelity® Large Cap Growth Enhanced Index Fund: For the 12 months, the fund returned 22.14%, lagging the 24.94% return of the Russell 1000® Growth Index. Weak security selection, most notably in the information technology, health care and industrials sectors, weighed on results. The fund's positioning in consumer discretionary also was challenging. Stock picking in energy helped the fund's relative performance. In terms of individual securities, a position in Amedisys, which provides home health-care services to elderly patients, hampered results. The stock of financial holding company Prosperity Bancshares underperformed, as did that of for-profit post-secondary education provider ITT Educational Services. Other sources of underperformance included Western Digital, which makes computer hard drives; defense contractor L-3 Communications Holdings; underweightings in "name your own price" travel agency Priceline.com and casino and gaming company Las Vegas Sands, both of which gained significant ground; and overweighting computer and peripherals maker Hewlett-Packard, whose shares experienced several big declines during the period. In contrast, Akamai Technologies, whose products facilitate the delivery of Internet content and applications, added the most to the fund's relative performance. Media company CBS was helpful, while energy stocks such as drill rig company Helmerich & Payne benefited from an increasingly favorable market backdrop, given the rising price of oil. Equipment-rental firm United Rentals, mining equipment company Joy Global and electronic-payment solutions provider VeriFone Systems all added to the fund's result. Many of the names I've mentioned were not in the index, and some were no longer held at period end.
The views expressed above reflect those of the portfolio manager(s) only through the end of the period as stated on the cover of this report and do not necessarily represent the views of Fidelity or any other person in the Fidelity organization. Any such views are subject to change at any time based upon market or other conditions and Fidelity disclaims any responsibility to update such views. These views may not be relied on as investment advice and, because investment decisions for a Fidelity fund are based on numerous factors, may not be relied on as an indication of trading intent on behalf of any Fidelity fund.
Annual Report
Fidelity Large Cap Growth Enhanced Index Fund
Investment Changes (Unaudited)
Top Ten Stocks as of February 28, 2011 | ||
| % of fund's | % of fund's net assets |
Exxon Mobil Corp. | 5.8 | 5.2 |
Apple, Inc. | 4.5 | 4.6 |
International Business Machines Corp. | 3.1 | 3.4 |
Microsoft Corp. | 2.1 | 2.7 |
Google, Inc. Class A | 2.0 | 2.0 |
Oracle Corp. | 1.8 | 1.7 |
Philip Morris International, Inc. | 1.6 | 1.6 |
Schlumberger Ltd. | 1.5 | 1.1 |
Hewlett-Packard Co. | 1.5 | 2.0 |
Cisco Systems, Inc. | 1.4 | 2.1 |
| 25.3 | |
Market Sectors as of February 28, 2011 | ||
| % of fund's | % of fund's net assets |
Information Technology | 30.0 | 31.1 |
Consumer Discretionary | 13.9 | 14.1 |
Energy | 12.9 | 10.5 |
Industrials | 12.6 | 13.3 |
Health Care | 9.3 | 10.0 |
Consumer Staples | 8.0 | 9.2 |
Materials | 5.4 | 5.2 |
Financials | 5.4 | 4.7 |
Telecommunication Services | 0.7 | 0.7 |
Utilities | 0.0 | 0.2 |
Annual Report
Fidelity Large Cap Growth Enhanced Index Fund
Investments February 28, 2011
Showing Percentage of Net Assets
Common Stocks - 98.2% | |||
Shares | Value | ||
CONSUMER DISCRETIONARY - 13.9% | |||
Auto Components - 1.0% | |||
Autoliv, Inc. | 2,810 | $ 210,441 | |
Johnson Controls, Inc. | 5,002 | 204,082 | |
Lear Corp. | 400 | 42,320 | |
TRW Automotive Holdings Corp. (a) | 3,400 | 193,120 | |
| 649,963 | ||
Automobiles - 0.8% | |||
Ford Motor Co. (a) | 31,504 | 474,135 | |
Harley-Davidson, Inc. (e) | 2,400 | 97,968 | |
| 572,103 | ||
Diversified Consumer Services - 0.5% | |||
Apollo Group, Inc. Class A (non-vtg.) (a) | 3,800 | 171,988 | |
Sotheby's Class A (ltd. vtg.) | 4,000 | 196,880 | |
| 368,868 | ||
Hotels, Restaurants & Leisure - 3.2% | |||
Brinker International, Inc. | 5,000 | 118,200 | |
Carnival Corp. unit | 2,000 | 85,340 | |
Las Vegas Sands Corp. (a)(e) | 909 | 42,396 | |
Marriott International, Inc. Class A | 900 | 35,289 | |
McDonald's Corp. | 9,900 | 749,232 | |
Panera Bread Co. Class A (a) | 1,700 | 198,475 | |
Starbucks Corp. | 9,200 | 303,416 | |
Starwood Hotels & Resorts Worldwide, Inc. (e) | 1,200 | 73,320 | |
Wyndham Worldwide Corp. | 3,000 | 93,840 | |
Wynn Resorts Ltd. (e) | 900 | 110,637 | |
Yum! Brands, Inc. | 7,700 | 387,541 | |
| 2,197,686 | ||
Household Durables - 0.3% | |||
Tempur-Pedic International, Inc. (a) | 1,200 | 56,328 | |
Tupperware Brands Corp. | 2,400 | 128,760 | |
| 185,088 | ||
Internet & Catalog Retail - 0.9% | |||
Amazon.com, Inc. (a) | 2,728 | 472,735 | |
Priceline.com, Inc. (a) | 350 | 158,858 | |
| 631,593 | ||
Leisure Equipment & Products - 0.3% | |||
Polaris Industries, Inc. (e) | 2,669 | 201,376 | |
Media - 1.3% | |||
CBS Corp. Class B | 11,993 | 286,153 | |
DIRECTV (a)(e) | 6,000 | 275,820 | |
Interpublic Group of Companies, Inc. | 11,000 | 145,200 | |
McGraw-Hill Companies, Inc. | 1,900 | 73,492 | |
News Corp. Class A | 4,000 | 69,480 | |
| 850,145 | ||
Multiline Retail - 0.9% | |||
Dollar Tree, Inc. (a) | 2,450 | 123,284 | |
Macy's, Inc. | 3,500 | 83,650 | |
| |||
Shares | Value | ||
Nordstrom, Inc. | 2,100 | $ 95,046 | |
Target Corp. | 5,663 | 297,591 | |
| 599,571 | ||
Specialty Retail - 3.9% | |||
Advance Auto Parts, Inc. (e) | 4,400 | 275,792 | |
AutoZone, Inc. (a) | 750 | 193,463 | |
Bed Bath & Beyond, Inc. (a) | 1,600 | 77,040 | |
Best Buy Co., Inc. (e) | 792 | 25,534 | |
Gap, Inc. (e) | 3,500 | 78,855 | |
Home Depot, Inc. | 13,360 | 500,599 | |
Limited Brands, Inc. | 5,000 | 160,100 | |
Lowe's Companies, Inc. | 6,002 | 157,072 | |
PetSmart, Inc. | 4,600 | 188,002 | |
Ross Stores, Inc. | 4,954 | 356,886 | |
Signet Jewelers Ltd. (a) | 3,400 | 149,158 | |
Staples, Inc. | 3,500 | 74,550 | |
TJX Companies, Inc. | 7,600 | 379,012 | |
Williams-Sonoma, Inc. | 1,600 | 57,744 | |
| 2,673,807 | ||
Textiles, Apparel & Luxury Goods - 0.8% | |||
Coach, Inc. | 2,450 | 134,554 | |
NIKE, Inc. Class B | 2,200 | 195,866 | |
Polo Ralph Lauren Corp. Class A | 750 | 95,033 | |
VF Corp. | 1,300 | 124,371 | |
| 549,824 | ||
TOTAL CONSUMER DISCRETIONARY | 9,480,024 | ||
CONSUMER STAPLES - 8.0% | |||
Beverages - 2.4% | |||
Brown-Forman Corp. Class B (non-vtg.) | 1,700 | 117,555 | |
Dr Pepper Snapple Group, Inc. (e) | 3,900 | 140,634 | |
PepsiCo, Inc. | 6,842 | 433,920 | |
The Coca-Cola Co. | 14,453 | 923,836 | |
| 1,615,945 | ||
Food & Staples Retailing - 2.1% | |||
Costco Wholesale Corp. | 3,600 | 269,244 | |
Sysco Corp. | 746 | 20,731 | |
Wal-Mart Stores, Inc. | 10,600 | 550,988 | |
Walgreen Co. | 7,270 | 315,082 | |
Whole Foods Market, Inc. | 4,200 | 245,952 | |
| 1,401,997 | ||
Food Products - 0.5% | |||
Corn Products International, Inc. | 1,145 | 55,899 | |
General Mills, Inc. | 1,188 | 44,122 | |
Hershey Co. | 2,861 | 149,688 | |
Tyson Foods, Inc. Class A | 6,000 | 111,780 | |
| 361,489 | ||
Household Products - 0.7% | |||
Colgate-Palmolive Co. | 3,900 | 306,228 | |
Common Stocks - continued | |||
Shares | Value | ||
CONSUMER STAPLES - continued | |||
Household Products - continued | |||
Kimberly-Clark Corp. | 1,575 | $ 103,793 | |
Procter & Gamble Co. | 1,100 | 69,355 | |
| 479,376 | ||
Personal Products - 0.1% | |||
Herbalife Ltd. | 1,200 | 94,092 | |
Tobacco - 2.2% | |||
Altria Group, Inc. | 9,000 | 228,330 | |
Lorillard, Inc. | 2,405 | 184,632 | |
Philip Morris International, Inc. | 17,500 | 1,098,650 | |
| 1,511,612 | ||
TOTAL CONSUMER STAPLES | 5,464,511 | ||
ENERGY - 12.9% | |||
Energy Equipment & Services - 4.3% | |||
Cameron International Corp. (a) | 1,200 | 70,956 | |
Complete Production Services, Inc. (a) | 4,563 | 131,460 | |
Core Laboratories NV | 2,464 | 254,654 | |
FMC Technologies, Inc. (a) | 1,200 | 112,860 | |
Halliburton Co. | 8,600 | 403,684 | |
Helmerich & Payne, Inc. (e) | 2,942 | 191,201 | |
McDermott International, Inc. (a) | 4,400 | 100,980 | |
National Oilwell Varco, Inc. | 3,400 | 270,538 | |
Oceaneering International, Inc. (a) | 2,700 | 225,801 | |
Oil States International, Inc. (a)(e) | 1,707 | 124,253 | |
Schlumberger Ltd. | 10,982 | 1,025,938 | |
| 2,912,325 | ||
Oil, Gas & Consumable Fuels - 8.6% | |||
Alpha Natural Resources, Inc. (a) | 550 | 29,821 | |
Arch Coal, Inc. | 1,800 | 60,354 | |
Chevron Corp. | 1,800 | 186,750 | |
Cimarex Energy Co. | 1,200 | 139,356 | |
ConocoPhillips | 6,600 | 513,942 | |
CVR Energy, Inc. (a) | 4,500 | 85,050 | |
EOG Resources, Inc. | 1,300 | 146,003 | |
Exxon Mobil Corp. | 45,900 | 3,925,822 | |
Murphy Oil Corp. | 1,000 | 73,530 | |
Occidental Petroleum Corp. | 1,377 | 140,413 | |
Peabody Energy Corp. | 3,373 | 220,898 | |
Valero Energy Corp. | 3,400 | 95,812 | |
W&T Offshore, Inc. | 4,000 | 102,120 | |
Whiting Petroleum Corp. (a) | 2,100 | 137,214 | |
| 5,857,085 | ||
TOTAL ENERGY | 8,769,410 | ||
FINANCIALS - 5.4% | |||
Capital Markets - 1.0% | |||
American Capital Ltd. (a)(e) | 10,526 | 98,313 | |
Ameriprise Financial, Inc. | 3,207 | 203,067 | |
| |||
Shares | Value | ||
Charles Schwab Corp. | 3,465 | $ 65,731 | |
Franklin Resources, Inc. | 800 | 100,496 | |
Morgan Stanley | 1,239 | 36,774 | |
T. Rowe Price Group, Inc. | 1,900 | 127,262 | |
Waddell & Reed Financial, Inc. Class A (e) | 1,500 | 60,570 | |
| 692,213 | ||
Commercial Banks - 0.6% | |||
East West Bancorp, Inc. | 9,000 | 208,980 | |
Signature Bank, New York (a)(e) | 3,600 | 186,804 | |
| 395,784 | ||
Consumer Finance - 1.0% | |||
American Express Co. | 8,600 | 374,702 | |
Credit Acceptance Corp. (a)(e) | 2,954 | 208,552 | |
Discover Financial Services | 5,970 | 129,848 | |
| 713,102 | ||
Diversified Financial Services - 0.6% | |||
IntercontinentalExchange, Inc. (a) | 700 | 89,740 | |
Moody's Corp. (e) | 6,700 | 213,730 | |
The NASDAQ Stock Market, Inc. (a)(e) | 3,500 | 100,135 | |
| 403,605 | ||
Insurance - 0.7% | |||
AFLAC, Inc. | 2,664 | 156,803 | |
Endurance Specialty Holdings Ltd. | 3,500 | 173,565 | |
Hartford Financial Services Group, Inc. | 1,400 | 41,440 | |
Marsh & McLennan Companies, Inc. | 2,500 | 76,100 | |
| 447,908 | ||
Real Estate Investment Trusts - 1.2% | |||
CBL & Associates Properties, Inc. (e) | 5,000 | 89,250 | |
MFA Financial, Inc. | 9,000 | 76,230 | |
Nationwide Health Properties, Inc. | 2,655 | 113,475 | |
Public Storage (e) | 1,800 | 202,050 | |
Rayonier, Inc. | 3,002 | 184,113 | |
Simon Property Group, Inc. (e) | 1,500 | 165,060 | |
| 830,178 | ||
Real Estate Management & Development - 0.3% | |||
CB Richard Ellis Group, Inc. Class A (a) | 2,400 | 60,096 | |
Jones Lang LaSalle, Inc. | 1,300 | 127,946 | |
| 188,042 | ||
TOTAL FINANCIALS | 3,670,832 | ||
HEALTH CARE - 9.3% | |||
Biotechnology - 1.1% | |||
Amgen, Inc. (a) | 811 | 41,629 | |
Biogen Idec, Inc. (a)(e) | 3,556 | 243,230 | |
Celgene Corp. (a) | 2,414 | 128,183 | |
Gilead Sciences, Inc. (a) | 8,483 | 330,667 | |
| 743,709 | ||
Health Care Equipment & Supplies - 2.3% | |||
Baxter International, Inc. | 3,113 | 165,456 | |
Common Stocks - continued | |||
Shares | Value | ||
HEALTH CARE - continued | |||
Health Care Equipment & Supplies - continued | |||
Becton, Dickinson & Co. | 2,300 | $ 184,000 | |
C. R. Bard, Inc. (e) | 1,000 | 97,760 | |
Cooper Companies, Inc. | 3,514 | 217,235 | |
Covidien PLC | 4,900 | 252,105 | |
Intuitive Surgical, Inc. (a) | 325 | 106,584 | |
Medtronic, Inc. | 5,999 | 239,480 | |
St. Jude Medical, Inc. | 750 | 35,910 | |
Stryker Corp. (e) | 2,651 | 167,702 | |
Varian Medical Systems, Inc. (a)(e) | 1,368 | 94,775 | |
| 1,561,007 | ||
Health Care Providers & Services - 2.2% | |||
AmerisourceBergen Corp. | 7,895 | 299,299 | |
Cardinal Health, Inc. | 5,964 | 248,341 | |
Express Scripts, Inc. (a) | 3,969 | 223,137 | |
Health Management Associates, Inc. Class A (a) | 5,000 | 50,000 | |
Humana, Inc. (a) | 2,518 | 163,695 | |
Laboratory Corp. of America Holdings (a) | 900 | 81,117 | |
McKesson Corp. | 1,100 | 87,208 | |
Medco Health Solutions, Inc. (a) | 3,043 | 187,571 | |
UnitedHealth Group, Inc. | 3,500 | 149,030 | |
| 1,489,398 | ||
Health Care Technology - 0.2% | |||
SXC Health Solutions Corp. (a) | 3,000 | 147,923 | |
Life Sciences Tools & Services - 1.6% | |||
Agilent Technologies, Inc. (a) | 2,200 | 92,576 | |
Bio-Rad Laboratories, Inc. Class A (a) | 1,285 | 146,696 | |
Illumina, Inc. (a)(e) | 1,388 | 96,327 | |
Life Technologies Corp. (a)(e) | 4,780 | 255,109 | |
Pharmaceutical Product Development, Inc. | 7,600 | 208,772 | |
Thermo Fisher Scientific, Inc. (a) | 1,400 | 78,148 | |
Waters Corp. (a) | 2,600 | 215,930 | |
| 1,093,558 | ||
Pharmaceuticals - 1.9% | |||
Abbott Laboratories | 10,900 | 524,290 | |
Allergan, Inc. | 2,700 | 200,259 | |
Eli Lilly & Co. | 4,969 | 171,729 | |
Endo Pharmaceuticals Holdings, Inc. (a)(e) | 2,546 | 90,434 | |
Forest Laboratories, Inc. (a) | 3,010 | 97,524 | |
Johnson & Johnson | 3,300 | 202,752 | |
| 1,286,988 | ||
TOTAL HEALTH CARE | 6,322,583 | ||
INDUSTRIALS - 12.6% | |||
Aerospace & Defense - 3.1% | |||
Honeywell International, Inc. | 7,950 | 460,385 | |
| |||
Shares | Value | ||
Lockheed Martin Corp. | 4,314 | $ 341,496 | |
Northrop Grumman Corp. | 2,203 | 146,896 | |
Precision Castparts Corp. | 667 | 94,547 | |
Rockwell Collins, Inc. | 700 | 45,108 | |
The Boeing Co. | 3,889 | 280,047 | |
United Technologies Corp. | 8,465 | 707,166 | |
| 2,075,645 | ||
Air Freight & Logistics - 1.0% | |||
C.H. Robinson Worldwide, Inc. | 357 | 25,843 | |
FedEx Corp. | 800 | 72,016 | |
United Parcel Service, Inc. Class B | 8,293 | 612,023 | |
| 709,882 | ||
Airlines - 0.4% | |||
Alaska Air Group, Inc. (a) | 1,500 | 89,175 | |
Delta Air Lines, Inc. (a) | 13,240 | 148,818 | |
| 237,993 | ||
Commercial Services & Supplies - 0.1% | |||
Stericycle, Inc. (a)(e) | 821 | 70,951 | |
Construction & Engineering - 0.4% | |||
KBR, Inc. | 7,300 | 239,440 | |
Electrical Equipment - 0.7% | |||
Cooper Industries PLC Class A | 900 | 57,915 | |
Emerson Electric Co. | 5,331 | 318,047 | |
Rockwell Automation, Inc. | 1,200 | 105,276 | |
| 481,238 | ||
Industrial Conglomerates - 1.9% | |||
3M Co. | 6,590 | 607,796 | |
General Electric Co. | 28,500 | 596,220 | |
Tyco International Ltd. | 2,400 | 108,816 | |
| 1,312,832 | ||
Machinery - 4.6% | |||
Caterpillar, Inc. | 5,700 | 586,701 | |
Cummins, Inc. | 1,518 | 153,500 | |
Danaher Corp. | 2,952 | 149,371 | |
Deere & Co. | 3,700 | 333,555 | |
Dover Corp. | 3,600 | 231,300 | |
Eaton Corp. | 625 | 69,238 | |
Gardner Denver, Inc. | 1,700 | 124,338 | |
Illinois Tool Works, Inc. | 2,704 | 146,286 | |
Joy Global, Inc. | 2,508 | 244,229 | |
Navistar International Corp. (a) | 1,000 | 61,980 | |
Oshkosh Co. (a) | 5,665 | 202,071 | |
PACCAR, Inc. | 1,800 | 90,234 | |
Parker Hannifin Corp. | 2,800 | 249,704 | |
Timken Co. | 4,900 | 238,728 | |
Toro Co. | 4,205 | 262,392 | |
| 3,143,627 | ||
Common Stocks - continued | |||
Shares | Value | ||
INDUSTRIALS - continued | |||
Road & Rail - 0.4% | |||
AMERCO (a) | 800 | $ 77,272 | |
Union Pacific Corp. | 2,317 | 221,065 | |
| 298,337 | ||
TOTAL INDUSTRIALS | 8,569,945 | ||
INFORMATION TECHNOLOGY - 30.0% | |||
Communications Equipment - 3.4% | |||
Cisco Systems, Inc. (a) | 51,219 | 950,625 | |
Harris Corp. (e) | 3,837 | 179,034 | |
InterDigital, Inc. (e) | 2,200 | 104,896 | |
Juniper Networks, Inc. (a) | 2,638 | 116,072 | |
Plantronics, Inc. | 1,397 | 48,741 | |
QUALCOMM, Inc. | 15,011 | 894,355 | |
| 2,293,723 | ||
Computers & Peripherals - 7.6% | |||
Apple, Inc. (a) | 8,625 | 3,046,436 | |
Dell, Inc. (a)(e) | 13,608 | 215,415 | |
EMC Corp. (a) | 17,700 | 481,617 | |
Hewlett-Packard Co. | 22,888 | 998,603 | |
NetApp, Inc. (a)(e) | 2,838 | 146,611 | |
QLogic Corp. (a)(e) | 9,896 | 178,722 | |
SanDisk Corp. (a) | 2,420 | 120,032 | |
| 5,187,436 | ||
Electronic Equipment & Components - 0.9% | |||
Anixter International, Inc. (e) | 950 | 68,039 | |
Corning, Inc. | 9,100 | 209,846 | |
National Instruments Corp. | 1,800 | 56,034 | |
Vishay Intertechnology, Inc. (a)(e) | 14,137 | 246,691 | |
| 580,610 | ||
Internet Software & Services - 2.5% | |||
eBay, Inc. (a) | 3,500 | 117,268 | |
Google, Inc. Class A (a) | 2,228 | 1,366,655 | |
IAC/InterActiveCorp (a) | 7,200 | 223,704 | |
| 1,707,627 | ||
IT Services - 6.0% | |||
Accenture PLC Class A | 8,100 | 416,988 | |
Automatic Data Processing, Inc. | 8,042 | 402,100 | |
CACI International, Inc. Class A (a) | 1,600 | 94,912 | |
Cognizant Technology Solutions Corp. Class A (a) | 2,300 | 176,801 | |
Fiserv, Inc. (a) | 3,400 | 215,118 | |
International Business Machines Corp. | 13,155 | 2,129,531 | |
MasterCard, Inc. Class A | 832 | 200,146 | |
Paychex, Inc. | 3,700 | 124,431 | |
The Western Union Co. | 4,500 | 98,955 | |
Visa, Inc. Class A | 3,500 | 255,675 | |
| 4,114,657 | ||
| |||
Shares | Value | ||
Office Electronics - 0.1% | |||
Zebra Technologies Corp. Class A (a) | 1,619 | $ 60,421 | |
Semiconductors & Semiconductor Equipment - 3.6% | |||
Altera Corp. | 4,246 | 177,738 | |
Analog Devices, Inc. | 5,900 | 235,292 | |
Applied Materials, Inc. | 7,700 | 126,511 | |
Broadcom Corp. Class A | 2,200 | 90,684 | |
Intel Corp. | 36,110 | 775,282 | |
Lam Research Corp. (a) | 2,800 | 153,720 | |
Linear Technology Corp. | 2,000 | 69,120 | |
Marvell Technology Group Ltd. (a) | 3,933 | 71,895 | |
Novellus Systems, Inc. (a) | 4,900 | 195,804 | |
NVIDIA Corp. (a) | 2,500 | 56,650 | |
Rambus, Inc. (a) | 2,000 | 41,100 | |
Teradyne, Inc. (a)(e) | 7,000 | 130,410 | |
Texas Instruments, Inc. | 5,000 | 178,050 | |
Veeco Instruments, Inc. (a) | 1,429 | 67,992 | |
Xilinx, Inc. | 2,000 | 66,500 | |
| 2,436,748 | ||
Software - 5.9% | |||
Activision Blizzard, Inc. | 7,000 | 77,840 | |
Adobe Systems, Inc. (a)(e) | 4,000 | 138,000 | |
ANSYS, Inc. (a)(e) | 2,400 | 135,168 | |
Autodesk, Inc. (a) | 3,300 | 138,765 | |
BMC Software, Inc. (a) | 4,250 | 210,375 | |
CA, Inc. | 10,800 | 267,624 | |
Citrix Systems, Inc. (a) | 1,200 | 84,192 | |
FactSet Research Systems, Inc. | 700 | 73,416 | |
Intuit, Inc. (a) | 5,000 | 262,900 | |
Microsoft Corp. | 54,986 | 1,461,528 | |
Oracle Corp. | 36,523 | 1,201,607 | |
| 4,051,415 | ||
TOTAL INFORMATION TECHNOLOGY | 20,432,637 | ||
MATERIALS - 5.4% | |||
Chemicals - 2.4% | |||
Air Products & Chemicals, Inc. | 827 | 76,084 | |
Albemarle Corp. | 1,200 | 69,072 | |
E.I. du Pont de Nemours & Co. | 4,000 | 219,480 | |
Lubrizol Corp. | 2,503 | 272,502 | |
Monsanto Co. | 3,761 | 270,378 | |
PPG Industries, Inc. | 1,848 | 163,326 | |
Praxair, Inc. | 2,300 | 228,574 | |
Rockwood Holdings, Inc. (a)(e) | 2,707 | 126,011 | |
Sigma Aldrich Corp. | 1,400 | 89,446 | |
W.R. Grace & Co. (a) | 3,600 | 136,944 | |
| 1,651,817 | ||
Containers & Packaging - 0.6% | |||
Ball Corp. | 6,200 | 223,820 | |
Common Stocks - continued | |||
Shares | Value | ||
MATERIALS - continued | |||
Containers & Packaging - continued | |||
Crown Holdings, Inc. (a) | 2,495 | $ 96,008 | |
Rock-Tenn Co. Class A | 829 | 56,911 | |
| 376,739 | ||
Metals & Mining - 1.8% | |||
Cliffs Natural Resources, Inc. (e) | 1,276 | 123,861 | |
Freeport-McMoRan Copper & Gold, Inc. | 11,200 | 593,040 | |
Newmont Mining Corp. | 5,100 | 281,877 | |
Southern Copper Corp. | 2,100 | 88,872 | |
Walter Energy, Inc. | 1,050 | 127,061 | |
| 1,214,711 | ||
Paper & Forest Products - 0.6% | |||
Domtar Corp. | 3,374 | 294,888 | |
International Paper Co. | 2,800 | 77,784 | |
MeadWestvaco Corp. (e) | 2,000 | 58,700 | |
| 431,372 | ||
TOTAL MATERIALS | 3,674,639 | ||
TELECOMMUNICATION SERVICES - 0.7% | |||
Diversified Telecommunication Services - 0.6% | |||
AT&T, Inc. | 4,295 | 121,892 | |
Qwest Communications International, Inc. | 17,000 | 115,940 | |
Verizon Communications, Inc. | 4,502 | 166,214 | |
| 404,046 | ||
Wireless Telecommunication Services - 0.1% | |||
American Tower Corp. Class A (a) | 1,775 | 95,779 | |
TOTAL TELECOMMUNICATION SERVICES | 499,825 | ||
TOTAL COMMON STOCKS (Cost $54,452,875) | 66,884,406 | ||
Investment Companies - 0.0% | |||
|
|
|
|
Ares Capital Corp. | 1,519 | 27,084 | |
U.S. Treasury Obligations - 0.4% | ||||
| Principal Amount |
| ||
U.S. Treasury Bills, yield at date of purchase 0.15% to 0.2% 5/5/11 to 7/28/11 (f) | $ 250,000 | 249,905 | ||
Money Market Funds - 9.2% | |||
Shares | Value | ||
Dreyfus Cash Management Institutional Shares, 0.10% (c) | 473,544 | $ 473,544 | |
Fidelity Securities Lending Cash Central Fund, 0.21% (b)(d) | 5,762,819 | 5,762,819 | |
TOTAL MONEY MARKET FUNDS (Cost $6,236,363) | 6,236,363 | ||
TOTAL INVESTMENT PORTFOLIO - 107.8% (Cost $60,959,998) | 73,397,758 | |
NET OTHER ASSETS (LIABILITIES) - (7.8)% | (5,282,895) | |
NET ASSETS - 100% | $ 68,114,863 | |
Futures Contracts | |||||
Expiration Date | Underlying Face Amount at Value | Unrealized Appreciation/(Depreciation) | |||
Purchased | |||||
Equity Index Contracts | |||||
17 CME E-mini S&P 500 Index Contracts | March 2011 | $ 1,127,185 | $ 20,297 | ||
|
The face value of futures purchased as a percentage of net assets is 1.7% |
Legend |
(a) Non-income producing |
(b) Affiliated fund that is available only to investment companies and other accounts managed by Fidelity Investments. The rate quoted is the annualized seven-day yield of the fund at period end. A complete unaudited listing of the fund's holdings as of its most recent quarter end is available upon request. In addition, each Fidelity Central Fund's financial statements, which are not covered by the Fund's Report of Independent Registered Public Accounting Firm, are available on the SEC's website or upon request. |
(c) The rate quoted is the annualized seven-day yield of the fund at period end. |
(d) Investment made with cash collateral received from securities on loan. |
(e) Security or a portion of the security is on loan at period end. |
(f) Security or a portion of the security was pledged to cover margin requirements for futures contracts. At the period end, the value of securities pledged amounted to $219,924. |
Affiliated Central Funds |
Information regarding fiscal year to date income earned by the Fund from investments in Fidelity Central Funds is as follows: |
Fund | Income earned |
Fidelity Securities Lending Cash Central Fund | $ 14,440 |
Other Information |
The following is a summary of the inputs used, as of February 28, 2011, involving the Fund's assets and liabilities carried at fair value. The inputs or methodology used for valuing securities may not be an indication of the risk associated with investing in those securities. For more information on valuation inputs, and their aggregation into the levels used in the table below, please refer to the Security Valuation section in the accompanying Notes to Financial Statements. |
Valuation Inputs at Reporting Date: | ||||
Description | Total | Level 1 | Level 2 | Level 3 |
Investments in Securities: | ||||
Equities: | ||||
Consumer Discretionary | $ 9,480,024 | $ 9,480,024 | $ - | $ - |
Consumer Staples | 5,464,511 | 5,464,511 | - | - |
Energy | 8,769,410 | 8,769,410 | - | - |
Financials | 3,670,832 | 3,670,832 | - | - |
Health Care | 6,322,583 | 6,322,583 | - | - |
Industrials | 8,569,945 | 8,569,945 | - | - |
Information Technology | 20,432,637 | 20,432,637 | - | - |
Materials | 3,674,639 | 3,674,639 | - | - |
Telecommunication Services | 499,825 | 499,825 | - | - |
Investment Companies | 27,084 | 27,084 | - | - |
U.S. Government and Government Agency Obligations | 249,905 | - | 249,905 | - |
Money Market Funds | 6,236,363 | 6,236,363 | - | - |
Total Investments in Securities: | $ 73,397,758 | $ 73,147,853 | $ 249,905 | $ - |
Derivative Instruments: | ||||
Assets | ||||
Futures Contracts | $ 20,297 | $ 20,297 | $ - | $ - |
Value of Derivative Instruments |
The following table is a summary of the Fund's value of derivative instruments by risk exposure as of February 28, 2011. For additional information on derivative instruments, please refer to the Derivative Instruments section in the accompanying Notes to Financial Statements. |
Risk Exposure / | Value | |
| Asset | Liability |
Equity Risk | ||
Futures Contracts (a) | $ 20,297 | $ - |
Total Value of Derivatives | $ 20,297 | $ - |
(a) Reflects cumulative appreciation/(depreciation) on futures contracts as disclosed on the Schedule of Investments. Only the period end variation margin is separately disclosed on the Statement of Assets and Liabilities. |
Income Tax Information |
At February 28, 2011, the Fund had a capital loss carryforward of approximately $6,700,751 of which $97,236, $3,305,345 and $3,298,170 will expire in fiscal 2016, 2017 and 2018, respectively. Capital loss carryforwards are only available to offset future capital gains of the Fund to the extent provided by regulations and may be limited. |
See accompanying notes which are an integral part of the financial statements.
Annual Report
Fidelity Large Cap Growth Enhanced Index Fund
Financial Statements
Statement of Assets and Liabilities
| February 28, 2011 | |
|
|
|
Assets | ||
Investment in securities, at value (including securities loaned of $5,657,028) - See accompanying schedule: Unaffiliated issuers (cost $55,197,179) | $ 67,634,939 |
|
Fidelity Central Funds (cost $5,762,819) | 5,762,819 |
|
Total Investments (cost $60,959,998) |
| $ 73,397,758 |
Receivable for fund shares sold | 453,189 | |
Dividends receivable | 121,982 | |
Interest receivable | 132 | |
Distributions receivable from Fidelity Central Funds | 599 | |
Receivable for daily variation on futures contracts | 4,083 | |
Total assets | 73,977,743 | |
|
|
|
Liabilities | ||
Payable for fund shares redeemed | 75,752 | |
Accrued management fee | 16,230 | |
Other affiliated payables | 8,079 | |
Collateral on securities loaned, at value | 5,762,819 | |
Total liabilities | 5,862,880 | |
|
|
|
Net Assets | $ 68,114,863 | |
Net Assets consist of: |
| |
Paid in capital | $ 62,384,358 | |
Undistributed net investment income | 107,902 | |
Accumulated undistributed net realized gain (loss) on investments and foreign currency transactions | (6,835,454) | |
Net unrealized appreciation (depreciation) on investments | 12,458,057 | |
Net Assets, for 6,684,550 shares outstanding | $ 68,114,863 | |
Net Asset Value, offering price and redemption price per share ($68,114,863 ÷ 6,684,550 shares) | $ 10.19 | |
Statement of Operations
| Year ended February 28, 2011 | |
|
|
|
Investment Income |
|
|
Dividends |
| $ 834,161 |
Interest |
| 1,311 |
Income from Fidelity Central Funds |
| 14,440 |
Total income |
| 849,912 |
|
|
|
Expenses | ||
Management fee | $ 149,792 | |
Transfer agent fees | 75,200 | |
Independent trustees' compensation | 607 | |
Miscellaneous | 141 | |
Total expenses before reductions | 225,740 | |
Expense reductions | (1) | 225,739 |
Net investment income (loss) | 624,173 | |
Realized and Unrealized Gain (Loss) Net realized gain (loss) on: | ||
Investment securities: |
|
|
Unaffiliated issuers | 55,116 | |
Foreign currency transactions | 39 | |
Futures contracts | 63,477 | |
Total net realized gain (loss) |
| 118,632 |
Change in net unrealized appreciation (depreciation) on: Investment securities | 9,172,643 | |
Futures contracts | 8,356 | |
Total change in net unrealized appreciation (depreciation) |
| 9,180,999 |
Net gain (loss) | 9,299,631 | |
Net increase (decrease) in net assets resulting from operations | $ 9,923,804 | |
See accompanying notes which are an integral part of the financial statements.
Annual Report
Statement of Changes in Net Assets
| Year ended February 28, | Year ended February 28, |
Increase (Decrease) in Net Assets |
|
|
Operations |
|
|
Net investment income (loss) | $ 624,173 | $ 547,835 |
Net realized gain (loss) | 118,632 | (1,843,372) |
Change in net unrealized appreciation (depreciation) | 9,180,999 | 15,270,964 |
Net increase (decrease) in net assets resulting from operations | 9,923,804 | 13,975,427 |
Distributions to shareholders from net investment income | (603,819) | (510,338) |
Share transactions | 32,035,214 | 31,875,934 |
Reinvestment of distributions | 566,082 | 480,740 |
Cost of shares redeemed | (23,618,873) | (18,113,385) |
Net increase (decrease) in net assets resulting from share transactions | 8,982,423 | 14,243,289 |
Total increase (decrease) in net assets | 18,302,408 | 27,708,378 |
|
|
|
Net Assets | ||
Beginning of period | 49,812,455 | 22,104,077 |
End of period (including undistributed net investment income of $107,902 and undistributed net investment income of $87,888, respectively) | $ 68,114,863 | $ 49,812,455 |
Other Information Shares | ||
Sold | 3,413,789 | 4,324,048 |
Issued in reinvestment of distributions | 59,959 | 59,401 |
Redeemed | (2,689,220) | (2,428,399) |
Net increase (decrease) | 784,528 | 1,955,050 |
Financial Highlights
Years ended February 28, | 2011 | 2010 | 2009 | 2008 G |
Selected Per-Share Data |
|
|
|
|
Net asset value, beginning of period | $ 8.44 | $ 5.60 | $ 9.25 | $ 10.00 |
Income from Investment Operations |
|
|
|
|
Net investment income (loss) D | .11 | .11 | .09 | .08 |
Net realized and unrealized gain (loss) | 1.75 | 2.83 | (3.65) | (.78) |
Total from investment operations | 1.86 | 2.94 | (3.56) | (.70) |
Distributions from net investment income | (.11) | (.10) | (.09) | (.05) |
Net asset value, end of period | $ 10.19 | $ 8.44 | $ 5.60 | $ 9.25 |
Total Return B, C | 22.14% | 52.50% | (38.61)% | (7.05)% |
Ratios to Average Net Assets E, H |
|
|
|
|
Expenses before reductions | .45% | .45% | .45% | .45% A |
Expenses net of fee waivers, if any | .45% | .45% | .45% | .45% A |
Expenses net of all reductions | .45% | .45% | .45% | .45% A |
Net investment income (loss) | 1.25% | 1.42% | 1.14% | .89% A |
Supplemental Data |
|
|
|
|
Net assets, end of period (000 omitted) | $ 68,115 | $ 49,812 | $ 22,104 | $ 34,942 |
Portfolio turnover rate F | 80% | 35% I | 58% I | 36% A |
A Annualized
B Total returns for periods of less than one year are not annualized.
C Total returns would have been lower had certain expenses not been reduced during the periods shown.
D Calculated based on average shares outstanding during the period.
E Fees and expenses of the underlying Fidelity Central Funds are not included in the Fund's expense ratio. The Fund indirectly bears its proportionate share of the expenses of any underlying Fidelity Central Funds.
F Amount does not include the portfolio activity of any underlying Fidelity Central Funds.
G For the period April 19, 2007 (commencement of operations) to February 29, 2008.
H Expense ratios reflect operating expenses of the Fund. Expenses before reductions do not reflect amounts reimbursed by the investment adviser or reductions from expense offset arrangements and do not represent the amount paid by the Fund during periods when reimbursements or reductions occur. Expenses net of fee waivers reflect expenses after reimbursement by the investment adviser but prior to reductions from expense offset arrangements. Expenses net of all reductions represent the net expenses paid by the Fund.
I Reflects adjustments to exclude transactions in money market mutual funds.
See accompanying notes which are an integral part of the financial statements.
Annual Report
Fidelity Large Cap Value Enhanced Index Fund
Performance: The Bottom Line
Average annual total return reflects the change in the value of an investment, assuming reinvestment of the fund's distributions from dividend income and capital gains (the profits earned upon the sale of securities that have grown in value, if any) and assuming a constant rate of performance each year. The $10,000 table and the fund's returns do not reflect the deduction of taxes that a shareholder would pay on fund distributions or the redemption of fund shares. During periods of reimbursement by Fidelity a fund's total returns will be greater than it would be had the reimbursement not occurred. How a fund did yesterday is no guarantee of how it will do tomorrow.
Average Annual Total Returns
Periods ended February 28, 2011 | Past 1 | Life of |
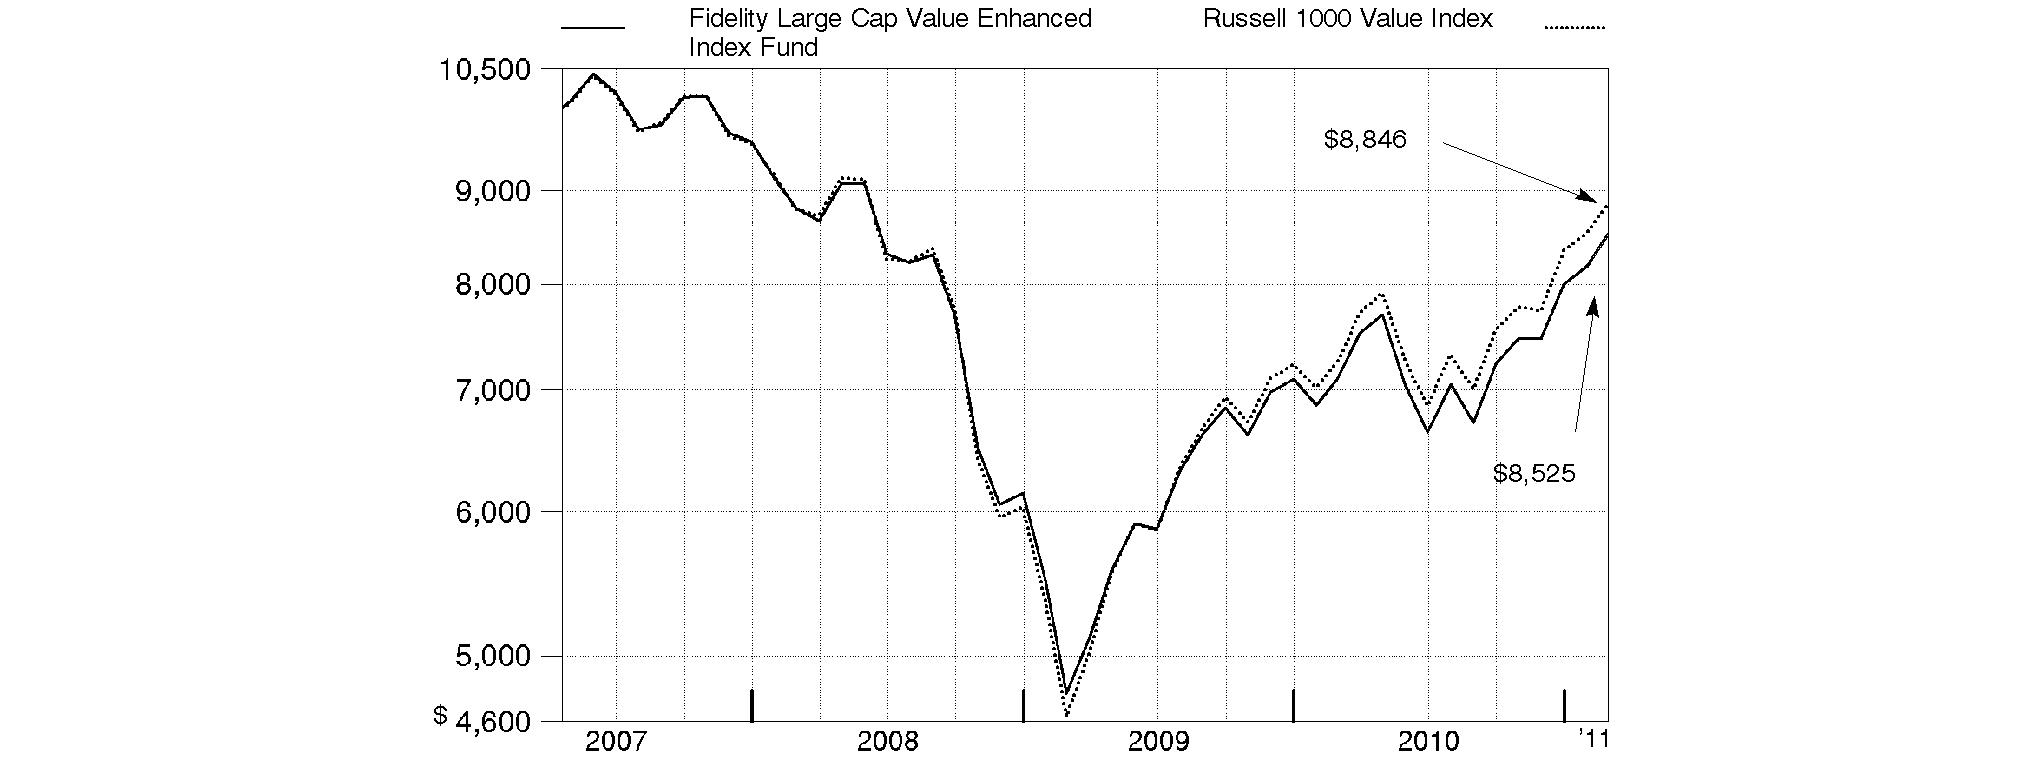
Fidelity Large Cap Value Enhanced Index Fund | 20.15% | -4.04% |
A From April 19, 2007.
$10,000 Over Life of Fund
Let's say hypothetically that $10,000 was invested in Fidelity Large Cap Value Enhanced Index Fund on April 19, 2007, when the fund started. The chart shows how the value of your investment would have changed, and also shows how the Russell 1000 Value Index performed over the same period.
Annual Report
Fidelity Large Cap Value Enhanced Index Fund
Management's Discussion of Fund Performance
Market Recap: Steady economic growth, encouraging monetary policy, improving credit-market conditions, an uptick in merger-and-acquisition activity and better-than-expected corporate earnings propelled U.S. stock markets forward during the 12-month period ending February 28, 2011. Uncertainty over the global effects of the debt crisis in Europe and China's attempt to rein in its economy plagued equities during the spring, but markets reacted positively to the Federal Reserve's second round of stimulative quantitative easing and the Congressional midterm elections in November, followed in December by the extension of Bush-era tax policies. For the full year, the S&P 500® Index advanced 22.57%, with all but one of the 10 major sectors tracked by MSCI® U.S. Investable Market classifications delivering a double-digit gain. While cyclically oriented sectors benefited from an overall improving economy, less economically sensitive sectors fell short of the broad market. Energy and materials stocks performed best, while the health care and consumer staples groups struggled the most.
Comments from Maximilian Kaufmann, member of the Geode Capital Management, LLC, investment management team for Fidelity® Large Cap Value Enhanced Index Fund: For the 12 months, the fund returned 20.15%, lagging the 22.16% return of the Russell 1000® Value Index. Weak security selection, most notably in the information technology, industrials and utilities sectors, weighed on results. The fund's positioning in financials also was challenging. Stock picking in materials and health care helped the fund's relative performance. Topping the list of detractors was financial holding company Prosperity Bancshares. Several other financials stocks lagged, including insurance provider Axis Capital Holdings and asset manager and financial planning firm Waddell & Reed Financial. In the technology sector, Hewlett-Packard saw its shares lose significant ground last August, following the unexpected resignation of the company's CEO. Also, late in the reporting period, the computer and peripherals company reduced its revenue target for the coming fiscal year. Underweighting strong-performing semiconductor manufacturer Micron Technology also hurt. Elsewhere, for-profit post-secondary education provider ITT Educational Services and apparel retailer Gap disappointed. On the positive side, weight-loss business Weight Watchers International added the most to the fund's result. Energy stocks such as oil-field services company RPC and energy equipment provider National Oilwell Varco benefited from an increasingly favorable market backdrop, given the rising price of oil. Paper company Domtar was helpful, as was media company CBS. Some of the names I've mentioned were not in the index, and some were no longer held at period end.
The views expressed above reflect those of the portfolio manager(s) only through the end of the period as stated on the cover of this report and do not necessarily represent the views of Fidelity or any other person in the Fidelity organization. Any such views are subject to change at any time based upon market or other conditions and Fidelity disclaims any responsibility to update such views. These views may not be relied on as investment advice and, because investment decisions for a Fidelity fund are based on numerous factors, may not be relied on as an indication of trading intent on behalf of any Fidelity fund.
Annual Report
Fidelity Large Cap Value Enhanced Index Fund
Investment Changes (Unaudited)
Top Ten Stocks as of February 28, 2011 | ||
| % of fund's | % of fund's net assets |
Chevron Corp. | 2.9 | 2.8 |
JPMorgan Chase & Co. | 2.9 | 2.8 |
General Electric Co. | 2.6 | 2.5 |
AT&T, Inc. | 2.4 | 3.5 |
Procter & Gamble Co. | 2.3 | 2.9 |
Wells Fargo & Co. | 2.3 | 2.2 |
Pfizer, Inc. | 2.2 | 2.2 |
Berkshire Hathaway, Inc. Class B | 2.2 | 2.6 |
Johnson & Johnson | 2.0 | 2.3 |
Bank of America Corp. | 1.8 | 2.2 |
| 23.6 | |
Market Sectors as of February 28, 2011 | ||
| % of fund's | % of fund's net assets |
Financials | 27.0 | 26.5 |
Energy | 13.8 | 11.3 |
Health Care | 13.1 | 14.1 |
Industrials | 9.3 | 8.5 |
Consumer Staples | 8.1 | 10.3 |
Consumer Discretionary | 8.1 | 7.8 |
Information Technology | 7.0 | 5.5 |
Utilities | 5.1 | 6.4 |
Telecommunication Services | 4.4 | 5.6 |
Materials | 3.3 | 3.6 |
Annual Report
Fidelity Large Cap Value Enhanced Index Fund
Investments February 28, 2011
Showing Percentage of Net Assets
Common Stocks - 99.2% | |||
Shares | Value | ||
CONSUMER DISCRETIONARY - 8.1% | |||
Auto Components - 0.4% | |||
Autoliv, Inc. | 1,100 | $ 82,379 | |
Lear Corp. | 800 | 84,640 | |
TRW Automotive Holdings Corp. (a) | 2,300 | 130,640 | |
| 297,659 | ||
Diversified Consumer Services - 0.2% | |||
Apollo Group, Inc. Class A (non-vtg.) (a) | 3,700 | 167,462 | |
Hotels, Restaurants & Leisure - 0.5% | |||
Brinker International, Inc. | 5,753 | 136,001 | |
Carnival Corp. unit | 1,500 | 64,005 | |
Wyndham Worldwide Corp. | 6,800 | 212,704 | |
| 412,710 | ||
Household Durables - 0.3% | |||
Stanley Black & Decker, Inc. | 1,600 | 121,328 | |
Tupperware Brands Corp. | 2,200 | 118,030 | |
| 239,358 | ||
Internet & Catalog Retail - 0.1% | |||
Liberty Media Corp. Interactive | 6,800 | 109,208 | |
Leisure Equipment & Products - 0.2% | |||
Polaris Industries, Inc. (d) | 2,610 | 196,925 | |
Media - 5.3% | |||
CBS Corp. Class B | 23,001 | 548,804 | |
Comcast Corp. Class A | 35,177 | 906,160 | |
Gannett Co., Inc. | 10,131 | 167,263 | |
Liberty Global, Inc. Class A (a) | 5,940 | 250,074 | |
News Corp. Class A | 22,055 | 383,095 | |
The Walt Disney Co. | 24,455 | 1,069,662 | |
Time Warner Cable, Inc. | 3,664 | 264,468 | |
Time Warner, Inc. | 16,997 | 649,285 | |
Viacom, Inc. Class B (non-vtg.) | 6,529 | 291,585 | |
| 4,530,396 | ||
Multiline Retail - 0.3% | |||
Macy's, Inc. | 11,063 | 264,406 | |
Specialty Retail - 0.5% | |||
Advance Auto Parts, Inc. (d) | 3,593 | 225,209 | |
Foot Locker, Inc. | 3,800 | 75,506 | |
Signet Jewelers Ltd. (a) | 3,543 | 155,431 | |
| 456,146 | ||
Textiles, Apparel & Luxury Goods - 0.3% | |||
VF Corp. | 2,100 | 200,907 | |
TOTAL CONSUMER DISCRETIONARY | 6,875,177 | ||
CONSUMER STAPLES - 8.1% | |||
Beverages - 1.2% | |||
Dr Pepper Snapple Group, Inc. (d) | 3,913 | 141,103 | |
Molson Coors Brewing Co. Class B | 1,500 | 68,595 | |
| |||
Shares | Value | ||
PepsiCo, Inc. | 5,763 | $ 365,489 | |
The Coca-Cola Co. | 6,726 | 429,926 | |
| 1,005,113 | ||
Food & Staples Retailing - 1.1% | |||
CVS Caremark Corp. | 11,008 | 363,924 | |
Kroger Co. | 1,848 | 42,319 | |
Wal-Mart Stores, Inc. | 8,900 | 462,622 | |
Walgreen Co. | 2,800 | 121,352 | |
| 990,217 | ||
Food Products - 2.3% | |||
Archer Daniels Midland Co. | 6,850 | 254,683 | |
ConAgra Foods, Inc. | 3,078 | 71,286 | |
Corn Products International, Inc. | 2,400 | 117,168 | |
Del Monte Foods Co. | 8,235 | 155,889 | |
General Mills, Inc. | 3,251 | 120,742 | |
Hershey Co. | 3,700 | 193,584 | |
Kraft Foods, Inc. Class A (d) | 14,144 | 450,345 | |
Smithfield Foods, Inc. (a) | 3,500 | 81,025 | |
The J.M. Smucker Co. | 2,623 | 180,567 | |
Tyson Foods, Inc. Class A | 16,717 | 311,438 | |
| 1,936,727 | ||
Household Products - 2.5% | |||
Energizer Holdings, Inc. (a) | 2,200 | 147,026 | |
Procter & Gamble Co. | 31,465 | 1,983,868 | |
| 2,130,894 | ||
Tobacco - 1.0% | |||
Altria Group, Inc. | 11,588 | 293,988 | |
Lorillard, Inc. | 1,700 | 130,509 | |
Philip Morris International, Inc. | 6,842 | 429,541 | |
| 854,038 | ||
TOTAL CONSUMER STAPLES | 6,916,989 | ||
ENERGY - 13.8% | |||
Energy Equipment & Services - 3.3% | |||
Baker Hughes, Inc. | 1,611 | 114,462 | |
Cameron International Corp. (a) | 1,300 | 76,869 | |
Complete Production Services, Inc. (a) | 3,100 | 89,311 | |
Halliburton Co. | 2,572 | 120,730 | |
Helmerich & Payne, Inc. (d) | 4,989 | 324,235 | |
McDermott International, Inc. (a) | 10,500 | 240,975 | |
National Oilwell Varco, Inc. | 10,202 | 811,773 | |
Oceaneering International, Inc. (a) | 4,200 | 351,246 | |
Oil States International, Inc. (a)(d) | 5,320 | 387,243 | |
Schlumberger Ltd. | 2,131 | 199,078 | |
SEACOR Holdings, Inc. | 600 | 56,862 | |
| 2,772,784 | ||
Oil, Gas & Consumable Fuels - 10.5% | |||
Alpha Natural Resources, Inc. (a) | 1,200 | 65,064 | |
Anadarko Petroleum Corp. | 5,832 | 477,233 | |
Apache Corp. | 3,739 | 465,954 | |
Arch Coal, Inc. | 1,600 | 53,648 | |
Common Stocks - continued | |||
Shares | Value | ||
ENERGY - continued | |||
Oil, Gas & Consumable Fuels - continued | |||
Chesapeake Energy Corp. (d) | 4,986 | $ 177,551 | |
Chevron Corp. | 24,096 | 2,499,956 | |
ConocoPhillips | 13,300 | 1,035,671 | |
CVR Energy, Inc. (a) | 6,000 | 113,400 | |
Devon Energy Corp. | 5,056 | 462,321 | |
Exxon Mobil Corp. | 6,700 | 573,051 | |
Hess Corp. | 3,292 | 286,503 | |
Marathon Oil Corp. | 3,051 | 151,330 | |
Murphy Oil Corp. | 2,100 | 154,413 | |
Noble Energy, Inc. | 692 | 64,121 | |
Occidental Petroleum Corp. | 7,418 | 756,413 | |
Peabody Energy Corp. | 4,938 | 323,390 | |
Pioneer Natural Resources Co. (d) | 1,200 | 122,808 | |
Spectra Energy Corp. | 7,234 | 193,510 | |
Valero Energy Corp. (d) | 16,500 | 464,970 | |
W&T Offshore, Inc. | 6,000 | 153,180 | |
Whiting Petroleum Corp. (a) | 5,200 | 339,768 | |
| 8,934,255 | ||
TOTAL ENERGY | 11,707,039 | ||
FINANCIALS - 27.0% | |||
Capital Markets - 3.1% | |||
Ameriprise Financial, Inc. | 7,500 | 474,900 | |
Bank of New York Mellon Corp. | 10,375 | 315,296 | |
BlackRock, Inc. Class A | 700 | 142,793 | |
Goldman Sachs Group, Inc. | 5,593 | 916,022 | |
Invesco Ltd. | 4,000 | 107,360 | |
Morgan Stanley | 9,735 | 288,935 | |
Raymond James Financial, Inc. | 2,400 | 91,968 | |
State Street Corp. | 5,956 | 266,352 | |
| 2,603,626 | ||
Commercial Banks - 5.3% | |||
BB&T Corp. | 3,700 | 102,120 | |
CIT Group, Inc. (a) | 1,295 | 56,099 | |
East West Bancorp, Inc. | 12,500 | 290,250 | |
Fifth Third Bancorp | 6,800 | 99,280 | |
Huntington Bancshares, Inc. | 8,000 | 54,720 | |
KeyCorp | 26,000 | 237,640 | |
M&T Bank Corp. | 1,800 | 158,490 | |
PNC Financial Services Group, Inc. | 7,185 | 443,315 | |
Prosperity Bancshares, Inc. | 3,000 | 122,460 | |
Signature Bank, New York (a)(d) | 2,400 | 124,536 | |
SunTrust Banks, Inc. | 5,500 | 165,935 | |
U.S. Bancorp, Delaware | 23,886 | 662,359 | |
Wells Fargo & Co. | 60,705 | 1,958,343 | |
| 4,475,547 | ||
Consumer Finance - 1.4% | |||
Capital One Financial Corp. (d) | 8,413 | 418,715 | |
| |||
Shares | Value | ||
Credit Acceptance Corp. (a)(d) | 2,687 | $ 189,702 | |
Discover Financial Services | 20,271 | 440,894 | |
SLM Corp. (a) | 8,500 | 125,970 | |
| 1,175,281 | ||
Diversified Financial Services - 7.0% | |||
Bank of America Corp. | 110,058 | 1,572,729 | |
Citigroup, Inc. (a) | 235,021 | 1,099,898 | |
CME Group, Inc. | 411 | 127,936 | |
JPMorgan Chase & Co. | 52,905 | 2,470,134 | |
Moody's Corp. (d) | 13,010 | 415,019 | |
The NASDAQ Stock Market, Inc. (a)(d) | 10,700 | 306,127 | |
| 5,991,843 | ||
Insurance - 7.1% | |||
ACE Ltd. | 3,621 | 229,028 | |
AFLAC, Inc. | 1,500 | 88,290 | |
Allied World Assurance Co. Holdings Ltd. | 1,800 | 111,078 | |
Allstate Corp. | 2,600 | 82,628 | |
Axis Capital Holdings Ltd. | 4,160 | 151,091 | |
Berkshire Hathaway, Inc. Class B (a) | 21,300 | 1,859,064 | |
Endurance Specialty Holdings Ltd. | 4,900 | 242,991 | |
Hartford Financial Services Group, Inc. | 4,800 | 142,080 | |
Lincoln National Corp. | 3,500 | 111,020 | |
MetLife, Inc. | 2,845 | 134,739 | |
Montpelier Re Holdings Ltd. (d) | 12,688 | 255,917 | |
PartnerRe Ltd. | 1,000 | 79,300 | |
Primerica, Inc. | 3,001 | 77,306 | |
Principal Financial Group, Inc. | 3,900 | 133,614 | |
Progressive Corp. | 4,000 | 83,320 | |
Protective Life Corp. | 12,120 | 344,572 | |
Prudential Financial, Inc. (d) | 7,800 | 513,474 | |
Reinsurance Group of America, Inc. | 5,000 | 301,950 | |
RenaissanceRe Holdings Ltd. | 1,861 | 124,724 | |
Symetra Financial Corp. | 17,000 | 243,100 | |
The Chubb Corp. | 3,500 | 212,380 | |
The Travelers Companies, Inc. | 4,282 | 256,620 | |
Torchmark Corp. (d) | 3,429 | 223,742 | |
Validus Holdings Ltd. | 2,786 | 86,227 | |
| 6,088,255 | ||
Real Estate Investment Trusts - 2.8% | |||
Annaly Capital Management, Inc. | 4,462 | 80,004 | |
Boston Properties, Inc. (d) | 500 | 47,960 | |
CBL & Associates Properties, Inc. (d) | 12,000 | 214,200 | |
Equity Residential (SBI) | 2,500 | 137,775 | |
HCP, Inc. (d) | 3,500 | 133,000 | |
Highwoods Properties, Inc. (SBI) (d) | 4,000 | 135,720 | |
Hospitality Properties Trust (SBI) | 10,855 | 249,665 | |
MFA Financial, Inc. | 21,000 | 177,870 | |
Nationwide Health Properties, Inc. | 3,800 | 162,412 | |
Public Storage (d) | 1,200 | 134,700 | |
Rayonier, Inc. | 5,100 | 312,783 | |
Simon Property Group, Inc. (d) | 2,095 | 230,534 | |
Ventas, Inc. | 2,200 | 121,924 | |
Common Stocks - continued | |||
Shares | Value | ||
FINANCIALS - continued | |||
Real Estate Investment Trusts - continued | |||
Vornado Realty Trust | 600 | $ 55,998 | |
Weyerhaeuser Co. | 6,500 | 158,665 | |
| 2,353,210 | ||
Real Estate Management & Development - 0.1% | |||
Jones Lang LaSalle, Inc. | 1,200 | 118,104 | |
Thrifts & Mortgage Finance - 0.2% | |||
New York Community Bancorp, Inc. | 6,000 | 111,960 | |
NewAlliance Bancshares, Inc. | 5,500 | 86,020 | |
| 197,980 | ||
TOTAL FINANCIALS | 23,003,846 | ||
HEALTH CARE - 13.1% | |||
Biotechnology - 1.4% | |||
Amgen, Inc. (a) | 9,500 | 487,635 | |
Biogen Idec, Inc. (a)(d) | 7,186 | 491,522 | |
Myriad Genetics, Inc. (a)(d) | 9,000 | 166,680 | |
| 1,145,837 | ||
Health Care Equipment & Supplies - 0.2% | |||
Cooper Companies, Inc. | 1,100 | 68,002 | |
Zimmer Holdings, Inc. (a) | 1,800 | 112,212 | |
| 180,214 | ||
Health Care Providers & Services - 3.3% | |||
Aetna, Inc. | 7,311 | 273,139 | |
Cardinal Health, Inc. | 12,002 | 499,763 | |
CIGNA Corp. | 6,000 | 252,420 | |
Health Management Associates, Inc. Class A (a) | 9,171 | 91,710 | |
Humana, Inc. (a) | 8,217 | 534,187 | |
McKesson Corp. | 1,600 | 126,848 | |
UnitedHealth Group, Inc. | 17,874 | 761,075 | |
WellPoint, Inc. | 3,863 | 256,774 | |
| 2,795,916 | ||
Life Sciences Tools & Services - 0.4% | |||
Bio-Rad Laboratories, Inc. Class A (a) | 600 | 68,496 | |
Life Technologies Corp. (a)(d) | 2,042 | 108,982 | |
Thermo Fisher Scientific, Inc. (a) | 3,200 | 178,624 | |
| 356,102 | ||
Pharmaceuticals - 7.8% | |||
Bristol-Myers Squibb Co. | 16,850 | 434,899 | |
Eli Lilly & Co. | 14,365 | 496,454 | |
Endo Pharmaceuticals Holdings, Inc. (a)(d) | 9,779 | 347,350 | |
Forest Laboratories, Inc. (a) | 12,137 | 393,239 | |
Johnson & Johnson | 27,925 | 1,715,712 | |
King Pharmaceuticals, Inc. (a) | 14,000 | 199,360 | |
| |||
Shares | Value | ||
Merck & Co., Inc. | 37,227 | $ 1,212,483 | |
Pfizer, Inc. | 97,051 | 1,867,261 | |
| 6,666,758 | ||
TOTAL HEALTH CARE | 11,144,827 | ||
INDUSTRIALS - 9.3% | |||
Aerospace & Defense - 1.8% | |||
General Dynamics Corp. | 3,675 | 279,741 | |
ITT Corp. | 1,500 | 86,895 | |
L-3 Communications Holdings, Inc. | 1,530 | 121,314 | |
Lockheed Martin Corp. | 2,000 | 158,320 | |
Northrop Grumman Corp. | 6,800 | 453,424 | |
Raytheon Co. | 7,026 | 359,801 | |
Rockwell Collins, Inc. | 1,000 | 64,440 | |
| 1,523,935 | ||
Air Freight & Logistics - 0.7% | |||
Atlas Air Worldwide Holdings, Inc. (a) | 4,823 | 329,314 | |
United Parcel Service, Inc. Class B | 3,939 | 290,698 | |
| 620,012 | ||
Airlines - 0.1% | |||
Alaska Air Group, Inc. (a) | 2,000 | 118,900 | |
Commercial Services & Supplies - 0.3% | |||
R.R. Donnelley & Sons Co. | 10,380 | 193,276 | |
Waste Management, Inc. | 2,546 | 94,355 | |
| 287,631 | ||
Construction & Engineering - 0.8% | |||
KBR, Inc. | 12,000 | 393,600 | |
URS Corp. (a) | 5,100 | 237,303 | |
| 630,903 | ||
Industrial Conglomerates - 2.9% | |||
General Electric Co. | 106,816 | 2,234,591 | |
Tyco International Ltd. | 5,200 | 235,768 | |
| 2,470,359 | ||
Machinery - 1.4% | |||
AGCO Corp. (a) | 1,800 | 98,604 | |
Eaton Corp. | 1,400 | 155,092 | |
Ingersoll-Rand Co. Ltd. | 3,600 | 163,080 | |
Joy Global, Inc. | 2,600 | 253,188 | |
Oshkosh Co. (a) | 5,013 | 178,814 | |
Parker Hannifin Corp. | 2,000 | 178,360 | |
Timken Co. | 2,599 | 126,623 | |
| 1,153,761 | ||
Road & Rail - 1.3% | |||
CSX Corp. | 5,024 | 375,092 | |
Norfolk Southern Corp. | 3,764 | 246,843 | |
Union Pacific Corp. | 5,100 | 486,591 | |
| 1,108,526 | ||
TOTAL INDUSTRIALS | 7,914,027 | ||
Common Stocks - continued | |||
Shares | Value | ||
INFORMATION TECHNOLOGY - 7.0% | |||
Communications Equipment - 0.5% | |||
Harris Corp. (d) | 3,770 | $ 175,908 | |
Motorola Mobility Holdings, Inc. | 1,943 | 58,679 | |
Motorola Solutions, Inc. | 2,221 | 85,819 | |
Plantronics, Inc. | 2,090 | 72,920 | |
| 393,326 | ||
Computers & Peripherals - 0.5% | |||
Hewlett-Packard Co. | 5,131 | 223,866 | |
QLogic Corp. (a)(d) | 7,400 | 133,644 | |
Western Digital Corp. (a) | 2,100 | 64,218 | |
| 421,728 | ||
Electronic Equipment & Components - 0.9% | |||
Corning, Inc. | 17,580 | 405,395 | |
Vishay Intertechnology, Inc. (a)(d) | 22,387 | 390,653 | |
| 796,048 | ||
Internet Software & Services - 0.4% | |||
eBay, Inc. (a) | 7,100 | 237,886 | |
IAC/InterActiveCorp (a) | 4,500 | 139,815 | |
| 377,701 | ||
IT Services - 1.0% | |||
Accenture PLC Class A | 4,200 | 216,216 | |
CACI International, Inc. Class A (a)(d) | 5,500 | 326,260 | |
Computer Sciences Corp. | 1,329 | 63,965 | |
Fiserv, Inc. (a) | 1,200 | 75,924 | |
International Business Machines Corp. | 1,041 | 168,517 | |
| 850,882 | ||
Office Electronics - 0.2% | |||
Xerox Corp. | 5,273 | 56,685 | |
Zebra Technologies Corp. Class A (a) | 2,327 | 86,844 | |
| 143,529 | ||
Semiconductors & Semiconductor Equipment - 1.8% | |||
Advanced Micro Devices, Inc. (a)(d) | 10,000 | 92,100 | |
Fairchild Semiconductor International, Inc. (a)(d) | 3,800 | 66,918 | |
Intel Corp. | 25,447 | 546,347 | |
KLA-Tencor Corp. | 3,000 | 146,460 | |
Micron Technology, Inc. (a) | 11,000 | 122,430 | |
Novellus Systems, Inc. (a) | 3,600 | 143,856 | |
RF Micro Devices, Inc. (a)(d) | 12,000 | 90,000 | |
Texas Instruments, Inc. | 8,400 | 299,124 | |
| 1,507,235 | ||
Software - 1.7% | |||
Activision Blizzard, Inc. | 8,000 | 88,960 | |
CA, Inc. | 2,300 | 56,994 | |
Microsoft Corp. | 32,500 | 863,850 | |
| |||
Shares | Value | ||
Oracle Corp. | 3,845 | $ 126,501 | |
Symantec Corp. (a) | 18,728 | 337,666 | |
| 1,473,971 | ||
TOTAL INFORMATION TECHNOLOGY | 5,964,420 | ||
MATERIALS - 3.3% | |||
Chemicals - 2.1% | |||
Cabot Corp. | 1,800 | 77,868 | |
Dow Chemical Co. | 11,490 | 426,968 | |
E.I. du Pont de Nemours & Co. | 7,146 | 392,101 | |
Lubrizol Corp. | 3,701 | 402,928 | |
PPG Industries, Inc. | 3,995 | 353,078 | |
Rockwood Holdings, Inc. (a)(d) | 2,763 | 128,618 | |
| 1,781,561 | ||
Containers & Packaging - 0.2% | |||
Ball Corp. | 3,918 | 141,440 | |
Rock-Tenn Co. Class A (d) | 1,240 | 85,126 | |
| 226,566 | ||
Metals & Mining - 0.3% | |||
Alcoa, Inc. (d) | 3,306 | 55,706 | |
Freeport-McMoRan Copper & Gold, Inc. | 2,854 | 151,119 | |
Walter Energy, Inc. | 400 | 48,404 | |
| 255,229 | ||
Paper & Forest Products - 0.7% | |||
Domtar Corp. | 4,228 | 369,527 | |
International Paper Co. | 2,500 | 69,450 | |
MeadWestvaco Corp. (d) | 4,500 | 132,075 | |
| 571,052 | ||
TOTAL MATERIALS | 2,834,408 | ||
TELECOMMUNICATION SERVICES - 4.4% | |||
Diversified Telecommunication Services - 4.2% | |||
AT&T, Inc. | 71,696 | 2,034,732 | |
CenturyLink, Inc. | 3,500 | 144,130 | |
Qwest Communications International, Inc. | 18,000 | 122,760 | |
Verizon Communications, Inc. | 35,268 | 1,302,095 | |
| 3,603,717 | ||
Wireless Telecommunication Services - 0.2% | |||
Sprint Nextel Corp. (a) | 35,485 | 155,069 | |
TOTAL TELECOMMUNICATION SERVICES | 3,758,786 | ||
UTILITIES - 5.1% | |||
Electric Utilities - 3.1% | |||
American Electric Power Co., Inc. | 5,770 | 206,451 | |
DPL, Inc. (d) | 7,633 | 198,611 | |
Duke Energy Corp. | 11,500 | 206,885 | |
Edison International | 3,800 | 141,056 | |
Entergy Corp. | 4,057 | 288,858 | |
Common Stocks - continued | |||
Shares | Value | ||
UTILITIES - continued | |||
Electric Utilities - continued | |||
Exelon Corp. (d) | 7,864 | $ 328,401 | |
FirstEnergy Corp. | 2,100 | 80,430 | |
NextEra Energy, Inc. | 4,622 | 256,382 | |
Northeast Utilities | 2,747 | 93,508 | |
Portland General Electric Co. (d) | 13,070 | 306,099 | |
PPL Corp. (d) | 1,439 | 36,594 | |
Progress Energy, Inc. | 2,943 | 134,525 | |
Southern Co. | 8,984 | 342,380 | |
| 2,620,180 | ||
Gas Utilities - 0.3% | |||
Energen Corp. | 4,030 | 246,233 | |
Multi-Utilities - 1.7% | |||
Ameren Corp. | 14,522 | 406,035 | |
Consolidated Edison, Inc. (d) | 1,782 | 89,064 | |
Dominion Resources, Inc. | 5,274 | 240,653 | |
PG&E Corp. | 3,719 | 171,297 | |
Public Service Enterprise Group, Inc. | 9,800 | 320,460 | |
Sempra Energy | 2,900 | 154,367 | |
Xcel Energy, Inc. (d) | 5,400 | 129,276 | |
| 1,511,152 | ||
TOTAL UTILITIES | 4,377,565 | ||
TOTAL COMMON STOCKS (Cost $70,948,301) | 84,497,084 | ||
Investment Companies - 0.1% | |||
|
|
|
|
Ares Capital Corp. | 4,500 | 80,235 | |
U.S. Treasury Obligations - 0.3% | ||||
| Principal Amount |
| ||
U.S. Treasury Bills, yield at date of purchase 0.19% to 0.2% 7/28/11 (e) | $ 230,000 | 229,860 | ||
Money Market Funds - 11.2% | |||
Shares | Value | ||
Dreyfus Cash Management Institutional Shares, 0.10% (f) | 434,386 | $ 434,386 | |
Fidelity Securities Lending Cash Central Fund, 0.21% (b)(c) | 9,098,844 | 9,098,844 | |
TOTAL MONEY MARKET FUNDS (Cost $9,533,230) | 9,533,230 | ||
TOTAL INVESTMENT PORTFOLIO - 110.8% (Cost $80,786,640) | 94,340,409 | |
NET OTHER ASSETS (LIABILITIES) - (10.8)% | (9,217,319) | |
NET ASSETS - 100% | $ 85,123,090 | |
Futures Contracts | |||||
Expiration Date | Underlying Face Amount at Value | Unrealized Appreciation/(Depreciation) | |||
Purchased | |||||
Equity Index Contracts | |||||
9 CME E-mini S&P 500 Index Contracts | March 2011 | $ 596,745 | $ 21,142 | ||
|
The face value of futures purchased as a percentage of net assets is 0.7% |
Legend |
(a) Non-income producing |
(b) Affiliated fund that is available only to investment companies and other accounts managed by Fidelity Investments. The rate quoted is the annualized seven-day yield of the fund at period end. A complete unaudited listing of the fund's holdings as of its most recent quarter end is available upon request. In addition, each Fidelity Central Fund's financial statements, which are not covered by the Fund's Report of Independent Registered Public Accounting Firm, are available on the SEC's website or upon request. |
(c) Investment made with cash collateral received from securities on loan. |
(d) Security or a portion of the security is on loan at period end. |
(e) Security or a portion of the security was pledged to cover margin requirements for futures contracts. At the period end, the value of securities pledged amounted to $229,860. |
(f) The rate quoted is the annualized seven-day yield at period end. |
Affiliated Central Funds |
Information regarding fiscal year to date income earned by the Fund from investments in Fidelity Central Funds is as follows: |
Fund | Income earned |
Fidelity Securities Lending Cash Central Fund | $ 13,555 |
Other Information |
The following is a summary of the inputs used, as of February 28, 2011, involving the Fund's assets and liabilities carried at fair value. The inputs or methodology used for valuing securities may not be an indication of the risk associated with investing in those securities. For more information on valuation inputs, and their aggregation into the levels used in the table below, please refer to the Security Valuation section in the accompanying Notes to Financial Statements. |
Valuation Inputs at Reporting Date: | ||||
Description | Total | Level 1 | Level 2 | Level 3 |
Investments in Securities: | ||||
Equities: | ||||
Consumer Discretionary | $ 6,875,177 | $ 6,875,177 | $ - | $ - |
Consumer Staples | 6,916,989 | 6,916,989 | - | - |
Energy | 11,707,039 | 11,707,039 | - | - |
Financials | 23,003,846 | 23,003,846 | - | - |
Health Care | 11,144,827 | 11,144,827 | - | - |
Industrials | 7,914,027 | 7,914,027 | - | - |
Information Technology | 5,964,420 | 5,964,420 | - | - |
Materials | 2,834,408 | 2,834,408 | - | - |
Telecommunication Services | 3,758,786 | 3,758,786 | - | - |
Utilities | 4,377,565 | 4,377,565 | - | - |
Investment Companies | 80,235 | 80,235 | - | - |
U.S. Government and Government Agency Obligations | 229,860 | - | 229,860 | - |
Money Market Funds | 9,533,230 | 9,533,230 | - | - |
Total Investments in Securities: | $ 94,340,409 | $ 94,110,549 | $ 229,860 | $ - |
Derivative Instruments: | ||||
Assets | ||||
Futures Contracts | $ 21,142 | $ 21,142 | $ - | $ - |
Value of Derivative Instruments |
The following table is a summary of the Fund's value of derivative instruments by risk exposure as of February 28, 2011. For additional information on derivative instruments, please refer to the Derivative Instruments section in the accompanying Notes to Financial Statements. |
Risk Exposure / | Value | |
| Asset | Liability |
Equity Risk | ||
Futures Contracts (a) | $ 21,142 | $ - |
Total Value of Derivatives | $ 21,142 | $ - |
(a) Reflects cumulative appreciation/(depreciation) on futures contracts as disclosed on the Schedule of Investments. Only the period end variation margin is separately disclosed on the Statement of Assets and Liabilities. |
Income Tax Information |
At February 28, 2011, the Fund had a capital loss carryforward of approximately $187,547 all of which will expire in fiscal 2017. Capital loss carryforwards are only available to offset future capital gains of the Fund to the extent provided by regulations and may be limited. |
See accompanying notes which are an integral part of the financial statements.
Annual Report
Fidelity Large Cap Value Enhanced Index Fund
Financial Statements
Statement of Assets and Liabilities
| February 28, 2011 | |
|
|
|
Assets | ||
Investment in securities, at value (including securities loaned of $8,941,816) - See accompanying schedule: Unaffiliated issuers (cost $71,687,796) | $ 85,241,565 |
|
Fidelity Central Funds (cost $9,098,844) | 9,098,844 |
|
Total Investments (cost $80,786,640) |
| $ 94,340,409 |
Receivable for fund shares sold | 69,260 | |
Dividends receivable | 181,607 | |
Interest receivable | 60 | |
Distributions receivable from Fidelity Central Funds | 766 | |
Receivable for daily variation on futures contracts | 4,184 | |
Total assets | 94,596,286 | |
|
|
|
Liabilities | ||
Payable for fund shares redeemed | 342,924 | |
Accrued management fee | 20,975 | |
Other affiliated payables | 10,453 | |
Collateral on securities loaned, at value | 9,098,844 | |
Total liabilities | 9,473,196 | |
|
|
|
Net Assets | $ 85,123,090 | |
Net Assets consist of: |
| |
Paid in capital | $ 71,933,982 | |
Undistributed net investment income | 167,330 | |
Accumulated undistributed net realized gain (loss) on investments | (553,133) | |
Net unrealized appreciation (depreciation) on investments | 13,574,911 | |
Net Assets, for 10,743,462 shares outstanding | $ 85,123,090 | |
Net Asset Value, offering price and redemption price per share ($85,123,090 ÷ 10,743,462 shares) | $ 7.92 | |
Statement of Operations
| Year ended February 28, 2011 | |
|
|
|
Investment Income |
|
|
Dividends |
| $ 1,535,859 |
Interest |
| 1,647 |
Income from Fidelity Central Funds (including $13,555 from security lending) |
| 13,555 |
Total income |
| 1,551,061 |
|
|
|
Expenses | ||
Management fee | $ 210,366 | |
Transfer agent fees | 105,612 | |
Independent trustees' compensation | 860 | |
Miscellaneous | 202 | |
Total expenses before reductions | 317,040 | |
Expense reductions | (10) | 317,030 |
Net investment income (loss) | 1,234,031 | |
Realized and Unrealized Gain (Loss) Net realized gain (loss) on: | ||
Investment securities: |
|
|
Unaffiliated issuers | 1,446,151 | |
Futures contracts | 23,654 | |
Total net realized gain (loss) |
| 1,469,805 |
Change in net unrealized appreciation (depreciation) on: Investment securities | 10,747,588 | |
Futures contracts | 9,029 | |
Total change in net unrealized appreciation (depreciation) |
| 10,756,617 |
Net gain (loss) | 12,226,422 | |
Net increase (decrease) in net assets resulting from operations | $ 13,460,453 | |
See accompanying notes which are an integral part of the financial statements.
Annual Report
Statement of Changes in Net Assets
| Year ended February 28, | Year ended February 28, |
Increase (Decrease) in Net Assets |
|
|
Operations |
|
|
Net investment income (loss) | $ 1,234,031 | $ 1,326,082 |
Net realized gain (loss) | 1,469,805 | 3,447,132 |
Change in net unrealized appreciation (depreciation) | 10,756,617 | 17,362,934 |
Net increase (decrease) in net assets resulting from operations | 13,460,453 | 22,136,148 |
Distributions to shareholders from net investment income | (1,184,075) | (1,285,327) |
Share transactions | 22,891,708 | 60,558,743 |
Reinvestment of distributions | 1,155,878 | 1,254,502 |
Cost of shares redeemed | (20,225,202) | (33,801,530) |
Net increase (decrease) in net assets resulting from share transactions | 3,822,384 | 28,011,715 |
Total increase (decrease) in net assets | 16,098,762 | 48,862,536 |
|
|
|
Net Assets | ||
Beginning of period | 69,024,328 | 20,161,792 |
End of period (including undistributed net investment income of $167,330 and undistributed net investment income of $203,537, respectively) | $ 85,123,090 | $ 69,024,328 |
Other Information Shares | ||
Sold | 3,182,934 | 11,338,883 |
Issued in reinvestment of distributions | 158,090 | 197,134 |
Redeemed | (2,904,695) | (5,617,182) |
Net increase (decrease) | 436,329 | 5,918,835 |
Financial Highlights
Years ended February 28, | 2011 | 2010 | 2009 | 2008 G |
Selected Per-Share Data |
|
|
|
|
Net asset value, beginning of period | $ 6.70 | $ 4.59 | $ 8.68 | $ 10.00 |
Income from Investment Operations |
|
|
|
|
Net investment income (loss) D | .12 | .13 | .20 | .18 |
Net realized and unrealized gain (loss) | 1.22 | 2.11 | (4.14) | (1.37) |
Total from investment operations | 1.34 | 2.24 | (3.94) | (1.19) |
Distributions from net investment income | (.12) | (.13) | (.15) | (.13) |
Net asset value, end of period | $ 7.92 | $ 6.70 | $ 4.59 | $ 8.68 |
Total Return B, C | 20.15% | 48.83% | (45.82)% | (12.00)% |
Ratios to Average Net Assets E, H |
|
|
|
|
Expenses before reductions | .45% | .45% | .45% | .45% A |
Expenses net of fee waivers, if any | .45% | .45% | .45% | .45% A |
Expenses net of all reductions | .45% | .45% | .45% | .45% A |
Net investment income (loss) | 1.76% | 2.11% | 2.81% | 2.12% A |
Supplemental Data |
|
|
|
|
Net assets, end of period (000 omitted) | $ 85,123 | $ 69,024 | $ 20,162 | $ 24,379 |
Portfolio turnover rate F | 83% | 89% I | 72% I | 65% A |
A Annualized
B Total returns for periods of less than one year are not annualized.
C Total returns would have been lower had certain expenses not been reduced during the periods shown.
D Calculated based on average shares outstanding during the period.
E Fees and expenses of the underlying Fidelity Central Funds are not included in the Fund's expense ratio. The Fund indirectly bears its proportionate share of the expenses of any underlying Fidelity Central Funds.
F Amount does not include the portfolio activity of any underlying Fidelity Central Funds.
G For the period April 19, 2007 (commencement of operations) to February 29, 2008.
H Expense ratios reflect operating expenses of the Fund. Expenses before reductions do not reflect amounts reimbursed by the investment adviser or reductions from expense offset arrangements and do not represent the amount paid by the Fund during periods when reimbursements or reductions occur. Expenses net of fee waivers reflect expenses after reimbursement by the investment adviser but prior to reductions from expense offset arrangements. Expenses net of all reductions represent the net expenses paid by the Fund.
I Reflects adjustments to exclude transactions in money market mutual funds.
See accompanying notes which are an integral part of the financial statements.
Annual Report
Fidelity Large Cap Core Enhanced Index Fund
Performance: The Bottom Line
Average annual total return reflects the change in the value of an investment, assuming reinvestment of the fund's distributions from dividend income and capital gains (the profits earned upon the sale of securities that have grown in value, if any) and assuming a constant rate of performance each year. The $10,000 table and the fund's returns do not reflect the deduction of taxes that a shareholder would pay on fund distributions or the redemption of fund shares. During periods of reimbursement by Fidelity a fund's total returns will be greater than it would be had the reimbursement not occurred. How a fund did yesterday is no guarantee of how it will do tomorrow.
Average Annual Total Returns
Periods ended February 28, 2011 | Past 1 | Life of |
Fidelity Large Cap Core Enhanced Index Fund | 20.25% | -0.91% |
A From April 19, 2007.
$10,000 Over Life of Fund
Let's say hypothetically that $10,000 was invested in Fidelity Large Cap Core Enhanced Index Fund on April 19, 2007, when the fund started. The chart shows how the value of your investment would have changed, and also shows how the S&P 500® Index performed over the same period.
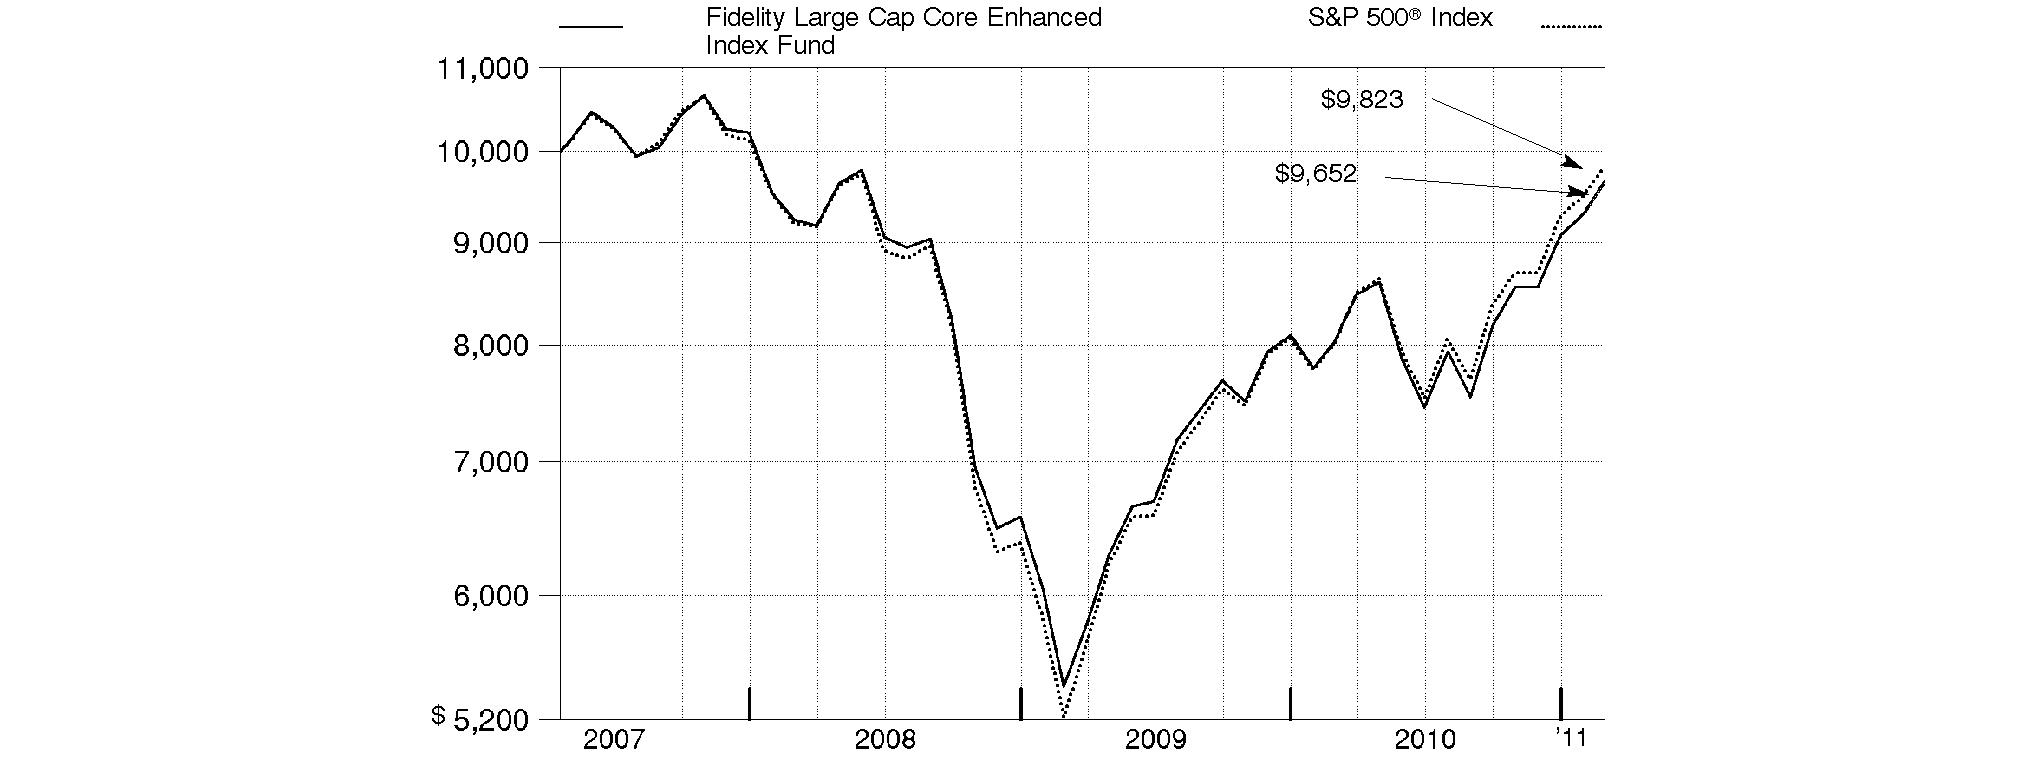
Annual Report
Fidelity Large Cap Core Enhanced Index Fund
Management's Discussion of Fund Performance
Market Recap: Steady economic growth, encouraging monetary policy, improving credit-market conditions, an uptick in merger-and-acquisition activity and better-than-expected corporate earnings propelled U.S. stock markets forward during the 12-month period ending February 28, 2011. Uncertainty over the global effects of the debt crisis in Europe and China's attempt to rein in its economy plagued equities during the spring, but markets reacted positively to the Federal Reserve's second round of stimulative quantitative easing and the Congressional midterm elections in November, followed in December by the extension of Bush-era tax policies. For the full year, the S&P 500® Index advanced 22.57%, with all but one of the 10 major sectors tracked by MSCI U.S. Investable Market classifications delivering a double-digit gain. While cyclically oriented sectors benefited from an overall improving economy, less economically sensitive sectors fell short of the broad market. Energy and materials stocks performed best, while the health care and consumer staples groups struggled the most.
Comments from Maximilian Kaufmann, member of the Geode Capital Management, LLC, investment management team for Fidelity® Large Cap Core Enhanced Index Fund: For the 12 months, the fund returned 20.25%, lagging the S&P 500®. Weak security selection, most notably in the information technology and industrials sectors, weighed on results. The fund's positioning in the consumer discretionary group also was challenging. Stock picking in energy and materials helped the fund's relative performance. The biggest detractor was Hewlett-Packard, whose shares lost significant ground last August following the unexpected resignation of the company's CEO. Also, late in the reporting period, the computer and peripherals company reduced its revenue target for the coming fiscal year. The stock of financial holding company Prosperity Bancshares underperformed, as did for-profit post-secondary education provider ITT Educational Services. Other sources of underperformance included defense contractors L-3 Communications Holdings and Raytheon; software giant Microsoft, which has faced an increasingly challenging competitive environment; SanDisk, a maker of flash memory for electronic devices whose shares we owned at inopportune times; and truck manufacturer Oshkosh. In contrast, energy stocks benefited from an increasingly favorable market backdrop, given the rising price of oil. Companies such as oil and gas equipment maker National Oilwell Varco and energy exploration firm Helmerich & Payne did very well. Paper company Domtar and weight-loss business Weight Watchers International added to the fund's result, as did media company CBS. Many of the names I've mentioned were not in the index, and some were no longer held at period end.
The views expressed above reflect those of the portfolio manager(s) only through the end of the period as stated on the cover of this report and do not necessarily represent the views of Fidelity or any other person in the Fidelity organization. Any such views are subject to change at any time based upon market or other conditions and Fidelity disclaims any responsibility to update such views. These views may not be relied on as investment advice and, because investment decisions for a Fidelity fund are based on numerous factors, may not be relied on as an indication of trading intent on behalf of any Fidelity fund.
Annual Report
Fidelity Large Cap Core Enhanced Index Fund
Investment Changes (Unaudited)
Top Ten Stocks as of February 28, 2011 | ||
| % of fund's | % of fund's net assets |
Exxon Mobil Corp. | 3.9 | 3.2 |
Apple, Inc. | 3.1 | 2.6 |
General Electric Co. | 2.3 | 2.1 |
Chevron Corp. | 2.1 | 1.7 |
Microsoft Corp. | 1.9 | 2.4 |
International Business Machines Corp. | 1.8 | 2.0 |
Google, Inc. Class A | 1.6 | 1.4 |
AT&T, Inc. | 1.5 | 2.3 |
Procter & Gamble Co. | 1.5 | 2.0 |
Wells Fargo & Co. | 1.5 | 1.6 |
| 21.2 | |
Market Sectors as of February 28, 2011 | ||
| % of fund's | % of fund's net assets |
Information Technology | 20.0 | 18.4 |
Financials | 15.1 | 14.7 |
Energy | 14.3 | 12.1 |
Health Care | 11.2 | 11.6 |
Consumer Discretionary | 11.1 | 10.8 |
Industrials | 10.3 | 10.2 |
Consumer Staples | 8.6 | 11.2 |
Materials | 4.4 | 3.8 |
Telecommunication Services | 2.8 | 3.5 |
Utilities | 1.7 | 2.7 |
Annual Report
Fidelity Large Cap Core Enhanced Index Fund
Investments February 28, 2011
Showing Percentage of Net Assets
Common Stocks - 99.5% | |||
Shares | Value | ||
CONSUMER DISCRETIONARY - 11.1% | |||
Auto Components - 0.2% | |||
Autoliv, Inc. | 21,515 | $ 1,611,258 | |
Johnson Controls, Inc. | 20,000 | 816,000 | |
| 2,427,258 | ||
Automobiles - 0.4% | |||
Ford Motor Co. (a) | 272,144 | 4,095,767 | |
Diversified Consumer Services - 0.1% | |||
Apollo Group, Inc. Class A (non-vtg.) (a) | 21,000 | 950,460 | |
Hotels, Restaurants & Leisure - 1.7% | |||
Brinker International, Inc. | 44,653 | 1,055,597 | |
Carnival Corp. unit | 12,000 | 512,040 | |
McDonald's Corp. | 71,184 | 5,387,205 | |
Starbucks Corp. | 70,000 | 2,308,600 | |
The Cheesecake Factory, Inc. (a)(e) | 76,036 | 2,208,085 | |
Wyndham Worldwide Corp. | 80,000 | 2,502,400 | |
Wynn Resorts Ltd. (e) | 8,000 | 983,440 | |
Yum! Brands, Inc. | 36,600 | 1,842,078 | |
| 16,799,445 | ||
Internet & Catalog Retail - 0.4% | |||
Amazon.com, Inc. (a) | 20,499 | 3,552,272 | |
Leisure Equipment & Products - 0.3% | |||
Polaris Industries, Inc. (e) | 37,107 | 2,799,723 | |
Media - 3.9% | |||
CBS Corp. Class B | 271,251 | 6,472,049 | |
Comcast Corp. Class A | 264,897 | 6,823,747 | |
DIRECTV (a)(e) | 42,438 | 1,950,875 | |
McGraw-Hill Companies, Inc. | 37,000 | 1,431,160 | |
News Corp. Class A | 153,646 | 2,668,831 | |
The Walt Disney Co. | 150,967 | 6,603,297 | |
Time Warner Cable, Inc. | 28,477 | 2,055,470 | |
Time Warner, Inc. | 194,722 | 7,438,380 | |
Viacom, Inc. Class B (non-vtg.) | 58,000 | 2,590,280 | |
| 38,034,089 | ||
Multiline Retail - 0.7% | |||
Macy's, Inc. | 109,408 | 2,614,851 | |
Nordstrom, Inc. | 25,000 | 1,131,500 | |
Target Corp. | 49,628 | 2,607,951 | |
| 6,354,302 | ||
Specialty Retail - 2.6% | |||
Advance Auto Parts, Inc. (e) | 36,044 | 2,259,238 | |
AutoZone, Inc. (a) | 3,800 | 980,210 | |
Bed Bath & Beyond, Inc. (a) | 25,000 | 1,203,750 | |
Home Depot, Inc. | 134,078 | 5,023,903 | |
Limited Brands, Inc. | 106,287 | 3,403,310 | |
Lowe's Companies, Inc. | 43,106 | 1,128,084 | |
Ross Stores, Inc. | 63,809 | 4,596,800 | |
TJX Companies, Inc. | 128,000 | 6,383,360 | |
| 24,978,655 | ||
| |||
Shares | Value | ||
Textiles, Apparel & Luxury Goods - 0.8% | |||
Coach, Inc. | 25,000 | $ 1,373,000 | |
NIKE, Inc. Class B | 15,074 | 1,342,038 | |
Polo Ralph Lauren Corp. Class A | 9,000 | 1,140,390 | |
VF Corp. | 41,811 | 4,000,058 | |
| 7,855,486 | ||
TOTAL CONSUMER DISCRETIONARY | 107,847,457 | ||
CONSUMER STAPLES - 8.6% | |||
Beverages - 2.1% | |||
Dr Pepper Snapple Group, Inc. (e) | 68,000 | 2,452,080 | |
PepsiCo, Inc. | 96,572 | 6,124,596 | |
The Coca-Cola Co. | 187,240 | 11,968,381 | |
| 20,545,057 | ||
Food & Staples Retailing - 1.7% | |||
Costco Wholesale Corp. | 16,568 | 1,239,121 | |
CVS Caremark Corp. | 67,892 | 2,244,510 | |
Wal-Mart Stores, Inc. | 150,155 | 7,805,057 | |
Walgreen Co. | 93,626 | 4,057,751 | |
Whole Foods Market, Inc. | 22,200 | 1,300,032 | |
| 16,646,471 | ||
Food Products - 1.2% | |||
Corn Products International, Inc. | 24,174 | 1,180,175 | |
General Mills, Inc. | 21,910 | 813,737 | |
H.J. Heinz Co. | 30,000 | 1,506,600 | |
Hershey Co. | 61,005 | 3,191,782 | |
Kraft Foods, Inc. Class A (e) | 81,662 | 2,600,118 | |
Tyson Foods, Inc. Class A | 130,000 | 2,421,900 | |
| 11,714,312 | ||
Household Products - 1.7% | |||
Colgate-Palmolive Co. | 21,087 | 1,655,751 | |
Kimberly-Clark Corp. | 12,598 | 830,208 | |
Procter & Gamble Co. | 228,717 | 14,420,607 | |
| 16,906,566 | ||
Tobacco - 1.9% | |||
Altria Group, Inc. | 109,981 | 2,790,218 | |
Lorillard, Inc. | 46,812 | 3,593,757 | |
Philip Morris International, Inc. | 183,656 | 11,529,924 | |
| 17,913,899 | ||
TOTAL CONSUMER STAPLES | 83,726,305 | ||
ENERGY - 14.3% | |||
Energy Equipment & Services - 3.7% | |||
Baker Hughes, Inc. | 16,000 | 1,136,800 | |
Cameron International Corp. (a) | 20,000 | 1,182,600 | |
Complete Production Services, Inc. (a) | 50,000 | 1,440,500 | |
Core Laboratories NV | 14,000 | 1,446,900 | |
Halliburton Co. | 70,245 | 3,297,300 | |
Helmerich & Payne, Inc. | 45,873 | 2,981,286 | |
McDermott International, Inc. (a) | 130,000 | 2,983,500 | |
Common Stocks - continued | |||
Shares | Value | ||
ENERGY - continued | |||
Energy Equipment & Services - continued | |||
National Oilwell Varco, Inc. | 103,114 | $ 8,204,781 | |
Oceaneering International, Inc. (a) | 38,000 | 3,177,940 | |
Schlumberger Ltd. | 107,503 | 10,042,930 | |
| 35,894,537 | ||
Oil, Gas & Consumable Fuels - 10.6% | |||
Anadarko Petroleum Corp. | 39,058 | 3,196,116 | |
Apache Corp. | 14,568 | 1,815,464 | |
Chevron Corp. | 194,104 | 20,138,290 | |
ConocoPhillips | 163,235 | 12,711,109 | |
Devon Energy Corp. | 31,367 | 2,868,198 | |
Exxon Mobil Corp. | 436,579 | 37,340,599 | |
Hess Corp. | 24,000 | 2,088,720 | |
Marathon Oil Corp. | 19,378 | 961,149 | |
Murphy Oil Corp. | 27,000 | 1,985,310 | |
Occidental Petroleum Corp. | 97,009 | 9,892,008 | |
Peabody Energy Corp. | 66,924 | 4,382,853 | |
Pioneer Natural Resources Co. (e) | 9,000 | 921,060 | |
Spectra Energy Corp. | 50,000 | 1,337,500 | |
Valero Energy Corp. (e) | 45,000 | 1,268,100 | |
Williams Companies, Inc. | 45,000 | 1,366,200 | |
| 102,272,676 | ||
TOTAL ENERGY | 138,167,213 | ||
FINANCIALS - 15.1% | |||
Capital Markets - 2.3% | |||
American Capital Ltd. (a)(e) | 100,000 | 934,000 | |
Ameriprise Financial, Inc. | 87,500 | 5,540,500 | |
Bank of New York Mellon Corp. | 50,000 | 1,519,500 | |
Franklin Resources, Inc. | 12,000 | 1,507,440 | |
Goldman Sachs Group, Inc. | 35,712 | 5,848,911 | |
Invesco Ltd. | 38,000 | 1,019,920 | |
Morgan Stanley | 90,000 | 2,671,200 | |
State Street Corp. | 37,107 | 1,659,425 | |
T. Rowe Price Group, Inc. | 20,000 | 1,339,600 | |
| 22,040,496 | ||
Commercial Banks - 2.7% | |||
East West Bancorp, Inc. | 145,000 | 3,366,900 | |
PNC Financial Services Group, Inc. | 71,611 | 4,418,399 | |
U.S. Bancorp, Delaware | 137,352 | 3,808,771 | |
Wells Fargo & Co. | 443,891 | 14,319,924 | |
| 25,913,994 | ||
Consumer Finance - 1.3% | |||
American Express Co. | 84,043 | 3,661,754 | |
Capital One Financial Corp. (e) | 69,276 | 3,447,867 | |
Discover Financial Services | 128,839 | 2,802,248 | |
SLM Corp. (a) | 205,846 | 3,050,638 | |
| 12,962,507 | ||
Diversified Financial Services - 3.9% | |||
Bank of America Corp. | 723,014 | 10,331,870 | |
| |||
Shares | Value | ||
Citigroup, Inc. (a) | 2,100,000 | $ 9,828,000 | |
JPMorgan Chase & Co. | 298,661 | 13,944,482 | |
Moody's Corp. (e) | 33,000 | 1,052,700 | |
The NASDAQ Stock Market, Inc. (a)(e) | 100,000 | 2,861,000 | |
| 38,018,052 | ||
Insurance - 3.1% | |||
ACE Ltd. | 62,621 | 3,960,778 | |
AFLAC, Inc. | 28,177 | 1,658,498 | |
Berkshire Hathaway, Inc. Class B (a) | 136,545 | 11,917,648 | |
Hartford Financial Services Group, Inc. | 50,000 | 1,480,000 | |
MetLife, Inc. | 41,510 | 1,965,914 | |
Montpelier Re Holdings Ltd. (e) | 76,442 | 1,541,835 | |
Protective Life Corp. | 144,000 | 4,093,920 | |
Prudential Financial, Inc. (e) | 31,588 | 2,079,438 | |
The Travelers Companies, Inc. | 21,022 | 1,259,848 | |
| 29,957,879 | ||
Real Estate Investment Trusts - 1.8% | |||
American Capital Agency Corp. (e) | 30,000 | 883,500 | |
CBL & Associates Properties, Inc. (e) | 75,000 | 1,338,750 | |
MFA Financial, Inc. | 175,000 | 1,482,250 | |
Nationwide Health Properties, Inc. | 51,780 | 2,213,077 | |
Public Storage (e) | 25,000 | 2,806,250 | |
Rayonier, Inc. | 64,000 | 3,925,120 | |
Simon Property Group, Inc. (e) | 39,000 | 4,291,560 | |
| 16,940,507 | ||
TOTAL FINANCIALS | 145,833,435 | ||
HEALTH CARE - 11.2% | |||
Biotechnology - 1.4% | |||
Amgen, Inc. (a) | 83,142 | 4,267,679 | |
Biogen Idec, Inc. (a)(e) | 77,187 | 5,279,591 | |
Celgene Corp. (a) | 17,264 | 916,718 | |
Gilead Sciences, Inc. (a) | 84,721 | 3,302,425 | |
| 13,766,413 | ||
Health Care Equipment & Supplies - 0.9% | |||
Baxter International, Inc. | 25,699 | 1,365,902 | |
Becton, Dickinson & Co. | 17,166 | 1,373,280 | |
Covidien PLC | 28,000 | 1,440,600 | |
Kinetic Concepts, Inc. (a) | 16,200 | 793,314 | |
Medtronic, Inc. | 48,163 | 1,922,667 | |
Stryker Corp. (e) | 26,000 | 1,644,760 | |
| 8,540,523 | ||
Health Care Providers & Services - 2.9% | |||
Aetna, Inc. | 42,000 | 1,569,120 | |
AmerisourceBergen Corp. | 32,000 | 1,213,120 | |
Cardinal Health, Inc. | 147,610 | 6,146,480 | |
CIGNA Corp. | 85,000 | 3,575,950 | |
Express Scripts, Inc. (a) | 17,164 | 964,960 | |
Humana, Inc. (a) | 89,076 | 5,790,831 | |
McKesson Corp. | 12,265 | 972,369 | |
Medco Health Solutions, Inc. (a) | 10,142 | 625,153 | |
Common Stocks - continued | |||
Shares | Value | ||
HEALTH CARE - continued | |||
Health Care Providers & Services - continued | |||
UnitedHealth Group, Inc. | 159,220 | $ 6,779,588 | |
WellPoint, Inc. | 9,000 | 598,230 | |
| 28,235,801 | ||
Life Sciences Tools & Services - 0.6% | |||
Agilent Technologies, Inc. (a) | 30,000 | 1,262,400 | |
Life Technologies Corp. (a)(e) | 23,468 | 1,252,487 | |
Pharmaceutical Product Development, Inc. | 50,000 | 1,373,500 | |
Thermo Fisher Scientific, Inc. (a) | 34,678 | 1,935,726 | |
| 5,824,113 | ||
Pharmaceuticals - 5.4% | |||
Abbott Laboratories | 145,903 | 7,017,934 | |
Allergan, Inc. | 12,600 | 934,542 | |
Bristol-Myers Squibb Co. | 108,432 | 2,798,630 | |
Eli Lilly & Co. | 116,578 | 4,028,936 | |
Endo Pharmaceuticals Holdings, Inc. (a)(e) | 52,984 | 1,881,992 | |
Forest Laboratories, Inc. (a) | 156,607 | 5,074,067 | |
Johnson & Johnson | 215,111 | 13,216,420 | |
Merck & Co., Inc. | 202,937 | 6,609,658 | |
Pfizer, Inc. | 559,387 | 10,762,606 | |
| 52,324,785 | ||
TOTAL HEALTH CARE | 108,691,635 | ||
INDUSTRIALS - 10.3% | |||
Aerospace & Defense - 2.5% | |||
General Dynamics Corp. | 57,104 | 4,346,756 | |
Honeywell International, Inc. | 61,941 | 3,587,003 | |
Lockheed Martin Corp. | 23,942 | 1,895,249 | |
Northrop Grumman Corp. | 80,000 | 5,334,400 | |
Raytheon Co. | 21,485 | 1,100,247 | |
The Boeing Co. | 29,432 | 2,119,398 | |
United Technologies Corp. | 73,871 | 6,171,183 | |
| 24,554,236 | ||
Air Freight & Logistics - 0.9% | |||
FedEx Corp. | 5,545 | 499,161 | |
United Parcel Service, Inc. Class B | 113,647 | 8,387,149 | |
| 8,886,310 | ||
Commercial Services & Supplies - 0.1% | |||
R.R. Donnelley & Sons Co. | 63,000 | 1,173,060 | |
Construction & Engineering - 0.6% | |||
KBR, Inc. | 135,000 | 4,428,000 | |
URS Corp. (a) | 27,128 | 1,262,266 | |
| 5,690,266 | ||
Electrical Equipment - 0.2% | |||
Emerson Electric Co. | 40,268 | 2,402,389 | |
Industrial Conglomerates - 3.0% | |||
3M Co. | 56,156 | 5,179,268 | |
| |||
Shares | Value | ||
General Electric Co. | 1,048,892 | $ 21,942,821 | |
Tyco International Ltd. | 37,000 | 1,677,580 | |
| 28,799,669 | ||
Machinery - 2.1% | |||
Caterpillar, Inc. | 44,138 | 4,543,124 | |
Cummins, Inc. | 4,062 | 410,749 | |
Danaher Corp. | 22,070 | 1,116,742 | |
Deere & Co. | 25,000 | 2,253,750 | |
Eaton Corp. | 13,500 | 1,495,530 | |
Illinois Tool Works, Inc. | 16,728 | 904,985 | |
Joy Global, Inc. | 26,247 | 2,555,933 | |
Oshkosh Co. (a) | 44,612 | 1,591,310 | |
PACCAR, Inc. | 7,935 | 397,782 | |
Parker Hannifin Corp. | 35,000 | 3,121,300 | |
Timken Co. | 35,000 | 1,705,200 | |
| 20,096,405 | ||
Road & Rail - 0.9% | |||
CSX Corp. | 38,000 | 2,837,080 | |
Norfolk Southern Corp. | 27,000 | 1,770,660 | |
Union Pacific Corp. | 40,543 | 3,868,208 | |
| 8,475,948 | ||
TOTAL INDUSTRIALS | 100,078,283 | ||
INFORMATION TECHNOLOGY - 20.0% | |||
Communications Equipment - 1.9% | |||
Cisco Systems, Inc. (a) | 395,516 | 7,340,777 | |
Harris Corp. (e) | 38,422 | 1,792,771 | |
Plantronics, Inc. | 29,493 | 1,029,011 | |
QUALCOMM, Inc. | 136,077 | 8,107,468 | |
| 18,270,027 | ||
Computers & Peripherals - 5.2% | |||
Apple, Inc. (a) | 84,103 | 29,706,021 | |
Dell, Inc. (a)(e) | 133,586 | 2,114,666 | |
EMC Corp. (a) | 114,798 | 3,123,654 | |
Hewlett-Packard Co. | 242,808 | 10,593,713 | |
QLogic Corp. (a)(e) | 215,000 | 3,882,900 | |
SanDisk Corp. (a) | 21,000 | 1,041,600 | |
| 50,462,554 | ||
Electronic Equipment & Components - 0.6% | |||
Corning, Inc. | 101,442 | 2,339,253 | |
Vishay Intertechnology, Inc. (a)(e) | 199,020 | 3,472,899 | |
| 5,812,152 | ||
Internet Software & Services - 1.9% | |||
eBay, Inc. (a) | 86,050 | 2,883,105 | |
Google, Inc. Class A (a) | 25,788 | 15,818,359 | |
| 18,701,464 | ||
IT Services - 3.5% | |||
Accenture PLC Class A | 71,000 | 3,655,080 | |
Automatic Data Processing, Inc. | 97,000 | 4,850,000 | |
Cognizant Technology Solutions Corp. Class A (a) | 18,000 | 1,383,660 | |
Common Stocks - continued | |||
Shares | Value | ||
INFORMATION TECHNOLOGY - continued | |||
IT Services - continued | |||
International Business Machines Corp. | 109,789 | $ 17,772,643 | |
MasterCard, Inc. Class A | 8,000 | 1,924,480 | |
Paychex, Inc. | 25,000 | 840,750 | |
The Western Union Co. (e) | 50,000 | 1,099,500 | |
Visa, Inc. Class A | 35,000 | 2,556,750 | |
| 34,082,863 | ||
Office Electronics - 0.1% | |||
Zebra Technologies Corp. Class A (a) | 28,936 | 1,079,892 | |
Semiconductors & Semiconductor Equipment - 2.3% | |||
Advanced Micro Devices, Inc. (a)(e) | 157,704 | 1,452,454 | |
Analog Devices, Inc. | 48,000 | 1,914,240 | |
Intel Corp. | 518,344 | 11,128,846 | |
KLA-Tencor Corp. | 25,000 | 1,220,500 | |
Lam Research Corp. (a) | 32,000 | 1,756,800 | |
Novellus Systems, Inc. (a) | 22,000 | 879,120 | |
Texas Instruments, Inc. | 93,000 | 3,311,730 | |
| 21,663,690 | ||
Software - 4.5% | |||
Activision Blizzard, Inc. | 195,000 | 2,168,400 | |
Adobe Systems, Inc. (a)(e) | 52,000 | 1,794,000 | |
BMC Software, Inc. (a) | 22,000 | 1,089,000 | |
CA, Inc. | 190,000 | 4,708,200 | |
Intuit, Inc. (a) | 52,000 | 2,734,160 | |
Microsoft Corp. | 681,751 | 18,120,942 | |
Oracle Corp. | 366,768 | 12,066,667 | |
Symantec Corp. (a) | 32,725 | 590,032 | |
| 43,271,401 | ||
TOTAL INFORMATION TECHNOLOGY | 193,344,043 | ||
MATERIALS - 4.4% | |||
Chemicals - 2.3% | |||
Dow Chemical Co. | 93,572 | 3,477,136 | |
E.I. du Pont de Nemours & Co. | 125,069 | 6,862,536 | |
Lubrizol Corp. | 28,659 | 3,120,105 | |
Monsanto Co. | 23,000 | 1,653,470 | |
PPG Industries, Inc. | 39,503 | 3,491,275 | |
Praxair, Inc. | 12,000 | 1,192,560 | |
Rockwood Holdings, Inc. (a)(e) | 31,131 | 1,449,148 | |
Sigma Aldrich Corp. | 17,000 | 1,086,130 | |
| 22,332,360 | ||
Containers & Packaging - 0.3% | |||
Ball Corp. | 86,732 | 3,131,025 | |
| |||
Shares | Value | ||
Metals & Mining - 1.1% | |||
Cliffs Natural Resources, Inc. (e) | 12,000 | $ 1,164,840 | |
Freeport-McMoRan Copper & Gold, Inc. | 108,670 | 5,754,077 | |
Newmont Mining Corp. | 61,161 | 3,380,368 | |
| 10,299,285 | ||
Paper & Forest Products - 0.7% | |||
Domtar Corp. | 56,006 | 4,894,924 | |
International Paper Co. | 42,000 | 1,166,760 | |
MeadWestvaco Corp. (e) | 30,000 | 880,500 | |
| 6,942,184 | ||
TOTAL MATERIALS | 42,704,854 | ||
TELECOMMUNICATION SERVICES - 2.8% | |||
Diversified Telecommunication Services - 2.8% | |||
AT&T, Inc. | 510,916 | 14,499,796 | |
CenturyLink, Inc. | 25,000 | 1,029,500 | |
Qwest Communications International, Inc. | 570,882 | 3,893,415 | |
Verizon Communications, Inc. | 219,195 | 8,092,679 | |
| 27,515,390 | ||
UTILITIES - 1.7% | |||
Electric Utilities - 1.0% | |||
American Electric Power Co., Inc. | 49,771 | 1,780,806 | |
Duke Energy Corp. | 47,989 | 863,322 | |
Exelon Corp. (e) | 48,975 | 2,045,196 | |
NextEra Energy, Inc. | 17,098 | 948,426 | |
Northeast Utilities | 29,220 | 994,649 | |
Portland General Electric Co. | 67,756 | 1,586,846 | |
Southern Co. | 22,509 | 857,818 | |
| 9,077,063 | ||
Multi-Utilities - 0.7% | |||
Ameren Corp. | 115,949 | 3,241,934 | |
Dominion Resources, Inc. | 21,000 | 958,230 | |
Public Service Enterprise Group, Inc. | 58,240 | 1,904,448 | |
Sempra Energy | 19,000 | 1,011,370 | |
| 7,115,982 | ||
TOTAL UTILITIES | 16,193,045 | ||
TOTAL COMMON STOCKS (Cost $933,067,615) | 964,101,660 | ||
U.S. Treasury Obligations - 0.3% | ||||
| Principal Amount |
| ||
U.S. Treasury Bills, yield at date of purchase 0.23% to 0.33% 5/5/11 to 6/30/11 (f) | $ 2,610,000 | 2,608,883 | ||
Money Market Funds - 6.6% | |||
Shares | Value | ||
Dreyfus Cash Management Institutional Shares, 0.10% (c) | 1,667,242 | $ 1,667,242 | |
Fidelity Securities Lending Cash Central Fund, 0.21% (b)(d) | 61,993,652 | 61,993,652 | |
TOTAL MONEY MARKET FUNDS (Cost $63,660,894) | 63,660,894 | ||
TOTAL INVESTMENT PORTFOLIO - 106.4% (Cost $999,336,331) | 1,030,371,437 | |
NET OTHER ASSETS (LIABILITIES) - (6.4)% | (61,725,730) | |
NET ASSETS - 100% | $ 968,645,707 | |
Futures Contracts | |||||
Expiration Date | Underlying Face Amount at Value | Unrealized Appreciation/(Depreciation) | |||
Purchased | |||||
Equity Index Contracts | |||||
70 CME E-mini S&P 500 Index Contracts | March 2011 | $ 4,641,350 | $ (33,627) | ||
The face value of futures purchased as a percentage of net assets is 0.5% |
Legend |
(a) Non-income producing |
(b) Affiliated fund that is available only to investment companies and other accounts managed by Fidelity Investments. The rate quoted is the annualized seven-day yield of the fund at period end. A complete unaudited listing of the fund's holdings as of its most recent quarter end is available upon request. In addition, each Fidelity Central Fund's financial statements, which are not covered by the Fund's Report of Independent Registered Public Accounting Firm, are available on the SEC's website or upon request. |
(c) The rate quoted is the annualized seven-day yield of the fund at period end. |
(d) Investment made with cash collateral received from securities on loan. |
(e) Security or a portion of the security is on loan at period end. |
(f) Security or a portion of the security was pledged to cover margin requirements for futures contracts. At the period end, the value of securities pledged amounted to $599,714. |
Affiliated Central Funds |
Information regarding fiscal year to date income earned by the Fund from investments in Fidelity Central Funds is as follows: |
Fund | Income earned |
Fidelity Securities Lending Cash Central Fund | $ 184,330 |
Other Information |
The following is a summary of the inputs used, as of February 28, 2011, involving the Fund's assets and liabilities carried at fair value. The inputs or methodology used for valuing securities may not be an indication of the risk associated with investing in those securities. For more information on valuation inputs, and their aggregation into the levels used in the table below, please refer to the Security Valuation section in the accompanying Notes to Financial Statements. |
Valuation Inputs at Reporting Date: | ||||
Description | Total | Level 1 | Level 2 | Level 3 |
Investments in Securities: | ||||
Equities: | ||||
Consumer Discretionary | $ 107,847,457 | $ 107,847,457 | $ - | $ - |
Consumer Staples | 83,726,305 | 83,726,305 | - | - |
Energy | 138,167,213 | 138,167,213 | - | - |
Financials | 145,833,435 | 145,833,435 | - | - |
Health Care | 108,691,635 | 108,691,635 | - | - |
Industrials | 100,078,283 | 100,078,283 | - | - |
Information Technology | 193,344,043 | 193,344,043 | - | - |
Materials | 42,704,854 | 42,704,854 | - | - |
Telecommunication Services | 27,515,390 | 27,515,390 | - | - |
Utilities | 16,193,045 | 16,193,045 | - | - |
U.S. Government and Government Agency Obligations | 2,608,883 | - | 2,608,883 | - |
Money Market Funds | 63,660,894 | 63,660,894 | - | - |
Total Investments in Securities: | $ 1,030,371,437 | $ 1,027,762,554 | $ 2,608,883 | $ - |
Derivative Instruments: | ||||
Liabilities | ||||
Futures Contracts | $ (33,627) | $ (33,627) | $ - | $ - |
Value of Derivative Instruments |
The following table is a summary of the Fund's value of derivative instruments by risk exposure as of February 28, 2011. For additional information on derivative instruments, please refer to the Derivative Instruments section in the accompanying Notes to Financial Statements. |
Risk Exposure / | Value | |
| Asset | Liability |
Equity Risk | ||
Futures Contracts (a) | $ - | $ (33,627) |
Total Value of Derivatives | $ - | $ (33,627) |
(a) Reflects cumulative appreciation/(depreciation) on futures contracts as disclosed on the Schedule of Investments. Only the period end variation margin is separately disclosed on the Statement of Assets and Liabilities. |
Income Tax Information |
At February 28, 2011, the Fund had a capital loss carryforward of approximately $85,601,774 of which $45,690,051 and $39,911,723 will expire in fiscal 2017 and 2018, respectively. Capital loss carryforwards are only available to offset future capital gains of the Fund to the extent provided by regulations and may be limited. |
See accompanying notes which are an integral part of the financial statements.
Annual Report
Fidelity Large Cap Core Enhanced Index Fund
Financial Statements
Statement of Assets and Liabilities
| February 28, 2011 | |
|
|
|
Assets | ||
Investment in securities, at value (including securities loaned of $61,064,409) - See accompanying schedule: Unaffiliated issuers (cost $937,342,679) | $ 968,377,785 |
|
Fidelity Central Funds (cost $61,993,652) | 61,993,652 |
|
Total Investments (cost $999,336,331) |
| $ 1,030,371,437 |
Receivable for fund shares sold | 188,410 | |
Dividends receivable | 2,105,544 | |
Interest receivable | 1,013 | |
Distributions receivable from Fidelity Central Funds | 6,094 | |
Receivable for daily variation on futures contracts | 34,609 | |
Total assets | 1,032,707,107 | |
|
|
|
Liabilities | ||
Payable for investments purchased | $ 1,440,110 | |
Payable for fund shares redeemed | 267,392 | |
Accrued management fee | 240,188 | |
Other affiliated payables | 120,058 | |
Collateral on securities loaned, at value | 61,993,652 | |
Total liabilities | 64,061,400 | |
|
|
|
Net Assets | $ 968,645,707 | |
Net Assets consist of: |
| |
Paid in capital | $ 1,024,813,524 | |
Undistributed net investment income | 2,062,802 | |
Accumulated undistributed net realized gain (loss) on investments | (89,232,098) | |
Net unrealized appreciation (depreciation) on investments | 31,001,479 | |
Net Assets, for 106,559,289 shares outstanding | $ 968,645,707 | |
Net Asset Value, offering price and redemption price per share ($968,645,707 ÷ 106,559,289 shares) | $ 9.09 | |
Statement of Operations
| Year ended February 28, 2011 | |
|
|
|
Investment Income |
|
|
Dividends |
| $ 19,087,153 |
Interest |
| 26,622 |
Income from Fidelity Central Funds |
| 184,330 |
Total income |
| 19,298,105 |
|
|
|
Expenses | ||
Management fee | $ 2,837,063 | |
Transfer agent fees | 1,424,511 | |
Independent trustees' compensation | 11,959 | |
Interest | 5,019 | |
Miscellaneous | 2,825 | |
Total expenses before reductions | 4,281,377 | |
Expense reductions | (115) | 4,281,262 |
Net investment income (loss) | 15,016,843 | |
Realized and Unrealized Gain (Loss) Net realized gain (loss) on: | ||
Investment securities: |
|
|
Unaffiliated issuers | 61,770,966 | |
Futures contracts | 2,736,397 | |
Total net realized gain (loss) |
| 64,507,363 |
Change in net unrealized appreciation (depreciation) on: Investment securities | 92,742,402 | |
Futures contracts | 127,815 | |
Total change in net unrealized appreciation (depreciation) |
| 92,870,217 |
Net gain (loss) | 157,377,580 | |
Net increase (decrease) in net assets resulting from operations | $ 172,394,423 | |
See accompanying notes which are an integral part of the financial statements.
Annual Report
Fidelity Large Cap Core Enhanced Index Fund
Financial Statements - continued
Statement of Changes in Net Assets
| Year ended February 28, | Year ended February 28, |
Increase (Decrease) in Net Assets |
|
|
Operations |
|
|
Net investment income (loss) | $ 15,016,843 | $ 17,726,017 |
Net realized gain (loss) | 64,507,363 | 16,226,928 |
Change in net unrealized appreciation (depreciation) | 92,870,217 | 348,621,025 |
Net increase (decrease) in net assets resulting from operations | 172,394,423 | 382,573,970 |
Distributions to shareholders from net investment income | (15,976,149) | (17,963,606) |
Share transactions | 140,360,567 | 212,649,935 |
Reinvestment of distributions | 15,540,824 | 17,876,296 |
Cost of shares redeemed | (349,858,780) | (312,499,917) |
Net increase (decrease) in net assets resulting from share transactions | (193,957,389) | (81,973,686) |
Total increase (decrease) in net assets | (37,539,115) | 282,636,678 |
|
|
|
Net Assets | ||
Beginning of period | 1,006,184,822 | 723,548,144 |
End of period (including undistributed net investment income of $2,062,802 and undistributed net investment income of $3,035,848, respectively) | $ 968,645,707 | $ 1,006,184,822 |
Other Information Shares | ||
Sold | 17,443,766 | 34,181,625 |
Issued in reinvestment of distributions | 1,846,723 | 2,454,564 |
Redeemed | (43,600,768) | (43,162,731) |
Net increase (decrease) | (24,310,279) | (6,526,542) |
Financial Highlights
Years ended February 28, | 2011 | 2010 | 2009 | 2008 G |
Selected Per-Share Data |
|
|
|
|
Net asset value, beginning of period | $ 7.69 | $ 5.27 | $ 9.20 | $ 10.00 |
Income from Investment Operations |
|
|
|
|
Net investment income (loss) D | .13 | .12 | .16 | .15 |
Net realized and unrealized gain (loss) | 1.42 | 2.43 | (3.95) | (.90) |
Total from investment operations | 1.55 | 2.55 | (3.79) | (.75) |
Distributions from net investment income | (.15) | (.13) | (.14) | (.05) |
Net asset value, end of period | $ 9.09 | $ 7.69 | $ 5.27 | $ 9.20 |
Total Return B, C | 20.25% | 48.52% | (41.51)% | (7.59)% |
Ratios to Average Net Assets E, H |
|
|
|
|
Expenses before reductions | .45% | .45% | .45% | .45% A |
Expenses net of fee waivers, if any | .45% | .45% | .45% | .45% A |
Expenses net of all reductions | .45% | .45% | .45% | .45% A |
Net investment income (loss) | 1.58% | 1.76% | 2.05% | 1.83% A |
Supplemental Data |
|
|
|
|
Net assets, end of period (000 omitted) | $ 968,646 | $ 1,006,185 | $ 723,548 | $ 834,523 |
Portfolio turnover rate F | 64% | 60% I | 45% I | 5% A |
A Annualized
B Total returns for periods of less than one year are not annualized.
C Total returns would have been lower had certain expenses not been reduced during the periods shown.
D Calculated based on average shares outstanding during the period.
E Fees and expenses of the underlying Fidelity Central Funds are not included in the Fund's expense ratio. The Fund indirectly bears its proportionate share of the expenses of any underlying Fidelity Central Funds.
F Amount does not include the portfolio activity of any underlying Fidelity Central Funds.
G For the period April 19, 2007 (commencement of operations) to February 29, 2008.
H Expense ratios reflect operating expenses of the Fund. Expenses before reductions do not reflect amounts reimbursed by the investment adviser or reductions from expense offset arrangements and do not represent the amount paid by the Fund during periods when reimbursements or reductions occur. Expenses net of fee waivers reflect expenses after reimbursement by the investment adviser but prior to reductions from expense offset arrangements. Expenses net of all reductions represent the net expenses paid by the Fund.
I Reflects adjustments to exclude transactions in money market mutual funds.
See accompanying notes which are an integral part of the financial statements.
Annual Report
Fidelity Mid Cap Enhanced Index Fund
Performance: The Bottom Line
Average annual total return reflects the change in the value of an investment, assuming reinvestment of the fund's distributions from dividend income and capital gains (the profits earned upon the sale of securities that have grown in value, if any) and assuming a constant rate of performance each year. The $10,000 table and the fund's returns do not reflect the deduction of taxes that a shareholder would pay on fund distributions or the redemption of fund shares. During periods of reimbursement by Fidelity a fund's total returns will be greater than it would be had the reimbursement not occurred. How a fund did yesterday is no guarantee of how it will do tomorrow.
Average Annual Total Returns
Periods ended February 28, 2011 | Past 1 | Life of |
Fidelity Mid Cap Enhanced Index Fund | 29.44% | 3.12% |
A From December 20, 2007.
$10,000 Over Life of Fund
Let's say hypothetically that $10,000 was invested in Fidelity Mid Cap Enhanced Index Fund on December 20, 2007, when the fund started. The chart shows how the value of your investment would have changed, and also shows how the Russell MidCap® Index performed over the same period.
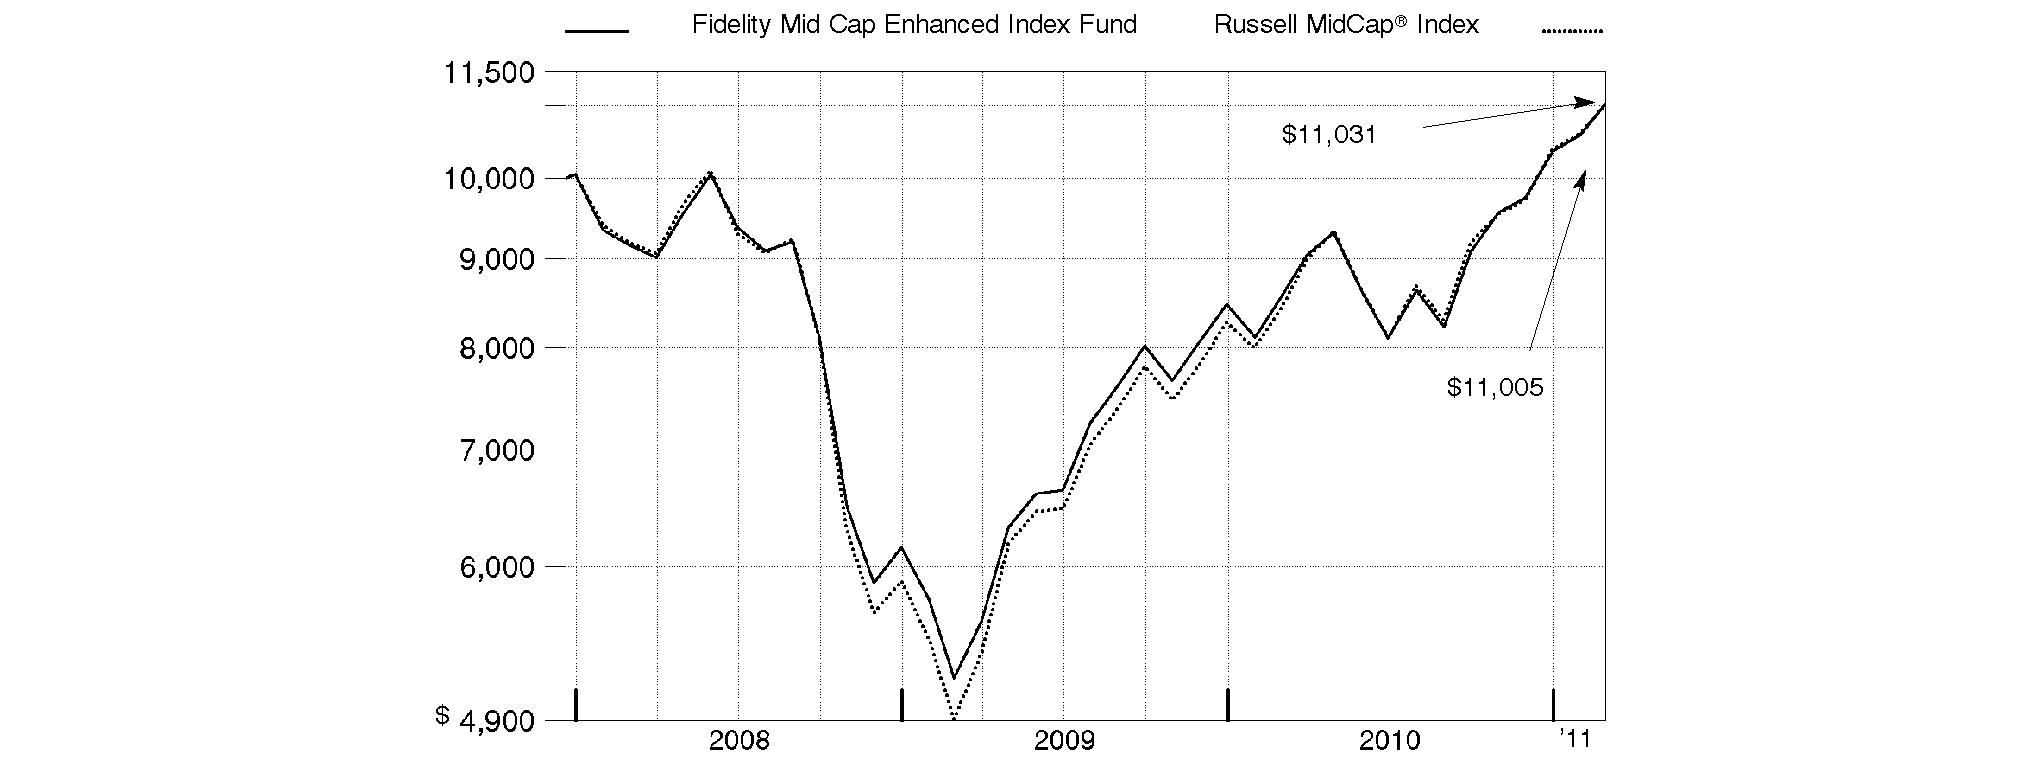
Annual Report
Fidelity Mid Cap Enhanced Index Fund
Management's Discussion of Fund Performance
Market Recap: Steady economic growth, encouraging monetary policy, improving credit-market conditions, an uptick in merger-and-acquisition activity and better-than-expected corporate earnings propelled U.S. stock markets forward during the 12-month period ending February 28, 2011. Uncertainty over the global effects of the debt crisis in Europe and China's attempt to rein in its economy plagued equities during the spring, but markets reacted positively to the Federal Reserve's second round of stimulative quantitative easing and the Congressional midterm elections in November, followed in December by the extension of Bush-era tax policies. For the full year, the S&P 500® Index advanced 22.57%, with all but one of the 10 major sectors tracked by MSCI U.S. Investable Market classifications delivering a double-digit gain. While cyclically oriented sectors benefited from an overall improving economy, less economically sensitive sectors fell short of the broad market. Energy and materials stocks performed best, while the health care and consumer staples groups struggled the most.
Comments from Maximilian Kaufmann, member of the Geode Capital Management, LLC, investment management team for Fidelity® Mid Cap Enhanced Index Fund: For the 12 months, the fund returned 29.44%, lagging the 31.05% return of the Russell Midcap® Index. Weak security selection, most notably in the financials, information technology, health care and consumer discretionary sectors, weighed on results. On an individual basis, stock picking in materials and energy helped the fund's relative performance. A position in Amedisys, which provides home health-care services to elderly patients, hampered results. The stock of mining company Golden Star Resources lagged, and underweighting strong-performing "name your own price" travel agency Priceline.com also hurt. Other sources of underperformance included for-profit post-secondary education provider ITT Educational Services; defense contractor L-3 Communications Holdings; insurance company Genworth Financial; hard-drive manufacturer Western Digital; and underweighting outperforming sales-oriented software company Salesforce.com. In contrast, the fund's top two contributors, Hecla Mining and CF Industries Holdings, were strong-performing materials stocks. Semiconductor company Fairchild Semiconductor International, wireless-radio manufacturer InterDigital, independent oil and gas company Cimarex, and auto-safety equipment maker TRW Automotive Holdings all added to the fund's result. Some of the names I've mentioned were not in the index, and some were no longer held at period end.
The views expressed above reflect those of the portfolio manager(s) only through the end of the period as stated on the cover of this report and do not necessarily represent the views of Fidelity or any other person in the Fidelity organization. Any such views are subject to change at any time based upon market or other conditions and Fidelity disclaims any responsibility to update such views. These views may not be relied on as investment advice and, because investment decisions for a Fidelity fund are based on numerous factors, may not be relied on as an indication of trading intent on behalf of any Fidelity fund.
Annual Report
Fidelity Mid Cap Enhanced Index Fund
Investment Changes (Unaudited)
Top Ten Stocks as of February 28, 2011 | ||
| % of fund's | % of fund's net assets |
Ameriprise Financial, Inc. | 0.8 | 0.1 |
Eaton Corp. | 0.8 | 0.7 |
Peabody Energy Corp. | 0.8 | 0.1 |
Agilent Technologies, Inc. | 0.8 | 0.2 |
Altera Corp. | 0.8 | 0.5 |
Parker Hannifin Corp. | 0.8 | 0.5 |
Intuit, Inc. | 0.7 | 1.0 |
Cimarex Energy Co. | 0.7 | 0.7 |
FMC Technologies, Inc. | 0.7 | 0.8 |
Cummins, Inc. | 0.7 | 0.2 |
| 7.6 | |
Market Sectors as of February 28, 2011 | ||
| % of fund's | % of fund's net assets |
Information Technology | 15.6 | 16.1 |
Financials | 15.5 | 17.3 |
Industrials | 13.1 | 13.9 |
Consumer Discretionary | 12.1 | 12.2 |
Energy | 10.6 | 8.5 |
Health Care | 10.1 | 8.9 |
Materials | 7.1 | 7.5 |
Consumer Staples | 4.1 | 6.9 |
Utilities | 3.5 | 6.4 |
Telecommunication Services | 1.4 | 1.5 |
Annual Report
Fidelity Mid Cap Enhanced Index Fund
Investments February 28, 2011
Showing Percentage of Net Assets
Common Stocks - 93.1% | |||
Shares | Value | ||
CONSUMER DISCRETIONARY - 12.1% | |||
Auto Components - 1.4% | |||
Autoliv, Inc. | 4,050 | $ 303,305 | |
Dana Holding Corp. (a) | 11,432 | 215,836 | |
TRW Automotive Holdings Corp. (a) | 5,957 | 338,358 | |
| 857,499 | ||
Automobiles - 0.4% | |||
Ford Motor Co. (a) | 14,590 | 219,580 | |
Diversified Consumer Services - 0.8% | |||
Apollo Group, Inc. Class A (non-vtg.) (a) | 8,270 | 374,300 | |
ITT Educational Services, Inc. (a)(e) | 2,000 | 151,700 | |
| 526,000 | ||
Hotels, Restaurants & Leisure - 1.3% | |||
Brinker International, Inc. | 12,640 | 298,810 | |
MGM Mirage, Inc. (a) | 1,736 | 24,200 | |
Panera Bread Co. Class A (a) | 1,300 | 151,775 | |
Starwood Hotels & Resorts Worldwide, Inc. | 569 | 34,766 | |
Wyndham Worldwide Corp. | 8,845 | 276,672 | |
| 786,223 | ||
Household Durables - 0.4% | |||
Jarden Corp. | 2,113 | 69,454 | |
Stanley Black & Decker, Inc. | 215 | 16,303 | |
Tupperware Brands Corp. | 3,172 | 170,178 | |
| 255,935 | ||
Internet & Catalog Retail - 0.9% | |||
Liberty Media Corp. Interactive Series A (a) | 24,163 | 388,058 | |
Priceline.com, Inc. (a) | 323 | 146,603 | |
| 534,661 | ||
Leisure Equipment & Products - 0.3% | |||
Mattel, Inc. | 7,581 | 189,980 | |
Media - 1.7% | |||
CBS Corp. Class B | 17,366 | 414,353 | |
Discovery Communications, Inc. (a) | 662 | 28,539 | |
Interpublic Group of Companies, Inc. | 24,200 | 319,440 | |
John Wiley & Sons, Inc. Class A | 5,500 | 262,955 | |
McGraw-Hill Companies, Inc. | 741 | 28,662 | |
| 1,053,949 | ||
Multiline Retail - 0.8% | |||
Dollar Tree, Inc. (a) | 3,688 | 185,580 | |
Macy's, Inc. | 11,984 | 286,418 | |
Nordstrom, Inc. | 185 | 8,373 | |
| 480,371 | ||
Specialty Retail - 2.9% | |||
Advance Auto Parts, Inc. | 2,000 | 125,360 | |
AutoZone, Inc. (a) | 1,418 | 365,773 | |
Bed Bath & Beyond, Inc. (a) | 880 | 42,372 | |
Limited Brands, Inc. | 9,813 | 314,212 | |
Ross Stores, Inc. | 4,000 | 288,160 | |
| |||
Shares | Value | ||
Signet Jewelers Ltd. (a) | 7,596 | $ 333,237 | |
Tiffany & Co., Inc. | 2,000 | 123,100 | |
TJX Companies, Inc. | 4,338 | 216,336 | |
| 1,808,550 | ||
Textiles, Apparel & Luxury Goods - 1.2% | |||
Coach, Inc. | 5,620 | 308,650 | |
Crocs, Inc. (a) | 6,000 | 105,900 | |
VF Corp. | 3,686 | 352,640 | |
| 767,190 | ||
TOTAL CONSUMER DISCRETIONARY | 7,479,938 | ||
CONSUMER STAPLES - 4.1% | |||
Beverages - 0.3% | |||
Brown-Forman Corp. Class B (non-vtg.) | 800 | 55,320 | |
Dr Pepper Snapple Group, Inc. | 3,500 | 126,210 | |
| 181,530 | ||
Food & Staples Retailing - 0.8% | |||
Andersons, Inc. | 5,000 | 240,200 | |
PriceSmart, Inc. | 6,813 | 242,475 | |
| 482,675 | ||
Food Products - 2.1% | |||
Bunge Ltd. | 3,000 | 216,510 | |
Corn Products International, Inc. | 5,960 | 290,967 | |
Del Monte Foods Co. | 4,468 | 84,579 | |
H.J. Heinz Co. | 5,180 | 260,140 | |
Hershey Co. | 5,035 | 263,431 | |
Mead Johnson Nutrition Co. Class A | 451 | 26,992 | |
Sara Lee Corp. | 9,677 | 165,670 | |
| 1,308,289 | ||
Household Products - 0.4% | |||
Energizer Holdings, Inc. (a) | 3,400 | 227,222 | |
Personal Products - 0.1% | |||
Avon Products, Inc. | 1,245 | 34,623 | |
Herbalife Ltd. | 505 | 39,597 | |
| 74,220 | ||
Tobacco - 0.4% | |||
Lorillard, Inc. | 3,258 | 250,117 | |
TOTAL CONSUMER STAPLES | 2,524,053 | ||
ENERGY - 10.6% | |||
Energy Equipment & Services - 5.6% | |||
Atwood Oceanics, Inc. (a) | 6,800 | 309,536 | |
Cameron International Corp. (a) | 4,866 | 287,727 | |
Core Laboratories NV (e) | 3,613 | 373,404 | |
Diamond Offshore Drilling, Inc. (e) | 3,000 | 234,690 | |
Dril-Quip, Inc. (a) | 2,346 | 179,938 | |
FMC Technologies, Inc. (a) | 4,599 | 432,536 | |
Helmerich & Payne, Inc. | 4,045 | 262,885 | |
McDermott International, Inc. (a) | 15,000 | 344,250 | |
Oceaneering International, Inc. (a) | 4,061 | 339,621 | |
Common Stocks - continued | |||
Shares | Value | ||
ENERGY - continued | |||
Energy Equipment & Services - continued | |||
Oil States International, Inc. (a) | 4,382 | $ 318,966 | |
Schlumberger Ltd. | 515 | 48,111 | |
SEACOR Holdings, Inc. | 2,648 | 250,951 | |
Weatherford International Ltd. (a) | 3,624 | 87,628 | |
| 3,470,243 | ||
Oil, Gas & Consumable Fuels - 5.0% | |||
Alpha Natural Resources, Inc. (a) | 2,168 | 117,549 | |
Cimarex Energy Co. | 3,840 | 445,939 | |
Cloud Peak Energy, Inc. (a) | 5,300 | 108,650 | |
Energy Partners Ltd. (a) | 6,542 | 107,093 | |
Murphy Oil Corp. | 3,749 | 275,664 | |
Noble Energy, Inc. | 885 | 82,004 | |
Peabody Energy Corp. | 7,522 | 492,616 | |
Spectra Energy Corp. | 13,694 | 366,315 | |
Stone Energy Corp. (a) | 5,800 | 175,624 | |
Valero Energy Corp. | 11,791 | 332,270 | |
W&T Offshore, Inc. | 13,945 | 356,016 | |
Whiting Petroleum Corp. (a) | 4,000 | 261,360 | |
| 3,121,100 | ||
TOTAL ENERGY | 6,591,343 | ||
FINANCIALS - 15.5% | |||
Capital Markets - 1.7% | |||
Ameriprise Financial, Inc. | 8,091 | 512,308 | |
Invesco Ltd. | 860 | 23,082 | |
Raymond James Financial, Inc. | 1,783 | 68,325 | |
T. Rowe Price Group, Inc. | 1,454 | 97,389 | |
Waddell & Reed Financial, Inc. Class A | 8,067 | 325,745 | |
| 1,026,849 | ||
Commercial Banks - 3.9% | |||
Banco Latin Americano de Exporaciones SA (BLADEX) Series E | 15,588 | 261,878 | |
Bank of the Ozarks, Inc. (e) | 6,500 | 279,825 | |
CIT Group, Inc. (a) | 7,943 | 344,091 | |
East West Bancorp, Inc. | 15,199 | 352,921 | |
Fifth Third Bancorp | 2,932 | 42,807 | |
First Citizen Bancshares, Inc. | 500 | 101,000 | |
International Bancshares Corp. | 12,459 | 237,842 | |
KeyCorp | 41,004 | 374,777 | |
M&T Bank Corp. | 4,091 | 360,213 | |
SunTrust Banks, Inc. | 2,580 | 77,839 | |
| 2,433,193 | ||
Consumer Finance - 1.5% | |||
Credit Acceptance Corp. (a) | 2,783 | 196,480 | |
Discover Financial Services | 17,329 | 376,906 | |
SLM Corp. (a) | 24,000 | 355,680 | |
| 929,066 | ||
| |||
Shares | Value | ||
Diversified Financial Services - 1.3% | |||
Moody's Corp. | 11,030 | $ 351,857 | |
NYSE Euronext | 4,053 | 149,961 | |
The NASDAQ Stock Market, Inc. (a) | 11,414 | 326,555 | |
| 828,373 | ||
Insurance - 2.2% | |||
American International Group, Inc. (a)(e) | 1,105 | 40,951 | |
American International Group, Inc. warrants 1/19/21 (a) | 589 | 6,832 | |
Aon Corp. | 1,461 | 76,907 | |
Aspen Insurance Holdings Ltd. | 3,817 | 112,792 | |
Axis Capital Holdings Ltd. | 4,610 | 167,435 | |
Endurance Specialty Holdings Ltd. | 6,277 | 311,276 | |
Hartford Financial Services Group, Inc. | 758 | 22,437 | |
Marsh & McLennan Companies, Inc. | 2,048 | 62,341 | |
PartnerRe Ltd. | 2,462 | 195,237 | |
Progressive Corp. | 2,546 | 53,033 | |
Reinsurance Group of America, Inc. | 2,951 | 178,211 | |
Symetra Financial Corp. | 9,105 | 130,202 | |
| 1,357,654 | ||
Real Estate Investment Trusts - 4.1% | |||
Annaly Capital Management, Inc. | 13,135 | 235,511 | |
Apartment Investment & Management Co. Class A | 2,444 | 62,689 | |
Boston Properties, Inc. | 424 | 40,670 | |
CommonWealth REIT | 2,944 | 84,522 | |
Equity Lifestyle Properties, Inc. | 3,400 | 197,336 | |
Equity Residential (SBI) | 1,091 | 60,125 | |
HCP, Inc. | 10,463 | 397,594 | |
Hospitality Properties Trust (SBI) | 7,885 | 181,355 | |
Host Hotels & Resorts, Inc. | 1,226 | 22,558 | |
Liberty Property Trust (SBI) | 1,200 | 40,524 | |
MFA Financial, Inc. | 27,044 | 229,063 | |
Public Storage | 2,253 | 252,899 | |
Rayonier, Inc. | 5,630 | 345,288 | |
Ventas, Inc. | 5,332 | 295,499 | |
Vornado Realty Trust | 635 | 59,265 | |
Weyerhaeuser Co. | 1,288 | 31,440 | |
| 2,536,338 | ||
Real Estate Management & Development - 0.8% | |||
CB Richard Ellis Group, Inc. Class A (a) | 6,190 | 154,998 | |
Jones Lang LaSalle, Inc. | 3,640 | 358,249 | |
| 513,247 | ||
TOTAL FINANCIALS | 9,624,720 | ||
HEALTH CARE - 10.1% | |||
Biotechnology - 0.8% | |||
Biogen Idec, Inc. (a) | 3,401 | 232,628 | |
Cephalon, Inc. (a) | 2,298 | 129,400 | |
United Therapeutics Corp. (a) | 2,000 | 134,860 | |
| 496,888 | ||
Common Stocks - continued | |||
Shares | Value | ||
HEALTH CARE - continued | |||
Health Care Equipment & Supplies - 1.2% | |||
C. R. Bard, Inc. | 78 | $ 7,625 | |
Hill-Rom Holdings, Inc. | 6,013 | 228,915 | |
Intuitive Surgical, Inc. (a) | 118 | 38,698 | |
Kinetic Concepts, Inc. (a) | 2,640 | 129,281 | |
Varian Medical Systems, Inc. (a) | 4,500 | 311,760 | |
| 716,279 | ||
Health Care Providers & Services - 2.1% | |||
AmerisourceBergen Corp. | 8,839 | 335,086 | |
CIGNA Corp. | 3,605 | 151,662 | |
Coventry Health Care, Inc. (a) | 3,000 | 90,600 | |
Humana, Inc. (a) | 6,294 | 409,173 | |
Laboratory Corp. of America Holdings (a)(e) | 1,590 | 143,307 | |
Quest Diagnostics, Inc. | 3,202 | 181,714 | |
| 1,311,542 | ||
Life Sciences Tools & Services - 3.7% | |||
Agilent Technologies, Inc. (a) | 11,216 | 471,969 | |
Bio-Rad Laboratories, Inc. Class A (a) | 2,742 | 313,027 | |
Bruker BioSciences Corp. (a) | 10,572 | 202,877 | |
Life Technologies Corp. (a) | 7,469 | 398,621 | |
Mettler-Toledo International, Inc. (a) | 937 | 160,574 | |
PerkinElmer, Inc. | 3,000 | 79,500 | |
Pharmaceutical Product Development, Inc. | 10,499 | 288,408 | |
Waters Corp. (a) | 4,771 | 396,232 | |
| 2,311,208 | ||
Pharmaceuticals - 2.3% | |||
Allergan, Inc. | 1,552 | 115,112 | |
Endo Pharmaceuticals Holdings, Inc. (a) | 6,500 | 230,880 | |
Forest Laboratories, Inc. (a) | 12,211 | 395,636 | |
Mylan, Inc. (a) | 17,542 | 401,186 | |
Perrigo Co. | 3,964 | 302,969 | |
| 1,445,783 | ||
TOTAL HEALTH CARE | 6,281,700 | ||
INDUSTRIALS - 13.1% | |||
Aerospace & Defense - 0.6% | |||
Goodrich Corp. | 148 | 12,762 | |
L-3 Communications Holdings, Inc. | 1,997 | 158,342 | |
Rockwell Collins, Inc. | 3,209 | 206,788 | |
| 377,892 | ||
Air Freight & Logistics - 0.7% | |||
Atlas Air Worldwide Holdings, Inc. (a) | 4,032 | 275,305 | |
C.H. Robinson Worldwide, Inc. | 364 | 26,350 | |
Expeditors International of Washington, Inc. | 2,820 | 134,796 | |
| 436,451 | ||
| |||
Shares | Value | ||
Airlines - 0.8% | |||
Alaska Air Group, Inc. (a) | 4,486 | $ 266,693 | |
Delta Air Lines, Inc. (a) | 18,635 | 209,457 | |
| 476,150 | ||
Commercial Services & Supplies - 0.9% | |||
Avery Dennison Corp. | 6,791 | 271,097 | |
Cintas Corp. | 3,875 | 108,965 | |
R.R. Donnelley & Sons Co. | 9,174 | 170,820 | |
| 550,882 | ||
Construction & Engineering - 1.4% | |||
Chicago Bridge & Iron Co. NV unit | 8,000 | 284,160 | |
Fluor Corp. | 784 | 55,476 | |
KBR, Inc. | 10,617 | 348,238 | |
URS Corp. (a) | 3,977 | 185,050 | |
| 872,924 | ||
Electrical Equipment - 1.2% | |||
Cooper Industries PLC Class A | 3,467 | 223,101 | |
Franklin Electric Co., Inc. | 5,563 | 236,428 | |
Hubbell, Inc. Class B | 3,280 | 221,433 | |
Rockwell Automation, Inc. | 300 | 26,319 | |
Roper Industries, Inc. | 870 | 73,193 | |
| 780,474 | ||
Machinery - 6.6% | |||
AGCO Corp. (a) | 5,918 | 324,188 | |
CNH Global NV (a) | 5,317 | 257,609 | |
Cummins, Inc. | 4,197 | 424,401 | |
Dover Corp. | 5,355 | 344,059 | |
Eaton Corp. | 4,617 | 511,471 | |
Ingersoll-Rand Co. Ltd. | 1,422 | 64,417 | |
Joy Global, Inc. | 3,817 | 371,699 | |
Lindsay Corp. (e) | 3,000 | 211,830 | |
Oshkosh Co. (a) | 7,082 | 252,615 | |
Pall Corp. | 3,446 | 187,325 | |
Parker Hannifin Corp. | 5,237 | 467,036 | |
SPX Corp. | 1,000 | 79,760 | |
Timken Co. | 6,069 | 295,682 | |
Toro Co. | 4,834 | 301,642 | |
| 4,093,734 | ||
Professional Services - 0.4% | |||
Dun & Bradstreet Corp. | 3,105 | 250,884 | |
Trading Companies & Distributors - 0.5% | |||
TAL International Group, Inc. | 5,697 | 198,711 | |
W.W. Grainger, Inc. | 885 | 117,891 | |
| 316,602 | ||
TOTAL INDUSTRIALS | 8,155,993 | ||
INFORMATION TECHNOLOGY - 15.6% | |||
Communications Equipment - 0.7% | |||
Comtech Telecommunications Corp. | 6,000 | 162,300 | |
Common Stocks - continued | |||
Shares | Value | ||
INFORMATION TECHNOLOGY - continued | |||
Communications Equipment - continued | |||
F5 Networks, Inc. (a) | 200 | $ 23,602 | |
InterDigital, Inc. (e) | 5,911 | 281,836 | |
| 467,738 | ||
Computers & Peripherals - 2.2% | |||
NetApp, Inc. (a) | 2,128 | 109,932 | |
QLogic Corp. (a) | 16,598 | 299,760 | |
SanDisk Corp. (a) | 8,000 | 396,800 | |
Synaptics, Inc. (a)(e) | 7,600 | 224,200 | |
Western Digital Corp. (a) | 10,973 | 335,554 | |
| 1,366,246 | ||
Electronic Equipment & Components - 1.7% | |||
AVX Corp. | 13,500 | 215,325 | |
Multi-Fineline Electronix, Inc. (a) | 7,417 | 212,275 | |
National Instruments Corp. | 4,500 | 140,085 | |
Power-One, Inc. (a)(e) | 14,835 | 122,092 | |
Vishay Intertechnology, Inc. (a) | 19,331 | 337,326 | |
| 1,027,103 | ||
Internet Software & Services - 0.2% | |||
IAC/InterActiveCorp (a) | 3,553 | 110,392 | |
IT Services - 1.9% | |||
Computer Sciences Corp. | 4,655 | 224,045 | |
DST Systems, Inc. | 1,000 | 51,000 | |
Fidelity National Information Services, Inc. | 4,675 | 151,423 | |
Fiserv, Inc. (a) | 5,630 | 356,210 | |
Lender Processing Services, Inc. | 851 | 28,994 | |
NeuStar, Inc. Class A (a) | 2,630 | 66,408 | |
Teradata Corp. (a) | 3,001 | 143,508 | |
The Western Union Co. | 7,994 | 175,788 | |
| 1,197,376 | ||
Office Electronics - 0.1% | |||
Xerox Corp. | 6,537 | 70,273 | |
Semiconductors & Semiconductor Equipment - 5.6% | |||
Advanced Micro Devices, Inc. (a)(e) | 37,848 | 348,580 | |
Altera Corp. | 11,218 | 469,585 | |
Analog Devices, Inc. | 10,186 | 406,218 | |
Cabot Microelectronics Corp. (a) | 1,497 | 73,084 | |
Fairchild Semiconductor International, Inc. (a) | 20,700 | 364,527 | |
Lam Research Corp. (a) | 6,000 | 329,400 | |
Lattice Semiconductor Corp. (a) | 11,769 | 78,146 | |
Linear Technology Corp. | 6,220 | 214,963 | |
Marvell Technology Group Ltd. (a) | 13,133 | 240,071 | |
Micron Technology, Inc. (a) | 11,411 | 127,004 | |
Novellus Systems, Inc. (a) | 9,005 | 359,840 | |
NVIDIA Corp. (a) | 2,052 | 46,498 | |
| |||
Shares | Value | ||
Skyworks Solutions, Inc. (a) | 2,054 | $ 73,821 | |
Teradyne, Inc. (a) | 17,500 | 326,025 | |
| 3,457,762 | ||
Software - 3.2% | |||
Autodesk, Inc. (a) | 4,000 | 168,200 | |
BMC Software, Inc. (a) | 5,217 | 258,242 | |
CA, Inc. | 15,037 | 372,617 | |
Citrix Systems, Inc. (a) | 428 | 30,028 | |
Intuit, Inc. (a) | 8,551 | 449,612 | |
MICROS Systems, Inc. (a) | 6,000 | 285,840 | |
salesforce.com, Inc. (a) | 592 | 78,304 | |
Take-Two Interactive Software, Inc. (a) | 21,586 | 346,887 | |
| 1,989,730 | ||
TOTAL INFORMATION TECHNOLOGY | 9,686,620 | ||
MATERIALS - 7.1% | |||
Chemicals - 3.6% | |||
Albemarle Corp. | 6,048 | 348,123 | |
Cabot Corp. | 7,201 | 311,515 | |
Celanese Corp. Class A | 1,150 | 47,668 | |
CF Industries Holdings, Inc. | 2,534 | 358,004 | |
Ecolab, Inc. | 700 | 34,048 | |
International Flavors & Fragrances, Inc. | 2,901 | 165,212 | |
Lubrizol Corp. | 2,988 | 325,304 | |
Nalco Holding Co. | 2,000 | 51,140 | |
OM Group, Inc. (a) | 4,667 | 164,232 | |
PPG Industries, Inc. | 3,964 | 350,338 | |
Sigma Aldrich Corp. | 894 | 57,118 | |
| 2,212,702 | ||
Containers & Packaging - 0.9% | |||
Ball Corp. | 6,000 | 216,600 | |
Crown Holdings, Inc. (a) | 9,022 | 347,167 | |
Sealed Air Corp. | 600 | 16,512 | |
| 580,279 | ||
Metals & Mining - 1.6% | |||
Cliffs Natural Resources, Inc. | 3,000 | 291,210 | |
Golden Star Resources Ltd. (a) | 26,194 | 82,796 | |
Hecla Mining Co. (a)(e) | 25,695 | 260,804 | |
Walter Energy, Inc. | 2,831 | 342,579 | |
| 977,389 | ||
Paper & Forest Products - 1.0% | |||
Domtar Corp. | 3,874 | 338,588 | |
International Paper Co. | 3,400 | 94,452 | |
MeadWestvaco Corp. | 7,266 | 213,257 | |
| 646,297 | ||
TOTAL MATERIALS | 4,416,667 | ||
TELECOMMUNICATION SERVICES - 1.4% | |||
Diversified Telecommunication Services - 0.8% | |||
CenturyLink, Inc. | 726 | 29,897 | |
Common Stocks - continued | |||
Shares | Value | ||
TELECOMMUNICATION SERVICES - continued | |||
Diversified Telecommunication Services - continued | |||
Qwest Communications International, Inc. | 52,951 | $ 361,126 | |
Windstream Corp. | 6,400 | 80,256 | |
| 471,279 | ||
Wireless Telecommunication Services - 0.6% | |||
Crown Castle International Corp. (a) | 972 | 40,970 | |
NII Holdings, Inc. (a) | 8,565 | 350,822 | |
| 391,792 | ||
TOTAL TELECOMMUNICATION SERVICES | 863,071 | ||
UTILITIES - 3.5% | |||
Electric Utilities - 1.3% | |||
DPL, Inc. | 6,105 | 158,852 | |
Edison International | 5,689 | 211,176 | |
FirstEnergy Corp. (e) | 2,454 | 93,988 | |
IDACORP, Inc. | 2,393 | 90,312 | |
Northeast Utilities | 4,188 | 142,560 | |
NV Energy, Inc. | 3,400 | 49,946 | |
PPL Corp. | 1,870 | 47,554 | |
Progress Energy, Inc. | 870 | 39,768 | |
| 834,156 | ||
Gas Utilities - 0.6% | |||
Energen Corp. | 3,737 | 228,331 | |
UGI Corp. | 4,122 | 131,451 | |
| 359,782 | ||
Independent Power Producers & Energy Traders - 0.2% | |||
AES Corp. (a) | 11,281 | 139,546 | |
Multi-Utilities - 0.9% | |||
CMS Energy Corp. | 4,250 | 81,855 | |
Consolidated Edison, Inc. | 5,718 | 285,786 | |
NiSource, Inc. | 8,300 | 159,028 | |
Sempra Energy | 745 | 39,656 | |
Xcel Energy, Inc. | 751 | 17,979 | |
| 584,304 | ||
Water Utilities - 0.5% | |||
American Water Works Co., Inc. | 10,000 | 277,400 | |
TOTAL UTILITIES | 2,195,188 | ||
TOTAL COMMON STOCKS (Cost $45,627,864) | 57,819,293 | ||
Investment Companies - 0.3% | |||
|
|
|
|
Ares Capital Corp. | 9,758 | 173,985 | |
U.S. Treasury Obligations - 0.4% | ||||
| Principal Amount | Value | ||
U.S. Treasury Bills, yield at date of purchase 0.15% to 0.31% 5/5/11 to 8/4/11 (f) | $ 280,000 | $ 279,865 | ||
Money Market Funds - 9.0% | |||
Shares |
| ||
Dreyfus Cash Management Institutional Shares, 0.10% (c) | 3,591,468 | 3,591,468 | |
Fidelity Securities Lending Cash Central Fund, 0.21% (b)(d) | 1,991,857 | 1,991,857 | |
TOTAL MONEY MARKET FUNDS (Cost $5,583,325) | 5,583,325 | ||
TOTAL INVESTMENT PORTFOLIO - 102.8% (Cost $51,664,874) | 63,856,468 | |
NET OTHER ASSETS (LIABILITIES) - (2.8)% | (1,752,507) | |
NET ASSETS - 100% | $ 62,103,961 | |
Futures Contracts | |||||
Expiration Date | Underlying Face Amount at Value | Unrealized Appreciation/(Depreciation) | |||
Purchased | |||||
Equity Index Contracts | |||||
41 CME E-mini S&P Midcap 400 Index Contracts | March 2011 | $ 3,960,190 | $ 88,106 | ||
|
The face value of futures purchased as a percentage of net assets is 6.4% |
Legend |
(a) Non-income producing |
(b) Affiliated fund that is available only to investment companies and other accounts managed by Fidelity Investments. The rate quoted is the annualized seven-day yield of the fund at period end. A complete unaudited listing of the fund's holdings as of its most recent quarter end is available upon request. In addition, each Fidelity Central Fund's financial statements, which are not covered by the Fund's Report of Independent Registered Public Accounting Firm, are available on the SEC's website or upon request. |
(c) The rate quoted is the annualized seven-day yield of the fund at period end. |
(d) Investment made with cash collateral received from securities on loan. |
(e) Security or a portion of the security is on loan at period end. |
(f) Security or a portion of the security was pledged to cover margin requirements for futures contracts. At the period end, the value of securities pledged amounted to $279,865. |
Affiliated Central Funds |
Information regarding fiscal year to date income earned by the Fund from investments in Fidelity Central Funds is as follows: |
Fund | Income earned |
Fidelity Securities Lending Cash Central Fund | $ 13,761 |
Other Information |
The following is a summary of the inputs used, as of February 28, 2011, involving the Fund's assets and liabilities carried at fair value. The inputs or methodology used for valuing securities may not be an indication of the risk associated with investing in those securities. For more information on valuation inputs, and their aggregation into the levels used in the table below, please refer to the Security Valuation section in the accompanying Notes to Financial Statements. |
Valuation Inputs at Reporting Date: | ||||
Description | Total | Level 1 | Level 2 | Level 3 |
Investments in Securities: | ||||
Equities: | ||||
Consumer Discretionary | $ 7,479,938 | $ 7,479,938 | $ - | $ - |
Consumer Staples | 2,524,053 | 2,524,053 | - | - |
Energy | 6,591,343 | 6,591,343 | - | - |
Financials | 9,624,720 | 9,624,720 | - | - |
Health Care | 6,281,700 | 6,281,700 | - | - |
Industrials | 8,155,993 | 8,155,993 | - | - |
Information Technology | 9,686,620 | 9,686,620 | - | - |
Materials | 4,416,667 | 4,416,667 | - | - |
Telecommunication Services | 863,071 | 863,071 | - | - |
Utilities | 2,195,188 | 2,195,188 | - | - |
Investment Companies | 173,985 | 173,985 | - | - |
U.S. Government and Government Agency Obligations | 279,865 | - | 279,865 | - |
Money Market Funds | 5,583,325 | 5,583,325 | - | - |
Total Investments in Securities: | $ 63,856,468 | $ 63,576,603 | $ 279,865 | $ - |
Derivative Instruments: | ||||
Assets | ||||
Futures Contracts | $ 88,106 | $ 88,106 | $ - | $ - |
Value of Derivative Instruments |
The following table is a summary of the Fund's value of derivative instruments by risk exposure as of February 28, 2011. For additional information on derivative instruments, please refer to the Derivative Instruments section in the accompanying Notes to Financial Statements. |
Risk Exposure / | Value | |
| Asset | Liability |
Equity Risk | ||
Futures Contracts (a) | $ 88,106 | $ - |
Total Value of Derivatives | $ 88,106 | $ - |
(a) Reflects cumulative appreciation/(depreciation) on futures contracts as disclosed on the Schedule of Investments. Only the period end variation margin is separately disclosed on the Statement of Assets and Liabilities. |
Income Tax Information |
At February 28, 2011, the fund had a capital loss carryforward of approximately $2,108,052 of which $320,881, $1,278,726, and $508,445 will expire in fiscal 2017, 2018, and 2019, respectively. Capital loss carryforwards are only available to offset future capital gains of the Fund to the extent provided by regulations and may be limited. |
See accompanying notes which are an integral part of the financial statements.
Annual Report
Fidelity Mid Cap Enhanced Index Fund
Financial Statements
Statement of Assets and Liabilities
| February 28, 2011 | |
|
|
|
Assets | ||
Investment in securities, at value (including securities loaned of $1,905,711) - See accompanying schedule: Unaffiliated issuers (cost $49,673,017) | $ 61,864,611 |
|
Fidelity Central Funds (cost $1,991,857) | 1,991,857 |
|
Total Investments (cost $51,664,874) |
| $ 63,856,468 |
Receivable for fund shares sold | 236,061 | |
Dividends receivable | 64,609 | |
Interest receivable | 247 | |
Distributions receivable from Fidelity Central Funds | 1,039 | |
Receivable for daily variation on futures contracts | 11,268 | |
Total assets | 64,169,692 | |
|
|
|
Liabilities | ||
Payable for fund shares redeemed | 44,231 | |
Accrued management fee | 22,232 | |
Other affiliated payables | 7,411 | |
Collateral on securities loaned, at value | 1,991,857 | |
Total liabilities | 2,065,731 | |
|
|
|
Net Assets | $ 62,103,961 | |
Net Assets consist of: |
| |
Paid in capital | $ 50,543,162 | |
Undistributed net investment income | 43,832 | |
Accumulated undistributed net realized gain (loss) on investments | (762,733) | |
Net unrealized appreciation (depreciation) on investments | 12,279,700 | |
Net Assets, for 6,043,289 shares outstanding | $ 62,103,961 | |
Net Asset Value, offering price and redemption price per share ($62,103,961 ÷ 6,043,289 shares) | $ 10.28 | |
Statement of Operations
| Year ended February 28, 2011 | |
|
|
|
Investment Income |
|
|
Dividends |
| $ 731,693 |
Interest |
| 2,043 |
Income from Fidelity Central Funds |
| 13,761 |
Total income |
| 747,497 |
|
|
|
Expenses | ||
Management fee | $ 190,899 | |
Transfer agent fees | 63,798 | |
Independent trustees' compensation | 497 | |
Miscellaneous | 117 | |
Total expenses before reductions | 255,311 | |
Expense reductions | (3) | 255,308 |
Net investment income (loss) | 492,189 | |
Realized and Unrealized Gain (Loss) Net realized gain (loss) on: | ||
Investment securities: |
|
|
Unaffiliated issuers | 1,852,325 | |
Futures contracts | 142,619 | |
Total net realized gain (loss) |
| 1,994,944 |
Change in net unrealized appreciation (depreciation) on: Investment securities | 8,638,686 | |
Futures contracts | 44,891 | |
Total change in net unrealized appreciation (depreciation) |
| 8,683,577 |
Net gain (loss) | 10,678,521 | |
Net increase (decrease) in net assets resulting from operations | $ 11,170,710 | |
See accompanying notes which are an integral part of the financial statements.
Annual Report
Fidelity Mid Cap Enhanced Index Fund
Financial Statements - continued
Statement of Changes in Net Assets
| Year ended February 28, | Year ended February 28, |
Increase (Decrease) in Net Assets |
|
|
Operations |
|
|
Net investment income (loss) | $ 492,189 | $ 298,703 |
Net realized gain (loss) | 1,994,944 | 815,083 |
Change in net unrealized appreciation (depreciation) | 8,683,577 | 9,222,441 |
Net increase (decrease) in net assets resulting from operations | 11,170,710 | 10,336,227 |
Distributions to shareholders from net investment income | (484,592) | (290,636) |
Distributions to shareholders from net realized gain | (1,597,001) | - |
Total distributions | (2,081,593) | (290,636) |
Share transactions | 33,715,367 | 21,915,812 |
Reinvestment of distributions | 2,003,001 | 272,697 |
Cost of shares redeemed | (16,323,316) | (12,855,104) |
Net increase (decrease) in net assets resulting from share transactions | 19,395,052 | 9,333,405 |
Redemption fees | 2,930 | 2,474 |
Total increase (decrease) in net assets | 28,487,099 | 19,381,470 |
|
|
|
Net Assets | ||
Beginning of period | 33,616,862 | 14,235,392 |
End of period (including undistributed net investment income of $43,832 and undistributed net investment income of $38,166, respectively) | $ 62,103,961 | $ 33,616,862 |
Other Information Shares | ||
Sold | 3,640,627 | 3,090,781 |
Issued in reinvestment of distributions | 217,027 | 34,827 |
Redeemed | (1,848,838) | (1,869,024) |
Net increase (decrease) | 2,008,816 | 1,256,584 |
Financial Highlights
Years ended February 28, | 2011 | 2010 | 2009 | 2008G |
Selected Per-Share Data |
|
|
|
|
Net asset value, beginning of period | $ 8.33 | $ 5.12 | $ 9.16 | $ 10.00 |
Income from Investment Operations |
|
|
|
|
Net investment income (loss)D | .10 | .09 | .10 | .02 |
Net realized and unrealized gain (loss) | 2.30 | 3.20 | (4.07) | (.86) |
Total from investment operations | 2.40 | 3.29 | (3.97) | (.84) |
Distributions from net investment income | (.10) | (.08) | (.08) | - |
Distributions from net realized gain | (.35) | - | - | - |
Total distributions | (.45) | (.08) | (.08) | - |
Redemption fees added to paid in capitalD | -I | -I | .01 | -I |
Net asset value, end of period | $ 10.28 | $ 8.33 | $ 5.12 | $ 9.16 |
Total ReturnB,C | 29.44% | 64.37% | (43.40)% | (8.40)% |
Ratios to Average Net AssetsE,H |
|
|
|
|
Expenses before reductions | .60% | .60% | .60% | .60% A |
Expenses net of fee waivers, if any | .60% | .60% | .60% | .60%A |
Expenses net of all reductions | .60% | .60% | .60% | .60%A |
Net investment income (loss) | 1.16% | 1.21% | 1.39% | 1.25%A |
Supplemental Data |
|
|
|
|
Net assets, end of period (000 omitted) | $ 62,104 | $ 33,617 | $ 14,235 | $ 5,967 |
Portfolio turnover rate F | 59% | 80%J | 58%J | 16% |
A Annualized
B Total returns for periods of less than one year are not annualized.
C Total returns would have been lower had certain expenses not been reduced during the periods shown.
D Calculated based on average shares outstanding during the period.
E Fees and expenses of the underlying Fidelity Central Funds are not included in the Fund's expense ratio. The Fund indirectly bears its proportionate share of the expenses of any underlying Fidelity Central Funds.
F Amount does not include the portfolio activity of any underlying Fidelity Central Funds.
G For the period December 20, 2007 (commencement of operations) to February 29, 2008.
H Expense ratios reflect operating expenses of the Fund. Expenses before reductions do not reflect amounts reimbursed by the investment adviser or reductions from expense offset arrangements and do not represent the amount paid by the Fund during periods when reimbursements or reductions occur. Expenses net of fee waivers reflect expenses after reimbursement by the investment adviser but prior to reductions from expense offset arrangements. Expenses net of all reductions represent the net expenses paid by the Fund.
I Amount represents less than $.01 per share.
J Reflects adjustments to exclude transactions in money market mutual funds.
See accompanying notes which are an integral part of the financial statements.
Annual Report
Fidelity Small Cap Enhanced Index Fund
Performance: The Bottom Line
Average annual total return reflects the change in the value of an investment, assuming reinvestment of the fund's distributions from dividend income and capital gains (the profits earned upon the sale of securities that have grown in value, if any) and assuming a constant rate of performance each year. The $10,000 table and the fund's returns do not reflect the deduction of taxes that a shareholder would pay on fund distributions or the redemption of fund shares. During periods of reimbursement by Fidelity a fund's total returns will be greater than it would be had the reimbursement not occurred. How a fund did yesterday is no guarantee of how it will do tomorrow.
Average Annual Total Returns
Periods ended February 28, 2011 | Past 1 | Life of |
Fidelity Small Cap Enhanced Index Fund | 34.01% | 2.90% |
A From December 20, 2007.
$10,000 Over Life of Fund
Let's say hypothetically that $10,000 was invested in Fidelity Small Cap Enhanced Index Fund on December 20, 2007, when the fund started. The chart shows how the value of your investment would have changed, and also shows how the Russell 2000® Index performed over the same period.
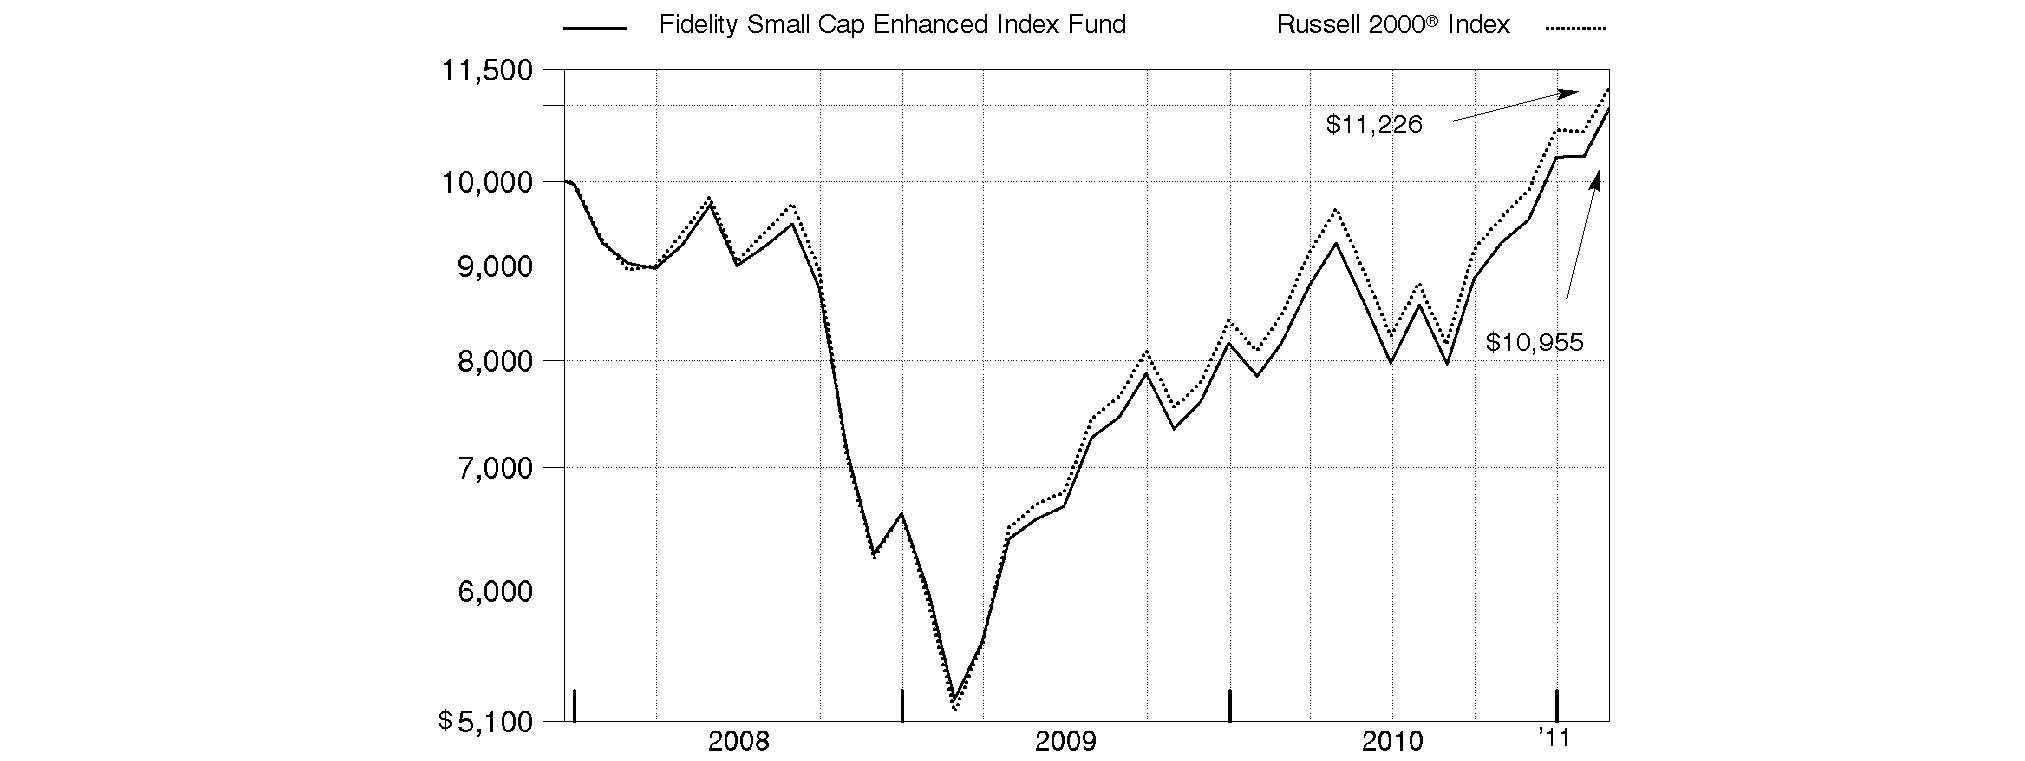
Annual Report
Fidelity Small Cap Enhanced Index Fund
Management's Discussion of Fund Performance
Market Recap: Steady economic growth, encouraging monetary policy, improving credit-market conditions, an uptick in merger-and-acquisition activity and better-than-expected corporate earnings propelled U.S. stock markets forward during the 12-month period ending February 28, 2011. Uncertainty over the global effects of the debt crisis in Europe and China's attempt to rein in its economy plagued equities during the spring, but markets reacted positively to the Federal Reserve's second round of stimulative quantitative easing and the Congressional midterm elections in November, followed in December by the extension of Bush-era tax policies. For the full year, the S&P 500® Index advanced 22.57%, with all but one of the 10 major sectors tracked by MSCI U.S. Investable Market classifications delivering a double-digit gain. While cyclically oriented sectors benefited from an overall improving economy, less economically sensitive sectors fell short of the broad market. Energy and materials stocks performed best, while the health care and consumer staples groups struggled the most.
Comments from Maximilian Kaufmann, member of the Geode Capital Management, LLC, investment management team for Fidelity® Small Cap Enhanced Index Fund: For the 12 months ending February 28, 2011, the fund returned 34.01%, beating the 32.60% return of the Russell 2000® Index. Strong security selection in financials and favorable positioning in energy were helpful factors. Within consumer discretionary, good stock picking in retailing and media outweighed the negative impact of the fund's choices in automobiles/components and consumer services. Stock selection in materials and, in health care, the equipment/services industry was disappointing. In the information technology sector, the picture for stock picking was mixed - we had success in the semiconductor industry but disappointing results among hardware and equipment names. In terms of individual securities, Skyworks Solutions, a supplier of semiconductors for wireless phones, was the fund's top contributor, benefiting from timely ownership. Another chip maker, Lattice Semiconductor, did well, as did Powerwave Technologies, whose products enhance wireless-network performance. Energy-related stocks benefited from an increasingly favorable market backdrop, given the rising price of oil. This led to the outperformance of ION Geophysical and OYO Geospace, both of which provide seismic data services, and offshore driller Hercules Offshore, which the fund owned at opportune times. Newcastle Investment, a real estate investment trust, also outperformed. In contrast, mining company Golden Star Resources lagged, as did Net 1 UEPS Technologies, which makes smart payment cards. An underweighting in wireless-network solutions provider Riverbed Technology also hampered performance, as did the fund's position in Amedisys, a provider of home health-care services to elderly patients. Not owning benchmark component Acme Packet, which offers interactive communications services, also hurt. Some of the names I've mentioned were no longer held at period end.
The views expressed above reflect those of the portfolio manager(s) only through the end of the period as stated on the cover of this report and do not necessarily represent the views of Fidelity or any other person in the Fidelity organization. Any such views are subject to change at any time based upon market or other conditions and Fidelity disclaims any responsibility to update such views. These views may not be relied on as investment advice and, because investment decisions for a Fidelity fund are based on numerous factors, may not be relied on as an indication of trading intent on behalf of any Fidelity fund.
Annual Report
Fidelity Small Cap Enhanced Index Fund
Investment Changes (Unaudited)
Top Ten Stocks as of February 28, 2011 | ||
| % of fund's | % of fund's net assets |
TIBCO Software, Inc. | 0.8 | 0.2 |
Atlas Air Worldwide Holdings, Inc. | 0.8 | 0.5 |
Hecla Mining Co. | 0.7 | 0.2 |
Dana Holding Corp. | 0.7 | 0.2 |
ION Geophysical Corp. | 0.7 | 0.3 |
Nordson Corp. | 0.7 | 0.5 |
InterDigital, Inc. | 0.7 | 0.6 |
W&T Offshore, Inc. | 0.7 | 0.0 |
Hercules Offshore, Inc. | 0.7 | 0.0 |
Stone Energy Corp. | 0.6 | 0.2 |
| 7.1 | |
Market Sectors as of February 28, 2011 | ||
| % of fund's | % of fund's net assets |
Information Technology | 20.6 | 19.2 |
Financials | 15.8 | 18.8 |
Industrials | 14.8 | 14.4 |
Consumer Discretionary | 12.1 | 13.4 |
Energy | 9.1 | 6.4 |
Health Care | 8.4 | 11.3 |
Materials | 7.3 | 6.6 |
Consumer Staples | 3.2 | 4.4 |
Utilities | 1.0 | 2.1 |
Telecommunication Services | 0.7 | 0.6 |
Annual Report
Fidelity Small Cap Enhanced Index Fund
Investments February 28, 2011
Showing Percentage of Net Assets
Common Stocks - 93.0% | |||
Shares | Value | ||
CONSUMER DISCRETIONARY - 12.1% | |||
Auto Components - 1.9% | |||
American Axle & Manufacturing Holdings, Inc. (a)(e) | 38,144 | $ 509,985 | |
Amerigon, Inc. (a) | 2,505 | 34,168 | |
Cooper Tire & Rubber Co. | 16,112 | 377,988 | |
Dana Holding Corp. (a) | 41,160 | 777,101 | |
Fuel Systems Solutions, Inc. (a)(e) | 9,692 | 282,231 | |
Superior Industries International, Inc. | 8,189 | 162,797 | |
| 2,144,270 | ||
Diversified Consumer Services - 1.0% | |||
Capella Education Co. (a) | 3,846 | 221,799 | |
Corinthian Colleges, Inc. (a)(e) | 19,213 | 100,676 | |
Mac-Gray Corp. | 1,777 | 28,361 | |
Pre-Paid Legal Services, Inc. (a)(e) | 4,327 | 285,322 | |
Sotheby's Class A (ltd. vtg.) | 9,405 | 462,914 | |
| 1,099,072 | ||
Hotels, Restaurants & Leisure - 1.5% | |||
AFC Enterprises, Inc. (a) | 7,067 | 104,521 | |
Cracker Barrel Old Country Store, Inc. | 7,672 | 382,372 | |
DineEquity, Inc. (a) | 7,857 | 449,499 | |
Domino's Pizza, Inc. (a) | 33,104 | 558,464 | |
Ruth's Hospitality Group, Inc. (a) | 18,847 | 94,423 | |
Shuffle Master, Inc. (a) | 13,343 | 125,558 | |
| 1,714,837 | ||
Household Durables - 2.2% | |||
American Greetings Corp. Class A | 12,259 | 265,407 | |
Blyth, Inc. | 6,096 | 209,520 | |
Helen of Troy Ltd. (a) | 16,991 | 474,559 | |
iRobot Corp. (a)(e) | 13,119 | 376,778 | |
Libbey, Inc. (a) | 12,518 | 215,184 | |
Standard Pacific Corp. (a)(e) | 55,572 | 222,288 | |
Tempur-Pedic International, Inc. (a) | 11,241 | 527,653 | |
Tupperware Brands Corp. | 3,798 | 203,763 | |
| 2,495,152 | ||
Internet & Catalog Retail - 0.2% | |||
Shutterfly, Inc. (a) | 5,215 | 222,681 | |
Leisure Equipment & Products - 0.6% | |||
Arctic Cat, Inc. (a) | 20,328 | 258,369 | |
Polaris Industries, Inc. | 5,637 | 425,312 | |
| 683,681 | ||
Media - 1.0% | |||
Cinemark Holdings, Inc. | 5,357 | 107,569 | |
Global Sources Ltd. (a) | 56,493 | 649,670 | |
Journal Communications, Inc. Class A (a) | 10,612 | 65,158 | |
Valassis Communications, Inc. (a) | 9,654 | 272,436 | |
| 1,094,833 | ||
Specialty Retail - 2.2% | |||
Finish Line, Inc. Class A | 19,341 | 337,694 | |
Jo-Ann Stores, Inc. (a) | 9,167 | 556,437 | |
Pier 1 Imports, Inc. (a) | 48,177 | 485,624 | |
| |||
Shares | Value | ||
Rent-A-Center, Inc. | 16,247 | $ 537,126 | |
Select Comfort Corp. (a) | 10,692 | 119,002 | |
The Cato Corp. Class A (sub. vtg.) | 10,943 | 265,368 | |
Tractor Supply Co. | 4,437 | 231,035 | |
| 2,532,286 | ||
Textiles, Apparel & Luxury Goods - 1.5% | |||
Crocs, Inc. (a) | 30,126 | 531,724 | |
Fossil, Inc. (a) | 4,775 | 366,434 | |
Liz Claiborne, Inc. (a) | 26,179 | 134,560 | |
Maidenform Brands, Inc. (a) | 8,969 | 243,419 | |
Movado Group, Inc. (a) | 10,925 | 153,715 | |
Warnaco Group, Inc. (a) | 2,753 | 161,629 | |
Wolverine World Wide, Inc. | 4,614 | 169,611 | |
| 1,761,092 | ||
TOTAL CONSUMER DISCRETIONARY | 13,747,904 | ||
CONSUMER STAPLES - 3.2% | |||
Beverages - 0.1% | |||
MGP Ingredients, Inc. | 5,910 | 53,722 | |
National Beverage Corp. | 2,141 | 27,169 | |
| 80,891 | ||
Food & Staples Retailing - 1.2% | |||
Andersons, Inc. | 5,993 | 287,904 | |
Casey's General Stores, Inc. | 6,582 | 270,323 | |
Nash-Finch Co. | 8,592 | 346,859 | |
PriceSmart, Inc. | 14,090 | 501,463 | |
| 1,406,549 | ||
Food Products - 0.7% | |||
B&G Foods, Inc. Class A | 5,854 | 87,810 | |
Chiquita Brands International, Inc. (a) | 16,485 | 283,377 | |
TreeHouse Foods, Inc. (a) | 7,234 | 377,398 | |
| 748,585 | ||
Personal Products - 1.1% | |||
Elizabeth Arden, Inc. (a) | 12,968 | 377,239 | |
Inter Parfums, Inc. | 9,751 | 176,201 | |
Nu Skin Enterprises, Inc. Class A | 20,712 | 661,127 | |
USANA Health Sciences, Inc. (a) | 2,036 | 70,894 | |
| 1,285,461 | ||
Tobacco - 0.1% | |||
Universal Corp. | 3,775 | 157,871 | |
TOTAL CONSUMER STAPLES | 3,679,357 | ||
ENERGY - 9.1% | |||
Energy Equipment & Services - 4.4% | |||
Bristow Group, Inc. (a) | 8,606 | 412,400 | |
Cal Dive International, Inc. (a) | 26,522 | 182,471 | |
Carbo Ceramics, Inc. | 473 | 58,638 | |
Complete Production Services, Inc. (a) | 23,933 | 689,510 | |
Dril-Quip, Inc. (a) | 5,899 | 452,453 | |
Gulf Island Fabrication, Inc. | 12,409 | 384,307 | |
Common Stocks - continued | |||
Shares | Value | ||
ENERGY - continued | |||
Energy Equipment & Services - continued | |||
Hercules Offshore, Inc. (a) | 153,898 | $ 760,256 | |
ION Geophysical Corp. (a)(e) | 60,538 | 776,097 | |
Newpark Resources, Inc. (a) | 52,504 | 366,478 | |
OYO Geospace Corp. (a) | 6,493 | 660,208 | |
Tesco Corp. (a)(e) | 13,146 | 241,755 | |
| 4,984,573 | ||
Oil, Gas & Consumable Fuels - 4.7% | |||
Bill Barrett Corp. (a) | 8,558 | 332,735 | |
Callon Petroleum Co. (a) | 15,639 | 131,055 | |
CAMAC Energy, Inc. (a)(e) | 47,184 | 81,628 | |
Cloud Peak Energy, Inc. (a) | 27,053 | 554,587 | |
Contango Oil & Gas Co. (a) | 4,760 | 291,693 | |
CVR Energy, Inc. (a) | 39,146 | 739,859 | |
DHT Holdings, Inc. (e) | 38,992 | 181,313 | |
Energy Partners Ltd. (a) | 13,552 | 221,846 | |
Petroquest Energy, Inc. (a)(e) | 51,060 | 440,137 | |
Ship Finance International Ltd. (NY Shares) | 8,297 | 172,495 | |
Stone Energy Corp. (a) | 24,567 | 743,889 | |
Vaalco Energy, Inc. (a) | 72,899 | 584,650 | |
W&T Offshore, Inc. (e) | 29,931 | 764,138 | |
Warren Resources, Inc. (a) | 31,805 | 156,481 | |
| 5,396,506 | ||
TOTAL ENERGY | 10,381,079 | ||
FINANCIALS - 15.8% | |||
Capital Markets - 0.5% | |||
PennantPark Investment Corp. | 4,405 | 55,944 | |
Prospect Capital Corp. (e) | 7,082 | 85,975 | |
TICC Capital Corp. | 33,250 | 419,615 | |
| 561,534 | ||
Commercial Banks - 4.3% | |||
Alliance Financial Corp. (e) | 2,608 | 82,752 | |
American National Bankshares, Inc. | 3,303 | 71,906 | |
BancFirst Corp. | 1,979 | 83,197 | |
Banco Latin Americano de Exporaciones SA (BLADEX) Series E | 25,952 | 435,994 | |
Bank of Marin Bancorp | 506 | 18,343 | |
Bank of the Ozarks, Inc. (e) | 11,675 | 502,609 | |
Cardinal Financial Corp. | 1,709 | 19,021 | |
Citizens & Northern Corp. | 4,631 | 72,753 | |
Community Bank System, Inc. | 15,113 | 380,243 | |
Community Trust Bancorp, Inc. | 593 | 16,966 | |
Eagle Bancorp, Inc., Maryland (a) | 5,939 | 87,897 | |
Financial Institutions, Inc. | 10,835 | 209,007 | |
First Financial Bancorp, Ohio | 18,927 | 320,434 | |
First Financial Bankshares, Inc. (e) | 738 | 37,048 | |
Independent Bank Corp., Massachusetts | 1,645 | 44,728 | |
International Bancshares Corp. | 22,114 | 422,156 | |
Merchants Bancshares, Inc. | 13,253 | 337,952 | |
| |||
Shares | Value | ||
NBT Bancorp, Inc. | 1,583 | $ 35,222 | |
Prosperity Bancshares, Inc. | 15,894 | 648,793 | |
Renasant Corp. (e) | 5,952 | 95,649 | |
Republic Bancorp, Inc., Kentucky Class A | 10,271 | 176,045 | |
S&T Bancorp, Inc. | 6,019 | 134,224 | |
Signature Bank, New York (a) | 3,690 | 191,474 | |
Southside Bancshares, Inc. | 803 | 18,316 | |
Trustmark Corp. | 6 | 141 | |
UMB Financial Corp. | 4,689 | 186,997 | |
Washington Trust Bancorp, Inc. | 6,192 | 142,292 | |
WesBanco, Inc. | 9,414 | 196,188 | |
| 4,968,347 | ||
Consumer Finance - 1.7% | |||
Credit Acceptance Corp. (a) | 3,273 | 231,074 | |
EZCORP, Inc. (non-vtg.) Class A (a) | 21,822 | 625,855 | |
First Cash Financial Services, Inc. (a) | 4,953 | 162,161 | |
Nelnet, Inc. Class A | 21,143 | 472,123 | |
World Acceptance Corp. (a)(e) | 7,877 | 471,123 | |
| 1,962,336 | ||
Diversified Financial Services - 0.6% | |||
Encore Capital Group, Inc. (a) | 10,028 | 273,062 | |
MarketAxess Holdings, Inc. | 5,281 | 112,961 | |
NewStar Financial, Inc. (a) | 30,073 | 318,473 | |
| 704,496 | ||
Insurance - 1.5% | |||
Amtrust Financial Services, Inc. | 13,467 | 258,970 | |
Aspen Insurance Holdings Ltd. | 8,052 | 237,937 | |
FBL Financial Group, Inc. Class A | 16,924 | 528,706 | |
Flagstone Reinsurance Holdings Ltd. | 33,710 | 384,294 | |
Horace Mann Educators Corp. | 8,122 | 137,668 | |
Platinum Underwriters Holdings Ltd. | 3,204 | 133,607 | |
| 1,681,182 | ||
Real Estate Investment Trusts - 6.5% | |||
Anworth Mortgage Asset Corp. | 7,134 | 50,937 | |
CapLease, Inc. | 8,020 | 43,067 | |
Capstead Mortgage Corp. | 44,541 | 585,269 | |
CBL & Associates Properties, Inc. | 41,219 | 735,759 | |
Chesapeake Lodging Trust | 17,276 | 321,334 | |
Colonial Properties Trust (SBI) | 6,827 | 134,560 | |
Colony Financial, Inc. | 11,715 | 248,944 | |
Crexus Investment Corp. | 6,571 | 86,737 | |
Dynex Capital, Inc. | 21,296 | 225,099 | |
Extra Space Storage, Inc. | 15,113 | 298,482 | |
First Industrial Realty Trust, Inc. (a)(e) | 31,256 | 350,380 | |
Hatteras Financial Corp. | 2,797 | 82,735 | |
Highwoods Properties, Inc. (SBI) | 4,115 | 139,622 | |
Home Properties, Inc. | 758 | 44,661 | |
MFA Financial, Inc. | 87,533 | 741,405 | |
Mid-America Apartment Communities, Inc. | 4,915 | 319,328 | |
Mission West Properties, Inc. | 8,631 | 59,122 | |
National Health Investors, Inc. | 5,324 | 252,996 | |
Common Stocks - continued | |||
Shares | Value | ||
FINANCIALS - continued | |||
Real Estate Investment Trusts - continued | |||
Nationwide Health Properties, Inc. | 4,350 | $ 185,919 | |
Newcastle Investment Corp. (a)(e) | 75,895 | 640,554 | |
NorthStar Realty Finance Corp. | 16,657 | 99,775 | |
Omega Healthcare Investors, Inc. | 19,186 | 459,888 | |
One Liberty Properties, Inc. | 9,574 | 142,461 | |
Parkway Properties, Inc. | 1,952 | 31,642 | |
Pennymac Mortgage Investment Trust | 12,102 | 228,123 | |
PS Business Parks, Inc. | 6,155 | 388,011 | |
Resource Capital Corp. | 9,944 | 73,685 | |
Sabra Health Care REIT, Inc. | 4,599 | 84,714 | |
Saul Centers, Inc. | 6,925 | 318,550 | |
| 7,373,759 | ||
Thrifts & Mortgage Finance - 0.7% | |||
BofI Holding, Inc. (a)(e) | 26,269 | 397,187 | |
Dime Community Bancshares, Inc. | 8,653 | 134,295 | |
Flushing Financial Corp. | 12,740 | 182,437 | |
Meridian Interstate Bancorp, Inc. (a) | 3,856 | 50,128 | |
NASB Financial, Inc. (e) | 705 | 10,631 | |
| 774,678 | ||
TOTAL FINANCIALS | 18,026,332 | ||
HEALTH CARE - 8.4% | |||
Biotechnology - 2.1% | |||
Alkermes, Inc. (a) | 2,700 | 38,691 | |
Alnylam Pharmaceuticals, Inc. (a) | 743 | 8,158 | |
ArQule, Inc. (a) | 24,580 | 156,575 | |
Array Biopharma, Inc. (a) | 39,576 | 110,813 | |
Celldex Therapeutics, Inc. (a) | 9,311 | 36,592 | |
Cepheid, Inc. (a) | 1,507 | 39,951 | |
Cubist Pharmaceuticals, Inc. (a) | 7,478 | 163,993 | |
Enzon Pharmaceuticals, Inc. (a) | 9,919 | 105,935 | |
Exelixis, Inc. (a) | 21,139 | 263,181 | |
Incyte Corp. (a)(e) | 10,567 | 144,557 | |
Inovio Pharmaceuticals, Inc. (a)(e) | 28,906 | 34,109 | |
InterMune, Inc. (a)(e) | 1,164 | 42,614 | |
Ligand Pharmaceuticals, Inc. Class B (a) | 6,342 | 68,747 | |
Medivation, Inc. (a) | 5,262 | 90,927 | |
Micromet, Inc. (a) | 13,210 | 82,298 | |
Nabi Biopharmaceuticals (a) | 28,349 | 160,455 | |
Neurocrine Biosciences, Inc. (a) | 22,691 | 153,164 | |
ONYX Pharmaceuticals, Inc. (a) | 1,105 | 38,940 | |
Osiris Therapeutics, Inc. (a)(e) | 19,191 | 127,236 | |
PDL BioPharma, Inc. | 15,915 | 88,328 | |
Regeneron Pharmaceuticals, Inc. (a) | 2,662 | 96,551 | |
SciClone Pharmaceuticals, Inc. (a) | 38,516 | 171,011 | |
Targacept, Inc. (a) | 3,295 | 94,468 | |
Theravance, Inc. (a) | 541 | 12,324 | |
Vanda Pharmaceuticals, Inc. (a) | 14,948 | 110,017 | |
| 2,439,635 | ||
| |||
Shares | Value | ||
Health Care Equipment & Supplies - 2.6% | |||
American Medical Systems Holdings, Inc. (a)(e) | 18,669 | $ 409,038 | |
Cantel Medical Corp. | 9,552 | 208,711 | |
Greatbatch, Inc. (a) | 9,099 | 226,383 | |
Haemonetics Corp. (a) | 1,724 | 106,285 | |
Invacare Corp. (e) | 14,055 | 415,606 | |
Kensey Nash Corp. (a) | 11,402 | 299,417 | |
Orthofix International NV (a) | 4,587 | 144,949 | |
Sirona Dental Systems, Inc. (a) | 10,872 | 548,601 | |
Steris Corp. | 9,567 | 323,843 | |
Thoratec Corp. (a) | 3,360 | 93,677 | |
Young Innovations, Inc. | 6,722 | 212,886 | |
| 2,989,396 | ||
Health Care Providers & Services - 2.6% | |||
Amedisys, Inc. (a)(e) | 6,093 | 218,861 | |
American Dental Partners, Inc. (a) | 5,624 | 72,268 | |
AmSurg Corp. (a) | 7,381 | 174,413 | |
Chemed Corp. | 5,129 | 335,642 | |
Chindex International, Inc. (a)(e) | 14,178 | 253,077 | |
Continucare Corp. (a) | 21,370 | 120,954 | |
Cross Country Healthcare, Inc. (a) | 4,729 | 39,345 | |
Emergency Medical Services Corp. | 1,917 | 121,059 | |
Hanger Orthopedic Group, Inc. (a) | 7,728 | 207,883 | |
Healthspring, Inc. (a) | 8,253 | 310,643 | |
Magellan Health Services, Inc. (a) | 2,197 | 105,412 | |
Owens & Minor, Inc. | 7,724 | 240,989 | |
PharMerica Corp. (a) | 29,298 | 344,252 | |
Providence Service Corp. (a) | 8,990 | 147,526 | |
Sun Healthcare Group, Inc. (a) | 13,127 | 192,967 | |
U.S. Physical Therapy, Inc. (a) | 966 | 19,098 | |
| 2,904,389 | ||
Life Sciences Tools & Services - 0.1% | |||
Affymetrix, Inc. (a) | 6,100 | 29,951 | |
Caliper Life Sciences, Inc. (a) | 5,039 | 33,711 | |
Dionex Corp. (a) | 236 | 27,806 | |
| 91,468 | ||
Pharmaceuticals - 1.0% | |||
Hi-Tech Pharmacal Co., Inc. (a) | 3,290 | 75,966 | |
Inspire Pharmaceuticals, Inc. (a) | 12,045 | 48,421 | |
Medicis Pharmaceutical Corp. Class A | 8,488 | 272,380 | |
Par Pharmaceutical Companies, Inc. (a) | 3,297 | 101,811 | |
Questcor Pharmaceuticals, Inc. (a) | 5,281 | 68,442 | |
Salix Pharmaceuticals Ltd. (a) | 1,212 | 40,408 | |
Santarus, Inc. (a) | 11,833 | 37,747 | |
SuperGen, Inc. (a) | 55,975 | 166,246 | |
ViroPharma, Inc. (a) | 16,161 | 289,767 | |
| 1,101,188 | ||
TOTAL HEALTH CARE | 9,526,076 | ||
Common Stocks - continued | |||
Shares | Value | ||
INDUSTRIALS - 14.8% | |||
Aerospace & Defense - 1.8% | |||
AAR Corp. (a)(e) | 11,274 | $ 307,667 | |
American Science & Engineering, Inc. | 4,952 | 465,488 | |
Ceradyne, Inc. (a) | 17,600 | 672,848 | |
Cubic Corp. | 6,179 | 310,865 | |
Esterline Technologies Corp. (a) | 4,209 | 301,238 | |
Global Defense Technology & Systems, Inc. (a) | 877 | 14,339 | |
| 2,072,445 | ||
Air Freight & Logistics - 1.1% | |||
Atlas Air Worldwide Holdings, Inc. (a) | 12,138 | 828,783 | |
Hub Group, Inc. Class A (a) | 7,198 | 251,642 | |
Park-Ohio Holdings Corp. (a) | 5,616 | 124,001 | |
| 1,204,426 | ||
Airlines - 0.5% | |||
Alaska Air Group, Inc. (a) | 9,781 | 581,480 | |
Building Products - 0.4% | |||
A.O. Smith Corp. | 6,560 | 265,024 | |
Ameron International Corp. | 576 | 40,700 | |
Gibraltar Industries, Inc. (a) | 11,172 | 120,993 | |
| 426,717 | ||
Commercial Services & Supplies - 1.4% | |||
American Reprographics Co. (a) | 4,633 | 41,234 | |
Consolidated Graphics, Inc. (a) | 6,820 | 371,963 | |
G&K Services, Inc. Class A | 8,509 | 275,862 | |
Interface, Inc. Class A | 6,439 | 107,338 | |
Multi-Color Corp. | 3,614 | 67,040 | |
Schawk, Inc. Class A | 10,245 | 185,127 | |
Steelcase, Inc. Class A | 20,964 | 203,560 | |
Tetra Tech, Inc. (a) | 10,152 | 238,572 | |
The Brink's Co. | 5,299 | 163,580 | |
| 1,654,276 | ||
Construction & Engineering - 0.7% | |||
EMCOR Group, Inc. (a) | 8,464 | 269,663 | |
Great Lakes Dredge & Dock Corp. | 66,286 | 521,671 | |
| 791,334 | ||
Electrical Equipment - 2.1% | |||
AZZ, Inc. | 3 | 128 | |
Belden, Inc. | 7,446 | 272,747 | |
Brady Corp. Class A | 14,970 | 535,028 | |
Franklin Electric Co., Inc. | 14,088 | 598,740 | |
Lihua International, Inc. (a) | 14,171 | 153,330 | |
Polypore International, Inc. (a) | 4,626 | 270,343 | |
Preformed Line Products Co. | 1,149 | 81,556 | |
Regal-Beloit Corp. (e) | 5,993 | 437,189 | |
| 2,349,061 | ||
Industrial Conglomerates - 0.1% | |||
Standex International Corp. | 1,466 | 50,240 | |
Tredegar Corp. | 1,411 | 27,543 | |
| 77,783 | ||
| |||
Shares | Value | ||
Machinery - 4.8% | |||
Actuant Corp. Class A | 5,933 | $ 167,904 | |
ArvinMeritor, Inc. (a) | 9,885 | 177,139 | |
Barnes Group, Inc. | 3,153 | 67,096 | |
Blount International, Inc. (a) | 6,580 | 100,016 | |
Briggs & Stratton Corp. | 17,217 | 346,578 | |
Colfax Corp. (a) | 20,018 | 443,999 | |
Graham Corp. | 21,450 | 455,384 | |
Kadant, Inc. (a) | 17,967 | 467,501 | |
L.B. Foster Co. Class A (a) | 6,299 | 264,558 | |
Lindsay Corp. (e) | 7,528 | 531,552 | |
NACCO Industries, Inc. Class A | 4,229 | 526,722 | |
Nordson Corp. | 7,058 | 768,687 | |
Robbins & Myers, Inc. | 15,630 | 666,307 | |
Tennant Co. | 7,820 | 317,883 | |
Twin Disc, Inc. | 5,146 | 166,525 | |
| 5,467,851 | ||
Professional Services - 0.8% | |||
CBIZ, Inc. (a)(e) | 20,881 | 147,837 | |
Huron Consulting Group, Inc. (a) | 16,417 | 456,721 | |
Kelly Services, Inc. Class A (non-vtg.) (a) | 12,649 | 265,882 | |
SFN Group, Inc. (a) | 1,198 | 16,568 | |
| 887,008 | ||
Road & Rail - 0.3% | |||
AMERCO (a) | 3,605 | 348,207 | |
Trading Companies & Distributors - 0.8% | |||
Aircastle Ltd. | 3,626 | 43,802 | |
Applied Industrial Technologies, Inc. | 11,556 | 370,254 | |
DXP Enterprises, Inc. (a) | 1,962 | 41,712 | |
TAL International Group, Inc. | 14,534 | 506,946 | |
| 962,714 | ||
TOTAL INDUSTRIALS | 16,823,302 | ||
INFORMATION TECHNOLOGY - 20.6% | |||
Communications Equipment - 2.5% | |||
Anaren, Inc. (a) | 20,538 | 435,816 | |
Arris Group, Inc. (a) | 20,078 | 265,030 | |
Aviat Networks, Inc. (a) | 38,727 | 236,622 | |
Bel Fuse, Inc. Class B (non-vtg.) | 3,194 | 69,949 | |
InterDigital, Inc. (e) | 16,061 | 765,788 | |
Plantronics, Inc. | 7,720 | 269,351 | |
Powerwave Technologies, Inc. (a) | 180,352 | 665,499 | |
Riverbed Technology, Inc. (a) | 3,465 | 143,070 | |
| 2,851,125 | ||
Computers & Peripherals - 0.8% | |||
Cray, Inc. (a) | 12,971 | 95,726 | |
Hutchinson Technology, Inc. (a)(e) | 58,585 | 183,957 | |
Synaptics, Inc. (a)(e) | 20,632 | 608,644 | |
| 888,327 | ||
Electronic Equipment & Components - 4.3% | |||
Anixter International, Inc. | 4,733 | 338,977 | |
Common Stocks - continued | |||
Shares | Value | ||
INFORMATION TECHNOLOGY - continued | |||
Electronic Equipment & Components - continued | |||
Brightpoint, Inc. (a) | 9,001 | $ 113,413 | |
Coherent, Inc. (a) | 9,634 | 594,900 | |
Insight Enterprises, Inc. (a) | 6,829 | 124,902 | |
Littelfuse, Inc. | 11,722 | 619,273 | |
Measurement Specialties, Inc. (a) | 14,242 | 440,647 | |
MTS Systems Corp. | 2,585 | 119,711 | |
Multi-Fineline Electronix, Inc. (a) | 16,161 | 462,528 | |
Newport Corp. (a) | 32,107 | 534,582 | |
OSI Systems, Inc. (a) | 6,671 | 250,963 | |
Power-One, Inc. (a)(e) | 53,813 | 442,881 | |
Pulse Electronics Corp. (e) | 79,198 | 478,356 | |
Rofin-Sinar Technologies, Inc. (a) | 904 | 35,057 | |
Rogers Corp. (a) | 4,594 | 216,653 | |
TTM Technologies, Inc. (a) | 5,180 | 90,857 | |
Zygo Corp. (a) | 2,410 | 34,897 | |
| 4,898,597 | ||
Internet Software & Services - 0.8% | |||
EarthLink, Inc. | 13,454 | 110,726 | |
j2 Global Communications, Inc. (a) | 8,179 | 237,927 | |
Mercadolibre, Inc. | 2,630 | 173,001 | |
Rackspace Hosting, Inc. (a) | 1,091 | 40,269 | |
ValueClick, Inc. (a) | 20,967 | 313,037 | |
| 874,960 | ||
IT Services - 2.4% | |||
Acxiom Corp. (a) | 19,200 | 329,088 | |
CACI International, Inc. Class A (a) | 4,330 | 256,856 | |
CSG Systems International, Inc. (a) | 8,355 | 163,340 | |
Euronet Worldwide, Inc. (a) | 9,201 | 166,262 | |
Jack Henry & Associates, Inc. | 9,923 | 316,643 | |
Maximus, Inc. | 1,485 | 109,890 | |
Teletech Holdings, Inc. (a) | 20,191 | 459,951 | |
Unisys Corp. (a) | 2,273 | 84,465 | |
VeriFone Systems, Inc. (a) | 16,016 | 727,767 | |
Wright Express Corp. (a) | 1,455 | 74,205 | |
| 2,688,467 | ||
Semiconductors & Semiconductor Equipment - 5.7% | |||
ATMI, Inc. (a) | 3,372 | 61,505 | |
Cabot Microelectronics Corp. (a) | 12,360 | 603,415 | |
Diodes, Inc. (a) | 6,333 | 183,404 | |
DSP Group, Inc. (a) | 4,657 | 36,744 | |
Entegris, Inc. (a) | 77,920 | 679,462 | |
GT Solar International, Inc. (a) | 45,891 | 490,575 | |
Kulicke & Soffa Industries, Inc. (a) | 25,685 | 246,319 | |
Lattice Semiconductor Corp. (a) | 97,899 | 650,049 | |
Nanometrics, Inc. (a) | 5,764 | 103,867 | |
Omnivision Technologies, Inc. (a) | 6,596 | 201,970 | |
Photronics, Inc. (a) | 69,196 | 618,612 | |
PMC-Sierra, Inc. (a) | 37,224 | 294,070 | |
RF Micro Devices, Inc. (a) | 88,495 | 663,713 | |
| |||
Shares | Value | ||
Sigma Designs, Inc. (a) | 19,766 | $ 270,399 | |
Skyworks Solutions, Inc. (a) | 20,054 | 720,741 | |
Tessera Technologies, Inc. (a) | 2,398 | 41,749 | |
Veeco Instruments, Inc. (a)(e) | 14,460 | 688,007 | |
| 6,554,601 | ||
Software - 4.1% | |||
AsiaInfo Holdings, Inc. (a) | 6,220 | 126,577 | |
Fair Isaac Corp. | 17,198 | 480,684 | |
Lawson Software, Inc. (a) | 17,305 | 175,473 | |
Manhattan Associates, Inc. (a) | 6,719 | 216,352 | |
Monotype Imaging Holdings, Inc. (a) | 43,624 | 583,689 | |
Net 1 UEPS Technologies, Inc. (a) | 30,004 | 306,041 | |
NetScout Systems, Inc. (a) | 4,182 | 104,508 | |
Opnet Technologies, Inc. | 11,270 | 384,082 | |
QAD, Inc.: | |||
Class A (a) | 10,828 | 98,427 | |
Class B | 3,690 | 32,989 | |
Quest Software, Inc. (a) | 16,992 | 455,216 | |
Renaissance Learning, Inc. | 5,670 | 60,896 | |
Take-Two Interactive Software, Inc. (a) | 40,542 | 651,510 | |
TIBCO Software, Inc. (a) | 38,441 | 946,405 | |
VirnetX Holding Corp. | 1,915 | 22,980 | |
| 4,645,829 | ||
TOTAL INFORMATION TECHNOLOGY | 23,401,906 | ||
MATERIALS - 7.3% | |||
Chemicals - 3.0% | |||
Arch Chemicals, Inc. | 10,319 | 370,968 | |
Ferro Corp. (a) | 16,685 | 265,625 | |
OM Group, Inc. (a) | 10,873 | 382,621 | |
Quaker Chemical Corp. | 6,563 | 254,185 | |
Rockwood Holdings, Inc. (a) | 6,561 | 305,415 | |
Senomyx, Inc. (a)(e) | 34,822 | 252,460 | |
Sensient Technologies Corp. | 3,614 | 120,635 | |
ShengdaTech, Inc. (a)(e) | 32,867 | 136,398 | |
Solutia, Inc. (a) | 14,382 | 333,806 | |
TPC Group, Inc. (a) | 6,574 | 190,975 | |
W.R. Grace & Co. (a) | 14,185 | 539,597 | |
Westlake Chemical Corp. | 4,562 | 218,109 | |
| 3,370,794 | ||
Containers & Packaging - 0.9% | |||
Boise, Inc. (e) | 23,117 | 207,591 | |
Rock-Tenn Co. Class A (e) | 6,523 | 447,804 | |
Silgan Holdings, Inc. | 9,419 | 343,605 | |
| 999,000 | ||
Metals & Mining - 1.3% | |||
Golden Star Resources Ltd. (a) | 142,699 | 451,054 | |
Hecla Mining Co. (a)(e) | 78,117 | 792,888 | |
Noranda Aluminium Holding Corp. (a) | 15,298 | 241,249 | |
| 1,485,191 | ||
Common Stocks - continued | |||
Shares | Value | ||
MATERIALS - continued | |||
Paper & Forest Products - 2.1% | |||
Buckeye Technologies, Inc. | 27,529 | $ 721,260 | |
Clearwater Paper Corp. (a) | 5,742 | 455,341 | |
Domtar Corp. | 6,803 | 594,582 | |
Glatfelter | 11,047 | 135,989 | |
Kapstone Paper & Packaging Corp. (a) | 32,066 | 549,932 | |
| 2,457,104 | ||
TOTAL MATERIALS | 8,312,089 | ||
TELECOMMUNICATION SERVICES - 0.7% | |||
Diversified Telecommunication Services - 0.5% | |||
Consolidated Communications Holdings, Inc. | 10,748 | 196,581 | |
Vonage Holdings Corp. (a)(e) | 77,002 | 340,349 | |
| 536,930 | ||
Wireless Telecommunication Services - 0.2% | |||
USA Mobility, Inc. | 19,627 | 292,835 | |
TOTAL TELECOMMUNICATION SERVICES | 829,765 | ||
UTILITIES - 1.0% | |||
Electric Utilities - 0.4% | |||
El Paso Electric Co. (a) | 11,438 | 321,408 | |
IDACORP, Inc. | 970 | 36,608 | |
Portland General Electric Co. | 4,195 | 98,247 | |
| 456,263 | ||
Gas Utilities - 0.3% | |||
Chesapeake Utilities Corp. | 2,888 | 117,946 | |
Piedmont Natural Gas Co., Inc. | 1,164 | 34,105 | |
Southwest Gas Corp. | 4,389 | 170,600 | |
| 322,651 | ||
Independent Power Producers & Energy Traders - 0.2% | |||
Black Hills Corp. | 6,032 | 185,906 | |
Multi-Utilities - 0.1% | |||
Avista Corp. | 4,723 | 105,417 | |
TOTAL UTILITIES | 1,070,237 | ||
TOTAL COMMON STOCKS (Cost $80,574,719) | 105,798,047 | ||
U.S. Treasury Obligations - 0.5% | ||||
| Principal Amount |
| ||
U.S. Treasury Bills, yield at date of purchase 0.13% to 0.19% 5/5/11 to 7/28/11 (f) | $ 570,000 | 569,711 | ||
Money Market Funds - 18.0% | |||
Shares | Value | ||
Dreyfus Cash Management Institutional Shares, 0.10% (c) | 7,012,825 | $ 7,012,825 | |
Fidelity Securities Lending Cash Central Fund, 0.21% (b)(d) | 13,504,271 | 13,504,271 | |
TOTAL MONEY MARKET FUNDS (Cost $20,517,096) | 20,517,096 | ||
TOTAL INVESTMENT PORTFOLIO - 111.5% (Cost $101,661,444) | 126,884,854 | |
NET OTHER ASSETS (LIABILITIES) - (11.5)% | (13,055,685) | |
NET ASSETS - 100% | $ 113,829,169 | |
Futures Contracts | |||||
Expiration Date | Underlying Face Amount at Value | Unrealized Appreciation/(Depreciation) | |||
Purchased | |||||
Equity Index Contracts | |||||
97 NYFE Russell Mini Index Contracts | March 2011 | $ 7,982,130 | $ 261,128 | ||
|
The face value of futures purchased as a percentage of net assets is 7.0% |
Legend |
(a) Non-income producing |
(b) Affiliated fund that is available only to investment companies and other accounts managed by Fidelity Investments. The rate quoted is the annualized seven-day yield of the fund at period end. A complete unaudited listing of the fund's holdings as of its most recent quarter end is available upon request. In addition, each Fidelity Central Fund's financial statements, which are not covered by the Fund's Report of Independent Registered Public Accounting Firm, are available on the SEC's website or upon request. |
(c) The rate quoted is the annualized seven-day yield of the fund at period end. |
(d) Investment made with cash collateral received from securities on loan. |
(e) Security or a portion of the security is on loan at period end. |
(f) Security or a portion of the security was pledged to cover margin requirements for futures contracts. At the period end, the value of securities pledged amounted to $519,742. |
Affiliated Central Funds |
Information regarding fiscal year to date income earned by the Fund from investments in Fidelity Central Funds is as follows: |
Fund | Income earned |
Fidelity Securities Lending Cash Central Fund | $ 110,147 |
Other Information |
The following is a summary of the inputs used, as of February 28, 2011, involving the Fund's assets and liabilities carried at fair value. The inputs or methodology used for valuing securities may not be an indication of the risk associated with investing in those securities. For more information on valuation inputs, and their aggregation into the levels used in the table below, please refer to the Security Valuation section in the accompanying Notes to Financial Statements. |
Valuation Inputs at Reporting Date: | ||||
Description | Total | Level 1 | Level 2 | Level 3 |
Investments in Securities: | ||||
Equities: | ||||
Consumer Discretionary | $ 13,747,904 | $ 13,747,904 | $ - | $ - |
Consumer Staples | 3,679,357 | 3,679,357 | - | - |
Energy | 10,381,079 | 10,381,079 | - | - |
Financials | 18,026,332 | 18,026,332 | - | - |
Health Care | 9,526,076 | 9,526,076 | - | - |
Industrials | 16,823,302 | 16,823,302 | - | - |
Information Technology | 23,401,906 | 23,401,906 | - | - |
Materials | 8,312,089 | 8,312,089 | - | - |
Telecommunication Services | 829,765 | 829,765 | - | - |
Utilities | 1,070,237 | 1,070,237 | - | - |
U.S. Government and Government Agency Obligations | 569,711 | - | 569,711 | - |
Money Market Funds | 20,517,096 | 20,517,096 | - | - |
Total Investments in Securities: | $ 126,884,854 | $ 126,315,143 | $ 569,711 | $ - |
Derivative Instruments: | ||||
Assets | ||||
Futures Contracts | $ 261,128 | $ 261,128 | $ - | $ - |
Value of Derivative Instruments |
The following table is a summary of the Fund's value of derivative instruments by risk exposure as of February 28, 2011. For additional information on derivative instruments, please refer to the Derivative Instruments section in the accompanying Notes to Financial Statements. |
Risk Exposure / | Value | |
| Asset | Liability |
Equity Risk | ||
Futures Contracts (a) | $ 261,128 | $ - |
Total Value of Derivatives | $ 261,128 | $ - |
(a) Reflects cumulative appreciation/(depreciation) on futures contracts as disclosed on the Schedule of Investments. Only the period end variation margin is separately disclosed on the Statement of Assets and Liabilities. |
See accompanying notes which are an integral part of the financial statements.
Annual Report
Fidelity Small Cap Enhanced Index Fund
Financial Statements
Statement of Assets and Liabilities
| February 28, 2011 | |
|
|
|
Assets | ||
Investment in securities, at value (including securities loaned of $13,026,093) - See accompanying schedule: Unaffiliated issuers (cost $88,157,173) | $ 113,380,583 |
|
Fidelity Central Funds (cost $13,504,271) | 13,504,271 |
|
Total Investments (cost $101,661,444) |
| $ 126,884,854 |
Receivable for investments sold | 241,384 | |
Receivable for fund shares sold | 275,690 | |
Dividends receivable | 39,160 | |
Interest receivable | 453 | |
Distributions receivable from Fidelity Central Funds | 5,851 | |
Receivable for daily variation on futures contracts | 7,996 | |
Other receivables | 293 | |
Total assets | 127,455,681 | |
|
|
|
Liabilities | ||
Payable for fund shares redeemed | 60,824 | |
Accrued management fee | 47,667 | |
Other affiliated payables | 13,750 | |
Collateral on securities loaned, at value | 13,504,271 | |
Total liabilities | 13,626,512 | |
|
|
|
Net Assets | $ 113,829,169 | |
Net Assets consist of: |
| |
Paid in capital | $ 85,337,518 | |
Accumulated undistributed net realized gain (loss) on investments and foreign currency transactions | 3,007,113 | |
Net unrealized appreciation (depreciation) on investments | 25,484,538 | |
Net Assets, for 10,621,623 shares outstanding | $ 113,829,169 | |
Net Asset Value, offering price and redemption price per share ($113,829,169 ÷ 10,621,623 shares) | $ 10.72 | |
Statement of Operations
| Year ended February 28, 2011 | |
|
|
|
Investment Income |
|
|
Dividends |
| $ 1,213,342 |
Interest |
| 6,004 |
Income from Fidelity Central Funds (including $110,147 from security lending) |
| 110,147 |
Total income |
| 1,329,493 |
|
|
|
Expenses | ||
Management fee | $ 531,952 | |
Transfer agent fees | 153,807 | |
Independent trustees' compensation | 1,243 | |
Interest | 2,188 | |
Miscellaneous | 294 | |
Total expenses before reductions | 689,484 | |
Expense reductions | (14) | 689,470 |
Net investment income (loss) | 640,023 | |
Realized and Unrealized Gain (Loss) Net realized gain (loss) on: | ||
Investment securities: |
|
|
Unaffiliated issuers | 11,417,839 | |
Foreign currency transactions | 5,400 | |
Futures contracts | 415,189 | |
Total net realized gain (loss) |
| 11,838,428 |
Change in net unrealized appreciation (depreciation) on: Investment securities | 17,289,555 | |
Futures contracts | 188,406 | |
Total change in net unrealized appreciation (depreciation) |
| 17,477,961 |
Net gain (loss) | 29,316,389 | |
Net increase (decrease) in net assets resulting from operations | $ 29,956,412 | |
See accompanying notes which are an integral part of the financial statements.
Annual Report
Statement of Changes in Net Assets
| Year ended February 28, | Year ended February 28, |
Increase (Decrease) in Net Assets |
|
|
Operations |
|
|
Net investment income (loss) | $ 640,023 | $ 563,933 |
Net realized gain (loss) | 11,838,428 | (3,276,533) |
Change in net unrealized appreciation (depreciation) | 17,477,961 | 33,214,854 |
Net increase (decrease) in net assets resulting from operations | 29,956,412 | 30,502,254 |
Distributions to shareholders from net investment income | (740,549) | (554,929) |
Share transactions | 62,154,022 | 39,570,131 |
Reinvestment of distributions | 708,498 | 525,603 |
Cost of shares redeemed | (63,524,536) | (42,285,209) |
Net increase (decrease) in net assets resulting from share transactions | (662,016) | (2,189,475) |
Redemption fees | 32,519 | 41,898 |
Total increase (decrease) in net assets | 28,586,366 | 27,799,748 |
|
|
|
Net Assets | ||
Beginning of period | 85,242,803 | 57,443,055 |
End of period (including undistributed net investment income of $0 and undistributed net investment income of $29,153, respectively) | $ 113,829,169 | $ 85,242,803 |
Other Information Shares | ||
Sold | 6,638,981 | 5,764,326 |
Issued in reinvestment of distributions | 71,090 | 69,527 |
Redeemed | (6,671,411) | (6,294,661) |
Net increase (decrease) | 38,660 | (460,808) |
Financial Highlights
Years ended February 28, | 2011 | 2010 | 2009 | 2008 G |
Selected Per-Share Data |
|
|
|
|
Net asset value, beginning of period | $ 8.05 | $ 5.20 | $ 9.03 | $ 10.00 |
Income from Investment Operations |
|
|
|
|
Net investment income (loss) D | .06 | .05 | .09 | .02 |
Net realized and unrealized gain (loss) | 2.67 | 2.86 | (3.87) | (.99) |
Total from investment operations | 2.73 | 2.91 | (3.78) | (.97) |
Distributions from net investment income | (.06) | (.06) | (.06) | - |
Redemption fees added to paid in capital D | - I | - I | .01 | - I |
Net asset value, end of period | $ 10.72 | $ 8.05 | $ 5.20 | $ 9.03 |
Total Return B, C | 34.01% | 55.93% | (41.94)% | (9.70)% |
Ratios to Average Net Assets E, H |
|
|
|
|
Expenses before reductions | .67% | .67% | .67% | .67% A |
Expenses net of fee waivers, if any | .67% | .67% | .67% | .67% A |
Expenses net of all reductions | .67% | .67% | .67% | .67% A |
Net investment income (loss) | .63% | .77% | 1.29% | 1.19% A |
Supplemental Data |
|
|
|
|
Net assets, end of period (000 omitted) | $ 113,829 | $ 85,243 | $ 57,443 | $ 6,343 |
Portfolio turnover rate F | 90% | 98% J | 36% J | 16% |
A Annualized
B Total returns for periods of less than one year are not annualized.
C Total returns would have been lower had certain expenses not been reduced during the periods shown.
D Calculated based on average shares outstanding during the period.
E Fees and expenses of the underlying Fidelity Central Funds are not included in the Fund's expense ratio. The Fund indirectly bears its proportionate share of the expenses of any underlying Fidelity Central Funds.
F Amount does not include the portfolio activity of any underlying Fidelity Central Funds.
G For the period December 20, 2007 (commencement of operations) to February 29, 2008.
H Expense ratios reflect operating expenses of the Fund. Expenses before reductions do not reflect amounts reimbursed by the investment adviser or reductions from expense offset arrangements and do not represent the amount paid by the Fund during periods when reimbursements or reductions occur. Expenses net of fee waivers reflect expenses after reimbursement by the investment adviser but prior to reductions from expense offset arrangements. Expenses net of all reductions represent the net expenses paid by the Fund.
I Amount represents less than $.01 per share.
J Reflects adjustments to exclude transactions in money market mutual funds.
See accompanying notes which are an integral part of the financial statements.
Annual Report
Fidelity International Enhanced Index Fund
Performance: The Bottom Line
Average annual total return reflects the change in the value of an investment, assuming reinvestment of the fund's distributions from dividend income and capital gains (the profits earned upon the sale of securities that have grown in value, if any) and assuming a constant rate of performance each year. The $10,000 table and the fund's returns do not reflect the deduction of taxes that a shareholder would pay on fund distributions or the redemption of fund shares. During periods of reimbursement by Fidelity a fund's total returns will be greater than it would be had the reimbursement not occurred. How a fund did yesterday is no guarantee of how it will do tomorrow.
Average Annual Total Returns
Periods ended February 28, 2011 | Past 1 | Life of |
Fidelity International Enhanced Index Fund | 20.95% | -5.46% |
A From December 20, 2007.
$10,000 Over Life of Fund
Let's say hypothetically that $10,000 was invested in Fidelity International Enhanced Index Fund on December 20, 2007, when the fund started. The chart shows how the value of your investment would have changed, and also shows how the MSCI® EAFE® (Europe, Australasia, Far East) Index performed over the same period.
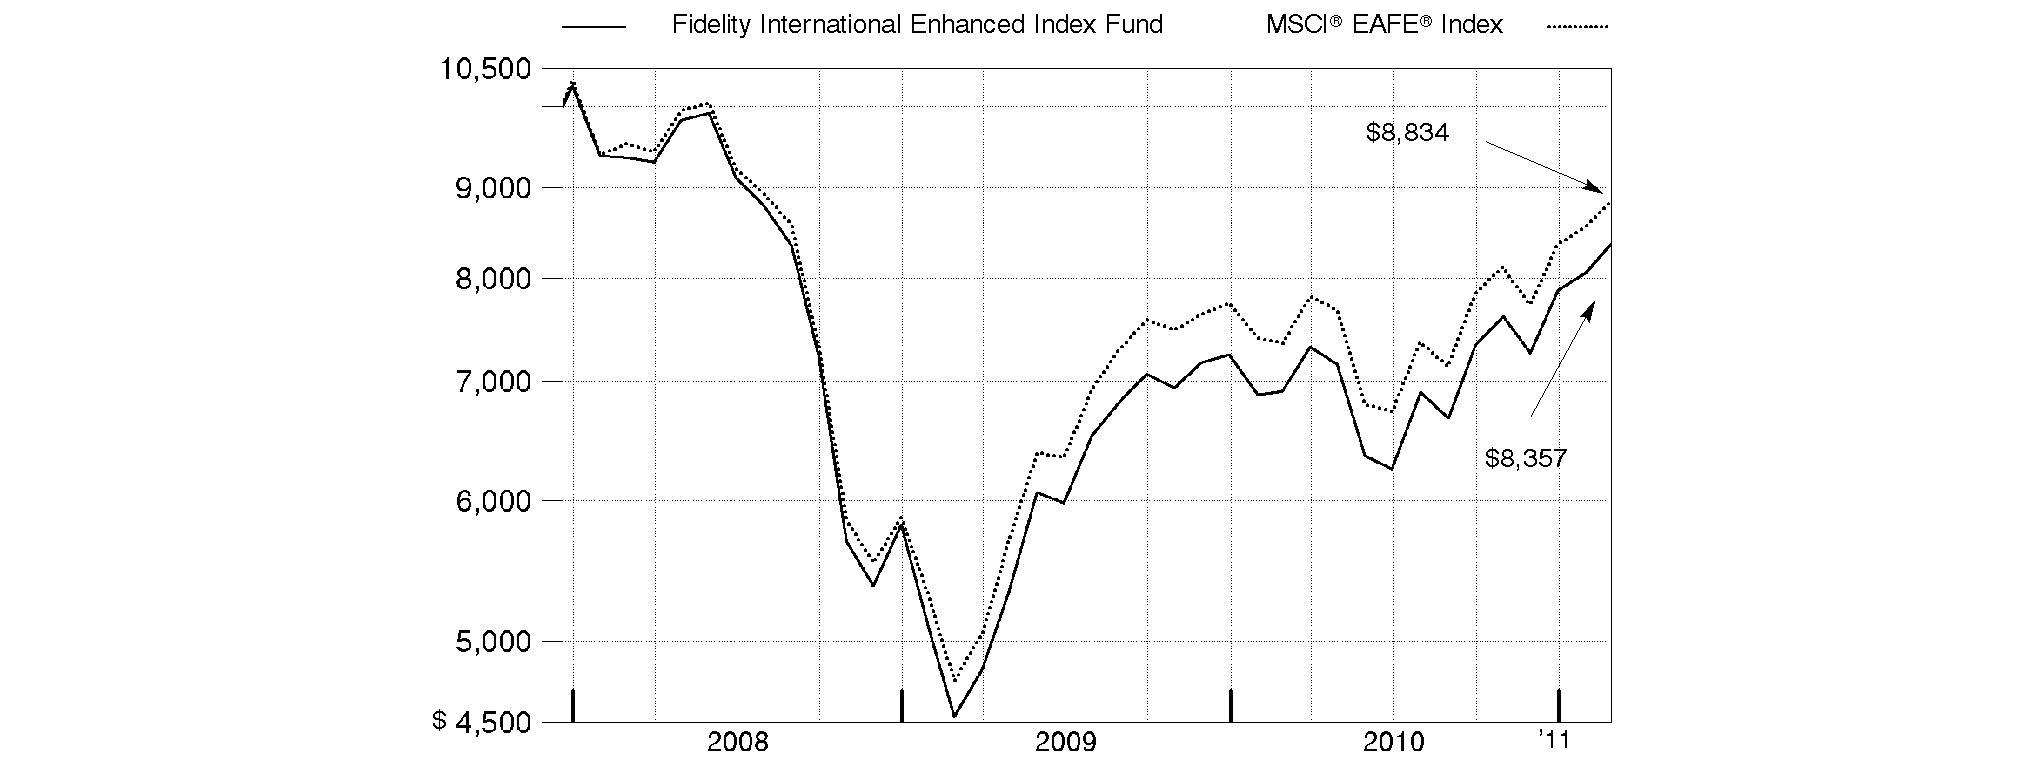
Annual Report
Fidelity International Enhanced Index Fund
Management's Discussion of Fund Performance
Market Recap: International equities delivered strong performance for the 12-month period ending February 28, 2011, after overcoming a precipitous decline early in the period due to concern about sovereign debt problems in Europe. Investor sentiment brightened substantially in the latter half, when signs of economic growth and subsiding debt fears helped propel stocks forward. For the full 12 months, the MSCI® EAFE® (Europe, Australasia, Far East) Index gained 20.16%, boosted in part by a falling U.S. dollar. The roughly 22% return for Europe was marginally ahead of the index, led by Sweden (+39%), Denmark (+38%), Germany (+32%) and the United Kingdom (+24%). Large European index components that underperformed included Switzerland and France, both returning around 18%. Concern regarding sovereign debt issues lingered into the latter part of 2010, as evident in the negative returns of debt-burdened Greece (-21%) and Ireland (-2%), both small index components. Italy and Spain, which also struggled with debt, fared better but still underperformed, gaining about 14% and 10%, respectively. Countries in the Asia-Pacific region rose by 20%. Hong Kong (+24%) and Australia (+22%) had the highest returns, while the roughly 17% advance of Japan trailed the MSCI® EAFE®, despite the positive impact of a weakening U.S. dollar relative to the Japanese yen.
Comments from Maximilian Kaufmann, member of the Geode Capital Management, LLC, investment management team for Fidelity® International Enhanced Index Fund: For the 12 months ending February 28, 2011, the fund gained 20.95%, outperforming the 20.16% result of the MSCI EAFE. Good results in the information technology, financials, materials and industrials groups proved especially helpful, as did favorable stock picking in Australia and Singapore. In contrast, the consumer discretionary and consumer staples sectors were sources of weakness, and stock selection in the U.K. and Sweden also hurt. Of final note, currency movements provided a healthy performance boost, as a weaker dollar overall lifted the fund's return for U.S. investors in foreign securities. (The fund's performance relative to the index can be affected by Fidelity's methodologies for valuing certain foreign stocks and for incorporating foreign exchange rates, which differ from those used by the index.) Relative to the index, the fund's top two individual contributors were Swiss semiconductor manufacturers, Infineon Technologies and STMicroElectronics. Sulzer, an out-of-benchmark company that makes pumps for industrial applications, also outperformed, as did Sacyr Vallehermoso, a leading Spanish construction business. Several Japanese firms also outperformed, including gaming company Sega Sammy Holdings; Hitachi, maker of a variety of consumer and business electronics; and Nitto Denko, which manufacturers optical film for liquid crystal display (LCD) panels. On the negative side, Resona Holdings, a Japanese bank, stood out. Not owning index components Automaker Bayerische Motoren Werke - better known as BMW - and Volvo and underweighting another vehicle maker, Volkswagen, hurt. Elsewhere, positions in Netherland-based energy giant Royal Dutch Shell and U.K.-based natural gas producer BG Group also detracted. Some of the names I've mentioned were no longer held at period end.
The views expressed above reflect those of the portfolio manager(s) only through the end of the period as stated on the cover of this report and do not necessarily represent the views of Fidelity or any other person in the Fidelity organization. Any such views are subject to change at any time based upon market or other conditions and Fidelity disclaims any responsibility to update such views. These views may not be relied on as investment advice and, because investment decisions for a Fidelity fund are based on numerous factors, may not be relied on as an indication of trading intent on behalf of any Fidelity fund.
Annual Report
Fidelity International Enhanced Index Fund
Investment Changes (Unaudited)
Geographic Diversification (% of fund's net assets) | |||
As of February 28, 2011 | |||
 | Japan | 20.6% |
|
 | United Kingdom | 18.6% |
|
 | Australia | 9.3% |
|
 | Germany | 8.7% |
|
 | France | 7.9% |
|
 | United States of America | 6.7% |
|
 | Switzerland | 5.7% |
|
 | Netherlands | 2.6% |
|
 | Sweden | 2.6% |
|
 | Other | 17.3% |
|

Percentages are adjusted for the effect of futures contracts, if applicable. |
As of August 31, 2010 | |||
| Japan | 21.6% |
|
| United Kingdom | 19.9% |
|
| Australia | 9.3% |
|
| France | 8.3% |
|
| Germany | 7.9% |
|
| Switzerland | 7.4% |
|
| United States of America | 3.6% |
|
| Hong Kong | 2.8% |
|
| Spain | 2.6% |
|
| Other | 16.6% |
|

Percentages are adjusted for the effect of futures contracts, if applicable. |
Asset Allocation | ||
| % of fund's | % of fund's net assets |
Stocks and Equity Futures | 98.7 | 99.3 |
Short-Term Investments and Net Other Assets | 1.3 | 0.7 |
Top Ten Stocks as of February 28, 2011 | ||
| % of fund's | % of fund's net assets |
BHP Billiton Ltd. (Australia, Metals & Mining) | 1.6 | 1.5 |
BP PLC (United Kingdom, Oil, Gas & Consumable Fuels) | 1.5 | 1.4 |
Nestle SA (Switzerland, Food Products) | 1.2 | 2.3 |
Siemens AG (Germany, Industrial Conglomerates) | 1.2 | 1.1 |
Roche Holding AG (participation certificate) (Switzerland, Pharmaceuticals) | 1.2 | 1.5 |
Rio Tinto PLC (United Kingdom, Metals & Mining) | 1.1 | 1.0 |
Total SA (France, Oil, Gas & Consumable Fuels) | 1.1 | 1.1 |
HSBC Holdings PLC (United Kingdom) (United Kingdom, Commercial Banks) | 1.5 | 1.7 |
Vodafone Group PLC (United Kingdom, Wireless Telecommunication Services) | 1.0 | 1.1 |
Commonwealth Bank of Australia (Australia, Commercial Banks) | 1.0 | 1.1 |
| 12.4 | |
Market Sectors as of February 28, 2011 | ||
| % of fund's | % of fund's net assets |
Financials | 22.8 | 22.7 |
Industrials | 12.3 | 11.0 |
Consumer Discretionary | 11.3 | 10.4 |
Materials | 10.4 | 10.1 |
Consumer Staples | 8.2 | 11.4 |
Health Care | 8.2 | 9.6 |
Energy | 7.1 | 7.1 |
Utilities | 4.8 | 5.0 |
Telecommunication Services | 4.1 | 4.9 |
Information Technology | 4.3 | 4.2 |
Annual Report
Fidelity International Enhanced Index Fund
Investments February 28, 2011
Showing Percentage of Net Assets
Common Stocks - 93.5% | |||
Shares | Value | ||
Australia - 9.3% | |||
AGL Energy Ltd. | 3,600 | $ 53,413 | |
ASX Ltd. | 829 | 30,891 | |
Australia & New Zealand Banking Group Ltd. | 3,440 | 85,029 | |
Bendigo & Adelaide Bank Ltd. | 5,400 | 51,672 | |
BHP Billiton Ltd. | 8,640 | 408,314 | |
Caltex Australia Ltd. | 7,331 | 119,023 | |
Coca-Cola Amatil Ltd. | 2,647 | 32,025 | |
Commonwealth Bank of Australia | 4,690 | 254,962 | |
Crown Ltd. | 7,400 | 63,192 | |
CSL Ltd. | 2,370 | 86,105 | |
DuluxGroup Ltd. | 2,500 | 7,118 | |
Fortescue Metals Group Ltd. | 16,000 | 109,206 | |
Fosters Group Ltd. | 13,957 | 81,371 | |
Incitec Pivot Ltd. | 10,999 | 49,631 | |
Insurance Australia Group Ltd. | 18,100 | 67,395 | |
MAp Group unit | 8,600 | 27,230 | |
Metcash Ltd. | 13,213 | 54,736 | |
National Australia Bank Ltd. | 2,950 | 78,002 | |
Orica Ltd. | 2,500 | 66,088 | |
QBE Insurance Group Ltd. | 2,245 | 41,594 | |
Rio Tinto Ltd. | 1,935 | 168,972 | |
Telstra Corp. Ltd. | 22,400 | 63,789 | |
Wesfarmers Ltd. | 3,000 | 101,633 | |
Westfield Group unit | 6,049 | 60,315 | |
Westfield Retail Trust unit | 7,479 | 20,435 | |
Westpac Banking Corp. | 4,051 | 97,782 | |
Woolworths Ltd. | 3,482 | 95,537 | |
TOTAL AUSTRALIA | 2,375,460 | ||
Austria - 0.6% | |||
OMV AG | 1,320 | 56,105 | |
Telekom Austria AG | 700 | 9,998 | |
Voestalpine AG | 2,039 | 94,193 | |
TOTAL AUSTRIA | 160,296 | ||
Bailiwick of Guernsey - 0.0% | |||
Resolution Ltd. | 1,537 | 7,227 | |
Bailiwick of Jersey - 0.8% | |||
Experian PLC | 8,662 | 109,848 | |
Petrofac Ltd. | 4,090 | 92,631 | |
TOTAL BAILIWICK OF JERSEY | 202,479 | ||
Belgium - 1.3% | |||
Anheuser-Busch InBev SA NV | 2,829 | 157,999 | |
Bekaert SA | 868 | 94,114 | |
Delhaize Group SA | 645 | 49,890 | |
Mobistar SA | 580 | 37,059 | |
Umicore SA | 51 | 2,569 | |
TOTAL BELGIUM | 341,631 | ||
| |||
Shares | Value | ||
Bermuda - 0.2% | |||
Noble Group Ltd. | 545 | $ 878 | |
Yue Yuen Industrial (Holdings) Ltd. | 15,500 | 48,761 | |
TOTAL BERMUDA | 49,639 | ||
Denmark - 1.1% | |||
Coloplast AS Series B | 621 | 87,477 | |
Novo Nordisk AS Series B | 1,505 | 189,716 | |
Novozymes AS Series B | 45 | 6,293 | |
TOTAL DENMARK | 283,486 | ||
Finland - 2.0% | |||
Fortum Corp. | 3,400 | 105,335 | |
KCI Konecranes Oyj | 1,875 | 84,042 | |
Kone Oyj (B Shares) | 1,920 | 104,792 | |
Nokia Corp. | 8,713 | 75,123 | |
Stora Enso Oyj (R Shares) | 8,332 | 93,882 | |
Wartsila Corp. | 563 | 43,276 | |
TOTAL FINLAND | 506,450 | ||
France - 7.9% | |||
Air Liquide SA | 22 | 2,848 | |
AXA SA | 2,102 | 44,150 | |
BNP Paribas SA | 1,600 | 124,929 | |
Bouygues SA | 702 | 32,458 | |
Carrefour SA | 844 | 41,441 | |
CNP Assurances | 1,600 | 35,483 | |
Compagnie de St. Gobain | 1,858 | 111,087 | |
Credit Agricole SA | 6,644 | 116,626 | |
Danone | 370 | 23,197 | |
Eutelsat Communications | 1,830 | 73,022 | |
France Telecom SA | 5,170 | 114,410 | |
GDF Suez | 2,623 | 106,330 | |
Gecina SA | 684 | 88,606 | |
Hermes International SA | 399 | 86,860 | |
Legrand SA | 1,200 | 50,334 | |
LVMH Moet Hennessy - Louis Vuitton | 85 | 13,402 | |
PagesJaunes Groupe SA (e) | 4,270 | 41,643 | |
Sanofi-Aventis | 1,420 | 98,194 | |
Schneider Electric SA | 249 | 41,200 | |
Societe Generale Series A | 1,800 | 126,560 | |
Technip SA | 995 | 98,232 | |
Total SA | 4,620 | 283,216 | |
Unibail-Rodamco | 490 | 98,522 | |
VINCI SA | 1,400 | 84,274 | |
Vivendi | 2,340 | 66,715 | |
TOTAL FRANCE | 2,003,739 | ||
Germany - 8.7% | |||
Allianz AG | 1,110 | 159,920 | |
BASF AG | 2,834 | 235,672 | |
Bayer AG | 2,785 | 215,917 | |
Commerzbank AG (a) | 10,473 | 90,272 | |
Daimler AG (Germany) | 2,028 | 142,871 | |
Common Stocks - continued | |||
Shares | Value | ||
Germany - continued | |||
Deutsche Bank AG | 2,820 | $ 181,271 | |
Deutsche Boerse AG | 677 | 51,982 | |
Deutsche Telekom AG | 5,892 | 79,236 | |
E.ON AG | 3,722 | 122,117 | |
Infineon Technologies AG | 9,805 | 107,273 | |
Kabel Deutschland Holding AG | 1,494 | 81,397 | |
Linde AG | 865 | 132,023 | |
Munich Re Group | 189 | 31,546 | |
RWE AG | 196 | 13,229 | |
SAP AG | 1,560 | 94,120 | |
Siemens AG | 2,270 | 305,710 | |
TUI AG (a) | 6,486 | 85,005 | |
Volkswagen AG | 97 | 14,725 | |
Wacker Chemie AG | 446 | 82,290 | |
TOTAL GERMANY | 2,226,576 | ||
Greece - 0.7% | |||
Coca-Cola Hellenic Bottling Co. SA | 554 | 15,092 | |
Greek Organization of Football Prognostics SA | 3,229 | 67,420 | |
Public Power Corp. of Greece | 5,294 | 81,897 | |
TOTAL GREECE | 164,409 | ||
Hong Kong - 2.5% | |||
ASM Pacific Technology Ltd. | 4,600 | 60,955 | |
Bank of East Asia Ltd. | 80 | 347 | |
BOC Hong Kong (Holdings) Ltd. | 16,000 | 49,615 | |
Cheung Kong Holdings Ltd. | 2,000 | 31,125 | |
CLP Holdings Ltd. | 10,000 | 81,472 | |
Hang Seng Bank Ltd. | 2,000 | 31,895 | |
Henderson Land Development Co. Ltd. | 4,024 | 25,499 | |
Henderson Land Development Co. Ltd. warrants 6/1/11 (a) | 800 | 58 | |
Hutchison Whampoa Ltd. | 5,000 | 58,873 | |
Hysan Development Co. Ltd. | 5,000 | 22,470 | |
Kerry Properties Ltd. | 8,000 | 38,726 | |
New World Development Co. Ltd. | 21,389 | 38,450 | |
Power Assets Holdings Ltd. | 3,500 | 22,852 | |
Sun Hung Kai Properties Ltd. | 4,495 | 72,608 | |
Wheelock and Co. Ltd. | 25,000 | 90,845 | |
TOTAL HONG KONG | 625,790 | ||
Ireland - 0.1% | |||
CRH PLC | 27 | 624 | |
Kerry Group PLC Class A | 680 | 24,680 | |
TOTAL IRELAND | 25,304 | ||
Israel - 0.7% | |||
Israel Chemicals Ltd. | 6,004 | 99,708 | |
Teva Pharmaceutical Industries Ltd. | 1,406 | 70,604 | |
TOTAL ISRAEL | 170,312 | ||
Italy - 1.9% | |||
Assicurazioni Generali SpA | 1,101 | 24,903 | |
| |||
Shares | Value | ||
Enel SpA | 3,784 | $ 22,548 | |
ENI SpA | 1,850 | 45,109 | |
EXOR SpA | 2,813 | 85,830 | |
Finmeccanica SpA | 4,420 | 55,323 | |
Intesa Sanpaolo SpA | 20,964 | 70,706 | |
Mediobanca SpA | 3,747 | 39,661 | |
Mediobanca SpA warrants 3/18/11 (a) | 3,569 | 10 | |
Pirelli & C SpA | 10,799 | 87,031 | |
Telecom Italia SpA | 19,506 | 30,454 | |
UniCredit SpA | 9,662 | 24,840 | |
TOTAL ITALY | 486,415 | ||
Japan - 20.6% | |||
Aeon Mall Co. Ltd. | 3,800 | 100,946 | |
Asahi Glass Co. Ltd. | 4,000 | 55,933 | |
Astellas Pharma, Inc. | 2,200 | 86,512 | |
Bank of Yokohama Ltd. | 7,000 | 37,788 | |
Canon, Inc. | 2,000 | 96,725 | |
Central Japan Railway Co. | 14 | 125,485 | |
Chiba Bank Ltd. | 4,000 | 27,449 | |
Chubu Electric Power Co., Inc. | 4,200 | 110,863 | |
Daito Trust Construction Co. Ltd. | 1,400 | 114,156 | |
DeNA Co. Ltd. | 3,300 | 127,280 | |
Dentsu, Inc. | 1,800 | 57,469 | |
East Japan Railway Co. | 1,700 | 118,547 | |
Eisai Co. Ltd. | 1,000 | 37,464 | |
Electric Power Development Co. Ltd. | 900 | 28,397 | |
Elpida Memory, Inc. (a) | 3,700 | 55,455 | |
Fuji Heavy Industries Ltd. | 14,000 | 120,646 | |
Fujifilm Holdings Corp. | 2,000 | 70,420 | |
Hino Motors Ltd. | 19,000 | 105,531 | |
Hitachi Ltd. | 29,000 | 176,517 | |
Honda Motor Co. Ltd. | 5,300 | 231,318 | |
INPEX Corp. | 12 | 84,328 | |
Isetan Mitsukoshi Holdings Ltd. | 1,400 | 16,962 | |
JFE Holdings, Inc. | 2,500 | 79,178 | |
JGC Corp. | 3,000 | 68,126 | |
Jupiter Telecommunications Co. | 40 | 43,032 | |
Kansai Electric Power Co., Inc. | 1,900 | 49,903 | |
Kao Corp. | 1,300 | 35,116 | |
KDDI Corp. | 13 | 84,428 | |
Kinden Corp. | 10,000 | 90,465 | |
Kirin Holdings Co. Ltd. | 2,000 | 28,637 | |
Kuraray Co. Ltd. | 2,000 | 28,408 | |
Lawson, Inc. | 700 | 34,444 | |
Marubeni Corp. | 8,000 | 61,408 | |
Minebea Ltd. | 16,000 | 95,190 | |
Mitsubishi Corp. | 1,000 | 27,824 | |
Mitsubishi UFJ Financial Group, Inc. | 7,400 | 41,110 | |
Mitsui & Co. Ltd. | 5,500 | 100,546 | |
Mitsui Engineering & Shipbuilding Co. | 24,000 | 66,331 | |
Mitsui OSK Lines Ltd. | 6,000 | 39,899 | |
Mizuho Financial Group, Inc. | 20,000 | 41,229 | |
Nintendo Co. Ltd. | 50 | 14,652 | |
Common Stocks - continued | |||
Shares | Value | ||
Japan - continued | |||
Nippon Electric Glass Co. Ltd. | 4,000 | $ 67,105 | |
Nippon Telegraph & Telephone Corp. | 400 | 19,568 | |
Nissan Motor Co. Ltd. | 14,300 | 146,943 | |
Nisshin Seifun Group, Inc. | 3,500 | 46,175 | |
Nitori Holdings Co. Ltd. | 800 | 70,807 | |
Nitto Denko Corp. | 2,100 | 126,436 | |
Nomura Holdings, Inc. | 4,200 | 26,636 | |
NTT Data Corp. | 16 | 57,186 | |
ORIX Corp. | 380 | 42,506 | |
Osaka Gas Co. Ltd. | 13,000 | 49,508 | |
Panasonic Corp. | 2,000 | 27,018 | |
Resona Holdings, Inc. | 11,700 | 63,922 | |
Sega Sammy Holdings, Inc. | 5,900 | 133,940 | |
Seven & i Holdings Co., Ltd. | 1,400 | 39,081 | |
Sony Corp. | 2,700 | 99,416 | |
Sony Financial Holdings, Inc. | 18 | 76,467 | |
Sumitomo Corp. | 4,300 | 63,890 | |
Sumitomo Heavy Industries Ltd. | 6,000 | 42,329 | |
Sumitomo Mitsui Financial Group, Inc. | 3,100 | 117,316 | |
Sumitomo Realty & Development Co. Ltd. | 4,000 | 107,880 | |
Takeda Pharmaceutical Co. Ltd. | 2,700 | 134,522 | |
Tokio Marine Holdings, Inc. | 2,600 | 85,492 | |
Tokyo Electric Power Co. | 2,000 | 51,773 | |
Tokyo Gas Co. Ltd. | 11,000 | 49,179 | |
Tokyu Land Corp. | 19,000 | 109,278 | |
Toyo Suisan Kaisha Ltd. | 1,500 | 33,906 | |
Toyoda Gosei Co. Ltd. | 2,300 | 53,873 | |
Toyota Motor Corp. | 3,200 | 149,537 | |
Yamada Denki Co. Ltd. | 720 | 54,836 | |
Yamaguchi Financial Group, Inc. | 3,000 | 31,027 | |
Yamazaki Baking Co. Ltd. | 5,000 | 60,758 | |
TOTAL JAPAN | 5,254,427 | ||
Luxembourg - 0.4% | |||
Aperam | 47 | 1,944 | |
Tenaris SA | 3,940 | 88,953 | |
TOTAL LUXEMBOURG | 90,897 | ||
Netherlands - 2.6% | |||
Akzo Nobel NV | 372 | 25,293 | |
ING Groep NV (Certificaten Van Aandelen) unit (a) | 13,820 | 173,372 | |
Koninklijke Ahold NV | 7,745 | 103,974 | |
Koninklijke KPN NV | 2,705 | 43,824 | |
Koninklijke Philips Electronics NV | 2,398 | 78,362 | |
STMicroelectronics NV | 7,741 | 99,453 | |
Unilever NV (Certificaten Van Aandelen) (Bearer) unit | 4,740 | 142,973 | |
TOTAL NETHERLANDS | 667,251 | ||
| |||
Shares | Value | ||
New Zealand - 0.6% | |||
Fletcher Building Ltd. | 8,805 | $ 58,100 | |
Sky City Entertainment Group Ltd. | 41,148 | 100,619 | |
TOTAL NEW ZEALAND | 158,719 | ||
Norway - 0.5% | |||
StatoilHydro ASA | 2,800 | 73,943 | |
Telenor ASA | 3,400 | 56,380 | |
TOTAL NORWAY | 130,323 | ||
Singapore - 1.4% | |||
Ascendas Real Estate Investment Trust (A-REIT) | 13,000 | 20,443 | |
ComfortDelgro Corp. Ltd. | 20,000 | 24,375 | |
Jardine Cycle & Carriage Ltd. | 2,000 | 52,964 | |
Oversea-Chinese Banking Corp. Ltd. | 9,171 | 66,414 | |
SembCorp Marine Ltd. | 27,000 | 113,579 | |
Yangzijiang Shipbuilding Holdings Ltd. | 60,000 | 84,447 | |
TOTAL SINGAPORE | 362,222 | ||
Spain - 2.5% | |||
Banco Bilbao Vizcaya Argentaria SA | 6,241 | 76,939 | |
Banco Santander SA | 14,442 | 177,813 | |
Iberdrola SA | 10,216 | 89,142 | |
Repsol YPF SA | 2,174 | 72,982 | |
Telefonica SA | 5,095 | 129,541 | |
Vallehermoso SA (a) | 7,432 | 82,511 | |
TOTAL SPAIN | 628,928 | ||
Sweden - 2.6% | |||
Alfa Laval AB | 1,600 | 32,668 | |
Getinge AB (B Shares) | 362 | 8,843 | |
H&M Hennes & Mauritz AB (B Shares) | 2,570 | 84,005 | |
Nordea Bank AB | 1,287 | 14,632 | |
Scania AB (B Shares) | 3,067 | 68,383 | |
Svenska Cellulosa AB (SCA) (B Shares) | 5,000 | 82,664 | |
Swedbank AB (A Shares) | 4,685 | 82,487 | |
Swedish Match Co. | 3,230 | 102,008 | |
Tele2 AB (B Shares) | 2,729 | 62,269 | |
Telefonaktiebolaget LM Ericsson | 7,561 | 97,125 | |
Volvo AB (B Shares) | 1,787 | 30,927 | |
TOTAL SWEDEN | 666,011 | ||
Switzerland - 5.7% | |||
ABB Ltd. (Reg.) | 1,048 | 25,665 | |
Credit Suisse Group | 2,031 | 93,945 | |
Nestle SA | 5,538 | 313,579 | |
Novartis AG | 3,740 | 210,209 | |
Pargesa Holding SA | 913 | 84,229 | |
Roche Holding AG (participation certificate) | 1,957 | 295,146 | |
Straumann Holding AG | 170 | 41,779 | |
Sulzer AG (Reg.) | 553 | 85,782 | |
Swiss Reinsurance Co. | 1,720 | 105,353 | |
Common Stocks - continued | |||
Shares | Value | ||
Switzerland - continued | |||
The Swatch Group AG (Bearer) | 100 | $ 42,575 | |
UBS AG (a) | 6,080 | 120,664 | |
Zurich Financial Services AG | 86 | 24,968 | |
TOTAL SWITZERLAND | 1,443,894 | ||
United Kingdom - 18.6% | |||
3i Group PLC | 18,197 | 92,396 | |
Anglo American PLC (United Kingdom) | 3,270 | 177,227 | |
AstraZeneca PLC: | |||
(United Kingdom) | 1,320 | 64,599 | |
sponsored ADR (e) | 3,188 | 156,754 | |
Aviva PLC | 5,824 | 44,212 | |
BAE Systems PLC | 18,290 | 97,804 | |
Barclays PLC | 34,970 | 181,504 | |
BG Group PLC | 3,414 | 83,066 | |
BHP Billiton PLC | 4,530 | 179,589 | |
BP PLC | 46,580 | 375,559 | |
British American Tobacco PLC (United Kingdom) | 1,781 | 71,363 | |
BT Group PLC | 25,000 | 74,265 | |
Cable & Wireless PLC | 14,975 | 11,687 | |
Centrica PLC | 16,449 | 90,955 | |
Compass Group PLC | 11,708 | 105,361 | |
Diageo PLC | 4,000 | 78,212 | |
EnQuest PLC (a) | 4,000 | 9,254 | |
GlaxoSmithKline PLC | 2,172 | 41,700 | |
GlaxoSmithKline PLC sponsored ADR | 5,929 | 228,919 | |
HSBC Holdings PLC: | |||
(United Kingdom) | 24,715 | 272,224 | |
sponsored ADR | 1,973 | 108,693 | |
Imperial Tobacco Group PLC | 2,110 | 67,719 | |
ITV PLC (a) | 55,731 | 79,012 | |
Land Securities Group PLC | 1,809 | 22,544 | |
Legal & General Group PLC | 53,160 | 102,679 | |
Lloyds Banking Group PLC (a) | 112,759 | 113,886 | |
National Grid PLC | 8,020 | 74,535 | |
Next PLC | 2,789 | 89,602 | |
Pearson PLC | 3,305 | 56,378 | |
Reckitt Benckiser Group PLC | 1,213 | 62,517 | |
Rio Tinto PLC | 4,109 | 289,378 | |
Royal Dutch Shell PLC: | |||
Class A (United Kingdom) | 5,601 | 201,388 | |
Class B | 3,129 | 111,870 | |
Serco Group PLC | 7,550 | 66,838 | |
Standard Chartered PLC (United Kingdom) | 5,675 | 150,118 | |
Tesco PLC | 10,024 | 65,875 | |
Thomas Cook Group PLC | 13,000 | 39,968 | |
Unilever PLC | 5,187 | 153,807 | |
Vedanta Resources PLC | 1,480 | 57,967 | |
Vodafone Group PLC | 90,000 | 255,550 | |
| |||
Shares | Value | ||
Wolseley PLC (a) | 2,952 | $ 102,757 | |
Xstrata PLC | 1,200 | 27,412 | |
TOTAL UNITED KINGDOM | 4,737,143 | ||
United States of America - 0.2% | |||
Synthes, Inc. | 306 | 41,999 | |
TOTAL COMMON STOCKS (Cost $20,370,964) | 23,811,027 | ||
Nonconvertible Preferred Stocks - 0.0% | |||
|
|
|
|
Germany - 0.0% | |||
Volkswagen AG | 12 | 2,035 | |
Government Obligations - 0.8% | ||||
| Principal Amount |
| ||
United States of America - 0.8% | ||||
U.S. Treasury Bills, yield at date of purchase 0.15% to 0.22% 6/9/11 to 8/4/11 (f) | $ 200,000 | 199,893 | ||
Money Market Funds - 5.4% | |||
Shares |
| ||
Dreyfus Cash Management Institutional Shares, 0.10% (c) | 1,201,445 | 1,201,445 | |
Fidelity Securities Lending Cash Central Fund, 0.21% (b)(d) | 188,750 | 188,750 | |
TOTAL MONEY MARKET FUNDS (Cost $1,390,195) | 1,390,195 | ||
TOTAL INVESTMENT PORTFOLIO - 99.7% (Cost $21,962,084) | 25,403,150 | |
NET OTHER ASSETS (LIABILITIES) - 0.3% | 71,917 | |
NET ASSETS - 100% | $ 25,475,067 | |
Futures Contracts | |||||
Expiration Date | Underlying Face Amount at Value | Unrealized Appreciation/(Depreciation) | |||
Purchased | |||||
Equity Index Contracts | |||||
15 CME E-mini MSCI EAFE Index Contracts | March 2011 | $ 1,318,575 | $ 74,937 | ||
|
The face value of futures purchased as a percentage of net assets is 5.2% |
Legend |
(a) Non-income producing |
(b) Affiliated fund that is available only to investment companies and other accounts managed by Fidelity Investments. The rate quoted is the annualized seven-day yield of the fund at period end. A complete unaudited listing of the fund's holdings as of its most recent quarter end is available upon request. In addition, each Fidelity Central Fund's financial statements, which are not covered by the Fund's Report of Independent Registered Public Accounting Firm, are available on the SEC's website or upon request. |
(c) The rate quoted is the annualized seven-day yield of the fund at period end. |
(d) Investment made with cash collateral received from securities on loan. |
(e) Security or a portion of the security is on loan at period end. |
(f) Security or a portion of the security was pledged to cover margin requirements for futures contracts. At the period end, the value of securities pledged amounted to $199,893. |
Affiliated Central Funds |
Information regarding fiscal year to date income earned by the Fund from investments in Fidelity Central Funds is as follows: |
Fund | Income earned |
Fidelity Securities Lending Cash Central Fund | $ 2,013 |
Other Information |
The following is a summary of the inputs used, as of February 28, 2011, involving the Fund's assets and liabilities carried at fair value. The inputs or methodology used for valuing securities may not be an indication of the risk associated with investing in those securities. For more information on valuation inputs, and their aggregation into the levels used in the table below, please refer to the Security Valuation section in the accompanying Notes to Financial Statements. |
Valuation Inputs at Reporting Date: | ||||
Description | Total | Level 1 | Level 2 | Level 3 |
Investments in Securities: | ||||
Equities: | ||||
Japan | $ 5,254,427 | $ 1,293,383 | $ 3,961,044 | $ - |
United Kingdom | 4,737,143 | 2,298,512 | 2,438,631 | - |
Australia | 2,375,460 | - | 2,375,460 | - |
Germany | 2,228,611 | 2,228,611 | - | - |
France | 2,003,739 | 1,507,919 | 495,820 | - |
Switzerland | 1,443,894 | 993,411 | 450,483 | - |
Netherlands | 667,251 | 173,091 | 494,160 | - |
Sweden | 666,011 | 568,886 | 97,125 | - |
Spain | 628,928 | 171,653 | 457,275 | - |
Other | 3,807,598 | 3,164,026 | 643,572 | - |
Government Obligations | 199,893 | - | 199,893 | - |
Money Market Funds | 1,390,195 | 1,390,195 | - | - |
Total Investments in Securities: | $ 25,403,150 | $ 13,789,687 | $ 11,613,463 | $ - |
Derivative Instruments: | ||||
Assets | ||||
Futures Contracts | $ 74,937 | $ 74,937 | $ - | $ - |
Value of Derivative Instruments |
The following table is a summary of the Fund's value of derivative instruments by risk exposure as of February 28, 2011. For additional information on derivative instruments, please refer to the Derivative Instruments section in the accompanying Notes to Financial Statements. |
Risk Exposure / | Value | |
| Asset | Liability |
Equity Risk | ||
Futures Contracts (a) | $ 74,937 | $ - |
Total Value of Derivatives | $ 74,937 | $ - |
(a) Reflects cumulative appreciation/(depreciation) on futures contracts as disclosed on the Schedule of Investments. Only the period end variation margin is separately disclosed on the Statement of Assets and Liabilities. |
Income Tax Information |
At February 28, 2011, the Fund had a capital loss carryforward of approximately $3,656,500 of which $1,011,502, $1,890,764 and $754,234 will expire in fiscal 2017, 2018 and 2019, respectively. Capital loss carryforwards are only available to offset future capital gains of the Fund to the extent provided by regulations and may be limited. |
See accompanying notes which are an integral part of the financial statements.
Annual Report
Fidelity International Enhanced Index Fund
Financial Statements
Statement of Assets and Liabilities
| February 28, 2011 | |
|
|
|
Assets | ||
Investment in securities, at value (including securities loaned of $186,554) - See accompanying schedule: Unaffiliated issuers (cost $21,773,334) | $ 25,214,400 |
|
Fidelity Central Funds (cost $188,750) | 188,750 |
|
Total Investments (cost $21,962,084) |
| $ 25,403,150 |
Foreign currency held at value (cost $353,899) | 364,204 | |
Receivable for investments sold | 717,149 | |
Receivable for fund shares sold | 133,547 | |
Dividends receivable | 78,702 | |
Interest receivable | 91 | |
Distributions receivable from Fidelity Central Funds | 93 | |
Receivable for daily variation on futures contracts | 16,022 | |
Other receivables | 1 | |
Total assets | 26,712,959 | |
|
|
|
Liabilities | ||
Payable for investments purchased | $ 1,020,995 | |
Payable for fund shares redeemed | 15,333 | |
Accrued management fee | 9,715 | |
Other affiliated payables | 3,099 | |
Collateral on securities loaned, at value | 188,750 | |
Total liabilities | 1,237,892 | |
|
|
|
Net Assets | $ 25,475,067 | |
Net Assets consist of: |
| |
Paid in capital | $ 25,687,318 | |
Undistributed net investment income | 49,936 | |
Accumulated undistributed net realized gain (loss) on investments and foreign currency transactions | (3,790,639) | |
Net unrealized appreciation (depreciation) on investments and assets and liabilities in foreign currencies | 3,528,452 | |
Net Assets, for 3,279,963 shares outstanding | $ 25,475,067 | |
Net Asset Value, offering price and redemption price per share ($25,475,067 ÷ 3,279,963 shares) | $ 7.77 | |
Statement of Operations
| Year ended February 28, 2011 | |
|
|
|
Investment Income |
|
|
Dividends |
| $ 742,790 |
Interest |
| 1,319 |
Income from Fidelity Central Funds (including $2,013 from security lending) |
| 2,013 |
Income before foreign taxes withheld |
| 746,122 |
Less foreign taxes withheld |
| (56,414) |
Total income |
| 689,708 |
|
|
|
Expenses | ||
Management fee | $ 103,919 | |
Transfer agent fees | 33,252 | |
Independent trustees' compensation | 272 | |
Miscellaneous | 64 | |
Total expenses before reductions | 137,507 | |
Expense reductions | (2) | 137,505 |
Net investment income (loss) | 552,203 | |
Realized and Unrealized Gain (Loss) Net realized gain (loss) on: | ||
Investment securities: |
|
|
Unaffiliated issuers | (829,975) | |
Foreign currency transactions | (8,577) | |
Futures contracts | 4,519 | |
Total net realized gain (loss) |
| (834,033) |
Change in net unrealized appreciation (depreciation) on: Investment securities | 3,719,810 | |
Assets and liabilities in foreign currencies | 12,636 | |
Futures contracts | 140,416 | |
Total change in net unrealized appreciation (depreciation) |
| 3,872,862 |
Net gain (loss) | 3,038,829 | |
Net increase (decrease) in net assets resulting from operations | $ 3,591,032 | |
See accompanying notes which are an integral part of the financial statements.
Annual Report
Statement of Changes in Net Assets
| Year ended February 28, | Year ended February 28, |
Increase (Decrease) in Net Assets |
|
|
Operations |
|
|
Net investment income (loss) | $ 552,203 | $ 421,189 |
Net realized gain (loss) | (834,033) | (362,231) |
Change in net unrealized appreciation (depreciation) | 3,872,862 | 6,388,004 |
Net increase (decrease) in net assets resulting from operations | 3,591,032 | 6,446,962 |
Distributions to shareholders from net investment income | (534,394) | (401,370) |
Distributions to shareholders from net realized gain | - | (57,303) |
Total distributions | (534,394) | (458,673) |
Share transactions | 14,443,401 | 12,786,877 |
Reinvestment of distributions | 507,651 | 432,668 |
Cost of shares redeemed | (12,491,341) | (12,200,610) |
Net increase (decrease) in net assets resulting from share transactions | 2,459,711 | 1,018,935 |
Redemption fees | 1,042 | 895 |
Total increase (decrease) in net assets | 5,517,391 | 7,008,119 |
|
|
|
Net Assets | ||
Beginning of period | 19,957,676 | 12,949,557 |
End of period (including undistributed net investment income of $49,936 and undistributed net investment income of $32,123, respectively) | $ 25,475,067 | $ 19,957,676 |
Other Information Shares | ||
Sold | 2,066,221 | 2,054,145 |
Issued in reinvestment of distributions | 70,971 | 64,721 |
Redeemed | (1,891,969) | (2,014,584) |
Net increase (decrease) | 245,223 | 104,282 |
Financial Highlights
Years ended February 28, | 2011 | 2010 | 2009 | 2008 G |
Selected Per-Share Data |
|
|
|
|
Net asset value, beginning of period | $ 6.58 | $ 4.42 | $ 9.35 | $ 10.00 |
Income from Investment Operations |
|
|
|
|
Net investment income (loss) D | .17 | .15 | .18 | .03 |
Net realized and unrealized gain (loss) | 1.19 | 2.17 | (4.96) | (.68) |
Total from investment operations | 1.36 | 2.32 | (4.78) | (.65) |
Distributions from net investment income | (.17) | (.14) | (.14) | - |
Distributions from net realized gain | - | (.02) | (.01) | - |
Total distributions | (.17) | (.16) | (.15) | - |
Redemption fees added to paid in capital D, I | - | - | - | - |
Net asset value, end of period | $ 7.77 | $ 6.58 | $ 4.42 | $ 9.35 |
Total Return B, C | 20.95% | 52.44% | (51.52)% | (6.50)% |
Ratios to Average Net Assets E, H |
|
|
|
|
Expenses before reductions | .62% | .62% | .62% | .62% A |
Expenses net of fee waivers, if any | .62% | .62% | .62% | .62% A |
Expenses net of all reductions | .62% | .62% | .62% | .62% A |
Net investment income (loss) | 2.50% | 2.39% | 2.69% | 1.58% A |
Supplemental Data |
|
|
|
|
Net assets, end of period (000 omitted) | $ 25,475 | $ 19,958 | $ 12,950 | $ 7,273 |
Portfolio turnover rate F | 32% | 22% J | 42% J | 15% |
A Annualized
B Total returns for periods of less than one year are not annualized.
C Total returns would have been lower had certain expenses not been reduced during the periods shown.
D Calculated based on average shares outstanding during the period.
E Fees and expenses of the underlying Fidelity Central Funds are not included in the Fund's expense ratio. The Fund indirectly bears its proportionate share of the expenses of any underlying Fidelity Central Funds.
F Amount does not include the portfolio activity of any underlying Fidelity Central Funds.
G For the period December 20, 2007 (commencement of operations) to February 29, 2008.
H Expense ratios reflect operating expenses of the Fund. Expenses before reductions do not reflect amounts reimbursed by the investment adviser or reductions from expense offset arrangements and do not represent the amount paid by the Fund during periods when reimbursements or reductions occur. Expenses net of fee waivers reflect expenses after reimbursement by the investment adviser but prior to reductions from expense offset arrangements. Expenses net of all reductions represent the net expenses paid by the Fund.
I Amount represents less than $.01 per share.
J Reflects adjustments to exclude transactions in money market mutual funds.
See accompanying notes which are an integral part of the financial statements.
Annual Report
Notes to Financial Statements
For the period ended February 28, 2011
1. Organization.
Fidelity Large Cap Growth Enhanced Index Fund, Fidelity Large Cap Value Enhanced Index Fund, Fidelity Large Cap Core Enhanced Index Fund, Fidelity Mid Cap Enhanced Index Fund, Fidelity Small Cap Enhanced Index Fund and Fidelity International Enhanced Index Fund (the Funds) are funds of Fidelity Commonwealth Trust II (the Trust) and are authorized to issue an unlimited number of shares. The Trust is registered under the Investment Company Act of 1940, as amended (the 1940 Act), as an open-end management investment company organized as a Delaware statutory trust.
2. Significant Accounting Policies.
The financial statements have been prepared in conformity with accounting principles generally accepted in the United States of America (GAAP), which require management to make certain estimates and assumptions at the date of the financial statements. Actual results could differ from those estimates. Subsequent events, if any, through the date that the financial statements were issued have been evaluated in the preparation of the financial statements. The following summarizes the significant accounting policies of the Funds:
Security Valuation. Investments are valued as of 4:00 p.m. Eastern time on the last calendar day of the period. Each Fund uses independent pricing services approved by the Board of Trustees to value their investments. When current market prices or quotations are not readily available or reliable, valuations may be determined in good faith in accordance with procedures adopted by the Board of Trustees. Factors used in determining value may include market or security specific events. The frequency with which these procedures are used cannot be predicted and they may be utilized to a significant extent. The value used for net asset value (NAV) calculation under these procedures may differ from published prices for the same securities.
Each Fund categorizes the inputs to valuation techniques used to value their investments into a disclosure hierarchy consisting of three levels as shown below.
Level 1 - quoted prices in active markets for identical investments
Level 2 - other significant observable inputs (including quoted prices for similar investments, interest rates, prepayment speeds, etc.)
Level 3 - unobservable inputs (including the Fund's own assumptions based on the best information available)
Changes in valuation techniques may result in transfers in or out of an assigned level within the disclosure hierarchy. The aggregate value of investments by input level, as of February 28, 2011, is included at the end of each Fund's Schedule of Investments. Valuation techniques used to value each Fund's investments by major category are as follows.
Equity securities, including restricted securities, for which market quotations are readily available, are valued at the last reported sale price or official closing price as reported by an independent pricing service on the primary market or exchange on which they are traded and are categorized as Level 1 in the hierarchy. In the event there were no sales during the day or closing prices are not available, securities are valued at the last quoted bid price or may be valued using the last available price and are generally categorized as Level 2 in the hierarchy. For foreign equity securities, when significant market or security specific events arise, comparisons to the valuation of American Depositary Receipts (ADRs), futures contracts, Exchange-traded funds (ETFs) and certain indexes as well as quoted prices for similar securities are used and are categorized as Level 2 in the hierarchy in these circumstances. Utilizing these techniques may result in significant transfers between Level 1 and Level 2 for Fidelity International Enhanced Index Fund. For restricted equity securities and private placements where observable inputs are limited, assumptions about market activity and risk are used and are categorized as Level 3 in the hierarchy.
Futures contracts are valued at the settlement price established each day by the board of trade or exchange on which they are traded and are categorized as Level 1 in the hierarchy. Investments in open-end mutual funds, including the Fidelity Central Funds, are valued at their closing net asset value each business day and are categorized as Level 1 in the hierarchy. Short-term securities with remaining maturities of sixty days or less for which quotations are not readily available are valued at amortized cost, which approximates fair value, and are categorized as Level 2 in the hierarchy.
Foreign Currency. Certain Funds may use foreign currency contracts to facilitate transactions in foreign-denominated securities. Gains and losses from these transactions may arise from changes in the value of the foreign currency or if the counterparties do not perform under the contracts' terms.
Foreign-denominated assets, including investment securities, and liabilities are translated into U.S. dollars at the exchange rate at period end. Purchases and sales of investment securities, income and dividends received and expenses denominated in foreign currencies are translated into U.S. dollars at the exchange rate in effect on the transaction date.
The effects of exchange rate fluctuations on investments are included with the net realized and unrealized gain (loss) on investment securities. Other foreign currency transactions resulting in realized and unrealized gain (loss) are disclosed separately.
Annual Report
2. Significant Accounting Policies - continued
Investment Transactions and Income. For financial reporting purposes, the Funds' investment holdings and NAV include trades executed through the end of the last business day of the period. The NAV per share for processing shareholder transactions is calculated as of the close of business of the New York Stock Exchange (NYSE), normally 4:00 p.m. Eastern time and includes trades executed through the end of the prior business day. Gains and losses on securities sold are determined on the basis of identified cost and may include proceeds received from litigation. Dividend income is recorded on the ex-dividend date, except for certain dividends from foreign securities where the ex-dividend date may have passed, which are recorded as soon as the Funds are informed of the ex-dividend date. Non-cash dividends included in dividend income, if any, are recorded at the fair market value of the securities received. Distributions received on securities that represent a return of capital or capital gain are recorded as a reduction of cost of investments and/or as a realized gain. The Funds estimate the components of distributions received that may be considered return of capital distributions or capital gain distributions. Interest income and distributions from the Fidelity Central Funds are accrued as earned. Interest income includes coupon interest and amortization of premium and accretion of discount on debt securities. Investment income is recorded net of foreign taxes withheld where recovery of such taxes is uncertain.
Expenses. Expenses directly attributable to a fund are charged to that fund. Expenses attributable to more than one fund are allocated among the respective funds on the basis of relative net assets or other appropriate methods. Expense estimates are accrued in the period to which they relate and adjustments are made when actual amounts are known.
Income Tax Information and Distributions to Shareholders. Each year each Fund intends to qualify as a regulated investment company, including distributing substantially all of its taxable income and realized gains under Subchapter M of the Internal Revenue Code and filing its U.S. federal tax return. As a result, no provision for income taxes is required. As of February 28, 2011, each Fund did not have any unrecognized tax benefits in the accompanying financial statements. A fund's federal tax return is subject to examination by the Internal Revenue Service (IRS) for a period of three years. Foreign taxes are provided for based on each Fund's understanding of the tax rules and rates that exist in the foreign markets in which it invests.
Distributions are declared and recorded on the ex-dividend date. Income and capital gain distributions are determined in accordance with income tax regulations, which may differ from GAAP. In addition, certain Funds claimed a portion of the payment made to redeeming shareholders as a distribution for income tax purposes.
Capital accounts within the financial statements are adjusted for permanent book-tax differences. These adjustments have no impact on net assets or the results of operations. Temporary book-tax differences will reverse in a subsequent period.
Book-tax differences are primarily due to futures transactions, foreign currency transactions, passive foreign investment companies (PFIC), market discount, capital loss carryforwards, losses deferred due to wash sales and excise tax regulations.
The federal tax cost of investment securities and unrealized appreciation (depreciation) as of period end were as follows for each Fund:
| Tax cost | Gross unrealized | Gross unrealized | Net unrealized |
Fidelity Large Cap Growth Enhanced Index Fund | $ 61,074,404 | $ 13,148,198 | $ (824,844) | $ 12,323,354 |
Fidelity Large Cap Value Enhanced Index Fund | 81,131,083 | 15,712,353 | (2,503,027) | 13,209,326 |
Fidelity Large Cap Core Enhanced Index Fund | 1,003,000,284 | 122,718,138 | (95,346,985) | 27,371,153 |
Fidelity Mid Cap Enhanced Index Fund | 51,670,365 | 12,781,219 | (595,116) | 12,186,103 |
Fidelity Small Cap Enhanced Index Fund | 101,798,737 | 27,140,266 | (2,054,149) | 25,086,117 |
Fidelity International Enhanced Index Fund | 22,036,907 | 4,658,384 | (1,292,141) | 3,366,243 |
The tax-based components of distributable earnings as of period end were as follows for each Fund:
February 28, 2011 | Undistributed | Undistributed | Capital loss | Net unrealized |
Fidelity Large Cap Growth Enhanced Index Fund | $ 107,902 | $ - | $ (6,700,751) | $ 12,323,354 |
Fidelity Large Cap Value Enhanced Index Fund | 167,330 | - | (187,547) | 13,209,326 |
Fidelity Large Cap Core Enhanced Index Fund | 2,062,802 | - | (85,601,774) | 27,337,526 |
Fidelity Mid Cap Enhanced Index Fund | 395,525 | 1,085,768 | (2,108,052) | 12,186,103 |
Fidelity Small Cap Enhanced Index Fund | - | 3,405,534 | - | 25,086,117 |
Fidelity International Enhanced Index Fund | 65,556 | - | (3,656,500) | 3,378,692 |
Annual Report
Notes to Financial Statements - continued
2. Significant Accounting Policies - continued
Income Tax Information and Distributions to Shareholders - continued
The tax character of distributions paid was as follows:
February 28, 2011 | Ordinary | Long-term | Total |
Fidelity Large Cap Growth Enhanced Index Fund | $ 603,819 | $ - | $ 603,819 |
Fidelity Large Cap Value Enhanced Index Fund | 1,184,075 | - | 1,184,075 |
Fidelity Large Cap Core Enhanced Index Fund | 15,976,149 | - | 15,976,149 |
Fidelity Mid Cap Enhanced Index Fund | 1,446,233 | 635,360 | 2,081,593 |
Fidelity Small Cap Enhanced Index Fund | 740,549 | - | 740,549 |
Fidelity International Enhanced Index Fund | 534,394 | - | 534,394 |
February 28, 2010 | Ordinary | Long-term | Total |
Fidelity Large Cap Growth Enhanced Index Fund | $ 510,338 | $ - | $ 510,338 |
Fidelity Large Cap Value Enhanced Index Fund | 1,285,327 | - | 1,285,327 |
Fidelity Large Cap Core Enhanced Index Fund | 17,963,606 | - | 17,963,606 |
Fidelity Mid Cap Enhanced Index Fund | 290,636 | - | 290,636 |
Fidelity Small Cap Enhanced Index Fund | 554,929 | - | 554,929 |
Fidelity International Enhanced Index Fund | 458,673 | - | 458,673 |
Short Term Trading (Redemption) Fees. Shares held by investors of Fidelity Small Cap Enhanced Index Fund less than 90 days are subject to a redemption fee equal to 1.50% of the net asset value of shares redeemed. Shares held by investors of Fidelity Mid Cap Enhanced Index Fund and Fidelity International Enhanced Index Fund less than 30 days are subject to a redemption fee equal to 0.75% and 1.00%, respectively, of the net asset value of shares redeemed. All redemption fees, which reduce the proceeds of the shareholder redemption, are retained by the Funds and accounted for as an addition to paid in capital.
3. Derivative Instruments.
Risk Exposures and the Use of Derivative Instruments. The Funds used derivative instruments (derivatives), including futures contracts in order to meet their investment objectives. The strategy is to use derivatives to increase returns, and to manage exposure to certain risks as defined below. The success of any strategy involving derivatives depends on analysis of numerous economic factors, and if the strategies for investment do not work as intended, the Funds may not achieve their objectives.
The Funds' use of derivatives increased or decreased their exposure to the following risks:
Equity Risk | Equity risk relates to the fluctuations in the value of financial instruments as a result of changes in market prices (other than those arising from interest rate risk or foreign exchange risk), whether caused by factors specific to an individual investment, its issuer, or all factors affecting all instruments traded in a market or market segment. |
The Funds are also exposed to additional risks from investing in derivatives, such as liquidity risk and counterparty credit risk. Liquidity risk is the risk that the Funds will be unable to sell the derivative in the open market in a timely manner. Counterparty credit risk is the risk that the counterparty will not be able to fulfill its obligation to the Funds. The Funds' maximum risk of loss from counterparty credit risk is generally the aggregate unrealized appreciation and unpaid counterparty payments in excess of any collateral pledged by the counterparty to the Funds. Counterparty risk related to exchange-traded futures contracts is minimal because of the protection provided by the exchange on which they trade. Derivatives involve, to varying degrees, risk of loss in excess of the amounts recognized in the Statement of Assets and Liabilities.
Annual Report
3. Derivative Instruments - continued
Net Realized Gain (Loss) and Change in Net Unrealized Appreciation (Depreciation) on Derivatives. The table below, which reflects the impacts of derivatives on the financial performance of the applicable Funds, summarizes the net realized gain (loss) and change in net unrealized appreciation (depreciation) for derivatives during the period.
Risk Exposure / Derivative Type | Net Realized Gain | Change in Net |
Fidelity Large Cap Growth Enhanced Index Fund |
|
|
Equity Risk |
|
|
Futures Contracts | $ 63,477 | $ 8,356 |
Total (a) | $ 63,477 | $ 8,356 |
|
|
|
Fidelity Large Cap Value Enhanced Index Fund |
|
|
Equity Risk |
|
|
Futures Contracts | $ 23,654 | $ 9,029 |
Total (a) | $ 23,654 | $ 9,029 |
|
|
|
Fidelity Large Cap Core Enhanced Index Fund |
|
|
Equity Risk |
|
|
Futures Contracts | $ 2,736,397 | $ 127,815 |
Total (a) | $ 2,736,397 | $ 127,815 |
|
|
|
Fidelity Mid Cap Enhanced Index Fund |
|
|
Equity Risk |
|
|
Futures Contracts | $ 142,619 | $ 44,891 |
Total (a) | $ 142,619 | $ 44,891 |
|
|
|
Fidelity Small Cap Enhanced Index Fund |
|
|
Equity Risk |
|
|
Futures Contracts | $ 415,189 | $ 188,406 |
Total (a) | $ 415,189 | $ 188,406 |
|
|
|
Fidelity International Enhanced Index Fund |
|
|
Equity Risk |
|
|
Futures Contracts | $ 4,519 | $ 140,416 |
Total (a) | $ 4,519 | $ 140,416 |
(a) A summary of the value of derivatives by risk exposure as of period end is included at the end of the Schedule of Investments and is representative of activity for the period.
Futures Contracts. A futures contract is an agreement between two parties to buy or sell a specified underlying instrument for a fixed price at a specified future date. The Funds used futures contracts to manage their exposure to the stock market.
Upon entering into a futures contract, a fund is required to deposit either cash or securities (initial margin) with a clearing broker in an amount equal to a certain percentage of the face value of the contract. Futures contracts are marked-to-market daily and subsequent payments (variation margin) are made or received by a fund depending on the daily fluctuations in the value of the futures contracts and are recorded as unrealized appreciation or (depreciation). Realized gain or (loss) is recorded upon the expiration or closing of a futures contract. The net realized gain (loss) and change in net unrealized appreciation (depreciation) on futures contracts during the period is included in the Statement of Operations.
The underlying face amount at value of open futures contracts at period end is shown in the Schedule of Investments under the caption "Futures Contracts." This amount reflects each contract's exposure to the underlying instrument at period end. Securities deposited to meet initial margin requirements are identified in the Schedule of Investments. The receivable and/or payable for the variation margin are reflected in the Statement of Assets and Liabilities.
Certain risks arise upon entering into futures contracts, including the risk that an illiquid market limits the ability to close out a futures contract prior to settlement date.
Annual Report
Notes to Financial Statements - continued
4. Purchases and Sales of Investments.
Purchases and sales of securities other than short-term securities, are noted in the table below.
| Purchases ($) | Sales ($) |
Fidelity Large Cap Growth Enhanced Index Fund | 47,961,246 | 39,439,045 |
Fidelity Large Cap Value Enhanced Index Fund | 61,425,902 | 57,153,330 |
Fidelity Large Cap Core Enhanced Index Fund | 586,736,118 | 754,702,058 |
Fidelity Mid Cap Enhanced Index Fund | 39,409,192 | 24,572,287 |
Fidelity Small Cap Enhanced Index Fund | 86,619,336 | 93,084,179 |
Fidelity International Enhanced Index Fund | 8,918,996 | 6,651,426 |
5. Fees and Other Transactions with Affiliates.
Management Fee and Expense Contract. Strategic Advisers, Inc. (Strategic Advisers), an affiliate of Fidelity Management & Research Company (FMR), provides the Funds with investment management related services. For these services, the Funds pay a monthly management fee to Strategic Advisers. The management fee is based on an annual rate of 0.30% of average net assets for Fidelity Large Cap Growth Enhanced Index, Fidelity Large Cap Value Enhanced Index and Fidelity Large Cap Core Enhanced Index, 0.45% of average net assets for Fidelity Mid Cap Enhanced Index, 0.52% of average net assets for Fidelity Small Cap Enhanced Index and 0.47% of average net assets for Fidelity International Enhanced Index. Under the management contract, Strategic Advisers pays all other ordinary fund-wide operating expenses (such as custody, audit, legal and pricing and bookkeeping fees), except the compensation of the independent Trustees and certain other expenses such as interest expense. The management fee paid to Strategic Advisers by the Funds is reduced by an amount equal to the fees and expenses paid by the Funds to the independent Trustees.
In addition, under the expense contract, Strategic Advisers pays other expenses such as those listed above for each of the Funds so that the total expenses do not exceed certain amounts of each Fund's average net assets with certain exceptions, as noted in the following table:
Fidelity Large Cap Growth Enhanced Index Fund | .45% |
Fidelity Large Cap Value Enhanced Index Fund | .45% |
Fidelity Large Cap Core Enhanced Index Fund | .45% |
Fidelity Mid Cap Enhanced Index Fund | .60% |
Fidelity Small Cap Enhanced Index Fund | .67% |
Fidelity International Enhanced Index Fund | .62% |
Sub-Adviser. Geode Capital Management, LLC (Geode), serves as sub-adviser for the Funds. Geode provides discretionary investment advisory services to the Funds and is paid by Strategic Advisers for providing these services.
Transfer Agent Fees. Fidelity Investments Institutional Operations Company, Inc. (FIIOC), an affiliate of FMR, is the Funds' transfer, dividend disbursing and shareholder servicing agent. FIIOC receives account fees and asset-based fees that vary according to type of account. FIIOC pays for typesetting, printing and mailing of shareholder reports, except proxy statements. Under the expense contract, each fund paid transfer agent fees at the following annual rates of 0.15% of average net assets.
6. Investments in Fidelity Central Funds.
The Funds invest in Fidelity Central Funds, which are open-end investment companies available only to other investment companies and accounts managed by FMR and its affiliates. The Funds' Schedules of Investments list each of the Fidelity Central Funds held as of period end, if any, as an investment of each Fund, but does not include the underlying holdings of each Fidelity Central Fund. As an Investing Fund, the Funds indirectly bear their proportionate share of the expenses of the underlying Fidelity Central Funds.
The Fidelity Securities Lending Cash Central Fund seeks preservation of capital and current income and is managed by Fidelity Investments Money Management, Inc. (FIMM), an affiliate of FMR.
A complete unaudited list of holdings for each Fidelity Central Fund is available upon request or at the Securities and Exchange Commission (the SEC) web site at www.sec.gov. In addition, the financial statements of the Fidelity Central Funds, which are not covered by the Funds' Report of Independent Registered Public Accounting Firm are available on the SEC web site or upon request.
Annual Report
6. Investments in Fidelity Central Funds - continued
Interfund Lending Program. Pursuant to an Exemptive Order issued by the SEC, the Funds, along with other registered investment companies having management contracts with FMR, may participate in an interfund lending program. This program provides an alternative credit facility allowing the funds to borrow from, or lend money to, other participating affiliated funds. At period end, there were no interfund loans outstanding. Each applicable fund's activity in this program during the period for which loans were outstanding was as follows:
| Borrower or | Average Daily | Weighted | Interest |
Fidelity Large Cap Core Enhanced Index Fund | Borrower | $ 24,741,188 | .46% | $ 5,019 |
Fidelity Small Cap Enhanced Index Fund | Borrower | 9,761,250 | .43% | 463 |
7. Committed Line of Credit.
Certain Funds participate with other funds managed by FMR or an affiliate in a $3.75 billion credit facility (the "line of credit") to be utilized for temporary or emergency purposes to fund shareholder redemptions or for other short-term liquidity purposes. The participating funds have agreed to pay commitment fees on their pro-rata portion of the line of credit, which are reflected in Miscellaneous expenses on the Statement of Operations, and are as follows:
Fidelity Large Cap Growth Enhanced Index Fund | $ 141 |
Fidelity Large Cap Value Enhanced Index Fund | 202 |
Fidelity Large Cap Core Enhanced Index Fund | 2,825 |
Fidelity Mid Cap Enhanced Index Fund | 117 |
Fidelity Small Cap Enhanced Index Fund | 294 |
Fidelity International Enhanced Index Fund | 64 |
During the period, there were no borrowings on this line of credit.
8. Security Lending.
Certain Funds lend portfolio securities through a lending agent from time to time in order to earn additional income. On the settlement date of the loan, each applicable Fund receives collateral (in the form of U.S. Treasury obligations, letters of credit and/or cash) against the loaned securities and maintains collateral in an amount not less than 100% of the market value of the loaned securities during the period of the loan. The market value of the loaned securities is determined at the close of business of the Funds and any additional required collateral is delivered to the Funds on the next business day. If the borrower defaults on its obligation to return the securities loaned because of insolvency or other reasons, a fund could experience delays and costs in recovering the securities loaned or in gaining access to the collateral. Any cash collateral received is invested in the Fidelity Securities Lending Cash Central Fund. The value of loaned securities and cash collateral at period end are disclosed on each applicable Fund's Statement of Assets and Liabilities. Security lending income represents the income earned on investing cash collateral, less rebates paid to borrowers and lending agent fees associated with the loan, plus any premium payments received for lending certain types of securities. Security lending income is presented on each applicable Fund's Statement of Operations as a component of income from Fidelity Central Funds.
9. Bank Borrowings.
Each Fund is permitted to have bank borrowings for temporary or emergency purposes to fund shareholder redemptions. Each Fund has established borrowing arrangements with certain banks. The interest rate on the borrowings is the bank's base rate, as revised from time to time. At period end, there were no bank borrowings outstanding. Each applicable Fund's activity in this program during the period for which loans were outstanding was as follows:
| Average Daily | Weighted | Interest |
Fidelity Small Cap Enhanced Index Fund | $ 12,322,750 | 1.26% | $ 1,725 |
Annual Report
Notes to Financial Statements - continued
10. Expense Reductions.
Through arrangements with each applicable Fund's custodian, credits realized as a result of uninvested cash balances were used to reduce each applicable Fund's expenses. All of the applicable expense reductions are noted in the table below.
| Expense |
Fidelity Large Cap Growth Enhanced Index Fund | $ 1 |
Fidelity Large Cap Value Enhanced Index Fund | 10 |
Fidelity Large Cap Core Enhanced Index Fund | 115 |
Fidelity Mid Cap Enhanced Index Fund | 3 |
Fidelity Small Cap Enhanced Index Fund | 14 |
Fidelity International Enhanced Index Fund | 2 |
11. Other.
The Funds' organizational documents provide former and current trustees and officers with a limited indemnification against liabilities arising in connection with the performance of their duties to the Funds. In the normal course of business, the Funds may also enter into contracts that provide general indemnifications. The Funds' maximum exposure under these arrangements is unknown as this would be dependent on future claims that may be made against the Funds. The risk of material loss from such claims is considered remote.
Annual Report
Report of Independent Registered Public Accounting Firm
To the Trustees of Fidelity Commonwealth Trust II and the Shareholders of Fidelity Large Cap Growth Enhanced Index Fund, Fidelity Large Cap Value Enhanced Index Fund, Fidelity Large Cap Core Enhanced Index Fund, Fidelity Mid Cap Enhanced Index Fund, Fidelity Small Cap Enhanced Index Fund and Fidelity International Enhanced Index Fund:
In our opinion, the accompanying statements of assets and liabilities, including the schedules of investments, and the related statements of operations and of changes in net assets and the financial highlights present fairly, in all material respects, the financial positions of Fidelity Large Cap Growth Enhanced Index Fund, Fidelity Large Cap Value Enhanced Index Fund, Fidelity Large Cap Core Enhanced Index Fund, Fidelity Mid Cap Enhanced Index Fund, Fidelity Small Cap Enhanced Index Fund and Fidelity International Enhanced Index Fund (funds of Fidelity Commonwealth Trust II) at February 28, 2011, the results of each of their operations for the year then ended, the changes in each of their net assets for each of the two years in the period then ended and the financial highlights for each of the periods indicated, in conformity with accounting principles generally accepted in the United States of America. These financial statements and financial highlights (hereafter referred to as "financial statements") are the responsibility of the Fidelity Commonwealth Trust II's management. Our responsibility is to express an opinion on these financial statements based on our audits. We conducted our audits of these financial statements in accordance with the standards of the Public Company Accounting Oversight Board (United States). Those standards require that we plan and perform the audit to obtain reasonable assurance about whether the financial statements are free of material misstatement. An audit includes examining, on a test basis, evidence supporting the amounts and disclosures in the financial statements, assessing the accounting principles used and significant estimates made by management, and evaluating the overall financial statement presentation. We believe that our audits, which included confirmation of securities at February 28, 2011 by correspondence with the custodian and brokers, provide a reasonable basis for our opinion.
/s/ PricewaterhouseCoopers LLP
PricewaterhouseCoopers LLP
Boston, Massachusetts
April 18, 2011
Annual Report
Trustees and Officers
The Trustees, Member of the Advisory Board, and executive officers of the trust and funds, as applicable, are listed below. The Board of Trustees governs each fund and is responsible for protecting the interests of shareholders. The Trustees are experienced executives who meet periodically throughout the year to oversee each fund's activities, review contractual arrangements with companies that provide services to each fund, oversee management of the risks associated with such activities and contractual arrangements, and review each fund's performance. Except for Boyce I. Greer, each of the Trustees oversees 17 funds advised by Strategic Advisers or an affiliate. Mr. Greer oversees 19 funds advised by Strategic Advisers or an affiliate.
The Trustees hold office without limit in time except that (a) any Trustee may resign; (b) any Trustee may be removed by written instrument, signed by at least two-thirds of the number of Trustees prior to such removal; (c) any Trustee who requests to be retired or who has become incapacitated by illness or injury may be retired by written instrument signed by a majority of the other Trustees; and (d) any Trustee may be removed at any special meeting of shareholders by a two-thirds vote of the outstanding voting securities of the trust. The executive officers and Advisory Board Member hold office without limit in time, except that any officer and Advisory Board Member may resign or may be removed by a vote of a majority of the Trustees at any regular meeting or any special meeting of the Trustees. Except as indicated, each individual has held the office shown or other offices in the same company for the past five years.
Experience, Skills, Attributes, and Qualifications of the Funds' Trustees. The Governance and Nominating Committee has adopted a statement of policy that describes the experience, qualifications, attributes, and skills that are necessary and desirable for potential Independent Trustee candidates (Statement of Policy). The Board believes that each Trustee satisfied at the time he or she was initially elected or appointed a Trustee, and continues to satisfy, the standards contemplated by the Statement of Policy. The Governance and Nominating Committee may also engage professional search firms to help identify potential Independent Trustee candidates with experience, qualifications, attributes, and skills consistent with the Statement of Policy. Additional criteria based on the composition and skills of the current Independent Trustees, as well as experience or skills that may be appropriate in light of future changes to board composition, business conditions, and regulatory or other developments, may be considered by the professional search firms and the Governance and Nominating Committee. In addition, the Board takes into account the Trustees' commitment and participation in Board and committee meetings, as well as their leadership of standing and ad hoc committees throughout their tenure.
In determining that a particular Trustee was and continues to be qualified to serve as a Trustee, the Board has considered a variety of criteria, none of which, in isolation, was controlling. The Board believes that, collectively, the Trustees have balanced and diverse experience, qualifications, attributes, and skills, which allow the Board to operate effectively in governing each fund and protecting the interests of shareholders. Information about the specific experience, skills, attributes, and qualifications of each Trustee, which in each case led to the Board's conclusion that the Trustee should serve (or continue to serve) as a trustee of the funds, is provided below.
Board Structure and Oversight Function. Roger T. Servison is an interested person (as defined in the 1940 Act) and currently serves as Chairman. The Trustees have determined that an interested Chairman is appropriate and benefits shareholders because an interested Chairman has a personal and professional stake in the quality and continuity of services provided to the funds. Independent Trustees exercise their informed business judgment to appoint an individual of their choosing to serve as Chairman, regardless of whether the Trustee happens to be independent or a member of management. The Independent Trustees have determined that they can act independently and effectively without having an Independent Trustee serve as Chairman and that a key structural component for assuring that they are in a position to do so is for the Independent Trustees to constitute a substantial majority for the Board. The Independent Trustees also regularly meet in executive session. Ralph F. Cox serves as the lead Independent Trustee and as such (i) acts as a liaison between the Independent Trustees and management with respect to matters important to the Independent Trustees and (ii) with management prepares agendas for Board meetings.
Fidelity funds are overseen by different Boards of Trustees. The funds' Board oversees asset allocation funds dedicated to Strategic Advisers' discretionary asset management programs, as well as the Fidelity enhanced index funds. Other boards oversee Fidelity's investment-grade bond, money market, and asset allocation funds and Fidelity's equity and high income funds. The funds may invest in Fidelity funds overseen by such other Boards. The use of separate Boards, each with its own committee structure, allows the Trustees of each group of Fidelity funds to focus on the unique issues of the funds they oversee, including common research, investment, and operational issues.
The Trustees primarily operate as a full Board, but also operate in committees, to facilitate the timely and efficient consideration of all matters of importance to the Trustees, each fund, and fund shareholders and to facilitate compliance with legal and regulatory requirements and oversight of the funds' activities and associated risks. The Board has charged Strategic Advisers and its affiliates with (i) identifying events or circumstances the occurrence of which could have demonstrably adverse effects on the funds' business and/or reputation; (ii) implementing processes and controls to lessen the possibility that such events or circumstances occur or to mitigate the effects of such events or circumstances if they do occur; and (iii) creating and maintaining a system designed to evaluate continuously business and market conditions in order to facilitate the identification and implementation processes described in (i) and (ii) above. Because the day-to-day operations and activities of the funds are carried out by or through Strategic Advisers, its affiliates and other service providers, the funds' exposure to risks is mitigated but not eliminated by the processes overseen by the Trustees. Board oversight of different aspects of the funds' activities is exercised primarily through the full Board, but also through the Audit Committee. Appropriate personnel, including but not limited to the funds' Chief Compliance Officer (CCO), FMR's internal auditor, the independent accountants, the funds' Treasurer and portfolio management personnel, make periodic reports to the Board's committees, as appropriate. The responsibilities of each committee, including their oversight responsibilities, are described further under "Standing Committees of the Funds' Trustees."
Annual Report
Trustees and Officers - continued
The fund's Statement of Additional Information (SAI) includes more information about the Trustees. To request a free copy, call Fidelity at 1-800-544-8544.
Interested Trustees*:
Correspondence intended for each Trustee who is an interested person may be sent to Fidelity Investments, 82 Devonshire Street, Boston, Massachusetts 02109.
Name, Age; Principal Occupations and Other Relevant Experience+ | |
Roger T. Servison (65) | |
| Year of Election or Appointment: 2006 Mr. Servison is Chairman of the Board of Trustees. Mr. Servison serves as President of Strategic New Business Development for Fidelity Investments and serves as a Director of Strategic Advisers. Previously, Mr. Servison oversaw Fidelity Investments Life Insurance Company (2005-2006) and Strategic Advisers (2005-2007). Mr. Servison also served as President and a Director of Fidelity Brokerage Services (Japan), LLC (1994-2004). |
Boyce I. Greer (55) | |
| Year of Election or Appointment: 2009 Mr. Greer is head of Institutional Investments for Fidelity Asset Management and Vice Chairman of Pyramis Global Advisors, LLC (2011-present), President and a Director of Strategic Advisers, Inc. and Global Asset Allocation (2008-present), Director of Ballyrock Investment Advisors LLC (2006-present), and serves as Vice President of a number of Fidelity funds (2005-present). Mr. Greer is also a Trustee of other investment companies advised by FMR. Mr. Greer is President of The North Carolina Capital Management Trust: Cash and Term Portfolios (2003-present), President of the Asset Allocation Division (2008-present), President of FIMM 130/30 LLC (2008-present), and an Executive Vice President of FMR (2005-present). Previously, Mr. Greer served as Executive Vice President of FMR Co., Inc. (2005-2009), President and Director of Fidelity Investments Money Management, Inc. (2007-2009), and as a Director and Managing Director of Strategic Advisers, Inc. (2002-2005). |
* Trustees have been determined to be "Interested Trustees" by virtue of, among other things, their affiliation with the trust or various entities under common control with Strategic Advisers.
+ The information above includes each Trustee's principal occupation during the last five years and other information relating to the experience, attributes, and skills relevant to each Trustee's qualifications to serve as a Trustee, which led to the conclusion that each Trustee should serve as a Trustee for each fund.
Independent Trustees:
Correspondence intended for each Independent Trustee (that is, the Trustees other than the Interested Trustees) may be sent to Fidelity Investments, P.O. Box 55235, Boston, Massachusetts 02205-5235.
Name, Age; Principal Occupations and Other Relevant Experience+ | |
Peter C. Aldrich (66) | |
| Year of Election or Appointment: 2006 Mr. Aldrich is a Director of the National Bureau of Economic Research and a Director of the funds of BlackRock Realty Group (2006-present). Previously, Mr. Aldrich served as a Trustee for Fidelity Rutland Square Trust (2005-2010), Managing Member of Poseidon, LLC (foreign private investment, 1998-2004), and Chairman and Managing Member of AEGIS, LLC (foreign private investment, 1997-2004). Mr. Aldrich also served as Faculty Chairman of The Research Council on Global Investment of The Conference Board (business and professional education non-profit, 1999-2004). Mr. Aldrich is a Member of the Boards of Trustees of the Museum of Fine Arts Boston and Massachusetts Eye and Ear Infirmary. |
Ralph F. Cox (78) | |
| Year of Election or Appointment: 2006 Mr. Cox is President of RABAR Enterprises (management consulting for the petroleum industry). Mr. Cox is a Director of Abraxas Petroleum (exploration and production). Mr. Cox is a member of the Advisory Boards of the Business and Engineering Schools of Texas A&M University and the Engineering School of University of Texas at Austin, and is an Advisory Director of CH2M Hill Companies (engineering). Previously, Mr. Cox served as a Trustee for Fidelity Rutland Square Trust (2005-2010). Mr. Ralph F. Cox and Mr. Howard E. Cox, Jr. are not related. |
Karen Kaplan (51) | |
| Year of Election or Appointment: 2007 Ms. Kaplan is President of Hill Holliday (advertising and specialized marketing, 2007-present). Ms. Kaplan is a Director of DSM (dba Delta Dental, Doral, and DentaQuest) (2004-present), Member of the board of Governors of the Chief Executives' Club of Boston (2010-present), Member of the board of the Massachusetts Conference for Women (2008-present), and Director of the Executive Committee of the Greater Boston Chamber of Commerce (2006-present). She is also a member of the Clinton Global Initiative, an action oriented community of the most effective CEOs, heads of state, Nobel Prize winners, and non-governmental leaders in the world. Previously, Ms. Kaplan served as an Advisory Board Member of Fidelity Rutland Square Trust (2006-2010), President of the Massachusetts Women's Forum (2008-2010), Treasurer of the Massachusetts Women's Forum (2002-2006), Vice Chair of the Board of the Massachusetts Society for the Prevention of Cruelty to Children (2003-2010), Director of United Way of Massachusetts Bay (2004-2006), Director of ADVO (direct mail marketing, 2003-2007), and Director of Tweeter Home Entertainment Group (2006-2007). |
+ The information above includes each Trustee's principal occupation during the last five years and other information relating to the experience, attributes, and skills relevant to each Trustee's qualifications to serve as a Trustee, which led to the conclusion that each Trustee should serve as a Trustee for each fund.
Advisory Board Member and Executive Officers:
Correspondence intended for each executive officer and Howard E. Cox, Jr. may be sent to Fidelity Investments, 82 Devonshire Street, Boston, Massachusetts 02109.
Name, Age; Principal Occupation | |
Howard E. Cox, Jr. (67) | |
| Year of Election or Appointment: 2009 Member of the Advisory Board of Fidelity Commonwealth Trust II. Mr. Cox is a Member of the Advisory Board of Devonshire Investors (2009-present). Mr. Cox serves as an Advisory Partner of Greylock (venture capital) and a Director of Stryker Corporation (medical products and services). Previously, Mr. Cox served as an Advisory Board Member of Fidelity Rutland Square Trust (2006-2010) and a Member of the Secretary of Defense's Business Board of Directors (2008-2010). Mr. Howard E. Cox, Jr. and Mr. Ralph F. Cox are not related. |
Kenneth B. Robins (41) | |
| Year of Election or Appointment: 2010 President and Treasurer of each fund. Mr. Robins also serves as President and Treasurer of other Fidelity Equity and High Income Funds (2008-present) and Assistant Treasurer of other Fidelity Fixed Income and Asset Allocation Funds (2009-present). Mr. Robins is an employee of Fidelity Investments (2004-present). Previously, Mr. Robins served as Deputy Treasurer of the Fidelity funds (2005-2008) and Treasurer and Chief Financial Officer of The North Carolina Capital Management Trust: Cash and Term Portfolios (2006-2008). |
Marc Bryant (45) | |
| Year of Election or Appointment: 2010 Secretary and Chief Legal Officer of each fund. Senior Vice President and Deputy General Counsel of Fidelity Investments. Prior to joining Fidelity Investments, Mr. Bryant served as a Senior Vice President and the Head of Global Retail Legal for AllianceBernstein L.P. (2006-2010), and as the General Counsel for ProFund Advisors LLC (2001-2006). |
Holly C. Laurent (56) | |
| Year of Election or Appointment: 2008 Anti-Money Laundering (AML) Officer of each fund. Ms. Laurent also serves as AML Officer of the Fidelity funds (2008-present) and The North Carolina Capital Management Trust: Cash and Term Portfolios (2008-present). Ms. Laurent is an employee of Fidelity Investments. Previously, Ms. Laurent was Senior Vice President and Head of Legal for Fidelity Business Services India Pvt. Ltd. (2006-2008), and Senior Vice President, Deputy General Counsel and Group Head for FMR LLC (2005-2006). |
Nicholas E. Steck (46) | |
| Year of Election or Appointment: 2009 Chief Financial Officer of each fund. Mr. Steck serves as Senior Vice President of Fidelity Pricing and Cash Management Services (2008-present) and is an employee of Fidelity Investments. During the period 2002 to 2009, Mr. Steck served as a Compliance Officer of FMR, Fidelity Investments Money Management, Inc., FMR LLC, Fidelity Research & Analysis (U.K.) Inc., Fidelity Management & Research (Hong Kong) Limited, and Fidelity Management & Research (Japan) Inc. |
Laura M. Doherty (41) | |
| Year of Election or Appointment: 2009 Chief Compliance Officer of each fund. Ms. Doherty also serves as Senior Vice President of the Office of the Chief Compliance Officer (2008-present). Previously, Ms. Doherty served as a Vice President in Fidelity's Corporate Audit department (1998-2008). |
James R. Rooney (52) | |
| Year of Election or Appointment: 2007 Assistant Treasurer of each fund. Mr. Rooney is an employee of FMR and also serves as Assistant Treasurer of other Strategic Advisers funds (2007-present). Previously, Mr. Rooney was a Vice President with Wellington Management Company, LLP (2001-2007) and an employee of Strategic Advisers (2007-2009). |
Margaret A. Carey (37) | |
| Year of Election or Appointment: 2009 Assistant Secretary of each fund. Ms. Carey is also Assistant Secretary of The North Carolina Capital Management Trust: Cash and Term Portfolios (2008-present) and is an employee of Fidelity Investments (2004-present). |
Annual Report
Distributions (Unaudited)
The Board of Trustees of each fund voted to pay to shareholders of record at the opening of business on record date, the following distributions per share derived from capital gains realized from sales of portfolio securities and dividends derived from net investment income:
| Pay Date | Record Date | Dividends | Capital Gains |
Fidelity Large Cap Growth Enhanced Index Fund | 04/18/11 | 04/15/11 | $0.017 | $0.000 |
Fidelity Large Cap Value Enhanced Index Fund | 04/18/11 | 04/15/11 | $0.017 | $0.000 |
Fidelity Large Cap Core Enhanced Index Fund | 04/18/11 | 04/15/11 | $0.025 | $0.000 |
Fidelity Mid Cap Enhanced Index Fund | 04/18/11 | 04/15/11 | $0.005 | $0.220 |
Fidelity Small Cap Enhanced Index Fund | 04/18/11 | 04/15/11 | $0.000 | $0.307 |
Fidelity International Enhanced Index Fund | 04/18/11 | 04/15/11 | $0.015 | $0.005 |
The funds hereby designate as capital gain dividend the amounts noted below for the taxable year ended February 28, 2011, or, if subsequently determined to be different, the net capital gain of such year.
Fidelity Mid Cap Enhanced Index Fund | $1,721,127 |
Fidelity Small Cap Enhanced Index Fund | $3,720,872 |
A percentage of the dividends distributed during the fiscal year for the following funds qualify for the dividends-received deduction for corporate shareholders:
| April 2010 | December 2010 |
Fidelity Large Cap Growth Enhanced Index Fund | 100% | 100% |
Fidelity Large Cap Value Enhanced Index Fund | 100% | 100% |
Fidelity Large Cap Core Enhanced Index Fund | 100% | 100% |
Fidelity Mid Cap Enhanced Index Fund | 11% | 100% |
Fidelity Small Cap Enhanced Index Fund | 100% | 100% |
A percentage of the dividends distributed during the fiscal year for the following funds may be taken into account as a dividend for purposes of the maximum rate under section 1(h)(11) of the Internal Revenue Code.
| April 2010 | December 2010 |
Fidelity Large Cap Growth Enhanced Index Fund | 100% | 100% |
Fidelity Large Cap Value Enhanced Index Fund | 100% | 100% |
Fidelity Large Cap Core Enhanced Index Fund | 100% | 100% |
Fidelity Mid Cap Enhanced Index Fund | 13% | 100% |
Fidelity Small Cap Enhanced Index Fund | 100% | 100% |
Fidelity International Enhanced Index Fund | 100% | 100% |
The amounts per share which represent income derived from sources within, and taxes paid to, foreign countries or possession of the United States are as follows:
| Pay Date | Income | Taxes |
Fidelity International Enhanced Index Fund | 04/19/10 | $0.007 | $0.0012 |
Fidelity International Enhanced Index Fund | 12/13/10 | $0.094 | $0.0166 |
The funds will notify shareholders in January 2012 of amounts for use in preparing 2011 income tax returns.
Annual Report
Board Approval of Investment Advisory Contracts and Management Fees
Fidelity Large Cap Core Enhanced Index Fund, Fidelity Large Cap Growth Enhanced Index Fund, Fidelity Large Cap Value Enhanced Index Fund, Fidelity Mid Cap Enhanced Index Fund, Fidelity Small Cap Enhanced Index Fund, and Fidelity International Enhanced Index Fund
Each year the Board of Trustees, including the Independent Trustees (together, the Board), votes at an in-person meeting on the renewal of the management contract with Strategic Advisers, Inc. (Strategic Advisers) and the sub-advisory agreement with Geode Capital Management, LLC (Geode) (together, the Advisory Contracts) for each fund. The Board, assisted by the advice of fund counsel and Independent Trustees' counsel, requests and considers a broad range of information relevant to the renewal of the Advisory Contracts throughout the year.
The Board meets regularly four times per year and considers at each of its meetings factors that it believes are relevant to its annual consideration of the renewal of each fund's Advisory Contracts, including the services and support provided to each fund and its shareholders. While the full Board or the Independent Trustees, as appropriate, act on all major matters, a portion of the activities of the Board (including certain of those described herein) may be conducted through committees.
At its September 2010 meeting, the Board of Trustees, including the Independent Trustees, unanimously determined to renew each fund's Advisory Contracts. In reaching its determination, the Board considered all factors it believed relevant, including, but not limited to, (i) the nature, extent, and quality of the services to be provided to each fund and its shareholders (including the investment performance of each fund); (ii) the competitiveness of each fund's management fee and total expenses; (iii) the total costs of the services to be provided and the profits, if any, to be realized by Strategic Advisers from its relationship with each fund; (iv) the extent to which economies of scale would be realized as each fund grows; and (v) whether fee levels reflect these economies of scale, if any, for the benefit of fund shareholders.
In considering whether to renew the Advisory Contracts for each fund, the Board reached a determination, with the assistance of fund counsel and Independent Trustees' counsel and through the exercise of its business judgment, that the renewal of the Advisory Contracts is in the best interests of each fund and its shareholders and that the compensation to be received by Strategic Advisers and Geode under the Advisory Contracts is fair and reasonable. The Board's decision to renew the Advisory Contracts was not based on any single factor, but rather was based on a comprehensive consideration of all the information provided to the Board at its meetings throughout the year. The Board, in reaching its determination to renew the Advisory Contracts, is aware that shareholders in each fund have a broad range of investment choices available to them, including a wide choice among mutual funds offered by competitors to Fidelity, and that each fund's shareholders, with the opportunity to review and weigh the disclosure provided by the fund in its prospectus and other public disclosures, have chosen to invest in that fund, managed by Strategic Advisers.
In its deliberations, the Board did not identify any particular information that was all-important or controlling.
Nature, Extent, and Quality of Services Provided. The Board considered the staffing within the investment adviser, Strategic Advisers, and the sub-adviser, Geode (together, the Investment Advisers), including the backgrounds of the Investment Advisers' investment personnel, and also took into consideration the funds' investment objectives and disciplines. The Independent Trustees also had discussions with senior management of Strategic Advisers' investment operations group and the members of the investment groups of the Investment Advisers. The Board considered the structure of each Investment Adviser's portfolio manager compensation program and whether such structures provide appropriate incentives to act in the best interest of each fund.
Resources Dedicated to Investment Management and Support Services. The Board reviewed the size, education, and experience of the Investment Advisers' investment staff, their use of technology, and the Investment Advisers' approach to recruiting, training, and retaining portfolio managers and other research, advisory, and management personnel. The Board noted that the Investment Advisers' analysts have access to a variety of technological tools and market and securities data that enable them to perform quantitative analysis and to specialize in various disciplines.
Shareholder and Administrative Services. The Board considered (i) the nature, extent, quality, and cost of advisory, administrative, distribution, and shareholder services performed by the Investment Advisers and their affiliates under the Advisory Contracts and under separate agreements covering transfer agency, pricing and bookkeeping services, and securities lending services for each fund; (ii) the nature and extent of Strategic Advisers' supervision of third party service providers, including Geode; and (iii) the resources devoted to, and the record of compliance with, each fund's compliance policies and procedures.
Investment Performance. The Board considered whether each fund has operated in accordance with its investment objective, as well as its record of compliance with its investment restrictions. It also reviewed each fund's absolute investment performance, as well as each fund's relative investment performance measured against (i) a broad-based securities market index, and (ii) a peer group of mutual funds. Because each fund had been in existence less than three years, for each fund the following table, which reflects information considered by the Board, shows, for the one-year period and the three-month period ended March 31, 2010, the fund's total return, the total return of a broad-based securities market index ("benchmark"), and how the fund's total returns ranked relative to a peer group of mutual funds identified by Lipper Inc. as having an investment objective similar to that of the fund.
Annual Report
Fund-specific performance results reviewed by the Board are discussed below, though due to the passage of time, they are likely to differ from performance results for more recent periods, including those shown elsewhere in this report.
Fidelity Large Cap Core Enhanced Index Fund
Total Return % for the One-Year and Three-month (Year to Date) Periods Ended March 31, 2010 vs. S&P 500 Index and Lipper Large-Cap Core Peer Group
| Year To Date Cumulative | Variance to Index | 1 Year | Variance to Index |
Large Cap Core Enhanced Index Fund (net) | 4.77 | -0.61 | 45.76 | -4.01 |
Large Cap Core Enhanced Index Fund (gross) | 4.89 | -0.50 | 46.40 | -3.37 |
|
|
|
|
|
S&P 500 | 5.39 |
| 49.77 |
|
LIPPER PEER GROUP RESULTS: |
|
|
|
|
LA Large-Cap Core Average/Total | 4.94 |
| 48.45 |
|
LA Large-Cap Core Median | 4.95 |
| 47.66 |
|
LA Large-Cap Core Rank/Count | 540 / 970 | 596/ 930 | ||
Quartile | 3 |
| 3 |
|
Percent Beaten | 44% |
| 36% |
|
The Board reviewed the relative investment performance of the fund against the Lipper Large-Cap Core peer group and observed that for the one-year period ended March 31, 2010, the fund under-performed 64% of its peers and was in the third quartile for the period. The Board also observed the cumulative return from January 1, 2010 to March 31, 2010, and noted that the fund under-performed 56% of its peers and was in the third quartile for the period. The Board also noted that the investment performance of the fund was lower than the fund's benchmark, the S&P 500 Index, for the one-year and three-month periods shown.
Fidelity Large Cap Growth Enhanced Index Fund
Total Return % for the One-Year and Three-month (Year to Date) Periods Ended March 31, 2010 vs. Russell 1000 Growth Index and Lipper Large-Cap Growth Peer Group
| Year To Date Cumulative | Variance to Index | 1 Year | Variance to Index |
Large Cap Growth Enhanced Index Fund (net) | 4.22 | -0.42 | 48.19 | -1.56 |
Large Cap Growth Enhanced Index Fund (gross) | 4.34 | -0.31 | 48.84 | -0.91 |
|
|
|
|
|
Russell 1000 Growth | 4.65 |
| 49.75 |
|
LIPPER PEER GROUP RESULTS: |
|
|
|
|
LA Large-Cap Growth Average/Total | 4.20 |
| 46.16 |
|
LA Large-Cap Growth Median | 4.23 |
| 46.09 |
|
LA Large-Cap Growth Rank/Count | 458 / 909 | 265/ 834 | ||
Quartile | 3 |
| 2 |
|
Percent Beaten | 50% |
| 68% |
|
The Board reviewed the relative investment performance of the fund against the Lipper Large-Cap Growth peer group and observed that for the one-year period ended March 31, 2010, the fund out-performed 68% of its peers and was in the second quartile for the period. The Board also observed the cumulative return from January 1, 2010 to March 31, 2010, and noted that the fund under-performed 50% of its peers and was in the third quartile for the period. The Board also noted that the investment performance of the fund was lower than the fund's benchmark, the Russell 1000 Growth Index, for the one-year and three-month periods shown.
Annual Report
Board Approval of Investment Advisory Contracts and Management Fees - continued
Fidelity Large Cap Value Enhanced Index Fund
Total Return % for the One-Year and Three-month (Year to Date) Periods Ended March 31, 2010 vs. Russell 1000 Value Index and Lipper Large-Cap Value Peer Group
| Year To Date Cumulative | Variance to Index | 1 Year | Variance to Index |
Large Cap Value Enhanced Index Fund (net) | 5.97 | -0.81 | 46.84 | -6.72 |
Large Cap Value Enhanced Index Fund (gross) | 6.09 | -0.69 | 47.48 | -6.08 |
|
|
|
|
|
Russell 1000 Value | 6.78 |
| 53.56 |
|
LIPPER PEER GROUP RESULTS: |
|
|
|
|
LA Large-Cap Value Average/Total | 5.79 |
| 49.90 |
|
LA Large-Cap Value Median | 5.80 |
| 49.39 |
|
LA Large-Cap Value Rank/Count | 255 / 568 | 363/ 542 | ||
Quartile | 2 |
| 3 |
|
Percent Beaten | 55% |
| 33% |
|
The Board reviewed the relative investment performance of the fund against the Lipper Large-Cap Value peer group and observed that for the one-year period ended March 31, 2010, the fund under-performed 67% of its peers and was in the third quartile for the period. The Board also observed the cumulative return from January 1, 2010 to March 31, 2010, and noted that the fund out-performed 55% of its peers and was in the second quartile for the period. The Board also noted that the investment performance of the fund was lower than the fund's benchmark, the Russell 1000 Value Index, for the one-year and three-month periods shown.
Fidelity Mid Cap Enhanced Index Fund
Total Return % for the One-Year and Three-month (Year to Date) Periods Ended March 31, 2010 vs. Russell MidCap Index and Lipper Mid-Cap Core Peer Group
| Year To Date Cumulative | Variance to Index | 1 Year | Variance to Index |
Mid Cap Enhanced Index Fund (net) | 6.76 | -1.91 | 61.79 | -5.92 |
Mid Cap Enhanced Index Fund (gross) | 6.92 | -1.75 | 62.73 | -4.99 |
|
|
|
|
|
Russell MidCap | 8.67 |
| 67.71 |
|
LIPPER PEER GROUP RESULTS: |
|
|
|
|
LA Mid-Cap Core Average/Total | 7.85 |
| 62.22 |
|
LA Mid-Cap Core Median | 7.93 |
| 59.62 |
|
LA Mid-Cap Core Rank/Count | 295 / 428 | 154/ 404 | ||
Quartile | 3 |
| 2 |
|
Percent Beaten | 31% |
| 62% |
|
The Board reviewed the relative investment performance of the fund against the Lipper Mid-Cap Core peer group and observed that for the one-year period ended March 31, 2010, the fund out-performed 62% of its peers and was in the second quartile for the period. The Board also observed the cumulative return from January 1, 2010 to March 31, 2010, and noted that the fund under-performed 69% of its peers and was in the third quartile for the period. The Board also noted that the investment performance of the fund was lower than the fund's benchmark, the Russell MidCap Index, for the one-year and three-month periods shown.
Fidelity Small Cap Enhanced Index Fund
Total Return % for the One-Year and Three-month (Year to Date) Periods Ended March 31, 2010 vs. Russell 2000 Index and Lipper Small-Cap Core Peer Group
| Year To Date Cumulative | Variance to Index | 1 Year | Variance to Index |
Small Cap Enhanced Index Fund (net) | 7.45 | -1.40 | 55.86 | -6.90 |
Small Cap Enhanced Index Fund (gross) | 7.63 | -1.22 | 56.87 | -5.89 |
|
|
|
|
|
Russell 2000 | 8.85 |
| 62.76 |
|
LIPPER PEER GROUP RESULTS: |
|
|
|
|
LA Small-Cap Core Average/Total | 8.03 |
| 63.07 |
|
LA Small-Cap Core Median | 8.08 |
| 61.26 |
|
LA Small-Cap Core Rank/Count | 499 / 753 | 535/ 733 | ||
Quartile | 3 |
| 3 |
|
Percent Beaten | 34% |
| 27% |
|
Annual Report
The Board reviewed the relative investment performance of the fund against the Lipper Small-Cap Core peer group and observed that for the one-year period ended March 31, 2010, the fund under-performed 73% of its peers and was in the third quartile for the period. The Board also observed the cumulative return from January 1, 2010 to March 31, 2010, and noted that the fund under-performed 66% of its peers and was in the third quartile for the period. The Board also noted that the investment performance of the fund was lower than the fund's benchmark, the Russell 2000 Index, for the one-year and three-month periods shown.
Fidelity International Enhanced Index Fund
Total Return % for the One-Year and Three-month (Year to Date) Periods Ended March 31, 2010 vs. MSCI EAFE Index and Lipper International Large-Cap Core Peer Group
| Year To Date Cumulative | Variance to Index | 1 Year | Variance to Index |
International Enhanced Index Fund (net) | 1.01 | 0.15 | 51.85 | -2.77 |
International Enhanced Index Fund (gross) | 1.17 | 0.31 | 52.76 | -1.86 |
|
|
|
|
|
MSCI EAFE (Net MA) | 0.86 |
| 54.63 |
|
LIPPER PEER GROUP RESULTS: |
|
|
|
|
LA International Large-Cap Core Average/Total | 1.00 |
| 51.26 |
|
LA International Large-Cap Core Median | 0.78 |
| 51.19 |
|
LA International Large-Cap Core Rank/Count | 160 / 411 | 184/ 401 | ||
Quartile | 2 |
| 2 |
|
Percent Beaten | 61% |
| 54% |
|
The Board reviewed the relative investment performance of the fund against the Lipper International Large-Cap Core peer group and observed that for the one-year period ended March 31, 2010, the fund out-performed 54% of its peers and was in the second quartile for the period. The Board also observed the cumulative return from January 1, 2010 to March 31, 2010, and noted that the fund out-performed 61% of its peers and was in the second quartile for the period. The Board also noted that the investment performance of the fund was lower than the fund's benchmark, the MSCI EAFE Index, for the one-year period and higher for the three-month period shown.
Based on its review, and giving particular weight to the nature and quality of the resources dedicated by the Investment Advisers to maintain and improve relative performance and factoring in the unprecedented market events in recent years, the Board concluded that the nature, extent, and quality of Investment Management and support services and of shareholder and administrative services provided to each fund will continue to benefit each fund's shareholders.
Competitiveness of Management Fee and Total Fund Expenses. The Board considered the amount and nature of fees paid by shareholders to the Investment Advisers. The Board considered information comparing the management fees and total expenses of the funds to those of other registered investment companies with investment objectives similar to those of the funds. The Board also considered expense contracts currently in effect between the funds and Strategic Advisers, which limit the total annual operating expenses (excluding interest, taxes, securities lending costs, brokerage commissions and certain other expenses) for Fidelity Large Cap Core Enhanced Index Fund, Fidelity Large Cap Growth Enhanced Index Fund, Fidelity Large Cap Value Enhanced Index Fund, Fidelity Mid Cap Enhanced Index Fund, Fidelity Small Cap Enhanced Index Fund, and Fidelity International Enhanced Index Fund to 0.45%, 0.45%, 0.45%, 0.60%, 0.67%, and 0.62%, respectively.
The Board noted that each fund's management fee and total expenses were compared to "mapped groups" of competitive funds. For comparison purposes, Strategic Advisers uses "mapped groups," which are created by combining similar Lipper investment objective categories that have comparable management fee characteristics. Combining Lipper investment objective categories aids the Board's management fee and total expense comparisons by broadening the competitive group used for comparison and by reducing the number of universes to which Strategic Advisers' funds are compared.
The Board considered two proprietary management fee comparisons. The group of funds used by the Board for management fee comparisons is referred to as the "Total Mapped Group." The comparison of management fees to Total Mapped Groups is intended to show a fund's standing relative to the total universe of funds available to investors, in terms of gross management fees before expense reimbursements or caps. Strategic Advisers then compared each fund to an "Asset-Size Peer Group" (ASPG), which is a sub-set of the competitive funds in the Total Mapped Group. The ASPG comparison focuses on a fund's standing relative to non-Fidelity funds similar in size to the fund within the Total Mapped Group. The ASPG represents at least 15% of the funds in the Total Mapped Group with comparable asset size and management fee characteristics, subject to a minimum of 50 funds (or all funds in the Total Mapped Group if fewer than 50). The Board also noted that the management fee paid by each fund was below the median of each fund's respective Total Mapped Group and ASPG.
Annual Report
Board Approval of Investment Advisory Contracts and Management Fees - continued
The Board further noted that each fund's total expenses were compared to competitive funds and classes having similar load types. This comparison, which is a proxy for comparing funds by distribution channel, showed each fund's position relative to competitive funds with the same load type. The Board also noted that each fund's total expenses paid (giving effect to each fund's expense contract with Strategic Advisers) were below the median of each fund's respective Total Mapped Group.
Based on its review, the Board concluded that each fund's management fee and total expenses were fair and reasonable in light of the services that each fund and its shareholders receive and the other factors considered.
Costs of the Services and Profitability. The Board considered information regarding the revenues earned and expenses incurred by Strategic Advisers and its affiliates attributable to the business of developing, marketing, distributing, managing, administering and servicing each fund and its shareholders.
Strategic Advisers presented information to the Board on its profitability for managing the funds. Strategic Advisers calculates the profitability for each fund using a series of detailed revenue and cost allocation methodologies. Strategic Advisers noted that, to the extent possible, it employs the same corporate reporting of revenues and expenses as those used by other Fidelity funds.
The Board concluded that the costs of the services provided by and the profits realized by Strategic Advisers and its affiliates in connection with the operation of each fund were reasonable.
Potential Fall-Out Benefits. The Board considered information regarding the potential of direct and indirect benefits to Strategic Advisers and its affiliates from their relationships with the funds, including non-advisory fee compensation paid to affiliates of Strategic Advisers, if any. The Board considered the receipt of these benefits in light of Strategic Advisers' and its affiliates' profitability and other considerations described above. The Board noted that Strategic Advisers did not calculate potential fall-out benefit revenue because Strategic Advisers did not believe that the management of the funds has resulted in significant quantifiable fall-out benefits to the businesses of Strategic Advisers and its affiliates when compared with all of Fidelity Management & Research Co.'s Funds.
Possible Economies of Scale. The Board considered whether there have been economies of scale in respect of the management of the funds. The Board considered that Fidelity Large Cap Core Enhanced Index Fund's, Fidelity Large Cap Growth Enhanced Index Fund's, Fidelity Large Cap Value Enhanced Index Fund's, Fidelity Mid Cap Enhanced Index Fund's, and Fidelity International Enhanced Index Fund's sub-advisory contracts provide for breakpoints as the respective funds' assets grow and noted that any potential decline in sub-advisory fees will accrue directly to Strategic Advisers. The Board also reviewed each fund's expense contract with Strategic Advisers, which limits the total annual expenses for Fidelity Large Cap Core Enhanced Index Fund, Fidelity Large Cap Growth Enhanced Index Fund, Fidelity Large Cap Value Enhanced Index Fund, Fidelity Mid Cap Enhanced Index Fund, Fidelity Small Cap Enhanced Index Fund, and Fidelity International Enhanced Index Fund to 0.45%, 0.45%, 0.45%, 0.60%, 0.67%, and 0.62%, respectively. The Board noted that each fund has not generated sufficient revenue to cover its expenses. The Board noted that as fund assets increase, it will continue to monitor whether management fee breakpoints are appropriate.
Conclusion. Based on its evaluation of all of the considerations noted above, and after considering all factors it believed relevant, the Board ultimately concluded that the advisory fee structures are fair and reasonable and that each fund's Advisory Contracts should be renewed.
Annual Report
Managing Your Investments
Fidelity offers several ways to conveniently manage your personal investments via your telephone or PC. You can access your account information, conduct trades and research your investments 24 hours a day.
By Phone
Fidelity Automated Service Telephone provides a single toll-free number to access account balances, positions, quotes and trading. It's easy to navigate the service, and on your first call, the system will help you create a personal identification number (PIN) for security.
(phone_graphic)
Fidelity Automated Service Telephone (FAST®)
1-800-544-5555
Press
 For mutual fund and brokerage trading.
 For quotes.*
 For account balances and holdings.
 To review orders and mutual fund activity.
 To change your PIN.

 To speak to a Fidelity representative.
By PC
Fidelity's web site on the Internet provides a wide range of information, including daily financial news, fund performance, interactive planning tools and news about Fidelity products and services.
(computer_graphic)
Fidelity's Web Site
www.fidelity.com
* When you call the quotes line, please remember that a fund's yield and return will vary and, except for money market funds, share price will also vary. This means that you may have a gain or loss when you sell your shares. There is no assurance that money market funds will be able to maintain a stable $1 share price; an investment in a money market fund is not insured or guaranteed by the U.S. government. Total returns are historical and include changes in share price, reinvestment of dividends and capital gains distributions, and the effects of any sales charges.
Annual Report
To Write Fidelity
We'll give your correspondence immediate attention and send you written confirmation upon completion of your request.
(letter_graphic)
Making Changes
To Your Account
(such as changing name, address, bank, etc.)
Fidelity Investments
P.O. Box 770001
Cincinnati, OH 45277-0002
(letter_graphic)
For Non-Retirement
Accounts
Buying shares
Fidelity Investments
P.O. Box 770001
Cincinnati, OH 45277-0003
Overnight Express
Fidelity Investments
Attn: Distribution Services
100 Crosby Parkway - KC1H
Covington, KY 41015
Selling shares
Fidelity Investments
P.O. Box 770001
Cincinnati, OH 45277-0035
Overnight Express
Fidelity Investments
Attn: Distribution Services
100 Crosby Parkway - KC1H
Covington, KY 41015
General Correspondence
Fidelity Investments
P.O. Box 500
Merrimack, NH 03054-0500
(letter_graphic)
For Retirement
Accounts
Buying shares
Fidelity Investments
P.O. Box 770001
Cincinnati, OH 45277-0003
Selling shares
Fidelity Investments
P.O. Box 770001
Cincinnati, OH 45277-0035
Overnight Express
Fidelity Investments
Attn: Distribution Services
100 Crosby Parkway - KC1H
Covington, KY 41015
General Correspondence
Fidelity Investments
P.O. Box 500
Merrimack, NH 03054-0500
Annual Report
To Visit Fidelity
For directions and hours,
please call 1-800-544-9797.
Arizona
7001 West Ray Road
Chandler, AZ
15445 N. Scottsdale Road
Scottsdale, AZ
17550 North 75th Avenue
Glendale, AZ
5330 E. Broadway Blvd
Tucson, AZ
California
815 East Birch Street
Brea, CA
1411 Chapin Avenue
Burlingame, CA
851 East Hamilton Avenue
Campbell, CA
601 Larkspur Landing Circle
Larkspur, CA
2000 Avenue of the Stars
Los Angeles, CA
27101 Puerta Real
Mission Viejo, CA
73575 El Paseo
Palm Desert, CA
251 University Avenue
Palo Alto, CA
123 South Lake Avenue
Pasadena, CA
16656 Bernardo Ctr. Drive
Rancho Bernardo, CA
1220 Roseville Parkway
Roseville, CA
1740 Arden Way
Sacramento, CA
7676 Hazard Center Drive
San Diego, CA
11943 El Camino Real
San Diego, CA
8 Montgomery Street
San Francisco, CA
3793 State Street
Santa Barbara, CA
1200 Wilshire Boulevard
Santa Monica, CA
398 West El Camino Real
Sunnyvale, CA
111 South Westlake Blvd
Thousand Oaks, CA
21701 Hawthorne Boulevard
Torrance, CA
2001 North Main Street
Walnut Creek, CA
6326 Canoga Avenue
Woodland Hills, CA
2211 Michelson Drive
Irvine, CA
Colorado
281 East Flatiron Circle
Broomfield, CO
1625 Broadway
Denver, CO
9185 Westview Road
Lone Tree, CO
Connecticut
48 West Putnam Avenue
Greenwich, CT
265 Church Street
New Haven, CT
300 Atlantic Street
Stamford, CT
29 South Main Street
West Hartford, CT
1261 Post Road
Fairfield, CT
Delaware
400 Delaware Avenue
Wilmington, DE
Florida
175 East Altamonte Drive
Altamonte Springs, FL
1400 Glades Road
Boca Raton, FL
121 Alhambra Plaza
Coral Gables, FL
2948 N. Federal Highway
Ft. Lauderdale, FL
4671 Town Center Parkway
Jacksonville, FL
8880 Tamiami Trail, North
Naples, FL
230 Royal Palm Way
Palm Beach, FL
3501 PGA Boulevard
Palm Beach Gardens, FL
3550 Tamiami Trail, South
Sarasota, FL
1502 N. Westshore Blvd.
Tampa, FL
2465 State Road 7
Wellington, FL
Georgia
3242 Peachtree Road
Atlanta, GA
1000 Abernathy Road
Atlanta, GA
Illinois
One North LaSalle Street
Chicago, IL
401 North Michigan Avenue
Chicago, IL
One Skokie Valley Road
Highland Park, IL
1415 West 22nd Street
Oak Brook, IL
15105 S LaGrange Road
Orland Park, IL
1572 East Golf Road
Schaumburg, IL
1823 Freedom Drive
Naperville, IL
Indiana
8480 Keystone Crossing
Indianapolis, IN
Kansas
5400 College Boulevard
Overland Park, KS
Maine
Three Canal Plaza
Portland, ME
Maryland
7315 Wisconsin Avenue
Bethesda, MD
610 York Road
Towson, MD
Massachusetts
801 Boylston Street
Boston, MA
155 Congress Street
Boston, MA
300 Granite Street
Braintree, MA
44 Mall Road
Burlington, MA
238 Main Street
Cambridge, MA
200 Endicott Street
Danvers, MA
405 Cochituate Road
Framingham, MA
551 Boston Turnpike
Shrewsbury, MA
Michigan
500 E. Eisenhower Pkwy.
Ann Arbor, MI
280 N. Old Woodward Ave.
Birmingham, MI
30200 Northwestern Hwy.
Farmington Hills, MI
43420 Grand River Avenue
Novi, MI
3480 28th Street
Grand Rapids, MI
2425 S. Linden Road STE E
Flint, MI
Minnesota
7740 France Avenue South
Edina, MN
8342 3rd Street North
Oakdale, MN
Missouri
1524 South Lindbergh Blvd.
St. Louis, MO
Nevada
2225 Village Walk Drive
Henderson, NV
New Jersey
501 Route 73 South
Marlton, NJ
150 Essex Street
Millburn, NJ
35 Morris Street
Morristown, NJ
396 Route 17, North
Paramus, NJ
3518 Route 1 North
Princeton, NJ
530 Broad Street
Shrewsbury, NJ
New Mexico
2261 Q Street NE
Albuquerque, NM
New York
1130 Franklin Avenue
Garden City, NY
37 West Jericho Turnpike
Huntington Station, NY
1271 Avenue of the Americas
New York, NY
980 Madison Avenue
New York, NY
61 Broadway
New York, NY
350 Park Avenue
New York, NY
200 Fifth Avenue
New York, NY
733 Third Avenue
New York, NY
2070 Broadway
New York, NY
1075 Northern Blvd.
Roslyn, NY
799 Central Park Avenue
Scarsdale, NY
3349 Monroe Avenue
Rochester, NY
North Carolina
4611 Sharon Road
Charlotte, NC
7011 Fayetteville Road
Durham, NC
Ohio
3805 Edwards Road
Cincinnati, OH
1324 Polaris Parkway
Columbus, OH
1800 Crocker Road
Westlake, OH
28699 Chagrin Boulevard
Woodmere Village, OH
Oregon
7493 SW Bridgeport Road
Tigard, OR
Pennsylvania
600 West DeKalb Pike
King of Prussia, PA
1735 Market Street
Philadelphia, PA
12001 Perry Highway
Wexford, PA
Rhode Island
10 Memorial Boulevard
Providence, RI
Tennessee
3018 Peoples Street
Johnson City, TN
7628 West Farmington Blvd.
Germantown, TN
2035 Mallory Lane
Franklin, TN
Texas
10000 Research Boulevard
Austin, TX
4001 Northwest Parkway
Dallas, TX
12532 Memorial Drive
Houston, TX
2701 Drexel Drive
Houston, TX
6560 Fannin Street
Houston, TX
1701 Lake Robbins Drive
The Woodlands, TX
6500 N. MacArthur Blvd.
Irving, TX
6005 West Park Boulevard
Plano, TX
1576 East Southlake Blvd.
Southlake, TX
15600 Southwest Freeway
Sugar Land, TX
139 N. Loop 1604 East
San Antonio, TX
Utah
279 West South Temple
Salt Lake City, UT
Virginia
1861 International Drive
McLean, VA
11957 Democracy Drive
Reston, VA
Washington
10500 NE 8th Street
Bellevue, WA
1518 6th Avenue
Seattle, WA
304 Strander Blvd
Tukwila, WA
Washington, DC
1900 K Street, N.W.
Washington, DC
Wisconsin
16020 West Bluemound Road
Brookfield, WI
Fidelity Brokerage Services, Inc., 100 Summer St., Boston, MA 02110 Member NYSE/SIPC
Annual Report
Investment Adviser
Strategic Advisers, Inc.
Boston, MA
Investment Sub-Adviser
Geode Capital Management, LLC
Boston, MA
General Distributor
Fidelity Distributors Corporation
Boston, MA
Transfer and Service Agents
Fidelity Investments Institutional Operations Company, Inc.
Boston, MA
Fidelity Service Company, Inc.
Boston, MA
Custodian
The Bank of New York Mellon
New York, NY
The Fidelity Telephone Connection
Mutual Fund 24-Hour Service
Exchanges/Redemptions
and Account Assistance 1-800-544-6666
Product Information 1-800-544-6666
Retirement Accounts 1-800-544-4774
(8 a.m. - 9 p.m.)
TDD Service 1-800-544-0118
for the deaf and hearing impaired
(9 a.m. - 9 p.m. Eastern time)
Fidelity Automated Service
Telephone (FAST®)
1-800-544-5555
Automated line for quickest service
GEI-UANN-0411
1.855137.103

Item 2. Code of Ethics
As of the end of the period, February 28, 2011, Fidelity Commonwealth Trust II (the "trust") has adopted a code of ethics, as defined in Item 2 of Form N-CSR, that applies to its President and Treasurer and its Chief Financial Officer. A copy of the code of ethics is filed as an exhibit to this Form N-CSR.
Item 3. Audit Committee Financial Expert
The Board of Trustees of the trust has determined that the trust does not have an audit committee financial expert serving on the trust's Audit Committee. The registrant has concluded that the services of a financial expert are not required at this point. Some of the reasons for determining that an audit committee financial expert is not necessary are the following: (i) the Audit Committee's expected access to the Fund's Treasurer, Chief Financial Officer, independent accountants and legal counsel; (ii) the Audit Committee's expected authority under its Charter to engage independent accounting and other experts without seeking approval from the full Board of Trustees; and (iii) the small number of Funds currently offered by the trust.
Item 4. Principal Accountant Fees and Services
Fees and Services
The following table presents fees billed by PricewaterhouseCoopers LLP ("PwC") in each of the last two fiscal years for services rendered to Fidelity International Enhanced Index Fund, Fidelity Large Cap Core Enhanced Index Fund, Fidelity Large Cap Growth Enhanced Index Fund, Fidelity Large Cap Value Enhanced Index Fund, Fidelity Mid Cap Enhanced Index Fund, and Fidelity Small Cap Enhanced Index Fund (the "Funds"):
Services Billed by PwC
February 28, 2011 FeesA
| Audit Fees | Audit-Related Fees | Tax Fees | All Other Fees |
Fidelity International Enhanced Index Fund | $44,000 | $- | $4,000 | $- |
Fidelity Large Cap Core Enhanced Index Fund | $45,000 | $- | $4,000 | $- |
Fidelity Large Cap Growth Enhanced Index Fund | $44,000 | $- | $4,000 | $- |
Fidelity Large Cap Value Enhanced Index Fund | $44,000 | $- | $4,000 | $- |
Fidelity Mid Cap Enhanced Index Fund | $44,000 | $- | $4,000 | $- |
Fidelity Small Cap Enhanced Index Fund | $44,000 | $- | $4,000 | $- |
February 28, 2010 FeesA
| Audit Fees | Audit-Related Fees | Tax Fees | All Other Fees |
Fidelity International Enhanced Index Fund | $44,000 | $- | $3,500 | $- |
Fidelity Large Cap Core Enhanced Index Fund | $46,000 | $- | $3,500 | $- |
Fidelity Large Cap Growth Enhanced Index Fund | $44,000 | $- | $3,500 | $- |
Fidelity Large Cap Value Enhanced Index Fund | $44,000 | $- | $3,500 | $- |
Fidelity Mid Cap Enhanced Index Fund | $44,000 | $- | $3,500 | $- |
Fidelity Small Cap Enhanced Index Fund | $44,000 | $- | $3,500 | $- |
A Amounts may reflect rounding.
The following table presents fees billed by PwC that were required to be approved by the Audit Committee for services that relate directly to the operations and financial reporting of the Funds and that are rendered on behalf of Strategic Advisers, Inc. ("Strategic Advisers") and entities controlling, controlled by, or under common control with Strategic Advisers (not including any sub-adviser whose role is primarily portfolio management and is subcontracted with or overseen by another investment adviser) that provide ongoing services to the Funds ("Fund Service Providers"):
Services Billed by PwC
| February 28, 2011A | February 28, 2010A |
Audit-Related Fees | $2,550,000 | $2,250,000 |
Tax Fees | $- | $- |
All Other Fees | $510,000 | $- |
A Amounts may reflect rounding.
"Audit-Related Fees" represent fees billed for assurance and related services that are reasonably related to the performance of the Fund audit or the review of the Fund's financial statements and that are not reported under Audit Fees.
"Tax Fees" represent fees billed for tax compliance, tax advice or tax planning that relate directly to the operations and financial reporting of the Fund.
"All Other Fees" represent fees billed for services provided to the fund or Fund Service Provider, a significant portion of which are assurance related, that relate directly to the operations and financial reporting of the fund, excluding those services that are reported under Audit Fees, Audit-Related Fees or Tax Fees.
Assurance services must be performed by an independent public accountant.
* * *
The aggregate non-audit fees billed by PwC for services rendered to the Funds, Strategic Advisers (not including any sub-adviser whose role is primarily portfolio management and is subcontracted with or overseen by another investment adviser), and any Fund Service Provider relating to Covered Services and Non-Covered Services (each as defined below) for each of the last two fiscal years of the Funds are as follows:
Billed By | February 28, 2011 A | February 28, 2010 A |
PwC | $4,975,000 | $2,870,000 |
A Amounts may reflect rounding.
The trust's Audit Committee has considered non-audit services that were not pre-approved that were provided by PwC to Fund Service Providers to be compatible with maintaining the independence of PwC in its audit of the Funds, taking into account representations from PwC, in accordance with Public Company Accounting Oversight Board rules, regarding its independence from the Funds and their related entities and Strategic Advisers' review of the appropriateness and permissibility under applicable law of such non-audit services prior to their provision to the Fund Service Providers.
Audit Committee Pre-Approval Policies and Procedures
The trust's Audit Committee must pre-approve all audit and non-audit services provided by the independent registered public accounting firm relating to the operations or financial reporting of the funds. Prior to the commencement of any audit or non-audit services to a fund, the Audit Committee reviews the services to determine whether they are appropriate and permissible under applicable law.
The trust's Audit Committee has adopted policies and procedures to, among other purposes, provide a framework for the Committee's consideration of non-audit services by the audit firms that audit the Fidelity funds. The policies and procedures require that any non-audit service provided by a fund audit firm to the trust and any non-audit service provided by a fund auditor to a Fund Service Provider that relates directly to the operations and financial reporting of the trust ("Covered Service") are subject to approval by the Audit Committee before such service is provided.
All Covered Services must be approved in advance of provision of the service either: (i) by formal resolution of the Audit Committee, or (ii) by oral or written approval of the service by the Chair of the Audit Committee (or if the Chair is unavailable, such other member of the Audit Committee as may be designated by the Chair to act in the Chair's absence). The approval contemplated by (ii) above is permitted where the Treasurer determines that action on such an engagement is necessary before the next meeting of the Audit Committee.
Non-audit services provided by a fund audit firm to a Fund Service Provider that do not relate directly to the operations and financial reporting of the trust ("Non-Covered Service") are not required to be approved, but are reported to the Audit Committee annually.
Non-Audit Services Approved Pursuant to Rule 2-01(c)(7)(i)(C) and (ii) of Regulation S-X ("De Minimis Exception")
There were no non-audit services approved or required to be approved by the Audit Committee pursuant to the De Minimis Exception during the Funds' last two fiscal years relating to services provided to (i) the Funds or (ii) any Fund Service Provider that relate directly to the operations and financial reporting of the Funds.
Item 5. Audit Committee of Listed Registrants
Not applicable.
Item 6. Investments
(a) Not applicable.
(b) Not applicable
Item 7. Disclosure of Proxy Voting Policies and Procedures for Closed-End Management Investment Companies
Not applicable.
Item 8. Portfolio Managers of Closed-End Management Investment Companies
Not applicable.
Item 9. Purchase of Equity Securities by Closed-End Management Investment Company and Affiliated Purchasers
Not applicable.
Item 10. Submission of Matters to a Vote of Security Holders
Not applicable.
Item 11. Controls and Procedures
(a)(i) The President and Treasurer and the Chief Financial Officer have concluded that the trust's disclosure controls and procedures (as defined in Rule 30a-3(c) under the Investment Company Act) provide reasonable assurances that material information relating to the trust is made known to them by the appropriate persons, based on their evaluation of these controls and procedures as of a date within 90 days of the filing date of this report.
(a)(ii) There was no change in the trust's internal control over financial reporting (as defined in Rule 30a-3(d) under the Investment Company Act) that occurred during the second fiscal quarter of the period covered by this report that has materially affected, or is reasonably likely to materially affect, the trust's internal control over financial reporting.
Item 12. Exhibits
(a) | (1) | Code of Ethics pursuant to Item 2 of Form N-CSR is filed and attached hereto as EX-99.CODE ETH. |
(a) | (2) | Certification pursuant to Rule 30a-2(a) under the Investment Company Act of 1940 (17 CFR 270.30a-2(a)) is filed and attached hereto as Exhibit 99.CERT. |
(a) | (3) | Not applicable. |
(b) |
| Certification pursuant to Rule 30a-2(b) under the Investment Company Act of 1940 (17 CFR 270.30a-2(b)) is furnished and attached hereto as Exhibit 99.906CERT. |
SIGNATURES
Pursuant to the requirements of the Securities Exchange Act of 1934 and the Investment Company Act of 1940, the registrant has duly caused this report to be signed on its behalf by the undersigned, thereunto duly authorized.
Fidelity Commonwealth Trust II
By: | /s/Kenneth B. Robins |
| Kenneth B. Robins |
| President and Treasurer |
|
|
Date: | April 28, 2011 |
Pursuant to the requirements of the Securities Exchange Act of 1934 and the Investment Company Act of 1940, this report has been signed below by the following persons on behalf of the registrant and in the capacities and on the dates indicated.
By: | /s/Kenneth B. Robins |
| Kenneth B. Robins |
| President and Treasurer |
|
|
Date: | April 28, 2011 |
By: | /s/Nicholas E. Steck |
| Nicholas E. Steck |
| Chief Financial Officer |
|
|
Date: | April 28, 2011 |