UNITED STATES
SECURITIES AND EXCHANGE COMMISSION
Washington, D.C. 20549
FORM N-CSR
CERTIFIED SHAREHOLDER REPORT OF REGISTERED
MANAGEMENT INVESTMENT COMPANIES
Investment Company Act file number 811-21990
Fidelity Commonwealth Trust II
(Exact name of registrant as specified in charter)
82 Devonshire St., Boston, Massachusetts 02109
(Address of principal executive offices) (Zip code)
Marc Bryant, Secretary
82 Devonshire St.
Boston, Massachusetts 02109
(Name and address of agent for service)
Registrant's telephone number, including area code: 617-563-7000
Date of fiscal year end: | May 31 |
|
|
Date of reporting period: | May 31, 2010 |
Item 1. Reports to Stockholders
Strategic Advisers®
Value Fund (formerly Fidelity Strategic Advisers Value Fund)
Offered exclusively to certain clients of Strategic Advisers, Inc. - not available for sale to the general public

Annual Report
May 31, 2010
Strategic Advisers, Inc.
A Fidelity Investments Company
Contents
Performance | How the fund has done over time. | |
Management's Discussion | The managers' review of fund performance, strategy and outlook. | |
Shareholder Expense Example | An example of shareholder expenses. | |
Investment Changes | A summary of major shifts in the fund's investments over the past six months. | |
Investments | A complete list of the fund's investments with their market values. | |
Financial Statements | Statements of assets and liabilities, operations, and changes in net assets, as well as financial highlights. | |
Notes | Notes to the financial statements. | |
Report of Independent Registered Public Accounting Firm |
| |
Trustees and Officers |
| |
Distributions |
| |
Board Approval of Investment Advisory Contracts and Management Fees |
|
To view a fund's proxy voting record for the 12-month period ended June 30, visit http://www.fidelity.com/proxyvotingresults or visit the Securities and Exchange Commission's (SEC) web site at http://www.sec.gov. You may also call 1-800-544-3455 to request a free copy of the proxy voting guidelines.
Standard & Poor's, S&P and S&P 500 are registered service marks of The McGraw-Hill Companies, Inc. and have been licensed for use by Fidelity Distributors Corporation.
Other third party marks appearing herein are the property of their respective owners.
All other marks appearing herein are registered or unregistered trademarks or service marks of FMR LLC or an affiliated company.
Annual Report
This report and the financial statements contained herein are submitted for the general information of the shareholders of the fund. This report is not authorized for distribution to prospective investors in the fund unless preceded or accompanied by an effective prospectus.
A fund files its complete schedule of portfolio holdings with the SEC for the first and third quarters of each fiscal year on Form N-Q. Forms N-Q are available on the SEC's web site at http://www.sec.gov. A fund's Forms N-Q may be reviewed and copied at the SEC's Public Reference Room in Washington, DC. Information regarding the operation of the SEC's Public Reference Room may be obtained by calling 1-800-SEC-0330. For a complete list of a fund's portfolio holdings, view the most recent holdings listing, semiannual report, or annual report on Fidelity's web site at http://www.fidelity.com or http://www.advisor.fidelity.com, as applicable.
NOT FDIC INSURED • MAY LOSE VALUE • NO BANK GUARANTEE
Neither the funds nor Fidelity Distributors Corporation is a bank.
Annual Report
Performance: The Bottom Line
Average annual total return reflects the change in the value of an investment, assuming reinvestment of the fund's dividend income and capital gains (the profits earned upon the sale of securities that have grown in value, if any) and assuming a constant rate of performance each year. The $10,000 table and the fund's returns do not reflect the deduction of taxes that a shareholder would pay on fund distributions or the redemption of fund shares. During periods of reimbursement by Fidelity, a fund's total return will be greater than it would be had the reimbursement not occurred. How a fund did yesterday is no guarantee of how it will do tomorrow.
Average Annual Total Returns
Periods ended May 31, 2010 | Past 1 | Life of |
Strategic Advisers Value Fund | 17.40% | 15.53% |
A From December 30, 2008.
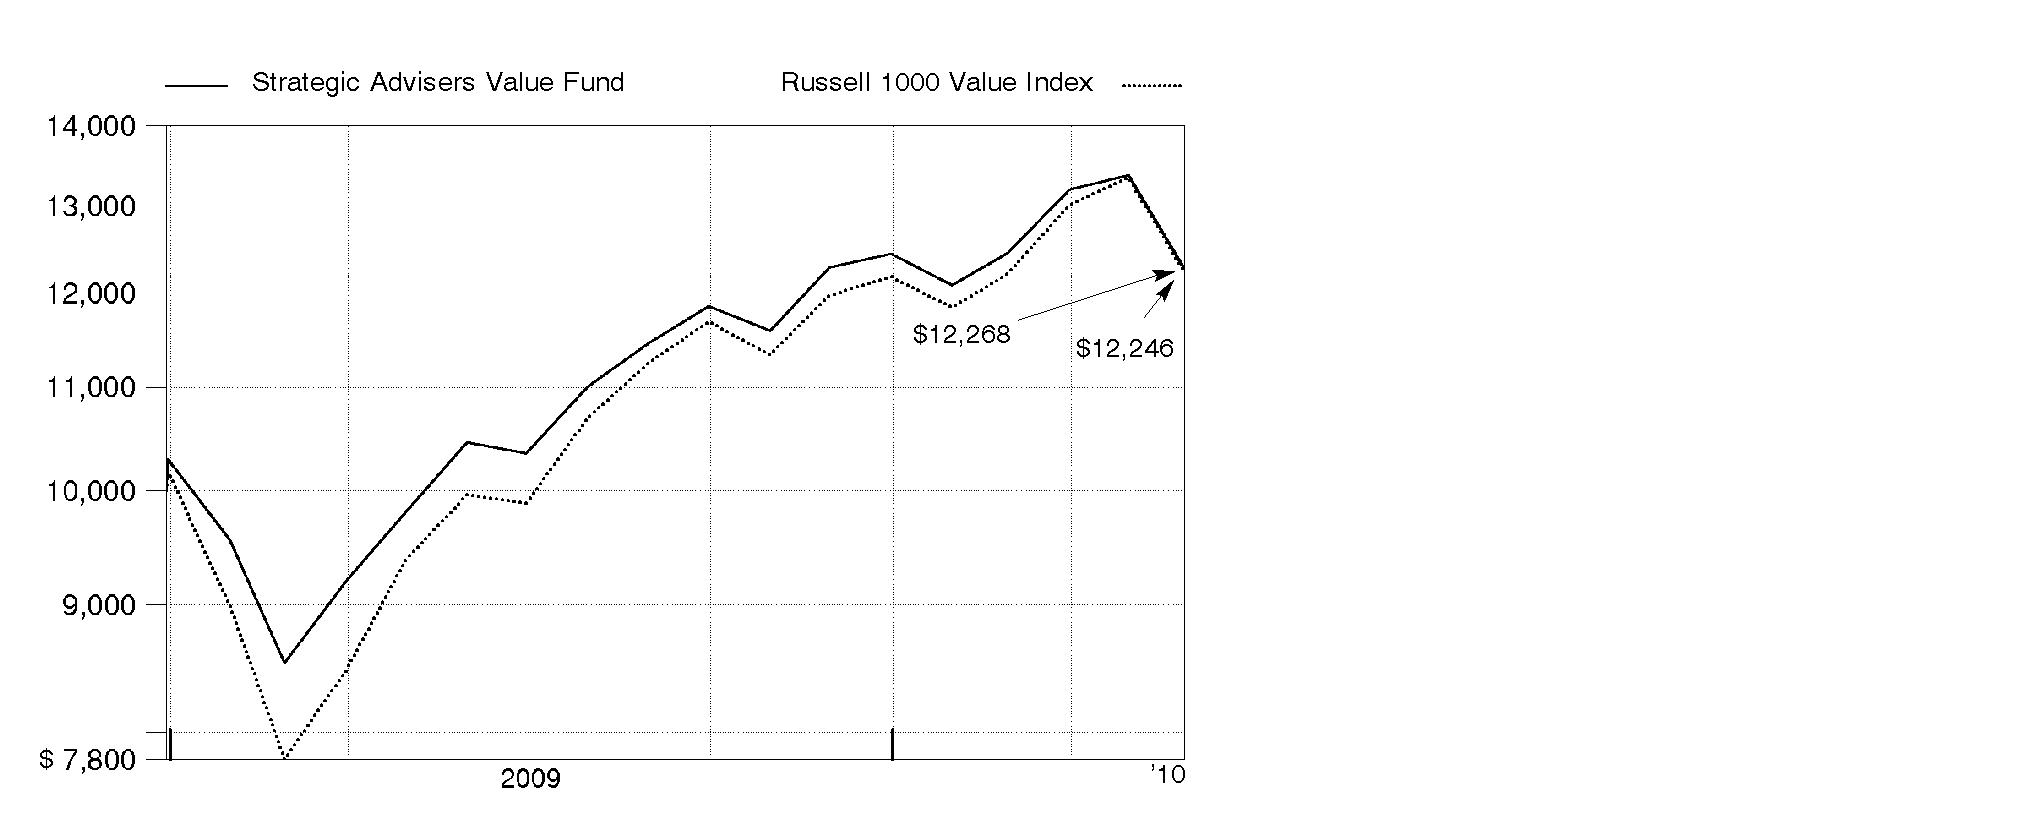
$10,000 Over Life of Fund
Let's say hypothetically that $10,000 was invested in Strategic Advisers Value Fund on December 30, 2008, when the fund started. The chart shows how the value of your investment would have changed, and also shows how the Russell 1000® Value Index performed over the same period.
Annual Report
Management's Discussion of Fund Performance
Market Recap: Despite bouts of volatility related to high unemployment rates and sovereign debt woes in Europe, U.S. stock markets posted double-digit gains during the 12-month period ending May 31, 2010. After a slow start, markets embarked on an upward trend in July, as unprecedented government stimulus and significant corporate cost cutting led to encouraging earnings reports, improved credit conditions and rising consumer confidence. Aside from a dip in January, positive news continued through mid-April, when the blue-chip Dow Jones Industrial AverageSM pushed above the 11,000 mark for the first time in 19 months. The milestone was short-lived, however, as Europe's troubling debt crisis fueled worries about global contagion, sparking a precipitous sell-off in May that marked the first official market correction since the rally began in March 2009. Nonetheless, positives outweighed negatives, and the Dow captured a 22.66% gain during the period, just ahead of the 20.99% rise of the large-cap benchmark S&P 500® Index. Small-cap stocks were among the best performers, as measured by the 33.62% return of the Russell 2000® Index. The technology-laden Nasdaq Composite® Index also fared well, returning 28.35% for the year.
Comments from John Stone and Kristina Stookey, Co-Managers of Strategic Advisers® Value Fund, Sub-Advised by Brandywine Global Investment Management, LLC, Cohen & Steers Capital Management, Inc., Eaton Vance Management and LSV Asset Management: For the 12-month period ending May 31, 2010, the fund returned 17.40%, falling short of the 22.98% gain of its benchmark, the Russell 1000® Value Index. In addition to employing sub-advisers to invest directly in individual securities, the fund recently began to include underlying mutual funds among its holdings. Unsuccessful security selection was the biggest detractor from the fund's performance, with stock picking in consumer discretionary, energy, industrials and information technology hurting the most. Poor positioning in health care also hampered results. Looking at individual stocks, the fund's three largest relative detractors came from the energy sector, including out-of-index picks Transocean - an offshore drilling firm - and France-based oil and gas company Total, and an overweighting in index component Hess, a global independent energy firm. Not having a stake in car and truck manufacturer Ford Motor - which is part of the Russell index - and an out-of-benchmark stake in agricultural company Monsanto also hurt. Conversely, underweightings in telecommunication services and utilities helped, along with positive security selection in consumer staples. Underweighting energy giant Exxon Mobil and telecom provider Verizon Communications gave the fund a boost, as did overweighting Capital One Financial. Capital One Financial was sold by period end.
The views expressed above reflect those of the portfolio manager(s) only through the end of the period as stated on the cover of this report and do not necessarily represent the views of Fidelity or any other person in the Fidelity organization. Any such views are subject to change at any time based upon market or other conditions and Fidelity disclaims any responsibility to update such views. These views may not be relied on as investment advice and, because investment decisions for a Fidelity fund are based on numerous factors, may not be relied on as an indication of trading intent on behalf of any Fidelity fund.
Annual Report
Shareholder Expense Example
As a shareholder of the Fund, you incur two types of costs: (1) transaction costs, and (2) ongoing costs, including management fees and other Fund expenses. This Example is intended to help you understand your ongoing costs (in dollars) of investing in the Fund and to compare these costs with the ongoing costs of investing in other mutual funds.
The Example is based on an investment of $1,000 invested at the beginning of the period and held for the entire period (December 1, 2009 to May 31, 2010).
Actual Expenses
The first line of the accompanying table provides information about actual account values and actual expenses. You may use the information in this line, together with the amount you invested, to estimate the expenses that you paid over the period. Simply divide your account value by $1,000.00 (for example, an $8,600 account value divided by $1,000.00 = 8.6), then multiply the result by the number in the first line under the heading entitled "Expenses Paid During Period" to estimate the expenses you paid on your account during this period.
In addition to the direct expenses incurred by the Fund presented in the table, as a shareholder of underlying mutual funds (Underlying Funds), the Fund also indirectly bears its proportionate share of the expenses of these Underlying Funds. These fees and expenses are not included in the Fund's annualized expense ratio used to calculate the expense estimate in the table below.
Hypothetical Example for Comparison Purposes
The second line of the accompanying table provides information about hypothetical account values and hypothetical expenses based on the Fund's actual expense ratio and an assumed rate of return of 5% per year before expenses, which is not the Fund's actual return. The hypothetical account values and expenses may not be used to estimate the actual ending account balance or expenses you paid for the period. You may use this information to compare the ongoing costs of investing in the Fund and other funds. To do so, compare this 5% hypothetical example with the 5% hypothetical examples that appear in the shareholder reports of the other funds.
In addition to the direct expenses incurred by the Fund presented in the table, as a shareholder of underlying mutual funds (Underlying Funds), the Fund also indirectly bears its proportionate share of the expenses of these Underlying Funds. These fees and expenses are not included in the Fund's annualized expense ratio used to calculate the expense estimate in the table below.
Please note that the expenses shown in the table are meant to highlight your ongoing costs only and do not reflect any transaction costs. Therefore, the second line of the table is useful in comparing ongoing costs only, and will not help you determine the relative total costs of owning different funds.
Annual Report
Shareholder Expense Example - continued
| Annualized | Beginning | Ending | Expenses Paid |
Actual | .72% | $ 1,000.00 | $ 998.70 | $ 3.59 |
Hypothetical (5% return per year before expenses) |
| $ 1,000.00 | $ 1,021.34 | $ 3.63 |
* Expenses are equal to the Fund's annualized expense ratio, multiplied by the average account value over the period, multiplied by 182/365 (to reflect the one-half year period).
If the contractual expense waiver effective April 1, 2010, had been in effect during the entire period, the annualized expense ratio would have been .64% and the expenses paid in the actual and hypothetical examples above would have been $3.19 and $3.23, respectively.
Annual Report
Investment Changes (Unaudited)
The information in the following tables is based on the direct investments of the Fund. |
Top Ten Holdings as of May 31, 2010 |
| % of fund's | % of fund's net assets |
American Beacon Large Cap Value Fund Institutional Class | 7.3 | 0.0 |
John Hancock Classic Value Fund Class I | 3.9 | 0.0 |
JPMorgan Chase & Co. | 2.5 | 3.0 |
Bank of America Corp. | 2.5 | 2.5 |
Hotchkis and Wiley Large Cap Value Fund | 2.4 | 0.0 |
Chevron Corp. | 2.1 | 3.2 |
ConocoPhillips | 1.9 | 0.0 |
Wells Fargo & Co. | 1.8 | 2.5 |
AT&T, Inc. | 1.7 | 2.6 |
Exxon Mobil Corp. | 1.6 | 1.5 |
| 27.7 |
Top Five Market Sectors as of May 31, 2010 |
| % of fund's | % of fund's net assets |
Financials | 18.4 | 23.2 |
Energy | 12.8 | 18.1 |
Consumer Discretionary | 9.8 | 9.4 |
Health Care | 9.4 | 9.2 |
Industrials | 8.9 | 10.2 |
Asset Allocation (% of fund's net assets) | |||||||
As of May 31, 2010* | As of November 30, 2009** | ||||||
 | Large Value Funds 13.9% |
|  | Large Value Funds 0.0% |
| ||
 | Mid-Cap Value |
| | Mid-Cap Value |
| ||
 | Stocks 83.0% |
| | Stocks 96.9% |
| ||
 | Short-Term |
| | Short-Term |
| ||
* Foreign investments | 5.2% |
| ** Foreign investments | 11.4% |
| ||

Asset allocations of equity funds in the pie charts reflect the categorizations of assets as defined by Morningstar as of the reporting dates indicated above. |
Annual Report
Investments May 31, 2010
Showing Percentage of Net Assets
Common Stocks - 83.0% | |||
Shares | Value | ||
CONSUMER DISCRETIONARY - 9.8% | |||
Auto Components - 0.4% | |||
Autoliv, Inc. (a) | 160,900 | $ 7,642,750 | |
Cooper Tire & Rubber Co. | 189,200 | 3,577,772 | |
| 11,220,522 | ||
Distributors - 0.1% | |||
Genuine Parts Co. | 90,600 | 3,679,266 | |
Diversified Consumer Services - 0.0% | |||
Career Education Corp. (a) | 2,700 | 75,600 | |
H&R Block, Inc. | 45,600 | 733,248 | |
ITT Educational Services, Inc. (a) | 5,800 | 585,452 | |
| 1,394,300 | ||
Hotels, Restaurants & Leisure - 1.9% | |||
Burger King Holdings, Inc. | 24,000 | 456,240 | |
Carnival Corp. unit | 597,334 | 21,641,411 | |
Darden Restaurants, Inc. | 118,600 | 5,087,940 | |
McDonald's Corp. | 406,856 | 27,206,461 | |
Royal Caribbean Cruises Ltd. (a) | 37,800 | 1,096,200 | |
Wyndham Worldwide Corp. | 85,100 | 2,008,360 | |
| 57,496,612 | ||
Household Durables - 0.4% | |||
D.R. Horton, Inc. | 48,400 | 589,996 | |
Mohawk Industries, Inc. (a) | 17,500 | 982,800 | |
National Presto Industries, Inc. | 1,100 | 106,964 | |
Newell Rubbermaid, Inc. | 72,300 | 1,204,518 | |
Toll Brothers, Inc. (a) | 28,600 | 602,602 | |
Tupperware Brands Corp. | 11,200 | 475,888 | |
Whirlpool Corp. | 93,000 | 9,712,920 | |
| 13,675,688 | ||
Leisure Equipment & Products - 0.2% | |||
Hasbro, Inc. | 107,400 | 4,312,110 | |
Mattel, Inc. | 152,200 | 3,296,652 | |
| 7,608,762 | ||
Media - 2.6% | |||
CBS Corp. Class B | 366,800 | 5,340,608 | |
Comcast Corp. Class A | 705,900 | 12,769,731 | |
DISH Network Corp. Class A | 78,200 | 1,630,470 | |
Gannett Co., Inc. | 354,600 | 5,510,484 | |
News Corp. Class A | 363,700 | 4,800,840 | |
Omnicom Group, Inc. | 80,900 | 3,070,155 | |
Scholastic Corp. | 95,400 | 2,494,710 | |
Common Stocks - continued | |||
Shares | Value | ||
CONSUMER DISCRETIONARY - continued | |||
Media - continued | |||
The Walt Disney Co. | 157,300 | $ 5,256,966 | |
Time Warner Cable, Inc. | 325,226 | 17,799,619 | |
Time Warner, Inc. | 505,200 | 15,656,148 | |
Viacom, Inc. Class B (non-vtg.) (a) | 159,200 | 5,350,712 | |
| 79,680,443 | ||
Multiline Retail - 1.0% | |||
Big Lots, Inc. (a) | 94,100 | 3,324,553 | |
Family Dollar Stores, Inc. | 121,600 | 4,953,984 | |
Macy's, Inc. | 295,400 | 6,560,834 | |
Nordstrom, Inc. | 174,200 | 6,915,740 | |
Sears Holdings Corp. (a) | 30,800 | 2,712,248 | |
Target Corp. | 129,800 | 7,077,994 | |
| 31,545,353 | ||
Specialty Retail - 2.6% | |||
Aeropostale, Inc. (a) | 16,500 | 457,215 | |
AutoNation, Inc. (a) | 19,700 | 394,591 | |
AutoZone, Inc. (a) | 7,300 | 1,393,424 | |
Best Buy Co., Inc. | 484,590 | 20,473,928 | |
Cabela's, Inc. Class A (a) | 150,400 | 2,588,384 | |
Gap, Inc. | 411,500 | 8,970,700 | |
Genesco, Inc. (a) | 73,300 | 2,281,096 | |
Guess?, Inc. | 3,100 | 117,769 | |
H&M Hennes & Mauritz AB (B Shares) | 40,700 | 2,314,724 | |
Home Depot, Inc. | 156,200 | 5,288,932 | |
RadioShack Corp. | 190,500 | 3,893,820 | |
Ross Stores, Inc. | 169,600 | 8,887,040 | |
The Children's Place Retail Stores, Inc. (a) | 84,600 | 3,987,198 | |
TJX Companies, Inc. | 408,637 | 18,576,638 | |
| 79,625,459 | ||
Textiles, Apparel & Luxury Goods - 0.6% | |||
NIKE, Inc. Class B | 109,700 | 7,940,086 | |
Unifirst Corp. | 69,000 | 3,105,000 | |
VF Corp. | 90,100 | 6,969,235 | |
| 18,014,321 | ||
TOTAL CONSUMER DISCRETIONARY | 303,940,726 | ||
Common Stocks - continued | |||
Shares | Value | ||
CONSUMER STAPLES - 6.3% | |||
Beverages - 0.6% | |||
Constellation Brands, Inc. Class A (sub. vtg.) (a) | 38,800 | $ 646,408 | |
PepsiCo, Inc. | 297,384 | 18,702,480 | |
| 19,348,888 | ||
Food & Staples Retailing - 2.0% | |||
Costco Wholesale Corp. | 47,400 | 2,761,050 | |
CVS Caremark Corp. | 571,800 | 19,801,434 | |
Kroger Co. | 169,300 | 3,408,009 | |
Safeway, Inc. | 360,900 | 7,990,326 | |
Sysco Corp. | 103,900 | 3,097,259 | |
Wal-Mart Stores, Inc. | 412,373 | 20,849,579 | |
Walgreen Co. | 149,500 | 4,789,980 | |
| 62,697,637 | ||
Food Products - 2.1% | |||
Archer Daniels Midland Co. | 203,300 | 5,137,391 | |
Campbell Soup Co. | 71,800 | 2,571,158 | |
ConAgra Foods, Inc. | 398,200 | 9,628,476 | |
Corn Products International, Inc. | 26,700 | 890,445 | |
Del Monte Foods Co. | 364,600 | 5,315,868 | |
Fresh Del Monte Produce, Inc. (a) | 114,900 | 2,298,000 | |
General Mills, Inc. | 49,700 | 3,540,131 | |
H.J. Heinz Co. | 41,000 | 1,811,380 | |
Hormel Foods Corp. | 100,200 | 3,987,960 | |
Kellogg Co. | 45,200 | 2,415,036 | |
McCormick & Co., Inc. (non-vtg.) | 27,200 | 1,049,104 | |
Nestle SA sponsored ADR | 280,789 | 12,674,815 | |
Ralcorp Holdings, Inc. (a) | 7,400 | 444,518 | |
Sara Lee Corp. | 474,500 | 6,723,665 | |
The J.M. Smucker Co. | 20,800 | 1,148,576 | |
Tyson Foods, Inc. Class A | 313,700 | 5,514,846 | |
| 65,151,369 | ||
Household Products - 1.0% | |||
Clorox Co. | 36,200 | 2,274,084 | |
Kimberly-Clark Corp. | 168,100 | 10,203,670 | |
Procter & Gamble Co. | 271,000 | 16,555,390 | |
| 29,033,144 | ||
Personal Products - 0.0% | |||
Herbalife Ltd. | 10,600 | 478,590 | |
Tobacco - 0.6% | |||
Altria Group, Inc. | 283,700 | 5,756,273 | |
Common Stocks - continued | |||
Shares | Value | ||
CONSUMER STAPLES - continued | |||
Tobacco - continued | |||
Lorillard, Inc. | 27,700 | $ 1,980,273 | |
Philip Morris International, Inc. | 95,200 | 4,200,224 | |
Reynolds American, Inc. | 123,700 | 6,449,718 | |
| 18,386,488 | ||
TOTAL CONSUMER STAPLES | 195,096,116 | ||
ENERGY - 12.8% | |||
Energy Equipment & Services - 1.9% | |||
Atwood Oceanics, Inc. (a) | 11,200 | 304,080 | |
Diamond Offshore Drilling, Inc. | 64,600 | 4,076,260 | |
Dresser-Rand Group, Inc. (a) | 21,200 | 674,796 | |
Halliburton Co. | 562,358 | 13,963,349 | |
Helix Energy Solutions Group, Inc. (a) | 177,509 | 1,933,073 | |
Helmerich & Payne, Inc. | 27,700 | 1,043,736 | |
Nabors Industries Ltd. (a) | 50,000 | 951,500 | |
National Oilwell Varco, Inc. | 108,600 | 4,140,918 | |
Noble Corp. | 234,600 | 6,819,822 | |
Oil States International, Inc. (a) | 44,600 | 1,741,184 | |
Pride International, Inc. (a) | 45,200 | 1,119,604 | |
Rowan Companies, Inc. (a) | 29,800 | 737,848 | |
Schlumberger Ltd. | 120,700 | 6,777,305 | |
Tidewater, Inc. | 85,900 | 3,591,479 | |
Transocean Ltd. (a) | 171,200 | 9,719,024 | |
| 57,593,978 | ||
Oil, Gas & Consumable Fuels - 10.9% | |||
Anadarko Petroleum Corp. | 298,859 | 15,639,291 | |
Apache Corp. | 309,871 | 27,745,849 | |
Berry Petroleum Co. Class A | 81,400 | 2,502,236 | |
Chevron Corp. | 901,400 | 66,586,418 | |
CNOOC Ltd. | 3,213,700 | 5,142,647 | |
ConocoPhillips | 1,142,542 | 59,252,228 | |
CVR Energy, Inc. (a) | 242,200 | 1,831,032 | |
Devon Energy Corp. | 83,400 | 5,325,090 | |
El Paso Corp. | 338,500 | 3,838,590 | |
Exxon Mobil Corp. | 837,600 | 50,641,296 | |
Hess Corp. | 437,782 | 23,290,002 | |
Marathon Oil Corp. | 404,500 | 12,575,905 | |
Murphy Oil Corp. | 76,300 | 4,072,894 | |
Occidental Petroleum Corp. | 343,519 | 28,343,753 | |
Common Stocks - continued | |||
Shares | Value | ||
ENERGY - continued | |||
Oil, Gas & Consumable Fuels - continued | |||
Peabody Energy Corp. | 382,856 | $ 14,916,070 | |
Pioneer Natural Resources Co. | 22,300 | 1,420,510 | |
Southern Union Co. | 100,300 | 2,183,531 | |
Sunoco, Inc. | 141,700 | 4,232,579 | |
Total SA | 131,600 | 6,108,769 | |
Williams Companies, Inc. | 198,600 | 3,922,350 | |
| 339,571,040 | ||
TOTAL ENERGY | 397,165,018 | ||
FINANCIALS - 18.4% | |||
Capital Markets - 2.1% | |||
Ameriprise Financial, Inc. | 185,600 | 7,385,024 | |
Bank of New York Mellon Corp. | 130,700 | 3,555,040 | |
Franklin Resources, Inc. | 52,400 | 5,139,916 | |
GFI Group, Inc. | 216,900 | 1,312,245 | |
Goldman Sachs Group, Inc. | 232,598 | 33,554,587 | |
Morgan Stanley | 366,600 | 9,938,526 | |
Raymond James Financial, Inc. | 24,500 | 692,615 | |
State Street Corp. | 69,100 | 2,637,547 | |
| 64,215,500 | ||
Commercial Banks - 3.9% | |||
BB&T Corp. | 163,700 | 4,950,288 | |
Comerica, Inc. | 60,700 | 2,312,670 | |
Fifth Third Bancorp | 797,504 | 10,359,577 | |
International Bancshares Corp. | 190,200 | 3,756,450 | |
PNC Financial Services Group, Inc. | 307,760 | 19,311,940 | |
SunTrust Banks, Inc. | 93,800 | 2,527,910 | |
Toronto-Dominion Bank | 72,600 | 4,991,902 | |
U.S. Bancorp, Delaware | 704,502 | 16,879,868 | |
Wells Fargo & Co. | 1,987,042 | 57,008,235 | |
| 122,098,840 | ||
Consumer Finance - 0.7% | |||
American Express Co. | 394,529 | 15,729,871 | |
AmeriCredit Corp. (a) | 23,500 | 508,070 | |
Nelnet, Inc. Class A | 162,277 | 3,213,085 | |
SLM Corp. (a) | 279,400 | 3,104,134 | |
| 22,555,160 | ||
Common Stocks - continued | |||
Shares | Value | ||
FINANCIALS - continued | |||
Diversified Financial Services - 5.8% | |||
Bank of America Corp. | 4,896,627 | $ 77,072,909 | |
Citigroup, Inc. (a) | 5,293,000 | 20,960,280 | |
JPMorgan Chase & Co. | 1,994,322 | 78,935,265 | |
PHH Corp. (a) | 132,900 | 2,930,445 | |
| 179,898,899 | ||
Insurance - 5.1% | |||
AFLAC, Inc. | 82,400 | 3,650,320 | |
Allstate Corp. | 266,300 | 8,156,769 | |
American Financial Group, Inc. | 207,900 | 5,800,410 | |
American National Insurance Co. | 5,300 | 552,684 | |
Arch Capital Group Ltd. (a) | 17,000 | 1,249,840 | |
Aspen Insurance Holdings Ltd. | 23,000 | 580,980 | |
Assurant, Inc. | 30,800 | 1,068,760 | |
Axis Capital Holdings Ltd. | 37,300 | 1,133,920 | |
Cincinnati Financial Corp. | 28,700 | 780,353 | |
Endurance Specialty Holdings Ltd. | 16,500 | 612,150 | |
Everest Re Group Ltd. | 70,400 | 5,116,672 | |
Genworth Financial, Inc. Class A (a) | 155,100 | 2,418,009 | |
Hanover Insurance Group, Inc. | 14,300 | 622,050 | |
Hartford Financial Services Group, Inc. | 170,100 | 4,264,407 | |
HCC Insurance Holdings, Inc. | 222,000 | 5,565,540 | |
Lincoln National Corp. | 542,364 | 14,350,951 | |
Loews Corp. | 327,200 | 10,637,272 | |
Markel Corp. (a) | 2,700 | 932,985 | |
MetLife, Inc. | 231,000 | 9,353,190 | |
Montpelier Re Holdings Ltd. | 187,300 | 2,923,753 | |
Old Republic International Corp. | 42,000 | 582,120 | |
Progressive Corp. | 175,600 | 3,440,004 | |
Prudential Financial, Inc. | 419,819 | 24,227,754 | |
Reinsurance Group of America, Inc. | 12,800 | 601,216 | |
RenaissanceRe Holdings Ltd. | 17,500 | 946,050 | |
The Chubb Corp. | 360,200 | 18,096,448 | |
The First American Corp. | 17,000 | 578,510 | |
The Travelers Companies, Inc. | 370,100 | 18,308,847 | |
Torchmark Corp. | 23,900 | 1,231,567 | |
Transatlantic Holdings, Inc. | 19,200 | 902,976 | |
Unum Group | 141,700 | 3,273,270 | |
W.R. Berkley Corp. | 26,500 | 722,390 | |
Common Stocks - continued | |||
Shares | Value | ||
FINANCIALS - continued | |||
Insurance - continued | |||
White Mountains Insurance Group Ltd. | 3,200 | $ 1,045,760 | |
XL Capital Ltd. Class A | 232,700 | 4,097,847 | |
| 157,825,774 | ||
Real Estate Investment Trusts - 0.7% | |||
AvalonBay Communities, Inc. | 93,415 | 9,160,275 | |
Corporate Office Properties Trust (SBI) | 60,100 | 2,278,391 | |
Public Storage | 44,500 | 4,124,705 | |
Simon Property Group, Inc. | 63,300 | 5,382,399 | |
| 20,945,770 | ||
Real Estate Management & Development - 0.1% | |||
Hongkong Land Holdings Ltd. | 538,000 | 2,571,640 | |
Thrifts & Mortgage Finance - 0.0% | |||
Hudson City Bancorp, Inc. | 91,000 | 1,147,510 | |
TOTAL FINANCIALS | 571,259,093 | ||
HEALTH CARE - 9.4% | |||
Biotechnology - 0.5% | |||
Amgen, Inc. (a) | 144,000 | 7,456,320 | |
Biogen Idec, Inc. (a) | 95,300 | 4,520,079 | |
Cephalon, Inc. (a) | 60,700 | 3,572,802 | |
| 15,549,201 | ||
Health Care Equipment & Supplies - 0.8% | |||
Becton, Dickinson & Co. | 32,300 | 2,302,990 | |
Covidien PLC | 106,600 | 4,518,774 | |
Kinetic Concepts, Inc. (a) | 71,800 | 2,972,520 | |
Medtronic, Inc. | 313,600 | 12,286,848 | |
Zimmer Holdings, Inc. (a) | 57,000 | 3,188,010 | |
| 25,269,142 | ||
Health Care Providers & Services - 2.1% | |||
Aetna, Inc. | 138,600 | 4,041,576 | |
AmerisourceBergen Corp. | 214,300 | 6,703,304 | |
Cardinal Health, Inc. | 55,500 | 1,914,195 | |
CIGNA Corp. | 49,500 | 1,656,765 | |
Community Health Systems, Inc. (a) | 17,000 | 662,660 | |
Coventry Health Care, Inc. (a) | 27,200 | 563,040 | |
DaVita, Inc. (a) | 17,900 | 1,135,397 | |
Health Net, Inc. (a) | 18,000 | 443,700 | |
Humana, Inc. (a) | 87,900 | 4,047,795 | |
Common Stocks - continued | |||
Shares | Value | ||
HEALTH CARE - continued | |||
Health Care Providers & Services - continued | |||
Laboratory Corp. of America Holdings (a) | 19,700 | $ 1,489,517 | |
LifePoint Hospitals, Inc. (a) | 71,400 | 2,533,986 | |
McKesson Corp. | 109,800 | 7,686,000 | |
MEDNAX, Inc. (a) | 1,500 | 84,825 | |
Omnicare, Inc. | 19,400 | 487,134 | |
UnitedHealth Group, Inc. | 480,200 | 13,959,414 | |
Universal American Financial Corp. (a) | 220,169 | 3,218,871 | |
Universal Health Services, Inc. Class B | 102,800 | 4,356,664 | |
WellPoint, Inc. (a) | 166,400 | 8,536,320 | |
| 63,521,163 | ||
Life Sciences Tools & Services - 0.6% | |||
Thermo Fisher Scientific, Inc. (a) | 368,578 | 19,188,171 | |
Pharmaceuticals - 5.4% | |||
Abbott Laboratories | 822,110 | 39,099,552 | |
Bristol-Myers Squibb Co. | 800,800 | 18,586,568 | |
Eli Lilly & Co. | 175,600 | 5,757,924 | |
Endo Pharmaceuticals Holdings, Inc. (a) | 119,300 | 2,498,142 | |
Forest Laboratories, Inc. (a) | 268,300 | 6,943,604 | |
Johnson & Johnson | 449,597 | 26,211,505 | |
Medicis Pharmaceutical Corp. Class A | 115,800 | 2,685,402 | |
Merck & Co., Inc. | 789,986 | 26,614,628 | |
Mylan, Inc. (a) | 79,300 | 1,541,592 | |
Par Pharmaceutical Companies, Inc. (a) | 115,700 | 3,211,832 | |
Pfizer, Inc. | 1,943,500 | 29,599,505 | |
Teva Pharmaceutical Industries Ltd. sponsored ADR | 111,900 | 6,134,358 | |
| 168,884,612 | ||
TOTAL HEALTH CARE | 292,412,289 | ||
INDUSTRIALS - 8.9% | |||
Aerospace & Defense - 4.2% | |||
General Dynamics Corp. | 346,509 | 23,527,961 | |
Goodrich Corp. | 21,600 | 1,499,040 | |
Honeywell International, Inc. | 80,300 | 3,434,431 | |
ITT Corp. | 31,800 | 1,535,304 | |
L-3 Communications Holdings, Inc. | 196,500 | 16,236,795 | |
Lockheed Martin Corp. | 230,700 | 18,437,544 | |
Northrop Grumman Corp. | 203,400 | 12,303,666 | |
Raytheon Co. | 253,900 | 13,306,899 | |
Rockwell Collins, Inc. | 27,100 | 1,581,014 | |
Common Stocks - continued | |||
Shares | Value | ||
INDUSTRIALS - continued | |||
Aerospace & Defense - continued | |||
Spirit AeroSystems Holdings, Inc. Class A (a) | 24,600 | $ 479,208 | |
The Boeing Co. | 203,037 | 13,030,915 | |
United Technologies Corp. | 340,450 | 22,939,521 | |
| 128,312,298 | ||
Air Freight & Logistics - 0.1% | |||
United Parcel Service, Inc. Class B | 60,600 | 3,803,256 | |
Airlines - 0.1% | |||
SkyWest, Inc. | 134,800 | 1,976,842 | |
Southwest Airlines Co. | 122,900 | 1,528,876 | |
| 3,505,718 | ||
Commercial Services & Supplies - 0.8% | |||
Avery Dennison Corp. | 3,600 | 123,048 | |
Deluxe Corp. | 125,700 | 2,698,779 | |
Pitney Bowes, Inc. | 140,000 | 3,169,600 | |
R.R. Donnelley & Sons Co. | 214,100 | 4,102,156 | |
The Brink's Co. | 85,700 | 1,942,819 | |
Waste Management, Inc. | 417,579 | 13,575,493 | |
| 25,611,895 | ||
Construction & Engineering - 0.3% | |||
Foster Wheeler AG (a) | 117,800 | 2,828,378 | |
KBR, Inc. | 123,100 | 2,705,738 | |
Tutor Perini Corp. (a) | 139,200 | 3,104,160 | |
| 8,638,276 | ||
Electrical Equipment - 0.0% | |||
Hubbell, Inc. Class B | 14,300 | 609,895 | |
Industrial Conglomerates - 1.7% | |||
3M Co. | 32,200 | 2,553,782 | |
General Electric Co. | 2,816,900 | 46,056,315 | |
Tyco International Ltd. | 130,900 | 4,737,271 | |
| 53,347,368 | ||
Machinery - 1.1% | |||
AGCO Corp. (a) | 16,500 | 474,705 | |
Albany International Corp. Class A | 123,200 | 2,318,624 | |
Bucyrus International, Inc. Class A | 53,200 | 2,849,392 | |
Caterpillar, Inc. | 215,364 | 13,085,517 | |
Flowserve Corp. | 10,600 | 1,008,060 | |
Joy Global, Inc. | 36,200 | 1,846,200 | |
Common Stocks - continued | |||
Shares | Value | ||
INDUSTRIALS - continued | |||
Machinery - continued | |||
PACCAR, Inc. | 279,021 | $ 11,439,861 | |
SPX Corp. | 12,800 | 756,480 | |
| 33,778,839 | ||
Professional Services - 0.0% | |||
Equifax, Inc. | 24,500 | 741,125 | |
Road & Rail - 0.5% | |||
Norfolk Southern Corp. | 39,700 | 2,241,462 | |
Union Pacific Corp. | 159,862 | 11,418,943 | |
Werner Enterprises, Inc. | 95,700 | 2,157,078 | |
| 15,817,483 | ||
Trading Companies & Distributors - 0.1% | |||
Aircastle Ltd. | 318,300 | 3,135,255 | |
TOTAL INDUSTRIALS | 277,301,408 | ||
INFORMATION TECHNOLOGY - 7.5% | |||
Communications Equipment - 0.5% | |||
Arris Group, Inc. (a) | 294,500 | 3,230,665 | |
Harris Corp. | 157,100 | 7,369,561 | |
QUALCOMM, Inc. | 145,700 | 5,181,092 | |
Tellabs, Inc. | 76,600 | 689,400 | |
| 16,470,718 | ||
Computers & Peripherals - 1.6% | |||
Dell, Inc. (a) | 264,600 | 3,527,118 | |
Hewlett-Packard Co. | 685,617 | 31,545,238 | |
Seagate Technology (a) | 456,700 | 7,014,912 | |
Western Digital Corp. (a) | 177,500 | 6,178,775 | |
| 48,266,043 | ||
Electronic Equipment & Components - 0.6% | |||
Arrow Electronics, Inc. (a) | 30,800 | 840,224 | |
Avnet, Inc. (a) | 39,400 | 1,131,568 | |
AVX Corp. | 33,000 | 461,010 | |
Corning, Inc. | 272,000 | 4,740,960 | |
Ingram Micro, Inc. Class A (a) | 42,600 | 722,496 | |
Molex, Inc. | 15,500 | 328,290 | |
Tech Data Corp. (a) | 85,000 | 3,455,250 | |
Tyco Electronics Ltd. | 187,400 | 5,400,868 | |
Vishay Intertechnology, Inc. (a) | 255,200 | 2,309,560 | |
| 19,390,226 | ||
Common Stocks - continued | |||
Shares | Value | ||
INFORMATION TECHNOLOGY - continued | |||
Internet Software & Services - 0.0% | |||
IAC/InterActiveCorp (a) | 36,800 | $ 863,144 | |
IT Services - 1.8% | |||
Alliance Data Systems Corp. (a) | 7,200 | 508,752 | |
Automatic Data Processing, Inc. | 121,900 | 4,983,272 | |
Broadridge Financial Solutions, Inc. | 35,700 | 682,584 | |
Computer Sciences Corp. | 107,900 | 5,393,921 | |
CSG Systems International, Inc. (a) | 185,800 | 3,812,616 | |
Fiserv, Inc. (a) | 20,700 | 984,285 | |
Hewitt Associates, Inc. Class A (a) | 24,000 | 894,000 | |
International Business Machines Corp. | 227,124 | 28,449,552 | |
Lender Processing Services, Inc. | 18,500 | 627,890 | |
MasterCard, Inc. Class A | 39,965 | 8,063,738 | |
Total System Services, Inc. | 51,100 | 746,060 | |
| 55,146,670 | ||
Semiconductors & Semiconductor Equipment - 1.7% | |||
Fairchild Semiconductor International, Inc. (a) | 571,400 | 5,714,000 | |
Intel Corp. | 1,588,839 | 34,032,931 | |
Micron Technology, Inc. (a) | 496,800 | 4,515,912 | |
Texas Instruments, Inc. | 312,400 | 7,628,808 | |
| 51,891,651 | ||
Software - 1.3% | |||
CA, Inc. | 135,700 | 2,747,925 | |
Microsoft Corp. | 909,783 | 23,472,401 | |
Oracle Corp. | 657,199 | 14,832,981 | |
| 41,053,307 | ||
TOTAL INFORMATION TECHNOLOGY | 233,081,759 | ||
MATERIALS - 3.2% | |||
Chemicals - 1.5% | |||
Air Products & Chemicals, Inc. | 113,633 | 7,847,495 | |
Ashland, Inc. | 107,700 | 5,773,797 | |
Dow Chemical Co. | 140,300 | 3,775,473 | |
E.I. du Pont de Nemours & Co. | 29,700 | 1,074,249 | |
Eastman Chemical Co. | 29,300 | 1,769,427 | |
Ecolab, Inc. | 61,900 | 2,923,537 | |
FMC Corp. | 22,300 | 1,350,265 | |
Huntsman Corp. | 36,600 | 365,268 | |
International Flavors & Fragrances, Inc. | 13,800 | 614,100 | |
Lubrizol Corp. | 94,100 | 8,334,437 | |
Common Stocks - continued | |||
Shares | Value | ||
MATERIALS - continued | |||
Chemicals - continued | |||
Monsanto Co. | 42,100 | $ 2,141,627 | |
Praxair, Inc. | 32,100 | 2,490,960 | |
RPM International, Inc. | 33,500 | 663,635 | |
Sigma Aldrich Corp. | 74,000 | 3,942,720 | |
Stepan Co. | 55,200 | 3,981,576 | |
The Scotts Miracle-Gro Co. Class A | 2,200 | 97,746 | |
Valspar Corp. | 17,500 | 548,975 | |
| 47,695,287 | ||
Containers & Packaging - 0.4% | |||
Ball Corp. | 24,400 | 1,201,700 | |
Crown Holdings, Inc. (a) | 26,700 | 627,717 | |
Greif, Inc. Class A | 8,000 | 438,400 | |
Pactiv Corp. (a) | 28,500 | 814,530 | |
Rock-Tenn Co. Class A | 33,100 | 1,703,326 | |
Sealed Air Corp. | 41,500 | 864,860 | |
Silgan Holdings, Inc. | 148,400 | 4,233,852 | |
Sonoco Products Co. | 17,000 | 525,470 | |
| 10,409,855 | ||
Metals & Mining - 1.3% | |||
Allegheny Technologies, Inc. | 51,100 | 2,794,148 | |
BHP Billiton Ltd. sponsored ADR | 128,488 | 8,331,162 | |
Cliffs Natural Resources, Inc. | 59,600 | 3,329,256 | |
Compass Minerals International, Inc. | 5,800 | 439,988 | |
Freeport-McMoRan Copper & Gold, Inc. | 206,500 | 14,465,325 | |
Reliance Steel & Aluminum Co. | 13,000 | 596,830 | |
United States Steel Corp. | 215,308 | 10,164,691 | |
| 40,121,400 | ||
Paper & Forest Products - 0.0% | |||
MeadWestvaco Corp. | 44,700 | 1,068,330 | |
TOTAL MATERIALS | 99,294,872 | ||
TELECOMMUNICATION SERVICES - 3.0% | |||
Diversified Telecommunication Services - 2.1% | |||
AT&T, Inc. | 2,115,800 | 51,413,940 | |
CenturyTel, Inc. | 213,400 | 7,326,022 | |
Verizon Communications, Inc. | 240,700 | 6,624,064 | |
Windstream Corp. | 113,500 | 1,211,045 | |
| 66,575,071 | ||
Common Stocks - continued | |||
Shares | Value | ||
TELECOMMUNICATION SERVICES - continued | |||
Wireless Telecommunication Services - 0.9% | |||
China Mobile (Hong Kong) Ltd. sponsored ADR | 80,800 | $ 3,762,856 | |
NII Holdings, Inc. (a) | 31,900 | 1,163,393 | |
Rogers Communications, Inc. Class B (non-vtg.) | 548,725 | 18,972,686 | |
Telephone & Data Systems, Inc. | 109,600 | 3,603,648 | |
| 27,502,583 | ||
TOTAL TELECOMMUNICATION SERVICES | 94,077,654 | ||
UTILITIES - 3.7% | |||
Electric Utilities - 1.5% | |||
American Electric Power Co., Inc. | 528,200 | 16,881,272 | |
DPL, Inc. | 20,800 | 520,832 | |
Duke Energy Corp. | 295,500 | 4,716,180 | |
Edison International | 76,000 | 2,459,360 | |
Entergy Corp. | 32,500 | 2,439,775 | |
Exelon Corp. | 157,400 | 6,075,640 | |
FPL Group, Inc. | 194,300 | 9,701,399 | |
NV Energy, Inc. | 61,200 | 721,548 | |
Pepco Holdings, Inc. | 33,100 | 533,903 | |
Pinnacle West Capital Corp. | 22,900 | 804,019 | |
Unisource Energy Corp. | 33,699 | 1,040,625 | |
Westar Energy, Inc. | 21,200 | 466,400 | |
| 46,360,953 | ||
Gas Utilities - 0.3% | |||
AGL Resources, Inc. | 20,200 | 737,300 | |
Atmos Energy Corp. | 76,600 | 2,077,392 | |
Energen Corp. | 18,500 | 818,995 | |
ONEOK, Inc. | 27,100 | 1,205,137 | |
Questar Corp. | 45,200 | 2,027,672 | |
Southwest Gas Corp. | 77,400 | 2,292,588 | |
| 9,159,084 | ||
Independent Power Producers & Energy Traders - 0.0% | |||
Constellation Energy Group, Inc. | 34,900 | 1,234,762 | |
Multi-Utilities - 1.9% | |||
Alliant Energy Corp. | 19,200 | 617,088 | |
Ameren Corp. | 125,200 | 3,087,432 | |
CMS Energy Corp. | 260,500 | 3,824,140 | |
Consolidated Edison, Inc. | 41,500 | 1,767,485 | |
Dominion Resources, Inc. | 19,600 | 763,616 | |
DTE Energy Co. | 91,800 | 4,177,818 | |
Common Stocks - continued | |||
Shares | Value | ||
UTILITIES - continued | |||
Multi-Utilities - continued | |||
Integrys Energy Group, Inc. | 13,400 | $ 605,948 | |
NiSource, Inc. | 71,300 | 1,066,648 | |
NSTAR | 16,100 | 565,271 | |
OGE Energy Corp. | 19,200 | 699,648 | |
PG&E Corp. | 276,228 | 11,463,462 | |
Public Service Enterprise Group, Inc. | 186,800 | 5,721,684 | |
SCANA Corp. | 18,000 | 653,220 | |
Sempra Energy | 238,000 | 10,948,000 | |
TECO Energy, Inc. | 37,200 | 578,460 | |
Wisconsin Energy Corp. | 207,000 | 10,143,000 | |
Xcel Energy, Inc. | 80,400 | 1,647,396 | |
| 58,330,316 | ||
TOTAL UTILITIES | 115,085,115 | ||
TOTAL COMMON STOCKS (Cost $2,594,749,935) | 2,578,714,050 | ||
Equity Funds - 15.2% | |||
|
|
|
|
Large Value Funds - 13.9% | |||
American Beacon Large Cap Value Fund Institutional Class | 13,205,087 | 225,939,047 | |
Hotchkis and Wiley Large Cap Value Fund Class I | 5,340,199 | 76,097,831 | |
Hotchkis and Wiley Large Cap Value Fund Class A | 680,554 | 9,650,262 | |
John Hancock Classic Value Fund Class I | 8,158,570 | 120,502,076 | |
TOTAL LARGE VALUE FUNDS | 432,189,216 | ||
Mid-Cap Value Funds - 1.3% | |||
T. Rowe Price Mid Cap Value Fund | 1,948,963 | 41,395,965 | |
TOTAL EQUITY FUNDS (Cost $499,853,888) | 473,585,181 | ||
Money Market Funds - 1.8% | |||
Shares | Value | ||
SSgA US Treasury Money Market Fund, 0% (b) | 55,585,965 | $ 55,585,965 | |
TOTAL INVESTMENT PORTFOLIO - 100.0% (Cost $3,150,189,788) | 3,107,885,196 | ||
NET OTHER ASSETS - 0.0% | (216,576) | ||
NET ASSETS - 100% | $ 3,107,668,620 | ||
Legend |
(a) Non-income producing |
(b) The rate quoted is the annualized seven-day yield of the fund at period end |
Other Information |
All investments are categorized as Level 1 under the Fair Value Hierarchy. The inputs or methodology used for valuing securities may not be an indication of the risk associated with investing in those securities. For more information on valuation inputs, please refer to the Security Valuation section in the accompanying Notes to Financial Statements. |
See accompanying notes which are an integral part of the financial statements.
Annual Report
Financial Statements
Statement of Assets and Liabilities
| May 31, 2010 | |
Assets | ||
Investment in securities, at value - See accompanying schedule: Unaffiliated issuers (cost $3,150,189,788) |
| $ 3,107,885,196 |
Receivable for investments sold | 36,166,491 | |
Receivable for fund shares sold | 3,230,228 | |
Dividends receivable | 6,753,562 | |
Total assets | 3,154,035,477 | |
|
|
|
Liabilities | ||
Payable for investments purchased | $ 43,474,207 | |
Payable for fund shares redeemed | 1,342,678 | |
Accrued management fee | 639,962 | |
Other affiliated payables | 659,628 | |
Other payables and accrued expenses | 250,382 | |
Total liabilities | 46,366,857 | |
|
|
|
Net Assets | $ 3,107,668,620 | |
Net Assets consist of: |
| |
Paid in capital | $ 3,126,221,578 | |
Undistributed net investment income | 11,598,867 | |
Accumulated undistributed net realized gain (loss) on investments and foreign currency transactions | 12,156,199 | |
Net unrealized appreciation (depreciation) on investments and assets and liabilities in foreign currencies | (42,308,024) | |
Net Assets, for 256,864,577 shares outstanding | $ 3,107,668,620 | |
Net Asset Value, offering price and redemption price per share ($3,107,668,620 ÷ 256,864,577 shares) | $ 12.10 | |
See accompanying notes which are an integral part of the financial statements.
Annual Report
Financial Statements - continued
Statement of Operations
| Year ended May 31, 2010 | |
Investment Income |
|
|
Dividends |
| $ 24,589,094 |
Interest |
| 466 |
Total Income | 24,589,560 | |
|
|
|
Expenses | ||
Management fee | $ 6,539,294 | |
Transfer agent fees | 3,316,651 | |
Accounting fees and expenses | 399,222 | |
Custodian fees and expenses | 41,277 | |
Independent trustees' compensation | 35,738 | |
Registration fees | 395,708 | |
Audit | 46,733 | |
Legal | 34,579 | |
Miscellaneous | 90,469 | |
Total expenses before reductions | 10,899,671 | |
Expense reductions | (2,095,753) | 8,803,918 |
Net investment income (loss) | 15,785,642 | |
Realized and Unrealized Gain (Loss) Net realized gain (loss) on: | ||
Investment securities: |
|
|
Unaffiliated issuers | 21,697,757 | |
Foreign currency transactions | (36,143) | |
Total net realized gain (loss) |
| 21,661,614 |
Change in net unrealized appreciation (depreciation) on: Investment securities | (71,589,057) | |
Assets and liabilities in foreign currencies | (4,303) | |
Total change in net unrealized appreciation (depreciation) |
| (71,593,360) |
Net gain (loss) | (49,931,746) | |
Net increase (decrease) in net assets resulting from operations | $ (34,146,104) | |
See accompanying notes which are an integral part of the financial statements.
Annual Report
Statement of Changes in Net Assets
| Year ended | For the period |
Increase (Decrease) in Net Assets |
|
|
Operations |
|
|
Net investment income (loss) | $ 15,785,642 | $ 3,072,534 |
Net realized gain (loss) | 21,661,614 | (8,770,011) |
Change in net unrealized appreciation (depreciation) | (71,593,360) | 29,285,336 |
Net increase (decrease) in net assets resulting | (34,146,104) | 23,587,859 |
Distributions to shareholders from net investment income | (6,776,199) | - |
Share transactions | 2,929,042,635 | 474,417,324 |
Reinvestment of distributions | 6,771,805 | - |
Cost of shares redeemed | (224,216,536) | (61,012,164) |
Net increase (decrease) in net assets resulting from share transactions | 2,711,597,904 | 413,405,160 |
Total increase (decrease) in net assets | 2,670,675,601 | 436,993,019 |
|
|
|
Net Assets | ||
Beginning of period | 436,993,019 | - |
End of period (including undistributed net investment income of $11,598,867 and undistributed net investment income of $3,072,534, respectively) | $ 3,107,668,620 | $ 436,993,019 |
Other Information Shares | ||
Sold | 232,657,995 | 48,505,402 |
Issued in reinvestment of distributions | 621,197 | - |
Redeemed | (18,225,613) | (6,694,404) |
Net increase (decrease) | 215,053,579 | 41,810,998 |
See accompanying notes which are an integral part of the financial statements.
Annual Report
Financial Highlights
Years ended May 31, | 2010 | 2009 E |
Selected Per-Share Data |
|
|
Net asset value, beginning of period | $ 10.45 | $ 10.00 |
Income from Investment Operations |
|
|
Net investment income (loss) D | .16 | .09 |
Net realized and unrealized gain (loss) | 1.64 G | .36 |
Total from investment operations | 1.80 | .45 |
Distributions from net investment income | (.15) | - |
Net asset value, end of period | $ 12.10 | $ 10.45 |
Total Return B, C | 17.40% | 4.50% |
Ratios to Average Net Assets F |
|
|
Expenses before reductions | .93% | 1.08% A |
Expenses net of fee waivers, if any | .75% | .90% A |
Expenses net of all reductions | .75% | .90% A |
Net investment income (loss) | 1.35% | 2.28% A |
Supplemental Data |
|
|
Net assets, end of period (000 omitted) | $ 3,107,669 | $ 436,993 |
Portfolio turnover rate | 39% | 40% |
A Annualized
B Total returns would have been lower had certain expenses not been reduced during the periods shown.
C Total returns for periods of less than one year are not annualized.
D Calculated based on average shares outstanding during the period.
E For the period December 30, 2008 (commencement of operations) to May 31, 2009.
F Expense ratios reflect operating expenses of the Fund. Expenses before reductions do not reflect amounts reimbursed by the investment adviser or reductions from expense offset arrangements and do not represent the amount paid by the Fund during periods when reimbursements or reductions occur. Expense ratios before reductions for start-up periods may not be representative of longer term operating periods. Expenses net of fee waivers reflect expenses after reimbursement by the investment adviser but prior to reductions from expense offset arrangements. Expenses net of all reductions represent the net expenses paid by the Fund. Fees and expenses of Underlying Funds are not included in the Fund's annualized ratios. The Fund indirectly bears its proportionate share of the expenses of these Underlying Funds.
G The amount shown for a share outstanding does not correspond with the aggregate net gain (loss) on investments for the period due to the timing of sales and repurchases of shares in relation to the fluctuating market values of the investments of the Fund.
See accompanying notes which are an integral part of the financial statements.
Annual Report
Notes to Financial Statements
For the period ended May 31, 2010
1. Organization.
Strategic Advisers Value Fund (the Fund) (formerly Fidelity Strategic Advisers Value Fund) is a non-diversified fund of Fidelity Commonwealth Trust II (the trust) and is authorized to issue an unlimited number of shares. The trust is registered under the Investment Company Act of 1940, as amended (the 1940 Act), as an open-end management investment company organized as a Delaware statutory trust. The Fund is offered exclusively to clients of Strategic Advisers, Inc. (Strategic Advisers), an affiliate of Fidelity Management & Research Company (FMR). During March 2010, the Board of Trustees approved an agreement and Plan of Reorganization providing for the reorganization whereby the Fund reorganized into Fidelity Rutland Square Trust II (Trust Reorganization) effective after the close of business on June 25, 2010. The Trust Reorganization does not impact the Fund's investment strategies or Strategic Adviser's management of the Fund.
2. Significant Accounting Policies.
The financial statements have been prepared in conformity with accounting principles generally accepted in the United States of America, which require management to make certain estimates and assumptions at the date of the financial statements. Actual results could differ from those estimates. The following summarizes the significant accounting policies of the Fund:
Security Valuation. Investments are valued as of 4:00 p.m. Eastern time on the last calendar day of the period. The Fund uses independent pricing services approved by the Board of Trustees to value its investments. When current market prices or quotations are not readily available or reliable, valuations may be determined in good faith in accordance with procedures adopted by the Board of Trustees. Factors used in determining value may include market or security specific events. The frequency with which these procedures are used cannot be predicted and they may be utilized to a significant extent. The value used for net asset value (NAV) calculation under these procedures may differ from published prices for the same securities.
The Fund categorizes the inputs to valuation techniques used to value its investments into a disclosure hierarchy consisting of three levels as shown below.
Level 1 - quoted prices in active markets for identical investments
Level 2 - other significant observable inputs (including quoted prices for similar investments, interest rates, prepayment speeds, etc.)
Level 3 - unobservable inputs (including the fund's own assumptions based on the best information available)
Changes in valuation techniques may result in transfers in or out of an assigned level within the disclosure hierarchy. The aggregate value of investments by input level, as of
Annual Report
Notes to Financial Statements - continued
2. Significant Accounting Policies - continued
Security Valuation - continued
May 31, 2010 is included at the end of the Fund's Schedule of Investments. Valuation techniques used to value the Fund's investments by major category are as follows.
Equity securities, including restricted securities, for which market quotations are readily available, are valued at the last reported sale price or official closing price as reported by an independent pricing service on the primary market or exchange on which they are traded and are categorized as Level 1 in the hierarchy. In the event there were no sales during the day or closing prices are not available, securities are valued at the last quoted bid price or may be valued using the last available price and are generally categorized as Level 2 in the hierarchy. For foreign equity securities, when significant market or security specific events arise, comparisons to the valuation of American Depositary Receipts (ADRs), futures contracts, Exchange-traded funds (ETFs) and certain indexes as well as quoted prices for similar securities are used and are categorized as Level 2 in the hierarchy in these circumstances. Utilizing these techniques may result in transfers between Level 1 and Level 2. For restricted equity securities and private placements where observable inputs are limited, assumptions about market activity and risk are used and are categorized as Level 3 in the hierarchy.
Investments in open-end mutual funds are valued at their closing net asset value each business day and are categorized as Level 1 in the hierarchy. If an unaffiliated Underlying Fund's NAV is unavailable, shares of that fund may be valued by another method that the Board of Trustees believes reflects fair value in accordance with the Board's fair value pricing policies and is categorized as Level 2 in the hierarchy. Short-term securities with remaining maturities of sixty days or less for which quotations are not readily available are valued at amortized cost, which approximates value and are categorized as Level 2 in the hierarchy.
Foreign Currency. The Fund uses foreign currency contracts to facilitate transactions in foreign-denominated securities. Losses from these transactions may arise from changes in the value of the foreign currency or if the counterparties do not perform under the contracts' terms.
Foreign-denominated assets, including investment securities, and liabilities are translated into U.S. dollars at the exchange rate at period end. Purchases and sales of investment securities, income and dividends received and expenses denominated in foreign currencies are translated into U.S. dollars at the exchange rate in effect on the transaction date.
The effects of exchange rate fluctuations on investments are included with the net realized and unrealized gain (loss) on investment securities. Other foreign currency transactions resulting in realized and unrealized gain (loss) are disclosed separately.
Annual Report
2. Significant Accounting Policies - continued
Investment Transactions and Income. For financial reporting purposes, the Fund's investment holdings and NAV include trades executed through the end of the last business day of the period. The NAV per share for processing shareholder transactions is calculated as of the close of business of the New York Stock Exchange (NYSE), normally 4:00 p.m. Eastern time and includes trades executed through the end of the prior business day. Gains and losses on securities sold are determined on the basis of identified cost. Dividend income is recorded on the ex-dividend date, except for certain dividends from foreign securities where the ex-dividend date may have passed, which are recorded as soon as the Fund is informed of the ex-dividend date. Non-cash dividends included in dividend income, if any, are recorded at the fair market value of the securities received. Income and capital gain distributions from the Underlying Funds, if any, are recorded on the ex-dividend date. Distributions received on securities that represent a return of capital or capital gain are recorded as a reduction of cost of investments and/or as a realized gain. The Fund estimates the components of distributions received that may be considered return of capital distributions or capital gain distributions. Interest income is accrued as earned. Interest income includes coupon interest and amortization of premium and accretion of discount on debt securities. Investment income is recorded net of foreign taxes withheld where recovery of such taxes is uncertain.
Expenses. Most expenses of the trust can be directly attributed to a fund. Expenses which cannot be directly attributed are apportioned among each Fund in the trust. Expense estimates are accrued in the period to which they relate and adjustments are made when actual amounts are known. All legal and other expenses associated with the Trust Reorganization will be paid by Strategic Advisers.
Income Tax Information and Distributions to Shareholders. Each year, the Fund intends to qualify as a regulated investment company by distributing substantially all of its taxable income and realized gains under Subchapter M of the Internal Revenue Code and filing its U.S. federal tax return. As a result, no provision for income taxes is required. As of May 31, 2010, the Fund did not have any unrecognized tax benefits in the accompanying financial statements. A Fund's federal tax return is subject to examination by the Internal Revenue Service (IRS) for a period of three years. Foreign taxes are provided for based on the Fund's understanding of the tax rules and rates that exist in the foreign markets in which it invests.
Distributions are recorded on the ex-dividend date. Income and capital gain distributions are determined in accordance with income tax regulations, which may differ from generally accepted accounting principles. In addition, the Fund claimed a portion of the payment made to redeeming shareholders as a distribution for income tax purposes.
Annual Report
Notes to Financial Statements - continued
2. Significant Accounting Policies - continued
Income Tax Information and Distributions to Shareholders - continued
Capital accounts within the financial statements are adjusted for permanent book-tax differences. These adjustments have no impact on net assets or the results of operations. Temporary book-tax differences will reverse in a subsequent period.
Book-tax differences are primarily due to foreign currency transactions and losses deferred due to wash sales and excise tax regulations.
The federal tax cost of investment securities and unrealized appreciation (depreciation) as of period end were as follows:
Gross unrealized appreciation | $ 131,386,282 |
Gross unrealized depreciation | (177,207,263) |
Net unrealized appreciation (depreciation) | $ (45,820,981) |
Tax Cost | $ 3,153,706,177 |
The tax-based components of distributable earnings as of period end were as follows:
Undistributed ordinary income | $ 22,425,359 |
Undistributed long-term capital gain | $ 4,846,095 |
Net unrealized appreciation (depreciation) | $ (45,824,413) |
The tax character of distributions paid was as follows:
| May 31, 2010 | May 31, 2009 |
Ordinary Income | $ 6,776,199 | $ - |
3. Purchases and Sales of Investments.
Purchases and sales of securities, other than short-term securities, aggregated $3,149,487,351 and $469,796,299, respectively.
4. Fees and Other Transactions with Affiliates.
Management Fee and Expense Contract. Strategic Advisers provides the Fund with investment management related services. For these services, the Fund pays a monthly management fee to Strategic Advisers. The management fee is calculated by adding the annual management fee rate of 0.25% of the Fund's average daily net assets throughout the month payable to Strategic Advisers to the aggregate of the fee rates, payable monthly, to the Fund's sub-advisers. The Fund's maximum aggregate annual management fee will not exceed 0.70% of the Fund's average daily net assets.
Annual Report
4. Fees and Other Transactions with Affiliates - continued
Management Fee and Expense Contract - continued
Strategic Advisers had contractually agreed to waive 0.13% of its management fee until May 31, 2012. Effective April 1, 2010, the contractual waiver was modified to 0.25% of Strategic Advisers' management fee until May 31, 2012.
Sub-Advisers. Brandywine Global Investment Management, LLC, Cohen & Steers Capital Management Inc., Eaton Vance Management and LSV Asset Management each serve as sub-adviser for the Fund. Each sub-adviser provides discretionary investment advisory services to the Fund and is paid by Strategic Advisers and not the Fund for providing these services.
Pyramis Global Advisors, LLC (Pyramis), an affiliate of Strategic Advisers, has been retained to serve as a sub-adviser for the Fund. As of the date of the report, however, Pyramis has not been allocated any portion of the Fund's assets. Pyramis in the future may provide discretionary investment advisory services for an allocated portion of the Fund's assets and will be paid by Strategic Advisers for providing these services.
Transfer Agent Fees. Fidelity Investments Institutional Operations Company, Inc. (FIIOC), an affiliate of Strategic Advisers, is the Fund's transfer, dividend disbursing and shareholder servicing agent. FIIOC receives account fees and asset-based fees that vary according to account size and type of account. The Fund does not directly pay transfer agent fees with respect to the portion of its assets invested in underlying funds. FIIOC pays for typesetting, printing and mailing of shareholder reports, except proxy statements. For the period, the transfer agent fees were equivalent to an annual rate of .28% of average net assets.
Accounting Fees. Fidelity Service Company, Inc. (FSC), an affiliate of Strategic Advisers, maintains the Fund's accounting records. The fee is based on the level of average net assets for the month.
5. Committed Line of Credit.
The Fund participates with other funds managed by FMR or an affiliate in a $3.75 billion credit facility (the "line of credit") to be utilized for temporary or emergency purposes to fund shareholder redemptions or for other short-term liquidity purposes. The Fund has agreed to pay commitment fees on its pro-rata portion of the line of credit, which amounted to $313 and is reflected in Miscellaneous Expense on the Statement of Operations. During the period, there were no borrowings on this line of credit.
Annual Report
Notes to Financial Statements - continued
6. Expense Reductions.
In addition to waiving a portion of its management fee, Strategic Advisers has contractually agreed to reimburse the Fund until May 31, 2012 to the extent that annual operating expenses exceed .90% of average net assets. Some expenses, for example interest expense, including commitment fees, are excluded from this reimbursement. During the period, this waiver reduced the Fund's expenses by $2,095,753.
7. Other.
The Fund's organizational documents provide former and current trustees and officers with a limited indemnification against liabilities arising in connection with the performance of their duties to the Fund. In the normal course of business, the Fund may also enter into contracts that provide general indemnifications. The Fund's maximum exposure under these arrangements is unknown as this would be dependent on future claims that may be made against the Fund. The risk of material loss from such claims is considered remote.
Annual Report
Report of Independent Registered Public Accounting Firm
To the Trustees of Fidelity Commonwealth Trust II and the Shareholders of Strategic Advisers Value Fund:
In our opinion, the accompanying statement of assets and liabilities, including the schedule of investments, and the related statements of operations and of changes in net assets and the financial highlights present fairly, in all material respects, the financial position of Strategic Advisers Value Fund (a fund of Fidelity Commonwealth Trust II) at May 31, 2010, the results of its operations for the year then ended and the changes in its net assets and the financial highlights for each of the periods indicated, in conformity with accounting principles generally accepted in the United States of America. These financial statements and financial highlights (hereafter referred to as "financial statements") are the responsibility of the Strategic Advisers Value Fund's management. Our responsibility is to express an opinion on these financial statements based on our audits. We conducted our audits of these financial statements in accordance with the standards of the Public Company Accounting Oversight Board (United States). Those standards require that we plan and perform the audit to obtain reasonable assurance about whether the financial statements are free of material misstatement. An audit includes examining, on a test basis, evidence supporting the amounts and disclosures in the financial statements, assessing the accounting principles used and significant estimates made by management, and evaluating the overall financial statement presentation. We believe that our audits, which included confirmation of securities at May 31, 2010 by correspondence with the custodian and brokers, provide a reasonable basis for our opinion.
/s/ PricewaterhouseCoopers LLP
PricewaterhouseCoopers LLP
Boston, Massachusetts
July 21, 2010
Annual Report
Trustees and Officers
The Trustees, Member of the Advisory Board, and executive officers of the trust and fund, as applicable, are listed below. The Board of Trustees governs the fund and is responsible for protecting the interests of shareholders. The Trustees are experienced executives who meet periodically throughout the year to oversee the fund's activities, review contractual arrangements with companies that provide services to the fund, oversee management of the risks associated with such activities and contractual arrangements, and review the fund's performance. Except for Boyce I. Greer and Karen Kaplan, each of the Trustees oversees 16 funds advised by Strategic Advisers or an affiliate. Mr. Greer and Ms. Kaplan oversee 11 and 9 funds, respectively, advised by Strategic Advisers or an affiliate.
The Trustees hold office without limit in time except that (a) any Trustee may resign; (b) any Trustee may be removed by written instrument, signed by at least two-thirds of the number of Trustees prior to such removal; (c) any Trustee who requests to be retired or who has become incapacitated by illness or injury may be retired by written instrument signed by a majority of the other Trustees; and (d) any Trustee may be removed at any special meeting of shareholders by a two-thirds vote of the outstanding voting securities of the trust. The executive officers and Advisory Board Member hold office without limit in time, except that any officer and Advisory Board Member may resign or may be removed by a vote of a majority of the Trustees at any regular meeting or any special meeting of the Trustees. Except as indicated, each individual has held the office shown or other offices in the same company for the past five years.
Experience, Skills, Attributes, and Qualifications of the Fund's Trustees. The Governance and Nominating Committee has adopted a statement of policy that describes the experience, qualifications, attributes and skills that are necessary and desirable for potential Independent Trustee candidates ("Statement of Policy"). The Board believes that each Trustee satisfied at the time he or she was initially elected or appointed a Trustee, and continues to satisfy, the standards contemplated by the Statement of Policy. The Governance and Nominating Committee may also engage professional search firms to help identify potential Independent Trustee candidates with experience, qualifications, attributes, and skills consistent with the Statement of Policy. Additional criteria based on the composition and skills of the current Independent Trustees as well as experience or skills that may be appropriate in light of future changes to board composition, business conditions, and regulatory or other developments may be considered by a professional search firm and the Governance and Nominating Committee. In addition, the Board takes into account the Trustees' commitment and participation in Board and committee meetings, as well as their leadership of standing and ad hoc committees throughout their tenure.
In determining that a particular Trustee was and continues to be qualified to serve as a Trustee, the Board has considered a variety of criteria, none of which, in isolation, was controlling. The Board believes that, collectively, the Trustees have balanced and diverse experience, qualifications, attributes, and skills, which allow the Board to operate effectively in governing the fund and protecting the interests of shareholders. Information about the specific experience, skills, attributes and qualifications of each Trustee, which in each case led to the Board's conclusion that the Trustee should serve (or continue to serve) as a trustee of the fund, is provided below.
Annual Report
Trustees and Officers - continued
Board Structure and Oversight Function. Roger T. Servison is an interested person (as defined in the 1940 Act) and currently serves as Chairman. The Trustees have determined that an interested Chairman is appropriate and benefits shareholders because an interested Chairman has a personal and professional stake in the quality and continuity of services provided to the fund. Independent Trustees exercise their informed business judgment to appoint an individual of their choosing to serve as Chairman, regardless of whether the Trustee happens to be independent or a member of management. The Independent Trustees have determined that they can act independently and effectively without having an Independent Trustee serve as Chairman and that a key structural component for assuring that they are in a position to do so is for the Independent Trustees to constitute a majority of the Board. The Independent Trustees also meet regularly in executive session. Ralph F. Cox serves as the lead Independent Trustee and as such (i) acts as a liaison between the Independent Trustees and management with respect to matters important to the Independent Trustees and (ii) with management prepares agendas for Board meetings.
Fidelity funds are are overseen by different Boards of Trustees. The fund's Board oversees asset allocation funds dedicated to Strategic Advisers' discretionary asset management programs, as well as the Fidelity enhanced index funds. Other boards oversee Fidelity's investment-grade bond, money market, and asset allocation funds and Fidelity's equity and high income funds. The fund may invest in Fidelity funds that are overseen by such other Boards. The use of separate Boards, each with its own committee structure, allows the Trustees of each group of Fidelity funds to focus on the unique issues of the funds they oversee, including common research, investment, and operational issues.
The Trustees primarily operate as a full Board, but also operate in committees, to facilitate the timely and efficient consideration of all matters of importance to the Trustees, the fund, and fund shareholders and to facilitate compliance with legal and regulatory requirements and oversight of the fund's activities and associated risks. The Board has charged Strategic Advisers and its affiliates with (i) identifying events or circumstances the occurrence of which could have demonstrably adverse effects on the fund's business and/or reputation; (ii) implementing processes and controls to lessen the possibility that such events or circumstances occur or to mitigate the effects of such events or circumstances if they do occur; and (iii) creating and maintaining a system designed to evaluate continuously business and market conditions in order to facilitate the identification and implementation processes described in (i) and (ii) above. Because the day-to-day operations and activities of the fund are carried out by or through Strategic Advisers, its affiliates and other service providers, the fund's exposure to risks is mitigated but not eliminated by the processes overseen by the Trustees. Board oversight of different aspects of the fund's activities is exercised primarily through the full Board, but also through the Audit Committee. Appropriate personnel, including but not limited to the fund's/funds' Chief Compliance Officer ("CCO"), FMR's internal auditor, the independent accountants, the fund's Treasurer and portfolio management personnel, make periodic reports to the Board's committees, as appropriate. The responsibilities of each committee, including their oversight responsibilities, are described further under "Standing Committees of the Fund's Trustees."
Annual Report
The fund's Statement of Additional Information (SAI) includes more information about the Trustees. To request a free copy, call Fidelity at 1-800-544-3455.
Interested Trustees*:
Correspondence intended for each Trustee who is an interested person may be sent to Fidelity Investments, 82 Devonshire Street, Boston, Massachusetts 02109.
Name, Age; Principal Occupation and Other Relevant Experience+ | |
Boyce I. Greer (54) | |
| Year of Election or Appointment: 2009 Mr. Greer oversees Strategic Advisers, Inc. and Global Asset Allocation (2008-present) and serves as Vice President of a number of Fidelity funds (2005-present). He is also a Trustee of other investment companies advised by FMR. Mr. Greer is President of the Asset Allocation Division (2008-present), President and a Director of Fidelity Investments Money Management, Inc. (2007-present), and an Executive Vice President of FMR and FMR Co., Inc. (2005-present). Previously, Mr. Greer served as a Director and Managing Director of Strategic Advisers, Inc. (2002-2005). |
Roger T. Servison (64) | |
| Year of Election or Appointment: 2006 Mr. Servison is Chairman of the Board of Trustees. Mr. Servison serves as President of Strategic New Business Development for Fidelity Investments and serves as a Director of Strategic Advisers. Previously, he oversaw Fidelity Investments Life Insurance Company (2005-2006) and Strategic Advisers (2005-2007). Mr. Servison also served as President and a Director of Fidelity Brokerage Services (Japan), LLC (1994-2004). |
* Trustees have been determined to be "Interested Trustees" by virtue of, among other things, their affiliation with the trust or various entities under common control with Strategic Advisers.
+ The information above includes each Trustee's principal occupation during the last five years and other information relating to the experience, attributes, and skills relevant to each Trustee's qualifications to serve as a Trustee, which led to the conclusion that each Trustee should serve as a Trustee for the fund.
Annual Report
Trustees and Officers - continued
Independent Trustees:
Correspondence intended for each Independent Trustee (that is, the Trustees other than the Interested Trustees) may be sent to Fidelity Investments, P.O. Box 55235, Boston, Massachusetts 02205-5235.
Name, Age; Principal Occupation and Other Relevant Experience+ | |
Peter C. Aldrich (66) | |
| Year of Election or Appointment: 2006 Mr. Aldrich is a Director of the National Bureau of Economic Research and a Director of the funds of BlackRock Realty Group (2006-present). Mr. Aldrich served as Managing Member of Poseidon, LLC (foreign private investment, 1998-2004), and Chairman and Managing Member of AEGIS, LLC (foreign private investment, 1997-2004). Mr. Aldrich also served as Faculty Chairman of The Research Council on Global Investment of The Conference Board (business and professional education non-profit, 1999-2004). Mr. Aldrich is a Member of the Boards of Trustees of the Museum of Fine Arts Boston and Massachusetts Eye and Ear Infirmary. |
Ralph F. Cox (77) | |
| Year of Election or Appointment: 2006 Mr. Cox is President of RABAR Enterprises (management consulting for the petroleum industry). Mr. Cox is a Director of Abraxas Petroleum (exploration and production). Mr. Cox is a member of the Advisory Boards of the Business and Engineering Schools of Texas A&M University and the Engineering School of University of Texas at Austin, and is an Advisory Director of CH2M Hill Companies (engineering). Mr. Ralph F. Cox and Mr. Howard E. Cox, Jr. are not related. |
Karen Kaplan (50) | |
| Year of Election or Appointment: 2007 Ms. Kaplan is President of Hill Holliday (advertising and specialized marketing, 2007-present). Ms. Kaplan is a Director of Delta Dental of Massachusetts (2004-present), President of the Massachusetts Women's Forum (2008-present), Vice Chair of the Board of the Massachusetts Society for the Prevention of Cruelty to Children (2006-present), and Director of the Executive Committee of the Greater Boston Chamber of Commerce (2006-present). Previously, Ms. Kaplan served as Treasurer of the Massachusetts Women's Forum and Director of United Way of Massachusetts Bay (2004-2006), a Director of ADVO (direct mail marketing, 2003-2007), and as a Director of Tweeter Home Entertainment Group (2006-2007). |
+ The information above includes each Trustee's principal occupation during the last five years and other information relating to the experience, attributes, and skills relevant to each Trustee's qualifications to serve as a Trustee, which led to the conclusion that each Trustee should serve as a Trustee for the fund.
Annual Report
Advisory Board Member and Executive Officers:
Correspondence intended for Howard E. Cox, Jr. may be sent to Fidelity Investments, P.O. Box 55235, Boston, Massachusetts 02205-5235. Correspondence intended for each executive officer may be sent to Fidelity Investments, 82 Devonshire Street, Boston, Massachusetts 02109.
Name, Age; Principal Occupation | |
Howard E. Cox, Jr. (66) | |
| Year of Election or Appointment: 2009 Member of the Advisory Board of Fidelity Commonwealth Trust II. Mr. Cox is a Member of the Advisory Board of Devonshire Investors (2009-present). Mr. Cox serves as a Partner of Greylock (venture capital) and a Director of Stryker Corporation (medical products and services). Mr. Cox is a Member of the Secretary of Defense's Business Board of Directors (2008-present). Mr. Howard E. Cox, Jr. and Mr. Ralph F. Cox are not related. |
Marc Bryant (44) | |
| Year of Election or Appointment: 2010 Secretary and Chief Legal Officer of the fund. Senior Vice President and Deputy General Counsel of Fidelity Investments. Prior to joining Fidelity Investments, Mr. Bryant served as a Senior Vice President and the Head of Global Retail Legal for AllianceBernstein L.P. (2006-2010), and as the General Counsel for ProFund Advisors LLC (2001-2006). |
Margaret Carey (36) | |
| Year of Election or Appointment: 2009 Assistant Secretary of the fund. Ms. Carey is also Assistant Secretary of The North Carolina Capital Management Trust: Cash Portfolio and Term Portfolio (2008-present) and is an employee of Fidelity Investments (2004-present). Prior to joining Fidelity Investments, Ms. Carey was an associate at Goodwin Procter LLP (1999-2004). |
Kenneth B. Robins (40) | |
| Year of Election or Appointment: 2010 President and Treasurer of the fund. Mr. Robins also serves as President and Treasurer of other Fidelity Equity and High Income Funds (2008-present) and Assistant Treasurer of other Fidelity Fixed Income and Asset Allocation Funds (2009-present). Mr. Robins is an employee of Fidelity Investments (2004-present). Previously, Mr. Robins served as Deputy Treasurer of the Fidelity funds (2005-2008) and Treasurer and Chief Financial Officer of The North Carolina Capital Management Trust: Cash and Term Portfolios (2006-2008). |
Laura M. Doherty (41) | |
| Year of Election or Appointment: 2009 Chief Compliance Officer of the fund. Ms. Doherty also serves as Senior Vice President of the Office of the Chief Compliance Officer (2008-present). Previously, Ms. Doherty served as a Vice President in Fidelity's Corporate Audit department (1998-2008). |
Holly C. Laurent (56) | |
| Year of Election or Appointment: 2008 Anti-Money Laundering (AML) Officer of the fund. Ms. Laurent also serves as AML Officer of the Fidelity funds (2008-present) and is an employee of Fidelity Investments. Previously, Ms. Laurent was Senior Vice President and Head of Legal for Fidelity Business Services India Pvt. Ltd. (2006-2008), and Senior Vice President, Deputy General Counsel and Group Head for FMR LLC (2005-2006). |
Nicholas E. Steck (46) | |
| Year of Election or Appointment: 2009 Chief Financial Officer of the fund. Mr. Steck serves as Senior Vice President of Fidelity Pricing and Cash Management Services (2008-present) and is an employee of Fidelity Investments. During the period 2002 to 2009, Mr. Steck served as a Compliance Officer of FMR, Fidelity Investments Money Management, Inc., FMR LLC, Fidelity Research & Analysis (U.K.) Inc., Fidelity Management & Research (Hong Kong) Limited, and Fidelity Management & Research (Japan) Inc. |
James R. Rooney (51) | |
| Year of Election or Appointment: 2008 Assistant Treasurer of the fund. Mr. Rooney is an employee of FMR and also serves as Assistant Treasurer of other Strategic Advisers funds (2007-present). Previously, Mr. Rooney was a Vice President with Wellington Management Company LLP (2001-2007) and an employee of Strategic Advisers (2007-2009). |
Annual Report
Distributions (Unaudited)
The Board of Trustees of Strategic Advisers Value Fund voted to pay on July 12, 2010, to shareholders of record at the opening of business on July 9, 2010, a distribution of $0.05 per share derived from capital gains realized from sales of portfolio securities and a dividend of $0.04 per share from net investment income.
The fund hereby designates as a capital gain dividend with respect to the taxable year ended May 31, 2010, $4,846,096, or, if subsequently determined to be different, the net capital gain of such year.
The fund designates 100% of the dividends distributed during the fiscal year as qualifying for the dividends received deduction for corporate shareholders.
The fund designates 100% of the dividends distributed during the fiscal year as amounts which may be taken into account as a dividend for the purposes of the maximum rate under section 1(h)(11) of the Internal Revenue Code.
The fund will notify shareholders in January 2011 of amounts for use in preparing 2010 income tax returns.
Annual Report
Board Approval of Investment Advisory Contracts and Management Fees
Strategic Advisers Value Fund (formerly known as Fidelity Strategic Advisers Value Fund)
On December 3, 2009, the Board of Trustees of Fidelity Commonwealth Trust II, including the Independent Trustees (together, the Board), voted to amend the sub-advisory agreement with Cohen & Steers Capital Management, Inc. (Cohen & Steers) by adding a new breakpoint to the fee paid to Cohen & Steers and to approve new sub-advisory agreements with LSV Asset Management (LSV) and Brandywine Global Investment Management, LLC (Brandywine) (together, the Sub-Advisory Contracts) for the fund. The Board, assisted by the advice of fund counsel and Independent Trustees' counsel, considered a broad range of information.
The Board ultimately reached a determination, with the assistance of counsel and through the exercise of its business judgment, that the approval of the Sub-Advisory Contracts and the compensation to be received by LSV and Brandywine (together, the Investment Advisers) and by Cohen & Steers is consistent with Strategic Advisers' fiduciary duty under applicable law.
In their deliberations, the Board did not identify any particular information that was all-important or controlling.
Nature, Extent, and Quality of Services Provided. The Board considered staffing within the Investment Advisers, including the Investment Advisers' backgrounds and investment personnel, and also took into consideration the fund's investment objective and discipline.
Resources Dedicated to Investment Management and Support Services. The Board reviewed the size, education, and experience of the Investment Advisers' investment staff, their use of technology, and the Investment Advisers' approach to recruiting, training, and retaining portfolio managers and other research, advisory, and management personnel. The Board noted that the Investment Advisers' analysts have access to a variety of technological tools and market and securities data that enable them to perform both fundamental and quantitative analysis and to specialize in various disciplines.
Shareholder and Administrative Services. The Board considered (i) the nature, extent, quality, and cost of advisory services to be performed by the Investment Advisers under their respective sub-advisory agreements and (ii) the resources to be devoted to the fund's compliance policies and procedures.
Investment Performance. The fund had been in existence less than one calendar year and therefore had no historical performance for the Board to review at the time it approved the fund's Sub-Advisory Contracts. Once the fund has been in operation for at least one calendar year, the Board will review the fund's absolute investment performance, as well as the fund's relative investment performance measured against a broad-based securities market index.
Annual Report
Board Approval of Investment Advisory Contracts and
Management Fees - continued
Based on its review, and giving particular weight to the nature and quality of the resources to be dedicated by the Investment Advisers, the Board concluded that the nature, extent, and quality of the services that will be provided to the fund will benefit the fund's shareholders.
Management Fee and Total Fund Expenses. In reviewing the sub-advisory agreements with LSV and Brandywine, the Board considered the amount and nature of fees to be paid by the fund to Strategic Advisers, Inc. (Strategic Advisers), the amount and nature of fees to be paid by Strategic Advisers to each Investment Adviser and the fund's projected total operating expenses. The Board considered Strategic Advisers' contractual agreement to waive 0.13% of its portion of the fund's management fee until May 31, 2012 and noted that the fund's maximum aggregate annual management fee rate may not exceed 0.70%. The Board also considered Strategic Advisers' contractual agreement to reimburse the fund through May 31, 2012 to the extent that total operating expenses (excluding interest, taxes, securities lending costs, brokerage commissions, and extraordinary expenses, if any), as a percentage of the fund's average net assets, exceed 0.90%. The Board noted that the addition of Brandywine and LSV as sub-advisers will not result in a change to the maximum aggregate annual management fee payable by the fund.
In reviewing the amended sub-advisory agreement with Cohen & Steers, the Board considered that adding a new breakpoint to the agreement would result in lower fees payable to Cohen & Steers should the assets the sub-adviser manages exceed a certain level. The Board noted that no other terms of the sub-advisory agreement with Cohen & Steers were modified.
Based on its review, the Board concluded that the fund's management fee structure and projected total expenses were fair and reasonable in light of the services that the fund and its shareholders will receive and the other factors considered.
Costs of Services and Profitability. The fund had been in existence less than one calendar year and therefore no revenue, cost, or profitability data was available for the Board to review in respect of the fund at the time it approved the Sub-Advisory Contracts. In connection with its future renewal of the fund's Sub-Advisory Contracts, the Board will consider the revenues earned and the expenses incurred by Strategic Advisers in conducting the business of developing, marketing, distributing, managing, administering and servicing the fund and its shareholders.
Possible Fall-Out Benefits. The fund had been in existence less than one calendar year and therefore the Board was unable to consider any direct and/or indirect benefits to Strategic Advisers and its affiliates from their relationships with the fund. The Board will consider any such potential benefits after the fund has been in operation for at least one calendar year.
Annual Report
Possible Economies of Scale. The Board noted that because the fund had been in existence less than one calendar year a determination on economies of scale was premature.
Conclusion. Based on its evaluation of all of the conclusions noted above, and after considering all material factors, the Board ultimately concluded that the advisory fee structures are fair and reasonable, and that the fund's Sub-Advisory Contracts should be approved.
Annual Report
Investment Adviser
Strategic Advisers, Inc.
Boston, MA
Investment Sub-Advisers
Brandywine Global Investment
Management, LLC
Cohen & Steers Capital Management, Inc.
Eaton Vance Management
LSV Asset Management
Pyramis Global Advisors, LLC
General Distributor
Fidelity Distributors Corporation
Boston, MA
Transfer and Service Agents
Fidelity Investments Institutional
Operations Company, Inc.
Boston, MA
Fidelity Service Company, Inc.
Boston, MA
Custodian
State Street Bank and Trust Company
Boston, MA
SUF-ANN-0710
1.912897.100
Item 2. Code of Ethics
As of the end of the period, May 31, 2010, Fidelity Commonwealth Trust II (the "trust") has adopted a code of ethics, as defined in Item 2 of Form N-CSR, that applies to its President and Treasurer and its Chief Financial Officer. A copy of the code of ethics is filed as an exhibit to this Form N-CSR.
Item 3. Audit Committee Financial Expert
The Board of Trustees of the trust has not designated an audit committee financial expert. Given the nature of the trust's series (Strategic Advisers Value Fund, the "Fund"), the registrant has concluded that the services of a financial expert are not required at this point. Some of the reasons for determining that an audit committee financial expert is not necessary are the following: (i) the Audit Committee's expected access to the Fund's Treasurer, Chief Financial Officer, independent accountants and legal counsel; (ii) the Audit Committee's expected authority under its Charter to engage independent accounting and other experts without seeking approval from the full Board of Trustees; and (iii) the small number of Funds currently offered by the trust.
Item 4. Principal Accountant Fees and Services
Fees and Services
The following table presents fees billed by PricewaterhouseCoopers LLP ("PwC") in each of the last two fiscal years for services rendered to the Fund:
Services Billed by PwC
May 31, 2010 FeesA
| Audit Fees | Audit-Related Fees | Tax Fees | All Other Fees |
Strategic Advisers Value Fund | $43,000 | $- | $3,500 | $- |
May 31, 2009 FeesA,B
| Audit Fees | Audit-Related Fees | Tax Fees | All Other Fees |
Strategic Advisers Value Fund | $37,000 | $- | $3,400 | $- |
A Amounts may reflect rounding.
B Strategic Advisers Value Fund commenced operations on December 30, 2008.
The following table presents fees billed by PwC that were required to be approved by the Audit Committee for services that relate directly to the operations and financial reporting of the Fund and that are rendered on behalf of Strategic Advisers, Inc. ("Strategic Advisers") and entities controlling, controlled by, or under common control with Strategic Advisers (not including any sub-adviser whose role is primarily portfolio management and is subcontracted with or overseen by another investment adviser) that provide ongoing services to the Fund ("Fund Service Providers"):
Services Billed by PwC
| May 31, 2010A | May 31, 2009A,B |
Audit-Related Fees | $1,530,000 | $3,225,000 |
Tax Fees | $- | $2,000 |
All Other Fees | $145,000 | $- |
A Amounts may reflect rounding.
B May include amounts billed prior to the Fund's commencement of operations.
"Audit-Related Fees" represent fees billed for assurance and related services that are reasonably related to the performance of the Fund audit or the review of the Fund's financial statements and that are not reported under Audit Fees.
"Tax Fees" represent fees billed for tax compliance, tax advice or tax planning that relate directly to the operations and financial reporting of the Fund.
"All Other Fees" represent fees billed for assurance services provided to the Fund or Fund Service Provider that relate directly to the operations and financial reporting of the Fund, excluding those services that are reported under Audit Fees, Audit-Related Fees or Tax Fees.
Assurance services must be performed by an independent public accountant.
* * *
The aggregate non-audit fees billed by PwC for services rendered to the Fund, Strategic Advisers (not including any sub-adviser whose role is primarily portfolio management and is subcontracted with or overseen by another investment adviser), and any Fund Service Provider relating to Covered Services and Non-Covered Services (each as defined below) for each of the last two fiscal years of the Fund are as follows:
Billed By | May 31, 2010 A | May 31, 2009 A,B,C |
PwC | $2,560,000 | $3,635,000 |
A Amounts may reflect rounding.
B May include amounts billed prior to the Fund's commencement of operations.
C Reflects current period presentation.
The trust's Audit Committee has considered non-audit services that were not pre-approved that were provided by PwC to Fund Service Providers to be compatible with maintaining the independence of PwC in its audit of the Fund, taking into account representations from PwC, in accordance with Public Company Accounting Oversight Board rules, regarding its independence from the Fund and its related entities and Strategic Advisers' review of the appropriateness and permissibility under applicable law of such non-audit services prior to their provision to the Fund Service Providers.
Audit Committee Pre-Approval Policies and Procedures
The trust's Audit Committee must pre-approve all audit and non-audit services provided by the independent registered public accounting firm relating to the operations or financial reporting of the funds. Prior to the commencement of any audit or non-audit services to a fund, the Audit Committee reviews the services to determine whether they are appropriate and permissible under applicable law.
The trust's Audit Committee has adopted policies and procedures to, among other purposes, provide a framework for the Committee's consideration of non-audit services by the audit firms that audit the Fidelity funds. The policies and procedures require that any non-audit service provided by a fund audit firm to the trust and any non-audit service provided by a fund auditor to a Fund Service Provider that relates directly to the operations and financial reporting of the trust ("Covered Service") are subject to approval by the Audit Committee before such service is provided.
All Covered Services must be approved in advance of provision of the service either: (i) by formal resolution of the Audit Committee, or (ii) by oral or written approval of the service by the Chair of the Audit Committee (or if the Chair is unavailable, such other member of the Audit Committee as may be designated by the Chair to act in the Chair's absence). The approval contemplated by (ii) above is permitted where the Treasurer determines that action on such an engagement is necessary before the next meeting of the Audit Committee.
Non-audit services provided by a fund audit firm to a Fund Service Provider that do not relate directly to the operations and financial reporting of the trust ("Non-Covered Service") are not required to be approved, but are reported to the Audit Committee annually.
Non-Audit Services Approved Pursuant to Rule 2-01(c)(7)(i)(C) and (ii) of Regulation S-X ("De Minimis Exception")
There were no non-audit services approved or required to be approved by the Audit Committee pursuant to the De Minimis Exception during the Fund's last two fiscal years relating to services provided to (i) the Fund or (ii) any Fund Service Provider that relate directly to the operations and financial reporting of the Fund.
Item 5. Audit Committee of Listed Registrants
Not applicable.
Item 6. Investments
(a) Not applicable.
(b) Not applicable
Item 7. Disclosure of Proxy Voting Policies and Procedures for Closed-End Management Investment Companies
Not applicable.
Item 8. Portfolio Managers of Closed-End Management Investment Companies
Not applicable.
Item 9. Purchase of Equity Securities by Closed-End Management Investment Company and Affiliated Purchasers
Not applicable.
Item 10. Submission of Matters to a Vote of Security Holders
Not applicable.
Item 11. Controls and Procedures
(a)(i) The President and Treasurer and the Chief Financial Officer have concluded that the trust's disclosure controls and procedures (as defined in Rule 30a-3(c) under the Investment Company Act) provide reasonable assurances that material information relating to the trust is made known to them by the appropriate persons, based on their evaluation of these controls and procedures as of a date within 90 days of the filing date of this report.
(a)(ii) There was no change in the trust's internal control over financial reporting (as defined in Rule 30a-3(d) under the Investment Company Act) that occurred during the second fiscal quarter of the period covered by this report that has materially affected, or is reasonably likely to materially affect, the trust's internal control over financial reporting.
Item 12. Exhibits
(a) | (1) | Code of Ethics pursuant to Item 2 of Form N-CSR is filed and attached hereto as EX-99.CODE ETH. |
(a) | (2) | Certification pursuant to Rule 30a-2(a) under the Investment Company Act of 1940 (17 CFR 270.30a-2(a)) is filed and attached hereto as Exhibit 99.CERT. |
(a) | (3) | Not applicable. |
(b) |
| Certification pursuant to Rule 30a-2(b) under the Investment Company Act of 1940 (17 CFR 270.30a-2(b)) is furnished and attached hereto as Exhibit 99.906CERT. |
SIGNATURES
Pursuant to the requirements of the Securities Exchange Act of 1934 and the Investment Company Act of 1940, the registrant has duly caused this report to be signed on its behalf by the undersigned, thereunto duly authorized.
Fidelity Commonwealth Trust II
By: | /s/Kenneth B. Robins |
| Kenneth B. Robins |
| President and Treasurer |
|
|
Date: | July 29, 2010 |
Pursuant to the requirements of the Securities Exchange Act of 1934 and the Investment Company Act of 1940, this report has been signed below by the following persons on behalf of the registrant and in the capacities and on the dates indicated.
By: | /s/Kenneth B. Robins |
| Kenneth B. Robins |
| President and Treasurer |
|
|
Date: | July 29, 2010 |
By: | /s/Nicholas E. Steck |
| Nicholas E. Steck |
| Chief Financial Officer |
|
|
Date: | July 29, 2010 |