UNITED STATES
SECURITIES AND EXCHANGE COMMISSION
Washington, D.C. 20549
FORM N-CSR
CERTIFIED SHAREHOLDER REPORT OF REGISTERED
MANAGEMENT INVESTMENT COMPANIES
Investment Company Act file number 811-21990
Fidelity Commonwealth Trust II
(Exact name of registrant as specified in charter)
82 Devonshire St., Boston, Massachusetts 02109
(Address of principal executive offices) (Zip code)
Marc Bryant, Secretary
82 Devonshire St.
Boston, Massachusetts 02109
(Name and address of agent for service)
Registrant's telephone number, including area code: 617-563-7000
Date of fiscal year end: | February 29 |
|
|
Date of reporting period: | February 29, 2012 |
Item 1. Reports to Stockholders
Fidelity® Large Cap Growth Enhanced Index Fund
Fidelity Large Cap Value Enhanced Index Fund
Fidelity Large Cap Core Enhanced Index Fund
Fidelity Mid Cap Enhanced Index Fund
Fidelity Small Cap Enhanced Index Fund
Fidelity International Enhanced Index Fund
Annual Report
(Fidelity Cover Art)
February 29, 2012
Contents
Shareholder Expense Example | An example of shareholder expenses | |
| ||
Fidelity® Large Cap Growth Enhanced Index Fund | Performance | |
| Management's Discussion | |
| Investment Changes | |
| Investments | |
| Financial Statements | |
| ||
Fidelity Large Cap Value Enhanced Index Fund | Performance | |
| Management's Discussion | |
| Investment Changes | |
| Investments | |
| Financial Statements | |
| ||
Fidelity Large Cap Core Enhanced Index Fund | Performance | |
| Management's Discussion | |
| Investment Changes | |
| Investments | |
| Financial Statements | |
|
|
|
Fidelity Mid Cap Enhanced Index Fund | Performance | |
| Management's Discussion | |
| Investment Changes | |
| Investments | |
| Financial Statements | |
| ||
Fidelity Small Cap Enhanced Index Fund | Performance | |
| Management's Discussion | |
| Investment Changes | |
| Investments | |
| Financial Statements | |
| ||
Fidelity International Enhanced Index Fund | Performance | |
| Management's Discussion | |
| Investment Changes | |
| Investments | |
| Financial Statements | |
| ||
Notes | Notes to the Financial Statements | |
Report of Independent Registered Public Accounting Firm |
| |
Trustees and Officers |
| |
Distributions |
| |
Board Approval of Investment Advisory Contracts and Management Fees |
| |
Annual Report
To view a fund's proxy voting guidelines and proxy voting record for the 12-month period ended June 30, visit http://www.fidelity.com/proxyvotingresults or visit the Securities and Exchange Commission's (SEC) web site at http://www.sec.gov. You may also call 1-800-544-8544 to request a free copy of the proxy voting guidelines.
Standard & Poor's, S&P and S&P 500 are registered service marks of The McGraw-Hill Companies, Inc. and have been licensed for use by Fidelity Distributors Corporation.
Other third party marks appearing herein are the property of their respective owners.
All other marks appearing herein are registered or unregistered trademarks or service marks of FMR LLC or an affiliated company.
This report and the financial statements contained herein are submitted for the general information of the shareholders of the funds. This report is not authorized for distribution to prospective investors in the funds unless preceded or accompanied by an effective prospectus.
A fund files its complete schedule of portfolio holdings with the SEC for the first and third quarters of each fiscal year on Form N-Q. Forms N-Q are available on the SEC's web site at http://www.sec.gov. A fund's Forms N-Q may be reviewed and copied at the SEC's Public Reference Room in Washington, DC. Information regarding the operation of the SEC's Public Reference Room may be obtained by calling 1-800-SEC-0330. For a complete list of a fund's portfolio holdings, view the most recent holdings listing, semiannual report, or annual report on Fidelity's web site at http://www.fidelity.com, http://www.advisor.fidelity.com, or http://www.401k.com, as applicable.
NOT FDIC INSURED • MAY LOSE VALUE • NO BANK GUARANTEE
Neither the funds nor Fidelity Distributors Corporation is a bank.
Annual Report
Shareholder Expense Example
As a shareholder of a Fund, you incur two types of costs: (1) transaction costs, including redemption fees, and (2) ongoing costs, including management fees and other Fund expenses. This Example is intended to help you understand your ongoing costs (in dollars) of investing in the Funds and to compare these costs with the ongoing costs of investing in other mutual funds.
The Example is based on an investment of $1,000 invested at the beginning of the period and held for the entire period (September 1, 2011 to February 29, 2012).
Actual Expenses
The first line of the accompanying table for each fund provides information about actual account values and actual expenses. You may use the information in this line, together with the amount you invested, to estimate the expenses that you paid over the period. Simply divide your account value by $1,000.00 (for example, an $8,600 account value divided by $1,000.00 = 8.6), then multiply the result by the number in the first line for a fund under the heading entitled "Expenses Paid During Period" to estimate the expenses you paid on your account during this period. In addition to the direct expenses incurred by each Fund presented in the table, as a shareholder of the underlying non-affiliated funds (the Underlying Funds), each Fund also indirectly bears its proportionate share of the expenses of the Underlying Funds. These fees and expenses are not included in each Fund's annualized expense ratio used to calculate the expense estimate in the table below. An annual index fund fee of $10 that is charged once a year may apply for certain accounts with a value of less than $10,000. This fee is not included in the table below. If it was, the estimate of expenses you paid during the period would be higher, and your ending account value lower, by this amount. In addition, each Fund, as a shareholder in the underlying Fidelity Central Funds, will indirectly bear its pro-rata share of the fees and expenses incurred by the underlying Fidelity Central Funds. These fees and expenses are not included in the Fund's annualized expense ratio used to calculate the expense estimate in the table below.
Hypothetical Example for Comparison Purposes
The second line of the accompanying table for each fund provides information about hypothetical account values and hypothetical expenses based on a fund's actual expense ratio and an assumed rate of return of 5% per year before expenses, which is not the Fund's actual return. The hypothetical account values and expenses may not be used to estimate the actual ending account balance or expenses you paid for the period. You may use this information to compare the ongoing costs of investing in the Fund and other funds. To do so, compare this 5% hypothetical example with the 5% hypothetical examples that appear in the shareholder reports of the other funds. In addition to the direct expenses incurred by each Fund presented in the table, as a shareholder of the underlying non-affiliated funds (the Underlying Funds), each Fund also indirectly bears its proportionate share of the expenses of the Underlying Funds. These fees and expenses are not included in each Fund's annualized expense ratio used to calculate the expense estimate in the table below. An annual index fund fee of $10 that is charged once a year may apply for certain accounts with a value of less than $10,000. This fee is not included in the table below. If it was, the estimate of expenses you paid during the period would be higher, and your ending account value lower, by this amount. In addition, each Fund, as a shareholder in the underlying Fidelity Central Funds, will indirectly bear its pro-rata share of the fees and expenses incurred by the underlying Fidelity Central Funds. These fees and expenses are not included in the Fund's annualized expense ratio used to calculate the expense estimate in the table below.
Please note that the expenses shown in the table are meant to highlight your ongoing costs only and do not reflect any transaction costs. Therefore, the second line of the table is useful in comparing ongoing costs only, and will not help you determine the relative total costs of owning different funds. In addition, if these transactional costs were included, your costs would have been higher.
| Annualized | Beginning | Ending | Expenses Paid |
Fidelity Large Cap Growth Enhanced Index Fund | .45% |
|
|
|
Actual |
| $ 1,000.00 | $ 1,140.40 | $ 2.39 |
Hypothetical A |
| $ 1,000.00 | $ 1,022.63 | $ 2.26 |
Fidelity Large Cap Value Enhanced Index Fund | .45% |
|
|
|
Actual |
| $ 1,000.00 | $ 1,129.10 | $ 2.38 |
Hypothetical A |
| $ 1,000.00 | $ 1,022.63 | $ 2.26 |
Fidelity Large Cap Core Enhanced Index Fund | .45% |
|
|
|
Actual |
| $ 1,000.00 | $ 1,134.80 | $ 2.39 |
Hypothetical A |
| $ 1,000.00 | $ 1,022.63 | $ 2.26 |
Fidelity Mid Cap Enhanced Index Fund | .60% |
|
|
|
Actual |
| $ 1,000.00 | $ 1,111.80 | $ 3.15 |
Hypothetical A |
| $ 1,000.00 | $ 1,021.88 | $ 3.02 |
Fidelity Small Cap Enhanced Index Fund | .67% |
|
|
|
Actual |
| $ 1,000.00 | $ 1,129.10 | $ 3.55 |
Hypothetical A |
| $ 1,000.00 | $ 1,021.53 | $ 3.37 |
Fidelity International Enhanced Index Fund | .62% |
|
|
|
Actual |
| $ 1,000.00 | $ 1,032.40 | $ 3.13 |
Hypothetical A |
| $ 1,000.00 | $ 1,021.78 | $ 3.12 |
A 5% return per year before expenses
* Expenses are equal to each Fund's annualized expense ratio, multiplied by the average account value over the period, multiplied by 182/366 (to reflect the one-half year period).
Annual Report
Fidelity® Large Cap Growth Enhanced Index Fund
Performance: The Bottom Line
Average annual total return reflects the change in the value of an investment, assuming reinvestment of the fund's distributions from dividend income and capital gains (the profits earned upon the sale of securities that have grown in value, if any) and assuming a constant rate of performance each year. The $10,000 table and the fund's returns do not reflect the deduction of taxes that a shareholder would pay on fund distributions or the redemption of fund shares. During periods of reimbursement by Fidelity a fund's total returns will be greater than it would be had the reimbursement not occurred. How a fund did yesterday is no guarantee of how it will do tomorrow.
Average Annual Total Returns
Periods ended February 29, 2012 | Past 1 | Life of |
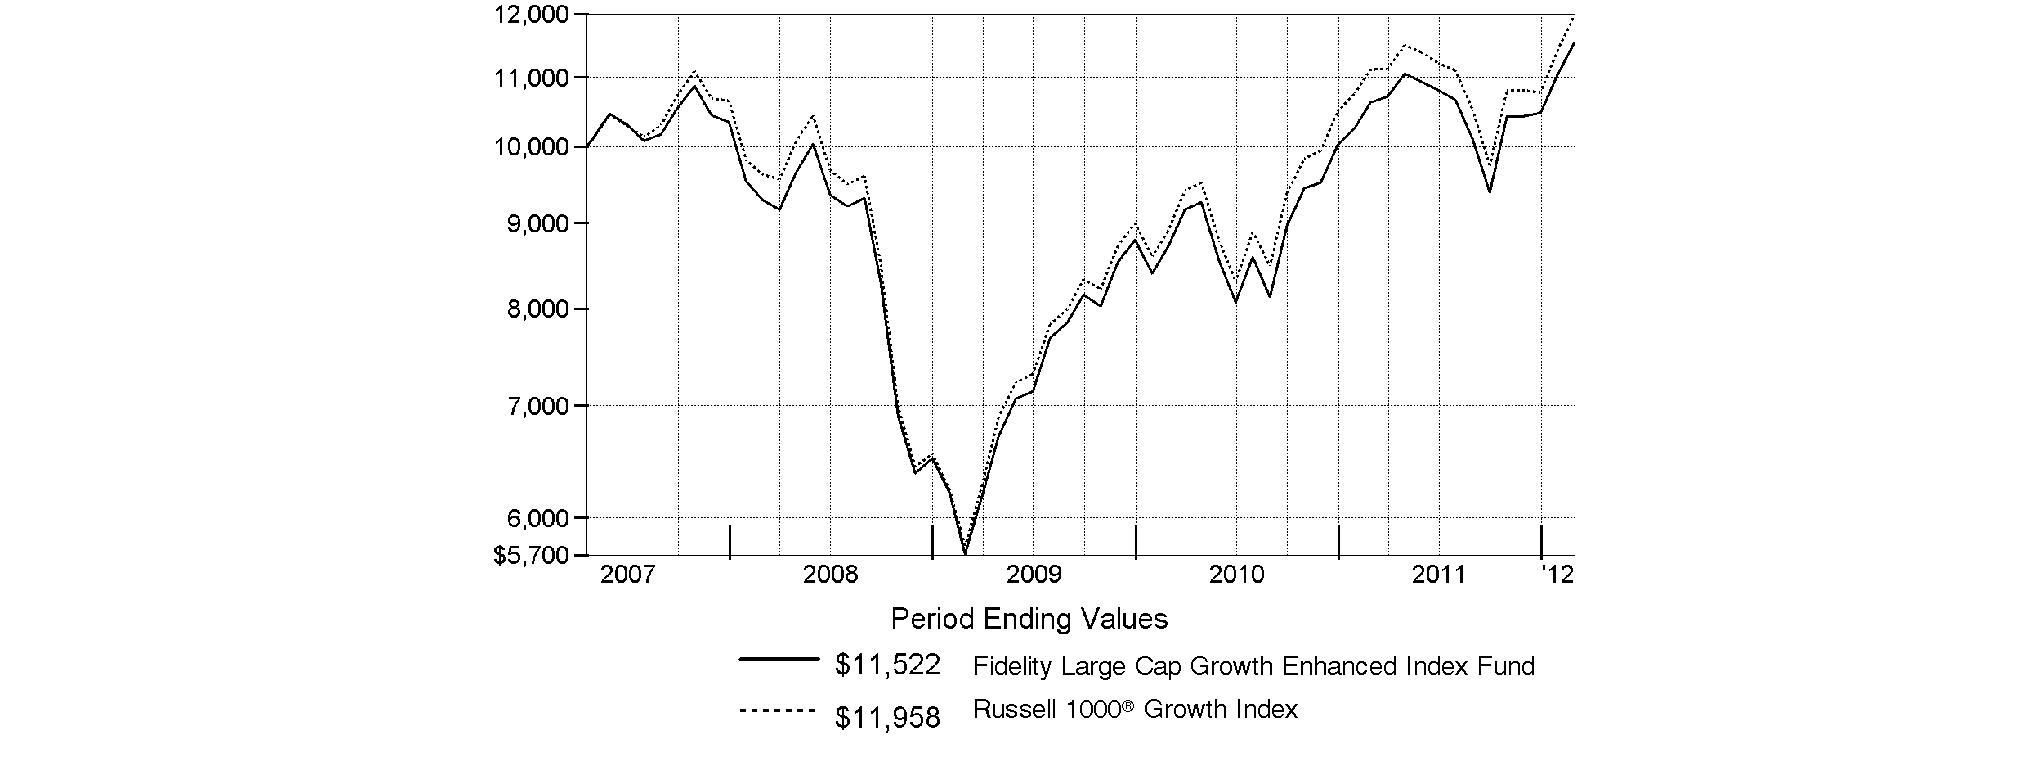
Fidelity Large Cap Growth Enhanced Index Fund | 8.40% | 2.95% |
A From April 19, 2007.
$10,000 Over Life of Fund
Let's say hypothetically that $10,000 was invested in Fidelity Large Cap Growth Enhanced Index Fund on April 19, 2007, when the fund started. The chart shows how the value of your investment would have changed, and also shows how the Russell 1000® Growth Index performed over the same period.
Annual Report
Fidelity Large Cap Growth Enhanced Index Fund
Management's Discussion of Fund Performance
Market Recap: U.S. stocks rose for the 12 months ending February 29, 2012, as encouraging economic news sparked a strong late-period rally that lifted major equity benchmarks past a number of significant milestones. Stocks recovered from early-period uncertainty that followed the March 2011 earthquake, tsunami and nuclear meltdown in Japan, but plummeted during the summer amid Europe's debt woes and a historic U.S. credit-rating downgrade. Despite continued volatility and mixed economic news, markets began to recover in early October. Investors gravitated toward defensive sectors and the perceived safety of larger, more-established and dividend-paying names, helping the Dow Jones® Industrial Average advance 8.83%, and close above the psychologically important 13,000 mark in late February - for the first time since May 2008. The rally accelerated late in the period and the market broadened, as investor confidence improved amid encouraging manufacturing, housing and employment data, and signs of progress in Europe. For the year, the S&P 500® Index added 5.12%, closing near a four-year high on the period's second-to-last day. The technology-laden Nasdaq Composite® Index added 7.73%, flirting with the 3,000 mark, its highest level in 12 years. Foreign developed-markets stocks reeled over Europe's turmoil, and the MSCI® EAFE® (Europe, Australasia, Far East) Index fell 7.35%.
Comments from Maximilian Kaufmann, Senior Portfolio Manager of the Geode Capital Management, LLC, investment management team for Fidelity® Large Cap Growth Enhanced Index Fund: For the year, the fund gained 8.40%, outpacing the 7.62% increase in the Russell 1000® Growth Index. Strong stock picking among diversified financials added to relative performance. Favorable security selection in the health care, energy and materials sectors also helped. The consumer discretionary sector supplied a mixed impact, with positive results among consumer durables/apparel and retailing stocks partially offset by weak industry positioning in the broader group. Stock picking in capital goods within the industrials sector and poor positioning underweighting consumer staples also detracted. Looking at individual stocks, the top contributor was biotechnology company Biogen Idec, whose shares rose strongly in October after a favorable trial of its experimental drug to treat multiple sclerosis. Polaris Industries, an off-road vehicle maker that is not in the index, and Cisco Systems, which makes network communications equipment, also turned in positive results. The fund was helped by its average underweighting in or no ownership of several underperforming stocks - Juniper Networks, a competitor of Cisco; First Solar, a maker of solar-energy equipment; and retailer Kohl's. First Solar was not in the benchmark. On the negative side, an out-of-benchmark stake in chemicals producer Huntsman hindered results. The company's shares dropped by more than 30% in August following a disappointing earnings announcement. Vishay Intertechnology, a semiconductor maker and out-of-benchmark holding, also detracted, as did satellite radio company Sirius XM Radio and NetApp, a data-storage-management company. Several of the stocks I've mentioned were not in the portfolio at period end.
The views expressed above reflect those of the portfolio manager(s) only through the end of the period as stated on the cover of this report and do not necessarily represent the views of Fidelity or any other person in the Fidelity organization. Any such views are subject to change at any time based upon market or other conditions and Fidelity disclaims any responsibility to update such views. These views may not be relied on as investment advice and, because investment decisions for a Fidelity fund are based on numerous factors, may not be relied on as an indication of trading intent on behalf of any Fidelity fund.
Annual Report
Fidelity Large Cap Growth Enhanced Index Fund
Investment Changes (Unaudited)
Top Ten Stocks as of February 29, 2012 | ||
| % of fund's | % of fund's net assets |
Apple, Inc. | 7.2 | 5.2 |
Exxon Mobil Corp. | 4.4 | 3.9 |
Microsoft Corp. | 3.6 | 3.4 |
IBM Corp. | 2.9 | 3.1 |
Google, Inc. Class A | 2.4 | 2.4 |
Philip Morris International, Inc. | 2.2 | 2.0 |
Oracle Corp. | 1.8 | 1.8 |
QUALCOMM, Inc. | 1.7 | 1.0 |
McDonald's Corp. | 1.6 | 1.1 |
The Coca-Cola Co. | 1.6 | 1.8 |
| 29.4 | |
Market Sectors as of February 29, 2012 | ||
| % of fund's | % of fund's net assets |
Information Technology | 30.0 | 26.4 |
Consumer Discretionary | 13.8 | 14.5 |
Industrials | 12.7 | 11.2 |
Health Care | 11.0 | 11.2 |
Consumer Staples | 10.5 | 13.6 |
Energy | 10.2 | 10.3 |
Materials | 5.5 | 5.4 |
Financials | 3.3 | 2.8 |
Telecommunication Services | 0.4 | 1.0 |
Utilities | 0.0 | 0.8 |
Annual Report
Fidelity Large Cap Growth Enhanced Index Fund
Investments February 29, 2012
Showing Percentage of Net Assets
Common Stocks - 97.4% | |||
Shares | Value | ||
CONSUMER DISCRETIONARY - 13.8% | |||
Auto Components - 0.1% | |||
Lear Corp. | 3,792 | $ 171,436 | |
Automobiles - 0.5% | |||
Ford Motor Co. | 60,804 | 752,754 | |
Distributors - 0.3% | |||
Genuine Parts Co. | 7,700 | 482,636 | |
Diversified Consumer Services - 0.5% | |||
Apollo Group, Inc. Class A (non-vtg.) (a)(e) | 11,598 | 494,539 | |
DeVry, Inc. | 6,900 | 245,157 | |
| 739,696 | ||
Hotels, Restaurants & Leisure - 4.2% | |||
Brinker International, Inc. | 17,351 | 478,714 | |
International Game Technology | 31,666 | 475,623 | |
McDonald's Corp. | 23,039 | 2,287,312 | |
Starbucks Corp. | 22,584 | 1,096,679 | |
Wyndham Worldwide Corp. | 40 | 1,760 | |
Wynn Resorts Ltd. | 4,300 | 509,722 | |
Yum! Brands, Inc. | 15,641 | 1,036,060 | |
| 5,885,870 | ||
Household Durables - 0.9% | |||
Garmin Ltd. | 10,100 | 476,619 | |
Harman International Industries, Inc. | 10,154 | 498,866 | |
Tupperware Brands Corp. | 4,300 | 269,567 | |
| 1,245,052 | ||
Internet & Catalog Retail - 0.6% | |||
Amazon.com, Inc. (a)(e) | 4,283 | 769,612 | |
Priceline.com, Inc. (a) | 160 | 100,323 | |
| 869,935 | ||
Leisure Equipment & Products - 0.4% | |||
Polaris Industries, Inc. | 7,938 | 524,384 | |
Media - 2.8% | |||
Comcast Corp. Class A | 6,800 | 199,784 | |
DIRECTV (a)(e) | 22,406 | 1,037,846 | |
DISH Network Corp. Class A | 19,072 | 556,330 | |
Liberty Media Corp. Capital Series A (a) | 4,863 | 437,135 | |
McGraw-Hill Companies, Inc. | 15,206 | 707,687 | |
Time Warner Cable, Inc. | 3,725 | 295,542 | |
Viacom, Inc. Class B (non-vtg.) | 16,153 | 769,206 | |
| 4,003,530 | ||
Multiline Retail - 0.6% | |||
Dollar Tree, Inc. (a) | 5,620 | 497,426 | |
Macy's, Inc. | 9,100 | 345,527 | |
Nordstrom, Inc. | 100 | 5,362 | |
Target Corp. | 80 | 4,535 | |
| 852,850 | ||
Specialty Retail - 2.0% | |||
AutoZone, Inc. (a) | 44 | 16,477 | |
Bed Bath & Beyond, Inc. (a)(e) | 10,600 | 633,244 | |
| |||
Shares | Value | ||
Home Depot, Inc. | 19,110 | $ 909,063 | |
Limited Brands, Inc. | 14,322 | 666,403 | |
O'Reilly Automotive, Inc. (a) | 700 | 60,550 | |
PetSmart, Inc. (e) | 8,200 | 457,068 | |
TJX Companies, Inc. | 1,400 | 51,254 | |
| 2,794,059 | ||
Textiles, Apparel & Luxury Goods - 0.9% | |||
Coach, Inc. | 13,228 | 989,984 | |
NIKE, Inc. Class B | 2,400 | 259,008 | |
| 1,248,992 | ||
TOTAL CONSUMER DISCRETIONARY | 19,571,194 | ||
CONSUMER STAPLES - 10.5% | |||
Beverages - 3.4% | |||
Dr Pepper Snapple Group, Inc. | 16,039 | 610,284 | |
Monster Beverage Corp. (a) | 9,182 | 525,119 | |
PepsiCo, Inc. | 23,089 | 1,453,222 | |
The Coca-Cola Co. | 31,354 | 2,190,390 | |
| 4,779,015 | ||
Food & Staples Retailing - 2.2% | |||
Costco Wholesale Corp. | 3,600 | 309,816 | |
Kroger Co. | 27,140 | 645,661 | |
Wal-Mart Stores, Inc. | 26,800 | 1,583,344 | |
Walgreen Co. | 16,985 | 563,223 | |
| 3,102,044 | ||
Food Products - 1.5% | |||
ConAgra Foods, Inc. | 18,081 | 474,626 | |
Hershey Co. | 1,816 | 110,231 | |
Hormel Foods Corp. (e) | 13,166 | 374,836 | |
Mead Johnson Nutrition Co. Class A | 4,747 | 369,079 | |
Sara Lee Corp. | 23,507 | 476,017 | |
Tyson Foods, Inc. Class A | 15,600 | 294,996 | |
| 2,099,785 | ||
Household Products - 0.6% | |||
Church & Dwight Co., Inc. (e) | 2,300 | 109,802 | |
Clorox Co. (e) | 3,100 | 209,591 | |
Colgate-Palmolive Co. (e) | 3,200 | 298,176 | |
Kimberly-Clark Corp. (e) | 4,168 | 303,764 | |
| 921,333 | ||
Tobacco - 2.8% | |||
Altria Group, Inc. (e) | 14,239 | 428,594 | |
Philip Morris International, Inc. (e) | 37,106 | 3,099,093 | |
Reynolds American, Inc. | 11,526 | 483,285 | |
| 4,010,972 | ||
TOTAL CONSUMER STAPLES | 14,913,149 | ||
ENERGY - 10.2% | |||
Energy Equipment & Services - 2.2% | |||
Halliburton Co. | 29,219 | 1,069,123 | |
Common Stocks - continued | |||
Shares | Value | ||
ENERGY - continued | |||
Energy Equipment & Services - continued | |||
Helmerich & Payne, Inc. (e) | 6,902 | $ 423,093 | |
Schlumberger Ltd. | 20,250 | 1,571,603 | |
| 3,063,819 | ||
Oil, Gas & Consumable Fuels - 8.0% | |||
Chevron Corp. | 6,655 | 726,194 | |
ConocoPhillips | 6,445 | 493,365 | |
CVR Energy, Inc. (a) | 1,000 | 27,210 | |
Denbury Resources, Inc. (a) | 14,000 | 278,740 | |
EOG Resources, Inc. | 884 | 100,652 | |
Exxon Mobil Corp. | 72,055 | 6,232,758 | |
Golar LNG Ltd. (NASDAQ) | 10,400 | 441,688 | |
HollyFrontier Corp. | 18,366 | 599,283 | |
Marathon Oil Corp. | 14,200 | 481,238 | |
Marathon Petroleum Corp. | 10,800 | 448,740 | |
Murphy Oil Corp. | 8,114 | 518,809 | |
Occidental Petroleum Corp. | 7,264 | 758,144 | |
Valero Energy Corp. (e) | 12,321 | 301,741 | |
| 11,408,562 | ||
TOTAL ENERGY | 14,472,381 | ||
FINANCIALS - 3.3% | |||
Capital Markets - 0.3% | |||
SEI Investments Co. | 23,900 | 472,025 | |
Commercial Banks - 1.0% | |||
Fifth Third Bancorp | 36,100 | 491,321 | |
KeyCorp | 34,936 | 282,982 | |
Wells Fargo & Co. | 22,309 | 698,049 | |
| 1,472,352 | ||
Consumer Finance - 0.9% | |||
American Express Co. (e) | 12,800 | 676,992 | |
Discover Financial Services | 17,283 | 518,663 | |
| 1,195,655 | ||
Diversified Financial Services - 0.3% | |||
The NASDAQ Stock Market, Inc. (a) | 18,400 | 484,656 | |
Insurance - 0.3% | |||
Validus Holdings Ltd. | 11,600 | 353,684 | |
Real Estate Investment Trusts - 0.5% | |||
Public Storage | 4,447 | 596,209 | |
Simon Property Group, Inc. (e) | 1,137 | 154,041 | |
| 750,250 | ||
TOTAL FINANCIALS | 4,728,622 | ||
HEALTH CARE - 11.0% | |||
Biotechnology - 2.9% | |||
Amgen, Inc. | 6,700 | 455,265 | |
Biogen Idec, Inc. (a) | 7,256 | 845,106 | |
Celgene Corp. (a) | 15,514 | 1,137,564 | |
| |||
Shares | Value | ||
Gilead Sciences, Inc. (a) | 25,999 | $ 1,182,955 | |
United Therapeutics Corp. (a) | 11,100 | 529,803 | |
| 4,150,693 | ||
Health Care Equipment & Supplies - 2.2% | |||
Baxter International, Inc. | 12,753 | 741,332 | |
Becton, Dickinson & Co. | 3,245 | 247,334 | |
C. R. Bard, Inc. (e) | 5,465 | 511,633 | |
Hill-Rom Holdings, Inc. | 14,300 | 485,771 | |
Intuitive Surgical, Inc. (a)(e) | 1,000 | 511,620 | |
Medtronic, Inc. (e) | 5,999 | 228,682 | |
Sirona Dental Systems, Inc. (a) | 3,700 | 184,630 | |
St. Jude Medical, Inc. | 1,416 | 59,642 | |
Stryker Corp. (e) | 351 | 18,828 | |
Thoratec Corp. (a)(e) | 3,859 | 133,136 | |
| 3,122,608 | ||
Health Care Providers & Services - 3.2% | |||
Aetna, Inc. | 10,100 | 472,276 | |
AmerisourceBergen Corp. | 14,822 | 553,602 | |
Cardinal Health, Inc. | 13,948 | 579,539 | |
Express Scripts, Inc. (a)(e) | 400 | 21,332 | |
HCA Holdings, Inc. | 5,529 | 147,458 | |
Health Net, Inc. (a) | 12,092 | 456,352 | |
Humana, Inc. | 5,733 | 499,344 | |
McKesson Corp. | 10,126 | 845,622 | |
Omnicare, Inc. | 3,000 | 105,540 | |
UnitedHealth Group, Inc. | 6,476 | 361,037 | |
WellPoint, Inc. | 7,037 | 461,838 | |
| 4,503,940 | ||
Health Care Technology - 0.3% | |||
Allscripts-Misys Healthcare Solutions, Inc. (a) | 9,200 | 177,744 | |
SXC Health Solutions Corp. (a) | 3,900 | 278,811 | |
| 456,555 | ||
Life Sciences Tools & Services - 0.5% | |||
Agilent Technologies, Inc. | 16,026 | 699,054 | |
Pharmaceuticals - 1.9% | |||
Abbott Laboratories (e) | 30,605 | 1,732,549 | |
Allergan, Inc. | 389 | 34,851 | |
Bristol-Myers Squibb Co. (e) | 300 | 9,651 | |
Eli Lilly & Co. | 18,977 | 744,657 | |
Johnson & Johnson | 3,500 | 227,780 | |
Sanofi rights (a) | 691 | 898 | |
| 2,750,386 | ||
TOTAL HEALTH CARE | 15,683,236 | ||
INDUSTRIALS - 12.7% | |||
Aerospace & Defense - 3.0% | |||
General Dynamics Corp. | 5,646 | 413,457 | |
Honeywell International, Inc. | 7,950 | 473,582 | |
L-3 Communications Holdings, Inc. | 4,200 | 295,050 | |
Lockheed Martin Corp. | 9,714 | 858,815 | |
Common Stocks - continued | |||
Shares | Value | ||
INDUSTRIALS - continued | |||
Aerospace & Defense - continued | |||
Northrop Grumman Corp. | 5,300 | $ 316,993 | |
Textron, Inc. | 17,300 | 475,923 | |
The Boeing Co. (e) | 6,070 | 454,947 | |
United Technologies Corp. (e) | 12,246 | 1,027,072 | |
| 4,315,839 | ||
Air Freight & Logistics - 0.4% | |||
United Parcel Service, Inc. Class B | 7,730 | 594,360 | |
Airlines - 0.3% | |||
Delta Air Lines, Inc. (a) | 48,200 | 472,842 | |
Construction & Engineering - 0.3% | |||
Fluor Corp. | 7,720 | 466,906 | |
Electrical Equipment - 1.8% | |||
AMETEK, Inc. | 12,100 | 575,960 | |
Emerson Electric Co. | 18,125 | 911,869 | |
Hubbell, Inc. Class B | 6,000 | 451,320 | |
Rockwell Automation, Inc. | 7,068 | 565,299 | |
| 2,504,448 | ||
Industrial Conglomerates - 1.2% | |||
3M Co. | 16,299 | 1,427,792 | |
Danaher Corp. | 1,552 | 81,992 | |
General Electric Co. | 6,133 | 116,834 | |
| 1,626,618 | ||
Machinery - 3.8% | |||
AGCO Corp. (a) | 4,621 | 238,582 | |
Caterpillar, Inc. (e) | 13,971 | 1,595,628 | |
Cummins, Inc. | 4,088 | 492,890 | |
Deere & Co. | 2,648 | 219,599 | |
Dover Corp. | 9,389 | 601,084 | |
Kennametal, Inc. | 100 | 4,607 | |
Lincoln Electric Holdings, Inc. | 5,700 | 263,283 | |
Oshkosh Truck Corp. (a)(e) | 16,800 | 391,608 | |
Pall Corp. (e) | 8,672 | 550,238 | |
Parker Hannifin Corp. (e) | 5,871 | 527,275 | |
Timken Co. | 2,077 | 108,835 | |
Toro Co. | 5,800 | 392,892 | |
| 5,386,521 | ||
Professional Services - 0.2% | |||
Towers Watson & Co. | 1,300 | 83,122 | |
Verisk Analytics, Inc. (a) | 4,117 | 179,090 | |
| 262,212 | ||
Road & Rail - 1.0% | |||
CSX Corp. | 36,536 | 767,621 | |
Union Pacific Corp. | 5,222 | 575,726 | |
| 1,343,347 | ||
| |||
Shares | Value | ||
Trading Companies & Distributors - 0.7% | |||
MSC Industrial Direct Co., Inc. Class A | 5,767 | $ 457,957 | |
W.W. Grainger, Inc. (e) | 2,855 | 593,069 | |
| 1,051,026 | ||
TOTAL INDUSTRIALS | 18,024,119 | ||
INFORMATION TECHNOLOGY - 30.0% | |||
Communications Equipment - 2.0% | |||
Cisco Systems, Inc. | 21,919 | 435,750 | |
QUALCOMM, Inc. | 38,206 | 2,375,649 | |
| 2,811,399 | ||
Computers & Peripherals - 8.7% | |||
Apple, Inc. (a) | 18,895 | 10,249,395 | |
Dell, Inc. (a)(e) | 51,110 | 884,203 | |
EMC Corp. (a)(e) | 22,555 | 624,548 | |
Western Digital Corp. (a) | 14,413 | 565,710 | |
| 12,323,856 | ||
Electronic Equipment & Components - 0.4% | |||
Dolby Laboratories, Inc. Class A (a)(e) | 12,300 | 468,261 | |
Jabil Circuit, Inc. | 100 | 2,583 | |
Tech Data Corp. (a)(e) | 2,443 | 130,652 | |
| 601,496 | ||
Internet Software & Services - 2.4% | |||
Google, Inc. Class A (a) | 5,610 | 3,468,383 | |
IT Services - 6.3% | |||
Accenture PLC Class A (e) | 17,753 | 1,057,014 | |
Automatic Data Processing, Inc. | 942 | 51,169 | |
DST Systems, Inc. | 6,900 | 365,700 | |
Fiserv, Inc. (a)(e) | 5,447 | 361,136 | |
IBM Corp. | 21,125 | 4,155,921 | |
MasterCard, Inc. Class A | 2,998 | 1,259,160 | |
The Western Union Co. | 25,300 | 441,991 | |
Total System Services, Inc. | 15,500 | 339,140 | |
Visa, Inc. Class A | 7,128 | 829,485 | |
| 8,860,716 | ||
Semiconductors & Semiconductor Equipment - 3.1% | |||
Applied Materials, Inc. | 39,392 | 482,158 | |
Avago Technologies Ltd. (e) | 15,644 | 588,371 | |
Broadcom Corp. Class A | 23,700 | 880,455 | |
Intel Corp. (e) | 16,410 | 441,101 | |
KLA-Tencor Corp. (e) | 11,257 | 544,839 | |
LSI Corp. (a) | 59,600 | 512,560 | |
Maxim Integrated Products, Inc. | 19,600 | 546,644 | |
NVIDIA Corp. (a)(e) | 25,300 | 383,295 | |
| 4,379,423 | ||
Software - 7.1% | |||
Activision Blizzard, Inc. | 100 | 1,195 | |
Adobe Systems, Inc. (a) | 100 | 3,289 | |
Autodesk, Inc. (a) | 14,282 | 540,574 | |
BMC Software, Inc. (a) | 10,957 | 410,230 | |
Intuit, Inc. | 13,296 | 769,041 | |
Common Stocks - continued | |||
Shares | Value | ||
INFORMATION TECHNOLOGY - continued | |||
Software - continued | |||
Microsoft Corp. | 159,651 | $ 5,067,323 | |
Oracle Corp. | 86,947 | 2,544,939 | |
Symantec Corp. (a) | 14,944 | 266,601 | |
Synopsys, Inc. (a) | 12,097 | 368,596 | |
VMware, Inc. Class A (a) | 763 | 75,453 | |
| 10,047,241 | ||
TOTAL INFORMATION TECHNOLOGY | 42,492,514 | ||
MATERIALS - 5.5% | |||
Chemicals - 4.7% | |||
Airgas, Inc. | 3,585 | 295,153 | |
Albemarle Corp. | 100 | 6,652 | |
CF Industries Holdings, Inc. (e) | 4,293 | 798,498 | |
E.I. du Pont de Nemours & Co. | 8,277 | 420,885 | |
Eastman Chemical Co. | 13,270 | 718,305 | |
Ecolab, Inc. | 600 | 36,000 | |
FMC Corp. (e) | 214 | 21,180 | |
Huntsman Corp. | 34,100 | 465,806 | |
LyondellBasell Industries NV Class A | 12,106 | 522,737 | |
Monsanto Co. | 14,061 | 1,088,040 | |
PPG Industries, Inc. | 8,316 | 758,835 | |
Praxair, Inc. | 1,489 | 162,301 | |
Rockwood Holdings, Inc. (a) | 9,865 | 525,311 | |
The Mosaic Co. | 100 | 5,775 | |
Valspar Corp. | 9,900 | 458,865 | |
Westlake Chemical Corp. (e) | 7,500 | 451,725 | |
| 6,736,068 | ||
Metals & Mining - 0.4% | |||
Freeport-McMoRan Copper & Gold, Inc. | 9,500 | 404,320 | |
Steel Dynamics, Inc. | 8,700 | 128,847 | |
| 533,167 | ||
Paper & Forest Products - 0.4% | |||
International Paper Co. | 14,239 | 500,501 | |
TOTAL MATERIALS | 7,769,736 | ||
TELECOMMUNICATION SERVICES - 0.4% | |||
Diversified Telecommunication Services - 0.4% | |||
Verizon Communications, Inc. (e) | 14,202 | 541,238 | |
UTILITIES - 0.0% | |||
Electric Utilities - 0.0% | |||
Northeast Utilities | 100 | 3,590 | |
Multi-Utilities - 0.0% | |||
CenterPoint Energy, Inc. | 100 | 1,949 | |
TOTAL UTILITIES | 5,539 | ||
TOTAL COMMON STOCKS (Cost $119,548,720) |
| ||
U.S. Treasury Obligations - 0.3% | ||||
| Principal Amount | Value | ||
U.S. Treasury Bills, yield at date of purchase 0.03% to 0.11% 6/7/12 to 6/28/12 (f) | $ 400,000 | $ 399,922 | ||
Money Market Funds - 21.2% | |||
Shares |
| ||
Dreyfus Cash Management Institutional Shares, 0.10% (c) | 6,487,570 | 6,487,570 | |
Fidelity Securities Lending Cash Central Fund, 0.12% (b)(d) | 23,605,400 | 23,605,400 | |
TOTAL MONEY MARKET FUNDS (Cost $30,092,970) |
| ||
TOTAL INVESTMENT PORTFOLIO - 118.9% (Cost $150,041,628) | 168,694,620 | ||
NET OTHER ASSETS (LIABILITIES) - (18.9)% | (26,868,467) | ||
NET ASSETS - 100% | $ 141,826,153 | ||
Futures Contracts | |||||
Expiration Date | Underlying Face Amount at Value | Unrealized Appreciation/(Depreciation) | |||
Purchased | |||||
Equity Index Contracts | |||||
53 CME E-mini S&P 500 Index Contracts | March 2012 | $ 3,615,660 | $ 2,004 | ||
The face value of futures purchased as a percentage of net assets is 2.5% |
Legend |
(a) Non-income producing |
(b) Affiliated fund that is available only to investment companies and other accounts managed by Fidelity Investments. The rate quoted is the annualized seven-day yield of the fund at period end. A complete unaudited listing of the fund's holdings as of its most recent quarter end is available upon request. In addition, each Fidelity Central Fund's financial statements, which are not covered by the Fund's Report of Independent Registered Public Accounting Firm, are available on the SEC's website or upon request. |
(c) The rate quoted is the annualized seven-day yield of the fund at period end. |
(d) Investment made with cash collateral received from securities on loan. |
(e) Security or a portion of the security is on loan at period end. |
(f) Security or a portion of the security was pledged to cover margin requirements for futures contracts. At the period end, the value of securities pledged amounted to $399,922. |
Affiliated Central Funds |
Information regarding fiscal year to date income earned by the Fund from investments in Fidelity Central Funds is as follows: |
Fund | Income earned |
Fidelity Securities Lending Cash Central Fund | $ 12,910 |
Other Information |
The following is a summary of the inputs used, as of February 29, 2012, involving the Fund's assets and liabilities carried at fair value. The inputs or methodology used for valuing securities may not be an indication of the risk associated with investing in those securities. For more information on valuation inputs, and their aggregation into the levels used in the table below, please refer to the Security Valuation section in the accompanying Notes to Financial Statements. |
Valuation Inputs at Reporting Date: | ||||
Description | Total | Level 1 | Level 2 | Level 3 |
Investments in Securities: | ||||
Equities: | ||||
Consumer Discretionary | $ 19,571,194 | $ 19,571,194 | $ - | $ - |
Consumer Staples | 14,913,149 | 14,913,149 | - | - |
Energy | 14,472,381 | 14,472,381 | - | - |
Financials | 4,728,622 | 4,728,622 | - | - |
Health Care | 15,683,236 | 15,683,236 | - | - |
Industrials | 18,024,119 | 18,024,119 | - | - |
Information Technology | 42,492,514 | 42,492,514 | - | - |
Materials | 7,769,736 | 7,769,736 | - | - |
Telecommunication Services | 541,238 | 541,238 | - | - |
Utilities | 5,539 | 5,539 | - | - |
U.S. Government and Government Agency Obligations | 399,922 | - | 399,922 | - |
Money Market Funds | 30,092,970 | 30,092,970 | - | - |
Total Investments in Securities: | $ 168,694,620 | $ 168,294,698 | $ 399,922 | $ - |
Derivative Instruments: | ||||
Assets | ||||
Futures Contracts | $ 2,004 | $ 2,004 | $ - | $ - |
Value of Derivative Instruments |
The following table is a summary of the Fund's value of derivative instruments by risk exposure as of February 29, 2012. For additional information on derivative instruments, please refer to the Derivative Instruments section in the accompanying Notes to Financial Statements. |
Risk Exposure / | Value | |
| Asset | Liability |
Equity Risk | ||
Futures Contracts (a) | $ 2,004 | $ - |
Total Value of Derivatives | $ 2,004 | $ - |
(a) Reflects cumulative appreciation/(depreciation) on futures contracts as disclosed on the Schedule of Investments. Only the period end variation margin is separately disclosed on the Statement of Assets and Liabilities. |
See accompanying notes which are an integral part of the financial statements.
Annual Report
Fidelity Large Cap Growth Enhanced Index Fund
Financial Statements
Statement of Assets and Liabilities
| February 29, 2012 | |
|
|
|
Assets | ||
Investment in securities, at value (including securities loaned of $22,925,686) - See accompanying schedule: Unaffiliated issuers (cost $126,436,228) | $ 145,089,220 |
|
Fidelity Central Funds (cost $23,605,400) | 23,605,400 |
|
Total Investments (cost $150,041,628) |
| $ 168,694,620 |
Receivable for investments sold | 2,762,149 | |
Receivable for fund shares sold | 675,512 | |
Dividends receivable | 280,290 | |
Interest receivable | 560 | |
Distributions receivable from Fidelity Central Funds | 1,715 | |
Total assets | 172,414,846 | |
|
|
|
Liabilities | ||
Payable for investments purchased | $ 6,753,230 | |
Payable for fund shares redeemed | 164,182 | |
Accrued management fee | 33,550 | |
Payable for daily variation margin on futures contracts | 15,592 | |
Other affiliated payables | 16,739 | |
Collateral on securities loaned, at value | 23,605,400 | |
Total liabilities | 30,588,693 | |
|
|
|
Net Assets | $ 141,826,153 | |
Net Assets consist of: |
| |
Paid in capital | $ 126,311,641 | |
Undistributed net investment income | 247,352 | |
Accumulated undistributed net realized gain (loss) on investments | (3,387,836) | |
Net unrealized appreciation (depreciation) on investments | 18,654,996 | |
Net Assets, for 12,977,336 shares outstanding | $ 141,826,153 | |
Net Asset Value, offering price and redemption price per share ($141,826,153 ÷ 12,977,336 shares) | $ 10.93 | |
Statement of Operations
| Year ended February 29, 2012 | |
|
|
|
Investment Income |
|
|
Dividends |
| $ 1,523,541 |
Interest |
| 3,341 |
Income from Fidelity Central Funds |
| 12,910 |
Total income |
| 1,539,792 |
|
|
|
Expenses | ||
Management fee | $ 263,625 | |
Transfer agent fees | 132,207 | |
Independent trustees' compensation | 791 | |
Miscellaneous | 225 | |
Total expenses before reductions | 396,848 | |
Expense reductions | (3) | 396,845 |
Net investment income (loss) | 1,142,947 | |
Realized and Unrealized Gain (Loss) Net realized gain (loss) on: | ||
Investment securities: |
|
|
Unaffiliated issuers | 2,789,110 | |
Futures contracts | 658,896 | |
Total net realized gain (loss) |
| 3,448,006 |
Change in net unrealized appreciation (depreciation) on: Investment securities | 6,215,232 | |
Futures contracts | (18,293) | |
Total change in net unrealized appreciation (depreciation) |
| 6,196,939 |
Net gain (loss) | 9,644,945 | |
Net increase (decrease) in net assets resulting from operations | $ 10,787,892 | |
See accompanying notes which are an integral part of the financial statements.
Annual Report
Fidelity Large Cap Growth Enhanced Index Fund
Financial Statements - continued
Statement of Changes in Net Assets
| Year ended | Year ended |
Increase (Decrease) in Net Assets |
|
|
Operations |
|
|
Net investment income (loss) | $ 1,142,947 | $ 624,173 |
Net realized gain (loss) | 3,448,006 | 118,632 |
Change in net unrealized appreciation (depreciation) | 6,196,939 | 9,180,999 |
Net increase (decrease) in net assets resulting from operations | 10,787,892 | 9,923,804 |
Distributions to shareholders from net investment income | (1,003,885) | (603,819) |
Share transactions | 100,274,570 | 32,035,214 |
Reinvestment of distributions | 950,430 | 566,082 |
Cost of shares redeemed | (37,297,717) | (23,618,873) |
Net increase (decrease) in net assets resulting from share transactions | 63,927,283 | 8,982,423 |
Total increase (decrease) in net assets | 73,711,290 | 18,302,408 |
|
|
|
Net Assets | ||
Beginning of period | 68,114,863 | 49,812,455 |
End of period (including undistributed net investment income of $247,352 and undistributed net investment income of $107,902, respectively) | $ 141,826,153 | $ 68,114,863 |
Other Information Shares | ||
Sold | 9,925,533 | 3,413,789 |
Issued in reinvestment of distributions | 95,150 | 59,959 |
Redeemed | (3,727,897) | (2,689,220) |
Net increase (decrease) | 6,292,786 | 784,528 |
Financial Highlights
Years ended February 28, | 2012 I | 2011 | 2010 | 2009 | 2008 G |
Selected Per-Share Data |
|
|
|
|
|
Net asset value, beginning of period | $ 10.19 | $ 8.44 | $ 5.60 | $ 9.25 | $ 10.00 |
Income from Investment Operations |
|
|
|
|
|
Net investment income (loss) D | .13 | .11 | .11 | .09 | .08 |
Net realized and unrealized gain (loss) | .72 | 1.75 | 2.83 | (3.65) | (.78) |
Total from investment operations | .85 | 1.86 | 2.94 | (3.56) | (.70) |
Distributions from net investment income | (.11) | (.11) | (.10) | (.09) | (.05) |
Net asset value, end of period | $ 10.93 | $ 10.19 | $ 8.44 | $ 5.60 | $ 9.25 |
Total Return B,C | 8.40% | 22.14% | 52.50% | (38.61)% | (7.05)% |
Ratios to Average Net Assets E,H |
|
|
|
|
|
Expenses before reductions | .45% | .45% | .45% | .45% | .45% A |
Expenses net of fee waivers, if any | .45% | .45% | .45% | .45% | .45% A |
Expenses net of all reductions | .45% | .45% | .45% | .45% | .45% A |
Net investment income (loss) | 1.30% | 1.25% | 1.42% | 1.14% | .89% A |
Supplemental Data |
|
|
|
|
|
Net assets, end of period (000 omitted) | $ 141,826 | $ 68,115 | $ 49,812 | $ 22,104 | $ 34,942 |
Portfolio turnover rate F | 77% | 80% | 35% J | 58% J | 36% A |
A Annualized
B Total returns for periods of less than one year are not annualized.
C Total returns would have been lower if certain expenses had not been reduced during the applicable periods shown.
D Calculated based on average shares outstanding during the period.
E Fees and expenses of any underlying funds and Fidelity Central Funds are not included in the Fund's expense ratio. The Fund indirectly bears its proportionate share of the expenses of any underlying funds and Fidelity Central Funds.
F Amount does not include the portfolio activity of any underlying funds and Fidelity Central Funds.
G For the period April 19, 2007 (commencement of operations) to February 29, 2008.
H Expense ratios reflect operating expenses of the Fund. Expenses before reductions do not reflect amounts reimbursed by the investment adviser or reductions from expense offset arrangements and do not represent the amount paid by the Fund during periods when reimbursements or reductions occur. Expenses net of fee waivers reflect expenses after reimbursement by the investment adviser but prior to reductions from expense offset arrangements. Expenses net of all reductions represent the net expenses paid by the Fund.
I For the year ended February 29.
J Reflects adjustments to exclude transactions in money market mutual funds.
See accompanying notes which are an integral part of the financial statements.
Annual Report
Fidelity Large Cap Value Enhanced Index Fund
Performance: The Bottom Line
Average annual total return reflects the change in the value of an investment, assuming reinvestment of the fund's distributions from dividend income and capital gains (the profits earned upon the sale of securities that have grown in value, if any) and assuming a constant rate of performance each year. The $10,000 table and the fund's returns do not reflect the deduction of taxes that a shareholder would pay on fund distributions or the redemption of fund shares. During periods of reimbursement by Fidelity a fund's total returns will be greater than it would be had the reimbursement not occurred. How a fund did yesterday is no guarantee of how it will do tomorrow.
Average Annual Total Returns
Periods ended February 29, 2012 | Past 1 | Life of |
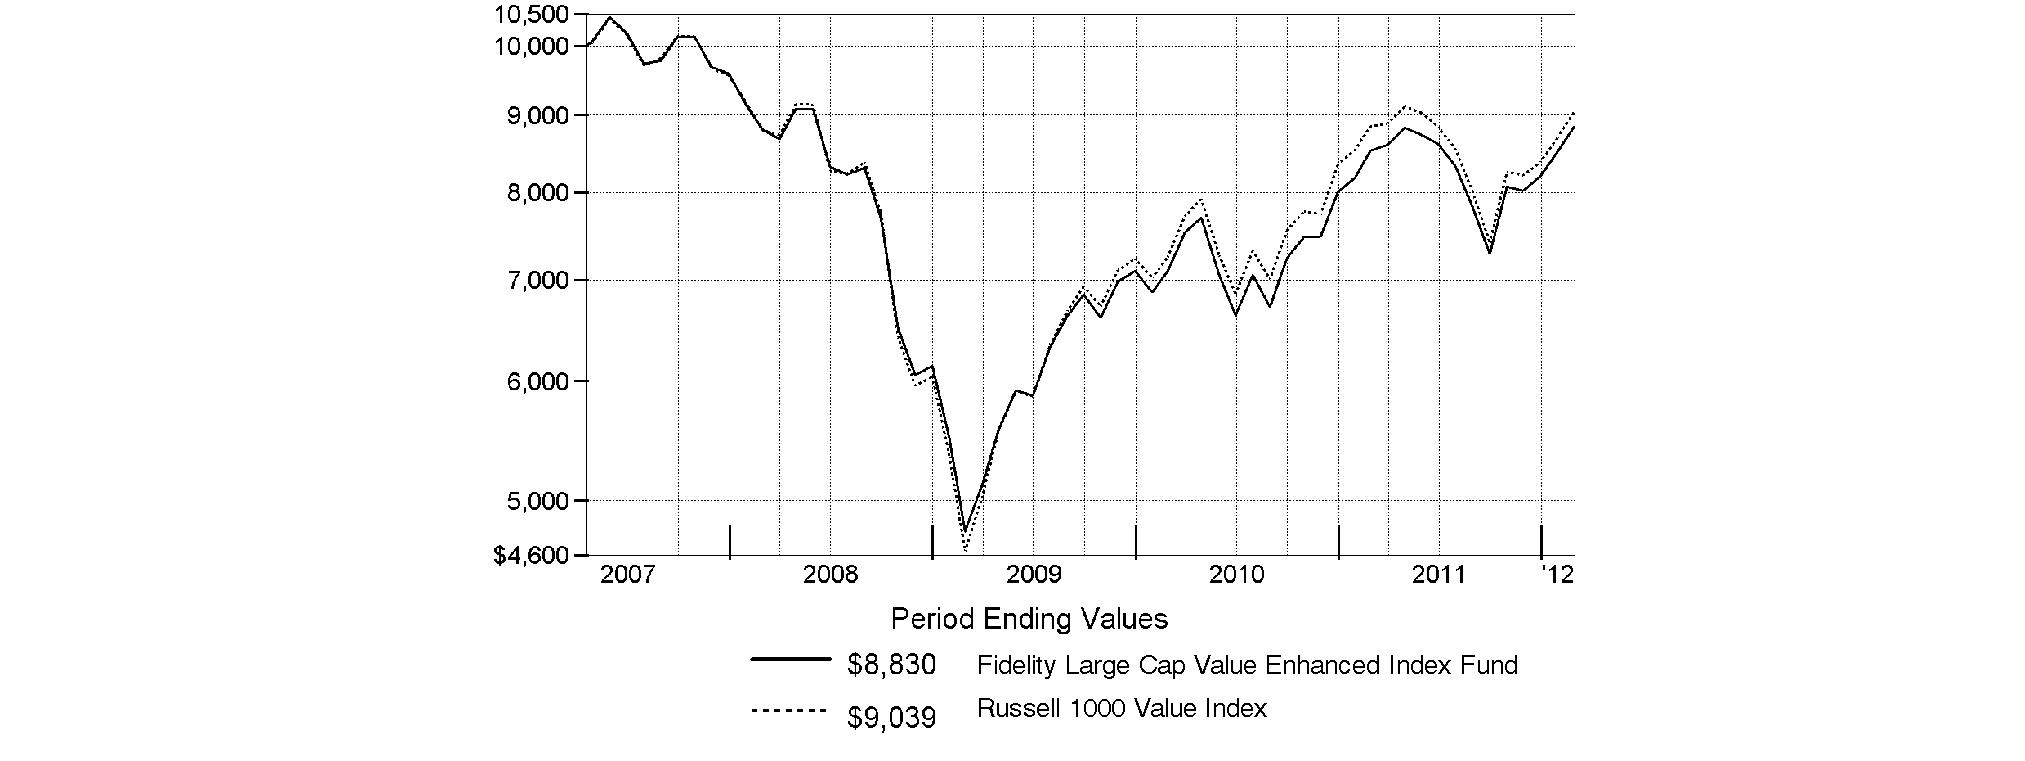
Fidelity Large Cap Value Enhanced Index Fund | 3.58% | -2.52% |
A From April 19, 2007.
$10,000 Over Life of Fund
Let's say hypothetically that $10,000 was invested in Fidelity Large Cap Value Enhanced Index Fund on April 19, 2007, when the fund started. The chart shows how the value of your investment would have changed, and also shows how the Russell 1000 Value Index performed over the same period.
Annual Report
Fidelity Large Cap Value Enhanced Index Fund
Management's Discussion of Fund Performance
Market Recap: U.S. stocks rose for the 12 months ending February 29, 2012, as encouraging economic news sparked a strong late-period rally that lifted major equity benchmarks past a number of significant milestones. Stocks recovered from early-period uncertainty that followed the March 2011 earthquake, tsunami and nuclear meltdown in Japan, but plummeted during the summer amid Europe's debt woes and a historic U.S. credit-rating downgrade. Despite continued volatility and mixed economic news, markets began to recover in early October. Investors gravitated toward defensive sectors and the perceived safety of larger, more-established and dividend-paying names, helping the Dow Jones® Industrial Average advance 8.83%, and close above the psychologically important 13,000 mark in late February - for the first time since May 2008. The rally accelerated late in the period and the market broadened, as investor confidence improved amid encouraging manufacturing, housing and employment data, and signs of progress in Europe. For the year, the S&P 500® Index added 5.12%, closing near a four-year high on the period's second-to-last day. The technology-laden Nasdaq Composite® Index added 7.73%, flirting with the 3,000 mark, its highest level in 12 years. Foreign developed-markets stocks reeled over Europe's turmoil, and the MSCI® EAFE® (Europe, Australasia, Far East) Index fell 7.35%.
Comments from Maximilian Kaufmann, Senior Portfolio Manager of the Geode Capital Management, LLC, investment management team for Fidelity® Large Cap Value Enhanced Index Fund: For the year, the fund gained 3.58%, outpacing the 2.18% increase in the Russell 1000® Value Index. Strong stock picking among diversified financials stocks added to relative performance. Favorable security selection in the consumer discretionary, health care and energy sectors also contributed. In contrast, stock selection in consumer staples - especially food/staples retailing - and industrials detracted, as did our positioning in utilities. Looking at individual stocks, shares in biotechnology company Biogen Idec rose strongly in October after a favorable trial of its experimental drug to treat multiple sclerosis. Other contributors included Polaris Industries, an off-road vehicle maker, financial information company Moody's, health benefits firm Humana and apparel manufacturer VF. Polaris and Moody's were not in the index. Also lifting relative performance was an average underweighting in poor-performing diversified financial stock Bank of America. In contrast, untimely ownership of retailer Target and lacking sufficient exposure to strong-performing credit card processor Visa detracted. Vishay Intertechnology, a semiconductor maker, was another lagged, as was a stake in chemicals producer Huntsman, whose shares dropped by more than 30% in August following a disappointing earnings announcement. Swedish auto-safety component manufacturer Autoliv also underperformed. Several of the stocks I've mentioned were not in the fund at period end.
The views expressed above reflect those of the portfolio manager(s) only through the end of the period as stated on the cover of this report and do not necessarily represent the views of Fidelity or any other person in the Fidelity organization. Any such views are subject to change at any time based upon market or other conditions and Fidelity disclaims any responsibility to update such views. These views may not be relied on as investment advice and, because investment decisions for a Fidelity fund are based on numerous factors, may not be relied on as an indication of trading intent on behalf of any Fidelity fund.
Annual Report
Fidelity Large Cap Value Enhanced Index Fund
Investment Changes (Unaudited)
Top Ten Stocks as of February 29, 2012 | ||
| % of fund's | % of fund's net assets |
Chevron Corp. | 3.3 | 3.3 |
General Electric Co. | 3.1 | 3.0 |
Wells Fargo & Co. | 2.4 | 1.9 |
Intel Corp. | 2.4 | 1.4 |
Pfizer, Inc. | 2.2 | 2.6 |
JPMorgan Chase & Co. | 2.2 | 2.4 |
AT&T, Inc. | 2.2 | 2.9 |
Procter & Gamble Co. | 2.1 | 2.2 |
Cisco Systems, Inc. | 1.9 | 1.7 |
ConocoPhillips | 1.9 | 1.7 |
| 23.7 | |
Market Sectors as of February 29, 2012 | ||
| % of fund's | % of fund's net assets |
Financials | 24.1 | 24.2 |
Health Care | 12.9 | 13.5 |
Energy | 11.9 | 11.5 |
Industrials | 10.0 | 8.1 |
Information Technology | 9.9 | 9.0 |
Consumer Discretionary | 9.6 | 8.2 |
Consumer Staples | 7.0 | 8.6 |
Utilities | 5.9 | 6.8 |
Telecommunication Services | 3.4 | 4.7 |
Materials | 3.0 | 3.2 |
Annual Report
Fidelity Large Cap Value Enhanced Index Fund
Investments February 29, 2012
Showing Percentage of Net Assets
Common Stocks - 97.7% | |||
Shares | Value | ||
CONSUMER DISCRETIONARY - 9.6% | |||
Auto Components - 0.5% | |||
Autoliv, Inc. | 370 | $ 24,642 | |
Lear Corp. | 6,697 | 302,771 | |
| 327,413 | ||
Automobiles - 0.7% | |||
Ford Motor Co. | 30,818 | 381,527 | |
General Motors Co. (a)(e) | 4,400 | 114,488 | |
| 496,015 | ||
Distributors - 0.4% | |||
Genuine Parts Co. | 4,934 | 309,263 | |
Diversified Consumer Services - 0.1% | |||
Apollo Group, Inc. Class A (non-vtg.) (a)(e) | 992 | 42,299 | |
Career Education Corp. (a) | 3,200 | 27,584 | |
| 69,883 | ||
Hotels, Restaurants & Leisure - 0.6% | |||
Brinker International, Inc. | 5,115 | 141,123 | |
International Game Technology | 16,979 | 255,025 | |
McDonald's Corp. | 400 | 39,712 | |
Wyndham Worldwide Corp. | 536 | 23,579 | |
| 459,439 | ||
Household Durables - 0.4% | |||
Harman International Industries, Inc. | 6,183 | 303,771 | |
Internet & Catalog Retail - 0.5% | |||
Liberty Media Corp. Interactive | 19,400 | 363,944 | |
Media - 2.8% | |||
Comcast Corp. Class A | 6,580 | 193,320 | |
DISH Network Corp. Class A | 8,891 | 259,350 | |
Liberty Media Corp. Capital Series A (a) | 3,921 | 352,459 | |
McGraw-Hill Companies, Inc. | 5,882 | 273,748 | |
News Corp. Class A | 11,429 | 227,094 | |
The Walt Disney Co. | 12,381 | 519,878 | |
Time Warner, Inc. | 3,822 | 142,217 | |
| 1,968,066 | ||
Multiline Retail - 0.8% | |||
Kohl's Corp. | 200 | 9,936 | |
Macy's, Inc. | 10,770 | 408,937 | |
Target Corp. | 2,165 | 122,734 | |
| 541,607 | ||
Specialty Retail - 2.4% | |||
Best Buy Co., Inc. (e) | 12,162 | 300,401 | |
Gap, Inc. (e) | 15,356 | 358,716 | |
Home Depot, Inc. | 1,000 | 47,570 | |
Limited Brands, Inc. | 5,957 | 277,179 | |
Lowe's Companies, Inc. | 22,733 | 645,163 | |
PetSmart, Inc. (e) | 923 | 51,448 | |
RadioShack Corp. | 9,431 | 66,866 | |
| 1,747,343 | ||
| |||
Shares | Value | ||
Textiles, Apparel & Luxury Goods - 0.4% | |||
Coach, Inc. | 3,734 | $ 279,453 | |
TOTAL CONSUMER DISCRETIONARY | 6,866,197 | ||
CONSUMER STAPLES - 7.0% | |||
Beverages - 0.3% | |||
Dr Pepper Snapple Group, Inc. | 5,968 | 227,082 | |
Food & Staples Retailing - 2.4% | |||
CVS Caremark Corp. | 8,437 | 380,509 | |
Kroger Co. | 11,601 | 275,988 | |
Safeway, Inc. (e) | 14,971 | 321,128 | |
Wal-Mart Stores, Inc. | 8,420 | 497,454 | |
Walgreen Co. | 7,468 | 247,639 | |
| 1,722,718 | ||
Food Products - 1.8% | |||
ConAgra Foods, Inc. (e) | 12,799 | 335,974 | |
Kraft Foods, Inc. Class A | 10,365 | 394,596 | |
Smithfield Foods, Inc. (a)(e) | 10,198 | 238,939 | |
Tyson Foods, Inc. Class A | 15,494 | 292,992 | |
| 1,262,501 | ||
Household Products - 2.1% | |||
Clorox Co. | 100 | 6,761 | |
Procter & Gamble Co. | 22,485 | 1,518,187 | |
| 1,524,948 | ||
Tobacco - 0.4% | |||
Philip Morris International, Inc. (e) | 3,039 | 253,817 | |
TOTAL CONSUMER STAPLES | 4,991,066 | ||
ENERGY - 11.9% | |||
Energy Equipment & Services - 1.2% | |||
Halliburton Co. | 6,490 | 237,469 | |
National Oilwell Varco, Inc. | 7,435 | 613,611 | |
SEACOR Holdings, Inc. (a) | 100 | 9,888 | |
| 860,968 | ||
Oil, Gas & Consumable Fuels - 10.7% | |||
Anadarko Petroleum Corp. | 1,441 | 121,217 | |
Apache Corp. | 643 | 69,399 | |
Chevron Corp. | 21,489 | 2,344,876 | |
ConocoPhillips | 17,330 | 1,326,612 | |
CVR Energy, Inc. (a)(e) | 5,864 | 159,559 | |
Devon Energy Corp. | 1,256 | 92,077 | |
Exxon Mobil Corp. | 10,769 | 931,519 | |
Hess Corp. | 6,756 | 438,600 | |
Marathon Oil Corp. | 15,655 | 530,548 | |
Marathon Petroleum Corp. | 10,269 | 426,677 | |
Murphy Oil Corp. | 5,637 | 360,430 | |
Occidental Petroleum Corp. | 3,718 | 388,048 | |
Common Stocks - continued | |||
Shares | Value | ||
ENERGY - continued | |||
Oil, Gas & Consumable Fuels - continued | |||
Valero Energy Corp. (e) | 16,481 | $ 403,620 | |
WPX Energy, Inc. | 500 | 9,080 | |
| 7,602,262 | ||
TOTAL ENERGY | 8,463,230 | ||
FINANCIALS - 24.1% | |||
Capital Markets - 2.8% | |||
American Capital Ltd. (a) | 35,830 | 319,245 | |
Bank of New York Mellon Corp. | 1,396 | 30,866 | |
Goldman Sachs Group, Inc. | 5,389 | 620,489 | |
Morgan Stanley | 27,948 | 518,156 | |
Raymond James Financial, Inc. | 7,700 | 272,349 | |
SEI Investments Co. | 14,403 | 284,459 | |
| 2,045,564 | ||
Commercial Banks - 6.4% | |||
BB&T Corp. (e) | 1,700 | 49,725 | |
Comerica, Inc. | 7,400 | 219,706 | |
Commerce Bancshares, Inc. | 2,600 | 100,386 | |
Fifth Third Bancorp | 27,815 | 378,562 | |
Huntington Bancshares, Inc. | 54,946 | 321,159 | |
KeyCorp | 40,660 | 329,346 | |
PNC Financial Services Group, Inc. | 9,173 | 545,977 | |
Regions Financial Corp. | 55,623 | 320,388 | |
U.S. Bancorp | 19,459 | 572,095 | |
Wells Fargo & Co. | 55,050 | 1,722,515 | |
| 4,559,859 | ||
Consumer Finance - 1.3% | |||
American Express Co. (e) | 8,876 | 469,452 | |
Discover Financial Services | 14,480 | 434,545 | |
| 903,997 | ||
Diversified Financial Services - 5.0% | |||
Bank of America Corp. | 124,483 | 992,130 | |
Citigroup, Inc. | 24,406 | 813,208 | |
Interactive Brokers Group, Inc. | 13,100 | 207,766 | |
JPMorgan Chase & Co. | 40,459 | 1,587,611 | |
| 3,600,715 | ||
Insurance - 6.1% | |||
ACE Ltd. (e) | 6,998 | 501,827 | |
AFLAC, Inc. | 7,566 | 357,494 | |
Allied World Assurance Co. Holdings | 101 | 6,663 | |
Arch Capital Group Ltd. (a) | 7,204 | 266,908 | |
Axis Capital Holdings Ltd. | 8,837 | 272,621 | |
Berkshire Hathaway, Inc. Class B (a) | 14,557 | 1,141,997 | |
Brown & Brown, Inc. | 10,803 | 255,275 | |
HCC Insurance Holdings, Inc. | 2,900 | 88,566 | |
Mercury General Corp. | 1,400 | 60,032 | |
MetLife, Inc. (e) | 1,845 | 71,125 | |
| |||
Shares | Value | ||
Progressive Corp. (e) | 17,703 | $ 379,198 | |
Prudential Financial, Inc. (e) | 6,495 | 397,234 | |
The Travelers Companies, Inc. | 8,417 | 487,933 | |
Torchmark Corp. | 43 | 2,083 | |
Validus Holdings Ltd. | 2,378 | 72,505 | |
| 4,361,461 | ||
Real Estate Investment Trusts - 2.5% | |||
American Campus Communities, Inc. (e) | 2,400 | 98,760 | |
Annaly Capital Management, Inc. (e) | 14,281 | 237,350 | |
Liberty Property Trust (SBI) (e) | 8,713 | 295,545 | |
MFA Financial, Inc. | 229 | 1,672 | |
Public Storage | 2,134 | 286,105 | |
Rayonier, Inc. (e) | 5,246 | 233,552 | |
Simon Property Group, Inc. (e) | 1,896 | 256,870 | |
Weyerhaeuser Co. | 16,877 | 352,561 | |
| 1,762,415 | ||
TOTAL FINANCIALS | 17,234,011 | ||
HEALTH CARE - 12.9% | |||
Biotechnology - 1.1% | |||
Amgen, Inc. | 11,635 | 790,598 | |
Health Care Equipment & Supplies - 0.3% | |||
Hill-Rom Holdings, Inc. | 7,000 | 237,790 | |
Medtronic, Inc. | 100 | 3,812 | |
| 241,602 | ||
Health Care Providers & Services - 4.1% | |||
Aetna, Inc. | 9,651 | 451,281 | |
Cardinal Health, Inc. | 7,503 | 311,750 | |
HCA Holdings, Inc. | 5,035 | 134,283 | |
Humana, Inc. | 4,437 | 386,463 | |
McKesson Corp. | 2,949 | 246,271 | |
UnitedHealth Group, Inc. | 15,653 | 872,655 | |
WellPoint, Inc. | 7,314 | 480,018 | |
| 2,882,721 | ||
Pharmaceuticals - 7.4% | |||
Abbott Laboratories (e) | 1,000 | 56,610 | |
Bristol-Myers Squibb Co. (e) | 24,860 | 799,746 | |
Eli Lilly & Co. | 13,364 | 524,403 | |
Johnson & Johnson | 18,268 | 1,188,881 | |
Merck & Co., Inc. | 29,077 | 1,109,869 | |
Pfizer, Inc. (e) | 76,117 | 1,606,069 | |
| 5,285,578 | ||
TOTAL HEALTH CARE | 9,200,499 | ||
INDUSTRIALS - 10.0% | |||
Aerospace & Defense - 2.3% | |||
Exelis, Inc. | 4,973 | 52,266 | |
General Dynamics Corp. | 6,701 | 490,714 | |
L-3 Communications Holdings, Inc. | 4,572 | 321,183 | |
Lockheed Martin Corp. | 1,424 | 125,896 | |
Common Stocks - continued | |||
Shares | Value | ||
INDUSTRIALS - continued | |||
Aerospace & Defense - continued | |||
Northrop Grumman Corp. | 6,718 | $ 401,804 | |
Raytheon Co. (e) | 4,814 | 243,203 | |
| 1,635,066 | ||
Air Freight & Logistics - 0.1% | |||
FedEx Corp. | 400 | 35,996 | |
Airlines - 0.5% | |||
Delta Air Lines, Inc. (a) | 24,500 | 240,345 | |
Southwest Airlines Co. | 15,600 | 140,088 | |
| 380,433 | ||
Commercial Services & Supplies - 0.0% | |||
Republic Services, Inc. | 909 | 27,115 | |
Electrical Equipment - 0.2% | |||
Hubbell, Inc. Class B | 2,300 | 173,006 | |
Industrial Conglomerates - 3.5% | |||
3M Co. | 3,467 | 303,709 | |
General Electric Co. | 113,995 | 2,171,605 | |
| 2,475,314 | ||
Machinery - 1.6% | |||
AGCO Corp. (a) | 5,060 | 261,248 | |
CNH Global NV (a)(e) | 6,462 | 277,284 | |
ITT Corp. | 750 | 18,713 | |
Oshkosh Truck Corp. (a) | 10,100 | 235,431 | |
Parker Hannifin Corp. (e) | 3,912 | 351,337 | |
| 1,144,013 | ||
Road & Rail - 1.8% | |||
CSX Corp. | 6,766 | 142,154 | |
Norfolk Southern Corp. (e) | 6,396 | 440,684 | |
Union Pacific Corp. | 6,125 | 675,281 | |
| 1,258,119 | ||
TOTAL INDUSTRIALS | 7,129,062 | ||
INFORMATION TECHNOLOGY - 9.9% | |||
Communications Equipment - 2.5% | |||
Cisco Systems, Inc. | 70,433 | 1,400,208 | |
Motorola Solutions, Inc. | 8,270 | 411,846 | |
| 1,812,054 | ||
Computers & Peripherals - 1.3% | |||
Apple, Inc. (a) | 500 | 271,220 | |
Hewlett-Packard Co. | 11,794 | 298,506 | |
Western Digital Corp. (a) | 9,544 | 374,602 | |
| 944,328 | ||
Electronic Equipment & Components - 0.4% | |||
Ingram Micro, Inc. Class A (a) | 7,900 | 151,127 | |
Tech Data Corp. (a)(e) | 3,201 | 171,189 | |
| 322,316 | ||
IT Services - 1.2% | |||
Computer Sciences Corp. | 10,136 | 321,919 | |
| |||
Shares | Value | ||
Fiserv, Inc. (a)(e) | 1,200 | $ 79,560 | |
Total System Services, Inc. | 12,912 | 282,515 | |
Visa, Inc. Class A | 1,623 | 188,869 | |
| 872,863 | ||
Semiconductors & Semiconductor Equipment - 4.0% | |||
Applied Materials, Inc. | 32,541 | 398,302 | |
Avago Technologies Ltd. | 7,646 | 287,566 | |
Intel Corp. (e) | 62,705 | 1,685,510 | |
KLA-Tencor Corp. (e) | 5,100 | 246,840 | |
Marvell Technology Group Ltd. (a) | 13,494 | 202,410 | |
| 2,820,628 | ||
Software - 0.5% | |||
Microsoft Corp. | 9,780 | 310,417 | |
Oracle Corp. | 519 | 15,191 | |
| 325,608 | ||
TOTAL INFORMATION TECHNOLOGY | 7,097,797 | ||
MATERIALS - 3.0% | |||
Chemicals - 2.2% | |||
CF Industries Holdings, Inc. (e) | 1,600 | 297,600 | |
Dow Chemical Co. (e) | 4,660 | 156,157 | |
Eastman Chemical Co. | 5,789 | 313,359 | |
LyondellBasell Industries NV Class A | 9,865 | 425,971 | |
PPG Industries, Inc. | 2,700 | 246,375 | |
Rockwood Holdings, Inc. (a) | 1,977 | 105,275 | |
| 1,544,737 | ||
Metals & Mining - 0.4% | |||
Freeport-McMoRan Copper & Gold, Inc. | 254 | 10,810 | |
Hecla Mining Co. | 44,000 | 223,520 | |
Newmont Mining Corp. | 1,301 | 77,279 | |
| 311,609 | ||
Paper & Forest Products - 0.4% | |||
Domtar Corp. | 2,959 | 283,679 | |
TOTAL MATERIALS | 2,140,025 | ||
TELECOMMUNICATION SERVICES - 3.4% | |||
Diversified Telecommunication Services - 3.4% | |||
AT&T, Inc. (e) | 51,604 | 1,578,566 | |
Verizon Communications, Inc. (e) | 21,431 | 816,735 | |
| 2,395,301 | ||
Wireless Telecommunication Services - 0.0% | |||
Telephone & Data Systems, Inc. | 900 | 22,743 | |
TOTAL TELECOMMUNICATION SERVICES | 2,418,044 | ||
UTILITIES - 5.9% | |||
Electric Utilities - 3.1% | |||
American Electric Power Co., Inc. | 10,666 | 401,148 | |
Cleco Corp. | 5,906 | 227,263 | |
Common Stocks - continued | |||
Shares | Value | ||
UTILITIES - continued | |||
Electric Utilities - continued | |||
Duke Energy Corp. (e) | 17,693 | $ 370,138 | |
Entergy Corp. | 5,321 | 354,538 | |
Exelon Corp. (e) | 1,975 | 77,163 | |
NextEra Energy, Inc. | 322 | 19,162 | |
Northeast Utilities | 8,399 | 301,524 | |
Pinnacle West Capital Corp. (e) | 6,152 | 289,329 | |
Progress Energy, Inc. | 69 | 3,663 | |
Southern Co. (e) | 3,243 | 143,308 | |
| 2,187,236 | ||
Gas Utilities - 0.4% | |||
Atmos Energy Corp. | 4,268 | 131,156 | |
UGI Corp. | 5,480 | 154,810 | |
| 285,966 | ||
Multi-Utilities - 2.0% | |||
Ameren Corp. | 10,650 | 341,546 | |
CenterPoint Energy, Inc. | 15,227 | 296,774 | |
Dominion Resources, Inc. | 1,074 | 54,205 | |
PG&E Corp. (e) | 7,073 | 294,803 | |
Public Service Enterprise Group, Inc. | 13,014 | 400,571 | |
Xcel Energy, Inc. | 708 | 18,755 | |
| 1,406,654 | ||
Water Utilities - 0.4% | |||
American Water Works Co., Inc. | 8,700 | 298,236 | |
TOTAL UTILITIES | 4,178,092 | ||
TOTAL COMMON STOCKS (Cost $59,761,378) |
| ||
U.S. Treasury Obligations - 0.1% | ||||
| Principal Amount |
| ||
U.S. Treasury Bills, yield at date of purchase 0.03% 6/7/12 (f) | $ 100,000 |
| ||
Money Market Funds - 22.7% | |||
Shares | Value | ||
Dreyfus Cash Management Institutional Shares, 0.10% (c) | 1,253,637 | $ 1,253,637 | |
Fidelity Securities Lending Cash Central Fund, 0.12% (b)(d) | 14,906,575 | 14,906,575 | |
TOTAL MONEY MARKET FUNDS (Cost $16,160,212) |
| ||
TOTAL INVESTMENT PORTFOLIO - 120.5% (Cost $76,021,581) | 85,978,219 | ||
NET OTHER ASSETS (LIABILITIES) - (20.5)% | (14,624,677) | ||
NET ASSETS - 100% | $ 71,353,542 | ||
Futures Contracts | |||||
Expiration Date | Underlying Face Amount at Value | Unrealized Appreciation/(Depreciation) | |||
Purchased | |||||
Equity Index Contracts | |||||
23 CME E-mini S&P 500 Index Contracts | March 2012 | $ 1,569,060 | $ 104,277 | ||
The face value of futures purchased as a percentage of net assets is 2.2% |
Legend |
(a) Non-income producing |
(b) Affiliated fund that is available only to investment companies and other accounts managed by Fidelity Investments. The rate quoted is the annualized seven-day yield of the fund at period end. A complete unaudited listing of the fund's holdings as of its most recent quarter end is available upon request. In addition, each Fidelity Central Fund's financial statements, which are not covered by the Fund's Report of Independent Registered Public Accounting Firm, are available on the SEC's website or upon request. |
(c) The rate quoted is the annualized seven-day yield of the fund at period end. |
(d) Investment made with cash collateral received from securities on loan. |
(e) Security or a portion of the security is on loan at period end. |
(f) Security or a portion of the security was pledged to cover margin requirements for futures contracts. At the period end, the value of securities pledged amounted to $99,984. |
Affiliated Central Funds |
Information regarding fiscal year to date income earned by the Fund from investments in Fidelity Central Funds is as follows: |
Fund | Income earned |
Fidelity Securities Lending Cash Central Fund | $ 13,774 |
Other Information |
The following is a summary of the inputs used, as of February 29, 2012, involving the Fund's assets and liabilities carried at fair value. The inputs or methodology used for valuing securities may not be an indication of the risk associated with investing in those securities. For more information on valuation inputs, and their aggregation into the levels used in the table below, please refer to the Security Valuation section in the accompanying Notes to Financial Statements. |
Valuation Inputs at Reporting Date: | ||||
Description | Total | Level 1 | Level 2 | Level 3 |
Investments in Securities: | ||||
Equities: | ||||
Consumer Discretionary | $ 6,866,197 | $ 6,866,197 | $ - | $ - |
Consumer Staples | 4,991,066 | 4,991,066 | - | - |
Energy | 8,463,230 | 8,463,230 | - | - |
Financials | 17,234,011 | 17,234,011 | - | - |
Health Care | 9,200,499 | 9,200,499 | - | - |
Industrials | 7,129,062 | 7,129,062 | - | - |
Information Technology | 7,097,797 | 7,097,797 | - | - |
Materials | 2,140,025 | 2,140,025 | - | - |
Telecommunication Services | 2,418,044 | 2,418,044 | - | - |
Utilities | 4,178,092 | 4,178,092 | - | - |
U.S. Government and Government Agency Obligations | 99,984 | - | 99,984 | - |
Money Market Funds | 16,160,212 | 16,160,212 | - | - |
Total Investments in Securities: | $ 85,978,219 | $ 85,878,235 | $ 99,984 | $ - |
Derivative Instruments: | ||||
Assets | ||||
Futures Contracts | $ 104,277 | $ 104,277 | $ - | $ - |
Value of Derivative Instruments |
The following table is a summary of the Fund's value of derivative instruments by risk exposure as of February 29, 2012. For additional information on derivative instruments, please refer to the Derivative Instruments section in the accompanying Notes to Financial Statements. |
Risk Exposure / | Value | |
| Asset | Liability |
Equity Risk | ||
Futures Contracts (a) | $ 104,277 | $ - |
Total Value of Derivatives | $ 104,277 | $ - |
(a) Reflects cumulative appreciation/(depreciation) on futures contracts as disclosed on the Schedule of Investments. Only the period end variation margin is separately disclosed on the Statement of Assets and Liabilities. |
See accompanying notes which are an integral part of the financial statements.
Annual Report
Fidelity Large Cap Value Enhanced Index Fund
Financial Statements
Statement of Assets and Liabilities
| February 29, 2012 | |
|
|
|
Assets | ||
Investment in securities, at value (including securities loaned of $14,450,926) - See accompanying schedule: Unaffiliated issuers (cost $61,115,006) | $ 71,071,644 |
|
Fidelity Central Funds (cost $14,906,575) | 14,906,575 |
|
Total Investments (cost $76,021,581) |
| $ 85,978,219 |
Receivable for fund shares sold | 135,322 | |
Dividends receivable | 196,061 | |
Interest receivable | 171 | |
Distributions receivable from Fidelity Central Funds | 838 | |
Total assets | 86,310,611 | |
|
|
|
Liabilities | ||
Payable for fund shares redeemed | $ 16,419 | |
Accrued management fee | 17,702 | |
Payable for daily variation margin on futures contracts | 7,557 | |
Other affiliated payables | 8,816 | |
Collateral on securities loaned, at value | 14,906,575 | |
Total liabilities | 14,957,069 | |
|
|
|
Net Assets | $ 71,353,542 | |
Net Assets consist of: |
| |
Paid in capital | $ 61,953,597 | |
Undistributed net investment income | 226,847 | |
Accumulated undistributed net realized gain (loss) on investments | (887,817) | |
Net unrealized appreciation (depreciation) on investments | 10,060,915 | |
Net Assets, for 9,176,348 shares outstanding | $ 71,353,542 | |
Net Asset Value, offering price and redemption price per share ($71,353,542 ÷ 9,176,348 shares) | $ 7.78 | |
Statement of Operations
| Year ended February 29, 2012 | |
|
|
|
Investment Income |
|
|
Dividends |
| $ 2,045,709 |
Interest |
| 1,579 |
Income from Fidelity Central Funds |
| 13,774 |
Total income |
| 2,061,062 |
|
|
|
Expenses | ||
Management fee | $ 247,646 | |
Transfer agent fees | 124,194 | |
Independent trustees' compensation | 742 | |
Interest | 287 | |
Miscellaneous | 248 | |
Total expenses | 373,117 | |
Net investment income (loss) | 1,687,945 | |
Realized and Unrealized Gain (Loss) Net realized gain (loss) on: | ||
Investment securities: |
|
|
Unaffiliated issuers | 3,266,980 | |
Futures contracts | 46,646 | |
Total net realized gain (loss) |
| 3,313,626 |
Change in net unrealized appreciation (depreciation) on: Investment securities | (3,597,131) | |
Futures contracts | 83,135 | |
Total change in net unrealized appreciation (depreciation) |
| (3,513,996) |
Net gain (loss) | (200,370) | |
Net increase (decrease) in net assets resulting from operations | $ 1,487,575 | |
See accompanying notes which are an integral part of the financial statements.
Annual Report
Statement of Changes in Net Assets
| Year ended | Year ended |
Increase (Decrease) in Net Assets |
|
|
Operations |
|
|
Net investment income (loss) | $ 1,687,945 | $ 1,234,031 |
Net realized gain (loss) | 3,313,626 | 1,469,805 |
Change in net unrealized appreciation (depreciation) | (3,513,996) | 10,756,617 |
Net increase (decrease) in net assets resulting from operations | 1,487,575 | 13,460,453 |
Distributions to shareholders from net investment income | (1,395,578) | (1,184,075) |
Distributions to shareholders from net realized gain | (2,874,041) | - |
Total distributions | (4,269,619) | (1,184,075) |
Share transactions | 44,771,312 | 22,891,708 |
Reinvestment of distributions | 4,155,117 | 1,155,878 |
Cost of shares redeemed | (59,913,933) | (20,225,202) |
Net increase (decrease) in net assets resulting from share transactions | (10,987,504) | 3,822,384 |
Total increase (decrease) in net assets | (13,769,548) | 16,098,762 |
Net Assets | ||
Beginning of period | 85,123,090 | 69,024,328 |
End of period (including undistributed net investment income of $226,847 and undistributed net investment income of $167,330, respectively) | $ 71,353,542 | $ 85,123,090 |
Other Information Shares | ||
Sold | 6,042,322 | 3,182,934 |
Issued in reinvestment of distributions | 580,129 | 158,090 |
Redeemed | (8,189,565) | (2,904,695) |
Net increase (decrease) | (1,567,114) | 436,329 |
Financial Highlights
Years ended February 28, | 2012 J | 2011 | 2010 | 2009 | 2008 H |
Selected Per-Share Data |
|
|
|
|
|
Net asset value, beginning of period | $ 7.92 | $ 6.70 | $ 4.59 | $ 8.68 | $ 10.00 |
Income from Investment Operations |
|
|
|
|
|
Net investment income (loss) D | .15 | .12 | .13 | .20 | .18 |
Net realized and unrealized gain (loss) | .10 G | 1.22 | 2.11 | (4.14) | (1.37) |
Total from investment operations | .25 | 1.34 | 2.24 | (3.94) | (1.19) |
Distributions from net investment income | (.13) | (.12) | (.13) | (.15) | (.13) |
Distributions from net realized gain | (.26) | - | - | - | - |
Total distributions | (.39) | (.12) | (.13) | (.15) | (.13) |
Net asset value, end of period | $ 7.78 | $ 7.92 | $ 6.70 | $ 4.59 | $ 8.68 |
Total Return B,C | 3.58% | 20.15% | 48.83% | (45.82)% | (12.00)% |
Ratios to Average Net Assets E,I |
|
|
|
|
|
Expenses before reductions | .45% | .45% | .45% | .45% | .45% A |
Expenses net of fee waivers, if any | .45% | .45% | .45% | .45% | .45% A |
Expenses net of all reductions | .45% | .45% | .45% | .45% | .45% A |
Net investment income (loss) | 2.04% | 1.76% | 2.11% | 2.81% | 2.12% A |
Supplemental Data |
|
|
|
|
|
Net assets, end of period (000 omitted) | $ 71,354 | $ 85,123 | $ 69,024 | $ 20,162 | $ 24,379 |
Portfolio turnover rate F | 85% | 83% | 89% K | 72% K | 65% A |
A Annualized
B Total returns for periods of less than one year are not annualized.
C Total returns would have been lower if certain expenses had not been reduced during the applicable periods shown.
D Calculated based on average shares outstanding during the period.
E Fees and expenses of any underlying funds and Fidelity Central Funds are not included in the Fund's expense ratio. The Fund indirectly bears its proportionate share of the expenses of any underlying funds and Fidelity Central Funds.
F Amount does not include the portfolio activity of any underlying funds and Fidelity Central Funds.
G The amount shown for a share outstanding does not correspond with the aggregate net gain (loss) on investments for the period due to the timing of sales and repurchases of shares in relation to fluctuating market values of the investments of the Fund.
H For the period April 19, 2007 (commencement of operations) to February 29, 2008.
I Expense ratios reflect operating expenses of the Fund. Expenses before reductions do not reflect amounts reimbursed by the investment adviser or reductions from expense offset arrangements and do not represent the amount paid by the Fund during periods when reimbursements or reductions occur. Expenses net of fee waivers reflect expenses after reimbursement by the investment adviser but prior to reductions from expense offset arrangements. Expenses net of all reductions represent the net expenses paid by the Fund.
J For the year ended February 29.
K Reflects adjustments to exclude transactions in money market mutual funds.
See accompanying notes which are an integral part of the financial statements.
Annual Report
Fidelity Large Cap Core Enhanced Index Fund
Performance: The Bottom Line
Average annual total return reflects the change in the value of an investment, assuming reinvestment of the fund's distributions from dividend income and capital gains (the profits earned upon the sale of securities that have grown in value, if any) and assuming a constant rate of performance each year. The $10,000 table and the fund's returns do not reflect the deduction of taxes that a shareholder would pay on fund distributions or the redemption of fund shares. During periods of reimbursement by Fidelity a fund's total returns will be greater than it would be had the reimbursement not occurred. How a fund did yesterday is no guarantee of how it will do tomorrow.
Average Annual Total Returns
Periods ended February 29, 2012 | Past 1 | Life of |
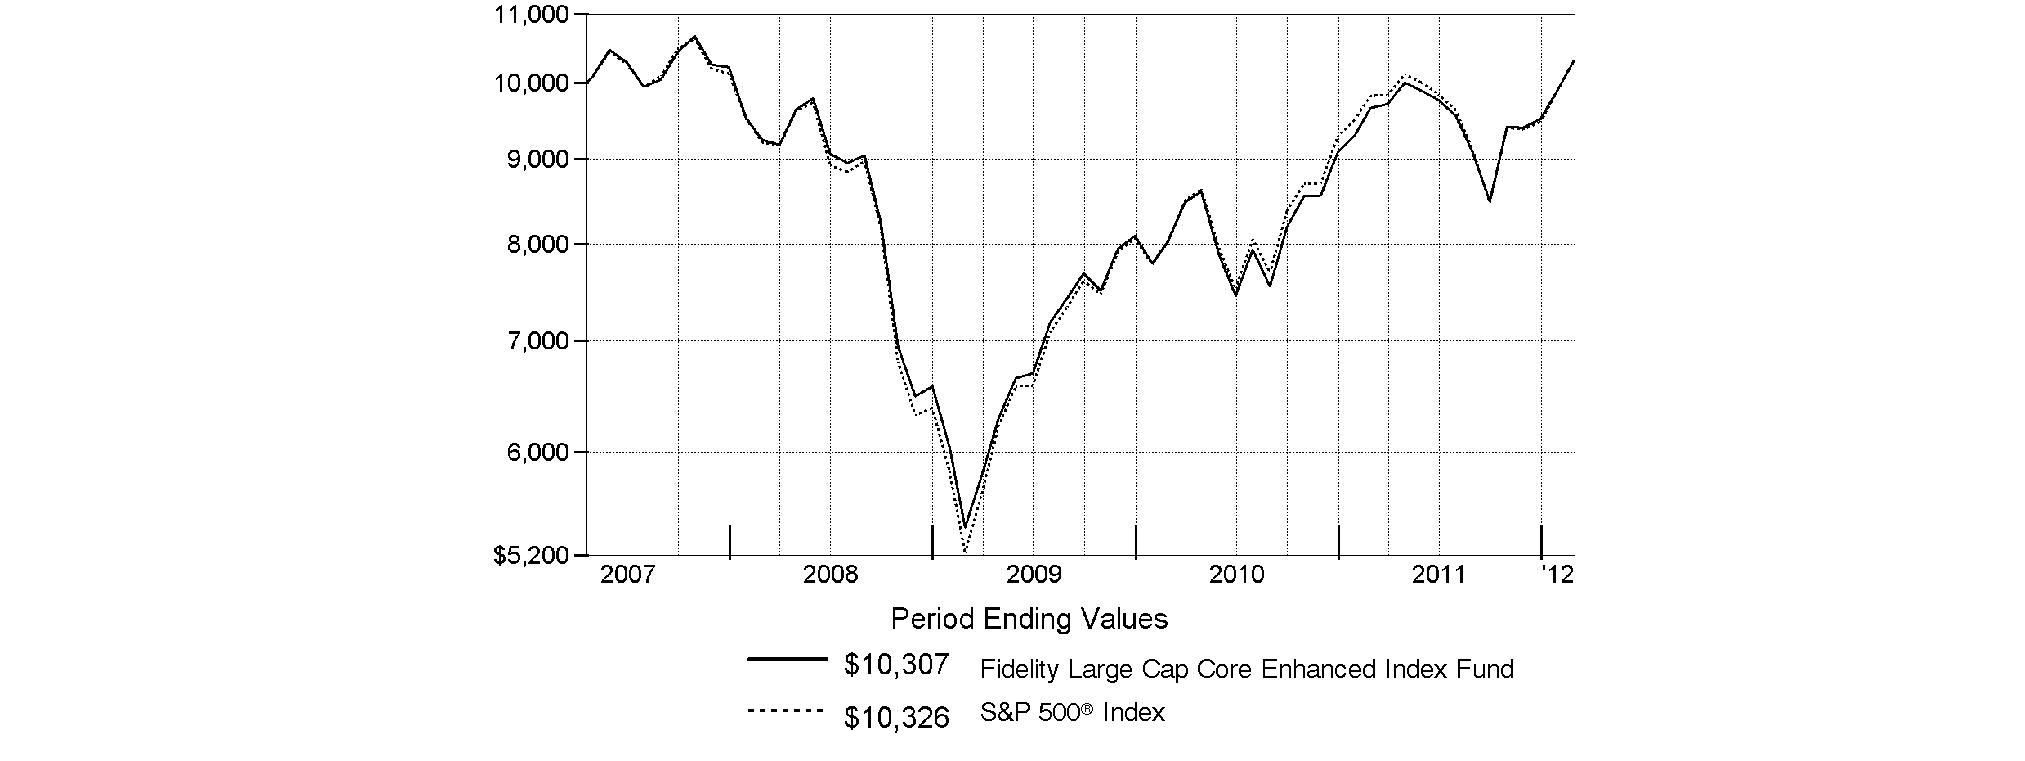
Fidelity Large Cap Core Enhanced Index Fund | 6.78% | 0.62% |
A From April 19, 2007.
$10,000 Over Life of Fund
Let's say hypothetically that $10,000 was invested in Fidelity Large Cap Core Enhanced Index Fund on April 19, 2007, when the fund started. The chart shows how the value of your investment would have changed, and also shows how the S&P 500® Index performed over the same period.
Annual Report
Fidelity Large Cap Core Enhanced Index Fund
Management's Discussion of Fund Performance
Market Recap: U.S. stocks rose for the 12 months ending February 29, 2012, as encouraging economic news sparked a strong late-period rally that lifted major equity benchmarks past a number of significant milestones. Stocks recovered from early-period uncertainty that followed the March 2011 earthquake, tsunami and nuclear meltdown in Japan, but plummeted during the summer amid Europe's debt woes and a historic U.S. credit-rating downgrade. Despite continued volatility and mixed economic news, markets began to recover in early October. Investors gravitated toward defensive sectors and the perceived safety of larger, more-established and dividend-paying names, helping the Dow Jones® Industrial Average advance 8.83%, and close above the psychologically important 13,000 mark in late February - for the first time since May 2008. The rally accelerated late in the period and the market broadened, as investor confidence improved amid encouraging manufacturing, housing and employment data, and signs of progress in Europe. For the year, the S&P 500® Index added 5.12%, closing near a four-year high on the period's second-to-last day. The technology-laden Nasdaq Composite® Index added 7.73%, flirting with the 3,000 mark, its highest level in 12 years. Foreign developed-markets stocks reeled over Europe's turmoil, and the MSCI® EAFE® (Europe, Australasia, Far East) Index fell 7.35%.
Comments from Maximilian Kaufmann, Senior Portfolio Manager of the Geode Capital Management, LLC, investment management team for Fidelity® Large Cap Core Enhanced Index Fund: For the year, the fund gained 6.78%, outpacing the S&P 500®. During the period, good positioning in the financials sector, led by strong stock picking among diversified financials, aided relative performance. Favorable security selection in the consumer discretionary and health care sectors also provided a boost. In contrast, stock picking in utilities and industrials detracted. The top contributor was biotechnology stock Biogen Idec, whose shares rose strongly in October after a favorable trial for its experimental drug to treat multiple sclerosis. Polaris Industries, an off-road vehicle maker that is not in the index, and cigarette manufacturer Lorillard also turned in strong gains. The fund's average underweighting in two weak-performing diversified financials companies, Bank of America and Citigroup, helped further, while other contributors included health benefits company Humana, apparel manufacturer VF and apparel retailer Limited Brands. On the negative side, an out-of-benchmark stake in chemicals producer Huntsman hindered results. The company's shares dropped by more than 30% in August following a disappointing earnings announcement. Vishay Intertechnology, an out-of-benchmark semiconductor maker, also detracted from relative performance, as did utility holding company Public Service Enterprise Group. Oil-field services company Halliburton and semiconductor manufacturer Micron Technology lagged, as well. Several of the stocks I've mentioned were not in the portfolio at period end.
The views expressed above reflect those of the portfolio manager(s) only through the end of the period as stated on the cover of this report and do not necessarily represent the views of Fidelity or any other person in the Fidelity organization. Any such views are subject to change at any time based upon market or other conditions and Fidelity disclaims any responsibility to update such views. These views may not be relied on as investment advice and, because investment decisions for a Fidelity fund are based on numerous factors, may not be relied on as an indication of trading intent on behalf of any Fidelity fund.
Annual Report
Fidelity Large Cap Core Enhanced Index Fund
Investment Changes (Unaudited)
Top Ten Stocks as of February 29, 2012 | ||
| % of fund's | % of fund's net assets |
Apple, Inc. | 4.2 | 3.2 |
Exxon Mobil Corp. | 3.6 | 3.3 |
Chevron Corp. | 2.1 | 2.2 |
Microsoft Corp. | 2.0 | 2.1 |
General Electric Co. | 1.9 | 1.8 |
Wells Fargo & Co. | 1.7 | 1.6 |
Google, Inc. Class A | 1.6 | 1.5 |
IBM Corp. | 1.5 | 1.9 |
Pfizer, Inc. | 1.4 | 1.7 |
Intel Corp. | 1.4 | 1.2 |
| 21.4 | |
Market Sectors as of February 29, 2012 | ||
| % of fund's | % of fund's net assets |
Information Technology | 20.5 | 18.9 |
Financials | 12.5 | 12.9 |
Energy | 12.0 | 12.0 |
Health Care | 11.8 | 12.6 |
Industrials | 11.0 | 9.3 |
Consumer Staples | 10.2 | 12.2 |
Consumer Discretionary | 9.3 | 9.5 |
Materials | 4.3 | 4.4 |
Utilities | 2.4 | 2.8 |
Telecommunication Services | 1.9 | 3.0 |
Annual Report
Fidelity Large Cap Core Enhanced Index Fund
Investments February 29, 2012
Showing Percentage of Net Assets
Common Stocks - 95.9% | |||
Shares | Value | ||
CONSUMER DISCRETIONARY - 9.3% | |||
Auto Components - 0.3% | |||
Lear Corp. | 19,926 | $ 900,854 | |
Automobiles - 0.7% | |||
Ford Motor Co. | 148,000 | 1,832,240 | |
Distributors - 0.3% | |||
Genuine Parts Co. | 12,683 | 794,970 | |
Diversified Consumer Services - 0.2% | |||
Apollo Group, Inc. Class A (non-vtg.) (a)(e) | 13,246 | 564,809 | |
Hotels, Restaurants & Leisure - 2.4% | |||
International Game Technology | 27,700 | 416,054 | |
McDonald's Corp. | 29,727 | 2,951,297 | |
Starbucks Corp. | 31,806 | 1,544,499 | |
Wynn Resorts Ltd. | 773 | 91,631 | |
Yum! Brands, Inc. | 19,008 | 1,259,090 | |
| 6,262,571 | ||
Internet & Catalog Retail - 0.2% | |||
Amazon.com, Inc. (a)(e) | 2,582 | 463,960 | |
Media - 2.1% | |||
Comcast Corp. Class A | 23,606 | 693,544 | |
DIRECTV (a)(e) | 30,676 | 1,420,912 | |
DISH Network Corp. Class A | 30,300 | 883,851 | |
Liberty Media Corp. Capital Series A (a) | 9,773 | 878,495 | |
McGraw-Hill Companies, Inc. | 24,672 | 1,148,235 | |
The Walt Disney Co. | 14,470 | 607,595 | |
| 5,632,632 | ||
Multiline Retail - 0.7% | |||
Kohl's Corp. | 13,452 | 668,295 | |
Macy's, Inc. | 19,980 | 758,641 | |
Target Corp. | 6,852 | 388,440 | |
| 1,815,376 | ||
Specialty Retail - 1.9% | |||
Bed Bath & Beyond, Inc. (a)(e) | 17,680 | 1,056,203 | |
Best Buy Co., Inc. (e) | 38,330 | 946,751 | |
Gap, Inc. (e) | 34,570 | 807,555 | |
Home Depot, Inc. | 14,751 | 701,705 | |
Limited Brands, Inc. | 19,199 | 893,329 | |
Lowe's Companies, Inc. | 17,711 | 502,638 | |
| 4,908,181 | ||
Textiles, Apparel & Luxury Goods - 0.5% | |||
Coach, Inc. | 18,120 | 1,356,101 | |
TOTAL CONSUMER DISCRETIONARY | 24,531,694 | ||
CONSUMER STAPLES - 10.2% | |||
Beverages - 1.7% | |||
Brown-Forman Corp. Class B (non-vtg.) | 1,513 | 123,536 | |
Dr Pepper Snapple Group, Inc. | 21,503 | 818,189 | |
| |||
Shares | Value | ||
PepsiCo, Inc. | 19,109 | $ 1,202,720 | |
The Coca-Cola Co. | 33,877 | 2,366,647 | |
| 4,511,092 | ||
Food & Staples Retailing - 2.6% | |||
CVS Caremark Corp. | 42,965 | 1,937,722 | |
Kroger Co. | 48,432 | 1,152,197 | |
Wal-Mart Stores, Inc. | 46,174 | 2,727,960 | |
Walgreen Co. | 27,656 | 917,073 | |
| 6,734,952 | ||
Food Products - 2.2% | |||
ConAgra Foods, Inc. (e) | 41,776 | 1,096,620 | |
Hershey Co. | 6,394 | 388,116 | |
Hormel Foods Corp. (e) | 23,049 | 656,205 | |
Kraft Foods, Inc. Class A | 13,045 | 496,623 | |
Mead Johnson Nutrition Co. Class A | 10,830 | 842,033 | |
Sara Lee Corp. | 41,916 | 848,799 | |
Smithfield Foods, Inc. (a)(e) | 25,071 | 587,414 | |
Tyson Foods, Inc. Class A | 45,756 | 865,246 | |
| 5,781,056 | ||
Household Products - 1.5% | |||
Church & Dwight Co., Inc. (e) | 700 | 33,418 | |
Clorox Co. (e) | 13,983 | 945,391 | |
Colgate-Palmolive Co. (e) | 417 | 38,856 | |
Procter & Gamble Co. | 42,833 | 2,892,084 | |
| 3,909,749 | ||
Tobacco - 2.2% | |||
Altria Group, Inc. (e) | 17,695 | 532,620 | |
Lorillard, Inc. | 7,349 | 963,307 | |
Philip Morris International, Inc. (e) | 42,606 | 3,558,453 | |
Reynolds American, Inc. | 16,100 | 675,073 | |
| 5,729,453 | ||
TOTAL CONSUMER STAPLES | 26,666,302 | ||
ENERGY - 12.0% | |||
Energy Equipment & Services - 1.6% | |||
Halliburton Co. | 39,791 | 1,455,953 | |
National Oilwell Varco, Inc. | 18,943 | 1,563,366 | |
Schlumberger Ltd. | 16,352 | 1,269,079 | |
| 4,288,398 | ||
Oil, Gas & Consumable Fuels - 10.4% | |||
Anadarko Petroleum Corp. | 540 | 45,425 | |
Chevron Corp. | 50,407 | 5,500,412 | |
ConocoPhillips | 41,806 | 3,200,249 | |
Exxon Mobil Corp. | 108,493 | 9,384,645 | |
Hess Corp. | 18,982 | 1,232,311 | |
HollyFrontier Corp. | 100 | 3,263 | |
Marathon Oil Corp. | 45,339 | 1,536,539 | |
Marathon Petroleum Corp. | 33,293 | 1,383,324 | |
Murphy Oil Corp. | 17,893 | 1,144,078 | |
Common Stocks - continued | |||
Shares | Value | ||
ENERGY - continued | |||
Oil, Gas & Consumable Fuels - continued | |||
Occidental Petroleum Corp. | 23,327 | $ 2,434,639 | |
Valero Energy Corp. (e) | 53,651 | 1,313,913 | |
| 27,178,798 | ||
TOTAL ENERGY | 31,467,196 | ||
FINANCIALS - 12.5% | |||
Capital Markets - 1.6% | |||
Goldman Sachs Group, Inc. | 17,668 | 2,034,294 | |
Morgan Stanley | 74,464 | 1,380,563 | |
SEI Investments Co. | 43,725 | 863,569 | |
| 4,278,426 | ||
Commercial Banks - 3.9% | |||
Fifth Third Bancorp | 86,386 | 1,175,713 | |
Huntington Bancshares, Inc. | 88,180 | 515,412 | |
KeyCorp | 127,857 | 1,035,642 | |
PNC Financial Services Group, Inc. | 22,776 | 1,355,628 | |
U.S. Bancorp | 63,430 | 1,864,842 | |
Wells Fargo & Co. | 139,562 | 4,366,895 | |
| 10,314,132 | ||
Consumer Finance - 1.2% | |||
American Express Co. (e) | 37,570 | 1,987,077 | |
Discover Financial Services | 41,901 | 1,257,449 | |
| 3,244,526 | ||
Diversified Financial Services - 2.0% | |||
Bank of America Corp. | 129,302 | 1,030,537 | |
Citigroup, Inc. | 63,990 | 2,132,147 | |
JPMorgan Chase & Co. | 54,902 | 2,154,354 | |
| 5,317,038 | ||
Insurance - 2.8% | |||
ACE Ltd. (e) | 18,852 | 1,351,877 | |
AFLAC, Inc. | 18,580 | 877,905 | |
Berkshire Hathaway, Inc. Class B (a) | 20,933 | 1,642,194 | |
Brown & Brown, Inc. | 4,006 | 94,662 | |
Marsh & McLennan Companies, Inc. | 8,365 | 260,988 | |
Progressive Corp. (e) | 42,603 | 912,556 | |
Prudential Financial, Inc. (e) | 24,400 | 1,492,304 | |
Validus Holdings Ltd. | 22,133 | 674,835 | |
| 7,307,321 | ||
Real Estate Investment Trusts - 1.0% | |||
Public Storage | 9,295 | 1,246,181 | |
Simon Property Group, Inc. | 7,709 | 1,044,415 | |
Weyerhaeuser Co. | 9,076 | 189,598 | |
| 2,480,194 | ||
TOTAL FINANCIALS | 32,941,637 | ||
| |||
Shares | Value | ||
HEALTH CARE - 11.8% | |||
Biotechnology - 1.5% | |||
Amgen, Inc. | 28,609 | $ 1,943,982 | |
Biogen Idec, Inc. (a) | 11,260 | 1,311,452 | |
Gilead Sciences, Inc. (a) | 11,700 | 532,350 | |
| 3,787,784 | ||
Health Care Equipment & Supplies - 1.1% | |||
Baxter International, Inc. | 19,347 | 1,124,641 | |
Becton, Dickinson & Co. | 1,658 | 126,373 | |
Covidien PLC | 1,198 | 62,596 | |
Hill-Rom Holdings, Inc. | 25,300 | 859,441 | |
Medtronic, Inc. (e) | 18,129 | 691,077 | |
| 2,864,128 | ||
Health Care Providers & Services - 3.4% | |||
Aetna, Inc. | 26,658 | 1,246,528 | |
Cardinal Health, Inc. | 27,483 | 1,141,919 | |
HCA Holdings, Inc. | 25,636 | 683,712 | |
Health Net, Inc. (a) | 5,200 | 196,248 | |
Humana, Inc. | 13,741 | 1,196,841 | |
McKesson Corp. | 15,512 | 1,295,407 | |
UnitedHealth Group, Inc. | 33,321 | 1,857,646 | |
WellPoint, Inc. | 20,309 | 1,332,880 | |
| 8,951,181 | ||
Life Sciences Tools & Services - 0.2% | |||
Agilent Technologies, Inc. | 11,318 | 493,691 | |
Pharmaceuticals - 5.6% | |||
Abbott Laboratories (e) | 40,868 | 2,313,537 | |
Bristol-Myers Squibb Co. (e) | 54,514 | 1,753,715 | |
Eli Lilly & Co. | 41,826 | 1,641,252 | |
Johnson & Johnson | 48,668 | 3,167,313 | |
Merck & Co., Inc. | 54,106 | 2,065,226 | |
Pfizer, Inc. (e) | 180,825 | 3,815,408 | |
| 14,756,451 | ||
TOTAL HEALTH CARE | 30,853,235 | ||
INDUSTRIALS - 11.0% | |||
Aerospace & Defense - 3.2% | |||
General Dynamics Corp. | 18,616 | 1,363,250 | |
Honeywell International, Inc. | 9,780 | 582,595 | |
L-3 Communications Holdings, Inc. | 14,430 | 1,013,708 | |
Lockheed Martin Corp. | 15,793 | 1,396,259 | |
Northrop Grumman Corp. | 20,205 | 1,208,461 | |
Raytheon Co. (e) | 20,172 | 1,019,089 | |
The Boeing Co. (e) | 3,296 | 247,035 | |
United Technologies Corp. (e) | 17,415 | 1,460,596 | |
| 8,290,993 | ||
Air Freight & Logistics - 0.3% | |||
United Parcel Service, Inc. Class B | 8,554 | 657,717 | |
Airlines - 0.3% | |||
Delta Air Lines, Inc. (a) | 77,500 | 760,275 | |
Common Stocks - continued | |||
Shares | Value | ||
INDUSTRIALS - continued | |||
Electrical Equipment - 0.1% | |||
AMETEK, Inc. | 3,200 | $ 152,320 | |
Emerson Electric Co. | 1,217 | 61,227 | |
| 213,547 | ||
Industrial Conglomerates - 3.0% | |||
3M Co. | 22,323 | 1,955,495 | |
General Electric Co. | 264,700 | 5,042,535 | |
Tyco International Ltd. | 18,831 | 975,822 | |
| 7,973,852 | ||
Machinery - 2.2% | |||
Caterpillar, Inc. (e) | 16,481 | 1,882,295 | |
Cummins, Inc. | 10,411 | 1,255,254 | |
Deere & Co. | 1,335 | 110,712 | |
Dover Corp. | 13,966 | 894,103 | |
Oshkosh Truck Corp. (a) | 33,700 | 785,547 | |
Parker Hannifin Corp. (e) | 10,451 | 938,604 | |
| 5,866,515 | ||
Road & Rail - 1.5% | |||
CSX Corp. | 54,490 | 1,144,835 | |
Norfolk Southern Corp. (e) | 13,825 | 952,543 | |
Union Pacific Corp. | 16,624 | 1,832,796 | |
| 3,930,174 | ||
Trading Companies & Distributors - 0.4% | |||
W.W. Grainger, Inc. (e) | 5,131 | 1,065,863 | |
TOTAL INDUSTRIALS | 28,758,936 | ||
INFORMATION TECHNOLOGY - 20.5% | |||
Communications Equipment - 2.5% | |||
Cisco Systems, Inc. | 158,999 | 3,160,900 | |
Motorola Solutions, Inc. | 20,542 | 1,022,992 | |
QUALCOMM, Inc. | 40,028 | 2,488,941 | |
| 6,672,833 | ||
Computers & Peripherals - 5.3% | |||
Apple, Inc. (a) | 20,350 | 11,038,653 | |
Dell, Inc. (a)(e) | 63,349 | 1,095,938 | |
EMC Corp. (a)(e) | 8,709 | 241,152 | |
Hewlett-Packard Co. | 10,500 | 265,755 | |
Western Digital Corp. (a) | 31,660 | 1,242,655 | |
| 13,884,153 | ||
Internet Software & Services - 1.6% | |||
Google, Inc. Class A (a) | 6,636 | 4,102,707 | |
IT Services - 4.1% | |||
Accenture PLC Class A (e) | 26,954 | 1,604,841 | |
Computer Sciences Corp. | 6,464 | 205,297 | |
Fiserv, Inc. (a)(e) | 2,642 | 175,165 | |
IBM Corp. | 19,624 | 3,860,630 | |
MasterCard, Inc. Class A | 4,149 | 1,742,580 | |
The Western Union Co. | 16,932 | 295,802 | |
| |||
Shares | Value | ||
Total System Services, Inc. | 42,354 | $ 926,706 | |
Visa, Inc. Class A | 17,652 | 2,054,163 | |
| 10,865,184 | ||
Semiconductors & Semiconductor Equipment - 3.4% | |||
Applied Materials, Inc. | 104,585 | 1,280,120 | |
Avago Technologies Ltd. | 26,926 | 1,012,687 | |
Broadcom Corp. Class A | 2,400 | 89,160 | |
Intel Corp. (e) | 140,390 | 3,773,683 | |
KLA-Tencor Corp. (e) | 20,100 | 972,840 | |
LSI Corp. (a) | 119,900 | 1,031,140 | |
Marvell Technology Group Ltd. (a) | 42,891 | 643,365 | |
| 8,802,995 | ||
Software - 3.6% | |||
Activision Blizzard, Inc. (e) | 52,022 | 621,663 | |
Intuit, Inc. | 6,067 | 350,915 | |
Microsoft Corp. | 163,860 | 5,200,916 | |
Oracle Corp. | 110,523 | 3,235,008 | |
| 9,408,502 | ||
TOTAL INFORMATION TECHNOLOGY | 53,736,374 | ||
MATERIALS - 4.3% | |||
Chemicals - 3.1% | |||
CF Industries Holdings, Inc. (e) | 6,829 | 1,270,194 | |
E.I. du Pont de Nemours & Co. | 9,145 | 465,023 | |
Eastman Chemical Co. | 19,300 | 1,044,709 | |
Huntsman Corp. | 64,300 | 878,338 | |
LyondellBasell Industries NV Class A | 24,888 | 1,074,664 | |
Monsanto Co. | 20,195 | 1,562,689 | |
PPG Industries, Inc. | 13,100 | 1,195,375 | |
The Mosaic Co. | 13,097 | 756,352 | |
| 8,247,344 | ||
Metals & Mining - 0.7% | |||
Freeport-McMoRan Copper & Gold, Inc. | 21,570 | 918,019 | |
Newmont Mining Corp. (e) | 17,056 | 1,013,126 | |
| 1,931,145 | ||
Paper & Forest Products - 0.5% | |||
International Paper Co. | 33,500 | 1,177,525 | |
TOTAL MATERIALS | 11,356,014 | ||
TELECOMMUNICATION SERVICES - 1.9% | |||
Diversified Telecommunication Services - 1.9% | |||
AT&T, Inc. (e) | 92,501 | 2,829,606 | |
Verizon Communications, Inc. (e) | 56,158 | 2,140,181 | |
| 4,969,787 | ||
UTILITIES - 2.4% | |||
Electric Utilities - 0.9% | |||
American Electric Power Co., Inc. | 21,434 | 806,133 | |
Duke Energy Corp. (e) | 439 | 9,184 | |
Entergy Corp. | 12,870 | 857,528 | |
Common Stocks - continued | |||
Shares | Value | ||
UTILITIES - continued | |||
Electric Utilities - continued | |||
Exelon Corp. (e) | 2,176 | $ 85,016 | |
Northeast Utilities | 20,139 | 722,990 | |
| 2,480,851 | ||
Multi-Utilities - 1.3% | |||
Ameren Corp. | 32,183 | 1,032,109 | |
CenterPoint Energy, Inc. | 46,740 | 910,963 | |
Public Service Enterprise Group, | 33,579 | 1,033,562 | |
Xcel Energy, Inc. | 16,951 | 449,032 | |
| 3,425,666 | ||
Water Utilities - 0.2% | |||
American Water Works Co., Inc. | 11,500 | 394,220 | |
TOTAL UTILITIES | 6,300,737 | ||
TOTAL COMMON STOCKS (Cost $249,758,112) |
| ||
U.S. Treasury Obligations - 0.3% | ||||
| Principal Amount |
| ||
U.S. Treasury Bills, yield at date of purchase 0.03% to 0.11% 6/7/12 to 6/28/12 (f) | $ 720,000 |
| ||
Money Market Funds - 22.0% | |||
Shares |
| ||
Dreyfus Cash Management Institutional Shares, 0.10% (c) | 9,279,857 | 9,279,857 | |
Fidelity Securities Lending Cash Central Fund, 0.12% (b)(d) | 48,268,375 | 48,268,375 | |
TOTAL MONEY MARKET FUNDS (Cost $57,548,232) |
| ||
TOTAL INVESTMENT PORTFOLIO - 118.2% (Cost $308,026,200) | 309,849,984 | ||
NET OTHER ASSETS (LIABILITIES) - (18.2)% | (47,625,219) | ||
NET ASSETS - 100% | $ 262,224,765 | ||
Futures Contracts | |||||
Expiration Date | Underlying Face Amount at Value | Unrealized Appreciation/(Depreciation) | |||
Purchased | |||||
Equity Index Contracts | |||||
156 CME E-mini S&P 500 Index Contracts | March 2012 | $ 10,642,320 | $ 233,621 | ||
The face value of futures purchased as a percentage of net assets is 4.1% |
Legend |
(a) Non-income producing |
(b) Affiliated fund that is available only to investment companies and other accounts managed by Fidelity Investments. The rate quoted is the annualized seven-day yield of the fund at period end. A complete unaudited listing of the fund's holdings as of its most recent quarter end is available upon request. In addition, each Fidelity Central Fund's financial statements, which are not covered by the Fund's Report of Independent Registered Public Accounting Firm, are available on the SEC's website or upon request. |
(c) The rate quoted is the annualized seven-day yield of the fund at period end. |
(d) Investment made with cash collateral received from securities on loan. |
(e) Security or a portion of the security is on loan at period end. |
(f) Security or a portion of the security was pledged to cover margin requirements for futures contracts. At the period end, the value of securities pledged amounted to $669,856. |
Affiliated Central Funds |
Information regarding fiscal year to date income earned by the Fund from investments in Fidelity Central Funds is as follows: |
Fund | Income earned |
Fidelity Securities Lending Cash Central Fund | $ 28,408 |
Other Information |
The following is a summary of the inputs used, as of February 29, 2012, involving the Fund's assets and liabilities carried at fair value. The inputs or methodology used for valuing securities may not be an indication of the risk associated with investing in those securities. For more information on valuation inputs, and their aggregation into the levels used in the table below, please refer to the Security Valuation section in the accompanying Notes to Financial Statements. |
Valuation Inputs at Reporting Date: | ||||
Description | Total | Level 1 | Level 2 | Level 3 |
Investments in Securities: | ||||
Equities: | ||||
Consumer Discretionary | $ 24,531,694 | $ 24,531,694 | $ - | $ - |
Consumer Staples | 26,666,302 | 26,666,302 | - | - |
Energy | 31,467,196 | 31,467,196 | - | - |
Financials | 32,941,637 | 32,941,637 | - | - |
Health Care | 30,853,235 | 30,853,235 | - | - |
Industrials | 28,758,936 | 28,758,936 | - | - |
Information Technology | 53,736,374 | 53,736,374 | - | - |
Materials | 11,356,014 | 11,356,014 | - | - |
Telecommunication Services | 4,969,787 | 4,969,787 | - | - |
Utilities | 6,300,737 | 6,300,737 | - | - |
U.S. Government and Government Agency Obligations | 719,840 | - | 719,840 | - |
Money Market Funds | 57,548,232 | 57,548,232 | - | - |
Total Investments in Securities: | $ 309,849,984 | $ 309,130,144 | $ 719,840 | $ - |
Derivative Instruments: | ||||
Assets | ||||
Futures Contracts | $ 233,621 | $ 233,621 | $ - | $ - |
Value of Derivative Instruments |
The following table is a summary of the Fund's value of derivative instruments by risk exposure as of February 29, 2012. For additional information on derivative instruments, please refer to the Derivative Instruments section in the accompanying Notes to Financial Statements. |
Risk Exposure / | Value | |
| Asset | Liability |
Equity Risk | ||
Futures Contracts (a) | $ 233,621 | $ - |
Total Value of Derivatives | $ 233,621 | $ - |
(a) Reflects cumulative appreciation/(depreciation) on futures contracts as disclosed on the Schedule of Investments. Only the period end variation margin is separately disclosed on the Statement of Assets and Liabilities. |
See accompanying notes which are an integral part of the financial statements.
Annual Report
Fidelity Large Cap Core Enhanced Index Fund
Financial Statements
Statement of Assets and Liabilities
| February 29, 2012 | |
|
|
|
Assets | ||
Investment in securities, at value (including securities loaned of $46,785,534) - See accompanying schedule: Unaffiliated issuers (cost $259,757,825) | $ 261,581,609 |
|
Fidelity Central Funds (cost $48,268,375) | 48,268,375 |
|
Total Investments (cost $308,026,200) |
| $ 309,849,984 |
Receivable for fund shares sold | 465,383 | |
Dividends receivable | 691,553 | |
Interest receivable | 910 | |
Distributions receivable from Fidelity Central Funds | 2,536 | |
Total assets | 311,010,366 | |
|
|
|
Liabilities | ||
Payable for fund shares redeemed | $ 365,870 | |
Accrued management fee | 64,300 | |
Payable for daily variation margin on futures contracts | 54,941 | |
Other affiliated payables | 32,115 | |
Collateral on securities loaned, at value | 48,268,375 | |
Total liabilities | 48,785,601 | |
|
|
|
Net Assets | $ 262,224,765 | |
Net Assets consist of: |
| |
Paid in capital | $ 280,531,484 | |
Undistributed net investment income | 8 | |
Accumulated undistributed net realized gain (loss) on investments | (20,364,132) | |
Net unrealized appreciation (depreciation) on investments | 2,057,405 | |
Net Assets, for 27,090,129 shares outstanding | $ 262,224,765 | |
Net Asset Value, offering price and redemption price per share ($262,224,765 ÷ 27,090,129 shares) | $ 9.68 | |
Statement of Operations
| Year ended February 29, 2012 | |
|
|
|
Investment Income |
|
|
Dividends |
| $ 6,458,024 |
Interest |
| 11,387 |
Income from Fidelity Central Funds |
| 28,408 |
Total income |
| 6,497,819 |
|
|
|
Expenses | ||
Management fee | $ 975,822 | |
Transfer agent fees | 481,539 | |
Independent trustees' compensation | 2,579 | |
Interest | 1,769 | |
Miscellaneous | 1,418 | |
Total expenses before reductions | 1,463,127 | |
Expense reductions | (36) | 1,463,091 |
Net investment income (loss) | 5,034,728 | |
Realized and Unrealized Gain (Loss) Net realized gain (loss) on: | ||
Investment securities: |
|
|
Unaffiliated issuers | 16,810,103 | |
Futures contracts | 1,434,578 | |
Total net realized gain (loss) |
| 18,244,681 |
Change in net unrealized appreciation (depreciation) on: Investment securities | (29,211,322) | |
Futures contracts | 267,248 | |
Total change in net unrealized appreciation (depreciation) |
| (28,944,074) |
Net gain (loss) | (10,699,393) | |
Net increase (decrease) in net assets resulting from operations | $ (5,664,665) | |
See accompanying notes which are an integral part of the financial statements.
Annual Report
Statement of Changes in Net Assets
| Year ended | Year ended |
Increase (Decrease) in Net Assets |
|
|
Operations |
|
|
Net investment income (loss) | $ 5,034,728 | $ 15,016,843 |
Net realized gain (loss) | 18,244,681 | 64,507,363 |
Change in net unrealized appreciation (depreciation) | (28,944,074) | 92,870,217 |
Net increase (decrease) in net assets resulting from operations | (5,664,665) | 172,394,423 |
Distributions to shareholders from net investment income | (2,264,397) | (15,976,149) |
Share transactions | 212,282,081 | 140,360,567 |
Reinvestment of distributions | 2,249,226 | 15,540,824 |
Cost of shares redeemed | (913,023,187) | (349,858,780) |
Net increase (decrease) in net assets resulting from share transactions | (698,491,880) | (193,957,389) |
Total increase (decrease) in net assets | (706,420,942) | (37,539,115) |
|
|
|
Net Assets | ||
Beginning of period | 968,645,707 | 1,006,184,822 |
End of period (including undistributed net investment income of $8 and undistributed net investment income of $2,062,802, respectively) | $ 262,224,765 | $ 968,645,707 |
Other Information Shares | ||
Sold | 23,586,792 | 17,443,766 |
Issued in reinvestment of distributions | 247,985 | 1,846,723 |
Redeemed | (103,303,937) | (43,600,768) |
Net increase (decrease) | (79,469,160) | (24,310,279) |
Financial Highlights
Years ended February 28, | 2012 J | 2011 | 2010 | 2009 | 2008 H |
Selected Per-Share Data |
|
|
|
|
|
Net asset value, beginning of period | $ 9.09 | $ 7.69 | $ 5.27 | $ 9.20 | $ 10.00 |
Income from Investment Operations |
|
|
|
|
|
Net investment income (loss) D | .14 | .13 | .12 | .16 | .15 |
Net realized and unrealized gain (loss) | .48 G | 1.42 | 2.43 | (3.95) | (.90) |
Total from investment operations | .62 | 1.55 | 2.55 | (3.79) | (.75) |
Distributions from net investment income | (.03) | (.15) | (.13) | (.14) | (.05) |
Net asset value, end of period | $ 9.68 | $ 9.09 | $ 7.69 | $ 5.27 | $ 9.20 |
Total Return B,C | 6.78% | 20.25% | 48.52% | (41.51)% | (7.59)% |
Ratios to Average Net Assets E,I |
|
|
|
|
|
Expenses before reductions | .45% | .45% | .45% | .45% | .45% A |
Expenses net of fee waivers, if any | .45% | .45% | .45% | .45% | .45% A |
Expenses net of all reductions | .45% | .45% | .45% | .45% | .45%A |
Net investment income (loss) | 1.53% | 1.58% | 1.76% | 2.05% | 1.83% A |
Supplemental Data |
|
|
|
|
|
Net assets, end of period (000 omitted) | $ 262,225 | $ 968,646 | $ 1,006,185 | $ 723,548 | $ 834,523 |
Portfolio turnover rate F | 104% | 64% | 60% K | 45% K | 5% A |
A Annualized
B Total returns for periods of less than one year are not annualized.
C Total returns would have been lower if certain expenses had not been reduced during the applicable periods shown.
D Calculated based on average shares outstanding during the period.
E Fees and expenses of any underlying funds and Fidelity Central Funds are not included in the Fund's expense ratio. The Fund indirectly bears its proportionate share of the expenses of any underlying funds and Fidelity Central Funds.
F Amount does not include the portfolio activity of any underlying funds and Fidelity Central Funds.
G The amount shown for a share outstanding does not correspond with the aggregate net gain (loss) on investments for the period due to the timing of sales and repurchases of shares in relation to fluctuating market values of the investments of the Fund.
H For the period April 19, 2007 (commencement of operations) to February 29, 2008.
I Expense ratios reflect operating expenses of the Fund. Expenses before reductions do not reflect amounts reimbursed by the investment adviser or reductions from expense offset arrangements and do not represent the amount paid by the Fund during periods when reimbursements or reductions occur. Expenses net of fee waivers reflect expenses after reimbursement by the investment adviser but prior to reductions from expense offset arrangements. Expenses net of all reductions represent the net expenses paid by the Fund.
J For the year ended February 29.
K Reflects adjustments to exclude transactions in money market mutual funds.
See accompanying notes which are an integral part of the financial statements.
Annual Report
Fidelity Mid Cap Enhanced Index Fund
Performance: The Bottom Line
Average annual total return reflects the change in the value of an investment, assuming reinvestment of the fund's distributions from dividend income and capital gains (the profits earned upon the sale of securities that have grown in value, if any) and assuming a constant rate of performance each year. The $10,000 table and the fund's returns do not reflect the deduction of taxes that a shareholder would pay on fund distributions or the redemption of fund shares. During periods of reimbursement by Fidelity a fund's total returns will be greater than it would be had the reimbursement not occurred. How a fund did yesterday is no guarantee of how it will do tomorrow.
Average Annual Total Returns
Periods ended February 29, 2012 | Past 1 | Life of |
Fidelity Mid Cap Enhanced Index Fund | 1.91% | 2.83% |
A From December 20, 2007.
$10,000 Over Life of Fund
Let's say hypothetically that $10,000 was invested in Fidelity Mid Cap Enhanced Index Fund on December 20, 2007, when the fund started. The chart shows how the value of your investment would have changed, and also shows how the Russell MidCap® Index performed over the same period.
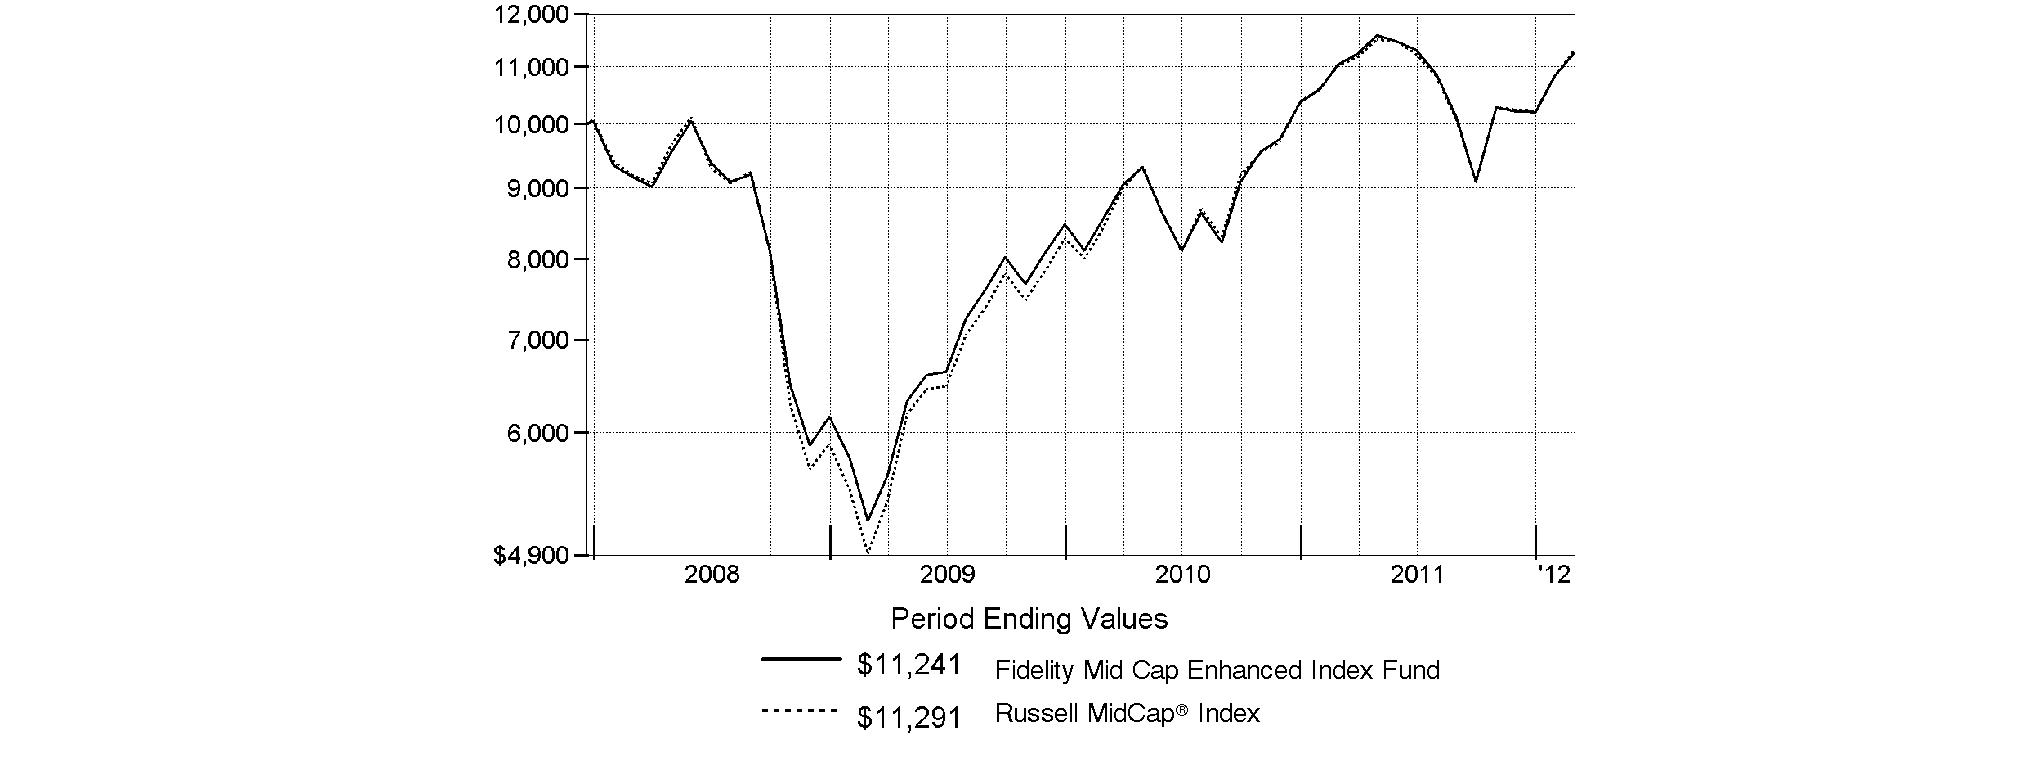
Annual Report
Fidelity Mid Cap Enhanced Index Fund
Management's Discussion of Fund Performance
Market Recap: U.S. stocks rose for the 12 months ending February 29, 2012, as encouraging economic news sparked a strong late-period rally that lifted major equity benchmarks past a number of significant milestones. Stocks recovered from early-period uncertainty that followed the March 2011 earthquake, tsunami and nuclear meltdown in Japan, but plummeted during the summer amid Europe's debt woes and a historic U.S. credit-rating downgrade. Despite continued volatility and mixed economic news, markets began to recover in early October. Investors gravitated toward defensive sectors and the perceived safety of larger, more-established and dividend-paying names, helping the Dow Jones® Industrial Average advance 8.83%, and close above the psychologically important 13,000 mark in late February - for the first time since May 2008. The rally accelerated late in the period and the market broadened, as investor confidence improved amid encouraging manufacturing, housing and employment data, and signs of progress in Europe. For the year, the S&P 500® Index added 5.12%, closing near a four-year high on the period's second-to-last day. The technology-laden Nasdaq Composite® Index added 7.73%, flirting with the 3,000 mark, its highest level in 12 years. Foreign developed-markets stocks reeled over Europe's turmoil, and the MSCI® EAFE® (Europe, Australasia, Far East) Index fell 7.35%.
Comments from Maximilian Kaufmann, Senior Portfolio Manager of the Geode Capital Management, LLC, investment management team for Fidelity® Mid Cap Enhanced Index Fund: For the year ending February 29, 2012, the fund gained 1.91%, lagging the 2.59% increase in the Russell Midcap® Index. Weak positioning in the utilities sector hampered performance the most compared with the Russell index, while security selection in information technology and industrials also hurt. In contrast, stock picking in consumer discretionary was a source of relative strength, led by the retailing and consumer durables/apparel industries. The fund's positioning in financials, health care and consumer staples also contributed. Looking at individual stocks, Vonage Holdings, an out-of-benchmark provider of Internet telephone service, topped the list of relative detractors. The company's stock dropped 46% during the reporting period. Not owning benchmark component Petrohawk Energy was another negative. Petrohawk's shares soared in July after the independent oil and gas producer agreed to be acquired by BHP Billiton. The transaction closed in August. Another very strong performer that, unfortunately, the fund did not own was biotechnology firm Pharmasset, which, in January, was acquired for a substantial premium by Gilead Sciences. Other notable underperformers were semiconductor maker Vishay Intertechnology and out-of-benchmark U.S. silver producer Hecla Mining. On the positive side, shares in Herbalife, a direct marketer of nutritional supplements and weight loss products, benefited following several strong earnings forecasts. An out-of-benchmark stake in biotechnology company Biogen Idec was helpful, as in October the company announced a promising late-stage trial of its experimental drug to treat multiple sclerosis. Retailer Macy's saw its stock price steadily rise during the period, while apparel company VF also gained ground. Several of the stocks I've mentioned were not in the portfolio at period end.
The views expressed above reflect those of the portfolio manager(s) only through the end of the period as stated on the cover of this report and do not necessarily represent the views of Fidelity or any other person in the Fidelity organization. Any such views are subject to change at any time based upon market or other conditions and Fidelity disclaims any responsibility to update such views. These views may not be relied on as investment advice and, because investment decisions for a Fidelity fund are based on numerous factors, may not be relied on as an indication of trading intent on behalf of any Fidelity fund.
Annual Report
Fidelity Mid Cap Enhanced Index Fund
Investment Changes (Unaudited)
Top Ten Stocks as of February 29, 2012 | ||
| % of fund's | % of fund's net assets |
Macy's, Inc. | 0.9 | 0.7 |
Discover Financial Services | 0.9 | 0.8 |
Intuit, Inc. | 0.8 | 0.7 |
Agilent Technologies, Inc. | 0.8 | 0.7 |
Valero Energy Corp. | 0.8 | 0.7 |
Ecolab, Inc. | 0.9 | 0.0 |
International Paper Co. | 0.8 | 0.6 |
CF Industries Holdings, Inc. | 0.8 | 0.8 |
Humana, Inc. | 0.8 | 0.8 |
Western Digital Corp. | 0.8 | 0.5 |
| 8.3 | |
Market Sectors as of February 29, 2012 | ||
| % of fund's | % of fund's net assets |
Financials | 16.7 | 16.2 |
Consumer Discretionary | 15.9 | 17.1 |
Information Technology | 15.1 | 12.8 |
Industrials | 13.3 | 10.7 |
Health Care | 9.7 | 10.1 |
Energy | 7.7 | 7.3 |
Consumer Staples | 6.9 | 7.9 |
Materials | 6.6 | 8.2 |
Utilities | 4.7 | 4.6 |
Telecommunication Services | 1.1 | 0.8 |
Annual Report
Fidelity Mid Cap Enhanced Index Fund
Investments February 29, 2012
Showing Percentage of Net Assets
Common Stocks - 97.7% | |||
Shares | Value | ||
CONSUMER DISCRETIONARY - 15.9% | |||
Auto Components - 1.3% | |||
Autoliv, Inc. | 3,949 | $ 263,003 | |
Lear Corp. | 10,077 | 455,581 | |
TRW Automotive Holdings Corp. (a) | 6,920 | 316,521 | |
| 1,035,105 | ||
Automobiles - 0.4% | |||
Ford Motor Co. | 27,197 | 336,699 | |
Distributors - 0.6% | |||
Genuine Parts Co. | 7,987 | 500,625 | |
Diversified Consumer Services - 0.6% | |||
Apollo Group, Inc. Class A (non-vtg.) (a) | 8,063 | 343,806 | |
Career Education Corp. (a) | 9,900 | 85,338 | |
| 429,144 | ||
Hotels, Restaurants & Leisure - 1.0% | |||
International Game Technology | 24,697 | 370,949 | |
Wyndham Worldwide Corp. | 9,686 | 426,087 | |
| 797,036 | ||
Household Durables - 0.8% | |||
Harman International Industries, Inc. | 9,672 | 475,185 | |
Leggett & Platt, Inc. | 7,048 | 159,496 | |
| 634,681 | ||
Internet & Catalog Retail - 0.0% | |||
Liberty Media Corp. Interactive | 100 | 1,876 | |
Leisure Equipment & Products - 0.6% | |||
Polaris Industries, Inc. | 7,082 | 467,837 | |
Media - 2.5% | |||
DISH Network Corp. Class A | 15,738 | 459,077 | |
Gannett Co., Inc. | 10,000 | 148,400 | |
Liberty Media Corp. Capital Series A (a) | 6,025 | 541,587 | |
McGraw-Hill Companies, Inc. | 12,252 | 570,208 | |
Valassis Communications, Inc. (a) | 10,700 | 267,286 | |
| 1,986,558 | ||
Multiline Retail - 2.1% | |||
Dollar General Corp. (a) | 9,400 | 395,364 | |
Dollar Tree, Inc. (a) | 6,211 | 549,736 | |
Macy's, Inc. | 18,794 | 713,608 | |
Nordstrom, Inc. | 180 | 9,652 | |
| 1,668,360 | ||
Specialty Retail - 5.5% | |||
AutoZone, Inc. (a) | 1,443 | 540,375 | |
Bed Bath & Beyond, Inc. (a) | 10,271 | 613,590 | |
Best Buy Co., Inc. | 18,392 | 454,282 | |
Gap, Inc. (e) | 22,500 | 525,600 | |
Limited Brands, Inc. | 12,532 | 583,114 | |
O'Reilly Automotive, Inc. (a) | 1,378 | 119,197 | |
PetSmart, Inc. | 9,285 | 517,546 | |
Ross Stores, Inc. | 4,600 | 245,318 | |
Staples, Inc. | 2,242 | 32,868 | |
| |||
Shares | Value | ||
TJX Companies, Inc. | 11,498 | $ 420,942 | |
Williams-Sonoma, Inc. | 7,217 | 278,576 | |
| 4,331,408 | ||
Textiles, Apparel & Luxury Goods - 0.5% | |||
Coach, Inc. | 5,204 | 389,467 | |
TOTAL CONSUMER DISCRETIONARY | 12,578,796 | ||
CONSUMER STAPLES - 6.9% | |||
Beverages - 2.0% | |||
Brown-Forman Corp. Class B (non-vtg.) | 4,606 | 376,080 | |
Coca-Cola Enterprises, Inc. | 16,893 | 488,208 | |
Constellation Brands, Inc. Class A (sub. vtg.) (a) | 11,475 | 250,614 | |
Dr Pepper Snapple Group, Inc. | 12,054 | 458,655 | |
| 1,573,557 | ||
Food & Staples Retailing - 0.6% | |||
Safeway, Inc. | 21,825 | 468,146 | |
Food Products - 3.1% | |||
Bunge Ltd. | 2,925 | 196,911 | |
ConAgra Foods, Inc. | 20,365 | 534,581 | |
Hershey Co. | 7,289 | 442,442 | |
Hormel Foods Corp. | 7,800 | 222,066 | |
Mead Johnson Nutrition Co. Class A | 1,339 | 104,107 | |
Sara Lee Corp. | 9,435 | 191,059 | |
Smithfield Foods, Inc. (a)(e) | 14,968 | 350,700 | |
The J.M. Smucker Co. | 343 | 25,835 | |
Tyson Foods, Inc. Class A | 21,507 | 406,697 | |
| 2,474,398 | ||
Personal Products - 0.7% | |||
Avon Products, Inc. | 1,214 | 22,690 | |
Herbalife Ltd. | 7,869 | 521,006 | |
| 543,696 | ||
Tobacco - 0.5% | |||
Lorillard, Inc. | 2,800 | 367,024 | |
TOTAL CONSUMER STAPLES | 5,426,821 | ||
ENERGY - 7.7% | |||
Energy Equipment & Services - 1.9% | |||
Core Laboratories NV | 50 | 6,083 | |
Diamond Offshore Drilling, Inc. (e) | 4,431 | 303,391 | |
Helmerich & Payne, Inc. (e) | 6,163 | 377,792 | |
Oceaneering International, Inc. | 9,454 | 513,069 | |
SEACOR Holdings, Inc. (a) | 3,607 | 356,660 | |
| 1,556,995 | ||
Oil, Gas & Consumable Fuels - 5.8% | |||
Cloud Peak Energy, Inc. (a) | 10,462 | 185,387 | |
CVR Energy, Inc. (a) | 11,929 | 324,588 | |
Denbury Resources, Inc. (a) | 25,500 | 507,705 | |
El Paso Corp. | 6,670 | 185,493 | |
EQT Corp. | 3,801 | 201,529 | |
Common Stocks - continued | |||
Shares | Value | ||
ENERGY - continued | |||
Oil, Gas & Consumable Fuels - continued | |||
Golar LNG Ltd. (NASDAQ) | 7,011 | $ 297,757 | |
HollyFrontier Corp. | 14,344 | 468,045 | |
Murphy Oil Corp. | 9,245 | 591,125 | |
Noble Energy, Inc. | 3,757 | 366,871 | |
Peabody Energy Corp. | 8,124 | 283,365 | |
Pioneer Natural Resources Co. | 253 | 27,739 | |
Spectra Energy Corp. | 1,740 | 54,601 | |
Targa Resources Corp. | 100 | 4,443 | |
Tesoro Corp. (a) | 15,444 | 409,729 | |
Valero Energy Corp. | 26,778 | 655,793 | |
| 4,564,170 | ||
TOTAL ENERGY | 6,121,165 | ||
FINANCIALS - 16.7% | |||
Capital Markets - 0.8% | |||
American Capital Ltd. (a) | 20,345 | 181,274 | |
Raymond James Financial, Inc. | 1,738 | 61,473 | |
SEI Investments Co. | 21,000 | 414,750 | |
| 657,497 | ||
Commercial Banks - 4.9% | |||
CapitalSource, Inc. | 58,100 | 392,175 | |
CIT Group, Inc. (a) | 4,300 | 175,053 | |
East West Bancorp, Inc. | 14,819 | 327,796 | |
Fifth Third Bancorp | 42,986 | 585,039 | |
First Citizen Bancshares, Inc. | 875 | 154,131 | |
Huntington Bancshares, Inc. | 66,007 | 385,811 | |
KeyCorp | 60,095 | 486,770 | |
M&T Bank Corp. | 4,185 | 341,580 | |
Regions Financial Corp. | 76,245 | 439,171 | |
SunTrust Banks, Inc. | 25,834 | 593,149 | |
| 3,880,675 | ||
Consumer Finance - 1.7% | |||
Credit Acceptance Corp. (a) | 1,492 | 143,620 | |
Discover Financial Services | 23,200 | 696,232 | |
SLM Corp. | 31,650 | 498,804 | |
| 1,338,656 | ||
Diversified Financial Services - 0.9% | |||
Interactive Brokers Group, Inc. | 12,000 | 190,320 | |
NYSE Euronext | 4,752 | 141,467 | |
The NASDAQ Stock Market, Inc. (a) | 14,207 | 374,212 | |
| 705,999 | ||
Insurance - 3.0% | |||
Allied World Assurance Co. Holdings | 5,800 | 382,626 | |
American International Group, Inc. (a) | 10,651 | 311,222 | |
American International Group, Inc. warrants 1/19/21 (a) | 574 | 4,747 | |
American National Insurance Co. | 975 | 70,298 | |
| |||
Shares | Value | ||
Aon Corp. | 756 | $ 35,388 | |
Arch Capital Group Ltd. (a) | 2,757 | 102,147 | |
Axis Capital Holdings Ltd. | 11,700 | 360,945 | |
HCC Insurance Holdings, Inc. | 3,662 | 111,837 | |
Marsh & McLennan Companies, Inc. | 6,393 | 199,462 | |
Principal Financial Group, Inc. | 5,800 | 160,428 | |
Progressive Corp. | 9,732 | 208,459 | |
Validus Holdings Ltd. | 12,685 | 386,766 | |
| 2,334,325 | ||
Real Estate Investment Trusts - 4.9% | |||
Annaly Capital Management, Inc. | 15,734 | 261,499 | |
AvalonBay Communities, Inc. | 292 | 37,864 | |
Camden Property Trust (SBI) | 6,337 | 392,894 | |
Equity Lifestyle Properties, Inc. | 26 | 1,729 | |
Equity Residential (SBI) | 2,391 | 136,024 | |
Hospitality Properties Trust (SBI) | 12,187 | 301,385 | |
Host Hotels & Resorts, Inc. | 1,195 | 18,857 | |
Liberty Property Trust (SBI) | 11,992 | 406,769 | |
MFA Financial, Inc. | 26,368 | 192,486 | |
Prologis, Inc. | 2,047 | 68,902 | |
Public Storage | 2,940 | 394,166 | |
Rayonier, Inc. | 9,630 | 428,728 | |
SL Green Realty Corp. | 2,862 | 217,655 | |
Vornado Realty Trust | 5,586 | 456,544 | |
Weyerhaeuser Co. | 26,656 | 556,844 | |
| 3,872,346 | ||
Thrifts & Mortgage Finance - 0.5% | |||
Washington Federal, Inc. | 24,000 | 388,800 | |
TOTAL FINANCIALS | 13,178,298 | ||
HEALTH CARE - 9.7% | |||
Biotechnology - 1.0% | |||
Biogen Idec, Inc. (a) | 3,109 | 362,105 | |
United Therapeutics Corp. (a) | 8,158 | 389,381 | |
Vertex Pharmaceuticals, Inc. (a) | 53 | 2,063 | |
| 753,549 | ||
Health Care Equipment & Supplies - 0.6% | |||
Boston Scientific Corp. (a) | 4,972 | 30,926 | |
C. R. Bard, Inc. | 76 | 7,115 | |
Hill-Rom Holdings, Inc. | 1,072 | 36,416 | |
Intuitive Surgical, Inc. (a) | 100 | 51,162 | |
The Cooper Companies, Inc. | 400 | 31,792 | |
Thoratec Corp. (a) | 1,800 | 62,100 | |
Varian Medical Systems, Inc. (a)(e) | 3,702 | 241,556 | |
Zimmer Holdings, Inc. | 585 | 35,539 | |
| 496,606 | ||
Health Care Providers & Services - 4.2% | |||
AmerisourceBergen Corp. | 8,618 | 321,882 | |
CIGNA Corp. | 9,911 | 437,174 | |
Coventry Health Care, Inc. (a) | 12,948 | 423,270 | |
Health Net, Inc. (a) | 12,490 | 471,373 | |
Common Stocks - continued | |||
Shares | Value | ||
HEALTH CARE - continued | |||
Health Care Providers & Services - continued | |||
Humana, Inc. | 7,209 | $ 627,904 | |
Omnicare, Inc. | 8,900 | 313,102 | |
Quest Diagnostics, Inc. | 4,689 | 272,196 | |
Wellcare Health Plans, Inc. (a) | 5,900 | 400,374 | |
| 3,267,275 | ||
Life Sciences Tools & Services - 2.2% | |||
Agilent Technologies, Inc. | 15,304 | 667,560 | |
Bio-Rad Laboratories, Inc. Class A (a) | 2,673 | 272,432 | |
Charles River Laboratories International, Inc. (a) | 10,700 | 375,891 | |
PerkinElmer, Inc. | 716 | 19,332 | |
Waters Corp. (a) | 4,652 | 416,819 | |
| 1,752,034 | ||
Pharmaceuticals - 1.7% | |||
Forest Laboratories, Inc. (a) | 14,806 | 481,491 | |
Warner Chilcott PLC (a) | 23,294 | 389,709 | |
Watson Pharmaceuticals, Inc. (a) | 8,390 | 489,305 | |
| 1,360,505 | ||
TOTAL HEALTH CARE | 7,629,969 | ||
INDUSTRIALS - 13.3% | |||
Aerospace & Defense - 1.2% | |||
Alliant Techsystems, Inc. | 2,200 | 132,000 | |
Exelis, Inc. | 37,385 | 392,916 | |
Goodrich Corp. | 534 | 67,268 | |
L-3 Communications Holdings, Inc. | 5,533 | 388,693 | |
| 980,877 | ||
Airlines - 1.0% | |||
Alaska Air Group, Inc. (a) | 4,436 | 304,177 | |
Delta Air Lines, Inc. (a) | 53,264 | 522,520 | |
| 826,697 | ||
Building Products - 0.5% | |||
Masco Corp. (e) | 30,000 | 356,400 | |
Commercial Services & Supplies - 0.6% | |||
Republic Services, Inc. | 16,380 | 488,615 | |
Construction & Engineering - 0.7% | |||
Fluor Corp. | 6,803 | 411,445 | |
KBR, Inc. | 2,997 | 108,851 | |
| 520,296 | ||
Electrical Equipment - 1.0% | |||
Hubbell, Inc. Class B | 3,198 | 240,554 | |
Rockwell Automation, Inc. | 6,749 | 539,785 | |
| 780,339 | ||
Machinery - 7.1% | |||
AGCO Corp. (a) | 8,435 | 435,499 | |
CNH Global NV (a) | 9,270 | 397,776 | |
Cummins, Inc. | 3,412 | 411,385 | |
Dover Corp. | 8,040 | 514,721 | |
| |||
Shares | Value | ||
Eaton Corp. | 9,003 | $ 469,867 | |
Ingersoll-Rand PLC | 1,773 | 70,707 | |
ITT Corp. | 292 | 7,285 | |
Kennametal, Inc. | 6,167 | 284,114 | |
Lincoln Electric Holdings, Inc. | 2,600 | 120,094 | |
Oshkosh Truck Corp. (a) | 16,400 | 382,284 | |
Pall Corp. | 7,914 | 502,143 | |
Parker Hannifin Corp. | 6,474 | 581,430 | |
Sauer-Danfoss, Inc. (a) | 900 | 48,726 | |
SPX Corp. | 975 | 71,312 | |
Timken Co. | 9,765 | 511,686 | |
Toro Co. | 5,900 | 399,666 | |
Wabtec Corp. | 5,500 | 411,015 | |
Xylem, Inc. | 585 | 15,198 | |
| 5,634,908 | ||
Trading Companies & Distributors - 1.2% | |||
MSC Industrial Direct Co., Inc. Class A | 4,800 | 381,168 | |
W.W. Grainger, Inc. | 2,700 | 560,871 | |
| 942,039 | ||
TOTAL INDUSTRIALS | 10,530,171 | ||
INFORMATION TECHNOLOGY - 15.1% | |||
Communications Equipment - 0.5% | |||
Brocade Communications Systems, Inc. (a) | 68,600 | 396,508 | |
Computers & Peripherals - 2.0% | |||
Lexmark International, Inc. Class A | 5,700 | 210,216 | |
NetApp, Inc. (a) | 6,209 | 266,987 | |
SanDisk Corp. (a) | 9,888 | 489,060 | |
Western Digital Corp. (a) | 15,682 | 615,519 | |
| 1,581,782 | ||
Electronic Equipment & Components - 1.4% | |||
Avnet, Inc. (a) | 10,500 | 375,270 | |
Ingram Micro, Inc. Class A (a) | 21,000 | 401,730 | |
Tech Data Corp. (a)(e) | 7,000 | 374,360 | |
| 1,151,360 | ||
IT Services - 4.2% | |||
Amdocs Ltd. (a) | 14,192 | 435,269 | |
Computer Sciences Corp. | 11,559 | 367,114 | |
DST Systems, Inc. | 5,479 | 290,387 | |
Fidelity National Information Services, Inc. | 14,250 | 452,152 | |
Fiserv, Inc. (a) | 7,137 | 473,183 | |
Global Payments, Inc. | 7,957 | 410,740 | |
The Western Union Co. | 26,211 | 457,906 | |
Total System Services, Inc. | 19,079 | 417,449 | |
| 3,304,200 | ||
Office Electronics - 0.1% | |||
Xerox Corp. | 6,374 | 52,458 | |
Semiconductors & Semiconductor Equipment - 3.1% | |||
Avago Technologies Ltd. | 14,562 | 547,677 | |
Common Stocks - continued | |||
Shares | Value | ||
INFORMATION TECHNOLOGY - continued | |||
Semiconductors & Semiconductor Equipment - continued | |||
KLA-Tencor Corp. | 7,200 | $ 348,480 | |
Lam Research Corp. (a)(e) | 10,700 | 446,190 | |
Linear Technology Corp. | 6,064 | 203,023 | |
LSI Corp. (a) | 43,100 | 370,660 | |
Marvell Technology Group Ltd. (a) | 32,307 | 484,605 | |
Micron Technology, Inc. (a) | 100 | 855 | |
NVIDIA Corp. (a) | 2,001 | 30,315 | |
| 2,431,805 | ||
Software - 3.8% | |||
Activision Blizzard, Inc. | 33,582 | 401,305 | |
Autodesk, Inc. (a) | 13,953 | 528,121 | |
BMC Software, Inc. (a) | 11,791 | 441,455 | |
CA, Inc. | 700 | 18,921 | |
Citrix Systems, Inc. (a) | 960 | 71,750 | |
Intuit, Inc. | 11,553 | 668,226 | |
MICROS Systems, Inc. (a) | 100 | 5,193 | |
Solera Holdings, Inc. | 100 | 4,800 | |
Synopsys, Inc. (a) | 13,800 | 420,486 | |
TIBCO Software, Inc. (a) | 16,200 | 469,314 | |
| 3,029,571 | ||
TOTAL INFORMATION TECHNOLOGY | 11,947,684 | ||
MATERIALS - 6.6% | |||
Chemicals - 4.8% | |||
Albemarle Corp. | 5,897 | 392,268 | |
Cabot Corp. | 4,366 | 176,867 | |
CF Industries Holdings, Inc. | 3,420 | 636,120 | |
Eastman Chemical Co. | 10,602 | 573,886 | |
Ecolab, Inc. | 10,900 | 654,000 | |
FMC Corp. | 800 | 79,176 | |
Huntsman Corp. | 12,010 | 164,057 | |
PPG Industries, Inc. | 6,575 | 599,969 | |
Rockwood Holdings, Inc. (a) | 8,756 | 466,257 | |
Valspar Corp. | 400 | 18,540 | |
| 3,761,140 | ||
Containers & Packaging - 0.5% | |||
Aptargroup, Inc. | 100 | 5,278 | |
Sealed Air Corp. | 21,565 | 423,321 | |
| 428,599 | ||
Metals & Mining - 0.0% | |||
Royal Gold, Inc. | 100 | 6,945 | |
Steel Dynamics, Inc. | 1,100 | 16,291 | |
| 23,236 | ||
| |||
Shares | Value | ||
Paper & Forest Products - 1.3% | |||
Domtar Corp. | 3,886 | $ 372,551 | |
International Paper Co. | 18,331 | 644,335 | |
| 1,016,886 | ||
TOTAL MATERIALS | 5,229,861 | ||
TELECOMMUNICATION SERVICES - 1.1% | |||
Diversified Telecommunication Services - 0.2% | |||
Vonage Holdings Corp. (a) | 45,167 | 107,949 | |
Wireless Telecommunication Services - 0.9% | |||
MetroPCS Communications, Inc. (a) | 34,800 | 358,440 | |
Telephone & Data Systems, Inc. | 14,842 | 375,057 | |
| 733,497 | ||
TOTAL TELECOMMUNICATION SERVICES | 841,446 | ||
UTILITIES - 4.7% | |||
Electric Utilities - 1.7% | |||
Entergy Corp. | 8,092 | 539,170 | |
Northeast Utilities | 7,149 | 256,649 | |
Pinnacle West Capital Corp. | 6,220 | 292,527 | |
Progress Energy, Inc. | 5,415 | 287,428 | |
| 1,375,774 | ||
Multi-Utilities - 2.6% | |||
Alliant Energy Corp. | 9,500 | 405,080 | |
Ameren Corp. | 14,100 | 452,187 | |
CenterPoint Energy, Inc. | 23,700 | 461,913 | |
DTE Energy Co. | 1,200 | 64,788 | |
NSTAR | 1,900 | 89,110 | |
Xcel Energy, Inc. | 20,400 | 540,396 | |
| 2,013,474 | ||
Water Utilities - 0.4% | |||
American Water Works Co., Inc. | 9,750 | 334,230 | |
TOTAL UTILITIES | 3,723,478 | ||
TOTAL COMMON STOCKS (Cost $69,633,209) |
| ||
U.S. Treasury Obligations - 0.4% | ||||
| Principal Amount |
| ||
U.S. Treasury Bills, yield at date of purchase 0.03% to 0.06% 3/1/12 to 6/7/12 (f) | $ 350,000 |
| ||
Money Market Funds - 6.3% | |||
Shares | Value | ||
Dreyfus Cash Management Institutional Shares, 0.10% (c) | 3,116,948 | $ 3,116,948 | |
Fidelity Securities Lending Cash Central Fund, 0.12% (b)(d) | 1,839,049 | 1,839,049 | |
TOTAL MONEY MARKET FUNDS (Cost $4,955,997) |
| ||
TOTAL INVESTMENT PORTFOLIO - 104.4% (Cost $74,939,179) | 82,513,639 | ||
NET OTHER ASSETS (LIABILITIES) - (4.4)% | (3,452,169) | ||
NET ASSETS - 100% | $ 79,061,470 | ||
Futures Contracts | |||||
Expiration Date | Underlying Face Amount at Value | Unrealized Appreciation/(Depreciation) | |||
Purchased | |||||
Equity Index Contracts | |||||
19 CME E-mini S&P Midcap 400 Index Contracts | March 2012 | $ 1,855,540 | $ 218,104 | ||
The face value of futures purchased as a percentage of net assets is 2.3% |
Legend |
(a) Non-income producing |
(b) Affiliated fund that is available only to investment companies and other accounts managed by Fidelity Investments. The rate quoted is the annualized seven-day yield of the fund at period end. A complete unaudited listing of the fund's holdings as of its most recent quarter end is available upon request. In addition, each Fidelity Central Fund's financial statements, which are not covered by the Fund's Report of Independent Registered Public Accounting Firm, are available on the SEC's website or upon request. |
(c) The rate quoted is the annualized seven-day yield of the fund at period end. |
(d) Investment made with cash collateral received from securities on loan. |
(e) Security or a portion of the security is on loan at period end. |
(f) Security or a portion of the security was pledged to cover margin requirements for futures contracts. At the period end, the value of securities pledged amounted to $319,953. |
Affiliated Central Funds |
Information regarding fiscal year to date income earned by the Fund from investments in Fidelity Central Funds is as follows: |
Fund | Income earned |
Fidelity Securities Lending Cash Central Fund | $ 10,851 |
Other Information |
The following is a summary of the inputs used, as of February 29, 2012, involving the Fund's assets and liabilities carried at fair value. The inputs or methodology used for valuing securities may not be an indication of the risk associated with investing in those securities. For more information on valuation inputs, and their aggregation into the levels used in the table below, please refer to the Security Valuation section in the accompanying Notes to Financial Statements. |
Valuation Inputs at Reporting Date: | ||||
Description | Total | Level 1 | Level 2 | Level 3 |
Investments in Securities: | ||||
Equities: | ||||
Consumer Discretionary | $ 12,578,796 | $ 12,578,796 | $ - | $ - |
Consumer Staples | 5,426,821 | 5,426,821 | - | - |
Energy | 6,121,165 | 6,121,165 | - | - |
Financials | 13,178,298 | 13,178,298 | - | - |
Health Care | 7,629,969 | 7,629,969 | - | - |
Industrials | 10,530,171 | 10,530,171 | - | - |
Information Technology | 11,947,684 | 11,947,684 | - | - |
Materials | 5,229,861 | 5,229,861 | - | - |
Telecommunication Services | 841,446 | 841,446 | - | - |
Utilities | 3,723,478 | 3,723,478 | - | - |
U.S. Government and Government Agency Obligations | 349,953 | - | 349,953 | - |
Money Market Funds | 4,955,997 | 4,955,997 | - | - |
Total Investments in Securities: | $ 82,513,639 | $ 82,163,686 | $ 349,953 | $ - |
Derivative Instruments: | ||||
Assets | ||||
Futures Contracts | $ 218,104 | $ 218,104 | $ - | $ - |
Value of Derivative Instruments |
The following table is a summary of the Fund's value of derivative instruments by risk exposure as of February 29, 2012. For additional information on derivative instruments, please refer to the Derivative Instruments section in the accompanying Notes to Financial Statements. |
Risk Exposure / | Value | |
| Asset | Liability |
Equity Risk | ||
Futures Contracts (a) | $ 218,104 | $ - |
Total Value of Derivatives | $ 218,104 | $ - |
(a) Reflects cumulative appreciation/(depreciation) on futures contracts as disclosed on the Schedule of Investments. Only the period end variation margin is separately disclosed on the Statement of Assets and Liabilities. |
See accompanying notes which are an integral part of the financial statements.
Annual Report
Fidelity Mid Cap Enhanced Index Fund
Financial Statements
Statement of Assets and Liabilities
| February 29, 2012 | |
|
|
|
Assets | ||
Investment in securities, at value (including securities loaned of $1,785,346) - See accompanying schedule: Unaffiliated issuers (cost $73,100,130) | $ 80,674,590 |
|
Fidelity Central Funds (cost $1,839,049) | 1,839,049 |
|
Total Investments (cost $74,939,179) |
| $ 82,513,639 |
Receivable for investments sold | 4,598,743 | |
Receivable for fund shares sold | 40,926 | |
Dividends receivable | 114,556 | |
Interest receivable | 247 | |
Distributions receivable from Fidelity Central Funds | 110 | |
Total assets | 87,268,221 | |
|
|
|
Liabilities | ||
Payable for investments purchased | $ 6,074,501 | |
Payable for fund shares redeemed | 241,934 | |
Accrued management fee | 29,695 | |
Payable for daily variation margin on futures contracts | 11,672 | |
Other affiliated payables | 9,900 | |
Collateral on securities loaned, at value | 1,839,049 | |
Total liabilities | 8,206,751 | |
|
|
|
Net Assets | $ 79,061,470 | |
Net Assets consist of: |
| |
Paid in capital | $ 72,462,475 | |
Undistributed net investment income | 118,757 | |
Accumulated undistributed net realized gain (loss) on investments | (1,312,326) | |
Net unrealized appreciation (depreciation) on investments | 7,792,564 | |
Net Assets, for 8,079,728 shares outstanding | $ 79,061,470 | |
Net Asset Value, offering price and redemption price per share ($79,061,470 ÷ 8,079,728 shares) | $ 9.79 | |
Statement of Operations
| Year ended February 29, 2012 | |
|
|
|
Investment Income |
|
|
Dividends |
| $ 1,135,110 |
Interest |
| 2,284 |
Income from Fidelity Central Funds |
| 10,851 |
Total income |
| 1,148,245 |
|
|
|
Expenses | ||
Management fee | $ 317,094 | |
Transfer agent fees | 105,912 | |
Independent trustees' compensation | 641 | |
Miscellaneous | 190 | |
Total expenses before reductions | 423,837 | |
Expense reductions | (1) | 423,836 |
Net investment income (loss) | 724,409 | |
Realized and Unrealized Gain (Loss) Net realized gain (loss) on: | ||
Investment securities: |
|
|
Unaffiliated issuers | 4,804,560 | |
Futures contracts | (66,140) | |
Total net realized gain (loss) |
| 4,738,420 |
Change in net unrealized appreciation (depreciation) on: Investment securities | (4,617,134) | |
Futures contracts | 129,998 | |
Total change in net unrealized appreciation (depreciation) |
| (4,487,136) |
Net gain (loss) | 251,284 | |
Net increase (decrease) in net assets resulting from operations | $ 975,693 | |
See accompanying notes which are an integral part of the financial statements.
Annual Report
Fund Name
Financial Statements - continued
Statement of Changes in Net Assets
| Year ended | Year ended |
Increase (Decrease) in Net Assets |
|
|
Operations |
|
|
Net investment income (loss) | $ 724,409 | $ 492,189 |
Net realized gain (loss) | 4,738,420 | 1,994,944 |
Change in net unrealized appreciation (depreciation) | (4,487,136) | 8,683,577 |
Net increase (decrease) in net assets resulting from operations | 975,693 | 11,170,710 |
Distributions to shareholders from net investment income | (511,180) | (484,592) |
Distributions to shareholders from net realized gain | (4,128,001) | (1,597,001) |
Total distributions | (4,639,181) | (2,081,593) |
Share transactions | 48,633,295 | 33,715,367 |
Reinvestment of distributions | 4,485,129 | 2,003,001 |
Cost of shares redeemed | (32,503,734) | (16,323,316) |
Net increase (decrease) in net assets resulting from share transactions | 20,614,690 | 19,395,052 |
Redemption fees | 6,307 | 2,930 |
Total increase (decrease) in net assets | 16,957,509 | 28,487,099 |
Net Assets | ||
Beginning of period | 62,103,961 | 33,616,862 |
End of period (including undistributed net investment income of $118,757 and undistributed net investment income of $43,832, respectively) | $ 79,061,470 | $ 62,103,961 |
Other Information Shares | ||
Sold | 5,003,022 | 3,640,627 |
Issued in reinvestment of distributions | 482,205 | 217,027 |
Redeemed | (3,448,788) | (1,848,838) |
Net increase (decrease) | 2,036,439 | 2,008,816 |
Financial Highlights
Years ended February 28, | 2012 I | 2011 | 2010 | 2009 | 2008 G |
Selected Per-Share Data |
|
|
|
|
|
Net asset value, beginning of period | $ 10.28 | $ 8.33 | $ 5.12 | $ 9.16 | $ 10.00 |
Income from Investment Operations |
|
|
|
|
|
Net investment income (loss) D | .10 | .10 | .09 | .10 | .02 |
Net realized and unrealized gain (loss) | .05 | 2.30 | 3.20 | (4.07) | (.86) |
Total from investment operations | .15 | 2.40 | 3.29 | (3.97) | (.84) |
Distributions from net investment income | (.07) | (.10) | (.08) | (.08) | - |
Distributions from net realized gain | (.58) | (.35) | - | - | - |
Total distributions | (.64) K | (.45) | (.08) | (.08) | - |
Redemption fees added to paid in capital D | - J | - J | - J | .01 | - J |
Net asset value, end of period | $ 9.79 | $ 10.28 | $ 8.33 | $ 5.12 | $ 9.16 |
Total Return B,C | 1.91% | 29.44% | 64.37% | (43.40)% | (8.40)% |
Ratios to Average Net Assets E,H |
|
|
|
|
|
Expenses before reductions | .60% | .60% | .60% | .60% | .60% A |
Expenses net of fee waivers, if any | .60% | .60% | .60% | .60% | .60% A |
Expenses net of all reductions | .60% | .60% | .60% | .60% | .60% A |
Net investment income (loss) | 1.03% | 1.16% | 1.21% | 1.39% | 1.25% A |
Supplemental Data |
|
|
|
|
|
Net assets, end of period (000 omitted) | $ 79,061 | $ 62,104 | $ 33,617 | $ 14,235 | $ 5,967 |
Portfolio turnover rate F | 92% | 59% | 80% L | 58% L | 16% |
A Annualized
B Total returns for periods of less than one year are not annualized.
C Total returns would have been lower if certain expenses had not been reduced during the applicable periods shown.
D Calculated based on average shares outstanding during the period.
E Fees and expenses of any underlying funds and Fidelity Central Funds are not included in the Fund's expense ratio. The Fund indirectly bears its proportionate share of the expenses of any underlying funds and Fidelity Central Funds.
F Amount does not include the portfolio activity of any underlying funds and Fidelity Central Funds.
G For the period December 20, 2007 (commencement of operations) to February 29, 2008.
H Expense ratios reflect operating expenses of the Fund. Expenses before reductions do not reflect amounts reimbursed by the investment adviser or reductions from expense offset arrangements and do not represent the amount paid by the Fund during periods when reimbursements or reductions occur. Expenses net of fee waivers reflect expenses after reimbursement by the investment adviser but prior to reductions from expense offset arrangements. Expenses net of all reductions represent the net expenses paid by the Fund.
I For the year ended February 29.
J Amount represents less than $.01 per share.
K Total distributions of $.64 per share is comprised of distributions from net investment income of $.069 and distributions from net realized gain of $.575 per share.
L Reflects adjustments to exclude transactions in money market mutual funds.
See accompanying notes which are an integral part of the financial statements.
Annual Report
Fidelity Small Cap Enhanced Index Fund
Performance: The Bottom Line
Average annual total return reflects the change in the value of an investment, assuming reinvestment of the fund's distributions from dividend income and capital gains (the profits earned upon the sale of securities that have grown in value, if any) and assuming a constant rate of performance each year. The $10,000 table and the fund's returns do not reflect the deduction of taxes that a shareholder would pay on fund distributions or the redemption of fund shares. During periods of reimbursement by Fidelity a fund's total returns will be greater than it would be had the reimbursement not occurred. How a fund did yesterday is no guarantee of how it will do tomorrow.
Average Annual Total Returns
Periods ended February 29, 2012 | Past 1 | Life of |
Fidelity Small Cap Enhanced Index Fund | 2.87% | 2.89% |
A From December 20, 2007.
$10,000 Over Life of Fund
Let's say hypothetically that $10,000 was invested in Fidelity Small Cap Enhanced Index Fund on December 20, 2007, when the fund started. The chart shows how the value of your investment would have changed, and also shows how the Russell 2000® Index performed over the same period.
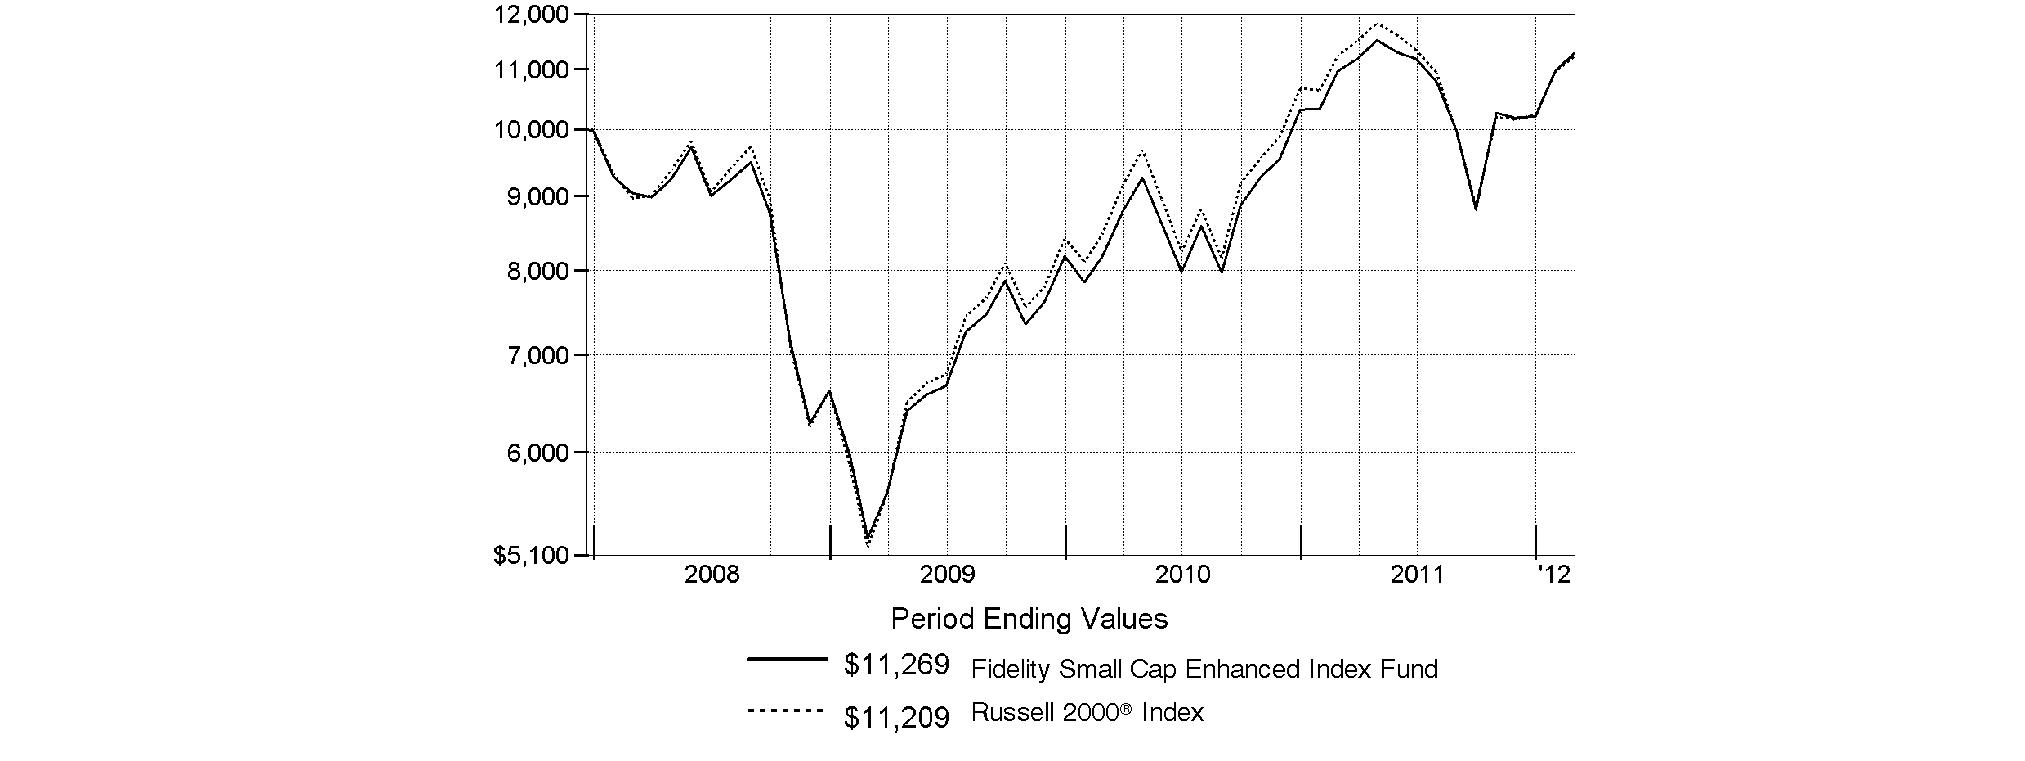
Annual Report
Fidelity Small Cap Enhanced Index Fund
Management's Discussion of Fund Performance
Market Recap: U.S. stocks rose for the 12 months ending February 29, 2012, as encouraging economic news sparked a strong late-period rally that lifted major equity benchmarks past a number of significant milestones. Stocks recovered from early-period uncertainty that followed the March 2011 earthquake, tsunami and nuclear meltdown in Japan, but plummeted during the summer amid Europe's debt woes and a historic U.S. credit-rating downgrade. Despite continued volatility and mixed economic news, markets began to recover in early October. Investors gravitated toward defensive sectors and the perceived safety of larger, more-established and dividend-paying names, helping the Dow Jones® Industrial Average advance 8.83%, and close above the psychologically important 13,000 mark in late February - for the first time since May 2008. The rally accelerated late in the period and the market broadened, as investor confidence improved amid encouraging manufacturing, housing and employment data, and signs of progress in Europe. For the year, the S&P 500® Index added 5.12%, closing near a four-year high on the period's second-to-last day. The technology-laden Nasdaq Composite® Index added 7.73%, flirting with the 3,000 mark, its highest level in 12 years. Foreign developed-markets stocks reeled over Europe's turmoil, and the MSCI® EAFE® (Europe, Australasia, Far East) Index fell 7.35%.
Comments from Maximilian Kaufmann, Senior Portfolio Manager of the Geode Capital Management, LLC, investment management team for Fidelity® Small Cap Enhanced Index Fund: For the year ending February 29, 2012, the fund gained 2.87%, significantly outpacing the -0.15 return of the Russell 2000® Index. The fund's strong relative performance was the result of highly favorable security selection. In consumer discretionary, for example, the consumer durables/apparel and retailing industries were especially helpful, more than making up for weak results in media. In financials, diversified financials and banks led the way. Stock picking in energy and information technology also contributed. In contrast, poor sector positioning in health care and weak stock picking in the capital goods industry within industrials hurt. Very strong quarterly profits throughout the period helped lift the shares of pizza delivery chain Domino's Pizza. PriceSmart, a U.S.-based membership warehouse retailer focused on Central America and the Caribbean, also performed very well for the fund, as did Arctic Cat, a maker of snowmobiles and all-terrain vehicles. Other outperformers included two specialty mattress manufacturers - Tempur-Pedic International, which was not in the benchmark, and Select Comfort. In contrast, the biggest individual detractor was Global Sources, a business-to-business marketing and media company with shares listed in Bermuda. Lincoln Educational Services, which provides post-secondary, career-oriented education, and silver producer Hecla Mining also lost significant ground. Several of the stocks I've mentioned were not in the portfolio at period end.
The views expressed above reflect those of the portfolio manager(s) only through the end of the period as stated on the cover of this report and do not necessarily represent the views of Fidelity or any other person in the Fidelity organization. Any such views are subject to change at any time based upon market or other conditions and Fidelity disclaims any responsibility to update such views. These views may not be relied on as investment advice and, because investment decisions for a Fidelity fund are based on numerous factors, may not be relied on as an indication of trading intent on behalf of any Fidelity fund.
Annual Report
Fidelity Small Cap Enhanced Index Fund
Investment Changes (Unaudited)
Top Ten Stocks as of February 29, 2012 | ||
| % of fund's | % of fund's net assets |
Wellcare Health Plans, Inc. | 0.8 | 0.7 |
Domino's Pizza, Inc. | 0.7 | 0.6 |
Nu Skin Enterprises, Inc. Class A | 0.7 | 0.7 |
Centene Corp. | 0.7 | 0.6 |
Pier 1 Imports, Inc. | 0.7 | 0.5 |
Aspen Technology, Inc. | 0.7 | 0.6 |
Hexcel Corp. | 0.7 | 0.7 |
Rent-A-Center, Inc. | 0.7 | 0.6 |
CVR Energy, Inc. | 0.7 | 0.8 |
H.B. Fuller Co. | 0.7 | 0.5 |
| 7.1 | |
Market Sectors as of February 29, 2012 | ||
| % of fund's | % of fund's net assets |
Financials | 19.8 | 19.1 |
Information Technology | 17.2 | 15.2 |
Consumer Discretionary | 15.1 | 14.0 |
Industrials | 14.5 | 12.9 |
Health Care | 10.9 | 10.5 |
Materials | 6.6 | 6.5 |
Energy | 6.4 | 7.2 |
Consumer Staples | 3.5 | 5.0 |
Utilities | 2.8 | 3.1 |
Telecommunication Services | 0.8 | 1.3 |
Annual Report
Fidelity Small Cap Enhanced Index Fund
Investments February 29, 2012
Showing Percentage of Net Assets
Common Stocks - 97.6% | |||
Shares | Value | ||
CONSUMER DISCRETIONARY - 15.1% | |||
Auto Components - 0.8% | |||
Dana Holding Corp. | 38,196 | $ 611,136 | |
Standard Motor Products, Inc. | 16,863 | 383,127 | |
| 994,263 | ||
Distributors - 0.4% | |||
Core-Mark Holding Co., Inc. | 295 | 11,824 | |
VOXX International Corp. (a) | 40,200 | 514,158 | |
| 525,982 | ||
Diversified Consumer Services - 0.5% | |||
Capella Education Co. (a) | 1,070 | 41,516 | |
Lincoln Educational Services Corp. | 32,300 | 273,258 | |
Sotheby's Class A (Ltd. vtg.) | 7,405 | 291,313 | |
| 606,087 | ||
Hotels, Restaurants & Leisure - 3.5% | |||
AFC Enterprises, Inc. (a) | 2,499 | 39,959 | |
Ameristar Casinos, Inc. | 25,168 | 499,333 | |
Biglari Holdings, Inc. (a) | 618 | 253,695 | |
Bob Evans Farms, Inc. | 16,400 | 603,520 | |
Carrols Restaurant Group, Inc. (a) | 4,700 | 55,836 | |
CEC Entertainment, Inc. | 2,000 | 76,320 | |
DineEquity, Inc. (a) | 2,307 | 123,148 | |
Domino's Pizza, Inc. (a) | 23,679 | 910,694 | |
Krispy Kreme Doughnuts, Inc. (a) | 12,900 | 105,522 | |
Multimedia Games Holdng Co., Inc. (a) | 1,981 | 20,266 | |
Papa John's International, Inc. (a) | 11,873 | 441,201 | |
Ruth's Hospitality Group, Inc. (a)(e) | 13,547 | 84,398 | |
Scientific Games Corp. Class A (a) | 23,900 | 251,189 | |
Shuffle Master, Inc. (a) | 2,043 | 29,828 | |
Sonic Corp. (a) | 54,665 | 451,533 | |
The Cheesecake Factory, Inc. (a)(e) | 11,800 | 349,752 | |
| 4,296,194 | ||
Household Durables - 2.0% | |||
Blyth, Inc. | 6,096 | 388,925 | |
Helen of Troy Ltd. (a) | 13,925 | 452,563 | |
iRobot Corp. (a) | 7,119 | 181,677 | |
Libbey, Inc. (a) | 7,710 | 96,761 | |
M.D.C. Holdings, Inc. | 10,848 | 266,644 | |
Tempur-Pedic International, Inc. (a) | 7,641 | 603,639 | |
Tupperware Brands Corp. | 7,394 | 463,530 | |
| 2,453,739 | ||
Leisure Equipment & Products - 1.7% | |||
Arctic Cat, Inc. (a) | 17,807 | 654,941 | |
Brunswick Corp. | 8,133 | 194,460 | |
Leapfrog Enterprises, Inc. Class A (a) | 4,571 | 32,134 | |
Polaris Industries, Inc. | 9,528 | 629,420 | |
Smith & Wesson Holding Corp. (a) | 2,679 | 14,011 | |
Steinway Musical Instruments, Inc. (a) | 866 | 21,615 | |
Sturm, Ruger & Co., Inc. | 12,019 | 502,154 | |
| 2,048,735 | ||
| |||
Shares | Value | ||
Media - 0.3% | |||
Global Sources Ltd. (a) | 53,046 | $ 282,735 | |
Specialty Retail - 5.3% | |||
Aeropostale, Inc. (a) | 24,251 | 435,790 | |
America's Car Mart, Inc. (a) | 2,632 | 117,414 | |
bebe Stores, Inc. | 15,900 | 142,464 | |
Big 5 Sporting Goods Corp. | 2,200 | 17,138 | |
Build-A-Bear Workshop, Inc. (a) | 1,049 | 5,717 | |
Conn's, Inc. (a)(e) | 17,900 | 237,354 | |
Express, Inc. (a) | 25,487 | 606,591 | |
Finish Line, Inc. Class A | 29,658 | 681,837 | |
GNC Holdings, Inc. | 15,059 | 487,460 | |
Group 1 Automotive, Inc. | 5,210 | 268,680 | |
Kirkland's, Inc. (a) | 622 | 9,921 | |
Pier 1 Imports, Inc. (a) | 48,921 | 839,974 | |
Rent-A-Center, Inc. | 22,815 | 808,107 | |
Select Comfort Corp. (a) | 26,126 | 773,068 | |
Stein Mart, Inc. (a) | 9,900 | 70,983 | |
Systemax, Inc. (a) | 2,400 | 46,320 | |
The Cato Corp. Class A (sub. vtg.) | 19,328 | 523,982 | |
Tractor Supply Co. | 4,437 | 379,230 | |
| 6,452,030 | ||
Textiles, Apparel & Luxury Goods - 0.6% | |||
Crocs, Inc. (a) | 8,760 | 172,134 | |
Iconix Brand Group, Inc. (a) | 9,000 | 163,440 | |
Movado Group, Inc. | 20,125 | 430,675 | |
| 766,249 | ||
TOTAL CONSUMER DISCRETIONARY | 18,426,014 | ||
CONSUMER STAPLES - 3.5% | |||
Beverages - 0.2% | |||
Coca-Cola Bottling Co. CONSOLIDATED | 3,285 | 211,685 | |
National Beverage Corp. | 1,453 | 23,263 | |
| 234,948 | ||
Food & Staples Retailing - 1.2% | |||
Andersons, Inc. | 2,503 | 107,854 | |
Casey's General Stores, Inc. | 6,000 | 307,380 | |
Ingles Markets, Inc. Class A | 800 | 14,296 | |
Rite Aid Corp. (a) | 61,800 | 95,172 | |
Ruddick Corp. | 17,459 | 715,121 | |
Spartan Stores, Inc. | 3,500 | 62,440 | |
Susser Holdings Corp. (a) | 3,025 | 76,654 | |
The Pantry, Inc. (a) | 1,623 | 20,174 | |
Village Super Market, Inc. Class A | 100 | 3,009 | |
Winn-Dixie Stores, Inc. (a) | 5,443 | 51,600 | |
| 1,453,700 | ||
Food Products - 1.1% | |||
B&G Foods, Inc. Class A | 28,554 | 664,737 | |
Darling International, Inc. (a) | 627 | 10,026 | |
Fresh Del Monte Produce, Inc. | 18,610 | 417,981 | |
Common Stocks - continued | |||
Shares | Value | ||
CONSUMER STAPLES - continued | |||
Food Products - continued | |||
Seneca Foods Corp. Class A (a) | 695 | $ 17,806 | |
Smart Balance, Inc. (a) | 28,109 | 168,373 | |
| 1,278,923 | ||
Personal Products - 1.0% | |||
Elizabeth Arden, Inc. (a)(e) | 6,968 | 258,861 | |
Nature's Sunshine Products, Inc. (a) | 5,261 | 77,600 | |
Nu Skin Enterprises, Inc. Class A | 15,717 | 907,814 | |
Nutraceutical International Corp. (a) | 800 | 10,416 | |
Schiff Nutrition International, Inc. (a) | 1,600 | 17,856 | |
| 1,272,547 | ||
TOTAL CONSUMER STAPLES | 4,240,118 | ||
ENERGY - 6.4% | |||
Energy Equipment & Services - 2.6% | |||
Bristow Group, Inc. | 4,352 | 205,458 | |
Gulf Island Fabrication, Inc. | 8,301 | 243,302 | |
Helix Energy Solutions Group, Inc. (a) | 41,761 | 803,482 | |
Hercules Offshore, Inc. (a) | 73,082 | 371,257 | |
Newpark Resources, Inc. (a) | 63,926 | 503,098 | |
OYO Geospace Corp. (a) | 4,264 | 469,253 | |
RigNet, Inc. (a) | 11,641 | 197,897 | |
Superior Energy Services, Inc. (a) | 3,052 | 89,546 | |
Tesco Corp. (a)(e) | 17,430 | 267,028 | |
TETRA Technologies, Inc. (a) | 7,132 | 64,830 | |
| 3,215,151 | ||
Oil, Gas & Consumable Fuels - 3.8% | |||
Alon USA Energy, Inc. | 27,700 | 260,380 | |
Callon Petroleum Co. (a) | 22,861 | 161,399 | |
CAMAC Energy, Inc. (a)(e) | 5,981 | 5,263 | |
Cloud Peak Energy, Inc. (a) | 21,936 | 388,706 | |
Crosstex Energy, Inc. | 19,631 | 269,534 | |
CVR Energy, Inc. (a) | 29,688 | 807,810 | |
Golar LNG Ltd. (NASDAQ) | 8,700 | 369,489 | |
Rex American Resources Corp. (a) | 7,931 | 243,244 | |
Stone Energy Corp. (a) | 20,099 | 642,163 | |
Targa Resources Corp. | 3,900 | 173,277 | |
Vaalco Energy, Inc. (a)(e) | 72,899 | 575,173 | |
Warren Resources, Inc. (a) | 30,987 | 120,849 | |
Western Refining, Inc. (e) | 32,600 | 591,690 | |
| 4,608,977 | ||
TOTAL ENERGY | 7,824,128 | ||
FINANCIALS - 19.8% | |||
Capital Markets - 1.1% | |||
American Capital Ltd. (a) | 71,743 | 639,230 | |
Arlington Asset Investment Corp. | 362 | 8,362 | |
Gleacher & Co., Inc. (a) | 29,872 | 45,405 | |
Kohlberg Capital Corp. | 12,800 | 89,600 | |
| |||
Shares | Value | ||
Medallion Financial Corp. | 2,647 | $ 28,985 | |
SWS Group, Inc. | 2,458 | 13,740 | |
TICC Capital Corp. | 19,050 | 186,309 | |
Triangle Capital Corp. | 16,385 | 319,508 | |
| 1,331,139 | ||
Commercial Banks - 4.4% | |||
Alliance Financial Corp. | 2,608 | 76,988 | |
American National Bankshares, Inc. | 3,203 | 68,064 | |
BancFirst Corp. | 1,979 | 81,000 | |
Banco Latin Americano de Exporaciones SA (BLADEX) Series E | 29,205 | 569,790 | |
Bank of Marin Bancorp | 2,098 | 73,787 | |
Bank of the Ozarks, Inc. | 13,750 | 403,563 | |
Banner Bank | 29,100 | 599,751 | |
BBCN Bancorp, Inc. (a) | 4,319 | 44,270 | |
Boston Private Financial Holdings, Inc. | 8,132 | 77,498 | |
Central Pacific Financial Corp. (a)(e) | 7,131 | 98,693 | |
Citizens & Northern Corp. | 5,531 | 110,067 | |
Columbia Banking Systems, Inc. | 1,577 | 33,354 | |
Community Bank System, Inc. | 4,013 | 109,635 | |
Eagle Bancorp, Inc., Maryland (a)(e) | 5,939 | 92,114 | |
Financial Institutions, Inc. | 532 | 8,704 | |
First Interstate Bancsystem, Inc. | 1,876 | 25,514 | |
First Merchants Corp. | 10,847 | 120,185 | |
Hanmi Financial Corp. (a) | 25,347 | 219,758 | |
MainSource Financial Group, Inc. | 3,635 | 36,859 | |
Merchants Bancshares, Inc. | 12,912 | 359,599 | |
National Penn Bancshares, Inc. | 8,069 | 70,604 | |
Old National Bancorp, Indiana | 24,338 | 294,003 | |
Orrstown Financial Services, Inc. | 69 | 597 | |
Pacific Capital Bancorp NA (a)(e) | 13,728 | 384,521 | |
Park Sterling Corp. (a) | 2,148 | 9,773 | |
Peoples Bancorp, Inc. | 2,000 | 32,340 | |
PrivateBancorp, Inc. | 20,278 | 294,031 | |
Republic Bancorp, Inc., Kentucky Class A | 16,229 | 422,928 | |
SCBT Financial Corp. | 717 | 22,205 | |
Southside Bancshares, Inc. | 4,486 | 95,597 | |
Southwest Bancorp, Inc., Oklahoma (a) | 635 | 5,436 | |
State Bank Financial Corp. (a) | 10,082 | 163,732 | |
Sterling Financial Corp., Washington (a) | 784 | 15,257 | |
Susquehanna Bancshares, Inc. | 3,700 | 34,299 | |
Washington Banking Co., Oak Harbor | 459 | 5,825 | |
Washington Trust Bancorp, Inc. | 6,033 | 141,836 | |
WesBanco, Inc. | 9,172 | 178,854 | |
| 5,381,031 | ||
Consumer Finance - 3.0% | |||
Advance America Cash Advance Centers, Inc. | 62,253 | 645,564 | |
Cash America International, Inc. | 11,594 | 537,730 | |
Credit Acceptance Corp. (a) | 4,873 | 469,075 | |
EZCORP, Inc. (non-vtg.) Class A (a) | 19,122 | 602,343 | |
First Cash Financial Services, Inc. (a) | 10,062 | 425,220 | |
Nelnet, Inc. Class A | 28,497 | 752,891 | |
Common Stocks - continued | |||
Shares | Value | ||
FINANCIALS - continued | |||
Consumer Finance - continued | |||
Nicholas Financial, Inc. | 269 | $ 3,489 | |
World Acceptance Corp. (a) | 2,563 | 162,802 | |
| 3,599,114 | ||
Diversified Financial Services - 0.4% | |||
Compass Diversified Holdings | 6,300 | 94,059 | |
MarketAxess Holdings, Inc. | 10,281 | 340,507 | |
PHH Corp. (a) | 7,300 | 99,426 | |
Vector Capital Corp. rights | 8,300 | 0 | |
| 533,992 | ||
Insurance - 1.1% | |||
Employers Holdings, Inc. | 2,261 | 39,093 | |
FBL Financial Group, Inc. Class A | 15,260 | 518,382 | |
First American Financial Corp. | 5,642 | 86,887 | |
Flagstone Reinsurance Holdings Ltd. | 7,228 | 57,246 | |
Horace Mann Educators Corp. | 2,194 | 38,022 | |
Maiden Holdings Ltd. | 54,478 | 471,235 | |
Primerica, Inc. | 1,421 | 35,553 | |
ProAssurance Corp. | 1,036 | 90,919 | |
Symetra Financial Corp. | 4,626 | 45,982 | |
| 1,383,319 | ||
Real Estate Investment Trusts - 8.8% | |||
AG Mortgage Investment Trust, Inc. (e) | 27,600 | 549,792 | |
Alexanders, Inc. | 1,073 | 407,150 | |
American Capital Mortgage Investment Corp. (e) | 20,961 | 451,919 | |
Anworth Mortgage Asset Corp. | 88,909 | 577,909 | |
Capstead Mortgage Corp. | 48,843 | 649,612 | |
CBL & Associates Properties, Inc. | 38,119 | 672,038 | |
Crexus Investment Corp. | 39,310 | 438,307 | |
CubeSmart | 27,000 | 304,560 | |
Dynex Capital, Inc. | 19,891 | 189,163 | |
Education Realty Trust, Inc. | 14,900 | 153,172 | |
Equity Lifestyle Properties, Inc. | 10,563 | 702,545 | |
Extra Space Storage, Inc. | 15,113 | 398,530 | |
Hatteras Financial Corp. | 1,455 | 41,438 | |
Highwoods Properties, Inc. (SBI) | 18,503 | 592,096 | |
Home Properties, Inc. | 12,306 | 709,195 | |
LTC Properties, Inc. | 19,228 | 593,376 | |
MFA Financial, Inc. | 97,769 | 713,714 | |
Mid-America Apartment Communities, Inc. | 4,915 | 306,549 | |
Mission West Properties, Inc. | 13,202 | 132,020 | |
National Health Investors, Inc. | 2,486 | 117,165 | |
NorthStar Realty Finance Corp. | 16,657 | 88,948 | |
Pennymac Mortgage Investment Trust | 13,296 | 239,328 | |
PS Business Parks, Inc. | 10,010 | 624,824 | |
RAIT Financial Trust (e) | 30,900 | 163,770 | |
RLJ Lodging Trust | 4,385 | 76,825 | |
Sabra Health Care REIT, Inc. | 14,893 | 212,672 | |
Saul Centers, Inc. | 6,438 | 243,743 | |
| |||
Shares | Value | ||
Universal Health Realty Income Trust (SBI) | 1,667 | $ 62,996 | |
Urstadt Biddle Properties, Inc. Class A | 2,522 | 47,968 | |
Winthrop Realty Trust | 17,408 | 198,277 | |
| 10,659,601 | ||
Thrifts & Mortgage Finance - 1.0% | |||
BofI Holding, Inc. (a) | 20,957 | 343,485 | |
Dime Community Bancshares, Inc. | 19,380 | 269,770 | |
Doral Financial Corp. (a) | 133,300 | 186,620 | |
Flushing Financial Corp. | 9,587 | 124,152 | |
Fox Chase Bancorp, Inc. | 5,400 | 67,554 | |
Kaiser Federal Financial Group, Inc. | 4,828 | 65,226 | |
NASB Financial, Inc. (a) | 705 | 9,778 | |
Ocwen Financial Corp. (a) | 8,240 | 132,746 | |
| 1,199,331 | ||
TOTAL FINANCIALS | 24,087,527 | ||
HEALTH CARE - 10.9% | |||
Biotechnology - 2.4% | |||
Alkermes PLC (a) | 4,300 | 75,723 | |
ARIAD Pharmaceuticals, Inc. (a) | 3,600 | 51,624 | |
Astex Pharmaceuticals, Inc. (a)(e) | 102,328 | 187,260 | |
AVEO Pharmaceuticals, Inc. (a) | 23,073 | 300,872 | |
Biosante Pharmaceuticals, Inc. (a) | 273,800 | 211,538 | |
Cepheid, Inc. (a) | 1,929 | 77,912 | |
Cubist Pharmaceuticals, Inc. (a) | 1,748 | 74,919 | |
Emergent BioSolutions, Inc. (a) | 5,800 | 88,566 | |
Geron Corp. (a) | 36,600 | 73,200 | |
Idenix Pharmaceuticals, Inc. (a) | 19,600 | 230,692 | |
Maxygen, Inc. (a) | 11,400 | 62,586 | |
Medivation, Inc. (a) | 3,332 | 218,279 | |
Momenta Pharmaceuticals, Inc. (a) | 13,200 | 193,512 | |
Nabi Biopharmaceuticals (a) | 51,004 | 95,377 | |
Neurocrine Biosciences, Inc. (a) | 6,325 | 49,778 | |
ONYX Pharmaceuticals, Inc. (a) | 2,821 | 108,101 | |
Osiris Therapeutics, Inc. (a)(e) | 5,786 | 30,203 | |
PDL BioPharma, Inc. | 59,002 | 376,433 | |
Progenics Pharmaceuticals, Inc. (a) | 8,100 | 78,975 | |
SciClone Pharmaceuticals, Inc. (a)(e) | 38,256 | 179,421 | |
Spectrum Pharmaceuticals, Inc. (a)(e) | 13,985 | 198,447 | |
| 2,963,418 | ||
Health Care Equipment & Supplies - 2.9% | |||
Accuray, Inc. (a) | 939 | 6,366 | |
ArthroCare Corp. (a) | 16,802 | 438,532 | |
Atrion Corp. | 200 | 41,200 | |
Cantel Medical Corp. | 8,448 | 170,565 | |
CONMED Corp. | 5,000 | 149,200 | |
Greatbatch, Inc. (a) | 18,169 | 449,683 | |
Haemonetics Corp. (a)(e) | 1,724 | 115,560 | |
Invacare Corp. | 17,330 | 286,118 | |
Kensey Nash Corp. | 5,668 | 127,983 | |
OraSure Technologies, Inc. (a) | 6,200 | 62,186 | |
RTI Biologics, Inc. (a) | 70,184 | 259,681 | |
Common Stocks - continued | |||
Shares | Value | ||
HEALTH CARE - continued | |||
Health Care Equipment & Supplies - continued | |||
Sirona Dental Systems, Inc. (a) | 10,262 | $ 512,074 | |
SurModics, Inc. (a)(e) | 5,200 | 73,840 | |
Symmetry Medical, Inc. (a) | 4,452 | 32,232 | |
Thoratec Corp. (a) | 15,957 | 550,517 | |
Young Innovations, Inc. | 7,269 | 219,887 | |
| 3,495,624 | ||
Health Care Providers & Services - 4.2% | |||
Alliance Healthcare Services, Inc. (a) | 4,100 | 5,576 | |
AMERIGROUP Corp. (a) | 8,428 | 572,514 | |
Centene Corp. (a) | 18,543 | 904,898 | |
Chemed Corp. | 5,212 | 322,206 | |
Chindex International, Inc. (a) | 2,422 | 22,597 | |
Five Star Quality Care, Inc. (a) | 93,135 | 329,698 | |
Magellan Health Services, Inc. (a) | 13,874 | 655,685 | |
Metropolitan Health Networks, Inc. (a)(e) | 4,263 | 35,639 | |
Molina Healthcare, Inc. (a)(e) | 21,771 | 739,343 | |
National Healthcare Corp. | 461 | 20,662 | |
PharMerica Corp. (a) | 2,797 | 34,291 | |
Providence Service Corp. (a) | 9,538 | 143,547 | |
Select Medical Holdings Corp. (a) | 711 | 5,987 | |
Skilled Healthcare Group, Inc. (a) | 1,770 | 11,558 | |
Sun Healthcare Group, Inc. (a) | 4,100 | 18,286 | |
Triple-S Management Corp. (a) | 3,488 | 82,561 | |
Universal American Spin Corp. (a) | 28,032 | 317,883 | |
Wellcare Health Plans, Inc. (a) | 14,247 | 966,801 | |
| 5,189,732 | ||
Health Care Technology - 0.3% | |||
Computer Programs & Systems, Inc. | 2,500 | 152,100 | |
HealthStream, Inc. (a)(e) | 6,400 | 130,752 | |
MedAssets, Inc. (a) | 5,147 | 73,499 | |
| 356,351 | ||
Life Sciences Tools & Services - 0.2% | |||
Affymetrix, Inc. (a) | 52,416 | 218,575 | |
Medtox Scientific, Inc. (a) | 1,600 | 24,800 | |
| 243,375 | ||
Pharmaceuticals - 0.9% | |||
Cornerstone Therapeutics, Inc. (a) | 6,486 | 37,230 | |
Medicis Pharmaceutical Corp. Class A | 1,117 | 39,028 | |
Par Pharmaceutical Companies, Inc. (a) | 8,048 | 298,661 | |
Pozen, Inc. (a) | 8,520 | 37,147 | |
Questcor Pharmaceuticals, Inc. (a)(e) | 255 | 9,920 | |
Salix Pharmaceuticals Ltd. (a)(e) | 2,043 | 100,761 | |
ViroPharma, Inc. (a) | 16,554 | 530,721 | |
| 1,053,468 | ||
TOTAL HEALTH CARE | 13,301,968 | ||
| |||
Shares | Value | ||
INDUSTRIALS - 14.5% | |||
Aerospace & Defense - 3.0% | |||
AeroVironment, Inc. (a) | 6,300 | $ 179,424 | |
American Science & Engineering, Inc. | 776 | 56,415 | |
Ceradyne, Inc. | 14,476 | 447,453 | |
Cubic Corp. | 6,179 | 295,356 | |
Curtiss-Wright Corp. | 21,037 | 781,525 | |
Esterline Technologies Corp. (a) | 9,992 | 648,980 | |
Hexcel Corp. (a)(e) | 32,000 | 808,640 | |
LMI Aerospace, Inc. (a) | 3,189 | 64,896 | |
Moog, Inc. Class A (a) | 9,803 | 430,450 | |
| 3,713,139 | ||
Air Freight & Logistics - 0.4% | |||
Atlas Air Worldwide Holdings, Inc. (a) | 10,168 | 433,360 | |
Park-Ohio Holdings Corp. (a) | 4,124 | 77,325 | |
| 510,685 | ||
Airlines - 1.3% | |||
Alaska Air Group, Inc. (a) | 11,710 | 802,955 | |
Hawaiian Holdings, Inc. (a) | 3,507 | 18,622 | |
JetBlue Airways Corp. (a) | 7,777 | 39,663 | |
Republic Airways Holdings, Inc. (a) | 2,724 | 14,464 | |
Spirit Airlines, Inc. (a) | 7,098 | 138,624 | |
US Airways Group, Inc. (a) | 76,376 | 565,946 | |
| 1,580,274 | ||
Building Products - 0.2% | |||
American Woodmark Corp. | 1,300 | 18,473 | |
Gibraltar Industries, Inc. (a) | 16,655 | 230,172 | |
| 248,645 | ||
Commercial Services & Supplies - 1.8% | |||
Cenveo, Inc. (a) | 2,522 | 9,836 | |
Consolidated Graphics, Inc. (a) | 7,328 | 342,144 | |
Courier Corp. | 1,000 | 10,780 | |
Encore Capital Group, Inc. (a) | 11,803 | 262,971 | |
Ennis, Inc. | 2,700 | 45,252 | |
G&K Services, Inc. Class A | 17,539 | 584,575 | |
Intersections, Inc. | 13,500 | 157,545 | |
Multi-Color Corp. | 1,114 | 24,363 | |
Steelcase, Inc. Class A | 21,900 | 192,282 | |
Sykes Enterprises, Inc. (a) | 2,387 | 32,893 | |
Tetra Tech, Inc. (a) | 10,152 | 249,333 | |
TMS International Corp. | 3,100 | 36,890 | |
Unifirst Corp. Massachusetts | 3,900 | 234,312 | |
| 2,183,176 | ||
Construction & Engineering - 0.8% | |||
Great Lakes Dredge & Dock Corp. | 66,286 | 469,968 | |
Layne Christensen Co. (a) | 8,400 | 203,196 | |
MasTec, Inc. (a) | 9,432 | 165,909 | |
Michael Baker Corp. (a) | 642 | 15,491 | |
Pike Electric Corp. (a) | 2,693 | 24,048 | |
Sterling Construction Co., Inc. (a) | 6,050 | 62,739 | |
| 941,351 | ||
Common Stocks - continued | |||
Shares | Value | ||
INDUSTRIALS - continued | |||
Electrical Equipment - 0.6% | |||
Brady Corp. Class A | 2,212 | $ 70,673 | |
EnerSys (a) | 3,990 | 133,984 | |
Franklin Electric Co., Inc. | 9,931 | 496,649 | |
| 701,306 | ||
Machinery - 2.9% | |||
Alamo Group, Inc. | 2,600 | 69,862 | |
Albany International Corp. Class A | 8,643 | 206,741 | |
Ampco-Pittsburgh Corp. | 900 | 19,089 | |
Astec Industries, Inc. (a) | 4,714 | 178,896 | |
Briggs & Stratton Corp. | 4,492 | 76,094 | |
Cascade Corp. | 6,700 | 356,708 | |
CLARCOR, Inc. | 9,296 | 469,169 | |
Hurco Companies, Inc. (a) | 2,133 | 50,829 | |
Kadant, Inc. (a) | 18,477 | 403,538 | |
L.B. Foster Co. Class A | 3,193 | 94,034 | |
NACCO Industries, Inc. Class A | 417 | 40,783 | |
Nordson Corp. | 10,416 | 572,568 | |
RBC Bearings, Inc. (a) | 7,300 | 332,223 | |
Sauer-Danfoss, Inc. (a) | 2,700 | 146,178 | |
Sun Hydraulics Corp. | 688 | 22,608 | |
Tennant Co. | 7,820 | 320,933 | |
Twin Disc, Inc. | 4,882 | 156,029 | |
| 3,516,282 | ||
Professional Services - 0.8% | |||
Barrett Business Services, Inc. | 400 | 6,808 | |
CBIZ, Inc. (a)(e) | 8,481 | 55,127 | |
GP Strategies Corp. (a) | 2,004 | 31,383 | |
Huron Consulting Group, Inc. (a) | 1,059 | 40,433 | |
ICF International, Inc. (a) | 4,624 | 119,900 | |
Insperity, Inc. | 10,964 | 330,345 | |
Kelly Services, Inc. Class A (non-vtg.) | 14,391 | 215,865 | |
Kforce, Inc. (a) | 1,592 | 22,447 | |
Navigant Consulting, Inc. (a) | 1,543 | 20,846 | |
On Assignment, Inc. (a) | 5,728 | 79,505 | |
RPX Corp. | 1,709 | 28,797 | |
TrueBlue, Inc. (a) | 2,550 | 42,228 | |
| 993,684 | ||
Road & Rail - 1.6% | |||
AMERCO | 6,037 | 628,693 | |
Arkansas Best Corp. | 10,900 | 194,020 | |
Marten Transport Ltd. | 3,900 | 81,393 | |
Quality Distribution, Inc. (a) | 4,500 | 58,545 | |
Swift Transporation Co. (a) | 53,400 | 625,848 | |
Werner Enterprises, Inc. | 12,700 | 307,594 | |
| 1,896,093 | ||
Trading Companies & Distributors - 0.9% | |||
Aceto Corp. | 1,011 | 8,381 | |
Aircastle Ltd. | 3,949 | 53,746 | |
Applied Industrial Technologies, Inc. | 17,707 | 711,290 | |
Beacon Roofing Supply, Inc. (a) | 7,980 | 188,168 | |
| |||
Shares | Value | ||
DXP Enterprises, Inc. (a) | 1,962 | $ 72,594 | |
H&E Equipment Services, Inc. (a) | 938 | 16,218 | |
Interline Brands, Inc. (a) | 1,765 | 36,288 | |
SeaCube Container Leasing Ltd. | 4,300 | 70,262 | |
| 1,156,947 | ||
Transportation Infrastructure - 0.2% | |||
Wesco Aircraft Holdings, Inc. (a) | 15,368 | 226,063 | |
TOTAL INDUSTRIALS | 17,667,645 | ||
INFORMATION TECHNOLOGY - 17.2% | |||
Communications Equipment - 1.1% | |||
Anaren, Inc. (a) | 20,185 | 354,045 | |
Black Box Corp. | 3,915 | 105,392 | |
Communications Systems, Inc. | 2,600 | 37,856 | |
Comtech Telecommunications Corp. | 10,200 | 329,154 | |
Plantronics, Inc. | 7,720 | 287,956 | |
Riverbed Technology, Inc. (a) | 2,735 | 77,865 | |
Tessco Technologies, Inc. | 10,789 | 197,654 | |
| 1,389,922 | ||
Computers & Peripherals - 0.6% | |||
Cray, Inc. (a) | 12,530 | 99,864 | |
Quantum Corp. (a) | 20,423 | 53,712 | |
Xyratex Ltd. | 33,178 | 568,007 | |
| 721,583 | ||
Electronic Equipment & Components - 3.4% | |||
Anixter International, Inc. (a)(e) | 9,759 | 678,641 | |
Brightpoint, Inc. (a) | 22,305 | 196,284 | |
Coherent, Inc. (a) | 9,634 | 534,494 | |
Daktronics, Inc. | 2,900 | 26,100 | |
Electro Scientific Industries, Inc. | 21,600 | 298,944 | |
Insight Enterprises, Inc. (a) | 17,839 | 372,835 | |
Measurement Specialties, Inc. (a)(e) | 3,503 | 113,918 | |
MTS Systems Corp. | 3,246 | 159,411 | |
Multi-Fineline Electronix, Inc. (a) | 3,513 | 92,603 | |
Newport Corp. (a) | 28,807 | 481,653 | |
OSI Systems, Inc. (a) | 6,671 | 393,589 | |
PC Connection, Inc. | 1,800 | 16,092 | |
SYNNEX Corp. (a) | 17,000 | 700,910 | |
Vishay Precision Group, Inc. (a) | 4,100 | 60,229 | |
X-Rite, Inc. (a) | 8,933 | 40,466 | |
| 4,166,169 | ||
Internet Software & Services - 0.5% | |||
InfoSpace, Inc. (a) | 24,223 | 281,229 | |
Liquidity Services, Inc. (a) | 5,672 | 245,314 | |
Perficient, Inc. (a) | 2,900 | 35,032 | |
| 561,575 | ||
IT Services - 3.2% | |||
Acxiom Corp. (a) | 2,632 | 36,953 | |
CACI International, Inc. Class A (a) | 12,484 | 738,304 | |
Cardtronics, Inc. (a) | 15,059 | 400,419 | |
Convergys Corp. (a) | 8,711 | 112,198 | |
Common Stocks - continued | |||
Shares | Value | ||
INFORMATION TECHNOLOGY - continued | |||
IT Services - continued | |||
CSG Systems International, Inc. (a) | 2,855 | $ 45,709 | |
Euronet Worldwide, Inc. (a) | 9,201 | 177,487 | |
Global Cash Access Holdings, Inc. (a) | 18,194 | 101,159 | |
Heartland Payment Systems, Inc. | 5,701 | 161,452 | |
Jack Henry & Associates, Inc. | 10,572 | 356,699 | |
Maximus, Inc. | 15,283 | 637,454 | |
Teletech Holdings, Inc. (a) | 27,126 | 414,214 | |
TNS, Inc. (a) | 882 | 16,167 | |
Unisys Corp. (a) | 6,870 | 128,332 | |
VeriFone Systems, Inc. (a) | 11,916 | 570,657 | |
| 3,897,204 | ||
Semiconductors & Semiconductor Equipment - 2.2% | |||
ATMI, Inc. (a) | 3,372 | 74,285 | |
DSP Group, Inc. (a) | 98 | 626 | |
Entegris, Inc. (a) | 63,418 | 573,299 | |
GT Advanced Technologies, Inc. (a) | 32,887 | 281,513 | |
Kulicke & Soffa Industries, Inc. (a) | 54,566 | 614,413 | |
Lattice Semiconductor Corp. (a) | 36,735 | 242,084 | |
LTX-Credence Corp. (a) | 55,951 | 377,669 | |
Tessera Technologies, Inc. (a) | 31,298 | 525,806 | |
| 2,689,695 | ||
Software - 6.2% | |||
ACI Worldwide, Inc. (a) | 18,359 | 693,603 | |
Actuate Corp. (a) | 26,115 | 157,735 | |
Aspen Technology, Inc. (a) | 39,800 | 818,288 | |
CommVault Systems, Inc. (a) | 3,273 | 168,789 | |
Fair Isaac Corp. | 19,908 | 805,876 | |
JDA Software Group, Inc. (a) | 12,220 | 306,233 | |
Manhattan Associates, Inc. (a) | 15,064 | 698,367 | |
Monotype Imaging Holdings, Inc. (a) | 39,324 | 551,716 | |
NetScout Systems, Inc. (a) | 6,432 | 136,551 | |
Opnet Technologies, Inc. | 5,170 | 147,593 | |
Parametric Technology Corp. (a) | 6,786 | 181,186 | |
Progress Software Corp. (a) | 22,032 | 510,922 | |
QAD, Inc.: | |||
Class A | 4,628 | 63,172 | |
Class B | 3,690 | 50,738 | |
Quest Software, Inc. (a) | 28,056 | 561,681 | |
SS&C Technologies Holdings, Inc. (a) | 944 | 19,560 | |
Take-Two Interactive Software, Inc. (a) | 38,337 | 592,307 | |
TeleCommunication Systems, Inc. | 25,560 | 68,501 | |
TeleNav, Inc. (a) | 28,872 | 194,020 | |
TIBCO Software, Inc. (a) | 20,809 | 602,837 | |
Vasco Data Security International, Inc. (a) | 2,971 | 26,858 | |
Verint Systems, Inc. (a) | 5,038 | 138,495 | |
| 7,495,028 | ||
TOTAL INFORMATION TECHNOLOGY | 20,921,176 | ||
| |||
Shares | Value | ||
MATERIALS - 6.6% | |||
Chemicals - 3.5% | |||
Ferro Corp. (a) | 24,385 | $ 135,337 | |
FutureFuel Corp. | 1,641 | 18,133 | |
Georgia Gulf Corp. (a) | 3,279 | 105,781 | |
H.B. Fuller Co. | 26,755 | 806,128 | |
Innophos Holdings, Inc. | 7,400 | 372,812 | |
Innospec, Inc. (a) | 10,400 | 321,984 | |
LSB Industries, Inc. (a) | 12,600 | 506,772 | |
Minerals Technologies, Inc. | 2,500 | 161,425 | |
OM Group, Inc. (a) | 15,473 | 425,198 | |
Rockwood Holdings, Inc. (a) | 9,492 | 505,449 | |
Sensient Technologies Corp. | 3,614 | 133,682 | |
TPC Group, Inc. (a) | 14,010 | 486,707 | |
Tredegar Corp. | 3,411 | 79,272 | |
W.R. Grace & Co. (a) | 4,068 | 231,713 | |
| 4,290,393 | ||
Construction Materials - 0.0% | |||
Headwaters, Inc. (a) | 10,204 | 31,020 | |
Containers & Packaging - 0.3% | |||
Boise, Inc. | 26,655 | 219,371 | |
Myers Industries, Inc. | 11,791 | 157,056 | |
| 376,427 | ||
Metals & Mining - 1.3% | |||
Coeur d'Alene Mines Corp. (a) | 3,500 | 99,540 | |
Golden Star Resources Ltd. (a) | 131,862 | 263,817 | |
Hecla Mining Co. | 96,444 | 489,936 | |
Noranda Aluminium Holding Corp. | 15,298 | 183,576 | |
Worthington Industries, Inc. | 27,500 | 463,925 | |
| 1,500,794 | ||
Paper & Forest Products - 1.5% | |||
Buckeye Technologies, Inc. | 19,598 | 669,468 | |
Domtar Corp. | 6,353 | 609,062 | |
Glatfelter | 9,152 | 142,863 | |
Kapstone Paper & Packaging Corp. (a) | 19,839 | 398,764 | |
| 1,820,157 | ||
TOTAL MATERIALS | 8,018,791 | ||
TELECOMMUNICATION SERVICES - 0.8% | |||
Diversified Telecommunication Services - 0.8% | |||
Consolidated Communications Holdings, Inc. | 10,366 | 196,643 | |
HickoryTech Corp. | 1,858 | 19,955 | |
Level 3 Communications, Inc. (a) | 15,933 | 387,331 | |
Premiere Global Services, Inc. (a) | 5,500 | 47,575 | |
Vonage Holdings Corp. (a) | 146,554 | 350,264 | |
| 1,001,768 | ||
UTILITIES - 2.8% | |||
Electric Utilities - 2.1% | |||
Cleco Corp. | 19,848 | 763,751 | |
Common Stocks - continued | |||
Shares | Value | ||
UTILITIES - continued | |||
Electric Utilities - continued | |||
El Paso Electric Co. | 20,198 | $ 661,081 | |
Empire District Electric Co. | 12,701 | 253,385 | |
IDACORP, Inc. | 2,037 | 82,458 | |
MGE Energy, Inc. | 2,358 | 103,422 | |
Portland General Electric Co. | 27,330 | 673,411 | |
Unisource Energy Corp. | 2,185 | 80,386 | |
| 2,617,894 | ||
Gas Utilities - 0.1% | |||
Southwest Gas Corp. | 4,389 | 187,191 | |
Multi-Utilities - 0.5% | |||
Avista Corp. | 4,723 | 116,658 | |
NorthWestern Energy Corp. | 14,198 | 493,097 | |
| 609,755 | ||
Water Utilities - 0.1% | |||
California Water Service Group | 3,372 | 64,776 | |
Consolidated Water Co., Inc. | 1,139 | 9,420 | |
| 74,196 | ||
TOTAL UTILITIES | 3,489,036 | ||
TOTAL COMMON STOCKS (Cost $104,492,602) |
| ||
U.S. Treasury Obligations - 0.3% | ||||
| Principal Amount |
| ||
U.S. Treasury Bills, yield at date of purchase 0.02% to 0.06% 3/1/12 to 5/3/12 (f) | $ 280,000 |
| ||
Money Market Funds - 5.9% | |||
Shares |
| ||
Dreyfus Cash Management Institutional Shares, 0.10% (c) | 2,498,256 | 2,498,256 | |
Fidelity Securities Lending Cash Central Fund, 0.12% (b)(d) | 4,693,309 | 4,693,309 | |
TOTAL MONEY MARKET FUNDS (Cost $7,191,565) |
| ||
TOTAL INVESTMENT PORTFOLIO - 103.8% (Cost $111,964,162) | 126,449,728 | ||
NET OTHER ASSETS (LIABILITIES) - (3.8)% | (4,576,174) | ||
NET ASSETS - 100% | $ 121,873,554 | ||
Futures Contracts | |||||
Expiration Date | Underlying Face Amount at Value | Unrealized Appreciation/(Depreciation) | |||
Purchased | |||||
Equity Index Contracts | |||||
35 NYFE Russell 2000 Mini Index Contracts | March 2012 | $ 2,835,000 | $ 51,765 | ||
The face value of futures purchased as a percentage of net assets is 2.3% |
Legend |
(a) Non-income producing |
(b) Affiliated fund that is available only to investment companies and other accounts managed by Fidelity Investments. The rate quoted is the annualized seven-day yield of the fund at period end. A complete unaudited listing of the fund's holdings as of its most recent quarter end is available upon request. In addition, each Fidelity Central Fund's financial statements, which are not covered by the Fund's Report of Independent Registered Public Accounting Firm, are available on the SEC's website or upon request. |
(c) The rate quoted is the annualized seven-day yield of the fund at period end. |
(d) Investment made with cash collateral received from securities on loan. |
(e) Security or a portion of the security is on loan at period end. |
(f) Security or a portion of the security was pledged to cover margin requirements for futures contracts. At the period end, the value of securities pledged amounted to $279,992. |
Affiliated Central Funds |
Information regarding fiscal year to date income earned by the Fund from investments in Fidelity Central Funds is as follows: |
Fund | Income earned |
Fidelity Securities Lending Cash Central Fund | $ 57,890 |
Other Information |
The following is a summary of the inputs used, as of February 29, 2012, involving the Fund's assets and liabilities carried at fair value. The inputs or methodology used for valuing securities may not be an indication of the risk associated with investing in those securities. For more information on valuation inputs, and their aggregation into the levels used in the table below, please refer to the Security Valuation section in the accompanying Notes to Financial Statements. |
Valuation Inputs at Reporting Date: | ||||
Description | Total | Level 1 | Level 2 | Level 3 |
Investments in Securities: | ||||
Equities: | ||||
Consumer Discretionary | $ 18,426,014 | $ 18,426,014 | $ - | $ - |
Consumer Staples | 4,240,118 | 4,240,118 | - | - |
Energy | 7,824,128 | 7,824,128 | - | - |
Financials | 24,087,527 | 24,087,527 | - | - |
Health Care | 13,301,968 | 13,301,968 | - | - |
Industrials | 17,667,645 | 17,667,645 | - | - |
Information Technology | 20,921,176 | 20,921,176 | - | - |
Materials | 8,018,791 | 8,018,791 | - | - |
Telecommunication Services | 1,001,768 | 1,001,768 | - | - |
Utilities | 3,489,036 | 3,489,036 | - | - |
U.S. Government and Government Agency Obligations | 279,992 | - | 279,992 | - |
Money Market Funds | 7,191,565 | 7,191,565 | - | - |
Total Investments in Securities: | $ 126,449,728 | $ 126,169,736 | $ 279,992 | $ - |
Derivative Instruments: | ||||
Assets | ||||
Futures Contracts | $ 51,765 | $ 51,765 | $ - | $ - |
Value of Derivative Instruments |
The following table is a summary of the Fund's value of derivative instruments by risk exposure as of February 29, 2012. For additional information on derivative instruments, please refer to the Derivative Instruments section in the accompanying Notes to Financial Statements. |
Risk Exposure / | Value | |
| Asset | Liability |
Equity Risk | ||
Futures Contracts (a) | $ 51,765 | $ - |
Total Value of Derivatives | $ 51,765 | $ - |
(a) Reflects cumulative appreciation/(depreciation) on futures contracts as disclosed on the Schedule of Investments. Only the period end variation margin is separately disclosed on the Statement of Assets and Liabilities. |
See accompanying notes which are an integral part of the financial statements.
Annual Report
Fidelity Small Cap Enhanced Index Fund
Financial Statements
Statement of Assets and Liabilities
| February 29, 2012 | |
|
|
|
Assets | ||
Investment in securities, at value (including securities loaned of $4,525,724) - See accompanying schedule: Unaffiliated issuers (cost $107,270,853) | $ 121,756,419 |
|
Fidelity Central Funds (cost $4,693,309) | 4,693,309 |
|
Total Investments (cost $111,964,162) |
| $ 126,449,728 |
Receivable for fund shares sold | 211,346 | |
Dividends receivable | 60,262 | |
Interest receivable | 136 | |
Distributions receivable from Fidelity Central Funds | 819 | |
Other receivables | 5 | |
Total assets | 126,722,296 | |
|
|
|
Liabilities | ||
Payable for fund shares redeemed | $ 39,323 | |
Accrued management fee | 53,178 | |
Payable for daily variation margin on futures contracts | 47,591 | |
Other affiliated payables | 15,341 | |
Collateral on securities loaned, at value | 4,693,309 | |
Total liabilities | 4,848,742 | |
|
|
|
Net Assets | $ 121,873,554 | |
Net Assets consist of: |
| |
Paid in capital | $ 106,809,392 | |
Undistributed net investment income | 59,138 | |
Accumulated undistributed net realized gain (loss) on investments | 467,692 | |
Net unrealized appreciation (depreciation) on investments | 14,537,332 | |
Net Assets, for 12,428,197 shares outstanding | $ 121,873,554 | |
Net Asset Value, offering price and redemption price per share ($121,873,554 ÷ 12,428,197 shares) | $ 9.81 | |
Statement of Operations
| Year ended February 29, 2012 | |
|
|
|
Investment Income |
|
|
Dividends |
| $ 1,502,701 |
Interest |
| 3,941 |
Income from Fidelity Central Funds |
| 57,890 |
Total income |
| 1,564,532 |
|
|
|
Expenses | ||
Management fee | $ 596,417 | |
Transfer agent fees | 172,343 | |
Independent trustees' compensation | 1,038 | |
Miscellaneous | 334 | |
Total expenses before reductions | 770,132 | |
Expense reductions | (12) | 770,120 |
Net investment income (loss) | 794,412 | |
Realized and Unrealized Gain (Loss) Net realized gain (loss) on: | ||
Investment securities: |
|
|
Unaffiliated issuers | 11,152,115 | |
Futures contracts | 708,144 | |
Total net realized gain (loss) |
| 11,860,259 |
Change in net unrealized appreciation (depreciation) on: Investment securities | (10,737,844) | |
Futures contracts | (209,362) | |
Total change in net unrealized appreciation (depreciation) |
| (10,947,206) |
Net gain (loss) | 913,053 | |
Net increase (decrease) in net assets resulting from operations | $ 1,707,465 | |
See accompanying notes which are an integral part of the financial statements.
Annual Report
Statement of Changes in Net Assets
| Year ended | Year ended |
Increase (Decrease) in Net Assets |
|
|
Operations |
|
|
Net investment income (loss) | $ 794,412 | $ 640,023 |
Net realized gain (loss) | 11,860,259 | 11,838,428 |
Change in net unrealized appreciation (depreciation) | (10,947,206) | 17,477,961 |
Net increase (decrease) in net assets resulting from operations | 1,707,465 | 29,956,412 |
Distributions to shareholders from net investment income | (628,524) | (740,549) |
Distributions to shareholders from net realized gain | (12,048,896) | - |
Total distributions | (12,677,420) | (740,549) |
Share transactions | 56,252,048 | 62,154,022 |
Reinvestment of distributions | 12,118,854 | 708,498 |
Cost of shares redeemed | (49,441,411) | (63,524,536) |
Net increase (decrease) in net assets resulting from share transactions | 18,929,491 | (662,016) |
Redemption fees | 84,849 | 32,519 |
Total increase (decrease) in net assets | 8,044,385 | 28,586,366 |
Net Assets | ||
Beginning of period | 113,829,169 | 85,242,803 |
End of period (including undistributed net investment income of $59,138 and undistributed net investment income of $0, respectively) | $ 121,873,554 | $ 113,829,169 |
Other Information Shares | ||
Sold | 5,595,208 | 6,638,981 |
Issued in reinvestment of distributions | 1,301,330 | 71,090 |
Redeemed | (5,089,964) | (6,671,411) |
Net increase (decrease) | 1,806,574 | 38,660 |
Financial Highlights
Years ended February 28, | 2012 I | 2011 | 2010 | 2009 | 2008 G |
Selected Per-Share Data |
|
|
|
|
|
Net asset value, beginning of period | $ 10.72 | $ 8.05 | $ 5.20 | $ 9.03 | $ 10.00 |
Income from Investment Operations |
|
|
|
|
|
Net investment income (loss) D | .07 | .06 | .05 | .09 | .02 |
Net realized and unrealized gain (loss) | .14 | 2.67 | 2.86 | (3.87) | (.99) |
Total from investment operations | .21 | 2.73 | 2.91 | (3.78) | (.97) |
Distributions from net investment income | (.06) | (.06) | (.06) | (.06) | - |
Distributions from net realized gain | (1.08) | - | - | - | - |
Total distributions | (1.13) K | (.06) | (.06) | (.06) | - |
Redemption fees added to paid in capital D | .01 | - J | - J | .01 | - J |
Net asset value, end of period | $ 9.81 | $ 10.72 | $ 8.05 | $ 5.20 | $ 9.03 |
Total Return B,C | 2.87% | 34.01% | 55.93% | (41.94)% | (9.70)% |
Ratios to Average Net Assets E,H |
|
|
|
|
|
Expenses before reductions | .67% | .67% | .67% | .67% | .67% A |
Expenses net of fee waivers, if any | .67% | .67% | .67% | .67% | .67% A |
Expenses net of all reductions | .67% | .67% | .67% | .67% | .67% A |
Net investment income (loss) | .69% | .63% | .77% | 1.29% | 1.19% A |
Supplemental Data |
|
|
|
|
|
Net assets, end of period (000 omitted) | $ 121,874 | $ 113,829 | $ 85,243 | $ 57,443 | $ 6,343 |
Portfolio turnover rate F | 79% | 90% | 98% L | 36% L | 16% |
A Annualized
B Total returns for periods of less than one year are not annualized.
C Total returns would have been lower if certain expenses had not been reduced during the applicable periods shown.
D Calculated based on average shares outstanding during the period.
E Fees and expenses of any underlying funds and Fidelity Central Funds are not included in the Fund's expense ratio. The Fund indirectly bears its proportionate share of the expenses of any underlying funds and Fidelity Central Funds.
F Amount does not include the portfolio activity of any underlying funds and Fidelity Central Funds.
G For the period December 20, 2007 (commencement of operations) to February 29, 2008.
H Expense ratios reflect operating expenses of the Fund. Expenses before reductions do not reflect amounts reimbursed by the investment adviser or reductions from expense offset arrangements and do not represent the amount paid by the Fund during periods when reimbursements or reductions occur. Expenses net of fee waivers reflect expenses after reimbursement by the investment adviser but prior to reductions from expense offset arrangements. Expenses net of all reductions represent the net expenses paid by the Fund.
I For the year ended February 29.
J Amount represents less than $.01 per share.
K Total distributions of $1.13 per share is comprised of distributions from net investment income of $.056 and distributions from net realized gain of $1.075 per share.
L Reflects adjustments to exclude transactions in money market mutual funds.
See accompanying notes which are an integral part of the financial statements.
Annual Report
Fidelity International Enhanced Index Fund
Performance: The Bottom Line
Average annual total return reflects the change in the value of an investment, assuming reinvestment of the fund's distributions from dividend income and capital gains (the profits earned upon the sale of securities that have grown in value, if any) and assuming a constant rate of performance each year. The $10,000 table and the fund's returns do not reflect the deduction of taxes that a shareholder would pay on fund distributions or the redemption of fund shares. During periods of reimbursement by Fidelity a fund's total returns will be greater than it would be had the reimbursement not occurred. How a fund did yesterday is no guarantee of how it will do tomorrow.
Average Annual Total Returns
Periods ended February 29, 2012 | Past 1 | Life of |
Fidelity International Enhanced Index Fund | -7.81% | -6.03% |
A From December 20, 2007.
$10,000 Over Life of Fund
Let's say hypothetically that $10,000 was invested in Fidelity International Enhanced Index Fund on December 20, 2007, when the fund started. The chart shows how the value of your investment would have changed, and also shows how the MSCI® EAFE® (Europe, Australasia, Far East) Index performed over the same period.
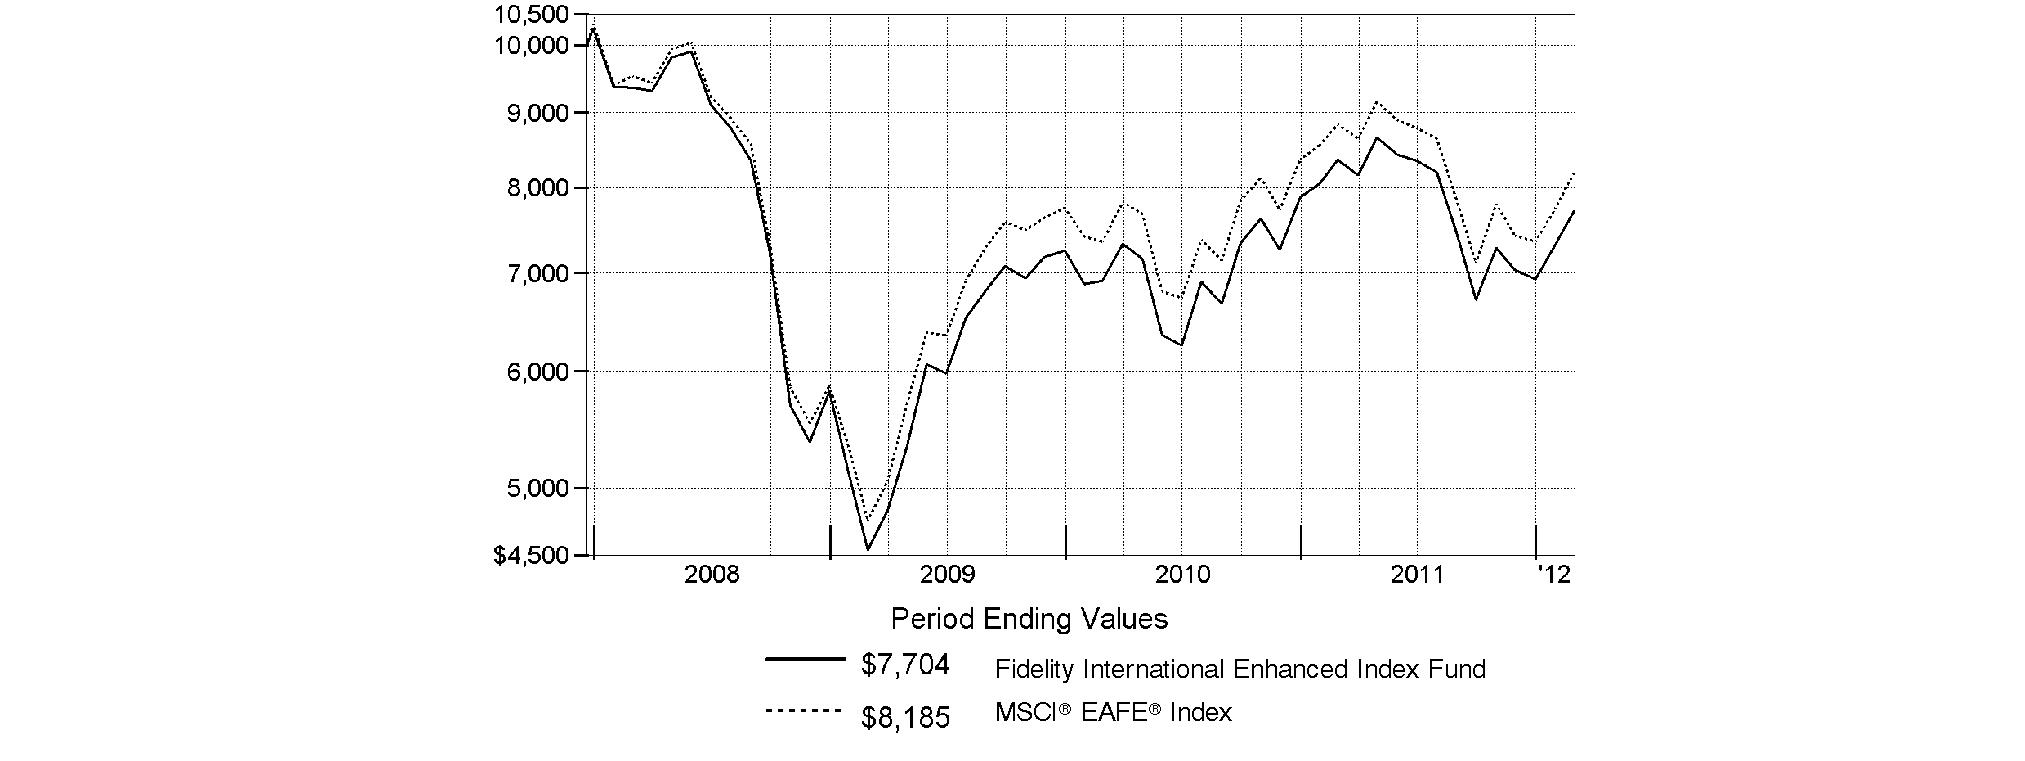
Annual Report
Fidelity International Enhanced Index Fund
Management's Discussion of Fund Performance
Market Recap: International equities experienced turbulent swings during the 12-month period ending February 29, 2012, jostled by a number of headline events. Investors' heightened sensitivity to risk in the face of Europe's sovereign debt crisis and a slow U.S. economic recovery sparked a global sell-off that pushed many overseas markets to their lowest level in more than a year by early fall. In addition, worries increased about a potentially sharp slowdown of gross domestic product (GDP) growth in China - one of the world economy's few bright spots during the Great Recession of 2007-2009. Japan faced its own challenges, as the nation continued to struggle to rebound from its devastating earthquake, tsunami and nuclear disaster in March 2011. After several months of declines, the market staged two mini-rallies, as investors' anxiety began to ease in October and then again later in the period amid hope for a resolution to Europe's debt woes. Despite these gains, the MSCI® ACWI® (All Country World Index) ex USA Index fell 5.99% for the year. Within the index, emerging markets posted a nominal increase, held back partly by a stronger U.S. dollar. The U.K. saw a slight loss, faring better than the rest of Europe (-11%), which was the worst-performing index component. Japan and Canada also had double-digit losses, each falling around 10%, while Asia-Pacific ex Japan declined only about 1%.
Comments from Maximilian Kaufmann, Senior Portfolio Manager of the Geode Capital Management, LLC, investment management team for Fidelity® International Enhanced Index Fund: For the year ending February 29, 2012, the fund returned -7.81%, modestly trailing the -7.35% return of the MSCI® EAFE® (Europe, Australasia, Far East) Index. Relative to the benchmark, the fund was hampered by poor sector allocation within consumer staples. Disappointing security selection in financials also was negative, despite a helpful underweighting in this weak-performing group. In the consumer discretionary sector, our industry positioning in automotive-related names hampered results, while good stock picking in media contributed. Also on the positive side, security selection in the software/services and transportation industries boosted performance on a relative basis. On a geographic basis, Europe, including the U.K., hindered results, driven in part by a weaker euro compared with the U.S. dollar, while the fund's positioning in Japan was a source of outperformance. (The fund's performance relative to the index can be affected by Fidelity's methodologies for valuing certain foreign stocks and for incorporating foreign exchange rates, which differ from those used by the index.) Looking at individual stocks, several European bank stocks weighed on results, most notably Germany's Commerzbank and France's Credit Agricole. In Greece, whose stock market was a particularly poor performer during the past year, Greek Organisation of Football Prognostics, which organizes and operates lottery games, lost ground, as did electric utility Public Power Corporation of Greece. Another utility stock, Italy's Enel, encountered difficulty of its own. Elsewhere, Belgian industrial company Bekaert detracted, while an average underweighting in outperforming U.K.-based energy giant Royal Dutch Shell was another drag on results. On the positive side, GREE, a Japanese social networking service, was a source of strong performance, as was Next, a U.K.-based clothing and home-products retailer, and an out-of-benchmark position in French luxury goods company Hermes International. Other outperformers included Norwegian oil-services company Aker Solutions and Italian tire manufacturer Pirelli. Of final note, the fund benefited from an underweighting in Tokyo Electric Power, whose Fukushima power plant was at the center of Japan's nuclear disaster and whose stock subsequently lost most of its value. Several of the stocks I've mentioned were not in the portfolio at period end.
The views expressed above reflect those of the portfolio manager(s) only through the end of the period as stated on the cover of this report and do not necessarily represent the views of Fidelity or any other person in the Fidelity organization. Any such views are subject to change at any time based upon market or other conditions and Fidelity disclaims any responsibility to update such views. These views may not be relied on as investment advice and, because investment decisions for a Fidelity fund are based on numerous factors, may not be relied on as an indication of trading intent on behalf of any Fidelity fund.
Annual Report
Fidelity International Enhanced Index Fund
Investment Changes (Unaudited)
Geographic Diversification (% of fund's net assets) | |||
As of February 29, 2012 | |||
 | Japan | 21.1% |
|
 | United Kingdom | 19.4% |
|
 | France | 7.9% |
|
 | Australia | 7.6% |
|
 | Germany | 7.2% |
|
 | Switzerland | 7.2% |
|
 | United States of America | 4.4% |
|
 | Spain | 2.9% |
|
 | Singapore | 2.7% |
|
 | Other | 19.6% |
|

Percentages are adjusted for the effect of futures contracts, if applicable. |
As of August 31, 2011 | |||
| Japan | 22.2% |
|
| United Kingdom | 18.8% |
|
| Australia | 8.6% |
|
| France | 8.2% |
|
| Switzerland | 7.2% |
|
| Germany | 7.0% |
|
| United States of America | 3.7% |
|
| Spain | 3.1% |
|
| Hong Kong | 2.9% |
|
| Other | 18.3% |
|

Percentages are adjusted for the effect of futures contracts, if applicable. |
Asset Allocation | ||
| % of fund's | % of fund's net assets |
Stocks and Equity Futures | 98.9 | 99.6 |
Short-Term Investments and Net Other Assets | 1.1 | 0.4 |
Top Ten Stocks as of February 29, 2012 | ||
| % of fund's | % of fund's net assets |
Nestle SA (Switzerland, Food Products) | 2.1 | 1.8 |
BP PLC (United Kingdom, Oil, Gas & Consumable Fuels) | 1.6 | 1.5 |
Royal Dutch Shell PLC Class B (United Kingdom, Oil, Gas & Consumable Fuels) | 1.5 | 0.6 |
Roche Holding AG (participation certificate) (Switzerland, Pharmaceuticals) | 1.4 | 1.6 |
Total SA (France, Oil, Gas & Consumable Fuels) | 1.4 | 1.3 |
BHP Billiton Ltd. (Australia, Metals & Mining) | 1.4 | 1.6 |
GlaxoSmithKline PLC (United Kingdom, Pharmaceuticals) | 1.4 | 1.4 |
British American Tobacco PLC (United Kingdom) (United Kingdom, Tobacco) | 1.2 | 0.5 |
Commonwealth Bank of Australia (Australia, Commercial Banks) | 1.1 | 1.0 |
BASF AG (Germany, Chemicals) | 0.9 | 0.8 |
| 14.0 | |
Market Sectors as of February 29, 2012 | ||
| % of fund's | % of fund's net assets |
Financials | 22.2 | 21.3 |
Industrials | 11.6 | 12.0 |
Consumer Discretionary | 11.3 | 11.1 |
Consumer Staples | 10.3 | 9.7 |
Materials | 9.4 | 9.9 |
Health Care | 9.2 | 9.0 |
Energy | 9.0 | 8.2 |
Telecommunication Services | 5.0 | 4.8 |
Information Technology | 3.9 | 5.1 |
Utilities | 3.7 | 5.4 |
Annual Report
Fidelity International Enhanced Index Fund
Investments February 29, 2012
Showing Percentage of Net Assets
Common Stocks - 95.2% | |||
Shares | Value | ||
Australia - 7.6% | |||
AGL Energy Ltd. | 42 | $ 628 | |
Australia & New Zealand Banking Group Ltd. | 6,940 | 163,347 | |
BHP Billiton Ltd. | 9,331 | 361,203 | |
Coca-Cola Amatil Ltd. | 2,647 | 34,061 | |
Commonwealth Bank of Australia | 5,340 | 283,040 | |
Crown Ltd. | 83 | 748 | |
CSL Ltd. | 3,882 | 136,452 | |
DuluxGroup Ltd. | 28 | 93 | |
Fortescue Metals Group Ltd. | 14,860 | 88,754 | |
National Australia Bank Ltd. | 8,772 | 222,645 | |
OneSteel Ltd. | 46,568 | 52,931 | |
Orica Ltd. | 28 | 817 | |
QBE Insurance Group Ltd. | 2,245 | 28,045 | |
Rio Tinto Ltd. | 1,044 | 75,509 | |
Stockland Corp. Ltd. unit | 28,000 | 95,177 | |
Tabcorp Holdings Ltd. | 29,284 | 85,725 | |
Telstra Corp. Ltd. | 33,436 | 118,316 | |
Wesfarmers Ltd. (price protected shares) | 3,056 | 97,882 | |
Westfield Group unit | 3,571 | 33,659 | |
Westfield Retail Trust unit | 7,479 | 20,130 | |
Westpac Banking Corp. | 4,051 | 90,787 | |
TOTAL AUSTRALIA | 1,989,949 | ||
Austria - 1.0% | |||
IMMOFINANZ Immobilien Anlagen AG | 12,758 | 44,649 | |
OMV AG | 2,779 | 103,402 | |
Raiffeisen International Bank-Holding AG (e) | 5 | 181 | |
Telekom Austria AG | 700 | 8,148 | |
Vienna Insurance Group AG Wien | 1,011 | 44,635 | |
Voestalpine AG | 2,039 | 72,269 | |
TOTAL AUSTRIA | 273,284 | ||
Bailiwick of Guernsey - 0.2% | |||
Resolution Ltd. | 11,366 | 48,638 | |
Bailiwick of Jersey - 0.9% | |||
Experian PLC | 8,153 | 122,629 | |
Petrofac Ltd. | 4,090 | 103,516 | |
TOTAL BAILIWICK OF JERSEY | 226,145 | ||
Belgium - 0.9% | |||
Anheuser-Busch InBev SA NV | 2,829 | 190,041 | |
Delhaize Group SA | 645 | 35,449 | |
KBC Groupe SA | 606 | 14,314 | |
TOTAL BELGIUM | 239,804 | ||
Bermuda - 0.9% | |||
First Pacific Co. Ltd. | 78,000 | 87,593 | |
Kerry Properties Ltd. | 8,000 | 37,957 | |
Orient Overseas International Ltd. | 15,000 | 103,177 | |
TOTAL BERMUDA | 228,727 | ||
| |||
Shares | Value | ||
Cayman Islands - 0.3% | |||
Wynn Macau Ltd. | 33,600 | $ 88,586 | |
Denmark - 1.4% | |||
A.P. Moller - Maersk A/S Series B | 16 | 129,011 | |
Novo Nordisk A/S Series B | 1,633 | 228,890 | |
TOTAL DENMARK | 357,901 | ||
Finland - 1.7% | |||
Metso Corp. | 2,266 | 107,619 | |
Nokia Corp. | 24,466 | 128,570 | |
Pohjola Bank PLC (A Shares) | 3,604 | 41,651 | |
Sampo OYJ (A Shares) | 2,202 | 62,044 | |
Stora Enso Oyj (R Shares) | 8,332 | 62,548 | |
Wartsila Corp. | 1,126 | 38,761 | |
TOTAL FINLAND | 441,193 | ||
France - 7.9% | |||
Air Liquide SA | 11 | 1,429 | |
AXA SA | 3,565 | 57,490 | |
BIC SA | 950 | 95,514 | |
BNP Paribas SA | 1,600 | 78,088 | |
Bouygues SA | 2,743 | 87,263 | |
Compagnie de St. Gobain | 1,858 | 88,217 | |
Compagnie Generale de Geophysique SA (a) | 1,125 | 34,412 | |
Credit Agricole SA | 77 | 493 | |
Danone | 370 | 25,030 | |
Eramet SA | 472 | 76,179 | |
Fonciere Des Regions | 594 | 43,064 | |
France Telecom SA | 10,210 | 155,665 | |
GDF Suez | 2,623 | 68,035 | |
Gecina SA | 144 | 13,828 | |
Hermes International Sca | 1 | 373 | |
Imerys | 754 | 45,573 | |
LVMH Moet Hennessy - Louis Vuitton SA | 105 | 17,667 | |
M6 Metropole Television SA | 5,362 | 94,005 | |
Natixis SA | 7,165 | 25,896 | |
Peugeot Citroen SA | 4,589 | 91,977 | |
Renault SA | 1,900 | 100,589 | |
Sanofi | 2,386 | 176,486 | |
Schneider Electric SA | 498 | 33,842 | |
Societe Generale Series A | 1,885 | 60,897 | |
Total SA | 6,676 | 373,431 | |
VINCI SA | 1,400 | 72,897 | |
Vivendi | 6,246 | 134,133 | |
TOTAL FRANCE | 2,052,473 | ||
Germany - 6.8% | |||
Allianz AG | 1,110 | 134,610 | |
BASF AG | 2,834 | 248,802 | |
Bayer AG | 2,785 | 205,915 | |
Bayerische Motoren Werke AG (BMW) | 991 | 91,662 | |
Commerzbank AG (a) | 17,896 | 44,964 | |
Continental AG | 1,092 | 99,404 | |
Common Stocks - continued | |||
Shares | Value | ||
Germany - continued | |||
Daimler AG (Germany) | 762 | $ 46,082 | |
Deutsche Bank AG | 1,274 | 59,446 | |
Deutsche Post AG | 2,349 | 41,260 | |
Deutsche Telekom AG | 3,106 | 36,247 | |
E.ON AG | 3,722 | 85,608 | |
Hannover Rueckversicherungs AG | 664 | 36,856 | |
Infineon Technologies AG | 9,805 | 99,155 | |
Kabel Deutschland Holding AG (a) | 1,543 | 92,645 | |
Linde AG | 10 | 1,663 | |
Munich Re Group | 158 | 23,038 | |
SAP AG | 1,560 | 105,313 | |
Siemens AG | 2,270 | 226,224 | |
Suedzucker AG (Bearer) | 3,064 | 88,760 | |
TUI AG (a) | 118 | 932 | |
Volkswagen AG | 97 | 16,437 | |
TOTAL GERMANY | 1,785,023 | ||
Greece - 0.4% | |||
Greek Organization of Football Prognostics SA | 9,585 | 85,553 | |
Public Power Corp. of Greece | 3,006 | 14,056 | |
TOTAL GREECE | 99,609 | ||
Hong Kong - 2.6% | |||
Cheung Kong Holdings Ltd. | 10,000 | 146,208 | |
Henderson Land Development Co. Ltd. | 24 | 151 | |
Hopewell Holdings Ltd. | 6,500 | 19,820 | |
Hutchison Whampoa Ltd. | 9,000 | 89,465 | |
Power Assets Holdings Ltd. | 500 | 3,745 | |
Sino Land Ltd. | 30,000 | 53,532 | |
SJM Holdings Ltd. | 50,000 | 104,692 | |
Sun Hung Kai Properties Ltd. | 3,583 | 55,158 | |
Wharf Holdings Ltd. | 18,000 | 112,673 | |
Wheelock and Co. Ltd. | 29,000 | 99,644 | |
TOTAL HONG KONG | 685,088 | ||
Ireland - 0.0% | |||
CRH PLC | 27 | 573 | |
Kerry Group PLC Class A | 3 | 128 | |
TOTAL IRELAND | 701 | ||
Israel - 0.0% | |||
Bank Hapoalim BM (Reg.) | 140 | 453 | |
Italy - 1.7% | |||
Assicurazioni Generali SpA | 1,101 | 17,733 | |
Enel SpA | 35,751 | 143,454 | |
ENI SpA | 3,382 | 77,778 | |
EXOR SpA | 1,728 | 43,440 | |
Fiat SpA | 15,937 | 92,186 | |
Intesa Sanpaolo SpA | 6,734 | 13,107 | |
Intesa Sanpaolo SpA (Risparmio Shares) | 15,170 | 24,272 | |
Pirelli & C SpA | 102 | 1,063 | |
| |||
Shares | Value | ||
Telecom Italia SpA | 19,506 | $ 22,406 | |
UniCredit SpA | 2,898 | 15,080 | |
TOTAL ITALY | 450,519 | ||
Japan - 21.1% | |||
Aeon Co. Ltd. | 6,900 | 87,592 | |
Aisin Seiki Co. Ltd. | 2,800 | 98,574 | |
Ajinomoto Co., Inc. | 8,000 | 94,274 | |
Aozora Bank Ltd. | 29,000 | 83,831 | |
Asahi Glass Co. Ltd. | 12,000 | 107,756 | |
Asahi Kasei Corp. | 17,000 | 107,694 | |
Bank of Yokohama Ltd. | 21,000 | 101,261 | |
Canon, Inc. | 4,300 | 196,082 | |
Central Japan Railway Co. | 12 | 98,456 | |
Daicel Chemical Industries Ltd. | 15,000 | 97,792 | |
Daihatsu Motor Co. Ltd. | 5,000 | 95,824 | |
Daiichi Sankyo Kabushiki Kaisha | 3,600 | 66,115 | |
Daito Trust Construction Co. Ltd. | 1,000 | 88,074 | |
Denso Corp. | 3,700 | 122,294 | |
East Japan Railway Co. | 400 | 25,635 | |
Eisai Co. Ltd. | 2,500 | 101,175 | |
Fuji Heavy Industries Ltd. | 13,000 | 98,186 | |
Fujifilm Holdings Corp. | 2,000 | 50,606 | |
Hino Motors Ltd. | 4,000 | 28,440 | |
Hitachi Ltd. | 24,000 | 140,809 | |
Honda Motor Co. Ltd. | 1,500 | 57,608 | |
Idemitsu Kosan Co. Ltd. | 800 | 82,465 | |
INPEX Corp. | 12 | 85,171 | |
Itochu Corp. | 8,000 | 91,027 | |
JGC Corp. | 3,000 | 86,832 | |
Kao Corp. | 3,100 | 79,278 | |
KDDI Corp. | 17 | 107,903 | |
Kuraray Co. Ltd. | 6,900 | 99,475 | |
Marubeni Corp. | 8,000 | 57,174 | |
Mitsubishi Corp. | 700 | 17,144 | |
Mitsubishi Electric Corp. | 10,000 | 89,673 | |
Mitsubishi UFJ Financial Group, Inc. | 46,400 | 239,786 | |
Mitsui & Co. Ltd. | 5,500 | 94,649 | |
Mizuho Financial Group, Inc. | 101,600 | 170,765 | |
Namco Bandai Holdings, Inc. | 5,800 | 80,977 | |
Nippon Telegraph & Telephone Corp. | 2,500 | 117,674 | |
Nissan Motor Co. Ltd. | 7,300 | 74,711 | |
Nitto Denko Corp. | 2,500 | 102,712 | |
NTT DoCoMo, Inc. | 18 | 30,701 | |
ORIX Corp. | 1,080 | 104,021 | |
Osaka Gas Co. Ltd. | 24,000 | 92,109 | |
Resona Holdings, Inc. | 21,300 | 101,921 | |
Sega Sammy Holdings, Inc. | 4,200 | 79,614 | |
Sekisui Chemical Co. Ltd. | 10,000 | 85,860 | |
Seven & i Holdings Co., Ltd. | 3,400 | 93,934 | |
Shinsei Bank Ltd. | 25,000 | 32,290 | |
Shionogi & Co. Ltd. | 6,800 | 94,102 | |
Showa Denko KK | 35,000 | 79,218 | |
SOFTBANK CORP. | 200 | 5,956 | |
Common Stocks - continued | |||
Shares | Value | ||
Japan - continued | |||
Sumitomo Corp. | 8,300 | $ 123,027 | |
Sumitomo Mitsui Financial Group, Inc. | 5,800 | 196,844 | |
Suzuki Motor Corp. | 4,400 | 104,297 | |
Takeda Pharmaceutical Co. Ltd. | 3,600 | 162,519 | |
Tokio Marine Holdings, Inc. | 200 | 5,523 | |
Tokyo Electron Ltd. | 1,800 | 99,859 | |
Toyo Suisan Kaisha Ltd. | 1,500 | 38,508 | |
Toyota Motor Corp. | 4,400 | 182,895 | |
Yamada Denki Co. Ltd. | 1,020 | 66,122 | |
Yamato Holdings Co. Ltd. | 5,500 | 86,734 | |
TOTAL JAPAN | 5,491,548 | ||
Netherlands - 2.5% | |||
Akzo Nobel NV | 1,875 | 106,347 | |
ASML Holding NV (Netherlands) | 2,000 | 90,931 | |
Heineken Holding NV (A Shares) | 2,159 | 96,353 | |
ING Groep NV (Certificaten Van Aandelen) (a) | 4,347 | 38,306 | |
Koninklijke Ahold NV | 8,597 | 118,881 | |
Koninklijke KPN NV | 2,705 | 29,315 | |
Koninklijke Philips Electronics NV | 242 | 5,074 | |
Royal DSM NV | 1,895 | 105,399 | |
STMicroelectronics NV | 636 | 4,713 | |
Unilever NV (Certificaten Van Aandelen) (Bearer) | 1,525 | 50,703 | |
TOTAL NETHERLANDS | 646,022 | ||
New Zealand - 0.6% | |||
Sky City Entertainment Group Ltd. | 21,890 | 68,615 | |
Telecom Corp. of New Zealand Ltd. | 42,784 | 76,306 | |
TOTAL NEW ZEALAND | 144,921 | ||
Norway - 1.8% | |||
Aker Solutions ASA | 6,505 | 112,812 | |
DnB NOR ASA | 5,563 | 71,399 | |
Gjensidige Forsikring ASA | 3,309 | 39,599 | |
Orkla ASA (A Shares) | 3,051 | 25,367 | |
StatoilHydro ASA | 5,516 | 157,300 | |
Telenor ASA | 3,400 | 62,826 | |
TOTAL NORWAY | 469,303 | ||
Portugal - 0.4% | |||
Energias de Portugal SA | 34,698 | 101,232 | |
Portugal Telecom SGPS SA (Reg.) | 18 | 93 | |
TOTAL PORTUGAL | 101,325 | ||
Singapore - 2.7% | |||
ComfortDelgro Corp. Ltd. | 74,000 | 90,529 | |
DBS Group Holdings Ltd. | 13,000 | 147,603 | |
Fraser & Neave Ltd. | 16,000 | 85,587 | |
Jardine Cycle & Carriage Ltd. | 2,000 | 76,424 | |
Oversea-Chinese Banking Corp. Ltd. | 506 | 3,633 | |
SembCorp Industries Ltd. | 11,000 | 46,528 | |
SembCorp Marine Ltd. | 23,000 | 98,389 | |
| |||
Shares | Value | ||
UOL Group Ltd. | 23,000 | $ 86,251 | |
Yangzijiang Shipbuilding Holdings Ltd. | 60,000 | 65,246 | |
TOTAL SINGAPORE | 700,190 | ||
Spain - 2.9% | |||
Banco Bilbao Vizcaya Argentaria SA | 6,241 | 55,868 | |
Banco Santander SA (Spain) | 24,321 | 201,306 | |
Bankia SA | 9,963 | 40,296 | |
Distribuidora Internacional de Alimentacion SA (a) | 18,261 | 89,281 | |
Gas Natural SDG SA | 5,106 | 86,388 | |
Iberdrola SA | 10,216 | 60,455 | |
MAPFRE SA (Reg.) | 11,507 | 39,566 | |
Repsol YPF SA | 2,174 | 56,679 | |
Telefonica SA | 6,930 | 117,933 | |
Vallehermoso SA | 104 | 416 | |
TOTAL SPAIN | 748,188 | ||
Sweden - 2.3% | |||
Getinge AB (B Shares) | 362 | 10,345 | |
Nordea Bank AB | 1,887 | 18,194 | |
Scania AB (B Shares) | 6,024 | 120,716 | |
Skandinaviska Enskilda Banken AB | 8,478 | 63,434 | |
Svenska Cellulosa AB (SCA) (B Shares) | 5,000 | 89,315 | |
Swedish Match Co. AB | 2,801 | 106,968 | |
Telefonaktiebolaget LM Ericsson | 7,561 | 75,745 | |
Volvo AB (B Shares) | 8,481 | 123,747 | |
TOTAL SWEDEN | 608,464 | ||
Switzerland - 7.2% | |||
ABB Ltd. (Reg.) | 919 | 18,810 | |
Compagnie Financiere Richemont SA Series A | 216 | 13,261 | |
Credit Suisse Group | 4,150 | 111,370 | |
Givaudan SA | 54 | 50,998 | |
Nestle SA | 8,987 | 549,272 | |
Novartis AG | 4,297 | 234,187 | |
Pargesa Holding SA | 515 | 38,221 | |
Roche Holding AG (participation certificate) | 2,163 | 376,517 | |
Schindler Holding AG (participation certificate) | 850 | 104,747 | |
Straumann Holding AG | 170 | 26,943 | |
Swatch Group AG (Bearer) | 100 | 45,336 | |
Swiss Re Ltd. | 1,402 | 83,209 | |
Transocean Ltd. (Switzerland) | 293 | 15,615 | |
UBS AG (a) | 6,080 | 85,139 | |
Zurich Financial Services AG | 474 | 119,338 | |
TOTAL SWITZERLAND | 1,872,963 | ||
United Kingdom - 19.4% | |||
Anglo American PLC (United Kingdom) | 1,003 | 42,275 | |
Common Stocks - continued | |||
Shares | Value | ||
United Kingdom - continued | |||
AstraZeneca PLC: | |||
(United Kingdom) | 1,860 | $ 83,225 | |
sponsored ADR | 3,188 | 143,109 | |
Aviva PLC | 13,107 | 76,700 | |
BAE Systems PLC | 18,290 | 90,982 | |
Barclays PLC | 38,287 | 148,250 | |
BG Group PLC | 4,154 | 100,279 | |
BHP Billiton PLC | 4,530 | 146,503 | |
BP PLC | 53,126 | 415,663 | |
British American Tobacco PLC (United Kingdom) | 6,194 | 312,409 | |
British Land Co. PLC | 5,130 | 38,380 | |
British Sky Broadcasting Group PLC | 6,474 | 69,002 | |
BT Group PLC | 25,000 | 85,110 | |
Cable & Wireless PLC | 14,975 | 8,254 | |
Centrica PLC | 60 | 290 | |
Diageo PLC | 4,000 | 95,499 | |
Eurasian Natural Resources Corp. PLC | 8,558 | 95,367 | |
GlaxoSmithKline PLC | 2,172 | 47,994 | |
GlaxoSmithKline PLC sponsored ADR | 7,029 | 311,455 | |
HSBC Holdings PLC: | |||
(United Kingdom) | 26,994 | 239,140 | |
sponsored ADR | 2,293 | 101,855 | |
Imperial Tobacco Group PLC | 4,329 | 171,545 | |
ITV PLC | 80,240 | 109,712 | |
Land Securities Group PLC | 5,137 | 55,161 | |
Legal & General Group PLC | 33,133 | 63,671 | |
Lloyds Banking Group PLC (a) | 30,894 | 17,197 | |
Man Group PLC | 18,491 | 38,505 | |
Marks & Spencer Group PLC | 18,404 | 106,276 | |
National Grid PLC | 17,103 | 174,177 | |
Next PLC | 27 | 1,190 | |
Pearson PLC | 3,305 | 62,930 | |
Prudential PLC | 2,393 | 27,147 | |
Reckitt Benckiser Group PLC | 1,500 | 83,040 | |
Rexam PLC | 52 | 343 | |
Rio Tinto PLC | 4,109 | 233,086 | |
Royal Dutch Shell PLC: | |||
Class A (United Kingdom) | 6,806 | 247,631 | |
Class B | 10,599 | 392,849 | |
Scottish & Southern Energy PLC | 5,819 | 119,414 | |
Serco Group PLC | 74 | 653 | |
Standard Chartered PLC (United Kingdom) | 3,824 | 98,396 | |
Tate & Lyle PLC | 8,200 | 90,986 | |
Tesco PLC | 10,024 | 50,406 | |
Unilever PLC | 687 | 22,208 | |
Vodafone Group PLC | 89,974 | 242,368 | |
Xstrata PLC | 6 | 115 | |
TOTAL UNITED KINGDOM | 5,060,747 | ||
TOTAL COMMON STOCKS (Cost $24,265,393) |
| ||
Nonconvertible Preferred Stocks - 0.4% | |||
Shares | Value | ||
Germany - 0.4% | |||
ProSiebenSat.1 Media AG | 4,061 | $ 105,523 | |
Volkswagen AG | 12 | 2,244 | |
TOTAL NONCONVERTIBLE PREFERRED STOCKS (Cost $77,320) |
| ||
Money Market Funds - 3.5% | |||
|
|
|
|
Dreyfus Cash Management Institutional Shares, 0.10% (c) | 914,666 | 914,666 | |
Fidelity Securities Lending Cash Central Fund, 0.12% (b)(d) | 188 | 188 | |
TOTAL MONEY MARKET FUNDS (Cost $914,854) |
| ||
TOTAL INVESTMENT PORTFOLIO - 99.1% (Cost $25,257,567) | 25,834,385 | ||
NET OTHER ASSETS (LIABILITIES) - 0.9% | 231,581 | ||
NET ASSETS - 100% | $ 26,065,966 | ||
Futures Contracts | |||||
Expiration Date | Underlying Face Amount at Value | Unrealized Appreciation/(Depreciation) | |||
Purchased | |||||
Equity Index Contracts | |||||
11 NYSE E-mini MSCI EAFE Index Contracts | March 2012 | $ 858,385 | $ 93,610 | ||
The face value of futures purchased as a percentage of net assets is 3.3% |
Legend |
(a) Non-income producing |
(b) Affiliated fund that is available only to investment companies and other accounts managed by Fidelity Investments. The rate quoted is the annualized seven-day yield of the fund at period end. A complete unaudited listing of the fund's holdings as of its most recent quarter end is available upon request. In addition, each Fidelity Central Fund's financial statements, which are not covered by the Fund's Report of Independent Registered Public Accounting Firm, are available on the SEC's website or upon request. |
(c) The rate quoted is the annualized seven-day yield of the fund at period end. |
(d) Investment made with cash collateral received from securities on loan. |
(e) Security or a portion of the security is on loan at period end. |
Affiliated Central Funds |
Information regarding fiscal year to date income earned by the Fund from investments in Fidelity Central Funds is as follows: |
Fund | Income earned |
Fidelity Securities Lending Cash Central Fund | $ 3,404 |
Other Information |
The following is a summary of the inputs used, as of February 29, 2012, involving the Fund's assets and liabilities carried at fair value. The inputs or methodology used for valuing securities may not be an indication of the risk associated with investing in those securities. For more information on valuation inputs, and their aggregation into the levels used in the table below, please refer to the Security Valuation section in the accompanying Notes to Financial Statements. |
Valuation Inputs at Reporting Date: | ||||
Description | Total | Level 1 | Level 2 | Level 3 |
Investments in Securities: | ||||
Equities: | ||||
Japan | $ 5,491,548 | $ 4,158,384 | $ 1,333,164 | $ - |
United Kingdom | 5,060,747 | 1,990,661 | 3,070,086 | - |
France | 2,052,473 | 1,312,479 | 739,994 | - |
Australia | 1,989,949 | 1,989,949 | - | - |
Germany | 1,892,790 | 1,501,807 | 390,983 | - |
Switzerland | 1,872,963 | 1,423,457 | 449,506 | - |
Spain | 748,188 | 373,081 | 375,107 | - |
Singapore | 700,190 | 700,190 | - | - |
Hong Kong | 685,088 | 685,088 | - | - |
Other | 4,425,595 | 3,278,166 | 1,147,429 | - |
Money Market Funds | 914,854 | 914,854 | - | - |
Total Investments in Securities: | $ 25,834,385 | $ 18,328,116 | $ 7,506,269 | $ - |
Derivative Instruments: | ||||
Assets | ||||
Futures Contracts | $ 93,610 | $ 93,610 | $ - | $ - |
During the period, transfers from Level 1 to Level 2 were $782,489 and transfers from Level 2 to Level 1 were $3,514,682. |
Value of Derivative Instruments |
The following table is a summary of the Fund's value of derivative instruments by risk exposure as of February 29, 2012. For additional information on derivative instruments, please refer to the Derivative Instruments section in the accompanying Notes to Financial Statements. |
Risk Exposure / | Value | |
| Asset | Liability |
Equity Risk | ||
Futures Contracts (a) | $ 93,610 | $ - |
Total Value of Derivatives | $ 93,610 | $ - |
(a) Reflects cumulative appreciation/(depreciation) on futures contracts as disclosed on the Schedule of Investments. Only the period end variation margin is separately disclosed on the Statement of Assets and Liabilities. |
See accompanying notes which are an integral part of the financial statements.
Annual Report
Fidelity International Enhanced Index Fund
Financial Statements
Statement of Assets and Liabilities
| February 29, 2012 | |
|
|
|
Assets | ||
Investment in securities, at value (including securities loaned of $181) - See accompanying schedule: Unaffiliated issuers (cost $25,257,379) | $ 25,834,197 |
|
Fidelity Central Funds (cost $188) | 188 |
|
Total Investments (cost $25,257,567) |
| $ 25,834,385 |
Segregated cash with broker for futures contracts | 66,600 | |
Foreign currency held at value (cost $112,216) | 113,130 | |
Receivable for fund shares sold | 14,349 | |
Dividends receivable | 99,710 | |
Interest receivable | 68 | |
Distributions receivable from Fidelity Central Funds | 472 | |
Total assets | 26,128,714 | |
|
|
|
Liabilities | ||
Payable for fund shares redeemed | $ 38,746 | |
Accrued management fee | 10,047 | |
Transfer agent fee payable | 3,207 | |
Payable for daily variation margin on futures contracts | 10,560 | |
Collateral on securities loaned, at value | 188 | |
Total liabilities | 62,748 | |
|
|
|
Net Assets | $ 26,065,966 | |
Net Assets consist of: |
| |
Paid in capital | $ 29,157,724 | |
Undistributed net investment income | 63,793 | |
Accumulated undistributed net realized gain (loss) on investments and foreign currency transactions | (3,826,412) | |
Net unrealized appreciation (depreciation) on investments and assets and liabilities in foreign currencies | 670,861 | |
Net Assets, for 3,751,191 shares outstanding | $ 26,065,966 | |
Net Asset Value, offering price and redemption price per share ($26,065,966 ÷ 3,751,191 shares) | $ 6.95 | |
Statement of Operations
| Year ended February 29, 2012 | |
|
|
|
Investment Income |
|
|
Dividends |
| $ 932,043 |
Interest |
| 1,170 |
Income from Fidelity Central Funds |
| 3,404 |
Income before foreign taxes withheld |
| 936,617 |
Less foreign taxes withheld |
| (69,581) |
Total income |
| 867,036 |
|
|
|
Expenses | ||
Management fee | $ 117,459 | |
Transfer agent fees | 37,559 | |
Independent trustees' compensation | 225 | |
Miscellaneous | 68 | |
Total expenses | 155,311 | |
Net investment income (loss) | 711,725 | |
Realized and Unrealized Gain (Loss) Net realized gain (loss) on: | ||
Investment securities: |
|
|
Unaffiliated issuers | 113,973 | |
Foreign currency transactions | 24,242 | |
Futures contracts | (156,152) | |
Total net realized gain (loss) |
| (17,937) |
Change in net unrealized appreciation (depreciation) on: Investment securities | (2,864,248) | |
Assets and liabilities in foreign currencies | (12,016) | |
Futures contracts | 18,673 | |
Total change in net unrealized appreciation (depreciation) |
| (2,857,591) |
Net gain (loss) | (2,875,528) | |
Net increase (decrease) in net assets resulting from operations | $ (2,163,803) | |
See accompanying notes which are an integral part of the financial statements.
Annual Report
Statement of Changes in Net Assets
| Year ended | Year ended |
Increase (Decrease) in Net Assets |
|
|
Operations |
|
|
Net investment income (loss) | $ 711,725 | $ 552,203 |
Net realized gain (loss) | (17,937) | (834,033) |
Change in net unrealized appreciation (depreciation) | (2,857,591) | 3,872,862 |
Net increase (decrease) in net assets resulting from operations | (2,163,803) | 3,591,032 |
Distributions to shareholders from net investment income | (697,868) | (534,394) |
Distributions to shareholders from net realized gain | (17,836) | - |
Total distributions | (715,704) | (534,394) |
Share transactions | 12,780,368 | 14,443,401 |
Reinvestment of distributions | 678,145 | 507,651 |
Cost of shares redeemed | (9,990,460) | (12,491,341) |
Net increase (decrease) in net assets resulting from share transactions | 3,468,053 | 2,459,711 |
Redemption fees | 2,353 | 1,042 |
Total increase (decrease) in net assets | 590,899 | 5,517,391 |
Net Assets | ||
Beginning of period | 25,475,067 | 19,957,676 |
End of period (including undistributed net investment income of $63,793 and undistributed net investment income of $49,936, respectively) | $ 26,065,966 | $ 25,475,067 |
Other Information Shares | ||
Sold | 1,810,888 | 2,066,221 |
Issued in reinvestment of distributions | 105,259 | 70,971 |
Redeemed | (1,444,919) | (1,891,969) |
Net increase (decrease) | 471,228 | 245,223 |
Financial Highlights
Years ended February 28, | 2012 I | 2011 | 2010 | 2009 | 2008 G |
Selected Per-Share Data |
|
|
|
|
|
Net asset value, beginning of period | $ 7.77 | $ 6.58 | $ 4.42 | $ 9.35 | $ 10.00 |
Income from Investment Operations |
|
|
|
|
|
Net investment income (loss)D | .20 | .17 | .15 | .18 | .03 |
Net realized and unrealized gain (loss) | (.82) | 1.19 | 2.17 | (4.96) | (.68) |
Total from investment operations | (.62) | 1.36 | 2.32 | (4.78) | (.65) |
Distributions from net investment income | (.19) | (.17) | (.14) | (.14) | - |
Distributions from net realized gain | (.01) | - | (.02) | (.01) | - |
Total distributions | (.20) | (.17) | (.16) | (.15) | - |
Redemption fees added to paid in capital D,J | - | - | - | - | - |
Net asset value, end of period | $ 6.95 | $ 7.77 | $ 6.58 | $ 4.42 | $ 9.35 |
Total Return B,C | (7.81)% | 20.95% | 52.44% | (51.52)% | (6.50)% |
Ratios to Average Net Assets E,H |
|
|
|
|
|
Expenses before reductions | .62% | .62% | .62% | .62% | .62% A |
Expenses net of fee waivers, if any | .62% | .62% | .62% | .62% | .62% A |
Expenses net of all reductions | .62% | .62% | .62% | .62% | .62% A |
Net investment income (loss) | 2.84% | 2.50% | 2.39% | 2.69% | 1.58% A |
Supplemental Data |
|
|
|
|
|
Net assets, end of period (000 omitted) | $ 26,066 | $ 25,475 | $ 19,958 | $ 12,950 | $ 7,273 |
Portfolio turnover rate F | 49% | 32% | 22% K | 42% K | 15% |
A Annualized
B Total returns for periods of less than one year are not annualized.
C Total returns would have been lower if certain expenses had not been reduced during the applicable periods shown.
D Calculated based on average shares outstanding during the period.
E Fees and expenses of any underlying funds and Fidelity Central Funds are not included in the Fund's expense ratio. The Fund indirectly bears its proportionate share of the expenses of any underlying funds and Fidelity Central Funds.
F Amount does not include the portfolio activity of any underlying funds and Fidelity Central Funds.
G For the period December 20, 2007 (commencement of operations) to February 29, 2008.
H Expense ratios reflect operating expenses of the Fund. Expenses before reductions do not reflect amounts reimbursed by the investment adviser or reductions from expense offset arrangements and do not represent the amount paid by the Fund during periods when reimbursements or reductions occur. Expenses net of fee waivers reflect expenses after reimbursement by the investment adviser but prior to reductions from expense offset arrangements. Expenses net of all reductions represent the net expenses paid by the Fund.
I For the year ended February 29.
J Amount represents less than $.01 per share.
K Reflects adjustments to exclude transactions in money market mutual funds.
See accompanying notes which are an integral part of the financial statements.
Annual Report
Notes to Financial Statements
For the period ended February 29, 2012
1. Organization.
Fidelity Large Cap Growth Enhanced Index Fund, Fidelity Large Cap Value Enhanced Index Fund, Fidelity Large Cap Core Enhanced Index Fund, Fidelity Mid Cap Enhanced Index Fund, Fidelity Small Cap Enhanced Index Fund and Fidelity International Enhanced Index Fund (the Funds) are funds of Fidelity Commonwealth Trust II (the Trust) and are authorized to issue an unlimited number of shares. The Trust is registered under the Investment Company Act of 1940, as amended (the 1940 Act), as an open-end management investment company organized as a Delaware statutory trust.
2. Significant Accounting Policies.
The financial statements have been prepared in conformity with accounting principles generally accepted in the United States of America (GAAP), which require management to make certain estimates and assumptions at the date of the financial statements. Actual results could differ from those estimates. Subsequent events, if any, through the date that the financial statements were issued have been evaluated in the preparation of the financial statements. The following summarizes the significant accounting policies of the Funds:
Security Valuation. Investments are valued as of 4:00 p.m. Eastern time on the last calendar day of the period. Each Fund uses independent pricing services approved by the Board of Trustees to value their investments. When current market prices or quotations are not readily available or reliable, valuations may be determined in good faith in accordance with procedures adopted by the Board of Trustees. Factors used in determining value may include market or security specific events, changes in interest rates and credit quality. The frequency with which these procedures are used cannot be predicted and they may be utilized to a significant extent. The value used for net asset value (NAV) calculation under these procedures may differ from published prices for the same securities.
Each Fund categorizes the inputs to valuation techniques used to value their investments into a disclosure hierarchy consisting of three levels as shown below:
Level 1 - quoted prices in active markets for identical investments
Level 2 - other significant observable inputs (including quoted prices for similar investments, interest rates, prepayment speeds, etc.)
Level 3 - unobservable inputs (including the Fund's own assumptions based on the best information available)
Changes in valuation techniques may result in transfers in or out of an assigned level within the disclosure hierarchy. The aggregate value of investments by input level, as of February 29, 2012, is included at the end of each Fund's Schedule of Investments. Valuation techniques used to value each Fund's investments by major category are as follows:
Equity securities, including restricted securities, for which market quotations are readily available, are valued at the last reported sale price or official closing price as reported by an independent pricing service on the primary market or exchange on which they are traded and are categorized as Level 1 in the hierarchy. In the event there were no sales during the day or closing prices are not available, securities are valued at the last quoted bid price or may be valued using the last available price and are generally categorized as Level 2 in the hierarchy. For foreign equity securities, when significant market or security specific events arise, comparisons to the valuation of American Depositary Receipts (ADRs), futures contracts, Exchange-traded funds (ETFs) and certain indexes as well as quoted prices for similar securities are used and are categorized as Level 2 in the hierarchy in these circumstances. Utilizing these techniques may result in transfers between Level 1 and Level 2. For restricted equity securities and private placements where observable inputs are limited, assumptions about market activity and risk are used and are categorized as Level 3 in the hierarchy.
Debt securities, including restricted securities, are valued based on evaluated prices received from independent pricing services or from dealers who make markets in such securities. For U.S. government and government agency obligations, pricing services utilize matrix pricing which considers yield or price of bonds of comparable quality, coupon, maturity and type as well as dealer supplied prices and are generally categorized as Level 2 in the hierarchy. When independent prices are unavailable or unreliable, debt securities may be valued utilizing pricing matrices which consider similar factors that would be used by independent pricing services. These are generally categorized as Level 2 in the hierarchy but may be Level 3 depending on the circumstances.
Futures contracts are valued at the settlement price or official closing price established each day by the board of trade or exchange on which they are traded and are categorized as Level 1 in the hierarchy. Investments in open-end mutual funds, including the Fidelity Central Funds, are valued at their closing net asset value each business day and are categorized as Level 1 in the hierarchy.
New Accounting Pronouncements. In May 2011, the Financial Accounting Standards Board issued Accounting Standard Update No. 2011-04, Fair Value Measurement (Topic 820) - Amendments to Achieve Common Fair Value Measurement and Disclosure Requirements in U.S. GAAP and IFRSs. The update is effective during interim and annual periods beginning after December 15, 2011 and will result in additional disclosure for transfers between levels as well as expanded disclosure for securities categorized as Level 3 under the fair value hierarchy.
Annual Report
2. Significant Accounting Policies - continued
New Accounting Pronouncements - continued
In December 2011, the Financial Accounting Standards Board issued Accounting Standard Update No. 2011-11, Disclosures about Offsetting Assets and Liabilities. The update creates new disclosure requirements requiring entities to disclose both gross and net information for derivatives and other financial instruments that are either offset in the Statement of Assets and Liabilities or subject to an enforceable master netting arrangement or similar agreement. The disclosure requirements are effective for interim and annual reporting periods beginning on or after January 1, 2013. Management is currently evaluating the impact of the update's adoption on the Fund's financial statement disclosures.
Foreign Currency. The Funds may use foreign currency contracts to facilitate transactions in foreign-denominated securities. Gains and losses from these transactions may arise from changes in the value of the foreign currency or if the counterparties do not perform under the contracts' terms.
Foreign-denominated assets, including investment securities, and liabilities are translated into U.S. dollars at the exchange rate at period end. Purchases and sales of investment securities, income and dividends received and expenses denominated in foreign currencies are translated into U.S. dollars at the exchange rate in effect on the transaction date.
The effects of exchange rate fluctuations on investments are included with the net realized and unrealized gain (loss) on investment securities. Other foreign currency transactions resulting in realized and unrealized gain (loss) are disclosed separately.
Investment Transactions and Income. For financial reporting purposes, the Funds' investment holdings and NAV include trades executed through the end of the last business day of the period. The NAV per share for processing shareholder transactions is calculated as of the close of business of the New York Stock Exchange (NYSE), normally 4:00 p.m. Eastern time and includes trades executed through the end of the prior business day. Gains and losses on securities sold are determined on the basis of identified cost and may include proceeds received from litigation. Dividend income is recorded on the ex-dividend date, except for certain dividends from foreign securities where the ex-dividend date may have passed, which are recorded as soon as the Funds are informed of the ex-dividend date. Non-cash dividends included in dividend income, if any, are recorded at the fair market value of the securities received. Distributions received on securities that represent a return of capital or capital gain are recorded as a reduction of cost of investments and/or as a realized gain. The Funds estimate the components of distributions received that may be considered return of capital distributions or capital gain distributions. Interest income and distributions from the Fidelity Central Funds are accrued as earned. Interest income includes coupon interest and amortization of premium and accretion of discount on debt securities. Investment income is recorded net of foreign taxes withheld where recovery of such taxes is uncertain.
Expenses. Expenses directly attributable to a fund are charged to that fund. Expenses attributable to more than one fund are allocated among the respective funds on the basis of relative net assets or other appropriate methods. Expense estimates are accrued in the period to which they relate and adjustments are made when actual amounts are known.
Income Tax Information and Distributions to Shareholders. Each year, each Fund intends to qualify as a regulated investment company under Subchapter M of the Internal Revenue Code, including distributing substantially all of its taxable income and realized gains. As a result, no provision for income taxes is required. As of February 29, 2012, each Fund did not have any unrecognized tax benefits in the financial statements; nor is each Fund aware of any tax positions for which it is reasonably possible that the total amounts of unrecognized tax benefits will significantly change in the next twelve months. Each Fund files a U.S. federal tax return, in addition to state and local tax returns as required. A fund's federal income tax returns are subject to examination by the Internal Revenue Service (IRS) for a period of three fiscal years after they are filed. State and local tax returns may be subject to examination for an additional fiscal year depending on the jurisdiction. Foreign taxes are provided for based on each Fund's understanding of the tax rules and rates that exist in the foreign markets in which it invests.
Distributions are declared and recorded on the ex-dividend date. Income and capital gain distributions are determined in accordance with income tax regulations, which may differ from GAAP. In addition, certain Funds claimed a portion of the payment made to redeeming shareholders as a distribution for income tax purposes.
Capital accounts within the financial statements are adjusted for permanent book-tax differences. These adjustments have no impact on net assets or the results of operations. Temporary book-tax differences will reverse in a subsequent period.
Book-tax differences are primarily due to futures transactions, foreign currency transactions, passive foreign investment companies (PFIC), market discount, partnerships, capital loss carryforwards and losses deferred due to wash sales and excise tax regulations.
Annual Report
Notes to Financial Statements - continued
2. Significant Accounting Policies - continued
Income Tax Information and Distributions to Shareholders - continued
The federal tax cost of investment securities and unrealized appreciation (depreciation) as of period end were as follows for each Fund:
| Tax cost | Gross unrealized | Gross unrealized | Net unrealized |
Fidelity Large Cap Growth Enhanced Index Fund | $ 150,136,004 | $ 20,002,080 | $ (1,443,464) | $ 18,558,616 |
Fidelity Large Cap Value Enhanced Index Fund | 76,227,513 | 11,597,959 | (1,847,253) | 9,750,706 |
Fidelity Large Cap Core Enhanced Index Fund | 311,062,948 | 19,473,646 | (20,686,610) | (1,212,964) |
Fidelity Mid Cap Enhanced Index Fund | 74,940,992 | 10,060,578 | (2,487,931) | 7,572,647 |
Fidelity Small Cap Enhanced Index Fund | 112,019,548 | 21,458,897 | (7,028,717) | 14,430,180 |
Fidelity International Enhanced Index Fund | 25,301,884 | 2,936,008 | (2,403,507) | 532,501 |
The tax-based components of distributable earnings as of period end were as follows for each Fund:
| Undistributed | Undistributed | Capital loss | Net unrealized |
Fidelity Large Cap Growth Enhanced Index Fund | $ 247,352 | $ - | $ (3,291,456) | $ 18,558,616 |
Fidelity Large Cap Value Enhanced Index Fund | 226,847 | 762,534 | - | 9,750,706 |
Fidelity Large Cap Core Enhanced Index Fund | - | - | (67,644,623) | (979,343) |
Fidelity Mid Cap Enhanced Index Fund | 118,757 | 1,029,346 | (1,652,795) | 7,572,647 |
Fidelity Small Cap Enhanced Index Fund | 59,139 | 1,391,520 | - | 14,430,180 |
Fidelity International Enhanced Index Fund | 73,413 | - | (3,375,241) | 532,934 |
Capital loss carryforwards are only available to offset future capital gains of the Funds to the extent provided by regulations and may be limited. Under the Regulated Investment Company Modernization Act of 2010 (the Act), the Funds are permitted to carry forward capital losses incurred in taxable years beginning after December 22, 2010 for an unlimited period and such capital losses are required to be used prior to any losses that expire. Capital loss carryforwards were as follows:
| Fiscal year of |
|
|
|
| 2017 | 2018 | 2019 | Total with |
Fidelity Large Cap Growth Enhanced Index Fund | $ - | $ (3,291,456) | $ - | $ (3,291,456) |
Fidelity Large Cap Core Enhanced Index Fund | (27,465,172) | (39,911,723) | - | (67,376,895) |
Fidelity Mid Cap Enhanced Index Fund | - | (1,144,350) | (508,445) | (1,652,795) |
Fidelity International Enhanced Index Fund | (730,243) | (1,890,764) | (754,234) | (3,375,241) |
| No expiration |
|
| Long-term | Total capital |
Fidelity Large Cap Growth Enhanced Index Fund | $ - | $ (3,291,456) |
Fidelity Large Cap Core Enhanced Index Fund | (267,728) | (67,644,623) |
Fidelity Mid Cap Enhanced Index Fund | - | (1,652,795) |
Fidelity International Enhanced Index Fund | - | (3,375,241) |
As a result of large redemptions in June 2011, Fidelity Large Cap Core Enhanced Index Fund had an "ownership change" under the Internal Revenue Code, which limits capital losses that will be available to offset future capital gains to approximately $2,804,338 per year plus certain gains in the fund existing at the time of the ownership change. As a result, at least $50,550,867 of Fidelity Large Cap Core Enhanced Index Fund's capital loss carryforward will expire unused. To properly reflect the amount of losses that will expire unused, an adjustment was made between Accumulated Undistributed Net Realized Loss and Paid in Capital in the current period.
Annual Report
2. Significant Accounting Policies - continued
Income Tax Information and Distributions to Shareholders - continued
Certain of the Funds intend to elect to defer to the fiscal year ending February 28, 2013 losses recognized during the period November 1, 2011 to February 29, 2012. Loss deferrals were as follows:
| Capital losses |
Fidelity Large Cap Value Enhanced Index Fund | $ (1,340,140) |
Fidelity International Enhanced Index Fund | (322,863) |
The tax character of distributions paid was as follows:
February 29, 2012 | Ordinary | Long-term | Total |
Fidelity Large Cap Growth Enhanced Index Fund | $ 1,003,885 | $ - | $ 1,003,885 |
Fidelity Large Cap Value Enhanced Index Fund | 1,691,757 | 2,577,862 | 4,269,619 |
Fidelity Large Cap Core Enhanced Index Fund | 2,264,397 | - | 2,264,397 |
Fidelity Mid Cap Enhanced Index Fund | 880,930 | 3,758,251 | 4,639,181 |
Fidelity Small Cap Enhanced Index Fund | 628,524 | 12,048,896 | 12,677,420 |
Fidelity International Enhanced Index Fund | 715,704 | - | 715,704 |
February 28, 2011 | Ordinary | Long-term | Total |
Fidelity Large Cap Growth Enhanced Index Fund | $ 603,819 | $ - | $ 603,819 |
Fidelity Large Cap Value Enhanced Index Fund | 1,184,075 | - | 1,184,075 |
Fidelity Large Cap Core Enhanced Index Fund | 15,976,149 | - | 15,976,149 |
Fidelity Mid Cap Enhanced Index Fund | 1,446,233 | 635,360 | 2,081,593 |
Fidelity Small Cap Enhanced Index Fund | 740,549 | - | 740,549 |
Fidelity International Enhanced Index Fund | 534,394 | - | 534,394 |
Short Term Trading (Redemption) Fees. Shares held by investors of Fidelity Small Cap Enhanced Index Fund less than 90 days are subject to a redemption fee equal to 1.50% of the net asset value of shares redeemed. Shares held by investors of Fidelity Mid Cap Enhanced Index Fund and Fidelity International Enhanced Index Fund less than 30 days are subject to a redemption fee equal to 0.75% and 1.00%, respectively, of the net asset value of shares redeemed. All redemption fees, which reduce the proceeds of the shareholder redemption, are retained by the Funds and accounted for as an addition to paid in capital. For Fidelity Small Cap Enhanced Index Fund, total redemption fees include $40,341 paid by an affiliate of FMR for fees not paid to the fund in prior periods.
3. Derivative Instruments.
Risk Exposures and the Use of Derivative Instruments. The Funds used derivative instruments (derivatives), including futures contracts in order to meet their investment objectives. The strategy is to use derivatives to increase returns and to manage exposure to certain risks as defined below. The success of any strategy involving derivatives depends on analysis of numerous economic factors, and if the strategies for investment do not work as intended, the Funds may not achieve their objectives.
The Funds' use of derivatives increased or decreased their exposure to the following risks:
Equity Risk | Equity risk relates to the fluctuations in the value of financial instruments as a result of changes in market prices (other than those arising from interest rate risk or foreign exchange risk), whether caused by factors specific to an individual investment, its issuer, or all factors affecting all instruments traded in a market or market segment. |
The Funds are also exposed to additional risks from investing in derivatives, such as liquidity risk and counterparty credit risk. Liquidity risk is the risk that the Funds will be unable to close out the derivative in the open market in a timely manner. Counterparty credit risk is the risk that the counterparty will not be able to fulfill its obligation to the Funds. Counterparty credit risk related to exchange-traded futures contracts is minimal because of the protection provided by the exchange on which they trade. Derivatives involve, to varying degrees, risk of loss in excess of the amounts recognized in the Statement of Assets and Liabilities.
Annual Report
Notes to Financial Statements - continued
3. Derivative Instruments - continued
Net Realized Gain (Loss) and Change in Net Unrealized Appreciation (Depreciation) on Derivatives. The table below, which reflects the impacts of derivatives on the financial performance of the Funds, summarizes the net realized gain (loss) and change in net unrealized appreciation (depreciation) for derivatives during the period.
Risk Exposure / Derivative Type | Net Realized | Change in Net Unrealized |
Fidelity Large Cap Growth Enhanced Index Fund |
|
|
Equity Risk |
|
|
Futures Contracts | $ 658,896 | $ (18,293) |
Total (a) | $ 658,896 | $ (18,293) |
Fidelity Large Cap Value Enhanced Index Fund |
|
|
Equity Risk |
|
|
Futures Contracts | $ 46,646 | $ 83,135 |
Total (a) | $ 46,646 | $ 83,135 |
Fidelity Large Cap Core Enhanced Index Fund |
|
|
Equity Risk |
|
|
Futures Contracts | $ 1,434,578 | $ 267,248 |
Total (a) | $ 1,434,578 | $ 267,248 |
Fidelity Mid Cap Enhanced Index Fund |
|
|
Equity Risk |
|
|
Futures Contracts | $ (66,140) | $ 129,998 |
Total (a) | $ (66,140) | $ 129,998 |
Fidelity Small Cap Enhanced Index Fund |
|
|
Equity Risk |
|
|
Futures Contracts | $ 708,144 | $ (209,362) |
Total (a) | $ 708,144 | $ (209,362) |
Fidelity International Enhanced Index Fund |
|
|
Equity Risk |
|
|
Futures Contracts | $ (156,152) | $ 18,673 |
Total (a) | $ (156,152) | $ 18,673 |
(a) A summary of the value of derivatives by risk exposure as of period end, is included at the end of the Schedule of Investments and is representative of activity for the period.
Futures Contracts. A futures contract is an agreement between two parties to buy or sell a specified underlying instrument for a fixed price at a specified future date. The Funds used futures contracts to manage their exposure to the stock market.
Upon entering into a futures contract, a fund is required to deposit either cash or securities (initial margin) with a clearing broker in an amount equal to a certain percentage of the face value of the contract. Futures contracts are marked-to-market daily and subsequent payments (variation margin) are made or received by a fund depending on the daily fluctuations in the value of the futures contracts and are recorded as unrealized appreciation or (depreciation). This receivable and/or payable is included in daily variation margin on futures contracts in the Statement of Assets and Liabilities. Realized gain or (loss) is recorded upon the expiration or closing of a futures contract.
The underlying face amount at value of open futures contracts at period end is shown in the Schedule of Investments under the caption "Futures Contracts." This amount reflects each contract's exposure to the underlying instrument at period end and is representative of activity for the period. Securities deposited to meet initial margin requirements are identified in the Schedule of Investments. Cash deposited to meet initial margin requirements is shown as segregated cash in the Statement of Assets and Liabilities.
4. Purchases and Sales of Investments.
Purchases and sales of securities, other than short-term securities, are noted in the table below.
| Purchases ($) | Sales ($) |
Fidelity Large Cap Growth Enhanced Index Fund | 128,368,588 | 66,022,321 |
Fidelity Large Cap Value Enhanced Index Fund | 69,302,866 | 83,739,129 |
Fidelity Large Cap Core Enhanced Index Fund | 356,928,261 | 1,056,818,935 |
Fidelity Mid Cap Enhanced Index Fund | 81,678,614 | 62,585,192 |
Fidelity Small Cap Enhanced Index Fund | 100,796,289 | 87,938,332 |
Fidelity International Enhanced Index Fund | 15,705,542 | 11,848,577 |
Annual Report
5. Fees and Other Transactions with Affiliates.
Management Fee and Expense Contract. Strategic Advisers, Inc. (Strategic Advisers), an affiliate of Fidelity Management & Research Company (FMR), provides the Funds with investment management related services. For these services, the Funds pay a monthly management fee to Strategic Advisers. The management fee is based on an annual rate of 0.30% of average net assets for Fidelity Large Cap Growth Enhanced Index, Fidelity Large Cap Value Enhanced Index and Fidelity Large Cap Core Enhanced Index, 0.45% of average net assets for Fidelity Mid Cap Enhanced Index, 0.52% of average net assets for Fidelity Small Cap Enhanced Index and 0.47% of average net assets for Fidelity International Enhanced Index. Under the management contract, Strategic Advisers pays all other ordinary fund-wide operating expenses (such as custody, audit, legal and pricing and bookkeeping fees), except the compensation of the independent Trustees and certain other expenses such as interest expense. The management fee paid to Strategic Advisers by the Funds is reduced by an amount equal to the fees and expenses paid by the Funds to the independent Trustees.
In addition, under the expense contract, Strategic Advisers pays other expenses such as those listed above for each of the Funds so that the total expenses do not exceed certain amounts of each Fund's average net assets with certain exceptions, as noted in the following table:
Fidelity Large Cap Growth Enhanced Index Fund | .45% |
Fidelity Large Cap Value Enhanced Index Fund | .45% |
Fidelity Large Cap Core Enhanced Index Fund | .45% |
Fidelity Mid Cap Enhanced Index Fund | .60% |
Fidelity Small Cap Enhanced Index Fund | .67% |
Fidelity International Enhanced Index Fund | .62% |
Sub-Adviser. Geode Capital Management, LLC (Geode), serves as sub-adviser for the Funds. Geode provides discretionary investment advisory services to the Funds and is paid by Strategic Advisers for providing these services.
Transfer Agent Fees. Fidelity Investments Institutional Operations Company, Inc. (FIIOC), an affiliate of FMR, is the Funds' transfer, dividend disbursing and shareholder servicing agent. FIIOC receives account fees and asset-based fees that vary according to type of account. FIIOC pays for typesetting, printing and mailing of shareholder reports, except proxy statements. Under the expense contract, each fund paid transfer agent fees at the annual rate of 0.15% of average net assets.
Interfund Lending Program. Pursuant to an Exemptive Order issued by the SEC, the Funds, along with other registered investment companies having management contracts with FMR, may participate in an interfund lending program. This program provides an alternative credit facility allowing the funds to borrow from, or lend money to, other participating affiliated funds. At period end, there were no interfund loans outstanding. Each applicable fund's activity in this program during the period for which loans were outstanding was as follows:
| Borrower or | Average Loan Balance | Weighted Average | Interest |
Fidelity Large Cap Value Enhanced Index Fund | Borrower | $ 5,240,833 | .33% | $ 287 |
Fidelity Large Cap Core Enhanced Index Fund | Borrower | 79,198,500 | .40% | 1,769 |
6. Investments in Fidelity Central Funds.
The Funds invest in Fidelity Central Funds, which are open-end investment companies available only to other investment companies and accounts managed by FMR and its affiliates. The Funds' Schedules of Investments list each of the Fidelity Central Funds held as of period end, if any, as an investment of each Fund, but does not include the underlying holdings of each Fidelity Central Fund. As an Investing Fund, each Fund indirectly bears its proportionate share of the expenses of the underlying Fidelity Central Funds.
The Fidelity Securities Lending Cash Central Fund seeks preservation of capital and current income and is managed by Fidelity Investments Money Management, Inc. (FIMM), an affiliate of FMR.
A complete unaudited list of holdings for each Fidelity Central Fund is available upon request or at the Securities and Exchange Commission (the SEC) web site at www.sec.gov. In addition, the financial statements of the Fidelity Central Funds, which are not covered by the Funds' Report of Independent Registered Public Accounting Firm, are available on the SEC web site or upon request.
7. Committed Line of Credit.
Certain Funds participate with other funds managed by FMR or an affiliate in a $4.0 billion credit facility (the "line of credit") to be utilized for temporary or emergency purposes to fund shareholder redemptions or for other short-term liquidity purposes. The participating funds have agreed to pay
Annual Report
Notes to Financial Statements - continued
7. Committed Line of Credit - continued
commitment fees on their pro-rata portion of the line of credit, which are reflected in Miscellaneous expenses on the Statement of Operations, and are as follows:
Fidelity Large Cap Growth Enhanced Index Fund | $ 225 |
Fidelity Large Cap Value Enhanced Index Fund | 248 |
Fidelity Large Cap Core Enhanced Index Fund | 1,423 |
Fidelity Mid Cap Enhanced Index Fund | 195 |
Fidelity Small Cap Enhanced Index Fund | 339 |
Fidelity International Enhanced Index Fund | 73 |
During the period, there were no borrowings on this line of credit.
8. Security Lending.
Certain Funds lend portfolio securities from time to time in order to earn additional income. On the settlement date of the loan, each applicable Fund receives collateral (in the form of U.S. Treasury obligations, letters of credit and/or cash) against the loaned securities and maintains collateral in an amount not less than 100% of the market value of the loaned securities during the period of the loan. The market value of the loaned securities is determined at the close of business of the Funds and any additional required collateral is delivered to the Funds on the next business day. If the borrower defaults on its obligation to return the securities loaned because of insolvency or other reasons, a fund could experience delays and costs in recovering the securities loaned or in gaining access to the collateral. Any cash collateral received is invested in the Fidelity Securities Lending Cash Central Fund. The value of loaned securities and cash collateral at period end are disclosed on each applicable Fund's Statement of Assets and Liabilities. Security lending income represents the income earned on investing cash collateral, less rebates paid to borrowers, plus any premium payments received for lending certain types of securities. Security lending income is presented on each applicable Fund's Statement of Operations as a component of income from Fidelity Central Funds.
9. Expense Reductions.
Through arrangements with each applicable Fund's custodian, credits realized as a result of uninvested cash balances were used to reduce each applicable Fund's expenses. All of the applicable expense reductions are noted in the table below.
| Expense |
|
|
Fidelity Large Cap Growth Enhanced Index Fund | $ 3 |
Fidelity Large Cap Core Enhanced Index Fund | 36 |
Fidelity Mid Cap Enhanced Index Fund | 1 |
Fidelity Small Cap Enhanced Index Fund | 12 |
10. Other.
The Funds' organizational documents provide former and current trustees and officers with a limited indemnification against liabilities arising in connection with the performance of their duties to the Funds. In the normal course of business, the Funds may also enter into contracts that provide general indemnifications. The Funds' maximum exposure under these arrangements is unknown as this would be dependent on future claims that may be made against the Funds. The risk of material loss from such claims is considered remote.
At the end of the period, Strategic Advisers U.S. Opportunity Fund and Strategic Advisers U.S. Opportunity II Fund were the owners of record of approximately 25% and 11%, of the total outstanding shares of the Fidelity Large Cap Core Enhanced Index Fund. In addition, Strategic Advisers U.S. Opportunity II Fund was the owner of record of approximately 12% of the total outstanding shares of the Fidelity Large Cap Value Enhanced Index Fund. Mutual funds managed by FMR or its affiliates were the owners of record, in aggregate, of approximately 49% of the total outstanding shares of the Fidelity Large Cap Core Enhanced Index Fund and Fidelity Large Cap Value Enhanced Index Fund.
Annual Report
Report of Independent Registered Public Accounting Firm
To the Trustees of Fidelity Commonwealth Trust II and the Shareholders of Fidelity Large Cap Growth Enhanced Index Fund, Fidelity Large Cap Value Enhanced Index Fund, Fidelity Large Cap Core Enhanced Index Fund, Fidelity Mid Cap Enhanced Index Fund, Fidelity Small Cap Enhanced Index Fund and Fidelity International Enhanced Index Fund:
In our opinion, the accompanying statements of assets and liabilities, including the schedules of investments, and the related statements of operations and of changes in net assets and the financial highlights present fairly, in all material respects, the financial positions of Fidelity Large Cap Growth Enhanced Index Fund, Fidelity Large Cap Value Enhanced Index Fund, Fidelity Large Cap Core Enhanced Index Fund, Fidelity Mid Cap Enhanced Index Fund, Fidelity Small Cap Enhanced Index Fund and Fidelity International Enhanced Index Fund (funds of Fidelity Commonwealth Trust II) February 29, 2012, the results of each of their operations for the year then ended, the changes in each of their net assets for each of the two years in the period then ended and the financial highlights for each of the periods indicated, in conformity with accounting principles generally accepted in the United States of America. These financial statements and financial highlights (hereafter referred to as "financial statements") are the responsibility of the Fidelity Commonwealth Trust II's management. Our responsibility is to express an opinion on these financial statements based on our audits. We conducted our audits of these financial statements in accordance with the standards of the Public Company Accounting Oversight Board (United States). Those standards require that we plan and perform the audit to obtain reasonable assurance about whether the financial statements are free of material misstatement. An audit includes examining, on a test basis, evidence supporting the amounts and disclosures in the financial statements, assessing the accounting principles used and significant estimates made by management, and evaluating the overall financial statement presentation. We believe that our audits, which included confirmation of securities at February 29, 2012 by correspondence with the custodian and brokers, provide a reasonable basis for our opinion.
/s/ PricewaterhouseCoopers LLP
PricewaterhouseCoopers LLP
Boston, Massachusetts
April 16, 2012
Annual Report
Trustees and Officers
The Trustees, Member of the Advisory Board, and executive officers of the trust and funds, as applicable, are listed below. The Board of Trustees governs each fund and is responsible for protecting the interests of shareholders. The Trustees are experienced executives who meet periodically throughout the year to oversee each fund's activities, review contractual arrangements with companies that provide services to each fund, oversee management of the risks associated with such activities and contractual arrangements, and review each fund's performance. Each of the Trustees oversees 22 funds advised by Strategic Advisers or an affiliate.
The Trustees hold office without limit in time except that (a) any Trustee may resign; (b) any Trustee may be removed by written instrument, signed by at least two-thirds of the number of Trustees prior to such removal; (c) any Trustee who requests to be retired or who has become incapacitated by illness or injury may be retired by written instrument signed by a majority of the other Trustees; and (d) any Trustee may be removed at any special meeting of shareholders by a two-thirds vote of the outstanding voting securities of the trust. The executive officers and Advisory Board Memeber hold office without limit in time, except that any officer may resign or may be removed by a vote of a majority of the Trustees at any regular meeting or any special meeting of the Trustees. Except as indicated, each individual has held the office shown or other offices in the same company for the past five years.
Experience, Skills, Attributes, and Qualifications of the Funds' Trustees. The Governance and Nominating Committee has adopted a statement of policy that describes the experience, qualifications, attributes, and skills that are necessary and desirable for potential Independent Trustee candidates (Statement of Policy). The Board believes that each Trustee satisfied at the time he or she was initially elected or appointed a Trustee, and continues to satisfy, the standards contemplated by the Statement of Policy. The Governance and Nominating Committee may also engage professional search firms to help identify potential Independent Trustee candidates with experience, qualifications, attributes, and skills consistent with the Statement of Policy. Additional criteria based on the composition and skills of the current Independent Trustees, as well as experience or skills that may be appropriate in light of future changes to board composition, business conditions, and regulatory or other developments, may be considered by the professional search firms and the Governance and Nominating Committee. In addition, the Board takes into account the Trustees' commitment and participation in Board and committee meetings, as well as their leadership of standing and ad hoc committees throughout their tenure.
In determining that a particular Trustee was and continues to be qualified to serve as a Trustee, the Board has considered a variety of criteria, none of which, in isolation, was controlling. The Board believes that, collectively, the Trustees have balanced and diverse experience, qualifications, attributes, and skills, which allow the Board to operate effectively in governing each fund and protecting the interests of shareholders. Information about the specific experience, skills, attributes, and qualifications of each Trustee, which in each case led to the Board's conclusion that the Trustee should serve (or continue to serve) as a trustee of the funds, is provided below.
Board Structure and Oversight Function. Roger T. Servison is an interested person (as defined in the 1940 Act) and currently serves as Chairman. The Trustees have determined that an interested Chairman is appropriate and benefits shareholders because an interested Chairman has a personal and professional stake in the quality and continuity of services provided to the funds. Independent Trustees exercise their informed business judgment to appoint an individual of their choosing to serve as Chairman, regardless of whether the Trustee happens to be independent or a member of management. The Independent Trustees have determined that they can act independently and effectively without having an Independent Trustee serve as Chairman and that a key structural component for assuring that they are in a position to do so is for the Independent Trustees to constitute a substantial majority for the Board. The Independent Trustees also regularly meet in executive session. Ralph F. Cox serves as the lead Independent Trustee and as such (i) acts as a liaison between the Independent Trustees and management with respect to matters important to the Independent Trustees and (ii) with management prepares agendas for Board meetings.
Fidelity funds are overseen by different Boards of Trustees. The funds' Board oversees asset allocation funds as well as the Fidelity enhanced index funds. Other boards oversee Fidelity's investment-grade bond, money market, and asset allocation funds and Fidelity's equity and high income funds. The funds may invest in Fidelity funds overseen by such other Boards. The use of separate Boards, each with its own committee structure, allows the Trustees of each group of Fidelity funds to focus on the unique issues of the funds they oversee, including common research, investment, and operational issues.
The Trustees primarily operate as a full Board, but also operate in committees, to facilitate the timely and efficient consideration of all matters of importance to the Trustees, each fund, and fund shareholders and to facilitate compliance with legal and regulatory requirements and oversight of the funds' activities and associated risks. The Board has charged Strategic Advisers and its affiliates with (i) identifying events or circumstances the occurrence of which could have demonstrably adverse effects on the funds' business and/or reputation; (ii) implementing processes and controls to lessen the possibility that such events or circumstances occur or to mitigate the effects of such events or circumstances if they do occur; and (iii) creating and maintaining a system designed to evaluate continuously business and market conditions in order to facilitate the identification and implementation processes described in (i) and (ii) above. Because the day-to-day operations and activities of the funds are carried out by or through Strategic Advisers, its affiliates and other service providers, the funds' exposure to risks is mitigated but not eliminated by the processes overseen by the Trustees. Board oversight of different aspects of the funds' activities is exercised primarily through the full Board, but also through the Audit and Compliance Committee. Appropriate personnel, including but not limited to the funds' Chief Compliance Officer (CCO), FMR's internal auditor, the independent accountants, the funds' Treasurer and portfolio management personnel, make periodic reports to the Board's committees, as appropriate. The responsibilities of each committee, including their oversight responsibilities, are described further under "Standing Committees of the Funds' Trustees."
Annual Report
Trustees and Officers - continued
Interested Trustees*:
Correspondence intended for each Trustee who is an interested person may be sent to Fidelity Investments, 82 Devonshire Street, Boston, Massachusetts 02109.
Name, Age; Principal Occupations and Other Relevant Experience+ | |
Roger T. Servison (66) | |
| Year of Election or Appointment: 2006 Mr. Servison is Chairman of the Board of Trustees. Mr. Servison serves as President of Strategic New Business Development for Fidelity Investments and serves as a Director of Strategic Advisers. Previously, Mr. Servison oversaw Fidelity Investments Life Insurance Company (2005-2006) and Strategic Advisers (2005-2007). Mr. Servison also served as President and a Director of Fidelity Brokerage Services (Japan), LLC (1994-2004). |
Derek L. Young (47) | |
| Year of Election or Appointment: 2012 Mr. Young is Vice President of Fidelity's Asset Allocation Funds (2009-present), President and a Director of Strategic Advisers, Inc. (2011-present), President of Fidelity Global Asset Allocation (GAA) (2011-present), and Vice Chairman of Pyramis Global Advisors, LLC (2011-present). Previously, Mr. Young served as Chief Investment Officer of GAA (2009-2011) and as a portfolio manager. |
* Trustees have been determined to be "Interested Trustees" by virtue of, among other things, their affiliation with the trust or various entities under common control with Strategic Advisers.
+ The information above includes each Trustee's principal occupation during the last five years and other information relating to the experience, attributes, and skills relevant to each Trustee's qualifications to serve as a Trustee, which led to the conclusion that each Trustee should serve as a Trustee for each fund.
Independent Trustees:
Correspondence intended for each Independent Trustee (that is, the Trustees other than the Interested Trustees) may be sent to Fidelity Investments, P.O. Box 55235, Boston, Massachusetts 02205-5235.
Name, Age; Principal Occupations and Other Relevant Experience+ | |
Peter C. Aldrich (67) | |
| Year of Election or Appointment: 2006 Mr. Aldrich is a Director of the National Bureau of Economic Research and a Director of the funds of BlackRock Realty Group (2006-present). Previously, Mr. Aldrich served as a Trustee for the Fidelity Rutland Square Trust (2005-2010), a Managing Member of Poseidon, LLC (foreign private investment, 1998-2004), and Chairman and Managing Member of AEGIS, LLC (foreign private investment, 1997-2004). Mr. Aldrich also served as Faculty Chairman of The Research Council on Global Investment of The Conference Board (business and professional education non-profit, 1999-2004). Mr. Aldrich is a Member of the Boards of Trustees of the Museum of Fine Arts Boston and Massachusetts Eye and Ear Infirmary. |
Amy Butte Liebowitz (44) | |
| Year of Election or Appointment: 2011 Ms. Butte Liebowitz is the founder and Chief Executive Officer of TILE Financial (financial internet service, 2008-present). Previously, Ms. Butte Liebowitz served as the Chief Financial Officer and member of the Board of Directors of MF Global (broker-dealer, 2006-2008), and Chief Financial Officer and Executive Vice President of the New York Stock Exchange (2004-2006). Ms. Butte Liebowitz is a member of the Boards of Directors of Accion International and the New York Women's Forum, as well as a selected participant in the World Economic Forum's Young Global Leader program. |
Ralph F. Cox (79) | |
| Year of Election or Appointment: 2006 Mr. Cox is President of RABAR Enterprises (management consulting for the petroleum industry). Mr. Cox is a Director of Abraxas Petroleum (exploration and production). Mr. Cox is a member of the Advisory Boards of the Business and Engineering Schools of Texas A&M University and the Engineering School of University of Texas at Austin. Previously, Mr. Cox served as a Trustee for the Fidelity Rutland Square Trust (2005-2010) and as an Advisory Director of CH2M Hill Companies (engineering, 1981-2011). Mr. Ralph F. Cox and Mr. Howard E. Cox, Jr. are not related. |
Karen Kaplan (52) | |
| Year of Election or Appointment: 2006 Ms. Kaplan is President of Hill Holliday (advertising and specialized marketing, 2007-present). Ms. Kaplan is a Director of DSM (dba Delta Dental, Doral, and DentaQuest) (2004-present), Member of the Board of Governors of the Chief Executives' Club of Boston (2010-present), Member of the Board of the Massachusetts Conference for Women (2008-present), and Director of the Executive Committee of the Greater Boston Chamber of Commerce (2006-present). She is also a member of the Clinton Global Initiative, an action oriented community of the most effective CEOs, heads of state, Nobel Prize winners, and non-governmental leaders in the world. Previously, Ms. Kaplan served as an Advisory Board Member of Fidelity Rutland Square Trust (2006-2010), President of the Massachusetts Women's Forum (2008-2010), Treasurer of the Massachusetts Women's Forum (2002-2006), Vice Chair of the Board of the Massachusetts Society for the Prevention of Cruelty to Children (2003-2010), Director of United Way of Massachusetts Bay (2004-2006), Director of ADVO (direct mail marketing, 2003-2007), and Director of Tweeter Home Entertainment Group (2006-2007). |
+ The information above includes each Trustee's principal occupation during the last five years and other information relating to the experience, attributes, and skills relevant to each Trustee's qualifications to serve as a Trustee, which led to the conclusion that each Trustee should serve as a Trustee for each fund.
Advisory Board Member and Executive Officers:
Correspondence intended for each executive officer and Howard E. Cox, Jr. may be sent to Fidelity Investments, 82 Devonshire Street, Boston, Massachusetts 02109.
Name, Age; Principal Occupation | |
Howard E. Cox, Jr. (68) | |
| Year of Election or Appointment: 2009 Member of the Advisory Board of Fidelity Commonwealth Trust II. Mr. Cox is a Member of the Advisory Board of Devonshire Investors (2009-present). Mr. Cox serves as an Advisory Partner of Greylock (venture capital) and a Director of Stryker Corporation (medical products and services). Previously, Mr. Cox served as an Advisory Board Member of Fidelity Rutland Square Trust (2006-2010) and a Member of the Secretary of Defense's Business Board of Directors (2008-2010). Mr. Howard E. Cox, Jr. and Mr. Ralph F. Cox are not related. |
Kenneth B. Robins (42) | |
| Year of Election or Appointment: 2010 President and Treasurer of each fund. Mr. Robins also serves as President and Treasurer of other Fidelity Equity and High Income Funds (2008-present) and Assistant Treasurer of other Fidelity Fixed Income and Asset Allocation Funds (2009-present). Mr. Robins is an employee of Fidelity Investments (2004-present). Previously, Mr. Robins served as Deputy Treasurer of the Fidelity funds (2005-2008) and Treasurer and Chief Financial Officer of The North Carolina Capital Management Trust: Cash and Term Portfolios (2006-2008). |
Marc Bryant (46) | |
| Year of Election or Appointment: 2010 Secretary and Chief Legal Officer of each fund. Senior Vice President and Deputy General Counsel of Fidelity Investments. Prior to joining Fidelity Investments, Mr. Bryant served as a Senior Vice President and the Head of Global Retail Legal for AllianceBernstein L.P. (2006-2010), and as the General Counsel for ProFund Advisors LLC (2001-2006). |
Holly C. Laurent (57) | |
| Year of Election or Appointment: 2008 Anti-Money Laundering (AML) Officer of each fund. Ms. Laurent also serves as AML Officer of the Fidelity funds (2008-present) and The North Carolina Capital Management Trust: Cash and Term Portfolios (2008-present). Ms. Laurent is an employee of Fidelity Investments. Previously, Ms. Laurent was Senior Vice President and Head of Legal for Fidelity Business Services India Pvt. Ltd. (2006-2008), and Senior Vice President, Deputy General Counsel and Group Head for FMR LLC (2005-2006). |
Nicholas E. Steck (47) | |
| Year of Election or Appointment: 2009 Chief Financial Officer of each fund. Mr. Steck serves as Senior Vice President of Fidelity Pricing and Cash Management Services (2008-present) and is an employee of Fidelity Investments. During the period 2002 to 2009, Mr. Steck served as a Compliance Officer of FMR, Fidelity Investments Money Management, Inc., FMR LLC, Fidelity Research & Analysis (U.K.) Inc., Fidelity Management & Research (Hong Kong) Limited, and Fidelity Management & Research (Japan) Inc. |
Laura M. Doherty (42) | |
| Year of Election or Appointment: 2009 Chief Compliance Officer of each fund. Ms. Doherty also serves as Senior Vice President of the Office of the Chief Compliance Officer (2008-present). Previously, Ms. Doherty served as a Vice President in Fidelity's Corporate Audit department (1998-2008). |
Adrien E. Deberghes (44) | |
| Year of Election or Appointment: 2011 Vice President and Assistant Treasurer of each fund. Mr. Deberghes also serves as Assistant Treasurer (2010-present) and Deputy Treasurer (2008-present) of other Fidelity funds and is an employee of Fidelity Investments (2008-present). Previously, Mr. Deberghes served as Senior Vice President of Mutual Fund Administration at State Street Corporation (2007-2008), Senior Director of Mutual Fund Administration at Investors Bank & Trust (2005-2007), and Director of Finance for Dunkin' Brands (2000-2005). |
Jonathan Davis (43) | |
| Year of Election or Appointment: 2010 Assistant Treasurer of each fund. Mr. Davis is also Assistant Treasurer of certain Fidelity funds. Mr. Davis is an employee of Fidelity Investments. Previously, Mr. Davis served as Vice President and Associate General Counsel of FMR LLC (2003-2010). |
Margaret A. Carey (38) | |
| Year of Election or Appointment: 2009 Assistant Secretary of each fund. Ms. Carey is also Assistant Secretary of The North Carolina Capital Management Trust: Cash and Term Portfolios (2008-present) and is an employee of Fidelity Investments (2004-present). |
Annual Report
Distributions (Unaudited)
The Board of Trustees of each fund voted to pay to shareholders of record at the opening of business on record date, the following distributions per share derived from capital gains realized from sales of portfolio securities and dividends derived from net investment income:
| Pay Date | Record Date | Dividends | Capital Gains |
Fidelity Large Cap Growth Enhanced Index Fund | 04/16/12 | 04/13/12 | $0.019 | $0.000 |
Fidelity Large Cap Value Enhanced Index Fund | 04/16/12 | 04/13/12 | $0.025 | $0.083 |
Fidelity Large Cap Core Enhanced Index Fund | 04/16/12 | 04/13/12 | $0.000 | $0.000 |
Fidelity Mid Cap Enhanced Index Fund | 04/16/12 | 04/13/12 | $0.016 | $0.130 |
Fidelity Small Cap Enhanced Index Fund | 04/16/12 | 04/13/12 | $0.005 | $0.111 |
Fidelity International Enhanced Index Fund | 04/16/12 | 04/13/12 | $0.018 | $0.003 |
The funds hereby designate as capital gain dividend the amounts noted below for the taxable year ended February 29, 2012, or, if subsequently determined to be different, the net capital gain of such year.
Fidelity Large Cap Value Enhanced Index Fund | $3,482,189 |
Fidelity Mid Cap Enhanced Index Fund | $4,636,766 |
Fidelity Small Cap Enhanced Index Fund | $10,935,180 |
A percentage of the dividends distributed during the fiscal year for the following funds qualify for the dividends-received deduction for corporate shareholders:
| April 2011 | December 2011 |
Fidelity Large Cap Growth Enhanced Index Fund | 100% | 100% |
Fidelity Large Cap Value Enhanced Index Fund | 100% | 100% |
Fidelity Large Cap Core Enhanced Index Fund | 100% | 0% |
Fidelity Mid Cap Enhanced Index Fund | 28% | 100% |
Fidelity Small Cap Enhanced Index Fund | 0% | 100% |
A percentage of the dividends distributed during the fiscal year for the following funds may be taken into account as a dividend for purposes of the maximum rate under section 1(h)(11) of the Internal Revenue Code.
| April 2011 | December 2011 |
Fidelity Large Cap Growth Enhanced Index Fund | 100% | 100% |
Fidelity Large Cap Value Enhanced Index Fund | 100% | 100% |
Fidelity Large Cap Core Enhanced Index Fund | 100% | 0% |
Fidelity Mid Cap Enhanced Index Fund | 39% | 100% |
Fidelity Small Cap Enhanced Index Fund | 0% | 100% |
Fidelity International Enhanced Index Fund | 100% | 100% |
The amounts per share which represent income derived from sources within, and taxes paid to, foreign countries or possession of the United States are as follows:
| Pay Date | Income | Taxes |
Fidelity International Enhanced Index Fund | 04/18/2011 | $0.015 | $0.0015 |
Fidelity International Enhanced Index Fund | 12/12/2011 | $0.093 | $0.0172 |
The funds will notify shareholders in January 2013 of amounts for use in preparing 2012 income tax returns.
Annual Report
Board Approval of Investment Advisory Contracts and Management Fees
Fidelity Large Cap Core Enhanced Index Fund, Fidelity Large Cap Growth Enhanced Index Fund, Fidelity Large Cap Value Enhanced Index Fund, Fidelity Mid Cap Enhanced Index Fund, Fidelity Small Cap Enhanced Index Fund, and Fidelity International Enhanced Index Fund
Each year the Board of Trustees, including the Independent Trustees (together, the Board), votes at an in-person meeting on the renewal of the management contract with Strategic Advisers, Inc. (Strategic Advisers) and Geode Capital Management, LLC (Geode) (the Sub-Advisory Agreement and, together with the management contract, the Advisory Contracts) for each fund. The Board, assisted by the advice of fund counsel and Independent Trustees' counsel, requests and considers a broad range of information relevant to the renewal of the Advisory Contracts throughout the year.
The Board meets at least four times per year and considers at each of its meetings one or more factors that are relevant to its annual consideration of the renewal of each fund's Advisory Contracts, including the services and support provided to each fund and its shareholders. The Board has established standing committees, each composed of Independent Trustees with varying backgrounds, to which the Board has assigned specific subject matter responsibilities in order to enhance effective decision making by the Board. While the full Board or the Independent Trustees, as appropriate, act on all major matters, a portion of the activities of the Board (including certain of those described herein) may be conducted through these committees.
At its September 2011 meeting, the Board of Trustees, including the Independent Trustees, unanimously determined to renew each fund's Advisory Contracts. In reaching its determination, the Board considered all factors it believed relevant, including, (i) the nature, extent, and quality of the services to be provided to each fund and its shareholders (including the investment performance of each fund); (ii) the competitiveness of each fund's management fee and total expenses; (iii) the total costs of the services to be provided and the profits, if any, to be realized by Strategic Advisers from its relationship with the funds; (iv) the extent to which economies of scale would be realized as each fund grows; and (v) whether fee levels reflect these economies of scale, if any, for the benefit of each fund's shareholders.
In considering whether to renew the Advisory Contracts for each fund, the Board reached a determination, with the assistance of fund counsel and Independent Trustees' counsel and through the exercise of its business judgment, that the renewal of the Advisory Contracts is in the best interests of each fund and its shareholders. In addition, with respect to the Sub-Advisory Agreement, the Board also concluded that the renewal of such agreements does not involve a conflict of interest from which Strategic Advisers or its affiliates derive an inappropriate advantage. The Board's decision to renew the Advisory Contracts was not based on any single factor, but rather was based on a comprehensive consideration of all the information provided to the Board throughout the year.
Nature, Extent, and Quality of Services Provided. The Board considered the staffing within the investment adviser, Strategic Advisers, and the sub-adviser, Geode (collectively, the Investment Advisers), including the backgrounds of each fund's investment personnel and each fund's investment objective and discipline. The Independent Trustees also had discussions with senior management of Strategic Advisers' investment operations and investment groups. The Board considered the structure of each Investment Adviser's portfolio manager compensation program and whether such structures provide appropriate incentives to act in the best interests of each fund.
Resources Dedicated to Investment Management and Support Services. The Board reviewed the general qualifications and capabilities of the Investment Advisers' investment staff, their use of technology, and the Investment Advisers' approach to recruiting, managing and compensating investment personnel. The Board noted that the Investment Advisers' analysts have extensive resources, tools, and capabilities that allow them to conduct sophisticated quantitative and fundamental analysis. Additionally, in their deliberations, the Board considered the Investment Advisers' trading capabilities and resources which are an integral part of the investment management process.
Shareholder and Administrative Services. The Board considered (i) the nature, extent, quality, and cost of advisory, administrative, and shareholder services performed by the Investment Advisers and their affiliates under the Advisory Contracts and under separate agreements covering transfer agency and pricing and bookkeeping, and securities lending services for each fund; (ii) the nature and extent of Strategic Advisers' supervision of third party service providers, including the sub-advisers, custodians and subcustodians; and (iii) the resources devoted to, and the record of compliance with, each fund's compliance policies and procedures.
Investment Performance. The Board considered whether each fund has operated in accordance with its investment objective, as well as its record of compliance with its investment restrictions. It also reviewed each fund's absolute investment performance, as well as each fund's relative investment performance measured against (i) a broad-based securities market index, and (ii) a peer group of mutual funds deemed appropriate by Strategic Advisers and reviewed by the Board. The following charts considered by the Board show for each fund, over the one- and three-year periods ended December 31, 2010, the cumulative total returns of each fund, cumulative total returns of a broad-based securities market index ("benchmark"), and a range of cumulative total returns of a peer group of mutual funds identified by Lipper Inc. as having an investment style similar to the respective fund based on underlying portfolio holdings. The box within each chart shows the 25th percentile return (bottom of box) and the 75th percentile return (top of box) of the peer group. Returns shown above the box are in the first quartile and returns shown below the box are in the fourth quartile. The percentage beaten numbers noted below each chart correspond to the percentile box and represent the percentage of funds in the peer group whose performance was equal to or lower than that of each fund.
Annual Report
Board Approval of Investment Advisory Contracts and Management Fees - continued
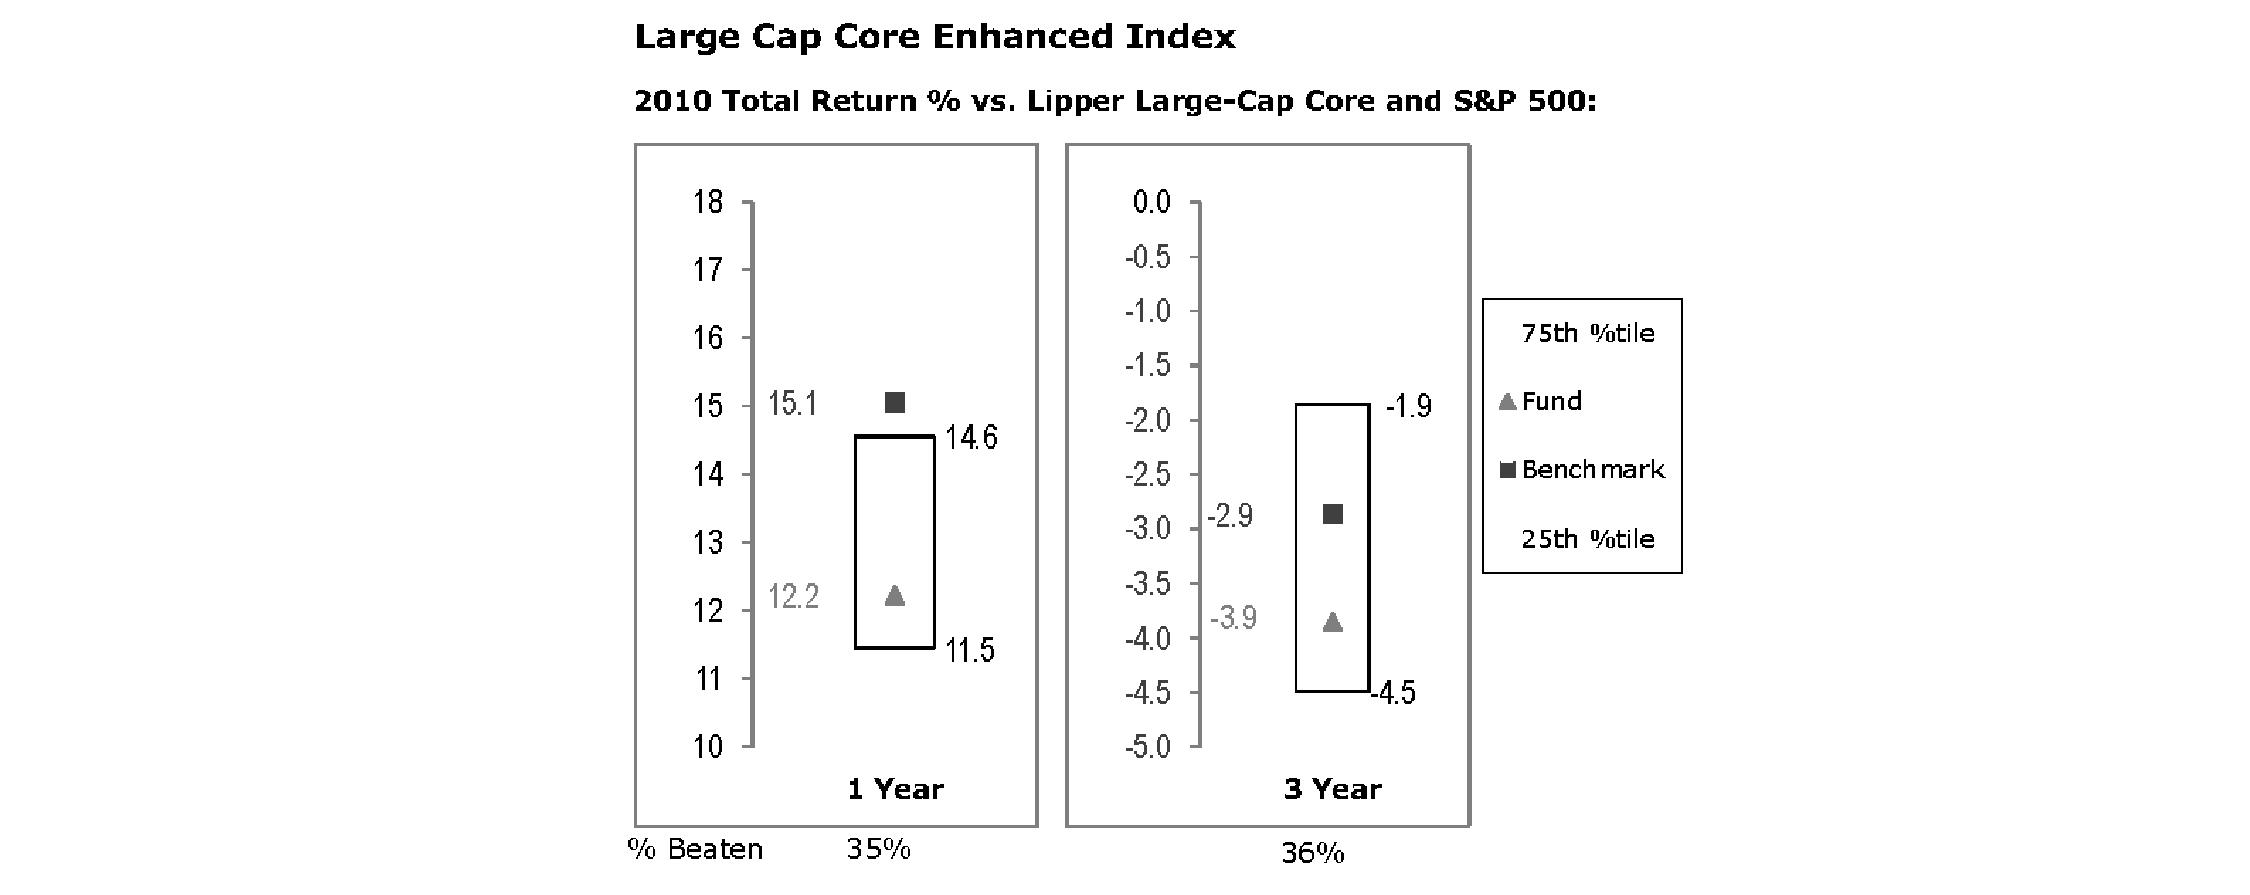
The Board reviewed the fund's relative investment performance against its peer group and noted that the performance of the fund was in the third quartile and that the fund had under-performed 65% and 64% of its peers for the one- and three-year periods, respectively, ended December 31, 2010. The Board also noted that the investment performance of the fund was lower than its benchmark for the one- and three-year periods shown.
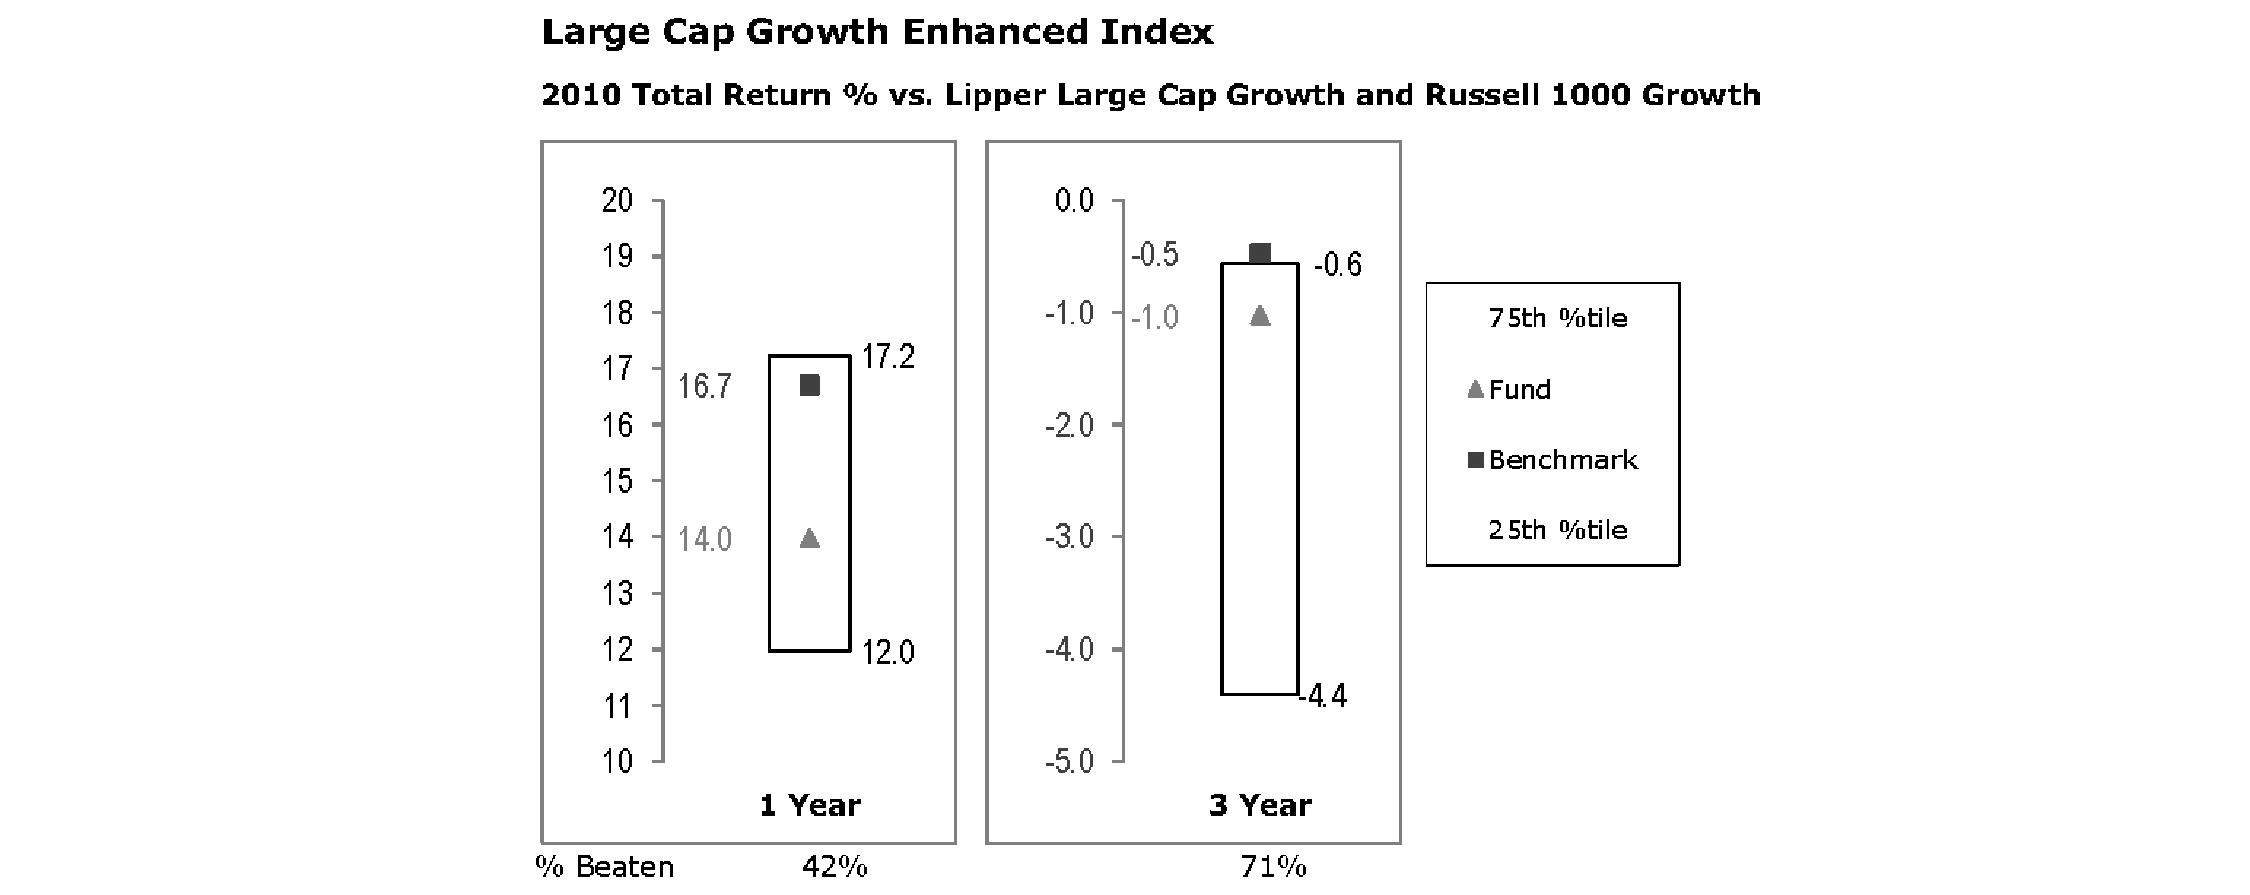
The Board reviewed the fund's relative investment performance against its peer group and noted that the performance of the fund was in the third quartile and that the fund had under-performed 58% of its peers for the one-year period and that the performance of the fund was in the second quartile and that the fund had out-performed 71% of its peers for the three-year period ended December 31, 2010. The Board also noted that the investment performance of the fund was lower than its benchmark for the one- and three-year periods shown.
Annual Report
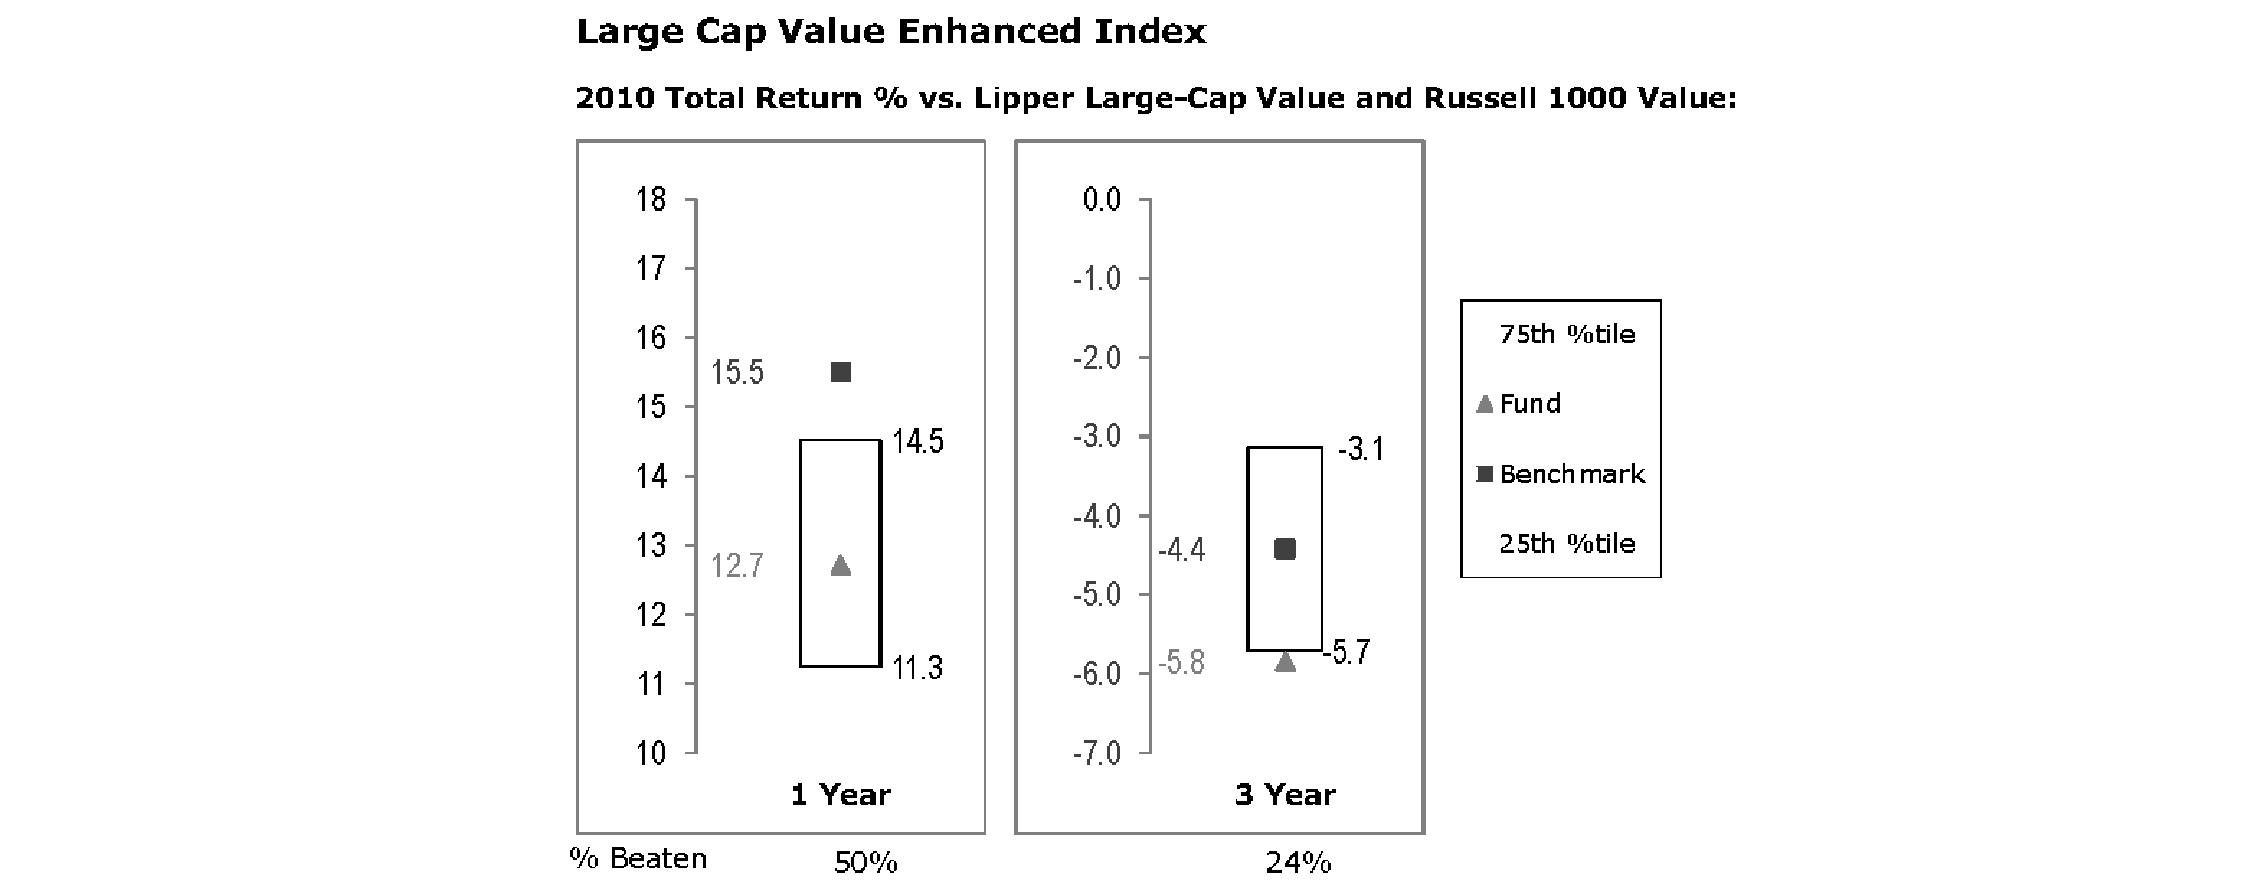
The Board reviewed the fund's relative investment performance against its peer group and noted that the performance of the fund was in the third quartile for the one-year period and fourth quartile for the three-year period and that the fund had under-performed 50% and 76% of its peers for the one- and three-year periods, respectively, ended December 31, 2010. The Board also noted that the investment performance of the fund was lower than its benchmark for the one- and three-year periods shown.
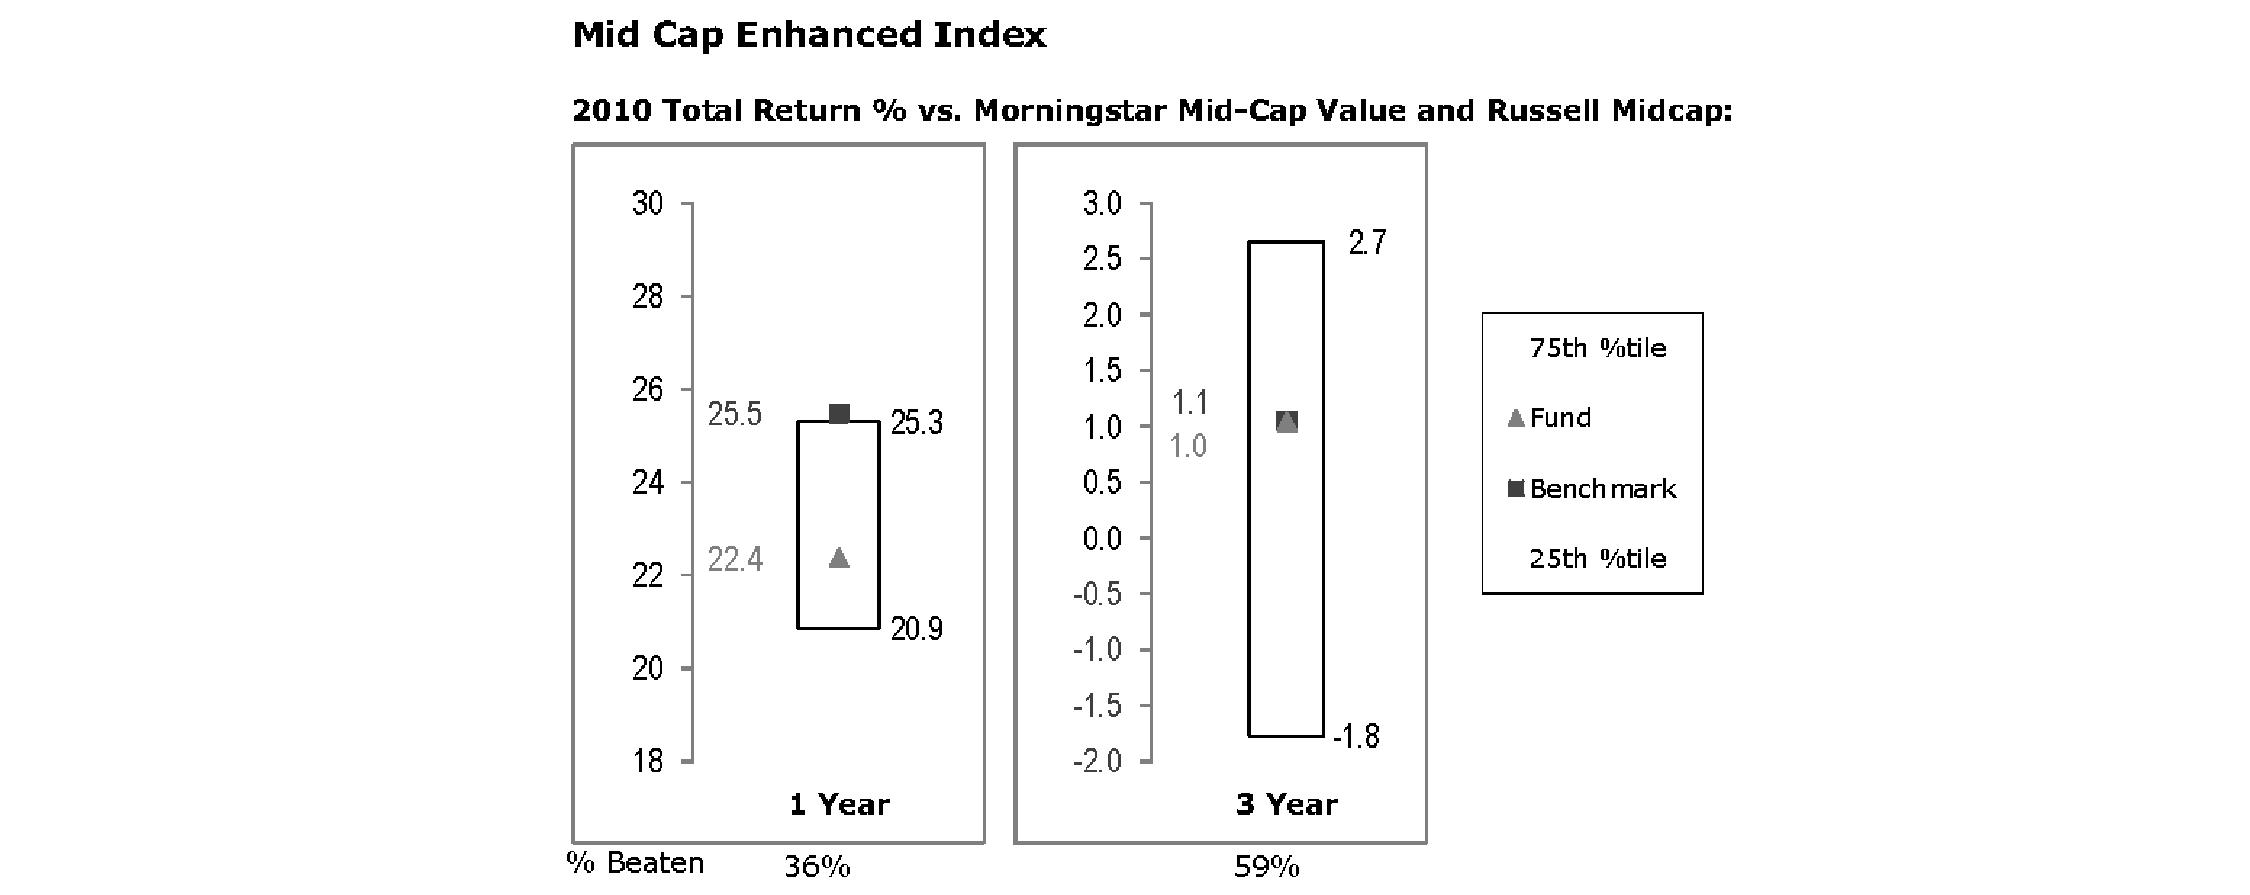
The Board reviewed the fund's relative investment performance against its peer group and noted that the performance of the fund was in the third quartile and that the fund had under-performed 64% of its peers for the one-year period and that the performance of the fund was in the second quartile and that the fund had out-performed 59% of its peers for the three-year period ended December 31, 2010. The Board also noted that the investment performance of the fund was lower than its benchmark for the one- and three-year periods shown.
Annual Report
Board Approval of Investment Advisory Contracts and Management Fees - continued
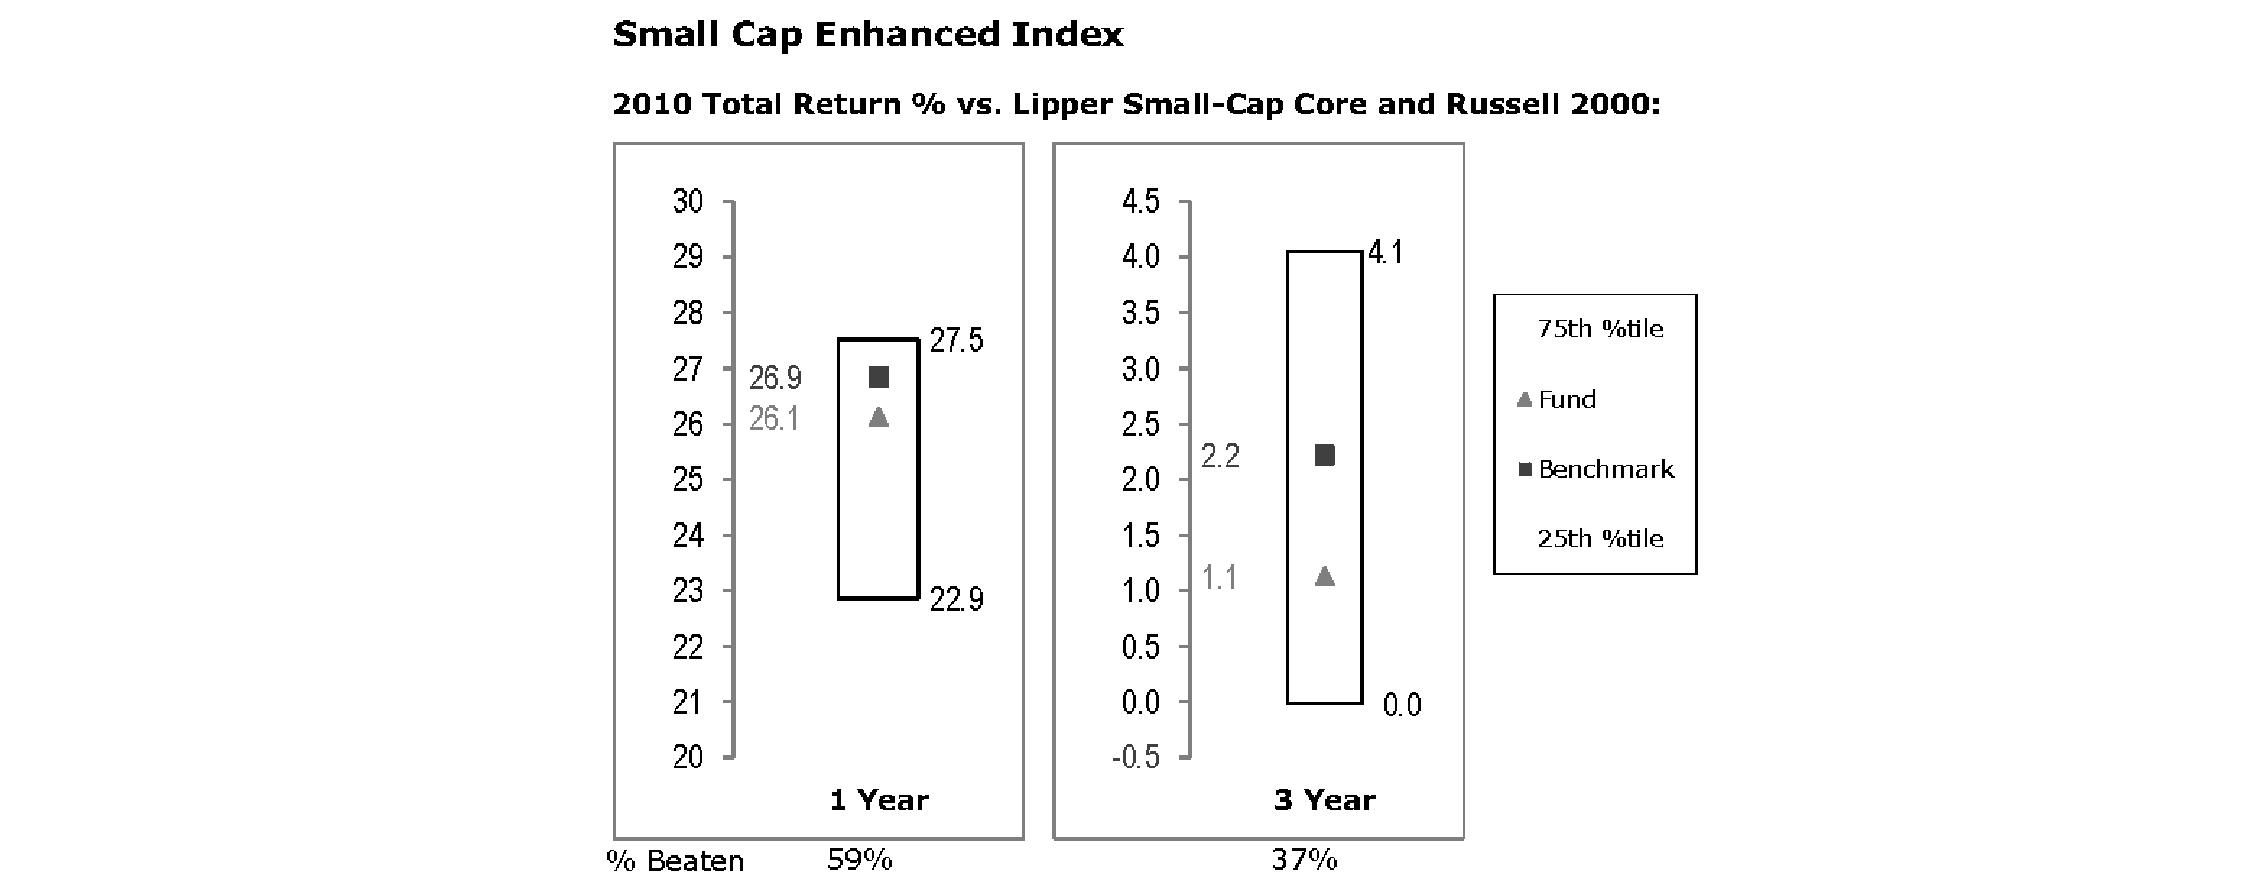
The Board reviewed the fund's relative investment performance against its peer group and noted that the performance of the fund was in the second quartile and that the fund had out-performed 59% of its peers for the one-year period and that the performance of the fund was in the third quartile and that the fund had under-performed 63% of its peers for the three-year period ended December 31, 2010. The Board also noted that the investment performance of the fund was lower than its benchmark for the one- and three-year periods shown.
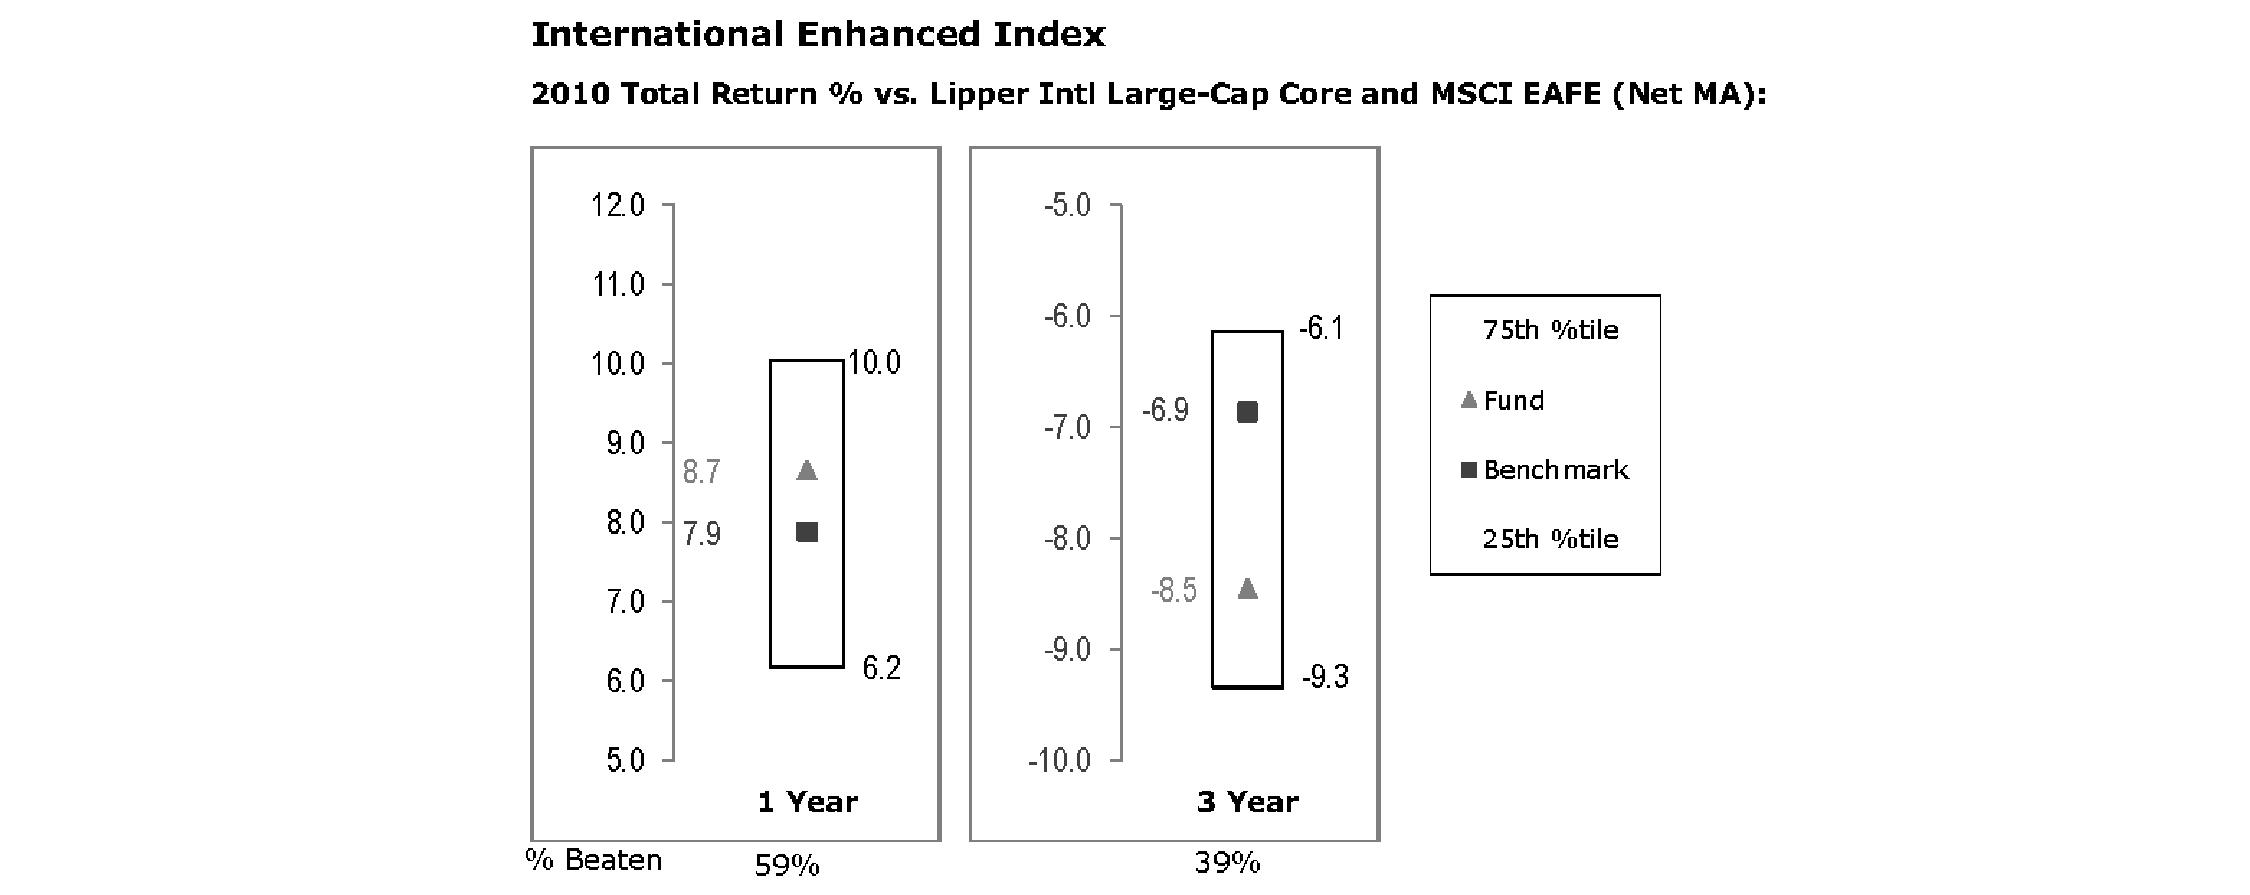
The Board reviewed the fund's relative investment performance against its peer group and noted that the performance of the fund was in the second quartile and that the fund had out-performed 59% of its peers for the one-year period and that the performance of the fund was in the third quartile and that the fund had under-performed 61% of its peers for the three-year period ended December 31, 2010. The Board also noted that the investment performance of the fund was higher than its benchmark for the one-year period and lower and three-year period shown.
Based on its review, the Board concluded that the nature, extent, and quality of services provided to each fund under the Advisory Contracts should benefit each fund's shareholders.
Competitiveness of Management Fee and Total Fund Expenses. The Board considered the amount and nature of fees paid to the Investment Advisers. The Board considered information comparing the management fees and total expenses of each fund to those of other registered investment companies with investment objectives similar to those of the funds. The Board also considered expense contracts currently in effect between the funds and Strategic Advisers, which limit the total annual operating expenses (excluding interest, taxes, securities lending costs, brokerage commissions and certain other expenses) for each fund to the following:
Annual Report
Fidelity Large Cap Core Enhanced Index Fund | 0.45% |
Fidelity Large Cap Growth Enhanced Index Fund | 0.45% |
Fidelity Large Cap Value Enhanced Index Fund | 0.45% |
Fidelity Mid Cap Enhanced Index Fund | 0.60% |
Fidelity Small Cap Enhanced Index Fund | 0.67% |
Fidelity International Enhanced Index Fund | 0.62% |
The Board considered each fund's management fee and total expenses compared to "mapped groups" of competitive funds. Strategic Advisers uses "mapped groups," which are created by Fidelity by combining similar Lipper investment objective categories that it believes have comparable management fee characteristics. Combining Lipper investment objective categories aids the Board's management fee and total expense comparisons by broadening the competitive group used for comparison and by reducing the number of universes to which Strategic Advisers' funds are compared.
Management Fee. The Board considered two proprietary management fee comparisons. The group of Lipper funds used by the Board for management fee comparisons is referred to as the "Total Mapped Group." The Total Mapped Group comparison focuses on a fund's standing relative to the total universe of comparable funds available to investors, in terms of gross management fees before expense reimbursements or caps. The Board also compared each fund's management fee to an "Asset-Size Peer Group" (ASPG), which is a sub-set of the competitive funds in the Total Mapped Group. The ASPG comparison focuses on a fund's standing relative to non-Fidelity funds similar in size to the fund within the Total Mapped Group. The ASPG represents at least 15% of the funds in the Total Mapped Group with comparable asset size and management fee characteristics, subject to a minimum of 50 funds (or all funds in the Total Mapped Group if fewer than 50). The Board noted that each fund's management fee was ranked below the median of its Total Mapped Group and below the median of its ASPG for the year ended February 28, 2011.
Based on its review, the Board concluded that each fund's management fee bears a reasonable relationship to the services rendered.
Total Expenses. In its review of each fund's total expenses, the Board considered each fund's management fee as well as other fund expenses, as applicable, such as transfer agent fees, pricing and bookkeeping fees, and custodial, legal, and audit fees. The Board also noted the effects of any waivers and reimbursements on fees and expenses. The Board further noted that each fund's total expenses were compared to classes of competitive funds having similar load types. This comparison, which is a proxy for comparing funds by distribution channel, showed each fund's position relative to competitive funds with the same load type. The Board noted that each fund's total expenses (giving effect to each fund's expense contract with Strategic Advisers) were below the median of each fund's Total Mapped Group for the year ended February 28, 2011.
Based on its review, the Board concluded that the total expenses of each fund were reasonable in light of the services that each fund and its shareholders receive and the other factors considered.
Costs of the Services and Profitability. The Board considered information regarding the revenues earned and expenses incurred by Strategic Advisers and its affiliates in conducting the business of developing, marketing, distributing, managing, administering and servicing each fund and its shareholders.
On an annual basis, Strategic Advisers presents information to the Board on its profitability for managing each fund. Strategic Advisers calculates the profitability for each fund using a series of detailed revenue and cost allocation methodologies. The Board reviews any significant changes from the prior year's methodologies. Strategic Advisers noted that, to the extent possible, it employs the same corporate reporting of revenues and expenses as those used by other Fidelity funds.
The Board also reviewed Strategic Advisers' and its affiliates' non-fund businesses and fall-out benefits related to the mutual fund business as well as cases where Strategic Advisers' affiliates may benefit from or be related to each fund's business.
The Board considered the costs of the services provided by and the profits realized, if any, by Strategic Advisers and its affiliates in connection with the operation of each fund and was satisfied that the profitability was not excessive under the circumstances.
Possible Economies of Scale. The Board considered whether economies of scale have been realized in respect of the management of the funds. The Board considered that each fund's sub-advisory contracts provide for breakpoints as the fund's assets grow and noted that any potential decline in sub-advisory fees would accrue directly to Strategic Advisers. The Board also considered expense contracts currently in effect between the funds and Strategic Advisers, which limit the total annual operating expenses (excluding interest, taxes, securities lending costs, brokerage commissions and certain other expenses) for each fund to the amounts described above. The Board noted that each fund has not generated sufficient revenue to cover its expenses. The Board also noted that as each fund's assets increase, it will continue to monitor whether management fee breakpoints are appropriate.
Conclusion. Based on its evaluation of all of the conclusions noted above, and after considering all factors it believed relevant, the Board ultimately concluded that the advisory fee structures bear a reasonable relationship to the services rendered and that each fund's Advisory Contracts should be renewed because each agreement is in the best interests of that fund and its shareholders. In addition, with respect to each Sub-Advisory Agreement, the Board concluded that the renewal of each agreement does not involve a conflict of interest from which Strategic Advisers or its affiliates derive an inappropriate advantage.
Annual Report
Managing Your Investments
Fidelity offers several ways to conveniently manage your personal investments via your telephone or PC. You can access your account information, conduct trades and research your investments 24 hours a day.
By Phone
Fidelity Automated Service Telephone provides a single toll-free number to access account balances, positions, quotes and trading. It's easy to navigate the service, and on your first call, the system will help you create a personal identification number (PIN) for security.
(phone graphic)Fidelity Automated Service Telephone (FAST®)
1-800-544-5555
Press
1 For mutual fund and brokerage trading.
2 For quotes.*
3 For account balances and holdings.
4 To review orders and mutual fund activity.
5 To change your PIN.
*0 To speak to a Fidelity representative.
By PC
Fidelity's web site on the Internet provides a wide range of information, including daily financial news, fund performance, interactive planning tools and news about Fidelity products and services.
(computer graphic)Fidelity's Web Site
www.fidelity.com
* When you call the quotes line, please remember that a fund's yield and return will vary and, except for money market funds, share price will also vary. This means that you may have a gain or loss when you sell your shares. There is no assurance that money market funds will be able to maintain a stable $1 share price; an investment in a money market fund is not insured or guaranteed by the U.S. government. Total returns are historical and include changes in share price, reinvestment of dividends and capital gains distributions, and the effects of any sales charges.
Annual Report
Investment Adviser
Strategic Advisers, Inc.
Boston, MA
Investment Sub-Adviser
Geode Capital Management, LLC
Boston, MA
General Distributor
Fidelity Distributors Corporation
Boston, MA
Transfer and Service Agents
Fidelity Investments Institutional Operations Company, Inc.
Boston, MA
Fidelity Service Company, Inc.
Boston, MA
Custodian
The Bank of New York Mellon
New York, NY
The Fidelity Telephone Connection
Mutual Fund 24-Hour Service
Exchanges/Redemptions
and Account Assistance 1-800-544-6666
Product Information 1-800-544-6666
Retirement Accounts 1-800-544-4774
(8 a.m. - 9 p.m.)
TDD Service 1-800-544-0118
for the deaf and hearing impaired
(9 a.m. - 9 p.m. Eastern time)
Fidelity Automated Service
Telephone (FAST®)
1-800-544-5555
Automated line for quickest service
GEI-UANN-0412
1.855137.104
(Fidelity Investment logo)(registered trademark)
Corporate Headquarters
82 Devonshire St., Boston, MA 02109
www.fidelity.com
Item 2. Code of Ethics
As of the end of the period, February 29, 2012, Fidelity Commonwealth Trust II (the "trust") has adopted a code of ethics, as defined in Item 2 of Form N-CSR, that applies to its President and Treasurer and its Chief Financial Officer. A copy of the code of ethics is filed as an exhibit to this Form N-CSR.
Item 3. Audit Committee Financial Expert
The Board of Trustees of the trust has determined that Amy Butte Liebowitz is an audit committee financial expert, as defined in Item 3 of Form N-CSR. Ms. Butte Liebowitz is independent for purposes of Item 3 of Form N-CSR.
Item 4. Principal Accountant Fees and Services
Fees and Services
The following table presents fees billed by PricewaterhouseCoopers LLP ("PwC") in each of the last two fiscal years for services rendered to Fidelity International Enhanced Index Fund, Fidelity Large Cap Core Enhanced Index Fund, Fidelity Large Cap Growth Enhanced Index Fund, Fidelity Large Cap Value Enhanced Index Fund, Fidelity Mid Cap Enhanced Index Fund, and Fidelity Small Cap Enhanced Index Fund (the "Funds"):
Services Billed by PwC
February 29, 2012 FeesA
| Audit Fees | Audit-Related Fees | Tax Fees | All Other Fees |
Fidelity International Enhanced Index Fund | $43,000 | $- | $4,000 | $- |
Fidelity Large Cap Core Enhanced Index Fund | $44,000 | $- | $4,000 | $- |
Fidelity Large Cap Growth Enhanced Index Fund | $43,000 | $- | $4,000 | $- |
Fidelity Large Cap Value Enhanced Index Fund | $44,000 | $- | $4,000 | $- |
Fidelity Mid Cap Enhanced Index Fund | $44,000 | $- | $4,000 | $- |
Fidelity Small Cap Enhanced Index Fund | $44,000 | $- | $4,000 | $- |
February 28, 2011 FeesA
| Audit Fees | Audit-Related Fees | Tax Fees | All Other Fees |
Fidelity International Enhanced Index Fund | $44,000 | $- | $4,000 | $- |
Fidelity Large Cap Core Enhanced Index Fund | $45,000 | $- | $4,000 | $- |
Fidelity Large Cap Growth Enhanced Index Fund | $44,000 | $- | $4,000 | $- |
Fidelity Large Cap Value Enhanced Index Fund | $44,000 | $- | $4,000 | $- |
Fidelity Mid Cap Enhanced Index Fund | $44,000 | $- | $4,000 | $- |
Fidelity Small Cap Enhanced Index Fund | $44,000 | $- | $4,000 | $- |
A Amounts may reflect rounding.
The following table presents fees billed by PwC that were required to be approved by the Audit Committee for services that relate directly to the operations and financial reporting of the Funds and that are rendered on behalf of Strategic Advisers, Inc. ("Strategic Advisers") and entities controlling, controlled by, or under common control with Strategic Advisers (not including any sub-adviser whose role is primarily portfolio management and is subcontracted with or overseen by another investment adviser) that provide ongoing services to the Funds ("Fund Service Providers"):
Services Billed by PwC
| February 29, 2012A | February 28, 2011A |
Audit-Related Fees | $3,795,000 | $2,550,000 |
Tax Fees | $- | $- |
All Other Fees | $- | $510,000 |
A Amounts may reflect rounding.
"Audit-Related Fees" represent fees billed for assurance and related services that are reasonably related to the performance of the Fund audit or the review of the Fund's financial statements and that are not reported under Audit Fees.
"Tax Fees" represent fees billed for tax compliance, tax advice or tax planning that relate directly to the operations and financial reporting of the Fund.
"All Other Fees" represent fees billed for services provided to the fund or Fund Service Provider, a significant portion of which are assurance related, that relate directly to the operations and financial reporting of the fund, excluding those services that are reported under Audit Fees, Audit-Related Fees or Tax Fees.
Assurance services must be performed by an independent public accountant.
* * *
The aggregate non-audit fees billed by PwC for services rendered to the Funds, Strategic Advisers (not including any sub-adviser whose role is primarily portfolio management and is subcontracted with or overseen by another investment adviser), and any Fund Service Provider relating to Covered Services and Non-Covered Services (each as defined below) for each of the last two fiscal years of the Funds are as follows:
Billed By | February 29, 2012 A | February 28, 2011 A |
PwC | $5,145,000 | $4,975,000 |
A Amounts may reflect rounding.
The trust's Audit Committee has considered non-audit services that were not pre-approved that were provided by PwC to Fund Service Providers to be compatible with maintaining the independence of PwC in its audit of the Funds, taking into account representations from PwC, in accordance with Public Company Accounting Oversight Board rules, regarding its independence from the Funds and their related entities and Strategic Advisers' review of the appropriateness and permissibility under applicable law of such non-audit services prior to their provision to the Fund Service Providers.
Audit Committee Pre-Approval Policies and Procedures
The trust's Audit Committee must pre-approve all audit and non-audit services provided by the independent registered public accounting firm relating to the operations or financial reporting of the funds. Prior to the commencement of any audit or non-audit services to a fund, the Audit Committee reviews the services to determine whether they are appropriate and permissible under applicable law.
The trust's Audit Committee has adopted policies and procedures to, among other purposes, provide a framework for the Committee's consideration of non-audit services by the audit firms that audit the Fidelity funds. The policies and procedures require that any non-audit service provided by a fund audit firm to the trust and any non-audit service provided by a fund auditor to a Fund Service Provider that relates directly to the operations and financial reporting of the trust ("Covered Service") are subject to approval by the Audit Committee before such service is provided.
All Covered Services must be approved in advance of provision of the service either: (i) by formal resolution of the Audit Committee, or (ii) by oral or written approval of the service by the Chair of the Audit Committee (or if the Chair is unavailable, such other member of the Audit Committee as may be designated by the Chair to act in the Chair's absence). The approval contemplated by (ii) above is permitted where the Treasurer determines that action on such an engagement is necessary before the next meeting of the Audit Committee.
Non-audit services provided by a fund audit firm to a Fund Service Provider that do not relate directly to the operations and financial reporting of the trust ("Non-Covered Service") are not required to be approved, but are reported to the Audit Committee annually.
Non-Audit Services Approved Pursuant to Rule 2-01(c)(7)(i)(C) and (ii) of Regulation S-X ("De Minimis Exception")
There were no non-audit services approved or required to be approved by the Audit Committee pursuant to the De Minimis Exception during the Funds' last two fiscal years relating to services provided to (i) the Funds or (ii) any Fund Service Provider that relate directly to the operations and financial reporting of the Funds.
Item 5. Audit Committee of Listed Registrants
Not applicable.
Item 6. Investments
(a) Not applicable.
(b) Not applicable
Item 7. Disclosure of Proxy Voting Policies and Procedures for Closed-End Management Investment Companies
Not applicable.
Item 8. Portfolio Managers of Closed-End Management Investment Companies
Not applicable.
Item 9. Purchase of Equity Securities by Closed-End Management Investment Company and Affiliated Purchasers
Not applicable.
Item 10. Submission of Matters to a Vote of Security Holders
Not applicable.
Item 11. Controls and Procedures
(a)(i) The President and Treasurer and the Chief Financial Officer have concluded that the trust's disclosure controls and procedures (as defined in Rule 30a-3(c) under the Investment Company Act) provide reasonable assurances that material information relating to the trust is made known to them by the appropriate persons, based on their evaluation of these controls and procedures as of a date within 90 days of the filing date of this report.
(a)(ii) There was no change in the trust's internal control over financial reporting (as defined in Rule 30a-3(d) under the Investment Company Act) that occurred during the second fiscal quarter of the period covered by this report that has materially affected, or is reasonably likely to materially affect, the trust's internal control over financial reporting.
Item 12. Exhibits
(a) | (1) | Code of Ethics pursuant to Item 2 of Form N-CSR is filed and attached hereto as EX-99.CODE ETH. |
(a) | (2) | Certification pursuant to Rule 30a-2(a) under the Investment Company Act of 1940 (17 CFR 270.30a-2(a)) is filed and attached hereto as Exhibit 99.CERT. |
(a) | (3) | Not applicable. |
(b) |
| Certification pursuant to Rule 30a-2(b) under the Investment Company Act of 1940 (17 CFR 270.30a-2(b)) is furnished and attached hereto as Exhibit 99.906CERT. |
SIGNATURES
Pursuant to the requirements of the Securities Exchange Act of 1934 and the Investment Company Act of 1940, the registrant has duly caused this report to be signed on its behalf by the undersigned, thereunto duly authorized.
Fidelity Commonwealth Trust II
By: | /s/Kenneth B. Robins |
| Kenneth B. Robins |
| President and Treasurer |
|
|
Date: | April 25, 2012 |
Pursuant to the requirements of the Securities Exchange Act of 1934 and the Investment Company Act of 1940, this report has been signed below by the following persons on behalf of the registrant and in the capacities and on the dates indicated.
By: | /s/Kenneth B. Robins |
| Kenneth B. Robins |
| President and Treasurer |
|
|
Date: | April 25, 2012 |
By: | /s/Nicholas E. Steck |
| Nicholas E. Steck |
| Chief Financial Officer |
|
|
Date: | April 25, 2012 |