UNITED STATES
SECURITIES AND EXCHANGE COMMISSION
Washington, D.C. 20549
FORM N-CSR
CERTIFIED SHAREHOLDER REPORT OF REGISTERED
MANAGEMENT INVESTMENT COMPANIES
Investment Company Act file number 811-21990
Fidelity Commonwealth Trust II
(Exact name of registrant as specified in charter)
245 Summer St., Boston, Massachusetts 02210
(Address of principal executive offices) (Zip code)
Marc Bryant, Secretary
245 Summer St.
Boston, Massachusetts 02210
(Name and address of agent for service)
Registrant's telephone number, including area code: 617-563-7000
Date of fiscal year end: | February 28 |
|
|
Date of reporting period: | February 28, 2014 |
Item 1. Reports to Stockholders
Fidelity® Large Cap Growth Enhanced Index Fund
Fidelity Large Cap Value Enhanced Index Fund
Fidelity Large Cap Core Enhanced Index Fund
Fidelity Mid Cap Enhanced Index Fund
Fidelity Small Cap Enhanced Index Fund
Fidelity International Enhanced Index Fund
Annual Report
(Fidelity Cover Art)
February 28, 2014
Contents
Shareholder Expense Example | An example of shareholder expenses | |
| ||
Fidelity® Large Cap Growth Enhanced Index Fund | Performance | |
| Management's Discussion | |
| Investment Changes | |
| Investments | |
| Financial Statements | |
| ||
Fidelity Large Cap Value Enhanced Index Fund | Performance | |
| Management's Discussion | |
| Investment Changes | |
| Investments | |
| Financial Statements | |
| ||
Fidelity Large Cap Core Enhanced Index Fund | Performance | |
| Management's Discussion | |
| Investment Changes | |
| Investments | |
| Financial Statements | |
|
|
|
Fidelity Mid Cap Enhanced Index Fund | Performance | |
| Management's Discussion | |
| Investment Changes | |
| Investments | |
| Financial Statements | |
| ||
Fidelity Small Cap Enhanced Index Fund | Performance | |
| Management's Discussion | |
| Investment Changes | |
| Investments | |
| Financial Statements | |
| ||
Fidelity International Enhanced Index Fund | Performance | |
| Management's Discussion | |
| Investment Changes | |
| Investments | |
| Financial Statements | |
| ||
Notes | Notes to the Financial Statements | |
Report of Independent Registered Public Accounting Firm |
| |
Trustees and Officers |
| |
Distributions |
| |
Board Approval of Investment Advisory Contracts and Management Fees |
| |
Annual Report
To view a fund's proxy voting guidelines and proxy voting record for the 12-month period ended June 30, visit http://www.fidelity.com/proxyvotingresults or visit the Securities and Exchange Commission's (SEC) web site at http://www.sec.gov. You may also call 1-800-544-8544 to request a free copy of the proxy voting guidelines.
The funds or securities referred to herein are not sponsored, endorsed, or promoted by MSCI, and MSCI bears no liability with respect to any such funds or securities or any index on which such funds or securities are based. The prospectus contains a more detailed description of the limited relationship MSCI has with Fidelity and any related funds.
Standard & Poor's, S&P and S&P 500 are registered service marks of The McGraw-Hill Companies, Inc. and have been licensed for use by Fidelity Distributors Corporation.
Other third-party marks appearing herein are the property of their respective owners.
All other marks appearing herein are registered or unregistered trademarks or service marks of FMR LLC or an affiliated company. © 2014 FMR LLC. All rights reserved.
This report and the financial statements contained herein are submitted for the general information of the shareholders of the funds. This report is not authorized for distribution to prospective investors in the funds unless preceded or accompanied by an effective prospectus.
A fund files its complete schedule of portfolio holdings with the SEC for the first and third quarters of each fiscal year on Form N-Q. Forms N-Q are available on the SEC's web site at http://www.sec.gov. A fund's Forms N-Q may be reviewed and copied at the SEC's Public Reference Room in Washington, DC. Information regarding the operation of the SEC's Public Reference Room may be obtained by calling 1-800-SEC-0330. For a complete list of a fund's portfolio holdings, view the most recent holdings listing, semiannual report, or annual report on Fidelity's web site at http://www.fidelity.com, http://www.advisor.fidelity.com, or http://www.401k.com, as applicable.
NOT FDIC INSURED • MAY LOSE VALUE • NO BANK GUARANTEE
Neither the funds nor Fidelity Distributors Corporation is a bank.
Annual Report
Shareholder Expense Example
As a shareholder of a Fund, you incur two types of costs: (1) transaction costs, including redemption fees and (2) ongoing costs, including management fees and other Fund expenses. This Example is intended to help you understand your ongoing costs (in dollars) of investing in the Funds and to compare these costs with the ongoing costs of investing in other mutual funds.
The Example is based on an investment of $1,000 invested at the beginning of the period and held for the entire period (September 1, 2013 to February 28, 2014).
Actual Expenses
The first line of the accompanying table for each fund provides information about actual account values and actual expenses. You may use the information in this line, together with the amount you invested, to estimate the expenses that you paid over the period. Simply divide your account value by $1,000.00 (for example, an $8,600 account value divided by $1,000.00 = 8.6), then multiply the result by the number in the first line for a fund under the heading entitled "Expenses Paid During Period" to estimate the expenses you paid on your account during this period. In addition to the direct expenses incurred by each Fund presented in the table, as a shareholder of the underlying non-affiliated funds (the Underlying Funds), each Fund also indirectly bears its proportionate share of the expenses of the Underlying Funds. These fees and expenses are not included in each Fund's annualized expense ratio used to calculate the expense estimate in the table below. A small balance maintenance fee of $12.00 that is charged once a year may apply for certain accounts with a value of less than $2,000. This fee is not included in the table below. If it was, the estimate of expenses you paid during the period would be higher, and your ending account value lower, by this amount. In addition, each Fund, as a shareholder in the underlying Fidelity Central Funds, will indirectly bear its pro-rata share of the fees and expenses incurred by the underlying Fidelity Central Funds. These fees and expenses are not included in the Fund's annualized expense ratio used to calculate the expense estimate in the table below.
Hypothetical Example for Comparison Purposes
The second line of the accompanying table for each fund provides information about hypothetical account values and hypothetical expenses based on a fund's actual expense ratio and an assumed rate of return of 5% per year before expenses, which is not the Fund's actual return. The hypothetical account values and expenses may not be used to estimate the actual ending account balance or expenses you paid for the period. You may use this information to compare the ongoing costs of investing in the Fund and other funds. To do so, compare this 5% hypothetical example with the 5% hypothetical examples that appear in the shareholder reports of the other funds. In addition to the direct expenses incurred by each Fund presented in the table, as a shareholder of the underlying non-affiliated funds (the Underlying Funds), each Fund also indirectly bears its proportionate share of the expenses of the Underlying Funds. These fees and expenses are not included in each Fund's annualized expense ratio used to calculate the expense estimate in the table below. A small balance maintenance fee of $12.00 that is charged once a year may apply for certain accounts with a value of less than $2,000. This fee is not included in the table below. If it was, the estimate of expenses you paid during the period would be higher, and your ending account value lower, by this amount. In addition, each Fund, as a shareholder in the underlying Fidelity Central Funds, will indirectly bear its pro-rata share of the fees and expenses incurred by the underlying Fidelity Central Funds. These fees and expenses are not included in the Fund's annualized expense ratio used to calculate the expense estimate in the table below.
Please note that the expenses shown in the table are meant to highlight your ongoing costs only and do not reflect any transaction costs. Therefore, the second line of the table is useful in comparing ongoing costs only, and will not help you determine the relative total costs of owning different funds. In addition, if these transactional costs were included, your costs would have been higher.
| Annualized | Beginning | Ending | Expenses Paid |
Fidelity Large Cap Growth Enhanced Index Fund | .45% |
|
|
|
Actual |
| $ 1,000.00 | $ 1,180.10 | $ 2.43 |
HypotheticalA |
| $ 1,000.00 | $ 1,022.56 | $ 2.26 |
Fidelity Large Cap Value Enhanced Index Fund | .45% |
|
|
|
Actual |
| $ 1,000.00 | $ 1,142.30 | $ 2.39 |
HypotheticalA |
| $ 1,000.00 | $ 1,022.56 | $ 2.26 |
Fidelity Large Cap Core Enhanced Index Fund | .45% |
|
|
|
Actual |
| $ 1,000.00 | $ 1,158.10 | $ 2.41 |
HypotheticalA |
| $ 1,000.00 | $ 1,022.56 | $ 2.26 |
Fidelity Mid Cap Enhanced Index Fund | .60% |
|
|
|
Actual |
| $ 1,000.00 | $ 1,188.00 | $ 3.26 |
HypotheticalA |
| $ 1,000.00 | $ 1,021.82 | $ 3.01 |
Fidelity Small Cap Enhanced Index Fund | .67% |
|
|
|
Actual |
| $ 1,000.00 | $ 1,177.00 | $ 3.62 |
HypotheticalA |
| $ 1,000.00 | $ 1,021.47 | $ 3.36 |
Fidelity International Enhanced Index Fund | .62% |
|
|
|
Actual |
| $ 1,000.00 | $ 1,166.40 | $ 3.33 |
HypotheticalA |
| $ 1,000.00 | $ 1,021.72 | $ 3.11 |
A 5% return per year before expenses
B Annualized expense ratio reflects expenses net of applicable fee waivers.
* Expenses are equal to each Fund's annualized expense ratio, multiplied by the average account value over the period, multiplied by 181/365 (to reflect the one-half year period).
Annual Report
Fidelity® Large Cap Growth Enhanced Index Fund
Performance: The Bottom Line
Average annual total return reflects the change in the value of an investment, assuming reinvestment of the fund's distributions from dividend income and capital gains (the profits earned upon the sale of securities that have grown in value, if any) and assuming a constant rate of performance each year. The $10,000 table and the fund's returns do not reflect the deduction of taxes that a shareholder would pay on fund distributions or the redemption of fund shares. During periods of reimbursement by Fidelity, a fund's total returns will be greater than it would be had the reimbursement not occurred. How a fund did yesterday is no guarantee of how it will do tomorrow.
Average Annual Total Returns
Periods ended February 28, 2014 | Past 1 | Past 5 | Life of |
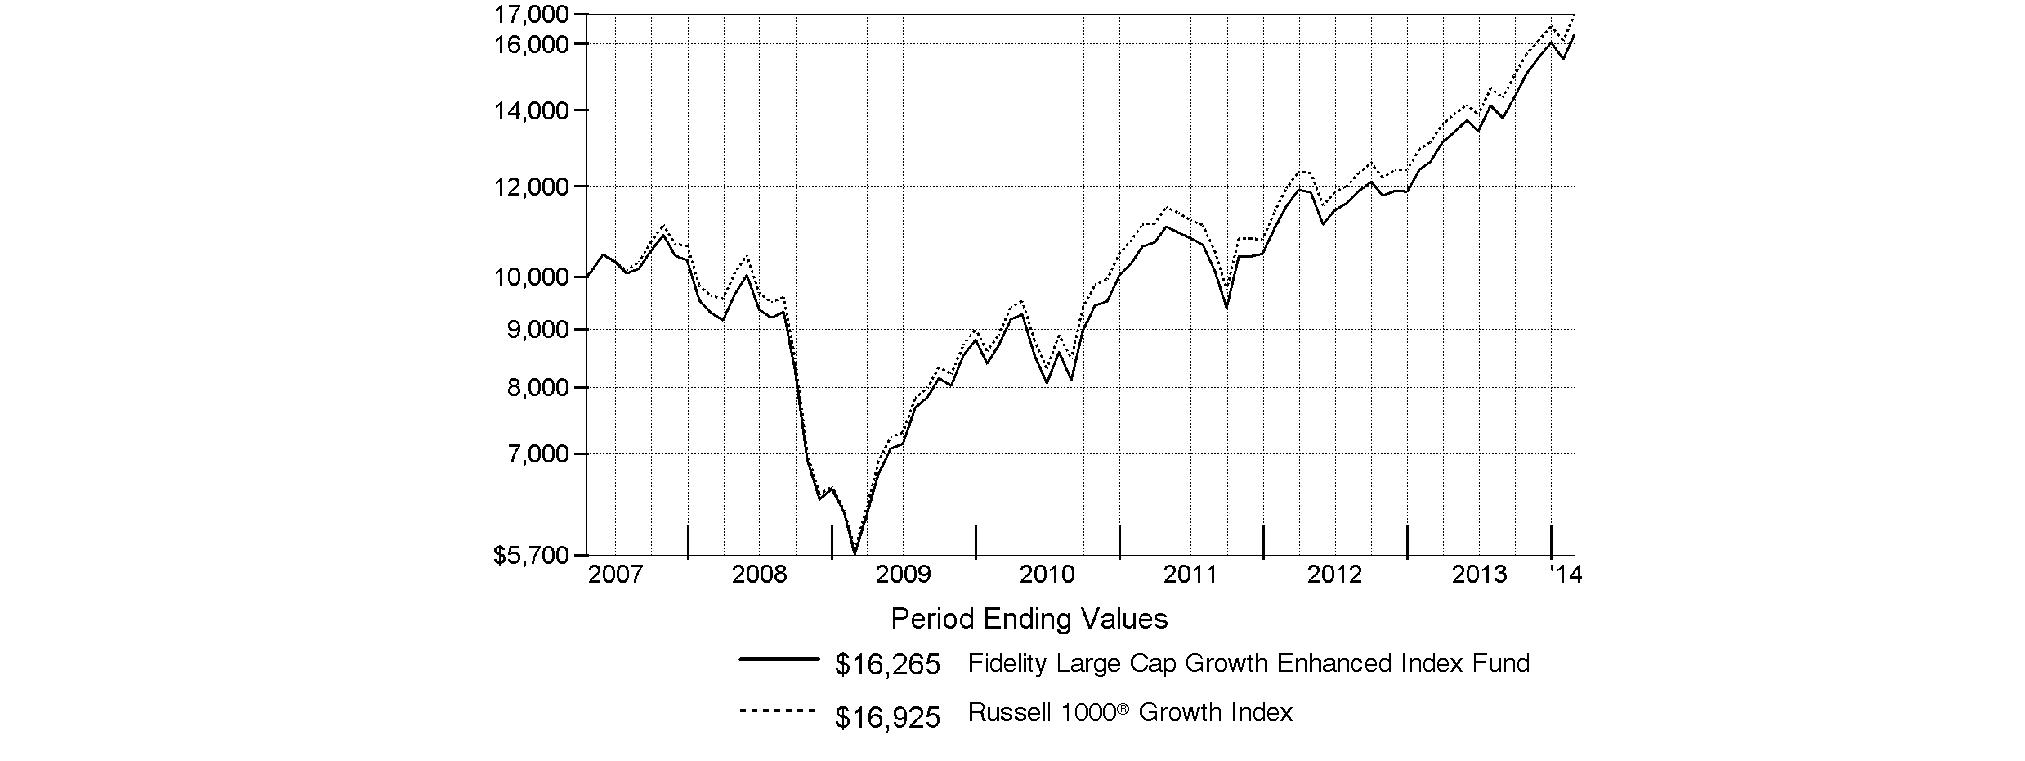
Fidelity Large Cap Growth Enhanced Index Fund | 29.08% | 23.30% | 7.34% |
A From April 19, 2007.
$10,000 Over Life of Fund
Let's say hypothetically that $10,000 was invested in Fidelity Large Cap Growth Enhanced Index Fund on April 19, 2007, when the fund started. The chart shows how the value of your investment would have changed, and also shows how the Russell 1000® Growth Index performed over the same period.
Annual Report
Fidelity Large Cap Growth Enhanced Index Fund
Management's Discussion of Fund Performance
Market Recap: Stocks overcame fears of higher interest rates - not to mention their worst January in four years - to finish sharply higher for the 12 months ending February 28, 2014. The broad S&P 500® Index and the blue-chip Dow Jones Industrial AverageSM gained 25.37% and 19.01%, respectively, amid generally favorable earnings reports and accommodative monetary policies worldwide. Performance generally increased along the risk spectrum, with smaller-cap and growth strategies leading the way. An ebullient market helped the growth-oriented Nasdaq Composite Index® to a 38.10% period gain, for example. On the other hand, both cyclical and defensive stocks had representation in the top-performing industry sectors: returns were highest in health care and consumer discretionary; lowest in utilities and telecommunication services. From a macroeconomic perspective, data still points to slow but steady improvement in the U.S., and Europe's recession may well be over. Reports from China have disappointed, but continue to suggest a relatively soft landing there. Mixed signals from the U.S. Federal Reserve as to when it might curtail its stimulative bond buying kept markets in flux during the spring and summer. Stocks regained momentum in October despite a federal budget impasse and brief government shutdown, and lower volatility prevailed through year-end. Shedding new-year concerns about China's economy, an emerging-markets sell-off and confirmation (at last) of Fed tapering - alongside confirmation of a presumably dovish Janet Yellen as new Fed chair - February saw stocks back in record territory, bearing down on the five-year anniversary of the market's bottom.
Comments from Maximilian Kaufmann, Senior Portfolio Manager of the Geode Capital Management, LLC, investment management team for Fidelity® Large Cap Growth Enhanced Index Fund: For the year, the fund gained 29.08%, in line with the 29.14% advance of its benchmark, the Russell 1000® Growth Index. Relative to the index, stock selection was subpar in the pharmaceuticals, biotechnology & life sciences industry within the health care sector; the retail industry within consumer discretionary; and the energy sector. The fund did better in other groups, including the health care equipment & services industry and the software & services group within information technology. Meanwhile, effective sector positioning added value, highlighted by underweightings in two lagging industries - real estate within the financials sector and food, beverage & tobacco within consumer staples. The fund's biggest relative detractor was Best Buy, whose shares plummeted in January after the company reported weak holiday sales. This was the latest in a string of challenges for the electronics retailer, which has been struggling to compete with online vendors. Also hampering results was Delek US Holdings, an out-of-benchmark holding that, similar to other energy refiners, struggled during the period amid declining refining margins. We did not hold Delek at period end. In health care, biotechnology stock Gilead Sciences enjoyed very good results, reflecting a favorable investment climate for its industry - the second-best performing group in the benchmark - but we missed out due to our average underweighting. On the positive side, the biggest contributor was an out-of-index stake in Rite Aid, a drugstore chain whose shares were up by triple digits during the period. Most notably, Rite Aid's stock rose by 23% in a single day in September, thanks to higher sales and a more-optimistic earnings forecast. Another strong-performing investment was Western Digital, a maker of computer hard drives whose shares rose steadily throughout most of the period. Further adding value was Northrop Grumman, as the defense contractor - which was not in the benchmark - turned in better-than-expected earnings despite reduced sales stemming from federal budget cutbacks.
The views expressed above reflect those of the portfolio manager(s) only through the end of the period as stated on the cover of this report and do not necessarily represent the views of Fidelity or any other person in the Fidelity organization. Any such views are subject to change at any time based upon market or other conditions and Fidelity disclaims any responsibility to update such views. These views may not be relied on as investment advice and, because investment decisions for a Fidelity fund are based on numerous factors, may not be relied on as an indication of trading intent on behalf of any Fidelity fund.
Annual Report
Fidelity Large Cap Growth Enhanced Index Fund
Investment Changes (Unaudited)
Top Ten Stocks as of February 28, 2014 | ||
| % of fund's | % of fund's net assets |
Apple, Inc. | 4.2 | 4.3 |
Google, Inc. Class A | 3.7 | 2.8 |
Microsoft Corp. | 3.5 | 3.6 |
Verizon Communications, Inc. | 2.5 | 2.0 |
Oracle Corp. | 1.8 | 1.8 |
QUALCOMM, Inc. | 1.8 | 1.8 |
Comcast Corp. Class A | 1.7 | 1.7 |
Gilead Sciences, Inc. | 1.7 | 0.6 |
Home Depot, Inc. | 1.6 | 1.8 |
Facebook, Inc. Class A | 1.5 | 0.4 |
| 24.0 | |
Market Sectors as of February 28, 2014 | ||
| % of fund's | % of fund's net assets |
Information Technology | 28.5 | 28.2 |
Consumer Discretionary | 17.3 | 19.8 |
Health Care | 14.4 | 13.8 |
Industrials | 12.0 | 10.2 |
Consumer Staples | 9.4 | 11.3 |
Financials | 6.5 | 7.0 |
Materials | 4.2 | 2.9 |
Energy | 3.6 | 3.7 |
Telecommunication Services | 2.5 | 2.0 |
Annual Report
Fidelity Large Cap Growth Enhanced Index Fund
Investments February 28, 2014
Showing Percentage of Net Assets
Common Stocks - 98.4% | |||
Shares | Value | ||
CONSUMER DISCRETIONARY - 17.3% | |||
Auto Components - 1.0% | |||
Gentex Corp. (e) | 27,851 | $ 873,686 | |
Lear Corp. | 13,866 | 1,125,919 | |
The Goodyear Tire & Rubber Co. | 16,423 | 441,286 | |
| 2,440,891 | ||
Diversified Consumer Services - 0.3% | |||
Apollo Ed Group, Inc. Class A (non-vtg.) (a)(e) | 23,703 | 790,021 | |
Hotels, Restaurants & Leisure - 2.7% | |||
Bally Technologies, Inc. (a)(e) | 18,327 | 1,241,654 | |
International Game Technology | 1,818 | 27,434 | |
Las Vegas Sands Corp. | 25,407 | 2,165,947 | |
McDonald's Corp. | 12,686 | 1,207,073 | |
Starbucks Corp. | 14,738 | 1,045,808 | |
Wynn Resorts Ltd. | 3,929 | 952,743 | |
| 6,640,659 | ||
Household Durables - 0.5% | |||
Whirlpool Corp. | 8,924 | 1,290,678 | |
Internet & Catalog Retail - 2.1% | |||
Amazon.com, Inc. (a) | 6,185 | 2,239,589 | |
priceline.com, Inc. (a) | 2,235 | 3,014,657 | |
| 5,254,246 | ||
Leisure Equipment & Products - 0.3% | |||
Polaris Industries, Inc. | 5,534 | 741,722 | |
Media - 4.5% | |||
Comcast Corp. Class A | 83,687 | 4,325,781 | |
Morningstar, Inc. | 15,052 | 1,259,250 | |
Starz - Liberty Capital Series A (a)(e) | 40,825 | 1,305,584 | |
The Walt Disney Co. | 17,464 | 1,411,266 | |
Time Warner Cable, Inc. | 5,448 | 764,627 | |
Viacom, Inc. Class B (non-vtg.) | 25,686 | 2,253,433 | |
| 11,319,941 | ||
Multiline Retail - 0.7% | |||
Dillard's, Inc. Class A | 13,559 | 1,255,292 | |
Macy's, Inc. | 6,836 | 395,531 | |
| 1,650,823 | ||
Specialty Retail - 3.7% | |||
Bed Bath & Beyond, Inc. (a) | 15,148 | 1,027,337 | |
Best Buy Co., Inc. | 173 | 4,607 | |
Gap, Inc. | 17,688 | 773,850 | |
Home Depot, Inc. | 48,054 | 3,941,870 | |
Lowe's Companies, Inc. | 1,159 | 57,985 | |
O'Reilly Automotive, Inc. (a) | 8,326 | 1,255,977 | |
PetSmart, Inc. (e) | 2,763 | 185,287 | |
TJX Companies, Inc. | 31,759 | 1,951,908 | |
| 9,198,821 | ||
Textiles, Apparel & Luxury Goods - 1.5% | |||
Coach, Inc. | 329 | 16,058 | |
| |||
Shares | Value | ||
Hanesbrands, Inc. | 19,047 | $ 1,395,764 | |
NIKE, Inc. Class B | 30,893 | 2,418,922 | |
| 3,830,744 | ||
TOTAL CONSUMER DISCRETIONARY | 43,158,546 | ||
CONSUMER STAPLES - 9.4% | |||
Beverages - 2.9% | |||
Dr. Pepper Snapple Group, Inc. | 28,619 | 1,491,336 | |
PepsiCo, Inc. | 38,841 | 3,109,999 | |
The Coca-Cola Co. | 66,393 | 2,536,213 | |
| 7,137,548 | ||
Food & Staples Retailing - 1.9% | |||
Costco Wholesale Corp. | 116 | 13,549 | |
CVS Caremark Corp. | 20,265 | 1,482,182 | |
Kroger Co. | 38,557 | 1,617,081 | |
Rite Aid Corp. (a) | 137,032 | 903,041 | |
Wal-Mart Stores, Inc. | 9,814 | 733,106 | |
| 4,748,959 | ||
Food Products - 2.0% | |||
Archer Daniels Midland Co. | 31,220 | 1,267,532 | |
General Mills, Inc. | 23,865 | 1,193,966 | |
Hormel Foods Corp. | 10,633 | 504,536 | |
The J.M. Smucker Co. | 6,566 | 656,666 | |
Tyson Foods, Inc. Class A | 32,802 | 1,294,039 | |
| 4,916,739 | ||
Household Products - 0.8% | |||
Colgate-Palmolive Co. | 3,811 | 239,445 | |
Energizer Holdings, Inc. | 2,092 | 203,635 | |
Kimberly-Clark Corp. | 13,838 | 1,527,023 | |
| 1,970,103 | ||
Personal Products - 0.6% | |||
Herbalife Ltd. | 3,162 | 210,589 | |
Nu Skin Enterprises, Inc. Class A (e) | 16,339 | 1,364,633 | |
| 1,575,222 | ||
Tobacco - 1.2% | |||
Altria Group, Inc. | 23,735 | 860,631 | |
Philip Morris International, Inc. | 26,563 | 2,149,212 | |
| 3,009,843 | ||
TOTAL CONSUMER STAPLES | 23,358,414 | ||
ENERGY - 3.6% | |||
Energy Equipment & Services - 1.8% | |||
Baker Hughes, Inc. | 14,181 | 897,374 | |
Dril-Quip, Inc. (a) | 10,923 | 1,174,878 | |
Oceaneering International, Inc. | 465 | 33,285 | |
Schlumberger Ltd. | 26,170 | 2,433,810 | |
| 4,539,347 | ||
Oil, Gas & Consumable Fuels - 1.8% | |||
EOG Resources, Inc. | 4,941 | 935,924 | |
Common Stocks - continued | |||
Shares | Value | ||
ENERGY - continued | |||
Oil, Gas & Consumable Fuels - continued | |||
HollyFrontier Corp. | 2,159 | $ 98,386 | |
Marathon Petroleum Corp. | 13,559 | 1,138,956 | |
Phillips 66 Co. | 15,795 | 1,182,414 | |
Western Refining, Inc. (e) | 29,488 | 1,074,838 | |
| 4,430,518 | ||
TOTAL ENERGY | 8,969,865 | ||
FINANCIALS - 6.5% | |||
Capital Markets - 2.9% | |||
Franklin Resources, Inc. | 25,246 | 1,344,350 | |
Goldman Sachs Group, Inc. | 6,433 | 1,070,773 | |
Lazard Ltd. Class A | 18,395 | 827,591 | |
SEI Investments Co. | 33,785 | 1,134,162 | |
T. Rowe Price Group, Inc. | 15,075 | 1,223,638 | |
Waddell & Reed Financial, Inc. Class A | 20,517 | 1,430,035 | |
| 7,030,549 | ||
Commercial Banks - 0.4% | |||
Wells Fargo & Co. | 22,615 | 1,049,788 | |
Consumer Finance - 1.4% | |||
American Express Co. | 36,185 | 3,302,967 | |
SLM Corp. | 10,057 | 240,765 | |
| 3,543,732 | ||
Diversified Financial Services - 1.0% | |||
CBOE Holdings, Inc. | 24,138 | 1,304,176 | |
MarketAxess Holdings, Inc. | 2,638 | 155,748 | |
McGraw Hill Financial, Inc. | 13,076 | 1,041,634 | |
| 2,501,558 | ||
Insurance - 0.6% | |||
The Chubb Corp. | 2,871 | 251,155 | |
The Travelers Companies, Inc. | 14,622 | 1,225,908 | |
| 1,477,063 | ||
Real Estate Investment Trusts - 0.2% | |||
Public Storage | 3,152 | 532,688 | |
TOTAL FINANCIALS | 16,135,378 | ||
HEALTH CARE - 14.4% | |||
Biotechnology - 6.7% | |||
Alexion Pharmaceuticals, Inc. (a) | 11,448 | 2,024,006 | |
Amgen, Inc. | 22,183 | 2,751,136 | |
Biogen Idec, Inc. (a) | 9,690 | 3,301,189 | |
Celgene Corp. (a) | 17,813 | 2,863,440 | |
Gilead Sciences, Inc. (a)(e) | 52,244 | 4,325,281 | |
United Therapeutics Corp. (a)(e) | 12,602 | 1,278,095 | |
| 16,543,147 | ||
Health Care Equipment & Supplies - 0.5% | |||
Medtronic, Inc. | 6,075 | 360,005 | |
| |||
Shares | Value | ||
St. Jude Medical, Inc. | 2,184 | $ 147,027 | |
Zimmer Holdings, Inc. | 8,786 | 824,478 | |
| 1,331,510 | ||
Health Care Providers & Services - 3.6% | |||
Aetna, Inc. | 17,874 | 1,299,619 | |
Cardinal Health, Inc. | 16,778 | 1,200,130 | |
Express Scripts Holding Co. (a) | 34,009 | 2,561,218 | |
Laboratory Corp. of America Holdings (a)(e) | 4,214 | 394,178 | |
McKesson Corp. | 12,772 | 2,261,283 | |
UnitedHealth Group, Inc. | 431 | 33,303 | |
WellPoint, Inc. | 13,758 | 1,246,337 | |
| 8,996,068 | ||
Health Care Technology - 0.0% | |||
Cerner Corp. (a)(e) | 397 | 24,364 | |
Life Sciences Tools & Services - 0.0% | |||
Charles River Laboratories International, Inc. (a) | 1,561 | 92,739 | |
Pharmaceuticals - 3.6% | |||
AbbVie, Inc. | 63,853 | 3,250,756 | |
Allergan, Inc. | 9,862 | 1,252,474 | |
Bristol-Myers Squibb Co. | 13,124 | 705,677 | |
Eli Lilly & Co. | 27,903 | 1,663,298 | |
Johnson & Johnson | 22,160 | 2,041,379 | |
| 8,913,584 | ||
TOTAL HEALTH CARE | 35,901,412 | ||
INDUSTRIALS - 12.0% | |||
Aerospace & Defense - 4.3% | |||
Honeywell International, Inc. | 10,363 | 978,682 | |
Lockheed Martin Corp. | 14,241 | 2,311,314 | |
Northrop Grumman Corp. | 10,763 | 1,302,646 | |
Raytheon Co. | 13,258 | 1,298,091 | |
The Boeing Co. | 27,879 | 3,594,161 | |
United Technologies Corp. | 11,218 | 1,312,730 | |
| 10,797,624 | ||
Air Freight & Logistics - 0.2% | |||
United Parcel Service, Inc. Class B | 5,233 | 501,164 | |
Airlines - 1.0% | |||
Alaska Air Group, Inc. | 8,831 | 765,118 | |
Copa Holdings SA Class A | 2,021 | 273,765 | |
Southwest Airlines Co. | 61,901 | 1,389,058 | |
Spirit Airlines, Inc. (a) | 1,160 | 65,517 | |
| 2,493,458 | ||
Building Products - 0.6% | |||
A.O. Smith Corp. | 4,253 | 211,374 | |
Lennox International, Inc. | 12,703 | 1,167,152 | |
| 1,378,526 | ||
Commercial Services & Supplies - 0.6% | |||
Cintas Corp. | 1,180 | 71,579 | |
Common Stocks - continued | |||
Shares | Value | ||
INDUSTRIALS - continued | |||
Commercial Services & Supplies - continued | |||
Pitney Bowes, Inc. (e) | 52,046 | $ 1,324,571 | |
UniFirst Corp. | 1,114 | 122,195 | |
| 1,518,345 | ||
Electrical Equipment - 1.3% | |||
Emerson Electric Co. | 23,988 | 1,565,457 | |
EnerSys | 11,232 | 797,921 | |
Rockwell Automation, Inc. | 7,578 | 930,882 | |
| 3,294,260 | ||
Industrial Conglomerates - 1.2% | |||
3M Co. | 23,067 | 3,107,817 | |
Machinery - 1.1% | |||
Graco, Inc. | 6,497 | 506,961 | |
Lincoln Electric Holdings, Inc. | 10,911 | 817,998 | |
Snap-On, Inc. | 5,222 | 585,752 | |
Toro Co. | 9,792 | 648,524 | |
WABCO Holdings, Inc. (a) | 789 | 80,833 | |
| 2,640,068 | ||
Marine - 0.1% | |||
Matson, Inc. | 8,384 | 202,222 | |
Professional Services - 0.3% | |||
Manpower, Inc. | 9,424 | 736,580 | |
Road & Rail - 1.3% | |||
Union Pacific Corp. | 18,244 | 3,290,853 | |
TOTAL INDUSTRIALS | 29,960,917 | ||
INFORMATION TECHNOLOGY - 28.5% | |||
Communications Equipment - 3.3% | |||
Cisco Systems, Inc. | 54,050 | 1,178,290 | |
Harris Corp. | 17,547 | 1,295,320 | |
Juniper Networks, Inc. (a) | 46,390 | 1,240,469 | |
QUALCOMM, Inc. | 58,818 | 4,428,407 | |
| 8,142,486 | ||
Computers & Peripherals - 5.4% | |||
Apple, Inc. | 19,855 | 10,448,491 | |
Hewlett-Packard Co. | 3,518 | 105,118 | |
NetApp, Inc. | 26,090 | 1,054,297 | |
SanDisk Corp. | 8,592 | 638,386 | |
Western Digital Corp. | 14,286 | 1,242,739 | |
| 13,489,031 | ||
Electronic Equipment & Components - 0.7% | |||
Dolby Laboratories, Inc. Class A (a)(e) | 18,257 | 752,736 | |
Zebra Technologies Corp. Class A (a) | 15,966 | 1,101,494 | |
| 1,854,230 | ||
Internet Software & Services - 5.5% | |||
eBay, Inc. (a) | 10,883 | 639,594 | |
| |||
Shares | Value | ||
Facebook, Inc. Class A (a) | 55,752 | $ 3,816,782 | |
Google, Inc. Class A (a) | 7,530 | 9,153,845 | |
| 13,610,221 | ||
IT Services - 7.0% | |||
Accenture PLC Class A | 1,544 | 128,692 | |
Amdocs Ltd. | 28,583 | 1,271,372 | |
Booz Allen Hamilton Holding Corp. | 46,123 | 969,967 | |
Broadridge Financial Solutions, Inc. | 19,197 | 724,879 | |
DST Systems, Inc. | 13,946 | 1,310,645 | |
FleetCor Technologies, Inc. (a) | 11,297 | 1,467,819 | |
IBM Corp. | 19,102 | 3,537,117 | |
Jack Henry & Associates, Inc. | 22,018 | 1,279,906 | |
MasterCard, Inc. Class A | 44,010 | 3,420,457 | |
Paychex, Inc. | 34,908 | 1,457,758 | |
Visa, Inc. Class A | 7,717 | 1,743,579 | |
| 17,312,191 | ||
Semiconductors & Semiconductor Equipment - 0.8% | |||
Intel Corp. | 53,775 | 1,331,469 | |
Micron Technology, Inc. (a) | 10,411 | 251,842 | |
Skyworks Solutions, Inc. (a)(e) | 12,773 | 452,931 | |
Texas Instruments, Inc. | 502 | 22,570 | |
| 2,058,812 | ||
Software - 5.8% | |||
Aspen Technology, Inc. (a) | 10,276 | 482,458 | |
CA Technologies, Inc. | 18,968 | 635,428 | |
Microsoft Corp. | 228,843 | 8,766,975 | |
Oracle Corp. | 116,271 | 4,547,359 | |
| 14,432,220 | ||
TOTAL INFORMATION TECHNOLOGY | 70,899,191 | ||
MATERIALS - 4.2% | |||
Chemicals - 3.6% | |||
E.I. du Pont de Nemours & Co. | 3,926 | 261,550 | |
International Flavors & Fragrances, Inc. | 15,174 | 1,423,169 | |
LyondellBasell Industries NV Class A | 23,965 | 2,110,837 | |
Monsanto Co. | 2,750 | 302,555 | |
NewMarket Corp. (e) | 1,841 | 680,562 | |
Sigma Aldrich Corp. | 14,633 | 1,381,502 | |
The Dow Chemical Co. | 29,321 | 1,428,226 | |
Westlake Chemical Corp. (e) | 10,113 | 1,348,366 | |
| 8,936,767 | ||
Containers & Packaging - 0.6% | |||
Packaging Corp. of America | 20,221 | 1,473,909 | |
TOTAL MATERIALS | 10,410,676 | ||
Common Stocks - continued | |||
Shares | Value | ||
TELECOMMUNICATION SERVICES - 2.5% | |||
Diversified Telecommunication Services - 2.5% | |||
Verizon Communications, Inc. | 129,298 | $ 6,151,999 | |
TOTAL COMMON STOCKS (Cost $186,507,820) |
| ||
U.S. Treasury Obligations - 0.0% | ||||
| Principal Amount |
| ||
U.S. Treasury Bills, yield at date of purchase 0.09% 6/26/14 (f) | $ 100,000 |
| ||
Money Market Funds - 7.7% | |||
Shares |
| ||
Dreyfus Cash Management Institutional Shares, 0.10% (c) | 3,308,598 | 3,308,598 | |
Fidelity Securities Lending Cash Central Fund, 0.09% (b)(d) | 15,756,050 | 15,756,050 | |
TOTAL MONEY MARKET FUNDS (Cost $19,064,648) |
| ||
TOTAL INVESTMENT PORTFOLIO - 106.1% (Cost $205,672,438) | 264,111,028 | |
NET OTHER ASSETS (LIABILITIES) - (6.1)% | (15,255,556) | |
NET ASSETS - 100% | $ 248,855,472 | |
Futures Contracts | |||||
Expiration Date | Underlying Face Amount at Value | Unrealized Appreciation/(Depreciation) | |||
Purchased | |||||
Equity Index Contracts | |||||
41 CME E-mini S&P 500 Index Contracts (United States) | March 2014 | $ 3,808,080 | $ 26,010 | ||
|
The face value of futures purchased as a percentage of net assets is 1.5% |
Legend |
(a) Non-income producing |
(b) Affiliated fund that is generally available only to investment companies and other accounts managed by Fidelity Investments. The rate quoted is the annualized seven-day yield of the fund at period end. A complete unaudited listing of the fund's holdings as of its most recent quarter end is available upon request. In addition, each Fidelity Central Fund's financial statements, which are not covered by the Fund's Report of Independent Registered Public Accounting Firm, are available on the SEC's website or upon request. |
(c) The rate quoted is the annualized seven-day yield of the fund at period end. |
(d) Investment made with cash collateral received from securities on loan. |
(e) Security or a portion of the security is on loan at period end. |
(f) Security or a portion of the security was pledged to cover margin requirements for futures contracts. At period end, the value of securities pledged amounted to $99,982. |
Affiliated Central Funds |
Information regarding fiscal year to date income earned by the Fund from investments in Fidelity Central Funds is as follows: |
Fund | Income earned |
Fidelity Securities Lending Cash Central Fund | $ 11,505 |
Other Information |
The following is a summary of the inputs used, as of February 28, 2014, involving the Fund's assets and liabilities carried at fair value. The inputs or methodology used for valuing securities may not be an indication of the risk associated with investing in those securities. For more information on valuation inputs, and their aggregation into the levels used in the table below, please refer to the Investment Valuation section in the accompanying Notes to Financial Statements. |
Valuation Inputs at Reporting Date: | ||||
Description | Total | Level 1 | Level 2 | Level 3 |
Investments in Securities: | ||||
Equities: | ||||
Consumer Discretionary | $ 43,158,546 | $ 43,158,546 | $ - | $ - |
Consumer Staples | 23,358,414 | 23,358,414 | - | - |
Energy | 8,969,865 | 8,969,865 | - | - |
Financials | 16,135,378 | 16,135,378 | - | - |
Health Care | 35,901,412 | 35,901,412 | - | - |
Industrials | 29,960,917 | 29,960,917 | - | - |
Information Technology | 70,899,191 | 70,899,191 | - | - |
Materials | 10,410,676 | 10,410,676 | - | - |
Telecommunication Services | 6,151,999 | 6,151,999 | - | - |
U.S. Government and Government Agency Obligations | 99,982 | - | 99,982 | - |
Money Market Funds | 19,064,648 | 19,064,648 | - | - |
Total Investments in Securities: | $ 264,111,028 | $ 264,011,046 | $ 99,982 | $ - |
Derivative Instruments: | ||||
Assets | ||||
Futures Contracts | $ 26,010 | $ 26,010 | $ - | $ - |
Value of Derivative Instruments |
The following table is a summary of the Fund's value of derivative instruments by primary risk exposure as of February 28, 2014. For additional information on derivative instruments, please refer to the Derivative Instruments section in the accompanying Notes to Financial Statements. |
Primary Risk Exposure / | Value | |
| Asset | Liability |
Equity Risk | ||
Futures Contracts (a) | $ 26,010 | $ - |
Total Value of Derivatives | $ 26,010 | $ - |
(a) Reflects gross cumulative appreciation (depreciation) on futures contracts as presented in the Schedule of Investments. Only the period end receivable or payable for daily variation margin and net unrealized appreciation (depreciation) are presented in the Statement of Assets and Liabilities. |
See accompanying notes which are an integral part of the financial statements.
Annual Report
Fidelity Large Cap Growth Enhanced Index
Financial Statements
Statement of Assets and Liabilities
| February 28, 2014 | |
|
|
|
Assets | ||
Investment in securities, at value (including securities loaned of $15,330,473) - See accompanying schedule: Unaffiliated issuers (cost $189,916,388) | $ 248,354,978 |
|
Fidelity Central Funds (cost $15,756,050) | 15,756,050 |
|
Total Investments (cost $205,672,438) |
| $ 264,111,028 |
Segregated cash with brokers for derivative instruments | 78,014 | |
Receivable for fund shares sold | 267,384 | |
Dividends receivable | 421,715 | |
Interest receivable | 79 | |
Distributions receivable from Fidelity Central Funds | 849 | |
Receivable for daily variation margin for derivative instruments | 7,415 | |
Total assets | 264,886,484 | |
|
|
|
Liabilities | ||
Payable for fund shares redeemed | $ 184,612 | |
Accrued management fee | 60,234 | |
Other affiliated payables | 30,116 | |
Collateral on securities loaned, at value | 15,756,050 | |
Total liabilities | 16,031,012 | |
|
|
|
Net Assets | $ 248,855,472 | |
Net Assets consist of: |
| |
Paid in capital | $ 184,750,710 | |
Undistributed net investment income | 598,723 | |
Accumulated undistributed net realized gain (loss) on investments | 5,041,439 | |
Net unrealized appreciation (depreciation) on investments | 58,464,600 | |
Net Assets, for 17,496,279 shares outstanding | $ 248,855,472 | |
Net Asset Value, offering price and redemption price per share ($248,855,472 ÷ 17,496,279 shares) | $ 14.22 | |
Statement of Operations
| Year ended February 28, 2014 | |
|
|
|
Investment Income |
|
|
Dividends |
| $ 3,860,448 |
Interest |
| 1,581 |
Income from Fidelity Central Funds |
| 11,505 |
Total income |
| 3,873,534 |
|
|
|
Expenses | ||
Management fee | $ 624,443 | |
Transfer agent fees | 313,409 | |
Independent trustees' compensation | 2,376 | |
Miscellaneous | 386 | |
Total expenses before reductions | 940,614 | |
Expense reductions | (5) | 940,609 |
Net investment income (loss) | 2,932,925 | |
Realized and Unrealized Gain (Loss) Net realized gain (loss) on: | ||
Investment securities: |
|
|
Unaffiliated issuers | 14,433,712 | |
Futures contracts | 642,976 | |
Total net realized gain (loss) |
| 15,076,688 |
Change in net unrealized appreciation (depreciation) on: Investment securities | 34,795,727 | |
Futures contracts | 4,279 | |
Total change in net unrealized appreciation (depreciation) |
| 34,800,006 |
Net gain (loss) | 49,876,694 | |
Net increase (decrease) in net assets resulting from operations | $ 52,809,619 | |
See accompanying notes which are an integral part of the financial statements.
Annual Report
Statement of Changes in Net Assets
| Year ended | Year ended |
Increase (Decrease) in Net Assets |
|
|
Operations |
|
|
Net investment income (loss) | $ 2,932,925 | $ 2,903,760 |
Net realized gain (loss) | 15,076,688 | 6,475,353 |
Change in net unrealized appreciation (depreciation) | 34,800,006 | 5,009,598 |
Net increase (decrease) in net assets resulting from operations | 52,809,619 | 14,388,711 |
Distributions to shareholders from net investment income | (2,727,604) | (2,493,084) |
Distributions to shareholders from net realized gain | (11,225,870) | - |
Total distributions | (13,953,474) | (2,493,084) |
Share transactions | 86,268,044 | 80,543,311 |
Reinvestment of distributions | 13,471,055 | 2,387,285 |
Cost of shares redeemed | (61,131,732) | (65,260,416) |
Net increase (decrease) in net assets resulting from share transactions | 38,607,367 | 17,670,180 |
Total increase (decrease) in net assets | 77,463,512 | 29,565,807 |
|
|
|
Net Assets | ||
Beginning of period | 171,391,960 | 141,826,153 |
End of period (including undistributed net investment income of $598,723 and undistributed net investment income of $553,491, respectively) | $ 248,855,472 | $ 171,391,960 |
Other Information Shares | ||
Sold | 6,581,361 | 7,227,786 |
Issued in reinvestment of distributions | 1,027,084 | 217,076 |
Redeemed | (4,678,770) | (5,855,594) |
Net increase (decrease) | 2,929,675 | 1,589,268 |
Financial Highlights
Years ended February 28, | 2014 | 2013 | 2012 F | 2011 | 2010 |
Selected Per-Share Data |
|
|
|
|
|
Net asset value, beginning of period | $ 11.77 | $ 10.93 | $ 10.19 | $ 8.44 | $ 5.60 |
Income from Investment Operations |
|
|
|
|
|
Net investment income (loss) B | .18 | .20 | .13 | .11 | .11 |
Net realized and unrealized gain (loss) | 3.15 | .81 | .72 | 1.75 | 2.83 |
Total from investment operations | 3.33 | 1.01 | .85 | 1.86 | 2.94 |
Distributions from net investment income | (.17) | (.17) | (.11) | (.11) | (.10) |
Distributions from net realized gain | (.71) | - | - | - | - |
Total distributions | (.88) | (.17) | (.11) | (.11) | (.10) |
Net asset value, end of period | $ 14.22 | $ 11.77 | $ 10.93 | $ 10.19 | $ 8.44 |
Total Return A | 29.08% | 9.36% | 8.40% | 22.14% | 52.50% |
Ratios to Average Net Assets C,E |
|
|
|
|
|
Expenses before reductions | .45% | .45% | .45% | .45% | .45% |
Expenses net of fee waivers, if any | .45% | .45% | .45% | .45% | .45% |
Expenses net of all reductions | .45% | .45% | .45% | .45% | .45% |
Net investment income (loss) | 1.41% | 1.80% | 1.30% | 1.25% | 1.42% |
Supplemental Data |
|
|
|
|
|
Net assets, end of period (000 omitted) | $ 248,855 | $ 171,392 | $ 141,826 | $ 68,115 | $ 49,812 |
Portfolio turnover rate D | 83% | 87% | 77% | 80% | 35% G |
A Total returns would have been lower if certain expenses had not been reduced during the applicable periods shown.
B Calculated based on average shares outstanding during the period.
C Fees and expenses of any underlying Fidelity Central Funds are not included in the Fund's expense ratio. The Fund indirectly bears its proportionate share of the expenses of any underlying Fidelity Central Funds.
D Amount does not include the portfolio activity of any underlying Fidelity Central Funds.
E Expense ratios reflect operating expenses of the Fund. Expenses before reductions do not reflect amounts reimbursed by the investment adviser or reductions from expense offset arrangements and do not represent the amount paid by the Fund during periods when reimbursements or reductions occur. Expenses net of fee waivers reflect expenses after reimbursement by the investment adviser but prior to reductions from expense offset arrangements. Expenses net of all reductions represent the net expenses paid by the Fund.
F For the year ended February 29.
G Reflects adjustments to exclude transactions in money market mutual funds.
See accompanying notes which are an integral part of the financial statements.
Annual Report
Fidelity Large Cap Value Enhanced Index Fund
Performance: The Bottom Line
Average annual total return reflects the change in the value of an investment, assuming reinvestment of the fund's distributions from dividend income and capital gains (the profits earned upon the sale of securities that have grown in value, if any) and assuming a constant rate of performance each year. The $10,000 table and the fund's returns do not reflect the deduction of taxes that a shareholder would pay on fund distributions or the redemption of fund shares. During periods of reimbursement by Fidelity, a fund's total returns will be greater than it would be had the reimbursement not occurred. How a fund did yesterday is no guarantee of how it will do tomorrow.
Average Annual Total Returns
Periods ended February 28, 2014 | Past 1 | Past 5 | Life of |
Fidelity Large Cap Value Enhanced Index Fund | 23.92% | 22.13% | 3.84% |
A From April 19, 2007.
$10,000 Over Life of Fund
Let's say hypothetically that $10,000 was invested in Fidelity Large Cap Value Enhanced Index Fund on April 19, 2007, when the fund started. The chart shows how the value of your investment would have changed, and also shows how the Russell 1000 Value Index performed over the same period.

Annual Report
Fidelity Large Cap Value Enhanced Index Fund
Management's Discussion of Fund Performance
Market Recap: Stocks overcame fears of higher interest rates - not to mention their worst January in four years - to finish sharply higher for the 12 months ending February 28, 2014. The broad S&P 500® Index and the blue-chip Dow Jones Industrial AverageSM gained 25.37% and 19.01%, respectively, amid generally favorable earnings reports and accommodative monetary policies worldwide. Performance generally increased along the risk spectrum, with smaller-cap and growth strategies leading the way. An ebullient market helped the growth-oriented Nasdaq Composite Index® to a 38.10% period gain, for example. On the other hand, both cyclical and defensive stocks had representation in the top-performing industry sectors: returns were highest in health care and consumer discretionary; lowest in utilities and telecommunication services. From a macroeconomic perspective, data still points to slow but steady improvement in the U.S., and Europe's recession may well be over. Reports from China have disappointed, but continue to suggest a relatively soft landing there. Mixed signals from the U.S. Federal Reserve as to when it might curtail its stimulative bond buying kept markets in flux during the spring and summer. Stocks regained momentum in October despite a federal budget impasse and brief government shutdown, and lower volatility prevailed through year-end. Shedding new-year concerns about China's economy, an emerging-markets sell-off and confirmation (at last) of Fed tapering - alongside confirmation of a presumably dovish Janet Yellen as new Fed chair - February saw stocks back in record territory, bearing down on the five-year anniversary of the market's bottom.
Comments from Maximilian Kaufmann, Senior Portfolio Manager of the Geode Capital Management, LLC, investment management team for Fidelity® Large Cap Value Enhanced Index Fund: For the year, the fund gained 23.92%, outpacing the 23.44% advance of its benchmark, the Russell 1000® Value Index. Relative to the index, the fund benefited from favorable security selection in the capital goods industry within the industrials sector, while our choices in the insurance group within financials proved detrimental. However, the fund meaningfully benefited from productive industry positioning. In particular, underweighting the lagging real estate group within financials added to our result, as did an allocation to the software & services group within information technology. Looking at individual stocks, the fund benefited the most from its position in Apollo Education Group, a for-profit provider of higher education and the parent company of the University of Phoenix. In a single day in October, Apollo saw its shares increase 28% - the company's biggest one-day gain ever - due to better-than-expected earnings and sales as a result of aggressive cost cutting. Another strong-performing investment was United Therapeutics, a drug maker whose shares were up sharply in December after the company - which was not in the benchmark - received permission from regulators to begin marketing the oral version of oreintram, its treatment for pulmonary arterial hypertension. Northrop Grumman also did very well, as the defense contractor turned in better-than-expected earnings despite reduced sales stemming from federal budget cutbacks. In contrast, the fund's biggest individual detractor was homebuilder PulteGroup, whose stock was up and down during the period but, in retrospect, we owned at the wrong times. Similarly, the fund did not own Micron Technology until July. This benchmark component saw its shares gain about 188% during the 12 months - a gain that, unfortunately, the fund missed for nearly all of the first half of the reporting period.
The views expressed above reflect those of the portfolio manager(s) only through the end of the period as stated on the cover of this report and do not necessarily represent the views of Fidelity or any other person in the Fidelity organization. Any such views are subject to change at any time based upon market or other conditions and Fidelity disclaims any responsibility to update such views. These views may not be relied on as investment advice and, because investment decisions for a Fidelity fund are based on numerous factors, may not be relied on as an indication of trading intent on behalf of any Fidelity fund.
Annual Report
Fidelity Large Cap Value Enhanced Index Fund
Investment Changes (Unaudited)
Top Ten Stocks as of February 28, 2014 | ||
| % of fund's | % of fund's net assets |
Exxon Mobil Corp. | 4.0 | 5.0 |
General Electric Co. | 3.1 | 2.7 |
Johnson & Johnson | 2.8 | 3.0 |
Wells Fargo & Co. | 2.7 | 2.8 |
Pfizer, Inc. | 2.6 | 2.3 |
Procter & Gamble Co. | 2.5 | 2.0 |
Chevron Corp. | 2.4 | 3.1 |
Berkshire Hathaway, Inc. Class B | 2.4 | 2.8 |
JPMorgan Chase & Co. | 2.4 | 2.7 |
Bank of America Corp. | 2.4 | 2.2 |
| 27.3 | |
Market Sectors as of February 28, 2014 | ||
| % of fund's | % of fund's net assets |
Financials | 28.3 | 28.5 |
Health Care | 15.1 | 14.0 |
Energy | 12.3 | 12.9 |
Industrials | 11.3 | 8.8 |
Information Technology | 10.6 | 10.5 |
Consumer Discretionary | 6.3 | 7.1 |
Consumer Staples | 5.7 | 6.3 |
Utilities | 4.1 | 4.3 |
Materials | 2.3 | 2.3 |
Telecommunication Services | 1.8 | 2.8 |
Annual Report
Fidelity Large Cap Value Enhanced Index Fund
Investments February 28, 2014
Showing Percentage of Net Assets
Common Stocks - 97.8% | |||
Shares | Value | ||
CONSUMER DISCRETIONARY - 6.3% | |||
Auto Components - 0.7% | |||
Gentex Corp. (e) | 12,772 | $ 400,658 | |
Lear Corp. | 10,797 | 876,716 | |
| 1,277,374 | ||
Diversified Consumer Services - 1.1% | |||
Apollo Ed Group, Inc. Class A (non-vtg.) (a)(e) | 28,221 | 940,606 | |
Graham Holdings Co. | 1,322 | 950,121 | |
| 1,890,727 | ||
Household Durables - 0.8% | |||
PulteGroup, Inc. | 14,826 | 311,198 | |
Whirlpool Corp. | 7,837 | 1,133,465 | |
| 1,444,663 | ||
Media - 2.6% | |||
Comcast Corp. Class A | 20,905 | 1,080,579 | |
Morningstar, Inc. | 2,213 | 185,140 | |
Starz - Liberty Capital Series A (a)(e) | 27,737 | 887,029 | |
The Walt Disney Co. | 18,398 | 1,486,742 | |
Time Warner, Inc. | 4,135 | 277,583 | |
Viacom, Inc. Class B (non-vtg.) | 9,368 | 821,855 | |
| 4,738,928 | ||
Specialty Retail - 0.4% | |||
Bed Bath & Beyond, Inc. (a) | 327 | 22,177 | |
Home Depot, Inc. | 8,051 | 660,424 | |
| 682,601 | ||
Textiles, Apparel & Luxury Goods - 0.7% | |||
Hanesbrands, Inc. | 10,619 | 778,160 | |
NIKE, Inc. Class B | 5,877 | 460,169 | |
| 1,238,329 | ||
TOTAL CONSUMER DISCRETIONARY | 11,272,622 | ||
CONSUMER STAPLES - 5.7% | |||
Beverages - 0.2% | |||
Dr. Pepper Snapple Group, Inc. | 6,394 | 333,191 | |
Food & Staples Retailing - 1.2% | |||
CVS Caremark Corp. | 29,833 | 2,181,986 | |
Food Products - 1.8% | |||
Archer Daniels Midland Co. | 33,335 | 1,353,401 | |
Mondelez International, Inc. | 8,370 | 284,831 | |
Pilgrims Pride Corp. (a) | 23,434 | 410,798 | |
Tyson Foods, Inc. Class A | 29,826 | 1,176,636 | |
| 3,225,666 | ||
Household Products - 2.5% | |||
Procter & Gamble Co. | 58,067 | 4,567,550 | |
TOTAL CONSUMER STAPLES | 10,308,393 | ||
| |||
Shares | Value | ||
ENERGY - 12.3% | |||
Energy Equipment & Services - 1.3% | |||
Baker Hughes, Inc. | 16,858 | $ 1,066,774 | |
Helmerich & Payne, Inc. | 2,264 | 223,570 | |
National Oilwell Varco, Inc. | 9,702 | 747,442 | |
Schlumberger Ltd. | 3,880 | 360,840 | |
| 2,398,626 | ||
Oil, Gas & Consumable Fuels - 11.0% | |||
Chevron Corp. | 38,036 | 4,386,692 | |
ConocoPhillips Co. | 19,515 | 1,297,748 | |
Exxon Mobil Corp. | 75,036 | 7,223,714 | |
HollyFrontier Corp. | 22,535 | 1,026,920 | |
Marathon Petroleum Corp. | 16,237 | 1,363,908 | |
Occidental Petroleum Corp. | 6,171 | 595,625 | |
Phillips 66 Co. | 23,709 | 1,774,856 | |
Valero Energy Corp. | 28,382 | 1,361,768 | |
Western Refining, Inc. (e) | 21,247 | 774,453 | |
| 19,805,684 | ||
TOTAL ENERGY | 22,204,310 | ||
FINANCIALS - 28.3% | |||
Capital Markets - 2.6% | |||
Goldman Sachs Group, Inc. | 13,967 | 2,324,807 | |
Morgan Stanley | 48,031 | 1,479,355 | |
SEI Investments Co. | 10,523 | 353,257 | |
TD Ameritrade Holding Corp. (e) | 16,570 | 553,935 | |
| 4,711,354 | ||
Commercial Banks - 5.6% | |||
Fifth Third Bancorp | 50,162 | 1,088,265 | |
Fulton Financial Corp. (e) | 20,935 | 257,710 | |
KeyCorp | 77,656 | 1,022,730 | |
PNC Financial Services Group, Inc. | 12,309 | 1,006,630 | |
Regions Financial Corp. | 106,945 | 1,137,895 | |
Synovus Financial Corp. | 241 | 839 | |
U.S. Bancorp | 13,654 | 561,726 | |
Wells Fargo & Co. | 106,257 | 4,932,450 | |
| 10,008,245 | ||
Consumer Finance - 1.9% | |||
American Express Co. | 9,086 | 829,370 | |
Capital One Financial Corp. | 11,043 | 810,887 | |
Discover Financial Services | 20,918 | 1,200,275 | |
SLM Corp. | 26,008 | 622,632 | |
| 3,463,164 | ||
Diversified Financial Services - 9.3% | |||
Bank of America Corp. | 256,771 | 4,244,425 | |
Berkshire Hathaway, Inc. Class B (a) | 37,604 | 4,353,791 | |
Citigroup, Inc. | 60,918 | 2,962,442 | |
JPMorgan Chase & Co. | 75,776 | 4,305,592 | |
The NASDAQ OMX Group, Inc. | 23,479 | 901,359 | |
| 16,767,609 | ||
Common Stocks - continued | |||
Shares | Value | ||
FINANCIALS - continued | |||
Insurance - 6.8% | |||
ACE Ltd. | 3,191 | $ 312,303 | |
Allstate Corp. | 24,716 | 1,341,090 | |
American Financial Group, Inc. | 13,444 | 768,459 | |
American International Group, Inc. | 10,353 | 515,269 | |
American National Insurance Co. | 2,843 | 322,652 | |
Aspen Insurance Holdings Ltd. | 23,383 | 878,265 | |
Axis Capital Holdings Ltd. | 18,300 | 804,651 | |
CNA Financial Corp. | 6,027 | 250,060 | |
CNO Financial Group, Inc. | 5,862 | 107,040 | |
First American Financial Corp. | 6,157 | 165,870 | |
Genworth Financial, Inc. Class A (a) | 40,338 | 626,853 | |
HCC Insurance Holdings, Inc. | 5,544 | 243,382 | |
PartnerRe Ltd. | 9,165 | 906,235 | |
Platinum Underwriters Holdings Ltd. | 7,883 | 462,101 | |
ProAssurance Corp. | 12,217 | 555,385 | |
StanCorp Financial Group, Inc. (e) | 884 | 58,503 | |
Symetra Financial Corp. | 8,796 | 173,281 | |
The Chubb Corp. | 10,536 | 921,689 | |
The Travelers Companies, Inc. | 15,300 | 1,282,752 | |
Unum Group | 28,667 | 997,038 | |
W.R. Berkley Corp. | 14,044 | 579,175 | |
| 12,272,053 | ||
Real Estate Investment Trusts - 2.1% | |||
Annaly Capital Management, Inc. | 34,648 | 387,365 | |
Chimera Investment Corp. | 277,775 | 886,102 | |
Corrections Corp. of America (e) | 20,902 | 697,082 | |
MFA Financial, Inc. | 126,618 | 995,217 | |
Public Storage | 2,322 | 392,418 | |
The Geo Group, Inc. | 11,189 | 360,621 | |
| 3,718,805 | ||
TOTAL FINANCIALS | 50,941,230 | ||
HEALTH CARE - 15.1% | |||
Biotechnology - 0.5% | |||
United Therapeutics Corp. (a)(e) | 8,278 | 839,555 | |
Health Care Equipment & Supplies - 1.9% | |||
Abbott Laboratories | 7,389 | 293,934 | |
CareFusion Corp. (a) | 24,536 | 994,444 | |
Medtronic, Inc. | 34,737 | 2,058,515 | |
| 3,346,893 | ||
Health Care Providers & Services - 3.5% | |||
Cardinal Health, Inc. | 17,537 | 1,254,422 | |
Express Scripts Holding Co. (a) | 13,736 | 1,034,458 | |
McKesson Corp. | 5,042 | 892,686 | |
UnitedHealth Group, Inc. | 21,861 | 1,689,199 | |
WellPoint, Inc. | 15,817 | 1,432,862 | |
| 6,303,627 | ||
Life Sciences Tools & Services - 1.0% | |||
Thermo Fisher Scientific, Inc. | 13,888 | 1,729,612 | |
| |||
Shares | Value | ||
Pharmaceuticals - 8.2% | |||
AbbVie, Inc. | 17,260 | $ 878,707 | |
Eli Lilly & Co. | 29,908 | 1,782,816 | |
Johnson & Johnson | 55,859 | 5,145,731 | |
Merck & Co., Inc. | 41,467 | 2,363,204 | |
Pfizer, Inc. | 146,287 | 4,697,276 | |
| 14,867,734 | ||
TOTAL HEALTH CARE | 27,087,421 | ||
INDUSTRIALS - 11.3% | |||
Aerospace & Defense - 3.3% | |||
Alliant Techsystems, Inc. | 1,256 | 169,296 | |
Exelis, Inc. | 9,510 | 194,289 | |
General Dynamics Corp. | 5,613 | 614,848 | |
L-3 Communications Holdings, Inc. | 9,721 | 1,121,803 | |
Northrop Grumman Corp. | 11,897 | 1,439,894 | |
Raytheon Co. | 15,806 | 1,547,565 | |
The Boeing Co. | 6,327 | 815,677 | |
| 5,903,372 | ||
Airlines - 1.3% | |||
Alaska Air Group, Inc. | 10,601 | 918,471 | |
Copa Holdings SA Class A | 1,847 | 250,195 | |
Southwest Airlines Co. | 55,304 | 1,241,022 | |
| 2,409,688 | ||
Commercial Services & Supplies - 0.8% | |||
ADT Corp. (e) | 7,403 | 227,346 | |
Cintas Corp. | 7,393 | 448,459 | |
Pitney Bowes, Inc. (e) | 1,697 | 43,189 | |
UniFirst Corp. | 6,409 | 703,003 | |
| 1,421,997 | ||
Construction & Engineering - 0.1% | |||
Jacobs Engineering Group, Inc. (a) | 2,638 | 159,995 | |
Industrial Conglomerates - 3.7% | |||
3M Co. | 8,130 | 1,095,355 | |
General Electric Co. | 218,186 | 5,557,197 | |
| 6,652,552 | ||
Machinery - 1.0% | |||
AGCO Corp. | 12,296 | 645,294 | |
Caterpillar, Inc. (e) | 1,191 | 115,491 | |
IDEX Corp. | 1,702 | 127,769 | |
Trinity Industries, Inc. | 14,198 | 1,019,558 | |
| 1,908,112 | ||
Professional Services - 0.6% | |||
Manpower, Inc. | 13,264 | 1,036,714 | |
Road & Rail - 0.5% | |||
Union Pacific Corp. | 4,902 | 884,223 | |
TOTAL INDUSTRIALS | 20,376,653 | ||
Common Stocks - continued | |||
Shares | Value | ||
INFORMATION TECHNOLOGY - 10.6% | |||
Communications Equipment - 2.7% | |||
Brocade Communications Systems, Inc. (a) | 99,788 | $ 954,971 | |
Cisco Systems, Inc. | 137,722 | 3,002,340 | |
Harris Corp. | 253 | 18,676 | |
Juniper Networks, Inc. (a) | 2,613 | 69,872 | |
QUALCOMM, Inc. | 11,537 | 868,621 | |
| 4,914,480 | ||
Computers & Peripherals - 3.4% | |||
Apple, Inc. | 5,643 | 2,969,572 | |
Hewlett-Packard Co. | 61,727 | 1,844,403 | |
Western Digital Corp. | 13,966 | 1,214,902 | |
| 6,028,877 | ||
IT Services - 1.3% | |||
Amdocs Ltd. | 23,516 | 1,045,992 | |
DST Systems, Inc. | 9,262 | 870,443 | |
Xerox Corp. | 43,368 | 476,614 | |
| 2,393,049 | ||
Semiconductors & Semiconductor Equipment - 1.7% | |||
Intel Corp. | 60,160 | 1,489,562 | |
Marvell Technology Group Ltd. | 41,354 | 632,303 | |
Micron Technology, Inc. (a) | 33,834 | 818,444 | |
| 2,940,309 | ||
Software - 1.5% | |||
Activision Blizzard, Inc. | 52,427 | 1,014,462 | |
CA Technologies, Inc. | 30,681 | 1,027,814 | |
Microsoft Corp. | 17,572 | 673,183 | |
| 2,715,459 | ||
TOTAL INFORMATION TECHNOLOGY | 18,992,174 | ||
MATERIALS - 2.3% | |||
Chemicals - 2.3% | |||
LyondellBasell Industries NV Class A | 10,458 | 921,141 | |
Sigma Aldrich Corp. | 4,573 | 431,737 | |
The Dow Chemical Co. | 38,535 | 1,877,040 | |
Westlake Chemical Corp. (e) | 6,903 | 920,377 | |
| 4,150,295 | ||
TELECOMMUNICATION SERVICES - 1.8% | |||
Diversified Telecommunication Services - 1.8% | |||
AT&T, Inc. | 74,684 | 2,384,660 | |
Verizon Communications, Inc. | 18,714 | 890,412 | |
| 3,275,072 | ||
UTILITIES - 4.1% | |||
Electric Utilities - 1.6% | |||
Duke Energy Corp. | 6,485 | 459,657 | |
Edison International | 19,710 | 1,032,213 | |
Entergy Corp. | 10,995 | 701,701 | |
| |||
Shares | Value | ||
Exelon Corp. | 10,136 | $ 308,236 | |
Pinnacle West Capital Corp. | 7,572 | 421,382 | |
| 2,923,189 | ||
Gas Utilities - 0.5% | |||
UGI Corp. | 22,041 | 985,012 | |
Multi-Utilities - 1.6% | |||
Alliant Energy Corp. | 871 | 47,243 | |
Ameren Corp. | 13,483 | 544,848 | |
CMS Energy Corp. | 507 | 14,414 | |
DTE Energy Co. | 11,985 | 860,044 | |
Public Service Enterprise Group, Inc. | 33,427 | 1,225,434 | |
Wisconsin Energy Corp. | 4,187 | 184,061 | |
| 2,876,044 | ||
Water Utilities - 0.4% | |||
American Water Works Co., Inc. | 14,710 | 659,596 | |
TOTAL UTILITIES | 7,443,841 | ||
TOTAL COMMON STOCKS (Cost $141,255,378) |
| ||
U.S. Treasury Obligations - 0.1% | ||||
| Principal Amount |
| ||
U.S. Treasury Bills, yield at date of purchase 0.08% 5/29/14 to 7/24/14 (f) | $ 250,000 |
| ||
Money Market Funds - 5.1% | |||
Shares |
| ||
Dreyfus Cash Management Institutional Shares, 0.10% (c) | 3,201,450 | 3,201,450 | |
Fidelity Securities Lending Cash Central Fund, 0.09% (b)(d) | 6,031,043 | 6,031,043 | |
TOTAL MONEY MARKET FUNDS (Cost $9,232,493) |
| ||
TOTAL INVESTMENT PORTFOLIO - 103.0% (Cost $150,737,792) | 185,534,456 | |
NET OTHER ASSETS (LIABILITIES) - (3.0)% | (5,453,091) | |
NET ASSETS - 100% | $ 180,081,365 | |
Futures Contracts | |||||
Expiration Date | Underlying Face Amount at Value | Unrealized Appreciation/(Depreciation) | |||
Purchased | |||||
Equity Index Contracts | |||||
42 CME E-mini S&P 500 Index Contracts (United States) | March 2014 | $ 3,900,960 | $ 135,920 | ||
|
The face value of futures purchased as a percentage of net assets is 2.2% |
Legend |
(a) Non-income producing |
(b) Affiliated fund that is generally available only to investment companies and other accounts managed by Fidelity Investments. The rate quoted is the annualized seven-day yield of the fund at period end. A complete unaudited listing of the fund's holdings as of its most recent quarter end is available upon request. In addition, each Fidelity Central Fund's financial statements, which are not covered by the Fund's Report of Independent Registered Public Accounting Firm, are available on the SEC's website or upon request. |
(c) The rate quoted is the annualized seven-day yield of the fund at period end. |
(d) Investment made with cash collateral received from securities on loan. |
(e) Security or a portion of the security is on loan at period end. |
(f) Security or a portion of the security was pledged to cover margin requirements for futures contracts. At period end, the value of securities pledged amounted to $249,952. |
Affiliated Central Funds |
Information regarding fiscal year to date income earned by the Fund from investments in Fidelity Central Funds is as follows: |
Fund | Income earned |
Fidelity Securities Lending Cash Central Fund | $ 6,505 |
Other Information |
The following is a summary of the inputs used, as of February 28, 2014, involving the Fund's assets and liabilities carried at fair value. The inputs or methodology used for valuing securities may not be an indication of the risk associated with investing in those securities. For more information on valuation inputs, and their aggregation into the levels used in the table below, please refer to the Investment Valuation section in the accompanying Notes to Financial Statements. |
Valuation Inputs at Reporting Date: | ||||
Description | Total | Level 1 | Level 2 | Level 3 |
Investments in Securities: | ||||
Equities: | ||||
Consumer Discretionary | $ 11,272,622 | $ 11,272,622 | $ - | $ - |
Consumer Staples | 10,308,393 | 10,308,393 | - | - |
Energy | 22,204,310 | 22,204,310 | - | - |
Financials | 50,941,230 | 50,941,230 | - | - |
Health Care | 27,087,421 | 27,087,421 | - | - |
Industrials | 20,376,653 | 20,376,653 | - | - |
Information Technology | 18,992,174 | 18,992,174 | - | - |
Materials | 4,150,295 | 4,150,295 | - | - |
Telecommunication Services | 3,275,072 | 3,275,072 | - | - |
Utilities | 7,443,841 | 7,443,841 | - | - |
U.S. Government and Government Agency Obligations | 249,952 | - | 249,952 | - |
Money Market Funds | 9,232,493 | 9,232,493 | - | - |
Total Investments in Securities: | $ 185,534,456 | $ 185,284,504 | $ 249,952 | $ - |
Derivative Instruments: | ||||
Assets | ||||
Futures Contracts | $ 135,920 | $ 135,920 | $ - | $ - |
Value of Derivative Instruments |
The following table is a summary of the Fund's value of derivative instruments by primary risk exposure as of February 28, 2014. For additional information on derivative instruments, please refer to the Derivative Instruments section in the accompanying Notes to Financial Statements. |
Primary Risk Exposure / | Value | |
| Asset | Liability |
Equity Risk | ||
Futures Contracts (a) | $ 135,920 | $ - |
Total Value of Derivatives | $ 135,920 | $ - |
(a) Reflects gross cumulative appreciation (depreciation) on futures contracts as presented in the Schedule of Investments. Only the period end receivable or payable for daily variation margin and net unrealized appreciation (depreciation) are presented in the Statement of Assets and Liabilities. |
See accompanying notes which are an integral part of the financial statements.
Annual Report
Fidelity Large Cap Value Enhanced Index Fund
Financial Statements
Statement of Assets and Liabilities
| February 28, 2014 | |
|
|
|
Assets | ||
Investment in securities, at value (including securities loaned of $5,850,256) - See accompanying schedule: Unaffiliated issuers (cost $144,706,749) | $ 179,503,413 |
|
Fidelity Central Funds (cost $6,031,043) | 6,031,043 |
|
Total Investments (cost $150,737,792) |
| $ 185,534,456 |
Receivable for fund shares sold | 697,942 | |
Dividends receivable | 435,451 | |
Interest receivable | 105 | |
Distributions receivable from Fidelity Central Funds | 364 | |
Receivable for daily variation margin for derivative instruments | 7,431 | |
Total assets | 186,675,749 | |
|
|
|
Liabilities | ||
Payable for fund shares redeemed | $ 498,980 | |
Accrued management fee | 42,906 | |
Other affiliated payables | 21,454 | |
Collateral on securities loaned, at value | 6,031,044 | |
Total liabilities | 6,594,384 | |
|
|
|
Net Assets | $ 180,081,365 | |
Net Assets consist of: |
| |
Paid in capital | $ 142,686,566 | |
Undistributed net investment income | 565,906 | |
Accumulated undistributed net realized gain (loss) on investments | 1,896,309 | |
Net unrealized appreciation (depreciation) on investments | 34,932,584 | |
Net Assets, for 17,631,100 shares outstanding | $ 180,081,365 | |
Net Asset Value, offering price and redemption price per share ($180,081,365 ÷ 17,631,100 shares) | $ 10.21 | |
Statement of Operations
| Year ended February 28, 2014 | |
|
|
|
Investment Income |
|
|
Dividends |
| $ 3,434,896 |
Interest |
| 1,747 |
Income from Fidelity Central Funds |
| 6,505 |
Total income |
| 3,443,148 |
|
|
|
Expenses | ||
Management fee | $ 419,373 | |
Transfer agent fees | 210,483 | |
Independent trustees' compensation | 1,593 | |
Miscellaneous | 248 | |
Total expenses before reductions | 631,697 | |
Expense reductions | (4) | 631,693 |
Net investment income (loss) | 2,811,455 | |
Realized and Unrealized Gain (Loss) Net realized gain (loss) on: | ||
Investment securities: |
|
|
Unaffiliated issuers | 9,361,928 | |
Futures contracts | 861,845 | |
Total net realized gain (loss) |
| 10,223,773 |
Change in net unrealized appreciation (depreciation) on: Investment securities | 16,153,070 | |
Futures contracts | (12,473) | |
Total change in net unrealized appreciation (depreciation) |
| 16,140,597 |
Net gain (loss) | 26,364,370 | |
Net increase (decrease) in net assets resulting from operations | $ 29,175,825 | |
See accompanying notes which are an integral part of the financial statements.
Annual Report
Statement of Changes in Net Assets
| Year ended | Year ended |
Increase (Decrease) in Net Assets |
|
|
Operations |
|
|
Net investment income (loss) | $ 2,811,455 | $ 1,862,514 |
Net realized gain (loss) | 10,223,773 | 4,128,067 |
Change in net unrealized appreciation (depreciation) | 16,140,597 | 8,731,072 |
Net increase (decrease) in net assets resulting from operations | 29,175,825 | 14,721,653 |
Distributions to shareholders from net investment income | (2,268,365) | (1,610,247) |
Distributions to shareholders from net realized gain | (8,439,014) | (1,265,614) |
Total distributions | (10,707,379) | (2,875,861) |
Share transactions | 119,086,235 | 49,477,878 |
Reinvestment of distributions | 10,328,295 | 2,776,149 |
Cost of shares redeemed | (74,541,681) | (28,713,291) |
Net increase (decrease) in net assets resulting from share transactions | 54,872,849 | 23,540,736 |
Total increase (decrease) in net assets | 73,341,295 | 35,386,528 |
|
|
|
Net Assets | ||
Beginning of period | 106,740,070 | 71,353,542 |
End of period (including undistributed net investment income of $565,906 and undistributed net investment income of $440,579, respectively) | $ 180,081,365 | $ 106,740,070 |
Other Information Shares | ||
Sold | 12,278,472 | 6,067,936 |
Issued in reinvestment of distributions | 1,075,131 | 349,249 |
Redeemed | (7,731,742) | (3,584,294) |
Net increase (decrease) | 5,621,861 | 2,832,891 |
Financial Highlights
Years ended February 28, | 2014 | 2013 | 2012 F | 2011 | 2010 |
Selected Per-Share Data |
|
|
|
|
|
Net asset value, beginning of period | $ 8.89 | $ 7.78 | $ 7.92 | $ 6.70 | $ 4.59 |
Income from Investment Operations |
|
|
|
|
|
Net investment income (loss) B | .20 | .18 | .15 | .12 | .13 |
Net realized and unrealized gain (loss) | 1.87 | 1.21 | .10 | 1.22 | 2.11 |
Total from investment operations | 2.07 | 1.39 | .25 | 1.34 | 2.24 |
Distributions from net investment income | (.16) | (.15) | (.13) | (.12) | (.13) |
Distributions from net realized gain | (.59) | (.13) | (.26) | - | - |
Total distributions | (.75) | (.28) | (.39) | (.12) | (.13) |
Net asset value, end of period | $ 10.21 | $ 8.89 | $ 7.78 | $ 7.92 | $ 6.70 |
Total Return A | 23.92% | 18.38% | 3.58% | 20.15% | 48.83% |
Ratios to Average Net Assets C,E |
|
|
|
|
|
Expenses before reductions | .45% | .45% | .45% | .45% | .45% |
Expenses net of fee waivers, if any | .45% | .45% | .45% | .45% | .45% |
Expenses net of all reductions | .45% | .45% | .45% | .45% | .45% |
Net investment income (loss) | 2.01% | 2.27% | 2.04% | 1.76% | 2.11% |
Supplemental Data |
|
|
|
|
|
Net assets, end of period (000 omitted) | $ 180,081 | $ 106,740 | $ 71,354 | $ 85,123 | $ 69,024 |
Portfolio turnover rate D | 85% | 76% | 85% | 83% | 89% G |
A Total returns would have been lower if certain expenses had not been reduced during the applicable periods shown.
B Calculated based on average shares outstanding during the period.
C Fees and expenses of any underlying Fidelity Central Funds are not included in the Fund's expense ratio. The Fund indirectly bears its proportionate share of the expenses of any underlying Fidelity Central Funds.
D Amount does not include the portfolio activity of any underlying Fidelity Central Funds.
E Expense ratios reflect operating expenses of the Fund. Expenses before reductions do not reflect amounts reimbursed by the investment adviser or reductions from expense offset arrangements and do not represent the amount paid by the Fund during periods when reimbursements or reductions occur. Expenses net of fee waivers reflect expenses after reimbursement by the investment adviser but prior to reductions from expense offset arrangements. Expenses net of all reductions represent the net expenses paid by the Fund.
F For the year ended February 29.
G Reflects adjustments to exclude transactions in money market mutual funds.
See accompanying notes which are an integral part of the financial statements.
Annual Report
Fidelity Large Cap Core Enhanced Index Fund
Performance: The Bottom Line
Average annual total return reflects the change in the value of an investment, assuming reinvestment of the fund's distributions from dividend income and capital gains (the profits earned upon the sale of securities that have grown in value, if any) and assuming a constant rate of performance each year. The $10,000 table and the fund's returns do not reflect the deduction of taxes that a shareholder would pay on fund distributions or the redemption of fund shares. During periods of reimbursement by Fidelity, a fund's total returns will be greater than it would be had the reimbursement not occurred. How a fund did yesterday is no guarantee of how it will do tomorrow.
Average Annual Total Returns
Periods ended February 28, 2014 | Past 1 | Past 5 | Life of |
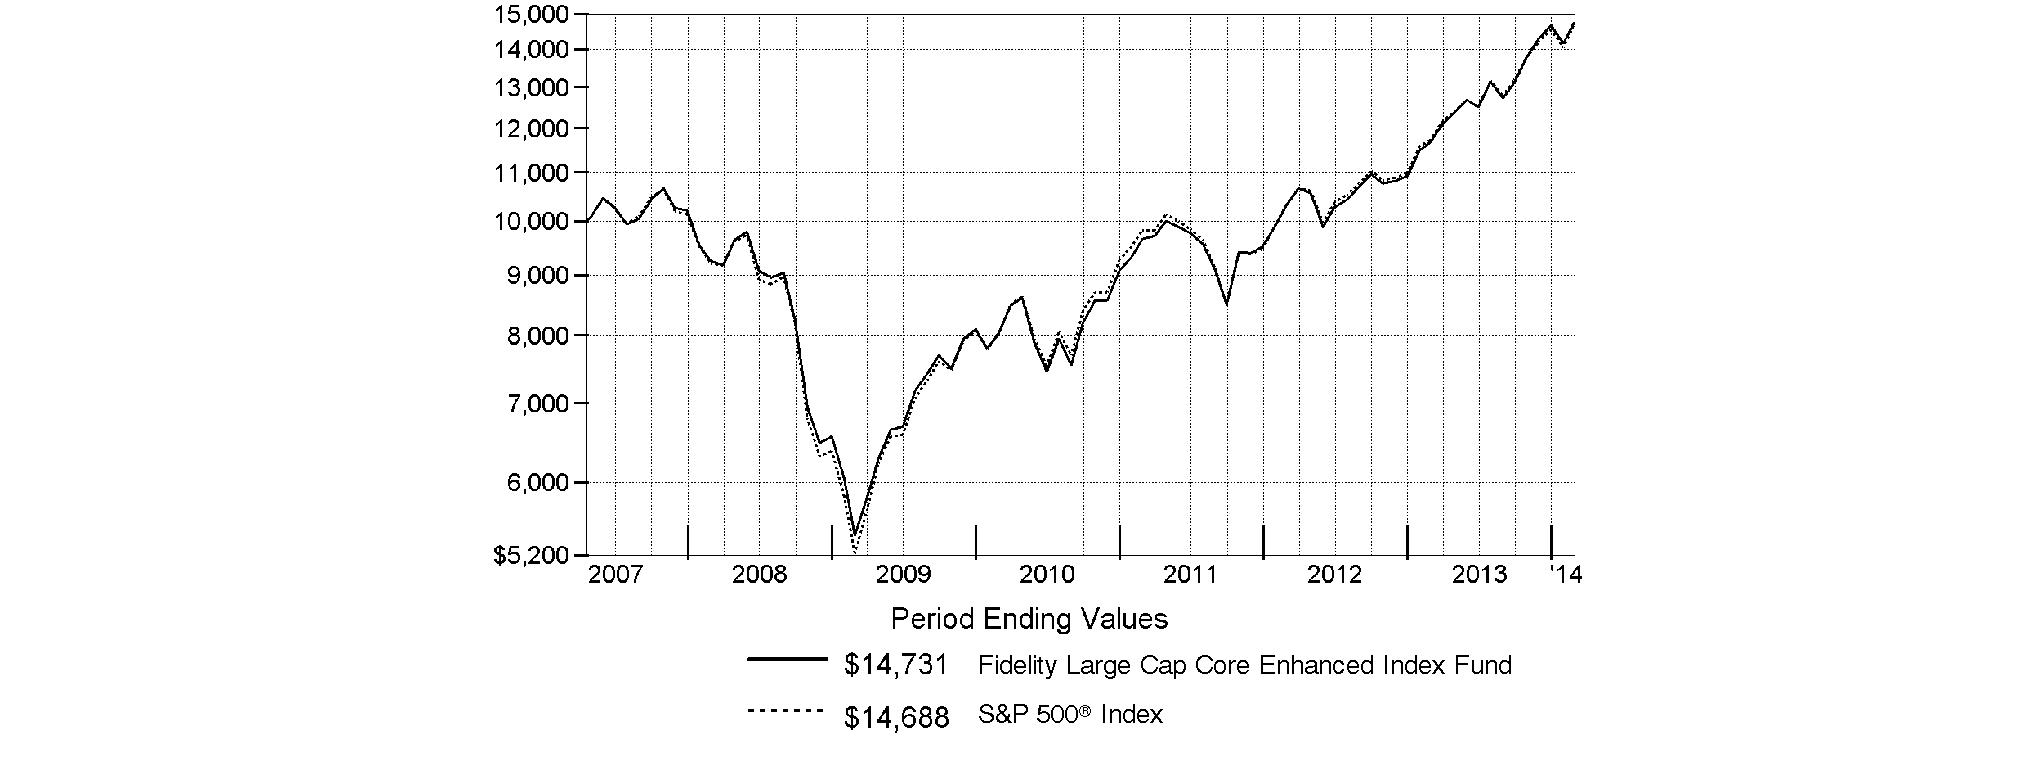
Fidelity Large Cap Core Enhanced Index Fund | 26.44% | 22.21% | 5.80% |
A From April 19, 2007.
$10,000 Over Life of Fund
Let's say hypothetically that $10,000 was invested in Fidelity Large Cap Core Enhanced Index Fund on April 19, 2007, when the fund started. The chart shows how the value of your investment would have changed, and also shows how the S&P 500® Index performed over the same period.
Annual Report
Fidelity Large Cap Core Enhanced Index Fund
Management's Discussion of Fund Performance
Market Recap: Stocks overcame fears of higher interest rates - not to mention their worst January in four years - to finish sharply higher for the 12 months ending February 28, 2014. The broad S&P 500® Index and the blue-chip Dow Jones Industrial AverageSM gained 25.37% and 19.01%, respectively, amid generally favorable earnings reports and accommodative monetary policies worldwide. Performance generally increased along the risk spectrum, with smaller-cap and growth strategies leading the way. An ebullient market helped the growth-oriented Nasdaq Composite Index® to a 38.10% period gain, for example. On the other hand, both cyclical and defensive stocks had representation in the top-performing industry sectors: returns were highest in health care and consumer discretionary; lowest in utilities and telecommunication services. From a macroeconomic perspective, data still points to slow but steady improvement in the U.S., and Europe's recession may well be over. Reports from China have disappointed, but continue to suggest a relatively soft landing there. Mixed signals from the U.S. Federal Reserve as to when it might curtail its stimulative bond buying kept markets in flux during the spring and summer. Stocks regained momentum in October despite a federal budget impasse and brief government shutdown, and lower volatility prevailed through year-end. Shedding new-year concerns about China's economy, an emerging-markets sell-off and confirmation (at last) of Fed tapering - alongside confirmation of a presumably dovish Janet Yellen as new Fed chair - February saw stocks back in record territory, bearing down on the five-year anniversary of the market's bottom.
Comments from Maximilian Kaufmann, Senior Portfolio Manager of the Geode Capital Management, LLC, investment management team for Fidelity® Large Cap Core Enhanced Index Fund: For the year, the fund gained 26.44%, outpacing its benchmark, the S&P 500® Index. Relative to the index, the fund benefited from favorable security selection in the capital goods industry within the industrials sector, and among health care equipment & services stocks. Our picks in the consumer staples sector also proved helpful, as did lacking much exposure to the underperforming real estate industry. In contrast, our stock choices in the energy sector, the retailing industry within consumer discretionary and the insurance group within financials all detracted. The biggest relative contributor was an out-of-index stake in Rite Aid, a drugstore chain whose shares were up by triple digits during the period. Most notably, Rite Aid's stock, which we bought in May, rose by 23% in a single day in September, thanks to higher sales and a more optimistic earnings forecast. Another strong-performing out-of-benchmark investment we established during the period was United Therapeutics, a drugmaker whose shares spiked sharply in December, after the company received permission from regulators to begin marketing the oral version of OrenitramTM, its treatment for pulmonary arterial hypertension. Defense contractors Northrop Grumman and Raytheon also saw stock price gains, as the companies turned in better-than-expected earnings despite reduced sales stemming from federal budget cutbacks. In contrast, the fund's biggest individual detractor was Delek US Holdings, an out-of-benchmark holding that, similar to other energy refiners, struggled amid declining refining margins. Untimely ownership of U.S. automaker Ford Motor and homebuilder PulteGroup also hurt. All of the detractors I've mentioned were not held at period end.
The views expressed above reflect those of the portfolio manager(s) only through the end of the period as stated on the cover of this report and do not necessarily represent the views of Fidelity or any other person in the Fidelity organization. Any such views are subject to change at any time based upon market or other conditions and Fidelity disclaims any responsibility to update such views. These views may not be relied on as investment advice and, because investment decisions for a Fidelity fund are based on numerous factors, may not be relied on as an indication of trading intent on behalf of any Fidelity fund.
Annual Report
Fidelity Large Cap Core Enhanced Index Fund
Investment Changes (Unaudited)
Top Ten Stocks as of February 28, 2014 | ||
| % of fund's | % of fund's net assets |
Apple, Inc. | 3.2 | 3.5 |
Google, Inc. Class A | 2.4 | 1.9 |
Microsoft Corp. | 2.3 | 2.0 |
Exxon Mobil Corp. | 2.1 | 3.1 |
Johnson & Johnson | 2.0 | 2.1 |
Wells Fargo & Co. | 1.8 | 1.8 |
Chevron Corp. | 1.7 | 2.0 |
Verizon Communications, Inc. | 1.7 | 0.6 |
JPMorgan Chase & Co. | 1.6 | 1.8 |
Pfizer, Inc. | 1.6 | 1.6 |
| 20.4 | |
Market Sectors as of February 28, 2014 | ||
| % of fund's | % of fund's net assets |
Information Technology | 20.4 | 19.5 |
Health Care | 15.3 | 14.5 |
Financials | 15.3 | 17.2 |
Industrials | 12.3 | 8.5 |
Consumer Discretionary | 11.1 | 13.9 |
Energy | 8.1 | 8.5 |
Consumer Staples | 7.5 | 10.1 |
Materials | 4.3 | 2.2 |
Telecommunication Services | 3.0 | 2.1 |
Utilities | 1.5 | 1.3 |
Annual Report
Fidelity Large Cap Core Enhanced Index Fund
Investments February 28, 2014
Showing Percentage of Net Assets
Common Stocks - 98.8% | |||
Shares | Value | ||
CONSUMER DISCRETIONARY - 11.1% | |||
Auto Components - 0.2% | |||
Lear Corp. | 11,600 | $ 941,920 | |
Diversified Consumer Services - 0.3% | |||
Graham Holdings Co. | 1,707 | 1,226,821 | |
Hotels, Restaurants & Leisure - 2.1% | |||
Bally Technologies, Inc. (a)(e) | 25,924 | 1,756,351 | |
Las Vegas Sands Corp. | 24,910 | 2,123,578 | |
McDonald's Corp. | 15,159 | 1,442,379 | |
Starbucks Corp. | 39,903 | 2,831,517 | |
Wynn Resorts Ltd. | 4,069 | 986,692 | |
| 9,140,517 | ||
Household Durables - 0.3% | |||
Whirlpool Corp. | 7,812 | 1,129,850 | |
Internet & Catalog Retail - 1.3% | |||
Amazon.com, Inc. (a) | 4,232 | 1,532,407 | |
priceline.com, Inc. (a) | 3,005 | 4,053,264 | |
| 5,585,671 | ||
Media - 3.7% | |||
Comcast Corp. Class A | 110,915 | 5,733,196 | |
Morningstar, Inc. | 4,861 | 406,671 | |
Starz - Liberty Capital Series A (a)(e) | 55,248 | 1,766,831 | |
The Walt Disney Co. | 66,708 | 5,390,673 | |
Viacom, Inc. Class B (non-vtg.) | 36,102 | 3,167,228 | |
| 16,464,599 | ||
Multiline Retail - 0.4% | |||
Dollar Tree, Inc. (a) | 19,062 | 1,044,026 | |
Macy's, Inc. | 11,968 | 692,468 | |
| 1,736,494 | ||
Specialty Retail - 2.1% | |||
Bed Bath & Beyond, Inc. (a) | 27,460 | 1,862,337 | |
Home Depot, Inc. | 53,039 | 4,350,789 | |
TJX Companies, Inc. | 53,178 | 3,268,320 | |
| 9,481,446 | ||
Textiles, Apparel & Luxury Goods - 0.7% | |||
NIKE, Inc. Class B | 42,079 | 3,294,786 | |
TOTAL CONSUMER DISCRETIONARY | 49,002,104 | ||
CONSUMER STAPLES - 7.5% | |||
Beverages - 1.2% | |||
Dr. Pepper Snapple Group, Inc. | 47,261 | 2,462,771 | |
PepsiCo, Inc. | 14,222 | 1,138,756 | |
The Coca-Cola Co. | 44,962 | 1,717,548 | |
| 5,319,075 | ||
Food & Staples Retailing - 1.5% | |||
CVS Caremark Corp. | 60,221 | 4,404,564 | |
Kroger Co. | 16,746 | 702,327 | |
| |||
Shares | Value | ||
Rite Aid Corp. (a) | 50,820 | $ 334,904 | |
Wal-Mart Stores, Inc. | 12,857 | 960,418 | |
| 6,402,213 | ||
Food Products - 1.7% | |||
Archer Daniels Midland Co. | 70,525 | 2,863,315 | |
Kraft Foods Group, Inc. | 41,386 | 2,287,404 | |
Tyson Foods, Inc. Class A | 63,053 | 2,487,441 | |
| 7,638,160 | ||
Household Products - 1.8% | |||
Kimberly-Clark Corp. | 14,790 | 1,632,077 | |
Procter & Gamble Co. | 81,989 | 6,449,255 | |
| 8,081,332 | ||
Personal Products - 0.5% | |||
Nu Skin Enterprises, Inc. Class A (e) | 26,948 | 2,250,697 | |
Tobacco - 0.8% | |||
Altria Group, Inc. | 63,269 | 2,294,134 | |
Philip Morris International, Inc. | 15,797 | 1,278,135 | |
| 3,572,269 | ||
TOTAL CONSUMER STAPLES | 33,263,746 | ||
ENERGY - 8.1% | |||
Energy Equipment & Services - 0.6% | |||
Schlumberger Ltd. | 27,343 | 2,542,899 | |
Oil, Gas & Consumable Fuels - 7.5% | |||
Chevron Corp. | 65,399 | 7,542,467 | |
ConocoPhillips Co. | 729 | 48,479 | |
EOG Resources, Inc. | 566 | 107,212 | |
Exxon Mobil Corp. | 96,909 | 9,329,429 | |
HollyFrontier Corp. | 24,891 | 1,134,283 | |
Marathon Petroleum Corp. | 33,989 | 2,855,076 | |
Occidental Petroleum Corp. | 42,712 | 4,122,562 | |
Phillips 66 Co. | 46,383 | 3,472,231 | |
Valero Energy Corp. | 57,348 | 2,751,557 | |
Western Refining, Inc. (e) | 43,781 | 1,595,817 | |
| 32,959,113 | ||
TOTAL ENERGY | 35,502,012 | ||
FINANCIALS - 15.3% | |||
Capital Markets - 3.2% | |||
Ameriprise Financial, Inc. | 1,686 | 183,757 | |
Franklin Resources, Inc. | 14,182 | 755,192 | |
Goldman Sachs Group, Inc. | 24,179 | 4,024,595 | |
Lazard Ltd. Class A | 7,680 | 345,523 | |
LPL Financial | 12,804 | 687,319 | |
Morgan Stanley | 31,202 | 961,022 | |
SEI Investments Co. | 48,450 | 1,626,467 | |
T. Rowe Price Group, Inc. | 32,148 | 2,609,453 | |
TD Ameritrade Holding Corp. (e) | 24,353 | 814,121 | |
Waddell & Reed Financial, Inc. Class A | 33,306 | 2,321,428 | |
| 14,328,877 | ||
Common Stocks - continued | |||
Shares | Value | ||
FINANCIALS - continued | |||
Commercial Banks - 3.1% | |||
Fifth Third Bancorp | 4,901 | $ 106,327 | |
KeyCorp | 169,263 | 2,229,194 | |
PNC Financial Services Group, Inc. | 13,948 | 1,140,667 | |
Regions Financial Corp. | 223,834 | 2,381,594 | |
Wells Fargo & Co. | 167,507 | 7,775,675 | |
| 13,633,457 | ||
Consumer Finance - 1.4% | |||
American Express Co. | 43,101 | 3,934,259 | |
Discover Financial Services | 29,516 | 1,693,628 | |
SLM Corp. | 26,194 | 627,084 | |
| 6,254,971 | ||
Diversified Financial Services - 5.4% | |||
Bank of America Corp. | 411,248 | 6,797,929 | |
Berkshire Hathaway, Inc. Class B (a) | 35,809 | 4,145,966 | |
CBOE Holdings, Inc. | 5,113 | 276,255 | |
Citigroup, Inc. | 36,863 | 1,792,648 | |
JPMorgan Chase & Co. | 126,285 | 7,175,514 | |
MarketAxess Holdings, Inc. | 5,116 | 302,049 | |
McGraw Hill Financial, Inc. | 34,053 | 2,712,662 | |
The NASDAQ OMX Group, Inc. | 11,174 | 428,970 | |
| 23,631,993 | ||
Insurance - 2.2% | |||
American Financial Group, Inc. | 4,523 | 258,535 | |
Aspen Insurance Holdings Ltd. | 49,328 | 1,852,760 | |
Axis Capital Holdings Ltd. | 2,080 | 91,458 | |
Brown & Brown, Inc. | 12,793 | 385,069 | |
CNA Financial Corp. | 1,670 | 69,288 | |
PartnerRe Ltd. | 836 | 82,664 | |
Platinum Underwriters Holdings Ltd. | 1,515 | 88,809 | |
The Chubb Corp. | 28,140 | 2,461,687 | |
The Travelers Companies, Inc. | 33,839 | 2,837,062 | |
Torchmark Corp. | 4,627 | 358,639 | |
Unum Group | 35,287 | 1,227,282 | |
| 9,713,253 | ||
TOTAL FINANCIALS | 67,562,551 | ||
HEALTH CARE - 15.3% | |||
Biotechnology - 4.4% | |||
Alexion Pharmaceuticals, Inc. (a) | 15,258 | 2,697,614 | |
Amgen, Inc. | 23,443 | 2,907,401 | |
Biogen Idec, Inc. (a) | 12,862 | 4,381,826 | |
Celgene Corp. (a) | 24,578 | 3,950,914 | |
Gilead Sciences, Inc. (a)(e) | 66,032 | 5,466,789 | |
United Therapeutics Corp. (a)(e) | 186 | 18,864 | |
| 19,423,408 | ||
| |||
Shares | Value | ||
Health Care Equipment & Supplies - 1.2% | |||
CareFusion Corp. (a) | 39,923 | $ 1,618,079 | |
Medtronic, Inc. | 59,446 | 3,522,770 | |
| 5,140,849 | ||
Health Care Providers & Services - 2.6% | |||
Aetna, Inc. | 20,389 | 1,482,484 | |
Cardinal Health, Inc. | 39,295 | 2,810,771 | |
McKesson Corp. | 18,175 | 3,217,884 | |
UnitedHealth Group, Inc. | 13,467 | 1,040,595 | |
WellPoint, Inc. | 32,914 | 2,981,679 | |
| 11,533,413 | ||
Life Sciences Tools & Services - 0.6% | |||
Thermo Fisher Scientific, Inc. | 22,109 | 2,753,455 | |
Pharmaceuticals - 6.5% | |||
AbbVie, Inc. | 85,956 | 4,376,020 | |
Bristol-Myers Squibb Co. | 4,247 | 228,361 | |
Eli Lilly & Co. | 63,565 | 3,789,110 | |
Forest Laboratories, Inc. (a) | 6,225 | 607,373 | |
Johnson & Johnson | 97,707 | 9,000,769 | |
Merck & Co., Inc. | 63,730 | 3,631,973 | |
Pfizer, Inc. | 223,415 | 7,173,856 | |
| 28,807,462 | ||
TOTAL HEALTH CARE | 67,658,587 | ||
INDUSTRIALS - 12.3% | |||
Aerospace & Defense - 4.7% | |||
Exelis, Inc. | 37,814 | 772,540 | |
General Dynamics Corp. | 27,973 | 3,064,162 | |
Honeywell International, Inc. | 3,971 | 375,021 | |
L-3 Communications Holdings, Inc. | 18,641 | 2,151,171 | |
Lockheed Martin Corp. | 21,425 | 3,477,278 | |
Northrop Grumman Corp. | 25,276 | 3,059,154 | |
Raytheon Co. | 32,701 | 3,201,755 | |
The Boeing Co. | 33,925 | 4,373,611 | |
United Technologies Corp. | 3,786 | 443,038 | |
| 20,917,730 | ||
Air Freight & Logistics - 1.4% | |||
FedEx Corp. | 19,348 | 2,579,669 | |
United Parcel Service, Inc. Class B | 37,245 | 3,566,954 | |
| 6,146,623 | ||
Airlines - 1.1% | |||
Copa Holdings SA Class A | 3,500 | 474,110 | |
Delta Air Lines, Inc. | 52,544 | 1,744,986 | |
Southwest Airlines Co. | 125,764 | 2,822,144 | |
| 5,041,240 | ||
Building Products - 0.3% | |||
Lennox International, Inc. | 14,156 | 1,300,653 | |
Commercial Services & Supplies - 0.6% | |||
Cintas Corp. | 10,336 | 626,982 | |
Common Stocks - continued | |||
Shares | Value | ||
INDUSTRIALS - continued | |||
Commercial Services & Supplies - continued | |||
Pitney Bowes, Inc. (e) | 77,543 | $ 1,973,469 | |
UniFirst Corp. | 2,111 | 231,556 | |
| 2,832,007 | ||
Electrical Equipment - 0.1% | |||
AMETEK, Inc. | 4,873 | 259,439 | |
Industrial Conglomerates - 2.5% | |||
3M Co. | 30,325 | 4,085,687 | |
General Electric Co. | 265,851 | 6,771,225 | |
| 10,856,912 | ||
Machinery - 0.2% | |||
Graco, Inc. | 3,248 | 253,441 | |
Toro Co. | 3,185 | 210,943 | |
WABCO Holdings, Inc. (a) | 4,591 | 470,348 | |
| 934,732 | ||
Professional Services - 0.4% | |||
Manpower, Inc. | 22,617 | 1,767,745 | |
Road & Rail - 1.0% | |||
Union Pacific Corp. | 24,012 | 4,331,285 | |
TOTAL INDUSTRIALS | 54,388,366 | ||
INFORMATION TECHNOLOGY - 20.4% | |||
Communications Equipment - 2.4% | |||
Cisco Systems, Inc. | 236,760 | 5,161,368 | |
Harris Corp. | 113 | 8,342 | |
QUALCOMM, Inc. | 72,929 | 5,490,824 | |
| 10,660,534 | ||
Computers & Peripherals - 4.5% | |||
Apple, Inc. | 26,735 | 14,069,025 | |
Hewlett-Packard Co. | 125,334 | 3,744,980 | |
NetApp, Inc. | 11,348 | 458,573 | |
Western Digital Corp. | 18,348 | 1,596,093 | |
| 19,868,671 | ||
Internet Software & Services - 3.5% | |||
Facebook, Inc. Class A (a) | 69,399 | 4,751,056 | |
Google, Inc. Class A (a) | 8,647 | 10,511,726 | |
| 15,262,782 | ||
IT Services - 3.9% | |||
Amdocs Ltd. | 51,013 | 2,269,058 | |
Broadridge Financial Solutions, Inc. | 35,455 | 1,338,781 | |
DST Systems, Inc. | 22,986 | 2,160,224 | |
IBM Corp. | 15,039 | 2,784,772 | |
MasterCard, Inc. Class A | 53,537 | 4,160,896 | |
Paychex, Inc. | 55,868 | 2,333,048 | |
Visa, Inc. Class A | 3,945 | 891,333 | |
Xerox Corp. | 125,258 | 1,376,585 | |
| 17,314,697 | ||
| |||
Shares | Value | ||
Semiconductors & Semiconductor Equipment - 1.7% | |||
Intel Corp. | 196,638 | $ 4,868,757 | |
Micron Technology, Inc. (a) | 112,216 | 2,714,505 | |
| 7,583,262 | ||
Software - 4.4% | |||
Activision Blizzard, Inc. | 39,092 | 756,430 | |
CA Technologies, Inc. | 68,937 | 2,309,390 | |
Microsoft Corp. | 260,666 | 9,986,114 | |
Oracle Corp. | 144,127 | 5,636,807 | |
Synopsys, Inc. (a) | 14,869 | 600,708 | |
| 19,289,449 | ||
TOTAL INFORMATION TECHNOLOGY | 89,979,395 | ||
MATERIALS - 4.3% | |||
Chemicals - 3.8% | |||
International Flavors & Fragrances, Inc. | 25,422 | 2,384,329 | |
LyondellBasell Industries NV Class A | 36,765 | 3,238,261 | |
PPG Industries, Inc. | 14,245 | 2,817,946 | |
Sigma Aldrich Corp. | 21,064 | 1,988,652 | |
The Dow Chemical Co. | 77,992 | 3,798,990 | |
The Scotts Miracle-Gro Co. Class A (e) | 6,137 | 350,484 | |
Westlake Chemical Corp. | 16,471 | 2,196,078 | |
| 16,774,740 | ||
Containers & Packaging - 0.5% | |||
Graphic Packaging Holding Co. (a) | 24,541 | 251,300 | |
Packaging Corp. of America | 26,408 | 1,924,879 | |
| 2,176,179 | ||
Metals & Mining - 0.0% | |||
Worthington Industries, Inc. | 1,769 | 70,512 | |
TOTAL MATERIALS | 19,021,431 | ||
TELECOMMUNICATION SERVICES - 3.0% | |||
Diversified Telecommunication Services - 3.0% | |||
AT&T, Inc. | 188,170 | 6,008,268 | |
Verizon Communications, Inc. | 155,457 | 7,396,644 | |
| 13,404,912 | ||
UTILITIES - 1.5% | |||
Electric Utilities - 0.4% | |||
Duke Energy Corp. | 430 | 30,478 | |
Edison International | 19,812 | 1,037,554 | |
Exelon Corp. | 25,422 | 773,083 | |
| 1,841,115 | ||
Independent Power Producers & Energy Traders - 0.1% | |||
The AES Corp. | 24,497 | 334,384 | |
Common Stocks - continued | |||
Shares | Value | ||
UTILITIES - continued | |||
Multi-Utilities - 1.0% | |||
DTE Energy Co. | 26,662 | $ 1,913,265 | |
Public Service Enterprise Group, Inc. | 72,447 | 2,655,907 | |
| 4,569,172 | ||
TOTAL UTILITIES | 6,744,671 | ||
TOTAL COMMON STOCKS (Cost $400,193,001) |
| ||
U.S. Treasury Obligations - 0.1% | ||||
| Principal Amount |
| ||
U.S. Treasury Bills, yield at date of purchase 0.08% 7/24/14 (f) | $ 500,000 |
| ||
Money Market Funds - 3.8% | |||
Shares |
| ||
Dreyfus Cash Management Institutional Shares, 0.10% (c) | 3,766,241 | 3,766,241 | |
Fidelity Securities Lending Cash Central Fund, 0.09% (b)(d) | 12,811,850 | 12,811,850 | |
TOTAL MONEY MARKET FUNDS (Cost $16,578,091) |
| ||
TOTAL INVESTMENT PORTFOLIO - 102.7% (Cost $417,270,921) | 453,605,762 | |
NET OTHER ASSETS (LIABILITIES) - (2.7)% | (11,832,563) | |
NET ASSETS - 100% | $ 441,773,199 | |
Futures Contracts | |||||
Expiration Date | Underlying Face Amount at Value | Unrealized Appreciation/(Depreciation) | |||
Purchased | |||||
Equity Index Contracts | |||||
52 CME E-mini S&P 500 Index Contracts (United States) | March 2014 | $ 4,829,760 | $ 201,521 | ||
1 CME S&P 500 Index Contracts (United States) | March 2014 | 464,400 | 3,520 | ||
TOTAL EQUITY INDEX CONTRACTS | $ 5,294,160 | $ 205,041 | |||
|
The face value of futures purchased as a percentage of net assets is 1.2% |
Legend |
(a) Non-income producing |
(b) Affiliated fund that is generally available only to investment companies and other accounts managed by Fidelity Investments. The rate quoted is the annualized seven-day yield of the fund at period end. A complete unaudited listing of the fund's holdings as of its most recent quarter end is available upon request. In addition, each Fidelity Central Fund's financial statements, which are not covered by the Fund's Report of Independent Registered Public Accounting Firm, are available on the SEC's website or upon request. |
(c) The rate quoted is the annualized seven-day yield of the fund at period end. |
(d) Investment made with cash collateral received from securities on loan. |
(e) Security or a portion of the security is on loan at period end. |
(f) Security or a portion of the security was pledged to cover margin requirements for futures contracts. At period end, the value of securities pledged amounted to $299,937. |
Affiliated Central Funds |
Information regarding fiscal year to date income earned by the Fund from investments in Fidelity Central Funds is as follows: |
Fund | Income earned |
Fidelity Securities Lending Cash Central Fund | $ 15,386 |
Other Information |
The following is a summary of the inputs used, as of February 28, 2014, involving the Fund's assets and liabilities carried at fair value. The inputs or methodology used for valuing securities may not be an indication of the risk associated with investing in those securities. For more information on valuation inputs, and their aggregation into the levels used in the table below, please refer to the Investment Valuation section in the accompanying Notes to Financial Statements. |
Valuation Inputs at Reporting Date: | ||||
Description | Total | Level 1 | Level 2 | Level 3 |
Investments in Securities: | ||||
Equities: | ||||
Consumer Discretionary | $ 49,002,104 | $ 49,002,104 | $ - | $ - |
Consumer Staples | 33,263,746 | 33,263,746 | - | - |
Energy | 35,502,012 | 35,502,012 | - | - |
Financials | 67,562,551 | 67,562,551 | - | - |
Health Care | 67,658,587 | 67,658,587 | - | - |
Industrials | 54,388,366 | 54,388,366 | - | - |
Information Technology | 89,979,395 | 89,979,395 | - | - |
Materials | 19,021,431 | 19,021,431 | - | - |
Telecommunication Services | 13,404,912 | 13,404,912 | - | - |
Utilities | 6,744,671 | 6,744,671 | - | - |
U.S. Government and Government Agency Obligations | 499,896 | - | 499,896 | - |
Money Market Funds | 16,578,091 | 16,578,091 | - | - |
Total Investments in Securities: | $ 453,605,762 | $ 453,105,866 | $ 499,896 | $ - |
Derivative Instruments: | ||||
Assets | ||||
Futures Contracts | $ 205,041 | $ 205,041 | $ - | $ - |
Value of Derivative Instruments |
The following table is a summary of the Fund's value of derivative instruments by primary risk exposure as of February 28, 2014. For additional information on derivative instruments, please refer to the Derivative Instruments section in the accompanying Notes to Financial Statements. |
Primary Risk Exposure / | Value | |
| Asset | Liability |
Equity Risk | ||
Futures Contracts (a) | $ 205,041 | $ - |
Total Value of Derivatives | $ 205,041 | $ - |
(a) Reflects gross cumulative appreciation (depreciation) on futures contracts as presented in the Schedule of Investments. Only the period end receivable or payable for daily variation margin and net unrealized appreciation (depreciation) are presented in the Statement of Assets and Liabilities. |
See accompanying notes which are an integral part of the financial statements.
Annual Report
Fidelity Large Cap Core Enhanced Index Fund
Financial Statements
Statement of Assets and Liabilities
| February 28, 2014 | |
|
|
|
Assets | ||
Investment in securities, at value (including securities loaned of $12,459,155) - See accompanying schedule: Unaffiliated issuers (cost $404,459,071) | $ 440,793,912 |
|
Fidelity Central Funds (cost $12,811,850) | 12,811,850 |
|
Total Investments (cost $417,270,921) |
| $ 453,605,762 |
Receivable for fund shares sold | 773,224 | |
Dividends receivable | 954,367 | |
Interest receivable | 264 | |
Distributions receivable from Fidelity Central Funds | 614 | |
Receivable for daily variation margin for derivative instruments | 10,375 | |
Total assets | 455,344,606 | |
|
|
|
Liabilities | ||
Payable for fund shares redeemed | $ 599,053 | |
Accrued management fee | 107,004 | |
Other affiliated payables | 53,500 | |
Collateral on securities loaned, at value | 12,811,850 | |
Total liabilities | 13,571,407 | |
|
|
|
Net Assets | $ 441,773,199 | |
Net Assets consist of: |
| |
Paid in capital | $ 417,550,804 | |
Undistributed net investment income | 1,034,389 | |
Accumulated undistributed net realized gain (loss) on investments | (13,351,876) | |
Net unrealized appreciation (depreciation) on investments | 36,539,882 | |
Net Assets, for 39,095,638 shares outstanding | $ 441,773,199 | |
Net Asset Value, offering price and redemption price per share ($441,773,199 ÷ 39,095,638 shares) | $ 11.30 | |
Statement of Operations
| Year ended February 28, 2014 | |
|
|
|
Investment Income |
|
|
Dividends |
| $ 4,975,063 |
Interest |
| 2,504 |
Income from Fidelity Central Funds |
| 15,386 |
Total income |
| 4,992,953 |
|
|
|
Expenses | ||
Management fee | $ 708,097 | |
Transfer agent fees | 352,964 | |
Independent trustees' compensation | 2,576 | |
Interest | 2,105 | |
Miscellaneous | 413 | |
Total expenses before reductions | 1,066,155 | |
Expense reductions | (18) | 1,066,137 |
Net investment income (loss) | 3,926,816 | |
Realized and Unrealized Gain (Loss) Net realized gain (loss) on: | ||
Investment securities: |
|
|
Unaffiliated issuers | 19,326,593 | |
Futures contracts | 699,134 | |
Total net realized gain (loss) |
| 20,025,727 |
Change in net unrealized appreciation (depreciation) on: Investment securities | 24,639,157 | |
Futures contracts | 211,606 | |
Total change in net unrealized appreciation (depreciation) |
| 24,850,763 |
Net gain (loss) | 44,876,490 | |
Net increase (decrease) in net assets resulting from operations | $ 48,803,306 | |
See accompanying notes which are an integral part of the financial statements.
Annual Report
Statement of Changes in Net Assets
| Year ended | Year ended |
Increase (Decrease) in Net Assets |
|
|
Operations |
|
|
Net investment income (loss) | $ 3,926,816 | $ 4,941,579 |
Net realized gain (loss) | 20,025,727 | 11,950,985 |
Change in net unrealized appreciation (depreciation) | 24,850,763 | 9,631,714 |
Net increase (decrease) in net assets resulting from operations | 48,803,306 | 26,524,278 |
Distributions to shareholders from net investment income | (3,668,730) | (4,152,614) |
Distributions to shareholders from net realized gain | (26,223,165) | (1,162,732) |
Total distributions | (29,891,895) | (5,315,346) |
Share transactions | 343,600,256 | 52,970,505 |
Reinvestment of distributions | 27,812,729 | 5,061,436 |
Cost of shares redeemed | (157,226,426) | (132,790,409) |
Net increase (decrease) in net assets resulting from share transactions | 214,186,559 | (74,758,468) |
Total increase (decrease) in net assets | 233,097,970 | (53,549,536) |
|
|
|
Net Assets | ||
Beginning of period | 208,675,229 | 262,224,765 |
End of period (including undistributed net investment income of $1,034,389 and undistributed net investment income of $1,427,838, respectively) | $ 441,773,199 | $ 208,675,229 |
Other Information Shares | ||
Sold | 30,726,909 | 5,322,241 |
Issued in reinvestment of distributions | 2,592,207 | 509,712 |
Redeemed | (13,726,993) | (13,418,567) |
Net increase (decrease) | 19,592,123 | (7,586,614) |
Financial Highlights
Years ended February 28, | 2014 | 2013 | 2012 F | 2011 | 2010 |
Selected Per-Share Data |
|
|
|
|
|
Net asset value, beginning of period | $ 10.70 | $ 9.68 | $ 9.09 | $ 7.69 | $ 5.27 |
Income from Investment Operations |
|
|
|
|
|
Net investment income (loss) B | .19 | .21 | .14 | .13 | .12 |
Net realized and unrealized gain (loss) | 2.45 | 1.03 | .48 | 1.42 | 2.43 |
Total from investment operations | 2.64 | 1.24 | .62 | 1.55 | 2.55 |
Distributions from net investment income | (.27) | (.18) | (.03) | (.15) | (.13) |
Distributions from net realized gain | (1.77) | (.05) | - | - | - |
Total distributions | (2.04) | (.22) G | (.03) | (.15) | (.13) |
Net asset value, end of period | $ 11.30 | $ 10.70 | $ 9.68 | $ 9.09 | $ 7.69 |
Total Return A | 26.44% | 13.03% | 6.78% | 20.25% | 48.52% |
Ratios to Average Net Assets C,E |
|
|
|
|
|
Expenses before reductions | .45% | .45% | .45% | .45% | .45% |
Expenses net of fee waivers, if any | .45% | .45% | .45% | .45% | .45% |
Expenses net of all reductions | .45% | .45% | .45% | .45% | .45% |
Net investment income (loss) | 1.67% | 2.08% | 1.53% | 1.58% | 1.76% |
Supplemental Data |
|
|
|
|
|
Net assets, end of period (000 omitted) | $ 441,773 | $ 208,675 | $ 262,225 | $ 968,646 | $ 1,006,185 |
Portfolio turnover rate D | 125% | 85% | 104% | 64% | 60% H |
A Total returns would have been lower if certain expenses had not been reduced during the applicable periods shown.
B Calculated based on average shares outstanding during the period.
C Fees and expenses of any underlying Fidelity Central Funds are not included in the Fund's expense ratio. The Fund indirectly bears its proportionate share of the expenses of any underlying Fidelity Central Funds.
D Amount does not include the portfolio activity of any underlying Fidelity Central Funds.
E Expense ratios reflect operating expenses of the Fund. Expenses before reductions do not reflect amounts reimbursed by the investment adviser or reductions from expense offset arrangements and do not represent the amount paid by the Fund during periods when reimbursements or reductions occur. Expenses net of fee waivers reflect expenses after reimbursement by the investment adviser but prior to reductions from expense offset arrangements. Expenses net of all reductions represent the net expenses paid by the Fund.
F For the year ended February 29.
G Total distributions of $0.22 per share is comprised of distributions from net investment income of $0.175 and distributions from net realized gain of $.049 per share.
H Reflects adjustment to exclude transactions in money market mutual funds.
See accompanying notes which are an integral part of the financial statements.
Annual Report
Fidelity Mid Cap Enhanced Index Fund
Performance: The Bottom Line
Average annual total return reflects the change in the value of an investment, assuming reinvestment of the fund's distributions from dividend income and capital gains (the profits earned upon the sale of securities that have grown in value, if any) and assuming a constant rate of performance each year. The $10,000 table and the fund's returns do not reflect the deduction of taxes that a shareholder would pay on fund distributions or the redemption of fund shares. During periods of reimbursement by Fidelity, a fund's total returns will be greater than it would be had the reimbursement not occurred. How a fund did yesterday is no guarantee of how it will do tomorrow.
Average Annual Total Returns
Periods ended February 28, 2014 | Past 1 | Past 5 | Life of |
Fidelity Mid Cap Enhanced Index Fund | 30.97% | 26.83% | 8.95% |
A From December 20, 2007.
$10,000 Over Life of Fund
Let's say hypothetically that $10,000 was invested in Fidelity Mid Cap Enhanced Index Fund on December 20, 2007, when the fund started. The chart shows how the value of your investment would have changed, and also shows how the Russell Midcap® Index performed over the same period.
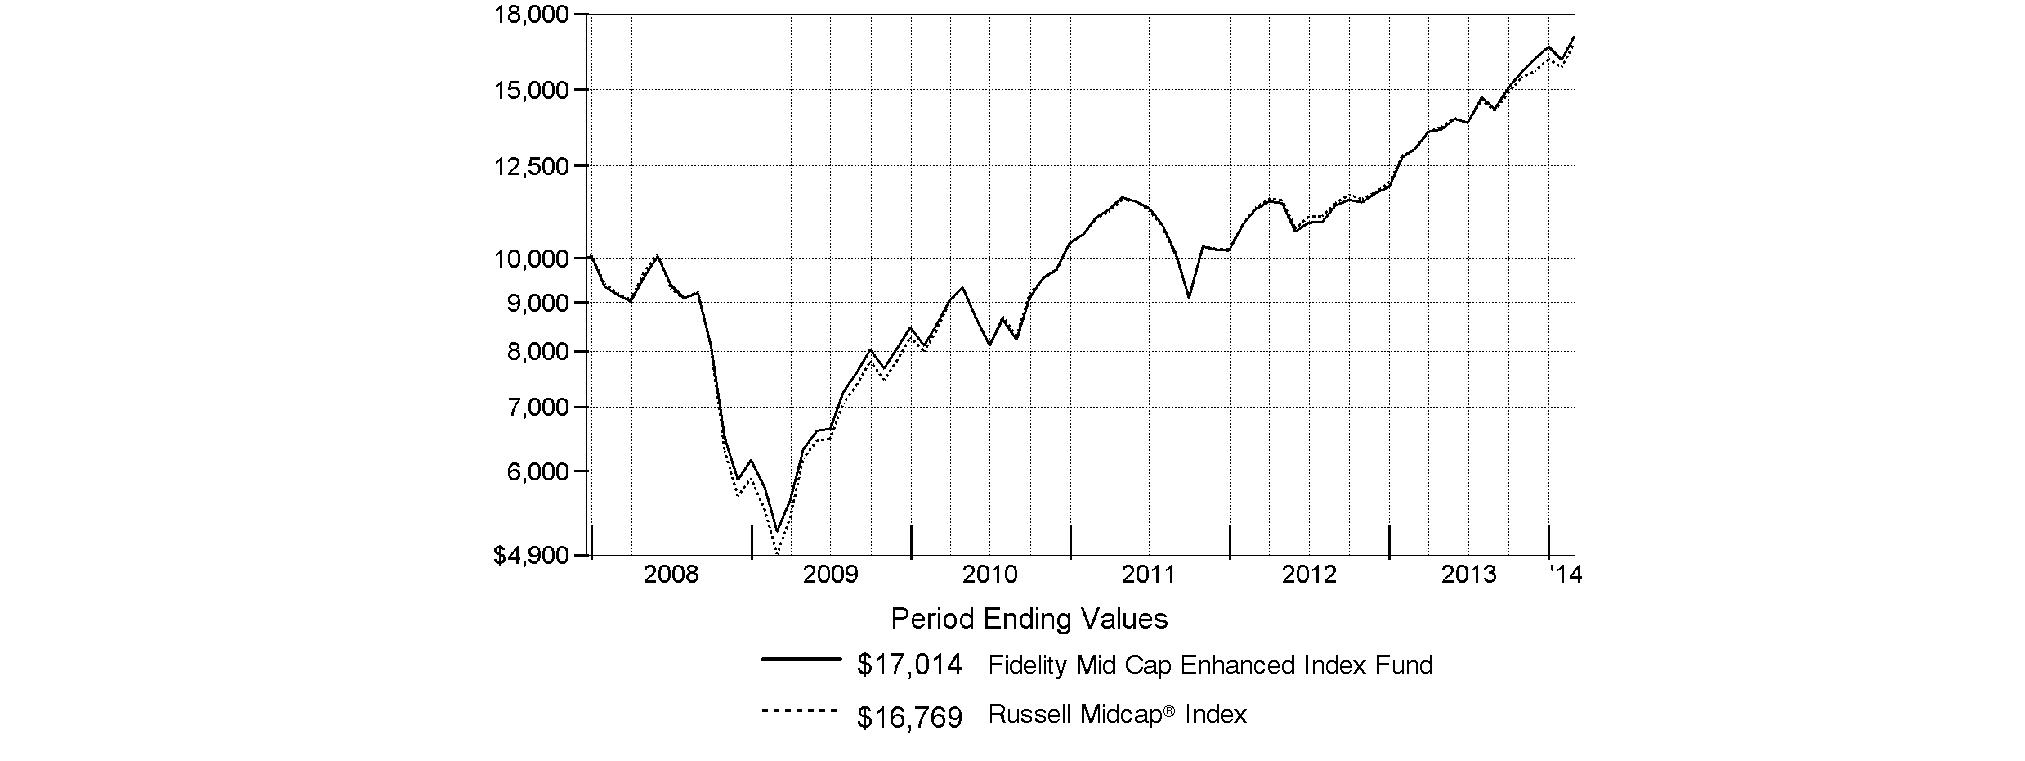
Annual Report
Fidelity Mid Cap Enhanced Index Fund
Management's Discussion of Fund Performance
Market Recap: Stocks overcame fears of higher interest rates - not to mention their worst January in four years - to finish sharply higher for the 12 months ending February 28, 2014. The broad S&P 500® Index and the blue-chip Dow Jones Industrial AverageSM gained 25.37% and 19.01%, respectively, amid generally favorable earnings reports and accommodative monetary policies worldwide. Performance generally increased along the risk spectrum, with smaller-cap and growth strategies leading the way. An ebullient market helped the growth-oriented Nasdaq Composite Index® to a 38.10% period gain, for example. On the other hand, both cyclical and defensive stocks had representation in the top-performing industry sectors: returns were highest in health care and consumer discretionary; lowest in utilities and telecommunication services. From a macroeconomic perspective, data still points to slow but steady improvement in the U.S., and Europe's recession may well be over. Reports from China have disappointed, but continue to suggest a relatively soft landing there. Mixed signals from the U.S. Federal Reserve as to when it might curtail its stimulative bond buying kept markets in flux during the spring and summer. Stocks regained momentum in October despite a federal budget impasse and brief government shutdown, and lower volatility prevailed through year-end. Shedding new-year concerns about China's economy, an emerging-markets sell-off and confirmation (at last) of Fed tapering - alongside confirmation of a presumably dovish Janet Yellen as new Fed chair - February saw stocks back in record territory, bearing down on the five-year anniversary of the market's bottom.
Comments from Maximilian Kaufmann, Senior Portfolio Manager of the Geode Capital Management, LLC, investment management team for Fidelity® Mid Cap Enhanced Index Fund: For the year, the fund gained 30.97%, outpacing the 29.11% advance of its benchmark, the Russell Midcap® Index. Relative to the index, the fund benefited from strong security selection, especially in the industrials and health care sectors. However, our picks were subpar in energy and consumer discretionary. Within financials, underweighting the lagging real estate industry more than offset weak stock picking in the insurance group. Looking at individual stocks, the fund's top relative contributor was an out-of-index stake in Rite Aid, a drugstore chain whose shares were up by triple digits during the period. Most notably, Rite Aid's stock rose by 23% in a single day in September, thanks to higher sales and a more-optimistic earnings forecast. Also adding value was Alliant Techsystems, which, like many other defense contractors, enjoyed very good performance during the period - somewhat unusually, given cutbacks in the federal budget. Alliant's stock, in fact, finished the period at a record high. Casino gaming company Wynn Resorts was another strong performer. In January, the company reported better-than-expected earnings, resulting in large part from strong financial performance in its largest market, Macau. On the negative side, our investment models recommended against owning a position in Tesla Motors, a maker of electric luxury vehicles and a benchmark member. In retrospect, this decision did not work out well - Tesla's shares were up roughly sevenfold, as the company turned in strong revenue growth and benefited from investors' optimism about future demand. Meanwhile, an overweighting in energy refiner Tesoro proved detrimental. It was a difficult period for this industry, as declining refining margins cut into earnings and weighed on companies' share prices, including Tesoro's.
The views expressed above reflect those of the portfolio manager(s) only through the end of the period as stated on the cover of this report and do not necessarily represent the views of Fidelity or any other person in the Fidelity organization. Any such views are subject to change at any time based upon market or other conditions and Fidelity disclaims any responsibility to update such views. These views may not be relied on as investment advice and, because investment decisions for a Fidelity fund are based on numerous factors, may not be relied on as an indication of trading intent on behalf of any Fidelity fund.
Annual Report
Fidelity Mid Cap Enhanced Index Fund
Investment Changes (Unaudited)
Top Ten Stocks as of February 28, 2014 | ||
| % of fund's | % of fund's net assets |
Alexion Pharmaceuticals, Inc. | 1.1 | 0.0 |
Delta Air Lines, Inc. | 1.0 | 0.3 |
Cardinal Health, Inc. | 0.9 | 0.8 |
Micron Technology, Inc. | 0.9 | 0.7 |
Intuit, Inc. | 0.9 | 0.5 |
Macy's, Inc. | 0.9 | 0.7 |
Wynn Resorts Ltd. | 0.9 | 0.7 |
Delphi Automotive PLC | 0.9 | 0.8 |
IntercontinentalExchange Group, Inc. | 0.9 | 0.0 |
McGraw Hill Financial, Inc. | 0.8 | 0.8 |
| 9.2 | |
Market Sectors as of February 28, 2014 | ||
| % of fund's | % of fund's net assets |
Financials | 19.0 | 20.5 |
Consumer Discretionary | 17.5 | 18.5 |
Information Technology | 15.6 | 15.1 |
Industrials | 15.2 | 10.6 |
Health Care | 11.2 | 12.1 |
Consumer Staples | 7.1 | 7.5 |
Materials | 4.9 | 3.8 |
Energy | 4.7 | 4.9 |
Utilities | 3.8 | 5.1 |
Annual Report
Fidelity Mid Cap Enhanced Index Fund
Investments February 28, 2014
Showing Percentage of Net Assets
Common Stocks - 99.0% | |||
Shares | Value | ||
CONSUMER DISCRETIONARY - 17.5% | |||
Auto Components - 3.2% | |||
Allison Transmission Holdings, Inc. | 9,278 | $ 276,299 | |
BorgWarner, Inc. | 28,882 | 1,774,799 | |
Delphi Automotive PLC | 35,205 | 2,343,597 | |
Gentex Corp. (e) | 36,693 | 1,151,059 | |
Lear Corp. | 20,191 | 1,639,509 | |
TRW Automotive Holdings Corp. (a)(e) | 18,228 | 1,500,529 | |
| 8,685,792 | ||
Diversified Consumer Services - 0.7% | |||
Apollo Ed Group, Inc. Class A (non-vtg.) (a)(e) | 13,600 | 453,288 | |
Graham Holdings Co. | 2,173 | 1,561,735 | |
| 2,015,023 | ||
Hotels, Restaurants & Leisure - 2.4% | |||
Bally Technologies, Inc. (a)(e) | 20,296 | 1,375,054 | |
International Game Technology | 63,053 | 951,470 | |
Wyndham Worldwide Corp. | 24,463 | 1,782,863 | |
Wynn Resorts Ltd. | 9,876 | 2,394,831 | |
| 6,504,218 | ||
Household Durables - 0.7% | |||
Whirlpool Corp. | 13,197 | 1,908,682 | |
Internet & Catalog Retail - 1.4% | |||
Liberty Interactive Corp.: | |||
(Venture Group) Series A (a) | 6,839 | 974,626 | |
Series A (a) | 51,796 | 1,512,443 | |
Netflix, Inc. (a) | 2,957 | 1,317,728 | |
| 3,804,797 | ||
Leisure Equipment & Products - 0.6% | |||
Mattel, Inc. | 20 | 746 | |
Polaris Industries, Inc. | 12,792 | 1,714,512 | |
| 1,715,258 | ||
Media - 1.5% | |||
Morningstar, Inc. | 15,109 | 1,264,019 | |
Starz - Liberty Capital Series A (a) | 49,093 | 1,569,994 | |
Viacom, Inc. Class B (non-vtg.) | 15,387 | 1,349,902 | |
| 4,183,915 | ||
Multiline Retail - 1.7% | |||
Dollar General Corp. (a) | 36,598 | 2,192,220 | |
Macy's, Inc. | 41,429 | 2,397,082 | |
| 4,589,302 | ||
Specialty Retail - 3.6% | |||
Bed Bath & Beyond, Inc. (a) | 1,728 | 117,193 | |
Best Buy Co., Inc. | 42,738 | 1,138,113 | |
GameStop Corp. Class A (e) | 31,963 | 1,192,540 | |
Gap, Inc. | 45,599 | 1,994,956 | |
GNC Holdings, Inc. | 27,299 | 1,269,949 | |
O'Reilly Automotive, Inc. (a) | 13,890 | 2,095,307 | |
Ross Stores, Inc. | 26,450 | 1,925,560 | |
| 9,733,618 | ||
| |||
Shares | Value | ||
Textiles, Apparel & Luxury Goods - 1.7% | |||
Coach, Inc. | 14,708 | $ 717,897 | |
Fossil Group, Inc. (a) | 13,122 | 1,507,849 | |
Hanesbrands, Inc. | 22,479 | 1,647,261 | |
VF Corp. | 10,093 | 591,349 | |
| 4,464,356 | ||
TOTAL CONSUMER DISCRETIONARY | 47,604,961 | ||
CONSUMER STAPLES - 7.1% | |||
Beverages - 0.7% | |||
Dr. Pepper Snapple Group, Inc. | 34,962 | 1,821,870 | |
Food & Staples Retailing - 1.0% | |||
Kroger Co. | 37,348 | 1,566,375 | |
Rite Aid Corp. (a) | 172,455 | 1,136,478 | |
| 2,702,853 | ||
Food Products - 3.9% | |||
Archer Daniels Midland Co. | 32,901 | 1,335,781 | |
Hormel Foods Corp. | 34,904 | 1,656,195 | |
Mead Johnson Nutrition Co. Class A | 25,388 | 2,070,391 | |
Pilgrims Pride Corp. (a)(e) | 38,600 | 676,658 | |
The Hershey Co. | 18,536 | 1,961,480 | |
Tyson Foods, Inc. Class A | 47,391 | 1,869,575 | |
WhiteWave Foods Co. (a) | 35,686 | 1,009,914 | |
| 10,579,994 | ||
Household Products - 0.9% | |||
Church & Dwight Co., Inc. (e) | 16,012 | 1,088,496 | |
Energizer Holdings, Inc. | 15,346 | 1,493,780 | |
| 2,582,276 | ||
Personal Products - 0.6% | |||
Nu Skin Enterprises, Inc. Class A | 20,259 | 1,692,032 | |
TOTAL CONSUMER STAPLES | 19,379,025 | ||
ENERGY - 4.7% | |||
Energy Equipment & Services - 1.9% | |||
Dril-Quip, Inc. (a) | 14,160 | 1,523,050 | |
Helmerich & Payne, Inc. | 19,363 | 1,912,096 | |
Oceaneering International, Inc. | 22,247 | 1,592,440 | |
| 5,027,586 | ||
Oil, Gas & Consumable Fuels - 2.8% | |||
Cabot Oil & Gas Corp. | 34,000 | 1,190,000 | |
CVR Energy, Inc. | 56 | 2,204 | |
HollyFrontier Corp. | 37,265 | 1,698,166 | |
Marathon Petroleum Corp. | 15,456 | 1,298,304 | |
Tesoro Corp. | 29,526 | 1,506,121 | |
Valero Energy Corp. | 25,716 | 1,233,854 | |
Western Refining, Inc. (e) | 19,987 | 728,526 | |
| 7,657,175 | ||
TOTAL ENERGY | 12,684,761 | ||
Common Stocks - continued | |||
Shares | Value | ||
FINANCIALS - 19.0% | |||
Capital Markets - 3.4% | |||
American Capital Ltd. (a) | 64 | $ 996 | |
Ameriprise Financial, Inc. | 41 | 4,469 | |
Artisan Partners Asset Management, Inc. | 30 | 1,895 | |
Lazard Ltd. Class A | 35,120 | 1,580,049 | |
LPL Financial | 26,667 | 1,431,485 | |
SEI Investments Co. | 45,150 | 1,515,686 | |
T. Rowe Price Group, Inc. | 27,665 | 2,245,568 | |
TD Ameritrade Holding Corp. (e) | 24,860 | 831,070 | |
Waddell & Reed Financial, Inc. Class A | 24,160 | 1,683,952 | |
| 9,295,170 | ||
Commercial Banks - 2.2% | |||
Fifth Third Bancorp | 99,903 | 2,167,396 | |
KeyCorp | 142,084 | 1,871,246 | |
Popular, Inc. (a) | 6,086 | 173,999 | |
Regions Financial Corp. | 171,378 | 1,823,462 | |
| 6,036,103 | ||
Consumer Finance - 1.1% | |||
Discover Financial Services | 22,997 | 1,319,568 | |
SLM Corp. | 69,092 | 1,654,062 | |
| 2,973,630 | ||
Diversified Financial Services - 4.3% | |||
CBOE Holdings, Inc. | 28,704 | 1,550,877 | |
ING U.S., Inc. | 16,493 | 591,604 | |
IntercontinentalExchange Group, Inc. | 11,219 | 2,342,976 | |
McGraw Hill Financial, Inc. | 28,818 | 2,295,642 | |
Moody's Corp. | 25,319 | 2,000,201 | |
MSCI, Inc. Class A (a)(e) | 35,474 | 1,550,569 | |
The NASDAQ OMX Group, Inc. | 33,728 | 1,294,818 | |
| 11,626,687 | ||
Insurance - 3.6% | |||
American International Group, Inc. warrants 1/19/21 (a) | 574 | 10,958 | |
Aspen Insurance Holdings Ltd. | 35,880 | 1,347,653 | |
Axis Capital Holdings Ltd. | 32,101 | 1,411,481 | |
Brown & Brown, Inc. | 61 | 1,836 | |
HCC Insurance Holdings, Inc. | 31,572 | 1,386,011 | |
PartnerRe Ltd. | 15,311 | 1,513,952 | |
ProAssurance Corp. | 30,069 | 1,366,937 | |
Torchmark Corp. | 12,128 | 940,041 | |
Unum Group | 50,349 | 1,751,138 | |
| 9,730,007 | ||
Real Estate Investment Trusts - 4.1% | |||
Annaly Capital Management, Inc. | 168,485 | 1,883,662 | |
BRE Properties, Inc. | 2,213 | 136,697 | |
Chimera Investment Corp. | 462,923 | 1,476,724 | |
Corrections Corp. of America (e) | 42,677 | 1,423,278 | |
Equity Lifestyle Properties, Inc. | 7,256 | 292,054 | |
Extra Space Storage, Inc. | 34,935 | 1,715,309 | |
| |||
Shares | Value | ||
General Growth Properties, Inc. | 7,349 | $ 161,825 | |
MFA Financial, Inc. | 188,836 | 1,484,251 | |
Public Storage | 8,358 | 1,412,502 | |
Rayonier, Inc. | 8,268 | 389,340 | |
Retail Properties America, Inc. | 21,188 | 295,361 | |
Weyerhaeuser Co. | 13,521 | 399,005 | |
| 11,070,008 | ||
Thrifts & Mortgage Finance - 0.3% | |||
Ocwen Financial Corp. (a) | 22,808 | 853,932 | |
TOTAL FINANCIALS | 51,585,537 | ||
HEALTH CARE - 11.2% | |||
Biotechnology - 1.6% | |||
Alexion Pharmaceuticals, Inc. (a) | 16,698 | 2,952,202 | |
United Therapeutics Corp. (a)(e) | 15,046 | 1,525,965 | |
| 4,478,167 | ||
Health Care Equipment & Supplies - 3.1% | |||
C.R. Bard, Inc. | 13,284 | 1,915,021 | |
CareFusion Corp. (a) | 41,643 | 1,687,791 | |
Hill-Rom Holdings, Inc. | 30,652 | 1,159,565 | |
St. Jude Medical, Inc. | 33,006 | 2,221,964 | |
Zimmer Holdings, Inc. | 13,851 | 1,299,778 | |
| 8,284,119 | ||
Health Care Providers & Services - 3.7% | |||
AmerisourceBergen Corp. | 29,242 | 1,984,070 | |
Cardinal Health, Inc. | 35,617 | 2,547,684 | |
Humana, Inc. | 16,590 | 1,865,711 | |
McKesson Corp. | 7,449 | 1,318,845 | |
Omnicare, Inc. | 9,270 | 546,003 | |
Quest Diagnostics, Inc. | 30 | 1,590 | |
VCA Antech, Inc. (a) | 14,772 | 457,489 | |
WellPoint, Inc. | 15,024 | 1,361,024 | |
| 10,082,416 | ||
Life Sciences Tools & Services - 0.8% | |||
Agilent Technologies, Inc. | 38,107 | 2,169,432 | |
Pharmaceuticals - 2.0% | |||
Actavis PLC (a) | 1,527 | 337,192 | |
Allergan, Inc. | 3,120 | 396,240 | |
Forest Laboratories, Inc. (a) | 11,953 | 1,166,254 | |
Jazz Pharmaceuticals PLC (a) | 10,823 | 1,644,501 | |
Zoetis, Inc. Class A | 64,148 | 1,989,871 | |
| 5,534,058 | ||
TOTAL HEALTH CARE | 30,548,192 | ||
INDUSTRIALS - 15.2% | |||
Aerospace & Defense - 3.7% | |||
Alliant Techsystems, Inc. | 11,574 | 1,560,059 | |
Exelis, Inc. | 74,614 | 1,524,364 | |
Hexcel Corp. (a) | 18,266 | 821,970 | |
Huntington Ingalls Industries, Inc. | 14,490 | 1,468,272 | |
Common Stocks - continued | |||
Shares | Value | ||
INDUSTRIALS - continued | |||
Aerospace & Defense - continued | |||
L-3 Communications Holdings, Inc. | 15,869 | $ 1,831,283 | |
Northrop Grumman Corp. | 11,062 | 1,338,834 | |
Raytheon Co. | 13,825 | 1,353,606 | |
Spirit AeroSystems Holdings, Inc. Class A (a) | 9,988 | 287,954 | |
| 10,186,342 | ||
Airlines - 3.4% | |||
Alaska Air Group, Inc. | 19,587 | 1,697,018 | |
Copa Holdings SA Class A | 11,085 | 1,501,574 | |
Delta Air Lines, Inc. | 82,378 | 2,735,773 | |
Southwest Airlines Co. | 97,328 | 2,184,040 | |
Spirit Airlines, Inc. (a) | 20,337 | 1,148,634 | |
| 9,267,039 | ||
Building Products - 0.7% | |||
A.O. Smith Corp. | 8,357 | 415,343 | |
Lennox International, Inc. | 16,772 | 1,541,011 | |
| 1,956,354 | ||
Commercial Services & Supplies - 0.7% | |||
ADT Corp. (e) | 4,648 | 142,740 | |
Cintas Corp. (e) | 4,243 | 257,380 | |
Pitney Bowes, Inc. (e) | 59,718 | 1,519,823 | |
| 1,919,943 | ||
Construction & Engineering - 0.1% | |||
AECOM Technology Corp. (a) | 5,567 | 177,810 | |
Electrical Equipment - 1.5% | |||
AMETEK, Inc. | 36,099 | 1,921,911 | |
Rockwell Automation, Inc. | 17,388 | 2,135,942 | |
| 4,057,853 | ||
Machinery - 4.5% | |||
AGCO Corp. (e) | 28,492 | 1,495,260 | |
Crane Co. | 50 | 3,571 | |
Dover Corp. | 13,690 | 1,290,967 | |
Graco, Inc. | 20,511 | 1,600,473 | |
IDEX Corp. | 21,601 | 1,621,587 | |
Lincoln Electric Holdings, Inc. | 20,395 | 1,529,013 | |
Parker Hannifin Corp. | 4,235 | 510,529 | |
Snap-On, Inc. | 14,496 | 1,626,016 | |
Toro Co. | 13,476 | 892,515 | |
WABCO Holdings, Inc. (a) | 16,090 | 1,648,421 | |
| 12,218,352 | ||
Professional Services - 0.6% | |||
Manpower, Inc. | 20,465 | 1,599,544 | |
Towers Watson & Co. | 10 | 1,091 | |
| 1,600,635 | ||
TOTAL INDUSTRIALS | 41,384,328 | ||
| |||
Shares | Value | ||
INFORMATION TECHNOLOGY - 15.6% | |||
Communications Equipment - 1.2% | |||
Brocade Communications Systems, Inc. (a) | 160,726 | $ 1,538,148 | |
Harris Corp. | 23,232 | 1,714,986 | |
| 3,253,134 | ||
Computers & Peripherals - 2.5% | |||
Lexmark International, Inc. Class A | 11,402 | 480,480 | |
NetApp, Inc. | 47,703 | 1,927,678 | |
SanDisk Corp. | 28,234 | 2,097,786 | |
Western Digital Corp. | 25,512 | 2,219,289 | |
| 6,725,233 | ||
Electronic Equipment & Components - 0.5% | |||
Ingram Micro, Inc. Class A (a) | 14,176 | 417,483 | |
Zebra Technologies Corp. Class A (a) | 14,840 | 1,023,812 | |
| 1,441,295 | ||
IT Services - 4.5% | |||
Amdocs Ltd. | 38,652 | 1,719,241 | |
Booz Allen Hamilton Holding Corp. | 34,302 | 721,371 | |
Broadridge Financial Solutions, Inc. | 27,265 | 1,029,526 | |
Computer Sciences Corp. | 15 | 948 | |
DST Systems, Inc. | 15,452 | 1,452,179 | |
FleetCor Technologies, Inc. (a) | 14,435 | 1,875,540 | |
Genpact Ltd. (a) | 10,357 | 172,755 | |
Jack Henry & Associates, Inc. | 13,482 | 783,709 | |
Paychex, Inc. | 46,207 | 1,929,604 | |
The Western Union Co. | 34,575 | 578,440 | |
Xerox Corp. | 176,811 | 1,943,153 | |
| 12,206,466 | ||
Semiconductors & Semiconductor Equipment - 2.7% | |||
Avago Technologies Ltd. | 4,292 | 264,816 | |
Marvell Technology Group Ltd. | 108,217 | 1,654,638 | |
Micron Technology, Inc. (a) | 103,101 | 2,494,013 | |
NVIDIA Corp. | 57,736 | 1,061,188 | |
Skyworks Solutions, Inc. (a)(e) | 50,105 | 1,776,723 | |
| 7,251,378 | ||
Software - 4.2% | |||
Activision Blizzard, Inc. | 82,892 | 1,603,960 | |
ANSYS, Inc. (a) | 8,827 | 737,231 | |
Aspen Technology, Inc. (a) | 26,213 | 1,230,700 | |
CA Technologies, Inc. | 54,827 | 1,836,705 | |
Intuit, Inc. | 31,228 | 2,440,468 | |
Symantec Corp. | 92,996 | 1,997,554 | |
Synopsys, Inc. (a) | 38,758 | 1,565,823 | |
| 11,412,441 | ||
TOTAL INFORMATION TECHNOLOGY | 42,289,947 | ||
Common Stocks - continued | |||
Shares | Value | ||
MATERIALS - 4.9% | |||
Chemicals - 4.0% | |||
CF Industries Holdings, Inc. | 85 | $ 21,327 | |
Eastman Chemical Co. | 21,583 | 1,887,002 | |
International Flavors & Fragrances, Inc. | 18,258 | 1,712,418 | |
LyondellBasell Industries NV Class A | 16,043 | 1,413,067 | |
NewMarket Corp. (e) | 4,150 | 1,534,131 | |
Sigma Aldrich Corp. | 19,182 | 1,810,973 | |
The Scotts Miracle-Gro Co. Class A (e) | 15,200 | 868,072 | |
Westlake Chemical Corp. (e) | 11,872 | 1,582,894 | |
| 10,829,884 | ||
Containers & Packaging - 0.7% | |||
Avery Dennison Corp. | 1,431 | 71,292 | |
Graphic Packaging Holding Co. (a) | 52 | 532 | |
Packaging Corp. of America | 23,938 | 1,744,841 | |
| 1,816,665 | ||
Metals & Mining - 0.2% | |||
Reliance Steel & Aluminum Co. | 7,681 | 532,140 | |
TOTAL MATERIALS | 13,178,689 | ||
UTILITIES - 3.8% | |||
Electric Utilities - 0.2% | |||
Edison International | 4,795 | 251,114 | |
Pinnacle West Capital Corp. | 3,955 | 220,096 | |
| 471,210 | ||
Gas Utilities - 0.4% | |||
UGI Corp. | 23,540 | 1,052,003 | |
Independent Power Producers & Energy Traders - 0.6% | |||
The AES Corp. | 118,794 | 1,621,538 | |
Multi-Utilities - 2.0% | |||
Alliant Energy Corp. | 50 | 2,712 | |
CMS Energy Corp. | 5,879 | 167,140 | |
DTE Energy Co. | 27,163 | 1,949,217 | |
Public Service Enterprise Group, Inc. | 60,354 | 2,212,578 | |
Wisconsin Energy Corp. | 28,243 | 1,241,562 | |
| 5,573,209 | ||
Water Utilities - 0.6% | |||
American Water Works Co., Inc. | 36,377 | 1,631,145 | |
TOTAL UTILITIES | 10,349,105 | ||
TOTAL COMMON STOCKS (Cost $223,447,755) |
| ||
U.S. Treasury Obligations - 0.1% | ||||
| Principal Amount |
| ||
U.S. Treasury Bills, yield at date of purchase 0.08% 5/29/14 (f) | $ 300,000 |
| ||
Money Market Funds - 8.4% | |||
Shares | Value | ||
Dreyfus Cash Management Institutional Shares, 0.10% (c) | 2,435,840 | $ 2,435,840 | |
Fidelity Securities Lending Cash Central Fund, 0.09% (b)(d) | 20,295,315 | 20,295,315 | |
TOTAL MONEY MARKET FUNDS (Cost $22,731,155) |
| ||
TOTAL INVESTMENT PORTFOLIO - 107.5% (Cost $246,478,848) | 292,035,664 | |
NET OTHER ASSETS (LIABILITIES) - (7.5)% | (20,361,312) | |
NET ASSETS - 100% | $ 271,674,352 | |
Futures Contracts | |||||
Expiration Date | Underlying Face Amount at Value | Unrealized Appreciation/(Depreciation) | |||
Purchased | |||||
Equity Index Contracts | |||||
19 CME E-mini S&P MidCap 400 Index Contracts (United States) | March 2014 | $ 2,610,980 | $ 41,230 | ||
|
The face value of futures purchased as a percentage of net assets is 1% |
Legend |
(a) Non-income producing |
(b) Affiliated fund that is generally available only to investment companies and other accounts managed by Fidelity Investments. The rate quoted is the annualized seven-day yield of the fund at period end. A complete unaudited listing of the fund's holdings as of its most recent quarter end is available upon request. In addition, each Fidelity Central Fund's financial statements, which are not covered by the Fund's Report of Independent Registered Public Accounting Firm, are available on the SEC's website or upon request. |
(c) The rate quoted is the annualized seven-day yield of the fund at period end. |
(d) Investment made with cash collateral received from securities on loan. |
(e) Security or a portion of the security is on loan at period end. |
(f) Security or a portion of the security was pledged to cover margin requirements for futures contracts. At period end, the value of securities pledged amounted to $129,984. |
Affiliated Central Funds |
Information regarding fiscal year to date income earned by the Fund from investments in Fidelity Central Funds is as follows: |
Fund | Income earned |
Fidelity Securities Lending Cash Central Fund | $ 33,613 |
Other Information |
The following is a summary of the inputs used, as of February 28, 2014, involving the Fund's assets and liabilities carried at fair value. The inputs or methodology used for valuing securities may not be an indication of the risk associated with investing in those securities. For more information on valuation inputs, and their aggregation into the levels used in the table below, please refer to the Investment Valuation section in the accompanying Notes to Financial Statements. |
Valuation Inputs at Reporting Date: | ||||
Description | Total | Level 1 | Level 2 | Level 3 |
Investments in Securities: | ||||
Equities: | ||||
Consumer Discretionary | $ 47,604,961 | $ 47,604,961 | $ - | $ - |
Consumer Staples | 19,379,025 | 19,379,025 | - | - |
Energy | 12,684,761 | 12,684,761 | - | - |
Financials | 51,585,537 | 51,585,537 | - | - |
Health Care | 30,548,192 | 30,548,192 | - | - |
Industrials | 41,384,328 | 41,384,328 | - | - |
Information Technology | 42,289,947 | 42,289,947 | - | - |
Materials | 13,178,689 | 13,178,689 | - | - |
Utilities | 10,349,105 | 10,349,105 | - | - |
U.S. Government and Government Agency Obligations | 299,964 | - | 299,964 | - |
Money Market Funds | 22,731,155 | 22,731,155 | - | - |
Total Investments in Securities: | $ 292,035,664 | $ 291,735,700 | $ 299,964 | $ - |
Derivative Instruments: | ||||
Assets | ||||
Futures Contracts | $ 41,230 | $ 41,230 | $ - | $ - |
Value of Derivative Instruments |
The following table is a summary of the Fund's value of derivative instruments by primary risk exposure as of February 28, 2014. For additional information on derivative instruments, please refer to the Derivative Instruments section in the accompanying Notes to Financial Statements. |
Primary Risk Exposure / | Value | |
| Asset | Liability |
Equity Risk | ||
Futures Contracts (a) | $ 41,230 | $ - |
Total Value of Derivatives | $ 41,230 | $ - |
(a) Reflects gross cumulative appreciation (depreciation) on futures contracts as presented in the Schedule of Investments. Only the period end receivable or payable for daily variation margin and net unrealized appreciation (depreciation) are presented in the Statement of Assets and Liabilities. |
See accompanying notes which are an integral part of the financial statements.
Annual Report
Fidelity Mid Cap Enhanced Index Fund
Financial Statements
Statement of Assets and Liabilities
| February 28, 2014 | |
|
|
|
Assets | ||
Investment in securities, at value (including securities loaned of $19,889,362) - See accompanying schedule: Unaffiliated issuers (cost $226,183,533) | $ 271,740,349 |
|
Fidelity Central Funds (cost $20,295,315) | 20,295,315 |
|
Total Investments (cost $246,478,848) |
| $ 292,035,664 |
Receivable for investments sold | 146,177 | |
Receivable for fund shares sold | 487,631 | |
Dividends receivable | 328,829 | |
Interest receivable | 32 | |
Distributions receivable from Fidelity Central Funds | 1,046 | |
Receivable for daily variation margin for derivative instruments | 3,800 | |
Total assets | 293,003,179 | |
|
|
|
Liabilities | ||
Payable for fund shares redeemed | $ 901,779 | |
Accrued management fee | 98,800 | |
Other affiliated payables | 32,933 | |
Collateral on securities loaned, at value | 20,295,315 | |
Total liabilities | 21,328,827 | |
|
|
|
Net Assets | $ 271,674,352 | |
Net Assets consist of: |
| |
Paid in capital | $ 212,159,093 | |
Undistributed net investment income | 368,966 | |
Accumulated undistributed net realized gain (loss) on investments | 13,548,247 | |
Net unrealized appreciation (depreciation) on investments | 45,598,046 | |
Net Assets, for 19,976,169 shares outstanding | $ 271,674,352 | |
Net Asset Value, offering price and redemption price per share ($271,674,352 ÷ 19,976,169 shares) | $ 13.60 | |
Statement of Operations
| Year ended February 28, 2014 | |
|
|
|
Investment Income |
|
|
Dividends |
| $ 4,270,582 |
Interest |
| 2,954 |
Income from Fidelity Central Funds |
| 33,613 |
Total income |
| 4,307,149 |
|
|
|
Expenses | ||
Management fee | $ 1,050,699 | |
Transfer agent fees | 351,119 | |
Independent trustees' compensation | 2,658 | |
Miscellaneous | 380 | |
Total expenses before reductions | 1,404,856 | |
Expense reductions | (23) | 1,404,833 |
Net investment income (loss) | 2,902,316 | |
Realized and Unrealized Gain (Loss) Net realized gain (loss) on: | ||
Investment securities: |
|
|
Unaffiliated issuers | 27,056,217 | |
Futures contracts | 1,059,523 | |
Total net realized gain (loss) |
| 28,115,740 |
Change in net unrealized appreciation (depreciation) on: Investment securities | 31,454,408 | |
Futures contracts | (101,368) | |
Total change in net unrealized appreciation (depreciation) |
| 31,353,040 |
Net gain (loss) | 59,468,780 | |
Net increase (decrease) in net assets resulting from operations | $ 62,371,096 | |
See accompanying notes which are an integral part of the financial statements.
Annual Report
Fidelity Mid Cap Enhanced Index Fund
Financial Statements - continued
Statement of Changes in Net Assets
| Year ended | Year ended |
Increase (Decrease) in Net Assets |
|
|
Operations |
|
|
Net investment income (loss) | $ 2,902,316 | $ 1,438,276 |
Net realized gain (loss) | 28,115,740 | 3,806,329 |
Change in net unrealized appreciation (depreciation) | 31,353,040 | 6,452,442 |
Net increase (decrease) in net assets resulting from operations | 62,371,096 | 11,697,047 |
Distributions to shareholders from net investment income | (2,628,221) | (1,338,905) |
Distributions to shareholders from net realized gain | (11,600,638) | (1,032,505) |
Total distributions | (14,228,859) | (2,371,410) |
Share transactions | 215,726,408 | 62,334,770 |
Reinvestment of distributions | 13,509,070 | 2,289,379 |
Cost of shares redeemed | (133,847,136) | (24,883,399) |
Net increase (decrease) in net assets resulting from share transactions | 95,388,342 | 39,740,750 |
Redemption fees | 13,605 | 2,311 |
Total increase (decrease) in net assets | 143,544,184 | 49,068,698 |
Net Assets | ||
Beginning of period | 128,130,168 | 79,061,470 |
End of period (including undistributed net investment income of $368,966 and undistributed net investment income of $209,469, respectively) | $ 271,674,352 | $ 128,130,168 |
Other Information Shares | ||
Sold | 17,672,910 | 5,905,950 |
Issued in reinvestment of distributions | 1,086,837 | 235,166 |
Redeemed | (10,461,161) | (2,543,261) |
Net increase (decrease) | 8,298,586 | 3,597,855 |
Financial Highlights
Years ended February 28, | 2014 | 2013 | 2012 F | 2011 | 2010 |
Selected Per-Share Data |
|
|
|
|
|
Net asset value, beginning of period | $ 10.97 | $ 9.79 | $ 10.28 | $ 8.33 | $ 5.12 |
Income from Investment Operations |
|
|
|
|
|
Net investment income (loss) B | .15 | .18 | .10 | .10 | .09 |
Net realized and unrealized gain (loss) | 3.17 | 1.30 | .05 | 2.30 | 3.20 |
Total from investment operations | 3.32 | 1.48 | .15 | 2.40 | 3.29 |
Distributions from net investment income | (.12) | (.17) | (.07) | (.10) | (.08) |
Distributions from net realized gain | (.57) | (.13) | (.58) | (.35) | - |
Total distributions | (.69) | (.30) | (.64) H | (.45) | (.08) |
Redemption fees added to paid in capital B,G | - | - | - | - | - |
Net asset value, end of period | $ 13.60 | $ 10.97 | $ 9.79 | $ 10.28 | $ 8.33 |
Total Return A | 30.97% | 15.57% | 1.91% | 29.44% | 64.37% |
Ratios to Average Net Assets C,E |
|
|
|
|
|
Expenses before reductions | .60% | .60% | .60% | .60% | .60% |
Expenses net of fee waivers, if any | .60% | .60% | .60% | .60% | .60% |
Expenses net of all reductions | .60% | .60% | .60% | .60% | .60% |
Net investment income (loss) | 1.24% | 1.80% | 1.03% | 1.16% | 1.21% |
Supplemental Data |
|
|
|
|
|
Net assets, end of period (000 omitted) | $ 271,674 | $ 128,130 | $ 79,061 | $ 62,104 | $ 33,617 |
Portfolio turnover rate D | 128% | 99% | 92% | 59% | 80% I |
A Total returns would have been lower if certain expenses had not been reduced during the applicable periods shown.
B Calculated based on average shares outstanding during the period.
C Fees and expenses of any underlying Fidelity Central Funds are not included in the Fund's expense ratio. The Fund indirectly bears its proportionate share of the expenses of any underlying Fidelity Central Funds.
D Amount does not include the portfolio activity of any underlying Fidelity Central Funds.
E Expense ratios reflect operating expenses of the Fund. Expenses before reductions do not reflect amounts reimbursed by the investment adviser or reductions from expense offset arrangements and do not represent the amount paid by the Fund during periods when reimbursements or reductions occur. Expenses net of fee waivers reflect expenses after reimbursement by the investment adviser but prior to reductions from expense offset arrangements. Expenses net of all reductions represent the net expenses paid by the Fund.
F For the year ended February 29.
G Amount represents less than $.01 per share.
H Total distributions of $.64 per share is comprised of distributions from net investment income of $.069 and distributions from net realized gain of $.575 per share.
I Reflects adjustments to exclude transactions in money market mutual funds.
See accompanying notes which are an integral part of the financial statements.
Annual Report
Fidelity Small Cap Enhanced Index Fund
Performance: The Bottom Line
Average annual total return reflects the change in the value of an investment, assuming reinvestment of the fund's distributions from dividend income and capital gains (the profits earned upon the sale of securities that have grown in value, if any) and assuming a constant rate of performance each year. The $10,000 table and the fund's returns do not reflect the deduction of taxes that a shareholder would pay on fund distributions or the redemption of fund shares. During periods of reimbursement by Fidelity, a fund's total returns will be greater than it would be had the reimbursement not occurred. How a fund did yesterday is no guarantee of how it will do tomorrow.
Average Annual Total Returns
Periods ended February 28, 2014 | Past 1 | Past 5 | Life of |
Fidelity Small Cap Enhanced Index Fund | 29.35% | 26.42% | 8.87% |
A From December 20, 2007.
$10,000 Over Life of Fund
Let's say hypothetically that $10,000 was invested in Fidelity Small Cap Enhanced Index Fund on December 20, 2007, when the fund started. The chart shows how the value of your investment would have changed, and also shows how the Russell 2000® Index performed over the same period.
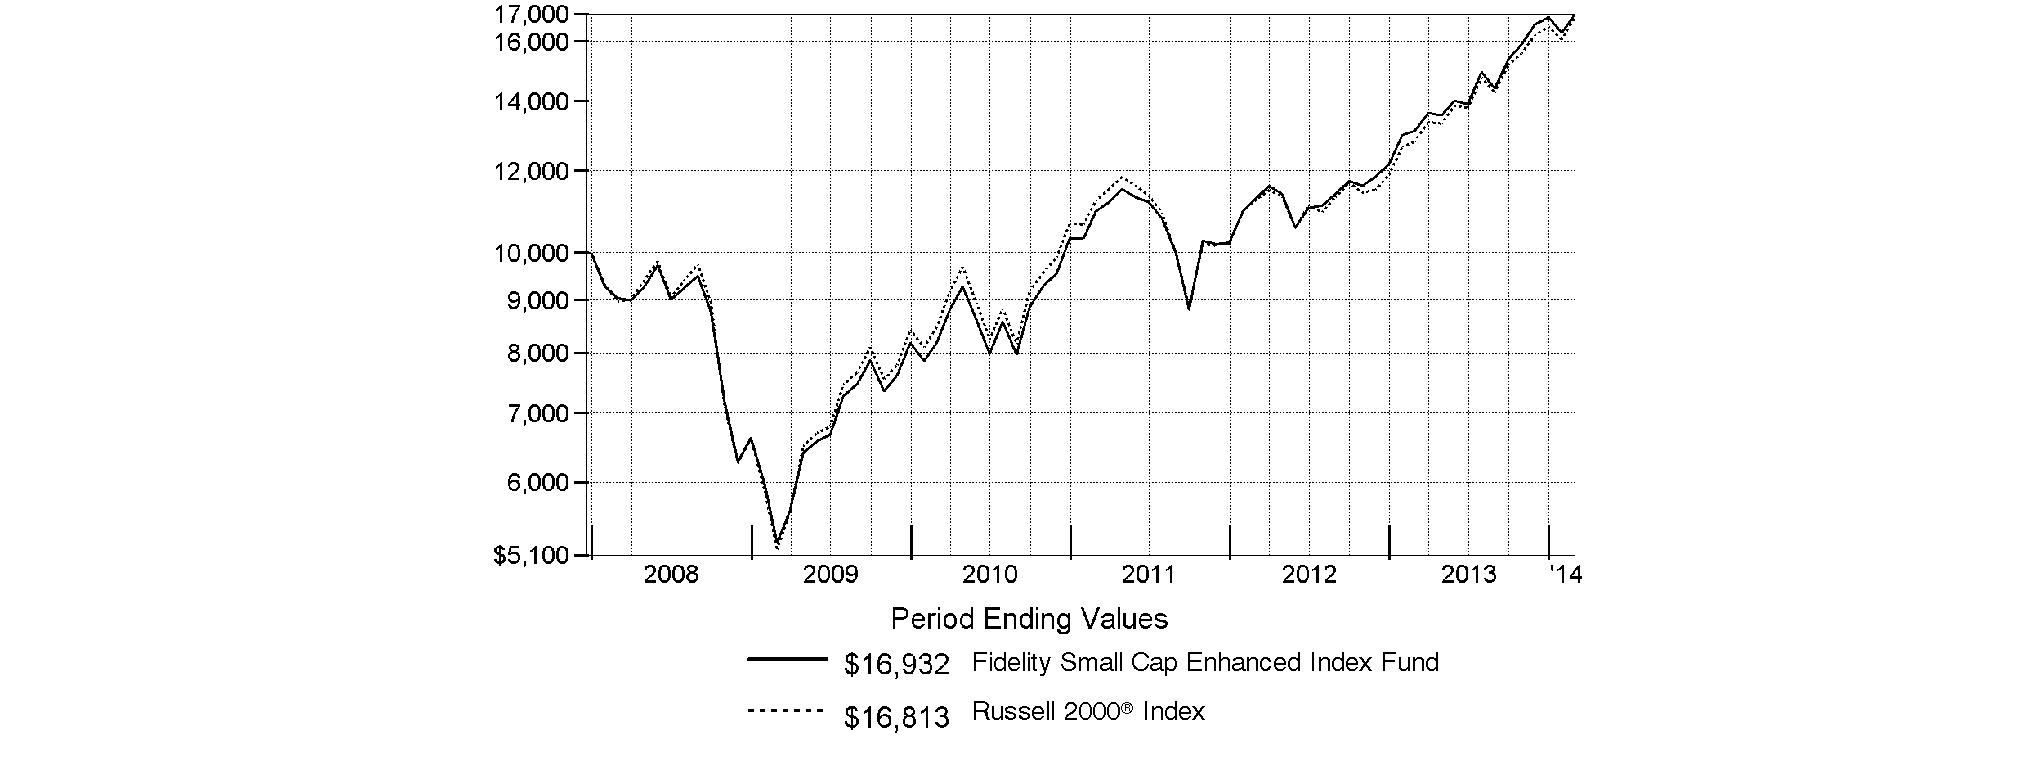
Annual Report
Fidelity Small Cap Enhanced Index Fund
Management's Discussion of Fund Performance
Market Recap: Stocks overcame fears of higher interest rates - not to mention their worst January in four years - to finish sharply higher for the 12 months ending February 28, 2014. The broad S&P 500® Index and the blue-chip Dow Jones Industrial AverageSM gained 25.37% and 19.01%, respectively, amid generally favorable earnings reports and accommodative monetary policies worldwide. Performance generally increased along the risk spectrum, with Smaller-cap and growth strategies leading the way. An ebullient market helped the growth-oriented Nasdaq Composite Index® to a 38.10% period gain, for example. On the other hand, both cyclical and defensive stocks had representation in the top-performing industry sectors: returns were highest in health care and consumer discretionary; lowest in utilities and telecommunication services. From a macroeconomic perspective, data still points to slow but steady improvement in the U.S., and Europe's recession may well be over. Reports from China have disappointed, but continue to suggest a relatively soft landing there. Mixed signals from the U.S. Federal Reserve as to when it might curtail its stimulative bond buying kept markets in flux during the spring and summer. Stocks regained momentum in October despite a federal budget impasse and brief government shutdown, and lower volatility prevailed through year-end. Shedding new-year concerns about China's economy, an emerging-markets sell-off and confirmation (at last) of Fed tapering - alongside confirmation of a presumably dovish Janet Yellen as new Fed chair - February saw stocks back in record territory, bearing down on the five-year anniversary of the market's bottom.
Comments from Maximilian Kaufmann, Senior Portfolio Manager of the Geode Capital Management, LLC, investment management team for Fidelity® Small Cap Enhanced Index Fund: For the year, the fund gained 29.35%, lagging the benchmark Russell 2000® Index. Relative to the index, the fund was hampered by disappointing security selection in the energy and financials sectors. The fund's three biggest detractors were energy stocks, two of which - Alon USA Energy and Delek US Holdings - were oil refiners. It was a difficult period for this industry, as declining refining margins cut into earnings and weighed on companies' share prices. Also detracting was Hercules Offshore, an offshore energy driller whose stock began dropping in the fall, a move that accelerated in January 2014 when the company received a ratings downgrade from an influential analyst firm. We sold Hercules in February. Because small-cap companies tend to be less widely followed, a single downgrade can have a disproportionate impact on a stock's near-term results. Also of note, a significant underweighting in the pharmaceuticals, biotechnology & life sciences industry within health care meaningfully detracted. On the positive side, our stock picking in the industrials and consumer staples sectors proved strong. Elsewhere, untimely ownership of AVG Technologies, a Dutch maker of antivirus and Internet security products, also detracted. On the positive side, the fund's biggest contributor was Rite Aid, a drugstore chain whose shares were up by triple digits during the period. Most notably, Rite Aid's stock rose by 23% in a single day in September, thanks to higher sales and a more-optimistic earnings forecast. In health care, the fund benefited from Alliance Healthcare Services, as our investment models recommended a large overweighting in the stock, which was added to the benchmark in July. This proved to be the right call, as this provider of outsourced diagnostic imaging services to hospitals saw its shares more than quadruple during the period.
The views expressed above reflect those of the portfolio manager(s) only through the end of the period as stated on the cover of this report and do not necessarily represent the views of Fidelity or any other person in the Fidelity organization. Any such views are subject to change at any time based upon market or other conditions and Fidelity disclaims any responsibility to update such views. These views may not be relied on as investment advice and, because investment decisions for a Fidelity fund are based on numerous factors, may not be relied on as an indication of trading intent on behalf of any Fidelity fund.
Annual Report
Fidelity Small Cap Enhanced Index Fund
Investment Changes (Unaudited)
Top Ten Stocks as of February 28, 2014 | ||
| % of fund's | % of fund's net assets |
Rite Aid Corp. | 0.8 | 0.7 |
Aspen Technology, Inc. | 0.8 | 0.7 |
Spirit Airlines, Inc. | 0.8 | 0.3 |
Manhattan Associates, Inc. | 0.7 | 0.5 |
Align Technology, Inc. | 0.7 | 0.0 |
Generac Holdings, Inc. | 0.7 | 0.6 |
Buffalo Wild Wings, Inc. | 0.7 | 0.0 |
Acxiom Corp. | 0.7 | 0.3 |
Dana Holding Corp. | 0.7 | 0.7 |
Team Health Holdings, Inc. | 0.7 | 0.7 |
| 7.3 | |
Market Sectors as of February 28, 2014 | ||
| % of fund's | % of fund's net assets |
Financials | 20.5 | 20.6 |
Information Technology | 19.4 | 19.1 |
Health Care | 15.7 | 11.9 |
Industrials | 15.7 | 14.9 |
Consumer Discretionary | 11.0 | 14.5 |
Energy | 4.8 | 4.9 |
Consumer Staples | 4.7 | 5.1 |
Materials | 4.5 | 4.8 |
Utilities | 1.2 | 2.7 |
Telecommunication Services | 0.7 | 0.0 |
Annual Report
Fidelity Small Cap Enhanced Index Fund
Investments February 28, 2014
Showing Percentage of Net Assets
Common Stocks - 98.2% | |||
Shares | Value | ||
CONSUMER DISCRETIONARY - 11.0% | |||
Auto Components - 1.9% | |||
Dana Holding Corp. (e) | 126,010 | $ 2,731,897 | |
Dorman Products, Inc. (a) | 22,087 | 1,272,653 | |
Drew Industries, Inc. | 6,808 | 335,226 | |
Remy International, Inc. | 18,168 | 404,965 | |
Standard Motor Products, Inc. | 14,427 | 507,109 | |
Stoneridge, Inc. (a) | 28,811 | 317,209 | |
Superior Industries International, Inc. | 6,041 | 110,429 | |
Tower International, Inc. (a) | 78,582 | 2,017,986 | |
| 7,697,474 | ||
Automobiles - 0.3% | |||
Winnebago Industries, Inc. (a) | 53,346 | 1,422,204 | |
Distributors - 0.1% | |||
VOXX International Corp. (a) | 22,215 | 288,795 | |
Diversified Consumer Services - 1.2% | |||
Bridgepoint Education, Inc. (a) | 43,381 | 836,819 | |
Capella Education Co. (e) | 13,954 | 927,662 | |
Hillenbrand, Inc. | 2,420 | 72,310 | |
ITT Educational Services, Inc. (a) | 20,000 | 620,600 | |
K12, Inc. (a) | 17,507 | 396,183 | |
LifeLock, Inc. (a)(e) | 114,518 | 2,280,053 | |
| 5,133,627 | ||
Hotels, Restaurants & Leisure - 3.6% | |||
Bloomin' Brands, Inc. (a) | 25,661 | 645,118 | |
Buffalo Wild Wings, Inc. (a)(e) | 18,961 | 2,749,345 | |
Cracker Barrel Old Country Store, Inc. (e) | 19,411 | 1,930,424 | |
Einstein Noah Restaurant Group, Inc. | 14,012 | 209,059 | |
Fiesta Restaurant Group, Inc. (a) | 10,309 | 517,821 | |
Interval Leisure Group, Inc. | 4,460 | 121,267 | |
Jack in the Box, Inc. (a) | 38,218 | 2,195,624 | |
Krispy Kreme Doughnuts, Inc. (a)(e) | 42,172 | 802,111 | |
Marcus Corp. | 6,638 | 93,662 | |
Marriott Vacations Worldwide Corp. (a) | 43,979 | 2,306,259 | |
Monarch Casino & Resort, Inc. (a) | 6,248 | 117,775 | |
Multimedia Games Holding Co., Inc. (a) | 57,972 | 1,914,525 | |
Texas Roadhouse, Inc. Class A | 53,351 | 1,411,134 | |
| 15,014,124 | ||
Household Durables - 1.0% | |||
Flexsteel Industries, Inc. | 32,804 | 1,218,669 | |
Helen of Troy Ltd. (a) | 10,105 | 659,958 | |
La-Z-Boy, Inc. | 46,522 | 1,188,172 | |
NACCO Industries, Inc. Class A | 14,762 | 865,496 | |
Universal Electronics, Inc. (a) | 1,825 | 76,267 | |
| 4,008,562 | ||
Media - 1.6% | |||
Carmike Cinemas, Inc. (a) | 126 | 3,749 | |
E.W. Scripps Co. Class A (a) | 66,908 | 1,312,735 | |
Entravision Communication Corp. | 322,138 | 2,135,775 | |
Global Sources Ltd. (a) | 58,086 | 394,404 | |
| |||
Shares | Value | ||
Gray Television, Inc. (a) | 36,757 | $ 431,895 | |
Harte-Hanks, Inc. | 1,076 | 8,597 | |
Live Nation Entertainment, Inc. (a) | 1,771 | 40,184 | |
MDC Partners, Inc. Class A | 21,732 | 488,753 | |
Meredith Corp. | 16,184 | 757,411 | |
Nexstar Broadcasting Group, Inc. | 25,719 | 1,097,687 | |
| 6,671,190 | ||
Specialty Retail - 1.3% | |||
Big 5 Sporting Goods Corp. | 102,039 | 1,548,952 | |
Destination Maternity Corp. | 8,389 | 236,905 | |
Express, Inc. (a)(e) | 17,645 | 322,727 | |
Haverty Furniture Companies, Inc. | 15,644 | 456,023 | |
Kirkland's, Inc. (a) | 3,304 | 58,415 | |
Office Depot, Inc. (a) | 342,923 | 1,690,610 | |
Stein Mart, Inc. | 2,535 | 34,451 | |
The Cato Corp. Class A (sub. vtg.) (e) | 22,858 | 641,624 | |
The Children's Place Retail Stores, Inc. | 6,388 | 346,038 | |
| 5,335,745 | ||
Textiles, Apparel & Luxury Goods - 0.0% | |||
Unifi, Inc. (a) | 4,326 | 107,025 | |
TOTAL CONSUMER DISCRETIONARY | 45,678,746 | ||
CONSUMER STAPLES - 4.7% | |||
Beverages - 0.0% | |||
Coca-Cola Bottling Co. Consolidated | 1,659 | 125,487 | |
Food & Staples Retailing - 1.3% | |||
Andersons, Inc. | 36,576 | 2,005,828 | |
Rite Aid Corp. (a) | 517,585 | 3,410,869 | |
| 5,416,697 | ||
Food Products - 2.4% | |||
Cal-Maine Foods, Inc. | 13,178 | 692,767 | |
Chiquita Brands International, Inc. (a) | 34,782 | 380,515 | |
Fresh Del Monte Produce, Inc. | 10,110 | 267,511 | |
J&J Snack Foods Corp. | 9,919 | 921,277 | |
Omega Protein Corp. (a) | 53,068 | 576,849 | |
Pilgrims Pride Corp. (a)(e) | 121,998 | 2,138,625 | |
Sanderson Farms, Inc. (e) | 31,826 | 2,445,510 | |
Seneca Foods Corp. Class A (a) | 6,141 | 185,949 | |
TreeHouse Foods, Inc. (a)(e) | 31,250 | 2,226,875 | |
| 9,835,878 | ||
Household Products - 0.4% | |||
Orchids Paper Products Co. | 15,600 | 525,252 | |
WD-40 Co. | 15,621 | 1,138,927 | |
| 1,664,179 | ||
Personal Products - 0.6% | |||
Nature's Sunshine Products, Inc. | 5,988 | 90,479 | |
Nu Skin Enterprises, Inc. Class A (e) | 26,328 | 2,198,915 | |
Common Stocks - continued | |||
Shares | Value | ||
CONSUMER STAPLES - continued | |||
Personal Products - continued | |||
Nutraceutical International Corp. (a) | 1,722 | $ 45,099 | |
USANA Health Sciences, Inc. (a)(e) | 1,362 | 99,658 | |
| 2,434,151 | ||
TOTAL CONSUMER STAPLES | 19,476,392 | ||
ENERGY - 4.8% | |||
Energy Equipment & Services - 1.7% | |||
Dril-Quip, Inc. (a) | 20,277 | 2,180,994 | |
Exterran Holdings, Inc. | 13,369 | 547,728 | |
Gulf Island Fabrication, Inc. | 7,236 | 151,739 | |
Matrix Service Co. (a) | 62,112 | 2,010,565 | |
Parker Drilling Co. (a) | 73,651 | 594,364 | |
RigNet, Inc. (a) | 9,523 | 455,390 | |
Tesco Corp. (a) | 50,248 | 953,205 | |
| 6,893,985 | ||
Oil, Gas & Consumable Fuels - 3.1% | |||
Adams Resources & Energy, Inc. | 795 | 58,512 | |
Alon U.S.A. Energy, Inc. | 37,361 | 500,264 | |
Contango Oil & Gas Co. (a) | 1,391 | 65,961 | |
CVR Energy, Inc. | 49,315 | 1,940,545 | |
Delek U.S. Holdings, Inc. | 34,861 | 967,741 | |
Evolution Petroleum Corp. | 10,191 | 132,483 | |
GasLog Ltd. | 53,381 | 1,124,204 | |
Green Plains Renewable Energy, Inc. | 85,268 | 2,253,633 | |
Renewable Energy Group, Inc. (a)(e) | 193,343 | 2,256,313 | |
Rex American Resources Corp. (a) | 23,843 | 1,136,834 | |
Warren Resources, Inc. (a) | 50,346 | 223,033 | |
Western Refining, Inc. (e) | 63,634 | 2,319,459 | |
| 12,978,982 | ||
TOTAL ENERGY | 19,872,967 | ||
FINANCIALS - 20.5% | |||
Capital Markets - 2.1% | |||
BGC Partners, Inc. Class A | 58,342 | 396,726 | |
Calamos Asset Management, Inc. | 11,791 | 140,667 | |
Evercore Partners, Inc. Class A | 43,193 | 2,403,259 | |
FBR & Co. (a) | 10,596 | 275,496 | |
GAMCO Investors, Inc. Class A | 1,116 | 87,115 | |
HFF, Inc. | 27,120 | 865,128 | |
Investment Technology Group, Inc. (a) | 82,037 | 1,417,599 | |
Manning & Napier, Inc. Class A | 3,391 | 49,814 | |
MCG Capital Corp. | 90,145 | 397,539 | |
Silvercrest Asset Management Group Class A | 1,169 | 19,651 | |
TCP Capital Corp. | 3,030 | 53,570 | |
WisdomTree Investments, Inc. (a)(e) | 159,138 | 2,479,370 | |
| 8,585,934 | ||
| |||
Shares | Value | ||
Commercial Banks - 5.9% | |||
1st Source Corp. | 300 | $ 9,360 | |
Ameris Bancorp (a) | 7,556 | 158,978 | |
BancFirst Corp. | 744 | 40,942 | |
BancorpSouth, Inc. | 12,929 | 309,391 | |
Bank of Kentucky Financial Corp. | 1,824 | 64,004 | |
Bank of Marin Bancorp | 2,570 | 113,671 | |
Banner Bank (e) | 19,040 | 755,698 | |
BBCN Bancorp, Inc. | 14,226 | 242,127 | |
BNC Bancorp | 8,737 | 152,286 | |
Central Pacific Financial Corp. | 35,375 | 697,949 | |
Chemical Financial Corp. | 11,333 | 334,210 | |
Citizens & Northern Corp. | 5,293 | 105,437 | |
Customers Bancorp, Inc. (a) | 32,045 | 633,530 | |
Eagle Bancorp, Inc., Maryland (e) | 9,624 | 329,718 | |
First Bancorp, Puerto Rico (a) | 192,981 | 1,005,431 | |
First Community Bancshares, Inc. | 6,729 | 112,711 | |
First Interstate Bancsystem, Inc. | 23,114 | 598,653 | |
First Merchants Corp. | 37,061 | 793,847 | |
Flushing Financial Corp. | 13,970 | 289,458 | |
Hanmi Financial Corp. | 59,766 | 1,400,317 | |
Home Bancshares, Inc. (e) | 16,175 | 542,833 | |
HomeTrust Bancshares, Inc. (a) | 2,240 | 35,101 | |
International Bancshares Corp. | 6,737 | 156,164 | |
Lakeland Financial Corp. | 1,224 | 46,512 | |
MainSource Financial Group, Inc. | 3,508 | 60,583 | |
MB Financial, Inc. (e) | 49,457 | 1,509,922 | |
Mercantile Bank Corp. | 1,040 | 21,112 | |
Merchants Bancshares, Inc. | 15,387 | 506,848 | |
Old National Bancorp, Indiana | 48,709 | 683,387 | |
OmniAmerican Bancorp, Inc. | 2,575 | 56,058 | |
Peoples Bancorp, Inc. | 4,699 | 114,985 | |
Pinnacle Financial Partners, Inc. | 5,145 | 185,632 | |
PrivateBancorp, Inc. | 86,364 | 2,492,465 | |
Republic Bancorp, Inc., Kentucky Class A | 4,340 | 104,551 | |
Simmons First National Corp. Class A | 2,198 | 78,315 | |
Southwest Bancorp, Inc., Oklahoma | 6,302 | 110,852 | |
Susquehanna Bancshares, Inc. | 87,833 | 960,893 | |
Umpqua Holdings Corp. (e) | 115,049 | 2,044,421 | |
United Community Banks, Inc., Georgia (a) | 129,413 | 2,159,903 | |
Univest Corp. of Pennsylvania | 2,356 | 45,400 | |
Washington Trust Bancorp, Inc. | 8,704 | 306,294 | |
WesBanco, Inc. | 10,404 | 310,143 | |
Wilshire Bancorp, Inc. | 111,471 | 1,131,431 | |
Wintrust Financial Corp. (e) | 52,376 | 2,423,961 | |
Yadkin Financial Corp. (a) | 9,459 | 181,613 | |
| 24,417,097 | ||
Consumer Finance - 1.1% | |||
Cash America International, Inc. (e) | 20,999 | 840,380 | |
Credit Acceptance Corp. (a) | 5,984 | 826,630 | |
Common Stocks - continued | |||
Shares | Value | ||
FINANCIALS - continued | |||
Consumer Finance - continued | |||
Nelnet, Inc. Class A | 55,743 | $ 2,236,409 | |
Regional Management Corp. (a) | 14,239 | 429,733 | |
| 4,333,152 | ||
Diversified Financial Services - 0.7% | |||
Gain Capital Holdings, Inc. (e) | 9,884 | 102,003 | |
MarketAxess Holdings, Inc. | 41,008 | 2,421,112 | |
Marlin Business Services Corp. | 22,548 | 484,782 | |
Vector Capital Corp. rights (a) | 8,300 | 0 | |
| 3,007,897 | ||
Insurance - 4.3% | |||
Amerisafe, Inc. | 6,521 | 283,924 | |
Argo Group International Holdings, Ltd. | 35,445 | 1,564,542 | |
eHealth, Inc. (a)(e) | 31,878 | 1,530,144 | |
Employers Holdings, Inc. | 759 | 14,930 | |
FBL Financial Group, Inc. Class A | 13,234 | 553,711 | |
First American Financial Corp. | 97,072 | 2,615,120 | |
HCI Group, Inc. | 789 | 38,203 | |
Hilltop Holdings, Inc. (a) | 68,599 | 1,681,361 | |
Horace Mann Educators Corp. | 78,267 | 2,239,219 | |
Navigators Group, Inc. (a) | 10,539 | 638,874 | |
Platinum Underwriters Holdings Ltd. | 30,378 | 1,780,758 | |
ProAssurance Corp. | 42,794 | 1,945,415 | |
Safety Insurance Group, Inc. | 1,484 | 82,852 | |
Selective Insurance Group, Inc. | 40,589 | 935,171 | |
Symetra Financial Corp. | 19,707 | 388,228 | |
United Fire Group, Inc. | 3,229 | 93,576 | |
Universal Insurance Holdings, Inc. | 114,796 | 1,533,675 | |
| 17,919,703 | ||
Real Estate Investment Trusts - 4.5% | |||
Agree Realty Corp. | 8,558 | 263,073 | |
Altisource Residential Corp. Class B | 86,160 | 2,462,453 | |
Apollo Commercial Real Estate Finance, Inc. | 33,324 | 557,844 | |
Ashford Hospitality Trust, Inc. | 1,844 | 20,616 | |
Capstead Mortgage Corp. (e) | 42,562 | 548,624 | |
Extra Space Storage, Inc. | 33,383 | 1,639,105 | |
MFA Financial, Inc. | 186,444 | 1,465,450 | |
National Health Investors, Inc. | 26,362 | 1,626,535 | |
New Residential Investment Corp. | 370,038 | 2,364,543 | |
Potlatch Corp. | 4,740 | 187,894 | |
RAIT Financial Trust (e) | 79,297 | 658,958 | |
RLJ Lodging Trust | 91,713 | 2,383,621 | |
Sovran Self Storage, Inc. | 20,475 | 1,514,945 | |
Sunstone Hotel Investors, Inc. | 51,015 | 689,723 | |
The Geo Group, Inc. | 71,473 | 2,303,575 | |
| 18,686,959 | ||
Thrifts & Mortgage Finance - 1.9% | |||
Dime Community Bancshares, Inc. | 25,180 | 423,024 | |
Doral Financial Corp. (a) | 13,401 | 154,112 | |
Farmer Mac Class C (non-vtg.) | 5,543 | 174,383 | |
| |||
Shares | Value | ||
Flagstar Bancorp, Inc. (a) | 61,845 | $ 1,369,248 | |
Fox Chase Bancorp, Inc. | 3,397 | 58,225 | |
Home Loan Servicing Solutions Ltd. (e) | 115,201 | 2,363,925 | |
HomeStreet, Inc. | 29,021 | 546,756 | |
Northwest Bancshares, Inc. | 47,392 | 680,075 | |
Oritani Financial Corp. | 4,089 | 64,034 | |
Provident Financial Holdings, Inc. | 6,196 | 95,233 | |
Simplicity Bancorp, Inc. | 5,626 | 99,243 | |
Waterstone Financial, Inc. Maryland (a) | 27,537 | 290,791 | |
WSFS Financial Corp. | 24,444 | 1,742,613 | |
| 8,061,662 | ||
TOTAL FINANCIALS | 85,012,404 | ||
HEALTH CARE - 15.7% | |||
Biotechnology - 2.3% | |||
Alnylam Pharmaceuticals, Inc. (a)(e) | 7,161 | 581,760 | |
Celldex Therapeutics, Inc. (a) | 2,341 | 68,404 | |
Cepheid, Inc. (a)(e) | 4,846 | 260,036 | |
Dyax Corp. (a)(e) | 69,031 | 667,530 | |
Emergent BioSolutions, Inc. (a) | 24,306 | 601,330 | |
Enanta Pharmaceuticals, Inc. (e) | 1,857 | 68,412 | |
Epizyme, Inc. | 1,236 | 36,956 | |
Insys Therapeutics, Inc. (a)(e) | 14,333 | 964,324 | |
Intercept Pharmaceuticals, Inc. (a) | 3,833 | 1,573,447 | |
Isis Pharmaceuticals, Inc. (a) | 38,205 | 1,948,455 | |
Ligand Pharmaceuticals, Inc. Class B (a) | 12,133 | 846,277 | |
NPS Pharmaceuticals, Inc. (a)(e) | 8,353 | 292,188 | |
Pharmacyclics, Inc. (a) | 3,955 | 548,400 | |
Puma Biotechnology, Inc. (a) | 602 | 69,989 | |
Repligen Corp. (a)(e) | 28,592 | 428,022 | |
XOMA Corp. (a) | 62,323 | 521,020 | |
| 9,476,550 | ||
Health Care Equipment & Supplies - 6.2% | |||
Align Technology, Inc. (a)(e) | 54,526 | 2,853,346 | |
Analogic Corp. | 2,489 | 234,613 | |
Angiodynamics, Inc. (a) | 1,328 | 20,451 | |
Anika Therapeutics, Inc. (a) | 34,450 | 1,356,297 | |
ArthroCare Corp. (a) | 5,226 | 252,155 | |
Cantel Medical Corp. | 28,430 | 919,711 | |
CONMED Corp. | 5,337 | 248,811 | |
Cryolife, Inc. | 9,981 | 99,411 | |
Cyberonics, Inc. (a)(e) | 36,043 | 2,467,864 | |
DexCom, Inc. (a) | 39,042 | 1,760,794 | |
Globus Medical, Inc. (a) | 27,869 | 659,381 | |
Greatbatch, Inc. (a) | 13,930 | 603,587 | |
ICU Medical, Inc. (a) | 762 | 44,089 | |
Masimo Corp. (a)(e) | 22,378 | 571,758 | |
Natus Medical, Inc. (a) | 69,937 | 1,755,419 | |
NuVasive, Inc. (a) | 65,314 | 2,400,290 | |
Orthofix International NV (a) | 29,905 | 664,489 | |
RTI Biologics, Inc. (a) | 78,417 | 294,848 | |
Sirona Dental Systems, Inc. (a)(e) | 27,583 | 1,943,498 | |
Common Stocks - continued | |||
Shares | Value | ||
HEALTH CARE - continued | |||
Health Care Equipment & Supplies - continued | |||
Steris Corp. | 2,902 | $ 133,927 | |
SurModics, Inc. (a) | 16,675 | 415,208 | |
Thoratec Corp. (a) | 67,047 | 2,490,126 | |
Vascular Solutions, Inc. (a) | 9,231 | 240,191 | |
West Pharmaceutical Services, Inc. | 52,520 | 2,393,862 | |
Zeltiq Aesthetics, Inc. (a) | 59,051 | 1,121,378 | |
| 25,945,504 | ||
Health Care Providers & Services - 5.3% | |||
Addus HomeCare Corp. (a) | 12,580 | 361,801 | |
Alliance Healthcare Services, Inc. (a) | 64,986 | 1,958,678 | |
Almost Family, Inc. (a) | 4,352 | 119,332 | |
AMN Healthcare Services, Inc. (a) | 39,523 | 550,555 | |
AmSurg Corp. (a) | 18,240 | 800,006 | |
Centene Corp. (a) | 3,540 | 225,427 | |
Corvel Corp. (a) | 15,436 | 710,210 | |
Cross Country Healthcare, Inc. (a) | 19,893 | 206,887 | |
Five Star Quality Care, Inc. (a) | 85,988 | 497,871 | |
Hanger, Inc. (a) | 37,792 | 1,339,726 | |
HealthSouth Corp. (e) | 38,285 | 1,251,154 | |
Kindred Healthcare, Inc. | 10,888 | 235,834 | |
Magellan Health Services, Inc. (a) | 34,905 | 2,134,092 | |
National Healthcare Corp. | 8,413 | 433,270 | |
Owens & Minor, Inc. (e) | 72,752 | 2,525,949 | |
PharMerica Corp. (a) | 58,916 | 1,419,876 | |
Providence Service Corp. (a) | 41,869 | 1,113,297 | |
Select Medical Holdings Corp. | 203,897 | 2,285,685 | |
Team Health Holdings, Inc. (a)(e) | 59,967 | 2,699,714 | |
Triple-S Management Corp. (a) | 10,722 | 179,594 | |
Wellcare Health Plans, Inc. (a) | 16,415 | 1,014,775 | |
| 22,063,733 | ||
Health Care Technology - 0.6% | |||
Omnicell, Inc. (a) | 81,243 | 2,338,174 | |
Quality Systems, Inc. | 15,242 | 266,125 | |
| 2,604,299 | ||
Life Sciences Tools & Services - 0.4% | |||
Affymetrix, Inc. (a)(e) | 71,803 | 554,319 | |
Albany Molecular Research, Inc. (a)(e) | 56,115 | 875,394 | |
Luminex Corp. (a) | 2,315 | 42,781 | |
PAREXEL International Corp. (a) | 2,261 | 121,122 | |
| 1,593,616 | ||
Pharmaceuticals - 0.9% | |||
Aratana Therapeutics, Inc. (e) | 17,565 | 410,494 | |
Impax Laboratories, Inc. (a) | 4,741 | 122,176 | |
Jazz Pharmaceuticals PLC (a) | 5,659 | 859,857 | |
Lannett Co., Inc. (a)(e) | 26,077 | 1,118,443 | |
Pozen, Inc. (e) | 15,808 | 125,832 | |
Prestige Brands Holdings, Inc. (a) | 23,935 | 681,908 | |
Questcor Pharmaceuticals, Inc. (e) | 5,201 | 315,961 | |
| |||
Shares | Value | ||
Sagent Pharmaceuticals, Inc. (a) | 1,517 | $ 32,100 | |
Sucampo Pharmaceuticals, Inc. | 13,556 | 122,004 | |
| 3,788,775 | ||
TOTAL HEALTH CARE | 65,472,477 | ||
INDUSTRIALS - 15.7% | |||
Aerospace & Defense - 3.3% | |||
AAR Corp. | 29,141 | 842,175 | |
American Science & Engineering, Inc. | 17,786 | 1,169,430 | |
Astronics Corp. (a) | 24,820 | 1,660,458 | |
Curtiss-Wright Corp. | 30,036 | 2,047,254 | |
Ducommun, Inc. (a) | 1,851 | 51,458 | |
Engility Holdings, Inc. (a) | 13,485 | 562,729 | |
Esterline Technologies Corp. (a) | 15,554 | 1,675,166 | |
Moog, Inc. Class A (a) | 31,742 | 1,965,782 | |
Orbital Sciences Corp. (a) | 12,116 | 344,337 | |
Taser International, Inc. (a)(e) | 124,095 | 2,386,347 | |
Teledyne Technologies, Inc. (a)(e) | 9,129 | 894,459 | |
| 13,599,595 | ||
Airlines - 1.0% | |||
SkyWest, Inc. | 65,985 | 838,010 | |
Spirit Airlines, Inc. (a) | 54,972 | 3,104,819 | |
| 3,942,829 | ||
Building Products - 0.4% | |||
AAON, Inc. (e) | 6,830 | 204,080 | |
American Woodmark Corp. (a) | 8,433 | 270,784 | |
Insteel Industries, Inc. | 4,323 | 86,028 | |
PGT, Inc. (a) | 90,916 | 1,053,716 | |
| 1,614,608 | ||
Commercial Services & Supplies - 1.9% | |||
ABM Industries, Inc. | 12,842 | 362,530 | |
ARC Document Solutions, Inc. (a) | 44,101 | 347,957 | |
Deluxe Corp. (e) | 22,950 | 1,158,516 | |
G&K Services, Inc. Class A | 22,670 | 1,419,822 | |
Intersections, Inc. | 33,157 | 203,252 | |
Kimball International, Inc. Class B | 70,455 | 1,322,440 | |
Multi-Color Corp. | 535 | 18,120 | |
Steelcase, Inc. Class A | 23,152 | 344,270 | |
UniFirst Corp. | 22,435 | 2,460,895 | |
Viad Corp. | 11,172 | 268,687 | |
| 7,906,489 | ||
Construction & Engineering - 0.7% | |||
Argan, Inc. | 51,723 | 1,478,761 | |
Comfort Systems U.S.A., Inc. | 37,564 | 617,177 | |
EMCOR Group, Inc. | 4,774 | 223,328 | |
Furmanite Corp. (a) | 13,387 | 158,502 | |
MYR Group, Inc. (a) | 4,976 | 115,792 | |
Primoris Services Corp. | 11,400 | 356,478 | |
| 2,950,038 | ||
Common Stocks - continued | |||
Shares | Value | ||
INDUSTRIALS - continued | |||
Electrical Equipment - 1.6% | |||
Acuity Brands, Inc. | 9,920 | $ 1,399,216 | |
EnerSys | 36,283 | 2,577,544 | |
Generac Holdings, Inc. (e) | 49,462 | 2,817,850 | |
| 6,794,610 | ||
Industrial Conglomerates - 0.0% | |||
Raven Industries, Inc. | 643 | 23,515 | |
Machinery - 2.2% | |||
Alamo Group, Inc. | 2,587 | 136,024 | |
Altra Industrial Motion Corp. | 1,456 | 51,542 | |
CIRCOR International, Inc. | 9,356 | 669,515 | |
Global Brass & Copper Holdings, Inc. | 26,002 | 440,214 | |
Hurco Companies, Inc. | 2,858 | 71,479 | |
Hyster-Yale Materials Handling Class A | 24,625 | 2,485,648 | |
Kadant, Inc. | 24,466 | 982,310 | |
L.B. Foster Co. Class A | 4,287 | 199,303 | |
Lydall, Inc. (a) | 2,554 | 51,744 | |
Mueller Industries, Inc. | 28,168 | 1,759,937 | |
Mueller Water Products, Inc. Class A | 174,547 | 1,684,379 | |
Standex International Corp. | 5,760 | 318,586 | |
Sun Hydraulics Corp. (e) | 1,433 | 60,616 | |
Xerium Technologies, Inc. (a) | 6,158 | 96,989 | |
| 9,008,286 | ||
Marine - 0.3% | |||
Matson, Inc. | 52,618 | 1,269,146 | |
Professional Services - 2.4% | |||
Barrett Business Services, Inc. | 26,594 | 1,861,580 | |
Exponent, Inc. | 2,846 | 202,749 | |
Huron Consulting Group, Inc. (a) | 6,352 | 420,312 | |
Insperity, Inc. | 20,966 | 611,998 | |
Korn/Ferry International (a) | 91,974 | 2,335,220 | |
Navigant Consulting, Inc. (a) | 13,990 | 243,846 | |
On Assignment, Inc. (a) | 39,029 | 1,342,598 | |
Resources Connection, Inc. | 41,132 | 563,508 | |
RPX Corp. (a) | 130,078 | 2,083,850 | |
WageWorks, Inc. (a) | 4,816 | 284,866 | |
| 9,950,527 | ||
Road & Rail - 1.2% | |||
AMERCO | 8,733 | 2,034,265 | |
Arkansas Best Corp. | 6,163 | 204,981 | |
Heartland Express, Inc. (e) | 24,114 | 491,443 | |
Marten Transport Ltd. | 6,525 | 127,172 | |
Old Dominion Freight Lines, Inc. (a)(e) | 37,560 | 1,999,694 | |
Universal Truckload Services, Inc. | 5,613 | 145,938 | |
| 5,003,493 | ||
Trading Companies & Distributors - 0.5% | |||
Aceto Corp. | 68,381 | 1,250,688 | |
DXP Enterprises, Inc. (a) | 9,311 | 947,487 | |
| 2,198,175 | ||
| |||
Shares | Value | ||
Transportation Infrastructure - 0.2% | |||
Wesco Aircraft Holdings, Inc. (a) | 42,088 | $ 912,889 | |
TOTAL INDUSTRIALS | 65,174,200 | ||
INFORMATION TECHNOLOGY - 19.4% | |||
Communications Equipment - 2.2% | |||
Arris Group, Inc. (a)(e) | 11,243 | 322,674 | |
Black Box Corp. | 29,692 | 789,807 | |
Communications Systems, Inc. | 7,654 | 103,099 | |
Comtech Telecommunications Corp. | 30,805 | 986,068 | |
Emulex Corp. (a) | 110,645 | 805,496 | |
Extreme Networks, Inc. (a) | 174,134 | 997,788 | |
Finisar Corp. (a)(e) | 20,322 | 481,631 | |
Ixia (a) | 19,308 | 238,647 | |
Oplink Communications, Inc. (a) | 2,488 | 43,590 | |
Plantronics, Inc. | 28,859 | 1,280,762 | |
Tessco Technologies, Inc. | 18,047 | 687,230 | |
Ubiquiti Networks, Inc. (a)(e) | 46,143 | 2,279,926 | |
| 9,016,718 | ||
Computers & Peripherals - 0.6% | |||
QLogic Corp. (a) | 117,212 | 1,338,561 | |
Super Micro Computer, Inc. (a) | 61,438 | 1,240,433 | |
| 2,578,994 | ||
Electronic Equipment & Components - 2.6% | |||
Aeroflex Holding Corp. (a) | 9,861 | 78,789 | |
Anixter International, Inc. | 255 | 27,272 | |
Benchmark Electronics, Inc. (a) | 97,498 | 2,324,352 | |
Daktronics, Inc. | 57,782 | 818,771 | |
Electro Scientific Industries, Inc. | 43,905 | 414,024 | |
Insight Enterprises, Inc. (a) | 19,840 | 455,923 | |
Methode Electronics, Inc. Class A | 18,806 | 637,523 | |
Newport Corp. (a) | 10,003 | 207,062 | |
PC Connection, Inc. | 6,063 | 122,776 | |
Plexus Corp. (a) | 9,389 | 386,357 | |
Sanmina Corp. (a) | 70,878 | 1,202,091 | |
ScanSource, Inc. (a) | 44,448 | 1,745,028 | |
SYNNEX Corp. (a) | 40,062 | 2,382,888 | |
| 10,802,856 | ||
Internet Software & Services - 1.9% | |||
comScore, Inc. (a) | 4,886 | 154,495 | |
Constant Contact, Inc. (a) | 42,280 | 1,165,660 | |
Conversant, Inc. (a)(e) | 10,989 | 273,187 | |
eGain Communications Corp. (a)(e) | 12,403 | 103,937 | |
j2 Global, Inc. | 16,412 | 843,577 | |
LogMeIn, Inc. (a) | 15,968 | 668,261 | |
Perficient, Inc. (a) | 10,914 | 222,755 | |
Shutterstock, Inc. (a) | 7,149 | 710,468 | |
Stamps.com, Inc. (a) | 26,413 | 929,209 | |
United Online, Inc. (e) | 109,809 | 1,230,959 | |
WebMD Health Corp. (a)(e) | 28,823 | 1,280,029 | |
Common Stocks - continued | |||
Shares | Value | ||
INFORMATION TECHNOLOGY - continued | |||
Internet Software & Services - continued | |||
XO Group, Inc. (a) | 21,769 | $ 259,922 | |
Yelp, Inc. (a)(e) | 2,807 | 265,037 | |
| 8,107,496 | ||
IT Services - 4.0% | |||
Acxiom Corp. (a) | 73,565 | 2,738,825 | |
Cardtronics, Inc. (a) | 41,051 | 1,663,387 | |
CSG Systems International, Inc. | 43,729 | 1,224,412 | |
ExlService Holdings, Inc. (a) | 21,786 | 609,790 | |
Forrester Research, Inc. | 4,215 | 152,667 | |
Global Cash Access Holdings, Inc. (a) | 133,495 | 1,121,358 | |
Hackett Group, Inc. | 9,107 | 53,640 | |
iGATE Corp. (a) | 37,465 | 1,268,190 | |
Jack Henry & Associates, Inc. | 34,461 | 2,003,218 | |
Maximus, Inc. | 14,004 | 669,251 | |
MoneyGram International, Inc. (a) | 6,024 | 114,637 | |
NCI, Inc. Class A (a) | 9,273 | 111,276 | |
Sapient Corp. (a) | 145,033 | 2,525,025 | |
Syntel, Inc. (a) | 19,481 | 1,838,227 | |
Teletech Holdings, Inc. (a) | 24,840 | 598,147 | |
| 16,692,050 | ||
Semiconductors & Semiconductor Equipment - 1.9% | |||
Cabot Microelectronics Corp. (a) | 30,071 | 1,328,236 | |
Integrated Device Technology, Inc. (a) | 190,776 | 2,249,249 | |
International Rectifier Corp. (a) | 15,710 | 423,385 | |
Intersil Corp. Class A | 21,593 | 274,663 | |
Kulicke & Soffa Industries, Inc. (a) | 80,003 | 923,235 | |
Lattice Semiconductor Corp. (a) | 49,948 | 378,106 | |
Power Integrations, Inc. | 5,899 | 348,808 | |
Rambus, Inc. (a)(e) | 132,922 | 1,225,541 | |
Silicon Image, Inc. (a) | 18,197 | 110,092 | |
Supertex, Inc. (a) | 1,253 | 41,261 | |
Ultra Clean Holdings, Inc. (a) | 55,643 | 732,262 | |
| 8,034,838 | ||
Software - 6.2% | |||
Actuate Corp. (a) | 23,781 | 135,076 | |
Advent Software, Inc. | 72,023 | 2,211,106 | |
Aspen Technology, Inc. (a) | 69,612 | 3,268,283 | |
AVG Technologies NV (a)(e) | 68,713 | 1,286,994 | |
Comverse, Inc. (a) | 21,837 | 755,779 | |
ePlus, Inc. (a) | 3,454 | 196,429 | |
Fair Isaac Corp. | 3,292 | 176,879 | |
Manhattan Associates, Inc. (a) | 80,000 | 3,031,200 | |
Monotype Imaging Holdings, Inc. | 42,864 | 1,219,052 | |
NetScout Systems, Inc. (a) | 32,700 | 1,241,946 | |
Parametric Technology Corp. (a) | 56,446 | 2,218,892 | |
Pegasystems, Inc. | 19,240 | 800,961 | |
QAD, Inc.: | |||
Class A | 6,212 | 117,345 | |
Class B | 3,694 | 61,394 | |
SS&C Technologies Holdings, Inc. (a) | 65,650 | 2,539,342 | |
| |||
Shares | Value | ||
Take-Two Interactive Software, Inc. (a)(e) | 19,699 | $ 389,449 | |
TeleCommunication Systems, Inc. | 181,935 | 394,799 | |
TeleNav, Inc. (a) | 63,691 | 382,783 | |
TiVo, Inc. (a) | 184,940 | 2,496,690 | |
Verint Systems, Inc. (a) | 57,379 | 2,685,911 | |
| 25,610,310 | ||
TOTAL INFORMATION TECHNOLOGY | 80,843,262 | ||
MATERIALS - 4.5% | |||
Chemicals - 2.2% | |||
A. Schulman, Inc. | 13,938 | 484,346 | |
FutureFuel Corp. | 92,932 | 1,612,370 | |
H.B. Fuller Co. | 26,105 | 1,265,570 | |
Innospec, Inc. | 1,003 | 43,641 | |
Landec Corp. (a) | 25,694 | 261,822 | |
Minerals Technologies, Inc. | 46,845 | 2,506,208 | |
Quaker Chemical Corp. | 5,058 | 390,882 | |
Sensient Technologies Corp. | 43,356 | 2,273,155 | |
Stepan Co. | 4,518 | 274,694 | |
Zep, Inc. | 9,497 | 167,147 | |
| 9,279,835 | ||
Containers & Packaging - 1.0% | |||
Berry Plastics Group, Inc. (a) | 8,868 | 215,758 | |
Graphic Packaging Holding Co. (a) | 255,331 | 2,614,589 | |
Myers Industries, Inc. | 56,208 | 1,208,472 | |
| 4,038,819 | ||
Metals & Mining - 0.6% | |||
Worthington Industries, Inc. | 61,226 | 2,440,468 | |
Paper & Forest Products - 0.7% | |||
P.H. Glatfelter Co. | 6,088 | 184,771 | |
Resolute Forest Products (a) | 8,860 | 181,541 | |
Schweitzer-Mauduit International, Inc. | 50,390 | 2,425,271 | |
| 2,791,583 | ||
TOTAL MATERIALS | 18,550,705 | ||
TELECOMMUNICATION SERVICES - 0.7% | |||
Diversified Telecommunication Services - 0.7% | |||
IDT Corp. Class B | 17,208 | 308,884 | |
Inteliquent, Inc. | 177,902 | 2,483,512 | |
Premiere Global Services, Inc. (a) | 16,771 | 189,680 | |
| 2,982,076 | ||
Wireless Telecommunication Services - 0.0% | |||
Shenandoah Telecommunications Co. (e) | 3,376 | 89,228 | |
TOTAL TELECOMMUNICATION SERVICES | 3,071,304 | ||
Common Stocks - continued | |||
Shares | Value | ||
UTILITIES - 1.2% | |||
Electric Utilities - 0.3% | |||
El Paso Electric Co. | 32,074 | $ 1,130,609 | |
Genie Energy Ltd. Class B (a) | 6,893 | 78,994 | |
| 1,209,603 | ||
Independent Power Producers & Energy Traders - 0.0% | |||
Black Hills Corp. | 3,246 | 184,081 | |
Multi-Utilities - 0.4% | |||
Avista Corp. | 3,191 | 94,454 | |
NorthWestern Energy Corp. | 29,982 | 1,377,373 | |
| 1,471,827 | ||
Water Utilities - 0.5% | |||
American States Water Co. | 62,795 | 1,885,734 | |
Consolidated Water Co., Inc. | 13,838 | 173,529 | |
| 2,059,263 | ||
TOTAL UTILITIES | 4,924,774 | ||
TOTAL COMMON STOCKS (Cost $346,770,238) |
| ||
U.S. Treasury Obligations - 0.1% | ||||
| Principal Amount |
| ||
U.S. Treasury Bills, yield at date of purchase 0.07% to 0.08% 5/29/14 to 9/18/14 (f) | $ 400,000 |
| ||
Money Market Funds - 17.7% | |||
Shares |
| ||
Dreyfus Cash Management Institutional Shares, 0.10% (c) | 5,507,196 | 5,507,196 | |
Fidelity Securities Lending Cash Central Fund, 0.09% (b)(d) | 67,810,808 | 67,810,808 | |
TOTAL MONEY MARKET FUNDS (Cost $73,318,004) |
| ||
TOTAL INVESTMENT PORTFOLIO - 116.0% (Cost $420,488,141) | 481,795,157 | |
NET OTHER ASSETS (LIABILITIES) - (16.0)% | (66,450,943) | |
NET ASSETS - 100% | $ 415,344,214 | |
Futures Contracts | |||||
Expiration Date | Underlying Face Amount at Value | Unrealized Appreciation/(Depreciation) | |||
Purchased | |||||
Equity Index Contracts | |||||
60 ICE Russell 2000 Index Contracts (United States) | March 2014 | $ 7,091,400 | $ 256,530 | ||
|
The face value of futures purchased as a percentage of net assets is 1.7% |
Legend |
(a) Non-income producing |
(b) Affiliated fund that is generally available only to investment companies and other accounts managed by Fidelity Investments. The rate quoted is the annualized seven-day yield of the fund at period end. A complete unaudited listing of the fund's holdings as of its most recent quarter end is available upon request. In addition, each Fidelity Central Fund's financial statements, which are not covered by the Fund's Report of Independent Registered Public Accounting Firm, are available on the SEC's website or upon request. |
(c) The rate quoted is the annualized seven-day yield of the fund at period end. |
(d) Investment made with cash collateral received from securities on loan. |
(e) Security or a portion of the security is on loan at period end. |
(f) Security or a portion of the security was pledged to cover margin requirements for futures contracts. At period end, the value of securities pledged amounted to $266,938. |
Affiliated Central Funds |
Information regarding fiscal year to date income earned by the Fund from investments in Fidelity Central Funds is as follows: |
Fund | Income earned |
Fidelity Securities Lending Cash Central Fund | $ 68,060 |
Other Information |
The following is a summary of the inputs used, as of February 28, 2014, involving the Fund's assets and liabilities carried at fair value. The inputs or methodology used for valuing securities may not be an indication of the risk associated with investing in those securities. For more information on valuation inputs, and their aggregation into the levels used in the table below, please refer to the Investment Valuation section in the accompanying Notes to Financial Statements. |
Valuation Inputs at Reporting Date: | ||||
Description | Total | Level 1 | Level 2 | Level 3 |
Investments in Securities: | ||||
Equities: | ||||
Consumer Discretionary | $ 45,678,746 | $ 45,678,746 | $ - | $ - |
Consumer Staples | 19,476,392 | 19,476,392 | - | - |
Energy | 19,872,967 | 19,872,967 | - | - |
Financials | 85,012,404 | 85,012,404 | - | - |
Health Care | 65,472,477 | 65,472,477 | - | - |
Industrials | 65,174,200 | 65,174,200 | - | - |
Information Technology | 80,843,262 | 80,843,262 | - | - |
Materials | 18,550,705 | 18,550,705 | - | - |
Telecommunication Services | 3,071,304 | 3,071,304 | - | - |
Utilities | 4,924,774 | 4,924,774 | - | - |
U.S. Government and Government Agency Obligations | 399,922 | - | 399,922 | - |
Money Market Funds | 73,318,004 | 73,318,004 | - | - |
Total Investments in Securities: | $ 481,795,157 | $ 481,395,235 | $ 399,922 | $ - |
Derivative Instruments: | ||||
Assets | ||||
Futures Contracts | $ 256,530 | $ 256,530 | $ - | $ - |
Value of Derivative Instruments |
The following table is a summary of the Fund's value of derivative instruments by primary risk exposure as of February 28, 2014. For additional information on derivative instruments, please refer to the Derivative Instruments section in the accompanying Notes to Financial Statements. |
Primary Risk Exposure / | Value | |
| Asset | Liability |
Equity Risk | ||
Futures Contracts (a) | $ 256,530 | $ - |
Total Value of Derivatives | $ 256,530 | $ - |
(a) Reflects gross cumulative appreciation (depreciation) on futures contracts as presented in the Schedule of Investments. Only the period end receivable or payable for daily variation margin and net unrealized appreciation (depreciation) are presented in the Statement of Assets and Liabilities. |
See accompanying notes which are an integral part of the financial statements.
Annual Report
Fidelity Small Cap Enhanced Index Fund
Financial Statements
Statement of Assets and Liabilities
| February 28, 2014 | |
|
|
|
Assets | ||
Investment in securities, at value (including securities loaned of $65,477,247) - See accompanying schedule: Unaffiliated issuers (cost $352,677,333) | $ 413,984,349 |
|
Fidelity Central Funds (cost $67,810,808) | 67,810,808 |
|
Total Investments (cost $420,488,141) |
| $ 481,795,157 |
Receivable for investments sold | 2,379,630 | |
Receivable for fund shares sold | 930,288 | |
Dividends receivable | 332,351 | |
Interest receivable | 217 | |
Distributions receivable from Fidelity Central Funds | 4,582 | |
Other receivables | 259 | |
Total assets | 485,442,484 | |
|
|
|
Liabilities | ||
Payable to custodian bank | $ 511,690 | |
Payable for investments purchased | 616,584 | |
Payable for fund shares redeemed | 902,479 | |
Accrued management fee | 174,250 | |
Payable for daily variation margin for derivative instruments | 32,194 | |
Other affiliated payables | 50,265 | |
Collateral on securities loaned, at value | 67,810,808 | |
Total liabilities | 70,098,270 | |
|
|
|
Net Assets | $ 415,344,214 | |
Net Assets consist of: |
| |
Paid in capital | $ 341,593,899 | |
Undistributed net investment income | 25,678 | |
Accumulated undistributed net realized gain (loss) on investments | 12,161,091 | |
Net unrealized appreciation (depreciation) on investments | 61,563,546 | |
Net Assets, for 32,602,857 shares outstanding | $ 415,344,214 | |
Net Asset Value, offering price and redemption price per share ($415,344,214 ÷ 32,602,857 shares) | $ 12.74 | |
Statement of Operations
| Year ended February 28, 2014 | |
|
|
|
Investment Income |
|
|
Dividends |
| $ 3,913,452 |
Interest |
| 5,469 |
Income from Fidelity Central Funds |
| 68,060 |
Total income |
| 3,986,981 |
|
|
|
Expenses | ||
Management fee | $ 1,514,279 | |
Transfer agent fees | 437,718 | |
Independent trustees' compensation | 3,145 | |
Miscellaneous | 467 | |
Total expenses before reductions | 1,955,609 | |
Expense reductions | (38) | 1,955,571 |
Net investment income (loss) | 2,031,410 | |
Realized and Unrealized Gain (Loss) Net realized gain (loss) on: | ||
Investment securities: |
|
|
Unaffiliated issuers | 26,525,460 | |
Futures contracts | 2,386,516 | |
Total net realized gain (loss) |
| 28,911,976 |
Change in net unrealized appreciation (depreciation) on: Investment securities | 40,585,195 | |
Futures contracts | 109,038 | |
Total change in net unrealized appreciation (depreciation) |
| 40,694,233 |
Net gain (loss) | 69,606,209 | |
Net increase (decrease) in net assets resulting from operations | $ 71,637,619 | |
See accompanying notes which are an integral part of the financial statements.
Annual Report
Statement of Changes in Net Assets
| Year ended | Year ended |
Increase (Decrease) in Net Assets |
|
|
Operations |
|
|
Net investment income (loss) | $ 2,031,410 | $ 2,572,404 |
Net realized gain (loss) | 28,911,976 | 11,106,179 |
Change in net unrealized appreciation (depreciation) | 40,694,233 | 6,331,981 |
Net increase (decrease) in net assets resulting from operations | 71,637,619 | 20,010,564 |
Distributions to shareholders from net investment income | (2,047,855) | (2,545,839) |
Distributions to shareholders from net realized gain | (19,111,093) | (6,901,191) |
Total distributions | (21,158,948) | (9,447,030) |
Share transactions | 265,804,326 | 52,452,774 |
Reinvestment of distributions | 20,432,555 | 9,101,641 |
Cost of shares redeemed | (79,093,040) | (36,450,246) |
Net increase (decrease) in net assets resulting from share transactions | 207,143,841 | 25,104,169 |
Redemption fees | 154,299 | 26,146 |
Total increase (decrease) in net assets | 257,776,811 | 35,693,849 |
Net Assets | ||
Beginning of period | 157,567,403 | 121,873,554 |
End of period (including undistributed net investment income of $25,678 and undistributed net investment income of $72,543, respectively) | $ 415,344,214 | $ 157,567,403 |
Other Information Shares | ||
Sold | 22,629,417 | 5,233,611 |
Issued in reinvestment of distributions | 1,736,748 | 954,511 |
Redeemed | (6,682,361) | (3,697,266) |
Net increase (decrease) | 17,683,804 | 2,490,856 |
Financial Highlights
Years ended February 28, | 2014 | 2013 | 2012 F | 2011 | 2010 |
Selected Per-Share Data |
|
|
|
|
|
Net asset value, beginning of period | $ 10.56 | $ 9.81 | $ 10.72 | $ 8.05 | $ 5.20 |
Income from Investment Operations |
|
|
|
|
|
Net investment income (loss) B | .08 | .20 | .07 | .06 | .05 |
Net realized and unrealized gain (loss) | 2.91 | 1.30 | .14 | 2.67 | 2.86 |
Total from investment operations | 2.99 | 1.50 | .21 | 2.73 | 2.91 |
Distributions from net investment income | (.07) | (.20) | (.06) | (.06) | (.06) |
Distributions from net realized gain | (.75) | (.55) | (1.08) | - | - |
Total distributions | (.82) | (.75) | (1.13) H | (.06) | (.06) |
Redemption fees added to paid in capital B | .01 | - G | .01 | - G | - G |
Net asset value, end of period | $ 12.74 | $ 10.56 | $ 9.81 | $ 10.72 | $ 8.05 |
Total Return A | 29.35% | 16.15% | 2.87% | 34.01% | 55.93% |
Ratios to Average Net Assets C,E |
|
|
|
|
|
Expenses before reductions | .67% | .67% | .67% | .67% | .67% |
Expenses net of fee waivers, if any | .67% | .67% | .67% | .67% | .67% |
Expenses net of all reductions | .67% | .67% | .67% | .67% | .67% |
Net investment income (loss) | .70% | 2.02% | .69% | .63% | .77% |
Supplemental Data |
|
|
|
|
|
Net assets, end of period (000 omitted) | $ 415,344 | $ 157,567 | $ 121,874 | $ 113,829 | $ 85,243 |
Portfolio turnover rate D | 107% | 106% | 79% | 90% | 98% I |
A Total returns would have been lower if certain expenses had not been reduced during the applicable periods shown.
B Calculated based on average shares outstanding during the period.
C Fees and expenses of any underlying Fidelity Central Funds are not included in the Fund's expense ratio. The Fund indirectly bears its proportionate share of the expenses of any underlying Fidelity Central Funds.
D Amount does not include the portfolio activity of any underlying Fidelity Central Funds.
E Expense ratios reflect operating expenses of the Fund. Expenses before reductions do not reflect amounts reimbursed by the investment adviser or reductions from expense offset arrangements and do not represent the amount paid by the Fund during periods when reimbursements or reductions occur. Expenses net of fee waivers reflect expenses after reimbursement by the investment adviser but prior to reductions from expense offset arrangements. Expenses net of all reductions represent the net expenses paid by the Fund.
F For the year ended February 29.
G Amount represents less than $.01 per share.
H Total distributions of $1.13 per share is comprised of distributions from net investment income of $.056 and distributions from net realized gain of $1.075 per share.
I Reflects adjustments to exclude transaction in money market mutual funds.
See accompanying notes which are an integral part of the financial statements.
Annual Report
Fidelity International Enhanced Index Fund
Performance: The Bottom Line
Average annual total return reflects the change in the value of an investment, assuming reinvestment of the fund's distributions from dividend income and capital gains (the profits earned upon the sale of securities that have grown in value, if any) and assuming a constant rate of performance each year. The $10,000 table and the fund's returns do not reflect the deduction of taxes that a shareholder would pay on fund distributions or the redemption of fund shares. During periods of reimbursement by Fidelity, a fund's total returns will be greater than it would be had the reimbursement not occurred. How a fund did yesterday is no guarantee of how it will do tomorrow.
Average Annual Total Returns
Periods ended February 28, 2014 | Past 1 | Past 5 | Life of |
Fidelity International Enhanced Index Fund | 21.21% | 17.91% | 0.53% |
A From December 20, 2007.
$10,000 Over Life of Fund
Let's say hypothetically that $10,000 was invested in Fidelity International Enhanced Index Fund on December 20, 2007, when the fund started. The chart shows how the value of your investment would have changed, and also shows how the MSCI EAFE Index performed over the same period.
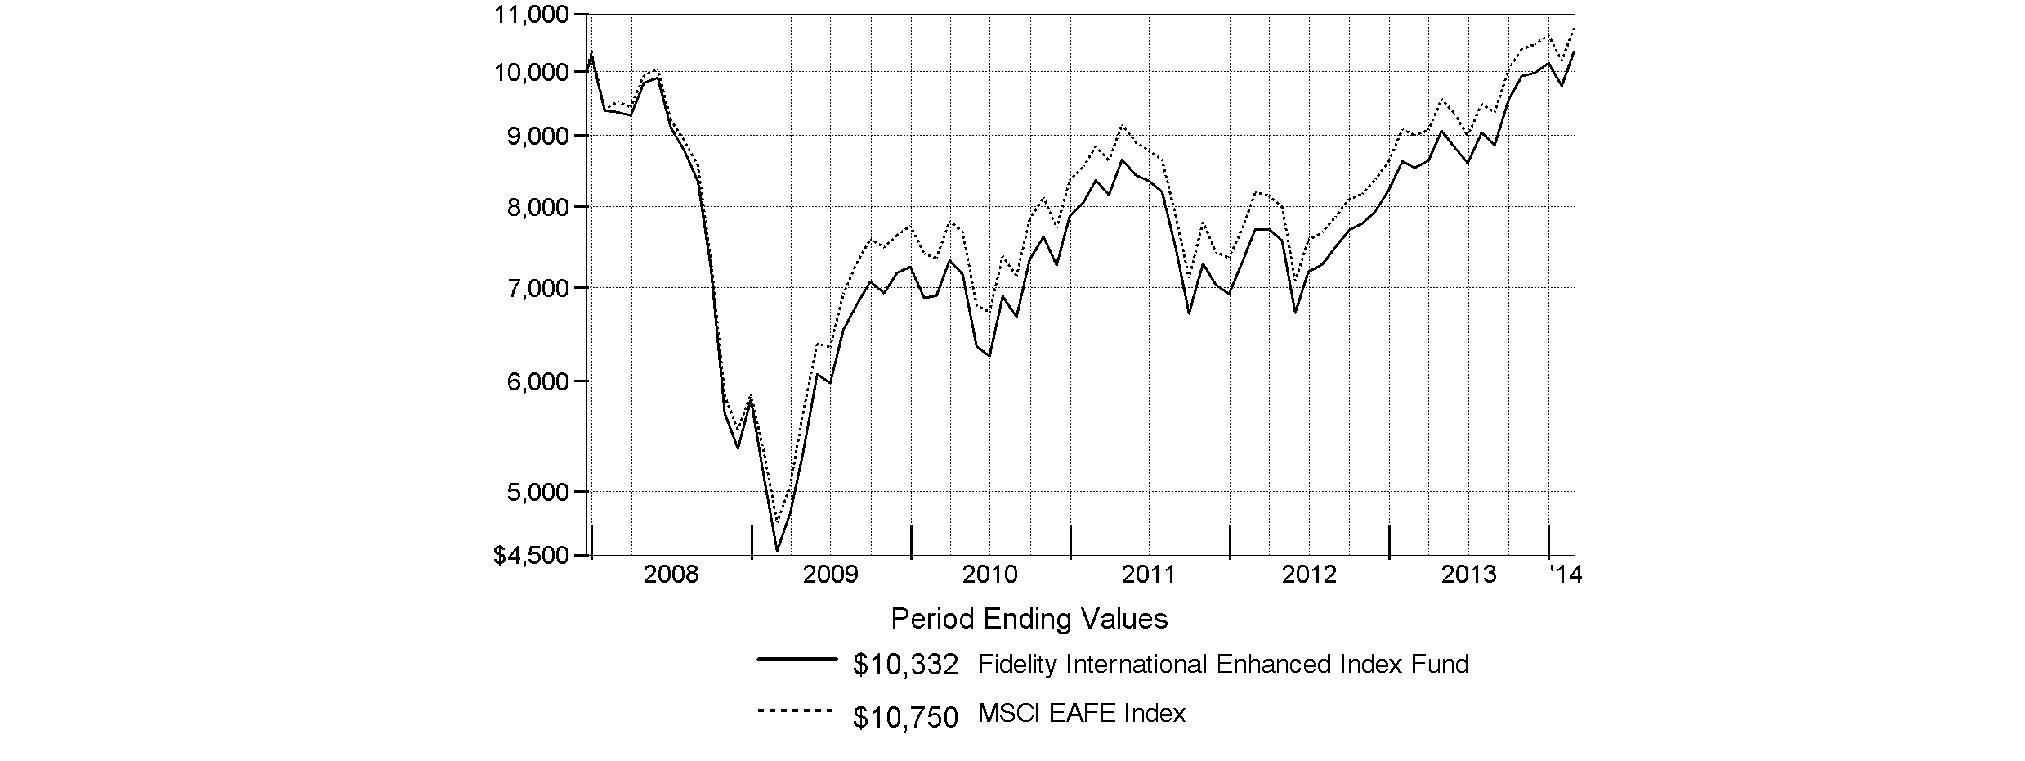
Annual Report
Fidelity International Enhanced Index Fund
Management's Discussion of Fund Performance
Market Recap: Overall, international equity markets remained upbeat for the 12 months ending February 28, 2014: the MSCI® ACWI® (All Country World Index) ex USA Index posted a 12.38% gain in U.S.-dollar terms. During the period, investors wrestled with fears of a U.S. debt default, a eurozone breakup, Middle East tensions, China's economic slowdown and a sell-off in emerging markets, plus off-again/on-again signals that the U.S. Federal Reserve would taper its massive stimulus program. But central banks worldwide maintained accommodative monetary policies, which, combined with modest cyclical improvements around the globe and generally low valuations, underpinned the broad equity rally. Economic stabilization helped bolster the U.K. (+22%) and the rest of Europe (+28%), with Italy (+39%) and Spain (+35%) in particular responding to rising sentiment and ultra-low interest rates. Japan's remarkable rebound (+14%) moderated later in the period but continued to benefit from expansionary policies, positive export trade and healthy consumer spending there, despite yen weakness. Asia-Pacific ex Japan fell flat, impeded by mining-industry malaise in Australia (-3%) and currency headwinds generally. Emerging-markets stocks (-7%) suffered from weakness in global commodities, U.S. dollar strength and major investor outflows driven by declining regional trade and Fed taper-talk.
Comments from Maximilian Kaufmann, Senior Portfolio Manager of the Geode Capital Management, LLC, investment management team for Fidelity® International Enhanced Index Fund: For the year, the fund gained 21.21%, surpassing the 19.42% increase in the benchmark MSCI® EAFE® Index. (The fund's performance relative to the index can be affected by Fidelity's methodologies for valuing certain foreign stocks and for incorporating foreign exchange rates, which differ from those used by the index.) Relative to the index, the fund benefited from favorable security selection across most sectors, especially materials and utilities, more than making up for weak picks in financials. On a regional basis, the fund benefited disproportionately from stock picks in Europe (excluding the U.K.) and, in particular, France, where our choices were especially helpful. Security selection in the U.K. also added value. Also of note, the fund was helped by a modest tailwind from favorable currency movements. The top relative contributor was Electricite de France (EDF), a state-owned electric utility and the world's largest nuclear operator. At the start of the reporting period, EDF's shares were not far above their lowest-ever price. Twelve months later, the stock had gained approximately 123%, driven by a more-favorable profit outlook and a regulatory change enabling EDF to charge higher electricity prices. Another triple-digit gainer was Actelion, a Swiss biopharmaceuticals company whose share value increased by 108%. Elsewhere, U.K.-based television network ITV enjoyed strong performance, as did Telecom Italia, the leading Italian telecommunication services provider, and Fuji Heavy Industries, a Japanese manufacturer of cars under the Subaru brand that benefited from growth in auto sales and market share in the U.S. In contrast, the fund's biggest individual detractor was SoftBank, in which the fund was significantly underweighted. As a result of our more limited exposure to this Japanese telecom provider, the fund did not fully capture the stock's increase of about 103%. SoftBank became better known in the U.S. for its July acquisition of mobile phone operator Sprint. Also detracting was Suedzcker, a German producer and supplier of sugar products whose shares returned -34%, as well as untimely ownership of Danish pharmaceuticals producer Novo-Nordisk.
The views expressed above reflect those of the portfolio manager(s) only through the end of the period as stated on the cover of this report and do not necessarily represent the views of Fidelity or any other person in the Fidelity organization. Any such views are subject to change at any time based upon market or other conditions and Fidelity disclaims any responsibility to update such views. These views may not be relied on as investment advice and, because investment decisions for a Fidelity fund are based on numerous factors, may not be relied on as an indication of trading intent on behalf of any Fidelity fund.
Annual Report
Fidelity International Enhanced Index Fund
Investment Changes (Unaudited)
Geographic Diversification (% of fund's net assets) | |||
As of February 28, 2014 | |||
 | United Kingdom | 19.9% |
|
 | Japan | 19.8% |
|
 | Germany | 9.4% |
|
 | France | 8.6% |
|
 | Switzerland | 8.3% |
|
 | Australia | 7.4% |
|
 | United States of America* | 5.1% |
|
 | Sweden | 3.0% |
|
 | Italy | 2.9% |
|
 | Other | 15.6% |
|

Percentages are based on country or territory of incorporation and are adjusted for the effect of futures contracts, if applicable. |
* Includes short-term investments and net other assets |
As of August 31, 2013 | |||
| United Kingdom | 21.8% |
|
| Japan | 20.9% |
|
| France | 9.3% |
|
| Germany | 9.1% |
|
| Switzerland | 8.4% |
|
| Australia | 7.7% |
|
| Hong Kong | 2.8% |
|
| Sweden | 2.5% |
|
| Italy | 2.5% |
|
| Other* | 15.0% |
|

Percentages are based on country or territory of incorporation and are adjusted for the effect of futures contracts, if applicable. |
* Includes short-term investments and net other assets |
Asset Allocation as of February 28, 2014 | ||
| % of fund's | % of fund's net assets |
Stocks and Equity Futures | 99.8 | 99.7 |
Short-Term Investments and Net Other Assets (Liabilities) | 0.2 | 0.3 |
Top Ten Stocks as of February 28, 2014 | ||
| % of fund's | % of fund's net assets |
Roche Holding AG (participation certificate) (Switzerland, Pharmaceuticals) | 2.0 | 1.9 |
HSBC Holding PLC (United Kingdom, Commercial Banks) | 1.6 | 1.5 |
Novartis AG (Switzerland, Pharmaceuticals) | 1.5 | 1.8 |
Toyota Motor Corp. (Japan, Automobiles) | 1.4 | 1.8 |
GlaxoSmithKline PLC (United Kingdom, Pharmaceuticals) | 1.4 | 1.3 |
Nestle SA (Switzerland, Food Products) | 1.4 | 1.6 |
Total SA (France, Oil, Gas & Consumable Fuels) | 1.4 | 1.4 |
BP PLC (United Kingdom, Oil, Gas & Consumable Fuels) | 1.3 | 1.5 |
Commonwealth Bank of Australia (Australia, Commercial Banks) | 1.1 | 1.4 |
Royal Dutch Shell PLC Class B (United Kingdom) (United Kingdom, Oil, Gas & Consumable Fuels) | 1.1 | 1.3 |
| 14.2 | |
Market Sectors as of February 28, 2014 | ||
| % of fund's | % of fund's net assets |
Financials | 22.2 | 25.8 |
Consumer Discretionary | 13.0 | 13.2 |
Industrials | 13.0 | 12.3 |
Health Care | 11.8 | 10.8 |
Consumer Staples | 8.7 | 10.5 |
Energy | 7.3 | 7.3 |
Materials | 6.1 | 6.4 |
Information Technology | 5.6 | 3.1 |
Telecommunication Services | 4.7 | 5.6 |
Utilities | 2.5 | 2.9 |
Annual Report
Fidelity International Enhanced Index Fund
Investments February 28, 2014
Showing Percentage of Net Assets
Common Stocks - 93.9% | |||
Shares | Value | ||
Australia - 7.4% | |||
Amcor Ltd. | 72 | $ 650 | |
ASX Ltd. | 3,673 | 123,107 | |
Australia & New Zealand Banking Group Ltd. | 14,677 | 420,938 | |
BHP Billiton Ltd. | 3,897 | 133,662 | |
Commonwealth Bank of Australia | 7,489 | 498,939 | |
Crown Ltd. | 54 | 833 | |
CSL Ltd. | 2,261 | 145,671 | |
DEXUS Property Group unit | 218,298 | 208,434 | |
Fortescue Metals Group Ltd. | 50,610 | 245,680 | |
Insurance Australia Group Ltd. | 30,498 | 147,777 | |
Leighton Holdings Ltd. | 243 | 3,918 | |
Macquarie Group Ltd. | 2,196 | 110,267 | |
National Australia Bank Ltd. | 9,778 | 303,120 | |
Orora Ltd. | 104 | 119 | |
Ramsay Health Care Ltd. | 11 | 474 | |
Rio Tinto Ltd. | 1,375 | 82,011 | |
Suncorp-Metway Ltd. | 6,718 | 72,777 | |
Sydney Airport unit | 29 | 105 | |
Telstra Corp. Ltd. | 415 | 1,870 | |
The GPT Group unit | 1,432 | 4,754 | |
Wesfarmers Ltd. | 5 | 192 | |
Westfield Retail Trust unit | 36,888 | 102,372 | |
Westpac Banking Corp. | 14,877 | 446,488 | |
Woodside Petroleum Ltd. | 8,297 | 280,975 | |
TOTAL AUSTRALIA | 3,335,133 | ||
Austria - 1.0% | |||
OMV AG | 4,987 | 226,951 | |
Voestalpine AG | 4,837 | 218,021 | |
TOTAL AUSTRIA | 444,972 | ||
Bailiwick of Jersey - 0.7% | |||
Shire PLC | 5,620 | 310,871 | |
Belgium - 1.2% | |||
Anheuser-Busch InBev SA NV | 852 | 89,114 | |
Belgacom SA | 3,417 | 103,079 | |
Delhaize Group SA | 629 | 45,242 | |
Solvay SA Class A | 604 | 93,708 | |
Telenet Group Holding NV | 3,009 | 192,050 | |
TOTAL BELGIUM | 523,193 | ||
Bermuda - 0.0% | |||
Yue Yuen Industrial (Holdings) Ltd. | 8,000 | 24,483 | |
Cayman Islands - 1.1% | |||
MGM China Holdings Ltd. | 52,000 | 221,788 | |
Sands China Ltd. | 34,000 | 284,336 | |
TOTAL CAYMAN ISLANDS | 506,124 | ||
Denmark - 1.2% | |||
A.P. Moller - Maersk A/S Series B | 23 | 281,199 | |
| |||
Shares | Value | ||
Coloplast A/S Series B | 2,235 | $ 188,258 | |
Novo Nordisk A/S Series B | 1,225 | 58,297 | |
TOTAL DENMARK | 527,754 | ||
Finland - 0.4% | |||
Kone Oyj (B Shares) | 3,272 | 133,277 | |
Sampo Oyj (A Shares) | 969 | 49,100 | |
Stora Enso Oyj (R Shares) | 11 | 125 | |
TOTAL FINLAND | 182,502 | ||
France - 8.6% | |||
AXA SA | 5,855 | 153,067 | |
BNP Paribas SA | 3,127 | 256,641 | |
Bouygues SA | 2,196 | 88,540 | |
Cap Gemini SA | 2,607 | 204,140 | |
Christian Dior SA | 913 | 180,589 | |
Compagnie de St. Gobain | 3,574 | 214,594 | |
EDF SA | 266 | 10,580 | |
France Telecom SA | 21,567 | 268,985 | |
GDF Suez | 13,286 | 340,916 | |
L'Oreal SA | 307 | 52,016 | |
Lafarge SA (Bearer) | 1 | 75 | |
LVMH Moet Hennessy - Louis Vuitton SA | 186 | 34,621 | |
Michelin CGDE Series B | 544 | 66,506 | |
Safran SA | 1,838 | 129,412 | |
Sanofi SA | 3,980 | 413,959 | |
Schneider Electric SA | 3,972 | 354,995 | |
SCOR SE | 1,513 | 53,003 | |
Societe Generale Series A | 1,310 | 87,471 | |
Total SA | 9,356 | 607,009 | |
Unibail-Rodamco | 88 | 23,188 | |
VINCI SA | 4,002 | 299,012 | |
TOTAL FRANCE | 3,839,319 | ||
Germany - 8.6% | |||
adidas AG | 401 | 46,715 | |
Allianz SE | 1,598 | 284,980 | |
BASF AG | 3,627 | 417,630 | |
Bayer AG | 2,524 | 358,491 | |
Bayerische Motoren Werke AG (BMW) | 648 | 75,311 | |
Continental AG | 383 | 93,228 | |
Daimler AG (Germany) | 748 | 69,712 | |
Deutsche Bank AG | 2,023 | 97,841 | |
Deutsche Post AG | 2,572 | 96,599 | |
Deutsche Telekom AG | 10,657 | 180,288 | |
E.ON AG | 15,195 | 289,856 | |
Fresenius Medical Care AG & Co. KGaA | 3,307 | 226,891 | |
Fresenius SE & Co. KGaA | 842 | 130,865 | |
Hannover Reuck SE | 649 | 55,272 | |
Infineon Technologies AG | 15,780 | 179,041 | |
Merck KGaA | 1,276 | 223,680 | |
Metro AG | 2 | 83 | |
Muenchener Rueckversicherungs AG | 867 | 189,860 | |
ProSiebenSat.1 Media AG | 5,134 | 244,837 | |
Common Stocks - continued | |||
Shares | Value | ||
Germany - continued | |||
SAP AG | 268 | $ 21,556 | |
Siemens AG | 2,965 | 395,316 | |
Suedzucker AG (Bearer) | 7,243 | 201,450 | |
TOTAL GERMANY | 3,879,502 | ||
Hong Kong - 1.8% | |||
BOC Hong Kong (Holdings) Ltd. | 30,500 | 92,555 | |
Cheung Kong Holdings Ltd. | 9,000 | 141,021 | |
Hang Seng Bank Ltd. | 3,800 | 61,599 | |
Hopewell Holdings Ltd. | 22,500 | 76,106 | |
Hutchison Whampoa Ltd. | 8,000 | 107,827 | |
Hysan Development Co. Ltd. | 19,005 | 79,345 | |
SJM Holdings Ltd. | 73,000 | 234,223 | |
TOTAL HONG KONG | 792,676 | ||
Ireland - 0.0% | |||
Bank of Ireland (a) | 53 | 28 | |
CRH PLC | 2 | 59 | |
TOTAL IRELAND | 87 | ||
Italy - 2.7% | |||
Assicurazioni Generali SpA | 1,780 | 40,023 | |
Atlantia SpA | 3,602 | 91,283 | |
Enel SpA | 59,933 | 307,739 | |
Eni SpA | 6,728 | 161,516 | |
EXOR SpA | 1,583 | 64,392 | |
Fiat SpA (a) | 23,216 | 243,062 | |
Intesa Sanpaolo SpA | 15,856 | 49,156 | |
Luxottica Group SpA | 701 | 38,921 | |
Prysmian SpA | 1,885 | 48,759 | |
Telecom Italia SpA | 87,526 | 99,418 | |
Terna SpA | 21 | 107 | |
UniCredit SpA | 8,318 | 66,190 | |
Unipolsai SpA (a) | 7,598 | 25,988 | |
TOTAL ITALY | 1,236,554 | ||
Japan - 19.8% | |||
Aisin Seiki Co. Ltd. | 2,200 | 76,309 | |
Ajinomoto Co., Inc. | 13,000 | 201,823 | |
Alfresa Holdings Corp. | 300 | 17,599 | |
Aozora Bank Ltd. | 6,000 | 17,484 | |
Bridgestone Corp. | 2,300 | 83,184 | |
Canon, Inc. | 5,300 | 165,364 | |
Central Japan Railway Co. | 1,800 | 210,082 | |
Coca-Cola West Co. Ltd. | 800 | 14,818 | |
Dai Nippon Printing Co. Ltd. | 11,000 | 110,819 | |
Daihatsu Motor Co. Ltd. | 6,000 | 96,394 | |
Daiwa House Industry Co. Ltd. | 3,000 | 54,602 | |
Daiwa Securities Group, Inc. | 23,000 | 208,143 | |
DENSO Corp. | 4,500 | 241,431 | |
Fuji Heavy Industries Ltd. | 8,000 | 217,157 | |
Fujifilm Holdings Corp. | 2,000 | 57,679 | |
| |||
Shares | Value | ||
Hino Motors Ltd. | 11,000 | $ 163,244 | |
Hirose Electric Co. Ltd. | 200 | 28,496 | |
Hitachi Ltd. | 41,000 | 324,679 | |
Honda Motor Co. Ltd. | 3,500 | 125,976 | |
Hoya Corp. | 5,600 | 165,959 | |
Ibiden Co. Ltd. | 4,100 | 80,171 | |
Itochu Corp. | 400 | 4,985 | |
Japan Tobacco, Inc. | 300 | 9,555 | |
JFE Holdings, Inc. | 3,000 | 61,232 | |
JTEKT Corp. | 2,100 | 35,149 | |
Kao Corp. | 6,100 | 210,048 | |
Kinden Corp. | 4,000 | 41,545 | |
Kobe Steel Ltd. (a) | 1,000 | 1,370 | |
Konica Minolta, Inc. | 3,000 | 30,607 | |
Marubeni Corp. | 1,000 | 7,030 | |
Mazda Motor Corp. (a) | 15,000 | 72,450 | |
Medipal Holdings Corp. | 13,600 | 209,806 | |
Mitsubishi Chemical Holdings Corp. | 900 | 4,073 | |
Mitsubishi Heavy Industries Ltd. | 32,000 | 197,140 | |
Mitsubishi UFJ Financial Group, Inc. | 17,300 | 100,248 | |
Mitsui & Co. Ltd. | 11,900 | 183,448 | |
Mizuho Financial Group, Inc. | 167,300 | 344,103 | |
MS&AD Insurance Group Holdings, Inc. | 1,300 | 30,890 | |
Namco Bandai Holdings, Inc. | 1,500 | 33,561 | |
NEC Corp. | 54,000 | 182,594 | |
Nippon Steel & Sumitomo Metal Corp. | 9,000 | 26,369 | |
Nippon Telegraph & Telephone Corp. | 4,600 | 258,976 | |
Nisshin Seifun Group, Inc. | 2,500 | 26,990 | |
Nomura Holdings, Inc. | 8,800 | 59,695 | |
NTT DoCoMo, Inc. | 10,600 | 176,676 | |
Omron Corp. | 500 | 21,003 | |
ORIX Corp. | 5,500 | 81,065 | |
Otsuka Holdings Co. Ltd. | 7,100 | 217,877 | |
Panasonic Corp. | 11,000 | 137,779 | |
Resona Holdings, Inc. | 44,100 | 230,408 | |
Ricoh Co. Ltd. | 10,200 | 128,483 | |
ROHM Co. Ltd. | 2,000 | 103,370 | |
SBI Holdings, Inc. Japan | 1,400 | 16,645 | |
Sekisui House Ltd. | 10,000 | 125,657 | |
Seven & i Holdings Co., Ltd. | 2,000 | 75,202 | |
Shimamura Co. Ltd. | 2,000 | 180,603 | |
SoftBank Corp. | 900 | 68,205 | |
Sojitz Corp. | 115,200 | 204,520 | |
Sumitomo Corp. | 9,300 | 123,028 | |
Sumitomo Mitsui Financial Group, Inc. | 8,300 | 372,654 | |
Suzuki Motor Corp. | 8,300 | 223,310 | |
Takashimaya Co. Ltd. | 7,000 | 60,957 | |
Tokyo Electric Power Co., Inc. (a) | 2,000 | 9,354 | |
Toppan Printing Co. Ltd. | 9,000 | 67,035 | |
Toyo Seikan Group Holdings Ltd. | 8,000 | 140,445 | |
Toyoda Gosei Co. Ltd. | 4,300 | 90,758 | |
Toyota Motor Corp. | 11,300 | 650,350 | |
Trend Micro, Inc. | 6,700 | 225,411 | |
Common Stocks - continued | |||
Shares | Value | ||
Japan - continued | |||
West Japan Railway Co. | 5,300 | $ 217,871 | |
Yamaguchi Financial Group, Inc. | 17,000 | 148,167 | |
TOTAL JAPAN | 8,890,110 | ||
Luxembourg - 0.2% | |||
Tenaris SA | 3,901 | 81,463 | |
Netherlands - 2.3% | |||
Airbus Group NV | 1,877 | 138,324 | |
CNH Industrial NV | 7,582 | 83,410 | |
ING Groep NV (Certificaten Van Aandelen) (a) | 8,347 | 121,216 | |
Koninklijke Ahold NV | 13,765 | 256,783 | |
Koninklijke Philips Electronics NV | 44 | 1,537 | |
Unilever NV (Certificaten Van Aandelen) (Bearer) | 10,370 | 410,080 | |
Ziggo NV | 297 | 13,590 | |
TOTAL NETHERLANDS | 1,024,940 | ||
New Zealand - 0.2% | |||
Telecom Corp. of New Zealand Ltd. | 35,711 | 74,850 | |
Norway - 1.4% | |||
DNB ASA | 6,553 | 118,897 | |
Statoil ASA | 9,579 | 252,656 | |
Telenor ASA | 7,808 | 172,499 | |
Yara International ASA | 2,561 | 103,857 | |
TOTAL NORWAY | 647,909 | ||
Portugal - 0.0% | |||
Energias de Portugal SA | 4 | 17 | |
Singapore - 1.6% | |||
CapitaLand Ltd. | 25,000 | 56,206 | |
ComfortDelgro Corp. Ltd. | 77,000 | 117,233 | |
DBS Group Holdings Ltd. | 11,106 | 144,733 | |
Jardine Cycle & Carriage Ltd. | 1,000 | 30,955 | |
United Overseas Bank Ltd. | 15,000 | 244,113 | |
Wilmar International Ltd. | 40,000 | 108,863 | |
TOTAL SINGAPORE | 702,103 | ||
Spain - 2.5% | |||
Abertis Infraestructuras SA | 5,655 | 132,851 | |
Amadeus IT Holding SA Class A | 6,251 | 274,939 | |
Banco Bilbao Vizcaya Argentaria SA | 13,492 | 166,687 | |
Banco Santander SA (Spain) | 45,071 | 406,840 | |
Criteria CaixaCorp SA | 3 | 19 | |
Distribuidora Internacional de Alimentacion SA | 9,116 | 78,265 | |
Gas Natural SDG SA | 992 | 25,461 | |
Grifols SA | 698 | 39,790 | |
Repsol YPF SA | 1 | 25 | |
Telefonica SA | 4 | 61 | |
TOTAL SPAIN | 1,124,938 | ||
| |||
Shares | Value | ||
Sweden - 3.0% | |||
H&M Hennes & Mauritz AB (B Shares) | 2,061 | $ 92,962 | |
Industrivarden AB (C Shares) | 2,875 | 55,602 | |
Investor AB (B Shares) | 2,744 | 97,791 | |
Nordea Bank AB | 13,635 | 195,328 | |
Securitas AB (B Shares) | 19,046 | 209,868 | |
Skandinaviska Enskilda Banken AB (A Shares) | 8,187 | 115,112 | |
Svenska Handelsbanken AB (A Shares) | 352 | 18,392 | |
Swedbank AB (A Shares) | 4,688 | 132,342 | |
Telefonaktiebolaget LM Ericsson | 19,611 | 253,508 | |
TeliaSonera AB | 20,217 | 155,798 | |
TOTAL SWEDEN | 1,326,703 | ||
Switzerland - 8.3% | |||
ABB Ltd. (Reg.) | 6,252 | 159,564 | |
Actelion Ltd. | 1,936 | 205,267 | |
Compagnie Financiere Richemont SA Series A | 1,349 | 134,363 | |
Credit Suisse Group AG | 2,849 | 89,454 | |
Geberit AG (Reg.) | 735 | 231,155 | |
Givaudan SA | 81 | 127,095 | |
Nestle SA | 8,065 | 609,272 | |
Novartis AG | 8,078 | 672,333 | |
Roche Holding AG (participation certificate) | 2,991 | 920,929 | |
Swiss Re Ltd. | 1,817 | 169,821 | |
Transocean Ltd. (Switzerland) | 2,129 | 89,977 | |
UBS AG | 8,850 | 189,328 | |
Zurich Insurance Group AG | 418 | 128,085 | |
TOTAL SWITZERLAND | 3,726,643 | ||
United Kingdom - 19.9% | |||
Anglo American PLC (United Kingdom) | 5,926 | 151,348 | |
Antofagasta PLC | 16,038 | 241,842 | |
AstraZeneca PLC: | |||
(United Kingdom) | 1,546 | 105,093 | |
sponsored ADR (e) | 3,408 | 230,926 | |
Aviva PLC | 10,303 | 81,914 | |
BAE Systems PLC | 39,244 | 270,027 | |
Barclays PLC | 41,335 | 174,126 | |
BG Group PLC | 954 | 17,389 | |
BHP Billiton PLC | 8,695 | 280,212 | |
BP PLC | 71,171 | 601,470 | |
British American Tobacco PLC (United Kingdom) | 6,349 | 346,093 | |
British Sky Broadcasting Group PLC | 17,490 | 275,306 | |
BT Group PLC | 3,134 | 21,555 | |
Burberry Group PLC | 1 | 26 | |
Capita Group PLC | 6,246 | 119,235 | |
Cobham PLC | 25,045 | 125,104 | |
Diageo PLC | 1,545 | 48,516 | |
easyJet PLC | 2,698 | 77,754 | |
GlaxoSmithKline PLC | 1,351 | 37,841 | |
Common Stocks - continued | |||
Shares | Value | ||
United Kingdom - continued | |||
GlaxoSmithKline PLC sponsored ADR (e) | 10,309 | $ 576,685 | |
HSBC Holdings PLC: | |||
(United Kingdom) | 36,054 | 380,514 | |
sponsored ADR (e) | 5,797 | 306,024 | |
ITV PLC | 69,092 | 233,594 | |
J Sainsbury PLC | 35,801 | 205,391 | |
Legal & General Group PLC | 5,299 | 21,332 | |
Lloyds Banking Group PLC (a) | 116,116 | 160,357 | |
Marks & Spencer Group PLC | 10,842 | 91,413 | |
Next PLC | 1,908 | 215,186 | |
Old Mutual PLC | 28,487 | 94,022 | |
Pearson PLC | 2 | 34 | |
Persimmon PLC | 8,446 | 204,511 | |
Prudential PLC | 5,779 | 130,852 | |
Reckitt Benckiser Group PLC | 963 | 79,243 | |
Rexam PLC | 1,308 | 10,814 | |
Rio Tinto PLC | 8,025 | 460,159 | |
Rolls-Royce Group PLC | 16,596 | 277,630 | |
Royal & Sun Alliance Insurance Group PLC | 34,690 | 56,493 | |
Royal Dutch Shell PLC: | |||
Class A (United Kingdom) | 13,071 | 475,851 | |
Class B (United Kingdom) | 12,609 | 490,522 | |
Scottish & Southern Energy PLC | 7,942 | 186,589 | |
Standard Chartered PLC (United Kingdom) | 9,710 | 205,687 | |
Standard Life PLC | 3 | 20 | |
Tate & Lyle PLC | 2,682 | 28,833 | |
Tesco PLC | 39,670 | 218,448 | |
Unilever PLC | 5,270 | 215,543 | |
Vodafone Group PLC | 85,096 | 354,592 | |
WM Morrison Supermarkets PLC | 4,570 | 18,008 | |
TOTAL UNITED KINGDOM | 8,904,124 | ||
TOTAL COMMON STOCKS (Cost $37,093,877) |
| ||
Nonconvertible Preferred Stocks - 1.0% | |||
|
|
|
|
Germany - 0.8% | |||
Henkel AG & Co. KGaA | 2,375 | 265,043 | |
Volkswagen AG | 389 | 101,481 | |
TOTAL GERMANY | 366,524 | ||
Italy - 0.2% | |||
Telecom Italia SpA (Risparmio Shares) | 78,802 | 68,993 | |
TOTAL NONCONVERTIBLE PREFERRED STOCKS (Cost $344,735) |
| ||
Government Obligations - 0.1% | ||||
| Principal Amount | Value | ||
United States of America - 0.1% | ||||
U.S. Treasury Bills, yield at date of purchase 0.04% 6/26/14 (f) | $ 50,000 | $ 49,991 | ||
Money Market Funds - 6.2% | |||
Shares |
| ||
Dreyfus Cash Management Institutional Shares, 0.10% (c) | 1,845,881 | 1,845,881 | |
Fidelity Securities Lending Cash Central Fund, 0.09% (b)(d) | 936,275 | 936,275 | |
TOTAL MONEY MARKET FUNDS (Cost $2,782,156) |
| ||
TOTAL INVESTMENT PORTFOLIO - 101.2% (Cost $40,270,761) | 45,374,634 | |
NET OTHER ASSETS (LIABILITIES) - (1.2)% | (546,731) | |
NET ASSETS - 100% | $ 44,827,903 | |
Futures Contracts | |||||
Expiration Date | Underlying Face Amount at Value | Unrealized Appreciation/(Depreciation) | |||
Purchased | |||||
Equity Index Contracts | |||||
23 NYSE E-mini MSCI EAFE Index Contracts (United States) | March 2014 | $ 2,218,695 | $ 14,922 | ||
|
The face value of futures purchased as a percentage of net assets is 4.9% |
Legend |
(a) Non-income producing |
(b) Affiliated fund that is generally available only to investment companies and other accounts managed by Fidelity Investments. The rate quoted is the annualized seven-day yield of the fund at period end. A complete unaudited listing of the fund's holdings as of its most recent quarter end is available upon request. In addition, each Fidelity Central Fund's financial statements, which are not covered by the Fund's Report of Independent Registered Public Accounting Firm, are available on the SEC's website or upon request. |
(c) The rate quoted is the annualized seven-day yield of the fund at period end. |
(d) Investment made with cash collateral received from securities on loan. |
(e) Security or a portion of the security is on loan at period end. |
(f) Security or a portion of the security was pledged to cover margin requirements for futures contracts. At period end, the value of securities pledged amounted to $49,991. |
Affiliated Central Funds |
Information regarding fiscal year to date income earned by the Fund from investments in Fidelity Central Funds is as follows: |
Fund | Income earned |
Fidelity Securities Lending Cash Central Fund | $ 2,153 |
Other Information |
Categorizations in the Schedule of Investments are based on country or territory of incorporation. |
The following is a summary of the inputs used, as of February 28, 2014, involving the Fund's assets and liabilities carried at fair value. The inputs or methodology used for valuing securities may not be an indication of the risk associated with investing in those securities. For more information on valuation inputs, and their aggregation into the levels used in the tables below, please refer to the Investment Valuation section in the accompanying Notes to Financial Statements. |
Valuation Inputs at Reporting Date: | ||||
Description | Total | Level 1 | Level 2 | Level 3 |
Investments in Securities: | ||||
Equities: | ||||
Consumer Discretionary | $ 5,846,922 | $ 3,869,716 | $ 1,977,206 | $ - |
Consumer Staples | 3,814,914 | 1,354,230 | 2,460,684 | - |
Energy | 3,285,804 | 615,317 | 2,670,487 | - |
Financials | 10,035,104 | 5,886,252 | 4,148,852 | - |
Health Care | 5,291,603 | 2,545,389 | 2,746,214 | - |
Industrials | 5,830,530 | 3,749,762 | 2,080,768 | - |
Information Technology | 2,447,000 | 1,057,119 | 1,389,881 | - |
Materials | 2,800,556 | 1,541,627 | 1,258,929 | - |
Telecommunication Services | 2,019,435 | 521,686 | 1,497,749 | - |
Utilities | 1,170,619 | 1,161,265 | 9,354 | - |
Government Obligations | 49,991 | - | 49,991 | - |
Money Market Funds | 2,782,156 | 2,782,156 | - | - |
Total Investments in Securities: | $ 45,374,634 | $ 25,084,519 | $ 20,290,115 | $ - |
Derivative Instruments: | ||||
Assets | ||||
Futures Contracts | $ 14,922 | $ 14,922 | $ - | $ - |
The following is a summary of transfers between Level 1 and Level 2 for the period ended February 28, 2014. Transfers are assumed to have occurred at the beginning of the period, and are primarily attributable to the valuation techniques used for foreign equity securities, as discussed in the accompanying Notes to Financial Statements: |
Transfers | Total |
Level 1 to Level 2 | $ 3,366,549 |
Level 2 to Level 1 | $ 0 |
Value of Derivative Instruments |
The following table is a summary of the Fund's value of derivative instruments by primary risk exposure as of February 28, 2014. For additional information on derivative instruments, please refer to the Derivative Instruments section in the accompanying Notes to Financial Statements. |
Primary Risk Exposure / | Value | |
| Asset | Liability |
Equity Risk | ||
Futures Contracts (a) | $ 14,922 | $ - |
Total Value of Derivatives | $ 14,922 | $ - |
(a) Reflects gross cumulative appreciation (depreciation) on futures contracts as presented in the Schedule of Investments. Only the period end receivable or payable for daily variation margin and net unrealized appreciation (depreciation) are presented in the Statement of Assets and Liabilities. |
See accompanying notes which are an integral part of the financial statements.
Annual Report
Fidelity International Enhanced Index Fund
Financial Statements
Statement of Assets and Liabilities
| February 28, 2014 | |
|
|
|
Assets | ||
Investment in securities, at value (including securities loaned of $910,019) - See accompanying schedule: Unaffiliated issuers (cost $39,334,486) | $ 44,438,359 |
|
Fidelity Central Funds (cost $936,275) | 936,275 |
|
Total Investments (cost $40,270,761) |
| $ 45,374,634 |
Segregated cash with brokers for derivative instruments | 73,948 | |
Foreign currency held at value (cost $106,672) | 108,405 | |
Receivable for fund shares sold | 34,585 | |
Dividends receivable | 224,936 | |
Interest receivable | 34 | |
Distributions receivable from Fidelity Central Funds | 48 | |
Receivable for daily variation margin for derivative instruments | 3,943 | |
Total assets | 45,820,533 | |
|
|
|
Liabilities | ||
Payable for fund shares redeemed | $ 34,096 | |
Accrued management fee | 16,875 | |
Other affiliated payables | 5,384 | |
Collateral on securities loaned, at value | 936,275 | |
Total liabilities | 992,630 | |
|
|
|
Net Assets | $ 44,827,903 | |
Net Assets consist of: |
| |
Paid in capital | $ 40,436,293 | |
Undistributed net investment income | 268,444 | |
Accumulated undistributed net realized gain (loss) on investments and foreign currency transactions | (1,001,442) | |
Net unrealized appreciation (depreciation) on investments and assets and liabilities in foreign currencies | 5,124,608 | |
Net Assets, for 5,062,748 shares outstanding | $ 44,827,903 | |
Net Asset Value, offering price and redemption price per share ($44,827,903 ÷ 5,062,748 shares) | $ 8.85 | |
Statement of Operations
| Year ended February 28, 2014 | |
|
|
|
Investment Income |
|
|
Dividends |
| $ 1,243,176 |
Special dividends |
| 271,337 |
Interest |
| 455 |
Income from Fidelity Central Funds |
| 2,153 |
Income before foreign taxes withheld |
| 1,517,121 |
Less foreign taxes withheld |
| (84,611) |
Total income |
| 1,432,510 |
|
|
|
Expenses | ||
Management fee | $ 167,365 | |
Transfer agent fees | 53,545 | |
Independent trustees' compensation | 408 | |
Miscellaneous | 66 | |
Total expenses | 221,384 | |
Net investment income (loss) | 1,211,126 | |
Realized and Unrealized Gain (Loss) Net realized gain (loss) on: | ||
Investment securities: |
|
|
Unaffiliated issuers | 2,591,126 | |
Foreign currency transactions | (15,597) | |
Futures contracts | 41,937 | |
Total net realized gain (loss) |
| 2,617,466 |
Change in net unrealized appreciation (depreciation) on: Investment securities | 2,926,382 | |
Assets and liabilities in foreign currencies | 10,886 | |
Futures contracts | 16,916 | |
Total change in net unrealized appreciation (depreciation) |
| 2,954,184 |
Net gain (loss) | 5,571,650 | |
Net increase (decrease) in net assets resulting from operations | $ 6,782,776 | |
See accompanying notes which are an integral part of the financial statements.
Annual Report
Statement of Changes in Net Assets
| Year ended | Year ended |
Increase (Decrease) in Net Assets |
|
|
Operations |
|
|
Net investment income (loss) | $ 1,211,126 | $ 779,169 |
Net realized gain (loss) | 2,617,466 | 344,459 |
Change in net unrealized appreciation (depreciation) | 2,954,184 | 1,499,563 |
Net increase (decrease) in net assets resulting from operations | 6,782,776 | 2,623,191 |
Distributions to shareholders from net investment income | (694,999) | (774,163) |
Distributions to shareholders from net realized gain | (57,603) | (63,148) |
Total distributions | (752,602) | (837,311) |
Share transactions | 19,510,478 | 9,411,727 |
Reinvestment of distributions | 723,305 | 807,297 |
Cost of shares redeemed | (11,849,737) | (7,659,451) |
Net increase (decrease) in net assets resulting from share transactions | 8,384,046 | 2,559,573 |
Redemption fees | 2,035 | 229 |
Total increase (decrease) in net assets | 14,416,255 | 4,345,682 |
Net Assets | ||
Beginning of period | 30,411,648 | 26,065,966 |
End of period (including undistributed net investment income of $268,444 and undistributed net investment income of $68,799, respectively) | $ 44,827,903 | $ 30,411,648 |
Other Information Shares | ||
Sold | 2,360,127 | 1,352,694 |
Issued in reinvestment of distributions | 88,370 | 114,634 |
Redeemed | (1,467,277) | (1,136,991) |
Net increase (decrease) | 981,220 | 330,337 |
Financial Highlights
Years ended February 28, | 2014 | 2013 | 2012 F | 2011 | 2010 |
Selected Per-Share Data |
|
|
|
|
|
Net asset value, beginning of period | $ 7.45 | $ 6.95 | $ 7.77 | $ 6.58 | $ 4.42 |
Income from Investment Operations |
|
|
|
|
|
Net investment income (loss) B | .28 J | .21 | .20 | .17 | .15 |
Net realized and unrealized gain (loss) | 1.29 | .52 | (.82) | 1.19 | 2.17 |
Total from investment operations | 1.57 | .73 | (.62) | 1.36 | 2.32 |
Distributions from net investment income | (.15) | (.21) | (.19) | (.17) | (.14) |
Distributions from net realized gain | (.01) | (.02) | (.01) | - | (.02) |
Total distributions | (.17) H | (.23) | (.20) | (.17) | (.16) |
Redemption fees added to paid in capital B,G | - | - | - | - | - |
Net asset value, end of period | $ 8.85 | $ 7.45 | $ 6.95 | $ 7.77 | $ 6.58 |
Total Return A | 21.21% | 10.64% | (7.81)% | 20.95% | 52.44% |
Ratios to Average Net Assets C,E |
|
|
|
|
|
Expenses before reductions | .62% | .62% | .62% | .62% | .62% |
Expenses net of fee waivers, if any | .62% | .62% | .62% | .62% | .62% |
Expenses net of all reductions | .62% | .62% | .62% | .62% | .62% |
Net investment income (loss) | 3.40% J | 3.04% | 2.84% | 2.50% | 2.39% |
Supplemental Data |
|
|
|
|
|
Net assets, end of period (000 omitted) | $ 44,828 | $ 30,412 | $ 26,066 | $ 25,475 | $ 19,958 |
Portfolio turnover rate D | 63% | 56% | 49% | 32% | 22% I |
A Total returns would have been lower if certain expenses had not been reduced during the applicable periods shown.
B Calculated based on average shares outstanding during the period.
C Fees and expenses of any underlying Fidelity Central Funds are not included in the Fund's expense ratio. The Fund indirectly bears its proportionate share of the expenses of any underlying Fidelity Central Funds.
D Amount does not include the portfolio activity of any underlying Fidelity Central Funds.
E Expense ratios reflect operating expenses of the Fund. Expenses before reductions do not reflect amounts reimbursed by the investment adviser or reductions from expense offset arrangements and do not represent the amount paid by the Fund during periods when reimbursements or reductions occur. Expenses net of fee waivers reflect expenses after reimbursement by the investment adviser but prior to reductions from expense offset arrangements. Expenses net of all reductions represent the net expenses paid by the Fund.
F For the year ended February 29.
G Amount represents less than $.01 per share.
H Total distributions of $.17 per share is comprised of distributions from net investment income of $.153 and distributions from net realized gain of $.013 per share.
I Reflects adjustments to exclude transactions in money market mutual funds.
J Investment income per share reflects a large, non-recurring dividend which amounted to $.06 per share. Excluding this non-recurring dividend, the ratio of net investment income (loss) to average net assets would have been 2.64%.
See accompanying notes which are an integral part of the financial statements.
Annual Report
Notes to Financial Statements
For the period ended February 28, 2014
1. Organization.
Fidelity Large Cap Growth Enhanced Index Fund, Fidelity Large Cap Value Enhanced Index Fund, Fidelity Large Cap Core Enhanced Index Fund, Fidelity Mid Cap Enhanced Index Fund, Fidelity Small Cap Enhanced Index Fund and Fidelity International Enhanced Index Fund (the Funds) are funds of Fidelity Commonwealth Trust II (the Trust) and are authorized to issue an unlimited number of shares. The Trust is registered under the Investment Company Act of 1940, as amended (the 1940 Act), as an open-end management investment company organized as a Delaware statutory trust.
2. Significant Accounting Policies.
The financial statements have been prepared in conformity with accounting principles generally accepted in the United States of America (GAAP), which require management to make certain estimates and assumptions at the date of the financial statements. Actual results could differ from those estimates. Subsequent events, if any, through the date that the financial statements were issued have been evaluated in the preparation of the financial statements. The following summarizes the significant accounting policies of the Funds:
Investment Valuation. Investments are valued as of 4:00 p.m. Eastern time on the last calendar day of the period. In accordance with valuation policies and procedures approved by the Board of Trustees (the Board), each Fund attempts to obtain prices from one or more third party pricing vendors or brokers to value its investments. When current market prices, quotations or currency exchange rates are not readily available or reliable, investments will be fair valued in good faith by the Strategic Advisers, Inc. (Strategic Advisers) Fair Value Committee (the Committee), in accordance with procedures adopted by the Board. Factors used in determining fair value vary by investment type and may include market or investment specific events, changes in interest rates and credit quality. The frequency with which these procedures are used cannot be predicted and they may be utilized to a significant extent. The Committee oversees each Fund's valuation policies and procedures and is responsible for approving and reporting to the Board all fair value determinations.
Each Fund categorizes the inputs to valuation techniques used to value their investments into a disclosure hierarchy consisting of three levels as shown below:
Level 1 - quoted prices in active markets for identical investments
Level 2 - other significant observable inputs (including quoted prices for similar investments, interest rates, prepayment speeds, etc.)
Level 3 - unobservable inputs (including the Fund's own assumptions based on the best information available)
Valuation techniques used to value each Fund's investments by major category are as follows:
Equity securities, including restricted securities, for which market quotations are readily available, are valued at the last reported sale price or official closing price as reported by a third party pricing vendor on the primary market or exchange on which they are traded and are categorized as Level 1 in the hierarchy. In the event there were no sales during the day or closing prices are not available, securities are valued at the last quoted bid price or may be valued using the last available price and are generally categorized as Level 2 in the hierarchy. For foreign equity securities, when market or security specific events arise, comparisons to the valuation of American Depositary Receipts (ADRs), futures contracts, Exchange-Traded Funds (ETFs) and certain indexes as well as quoted prices for similar securities may be used and would be categorized as Level 2 in the hierarchy. Utilizing these techniques may result in transfers between Level 1 and Level 2. For equity securities, including restricted securities, where observable inputs are limited, assumptions about market activity and risk are used and these securities may be categorized as Level 3 in the hierarchy.
Debt securities, including restricted securities, are valued based on evaluated prices received from third party pricing vendors or from brokers who make markets in such securities. U.S. government and government agency obligations are valued by pricing vendors who utilize matrix pricing which considers yield or price of bonds of comparable quality, coupon, maturity and type or by broker-supplied prices. When independent prices are unavailable or unreliable, debt securities may be valued utilizing pricing methodologies which consider similar factors that would be used by third party pricing vendors. Debt securities are generally categorized as Level 2 in the hierarchy but may be Level 3 depending on the circumstances.
Futures contracts are valued at the settlement price established each day by the board of trade or exchange on which they are traded and are categorized as Level 1 in the hierarchy. Investments in open-end mutual funds, including the Fidelity Central Funds, are valued at their closing net asset value (NAV) each business day and are categorized as Level 1 in the hierarchy.
Changes in valuation techniques may result in transfers in or out of an assigned level within the disclosure hierarchy. The aggregate value of investments by input level, as of February 28, 2014, including information on transfers between Levels 1 and 2, is included at the end of each applicable Fund's Schedule of Investments.
Annual Report
2. Significant Accounting Policies - continued
Foreign Currency. The Funds may use foreign currency contracts to facilitate transactions in foreign-denominated securities. Gains and losses from these transactions may arise from changes in the value of the foreign currency or if the counterparties do not perform under the contracts' terms.
Foreign-denominated assets, including investment securities, and liabilities are translated into U.S. dollars at the exchange rates at period end. Purchases and sales of investment securities, income and dividends received and expenses denominated in foreign currencies are translated into U.S. dollars at the exchange rate in effect on the transaction date.
The effects of exchange rate fluctuations on investments are included with the net realized and unrealized gain (loss) on investment securities. Other foreign currency transactions resulting in realized and unrealized gain (loss) are disclosed separately.
Investment Transactions and Income. For financial reporting purposes, the Funds' investment holdings and NAV include trades executed through the end of the last business day of the period. The NAV per share for processing shareholder transactions is calculated as of the close of business of the New York Stock Exchange (NYSE), normally 4:00 p.m. Eastern time and includes trades executed through the end of the prior business day. Gains and losses on securities sold are determined on the basis of identified cost and may include proceeds received from litigation. Dividend income is recorded on the ex-dividend date, except for certain dividends from foreign securities where the ex-dividend date may have passed, which are recorded as soon as the Funds are informed of the ex-dividend date. Non-cash dividends included in dividend income, if any, are recorded at the fair market value of the securities received. Distributions received on securities that represent a return of capital or capital gain are recorded as a reduction of cost of investments and/or as a realized gain. Subsequent to ex-dividend date the Funds determine the components of these distributions, based upon receipt of tax filings or other correspondence relating to the underlying investment. Large, non-recurring dividends recognized by the Funds are presented separately on the Statement of Operations as "Special Dividends" and the impact of these dividends is presented in the Financial Highlights. Interest income and distributions from the Fidelity Central Funds are accrued as earned. Interest income includes coupon interest and amortization of premium and accretion of discount on debt securities. Investment income is recorded net of foreign taxes withheld where recovery of such taxes is uncertain.
Expenses. Expenses directly attributable to a fund are charged to that fund. Expenses attributable to more than one fund are allocated among the respective funds on the basis of relative net assets or other appropriate methods. Expense estimates are accrued in the period to which they relate and adjustments are made when actual amounts are known.
Income Tax Information and Distributions to Shareholders. Each year, each Fund intends to qualify as a regulated investment company under Subchapter M of the Internal Revenue Code, including distributing substantially all of its taxable income and realized gains. As a result, no provision for U.S. Federal income taxes is required. As of February 28, 2014, each Fund did not have any unrecognized tax benefits in the financial statements; nor is each Fund aware of any tax positions for which it is reasonably possible that the total amounts of unrecognized tax benefits will significantly change in the next twelve months. Each Fund files a U.S. federal tax return, in addition to state and local tax returns as required. The Fund's federal income tax returns are subject to examination by the Internal Revenue Service (IRS) for a period of three fiscal years after they are filed. State and local tax returns may be subject to examination for an additional fiscal year depending on the jurisdiction. Foreign taxes are provided for based on each Fund's understanding of the tax rules and rates that exist in the foreign markets in which it invests.
Distributions are declared and recorded on the ex-dividend date. Income and capital gain distributions are determined in accordance with income tax regulations, which may differ from GAAP. In addition, certain Funds claimed a portion of the payment made to redeeming shareholders as a distribution for income tax purposes.
Capital accounts within the financial statements are adjusted for permanent book-tax differences. These adjustments have no impact on net assets or the results of operations. Capital accounts are not adjusted for temporary book-tax differences which will reverse in a subsequent period.
Book-tax differences are primarily due to the futures contracts, foreign currency transactions, passive foreign investment companies (PFIC), market discount, capital loss carryforwards and losses deferred due to wash sales and excise tax regulations.
The federal tax cost of investment securities and unrealized appreciation (depreciation) as of period end were as follows for each Fund:
| Tax cost | Gross unrealized | Gross unrealized | Net unrealized |
Fidelity Large Cap Growth Enhanced Index Fund | $ 205,755,316 | $ 59,604,959 | $ (1,249,247) | $ 58,355,712 |
Fidelity Large Cap Value Enhanced Index Fund | 150,980,292 | 35,396,337 | (842,173) | 34,554,164 |
Fidelity Large Cap Core Enhanced Index Fund | 418,306,404 | 43,194,680 | (7,895,322) | 35,299,358 |
Fidelity Mid Cap Enhanced Index Fund | 246,608,321 | 48,655,034 | (3,227,691) | 45,427,343 |
Fidelity Small Cap Enhanced Index Fund | 420,943,159 | 70,340,153 | (9,488,155) | 60,851,998 |
Fidelity International Enhanced Index Fund | 40,342,142 | 6,459,611 | (1,427,119) | 5,032,492 |
Annual Report
Notes to Financial Statements - continued
2. Significant Accounting Policies - continued
Income Tax Information and Distributions to Shareholders - continued
The tax-based components of distributable earnings as of period end were as follows for each Fund:
| Undistributed | Undistributed | Capital loss | Net unrealized |
Fidelity Large Cap Growth Enhanced Index Fund | $ 1,941,954 | $ 3,807,098 | $ - | $ 58,355,712 |
Fidelity Large Cap Value Enhanced Index Fund | 1,753,031 | 1,087,606 | - | 34,554,164 |
Fidelity Large Cap Core Enhanced Index Fund | 4,064,444 | 2,471,063 | (17,612,468) | 35,299,358 |
Fidelity Mid Cap Enhanced Index Fund | 9,553,040 | 5,158,585 | (623,709) | 45,427,343 |
Fidelity Small Cap Enhanced Index Fund | 6,845,532 | 6,052,785 | - | 60,851,998 |
Fidelity International Enhanced Index Fund | 282,189 | - | (928,884) | 5,038,305 |
Capital loss carryforwards are only available to offset future capital gains of the Funds to the extent provided by regulations and may be limited. Under the Regulated Investment Company Modernization Act of 2010 (the Act), the Funds are permitted to carry forward capital losses incurred in taxable years beginning after December 22, 2010 for an unlimited period and such capital losses are required to be used prior to any losses that expire. The capital loss carryforward information presented below, including any applicable limitation, is estimated as of fiscal period end and is subject to adjustment.
|
Fiscal year of expiration | Total with | |
| 2018 | 2019 |
|
Fidelity Large Cap Core Enhanced Index Fund | $ (11,201,287) | $ - | $ (11,201,287) |
Fidelity Mid Cap Enhanced Index Fund | (115,264) | (508,445) | (623,709) |
Fidelity International Enhanced Index Fund | (174,650) | (754,234) | (928,884) |
| No expiration | Total capital loss |
Fidelity Large Cap Core Enhanced Index Fund | $ (6,411,181) | $ (17,612,468) |
Due to large redemptions or subscriptions in a prior period, capital losses that will be available to offset future capital gains of Fidelity Large Cap Core Enhanced Index Fund, Fidelity Mid Cap Enhanced Index Fund and Fidelity International Enhanced Index Fund will be limited to approximately $4,403,117, $541,266 and $706,051 per year, respectively.
The tax character of distributions paid was as follows:
February 28, 2014 |
|
|
|
| Ordinary Income | Long-term | Total |
Fidelity Large Cap Growth Enhanced Index Fund | $ 5,989,402 | $ 7,964,072 | $ 13,953,474 |
Fidelity Large Cap Value Enhanced Index Fund | 4,689,838 | 6,017,541 | 10,707,379 |
Fidelity Large Cap Core Enhanced Index Fund | 16,163,013 | 13,728,882 | 29,891,895 |
Fidelity Mid Cap Enhanced Index Fund | 6,050,250 | 8,178,609 | 14,228,859 |
Fidelity Small Cap Enhanced Index Fund | 8,535,038 | 12,623,910 | 21,158,948 |
Fidelity International Enhanced Index Fund | 752,602 | - | 752,602 |
February 28, 2013 |
|
|
|
| Ordinary Income | Long-term | Total |
Fidelity Large Cap Growth Enhanced Index Fund | $ 2,493,084 | $ - | $ 2,493,084 |
Fidelity Large Cap Value Enhanced Index Fund | 1,610,247 | 1,265,614 | 2,875,861 |
Fidelity Large Cap Core Enhanced Index Fund | 4,152,614 | 1,162,732 | 5,315,346 |
Fidelity Mid Cap Enhanced Index Fund | 1,338,905 | 1,032,505 | 2,371,410 |
Fidelity Small Cap Enhanced Index Fund | 2,545,839 | 6,901,191 | 9,447,030 |
Fidelity International Enhanced Index Fund | 837,311 | - | 837,311 |
Short Term Trading (Redemption) Fees. Shares held by investors of Fidelity Small Cap Enhanced Index Fund less than 90 days may be subject to a redemption fee equal to 1.50% of the NAV of shares redeemed. Shares held by investors of Fidelity Mid Cap Enhanced Index Fund and Fidelity International Enhanced Index Fund less than 30 days may be subject to a redemption fee equal to 0.75% and 1.00%, respectively, of the net asset value of shares redeemed. All redemption fees, which reduce the proceeds of the shareholder redemption, are retained by the Funds and accounted for as an addition to paid in capital.
Annual Report
3. Derivative Instruments.
Risk Exposures and the Use of Derivative Instruments. The Funds' investment objective allows the Funds to enter into various types of derivative contracts, including futures contracts. Derivatives are investments whose value is primarily derived from underlying assets, indices or reference rates and may be transacted on an exchange or over-the-counter (OTC). Derivatives may involve a future commitment to buy or sell a specified asset based on specified terms, to exchange future cash flows at periodic intervals based on a notional principal amount, or for one party to make one or more payments upon the occurrence of specified events in exchange for periodic payments from the other party.
The Funds used derivatives to increase returns and to manage exposure to certain risks as defined below. The success of any strategy involving derivatives depends on analysis of numerous economic factors, and if the strategies for investment do not work as intended, the Funds may not achieve their objectives.
The Funds' use of derivatives increased or decreased their exposure to the following risk:
Equity Risk | Equity risk relates to the fluctuations in the value of financial instruments as a result of changes in market prices (other than those arising from interest rate risk or foreign exchange risk), whether caused by factors specific to an individual investment, its issuer, or all factors affecting all instruments traded in a market or market segment. |
The Funds are also exposed to additional risks from investing in derivatives, such as liquidity risk and counterparty credit risk. Liquidity risk is the risk that the Funds will be unable to close out the derivative in the open market in a timely manner. Counterparty credit risk is the risk that the counterparty will not be able to fulfill its obligation to the Funds. Counterparty credit risk related to exchange-traded futures contracts may be mitigated by the protection provided by the exchange on which they trade.
Investing in derivatives may involve greater risks than investing in the underlying assets directly and, to varying degrees, may involve risk of loss in excess of any initial investment and collateral received and amounts recognized in the Statement of Assets and Liabilities. In addition, there may be the risk that the change in value of the derivative contract does not correspond to the change in value of the underlying instrument.
Net Realized Gain (Loss) and Change in Net Unrealized Appreciation (Depreciation) on Derivatives. The table below, which reflects the impacts of derivatives on the financial performance of the Funds, summarizes the net realized gain (loss) and change in net unrealized appreciation (depreciation) for derivatives during the period as presented in the Statement of Operations.
Primary Risk Exposure / Derivative Type | Net Realized Gain | Change in Net |
Fidelity Large Cap Growth Enhanced Index Fund |
|
|
Equity Risk |
|
|
Futures Contracts (a) | $ 642,976 | $ 4,279 |
Fidelity Large Cap Value Enhanced Index Fund |
|
|
Equity Risk |
|
|
Futures Contracts (a) | $ 861,845 | $ (12,473) |
Fidelity Large Cap Core Enhanced Index Fund |
|
|
Equity Risk |
|
|
Futures Contracts (a) | $ 699,134 | $ 211,606 |
Fidelity Mid Cap Enhanced Index Fund |
|
|
Equity Risk |
|
|
Futures Contracts (a) | $ 1,059,523 | $ (101,368) |
Fidelity Small Cap Enhanced Index Fund |
|
|
Equity Risk |
|
|
Futures Contracts (a) | $ 2,386,516 | $ 109,038 |
Fidelity International Enhanced Index Fund |
|
|
Equity Risk |
|
|
Futures Contracts (a) | $ 41,937 | $ 16,916 |
(a) A summary of the value of derivatives by primary risk exposure as of period end is included at the end of the Schedule of Investments.
Annual Report
Notes to Financial Statements - continued
3. Derivative Instruments - continued
Futures Contracts. A futures contract is an agreement between two parties to buy or sell a specified underlying instrument for a fixed price at a specified future date. The Funds used futures contracts to manage their exposure to the stock market.
Upon entering into a futures contract, a fund is required to deposit either cash or securities (initial margin) with a clearing broker in an amount equal to a certain percentage of the face value of the contract. Futures contracts are marked-to-market daily and subsequent daily payments (variation margin) are made or received by a fund depending on the daily fluctuations in the value of the futures contracts and are recorded as unrealized appreciation or (depreciation). This receivable and/or payable, if any, is included in daily variation margin for derivative instruments in the Statement of Assets and Liabilities. Realized gain or (loss) is recorded upon the expiration or closing of a futures contract.
Any open futures contracts at period end are presented in the Schedule of Investments under the caption "Futures Contracts." The underlying face amount at value reflects each contract's exposure to the underlying instrument or index at period end and is representative of volume of activity during the period. Securities deposited to meet initial margin requirements are identified in the Schedule of Investments. Cash deposited to meet initial margin requirements is presented as segregated cash with brokers for derivative instruments in the Statement of Assets and Liabilities.
4. Purchases and Sales of Investments.
Purchases and sales of securities, other than short-term securities, are noted in the table below.
| Purchases ($) | Sales ($) |
Fidelity Large Cap Growth Enhanced Index Fund | 198,402,304 | 171,622,591 |
Fidelity Large Cap Value Enhanced Index Fund | 164,374,569 | 116,316,568 |
Fidelity Large Cap Core Enhanced Index Fund | 487,196,969 | 299,782,556 |
Fidelity Mid Cap Enhanced Index Fund | 377,113,135 | 291,468,916 |
Fidelity Small Cap Enhanced Index Fund | 493,835,000 | 303,857,571 |
Fidelity International Enhanced Index Fund | 29,232,600 | 21,904,535 |
5. Fees and Other Transactions with Affiliates.
Management Fee and Expense Contract. Strategic Advisers, Inc. (the investment adviser), an affiliate of Fidelity Management & Research Company (FMR), provides the Funds with investment management related services. For these services, the Funds pay a monthly management fee to the investment adviser. The management fee is based on an annual rate of 0.30% of average net assets for Fidelity Large Cap Growth Enhanced Index, Fidelity Large Cap Value Enhanced Index and Fidelity Large Cap Core Enhanced Index, 0.45% of average net assets for Fidelity Mid Cap Enhanced Index, 0.52% of average net assets for Fidelity Small Cap Enhanced Index and 0.47% of average net assets for Fidelity International Enhanced Index. Under the management contract, the investment adviser pays all other ordinary fund-wide operating expenses (such as custody, audit, legal and pricing and bookkeeping fees), except the compensation of the independent Trustees and certain other expenses such as interest expense. The management fee paid to the investment adviser by the Funds is reduced by an amount equal to the fees and expenses paid by the Funds to the independent Trustees.
In addition, under the expense contract, the investment adviser pays other expenses such as those listed above for each of the Funds so that the total expenses do not exceed certain amounts of each Fund's average net assets with certain exceptions, as noted in the following table:
Fidelity Large Cap Growth Enhanced Index Fund | .45% |
Fidelity Large Cap Value Enhanced Index Fund | .45% |
Fidelity Large Cap Core Enhanced Index Fund | .45% |
Fidelity Mid Cap Enhanced Index Fund | .60% |
Fidelity Small Cap Enhanced Index Fund | .67% |
Fidelity International Enhanced Index Fund | .62% |
Sub-Adviser. Geode Capital Management, LLC (Geode), serves as sub-adviser for the Funds. Geode provides discretionary investment advisory services to the Funds and is paid by the investment adviser for providing these services.
Transfer Agent Fees. Fidelity Investments Institutional Operations Company, Inc. (FIIOC), an affiliate of the investment adviser, is the Funds' transfer, dividend disbursing and shareholder servicing agent. FIIOC receives account fees and asset-based fees that vary according to type of account. FIIOC pays for typesetting, printing and mailing of shareholder reports, except proxy statements. Under the expense contract, each fund paid transfer agent fees at the annual rate of 0.15% of average net assets.
Annual Report
5. Fees and Other Transactions with Affiliates - continued
Interfund Lending Program. Pursuant to an Exemptive Order issued by the SEC, the Funds, along with other registered investment companies having management contracts with FMR or other affiliated entities of FMR, may participate in an interfund lending program. This program provides an alternative credit facility allowing the funds to borrow from, or lend money to, other participating affiliated funds. At period end, there were no interfund loans outstanding. Each applicable fund's activity in this program during the period for which loans were outstanding was as follows:
| Borrower or | Average Loan Balance | Weighted | Interest Expense |
Fidelity Large Cap Core Enhanced Index Fund | Borrower | $ 15,368,167 | .30% | $ 769 |
6. Investments in Fidelity Central Funds.
The Funds invest in Fidelity Central Funds, which are open-end investment companies available only to other investment companies and accounts managed by the investment adviser and its affiliates. The Funds' Schedules of Investments list each of the Fidelity Central Funds held as of period end, if any, as an investment of each Fund, but do not include the underlying holdings of each Fidelity Central Fund. As an Investing Fund, each Fund indirectly bears its proportionate share of the expenses of the underlying Fidelity Central Funds.
The Fidelity Securities Lending Cash Central Fund seeks preservation of capital and current income and is managed by Fidelity Investments Money Management, Inc. (FIMM), an affiliate of the investment adviser. Annualized expenses of the Money Market Central Funds as of their most recent shareholder report date are less than .01%.
A complete unaudited list of holdings for each Fidelity Central Fund is available upon request or at the Securities and Exchange Commission (the SEC) website at www.sec.gov. In addition, the financial statements of the Fidelity Central Funds, which are not covered by the Funds' Report of Independent Registered Public Accounting Firm, are available on the SEC website or upon request.
7. Committed Line of Credit.
Certain Funds participate with other funds managed by the investment adviser or an affiliate in a $4.25 billion credit facility (the "line of credit") to be utilized for temporary or emergency purposes to fund shareholder redemptions or for other short-term liquidity purposes. The participating funds have agreed to pay commitment fees on their pro-rata portion of the line of credit, which are reflected in Miscellaneous expenses on the Statement of Operations, and are as follows:
Fidelity Large Cap Growth Enhanced Index Fund | $ 386 |
Fidelity Large Cap Value Enhanced Index Fund | 248 |
Fidelity Large Cap Core Enhanced Index Fund | 413 |
Fidelity Mid Cap Enhanced Index Fund | 380 |
Fidelity Small Cap Enhanced Index Fund | 467 |
Fidelity International Enhanced Index Fund | 66 |
During the period, there were no borrowings on this line of credit.
8. Security Lending.
Certain Funds lend portfolio securities through a lending agent from time to time in order to earn additional income. On the settlement date of the loan, each applicable Fund receives collateral (in the form of U.S. Treasury obligations, letters of credit and/or cash) against the loaned securities and maintains collateral in an amount not less than 100% of the market value of the loaned securities during the period of the loan. The market value of the loaned securities is determined at the close of business of the Funds and any additional required collateral is delivered to the Funds on the next business day. If the borrower defaults on its obligation to return the securities loaned because of insolvency or other reasons, the Funds may apply collateral received from the borrower against the obligation. The Funds may experience delays and costs in recovering the securities loaned. Any cash collateral received is invested in the Fidelity Securities Lending Cash Central Fund. The value of loaned securities and cash collateral at period end are disclosed on each applicable Fund's Statement of Assets and Liabilities. Security lending income represents the income earned on investing cash collateral, less rebates paid to borrowers and any lending agent fees associated with the loan, plus any premium payments received for lending certain types of securities. Security lending income is presented on each applicable Fund's Statement of Operations as a income from Fidelity Central Funds.
Annual Report
Notes to Financial Statements - continued
9. Bank Borrowings.
Each Fund is permitted to have bank borrowings for temporary or emergency purposes to fund shareholder redemptions or for other short-term liquidity requirements. Each Fund has established borrowing arrangements with certain banks. The interest rate on the borrowings is the bank's base rate, as revised from time to time. Each applicable Fund's activity in this program during the period for which loans were outstanding was as follows:
| Average Loan | Weighted | Interest Expense |
Fidelity Large Cap Core Enhanced Index Fund | $ 41,112,000 | .58% | $ 1,336 |
10. Expense Reductions.
Through arrangements with each applicable Fund's custodian, credits realized as a result of uninvested cash balances were used to reduce each applicable Fund's expenses. All of the applicable expense reductions are noted in the table below.
|
|
Fidelity Large Cap Growth Enhanced Index Fund | $ 5 |
Fidelity Large Cap Value Enhanced Index Fund | 4 |
Fidelity Large Cap Core Enhanced Index Fund | 18 |
Fidelity Mid Cap Enhanced Index Fund | 23 |
Fidelity Small Cap Enhanced Index Fund | 38 |
11. Other.
The Funds' organizational documents provide former and current trustees and officers with a limited indemnification against liabilities arising in connection with the performance of their duties to the Funds. In the normal course of business, the Funds may also enter into contracts that provide general indemnifications. The Funds' maximum exposure under these arrangements is unknown as this would be dependent on future claims that may be made against the Funds. The risk of material loss from such claims is considered remote.
Annual Report
Report of Independent Registered Public Accounting Firm
To the Trustees of Fidelity Commonwealth Trust II and the Shareholders of Fidelity Large Cap Growth Enhanced Index Fund, Fidelity Large Cap Value Enhanced Index Fund, Fidelity Large Cap Core Enhanced Index Fund, Fidelity Mid Cap Enhanced Index Fund, Fidelity Small Cap Enhanced Index Fund and Fidelity International Enhanced Index Fund:
In our opinion, the accompanying statements of assets and liabilities, including the schedules of investments, and the related statements of operations and of changes in net assets and the financial highlights present fairly, in all material respects, the financial positions of Fidelity Large Cap Growth Enhanced Index Fund, Fidelity Large Cap Value Enhanced Index Fund, Fidelity Large Cap Core Enhanced Index Fund, Fidelity Mid Cap Enhanced Index Fund, Fidelity Small Cap Enhanced Index Fund and Fidelity International Enhanced Index Fund (funds of Fidelity Commonwealth Trust II) at February 28, 2014, the results of each of their operations for the year then ended, the changes in each of their net assets for each of the two years in the period then ended and the financial highlights for each of the five years in the period then ended, in conformity with accounting principles generally accepted in the United States of America. These financial statements and financial highlights (hereafter referred to as "financial statements") are the responsibility of the Fidelity Commonwealth Trust II's management. Our responsibility is to express an opinion on these financial statements based on our audits. We conducted our audits of these financial statements in accordance with the standards of the Public Company Accounting Oversight Board (United States). Those standards require that we plan and perform the audit to obtain reasonable assurance about whether the financial statements are free of material misstatement. An audit includes examining, on a test basis, evidence supporting the amounts and disclosures in the financial statements, assessing the accounting principles used and significant estimates made by management, and evaluating the overall financial statement presentation. We believe that our audits, which included confirmation of securities at February 28, 2014 by correspondence with the custodian and brokers, provide a reasonable basis for our opinion.
PricewaterhouseCoopers LLP
Boston, Massachusetts
April 17, 2014
Annual Report
Trustees and Officers
The Trustees, Members of the Advisory Board, and officers of the trust and funds, as applicable, are listed below. The Board of Trustees governs each fund and is responsible for protecting the interests of shareholders. The Trustees are experienced executives who meet periodically throughout the year to oversee each fund's activities, review contractual arrangements with companies that provide services to each fund, oversee management of the risks associated with such activities and contractual arrangements, and review each fund's performance. Each of the Trustees oversees 26 funds.
The Trustees hold office without limit in time except that (a) any Trustee may resign; (b) any Trustee may be removed by written instrument, signed by at least two-thirds of the number of Trustees prior to such removal; (c) any Trustee who requests to be retired or who has become incapacitated by illness or injury may be retired by written instrument signed by a majority of the other Trustees; and (d) any Trustee may be removed at any special meeting of shareholders by a two-thirds vote of the outstanding voting securities of the trust. The officers and Advisory Board Members hold office without limit in time, except that any officer and Advisory Board Member may resign or may be removed by a vote of a majority of the Trustees at any regular meeting or any special meeting of the Trustees. Except as indicated, each individual has held the office shown or other offices in the same company for the past five years.
Experience, Skills, Attributes, and Qualifications of the Funds' Trustees. The Governance and Nominating Committee has adopted a statement of policy that describes the experience, qualifications, attributes, and skills that are necessary and desirable for potential Independent Trustee candidates (Statement of Policy). The Board believes that each Trustee satisfied at the time he or she was initially elected or appointed a Trustee, and continues to satisfy, the standards contemplated by the Statement of Policy. The Governance and Nominating Committee may also engage professional search firms to help identify potential Independent Trustee candidates with experience, qualifications, attributes, and skills consistent with the Statement of Policy. Additional criteria based on the composition and skills of the current Independent Trustees, as well as experience or skills that may be appropriate in light of future changes to board composition, business conditions, and regulatory or other developments, may be considered by the professional search firms and the Governance and Nominating Committee. In addition, the Board takes into account the Trustees' commitment and participation in Board and committee meetings, as well as their leadership of standing and ad hoc committees throughout their tenure.
In determining that a particular Trustee was and continues to be qualified to serve as a Trustee, the Board has considered a variety of criteria, none of which, in isolation, was controlling. The Board believes that, collectively, the Trustees have balanced and diverse experience, qualifications, attributes, and skills, which allow the Board to operate effectively in governing each fund and protecting the interests of shareholders. Information about the specific experience, skills, attributes, and qualifications of each Trustee, which in each case led to the Board's conclusion that the Trustee should serve (or continue to serve) as a trustee of the funds, is provided below.
Board Structure and Oversight Function. Roger T. Servison is an interested person (as defined in the 1940 Act) and currently serves as Chairman. The Trustees have determined that an interested Chairman is appropriate and benefits shareholders because an interested Chairman has a personal and professional stake in the quality and continuity of services provided to the funds. Independent Trustees exercise their informed business judgment to appoint an individual of their choosing to serve as Chairman, regardless of whether the Trustee happens to be independent or a member of management. The Independent Trustees have determined that they can act independently and effectively without having an Independent Trustee serve as Chairman and that a key structural component for assuring that they are in a position to do so is for the Independent Trustees to constitute a substantial majority for the Board. The Independent Trustees also regularly meet in executive session. Ralph F. Cox serves as the lead Independent Trustee and as such (i) acts as a liaison between the Independent Trustees and management with respect to matters important to the Independent Trustees and (ii) with management prepares agendas for Board meetings.
Fidelity funds are overseen by different Boards of Trustees. The funds' Board oversees asset allocation funds as well as the Fidelity enhanced index funds. Other boards oversee Fidelity's investment-grade bond, money market, and asset allocation funds and Fidelity's equity and high income funds. The funds may invest in Fidelity funds overseen by such other Boards. The use of separate Boards, each with its own committee structure, allows the Trustees of each group of Fidelity funds to focus on the unique issues of the funds they oversee, including common research, investment, and operational issues.
The Trustees primarily operate as a full Board, but also operate in committees, to facilitate the timely and efficient consideration of all matters of importance to the Trustees, each fund, and fund shareholders and to facilitate compliance with legal and regulatory requirements and oversight of the funds' activities and associated risks. The Board has charged Strategic Advisers and its affiliates with (i) identifying events or circumstances the occurrence of which could have demonstrably adverse effects on the funds' business and/or reputation; (ii) implementing processes and controls to lessen the possibility that such events or circumstances occur or to mitigate the effects of such events or circumstances if they do occur; and (iii) creating and maintaining a system designed to evaluate continuously business and market conditions in order to facilitate the identification and implementation processes described in (i) and (ii) above. Because the day-to-day operations and activities of the funds are carried out by or through Strategic Advisers, its affiliates and other service providers, the funds' exposure to risks is mitigated but not eliminated by the processes overseen by the Trustees. Board oversight of different aspects of the funds' activities is exercised primarily through the full Board, but also through the Audit and Compliance Committee. Appropriate personnel, including but not limited to the funds' Chief Compliance Officer (CCO), FMR's internal auditor, the independent accountants, the funds' Treasurer and portfolio management personnel, make periodic reports to the Board's committees, as appropriate. The responsibilities of each committee, including their oversight responsibilities, are described further under "Standing Committees of the Funds' Trustees."
Annual Report
The funds' Statement of Additional Information (SAI) includes more information about the Trustees. To request a free copy, call Fidelity at 1-800-544-8544.
Interested Trustees*:
Correspondence intended for each Trustee who is an interested person may be sent to Fidelity Investments, 245 Summer Street, Boston, Massachusetts 02210.
Name, Year of Birth; Principal Occupations and Other Relevant Experience+ | |
Roger T. Servison (1945) | |
Year of Election or Appointment: 2006 Trustee Chairman of the Board of Trustees | |
| Mr. Servison also serves as Trustee of other funds. Mr. Servison serves as President of Strategic New Business Development for Fidelity Investments and serves as a Director of Strategic Advisers. Previously, Mr. Servison oversaw Fidelity Investments Life Insurance Company (2005-2006) and Strategic Advisers (2005-2007). Mr. Servison also served as President and a Director of Fidelity Brokerage Services (Japan), LLC (1994-2004). |
Derek L. Young (1964) | |
Year of Election or Appointment: 2012 Trustee | |
| Mr. Young also serves as Trustee or an officer of other funds. He is President and a Director of Strategic Advisers, Inc. (2011-present), President of Fidelity Global Asset Allocation (GAA) (2011-present), and Vice Chairman of Pyramis Global Advisors, LLC (2011-present). Previously, Mr. Young served as Chief Investment Officer of GAA (2009-2011) and as a portfolio manager. |
* Trustees have been determined to be "Interested Trustees" by virtue of, among other things, their affiliation with the trust or various entities under common control with Strategic Advisers.
+ The information above includes each Trustee's principal occupation during the last five years and other information relating to the experience, attributes, and skills relevant to each Trustee's qualifications to serve as a Trustee, which led to the conclusion that each Trustee should serve as a Trustee for each fund.
Independent Trustees:
Correspondence intended for each Independent Trustee (that is, the Trustees other than the Interested Trustees) may be sent to Fidelity Investments, P.O. Box 55235, Boston, Massachusetts 02205-5235.
Name, Year of Birth; Principal Occupations and Other Relevant Experience+ | |
Peter C. Aldrich (1944) | |
Year of Election or Appointment: 2006 Trustee | |
| Mr. Aldrich also serves as Trustee of other funds. Mr. Aldrich is a Director of the National Bureau of Economic Research and a Director of the funds of BlackRock Realty Group (2006-present). Previously, Mr. Aldrich served as a Trustee for the Fidelity Rutland Square Trust (2005-2010), a Managing Member of Poseidon, LLC (foreign private investment, 1998-2004), and Chairman and Managing Member of AEGIS, LLC (foreign private investment, 1997-2004). Mr. Aldrich also served as Faculty Chairman of The Research Council on Global Investment of The Conference Board (business and professional education non-profit, 1999-2004). Mr. Aldrich is a Member of the Boards of Trustees of the Museum of Fine Arts Boston and Massachusetts Eye and Ear Infirmary and an Overseer of the Longy School of Music. |
Amy Butte Liebowitz (1968) | |
Year of Election or Appointment: 2011 Trustee | |
| Ms. Butte Liebowitz also serves as Trustee of other funds. Ms. Butte Liebowitz was the founder and Chief Executive Officer of TILE Financial (financial internet service, 2008-2012). Previously, Ms. Butte Liebowitz served as the Chief Financial Officer and member of the Board of Directors of MF Global (broker-dealer, 2006-2008), and Chief Financial Officer and Executive Vice President of the New York Stock Exchange (2004-2006). Ms. Butte Liebowitz is a member of the Boards of Directors of Accion International and the New York Women's Forum, as well as an alumna of the World Economic Forum's Young Global Leader program. |
Ralph F. Cox (1932) | |
Year of Election or Appointment: 2006 Trustee | |
| Mr. Cox also serves as Trustee of other funds. Mr. Cox is President of RABAR Enterprises (management consulting for the petroleum industry). Mr. Cox is a Director of Abraxas Petroleum (exploration and production). Mr. Cox is a member of the Advisory Boards of the Business and Engineering Schools of Texas A&M University and the Engineering School of University of Texas at Austin. Previously, Mr. Cox served as a Trustee for the Fidelity Rutland Square Trust (2005-2010) and as an Advisory Director of CH2M Hill Companies (engineering, 1981-2011). Mr. Ralph F. Cox and Mr. Howard E. Cox, Jr. are not related. |
Karen Kaplan (1960) | |
Year of Election or Appointment: 2006 Trustee | |
| Ms. Kaplan also serves as Trustee of other funds. Ms. Kaplan is Chief Executive Officer (2013-present) and President (2007-present) of Hill Holliday (advertising and specialized marketing). Ms. Kaplan is a Director of DSM (dba Delta Dental and DentaQuest) (2004-present), Director of Vera Bradley (2012-present), Member of the Board of Governors of the Chief Executives' Club of Boston (2010-present), Member of the Board of Directors of the Massachusetts Conference for Women (2008-present), Chairman of the Executive Committee of the Greater Boston Chamber of Commerce (2006-present), Member of the Board of Directors of Jobs for Massachusetts (2012-present), Member of the National Association of Corporate Directors Chapter (2012-present), and Member of the Board of Directors of the Post Office Square Trust (2012-present). She is also a member of the Clinton Global Initiative, an action oriented community of the most effective CEOs, heads of state, Nobel Prize winners, and non-governmental leaders in the world. Previously, Ms. Kaplan served as an Advisory Board Member of Fidelity Rutland Square Trust (2006-2010), President of the Massachusetts Women's Forum (2008-2010), Treasurer of the Massachusetts Women's Forum (2002-2006), Vice Chair of the Board of the Massachusetts Society for the Prevention of Cruelty to Children (2003-2010), Director of United Way of Massachusetts Bay (2004-2006), Director of ADVO (direct mail marketing, 2003-2007), and Director of Tweeter Home Entertainment Group (2006-2007). |
+ The information above includes each Trustee's principal occupation during the last five years and other information relating to the experience, attributes, and skills relevant to each Trustee's qualifications to serve as a Trustee, which led to the conclusion that each Trustee should serve as a Trustee for each fund.
Advisory Board Members and Officers:
Correspondence intended for Mary C. Farrell may be sent to Fidelity Investments, P.O. Box 55235, Boston, Massachusetts 02205-5235. Correspondence intended for each officer and Howard E. Cox, Jr. may be sent to Fidelity Investments, 245 Summer Street, Boston, Massachusetts 02210. Officers appear below in alphabetical order.
Name, Year of Birth; Principal Occupation | |
Howard E. Cox, Jr. (1944) | |
Year of Election or Appointment: 2009 Member of the Advisory Board | |
| Mr. Cox also serves as Member of the Advisory Board of other funds. Mr. Cox is a Member of the Advisory Board of Devonshire Investors (2009-present). Mr. Cox serves as an Advisory Partner of Greylock (venture capital) and a Director of Stryker Corporation (medical products and services). Previously, Mr. Cox served as an Advisory Board Member of Fidelity Rutland Square Trust (2006-2010) and a Member of the Secretary of Defense's Business Board of Directors (2008-2010). Mr. Howard E. Cox, Jr. and Mr. Ralph F. Cox are not related. |
Mary C. Farrell (1949) | |
Year of Election or Appointment: 2013 Member of the Advisory Board | |
| Ms. Farrell also serves as Trustee or Member of the Advisory Board of other funds. Ms. Farrell is a Director of the W.R. Berkley Corporation (insurance provider) and President (2009-present) and Director (2006-present) of the Howard Gilman Foundation (charitable organization). Previously, Ms. Farrell was Managing Director and Chief Investment Strategist at UBS Wealth Management USA and Co-Head of UBS Wealth Management Investment Strategy & Research Group (2003-2005). Ms. Farrell also served as Investment Strategist at PaineWebber (1982-2000) and UBS PaineWebber (2000-2002). Ms. Farrell also serves as Trustee on the Board of Overseers of the New York University Stern School of Business, the Board of Trustees of Yale-New Haven Hospital and the Board of Trustees of Fidelity Rutland Square Trust II. |
Elizabeth Paige Baumann (1968) | |
Year of Election or Appointment: 2012 Anti-Money Laundering (AML) Officer | |
| Ms. Baumann also serves as AML Officer of other funds. She is Chief AML Officer of FMR LLC (2012-present) and is an employee of Fidelity Investments. Previously, Ms. Baumann served as Vice President and Deputy Anti-Money Laundering Officer (2007-2012). |
Marc Bryant (1966) | |
Year of Election or Appointment: 2010 Secretary and Chief Legal Officer (CLO) | |
| Mr. Bryant also serves as an officer of other funds. He is Senior Vice President and Deputy General Counsel of FMR LLC. Prior to joining Fidelity Investments, Mr. Bryant served as a Senior Vice President and the Head of Global Retail Legal for AllianceBernstein L.P. (2006-2010), and as the General Counsel for ProFund Advisors LLC (2001-2006). |
Margaret A. Carey (1973) | |
Year of Election or Appointment: 2009 Assistant Secretary | |
| Ms. Carey also serves as Assistant Secretary of other funds. Ms. Carey serves as Vice President, Associate General Counsel (2007-present), and is an employee of Fidelity Investments (2004-present). Previously, Ms. Carey served as Assistant Secretary of The North Carolina Capital Management Trust: Cash and Term Portfolios (2008-2013). |
Jonathan Davis (1968) | |
Year of Election or Appointment: 2010 Assistant Treasurer | |
| Mr. Davis also serves as Assistant Treasurer of other funds. Mr. Davis is an employee of Fidelity Investments. Previously, Mr. Davis served as Vice President and Associate General Counsel of FMR LLC (2003-2010). |
Adrien E. Deberghes (1967) | |
Year of Election or Appointment: 2011 Vice President and Assistant Treasurer | |
| Mr. Deberghes also serves as an officer of other funds. He is an employee of Fidelity Investments (2008-present). Prior to joining Fidelity Investments, Mr. Deberghes was Senior Vice President of Mutual Fund Administration at State Street Corporation (2007-2008), Senior Director of Mutual Fund Administration at Investors Bank & Trust (2005-2007), and Director of Finance for Dunkin' Brands (2000-2005). |
Stephanie J. Dorsey (1969) | |
Year of Election or Appointment: 2012 Assistant Treasurer | |
| Ms. Dorsey also serves as an officer of other funds. She is an employee of Fidelity Investments (2008-present) and has served in other fund officer roles. Prior to joining Fidelity Investments, Ms. Dorsey served as Treasurer (2004-2008) of the JPMorgan Mutual Funds and Vice President (2004-2008) of JPMorgan Chase Bank. |
Kenneth B. Robins (1969) | |
Year of Election or Appointment: 2010 President and Treasurer | |
| Mr. Robins also serves as an officer of other funds. Mr. Robins serves as Executive Vice President of Fidelity Investments Money Management, Inc. (FIMM) (2013-present) and is an employee of Fidelity Investments (2004-present). Previously, Mr. Robins served in other fund officer roles. |
Nicholas E. Steck (1964) | |
Year of Election or Appointment: 2009 Chief Financial Officer | |
| Mr. Steck also serves as Chief Financial Officer of other funds. Mr. Steck serves as Senior Vice President of Fidelity Pricing and Cash Management Services (FPCMS) (2008-present) and is an employee of Fidelity Investments. During the period 2002 to 2009, Mr. Steck served as a Compliance Officer of FMR, Fidelity Investments Money Management, Inc., FMR LLC, Fidelity Research & Analysis (U.K.) Inc., Fidelity Management & Research (Hong Kong) Limited, and Fidelity Management & Research (Japan) Inc. |
Bruce Treff (1966) | |
Year of Election or Appointment: 2013 Chief Compliance Officer | |
| Mr. Treff also serves as Compliance Officer of other funds. Mr. Treff serves as Senior Vice President of Asset Management Compliance (2013-present). Prior to joining Fidelity Investments, Mr. Treff served as Managing Director of Citibank, N.A. (2005-2013). |
Annual Report
Distributions (Unaudited)
The Board of Trustees of each fund voted to pay to shareholders of record at the opening of business on record date, the following distributions per share derived from capital gains realized from sales of portfolio securities and dividends derived from net investment income:
| Pay Date | Record Date | Dividends | Capital Gains |
Fidelity Large Cap Growth Enhanced Index Fund | 04/14/14 | 04/11/14 | $0.035 | $0.296 |
Fidelity Large Cap Value Enhanced Index Fund | 04/14/14 | 04/11/14 | $0.029 | $0.114 |
Fidelity Large Cap Core Enhanced Index Fund | 04/14/14 | 04/11/14 | $0.026 | $0.139 |
Fidelity Mid Cap Enhanced Index Fund | 04/14/14 | 04/11/14 | $0.019 | $0.720 |
Fidelity Small Cap Enhanced Index Fund | 04/14/14 | 04/11/14 | $0.001 | $0.393 |
Fidelity International Enhanced Index Fund | 04/14/14 | 04/11/14 | $0.051 | $0.003 |
The funds hereby designate as capital gain dividend the amounts noted below for the taxable year ended February 28, 2014, or, if subsequently determined to be different, the net capital gain of such year.
Fidelity Large Cap Growth Enhanced Index Fund | $9,122,771 |
Fidelity Large Cap Value Enhanced Index Fund | $5,043,581 |
Fidelity Large Cap Core Enhanced Index Fund | $10,861,933 |
Fidelity Mid Cap Enhanced Index Fund | $10,678,311 |
Fidelity Small Cap Enhanced Index Fund | $14,417,350 |
A percentage of the dividends distributed during the fiscal year for the following funds qualifies for the dividends-received deduction for corporate shareholders:
| April 2013 | December 2013 |
Fidelity Large Cap Growth Enhanced Index Fund | 100% | 54% |
Fidelity Large Cap Value Enhanced Index Fund | 100% | 55% |
Fidelity Large Cap Core Enhanced Index Fund | 22% | 36% |
Fidelity Mid Cap Enhanced Index Fund | 97% | 47% |
Fidelity Small Cap Enhanced Index Fund | 10% | 27% |
A percentage of the dividends distributed during the fiscal year for the following funds may be taken into account as a dividend for purposes of the maximum rate under section 1(h)(11) of the Internal Revenue Code.
| April 2013 | December 2013 |
Fidelity Large Cap Growth Enhanced Index Fund | 100% | 56% |
Fidelity Large Cap Value Enhanced Index Fund | 100% | 57% |
Fidelity Large Cap Core Enhanced Index Fund | 25% | 38% |
Fidelity Mid Cap Enhanced Index Fund | 98% | 50% |
Fidelity Small Cap Enhanced Index Fund | 11% | 29% |
Fidelity International Enhanced Index Fund | 100% | 100% |
The amounts per share which represent income derived from sources within, and taxes paid to, foreign countries or possession of the United States are as follows:
| Pay Date | Income | Taxes |
Fidelity International Enhanced Index Fund | 04/15/13 | $0.0123 | $0.0021 |
Fidelity International Enhanced Index Fund | 12/16/13 | $0.1006 | $0.0145 |
The funds will notify shareholders in January 2015 of amounts for use in preparing 2014 income tax returns.
Annual Report
Board Approval of Investment Advisory Contracts and Management Fees
Fidelity International Enhanced Index Fund, Fidelity Large Cap Core Enhanced Index Fund, Fidelity Large Cap Growth Enhanced Index Fund, Fidelity Large Cap Value Enhanced Index Fund, Fidelity Mid Cap Enhanced Index Fund, and Fidelity Small Cap Enhanced Index Fund
Each year the Board of Trustees, including the Independent Trustees (together, the Board), votes at an in-person meeting on the renewal of the management contract with Strategic Advisers, Inc. (Strategic Advisers) and the sub-advisory agreements with Geode Capital Management, LLC (Geode) (the Sub-Advisory Agreements and, together with the management contract, the Advisory Contracts) for each fund. The Board, assisted by the advice of fund counsel and Independent Trustees' counsel, requests and considers a broad range of information relevant to the renewal of the Advisory Contracts throughout the year.
The Board meets at least four times per year and, at each of its meetings, considers factors that are relevant to its annual consideration of the renewal of each fund's Advisory Contracts, including the services and support provided to each fund and its shareholders. The Board has established standing committees, each composed of Independent Trustees with varying backgrounds, to which the Board has assigned specific subject matter responsibilities in order to enhance effective decision-making by the Board. While the full Board or the Independent Trustees, as appropriate, act on all major matters, a portion of the activities of the Board (including certain of those described herein) may be conducted through these committees.
At its September 2013 meeting, the Board, including the Independent Trustees, unanimously determined to renew each fund's Advisory Contracts. In reaching its determination, the Board considered all factors it believed relevant, including, (i) the nature, extent, and quality of the services to be provided to each fund and its shareholders (including the investment performance of each fund); (ii) the competitiveness of each fund's management fee and total expenses relative to peer funds; (iii) the total costs of the services to be provided by and the profits, if any, to be realized by Strategic Advisers from its relationship with the funds; (iv) the extent to which economies of scale exist and would be realized as each fund grows; and (v) whether fee levels reflect these economies of scale, if any, for the benefit of each fund's shareholders.
In considering whether to renew the Advisory Contracts for each fund, the Board reached a determination, with the assistance of fund counsel and Independent Trustees' counsel and through the exercise of its business judgment, that the renewal of the Advisory Contracts was in the best interests of each fund and its shareholders. In addition, with respect to the Sub-Advisory Agreements, the Board also concluded that the renewal of such agreements does not involve a conflict of interest from which Strategic Advisers or its affiliates derive an inappropriate advantage. Also, the Board found that the advisory fees to be charged under the Advisory Contracts bear a reasonable relationship to the services rendered and are based on services provided that are in addition to, rather than duplicative of, services provided under the advisory contract of any underlying fund in which each fund may invest. The Board's decision to renew the Advisory Contracts was not based on any single factor, but rather was based on a comprehensive consideration of all the information provided to the Board throughout the year.
Nature, Extent, and Quality of Services Provided. The Board considered the staffing within the investment adviser, Strategic Advisers, and the sub-adviser, Geode (collectively, the Investment Advisers), including the backgrounds of each fund's investment personnel and each fund's investment objective, strategies and related investment philosophy. The Independent Trustees also had discussions with senior management of Strategic Advisers' investment operations and investment groups. The Board considered the structure of each Investment Adviser's portfolio manager compensation program and whether such structures provide appropriate incentives to act in the best interests of each fund.
Resources Dedicated to Investment Management and Support Services. The Board reviewed the general qualifications and capabilities of the Investment Advisers' investment staff, their use of technology, and the Investment Advisers' approach to managing and compensating investment personnel. The Board noted that the Investment Advisers' analysts have extensive resources, tools, and capabilities that allow them to conduct sophisticated quantitative and/or fundamental analysis. Additionally, in its deliberations, the Board considered the Investment Advisers' trading capabilities and resources, which are an integral part of the investment management process.
Shareholder and Administrative Services. The Board considered (i) the nature, extent, quality, and cost of advisory, administrative, and shareholder services performed by the Investment Advisers and their affiliates under the Advisory Contracts and under separate agreements covering transfer agency and pricing and bookkeeping, and securities lending services for each fund; (ii) the nature and extent of Strategic Advisers' supervision of third party service providers, including the sub-adviser, custodians and subcustodians; and (iii) the resources devoted to, and the record of compliance with, each fund's compliance policies and procedures.
Investment Performance. The Board considered whether each fund has operated in accordance with its investment objective, as well as its record of compliance with its investment restrictions. It also reviewed each fund's absolute investment performance, as well as each fund's relative investment performance over multiple periods measured against (i) a broad-based securities market index, and (ii) a peer group of mutual funds deemed appropriate by Strategic Advisers and reviewed by the Board. The following charts considered by the Board show for each fund, over the one-, three-, and five-year periods ended December 31, 2012, the cumulative total returns of each fund, the cumulative total returns of a broad-based securities market index ("benchmark"), and a range of cumulative total returns of a peer group of mutual funds identified by Lipper Inc. as having an investment style similar to the respective fund based on underlying portfolio holdings. The box within each chart shows the 25th percentile return (top of box) and the 75th percentile return (bottom of box) of the peer group. Returns shown above the box are in the first quartile and returns shown below the box are in the fourth quartile. The percentage beaten numbers noted below each chart correspond to the percentile box and represent the percentage of funds in the peer group whose performance was equal to or lower than that of each fund.
Annual Report
Fidelity International Enhanced Index Fund
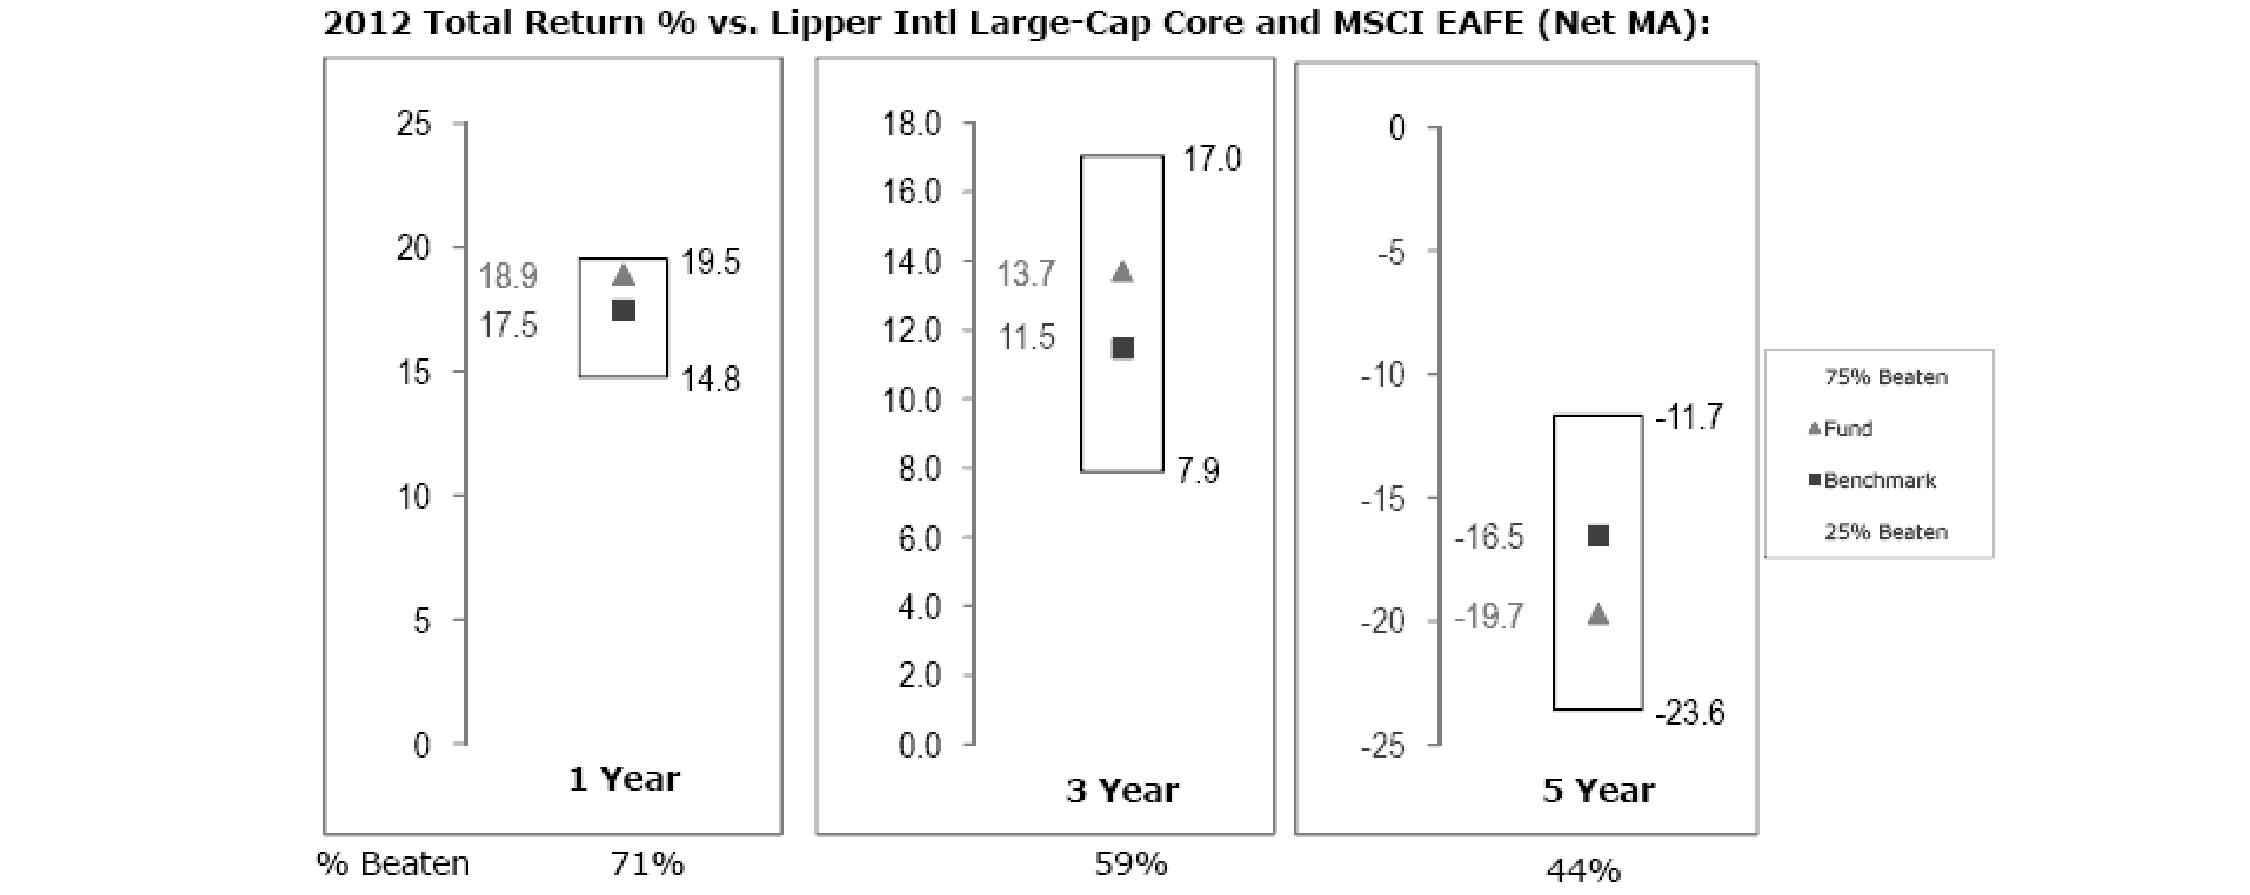
The Board reviewed the fund's relative investment performance against its peer group and noted that the performance of the fund was in the second quartile for the one- and three-year periods and in the third quartile for the five-year period and that the fund had out-performed 71% and 59% and under-performed 56% of its peers for the one-, three-, and five-year periods, respectively, ended December 31, 2012. The Board also noted that the investment performance of the fund was higher than its benchmark for the one- and three-year periods and lower than its benchmark for the five-year period shown.
Fidelity Large Cap Core Enhanced Index Fund
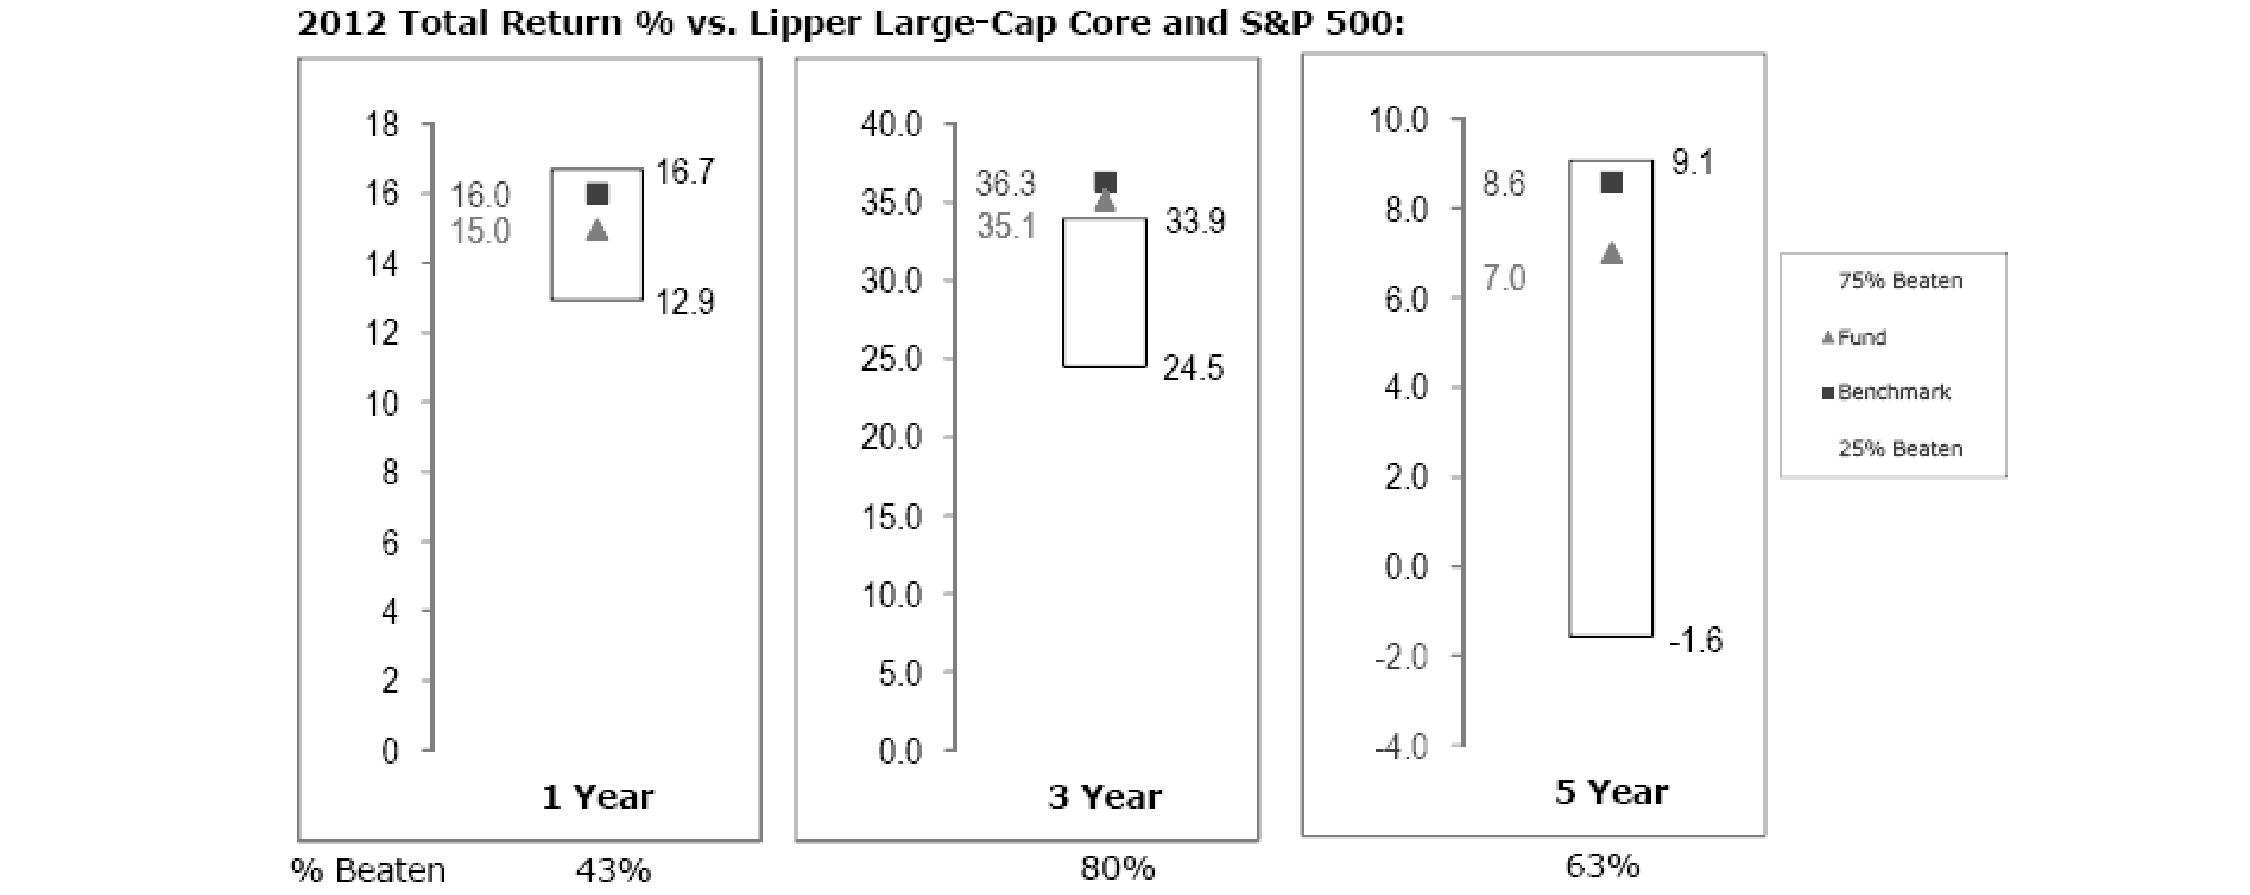
The Board reviewed the fund's relative investment performance against its peer group and noted that the performance of the fund was in the third quartile for the one-year period, in the first quartile for the three-year period, and in the second quartile for the five-year period and that the fund had under-performed 57% and out-performed 80% and 63% of its peers for the one-, three-, and five-year periods, respectively, ended December 31, 2012. The Board also noted that the investment performance of the fund was lower than its benchmark for each period shown.
Annual Report
Board Approval of Investment Advisory Contracts and Management Fees - continued
Fidelity Large Cap Growth Enhanced Index Fund
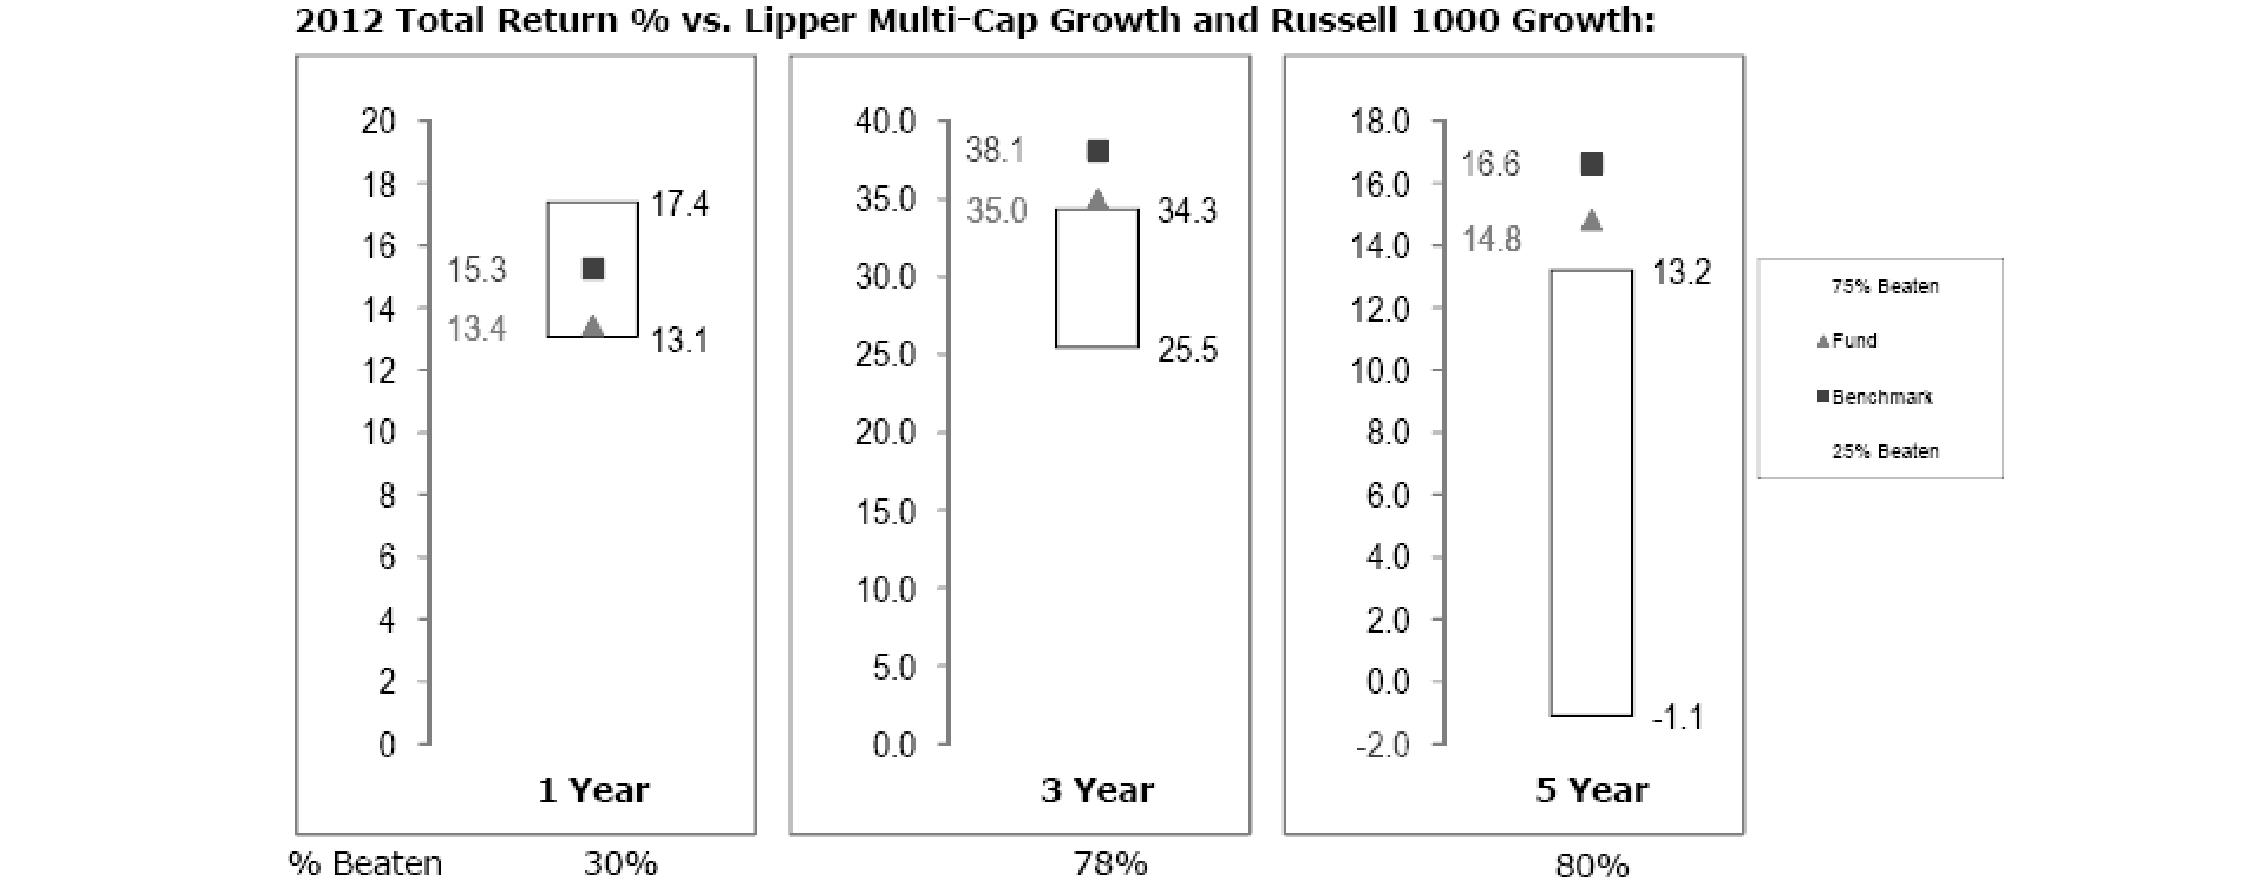
The Board reviewed the fund's relative investment performance against its peer group and noted that the performance of the fund was in the third quartile for the one-year period and in the first quartile for the three- and five-year periods and that the fund had under-performed 70% and out-performed 78% and 80% of its peers for the one-, three-, and five-year periods, respectively, ended December 31, 2012. The Board also noted that the investment performance of the fund was lower than its benchmark for each period shown.
Fidelity Large Cap Value Enhanced Index Fund
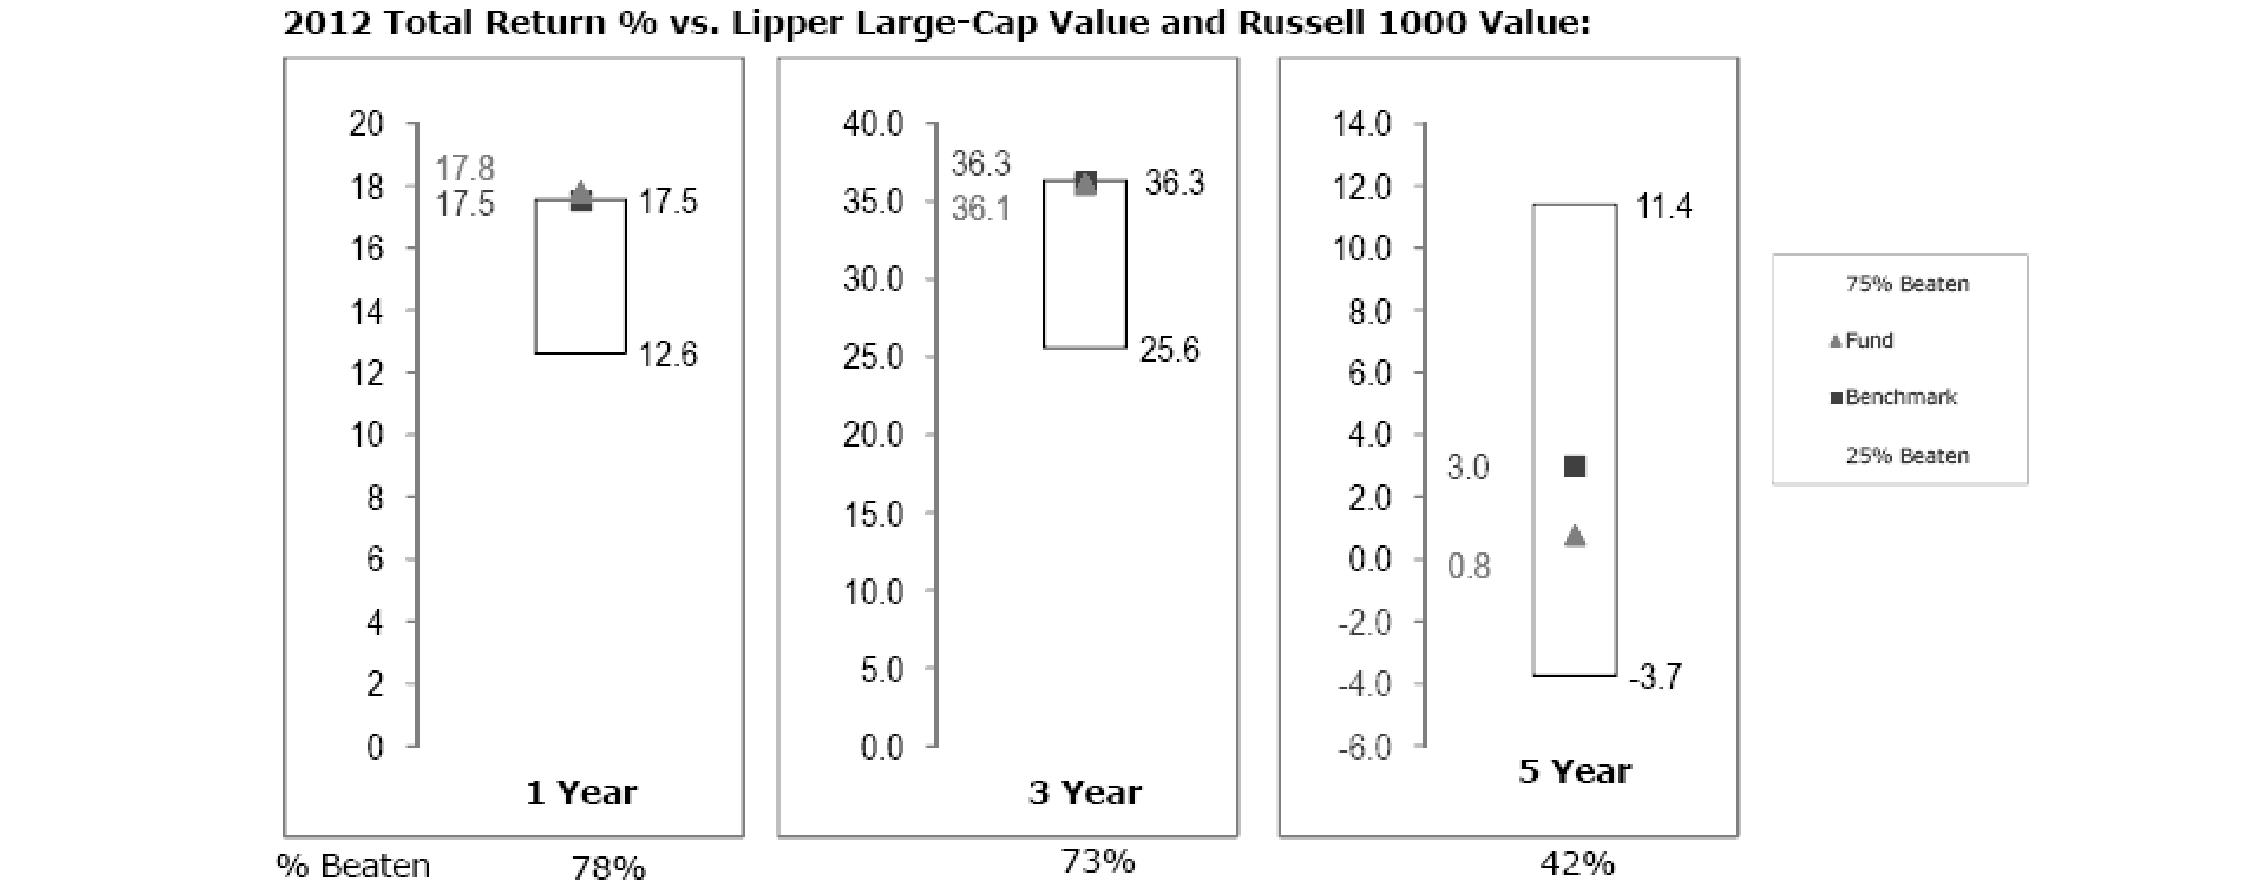
The Board reviewed the fund's relative investment performance against its peer group and noted that the performance of the fund was in the first quartile for the one-year period, in the second quartile for the three-year period, and in the third quartile for the five-year period and that the fund had out-performed 78% and 73% and under-performed 58% of its peers for the one-, three-, and five-year periods, respectively, ended December 31, 2012. The Board also noted that the investment performance of the fund was higher than its benchmark for the one-year period and lower than its benchmark for the three-and five-year periods shown.
Annual Report
Fidelity Mid Cap Enhanced Index Fund
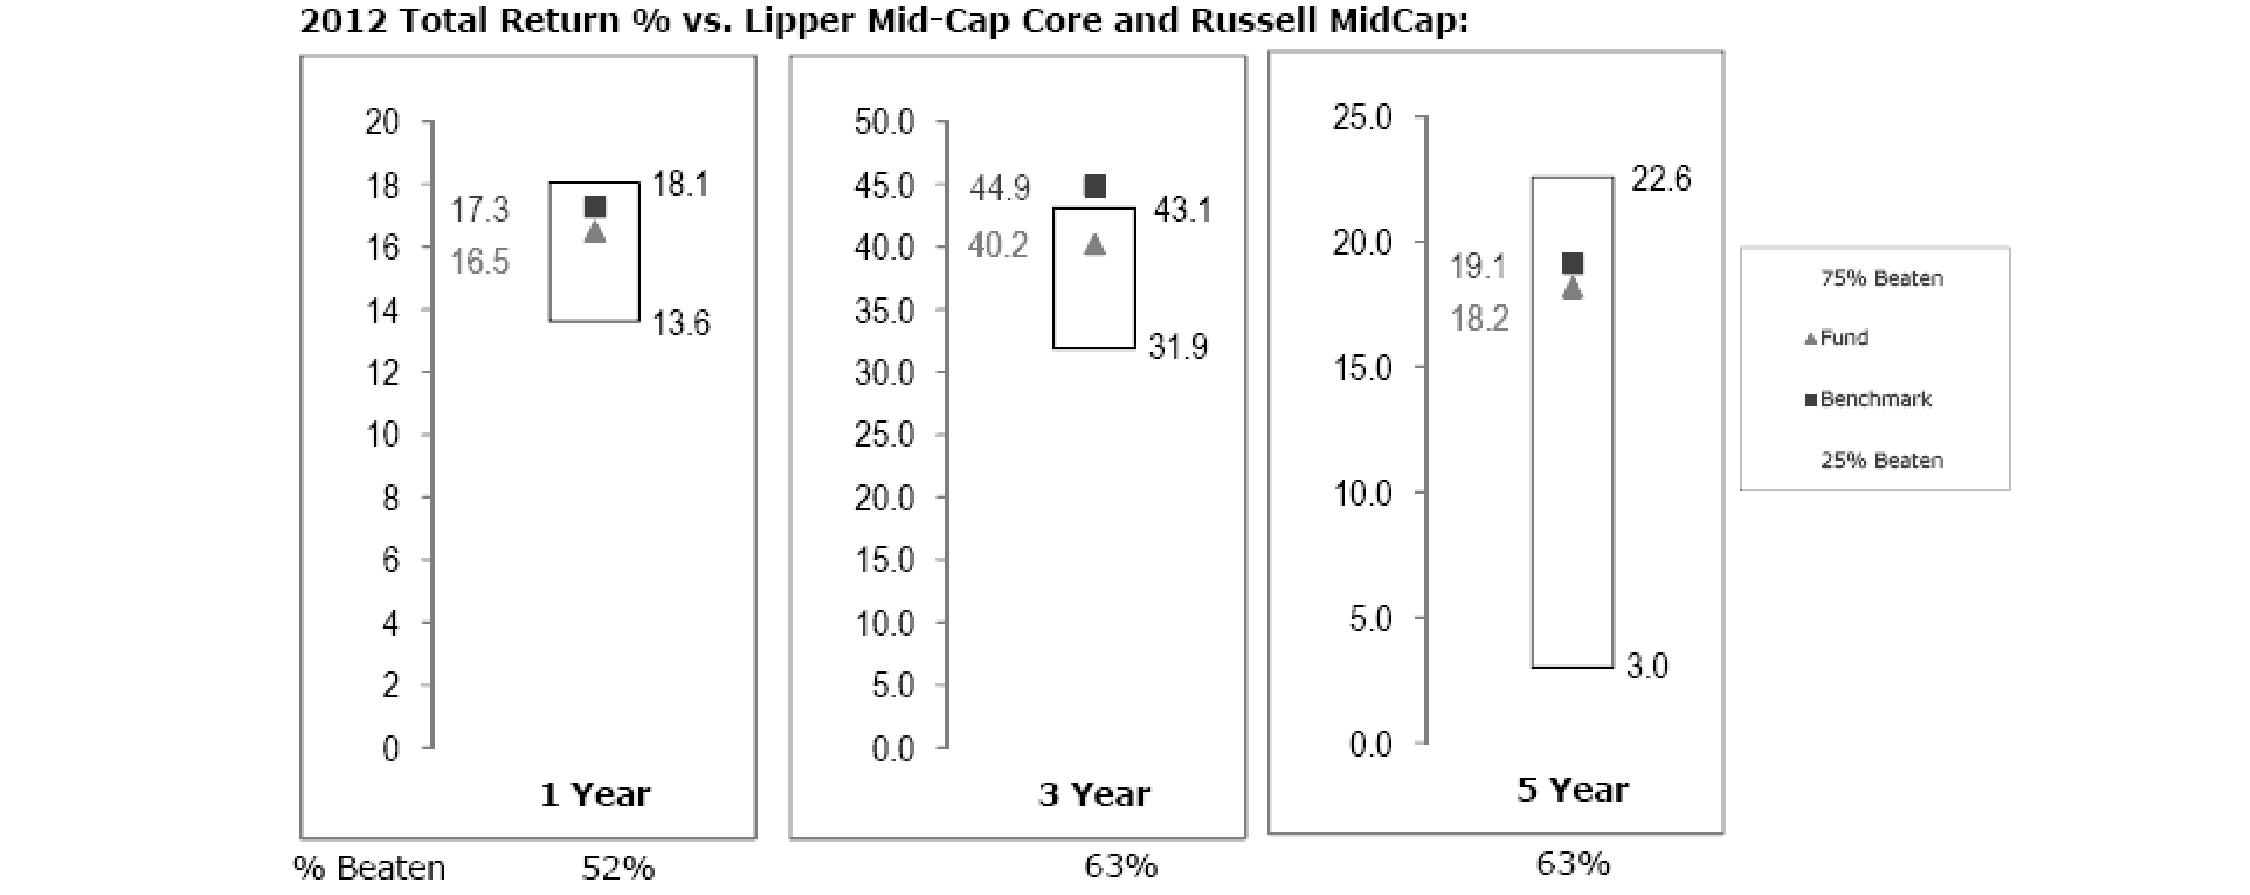
The Board reviewed the fund's relative investment performance against its peer group and noted that the performance of the fund was in the second quartile for each period and that the fund had out-performed 52%, 63%, and 63% of its peers for the one-, three-, and five-year periods, respectively, ended December 31, 2012. The Board also noted that the investment performance of the fund was lower than its benchmark for each period shown.
Fidelity Small Cap Enhanced Index Fund
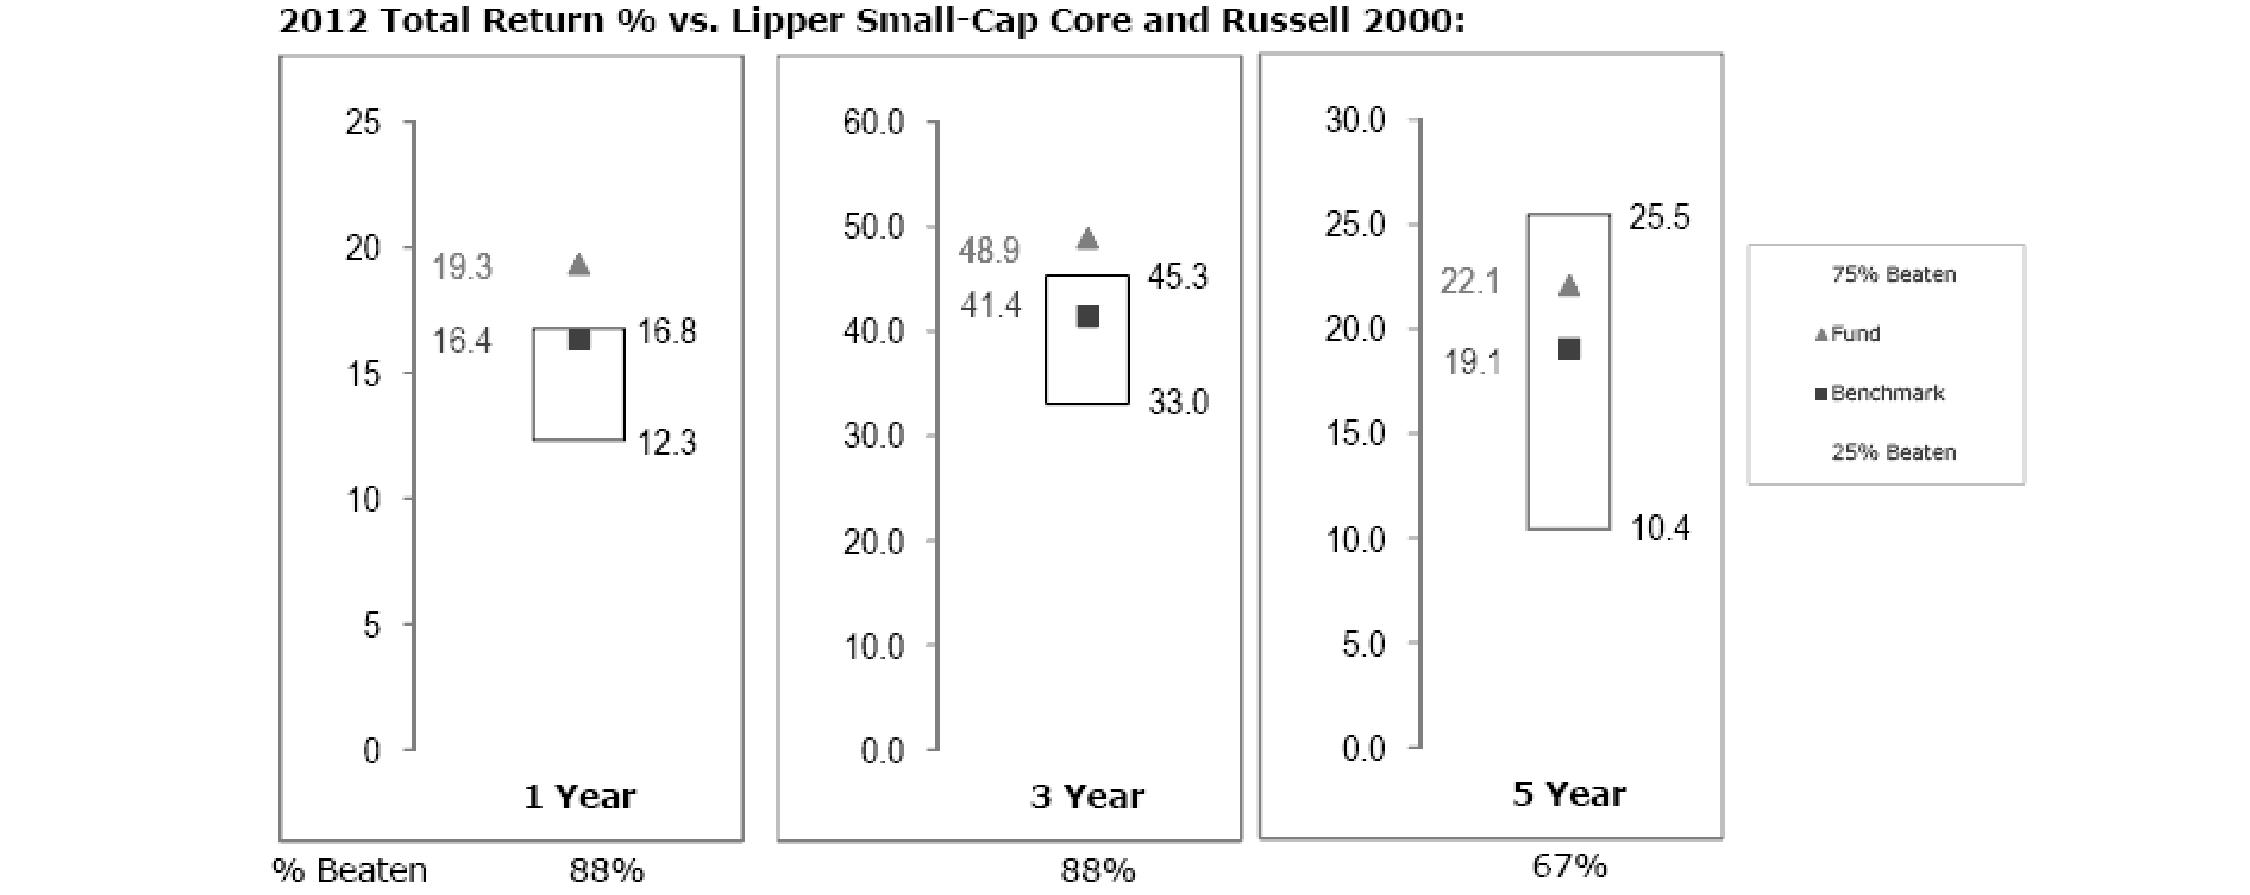
The Board reviewed the fund's relative investment performance against its peer group and noted that the performance of the fund was in the first quartile for the one- and three-year periods and in the second quartile for the five-year period and that the fund had out-performed 88%, 88%, and 67% of its peers for the one-, three-, and five-year periods, respectively, ended December 31, 2012. The Board also noted that the investment performance of the fund was higher than its benchmark for each period shown.
Based on its review, the Board concluded that the nature, extent, and quality of services provided to each fund under the Advisory Contracts should benefit each fund's shareholders.
Competitiveness of Management Fee and Total Fund Expenses. The Board considered the amount and nature of fees paid to the Investment Advisers. The Board also considered information comparing the management fees and total expenses of each fund to those of other registered investment companies with investment objectives similar to those of the funds. The Board also considered expense contracts currently in effect between the funds and Strategic Advisers, which limit each fund's total annual operating expenses (excluding interest, taxes, securities lending costs, brokerage commissions and certain other expenses) to the following:
Annual Report
Board Approval of Investment Advisory Contracts and Management Fees - continued
Fidelity International Enhanced Index Fund | 0.62% |
Fidelity Large Cap Core Enhanced Index Fund | 0.45% |
Fidelity Large Cap Growth Enhanced Index Fund | 0.45% |
Fidelity Large Cap Value Enhanced Index Fund | 0.45% |
Fidelity Mid Cap Enhanced Index Fund | 0.60% |
Fidelity Small Cap Enhanced Index Fund | 0.67% |
The Board considered each fund's management fee and total expenses compared to "mapped groups" of competitive funds. Strategic Advisers uses "mapped groups," which are created by Fidelity by combining similar Lipper investment objective categories that it believes have comparable investment mandates. Combining Lipper investment objective categories aids the Board's management fee and total expense comparisons by broadening the competitive group used for comparison and by reducing the number of universes to which Strategic Advisers' funds are compared.
Management Fee. The Board considered two proprietary management fee comparisons. The group of Lipper funds used by the Board for management fee comparisons is referred to as the "Total Mapped Group." The Total Mapped Group comparison focuses on a fund's standing in terms of gross management fees before expense reimbursements or caps relative to the total universe of funds with comparable investment mandates, regardless of whether their management fee structures are also comparable. "TMG %" represents the percentage of funds in the Total Mapped Group that had management fees that were lower than the fund's. For example, a hypothetical TMG % of 50% would mean that half of the funds in the Total Mapped Group had higher, and half had lower, management fees than the fund. Each fund's actual TMG %s is in the charts below. The Board also compared each fund's management fee to an "Asset-Size Peer Group" (ASPG), which is a sub-set of the competitive funds in the Total Mapped Group. The ASPG comparison focuses on a fund's standing relative to non-Fidelity funds within the Total Mapped Group that are similar in size and management fee structure. For example, if a fund is in the first quartile of the ASPG, the fund's management fee ranks in the least expensive or lowest 25% of funds in the ASPG. The ASPG represents at least 15% of the funds in the Total Mapped Group with comparable asset size and management fee structures, subject to a minimum of 50 funds (or all funds in the Total Mapped Group if fewer than 50). Additional information, such as the ASPG quartile in which each fund's management fee rate ranked, is also included in the chart and considered by the Board.
Fidelity International Enhanced Index Fund
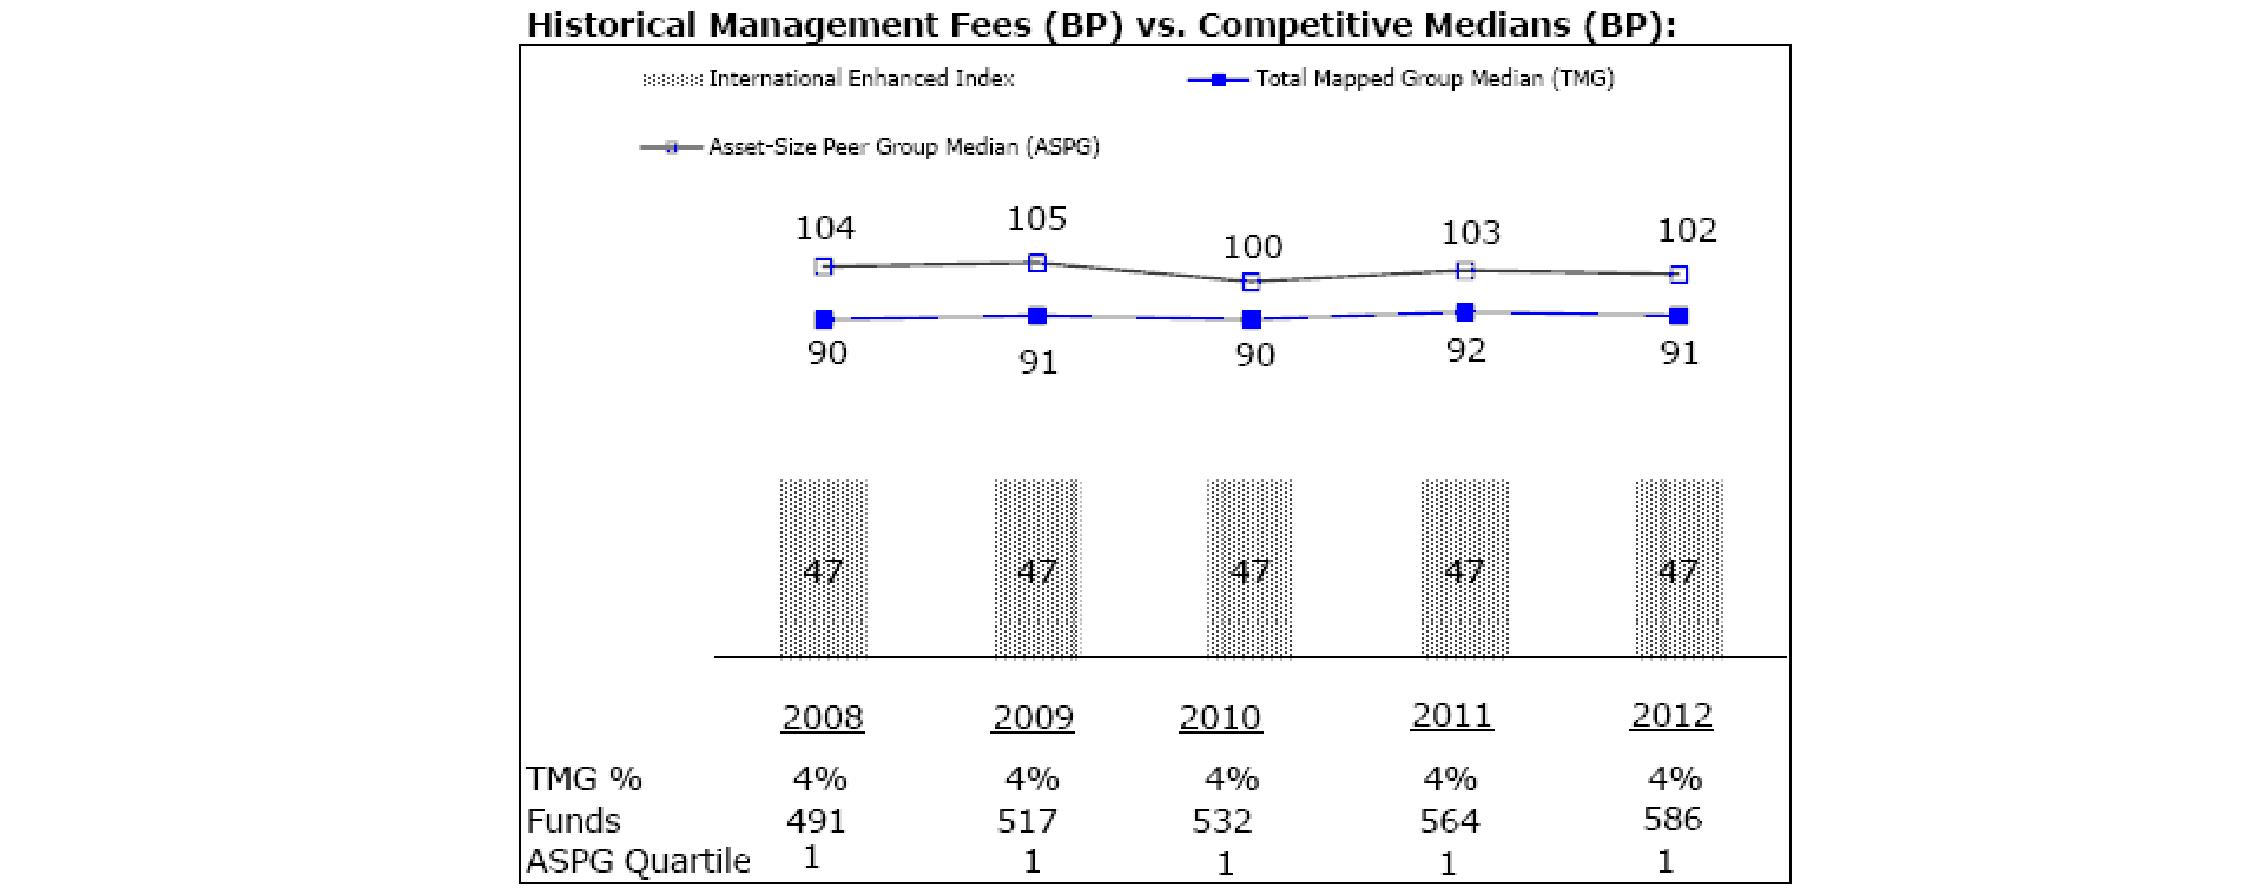
Annual Report
Fidelity Large Cap Core Enhanced Index Fund
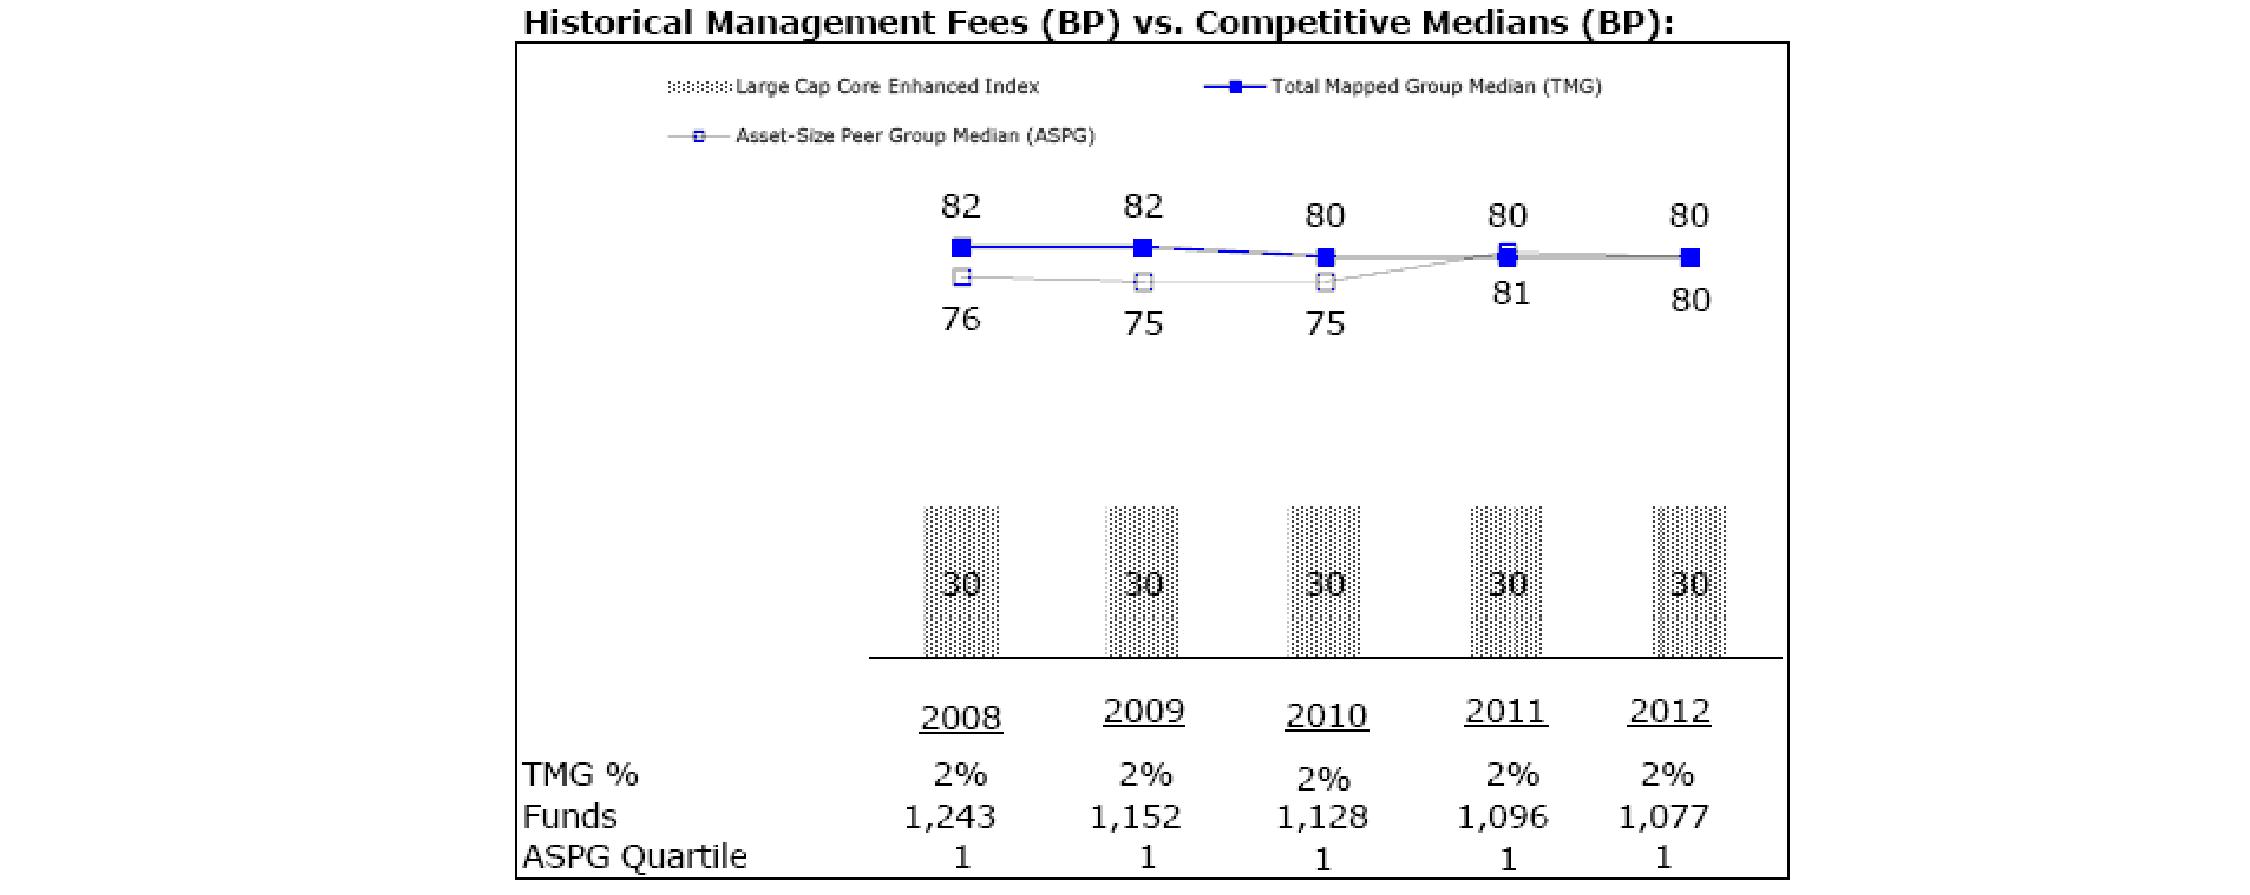
Fidelity Large Cap Growth Enhanced Index Fund
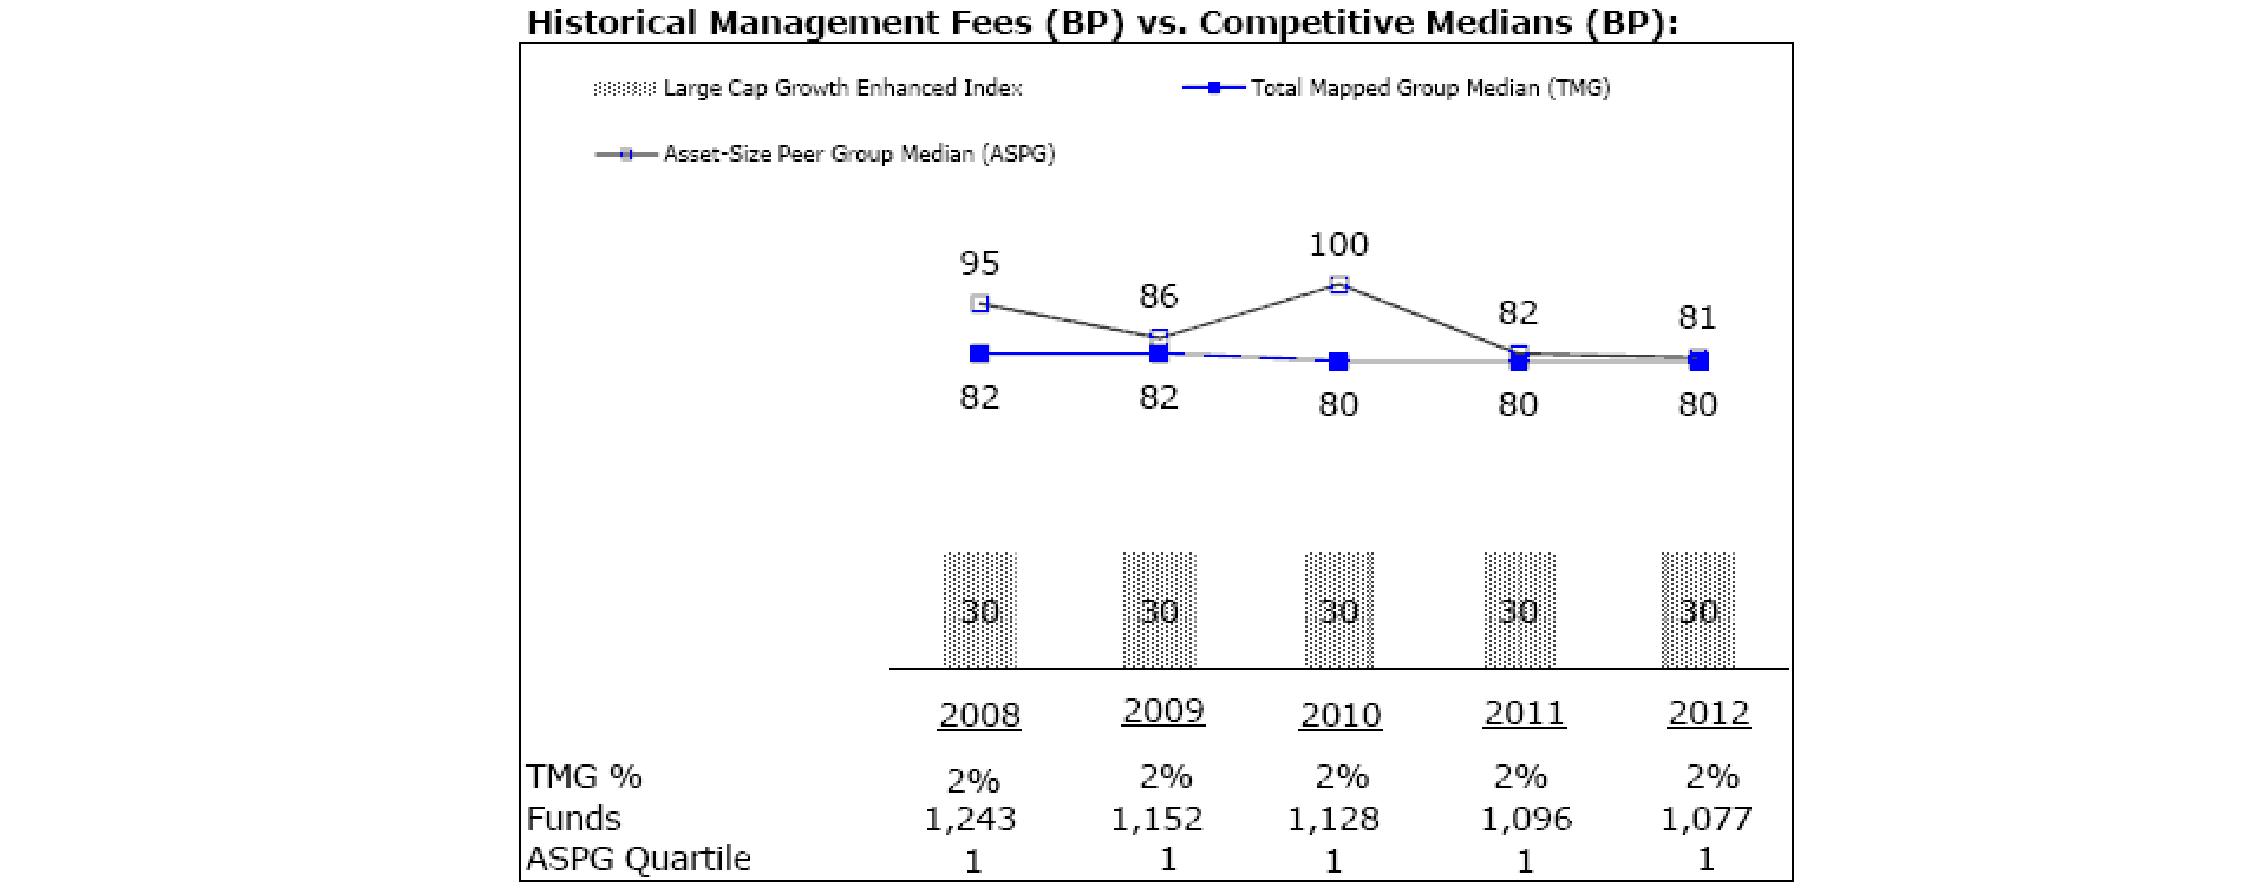
Annual Report
Board Approval of Investment Advisory Contracts and Management Fees - continued
Fidelity Large Cap Value Enhanced Index Fund
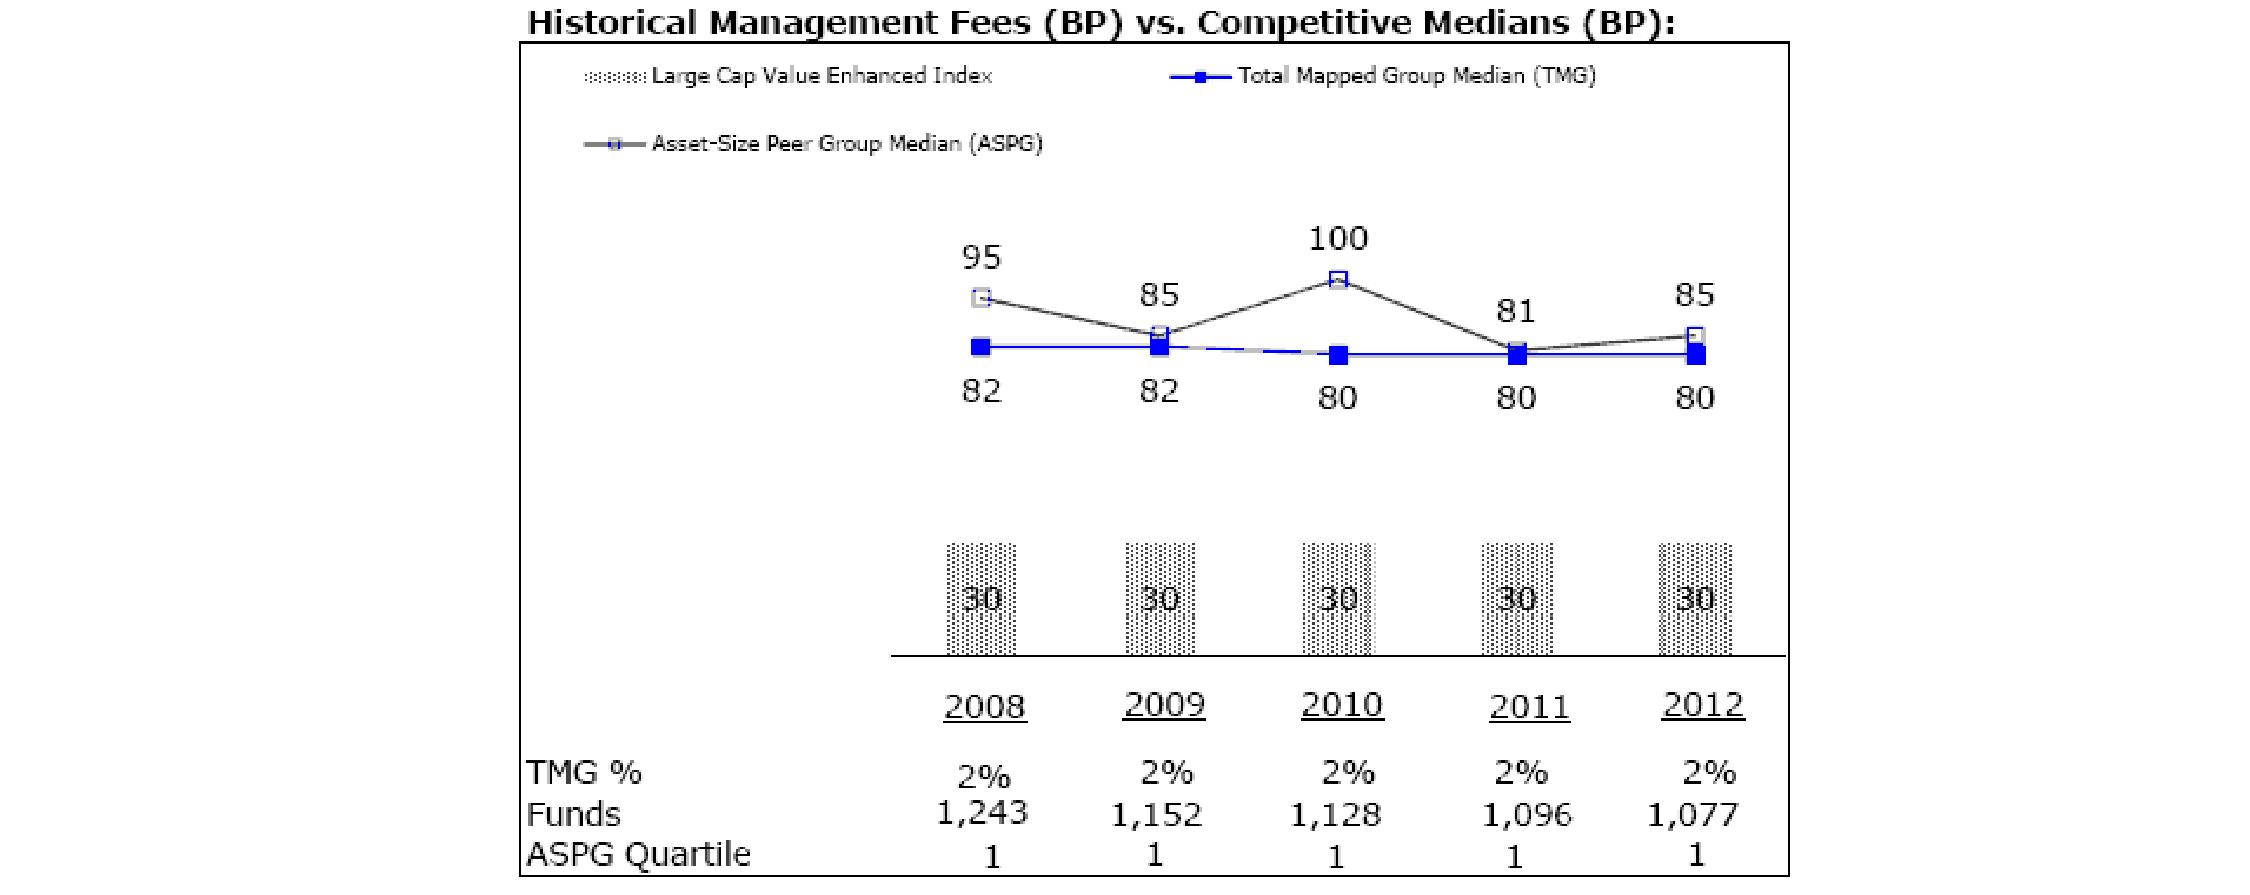
Fidelity Mid Cap Enhanced Index Fund
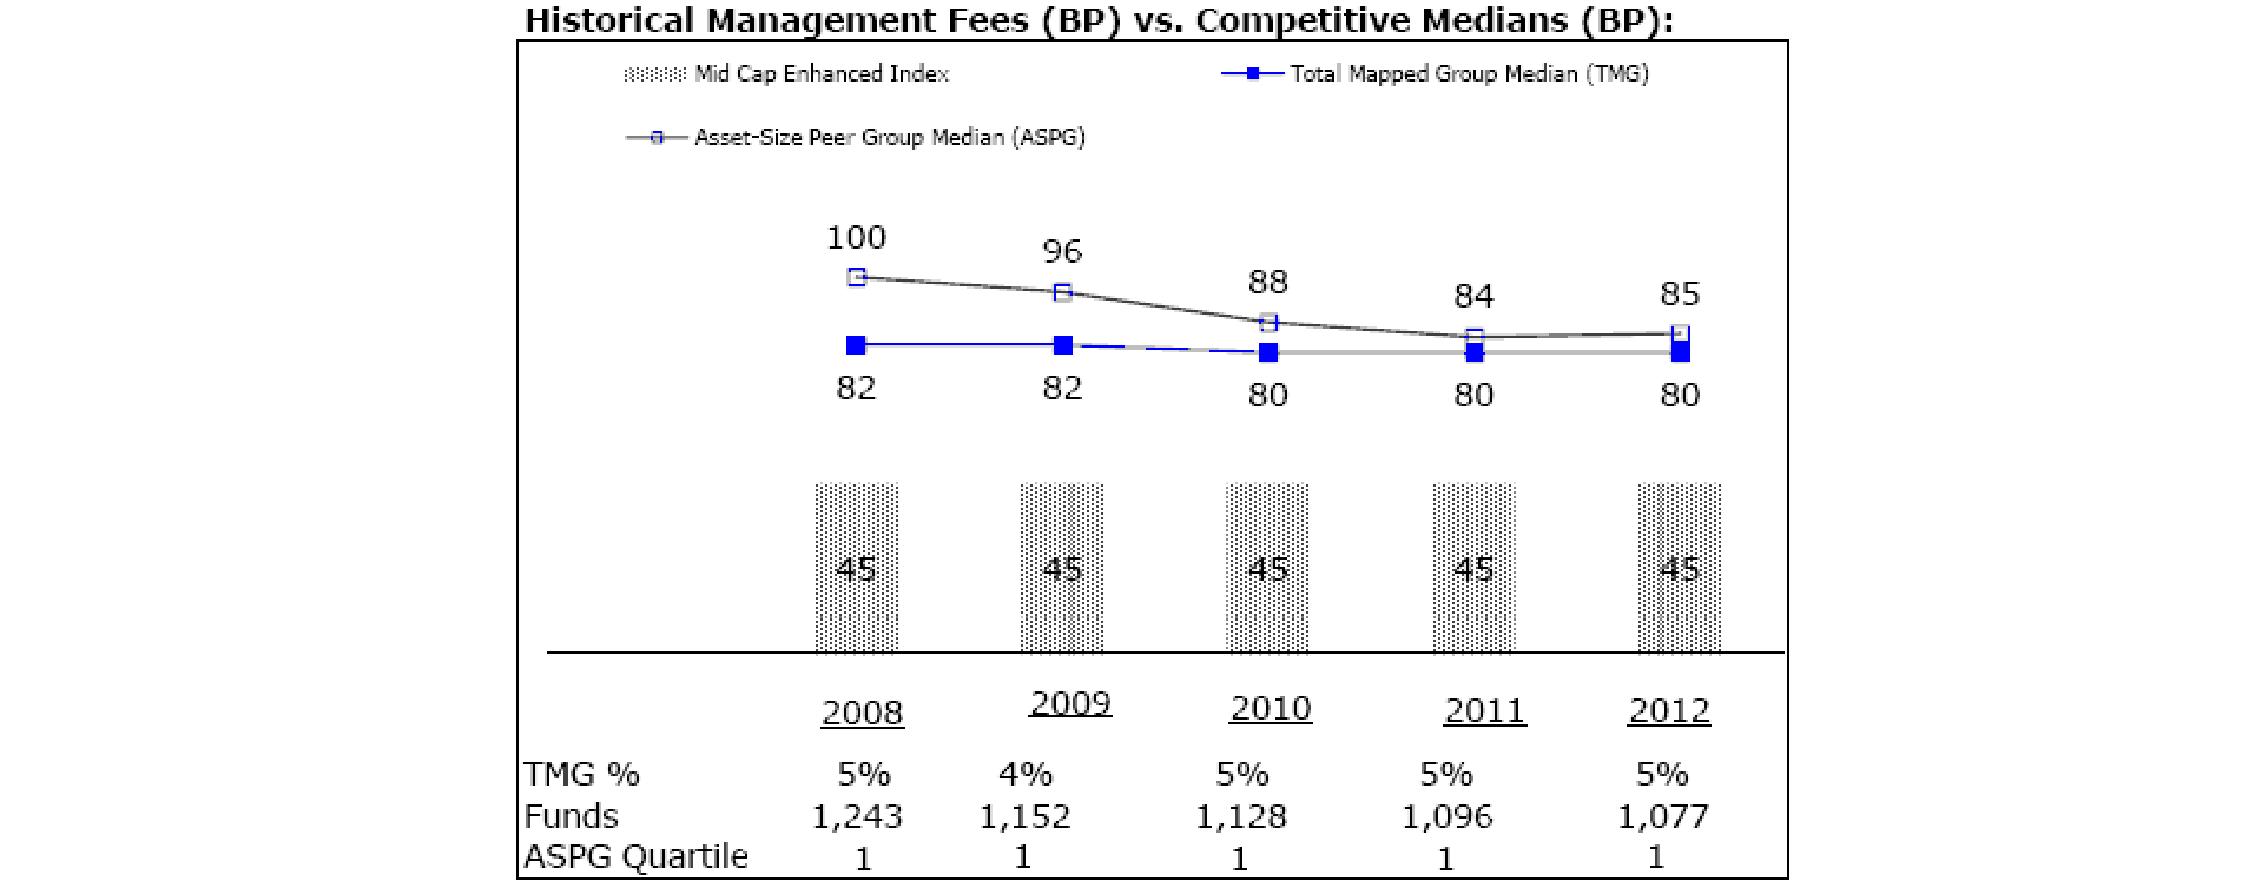
Annual Report
Fidelity Small Cap Enhanced Index Fund
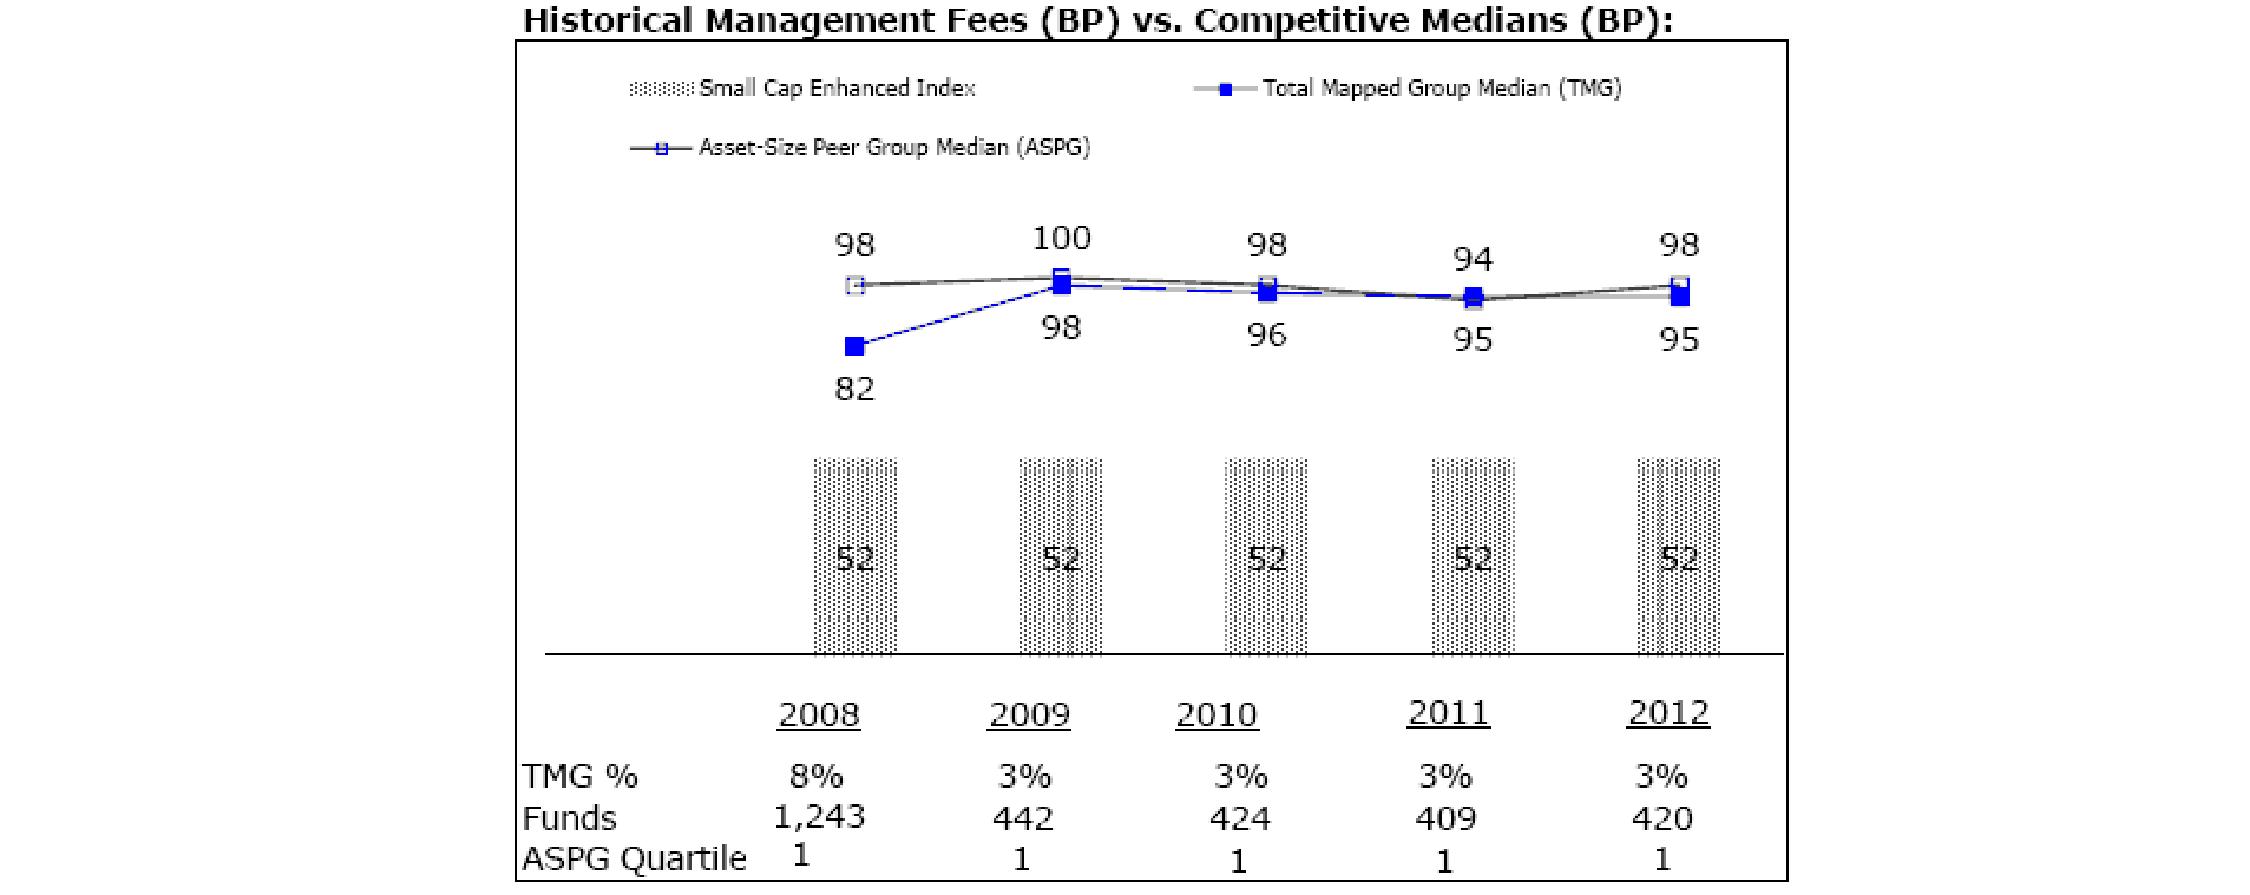
The Board noted that each fund's management fee was ranked below the median of its Total Mapped Group and below the median of its ASPG for the fiscal year ended February 28, 2013.
Based on its review, the Board concluded that each fund's management fee bears a reasonable relationship to the services rendered.
Total Expenses. In its review of each fund's total expenses, the Board considered each fund's management fee as well as other fund expenses, as applicable, such as transfer agent fees, pricing and bookkeeping fees, and custodial, legal, and audit fees. The Board also noted the effects of any waivers and reimbursements on fees and expenses. The Board further noted that each fund's total expenses were compared to classes of competitive funds having similar load types. This comparison, which is a proxy for comparing funds by distribution channel, showed each fund's position relative to competitive funds with the same load type. The Board noted that each fund's total expenses (giving effect to each fund's expense contract with Strategic Advisers) were below the median of each fund's Total Mapped Group for the fiscal year ended February 28, 2013.
Based on its review, the Board concluded that the total expenses of each fund were reasonable in light of the services that each fund and its shareholders receive and the other factors considered.
Costs of the Services and Profitability. The Board considered information regarding the revenues earned and expenses incurred by Strategic Advisers and its affiliates in conducting the business of developing, marketing, distributing, managing, administering and servicing each fund and servicing each fund's shareholders.
On an annual basis, Strategic Advisers presents information to the Board on its profitability for managing each fund. Strategic Advisers calculates the profitability for each fund using a series of detailed revenue and cost allocation methodologies. The Board reviews any significant changes from the prior year's methodologies. Strategic Advisers noted that, to the extent possible, it employs the same corporate reporting of revenues and expenses as those used by other Fidelity funds.
The Board also reviewed Strategic Advisers' and its affiliates' non-fund businesses and fall-out benefits related to the mutual fund business, as well as cases where Strategic Advisers' affiliates may benefit from or be related to each fund's business.
The Board considered the costs of the services provided by and the profits realized, if any, by Strategic Advisers and its affiliates in connection with the operation of each fund and was satisfied that the profitability was not excessive under the circumstances.
Possible Economies of Scale. The Board considered whether economies of scale have been realized in respect of the management of the Strategic Advisers funds. The Board considered that each fund's sub-advisory contract provides for breakpoints as the fund's assets grow and noted that any potential decline in sub-advisory fees would accrue directly to Strategic Advisers. The Board also considered expense contracts currently in effect between the funds and Strategic Advisers, which limit the total annual operating expenses (excluding interest, taxes, securities lending costs, brokerage commissions and certain other expenses) for each fund to the amounts described above. The Board noted that each fund has not generated sufficient revenue to cover its expenses. The Board also noted that as each fund's assets increase, it will continue to monitor whether management fee breakpoints are appropriate.
Annual Report
Board Approval of Investment Advisory Contracts and Management Fees - continued
Conclusion. Based on its evaluation of all of the conclusions noted above, and after considering all factors it believed relevant, the Board ultimately concluded that the advisory fee structures bear a reasonable relationship to the services rendered and that each fund's Advisory Contracts should be renewed because each agreement is in the best interests of that fund and its shareholders. The Board also concluded that the advisory fees charged thereunder are based on services provided that are in addition to, rather than duplicative of, services provided under the advisory contract of any underlying fund in which each fund may invest. In addition, with respect to each Sub-Advisory Agreement, the Board concluded that the renewal of each agreement does not involve a conflict of interest from which Strategic Advisers or its affiliates derive an inappropriate advantage.
Annual Report
Investment Adviser
Strategic Advisers, Inc.
Boston, MA
Investment Sub-Adviser
Geode Capital Management, LLC
Boston, MA
General Distributor
Fidelity Distributors Corporation
Smithfield, RI
Transfer and Service Agents
Fidelity Investments Institutional Operations Company, Inc.
Boston, MA
Fidelity Service Company, Inc.
Boston, MA
Custodian
The Bank of New York Mellon
New York, NY
The Fidelity Telephone Connection
Mutual Fund 24-Hour Service
Exchanges/Redemptions
and Account Assistance 1-800-544-6666
Product Information 1-800-544-6666
Retirement Accounts 1-800-544-4774
(8 a.m. - 9 p.m.)
TDD Service 1-800-544-0118
for the deaf and hearing impaired
(9 a.m. - 9 p.m. Eastern time)
Fidelity Automated Service
Telephone (FAST®)
1-800-544-5555
Automated line for quickest service
(Fidelity Investment logo)(registered trademark)
Corporate Headquarters
245 Summer St., Boston, MA 02210
www.fidelity.com
GEI-UANN-0414
1.855137.106
Item 2. Code of Ethics
As of the end of the period, February 28, 2014, Fidelity Commonwealth Trust II (the "trust") has adopted a code of ethics, as defined in Item 2 of Form N-CSR, that applies to its President and Treasurer and its Chief Financial Officer. A copy of the code of ethics is filed as an exhibit to this Form N-CSR.
Item 3. Audit Committee Financial Expert
The Board of Trustees of the trust has determined that Amy Butte Liebowitz is an audit committee financial expert, as defined in Item 3 of Form N-CSR. Ms. Butte Liebowitz is independent for purposes of Item 3 of Form N-CSR.
Item 4. Principal Accountant Fees and Services
Fees and Services
The following table presents fees billed by PricewaterhouseCoopers LLP ("PwC") in each of the last two fiscal years for services rendered to Fidelity International Enhanced Index Fund, Fidelity Large Cap Core Enhanced Index Fund, Fidelity Large Cap Growth Enhanced Index Fund, Fidelity Large Cap Value Enhanced Index Fund, Fidelity Mid Cap Enhanced Index Fund, and Fidelity Small Cap Enhanced Index Fund (the "Funds"):
Services Billed by PwC
February 28, 2014 FeesA
| Audit Fees | Audit-Related Fees | Tax Fees | All Other Fees |
Fidelity International Enhanced Index Fund | $43,000 | $- | $4,000 | $1,400 |
Fidelity Large Cap Core Enhanced Index Fund | $43,000 | $- | $4,000 | $1,400 |
Fidelity Large Cap Growth Enhanced Index Fund | $43,000 | $- | $4,000 | $1,400 |
Fidelity Large Cap Value Enhanced Index Fund | $43,000 | $- | $4,000 | $1,400 |
Fidelity Mid Cap Enhanced Index Fund | $43,000 | $- | $4,000 | $1,400 |
Fidelity Small Cap Enhanced Index Fund | $43,000 | $- | $4,000 | $1,400 |
February 28, 2013 FeesA
| Audit Fees | Audit-Related Fees | Tax Fees | All Other Fees |
Fidelity International Enhanced Index Fund | $47,000 | $- | $4,000 | $500 |
Fidelity Large Cap Core Enhanced Index Fund | $49,000 | $- | $4,000 | $500 |
Fidelity Large Cap Growth Enhanced Index Fund | $44,000 | $- | $4,000 | $500 |
Fidelity Large Cap Value Enhanced Index Fund | $44,000 | $- | $4,000 | $500 |
Fidelity Mid Cap Enhanced Index Fund | $47,000 | $- | $4,000 | $500 |
Fidelity Small Cap Enhanced Index Fund | $45,000 | $- | $4,000 | $500 |
A Amounts may reflect rounding.
The following table presents fees billed by PwC that were required to be approved by the Audit Committee for services that relate directly to the operations and financial reporting of the Funds and that are rendered on behalf of Strategic Advisers, Inc. ("Strategic Advisers") and entities controlling, controlled by, or under common control with Strategic Advisers (not including any sub-adviser whose role is primarily portfolio management and is subcontracted with or overseen by another investment adviser) that provide ongoing services to the Funds ("Fund Service Providers"):
Services Billed by PwC
| February 28, 2014A | February 28, 2013A |
Audit-Related Fees | $4,970,000 | $4,755,000 |
Tax Fees | $- | $- |
All Other Fees | $50,000 | $- |
A Amounts may reflect rounding.
"Audit-Related Fees" represent fees billed for assurance and related services that are reasonably related to the performance of the Fund audit or the review of the Fund's financial statements and that are not reported under Audit Fees.
"Tax Fees" represent fees billed for tax compliance, tax advice or tax planning that relate directly to the operations and financial reporting of the Fund.
"All Other Fees" represent fees billed for services provided to the fund or Fund Service Provider, a significant portion of which are assurance related, that relate directly to the operations and financial reporting of the fund, excluding those services that are reported under Audit Fees, Audit-Related Fees or Tax Fees.
Assurance services must be performed by an independent public accountant.
* * *
The aggregate non-audit fees billed by PwC for services rendered to the Funds, Strategic Advisers (not including any sub-adviser whose role is primarily portfolio management and is subcontracted with or overseen by another investment adviser), and any Fund Service Provider relating to Covered Services and Non-Covered Services (each as defined below) for each of the last two fiscal years of the Funds are as follows:
Billed By | February 28, 2014 A | February 28, 2013 A |
PwC | $5,515,000 | $5,430,000 |
A Amounts may reflect rounding.
The trust's Audit Committee has considered non-audit services that were not pre-approved that were provided by PwC to Fund Service Providers to be compatible with maintaining the independence of PwC in its audit of the Funds, taking into account representations from PwC, in accordance with Public Company Accounting Oversight Board rules, regarding its independence from the Funds and their related entities and Strategic Advisers' review of the appropriateness and permissibility under applicable law of such non-audit services prior to their provision to the Fund Service Providers.
Audit Committee Pre-Approval Policies and Procedures
The trust's Audit Committee must pre-approve all audit and non-audit services provided by the independent registered public accounting firm relating to the operations or financial reporting of the funds. Prior to the commencement of any audit or non-audit services to a fund, the Audit Committee reviews the services to determine whether they are appropriate and permissible under applicable law.
The trust's Audit Committee has adopted policies and procedures to, among other purposes, provide a framework for the Committee's consideration of non-audit services by the audit firms that audit the Fidelity funds. The policies and procedures require that any non-audit service provided by a fund audit firm to the trust and any non-audit service provided by a fund auditor to a Fund Service Provider that relates directly to the operations and financial reporting of the trust ("Covered Service") are subject to approval by the Audit Committee before such service is provided.
All Covered Services must be approved in advance of provision of the service either: (i) by formal resolution of the Audit Committee, or (ii) by oral or written approval of the service by the Chair of the Audit Committee (or if the Chair is unavailable, such other member of the Audit Committee as may be designated by the Chair to act in the Chair's absence). The approval contemplated by (ii) above is permitted where the Treasurer determines that action on such an engagement is necessary before the next meeting of the Audit Committee.
Non-audit services provided by a fund audit firm to a Fund Service Provider that do not relate directly to the operations and financial reporting of the trust ("Non-Covered Service") are not required to be approved, but are reported to the Audit Committee annually.
Non-Audit Services Approved Pursuant to Rule 2-01(c)(7)(i)(C) and (ii) of Regulation S-X ("De Minimis Exception")
There were no non-audit services approved or required to be approved by the Audit Committee pursuant to the De Minimis Exception during the Funds' last two fiscal years relating to services provided to (i) the Funds or (ii) any Fund Service Provider that relate directly to the operations and financial reporting of the Funds.
Item 5. Audit Committee of Listed Registrants
Not applicable.
Item 6. Investments
(a) Not applicable.
(b) Not applicable
Item 7. Disclosure of Proxy Voting Policies and Procedures for Closed-End Management Investment Companies
Not applicable.
Item 8. Portfolio Managers of Closed-End Management Investment Companies
Not applicable.
Item 9. Purchase of Equity Securities by Closed-End Management Investment Company and Affiliated Purchasers
Not applicable.
Item 10. Submission of Matters to a Vote of Security Holders
Not applicable.
Item 11. Controls and Procedures
(a)(i) The President and Treasurer and the Chief Financial Officer have concluded that the trust's disclosure controls and procedures (as defined in Rule 30a-3(c) under the Investment Company Act) provide reasonable assurances that material information relating to the trust is made known to them by the appropriate persons, based on their evaluation of these controls and procedures as of a date within 90 days of the filing date of this report.
(a)(ii) There was no change in the trust's internal control over financial reporting (as defined in Rule 30a-3(d) under the Investment Company Act) that occurred during the second fiscal quarter of the period covered by this report that has materially affected, or is reasonably likely to materially affect, the trust's internal control over financial reporting.
Item 12. Exhibits
(a) | (1) | Code of Ethics pursuant to Item 2 of Form N-CSR is filed and attached hereto as EX-99.CODE ETH. |
(a) | (2) | Certification pursuant to Rule 30a-2(a) under the Investment Company Act of 1940 (17 CFR 270.30a-2(a)) is filed and attached hereto as Exhibit 99.CERT. |
(a) | (3) | Not applicable. |
(b) |
| Certification pursuant to Rule 30a-2(b) under the Investment Company Act of 1940 (17 CFR 270.30a-2(b)) is furnished and attached hereto as Exhibit 99.906CERT. |
SIGNATURES
Pursuant to the requirements of the Securities Exchange Act of 1934 and the Investment Company Act of 1940, the registrant has duly caused this report to be signed on its behalf by the undersigned, thereunto duly authorized.
Fidelity Commonwealth Trust II
By: | /s/Kenneth B. Robins |
| Kenneth B. Robins |
| President and Treasurer |
|
|
Date: | April 25, 2014 |
Pursuant to the requirements of the Securities Exchange Act of 1934 and the Investment Company Act of 1940, this report has been signed below by the following persons on behalf of the registrant and in the capacities and on the dates indicated.
By: | /s/Kenneth B. Robins |
| Kenneth B. Robins |
| President and Treasurer |
|
|
Date: | April 25, 2014 |
By: | /s/Nicholas E. Steck |
| Nicholas E. Steck |
| Chief Financial Officer |
|
|
Date: | April 25, 2014 |