UNITED STATES
SECURITIES AND EXCHANGE COMMISSION
Washington, D.C. 20549
FORM N-CSR
CERTIFIED SHAREHOLDER REPORT OF REGISTERED
MANAGEMENT INVESTMENT COMPANIES
Investment Company Act file number 811-21991
Fidelity Rutland Square Trust II
(Exact name of registrant as specified in charter)
245 Summer St., Boston, MA 02210
(Address of principal executive offices) (Zip code)
Nicole Macarchuk, Secretary
245 Summer St.
Boston, Massachusetts 02210
(Name and address of agent for service)
Registrant's telephone number, including area code:
617-563-7000
| |
Date of fiscal year end: | May 31 |
|
|
Date of reporting period: | November 30, 2024 |
Item 1.
Reports to Stockholders
| |
| | SEMI-ANNUAL SHAREHOLDER REPORT | AS OF NOVEMBER 30, 2024 | |
| | Strategic Advisers® Municipal Bond Fund Strategic Advisers® Municipal Bond Fund : FSMUX |
| | | |
This semi-annual shareholder report contains information about Strategic Advisers® Municipal Bond Fund for the period June 1, 2024 to November 30, 2024. You can find additional information about the Fund at fundresearch.fidelity.com/prospectus/sec. You can also request this information by contacting us at 1-800-544-3455 or by sending an e-mail to fidfunddocuments@fidelity.com.
What were your Fund costs for the last six months?(based on hypothetical $10,000 investment)
| | Costs of a $10,000 investment | Costs paid as a percentage of a $10,000 investment | |
| Strategic Advisers® Municipal Bond Fund | $ 4 | 0.09% | |
Key Fund Statistics(as of November 30, 2024)
KEY FACTS | | |
| Fund Size | $11,756,563,545 | |
| Number of Holdings | 7,202 | |
| Portfolio Turnover | 26% | |
What did the Fund invest in?
(as of November 30, 2024)
REVENUE SOURCES (% of Fund's net assets) |
| Other | 26.6 | |
| Transportation | 18.6 | |
| General Obligations | 15.4 | |
| Health Care | 10.6 | |
| Special Tax | 8.8 | |
| Others(Individually Less Than 5%) | 20.0 | |
| 100.0 | |
| |
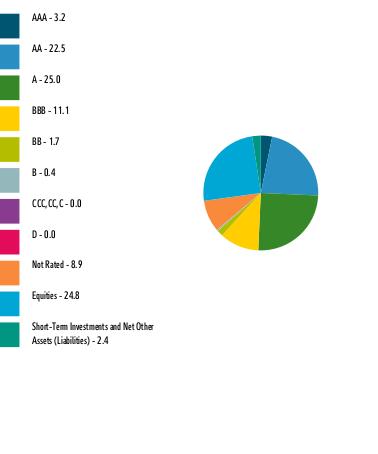
| AAA | 3.2 |
| AA | 22.5 |
| A | 25.0 |
| BBB | 11.1 |
| BB | 1.7 |
| B | 0.4 |
| CCC,CC,C | 0.0 |
| D | 0.0 |
| Not Rated | 8.9 |
| Equities | 24.8 |
| Short-Term Investments and Net Other Assets (Liabilities) | 2.4 |
QUALITY DIVERSIFICATION (% of Fund's net assets) |
|
| |
| We have used ratings from Moody's Investors Service, Inc. Where Moody's® ratings are not available, we have used S&P® ratings. All ratings are as of the date indicated and do not reflect subsequent changes. |
TOP STATES (% of Fund's net assets) |
| New York | 8.6 |
| Illinois | 7.3 |
| California | 6.5 |
| Texas | 4.4 |
| New Jersey | 3.6 |
| | |
| Fidelity, the Fidelity Investments Logo and all other Fidelity trademarks or service marks used herein are trademarks or service marks of FMR LLC. Any third-party marks that are used herein are trademarks or service marks of their respective owners. © 2025 FMR LLC. All rights reserved. |
| | For additional information about the Fund; including its prospectus, financial information, holdings and proxy information, scan the QR code or visit fundresearch.fidelity.com/prospectus/sec 1.9915127.100 6352-TSRS-0125 |
| |
| | SEMI-ANNUAL SHAREHOLDER REPORT | AS OF NOVEMBER 30, 2024 | |
| | Strategic Advisers® Fidelity® Emerging Markets Fund Strategic Advisers® Fidelity® Emerging Markets Fund : FGOMX |
| | | |
This semi-annual shareholder report contains information about Strategic Advisers® Fidelity® Emerging Markets Fund for the period June 1, 2024 to November 30, 2024. You can find additional information about the Fund at fundresearch.fidelity.com/prospectus/sec. You can also request this information by contacting us at 1-800-544-3455 or by sending an e-mail to fidfunddocuments@fidelity.com.
What were your Fund costs for the last six months?(based on hypothetical $10,000 investment)
| | Costs of a $10,000 investment | Costs paid as a percentage of a $10,000 investment | |
| Strategic Advisers® Fidelity® Emerging Markets Fund | $ 10 | 0.20% | |
Key Fund Statistics(as of November 30, 2024)
KEY FACTS | | |
| Fund Size | $19,805,355,277 | |
| Number of Holdings | 292 | |
| Portfolio Turnover | 45% | |
What did the Fund invest in?
(as of November 30, 2024)
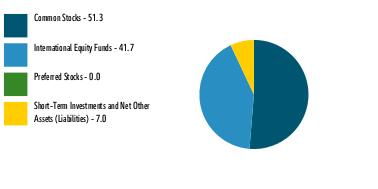
| Common Stocks | 51.3 |
| International Equity Funds | 41.7 |
| Preferred Stocks | 0.0 |
| Short-Term Investments and Net Other Assets (Liabilities) | 7.0 |
ASSET ALLOCATION (% of Fund's net assets) |
|
|
TOP HOLDINGS(% of Fund's net assets) | | |
| Fidelity SAI Emerging Markets Value Index Fund | 21.8 | |
| Fidelity SAI Emerging Markets Index Fund | 8.2 | |
| Fidelity SAI Emerging Markets Low Volatility Index Fund | 6.0 | |
| Taiwan Semiconductor Manufacturing Co Ltd | 5.8 | |
| Invesco Government & Agency Portfolio Institutional Class | 5.1 | |
| Fidelity Advisor Emerging Markets Fund - Class Z | 5.0 | |
| Tencent Holdings Ltd | 3.3 | |
| Samsung Electronics Co Ltd | 2.1 | |
| Meituan B Shares | 1.3 | |
| HDFC Bank Ltd/Gandhinagar | 1.1 | |
| | 59.7 | |
| Fidelity, the Fidelity Investments Logo and all other Fidelity trademarks or service marks used herein are trademarks or service marks of FMR LLC. Any third-party marks that are used herein are trademarks or service marks of their respective owners. © 2025 FMR LLC. All rights reserved. |
| | For additional information about the Fund; including its prospectus, financial information, holdings and proxy information, scan the QR code or visit fundresearch.fidelity.com/prospectus/sec 1.9915123.100 3310-TSRS-0125 |
| |
| | SEMI-ANNUAL SHAREHOLDER REPORT | AS OF NOVEMBER 30, 2024 | |
| | Strategic Advisers® Fidelity® U.S. Total Stock Fund Strategic Advisers® Fidelity® U.S. Total Stock Fund : FCTDX |
| | | |
This semi-annual shareholder report contains information about Strategic Advisers® Fidelity® U.S. Total Stock Fund for the period June 1, 2024 to November 30, 2024. You can find additional information about the Fund at fundresearch.fidelity.com/prospectus/sec. You can also request this information by contacting us at 1-800-544-3455 or by sending an e-mail to fidfunddocuments@fidelity.com.
What were your Fund costs for the last six months?(based on hypothetical $10,000 investment)
| | Costs of a $10,000 investment | Costs paid as a percentage of a $10,000 investment | |
| Strategic Advisers® Fidelity® U.S. Total Stock Fund | $ 7 | 0.13% | |
Key Fund Statistics(as of November 30, 2024)
KEY FACTS | | |
| Fund Size | $144,977,571,981 | |
| Number of Holdings | 1,842 | |
| Portfolio Turnover | 32% | |
What did the Fund invest in?
(as of November 30, 2024)
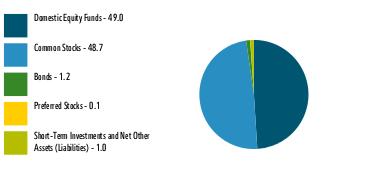
| Domestic Equity Funds | 49.0 |
| Common Stocks | 48.7 |
| Bonds | 1.2 |
| Preferred Stocks | 0.1 |
| Short-Term Investments and Net Other Assets (Liabilities) | 1.0 |
ASSET ALLOCATION (% of Fund's net assets) |
|
|
TOP HOLDINGS(% of Fund's net assets) | | |
| Fidelity SAI U.S. Quality Index Fund | 10.3 | |
| Fidelity Growth Company Fund | 10.1 | |
| Fidelity Magellan Fund | 6.0 | |
| Fidelity SAI U.S. Low Volatility Index Fund | 6.0 | |
| Fidelity Contrafund | 4.0 | |
| Fidelity SAI U.S. Value Index Fund | 2.8 | |
| Fidelity Extended Market Index Fund | 2.6 | |
| Fidelity Blue Chip Growth Fund | 2.3 | |
| Microsoft Corp | 2.3 | |
| Fidelity SAI U.S. Large Cap Index Fund | 2.0 | |
| | 48.4 | |
| Fidelity, the Fidelity Investments Logo and all other Fidelity trademarks or service marks used herein are trademarks or service marks of FMR LLC. Any third-party marks that are used herein are trademarks or service marks of their respective owners. © 2025 FMR LLC. All rights reserved. |
| | For additional information about the Fund; including its prospectus, financial information, holdings and proxy information, scan the QR code or visit fundresearch.fidelity.com/prospectus/sec 1.9915121.100 3080-TSRS-0125 |
| |
| | SEMI-ANNUAL SHAREHOLDER REPORT | AS OF NOVEMBER 30, 2024 | |
| | Strategic Advisers® Fidelity® Core Income Fund Strategic Advisers® Fidelity® Core Income Fund : FIWGX |
| | | |
This semi-annual shareholder report contains information about Strategic Advisers® Fidelity® Core Income Fund for the period June 1, 2024 to November 30, 2024. You can find additional information about the Fund at fundresearch.fidelity.com/prospectus/sec. You can also request this information by contacting us at 1-800-544-3455 or by sending an e-mail to fidfunddocuments@fidelity.com.
What were your Fund costs for the last six months?(based on hypothetical $10,000 investment)
| | Costs of a $10,000 investment | Costs paid as a percentage of a $10,000 investment | |
| Strategic Advisers® Fidelity® Core Income Fund | $ 3 | 0.05% | |
Key Fund Statistics(as of November 30, 2024)
KEY FACTS | | |
| Fund Size | $70,773,653,731 | |
| Number of Holdings | 6,208 | |
| Portfolio Turnover | 221% | |
What did the Fund invest in?
(as of November 30, 2024)
| Fixed-Income Funds | 47.1 |
| U.S. Government Agency - Mortgage Securities | 19.7 |
| U.S. Treasury Obligations | 14.3 |
| Corporate Bonds | 13.3 |
| CMOs and Other Mortgage Related Securities | 5.6 |
| Asset-Backed Securities | 4.0 |
| Purchased Options | 0.1 |
| Preferred Securities | 0.1 |
| Foreign Government and Government Agency Obligations | 0.1 |
| Municipal Securities | 0.0 |
| Other Investments | 0.0 |
| Bank Loan Obligations | 0.0 |
| Common Stocks | 0.0 |
ASSET ALLOCATION (% of Fund's net assets) |
|
| Short-Term Investments and Net Other Assets (Liabilities) - (4.3)% |
|
TOP HOLDINGS(% of Fund's net assets) | | |
| Fidelity SAI Total Bond Fund | 23.3 | |
| US Treasury Notes | 10.9 | |
| Fidelity SAI U.S. Treasury Bond Index Fund | 8.7 | |
| Fannie Mae Mortgage pass-thru certificates | 6.6 | |
| Ginnie Mae II Pool | 5.7 | |
| Freddie Mac Gold Pool | 4.2 | |
| Fidelity SAI Intermediate Treasury Bond Index Fund | 3.9 | |
| Fidelity SAI Long-Term Treasury Bond Index Fund | 3.6 | |
| US Treasury Bonds | 3.4 | |
| Uniform Mortgage Backed Securities | 2.4 | |
| | 72.7 | |
| Fidelity, the Fidelity Investments Logo and all other Fidelity trademarks or service marks used herein are trademarks or service marks of FMR LLC. Any third-party marks that are used herein are trademarks or service marks of their respective owners. © 2025 FMR LLC. All rights reserved. |
| | For additional information about the Fund; including its prospectus, financial information, holdings and proxy information, scan the QR code or visit fundresearch.fidelity.com/prospectus/sec 1.9915122.100 3306-TSRS-0125 |
| |
| | SEMI-ANNUAL SHAREHOLDER REPORT | AS OF NOVEMBER 30, 2024 | |
| | Strategic Advisers® U.S. Total Stock Fund Strategic Advisers® U.S. Total Stock Fund : FSAKX |
| | | |
This semi-annual shareholder report contains information about Strategic Advisers® U.S. Total Stock Fund for the period June 1, 2024 to November 30, 2024. You can find additional information about the Fund at fundresearch.fidelity.com/prospectus/sec. You can also request this information by contacting us at 1-800-544-3455 or by sending an e-mail to fidfunddocuments@fidelity.com.
What were your Fund costs for the last six months?(based on hypothetical $10,000 investment)
| | Costs of a $10,000 investment | Costs paid as a percentage of a $10,000 investment | |
| Strategic Advisers® U.S. Total Stock Fund | $ 9 | 0.18% | |
Key Fund Statistics(as of November 30, 2024)
KEY FACTS | | |
| Fund Size | $79,464,747,781 | |
| Number of Holdings | 2,416 | |
| Portfolio Turnover | 64% | |
What did the Fund invest in?
(as of November 30, 2024)
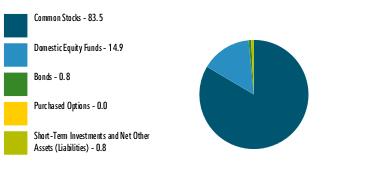
| Common Stocks | 83.5 |
| Domestic Equity Funds | 14.9 |
| Bonds | 0.8 |
| Purchased Options | 0.0 |
| Short-Term Investments and Net Other Assets (Liabilities) | 0.8 |
ASSET ALLOCATION (% of Fund's net assets) |
|
|
TOP HOLDINGS(% of Fund's net assets) | | |
| NVIDIA Corp | 4.9 | |
| Microsoft Corp | 4.7 | |
| Fidelity Growth Company Fund | 4.6 | |
| Apple Inc | 4.4 | |
| Fidelity Extended Market Index Fund | 4.1 | |
| Amazon.com Inc | 3.1 | |
| Fidelity SAI U.S. Quality Index Fund | 2.2 | |
| Meta Platforms Inc Class A | 1.9 | |
| Alphabet Inc Class C | 1.4 | |
| Fidelity SAI U.S. Low Volatility Index Fund | 1.3 | |
| | 32.6 | |
| Fidelity, the Fidelity Investments Logo and all other Fidelity trademarks or service marks used herein are trademarks or service marks of FMR LLC. Any third-party marks that are used herein are trademarks or service marks of their respective owners. © 2025 FMR LLC. All rights reserved. |
| | For additional information about the Fund; including its prospectus, financial information, holdings and proxy information, scan the QR code or visit fundresearch.fidelity.com/prospectus/sec 1.9916852.100 7609-TSRS-0125 |
| |
| | SEMI-ANNUAL SHAREHOLDER REPORT | AS OF NOVEMBER 30, 2024 | |
| | Strategic Advisers® Tax-Sensitive Short Duration Fund Strategic Advisers® Tax-Sensitive Short Duration Fund : FGNSX |
| | | |
This semi-annual shareholder report contains information about Strategic Advisers® Tax-Sensitive Short Duration Fund for the period June 1, 2024 to November 30, 2024. You can find additional information about the Fund at fundresearch.fidelity.com/prospectus/sec. You can also request this information by contacting us at 1-800-544-3455 or by sending an e-mail to fidfunddocuments@fidelity.com.
What were your Fund costs for the last six months?(based on hypothetical $10,000 investment)
| | Costs of a $10,000 investment | Costs paid as a percentage of a $10,000 investment | |
| Strategic Advisers® Tax-Sensitive Short Duration Fund | $ 4 | 0.07% | |
Key Fund Statistics(as of November 30, 2024)
KEY FACTS | | |
| Fund Size | $3,610,660,619 | |
| Number of Holdings | 1,410 | |
| Portfolio Turnover | 75% | |
What did the Fund invest in?
(as of November 30, 2024)
REVENUE SOURCES (% of Fund's net assets) |
| General Obligations | 17.9 | |
| Other | 14.5 | |
| Health Care | 10.1 | |
| Transportation | 9.2 | |
| Housing | 6.4 | |
| Synthetics | 6.0 | |
| Electric Utilities | 5.7 | |
| Others(Individually Less Than 5%) | 30.2 | |
| 100.0 | |
| |
| AAA | 11.4 |
| AA | 22.3 |
| A | 28.8 |
| BBB | 9.0 |
| BB | 0.2 |
| Not Rated | 7.7 |
| Equities | 10.7 |
| Short-Term Investments and Net Other Assets (Liabilities) | 9.9 |
QUALITY DIVERSIFICATION (% of Fund's net assets) |
|
| |
| We have used ratings from Moody's Investors Service, Inc. Where Moody's® ratings are not available, we have used S&P® ratings. All ratings are as of the date indicated and do not reflect subsequent changes. |
TOP STATES (% of Fund's net assets) |
| Texas | 11.2 |
| Illinois | 7.4 |
| New York | 4.2 |
| Georgia | 4.2 |
| Florida | 3.3 |
| | |
| Fidelity, the Fidelity Investments Logo and all other Fidelity trademarks or service marks used herein are trademarks or service marks of FMR LLC. Any third-party marks that are used herein are trademarks or service marks of their respective owners. © 2025 FMR LLC. All rights reserved. |
| | For additional information about the Fund; including its prospectus, financial information, holdings and proxy information, scan the QR code or visit fundresearch.fidelity.com/prospectus/sec 1.9915120.100 3058-TSRS-0125 |
| |
| | SEMI-ANNUAL SHAREHOLDER REPORT | AS OF NOVEMBER 30, 2024 | |
| | Strategic Advisers® Short Duration Fund Strategic Advisers® Short Duration Fund : FAUDX |
| | | |
This semi-annual shareholder report contains information about Strategic Advisers® Short Duration Fund for the period June 1, 2024 to November 30, 2024. You can find additional information about the Fund at fundresearch.fidelity.com/prospectus/sec. You can also request this information by contacting us at 1-800-544-3455 or by sending an e-mail to fidfunddocuments@fidelity.com.
What were your Fund costs for the last six months?(based on hypothetical $10,000 investment)
| | Costs of a $10,000 investment | Costs paid as a percentage of a $10,000 investment | |
| Strategic Advisers® Short Duration Fund | $ 2 | 0.04% | |
Key Fund Statistics(as of November 30, 2024)
KEY FACTS | | |
| Fund Size | $4,409,384,045 | |
| Number of Holdings | 1,218 | |
| Portfolio Turnover | 67% | |
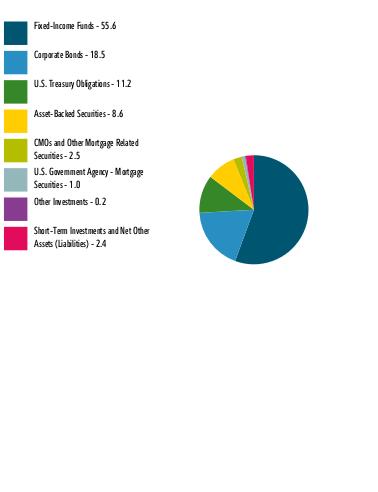
What did the Fund invest in?
(as of November 30, 2024)
| Fixed-Income Funds | 55.6 |
| Corporate Bonds | 18.5 |
| U.S. Treasury Obligations | 11.2 |
| Asset-Backed Securities | 8.6 |
| CMOs and Other Mortgage Related Securities | 2.5 |
| U.S. Government Agency - Mortgage Securities | 1.0 |
| Other Investments | 0.2 |
| Short-Term Investments and Net Other Assets (Liabilities) | 2.4 |
ASSET ALLOCATION (% of Fund's net assets) |
|
|
TOP HOLDINGS(% of Fund's net assets) | | |
| PIMCO Short-Term Fund Institutional Class | 11.6 | |
| JPMorgan Ultra-Short Income ETF | 10.6 | |
| Baird Ultra Short Bond Fund Institutional Class | 8.8 | |
| US Treasury Notes | 7.8 | |
| T. Rowe Price Ultra Short-Term Bond Fund | 7.4 | |
| Morgan Stanley Institutional Fund Trust Ultra-Short Income Portfolio Class IR | 5.6 | |
| Baird Short-Term Bond Fund Institutional Class | 3.8 | |
| US Treasury Bill | 3.4 | |
| iShares Ultra Short-Term Bond Active ETF | 3.3 | |
| iShares 1-3 Year Treasury Bond ETF | 2.6 | |
| | 64.9 | |
| Fidelity, the Fidelity Investments Logo and all other Fidelity trademarks or service marks used herein are trademarks or service marks of FMR LLC. Any third-party marks that are used herein are trademarks or service marks of their respective owners. © 2025 FMR LLC. All rights reserved. |
| | For additional information about the Fund; including its prospectus, financial information, holdings and proxy information, scan the QR code or visit fundresearch.fidelity.com/prospectus/sec 1.9915119.100 2387-TSRS-0125 |
| |
| | SEMI-ANNUAL SHAREHOLDER REPORT | AS OF NOVEMBER 30, 2024 | |
| | Strategic Advisers® Alternatives Fund Strategic Advisers® Alternatives Fund : FSLTX |
| | | |
This semi-annual shareholder report contains information about Strategic Advisers® Alternatives Fund for the period June 1, 2024 to November 30, 2024. You can find additional information about the Fund at fundresearch.fidelity.com/prospectus/sec. You can also request this information by contacting us at 1-800-544-3455 or by sending an e-mail to fidfunddocuments@fidelity.com.
What were your Fund costs for the last six months?(based on hypothetical $10,000 investment)
| | Costs of a $10,000 investment | Costs paid as a percentage of a $10,000 investment | |
| Strategic Advisers® Alternatives Fund | $ 7 | 0.13% | |
Key Fund Statistics(as of November 30, 2024)
KEY FACTS | | |
| Fund Size | $2,238,501,299 | |
| Number of Holdings | 1,196 | |
| Portfolio Turnover | 89% | |
What did the Fund invest in?
(as of November 30, 2024)
DERIVATIVE EXPOSURE (% of Fund's net assets) | | |
| Futures Contracts | 60.0 | |
| Swaps | 58.5 | |
| Forward Foreign Currency Contracts | 26.7 | |
| |
| Alternative Funds | 31.1 |
| Fixed-Income Funds | 4.0 |
| Corporate Bonds | 0.5 |
| Asset-Backed Securities | 0.3 |
| U.S. Treasury Obligations | 0.1 |
| CMOs and Other Mortgage Related Securities | 0.1 |
| Foreign Government and Government Agency Obligations | 0.0 |
| U.S. Government Agency - Mortgage Securities | 0.0 |
| Purchased Options | 0.0 |
| Futures Contracts | 24.4 |
| Swaps | 23.7 |
| Forward Foreign Currency Contracts | 10.9 |
| Short-Term Investments and Net Other Assets (Liabilities) | 4.9 |
ASSET ALLOCATION (% of Fund's Total Exposure) |
|
|
TOP HOLDINGS(% of Fund's net assets) | | |
| Fidelity SAI Convertible Arbitrage Fund | 14.4 | |
| BlackRock Systematic Multi-Strategy Fund Investor A Shares | 10.4 | |
| Eaton Vance Global Macro Absolute Return Advantage Fund Class A | 9.8 | |
| BlackRock Global Equity Market Neutral Fund A Shares | 8.2 | |
| Absolute Convertible Arbitrage Fund Investor Shares | 7.2 | |
| Stone Ridge Diversified Alternatives Fund Class I | 7.0 | |
| First Trust Merger Arbitrage Fund Class I | 6.6 | |
| The Merger Fund Class A | 6.2 | |
| Federated Hermes MDT Market Neutral Fund A Shares | 6.2 | |
| State Street Institutional U.S. Government Money Market Fund Premier Class | 5.4 | |
| | 81.4 | |
| Fidelity, the Fidelity Investments Logo and all other Fidelity trademarks or service marks used herein are trademarks or service marks of FMR LLC. Any third-party marks that are used herein are trademarks or service marks of their respective owners. © 2025 FMR LLC. All rights reserved. |
| | For additional information about the Fund; including its prospectus, financial information, holdings and proxy information, scan the QR code or visit fundresearch.fidelity.com/prospectus/sec 1.9915143.100 6570-TSRS-0125 |
Item 2.
Code of Ethics
Not applicable.
Item 3.
Audit Committee Financial Expert
Not applicable.
Item 4.
Principal Accountant Fees and Services
Not applicable.
Item 5.
Audit Committee of Listed Registrants
Not applicable.
Item 6.
Investments
(a)
Not applicable.
(b)
Not applicable
Item 7.
Financial Statements and Financial Highlights for Open-End Management Investment Companies
Strategic Advisers® Short Duration Fund
Offered exclusively to certain managed account clients of Strategic Advisers LLC or its affiliates - not available for sale to the general public
Semi-Annual Report
November 30, 2024
Contents
To view a fund's proxy voting guidelines and proxy voting record for the 12-month period ended June 30, visit http://www.fidelity.com/proxyvotingresults or visit the Securities and Exchange Commission's (SEC) web site at http://www.sec.gov.
You may also call 1-800-544-3455 to request a free copy of the proxy voting guidelines.
Standard & Poor's, S&P and S&P 500 are registered service marks of The McGraw-Hill Companies, Inc. and have been licensed for use by Fidelity Distributors Corporation.
Other third-party marks appearing herein are the property of their respective owners.
All other marks appearing herein are registered or unregistered trademarks or service marks of FMR LLC or an affiliated company. © 2025 FMR LLC. All rights reserved.
This report and the financial statements contained herein are submitted for the general information of the shareholders of the Fund. This report is not authorized for distribution to prospective investors in the Fund unless preceded or accompanied by an effective prospectus.
A fund files its complete schedule of portfolio holdings with the SEC for the first and third quarters of each fiscal year on Form N-PORT. Forms N-PORT are available on the SEC's web site at http://www.sec.gov. A fund's Forms N-PORT may be reviewed and copied at the SEC's Public Reference Room in Washington, DC. Information regarding the operation of the SEC's Public Reference Room may be obtained by calling 1-800-SEC-0330.
For a complete list of a fund's portfolio holdings, view the most recent holdings listing, semiannual report, or annual report on Fidelity's web site at http://www.fidelity.com, http://www.institutional.fidelity.com, or http://www.401k.com, as applicable.
NOT FDIC INSURED •MAY LOSE VALUE •NO BANK GUARANTEE
Neither the Fund nor Fidelity Distributors Corporation is a bank.
Item 7: Financial Statements and Financial Highlights for Open-End Management Investment Companies (Semi-Annual Report)
Strategic Advisers® Short Duration Fund
Schedule of Investments November 30, 2024 (Unaudited)
Showing Percentage of Net Assets
| Nonconvertible Bonds - 18.5% |
| | | Principal Amount (a) | Value ($) |
| COMMUNICATION SERVICES - 0.7% | | | |
| Diversified Telecommunication Services - 0.2% | | | |
| AT&T, Inc. 4.1% 2/15/28 | | 340,000 | 334,966 |
| KT Corp.: | | | |
| 4% 8/8/25 (b) | | 1,525,000 | 1,515,505 |
| 4.125% 2/2/28 (b) | | 900,000 | 886,407 |
| NBN Co. Ltd. 1.45% 5/5/26 (b) | | 1,765,000 | 1,686,332 |
| NTT Finance Corp. 4.239% 7/25/25 (b) | | 235,000 | 234,319 |
| SBA Tower Trust 4.831% 10/15/29 (b) | | 2,245,000 | 2,204,536 |
| | | | 6,862,065 |
| Entertainment - 0.1% | | | |
| Take-Two Interactive Software, Inc.: | | | |
| 3.55% 4/14/25 | | 340,000 | 338,118 |
| 5% 3/28/26 | | 1,375,000 | 1,379,813 |
| | | | 1,717,931 |
| Media - 0.1% | | | |
| Charter Communications Operating LLC/Charter Communications Operating Capital Corp.: | | | |
| 4.908% 7/23/25 | | 1,034,000 | 1,033,446 |
| 6.15% 11/10/26 | | 435,000 | 444,204 |
| COX Communications, Inc.: | | | |
| 3.35% 9/15/26 (b) | | 345,000 | 335,756 |
| 3.5% 8/15/27 (b) | | 350,000 | 339,190 |
| 3.85% 2/1/25 (b) | | 240,000 | 239,357 |
| Warnermedia Holdings, Inc. 3.638% 3/15/25 | | 3,000,000 | 2,987,392 |
| | | | 5,379,345 |
| Wireless Telecommunication Services - 0.3% | | | |
| Rogers Communications, Inc.: | | | |
| 2.95% 3/15/25 | | 1,305,000 | 1,297,121 |
| 3.2% 3/15/27 | | 1,790,000 | 1,730,471 |
| 5% 2/15/29 | | 1,025,000 | 1,029,749 |
| T-Mobile U.S.A., Inc.: | | | |
| 2.625% 4/15/26 | | 3,455,000 | 3,359,783 |
| 3.5% 4/15/25 | | 5,150,000 | 5,122,845 |
| 5.375% 4/15/27 | | 2,000,000 | 2,005,436 |
| | | | 14,545,405 |
TOTAL COMMUNICATION SERVICES | | | 28,504,746 |
| CONSUMER DISCRETIONARY - 2.0% | | | |
| Automobile Components - 0.0% | | | |
| Aptiv PLC / Aptiv Global Financing DAC 4.65% 9/13/29 | | 555,000 | 543,293 |
| Automobiles - 1.4% | | | |
| American Honda Finance Corp.: | | | |
| U.S. Secured Overnight Fin. Rate (SOFR) Index + 0.450% 5.3035% 6/13/25 (c)(d) | | 3,000,000 | 3,001,874 |
| 4.9% 3/12/27 | | 1,500,000 | 1,512,950 |
| 4.95% 1/9/26 | | 2,308,000 | 2,316,255 |
| BMW U.S. Capital LLC: | | | |
| U.S. Secured Overnight Fin. Rate (SOFR) Averages Index + 0.800% 5.3849% 8/13/26 (b)(c)(d) | | 3,000,000 | 3,018,197 |
| U.S. Secured Overnight Fin. Rate (SOFR) Averages Index + 0.840% 5.6202% 4/1/25 (b)(c)(d) | | 7,500,000 | 7,514,837 |
| 4.6% 8/13/27 (b) | | 1,965,000 | 1,962,462 |
| General Motors Financial Co., Inc.: | | | |
| 2.75% 6/20/25 | | 2,000,000 | 1,975,771 |
| 2.9% 2/26/25 | | 2,035,000 | 2,024,232 |
| 3.8% 4/7/25 | | 4,000,000 | 3,981,357 |
| 5.35% 7/15/27 | | 1,155,000 | 1,169,677 |
| 5.4% 4/6/26 | | 2,495,000 | 2,512,266 |
| 5.4% 5/8/27 | | 420,000 | 425,707 |
| 5.55% 7/15/29 | | 345,000 | 352,704 |
| Hyundai Capital America: | | | |
| 5.25% 1/8/27 (b) | | 675,000 | 681,585 |
| 5.45% 6/24/26 (b) | | 2,000,000 | 2,016,764 |
| 5.5% 3/30/26 (b) | | 935,000 | 942,023 |
| 5.6% 3/30/28 (b) | | 580,000 | 592,279 |
| 5.8% 6/26/25 (b) | | 5,000,000 | 5,024,028 |
| 6.25% 11/3/25 (b) | | 440,000 | 444,897 |
| Hyundai Capital Services, Inc. 2.125% 4/24/25 (b) | | 380,000 | 375,777 |
| Mercedes-Benz Finance North America LLC: | | | |
| 4.8% 3/30/26 (b) | | 670,000 | 670,867 |
| 4.8% 1/11/27 (b) | | 2,040,000 | 2,046,156 |
| 4.95% 3/30/25 (b) | | 5,000,000 | 4,999,978 |
| Volkswagen Group of America Finance LLC: | | | |
| U.S. Secured Overnight Fin. Rate (SOFR) Index + 1.060% 5.6385% 8/14/26 (b)(c)(d) | | 2,956,000 | 2,962,821 |
| 3.95% 6/6/25 (b) | | 760,000 | 756,138 |
| 4.85% 8/15/27 (b) | | 1,375,000 | 1,365,816 |
| 5.4% 3/20/26 (b) | | 2,000,000 | 2,008,506 |
| 5.7% 9/12/26 (b) | | 565,000 | 571,092 |
| 5.8% 9/12/25 (b) | | 5,660,000 | 5,701,215 |
| 6% 11/16/26 (b) | | 650,000 | 660,513 |
| | | | 63,588,744 |
| Distributors - 0.0% | | | |
| Genuine Parts Co. 1.75% 2/1/25 | | 410,000 | 407,865 |
| Diversified Consumer Services - 0.0% | | | |
| ERAC U.S.A. Finance LLC: | | | |
| 4.6% 5/1/28 (b) | | 1,205,000 | 1,204,004 |
| 5% 2/15/29 (b) | | 505,000 | 512,522 |
| | | | 1,716,526 |
| Hotels, Restaurants & Leisure - 0.1% | | | |
| Darden Restaurants, Inc. 4.35% 10/15/27 | | 1,120,000 | 1,108,467 |
| Marriott International, Inc.: | | | |
| 3.125% 6/15/26 | | 1,445,000 | 1,411,148 |
| 3.75% 3/15/25 | | 180,000 | 179,348 |
| 5.45% 9/15/26 | | 325,000 | 329,594 |
| 5.75% 5/1/25 | | 190,000 | 190,455 |
| Sands China Ltd. 3.8% 1/8/26 | | 1,300,000 | 1,274,262 |
| Starbucks Corp.: | | | |
| 3.5% 3/1/28 | | 445,000 | 432,293 |
| 4% 11/15/28 | | 315,000 | 308,749 |
| 4.75% 2/15/26 | | 765,000 | 767,022 |
| | | | 6,001,338 |
| Household Durables - 0.0% | | | |
| Mohawk Industries, Inc. 5.85% 9/18/28 | | 520,000 | 537,613 |
| Leisure Products - 0.1% | | | |
| Mattel, Inc.: | | | |
| 3.375% 4/1/26 (b) | | 1,035,000 | 1,008,444 |
| 5.875% 12/15/27 (b) | | 1,075,000 | 1,077,623 |
| | | | 2,086,067 |
| Specialty Retail - 0.3% | | | |
| Advance Auto Parts, Inc. 5.9% 3/9/26 | | 800,000 | 805,307 |
| AutoZone, Inc.: | | | |
| 3.625% 4/15/25 | | 485,000 | 482,551 |
| 6.25% 11/1/28 | | 630,000 | 664,783 |
| Lowe's Companies, Inc.: | | | |
| 1.7% 9/15/28 | | 215,000 | 193,452 |
| 3.35% 4/1/27 | | 345,000 | 335,712 |
| 4.4% 9/8/25 | | 1,200,000 | 1,197,324 |
| 4.8% 4/1/26 | | 635,000 | 636,738 |
| O'Reilly Automotive, Inc. 5.75% 11/20/26 | | 2,298,000 | 2,343,909 |
| Ross Stores, Inc.: | | | |
| 0.875% 4/15/26 | | 1,010,000 | 958,781 |
| 4.6% 4/15/25 | | 2,175,000 | 2,172,616 |
| The Home Depot, Inc. U.S. Secured Overnight Fin. Rate (SOFR) Index + 0.330% 5.1528% 12/24/25 (c)(d) | | 2,335,000 | 2,339,619 |
| | | | 12,130,792 |
| Textiles, Apparel & Luxury Goods - 0.1% | | | |
| VF Corp.: | | | |
| 2.4% 4/23/25 | | 1,986,000 | 1,961,537 |
| 2.8% 4/23/27 | | 1,025,000 | 965,697 |
| | | | 2,927,234 |
TOTAL CONSUMER DISCRETIONARY | | | 89,939,472 |
| CONSUMER STAPLES - 0.8% | | | |
| Beverages - 0.1% | | | |
| Coca-Cola Europacific Partners PLC 1.5% 1/15/27 (b) | | 475,000 | 444,501 |
| Heineken NV 3.5% 1/29/28 (b) | | 4,003,000 | 3,886,650 |
| Pernod Ricard SA 3.25% 6/8/26 (b) | | 1,375,000 | 1,346,215 |
| | | | 5,677,366 |
| Consumer Staples Distribution & Retail - 0.2% | | | |
| Dollar General Corp.: | | | |
| 3.875% 4/15/27 | | 373,000 | 365,140 |
| 4.125% 5/1/28 | | 1,279,000 | 1,250,386 |
| 4.625% 11/1/27 | | 620,000 | 616,982 |
| 5.2% 7/5/28 | | 584,000 | 588,385 |
| Dollar Tree, Inc. 4% 5/15/25 | | 3,000,000 | 2,985,562 |
| Kroger Co.: | | | |
| 2.65% 10/15/26 | | 812,000 | 782,615 |
| 3.7% 8/1/27 | | 203,000 | 198,607 |
| 4.6% 8/15/27 | | 368,000 | 369,618 |
| Mars, Inc. 4.55% 4/20/28 (b) | | 1,660,000 | 1,659,418 |
| Mondelez International Holdings Netherlands BV 4.25% 9/15/25 (b) | | 745,000 | 742,073 |
| | | | 9,558,786 |
| Food Products - 0.1% | | | |
| Campbell Soup Co. 5.3% 3/20/26 | | 579,000 | 582,768 |
| Mondelez International, Inc. 2.625% 3/17/27 | | 815,000 | 780,999 |
| Viterra Finance BV: | | | |
| 2% 4/21/26 (b) | | 515,000 | 492,668 |
| 4.9% 4/21/27 (b) | | 1,230,000 | 1,222,069 |
| | | | 3,078,504 |
| Tobacco - 0.4% | | | |
| Altria Group, Inc.: | | | |
| 2.35% 5/6/25 | | 3,000,000 | 2,967,355 |
| 2.625% 9/16/26 | | 855,000 | 825,646 |
| BAT International Finance PLC: | | | |
| 1.668% 3/25/26 | | 2,985,000 | 2,866,575 |
| 4.448% 3/16/28 | | 1,985,000 | 1,968,706 |
| Imperial Brands Finance PLC 4.25% 7/21/25 (b) | | 1,061,000 | 1,055,563 |
| Philip Morris International, Inc.: | | | |
| 4.75% 2/12/27 | | 1,375,000 | 1,380,936 |
| 4.875% 2/13/26 | | 800,000 | 802,634 |
| 5% 11/17/25 | | 500,000 | 502,162 |
| Reynolds American, Inc. 4.45% 6/12/25 | | 5,000,000 | 4,990,370 |
| | | | 17,359,947 |
TOTAL CONSUMER STAPLES | | | 35,674,603 |
| ENERGY - 1.0% | | | |
| Oil, Gas & Consumable Fuels - 1.0% | | | |
| 6297782 LLC 4.911% 9/1/27 (b) | | 740,000 | 739,224 |
| Canadian Natural Resources Ltd. 2.05% 7/15/25 | | 1,930,000 | 1,896,418 |
| Columbia Pipeline Group, Inc. 4.5% 6/1/25 | | 3,000,000 | 2,989,000 |
| Columbia Pipelines Holding Co. LLC 6.055% 8/15/26 (b) | | 150,000 | 152,412 |
| DCP Midstream Operating LP 5.375% 7/15/25 | | 1,510,000 | 1,512,506 |
| Diamondback Energy, Inc. 5.2% 4/18/27 | | 525,000 | 531,739 |
| Enbridge, Inc.: | | | |
| 2.5% 1/15/25 | | 1,115,000 | 1,111,497 |
| 2.5% 2/14/25 | | 615,000 | 611,722 |
| 5.9% 11/15/26 | | 400,000 | 408,434 |
| 6% 11/15/28 | | 325,000 | 340,545 |
| Energy Transfer LP: | | | |
| 2.9% 5/15/25 | | 255,000 | 252,565 |
| 5.25% 7/1/29 | | 645,000 | 654,568 |
| 5.625% 5/1/27 (b) | | 2,000,000 | 2,005,006 |
| 6.05% 12/1/26 | | 1,885,000 | 1,927,861 |
| EQT Corp. 3.125% 5/15/26 (b) | | 1,715,000 | 1,668,152 |
| Gray Oak Pipeline LLC 2.6% 10/15/25 (b) | | 385,000 | 376,935 |
| Marathon Petroleum Corp. 4.7% 5/1/25 | | 3,000,000 | 2,996,511 |
| MPLX LP 4.875% 6/1/25 | | 3,000,000 | 2,999,906 |
| Occidental Petroleum Corp.: | | | |
| 5% 8/1/27 | | 655,000 | 656,864 |
| 5.2% 8/1/29 | | 465,000 | 466,613 |
| 5.875% 9/1/25 | | 1,120,000 | 1,124,182 |
| ONEOK, Inc.: | | | |
| 4.25% 9/24/27 | | 1,570,000 | 1,553,392 |
| 5.55% 11/1/26 | | 990,000 | 1,002,975 |
| Ovintiv, Inc.: | | | |
| 5.375% 1/1/26 | | 461,000 | 462,305 |
| 5.65% 5/15/25 | | 760,000 | 762,315 |
| Phillips 66 Co. 3.85% 4/9/25 | | 3,000,000 | 2,987,714 |
| Pioneer Natural Resources Co. 5.1% 3/29/26 | | 842,000 | 848,123 |
| Sabine Pass Liquefaction LLC 5.625% 3/1/25 | | 374,000 | 374,237 |
| The Williams Companies, Inc.: | | | |
| 4.8% 11/15/29 | | 670,000 | 669,353 |
| 5.4% 3/2/26 | | 2,140,000 | 2,155,453 |
| Transcontinental Gas Pipe Line Co. LLC 7.85% 2/1/26 | | 3,000,000 | 3,080,733 |
| Western Midstream Operating LP 4.65% 7/1/26 | | 2,000,000 | 1,988,138 |
| Woodside Finance Ltd. 3.7% 9/15/26 (b) | | 487,000 | 476,375 |
| | | | 41,783,773 |
| FINANCIALS - 9.2% | | | |
| Banks - 5.3% | | | |
| Banco del Estado de Chile 2.704% 1/9/25 (b) | | 665,000 | 661,010 |
| Banco Santander Mexico SA 5.375% 4/17/25 (Reg. S) | | 2,050,000 | 2,048,586 |
| Banco Santander SA: | | | |
| 3.496% 3/24/25 | | 1,400,000 | 1,393,763 |
| 5.552% 3/14/28 (c) | | 800,000 | 809,288 |
| Bank of America Corp.: | | | |
| 1.319% 6/19/26 (c) | | 4,500,000 | 4,414,805 |
| 1.658% 3/11/27 (c) | | 3,100,000 | 2,978,884 |
| 1.734% 7/22/27 (c) | | 765,000 | 728,040 |
| 2.015% 2/13/26 (c) | | 4,400,000 | 4,373,596 |
| 3.384% 4/2/26 (c) | | 5,445,000 | 5,416,947 |
| 5.08% 1/20/27 (c) | | 645,000 | 646,837 |
| Bank of Montreal: | | | |
| 0.949% 1/22/27 (c) | | 3,200,000 | 3,064,747 |
| 3.7% 6/7/25 | | 1,490,000 | 1,482,277 |
| 4.567% 9/10/27 (c) | | 2,804,000 | 2,798,510 |
| 5.92% 9/25/25 | | 5,000,000 | 5,049,462 |
| Banque Federative du Credit Mutuel SA: | | | |
| 0.998% 2/4/25 (b) | | 1,145,000 | 1,137,348 |
| 4.935% 1/26/26 (b) | | 650,000 | 651,111 |
| Barclays PLC: | | | |
| 2.852% 5/7/26 (c) | | 5,300,000 | 5,249,305 |
| 5.304% 8/9/26 (c) | | 3,000,000 | 3,005,072 |
| 7.325% 11/2/26 (c) | | 4,145,000 | 4,228,516 |
| BNP Paribas SA 2.219% 6/9/26 (b)(c) | | 2,000,000 | 1,970,228 |
| BPCE SA: | | | |
| 1.652% 10/6/26 (b)(c) | | 4,500,000 | 4,373,173 |
| 4.5% 3/15/25 (b) | | 1,915,000 | 1,909,334 |
| CaixaBank SA 6.684% 9/13/27 (b)(c) | | 1,530,000 | 1,572,696 |
| Canadian Imperial Bank of Commerce: | | | |
| U.S. Secured Overnight Fin. Rate (SOFR) Averages Index + 0.940% 5.7022% 4/7/25 (c)(d) | | 5,000,000 | 5,012,843 |
| 3.945% 8/4/25 | | 1,935,000 | 1,925,332 |
| Citibank NA 4.929% 8/6/26 | | 3,000,000 | 3,016,020 |
| Citigroup, Inc.: | | | |
| U.S. Secured Overnight Fin. Rate (SOFR) Index + 0.690% 5.4004% 1/25/26 (c)(d) | | 10,000,000 | 10,005,090 |
| 3.106% 4/8/26 (c) | | 2,000,000 | 1,987,638 |
| 4.4% 6/10/25 | | 355,000 | 354,059 |
| 5.174% 2/13/30 (c) | | 710,000 | 717,627 |
| Commonwealth Bank of Australia U.S. Secured Overnight Fin. Rate (SOFR) Index + 0.460% 5.0403% 11/27/26 (b)(c)(d) | | 3,000,000 | 2,998,818 |
| Cooperatieve Rabobank UA/NY 4.333% 8/28/26 | | 5,100,000 | 5,091,033 |
| Danske Bank A/S: | | | |
| 4.613% 10/2/30 (b)(c) | | 770,000 | 757,018 |
| 5.427% 3/1/28 (b)(c) | | 730,000 | 739,297 |
| 6.259% 9/22/26 (b)(c) | | 5,700,000 | 5,756,042 |
| 6.466% 1/9/26 (b)(c) | | 5,260,000 | 5,266,441 |
| DNB Bank ASA: | | | |
| 1.535% 5/25/27 (b)(c) | | 2,000,000 | 1,904,313 |
| 5.896% 10/9/26 (b)(c) | | 3,100,000 | 3,124,228 |
| Fifth Third Bancorp 4.895% 9/6/30 (c) | | 320,000 | 318,639 |
| HDFC Bank Ltd. 5.686% 3/2/26 (Reg. S) | | 1,600,000 | 1,613,472 |
| HSBC Holdings PLC: | | | |
| 1.645% 4/18/26 (c) | | 2,600,000 | 2,567,316 |
| 2.099% 6/4/26 (c) | | 5,500,000 | 5,420,722 |
| 2.999% 3/10/26 (c) | | 5,100,000 | 5,071,259 |
| 5.13% 11/19/28 (c) | | 1,220,000 | 1,225,270 |
| 5.597% 5/17/28 (c) | | 1,045,000 | 1,059,987 |
| 7.336% 11/3/26 (c) | | 2,000,000 | 2,042,473 |
| JPMorgan Chase & Co.: | | | |
| U.S. Secured Overnight Fin. Rate (SOFR) Index + 0.880% 5.6102% 4/22/27 (c)(d) | | 747,000 | 751,118 |
| U.S. Secured Overnight Fin. Rate (SOFR) Index + 1.320% 6.0221% 4/26/26 (c)(d) | | 5,000,000 | 5,021,638 |
| 1.578% 4/22/27 (c) | | 3,200,000 | 3,061,945 |
| 2.005% 3/13/26 (c) | | 2,000,000 | 1,984,299 |
| 2.083% 4/22/26 (c) | | 3,870,000 | 3,828,467 |
| 4.08% 4/26/26 (c) | | 1,710,000 | 1,703,958 |
| 4.979% 7/22/28 (c) | | 800,000 | 805,194 |
| 5.04% 1/23/28 (c) | | 710,000 | 714,232 |
| 5.546% 12/15/25 (c) | | 5,000,000 | 5,000,487 |
| Lloyds Banking Group PLC: | | | |
| 2.438% 2/5/26 (c) | | 1,340,000 | 1,333,730 |
| 4.716% 8/11/26 (c) | | 2,000,000 | 1,994,910 |
| 5.462% 1/5/28 (c) | | 800,000 | 809,068 |
| 5.985% 8/7/27 (c) | | 2,000,000 | 2,032,870 |
| Mizuho Financial Group, Inc. U.S. Secured Overnight Fin. Rate (SOFR) Index + 0.960% 5.5301% 5/22/26 (c)(d) | | 5,000,000 | 5,015,495 |
| Morgan Stanley Bank, West Valley City Utah: | | | |
| U.S. Secured Overnight Fin. Rate (SOFR) Index + 0.680% 5.4176% 10/15/27 (c)(d) | | 3,000,000 | 3,001,797 |
| 4.754% 4/21/26 | | 775,000 | 776,999 |
| National Bank of Canada 4.5% 10/10/29 | | 1,200,000 | 1,182,965 |
| NatWest Group PLC 7.472% 11/10/26 (c) | | 3,000,000 | 3,067,110 |
| NatWest Markets PLC: | | | |
| U.S. Secured Overnight Fin. Rate (SOFR) Index + 1.450% 6.2409% 3/22/25 (b)(c)(d) | | 4,248,000 | 4,263,306 |
| 3.479% 3/22/25 (b) | | 355,000 | 353,540 |
| PNC Financial Services Group, Inc.: | | | |
| 4.758% 1/26/27 (c) | | 4,020,000 | 4,018,618 |
| 5.102% 7/23/27 (c) | | 3,000,000 | 3,016,778 |
| 5.812% 6/12/26 (c) | | 345,000 | 346,843 |
| PT Bank Mandiri (Persero) Tbk 5.5% 4/4/26 (Reg. S) | | 1,900,000 | 1,904,750 |
| QNB Finance Ltd. 2.625% 5/12/25 (Reg. S) | | 2,000,000 | 1,973,500 |
| Royal Bank of Canada: | | | |
| U.S. Secured Overnight Fin. Rate (SOFR) Averages Index + 0.720% 5.4526% 10/18/27 (c)(d) | | 3,100,000 | 3,103,379 |
| 5.069% 7/23/27 (c) | | 3,500,000 | 3,521,978 |
| Santander Holdings U.S.A., Inc.: | | | |
| 2.49% 1/6/28 (c) | | 760,000 | 721,123 |
| 4.5% 7/17/25 | | 5,000,000 | 4,981,245 |
| 6.124% 5/31/27 (c) | | 160,000 | 162,391 |
| Societe Generale: | | | |
| 2.226% 1/21/26 (b)(c) | | 2,000,000 | 1,990,903 |
| 5.519% 1/19/28 (b)(c) | | 1,695,000 | 1,707,167 |
| Standard Chartered PLC: | | | |
| 4.3% 2/19/27 (b) | | 327,000 | 320,940 |
| 5.688% 5/14/28 (b)(c) | | 780,000 | 791,741 |
| State Bank of India 1.8% 7/13/26 (Reg. S) | | 1,850,000 | 1,760,728 |
| The Toronto-Dominion Bank U.S. Secured Overnight Fin. Rate (SOFR) Index + 0.480% 5.2288% 10/10/25 (c)(d) | | 4,000,000 | 4,015,166 |
| Truist Financial Corp. 6.047% 6/8/27 (c) | | 3,000,000 | 3,052,638 |
| U.S. Bancorp: | | | |
| 4.548% 7/22/28 (c) | | 1,070,000 | 1,064,800 |
| 5.727% 10/21/26 (c) | | 3,415,000 | 3,440,582 |
| Wells Fargo & Co.: | | | |
| U.S. Secured Overnight Fin. Rate (SOFR) Index + 1.320% 6.0264% 4/25/26 (c)(d) | | 6,000,000 | 6,023,222 |
| 2.188% 4/30/26 (c) | | 2,840,000 | 2,808,905 |
| 3.196% 6/17/27 (c) | | 3,200,000 | 3,121,646 |
| 3.908% 4/25/26 (c) | | 1,460,000 | 1,454,340 |
| 4.54% 8/15/26 (c) | | 1,055,000 | 1,052,520 |
| Wells Fargo Bank NA 5.55% 8/1/25 | | 3,000,000 | 3,016,121 |
| | | | 234,013,624 |
| Capital Markets - 1.8% | | | |
| Athene Global Funding: | | | |
| 1.608% 6/29/26 (b) | | 2,700,000 | 2,565,139 |
| 1.716% 1/7/25 (b) | | 2,405,000 | 2,397,692 |
| 4.86% 8/27/26 (b) | | 2,885,000 | 2,879,144 |
| 5.349% 7/9/27 (b) | | 860,000 | 867,779 |
| 5.62% 5/8/26 (b) | | 3,100,000 | 3,129,411 |
| 5.684% 2/23/26 (b) | | 6,320,000 | 6,371,393 |
| Bank of New York Mellon Corp. 4.947% 4/26/27 (c) | | 920,000 | 923,984 |
| Bank of New York, New York 5.148% 5/22/26 (c) | | 660,000 | 661,092 |
| Charles Schwab Corp.: | | | |
| 2.45% 3/3/27 | | 1,489,000 | 1,423,230 |
| 3.2% 3/2/27 | | 375,000 | 364,236 |
| Deutsche Bank AG New York Branch: | | | |
| 2.129% 11/24/26 (c) | | 3,200,000 | 3,111,397 |
| 6.119% 7/14/26 (c) | | 2,000,000 | 2,014,261 |
| 7.146% 7/13/27 (c) | | 3,000,000 | 3,097,807 |
| Goldman Sachs Group, Inc.: | | | |
| 1.093% 12/9/26 (c) | | 3,100,000 | 2,984,829 |
| 3.5% 4/1/25 | | 1,005,000 | 1,000,627 |
| 4.482% 8/23/28 (c) | | 735,000 | 729,250 |
| 5.798% 8/10/26 (c) | | 700,000 | 704,564 |
| LPL Holdings, Inc.: | | | |
| 5.7% 5/20/27 | | 1,163,000 | 1,182,209 |
| 6.75% 11/17/28 | | 325,000 | 344,525 |
| Morgan Stanley: | | | |
| 2.188% 4/28/26 (c) | | 4,600,000 | 4,550,282 |
| 2.63% 2/18/26 (c) | | 1,070,000 | 1,064,790 |
| 4.679% 7/17/26 (c) | | 4,700,000 | 4,693,963 |
| 6.138% 10/16/26 (c) | | 3,000,000 | 3,033,787 |
| NASDAQ, Inc. 5.65% 6/28/25 | | 651,000 | 653,850 |
| Northern Trust Corp. 3.95% 10/30/25 | | 545,000 | 541,934 |
| S&P Global, Inc. 2.45% 3/1/27 | | 2,215,000 | 2,119,872 |
| State Street Bank & Trust Co., Boston U.S. Secured Overnight Fin. Rate (SOFR) Index + 0.460% 5.0345% 11/25/26 (c)(d) | | 1,935,000 | 1,935,728 |
| State Street Corp.: | | | |
| 2.901% 3/30/26 (c) | | 2,000,000 | 1,986,899 |
| 4.33% 10/22/27 | | 2,545,000 | 2,535,098 |
| 4.857% 1/26/26 (c) | | 405,000 | 404,894 |
| 5.104% 5/18/26 (c) | | 635,000 | 635,922 |
| 5.272% 8/3/26 | | 1,155,000 | 1,168,555 |
| UBS AG U.S. Secured Overnight Fin. Rate (SOFR) Averages Index + 1.260% 5.8331% 2/21/25 (c)(d) | | 5,000,000 | 5,011,474 |
| UBS Group AG: | | | |
| 1.494% 8/10/27 (b)(c) | | 375,000 | 353,915 |
| 2.193% 6/5/26 (b)(c) | | 4,300,000 | 4,238,100 |
| 4.488% 5/12/26 (b)(c) | | 4,470,000 | 4,458,795 |
| 6.327% 12/22/27 (b)(c) | | 2,080,000 | 2,137,002 |
| 6.373% 7/15/26 (b)(c) | | 2,000,000 | 2,015,824 |
| | | | 80,293,253 |
| Consumer Finance - 1.0% | | | |
| AerCap Ireland Capital Ltd./AerCap Global Aviation Trust: | | | |
| 4.45% 10/1/25 | | 2,000,000 | 1,994,076 |
| 6.1% 1/15/27 | | 695,000 | 712,227 |
| 6.45% 4/15/27 | | 1,551,000 | 1,606,965 |
| Ally Financial, Inc. 5.8% 5/1/25 | | 3,000,000 | 3,005,634 |
| American Express Co.: | | | |
| U.S. Secured Overnight Fin. Rate (SOFR) Averages Index + 0.930% 5.8563% 3/4/25 (c)(d) | | 8,000,000 | 8,008,359 |
| 5.043% 7/26/28 (c) | | 710,000 | 715,344 |
| 5.098% 2/16/28 (c) | | 380,000 | 382,730 |
| 5.532% 4/25/30 (c) | | 845,000 | 868,125 |
| 6.338% 10/30/26 (c) | | 2,654,000 | 2,691,470 |
| Capital One Financial Corp.: | | | |
| 2.636% 3/3/26 (c) | | 1,400,000 | 1,391,371 |
| 4.985% 7/24/26 (c) | | 3,885,000 | 3,883,802 |
| 6.312% 6/8/29 (c) | | 415,000 | 431,106 |
| 7.149% 10/29/27 (c) | | 410,000 | 426,498 |
| Ford Motor Credit Co. LLC: | | | |
| 5.125% 6/16/25 | | 1,405,000 | 1,404,059 |
| 5.125% 11/5/26 | | 780,000 | 778,377 |
| 5.8% 3/5/27 | | 835,000 | 845,506 |
| John Deere Capital Corp.: | | | |
| 4.9% 6/11/27 | | 2,360,000 | 2,388,820 |
| 4.95% 3/6/26 | | 1,300,000 | 1,307,531 |
| Toyota Motor Credit Corp.: | | | |
| U.S. Secured Overnight Fin. Rate (SOFR) Averages Index + 0.450% 5.2018% 4/10/26 (c)(d) | | 3,100,000 | 3,100,814 |
| U.S. Secured Overnight Fin. Rate (SOFR) Index + 0.770% 5.3882% 8/7/26 (c)(d) | | 3,031,000 | 3,049,977 |
| 3.05% 3/22/27 | | 640,000 | 621,002 |
| 4.35% 10/8/27 | | 1,605,000 | 1,600,556 |
| 4.55% 8/7/26 | | 1,215,000 | 1,216,624 |
| | | | 42,430,973 |
| Financial Services - 0.6% | | | |
| CNH Industrial Capital LLC: | | | |
| 1.45% 7/15/26 | | 2,200,000 | 2,088,163 |
| 5.45% 10/14/25 | | 2,800,000 | 2,816,520 |
| Corebridge Financial, Inc. 3.5% 4/4/25 | | 5,900,000 | 5,870,395 |
| Corebridge Global Funding: | | | |
| 4.65% 8/20/27 (b) | | 415,000 | 414,663 |
| 5.2% 1/12/29 (b) | | 325,000 | 329,515 |
| Crown Castle Towers LLC/Crown Atlantic Holdings Sub LLC/Crown Communication, Inc.: | | | |
| 3.663% 5/15/45 (b) | | 1,940,000 | 1,925,725 |
| 4.241% 7/15/48 (b) | | 290,000 | 280,136 |
| Fiserv, Inc. 5.15% 3/15/27 | | 1,805,000 | 1,826,776 |
| Korea Housing Finance Corp. 4.625% 2/24/28 (b) | | 1,600,000 | 1,602,968 |
| PayPal Holdings, Inc.: | | | |
| 2.65% 10/1/26 | | 1,295,000 | 1,252,903 |
| 2.85% 10/1/29 | | 1,504,000 | 1,392,548 |
| Penske Truck Leasing Co. LP / PTL Finance Corp.: | | | |
| 1.7% 6/15/26 (b) | | 295,000 | 281,001 |
| 3.95% 3/10/25 (b) | | 660,000 | 657,908 |
| 5.35% 1/12/27 (b) | | 335,000 | 338,314 |
| 5.75% 5/24/26 (b) | | 2,170,000 | 2,195,248 |
| The Western Union Co. 2.85% 1/10/25 | | 2,365,000 | 2,359,584 |
| | | | 25,632,367 |
| Insurance - 0.5% | | | |
| Brighthouse Financial Global Funding: | | | |
| 1.55% 5/24/26 (b) | | 250,000 | 237,878 |
| 1.75% 1/13/25 (b) | | 250,000 | 249,001 |
| CNO Global Funding: | | | |
| 1.65% 1/6/25 (b) | | 1,300,000 | 1,295,789 |
| 1.75% 10/7/26 (b) | | 1,360,000 | 1,282,979 |
| Equitable Financial Life Global Funding: | | | |
| 1% 1/9/26 (b) | | 355,000 | 340,756 |
| 1.4% 7/7/25 (b) | | 116,000 | 113,686 |
| 1.7% 11/12/26 (b) | | 460,000 | 434,407 |
| Health Care Service Corp.: | | | |
| 1.5% 6/1/25 (b) | | 1,800,000 | 1,770,014 |
| 5.2% 6/15/29 (b) | | 585,000 | 596,302 |
| Jackson National Life Global Funding: | | | |
| 1.75% 1/12/25 (b) | | 1,145,000 | 1,140,731 |
| 5.55% 7/2/27 (b) | | 715,000 | 726,551 |
| 5.6% 4/10/26 (b) | | 1,220,000 | 1,229,569 |
| Marsh & McLennan Companies, Inc.: | | | |
| 3.75% 3/14/26 | | 170,000 | 168,445 |
| 4.55% 11/8/27 | | 1,540,000 | 1,544,043 |
| MassMutual Global Funding II 5.1% 4/9/27 (b) | | 2,030,000 | 2,058,892 |
| Northwestern Mutual Global Funding 4.35% 9/15/27 (b) | | 845,000 | 842,990 |
| Protective Life Global Funding: | | | |
| U.S. Secured Overnight Fin. Rate (SOFR) Index + 0.980% 5.7617% 3/28/25 (b)(c)(d) | | 7,500,000 | 7,517,634 |
| 3.218% 3/28/25 (b) | | 715,000 | 711,543 |
| Reinsurance Group of America, Inc. 3.95% 9/15/26 | | 865,000 | 853,227 |
| | | | 23,114,437 |
TOTAL FINANCIALS | | | 405,484,654 |
| HEALTH CARE - 1.1% | | | |
| Biotechnology - 0.1% | | | |
| AbbVie, Inc. 2.95% 11/21/26 | | 2,215,000 | 2,151,284 |
| Amgen, Inc. 5.25% 3/2/25 | | 3,000,000 | 3,002,163 |
| CSL Finance PLC 3.85% 4/27/27 (b) | | 395,000 | 386,813 |
| | | | 5,540,260 |
| Health Care Equipment & Supplies - 0.2% | | | |
| Becton, Dickinson & Co.: | | | |
| 3.734% 12/15/24 | | 1,055,000 | 1,054,350 |
| 4.693% 2/13/28 | | 1,325,000 | 1,329,102 |
| 6.7% 12/1/26 | | 731,000 | 757,143 |
| Solventum Corp. 5.45% 2/25/27 (b) | | 2,010,000 | 2,035,090 |
| Stryker Corp. 4.25% 9/11/29 | | 900,000 | 888,201 |
| | | | 6,063,886 |
| Health Care Providers & Services - 0.6% | | | |
| Centene Corp. 4.625% 12/15/29 | | 810,000 | 776,611 |
| CVS Health Corp.: | | | |
| 1.3% 8/21/27 | | 2,175,000 | 1,980,881 |
| 2.875% 6/1/26 | | 733,000 | 712,173 |
| 3% 8/15/26 | | 415,000 | 402,382 |
| 5% 2/20/26 | | 2,090,000 | 2,092,456 |
| Elevance Health, Inc.: | | | |
| 2.375% 1/15/25 | | 410,000 | 408,691 |
| 3.35% 12/1/24 | | 5,000,000 | 5,000,000 |
| 5.35% 10/15/25 | | 305,000 | 306,411 |
| HCA Holdings, Inc.: | | | |
| 3.125% 3/15/27 | | 1,140,000 | 1,098,006 |
| 5.375% 2/1/25 | | 3,575,000 | 3,574,543 |
| 5.625% 9/1/28 | | 2,100,000 | 2,144,578 |
| 5.875% 2/15/26 | | 5,665,000 | 5,709,038 |
| Highmark, Inc. 1.45% 5/10/26 (b) | | 435,000 | 412,124 |
| Humana, Inc.: | | | |
| 1.35% 2/3/27 | | 120,000 | 111,583 |
| 4.5% 4/1/25 | | 1,205,000 | 1,203,362 |
| 5.75% 3/1/28 | | 300,000 | 307,364 |
| ICON Investments Six Designated Activity 5.809% 5/8/27 | | 1,490,000 | 1,518,663 |
| PeaceHealth Obligated Group 1.375% 11/15/25 | | 190,000 | 183,626 |
| | | | 27,942,492 |
| Health Care Technology - 0.0% | | | |
| IQVIA, Inc. 6.25% 2/1/29 | | 440,000 | 458,982 |
| Pharmaceuticals - 0.2% | | | |
| Bayer U.S. Finance II LLC 4.25% 12/15/25 (b) | | 2,000,000 | 1,982,780 |
| Perrigo Finance PLC 3.9% 12/15/24 | | 661,000 | 659,334 |
| Utah Acquisition Sub, Inc. 3.95% 6/15/26 | | 1,230,000 | 1,211,005 |
| Viatris, Inc. 2.3% 6/22/27 | | 736,000 | 690,528 |
| Zoetis, Inc.: | | | |
| 3% 9/12/27 | | 2,109,000 | 2,027,177 |
| 5.4% 11/14/25 | | 920,000 | 925,557 |
| | | | 7,496,381 |
TOTAL HEALTH CARE | | | 47,502,001 |
| INDUSTRIALS - 1.1% | | | |
| Aerospace & Defense - 0.2% | | | |
| BAE Systems PLC 5% 3/26/27 (b) | | 840,000 | 846,179 |
| Huntington Ingalls Industries, Inc. 5.353% 1/15/30 | | 330,000 | 332,840 |
| The Boeing Co.: | | | |
| 2.196% 2/4/26 | | 2,795,000 | 2,701,132 |
| 4.875% 5/1/25 | | 3,000,000 | 2,996,443 |
| 6.259% 5/1/27 (b) | | 1,695,000 | 1,736,938 |
| | | | 8,613,532 |
| Air Freight & Logistics - 0.0% | | | |
| FedEx Corp. 3.25% 4/1/26 | | 1,235,000 | 1,213,625 |
| Building Products - 0.0% | | | |
| Carrier Global Corp. 2.242% 2/15/25 | | 259,000 | 257,457 |
| Owens Corning: | | | |
| 3.4% 8/15/26 | | 517,000 | 505,400 |
| 5.5% 6/15/27 | | 690,000 | 703,537 |
| | | | 1,466,394 |
| Commercial Services & Supplies - 0.0% | | | |
| Element Fleet Management Corp. 5.643% 3/13/27 (b) | | 660,000 | 671,307 |
| HPHT Finance (21) (II) Ltd. 1.5% 9/17/26 (Reg. S) | | 650,000 | 611,698 |
| | | | 1,283,005 |
| Electrical Equipment - 0.1% | | | |
| Regal Rexnord Corp. 6.05% 2/15/26 | | 2,270,000 | 2,292,327 |
| Ground Transportation - 0.2% | | | |
| Canadian Pacific Railway Co.: | | | |
| 1.35% 12/2/24 | | 7,739,000 | 7,739,000 |
| 1.75% 12/2/26 | | 580,000 | 548,145 |
| Uber Technologies, Inc. 4.5% 8/15/29 (b) | | 1,842,000 | 1,795,378 |
| | | | 10,082,523 |
| Industrial Conglomerates - 0.1% | | | |
| Trane Technologies Financing Ltd. 3.5% 3/21/26 | | 1,842,000 | 1,814,569 |
| Machinery - 0.3% | | | |
| Caterpillar Financial Services Corp. 4.6% 11/15/27 | | 2,205,000 | 2,213,895 |
| Daimler Trucks Finance North America LLC: | | | |
| 1.625% 12/13/24 (b) | | 9,065,000 | 9,056,044 |
| 5% 1/15/27 (b) | | 325,000 | 326,602 |
| 5.125% 9/25/27 (b) | | 690,000 | 696,199 |
| 5.15% 1/16/26 (b) | | 275,000 | 275,993 |
| 5.2% 1/17/25 (b) | | 355,000 | 355,123 |
| Fortive Corp. 3.15% 6/15/26 | | 888,000 | 866,767 |
| Otis Worldwide Corp. 2.056% 4/5/25 | | 1,000,000 | 990,124 |
| | | | 14,780,747 |
| Passenger Airlines - 0.0% | | | |
| American Airlines 2017-2 Class B Pass Through Trust equipment trust certificate 3.7% 4/15/27 | | 267,392 | 263,638 |
| Trading Companies & Distributors - 0.1% | | | |
| GATX Corp.: | | | |
| 3.25% 3/30/25 | | 1,793,000 | 1,782,099 |
| 3.25% 9/15/26 | | 455,000 | 443,107 |
| 3.85% 3/30/27 | | 284,000 | 278,087 |
| 5.4% 3/15/27 | | 1,170,000 | 1,185,745 |
| | | | 3,689,038 |
| Transportation Infrastructure - 0.1% | | | |
| Avolon Holdings Funding Ltd.: | | | |
| 2.125% 2/21/26 (b) | | 2,010,000 | 1,938,836 |
| 2.875% 2/15/25 (b) | | 980,000 | 973,763 |
| 5.75% 3/1/29 (b) | | 685,000 | 701,117 |
| 6.375% 5/4/28 (b) | | 300,000 | 311,385 |
| | | | 3,925,101 |
TOTAL INDUSTRIALS | | | 49,424,499 |
| INFORMATION TECHNOLOGY - 0.6% | | | |
| Electronic Equipment, Instruments & Components - 0.1% | | | |
| Amphenol Corp.: | | | |
| 2.05% 3/1/25 | | 910,000 | 903,149 |
| 4.75% 3/30/26 | | 340,000 | 340,230 |
| 5.05% 4/5/27 | | 1,030,000 | 1,041,350 |
| Dell International LLC/EMC Corp. 6.02% 6/15/26 | | 3,000,000 | 3,045,908 |
| | | | 5,330,637 |
| IT Services - 0.0% | | | |
| CDW LLC/CDW Finance Corp. 5.1% 3/1/30 | | 325,000 | 323,655 |
| Semiconductors & Semiconductor Equipment - 0.2% | | | |
| Foundry JV Holdco LLC 5.9% 1/25/30 (b) | | 330,000 | 336,070 |
| Intel Corp.: | | | |
| 3.4% 3/25/25 | | 1,675,000 | 1,666,760 |
| 3.75% 8/5/27 | | 655,000 | 638,145 |
| 4% 8/5/29 | | 715,000 | 690,195 |
| 4.875% 2/10/28 | | 222,000 | 222,407 |
| Micron Technology, Inc.: | | | |
| 4.185% 2/15/27 | | 165,000 | 163,016 |
| 4.975% 2/6/26 | | 160,000 | 160,176 |
| 5.375% 4/15/28 | | 935,000 | 952,675 |
| NXP BV/NXP Funding LLC/NXP U.S.A., Inc.: | | | |
| 2.7% 5/1/25 | | 1,520,000 | 1,503,797 |
| 3.15% 5/1/27 | | 70,000 | 67,475 |
| 3.875% 6/18/26 | | 2,565,000 | 2,533,989 |
| 4.4% 6/1/27 | | 155,000 | 154,058 |
| Qorvo, Inc. 1.75% 12/15/24 | | 510,000 | 508,782 |
| | | | 9,597,545 |
| Software - 0.2% | | | |
| Atlassian Corp. PLC 5.25% 5/15/29 | | 425,000 | 433,295 |
| Cadence Design Systems, Inc. 4.2% 9/10/27 | | 570,000 | 566,468 |
| Fortinet, Inc. 1% 3/15/26 | | 1,485,000 | 1,415,862 |
| Oracle Corp.: | | | |
| 2.5% 4/1/25 | | 4,000,000 | 3,967,683 |
| 2.95% 5/15/25 | | 2,000,000 | 1,982,865 |
| 5.8% 11/10/25 | | 510,000 | 514,895 |
| Roper Technologies, Inc. 1% 9/15/25 | | 235,000 | 228,415 |
| Workday, Inc. 3.5% 4/1/27 | | 525,000 | 512,950 |
| | | | 9,622,433 |
| Technology Hardware, Storage & Peripherals - 0.1% | | | |
| Hewlett Packard Enterprise Co. 4.45% 9/25/26 | | 1,481,000 | 1,474,585 |
TOTAL INFORMATION TECHNOLOGY | | | 26,348,855 |
| MATERIALS - 0.4% | | | |
| Chemicals - 0.2% | | | |
| Celanese U.S. Holdings LLC 6.05% 3/15/25 | | 659,000 | 659,942 |
| FMC Corp.: | | | |
| 3.2% 10/1/26 | | 535,000 | 518,421 |
| 3.45% 10/1/29 | | 848,000 | 787,349 |
| International Flavors & Fragrances, Inc. 1.23% 10/1/25 (b) | | 2,000,000 | 1,939,306 |
| LYB International Finance III LLC 1.25% 10/1/25 | | 942,000 | 915,070 |
| MEGlobal BV 4.25% 11/3/26 (Reg. S) | | 1,850,000 | 1,810,688 |
| MEGlobal Canada, Inc. 5% 5/18/25 (Reg. S) | | 1,350,000 | 1,345,154 |
| Nutrien Ltd. 4.9% 3/27/28 | | 400,000 | 402,949 |
| Sherwin-Williams Co.: | | | |
| 4.25% 8/8/25 | | 420,000 | 418,433 |
| 4.55% 3/1/28 | | 895,000 | 895,388 |
| | | | 9,692,700 |
| Containers & Packaging - 0.1% | | | |
| Amcor Flexibles North America, Inc. 4% 5/17/25 | | 1,055,000 | 1,049,793 |
| Brambles U.S.A., Inc. 4.125% 10/23/25 (b) | | 2,100,000 | 2,084,378 |
| Sonoco Products Co. 4.45% 9/1/26 | | 530,000 | 526,797 |
| | | | 3,660,968 |
| Metals & Mining - 0.1% | | | |
| BHP Billiton Financial (U.S.A.) Ltd. 5.25% 9/8/26 | | 1,560,000 | 1,577,822 |
| Newmont Corp. / Newcrest Finance Pty Ltd. 5.3% 3/15/26 | | 450,000 | 452,929 |
| Nucor Corp. 3.95% 5/23/25 | | 525,000 | 522,808 |
| POSCO 5.625% 1/17/26 (b) | | 1,375,000 | 1,384,943 |
| Steel Dynamics, Inc. 2.8% 12/15/24 | | 395,000 | 394,645 |
| | | | 4,333,147 |
TOTAL MATERIALS | | | 17,686,815 |
| REAL ESTATE - 0.4% | | | |
| Equity Real Estate Investment Trusts (REITs) - 0.4% | | | |
| American Tower Corp.: | | | |
| 1.6% 4/15/26 | | 2,043,000 | 1,958,570 |
| 2.4% 3/15/25 | | 665,000 | 659,996 |
| 3.55% 7/15/27 | | 645,000 | 627,211 |
| Crown Castle, Inc.: | | | |
| 1.05% 7/15/26 | | 1,005,000 | 947,110 |
| 1.35% 7/15/25 | | 3,100,000 | 3,033,717 |
| 2.9% 3/15/27 | | 1,115,000 | 1,072,104 |
| 4.45% 2/15/26 | | 905,000 | 901,234 |
| 5% 1/11/28 | | 305,000 | 307,006 |
| 5.6% 6/1/29 | | 515,000 | 529,890 |
| Kilroy Realty LP 4.375% 10/1/25 | | 755,000 | 750,589 |
| Kite Realty Group Trust 4% 3/15/25 | | 3,000,000 | 2,989,918 |
| Realty Income Corp. 5.05% 1/13/26 | | 230,000 | 229,677 |
| Ventas Realty LP 2.65% 1/15/25 | | 2,114,000 | 2,107,542 |
| WP Carey, Inc. 4% 2/1/25 | | 1,440,000 | 1,436,338 |
| | | | 17,550,902 |
| Real Estate Management & Development - 0.0% | | | |
| Essex Portfolio LP 3.375% 4/15/26 | | 794,000 | 778,101 |
TOTAL REAL ESTATE | | | 18,329,003 |
| UTILITIES - 1.2% | | | |
| Electric Utilities - 0.8% | | | |
| American Electric Power Co., Inc. 5.2% 1/15/29 | | 1,165,000 | 1,184,535 |
| Appalachian Power Co. 3.3% 6/1/27 | | 1,723,000 | 1,665,415 |
| ENEL Finance International NV: | | | |
| 1.625% 7/12/26 (b)(e) | | 4,805,000 | 4,568,062 |
| 7.05% 10/14/25 (b)(e) | | 4,025,000 | 4,097,764 |
| Eversource Energy 4.75% 5/15/26 | | 2,000,000 | 2,000,088 |
| Exelon Corp.: | | | |
| 3.4% 4/15/26 | | 1,136,000 | 1,116,955 |
| 5.15% 3/15/29 | | 380,000 | 386,013 |
| FirstEnergy Corp. 3.9% 7/15/27 (e) | | 800,000 | 780,105 |
| FirstEnergy Transmission LLC 4.55% 1/15/30 (b) | | 310,000 | 305,220 |
| Georgia Power Co. 5.004% 2/23/27 | | 315,000 | 318,540 |
| Korea Electric Power Corp. 5.375% 4/6/26 (b) | | 1,750,000 | 1,762,341 |
| Korea Hydro & Nuclear Power Co. Ltd. 1.25% 4/27/26 (b) | | 1,421,000 | 1,353,748 |
| NextEra Energy Capital Holdings, Inc.: | | | |
| 1.875% 1/15/27 | | 1,255,000 | 1,185,830 |
| 4.45% 6/20/25 | | 1,050,000 | 1,047,608 |
| 5.749% 9/1/25 | | 315,000 | 317,004 |
| 6.051% 3/1/25 | | 420,000 | 421,176 |
| Pacific Gas & Electric Co.: | | | |
| U.S. Secured Overnight Fin. Rate (SOFR) Averages Index + 0.950% 5.8548% 9/4/25 (c)(d) | | 4,100,000 | 4,109,098 |
| 3.15% 1/1/26 | | 2,645,000 | 2,596,043 |
| 3.5% 6/15/25 | | 1,455,000 | 1,442,692 |
| Southern California Edison Co.: | | | |
| 4.4% 9/6/26 | | 1,915,000 | 1,908,698 |
| 5.35% 3/1/26 | | 1,790,000 | 1,804,752 |
| Southern Co. 5.113% 8/1/27 (e) | | 705,000 | 714,307 |
| Vistra Operations Co. LLC: | | | |
| 5.05% 12/30/26 (b)(f) | | 1,161,000 | 1,162,682 |
| 5.125% 5/13/25 (b) | | 465,000 | 464,699 |
| | | | 36,713,375 |
| Gas Utilities - 0.1% | | | |
| Southern California Gas Co. 2.95% 4/15/27 | | 815,000 | 785,926 |
| The East Ohio Gas Co. 1.3% 6/15/25 (b) | | 2,069,000 | 2,029,721 |
| | | | 2,815,647 |
| Independent Power and Renewable Electricity Producers - 0.1% | | | |
| Constellation Energy Generation, LLC: | | | |
| 3.25% 6/1/25 | | 3,000,000 | 2,972,808 |
| 5.6% 3/1/28 | | 520,000 | 534,737 |
| The AES Corp. 3.3% 7/15/25 (b) | | 820,000 | 810,065 |
| | | | 4,317,610 |
| Multi-Utilities - 0.2% | | | |
| Dominion Energy, Inc.: | | | |
| 1.45% 4/15/26 | | 2,000,000 | 1,912,684 |
| 3.3% 3/15/25 | | 5,000,000 | 4,976,126 |
| DTE Energy Co. 4.95% 7/1/27 | | 600,000 | 603,897 |
| Engie SA 5.25% 4/10/29 (b) | | 385,000 | 391,883 |
| NiSource, Inc. 5.25% 3/30/28 | | 210,000 | 213,725 |
| Sempra: | | | |
| 3.3% 4/1/25 | | 760,000 | 755,978 |
| 5.4% 8/1/26 | | 330,000 | 333,533 |
| | | | 9,187,826 |
TOTAL UTILITIES | | | 53,034,458 |
| TOTAL NONCONVERTIBLE BONDS (Cost $811,170,280) | | | 813,712,879 |
| | | | |
| U.S. Treasury Obligations - 11.2% |
| | | Principal Amount (a) | Value ($) |
| U.S. Treasury Bills, yield at date of purchase 4.29% to 5.25% 1/2/25 to 11/28/25 | | 153,122,600 | 149,274,600 |
| U.S. Treasury Notes: | | | |
| 3.5% 9/30/26 (g) | | 68,005,000 | 67,157,594 |
| 3.75% 8/31/26 | | 42,390,000 | 42,047,237 |
| 4.125% 10/31/26 | | 51,075,000 | 51,003,176 |
| 4.375% 7/31/26 | | 41,815,000 | 41,903,204 |
| 4.5% 11/15/25 | | 120,725,800 | 120,860,674 |
| 5% 10/31/25 | | 22,000,000 | 22,115,500 |
| TOTAL U.S. TREASURY OBLIGATIONS (Cost $494,723,239) | | | 494,361,985 |
| | | | |
| U.S. Government Agency - Mortgage Securities - 1.0% |
| | | Principal Amount (a) | Value ($) |
| Fannie Mae - 0.6% | | | |
| FTSE USD IBOR Consumer Cash Fallbacks Term 1Y + 1.530% 6.836% 7/1/35 (c)(d) | | 1,629 | 1,664 |
| FTSE USD IBOR Consumer Cash Fallbacks Term 1Y + 1.590% 6.331% 12/1/35 (c)(d) | | 4,061 | 4,152 |
| FTSE USD IBOR Consumer Cash Fallbacks Term 1Y + 1.650% 7.529% 8/1/37 (c)(d) | | 637 | 649 |
| FTSE USD IBOR Consumer Cash Fallbacks Term 1Y + 1.690% 7.44% 5/1/38 (c)(d) | | 4,210 | 4,301 |
| FTSE USD IBOR Consumer Cash Fallbacks Term 1Y + 1.780% 6.538% 5/1/38 (c)(d) | | 2,182 | 2,233 |
| FTSE USD IBOR Consumer Cash Fallbacks Term 1Y + 1.830% 6.989% 4/1/38 (c)(d) | | 4,939 | 5,065 |
| FTSE USD IBOR Consumer Cash Fallbacks Term 1Y + 1.850% 7.631% 8/1/38 (c)(d) | | 4,019 | 4,123 |
| FTSE USD IBOR Consumer Cash Fallbacks Term 1Y + 1.900% 7.281% 5/1/38 (c)(d) | | 5,408 | 5,540 |
| FTSE USD IBOR Consumer Cash Fallbacks Term 1Y + 2.040% 6.29% 12/1/36 (c)(d) | | 921 | 944 |
| FTSE USD IBOR Consumer Cash Fallbacks Term 6M + 1.370% 6.768% 10/1/33 (c)(d) | | 14,248 | 14,320 |
| 2% 10/1/50 to 2/1/52 | | 426,224 | 343,429 |
| 2.5% 1/1/52 to 1/1/54 | | 1,552,750 | 1,305,966 |
| 3% 9/1/28 to 11/1/51 | | 2,686,055 | 2,408,358 |
| 3.5% 11/1/26 to 7/1/50 | | 578,616 | 534,718 |
| 4% 1/1/47 to 9/1/52 | | 3,379,483 | 3,169,552 |
| 4.5% 5/1/41 to 1/1/50 | | 960,851 | 942,303 |
| 5% 10/1/33 to 9/1/54 | | 13,201,186 | 13,024,873 |
| 5.5% 1/1/25 to 3/1/54 | | 3,365,224 | 3,397,679 |
| 6% to 6% 3/1/34 to 2/1/49 | | 765,455 | 797,930 |
| 6.5% 7/1/32 to 12/1/32 | | 33,280 | 34,446 |
TOTAL FANNIE MAE | | | 26,002,245 |
| Freddie Mac - 0.3% | | | |
| FTSE USD IBOR Consumer Cash Fallbacks Term 1Y + 1.620% 7.26% 6/1/38 (c)(d) | | 9,079 | 9,228 |
| FTSE USD IBOR Consumer Cash Fallbacks Term 1Y + 1.720% 7.597% 7/1/35 (c)(d) | | 2,479 | 2,522 |
| FTSE USD IBOR Consumer Cash Fallbacks Term 1Y + 1.730% 6.108% 2/1/37 (c)(d) | | 1,548 | 1,580 |
| FTSE USD IBOR Consumer Cash Fallbacks Term 1Y + 1.730% 7.606% 10/1/36 (c)(d) | | 5,789 | 5,897 |
| FTSE USD IBOR Consumer Cash Fallbacks Term 1Y + 1.740% 7.03% 5/1/38 (c)(d) | | 4,645 | 4,740 |
| FTSE USD IBOR Consumer Cash Fallbacks Term 1Y + 1.770% 7.232% 5/1/37 (c)(d) | | 2,007 | 2,048 |
| FTSE USD IBOR Consumer Cash Fallbacks Term 1Y + 1.910% 6.291% 2/1/37 (c)(d) | | 1,455 | 1,489 |
| FTSE USD IBOR Consumer Cash Fallbacks Term 1Y + 1.940% 6.204% 12/1/36 (c)(d) | | 3,659 | 3,762 |
| FTSE USD IBOR Consumer Cash Fallbacks Term 1Y + 2.020% 6.565% 11/1/36 (c)(d) | | 2,344 | 2,409 |
| FTSE USD IBOR Consumer Cash Fallbacks Term 1Y + 2.080% 6.582% 2/1/38 (c)(d) | | 9,526 | 9,778 |
| FTSE USD IBOR Consumer Cash Fallbacks Term 1Y + 2.160% 6.558% 2/1/37 (c)(d) | | 2,372 | 2,439 |
| U.S. TREASURY 1 YEAR INDEX + 2.340% 6.681% 11/1/34 (c)(d) | | 4,002 | 4,068 |
| 1.5% 2/1/36 | | 641,572 | 564,013 |
| 2.5% 1/1/52 to 4/1/52 | | 1,289,026 | 1,092,505 |
| 3% 11/1/34 | | 156,763 | 149,081 |
| 3.5% 12/1/47 to 2/1/52 | | 1,506,857 | 1,380,369 |
| 4% 12/1/49 | | 116,020 | 109,849 |
| 4.5% 5/1/50 to 10/1/52 | | 8,988,513 | 8,647,550 |
| 5% 12/1/41 | | 207,366 | 209,348 |
| 5.5% 10/1/38 | | 1,418 | 1,463 |
| 6% 9/1/34 to 9/1/35 | | 48,416 | 50,239 |
| 7% 3/1/39 | | 63,616 | 66,795 |
| 7.5% 6/1/38 | | 56,384 | 59,530 |
TOTAL FREDDIE MAC | | | 12,380,702 |
| Ginnie Mae - 0.1% | | | |
| 6% 7/15/36 | | 86,896 | 89,127 |
| 3% 9/20/47 | | 862,928 | 771,638 |
| 3.5% 8/20/44 to 7/20/52 | | 2,759,743 | 2,533,026 |
| 4% 3/20/48 to 10/20/52 | | 1,201,584 | 1,133,257 |
| 4.5% 9/20/40 to 7/20/41 | | 264,291 | 261,024 |
| 5% 12/20/34 to 5/20/48 | | 415,206 | 418,096 |
| 5.5% 9/15/45 to 4/20/53 | | 1,737,308 | 1,746,481 |
TOTAL GINNIE MAE | | | 6,952,649 |
| TOTAL U.S. GOVERNMENT AGENCY - MORTGAGE SECURITIES (Cost $47,355,787) | | | 45,335,596 |
| | | | |
| Asset-Backed Securities - 8.6% |
| | | Principal Amount (a) | Value ($) |
| Affirm Asset Securitization Trust: | | | |
| Series 2024-X1 Class A, 6.27% 5/15/29 (b) | | 194,256 | 194,908 |
| Series 2024-X2 Class A, 5.22% 12/17/29 (b) | | 2,720,000 | 2,720,877 |
| Ally Auto Receivables Trust: | | | |
| Series 2023-A: | | | |
Class B, 6.01% 1/17/34 (b) | | 140,474 | 141,103 |
Class C, 6.08% 1/17/34 (b) | | 281,270 | 285,233 |
| Series 2024-1 Class A2, 5.32% 1/15/27 | | 2,167,929 | 2,170,526 |
| Ally Bank Midvale Utah: | | | |
| Series 2024-A: | | | |
Class B, 5.827% 5/17/32 (b) | | 202,912 | 205,242 |
Class C, 6.022% 5/17/32 (b) | | 202,912 | 205,523 |
| Series 2024-B: | | | |
Class A2, 4.97% 9/15/32 (b) | | 275,000 | 275,182 |
Class C, 5.215% 9/15/32 (b) | | 305,000 | 305,202 |
| AmeriCredit Automobile Receivables Series 2023-1 Class C, 5.8% 12/18/28 | | 625,000 | 637,030 |
| AmeriCredit Automobile Receivables Trust: | | | |
| Series 2020-3 Class C, 1.06% 8/18/26 | | 160,817 | 159,609 |
| Series 2021-1: | | | |
Class C, 0.89% 10/19/26 | | 429,930 | 425,467 |
Class D, 1.21% 12/18/26 | | 470,000 | 460,126 |
| Series 2021-2 Class D, 1.29% 6/18/27 | | 995,000 | 956,072 |
| Series 2022-1 Class D, 3.23% 2/18/28 | | 1,830,000 | 1,773,029 |
| Amsr 2020-Sfr3 Trust Series 2020-SFR3 Class C, 2.056% 9/17/37 (b) | | 915,000 | 893,350 |
| Amur Equipment Finance Receivables: | | | |
| Series 2021-1A: | | | |
Class C, 1.75% 6/21/27 (b) | | 999,320 | 997,336 |
Class E, 4.13% 3/20/28 (b) | | 1,265,000 | 1,263,717 |
| Series 2022-1A: | | | |
Class C, 2.37% 4/20/28 (b) | | 300,000 | 293,699 |
Class E, 5.02% 12/20/28 (b) | | 830,000 | 826,175 |
| Series 2024-1A: | | | |
Class A2, 5.38% 1/21/31 (b) | | 280,528 | 282,769 |
Class C, 5.55% 1/21/31 (b) | | 220,000 | 223,198 |
| Apidos CLO Series 2024-18A Class AR, CME Term SOFR 3 Month Index + 1.150% 5.7816% 10/22/30 (b)(c)(d) | | 1,019,312 | 1,020,841 |
| Apidos Clo Xxv Series 2024-25A Class A1R2, CME Term SOFR 3 Month Index + 1.150% 5.7674% 10/20/31 (b)(c)(d) | | 1,289,997 | 1,291,403 |
| Applebee's/IHOP Funding LLC Series 2019-1A Class A2II, 4.723% 6/5/49 (b) | | 970,200 | 951,411 |
| Arbys Funding 2015-1A LLC Series 2020-1A Class A2, 3.237% 7/30/50 (b) | | 2,149,588 | 2,036,374 |
| Ares CLO Series 2024-54A Class AR, CME Term SOFR 3 Month Index + 1.270% 5.9259% 10/15/32 (b)(c)(d) | | 935,000 | 936,306 |
| Ares XXXIV CLO Ltd. Series 2024-2A Class AR3, CME Term SOFR 3 Month Index + 1.320% 5.9675% 4/17/33 (b)(c)(d) | | 4,390,000 | 4,399,899 |
| Ari Fleet Lease Trust 2024-B Series 2024-B Class A2, 5.54% 4/15/33 (b) | | 1,133,000 | 1,141,505 |
| Auxilior Term Funding 2024-1 L Series 2024-1A Class A3, 5.49% 7/15/31 (b) | | 485,000 | 491,598 |
| Auxilior Term Funding LLC Series 2023-1A Class A2, 6.18% 12/15/28 (b) | | 975,277 | 985,995 |
| Avis Budget Rental Car Funding (AESOP) LLC: | | | |
| Series 2020-1A Class A, 2.33% 8/20/26 (b) | | 540,000 | 533,178 |
| Series 2022-5A Class C, 6.24% 4/20/27 (b) | | 300,000 | 300,901 |
| Series 2024-2A Class C, 6.18% 10/20/27 (b) | | 210,000 | 210,479 |
| Barings Clo Ltd. Series 2024-4A Class BR, CME Term SOFR 3 Month Index + 1.800% 6.4559% 10/15/30 (b)(c)(d) | | 1,525,000 | 1,526,728 |
| Bayview Opportunity Master Fun Series 2024-CAR1 Class A, U.S. 30-Day Avg. Secured Overnight Fin. Rate (SOFR) Index + 1.100% 5.834% 12/26/31 (b)(c)(d) | | 363,070 | 363,615 |
| Blue Owl Asset Leasing Trust 2 Series 2024-1A: | | | |
| Class A2, 5.05% 3/15/29 (b) | | 1,050,000 | 1,050,702 |
| Class B, 5.41% 3/15/30 (b) | | 240,000 | 240,338 |
| BlueMountain CLO Ltd. Series 2024-3A Class A1R2, CME Term SOFR 3 Month Index + 1.200% 5.7235% 11/15/30 (b)(c)(d) | | 1,413,887 | 1,414,941 |
| BMW Vehicle Lease Trust: | | | |
| Series 2023-2 Class A2, 5.95% 8/25/25 | | 143,358 | 143,472 |
| Series 2024-1 Class A2A, 5.1% 7/27/26 | | 1,519,284 | 1,522,155 |
| BMW Vehicle Owner Trust Series 2023-A Class A2A, 5.72% 4/27/26 | | 668,776 | 669,854 |
| Bofa Auto Trust 2024-1 Series 2024-1A Class A2, 5.57% 12/15/26 (b) | | 1,495,502 | 1,500,827 |
| BRE Grand Islander Timeshare Issuer Series 2019-A Class A, 3.28% 9/26/33 (b) | | 684,487 | 669,412 |
| Buckhorn Park Clo Ltd. Series 2024-1A Class ARR, CME Term SOFR 3 Month Index + 1.070% 5.6277% 7/18/34 (b)(c)(d) | | 2,500,000 | 2,500,000 |
| Capital One Prime Auto Receiva: | | | |
| Series 2023-2 Class A2A, 5.91% 10/15/26 | | 2,361,063 | 2,369,646 |
| Series 2024-1 Class A2A, 4.61% 10/15/27 | | 2,570,000 | 2,570,993 |
| Capital One Prime Auto Receivables Series 2023-1 Class A2, 5.2% 5/15/26 | | 201,882 | 201,932 |
| Carmax Series 2023-3: | | | |
| Class B, 5.47% 2/15/29 | | 315,000 | 319,003 |
| Class C, 5.61% 2/15/29 | | 975,000 | 987,207 |
| Class D, 6.44% 12/16/30 | | 350,000 | 357,835 |
| CarMax Auto Owner Trust: | | | |
| Series 2020-4 Class D, 1.75% 4/15/27 | | 540,000 | 539,250 |
| Series 2023 2 Class A2A, 5.5% 6/15/26 | | 340,666 | 341,007 |
| Series 2023 2: | | | |
Class C, 5.57% 11/15/28 | | 955,000 | 970,202 |
Class D, 6.55% 10/15/29 | | 635,000 | 650,824 |
| Carmax Auto Owner Trust: | | | |
| Series 2024-1: | | | |
Class A2A, 5.3% 3/15/27 | | 1,836,077 | 1,840,317 |
Class A4, 4.94% 8/15/29 | | 265,000 | 267,530 |
Class C, 5.47% 8/15/29 | | 505,000 | 510,008 |
| Series 2024-2: | | | |
Class A2A, 5.65% 5/17/27 | | 2,317,889 | 2,329,427 |
Class D, 6.42% 10/15/30 | | 70,000 | 72,036 |
| Carmax Auto Owner Trust 2023-4 Series 2023-4 Class A2A, 6.08% 12/15/26 | | 1,173,203 | 1,178,160 |
| Carmax Auto Owner Trust 2024-3 Series 2024-3: | | | |
| Class A2A, 5.21% 9/15/27 | | 2,158,000 | 2,166,712 |
| Class A4, 4.85% 1/15/30 | | 200,000 | 201,408 |
| Class D, 5.67% 1/15/31 | | 255,000 | 256,830 |
| Carmax Auto Owner Trust 2024-4 Series 2024-4 Class A2A, 4.67% 12/15/27 | | 1,850,000 | 1,852,040 |
| Carmax Select Receivables Trust Series 2024-A: | | | |
| Class A2A, 5.78% 9/15/27 | | 151,000 | 151,832 |
| Class B, 5.35% 1/15/30 | | 270,000 | 273,531 |
| Class C, 5.62% 1/15/30 | | 1,150,000 | 1,172,468 |
| Carvana Auto Receivables Trust: | | | |
| Series 2021-P4 Class B, 1.98% 2/10/28 | | 445,000 | 418,454 |
| Series 2022-N1 Class C, 3.32% 12/11/28 (b) | | 95,291 | 93,176 |
| Series 2024-N2 Class B, 5.67% 9/10/30 (b) | | 815,000 | 825,938 |
| Cent CLO LP Series 2021-21A Class A1R3, CME Term SOFR 3 Month Index + 1.230% 5.8488% 7/27/30 (b)(c)(d) | | 127,586 | 127,583 |
| CFMT LLC Series 2023 HB12 Class A, 4.25% 4/25/33 (b) | | 178,610 | 176,053 |
| Chase Auto Credit Linked Notes Series 2021-3 Class B, 0.76% 2/26/29 (b) | | 317,012 | 313,608 |
| Chase Auto Owner Trust: | | | |
| Series 2024-1A Class A2, 5.48% 4/26/27 (b) | | 1,441,787 | 1,446,524 |
| Series 2024-4A Class A2, 5.25% 9/27/27 (b) | | 2,442,000 | 2,450,690 |
| Chase Auto Owner Trust 24-3 Series 2024-3A Class A2, 5.53% 9/27/27 (b) | | 1,299,606 | 1,305,665 |
| Chesapeake Funding II LLC: | | | |
| Series 2021-1A Class A2, U.S. 30-Day Avg. Secured Overnight Fin. Rate (SOFR) Index + 0.340% 5.1501% 4/15/33 (b)(c)(d) | | 47,601 | 47,600 |
| Series 2023 1A Class A1, 5.65% 5/15/35 (b) | | 1,236,698 | 1,243,594 |
| Series 2023-2A Class A1, 6.16% 10/15/35 (b) | | 244,078 | 247,452 |
| Series 2024-1A Class A1, 5.52% 5/15/36 (b) | | 465,544 | 470,078 |
| CIM Trust Series 2020-INV1 Class A2, 2.5% 4/25/50 (b) | | 168,612 | 140,464 |
| Citibank Credit Card Issuance Trust Series 2023-A1 Class A1, 5.23% 12/8/27 | | 1,139,000 | 1,146,775 |
| Citizens Auto Receivables Trust: | | | |
| Series 2024-1 Class A2A, 5.43% 10/15/26 (b) | | 1,817,952 | 1,821,772 |
| Series 2024-2 Class A2A, 5.54% 11/16/26 (b) | | 2,382,319 | 2,389,600 |
| Cnh Equipment Trust: | | | |
| Series 2024-25A Class D2, 5.23% 11/17/31 | | 435,000 | 443,250 |
| Series 2024-B Class A3, 5.19% 9/17/29 | | 490,000 | 497,750 |
| Crossroads Asset Trust Series 2024-A Class A2, 5.9% 8/20/30 (b) | | 415,000 | 419,927 |
| Cyrusone Data Centers Issuer I Series 2024-2A Class A2, 4.5% 5/20/49 (b) | | 1,500,000 | 1,442,184 |
| Daimler Trucks Retail Trust 20: | | | |
| Series 2023-1 Class A2, 6.03% 9/15/25 | | 232,355 | 232,620 |
| Series 2024-1 Class A2, 5.6% 4/15/26 | | 2,418,523 | 2,425,280 |
| Dell Equipment Finance Trust 2: | | | |
| Series 2023-3: | | | |
Class A2, 6.1% 4/23/29 (b) | | 1,101,785 | 1,105,863 |
Class D, 6.75% 10/22/29 (b) | | 100,000 | 102,112 |
| Series 2024-1: | | | |
Class A2, 5.58% 3/22/30 (b) | | 1,950,000 | 1,957,152 |
Class D, 6.12% 9/23/30 (b) | | 195,000 | 198,292 |
| Dell Equipment Finance Trust 2023-2 Series 2023-2 Class A2, 5.84% 1/22/29 (b) | | 368,547 | 369,012 |
| Dell Equipment Finance Trust 2024-2 Series 2024-2: | | | |
| Class A2, 4.69% 8/22/30 (b) | | 1,824,000 | 1,825,887 |
| Class B, 4.82% 8/22/30 (b) | | 105,000 | 104,830 |
| Class D, 5.29% 2/24/31 (b) | | 865,000 | 866,139 |
| Discover Card Execution Note Trust Series 2022-A1 Class A1, 1.96% 2/15/27 | | 5,000,000 | 4,972,348 |
| Dllaa 2023-1A Series 2023-1A: | | | |
| Class A2, 5.93% 7/20/26 (b) | | 135,720 | 136,256 |
| Class A3, 5.64% 2/22/28 (b) | | 660,000 | 670,158 |
| DLLAD: | | | |
| Series 2023-1A Class A2, 5.19% 4/20/26 (b) | | 484,913 | 485,282 |
| Series 2024-1A Class A2, 5.5% 8/20/27 (b) | | 1,013,000 | 1,018,617 |
| Dllmt 2023-1 LLC Series 2023-1A Class A2, 5.78% 11/20/25 (b) | | 587,093 | 588,081 |
| DLLST Series 2024-1A: | | | |
| Class A2, 5.33% 1/20/26 (b) | | 1,291,051 | 1,293,333 |
| Class A3, 5.05% 8/20/27 (b) | | 245,000 | 245,844 |
| Class A4, 4.93% 4/22/30 (b) | | 65,000 | 65,142 |
| Drive Auto Receivables Trust Series 2024-1 Class A2, 5.83% 12/15/26 | | 547,573 | 548,276 |
| Driven Brands Funding LLC Series 2019-1A Class A2, 4.641% 4/20/49 (b) | | 708,211 | 698,590 |
| Dryden 45 Senior Loan Fund Series 2024-45A Class BRR, CME Term SOFR 3 Month Index + 1.650% 6.3059% 10/15/30 (b)(c)(d) | | 1,290,000 | 1,292,410 |
| Dryden 68 CLO Ltd. Series 2024-68A Class ARR, CME Term SOFR 3 Month Index + 1.100% 0% 7/15/35 (b)(c)(d) | | 2,331,000 | 2,331,000 |
| Dryden CLO, Ltd. / Dryden CLO, LLC Series 2021-86A Class A1R, CME Term SOFR 3 Month Index + 1.360% 6.0091% 7/17/34 (b)(c)(d) | | 1,867,000 | 1,870,389 |
| Elara Hgv Timeshare Issuer LLC Series 2023-A: | | | |
| Class A, 6.16% 2/25/38 (b) | | 221,097 | 225,407 |
| Class C, 7.3% 2/25/38 (b) | | 302,733 | 309,337 |
| Enterprise Fleet Financing: | | | |
| Series 2023-2 Class A2, 5.56% 4/22/30 (b) | | 1,019,417 | 1,027,085 |
| Series 2024-2 Class A2, 5.74% 12/20/26 (b) | | 460,000 | 463,967 |
| Enterprise Fleet Financing 202: | | | |
| Series 2024-3: | | | |
Class A2, 5.31% 4/20/27 (b) | | 1,790,000 | 1,801,272 |
Class A3, 4.98% 8/21/28 (b) | | 295,000 | 297,432 |
Class A4, 5.06% 3/20/31 (b) | | 205,000 | 207,190 |
| Series 2024-4: | | | |
Class A2, 4.69% 7/20/27 (b) | | 2,600,000 | 2,599,995 |
Class A4, 4.7% 6/20/31 (b) | | 830,000 | 829,673 |
| Enterprise Fleet Financing 2023-3 L Series 2023-3 Class A2, 6.4% 3/20/30 (b) | | 1,557,044 | 1,584,530 |
| Enterprise Fleet Financing LLC: | | | |
| Series 2021-2 Class A2, 0.48% 5/20/27 (b) | | 3,448 | 3,440 |
| Series 2022-3 Class A2, 4.38% 7/20/29 (b) | | 206,289 | 205,759 |
| Series 2024-1 Class A2, 5.23% 3/20/30 (b) | | 2,530,131 | 2,545,960 |
| Exeter Automobile Receivables: | | | |
| Series 2023-1A Class D, 6.69% 6/15/29 | | 80,000 | 81,365 |
| Series 2024-4A Class C, 5.48% 8/15/30 | | 850,000 | 856,842 |
| Finance of America Hecm Buyout 20 Series 2024-HB1 Class A1A, 4% 10/1/34 (b) | | 1,253,717 | 1,227,334 |
| Firstkey Homes 2020-Sfr2 Series 2020-SFR2 Class D, 1.968% 10/19/37 (b) | | 1,100,000 | 1,064,033 |
| Flatiron Clo 28 Ltd. / Flatiron Series 2024-1A Class A1, CME Term SOFR 3 Month Index + 1.320% 6.5866% 7/15/36 (b)(c)(d) | | 2,797,000 | 2,805,486 |
| Ford Credit Auto Lease Trust: | | | |
| Series 2023-B: | | | |
Class A2A, 5.9% 2/15/26 | | 343,460 | 343,714 |
Class B, 6.2% 2/15/27 | | 250,000 | 253,590 |
Class C, 6.43% 4/15/27 | | 575,000 | 585,919 |
| Series 2024-A Class A2A, 5.24% 7/15/26 | | 1,246,882 | 1,249,024 |
| Ford Credit Auto Owner Trust: | | | |
| Series 2020-1: | | | |
Class A, 2.04% 8/15/31 (b) | | 2,000,000 | 1,988,924 |
Class B, 2.29% 8/15/31 (b) | | 740,000 | 735,799 |
| Series 2020-2 Class C, 1.74% 4/15/33 (b) | | 570,000 | 552,023 |
| Series 2023-A Class B, 5.07% 1/15/29 | | 1,495,000 | 1,507,114 |
| Series 2023-B Class A2A, 5.57% 6/15/26 | | 937,969 | 939,549 |
| Ford Credit Auto Owner Trust 2 Series 2024-D Class A2A, 4.59% 10/15/27 | | 1,690,000 | 1,691,281 |
| Ford Credit Floorplan Master Owner Trust: | | | |
| Series 2023-1: | | | |
Class C, 5.75% 5/15/28 (b) | | 405,000 | 407,759 |
Class D, 6.62% 5/15/28 (b) | | 750,000 | 758,986 |
| Series 2024-1 Class B, 5.48% 4/15/29 (b) | | 550,000 | 556,922 |
| Fordl 2023-A Series 2023-A Class C, 5.54% 12/15/26 | | 1,445,000 | 1,449,064 |
| FORDO Series 2024-B Class A2A, 5.4% 4/15/27 | | 2,077,000 | 2,086,510 |
| Fortress Credit Bsl Vii Ltd. Series 2024-1A: | | | |
| Class A1R, CME Term SOFR 3 Month Index + 1.090% 5.6495% 7/23/32 (b)(c)(d) | | 630,000 | 630,083 |
| Class A2R, CME Term SOFR 3 Month Index + 1.400% 5.9595% 7/23/32 (b)(c)(d) | | 980,000 | 980,174 |
| Class BR, CME Term SOFR 3 Month Index + 1.650% 6.2095% 7/23/32 (b)(c)(d) | | 1,250,000 | 1,250,220 |
| Fortress Credit Bsl Xv Ltd. Series 2024-2A Class AR, CME Term SOFR 3 Month Index + 1.400% 6.0324% 10/18/33 (b)(c)(d) | | 2,310,000 | 2,310,601 |
| Freddie Mac STACR REMIC Trust Series 2023-HQA3 Class A1, U.S. 30-Day Avg. Secured Overnight Fin. Rate (SOFR) Index + 1.850% 6.584% 11/25/43 (b)(c)(d) | | 273,844 | 277,009 |
| GM Financial Automobile Leasing Trust: | | | |
| Series 2023-1: | | | |
Class A3, 5.16% 4/20/26 | | 1,907,133 | 1,909,581 |
Class C, 5.76% 1/20/27 | | 955,000 | 959,374 |
| Series 2024-2: | | | |
Class A2A, 5.43% 9/21/26 | | 1,868,088 | 1,876,882 |
Class B, 5.56% 5/22/28 | | 1,175,000 | 1,188,970 |
| GM Financial Consumer Automobile Series 2024-1 Class ASB, 5.12% 2/16/27 | | 1,493,963 | 1,496,774 |
| Gm Financial Consumer Automobile Re: | | | |
| Series 2023-1 Class A2A, 5.19% 3/16/26 | | 39,873 | 39,882 |
| Series 2023-3 Class A2A, 5.74% 9/16/26 | | 626,732 | 628,093 |
| Series 2024-4 Class A2A, 4.53% 10/18/27 | | 2,253,000 | 2,252,626 |
| GM Financial Consumer Automobile Receivables Series 2023 2 Class A2A, 5.1% 5/18/26 | | 310,570 | 310,665 |
| GM Financial Consumer Automobile Receivables Trust Series 2023-4 Class A2A, 5.89% 11/16/26 | | 1,456,103 | 1,461,309 |
| GM Financial Leasing Trust Series 2024-1 Class A2A, 5.18% 6/22/26 | | 2,310,631 | 2,315,589 |
| Gm Financial Leasing Trust 202 Series 2023-3 Class A2A, 5.58% 1/20/26 | | 896,535 | 897,801 |
| GMF Floorplan Owner Revolving Trust Series 2024-3A Class A1, 4.68% 11/15/28 (b) | | 2,600,000 | 2,599,781 |
| Goldentree Ln Management U.S. Clo 11 L Series 2021-11A Class A, CME Term SOFR 3 Month Index + 1.390% 6.009% 10/20/34 (b)(c)(d) | | 1,365,000 | 1,365,000 |
| Hardee's Funding LLC / Carl's Jr. Funding LLC: | | | |
| Series 2018-1A Class A23, 5.71% 6/20/48 (b) | | 676,800 | 662,263 |
| Series 2020-1A Class A2, 3.981% 12/20/50 (b) | | 2,559,057 | 2,403,517 |
| Series 2021-1A Class A2, 2.865% 6/20/51 (b) | | 272,835 | 243,681 |
| Harot 2023-4 Series 2023-4 Class A2, 5.87% 6/22/26 | | 1,442,198 | 1,447,831 |
| Hartwick Park Clo Ltd. Series 2024-1A Class AR, CME Term SOFR 3 Month Index + 1.160% 0% 1/20/37 (b)(c)(d) | | 2,049,000 | 2,049,000 |
| Hilton Grand Vacations Trust Series 2020-AA: | | | |
| Class A, 2.74% 2/25/39 (b) | | 198,040 | 191,292 |
| Class B, 4.22% 2/25/39 (b) | | 305,119 | 299,707 |
| Hilton Grand Vacations Trust 2: | | | |
| Series 2022-1D Class A, 3.61% 6/20/34 (b) | | 159,978 | 155,773 |
| Series 2023-1A: | | | |
Class B, 6.11% 1/25/38 (b) | | 841,829 | 854,212 |
Class C, 6.94% 1/25/38 (b) | | 156,121 | 159,405 |
| Home Partners of America Trust Series 2022-1 Class A, 3.93% 4/17/39 (b) | | 725,021 | 709,675 |
| Honda Auto Receivables Series 2023-1 Class A2, 5.22% 10/21/25 | | 55,931 | 55,942 |
| Honda Auto Receivables 2023-3 Series 2023-3 Class A2, 5.71% 3/18/26 | | 818,487 | 820,244 |
| Honda Auto Receivables 2024-2 Series 2024-2 Class A2, 5.48% 11/18/26 | | 2,384,000 | 2,393,946 |
| HPEFS Equipment Trust: | | | |
| Series 2024-1A: | | | |
Class A2, 5.38% 5/20/31 (b) | | 2,349,165 | 2,352,386 |
Class C, 5.33% 5/20/31 (b) | | 1,220,000 | 1,225,919 |
| Series 2024-2A: | | | |
Class A2, 5.5% 10/20/31 (b) | | 1,449,000 | 1,456,520 |
Class B, 5.35% 10/20/31 (b) | | 170,000 | 171,965 |
Class D, 5.82% 4/20/32 (b) | | 420,000 | 426,031 |
| Hpefs Equipment Trust 2023-2 Series 2023-2A: | | | |
| Class C, 6.48% 1/21/31 (b) | | 210,000 | 213,018 |
| Class D, 6.97% 7/21/31 (b) | | 215,000 | 220,004 |
| HPEFS Equiptment Trust: | | | |
| Series 2023 1A Class C, 5.91% 4/20/28 (b) | | 535,000 | 539,348 |
| Series 2023-1A Class B, 5.73% 4/20/28 (b) | | 985,000 | 990,585 |
| Huntington Auto Trust Series 2024-1A Class A2, 5.5% 3/15/27 (b) | | 2,034,882 | 2,040,826 |
| Huntington Bank Auto Credit: | | | |
| Series 2024-1 Class B1, 6.153% 5/20/32 (b) | | 1,063,713 | 1,074,873 |
| Series 2024-2 Class B1, 5.442% 10/20/32 (b) | | 1,330,000 | 1,330,729 |
| Hyundai Auto Lease Securitizat: | | | |
| Series 2023-C: | | | |
Class A2A, 5.85% 3/16/26 (b) | | 1,444,510 | 1,448,523 |
Class A3, 5.8% 12/15/26 (b) | | 4,000,000 | 4,036,753 |
| Series 2024-B Class A2A, 5.51% 10/15/26 (b) | | 2,235,700 | 2,244,889 |
| Hyundai Auto Receivables Trust: | | | |
| Series 2023-B Class A2A, 5.77% 5/15/26 | | 722,105 | 723,600 |
| Series 2023-C Class A2A, 5.8% 1/15/27 | | 1,259,493 | 1,264,784 |
| Series 2024-A Class A2A, 5.29% 4/15/27 | | 2,062,043 | 2,068,160 |
| Series 2024-C Class A2A, 4.53% 9/15/27 | | 2,191,000 | 2,190,413 |
| Jack In The Box Funding LLC Series 2022-1A Class A2I, 3.445% 2/26/52 (b) | | 765,450 | 727,717 |
| Jersey Mikes Funding LLC: | | | |
| Series 2019-1A Class A2, 4.433% 2/15/50 (b) | | 193,538 | 191,351 |
| Series 2021-1A Class A2I, 2.891% 2/15/52 (b) | | 49,750 | 47,591 |
| John Deere Owner Trust: | | | |
| Series 2024-A Class A2A, 5.19% 2/16/27 | | 2,768,047 | 2,775,344 |
| Series 2024-C Class A2B, U.S. 30-Day Avg. Secured Overnight Fin. Rate (SOFR) Index + 0.430% 5.2283% 8/16/27 (c)(d) | | 2,316,000 | 2,319,804 |
| John Deere Owner Trust 2023-B Series 2023-B Class A2, 5.59% 6/15/26 | | 852,431 | 853,587 |
| Juniper Valley Park CLO LLC Series 2024-1A Class AR, CME Term SOFR 3 Month Index + 1.250% 5.8674% 7/20/36 (b)(c)(d) | | 2,500,000 | 2,508,318 |
| Kubota Credit Owner Trust Series 2024-2A Class A2, 5.45% 4/15/27 (b) | | 895,000 | 900,799 |
| Madison Park Funding XXIII, Ltd. Series 2021-23A: | | | |
| Class AR, CME Term SOFR 3 Month Index + 1.230% 5.8488% 7/27/31 (b)(c)(d) | | 951,829 | 953,179 |
| Class BR, CME Term SOFR 3 Month Index + 1.810% 6.4288% 7/27/31 (b)(c)(d) | | 1,110,000 | 1,112,993 |
| Madison Park Funding Xxiv Ltd. Series 2024-24A Class CR2, CME Term SOFR 3 Month Index + 2.050% 6.6674% 10/20/29 (b)(c)(d) | | 855,000 | 856,634 |
| Madison Park Funding XXXIII Ltd. Series 2022-33A Class AR, CME Term SOFR 3 Month Index + 1.290% 5.9459% 10/15/32 (b)(c)(d) | | 1,910,000 | 1,912,042 |
| Madison Pk Funding Xlii Ltd. Series 2024-13A Class AR, CME Term SOFR 3 Month Index + 1.150% 5.7763% 11/21/30 (b)(c)(d) | | 1,357,646 | 1,359,558 |
| Madison Pk Funding Xxix Ltd. / Madi Series 2024-29A Class BR, CME Term SOFR 3 Month Index + 1.800% 6.4324% 10/18/30 (b)(c)(d) | | 1,965,000 | 1,968,327 |
| Magnetite Xxii Ltd. / Magnetite Series 2024-22A Class ARR, CME Term SOFR 3 Month Index + 1.250% 5.9059% 7/15/36 (b)(c)(d) | | 2,408,000 | 2,412,445 |
| Marathon Static CLO Ltd. Series 2024-18A Class A1R2, CME Term SOFR 3 Month Index + 1.150% 5.7674% 7/20/30 (b)(c)(d) | | 757,566 | 757,637 |
| Marble Point CLO Ltd.: | | | |
| Series 2018-1A Class A, CME Term SOFR 3 Month Index + 1.270% 5.9189% 7/16/31 (b)(c)(d) | | 374,575 | 375,265 |
| Series 2024-2A Class A12R, CME Term SOFR 3 Month Index + 1.200% 5.8174% 1/20/32 (b)(c)(d) | | 2,163,481 | 2,165,644 |
| Marble Point Clo Xv Ltd. Series 2024-1A Class A1R2, CME Term SOFR 3 Month Index + 1.040% 5.5975% 7/23/32 (b)(c)(d) | | 1,545,000 | 1,545,000 |
| Marlette Funding Trust 2024-1 Series 2024-1A Class A, 5.95% 7/17/34 (b) | | 102,841 | 103,280 |
| Mercedes-Benz Auto Lease Trust Series 2024-A Class A2A, 5.44% 2/16/27 | | 2,981,000 | 2,994,586 |
| Mercedes-Benz Auto Receivables: | | | |
| Series 2023-2 Class A2, 5.92% 11/16/26 | | 931,710 | 935,140 |
| Series 2024-1 Class A2A, 5.06% 5/17/27 | | 1,859,795 | 1,862,297 |
| MFRA Trust Series 2021-INV1 Class A1, 0.852% 1/25/56 (b)(c) | | 99,506 | 95,110 |
| Midocean Credit Clo Vi Series 2024-6A Class ARRR, CME Term SOFR 3 Month Index + 1.230% 5.8474% 4/20/33 (b)(c)(d) | | 796,491 | 798,084 |
| Midocean Credit Clo Xi Ltd. / Midocean Credit Clo Xi LLC Series 2023-11A: | | | |
| Class A1R, CME Term SOFR 3 Month Index + 1.730% 6.3624% 10/18/33 (b)(c)(d) | | 530,000 | 530,000 |
| Class BR, CME Term SOFR 3 Month Index + 2.650% 7.2824% 10/18/33 (b)(c)(d) | | 790,000 | 790,000 |
| MMAF Equipment Finance LLC: | | | |
| Series 2021-A Class A5, 1.19% 11/13/43 (b) | | 215,000 | 205,493 |
| Series 2023-A Class A2, 5.79% 11/13/26 (b) | | 1,205,282 | 1,210,826 |
| MVW LLC: | | | |
| Series 2020-1A: | | | |
Class A, 1.74% 10/20/37 (b) | | 207,664 | 198,494 |
Class B, 2.73% 10/20/37 (b) | | 146,529 | 141,536 |
| Series 2023 1A Class A, 4.93% 10/20/40 (b) | | 691,197 | 688,959 |
| MVW Owner Trust Series 2021-1WA: | | | |
| Class B, 1.44% 1/22/41 (b) | | 54,096 | 50,936 |
| Class C, 1.94% 1/22/41 (b) | | 86,295 | 81,703 |
| Mvwot Series 2023-2A: | | | |
| Class A, 6.18% 11/20/40 (b) | | 223,292 | 227,946 |
| Class B, 6.33% 11/20/40 (b) | | 143,329 | 145,981 |
| Navient Private Education Loan Trust: | | | |
| Series 2019-D Class A2A, 3.01% 12/15/59 (b) | | 214,309 | 205,984 |
| Series 2020-CA Class A2A, 2.15% 11/15/68 (b) | | 1,411,702 | 1,328,308 |
| Navient Private Education Refi Loan Trust: | | | |
| Series 2019-A Class A2A, 3.42% 1/15/43 (b) | | 342,664 | 337,631 |
| Series 2019-GA Class A, 2.4% 10/15/68 (b) | | 150,274 | 143,657 |
| Series 2020-DA Class A, 1.69% 5/15/69 (b) | | 252,751 | 235,607 |
| Navient Student Loan Trust Series 2019-EA Class A2A, 2.64% 5/15/68 (b) | | 355,911 | 344,372 |
| Navistar Financial Dealer Note Master Trust: | | | |
| Series 2023-1 Class A, 6.18% 8/25/28 (b) | | 900,000 | 908,852 |
| Series 2024-1: | | | |
Class A, 5.59% 4/25/29 (b) | | 180,000 | 181,968 |
Class B, 5.79% 4/25/29 (b) | | 100,000 | 100,954 |
Class C, 6.13% 4/25/29 (b) | | 155,000 | 156,387 |
| Nelnet Student Loan Trust: | | | |
| Series 2005-4 Class A4, U.S. 90-Day Avg. Secured Overnight Fin. Rate (SOFR) Index + 0.440% 5.8126% 3/22/32 (c)(d) | | 235,689 | 228,469 |
| Series 2020-1A Class A, CME Term SOFR 1 Month Index + 0.850% 5.4422% 3/26/68 (b)(c)(d) | | 155,032 | 154,405 |
| Series 2021-CA Class AFX, 1.32% 4/20/62 (b) | | 789,086 | 724,978 |
| Series 2021-DA Class AFX, 1.63% 4/20/62 (b) | | 280,131 | 260,164 |
| Neuberger Berman Ln Advisers N Series 2024-50A Class AR, CME Term SOFR 3 Month Index + 1.250% 5.8763% 7/23/36 (b)(c)(d) | | 2,519,000 | 2,523,650 |
| Neuberger Berman Loan Advisers CLO 40, Ltd. / Neuberger Berman Loan Advisers CLO 40 LLC Series 2021-40A Class A, CME Term SOFR 3 Month Index + 1.320% 5.9689% 4/16/33 (b)(c)(d) | | 447,755 | 448,707 |
| Nissan Auto Receivables 2023-B Series 2023-B Class A2A, 5.95% 5/15/26 | | 1,685,245 | 1,691,251 |
| Nissan Master Owner Trust Receiva Series 2024-A Class A, U.S. 30-Day Avg. Secured Overnight Fin. Rate (SOFR) Index + 0.670% 5.4756% 2/15/28 (b)(c)(d) | | 3,000,000 | 3,008,100 |
| Northwoods Capital Xiv-B Ltd. Series 2024-14BA Class AR, CME Term SOFR 3 Month Index + 1.250% 5.7662% 11/13/31 (b)(c)(d) | | 2,391,151 | 2,394,656 |
| OCP CLO Ltd. Series 2014-7A Class A1RR, CME Term SOFR 3 Month Index + 1.380% 5.999% 7/20/29 (b)(c)(d) | | 309,694 | 309,826 |
| Octagon Investment Partners 39 Series 2024-3A Class AR, CME Term SOFR 3 Month Index + 1.150% 5.7674% 10/20/30 (b)(c)(d) | | 1,201,956 | 1,204,024 |
| Octane Receivable Trust Series 2024-1A Class A2, 5.68% 5/20/30 (b) | | 340,450 | 343,343 |
| Octane Receivables Trust: | | | |
| Series 2021-2A Class A, 1.21% 9/20/28 (b) | | 55,603 | 55,116 |
| Series 2022-1A Class B, 4.9% 5/22/28 (b) | | 780,000 | 778,989 |
| Series 2023-1A Class A, 5.87% 5/21/29 (b) | | 76,446 | 76,776 |
| Octane Receivables Trust 2023- Series 2023-3A: | | | |
| Class B, 6.48% 7/20/29 (b) | | 230,000 | 234,842 |
| Class C, 6.74% 8/20/29 (b) | | 100,000 | 102,840 |
| Octane Receivables Trust 2024- Series 2024-3A: | | | |
| Class A2, 4.94% 5/20/30 (b) | | 365,000 | 365,072 |
| Class C, 5.51% 10/20/31 (b) | | 300,000 | 301,273 |
| OZLM Ltd.: | | | |
| Series 2024-21A Class A1R, CME Term SOFR 3 Month Index + 1.150% 5.7674% 1/20/31 (b)(c)(d) | | 1,212,018 | 1,213,421 |
| Series 2024-2A Class A1A2, CME Term SOFR 3 Month Index + 1.200% 5.7892% 7/30/31 (b)(c)(d) | | 718,035 | 718,465 |
| Palmer Square Loan Funding 202: | | | |
| Series 2024-2A Class A1N, CME Term SOFR 3 Month Index + 1.000% 0% 1/15/33 (b)(c)(d)(f) | | 452,000 | 452,000 |
| Series 2024-3A Class A1, CME Term SOFR 3 Month Index + 1.080% 5.6023% 8/8/32 (b)(c)(d) | | 1,449,748 | 1,451,312 |
| Post Road Equipment Finance Series 2024-1A Class A2, 5.59% 11/15/29 (b) | | 93,112 | 93,706 |
| Progress Residential 2021-Sfr1 Series 2021-SFR1 Class D, 1.805% 4/17/38 (b) | | 950,000 | 912,698 |
| Progress Residential Trust: | | | |
| Series 2021-SFR2 Class A, 1.546% 4/19/38 (b) | | 568,876 | 549,364 |
| Series 2021-SFR8: | | | |
Class B, 1.681% 10/17/38 (b) | | 496,000 | 468,345 |
Class C, 1.931% 10/17/38 (b) | | 2,225,000 | 2,114,007 |
| Rockford Tower Clo 2019-2 Ltd. Series 2024-2A Class AR2, CME Term SOFR 3 Month Index + 1.130% 5.651% 8/20/32 (b)(c)(d) | | 1,451,416 | 1,451,706 |
| Romark Clo Ii Ltd. Series 2024-2A Class A2R, CME Term SOFR 3 Month Index + 1.650% 6.2759% 7/25/31 (b)(c)(d) | | 2,150,000 | 2,152,217 |
| Rr 16 Ltd. Series 2021-16A Class A1, CME Term SOFR 3 Month Index + 1.370% 6.0275% 7/15/36 (b)(c)(d) | | 1,320,000 | 1,322,459 |
| Sabey Data Ctr Issuer LLC Series 2021-1 Class A2, 1.881% 6/20/46 (b) | | 733,000 | 692,473 |
| Santander Bank, N.A.: | | | |
| Series 2021-1A Class B, 1.833% 12/15/31 (b) | | 4,487 | 4,480 |
| Series 2022-B Class C, 5.916% 8/16/32 (b) | | 14,078 | 14,083 |
| Series 2022-C: | | | |
Class A2, 6.024% 12/15/32 (b) | | 132,500 | 134,278 |
Class D, 8.197% 12/15/32 (b) | | 312,384 | 315,636 |
| Series 2022-C, Class B, 6.451% 12/15/32 (b) | | 283,228 | 284,547 |
| Series 2023-A Class B, 6.493% 6/15/33 (b) | | 192,459 | 193,687 |
| Series 2023-B: | | | |
Class A2, 5.644% 12/15/33 (b) | | 172,782 | 174,439 |
Class D, 6.663% 12/15/33 (b) | | 529,380 | 535,114 |
| Series 2024-A: | | | |
Class B, 5.622% 6/15/32 (b) | | 345,000 | 347,559 |
Class C, 5.818% 6/15/32 (b) | | 420,000 | 422,520 |
| Santander Consumer Auto Receivables Trust Series 2021 AA Class D, 1.57% 1/15/27 (b) | | 801,000 | 779,209 |
| Santander Drive Auto Receivabl Series 2024-3 Class A2, 5.91% 6/15/27 | | 1,662,015 | 1,668,790 |
| Santander Drive Auto Receivables Trust: | | | |
| Series 2021-1 Class E, 2.51% 12/15/28 | | 4,100,000 | 4,020,460 |
| Series 2021-3 Class E, 2.7% 10/16/28 (b) | | 4,300,000 | 4,186,800 |
| Series 2021-4: | | | |
Class D, 1.67% 10/15/27 | | 1,286,269 | 1,262,905 |
Class E, 4.03% 3/15/29 (b) | | 3,500,000 | 3,451,912 |
| Series 2022-2 Class C, 3.76% 7/16/29 | | 1,990,000 | 1,964,561 |
| Santander Retail Auto Lease Trust Series 2022-B Class B, 3.85% 3/22/27 (b) | | 445,000 | 444,251 |
| SBA Tower Trust: | | | |
| Series 2019, 2.836% 1/15/50 (b) | | 1,590,000 | 1,585,354 |
| 1.631% 5/15/51 (b) | | 1,149,000 | 1,073,679 |
| 1.884% 7/15/50 (b) | | 565,000 | 545,353 |
| 2.328% 7/15/52 (b) | | 440,000 | 402,510 |
| 6.599% 11/15/52 (b) | | 1,160,000 | 1,195,230 |
| Sbna Auto Lease Trust Series 2024-B: | | | |
| Class A2, 5.67% 11/20/26 (b) | | 1,537,613 | 1,543,567 |
| Class A4, 5.55% 12/20/28 (b) | | 1,080,000 | 1,096,752 |
| SBNA Auto Lease Trust 2024-A Series 2024-A: | | | |
| Class A3, 5.39% 11/20/26 (b) | | 260,000 | 261,374 |
| Class A4, 5.24% 1/22/29 (b) | | 250,000 | 251,374 |
| Sbna Auto Lease Trust 2024-C Series 2024-C Class A2, 4.94% 11/20/26 (b) | | 1,611,000 | 1,612,390 |
| Scf Equipment Leasing Series 2023-1A Class A3, 6.17% 5/20/32 (b) | | 430,000 | 444,965 |
| Scf Equipment Leasing 2021-1 LLC / Series 2021-1A Class E, 3.56% 8/20/32 (b) | | 1,625,000 | 1,607,722 |
| Seb Funding LLC Series 2024-1A Class A2, 7.386% 4/30/54 (b) | | 1,130,000 | 1,159,442 |
| Sfs Auto Receivables Securitiz: | | | |
| Series 2023-1A Class A2A, 5.89% 3/22/27 (b) | | 98,817 | 99,068 |
| Series 2024-3A Class A2, 4.71% 5/22/28 (b) | | 1,252,000 | 1,252,165 |
| Sfs Auto Receivables Securitization Trust: | | | |
| Series 2024-1A: | | | |
Class A2, 5.35% 6/21/27 (b) | | 584,204 | 585,340 |
Class A3, 4.95% 5/21/29 (b) | | 285,000 | 286,329 |
Class C, 5.51% 1/20/32 (b) | | 95,000 | 96,063 |
| Series 2024-2A: | | | |
Class A2, 5.71% 10/20/27 (b) | | 1,981,916 | 1,990,774 |
Class A4, 5.26% 8/20/30 (b) | | 290,000 | 295,364 |
| Sierra Timeshare Receivables Funding LLC: | | | |
| Series 2020-2A: | | | |
Class B, 2.32% 7/20/37 (b) | | 436,524 | 430,177 |
Class C, 3.51% 7/20/37 (b) | | 107,048 | 105,872 |
| Series 2021-1A Class B, 1.34% 11/20/37 (b) | | 76,924 | 74,279 |
| Series 2021-2A: | | | |
Class B, 1.8% 9/20/38 (b) | | 135,412 | 130,106 |
Class C, 1.95% 9/20/38 (b) | | 283,297 | 271,381 |
| SMB Private Education Loan Trust: | | | |
| Series 2016-C Class A2B, CME Term SOFR 1 Month Index + 1.210% 5.8238% 9/15/34 (b)(c)(d) | | 31,304 | 31,313 |
| Series 2018-B Class A2B, CME Term SOFR 1 Month Index + 0.830% 5.4438% 1/15/37 (b)(c)(d) | | 398,775 | 397,507 |
| Series 2020-BA Class A1A, 1.29% 7/15/53 (b) | | 177,546 | 164,981 |
| Series 2020-PTB Class A2A, 1.6% 9/15/54 (b) | | 1,082,239 | 999,628 |
| Sound Point Clo Xxii Ltd. Series 2024-1A Class BRR, CME Term SOFR 3 Month Index + 1.650% 0% 1/20/32 (b)(c)(d) | | 250,000 | 250,000 |
| Symphony CLO XXI, Ltd. Series 2021-21A Class AR, CME Term SOFR 3 Month Index + 1.320% 5.9775% 7/15/32 (b)(c)(d) | | 3,112,539 | 3,114,930 |
| Symphony CLO XXIII Ltd. Series 2021-23A: | | | |
| Class AR, CME Term SOFR 3 Month Index + 1.280% 5.9375% 1/15/34 (b)(c)(d) | | 5,021,618 | 5,028,447 |
| Class BR, CME Term SOFR 3 Month Index + 1.860% 6.5175% 1/15/34 (b)(c)(d) | | 1,250,000 | 1,250,484 |
| Symphony CLO XXVI Ltd. / Symphony CLO XXVI LLC Series 2021-26A Class AR, CME Term SOFR 3 Month Index + 1.340% 5.959% 4/20/33 (b)(c)(d) | | 416,617 | 417,203 |
| Symphony Static CLO Ltd. Series 2021-1A Class B, CME Term SOFR 3 Month Index + 1.710% 6.3375% 10/25/29 (b)(c)(d) | | 1,385,000 | 1,386,210 |
| TCI-Flatiron CLO Ltd. / LLC Series 2021-1A Class AR, CME Term SOFR 3 Month Index + 1.220% 5.707% 11/18/30 (b)(c)(d) | | 858,788 | 859,849 |
| Tesla Series 2024-A Class A2A, 5.37% 6/22/26 (b) | | 142,246 | 142,502 |
| Tesla Auto Lease Trust 2023-B Series 2023-B Class A2, 6.02% 9/22/25 (b) | | 247,275 | 247,603 |
| Tesla Auto Lease Trust 2024-B Series 2024-B Class A2A, 4.79% 1/20/27 (b) | | 1,440,000 | 1,440,497 |
| Tesla Auto Lease Trust 23-A Series 2023-A Class A2, 5.86% 8/20/25 (b) | | 274,130 | 274,247 |
| Tesla Electric Vehicle Trust 2023-1 Series 2023-1 Class A2A, 5.54% 12/21/26 (b) | | 2,149,359 | 2,157,308 |
| Thl Credit Wind River 18-2 Clo Series 2024-2A Class A1R, CME Term SOFR 3 Month Index + 1.200% 5.8559% 7/15/30 (b)(c)(d) | | 691,343 | 692,311 |
| Thl Credit Wind River 2019-3 C Series 2024-3A: | | | |
| Class AR2, CME Term SOFR 3 Month Index + 1.060% 0% 4/15/31 (b)(c)(d) | | 495,000 | 495,000 |
| Class BR2, CME Term SOFR 3 Month Index + 1.550% 0% 4/15/31 (b)(c)(d) | | 1,135,000 | 1,135,000 |
| Class CR2, CME Term SOFR 3 Month Index + 2.000% 0% 4/15/31 (b)(c)(d) | | 490,000 | 490,000 |
| THL Credit Wind River CLO Ltd. Series 2024-1A Class A1R3, CME Term SOFR 3 Month Index + 1.200% 5.8174% 10/20/30 (b)(c)(d) | | 1,218,507 | 1,219,452 |
| Tiaa Clo I Ltd. Series 2024-1A Class ARR, CME Term SOFR 3 Month Index + 1.250% 5.8674% 7/20/31 (b)(c)(d) | | 2,441,142 | 2,445,809 |
| Towd Point Mortgage Trust: | | | |
| Series 2017-3 Class A1, 2.75% 7/25/57 (b)(c) | | 27,100 | 26,893 |
| Series 2019-1 Class A1, 3.75% 3/25/58 (b)(c) | | 377,868 | 364,196 |
| Toyota Auto Receivables 2023-D Series 2023-D Class A2A, 5.8% 11/16/26 | | 1,018,326 | 1,022,063 |
| Toyota Auto Receivables Owner Trust: | | | |
| Series 2023-A Class A2, 5.05% 1/15/26 | | 19,241 | 19,243 |
| Series 2023-C Class A2A, 5.6% 8/17/26 | | 980,294 | 982,587 |
| Toyota Lease Owner Trust Series 2024-A Class A2A, 5.33% 7/20/26 (b) | | 1,472,783 | 1,475,138 |
| Toyota Lease Owner Trust 2023- Series 2023-B Class A2A, 5.73% 4/20/26 (b) | | 808,774 | 811,532 |
| Tricon Residential Trust Series 2024-SFR2: | | | |
| Class A, 4.75% 6/17/40 (b) | | 559,652 | 554,450 |
| Class D, 6% 6/17/40 (b) | | 1,020,000 | 1,015,458 |
| Trinitas Clo Ix Ltd. Series 2024-9A: | | | |
| Class ARRR, CME Term SOFR 3 Month Index + 1.200% 5.8174% 1/20/32 (b)(c)(d) | | 1,292,280 | 1,294,186 |
| Class BRRR, CME Term SOFR 3 Month Index + 1.700% 6.3174% 1/20/32 (b)(c)(d) | | 815,000 | 816,516 |
| Trinitas Clo Vi Ltd. / Trinitas Series 2024-6A Class ARRR, CME Term SOFR 3 Month Index + 1.330% 5.9559% 1/25/34 (b)(c)(d) | | 2,310,000 | 2,318,540 |
| Usaa Auto Owner Trust 2023-A Series 2023-A Class A2, 5.83% 7/15/26 (b) | | 509,908 | 510,613 |
| USCLN Series 2023-1 Class B, 6.789% 8/25/32 (b) | | 283,042 | 286,940 |
| Valley Stream Park Clo Ltd. / Vy Series 2024-1A Class ARR, CME Term SOFR 3 Month Index + 1.190% 0% 1/20/37 (b)(c)(d) | | 1,526,000 | 1,526,000 |
| Verdant Receivables 2023-1 LLC Series 2023-1A Class A2, 6.24% 1/13/31 (b) | | 734,457 | 745,011 |
| Verdant Receivables LLC Series 2024-1A Class A2, 5.68% 12/12/31 (b) | | 255,000 | 258,404 |
| Verizon Master Trust: | | | |
| Series 2023 2 Class A, 4.89% 4/13/28 | | 1,891,000 | 1,892,587 |
| Series 2023-5 Class A1A, 5.61% 9/8/28 | | 2,177,000 | 2,194,296 |
| Volkswagen Auto Lease Trust 20 Series 2023-A Class A2A, 5.87% 1/20/26 | | 1,165,481 | 1,167,617 |
| Volkswagen Auto Loan Enhanced: | | | |
| Series 2023-1 Class A2A, 5.5% 12/21/26 | | 878,230 | 880,310 |
| Series 2023-2 Class A2A, 5.72% 3/22/27 | | 1,541,930 | 1,549,781 |
| Series 2024-1 Class A2A, 4.65% 11/22/27 | | 2,570,000 | 2,572,249 |
| Volvo Financial Equipment LLC Series 2024-1A Class A2, 4.56% 5/17/27 (b) | | 1,524,000 | 1,521,043 |
| Voya Clo 2022-1 Ltd. / Voya Clo Series 2024-1A Class A1R, CME Term SOFR 3 Month Index + 1.250% 5.8674% 4/20/35 (b)(c)(d) | | 1,888,000 | 1,889,278 |
| Voya Clo Ltd. Series 2024-3A Class BR2, CME Term SOFR 3 Month Index + 1.800% 6.4559% 10/15/31 (b)(c)(d) | | 1,770,000 | 1,772,005 |
| Wheels Fleet Lease Funding 1 L: | | | |
| Series 2023-2A Class A, 6.46% 8/18/38 (b) | | 1,139,986 | 1,160,902 |
| Series 2024-1A Class A1, 5.49% 2/18/39 (b) | | 1,280,000 | 1,293,436 |
| Series 2024-2A Class A1, 4.87% 6/21/39 (b) | | 695,000 | 696,661 |
| World Omni Auto Receivables Trust: | | | |
| Series 2022-A: | | | |
Class A3, 1.66% 5/17/27 | | 490,985 | 484,296 |
Class C, 2.55% 9/15/28 | | 600,000 | 581,453 |
| Series 2023-C Class A2A, 5.57% 12/15/26 | | 835,884 | 837,528 |
| Series 2023-D Class A2A, 5.91% 2/16/27 | | 729,932 | 733,116 |
| Series 2024-B Class A2A, 5.48% 9/15/27 | | 1,964,010 | 1,971,815 |
| World Omni Automobile Lease Series 2023-A Class A2A, 5.47% 11/17/25 | | 40,355 | 40,371 |
| World Omni Automobile Lease Se Series 2024-A Class A2A, 5.32% 2/16/27 | | 2,028,134 | 2,037,546 |
| World Omni Select Auto Trust Series 2023-A Class B, 5.87% 8/15/28 | | 280,000 | 283,382 |
| World Omni Select Auto Trust 2024 Series 2024-A Class A2A, 5.37% 2/15/28 | | 2,265,000 | 2,273,619 |
| TOTAL ASSET-BACKED SECURITIES (Cost $375,903,377) | | | 377,156,251 |
| | | | |
| Collateralized Mortgage Obligations - 0.8% |
| | | Principal Amount (a) | Value ($) |
| Private Sponsor - 0.8% | | | |
| Angel Oak Mortgage Trust: | | | |
| sequential payer: | | | |
Series 2021-1: | | | |
Class A1, 0.909% 1/25/66 (b) | | 417,596 | 358,816 |
Class A2, 1.115% 1/25/66 (b) | | 122,301 | 105,525 |
Series 2021-2 Class A1, 0.985% 4/25/66 (b) | | 381,186 | 323,578 |
| Series 2021-6 Class A3, 1.714% 9/25/66 (b) | | 341,168 | 284,950 |
| Angel Oak Mortgage Trust 2024- Series 2024-9 Class A2, 5.341% 9/25/69 (b) | | 1,327,189 | 1,313,965 |
| Angel Oak Mortgage Trust LLC: | | | |
| Series 2020-3 Class A3, 2.872% 4/25/65 (b)(c) | | 319,153 | 306,075 |
| Series 2022-2 Class A1, 3.353% 1/25/67 (b)(c) | | 1,489,347 | 1,395,184 |
| Bayview MSR Opportunity Master Fund Trust sequential payer: | | | |
| Series 2021-1 Class A5, 2.5% 12/25/51 (b) | | 691,568 | 606,775 |
| Series 2021-5 Class A5, 2.5% 11/25/51 (b) | | 1,360,222 | 1,198,547 |
| BINOM Securitization Trust sequential payer Series 2021-INV1: | | | |
| Class A2, 2.37% 6/25/56 (b) | | 859,711 | 777,258 |
| Class A3, 2.625% 6/25/56 (b) | | 269,713 | 245,491 |
| Brass PLC Series 2021-10A Class A1, 0.669% 4/16/69 (b)(c) | | 41,630 | 41,406 |
| BRAVO Residential Funding Trust sequential payer Series 2021-NQM3 Class A1, 1.699% 4/25/60 (b) | | 360,936 | 335,706 |
| Cfmt LLC floater sequential payer Series 2024-HB13 Class A, 3% 5/25/34 (b)(c) | | 329,085 | 320,118 |
| CFMT LLC sequential payer Series 2022-HB8 Class A, 3.75% 4/25/25 (b) | | 1,364,900 | 1,354,390 |
| Citigroup Mortgage Loan Trust Series 2020-EXP2 Class A3, 2.5% 8/25/50 (b) | | 169,707 | 141,346 |
| Colt 2024-6 Mortgage Loan Trus Series 2024-6 Class A2, 5.644% 11/25/69 (b) | | 1,301,602 | 1,297,225 |
| Colt 2024-Investment4 Mtg Ln Trust Series 2024-INV4 Class A3, 6.111% 5/25/69 (b)(c) | | 1,240,000 | 1,241,068 |
| Colt Funding LLC Series 2021-1 Class A2, 1.167% 6/25/66 (b) | | 371,958 | 315,811 |
| COLT Mortgage Loan Trust sequential payer Series 2020-3 Class A1, 1.506% 4/27/65 (b) | | 36,295 | 34,920 |
| Connecticut Avenue Securities floater Series 2024-R06 Class 1A1, U.S. 30-Day Avg. Secured Overnight Fin. Rate (SOFR) Index + 1.150% 5.884% 9/25/44 (b)(c)(d) | | 775,098 | 775,586 |
| Deephaven Residential Mortgage Trust: | | | |
| Series 2021-1 Class A2, 0.973% 5/25/65 (b) | | 62,083 | 58,217 |
| Series 2021-2 Class A3, 1.26% 4/25/66 (b) | | 159,110 | 140,897 |
| Efmt 2024-Investment2 sequential payer Series 2024-INV2: | | | |
| Class A1, 5.035% 10/25/69 (b) | | 939,108 | 930,067 |
| Class A2, 5.289% 10/25/69 (b) | | 322,974 | 319,356 |
| Efmt 2024-Nqm1 Series 2024-NQM1 Class A1B, 5.81% 11/25/69 (b) | | 1,954,418 | 1,952,450 |
| Ellington Financial Mortgage Trust: | | | |
| Series 2019-2 Class A3, 3.046% 11/25/59 (b) | | 54,068 | 51,426 |
| Series 2021-2 Class A3, 1.291% 6/25/66 (b) | | 231,809 | 192,568 |
| Series 2021-3 Class A3, 1.55% 9/25/66 (b) | | 231,398 | 192,445 |
| Flagstar Mortgage Trust floater sequential payer Series 2020-1INV Class A11, CME Term SOFR 1 Month Index + 0.960% 5.5522% 3/25/50 (b)(c)(d) | | 200,616 | 192,100 |
| Freddie Mac Stacr Remic Trust floater Series 2024-HQA1 Class A1, U.S. 30-Day Avg. Secured Overnight Fin. Rate (SOFR) Index + 1.250% 5.984% 3/25/44 (b)(c)(d) | | 1,280,609 | 1,284,170 |
| Galton Funding Mortgage Trust: | | | |
| sequential payer: | | | |
Series 2019-H1 Class M1, 3.339% 10/25/59 (b) | | 600,000 | 562,447 |
Series 2020-H1 Class M1, 2.832% 1/25/60 (b) | | 625,000 | 538,581 |
| Series 2018-1 Class A33, 3.5% 11/25/57 (b) | | 49,867 | 45,410 |
| Series 2019-1: | | | |
Class A21, 4.5% 2/25/59 (b) | | 42,946 | 41,505 |
Class A32, 4% 2/25/59 (b) | | 21,709 | 20,564 |
| GS Mortgage-Backed Securites Trust Series 2014-EB1A Class 2A1, 5.896% 7/25/44 (b)(c) | | 5,086 | 5,100 |
| Imperial Fund Mortgage Trust: | | | |
| sequential payer Series 2022-NQM4 Class A1, 4.767% 6/25/67 (b) | | 1,251,518 | 1,248,517 |
| Series 2021-NQM2 Class A3, 1.516% 9/25/56 (b) | | 373,858 | 316,828 |
| J.P. Morgan Mortgage Trust Series 2020-INV1 Class A15, 3.5% 8/25/50 (b) | | 136,203 | 120,328 |
| MFRA Trust Series 2021-NQM2: | | | |
| Class A1, 1.029% 11/25/64 (b) | | 444,069 | 388,103 |
| Class A2, 1.317% 11/25/64 (b) | | 165,999 | 145,463 |
| New Residential Mortgage Loan Trust Series 2021-INV2 Class A7, 2.5% 9/25/51 (b) | | 1,304,459 | 1,154,231 |
| Obx 2024-Nqm17 Trust Series 2024-NQM17 Class A3, 6.015% 11/25/64 (b) | | 730,000 | 731,033 |
| OBX Trust: | | | |
| floater: | | | |
Series 2019-EXP2 Class 2A2, CME Term SOFR 1 Month Index + 1.310% 6.0521% 6/25/59 (b)(c)(d) | | 92,177 | 91,144 |
Series 2020-EXP1 Class 2A2, CME Term SOFR 1 Month Index + 1.060% 5.6522% 2/25/60 (b)(c)(d) | | 124,368 | 120,935 |
| sequential payer Series 2021-NQM1 Class A2, 1.175% 2/25/66 (b) | | 246,755 | 210,500 |
| Series 2020-EXP1 Class 1A8, 3.5% 2/25/60 (b)(c) | | 293,428 | 258,435 |
| Series 2020-EXP2: | | | |
Class A8, 3% 5/25/60 (b) | | 348,408 | 301,147 |
Class A9, 3% 5/25/60 (b) | | 85,711 | 73,709 |
| Series 2020-INV1 Class A5, 3.5% 12/25/49 (b) | | 78,201 | 69,772 |
| Ocwen Ln Investment Trust 2023-Hb1 Series 2023-HB1 Class A, 3% 6/25/36 (b) | | 56,637 | 55,556 |
| Oss 2024-H6 Mtg Trust Series 2024-H6 Class A2, 5.383% 9/25/69 (b) | | 1,669,517 | 1,657,969 |
| Rckt Mtg Trust 2024-Ces-8 Series 2024-CES8 Class A1A, 5.4896% 11/25/44 | | 1,403,295 | 1,397,532 |
| Sequoia Mortgage Trust: | | | |
| sequential payer Series 2018-CH2 Class A3, 4% 6/25/48 (b) | | 86,511 | 80,233 |
| Series 2018-CH2 Class A21, 4% 6/25/48 (b) | | 38,604 | 35,803 |
| Series 2018-CH3 Class A19, 4.5% 8/25/48 (b) | | 4,881 | 4,788 |
| SG Residential Mortgage Trust Series 2020-2 Class A1, 1.381% 5/25/65 (b) | | 133,599 | 121,776 |
| Starwood Mortgage Residential Trust: | | | |
| sequential payer Series 2019-INV1 Class A3, 2.916% 9/27/49 (b) | | 440,740 | 431,581 |
| Series 2020-1 Class A2, 2.408% 2/25/50 (b) | | 320,452 | 302,676 |
| Series 2021-2 Class A1, 0.943% 5/25/65 (b) | | 285,075 | 266,343 |
| Series 2021-4 Class A1, 1.162% 8/25/56 (b) | | 852,911 | 752,145 |
| Toorak Mortgage Corp. Series 2021-INV1 Class A2, 1.409% 7/25/56 (b) | | 148,780 | 133,120 |
| Towd Point Mortgage Trust floater Series 2019-HY3 Class M1, CME Term SOFR 1 Month Index + 1.610% 6.2022% 10/25/59 (b)(c)(d) | | 420,000 | 433,947 |
| Verus Securitization Trust: | | | |
| Series 2020-5 Class A3, 2.733% 5/25/65 (b)(c) | | 92,441 | 87,528 |
| Series 2021-1: | | | |
Class A2, 1.052% 1/25/66 (b) | | 150,530 | 133,575 |
Class A3, 1.155% 1/25/66 (b) | | 88,950 | 78,955 |
| Series 2021-2 Class A1, 1.031% 2/25/66 (b) | | 216,486 | 193,473 |
| Series 2021-5 Class A3, 1.373% 9/25/66 (b) | | 308,989 | 262,094 |
| Series 2021-R1 Class A2, 1.057% 10/25/63 (b) | | 53,774 | 51,050 |
| Series 2021-R2 Class A1, 0.918% 2/25/64 (b) | | 276,639 | 253,887 |
| Series 2022-1 Class A3, 3.288% 1/25/67 (b) | | 1,462,679 | 1,330,767 |
| Series 2022-6 Class A1, 4.91% 6/25/67 (b) | | 502,976 | 497,434 |
| Series 2023-6 Class A2, 6.939% 9/25/68 (b) | | 358,116 | 362,385 |
| Series 2023-7 Class A2, 7.272% 10/25/68 (b) | | 136,998 | 139,261 |
| Series 2023-8 Class A2, 6.6642% 12/25/68 (b) | | 301,165 | 304,317 |
| Series 2023-INV3 Class A2, 7.33% 11/25/68 (b) | | 357,302 | 363,982 |
| Vista Point Securitization Trust sequential payer Series 2020-2 Class A3, 2.496% 4/25/65 (b) | | 542,769 | 516,774 |
TOTAL PRIVATE SPONSOR | | | 34,780,139 |
| U.S. Government Agency - 0.0% | | | |
| Fannie Mae Series 2017-90 Class KA, 3% 11/25/47 | | 355,217 | 331,912 |
| Freddie Mac planned amortization class Series 3713 Class PA, 2% 2/15/40 | | 28,630 | 28,428 |
| Freddie Mac STACR REMIC Trust floater: | | | |
| Series 2021-DNA5 Class M2, U.S. 30-Day Avg. Secured Overnight Fin. Rate (SOFR) Index + 1.650% 6.384% 1/25/34 (b)(c)(d) | | 196,013 | 197,249 |
| Series 2021-DNA7 Class M2, U.S. 30-Day Avg. Secured Overnight Fin. Rate (SOFR) Index + 1.800% 6.534% 11/25/41 (b)(c)(d) | | 555,000 | 560,204 |
| Series 2022-DNA5 Class M1A, U.S. 30-Day Avg. Secured Overnight Fin. Rate (SOFR) Index + 2.950% 7.684% 6/25/42 (b)(c)(d) | | 758,533 | 780,077 |
| Freddie Mac Whole Loan Securities Trust Series 2017-SC02 Class M1, 3.8588% 5/25/47 (b)(c) | | 19,798 | 19,409 |
TOTAL U.S. GOVERNMENT AGENCY | | | 1,917,279 |
| TOTAL COLLATERALIZED MORTGAGE OBLIGATIONS (Cost $38,632,472) | | | 36,697,418 |
| | | | |
| Commercial Mortgage Securities - 1.7% |
| | | Principal Amount (a) | Value ($) |
| ALEN Mortgage Trust floater Series 2021-ACEN Class A, CME Term SOFR 1 Month Index + 1.260% 5.8745% 4/15/34 (b)(c)(d) | | 1,315,000 | 1,193,362 |
| BAMLL Commercial Mortgage Securities Trust floater Series 2022-DKLX Class A, CME Term SOFR 1 Month Index + 1.150% 5.76% 1/15/39 (b)(c)(d) | | 919,603 | 915,874 |
| BANK Series 2019-BN19 Class A1, 2.263% 8/15/61 | | 39,686 | 36,397 |
| Bank 2024-Bnk47 sequential payer Series 2024-BNK47 Class A1, 5.523% 6/15/57 | | 188,273 | 190,973 |
| BANK5 Series 2024-5YR8 Class A/S, 6.378% 8/15/57 (c) | | 740,000 | 772,537 |
| Bank5 2024-5Yr10 Series 2024-5YR10 Class A/S, 5.637% 10/15/57 | | 585,000 | 594,667 |
| Bank5 2024-5Yr11 Series 2024-5YR11 Class A/S, 6.139% 11/15/57 | | 690,000 | 716,624 |
| Bank5 2024-5Yr12: | | | |
| sequential payer Series 2024-5YR12 Class A3, 5.902% 12/15/57 | | 405,000 | 421,483 |
| Series 2024-5YR12 Class A/S, 6.122% 12/15/57 (c) | | 1,065,000 | 1,108,533 |
| Bank5 2024-5Yr9 sequential payer Series 2024-5YR9 Class A1, 4.8894% 8/15/57 | | 902,654 | 901,015 |
| Bbcms Trust sequential payer Series 2024-5C27 Class A1, 5.502% 7/15/57 | | 249,617 | 253,100 |
| BCP Trust floater Series 2021-330N Class A, CME Term SOFR 1 Month Index + 0.910% 5.5235% 6/15/38 (b)(c)(d) | | 500,000 | 463,033 |
| Benchmark 2024-V11 Mtg Trust sequential payer Series 2024-V11 Class AM, 6.201% 11/15/57 | | 585,000 | 608,585 |
| Benchmark 2024-V9 Mortgage Tru sequential payer Series 2024-V9 Class A/S, 6.0641% 8/15/57 (c) | | 1,025,000 | 1,058,037 |
| Benchmark Mortgage Trust sequential payer Series 2024-V6 Class A1, 5.5678% 3/15/57 | | 428,010 | 432,312 |
| BLOX Trust floater sequential payer Series 2021-BLOX Class A, CME Term SOFR 1 Month Index + 1.110% 5.7245% 9/15/26 (b)(c)(d) | | 2,040,000 | 1,990,469 |
| BLP Commercial Mortgage Trust sequential payer Series 2024-IND2 Class A, CME Term SOFR 1 Month Index + 1.340% 5.9514% 3/15/41 (b)(c)(d) | | 434,000 | 434,271 |
| Bmark 2024-V8 sequential payer Series 2024-V8 Class A1, 5.514% 7/15/57 | | 458,972 | 463,981 |
| BMO sequential payer Series 2024-C8 Class A1, 5.5422% 3/15/57 | | 478,114 | 479,192 |
| Bmo 2024-5C5 Mtg Trust Series 2024-5C5 Class A/S, 6.3638% 2/15/57 (c) | | 1,055,000 | 1,099,411 |
| BMP floater Series 2024-MF23 Class A, CME Term SOFR 1 Month Index + 1.370% 5.9812% 6/15/41 (b)(c)(d) | | 571,000 | 571,714 |
| BPR Trust floater: | | | |
| Series 2021-TY Class B, CME Term SOFR 1 Month Index + 1.260% 5.8745% 9/15/38 (b)(c)(d) | | 780,000 | 772,306 |
| Series 2022-OANA Class A, CME Term SOFR 1 Month Index + 1.890% 6.5073% 4/15/37 (b)(c)(d) | | 3,529,000 | 3,546,645 |
| BSREP Commercial Mortgage Trust floater Series 2021-DC Class D, CME Term SOFR 1 Month Index + 2.010% 6.6245% 8/15/38 (b)(c)(d) | | 322,220 | 232,331 |
| BX Commercial Mortgage Trust: | | | |
| floater: | | | |
Series 2021-BXMF Class A, CME Term SOFR 1 Month Index + 0.750% 5.3594% 10/15/26 (b)(c)(d) | | 1,385,765 | 1,378,836 |
Series 2021-PAC Class A, CME Term SOFR 1 Month Index + 0.800% 5.4126% 10/15/36 (b)(c)(d) | | 1,872,000 | 1,863,246 |
Series 2021-VINO Class A, CME Term SOFR 1 Month Index + 0.760% 5.3758% 5/15/38 (b)(c)(d) | | 278,321 | 277,799 |
Series 2022-LP2 Class A, CME Term SOFR 1 Month Index + 1.010% 5.6222% 2/15/39 (b)(c)(d) | | 1,818,784 | 1,816,514 |
Series 2023-XL3 Class A, CME Term SOFR 1 Month Index + 1.760% 6.3707% 12/9/40 (b)(c)(d) | | 529,820 | 531,642 |
| floater sequential payer: | | | |
Series 2019-IMC Class A, CME Term SOFR 1 Month Index + 1.040% 5.6553% 4/15/34 (b)(c)(d) | | 1,005,541 | 996,114 |
Series 2021-SOAR Class A, CME Term SOFR 1 Month Index + 0.780% 5.3945% 6/15/38 (b)(c)(d) | | 1,557,963 | 1,555,042 |
| BX Commercial Mortgage Trust 2024-Xl4 floater sequential payer Series 2024-XL4 Class A, CME Term SOFR 1 Month Index + 1.440% 6.0513% 2/15/39 (b)(c)(d) | | 1,011,862 | 1,015,024 |
| BX Commercial Mtg Trust floater Series 2024-MDHS: | | | |
| Class A, 6.2506% 5/15/41 (b)(c) | | 2,070,924 | 2,077,396 |
| Class B, CME Term SOFR 1 Month Index + 1.840% 6.4503% 5/15/41 (b)(c)(d) | | 875,348 | 876,169 |
| BX Trust floater: | | | |
| Series 2021-ACNT Class A, CME Term SOFR 1 Month Index + 0.960% 5.5735% 11/15/38 (b)(c)(d) | | 1,591,426 | 1,588,442 |
| Series 2022-GPA Class A, CME Term SOFR 1 Month Index + 2.160% 6.7743% 8/15/39 (b)(c)(d) | | 561,992 | 562,519 |
| Series 2024-CNYN Class A, CME Term SOFR 1 Month Index + 1.440% 6.0512% 4/15/41 (b)(c)(d) | | 1,442,587 | 1,444,378 |
| CAMB Commercial Mortgage Trust floater Series 2019-LIFE Class A, CME Term SOFR 1 Month Index + 1.360% 5.977% 12/15/37 (b)(c)(d) | | 1,015,000 | 1,015,000 |
| Citigroup Commercial Mortgage Trust Series 2013-375P Class C, 3.6348% 5/10/35 (b)(c) | | 560,000 | 540,400 |
| COMM Mortgage Trust Series 2014-CR15 Class B, 4.027% 2/10/47 (c) | | 480,009 | 463,062 |
| Credit Suisse Mortgage Trust: | | | |
| sequential payer Series 2020-NET Class A, 2.2569% 8/15/37 (b) | | 231,112 | 223,041 |
| Series 2020-NET Class D, 3.8277% 8/15/37 (b)(c) | | 985,000 | 945,838 |
| CSAIL Commercial Mortgage Trust sequential payer Series 2015-C3 Class A4, 3.7182% 8/15/48 | | 670,000 | 663,128 |
| CSMC Trust Series 2017-CHOP Class A, PRIME RATE - 2.300% 5.444% 7/15/32 (b)(c)(d) | | 997,340 | 977,568 |
| ELP Commercial Mortgage Trust floater Series 2021-ELP Class A, CME Term SOFR 1 Month Index + 0.810% 5.4255% 11/15/38 (b)(c)(d) | | 2,552,030 | 2,542,459 |
| Extended Stay America Trust floater Series 2021-ESH: | | | |
| Class A, CME Term SOFR 1 Month Index + 1.190% 5.8035% 7/15/38 (b)(c)(d) | | 765,158 | 765,636 |
| Class C, CME Term SOFR 1 Month Index + 1.810% 6.4235% 7/15/38 (b)(c)(d) | | 722,599 | 724,180 |
| Freddie Mac Series 2023-K753 Class A1, 4.6% 6/25/30 | | 561,450 | 564,042 |
| GS Mortgage Securities Corp. Trust floater Series 2021-ROSS Class B, CME Term SOFR 1 Month Index + 1.860% 6.4745% 5/15/26 (b)(c)(d) | | 685,000 | 573,769 |
| GS Mortgage Securities Trust floater Series 2021-IP Class A, CME Term SOFR 1 Month Index + 1.060% 5.6745% 10/15/36 (b)(c)(d) | | 1,087,000 | 1,078,848 |
| Hilt Commercial Mortgage Trust floater Series 2024-ORL Class B, CME Term SOFR 1 Month Index + 1.940% 6.55% 5/15/37 (b)(c)(d) | | 965,000 | 964,397 |
| Hyt Commercial Mortgage Trust floater Series 2024-RGCY Class A, CME Term SOFR 1 Month Index + 1.840% 6.4508% 9/15/41 (b)(c)(d) | | 1,595,000 | 1,592,504 |
| J.P. Morgan Chase Commercial Mortgage Securities Trust floater Series 2020-609M: | | | |
| Class B, CME Term SOFR 1 Month Index + 2.130% 6.7445% 10/15/33 (b)(c)(d) | | 995,000 | 955,200 |
| Class C, CME Term SOFR 1 Month Index + 2.530% 7.1445% 10/15/33 (b)(c)(d) | | 805,000 | 740,600 |
| JPMorgan Chase Commercial Mortgage Securities Trust floater Series 2019-BKWD: | | | |
| Class A, CME Term SOFR 1 Month Index + 1.610% 6.2245% 9/15/29 (b)(c)(d) | | 742,319 | 697,780 |
| Class C, CME Term SOFR 1 Month Index + 2.210% 6.8245% 9/15/29 (b)(c)(d) | | 575,000 | 488,750 |
| KNDR Trust floater Series 2021-KIND Class C, CME Term SOFR 1 Month Index + 1.860% 6.4745% 8/15/38 (b)(c)(d) | | 972,018 | 958,780 |
| Life Financial Services Trust floater Series 2022-BMR2 Class A1, CME Term SOFR 1 Month Index + 1.290% 5.9045% 5/15/39 (b)(c)(d) | | 2,874,000 | 2,803,946 |
| LIFE Mortgage Trust floater Series 2021-BMR Class A, CME Term SOFR 1 Month Index + 0.810% 5.4235% 3/15/38 (b)(c)(d) | | 1,316,603 | 1,300,145 |
| Medical Commercial Mtg Trust 2024-Mob floater Series 2024-MOB Class A, CME Term SOFR 1 Month Index + 1.590% 6.2008% 5/15/41 (b)(c)(d) | | 995,000 | 992,515 |
| MHC Commercial Mortgage Trust floater Series 2021-MHC Class B, CME Term SOFR 1 Month Index + 1.210% 5.8244% 4/15/38 (b)(c)(d) | | 568,000 | 566,408 |
| MHP Commercial Mortgage Trust floater Series 2021-STOR Class A, CME Term SOFR 1 Month Index + 0.810% 5.4245% 7/15/38 (b)(c)(d) | | 907,000 | 904,166 |
| Morgan Stanley Capital I Trust: | | | |
| floater Series 2018-BOP Class A, CME Term SOFR 1 Month Index + 0.890% 5.507% 8/15/33 (b)(c)(d) | | 3,654,512 | 2,982,118 |
| sequential payer Series 2014-150E Class A, 3.912% 9/9/32 (b) | | 1,325,000 | 1,159,375 |
| OPEN Trust sequential payer Series 2023-AIR Class A, CME Term SOFR 1 Month Index + 3.080% 7.6984% 10/15/28 (b)(c)(d) | | 542,195 | 547,275 |
| OPG Trust floater Series 2021-PORT Class A, CME Term SOFR 1 Month Index + 0.590% 5.2085% 10/15/36 (b)(c)(d) | | 2,370,900 | 2,359,046 |
| RLGH Trust floater Series 2021-TROT Class A, CME Term SOFR 1 Month Index + 0.910% 5.5245% 4/15/36 (b)(c)(d) | | 650,000 | 645,568 |
| SDR Commercial Mortgage Trust floater Series 2024-DSNY Class B, CME Term SOFR 1 Month Index + 1.740% 6.3504% 5/15/39 (b)(c)(d) | | 790,000 | 781,308 |
| SREIT Trust floater Series 2021-MFP Class A, CME Term SOFR 1 Month Index + 0.840% 5.4546% 11/15/38 (b)(c)(d) | | 1,677,381 | 1,676,140 |
| Texas Trust 2024-Hou floater Series 2024-HOU Class B, CME Term SOFR 1 Month Index + 2.090% 6.7% 6/15/39 (b)(c)(d) | | 1,070,000 | 1,066,093 |
| Voya CLO Ltd. floater Series 2024-2A Class AR, CME Term SOFR 3 Month Index + 1.200% 5.8174% 7/20/32 (b)(c)(d) | | 4,000,000 | 4,007,208 |
| Wells Fargo Commercial Mortgage Trust: | | | |
| sequential payer Series 2015-C28 Class A3, 3.29% 5/15/48 | | 1,100,109 | 1,092,523 |
| Series 2015-NXS2 Class A2, 3.02% 7/15/58 | | 76,633 | 76,174 |
| Wells Fargo Commercial Mtg Trust 2024-G floater Series 2024-GRP Class A, CME Term SOFR 1 Month Index + 1.790% 6.4006% 10/15/41 (b)(c)(d) | | 1,060,000 | 1,059,596 |
| TOTAL COMMERCIAL MORTGAGE SECURITIES (Cost $78,364,505) | | | 76,734,559 |
| | | | |
| Bank Notes - 0.2% |
| | | Principal Amount (a) | Value ($) |
| Citibank NA 5.438% 4/30/26 | | 5,000,000 | 5,051,329 |
| Goldman Sachs Bank U.S.A. 5.283% 3/18/27 (c) | | 3,100,000 | 3,120,069 |
| TOTAL BANK NOTES (Cost $8,118,793) | | | 8,171,398 |
| | | | |
| Commercial Paper - 0.3% |
| | | Principal Amount (a) | Value ($) |
| Brunswick Corp. 0% 12/2/24 | | 2,470,000 | 2,469,021 |
| Conagra Brands, Inc. 0% 12/10/24 | | 2,470,000 | 2,466,289 |
| Constellation Brands, Inc. 0% 12/10/24 | | 2,465,000 | 2,461,252 |
| Crown Castle, Inc. 0% 12/3/24 | | 2,455,000 | 2,453,646 |
| FMC Corp. 0% 12/23/24 | | 2,445,000 | 2,436,287 |
| TOTAL COMMERCIAL PAPER (Cost $12,289,948) | | | 12,286,495 |
| | | | |
| Short-Term Funds - 55.6% |
| | | Shares | Value ($) |
| Short-Term Funds - 55.6% | | | |
| Baird Short-Term Bond Fund - Institutional Class | | 17,762,056 | 168,561,910 |
| Baird Ultra Short Bond Fund Institutional Class | | 37,806,321 | 382,978,030 |
| BlackRock Ultra Short-Term Bond ETF | | 2,849,382 | 144,321,198 |
| Fidelity SAI Short-Term Bond Fund (h) | | 8,781,499 | 85,268,351 |
| iShares 1-3 Year Treasury Bond ETF (i) | | 1,402,140 | 115,424,165 |
| iShares Short Treasury Bond ETF (i) | | 5,928 | 655,074 |
| JPMorgan Ultra-Short Income ETF (i) | | 9,223,541 | 466,618,939 |
| Morgan Stanley Institutional Fund Trust Ultra-Short Income Portfolio Class IR | | 24,844,223 | 248,193,788 |
| PIMCO Short-Term Fund Institutional Class | | 53,056,806 | 512,528,743 |
| SPDR Bloomberg 1-3 Month T-Bill ETF (i) | | 7,212 | 661,917 |
| T. Rowe Price Ultra Short-Term Bond Fund | | 64,436,375 | 326,692,420 |
| | | | |
| TOTAL SHORT-TERM FUNDS (Cost $2,445,053,789) | | | 2,451,904,535 |
| | | | |
| Money Market Funds - 5.3% |
| | | Shares | Value ($) |
| Fidelity Cash Central Fund 4.64% (j) | | 6,814,683 | 6,816,046 |
| Fidelity Investments Money Market Government Portfolio Institutional Class 4.55% (h)(k) | | 78,544,740 | 78,544,740 |
| Fidelity Securities Lending Cash Central Fund 4.64% (j)(l) | | 138,307,783 | 138,321,614 |
| State Street Institutional U.S. Government Money Market Fund Premier Class 4.59% (k) | | 8,716,670 | 8,716,670 |
| TOTAL MONEY MARKET FUNDS (Cost $232,399,070) | | | 232,399,070 |
| | | | |
| TOTAL INVESTMENT IN SECURITIES - 103.2% (Cost $4,544,011,260) | 4,548,760,186 |
NET OTHER ASSETS (LIABILITIES) - (3.2)% | (139,376,141) |
| NET ASSETS - 100.0% | 4,409,384,045 |
| | |
| Futures Contracts |
| | Number of contracts | Expiration Date | Notional Amount ($) | Value ($) | Unrealized Appreciation/ (Depreciation) ($) |
| Purchased | | | | | |
| | | | | | |
| Treasury Contracts | | | | | |
| CBOT 2-Year U.S. Treasury Note Contracts (United States) | 986 | Mar 2025 | 203,223,844 | 565,045 | 565,045 |
| | | | | | |
| Sold | | | | | |
| | | | | | |
| Treasury Contracts | | | | | |
| CBOT 10-Year U.S. Treasury Note Contracts (United States) | 189 | Mar 2025 | 21,014,438 | (107,235) | (107,235) |
| CBOT 5-Year U.S. Treasury Note Contracts (United States) | 86 | Mar 2025 | 9,253,734 | (25,419) | (25,419) |
| CBOT Ultra 10-Year U.S. Treasury Note Contracts (United States) | 65 | Mar 2025 | 7,461,797 | (125,522) | (125,522) |
| CBOT Ultra Long Term U.S. Treasury Bond Contracts (United States) | 46 | Mar 2025 | 5,850,625 | (93,033) | (93,033) |
| | | | | | |
| TOTAL SOLD | | | | | (351,209) |
| | | | | | |
| TOTAL FUTURES CONTRACTS | | | | | 213,836 |
| The notional amount of futures purchased as a percentage of Net Assets is 4.6% |
| The notional amount of futures sold as a percentage of Net Assets is 1.0% |
Security Type Abbreviations
Legend
| (a) | Amount is stated in United States dollars unless otherwise noted. |
| (b) | Security exempt from registration under Rule 144A of the Securities Act of 1933. These securities may be resold in transactions exempt from registration, normally to qualified institutional buyers. At the end of the period, the value of these securities amounted to $575,461,606 or 13.1% of net assets. |
| (c) | Coupon rates for floating and adjustable rate securities reflect the rates in effect at period end. |
| (d) | Coupon is indexed to a floating interest rate which may be multiplied by a specified factor and/or subject to caps or floors. |
| (e) | Security initially issued at one coupon which converts to a higher coupon at a specified date. The rate shown is the rate at period end. |
| (f) | Security or a portion of the security purchased on a delayed delivery or when-issued basis. |
| (g) | Security or a portion of the security was pledged to cover margin requirements for futures contracts. At period end, the value of securities pledged amounted to $1,072,727. |
| (i) | Security or a portion of the security is on loan at period end. |
| (j) | Affiliated fund that is generally available only to investment companies and other accounts managed by Fidelity Investments. The rate quoted is the annualized seven-day yield of the fund at period end. A complete unaudited listing of the fund's holdings as of its most recent quarter end is available upon request. In addition, each Fidelity Central Fund's financial statements are available on the SEC's website or upon request. |
| (k) | The rate quoted is the annualized seven-day yield of the fund at period end. |
| (l) | Investment made with cash collateral received from securities on loan. |
Affiliated Central Funds
Fiscal year to date information regarding the Fund's investments in Fidelity Central Funds, including the ownership percentage, is presented below.
| Affiliate | Value, beginning of period ($) | Purchases ($) | Sales Proceeds ($) | Dividend Income ($) | Realized Gain (loss) ($) | Change in Unrealized appreciation (depreciation) ($) | Value, end of period ($) | % ownership, end of period |
| Fidelity Cash Central Fund 4.64% | 50,932,775 | 279,913,878 | 324,030,645 | 978,734 | 38 | - | 6,816,046 | 0.0% |
| Fidelity Securities Lending Cash Central Fund 4.64% | 202,488,489 | 2,240,701,041 | 2,304,867,916 | 48,731 | - | - | 138,321,614 | 0.5% |
| Total | 253,421,264 | 2,520,614,919 | 2,628,898,561 | 1,027,465 | 38 | - | 145,137,660 | |
| | | | | | | | | |
Amounts in the dividend income column in the above table include any capital gain distributions from underlying funds, which are presented in the corresponding line item in the Statement of Operations, if applicable.
Amounts in the dividend income column for Fidelity Securities Lending Cash Central Fund represents the income earned on investing cash collateral, less rebates paid to borrowers and any lending agent fees associated with the loan, plus any premium payments received for lending certain types of securities.
Amounts included in the purchases and sales proceeds columns may include in-kind transactions, if applicable.
Affiliated Underlying Funds
Fiscal year to date information regarding the Fund's investments in affiliated Underlying Funds is presented below. Exchanges between classes of the same affiliated Underlying Funds may occur. If an Underlying Funds changes its name, the name presented below is the name in effect at period end.
| Affiliate | Value, beginning of period ($) | Purchases ($) | Sales Proceeds ($) | Dividend Income ($) | Realized Gain (loss) ($) | Change in Unrealized appreciation (depreciation) ($) | Value, end of period ($) |
| Fidelity Investments Money Market Government Portfolio Institutional Class 4.55% | 26,804,765 | 251,860,772 | 200,120,797 | 456,626 | - | - | 78,544,740 |
| Fidelity SAI Short-Term Bond Fund | 120,580,207 | 2,235,965 | 39,062,111 | 2,235,744 | (1,056,818) | 2,571,108 | 85,268,351 |
| | 147,384,972 | 254,096,737 | 239,182,908 | 2,692,370 | (1,056,818) | 2,571,108 | 163,813,091 |
Amounts in the dividend income column in the above table include any capital gain distributions from underlying funds, which are presented in the corresponding line item in the Statement of Operations, if applicable.
Amounts included in the purchases and sales proceeds columns may include in-kind transactions, if applicable.
Investment Valuation
The following is a summary of the inputs used, as of November 30, 2024, involving the Fund's assets and liabilities carried at fair value. The inputs or methodology used for valuing securities may not be an indication of the risk associated with investing in those securities. For more information on valuation inputs, and their aggregation into the levels used below, please refer to the Investment Valuation section in the accompanying Notes to Financial Statements.
| Valuation Inputs at Reporting Date: |
| Description | Total ($) | Level 1 ($) | Level 2 ($) | Level 3 ($) |
Investments in Securities: | | | | |
|
| Corporate Bonds | 813,712,879 | - | 813,712,879 | - |
|
| U.S. Government and Government Agency Obligations | 494,361,985 | - | 494,361,985 | - |
|
| U.S. Government Agency - Mortgage Securities | 45,335,596 | - | 45,335,596 | - |
|
| Asset-Backed Securities | 377,156,251 | - | 377,156,251 | - |
|
| Collateralized Mortgage Obligations | 36,697,418 | - | 36,697,418 | - |
|
| Commercial Mortgage Securities | 76,734,559 | - | 76,734,559 | - |
|
| Bank Notes | 8,171,398 | - | 8,171,398 | - |
|
| Commercial Paper | 12,286,495 | - | 12,286,495 | - |
|
| Short-Term Funds | 2,451,904,535 | 2,451,904,535 | - | - |
|
| Money Market Funds | 232,399,070 | 232,399,070 | - | - |
| Total Investments in Securities: | 4,548,760,186 | 2,684,303,605 | 1,864,456,581 | - |
Derivative Instruments: Assets | | | | |
Futures Contracts | 565,045 | 565,045 | - | - |
| Total Assets | 565,045 | 565,045 | - | - |
| Liabilities | | | | |
Futures Contracts | (351,209) | (351,209) | - | - |
| Total Liabilities | (351,209) | (351,209) | - | - |
| Total Derivative Instruments: | 213,836 | 213,836 | - | - |
Value of Derivative Instruments
The following table is a summary of the Fund's value of derivative instruments by primary risk exposure as of November 30, 2024. For additional information on derivative instruments, please refer to the Derivative Instruments section in the accompanying Notes to Financial Statements.
Primary Risk Exposure / Derivative Type | Value |
| Asset ($) | Liability ($) |
| Interest Rate Risk | | |
Futures Contracts (a) | 565,045 | (351,209) |
| Total Interest Rate Risk | 565,045 | (351,209) |
| Total Value of Derivatives | 565,045 | (351,209) |
(a)Reflects gross cumulative appreciation (depreciation) on futures contracts as presented in the Schedule of Investments. In the Statement of Assets and Liabilities, the period end daily variation margin is included in receivable or payable for daily variation margin on futures contracts, and the net cumulative appreciation (depreciation) is included in Total accumulated earnings (loss).
Financial Statements (Unaudited)
| Statement of Assets and Liabilities |
| As of November 30, 2024 (Unaudited) |
| Assets | | | | |
| Investment in securities, at value (including securities loaned of $135,207,488) - See accompanying schedule: | | | | |
Unaffiliated issuers (cost $4,232,892,943) | $ | 4,239,809,435 | | |
Fidelity Central Funds (cost $145,137,660) | | 145,137,660 | | |
Other affiliated issuers (cost $165,980,657) | | 163,813,091 | | |
| | | | | |
| | | | | |
| Total Investment in Securities (cost $4,544,011,260) | | | $ | 4,548,760,186 |
| Foreign currency held at value (cost $334) | | | | 340 |
| Receivable for investments sold | | | | 3,785,871 |
| Receivable for fund shares sold | | | | 2,742,099 |
| Interest receivable | | | | 11,595,362 |
| Distributions receivable from Fidelity Central Funds | | | | 99,862 |
| Prepaid expenses | | | | 2,993 |
| Other receivables | | | | 111,999 |
Total assets | | | | 4,567,098,712 |
| Liabilities | | | | |
| Payable to custodian bank | $ | 74,169 | | |
| Payable for investments purchased | | | | |
Regular delivery | | 10,886,968 | | |
Delayed delivery | | 1,612,396 | | |
| Payable for fund shares redeemed | | 4,475,410 | | |
| Distributions payable | | 2,037,976 | | |
| Accrued management fee | | 137,349 | | |
| Payable for daily variation margin on futures contracts | | 8,570 | | |
| Other payables and accrued expenses | | 182,754 | | |
| Collateral on securities loaned | | 138,299,075 | | |
| Total liabilities | | | | 157,714,667 |
| Net Assets | | | $ | 4,409,384,045 |
| Net Assets consist of: | | | | |
| Paid in capital | | | $ | 4,481,290,017 |
| Total accumulated earnings (loss) | | | | (71,905,972) |
| Net Assets | | | $ | 4,409,384,045 |
Net Asset Value, offering price and redemption price per share ($4,409,384,045 ÷ 440,851,558 shares) | | | $ | 10.00 |
| Statement of Operations |
Six months ended November 30, 2024 (Unaudited) |
| Investment Income | | | | |
| Dividends: | | | | |
| Unaffiliated issuers | | | $ | 63,634,985 |
| Affiliated issuers | | | | 2,692,370 |
| Interest | | | | 44,873,105 |
| Income from Fidelity Central Funds (including $48,731 from security lending) | | | | 1,027,465 |
| Total income | | | | 112,227,925 |
| Expenses | | | | |
| Management fee | $ | 6,429,349 | | |
| Custodian fees and expenses | | 23,631 | | |
| Independent trustees' fees and expenses | | 10,812 | | |
| Registration fees | | 40,243 | | |
| Audit fees | | 35,906 | | |
| Legal | | 2,687 | | |
| Miscellaneous | | 9,029 | | |
| Total expenses before reductions | | 6,551,657 | | |
| Expense reductions | | (5,653,274) | | |
| Total expenses after reductions | | | | 898,383 |
| Net Investment income (loss) | | | | 111,329,542 |
| Realized and Unrealized Gain (Loss) | | | | |
| Net realized gain (loss) on: | | | | |
| Investment Securities: | | | | |
| Unaffiliated issuers | | 4,541,437 | | |
| Fidelity Central Funds | | 38 | | |
| Other affiliated issuers | | (1,056,818) | | |
| Futures contracts | | 418,380 | | |
| Total net realized gain (loss) | | | | 3,903,037 |
| Change in net unrealized appreciation (depreciation) on: | | | | |
| Investment Securities: | | | | |
| Unaffiliated issuers | | 18,501,928 | | |
| Affiliated issuers | | 2,571,108 | | |
| Assets and liabilities in foreign currencies | | (9) | | |
| Futures contracts | | 57,359 | | |
| Total change in net unrealized appreciation (depreciation) | | | | 21,130,386 |
| Net gain (loss) | | | | 25,033,423 |
| Net increase (decrease) in net assets resulting from operations | | | $ | 136,362,965 |
| Statement of Changes in Net Assets |
| |
| | Six months ended November 30, 2024 (Unaudited) | | Year ended May 31, 2024 |
| Increase (Decrease) in Net Assets | | | | |
| Operations | | | | |
| Net investment income (loss) | $ | 111,329,542 | $ | 204,006,163 |
| Net realized gain (loss) | | 3,903,037 | | (15,095,074) |
| Change in net unrealized appreciation (depreciation) | | 21,130,386 | | 48,314,533 |
| Net increase (decrease) in net assets resulting from operations | | 136,362,965 | | 237,225,622 |
| Distributions to shareholders | | (104,168,165) | | (195,180,850) |
| | | | | |
| Share transactions | | | | |
| Proceeds from sales of shares | | 959,637,610 | | 1,947,120,512 |
| Reinvestment of distributions | | 90,240,569 | | 158,239,948 |
| Cost of shares redeemed | | (1,265,611,569) | | (1,876,623,334) |
| | | | | |
Net increase (decrease) in net assets resulting from share transactions | | (215,733,390) | | 228,737,126 |
| Total increase (decrease) in net assets | | (183,538,590) | | 270,781,898 |
| | | | | |
| Net Assets | | | | |
| Beginning of period | | 4,592,922,635 | | 4,322,140,737 |
| End of period | $ | 4,409,384,045 | $ | 4,592,922,635 |
| | | | | |
| Other Information | | | | |
| Shares | | | | |
| Sold | | 96,080,181 | | 196,758,095 |
| Issued in reinvestment of distributions | | 9,035,228 | | 16,012,440 |
| Redeemed | | (126,771,870) | | (189,967,704) |
| Net increase (decrease) | | (21,656,461) | | 22,802,831 |
| | | | | |
Financial Highlights
Strategic Advisers® Short Duration Fund |
| |
| | Six months ended (Unaudited) November 30, 2024 | | Years ended May 31, 2024 | | 2023 | | 2022 | | 2021 | | 2020 |
Selected Per-Share Data | | | | | | | | | | | | |
| Net asset value, beginning of period | $ | 9.93 | $ | 9.83 | $ | 9.89 | $ | 10.13 | $ | 10.06 | $ | 10.04 |
| Income from Investment Operations | | | | | | | | | | | | |
Net investment income (loss) A,B | | .249 | | .474 | | .296 | | .075 | | .106 | | .229 |
| Net realized and unrealized gain (loss) | | .054 | | .081 | | (.052) | | (.230) | | .081 | | .020 |
| Total from investment operations | | .303 | | .555 | | .244 | | (.155) | | .187 | | .249 |
| Distributions from net investment income | | (.233) | | (.451) | | (.304) | | (.085) | | (.112) | | (.229) |
| Distributions from net realized gain | | - | | (.004) | | - | | - | | (.005) | | - |
| Total distributions | | (.233) | | (.455) | | (.304) | | (.085) | | (.117) | | (.229) |
| Net asset value, end of period | $ | 10.00 | $ | 9.93 | $ | 9.83 | $ | 9.89 | $ | 10.13 | $ | 10.06 |
Total Return C,D | | | | 5.76% | | 2.52% | | (1.54)% | | 1.86% | | 2.51% |
Ratios to Average Net Assets B,E,F | | | | | | | | | | | | |
| Expenses before reductions | | .29% G | | .29% | | .30% | | .30% | | .30% | | .30% |
| Expenses net of fee waivers, if any | | | | .04% | | .05% | | .05% | | .05% | | .05% |
| Expenses net of all reductions | | .04% G | | .04% | | .05% | | .05% | | .05% | | .05% |
| Net investment income (loss) | | 4.98% G | | 4.80% | | 3.01% | | .74% | | 1.05% | | 2.28% |
| Supplemental Data | | | | | | | | | | | | |
| Net assets, end of period (000 omitted) | $ | 4,409,384 | $ | 4,592,923 | $ | 4,322,141 | $ | 5,779,380 | $ | 6,180,788 | $ | 8,049,040 |
Portfolio turnover rate H | | | | 59% | | 49% | | 43% | | 102% | | 58% |
ACalculated based on average shares outstanding during the period.
BNet investment income (loss) is affected by the timing of the declaration of dividends by any underlying mutual funds or exchange-traded funds (ETFs). Net investment income (loss) of any mutual funds or ETFs is not included in the Fund's net investment income (loss) ratio.
CTotal returns for periods of less than one year are not annualized.
DTotal returns would have been lower if certain expenses had not been reduced during the applicable periods shown.
EFees and expenses of any underlying mutual funds or exchange-traded funds (ETFs) are not included in the Fund's expense ratio. The Fund indirectly bears its proportionate share of these expenses. For additional expense information related to investments in Fidelity Central Funds, please refer to the "Investments in Fidelity Central Funds" note found in the Notes to Financial Statements section of the most recent Annual or Semi-Annual report.
FExpense ratios reflect operating expenses of the class. Expenses before reductions do not reflect amounts reimbursed, waived, or reduced through arrangements with the investment adviser, brokerage services, or other offset arrangements, if applicable, and do not represent the amount paid by the class during periods when reimbursements, waivers or reductions occur.
GAnnualized.
HAmount does not include the portfolio activity of any underlying mutual funds or exchange-traded funds (ETFs), derivatives or securities that mature within one year from acquisition.
Notes to Financial Statements
(Unaudited)For the period ended November 30, 2024
1. Organization.
Strategic Advisers Short Duration Fund (the Fund) is a fund of Fidelity Rutland Square Trust II (the Trust), and is authorized to issue an unlimited number of shares. The Trust is registered under the Investment Company Act of 1940, as amended (the 1940 Act), as an open-end management investment company organized as a Delaware statutory trust. The Fund is offered exclusively to certain managed account clients of Strategic Advisers LLC (Strategic Advisers), an affiliate of Fidelity Management & Research Company LLC (FMR).
2. Significant Accounting Policies.
The Fund is an investment company and applies the accounting and reporting guidance of the Financial Accounting Standards Board (FASB) Accounting Standards Codification Topic 946 Financial Services - Investment Companies. The financial statements have been prepared in conformity with accounting principles generally accepted in the United States of America (GAAP), which require management to make certain estimates and assumptions at the date of the financial statements. Actual results could differ from those estimates. Subsequent events, if any, through the date that the financial statements were issued have been evaluated in the preparation of the financial statements. The Fund's Schedule of Investments lists any underlying mutual funds or exchange-traded funds (ETFs) but does not include the underlying holdings of these funds. The following summarizes the significant accounting policies of the Fund:
Investment Valuation. Investments are valued as of 4:00 p.m. Eastern time on the last calendar day of the period. The Board of Trustees (the Board) has designated the Fund's investment adviser as the valuation designee responsible for the fair valuation function and performing fair value determinations as needed. The investment adviser has established a Fair Value Committee (the Committee) to carry out the day-to-day fair valuation responsibilities and has adopted policies and procedures to govern the fair valuation process and the activities of the Committee. In accordance with these fair valuation policies and procedures, which have been approved by the Board, the Fund attempts to obtain prices from one or more third party pricing services or brokers to value its investments. When current market prices, quotations or currency exchange rates are not readily available or reliable, investments will be fair valued in good faith by the Committee, in accordance with the policies and procedures. Factors used in determining fair value vary by investment type and may include market or investment specific events, transaction data, estimated cash flows, and market observations of comparable investments. The frequency that the fair valuation procedures are used cannot be predicted and they may be utilized to a significant extent. The Committee manages the Fund's fair valuation practices and maintains the fair valuation policies and procedures. The Fund's investment adviser reports to the Board information regarding the fair valuation process and related material matters.
The Fund categorizes the inputs to valuation techniques used to value its investments into a disclosure hierarchy consisting of three levels as shown below:
Level 1 - unadjusted quoted prices in active markets for identical investments
Level 2 - other significant observable inputs (including quoted prices for similar investments, interest rates, prepayment speeds, etc.)
Level 3 - unobservable inputs (including the Fund's own assumptions based on the best information available)
Valuation techniques used to value the Fund's investments by major category are as follows:
Debt securities, including restricted securities, are valued based on evaluated prices received from third party pricing services or from brokers who make markets in such securities. Corporate bonds, bank notes, U.S. government and government agency obligations and commercial paper are valued by pricing services who utilize matrix pricing which considers yield or price of bonds of comparable quality, coupon, maturity and type or by broker-supplied prices. Asset backed securities, collateralized mortgage obligations, commercial mortgage securities and U.S. government agency mortgage securities are valued by pricing services who utilize matrix pricing which considers prepayment speed assumptions, attributes of the collateral, yield or price of bonds of comparable quality, coupon, maturity and type or by broker-supplied prices. When independent prices are unavailable or unreliable, debt securities may be valued utilizing pricing methodologies which consider similar factors that would be used by third party pricing services. Debt securities are generally categorized as Level 2 in the hierarchy but may be Level 3 depending on the circumstances.
Exchange-Traded Funds (ETFs) are valued at their last sale price or official closing price as reported by a third party pricing service on the primary market or exchange on which they are traded and are categorized as Level 1 in the hierarchy. In the event there were no sales during the day but the exchange reports a closing bid level, ETFs are valued at the closing bid and would be categorized as Level 1 in the hierarchy. In the event there was no closing bid, ETFs may be valued by another method that the Board believes reflects fair value in accordance with the Board's fair value pricing policies and may be categorized as Level 2 in the hierarchy.
Futures contracts are valued at the settlement price established each day by the board of trade or exchange on which they are traded and are categorized as Level 1 in the hierarchy. Investments in open-end mutual funds, including the Fidelity Central Funds, are valued at their closing net asset value (NAV) each business day and are categorized as Level 1 in the hierarchy. If an unaffiliated open-end mutual fund's NAV is unavailable, shares of that fund may be valued by another method that the Board believes reflects fair value in accordance with the Board's fair value pricing policies and is categorized as Level 2 in the hierarchy.
Changes in valuation techniques may result in transfers in or out of an assigned level within the disclosure hierarchy. The aggregate value of investments by input level as of November 30, 2024 is included at the end of the Fund's Schedule of Investments.
Foreign Currency. Certain Funds may use foreign currency contracts to facilitate transactions in foreign-denominated securities. Gains and losses from these transactions may arise from changes in the value of the foreign currency or if the counterparties do not perform under the contracts' terms.
Foreign-denominated assets, including investment securities, and liabilities are translated into U.S. dollars at the exchange rates at period end. Purchases and sales of investment securities, income and dividends received, and expenses denominated in foreign currencies are translated into U.S. dollars at the exchange rate in effect on the transaction date.
The effects of exchange rate fluctuations on investments are included with the net realized and unrealized gain (loss) on investment securities. Other foreign currency transactions resulting in realized and unrealized gain (loss) are disclosed separately.
Investment Transactions and Income. For financial reporting purposes, the Fund's investment holdings and NAV include trades executed through the end of the last business day of the period. The NAV per share for processing shareholder transactions is calculated as of the close of business of the New York Stock Exchange (NYSE), normally 4:00 p.m. Eastern time and includes trades executed through the end of the prior business day. Gains and losses on securities sold are determined on the basis of identified cost and include proceeds received from litigation. Commissions paid to certain brokers with whom the investment adviser, or its affiliates, places trades on behalf of a fund include an amount in addition to trade execution, which may be rebated back to a fund. Any such rebates are included in net realized gain (loss) on investments in the Statement of Operations. Dividend income is recorded on the ex-dividend date, except for certain dividends from foreign securities where the ex-dividend date may have passed, which are recorded as soon as the Fund is informed of the ex-dividend date. Non-cash dividends included in dividend income, if any, are recorded at the fair market value of the securities received. Income and capital gain distributions from Fidelity Central Funds, if any, are recorded on the ex-dividend date. Income and capital gain distributions from any underlying mutual funds or exchange-traded funds (ETFs) are recorded on the ex-dividend date. Interest income is accrued as earned and includes coupon interest and amortization of premium and accretion of discount on debt securities as applicable. Investment income is recorded net of foreign taxes withheld where recovery of such taxes is uncertain. Debt obligations may be placed on non-accrual status and related interest income may be reduced by ceasing current accruals and writing off interest receivables when the collection of all or a portion of interest has become doubtful based on consistently applied procedures. A debt obligation is removed from non-accrual status when the issuer resumes interest payments or when collectability of interest is reasonably assured.
Expenses. Expenses directly attributable to a fund are charged to that fund. Expenses attributable to more than one fund are allocated among the respective funds on the basis of relative net assets or other appropriate methods. Expenses included in the accompanying financial statements reflect the expenses of that fund and do not include any expenses associated with any underlying mutual funds or exchange-traded funds. Although not included in a fund's expenses, a fund indirectly bears its proportionate share of these expenses through the net asset value of each underlying mutual fund or exchange-traded fund. Expense estimates are accrued in the period to which they relate and adjustments are made when actual amounts are known.
Deferred Trustee Compensation. Under a Deferred Compensation Plan (the Plan) for certain Funds, certain independent Trustees have elected to defer receipt of a portion of their annual compensation. Deferred amounts are invested in affiliated mutual funds, are marked-to-market and remain in a fund until distributed in accordance with the Plan. The investment of deferred amounts and the offsetting payable to the Trustees presented below are included in the accompanying Statement of Assets and Liabilities in other receivables and other payables and accrued expenses, as applicable.
| Strategic Advisers Short Duration Fund | $111,995 |
Income Tax Information and Distributions to Shareholders. Each year, the Fund intends to qualify as a regulated investment company under Subchapter M of the Internal Revenue Code, including distributing substantially all of its taxable income and realized gains. As a result, no provision for U.S. Federal income taxes is required. The Fund files a U.S. federal tax return, in addition to state and local tax returns as required. The Fund's federal income tax returns are subject to examination by the Internal Revenue Service (IRS) for a period of three fiscal years after they are filed. State and local tax returns may be subject to examination for an additional fiscal year depending on the jurisdiction. Foreign taxes are provided for based on the Fund's understanding of the tax rules and rates that exist in the foreign markets in which it invests.
Distributions are declared and recorded daily and paid monthly from net investment income. Distributions from realized gains, if any, are declared and recorded on the ex-dividend date. Income and capital gain distributions are determined in accordance with income tax regulations, which may differ from GAAP.
Capital accounts within the financial statements are adjusted for permanent book-tax differences. These adjustments have no impact on net assets or the results of operations. Capital accounts are not adjusted for temporary book-tax differences which will reverse in a subsequent period.
Book-tax differences are primarily due to futures contracts, foreign currency transactions, market discount, capital loss carryforwards, and losses deferred due to wash sales.
As of period end, the cost and unrealized appreciation (depreciation) in securities, and derivatives if applicable, for federal income tax purposes were as follows:
| Gross unrealized appreciation | $26,546,626 |
| Gross unrealized depreciation | (16,811,273) |
| Net unrealized appreciation (depreciation) | $9,735,353 |
| Tax cost | $4,539,238,669 |
Capital loss carryforwards are only available to offset future capital gains of the Fund to the extent provided by regulations and may be limited. The capital loss carryforward information presented below, including any applicable limitation, is estimated as of prior fiscal period end and is subject to adjustment.
Short-term | $(22,600,937) |
Long-term | (75,065,377) |
| Total capital loss carryforward | $(97,666,314) |
Delayed Delivery Transactions and When-Issued Securities. During the period, certain Funds transacted in securities on a delayed delivery or when-issued basis. Payment and delivery may take place after the customary settlement period for that security. The price of the underlying securities and the date when the securities will be delivered and paid for are fixed at the time the transaction is negotiated. Securities purchased on a delayed delivery or when-issued basis are identified as such in the Schedule of Investments. Compensation for interest forgone in the purchase of a delayed delivery or when-issued debt security may be received. With respect to purchase commitments, each applicable Fund identifies securities as segregated in its records with a value at least equal to the amount of the commitment. Payables and receivables associated with the purchases and sales of delayed delivery securities having the same coupon, settlement date and broker are offset. Delayed delivery or when-issued securities that have been purchased from and sold to different brokers are reflected as both payables and receivables in the Statement of Assets and Liabilities under the caption "Delayed delivery", as applicable. Losses may arise due to changes in the value of the underlying securities or if the counterparty does not perform under the contract's terms, or if the issuer does not issue the securities due to political, economic, or other factors.
Restricted Securities (including Private Placements). Funds may invest in securities that are subject to legal or contractual restrictions on resale. These securities generally may be resold in transactions exempt from registration or to the public if the securities are registered. Disposal of these securities may involve time-consuming negotiations and expense, and prompt sale at an acceptable price may be difficult. Information regarding restricted securities held at period end is included at the end of the Schedule of Investments, if applicable.
New Accounting Pronouncement. In November 2023, the FASB issued Accounting Standards Update (ASU) 2023-07 Segment Reporting (Topic 280): Improvements to Reportable Segment Disclosures. Effective for fiscal years beginning after December 15, 2023 and interim periods within fiscal years beginning after December 15, 2024, the amendments enhance required disclosures of segment information for public entities on an annual and interim basis. The ASU allows for early adoption with updates applied retrospectively. Management is currently evaluating the impact of the ASU but does not expect this guidance to materially impact the financial statements.
3. Derivative Instruments.
Risk Exposures and the Use of Derivative Instruments. The Fund's investment objectives allow for various types of derivative instruments, including futures contracts. Derivatives are investments whose value is primarily derived from underlying assets, indices or reference rates and may be transacted on an exchange or over-the-counter (OTC). Derivatives may involve a future commitment to buy or sell a specified asset based on specified terms, to exchange future cash flows at periodic intervals based on a notional principal amount, or for one party to make one or more payments upon the occurrence of specified events in exchange for periodic payments from the other party.
Derivatives were used to increase returns and to manage exposure to certain risks as defined below. The success of any strategy involving derivatives depends on analysis of numerous economic factors, and if the strategies for investment do not work as intended, the objectives may not be achieved.
Derivatives were used to increase or decrease exposure to the following risk(s):
| Interest Rate Risk | Interest rate risk relates to the fluctuations in the value of interest-bearing securities due to changes in the prevailing levels of market interest rates. |
Funds are also exposed to additional risks from investing in derivatives, such as liquidity risk and counterparty credit risk. Liquidity risk is the risk that a fund will be unable to close out the derivative in the open market in a timely manner. Counterparty credit risk is the risk that the counterparty will not be able to fulfill its obligation to a fund. Counterparty credit risk related to exchange-traded contracts may be mitigated by the protection provided by the exchange on which they trade.
Investing in derivatives may involve greater risks than investing in the underlying assets directly and, to varying degrees, may involve risk of loss in excess of any initial investment and collateral received and amounts recognized in the Statement of Assets and Liabilities. In addition, there may be the risk that the change in value of the derivative contract does not correspond to the change in value of the underlying instrument.
Futures Contracts. A futures contract is an agreement between two parties to buy or sell a specified underlying instrument for a fixed price at a specified future date. Futures contracts were used to manage exposure to the bond market and fluctuations in interest rates.
Upon entering into a futures contract, a fund is required to deposit either cash or securities (initial margin) with a clearing broker in an amount equal to a certain percentage of the face value of the contract. Futures contracts are marked-to-market daily and subsequent daily payments are made or received by a fund depending on the daily fluctuations in the value of the futures contracts and are recorded as unrealized appreciation or (depreciation). This receivable and/or payable, if any, is included in daily variation margin on futures contracts in the Statement of Assets and Liabilities. Realized gain or (loss) is recorded upon the expiration or closing of a futures contract. The net realized gain (loss) and change in net unrealized appreciation (depreciation) on futures contracts during the period is presented in the Statement of Operations.
Any open futures contracts at period end are presented in the Schedule of Investments under the caption "Futures Contracts". The notional amount at value reflects each contract's exposure to the underlying instrument or index at period end, and is representative of volume of activity during the period unless an average notional amount is presented. Any securities deposited to meet initial margin requirements are identified in the Schedule of Investments. Any cash deposited to meet initial margin requirements is presented as segregated cash with brokers for derivative instruments in the Statement of Assets and Liabilities.
4. Purchases and Sales of Investments.
Purchases and sales of securities, other than short-term securities, U.S. government securities and in-kind transactions, as applicable, are noted in the table below.
| | Purchases ($) | Sales ($) |
| Strategic Advisers Short Duration Fund | 1,042,355,208 | 1,281,641,025 |
5. Fees and Other Transactions with Affiliates.
Management Fee. Strategic Advisers (the investment adviser) provides the Fund with investment management related services. For these services, the Fund pays a monthly management fee to the investment adviser. The management fee is calculated by adding the annual management fee rate of .25% of the Fund's average net assets throughout the month to the aggregate of the fee rates, payable monthly by the investment adviser, to the Fund's sub-advisers. The Fund's maximum aggregate management fee will not exceed .55% of the Fund's average net assets. For the reporting period, the total annualized management fee rate was .29% of the Fund's average net assets.
During the period, the investment adviser waived a portion of its management fee as described in the Expense Reductions note.
Sub-Advisers. FIAM LLC (an affiliate of the investment adviser) and T. Rowe Price Associates, Inc. each served as a sub-adviser for the Fund during the period. Sub-advisers provide discretionary investment advisory services for their allocated portion of the Fund's assets and are paid as described in the Management Fee note.
Effective January 1, 2025, the sub-subadvisory agreements between FIAM LLC (FIAM) and each of FMR Investment Management (UK) Limited, Fidelity Management & Research (Hong Kong) Limited, and Fidelity Management & Research (Japan) Limited (collectively, the Sub-Subadvisers) were amended. FIAM or an affiliate, and not the fund, pays the Sub-Subadvisers. Under the terms of the sub-subadvisory agreements, FIAM or an affiliate pays each Sub-Subadviser monthly fees equal to 110% of the Sub-Subadviser's costs for providing sub-subadvisory services.
Brokerage Commissions. A portion of portfolio transactions were placed with brokerage firms which are affiliates of the investment adviser. Brokerage commissions are included in net realized gain (loss) and change in net unrealized appreciation (depreciation) in the Statement of Operations. The commissions paid to these affiliated firms were as follows:
| | Amount ($) |
| Strategic Advisers Short Duration Fund | 851 |
Interfund Trades. Funds may purchase from or sell securities to other funds affiliated with each sub-adviser under procedures adopted by the Board. The procedures have been designed to ensure these interfund trades are executed in accordance with Rule 17a-7 of the 1940 Act. Any interfund trades are included within the respective purchases and sales amounts shown in the Purchases and Sales of Investments note. During the period, there were no interfund trades.
6. Investments in Fidelity Central Funds.
Funds may invest in Fidelity Central Funds, which are open-end investment companies generally available only to other investment companies and accounts managed by the investment adviser and its affiliates. The Schedule of Investments lists any Fidelity Central Funds held as an investment as of period end, but does not include the underlying holdings of each Fidelity Central Fund. An investing fund indirectly bears its proportionate share of the expenses of the underlying Fidelity Central Funds.
Based on its investment objective, each Fidelity Central Fund may invest or participate in various investment vehicles or strategies that are similar to those of the investing fund. These strategies are consistent with the investment objectives of the investing fund and may involve certain economic risks which may cause a decline in value of each of the Fidelity Central Funds and thus a decline in the value of the investing fund.
| Fidelity Central Fund | Investment Manager | Investment Objective | Investment Practices | Expense RatioA |
| Fidelity Money Market Central Funds | Fidelity Management & Research Company LLC (FMR) | Each fund seeks to obtain a high level of current income consistent with the preservation of capital and liquidity. | Short-term Investments | Less than .005% |
A Expenses expressed as a percentage of average net assets and are as of each underlying Central Fund's most recent annual or semi-annual shareholder report.
A complete unaudited list of holdings for each Fidelity Central Fund is available upon request or at the Securities and Exchange Commission website at www.sec.gov. In addition, the financial statements of the Fidelity Central Funds, which are not covered by the Report of Independent Registered Public Accounting Firm, are available on the Securities and Exchange Commission website or upon request.
7. Committed Line of Credit.
Certain Funds participate with other funds managed by the investment adviser or an affiliate in a $4.25 billion credit facility (the "line of credit") to be utilized for temporary or emergency purposes to fund shareholder redemptions or for other short-term liquidity purposes. The participating funds have agreed to pay commitment fees on their pro-rata portion of the line of credit, which are reflected in Miscellaneous expenses on the Statement of Operations, and are listed below. During the period, there were no borrowings on this line of credit.
| | Amount ($) |
| Strategic Advisers Short Duration Fund | 2,997 |
8. Security Lending.
Funds lend portfolio securities from time to time in order to earn additional income. Lending agents are used, including National Financial Services (NFS), an affiliate of the investment adviser. Pursuant to a securities lending agreement, NFS will receive a fee, which is capped at 9.9% of a fund's daily lending revenue, for its services as lending agent. A fund may lend securities to certain qualified borrowers, including NFS. On the settlement date of the loan, a fund receives collateral (in the form of U.S. Treasury obligations, letters of credit and/or cash) against the loaned securities and maintains collateral in an amount not less than 100% of the market value of the loaned securities during the period of the loan. The market value of the loaned securities is determined at the close of business of a fund and any additional required collateral is delivered to a fund on the next business day. A fund or borrower may terminate the loan at any time, and if the borrower defaults on its obligation to return the securities loaned because of insolvency or other reasons, a fund may apply collateral received from the borrower against the obligation. A fund may experience delays and costs in recovering the securities loaned. Any cash collateral received is invested in the Fidelity Securities Lending Cash Central Fund. Any loaned securities are identified as such in the Schedule of Investments, and the value of loaned securities and cash collateral at period end, as applicable, are presented in the Statement of Assets and Liabilities. Security lending income represents the income earned on investing cash collateral, less rebates paid to borrowers and any lending agent fees associated with the loan, plus any premium payments received for lending certain types of securities. Security lending income is presented in the Statement of Operations as a component of income from Fidelity Central Funds. Affiliated security lending activity, if any, was as follows:
| | Total Security Lending Fees Paid to NFS ($) | Security Lending Income From Securities Loaned to NFS ($) | Value of Securities Loaned to NFS at Period End ($) |
| Strategic Advisers Short Duration Fund | 5,385 | - | - |
9. Expense Reductions.
The investment adviser has contractually agreed to waive the Fund's management fee in an amount equal to .25% of the Fund's average net assets until September 30, 2027. During the period, this waiver reduced the Fund's management fee by $5,571,188. Expense reductions also include certain voluntary fee discount arrangements, which are currently in effect for the Fund. During the period, these voluntary arrangements amounted to $56,305.
Through arrangements with the Fund's custodian, credits realized as a result of certain uninvested cash balances were used to reduce the Fund's expenses by $25,781.
10. Other.
A fund's organizational documents provide former and current trustees and officers with a limited indemnification against liabilities arising in connection with the performance of their duties to the fund. In the normal course of business, a fund may also enter into contracts that provide general indemnifications. A fund's maximum exposure under these arrangements is unknown as this would be dependent on future claims that may be made against a fund. The risk of material loss from such claims is considered remote.
11. Risk and Uncertainties.
Many factors affect a fund's performance. Developments that disrupt global economies and financial markets, such as pandemics, epidemics, outbreaks of infectious diseases, war, terrorism, and environmental disasters, may significantly affect a fund's investment performance. The effects of these developments to a fund will be impacted by the types of securities in which a fund invests, the financial condition, industry, economic sector, and geographic location of an issuer, and a fund's level of investment in the securities of that issuer. Significant concentrations in security types, issuers, industries, sectors, and geographic locations may magnify the factors that affect a fund's performance.
Item 8: Changes in and Disagreements with Accountants for Open-End Management Investment Companies
(Unaudited)
Note: This is not applicable for any fund included in this document.
Item 9: Proxy Disclosures for Open-End Management Investment Companies
(Unaudited)
| A special meeting of shareholders was held on July 9, 2024. The results of votes taken among shareholders on the proposal before them are reported below. Each vote reported represents one dollar of net asset value held on the record date for the meeting. |
| Proposal 1 |
| To elect a Board of Trustees. |
| | # of Votes | % of Votes |
| Charles S. Morrison |
| Affirmative | 381,775,585,183.64 | 95.17 |
| Withheld | 19,363,639,577.49 | 4.83 |
| TOTAL | 401,139,224,761.13 | 100.00 |
| Nancy D. Prior |
| Affirmative | 381,252,305,731.53 | 95.04 |
| Withheld | 19,886,919,029.60 | 4.96 |
| TOTAL | 401,139,224,761.13 | 100.00 |
| Mary C. Farrell |
| Affirmative | 381,226,030,239.11 | 95.04 |
| Withheld | 19,913,194,522.02 | 4.96 |
| TOTAL | 401,139,224,761.13 | 100.00 |
| Karen Kaplan |
| Affirmative | 381,519,946,847.38 | 95.11 |
| Withheld | 19,619,277,913.75 | 4.89 |
| TOTAL | 401,139,224,761.13 | 100.00 |
| Christine Marcks |
| Affirmative | 380,186,327,029.51 | 94.78 |
| Withheld | 20,952,897,731.62 | 5.22 |
| TOTAL | 401,139,224,761.13 | 100.00 |
| Harold Singleton III |
| Affirmative | 382,499,458,473.65 | 95.35 |
| Withheld | 18,639,766,287.48 | 4.65 |
| TOTAL | 401,139,224,761.13 | 100.00 |
| Heidi L. Steiger |
| Affirmative | 380,661,676,515.00 | 94.90 |
| Withheld | 20,477,548,246.13 | 5.10 |
| TOTAL | 401,139,224,761.13 | 100.00 |
| | | |
| Proposal 1 reflects trust-wide proposal and voting results. |
Item 10: Remuneration Paid to Directors, Officers, and others of Open-End Management Investment Companies
(Unaudited)
Note: This information is disclosed as part of the financial statements for each Fund as part of Item 7: Financial Statements and Financial Highlights for Open-End Management Investment companies.
Item 11: Statement Regarding Basis for Approval of Investment Advisory Contract
(Unaudited)
Board Approval of Investment Advisory Contracts and Management Fees
Strategic Advisers Short Duration Fund
Each year, the Board of Trustees, including the Independent Trustees (together, the Board), considers the renewal of the fund's management contract with Strategic Advisers LLC (Strategic Advisers), the sub-advisory agreements with FIAM LLC and T. Rowe Price Associates, Inc. (each a Sub-Adviser and collectively, the Sub-Advisers) (collectively, the Sub-Advisory Agreements), and the sub-sub-advisory agreements with FMR Investment Management (UK) Limited, Fidelity Management & Research (Japan) Limited, Fidelity Management & Research (Hong Kong) Limited, T. Rowe Price International Ltd., and T. Rowe Price Hong Kong Limited (each a Sub-Sub-Adviser and collectively, the Sub-Sub-Advisers) (collectively, the Sub-Sub-Advisory Agreements and, together with the management contract and the Sub-Advisory Agreements, the Advisory Contracts) for the fund. Strategic Advisers and the Sub-Advisers and Sub-Sub-Advisers, as applicable, are referred to herein as the Investment Advisers. The Board, assisted by the advice of fund counsel and Independent Trustees' counsel, requests and considers a broad range of information relevant to the renewal of the Advisory Contracts throughout the year.
The Board meets at least four times per year and, at each of its meetings, covers an extensive agenda of topics and materials and considers factors that are relevant to its annual consideration of the renewal of the fund's Advisory Contracts, including the services and support provided to the fund and its shareholders. The full Board or the Independent Trustees, as appropriate, act on all major matters; however, a portion of the activities of the Board (including certain of those described herein) may be conducted through standing committees that have been established by the Board. The Board, acting directly and through its committees, requests and receives information concerning the annual consideration of the renewal of the fund's Advisory Contracts.
At its September 2024 meeting, the Board, including the Independent Trustees, unanimously determined to renew the fund's Advisory Contracts. The Board also approved updating the address for notice of Strategic Advisers LLC in each Sub-Advisory Agreement. In reaching its determination to renew the fund's Advisory Contracts, the Board considered all factors it believed relevant, including (i) the nature, extent, and quality of the services provided to the fund and its shareholders (including the investment performance of the fund); (ii) the competitiveness relative to peer funds of the fund's management fee and total expenses; (iii) the total costs of the services provided by and the profits, if any, realized by Strategic Advisers from its relationships with the fund; and (iv) the extent to which, if any, economies of scale exist and are realized as the fund grows and whether any economies of scale are appropriately shared with fund shareholders. The Board's decision to renew the Advisory Contracts was not based on any single factor, but rather was based on a comprehensive consideration of all the information provided to the Board throughout the year.
The Board reached a determination, with the assistance of fund counsel and Independent Trustees' counsel and through the exercise of its business judgment, that the renewal of the Advisory Contracts is in the best interests of the fund and its shareholders. In addition, the Board concluded that the renewal of each Sub-Advisory Agreement and Sub-Sub-Advisory Agreement does not involve a conflict of interest from which Strategic Advisers or its affiliates derive an inappropriate advantage. Also, the Board found that the advisory fees charged under the Advisory Contracts bear a reasonable relationship to the services rendered.
Nature, Extent, and Quality of Services Provided. The Board considered the staffing within the Investment Advisers, including the backgrounds of the fund's investment personnel and also considered the fund's investment objective, strategies, and related investment philosophy. The Independent Trustees also had discussions with senior management of Strategic Advisers' investment operations and investment groups. The Board considered the structure of each Investment Adviser's investment personnel compensation program and whether such structures provide appropriate incentives to act in the best interests of the fund.
The Trustees also discussed with representatives of Strategic Advisers, at meetings throughout the year, Strategic Advisers' role in, among other things, (i) setting, implementing and monitoring the investment strategies for the funds; (ii) identifying and recommending sub-advisers for the funds; (iii) overseeing compliance with federal securities laws by each sub-adviser with respect to the portion of fund assets allocated to the sub-adviser; (iv) monitoring and overseeing the performance and investment capabilities of each sub-adviser; and (v) recommending the replacement of a sub-adviser as appropriate. The Trustees considered that the Board had received from Strategic Advisers substantial information and periodic reports about Strategic Advisers' sub-adviser oversight and due diligence processes, as well as periodic reports regarding the performance of each sub-adviser.
The Board also considered the nature, extent and quality of services provided by each Sub-Adviser. The Trustees noted that under the Sub-Advisory Agreements subject to oversight by Strategic Advisers, each Sub-Adviser is responsible for, among other things, identifying investments for the portion of fund assets allocated to the Sub-Adviser, if any, and executing portfolio transactions to implement its investment strategy. In addition, the Trustees noted that each Sub-Adviser is responsible for providing such reporting as may be requested from Strategic Advisers to fulfill its oversight responsibilities discussed above.
Resources Dedicated to Investment Management and Support Services. The Board reviewed the general qualifications and capabilities of the Investment Advisers' investment staffs, their use of technology, and the Investment Advisers' approach to managing and compensating investment personnel. The Board noted that the Investment Advisers' analysts have extensive resources, tools, and capabilities that allow them to conduct sophisticated quantitative and/or fundamental analysis. Additionally, in its deliberations, the Board considered the Investment Advisers' trading capabilities and resources and global compliance infrastructure, which are integral parts of the investment management process.
Shareholder and Administrative Services. The Board considered (i) the nature, extent, quality, and cost of administrative and shareholder services performed by Strategic Advisers and its affiliates under the management contract and under separate agreements covering transfer agency, pricing and bookkeeping, and securities lending services for the fund; (ii) the nature and extent of Strategic Advisers' supervision of third party service providers, including sub-advisers, custodians and subcustodians; and (iii) the resources devoted to, and the record of compliance with, the fund's compliance policies and procedures.
Investment Performance. In connection with the renewal of the Advisory Contracts, the Board considered annualized return information for the fund over different time periods, measured against an appropriate securities market index (benchmark index) and a peer group of mutual funds with similar objectives (peer group).
The Board considered discussions that occur at Board meetings throughout the year with representatives of Strategic Advisers about fund investment performance and the performance of each Sub-Adviser as part of regularly scheduled fund reviews and other reports to the Board on fund performance, taking into account various factors including general market conditions. The Board also considered information about performance attribution. In its discussions with representatives of Strategic Advisers regarding fund performance, the Board gave particular attention to information indicating underperformance of certain funds over different time periods and discussed with Strategic Advisers the reasons for any such underperformance.
In addition to reviewing absolute and relative fund performance, the Independent Trustees periodically consider the appropriateness of fund performance metrics in evaluating the results achieved. The Independent Trustees generally give greater weight to fund performance over longer time periods than over shorter time periods. Depending on the circumstances, the Independent Trustees may be satisfied with the fund's performance notwithstanding that it lags its benchmark index peer group for certain periods.
Based on its review, the Board concluded that the nature, extent, and quality of services provided to the fund under the Advisory Contracts should continue to benefit the shareholders of the fund.
Competitiveness of Management Fee and Total Fund Expenses. The Board considered the amount and nature of fees paid to the Investment Advisers. The Board noted that the Sub-Sub-Advisers are compensated by the applicable Sub-Advisers and the Fund and Strategic Advisers are not responsible for any such fees or expenses. The Board also considered information comparing the management fees and total expenses of the fund to those of other registered investment companies with investment objectives similar to those of the fund, as discussed below. The Board also noted Strategic Advisers' proposal to extend the management fee waiver and considered the fund's contractual maximum aggregate annual management fee rate. In considering the fund's management fee and management fee waiver and comparisons to other registered investment companies with investment objectives similar to those of the fund, the Board noted that shares of the fund are offered only to clients that participate in the Fidelity Portfolio Advisory Service managed account program. In its review of the fund's total expenses, the Board considered the fund's management fee rate as well as other fund expenses, as applicable, such as expenses from holding Fidelity and non-Fidelity mutual funds and ETFs, pricing and bookkeeping fees, and custodial, legal, and audit fees.
Comparisons of Management Fees and Total Expense Ratios. Among other things, the Board reviewed data for selected groups of competitive funds and classes (referred to as "mapped groups") that were compiled by Fidelity based on combining similar investment objective categories (as classified by Lipper) that have comparable investment mandates. The data reviewed by the Board included (i) gross management fee comparisons (before taking into account expense reimbursements or caps) relative to the total universe of funds within the mapped group; (ii) gross management fee comparisons relative to a subset of non-Strategic Advisers funds in the mapped group that are similar in size and management fee structure to the fund (referred to as the "asset size peer group"); (iii) total expense comparisons of the fund relative to funds and classes in the mapped group that have a similar sales load structure to the fund (referred to as the "similar sales load structure group"); and (iv) total expense comparisons of the fund relative to funds and classes in the similar sales load structure group that are similar in size and management fee structure to each fund (referred to as the "total expense asset size peer group").
The information provided to the Board indicated that the fund's management fee rate ranked above the competitive median of the mapped group for the 12-month period ended December 31, 2023 and above the competitive median of the asset size peer group for the 12-month period ended December 31, 2023. The Board also noted that the fund's management fee rate was compared on a pre-waiver basis and, therefore, did not reflect the management fee waiver noted above. Giving effect to the waiver, the fund's management fee was below the median of the mapped group for the 12-month period ended December 31, 2023 and below the median of the asset size peer group for the 12-month period ended December 31, 2023. Further, the information provided to the Board indicated that the total expense ratio of the fund ranked below the competitive median of the similar sales load structure group for the 12-month period ended December 31, 2023 and below the competitive median of the total expense asset size peer group for the 12-month period ended December 31, 2023.
Fees Charged to Other Clients. The Board also considered fee structures paid by the Investment Advisers' other clients, such as other funds advised or subadvised by the Investment Advisers, pension plan clients, and other institutional clients with similar investment mandates.
Based on its review, the Board concluded that the fund's management fee bears a reasonable relationship to the services rendered. Further, based on its review of the total expense ratios and fees charged to other clients of Strategic Advisers or its affiliates and each Sub-Adviser, the Board concluded that the total expenses of the fund were reasonable in light of the services that the fund and its shareholders receive and the other factors considered.
Costs of the Services and Profitability. The Board considered information regarding the revenues earned and the expenses incurred by Strategic Advisers and its affiliates in conducting the business of developing, marketing, distributing, managing, administering and servicing the fund and servicing the fund's shareholders.
On an annual basis, Strategic Advisers presents to the Board information about the profitability of its relationships with the fund. Strategic Advisers calculates profitability information for the fund using a series of detailed revenue and cost allocation methodologies. The Board reviews any significant changes from the prior year's methodologies. Strategic Advisers noted that, to the extent possible, it employs the same corporate reporting of revenues and expenses as those used by other Fidelity funds.
A public accounting firm has been engaged annually by the Board as part of the Board's assessment of Fidelity's profitability analysis. The engagement includes the review and assessment of the methodologies used by Fidelity in determining the revenues and expenses attributable to Fidelity's fund business. After considering the reports issued under the engagement and information provided by Fidelity, the Board concluded that while other allocation methods may also be reasonable, Fidelity's profitability methodologies are reasonable in all material respects.
The Board also reviewed Fidelity's non-fund businesses and potential indirect benefits such businesses may have received as a result of their association with Fidelity's fund business (i.e., fall-out benefits) as well as cases where Fidelity's affiliates may benefit from the fund's business. The Board noted that changes to fall-out benefits year-over-year reflect business developments at Fidelity's various businesses.
The Board considered the costs of the services provided by and the profits realized, if any, by Strategic Advisers and its affiliates in connection with the operation of the fund and was satisfied that the profitability was not excessive.
The Board also considered information regarding the profitability of the Sub-Advisers' respective relationships with the fund and the potential fall-out benefits, if any, that may accrue to the Sub-Advisers as a result of their respective relationships with the fund. The Board noted the difficulty in evaluating a Sub-Adviser's costs and the profitability of a Sub-Advisory Agreement to a Sub-Adviser because of, among other things, differences in the type and content of information provided by each Sub-Adviser due to differences in business models, cost accounting methods, and profitability calculation methodologies among the Sub-Advisers. Accordingly, the Board considered profitability information provided by the Sub-Advisers in light of the nature of the relationships between Strategic Advisers and the Sub-Advisers with respect to the negotiation of sub-advisory fees.
Possible Economies of Scale. The Board considered whether there have been economies of scale in respect of the management of the Strategic Advisers funds, whether the Strategic Advisers funds (including the fund) have appropriately benefited from any such economies of scale, and whether there is potential for realization of any further economies of scale as assets grow through increased services to the fund, through waivers or reimbursements, or through fee or expense ratio reductions. The Board considered that the fund's Sub-Advisory Agreements provide for breakpoints as the fund's assets grow and noted that any potential decline in sub-advisory fees under such contracts would accrue directly to the fund. The Board also took Strategic Advisers' management fee waiver into consideration.
Conclusion. Based on its evaluation of all of the conclusions noted above, and after considering all factors it believed relevant, the Board concluded that the advisory fee arrangements bear a reasonable relationship to the services rendered and that the fund's Advisory Contracts should be renewed because each agreement is in the best interests of the fund and its shareholders. In addition, the Board concluded that the renewal of each Sub-Advisory Agreement and Sub-Sub-Advisory Agreement does not involve a conflict of interest from which Strategic Advisers or its affiliates derive an inappropriate advantage.
1.934461.112
ASD-SANN-0125
Strategic Advisers® Fidelity® Emerging Markets Fund
Offered exclusively to certain managed account clients of Strategic Advisers LLC or its affiliates - not available for sale to the general public
Semi-Annual Report
November 30, 2024
Contents
To view a fund's proxy voting guidelines and proxy voting record for the 12-month period ended June 30, visit http://www.fidelity.com/proxyvotingresults or visit the Securities and Exchange Commission's (SEC) web site at http://www.sec.gov.
You may also call 1-800-544-3455 to request a free copy of the proxy voting guidelines.
Standard & Poor's, S&P and S&P 500 are registered service marks of The McGraw-Hill Companies, Inc. and have been licensed for use by Fidelity Distributors Corporation.
Other third-party marks appearing herein are the property of their respective owners.
All other marks appearing herein are registered or unregistered trademarks or service marks of FMR LLC or an affiliated company. © 2025 FMR LLC. All rights reserved.
This report and the financial statements contained herein are submitted for the general information of the shareholders of the Fund. This report is not authorized for distribution to prospective investors in the Fund unless preceded or accompanied by an effective prospectus.
A fund files its complete schedule of portfolio holdings with the SEC for the first and third quarters of each fiscal year on Form N-PORT. Forms N-PORT are available on the SEC's web site at http://www.sec.gov. A fund's Forms N-PORT may be reviewed and copied at the SEC's Public Reference Room in Washington, DC. Information regarding the operation of the SEC's Public Reference Room may be obtained by calling 1-800-SEC-0330.
For a complete list of a fund's portfolio holdings, view the most recent holdings listing, semiannual report, or annual report on Fidelity's web site at http://www.fidelity.com, http://www.institutional.fidelity.com, or http://www.401k.com, as applicable.
NOT FDIC INSURED •MAY LOSE VALUE •NO BANK GUARANTEE
Neither the Fund nor Fidelity Distributors Corporation is a bank.
Item 7: Financial Statements and Financial Highlights for Open-End Management Investment Companies (Semi-Annual Report)
Strategic Advisers® Fidelity® Emerging Markets Fund
Schedule of Investments November 30, 2024 (Unaudited)
Showing Percentage of Net Assets
| Common Stocks - 51.0% |
| | | Shares | Value ($) |
| COMMUNICATION SERVICES - 4.4% | | | |
| Diversified Telecommunication Services - 0.1% | | | |
| HKT Trust/HKT Ltd. unit | | 1,320,000 | 1,640,668 |
| KT Corp. | | 903,137 | 31,741,517 |
| | | | 33,382,185 |
| Entertainment - 0.2% | | | |
| International Games Systems Co. Ltd. | | 276,000 | 8,224,415 |
| Sea Ltd. ADR Class A (a) | | 166,000 | 18,890,800 |
| Tencent Music Entertainment Group ADR | | 812,100 | 9,266,061 |
| | | | 36,381,276 |
| Interactive Media & Services - 3.5% | | | |
| NAVER Corp. | | 232,370 | 34,596,192 |
| Nebius Group NV Series A (a)(b) | | 563,600 | 12,393,564 |
| Tencent Holdings Ltd. | | 12,438,425 | 642,360,847 |
| Webtoon Entertainment, Inc. (b) | | 556,598 | 6,835,023 |
| | | | 696,185,626 |
| Wireless Telecommunication Services - 0.6% | | | |
| America Movil S.A.B. de CV Series L | | 10,140,284 | 7,540,564 |
| Bharti Airtel Ltd. | | 3,350,135 | 64,618,816 |
| Far EasTone Telecommunications Co. Ltd. | | 2,431,000 | 6,749,468 |
| MTN Group Ltd. | | 7,577,763 | 34,002,938 |
| | | | 112,911,786 |
TOTAL COMMUNICATION SERVICES | | | 878,860,873 |
| CONSUMER DISCRETIONARY - 8.7% | | | |
| Automobile Components - 0.3% | | | |
| Fuyao Glass Industries Group Co. Ltd.: | | | |
| (A Shares) | | 2,027,200 | 15,681,817 |
| (H Shares) (c) | | 568,000 | 3,821,954 |
| Hyundai Mobis | | 224,020 | 38,584,303 |
| | | | 58,088,074 |
| Automobiles - 0.6% | | | |
| BYD Co. Ltd. (H Shares) | | 1,101,598 | 36,336,191 |
| Eicher Motors Ltd. | | 331,299 | 18,948,794 |
| Ferrari NV | | 17,000 | 7,380,720 |
| Hyundai Motor Co. Ltd. | | 266,721 | 42,047,026 |
| Hyundai Motor India Ltd. | | 215,017 | 4,895,984 |
| Hyundai Motor India Ltd. (k) | | 60,701 | 1,382,175 |
| Li Auto, Inc. Class A (a) | | 490,913 | 5,814,109 |
| | | | 116,804,999 |
| Broadline Retail - 3.2% | | | |
| Alibaba Group Holding Ltd. | | 12,906,473 | 140,954,783 |
| Alibaba Group Holding Ltd. sponsored ADR | | 317,559 | 27,745,130 |
| Allegro.eu SA (a)(c) | | 1,990,428 | 14,102,674 |
| Coupang, Inc. Class A (a) | | 266,951 | 6,769,877 |
| JD.com, Inc.: | | | |
| Class A | | 292,000 | 5,458,354 |
| sponsored ADR | | 2,113,630 | 79,007,489 |
| MercadoLibre, Inc. (a) | | 9,373 | 18,606,998 |
| Naspers Ltd. Class N | | 679,960 | 154,273,117 |
| PDD Holdings, Inc. ADR (a) | | 1,703,027 | 164,444,287 |
| Vipshop Holdings Ltd. ADR | | 2,034,980 | 28,103,074 |
| | | | 639,465,783 |
| Diversified Consumer Services - 0.3% | | | |
| New Oriental Education & Technology Group, Inc. | | 5,581,100 | 32,868,401 |
| New Oriental Education & Technology Group, Inc. sponsored ADR | | 436,590 | 25,461,929 |
| | | | 58,330,330 |
| Hotels, Restaurants & Leisure - 2.6% | | | |
| MakeMyTrip Ltd. (a)(b) | | 415,392 | 47,662,078 |
| Meituan Class B (a)(c) | | 11,136,613 | 234,907,706 |
| OPAP SA | | 831,695 | 13,631,641 |
| Shangri-La Asia Ltd. | | 35,320,000 | 24,560,566 |
| Trip.com Group Ltd. (a) | | 44,450 | 2,889,412 |
| Trip.com Group Ltd. ADR (a) | | 1,303,052 | 84,242,312 |
| Yum China Holdings, Inc. | | 933,182 | 43,439,622 |
| Zomato Ltd. (a) | | 23,503,677 | 78,131,016 |
| | | | 529,464,353 |
| Household Durables - 0.9% | | | |
| Chervon Holdings Ltd. | | 165,800 | 361,435 |
| Haier Smart Home Co. Ltd. | | 20,287,492 | 68,235,406 |
| Haier Smart Home Co. Ltd. (A Shares) | | 24,601,897 | 96,820,281 |
| Midea Group Co. Ltd.: | | | |
| (A Shares) | | 240,458 | 2,339,985 |
| (H Shares) | | 795,039 | 7,086,884 |
| | | | 174,843,991 |
| Specialty Retail - 0.1% | | | |
| MR DIY Group M Sdn Bhd (c) | | 13,189,798 | 5,380,518 |
| Pepkor Holdings Ltd. (c) | | 9,826,963 | 14,592,561 |
| | | | 19,973,079 |
| Textiles, Apparel & Luxury Goods - 0.7% | | | |
| Anta Sports Products Ltd. | | 3,681,200 | 36,386,154 |
| ECLAT Textile Co. Ltd. | | 3,362,000 | 55,310,897 |
| Hermes International SCA | | 5,800 | 12,656,695 |
| Li Ning Co. Ltd. | | 3,939,500 | 8,081,545 |
| Samsonite International SA (c) | | 5,797,200 | 15,647,969 |
| Shenzhou International Group Holdings Ltd. | | 760,408 | 5,815,460 |
| | | | 133,898,720 |
TOTAL CONSUMER DISCRETIONARY | | | 1,730,869,329 |
| CONSUMER STAPLES - 3.0% | | | |
| Beverages - 0.9% | | | |
| Becle S.A.B. de CV (b) | | 2,956,000 | 3,787,409 |
| China Resources Beverage Holdings Co. Ltd. | | 1,779,066 | 2,574,844 |
| Fomento Economico Mexicano S.A.B. de CV sponsored ADR | | 648,261 | 57,948,051 |
| Kweichow Moutai Co. Ltd. (A Shares) | | 312,641 | 66,300,635 |
| Tsingtao Brewery Co. Ltd.: | | | |
| (A Shares) | | 199,982 | 2,023,796 |
| (H Shares) | | 2,570,006 | 16,087,313 |
| Wuliangye Yibin Co. Ltd. (A Shares) | | 1,274,897 | 26,006,377 |
| | | | 174,728,425 |
| Consumer Staples Distribution & Retail - 1.3% | | | |
| Atacadao SA | | 2,808,700 | 3,015,590 |
| BBB Foods, Inc. (b) | | 263,400 | 7,433,148 |
| BGF Retail Co. Ltd. | | 114,219 | 8,882,197 |
| Bim Birlesik Magazalar A/S JSC | | 611,766 | 8,348,896 |
| CP ALL PCL (For. Reg.) | | 3,612,016 | 6,460,839 |
| Dino Polska SA (a)(c) | | 96,300 | 9,152,004 |
| Raia Drogasil SA | | 3,762,340 | 14,969,821 |
| Shoprite Holdings Ltd. | | 3,095,297 | 50,983,259 |
| Wal-Mart de Mexico SA de CV Series V | | 53,213,547 | 141,526,925 |
| | | | 250,772,679 |
| Food Products - 0.6% | | | |
| China Mengniu Dairy Co. Ltd. | | 9,151,000 | 19,972,234 |
| Gruma S.A.B. de CV Series B | | 2,548,776 | 43,546,169 |
| PT Indofood CBP Sukses Makmur Tbk | | 19,143,600 | 14,449,220 |
| PT Indofood Sukses Makmur Tbk | | 41,472,300 | 19,859,984 |
| Tiger Brands Ltd. | | 1,574,432 | 22,191,121 |
| Uni-President Enterprises Corp. | | 807,000 | 2,108,055 |
| | | | 122,126,783 |
| Tobacco - 0.2% | | | |
| ITC Ltd. | | 2,243,587 | 12,671,857 |
| KT&G Corp. | | 379,464 | 33,220,039 |
| | | | 45,891,896 |
TOTAL CONSUMER STAPLES | | | 593,519,783 |
| ENERGY - 1.7% | | | |
| Energy Equipment & Services - 0.3% | | | |
| ADNOC Drilling Co. PJSC | | 38,902,078 | 56,027,550 |
| Oil, Gas & Consumable Fuels - 1.4% | | | |
| Adnoc Gas PLC | | 50,542,900 | 48,161,650 |
| Cameco Corp. | | 204,700 | 12,166,056 |
| China Merchants Energy Shipping Co. Ltd. (A Shares) | | 3,190,875 | 2,790,634 |
| COSCO Shipping Energy Transportation Co. Ltd. (H Shares) | | 770,000 | 586,902 |
| Gazprom OAO (a)(d) | | 5,946,277 | 59 |
| Gaztransport et Technigaz SA | | 156,245 | 22,735,909 |
| LUKOIL PJSC (a)(d) | | 345,667 | 0 |
| LUKOIL PJSC sponsored ADR (a)(d) | | 499,400 | 5 |
| Paladin Energy Ltd. (Australia) (a) | | 3,729,411 | 18,630,870 |
| Petroleo Brasileiro SA - Petrobras: | | | |
| (ON) | | 818,750 | 5,834,995 |
| sponsored ADR | | 4,189,608 | 59,827,602 |
| PTT Exploration and Production PCL (For. Reg.) | | 1,999,406 | 7,447,057 |
| Reliance Industries Ltd. | | 5,907,703 | 90,552,182 |
| Saudi Arabian Oil Co. (c) | | 776,700 | 5,675,002 |
| | | | 274,408,923 |
TOTAL ENERGY | | | 330,436,473 |
| FINANCIALS - 11.6% | | | |
| Banks - 8.6% | | | |
| Absa Group Ltd. | | 805,504 | 7,751,013 |
| Abu Dhabi Commercial Bank PJSC | | 3,230,800 | 8,813,552 |
| Al Rajhi Bank | | 2,591,025 | 62,829,029 |
| Alinma Bank | | 1,329,924 | 9,841,062 |
| Axis Bank Ltd. | | 3,480,220 | 46,891,294 |
| Axis Bank Ltd. sponsored GDR (Reg. S) | | 357,607 | 23,959,669 |
| Banco Bradesco SA | | 457,905 | 843,998 |
| Banco del Bajio SA (c) | | 2,490,700 | 5,275,362 |
| Bank of Chengdu Co. Ltd. (A Shares) | | 2,224,200 | 4,906,494 |
| Capitec Bank Holdings Ltd. | | 207,972 | 37,746,089 |
| China Construction Bank Corp. (H Shares) | | 123,191,404 | 93,140,039 |
| China Merchants Bank Co. Ltd. (H Shares) | | 10,290,975 | 46,626,847 |
| CIMB Group Holdings Bhd | | 30,233,052 | 56,108,925 |
| Credicorp Ltd. (United States) (b) | | 544,113 | 100,916,638 |
| CTBC Financial Holding Co. Ltd. | | 2,213,000 | 2,557,266 |
| Eurobank Ergasias Services and Holdings SA | | 5,394,884 | 11,440,637 |
| Grupo Financiero Banorte S.A.B. de CV | | 5,555,908 | 37,268,459 |
| Hana Financial Group, Inc. | | 135,468 | 6,075,946 |
| HDFC Bank Ltd. | | 9,265,513 | 197,504,607 |
| HDFC Bank Ltd. sponsored ADR | | 1,316,340 | 87,878,858 |
| ICICI Bank Ltd. | | 7,984,630 | 122,712,872 |
| ICICI Bank Ltd. sponsored ADR | | 2,657,747 | 81,194,171 |
| Industrial & Commercial Bank of China Ltd. (H Shares) | | 13,890,000 | 8,141,183 |
| Inter & Co., Inc. (depository receipt) unit (a) | | 4,383,380 | 20,041,681 |
| KB Financial Group, Inc. | | 386,875 | 26,724,609 |
| Kotak Mahindra Bank Ltd. | | 385,400 | 8,065,436 |
| National Bank of Greece SA | | 8,609,475 | 60,647,686 |
| Nu Holdings Ltd. Class A (a) | | 7,134,317 | 89,392,992 |
| OTP Bank PLC | | 1,684,690 | 91,256,334 |
| Piraeus Financial Holdings SA | | 4,225,471 | 15,537,444 |
| Powszechna Kasa Oszczednosci Bank SA | | 6,168,787 | 84,923,272 |
| PT Bank Central Asia Tbk | | 242,100,162 | 153,556,745 |
| PT Bank Mandiri (Persero) Tbk | | 45,677,147 | 17,760,082 |
| Sberbank of Russia (a)(d) | | 3,314,825 | 0 |
| Sberbank of Russia: | | | |
| (RTSX) (a)(d) | | 617,111 | 6 |
| sponsored ADR (a)(d) | | 1,653,549 | 17 |
| Standard Bank Group Ltd. | | 5,234,746 | 69,052,723 |
| The Saudi National Bank | | 1,650,864 | 14,259,239 |
| | | | 1,711,642,276 |
| Capital Markets - 0.5% | | | |
| 360 ONE WAM Ltd. | | 1,078,700 | 14,264,366 |
| Banco BTG Pactual SA unit | | 11,327,142 | 56,628,180 |
| VEF AB (a) | | 11,679,700 | 2,298,848 |
| XP, Inc. Class A | | 1,187,304 | 16,076,096 |
| | | | 89,267,490 |
| Consumer Finance - 0.5% | | | |
| Bajaj Finance Ltd. | | 162,100 | 12,632,886 |
| Five Star Business Finance Ltd. (a) | | 2,047,712 | 15,915,543 |
| Kaspi.KZ JSC ADR | | 741,516 | 78,897,302 |
| | | | 107,445,731 |
| Financial Services - 0.5% | | | |
| Chailease Holding Co. Ltd. | | 3,544,719 | 13,001,805 |
| FirstRand Ltd. | | 19,730,138 | 84,654,833 |
| | | | 97,656,638 |
| Insurance - 1.5% | | | |
| AIA Group Ltd. | | 6,414,400 | 48,297,865 |
| China Life Insurance Co. Ltd. (H Shares) | | 54,974,861 | 104,014,133 |
| Fubon Financial Holding Co. Ltd. | | 2,508,350 | 6,837,748 |
| HDFC Standard Life Insurance Co. Ltd. (c) | | 3,044,147 | 23,724,785 |
| OUTsurance Group Ltd. | | 1,328,140 | 4,789,763 |
| PICC Property & Casualty Co. Ltd. (H Shares) | | 20,080,000 | 30,403,907 |
| Ping An Insurance Group Co. of China Ltd. (H Shares) | | 9,360,411 | 54,438,123 |
| Samsung Fire & Marine Insurance Co. Ltd. | | 48,628 | 13,760,322 |
| SBI Life Insurance Co. Ltd. (c) | | 508,700 | 8,669,279 |
| | | | 294,935,925 |
TOTAL FINANCIALS | | | 2,300,948,060 |
| HEALTH CARE - 1.8% | | | |
| Biotechnology - 0.3% | | | |
| BioNTech SE ADR (a) | | 61,400 | 7,269,146 |
| Innovent Biologics, Inc. (a)(c) | | 3,620,267 | 17,938,470 |
| Zai Lab Ltd. ADR (a) | | 902,100 | 26,025,585 |
| | | | 51,233,201 |
| Health Care Equipment & Supplies - 0.2% | | | |
| Shenzhen Mindray Bio-Medical Electronics Co. Ltd. (A Shares) | | 919,326 | 33,317,355 |
| Health Care Providers & Services - 0.3% | | | |
| Apollo Hospitals Enterprise Ltd. | | 145,251 | 11,741,852 |
| Bumrungrad Hospital PCL (For. Reg.) | | 464,500 | 2,823,012 |
| Hapvida Participacoes e Investimentos SA (a)(c) | | 13,593,265 | 5,964,336 |
| Max Healthcare Institute Ltd. | | 3,031,004 | 35,183,428 |
| | | | 55,712,628 |
| Life Sciences Tools & Services - 0.4% | | | |
| Samsung Biologics Co. Ltd. (a)(c) | | 46,092 | 32,366,150 |
| WuXi AppTec Co. Ltd. (H Shares) (c) | | 7,008,600 | 42,384,914 |
| | | | 74,751,064 |
| Pharmaceuticals - 0.6% | | | |
| Hansoh Pharmaceutical Group Co. Ltd. (c) | | 24,062,000 | 59,691,080 |
| Mankind Pharma Ltd. (a) | | 656,877 | 19,930,516 |
| Richter Gedeon PLC | | 1,891,713 | 50,339,715 |
| | | | 129,961,311 |
TOTAL HEALTH CARE | | | 344,975,559 |
| INDUSTRIALS - 4.2% | | | |
| Aerospace & Defense - 0.7% | | | |
| Hindustan Aeronautics Ltd. | | 1,021,309 | 54,243,419 |
| Korea Aerospace Industries Ltd. | | 1,839,502 | 77,307,445 |
| | | | 131,550,864 |
| Air Freight & Logistics - 0.0% | | | |
| Delhivery Private Ltd. (a) | | 1,594,300 | 6,345,012 |
| Commercial Services & Supplies - 0.0% | | | |
| Tuhu Car, Inc. (a)(c) | | 1,201,800 | 3,313,446 |
| Construction & Engineering - 0.4% | | | |
| Larsen & Toubro Ltd. | | 1,842,713 | 81,322,654 |
| Electrical Equipment - 0.8% | | | |
| Contemporary Amperex Technology Co. Ltd. | | 2,071,152 | 75,383,310 |
| Dongfang Electric Corp. Ltd.: | | | |
| (A Shares) | | 433,988 | 913,998 |
| (H Shares) | | 826,800 | 993,648 |
| Sieyuan Electric Co. Ltd. (A Shares) | | 1,676,996 | 18,043,416 |
| Voltronic Power Technology Corp. | | 120,000 | 6,840,906 |
| Weg SA | | 5,274,283 | 47,143,156 |
| | | | 149,318,434 |
| Ground Transportation - 0.3% | | | |
| Full Truck Alliance Co. Ltd. ADR | | 1,812,162 | 18,139,742 |
| Localiza Rent a Car SA | | 4,858,416 | 29,731,232 |
| Vamos Locacao de Caminhoes Maquinas e Equipamentos SA | | 18,005,627 | 16,967,808 |
| | | | 64,838,782 |
| Industrial Conglomerates - 0.1% | | | |
| SK Square Co. Ltd. (a) | | 207,246 | 11,090,854 |
| Machinery - 1.2% | | | |
| Airtac International Group | | 715,380 | 17,510,289 |
| Hd Hyundai Mipo (a) | | 478,750 | 43,252,463 |
| HIWIN Technologies Corp. | | 6,188,112 | 44,336,200 |
| Huaming Power Equipement Co. Ltd. | | 678,580 | 1,602,730 |
| Jiangsu Hengli Hydraulic Co. Ltd. | | 860,900 | 6,333,952 |
| Samsung Heavy Industries Co. Ltd. (a) | | 3,063,360 | 25,613,350 |
| Shandong Himile Mechanical Science & Technology Co. Ltd. (A Shares) | | 347,188 | 2,126,523 |
| Shenzhen Inovance Technology Co. Ltd. (A Shares) | | 9,067,990 | 76,020,395 |
| Sinotruk Hong Kong Ltd. | | 3,654,659 | 10,123,124 |
| Techtronic Industries Co. Ltd. | | 985,000 | 13,876,093 |
| Wuxi Lead Intelligent Equipment Co. Ltd. (A Shares) (a) | | 598,700 | 1,964,689 |
| | | | 242,759,808 |
| Marine Transportation - 0.1% | | | |
| Pacific Basin Shipping Ltd. | | 102,516,400 | 24,377,293 |
| Professional Services - 0.2% | | | |
| Computer Age Management Services Private Ltd. | | 380,077 | 22,237,577 |
| TaskUs, Inc. (a)(b) | | 291,900 | 4,279,254 |
| | | | 26,516,831 |
| Trading Companies & Distributors - 0.0% | | | |
| BOC Aviation Ltd. Class A (c) | | 191,800 | 1,482,875 |
| Transportation Infrastructure - 0.4% | | | |
| Grupo Aeroportuario del Pacifico S.A.B. de CV Series B | | 2,144,339 | 40,214,348 |
| International Container Terminal Services, Inc. | | 3,844,803 | 24,252,394 |
| TAV Havalimanlari Holding A/S (a) | | 2,239,528 | 17,702,184 |
| | | | 82,168,926 |
TOTAL INDUSTRIALS | | | 825,085,779 |
| INFORMATION TECHNOLOGY - 12.3% | | | |
| Communications Equipment - 0.0% | | | |
| Accton Technology Corp. | | 345,000 | 7,047,102 |
| Electronic Equipment, Instruments & Components - 0.8% | | | |
| Delta Electronics, Inc. | | 83,000 | 984,405 |
| E Ink Holdings, Inc. | | 1,992,499 | 17,445,777 |
| Elite Material Co. Ltd. | | 1,217,000 | 17,712,941 |
| Hon Hai Precision Industry Co. Ltd. (Foxconn) | | 10,820,373 | 65,917,061 |
| Lotes Co. Ltd. | | 79,000 | 4,400,392 |
| Yageo Corp. | | 3,564,222 | 56,942,610 |
| | | | 163,403,186 |
| IT Services - 1.1% | | | |
| Coforge Ltd. | | 174,396 | 17,976,124 |
| Globant SA (a)(b) | | 45,200 | 10,294,752 |
| HCL Technologies Ltd. | | 576,214 | 12,627,999 |
| Infosys Ltd. | | 1,483,437 | 32,680,450 |
| Infosys Ltd. sponsored ADR (b) | | 339,513 | 7,493,052 |
| Tata Consultancy Services Ltd. | | 2,801,722 | 141,755,448 |
| | | | 222,827,825 |
| Semiconductors & Semiconductor Equipment - 7.7% | | | |
| Alchip Technologies Ltd. | | 350,704 | 24,106,209 |
| ASML Holding NV (Netherlands) | | 31,802 | 21,730,599 |
| ASPEED Tech, Inc. | | 45,000 | 5,738,459 |
| BE Semiconductor Industries NV | | 48,600 | 5,803,460 |
| Disco Corp. | | 28,100 | 7,678,755 |
| eMemory Technology, Inc. | | 73,000 | 6,645,791 |
| Gudeng Precision Industrial Co. Ltd. | | 149,000 | 2,304,116 |
| Jentech Precision Industrial Co. Ltd. | | 91,000 | 3,913,393 |
| MediaTek, Inc. | | 1,236,370 | 48,563,061 |
| NAURA Technology Group Co. Ltd. | | 651,300 | 37,544,859 |
| NVIDIA Corp. | | 333,600 | 46,120,200 |
| SK Hynix, Inc. | | 620,349 | 72,441,564 |
| Taiwan Semiconductor Manufacturing Co. Ltd. | | 36,702,344 | 1,144,088,151 |
| Taiwan Semiconductor Manufacturing Co. Ltd. sponsored ADR | | 483,249 | 89,236,760 |
| | | | 1,515,915,377 |
| Software - 0.1% | | | |
| Insyde Software Corp. | | 364,000 | 5,304,207 |
| Totvs SA | | 1,204,200 | 5,461,810 |
| | | | 10,766,017 |
| Technology Hardware, Storage & Peripherals - 2.6% | | | |
| ASUSTeK Computer, Inc. | | 251,000 | 4,580,470 |
| Samsung Electronics Co. Ltd. | | 10,509,729 | 413,354,986 |
| Samsung Electronics Co. Ltd. GDR (Reg. S) | | 18,488 | 18,136,728 |
| Xiaomi Corp. Class B (a)(c) | | 22,008,048 | 79,208,705 |
| | | | 515,280,889 |
TOTAL INFORMATION TECHNOLOGY | | | 2,435,240,396 |
| MATERIALS - 2.7% | | | |
| Chemicals - 0.2% | | | |
| PhosAgro PJSC (a)(d) | | 88,909 | 0 |
| PhosAgro PJSC: | | | |
| GDR (Reg. S) (a)(d) | | 1 | 0 |
| sponsored GDR (Reg. S) (a)(d) | | 1,718 | 0 |
| Sabic Agriculture-Nutrients Co. | | 166,700 | 4,916,383 |
| Shandong Sinocera Functional Material Co. Ltd. (A Shares) | | 3,814,300 | 9,819,489 |
| Solar Industries India Ltd. | | 191,584 | 24,268,681 |
| | | | 39,004,553 |
| Construction Materials - 0.2% | | | |
| Anhui Conch Cement Co. Ltd.: | | | |
| (A Shares) | | 1,006,487 | 3,576,349 |
| (H Shares) | | 1,881,500 | 4,909,312 |
| JK Cement Ltd. | | 586,700 | 29,746,217 |
| Ultratech Cement Ltd. | | 44,800 | 5,943,904 |
| | | | 44,175,782 |
| Metals & Mining - 2.3% | | | |
| African Rainbow Minerals Ltd. (b) | | 1,069,162 | 9,434,752 |
| AngloGold Ashanti PLC (b) | | 1,008,672 | 25,156,280 |
| Antofagasta PLC | | 2,239,300 | 48,510,989 |
| China Hongqiao Group Ltd. | | 504,500 | 735,351 |
| Endeavour Mining PLC | | 344,972 | 6,857,306 |
| First Quantum Minerals Ltd. (a) | | 690,387 | 9,448,102 |
| Gerdau SA sponsored ADR | | 21,474,786 | 72,155,281 |
| Grupo Mexico SA de CV Series B | | 13,176,637 | 64,615,358 |
| Impala Platinum Holdings Ltd. (a) | | 10,558,572 | 60,128,383 |
| Ivanhoe Mines Ltd. (a) | | 672,454 | 9,121,032 |
| Jindal Steel & Power Ltd. | | 1,300,939 | 13,990,963 |
| Northam Platinum Holdings Ltd. | | 1,911,294 | 11,992,355 |
| Southern Copper Corp. | | 19,710 | 1,977,899 |
| Tata Steel Ltd. | | 3,987,160 | 6,834,416 |
| Vale SA | | 287,114 | 2,819,222 |
| Vale SA sponsored ADR | | 4,962,037 | 48,925,685 |
| Zhaojin Mining Industry Co. Ltd. (H Shares) | | 1,339,500 | 1,955,877 |
| Zijin Mining Group Co. Ltd. (H Shares) | | 24,372,452 | 46,802,626 |
| | | | 441,461,877 |
TOTAL MATERIALS | | | 524,642,212 |
| REAL ESTATE - 0.3% | | | |
| Equity Real Estate Investment Trusts (REITs) - 0.0% | | | |
| Prologis Property Mexico SA (b) | | 1,847,600 | 5,523,907 |
| Real Estate Management & Development - 0.3% | | | |
| Ayala Land, Inc. | | 31,652,913 | 15,460,547 |
| China Overseas Land and Investment Ltd. | | 2,968,000 | 5,089,090 |
| Corporacion Inmobiliaria Vesta S.A.B. de CV ADR | | 288,442 | 6,951,452 |
| Emaar Properties PJSC | | 5,067,784 | 13,176,335 |
| KE Holdings, Inc. ADR | | 882,772 | 16,640,252 |
| | | | 57,317,676 |
TOTAL REAL ESTATE | | | 62,841,583 |
| UTILITIES - 0.3% | | | |
| Electric Utilities - 0.1% | | | |
| Equatorial Energia SA | | 1,473,700 | 7,441,000 |
| Power Grid Corp. of India Ltd. | | 3,038,400 | 11,849,459 |
| Tenaga Nasional Bhd | | 2,727,454 | 8,383,124 |
| | | | 27,673,583 |
| Independent Power and Renewable Electricity Producers - 0.2% | | | |
| NTPC Ltd. | | 8,606,395 | 37,121,727 |
TOTAL UTILITIES | | | 64,795,310 |
| TOTAL COMMON STOCKS (Cost $9,121,266,879) | | | 10,092,215,357 |
| | | | |
| Nonconvertible Preferred Stocks - 0.3% |
| | | Shares | Value ($) |
| FINANCIALS - 0.3% | | | |
| Banks - 0.3% | | | |
| Itau Unibanco Holding SA | | 12,502,474 | 67,304,071 |
| Sberbank of Russia (a)(d) | | 2,462,434 | 25 |
| Sberbank of Russia (Russia) (a)(d) | | 3,791,522 | 0 |
| TOTAL NONCONVERTIBLE PREFERRED STOCKS (Cost $88,969,391) | | | 67,304,096 |
| | | | |
| Equity Funds - 41.7% |
| | | Shares | Value ($) |
| Diversified Emerging Markets Funds - 41.7% | | | |
| Fidelity Advisor China Region Fund Class Z (e) | | 3,855,672 | 149,561,533 |
| Fidelity Advisor Emerging Markets Fund Class Z (e) | | 25,371,279 | 986,942,753 |
| Fidelity SAI Emerging Markets Index Fund (e) | | 115,938,387 | 1,619,659,271 |
| Fidelity SAI Emerging Markets Low Volatility Index Fund (e) | | 101,924,433 | 1,182,323,428 |
| Fidelity SAI Emerging Markets Value Index Fund (e) | | 317,167,517 | 4,326,164,939 |
| | | | |
| TOTAL EQUITY FUNDS (Cost $7,677,203,272) | | | 8,264,651,924 |
| | | | |
| U.S. Treasury Obligations - 0.2% |
| | | Principal Amount (f) | Value ($) |
U.S. Treasury Bills, yield at date of purchase 4.39% to 4.93% 12/12/24 to 2/27/25 (g) (Cost $33,994,851) | | 34,130,000 | 34,000,704 |
| | | | |
| Money Market Funds - 7.1% |
| | | Shares | Value ($) |
| Fidelity Cash Central Fund 4.64% (h) | | 309,402,041 | 309,463,922 |
| Fidelity Securities Lending Cash Central Fund 4.64% (h)(i) | | 84,620,422 | 84,628,884 |
| Invesco Government & Agency Portfolio Institutional Class 4.57% (j) | | 1,017,607,357 | 1,017,607,357 |
| TOTAL MONEY MARKET FUNDS (Cost $1,411,680,020) | | | 1,411,700,163 |
| | | | |
| TOTAL INVESTMENT IN SECURITIES - 100.3% (Cost $18,333,114,413) | 19,869,872,244 |
NET OTHER ASSETS (LIABILITIES) - (0.3)% | (64,516,967) |
| NET ASSETS - 100.0% | 19,805,355,277 |
| | |
| Futures Contracts |
| | Number of contracts | Expiration Date | Notional Amount ($) | Value ($) | Unrealized Appreciation/ (Depreciation) ($) |
| Purchased | | | | | |
| | | | | | |
| Equity Index Contracts | | | | | |
| ICE E-mini MSCI Emerging Markets Index Contracts (United States) | 17,918 | Dec 2024 | 977,068,540 | (21,070,231) | (21,070,231) |
| | | | | | |
| The notional amount of futures purchased as a percentage of Net Assets is 4.9% |
For the period, the average monthly notional amount at value for futures contracts in the aggregate was $676,560,497.
Legend
| (b) | Security or a portion of the security is on loan at period end. |
| (c) | Security exempt from registration under Rule 144A of the Securities Act of 1933. These securities may be resold in transactions exempt from registration, normally to qualified institutional buyers. At the end of the period, the value of these securities amounted to $583,299,790 or 2.9% of net assets. |
| (f) | Amount is stated in United States dollars unless otherwise noted. |
| (g) | Security or a portion of the security was pledged to cover margin requirements for futures contracts. At period end, the value of securities pledged amounted to $31,127,403. |
| (h) | Affiliated fund that is generally available only to investment companies and other accounts managed by Fidelity Investments. The rate quoted is the annualized seven-day yield of the fund at period end. A complete unaudited listing of the fund's holdings as of its most recent quarter end is available upon request. In addition, each Fidelity Central Fund's financial statements are available on the SEC's website or upon request. |
| (i) | Investment made with cash collateral received from securities on loan. |
| (j) | The rate quoted is the annualized seven-day yield of the fund at period end. |
| (k) | Equity security is subject to lock-up or market standoff agreement. Fair value is based on the unadjusted market price of the equivalent equity security. As of period end, the total fair value of unadjusted equity securities subject to contractual sale restrictions is $1,382,175 and all restrictions are set to expire on or before January 31, 2025. Under normal market conditions, there are no circumstances that could cause the restrictions to lapse. |
Affiliated Central Funds
Fiscal year to date information regarding the Fund's investments in Fidelity Central Funds, including the ownership percentage, is presented below.
| Affiliate | Value, beginning of period ($) | Purchases ($) | Sales Proceeds ($) | Dividend Income ($) | Realized Gain (loss) ($) | Change in Unrealized appreciation (depreciation) ($) | Value, end of period ($) | % ownership, end of period |
| Fidelity Cash Central Fund 4.64% | 209,626,067 | 2,613,161,120 | 2,513,322,485 | 7,622,038 | (780) | - | 309,463,922 | 0.6% |
| Fidelity Securities Lending Cash Central Fund 4.64% | 76,498,227 | 638,885,692 | 630,755,035 | 351,247 | - | - | 84,628,884 | 0.3% |
| Total | 286,124,294 | 3,252,046,812 | 3,144,077,520 | 7,973,285 | (780) | - | 394,092,806 | |
| | | | | | | | | |
Amounts in the dividend income column in the above table include any capital gain distributions from underlying funds, which are presented in the corresponding line item in the Statement of Operations, if applicable.
Amounts in the dividend income column for Fidelity Securities Lending Cash Central Fund represents the income earned on investing cash collateral, less rebates paid to borrowers and any lending agent fees associated with the loan, plus any premium payments received for lending certain types of securities.
Amounts included in the purchases and sales proceeds columns may include in-kind transactions, if applicable.
Affiliated Underlying Funds
Fiscal year to date information regarding the Fund's investments in affiliated Underlying Funds is presented below. Exchanges between classes of the same affiliated Underlying Funds may occur. If an Underlying Funds changes its name, the name presented below is the name in effect at period end.
| Affiliate | Value, beginning of period ($) | Purchases ($) | Sales Proceeds ($) | Dividend Income ($) | Realized Gain (loss) ($) | Change in Unrealized appreciation (depreciation) ($) | Value, end of period ($) |
| Fidelity Advisor China Region Fund Class Z | 122,101,614 | 15,999,999 | - | - | - | 11,459,920 | 149,561,533 |
| Fidelity Advisor Emerging Markets Fund Class Z | 1,610,032,951 | 327,000,000 | 1,042,505,854 | - | (42,266,935) | 134,682,591 | 986,942,753 |
| Fidelity SAI Emerging Markets Index Fund | 1,655,648,109 | 482,652,388 | 611,991,224 | - | 94,335,057 | (985,059) | 1,619,659,271 |
| Fidelity SAI Emerging Markets Low Volatility Index Fund | 860,206,966 | 282,999,999 | - | - | - | 39,116,463 | 1,182,323,428 |
| Fidelity SAI Emerging Markets Value Index Fund | 3,078,907,445 | 1,148,000,000 | - | - | - | 99,257,494 | 4,326,164,939 |
| | 7,326,897,085 | 2,256,652,386 | 1,654,497,078 | - | 52,068,122 | 283,531,409 | 8,264,651,924 |
Amounts in the dividend income column in the above table include any capital gain distributions from underlying funds, which are presented in the corresponding line item in the Statement of Operations, if applicable.
Amounts included in the purchases and sales proceeds columns may include in-kind transactions, if applicable.
Investment Valuation
The following is a summary of the inputs used, as of November 30, 2024, involving the Fund's assets and liabilities carried at fair value. The inputs or methodology used for valuing securities may not be an indication of the risk associated with investing in those securities. For more information on valuation inputs, and their aggregation into the levels used below, please refer to the Investment Valuation section in the accompanying Notes to Financial Statements.
| Valuation Inputs at Reporting Date: |
| Description | Total ($) | Level 1 ($) | Level 2 ($) | Level 3 ($) |
Investments in Securities: | | | | |
|
| Equities: | | | | |
Communication Services | 878,860,873 | 56,566,680 | 822,294,193 | - |
Consumer Discretionary | 1,730,869,329 | 675,016,493 | 1,055,852,836 | - |
Consumer Staples | 593,519,783 | 328,362,404 | 265,157,379 | - |
Energy | 330,436,473 | 211,015,666 | 119,420,743 | 64 |
Financials | 2,368,252,156 | 1,189,732,569 | 1,178,519,539 | 48 |
Health Care | 344,975,559 | 209,613,246 | 135,362,313 | - |
Industrials | 825,085,779 | 228,344,203 | 596,741,576 | - |
Information Technology | 2,435,240,396 | 182,546,762 | 2,252,693,634 | - |
Materials | 524,642,212 | 348,906,703 | 175,735,509 | - |
Real Estate | 62,841,583 | 47,381,036 | 15,460,547 | - |
Utilities | 64,795,310 | 7,441,000 | 57,354,310 | - |
|
| Equity Funds | 8,264,651,924 | 8,264,651,924 | - | - |
|
| Other Short-Term Investments | 34,000,704 | - | 34,000,704 | - |
|
| Money Market Funds | 1,411,700,163 | 1,411,700,163 | - | - |
| Total Investments in Securities: | 19,869,872,244 | 13,161,278,849 | 6,708,593,283 | 112 |
Derivative Instruments: Liabilities | | | | |
Futures Contracts | (21,070,231) | (21,070,231) | - | - |
| Total Liabilities | (21,070,231) | (21,070,231) | - | - |
| Total Derivative Instruments: | (21,070,231) | (21,070,231) | - | - |
Value of Derivative Instruments
The following table is a summary of the Fund's value of derivative instruments by primary risk exposure as of November 30, 2024. For additional information on derivative instruments, please refer to the Derivative Instruments section in the accompanying Notes to Financial Statements.
Primary Risk Exposure / Derivative Type | Value |
| Asset ($) | Liability ($) |
| Equity Risk | | |
Futures Contracts (a) | 0 | (21,070,231) |
| Total Equity Risk | 0 | (21,070,231) |
| Total Value of Derivatives | 0 | (21,070,231) |
(a)Reflects gross cumulative appreciation (depreciation) on futures contracts as presented in the Schedule of Investments. In the Statement of Assets and Liabilities, the period end daily variation margin is included in receivable or payable for daily variation margin on futures contracts, and the net cumulative appreciation (depreciation) is included in Total accumulated earnings (loss).
Financial Statements (Unaudited)
| Statement of Assets and Liabilities |
| As of November 30, 2024 (Unaudited) |
| Assets | | | | |
| Investment in securities, at value (including securities loaned of $82,852,301) - See accompanying schedule: | | | | |
Unaffiliated issuers (cost $10,261,838,478) | $ | 11,211,127,514 | | |
Fidelity Central Funds (cost $394,072,663) | | 394,092,806 | | |
Other affiliated issuers (cost $7,677,203,272) | | 8,264,651,924 | | |
| | | | | |
| | | | | |
| Total Investment in Securities (cost $18,333,114,413) | | | $ | 19,869,872,244 |
| Foreign currency held at value (cost $698,360) | | | | 696,118 |
| Receivable for investments sold | | | | 63,975,440 |
| Receivable for fund shares sold | | | | 33,390,427 |
| Dividends receivable | | | | 5,905,201 |
| Interest receivable | | | | 3,199,079 |
| Distributions receivable from Fidelity Central Funds | | | | 1,199,025 |
| Receivable for daily variation margin on futures contracts | | | | 8,779,820 |
| Prepaid expenses | | | | 8,895 |
| Other receivables | | | | 1,654,377 |
Total assets | | | | 19,988,680,626 |
| Liabilities | | | | |
| Payable to custodian bank | $ | 3,835,779 | | |
| Payable for investments purchased | | 61,121,386 | | |
| Payable for fund shares redeemed | | 7,035,166 | | |
| Accrued management fee | | 3,044,199 | | |
| Deferred taxes | | 22,229,744 | | |
| Other payables and accrued expenses | | 1,431,248 | | |
| Collateral on securities loaned | | 84,627,827 | | |
| Total liabilities | | | | 183,325,349 |
| Net Assets | | | $ | 19,805,355,277 |
| Net Assets consist of: | | | | |
| Paid in capital | | | $ | 19,437,049,590 |
| Total accumulated earnings (loss) | | | | 368,305,687 |
| Net Assets | | | $ | 19,805,355,277 |
Net Asset Value, offering price and redemption price per share ($19,805,355,277 ÷ 1,585,671,242 shares) | | | $ | 12.49 |
| Statement of Operations |
Six months ended November 30, 2024 (Unaudited) |
| Investment Income | | | | |
| Dividends: | | | | |
| Unaffiliated issuers | | | $ | 144,413,292 |
| Interest | | | | 959,598 |
| Income from Fidelity Central Funds (including $351,247 from security lending) | | | | 7,973,285 |
| Income before foreign taxes withheld | | | $ | 153,346,175 |
| Less foreign taxes withheld | | | | (12,612,934) |
| Total income | | | | 140,733,241 |
| Expenses | | | | |
| Management fee | $ | 38,050,738 | | |
| Custodian fees and expenses | | 991,249 | | |
| Independent trustees' fees and expenses | | 41,119 | | |
| Registration fees | | 1,063,783 | | |
| Audit fees | | 44,903 | | |
| Legal | | 8,746 | | |
| Miscellaneous | | 28,772 | | |
| Total expenses before reductions | | 40,229,310 | | |
| Expense reductions | | (22,452,587) | | |
| Total expenses after reductions | | | | 17,776,723 |
| Net Investment income (loss) | | | | 122,956,518 |
| Realized and Unrealized Gain (Loss) | | | | |
| Net realized gain (loss) on: | | | | |
| Investment Securities: | | | | |
| Unaffiliated issuers (net of foreign taxes of $12,559,537) | | (150,457,399) | | |
| Fidelity Central Funds | | (780) | | |
| Other affiliated issuers | | 52,068,122 | | |
| Foreign currency transactions | | (6,884,393) | | |
| Futures contracts | | 87,701,965 | | |
| Total net realized gain (loss) | | | | (17,572,485) |
| Change in net unrealized appreciation (depreciation) on: | | | | |
| Investment Securities: | | | | |
| Unaffiliated issuers (net of increase in deferred foreign taxes of $2,707,723) | | 93,837,870 | | |
| Affiliated issuers | | 283,531,409 | | |
| Assets and liabilities in foreign currencies | | (344,889) | | |
| Futures contracts | | (23,314,605) | | |
| Total change in net unrealized appreciation (depreciation) | | | | 353,709,785 |
| Net gain (loss) | | | | 336,137,300 |
| Net increase (decrease) in net assets resulting from operations | | | $ | 459,093,818 |
| Statement of Changes in Net Assets |
| |
| | Six months ended November 30, 2024 (Unaudited) | | Year ended May 31, 2024 |
| Increase (Decrease) in Net Assets | | | | |
| Operations | | | | |
| Net investment income (loss) | $ | 122,956,518 | $ | 295,419,871 |
| Net realized gain (loss) | | (17,572,485) | | (212,585,574) |
| Change in net unrealized appreciation (depreciation) | | 353,709,785 | | 1,602,775,331 |
| Net increase (decrease) in net assets resulting from operations | | 459,093,818 | | 1,685,609,628 |
| Distributions to shareholders | | (71,107,081) | | (287,946,627) |
| | | | | |
| Share transactions | | | | |
| Proceeds from sales of shares | | 6,322,945,198 | | 6,926,016,382 |
| Reinvestment of distributions | | 70,942,299 | | 267,873,293 |
| Cost of shares redeemed | | (2,041,738,483) | | (1,906,066,597) |
| | | | | |
Net increase (decrease) in net assets resulting from share transactions | | 4,352,149,014 | | 5,287,823,078 |
| Total increase (decrease) in net assets | | 4,740,135,751 | | 6,685,486,079 |
| | | | | |
| Net Assets | | | | |
| Beginning of period | | 15,065,219,526 | | 8,379,733,447 |
| End of period | $ | 19,805,355,277 | $ | 15,065,219,526 |
| | | | | |
| Other Information | | | | |
| Shares | | | | |
| Sold | | 500,507,998 | | 602,514,563 |
| Issued in reinvestment of distributions | | 5,444,536 | | 23,271,522 |
| Redeemed | | (157,054,786) | | (164,253,174) |
| Net increase (decrease) | | 348,897,748 | | 461,532,911 |
| | | | | |
Financial Highlights
Strategic Advisers® Fidelity® Emerging Markets Fund |
| |
| | Six months ended (Unaudited) November 30, 2024 | | Years ended May 31, 2024 | | 2023 | | 2022 | | 2021 | | 2020 |
Selected Per-Share Data | | | | | | | | | | | | |
| Net asset value, beginning of period | $ | 12.18 | $ | 10.81 | $ | 11.81 | $ | 15.70 | $ | 10.32 | $ | 10.71 |
| Income from Investment Operations | | | | | | | | | | | | |
Net investment income (loss) A,B | | .09 | | .31 | | .29 | | .26 | | .15 | | .26 C |
| Net realized and unrealized gain (loss) | | .27 | | 1.39 | | (1.03) | | (3.50) | | 5.34 | | (.39) |
| Total from investment operations | | .36 | | 1.70 | | (.74) | | (3.24) | | 5.49 | | (.13) |
| Distributions from net investment income | | (.05) | | (.33) | | (.26) | | (.24) | | (.11) | | (.26) |
| Distributions from net realized gain | | - | | - | | - | | (.40) | | - | | - |
| Total distributions | | (.05) | | (.33) | | (.26) | | (.65) D | | (.11) | | (.26) |
| Net asset value, end of period | $ | 12.49 | $ | 12.18 | $ | 10.81 | $ | 11.81 | $ | 15.70 | $ | 10.32 |
Total Return E,F | | | | 15.88% | | (6.28)% | | (21.40)% | | 53.25% | | (1.58)% |
Ratios to Average Net Assets B,G,H | | | | | | | | | | | | |
| Expenses before reductions | | .45% I | | .45% | | .47% | | .50% | | .51% | | .49% |
| Expenses net of fee waivers, if any | | | | .20% | | .22% | | .25% | | .25% | | .24% |
| Expenses net of all reductions | | .20% I | | .20% | | .22% | | .25% | | .24% | | .23% |
| Net investment income (loss) | | 1.38% I | | 2.69% | | 2.72% | | 1.89% | | 1.05% | | 2.35% C |
| Supplemental Data | | | | | | | | | | | | |
| Net assets, end of period (000 omitted) | $ | 19,805,355 | $ | 15,065,220 | $ | 8,379,733 | $ | 8,996,224 | $ | 7,503,942 | $ | 2,976,388 |
Portfolio turnover rate J | | | | 33% | | 43% | | 29% | | 47% | | 49% |
ACalculated based on average shares outstanding during the period.
BNet investment income (loss) is affected by the timing of the declaration of dividends by any underlying mutual funds or exchange-traded funds (ETFs). Net investment income (loss) of any mutual funds or ETFs is not included in the Fund's net investment income (loss) ratio.
CNet investment income per share reflects one or more large, non-recurring dividend(s) which amounted to $.06 per share. Excluding such non-recurring dividend(s), the ratio of net investment income (loss) to average net assets would have been 1.80%.
DTotal distributions per share do not sum due to rounding.
ETotal returns for periods of less than one year are not annualized.
FTotal returns would have been lower if certain expenses had not been reduced during the applicable periods shown.
GFees and expenses of any underlying mutual funds or exchange-traded funds (ETFs) are not included in the Fund's expense ratio. The Fund indirectly bears its proportionate share of these expenses. For additional expense information related to investments in Fidelity Central Funds, please refer to the "Investments in Fidelity Central Funds" note found in the Notes to Financial Statements section of the most recent Annual or Semi-Annual report.
HExpense ratios reflect operating expenses of the class. Expenses before reductions do not reflect amounts reimbursed, waived, or reduced through arrangements with the investment adviser, brokerage services, or other offset arrangements, if applicable, and do not represent the amount paid by the class during periods when reimbursements, waivers or reductions occur.
IAnnualized.
JAmount does not include the portfolio activity of any underlying mutual funds or exchange-traded funds (ETFs).
Notes to Financial Statements
(Unaudited)For the period ended November 30, 2024
1. Organization.
Strategic Advisers Fidelity Emerging Markets Fund (the Fund) is a fund of Fidelity Rutland Square Trust II (the Trust), and is authorized to issue an unlimited number of shares. The Trust is registered under the Investment Company Act of 1940, as amended (the 1940 Act), as an open-end management investment company organized as a Delaware statutory trust. The Fund is offered exclusively to certain managed account clients of Strategic Advisers LLC (Strategic Advisers), an affiliate of Fidelity Management & Research Company LLC (FMR). The Fund's investments in emerging markets can be subject to social, economic, regulatory, and political uncertainties and can be extremely volatile.
2. Significant Accounting Policies.
The Fund is an investment company and applies the accounting and reporting guidance of the Financial Accounting Standards Board (FASB) Accounting Standards Codification Topic 946 Financial Services - Investment Companies. The financial statements have been prepared in conformity with accounting principles generally accepted in the United States of America (GAAP), which require management to make certain estimates and assumptions at the date of the financial statements. Actual results could differ from those estimates. Subsequent events, if any, through the date that the financial statements were issued have been evaluated in the preparation of the financial statements. The Fund's Schedule of Investments lists any underlying mutual funds or exchange-traded funds (ETFs) but does not include the underlying holdings of these funds. The following summarizes the significant accounting policies of the Fund:
Investment Valuation. Investments are valued as of 4:00 p.m. Eastern time on the last calendar day of the period. The Board of Trustees (the Board) has designated the Fund's investment adviser as the valuation designee responsible for the fair valuation function and performing fair value determinations as needed. The investment adviser has established a Fair Value Committee (the Committee) to carry out the day-to-day fair valuation responsibilities and has adopted policies and procedures to govern the fair valuation process and the activities of the Committee. In accordance with these fair valuation policies and procedures, which have been approved by the Board, the Fund attempts to obtain prices from one or more third party pricing services or brokers to value its investments. When current market prices, quotations or currency exchange rates are not readily available or reliable, investments will be fair valued in good faith by the Committee, in accordance with the policies and procedures. Factors used in determining fair value vary by investment type and may include market or investment specific events, transaction data, estimated cash flows, and market observations of comparable investments. The frequency that the fair valuation procedures are used cannot be predicted and they may be utilized to a significant extent. The Committee manages the Fund's fair valuation practices and maintains the fair valuation policies and procedures. The Fund's investment adviser reports to the Board information regarding the fair valuation process and related material matters.
The Fund categorizes the inputs to valuation techniques used to value its investments into a disclosure hierarchy consisting of three levels as shown below:
Level 1 - unadjusted quoted prices in active markets for identical investments
Level 2 - other significant observable inputs (including quoted prices for similar investments, interest rates, prepayment speeds, etc.)
Level 3 - unobservable inputs (including the Fund's own assumptions based on the best information available)
Valuation techniques used to value the Fund's investments by major category are as follows:
Equity securities, including restricted securities, for which market quotations are readily available, are valued at the last reported sale price or official closing price as reported by a third party pricing service on the primary market or exchange on which they are traded and are categorized as Level 1 in the hierarchy. In the event there were no sales during the day or closing prices are not available, securities are valued at the last quoted bid price or may be valued using the last available price and are generally categorized as Level 2 in the hierarchy. For foreign equity securities, when market or security specific events arise, comparisons to the valuation of American Depositary Receipts (ADRs), futures contracts, Exchange-Traded Funds (ETFs) and certain indexes as well as quoted prices for similar securities may be used and would be categorized as Level 2 in the hierarchy. For equity securities, including restricted securities, where observable inputs are limited, assumptions about market activity and risk are used and these securities may be categorized as Level 3 in the hierarchy.
Debt securities, including restricted securities, are valued based on evaluated prices received from third party pricing services or from brokers who make markets in such securities. U.S. government and government agency obligations are valued by pricing services who utilize matrix pricing which considers yield or price of bonds of comparable quality, coupon, maturity and type or by broker-supplied prices. When independent prices are unavailable or unreliable, debt securities may be valued utilizing pricing methodologies which consider similar factors that would be used by third party pricing services. Debt securities are generally categorized as Level 2 in the hierarchy but may be Level 3 depending on the circumstances.
Futures contracts are valued at the settlement price established each day by the board of trade or exchange on which they are traded and are categorized as Level 1 in the hierarchy. Investments in open-end mutual funds, including the Fidelity Central Funds, are valued at their closing net asset value (NAV) each business day and are categorized as Level 1 in the hierarchy. If an unaffiliated open-end mutual fund's NAV is unavailable, shares of that fund may be valued by another method that the Board believes reflects fair value in accordance with the Board's fair value pricing policies and is categorized as Level 2 in the hierarchy.
Changes in valuation techniques may result in transfers in or out of an assigned level within the disclosure hierarchy. The aggregate value of investments by input level as of November 30, 2024 is included at the end of the Fund's Schedule of Investments.
Foreign Currency. Certain Funds may use foreign currency contracts to facilitate transactions in foreign-denominated securities. Gains and losses from these transactions may arise from changes in the value of the foreign currency or if the counterparties do not perform under the contracts' terms.
Foreign-denominated assets, including investment securities, and liabilities are translated into U.S. dollars at the exchange rates at period end. Purchases and sales of investment securities, income and dividends received, and expenses denominated in foreign currencies are translated into U.S. dollars at the exchange rate in effect on the transaction date.
The effects of exchange rate fluctuations on investments are included with the net realized and unrealized gain (loss) on investment securities. Other foreign currency transactions resulting in realized and unrealized gain (loss) are disclosed separately.
Investment Transactions and Income. For financial reporting purposes, the Fund's investment holdings and NAV include trades executed through the end of the last business day of the period. The NAV per share for processing shareholder transactions is calculated as of the close of business of the New York Stock Exchange (NYSE), normally 4:00 p.m. Eastern time and includes trades executed through the end of the prior business day. Gains and losses on securities sold are determined on the basis of identified cost. Commissions paid to certain brokers with whom the investment adviser, or its affiliates, places trades on behalf of a fund include an amount in addition to trade execution, which may be rebated back to a fund. Any such rebates are included in net realized gain (loss) on investments in the Statement of Operations. Dividend income is recorded on the ex-dividend date, except for certain dividends from foreign securities where the ex-dividend date may have passed, which are recorded as soon as the Fund is informed of the ex-dividend date. Non-cash dividends included in dividend income, if any, are recorded at the fair market value of the securities received. Income and capital gain distributions from Fidelity Central Funds, if any, are recorded on the ex-dividend date. Income and capital gain distributions from any underlying mutual funds or exchange-traded funds (ETFs) are recorded on the ex-dividend date. Interest income is accrued as earned and includes coupon interest and amortization of premium and accretion of discount on debt securities as applicable. Investment income is recorded net of foreign taxes withheld where recovery of such taxes is uncertain. Funds may file withholding tax reclaims in certain jurisdictions to recover a portion of amounts previously withheld. Any withholding tax reclaims income is included in the Statement of Operations in foreign taxes withheld. Any receivables for withholding tax reclaims are included in the Statement of Assets and Liabilities in dividends receivable.
Expenses. Expenses directly attributable to a fund are charged to that fund. Expenses attributable to more than one fund are allocated among the respective funds on the basis of relative net assets or other appropriate methods. Expenses included in the accompanying financial statements reflect the expenses of that fund and do not include any expenses associated with any underlying mutual funds or exchange-traded funds. Although not included in a fund's expenses, a fund indirectly bears its proportionate share of these expenses through the net asset value of each underlying mutual fund or exchange-traded fund. Expense estimates are accrued in the period to which they relate and adjustments are made when actual amounts are known.
Deferred Trustee Compensation. Under a Deferred Compensation Plan (the Plan) for certain Funds, certain independent Trustees have elected to defer receipt of a portion of their annual compensation. Deferred amounts are invested in affiliated mutual funds, are marked-to-market and remain in a fund until distributed in accordance with the Plan. The investment of deferred amounts and the offsetting payable to the Trustees presented below are included in the accompanying Statement of Assets and Liabilities in other receivables and other payables and accrued expenses, as applicable.
| Strategic Advisers Fidelity Emerging Markets Fund | $9,134 |
Income Tax Information and Distributions to Shareholders. Each year, the Fund intends to qualify as a regulated investment company under Subchapter M of the Internal Revenue Code, including distributing substantially all of its taxable income and realized gains. As a result, no provision for U.S. Federal income taxes is required. The Fund files a U.S. federal tax return, in addition to state and local tax returns as required. The Fund's federal income tax returns are subject to examination by the Internal Revenue Service (IRS) for a period of three fiscal years after they are filed. State and local tax returns may be subject to examination for an additional fiscal year depending on the jurisdiction. Foreign taxes are provided for based on the Fund's understanding of the tax rules and rates that exist in the foreign markets in which it invests. The Fund is subject to a tax imposed on capital gains by certain countries in which it invests. An estimated deferred tax liability for net unrealized appreciation on the applicable securities is included in Deferred taxes on the Statement of Assets and Liabilities.
Distributions are declared and recorded on the ex-dividend date. Income and capital gain distributions are determined in accordance with income tax regulations, which may differ from GAAP.
Capital accounts within the financial statements are adjusted for permanent book-tax differences. These adjustments have no impact on net assets or the results of operations. Capital accounts are not adjusted for temporary book-tax differences which will reverse in a subsequent period.
Book-tax differences are primarily due to futures contracts, foreign currency transactions, certain foreign taxes, passive foreign investment companies (PFIC), capital loss carryforwards and losses deferred due to wash sales.
As of period end, the cost and unrealized appreciation (depreciation) in securities, and derivatives if applicable, for federal income tax purposes were as follows:
| Gross unrealized appreciation | $2,287,140,636 |
| Gross unrealized depreciation | (888,102,650) |
| Net unrealized appreciation (depreciation) | $1,399,037,986 |
| Tax cost | $18,449,764,027 |
Capital loss carryforwards are only available to offset future capital gains of the Fund to the extent provided by regulations and may be limited. The capital loss carryforward information presented below, including any applicable limitation, is estimated as of prior fiscal period end and is subject to adjustment.
Short-term | $(645,412,334) |
Long-term | (432,468,912) |
| Total capital loss carryforward | $(1,077,881,246) |
Restricted Securities (including Private Placements). Funds may invest in securities that are subject to legal or contractual restrictions on resale. These securities generally may be resold in transactions exempt from registration or to the public if the securities are registered. Disposal of these securities may involve time-consuming negotiations and expense, and prompt sale at an acceptable price may be difficult. Information regarding restricted securities held at period end is included at the end of the Schedule of Investments, if applicable.
New Accounting Pronouncement. In November 2023, the FASB issued Accounting Standards Update (ASU) 2023-07 Segment Reporting (Topic 280): Improvements to Reportable Segment Disclosures. Effective for fiscal years beginning after December 15, 2023 and interim periods within fiscal years beginning after December 15, 2024, the amendments enhance required disclosures of segment information for public entities on an annual and interim basis. The ASU allows for early adoption with updates applied retrospectively. Management is currently evaluating the impact of the ASU but does not expect this guidance to materially impact the financial statements.
3. Derivative Instruments.
Risk Exposures and the Use of Derivative Instruments. The Fund's investment objectives allow for various types of derivative instruments, including futures contracts. Derivatives are investments whose value is primarily derived from underlying assets, indices or reference rates and may be transacted on an exchange or over-the-counter (OTC). Derivatives may involve a future commitment to buy or sell a specified asset based on specified terms, to exchange future cash flows at periodic intervals based on a notional principal amount, or for one party to make one or more payments upon the occurrence of specified events in exchange for periodic payments from the other party.
Derivatives were used to increase returns and to manage exposure to certain risks as defined below. The success of any strategy involving derivatives depends on analysis of numerous economic factors, and if the strategies for investment do not work as intended, the objectives may not be achieved.
Derivatives were used to increase or decrease exposure to the following risk(s):
| | |
| Equity Risk | Equity risk relates to the fluctuations in the value of financial instruments as a result of changes in market prices (other than those arising from interest rate risk or foreign exchange risk), whether caused by factors specific to an individual investment, its issuer, or all factors affecting all instruments traded in a market or market segment. |
Funds are also exposed to additional risks from investing in derivatives, such as liquidity risk and counterparty credit risk. Liquidity risk is the risk that a fund will be unable to close out the derivative in the open market in a timely manner. Counterparty credit risk is the risk that the counterparty will not be able to fulfill its obligation to a fund. Counterparty credit risk related to exchange-traded contracts may be mitigated by the protection provided by the exchange on which they trade.
Investing in derivatives may involve greater risks than investing in the underlying assets directly and, to varying degrees, may involve risk of loss in excess of any initial investment and collateral received and amounts recognized in the Statement of Assets and Liabilities. In addition, there may be the risk that the change in value of the derivative contract does not correspond to the change in value of the underlying instrument.
Futures Contracts. A futures contract is an agreement between two parties to buy or sell a specified underlying instrument for a fixed price at a specified future date. Futures contracts were used to manage exposure to the stock market.
Upon entering into a futures contract, a fund is required to deposit either cash or securities (initial margin) with a clearing broker in an amount equal to a certain percentage of the face value of the contract. Futures contracts are marked-to-market daily and subsequent daily payments are made or received by a fund depending on the daily fluctuations in the value of the futures contracts and are recorded as unrealized appreciation or (depreciation). This receivable and/or payable, if any, is included in daily variation margin on futures contracts in the Statement of Assets and Liabilities. Realized gain or (loss) is recorded upon the expiration or closing of a futures contract. The net realized gain (loss) and change in net unrealized appreciation (depreciation) on futures contracts during the period is presented in the Statement of Operations.
Any open futures contracts at period end are presented in the Schedule of Investments under the caption "Futures Contracts". The notional amount at value reflects each contract's exposure to the underlying instrument or index at period end, and is representative of volume of activity during the period unless an average notional amount is presented. Any securities deposited to meet initial margin requirements are identified in the Schedule of Investments. Any cash deposited to meet initial margin requirements is presented as segregated cash with brokers for derivative instruments in the Statement of Assets and Liabilities.
4. Purchases and Sales of Investments.
Purchases and sales of securities, other than short-term securities, U.S. government securities and in-kind transactions, as applicable, are noted in the table below.
| | Purchases ($) | Sales ($) |
| Strategic Advisers Fidelity Emerging Markets Fund | 8,473,959,153 | 3,803,938,321 |
5. Fees and Other Transactions with Affiliates.
Management Fee. Strategic Advisers (the investment adviser) provides the Fund with investment management related services. For these services, the Fund pays a monthly management fee to the investment adviser. The management fee is calculated by adding the annual management fee rate of .25% of the Fund's average net assets throughout the month to the aggregate of the fee rates, payable monthly by the investment adviser, to the Fund's sub-advisers. The Fund's maximum aggregate management fee will not exceed 1.20% of the Fund's average net assets. For the reporting period, the total annualized management fee rate was .42% of the Fund's average net assets.
During the period, the investment adviser waived a portion of its management fee as described in the Expense Reductions note.
Sub-Advisers. FIAM LLC (an affiliate of the investment adviser) and FIL Investment Advisors each served as a sub-adviser for the Fund during the period. Sub-advisers provide discretionary investment advisory services for their allocated portion of the Fund's assets and are paid as described in the Management Fee note.
Fidelity Diversifying Solutions LLC and Geode Capital Management, LLC (Geode) have been retained to serve as a sub-adviser for the Fund. As of the date of this report, however, these sub-advisers have not been allocated any portion of the Fund's assets. These sub-advisers in the future may provide discretionary investment advisory services for an allocated portion of the Fund's assets and will be paid by the investment adviser for providing these services.
Effective January 1, 2025, the sub-subadvisory agreements between FIAM LLC (FIAM) or Fidelity Diversifying Solutions LLC (FDS) and each of FMR Investment Management (UK) Limited, Fidelity Management & Research (Hong Kong) Limited, and Fidelity Management & Research (Japan) Limited (collectively, the Sub-Subadvisers) were amended. FIAM, FDS, or an affiliate, as applicable, and not the fund, pays the Sub-Subadvisers. Under the terms of the sub-subadvisory agreements, FIAM, FDS, or an affiliate, as applicable, pays each Sub-Subadviser monthly fees equal to 110% of the Sub-Subadviser's costs for providing sub-subadvisory services.
Interfund Trades. Funds may purchase from or sell securities to other funds affiliated with each sub-adviser under procedures adopted by the Board. The procedures have been designed to ensure these interfund trades are executed in accordance with Rule 17a-7 of the 1940 Act. Any interfund trades are included within the respective purchases and sales amounts shown in the Purchases and Sales of Investments note. Interfund trades during the period are noted in the table below.
| | Purchases ($) | Sales ($) | Realized Gain (Loss)($) |
| Strategic Advisers Fidelity Emerging Markets Fund | 26,333,855 | 39,133,881 | 3,914,334 |
Brokerage Commissions. A portion of portfolio transactions were placed with brokerage firms which are affiliates of the investment adviser. Brokerage commissions are included in net realized gain (loss) and change in net unrealized appreciation (depreciation) in the Statement of Operations. The commissions paid to these affiliated firms were as follows:
| | Amount ($) |
| Strategic Advisers Fidelity Emerging Markets Fund | 6,418 |
Affiliated Exchanges In-Kind. During the period, the Fund redeemed shares of Fidelity Emerging Markets Fund, in exchange for investments and cash, if any, as noted in the table below. The Fund had a net realized loss of $42,266,952 on the Fund's redemptions of Fidelity Emerging Markets Fund, which is included in "Net Realized gain (loss) - Affiliated Issuers" in the accompanying Statement of Operations. The Fund recognized a net loss on the exchanges for federal income tax purposes.
| Fund Name | Value of Investments ($) | Net realized gain (loss) ($) | Shares redeemed |
| Fidelity Emerging Markets Fund | 1,042,505,854 | (42,266,952) | 25,371,279 |
6. Investments in Fidelity Central Funds.
Funds may invest in Fidelity Central Funds, which are open-end investment companies generally available only to other investment companies and accounts managed by the investment adviser and its affiliates. The Schedule of Investments lists any Fidelity Central Funds held as an investment as of period end, but does not include the underlying holdings of each Fidelity Central Fund. An investing fund indirectly bears its proportionate share of the expenses of the underlying Fidelity Central Funds.
Based on its investment objective, each Fidelity Central Fund may invest or participate in various investment vehicles or strategies that are similar to those of the investing fund. These strategies are consistent with the investment objectives of the investing fund and may involve certain economic risks which may cause a decline in value of each of the Fidelity Central Funds and thus a decline in the value of the investing fund.
| Fidelity Central Fund | Investment Manager | Investment Objective | Investment Practices | Expense RatioA |
| Fidelity Money Market Central Funds | Fidelity Management & Research Company LLC (FMR) | Each fund seeks to obtain a high level of current income consistent with the preservation of capital and liquidity. | Short-term Investments | Less than .005% |
A Expenses expressed as a percentage of average net assets and are as of each underlying Central Fund's most recent annual or semi-annual shareholder report.
A complete unaudited list of holdings for each Fidelity Central Fund is available upon request or at the Securities and Exchange Commission website at www.sec.gov. In addition, the financial statements of the Fidelity Central Funds, which are not covered by the Report of Independent Registered Public Accounting Firm, are available on the Securities and Exchange Commission website or upon request.
7. Committed Line of Credit.
Certain Funds participate with other funds managed by the investment adviser or an affiliate in a $4.25 billion credit facility (the "line of credit") to be utilized for temporary or emergency purposes to fund shareholder redemptions or for other short-term liquidity purposes. The participating funds have agreed to pay commitment fees on their pro-rata portion of the line of credit, which are reflected in Miscellaneous expenses on the Statement of Operations, and are listed below. During the period, there were no borrowings on this line of credit.
| | Amount ($) |
| Strategic Advisers Fidelity Emerging Markets Fund | 10,904 |
8. Security Lending.
Funds lend portfolio securities from time to time in order to earn additional income. Lending agents are used, including National Financial Services (NFS), an affiliate of the investment adviser. Pursuant to a securities lending agreement, NFS will receive a fee, which is capped at 9.9% of a fund's daily lending revenue, for its services as lending agent. A fund may lend securities to certain qualified borrowers, including NFS. On the settlement date of the loan, a fund receives collateral (in the form of U.S. Treasury obligations, letters of credit and/or cash) against the loaned securities and maintains collateral in an amount not less than 100% of the market value of the loaned securities during the period of the loan. The market value of the loaned securities is determined at the close of business of a fund and any additional required collateral is delivered to a fund on the next business day. A fund or borrower may terminate the loan at any time, and if the borrower defaults on its obligation to return the securities loaned because of insolvency or other reasons, a fund may apply collateral received from the borrower against the obligation. A fund may experience delays and costs in recovering the securities loaned. Any cash collateral received is invested in the Fidelity Securities Lending Cash Central Fund. Any loaned securities are identified as such in the Schedule of Investments, and the value of loaned securities and cash collateral at period end, as applicable, are presented in the Statement of Assets and Liabilities. Security lending income represents the income earned on investing cash collateral, less rebates paid to borrowers and any lending agent fees associated with the loan, plus any premium payments received for lending certain types of securities. Security lending income is presented in the Statement of Operations as a component of income from Fidelity Central Funds. Affiliated security lending activity, if any, was as follows:
| | Total Security Lending Fees Paid to NFS ($) | Security Lending Income From Securities Loaned to NFS ($) | Value of Securities Loaned to NFS at Period End ($) |
| Strategic Advisers Fidelity Emerging Markets Fund | 39,608 | - | - |
9. Expense Reductions.
The investment adviser has contractually agreed to waive the Fund's management fee in an amount equal to .25% of the Fund's average net assets until September 30, 2027. During the period, this waiver reduced the Fund's management fee by $22,295,798. Expense reductions also include certain voluntary fee discount arrangements, which are currently in effect for the Fund. During the period, these voluntary arrangements amounted to $126,561.
Through arrangements with the Fund's, credits realized as a result of certain uninvested cash balances were used to reduce the Fund's expenses by $30,228.
10. Other.
A fund's organizational documents provide former and current trustees and officers with a limited indemnification against liabilities arising in connection with the performance of their duties to the fund. In the normal course of business, a fund may also enter into contracts that provide general indemnifications. A fund's maximum exposure under these arrangements is unknown as this would be dependent on future claims that may be made against a fund. The risk of material loss from such claims is considered remote.
Funds do not invest in underlying mutual funds for the purpose of exercising management or control; however, investments by funds within their principal investment strategies may represent a significant portion of the underlying mutual fund's net assets. At the end of the period, certain Funds were the owners of record of 10% or more of the total outstanding shares of the following underlying mutual funds as shown below.
| Fund | Strategic Advisers Fidelity Emerging Markets Fund |
| Fidelity China Region Fund | 14% |
| Fidelity Emerging Markets Fund | 11% |
| Fidelity SAI Emerging Markets Index Fund | 30% |
| Fidelity SAI Emerging Markets Low Volatility Index Fund | 57% |
| Fidelity SAI Emerging Markets Value Index Fund | 71% |
11. Risk and Uncertainties.
Many factors affect a fund's performance. Developments that disrupt global economies and financial markets, such as pandemics, epidemics, outbreaks of infectious diseases, war, terrorism, and environmental disasters, may significantly affect a fund's investment performance. The effects of these developments to a fund will be impacted by the types of securities in which a fund invests, the financial condition, industry, economic sector, and geographic location of an issuer, and a fund's level of investment in the securities of that issuer. Significant concentrations in security types, issuers, industries, sectors, and geographic locations may magnify the factors that affect a fund's performance.
Item 8: Changes in and Disagreements with Accountants for Open-End Management Investment Companies
(Unaudited)
Note: This is not applicable for any fund included in this document.
Item 9: Proxy Disclosures for Open-End Management Investment Companies
(Unaudited)
| A special meeting of shareholders was held on July 9, 2024. The results of votes taken among shareholders on the proposal before them are reported below. Each vote reported represents one dollar of net asset value held on the record date for the meeting. |
| Proposal 1 |
| To elect a Board of Trustees. |
| | # of Votes | % of Votes |
| Charles S. Morrison |
| Affirmative | 381,775,585,183.64 | 95.17 |
| Withheld | 19,363,639,577.49 | 4.83 |
| TOTAL | 401,139,224,761.13 | 100.00 |
| Nancy D. Prior |
| Affirmative | 381,252,305,731.53 | 95.04 |
| Withheld | 19,886,919,029.60 | 4.96 |
| TOTAL | 401,139,224,761.13 | 100.00 |
| Mary C. Farrell |
| Affirmative | 381,226,030,239.11 | 95.04 |
| Withheld | 19,913,194,522.02 | 4.96 |
| TOTAL | 401,139,224,761.13 | 100.00 |
| Karen Kaplan |
| Affirmative | 381,519,946,847.38 | 95.11 |
| Withheld | 19,619,277,913.75 | 4.89 |
| TOTAL | 401,139,224,761.13 | 100.00 |
| Christine Marcks |
| Affirmative | 380,186,327,029.51 | 94.78 |
| Withheld | 20,952,897,731.62 | 5.22 |
| TOTAL | 401,139,224,761.13 | 100.00 |
| Harold Singleton III |
| Affirmative | 382,499,458,473.65 | 95.35 |
| Withheld | 18,639,766,287.48 | 4.65 |
| TOTAL | 401,139,224,761.13 | 100.00 |
| Heidi L. Steiger |
| Affirmative | 380,661,676,515.00 | 94.90 |
| Withheld | 20,477,548,246.13 | 5.10 |
| TOTAL | 401,139,224,761.13 | 100.00 |
| | | |
| Proposal 3 |
| To approve sub-advisory agreements among Strategic Advisers, Fidelity Diversifying Solutions LLC (FDS), and the trust, and sub-subadvisory agreements between FDS and each of FMR Investment Management (UK) Limited (FMR UK), Fidelity Management & Research (Hong Kong) Limited (FMR H.K.), and Fidelity Management & Research (Japan) Limited (FMR Japan). |
| | # of Votes | % of Votes |
| Affirmative | 19,560,769,300.60 | 92.93 |
| Against | 658,514,273.07 | 3.13 |
| Abstain | 829,374,437.13 | 3.94 |
| TOTAL | 21,048,658,010.80 | 100.00 |
| | | |
| Proposal 1 reflects trust-wide proposal and voting results. |
Item 10: Remuneration Paid to Directors, Officers, and others of Open-End Management Investment Companies
(Unaudited)
Note: This information is disclosed as part of the financial statements for each Fund as part of Item 7: Financial Statements and Financial Highlights for Open-End Management Investment companies.
Item 11: Statement Regarding Basis for Approval of Investment Advisory Contract
(Unaudited)
Board Approval of Investment Advisory Contracts and Management Fees
Strategic Advisers Fidelity Emerging Markets Fund
Each year, the Board of Trustees, including the Independent Trustees (together, the Board), considers the renewal of the fund's management contract with Strategic Advisers LLC (Strategic Advisers), the sub-advisory agreements with FIAM LLC (FIAM), FIL Investment Advisors (FIL), and Geode Capital Management, LLC (each a Sub-Adviser and collectively, the Sub-Advisers) (collectively, the Sub-Advisory Agreements), and the sub-sub-advisory agreements with FMR Investment Management (UK) Limited, Fidelity Management & Research (Japan) Limited, Fidelity Management & Research (Hong Kong) Limited, and FIL Investment Advisors (UK) Limited (each a Sub-Sub-Adviser and collectively, the Sub-Sub-Advisers) (collectively, the Sub-Sub-Advisory Agreements and, together with the management contract and the Sub-Advisory Agreements, the Advisory Contracts) for the fund. Strategic Advisers and the Sub-Advisers and Sub-Sub-Advisers, as applicable, are referred to herein as the Investment Advisers. The Board, assisted by the advice of fund counsel and Independent Trustees' counsel, requests and considers a broad range of information relevant to the renewal of the Advisory Contracts throughout the year.
The Board meets at least four times per year and, at each of its meetings, covers an extensive agenda of topics and materials and considers factors that are relevant to its annual consideration of the renewal of the fund's Advisory Contracts, including the services and support provided to the fund and its shareholders. The full Board or the Independent Trustees, as appropriate, act on all major matters; however, a portion of the activities of the Board (including certain of those described herein) may be conducted through standing committees that have been established by the Board. The Board, acting directly and through its committees, requests and receives information concerning the annual consideration of the renewal of the fund's Advisory Contracts.
At its September 2024 meeting, the Board, including the Independent Trustees, unanimously determined to renew the fund's Advisory Contracts. The Board also approved updating the address for notice of Strategic Advisers LLC in each Sub-Advisory Agreement. In addition, the Board approved amendments to the existing fee schedules to the Sub-Advisory Agreements with FIAM (for one mandate) and FIL which resulted in the same or lower fees at all asset levels (Fee Schedule Amendments). The Board also approved an amendment to the Sub-Advisory Agreement with FIAM to add a new mandate (Mandate Amendment and, together with the Fee Schedule Amendments, the Amendments). The Board noted that the new mandate (once funded) is expected to increase the fund's total management fee rate and decrease total net expenses. The Board also noted that no other contract terms are impacted by the Amendments.
In reaching its determination to renew the fund's Advisory Contracts and approve the Amendments, the Board considered all factors it believed relevant, including (i) the nature, extent, and quality of the services provided to the fund and its shareholders (including the investment performance of the fund); (ii) the competitiveness relative to peer funds of the fund's management fee and total expenses; (iii) the total costs of the services provided by and the profits, if any, realized by Strategic Advisers from its relationships with the fund; and (iv) the extent to which, if any, economies of scale exist and are realized as the fund grows and whether any economies of scale are appropriately shared with fund shareholders. The Board's decision to renew the Advisory Contracts and approve the Amendments was not based on any single factor, but rather was based on a comprehensive consideration of all the information provided to the Board throughout the year.
The Board reached a determination, with the assistance of fund counsel and Independent Trustees' counsel and through the exercise of its business judgment, that the renewal of the Advisory Contracts and the approval of the Amendments are in the best interests of the fund and its shareholders. In addition, the Board concluded that the renewal of each Sub-Advisory Agreement and Sub-Sub-Advisory Agreement and the approval of the Amendments do not involve a conflict of interest from which Strategic Advisers or its affiliates derive an inappropriate advantage. Also, the Board found that the advisory fees charged under the Advisory Contracts bear a reasonable relationship to the services rendered.
Nature, Extent, and Quality of Services Provided. The Board considered the staffing within the Investment Advisers, including the backgrounds of the fund's investment personnel and also considered the fund's investment objective, strategies, and related investment philosophy. The Independent Trustees also had discussions with senior management of Strategic Advisers' investment operations and investment groups. The Board considered the structure of each Investment Adviser's investment personnel compensation program and whether such structures provide appropriate incentives to act in the best interests of the fund. In approving the Mandate Amendment, the Board also took into consideration additional information about the new investment mandate provided by Strategic Advisers and FIAM.
The Trustees also discussed with representatives of Strategic Advisers, at meetings throughout the year, Strategic Advisers' role in, among other things, (i) setting, implementing and monitoring the investment strategies for the funds; (ii) identifying and recommending sub-advisers for the funds; (iii) overseeing compliance with federal securities laws by each sub-adviser with respect to the portion of fund assets allocated to the sub-adviser; (iv) monitoring and overseeing the performance and investment capabilities of each sub-adviser; and (v) recommending the replacement of a sub-adviser as appropriate. The Trustees considered that the Board had received from Strategic Advisers substantial information and periodic reports about Strategic Advisers' sub-adviser oversight and due diligence processes, as well as periodic reports regarding the performance of each sub-adviser.
The Board also considered the nature, extent and quality of services provided by each Sub-Adviser. The Trustees noted that under the Sub-Advisory Agreements subject to oversight by Strategic Advisers, each Sub-Adviser is responsible for, among other things, identifying investments for the portion of fund assets allocated to the Sub-Adviser, if any, and executing portfolio transactions to implement its investment strategy. In addition, the Trustees noted that each Sub-Adviser is responsible for providing such reporting as may be requested from Strategic Advisers to fulfill its oversight responsibilities discussed above.
Resources Dedicated to Investment Management and Support Services. The Board reviewed the general qualifications and capabilities of the Investment Advisers' investment staffs, their use of technology, and the Investment Advisers' approach to managing and compensating investment personnel. The Board noted that the Investment Advisers' analysts have extensive resources, tools, and capabilities that allow them to conduct sophisticated quantitative and/or fundamental analysis. Additionally, in its deliberations, the Board considered the Investment Advisers' trading capabilities and resources and global compliance infrastructure, which are integral parts of the investment management process.
Shareholder and Administrative Services. The Board considered (i) the nature, extent, quality, and cost of administrative and shareholder services performed by Strategic Advisers and its affiliates under the management contract and under separate agreements covering transfer agency, pricing and bookkeeping, and securities lending services for the fund; (ii) the nature and extent of Strategic Advisers' supervision of third party service providers, including sub-advisers, custodians and subcustodians; and (iii) the resources devoted to, and the record of compliance with, the fund's compliance policies and procedures.
Investment Performance. In connection with the renewal of the Advisory Contracts, the Board considered annualized return information for the fund over different time periods, measured against an appropriate securities market index (benchmark index) and a peer group of mutual funds with similar objectives (peer group). In connection with the approval of the Mandate Amendment, the Board considered the historical investment performance of FIAM and its portfolio managers in managing an account under a similar investment mandate.
The Board considered discussions that occur at Board meetings throughout the year with representatives of Strategic Advisers about fund investment performance and the performance of each Sub-Adviser as part of regularly scheduled fund reviews and other reports to the Board on fund performance, taking into account various factors including general market conditions. The Board also considered information about performance attribution. In its discussions with representatives of Strategic Advisers regarding fund performance, the Board gave particular attention to information indicating underperformance of certain funds over different time periods and discussed with Strategic Advisers the reasons for any such underperformance.
In addition to reviewing absolute and relative fund performance, the Independent Trustees periodically consider the appropriateness of fund performance metrics in evaluating the results achieved. The Independent Trustees generally give greater weight to fund performance over longer time periods than over shorter time periods. Depending on the circumstances, the Independent Trustees may be satisfied with the fund's performance notwithstanding that it lags its benchmark index peer group for certain periods.
Based on its review, the Board concluded that the nature, extent, and quality of services provided to the fund under the Advisory Contracts should continue to benefit the shareholders of the fund.
Competitiveness of Management Fee and Total Fund Expenses. The Board considered the amount and nature of fees paid to the Investment Advisers. The Board noted that the Sub-Sub-Advisers are compensated by the applicable Sub-Advisers and the Fund and Strategic Advisers are not responsible for any such fees or expenses. The Board also considered information comparing the management fees and total expenses of the fund to those of other registered investment companies with investment objectives similar to those of the fund, as discussed below. The Board also noted Strategic Advisers' proposal to extend the management fee waiver and considered the fund's contractual maximum aggregate annual management fee rate. In considering the fund's management fee and management fee waiver and comparisons to other registered investment companies with investment objectives similar to those of the fund, the Board noted that shares of the fund are offered only to clients that participate in the Fidelity Portfolio Advisory Service managed account program.
In its review of the fund's total expenses, the Board considered the fund's management fee rate as well as other fund expenses, as applicable, such as expenses from holding Fidelity and non-Fidelity mutual funds and ETFs, pricing and bookkeeping fees, and custodial, legal, and audit fees.
Comparisons of Management Fees and Total Expense Ratios. Among other things, the Board reviewed data for selected groups of competitive funds and classes (referred to as "mapped groups") that were compiled by Fidelity based on combining similar investment objective categories (as classified by Lipper) that have comparable investment mandates. The data reviewed by the Board included (i) gross management fee comparisons (before taking into account expense reimbursements or caps) relative to the total universe of funds within the mapped group; (ii) gross management fee comparisons relative to a subset of non-Strategic Advisers funds in the mapped group that are similar in size and management fee structure to the fund (referred to as the "asset size peer group"); (iii) total expense comparisons of the fund relative to funds and classes in the mapped group that have a similar sales load structure to the fund (referred to as the "similar sales load structure group"); and (iv) total expense comparisons of the fund relative to funds and classes in the similar sales load structure group that are similar in size and management fee structure to each fund (referred to as the "total expense asset size peer group").
The information provided to the Board indicated that the fund's management fee rate ranked below the competitive median of the mapped group for the 12-month period ended December 31, 2023 and below the competitive median of the asset size peer group for the 12-month period ended December 31, 2023. Further, the information provided to the Board indicated that the total expense ratio of the fund ranked below the competitive median of the similar sales load structure group for the 12-month period ended December 31, 2023 and below the competitive median of the total expense asset size peer group for the 12-month period ended December 31, 2023.
Fees Charged to Other Clients. The Board also considered fee structures paid by the Investment Advisers' other clients, such as other funds advised or subadvised by the Investment Advisers, pension plan clients, and other institutional clients with similar investment mandates.
Based on its review, the Board concluded that the fund's management fee bears a reasonable relationship to the services rendered. Further, based on its review of the total expense ratios and fees charged to other clients of Strategic Advisers or its affiliates and each Sub-Adviser, the Board concluded that the total expenses of the fund were reasonable in light of the services that the fund and its shareholders receive and the other factors considered.
Costs of the Services and Profitability. The Board considered information regarding the revenues earned and the expenses incurred by Strategic Advisers and its affiliates in conducting the business of developing, marketing, distributing, managing, administering and servicing the fund and servicing the fund's shareholders.
On an annual basis, Strategic Advisers presents to the Board information about the profitability of its relationships with the fund. Strategic Advisers calculates profitability information for the fund using a series of detailed revenue and cost allocation methodologies. The Board reviews any significant changes from the prior year's methodologies. Strategic Advisers noted that, to the extent possible, it employs the same corporate reporting of revenues and expenses as those used by other Fidelity funds.
A public accounting firm has been engaged annually by the Board as part of the Board's assessment of Fidelity's profitability analysis. The engagement includes the review and assessment of the methodologies used by Fidelity in determining the revenues and expenses attributable to Fidelity's fund business. After considering the reports issued under the engagement and information provided by Fidelity, the Board concluded that while other allocation methods may also be reasonable, Fidelity's profitability methodologies are reasonable in all material respects.
The Board also reviewed Fidelity's non-fund businesses and potential indirect benefits such businesses may have received as a result of their association with Fidelity's fund business (i.e., fall-out benefits) as well as cases where Fidelity's affiliates may benefit from the fund's business. The Board noted that changes to fall-out benefits year-over-year reflect business developments at Fidelity's various businesses.
The Board considered the costs of the services provided by and the profits realized, if any, by Strategic Advisers and its affiliates in connection with the operation of the fund and was satisfied that the profitability was not excessive.
The Board also considered information regarding the profitability of the Sub-Advisers' respective relationships with the fund and the potential fall-out benefits, if any, that may accrue to the Sub-Advisers as a result of their respective relationships with the fund. The Board considered profitability information provided by the Sub-Advisers in light of the nature of the relationships between Strategic Advisers and the Sub-Advisers with respect to the negotiation of sub-advisory fees.
Possible Economies of Scale. The Board considered whether there have been economies of scale in respect of the management of the Strategic Advisers funds, whether the Strategic Advisers funds (including the fund) have appropriately benefited from any such economies of scale, and whether there is potential for realization of any further economies of scale as assets grow through increased services to the fund, through waivers or reimbursements, or through fee or expense ratio reductions. The Board considered that certain of the fund's Sub-Advisory Agreements provide for breakpoints as the fund's assets grow and noted that any potential decline in sub-advisory fees under such contracts would accrue directly to the fund. The Board also took Strategic Advisers' management fee waiver into consideration.
Conclusion. Based on its evaluation of all of the conclusions noted above, and after considering all factors it believed relevant, the Board concluded that the advisory fee arrangements bear a reasonable relationship to the services rendered and that the fund's Advisory Contracts should be renewed and the Amendments should be approved because each agreement is in the best interests of the fund and its shareholders. In addition, the Board concluded that the renewal of each Sub-Advisory Agreement and Sub-Sub-Advisory Agreement and the approval of the Amendments do not involve a conflict of interest from which Strategic Advisers or its affiliates derive an inappropriate advantage.
1.9890708.106
STE-SANN-0125
Strategic Advisers® Fidelity® U.S. Total Stock Fund
Offered exclusively to certain managed account clients of Strategic Advisers LLC or its affiliates - not available for sale to the general public
Semi-Annual Report
November 30, 2024
Contents
To view a fund's proxy voting guidelines and proxy voting record for the 12-month period ended June 30, visit http://www.fidelity.com/proxyvotingresults or visit the Securities and Exchange Commission's (SEC) web site at http://www.sec.gov.
You may also call 1-800-544-3455 to request a free copy of the proxy voting guidelines.
Standard & Poor's, S&P and S&P 500 are registered service marks of The McGraw-Hill Companies, Inc. and have been licensed for use by Fidelity Distributors Corporation.
Other third-party marks appearing herein are the property of their respective owners.
All other marks appearing herein are registered or unregistered trademarks or service marks of FMR LLC or an affiliated company. © 2025 FMR LLC. All rights reserved.
This report and the financial statements contained herein are submitted for the general information of the shareholders of the Fund. This report is not authorized for distribution to prospective investors in the Fund unless preceded or accompanied by an effective prospectus.
A fund files its complete schedule of portfolio holdings with the SEC for the first and third quarters of each fiscal year on Form N-PORT. Forms N-PORT are available on the SEC's web site at http://www.sec.gov. A fund's Forms N-PORT may be reviewed and copied at the SEC's Public Reference Room in Washington, DC. Information regarding the operation of the SEC's Public Reference Room may be obtained by calling 1-800-SEC-0330.
For a complete list of a fund's portfolio holdings, view the most recent holdings listing, semiannual report, or annual report on Fidelity's web site at http://www.fidelity.com, http://www.institutional.fidelity.com, or http://www.401k.com, as applicable.
NOT FDIC INSURED •MAY LOSE VALUE •NO BANK GUARANTEE
Neither the Fund nor Fidelity Distributors Corporation is a bank.
Item 7: Financial Statements and Financial Highlights for Open-End Management Investment Companies (Semi-Annual Report)
Strategic Advisers® Fidelity® U.S. Total Stock Fund
Schedule of Investments November 30, 2024 (Unaudited)
Showing Percentage of Net Assets
| Common Stocks - 48.7% |
| | | Shares | Value ($) |
| COMMUNICATION SERVICES - 3.4% | | | |
| Diversified Telecommunication Services - 0.2% | | | |
| AT&T, Inc. | | 1,809,685 | 41,912,305 |
| Cellnex Telecom SA (b) | | 1,038,400 | 37,287,246 |
| Cogent Communications Group, Inc. | | 91,990 | 7,560,658 |
| Deutsche Telekom AG | | 4,710,800 | 150,738,016 |
| GCI Liberty, Inc. Class A (Escrow) (c)(d)(e) | | 206,400 | 2 |
| Iridium Communications, Inc. | | 220,900 | 6,565,148 |
| Liberty Latin America Ltd. Class C (c) | | 837,320 | 5,785,881 |
| Verizon Communications, Inc. | | 524,127 | 23,239,791 |
| | | | 273,089,047 |
| Entertainment - 0.7% | | | |
| Cinemark Holdings, Inc. (c)(f) | | 211,780 | 7,310,646 |
| Electronic Arts, Inc. | | 30,880 | 5,054,130 |
| IMAX Corp. (c) | | 1,074,300 | 28,275,576 |
| Live Nation Entertainment, Inc. (c) | | 477,300 | 65,986,725 |
| Netflix, Inc. (c) | | 292,481 | 259,375,076 |
| Playtika Holding Corp. | | 49,218 | 414,416 |
| Roblox Corp. Class A (c) | | 240,600 | 12,061,278 |
| Roku, Inc. Class A (c) | | 175,810 | 12,136,164 |
| Sea Ltd. ADR Class A (c) | | 225,600 | 25,673,280 |
| Spotify Technology SA (c) | | 101,400 | 48,363,744 |
| The Walt Disney Co. | | 4,232,783 | 497,225,019 |
| TKO Group Holdings, Inc. (c) | | 296,300 | 40,877,548 |
| Universal Music Group NV | | 1,710,883 | 41,197,282 |
| Warner Bros Discovery, Inc. (c) | | 422,921 | 4,432,212 |
| | | | 1,048,383,096 |
| Interactive Media & Services - 2.0% | | | |
| Alphabet, Inc.: | | | |
| Class A | | 2,193,740 | 370,632,373 |
| Class C | | 6,794,140 | 1,158,332,929 |
| Bumble, Inc. Class A (c) | | 2,122,600 | 18,445,394 |
| Cars.com, Inc. (c) | | 506,600 | 10,066,142 |
| IAC, Inc. Class A (c) | | 254,560 | 12,048,325 |
| Match Group, Inc. (c) | | 946,300 | 30,981,862 |
| Meta Platforms, Inc. Class A | | 1,935,041 | 1,111,332,747 |
| Pinterest, Inc. Class A (c) | | 933,414 | 28,301,112 |
| QuinStreet, Inc. (c) | | 362,400 | 8,255,472 |
| Snap, Inc. Class A (c) | | 3,352,011 | 39,587,250 |
| Yelp, Inc. Class A (c) | | 169,344 | 6,472,328 |
| Ziff Davis, Inc. (c) | | 103,212 | 6,074,026 |
| | | | 2,800,529,960 |
| Media - 0.5% | | | |
| Charter Communications, Inc. Class A (c) | | 19,800 | 7,859,907 |
| Comcast Corp. Class A | | 14,933,958 | 644,997,646 |
| Interpublic Group of Companies, Inc. | | 378,125 | 11,650,031 |
| Ipsos SA | | 23,900 | 1,116,330 |
| Liberty Broadband Corp.: | | | |
| Class A (c) | | 402,725 | 34,098,726 |
| Class C (c) | | 128,900 | 10,974,546 |
| News Corp.: | | | |
| Class A | | 46,545 | 1,366,096 |
| Class B | | 13,773 | 441,976 |
| Nexstar Media Group, Inc. | | 15,165 | 2,586,997 |
| Pico Far East Holdings Ltd. | | 1,026,000 | 238,697 |
| TEGNA, Inc. | | 425,769 | 7,991,684 |
| The New York Times Co. Class A | | 563,619 | 30,581,967 |
| Thryv Holdings, Inc. (c) | | 448,245 | 7,091,236 |
| WPP PLC | | 720,000 | 7,875,408 |
| | | | 768,871,247 |
| Wireless Telecommunication Services - 0.0% | | | |
| Gogo, Inc. (c)(f) | | 462,100 | 3,710,663 |
| T-Mobile U.S., Inc. | | 98,378 | 24,293,463 |
| | | | 28,004,126 |
TOTAL COMMUNICATION SERVICES | | | 4,918,877,476 |
| CONSUMER DISCRETIONARY - 3.9% | | | |
| Automobile Components - 0.2% | | | |
| Adient PLC (c) | | 660,600 | 12,703,338 |
| Akwel | | 5,700 | 48,188 |
| Aptiv PLC (c) | | 682,100 | 37,877,013 |
| Autoliv, Inc. | | 320,870 | 31,804,634 |
| BorgWarner, Inc. | | 571,956 | 19,629,530 |
| Brembo N.V. | | 472,600 | 4,375,918 |
| Cie Automotive SA | | 411,580 | 10,916,923 |
| DaikyoNishikawa Corp. | | 619,300 | 2,520,828 |
| Gentex Corp. | | 580,355 | 17,735,649 |
| Gentherm, Inc. (c) | | 81,930 | 3,449,253 |
| LCI Industries (f) | | 114,650 | 13,850,867 |
| Lear Corp. | | 244,590 | 23,930,686 |
| Mobileye Global, Inc. Class A (c)(f) | | 183,838 | 3,318,276 |
| Patrick Industries, Inc. (f) | | 220,153 | 29,586,362 |
| | | | 211,747,465 |
| Automobiles - 0.3% | | | |
| Ford Motor Co. | | 1,297,021 | 14,435,844 |
| General Motors Co. | | 320,200 | 17,799,918 |
| Harley-Davidson, Inc. | | 388,600 | 13,068,618 |
| Mercedes-Benz Group AG (Germany) | | 60,500 | 3,401,267 |
| Rivian Automotive, Inc. Class A (c)(f) | | 789,700 | 9,658,031 |
| Stellantis NV | | 113,700 | 1,500,840 |
| Tesla, Inc. (c) | | 1,174,200 | 405,286,872 |
| | | | 465,151,390 |
| Broadline Retail - 0.9% | | | |
| Amazon.com, Inc. (c) | | 5,563,194 | 1,156,532,401 |
| ASKUL Corp. | | 340,900 | 4,249,430 |
| B&M European Value Retail SA | | 1,426,500 | 6,296,755 |
| Dillard's, Inc. Class A (f) | | 8,235 | 3,649,093 |
| eBay, Inc. | | 136,700 | 8,651,743 |
| Etsy, Inc. (c) | | 204,300 | 11,207,898 |
| Europris ASA (b) | | 984,481 | 5,907,269 |
| Global-e Online Ltd. (c) | | 102,810 | 5,374,907 |
| Kohl's Corp. (f) | | 90,680 | 1,357,480 |
| Macy's, Inc. | | 491,400 | 7,980,336 |
| Max Stock Ltd. | | 367,700 | 1,120,546 |
| PDD Holdings, Inc. ADR (c) | | 170,200 | 16,434,512 |
| | | | 1,228,762,370 |
| Distributors - 0.0% | | | |
| Arata Corp. | | 146,400 | 2,940,427 |
| Autohellas SA | | 196,880 | 2,155,428 |
| Green Cross Holdings Co. Ltd. | | 28,900 | 235,079 |
| Inchcape PLC | | 1,399,689 | 13,713,964 |
| LKQ Corp. | | 667,000 | 26,206,430 |
| | | | 45,251,328 |
| Diversified Consumer Services - 0.2% | | | |
| ADT, Inc. | | 1,351,343 | 10,297,234 |
| Adtalem Global Education, Inc. (c) | | 26,399 | 2,413,133 |
| Carriage Services, Inc. | | 57,020 | 2,312,161 |
| European Wax Center, Inc. Class A (c) | | 392,640 | 2,359,766 |
| Frontdoor, Inc. (c) | | 195,281 | 11,443,467 |
| Grand Canyon Education, Inc. (c) | | 53,700 | 8,838,483 |
| H&R Block, Inc. | | 2,405,200 | 142,580,256 |
| Laureate Education, Inc. | | 3,848,381 | 73,119,239 |
| ME Group International PLC | | 470,283 | 1,310,521 |
| OneSpaWorld Holdings Ltd. | | 464,900 | 8,828,451 |
| Perdoceo Education Corp. | | 164,687 | 4,520,658 |
| Service Corp. International (f) | | 954,116 | 84,525,136 |
| | | | 352,548,505 |
| Hotels, Restaurants & Leisure - 0.7% | | | |
| Airbnb, Inc. Class A (c) | | 396,300 | 53,940,393 |
| Aramark | | 723,020 | 29,419,684 |
| Booking Holdings, Inc. | | 45,767 | 238,079,019 |
| Boyd Gaming Corp. | | 42,761 | 3,157,900 |
| Brinker International, Inc. (c) | | 85,170 | 11,265,436 |
| Caesars Entertainment, Inc. (c) | | 426,300 | 16,408,287 |
| Carnival Corp. (c) | | 554,560 | 14,102,461 |
| Chipotle Mexican Grill, Inc. (c) | | 41,741 | 2,567,906 |
| Churchill Downs, Inc. | | 352,400 | 50,079,564 |
| Domino's Pizza, Inc. | | 154,017 | 73,341,355 |
| Doordash, Inc. (c) | | 34,494 | 6,225,477 |
| Dutch Bros, Inc. Class A (c) | | 790,640 | 42,481,087 |
| Expedia Group, Inc. Class A (c) | | 146,481 | 27,043,322 |
| Flutter Entertainment PLC (c) | | 98,900 | 27,195,170 |
| Flutter Entertainment PLC (c) | | 157,500 | 43,520,400 |
| Golden Entertainment, Inc. | | 54,504 | 1,838,965 |
| Hilton Grand Vacations, Inc. (c) | | 369,500 | 15,663,105 |
| Hollywood Bowl Group PLC | | 696,700 | 2,836,851 |
| International Game Technology PLC | | 901,530 | 17,336,422 |
| Light & Wonder, Inc. Class A (c) | | 62,669 | 5,956,062 |
| Marriott International, Inc. Class A | | 474,800 | 137,259,932 |
| Marriott Vacations Worldwide Corp. | | 21,312 | 2,115,216 |
| McDonald's Corp. | | 42,196 | 12,490,438 |
| MGM Resorts International (c)(f) | | 286,392 | 10,980,269 |
| MTY Food Group, Inc. (f) | | 138,000 | 4,686,904 |
| Noodles & Co. Class A (c) | | 369,360 | 251,202 |
| Red Rock Resorts, Inc. | | 313,660 | 15,711,229 |
| Restaurant Brands International, Inc. | | 634,300 | 44,184,213 |
| Royal Caribbean Cruises Ltd. | | 23,403 | 5,711,736 |
| Starbucks Corp. | | 799,602 | 81,927,221 |
| Travel+Leisure Co. | | 21,112 | 1,179,527 |
| Wendy's Co. (f) | | 107,625 | 1,975,995 |
| Yum! Brands, Inc. | | 389,000 | 54,047,660 |
| | | | 1,054,980,408 |
| Household Durables - 0.3% | | | |
| Barratt Developments PLC | | 1,494,725 | 8,134,695 |
| Berkeley Group Holdings PLC | | 434,397 | 22,957,496 |
| Cavco Industries, Inc. (c) | | 66,606 | 34,268,787 |
| Cuckoo Holdings Co. Ltd. | | 41,065 | 680,765 |
| D.R. Horton, Inc. | | 65,513 | 11,057,284 |
| FJ Next Co. Ltd. | | 114,900 | 877,023 |
| Garmin Ltd. | | 42,203 | 8,972,358 |
| Helen of Troy Ltd. (c) | | 192,400 | 14,108,692 |
| Installed Building Products, Inc. (f) | | 101,248 | 23,159,468 |
| KB Home | | 182,878 | 15,131,326 |
| Leggett & Platt, Inc. | | 154,228 | 1,941,731 |
| LGI Homes, Inc. (c) | | 47,790 | 5,232,527 |
| M/I Homes, Inc. (c) | | 88,972 | 14,683,049 |
| Mohawk Industries, Inc. (c) | | 108,561 | 15,071,524 |
| Newell Brands, Inc. | | 218,205 | 2,092,586 |
| Pressance Corp. | | 285,000 | 3,518,330 |
| PulteGroup, Inc. | | 3,384 | 457,754 |
| SharkNinja, Inc. | | 193,670 | 19,473,519 |
| Taylor Morrison Home Corp. (c) | | 113,368 | 8,374,494 |
| Tempur Sealy International, Inc. | | 637,700 | 35,698,446 |
| Toll Brothers, Inc. | | 479,971 | 79,276,810 |
| TopBuild Corp. (c)(f) | | 125,828 | 49,153,450 |
| TRI Pointe Homes, Inc. (c) | | 535,114 | 23,293,512 |
| Vistry Group PLC (c) | | 425,663 | 3,553,125 |
| Whirlpool Corp. | | 186,652 | 20,796,766 |
| Worthington Enterprises, Inc. | | 75,963 | 3,108,406 |
| | | | 425,073,923 |
| Leisure Products - 0.0% | | | |
| BRP, Inc. Subordinate Voting Shares | | 72,400 | 3,532,994 |
| Brunswick Corp. | | 351,000 | 28,259,010 |
| Malibu Boats, Inc. Class A (c)(f) | | 50,891 | 2,206,125 |
| | | | 33,998,129 |
| Specialty Retail - 1.0% | | | |
| Abercrombie & Fitch Co. Class A (c) | | 79,285 | 11,868,172 |
| Academy Sports & Outdoors, Inc. | | 994,027 | 48,955,830 |
| Advance Auto Parts, Inc. (f) | | 251,100 | 10,382,985 |
| America's Car Mart, Inc. (c) | | 57,290 | 2,644,506 |
| American Eagle Outfitters, Inc. | | 285,227 | 5,487,767 |
| Arcland Sakamoto Co. Ltd. | | 293,500 | 3,297,621 |
| Bath & Body Works, Inc. | | 135,219 | 4,900,337 |
| Best Buy Co., Inc. | | 76,741 | 6,906,690 |
| Boot Barn Holdings, Inc. (c) | | 131,440 | 18,025,682 |
| Burlington Stores, Inc. (c) | | 37,400 | 10,542,312 |
| Caleres, Inc. (f) | | 228,293 | 7,093,064 |
| Camping World Holdings, Inc. Class A (f) | | 241,520 | 5,902,749 |
| Carvana Co. Class A (c) | | 163,164 | 42,491,169 |
| Dick's Sporting Goods, Inc. | | 155,349 | 32,194,527 |
| Dunelm Group PLC | | 133,800 | 1,947,704 |
| Floor & Decor Holdings, Inc. Class A (c) | | 136,200 | 15,283,002 |
| Foot Locker, Inc. (c)(f) | | 456,800 | 11,488,520 |
| Gap, Inc. | | 861,881 | 20,900,614 |
| JD Sports Fashion PLC | | 11,734,854 | 15,200,791 |
| Jumbo SA | | 481,660 | 12,561,977 |
| Lowe's Companies, Inc. | | 1,735,210 | 472,723,260 |
| Maisons du Monde SA (b)(f) | | 415,000 | 1,580,977 |
| Monro, Inc. (f) | | 73,937 | 2,079,108 |
| Murphy U.S.A., Inc. | | 246,312 | 134,929,714 |
| Petco Health & Wellness Co., Inc. Class A (c)(f) | | 227,615 | 971,916 |
| Pets At Home Group PLC | | 3,143,500 | 9,303,876 |
| RH (c) | | 67,435 | 25,971,916 |
| Ross Stores, Inc. | | 1,180,713 | 182,857,022 |
| Sally Beauty Holdings, Inc. (c) | | 313,500 | 4,367,055 |
| Sportsman's Warehouse Holdings, Inc. (c) | | 326,220 | 698,111 |
| The Buckle, Inc. (f) | | 67,791 | 3,531,233 |
| The Home Depot, Inc. | | 282,671 | 121,302,606 |
| The Hour Glass Ltd. | | 1,687,200 | 1,927,377 |
| TJX Companies, Inc. | | 1,015,071 | 127,584,274 |
| Ulta Beauty, Inc. (c) | | 216,300 | 83,630,232 |
| Valvoline, Inc. (c) | | 506,187 | 20,100,686 |
| WH Smith PLC | | 225,145 | 3,523,775 |
| Williams-Sonoma, Inc. | | 74,400 | 12,798,288 |
| | | | 1,497,957,445 |
| Textiles, Apparel & Luxury Goods - 0.3% | | | |
| Crocs, Inc. (c) | | 553,420 | 58,441,152 |
| Gildan Activewear, Inc. | | 142,000 | 7,053,091 |
| Kontoor Brands, Inc. | | 224,776 | 20,629,941 |
| Levi Strauss & Co. Class A | | 575,700 | 10,051,722 |
| NIKE, Inc. Class B | | 1,004,100 | 79,092,957 |
| Oxford Industries, Inc. | | 104,500 | 8,691,265 |
| PVH Corp. | | 656,549 | 71,150,215 |
| Rocky Brands, Inc. | | 292,159 | 6,339,850 |
| Skechers U.S.A., Inc. Class A (sub. vtg.) (c) | | 155,600 | 9,930,392 |
| Tapestry, Inc. (f) | | 1,950,030 | 121,447,868 |
| VF Corp. | | 635,500 | 12,856,165 |
| Wolverine World Wide, Inc. | | 1,098,500 | 25,474,215 |
| | | | 431,158,833 |
TOTAL CONSUMER DISCRETIONARY | | | 5,746,629,796 |
| CONSUMER STAPLES - 3.1% | | | |
| Beverages - 0.8% | | | |
| Boston Beer Co., Inc. Class A (c) | | 29,837 | 9,435,653 |
| Celsius Holdings, Inc. (c) | | 204,000 | 5,803,800 |
| Coca-Cola Consolidated, Inc. | | 23,443 | 30,576,470 |
| Coca-Cola Europacific Partners PLC | | 1,190,600 | 92,366,748 |
| Coca-Cola HBC AG | | 52,800 | 1,883,877 |
| Davide Campari Milano NV | | 789,500 | 4,738,102 |
| Diageo PLC | | 1,811,300 | 54,112,147 |
| Diageo PLC sponsored ADR | | 486,405 | 58,057,301 |
| Keurig Dr. Pepper, Inc. | | 9,488,710 | 309,806,382 |
| Molson Coors Beverage Co. Class B | | 107,435 | 6,667,416 |
| Monster Beverage Corp. (c) | | 229,200 | 12,635,796 |
| National Beverage Corp. | | 58,705 | 2,899,440 |
| PepsiCo, Inc. | | 337,000 | 55,082,650 |
| Pernod Ricard SA | | 203,200 | 22,740,076 |
| Primo Brands Corp. Class A | | 1,790,470 | 51,064,204 |
| The Coca-Cola Co. | | 6,944,286 | 444,989,847 |
| The Vita Coco Co., Inc. (c)(f) | | 73,932 | 2,627,543 |
| | | | 1,165,487,452 |
| Consumer Staples Distribution & Retail - 1.0% | | | |
| Acomo NV | | 110,100 | 2,036,093 |
| Alimentation Couche-Tard, Inc. (multi-vtg.) | | 1,616,200 | 94,809,833 |
| Belc Co. Ltd. | | 10,700 | 477,018 |
| BJ's Wholesale Club Holdings, Inc. (c) | | 1,066,851 | 102,737,751 |
| Casey's General Stores, Inc. | | 31,800 | 13,384,302 |
| Costco Wholesale Corp. | | 267,200 | 259,686,336 |
| G-7 Holdings, Inc. | | 439,100 | 4,293,709 |
| Ingles Markets, Inc. Class A | | 33,000 | 2,438,700 |
| Kroger Co. | | 232,118 | 14,177,767 |
| MARR SpA | | 457,100 | 4,728,966 |
| Metro, Inc. | | 262,300 | 17,123,831 |
| Performance Food Group Co. (c) | | 1,503,489 | 132,667,869 |
| PriceSmart, Inc. | | 58,537 | 5,253,110 |
| Sysco Corp. | | 574,455 | 44,296,225 |
| Target Corp. | | 342,091 | 45,262,060 |
| U.S. Foods Holding Corp. (c) | | 3,197,780 | 223,109,111 |
| Walmart, Inc. (g) | | 4,887,031 | 452,050,368 |
| Weis Markets, Inc. (f) | | 38,249 | 2,785,675 |
| YAKUODO Holdings Co. Ltd. | | 41,300 | 562,849 |
| | | | 1,421,881,573 |
| Food Products - 0.3% | | | |
| Armanino Foods of Distinction | | 572,900 | 4,010,300 |
| Bunge Global SA | | 540,300 | 48,486,522 |
| Darling Ingredients, Inc. (c) | | 126,050 | 5,108,807 |
| Flowers Foods, Inc. (f) | | 412,386 | 9,328,171 |
| Freshpet, Inc. (c) | | 74,400 | 11,386,920 |
| General Mills, Inc. | | 63,766 | 4,225,135 |
| Gruma S.A.B. de CV Series B | | 59,500 | 1,016,565 |
| Ingredion, Inc. | | 29,544 | 4,353,013 |
| Lamb Weston Holdings, Inc. | | 399,500 | 30,857,380 |
| Lancaster Colony Corp. | | 50,721 | 9,425,991 |
| McCormick & Co., Inc. (non-vtg.) | | 37,879 | 2,970,092 |
| Mondelez International, Inc. | | 2,275,857 | 147,816,912 |
| Nomad Foods Ltd. (f) | | 366,400 | 6,708,784 |
| Pickles Holdings Co. Ltd. | | 132,000 | 900,792 |
| Post Holdings, Inc. (c) | | 93,118 | 11,218,857 |
| S Foods, Inc. | | 207,700 | 3,648,268 |
| Societe LDC SA | | 20,718 | 1,444,987 |
| SunOpta, Inc. (c)(f) | | 934,455 | 7,242,026 |
| Tate & Lyle PLC | | 1,294,594 | 12,140,646 |
| The Kraft Heinz Co. | | 139,461 | 4,458,568 |
| The Simply Good Foods Co. (c) | | 1,872,400 | 74,502,796 |
| Tootsie Roll Industries, Inc. | | 41,137 | 1,361,635 |
| TreeHouse Foods, Inc. (c) | | 143,720 | 4,935,345 |
| Tyson Foods, Inc. Class A | | 684,400 | 44,143,800 |
| | | | 451,692,312 |
| Household Products - 0.4% | | | |
| Colgate-Palmolive Co. | | 1,016,638 | 98,237,730 |
| Energizer Holdings, Inc. | | 175,900 | 6,703,549 |
| Kimberly-Clark Corp. | | 16,147 | 2,250,084 |
| Procter & Gamble Co. | | 2,748,496 | 492,695,393 |
| The Clorox Co. | | 70,436 | 11,774,786 |
| Transaction Co. Ltd. | | 50,400 | 754,577 |
| WD-40 Co. (f) | | 34,023 | 9,427,433 |
| | | | 621,843,552 |
| Personal Care Products - 0.5% | | | |
| BellRing Brands, Inc. (c) | | 805,700 | 63,215,222 |
| Estee Lauder Companies, Inc. Class A | | 634,711 | 45,775,357 |
| Haleon PLC | | 19,922,300 | 95,031,691 |
| Haleon PLC ADR | | 10,598,159 | 102,378,216 |
| Hengan International Group Co. Ltd. | | 414,000 | 1,183,997 |
| Herbalife Ltd. (c)(f) | | 238,887 | 1,856,152 |
| Kenvue, Inc. | | 16,164,086 | 389,231,191 |
| Sarantis SA | | 278,008 | 3,149,375 |
| USANA Health Sciences, Inc. (c) | | 27,739 | 1,068,784 |
| | | | 702,889,985 |
| Tobacco - 0.1% | | | |
| Altria Group, Inc. | | 203,364 | 11,742,237 |
| British American Tobacco PLC sponsored ADR | | 616,300 | 23,382,422 |
| KT&G Corp. | | 91,269 | 7,990,112 |
| Philip Morris International, Inc. | | 882,823 | 117,468,428 |
| | | | 160,583,199 |
TOTAL CONSUMER STAPLES | | | 4,524,378,073 |
| ENERGY - 2.9% | | | |
| Energy Equipment & Services - 0.2% | | | |
| Archrock, Inc. | | 342,800 | 8,782,536 |
| Baker Hughes Co. Class A | | 75,847 | 3,333,476 |
| Cactus, Inc. Class A | | 765,132 | 52,533,963 |
| Expro Group Holdings NV (c) | | 571,092 | 7,932,468 |
| Halliburton Co. | | 201,375 | 6,415,808 |
| Kodiak Gas Services, Inc. | | 367,980 | 14,881,111 |
| Liberty Energy, Inc. Class A | | 296,900 | 5,462,960 |
| Oceaneering International, Inc. (c) | | 229,476 | 6,879,690 |
| TechnipFMC PLC | | 1,383,194 | 43,390,796 |
| Tidewater, Inc. (c) | | 194,200 | 10,044,024 |
| Valaris Ltd. (c)(f) | | 128,900 | 5,953,891 |
| Vallourec SA (c)(f) | | 172,300 | 3,022,495 |
| Weatherford International PLC | | 315,126 | 25,934,870 |
| | | | 194,568,088 |
| Oil, Gas & Consumable Fuels - 2.7% | | | |
| Africa Oil Corp. (f) | | 9,910,100 | 13,873,645 |
| Antero Midstream GP LP | | 135,372 | 2,161,891 |
| Antero Resources Corp. (c) | | 1,114,500 | 36,433,005 |
| Athabasca Oil Corp. (c) | | 16,045,900 | 58,737,358 |
| California Resources Corp. | | 61,913 | 3,662,773 |
| Canadian Natural Resources Ltd. | | 2,819,700 | 95,362,254 |
| Cenovus Energy, Inc. (Canada) | | 754,480 | 11,904,191 |
| Chevron Corp. | | 167,173 | 27,070,324 |
| China Petroleum & Chemical Corp. (H Shares) | | 5,988,000 | 3,201,810 |
| Chord Energy Corp. | | 326,307 | 41,610,669 |
| Civitas Resources, Inc. | | 788,545 | 40,909,715 |
| CNX Resources Corp. (c)(f) | | 543,927 | 22,039,922 |
| ConocoPhillips Co. | | 177,682 | 19,250,068 |
| CONSOL Energy, Inc. | | 196,364 | 25,664,775 |
| Coterra Energy, Inc. | | 11,090 | 296,325 |
| Devon Energy Corp. | | 471,923 | 17,909,478 |
| Diamondback Energy, Inc. | | 142,952 | 25,386,846 |
| Dorian LPG Ltd. | | 85,598 | 2,094,583 |
| DT Midstream, Inc. | | 482,936 | 51,249,168 |
| Enterprise Products Partners LP | | 440,700 | 15,173,301 |
| EOG Resources, Inc. | | 193,320 | 25,761,823 |
| Expand Energy Corp. | | 382,241 | 37,826,569 |
| Exxon Mobil Corp. | | 14,547,439 | 1,716,015,904 |
| FutureFuel Corp. | | 65,405 | 340,760 |
| Galp Energia SGPS SA | | 4,411,700 | 72,532,302 |
| Golar LNG Ltd. | | 193,799 | 7,629,867 |
| Gulfport Energy Corp. (c) | | 130,500 | 22,941,900 |
| Hess Corp. | | 38,400 | 5,651,712 |
| Imperial Oil Ltd. (f) | | 3,386,400 | 249,762,268 |
| Imperial Oil Ltd. (U.S.) (f) | | 1,322,200 | 97,737,024 |
| Kinder Morgan, Inc. | | 178,429 | 5,044,188 |
| Kosmos Energy Ltd. (c) | | 3,684,200 | 14,515,748 |
| Marathon Petroleum Corp. | | 240,200 | 37,507,230 |
| Matador Resources Co. | | 48,364 | 2,902,324 |
| MEG Energy Corp. | | 3,706,625 | 66,796,292 |
| Murphy Oil Corp. | | 430,404 | 13,975,218 |
| Northern Oil & Gas, Inc. (f) | | 1,096,850 | 47,702,007 |
| Occidental Petroleum Corp. | | 231,974 | 11,733,245 |
| Oil & Natural Gas Corp. Ltd. | | 824,100 | 2,508,366 |
| Ovintiv, Inc. | | 1,229,730 | 55,854,337 |
| Parex Resources, Inc. | | 1,913,900 | 20,395,977 |
| Parkland Corp. (f) | | 810,200 | 21,110,743 |
| Range Resources Corp. | | 872,000 | 31,165,280 |
| Scorpio Tankers, Inc. | | 107,332 | 5,437,439 |
| Shell PLC: | | | |
| ADR (f) | | 10,140,884 | 656,520,830 |
| (London) | | 494,812 | 15,901,812 |
| rights (c)(h) | | 494,812 | 170,215 |
| Sitio Royalties Corp. Class A (f) | | 376,377 | 8,920,135 |
| Targa Resources Corp. | | 170,180 | 34,767,774 |
| Texas Pacific Land Corp. (f) | | 46,748 | 74,801,007 |
| The Williams Companies, Inc. | | 124,794 | 7,302,945 |
| TotalEnergies SE sponsored ADR | | 297,920 | 17,276,381 |
| Unit Corp. | | 23,700 | 679,996 |
| Uranium Energy Corp. (c)(f) | | 298,180 | 2,477,876 |
| Valero Energy Corp. | | 376,200 | 52,321,896 |
| Viper Energy, Inc. Class A | | 46,129 | 2,496,040 |
| Vitesse Energy, Inc. (f) | | 21,100 | 592,488 |
| | | | 3,961,070,019 |
TOTAL ENERGY | | | 4,155,638,107 |
| FINANCIALS - 9.0% | | | |
| Banks - 4.0% | | | |
| ACNB Corp. (f) | | 43,900 | 2,057,154 |
| AIB Group PLC | | 3,822,800 | 20,804,681 |
| Associated Banc-Corp. | | 1,776,825 | 47,423,459 |
| Axos Financial, Inc. (c) | | 368,777 | 30,553,174 |
| Bancorp, Inc., Delaware (c) | | 1,051,845 | 61,459,303 |
| Bank of America Corp. (g) | | 21,531,107 | 1,022,942,894 |
| Bank of Ireland Group PLC | | 312,900 | 2,740,486 |
| Bankinter SA | | 97,300 | 770,341 |
| BankUnited, Inc. | | 152,610 | 6,420,303 |
| Bar Harbor Bankshares | | 101,400 | 3,649,386 |
| BOK Financial Corp. | | 46,350 | 5,509,625 |
| Byline Bancorp, Inc. | | 160,440 | 5,041,025 |
| Cadence Bank | | 1,275,111 | 48,696,489 |
| Camden National Corp. | | 139,420 | 6,568,076 |
| Citigroup, Inc. | | 3,022,575 | 214,209,890 |
| ConnectOne Bancorp, Inc. | | 186,810 | 5,137,275 |
| Cullen/Frost Bankers, Inc. | | 213,400 | 30,008,308 |
| East West Bancorp, Inc. | | 255,100 | 27,979,368 |
| Eastern Bankshares, Inc. | | 1,216,280 | 22,671,459 |
| Esquire Financial Holdings, Inc. | | 16,052 | 1,247,080 |
| Eurobank Ergasias Services and Holdings SA | | 13,860,336 | 29,392,860 |
| First Bancorp, Puerto Rico | | 614,298 | 12,703,683 |
| First Foundation, Inc. | | 1,433,919 | 11,399,656 |
| First Interstate Bancsystem, Inc. Class A | | 340,080 | 11,892,598 |
| First Northwest Bancorp | | 165,187 | 1,883,132 |
| FNB Corp., Pennsylvania | | 1,304,980 | 22,380,407 |
| Greene County Bancorp, Inc. | | 100,600 | 3,060,252 |
| Hanmi Financial Corp. | | 608,938 | 16,106,410 |
| HDFC Bank Ltd. | | 638,771 | 13,616,107 |
| Independent Bank Corp. | | 168,980 | 6,358,717 |
| Independent Bank Group, Inc. | | 136,010 | 9,101,789 |
| JPMorgan Chase & Co. (g) | | 3,545,487 | 885,379,014 |
| KeyCorp | | 5,537,265 | 107,865,922 |
| M&T Bank Corp. | | 1,357,143 | 298,557,889 |
| National Bank of Greece SA | | 243,200 | 1,713,173 |
| Nicolet Bankshares, Inc. | | 62,642 | 6,978,319 |
| Orrstown Financial Services, Inc. | | 131,240 | 5,183,980 |
| Pathward Financial, Inc. | | 340,392 | 28,552,081 |
| Pinnacle Financial Partners, Inc. | | 47,920 | 6,091,111 |
| Piraeus Financial Holdings SA | | 4,180,546 | 15,372,251 |
| Plumas Bancorp | | 145,000 | 7,264,500 |
| PNC Financial Services Group, Inc. | | 1,908,274 | 409,744,593 |
| Popular, Inc. | | 30,970 | 3,077,179 |
| Preferred Bank, Los Angeles | | 30,932 | 2,917,816 |
| Prosperity Bancshares, Inc. | | 3,581 | 299,837 |
| QCR Holdings, Inc. | | 141,444 | 13,028,407 |
| Signature Bank (c)(f) | | 30,400 | 37,392 |
| Southern Missouri Bancorp, Inc. | | 84,300 | 5,534,295 |
| Spar Nord Bank A/S | | 35,100 | 692,326 |
| Sparebank 1 Oestlandet (f) | | 266,020 | 3,631,921 |
| Sparebanken Nord-Norge | | 45,200 | 483,975 |
| Synovus Financial Corp. | | 453,950 | 25,906,927 |
| The Bank of NT Butterfield & Son Ltd. | | 49,522 | 1,878,369 |
| Truist Financial Corp. | | 228,719 | 10,905,322 |
| U.S. Bancorp | | 7,262,812 | 387,035,251 |
| UMB Financial Corp. | | 163,541 | 20,522,760 |
| Union Bankshares, Inc. | | 74,712 | 2,570,093 |
| United Community Bank, Inc. (f) | | 794,518 | 26,862,654 |
| Univest Corp. of Pennsylvania | | 641,085 | 20,360,860 |
| Washington Trust Bancorp, Inc. | | 121,300 | 4,505,082 |
| Webster Financial Corp. | | 1,164,181 | 71,923,102 |
| Wells Fargo & Co. | | 21,936,820 | 1,670,927,579 |
| West Bancorp., Inc. | | 128,100 | 3,057,747 |
| Westamerica Bancorp. | | 66,434 | 3,802,018 |
| Western Alliance Bancorp. | | 119,190 | 11,157,376 |
| Wintrust Financial Corp. | | 259,540 | 35,819,115 |
| | | | 5,803,425,623 |
| Capital Markets - 1.6% | | | |
| 3i Group PLC | | 184,200 | 8,693,350 |
| Antin Infrastructure Partners SA | | 208,726 | 2,276,295 |
| Artisan Partners Asset Management, Inc. Class A, (f) | | 175,492 | 8,562,255 |
| Banca Generali SpA | | 238,520 | 11,176,163 |
| Bank of New York Mellon Corp. | | 1,166,819 | 95,527,472 |
| BlackRock, Inc. | | 294,248 | 300,956,854 |
| Blue Owl Capital, Inc. Class A | | 1,098,000 | 26,055,540 |
| Bridge Investment Group Holdings, Inc. | | 197,175 | 1,950,061 |
| Carlyle Group LP | | 174,500 | 9,288,635 |
| Cboe Global Markets, Inc. | | 256,942 | 55,460,931 |
| Charles Schwab Corp. | | 1,270,773 | 105,169,173 |
| CME Group, Inc. | | 101,083 | 24,057,754 |
| Cohen & Steers, Inc. (f) | | 65,974 | 6,904,839 |
| Coinbase Global, Inc. Class A (c) | | 7,771 | 2,301,770 |
| Diamond Hill Investment Group, Inc. | | 6,961 | 1,151,001 |
| Digitalbridge Group, Inc. Class A | | 728,751 | 9,546,638 |
| Evercore, Inc. Class A | | 81,959 | 25,235,176 |
| Federated Hermes, Inc. Class B | | 670,759 | 28,674,947 |
| Goldman Sachs Group, Inc. | | 19,938 | 12,133,669 |
| Hamilton Lane, Inc. Class A | | 96,498 | 18,566,215 |
| Interactive Brokers Group, Inc. | | 149,562 | 28,579,803 |
| Intercontinental Exchange, Inc. | | 600,836 | 96,710,563 |
| Janus Henderson Group PLC (f) | | 22,068 | 999,239 |
| KKR & Co., Inc. Class A | | 826,307 | 134,580,621 |
| Lazard, Inc. Class A | | 443,067 | 25,728,901 |
| London Stock Exchange Group PLC | | 218,203 | 31,272,573 |
| LPL Financial | | 284,497 | 92,504,200 |
| MarketAxess Holdings, Inc. | | 475,774 | 123,077,976 |
| Moody's Corp. | | 36,200 | 18,099,276 |
| Morgan Stanley | | 1,503,531 | 197,879,715 |
| MSCI, Inc. | | 7,200 | 4,389,336 |
| Northern Trust Corp. | | 2,837,098 | 315,371,814 |
| P10, Inc. Class A (f) | | 473,850 | 6,681,285 |
| Patria Investments Ltd. | | 140,658 | 1,682,270 |
| Perella Weinberg Partners Class A | | 682,590 | 17,522,085 |
| Piper Sandler Cos. | | 33,410 | 11,459,296 |
| PJT Partners, Inc. Class A (f) | | 100,154 | 16,761,773 |
| Rathbone Brothers PLC | | 654,340 | 13,888,017 |
| Raymond James Financial, Inc. | | 356,401 | 60,331,561 |
| S&P Global, Inc. | | 41,976 | 21,932,880 |
| SEI Investments Co. | | 450,541 | 37,228,203 |
| State Street Corp. | | 742,920 | 73,185,049 |
| StepStone Group, Inc. Class A | | 558,829 | 36,821,243 |
| Stifel Financial Corp. | | 777,920 | 90,083,136 |
| T. Rowe Price Group, Inc. | | 92,383 | 11,440,711 |
| Tradeweb Markets, Inc. Class A | | 229,798 | 31,137,629 |
| UBS Group AG | | 1,026,645 | 33,201,699 |
| Van Lanschot Kempen NV (Bearer) | | 5,800 | 260,182 |
| Virtu Financial, Inc. Class A | | 1,060,595 | 39,570,799 |
| Vontobel Holdings AG | | 27,634 | 1,822,505 |
| | | | 2,327,893,078 |
| Consumer Finance - 0.2% | | | |
| Aeon Credit Service (Asia) Co. Ltd. | | 3,004,000 | 2,262,653 |
| American Express Co. | | 39,004 | 11,883,739 |
| Capital One Financial Corp. | | 54,838 | 10,529,444 |
| Discover Financial Services | | 536,932 | 97,952,505 |
| FirstCash Holdings, Inc. | | 545,089 | 59,338,389 |
| NerdWallet, Inc. (c) | | 458,400 | 6,417,600 |
| OneMain Holdings, Inc. | | 1,231,833 | 70,645,623 |
| SLM Corp. (f) | | 551,566 | 15,101,877 |
| Synchrony Financial | | 54,008 | 3,646,620 |
| | | | 277,778,450 |
| Financial Services - 1.5% | | | |
| Affirm Holdings, Inc. Class A, (c) | | 408,500 | 28,599,085 |
| Apollo Global Management, Inc. | | 1,070,420 | 187,355,613 |
| AvidXchange Holdings, Inc. (c) | | 3,540,682 | 40,505,402 |
| Berkshire Hathaway, Inc.: | | | |
| Class A (c) | | 61 | 44,166,440 |
| Class B (c) | | 1,021,522 | 493,415,556 |
| BFF Bank SpA (b) | | 711,400 | 6,750,912 |
| Block, Inc. Class A (c) | | 1,255,074 | 111,136,803 |
| Cannae Holdings, Inc. | | 1,091,060 | 23,676,002 |
| Cass Information Systems, Inc. | | 26,591 | 1,193,138 |
| Corebridge Financial, Inc. | | 230,700 | 7,467,759 |
| Corpay, Inc. (c) | | 151,880 | 57,893,618 |
| Enact Holdings, Inc. | | 44,995 | 1,584,274 |
| Essent Group Ltd. | | 285,015 | 16,468,167 |
| Euronet Worldwide, Inc. (c) | | 32,087 | 3,373,306 |
| EVERTEC, Inc. | | 1,306,756 | 47,043,216 |
| Federal Agricultural Mortgage Corp. Class C (non-vtg.) | | 37,900 | 8,090,513 |
| Fidelity National Information Services, Inc. | | 77,657 | 6,624,142 |
| Fiserv, Inc. (c) | | 514,006 | 113,574,766 |
| Flywire Corp. (c) | | 1,105,210 | 25,099,319 |
| Global Payments, Inc. | | 139,999 | 16,654,281 |
| HA Sustainable Infrastructure Capital, Inc. | | 390,220 | 12,237,299 |
| International Money Express, Inc. (c)(f) | | 81,938 | 1,726,434 |
| Jackson Financial, Inc. | | 52,833 | 5,293,338 |
| MasterCard, Inc. Class A | | 383,966 | 204,630,840 |
| NMI Holdings, Inc. (c) | | 173,390 | 6,933,866 |
| PayPal Holdings, Inc. (c) | | 1,018,502 | 88,375,419 |
| Radian Group, Inc. | | 85,010 | 3,042,508 |
| Sezzle, Inc. (c) | | 7,255 | 3,076,338 |
| UWM Holdings Corp. Class A | | 2,967,023 | 19,315,320 |
| Visa, Inc. Class A | | 1,672,924 | 527,104,894 |
| Voya Financial, Inc. | | 584,478 | 48,511,674 |
| Walker & Dunlop, Inc. (f) | | 57,850 | 6,373,913 |
| WEX, Inc. (c) | | 194,500 | 36,694,370 |
| Zenkoku Hosho Co. Ltd. | | 97,000 | 3,477,646 |
| | | | 2,207,466,171 |
| Insurance - 1.7% | | | |
| Allstate Corp. | | 49,274 | 10,218,935 |
| American Financial Group, Inc. | | 277,303 | 40,724,719 |
| Aon PLC | | 62,295 | 24,390,984 |
| Arthur J. Gallagher & Co. | | 344,823 | 107,667,534 |
| ASR Nederland NV | | 126,100 | 6,036,505 |
| Assurant, Inc. | | 112,215 | 25,484,027 |
| Axis Capital Holdings Ltd. | | 15,642 | 1,455,332 |
| Chubb Ltd. | | 1,727,169 | 498,685,505 |
| Cincinnati Financial Corp. | | 66,916 | 10,695,184 |
| CNO Financial Group, Inc. | | 80,109 | 3,196,349 |
| Direct Line Insurance Group PLC | | 10,175,168 | 30,400,478 |
| Erie Indemnity Co. Class A | | 62,613 | 27,584,783 |
| Everest Re Group Ltd. | | 87,359 | 33,856,854 |
| F&G Annuities & Life, Inc. | | 14,700 | 710,451 |
| Fairfax Financial Holdings Ltd. (sub. vtg.) | | 37,547 | 53,191,472 |
| First American Financial Corp. | | 199,211 | 13,974,652 |
| Globe Life, Inc. | | 352,458 | 39,207,428 |
| Goosehead Insurance Class A (c)(f) | | 63,357 | 7,990,585 |
| Grupo Catalana Occidente SA | | 68,340 | 2,617,913 |
| Hartford Financial Services Group, Inc. | | 700,629 | 86,394,562 |
| HCI Group, Inc. (f) | | 18,409 | 2,243,505 |
| Kemper Corp. | | 7,099 | 507,508 |
| Kinsale Capital Group, Inc. | | 55,509 | 28,222,996 |
| Lincoln National Corp. | | 408,932 | 14,533,443 |
| Loews Corp. | | 202,069 | 17,525,444 |
| Markel Group, Inc. (c) | | 2,553 | 4,551,795 |
| Marsh & McLennan Companies, Inc. | | 639,239 | 149,089,712 |
| MetLife, Inc. | | 12,249 | 1,080,729 |
| NN Group NV | | 153,459 | 7,130,518 |
| Primerica, Inc. | | 230,613 | 69,818,086 |
| Principal Financial Group, Inc. | | 53,573 | 4,665,673 |
| Progressive Corp. | | 233,482 | 62,778,640 |
| Prudential Financial, Inc. | | 103,035 | 13,333,759 |
| Prudential PLC | | 896,289 | 7,345,710 |
| Reinsurance Group of America, Inc. | | 302,113 | 69,002,609 |
| RLI Corp. | | 100,041 | 17,597,212 |
| Selective Insurance Group, Inc. | | 482,770 | 49,285,989 |
| Stewart Information Services Corp. | | 182,500 | 13,703,925 |
| The Baldwin Insurance Group, Inc. Class A, (c) | | 1,905,155 | 93,276,389 |
| The Travelers Companies, Inc. | | 1,648,721 | 438,625,735 |
| TWFG, Inc. Class A | | 359,100 | 12,679,821 |
| Universal Insurance Holdings, Inc. | | 63,312 | 1,432,751 |
| Unum Group | | 1,094,306 | 84,152,131 |
| Willis Towers Watson PLC | | 656,344 | 211,342,768 |
| | | | 2,398,411,100 |
TOTAL FINANCIALS | | | 13,014,974,422 |
| HEALTH CARE - 5.8% | | | |
| Biotechnology - 0.9% | | | |
| AbbVie, Inc. | | 376,612 | 68,893,633 |
| ADMA Biologics, Inc. (c) | | 237,970 | 4,785,577 |
| Alkermes PLC (c) | | 47,561 | 1,380,220 |
| Alnylam Pharmaceuticals, Inc. (c) | | 246,600 | 62,407,062 |
| Amgen, Inc. | | 22,152 | 6,266,136 |
| AnaptysBio, Inc. (c)(f) | | 128,340 | 3,203,366 |
| Apogee Therapeutics, Inc. (c)(f) | | 91,180 | 4,116,777 |
| Arcellx, Inc. (c)(f) | | 77,030 | 6,784,032 |
| Arcus Biosciences, Inc. (c) | | 329,700 | 5,090,568 |
| Argenx SE ADR (c) | | 134,800 | 83,110,940 |
| Ascendis Pharma A/S sponsored ADR (c) | | 132,000 | 17,962,560 |
| Astria Therapeutics, Inc. (c)(f) | | 512,210 | 5,321,862 |
| Autolus Therapeutics PLC ADR (c) | | 879,930 | 2,921,368 |
| Avidity Biosciences, Inc. (c) | | 306,300 | 13,180,089 |
| Beam Therapeutics, Inc. (c) | | 193,800 | 5,304,306 |
| Biogen, Inc. (c) | | 90,562 | 14,546,974 |
| BioMarin Pharmaceutical, Inc. (c) | | 59,918 | 3,956,386 |
| BioNTech SE ADR (c) | | 778,200 | 92,131,098 |
| Blueprint Medicines Corp. (c) | | 412,618 | 39,768,123 |
| Cargo Therapeutics, Inc. (c)(f) | | 406,000 | 7,381,080 |
| Celldex Therapeutics, Inc. (c) | | 429,779 | 11,793,136 |
| Cogent Biosciences, Inc. (c) | | 451,460 | 4,293,385 |
| Crinetics Pharmaceuticals, Inc. (c)(f) | | 297,440 | 17,013,568 |
| Cytokinetics, Inc. (c) | | 729,950 | 37,855,207 |
| Day One Biopharmaceuticals, Inc. (c)(f) | | 516,200 | 7,190,666 |
| Disc Medicine, Inc. (c) | | 87,700 | 5,564,565 |
| Dyne Therapeutics, Inc. (c) | | 322,070 | 9,858,563 |
| Exact Sciences Corp. (c) | | 1,119,900 | 69,523,392 |
| Exelixis, Inc. (c) | | 407,073 | 14,841,882 |
| Gilead Sciences, Inc. | | 3,147,389 | 291,385,274 |
| Immunovant, Inc. (c)(f) | | 144,420 | 4,072,644 |
| Incyte Corp. (c) | | 130,237 | 9,714,378 |
| Intellia Therapeutics, Inc. (c)(f) | | 187,900 | 2,934,998 |
| Keros Therapeutics, Inc. (c) | | 412,570 | 23,821,792 |
| Legend Biotech Corp. ADR (c) | | 1,060,000 | 44,594,200 |
| Madrigal Pharmaceuticals, Inc. (c)(f) | | 18,560 | 6,091,206 |
| Merus BV (c) | | 646,450 | 28,986,818 |
| Moonlake Immunotherapeutics Class A (c)(f) | | 340,070 | 18,510,010 |
| Natera, Inc. (c) | | 134,400 | 22,549,632 |
| Nurix Therapeutics, Inc. (c) | | 642,493 | 14,205,520 |
| Perspective Therapeutics, Inc. (c)(f) | | 536,300 | 2,332,905 |
| PTC Therapeutics, Inc. (c) | | 202,000 | 8,863,760 |
| Regeneron Pharmaceuticals, Inc. (c) | | 89,736 | 67,321,742 |
| Repligen Corp. (c) | | 102,500 | 15,430,350 |
| Revolution Medicines, Inc. (c) | | 24,220 | 1,401,127 |
| Sarepta Therapeutics, Inc. (c) | | 129,200 | 17,227,528 |
| Soleno Therapeutics, Inc. (c) | | 33,330 | 1,756,824 |
| Spyre Therapeutics, Inc. (c)(f) | | 141,060 | 4,010,336 |
| Travere Therapeutics, Inc. (c) | | 106,630 | 2,005,710 |
| United Therapeutics Corp. (c) | | 116,528 | 43,172,459 |
| Upstream Bio, Inc. | | 55,620 | 1,216,409 |
| Vaxcyte, Inc. (c) | | 833,930 | 78,672,956 |
| Viridian Therapeutics, Inc. (c)(f) | | 263,550 | 5,679,503 |
| Xenon Pharmaceuticals, Inc. (c) | | 724,405 | 30,881,385 |
| | | | 1,373,285,987 |
| Health Care Equipment & Supplies - 1.0% | | | |
| Abbott Laboratories | | 629,619 | 74,779,849 |
| Atricure, Inc. (c)(f) | | 169,100 | 6,114,656 |
| Becton, Dickinson & Co. | | 218,319 | 48,444,986 |
| Boston Scientific Corp. (c) | | 5,933,387 | 537,920,865 |
| GE Healthcare Technologies, Inc. | | 93,383 | 7,771,333 |
| Glaukos Corp. (c) | | 463,880 | 66,636,362 |
| Haemonetics Corp. (c) | | 129,398 | 11,318,443 |
| ICU Medical, Inc. (c) | | 60,000 | 9,837,600 |
| IDEXX Laboratories, Inc. (c) | | 4,806 | 2,026,931 |
| InBody Co. Ltd. | | 31,800 | 512,277 |
| Inspire Medical Systems, Inc. (c) | | 266,740 | 51,416,802 |
| Insulet Corp. (c) | | 380,000 | 101,376,400 |
| Integra LifeSciences Holdings Corp. (c) | | 163,930 | 4,029,399 |
| Intuitive Surgical, Inc. (c) | | 90,000 | 48,780,000 |
| iRhythm Technologies, Inc. (c) | | 60,250 | 5,239,641 |
| Koninklijke Philips Electronics NV (depository receipt) (NY Reg.) | | 437,965 | 11,930,167 |
| Lantheus Holdings, Inc. (c) | | 279,400 | 24,942,038 |
| LeMaitre Vascular, Inc. (f) | | 37,241 | 3,984,415 |
| Masimo Corp. (c) | | 678,500 | 117,068,390 |
| Medtronic PLC | | 168,924 | 14,618,683 |
| Merit Medical Systems, Inc. (c) | | 203,300 | 21,122,870 |
| Penumbra, Inc. (c) | | 664,500 | 162,217,740 |
| Pulmonx Corp. (c) | | 719,300 | 4,639,485 |
| RxSight, Inc. (c) | | 151,000 | 7,078,880 |
| Solventum Corp. | | 283,463 | 20,270,439 |
| Stryker Corp. | | 340,220 | 133,417,273 |
| Tandem Diabetes Care, Inc. (c)(f) | | 269,600 | 8,257,848 |
| Utah Medical Products, Inc. | | 8,325 | 543,206 |
| Value Added Technology Co. Ltd. | | 80,700 | 1,182,333 |
| Vieworks Co. Ltd. | | 119,600 | 1,791,605 |
| ViewRay, Inc. (c)(f) | | 788,420 | 1 |
| | | | 1,509,270,917 |
| Health Care Providers & Services - 2.2% | | | |
| Acadia Healthcare Co., Inc. (c) | | 246,920 | 10,032,360 |
| Addus HomeCare Corp. (c) | | 53,100 | 6,522,804 |
| agilon health, Inc. (c) | | 1,737,600 | 3,631,584 |
| AMN Healthcare Services, Inc. (c) | | 65,780 | 1,712,253 |
| BrightSpring Health Services, Inc. (c) | | 347,710 | 6,710,803 |
| Cardinal Health, Inc. | | 612,995 | 74,932,509 |
| Centene Corp. (c) | | 3,252,066 | 195,123,960 |
| Chemed Corp. | | 39,316 | 22,504,085 |
| Cigna Group | | 1,559,983 | 526,962,257 |
| Corvel Corp. (c) | | 22,743 | 8,310,292 |
| CVS Health Corp. | | 4,086,349 | 244,567,988 |
| Elevance Health, Inc. | | 397,012 | 161,568,004 |
| Guardant Health, Inc. (c)(f) | | 160,300 | 5,708,283 |
| Henry Schein, Inc. (c) | | 306,200 | 23,592,710 |
| Humana, Inc. | | 258,941 | 76,744,934 |
| Labcorp Holdings, Inc. | | 151,160 | 36,453,746 |
| LifeStance Health Group, Inc. (c) | | 3,383,880 | 25,446,778 |
| McKesson Corp. | | 383,551 | 241,061,804 |
| Molina Healthcare, Inc. (c) | | 128,500 | 38,280,150 |
| National Research Corp. Class A | | 35,356 | 695,099 |
| Option Care Health, Inc. (c) | | 270,870 | 6,446,706 |
| Owens & Minor, Inc. (c) | | 1,250,390 | 16,842,753 |
| PACS Group, Inc. | | 95,070 | 1,503,057 |
| Pennant Group, Inc. (c) | | 220,410 | 6,872,384 |
| Privia Health Group, Inc. (c) | | 1,800,000 | 38,664,000 |
| Quest Diagnostics, Inc. | | 87,440 | 14,222,990 |
| Sinopharm Group Co. Ltd. (H Shares) | | 4,015,200 | 10,476,679 |
| Surgery Partners, Inc. (c) | | 2,032,611 | 48,457,446 |
| Tenet Healthcare Corp. (c) | | 386,239 | 55,108,581 |
| The Ensign Group, Inc. | | 127,475 | 18,638,120 |
| UnitedHealth Group, Inc. | | 1,900,400 | 1,159,624,080 |
| Universal Health Services, Inc. Class B | | 282,052 | 57,820,660 |
| | | | 3,145,239,859 |
| Health Care Technology - 0.1% | | | |
| Doximity, Inc. Class A (c) | | 306,670 | 16,253,510 |
| HealthStream, Inc. | | 60,285 | 1,995,434 |
| Phreesia, Inc. (c) | | 690,000 | 14,510,700 |
| Simulations Plus, Inc. (f) | | 36,827 | 1,169,994 |
| Veeva Systems, Inc. Class A (c) | | 193,219 | 44,024,949 |
| | | | 77,954,587 |
| Life Sciences Tools & Services - 0.4% | | | |
| 10X Genomics, Inc. Class A (c) | | 1,508,000 | 23,977,200 |
| Agilent Technologies, Inc. | | 27,693 | 3,820,803 |
| Bio-Rad Laboratories, Inc. Class A (c) | | 3,494 | 1,189,812 |
| Bruker Corp. | | 778,750 | 45,128,563 |
| Danaher Corp. | | 1,058,689 | 253,757,166 |
| Fortrea Holdings, Inc. (c) | | 497,210 | 10,466,271 |
| ICON PLC (c) | | 70,560 | 14,835,240 |
| Illumina, Inc. (c) | | 51,931 | 7,485,854 |
| IQVIA Holdings, Inc. (c) | | 31,980 | 6,422,863 |
| Medpace Holdings, Inc. (c) | | 78,245 | 26,652,594 |
| QIAGEN NV | | 157,505 | 6,840,442 |
| Thermo Fisher Scientific, Inc. | | 264,192 | 139,924,009 |
| | | | 540,500,817 |
| Pharmaceuticals - 1.2% | | | |
| Arvinas Holding Co. LLC (c) | | 388,310 | 10,375,643 |
| AstraZeneca PLC sponsored ADR | | 3,034,820 | 205,214,528 |
| Axsome Therapeutics, Inc. (c) | | 64,480 | 6,333,226 |
| Bristol-Myers Squibb Co. | | 2,582,355 | 152,927,063 |
| Corcept Therapeutics, Inc. (c) | | 212,368 | 12,249,386 |
| Dawnrays Pharmaceutical Holdings Ltd. | | 2,110,000 | 325,450 |
| Elanco Animal Health, Inc. (c) | | 5,146,840 | 67,989,756 |
| Eli Lilly & Co. | | 363,700 | 289,268,795 |
| Enliven Therapeutics, Inc. (c)(f) | | 185,265 | 4,516,761 |
| Faes Farma SA | | 112,111 | 421,173 |
| Galderma Group AG (c) | | 323,710 | 33,162,867 |
| Genomma Lab Internacional SA de CV | | 1,294,600 | 1,725,070 |
| GSK PLC sponsored ADR (f) | | 6,904,327 | 235,644,681 |
| Hypera SA | | 1,541,500 | 4,962,581 |
| Johnson & Johnson | | 1,727,492 | 267,778,535 |
| Merck & Co., Inc. | | 1,915,600 | 194,701,584 |
| Organon & Co. | | 135,205 | 2,145,703 |
| Pfizer, Inc. | | 1,257,690 | 32,964,055 |
| Prestige Consumer Healthcare, Inc. (c) | | 119,595 | 10,138,068 |
| Royalty Pharma PLC Class A | | 975,400 | 26,004,164 |
| Sanofi SA sponsored ADR | | 10,000 | 484,900 |
| Septerna, Inc. | | 142,968 | 3,615,661 |
| Structure Therapeutics, Inc. ADR (c)(f) | | 72,210 | 2,393,762 |
| Supernus Pharmaceuticals, Inc. (c) | | 138,005 | 5,046,843 |
| UCB SA | | 1,047,400 | 205,152,785 |
| | | | 1,775,543,040 |
TOTAL HEALTH CARE | | | 8,421,795,207 |
| INDUSTRIALS - 6.8% | | | |
| Aerospace & Defense - 2.0% | | | |
| AerSale Corp. (c) | | 346,030 | 2,179,989 |
| Airbus Group NV | | 344,798 | 53,893,935 |
| Bombardier, Inc. Class B (sub. vtg.) (c) | | 469,200 | 32,427,265 |
| Cadre Holdings, Inc. | | 502,370 | 16,774,134 |
| Curtiss-Wright Corp. | | 71,538 | 26,728,743 |
| Embraer SA sponsored ADR (c)(g) | | 278,800 | 10,658,524 |
| GE Aerospace | | 5,560,761 | 1,012,948,224 |
| General Dynamics Corp. | | 151,870 | 43,132,599 |
| HEICO Corp. Class A | | 97,346 | 20,552,661 |
| Howmet Aerospace, Inc. | | 845,463 | 100,085,910 |
| Huntington Ingalls Industries, Inc. | | 276,431 | 54,711,224 |
| Kratos Defense & Security Solutions, Inc. (c)(f) | | 1,060,210 | 28,721,089 |
| L3Harris Technologies, Inc. | | 409,103 | 100,741,614 |
| Lockheed Martin Corp. | | 529,534 | 280,340,595 |
| Northrop Grumman Corp. | | 476,558 | 233,346,625 |
| Rolls-Royce Holdings PLC (c) | | 4,687,600 | 33,345,017 |
| RTX Corp. | | 584,417 | 71,199,523 |
| Spirit AeroSystems Holdings, Inc. Class A (c) | | 2,441,505 | 79,007,102 |
| Textron, Inc. | | 344,765 | 29,522,227 |
| The Boeing Co. (c) | | 3,501,112 | 544,212,849 |
| TransDigm Group, Inc. | | 70,500 | 88,334,385 |
| V2X, Inc. (c) | | 488,306 | 29,420,437 |
| Woodward, Inc. | | 152,931 | 27,576,518 |
| | | | 2,919,861,189 |
| Air Freight & Logistics - 0.3% | | | |
| AZ-Com Maruwa Holdings, Inc. | | 555,900 | 3,789,847 |
| C.H. Robinson Worldwide, Inc. | | 403,632 | 42,615,467 |
| Deutsche Post AG ADR | | 874,900 | 32,191,793 |
| FedEx Corp. | | 608,783 | 184,260,351 |
| Logista Integral SA | | 260,900 | 8,348,380 |
| Radiant Logistics, Inc. (c)(f) | | 654,550 | 4,896,034 |
| United Parcel Service, Inc. Class B | | 1,236,560 | 167,825,923 |
| | | | 443,927,795 |
| Building Products - 0.5% | | | |
| A.O. Smith Corp. | | 319,711 | 23,815,272 |
| AAON, Inc. (f) | | 36,190 | 4,934,145 |
| Allegion PLC | | 167,668 | 23,614,361 |
| Armstrong World Industries, Inc. | | 140,942 | 22,526,760 |
| AZZ, Inc. | | 235,170 | 21,903,734 |
| Builders FirstSource, Inc. (c) | | 114,593 | 21,368,157 |
| Fortune Brands Innovations, Inc. | | 173,754 | 13,604,938 |
| Gibraltar Industries, Inc. (c) | | 264,589 | 19,166,827 |
| Hayward Holdings, Inc. (c) | | 1,173,200 | 18,958,912 |
| Inwido AB | | 67,800 | 1,138,497 |
| Janus International Group, Inc. (c) | | 1,957,490 | 14,642,025 |
| Johnson Controls International PLC | | 1,024,333 | 85,900,565 |
| MasterBrand, Inc. (c) | | 305,531 | 5,285,686 |
| Nihon Dengi Co. Ltd. | | 38,500 | 1,713,799 |
| Nihon Flush Co. Ltd. | | 97,378 | 536,957 |
| Owens Corning | | 81,828 | 16,825,473 |
| Simpson Manufacturing Co. Ltd. | | 113,500 | 21,383,400 |
| Tecnoglass, Inc. (f) | | 341,712 | 27,695,758 |
| The AZEK Co., Inc. Class A, (c) | | 118,200 | 6,278,784 |
| Trane Technologies PLC | | 580,764 | 241,725,592 |
| Trex Co., Inc. (c) | | 273,100 | 20,490,693 |
| UFP Industries, Inc. | | 187,600 | 25,494,840 |
| | | | 639,005,175 |
| Commercial Services & Supplies - 0.2% | | | |
| ACV Auctions, Inc. Class A (c) | | 478,720 | 10,828,646 |
| Brady Corp. Class A | | 738,247 | 55,287,318 |
| Cintas Corp. | | 76,909 | 17,365,283 |
| CoreCivic, Inc. (c) | | 390,300 | 8,715,399 |
| Ennis, Inc. | | 65,230 | 1,391,356 |
| GFL Environmental, Inc. | | 782,500 | 36,848,845 |
| MSA Safety, Inc. | | 98,306 | 17,086,566 |
| Prestige International, Inc. | | 528,310 | 2,341,139 |
| Republic Services, Inc. | | 125,824 | 27,467,379 |
| Rollins, Inc. | | 8,542 | 429,919 |
| Takkt AG | | 398,854 | 3,422,490 |
| Tetra Tech, Inc. | | 352,500 | 14,632,275 |
| The Brink's Co. | | 592,416 | 57,292,551 |
| Veralto Corp. | | 111,833 | 12,099,212 |
| Vestis Corp. | | 242,961 | 3,906,813 |
| VSE Corp. | | 208,320 | 24,427,603 |
| Waste Management, Inc. | | 51,947 | 11,855,344 |
| | | | 305,398,138 |
| Construction & Engineering - 0.3% | | | |
| Arcosa, Inc. | | 27,916 | 3,032,794 |
| Bowman Consulting Group Ltd. (c)(f) | | 267,520 | 7,327,373 |
| Centuri Holdings, Inc. (f) | | 699,880 | 13,864,623 |
| Comfort Systems U.S.A., Inc. | | 146,191 | 72,111,635 |
| Construction Partners, Inc. Class A (c) | | 98,510 | 10,009,601 |
| EMCOR Group, Inc. | | 177,877 | 90,738,615 |
| IES Holdings, Inc. (c) | | 196,987 | 61,037,407 |
| Norconsult A/S | | 234,600 | 880,737 |
| Quanta Services, Inc. | | 169,300 | 58,327,236 |
| Raiznext Corp. | | 206,100 | 2,045,640 |
| Sterling Construction Co., Inc. (c) | | 156,410 | 30,413,925 |
| Valmont Industries, Inc. | | 37,395 | 13,008,225 |
| Willscot Holdings Corp. (c) | | 515,000 | 19,693,600 |
| | | | 382,491,411 |
| Electrical Equipment - 0.9% | | | |
| Acuity Brands, Inc. | | 186,132 | 59,690,671 |
| Allient, Inc. | | 257,900 | 6,697,663 |
| AMETEK, Inc. | | 830,923 | 161,514,813 |
| AQ Group AB | | 767,500 | 9,365,175 |
| Eaton Corp. PLC | | 409,836 | 153,860,631 |
| EnerSys | | 26,920 | 2,602,087 |
| Fluence Energy, Inc. Class A (c)(f) | | 232,330 | 4,370,127 |
| GE Vernova LLC | | 1,590,892 | 531,548,835 |
| GrafTech International Ltd. (c) | | 1,761,800 | 3,453,128 |
| Hubbell, Inc. | | 78,936 | 36,317,664 |
| Nextracker, Inc. Class A (c) | | 553,500 | 21,121,560 |
| nVent Electric PLC | | 297,600 | 23,305,056 |
| Powell Industries, Inc. (f) | | 22,013 | 5,885,836 |
| Regal Rexnord Corp. | | 902,604 | 155,888,737 |
| Sensata Technologies PLC | | 225,900 | 7,260,426 |
| Vertiv Holdings Co. | | 939,693 | 119,904,827 |
| | | | 1,302,787,236 |
| Ground Transportation - 0.3% | | | |
| ArcBest Corp. | | 98,373 | 11,340,439 |
| CSX Corp. | | 2,362,283 | 86,341,444 |
| Knight-Swift Transportation Holdings, Inc. | | 748,885 | 44,453,814 |
| Landstar System, Inc. | | 89,776 | 16,691,154 |
| Lyft, Inc. (c) | | 396,113 | 6,876,522 |
| Norfolk Southern Corp. | | 92,411 | 25,491,574 |
| Old Dominion Freight Lines, Inc. | | 433,300 | 97,553,162 |
| Proficient Auto Logistics, Inc. | | 672,800 | 7,010,576 |
| Stef SA | | 52,034 | 7,148,301 |
| Uber Technologies, Inc. (c) | | 409,400 | 29,460,424 |
| Union Pacific Corp. | | 436,693 | 106,841,309 |
| Universal Logistics Holdings, Inc. (f) | | 349,782 | 18,227,140 |
| XPO, Inc. (c) | | 193,000 | 29,415,130 |
| | | | 486,850,989 |
| Industrial Conglomerates - 0.2% | | | |
| 3M Co. | | 191,637 | 25,589,289 |
| DCC PLC (United Kingdom) | | 281,200 | 20,484,791 |
| Honeywell International, Inc. | | 11,366 | 2,647,482 |
| Metlen Energy & Metals SA | | 87,400 | 2,868,700 |
| Siemens AG | | 891,200 | 173,122,623 |
| | | | 224,712,885 |
| Machinery - 1.3% | | | |
| Allison Transmission Holdings, Inc. | | 615,501 | 72,936,869 |
| Beijer Alma AB (B Shares) | | 232,520 | 3,669,779 |
| Blue Bird Corp. (c)(f) | | 171,400 | 6,967,410 |
| Caterpillar, Inc. | | 338,545 | 137,486,510 |
| Chart Industries, Inc. (c)(f) | | 188,200 | 36,369,650 |
| Crane Co. | | 217,460 | 39,595,117 |
| Cummins, Inc. | | 159,805 | 59,933,267 |
| Daiwa Industries Ltd. | | 325,400 | 3,175,377 |
| Deere & Co. | | 710,700 | 331,115,130 |
| Donaldson Co., Inc. | | 348,431 | 27,195,040 |
| Dover Corp. | | 589,700 | 121,419,230 |
| EnPro Industries, Inc. | | 105,570 | 19,963,287 |
| ESAB Corp. | | 416,118 | 53,712,511 |
| Estic Corp. | | 18,000 | 107,797 |
| Federal Signal Corp. | | 153,385 | 14,941,233 |
| Flowserve Corp. | | 196,987 | 12,020,147 |
| Fortive Corp. | | 1,033,247 | 81,967,485 |
| Gates Industrial Corp. PLC (c) | | 1,061,072 | 23,513,356 |
| Graco, Inc. | | 424,593 | 38,671,930 |
| Hillenbrand, Inc. | | 554,000 | 18,852,620 |
| Hy-Lok Corp. | | 76,816 | 1,421,312 |
| Ingersoll Rand, Inc. | | 1,309,300 | 136,389,781 |
| ITT, Inc. | | 193,293 | 30,176,903 |
| JOST Werke AG (b) | | 89,100 | 3,912,199 |
| Lincoln Electric Holdings, Inc. | | 142,860 | 31,212,053 |
| Miller Industries, Inc. (f) | | 154,400 | 11,366,928 |
| Mueller Industries, Inc. | | 103,970 | 8,397,657 |
| Mueller Water Products, Inc. | | 29,119 | 729,140 |
| Nordson Corp. | | 27,600 | 7,203,324 |
| NORMA Group AG | | 85,768 | 1,225,390 |
| Oshkosh Corp. | | 93,325 | 10,602,653 |
| Otis Worldwide Corp. | | 139,504 | 14,366,122 |
| PACCAR, Inc. | | 123,808 | 14,485,536 |
| Parker Hannifin Corp. | | 277,639 | 195,152,453 |
| Pentair PLC | | 1,247,096 | 135,920,993 |
| REV Group, Inc. | | 536,339 | 16,637,236 |
| Snap-On, Inc. | | 132,344 | 48,926,253 |
| Standex International Corp. | | 28,682 | 5,962,701 |
| Stanley Black & Decker, Inc. | | 89,947 | 8,045,759 |
| Terex Corp. | | 414,240 | 22,696,210 |
| Timken Co. | | 291,410 | 22,569,705 |
| Watts Water Technologies, Inc. Class A | | 65,964 | 14,234,372 |
| Westinghouse Air Brake Tech Co. | | 167,342 | 33,572,152 |
| | | | 1,878,820,577 |
| Marine Transportation - 0.0% | | | |
| Kirby Corp. (c) | | 209,200 | 26,465,892 |
| Matson, Inc. | | 5,573 | 853,672 |
| | | | 27,319,564 |
| Passenger Airlines - 0.0% | | | |
| Delta Air Lines, Inc. | | 360,400 | 23,000,728 |
| Jet2 PLC | | 390,597 | 7,818,048 |
| Ryanair Holdings PLC sponsored ADR (f) | | 123,750 | 5,449,950 |
| SkyWest, Inc. (c) | | 76,704 | 8,801,017 |
| United Airlines Holdings, Inc. (c) | | 10,104 | 978,370 |
| | | | 46,048,113 |
| Professional Services - 0.4% | | | |
| Altech Corp. | | 59,000 | 1,022,932 |
| Automatic Data Processing, Inc. | | 19,530 | 5,994,343 |
| Barrett Business Services, Inc. | | 201,805 | 8,659,453 |
| CACI International, Inc. (c) | | 110,219 | 50,687,514 |
| CBIZ, Inc. (c) | | 106,810 | 8,820,370 |
| CRA International, Inc. | | 56,846 | 11,086,675 |
| Creek & River Co. Ltd. | | 20,500 | 216,626 |
| Dun & Bradstreet Holdings, Inc. | | 2,573,422 | 32,682,459 |
| E-Credible Co. Ltd. | | 47,700 | 446,362 |
| Equifax, Inc. | | 30,000 | 7,846,800 |
| ExlService Holdings, Inc. (c) | | 810,596 | 37,579,231 |
| Exponent, Inc. | | 127,200 | 12,555,912 |
| Franklin Covey Co. (c) | | 28,640 | 1,041,923 |
| Genpact Ltd. | | 2,705,752 | 124,897,512 |
| ICF International, Inc. | | 108,150 | 14,986,346 |
| Insperity, Inc. | | 89,801 | 7,080,809 |
| KBR, Inc. | | 614,550 | 37,383,077 |
| Kforce, Inc. | | 351,356 | 21,077,846 |
| Leidos Holdings, Inc. | | 98,945 | 16,365,503 |
| Maximus, Inc. | | 1,190,884 | 88,720,858 |
| Multiconsult A/S (b) | | 45,600 | 801,235 |
| Paycom Software, Inc. | | 120,686 | 27,989,497 |
| Paylocity Holding Corp. (c) | | 109,080 | 22,638,463 |
| Quick Co. Ltd. | | 180,800 | 2,448,289 |
| Robert Half, Inc. (f) | | 255,236 | 19,043,158 |
| Science Applications International Corp. | | 224,995 | 27,955,629 |
| SS&C Technologies Holdings, Inc. | | 261,465 | 20,221,703 |
| TrueBlue, Inc. (c) | | 285,980 | 2,150,570 |
| Verra Mobility Corp. Class A (c) | | 173,870 | 4,113,764 |
| Will Group, Inc. | | 187,400 | 1,196,184 |
| Wilmington PLC | | 114,400 | 591,007 |
| WNS Holdings Ltd. (f) | | 370,459 | 20,089,992 |
| | | | 638,392,042 |
| Trading Companies & Distributors - 0.4% | | | |
| AerCap Holdings NV | | 79,600 | 7,909,056 |
| Alligo AB (B Shares) | | 43,100 | 464,298 |
| Applied Industrial Technologies, Inc. | | 225,780 | 62,026,282 |
| Beacon Roofing Supply, Inc. (c) | | 465,599 | 52,621,999 |
| Boise Cascade Co. | | 31,789 | 4,692,056 |
| Bossard Holding AG Series A | | 4,612 | 1,043,910 |
| Chori Co. Ltd. | | 70,700 | 1,828,754 |
| Core & Main, Inc. Class A (c) | | 1,217,844 | 59,126,326 |
| DXP Enterprises, Inc. (c)(f) | | 60,370 | 4,423,310 |
| Ferguson Enterprises, Inc. | | 466,700 | 100,774,531 |
| FTAI Aviation Ltd. | | 188,530 | 31,827,635 |
| Global Industrial Co. | | 342,800 | 9,684,100 |
| GMS, Inc. (c) | | 374,873 | 37,618,506 |
| Itochu Corp. | | 256,400 | 12,686,184 |
| Kamei Corp. | | 108,524 | 1,315,069 |
| Mitani Shoji Co. Ltd. | | 279,400 | 3,546,306 |
| Momentum Group Komponenter & Tjanster AB | | 112,000 | 1,804,653 |
| MSC Industrial Direct Co., Inc. Class A | | 114,482 | 9,831,714 |
| RS GROUP PLC | | 2,114,491 | 19,224,223 |
| Rush Enterprises, Inc. Class A | | 389,280 | 24,115,896 |
| Totech Corp. | | 98,000 | 1,605,441 |
| Watsco, Inc. | | 142,948 | 78,850,117 |
| WESCO International, Inc. | | 118,916 | 25,159,058 |
| Xometry, Inc. Class A (c)(f) | | 155,870 | 4,839,764 |
| | | | 557,019,188 |
| Transportation Infrastructure - 0.0% | | | |
| Qingdao Port International Co. Ltd. (H Shares) (b) | | 4,142,814 | 2,870,150 |
TOTAL INDUSTRIALS | | | 9,855,504,452 |
| INFORMATION TECHNOLOGY - 9.8% | | | |
| Communications Equipment - 0.3% | | | |
| Ciena Corp. (c) | | 807,253 | 56,281,679 |
| Cisco Systems, Inc. | | 5,616,880 | 332,575,465 |
| Extreme Networks, Inc. (c) | | 114,561 | 1,901,713 |
| Juniper Networks, Inc. | | 768,558 | 27,606,603 |
| Lumentum Holdings, Inc. (c) | | 710,453 | 61,788,097 |
| Motorola Solutions, Inc. | | 31,231 | 15,606,131 |
| NetScout Systems, Inc. (c) | | 154,632 | 3,383,348 |
| | | | 499,143,036 |
| Electronic Equipment, Instruments & Components - 0.4% | | | |
| Advanced Energy Industries, Inc. | | 240,850 | 27,707,384 |
| Arrow Electronics, Inc. (c) | | 17,603 | 2,115,176 |
| Avnet, Inc. | | 264,040 | 14,445,628 |
| Badger Meter, Inc. | | 73,790 | 15,999,148 |
| Bel Fuse, Inc. Class B (non-vtg.) | | 24,768 | 1,985,898 |
| Belden, Inc. | | 374,000 | 45,777,600 |
| CDW Corp. | | 53,600 | 9,429,848 |
| Cognex Corp. | | 405,464 | 16,210,451 |
| Corning, Inc. | | 22,515 | 1,095,805 |
| Crane NXT Co. | | 718,058 | 45,007,875 |
| CTS Corp. | | 73,524 | 4,037,203 |
| Daiwabo Holdings Co. Ltd. | | 262,260 | 5,363,871 |
| ePlus, Inc. (c) | | 226,742 | 18,334,358 |
| Fabrinet (c) | | 182,117 | 42,721,006 |
| Flex Ltd. (c) | | 264,600 | 10,311,462 |
| Hon Hai Precision Industry Co. Ltd. (Foxconn) | | 5,268,000 | 32,092,339 |
| Insight Enterprises, Inc. (c)(f) | | 353,746 | 55,343,562 |
| IPG Photonics Corp. (c) | | 72,067 | 5,624,109 |
| Itron, Inc. (c) | | 9,732 | 1,153,534 |
| Jabil, Inc. | | 279,300 | 37,937,319 |
| Kingboard Chemical Holdings Ltd. | | 707,000 | 1,697,527 |
| Makus, Inc. | | 287,084 | 1,685,846 |
| Maruwa Ceramic Co. Ltd. | | 15,500 | 4,417,472 |
| Methode Electronics, Inc. | | 361,628 | 3,948,978 |
| Napco Security Technologies, Inc. | | 328,837 | 12,900,276 |
| PC Connection, Inc. | | 28,139 | 2,042,329 |
| Redington (India) Ltd. | | 1,194,288 | 2,793,863 |
| Riken Keiki Co. Ltd. | | 36,400 | 913,558 |
| Sanmina Corp. (c) | | 392,565 | 31,173,587 |
| TD SYNNEX Corp. | | 412,000 | 49,023,880 |
| Thinking Electronic Industries Co. Ltd. | | 202,000 | 965,176 |
| Trimble, Inc. (c) | | 46,974 | 3,427,693 |
| Vishay Precision Group, Inc. (c) | | 302,994 | 6,959,772 |
| Vontier Corp. | | 853,940 | 33,525,684 |
| Zebra Technologies Corp. Class A (c) | | 19,708 | 8,021,156 |
| | | | 556,190,373 |
| IT Services - 0.4% | | | |
| Accenture PLC Class A | | 41,465 | 15,025,672 |
| Amdocs Ltd. | | 2,012,125 | 174,491,480 |
| ASGN, Inc. (c) | | 697,084 | 63,818,040 |
| Avant Group Corp. | | 185,100 | 2,616,626 |
| Capgemini SA | | 347,400 | 55,844,622 |
| Cognizant Technology Solutions Corp. Class A | | 851,000 | 68,496,990 |
| DTS Corp. | | 112,300 | 3,122,468 |
| EPAM Systems, Inc. (c) | | 271,800 | 66,297,456 |
| Future Corp. | | 28,200 | 355,292 |
| Hackett Group, Inc. | | 63,082 | 1,976,990 |
| IBM Corp. | | 132,737 | 30,185,721 |
| Kyndryl Holdings, Inc. (c) | | 257,689 | 8,944,385 |
| MongoDB, Inc. Class A (c) | | 203,000 | 65,465,470 |
| Okta, Inc. Class A (c) | | 177,377 | 13,757,360 |
| Sopra Steria Group | | 63,880 | 12,069,928 |
| TDC Soft, Inc. | | 373,600 | 3,321,111 |
| Twilio, Inc. Class A (c) | | 377,953 | 39,511,207 |
| | | | 625,300,818 |
| Semiconductors & Semiconductor Equipment - 3.4% | | | |
| Advanced Micro Devices, Inc. (c) | | 335,400 | 46,008,495 |
| AEHR Test Systems (c)(f) | | 368,178 | 4,377,636 |
| Alchip Technologies Ltd. | | 227,000 | 15,603,214 |
| Allegro MicroSystems LLC (c) | | 577,790 | 12,555,377 |
| Analog Devices, Inc. | | 92,525 | 20,175,076 |
| Applied Materials, Inc. | | 261,827 | 45,743,795 |
| ASML Holding NV: | | | |
| (depository receipt) | | 33,600 | 23,070,096 |
| (Netherlands) | | 159,000 | 108,646,161 |
| Astera Labs, Inc. (c) | | 422,800 | 43,654,100 |
| Axcelis Technologies, Inc. (c)(f) | | 77,230 | 5,733,555 |
| BE Semiconductor Industries NV | | 109,643 | 13,092,772 |
| Broadcom, Inc. | | 1,108,600 | 179,681,888 |
| Cirrus Logic, Inc. (c) | | 331,182 | 34,591,960 |
| Diodes, Inc. (c) | | 690,797 | 44,901,805 |
| Entegris, Inc. | | 187,100 | 19,763,373 |
| FormFactor, Inc. (c) | | 164,847 | 6,603,771 |
| Ichor Holdings Ltd. (c) | | 194,990 | 6,387,872 |
| Impinj, Inc. (c)(f) | | 11,870 | 2,281,533 |
| Intel Corp. | | 1,530,419 | 36,806,577 |
| KLA Corp. | | 13,043 | 8,439,212 |
| Lam Research Corp. | | 306,000 | 22,607,280 |
| Lattice Semiconductor Corp. (c) | | 1,056,471 | 59,954,729 |
| MACOM Technology Solutions Holdings, Inc. (c) | | 51,011 | 6,775,281 |
| Marvell Technology, Inc. | | 2,436,011 | 225,793,860 |
| Micron Technology, Inc. | | 2,740,442 | 268,426,294 |
| MKS Instruments, Inc. | | 215,630 | 24,504,193 |
| Nova Ltd. (c)(f) | | 37,400 | 6,872,624 |
| NVE Corp. | | 12,135 | 937,793 |
| NVIDIA Corp. | | 20,145,180 | 2,785,071,135 |
| NXP Semiconductors NV | | 354,342 | 81,275,425 |
| ON Semiconductor Corp. (c) | | 1,248,200 | 88,771,984 |
| Onto Innovation, Inc. (c) | | 32,960 | 5,411,373 |
| Penguin Solutions, Inc. (c)(f) | | 793,640 | 14,396,630 |
| Photronics, Inc. (c) | | 159,041 | 3,961,711 |
| Power Integrations, Inc. (f) | | 135,067 | 8,848,239 |
| Qorvo, Inc. (c) | | 64,277 | 4,438,327 |
| Qualcomm, Inc. | | 537,424 | 85,197,827 |
| Renesas Electronics Corp. | | 3,490,200 | 45,777,780 |
| Silicon Motion Tech Corp. sponsored ADR | | 49,860 | 2,646,070 |
| Sitronix Technology Corp. | | 21,000 | 134,514 |
| Skyworks Solutions, Inc. | | 217,788 | 19,076,051 |
| SolarEdge Technologies, Inc. (c)(f) | | 409,700 | 6,473,260 |
| Sumco Corp. (f) | | 795,020 | 6,427,770 |
| Synaptics, Inc. (c) | | 67,340 | 5,403,362 |
| Taiwan Semiconductor Manufacturing Co. Ltd. | | 9,074,000 | 282,855,392 |
| Taiwan Semiconductor Manufacturing Co. Ltd. sponsored ADR | | 395,800 | 73,088,428 |
| Teradyne, Inc. | | 217,500 | 23,925,000 |
| Texas Instruments, Inc. | | 23,906 | 4,805,823 |
| Topco Scientific Co. Ltd. | | 574,455 | 5,268,145 |
| Ultra Clean Holdings, Inc. (c) | | 107,360 | 4,125,845 |
| | | | 4,851,370,413 |
| Software - 3.8% | | | |
| Adobe, Inc. (c) | | 751,499 | 387,720,879 |
| Agilysys, Inc. (c) | | 48,630 | 6,531,009 |
| Alarm.com Holdings, Inc. (c) | | 42,681 | 2,780,240 |
| ANSYS, Inc. (c) | | 1,570 | 551,227 |
| Autodesk, Inc. (c) | | 511,977 | 149,446,086 |
| Bill Holdings, Inc. (c) | | 146,254 | 13,195,036 |
| Blackbaud, Inc. (c) | | 57,617 | 4,836,371 |
| BlackLine, Inc. (c) | | 438,830 | 27,211,848 |
| CCC Intelligent Solutions Holdings, Inc. (c)(d) | | 134,385 | 1,693,251 |
| Cellebrite DI Ltd. (c) | | 556,980 | 11,239,856 |
| Clear Secure, Inc. | | 219,510 | 5,680,919 |
| CommVault Systems, Inc. (c) | | 108,757 | 18,661,614 |
| Cresco Ltd. | | 607,200 | 4,975,619 |
| Dassault Systemes SA | | 180,210 | 6,220,278 |
| DocuSign, Inc. (c) | | 94,106 | 7,499,307 |
| Dolby Laboratories, Inc. Class A | | 149,994 | 11,747,530 |
| Dropbox, Inc. Class A (c) | | 727,261 | 20,116,039 |
| Elastic NV (c) | | 902,997 | 98,842,052 |
| Five9, Inc. (c)(f) | | 1,474,772 | 60,878,588 |
| Gen Digital, Inc. | | 5,738,800 | 177,041,980 |
| HubSpot, Inc. (c) | | 161,900 | 116,737,995 |
| Informatica, Inc. Class A (c) | | 91,855 | 2,435,995 |
| Intapp, Inc. (c) | | 31,530 | 1,972,202 |
| Intuit, Inc. | | 152,200 | 97,671,306 |
| Manhattan Associates, Inc. (c) | | 154,563 | 44,118,463 |
| Microsoft Corp. | | 7,579,102 | 3,209,446,534 |
| Open Text Corp. (f) | | 242,700 | 7,389,951 |
| Open Text Corp. (f) | | 358,200 | 10,900,026 |
| Oracle Corp. | | 802,300 | 148,297,132 |
| Pegasystems, Inc. | | 19,934 | 1,893,132 |
| PTC, Inc. (c) | | 8,000 | 1,600,480 |
| Qualys, Inc. (c) | | 92,730 | 14,243,328 |
| Rapid7, Inc. (c) | | 699,730 | 29,808,498 |
| RingCentral, Inc. Class A (c) | | 11,209 | 421,795 |
| Roper Technologies, Inc. | | 3,342 | 1,893,042 |
| Sage Group PLC | | 1,887,600 | 31,512,621 |
| Salesforce, Inc. | | 907,811 | 299,568,552 |
| SAP SE sponsored ADR | | 663,755 | 157,708,188 |
| ServiceNow, Inc. (c) | | 511 | 536,264 |
| SolarWinds, Inc. | | 53,400 | 712,890 |
| SPS Commerce, Inc. (c) | | 52,410 | 10,118,799 |
| Synopsys, Inc. (c) | | 264,100 | 147,497,209 |
| System Research Co. Ltd. | | 294,000 | 2,721,585 |
| Telos Corp. (c)(f) | | 180,140 | 612,476 |
| Tenable Holdings, Inc. (c) | | 2,048,119 | 85,980,036 |
| Teradata Corp. (c) | | 476,448 | 14,722,243 |
| Varonis Systems, Inc. (c) | | 273,590 | 13,668,556 |
| Workday, Inc. Class A (c) | | 185,454 | 46,361,645 |
| Workiva, Inc. Class A (c) | | 335,980 | 32,674,055 |
| Zoom Communications, Inc. Class A (c) | | 287,756 | 23,794,544 |
| | | | 5,573,889,271 |
| Technology Hardware, Storage & Peripherals - 1.5% | | | |
| Apple, Inc. | | 7,893,773 | 1,873,429,146 |
| Dell Technologies, Inc. Class C | | 1,137,105 | 145,083,227 |
| Hewlett Packard Enterprise Co. | | 249,457 | 5,293,478 |
| MCJ Co. Ltd. | | 689,000 | 6,364,322 |
| NetApp, Inc. | | 37,190 | 4,560,982 |
| Samsung Electronics Co. Ltd. | | 548,400 | 21,568,955 |
| Seagate Technology Holdings PLC | | 227,300 | 23,032,309 |
| TSC Auto ID Technology Corp. | | 48,290 | 307,210 |
| Western Digital Corp. (c) | | 93,375 | 6,815,441 |
| Wiwynn Corp. | | 358,000 | 21,610,774 |
| | | | 2,108,065,844 |
TOTAL INFORMATION TECHNOLOGY | | | 14,213,959,755 |
| MATERIALS - 1.5% | | | |
| Chemicals - 0.7% | | | |
| AdvanSix, Inc. | | 120,000 | 3,896,400 |
| Air Products & Chemicals, Inc. | | 274,600 | 91,807,018 |
| Aspen Aerogels, Inc. (c)(f) | | 166,220 | 2,460,056 |
| Avient Corp. | | 864 | 44,280 |
| Axalta Coating Systems Ltd. (c) | | 1,811,379 | 73,288,394 |
| Balchem Corp. | | 253,810 | 45,817,781 |
| C. Uyemura & Co. Ltd. | | 81,800 | 5,795,408 |
| Cabot Corp. | | 291,200 | 31,921,344 |
| Celanese Corp. | | 136,720 | 10,009,271 |
| CF Industries Holdings, Inc. | | 1,173,260 | 105,194,492 |
| Corteva, Inc. | | 491,800 | 30,609,632 |
| Dow, Inc. | | 504,100 | 22,286,261 |
| DuPont de Nemours, Inc. | | 247,983 | 20,728,899 |
| Ecolab, Inc. | | 308,109 | 76,648,276 |
| Element Solutions, Inc. | | 1,062,012 | 30,458,504 |
| Hawkins, Inc. | | 58,168 | 7,824,178 |
| Innospec, Inc. | | 58,518 | 6,940,820 |
| International Flavors & Fragrances, Inc. | | 58,007 | 5,299,520 |
| Linde PLC | | 329,477 | 151,885,602 |
| LyondellBasell Industries NV Class A | | 310,000 | 25,835,400 |
| Minerals Technologies, Inc. | | 250,354 | 20,421,376 |
| Nutrien Ltd. (f) | | 1,469,200 | 68,552,872 |
| Olin Corp. | | 136,939 | 5,832,232 |
| PPG Industries, Inc. | | 145,562 | 18,103,546 |
| RPM International, Inc. | | 323,241 | 44,859,386 |
| Scientex Bhd | | 2,007,400 | 2,059,017 |
| Sherwin-Williams Co. | | 66,300 | 26,347,620 |
| Soulbrain Co. Ltd. | | 34,840 | 4,529,029 |
| The Chemours Co. LLC | | 1,459,800 | 31,736,052 |
| Tronox Holdings PLC | | 2,606,032 | 31,532,987 |
| | | | 1,002,725,653 |
| Construction Materials - 0.2% | | | |
| CRH PLC | | 1,386,559 | 141,803,389 |
| Eagle Materials, Inc. | | 252,472 | 77,993,650 |
| Martin Marietta Materials, Inc. | | 48,600 | 29,160,000 |
| RHI Magnesita NV | | 121,380 | 4,780,227 |
| United States Lime & Minerals, Inc. | | 25,716 | 3,934,548 |
| Vertex Corp. | | 34,500 | 445,503 |
| Vulcan Materials Co. | | 32,785 | 9,446,342 |
| Wienerberger AG | | 464,013 | 13,053,004 |
| | | | 280,616,663 |
| Containers & Packaging - 0.3% | | | |
| Aptargroup, Inc. | | 401,146 | 69,382,212 |
| Avery Dennison Corp. | | 52,600 | 10,832,970 |
| Berry Global Group, Inc. | | 43,683 | 3,158,718 |
| Corticeira Amorim SGPS SA | | 224,580 | 1,974,543 |
| Crown Holdings, Inc. | | 905,266 | 83,365,946 |
| Graphic Packaging Holding Co. (f) | | 1,238,924 | 37,279,223 |
| International Paper Co. | | 838,700 | 49,340,721 |
| Mayr-Melnhof Karton AG (f) | | 40,600 | 3,050,478 |
| Packaging Corp. of America | | 88,351 | 21,986,146 |
| Sealed Air Corp. | | 259,471 | 9,496,639 |
| Silgan Holdings, Inc. | | 933,500 | 53,704,255 |
| Smurfit Westrock PLC | | 648,044 | 35,655,381 |
| Sonoco Products Co. | | 70,820 | 3,674,142 |
| | | | 382,901,374 |
| Metals & Mining - 0.3% | | | |
| Arch Resources, Inc. Class A, (f) | | 121,900 | 20,957,048 |
| ATI, Inc. (c) | | 405,760 | 24,414,579 |
| Carpenter Technology Corp. | | 85,270 | 16,545,791 |
| Commercial Metals Co. | | 124,000 | 7,649,560 |
| Constellium NV (c) | | 588,710 | 7,217,585 |
| First Quantum Minerals Ltd. (c) | | 12,784,201 | 174,954,674 |
| Freeport-McMoRan, Inc. | | 1,154,217 | 51,016,391 |
| Hecla Mining Co. | | 575,757 | 3,178,179 |
| Ivanhoe Electric, Inc. (c)(f) | | 808,800 | 7,691,688 |
| Ivanhoe Mines Ltd. (c) | | 3,694,400 | 50,110,108 |
| Newmont Corp. | | 63,170 | 2,649,350 |
| Nucor Corp. | | 263,078 | 40,695,536 |
| Southern Copper Corp. | | 19,518 | 1,958,631 |
| Steel Dynamics, Inc. | | 101,840 | 14,794,297 |
| Teck Resources Ltd. Class B | | 206,000 | 9,616,080 |
| Warrior Metropolitan Coal, Inc. | | 249,808 | 17,566,499 |
| Wheaton Precious Metals Corp. | | 267,300 | 16,660,809 |
| Worthington Steel, Inc. | | 20,500 | 919,220 |
| | | | 468,596,025 |
| Paper & Forest Products - 0.0% | | | |
| Louisiana-Pacific Corp. | | 276,862 | 32,725,088 |
| Magnera Corp. (c) | | 12,069 | 247,173 |
| Stella-Jones, Inc. | | 32,000 | 1,632,399 |
| Sylvamo Corp. | | 73,286 | 6,763,565 |
| | | | 41,368,225 |
TOTAL MATERIALS | | | 2,176,207,940 |
| REAL ESTATE - 1.0% | | | |
| Equity Real Estate Investment Trusts (REITs) - 0.9% | | | |
| Agree Realty Corp. | | 244,700 | 18,792,960 |
| American Homes 4 Rent Class A | | 146,012 | 5,590,799 |
| American Tower Corp. | | 576,690 | 120,528,210 |
| Armada Hoffler Properties, Inc. Class A, | | 381,840 | 4,219,332 |
| Brixmor Property Group, Inc. | | 482,860 | 14,519,600 |
| Camden Property Trust (SBI) | | 81,200 | 10,214,960 |
| CareTrust (REIT), Inc. | | 141,010 | 4,200,688 |
| COPT Defense Properties (SBI) | | 394,000 | 12,982,300 |
| Crown Castle, Inc. | | 1,526,971 | 162,240,669 |
| CubeSmart | | 1,095,200 | 54,278,112 |
| Curbline Properties Corp. | | 708,044 | 17,177,147 |
| Digital Realty Trust, Inc. | | 178,900 | 35,008,941 |
| Douglas Emmett, Inc. (f) | | 409,280 | 7,923,661 |
| Equinix, Inc. | | 80,251 | 78,764,751 |
| Equity Residential (SBI) | | 70,504 | 5,404,837 |
| Essex Property Trust, Inc. | | 55,100 | 17,106,346 |
| Extra Space Storage, Inc. | | 25,012 | 4,276,052 |
| Federal Realty Investment Trust (SBI) | | 157,700 | 18,395,705 |
| First Industrial Realty Trust, Inc. | | 141,776 | 7,577,927 |
| Four Corners Property Trust, Inc. | | 510,790 | 15,175,571 |
| Gaming & Leisure Properties | | 33,287 | 1,717,942 |
| Healthpeak Properties, Inc. | | 537,993 | 11,830,466 |
| Invitation Homes, Inc. | | 941,500 | 32,246,375 |
| Lamar Advertising Co. Class A | | 406,562 | 54,487,439 |
| LXP Industrial Trust (REIT) | | 795,670 | 7,439,515 |
| Mid-America Apartment Communities, Inc. | | 237,300 | 38,955,168 |
| NNN (REIT), Inc. | | 333,700 | 14,676,126 |
| Omega Healthcare Investors, Inc. | | 247,900 | 10,067,219 |
| Outfront Media, Inc. | | 1,677,390 | 32,222,662 |
| Phillips Edison & Co., Inc. (f) | | 14,885 | 587,958 |
| Plymouth Industrial REIT, Inc. | | 1,207,730 | 22,632,860 |
| Postal Realty Trust, Inc. Class A | | 186,260 | 2,639,304 |
| Prologis, Inc. | | 436,800 | 51,009,504 |
| Public Storage Operating Co. | | 133,321 | 46,402,374 |
| Regency Centers Corp. | | 22,013 | 1,663,963 |
| Ryman Hospitality Properties, Inc. | | 100,500 | 11,782,620 |
| Sabra Health Care REIT, Inc. | | 690,600 | 12,934,938 |
| Simon Property Group, Inc. | | 361,312 | 66,336,883 |
| STAG Industrial, Inc. | | 268,400 | 9,874,436 |
| Sun Communities, Inc. | | 393,800 | 49,748,754 |
| Tanger, Inc. | | 389,860 | 14,413,124 |
| Terreno Realty Corp. | | 456,200 | 27,659,406 |
| The Macerich Co. | | 1,685,772 | 35,755,224 |
| Urban Edge Properties | | 367,140 | 8,447,891 |
| Ventas, Inc. | | 431,900 | 27,671,833 |
| VICI Properties, Inc. | | 293,085 | 9,557,502 |
| Welltower, Inc. | | 340,600 | 47,064,108 |
| | | | 1,264,204,162 |
| Real Estate Management & Development - 0.1% | | | |
| Arealink Co. Ltd. | | 173,000 | 2,521,893 |
| CBRE Group, Inc. (c) | | 291,300 | 40,779,087 |
| Compass, Inc. Class A (c) | | 2,428,900 | 17,220,901 |
| CoStar Group, Inc. (c) | | 81,183 | 6,603,425 |
| Cushman & Wakefield PLC (c) | | 844,502 | 12,920,881 |
| Jones Lang LaSalle, Inc. (c) | | 98,307 | 27,584,944 |
| LandBridge Co. LLC | | 72,210 | 5,487,960 |
| Newmark Group, Inc. Class A | | 1,500,753 | 23,231,656 |
| Robinsons Land Corp. | | 2,929,000 | 663,646 |
| Savills PLC | | 359,600 | 4,914,334 |
| Zillow Group, Inc.: | | | |
| Class A (c) | | 91,479 | 7,458,283 |
| Class C (c) | | 177,168 | 15,007,901 |
| | | | 164,394,911 |
TOTAL REAL ESTATE | | | 1,428,599,073 |
| UTILITIES - 1.5% | | | |
| Electric Utilities - 1.0% | | | |
| Allete, Inc. | | 134,230 | 8,708,842 |
| American Electric Power Co., Inc. | | 9,915 | 990,112 |
| Constellation Energy Corp. | | 205,121 | 52,625,844 |
| Duke Energy Corp. | | 389,739 | 45,618,950 |
| Edison International | | 2,913,843 | 255,689,723 |
| Entergy Corp. | | 371,100 | 57,954,687 |
| Evergy, Inc. | | 195,467 | 12,633,032 |
| Eversource Energy | | 556,640 | 35,897,714 |
| Exelon Corp. | | 204,320 | 8,082,899 |
| FirstEnergy Corp. | | 346,000 | 14,722,300 |
| IDACORP, Inc. | | 146,430 | 17,347,562 |
| Kansai Electric Power Co., Inc. | | 953,800 | 12,289,081 |
| NextEra Energy, Inc. | | 1,506,633 | 118,526,818 |
| NRG Energy, Inc. | | 382,501 | 38,865,927 |
| OGE Energy Corp. | | 386,864 | 17,006,541 |
| Otter Tail Corp. | | 10,738 | 865,912 |
| PG&E Corp. | | 20,691,991 | 447,567,765 |
| Pinnacle West Capital Corp. | | 152,800 | 14,317,360 |
| Southern Co. (g) | | 2,474,339 | 220,537,835 |
| TXNM Energy, Inc. | | 333,000 | 16,333,650 |
| Xcel Energy, Inc. | | 544,285 | 39,493,320 |
| | | | 1,436,075,874 |
| Gas Utilities - 0.1% | | | |
| Brookfield Infrastructure Corp. A Shares (f) | | 1,178,660 | 52,910,047 |
| China Resource Gas Group Ltd. | | 268,900 | 960,851 |
| New Jersey Resources Corp. | | 112,104 | 5,782,324 |
| UGI Corp. | | 1,250,364 | 37,973,555 |
| | | | 97,626,777 |
| Independent Power and Renewable Electricity Producers - 0.1% | | | |
| Brookfield Renewable Corp. (f) | | 63,507 | 2,027,143 |
| Clearway Energy, Inc.: | | | |
| Class A | | 29,800 | 828,738 |
| Class C (f) | | 26,737 | 788,474 |
| Sunnova Energy International, Inc. (c)(f) | | 292,590 | 1,620,949 |
| The AES Corp. | | 3,509,442 | 45,763,124 |
| Vistra Corp. | | 398,417 | 63,682,973 |
| | | | 114,711,401 |
| Multi-Utilities - 0.3% | | | |
| Ameren Corp. | | 145,500 | 13,733,745 |
| Black Hills Corp. | | 30,670 | 1,965,027 |
| CenterPoint Energy, Inc. | | 1,085,243 | 35,400,627 |
| Consolidated Edison, Inc. | | 82,731 | 8,321,911 |
| DTE Energy Co. | | 66,000 | 8,301,480 |
| National Grid PLC | | 11,263,420 | 142,174,229 |
| NiSource, Inc. | | 828,900 | 31,572,801 |
| Public Service Enterprise Group, Inc. | | 458,112 | 43,199,962 |
| Sempra | | 2,162,700 | 202,580,109 |
| | | | 487,249,891 |
| Water Utilities - 0.0% | | | |
| Consolidated Water Co., Inc. | | 32,972 | 887,936 |
TOTAL UTILITIES | | | 2,136,551,879 |
| TOTAL COMMON STOCKS (Cost $48,969,319,461) | | | 70,593,116,180 |
| | | | |
| Nonconvertible Preferred Stocks - 0.1% |
| | | Shares | Value ($) |
| INFORMATION TECHNOLOGY - 0.1% | | | |
| Technology Hardware, Storage & Peripherals - 0.1% | | | |
Samsung Electronics Co. Ltd. (Cost $146,319,219) | | 3,490,340 | 116,686,394 |
| TOTAL NONCONVERTIBLE PREFERRED STOCKS (Cost $146,319,219) | | | 116,686,394 |
| | | | |
| Nonconvertible Bonds - 0.7% |
| | | Principal Amount (i) | Value ($) |
| COMMUNICATION SERVICES - 0.0% | | | |
| Diversified Telecommunication Services - 0.0% | | | |
| AT&T, Inc.: | | | |
| 1.7% 3/25/26 | | 2,000,000 | 1,924,630 |
| 2.95% 7/15/26 | | 3,870,000 | 3,773,812 |
| NTT Finance Corp.: | | | |
| 4.372% 7/27/27 (b) | | 2,000,000 | 1,987,673 |
| 5.104% 7/2/27 (b) | | 3,000,000 | 3,034,222 |
| Verizon Communications, Inc. 4.125% 3/16/27 | | 1,820,000 | 1,803,241 |
| | | | 12,523,578 |
| Media - 0.0% | | | |
| Charter Communications Operating LLC/Charter Communications Operating Capital Corp.: | | | |
| 3.75% 2/15/28 | | 2,000,000 | 1,920,251 |
| 4.908% 7/23/25 | | 703,000 | 702,623 |
| COX Communications, Inc. 3.35% 9/15/26 (b) | | 2,000,000 | 1,946,409 |
| Warnermedia Holdings, Inc.: | | | |
| 3.638% 3/15/25 | | 3,000,000 | 2,987,392 |
| 3.755% 3/15/27 | | 5,500,000 | 5,326,799 |
| | | | 12,883,474 |
| Wireless Telecommunication Services - 0.0% | | | |
| Rogers Communications, Inc.: | | | |
| 2.9% 11/15/26 | | 2,000,000 | 1,928,537 |
| 3.2% 3/15/27 | | 3,000,000 | 2,900,231 |
| T-Mobile U.S.A., Inc.: | | | |
| 1.5% 2/15/26 | | 3,000,000 | 2,886,414 |
| 2.25% 2/15/26 | | 2,840,000 | 2,754,019 |
| 2.625% 4/15/26 | | 3,000,000 | 2,917,322 |
| 3.5% 4/15/25 | | 2,000,000 | 1,989,455 |
| | | | 15,375,978 |
TOTAL COMMUNICATION SERVICES | | | 40,783,030 |
| CONSUMER DISCRETIONARY - 0.1% | | | |
| Automobiles - 0.1% | | | |
| BMW U.S. Capital LLC: | | | |
| U.S. Secured Overnight Fin. Rate (SOFR) Averages Index + 0.840% 5.6202% 4/1/25 (b)(j)(k) | | 1,000,000 | 1,001,978 |
| 4.65% 8/13/26 (b) | | 3,084,000 | 3,086,576 |
| General Motors Financial Co., Inc.: | | | |
| 1.25% 1/8/26 | | 1,610,000 | 1,548,164 |
| 1.5% 6/10/26 | | 2,000,000 | 1,902,946 |
| 4.35% 4/9/25 | | 3,000,000 | 2,993,371 |
| 5% 4/9/27 | | 1,800,000 | 1,807,269 |
| 5.4% 5/8/27 | | 3,000,000 | 3,040,765 |
| Hyundai Capital America: | | | |
| 1.5% 6/15/26 (b) | | 2,000,000 | 1,900,728 |
| 2.75% 9/27/26 (b) | | 2,000,000 | 1,925,928 |
| 5.5% 3/30/26 (b) | | 2,000,000 | 2,015,022 |
| 5.65% 6/26/26 (b) | | 2,500,000 | 2,527,622 |
| 5.8% 6/26/25 (b) | | 2,000,000 | 2,009,611 |
| 5.95% 9/21/26 (b) | | 4,000,000 | 4,071,800 |
| Mercedes-Benz Finance North America LLC: | | | |
| 4.75% 8/1/27 (b) | | 4,500,000 | 4,504,818 |
| 4.8% 1/11/27 (b) | | 1,900,000 | 1,905,733 |
| 4.95% 3/30/25 (b) | | 2,500,000 | 2,499,989 |
| Volkswagen Group of America Finance LLC: | | | |
| 1.25% 11/24/25 (b) | | 3,000,000 | 2,899,241 |
| 3.2% 9/26/26 (b) | | 3,000,000 | 2,900,234 |
| 3.95% 6/6/25 (b) | | 3,000,000 | 2,984,754 |
| 4.625% 11/13/25 (b) | | 1,490,000 | 1,486,475 |
| 5.7% 9/12/26 (b) | | 3,550,000 | 3,588,276 |
| 6% 11/16/26 (b) | | 3,900,000 | 3,963,076 |
| | | | 56,564,376 |
| Specialty Retail - 0.0% | | | |
| AutoZone, Inc.: | | | |
| 3.125% 4/21/26 | | 1,500,000 | 1,468,664 |
| 3.625% 4/15/25 | | 3,000,000 | 2,984,849 |
| Lowe's Companies, Inc.: | | | |
| 4% 4/15/25 | | 1,500,000 | 1,495,775 |
| 4.8% 4/1/26 | | 225,000 | 225,616 |
| O'Reilly Automotive, Inc. 5.75% 11/20/26 | | 2,230,000 | 2,274,550 |
| Ross Stores, Inc. 0.875% 4/15/26 | | 3,500,000 | 3,322,508 |
| | | | 11,771,962 |
TOTAL CONSUMER DISCRETIONARY | | | 68,336,338 |
| CONSUMER STAPLES - 0.0% | | | |
| Consumer Staples Distribution & Retail - 0.0% | | | |
| Dollar Tree, Inc. 4% 5/15/25 | | 1,500,000 | 1,492,781 |
| Mondelez International Holdings Netherlands BV 1.25% 9/24/26 (b) | | 1,960,000 | 1,840,519 |
| | | | 3,333,300 |
| Food Products - 0.0% | | | |
| Bunge Ltd. Finance Corp. 4.1% 1/7/28 | | 2,243,000 | 2,205,939 |
| Tobacco - 0.0% | | | |
| Altria Group, Inc. 2.625% 9/16/26 | | 5,000,000 | 4,828,337 |
| BAT Capital Corp.: | | | |
| 3.215% 9/6/26 | | 5,510,000 | 5,365,430 |
| 3.557% 8/15/27 | | 4,000,000 | 3,883,325 |
| 4.7% 4/2/27 | | 2,000,000 | 1,997,871 |
| BAT International Finance PLC 1.668% 3/25/26 | | 2,000,000 | 1,920,653 |
| Imperial Brands Finance PLC: | | | |
| 3.5% 7/26/26 (b) | | 4,000,000 | 3,909,759 |
| 6.125% 7/27/27 (b) | | 2,000,000 | 2,059,202 |
| Philip Morris International, Inc. 4.75% 2/12/27 | | 2,102,000 | 2,111,075 |
| Reynolds American, Inc. 4.45% 6/12/25 | | 4,000,000 | 3,992,296 |
| | | | 30,067,948 |
TOTAL CONSUMER STAPLES | | | 35,607,187 |
| ENERGY - 0.1% | | | |
| Energy Equipment & Services - 0.0% | | | |
| Baker Hughes Co. 2.061% 12/15/26 | | 2,930,000 | 2,791,520 |
| Oil, Gas & Consumable Fuels - 0.1% | | | |
| 6297782 LLC 4.911% 9/1/27 (b) | | 921,000 | 920,034 |
| Canadian Natural Resources Ltd.: | | | |
| 2.05% 7/15/25 | | 2,000,000 | 1,965,200 |
| 3.85% 6/1/27 | | 6,000,000 | 5,876,505 |
| Cenovus Energy, Inc. 4.25% 4/15/27 | | 5,500,000 | 5,435,770 |
| DCP Midstream Operating LP: | | | |
| 5.375% 7/15/25 | | 1,909,000 | 1,912,168 |
| 5.625% 7/15/27 | | 2,809,000 | 2,855,677 |
| Devon Energy Corp. 5.85% 12/15/25 | | 2,000,000 | 2,014,206 |
| Diamondback Energy, Inc. 5.2% 4/18/27 | | 3,633,000 | 3,679,637 |
| Enbridge, Inc.: | | | |
| 5.25% 4/5/27 | | 1,675,000 | 1,699,629 |
| 5.3% 4/5/29 | | 1,400,000 | 1,425,712 |
| 5.9% 11/15/26 | | 3,288,000 | 3,357,328 |
| Energy Transfer LP: | | | |
| 2.9% 5/15/25 | | 2,000,000 | 1,980,898 |
| 4.2% 4/15/27 | | 2,760,000 | 2,729,029 |
| 4.4% 3/15/27 | | 2,000,000 | 1,986,661 |
| 5.625% 5/1/27 (b) | | 2,000,000 | 2,005,006 |
| 6% 2/1/29 (b) | | 3,900,000 | 3,960,575 |
| 6.05% 12/1/26 | | 3,900,000 | 3,988,678 |
| EQT Corp. 3.125% 5/15/26 (b) | | 4,000,000 | 3,890,733 |
| MPLX LP: | | | |
| 1.75% 3/1/26 | | 5,000,000 | 4,812,892 |
| 4% 2/15/25 | | 2,000,000 | 1,994,979 |
| 4.125% 3/1/27 | | 3,700,000 | 3,654,750 |
| Northwest Pipeline Corp. 4% 4/1/27 | | 3,000,000 | 2,948,960 |
| Occidental Petroleum Corp. 5% 8/1/27 | | 2,738,000 | 2,745,792 |
| ONEOK, Inc. 4.25% 9/24/27 | | 383,000 | 378,949 |
| Petroleos Mexicanos 6.5% 3/13/27 | | 2,000,000 | 1,951,260 |
| Phillips 66 Co.: | | | |
| 3.55% 10/1/26 | | 1,850,000 | 1,814,565 |
| 3.85% 4/9/25 | | 2,000,000 | 1,991,809 |
| Pioneer Natural Resources Co. 1.125% 1/15/26 | | 1,500,000 | 1,444,359 |
| The Williams Companies, Inc.: | | | |
| 3.9% 1/15/25 | | 3,000,000 | 2,995,778 |
| 5.4% 3/2/26 | | 312,000 | 314,253 |
| Western Midstream Operating LP 4.65% 7/1/26 | | 3,000,000 | 2,982,207 |
| | | | 81,713,999 |
TOTAL ENERGY | | | 84,505,519 |
| FINANCIALS - 0.4% | | | |
| Banks - 0.3% | | | |
| ABN AMRO Bank NV 6.339% 9/18/27 (b)(j) | | 4,000,000 | 4,098,343 |
| Banco Santander SA 5.365% 7/15/28 (j) | | 3,800,000 | 3,838,902 |
| Bank of America Corp.: | | | |
| 1.197% 10/24/26 (j) | | 3,000,000 | 2,908,355 |
| 1.658% 3/11/27 (j) | | 3,600,000 | 3,459,349 |
| 3.366% 1/23/26 (j) | | 3,000,000 | 2,992,449 |
| 3.559% 4/23/27 (j) | | 4,000,000 | 3,931,013 |
| 3.824% 1/20/28 (j) | | 4,560,000 | 4,473,276 |
| 3.95% 4/21/25 | | 3,000,000 | 2,987,765 |
| 5.08% 1/20/27 (j) | | 2,000,000 | 2,005,697 |
| 5.933% 9/15/27 (j) | | 3,700,000 | 3,770,341 |
| Bank of Ireland Group PLC 2.029% 9/30/27 (b)(j) | | 3,700,000 | 3,511,284 |
| Bank of Montreal: | | | |
| 4.567% 9/10/27 (j) | | 4,382,000 | 4,373,420 |
| 5.266% 12/11/26 | | 5,000,000 | 5,067,206 |
| 5.3% 6/5/26 | | 1,770,000 | 1,788,527 |
| Bank of Nova Scotia: | | | |
| 1.3% 9/15/26 | | 1,960,000 | 1,851,682 |
| 4.404% 9/8/28 (j) | | 4,920,000 | 4,883,461 |
| 5.35% 12/7/26 | | 1,945,000 | 1,973,713 |
| 5.45% 6/12/25 | | 2,000,000 | 2,008,366 |
| Banque Federative du Credit Mutuel SA: | | | |
| 5.088% 1/23/27 (b) | | 1,900,000 | 1,915,183 |
| 5.896% 7/13/26 (b) | | 2,000,000 | 2,035,975 |
| Barclays PLC: | | | |
| 2.279% 11/24/27 (j) | | 4,200,000 | 3,987,376 |
| 2.852% 5/7/26 (j) | | 1,000,000 | 990,435 |
| 5.304% 8/9/26 (j) | | 1,490,000 | 1,492,519 |
| 5.501% 8/9/28 (j) | | 2,000,000 | 2,024,990 |
| 5.674% 3/12/28 (j) | | 3,300,000 | 3,353,463 |
| 5.829% 5/9/27 (j) | | 2,670,000 | 2,700,442 |
| 6.496% 9/13/27 (j) | | 2,800,000 | 2,870,049 |
| 7.325% 11/2/26 (j) | | 3,500,000 | 3,570,521 |
| BNP Paribas SA: | | | |
| 1.323% 1/13/27 (b)(j) | | 3,610,000 | 3,462,770 |
| 1.675% 6/30/27 (b)(j) | | 4,300,000 | 4,085,134 |
| 2.219% 6/9/26 (b)(j) | | 1,500,000 | 1,477,671 |
| BPCE SA: | | | |
| 1.652% 10/6/26 (b)(j) | | 1,590,000 | 1,545,188 |
| 5.203% 1/18/27 (b) | | 1,500,000 | 1,515,103 |
| 5.975% 1/18/27 (b)(j) | | 3,000,000 | 3,024,897 |
| 6.612% 10/19/27 (b)(j) | | 3,640,000 | 3,739,751 |
| Canadian Imperial Bank of Commerce: | | | |
| 3.945% 8/4/25 | | 2,000,000 | 1,990,007 |
| 5.926% 10/2/26 | | 2,000,000 | 2,043,965 |
| Citibank NA: | | | |
| 4.929% 8/6/26 | | 4,500,000 | 4,524,030 |
| 5.864% 9/29/25 | | 2,000,000 | 2,017,995 |
| Citigroup, Inc.: | | | |
| 1.122% 1/28/27 (j) | | 5,000,000 | 4,789,547 |
| 1.462% 6/9/27 (j) | | 3,000,000 | 2,852,607 |
| 2.014% 1/25/26 (j) | | 1,500,000 | 1,492,908 |
| 3.106% 4/8/26 (j) | | 2,000,000 | 1,987,638 |
| 5.61% 9/29/26 (j) | | 2,000,000 | 2,011,990 |
| Citizens Bank NA 4.575% 8/9/28 (j) | | 3,000,000 | 2,981,046 |
| Cooperatieve Rabobank UA 3.649% 4/6/28 (b)(j) | | 5,800,000 | 5,644,892 |
| Credit Agricole SA: | | | |
| 1.247% 1/26/27 (b)(j) | | 2,000,000 | 1,913,937 |
| 5.134% 3/11/27 (b) | | 3,500,000 | 3,538,114 |
| Danske Bank A/S: | | | |
| 1.549% 9/10/27 (b)(j) | | 2,000,000 | 1,890,158 |
| 5.427% 3/1/28 (b)(j) | | 3,000,000 | 3,038,207 |
| 6.259% 9/22/26 (b)(j) | | 2,227,000 | 2,248,896 |
| 6.466% 1/9/26 (b)(j) | | 1,960,000 | 1,962,400 |
| DNB Bank ASA 1.535% 5/25/27 (b)(j) | | 5,660,000 | 5,389,206 |
| Fifth Third Bancorp 2.375% 1/28/25 | | 3,000,000 | 2,987,759 |
| HSBC Holdings PLC: | | | |
| 1.645% 4/18/26 (j) | | 1,000,000 | 987,429 |
| 4.292% 9/12/26 (j) | | 1,510,000 | 1,502,623 |
| 5.597% 5/17/28 (j) | | 3,400,000 | 3,448,762 |
| 5.887% 8/14/27 (j) | | 4,660,000 | 4,731,258 |
| 7.336% 11/3/26 (j) | | 2,000,000 | 2,042,473 |
| Huntington Bancshares, Inc.: | | | |
| 4.443% 8/4/28 (j) | | 3,000,000 | 2,969,707 |
| 6.208% 8/21/29 (j) | | 4,350,000 | 4,531,970 |
| ING Groep NV: | | | |
| 1.726% 4/1/27 (j) | | 3,724,000 | 3,568,236 |
| 6.083% 9/11/27 (j) | | 3,000,000 | 3,060,653 |
| JPMorgan Chase & Co.: | | | |
| U.S. Secured Overnight Fin. Rate (SOFR) Index + 0.920% 5.4945% 2/24/26 (j)(k) | | 3,000,000 | 3,005,070 |
| 1.47% 9/22/27 (j) | | 4,100,000 | 3,867,937 |
| 1.578% 4/22/27 (j) | | 2,910,000 | 2,784,456 |
| 2.182% 6/1/28 (j) | | 3,000,000 | 2,820,131 |
| 4.505% 10/22/28 (j) | | 5,000,000 | 4,970,961 |
| 4.979% 7/22/28 (j) | | 6,100,000 | 6,139,602 |
| 5.04% 1/23/28 (j) | | 2,200,000 | 2,213,114 |
| 5.571% 4/22/28 (j) | | 2,384,000 | 2,428,786 |
| 6.07% 10/22/27 (j) | | 3,400,000 | 3,480,522 |
| KeyCorp U.S. Secured Overnight Fin. Rate (SOFR) Averages Index + 1.250% 5.8228% 5/23/25 (j)(k) | | 1,500,000 | 1,502,902 |
| Lloyds Banking Group PLC: | | | |
| 1.627% 5/11/27 (j) | | 5,038,000 | 4,807,978 |
| 5.462% 1/5/28 (j) | | 2,200,000 | 2,224,937 |
| 5.985% 8/7/27 (j) | | 3,305,000 | 3,359,318 |
| Mitsubishi UFJ Financial Group, Inc.: | | | |
| 1.538% 7/20/27 (j) | | 3,620,000 | 3,438,030 |
| 4.08% 4/19/28 (j) | | 6,000,000 | 5,911,100 |
| Mizuho Financial Group, Inc.: | | | |
| 1.234% 5/22/27 (j) | | 2,960,000 | 2,810,728 |
| 1.554% 7/9/27 (j) | | 3,000,000 | 2,851,383 |
| 2.226% 5/25/26 (j) | | 2,000,000 | 1,973,786 |
| 2.839% 9/13/26 | | 3,000,000 | 2,910,598 |
| 3.477% 4/12/26 (b) | | 2,000,000 | 1,965,577 |
| 5.414% 9/13/28 (j) | | 2,000,000 | 2,034,458 |
| Morgan Stanley Bank, West Valley City Utah: | | | |
| 4.754% 4/21/26 | | 941,000 | 943,428 |
| 5.479% 7/16/25 | | 2,000,000 | 2,009,635 |
| 5.882% 10/30/26 | | 2,000,000 | 2,046,959 |
| NatWest Group PLC: | | | |
| 1.642% 6/14/27 (j) | | 3,000,000 | 2,854,262 |
| 3.073% 5/22/28 (j) | | 3,800,000 | 3,641,366 |
| 5.847% 3/2/27 (j) | | 2,758,000 | 2,787,780 |
| 7.472% 11/10/26 (j) | | 2,000,000 | 2,044,740 |
| NatWest Markets PLC: | | | |
| U.S. Secured Overnight Fin. Rate (SOFR) Index + 1.450% 6.2409% 3/22/25 (b)(j)(k) | | 2,000,000 | 2,007,206 |
| 5.416% 5/17/27 (b) | | 2,400,000 | 2,438,149 |
| PNC Financial Services Group, Inc.: | | | |
| 5.102% 7/23/27 (j) | | 4,600,000 | 4,625,726 |
| 5.3% 1/21/28 (j) | | 5,595,000 | 5,659,738 |
| 6.615% 10/20/27 (j) | | 5,600,000 | 5,780,396 |
| Royal Bank of Canada 5.069% 7/23/27 (j) | | 4,600,000 | 4,628,886 |
| Santander Holdings U.S.A., Inc.: | | | |
| 2.49% 1/6/28 (j) | | 3,000,000 | 2,846,538 |
| 3.244% 10/5/26 | | 4,700,000 | 4,552,384 |
| 6.124% 5/31/27 (j) | | 1,162,000 | 1,179,366 |
| Societe Generale U.S. Secured Overnight Fin. Rate (SOFR) Index + 1.050% 5.7789% 1/21/26 (b)(j)(k) | | 3,000,000 | 3,002,871 |
| Sumitomo Mitsui Financial Group, Inc.: | | | |
| 5.464% 1/13/26 | | 3,000,000 | 3,022,840 |
| 5.88% 7/13/26 | | 1,760,000 | 1,791,655 |
| The Toronto-Dominion Bank: | | | |
| 1.2% 6/3/26 | | 1,000,000 | 950,446 |
| 5.264% 12/11/26 | | 2,075,000 | 2,101,898 |
| 5.532% 7/17/26 | | 3,000,000 | 3,037,787 |
| Truist Financial Corp.: | | | |
| 1.267% 3/2/27 (j) | | 3,000,000 | 2,871,033 |
| 5.9% 10/28/26 (j) | | 3,900,000 | 3,935,500 |
| 6.047% 6/8/27 (j) | | 5,460,000 | 5,555,800 |
| U.S. Bancorp: | | | |
| 3.1% 4/27/26 | | 1,500,000 | 1,469,722 |
| 6.787% 10/26/27 (j) | | 3,720,000 | 3,853,969 |
| Wells Fargo & Co.: | | | |
| 2.164% 2/11/26 (j) | | 1,000,000 | 994,595 |
| 2.393% 6/2/28 (j) | | 5,900,000 | 5,565,707 |
| 3% 2/19/25 | | 3,000,000 | 2,987,887 |
| 3.196% 6/17/27 (j) | | 5,350,000 | 5,219,002 |
| 5.707% 4/22/28 (j) | | 3,000,000 | 3,060,107 |
| Wells Fargo Bank NA 5.254% 12/11/26 | | 2,000,000 | 2,025,976 |
| | | | 354,857,757 |
| Capital Markets - 0.1% | | | |
| Athene Global Funding: | | | |
| 1.608% 6/29/26 (b) | | 2,500,000 | 2,375,129 |
| 1.716% 1/7/25 (b) | | 3,000,000 | 2,990,883 |
| 4.86% 8/27/26 (b) | | 5,300,000 | 5,289,242 |
| 5.516% 3/25/27 (b) | | 2,500,000 | 2,535,107 |
| 5.684% 2/23/26 (b) | | 2,700,000 | 2,721,956 |
| Deutsche Bank AG New York Branch: | | | |
| 2.129% 11/24/26 (j) | | 4,000,000 | 3,889,246 |
| 2.552% 1/7/28 (j) | | 3,900,000 | 3,705,702 |
| 5.706% 2/8/28 (j) | | 6,000,000 | 6,076,347 |
| 7.146% 7/13/27 (j) | | 720,000 | 743,474 |
| Goldman Sachs Group, Inc.: | | | |
| 1.093% 12/9/26 (j) | | 3,000,000 | 2,888,544 |
| 1.431% 3/9/27 (j) | | 2,910,000 | 2,788,399 |
| 1.542% 9/10/27 (j) | | 2,000,000 | 1,887,753 |
| 1.948% 10/21/27 (j) | | 5,800,000 | 5,492,259 |
| 4.387% 6/15/27 (j) | | 3,000,000 | 2,981,005 |
| Intercontinental Exchange, Inc.: | | | |
| 3.625% 9/1/28 | | 3,700,000 | 3,570,331 |
| 3.65% 5/23/25 | | 1,500,000 | 1,492,415 |
| Moody's Corp. 3.75% 3/24/25 | | 3,000,000 | 2,989,188 |
| Morgan Stanley: | | | |
| U.S. Secured Overnight Fin. Rate (SOFR) Index + 0.500% 5.2137% 1/22/25 (j)(k) | | 3,000,000 | 3,000,458 |
| 0.985% 12/10/26 (j) | | 3,000,000 | 2,883,912 |
| 1.512% 7/20/27 (j) | | 5,860,000 | 5,555,245 |
| 1.593% 5/4/27 (j) | | 4,000,000 | 3,822,085 |
| 3.591% 7/22/28 (j) | | 3,000,000 | 2,904,248 |
| NASDAQ, Inc. 5.65% 6/28/25 | | 318,000 | 319,392 |
| UBS Group AG: | | | |
| U.S. Secured Overnight Fin. Rate (SOFR) Index + 1.580% 6.1772% 5/12/26 (b)(j)(k) | | 2,000,000 | 2,011,260 |
| 1.305% 2/2/27 (b)(j) | | 3,000,000 | 2,873,046 |
| 1.364% 1/30/27 (b)(j) | | 3,720,000 | 3,566,798 |
| 1.494% 8/10/27 (b)(j) | | 4,100,000 | 3,869,475 |
| 4.125% 4/15/26 (b) | | 3,000,000 | 2,967,258 |
| 4.703% 8/5/27 (b)(j) | | 2,730,000 | 2,717,586 |
| | | | 90,907,743 |
| Consumer Finance - 0.0% | | | |
| AerCap Ireland Capital Ltd./AerCap Global Aviation Trust: | | | |
| 1.75% 1/30/26 | | 3,000,000 | 2,896,564 |
| 6.1% 1/15/27 | | 2,000,000 | 2,049,574 |
| 6.45% 4/15/27 | | 1,998,000 | 2,070,094 |
| 6.5% 7/15/25 | | 1,500,000 | 1,511,542 |
| Ally Financial, Inc.: | | | |
| 5.8% 5/1/25 | | 2,000,000 | 2,003,756 |
| 7.1% 11/15/27 | | 5,120,000 | 5,420,925 |
| American Express Co.: | | | |
| 5.098% 2/16/28 (j) | | 2,850,000 | 2,870,473 |
| 5.389% 7/28/27 (j) | | 1,700,000 | 1,717,953 |
| 6.338% 10/30/26 (j) | | 1,694,000 | 1,717,916 |
| Capital One Financial Corp.: | | | |
| 1.878% 11/2/27 (j) | | 3,700,000 | 3,493,996 |
| 4.985% 7/24/26 (j) | | 1,500,000 | 1,499,538 |
| 7.149% 10/29/27 (j) | | 4,400,000 | 4,577,056 |
| Ford Motor Credit Co. LLC: | | | |
| 5.8% 3/5/27 | | 2,200,000 | 2,227,680 |
| 5.85% 5/17/27 | | 4,000,000 | 4,059,385 |
| 6.95% 3/6/26 | | 65,000 | 66,208 |
| 6.95% 6/10/26 | | 2,000,000 | 2,047,374 |
| | | | 40,230,034 |
| Financial Services - 0.0% | | | |
| CNH Industrial Capital LLC: | | | |
| 1.45% 7/15/26 | | 5,700,000 | 5,410,239 |
| 4.5% 10/8/27 | | 3,700,000 | 3,671,523 |
| Corebridge Financial, Inc.: | | | |
| 3.5% 4/4/25 | | 1,500,000 | 1,492,473 |
| 3.65% 4/5/27 | | 2,810,000 | 2,740,983 |
| Corebridge Global Funding: | | | |
| 0.9% 9/22/25 (b) | | 2,000,000 | 1,942,147 |
| 5.75% 7/2/26 (b) | | 2,000,000 | 2,031,200 |
| Jackson Financial, Inc. 5.17% 6/8/27 | | 2,000,000 | 2,016,328 |
| JBS U.S.A. Holding Lux Sarl/ JBS U.S.A. Food Co./ JBS Lux Co. Sarl 2.5% 1/15/27 | | 3,000,000 | 2,848,536 |
| Nationwide Building Society 6.557% 10/18/27 (b)(j) | | 2,000,000 | 2,056,684 |
| The Western Union Co. 1.35% 3/15/26 | | 3,000,000 | 2,863,381 |
| | | | 27,073,494 |
| Insurance - 0.0% | | | |
| Aon North America, Inc. 5.125% 3/1/27 | | 3,250,000 | 3,284,772 |
| Equitable Financial Life Global Funding: | | | |
| 1% 1/9/26 (b) | | 3,900,000 | 3,743,512 |
| 1.3% 7/12/26 (b) | | 1,000,000 | 947,465 |
| Jackson National Life Global Funding 5.55% 7/2/27 (b) | | 2,512,000 | 2,552,582 |
| MassMutual Global Funding II: | | | |
| 4.5% 4/10/26 (b) | | 2,000,000 | 2,000,035 |
| 5.1% 4/9/27 (b) | | 3,400,000 | 3,448,390 |
| Metropolitan Tower Global Funding 4% 10/1/27 (b) | | 1,400,000 | 1,382,080 |
| | | | 17,358,836 |
TOTAL FINANCIALS | | | 530,427,864 |
| HEALTH CARE - 0.0% | | | |
| Biotechnology - 0.0% | | | |
| Amgen, Inc.: | | | |
| 5.15% 3/2/28 | | 342,000 | 347,132 |
| 5.25% 3/2/25 | | 2,000,000 | 2,001,442 |
| | | | 2,348,574 |
| Health Care Equipment & Supplies - 0.0% | | | |
| Boston Scientific Corp. 1.9% 6/1/25 | | 3,000,000 | 2,956,422 |
| Health Care Providers & Services - 0.0% | | | |
| Cigna Group: | | | |
| 1.25% 3/15/26 | | 803,000 | 768,511 |
| 3.4% 3/1/27 | | 3,000,000 | 2,920,855 |
| CVS Health Corp.: | | | |
| 2.875% 6/1/26 | | 3,870,000 | 3,760,042 |
| 5% 2/20/26 | | 2,000,000 | 2,002,351 |
| HCA Holdings, Inc.: | | | |
| 4.5% 2/15/27 | | 4,000,000 | 3,969,100 |
| 5.25% 6/15/26 | | 2,735,000 | 2,742,173 |
| 5.875% 2/15/26 | | 2,000,000 | 2,015,547 |
| ICON Investments Six Designated Activity 5.809% 5/8/27 | | 3,353,000 | 3,417,501 |
| | | | 21,596,080 |
| Pharmaceuticals - 0.0% | | | |
| Bristol-Myers Squibb Co. 4.9% 2/22/27 | | 1,624,000 | 1,642,259 |
| Haleon U.S. Capital LLC 3.375% 3/24/27 | | 1,870,000 | 1,818,947 |
| Haleon UK Capital PLC 3.125% 3/24/25 | | 1,000,000 | 994,960 |
| | | | 4,456,166 |
TOTAL HEALTH CARE | | | 31,357,242 |
| INDUSTRIALS - 0.1% | | | |
| Aerospace & Defense - 0.0% | | | |
| BAE Systems PLC 5% 3/26/27 (b) | | 1,066,000 | 1,073,841 |
| L3Harris Technologies, Inc. 5.4% 1/15/27 | | 2,000,000 | 2,032,999 |
| RTX Corp. 5.75% 11/8/26 | | 721,000 | 735,211 |
| The Boeing Co.: | | | |
| 4.875% 5/1/25 | | 3,000,000 | 2,996,443 |
| 6.259% 5/1/27 (b) | | 302,000 | 309,472 |
| | | | 7,147,966 |
| Building Products - 0.0% | | | |
| Carrier Global Corp. 2.242% 2/15/25 | | 3,000,000 | 2,982,131 |
| Commercial Services & Supplies - 0.0% | | | |
| Republic Services, Inc. 3.2% 3/15/25 | | 1,500,000 | 1,492,204 |
| Ground Transportation - 0.0% | | | |
| Canadian Pacific Railway Co. 1.35% 12/2/24 | | 3,000,000 | 3,000,000 |
| Machinery - 0.1% | | | |
| Daimler Trucks Finance North America LLC: | | | |
| 2% 12/14/26 (b) | | 2,920,000 | 2,763,993 |
| 5% 1/15/27 (b) | | 2,300,000 | 2,311,340 |
| 5.125% 9/25/27 (b) | | 1,185,000 | 1,195,645 |
| 5.2% 1/17/25 (b) | | 610,000 | 610,212 |
| 5.6% 8/8/25 (b) | | 1,460,000 | 1,469,558 |
| Ingersoll Rand, Inc. 5.197% 6/15/27 | | 4,100,000 | 4,155,892 |
| Otis Worldwide Corp. 2.056% 4/5/25 | | 3,000,000 | 2,970,372 |
| | | | 15,477,012 |
| Trading Companies & Distributors - 0.0% | | | |
| Air Lease Corp.: | | | |
| 1.875% 8/15/26 | | 2,000,000 | 1,904,348 |
| 2.3% 2/1/25 | | 3,000,000 | 2,984,398 |
| 2.875% 1/15/26 | | 2,158,000 | 2,111,550 |
| 3.375% 7/1/25 | | 3,000,000 | 2,974,074 |
| | | | 9,974,370 |
| Transportation Infrastructure - 0.0% | | | |
| Avolon Holdings Funding Ltd.: | | | |
| 2.125% 2/21/26 (b) | | 3,500,000 | 3,376,082 |
| 2.875% 2/15/25 (b) | | 4,500,000 | 4,471,359 |
| 3.25% 2/15/27 (b) | | 3,800,000 | 3,649,783 |
| 6.375% 5/4/28 (b) | | 571,000 | 592,670 |
| | | | 12,089,894 |
TOTAL INDUSTRIALS | | | 52,163,577 |
| INFORMATION TECHNOLOGY - 0.0% | | | |
| Communications Equipment - 0.0% | | | |
| Cisco Systems, Inc. 4.8% 2/26/27 | | 3,000,000 | 3,028,133 |
| Electronic Equipment, Instruments & Components - 0.0% | | | |
| Amphenol Corp. 5.05% 4/5/27 | | 589,000 | 595,490 |
| Dell International LLC/EMC Corp.: | | | |
| 4.9% 10/1/26 | | 3,000,000 | 3,005,849 |
| 6.02% 6/15/26 | | 4,015,000 | 4,076,441 |
| | | | 7,677,780 |
| Semiconductors & Semiconductor Equipment - 0.0% | | | |
| Broadcom, Inc.: | | | |
| 4.15% 2/15/28 | | 3,547,000 | 3,497,286 |
| 5.05% 7/12/27 | | 3,800,000 | 3,838,082 |
| Micron Technology, Inc. 4.185% 2/15/27 | | 5,450,000 | 5,384,457 |
| NXP BV/NXP Funding LLC 5.35% 3/1/26 | | 4,000,000 | 4,014,200 |
| NXP BV/NXP Funding LLC/NXP U.S.A., Inc. 3.875% 6/18/26 | | 2,760,000 | 2,726,632 |
| | | | 19,460,657 |
| Software - 0.0% | | | |
| Oracle Corp. 2.65% 7/15/26 | | 4,000,000 | 3,879,468 |
| Roper Technologies, Inc. 1% 9/15/25 | | 2,000,000 | 1,943,960 |
| VMware, Inc. 1.4% 8/15/26 | | 2,000,000 | 1,889,676 |
| | | | 7,713,104 |
| Technology Hardware, Storage & Peripherals - 0.0% | | | |
| Hewlett Packard Enterprise Co.: | | | |
| 4.4% 9/25/27 | | 1,832,000 | 1,821,523 |
| 4.45% 9/25/26 | | 2,255,000 | 2,245,232 |
| | | | 4,066,755 |
TOTAL INFORMATION TECHNOLOGY | | | 41,946,429 |
| MATERIALS - 0.0% | | | |
| Chemicals - 0.0% | | | |
| Celanese U.S. Holdings LLC: | | | |
| 1.4% 8/5/26 | | 2,904,000 | 2,711,499 |
| 6.05% 3/15/25 | | 1,500,000 | 1,502,143 |
| 6.165% 7/15/27 | | 5,000,000 | 5,101,352 |
| The Mosaic Co. 4.05% 11/15/27 | | 3,700,000 | 3,632,984 |
| | | | 12,947,978 |
| Containers & Packaging - 0.0% | | | |
| Sonoco Products Co. 4.45% 9/1/26 | | 825,000 | 820,015 |
| Metals & Mining - 0.0% | | | |
| Glencore Funding LLC 5.338% 4/4/27 (b) | | 3,800,000 | 3,846,694 |
TOTAL MATERIALS | | | 17,614,687 |
| REAL ESTATE - 0.0% | | | |
| Equity Real Estate Investment Trusts (REITs) - 0.0% | | | |
| American Tower Corp.: | | | |
| 1.6% 4/15/26 | | 3,000,000 | 2,876,021 |
| 3.125% 1/15/27 | | 3,600,000 | 3,488,951 |
| Crown Castle, Inc. 4% 3/1/27 | | 2,000,000 | 1,967,602 |
| Omega Healthcare Investors, Inc. 4.5% 1/15/25 | | 3,000,000 | 2,995,884 |
| | | | 11,328,458 |
| UTILITIES - 0.0% | | | |
| Electric Utilities - 0.0% | | | |
| Cleco Corporate Holdings LLC 3.743% 5/1/26 | | 2,600,000 | 2,547,078 |
| Duke Energy Corp. 2.65% 9/1/26 | | 1,000,000 | 966,776 |
| Edison International 5.75% 6/15/27 | | 2,000,000 | 2,042,945 |
| Enel Americas SA 4% 10/25/26 | | 3,600,000 | 3,522,384 |
| Enel Finance America LLC 7.1% 10/14/27 (b) | | 2,000,000 | 2,118,278 |
| ENEL Finance International NV: | | | |
| 1.625% 7/12/26 (b)(l) | | 3,000,000 | 2,852,068 |
| 5.125% 6/26/29 (b) | | 4,400,000 | 4,439,991 |
| Eversource Energy 4.75% 5/15/26 | | 1,800,000 | 1,800,080 |
| Exelon Corp. 5.15% 3/15/29 | | 586,000 | 595,273 |
| FirstEnergy Corp. 3.9% 7/15/27 (l) | | 3,800,000 | 3,705,497 |
| Firstenergy Pennsylvania Elect 5.15% 3/30/26 (b) | | 576,000 | 576,823 |
| Georgia Power Co. 5.004% 2/23/27 | | 827,000 | 836,294 |
| Pacific Gas & Electric Co.: | | | |
| 2.1% 8/1/27 | | 3,900,000 | 3,639,315 |
| 5.45% 6/15/27 | | 2,000,000 | 2,028,556 |
| Southern California Edison Co. 3.7% 8/1/25 | | 1,500,000 | 1,488,818 |
| Southern Co. 5.5% 3/15/29 | | 893,000 | 920,669 |
| Vistra Operations Co. LLC 5.05% 12/30/26 (b)(h) | | 1,265,000 | 1,266,833 |
| | | | 35,347,678 |
| Independent Power and Renewable Electricity Producers - 0.0% | | | |
| The AES Corp. 3.3% 7/15/25 (b) | | 2,000,000 | 1,975,767 |
| Multi-Utilities - 0.0% | | | |
| CenterPoint Energy, Inc.: | | | |
| 1.45% 6/1/26 | | 3,000,000 | 2,860,347 |
| 5.25% 8/10/26 | | 2,000,000 | 2,012,017 |
| Dominion Energy, Inc. 2.85% 8/15/26 | | 2,000,000 | 1,938,607 |
| DTE Energy Co. 4.95% 7/1/27 | | 1,227,000 | 1,234,970 |
| NiSource, Inc. 0.95% 8/15/25 | | 3,000,000 | 2,918,155 |
| Puget Energy, Inc. 3.65% 5/15/25 | | 2,000,000 | 1,986,247 |
| | | | 12,950,343 |
TOTAL UTILITIES | | | 50,273,788 |
| TOTAL NONCONVERTIBLE BONDS (Cost $957,606,808) | | | 964,344,119 |
| | | | |
| U.S. Treasury Obligations - 0.4% |
| | | Principal Amount (i) | Value ($) |
| U.S. Treasury Bills, yield at date of purchase 4.44% to 5.02% 12/5/24 to 2/27/25 (a) | | 2,707,000 | 2,687,618 |
| U.S. Treasury Notes: | | | |
| 3.625% 5/31/28 | | 25,907,700 | 25,492,772 |
| 3.875% 1/15/26 | | 26,336,600 | 26,211,090 |
| 4.125% 6/15/26 | | 99,124,800 | 98,931,197 |
| 4.125% 10/31/27 | | 39,744,500 | 39,760,025 |
| 4.25% 3/15/27 (a) | | 182,069,800 | 182,418,293 |
| 4.5% 7/15/26 (m) | | 180,442,500 | 181,154,402 |
| TOTAL U.S. TREASURY OBLIGATIONS (Cost $555,720,424) | | | 556,655,397 |
| | | | |
| Asset-Backed Securities - 0.1% |
| | | Principal Amount (i) | Value ($) |
| Affirm Asset Securitization Trust Series 2024-X2 Class A, 5.22% 12/17/29 (b) | | 4,735,000 | 4,736,527 |
| Ally Auto Receivables Trust Series 2024-1 Class A3, 5.08% 12/15/28 | | 527,000 | 530,801 |
| American Express Credit Account Master Trust: | | | |
| Series 2023-1 Class A, 4.87% 5/15/28 | | 863,000 | 867,515 |
| Series 2024-1 Class A, 5.23% 4/15/29 | | 5,000,000 | 5,090,386 |
| Ares CLO Series 2024-54A Class AR, CME Term SOFR 3 Month Index + 1.270% 5.9259% 10/15/32 (b)(j)(k) | | 1,259,000 | 1,260,759 |
| Ares XXXIV CLO Ltd. Series 2024-2A Class AR3, CME Term SOFR 3 Month Index + 1.320% 5.9675% 4/17/33 (b)(j)(k) | | 4,748,000 | 4,758,707 |
| ARI Fleet Lease Trust Series 2024-A Class A2, 5.3% 11/15/32 (b) | | 2,019,000 | 2,026,703 |
| Ari Fleet Lease Trust 2023-B Series 2023-B Class A2, 6.05% 7/15/32 (b) | | 958,476 | 968,190 |
| Ari Fleet Lease Trust 2024-B Series 2024-B Class A3, 5.26% 4/15/33 (b) | | 316,000 | 320,802 |
| Bank of America Credit Card Master Trust Series 2023-A2 Class A2, 4.98% 11/15/28 | | 1,026,000 | 1,035,988 |
| BMW Vehicle Lease Trust: | | | |
| Series 2023-2 Class A3, 5.99% 9/25/26 | | 1,057,000 | 1,064,532 |
| Series 2024-1 Class A3, 4.98% 3/25/27 | | 1,516,000 | 1,524,377 |
| BMW Vehicle Owner Trust Series 2023-A Class A3, 5.47% 2/25/28 | | 247,000 | 249,207 |
| Bofa Auto Trust 2024-1 Series 2024-1A Class A3, 5.35% 11/15/28 (b) | | 241,000 | 244,263 |
| Buckhorn Park Clo Ltd. Series 2024-1A Class ARR, CME Term SOFR 3 Month Index + 1.070% 5.6277% 7/18/34 (b)(j)(k) | | 4,537,000 | 4,537,000 |
| Capital One Prime Auto Receiva Series 2024-1 Class A3, 4.62% 7/16/29 | | 3,405,000 | 3,409,947 |
| Carmax Series 2023-3 Class A3, 5.28% 5/15/28 | | 1,154,000 | 1,163,233 |
| CarMax Auto Owner Trust Series 2023 2 Class A3, 5.05% 1/18/28 | | 1,534,000 | 1,541,115 |
| Carmax Auto Owner Trust Series 2024-2 Class A3, 5.5% 1/16/29 | | 476,000 | 484,341 |
| Carmax Auto Owner Trust 2023-4 Series 2023-4 Class A3, 6% 7/17/28 | | 302,000 | 307,797 |
| Carmax Auto Owner Trust 2024-3 Series 2024-3 Class A3, 4.89% 7/16/29 | | 2,196,000 | 2,213,806 |
| Cent CLO LP Series 2021-21A Class A1R3, CME Term SOFR 3 Month Index + 1.230% 5.8488% 7/27/30 (b)(j)(k) | | 21,836 | 21,836 |
| CFMT LLC Series 2023 HB12 Class A, 4.25% 4/25/33 (b) | | 112,458 | 110,848 |
| Chase Auto Owner Trust: | | | |
| Series 2024-1A Class A3, 5.13% 5/25/29 (b) | | 544,000 | 549,782 |
| Series 2024-4A Class A3, 4.94% 7/25/29 (b) | | 3,339,000 | 3,363,952 |
| Chase Auto Owner Trust 24-3 Series 2024-3A Class A3, 5.22% 7/25/29 (b) | | 2,619,000 | 2,653,078 |
| Chase Issuance Trust: | | | |
| Series 2023-A1 Class A, 5.16% 9/15/28 | | 2,080,000 | 2,105,794 |
| Series 2023-A2 Class A, 5.08% 9/15/30 | | 2,080,000 | 2,127,212 |
| Chesapeake Funding II LLC: | | | |
| Series 2021-1A Class A2, U.S. 30-Day Avg. Secured Overnight Fin. Rate (SOFR) Index + 0.340% 5.1501% 4/15/33 (b)(j)(k) | | 24,968 | 24,967 |
| Series 2023 1A Class A1, 5.65% 5/15/35 (b) | | 777,268 | 781,602 |
| Series 2023-2A Class A1, 6.16% 10/15/35 (b) | | 162,482 | 164,728 |
| Series 2024-1A Class A1, 5.52% 5/15/36 (b) | | 619,584 | 625,619 |
| Citibank Credit Card Issuance Trust Series 2023-A1 Class A1, 5.23% 12/8/27 | | 748,000 | 753,106 |
| Citizens Auto Receivables Trust: | | | |
| Series 2024-1 Class A3, 5.11% 4/17/28 (b) | | 817,000 | 821,900 |
| Series 2024-2 Class A3, 5.33% 8/15/28 (b) | | 740,000 | 747,683 |
| Daimler Trucks Retail Trust 20 Series 2024-1 Class A3, 5.49% 12/15/27 | | 2,243,000 | 2,271,999 |
| Dell Equipment Finance Trust 2: | | | |
| Series 2023-3 Class A3, 5.93% 4/23/29 (b) | | 773,000 | 782,464 |
| Series 2024-1 Class A3, 5.39% 3/22/30 (b) | | 1,003,000 | 1,012,992 |
| Dell Equipment Finance Trust 2023-2 Series 2023-2 Class A3, 5.65% 1/22/29 (b) | | 498,000 | 500,945 |
| Dell Equipment Finance Trust 2024-2 Series 2024-2 Class A3, 4.59% 8/22/30 (b) | | 827,000 | 827,294 |
| Dllaa 2023-1A Series 2023-1A Class A3, 5.64% 2/22/28 (b) | | 134,000 | 136,062 |
| DLLAD Series 2024-1A Class A3, 5.3% 7/20/29 (b) | | 199,000 | 202,297 |
| Dllmt 2024-1 LLC Series 2024-1A Class A3, 4.84% 8/21/28 (b) | | 1,310,000 | 1,314,352 |
| DLLST Series 2024-1A Class A3, 5.05% 8/20/27 (b) | | 1,500,000 | 1,505,166 |
| Dryden 104 Clo Ltd. / Dryden 10 Series 2024-104A Class A1R, CME Term SOFR 3 Month Index + 1.290% 5.811% 8/20/34 (b)(j)(k) | | 2,406,000 | 2,411,770 |
| Dryden 68 CLO Ltd. Series 2024-68A Class ARR, CME Term SOFR 3 Month Index + 1.100% 0% 7/15/35 (b)(j)(k) | | 4,111,000 | 4,111,000 |
| Dryden CLO, Ltd. / Dryden CLO, LLC Series 2021-86A Class A1R, CME Term SOFR 3 Month Index + 1.360% 6.0091% 7/17/34 (b)(j)(k) | | 878,000 | 879,594 |
| Enterprise Fleet Financing: | | | |
| Series 2023-2 Class A2, 5.56% 4/22/30 (b) | | 1,083,654 | 1,091,806 |
| Series 2024-2: | | | |
Class A2, 5.74% 12/20/26 (b) | | 620,000 | 625,346 |
Class A3, 5.61% 4/20/28 (b) | | 424,000 | 432,129 |
| Enterprise Fleet Financing 202: | | | |
| Series 2024-3 Class A3, 4.98% 8/21/28 (b) | | 2,415,000 | 2,434,910 |
| Series 2024-4 Class A3, 4.56% 11/20/28 (b) | | 991,000 | 990,445 |
| Enterprise Fleet Financing 2023-3 L Series 2023-3 Class A2, 6.4% 3/20/30 (b) | | 412,333 | 419,612 |
| Enterprise Fleet Financing LLC: | | | |
| Series 2023-1 Class A2, 5.51% 1/22/29 (b) | | 637,781 | 640,592 |
| Series 2024-1 Class A2, 5.23% 3/20/30 (b) | | 1,808,872 | 1,820,188 |
| Flatiron CLO Ltd. / Flatiron CLO LLC Series 2024-1A Class AR, CME Term SOFR 3 Month Index + 1.380% 5.901% 5/20/36 (b)(j)(k) | | 1,693,000 | 1,698,328 |
| Ford Credit Auto Owner Trust: | | | |
| Series 2020-1 Class B, 2.29% 8/15/31 (b) | | 2,400,000 | 2,386,376 |
| Series 2020-2 Class A, 1.06% 4/15/33 (b) | | 1,409,000 | 1,365,617 |
| Series 2023-B Class A3, 5.23% 5/15/28 | | 982,000 | 990,049 |
| Ford Credit Auto Owner Trust 2 Series 2024-D Class A3, 4.61% 8/15/29 | | 1,895,000 | 1,896,102 |
| Ford Credit Floorplan Master Owner Trust: | | | |
| Series 2023-1 Class A1, 4.92% 5/15/28 (b) | | 986,000 | 990,439 |
| Series 2024-1 Class A1, 5.29% 4/15/29 (b) | | 3,118,000 | 3,171,271 |
| GM Financial Automobile Leasing Trust Series 2023-2 Class A3, 5.05% 7/20/26 | | 970,495 | 971,747 |
| Gm Financial Consumer Automobile Re Series 2023-3 Class A3, 5.45% 6/16/28 | | 282,000 | 284,781 |
| GM Financial Leasing Trust Series 2024-1 Class A3, 5.09% 3/22/27 | | 2,671,000 | 2,687,504 |
| Gm Financial Leasing Trust 202 Series 2023-3 Class A3, 5.38% 11/20/26 | | 141,000 | 141,689 |
| GMF Floorplan Owner Revolving Trust: | | | |
| Series 2023-1 Class B, 5.73% 6/15/28 (b) | | 1,104,000 | 1,115,159 |
| Series 2024-1A Class A1, 5.13% 3/15/29 (b) | | 6,264,000 | 6,341,603 |
| Series 2024-4A Class A1, 4.73% 11/15/29 (b) | | 1,055,000 | 1,058,865 |
| Hartwick Park Clo Ltd. Series 2024-1A Class AR, CME Term SOFR 3 Month Index + 1.160% 0% 1/20/37 (b)(j)(k) | | 3,615,000 | 3,615,000 |
| Huntington Auto Trust Series 2024-1A Class A3, 5.23% 1/16/29 (b) | | 2,719,000 | 2,745,780 |
| Hyundai Auto Lease Securitizat: | | | |
| Series 2023-C Class A3, 5.8% 12/15/26 (b) | | 1,363,000 | 1,375,524 |
| Series 2024-B Class A3, 5.41% 5/17/27 (b) | | 1,108,000 | 1,121,002 |
| Hyundai Auto Receivables Trust: | | | |
| Series 2023-B Class A3, 5.48% 4/17/28 | | 285,000 | 287,953 |
| Series 2024-A Class A3, 4.99% 2/15/29 | | 577,000 | 581,585 |
| John Deere Owner Trust Series 2024-A Class A3, 4.96% 11/15/28 | | 3,371,000 | 3,401,659 |
| Juniper Valley Park CLO LLC Series 2024-1A Class AR, CME Term SOFR 3 Month Index + 1.250% 5.8674% 7/20/36 (b)(j)(k) | | 4,000,000 | 4,013,308 |
| Kubota Credit Owner Trust Series 2024-2A Class A3, 5.26% 11/15/28 (b) | | 593,000 | 602,452 |
| Magnetite Xxii Ltd. / Magnetite Series 2024-22A Class ARR, CME Term SOFR 3 Month Index + 1.250% 5.9059% 7/15/36 (b)(j)(k) | | 3,656,000 | 3,662,749 |
| Marlette Funding Trust 2024-1 Series 2024-1A Class A, 5.95% 7/17/34 (b) | | 140,185 | 140,785 |
| Mercedes-Benz Auto Lease Trust: | | | |
| Series 2024-A Class A3, 5.32% 1/18/28 | | 714,000 | 723,192 |
| Series 2024-B Class A3, 4.23% 2/15/28 | | 3,874,000 | 3,855,609 |
| Merchants Fleet Funding LLC Series 2024-1A Class A, 5.82% 4/20/37 (b) | | 931,000 | 939,066 |
| Neuberger Berman Ln Advisers N Series 2024-50A Class AR, CME Term SOFR 3 Month Index + 1.250% 5.8763% 7/23/36 (b)(j)(k) | | 6,075,000 | 6,086,214 |
| Nissan Master Owner Trust Receiva Series 2024-B Class A, 5.05% 2/15/29 (b) | | 1,063,000 | 1,072,354 |
| Oportun Funding Trust Series 2024-3 Class A, 5.26% 8/15/29 (b) | | 697,414 | 697,591 |
| Palmer Square Loan Funding 202: | | | |
| Series 2024-2A Class A1N, CME Term SOFR 3 Month Index + 1.000% 0% 1/15/33 (b)(h)(j)(k) | | 763,000 | 763,000 |
| Series 2024-3A Class A1, CME Term SOFR 3 Month Index + 1.080% 5.6023% 8/8/32 (b)(j)(k) | | 1,956,231 | 1,958,341 |
| Palmer Square Loan Funding, Ltd. / Palmer Square Loan Funding LLC Series 2022-1A Class A1, CME Term SOFR 3 Month Index + 1.050% 5.6973% 4/15/30 (b)(j)(k) | | 2,561,001 | 2,562,154 |
| Porsche Financial Auto Securitization Trust Series 2023-2A Class A3, 5.79% 1/22/29 (b) | | 674,000 | 682,311 |
| Porsche Innovative Lease Owner Series 2024-2A Class A3, 4.35% 10/20/27 (b) | | 3,160,000 | 3,145,833 |
| Rr 16 Ltd. Series 2021-16A Class A1, CME Term SOFR 3 Month Index + 1.370% 6.0275% 7/15/36 (b)(j)(k) | | 1,614,000 | 1,617,007 |
| Sbna Auto Lease Trust Series 2024-B Class A3, 5.56% 11/22/27 (b) | | 631,000 | 638,847 |
| Sbna Auto Lease Trust 2024-C Series 2024-C Class A3, 4.56% 2/22/28 (b) | | 625,000 | 624,246 |
| Sfs Auto Receivables Securitiz Series 2023-1A Class A3, 5.47% 10/20/28 (b) | | 1,579,000 | 1,593,294 |
| Sfs Auto Receivables Securitization Trust: | | | |
| Series 2024-1A Class A3, 4.95% 5/21/29 (b) | | 627,000 | 629,923 |
| Series 2024-2A Class A3, 5.33% 11/20/29 (b) | | 359,000 | 363,621 |
| Tesla Series 2024-A Class A3, 5.3% 6/21/27 (b) | | 1,216,000 | 1,221,824 |
| Tesla Auto Lease Trust 2023-B Series 2023-B Class A3, 6.13% 9/21/26 (b) | | 1,764,000 | 1,775,988 |
| Tesla Auto Lease Trust 23-A Series 2023-A Class A3, 5.89% 6/22/26 (b) | | 322,000 | 323,186 |
| TMUST Series 2024-1A Class A, 5.05% 9/20/29 (b) | | 1,811,000 | 1,825,550 |
| Toyota Lease Owner Trust 2023- Series 2023-B Class A3, 5.66% 11/20/26 (b) | | 1,484,000 | 1,498,067 |
| Upstart Securitization Trust 2 Series 2023-3 Class A, 6.9% 10/20/33 (b) | | 543,645 | 549,321 |
| Valley Stream Park Clo Ltd. / Vy Series 2024-1A Class ARR, CME Term SOFR 3 Month Index + 1.190% 0% 1/20/37 (b)(j)(k) | | 2,570,000 | 2,570,000 |
| Verizon Master Trust: | | | |
| Series 2023 2 Class A, 4.89% 4/13/28 | | 1,189,000 | 1,189,998 |
| Series 2023-4 Class A1A, 5.16% 6/20/29 | | 1,573,000 | 1,588,368 |
| Series 2024-8 Class A1A, 4.62% 11/20/30 | | 4,600,000 | 4,602,530 |
| Volkswagen Auto Lease Trust 20 Series 2023-A Class A3, 5.81% 10/20/26 | | 1,708,000 | 1,722,939 |
| Volkswagen Auto Loan Enhanced: | | | |
| Series 2023-1 Class A3, 5.02% 6/20/28 | | 699,000 | 702,868 |
| Series 2024-1 Class A3, 4.63% 7/20/29 | | 4,570,000 | 4,584,100 |
| Volvo Financial Equipment LLC Series 2024-1A Class A3, 4.29% 10/16/28 (b) | | 301,000 | 298,180 |
| Voya Clo 2022-1 Ltd. / Voya Clo Series 2024-1A Class A1R, CME Term SOFR 3 Month Index + 1.250% 5.8674% 4/20/35 (b)(j)(k) | | 2,950,000 | 2,951,997 |
| Voya CLO Ltd./Voya CLO LLC Series 2021-2A Class A1R, CME Term SOFR 3 Month Index + 1.420% 6.039% 7/19/34 (b)(j)(k) | | 1,016,000 | 1,017,913 |
| Wells Fargo Card Issuance Trust Series 2024-A1 Class A, 4.94% 2/15/29 | | 2,470,000 | 2,496,975 |
| Wheels Fleet Lease Funding 1 L: | | | |
| Series 2023-2A Class A, 6.46% 8/18/38 (b) | | 1,279,366 | 1,302,838 |
| Series 2024-1A Class A1, 5.49% 2/18/39 (b) | | 3,185,000 | 3,218,432 |
| Series 2024-2A Class A2, CME Term SOFR 1 Month Index + 1.000% 5.6105% 6/21/39 (b)(j)(k) | | 1,886,000 | 1,891,634 |
| Series 2024-3A Class A1, 4.8% 9/19/39 (b) | | 3,185,000 | 3,180,274 |
| World Omni Auto Receivables Trust: | | | |
| Series 2023-C Class A3, 5.15% 11/15/28 | | 173,000 | 174,123 |
| Series 2023-D Class A3, 5.79% 2/15/29 | | 1,017,000 | 1,035,016 |
| Series 2024-A Class A3, 4.86% 3/15/29 | | 2,240,000 | 2,247,336 |
| Series 2024-B Class A3, 5.27% 9/17/29 | | 1,644,000 | 1,668,236 |
| World Omni Automobile Lease Se Series 2024-A Class A3, 5.26% 10/15/27 | | 1,490,000 | 1,508,381 |
| TOTAL ASSET-BACKED SECURITIES (Cost $198,052,508) | | | 199,345,070 |
| | | | |
| Collateralized Mortgage Obligations - 0.0% |
| | | Principal Amount (i) | Value ($) |
| Private Sponsor - 0.0% | | | |
| Cfmt 2024-Hb15 LLC sequential payer Series 2024-HB15 Class A, 4% 8/25/34 (b)(j) | | 272,341 | 267,331 |
| Cfmt LLC floater sequential payer Series 2024-HB13 Class A, 3% 5/25/34 (b)(j) | | 448,827 | 436,597 |
| Ocwen Ln Investment Trust 2023-Hb1 Series 2023-HB1 Class A, 3% 6/25/36 (b) | | 36,317 | 35,624 |
| Ocwen Loan Invest Trust Series 2024-HB1 Class A, 3% 2/25/37 (b) | | 53,011 | 51,222 |
| Prpm 2024-Rpl2 LLC Series 2024-RPL2 Class A1, 3.5% 5/25/54 (b)(j) | | 1,490,195 | 1,428,501 |
| | | | |
| TOTAL COLLATERALIZED MORTGAGE OBLIGATIONS (Cost $2,183,976) | | | 2,219,275 |
| | | | |
| Commercial Mortgage Securities - 0.0% |
| | | Principal Amount (i) | Value ($) |
| Benchmark Mortgage Trust sequential payer Series 2019-B9 Class AAB, 3.9325% 3/15/52 | | 1,532,028 | 1,508,501 |
| BLP Commercial Mortgage Trust sequential payer Series 2024-IND2 Class A, CME Term SOFR 1 Month Index + 1.340% 5.9514% 3/15/41 (b)(j)(k) | | 409,000 | 409,256 |
| BMP floater Series 2024-MF23 Class A, CME Term SOFR 1 Month Index + 1.370% 5.9812% 6/15/41 (b)(j)(k) | | 778,000 | 778,973 |
| BX Commercial Mortgage Trust: | | | |
| floater: | | | |
Series 2021-LBA Class AJV, CME Term SOFR 1 Month Index + 0.910% 5.5245% 2/15/36 (b)(j)(k) | | 100,000 | 99,970 |
Series 2021-PAC Class A, CME Term SOFR 1 Month Index + 0.800% 5.4126% 10/15/36 (b)(j)(k) | | 576,000 | 573,307 |
Series 2022-LP2 Class A, CME Term SOFR 1 Month Index + 1.010% 5.6222% 2/15/39 (b)(j)(k) | | 3,850,389 | 3,845,585 |
Series 2023-XL3 Class A, CME Term SOFR 1 Month Index + 1.760% 6.3707% 12/9/40 (b)(j)(k) | | 365,607 | 366,864 |
| floater sequential payer: | | | |
Series 2019-IMC Class A, CME Term SOFR 1 Month Index + 1.040% 5.6553% 4/15/34 (b)(j)(k) | | 150,242 | 148,834 |
Series 2021-SOAR Class A, CME Term SOFR 1 Month Index + 0.780% 5.3945% 6/15/38 (b)(j)(k) | | 3,553,418 | 3,546,756 |
Series 2024-XL5 Class A, CME Term SOFR 1 Month Index + 1.390% 6.0009% 3/15/41 (b)(j)(k) | | 5,030,218 | 5,044,366 |
| BX Commercial Mortgage Trust 2024-Xl4 floater sequential payer Series 2024-XL4 Class A, CME Term SOFR 1 Month Index + 1.440% 6.0513% 2/15/39 (b)(j)(k) | | 2,813,967 | 2,822,761 |
| BX Commercial Mtg Trust floater Series 2024-MDHS Class A, 6.2506% 5/15/41 (b)(j) | | 3,985,254 | 3,997,708 |
| BX Trust floater: | | | |
| Series 2021-ACNT Class A, CME Term SOFR 1 Month Index + 0.960% 5.5735% 11/15/38 (b)(j)(k) | | 2,597,540 | 2,592,670 |
| Series 2022-GPA Class A, CME Term SOFR 1 Month Index + 2.160% 6.7743% 8/15/39 (b)(j)(k) | | 172,451 | 172,612 |
| Series 2024-CNYN Class A, CME Term SOFR 1 Month Index + 1.440% 6.0512% 4/15/41 (b)(j)(k) | | 1,763,799 | 1,765,989 |
| CSAIL Commercial Mortgage Trust sequential payer Series 2015-C4 Class A3, 3.5438% 11/15/48 | | 1,369,184 | 1,356,302 |
| ELP Commercial Mortgage Trust floater Series 2021-ELP Class A, CME Term SOFR 1 Month Index + 0.810% 5.4255% 11/15/38 (b)(j)(k) | | 5,353,768 | 5,333,692 |
| GS Mortgage Securities Trust: | | | |
| floater Series 2021-IP Class A, CME Term SOFR 1 Month Index + 1.060% 5.6745% 10/15/36 (b)(j)(k) | | 2,300,000 | 2,282,750 |
| sequential payer: | | | |
Series 2017-GS6 Class A2, 3.164% 5/10/50 | | 124,723 | 119,189 |
Series 2017-GS7 Class AAB, 3.203% 8/10/50 | | 2,342,468 | 2,303,692 |
| Life Financial Services Trust floater Series 2022-BMR2 Class A1, CME Term SOFR 1 Month Index + 1.290% 5.9045% 5/15/39 (b)(j)(k) | | 2,500,000 | 2,439,063 |
| LIFE Mortgage Trust floater Series 2021-BMR Class A, CME Term SOFR 1 Month Index + 0.810% 5.4235% 3/15/38 (b)(j)(k) | | 1,459,367 | 1,441,125 |
| OPEN Trust sequential payer Series 2023-AIR Class A, CME Term SOFR 1 Month Index + 3.080% 7.6984% 10/15/28 (b)(j)(k) | | 343,278 | 346,495 |
| SREIT Trust floater: | | | |
| Series 2021-FLWR Class A, CME Term SOFR 1 Month Index + 0.690% 5.3% 7/15/36 (b)(j)(k) | | 115,000 | 114,784 |
| Series 2021-MFP Class A, CME Term SOFR 1 Month Index + 0.840% 5.4546% 11/15/38 (b)(j)(k) | | 128,220 | 128,125 |
| Voya CLO Ltd. floater Series 2024-2A Class AR, CME Term SOFR 3 Month Index + 1.200% 5.8174% 7/20/32 (b)(j)(k) | | 3,500,000 | 3,506,307 |
| Wells Fargo Commercial Mtg Trust 2024-G floater Series 2024-GRP Class A, CME Term SOFR 1 Month Index + 1.790% 6.4006% 10/15/41 (b)(j)(k) | | 1,775,000 | 1,774,324 |
| TOTAL COMMERCIAL MORTGAGE SECURITIES (Cost $48,421,074) | | | 48,820,000 |
| | | | |
| Bank Notes - 0.0% |
| | | Principal Amount (i) | Value ($) |
| Citizens Bank NA 2.25% 4/28/25 | | 3,000,000 | 2,967,606 |
| Goldman Sachs Bank U.S.A. 5.283% 3/18/27 (j) | | 3,500,000 | 3,522,659 |
| Morgan Stanley Bank, West Valley City Utah 4.968% 7/14/28 (j) | | 3,117,000 | 3,133,860 |
| Truist Bank 1.5% 3/10/25 | | 2,000,000 | 1,981,093 |
| TOTAL BANK NOTES (Cost $11,556,004) | | | 11,605,218 |
| | | | |
| Other - 0.0% |
| | | Shares | Value ($) |
| Commodity Funds - Broad Basket - 0.0% | | | |
Fidelity SAI Inflation-Focused Fund (n) (Cost $1,082) | | 14 | 1,178 |
| | | | |
| Money Market Funds - 1.6% |
| | | Shares | Value ($) |
| Fidelity Cash Central Fund 4.64% (o) | | 1,398,790,298 | 1,399,070,056 |
| Fidelity Securities Lending Cash Central Fund 4.64% (o)(p) | | 931,159,143 | 931,252,259 |
| TOTAL MONEY MARKET FUNDS (Cost $2,330,318,552) | | | 2,330,322,315 |
| | | | |
| Equity Funds - 49.0% |
| | | Shares | Value ($) |
| Large Blend Funds - 8.0% | | | |
| Fidelity SAI U.S. Large Cap Index Fund (n) | | 115,446,776 | 2,883,860,470 |
| Fidelity SAI U.S. Low Volatility Index Fund (n) | | 373,879,544 | 8,625,401,086 |
TOTAL LARGE BLEND FUNDS | | | 11,509,261,556 |
| Large Growth Funds - 32.7% | | | |
| Fidelity Blue Chip Growth Fund (n) | | 15,024,987 | 3,398,051,029 |
| Fidelity Contrafund (n) | | 264,008,197 | 5,826,660,916 |
| Fidelity Growth Company Fund (n) | | 336,687,815 | 14,625,718,699 |
| Fidelity Magellan Fund (n) | | 551,317,184 | 8,683,245,641 |
| Fidelity SAI U.S. Momentum Index Fund (n) | | 1,020,824 | 18,150,250 |
| Fidelity SAI U.S. Quality Index Fund (n) | | 661,862,063 | 14,819,091,573 |
TOTAL LARGE GROWTH FUNDS | | | 47,370,918,108 |
| Large Value Funds - 2.8% | | | |
| Fidelity SAI U.S. Value Index Fund (n) | | 315,559,467 | 4,108,584,259 |
| Mid-Cap Blend Funds - 0.8% | | | |
| Fidelity SAI Small-Mid Cap 500 Index Fund (n) | | 162,086,501 | 1,141,088,964 |
| Mid-Cap Growth Funds - 2.6% | | | |
| Fidelity Extended Market Index Fund (n) | | 38,228,590 | 3,754,812,158 |
| Small Blend Funds - 1.0% | | | |
| Fidelity Small Cap Index Fund (n) | | 47,702,217 | 1,451,578,457 |
| Small Growth Funds - 1.1% | | | |
| Fidelity Advisor Small Cap Growth Fund Class Z (n) | | 44,331,023 | 1,638,031,309 |
| TOTAL EQUITY FUNDS (Cost $50,783,085,815) | | | 70,974,274,811 |
| | | | |
| TOTAL INVESTMENT IN SECURITIES - 100.6% (Cost $104,002,584,923) | 145,797,389,957 |
NET OTHER ASSETS (LIABILITIES) - (0.6)% | (819,817,976) |
| NET ASSETS - 100.0% | 144,977,571,981 |
| | |
| Futures Contracts |
| | Number of contracts | Expiration Date | Notional Amount ($) | Value ($) | Unrealized Appreciation/ (Depreciation) ($) |
| Purchased | | | | | |
| | | | | | |
| Equity Index Contracts | | | | | |
| CME E-mini Russell 2000 Index Contracts (United States) | 32 | Dec 2024 | 3,911,360 | 291,584 | 291,584 |
| CME E-mini S&P 500 Index Contracts (United States) | 4,780 | Dec 2024 | 1,446,308,500 | 84,264,079 | 84,264,079 |
| CME E-mini S&P MidCap 400 Index Contracts (United States) | 17 | Dec 2024 | 5,742,260 | 404,692 | 404,692 |
| | | | | | |
| TOTAL FUTURES CONTRACTS | | | | | 84,960,355 |
| The notional amount of futures purchased as a percentage of Net Assets is 1.0% |
| Written Options |
| | Counterparty | Number of Contracts | Notional Amount ($) | Exercise Price ($) | Expiration Date | Value ($) |
| Call Options | | | | | | |
| Bank of America Corp. | Chicago Board Options Exchange | 4,232 | 20,106,232 | 45.00 | 12/20/24 | (1,136,292) |
| Embraer SA sponsored ADR | Chicago Board Options Exchange | 2,422 | 9,259,306 | 40.00 | 12/20/24 | (169,540) |
| JPMorgan Chase & Co. | Chicago Board Options Exchange | 255 | 6,367,860 | 265.00 | 01/17/25 | (71,783) |
| JPMorgan Chase & Co. | Chicago Board Options Exchange | 275 | 6,867,300 | 240.00 | 12/20/24 | (320,375) |
| Southern Co. | Chicago Board Options Exchange | 3,042 | 27,113,346 | 95.00 | 01/17/25 | (98,865) |
| Walmart, Inc. | Chicago Board Options Exchange | 1,461 | 13,514,250 | 100.00 | 02/21/25 | (227,186) |
| | | | | | | |
| TOTAL WRITTEN OPTIONS | | | | | | (2,024,041) |
| Total Return Swaps |
| Underlying Reference | Pay/ Receive Reference | Reference Payment Frequency | Financing Rate | Financing Frequency | Counterparty | Maturity Date | Units | Notional Amount | Value ($) | Upfront Premium Received/ (Paid) ($) | Unrealized Appreciation/ (Depreciation) ($) |
| S&P 500 Total Return | Receives | Monthly | U.S. Secured Overnight Fin. Rate (SOFR) Index plus 116 basis points | Monthly | Goldman Sachs Intl. | Nov 2025 | 19,383 | | 249,350,995 | 6,593,620 | 0 | 6,593,620 |
| S&P 500 Total Return | Receives | Monthly | U.S. Secured Overnight Fin. Rate (SOFR) Index plus 108 basis points | Monthly | Goldman Sachs Intl. | Nov 2025 | 3,835 | | 49,988,412 | 611,958 | 0 | 611,958 |
| S&P 500 Total Return | Receives | Monthly | U.S. Secured Overnight Fin. Rate (SOFR) Index plus 93 basis points | Monthly | Morgan Stanley Capital Services LLC | Oct 2025 | 24,693 | | 315,374,057 | 9,778,088 | 0 | 9,778,088 |
| TOTAL RETURN SWAPS | | | | | | | | | | 16,983,666 | 0 | 16,983,666 |
Legend
| (a) | Security or a portion of the security was pledged to cover margin requirements for futures contracts. At period end, the value of securities pledged amounted to $68,277,237. |
| (b) | Security exempt from registration under Rule 144A of the Securities Act of 1933. These securities may be resold in transactions exempt from registration, normally to qualified institutional buyers. At the end of the period, the value of these securities amounted to $467,321,902 or 0.3% of net assets. |
| (d) | Restricted securities (including private placements) - Investment in securities not registered under the Securities Act of 1933 (excluding 144A issues). At the end of the period, the value of restricted securities (excluding 144A issues) amounted to $1,693,253 or 0.0% of net assets. |
| (f) | Security or a portion of the security is on loan at period end. |
| (g) | Security or a portion of the security is pledged as collateral for options written. At period end, the value of securities pledged amounted to $83,228,294. |
| (h) | Security or a portion of the security purchased on a delayed delivery or when-issued basis. |
| (i) | Amount is stated in United States dollars unless otherwise noted. |
| (j) | Coupon rates for floating and adjustable rate securities reflect the rates in effect at period end. |
| (k) | Coupon is indexed to a floating interest rate which may be multiplied by a specified factor and/or subject to caps or floors. |
| (l) | Security initially issued at one coupon which converts to a higher coupon at a specified date. The rate shown is the rate at period end. |
| (m) | Security or a portion of the security has been segregated as collateral for open bi-lateral over the counter (OTC) swaps. At period end, the value of securities pledged amounted to $17,100,571. |
| (o) | Affiliated fund that is generally available only to investment companies and other accounts managed by Fidelity Investments. The rate quoted is the annualized seven-day yield of the fund at period end. A complete unaudited listing of the fund's holdings as of its most recent quarter end is available upon request. In addition, each Fidelity Central Fund's financial statements are available on the SEC's website or upon request. |
| (p) | Investment made with cash collateral received from securities on loan. |
| Additional information on each restricted holding is as follows: |
| Security | Acquisition Date | Acquisition Cost ($) |
| CCC Intelligent Solutions Holdings, Inc. | 2/02/21 | 1,343,850 |
| | | |
| GCI Liberty, Inc. Class A (Escrow) | 5/23/23 | 0 |
| | | |
Affiliated Central Funds
Fiscal year to date information regarding the Fund's investments in Fidelity Central Funds, including the ownership percentage, is presented below.
| Affiliate | Value, beginning of period ($) | Purchases ($) | Sales Proceeds ($) | Dividend Income ($) | Realized Gain (loss) ($) | Change in Unrealized appreciation (depreciation) ($) | Value, end of period ($) | % ownership, end of period |
| Fidelity Cash Central Fund 4.64% | 988,367,069 | 5,525,814,404 | 5,115,106,041 | 30,246,079 | (5,377) | 1 | 1,399,070,056 | 2.6% |
| Fidelity Securities Lending Cash Central Fund 4.64% | 792,033,763 | 2,596,920,991 | 2,457,702,495 | 1,007,089 | - | - | 931,252,259 | 3.6% |
| Total | 1,780,400,832 | 8,122,735,395 | 7,572,808,536 | 31,253,168 | (5,377) | 1 | 2,330,322,315 | |
| | | | | | | | | |
Amounts in the dividend income column in the above table include any capital gain distributions from underlying funds, which are presented in the corresponding line item in the Statement of Operations, if applicable.
Amounts in the dividend income column for Fidelity Securities Lending Cash Central Fund represents the income earned on investing cash collateral, less rebates paid to borrowers and any lending agent fees associated with the loan, plus any premium payments received for lending certain types of securities.
Amounts included in the purchases and sales proceeds columns may include in-kind transactions, if applicable.
Affiliated Underlying Funds
Fiscal year to date information regarding the Fund's investments in affiliated Underlying Funds is presented below. Exchanges between classes of the same affiliated Underlying Funds may occur. If an Underlying Funds changes its name, the name presented below is the name in effect at period end.
| Affiliate | Value, beginning of period ($) | Purchases ($) | Sales Proceeds ($) | Dividend Income ($) | Realized Gain (loss) ($) | Change in Unrealized appreciation (depreciation) ($) | Value, end of period ($) |
| Fidelity Advisor Small Cap Growth Fund Class Z | 1,180,230,254 | 240,667,506 | - | 19,429,332 | - | 217,133,549 | 1,638,031,309 |
| Fidelity Blue Chip Growth Fund | 2,834,601,385 | 406,033,204 | 125,000,000 | 159,927,326 | 8,045,236 | 274,371,204 | 3,398,051,029 |
| Fidelity Contrafund | 5,667,816,012 | - | 602,290,325 | - | 110,066,789 | 651,068,440 | 5,826,660,916 |
| Fidelity Extended Market Index Fund | 2,978,386,225 | 851,882,309 | 695,862,025 | - | 24,404,019 | 596,001,630 | 3,754,812,158 |
| Fidelity Growth Company Fund | 12,525,496,474 | 343,952,374 | 125,000,000 | - | 818,973 | 1,880,450,878 | 14,625,718,699 |
| Fidelity Magellan Fund | 7,343,976,910 | 479,315,088 | 125,000,000 | - | (8,443,554) | 993,397,197 | 8,683,245,641 |
| Fidelity SAI Inflation-Focused Fund | 1,222 | 27 | - | 28 | - | (71) | 1,178 |
| Fidelity SAI Small-Mid Cap 500 Index Fund | 1,245,839,035 | 60,739,505 | 279,338,681 | 60,739,504 | 33,240,467 | 80,608,638 | 1,141,088,964 |
| Fidelity SAI U.S. Large Cap Index Fund | 2,695,197,081 | 3,862,484,990 | 4,029,531,907 | 39,915,988 | 179,923,485 | 175,786,821 | 2,883,860,470 |
| Fidelity SAI U.S. Low Volatility Index Fund | 6,937,888,747 | 2,344,936,408 | 1,818,421,128 | - | 69,229,617 | 1,091,767,442 | 8,625,401,086 |
| Fidelity SAI U.S. Momentum Index Fund | 15,688,110 | 465,384 | - | 465,384 | - | 1,996,756 | 18,150,250 |
| Fidelity SAI U.S. Quality Index Fund | 11,897,911,703 | 2,613,520,361 | 160,935,098 | 1,238,550,863 | 10,334,222 | 458,260,385 | 14,819,091,573 |
| Fidelity SAI U.S. Value Index Fund | 2,673,481,415 | 1,063,391,936 | - | 93,507,801 | - | 371,710,908 | 4,108,584,259 |
| Fidelity Small Cap Index Fund | 1,474,548,882 | 1,949,248 | 279,338,681 | 1,949,248 | 47,054,343 | 207,364,665 | 1,451,578,457 |
| | 59,471,063,455 | 12,269,338,340 | 8,240,717,845 | 1,614,485,474 | 474,673,597 | 6,999,918,442 | 70,974,275,989 |
Amounts in the dividend income column in the above table include any capital gain distributions from underlying funds, which are presented in the corresponding line item in the Statement of Operations, if applicable.
Amounts included in the purchases and sales proceeds columns may include in-kind transactions, if applicable.
Investment Valuation
The following is a summary of the inputs used, as of November 30, 2024, involving the Fund's assets and liabilities carried at fair value. The inputs or methodology used for valuing securities may not be an indication of the risk associated with investing in those securities. For more information on valuation inputs, and their aggregation into the levels used below, please refer to the Investment Valuation section in the accompanying Notes to Financial Statements.
| Valuation Inputs at Reporting Date: |
| Description | Total ($) | Level 1 ($) | Level 2 ($) | Level 3 ($) |
Investments in Securities: | | | | |
|
| Equities: | | | | |
Communication Services | 4,918,877,476 | 4,869,804,784 | 49,072,690 | 2 |
Consumer Discretionary | 5,746,629,796 | 5,717,662,891 | 28,966,905 | - |
Consumer Staples | 4,524,378,073 | 4,362,506,021 | 161,872,052 | - |
Energy | 4,155,638,107 | 4,064,695,627 | 90,942,480 | - |
Financials | 13,014,974,422 | 12,917,974,921 | 96,999,501 | - |
Health Care | 8,421,795,207 | 8,418,308,992 | 3,486,215 | - |
Industrials | 9,855,504,452 | 9,548,397,226 | 307,107,226 | - |
Information Technology | 14,330,646,149 | 13,606,157,716 | 724,488,433 | - |
Materials | 2,176,207,940 | 2,169,619,894 | 6,588,046 | - |
Real Estate | 1,428,599,073 | 1,427,935,427 | 663,646 | - |
Utilities | 2,136,551,879 | 1,982,088,569 | 154,463,310 | - |
|
| Corporate Bonds | 964,344,119 | - | 964,344,119 | - |
|
| U.S. Government and Government Agency Obligations | 556,655,397 | - | 556,655,397 | - |
|
| Asset-Backed Securities | 199,345,070 | - | 199,345,070 | - |
|
| Collateralized Mortgage Obligations | 2,219,275 | - | 2,219,275 | - |
|
| Commercial Mortgage Securities | 48,820,000 | - | 48,820,000 | - |
|
| Bank Notes | 11,605,218 | - | 11,605,218 | - |
|
| Other | 1,178 | 1,178 | - | - |
|
| Money Market Funds | 2,330,322,315 | 2,330,322,315 | - | - |
|
| Equity Funds | 70,974,274,811 | 70,974,274,811 | - | - |
| Total Investments in Securities: | 145,797,389,957 | 142,389,750,372 | 3,407,639,583 | 2 |
Derivative Instruments: Assets | | | | |
Futures Contracts | 84,960,355 | 84,960,355 | - | - |
Swaps | 16,983,666 | - | 16,983,666 | - |
| Total Assets | 101,944,021 | 84,960,355 | 16,983,666 | - |
| Liabilities | | | | |
Written Options | (2,024,041) | (2,024,041) | - | - |
| Total Liabilities | (2,024,041) | (2,024,041) | - | - |
| Total Derivative Instruments: | 99,919,980 | 82,936,314 | 16,983,666 | - |
Value of Derivative Instruments
The following table is a summary of the Fund's value of derivative instruments by primary risk exposure as of November 30, 2024. For additional information on derivative instruments, please refer to the Derivative Instruments section in the accompanying Notes to Financial Statements.
Primary Risk Exposure / Derivative Type | Value |
| Asset ($) | Liability ($) |
| Equity Risk | | |
Futures Contracts (a) | 84,960,355 | 0 |
Swaps (b) | 16,983,666 | 0 |
Written Options (c) | 0 | (2,024,041) |
| Total Equity Risk | 101,944,021 | (2,024,041) |
| Total Value of Derivatives | 101,944,021 | (2,024,041) |
(a)Reflects gross cumulative appreciation (depreciation) on futures contracts as presented in the Schedule of Investments. In the Statement of Assets and Liabilities, the period end daily variation margin is included in receivable or payable for daily variation margin on futures contracts, and the net cumulative appreciation (depreciation) is included in Total accumulated earnings (loss).
(b)For bi-lateral over-the-counter (OTC) swaps, reflects gross value which is presented in the Statement of Assets and Liabilities in the bi-lateral OTC swaps, at value line-items.
(c)Gross value is presented in the Statement of Assets and Liabilities in the written options, at value line-item.
Financial Statements (Unaudited)
| Statement of Assets and Liabilities |
| As of November 30, 2024 (Unaudited) |
| Assets | | | | |
| Investment in securities, at value (including securities loaned of $908,038,253) - See accompanying schedule: | | | | |
Unaffiliated issuers (cost $50,889,179,474) | $ | 72,492,791,653 | | |
Fidelity Central Funds (cost $2,330,318,552) | | 2,330,322,315 | | |
Other affiliated issuers (cost $50,783,086,897) | | 70,974,275,989 | | |
| | | | | |
| | | | | |
| Total Investment in Securities (cost $104,002,584,923) | | | $ | 145,797,389,957 |
| Segregated cash with brokers for derivative instruments | | | | 5,436,014 |
| Cash | | | | 4,388,129 |
| Foreign currency held at value (cost $928,114) | | | | 924,054 |
| Receivable for investments sold | | | | 4,553,991 |
| Receivable for fund shares sold | | | | 225,379,223 |
| Dividends receivable | | | | 85,843,957 |
| Interest receivable | | | | 18,226,970 |
| Distributions receivable from Fidelity Central Funds | | | | 5,147,884 |
| Receivable for daily variation margin on futures contracts | | | | 8,745,378 |
| Bi-lateral OTC swaps, at value | | | | 16,983,666 |
| Prepaid expenses | | | | 75,734 |
| Other receivables | | | | 524,166 |
Total assets | | | | 146,173,619,123 |
| Liabilities | | | | |
| Payable for investments purchased | | | | |
Regular delivery | $ | 188,398,596 | | |
Delayed delivery | | 2,197,558 | | |
| Payable for fund shares redeemed | | 54,327,078 | | |
| Accrued management fee | | 14,265,187 | | |
| Written options, at value (premium received $1,176,904) | | 2,024,041 | | |
| Other payables and accrued expenses | | 3,586,051 | | |
| Collateral on securities loaned | | 931,248,631 | | |
| Total liabilities | | | | 1,196,047,142 |
| Net Assets | | | $ | 144,977,571,981 |
| Net Assets consist of: | | | | |
| Paid in capital | | | $ | 100,090,996,639 |
| Total accumulated earnings (loss) | | | | 44,886,575,342 |
| Net Assets | | | $ | 144,977,571,981 |
Net Asset Value, offering price and redemption price per share ($144,977,571,981 ÷ 7,861,068,805 shares) | | | $ | 18.44 |
| Statement of Operations |
Six months ended November 30, 2024 (Unaudited) |
| Investment Income | | | | |
| Dividends: | | | | |
| Unaffiliated issuers | | | $ | 467,018,460 |
| Affiliated issuers | | | | 170,584,757 |
| Interest | | | | 39,249,747 |
| Income from Fidelity Central Funds (including $1,007,089 from security lending) | | | | 31,253,168 |
| Total income | | | | 708,106,132 |
| Expenses | | | | |
| Management fee | $ | 243,740,795 | | |
| Custodian fees and expenses | | 352,283 | | |
| Independent trustees' fees and expenses | | 305,624 | | |
| Registration fees | | 4,309,926 | | |
| Audit fees | | 54,508 | | |
| Legal | | 71,968 | | |
| Miscellaneous | | 233,600 | | |
| Total expenses before reductions | | 249,068,704 | | |
| Expense reductions | | (165,195,439) | | |
| Total expenses after reductions | | | | 83,873,265 |
| Net Investment income (loss) | | | | 624,232,867 |
| Realized and Unrealized Gain (Loss) | | | | |
| Net realized gain (loss) on: | | | | |
| Investment Securities: | | | | |
| Unaffiliated issuers (net of foreign taxes of $40,084) | | 690,002,515 | | |
| Fidelity Central Funds | | (5,377) | | |
| Other affiliated issuers | | 474,673,597 | | |
| Foreign currency transactions | | (143,551) | | |
| Futures contracts | | 79,596,645 | | |
| Swaps | | 68,015,863 | | |
| Written options | | 10,824,825 | | |
| Capital gain distributions from underlying funds: | | | | |
| Affiliated issuers | | 1,443,900,717 | | |
| Total net realized gain (loss) | | | | 2,766,865,234 |
| Change in net unrealized appreciation (depreciation) on: | | | | |
| Investment Securities: | | | | |
| Unaffiliated issuers (net of increase in deferred foreign taxes of $315,323) | | 7,109,010,238 | | |
| Fidelity Central Funds | | 1 | | |
| Other affiliated issuers | | 6,999,918,442 | | |
| Assets and liabilities in foreign currencies | | 35,290 | | |
| Futures contracts | | 71,152,630 | | |
| Swaps | | (11,896,618) | | |
| Written options | | 2,108,991 | | |
| Total change in net unrealized appreciation (depreciation) | | | | 14,170,328,974 |
| Net gain (loss) | | | | 16,937,194,208 |
| Net increase (decrease) in net assets resulting from operations | | | $ | 17,561,427,075 |
| Statement of Changes in Net Assets |
| |
| | Six months ended November 30, 2024 (Unaudited) | | Year ended May 31, 2024 |
| Increase (Decrease) in Net Assets | | | | |
| Operations | | | | |
| Net investment income (loss) | $ | 624,232,867 | $ | 1,033,653,931 |
| Net realized gain (loss) | | 2,766,865,234 | | 2,527,947,055 |
| Change in net unrealized appreciation (depreciation) | | 14,170,328,974 | | 20,610,702,610 |
| Net increase (decrease) in net assets resulting from operations | | 17,561,427,075 | | 24,172,303,596 |
| Distributions to shareholders | | (2,292,108,180) | | (2,007,968,736) |
| | | | | |
| Share transactions | | | | |
| Proceeds from sales of shares | | 26,029,264,050 | | 38,744,491,874 |
| Reinvestment of distributions | | 2,271,507,798 | | 1,934,598,176 |
| Cost of shares redeemed | | (17,291,427,621) | | (17,775,994,286) |
| | | | | |
Net increase (decrease) in net assets resulting from share transactions | | 11,009,344,227 | | 22,903,095,764 |
| Total increase (decrease) in net assets | | 26,278,663,122 | | 45,067,430,624 |
| | | | | |
| Net Assets | | | | |
| Beginning of period | | 118,698,908,859 | | 73,631,478,235 |
| End of period | $ | 144,977,571,981 | $ | 118,698,908,859 |
| | | | | |
| Other Information | | | | |
| Shares | | | | |
| Sold | | 1,512,240,421 | | 2,611,891,127 |
| Issued in reinvestment of distributions | | 133,304,448 | | 134,415,665 |
| Redeemed | | (991,266,912) | | (1,215,524,166) |
| Net increase (decrease) | | 654,277,957 | | 1,530,782,626 |
| | | | | |
Financial Highlights
Strategic Advisers® Fidelity® U.S. Total Stock Fund |
| |
| | Six months ended (Unaudited) November 30, 2024 | | Years ended May 31, 2024 | | 2023 | | 2022 | | 2021 | | 2020 |
Selected Per-Share Data | | | | | | | | | | | | |
| Net asset value, beginning of period | $ | 16.47 | $ | 12.97 | $ | 13.26 | $ | 15.07 | $ | 10.56 | $ | 9.72 |
| Income from Investment Operations | | | | | | | | | | | | |
Net investment income (loss) A,B | | .08 | | .16 | | .15 | | .15 | | .14 | | .16 |
| Net realized and unrealized gain (loss) | | 2.20 | | 3.67 | | .24 | | (.75) | | 4.73 | | 1.00 |
| Total from investment operations | | 2.28 | | 3.83 | | .39 | | (.60) | | 4.87 | | 1.16 |
| Distributions from net investment income | | (.06) | | (.16) | | (.15) | | (.12) | | (.18) | | (.17) |
| Distributions from net realized gain | | (.25) | | (.18) | | (.54) | | (1.09) | | (.19) | | (.16) |
| Total distributions | | (.31) | | (.33) C | | (.68) C | | (1.21) | | (.36) C | | (.32) C |
| Net asset value, end of period | $ | 18.44 | $ | 16.47 | $ | 12.97 | $ | 13.26 | $ | 15.07 | $ | 10.56 |
Total Return D,E | | | | 29.93% | | 3.45% | | (4.85)% | | 46.63% | | 11.84% |
Ratios to Average Net Assets B,F,G | | | | | | | | | | | | |
| Expenses before reductions | | .38% H | | .38% | | .38% | | .38% | | .38% | | .39% |
| Expenses net of fee waivers, if any | | | | .13% | | .13% | | .13% | | .13% | | .14% |
| Expenses net of all reductions | | .13% H | | .13% | | .13% | | .13% | | .13% | | .14% |
| Net investment income (loss) | | .94% H | | 1.12% | | 1.24% | | 1.03% | | 1.11% | | 1.55% |
| Supplemental Data | | | | | | | | | | | | |
| Net assets, end of period (000 omitted) | $ | 144,977,572 | $ | 118,698,909 | $ | 73,631,478 | $ | 68,865,016 | $ | 60,113,747 | $ | 33,429,994 |
Portfolio turnover rate I | | | | 30% | | 39% | | 35% | | 46% | | 52% |
ACalculated based on average shares outstanding during the period.
BNet investment income (loss) is affected by the timing of the declaration of dividends by any underlying mutual funds or exchange-traded funds (ETFs). Net investment income (loss) of any mutual funds or ETFs is not included in the Fund's net investment income (loss) ratio.
CTotal distributions per share do not sum due to rounding.
DTotal returns for periods of less than one year are not annualized.
ETotal returns would have been lower if certain expenses had not been reduced during the applicable periods shown.
FFees and expenses of any underlying mutual funds or exchange-traded funds (ETFs) are not included in the Fund's expense ratio. The Fund indirectly bears its proportionate share of these expenses. For additional expense information related to investments in Fidelity Central Funds, please refer to the "Investments in Fidelity Central Funds" note found in the Notes to Financial Statements section of the most recent Annual or Semi-Annual report.
GExpense ratios reflect operating expenses of the class. Expenses before reductions do not reflect amounts reimbursed, waived, or reduced through arrangements with the investment adviser, brokerage services, or other offset arrangements, if applicable, and do not represent the amount paid by the class during periods when reimbursements, waivers or reductions occur.
HAnnualized.
IAmount does not include the portfolio activity of any underlying mutual funds or exchange-traded funds (ETFs), derivatives or securities that mature within one year from acquisition.
Notes to Financial Statements
(Unaudited)For the period ended November 30, 2024
1. Organization.
Strategic Advisers Fidelity U.S. Total Stock Fund (the Fund) is a fund of Fidelity Rutland Square Trust II (the Trust), and is authorized to issue an unlimited number of shares. The Trust is registered under the Investment Company Act of 1940, as amended (the 1940 Act), as an open-end management investment company organized as a Delaware statutory trust. The Fund is offered exclusively to certain managed account clients of Strategic Advisers LLC (Strategic Advisers), an affiliate of Fidelity Management & Research Company LLC (FMR).
2. Significant Accounting Policies.
The Fund is an investment company and applies the accounting and reporting guidance of the Financial Accounting Standards Board (FASB) Accounting Standards Codification Topic 946 Financial Services - Investment Companies. The financial statements have been prepared in conformity with accounting principles generally accepted in the United States of America (GAAP), which require management to make certain estimates and assumptions at the date of the financial statements. Actual results could differ from those estimates. Subsequent events, if any, through the date that the financial statements were issued have been evaluated in the preparation of the financial statements. The Fund's Schedule of Investments lists any underlying mutual funds or exchange-traded funds (ETFs) but does not include the underlying holdings of these funds. The following summarizes the significant accounting policies of the Fund:
Investment Valuation. Investments are valued as of 4:00 p.m. Eastern time on the last calendar day of the period. The Board of Trustees (the Board) has designated the Fund's investment adviser as the valuation designee responsible for the fair valuation function and performing fair value determinations as needed. The investment adviser has established a Fair Value Committee (the Committee) to carry out the day-to-day fair valuation responsibilities and has adopted policies and procedures to govern the fair valuation process and the activities of the Committee. In accordance with these fair valuation policies and procedures, which have been approved by the Board, the Fund attempts to obtain prices from one or more third party pricing services or brokers to value its investments. When current market prices, quotations or currency exchange rates are not readily available or reliable, investments will be fair valued in good faith by the Committee, in accordance with the policies and procedures. Factors used in determining fair value vary by investment type and may include market or investment specific events, transaction data, estimated cash flows, and market observations of comparable investments. The frequency that the fair valuation procedures are used cannot be predicted and they may be utilized to a significant extent. The Committee manages the Fund's fair valuation practices and maintains the fair valuation policies and procedures. The Fund's investment adviser reports to the Board information regarding the fair valuation process and related material matters.
The Fund categorizes the inputs to valuation techniques used to value its investments into a disclosure hierarchy consisting of three levels as shown below:
Level 1 - unadjusted quoted prices in active markets for identical investments
Level 2 - other significant observable inputs (including quoted prices for similar investments, interest rates, prepayment speeds, etc.)
Level 3 - unobservable inputs (including the Fund's own assumptions based on the best information available)
Valuation techniques used to value the Fund's investments by major category are as follows:
Equity securities, including restricted securities, for which market quotations are readily available, are valued at the last reported sale price or official closing price as reported by a third party pricing service on the primary market or exchange on which they are traded and are categorized as Level 1 in the hierarchy. In the event there were no sales during the day or closing prices are not available, securities are valued at the last quoted bid price or may be valued using the last available price and are generally categorized as Level 2 in the hierarchy. For foreign equity securities, when market or security specific events arise, comparisons to the valuation of American Depositary Receipts (ADRs), futures contracts, Exchange-Traded Funds (ETFs) and certain indexes as well as quoted prices for similar securities may be used and would be categorized as Level 2 in the hierarchy. For equity securities, including restricted securities, where observable inputs are limited, assumptions about market activity and risk are used and these securities may be categorized as Level 3 in the hierarchy.
Debt securities, including restricted securities, are valued based on evaluated prices received from third party pricing services or from brokers who make markets in such securities. Corporate bonds, bank notes and U.S. government and government agency obligations are valued by pricing services who utilize matrix pricing which considers yield or price of bonds of comparable quality, coupon, maturity and type or by broker-supplied prices. Asset backed securities, collateralized mortgage obligations and commercial mortgage securities are valued by pricing services who utilize matrix pricing which considers prepayment speed assumptions, attributes of the collateral, yield or price of bonds of comparable quality, coupon, maturity and type or by broker-supplied prices. Swaps are marked-to-market daily based on valuations from third party pricing services, registered derivatives clearing organizations (clearinghouses) or broker-supplied valuations. These pricing sources may utilize inputs such as interest rate curves, credit spread curves, default possibilities and recovery rates. When independent prices are unavailable or unreliable, debt securities and swaps may be valued utilizing pricing methodologies which consider similar factors that would be used by third party pricing services. Debt securities and swaps are generally categorized as Level 2 in the hierarchy but may be Level 3 depending on the circumstances.
Futures contracts are valued at the settlement price established each day by the board of trade or exchange on which they are traded and are categorized as Level 1 in the hierarchy. Exchange-traded options are valued using the last sale price or, in the absence of a sale, the last offering price and are categorized as Level 1 in the hierarchy. Investments in open-end mutual funds, including the Fidelity Central Funds, are valued at their closing net asset value (NAV) each business day and are categorized as Level 1 in the hierarchy.
Changes in valuation techniques may result in transfers in or out of an assigned level within the disclosure hierarchy. The aggregate value of investments by input level as of November 30, 2024 is included at the end of the Fund's Schedule of Investments.
Foreign Currency. Certain Funds may use foreign currency contracts to facilitate transactions in foreign-denominated securities. Gains and losses from these transactions may arise from changes in the value of the foreign currency or if the counterparties do not perform under the contracts' terms.
Foreign-denominated assets, including investment securities, and liabilities are translated into U.S. dollars at the exchange rates at period end. Purchases and sales of investment securities, income and dividends received, and expenses denominated in foreign currencies are translated into U.S. dollars at the exchange rate in effect on the transaction date.
The effects of exchange rate fluctuations on investments are included with the net realized and unrealized gain (loss) on investment securities. Other foreign currency transactions resulting in realized and unrealized gain (loss) are disclosed separately.
Investment Transactions and Income. For financial reporting purposes, the Fund's investment holdings and NAV include trades executed through the end of the last business day of the period. The NAV per share for processing shareholder transactions is calculated as of the close of business of the New York Stock Exchange (NYSE), normally 4:00 p.m. Eastern time and includes trades executed through the end of the prior business day. Gains and losses on securities sold are determined on the basis of identified cost and include proceeds received from litigation. Commissions paid to certain brokers with whom the investment adviser, or its affiliates, places trades on behalf of a fund include an amount in addition to trade execution, which may be rebated back to a fund. Any such rebates are included in net realized gain (loss) on investments in the Statement of Operations. Dividend income is recorded on the ex-dividend date, except for certain dividends from foreign securities where the ex-dividend date may have passed, which are recorded as soon as the Fund is informed of the ex-dividend date. Non-cash dividends included in dividend income, if any, are recorded at the fair market value of the securities received. Income and capital gain distributions from Fidelity Central Funds, if any, are recorded on the ex-dividend date. Income and capital gain distributions from any underlying mutual funds or exchange-traded funds (ETFs) are recorded on the ex-dividend date. Certain distributions received by the Fund represent a return of capital or capital gain. The Fund determines the components of these distributions subsequent to the ex-dividend date, based upon receipt of tax filings or other correspondence relating to the underlying investment. These distributions are recorded as a reduction of cost of investments and/or as a realized gain. Interest income is accrued as earned and includes coupon interest and amortization of premium and accretion of discount on debt securities as applicable. Investment income is recorded net of foreign taxes withheld where recovery of such taxes is uncertain. Funds may file withholding tax reclaims in certain jurisdictions to recover a portion of amounts previously withheld. Any withholding tax reclaims income is included in the Statement of Operations in dividends. Any receivables for withholding tax reclaims are included in the Statement of Assets and Liabilities in dividends receivable.
Expenses. Expenses directly attributable to a fund are charged to that fund. Expenses attributable to more than one fund are allocated among the respective funds on the basis of relative net assets or other appropriate methods. Expenses included in the accompanying financial statements reflect the expenses of that fund and do not include any expenses associated with any underlying mutual funds or exchange-traded funds. Although not included in a fund's expenses, a fund indirectly bears its proportionate share of these expenses through the net asset value of each underlying mutual fund or exchange-traded fund. Expense estimates are accrued in the period to which they relate and adjustments are made when actual amounts are known.
Deferred Trustee Compensation. Under a Deferred Compensation Plan (the Plan) for certain Funds, certain independent Trustees have elected to defer receipt of a portion of their annual compensation. Deferred amounts are invested in affiliated mutual funds, are marked-to-market and remain in a fund until distributed in accordance with the Plan. The investment of deferred amounts and the offsetting payable to the Trustees presented below are included in the accompanying Statement of Assets and Liabilities in other receivables and other payables and accrued expenses, as applicable.
| Strategic Advisers Fidelity U.S. Total Stock Fund | $95,397 |
Income Tax Information and Distributions to Shareholders. Each year, the Fund intends to qualify as a regulated investment company under Subchapter M of the Internal Revenue Code, including distributing substantially all of its taxable income and realized gains. As a result, no provision for U.S. Federal income taxes is required. The Fund files a U.S. federal tax return, in addition to state and local tax returns as required. The Fund's federal income tax returns are subject to examination by the Internal Revenue Service (IRS) for a period of three fiscal years after they are filed. State and local tax returns may be subject to examination for an additional fiscal year depending on the jurisdiction. Foreign taxes are provided for based on the Fund's understanding of the tax rules and rates that exist in the foreign markets in which it invests. The Fund is subject to a tax imposed on capital gains by certain countries in which it invests. An estimated deferred tax liability for net unrealized appreciation on the applicable securities is included in Other payables and accrued expenses on the Statement of Assets and Liabilities.
Distributions are declared and recorded on the ex-dividend date. Income and capital gain distributions are determined in accordance with income tax regulations, which may differ from GAAP.
Capital accounts within the financial statements are adjusted for permanent book-tax differences. These adjustments have no impact on net assets or the results of operations. Capital accounts are not adjusted for temporary book-tax differences which will reverse in a subsequent period.
Book-tax differences are primarily due to the short-term gain distributions from the underlying mutual funds or exchange-traded funds (ETFs), futures contracts, swaps, foreign currency transactions, certain foreign taxes, passive foreign investment companies (PFIC), partnerships and losses deferred due to wash sales.
As of period end, the cost and unrealized appreciation (depreciation) in securities, and derivatives if applicable, for federal income tax purposes were as follows:
| Gross unrealized appreciation | $43,026,520,470 |
| Gross unrealized depreciation | (1,440,444,901) |
| Net unrealized appreciation (depreciation) | $41,586,075,569 |
| Tax cost | $104,312,411,272 |
Delayed Delivery Transactions and When-Issued Securities. During the period, certain Funds transacted in securities on a delayed delivery or when-issued basis. Payment and delivery may take place after the customary settlement period for that security. The price of the underlying securities and the date when the securities will be delivered and paid for are fixed at the time the transaction is negotiated. Securities purchased on a delayed delivery or when-issued basis are identified as such in the Schedule of Investments. Compensation for interest forgone in the purchase of a delayed delivery or when-issued debt security may be received. With respect to purchase commitments, each applicable Fund identifies securities as segregated in its records with a value at least equal to the amount of the commitment. Payables and receivables associated with the purchases and sales of delayed delivery securities having the same coupon, settlement date and broker are offset. Delayed delivery or when-issued securities that have been purchased from and sold to different brokers are reflected as both payables and receivables in the Statement of Assets and Liabilities under the caption "Delayed delivery", as applicable. Losses may arise due to changes in the value of the underlying securities or if the counterparty does not perform under the contract's terms, or if the issuer does not issue the securities due to political, economic, or other factors.
Restricted Securities (including Private Placements). Funds may invest in securities that are subject to legal or contractual restrictions on resale. These securities generally may be resold in transactions exempt from registration or to the public if the securities are registered. Disposal of these securities may involve time-consuming negotiations and expense, and prompt sale at an acceptable price may be difficult. Information regarding restricted securities held at period end is included at the end of the Schedule of Investments, if applicable.
New Accounting Pronouncement. In November 2023, the FASB issued Accounting Standards Update (ASU) 2023-07 Segment Reporting (Topic 280): Improvements to Reportable Segment Disclosures. Effective for fiscal years beginning after December 15, 2023 and interim periods within fiscal years beginning after December 15, 2024, the amendments enhance required disclosures of segment information for public entities on an annual and interim basis. The ASU allows for early adoption with updates applied retrospectively. Management is currently evaluating the impact of the ASU but does not expect this guidance to materially impact the financial statements.
3. Derivative Instruments.
Risk Exposures and the Use of Derivative Instruments. The Fund's investment objectives allow for various types of derivative instruments, including futures contracts, swaps and options. Derivatives are investments whose value is primarily derived from underlying assets, indices or reference rates and may be transacted on an exchange or over-the-counter (OTC). Derivatives may involve a future commitment to buy or sell a specified asset based on specified terms, to exchange future cash flows at periodic intervals based on a notional principal amount, or for one party to make one or more payments upon the occurrence of specified events in exchange for periodic payments from the other party.
Derivatives were used to increase returns, to gain exposure to certain types of assets and to manage exposure to certain risks as defined below. The success of any strategy involving derivatives depends on analysis of numerous economic factors, and if the strategies for investment do not work as intended, the objectives may not be achieved.
Derivatives were used to increase or decrease exposure to the following risk(s):
| | |
| Equity Risk | Equity risk relates to the fluctuations in the value of financial instruments as a result of changes in market prices (other than those arising from interest rate risk or foreign exchange risk), whether caused by factors specific to an individual investment, its issuer, or all factors affecting all instruments traded in a market or market segment. |
| Interest Rate Risk | Interest rate risk relates to the fluctuations in the value of interest-bearing securities due to changes in the prevailing levels of market interest rates. |
Funds are also exposed to additional risks from investing in derivatives, such as liquidity risk and counterparty credit risk. Liquidity risk is the risk that a fund will be unable to close out the derivative in the open market in a timely manner. Counterparty credit risk is the risk that the counterparty will not be able to fulfill its obligation to a fund. Derivative counterparty credit risk is managed through formal evaluation of the creditworthiness of all potential counterparties. On certain OTC derivatives such as bi-lateral swaps, a fund attempts to reduce its exposure to counterparty credit risk by entering into an International Swaps and Derivatives Association, Inc. (ISDA) Master Agreement with each of its counterparties. The ISDA Master Agreement gives a fund the right to terminate all transactions traded under such agreement upon the deterioration in the credit quality of the counterparty beyond specified levels. The ISDA Master Agreement gives each party the right, upon an event of default by the other party or a termination of the agreement, to close out all transactions traded under such agreement and to net amounts owed under each transaction to one net payable by one party to the other. To mitigate counterparty credit risk on bi-lateral OTC derivatives, a fund receives collateral in the form of cash or securities once net unrealized appreciation on outstanding derivative contracts under an ISDA Master Agreement exceeds certain applicable thresholds, subject to certain minimum transfer provisions. The collateral received is held in segregated accounts with the custodian bank in accordance with the collateral agreements entered into between a fund, the counterparty and the custodian bank. A fund could experience delays and costs in gaining access to the collateral even though it is held by the custodian bank. The maximum risk of loss to a fund from counterparty credit risk related to bi-lateral OTC derivatives is generally the aggregate unrealized appreciation and unpaid counterparty payments in excess of any collateral pledged by the counterparty to a fund. A fund may be required to pledge collateral for the benefit of the counterparties on bi-lateral OTC derivatives in an amount not less than each counterparty's unrealized appreciation on outstanding derivative contracts, subject to certain minimum transfer provisions, and any such pledged collateral is identified in the Schedule of Investments. Exchange-traded contracts are not covered by the ISDA Master Agreement; however counterparty credit risk related to these contracts may be mitigated by the protection provided by the exchange on which they trade.
Investing in derivatives may involve greater risks than investing in the underlying assets directly and, to varying degrees, may involve risk of loss in excess of any initial investment and collateral received and amounts recognized in the Statement of Assets and Liabilities. In addition, there may be the risk that the change in value of the derivative contract does not correspond to the change in value of the underlying instrument.
Net Realized Gain (Loss) and Change in Net Unrealized Appreciation (Depreciation) on Derivatives. The table below, which reflects the impacts of derivatives on the financial performance, summarizes the net realized gain (loss) and change in net unrealized appreciation (depreciation) for derivatives during the period as presented in the Statement of Operations.
| Primary Risk Exposure / Derivative Type | Net Realized Gain (Loss) ($) | Change in Net Unrealized Appreciation (Depreciation) ($) |
| Strategic Advisers Fidelity U.S. Total Stock Fund | | |
| Equity Risk | | |
| Futures Contracts | 79,384,868 | 71,060,359 |
| Written Options | 10,824,825 | 2,108,991 |
| Swaps | 68,015,863 | (11,896,618) |
| Total Equity Risk | 158,225,556 | 61,272,732 |
| Interest Rate Risk | | |
| Futures Contracts | 211,777 | 92,271 |
| Total Interest Rate Risk | 211,777 | 92,271 |
| Totals | 158,437,333 | 61,365,003 |
If there are any open positions at period end, a summary of the value of derivatives by primary risk exposure is included at the end of the Schedule of Investments.
Futures Contracts. A futures contract is an agreement between two parties to buy or sell a specified underlying instrument for a fixed price at a specified future date. Futures contracts were used to manage exposure to the stock market, bond market and fluctuations in interest rates.
Upon entering into a futures contract, a fund is required to deposit either cash or securities (initial margin) with a clearing broker in an amount equal to a certain percentage of the face value of the contract. Futures contracts are marked-to-market daily and subsequent daily payments are made or received by a fund depending on the daily fluctuations in the value of the futures contracts and are recorded as unrealized appreciation or (depreciation). This receivable and/or payable, if any, is included in daily variation margin on futures contracts in the Statement of Assets and Liabilities. Realized gain or (loss) is recorded upon the expiration or closing of a futures contract. The net realized gain (loss) and change in net unrealized appreciation (depreciation) on futures contracts during the period is presented in the Statement of Operations.
Any open futures contracts at period end are presented in the Schedule of Investments under the caption "Futures Contracts". The notional amount at value reflects each contract's exposure to the underlying instrument or index at period end, and is representative of volume of activity during the period unless an average notional amount is presented. Any securities deposited to meet initial margin requirements are identified in the Schedule of Investments. Any cash deposited to meet initial margin requirements is presented as segregated cash with brokers for derivative instruments in the Statement of Assets and Liabilities.
Options. Options give the purchaser the right, but not the obligation, to buy (call) or sell (put) an underlying security or financial instrument at an agreed exercise or strike price between or on certain dates. Options obligate the seller (writer) to buy (put) or sell (call) an underlying instrument at the exercise or strike price or cash settle an underlying derivative instrument if the holder exercises the option on or before the expiration date.
Exchange-traded written covered call options were used to manage exposure to the market. When a fund writes a covered call option, a fund holds the underlying instrument which must be delivered to the holder upon the exercise of the option.
Upon entering into a written options contract, a fund will receive a premium. Premiums received are reflected as a liability on the Statement of Assets and Liabilities. Options are valued daily and any unrealized appreciation (depreciation) is reflected in total accumulated earnings (loss) in the Statement of Assets and Liabilities. When a written option is exercised, the premium is added to the proceeds from the sale of the underlying instrument in determining the gain or loss realized on that investment. When an option is closed, a gain or loss is realized depending on whether the proceeds or amount paid for the closing sale transaction are greater or less than the premium received. When an option expires, gains and losses are realized to the extent of premiums received. The net realized gain (loss) on closed and expired written options and the change in net unrealized appreciation (depreciation) on written options are presented in the Statement of Operations.
Writing call options tends to decrease exposure to the underlying instrument and risk of loss is the change in value in excess of the premium received.
Any open options at period end are presented in the Schedule of Investments under the caption "Written Options", and are representative of volume of activity during the period unless an average contracts amount is presented.
Swaps. A swap is a contract between two parties to exchange future cash flows at periodic intervals based on a notional principal amount. A bi-lateral OTC swap is a transaction between a fund and a dealer counterparty where cash flows are exchanged between the two parties for the life of the swap.
Bi-lateral OTC swaps are marked-to-market daily and changes in value are reflected in the Statement of Assets and Liabilities in the bi-lateral OTC swaps at value line items. Any upfront premiums paid or received upon entering a bi-lateral OTC swap to compensate for differences between stated terms of the swap and prevailing market conditions (e.g. credit spreads, interest rates or other factors) are recorded in total accumulated earnings (loss) in the Statement of Assets and Liabilities and amortized to realized gain or (loss) ratably over the term of the swap. Any unamortized upfront premiums are presented in the Schedule of Investments.
Payments are exchanged at specified intervals, accrued daily commencing with the effective date of the contract and recorded as realized gain or (loss). Some swaps may be terminated prior to the effective date and realize a gain or loss upon termination. The net realized gain (loss) and change in net unrealized appreciation (depreciation) on swaps during the period is presented in the Statement of Operations.
Any open swaps at period end are included in the Schedule of Investments under the caption "Swaps", and are representative of volume of activity during the period unless an average notional amount is presented.
Total Return Swaps. Total return swaps are agreements between counterparties to exchange cash flows, one based on a market-linked return of an individual asset or a basket of assets (i.e., an index), and the other on a fixed or floating rate. To the extent the total return of the instrument or index underlying the transaction exceeds or falls short of the offsetting payment obligation, a fund will receive a payment from or make a payment to the counterparty. A fund enters into total return swaps to manage its market exposure.
4. Purchases and Sales of Investments.
Purchases and sales of securities, other than short-term securities, U.S. government securities and in-kind transactions, as applicable, are noted in the table below.
| | Purchases ($) | Sales ($) |
| Strategic Advisers Fidelity U.S. Total Stock Fund | 31,491,119,805 | 20,939,434,952 |
5. Fees and Other Transactions with Affiliates.
Management Fee. Strategic Advisers (the investment adviser) provides the Fund with investment management related services. For these services, the Fund pays a monthly management fee to the investment adviser. The management fee is calculated by adding the annual management fee rate of .25% of the Fund's average net assets throughout the month to the aggregate of the fee rates, payable monthly by the investment adviser, to the Fund's sub-advisers. The Fund's maximum aggregate management fee will not exceed 1.00% of the Fund's average net assets. For the reporting period, the total annualized management fee rate was .37% of the Fund's average net assets.
During the period, the investment adviser waived a portion of its management fee as described in the Expense Reductions note.
Sub-Advisers. FIAM LLC (an affiliate of the investment adviser), Fidelity Diversifying Solutions LLC and Geode Capital Management, LLC each served as a sub-adviser for the Fund during the period. Sub-advisers provide discretionary investment advisory services for their allocated portion of the Fund's assets and are paid as described in the Management Fee note.
FIL Investment Advisors (FIL) has been retained to serve as a sub-adviser for the Fund. As of the date of this report, however, FIL has not been allocated any portion of the Fund's assets. FIL in the future may provide discretionary investment advisory services for an allocated portion of the Fund's assets and will be paid by the investment adviser for providing these services.
Effective January 1, 2025, the sub-subadvisory agreements between FIAM LLC (FIAM) or Fidelity Diversifying Solutions LLC (FDS) and each of FMR Investment Management (UK) Limited, Fidelity Management & Research (Hong Kong) Limited, and Fidelity Management & Research (Japan) Limited (collectively, the Sub-Subadvisers) were amended. FIAM, FDS, or an affiliate, as applicable, and not the fund, pays the Sub-Subadvisers. Under the terms of the sub-subadvisory agreements, FIAM, FDS, or an affiliate, as applicable, pays each Sub-Subadviser monthly fees equal to 110% of the Sub-Subadviser's costs for providing sub-subadvisory services.
Brokerage Commissions. A portion of portfolio transactions were placed with brokerage firms which are affiliates of the investment adviser. Brokerage commissions are included in net realized gain (loss) and change in net unrealized appreciation (depreciation) in the Statement of Operations. The commissions paid to these affiliated firms were as follows:
| | Amount ($) |
| Strategic Advisers Fidelity U.S. Total Stock Fund | 239,099 |
Interfund Trades. Funds may purchase from or sell securities to other funds affiliated with each sub-adviser under procedures adopted by the Board. The procedures have been designed to ensure these interfund trades are executed in accordance with Rule 17a-7 of the 1940 Act. Any interfund trades are included within the respective purchases and sales amounts shown in the Purchases and Sales of Investments note. Interfund trades during the period are noted in the table below.
| | Purchases ($) | Sales ($) | Realized Gain (Loss) ($) |
| Strategic Advisers Fidelity U.S. Total Stock Fund | 1,351,871,475 | 728,005,357 | 42,425,197 |
Prior Fiscal Year Affiliated Exchanges In-Kind. During the prior period, the Fund redeemed shares of Fidelity Large Cap Value Enhanced Index Fund in exchange for investments and cash, if any, as noted in the following table. The Fund had a net realized gain of $10,891,114 on the Fund's redemptions of Fidelity Large Cap Value Enhanced Index Fund, which is included in "Net Realized gain (loss)" in the accompanying Statement of Changes in Net Assets. The Fund recognized a net loss on the exchanges for federal income tax purposes.
| | Value of Investments ($) | Net realized gain (loss) | Value of Investments ($) |
Fidelity Large Cap Value Enhanced Index Fund | 3,520,085,005 | 10,891,114 | 262,301,416 |
6. Investments in Fidelity Central Funds.
Funds may invest in Fidelity Central Funds, which are open-end investment companies generally available only to other investment companies and accounts managed by the investment adviser and its affiliates. The Schedule of Investments lists any Fidelity Central Funds held as an investment as of period end, but does not include the underlying holdings of each Fidelity Central Fund. An investing fund indirectly bears its proportionate share of the expenses of the underlying Fidelity Central Funds.
Based on its investment objective, each Fidelity Central Fund may invest or participate in various investment vehicles or strategies that are similar to those of the investing fund. These strategies are consistent with the investment objectives of the investing fund and may involve certain economic risks which may cause a decline in value of each of the Fidelity Central Funds and thus a decline in the value of the investing fund.
| Fidelity Central Fund | Investment Manager | Investment Objective | Investment Practices | Expense RatioA |
| Fidelity Money Market Central Funds | Fidelity Management & Research Company LLC (FMR) | Each fund seeks to obtain a high level of current income consistent with the preservation of capital and liquidity. | Short-term Investments | Less than .005% |
A Expenses expressed as a percentage of average net assets and are as of each underlying Central Fund's most recent annual or semi-annual shareholder report.
A complete unaudited list of holdings for each Fidelity Central Fund is available upon request or at the Securities and Exchange Commission website at www.sec.gov. In addition, the financial statements of the Fidelity Central Funds, which are not covered by the Report of Independent Registered Public Accounting Firm, are available on the Securities and Exchange Commission website or upon request.
7. Committed Line of Credit.
Certain Funds participate with other funds managed by the investment adviser or an affiliate in a $4.25 billion credit facility (the "line of credit") to be utilized for temporary or emergency purposes to fund shareholder redemptions or for other short-term liquidity purposes. The participating funds have agreed to pay commitment fees on their pro-rata portion of the line of credit, which are reflected in Miscellaneous expenses on the Statement of Operations, and are listed below. During the period, there were no borrowings on this line of credit.
| | Amount ($) |
| Strategic Advisers Fidelity U.S. Total Stock Fund | 81,761 |
8. Security Lending.
Funds lend portfolio securities from time to time in order to earn additional income. Lending agents are used, including National Financial Services (NFS), an affiliate of the investment adviser. Pursuant to a securities lending agreement, NFS will receive a fee, which is capped at 9.9% of a fund's daily lending revenue, for its services as lending agent. A fund may lend securities to certain qualified borrowers, including NFS. On the settlement date of the loan, a fund receives collateral (in the form of U.S. Treasury obligations, letters of credit and/or cash) against the loaned securities and maintains collateral in an amount not less than 100% of the market value of the loaned securities during the period of the loan. The market value of the loaned securities is determined at the close of business of a fund and any additional required collateral is delivered to a fund on the next business day. A fund or borrower may terminate the loan at any time, and if the borrower defaults on its obligation to return the securities loaned because of insolvency or other reasons, a fund may apply collateral received from the borrower against the obligation. A fund may experience delays and costs in recovering the securities loaned. Any cash collateral received is invested in the Fidelity Securities Lending Cash Central Fund. Any loaned securities are identified as such in the Schedule of Investments, and the value of loaned securities and cash collateral at period end, as applicable, are presented in the Statement of Assets and Liabilities. Security lending income represents the income earned on investing cash collateral, less rebates paid to borrowers and any lending agent fees associated with the loan, plus any premium payments received for lending certain types of securities. Security lending income is presented in the Statement of Operations as a component of income from Fidelity Central Funds. Affiliated security lending activity, if any, was as follows:
| | Total Security Lending Fees Paid to NFS ($) | Security Lending Income From Securities Loaned to NFS ($) | Value of Securities Loaned to NFS at Period End ($) |
| Strategic Advisers Fidelity U.S. Total Stock Fund | 111,679 | - | - |
9. Expense Reductions.
The investment adviser has contractually agreed to waive the Fund's management fee in an amount equal to .25% of the Fund's average net assets until September 30, 2027. During the period, this waiver reduced the Fund's management fee by $165,153,147.
Through arrangements with the Fund's custodian, credits realized as a result of certain uninvested cash balances were used to reduce the Fund's expenses by $42,292.
10. Other.
A fund's organizational documents provide former and current trustees and officers with a limited indemnification against liabilities arising in connection with the performance of their duties to the fund. In the normal course of business, a fund may also enter into contracts that provide general indemnifications. A fund's maximum exposure under these arrangements is unknown as this would be dependent on future claims that may be made against a fund. The risk of material loss from such claims is considered remote.
Funds do not invest in underlying mutual funds for the purpose of exercising management or control; however, investments by funds within their principal investment strategies may represent a significant portion of the underlying mutual fund's net assets. At the end of the period, certain Funds were the owners of record of 10% or more of the total outstanding shares of the following underlying mutual funds as shown below.
| Fund | Strategic Advisers Fidelity U.S. Total Stock Fund |
| Fidelity Growth Company Fund | 21% |
| Fidelity Magellan Fund | 23% |
| Fidelity SAI Small-Mid Cap 500 Index Fund | 100% |
| Fidelity SAI U.S. Large Cap Index Fund | 21% |
| Fidelity SAI U.S. Low Volatility Index Fund | 57% |
| Fidelity SAI U.S. Quality Index Fund | 84% |
| Fidelity SAI U.S. Value Index Fund | 84% |
| Fidelity Small Cap Growth Fund | 19% |
11. Risk and Uncertainties.
Many factors affect a fund's performance. Developments that disrupt global economies and financial markets, such as pandemics, epidemics, outbreaks of infectious diseases, war, terrorism, and environmental disasters, may significantly affect a fund's investment performance. The effects of these developments to a fund will be impacted by the types of securities in which a fund invests, the financial condition, industry, economic sector, and geographic location of an issuer, and a fund's level of investment in the securities of that issuer. Significant concentrations in security types, issuers, industries, sectors, and geographic locations may magnify the factors that affect a fund's performance.
Item 8: Changes in and Disagreements with Accountants for Open-End Management Investment Companies
(Unaudited)
Note: This is not applicable for any fund included in this document.
Item 9: Proxy Disclosures for Open-End Management Investment Companies
(Unaudited)
| A special meeting of shareholders was held on July 9, 2024. The results of votes taken among shareholders on the proposal before them are reported below. Each vote reported represents one dollar of net asset value held on the record date for the meeting. |
| Proposal 1 |
| To elect a Board of Trustees. |
| | # of Votes | % of Votes |
| Charles S. Morrison |
| Affirmative | 381,775,585,183.64 | 95.17 |
| Withheld | 19,363,639,577.49 | 4.83 |
| TOTAL | 401,139,224,761.13 | 100.00 |
| Nancy D. Prior |
| Affirmative | 381,252,305,731.53 | 95.04 |
| Withheld | 19,886,919,029.60 | 4.96 |
| TOTAL | 401,139,224,761.13 | 100.00 |
| Mary C. Farrell |
| Affirmative | 381,226,030,239.11 | 95.04 |
| Withheld | 19,913,194,522.02 | 4.96 |
| TOTAL | 401,139,224,761.13 | 100.00 |
| Karen Kaplan |
| Affirmative | 381,519,946,847.38 | 95.11 |
| Withheld | 19,619,277,913.75 | 4.89 |
| TOTAL | 401,139,224,761.13 | 100.00 |
| Christine Marcks |
| Affirmative | 380,186,327,029.51 | 94.78 |
| Withheld | 20,952,897,731.62 | 5.22 |
| TOTAL | 401,139,224,761.13 | 100.00 |
| Harold Singleton III |
| Affirmative | 382,499,458,473.65 | 95.35 |
| Withheld | 18,639,766,287.48 | 4.65 |
| TOTAL | 401,139,224,761.13 | 100.00 |
| Heidi L. Steiger |
| Affirmative | 380,661,676,515.00 | 94.90 |
| Withheld | 20,477,548,246.13 | 5.10 |
| TOTAL | 401,139,224,761.13 | 100.00 |
| | | |
| Proposal 3 |
| To approve sub-advisory agreements among Strategic Advisers, Fidelity Diversifying Solutions LLC (FDS), and the trust, and sub-subadvisory agreements between FDS and each of FMR Investment Management (UK) Limited (FMR UK), Fidelity Management & Research (Hong Kong) Limited (FMR H.K.), and Fidelity Management & Research (Japan) Limited (FMR Japan). |
| | # of Votes | % of Votes |
| Affirmative | 19,560,769,300.60 | 92.93 |
| Against | 658,514,273.07 | 3.13 |
| Abstain | 829,374,437.13 | 3.94 |
| TOTAL | 21,048,658,010.80 | 100.00 |
| | | |
Item 10: Remuneration Paid to Directors, Officers, and others of Open-End Management Investment Companies
(Unaudited)
Note: This information is disclosed as part of the financial statements for each Fund as part of Item 7: Financial Statements and Financial Highlights for Open-End Management Investment companies.
Item 11: Statement Regarding Basis for Approval of Investment Advisory Contract
(Unaudited)
Board Approval of Investment Advisory Contracts and Management Fees
Strategic Advisers Fidelity U.S. Total Stock Fund
Each year, the Board of Trustees, including the Independent Trustees (together, the Board), considers the renewal of the fund's management contract with Strategic Advisers LLC (Strategic Advisers), the sub-advisory agreements with FIAM LLC, FIL Investment Advisors, and Geode Capital Management, LLC (each a Sub-Adviser and collectively, the Sub-Advisers) (collectively, the Sub-Advisory Agreements), and the sub-sub-advisory agreements with FMR Investment Management (UK) Limited, Fidelity Management & Research (Japan) Limited, Fidelity Management & Research (Hong Kong) Limited, and FIL Investment Advisors (UK) Limited (each a Sub-Sub-Adviser and collectively, the Sub-Sub-Advisers) (collectively, the Sub-Sub-Advisory Agreements and, together with the management contract and the Sub-Advisory Agreements, the Advisory Contracts) for the fund. Strategic Advisers and the Sub-Advisers and Sub-Sub-Advisers, as applicable, are referred to herein as the Investment Advisers. The Board, assisted by the advice of fund counsel and Independent Trustees' counsel, requests and considers a broad range of information relevant to the renewal of the Advisory Contracts throughout the year.
The Board meets at least four times per year and, at each of its meetings, covers an extensive agenda of topics and materials and considers factors that are relevant to its annual consideration of the renewal of the fund's Advisory Contracts, including the services and support provided to the fund and its shareholders. The full Board or the Independent Trustees, as appropriate, act on all major matters; however, a portion of the activities of the Board (including certain of those described herein) may be conducted through standing committees that have been established by the Board. The Board, acting directly and through its committees, requests and receives information concerning the annual consideration of the renewal of the fund's Advisory Contracts.
At its September 2024 meeting, the Board, including the Independent Trustees, unanimously determined to renew the fund's Advisory Contracts. The Board also approved updating the address for notice of Strategic Advisers LLC in each Sub-Advisory Agreement. In reaching its determination to renew the fund's Advisory Contracts, the Board considered all factors it believed relevant, including (i) the nature, extent, and quality of the services provided to the fund and its shareholders (including the investment performance of the fund); (ii) the competitiveness relative to peer funds of the fund's management fee and total expenses; (iii) the total costs of the services provided by and the profits, if any, realized by Strategic Advisers from its relationships with the fund; and (iv) the extent to which, if any, economies of scale exist and are realized as the fund grows and whether any economies of scale are appropriately shared with fund shareholders. The Board's decision to renew the Advisory Contracts was not based on any single factor, but rather was based on a comprehensive consideration of all the information provided to the Board throughout the year.
The Board reached a determination, with the assistance of fund counsel and Independent Trustees' counsel and through the exercise of its business judgment, that the renewal of the Advisory Contracts is in the best interests of the fund and its shareholders. In addition, the Board concluded that the renewal of each Sub-Advisory Agreement and Sub-Sub-Advisory Agreement does not involve a conflict of interest from which Strategic Advisers or its affiliates derive an inappropriate advantage. Also, the Board found that the advisory fees charged under the Advisory Contracts bear a reasonable relationship to the services rendered.
Nature, Extent, and Quality of Services Provided. The Board considered the staffing within the Investment Advisers, including the backgrounds of the fund's investment personnel and also considered the fund's investment objective, strategies, and related investment philosophy. The Independent Trustees also had discussions with senior management of Strategic Advisers' investment operations and investment groups. The Board considered the structure of each Investment Adviser's investment personnel compensation program and whether such structures provide appropriate incentives to act in the best interests of the fund.
The Trustees also discussed with representatives of Strategic Advisers, at meetings throughout the year, Strategic Advisers' role in, among other things, (i) setting, implementing and monitoring the investment strategies for the funds; (ii) identifying and recommending sub-advisers for the funds; (iii) overseeing compliance with federal securities laws by each sub-adviser with respect to the portion of fund assets allocated to the sub-adviser; (iv) monitoring and overseeing the performance and investment capabilities of each sub-adviser; and (v) recommending the replacement of a sub-adviser as appropriate. The Trustees considered that the Board had received from Strategic Advisers substantial information and periodic reports about Strategic Advisers' sub-adviser oversight and due diligence processes, as well as periodic reports regarding the performance of each sub-adviser.
The Board also considered the nature, extent and quality of services provided by each Sub-Adviser. The Trustees noted that under the Sub-Advisory Agreements subject to oversight by Strategic Advisers, each Sub-Adviser is responsible for, among other things, identifying investments for the portion of fund assets allocated to the Sub-Adviser, if any, and executing portfolio transactions to implement its investment strategy. In addition, the Trustees noted that each Sub-Adviser is responsible for providing such reporting as may be requested from Strategic Advisers to fulfill its oversight responsibilities discussed above.
Resources Dedicated to Investment Management and Support Services. The Board reviewed the general qualifications and capabilities of the Investment Advisers' investment staffs, their use of technology, and the Investment Advisers' approach to managing and compensating investment personnel. The Board noted that the Investment Advisers' analysts have extensive resources, tools, and capabilities that allow them to conduct sophisticated quantitative and/or fundamental analysis. Additionally, in its deliberations, the Board considered the Investment Advisers' trading capabilities and resources and global compliance infrastructure, which are integral parts of the investment management process.
Shareholder and Administrative Services. The Board considered (i) the nature, extent, quality, and cost of administrative and shareholder services performed by Strategic Advisers and its affiliates under the management contract and under separate agreements covering transfer agency, pricing and bookkeeping, and securities lending services for the fund; (ii) the nature and extent of Strategic Advisers' supervision of third party service providers, including sub-advisers, custodians and subcustodians; and (iii) the resources devoted to, and the record of compliance with, the fund's compliance policies and procedures.
Investment Performance. In connection with the renewal of the Advisory Contracts, the Board considered annualized return information for the fund over different time periods, measured against an appropriate securities market index (benchmark index) and a peer group of mutual funds with similar objectives (peer group).
The Board considered discussions that occur at Board meetings throughout the year with representatives of Strategic Advisers about fund investment performance and the performance of each Sub-Adviser as part of regularly scheduled fund reviews and other reports to the Board on fund performance, taking into account various factors including general market conditions. The Board also considered information about performance attribution. In its discussions with representatives of Strategic Advisers regarding fund performance, the Board gave particular attention to information indicating underperformance of certain funds over different time periods and discussed with Strategic Advisers the reasons for any such underperformance.
In addition to reviewing absolute and relative fund performance, the Independent Trustees periodically consider the appropriateness of fund performance metrics in evaluating the results achieved. The Independent Trustees generally give greater weight to fund performance over longer time periods than over shorter time periods. Depending on the circumstances, the Independent Trustees may be satisfied with the fund's performance notwithstanding that it lags its benchmark index peer group for certain periods.
Based on its review, the Board concluded that the nature, extent, and quality of services provided to the fund under the Advisory Contracts should continue to benefit the shareholders of the fund.
Competitiveness of Management Fee and Total Fund Expenses. The Board considered the amount and nature of fees paid to the Investment Advisers. The Board noted that the Sub-Sub-Advisers are compensated by the applicable Sub-Advisers and the Fund and Strategic Advisers are not responsible for any such fees or expenses. The Board also considered information comparing the management fees and total expenses of the fund to those of other registered investment companies with investment objectives similar to those of the fund, as discussed below. The Board also noted Strategic Advisers' proposal to extend the management fee waiver and considered the fund's contractual maximum aggregate annual management fee rate. In considering the fund's management fee and management fee waiver and comparisons to other registered investment companies with investment objectives similar to those of the fund, the Board noted that shares of the fund are offered only to clients that participate in the Fidelity Portfolio Advisory Service managed account program.
In its review of the fund's total expenses, the Board considered the fund's management fee rate as well as other fund expenses, as applicable, such as expenses from holding Fidelity and non-Fidelity mutual funds and ETFs, pricing and bookkeeping fees, and custodial, legal, and audit fees.
Comparisons of Management Fees and Total Expense Ratios. Among other things, the Board reviewed data for selected groups of competitive funds and classes (referred to as "mapped groups") that were compiled by Fidelity based on combining similar investment objective categories (as classified by Lipper) that have comparable investment mandates. The data reviewed by the Board included (i) gross management fee comparisons (before taking into account expense reimbursements or caps) relative to the total universe of funds within the mapped group; (ii) gross management fee comparisons relative to a subset of non-Strategic Advisers funds in the mapped group that are similar in size and management fee structure to the fund (referred to as the "asset size peer group"); (iii) total expense comparisons of the fund relative to funds and classes in the mapped group that have a similar sales load structure to the fund (referred to as the "similar sales load structure group"); and (iv) total expense comparisons of the fund relative to funds and classes in the similar sales load structure group that are similar in size and management fee structure to each fund (referred to as the "total expense asset size peer group").
The information provided to the Board indicated that the fund's management fee rate ranked below the competitive median of the mapped group for the 12-month period ended December 31, 2023 and above the competitive median of the asset size peer group for the 12-month period ended December 31, 2023. The Board also noted that the fund's management fee rate was compared on a pre-waiver basis and, therefore, did not reflect the management fee waiver noted above. Giving effect to the waiver, the fund's management fee was below the median of the asset size peer group for the 12-month period ended December 31, 2023. Further, the information provided to the Board indicated that the total expense ratio of the fund ranked below the competitive median of the similar sales load structure group for the 12-month period ended December 31, 2023 and below the competitive median of the total expense asset size peer group for the 12-month period ended December 31, 2023.
Fees Charged to Other Clients. The Board also considered fee structures paid by the Investment Advisers' other clients, such as other funds advised or subadvised by the Investment Advisers, pension plan clients, and other institutional clients with similar investment mandates.
Based on its review, the Board concluded that the fund's management fee bears a reasonable relationship to the services rendered. Further, based on its review of the total expense ratios and fees charged to other clients of Strategic Advisers or its affiliates and each Sub-Adviser, the Board concluded that the total expenses of the fund were reasonable in light of the services that the fund and its shareholders receive and the other factors considered.
Costs of the Services and Profitability. The Board considered information regarding the revenues earned and the expenses incurred by Strategic Advisers and its affiliates in conducting the business of developing, marketing, distributing, managing, administering and servicing the fund and servicing the fund's shareholders.
On an annual basis, Strategic Advisers presents to the Board information about the profitability of its relationships with the fund. Strategic Advisers calculates profitability information for the fund using a series of detailed revenue and cost allocation methodologies. The Board reviews any significant changes from the prior year's methodologies. Strategic Advisers noted that, to the extent possible, it employs the same corporate reporting of revenues and expenses as those used by other Fidelity funds.
A public accounting firm has been engaged annually by the Board as part of the Board's assessment of Fidelity's profitability analysis. The engagement includes the review and assessment of the methodologies used by Fidelity in determining the revenues and expenses attributable to Fidelity's fund business. After considering the reports issued under the engagement and information provided by Fidelity, the Board concluded that while other allocation methods may also be reasonable, Fidelity's profitability methodologies are reasonable in all material respects.
The Board also reviewed Fidelity's non-fund businesses and potential indirect benefits such businesses may have received as a result of their association with Fidelity's fund business (i.e., fall-out benefits) as well as cases where Fidelity's affiliates may benefit from the fund's business. The Board noted that changes to fall-out benefits year-over-year reflect business developments at Fidelity's various businesses.
The Board considered the costs of the services provided by and the profits realized, if any, by Strategic Advisers and its affiliates in connection with the operation of the fund and was satisfied that the profitability was not excessive.
The Board also considered information regarding the profitability of the Sub-Advisers' respective relationships with the fund and the potential fall-out benefits, if any, that may accrue to the Sub-Advisers as a result of their respective relationships with the fund. The Board considered profitability information provided by the Sub-Advisers in light of the nature of the relationships between Strategic Advisers and the Sub-Advisers with respect to the negotiation of sub-advisory fees.
Possible Economies of Scale. The Board considered whether there have been economies of scale in respect of the management of the Strategic Advisers funds, whether the Strategic Advisers funds (including the fund) have appropriately benefited from any such economies of scale, and whether there is potential for realization of any further economies of scale as assets grow through increased services to the fund, through waivers or reimbursements, or through fee or expense ratio reductions. The Board considered that certain of the fund's Sub-Advisory Agreements provide for breakpoints as the fund's assets grow and noted that any potential decline in sub-advisory fees under such contracts would accrue directly to the fund. The Board also took Strategic Advisers' management fee waiver into consideration.
Conclusion. Based on its evaluation of all of the conclusions noted above, and after considering all factors it believed relevant, the Board concluded that the advisory fee arrangements bear a reasonable relationship to the services rendered and that the fund's Advisory Contracts should be renewed because each agreement is in the best interests of the fund and its shareholders. In addition, the Board concluded that the renewal of each Sub-Advisory Agreement and Sub-Sub-Advisory Agreement does not involve a conflict of interest from which Strategic Advisers or its affiliates derive an inappropriate advantage.
1.9887484.106
TSF-SANN-0125
Strategic Advisers® Municipal Bond Fund
Offered exclusively to certain managed account clients of Strategic Advisers LLC or its affiliates - not available for sale to the general public
Semi-Annual Report
November 30, 2024
Contents
To view a fund's proxy voting guidelines and proxy voting record for the 12-month period ended June 30, visit http://www.fidelity.com/proxyvotingresults or visit the Securities and Exchange Commission's (SEC) web site at http://www.sec.gov.
You may also call 1-800-544-3455 to request a free copy of the proxy voting guidelines.
Standard & Poor's, S&P and S&P 500 are registered service marks of The McGraw-Hill Companies, Inc. and have been licensed for use by Fidelity Distributors Corporation.
Other third-party marks appearing herein are the property of their respective owners.
All other marks appearing herein are registered or unregistered trademarks or service marks of FMR LLC or an affiliated company. © 2025 FMR LLC. All rights reserved.
This report and the financial statements contained herein are submitted for the general information of the shareholders of the Fund. This report is not authorized for distribution to prospective investors in the Fund unless preceded or accompanied by an effective prospectus.
A fund files its complete schedule of portfolio holdings with the SEC for the first and third quarters of each fiscal year on Form N-PORT. Forms N-PORT are available on the SEC's web site at http://www.sec.gov. A fund's Forms N-PORT may be reviewed and copied at the SEC's Public Reference Room in Washington, DC. Information regarding the operation of the SEC's Public Reference Room may be obtained by calling 1-800-SEC-0330.
For a complete list of a fund's portfolio holdings, view the most recent holdings listing, semiannual report, or annual report on Fidelity's web site at http://www.fidelity.com, http://www.institutional.fidelity.com, or http://www.401k.com, as applicable.
NOT FDIC INSURED •MAY LOSE VALUE •NO BANK GUARANTEE
Neither the Fund nor Fidelity Distributors Corporation is a bank.
Item 7: Financial Statements and Financial Highlights for Open-End Management Investment Companies (Semi-Annual Report)
Strategic Advisers® Municipal Bond Fund
Schedule of Investments November 30, 2024 (Unaudited)
Showing Percentage of Net Assets
| Municipal Bonds - 72.3% |
| | | Principal Amount (a) | Value ($) |
| Alabama - 1.8% | | | |
| Alabama Hsg. Fin. Auth. Single Family Mtg. Rev. Series 2024 B, 6% 4/1/55 | | 1,525,000 | 1,688,339 |
| Alabama Spl. Care Facilities Fing. Auth. Mobile Rev. Series 2016 C, 5% 11/15/46 | | 2,500,000 | 2,532,903 |
| Alabama State Corrections Institution Fin. Auth. Series 2022 A, 5.25% 7/1/47 | | 2,000,000 | 2,164,298 |
| Birmingham Arpt. Auth. Series 2020: | | | |
| 4% 7/1/35 (Build America Mutual Assurance Insured) | | 60,000 | 61,217 |
| 4% 7/1/36 (Build America Mutual Assurance Insured) | | 225,000 | 228,766 |
| 4% 7/1/38 (Build America Mutual Assurance Insured) | | 335,000 | 339,188 |
| Birmingham Spl. Care Facilities Auth. Rev. Series 2015 1, 5.25% 6/1/25 | | 60,000 | 59,849 |
| Black Belt Energy Gas District Bonds: | | | |
| (Proj. No.7) Series 2021 C2, SIFMA Municipal Swap Index + 0.350% 3.53%, tender 12/1/26 (b)(c) | | 1,000,000 | 974,765 |
| Series 2019 A, 4%, tender 12/1/25 (b) | | 6,740,000 | 6,767,058 |
| Series 2021 A, 4%, tender 12/1/31 (b) | | 4,500,000 | 4,556,945 |
| Series 2021 B, 4%, tender 12/1/26 (b) | | 5,415,000 | 5,451,229 |
| Series 2022 B1, 4%, tender 10/1/27 (b) | | 3,280,000 | 3,308,727 |
| Series 2022 B2, 3.83%, tender 10/1/27 (b) | | 5,285,000 | 5,140,761 |
| Series 2022 C1, 5.25%, tender 6/1/29 (b) | | 9,155,000 | 9,715,403 |
| Series 2022 D1, 4%, tender 6/1/27 (b) | | 3,570,000 | 3,616,631 |
| Series 2022 E, 5%, tender 6/1/28 (b) | | 3,645,000 | 3,810,077 |
| Series 2022 F, 5.5%, tender 12/1/28 (b) | | 10,470,000 | 11,138,863 |
| Series 2023 B2, 5.25%, tender 12/1/30 (b) | | 1,840,000 | 2,003,112 |
| Series 2023 C, 5.5%, tender 6/1/32 (b) | | 6,500,000 | 7,155,870 |
| Series 2023 D1, 5.5%, tender 2/1/29 (b) | | 4,575,000 | 4,886,342 |
| Series 2024 A, 5.25%, tender 9/1/32 (b) | | 3,000,000 | 3,271,706 |
| Series 2024 C, 5%, tender 7/1/31 (b) | | 2,000,000 | 2,142,460 |
| Series 2024 D, 5%, tender 11/1/34 (b)(d) | | 4,125,000 | 4,488,494 |
| Cooper Green Mercy Health Svcs. Series 2022 A: | | | |
| 5.25% 9/1/42 | | 550,000 | 604,051 |
| 5.25% 9/1/52 | | 2,620,000 | 2,799,194 |
| Energy Southeast Ala Coop. District Bonds: | | | |
| Series 2023 A1, 5.5%, tender 1/1/31 (b) | | 1,000,000 | 1,088,873 |
| Series 2023 B1, 5.75%, tender 11/1/31 (b) | | 2,005,000 | 2,229,167 |
| Series 2023 B2, 5.262%, tender 11/1/31 (b) | | 3,000,000 | 3,073,970 |
| Series 2024 B, 5.25%, tender 6/1/32 (b) | | 7,480,000 | 8,151,203 |
| Homewood Ala Edl. Bldg. Auth. Lea (CHF - Horizons II, L.L.C. Student Hsg. & Proj. at Samford Univ.) Series 2024 A: | | | |
| 5.25% 10/1/38 | | 670,000 | 731,401 |
| 5.5% 10/1/42 | | 1,040,000 | 1,135,427 |
| Homewood Edl. Bldg. Auth. Rev.: | | | |
| (CHF - Horizons II, L.L.C. Student Hsg. & Proj. at Samford Univ.) Series 2024 C: | | | |
5% 10/1/56 | | 1,200,000 | 1,220,785 |
5.5% 10/1/54 | | 1,100,000 | 1,172,886 |
| Series 2019 A: | | | |
4% 12/1/33 | | 15,000 | 14,879 |
4% 12/1/35 | | 50,000 | 49,058 |
4% 12/1/36 | | 65,000 | 63,408 |
4% 12/1/37 | | 70,000 | 67,800 |
4% 12/1/38 | | 125,000 | 120,224 |
4% 12/1/39 | | 95,000 | 90,671 |
4% 12/1/41 | | 310,000 | 290,221 |
4% 12/1/44 | | 210,000 | 192,377 |
4% 12/1/49 | | 125,000 | 111,841 |
| Hoover Indl. Dev. Board Envir. Impt. Rev.: | | | |
| (United States Steel Corp. Proj.) Series 2019, 5.75% 10/1/49 (e) | | 1,655,000 | 1,739,642 |
| Bonds (United States Steel Corp. Proj.) Series 2020, 6.375%, tender 11/1/30 (b)(e) | | 195,000 | 223,064 |
| Huntsville Redstone Village Spl. Care Facilities Finanacing Auth.: | | | |
| Series 2007: | | | |
5.5% 1/1/28 (f) | | 520,000 | 291,200 |
5.5% 1/1/43 (f) | | 405,000 | 226,800 |
| Series 2008 A, 6.875% 1/1/43 (f) | | 280,000 | 156,800 |
| Series 2011 A, 7.5% 1/1/47 (f) | | 500,000 | 280,000 |
| Infirmary Health Systems Spl. Care Facilities Fing. Auth. Rev. Series 2021 A, 3% 2/1/46 | | 2,270,000 | 1,778,011 |
| Jacksonville Fla Pub. Edl. Bldga (JSU Foundation Proj.): | | | |
| Series 2023 A: | | | |
5.25% 8/1/53 (Assured Guaranty Muni. Corp. Insured) | | 600,000 | 640,054 |
5.5% 8/1/58 (Assured Guaranty Muni. Corp. Insured) | | 500,000 | 540,543 |
| Series 2024 A, 5% 8/1/56 (d) | | 885,000 | 926,991 |
| Jefferson County Gen. Oblig. Series 2018 A, 5% 4/1/26 | | 355,000 | 364,460 |
| Jefferson County Swr. Rev. Series 2024: | | | |
| 5.25% 10/1/45 | | 2,000,000 | 2,198,288 |
| 5.25% 10/1/49 | | 9,640,000 | 10,472,616 |
| 5.5% 10/1/53 | | 6,610,000 | 7,290,357 |
| Lauderdale County Ala Agricultur Series 2024: | | | |
| 4.75% 7/1/64 | | 240,000 | 242,928 |
| 5.25% 7/1/64 | | 235,000 | 250,079 |
| Lower Alabama Gas District: | | | |
| (Gas Proj.) Series 2016 A, 5% 9/1/34 | | 545,000 | 588,836 |
| Series 2016 A, 5% 9/1/46 | | 5,235,000 | 5,854,115 |
| Mobile County Ala Indl. Dev. Auths (AM/NS Calvert LLC Proj.) Series 2024 A, 5% 6/1/54 (e) | | 4,175,000 | 4,249,401 |
| Montgomery Edl. Bldg. Auth. Series 2016 A, 5% 10/1/43 | | 300,000 | 293,250 |
| Montgomery Med. Clinic Facilities Series 2015: | | | |
| 5% 3/1/26 (f) | | 5,000 | 3,400 |
| 5% 3/1/33 (f) | | 605,000 | 411,400 |
| 5% 3/1/36 (f) | | 1,340,000 | 911,200 |
| Prichard Wtrwks. & Swr. Board Series 2019, 4% 11/1/49 | | 200,000 | 116,000 |
| Southeast Alabama Gas Supply District: | | | |
| (Proj. No. 1) Series 2024 A: | | | |
5% 4/1/31 | | 1,500,000 | 1,615,916 |
5% 4/1/32 | | 1,250,000 | 1,342,882 |
| Bonds (Proj. No.2) Series 2024 B, 5%, tender 5/1/32 (b) | | 1,250,000 | 1,337,820 |
| Southeast Energy Auth. A C: | | | |
| Bonds Series 2024 C, 5%, tender 11/1/32 (b) | | 14,465,000 | 15,629,456 |
| Series 2024 A, 5% 11/1/35 | | 1,505,000 | 1,582,911 |
| Southeast Energy Auth. Coop. Dis Bonds (Proj. No. 6) Series 2023 B, 5%, tender 6/1/30 (b) | | 2,060,000 | 2,200,965 |
| Southeast Energy Auth. Rev.: | | | |
| (Proj. No. 2) Series 2021 B1: | | | |
4% 6/1/29 | | 75,000 | 75,810 |
4% 6/1/30 | | 55,000 | 55,728 |
4% 6/1/31 | | 50,000 | 50,255 |
| Bonds: | | | |
(Proj. No. 2) Series 2021 B1, 4%, tender 12/1/31 (b) | | 9,855,000 | 10,028,255 |
(Proj. No. 5) Series 2023 A, 5.25%, tender 7/1/29 (b) | | 4,835,000 | 5,145,260 |
Series 2022 A1, 5.5%, tender 12/1/29 (b) | | 1,415,000 | 1,527,999 |
Series 2022 B1, 5%, tender 8/1/28 (b) | | 3,785,000 | 3,954,622 |
| Stadium Trace Village Impt. District Dev. Series 2021, 3.625% 3/1/36 | | 325,000 | 301,193 |
| The DCH Health Care Auth. Series 2015, 5% 6/1/33 | | 165,000 | 165,931 |
| Tuscaloosa County Indl. Dev. Gulf Opportunity (Hunt Refining Proj.) Series 2019 A, 5.25% 5/1/44 (g) | | 7,555,000 | 7,722,566 |
| Univ. of North Alabama Rev. Series 2019 B, 5% 11/1/38 | | 320,000 | 339,242 |
| Univ. of South Alabama Univ. Rev.: | | | |
| Series 2019 A, 5% 4/1/49 | | 525,000 | 543,556 |
| Series 2024 A: | | | |
5% 4/1/41 (Build America Mutual Assurance Insured) | | 820,000 | 910,600 |
5% 4/1/42 (Build America Mutual Assurance Insured) | | 800,000 | 884,310 |
5% 4/1/43 (Build America Mutual Assurance Insured) | | 1,265,000 | 1,391,052 |
5% 4/1/44 (Build America Mutual Assurance Insured) | | 900,000 | 986,808 |
5.25% 4/1/54 (Build America Mutual Assurance Insured) | | 905,000 | 988,229 |
TOTAL ALABAMA | | | 207,541,240 |
| Alaska - 0.1% | | | |
| Alaska Hsg. Fin. Corp.: | | | |
| Series 2019 B: | | | |
5% 12/1/37 | | 480,000 | 510,328 |
5% 12/1/38 | | 365,000 | 387,449 |
5% 12/1/39 | | 240,000 | 254,644 |
| Series 2021 A: | | | |
4% 6/1/26 | | 425,000 | 430,815 |
4% 12/1/29 | | 690,000 | 720,049 |
4% 6/1/30 | | 70,000 | 73,240 |
5% 6/1/27 | | 50,000 | 52,528 |
5% 12/1/27 | | 65,000 | 68,970 |
5% 6/1/28 | | 85,000 | 90,936 |
5% 12/1/28 | | 965,000 | 1,041,193 |
5% 6/1/29 | | 725,000 | 787,683 |
| Alaska Hsg. Fin. Corp. Mtg. Rev. Series 2022 A, 3% 6/1/51 | | 500,000 | 489,690 |
| Alaska Indl. Dev. & Export Auth. Rev.: | | | |
| (Greater Fairbanks Cmnty. Hosp. Foundation Proj.) Series 2014, 5% 4/1/32 | | 500,000 | 500,994 |
| (Tanana Chiefs Conference Proj.) Series 2019 A, 4% 10/1/49 | | 700,000 | 671,710 |
| Alaska Int'l. Arpts. Revs.: | | | |
| Series 2016 A, 5% 10/1/26 | | 90,000 | 91,243 |
| Series 2016 B, 5% 10/1/33 | | 125,000 | 126,532 |
| Series 2021 C, 5% 10/1/27 (e) | | 1,090,000 | 1,139,663 |
| Alaska Muni. Bond Bank Series 2023 TWO: | | | |
| 5.25% 12/1/47 (e) | | 420,000 | 447,542 |
| 5.25% 12/1/52 (e) | | 525,000 | 555,252 |
| Anchorage Gen. Oblig. Series 2015 B, 5% 9/1/26 | | 1,250,000 | 1,268,663 |
| Anchorage Port Rev. Series 2020 A, 5% 12/1/50 (e) | | 1,375,000 | 1,414,222 |
| Northern Tobacco Securitization Corp. Tobacco Settlement Rev. Series 2021 A: | | | |
| 4% 6/1/34 | | 240,000 | 244,861 |
| 4% 6/1/35 | | 600,000 | 610,535 |
| 4% 6/1/37 | | 685,000 | 691,314 |
| 4% 6/1/40 | | 325,000 | 320,657 |
| 4% 6/1/50 | | 905,000 | 825,825 |
TOTAL ALASKA | | | 13,816,538 |
| Arizona - 1.3% | | | |
| Paz County Ariz Indl. Dev. Auth. (Charter School Solutions-Harmoney Pub. Schools Proj.) Series 2018 A, 5% 2/15/38 | | 140,000 | 142,062 |
| Arizona Board of Regents Arizona State Univ. Rev. Series 2015 D: | | | |
| 5% 7/1/41 | | 830,000 | 835,919 |
| 5% 7/1/46 | | 600,000 | 603,454 |
| Arizona Board of Regents Ctfs. of Prtn. (Univ. of Arizona Univ. Revs.) Series 2018 B: | | | |
| 5% 6/1/27 | | 30,000 | 31,522 |
| 5% 6/1/30 | | 80,000 | 85,545 |
| Arizona Health Facilities Auth. Rev.: | | | |
| (Banner Health Sys. Proj.) Series 2007 B, S&P Municipal Bond 7 Day High Grade Rate Index + 0.810% 4.08%, tender 1/1/37 (b)(c) | | 2,050,000 | 2,000,750 |
| (Scottsdale Lincoln Hospitals Proj.) Series 2014 A, 5% 12/1/39 | | 585,000 | 585,000 |
| Arizona Indl. Dev. Auth. Econ. Dev. Rev. (Legacy Cares, Inc. Proj.) Series 2020 A, 7.75% 7/1/50 (g) | | 1,980,000 | 59,400 |
| Arizona Indl. Dev. Auth. Ed. Rev.: | | | |
| (Academies of Math & Science Projs.): | | | |
Series 2017 A, 5% 7/1/47 | | 315,000 | 317,942 |
Series 2018 A: | | | |
5% 7/1/48 | | 435,000 | 439,385 |
5% 7/1/52 | | 260,000 | 262,018 |
| (American Charter Schools Foundation Proj.) Series 2017, 6% 7/1/47 (g) | | 325,000 | 333,232 |
| (Arizona Agribusiness & Equine Ctr., Inc. Proj.) Series 2017 B: | | | |
5% 3/1/37 (g) | | 250,000 | 252,001 |
5% 3/1/42 (g) | | 250,000 | 249,951 |
| (BASIS Schools Projs.): | | | |
Series 2017 A: | | | |
5.125% 7/1/37 (g) | | 210,000 | 212,531 |
5.25% 7/1/47 (g) | | 160,000 | 160,994 |
Series 2017 D: | | | |
5% 7/1/37 (g) | | 145,000 | 147,430 |
5% 7/1/47 (g) | | 235,000 | 235,925 |
5% 7/1/51 (g) | | 710,000 | 711,495 |
Series 2017 F: | | | |
5% 7/1/37 | | 210,000 | 215,585 |
5% 7/1/47 | | 865,000 | 878,335 |
5% 7/1/52 | | 635,000 | 643,017 |
Series 2017 G: | | | |
5% 7/1/37 (g) | | 35,000 | 35,551 |
5% 7/1/47 (g) | | 35,000 | 35,138 |
5% 7/1/51 (g) | | 65,000 | 65,137 |
| (Cadence Campus Proj.) Series 2020 A: | | | |
4% 7/15/40 (g) | | 130,000 | 120,262 |
4% 7/15/50 (g) | | 225,000 | 193,695 |
| (Doral Academy of Nevada, Fire Mesa and Red Rock Campus Projs.) Series 2019 A: | | | |
5% 7/15/39 | | 185,000 | 187,349 |
5% 7/15/49 | | 165,000 | 165,304 |
| (Greathearts Arizona Projs.) Series 2021 A: | | | |
3% 7/1/46 | | 300,000 | 236,055 |
3% 7/1/52 | | 350,000 | 261,420 |
| (KIPP Nashville Projs.) Series 2022 A: | | | |
5% 7/1/47 | | 700,000 | 715,332 |
5% 7/1/57 | | 330,000 | 334,685 |
| (KIPP NYC Pub. Charter Schools - Macombs Facility Proj.) Series 2021 A, 4% 7/1/51 | | 250,000 | 227,555 |
| (Leman Academy of Excellence Projs.) Series 2022 A, 4.5% 7/1/54 | | 690,000 | 651,525 |
| (Odyssey Preparatory Academy Proj.): | | | |
Series 2017 A: | | | |
5.25% 7/1/37 (g) | | 420,000 | 425,808 |
5.5% 7/1/52 (g) | | 800,000 | 802,047 |
Series 2019, 5% 7/1/49 (g) | | 610,000 | 583,343 |
| Academies of Math & Science Projs. Series 2023: | | | |
5.25% 7/1/43 (g) | | 35,000 | 35,926 |
5.375% 7/1/53 (g) | | 120,000 | 122,324 |
5.5% 7/1/58 (g) | | 105,000 | 107,670 |
| Series 2023 A: | | | |
5.25% 7/1/53 (g) | | 120,000 | 120,848 |
5.5% 7/1/58 (g) | | 120,000 | 121,624 |
| Arizona Indl. Dev. Auth. Hosp. Rev.: | | | |
| Series 2020 A, 4% 2/1/50 | | 965,000 | 951,709 |
| Series 2021 A: | | | |
4% 2/1/38 | | 85,000 | 86,513 |
4% 2/1/39 | | 85,000 | 86,409 |
5% 2/1/29 | | 990,000 | 1,072,150 |
| Arizona Indl. Dev. Auth. Lease Rev. Series 2020 A: | | | |
| 4% 9/1/37 | | 25,000 | 25,315 |
| 4% 9/1/38 | | 25,000 | 25,310 |
| 4% 9/1/39 | | 20,000 | 20,206 |
| 4% 9/1/40 | | 25,000 | 25,010 |
| 4% 9/1/46 | | 1,000,000 | 958,704 |
| 5% 9/1/31 | | 10,000 | 10,788 |
| 5% 9/1/32 | | 15,000 | 16,187 |
| 5% 9/1/33 | | 25,000 | 26,971 |
| 5% 9/1/34 | | 20,000 | 21,576 |
| Arizona Indl. Dev. Auth. Rev.: | | | |
| (Lincoln South Beltway Proj.) Series 2020, 5% 2/1/26 | | 600,000 | 614,922 |
| (Provident Group-Eastern Michigan Univ. Parking Proj.) Series 2018: | | | |
5% 5/1/37 | | 60,000 | 33,000 |
5% 5/1/43 | | 55,000 | 30,250 |
5% 5/1/48 | | 135,000 | 74,250 |
5% 5/1/51 | | 135,000 | 74,250 |
| Series 2019 2, 3.625% 5/20/33 | | 1,217,713 | 1,173,874 |
| Arizona Indl. Dev. Auth. Sr. Living: | | | |
| (Great Lakes Sr. Living Cmntys. LLC Proj.) Series 2021, 7.75% 1/1/54 (f)(g) | | 100,000 | 18,000 |
| Series 2019 B, 5% 1/1/49 | | 100,000 | 76,000 |
| Arizona Indl. Dev. Auth. Sr. Nat'l. Charter School Revolving Ln. Fund: | | | |
| Series 2019 A, 4% 11/1/49 | | 250,000 | 243,753 |
| Series 2020 A: | | | |
4% 11/1/36 | | 230,000 | 235,116 |
4% 11/1/38 | | 125,000 | 127,081 |
4% 11/1/39 | | 160,000 | 162,195 |
4% 11/1/40 | | 170,000 | 171,760 |
4% 11/1/45 | | 425,000 | 423,331 |
| Series 2021 A, 4% 11/1/51 | | 790,000 | 766,164 |
| Series 2022 A, 4.25% 11/1/52 | | 740,000 | 742,201 |
| Series 2023 A, 5.25% 11/1/53 | | 2,000,000 | 2,163,119 |
| Series 2024 A: | | | |
5% 11/1/49 | | 150,000 | 162,404 |
5% 11/1/54 | | 680,000 | 730,743 |
| Arizona Indl. Dev. Auth. Student Hsg. Rev. Series 2019 A: | | | |
| 5% 6/1/49 | | 235,000 | 245,704 |
| 5% 6/1/54 | | 130,000 | 135,359 |
| Arizona State Univ. Revs.: | | | |
| Series 2021 C: | | | |
5% 7/1/32 | | 70,000 | 78,695 |
5% 7/1/34 | | 70,000 | 78,404 |
5% 7/1/35 | | 55,000 | 61,450 |
5% 7/1/37 | | 825,000 | 916,689 |
5% 7/1/38 | | 1,325,000 | 1,467,956 |
| Series 2023 A, 5.5% 7/1/48 | | 1,000,000 | 1,132,328 |
| Series 2023 B, 4% 7/1/53 | | 2,790,000 | 2,788,067 |
| Chandler Indl. Dev. Auth. Indl. Dev. Rev. Bonds: | | | |
| (Intel Corp. Proj.): | | | |
Series 2005, 3.8%, tender 6/15/28 (b) | | 2,750,000 | 2,793,587 |
Series 2007, 4.1%, tender 6/15/28 (b)(e) | | 1,600,000 | 1,610,043 |
Series 2019, 4%, tender 6/1/29 (b)(e) | | 6,650,000 | 6,723,296 |
Series 2022 2, 5%, tender 9/1/27 (b)(e) | | 9,765,000 | 10,031,159 |
| Series 2022 1, 5%, tender 9/1/27 (b)(e) | | 1,000,000 | 1,027,120 |
| Gilbert Wtr. Resources Municpal Property Series 2022 2022, 4% 7/15/40 | | 4,000,000 | 4,128,994 |
| Glendale Gen. Oblig. Series 2017, 5% 7/1/31 | | 455,000 | 476,758 |
| Glendale Indl. Dev. Auth.: | | | |
| (Terraces of Phoenix Proj.) Series 2018 A: | | | |
5% 7/1/38 | | 45,000 | 45,099 |
5% 7/1/48 | | 50,000 | 47,132 |
| Series 2019 A, 3% 7/1/35 (e) | | 155,000 | 141,184 |
| Series 2021 A, 2.125% 7/1/33 (e) | | 270,000 | 222,449 |
| Indl. Dev. Auth. of The City of Glendale Sr. Living Rev.: | | | |
| (Royal Oaks Inspirata Pointe Proj.) Series 2020 A, 5% 5/15/56 | | 350,000 | 337,429 |
| Series 2019 A: | | | |
5% 11/15/42 | | 770,000 | 773,144 |
5% 11/15/48 | | 850,000 | 848,030 |
| Maricopa County Usd # 60 Cph Series 2023: | | | |
| 4.25% 6/1/47 (Assured Guaranty Muni. Corp. Insured) | | 175,000 | 176,234 |
| 5% 6/1/53 (Assured Guaranty Muni. Corp. Insured) | | 1,185,000 | 1,257,313 |
| Maricopa County & Phoenx Indl. Dev. Auth. Series 2024 B, 6% 3/1/55 | | 1,250,000 | 1,361,519 |
| Maricopa County Indl. Dev. Auth.: | | | |
| (Choice Academies, Inc. Proj.) Series 2022, 5.75% 9/1/45 (g) | | 1,220,000 | 1,252,933 |
| (Creighton Univ. Proj.) Series 2020, 5% 7/1/47 | | 575,000 | 603,117 |
| (Great Hearts Arizona Projs.) Series 2017 A, 5% 7/1/52 | | 240,000 | 242,680 |
| (Greathearts Arizona Projs.) Series 2017 C: | | | |
5% 7/1/37 | | 70,000 | 71,706 |
5% 7/1/48 | | 145,000 | 146,906 |
| (Legacy Traditional Schools Proj.): | | | |
Series 2019 A: | | | |
4% 7/1/34 | | 35,000 | 35,110 |
5% 7/1/39 | | 230,000 | 239,740 |
5% 7/1/49 | | 430,000 | 440,190 |
5% 7/1/54 | | 145,000 | 147,863 |
Series 2019 B: | | | |
5% 7/1/39 (g) | | 180,000 | 184,139 |
5% 7/1/49 (g) | | 95,000 | 95,840 |
5% 7/1/54 (g) | | 435,000 | 437,156 |
| Series 2021 A, 4% 9/1/51 | | 705,000 | 682,387 |
| Maricopa County Indl. Dev. Auth. Rev. (Commercial Metals Co. Proj.) Series 2022, 4% 10/15/47 (e)(g) | | 1,120,000 | 1,014,179 |
| Maricopa County Indl. Dev. Auth. Sr. Living Facilities Series 2016: | | | |
| 5.75% 1/1/36 (g) | | 595,000 | 543,523 |
| 6% 1/1/48 (g) | | 1,430,000 | 1,202,468 |
| Maricopa County Poll. Cont. Rev.: | | | |
| (Palo Verde Proj.) Series 2009 B, 3.6% 4/1/40 | | 350,000 | 322,081 |
| Bonds Series 2010 B, 0.875%, tender 10/1/26 (b) | | 165,000 | 155,912 |
| Series 2012 A, 4.5% 8/1/42 | | 455,000 | 455,006 |
| Maricopa County Rev.: | | | |
| Series 2016 A, 5% 1/1/38 | | 640,000 | 658,999 |
| Series 2017 A, 4% 1/1/41 | | 1,165,000 | 1,170,881 |
| Series 2017 D, 3% 1/1/48 | | 2,605,000 | 2,194,511 |
| Series 2019 E, 3% 1/1/49 | | 1,545,000 | 1,290,285 |
| Maricopa County Spl. Health Care District Gen. Oblig. Series 2018 C, 5% 7/1/36 | | 150,000 | 158,203 |
| Maricopa County Unified School District #48 Scottsdale Series 2017 B, 5% 7/1/31 | | 45,000 | 47,301 |
| Mesa Util. Sys. Rev. Series 2021, 4% 7/1/35 | | 500,000 | 523,164 |
| Navajo Nation Arizona Series 2015 A, 5.5% 12/1/30 (g) | | 1,260,000 | 1,278,058 |
| Phoenix Ariz Indl. Dev. Auth. Rev.: | | | |
| (Guam Facilities Foundation, Inc. Proj.) Series 2014, 5.375% 2/1/41 | | 1,740,000 | 1,639,425 |
| (Guam Facilities Foundation, Inc. Proj.) Series 2014, 5.125% 2/1/34 | | 1,215,000 | 1,169,979 |
| Phoenix Civic Impt. Board Arpt. Rev.: | | | |
| Series 2017 A: | | | |
5% 7/1/33 (e) | | 135,000 | 139,324 |
5% 7/1/36 (e) | | 210,000 | 216,001 |
5% 7/1/37 (e) | | 160,000 | 164,366 |
5% 7/1/47 (e) | | 885,000 | 898,149 |
| Series 2017 B: | | | |
5% 7/1/29 | | 305,000 | 321,146 |
5% 7/1/30 | | 225,000 | 236,767 |
5% 7/1/33 | | 425,000 | 445,877 |
5% 7/1/34 | | 110,000 | 115,294 |
5% 7/1/35 | | 110,000 | 115,155 |
5% 7/1/36 | | 485,000 | 507,119 |
5% 7/1/37 | | 305,000 | 318,354 |
| Series 2018: | | | |
5% 7/1/37 (e) | | 740,000 | 767,504 |
5% 7/1/38 (e) | | 740,000 | 766,205 |
5% 7/1/48 (e) | | 4,425,000 | 4,531,559 |
| Series 2019 A, 5% 7/1/44 | | 425,000 | 447,861 |
| Series 2019 B: | | | |
5% 7/1/35 (e) | | 1,730,000 | 1,829,494 |
5% 7/1/49 (e) | | 500,000 | 516,814 |
| Series 2023: | | | |
5% 7/1/30 (e) | | 1,175,000 | 1,269,076 |
5% 7/1/31 (e) | | 1,095,000 | 1,193,980 |
| Phoenix Civic Impt. Corp. Series 2019 A: | | | |
| 5% 7/1/30 | | 60,000 | 64,725 |
| 5% 7/1/32 | | 75,000 | 80,646 |
| 5% 7/1/36 | | 35,000 | 37,342 |
| 5% 7/1/37 | | 30,000 | 31,944 |
| 5% 7/1/38 | | 45,000 | 47,826 |
| 5% 7/1/39 | | 30,000 | 31,798 |
| 5% 7/1/45 | | 2,700,000 | 2,821,746 |
| Phoenix Civic Impt. Corp. District Rev. (Plaza Expansion Proj.) Series 2005 B, 5.5% 7/1/38 (Nat'l. Pub. Fin. Guarantee Corp. Insured) (h) | | 280,000 | 347,705 |
| Phoenix Civic Impt. Corp. Wtr. Sys. Rev.: | | | |
| Series 2020 A, 5% 7/1/44 | | 1,785,000 | 1,922,386 |
| Series 2021 A, 5% 7/1/45 | | 990,000 | 1,073,292 |
| Phoenix IDA Student Hsg. Rev.: | | | |
| (Downton Phoenix Student Hsg., LLC - Arizona State Univ. Proj.) Series 2018 A, 5% 7/1/37 | | 105,000 | 107,764 |
| (Downtown Phoenix Student Hsg. II LLC Arizona State Univ. Proj.) Series 2019 A: | | | |
5% 7/1/44 | | 225,000 | 229,682 |
5% 7/1/49 | | 665,000 | 674,062 |
5% 7/1/54 | | 585,000 | 590,688 |
5% 7/1/59 | | 475,000 | 478,646 |
| Series 2018 A, (Downtown Phoenix Student Hsg., LLC AZ State Univ. Proj.) 5% 7/1/42 | | 1,085,000 | 1,106,376 |
| Phoenix Indl. Dev. Auth. (Provident Group - Falcon Properties LLC, Proj.): | | | |
| Series 2022 A: | | | |
4% 12/1/41 (g) | | 510,000 | 420,015 |
4% 12/1/51 (g) | | 1,695,000 | 1,273,533 |
| Series 2022 B: | | | |
4.15% 12/1/57 (g) | | 635,000 | 464,837 |
5.75% 12/15/57 (g) | | 745,000 | 589,328 |
| Phoenix Indl. Dev. Auth. Rev.: | | | |
| (BASIS Schools Projs.) Series 2016 A, 5% 7/1/35 (g) | | 25,000 | 25,118 |
| (Basis Schools Projs.) Series 2016 A, 5% 7/1/46 (g) | | 370,000 | 370,368 |
| (BASIS Schools, Inc. Projs. Series 2015 A: | | | |
5% 7/1/35 (g) | | 100,000 | 100,461 |
5% 7/1/45 (g) | | 120,000 | 120,139 |
| (Legacy Traditional School Projs.) Series 2015: | | | |
5% 7/1/35 (g) | | 175,000 | 175,875 |
5% 7/1/45 (g) | | 195,000 | 195,381 |
| (Legacy Traditional Schools Projs.) Series 2016 A, 5% 7/1/46 (g) | | 130,000 | 130,616 |
| Series 2016 A: | | | |
5% 7/1/36 | | 145,000 | 145,651 |
5% 7/1/41 | | 115,000 | 115,320 |
5% 7/1/46 | | 505,000 | 505,945 |
| Phoenix Indl. Solid Waste Disp. Rev. Bonds (Republic Svc., Inc. Proj.) Series 2013, 4.25%, tender 2/3/25 (b)(e) | | 12,400,000 | 12,405,382 |
| Pima County Indl. Dev. Auth. Ed. Rev.: | | | |
| (American Leadership Academy Proj.): | | | |
Series 2021: | | | |
4% 6/15/41 (g) | | 50,000 | 45,571 |
4% 6/15/51 (g) | | 75,000 | 63,552 |
4% 6/15/57 (g) | | 65,000 | 53,968 |
Series 2022: | | | |
4% 6/15/41 (g) | | 510,000 | 464,819 |
4% 6/15/51 (g) | | 1,150,000 | 974,468 |
4% 6/15/57 (g) | | 1,225,000 | 1,017,085 |
| Series 2015, 5.625% 6/15/45 (g) | | 300,000 | 301,177 |
| Pima County Indl. Dev. Auth. S: | | | |
| Series 2022 A: | | | |
6.75% 11/15/42 (g) | | 250,000 | 275,268 |
6.875% 11/15/52 (g) | | 715,000 | 779,891 |
7% 11/15/57 (g) | | 320,000 | 349,881 |
| Series 2022 B3, 5.125% 11/15/29 (g) | | 310,000 | 312,275 |
| Pinal County Indl. Dev. Auth. Series 2021 B, 5.5% 10/1/33 (e)(g) | | 400,000 | 398,610 |
| Queen Creek Excise Tax & State Shared Rev. Series 2018 A: | | | |
| 5% 8/1/42 | | 395,000 | 416,203 |
| 5% 8/1/47 | | 480,000 | 502,835 |
| Salt River Proj. Agricultural Impt. & Pwr. District Elec. Sys. Rev.: | | | |
| Series 2015 A, 5% 12/1/45 | | 2,500,000 | 2,520,819 |
| Series 2023 A, 5% 1/1/47 | | 8,675,000 | 9,551,781 |
| Series 2023 B, 5.25% 1/1/53 | | 2,730,000 | 3,045,239 |
| Salt Verde Finl. Corp. Sr. Gas Rev.: | | | |
| Series 2007 1, 5.25% 12/1/28 | | 2,890,000 | 3,068,582 |
| Series 2007: | | | |
5% 12/1/37 | | 2,265,000 | 2,504,360 |
5.5% 12/1/29 | | 1,080,000 | 1,173,247 |
| Sierra Vista Ariz Indl. Dev. Auth.: | | | |
| (American Leadership Academy Proj.) Series 2023, 5.5% 6/15/47 (g) | | 1,500,000 | 1,551,930 |
| Series 2024: | | | |
5% 6/15/54 (g) | | 1,500,000 | 1,504,911 |
5% 6/15/59 (g) | | 455,000 | 455,232 |
| Tempe Indl. Dev. Auth. Rev.: | | | |
| (Friendship Village of Tempe Proj.): | | | |
Series 2019: | | | |
5% 12/1/50 | | 325,000 | 326,510 |
5% 12/1/54 | | 365,000 | 366,055 |
Series 2021 A, 4% 12/1/46 | | 350,000 | 308,998 |
| (Mirabella At ASU, Inc. Proj.) Series 2017 A, 6.125% 10/1/52 (g) | | 435,000 | 280,559 |
TOTAL ARIZONA | | | 157,708,704 |
| Arkansas - 0.2% | | | |
| Arkansas Dev. Auth. Indl. Dev. Rev.: | | | |
| (Big River Steel Proj.): | | | |
Series 2019, 4.5% 9/1/49 (e)(g) | | 4,000,000 | 4,003,680 |
Series 2020 A, 4.75% 9/1/49 (e)(g) | | 1,255,000 | 1,259,528 |
| (Hybar Steel Proj.) Series 2023 A, 6.875% 7/1/48 (e)(g) | | 2,500,000 | 2,762,969 |
| Arkansas Dev. Fin. Auth.: | | | |
| (Lisa Academy Proj.) Series 2018 A, 4.5% 7/1/39 | | 5,000 | 4,940 |
| (Liza Academy Proj.) Series 2018 A, 4% 7/1/28 | | 45,000 | 44,799 |
| Series 2018 A, 4.5% 7/1/33 | | 90,000 | 90,009 |
| Arkansas Dev. Fin. Auth. Health Care Rev.: | | | |
| Bonds Series 2020 B2, 5%, tender 9/1/27 (b) | | 260,000 | 266,785 |
| Series 2019, 5% 12/1/47 | | 1,475,000 | 1,538,825 |
| Series 2020 B1: | | | |
5% 9/1/26 | | 950,000 | 975,077 |
5% 9/1/28 | | 430,000 | 454,248 |
5% 9/1/29 | | 365,000 | 389,530 |
5% 9/1/40 | | 110,000 | 114,861 |
| Series 2021 B1: | | | |
5% 9/1/37 | | 125,000 | 131,365 |
5% 9/1/39 | | 100,000 | 104,495 |
| Arkansas Dev. Fin. Auth. Health Rev. (CARTI Surgery Ctr. Proj.) Series 2021 B: | | | |
| 3% 7/1/32 | | 35,000 | 30,507 |
| 3.125% 7/1/36 | | 100,000 | 81,840 |
| 4% 7/1/52 | | 165,000 | 121,567 |
| 4.25% 7/1/41 | | 35,000 | 31,217 |
| Arkansas Dev. Fin. Auth. Hosp. Rev.: | | | |
| Series 2015 A, 5% 2/1/35 | | 130,000 | 130,022 |
| Series 2015 C, 5% 2/1/35 | | 170,000 | 170,028 |
| Series 2017, 5% 2/1/38 | | 355,000 | 360,457 |
| Series 2024, 5% 2/1/34 | | 250,000 | 261,176 |
| Arkansas Dev. Fin. Auth. Tobacco Settlement Rev. Series 2006, 0% 7/1/46 (AMBAC Insured) | | 1,065,000 | 408,160 |
| Arkansas Dev. Fing. Auth. Envir. Impt. Rev.: | | | |
| (United States Steel Corp. Proj.) Series 2023, 5.7% 5/1/53 (e) | | 4,500,000 | 4,782,522 |
| Series 2022, 5.45% 9/1/52 (e) | | 1,000,000 | 1,044,642 |
| Little Rock School District Series 2021 A, 3% 2/1/50 | | 1,000,000 | 777,662 |
| Osceola Solid Waste Disp. Rev. Bonds (Plum Point Energy Associates, LLC Proj.) Series 2006, 5.5%, tender 2/1/26 (b)(e) | | 2,000,000 | 2,008,391 |
| Pulaski County Pub. Facilities Board Series 2014, 5% 12/1/42 | | 320,000 | 320,083 |
TOTAL ARKANSAS | | | 22,669,385 |
| California - 6.4% | | | |
| ABC Unified School District Series 1997 C, 0% 8/1/28 (Nat'l. Pub. Fin. Guarantee Corp. Insured) | | 475,000 | 426,370 |
| Alameda Corridor Trans. Auth. Rev.: | | | |
| Series 1999 A, 0% 10/1/36 (Nat'l. Pub. Fin. Guarantee Corp. Insured) | | 6,500,000 | 4,256,294 |
| Series 2016 B: | | | |
5% 10/1/34 | | 1,625,000 | 1,664,353 |
5% 10/1/37 | | 540,000 | 552,073 |
| Series 2022 C: | | | |
0% 10/1/52 (Assured Guaranty Muni. Corp. Insured) | | 3,930,000 | 2,244,176 |
5% 10/1/52 (Assured Guaranty Muni. Corp. Insured) | | 2,250,000 | 2,444,489 |
| Series 2022, 0% 10/1/48 | | 2,000,000 | 1,185,707 |
| Series 2024 A, 0% 10/1/52 (Assured Guaranty Muni. Corp. Insured) | | 1,445,000 | 401,612 |
| Allan-Hancock Joint Cmnty. College District Series 2012 C, 0% 8/1/44 (i) | | 1,500,000 | 1,119,689 |
| Antelope Valley Cmnty. College District Series B, 3% 8/1/50 | | 1,200,000 | 987,878 |
| Bay Area Toll Auth. San Francisco Bay Toll Bridge Rev. Bonds Series 2001 A, 4.43%, tender 4/1/27 (b) | | 6,505,000 | 6,559,224 |
| Burbank Glendale Pasadena Arpt. Auth. Rev. Series 2024 B: | | | |
| 4.125% 7/1/41 (Assured Guaranty Muni. Corp. Insured) (e) | | 1,000,000 | 1,011,811 |
| 5% 7/1/32 (e) | | 1,000,000 | 1,095,691 |
| 5% 7/1/34 (e) | | 750,000 | 832,782 |
| 5% 7/1/35 (e) | | 705,000 | 782,833 |
| CA Muni. Fin. Auth. Chrter School Rev. Series 2016 A, 5% 7/1/46 (g) | | 670,000 | 670,371 |
| California Cmnty. Choice Fing. Auth. Clean Energy Proj. Rev. Bonds: | | | |
| Series 2021 B1, 4%, tender 8/1/31 (b) | | 3,280,000 | 3,337,183 |
| Series 2021 B2, 3.63%, tender 8/1/31 (b) | | 1,000,000 | 945,328 |
| Series 2022 A1, 4%, tender 8/1/28 (b) | | 2,390,000 | 2,426,459 |
| Series 2023 A1, 5%, tender 8/1/29 (b) | | 1,750,000 | 1,858,541 |
| Series 2023 A2, U.S. Secured Overnight Fin. Rate (SOFR) Index + 1.950% 5.019%, tender 8/1/29 (b)(c) | | 3,250,000 | 3,296,590 |
| Series 2023 B1, 5%, tender 8/1/29 (b) | | 11,390,000 | 12,074,075 |
| Series 2023 C, 5.25%, tender 10/1/31 (b) | | 15,175,000 | 16,334,983 |
| Series 2023 D, 5.5%, tender 11/1/28 (b) | | 2,500,000 | 2,673,775 |
| Series 2023 E1, 5%, tender 3/1/31 (b) | | 5,165,000 | 5,558,016 |
| Series 2023 E2, U.S. Secured Overnight Fin. Rate (SOFR) Index + 1.670% 4.732%, tender 3/1/31 (b)(c) | | 2,500,000 | 2,528,225 |
| Series 2023 F, 5.5%, tender 11/1/30 (b) | | 5,890,000 | 6,549,722 |
| Series 2023 G1, 5.25%, tender 4/1/30 (b) | | 500,000 | 539,198 |
| Series 2024 A, 5%, tender 4/1/32 (b) | | 2,500,000 | 2,712,573 |
| Series 2024 B, 5%, tender 12/1/32 (b) | | 13,905,000 | 15,076,153 |
| Series 2024 C, 5%, tender 10/1/32 (b) | | 4,250,000 | 4,603,878 |
| Series 2024 E, 5%, tender 9/1/32 (b) | | 9,400,000 | 10,243,826 |
| Series 2024 F, 5%, tender 11/1/32 (b) | | 1,500,000 | 1,636,964 |
| California Cmnty. College Finga: | | | |
| (NCCD - Napa Valley Properties LLC - Napa Valley College Proj.) Series 2022 A, 5.75% 7/1/60 (g) | | 900,000 | 873,323 |
| (NCCD - Orange Coast Properties LLC - Orange Coast College Proj.) Series 2018, 5.25% 5/1/48 | | 1,000,000 | 1,037,965 |
| California Cmnty. Hsg. Agcy. Essential Hsg. Rev.: | | | |
| Series 2019 A, 5% 8/1/49 (g) | | 2,575,000 | 2,468,833 |
| Series 2020 A, 5% 2/1/50 (g) | | 150,000 | 113,263 |
| Series 2021 A: | | | |
4% 2/1/56 (g) | | 5,300,000 | 3,599,134 |
4% 2/1/56 (g) | | 5,940,000 | 4,957,602 |
| Series 2021 A1, 4% 2/1/56 (g) | | 750,000 | 634,966 |
| Series 2021 A2, 4% 8/1/50 (g) | | 2,625,000 | 2,122,970 |
| California Edl. Facilities Auth. Rev.: | | | |
| Series 2016 U7, 5% 6/1/46 | | 500,000 | 621,622 |
| Series 2017 A, 5% 4/1/47 | | 1,730,000 | 1,762,234 |
| California Gen. Oblig.: | | | |
| Series 2004, 5.25% 12/1/33 | | 20,000 | 20,041 |
| Series 2016: | | | |
5% 8/1/26 | | 1,550,000 | 1,608,636 |
5% 9/1/29 | | 270,000 | 279,717 |
| Series 2017, 4% 8/1/36 | | 2,500,000 | 2,522,357 |
| Series 2019, 3% 10/1/36 | | 3,110,000 | 3,058,738 |
| Series 2020, 4% 11/1/37 | | 1,375,000 | 1,434,050 |
| Series 2021: | | | |
5% 9/1/32 | | 340,000 | 387,089 |
5% 9/1/41 | | 3,000,000 | 3,329,810 |
| Series 2022 B, 5% 11/1/32 | | 3,500,000 | 4,058,657 |
| Series 2022: | | | |
5% 4/1/35 | | 155,000 | 177,089 |
5% 9/1/42 | | 2,000,000 | 2,243,950 |
5% 11/1/42 | | 3,155,000 | 3,547,183 |
5% 4/1/47 | | 9,580,000 | 10,544,483 |
5.5% 12/1/52 | | 1,580,000 | 1,729,188 |
| Series 2023: | | | |
5% 10/1/45 | | 2,250,000 | 2,517,567 |
5.25% 10/1/50 | | 2,850,000 | 3,211,171 |
| California Health Facilities Fing. Auth. Rev.: | | | |
| Series 2015: | | | |
5% 11/15/28 | | 250,000 | 254,716 |
5% 11/15/32 | | 55,000 | 55,969 |
5% 11/15/33 | | 480,000 | 488,305 |
| Series 2016 A: | | | |
5% 11/15/41 (Pre-Refunded to 11/15/25 @ 100) | | 1,000,000 | 1,021,198 |
5% 11/15/46 (Pre-Refunded to 11/15/25 @ 100) | | 540,000 | 551,447 |
| Series 2017 A, 5% 11/15/56 | | 360,000 | 371,733 |
| Series 2017 A2, 5% 11/1/47 | | 3,020,000 | 3,636,077 |
| Series 2018 A, 5% 11/15/35 | | 440,000 | 464,843 |
| Series 2019, 5% 11/15/49 | | 1,805,000 | 1,834,289 |
| Series 2020 A, 4% 4/1/45 | | 250,000 | 251,111 |
| Series 2020: | | | |
4% 4/1/49 | | 725,000 | 717,566 |
4% 4/1/49 (Pre-Refunded to 4/1/30 @ 100) | | 25,000 | 26,753 |
| Series 2024 B, 5% 11/15/43 | | 1,150,000 | 1,213,647 |
| Series A, 5% 8/15/47 | | 300,000 | 304,921 |
| California Hsg. Fin. Agcy.: | | | |
| Series 2019 A, 4.25% 1/15/35 | | 683,662 | 707,153 |
| Series 2021 1: | | | |
0.798% 11/20/35 (b) | | 14,263,281 | 653,250 |
3.5% 11/20/35 | | 1,068,651 | 1,046,196 |
| Series 2021 3, 0.789% 8/20/36 (b) | | 5,095,950 | 246,256 |
| Series 2023 A1, 4.375% 9/20/36 | | 10,584,635 | 11,051,321 |
| California Infrastructure & Econ. Dev. Bank Series 2022 B: | | | |
| 5% 11/1/47 | | 325,000 | 351,191 |
| 5% 11/1/57 | | 275,000 | 292,396 |
| California Infrastructure and Econ. Dev. Bank Rev.: | | | |
| Bonds: | | | |
(Brightline West Passenger Rail Proj.) Series 2020 A4, 8%, tender 8/15/25 (b)(e)(g) | | 1,100,000 | 1,133,512 |
(Los Angeles County Museum of Art Proj.) Series 2021 A, 1.2%, tender 6/1/28 (b) | | 2,335,000 | 2,095,604 |
| Series 2023: | | | |
4% 10/1/41 | | 1,165,000 | 1,220,435 |
4% 10/1/43 | | 10,000,000 | 10,378,059 |
| California Muni. Fin. Auth.: | | | |
| (United Airlines, Inc. Los Angeles Int'l. Arpt. proj.) Series 2019, 4% 7/15/29 (e) | | 1,540,000 | 1,535,060 |
| Series 2018 A, 5% 6/1/48 | | 1,685,000 | 1,769,014 |
| Series 2021 A, 4% 11/1/36 (g) | | 410,000 | 394,459 |
| California Muni. Fin. Auth. Ctfs. of Prtn. Series 2022 A, 5.25% 11/1/52 (Assured Guaranty Muni. Corp. Insured) | | 1,610,000 | 1,721,610 |
| California Muni. Fin. Auth. Rev.: | | | |
| (LINXS APM Proj.) Series 2018 A: | | | |
5% 12/31/36 (e) | | 1,260,000 | 1,301,602 |
5% 12/31/43 (e) | | 10,415,000 | 10,595,123 |
5% 12/31/47 (e) | | 2,335,000 | 2,367,458 |
| Series 2015, 5.5% 11/1/45 (g) | | 250,000 | 251,922 |
| Series 2016 A, 5% 11/1/46 (g) | | 250,000 | 250,640 |
| Series 2017 A: | | | |
5% 2/1/42 | | 370,000 | 376,327 |
5.25% 11/1/36 | | 355,000 | 360,438 |
5.25% 11/1/41 | | 330,000 | 333,334 |
5.25% 11/1/47 | | 760,000 | 764,107 |
| Series 2018 A, 4% 12/31/47 (e) | | 3,900,000 | 3,711,453 |
| Series 2019, 5% 8/1/39 (g) | | 455,000 | 421,037 |
| Series 2021 A, 4% 2/1/51 | | 355,000 | 351,807 |
| Series 2022, 5.25% 6/1/53 | | 2,075,000 | 2,278,096 |
| California Muni. Fin. Auth. School Fa Series 2024 A: | | | |
| 5.75% 5/1/54 (g) | | 435,000 | 452,064 |
| 5.875% 5/1/59 (g) | | 390,000 | 406,858 |
| California Muni. Fin. Auth. Solid Waste Disp. Rev. Bonds: | | | |
| (Republic Svcs., INC. Proj.) Series 2024 A, 3.875%, tender 3/1/34 (b)(e) | | 4,860,000 | 4,922,945 |
| (Waste Mgmt., Inc. Proj.): | | | |
Series 2017 A, 4.25%, tender 12/2/24 (b)(e) | | 1,750,000 | 1,753,953 |
Series 2019 A, 2.4%, tender 10/1/29 (b)(e) | | 910,000 | 863,244 |
Series 2024 A, 4.125%, tender 3/3/25 (b)(e) | | 1,150,000 | 1,150,523 |
| California Muni. Fin. Auth. Spl. Ta Series 2024: | | | |
| 5% 9/1/44 | | 910,000 | 968,165 |
| 5% 9/1/49 | | 785,000 | 827,869 |
| 5% 9/1/54 | | 750,000 | 785,645 |
| California Muni. Fin. Auth. Student Hsg.: | | | |
| (CHF-Davis I, LLC - West Village Student Hsg. Proj.) Series 2018: | | | |
5% 5/15/34 | | 170,000 | 179,510 |
5% 5/15/35 | | 120,000 | 126,538 |
5% 5/15/36 | | 215,000 | 226,143 |
5% 5/15/38 | | 170,000 | 178,151 |
5% 5/15/39 | | 75,000 | 78,377 |
5% 5/15/43 | | 225,000 | 233,221 |
| (CHF-Riverside II, LLC-UCR North District Phase I Student Hsg. Proj.) Series 2019: | | | |
5% 5/15/49 | | 420,000 | 434,777 |
5% 5/15/52 | | 350,000 | 361,475 |
| Series 2018: | | | |
5% 5/15/36 | | 1,000,000 | 1,058,800 |
5% 5/15/39 | | 1,600,000 | 1,683,098 |
5% 5/15/48 | | 750,000 | 777,332 |
5% 5/15/51 | | 725,000 | 749,434 |
| Series 2021, 3% 5/15/51 (Build America Mutual Assurance Insured) | | 250,000 | 201,744 |
| California Poll. Cont. Fing. Auth. Series 2019: | | | |
| 5% 7/1/29 (g) | | 480,000 | 502,348 |
| 5% 7/1/39 (g) | | 1,760,000 | 1,830,239 |
| 5% 11/21/45 (g) | | 1,930,000 | 1,983,144 |
| California Pub. Fin. Auth.: | | | |
| (Enso Village Proj.) Series 2021 B1, 3.125% 5/15/29 (g) | | 430,000 | 423,400 |
| (Enso Villiage Proj.) Series 2021 B2, 2.375% 11/15/28 (g) | | 675,000 | 665,576 |
| Series 2021 A: | | | |
5% 11/15/36 (g) | | 290,000 | 295,488 |
5% 11/15/46 (g) | | 105,000 | 102,214 |
5% 11/15/56 (g) | | 550,000 | 517,144 |
| California Pub. Fin. Auth. Rev.: | | | |
| Series 2017: | | | |
5% 10/15/37 | | 105,000 | 106,950 |
5% 10/15/47 | | 105,000 | 106,023 |
| Series 2019 A, 6.25% 7/1/54 (g) | | 250,000 | 262,259 |
| Series 2019 B, 7.5% 7/1/36 (g) | | 225,000 | 226,560 |
| Series 2021 A, 4% 10/15/26 | | 85,000 | 85,462 |
| California Pub. Works Board Lease Rev.: | | | |
| (Various Cap. Projs.) Series 2022 C: | | | |
5% 8/1/30 | | 35,000 | 39,313 |
5% 8/1/31 | | 450,000 | 513,761 |
5% 8/1/32 | | 130,000 | 147,834 |
5% 8/1/34 | | 840,000 | 949,953 |
| Series 2014 B, 5% 10/1/34 | | 1,505,000 | 1,507,313 |
| California School Fin. Auth. (New Designs Charter School Proj.) Series 2024 A, 5% 6/1/54 (g) | | 850,000 | 855,601 |
| California School Fin. Auth. Charter School Rev.: | | | |
| (Partnerships to Uplift Cmntys. Proj.) Series 2023, 5.5% 8/1/43 (g) | | 550,000 | 587,801 |
| Series 2016, 5% 8/1/41 (Pre-Refunded to 8/1/25 @ 100) (g) | | 50,000 | 50,669 |
| Series 2021 A: | | | |
4% 6/1/51 (g) | | 250,000 | 214,811 |
4% 8/1/51 (g) | | 150,000 | 137,589 |
4% 6/1/61 (g) | | 250,000 | 183,807 |
4% 8/1/61 (g) | | 240,000 | 213,546 |
| Series 2022 A: | | | |
5% 7/1/42 (g) | | 500,000 | 513,326 |
5% 7/1/52 (g) | | 2,045,000 | 2,017,674 |
| Series 2022 B, 5% 7/1/42 (g) | | 2,125,000 | 2,147,478 |
| Series 2024 A, 5.125% 6/1/64 (g) | | 1,475,000 | 1,469,540 |
| California School Fin. Auth. School Facility Rev.: | | | |
| (KIPP SoCal Projs.) Series 2020 A, 4% 7/1/50 (g) | | 735,000 | 698,794 |
| Series 2015 A, 5% 7/1/45 (g) | | 285,000 | 286,174 |
| Series 2019, 5% 7/1/49 (g) | | 1,225,000 | 1,236,584 |
| California State Univ. Rev.: | | | |
| Series 2016 A, 4% 11/1/45 | | 360,000 | 360,867 |
| Series 2017 A, 5% 11/1/42 | | 500,000 | 520,988 |
| Series 2020 C: | | | |
3% 11/1/40 | | 1,350,000 | 1,233,405 |
4% 11/1/45 | | 750,000 | 758,593 |
| Series 2024 A, 5.5% 11/1/55 | | 2,000,000 | 2,341,592 |
| California Statewide Cmntys. Dev. Auth.: | | | |
| (NCCD-Hooper Street LLC-California College of the Arts Proj.) Series 2019: | | | |
5% 7/1/29 (g) | | 130,000 | 133,448 |
5.25% 7/1/39 (g) | | 100,000 | 102,857 |
5.25% 7/1/49 (g) | | 380,000 | 386,034 |
5.25% 7/1/52 (g) | | 165,000 | 167,263 |
| Series 2016: | | | |
5% 5/15/25 | | 55,000 | 55,409 |
5% 5/15/26 | | 55,000 | 56,474 |
5% 5/15/27 | | 55,000 | 56,573 |
5% 5/15/28 | | 55,000 | 56,575 |
5% 5/15/32 | | 70,000 | 71,798 |
5% 5/15/33 | | 85,000 | 87,111 |
5% 5/15/40 | | 1,205,000 | 1,227,186 |
| Series 2017: | | | |
5% 5/15/37 | | 1,000,000 | 1,032,750 |
5% 5/15/47 | | 1,180,000 | 1,204,416 |
| California Statewide Cmntys. Dev. Auth. Hosp. Rev. Series 2018, 5% 1/1/48 | | 350,000 | 363,450 |
| California Statewide Cmntys. Dev. Auth. Multi-family Hsg. Rev. Bonds Series 2020 R, 3.95%, tender 4/1/60 (g)(h) | | 2,500,000 | 2,131,867 |
| California Statewide Cmntys. Dev. Auth. Poll. Cont. Rev. Series 2010 A, 1.75% 9/1/29 | | 300,000 | 270,425 |
| California Statewide Cmntys. Dev. Auth. Rev.: | | | |
| (Viamonte Sr. Living 1 Proj.) Series 2018 A, 3.5% 7/1/34 | | 165,000 | 166,039 |
| Series 2014 A: | | | |
5.25% 12/1/44 | | 560,000 | 560,007 |
5.5% 12/1/54 | | 2,920,000 | 2,920,185 |
| Series 2014, 6.375% 11/1/43 (g) | | 350,000 | 350,530 |
| Series 2015 A, 5% 10/1/45 | | 615,000 | 618,236 |
| Series 2015, 5% 2/1/45 (f)(j) | | 256,630 | 179,641 |
| Series 2016 A: | | | |
5% 12/1/27 (g) | | 420,000 | 429,279 |
5% 12/1/46 (g) | | 1,715,000 | 1,733,209 |
5.25% 12/1/56 (g) | | 6,305,000 | 6,369,572 |
| Series 2017 A: | | | |
3.5% 11/1/27 (g) | | 530,000 | 521,862 |
5% 11/1/32 (g) | | 100,000 | 102,579 |
5% 11/1/41 (g) | | 200,000 | 201,934 |
| Series 2018 A: | | | |
5% 3/1/34 | | 210,000 | 219,034 |
5% 3/1/35 | | 315,000 | 328,587 |
5.25% 12/1/48 (g) | | 250,000 | 257,386 |
5.5% 12/1/58 (g) | | 4,875,000 | 5,054,453 |
| Series 2019 B: | | | |
4% 9/2/29 | | 170,000 | 173,653 |
5% 9/2/44 | | 1,000,000 | 1,041,696 |
5% 9/2/49 | | 70,000 | 72,539 |
| Series 2021 A: | | | |
4% 9/2/28 | | 35,000 | 35,150 |
4% 9/2/29 | | 40,000 | 40,182 |
4% 9/2/30 | | 45,000 | 45,252 |
4% 9/2/31 | | 35,000 | 35,198 |
4% 9/2/41 | | 230,000 | 223,529 |
4% 9/2/51 | | 140,000 | 128,329 |
| Series 2021 B: | | | |
4% 9/2/41 | | 640,000 | 625,752 |
4% 9/2/51 | | 755,000 | 698,674 |
| Series 2021 C1: | | | |
4% 9/2/31 | | 85,000 | 83,941 |
4% 9/2/41 | | 450,000 | 420,891 |
4% 9/2/51 | | 105,000 | 92,977 |
| Series 2022 A: | | | |
5.25% 8/15/52 (Assured Guaranty Muni. Corp. Insured) | | 725,000 | 784,009 |
5.375% 8/15/57 (Assured Guaranty Muni. Corp. Insured) | | 690,000 | 749,824 |
| Series 2022 A1, 5% 9/2/52 | | 1,525,000 | 1,578,534 |
| Series 2022 B, 5% 9/2/52 | | 500,000 | 517,552 |
| Series 2023 D, 5.25% 9/2/43 | | 1,300,000 | 1,365,846 |
| California Statewide Fing. Auth. Series 2002 A, 6% 5/1/43 | | 210,000 | 214,496 |
| Carlsbad Unified School District: | | | |
| Series 2018 A, 3% 8/1/42 | | 725,000 | 642,264 |
| Series 2021 B, 3% 8/1/46 | | 250,000 | 213,542 |
| Chabot-Las Positas Cmnty. College District Series 2023 C, 5.25% 8/1/48 | | 500,000 | 566,588 |
| Chino Valley Unified School District Series 2020 B, 3.375% 8/1/50 (Assured Guaranty Muni. Corp. Insured) | | 10,690,000 | 9,682,940 |
| CMFA Spl. Fin. Agcy. Essential Hsg. Rev.: | | | |
| Series 2020 A1, 4% 8/1/56 (g) | | 655,000 | 589,471 |
| Series 2021 A1, 3% 12/1/56 (g) | | 450,000 | 322,114 |
| Series 2021, 4% 8/1/45 (g) | | 835,000 | 733,530 |
| CMFA Spl. Fin. Agcy. VII Essential Hsg. Rev. Series 2021 A2, 4% 8/1/47 (g) | | 1,830,000 | 1,600,754 |
| CMFA Spl. Fin. Agcy. XII: | | | |
| Series 2022 A1, 3.25% 2/1/57 (g) | | 240,000 | 181,817 |
| Series 2022 A2, 4.375% 8/1/49 (g) | | 455,000 | 384,526 |
| College of the Sequoias Cmnty. College District Series 2021 E, 3% 8/1/51 | | 455,000 | 382,316 |
| Corona-Norco Unified School District Series 2014, 3% 8/1/44 | | 750,000 | 648,568 |
| CSCDA Cmnty. Impt. Auth. Essential Hsg. Rev.: | | | |
| Series 2020 A, 5% 7/1/51 (g) | | 605,000 | 594,235 |
| Series 2021 A, 4% 8/1/56 (g) | | 500,000 | 455,867 |
| Series 2021 A1: | | | |
2.65% 12/1/46 (g) | | 1,940,000 | 1,531,742 |
3% 7/1/45 (g) | | 2,000,000 | 1,622,719 |
| Series 2021 A2: | | | |
3% 12/1/56 (g) | | 200,000 | 140,856 |
3.125% 7/1/56 (g) | | 1,715,000 | 1,198,003 |
3.125% 8/1/56 (g) | | 600,000 | 457,920 |
3.25% 5/1/57 (g) | | 250,000 | 185,195 |
4% 7/1/56 (g) | | 1,000,000 | 826,353 |
4% 7/1/56 (g) | | 2,319,888 | 1,844,012 |
4% 9/1/56 (g) | | 3,150,000 | 2,490,369 |
4% 10/1/56 (g) | | 3,375,000 | 2,774,627 |
4% 6/1/58 (g) | | 250,000 | 201,200 |
| Series 2021 B, 4% 3/1/57 (g) | | 1,915,000 | 1,452,272 |
| Ctr. Joint Unified School Ditrict Series 2021 B, 3% 8/1/51 | | 1,740,000 | 1,423,562 |
| Desert Cmnty. College District Series 2024, 4% 8/1/51 | | 5,000,000 | 5,043,037 |
| El Camino Cmnty. College District Series 2012 C, 0% 8/1/38 | | 1,700,000 | 1,020,978 |
| Escondido Gen. Oblig. Series 2015, 5% 9/1/36 | | 800,000 | 811,867 |
| Escondido Union High School District Series 2009 A, 0% 8/1/31 (Assured Guaranty, Inc. Insured) | | 855,000 | 701,315 |
| Facilities Fing. Auth. Sp (Irvine Great Park Infrastructure) Series 2023 A, 5.25% 9/1/53 | | 4,000,000 | 4,488,402 |
| Folsom Cordova Union School District No. 4 Series A, 0% 10/1/31 (Nat'l. Pub. Fin. Guarantee Corp. Insured) | | 225,000 | 182,140 |
| Foothill/Eastern Trans. Corridor Agcy. Toll Road Rev.: | | | |
| Series 2013 B2, 3.5% 1/15/53 (b) | | 450,000 | 415,198 |
| Series 2021 A: | | | |
4% 1/15/46 | | 1,414,000 | 1,430,373 |
4% 1/15/46 | | 3,531,000 | 3,543,133 |
| Series 2021 C, 4% 1/15/43 | | 250,000 | 252,969 |
| Freddie Mac Series 2022-ML13 Class XCA, 0.9625% 7/25/36 (b)(k) | | 9,552,071 | 419,897 |
| Fresno Arpt. Rev. Series 2023 A, 5% 7/1/34 (Build America Mutual Assurance Insured) (e) | | 1,000,000 | 1,109,888 |
| Fresno Unified School District Series B, 3% 8/1/43 | | 1,470,000 | 1,257,977 |
| Golden State Tobacco Securitization Corp. Tobacco Settlement Rev.: | | | |
| Series 2015 A: | | | |
5% 6/1/34 (Pre-Refunded to 6/1/25 @ 100) | | 1,475,000 | 1,491,003 |
5% 6/1/35 (Pre-Refunded to 6/1/25 @ 100) | | 875,000 | 884,494 |
| Series 2021 B1, 3.85% 6/1/50 | | 4,120,000 | 3,822,733 |
| Series 2021 B2, 0% 6/1/66 (i) | | 80,090,000 | 8,955,472 |
| Series 2022 A1, 5% 6/1/51 | | 1,425,000 | 1,502,259 |
| Hastings Campus Hsg. Fin. Auth.: | | | |
| Series 2020 A: | | | |
5% 7/1/45 (g) | | 1,800,000 | 1,758,695 |
5% 7/1/61 (g) | | 3,730,000 | 3,514,927 |
| Series 2020 B, 0% 7/1/61 (g)(i) | | 2,605,000 | 1,273,000 |
| Indio Pub. Fing. Auth. Lease Rev. Series 2022 A, 4.5% 11/1/52 | | 1,115,000 | 1,157,142 |
| Inland Empire Tobacco Securitization Auth.: | | | |
| Series 2007 C1, 0% 6/1/36 | | 1,500,000 | 691,643 |
| Series 2007: | | | |
0% 6/1/57 | | 9,000,000 | 732,516 |
0% 6/1/57 (g) | | 17,305,000 | 1,302,625 |
0% 6/1/57 (g) | | 11,325,000 | 729,380 |
| Irvine Reassessment District 12-1 Ltd. Oblig.: | | | |
| Series 2012, 4% 9/2/27 | | 45,000 | 45,123 |
| Series 2012, 4% 9/2/28 | | 60,000 | 60,159 |
| Irvine Unified School District Cmnty. Facilities District Series 2017 D, 5% 3/1/57 | | 770,000 | 784,970 |
| Kern Cmnty. College District Gen. Oblig. Series 2006: | | | |
| 0% 11/1/28 (Assured Guaranty Muni. Corp. Insured) | | 600,000 | 535,835 |
| 0% 11/1/30 (Assured Guaranty Muni. Corp. Insured) | | 605,000 | 506,679 |
| Ladera Ranch Cmnty. Facilities District 2004-1 Series 2022 A, 5% 8/15/47 | | 2,500,000 | 2,621,303 |
| Live Oak School District Ctfs. of Prtn. (2016 Rfdg. and School Fing. Projs.) Series 2016, 5% 8/1/39 (Assured Guaranty Muni. Corp. Insured) | | 750,000 | 773,860 |
| Lodi Unified School District Series 2021, 3% 8/1/46 | | 2,700,000 | 2,327,085 |
| Long Beach Arpt. Rev.: | | | |
| Series 2022 A: | | | |
5% 6/1/33 (Assured Guaranty Muni. Corp. Insured) | | 30,000 | 34,912 |
5% 6/1/34 (Assured Guaranty Muni. Corp. Insured) | | 25,000 | 29,023 |
5% 6/1/35 (Assured Guaranty Muni. Corp. Insured) | | 20,000 | 23,146 |
5% 6/1/36 (Assured Guaranty Muni. Corp. Insured) | | 50,000 | 57,680 |
5% 6/1/37 (Assured Guaranty Muni. Corp. Insured) | | 45,000 | 51,743 |
5% 6/1/39 (Assured Guaranty Muni. Corp. Insured) | | 30,000 | 34,216 |
| Series 2022 B: | | | |
5% 6/1/33 (Assured Guaranty Muni. Corp. Insured) | | 30,000 | 34,912 |
5% 6/1/34 (Assured Guaranty Muni. Corp. Insured) | | 25,000 | 29,023 |
5% 6/1/35 (Assured Guaranty Muni. Corp. Insured) | | 20,000 | 23,146 |
5% 6/1/36 (Assured Guaranty Muni. Corp. Insured) | | 20,000 | 23,072 |
5% 6/1/37 (Assured Guaranty Muni. Corp. Insured) | | 30,000 | 34,495 |
5% 6/1/38 (Assured Guaranty Muni. Corp. Insured) | | 20,000 | 22,921 |
5% 6/1/39 (Assured Guaranty Muni. Corp. Insured) | | 35,000 | 39,919 |
| Long Beach Bond Fin. Auth. Natural Gas Purchase Rev. Series 2007 A: | | | |
| 5% 11/15/29 | | 600,000 | 637,336 |
| 5.5% 11/15/37 | | 900,000 | 1,055,341 |
| Long Beach Hbr. Rev. Series 2019 A, 5% 5/15/39 | | 480,000 | 522,925 |
| Long Beach Marina Rev. (Alamitos Bay Marina Proj.) Series 2015, 5% 5/15/40 | | 540,000 | 542,151 |
| Long Beach Unified School District: | | | |
| Series 2009, 5.5% 8/1/29 | | 20,000 | 20,035 |
| Series 2015 D1, 0% 8/1/30 | | 720,000 | 575,808 |
| Los Angeles County Metropolitan Trans. Auth. Sales Tax Rev. Series 2019 A, 5% 7/1/38 | | 1,445,000 | 1,550,511 |
| Los Angeles County Pub. Works Fing. Auth. Lease Rev. (Multiple Cap. Projs.) Series 2015 A, 5% 12/1/33 | | 825,000 | 825,000 |
| Los Angeles Dept. Arpt. Rev.: | | | |
| Series 2015 A, 4.75% 5/15/40 (e) | | 790,000 | 792,163 |
| Series 2016 B, 5% 5/15/41 (e) | | 2,600,000 | 2,631,699 |
| Series 2018 A: | | | |
5% 5/15/44 (e) | | 1,515,000 | 1,559,857 |
5.25% 5/15/38 (e) | | 375,000 | 393,387 |
| Series 2018 C, 5% 5/15/44 (e) | | 1,565,000 | 1,601,079 |
| Series 2018 E, 5% 5/15/43 | | 1,050,000 | 1,124,218 |
| Series 2018, 5% 5/15/43 (e) | | 3,150,000 | 3,273,290 |
| Series 2019 D, 5% 5/15/38 (e) | | 725,000 | 754,939 |
| Series 2020 C: | | | |
4% 5/15/50 (e) | | 750,000 | 734,400 |
5% 5/15/37 (e) | | 770,000 | 819,389 |
| Series 2021 A: | | | |
5% 5/15/36 (e) | | 365,000 | 393,331 |
5% 5/15/37 (e) | | 270,000 | 290,458 |
5% 5/15/38 (e) | | 595,000 | 638,221 |
5% 5/15/39 (e) | | 885,000 | 945,213 |
| Series 2021 D, 4% 5/15/40 (e) | | 1,000,000 | 999,435 |
| Series 2022 A, 4% 5/15/41 (e) | | 2,000,000 | 1,998,722 |
| Series 2022 G: | | | |
4% 5/15/47 (e) | | 2,000,000 | 1,984,357 |
5% 5/15/47 (e) | | 500,000 | 528,732 |
5.5% 5/15/36 (e) | | 400,000 | 451,639 |
5.5% 5/15/40 (e) | | 300,000 | 333,906 |
| Series 2022 H, 5.5% 5/15/47 (e) | | 2,925,000 | 3,195,770 |
| Series F: | | | |
4% 5/15/49 (e) | | 850,000 | 822,291 |
5% 5/15/34 (e) | | 385,000 | 407,961 |
5% 5/15/44 (e) | | 1,920,000 | 1,991,900 |
| Los Angeles Dept. of Wtr. & Pwr. Rev.: | | | |
| Series 2016 A: | | | |
5% 7/1/38 | | 860,000 | 877,025 |
5% 7/1/46 | | 480,000 | 487,370 |
| Series 2017 A, 5% 7/1/42 | | 1,805,000 | 1,866,585 |
| Series 2017 B, 5% 7/1/39 | | 2,655,000 | 2,755,722 |
| Series 2017 C: | | | |
5% 7/1/37 | | 1,165,000 | 1,223,652 |
5% 7/1/38 | | 240,000 | 251,645 |
5% 7/1/42 | | 3,135,000 | 3,265,047 |
| Series 2021 B, 5% 7/1/51 | | 5,225,000 | 5,647,366 |
| Series 2021 C: | | | |
5% 7/1/40 | | 255,000 | 285,960 |
5% 7/1/51 | | 5,000,000 | 5,433,773 |
| Series B, 5% 7/1/50 | | 3,455,000 | 3,714,914 |
| Los Angeles Dept. of Wtr. & Pwr. Wtrwks. Rev.: | | | |
| Series 2020 A, 5% 7/1/40 | | 70,000 | 77,386 |
| Series 2021 B, 5% 7/1/46 | | 1,520,000 | 1,656,338 |
| Series 2022 D, 5% 7/1/52 | | 1,200,000 | 1,319,020 |
| Los Angeles Hbr. Dept. Rev. Series 2019 A, 5% 8/1/25 (e) | | 620,000 | 626,241 |
| Los Angeles Unified School District: | | | |
| Series 2018 B1, 5.25% 7/1/42 | | 7,000,000 | 7,443,301 |
| Series 2020 C: | | | |
4% 7/1/33 | | 750,000 | 796,292 |
4% 7/1/38 | | 1,170,000 | 1,218,672 |
| Series 2024 A, 5% 7/1/27 | | 1,500,000 | 1,599,555 |
| Series C, 4% 7/1/44 | | 1,000,000 | 1,013,849 |
| Los Angeles Unified School District Ctfs. of Prtn. Series 2023 A: | | | |
| 5% 10/1/32 | | 1,775,000 | 2,051,573 |
| 5% 10/1/33 | | 4,000,000 | 4,681,848 |
| 5% 10/1/35 | | 1,705,000 | 1,979,116 |
| Los Angeles Wastewtr. Sys. Rev.: | | | |
| Series 2013 A, 5% 6/1/43 | | 400,000 | 400,107 |
| Series 2018 A, 5% 6/1/48 | | 2,025,000 | 2,125,030 |
| Middle Fork Proj. Fin. Auth. Series 2020: | | | |
| 5% 4/1/25 | | 185,000 | 185,610 |
| 5% 4/1/26 | | 130,000 | 132,130 |
| Modesto Elementary School District, Stanislaus County Series 2021 B: | | | |
| 3% 8/1/46 | | 380,000 | 328,700 |
| 3% 8/1/50 | | 235,000 | 198,388 |
| Modesto Irrigation District Fing. Auth. Rev. Series 2007 F, CME Term SOFR 3 Month Index + 0.580% 4.116% 9/1/27 (Nat'l. Pub. Fin. Guarantee Corp. Insured) (b)(c) | | 880,000 | 873,556 |
| Monrovia Unified School District Series B, 0% 8/1/29 (Nat'l. Pub. Fin. Guarantee Corp. Insured) | | 550,000 | 476,308 |
| Montebello Pub. Fing. Auth. (Montebello Home2 Suites by Hilton Hotel Proj.) Series 2016 A: | | | |
| 5% 6/1/41 | | 1,385,000 | 1,416,084 |
| 5% 6/1/46 | | 425,000 | 433,897 |
| Moreno Valley Unified School District Series 2021 C, 3% 8/1/46 | | 250,000 | 213,925 |
| Mount Diablo Unified School District Series 2022 B: | | | |
| 4% 8/1/29 | | 105,000 | 111,989 |
| 4% 8/1/31 | | 735,000 | 794,888 |
| 4% 8/1/33 | | 85,000 | 91,212 |
| MSR Energy Auth. Gas Rev.: | | | |
| Series 2009 A: | | | |
6.125% 11/1/29 | | 345,000 | 369,374 |
6.5% 11/1/39 | | 1,750,000 | 2,274,094 |
7% 11/1/34 | | 1,810,000 | 2,289,436 |
| Series 2009 B: | | | |
6.5% 11/1/39 | | 3,775,000 | 4,905,546 |
7% 11/1/34 | | 6,980,000 | 8,828,873 |
| Series 2009 C: | | | |
6.125% 11/1/29 | | 1,045,000 | 1,118,770 |
6.5% 11/1/39 | | 615,000 | 799,182 |
7% 11/1/34 | | 1,205,000 | 1,524,182 |
| Murrieta Valley Unified School District Series 2022, 5.25% 9/1/51 | | 2,000,000 | 2,218,198 |
| Northern California Gas Auth. #1 Gas Proj. Rev. Series 2007 B, CME Term SOFR 3 Month Index + 0.720% 3.973% 7/1/27 (b)(c) | | 1,135,000 | 1,135,523 |
| Novato Unified School District Series 2019 B, 3% 8/1/41 | | 840,000 | 764,146 |
| Oak Grove School District Series 2023, 5% 8/1/52 | | 500,000 | 551,342 |
| Ocean View School District Series 2021, 3% 8/1/47 (Assured Guaranty Muni. Corp. Insured) | | 750,000 | 634,959 |
| Oceanside Unified School District Series 2009: | | | |
| 0% 8/1/27 | | 35,000 | 32,504 |
| 0% 8/1/27 (Escrowed to Maturity) | | 40,000 | 37,148 |
| 0% 8/1/27 (Escrowed to Maturity) | | 15,000 | 13,930 |
| 0% 8/1/29 | | 35,000 | 30,705 |
| 0% 8/1/29 | | 655,000 | 570,899 |
| 0% 8/1/29 (Escrowed to Maturity) | | 55,000 | 48,251 |
| 0% 8/1/30 | | 35,000 | 29,646 |
| 0% 8/1/30 (Escrowed to Maturity) | | 45,000 | 38,330 |
| Palo Alto Unified School District Gen. Oblig. Series 2022, 3.25% 8/1/42 | | 1,585,000 | 1,533,465 |
| Peninsula Corridor Joint Powers Board Series 2022 A, 5% 6/1/47 | | 750,000 | 814,235 |
| Pomona Unified School District Series 2016 F, 3% 8/1/48 | | 205,000 | 173,774 |
| Poway Unified School District: | | | |
| (District #2007-1 School Facilities Proj.) Series 2008 A, 0% 8/1/32 (i) | | 790,000 | 623,092 |
| Series 2011, 0% 8/1/46 (i) | | 140,000 | 56,054 |
| Series B: | | | |
0% 8/1/33 (i) | | 245,000 | 186,436 |
0% 8/1/37 (i) | | 1,395,000 | 898,882 |
0% 8/1/38 (i) | | 3,365,000 | 2,071,564 |
0% 8/1/39 | | 3,300,000 | 1,941,681 |
0% 8/1/41 (i) | | 750,000 | 402,186 |
| Poway Unified School District Pub. Fing. Series 2015 A: | | | |
| 5% 9/1/26 | | 155,000 | 156,985 |
| 5% 9/1/27 | | 60,000 | 60,736 |
| 5% 9/1/29 | | 320,000 | 323,746 |
| 5% 9/1/30 | | 75,000 | 75,858 |
| 5% 9/1/31 | | 145,000 | 146,590 |
| Pub. Utils. Commission San Francisco City & County Wastewtr. Rev. Series 2021 A, 1% 10/1/25 (Escrowed to Maturity) | | 3,000,000 | 2,934,523 |
| Rancho Cucamonga Redev. Agcy. Series 2014: | | | |
| 5% 9/1/30 (Assured Guaranty Muni. Corp. Insured) | | 295,000 | 295,526 |
| 5% 9/1/31 (Assured Guaranty Muni. Corp. Insured) | | 825,000 | 826,386 |
| 5% 9/1/32 (Assured Guaranty Muni. Corp. Insured) | | 775,000 | 776,219 |
| Richmond Joint Powers Fing. Auth. Rev. Series 2019 A, 5% 11/1/36 (Assured Guaranty Muni. Corp. Insured) | | 580,000 | 629,723 |
| Richmond Wastewtr. Rev. Series 2017 A, 5.25% 8/1/47 | | 1,400,000 | 1,460,857 |
| River Islands Pub. Fing. Auth.: | | | |
| Series 2022 A-1, 5.25% 9/1/52 (Assured Guaranty Muni. Corp. Insured) | | 1,840,000 | 1,997,130 |
| Series 2022, 5.25% 9/1/52 (Assured Guaranty Muni. Corp. Insured) | | 425,000 | 461,294 |
| Series 2023, 5.5% 9/1/48 | | 1,250,000 | 1,336,027 |
| Riverside County Trans. Commission Sales Tax Rev.: | | | |
| Series 2016 A, 2% 6/1/29 | | 430,000 | 402,644 |
| Series 2017 B, 5% 6/1/38 | | 1,710,000 | 1,811,061 |
| Riverside County Trans. Commission Toll Rev. Series 2021 B1: | | | |
| 4% 6/1/37 | | 560,000 | 577,009 |
| 4% 6/1/38 | | 2,150,000 | 2,208,711 |
| 4% 6/1/46 | | 1,960,000 | 1,967,171 |
| Roseville Natural Gas Fing. Auth. Series 2007, 5% 2/15/27 | | 965,000 | 994,845 |
| Sacramento Area Flood Cont. Agcy. Series 2016 A, 5% 10/1/36 | | 500,000 | 517,139 |
| Sacramento City Fing. Auth. Rev. Series A, 0% 12/1/26 (Nat'l. Pub. Fin. Guarantee Corp. Insured) | | 695,000 | 650,148 |
| Sacramento City Unified School District Series 2022 A: | | | |
| 5.5% 8/1/47 | | 1,500,000 | 1,659,056 |
| 5.5% 8/1/52 | | 3,000,000 | 3,296,833 |
| Sacramento County Arpt. Sys. Rev.: | | | |
| Series 2016 B, 5% 7/1/41 | | 1,280,000 | 1,313,703 |
| Series 2018 C, 5% 7/1/37 (e) | | 590,000 | 613,129 |
| Sacramento Spl. Tax Greenbriar Cmnty. Facilities District No. 2018-03 Area No. 1: | | | |
| Series 2021: | | | |
4% 9/1/41 | | 295,000 | 296,253 |
4% 9/1/46 | | 805,000 | 788,223 |
| Series 2022: | | | |
5.25% 9/1/42 (g) | | 1,065,000 | 1,147,570 |
5.25% 9/1/47 (g) | | 1,060,000 | 1,131,176 |
| Sacramento Wtr. Rev. Series 2017, 5.25% 9/1/47 | | 525,000 | 549,621 |
| San Bernardino Unified School District (2019 Fing. Proj.) Series 2019, 5% 10/1/38 (Assured Guaranty Muni. Corp. Insured) | | 420,000 | 447,447 |
| San Diego Cmnty. College District Series 2011, 0% 8/1/35 | | 170,000 | 120,409 |
| San Diego County Reg'l. Arpt. Auth. Arpt. Rev.: | | | |
| Series 2021 A, 5% 7/1/56 | | 5,000,000 | 5,367,399 |
| Series 2021 B: | | | |
4% 7/1/41 (e) | | 355,000 | 354,768 |
4% 7/1/46 (e) | | 405,000 | 398,335 |
4% 7/1/56 (e) | | 805,000 | 771,539 |
5% 7/1/46 (e) | | 505,000 | 529,611 |
5% 7/1/51 (e) | | 505,000 | 525,918 |
| Series 2023 B: | | | |
5% 7/1/48 (e) | | 1,000,000 | 1,063,288 |
5% 7/1/53 (e) | | 1,400,000 | 1,478,069 |
| San Diego County Reg'l. Trans. Commission Sales Tax Rev. Series 2016 A, 5% 4/1/48 | | 2,820,000 | 2,874,318 |
| San Diego County Wtr. Auth. Rev. Series 2022 A: | | | |
| 5% 5/1/47 | | 1,780,000 | 1,967,376 |
| 5% 5/1/52 | | 3,030,000 | 3,322,636 |
| San Diego Pub. Facilities Fing. Auth. Wtr. Rev. Series 2023 A, 5.25% 8/1/48 | | 750,000 | 851,084 |
| San Diego Unified School District: | | | |
| Series 2008 C: | | | |
0% 7/1/34 | | 515,000 | 377,643 |
0% 7/1/37 (i) | | 285,000 | 185,939 |
| Series 2008 E, 0% 7/1/47 (i) | | 1,200,000 | 1,018,748 |
| Series 2012 R2, 0% 7/1/41 (i) | | 1,350,000 | 1,398,711 |
| Series 2017 I, 5% 7/1/41 | | 250,000 | 259,945 |
| Series 2020 D2, 3% 7/1/37 | | 590,000 | 559,207 |
| Series 2023 ZR 4B, 5% 7/1/40 | | 810,000 | 935,331 |
| San Francisco Bay Area Rapid Transit Fing. Auth. Series 2020, 3% 8/1/50 | | 1,250,000 | 1,029,040 |
| San Francisco Calif City & Cnt Series 2023 B, 5.75% 9/1/53 (g) | | 510,000 | 555,450 |
| San Francisco City & County Arpts. Commission Int'l. Arpt. Rev.: | | | |
| Second Series 2019 A, 5% 5/1/44 (e) | | 2,950,000 | 3,059,547 |
| Series 2017 A, 5% 5/1/47 (e) | | 1,500,000 | 1,520,915 |
| Series 2018 D, 5% 5/1/48 (e) | | 1,085,000 | 1,109,994 |
| Series 2019 A: | | | |
5% 1/1/35 (e) | | 860,000 | 904,344 |
5% 1/1/37 (e) | | 280,000 | 293,343 |
5% 1/1/47 (e) | | 360,000 | 371,185 |
5% 5/1/49 (e) | | 9,525,000 | 9,834,654 |
| Series 2019 E: | | | |
5% 5/1/38 (e) | | 915,000 | 960,306 |
5% 5/1/39 (e) | | 1,045,000 | 1,093,289 |
5% 5/1/40 (e) | | 485,000 | 506,129 |
5% 5/1/45 (e) | | 2,000,000 | 2,073,513 |
5% 5/1/50 (e) | | 11,230,000 | 11,586,868 |
| Series 2021 A: | | | |
5% 5/1/31 (e) | | 1,775,000 | 1,938,010 |
5% 5/1/34 (e) | | 1,650,000 | 1,784,311 |
5% 5/1/35 (e) | | 2,410,000 | 2,599,300 |
| Series 2022 A: | | | |
5% 5/1/26 (e) | | 2,215,000 | 2,266,777 |
5% 5/1/27 (e) | | 2,245,000 | 2,340,099 |
5% 5/1/28 (e) | | 2,990,000 | 3,161,074 |
5% 5/1/29 (e) | | 2,005,000 | 2,145,310 |
| Series 2022 B, 5% 5/1/52 | | 7,420,000 | 8,081,460 |
| Series 2023 C: | | | |
5% 5/1/33 (e) | | 5,000,000 | 5,542,074 |
5.5% 5/1/42 (e) | | 2,110,000 | 2,369,800 |
5.5% 5/1/43 (e) | | 1,570,000 | 1,756,964 |
5.75% 5/1/48 (e) | | 5,050,000 | 5,669,582 |
| Series 2024 A: | | | |
5% 5/1/31 (e) | | 1,125,000 | 1,228,316 |
5% 5/1/39 (e) | | 1,225,000 | 1,335,249 |
5.25% 5/1/42 (e) | | 5,500,000 | 6,090,412 |
5.25% 5/1/43 (e) | | 2,295,000 | 2,531,295 |
5.25% 5/1/44 (e) | | 1,615,000 | 1,775,813 |
5.25% 5/1/49 (e) | | 1,920,000 | 2,087,066 |
| San Francisco City & County Redev. Agcy. Successor (Mission Bay South Redev. Proj.) Series 2014 A, 5% 8/1/43 | | 70,000 | 70,049 |
| San Francisco Cmnty. College District Gen. Oblig. Series 2024 B: | | | |
| 5% 6/15/25 | | 3,150,000 | 3,186,190 |
| 5% 6/15/26 | | 1,220,000 | 1,263,852 |
| San Jose Int. Arpt. Rev. Series 2017 A, 5% 3/1/41 (e) | | 1,400,000 | 1,425,940 |
| San Leandro Unified School District Series 2020 B, 5.25% 8/1/48 | | 1,600,000 | 1,770,020 |
| San Marcos Redev. Agcy. Successor Series 2015 A: | | | |
| 5% 10/1/30 | | 460,000 | 467,539 |
| 5% 10/1/33 | | 330,000 | 335,161 |
| San Marcos Unified School District Series 2010 B, 0% 8/1/47 (i) | | 2,795,000 | 1,103,560 |
| San Mateo County Cmnty. College District Series A, 0% 9/1/26 (Nat'l. Pub. Fin. Guarantee Corp. Insured) | | 660,000 | 628,374 |
| San Mateo County Joint Powers Fing. Auth. (Cap. Projs.) Series 2018 A, 5% 7/15/43 | | 1,270,000 | 1,341,649 |
| San Mateo Unified School District Series 2011 A, 0% 9/1/41 (i) | | 1,750,000 | 1,891,197 |
| Sanger Unified School District Series 2022, 5% 6/1/52 (Assured Guaranty Muni. Corp. Insured) | | 65,000 | 65,027 |
| Santa Ana Unified School District Series 2009 B, 0% 8/1/47 (Assured Guaranty, Inc. Insured) | | 600,000 | 222,189 |
| Santa Clara Unified School District Series 2019, 3.25% 7/1/44 | | 1,915,000 | 1,793,807 |
| Santa Cruz City High School District Series 2021 C, 2% 8/1/36 | | 720,000 | 595,599 |
| Santa Monica-Malibu Unified School District Series 2018 B, 3% 8/1/44 | | 750,000 | 654,149 |
| Santa Rosa Wastewtr. Rev. Series 2002 B, 0% 9/1/25 (AMBAC Insured) | | 95,000 | 92,870 |
| Southern California Pub. Pwr. Auth. Bonds Series 2024 A, 5%, tender 9/1/30 (b) | | 1,500,000 | 1,607,551 |
| Southern California Wtr. Replenishment Fing. Auth. Series 2018 A, 5% 8/1/48 | | 3,615,000 | 3,802,658 |
| Southwestern Cmnty. College District Gen. Oblig. Series 2021 D, 3% 8/1/41 | | 1,740,000 | 1,575,372 |
| Stockton Unified School District Gen. Oblig. Series 2011, 0% 8/1/42 (Assured Guaranty Muni. Corp. Insured) | | 300,000 | 152,302 |
| Successor Agcy. to the Inland Valley Dev. Agcy. Tax Allocation Series 2014 A, 5.25% 9/1/37 | | 1,215,000 | 1,223,809 |
| Sunnyvale School District Series 2019 C, 3% 9/1/44 | | 1,250,000 | 1,113,220 |
| Sutter Calif Union High School District Series 2010 B, 0% 6/1/50 (Pre-Refunded to 8/1/25 @ 100) | | 250,000 | 40,312 |
| Temecula Valley Unified School District Gen. Oblig. Series 2021 D, 3% 8/1/47 | | 1,250,000 | 1,052,476 |
| Tobacco Securitization Auth. Southern California Tobacco Settlement: | | | |
| Series 2006 2C, 0% 6/1/46 | | 2,065,000 | 438,454 |
| Series 2019 A1: | | | |
5% 6/1/27 | | 55,000 | 57,233 |
5% 6/1/28 | | 85,000 | 89,771 |
5% 6/1/29 | | 55,000 | 58,944 |
5% 6/1/48 | | 770,000 | 796,077 |
| Series 2019 B2, 0% 6/1/54 | | 500,000 | 100,111 |
| Twin Rivers Unified School District Series 2008, 0% 8/1/32 (Assured Guaranty Muni. Corp. Insured) | | 750,000 | 581,116 |
| Univ. of California Regents Med. Ctr. Pool Rev. Series 2022 P: | | | |
| 3.5% 5/15/54 | | 1,950,000 | 1,840,243 |
| 5% 5/15/47 | | 4,500,000 | 4,958,174 |
| Univ. of California Revs.: | | | |
| Series 2016 AR, 5% 5/15/41 | | 1,500,000 | 1,536,155 |
| Series 2016 K, 5% 5/15/35 | | 1,445,000 | 1,487,021 |
| Series 2017 AV, 5% 5/15/36 | | 90,000 | 94,224 |
| Series 2018 O, 5.5% 5/15/58 | | 4,425,000 | 4,702,892 |
| Series 2023 BN, 5.5% 5/15/40 | | 2,350,000 | 2,798,152 |
| Val Verde Unified School District Series 2021 F, 3% 8/1/47 (Assured Guaranty Muni. Corp. Insured) | | 1,570,000 | 1,283,552 |
| Vista Unified School District Series 2022 B, 5.25% 8/1/48 (Build America Mutual Assurance Insured) | | 1,000,000 | 1,114,753 |
| Washington Township Health Care District Gen. Oblig.: | | | |
| Series 2013 A, 5.5% 8/1/38 | | 545,000 | 546,374 |
| Series 2023 B, 5.25% 8/1/48 | | 1,000,000 | 1,117,300 |
| Washington Township Health Care District Rev.: | | | |
| Series 2017 A, 5% 7/1/35 | | 50,000 | 51,042 |
| Series 2017 B: | | | |
5% 7/1/29 | | 30,000 | 30,877 |
5% 7/1/30 | | 60,000 | 61,716 |
| West Contra Costa Healthcare District Series 2021, 3% 7/1/42 | | 300,000 | 269,220 |
| West Sacramento Fing. Auth. Spl. Tax Rev. Series 2006 A, 5% 9/1/34 | | 280,000 | 314,649 |
| Yosemite Cmnty. College District Series 2010 D, 0% 8/1/42 (i) | | 3,420,000 | 2,978,860 |
TOTAL CALIFORNIA | | | 747,198,270 |
| Colorado - 2.1% | | | |
| Adams County Co. Scd # Oo1 Series 2017, 5.25% 12/1/40 | | 1,000,000 | 1,042,412 |
| Aerotropolis Reg'l. Trans. Auth. Spl. Rev. Series 2021, 4.375% 12/1/52 | | 1,945,000 | 1,780,117 |
| Arkansas River Pwr. Auth. Rev. Series 2018 A: | | | |
| 5% 10/1/38 | | 635,000 | 651,782 |
| 5% 10/1/43 | | 1,205,000 | 1,229,223 |
| Berthoud-Heritage Metropolitan District No. 1 Ltd. Tax Supported Rev. Series 2019, 5.625% 12/1/48 | | 1,215,000 | 1,221,707 |
| Canyons Metropolitan District No. 5: | | | |
| Series 2017 A, 6.125% 12/1/47 | | 500,000 | 505,000 |
| Series 2024 B, 6.5% 12/1/54 | | 600,000 | 627,481 |
| Cherry Creek School District No. 5 Gen. Oblig. Series 2017 B, 2.3% 12/15/28 | | 1,000,000 | 957,880 |
| Colorado Ctfs. of Prtn.: | | | |
| Series 2021 A, 4% 12/15/38 | | 680,000 | 694,512 |
| Series 2022: | | | |
6% 12/15/36 | | 2,115,000 | 2,562,217 |
6% 12/15/40 | | 4,940,000 | 5,903,663 |
6% 12/15/41 | | 5,550,000 | 6,593,575 |
| Colorado Edl. & Cultural Facilities Auth.: | | | |
| (American Academy Proj.) Series 2020: | | | |
5% 12/1/40 | | 755,000 | 782,985 |
5% 12/1/50 | | 3,870,000 | 3,948,323 |
5% 12/1/55 | | 305,000 | 309,941 |
| (Highline Academy Charter School Proj.) Series 2022, 5.25% 12/1/52 | | 1,825,000 | 1,901,772 |
| (Leman Academy of Ecellence - Douglas County, Colorado Campus Proj.) Series 2023 A: | | | |
4.25% 7/1/43 | | 1,745,000 | 1,705,877 |
4.5% 7/1/58 | | 1,470,000 | 1,406,915 |
| (Pinnacle Charter School, Inc. Proj.) Series 2021: | | | |
4% 12/1/36 | | 290,000 | 288,556 |
4% 12/1/41 | | 355,000 | 338,423 |
| (Prospect Ridge Academy Proj.) Series 2020 A: | | | |
5% 3/15/40 | | 370,000 | 386,511 |
5% 3/15/50 | | 765,000 | 784,217 |
5% 3/15/55 | | 1,130,000 | 1,154,270 |
| (Windsor Charter Academy Proj.) Series 2020: | | | |
4% 9/1/50 | | 100,000 | 92,132 |
4% 9/1/55 | | 185,000 | 166,904 |
| Series 2022 A: | | | |
4% 6/1/52 | | 300,000 | 277,141 |
4% 6/1/56 | | 300,000 | 273,604 |
| Series 2024 A: | | | |
5.75% 4/1/59 (g) | | 550,000 | 572,303 |
5.8% 4/1/54 (g) | | 600,000 | 628,412 |
| Colorado Edl. & Cultural Facilities Auth. Rev.: | | | |
| (DCS Montessori Charter School Proj.) Series 2012, 5% 7/15/37 | | 115,000 | 115,139 |
| (Liberty Common Proj.) Series 2014 A: | | | |
5% 1/15/39 | | 155,000 | 155,035 |
5% 1/15/44 | | 125,000 | 125,006 |
| (Peak to Peak Charter School Proj.) Series 2014: | | | |
5% 8/15/30 | | 100,000 | 100,100 |
5% 8/15/34 | | 105,000 | 105,251 |
| (Stargate Charter School Proj.) Series 2018 A, 4% 12/1/48 | | 730,000 | 677,412 |
| (The Classical Academy Proj.) Series 2015 A, 5% 12/1/38 | | 215,000 | 215,102 |
| (Twin Peaks Charter Academy Proj.) Series 2014, 5% 11/15/31 | | 395,000 | 395,381 |
| (Univ. of Denver Proj.) Series 2017 A: | | | |
5% 3/1/43 | | 890,000 | 916,602 |
5% 3/1/47 | | 1,180,000 | 1,208,743 |
| Series 2013, 5% 6/1/29 | | 190,000 | 190,208 |
| Series 2018: | | | |
5% 4/1/38 | | 65,000 | 67,056 |
5% 4/1/48 | | 75,000 | 76,204 |
5% 4/1/53 | | 80,000 | 81,034 |
| Colorado Health Facilities Auth. Rev.: | | | |
| (Mental Health Ctr. of Denver Proj.) Series 2014, 5.75% 2/1/44 | | 695,000 | 695,552 |
| (Sunny Vista Living Ctr. Proj.) Series 2015 A: | | | |
5.75% 12/1/35 (g) | | 215,000 | 155,311 |
6.125% 12/1/45 (g) | | 950,000 | 640,436 |
6.25% 12/1/50 (g) | | 790,000 | 532,069 |
| Series 2013, 8% 8/1/43 | | 1,340,000 | 896,706 |
| Colorado Health Facilities Auth. Rev. Bonds: | | | |
| (Adventist Health Sys. / Sunbelt Obligated Group) Series 2016 A, 5% 11/15/41 | | 3,610,000 | 3,673,970 |
| (Bethesda Proj.) Series 2018 A1, 5% 9/15/48 | | 1,195,000 | 1,171,449 |
| (Boulder Cmnty. Health Proj.) Series 2020: | | | |
4% 10/1/35 | | 160,000 | 161,409 |
4% 10/1/37 | | 95,000 | 95,677 |
4% 10/1/38 | | 70,000 | 70,286 |
4% 10/1/39 | | 70,000 | 70,137 |
4% 10/1/40 | | 60,000 | 59,884 |
| (Frasier Proj.) Series 2023 A: | | | |
4% 5/15/31 | | 50,000 | 49,806 |
4% 5/15/32 | | 60,000 | 59,736 |
4% 5/15/33 | | 60,000 | 59,706 |
4% 5/15/34 | | 65,000 | 64,651 |
4% 5/15/35 | | 65,000 | 64,464 |
4% 5/15/36 | | 70,000 | 69,064 |
4% 5/15/41 | | 115,000 | 108,441 |
4% 5/15/48 | | 180,000 | 159,303 |
| (Parkview Episcopal Med. Ctr., Co. Proj.) Series 2017: | | | |
5% 9/1/25 (Escrowed to Maturity) | | 15,000 | 15,217 |
5% 9/1/28 (Pre-Refunded to 9/1/27 @ 100) | | 125,000 | 132,107 |
| (Parkview Med. Ctr., Inc. Proj.) Series 2016: | | | |
4% 9/1/35 (Pre-Refunded to 9/1/26 @ 100) | | 200,000 | 203,476 |
4% 9/1/36 (Pre-Refunded to 9/1/26 @ 100) | | 160,000 | 162,781 |
| Bonds: | | | |
Series 2018 B, 5%, tender 11/20/25 (b) | | 65,000 | 66,158 |
Series 2019 B: | | | |
5%, tender 8/1/26 (b) | | 50,000 | 50,968 |
5%, tender 11/19/26 (b) | | 920,000 | 953,602 |
| Series 2018 A: | | | |
4% 11/15/48 | | 6,705,000 | 6,525,539 |
5% 12/1/48 | | 350,000 | 356,125 |
| Series 2019 A: | | | |
4% 1/1/36 | | 250,000 | 256,161 |
4% 1/1/37 | | 1,975,000 | 2,017,406 |
4% 11/15/38 | | 2,550,000 | 2,591,394 |
4% 11/1/39 | | 225,000 | 225,114 |
4% 11/15/43 | | 1,000,000 | 990,800 |
5% 11/1/25 | | 1,305,000 | 1,327,960 |
5% 11/1/26 | | 95,000 | 98,794 |
5% 11/15/39 | | 1,770,000 | 1,905,508 |
5% 11/1/44 | | 2,950,000 | 3,116,579 |
| Series 2019 A1, 4% 8/1/44 | | 6,350,000 | 6,123,351 |
| Series 2019 A2: | | | |
3.25% 8/1/49 | | 1,810,000 | 1,450,891 |
3.25% 8/1/49 | | 400,000 | 336,841 |
4% 8/1/49 | | 8,475,000 | 7,914,502 |
5% 8/1/37 | | 1,000,000 | 1,060,718 |
5% 8/1/38 | | 2,790,000 | 2,955,144 |
5% 8/1/44 | | 11,525,000 | 12,003,761 |
| Series 2020 A, 4% 9/1/50 (Pre-Refunded to 9/1/30 @ 100) | | 660,000 | 709,929 |
| Series 2021 A: | | | |
3% 11/15/51 | | 2,750,000 | 2,197,072 |
4% 11/15/50 | | 1,690,000 | 1,625,426 |
| Series 2022 A: | | | |
5.25% 11/1/52 | | 2,680,000 | 2,909,366 |
5.5% 11/1/47 | | 2,225,000 | 2,487,355 |
| Series 2024 A: | | | |
5% 5/15/33 | | 1,000,000 | 1,134,949 |
5% 5/15/35 | | 1,250,000 | 1,409,085 |
5.25% 12/1/54 | | 1,000,000 | 1,097,006 |
| Series 2024 B, 5% 11/15/34 | | 1,750,000 | 2,041,994 |
| Colorado High Performance Trans. Enterprise C-470 Express Lanes Sr. Rev. Series 2017: | | | |
| 5% 12/31/47 | | 3,670,000 | 3,670,834 |
| 5% 12/31/51 | | 2,625,000 | 2,625,278 |
| 5% 12/31/56 | | 3,260,000 | 3,260,246 |
| Colorado Hsg. & Fin. Auth.: | | | |
| Series 2019 F, 4.25% 11/1/49 | | 265,000 | 267,937 |
| Series 2019 H, 4.25% 11/1/49 | | 600,000 | 606,924 |
| Series 2021 B, 3% 5/1/51 | | 825,000 | 810,507 |
| Series 2022 B, 3.25% 5/1/52 | | 1,400,000 | 1,383,153 |
| Series 2023 D, 5.75% 5/1/53 | | 4,450,000 | 4,736,597 |
| Colorado Int'l. Ctr. Metropolitan District No. 14 Ltd. Tax Gen. Oblig. Series 2018, 5.875% 12/1/46 | | 990,000 | 997,212 |
| Colorado Reg'l. Trans. District (Denver Transit Partners Eagle P3 Proj.) Series 2020 A, 3% 7/15/37 | | 240,000 | 216,824 |
| Colorado Reg'l. Trans. District Sales Tax Rev.: | | | |
| (FasTracks Proj.) Series 2016 A, 5% 11/1/36 | | 585,000 | 603,091 |
| (Fastracks Proj.) Series 2016 A, 5% 11/1/46 | | 1,475,000 | 1,504,939 |
| Series 2013 A, 5% 11/1/31 | | 1,560,000 | 1,777,772 |
| Colorado Science & Technologyp: | | | |
| Series 2024 A, 5% 12/1/54 (Assured Guaranty Muni. Corp. Insured) | | 920,000 | 985,112 |
| Series 2024 B: | | | |
4.5% 12/15/44 (Assured Guaranty Muni. Corp. Insured) | | 700,000 | 719,636 |
4.75% 12/15/54 (Assured Guaranty Muni. Corp. Insured) | | 1,315,000 | 1,362,481 |
| Colorado Springs Utils. Rev.: | | | |
| Series 2021 B, 4% 11/15/46 | | 2,500,000 | 2,506,723 |
| Series 2022 B, 5.25% 11/15/52 | | 1,000,000 | 1,103,228 |
| Colorado State Bldg. Excellent Schools Today Ctfs. of Prtn.: | | | |
| Series 2017 J, 5.25% 3/15/42 | | 1,500,000 | 1,557,074 |
| Series 2018 N, 5% 3/15/37 | | 130,000 | 136,790 |
| Series 2021 S, 4% 3/15/46 | | 3,295,000 | 3,299,368 |
| Colorado Wtr. Resources and Pwr. Dev. Auth. Wtr. Resources Rev. (City of Sterling, Colorado Wasterwater Util. Enterprise Proj.) Series 2023 A, 5% 9/1/55 (AGM Group Holdings, Inc. Insured) (Assured Guaranty Municipal Corp. Insured) | | 205,000 | 219,370 |
| Copper Ridge Metropolitan District Colo Tax Series 2019, 5% 12/1/39 | | 500,000 | 490,740 |
| Denver City & County Arpt. Rev.: | | | |
| Bonds Series 2020 B2, 5%, tender 11/15/25 (b)(e) | | 840,000 | 850,841 |
| Series 2017 A: | | | |
5% 11/15/26 (e) | | 420,000 | 432,564 |
5% 11/15/27 (e) | | 355,000 | 371,920 |
| Series 2018 A: | | | |
5% 12/1/29 (e) | | 1,250,000 | 1,321,539 |
5% 12/1/30 (e) | | 945,000 | 1,022,474 |
5% 12/1/34 (e) | | 1,370,000 | 1,504,032 |
5% 12/1/36 (e) | | 500,000 | 551,555 |
5% 12/1/36 (e) | | 2,605,000 | 2,715,523 |
5% 12/1/37 (e) | | 2,715,000 | 2,824,508 |
5% 12/1/43 (e) | | 1,625,000 | 1,675,971 |
5% 12/1/48 (e) | | 955,000 | 980,491 |
5.25% 12/1/48 (e) | | 4,130,000 | 4,296,283 |
| Series 2022 A: | | | |
4.125% 11/15/47 (e) | | 740,000 | 736,910 |
4.125% 11/15/53 (e) | | 695,000 | 679,668 |
5% 11/15/47 (e) | | 1,130,000 | 1,195,786 |
5.5% 11/15/35 (e) | | 1,075,000 | 1,228,279 |
5.5% 11/15/40 (e) | | 2,650,000 | 2,982,828 |
5.5% 11/15/42 (e) | | 1,250,000 | 1,396,688 |
| Series 2022 D, 5.75% 11/15/38 (e) | | 500,000 | 577,215 |
| Series 2023: | | | |
5% 11/15/32 (e) | | 1,000,000 | 1,091,313 |
5.25% 11/15/35 (e) | | 2,500,000 | 2,824,397 |
5.25% 11/15/36 (e) | | 750,000 | 844,422 |
5.5% 11/15/42 (e) | | 765,000 | 861,810 |
| Denver City & County Board Wtr. Rev.: | | | |
| Series 2016 A, 3% 9/15/42 | | 1,000,000 | 882,732 |
| Series 2020 A: | | | |
3% 9/15/47 | | 1,200,000 | 983,838 |
5% 9/15/45 | | 4,065,000 | 4,379,331 |
5% 9/15/46 | | 6,240,000 | 6,717,129 |
| Series 2020 B, 5% 9/15/28 | | 1,850,000 | 2,011,076 |
| Denver City & County Ctfs. of Prtn. Series 2018 A, 5.375% 6/1/43 | | 2,000,000 | 2,049,067 |
| Denver City & County School District # 1 Series 2021, 4% 12/1/35 | | 800,000 | 834,766 |
| Denver City & County Spl. Facilities Arpt. Rev. (United Airlines, Inc. Proj.) Series 2017, 5% 10/1/32 (e) | | 4,825,000 | 4,826,306 |
| Denver Convention Ctr. Hotel Auth. Series 2016, 5% 12/1/40 | | 345,000 | 349,144 |
| Denver Dedicated Tax Rev. Series 2018 A1, 5% 8/1/48 | | 5,500,000 | 5,627,037 |
| Denver Health & Hosp. Auth. Healthcare Rev.: | | | |
| Series 2014 A, 5.25% 12/1/45 | | 255,000 | 255,134 |
| Series 2019 A, 4% 12/1/38 | | 165,000 | 160,346 |
| E-470 Pub. Hwy. Auth. Rev. Series 2020 A, 5% 9/1/36 | | 1,695,000 | 1,858,087 |
| Fruita Healthcare Rev. (The Colorado Canyons Hosp. and Med. Ctr. Proj.) Series 2017 A, 5.5% 1/1/48 (g) | | 350,000 | 351,837 |
| Hogback Metropolitan District Series 2021 A, 5% 12/1/51 | | 500,000 | 457,207 |
| Johnstown Plaza Metropolitan District Series 2022, 4.25% 12/1/46 | | 649,000 | 602,929 |
| Jones District Cmnty. Auth. Board Colo Series 2020 A, 0% 12/1/50 (i) | | 500,000 | 473,330 |
| Lakes At Centerra Metropolitan District #2 Series 2024 A, 5% 12/1/49 (Assured Guaranty Muni. Corp. Insured) | | 1,500,000 | 1,607,754 |
| Painted Prairie Metropolitan District # 2 Series 2018, 5.25% 12/1/48 | | 500,000 | 500,116 |
| Palisade Colo Metropolitan District # 2 Series 2024 B, 0% 12/15/54 (g)(i) | | 700,000 | 641,609 |
| Park Creek Metropolitan District: | | | |
| Series 2015 A, 5% 12/1/45 | | 1,125,000 | 1,133,827 |
| Series 2016 A: | | | |
5% 12/1/30 | | 310,000 | 321,716 |
5% 12/1/31 | | 350,000 | 362,883 |
5% 12/1/32 | | 370,000 | 383,619 |
5% 12/1/33 | | 375,000 | 388,730 |
5% 12/1/34 | | 305,000 | 315,448 |
5% 12/1/35 | | 345,000 | 356,075 |
| Series 2019 A, 4% 12/1/37 (Assured Guaranty Muni. Corp. Insured) | | 250,000 | 253,957 |
| Peak Metropolitan District # 1 Series 2021 A, 5% 12/1/51 (g) | | 500,000 | 445,780 |
| Pub. Auth. For Colorado Energy Rev. Series 2008: | | | |
| 6.25% 11/15/28 | | 915,000 | 967,491 |
| 6.5% 11/15/38 | | 5,125,000 | 6,286,764 |
| Pueblo Urban Renewal Auth. Tax Increment Rev. (Evraz Proj.) Series 2021 A, 4.75% 12/1/45 (g) | | 820,000 | 564,879 |
| Rampart Range Metropolitan District No. 5 Ltd. Tax Supported & Spl. Rev. Series 2021: | | | |
| 4% 12/1/36 | | 500,000 | 486,258 |
| 4% 12/1/51 | | 1,250,000 | 1,085,957 |
| Riverwalk Metropolitan District No. 2 Rev. Series 2022 A, 5% 12/1/52 | | 890,000 | 809,478 |
| St Vrain Lakes Metropolitan Di Series 2024 A, 0% 9/20/54 (g)(i) | | 1,000,000 | 730,850 |
| Sterling Ranch Cmnty. Auth. Board Series 2024 A, 5.75% 12/1/54 (g) | | 600,000 | 614,709 |
| Sterling Ranch Cmnty. Auth. Brdc Series 2024, 5.625% 12/1/43 | | 750,000 | 783,333 |
| Univ. of Colorado Enterprise Sys. Rev. Bonds: | | | |
| Series 2021 C3A, 2%, tender 10/15/25 (b) | | 795,000 | 783,595 |
| Series 2021 C3B, 2%, tender 10/15/26 (b) | | 675,000 | 656,273 |
| Vauxmont Metropolitan District: | | | |
| Series 2019: | | | |
5% 12/15/26 (Assured Guaranty Muni. Corp. Insured) | | 9,000 | 9,278 |
5% 12/15/32 (Assured Guaranty Muni. Corp. Insured) | | 127,000 | 130,909 |
| Series 2020: | | | |
5% 12/1/33 (Assured Guaranty Muni. Corp. Insured) | | 180,000 | 195,025 |
5% 12/1/50 (Assured Guaranty Muni. Corp. Insured) | | 457,000 | 477,244 |
| Villages at Castle Rock Metropolitan District Series 2021 A, 4.125% 12/1/51 (g) | | 700,000 | 664,480 |
| Whispering Pines Metropolitan District # 1 Series 2023, 5% 12/1/52 (Assured Guaranty Muni. Corp. Insured) | | 255,000 | 268,696 |
TOTAL COLORADO | | | 243,382,146 |
| Connecticut - 0.7% | | | |
| Bridgeport Gen. Oblig. Series 2019 A, 5% 2/1/25 (Build America Mutual Assurance Insured) | | 45,000 | 45,143 |
| Connecticut Arpt. Auth. Customer Facility Charge Rev. (Ground Trans. Ctr. Proj.) Series 2019 A: | | | |
| 4% 7/1/49 (e) | | 410,000 | 388,764 |
| 5% 7/1/49 (e) | | 480,000 | 489,523 |
| Connecticut Gen. Oblig.: | | | |
| Series 2016 B, 5% 5/15/26 | | 905,000 | 933,583 |
| Series 2017 A, 5% 4/15/33 | | 15,000 | 15,611 |
| Series 2018 F: | | | |
5% 9/15/25 | | 395,000 | 401,214 |
5% 9/15/27 | | 55,000 | 58,474 |
5% 9/15/28 | | 1,200,000 | 1,299,874 |
| Series 2019 A: | | | |
5% 4/15/26 | | 40,000 | 41,183 |
5% 4/15/39 | | 400,000 | 427,614 |
| Series 2020 A, 4% 1/15/34 | | 535,000 | 558,738 |
| Series 2021 A: | | | |
3% 1/15/37 | | 1,300,000 | 1,219,960 |
3% 1/15/39 | | 645,000 | 591,288 |
3% 1/15/40 | | 755,000 | 685,886 |
| Series 2022 B, 3% 1/15/42 | | 4,000,000 | 3,620,976 |
| Series 2022 C: | | | |
5% 6/15/32 | | 150,000 | 171,973 |
5% 6/15/36 | | 125,000 | 141,082 |
5% 6/15/38 | | 75,000 | 84,146 |
5% 6/15/40 | | 300,000 | 334,065 |
| Series 2022 D: | | | |
5% 9/15/28 | | 705,000 | 763,676 |
5% 9/15/32 | | 75,000 | 86,246 |
| Series 2024 D, 5% 5/1/32 | | 1,500,000 | 1,717,113 |
| Connecticut Health & Edl. Facilities Auth. Rev.: | | | |
| (Church Home of Hartford, Inc. Proj.) Series 2016 A: | | | |
5% 9/1/46 (g) | | 190,000 | 189,137 |
5% 9/1/53 (g) | | 230,000 | 222,691 |
| (Sacred Heart Univ., CT. Proj.) Series 2017 I-1: | | | |
5% 7/1/26 | | 60,000 | 61,789 |
5% 7/1/27 | | 40,000 | 41,955 |
5% 7/1/28 | | 80,000 | 83,700 |
5% 7/1/29 | | 50,000 | 52,272 |
5% 7/1/34 | | 60,000 | 62,324 |
5% 7/1/35 | | 65,000 | 67,290 |
5% 7/1/36 | | 20,000 | 20,688 |
5% 7/1/37 | | 85,000 | 87,779 |
5% 7/1/42 | | 425,000 | 432,006 |
| Bonds Series 2020 B: | | | |
5%, tender 1/1/25 (b) | | 155,000 | 155,124 |
5%, tender 1/1/27 (b) | | 380,000 | 391,608 |
| Series 2016 F: | | | |
5% 7/1/25 | | 635,000 | 636,920 |
5% 7/1/31 | | 555,000 | 560,697 |
5% 7/1/32 | | 580,000 | 585,512 |
5% 7/1/33 | | 365,000 | 368,191 |
5% 7/1/34 | | 255,000 | 257,074 |
5% 7/1/43 | | 2,340,000 | 2,341,168 |
| Series 2016 K, 4% 7/1/46 | | 1,325,000 | 1,251,169 |
| Series 2019 A: | | | |
4% 7/1/49 | | 1,365,000 | 1,265,703 |
5% 7/1/26 (f)(g) | | 845,000 | 549,250 |
5% 7/1/27 (f)(g) | | 490,000 | 318,500 |
5% 7/1/49 (f)(g) | | 1,125,000 | 731,250 |
| Series 2019 Q-1, 5% 11/1/26 | | 645,000 | 670,758 |
| Series 2019, 4% 7/1/44 | | 955,000 | 775,027 |
| Series 2020 A: | | | |
4% 7/1/39 | | 170,000 | 170,792 |
4% 7/1/40 | | 940,000 | 928,149 |
| Series 2020 C, 4% 7/1/45 | | 235,000 | 227,665 |
| Series 2020 K: | | | |
4% 7/1/45 | | 185,000 | 184,299 |
5% 7/1/37 | | 55,000 | 59,352 |
5% 7/1/38 | | 85,000 | 91,387 |
5% 7/1/39 | | 85,000 | 91,136 |
5% 7/1/40 | | 65,000 | 69,363 |
| Series 2021 G: | | | |
4% 3/1/46 | | 795,000 | 803,205 |
4% 3/1/51 | | 1,280,000 | 1,288,050 |
| Series 2021 S, 4% 6/1/51 | | 730,000 | 727,968 |
| Series 2022 M: | | | |
4% 7/1/37 | | 195,000 | 197,689 |
4% 7/1/39 | | 1,400,000 | 1,402,488 |
4% 7/1/39 | | 70,000 | 70,622 |
4% 7/1/40 | | 75,000 | 75,443 |
4% 7/1/52 | | 1,390,000 | 1,345,841 |
5% 7/1/32 | | 100,000 | 110,542 |
| Series 2024 A1, 5% 7/1/44 | | 1,700,000 | 1,727,912 |
| Series K1: | | | |
5% 7/1/27 | | 60,000 | 61,794 |
5% 7/1/29 | | 155,000 | 160,878 |
5% 7/1/30 | | 120,000 | 124,327 |
5% 7/1/31 | | 1,075,000 | 1,111,201 |
5% 7/1/32 | | 70,000 | 72,177 |
5% 7/1/33 | | 245,000 | 252,065 |
5% 7/1/34 | | 1,390,000 | 1,427,322 |
5% 7/1/35 | | 140,000 | 143,480 |
| Series K3: | | | |
5% 7/1/43 | | 1,475,000 | 1,487,530 |
5% 7/1/48 | | 250,000 | 250,609 |
| Series N: | | | |
4% 7/1/39 | | 1,100,000 | 943,910 |
4% 7/1/49 | | 1,255,000 | 992,026 |
5% 7/1/32 | | 30,000 | 30,229 |
5% 7/1/33 | | 30,000 | 30,143 |
5% 7/1/34 | | 15,000 | 15,029 |
| Series R: | | | |
4% 7/1/36 | | 65,000 | 65,811 |
5% 6/1/32 | | 35,000 | 38,435 |
5% 6/1/33 | | 25,000 | 27,389 |
5% 6/1/34 | | 35,000 | 38,459 |
5% 6/1/35 | | 55,000 | 60,234 |
| Connecticut Higher Ed. Supplemental Ln. Auth. Rev. Series 2019 B, 3.25% 11/15/35 (e) | | 160,000 | 144,309 |
| Connecticut Hsg. Fin. Auth.: | | | |
| Series 2019 B1, 4% 5/15/49 | | 45,000 | 45,487 |
| Series 2021 B1, 3% 11/15/49 | | 745,000 | 730,759 |
| Series 2023 B, 5.75% 11/15/53 | | 1,520,000 | 1,630,613 |
| Series 2024 D1, 4.8% 11/15/54 | | 1,150,000 | 1,184,621 |
| Series C, 5% 11/15/25 (e) | | 630,000 | 638,407 |
| Connecticut Spl. Tax Oblig. Trans. Infrastructure Rev.: | | | |
| Series 2018 A: | | | |
5% 1/1/33 | | 1,860,000 | 1,970,281 |
5% 1/1/38 | | 1,865,000 | 1,959,581 |
| Series 2020 A: | | | |
5% 5/1/32 | | 665,000 | 735,461 |
5% 5/1/35 | | 1,025,000 | 1,122,565 |
| Series 2021 A, 4% 5/1/40 | | 3,250,000 | 3,320,630 |
| Series 2022 A, 5.25% 7/1/40 | | 4,000,000 | 4,559,612 |
| Series A, 5% 9/1/33 | | 320,000 | 320,045 |
| Connecticut State Revolving Fund Gen. Rev. Series 2017 A, 5% 5/1/33 | | 875,000 | 915,813 |
| Great Pond Impt. District Spl. Oblig. Series 2022: | | | |
| 5.5% 10/1/42 (g) | | 555,000 | 577,762 |
| 5.75% 10/1/52 (g) | | 1,495,000 | 1,558,731 |
| Hamden Gen. Oblig. (Whitney Ctr. Proj.) Series 2019: | | | |
| 5% 1/1/40 | | 1,265,000 | 1,269,854 |
| 5% 1/1/50 | | 1,330,000 | 1,265,373 |
| Hartford Gen. Oblig. Series 2015 C, 5% 7/15/32 (Assured Guaranty Muni. Corp. Insured) | | 960,000 | 972,032 |
| Hbr. Point Infrastructure Impt. District Series 2017: | | | |
| 5% 4/1/30 (g) | | 590,000 | 602,938 |
| 5% 4/1/39 (g) | | 1,820,000 | 1,843,101 |
| Mohegan Tribal Fin. Auth. Conn Series 2015, 7% 2/1/45 (g) | | 1,960,000 | 1,975,879 |
| New Britain Gen. Oblig. Series 2017 C, 5% 3/1/29 (Assured Guaranty Muni. Corp. Insured) | | 130,000 | 135,969 |
| New Canaan Conn Hsg. Auth. Multi Series 2024 A, 4% 12/1/34 | | 3,000,000 | 3,035,597 |
| New Haven Gen. Oblig. Series 2016 A: | | | |
| 5% 8/15/25 (Assured Guaranty Muni. Corp. Insured) | | 30,000 | 30,334 |
| 5% 8/15/32 (Assured Guaranty Muni. Corp. Insured) | | 210,000 | 216,444 |
| Norwalk Conn Hsg. Auth. Multi-family Series 2024, 4.4% 9/1/42 | | 555,000 | 563,229 |
| Steelpointe Hbr. Infrastructure Impt. District: | | | |
| (Steelpointe Hbr. Proj.) Series 2024, 6% 4/1/52 (g) | | 660,000 | 711,463 |
| (Steelpointe Hbr. Proj.): | | | |
Series 2021, 4% 4/1/51 (g) | | 1,365,000 | 1,170,256 |
Series 2024, 5.625% 4/1/44 (g) | | 120,000 | 127,248 |
| Stratford Gen. Oblig. Series 2019, 5% 1/1/28 | | 250,000 | 261,166 |
| Univ. of Connecticut Gen. Oblig. Series 2019 A, 5% 11/1/25 | | 660,000 | 672,272 |
| West Haven Gen. Oblig. Series 2020, 4% 3/15/40 | | 160,000 | 161,649 |
TOTAL CONNECTICUT | | | 79,590,146 |
| Delaware - 0.3% | | | |
| Bridgeville De Spl. Oblig. Series 2024, 5.25% 7/1/44 (g) | | 375,000 | 394,949 |
| Delaware Econ. Dev. Auth. Retirement Communitites Rev.: | | | |
| Series 2018 B, 5% 11/15/48 | | 2,495,000 | 2,543,819 |
| Series 2023 B, 5.25% 11/15/53 | | 3,330,000 | 3,460,135 |
| Delaware Econ. Dev. Auth. Rev. (Newark Charter School, Inc. Proj.) Series 2016 A, 5% 9/1/46 | | 100,000 | 101,071 |
| Delaware Gen. Oblig.: | | | |
| Series 2019, 5% 2/1/30 | | 706,000 | 771,914 |
| Series 2020 A, 5% 1/1/31 | | 706,000 | 785,822 |
| Delaware Health Facilities Auth. Rev.: | | | |
| (Beebe Med. Ctr. Proj.) Series 2018: | | | |
5% 6/1/37 | | 140,000 | 144,939 |
5% 6/1/43 | | 1,700,000 | 1,737,393 |
5% 6/1/48 | | 2,500,000 | 2,547,049 |
5% 6/1/50 | | 930,000 | 945,929 |
| Series 2018: | | | |
4.375% 6/1/48 | | 350,000 | 342,534 |
5% 6/1/48 | | 300,000 | 307,853 |
| Series 2020 A: | | | |
5% 10/1/36 | | 1,150,000 | 1,240,374 |
5% 10/1/45 | | 2,785,000 | 2,943,121 |
| Delaware Hsg. Auth. Rev. Series 2024 C, 4.6% 7/1/49 | | 1,750,000 | 1,781,335 |
| Delaware State Hsg. Auth. Series 2023, 4.65% 1/1/41 | | 5,100,842 | 5,381,132 |
| Delaware Trans. Auth.: | | | |
| (U.S. 301 Proj.) Series 2015, 5% 6/1/55 | | 3,313,000 | 3,328,689 |
| Series 2015, 5% 6/1/45 | | 740,000 | 744,375 |
| Delaware Trans. Auth. Grant Series 2020: | | | |
| 5% 9/1/34 | | 590,000 | 653,357 |
| 5% 9/1/35 | | 590,000 | 651,093 |
| Delaware Trans. Auth. Trans. Sys. Rev. Series 2024, 3% 7/1/43 (d) | | 3,000,000 | 2,678,042 |
| Kent County Student Hsg. & Dining Facility Rev. (CHF Dover, L.L.C. Delaware State Univ. Proj.) Series 2018 A: | | | |
| 5% 7/1/32 | | 35,000 | 35,947 |
| 5% 7/1/40 | | 160,000 | 162,721 |
| 5% 7/1/48 | | 415,000 | 417,558 |
| 5% 7/1/53 | | 910,000 | 912,510 |
| 5% 7/1/58 | | 1,470,000 | 1,471,974 |
| Sussex County Rev. (Cadbury at Lewes Proj.) Series 2016, 5% 1/1/36 | | 1,290,000 | 1,301,922 |
| The Delaware Econ. Dev. Auth. Charter School Rev.: | | | |
| (Aspira of Delaware Charter Operations, Inc. Proj.) Series 2022 A: | | | |
3% 6/1/32 | | 300,000 | 275,159 |
4% 6/1/52 | | 130,000 | 109,143 |
4% 6/1/57 | | 125,000 | 102,259 |
| (Newark Charter School, Inc. Proj.) Series 2020: | | | |
4% 9/1/30 | | 35,000 | 35,377 |
5% 9/1/40 | | 185,000 | 192,741 |
5% 9/1/50 | | 245,000 | 251,502 |
| (Newark Charter School, INC. Proj.) Series 2021, 4% 9/1/51 | | 400,000 | 363,962 |
TOTAL DELAWARE | | | 39,117,700 |
| District Of Columbia - 1.2% | | | |
| District Columbia Hsg. Fin. Agcy. Series 2024 FN, 4.8% 6/1/45 | | 390,085 | 405,974 |
| District of Columbia Gen. Oblig.: | | | |
| Series 2017 A, 5% 6/1/33 | | 130,000 | 136,180 |
| Series 2017 D, 5% 6/1/42 | | 30,000 | 31,040 |
| Series 2021 D: | | | |
4% 2/1/27 | | 920,000 | 944,220 |
5% 2/1/28 | | 920,000 | 987,681 |
5% 2/1/29 | | 1,220,000 | 1,334,834 |
| Series 2023 A, 5.25% 1/1/48 | | 3,000,000 | 3,324,998 |
| District of Columbia Hosp. Rev. Series 2015: | | | |
| 5% 7/15/29 | | 225,000 | 229,318 |
| 5% 7/15/30 | | 365,000 | 371,847 |
| 5% 7/15/40 | | 750,000 | 758,589 |
| District of Columbia Income Tax Rev.: | | | |
| Series 2022 A: | | | |
5% 7/1/36 | | 500,000 | 567,483 |
5.5% 7/1/47 | | 1,000,000 | 1,125,140 |
| Series 2023 A, 5.25% 5/1/48 | | 4,610,000 | 5,126,902 |
| District of Columbia Rev.: | | | |
| (Ingleside At Rock Creek Proj.) Series 2017 A, 4.125% 7/1/27 | | 155,000 | 155,126 |
| (Ingleside at Rock Creek Proj.) Series 2017 A: | | | |
5% 7/1/32 | | 535,000 | 544,314 |
5% 7/1/37 | | 555,000 | 561,044 |
5% 7/1/42 | | 945,000 | 947,816 |
5% 7/1/52 | | 2,115,000 | 2,040,102 |
| Series 2009 A: | | | |
5.125% 1/1/35 (Pre-Refunded to 1/1/35 @ 100) | | 220,000 | 203,426 |
5.25% 1/1/39 (Pre-Refunded to 1/1/39 @ 100) | | 140,000 | 126,232 |
| Series 2016 A: | | | |
5% 6/1/36 | | 420,000 | 424,648 |
5% 6/1/41 | | 275,000 | 276,721 |
5% 6/1/46 | | 405,000 | 406,837 |
| Series 2017 B: | | | |
5% 7/1/42 | | 2,230,000 | 2,283,875 |
5% 7/1/48 | | 1,735,000 | 1,765,440 |
| Series 2018: | | | |
5% 10/1/25 | | 30,000 | 30,376 |
5% 10/1/26 | | 55,000 | 56,551 |
5% 10/1/27 | | 60,000 | 62,712 |
5% 10/1/43 | | 200,000 | 205,792 |
5% 10/1/48 | | 5,055,000 | 5,160,262 |
| Series 2019: | | | |
4% 7/1/39 | | 1,020,000 | 1,011,211 |
4% 7/1/49 | | 95,000 | 89,162 |
| Series 2020, 5% 6/1/55 | | 300,000 | 295,979 |
| Series 2024 A, 6% 6/1/58 | | 550,000 | 580,491 |
| District of Columbia Student Dorm. Rev.: | | | |
| Series 2013 A, 5% 10/1/35 | | 960,000 | 960,058 |
| Series 2013: | | | |
5% 10/1/30 | | 640,000 | 640,071 |
5% 10/1/45 | | 490,000 | 486,769 |
| District of Columbia Tax Increment Rev.: | | | |
| (Union Market Infastructure Proj.) Series 2021 A, 0% 6/1/46 (g)(i) | | 500,000 | 387,467 |
| (Union Market Infrastructure Proj.) Series 2021 A, 0% 6/1/31 (g)(i) | | 100,000 | 89,509 |
| Series 2024 B: | | | |
0% 6/1/41 (g)(i) | | 400,000 | 244,657 |
0% 6/1/49 (g)(i) | | 875,000 | 523,152 |
| District of Columbia Tobacco Settlement Fing. Corp.: | | | |
| Series 2006 A, 0% 6/15/46 | | 22,030,000 | 5,637,426 |
| Series 2006 B, 0% 6/15/46 | | 3,230,000 | 724,882 |
| District of Columbia Univ. Rev. Series 2017, 5% 4/1/35 | | 640,000 | 658,895 |
| Howard Univ. 4.756% 10/1/51 | | 300,000 | 255,214 |
| Metropolitan Washington Arpts. Auth. Dulles Toll Road Rev.: | | | |
| (Dulles Metrorail And Cap. Impt. Proj.) Series 2019 B, 4% 10/1/53 (Assured Guaranty Muni. Corp. Insured) | | 550,000 | 535,517 |
| (Dulles Metrorail and Cap. Impt. Projs.): | | | |
Series 2019 A: | | | |
5% 10/1/31 | | 505,000 | 541,916 |
5% 10/1/32 | | 635,000 | 680,846 |
5% 10/1/33 | | 70,000 | 74,963 |
5% 10/1/34 | | 110,000 | 117,668 |
5% 10/1/36 | | 110,000 | 117,168 |
5% 10/1/38 | | 95,000 | 100,998 |
5% 10/1/44 | | 3,550,000 | 3,730,539 |
Series 2019 B, 3% 10/1/50 (Assured Guaranty Muni. Corp. Insured) | | 2,760,000 | 2,165,365 |
| (Dulles Metrorail And Cap. Impt. Projs.) Series 2019 B, 4% 10/1/49 | | 8,650,000 | 8,237,174 |
| (Dulles Metrorail and Cap. Impt. Projs.) Series 2019 B, 5% 10/1/47 | | 480,000 | 497,809 |
| (Dulles Metrorail and Cap. Impts. Projs.) Series 2022 A, 4% 10/1/52 (Assured Guaranty Muni. Corp. Insured) | | 5,635,000 | 5,496,810 |
| Series 2009 B: | | | |
0% 10/1/37 | | 1,800,000 | 1,116,088 |
0% 10/1/38 | | 1,405,000 | 808,002 |
0% 10/1/39 | | 280,000 | 152,714 |
0% 10/1/40 | | 705,000 | 363,735 |
| Series 2009 C, 6.5% 10/1/41 (Pre-Refunded to 10/1/26 @ 100) | | 1,270,000 | 1,349,837 |
| Series 2010 B, 6.5% 10/1/44 | | 4,605,000 | 5,069,755 |
| Series 2019 B, 4% 10/1/49 | | 395,000 | 389,311 |
| Metropolitan Washington DC Arpts. Auth. Sys. Rev.: | | | |
| Series 2015 B, 5% 10/1/40 (e) | | 5,000,000 | 5,031,425 |
| Series 2016 A, 5% 10/1/32 (e) | | 250,000 | 255,644 |
| Series 2017 A: | | | |
5% 10/1/28 (e) | | 810,000 | 843,045 |
5% 10/1/30 (e) | | 1,005,000 | 1,044,722 |
5% 10/1/31 (e) | | 175,000 | 181,556 |
5% 10/1/32 (e) | | 270,000 | 279,631 |
5% 10/1/33 (e) | | 135,000 | 139,688 |
5% 10/1/35 (e) | | 305,000 | 314,812 |
5% 10/1/42 (e) | | 1,000,000 | 1,023,026 |
| Series 2018 A, 5% 10/1/48 (e) | | 3,615,000 | 3,707,578 |
| Series 2019 A: | | | |
5% 10/1/25 (e) | | 430,000 | 435,312 |
5% 10/1/28 (e) | | 1,685,000 | 1,782,077 |
5% 10/1/35 (e) | | 250,000 | 263,465 |
| Series 2019 B, 5% 10/1/25 | | 105,000 | 106,834 |
| Series 2020 A: | | | |
4% 10/1/38 (e) | | 1,800,000 | 1,797,753 |
5% 10/1/27 (e) | | 540,000 | 564,604 |
5% 10/1/28 (e) | | 270,000 | 285,555 |
| Series 2023 A: | | | |
5% 10/1/31 (e) | | 1,000,000 | 1,092,015 |
5% 10/1/32 (e) | | 3,000,000 | 3,301,426 |
5.25% 10/1/48 (e) | | 4,000,000 | 4,308,956 |
| Series 2024 A: | | | |
5% 10/1/29 (e) | | 4,100,000 | 4,389,507 |
5% 10/1/30 (e) | | 3,400,000 | 3,679,971 |
5.5% 10/1/54 (e) | | 3,675,000 | 4,041,342 |
| Washington D.C. Metropolitan Transit Auth. Rev. Series 2017 B, 5% 7/1/33 | | 255,000 | 266,809 |
| Washington Metropolitan Area Transit Auth.: | | | |
| Series 2021 A, 3% 7/15/36 | | 750,000 | 725,025 |
| Series 2023 A: | | | |
5% 7/15/48 | | 1,750,000 | 1,895,379 |
5.25% 7/15/53 | | 5,325,000 | 5,859,420 |
5.5% 7/15/51 | | 5,600,000 | 6,284,514 |
| Series 2023, 4.125% 7/15/47 | | 2,785,000 | 2,816,651 |
| Series 2024 A, 5% 7/15/56 | | 4,520,000 | 4,907,625 |
TOTAL DISTRICT OF COLUMBIA | | | 136,352,005 |
| Florida - 3.7% | | | |
| Alachua County Health Facilities Auth. Continuing Care Retirement Cmnty. Rev. (Oak Hammock at The Univ. of Florida, Inc. Proj.) Series 2022: | | | |
| 4% 10/1/40 | | 140,000 | 130,861 |
| 4% 10/1/46 | | 190,000 | 167,128 |
| Alachua County Health Facilities Auth. Health Facilities Rev.: | | | |
| (East Ridge Retirement Villiage, Inc. Proj.) Series 2014: | | | |
6% 11/15/34 | | 800,000 | 520,000 |
6.375% 11/15/49 | | 1,330,000 | 864,500 |
| Series 2007, 3 month U.S. LIBOR + 0.870% 3.939% 12/1/37 (b)(c) | | 2,000,000 | 1,922,021 |
| Series 2019 A, 4% 12/1/49 | | 3,840,000 | 3,735,451 |
| Series 2019 B1: | | | |
5% 12/1/35 | | 210,000 | 225,026 |
5% 12/1/36 | | 360,000 | 384,615 |
5% 12/1/37 | | 475,000 | 505,784 |
| Antillia Cmnty. Dev. District Fla Sp Series 2024, 5.875% 5/1/54 | | 1,000,000 | 1,024,938 |
| Atlantic Beach Health Care Facilities Series A, 5% 11/15/43 | | 55,000 | 56,357 |
| Avenir Cmnty. Dev. District: | | | |
| Assessment Area Three - Master Infrastructure Proj. Series 2023, 5.375% 5/1/43 | | 565,000 | 579,652 |
| Series 2023, 5.625% 5/1/54 | | 640,000 | 660,417 |
| Babcock Ranch Cmnty. Independent Spl. (Series 2024 Proj.): | | | |
| Seires 2024, 5% 5/1/44 (g) | | 365,000 | 368,567 |
| Series 2024, 5.25% 5/1/55 (g) | | 500,000 | 504,421 |
| Bellalago Edl. Facilities Benefit District Series 2014: | | | |
| 4.375% 5/1/30 | | 220,000 | 220,120 |
| 4.5% 5/1/33 | | 100,000 | 100,038 |
| Boggy Creek Impt. District Spl. Assessment Rev. Series 2013, 5.125% 5/1/43 | | 1,195,000 | 1,195,140 |
| Brevard County Health Facilities Auth. Rev.: | | | |
| Series 2022 A, 5% 4/1/40 | | 1,905,000 | 2,078,740 |
| Series 2023 A, 5% 4/1/32 | | 130,000 | 145,271 |
| Brevard County Hsg. Fin. Auth. Series 2024, 4.45% 1/1/40 | | 2,675,000 | 2,714,399 |
| Brevard County School Board Ctfs. of Prtn. Series 2015 C, 5% 7/1/28 | | 210,000 | 212,273 |
| Broward County Arpt. Sys. Rev.: | | | |
| Series 2012 Q1, 5% 10/1/25 | | 635,000 | 635,802 |
| Series 2015 A: | | | |
5% 10/1/40 (e) | | 3,230,000 | 3,249,512 |
5% 10/1/45 (e) | | 5,300,000 | 5,321,440 |
| Series 2017: | | | |
5% 10/1/25 (e) | | 30,000 | 30,376 |
5% 10/1/26 (e) | | 120,000 | 123,470 |
5% 10/1/27 (e) | | 120,000 | 125,203 |
5% 10/1/29 (e) | | 325,000 | 337,645 |
5% 10/1/30 (e) | | 90,000 | 93,311 |
5% 10/1/32 (e) | | 425,000 | 439,581 |
5% 10/1/33 (e) | | 160,000 | 165,339 |
5% 10/1/34 (e) | | 155,000 | 159,912 |
5% 10/1/35 (e) | | 185,000 | 190,701 |
5% 10/1/36 (e) | | 245,000 | 252,230 |
5% 10/1/37 (e) | | 270,000 | 277,572 |
5% 10/1/42 (e) | | 2,650,000 | 2,703,916 |
5% 10/1/47 (e) | | 805,000 | 818,033 |
| Series 2019 A: | | | |
5% 10/1/28 (e) | | 360,000 | 380,078 |
5% 10/1/38 (e) | | 640,000 | 670,649 |
5% 10/1/39 (e) | | 960,000 | 1,005,572 |
5% 10/1/44 (e) | | 745,000 | 770,065 |
5% 10/1/49 (e) | | 2,195,000 | 2,261,754 |
| Series A: | | | |
5% 10/1/28 (e) | | 365,000 | 369,209 |
5% 10/1/30 (e) | | 425,000 | 429,391 |
5% 10/1/31 (e) | | 365,000 | 368,546 |
5% 10/1/32 (e) | | 340,000 | 343,176 |
| Broward County Port Facilities Rev.: | | | |
| Series 2019 B: | | | |
5% 9/1/32 (e) | | 2,500,000 | 2,700,473 |
5% 9/1/33 (e) | | 2,075,000 | 2,239,913 |
| Series 2022, 5.25% 9/1/47 (e) | | 2,000,000 | 2,131,627 |
| Broward County School Board Ctfs. of Prtn.: | | | |
| (Broward County School District Proj.) Series 2016 A, 5% 7/1/28 | | 170,000 | 174,857 |
| Series 2015 A: | | | |
5% 7/1/27 | | 120,000 | 121,326 |
5% 7/1/27 (Assured Guaranty Muni. Corp. Insured) | | 560,000 | 566,513 |
| Series 2015 B: | | | |
5% 7/1/31 | | 2,110,000 | 2,126,757 |
5% 7/1/32 | | 1,930,000 | 1,943,998 |
| Series 2016, 5% 7/1/32 | | 325,000 | 333,071 |
| Broward County School District Series 2022, 5% 7/1/46 | | 1,800,000 | 1,957,475 |
| Cap. Projs Fin. Auth. Fla Edl. (Navigator Academy of Leadership Obligated Group Proj.) Series 2024, 5% 6/15/54 (g) | | 625,000 | 625,730 |
| Cap. Projs. Fin. Auth. Student Hsg. Rev.: | | | |
| (Cap. Projs. Ln. Prog. - Florida Univs.) Series 2020 A: | | | |
5% 10/1/30 | | 760,000 | 809,649 |
5% 10/1/31 | | 100,000 | 106,181 |
5% 10/1/34 | | 190,000 | 199,592 |
| (Provident Group - Continuum Properties Proj.) Series 2023 A1, 5% 11/1/58 | | 350,000 | 350,727 |
| Series 2020 A1: | | | |
5% 10/1/32 | | 100,000 | 105,776 |
5% 10/1/33 | | 100,000 | 105,430 |
| Cap. Region Cmnty. Dev. District Series 2018 A1, 5.125% 5/1/39 | | 130,000 | 132,260 |
| Cap. Trust Agcy. Edl. Facilities Rev.: | | | |
| (Liza Jackson Preparatory School, Inc. Proj.) Series 2020 A: | | | |
4% 8/1/30 | | 15,000 | 15,016 |
5% 8/1/55 | | 100,000 | 100,547 |
| Series 2020 A, 5% 8/1/40 | | 30,000 | 30,722 |
| Cap. Trust Agcy. Rev.: | | | |
| (Aero Miami FX, LLC Proj.) Series 2010 A, 5.35% 7/1/29 | | 1,075,000 | 1,076,271 |
| (The Marie Selby Botanical Gardens, Inc. Proj.) Series 2021: | | | |
4% 6/15/41 (g) | | 380,000 | 331,889 |
4% 6/15/51 (g) | | 530,000 | 419,375 |
| Cap. Trust Agcy. Student Hsg. Rev. Series 2018 A, 5.25% 12/1/58 (g) | | 1,285,000 | 1,296,924 |
| Cap. Trust Auth. (Mason Classical Academy Proj.) Series 2024 A: | | | |
| 5% 6/1/54 (g) | | 200,000 | 202,112 |
| 5% 6/1/64 (g) | | 425,000 | 426,835 |
| Cape Coral Wtr. & Swr. Rev.: | | | |
| Series 2017: | | | |
4% 10/1/42 | | 2,835,000 | 2,847,879 |
5% 10/1/39 | | 1,205,000 | 1,260,455 |
| Series 2023, 5.25% 10/1/48 | | 1,000,000 | 1,121,312 |
| Celebration Pointe Cmnty. Dev. District No. 1 Spl. Assessment Rev.: | | | |
| Series 2014, 5.125% 5/1/45 | | 130,000 | 130,021 |
| Series 2017, 5% 5/1/32 | | 135,000 | 137,270 |
| Series 2021: | | | |
3% 5/1/31 | | 55,000 | 51,676 |
3.375% 5/1/41 | | 200,000 | 169,913 |
4% 5/1/53 | | 810,000 | 675,972 |
| Central Florida Expressway Auth. Sr. Lien Rev.: | | | |
| Orlando & Orange County Expressway Auth. Rev. Series 2017, 5% 7/1/39 | | 130,000 | 135,291 |
| Series 2016 B, 5% 7/1/34 (Pre-Refunded to 7/1/26 @ 100) | | 530,000 | 548,306 |
| Series 2017, 5% 7/1/42 | | 1,545,000 | 1,602,979 |
| Series 2021: | | | |
4% 7/1/34 (Assured Guaranty Muni. Corp. Insured) | | 235,000 | 247,393 |
4% 7/1/35 (Assured Guaranty Muni. Corp. Insured) | | 230,000 | 240,100 |
4% 7/1/37 (Assured Guaranty Muni. Corp. Insured) | | 255,000 | 264,178 |
4% 7/1/38 (Assured Guaranty Muni. Corp. Insured) | | 235,000 | 242,114 |
4% 7/1/39 (Assured Guaranty Muni. Corp. Insured) | | 195,000 | 200,252 |
5% 7/1/32 (Assured Guaranty Muni. Corp. Insured) | | 190,000 | 214,830 |
5% 7/1/33 (Assured Guaranty Muni. Corp. Insured) | | 170,000 | 191,092 |
| Charlotte County Fla Indl. Dev. Auth. (Town & Country Utils. Proj.) Series 2021 A, 4% 10/1/51 (e)(g) | | 500,000 | 432,477 |
| Cityplace Cmnty. Dev. District Series 2012, 5% 5/1/26 | | 315,000 | 318,868 |
| Collier County Health Facilities Auth. Series 2022, 4% 5/1/52 | | 1,400,000 | 1,256,186 |
| Collier County Indl. Dev. Auth.: | | | |
| (The Arlington of Naples Proj.) Series 2013 A, 8.125% 5/15/44 (g) | | 201,337 | 2,597 |
| Series 2013 A, 7.75% 5/15/35 (g) | | 130,496 | 1,683 |
| Collier County Indl. Dev. Auth. Healthcare Facilities Rev. (NCH Healthcare Sys. Projs.) Series 2024 A, 5% 10/1/54 (Assured Guaranty Muni. Corp. Insured) | | 1,045,000 | 1,122,447 |
| County of Osceola (Poinciana Parkway Proj.) Series 2014 B2, 6% 10/1/36 (Pre-Refunded to 10/1/31 @ 100) | | 300,000 | 355,550 |
| Del Webb Bexley Cmnty. Dev. District Series 2018: | | | |
| 5.3% 5/1/39 | | 145,000 | 149,490 |
| 5.4% 5/1/49 | | 180,000 | 183,581 |
| Double Branch Cmnty. Dev. District Spl. Assessment Series 2013 A1, 4% 5/1/25 | | 35,000 | 35,004 |
| Duval County School Board Ctfs. of Prtn.: | | | |
| Series 2015 B: | | | |
5% 7/1/28 | | 250,000 | 252,648 |
5% 7/1/29 | | 355,000 | 358,698 |
| Series 2016 A, 5% 7/1/33 | | 160,000 | 164,303 |
| Series 2022 A, 5% 7/1/34 (Assured Guaranty Muni. Corp. Insured) | | 1,150,000 | 1,264,520 |
| Epperson North Cmnty. Dev. District Series 2021 A: | | | |
| 3.4% 11/1/41 | | 425,000 | 352,170 |
| 4% 11/1/51 | | 370,000 | 314,100 |
| Escambia County Health Facilities Auth. Health Facilities Rev. Series 2020 A: | | | |
| 4% 8/15/45 | | 705,000 | 663,475 |
| 4% 8/15/50 | | 3,875,000 | 3,543,017 |
| Everest Gmr Cmnty. Dev. District Fla Series 2023, 6.2% 5/1/54 | | 1,000,000 | 1,040,415 |
| FAU Fin. Corp. Cap. Impt. (Student Hsg. Proj.) Series 2019 A: | | | |
| 5% 7/1/36 | | 965,000 | 1,026,776 |
| 5% 7/1/38 | | 965,000 | 1,021,591 |
| 5% 7/1/39 | | 600,000 | 633,328 |
| Florida Dept. of Mgmt. Svcs. Ctfs. of Prtn. Series 2018 A, 5% 11/1/26 | | 845,000 | 879,529 |
| Florida Dept. of Trans. Tpk. Rev.: | | | |
| Series 2019 B, 3% 7/1/49 | | 500,000 | 409,754 |
| Series 2021 C, 3% 7/1/51 | | 850,000 | 677,553 |
| Series 2024 C, 4% 7/1/54 | | 4,920,000 | 4,881,818 |
| Florida Dev. Fin. Corp.: | | | |
| (The Glenridge On Palmer Ranch Proj.) Series 2021, 5% 6/1/51 (g) | | 1,790,000 | 1,755,471 |
| (The Mayflower Retirement Cmnty. Proj.) Series 2021 A: | | | |
4% 6/1/36 (g) | | 170,000 | 157,555 |
4% 6/1/46 (g) | | 105,000 | 86,857 |
| Series 2021 A, 4% 6/1/41 (g) | | 100,000 | 87,483 |
| Florida Dev. Fin. Corp. Edl. Facilities: | | | |
| (Mater Academy Projs.): | | | |
Series 2020 A, 5% 6/15/55 | | 1,450,000 | 1,454,521 |
Series 2022 A: | | | |
5% 6/15/47 | | 250,000 | 251,648 |
5% 6/15/52 | | 235,000 | 235,911 |
5% 6/15/56 | | 345,000 | 345,994 |
| (River City Science Academy Projs.): | | | |
Series 2021 A: | | | |
4% 7/1/35 | | 30,000 | 29,710 |
4% 7/1/45 | | 55,000 | 50,516 |
4% 7/1/55 | | 80,000 | 69,136 |
Series 2022 A1: | | | |
5% 7/1/42 | | 915,000 | 949,721 |
5% 7/1/51 | | 825,000 | 841,771 |
5% 2/1/57 | | 1,460,000 | 1,482,303 |
| Series 2015 A, 6.125% 6/15/46 (g) | | 730,000 | 733,715 |
| Series 2016 A, 4.75% 7/15/36 (g) | | 350,000 | 350,558 |
| Series 2017 A, 6.125% 6/15/47 (g) | | 250,000 | 252,584 |
| Series 2020 C: | | | |
5% 9/15/40 (g) | | 105,000 | 104,301 |
5% 9/15/50 (g) | | 210,000 | 199,192 |
| Series 2021 A, 4% 7/1/51 (g) | | 135,000 | 118,681 |
| Florida Dev. Fin. Corp. Healthcare Facility Rev.: | | | |
| (UF Health Jacksonville Proj.) Series 2022 A: | | | |
4% 2/1/46 (Assured Guaranty Muni. Corp. Insured) | | 1,385,000 | 1,372,253 |
4% 2/1/52 | | 300,000 | 260,705 |
5% 2/1/52 | | 195,000 | 196,736 |
| Series 2021 B, 4% 2/1/52 | | 400,000 | 390,778 |
| Florida Dev. Fin. Corp. Rev.: | | | |
| (Brightline Florida Passenger Rail Proj.) Series 2024: | | | |
5.25% 7/1/53 (Assured Guaranty Muni. Corp. Insured) (e) | | 18,505,000 | 19,450,241 |
5.5% 7/1/53 (e) | | 3,500,000 | 3,652,155 |
| Bonds (Brightline Florida Passenger Rail Proj.) Series 2024, 12%, tender 7/15/28 (b)(e)(g) | | 4,250,000 | 4,534,110 |
| Florida Dev. Fin. Corp. Solid Waste Disp. Rev.: | | | |
| Bonds: | | | |
(GFL Solid Waste Southeast LLC Proj.) Series 2024 A, 4.375%, tender 10/1/31 (b)(e)(g) | | 2,775,000 | 2,805,067 |
(Waste Pro U.S.A., INC Proj.) Series 2023, 6.125%, tender 7/1/26 (b)(e)(g) | | 3,300,000 | 3,385,953 |
| Series 2021, 3% 6/1/32 (e) | | 760,000 | 695,303 |
| Florida Dev. Fin. Corp. Student H (SFP - Tampa I - The Henry Proj.) Series 2024 A1, 5.25% 6/1/54 (g) | | 495,000 | 504,228 |
| Florida Higher Edl. Facilities Fing. Auth.: | | | |
| (Jacksonville Univ. Proj.) Series 2018 A1: | | | |
4.5% 6/1/33 (g) | | 705,000 | 687,924 |
4.75% 6/1/38 (g) | | 1,605,000 | 1,538,243 |
5% 6/1/48 (g) | | 3,480,000 | 3,262,497 |
| (Ringling College Proj.) Series 2017: | | | |
4% 3/1/47 | | 300,000 | 267,374 |
5% 3/1/47 | | 250,000 | 251,562 |
| (St. Leo Univ. Proj.) Series 2019: | | | |
5% 3/1/25 | | 45,000 | 44,772 |
5% 3/1/49 | | 270,000 | 194,223 |
| Series 2019: | | | |
4% 10/1/37 | | 240,000 | 229,307 |
4% 10/1/38 | | 335,000 | 316,570 |
4% 10/1/39 | | 400,000 | 373,210 |
4% 10/1/44 | | 625,000 | 561,538 |
5% 10/1/27 | | 35,000 | 36,231 |
5% 10/1/31 | | 195,000 | 204,415 |
5% 10/1/33 | | 270,000 | 281,225 |
5% 10/1/34 | | 225,000 | 233,635 |
5% 10/1/36 | | 170,000 | 175,318 |
| Florida Hsg. Fin. Corp. Multi-family Mtg. Rev. Bonds Series 2023 C, 5%, tender 12/1/25 (b) | | 925,000 | 939,923 |
| Florida Hsg. Fin. Corp. Rev.: | | | |
| Series 2019 1, 4% 7/1/50 | | 480,000 | 481,982 |
| Series 2021 1, 3% 1/1/52 | | 1,060,000 | 1,043,981 |
| Series 2021 2, 3% 7/1/52 | | 1,340,000 | 1,316,576 |
| Florida Ins. Assistance Interlo Series 2023 A1, 5% 9/1/27 | | 10,000,000 | 10,327,240 |
| Florida Mid-Bay Bridge Auth. Rev.: | | | |
| Series 2015 A: | | | |
5% 10/1/28 | | 120,000 | 121,342 |
5% 10/1/29 | | 815,000 | 823,991 |
5% 10/1/35 | | 1,895,000 | 1,912,075 |
5% 10/1/40 | | 480,000 | 482,667 |
| Series 2015 C: | | | |
5% 10/1/30 | | 400,000 | 403,964 |
5% 10/1/35 | | 110,000 | 110,892 |
5% 10/1/40 | | 245,000 | 246,461 |
| Florida Muni. Pwr. Agcy. Rev.: | | | |
| (Pwr. Supply Proj.) Series 2017 A: | | | |
5% 10/1/26 | | 500,000 | 518,327 |
5% 10/1/28 | | 20,000 | 21,367 |
| (Requirements Pwr. Supply Proj.) Series 2016 A: | | | |
5% 10/1/30 | | 320,000 | 329,972 |
5% 10/1/31 | | 350,000 | 360,592 |
| Series 2015 B: | | | |
5% 10/1/28 | | 120,000 | 121,751 |
5% 10/1/29 | | 70,000 | 71,016 |
5% 10/1/30 | | 220,000 | 223,065 |
| Fort Lauderdale (Parks and Recreation Projs.) Series 2022 A, 5% 7/1/48 | | 600,000 | 653,083 |
| Fort Myers Util. Sys. Rev. Series 2019 A, 4% 10/1/49 | | 700,000 | 695,405 |
| Fort Pierce Utils. Auth. Series 2022 A, 4% 10/1/52 (Assured Guaranty Muni. Corp. Insured) | | 965,000 | 963,879 |
| Gainesville Utils. Sys. Rev. Series 2017 A, 5% 10/1/35 | | 280,000 | 294,243 |
| Golden Gem Cmnty. Dev. District Flas Series 2024, 6% 5/1/55 | | 1,000,000 | 1,027,042 |
| Greater Orlando Aviation Auth. Arpt. Facilities Rev.: | | | |
| Series 2015 A, 5% 10/1/31 (e) | | 1,220,000 | 1,233,150 |
| Series 2016 A, 5% 10/1/46 (Pre-Refunded to 10/1/26 @ 100) (e) | | 120,000 | 123,796 |
| Series 2016: | | | |
5% 10/1/26 (e) | | 210,000 | 216,450 |
5% 10/1/27 (e) | | 120,000 | 125,468 |
| Series 2017 A: | | | |
5% 10/1/25 (e) | | 40,000 | 40,501 |
5% 10/1/25 (Escrowed to Maturity) (e) | | 80,000 | 80,904 |
5% 10/1/27 (e) | | 55,000 | 57,506 |
5% 10/1/27 (Escrowed to Maturity) (e) | | 185,000 | 193,282 |
5% 10/1/29 (Pre-Refunded to 10/1/27 @ 100) (e) | | 365,000 | 381,341 |
5% 10/1/30 (Pre-Refunded to 10/1/27 @ 100) (e) | | 390,000 | 407,460 |
5% 10/1/31 (e) | | 1,050,000 | 1,088,762 |
5% 10/1/32 (e) | | 295,000 | 305,523 |
5% 10/1/34 (e) | | 730,000 | 754,520 |
5% 10/1/37 (e) | | 760,000 | 782,341 |
5% 10/1/42 (e) | | 1,145,000 | 1,169,829 |
5% 10/1/47 (e) | | 900,000 | 914,571 |
5% 10/1/52 (e) | | 440,000 | 445,784 |
| Series 2019 A: | | | |
5% 10/1/34 (e) | | 2,500,000 | 2,655,337 |
5% 10/1/49 (e) | | 1,025,000 | 1,062,962 |
5% 10/1/54 (e) | | 5,920,000 | 6,114,357 |
| Halifax Hosp. Med. Ctr. Rev.: | | | |
| Series 2015, 5% 6/1/28 (Pre-Refunded to 6/1/25 @ 100) | | 35,000 | 35,343 |
| Series 2016, 5% 6/1/36 | | 120,000 | 121,330 |
| Hickory Tree Cmnty. Develop (Assessment Area One Proj.) Series 2024, 5.15% 5/1/44 | | 1,000,000 | 1,004,712 |
| Highlands County Health Facilities Auth. Rev. Bonds Series 2024 C, 5%, tender 11/15/31 (b) | | 1,500,000 | 1,678,643 |
| Hillsborough County Aviation Auth. Rev.: | | | |
| Series 2018 E, 5% 10/1/43 (e) | | 1,275,000 | 1,312,016 |
| Series 2018 F: | | | |
5% 10/1/37 | | 95,000 | 101,005 |
5% 10/1/43 | | 130,000 | 136,118 |
| Series 2024 B, 5.5% 10/1/49 (e) | | 1,750,000 | 1,956,283 |
| Hillsborough County Indl. Dev.: | | | |
| (Tampa Gen. Hosp. Proj.) Series 2020 A, 4% 8/1/55 | | 3,455,000 | 3,303,764 |
| Series 2020, 4% 8/1/50 | | 525,000 | 507,013 |
| Hillsborough County Indl. Dev. Auth. Series 2024 C, 5.5% 11/15/54 | | 1,240,000 | 1,406,540 |
| Hillsborough County Port District (Tampa Port Auth. Proj.) Series 2018 B: | | | |
| 5% 6/1/30 (e) | | 240,000 | 252,925 |
| 5% 6/1/31 (e) | | 255,000 | 268,148 |
| 5% 6/1/46 (e) | | 1,475,000 | 1,515,503 |
| Hillsborough County School Board Ctfs. of Prtn. Series 2015 A, 5% 7/1/26 | | 445,000 | 449,171 |
| Hobe-St Lucie Conservancy District Series 2024, 5.6% 5/1/44 | | 775,000 | 807,566 |
| Jacksonville Edl. Facilities Rev. (Jacksonville Univ. Proj.) Series 2018 B, 5% 6/1/53 (g) | | 2,550,000 | 2,341,533 |
| Jacksonville Health Care Facilities (Baptist Med. Ctr. Proj.) Series 2017: | | | |
| 5% 8/15/26 | | 110,000 | 113,605 |
| 5% 8/15/34 | | 155,000 | 160,561 |
| Jacksonville Spl. Rev. Series 2022 A: | | | |
| 5% 10/1/25 | | 25,000 | 25,407 |
| 5% 10/1/26 | | 20,000 | 20,791 |
| 5% 10/1/27 | | 15,000 | 15,934 |
| 5% 10/1/28 | | 30,000 | 32,457 |
| 5% 10/1/29 | | 25,000 | 27,526 |
| 5% 10/1/30 | | 20,000 | 22,352 |
| 5% 10/1/32 | | 20,000 | 22,802 |
| Lakes of Sarasota Cmnty. Dev. Di Series 2024 A, 5.3% 5/1/44 | | 425,000 | 428,477 |
| Lakewood Ranch Stewardship District Spl. Assessment Rev.: | | | |
| (Lakewood Centre & NW Sector Projs.) Series 2018, 5.65% 5/1/48 (g) | | 125,000 | 129,299 |
| (Lakewood Centre North Proj.) Series 2015: | | | |
4.875% 5/1/35 | | 25,000 | 25,069 |
4.875% 5/1/45 | | 35,000 | 35,014 |
| (Lakewood Nat'l. and Polo Run Projs.) Series 2017: | | | |
5.25% 5/1/37 | | 500,000 | 510,609 |
5.375% 5/1/47 | | 1,185,000 | 1,207,050 |
| (Northeast Sector Proj. - Phase 1B) Series 2018: | | | |
5.3% 5/1/39 | | 140,000 | 144,825 |
5.45% 5/1/48 | | 240,000 | 246,545 |
| (Villages of Lakewood Ranch South Proj.) Series 2016: | | | |
5% 5/1/36 | | 250,000 | 252,892 |
5.125% 5/1/46 | | 400,000 | 401,791 |
| Series 2023, 6.3% 5/1/54 | | 655,000 | 698,053 |
| Laurel Road Cmnty. Dev. District: | | | |
| Series 2021 A1, 3% 5/1/31 | | 350,000 | 321,604 |
| Series 2021 A2, 3.125% 5/1/31 | | 580,000 | 536,641 |
| Lee County Arpt. Rev.: | | | |
| Series 2021 A, 5% 10/1/25 (e) | | 2,525,000 | 2,553,497 |
| Series 2021 B: | | | |
5% 10/1/37 (e) | | 1,250,000 | 1,328,518 |
5% 10/1/46 (e) | | 1,010,000 | 1,051,670 |
| Series 2024: | | | |
5.25% 10/1/49 (e) | | 1,750,000 | 1,891,547 |
5.25% 10/1/54 (e) | | 1,750,000 | 1,877,700 |
5.25% 10/1/54 (Assured Guaranty Muni. Corp. Insured) (e) | | 3,855,000 | 4,174,840 |
5.25% 10/1/54 (Assured Guaranty Muni. Corp. Insured) (e) | | 980,000 | 1,058,849 |
| Lee County Indl. Dev. Auth. Health Care Facilities Rev.: | | | |
| (Shell Point Obligated Group Proj.) Series 2024 C, 5% 11/15/54 | | 1,940,000 | 2,005,440 |
| (Shell Point/Waterside Health Proj.) Series 2019, 5% 11/15/49 | | 445,000 | 455,484 |
| Series 2024 A, 5.25% 11/15/54 | | 805,000 | 849,528 |
| Series 2024 B1, 4.75% 11/15/29 | | 235,000 | 236,562 |
| Series 2024 B2, 4.375% 11/15/29 | | 180,000 | 181,219 |
| Shell Point/Waterside Health Proj. Series 2019, 5% 11/15/44 | | 440,000 | 453,718 |
| Lee County Indl. Developm: | | | |
| Series 2019 A1: | | | |
5% 4/1/39 | | 405,000 | 424,568 |
5% 4/1/44 | | 205,000 | 212,465 |
| Series 2024, 5% 4/1/26 | | 65,000 | 66,443 |
| Lee County School Board Ctfs. Series 2019 A: | | | |
| 5% 8/1/27 | | 255,000 | 269,912 |
| 5% 8/1/28 | | 130,000 | 140,124 |
| Ltc Ranch West Residential Commission (Assessment Area Two Proj. - Pod 5) Series 2024 AA2, 4.85% 5/1/31 | | 140,000 | 141,426 |
| Malabar Springs Cmnty. Deve Series 2024, 5.5% 5/1/54 | | 400,000 | 400,916 |
| Manatee County Rev. Series 2023, 5.5% 10/1/53 | | 2,975,000 | 3,363,574 |
| Manatee County School District Series 2017, 5% 10/1/28 (Assured Guaranty Muni. Corp. Insured) | | 160,000 | 167,510 |
| Miami Beach Health Facilities Auth. Hosp. Rev.: | | | |
| Series 2014 A, 5% 11/15/39 | | 85,000 | 85,035 |
| Series 2021 B, 3% 11/15/51 | | 310,000 | 234,131 |
| Miami-Dade County: | | | |
| Series 2021 A1, 4% 10/1/45 (Assured Guaranty Muni. Corp. Insured) (e) | | 1,325,000 | 1,266,964 |
| Series 2022 A: | | | |
5% 10/1/47 (e) | | 3,000,000 | 3,163,248 |
5.25% 10/1/52 (e) | | 11,920,000 | 12,742,994 |
| Miami-Dade County Aviation Rev.: | | | |
| Series 2015 A: | | | |
5% 10/1/29 (e) | | 195,000 | 197,058 |
5% 10/1/31 (e) | | 160,000 | 161,397 |
5% 10/1/38 (e) | | 805,000 | 809,689 |
| Series 2016 A: | | | |
5% 10/1/29 | | 175,000 | 180,388 |
5% 10/1/31 | | 210,000 | 216,039 |
5% 10/1/41 | | 3,440,000 | 3,498,419 |
| Series 2017 B, 5% 10/1/40 (e) | | 725,000 | 739,611 |
| Series 2019 A, 5% 10/1/49 (e) | | 4,835,000 | 4,960,825 |
| Series 2020 A: | | | |
4% 10/1/35 | | 90,000 | 91,833 |
4% 10/1/37 | | 130,000 | 131,743 |
4% 10/1/39 | | 1,590,000 | 1,606,363 |
5% 10/1/31 | | 120,000 | 133,259 |
| Series 2024 A: | | | |
5% 10/1/33 (e) | | 4,000,000 | 4,380,722 |
5% 10/1/34 (e) | | 3,125,000 | 3,428,328 |
| Miami-Dade County Edl. Facilities Rev.: | | | |
| Series 2015 A, 5% 4/1/40 | | 3,355,000 | 3,375,023 |
| Series 2018 A, 5% 4/1/53 | | 2,950,000 | 3,032,156 |
| Series 2024 B, 5.25% 4/1/44 (d) | | 2,500,000 | 2,808,369 |
| Miami-Dade County Expressway Auth.: | | | |
| Series 2010 A, 5% 7/1/40 | | 185,000 | 188,873 |
| Series 2014 A: | | | |
5% 7/1/25 | | 80,000 | 80,075 |
5% 7/1/27 | | 55,000 | 55,062 |
5% 7/1/28 | | 125,000 | 125,144 |
5% 7/1/29 | | 55,000 | 55,063 |
| Series 2014 B: | | | |
5% 7/1/28 | | 120,000 | 120,138 |
5% 7/1/30 | | 140,000 | 140,153 |
| Series 2016 A: | | | |
5% 7/1/32 | | 525,000 | 537,649 |
5% 7/1/33 | | 445,000 | 455,584 |
| Miami-Dade County Health Facilities Auth. Hosp. Rev. (Nicklaus Children's Hosp. Proj.) Series 2017, 5% 8/1/47 | | 1,565,000 | 1,593,286 |
| Miami-Dade County School Board Ctfs. of Prtn.: | | | |
| Series 2015 A, 5% 5/1/29 | | 1,185,000 | 1,193,792 |
| Series 2015 B, 5% 5/1/28 | | 110,000 | 110,830 |
| Series 2016 A, 5% 5/1/32 | | 1,775,000 | 1,814,943 |
| Series 2016 B, 5% 8/1/26 | | 250,000 | 258,758 |
| Miami-Dade County School District Series 2022 A: | | | |
| 5% 3/15/35 | | 1,300,000 | 1,468,383 |
| 5% 3/15/52 | | 750,000 | 809,953 |
| Miami-Dade County Transit Sales Surtax Rev.: | | | |
| Series 2017, 4% 7/1/32 | | 1,700,000 | 1,716,775 |
| Series 2019, 3% 7/1/37 | | 1,000,000 | 947,883 |
| Miami-Dade County Wtr. & Swr. Rev.: | | | |
| Series 2017 B, 4% 10/1/38 | | 650,000 | 661,003 |
| Series 2019 B: | | | |
4% 10/1/49 | | 3,210,000 | 3,183,956 |
4% 10/1/49 | | 255,000 | 252,931 |
| Series 2021: | | | |
4% 10/1/48 | | 810,000 | 809,619 |
5% 10/1/32 | | 495,000 | 554,803 |
| Series 2024 A, 5.25% 10/1/54 | | 2,000,000 | 2,215,997 |
| Middleton Cmnty. Dev. District A Fla Series 2024, 4.75% 5/1/55 | | 100,000 | 99,894 |
| Midtown Miami Cmnty. Dev. District: | | | |
| (Infrastructure Proj.) Series 2014 B: | | | |
5% 5/1/29 | | 55,000 | 55,025 |
5% 5/1/37 | | 25,000 | 25,006 |
| (Parking Garage Proj.) Series 2014 A, 5% 5/1/37 | | 45,000 | 45,010 |
| Mirada Cmnty. Dev. District Series 2024, 6% 5/1/55 | | 750,000 | 767,823 |
| North -1 Pasco Cmnty. Dev. Dis Series 2021, 4% 5/1/51 | | 1,385,000 | 1,178,148 |
| Okaloosa Fla Gas District Gas Sysr Series 2024 B, 5.25% 10/1/44 (Assured Guaranty Muni. Corp. Insured) | | 1,140,000 | 1,284,868 |
| Orange County Health Facilities Auth.: | | | |
| (Presbyterian Retirement Cmntys. Obligated Group Proj.): | | | |
Series 2023 A, 4% 8/1/47 | | 1,065,000 | 982,082 |
Series 2024, 5% 8/1/54 | | 860,000 | 885,174 |
| Series 2016 A: | | | |
5% 10/1/39 | | 1,875,000 | 1,918,692 |
5% 10/1/44 | | 280,000 | 285,476 |
| Series 2022, 4% 10/1/52 | | 7,640,000 | 7,478,238 |
| Series 2023 A, 5% 10/1/53 | | 4,000,000 | 4,255,554 |
| Orange County School Board Ctfs. of Prtn. Series 2015 D, 5% 8/1/30 (Pre-Refunded to 8/1/25 @ 100) | | 55,000 | 55,736 |
| Osceola County Trans. Impt. Rev.: | | | |
| Series 2019 A1, 5% 10/1/44 | | 810,000 | 846,935 |
| Series 2019 A2: | | | |
0% 10/1/35 | | 115,000 | 73,680 |
0% 10/1/36 | | 140,000 | 85,559 |
0% 10/1/37 | | 50,000 | 29,056 |
0% 10/1/38 | | 160,000 | 88,278 |
0% 10/1/39 | | 195,000 | 102,164 |
0% 10/1/40 | | 210,000 | 104,097 |
0% 10/1/41 | | 230,000 | 107,952 |
0% 10/1/42 | | 185,000 | 82,224 |
| Palm Beach County Arpt. Sys. Rev. Series 2016: | | | |
| 5% 10/1/27 (e) | | 120,000 | 123,333 |
| 5% 10/1/29 (e) | | 125,000 | 128,086 |
| 5% 10/1/30 (e) | | 225,000 | 230,445 |
| 5% 10/1/31 (e) | | 160,000 | 163,743 |
| 5% 10/1/32 (e) | | 245,000 | 250,531 |
| 5% 10/1/33 (e) | | 525,000 | 536,529 |
| 5% 10/1/34 (e) | | 545,000 | 556,562 |
| 5% 10/1/35 (e) | | 575,000 | 586,665 |
| Palm Beach County Edl. Facilities Auth. Series 2024, 5% 10/1/43 | | 1,375,000 | 1,423,856 |
| Palm Beach County Health Facilities: | | | |
| Series 2018 A, 5% 11/15/45 | | 1,180,000 | 1,207,812 |
| Series 2020 B, 5% 11/15/42 | | 190,000 | 197,989 |
| Palm Beach County Health Facilities Auth. Hosp. Rev.: | | | |
| (Jupiter Med. Ctr. Proj.) Series 2022: | | | |
5% 11/1/47 | | 2,105,000 | 2,186,314 |
5% 11/1/52 | | 270,000 | 279,252 |
| Series 2019, 4% 8/15/49 | | 7,600,000 | 7,400,154 |
| Palm Beach County Health Facilities Auth. Rev.: | | | |
| Series 2019 B, 5% 5/15/53 | | 2,615,000 | 2,532,413 |
| Series 2020 A, 5% 6/1/55 | | 305,000 | 303,863 |
| Series 2022: | | | |
4% 6/1/31 | | 120,000 | 119,260 |
4% 6/1/36 | | 690,000 | 667,264 |
4% 6/1/41 | | 375,000 | 346,972 |
4.25% 6/1/56 | | 2,995,000 | 2,604,750 |
| Palm Beach County School Board Ctfs. of Prtn. Series 2015 D, 5% 8/1/29 | | 730,000 | 737,954 |
| Pasco County Tax Alloc Series 2023 A: | | | |
| 5% 9/1/48 (Assured Guaranty Muni. Corp. Insured) | | 1,210,000 | 1,289,978 |
| 5.75% 9/1/54 (Assured Guaranty Muni. Corp. Insured) | | 4,180,000 | 4,697,229 |
| Pasco County School Board Ctfs. of Prtn. Series 2018 A, 5% 8/1/35 (Build America Mutual Assurance Insured) | | 130,000 | 138,504 |
| Pinellas Ed. Facilities Crsuis Vrdn Series 2018 A, 5% 12/15/48 (g) | | 250,000 | 251,140 |
| Pompano Beach Rev. (John Knox Village Proj.): | | | |
| Series 2020: | | | |
4% 9/1/40 | | 40,000 | 38,133 |
4% 9/1/50 | | 1,130,000 | 993,485 |
| Series 2021 A: | | | |
4% 9/1/51 | | 1,065,000 | 930,958 |
4% 9/1/56 | | 1,465,000 | 1,246,603 |
| Putnam County Dev. Auth. Poll. Cont. Rev. (Seminole Elec. Coop., Inc. Proj.) Series 2018 A, 5% 3/15/42 | | 800,000 | 830,162 |
| Reunion East Cmnty. Dev. District Series 2022 A2, 7.375% 5/1/33 (f) | | 205,000 | 2 |
| Sarasota County Health Facilities Auth. Retirement Facility Rev. (Village On The Isle Proj.) Series 2017 A: | | | |
| 5% 1/1/37 | | 195,000 | 197,541 |
| 5% 1/1/42 | | 225,000 | 226,429 |
| 5% 1/1/47 | | 450,000 | 450,738 |
| 5% 1/1/52 | | 950,000 | 946,606 |
| Sarasota County Pub. Hosp. Board Series 1998 B, 5.5% 7/1/28 (Nat'l. Pub. Fin. Guarantee Corp. Insured) | | 840,000 | 880,802 |
| Sarasota County Pub. Hosp. District Hosp. Rev. (Sarasota Memorial Hosp. Proj.) Series 2018, 5% 7/1/41 | | 2,950,000 | 3,089,289 |
| Sarasota County Util. Sys. Rev. Series 2022, 5.25% 10/1/52 | | 2,000,000 | 2,203,961 |
| Sawyers Landing Cmnty. Dev. District Spl. Assessment Rev. Series 2021: | | | |
| 4.125% 5/1/41 | | 430,000 | 389,489 |
| 4.25% 5/1/53 | | 570,000 | 494,715 |
| Seminole County Indl. Dev. Auth. Retirement Facility Rev. (Legacy Pointe At UCF Proj.) Series 2019 A, 5.5% 11/15/49 | | 945,000 | 944,460 |
| Seminole Palms Cmnty. Dev. Distf Series 2024: | | | |
| 4.45% 5/1/31 (g) | | 265,000 | 265,334 |
| 5.5% 5/1/55 (g) | | 200,000 | 200,380 |
| Shadowlawn Cmnty. Dev. District Flas Series 2024, 5.85% 5/1/54 | | 650,000 | 660,321 |
| South Broward Hosp. District Rev.: | | | |
| Series 2018, 4% 5/1/48 | | 875,000 | 855,363 |
| Series 2021 A: | | | |
3% 5/1/51 | | 2,600,000 | 2,051,259 |
3% 5/1/51 (Build America Mutual Assurance Insured) | | 1,500,000 | 1,228,534 |
| South Florida Wtr. Mgmt. District Ctfs. of Prtn. Series 2015: | | | |
| 5% 10/1/27 | | 30,000 | 30,840 |
| 5% 10/1/28 | | 225,000 | 231,062 |
| 5% 10/1/29 | | 605,000 | 620,741 |
| 5% 10/1/30 | | 110,000 | 112,746 |
| 5% 10/1/32 | | 950,000 | 972,465 |
| South Miami Health Facilities Auth. Hosp. Rev.: | | | |
| (Baptist Med. Ctr., FL. Proj.) Series 2017: | | | |
4% 8/15/33 | | 305,000 | 309,015 |
5% 8/15/27 | | 270,000 | 284,063 |
5% 8/15/28 | | 285,000 | 299,985 |
5% 8/15/29 | | 85,000 | 89,292 |
5% 8/15/32 | | 505,000 | 526,915 |
5% 8/15/35 | | 565,000 | 587,370 |
5% 8/15/37 | | 280,000 | 290,441 |
5% 8/15/42 | | 4,240,000 | 4,375,722 |
| Series 2017, 4% 8/15/47 | | 5,960,000 | 5,829,157 |
| Southern Grove Cmnty. Dev. Distn Series 2021, 4% 5/1/48 | | 620,000 | 550,192 |
| St Lucie County Fla Hsg. Fin. Auth. Series 2024, 4.45% 1/1/41 | | 3,000,000 | 3,024,772 |
| St. Johns County Indl. Dev. Auth. (Vicars Landing Proj.) Series 2021 A: | | | |
| 4% 12/15/27 | | 20,000 | 19,630 |
| 4% 12/15/28 | | 20,000 | 19,526 |
| 4% 12/15/29 | | 20,000 | 19,439 |
| 4% 12/15/30 | | 20,000 | 19,364 |
| 4% 12/15/31 | | 20,000 | 19,263 |
| 4% 12/15/36 | | 100,000 | 93,030 |
| 4% 12/15/41 | | 75,000 | 65,884 |
| 4% 12/15/46 | | 75,000 | 62,292 |
| 4% 12/15/50 | | 70,000 | 56,017 |
| Sterling Hill Cmnty. Dev. District Series 2003 B, 5.5% | | 9,503 | 4,371 |
| Sumter County Indl. Dev. Auth. Hosp. Rev.: | | | |
| (Central Florida Health Alliance Projs.) Series 2014 A: | | | |
5.125% 7/1/34 | | 100,000 | 100,106 |
5.25% 7/1/44 | | 310,000 | 310,224 |
| Series 2014 A: | | | |
5% 7/1/26 | | 50,000 | 50,057 |
5% 7/1/29 | | 45,000 | 45,052 |
| Tallahassee Health Facilities Rev.: | | | |
| (Tallahassee Memorial Healthcare, Inc. Proj.) Series 2016 A: | | | |
5% 12/1/29 | | 80,000 | 80,963 |
5% 12/1/36 | | 60,000 | 60,342 |
5% 12/1/41 | | 135,000 | 135,104 |
| Series 2015 A, 5% 12/1/40 | | 350,000 | 350,153 |
| Tampa Bay Wtr. Reg'l. Wtr. Supply Auth. Util. Sys. Rev.: | | | |
| Series 2015 A, 4% 10/1/28 | | 460,000 | 462,552 |
| Series 2022 A, 5.25% 10/1/57 | | 1,000,000 | 1,101,639 |
| Tampa Health Sys. Rev. Series 2016 A, 5% 11/15/46 | | 1,000,000 | 1,013,443 |
| Tampa Hosp. Rev. (H. Lee Moffitt Cancer Ctr. Proj.): | | | |
| Series 2016 B, 5% 7/1/37 | | 60,000 | 60,947 |
| Series 2020 B: | | | |
4% 7/1/45 | | 4,120,000 | 4,030,234 |
5% 7/1/40 | | 45,000 | 47,854 |
5% 7/1/50 | | 6,180,000 | 6,446,252 |
| Tampa Non-Ad Valorem Impt. Rev. Series 2021 C, 3% 10/1/36 | | 500,000 | 479,542 |
| Tampa Rev. (The Univ. of Tampa Proj.) Series 2015, 5% 4/1/45 | | 860,000 | 862,451 |
| Tampa Sports Auth. Rev. Series 1995, 6.1% 10/1/26 | | 90,000 | 92,987 |
| Tampa Tax Allocation (H. Lee Moffitt Cancer Ctr. Proj.) Series 2020 A: | | | |
| 0% 9/1/34 | | 305,000 | 208,679 |
| 0% 9/1/35 | | 165,000 | 107,994 |
| 0% 9/1/36 | | 255,000 | 159,548 |
| 0% 9/1/37 | | 685,000 | 409,072 |
| 0% 9/1/38 | | 230,000 | 131,009 |
| 0% 9/1/39 | | 220,000 | 119,187 |
| 0% 9/1/40 | | 290,000 | 149,220 |
| 0% 9/1/41 | | 165,000 | 80,591 |
| 0% 9/1/42 | | 165,000 | 76,516 |
| 0% 9/1/45 | | 120,000 | 47,563 |
| 0% 9/1/49 | | 1,835,000 | 590,464 |
| Tampa-Hillsborough County Expressway Auth. Rev. Series 2017, 5% 7/1/47 | | 4,425,000 | 4,531,479 |
| The Crossings at Fleming Island Cmnty. Dev. District Spl. Assessment Series 2014 A1, 4.5% 5/1/30 | | 50,000 | 49,997 |
| Two Rivs West Cmnty. Dev. District F (Series 2024 Proj.) Series 2024, 5.625% 5/1/44 (g) | | 500,000 | 508,409 |
| Venice Fla Retirement Cmnty. Re (Village on the Isle Proj.): | | | |
| Series 2024 A: | | | |
5.5% 1/1/55 (d) | | 1,000,000 | 1,029,222 |
5.625% 1/1/60 (d) | | 365,000 | 377,187 |
| Series 2024 B2, 4.5% 1/1/30 (d) | | 800,000 | 802,494 |
| Viera Stewardship District Spl. Assessment Rev.: | | | |
| (Village 2 - Series 2021 Proj.) Series 2021, 4% 5/1/53 | | 290,000 | 242,190 |
| Series 2021, 3.125% 5/1/41 | | 100,000 | 81,309 |
| Series 2023, 5.5% 5/1/54 | | 1,300,000 | 1,340,658 |
| Village Cmnty. Dev. District: | | | |
| Series 2020, 3.5% 5/1/40 (Assured Guaranty Muni. Corp. Insured) | | 965,000 | 963,164 |
| Series 2022: | | | |
5.375% 5/1/42 | | 2,250,000 | 2,366,597 |
5.5% 5/1/53 | | 1,040,000 | 1,086,380 |
| Village Cmnty. Dev. District No. 15: | | | |
| Series 2023: | | | |
4.85% 5/1/38 (g) | | 100,000 | 104,416 |
5% 5/1/43 (g) | | 1,110,000 | 1,151,711 |
5.25% 5/1/54 (g) | | 2,490,000 | 2,585,871 |
| Series 2024: | | | |
4.2% 5/1/39 (g) | | 500,000 | 502,423 |
4.8% 5/1/55 (g) | | 445,000 | 448,559 |
| Volusia County Edl. Facilities Auth. Rev. (Embry-Riddle Aeronautical Univ., Inc. Proj.): | | | |
| Series 2017, 5% 10/15/47 | | 665,000 | 682,662 |
| Series 2020 A: | | | |
5% 10/15/44 | | 215,000 | 225,994 |
5% 10/15/49 | | 405,000 | 422,868 |
| Volusia County School Board Ctfs. of Prtn. (Florida Master Lease Prog.) Series 2016 A: | | | |
| 5% 8/1/29 (Build America Mutual Assurance Insured) | | 120,000 | 122,806 |
| 5% 8/1/31 (Build America Mutual Assurance Insured) | | 125,000 | 127,807 |
| West Palm Beach Cmnty. Redev. Agcy. Tax Increment Rev. Series 2019: | | | |
| 5% 3/1/34 | | 1,650,000 | 1,781,215 |
| 5% 3/1/35 | | 1,600,000 | 1,727,982 |
| West Villages Impt. District Series 2024, 5.625% 5/1/54 | | 570,000 | 578,900 |
| Westside Haines City Cmnty. Dev. (Assessment Area Two Proj.) Series 2024, 5.75% 5/1/44 | | 415,000 | 425,924 |
| Westview North Cmnty. Dev. Distf Series 2022, 6% 6/15/52 | | 500,000 | 529,635 |
| Westview South Cmnty. Dev. Distf (Assessment Area One - 2023 Proj. Area) Series 2023, 5.6% 5/1/53 | | 970,000 | 997,784 |
| Wildwood Util. Dependent District Series 2023, 5.5% 10/1/53 (Assured Guaranty Muni. Corp. Insured) | | 2,250,000 | 2,477,239 |
TOTAL FLORIDA | | | 435,194,468 |
| Georgia - 2.9% | | | |
| Atlanta Arpt. Passenger Facilities Charge Rev.: | | | |
| Series 2019 D: | | | |
4% 7/1/35 (e) | | 3,590,000 | 3,604,043 |
4% 7/1/37 (e) | | 850,000 | 851,487 |
4% 7/1/39 (e) | | 1,065,000 | 1,063,718 |
| Series 2023 E: | | | |
5% 7/1/40 (e) | | 1,435,000 | 1,547,524 |
5.25% 7/1/41 (e) | | 4,400,000 | 4,871,711 |
5.25% 7/1/44 (e) | | 1,750,000 | 1,917,962 |
| Atlanta Arpt. Rev. Series 2019 B: | | | |
| 5% 7/1/25 (e) | | 330,000 | 332,616 |
| 5% 7/1/44 (e) | | 2,090,000 | 2,165,866 |
| Atlanta Dev. Auth. Rev.: | | | |
| (Gluch Enterprise Zone Proj.) Series 2024 1, 0% 12/15/48 (g)(i) | | 4,753,000 | 4,094,520 |
| (New Downtown Atlanta Stadium Proj.) Series 2015 A1: | | | |
5.25% 7/1/40 | | 670,000 | 676,026 |
5.25% 7/1/44 | | 3,245,000 | 3,270,336 |
| (Westside Gulch Area Proj.): | | | |
Series 2024 A1, 5% 4/1/34 (g) | | 900,000 | 920,652 |
Series 2024 A2, 5.5% 4/1/39 (g) | | 1,295,000 | 1,344,885 |
| Atlanta Dev. Auth. Sr. Health Care Facilities Current Interest Rev. (Georgia Proton Treatment Ctr. Proj.) Series 2017 A1: | | | |
| 6.5% 1/1/29 | | 505,000 | 227,250 |
| 6.75% 1/1/35 | | 2,745,000 | 1,235,250 |
| 7% 1/1/40 | | 2,910,000 | 1,309,500 |
| Atlanta Gen. Oblig. Series 2022 A1, 5% 12/1/42 | | 3,025,000 | 3,361,751 |
| Atlanta Urban Redev. Agcy.: | | | |
| (Atlanta Beltine Trail Completion Proj.) Series 2021, 2.375% 7/1/26 (g) | | 140,000 | 138,199 |
| Series 2021 A: | | | |
2.875% 7/1/31 (g) | | 165,000 | 154,623 |
3.625% 7/1/42 (g) | | 590,000 | 545,859 |
| Series 2021, 3.875% 7/1/51 (g) | | 430,000 | 391,980 |
| Atlanta Wtr. & Wastewtr. Rev.: | | | |
| Series 2001, 5.5% 11/1/27 (Nat'l. Pub. Fin. Guarantee Corp. Insured) | | 150,000 | 157,714 |
| Series 2015, 5% 11/1/29 | | 750,000 | 756,269 |
| Augusta Dev. Auth. Rev. (Wellstar Health Sys., Inc. Proj.) Series 2023 A: | | | |
| 5.125% 4/1/53 | | 2,345,000 | 2,517,077 |
| 5.125% 4/1/53 (Assured Guaranty Muni. Corp. Insured) | | 2,500,000 | 2,711,016 |
| Bainbridge Combined Utils. Rev. Series 2021, 4% 12/1/51 | | 1,315,000 | 1,289,123 |
| Bibb County Dev. Auth. Rev. (USG Real Estate Foundation IX, LLC Proj.) Series 2019, 4% 6/1/44 | | 180,000 | 178,292 |
| Brookhaven Dev. Auth. Rev. Series 2019 A: | | | |
| 4% 7/1/44 | | 3,735,000 | 3,734,604 |
| 4% 7/1/49 | | 4,285,000 | 4,259,005 |
| Burke County Indl. Dev. Auth. Poll. Cont. Rev.: | | | |
| (Georgia Transmission Corp. Proj.) Series 2012, 2.75% 1/1/52 (b) | | 1,890,000 | 1,305,781 |
| Bonds: | | | |
(Georgia Pwr. Co. Plant Vogtle Proj.): | | | |
Series 2008 2, 3.375%, tender 3/12/27 (b) | | 1,000,000 | 1,005,330 |
Series 2013 1, 3.375%, tender 3/12/27 (b) | | 1,060,000 | 1,065,650 |
(Oglethorpe Pwr. Corp. Vogtle Proj.) Series 2013 A, 1.5%, tender 2/3/25 (b) | | 1,075,000 | 1,068,030 |
| Cobb County Dev. Auth. Series 2015 C: | | | |
| 5% 7/15/30 | | 130,000 | 130,500 |
| 5% 7/15/30 (Pre-Refunded to 7/15/25 @ 100) | | 5,000 | 5,059 |
| 5% 7/15/33 | | 230,000 | 230,711 |
| Cobb County Kennestone Hosp. Auth. Rev. (Wellstar Health Sys., Inc. Proj.): | | | |
| Series 2020 A, 5% 4/1/50 | | 1,360,000 | 1,423,134 |
| Series 2022 A, 4% 4/1/52 | | 2,000,000 | 1,965,662 |
| Cobb-Marietta Coliseum & Exhibit Hall Auth. Rev. Series 1993, 5.625% 10/1/26 (Nat'l. Pub. Fin. Guarantee Corp. Insured) | | 75,000 | 77,186 |
| Columbia County Hosp. Auth. Rev. (Wellstar Health Sys., Inc. Proj.) Series 2023 A, 5.75% 4/1/53 | | 1,530,000 | 1,734,656 |
| Columbus Med. Ctr. Hosp. Auth. Bonds (Piedmont Healthcare, Inc. Proj.) Series 2019 B, 5%, tender 7/1/29 (b) | | 1,200,000 | 1,279,151 |
| Coweta Cnt Wtr.&Sew Auth. Rev. Series 2024: | | | |
| 4.25% 6/1/57 | | 450,000 | 453,830 |
| 5% 6/1/54 | | 1,000,000 | 1,091,530 |
| Coweta County Dev. Auth. Rev. (Piedmont Healthcare, Inc. Proj.) Series 2019 A, 5% 7/1/44 | | 4,210,000 | 4,429,043 |
| Dalton Whitfield County Joint Dev. Auth. Rev. Series 2017, 4% 8/15/48 | | 610,000 | 581,676 |
| DeKalb County Dev. Auth. Rev. (The Globe Academy, Inc. Proj.) Series 2024 A, 5% 6/1/45 | | 245,000 | 248,863 |
| DeKalb Private Hosp. Auth. Rev. Series 2019 B, 5% 7/1/35 | | 75,000 | 80,963 |
| Fulton County Dev. Auth. (Robert W. Woodruff Arts Ctr., Inc. Proj.) Series 2015 A, 5% 3/15/36 | | 775,000 | 787,377 |
| Fulton County Dev. Auth. Hosp. Rev. (Wellstar Health Sys., Inc. Proj.): | | | |
| Series 2017 A: | | | |
5% 4/1/42 | | 1,455,000 | 1,489,765 |
5% 4/1/47 | | 5,500,000 | 5,598,841 |
| Series 2020 A, 4% 4/1/50 | | 1,510,000 | 1,502,978 |
| Fulton County Dev. Auth. Rev.: | | | |
| (Piedmont Healthcare, Inc. Proj.) Series 2019 A, 4% 7/1/49 | | 1,000,000 | 981,690 |
| (Robert W. Woodruff Arts Ctr., Inc. Proj.) Series 2019 A, 5% 3/15/44 | | 1,085,000 | 1,130,280 |
| Series 2019 C, 5% 7/1/38 | | 70,000 | 75,077 |
| Series 2019, 4% 6/15/49 | | 340,000 | 332,370 |
| Fulton County Residential Care Facilities: | | | |
| (Canterbury Court Proj.): | | | |
Series 2019 A: | | | |
5% 4/1/47 (g) | | 335,000 | 333,015 |
5% 4/1/54 (g) | | 535,000 | 521,780 |
Series 2021 A: | | | |
4% 4/1/41 (g) | | 420,000 | 390,623 |
4% 4/1/51 (g) | | 1,195,000 | 1,023,545 |
| (Lenbrook Square Foundation, Inc. Proj.) Series 2016, 5% 7/1/36 | | 500,000 | 505,904 |
| (Lenbrook Square Foundation, INC. Proj.) Series 2016, 5% 7/1/42 | | 1,395,000 | 1,403,064 |
| Gainesville & Hall County Dev. Auth. Retirement Cmnty. Rev. Series 2016, 5% 11/15/33 | | 590,000 | 605,108 |
| Gainesville & Hall County Hosp. Auth. Rev.: | | | |
| (Northeast Georgia Health Sys., Inc. Proj.): | | | |
Series 2014 A, 5.25% 8/15/49 (Pre-Refunded to 2/15/25 @ 100) | | 3,245,000 | 3,259,240 |
Series 2017 A: | | | |
5% 2/15/42 | | 850,000 | 870,152 |
5% 2/15/45 | | 1,065,000 | 1,086,524 |
Series 2017 B, 5.5% 2/15/42 | | 3,030,000 | 3,173,082 |
Series 2024: | | | |
5% 10/15/30 | | 1,250,000 | 1,379,185 |
5% 10/15/34 | | 2,625,000 | 3,002,889 |
| (Northeast Georgia health Sys., INC. Proj.) Series 2021 A, 2.5% 2/15/51 | | 1,500,000 | 1,035,182 |
| Series 2020 A, 3% 2/15/47 | | 5,845,000 | 4,749,410 |
| Series 2021 A, 4% 2/15/51 | | 1,000,000 | 978,289 |
| Georgia Gen. Oblig. Series 2023 A, 4% 7/1/42 | | 2,250,000 | 2,338,202 |
| Georgia Higher Ed. Facilities Auth. Rev.: | | | |
| (USG Real Estate Foundation II, LLC Projs.) Series 2019, 5% 6/15/34 | | 265,000 | 283,553 |
| (USG Real Estate Roundation II, LLC Projs.) Series 2019, 5% 6/15/35 | | 240,000 | 256,288 |
| Georgia Hsg. & Fin. Auth. Rev. Series 2017 A, 4% 12/1/47 | | 135,000 | 134,952 |
| Georgia Muni. Elec. Auth. Pwr. Rev.: | | | |
| Series 2016 A, 5% 1/1/30 | | 1,950,000 | 2,004,309 |
| Series 2018 A: | | | |
5% 1/1/26 | | 205,000 | 209,116 |
5% 1/1/27 | | 375,000 | 390,768 |
5% 1/1/28 | | 105,000 | 111,509 |
| Series 2018 HH: | | | |
5% 1/1/26 | | 1,070,000 | 1,091,485 |
5% 1/1/27 | | 605,000 | 630,440 |
5% 1/1/28 | | 630,000 | 669,051 |
5% 1/1/44 | | 500,000 | 515,790 |
| Series 2019 A: | | | |
4% 1/1/49 | | 1,460,000 | 1,410,664 |
4% 1/1/49 (Build America Mutual Assurance Insured) | | 550,000 | 543,713 |
5% 1/1/26 | | 80,000 | 81,606 |
5% 1/1/30 | | 50,000 | 53,559 |
5% 1/1/32 | | 50,000 | 53,403 |
5% 1/1/34 | | 105,000 | 111,825 |
5% 1/1/35 | | 50,000 | 53,162 |
5% 1/1/36 | | 65,000 | 68,976 |
5% 1/1/37 | | 60,000 | 63,558 |
5% 1/1/38 | | 65,000 | 68,715 |
5% 1/1/39 | | 2,500,000 | 2,609,623 |
5% 1/1/39 | | 80,000 | 84,273 |
5% 1/1/44 | | 265,000 | 276,388 |
5% 1/1/49 | | 3,715,000 | 3,818,344 |
5% 1/1/56 | | 400,000 | 410,925 |
5% 1/1/56 | | 410,000 | 419,965 |
| Series 2019 B, 4% 1/1/49 | | 1,950,000 | 1,907,196 |
| Series 2019 B2, 4% 1/1/49 | | 1,395,000 | 1,327,587 |
| Series 2020 A: | | | |
5% 1/1/45 | | 470,000 | 497,976 |
5% 1/1/50 | | 540,000 | 566,415 |
| Series 2021 A: | | | |
4% 1/1/35 (Assured Guaranty Muni. Corp. Insured) | | 775,000 | 791,106 |
4% 1/1/37 (Assured Guaranty Muni. Corp. Insured) | | 465,000 | 472,485 |
4% 1/1/39 (Assured Guaranty Muni. Corp. Insured) | | 705,000 | 712,067 |
4% 1/1/39 (Assured Guaranty Muni. Corp. Insured) | | 430,000 | 434,906 |
4% 1/1/40 (Assured Guaranty Muni. Corp. Insured) | | 500,000 | 503,778 |
4% 1/1/41 (Assured Guaranty Muni. Corp. Insured) | | 360,000 | 361,887 |
4% 1/1/46 (Assured Guaranty Muni. Corp. Insured) | | 255,000 | 255,626 |
4% 1/1/46 (Assured Guaranty Muni. Corp. Insured) | | 160,000 | 160,393 |
4% 1/1/51 | | 240,000 | 229,471 |
4% 1/1/51 | | 240,000 | 230,199 |
5% 1/1/31 (Assured Guaranty Muni. Corp. Insured) | | 365,000 | 398,287 |
5% 1/1/33 (Assured Guaranty Muni. Corp. Insured) | | 705,000 | 766,107 |
5% 1/1/33 (Assured Guaranty Muni. Corp. Insured) | | 415,000 | 450,971 |
5% 1/1/34 (Assured Guaranty Muni. Corp. Insured) | | 625,000 | 678,137 |
5% 1/1/34 (Assured Guaranty Muni. Corp. Insured) | | 440,000 | 477,408 |
5% 1/1/62 (Assured Guaranty Muni. Corp. Insured) | | 575,000 | 596,632 |
| Series 2022 A, 5% 7/1/52 | | 2,250,000 | 2,378,044 |
| Series 2023 A: | | | |
5% 7/1/48 (Assured Guaranty Muni. Corp. Insured) | | 1,700,000 | 1,824,041 |
5% 7/1/64 (Assured Guaranty Muni. Corp. Insured) | | 1,125,000 | 1,188,471 |
5.25% 7/1/64 | | 1,800,000 | 1,932,153 |
5.5% 7/1/64 | | 1,990,000 | 2,162,820 |
| Series 2024 A, 5.25% 1/1/54 (Build America Mutual Assurance Insured) | | 1,650,000 | 1,804,399 |
| Series GG, 5% 1/1/26 | | 650,000 | 650,886 |
| Georgia Port Auth. Rev. Series 2022: | | | |
| 4% 7/1/52 | | 4,000,000 | 4,021,057 |
| 5% 7/1/47 | | 3,700,000 | 4,032,149 |
| 5.25% 7/1/52 | | 4,275,000 | 4,694,982 |
| Georgia Road & Thruway Auth. Rev.: | | | |
| Series 2020: | | | |
5% 6/1/31 | | 1,415,000 | 1,576,548 |
5% 6/1/32 | | 2,120,000 | 2,353,257 |
| Series 2021 A: | | | |
3% 7/15/49 | | 2,190,000 | 1,785,557 |
3% 7/15/50 | | 2,500,000 | 2,023,305 |
| Glynn-Brunswick Memorial Hosp. Auth. Rev.: | | | |
| (Southeast Georgia Health Sys. Proj.) Series 2017: | | | |
4% 8/1/43 | | 270,000 | 245,485 |
5% 8/1/43 | | 330,000 | 332,067 |
| (Southwest Georgia Health Sys. Proj.) Series 2020: | | | |
4% 8/1/35 | | 45,000 | 43,513 |
4% 8/1/36 | | 70,000 | 67,218 |
4% 8/1/37 | | 40,000 | 38,112 |
| Griffin-Spalding County Hosp. (Wellstar Health Sys., Inc. Proj.) Series 2017 A: | | | |
| 4% 4/1/42 | | 810,000 | 810,832 |
| 5% 4/1/37 | | 440,000 | 454,773 |
| Hosp. Auth. of Savannah Auth. Rev. Series 2019 A: | | | |
| 4% 7/1/35 | | 275,000 | 278,104 |
| 4% 7/1/36 | | 1,090,000 | 1,101,393 |
| 4% 7/1/43 | | 1,285,000 | 1,277,805 |
| Macon-Bibb County Urban Dev. Auh. Series 2017 A: | | | |
| 5% 6/15/27 (g) | | 25,000 | 25,351 |
| 5.75% 6/15/37 (g) | | 220,000 | 227,566 |
| 5.875% 6/15/47 (g) | | 350,000 | 358,957 |
| 6% 6/15/52 (g) | | 215,000 | 220,517 |
| Main Street Natural Gas, Inc.: | | | |
| Bonds: | | | |
Series 2019 B, 4%, tender 12/1/24 (b) | | 2,690,000 | 2,690,000 |
Series 2019 C, 4%, tender 9/1/26 (b) | | 5,635,000 | 5,683,589 |
Series 2021 A, 4%, tender 9/1/27 (b) | | 46,345,000 | 46,981,915 |
Series 2021 C, 4%, tender 12/1/28 (b) | | 8,770,000 | 8,893,127 |
Series 2022 B, 5%, tender 6/1/29 (b) | | 5,325,000 | 5,646,151 |
Series 2022 E, 4%, tender 12/1/29 (b) | | 13,870,000 | 14,096,540 |
Series 2023 A, 5%, tender 6/1/30 (b) | | 5,500,000 | 5,854,940 |
Series 2023 C, 5%, tender 9/1/30 (b) | | 15,305,000 | 16,400,287 |
Series 2023 D, 5%, tender 12/1/30 (b) | | 13,250,000 | 14,160,692 |
Series 2023 E2, 4.769%, tender 6/1/31 (Liquidity Facility Royal Bank of Canada) (b) | | 1,500,000 | 1,546,467 |
Series 2024 A1, 5%, tender 9/1/31 (b) | | 1,235,000 | 1,334,973 |
Series 2024 B, 5%, tender 3/1/32 (b) | | 2,850,000 | 3,096,162 |
Series 2024 C, 5%, tender 12/1/31 (b) | | 3,000,000 | 3,214,482 |
Series 2024 D, 5%, tender 4/1/31 (b) | | 1,580,000 | 1,701,223 |
| Series 2019 A: | | | |
4% 5/15/39 | | 250,000 | 237,259 |
5% 5/15/31 | | 2,410,000 | 2,516,542 |
5% 5/15/32 | | 740,000 | 771,270 |
5% 5/15/34 | | 730,000 | 756,414 |
5% 5/15/37 | | 375,000 | 403,769 |
5% 5/15/43 | | 865,000 | 898,073 |
5% 5/15/49 | | 1,250,000 | 1,374,614 |
| Main Street Natural Gas, Inc. Georgia Gas Proj. Rev. Series 2007 A: | | | |
| 5.5% 9/15/26 | | 2,590,000 | 2,674,904 |
| 5.5% 9/15/27 | | 750,000 | 789,578 |
| 5.5% 9/15/28 | | 370,000 | 394,735 |
| Marietta Dev. Auth. Rev.: | | | |
| (Life Univ., Inc. Proj.) Series 2017 A: | | | |
5% 11/1/27 (g) | | 385,000 | 389,920 |
5% 11/1/37 (g) | | 395,000 | 399,028 |
| (Life Univ., Inc. Proj.) Series 2017 A, 5% 11/1/47 (g) | | 1,550,000 | 1,536,155 |
| Monroe County Dev. Auth. Poll. Cont. Rev.: | | | |
| (Georgia Pwr. Co. Plant Scherer Proj.) Series 1995, 2.25% 7/1/25 | | 70,000 | 69,178 |
| Bonds (Oglethorpe Pwr. Corp. Scherer Proj.) Series 2013 A, 1.5%, tender 2/3/25 (b) | | 1,825,000 | 1,813,167 |
| Paulding County Hosp. Auth. Rev. Series 2022 A: | | | |
| 5% 4/1/26 | | 15,000 | 15,378 |
| 5% 4/1/27 | | 10,000 | 10,447 |
| 5% 4/1/28 | | 25,000 | 26,591 |
| 5% 4/1/29 | | 20,000 | 21,609 |
| 5% 4/1/30 | | 15,000 | 16,423 |
| 5% 4/1/31 | | 20,000 | 22,117 |
| 5% 4/1/32 | | 15,000 | 16,762 |
| Private Colleges & Univs. Auth. Rev.: | | | |
| (The Savannah College of Art & Design Projs.) Series 2021: | | | |
4% 4/1/37 | | 705,000 | 720,054 |
4% 4/1/38 | | 85,000 | 86,686 |
4% 4/1/40 | | 80,000 | 80,967 |
5% 4/1/27 | | 25,000 | 26,116 |
5% 4/1/30 | | 390,000 | 424,594 |
5% 4/1/31 | | 40,000 | 44,065 |
5% 4/1/36 | | 490,000 | 535,292 |
| Series 2016 B, 5% 10/1/38 | | 865,000 | 889,842 |
| Series 2020 B: | | | |
4% 9/1/37 | | 950,000 | 984,500 |
4% 9/1/38 | | 1,425,000 | 1,472,170 |
5% 9/1/25 | | 875,000 | 888,153 |
5% 9/1/33 | | 140,000 | 156,134 |
| World Congress Ctr. Auth. Convention Ctr. Hotel Second Tier Rev.: | | | |
| Series 2021 A: | | | |
2.375% 1/1/31 | | 390,000 | 358,881 |
4% 1/1/36 | | 1,330,000 | 1,344,779 |
4% 1/1/54 | | 8,110,000 | 7,554,150 |
| Series 2021 B: | | | |
3.625% 1/1/31 (g) | | 505,000 | 479,653 |
5% 1/1/36 (g) | | 710,000 | 720,256 |
5% 1/1/54 (g) | | 4,145,000 | 4,069,469 |
TOTAL GEORGIA | | | 339,803,383 |
| Guam - 0.1% | | | |
| Guam Dept. of Ed. (John F. Kennedy High School Rfdg. And Energy Efficiency Proj.) Series 2020 A, 5% 2/1/40 | | 300,000 | 300,320 |
| Guam Govt. Bus. Privilege Tax Rev.: | | | |
| Series 2015 D: | | | |
5% 11/15/34 | | 470,000 | 474,420 |
5% 11/15/35 | | 400,000 | 403,450 |
| Series 2021 F: | | | |
4% 1/1/42 | | 805,000 | 786,685 |
5% 1/1/29 | | 240,000 | 253,322 |
| Series 2021, 4% 1/1/36 | | 1,580,000 | 1,583,205 |
| Guam Int'l. Arpt. Auth. Rev.: | | | |
| Series 2021 A: | | | |
3.839% 10/1/36 | | 180,000 | 156,260 |
4.46% 10/1/43 | | 205,000 | 175,335 |
| Series 2023 A: | | | |
5.25% 10/1/30 (e) | | 1,500,000 | 1,604,705 |
5.375% 10/1/40 (e) | | 525,000 | 569,091 |
| Series 2024 A: | | | |
5.25% 10/1/37 (e) | | 175,000 | 189,647 |
5.25% 10/1/39 (e) | | 200,000 | 216,747 |
5.25% 10/1/41 (e) | | 200,000 | 215,836 |
| Guam Pwr. Auth. Rev. Series 2022 A: | | | |
| 5% 10/1/38 | | 1,000,000 | 1,087,528 |
| 5% 10/1/43 | | 200,000 | 212,762 |
| 5% 10/1/44 | | 1,350,000 | 1,430,472 |
| Guam Wtrwks. Auth. Wtr. and Wastewtr. Sys. Rev. Series 2016, 5% 1/1/46 | | 750,000 | 760,254 |
| Port Auth. of Guam Port Rev. Series 2018 A, 5% 7/1/48 | | 350,000 | 355,408 |
TOTAL GUAM | | | 10,775,447 |
| Hawaii - 0.1% | | | |
| Hawaii Arpts. Sys. Rev.: | | | |
| Series 2018 A: | | | |
5% 7/1/29 (e) | | 155,000 | 162,935 |
5% 7/1/30 (e) | | 185,000 | 194,311 |
5% 7/1/31 (e) | | 175,000 | 183,564 |
5% 7/1/32 (e) | | 185,000 | 193,314 |
5% 7/1/33 (e) | | 185,000 | 193,077 |
5% 7/1/43 (e) | | 1,770,000 | 1,818,309 |
| Series 2022 A: | | | |
4% 7/1/40 (e) | | 250,000 | 249,855 |
5% 7/1/47 (e) | | 1,000,000 | 1,049,243 |
| Hawaii Dept. of Budget & Fin. Spl. Purp. Rev.: | | | |
| Series 2018, 6% 7/1/28 (g) | | 1,000,000 | 1,028,197 |
| Series 2019, 3.5% 10/1/49 (e) | | 1,900,000 | 1,563,795 |
| Hawaii Gen. Oblig.: | | | |
| Series 2020 A, 4% 7/1/36 (e) | | 150,000 | 150,554 |
| Series 2020 C: | | | |
4% 7/1/37 | | 60,000 | 61,799 |
4% 7/1/38 | | 70,000 | 71,913 |
4% 7/1/40 | | 60,000 | 61,014 |
| Series FG, 5% 10/1/27 | | 65,000 | 67,622 |
| Honolulu City & County Gen. Oblig. Series 2022 A, 5% 11/1/25 | | 270,000 | 275,320 |
| Honolulu City and County Wastewtr. Sys.: | | | |
| Series 2016 A, 3% 7/1/41 | | 2,700,000 | 2,364,019 |
| Series 2025 A, 5% 7/1/38 (d) | | 1,000,000 | 1,148,803 |
| Kauai County Hawaii Cmnty. Facilities D: | | | |
| (Kukui'ula Dev. Proj.) Series 2019 1, 5% 5/15/49 | | 250,000 | 248,645 |
| Series 2022: | | | |
4.375% 5/15/42 | | 250,000 | 236,176 |
5% 5/15/51 | | 550,000 | 552,361 |
TOTAL HAWAII | | | 11,874,826 |
| Idaho - 0.2% | | | |
| Avimor Cmnty. Infrastructure Di Series 2024 B, 5.5% 9/1/53 (g) | | 1,361,000 | 1,395,740 |
| Idaho Energy Resources Auth. (Idaho Falls Pwr. Proj.) Series 2024, 5% 9/15/37 | | 1,000,000 | 1,142,142 |
| Idaho Health Facilities Auth. Rev.: | | | |
| (St. Luke's Health Sys. Proj.): | | | |
Series 2014 A, 5% 3/1/39 | | 2,575,000 | 2,575,574 |
Series 2021 A, 3% 3/1/51 | | 250,000 | 193,978 |
| Series 2015 ID: | | | |
5% 12/1/24 | | 30,000 | 30,003 |
5.5% 12/1/27 | | 180,000 | 182,148 |
| Idaho Hsg. & Fin. Assn Sales Tax Series 2023 A, 5.25% 8/15/48 | | 8,900,000 | 9,906,370 |
| Idaho Hsg. & Fin. Assoc. Single Family Mtg.: | | | |
| (Idaho St Garvee Proj.) Series 2017 A: | | | |
5% 7/15/25 | | 40,000 | 40,486 |
5% 7/15/26 | | 30,000 | 31,044 |
| Series 2019 A, 4% 1/1/50 | | 760,000 | 764,183 |
| Series 2021 A: | | | |
5% 7/15/29 | | 190,000 | 208,444 |
5% 7/15/30 | | 65,000 | 72,340 |
5% 7/15/31 | | 40,000 | 45,014 |
5% 7/15/32 | | 80,000 | 89,746 |
| Series 2023 C: | | | |
4.75% 7/1/48 | | 995,000 | 1,031,941 |
4.8% 7/1/53 | | 995,000 | 1,016,364 |
| Series 2024 A, 4.65% 1/1/54 | | 875,000 | 881,427 |
| Idaho Hsg. and Fin. Assoc.: | | | |
| (Gem Prep: Meridian Proj.) Series 2022 A, 4% 5/1/57 | | 300,000 | 266,270 |
| (Sage Int'l. School of Middleton Proj.) Series 2024 A, 4.75% 5/1/54 | | 395,000 | 396,774 |
| (White Pine Charter School Proj.) Series 2023 A, 5.75% 5/1/48 | | 525,000 | 564,101 |
| Pwr. County Idaho Indl. Dev. Corp. Solid Waste Disp. Rev. Series 1999, 6.45% 8/1/32 (e) | | 640,000 | 642,062 |
| Spring Valley Cmnty. Infrastructure District No. 1 Eagle Spl. Assessment: | | | |
| Series 2021, 3.75% 9/1/51 (g) | | 4,527,000 | 4,316,665 |
| Series 2024, 6.25% 9/1/53 (g) | | 1,500,000 | 1,596,535 |
TOTAL IDAHO | | | 27,389,351 |
| Illinois - 6.5% | | | |
| Bellwood Ill Tax Increment Rev.: | | | |
| (Bellwood Workforce Hsg. Proj.) Series 2024, 5% 12/1/38 | | 825,000 | 875,330 |
| Bellwood Workforce Hsg. Proj. Series 2024, 5% 12/1/39 | | 220,000 | 232,414 |
| Bridgeview Fin. Corp. Series 2017 A, 5% 12/1/42 | | 350,000 | 327,938 |
| Bridgeview Gen. Oblig.: | | | |
| Series 2005, 5.14% 12/1/36 | | 1,960,000 | 1,796,032 |
| Series 2015 A, 5.625% 12/1/41 | | 250,000 | 250,436 |
| Carol Stream Park District Dupage County Series 2020 C, 3% 11/1/32 | | 265,000 | 257,733 |
| Champaign County Cmnty. Unit: | | | |
| Series 2019: | | | |
4% 6/1/26 | | 5,000 | 5,069 |
4% 6/1/27 | | 55,000 | 56,315 |
4% 6/1/28 | | 40,000 | 41,348 |
4% 6/1/29 | | 100,000 | 104,152 |
4% 6/1/30 | | 65,000 | 67,436 |
4% 6/1/31 | | 80,000 | 82,765 |
4% 6/1/34 | | 65,000 | 66,564 |
4% 6/1/35 | | 85,000 | 86,925 |
4% 6/1/36 | | 100,000 | 102,117 |
| Series 2020 A: | | | |
5% 1/1/29 | | 45,000 | 47,767 |
5% 1/1/30 | | 40,000 | 42,422 |
5% 1/1/31 | | 55,000 | 58,198 |
5% 1/1/33 | | 105,000 | 110,813 |
| Chicago Board of Ed.: | | | |
| Series 1998 B, 0% 12/1/30 | | 400,000 | 316,132 |
| Series 1998 B1: | | | |
0% 12/1/27 (FGIC Insured) | | 2,180,000 | 1,945,227 |
0% 12/1/29 (Assured Guaranty Muni. Corp. Insured) | | 1,995,000 | 1,658,324 |
| Series 1999 A: | | | |
0% 12/1/26 (Nat'l. Pub. Fin. Guarantee Corp. Insured) | | 2,750,000 | 2,548,662 |
0% 12/1/27 (FGIC Insured) | | 300,000 | 267,692 |
0% 12/1/29 | | 700,000 | 576,190 |
0% 12/1/30 (Nat'l. Pub. Fin. Guarantee Corp. Insured) | | 305,000 | 241,051 |
5.5% 12/1/26 (Assured Guaranty, Inc. Insured) (FGIC Insured) | | 500,000 | 519,664 |
| Series 2005 A: | | | |
5.5% 12/1/29 (AMBAC Insured) | | 165,000 | 173,088 |
5.5% 12/1/30 (AMBAC Insured) | | 120,000 | 126,792 |
5.5% 12/1/31 (AMBAC Insured) | | 330,000 | 350,154 |
| Series 2012 A, 5% 12/1/42 | | 3,625,000 | 3,606,383 |
| Series 2015 C, 5.25% 12/1/35 | | 130,000 | 130,032 |
| Series 2016 A, 7% 12/1/44 | | 1,955,000 | 1,996,126 |
| Series 2016 B, 6.5% 12/1/46 | | 40,000 | 41,295 |
| Series 2016: | | | |
5.75% 4/1/35 | | 1,670,000 | 1,739,956 |
6% 4/1/46 | | 8,945,000 | 9,266,506 |
| Series 2017 A, 7% 12/1/46 (g) | | 690,000 | 737,422 |
| Series 2017 B, 7% 12/1/42 (g) | | 400,000 | 429,453 |
| Series 2017 C: | | | |
5% 12/1/25 | | 560,000 | 564,787 |
5% 12/1/26 | | 65,000 | 66,265 |
5% 12/1/30 | | 310,000 | 316,393 |
| Series 2017 D, 5% 12/1/31 | | 475,000 | 483,533 |
| Series 2017 G: | | | |
5% 12/1/34 | | 195,000 | 197,119 |
5% 12/1/44 | | 600,000 | 601,265 |
| Series 2017 H: | | | |
5% 12/1/36 | | 480,000 | 484,029 |
5% 12/1/46 | | 1,020,000 | 1,020,054 |
| Series 2017: | | | |
5% 4/1/36 | | 215,000 | 218,863 |
5% 4/1/37 | | 210,000 | 213,560 |
5% 4/1/42 | | 380,000 | 383,667 |
5% 4/1/46 | | 920,000 | 925,187 |
| Series 2018 A: | | | |
5% 12/1/24 (Assured Guaranty Muni. Corp. Insured) | | 295,000 | 295,015 |
5% 12/1/25 | | 70,000 | 70,598 |
5% 12/1/26 | | 70,000 | 71,363 |
5% 12/1/27 (Assured Guaranty Muni. Corp. Insured) | | 1,250,000 | 1,305,374 |
5% 12/1/28 | | 575,000 | 597,239 |
5% 12/1/29 | | 250,000 | 258,381 |
5% 12/1/30 | | 835,000 | 860,162 |
5% 12/1/32 | | 100,000 | 102,609 |
5% 12/1/34 (Assured Guaranty Muni. Corp. Insured) | | 100,000 | 104,278 |
5% 12/1/35 | | 70,000 | 71,291 |
5% 12/1/35 (Assured Guaranty Muni. Corp. Insured) | | 100,000 | 104,075 |
| Series 2018 C: | | | |
5% 12/1/24 | | 100,000 | 100,006 |
5% 12/1/25 | | 580,000 | 584,958 |
5% 12/1/32 (Assured Guaranty Muni. Corp. Insured) | | 2,500,000 | 2,614,174 |
5% 12/1/46 | | 1,425,000 | 1,425,100 |
| Series 2018: | | | |
5% 4/1/38 | | 290,000 | 297,412 |
5% 4/1/42 | | 1,060,000 | 1,077,600 |
5% 4/1/46 | | 350,000 | 353,839 |
| Series 2019 A: | | | |
5% 12/1/25 | | 140,000 | 141,197 |
5% 12/1/26 | | 115,000 | 117,238 |
5% 12/1/28 | | 405,000 | 420,664 |
5% 12/1/29 | | 175,000 | 183,194 |
5% 12/1/30 | | 1,040,000 | 1,081,444 |
5% 12/1/31 | | 465,000 | 482,251 |
5% 12/1/33 | | 1,090,000 | 1,123,311 |
| Series 2021 A: | | | |
5% 12/1/35 | | 2,500,000 | 2,579,861 |
5% 12/1/36 | | 195,000 | 200,332 |
5% 12/1/37 | | 750,000 | 768,421 |
5% 12/1/38 | | 250,000 | 255,509 |
5% 12/1/39 | | 2,690,000 | 2,742,393 |
5% 12/1/40 | | 2,015,000 | 2,046,082 |
| Series 2021 B: | | | |
5% 12/1/31 | | 350,000 | 365,277 |
5% 12/1/36 | | 615,000 | 631,815 |
| Series 2022 A: | | | |
4% 12/1/47 | | 500,000 | 432,071 |
4% 12/1/47 | | 3,485,000 | 2,969,216 |
5% 12/1/43 | | 7,015,000 | 7,080,763 |
5% 12/1/47 | | 5,685,000 | 5,685,322 |
| Series 2022 B: | | | |
4% 12/1/35 | | 1,535,000 | 1,462,708 |
4% 12/1/36 | | 2,880,000 | 2,725,888 |
4% 12/1/38 | | 475,000 | 441,753 |
4% 12/1/39 | | 1,000,000 | 921,237 |
4% 12/1/40 | | 265,000 | 241,124 |
4% 12/1/41 | | 1,965,000 | 1,766,266 |
| Series 2023 A: | | | |
5.875% 12/1/47 | | 2,135,000 | 2,311,280 |
6% 12/1/49 | | 2,705,000 | 2,942,610 |
| Series 2023: | | | |
5% 4/1/45 | | 795,000 | 832,003 |
5.75% 4/1/48 | | 8,195,000 | 8,981,629 |
| Chicago Gen. Oblig.: | | | |
| (Cap. Impt. Proj.) Series 1999, 0% 1/1/27 (Escrowed to Maturity) | | 385,000 | 360,919 |
| (City Colleges Proj.) Series 1999, 0% 1/1/26 (Escrowed to Maturity) | | 2,065,000 | 1,994,054 |
| Series 2005 D, 5.5% 1/1/40 | | 1,690,000 | 1,689,983 |
| Series 2007 E, 5.5% 1/1/35 | | 210,000 | 210,074 |
| Series 2013 A, 5.5% 1/1/33 | | 195,000 | 195,097 |
| Series 2015 C, 5% 1/1/38 | | 500,000 | 502,268 |
| Series 2017 A: | | | |
5.625% 1/1/31 | | 60,000 | 62,192 |
5.75% 1/1/34 | | 300,000 | 310,746 |
6% 1/1/38 | | 1,000,000 | 1,038,702 |
6% 1/1/38 | | 12,425,000 | 12,880,025 |
| Series 2019 A: | | | |
5% 1/1/39 | | 920,000 | 944,304 |
5% 1/1/40 | | 790,000 | 808,855 |
5% 1/1/44 | | 5,450,000 | 5,537,923 |
5.5% 1/1/35 | | 3,065,000 | 3,245,807 |
5.5% 1/1/49 | | 6,040,000 | 6,220,228 |
| Series 2020 A: | | | |
5% 1/1/26 | | 230,000 | 233,686 |
5% 1/1/27 | | 1,485,000 | 1,530,391 |
5% 1/1/28 | | 2,830,000 | 2,952,969 |
5% 1/1/29 | | 2,310,000 | 2,439,966 |
5% 1/1/30 | | 4,310,000 | 4,593,744 |
5% 1/1/32 | | 85,000 | 89,936 |
| Series 2021 A: | | | |
4% 1/1/35 | | 530,000 | 532,194 |
5% 1/1/31 | | 95,000 | 101,994 |
5% 1/1/32 | | 5,245,000 | 5,598,827 |
5% 1/1/33 | | 990,000 | 1,049,799 |
5% 1/1/34 | | 705,000 | 744,567 |
| Series 2021 B: | | | |
4% 1/1/32 | | 82,000 | 83,162 |
4% 1/1/37 | | 250,000 | 249,587 |
4% 1/1/38 | | 110,000 | 109,224 |
| Series 2023 A: | | | |
5.25% 1/1/38 | | 10,840,000 | 11,528,364 |
5.5% 1/1/39 | | 1,630,000 | 1,753,389 |
5.5% 1/1/40 | | 600,000 | 642,987 |
5.5% 1/1/41 | | 6,235,000 | 6,551,129 |
5.5% 1/1/43 | | 955,000 | 998,805 |
| Chicago Midway Arpt. Rev.: | | | |
| Series 2016 A: | | | |
4% 1/1/33 (e) | | 905,000 | 906,687 |
5% 1/1/28 (e) | | 245,000 | 248,126 |
| Series 2016 B: | | | |
4% 1/1/35 | | 235,000 | 235,615 |
5% 1/1/36 | | 495,000 | 501,626 |
5% 1/1/37 | | 625,000 | 633,050 |
5% 1/1/46 | | 660,000 | 665,042 |
| Series 2023, 5.75% 1/1/48 (Build America Mutual Assurance Insured) (e) | | 1,025,000 | 1,143,539 |
| Chicago O'Hare Int'l. Arpt. Rev.: | | | |
| Series 2015 A, 5% 1/1/27 (e) | | 1,475,000 | 1,476,648 |
| Series 2015 B, 5% 1/1/28 | | 635,000 | 635,814 |
| Series 2015 C, 5% 1/1/46 (e) | | 290,000 | 290,324 |
| Series 2016 B: | | | |
5% 1/1/35 | | 540,000 | 546,790 |
5% 1/1/41 | | 360,000 | 363,663 |
| Series 2016 C: | | | |
5% 1/1/32 | | 265,000 | 268,957 |
5% 1/1/33 | | 405,000 | 410,429 |
5% 1/1/36 | | 1,500,000 | 1,518,489 |
| Series 2016 D, 5% 1/1/47 | | 3,420,000 | 3,485,235 |
| Series 2016 G: | | | |
5% 1/1/37 (e) | | 245,000 | 249,496 |
5% 1/1/47 (e) | | 395,000 | 398,997 |
5% 1/1/52 (e) | | 365,000 | 367,867 |
5.25% 1/1/29 (e) | | 40,000 | 41,370 |
5.25% 1/1/31 (e) | | 50,000 | 51,660 |
| Series 2017 A, 5% 1/1/31 | | 430,000 | 445,203 |
| Series 2017 B: | | | |
5% 1/1/34 | | 85,000 | 87,787 |
5% 1/1/35 | | 395,000 | 407,594 |
5% 1/1/36 | | 90,000 | 92,772 |
5% 1/1/37 | | 1,395,000 | 1,436,614 |
5% 1/1/38 | | 125,000 | 128,589 |
| Series 2017 C: | | | |
5% 1/1/30 | | 75,000 | 77,699 |
5% 1/1/31 | | 75,000 | 77,652 |
5% 1/1/32 | | 80,000 | 82,750 |
| Series 2017 D: | | | |
5% 1/1/28 (e) | | 365,000 | 375,803 |
5% 1/1/29 (e) | | 305,000 | 313,930 |
5% 1/1/32 (e) | | 330,000 | 337,732 |
5% 1/1/34 (e) | | 495,000 | 505,528 |
5% 1/1/35 (e) | | 365,000 | 372,437 |
5% 1/1/36 (e) | | 450,000 | 458,688 |
5% 1/1/37 (e) | | 245,000 | 249,496 |
5% 1/1/52 (e) | | 500,000 | 503,927 |
| Series 2018 A: | | | |
4% 1/1/43 (e) | | 2,500,000 | 2,474,390 |
5% 1/1/37 (e) | | 3,680,000 | 3,824,277 |
5% 1/1/38 (e) | | 2,880,000 | 2,992,349 |
5% 1/1/39 (e) | | 2,415,000 | 2,500,348 |
5% 1/1/48 (e) | | 2,095,000 | 2,144,038 |
5% 1/1/53 (e) | | 690,000 | 706,109 |
| Series 2018 B: | | | |
5% 1/1/36 | | 145,000 | 154,269 |
5% 1/1/37 | | 210,000 | 223,030 |
5% 1/1/48 | | 735,000 | 763,615 |
5% 1/1/53 | | 90,000 | 93,189 |
| Series 2020 A: | | | |
4% 1/1/36 | | 2,500,000 | 2,534,197 |
4% 1/1/36 (Assured Guaranty Muni. Corp. Insured) | | 1,900,000 | 1,930,394 |
4% 1/1/38 | | 45,000 | 45,402 |
| Series 2022 A: | | | |
4.5% 1/1/48 (e) | | 4,235,000 | 4,280,542 |
4.625% 1/1/53 (e) | | 2,325,000 | 2,340,454 |
5.5% 1/1/53 (Assured Guaranty Muni. Corp. Insured) (e) | | 5,750,000 | 6,173,344 |
5.5% 1/1/55 (e) | | 740,000 | 795,559 |
| Series 2022 C: | | | |
5% 1/1/37 (e) | | 1,000,000 | 1,067,494 |
5% 1/1/38 (e) | | 1,000,000 | 1,063,986 |
5% 1/1/39 (e) | | 1,400,000 | 1,481,052 |
5% 1/1/41 (e) | | 2,000,000 | 2,100,153 |
| Series 2023: | | | |
5% 1/1/38 (Build America Mutual Assurance Insured) | | 785,000 | 875,744 |
5.25% 1/1/43 (Build America Mutual Assurance Insured) | | 605,000 | 673,070 |
| Series 2024 A: | | | |
5% 1/1/36 (e) | | 795,000 | 858,049 |
5% 1/1/39 (e) | | 1,780,000 | 1,907,255 |
5.5% 1/1/59 (e) | | 2,075,000 | 2,267,026 |
| Series 2024 C: | | | |
5% 1/1/38 (e) | | 760,000 | 825,507 |
5% 1/1/39 (e) | | 2,250,000 | 2,434,941 |
5.25% 1/1/40 (e) | | 1,285,000 | 1,433,541 |
| Chicago O'Hare Int'l. Arpt. Spl. Facilities Rev. Series 2018: | | | |
| 5% 7/1/33 (e) | | 155,000 | 159,648 |
| 5% 7/1/38 (e) | | 715,000 | 730,655 |
| 5% 7/1/48 (e) | | 3,915,000 | 3,954,714 |
| Chicago Park District Gen. Oblig. Series 2021 C, 4% 1/1/35 | | 890,000 | 902,245 |
| Chicago Transit Auth.: | | | |
| Series 2014, 5% 12/1/44 (Assured Guaranty Muni. Corp. Insured) | | 2,500,000 | 2,501,362 |
| Series 2017: | | | |
5% 12/1/46 | | 150,000 | 152,746 |
5% 12/1/51 | | 2,370,000 | 2,407,703 |
| Series 2020 A: | | | |
4% 12/1/50 (Build America Mutual Assurance Insured) | | 1,635,000 | 1,608,078 |
4% 12/1/55 | | 675,000 | 643,763 |
5% 12/1/45 | | 2,165,000 | 2,273,020 |
5% 12/1/55 | | 360,000 | 372,194 |
| Series 2022 A: | | | |
4% 12/1/49 | | 1,205,000 | 1,181,528 |
5% 12/1/57 | | 2,115,000 | 2,211,357 |
| Chicago Transit Auth. Cap. Grant Receipts Rev. Series 2017: | | | |
| 5% 6/1/25 | | 75,000 | 75,528 |
| 5% 6/1/26 | | 120,000 | 122,869 |
| Chicago Wastewtr. Transmission Rev.: | | | |
| Series 1998, 0% 1/1/26 (Nat'l. Pub. Fin. Guarantee Corp. Insured) | | 2,235,000 | 2,156,149 |
| Series 2008 C: | | | |
5% 1/1/34 | | 140,000 | 140,231 |
5% 1/1/35 | | 140,000 | 140,231 |
5% 1/1/39 | | 480,000 | 480,791 |
| Series 2017 A: | | | |
5% 1/1/47 | | 385,000 | 394,155 |
5.25% 1/1/42 (Assured Guaranty Muni. Corp. Insured) | | 1,250,000 | 1,289,662 |
| Series 2017 B: | | | |
5% 1/1/30 | | 1,150,000 | 1,195,298 |
5% 1/1/36 | | 970,000 | 999,283 |
5% 1/1/38 | | 240,000 | 247,045 |
| Series 2023 A: | | | |
5.25% 1/1/53 (Assured Guaranty Muni. Corp. Insured) | | 1,750,000 | 1,901,013 |
5.25% 1/1/58 (Assured Guaranty Muni. Corp. Insured) | | 3,000,000 | 3,256,231 |
5.5% 1/1/62 (Assured Guaranty Muni. Corp. Insured) | | 750,000 | 837,892 |
| Series 2024 A: | | | |
5% 1/1/26 | | 500,000 | 510,087 |
5% 1/1/27 | | 600,000 | 624,977 |
5% 1/1/28 | | 600,000 | 637,555 |
| Chicago Wtr. Rev.: | | | |
| Series 2012, 4% 11/1/37 | | 85,000 | 85,035 |
| Series 2014, 5% 11/1/39 | | 1,000,000 | 1,000,985 |
| Series 2017 2: | | | |
5% 11/1/32 (Assured Guaranty Muni. Corp. Insured) | | 240,000 | 252,367 |
5% 11/1/34 (Assured Guaranty Muni. Corp. Insured) | | 1,445,000 | 1,516,319 |
5% 11/1/37 (Assured Guaranty Muni. Corp. Insured) | | 575,000 | 600,991 |
| Series 2017: | | | |
5% 11/1/29 | | 240,000 | 253,274 |
5.25% 11/1/35 (Assured Guaranty Muni. Corp. Insured) | | 750,000 | 785,962 |
| Series 2023 A, 5.25% 11/1/48 (Assured Guaranty Muni. Corp. Insured) | | 3,720,000 | 4,089,094 |
| Cook County Cmnty. College District Series 2017, 5% 12/1/47 | | 2,060,000 | 2,105,185 |
| Cook County Cmnty. Consolidated School District No. 59 Series 2020: | | | |
| 5% 3/1/25 | | 55,000 | 55,248 |
| 5% 3/1/28 | | 85,000 | 90,941 |
| Cook County Cmnty. Unit School District #401 Elmwood Park Series 2021, 4% 12/1/25 | | 1,500,000 | 1,512,399 |
| Cook County Gen. Oblig.: | | | |
| Series 2016 A: | | | |
5% 11/15/26 | | 690,000 | 716,441 |
5% 11/15/27 | | 340,000 | 352,268 |
5% 11/15/28 | | 445,000 | 460,886 |
5% 11/15/30 | | 605,000 | 625,900 |
5% 11/15/31 | | 2,400,000 | 2,480,144 |
| Series 2021 A: | | | |
5% 11/15/31 | | 235,000 | 261,388 |
5% 11/15/32 | | 155,000 | 171,288 |
5% 11/15/33 | | 1,475,000 | 1,628,058 |
| Series 2021 B: | | | |
4% 11/15/25 | | 560,000 | 564,415 |
4% 11/15/26 | | 285,000 | 290,553 |
4% 11/15/27 | | 290,000 | 298,270 |
4% 11/15/28 | | 145,000 | 149,952 |
| Cook County Ill High School District # Series 2021 A: | | | |
| 2% 12/15/33 | | 205,000 | 171,002 |
| 2% 12/15/34 | | 215,000 | 176,226 |
| Cook County Ill Hsd 209 Proviso Series 2018 B, 4% 12/1/38 (Assured Guaranty Muni. Corp. Insured) | | 905,000 | 915,646 |
| Cook County Sales Tax Rev.: | | | |
| Series 2018, 4% 11/15/37 | | 750,000 | 758,363 |
| Series 2021 A: | | | |
4% 11/15/39 | | 295,000 | 297,974 |
4% 11/15/40 | | 665,000 | 669,101 |
4% 11/15/41 | | 905,000 | 911,496 |
| Series 2022 A, 5.25% 11/15/45 | | 1,150,000 | 1,266,849 |
| DuPage & Cook Counties Cmnty. Unit School District #205 Series 2020, 3% 1/1/37 | | 1,885,000 | 1,758,291 |
| Elk Grove Village Series 2017, 5% 1/1/34 | | 325,000 | 338,249 |
| Galesburg Rev. (Knox College Proj.) Series 2021 A, 4% 10/1/46 | | 300,000 | 268,759 |
| Grundy & Will Counties Cmnty. School Gen. Oblig. Series 2018: | | | |
| 5% 2/1/29 | | 35,000 | 36,396 |
| 5% 2/1/29 (Pre-Refunded to 2/1/27 @ 100) | | 5,000 | 5,228 |
| Illinois Dev. Fin. Auth. Envir. Facilities Rev. Series 2002, 8% 6/1/32 (e) | | 245,000 | 245,329 |
| Illinois Fin. Auth.: | | | |
| Series 2016 C: | | | |
4% 2/15/41 | | 4,815,000 | 4,793,674 |
4% 2/15/41 (Pre-Refunded to 2/15/27 @ 100) | | 150,000 | 153,121 |
| Series 2020 A: | | | |
3% 5/15/50 | | 4,750,000 | 3,762,455 |
3% 5/15/50 (Build America Mutual Assurance Insured) | | 2,195,000 | 1,818,906 |
3.25% 8/15/49 | | 3,985,000 | 3,308,042 |
4% 8/15/39 | | 930,000 | 935,650 |
4% 8/15/40 | | 500,000 | 500,314 |
4% 5/15/50 | | 5,570,000 | 5,238,776 |
| Series 2021 A: | | | |
2.25% 7/1/33 (e) | | 115,000 | 95,936 |
5% 5/15/32 | | 135,000 | 136,863 |
5% 5/15/33 | | 145,000 | 146,920 |
5.125% 11/1/55 (g) | | 680,000 | 597,260 |
| Series 2021 B, 7% 11/1/37 (g) | | 210,000 | 208,135 |
| Series 2021: | | | |
4% 10/1/32 (g) | | 680,000 | 674,286 |
4% 10/1/33 | | 170,000 | 144,924 |
4% 10/1/33 (g) | | 1,065,000 | 1,050,624 |
4% 10/1/34 (g) | | 890,000 | 873,385 |
5% 10/1/31 | | 240,000 | 226,015 |
| Series 2022 A: | | | |
5% 8/15/47 | | 10,000,000 | 10,662,687 |
5% 8/15/51 | | 2,075,000 | 2,203,181 |
5% 8/15/52 | | 2,750,000 | 2,905,456 |
5.5% 10/1/42 | | 1,970,000 | 2,082,005 |
5.5% 10/1/47 | | 1,820,000 | 1,907,008 |
6.125% 5/15/35 | | 1,045,000 | 1,136,571 |
6.125% 5/15/36 | | 1,215,000 | 1,319,207 |
| Series 2022: | | | |
5% 3/1/34 | | 90,000 | 92,264 |
5% 3/1/38 | | 110,000 | 110,688 |
5% 3/1/42 | | 70,000 | 69,554 |
5% 6/1/44 | | 500,000 | 530,342 |
5% 3/1/47 | | 125,000 | 122,356 |
5% 6/1/47 | | 375,000 | 394,146 |
5% 3/1/52 | | 110,000 | 105,645 |
| Series 2023 A: | | | |
5.25% 8/1/38 (g) | | 300,000 | 328,128 |
5.5% 8/1/43 (g) | | 360,000 | 390,760 |
| Illinois Fin. Auth. Academic Facilities (Provident Group UIUC Properties LLC Univ. of Illinois at Urbana-Champaign Proj.) Series 2019 A: | | | |
| 5% 10/1/27 | | 15,000 | 15,778 |
| 5% 10/1/28 | | 15,000 | 16,036 |
| 5% 10/1/31 | | 10,000 | 10,797 |
| 5% 10/1/32 | | 15,000 | 16,115 |
| 5% 10/1/33 | | 30,000 | 32,112 |
| 5% 10/1/35 | | 15,000 | 15,958 |
| 5% 10/1/36 | | 15,000 | 15,931 |
| 5% 10/1/37 | | 20,000 | 21,209 |
| 5% 10/1/38 | | 20,000 | 21,183 |
| 5% 10/1/39 | | 35,000 | 37,196 |
| 5% 10/1/44 | | 305,000 | 321,235 |
| 5% 10/1/49 | | 370,000 | 385,119 |
| 5% 10/1/51 | | 390,000 | 405,084 |
| Illinois Fin. Auth. Health Svcs. Facility Lease Rev. (Provident Group - UIC Surgery Ctr. LLC - Univ. of Illinois Health Svcs. Facility Proj.) Series 2020: | | | |
| 4% 10/1/50 | | 2,155,000 | 1,997,655 |
| 4% 10/1/55 | | 250,000 | 227,831 |
| Illinois Fin. Auth. Rev.: | | | |
| (Bradley Univ. Proj.) Series 2017 C: | | | |
5% 8/1/29 | | 150,000 | 155,953 |
5% 8/1/30 | | 110,000 | 114,292 |
5% 8/1/31 | | 130,000 | 134,830 |
5% 8/1/32 | | 150,000 | 155,240 |
| (Depaul Univ. Proj.) Series 2016 A: | | | |
4% 10/1/31 | | 85,000 | 85,914 |
4% 10/1/34 | | 120,000 | 120,960 |
5% 10/1/29 | | 120,000 | 123,839 |
5% 10/1/30 | | 120,000 | 123,820 |
5% 10/1/33 | | 85,000 | 87,262 |
| (Franciscan Cmntys. Proj.) Series 2017 A, 5% 5/15/37 | | 545,000 | 553,444 |
| (Franciscan Communitites Proj.) Series 2017 A, 5% 5/15/47 | | 220,000 | 220,628 |
| (Northwestern Memorial Hosp.,IL. Proj.) Series 2017 A: | | | |
5% 7/15/25 | | 65,000 | 65,718 |
5% 7/15/30 | | 85,000 | 90,153 |
| (OSF Healthcare Sys.) Series 2018 A: | | | |
4.125% 5/15/47 | | 4,755,000 | 4,655,400 |
5% 5/15/43 | | 5,635,000 | 5,765,773 |
| (Presence Health Proj.) Series 2016 C: | | | |
3.625% 2/15/32 | | 140,000 | 140,096 |
4% 2/15/33 | | 30,000 | 30,377 |
5% 2/15/29 | | 945,000 | 986,645 |
5% 2/15/36 | | 610,000 | 631,834 |
| (Rosalind Franklin Univ. Research Bldg. Proj.) Series 2017 C: | | | |
5% 8/1/46 | | 295,000 | 298,183 |
5% 8/1/49 | | 190,000 | 191,533 |
| (Rush Univ. Med. Ctr. Proj.) Series 2015 A, 5% 11/15/34 | | 125,000 | 125,717 |
| (The Admiral at the Lake Proj.) Series 2017: | | | |
5% 5/15/33 | | 920,000 | 868,474 |
5.125% 5/15/38 | | 1,550,000 | 1,406,453 |
5.25% 5/15/42 | | 280,000 | 245,260 |
5.25% 5/15/54 | | 1,690,000 | 1,357,744 |
| (Township High School District # 207 Proj.) Series 2019, 4% 12/1/37 | | 875,000 | 896,045 |
| Series 2008 A1, 4% 11/1/30 | | 625,000 | 634,868 |
| Series 2013: | | | |
5% 11/15/28 | | 350,000 | 350,243 |
5% 11/15/29 | | 170,000 | 170,126 |
| Series 2015 A: | | | |
5% 11/15/31 | | 195,000 | 197,255 |
5% 12/1/37 | | 350,000 | 347,081 |
| Series 2015 C: | | | |
4.125% 8/15/37 | | 105,000 | 101,678 |
5% 8/15/35 | | 705,000 | 710,167 |
5% 8/15/44 | | 2,205,000 | 2,213,954 |
| Series 2015: | | | |
5.25% 5/15/45 (Pre-Refunded to 5/15/25 @ 100) | | 170,000 | 171,531 |
5.25% 5/15/50 (Pre-Refunded to 5/15/25 @ 100) | | 455,000 | 459,097 |
6.125% 11/15/35 | | 390,000 | 393,596 |
6.375% 11/15/43 | | 565,000 | 569,852 |
| Series 2016 A: | | | |
5% 2/15/29 | | 625,000 | 637,414 |
5% 7/1/30 (Pre-Refunded to 7/1/26 @ 100) | | 85,000 | 87,802 |
5% 7/1/33 (Pre-Refunded to 7/1/26 @ 100) | | 185,000 | 191,099 |
5% 8/15/35 (Pre-Refunded to 8/15/26 @ 100) | | 65,000 | 67,046 |
5% 7/1/36 (Pre-Refunded to 7/1/26 @ 100) | | 400,000 | 413,187 |
5% 8/15/36 (Pre-Refunded to 8/15/26 @ 100) | | 245,000 | 252,713 |
5.25% 8/15/29 (Pre-Refunded to 8/15/26 @ 100) | | 55,000 | 56,958 |
5.25% 8/15/31 (Pre-Refunded to 8/15/26 @ 100) | | 75,000 | 77,670 |
| Series 2016 B: | | | |
4% 8/15/41 | | 250,000 | 250,670 |
5% 8/15/30 | | 170,000 | 176,934 |
5% 8/15/33 | | 255,000 | 264,442 |
| Series 2016 C: | | | |
3.75% 2/15/34 | | 215,000 | 215,261 |
4% 2/15/36 | | 925,000 | 926,276 |
5% 2/15/31 | | 3,685,000 | 3,838,531 |
5% 2/15/32 | | 630,000 | 655,459 |
5% 2/15/34 | | 555,000 | 576,429 |
5% 2/15/41 | | 870,000 | 891,181 |
| Series 2016: | | | |
4% 12/1/35 | | 25,000 | 25,065 |
5% 5/15/29 | | 150,000 | 153,213 |
5% 12/1/29 | | 270,000 | 276,146 |
5% 12/1/33 | | 285,000 | 290,714 |
5% 12/1/40 | | 1,000,000 | 1,015,455 |
5% 12/1/46 | | 1,970,000 | 1,992,425 |
| Series 2017 A: | | | |
4% 7/15/47 | | 3,705,000 | 3,571,923 |
5% 8/1/42 | | 210,000 | 213,148 |
5% 3/1/47 | | 2,135,000 | 2,157,567 |
5% 8/1/47 | | 245,000 | 247,413 |
| Series 2017: | | | |
5% 1/1/29 | | 405,000 | 422,950 |
5% 2/15/32 | | 160,000 | 162,762 |
5% 7/1/33 | | 190,000 | 196,953 |
5% 2/15/37 | | 300,000 | 75,000 |
5.125% 2/15/45 | | 300,000 | 75,000 |
5.25% 2/15/37 | | 115,000 | 116,959 |
| Series 2019 A, 3% 7/1/35 (e) | | 75,000 | 67,497 |
| Series 2019: | | | |
4% 9/1/35 | | 375,000 | 344,054 |
4% 9/1/37 | | 1,020,000 | 915,678 |
4% 9/1/39 | | 55,000 | 48,154 |
5% 9/1/30 | | 10,000 | 10,193 |
5% 9/1/38 | | 50,000 | 49,749 |
| Illinois Fin. Auth. Student Hsg. and Academic Facility Rev.: | | | |
| (CHF - Chicago, LLC - Univ. of Illinois At Chicago Proj.) Series 2017 A, 5% 2/15/28 | | 40,000 | 41,191 |
| (CHF - Chicago, LLC - Univ. of Illinois at Chicago Proj.) Series 2017 A, 5% 2/15/37 | | 100,000 | 101,652 |
| (CHF - Chicago, LLC - Univ. of Illinois At Chicago Proj.) Series 2017 A: | | | |
5% 2/15/47 | | 1,410,000 | 1,418,757 |
5% 2/15/50 | | 1,050,000 | 1,055,946 |
| Illinois Gen. Oblig.: | | | |
| Series 2006: | | | |
5.5% 1/1/28 | | 320,000 | 342,507 |
5.5% 1/1/31 | | 110,000 | 123,894 |
| Series 2014 February, 5.25% 2/1/33 | | 1,865,000 | 1,868,894 |
| Series 2014: | | | |
5% 4/1/28 | | 310,000 | 310,595 |
5% 5/1/29 | | 500,000 | 500,930 |
5% 5/1/36 | | 2,165,000 | 2,169,028 |
5.25% 2/1/30 | | 425,000 | 425,887 |
5.25% 2/1/32 | | 1,590,000 | 1,593,320 |
| Series 2016: | | | |
4% 6/1/41 | | 1,900,000 | 1,872,296 |
4.5% 11/1/39 | | 400,000 | 402,115 |
5% 2/1/25 | | 555,000 | 556,439 |
5% 2/1/26 | | 395,000 | 403,469 |
5% 6/1/26 | | 180,000 | 184,958 |
5% 2/1/27 | | 7,130,000 | 7,414,921 |
5% 1/1/28 | | 1,000,000 | 1,017,789 |
5% 2/1/28 | | 195,000 | 202,312 |
5% 11/1/28 | | 425,000 | 437,829 |
5% 2/1/29 | | 315,000 | 326,181 |
5% 1/1/33 | | 600,000 | 608,941 |
5% 11/1/33 | | 445,000 | 456,420 |
| Series 2017 A: | | | |
4.5% 12/1/41 | | 350,000 | 353,247 |
5% 12/1/26 | | 185,000 | 191,891 |
5% 12/1/34 | | 625,000 | 650,590 |
| Series 2017 B, 5% 12/1/27 | | 450,000 | 474,619 |
| Series 2017 C, 5% 11/1/29 | | 3,305,000 | 3,456,965 |
| Series 2017 D: | | | |
5% 11/1/25 | | 75,000 | 76,255 |
5% 11/1/26 | | 3,110,000 | 3,220,581 |
5% 11/1/27 | | 14,385,000 | 15,147,736 |
5% 11/1/28 | | 4,650,000 | 4,866,876 |
| Series 2018 A: | | | |
5% 10/1/26 | | 85,000 | 87,865 |
5% 10/1/28 | | 260,000 | 277,568 |
5% 10/1/29 | | 105,000 | 111,535 |
5% 10/1/30 | | 1,170,000 | 1,238,992 |
5% 10/1/31 | | 295,000 | 311,577 |
5% 5/1/39 | | 725,000 | 751,022 |
6% 5/1/27 | | 1,475,000 | 1,575,191 |
| Series 2018 B: | | | |
5% 10/1/26 | | 65,000 | 67,191 |
5% 10/1/31 | | 765,000 | 807,706 |
5% 10/1/32 | | 795,000 | 836,897 |
| Series 2019 B, 4% 11/1/33 | | 1,475,000 | 1,493,439 |
| Series 2019 C, 4% 11/1/41 | | 700,000 | 689,675 |
| Series 2020 B: | | | |
4% 10/1/32 | | 475,000 | 482,740 |
5% 10/1/28 | | 280,000 | 298,919 |
| Series 2020 C: | | | |
4% 10/1/41 | | 350,000 | 345,511 |
4.25% 10/1/45 | | 800,000 | 804,686 |
| Series 2020: | | | |
4% 10/1/42 | | 350,000 | 346,488 |
5.5% 5/1/25 | | 400,000 | 403,678 |
5.5% 5/1/26 | | 475,000 | 490,662 |
5.5% 5/1/39 | | 1,655,000 | 1,804,417 |
5.75% 5/1/45 | | 925,000 | 1,014,187 |
| Series 2021 A: | | | |
4% 3/1/38 | | 1,705,000 | 1,705,019 |
4% 3/1/40 | | 1,800,000 | 1,784,893 |
5% 3/1/25 | | 895,000 | 898,587 |
5% 3/1/32 | | 20,000 | 21,911 |
5% 3/1/33 | | 65,000 | 71,047 |
5% 3/1/34 | | 2,560,000 | 2,794,097 |
5% 3/1/35 | | 965,000 | 1,050,596 |
5% 3/1/36 | | 455,000 | 494,035 |
5% 3/1/37 | | 40,000 | 43,315 |
5% 3/1/46 | | 7,995,000 | 8,421,541 |
| Series 2021 B: | | | |
4% 12/1/34 | | 315,000 | 318,686 |
4% 12/1/37 | | 1,500,000 | 1,501,659 |
| Series 2021 C, 4% 3/1/25 | | 320,000 | 320,505 |
| Series 2022 A: | | | |
5% 3/1/29 | | 1,695,000 | 1,820,214 |
5% 3/1/31 | | 1,695,000 | 1,865,739 |
5% 3/1/32 | | 105,000 | 116,744 |
5% 3/1/34 | | 250,000 | 276,100 |
5% 3/1/36 | | 4,815,000 | 5,283,175 |
5.25% 3/1/37 | | 205,000 | 227,635 |
5.5% 3/1/42 | | 4,100,000 | 4,534,104 |
5.5% 3/1/47 | | 9,200,000 | 10,005,969 |
| Series 2022 B: | | | |
5% 3/1/29 | | 205,000 | 220,144 |
5% 3/1/32 | | 230,000 | 255,726 |
5% 10/1/34 | | 6,985,000 | 7,752,260 |
| Series 2023 B: | | | |
5.25% 5/1/39 | | 5,590,000 | 6,171,337 |
5.25% 5/1/41 | | 2,120,000 | 2,323,109 |
5.5% 5/1/47 | | 2,605,000 | 2,839,905 |
| Series 2023 D: | | | |
5% 7/1/29 | | 5,120,000 | 5,523,464 |
5% 7/1/35 | | 485,000 | 535,528 |
| Series 2024 B: | | | |
4.25% 5/1/46 | | 2,500,000 | 2,514,984 |
5% 5/1/33 | | 1,940,000 | 2,178,269 |
5% 5/1/38 | | 1,485,000 | 1,652,167 |
5.25% 5/1/42 | | 1,295,000 | 1,439,860 |
5.25% 5/1/47 | | 200,000 | 218,170 |
5.25% 5/1/48 | | 200,000 | 217,426 |
5.25% 5/1/49 | | 3,250,000 | 3,523,358 |
| Illinois Hsg. Dev. Auth.: | | | |
| Series 2021, 3% 4/1/51 | | 1,940,000 | 1,904,067 |
| Series 2022 G, 6.25% 10/1/52 | | 510,000 | 551,083 |
| Series 2023 A: | | | |
4.8% 10/1/43 | | 2,845,000 | 2,934,468 |
4.9% 4/1/47 | | 740,000 | 771,293 |
| Series 2023 K, 5.25% 10/1/43 | | 1,000,000 | 1,057,664 |
| Series 2024 A, 6% 10/1/54 | | 985,000 | 1,073,540 |
| Series 2024 C, 4.7% 10/1/44 | | 1,750,000 | 1,794,533 |
| Illinois Hsg. Dev. Auth. Multi-family Hsg. Rev. Series 2019, 2.9% 7/1/35 | | 1,274,376 | 1,138,146 |
| Illinois Hsg. Dev. Auth. Rev.: | | | |
| Series 2018 A, 4.5% 10/1/48 | | 575,000 | 582,392 |
| Series 2019 D, 2.7% 10/1/34 | | 345,000 | 309,946 |
| Series 2021 A, 3% 4/1/51 | | 505,000 | 496,335 |
| Series D, 3.75% 4/1/50 | | 155,000 | 155,188 |
| Illinois Muni. Elec. Agcy. Pwr. Supply Series 2015 A: | | | |
| 4% 2/1/34 | | 925,000 | 925,589 |
| 5% 2/1/31 | | 600,000 | 605,200 |
| Illinois Reg'l. Trans. Auth.: | | | |
| Series 2003 A: | | | |
6% 7/1/29 (Nat'l. Pub. Fin. Guarantee Corp. Insured) | | 4,235,000 | 4,592,453 |
6% 7/1/33 (FGIC Insured) | | 1,645,000 | 1,930,435 |
| Series 2003 B, 5.5% 6/1/27 | | 1,050,000 | 1,093,234 |
| Series 2016 A, 4% 6/1/46 | | 2,190,000 | 2,171,542 |
| Illinois Sales Tax Rev.: | | | |
| Series 2021 A, 3% 6/15/33 (Build America Mutual Assurance Insured) | | 1,920,000 | 1,802,479 |
| Series 2024 A, 5% 6/15/30 | | 640,000 | 704,462 |
| Illinois Sports Facilities Auth.: | | | |
| Series 2014, 5% 6/15/27 (Assured Guaranty Muni. Corp. Insured) | | 375,000 | 376,949 |
| Series 2019: | | | |
5% 6/15/28 | | 480,000 | 498,700 |
5% 6/15/28 | | 300,000 | 317,513 |
5% 6/15/29 | | 590,000 | 633,040 |
5% 6/15/29 | | 480,000 | 504,329 |
| Illinois State Univ. Revs. Series 2018 A: | | | |
| 5% 4/1/31 (Assured Guaranty Muni. Corp. Insured) | | 180,000 | 191,196 |
| 5% 4/1/33 (Assured Guaranty Muni. Corp. Insured) | | 120,000 | 126,691 |
| 5% 4/1/36 (Assured Guaranty Muni. Corp. Insured) | | 180,000 | 189,019 |
| Illinois Toll Hwy. Auth. Toll Hwy. Rev.: | | | |
| Series 2014 C: | | | |
5% 1/1/37 | | 1,475,000 | 1,477,319 |
5% 1/1/38 | | 750,000 | 751,139 |
5% 1/1/39 | | 1,000,000 | 1,001,347 |
| Series 2015 A: | | | |
5% 1/1/37 | | 700,000 | 708,056 |
5% 1/1/40 | | 2,000,000 | 2,017,866 |
| Series 2016 A, 5% 12/1/31 | | 910,000 | 928,860 |
| Series 2016 B, 5% 1/1/41 | | 1,235,000 | 1,256,483 |
| Series 2017 A, 5% 1/1/42 | | 5,425,000 | 5,653,813 |
| Series 2019 A: | | | |
5% 1/1/40 | | 1,445,000 | 1,551,978 |
5% 1/1/44 | | 425,000 | 452,754 |
| Series A: | | | |
5% 1/1/38 | | 65,000 | 71,660 |
5% 1/1/40 | | 805,000 | 879,962 |
5% 1/1/41 | | 2,135,000 | 2,319,699 |
5% 1/1/45 | | 7,155,000 | 7,678,798 |
| Joliet School District #86 Gen. Oblig. Series 2024, 4% 1/1/49 | | 455,000 | 448,823 |
| Kane County School District No. 131 Series 2020 A: | | | |
| 4% 12/1/30 (Assured Guaranty Muni. Corp. Insured) | | 30,000 | 31,162 |
| 4% 12/1/31 (Assured Guaranty Muni. Corp. Insured) | | 40,000 | 41,414 |
| 4% 12/1/33 (Assured Guaranty Muni. Corp. Insured) | | 15,000 | 15,446 |
| 4% 12/1/35 (Assured Guaranty Muni. Corp. Insured) | | 20,000 | 20,356 |
| 4% 12/1/36 (Assured Guaranty Muni. Corp. Insured) | | 65,000 | 66,237 |
| 4% 12/1/38 (Assured Guaranty Muni. Corp. Insured) | | 35,000 | 35,503 |
| 4% 12/1/39 (Assured Guaranty Muni. Corp. Insured) | | 175,000 | 176,984 |
| Kane, McHenry, Cook & DeKalb Counties Unit School District #300: | | | |
| Series 2015 5% 1/1/28 | | 155,000 | 155,202 |
| Series 2017, 5% 1/1/29 | | 60,000 | 63,142 |
| Kendall, Kane & Will Counties Cmnty. Unit School District #308 Series 2016, 5% 2/1/33 | | 605,000 | 614,247 |
| Lake County High Scd # 115 Series 2023, 4.25% 11/1/43 | | 2,170,000 | 2,236,433 |
| Lake County Ill Cmnty. Cons School D Series 2023, 5.25% 5/1/43 | | 2,635,000 | 2,881,774 |
| Macon County School District Series 2020 C: | | | |
| 4% 1/1/35 (Assured Guaranty Muni. Corp. Insured) | | 400,000 | 404,530 |
| 4% 1/1/45 (Assured Guaranty Muni. Corp. Insured) | | 250,000 | 248,076 |
| Madison County Cmnty. United School District #007 Series 2017: | | | |
| 5% 12/1/28 | | 160,000 | 162,335 |
| 5% 12/1/29 | | 165,000 | 167,327 |
| McHenry County Cmnty. School District #200 Series 2006 B: | | | |
| 0% 1/15/25 | | 250,000 | 248,879 |
| 0% 1/15/26 | | 185,000 | 177,826 |
| Metropolitan Pier & Exposition: | | | |
| (McCormick Place Expansion Proj.): | | | |
Series 2002 A: | | | |
0% 12/15/30 (Nat'l. Pub. Fin. Guarantee Corp. Insured) | | 540,000 | 439,414 |
0% 12/15/32 (Nat'l. Pub. Fin. Guarantee Corp. Insured) | | 11,400,000 | 8,573,542 |
0% 6/15/36 (Nat'l. Pub. Fin. Guarantee Corp. Insured) | | 5,000,000 | 3,245,307 |
Series 2010 B1: | | | |
0% 6/15/43 (Assured Guaranty Muni. Corp. Insured) | | 12,710,000 | 5,968,302 |
0% 6/15/44 (Assured Guaranty Muni. Corp. Insured) | | 250,000 | 111,822 |
0% 6/15/45 (Assured Guaranty Muni. Corp. Insured) | | 9,890,000 | 4,211,441 |
0% 6/15/46 (Assured Guaranty Muni. Corp. Insured) | | 5,625,000 | 2,285,693 |
0% 6/15/47 (Assured Guaranty Muni. Corp. Insured) | | 1,190,000 | 460,926 |
Series 2012 B, 0% 12/15/51 | | 3,925,000 | 1,162,796 |
Series A: | | | |
0% 6/15/34 (Nat'l. Pub. Fin. Guarantee Corp. Insured) | | 1,600,000 | 1,132,950 |
0% 12/15/37 (Nat'l. Pub. Fin. Guarantee Corp. Insured) | | 500,000 | 302,925 |
0% 6/15/38 (Nat'l. Pub. Fin. Guarantee Corp. Insured) | | 1,000,000 | 592,373 |
| Series 1994, 0% 6/15/28 (Nat'l. Pub. Fin. Guarantee Corp. Insured) | | 810,000 | 720,810 |
| Series 1998 B, 5.5% 6/15/29 | | 1,105,000 | 1,148,406 |
| Series 2002 A: | | | |
0% 12/15/33 (Nat'l. Pub. Fin. Guarantee Corp. Insured) | | 11,815,000 | 8,550,624 |
0% 6/15/35 (Nat'l. Pub. Fin. Guarantee Corp. Insured) | | 3,750,000 | 2,542,670 |
0% 12/15/40 (Assured Guaranty Muni. Corp. Insured) | | 1,300,000 | 693,800 |
| Series 2002, 0% 12/15/36 (Nat'l. Pub. Fin. Guarantee Corp. Insured) | | 8,240,000 | 5,234,253 |
| Series 2010 B1, 0% 6/15/26 (Assured Guaranty Muni. Corp. Insured) | | 510,000 | 485,526 |
| Series 2012 B, 0% 12/15/50 | | 1,200,000 | 373,567 |
| Series 2015 A: | | | |
0% 12/15/52 (Assured Guaranty Muni. Corp. Insured) | | 800,000 | 238,225 |
5% 6/15/53 | | 895,000 | 900,652 |
| Series 2017 A: | | | |
0% 12/15/56 | | 1,340,000 | 331,299 |
0% 12/15/56 (Build America Mutual Assurance Insured) | | 1,100,000 | 271,962 |
5% 6/15/57 | | 3,255,000 | 3,320,091 |
| Series 2017 B: | | | |
0% 12/15/54 (Build America Mutual Assurance Insured) | | 3,050,000 | 827,668 |
0% 12/15/56 (Assured Guaranty Muni. Corp. Insured) | | 4,000,000 | 988,953 |
5% 12/15/25 | | 120,000 | 121,935 |
5% 12/15/26 | | 405,000 | 419,229 |
5% 12/15/27 | | 40,000 | 42,171 |
5% 12/15/28 | | 110,000 | 115,593 |
5% 12/15/31 | | 80,000 | 83,837 |
5% 12/15/32 | | 50,000 | 52,333 |
5% 12/15/34 | | 50,000 | 52,219 |
| Series 2020 A: | | | |
4% 6/15/50 | | 5,390,000 | 5,106,528 |
5% 12/15/45 | | 105,000 | 109,547 |
5% 6/15/50 | | 15,765,000 | 16,337,117 |
| Series 2020 B, 5% 6/15/42 | | 1,805,000 | 1,910,115 |
| Series 2022 A: | | | |
0% 12/15/35 | | 50,000 | 33,187 |
0% 6/15/36 | | 625,000 | 404,746 |
0% 12/15/36 | | 215,000 | 136,251 |
0% 6/15/37 | | 200,000 | 123,940 |
0% 12/15/38 | | 420,000 | 242,202 |
0% 6/15/39 | | 455,000 | 254,405 |
0% 12/15/39 | | 1,235,000 | 676,857 |
0% 6/15/40 | | 555,000 | 293,889 |
0% 12/15/40 | | 1,040,000 | 539,557 |
0% 6/15/41 | | 410,000 | 206,372 |
0% 12/15/41 | | 775,000 | 382,081 |
4% 12/15/42 | | 3,390,000 | 3,365,269 |
4% 12/15/47 | | 4,200,000 | 4,038,724 |
4% 6/15/52 | | 16,800,000 | 15,789,769 |
| Northern Ill Univ. Ctfs. Prtn. (Energy Savings Projs.) Series 2024, 5.5% 4/1/49 (Build America Mutual Assurance Insured) (d) | | 1,500,000 | 1,624,771 |
| Northern Illinois Muni. Pwr. Agcy. Rev. (Prairie State Proj.) Series 2016 A, 5% 12/1/41 | | 1,000,000 | 1,018,139 |
| Northern Illinois Univ. Revs. Series 2020 B: | | | |
| 4% 4/1/36 (Build America Mutual Assurance Insured) | | 85,000 | 85,908 |
| 4% 4/1/38 (Build America Mutual Assurance Insured) | | 85,000 | 85,528 |
| 4% 4/1/40 (Build America Mutual Assurance Insured) | | 55,000 | 54,647 |
| 5% 4/1/34 (Build America Mutual Assurance Insured) | | 955,000 | 1,015,598 |
| Railsplitter Tobacco Settlement Auth. Rev. Series 2017, 5% 6/1/28 (Pre-Refunded to 6/1/26 @ 100) | | 335,000 | 344,908 |
| Rock Island County Pub. Bldg. Commission Series 2016, 5% 12/1/36 (Assured Guaranty Muni. Corp. Insured) | | 500,000 | 519,294 |
| Romeoville Gen. Oblig. Rev.: | | | |
| (Lewis Univ. Proj.) Series 2015, 5% 10/1/42 | | 360,000 | 359,992 |
| Series 2018 B, 5% 10/1/39 | | 295,000 | 295,067 |
| Rosemont Gen. Oblig. Series 2016 A, 5% 12/1/40 (Assured Guaranty Muni. Corp. Insured) | | 1,300,000 | 1,343,776 |
| Sales Tax Securitization Corp.: | | | |
| Series 2017 A, 5% 1/1/28 | | 750,000 | 795,781 |
| Series 2018 C: | | | |
5.25% 1/1/34 | | 1,500,000 | 1,619,382 |
5.25% 1/1/48 (Build America Mutual Assurance Insured) | | 5,640,000 | 5,901,402 |
| Series 2023 C, 5% 1/1/31 | | 2,410,000 | 2,667,709 |
| Series 2023 D, 5% 1/1/36 | | 1,690,000 | 1,889,401 |
| Sangamon County Wtr. Reclamation District Series 2019 A, 4% 1/1/49 | | 400,000 | 392,165 |
| Schaumburg Village Gen. Oblig.: | | | |
| Series 2013 A, 4% 12/1/41 | | 5,300,000 | 5,300,616 |
| Series 2023, 4% 12/1/30 | | 2,270,000 | 2,396,954 |
| Southern Illinois Univ. Rev. Series 2021 A: | | | |
| 4% 4/1/28 | | 125,000 | 127,865 |
| 4% 4/1/31 | | 200,000 | 207,452 |
| 4% 4/1/36 | | 135,000 | 134,447 |
| 4% 4/1/38 | | 210,000 | 207,752 |
| Springfield Elec. Rev. Series 2024, 3% 3/1/37 (d) | | 2,000,000 | 1,856,569 |
| St Clair County Ill Cmnty. Unit Series 2024 B, 5% 1/1/44 (Assured Guaranty Muni. Corp. Insured) | | 820,000 | 881,834 |
| Univ. of Illinois Rev.: | | | |
| Series 2018 A: | | | |
5% 4/1/29 | | 225,000 | 240,060 |
5% 4/1/30 | | 505,000 | 538,308 |
| Series 2020 A: | | | |
4% 4/1/32 | | 470,000 | 483,420 |
4% 4/1/35 | | 630,000 | 645,167 |
4% 4/1/36 | | 320,000 | 326,848 |
4% 4/1/38 | | 410,000 | 417,515 |
| Upper Illinois River Valley Dev. Auth. Edl. Facility Rev. (Cambridge Lakes Learning Ctr. Proj.) Series 2017 A: | | | |
| 5% 12/1/32 (g) | | 565,000 | 568,841 |
| 5.25% 12/1/47 (g) | | 1,135,000 | 1,105,373 |
| Upper Illinois River Valley Dev. Auth. Rev. Series 2018: | | | |
| 5% 12/1/43 | | 400,000 | 405,870 |
| 5% 12/1/48 | | 250,000 | 251,975 |
| Western Illinois Econ. Dev. Auth. (City of Quincy Proj.) Series 2019 B: | | | |
| 4% 12/1/29 | | 140,000 | 142,911 |
| 4% 12/1/30 | | 180,000 | 183,697 |
| 4% 12/1/32 | | 250,000 | 252,472 |
| 4% 12/1/34 | | 370,000 | 373,803 |
| 4% 12/1/36 | | 425,000 | 427,435 |
| Will County Cmnty. Unit School District #365-U Series 2007: | | | |
| 0% 11/1/26 | | 135,000 | 127,502 |
| 0% 11/1/26 (Assured Guaranty Muni. Corp. Insured) | | 790,000 | 740,523 |
| Will County School District Series 2022, 5.5% 1/1/49 | | 300,000 | 330,803 |
| Yorkville Svc. Area 2004-106 Tax Series 2016, 5% 3/1/32 (Assured Guaranty Muni. Corp. Insured) | | 745,000 | 760,388 |
TOTAL ILLINOIS | | | 768,139,663 |
| Indiana - 0.8% | | | |
| Ball State Univ. Series 2019 S, 4% 7/1/36 | | 435,000 | 442,017 |
| Carmel Wtrwks. Rev. Series 2024 C: | | | |
| 5.25% 5/1/47 | | 300,000 | 322,782 |
| 5.25% 5/1/51 | | 1,375,000 | 1,468,757 |
| Crown Point Multi-School Bldg. Corp. Series 2021, 5% 1/15/40 | | 1,500,000 | 1,628,247 |
| East Chicago Solid Waste Disp. Rev. Series 1998, 5.5% 9/1/28 (e) | | 245,000 | 238,411 |
| Fishers Town Hall Bldg. Corp. Series 2023 A, 5.75% 1/15/63 | | 4,110,000 | 4,767,340 |
| Greater Clark Bldg. Corp. Ind. Series 2022, 6% 7/15/38 | | 300,000 | 355,717 |
| Indiana Dev. Fin. Auth. Envir. Rev. (United States Steel Corp. Proj.) Series 2021 A, 4.125% 12/1/26 | | 1,945,000 | 1,954,637 |
| Indiana Fin. Auth. Edl. Facilities Rev.: | | | |
| (Depauw Univ. Proj.) Series 2022 A, 5.5% 7/1/52 | | 5,600,000 | 5,917,444 |
| (Rose-Hulman Institute of Technology Proj.) Series 2023, 5.75% 6/1/48 | | 1,630,000 | 1,817,670 |
| (Valparaiso Univ. Proj.) Series 2021: | | | |
5% 10/1/28 | | 50,000 | 52,044 |
5% 10/1/33 | | 35,000 | 36,746 |
| Indiana Fin. Auth. Envir. Facilities Rev. Bonds (Indianapolis Pwr. & Lt. Co. Proj.): | | | |
| Series 2020 A, 0.75%, tender 4/1/26 (b) | | 210,000 | 201,960 |
| Series 2020 B, 0.95%, tender 4/1/26 (b)(e) | | 945,000 | 910,063 |
| Indiana Fin. Auth. Exempt Facilities Rev. (Resources Polyflow Indiana Proj.) Series 2019, 7% 3/1/39 (e)(g) | | 350,000 | 164,567 |
| Indiana Fin. Auth. Health Facilities Rev.: | | | |
| (Margaret Mary Health Proj.) Series 2024 A: | | | |
5.5% 3/1/44 | | 650,000 | 707,243 |
5.75% 3/1/54 | | 1,635,000 | 1,774,950 |
| Series 2017 A, 5% 8/15/51 | | 1,270,000 | 1,297,018 |
| Series 2024: | | | |
4.25% 3/1/49 | | 360,000 | 357,804 |
5% 3/1/43 | | 755,000 | 815,079 |
5.25% 3/1/54 | | 1,660,000 | 1,814,218 |
| Indiana Fin. Auth. Health Sys. Rev.: | | | |
| Bonds Series 2019 B, 2.25%, tender 7/1/25 (b) | | 35,000 | 34,667 |
| Series 2016 A, 4% 11/1/51 | | 2,705,000 | 2,630,538 |
| Series 2023 A: | | | |
5% 10/1/41 | | 1,250,000 | 1,392,614 |
5% 10/1/42 | | 2,000,000 | 2,214,976 |
5% 10/1/46 | | 500,000 | 543,560 |
| Indiana Fin. Auth. Hosp. Rev.: | | | |
| (Parkview Health Sys. Proj.) Series 2017 A: | | | |
5% 11/1/28 | | 25,000 | 26,885 |
5% 11/1/29 | | 80,000 | 87,276 |
5% 11/1/30 | | 20,000 | 22,126 |
| Bonds Series 2011 L, 0.7%, tender 1/1/26 (b) | | 1,000,000 | 969,820 |
| Series 2020 A, 4% 7/1/45 | | 1,205,000 | 1,148,254 |
| Series 2022: | | | |
4.25% 1/1/47 (Assured Guaranty Muni. Corp. Insured) | | 535,000 | 536,290 |
5% 1/1/52 (Assured Guaranty Muni. Corp. Insured) | | 1,500,000 | 1,572,424 |
| Series 2024 A: | | | |
5.5% 9/15/39 | | 700,000 | 762,866 |
5.5% 9/15/44 | | 245,000 | 261,543 |
| Indiana Fin. Auth. Midwestern Disaster Relief Rev. Series 2012 A, 4.25% 11/1/30 | | 4,095,000 | 4,223,608 |
| Indiana Fin. Auth. Poll. Cont. Rev. Series 2010 B, 2.5% 11/1/30 | | 385,000 | 355,342 |
| Indiana Fin. Auth. Rev.: | | | |
| (Butler Univ. Proj.) Series 2019, 4% 2/1/44 | | 145,000 | 141,346 |
| (Citizens Energy Group Proj.) Series 2023 A: | | | |
5% 10/1/32 | | 2,100,000 | 2,407,025 |
5% 10/1/33 | | 1,400,000 | 1,621,209 |
| (Marquette Proj.) Series 2015 A, 5% 3/1/39 | | 285,000 | 285,080 |
| Series 2015 A, 5.25% 2/1/32 | | 1,025,000 | 1,035,891 |
| Series 2015, 5% 3/1/36 | | 250,000 | 250,810 |
| Series 2016: | | | |
5% 9/1/26 | | 160,000 | 165,039 |
5% 9/1/27 | | 185,000 | 191,463 |
5% 9/1/29 | | 185,000 | 190,846 |
5% 9/1/30 | | 170,000 | 175,323 |
5% 9/1/31 | | 100,000 | 103,099 |
| Series 2018 A: | | | |
5% 11/15/48 | | 350,000 | 352,560 |
5% 11/15/53 | | 300,000 | 301,016 |
| Series 2019 E, 5% 2/1/25 | | 785,000 | 787,460 |
| Indiana Fin. Auth. Wastewtr. Util. Rev.: | | | |
| (CWA Auth. Proj.): | | | |
Series 2016 A, 5% 10/1/46 | | 2,800,000 | 2,845,670 |
Series 2023 A: | | | |
5% 10/1/35 | | 1,100,000 | 1,254,148 |
5% 10/1/36 | | 1,000,000 | 1,136,166 |
5% 10/1/37 | | 625,000 | 707,316 |
5% 10/1/39 | | 1,000,000 | 1,122,767 |
| CWA Auth. Proj. Series 2022 B, 5.25% 10/1/47 | | 1,900,000 | 2,051,471 |
| Series 2021 2, 5% 10/1/41 | | 1,235,000 | 1,353,429 |
| Indiana Finl. Authorities Student Hsg.: | | | |
| (CHF - Tippecanoe, L.L.C. - Student housing Proj.) Series 2023 A, 5.125% 6/1/58 | | 1,700,000 | 1,763,365 |
| (CHF - Tippecanoe, L.L.C. - Student Hsg. Proj.) Series 2023 A: | | | |
5% 6/1/43 | | 855,000 | 897,160 |
5% 6/1/53 | | 890,000 | 918,687 |
| (SFP-PUFW I, LLC -- Student Hsg. Proj.) Series 2024 A, 5% 7/1/59 | | 725,000 | 741,018 |
| Indiana Hsg. & Cmnty. Dev. Auth.: | | | |
| (Glasswater Creek of Whitestown Proj.) Series 2020, 5.375% 10/1/40 (g) | | 480,000 | 423,852 |
| Series 2019 B, 3.5% 1/1/49 | | 20,000 | 19,879 |
| Series 2020 B1, 3.25% 7/1/49 | | 250,000 | 247,639 |
| Series 2021 B, 3% 7/1/50 | | 340,000 | 334,545 |
| Series 2021 C1, 3% 1/1/52 | | 1,000,000 | 978,819 |
| Series A: | | | |
3.75% 1/1/49 | | 110,000 | 109,959 |
5% 1/1/28 | | 20,000 | 21,101 |
5% 7/1/28 | | 20,000 | 21,229 |
5% 1/1/29 | | 20,000 | 21,432 |
5% 7/1/29 | | 15,000 | 16,190 |
| Indiana Muni. Pwr. Agcy. Pwr. Supply Sys. Rev.: | | | |
| Series 2014 A, 5% 1/1/28 | | 1,500,000 | 1,502,301 |
| Series 2016 A, 5% 1/1/42 | | 3,050,000 | 3,108,028 |
| Series 2017 A: | | | |
5% 1/1/32 | | 225,000 | 237,563 |
5% 1/1/34 | | 110,000 | 115,786 |
| Indiana Secondary Mkt For Ed. L Series 2022 1A, 4.5% 6/1/39 (e) | | 415,000 | 411,256 |
| Indianapolis Local Pub. Impt.: | | | |
| (Ad Valorem Property Tax Fund Proj.) Series 2023 D, 6% 2/1/48 | | 1,250,000 | 1,452,201 |
| (Courthouse and Jail Proj.) Series 2019 A, 5% 2/1/49 | | 995,000 | 1,041,973 |
| (Indianapolis Arpt. Auth. Proj.): | | | |
Series 2015 I, 5% 1/1/28 (e) | | 425,000 | 425,466 |
Series 2019 D, 5% 1/1/28 (e) | | 3,695,000 | 3,865,222 |
| Series 2016: | | | |
4% 1/1/32 (e) | | 120,000 | 120,332 |
4% 1/1/33 (e) | | 120,000 | 120,417 |
4% 1/1/34 (e) | | 150,000 | 150,444 |
4% 1/1/35 (e) | | 340,000 | 340,620 |
5% 1/1/26 (e) | | 125,000 | 127,043 |
| Series 2023 E, 6.125% 3/1/57 | | 375,000 | 408,722 |
| Series 2023 F1, 5.25% 3/1/67 | | 2,005,000 | 2,167,774 |
| Mount Vernon Ind. Envir. Bonds Series 2015, 4.25%, tender 9/1/28 (b)(e) | | 250,000 | 252,849 |
| Northern Indiana Commuter Trans. District Series 2016, 5% 7/1/41 | | 600,000 | 609,733 |
| Purdue Univ. Rev. Series 2018 DD: | | | |
| 5% 7/1/34 | | 145,000 | 154,331 |
| 5% 7/1/35 | | 285,000 | 302,505 |
| 5% 7/1/36 | | 310,000 | 328,766 |
| 5% 7/1/37 | | 290,000 | 307,133 |
| Saint Joseph County Econ. Dev. Auth. Rev. (St. Mary's College Proj.): | | | |
| Series 2019: | | | |
4% 4/1/39 | | 55,000 | 54,748 |
4% 4/1/46 | | 125,000 | 119,689 |
5% 4/1/40 | | 125,000 | 131,316 |
5% 4/1/43 | | 1,290,000 | 1,341,137 |
| Series 2020: | | | |
4% 4/1/37 | | 680,000 | 682,574 |
5% 4/1/29 | | 60,000 | 63,896 |
5% 4/1/32 | | 50,000 | 53,442 |
| Saint Joseph County Ind. Edl. Facilities Rev. Series 1996, 6.5% 3/1/26 | | 210,000 | 218,991 |
| Shoals Exempt Facilities Rev. (Nat'l. Gypsum Co. Proj.) Series 2013, 7.25% 11/1/43 (e) | | 255,000 | 255,511 |
| Terre Haute Ind. San District Series 2023, 5.25% 9/28/28 | | 1,650,000 | 1,653,292 |
| Valparaiso Exempt Facilities Rev. (Pratt Paper (IN), LLC Proj.) Series 2024: | | | |
| 4.5% 1/1/34 (e)(g) | | 1,050,000 | 1,074,023 |
| 4.875% 1/1/44 (e)(g) | | 1,350,000 | 1,391,735 |
| 5% 1/1/54 (e)(g) | | 2,000,000 | 2,050,280 |
| Warrick County Envir. Impt. Rev. Bonds Series 2015, 4.25%, tender 9/1/28 (b)(e) | | 250,000 | 252,849 |
| Whiting Envir. Facilities Rev. Bonds: | | | |
| (BP Products North America, Inc. Proj.) Series 2019 A, 5%, tender 6/5/26 (b)(e) | | 1,600,000 | 1,628,193 |
| (BP Products North America INC. Proj.) Series 2015, 4.4%, tender 6/10/31 (b)(e) | | 2,775,000 | 2,851,497 |
TOTAL INDIANA | | | 100,195,150 |
| Iowa - 0.1% | | | |
| Coralville Gen. Oblig.: | | | |
| Series 2017 B, 4.25% 5/1/37 | | 150,000 | 127,646 |
| Series 2022 C, 5% 5/1/42 | | 300,000 | 302,745 |
| Iowa Fin. Auth. Series 2018 A: | | | |
| 5% 3/1/33 | | 165,000 | 167,301 |
| 5% 3/1/38 | | 130,000 | 131,154 |
| 5% 3/1/48 | | 240,000 | 238,221 |
| Iowa Fin. Auth. Midwestern Disaster Area Rev. (Iowa Fertilizer Co. Proj.) Series 2022, 5% 12/1/50 (Pre-Refunded to 12/1/32 @ 100) | | 1,130,000 | 1,304,755 |
| Iowa Fin. Auth. Rev. Series 2018 B, 5% 2/15/48 | | 205,000 | 213,070 |
| Iowa Fin. Auth. Single Family Mtg.: | | | |
| (Mtg.-Backed Securities Prog.): | | | |
Series 2020 A, 3.75% 1/1/50 | | 695,000 | 694,801 |
Series 2021 A, 3% 1/1/47 | | 585,000 | 575,054 |
| Series 2018 A, 4% 7/1/47 | | 80,000 | 80,162 |
| Iowa Higher Ed. Ln. Auth. Rev. (Des Moines Univ. Proj.): | | | |
| Series 2020: | | | |
4% 10/1/45 | | 650,000 | 633,117 |
4% 10/1/50 | | 120,000 | 113,697 |
| Series 2022: | | | |
4.75% 10/1/42 | | 170,000 | 176,517 |
5% 10/1/47 | | 180,000 | 187,743 |
5.375% 10/1/52 | | 200,000 | 211,236 |
| Iowa Student Ln. Liquidity Corp. Student Ln. Rev.: | | | |
| Series 2019 B: | | | |
3% 12/1/39 (e) | | 35,000 | 33,223 |
5% 12/1/29 (e) | | 740,000 | 781,566 |
| Series 2019 C, 3.5% 12/1/44 (e) | | 1,250,000 | 1,048,346 |
| Series 2024 C, 5% 12/1/54 (e) | | 295,000 | 292,288 |
| Tobacco Settlement Auth. Tobacco Settlement Rev.: | | | |
| Series 2021 A2: | | | |
4% 6/1/34 | | 705,000 | 721,161 |
4% 6/1/36 | | 705,000 | 716,958 |
4% 6/1/39 | | 705,000 | 709,423 |
4% 6/1/49 | | 1,290,000 | 1,216,098 |
5% 6/1/32 | | 635,000 | 687,375 |
| Series 2021 B1, 4% 6/1/49 | | 765,000 | 763,718 |
| Series 2021 B2, 0% 6/1/65 | | 9,100,000 | 1,408,822 |
| Waukee Cmnty. School District Series 2020 B, 2% 6/1/37 | | 1,000,000 | 781,958 |
TOTAL IOWA | | | 14,318,155 |
| Kansas - 0.2% | | | |
| City of Topeka Health Care Facilities Rev. Series 2022 A: | | | |
| 6.25% 12/1/42 | | 340,000 | 357,577 |
| 6.5% 12/1/52 | | 630,000 | 657,737 |
| Coffeyville Elec. Util. Sys. Rev. Series 2015 B, 5% 6/1/38 (Pre-Refunded to 6/1/25 @ 100) (g) | | 800,000 | 803,791 |
| Hutchinson Hosp. Facilities Rev. Series 2016: | | | |
| 5% 12/1/36 | | 275,000 | 270,004 |
| 5% 12/1/41 | | 145,000 | 128,653 |
| Lenexa Health Care Facilities Rev. Series 2018 A: | | | |
| 5% 5/15/30 | | 175,000 | 178,895 |
| 5% 5/15/32 | | 160,000 | 163,304 |
| 5% 5/15/39 | | 165,000 | 166,955 |
| Lyon Unified School District Series 2019: | | | |
| 4% 9/1/33 | | 110,000 | 111,854 |
| 4% 9/1/39 | | 640,000 | 645,779 |
| Overland Park Dev. Corp. Rev. Series 2019: | | | |
| 5% 3/1/32 | | 215,000 | 221,906 |
| 5% 3/1/33 | | 230,000 | 236,828 |
| 5% 3/1/34 | | 240,000 | 246,789 |
| 5% 3/1/36 | | 265,000 | 271,277 |
| 5% 3/1/38 | | 295,000 | 301,612 |
| 5% 3/1/44 | | 495,000 | 502,488 |
| 5% 3/1/49 | | 975,000 | 986,231 |
| Overland Park Sales Tax Spl. Oblig. Rev. (Bluhawk Star Bond Proj.) Series 2022 A, 6.5% 11/15/42 (g) | | 4,850,000 | 5,012,703 |
| Sedgwick County Pub. Commission: | | | |
| (Board of Trustees of Wichita State Univ. - Experiential Engineering Proj.) Series 2014 3, 5% 2/1/39 | | 1,050,000 | 1,052,452 |
| (Board of trustees of Wichita State Univ. - Experiential Engineering Proj.) Series 2014 3, 5% 2/1/44 | | 725,000 | 726,597 |
| Sedgwick Unified School District Series 2019 A: | | | |
| 4% 9/1/31 | | 240,000 | 244,784 |
| 4% 9/1/32 | | 180,000 | 183,096 |
| Univ. of Kansas Hosp. Auth. Health Facilities Rev. Series 2019 A, 5% 9/1/48 | | 4,640,000 | 4,788,173 |
| Wichita Health Care Facilities Series 2018 I: | | | |
| 4.625% 5/15/41 | | 30,000 | 28,095 |
| 5% 5/15/33 | | 230,000 | 232,106 |
| 5% 5/15/38 | | 365,000 | 366,064 |
| 5% 5/15/47 | | 150,000 | 139,044 |
| Wyandotte County-Kansas City Unified Govt. Sales Tax Spl. Oblig. Rev.: | | | |
| (Vacation Village Proj. Area 4 - Major Multi-Sport Athletic Complex Proj.) Series 2015, 0% 9/1/34 (g) | | 2,100,000 | 931,222 |
| Series 2015 A, 5.75% 9/1/32 | | 780,000 | 736,468 |
| Wyandotte County/Kansas City K (Legends Apts. Garage and West Lawn Proj.) Series 2018, 4.5% 6/1/40 | | 75,000 | 75,097 |
| Wyandotte County/Kansas City Unified Govt. Util. Sys. Rev. Series 2016 A: | | | |
| 5% 9/1/40 | | 480,000 | 484,431 |
| 5% 9/1/45 | | 725,000 | 730,038 |
TOTAL KANSAS | | | 21,982,050 |
| Kentucky - 0.9% | | | |
| Ashland Med. Ctr. Rev.: | | | |
| (Ashland Hosp. Corp. d/b/a King's Daughters Med. Ctr. Proj.) Series 2016 A, 5% 2/1/40 | | 65,000 | 65,419 |
| Series 2019: | | | |
3% 2/1/40 (Assured Guaranty Muni. Corp. Insured) | | 1,110,000 | 994,448 |
4% 2/1/33 | | 170,000 | 168,770 |
4% 2/1/35 | | 135,000 | 132,288 |
4% 2/1/36 | | 50,000 | 48,689 |
4% 2/1/37 | | 35,000 | 33,992 |
4% 2/1/38 | | 195,000 | 188,004 |
5% 2/1/25 | | 60,000 | 60,084 |
5% 2/1/28 | | 175,000 | 182,606 |
5% 2/1/32 | | 100,000 | 104,041 |
| Boyle County Edl. Facilities Rev.: | | | |
| Series 2017, 5% 6/1/37 | | 115,000 | 118,245 |
| Series 2023 A, 5.25% 6/1/49 | | 700,000 | 744,717 |
| Campbellsville Indl. Bldg. Rev. (Capmpbellsville Univ. Proj.) Series 2017, 5% 3/1/39 | | 300,000 | 298,165 |
| Carroll County Poll. Ctlr Rev. Bonds (Kentucky Utils. Co. Proj.) Series 2016 A, 1.55%, tender 9/1/26 (b) | | 500,000 | 475,801 |
| Columbia Edl. Dev. Rev. (Lindsey Wilson College Proj.) Series 2019, 5% 12/1/33 | | 300,000 | 304,257 |
| Econ. Dev. Fin. Auth. Lousiville Arena Proj. Rev.: | | | |
| Louisville Arena Auth., Inc. Series 2017 A, 5% 12/1/47 (Assured Guaranty Muni. Corp. Insured) | | 190,000 | 190,035 |
| Series 2017 A, 5% 12/1/45 (Assured Guaranty Muni. Corp. Insured) | | 940,000 | 973,263 |
| Henderson Rev. (Pratt Paper (KY), LLC Proj.): | | | |
| Series 2022 A: | | | |
4.45% 1/1/42 (e)(g) | | 300,000 | 297,938 |
4.7% 1/1/52 (e)(g) | | 1,100,000 | 1,098,821 |
| Series 2022 B: | | | |
4.45% 1/1/42 (e)(g) | | 1,010,000 | 1,003,058 |
4.7% 1/1/52 (e)(g) | | 1,535,000 | 1,533,355 |
| Kenton County Arpt. Board Arpt. Rev.: | | | |
| Series 2016: | | | |
5% 1/1/28 | | 195,000 | 199,005 |
5% 1/1/31 | | 185,000 | 188,331 |
5% 1/1/32 | | 185,000 | 188,235 |
5% 1/1/33 | | 75,000 | 76,277 |
| Series 2019: | | | |
5% 1/1/38 | | 45,000 | 47,801 |
5% 1/1/39 | | 45,000 | 47,631 |
5% 1/1/44 | | 125,000 | 130,947 |
5% 1/1/49 | | 160,000 | 166,301 |
| Series 2024 A, 5.25% 1/1/49 (e) | | 850,000 | 911,151 |
| Kentucky Econ. Dev. Fin. Auth.: | | | |
| (Masonic Home Independent Living II, Inc. - The Meadow Proj. and Grove Pointe Proj.) Series 2016 A: | | | |
5% 5/15/46 | | 995,000 | 839,378 |
5% 5/15/51 | | 520,000 | 423,535 |
| Series 2019 A1: | | | |
5% 8/1/33 | | 55,000 | 58,883 |
5% 8/1/44 | | 1,260,000 | 1,312,342 |
| Series 2019 A2, 5% 8/1/49 | | 2,590,000 | 2,681,171 |
| Kentucky Econ. Dev. Fin. Auth. Healthcare Facilities Rev.: | | | |
| (Baptist Life Cmntys. Proj.) Series 2016 A: | | | |
6.25% 11/15/46 | | 590,000 | 456,035 |
6.375% 11/15/51 | | 820,000 | 621,534 |
| Series 2012: | | | |
5.375% 11/15/42 | | 635,000 | 544,079 |
5.5% 11/15/45 | | 230,000 | 195,174 |
| Kentucky Econ. Dev. Fin. Auth. Hosp. Rev.: | | | |
| Series 2015 A: | | | |
5% 6/1/25 | | 5,000 | 5,009 |
5% 6/1/26 | | 5,000 | 5,015 |
5% 6/1/27 | | 5,000 | 5,026 |
5% 6/1/28 | | 5,000 | 5,025 |
5% 6/1/29 | | 5,000 | 5,024 |
5% 6/1/30 | | 5,000 | 5,024 |
5.25% 6/1/50 | | 3,405,000 | 3,411,966 |
| Series 2017 A: | | | |
5% 6/1/37 | | 1,570,000 | 1,601,875 |
5% 6/1/41 | | 1,310,000 | 1,328,732 |
5% 6/1/45 | | 3,320,000 | 3,352,936 |
5.25% 6/1/41 | | 2,005,000 | 2,045,405 |
| Series 2017 B: | | | |
5% 8/15/32 | | 150,000 | 156,786 |
5% 8/15/33 | | 75,000 | 78,282 |
5% 8/15/35 | | 85,000 | 88,471 |
5% 8/15/41 (Escrowed to Maturity) | | 900,000 | 926,982 |
5% 8/15/46 | | 570,000 | 584,325 |
| Kentucky Higher Ed. Student Ln. Corp. Rev. Series 2019 B1, 5% 6/1/36 (e) | | 1,380,000 | 1,437,104 |
| Kentucky Muni. Pwr. Agcy. Pwr. Sys. Rev. (Prairie State Proj.) Series 2019 A, 4% 9/1/45 | | 750,000 | 702,745 |
| Kentucky State Property & Buildings Commission Rev.: | | | |
| (Proj. No. 112) Series 2016 B, 5% 11/1/27 | | 70,000 | 72,695 |
| (Proj. No. 119) Series 2018: | | | |
5% 5/1/26 | | 125,000 | 128,654 |
5% 5/1/28 | | 65,000 | 69,722 |
5% 5/1/29 | | 765,000 | 817,852 |
5% 5/1/30 | | 70,000 | 74,675 |
5% 5/1/31 | | 30,000 | 31,939 |
5% 5/1/32 | | 190,000 | 201,350 |
5% 5/1/33 | | 170,000 | 180,101 |
5% 5/1/34 | | 190,000 | 201,495 |
5% 5/1/35 | | 115,000 | 121,583 |
5% 5/1/36 | | 100,000 | 105,668 |
5% 5/1/38 | | 255,000 | 270,441 |
| Series 2024 A: | | | |
5% 10/1/35 | | 2,250,000 | 2,601,985 |
5% 10/1/39 | | 1,410,000 | 1,599,673 |
| Series A: | | | |
4% 11/1/34 | | 80,000 | 81,369 |
4% 11/1/35 | | 25,000 | 25,406 |
4% 11/1/36 | | 65,000 | 65,944 |
4% 11/1/37 | | 80,000 | 81,059 |
4% 11/1/38 | | 35,000 | 35,399 |
5% 8/1/27 | | 25,000 | 25,311 |
5% 11/1/29 | | 285,000 | 307,201 |
5% 11/1/30 | | 120,000 | 128,988 |
| Kentucky State Univ. Ctfs. of Prtn. (Kentucky State Univ. Proj.) Series 2021, 4% 11/1/51 | | 45,000 | 44,274 |
| Kentucky Tpk. Auth. Econ. Dev. Road Rev. (Revitalization Projs.) Series 2024 A, 5% 7/1/27 | | 2,250,000 | 2,379,158 |
| Kentucky, Inc. Pub. Energy: | | | |
| Bonds: | | | |
Series 2018 C2, 4.629%, tender 12/1/24 (b) | | 1,500,000 | 1,502,862 |
Series 2019 C, 4%, tender 2/1/28 (b) | | 3,435,000 | 3,489,549 |
Series 2022 A2, U.S. Secured Overnight Fin. Rate (SOFR) Index + 1.200% 4.269%, tender 8/1/30 (b)(c) | | 1,950,000 | 1,956,650 |
Series 2024 A, 5%, tender 7/1/30 (b) | | 4,615,000 | 4,901,960 |
Series 2024 A1, 5.25%, tender 2/1/32 (b) | | 7,970,000 | 8,656,549 |
Series 2024 B, 5%, tender 8/1/32 (b) | | 3,600,000 | 3,872,506 |
Series A, 4%, tender 6/1/26 (b) | | 6,810,000 | 6,861,772 |
Series C1, 4%, tender 6/1/25 (b) | | 12,570,000 | 12,599,678 |
| Series A: | | | |
4% 12/1/24 | | 30,000 | 30,000 |
4% 6/1/25 | | 40,000 | 40,051 |
| Louisville & Jefferson County: | | | |
| Bonds: | | | |
Series 2020 C, 5%, tender 10/1/26 (b) | | 420,000 | 433,067 |
Series 2020 D, 5%, tender 10/1/29 (b) | | 505,000 | 543,382 |
| Series 2016 A: | | | |
5% 10/1/26 | | 360,000 | 371,706 |
5% 10/1/31 | | 360,000 | 367,871 |
5% 10/1/32 | | 435,000 | 443,913 |
5% 10/1/33 | | 245,000 | 249,602 |
| Series 2020 A: | | | |
3% 10/1/43 | | 3,785,000 | 3,054,174 |
4% 10/1/39 | | 335,000 | 332,657 |
5% 10/1/37 | | 1,525,000 | 1,611,665 |
5% 10/1/38 | | 360,000 | 379,451 |
| Louisville & Jefferson County Metropolitan Govt. Hosp. Rev. (UOFL Health Proj.) Series 2022 A, 5% 5/15/47 (Assured Guaranty Muni. Corp. Insured) | | 2,500,000 | 2,654,835 |
| Louisville/Jefferson County Metropolitan Govt. Poll. Cont. Rev. Bonds Series 2019 A, 1.75%, tender 7/1/26 (b) | | 1,385,000 | 1,348,249 |
| Owensboro Elec. Lt. & Pwr. Rev. Series 2019, 4% 1/1/25 | | 540,000 | 539,939 |
| Trimble County Poll. Cont. Rev. Bonds (Louisville Gas and Elec. Co. Proj.) Series 2016 A, 1.3%, tender 9/1/27 (b)(e) | | 2,500,000 | 2,305,161 |
TOTAL KENTUCKY | | | 102,048,729 |
| Louisiana - 0.6% | | | |
| Cap. Area Fin. Auth. (Mortgaged-Backed Securities Prog.) Series 2023, 6.5% 4/1/54 | | 2,065,000 | 2,318,393 |
| East Baton Rouge Sewerage Commission Rev. Bonds Series 2021 A, 1.3%, tender 2/1/28 (b) | | 2,010,000 | 1,815,423 |
| Jefferson Parish Econ. Dev. & Port District Rev. Series 2018 A: | | | |
| 5.5% 6/15/38 (g) | | 335,000 | 341,195 |
| 5.625% 6/15/48 (g) | | 395,000 | 399,075 |
| Lafayette Parish School Board Sales Tax Rev. Series 2023: | | | |
| 4% 4/1/48 | | 1,900,000 | 1,928,039 |
| 4% 4/1/53 | | 1,900,000 | 1,917,182 |
| Louisiana Hsg. Corp. Single Fami (Home Ownership Prog.) Series 2023 C, 5.75% 12/1/53 | | 705,000 | 767,399 |
| Louisiana Local Govt. Envir. Facilities: | | | |
| (CDF Healthcare of Louisiana, LLC Proj.) Series 2015 A, 5.625% 6/1/45 | | 955,000 | 854,836 |
| (St. James Place of Baton Rouge Proj.) Series 2015 A: | | | |
6% 11/15/35 | | 120,000 | 120,471 |
6.25% 11/15/45 | | 765,000 | 766,688 |
| Louisiana Local Govt. Envir. Facilities and Cmnty. Dev. Auth.: | | | |
| (Provident Group - ULM Properties LLC - Univ. of Louisana at Monroe Proj.) Series 2019 A: | | | |
5% 7/1/39 (g) | | 255,000 | 242,537 |
5% 7/1/54 (g) | | 410,000 | 358,585 |
| (Provident Group - ULM Properties LLC - Univ. of Louisiana at Monroe Proj.) Series 2019 A, 5% 7/1/29 (g) | | 95,000 | 94,895 |
| (Ragin' Cajun Facilities, Inc. - Student Hsg. and Parking Proj.) Series 2018, 5% 10/1/48 (Assured Guaranty Muni. Corp. Insured) | | 545,000 | 555,520 |
| (Westlake Chemical Corp. Projs.) Series 2017, 3.5% 11/1/32 | | 2,000,000 | 1,961,041 |
| Louisiana Local Govt. Envir. Facilities And Cmnty. Dev. Auth. Facilities Rev. (The Glen Retirement Sys. Proj.) Series 2019 A, 5% 1/1/49 | | 595,000 | 452,371 |
| Louisiana Offshore Term. Auth. Deepwater Port Rev. (Loop LLC Proj.) Series 2013 A, 4.2%, tender 9/1/28 (b) | | 1,000,000 | 1,012,027 |
| Louisiana Pub. Facilities Auth. Hosp. Rev. Series 2020 A, 3% 6/1/50 (Assured Guaranty Muni. Corp. Insured) | | 2,190,000 | 1,812,542 |
| Louisiana Pub. Facilities Auth. Lease Rev. (Provident Group - Flagship Properties LLC - Louisiana State Univ. Nicholson Gateway Proj.) Series 2016 A, 5% 7/1/46 | | 1,145,000 | 1,155,936 |
| Louisiana Pub. Facilities Auth. Rev.: | | | |
| (I-10 Calccasieu River Bridge Pub.-Private Partnership Proj.) Series 2024: | | | |
5% 9/1/66 (e) | | 3,500,000 | 3,633,764 |
5.75% 9/1/64 (e) | | 8,760,000 | 9,630,191 |
| (Loyola Univ. Proj.) Series 2017, 5.25% 10/1/46 | | 2,110,000 | 2,249,043 |
| (Ochsner Clinic Foundation Proj.): | | | |
Series 2015, 5% 5/15/47 | | 300,000 | 301,120 |
Series 2017: | | | |
4% 5/15/42 | | 750,000 | 750,740 |
5% 5/15/27 | | 55,000 | 57,169 |
| (Provident Group - HSC Properties, Inc. LSU Health Foundation) Series 2020 A1: | | | |
5.1% 1/1/57 (g) | | 1,980,000 | 1,668,548 |
5.375% 1/1/40 (g) | | 860,000 | 820,222 |
5.5% 1/1/50 (g) | | 590,000 | 540,555 |
| (Tulane Univ. of Louisiana Proj.): | | | |
Series 2016 A: | | | |
5% 12/15/28 | | 245,000 | 254,848 |
5% 12/15/29 | | 240,000 | 249,409 |
Series 2020 A, 5% 4/1/45 | | 1,045,000 | 1,111,975 |
| Loyola Univ. Proj. Series 2021, 4% 10/1/41 | | 235,000 | 228,727 |
| Series 2018 E: | | | |
5% 7/1/32 | | 95,000 | 101,637 |
5% 7/1/33 | | 75,000 | 80,099 |
5% 7/1/34 | | 90,000 | 96,051 |
| Louisiana Pub. Facilities Auth. Solid Waste Disp. Rev. Bonds (Waste Pro U.S.A., Inc. Proj.) Series 2023, 6.75%, tender 10/1/28 (b)(e)(g) | | 2,800,000 | 3,054,079 |
| New Orleans Aviation Board Series 2018 A, 5% 10/1/48 (Assured Guaranty Muni. Corp. Insured) | | 255,000 | 263,034 |
| New Orleans Aviation Board Rev.: | | | |
| (North Term. Proj.): | | | |
Series 2015 B: | | | |
5% 1/1/29 (e) | | 630,000 | 630,730 |
5% 1/1/31 (e) | | 305,000 | 305,353 |
5% 1/1/34 (e) | | 1,180,000 | 1,181,367 |
5% 1/1/35 (e) | | 1,615,000 | 1,616,870 |
Series 2017 A: | | | |
5% 1/1/43 | | 550,000 | 561,624 |
5% 1/1/48 | | 1,255,000 | 1,276,849 |
Series 2017 B: | | | |
5% 1/1/27 (e) | | 50,000 | 51,531 |
5% 1/1/28 (e) | | 30,000 | 30,858 |
5% 1/1/32 (e) | | 50,000 | 51,313 |
5% 1/1/33 (e) | | 85,000 | 87,157 |
5% 1/1/34 (e) | | 25,000 | 25,607 |
5% 1/1/35 (e) | | 50,000 | 51,190 |
5% 1/1/37 (e) | | 705,000 | 720,340 |
5% 1/1/48 (e) | | 1,080,000 | 1,091,286 |
| Series 2017 D2: | | | |
5% 1/1/27 (e) | | 60,000 | 61,837 |
5% 1/1/28 (e) | | 90,000 | 92,573 |
5% 1/1/31 (e) | | 80,000 | 82,178 |
5% 1/1/33 (e) | | 125,000 | 128,172 |
5% 1/1/34 (e) | | 150,000 | 153,643 |
5% 1/1/36 (e) | | 115,000 | 117,613 |
5% 1/1/37 (e) | | 185,000 | 189,025 |
5% 1/1/38 (e) | | 365,000 | 372,538 |
| New Orleans Swr. Svc. Rev. Series 2015: | | | |
| 5% 6/1/40 (Pre-Refunded to 6/1/25 @ 100) | | 440,000 | 444,316 |
| 5% 6/1/45 (Pre-Refunded to 6/1/25 @ 100) | | 400,000 | 403,924 |
| New Orleans Wtr. Series 2015, 5% 12/1/45 (Pre-Refunded to 12/1/25 @ 100) | | 1,625,000 | 1,658,175 |
| Saint James Parish Gen. Oblig.: | | | |
| (Nustar Logistics, L.P. Proj.) Series 2010, 6.35% 7/1/40 (g) | | 750,000 | 829,379 |
| Bonds (Nustar Logistics, L.P. Proj.): | | | |
Series 2008, 6.1%, tender 6/1/30 (b)(g) | | 740,000 | 822,630 |
Series 2010 B, 6.1%, tender 6/1/30 (b)(g) | | 975,000 | 1,086,573 |
Series 2011, 5.85%, tender 6/1/25 (b)(g) | | 1,410,000 | 1,423,787 |
| Shreveport Gen. Oblig. Series 2024, 5% 3/1/54 (d) | | 3,235,000 | 3,420,507 |
| Shreveport Wtr. & Swr. Rev.: | | | |
| Series 2017 A, 5% 12/1/41 (Assured Guaranty Muni. Corp. Insured) | | 565,000 | 583,791 |
| Series 2019 B: | | | |
4% 12/1/44 (Assured Guaranty Muni. Corp. Insured) | | 210,000 | 204,325 |
4% 12/1/49 (Assured Guaranty Muni. Corp. Insured) | | 265,000 | 255,859 |
| St. John Baptist Parish Rev.: | | | |
| (Marathon Oil Corp.) Series 2017, 2.2% 6/1/37 (b) | | 2,320,000 | 2,274,983 |
| Bonds: | | | |
(Marathon Oil Corp.) Series 2017, 4.05%, tender 7/1/26 (b) | | 2,000,000 | 2,017,601 |
Series 2017 B2, 2.375%, tender 7/1/26 (b) | | 1,790,000 | 1,760,043 |
TOTAL LOUISIANA | | | 70,030,913 |
| Maine - 0.2% | | | |
| Auburn (Edward Little High School Proj.) Series 2021, 2.25% 11/1/39 | | 2,640,000 | 1,995,091 |
| Brunswick Series 2020, 2.375% 11/1/37 | | 330,000 | 273,985 |
| Maine Fin. Auth. Rev. (Go Lab. Madison, LLC Proj.) Series 2021, 8% 12/1/51 (e)(g) | | 900,000 | 295,609 |
| Maine Fin. Auth. Solid Waste Disposable Rev. (Casella Waste Sys., Inc. Proj.) Series 2005 R3, 5.25% 1/1/25 (e)(g) | | 120,000 | 120,125 |
| Maine Fin. Auth. Student Ln. Rev. (Supplemental Ed. Ln. Prog.): | | | |
| Series 2021 A1: | | | |
5% 12/1/28 (Assured Guaranty Muni. Corp. Insured) (e) | | 105,000 | 110,519 |
5% 12/1/29 (Assured Guaranty Muni. Corp. Insured) (e) | | 105,000 | 110,556 |
5% 12/1/30 (Assured Guaranty Muni. Corp. Insured) (e) | | 105,000 | 111,208 |
| Series 2024 A1: | | | |
4.5% 12/1/38 (Assured Guaranty Muni. Corp. Insured) (e) | | 960,000 | 975,967 |
4.5% 12/1/39 (Assured Guaranty Muni. Corp. Insured) (e) | | 860,000 | 872,473 |
5% 12/1/45 (Assured Guaranty Muni. Corp. Insured) (e) | | 300,000 | 308,522 |
| Maine Health & Higher Edl. Facilities Series 2024 B, 5.25% 10/1/54 | | 3,985,000 | 4,418,390 |
| Maine Health & Higher Edl. Facilities Auth. Rev.: | | | |
| Series 2016 A, 4% 7/1/41 | | 350,000 | 314,386 |
| Series 2017 A, 5% 7/1/47 | | 2,645,000 | 2,698,212 |
| Series 2017 B: | | | |
4% 7/1/25 | | 55,000 | 55,164 |
4% 7/1/31 | | 85,000 | 86,092 |
4% 7/1/32 | | 60,000 | 60,608 |
4% 7/1/34 | | 125,000 | 126,188 |
5% 7/1/26 | | 40,000 | 41,068 |
5% 7/1/28 | | 65,000 | 68,006 |
5% 7/1/29 | | 50,000 | 52,121 |
5% 7/1/33 | | 140,000 | 145,735 |
5% 7/1/35 | | 90,000 | 93,599 |
| Series 2018 A: | | | |
5% 7/1/30 | | 65,000 | 69,171 |
5% 7/1/31 | | 60,000 | 63,649 |
5% 7/1/34 | | 110,000 | 116,197 |
5% 7/1/35 | | 155,000 | 163,358 |
5% 7/1/36 | | 180,000 | 189,185 |
5% 7/1/37 | | 170,000 | 178,278 |
5% 7/1/38 | | 125,000 | 130,804 |
5% 7/1/43 | | 250,000 | 257,745 |
| Series 2020 A: | | | |
4% 7/1/36 | | 315,000 | 321,648 |
4% 7/1/37 | | 255,000 | 259,708 |
4% 7/1/38 | | 265,000 | 268,741 |
4% 7/1/39 | | 330,000 | 333,325 |
4% 7/1/40 | | 465,000 | 468,458 |
4% 7/1/50 | | 1,660,000 | 1,592,809 |
| Series 2021 A, 4% 7/1/51 | | 1,000,000 | 990,622 |
| Maine Hsg. Auth. Mtg.: | | | |
| Series 2020 C, 4% 11/15/50 | | 445,000 | 447,707 |
| Series C, 3.5% 11/15/46 | | 40,000 | 40,002 |
| Maine Hsg. Auth. Mtg. Purchase Rev. Series 2014 C1, 3.5% 11/15/44 (e) | | 15,000 | 15,000 |
| Maine Tpk. Auth. Tpk. Rev.: | | | |
| Series 2015: | | | |
5% 7/1/32 | | 125,000 | 126,239 |
5% 7/1/38 | | 80,000 | 80,503 |
| Series 2018: | | | |
5% 7/1/33 | | 40,000 | 42,728 |
5% 7/1/34 | | 55,000 | 58,598 |
5% 7/1/35 | | 60,000 | 63,704 |
5% 7/1/36 | | 110,000 | 116,660 |
5% 7/1/47 | | 30,000 | 31,287 |
TOTAL MAINE | | | 19,759,750 |
| Maryland - 1.3% | | | |
| Anne Arundel County Gen. Oblig.: | | | |
| Series 2021, 3% 10/1/37 | | 2,540,000 | 2,378,936 |
| Series 2023, 5% 10/1/46 | | 2,195,000 | 2,431,769 |
| Series 2024, 4% 10/1/53 | | 500,000 | 503,539 |
| Baltimore Convention Ctr. Hotel Rev. Series 2017: | | | |
| 5% 9/1/25 | | 305,000 | 306,335 |
| 5% 9/1/26 | | 100,000 | 101,270 |
| 5% 9/1/33 | | 210,000 | 212,866 |
| 5% 9/1/34 | | 765,000 | 774,631 |
| 5% 9/1/36 | | 870,000 | 878,723 |
| 5% 9/1/39 | | 500,000 | 502,882 |
| 5% 9/1/42 | | 1,135,000 | 1,141,038 |
| 5% 9/1/46 | | 3,685,000 | 3,700,982 |
| Baltimore County Gen. Oblig.: | | | |
| Series 2018, 5% 3/1/25 | | 500,000 | 502,434 |
| Series 2020, 4% 1/1/45 | | 250,000 | 235,137 |
| Baltimore Gen. Oblig.: | | | |
| (East Baltimore Research Park Proj.) Series 2017 A, 5% 9/1/38 | | 330,000 | 333,477 |
| Series 2022, 5% 6/1/51 | | 600,000 | 608,273 |
| Baltimore Proj. Rev.: | | | |
| (Wastewtr. Projs.) Series 2014 C, 5% 7/1/33 | | 945,000 | 945,852 |
| (Wtr. Projs.): | | | |
Series 2014 C, 5% 7/1/31 | | 635,000 | 635,909 |
Series 2019 A, 4% 7/1/49 | | 1,385,000 | 1,381,612 |
Series 2020 A: | | | |
4% 7/1/45 | | 1,415,000 | 1,419,075 |
5% 7/1/50 | | 1,555,000 | 1,643,701 |
| Brunswick Spl. Oblig. Series 2019: | | | |
| 4% 7/1/29 | | 80,000 | 79,587 |
| 5% 7/1/36 | | 84,000 | 85,729 |
| City of Westminster Series 2016: | | | |
| 5% 11/1/27 | | 315,000 | 323,292 |
| 5% 11/1/28 | | 335,000 | 343,638 |
| 5% 11/1/29 | | 355,000 | 364,092 |
| 5% 11/1/30 | | 375,000 | 384,057 |
| 5% 11/1/31 | | 110,000 | 112,520 |
| Frederick County Edl. Facilities Rev. Series 2017 A, 5% 9/1/45 (g) | | 500,000 | 484,520 |
| Frederick County Gen. Oblig. Series 2021 A, 1.75% 10/1/36 | | 1,250,000 | 989,062 |
| Frederick County Tax Increment and Spl. Tax Series 2020 B, 4.625% 7/1/43 (g) | | 455,000 | 453,733 |
| Gaithersburg Eco Dev. Rev. Bd Series 2018 A: | | | |
| 5% 1/1/27 | | 210,000 | 213,299 |
| 5% 1/1/28 | | 280,000 | 286,962 |
| 5% 1/1/33 | | 1,750,000 | 1,795,658 |
| 5% 1/1/36 | | 85,000 | 86,850 |
| Howard County Spl. Oblig. (Downtown Columbia Proj.) Series 2017 A, 4.5% 2/15/47 (g) | | 235,000 | 226,579 |
| Hsg. Opportunities Commission of Montgomery County Series 2021 C, 0.8% 7/1/25 | | 375,000 | 367,123 |
| Maryland Cmnty. Dev. Admin Dept. Hsg. & Cmnty. Dev.: | | | |
| Series 2014 C, 4% 9/1/44 | | 60,000 | 59,955 |
| Series 2018 A, 4.5% 9/1/48 | | 575,000 | 582,887 |
| Series 2019 C: | | | |
3.5% 3/1/50 | | 80,000 | 79,522 |
5% 9/1/27 | | 45,000 | 47,203 |
5% 9/1/28 | | 5,000 | 5,353 |
| Series 2023 E, 6.25% 3/1/54 | | 855,000 | 937,192 |
| Maryland Dept. of Trans.: | | | |
| Series 2016: | | | |
3% 11/1/30 | | 1,680,000 | 1,670,746 |
3% 11/1/31 | | 1,500,000 | 1,486,148 |
| Series 2021 B: | | | |
4% 8/1/37 (e) | | 640,000 | 641,389 |
4% 8/1/38 (e) | | 575,000 | 574,781 |
4% 8/1/51 (e) | | 1,270,000 | 1,213,585 |
5% 8/1/36 (e) | | 625,000 | 665,762 |
5% 8/1/46 (e) | | 6,265,000 | 6,540,165 |
| Series 2024 A: | | | |
5.25% 8/1/49 (Assured Guaranty Muni. Corp. Insured) (e) | | 3,300,000 | 3,587,813 |
5.25% 8/1/54 (Assured Guaranty Muni. Corp. Insured) (e) | | 500,000 | 540,088 |
| Maryland Econ. Dev. Auth. Rev.: | | | |
| (Ports America Chesapeake LLC. Proj.) Series 2017 A: | | | |
5% 6/1/25 | | 150,000 | 150,639 |
5% 6/1/27 | | 140,000 | 145,121 |
5% 6/1/30 | | 530,000 | 555,961 |
5% 6/1/32 | | 145,000 | 151,638 |
5% 6/1/35 | | 1,085,000 | 1,130,101 |
| (Trans. Facilities Proj.) Series 2017 A, 5% 6/1/28 | | 210,000 | 220,649 |
| Series 2022 A: | | | |
5% 12/31/42 | | 1,000,000 | 1,059,612 |
5.25% 6/30/53 | | 1,500,000 | 1,580,544 |
| Maryland Econ. Dev. Corp.: | | | |
| (Port Covington Proj.) Series 2020: | | | |
4% 9/1/40 | | 485,000 | 458,477 |
4% 9/1/50 | | 1,090,000 | 954,910 |
| (Purple Line Lt. Rail Proj.): | | | |
Series 2022 A, 5% 11/12/28 (e) | | 2,750,000 | 2,802,441 |
Series 2022 B: | | | |
5.25% 6/30/52 (e) | | 1,000,000 | 1,048,464 |
5.25% 6/30/55 (e) | | 11,120,000 | 11,628,382 |
| Purple Line Lt. Rail Proj. Series 2022 B, 5.25% 6/30/47 (e) | | 1,350,000 | 1,425,597 |
| Maryland Econ. Dev. Corp. Rev. Bonds (Constellation Energy Group INC. Proj.) Series 2006 B, 4.1%, tender 4/3/28 (b) | | 800,000 | 822,104 |
| Maryland Econ. Dev. Corp. Sr. Parking Facilities Rev.: | | | |
| (Baltimore City Proj.): | | | |
Series 2018 A, 5% 6/1/58 | | 715,000 | 727,231 |
Series 2018 C: | | | |
4% 6/1/48 | | 115,000 | 96,609 |
4% 6/1/58 | | 340,000 | 272,627 |
| Series 2018 C, 4% 6/1/38 | | 35,000 | 32,114 |
| Maryland Econ. Dev. Corp. Student Hsg. Rev.: | | | |
| (Bowie State Univ. Proj.) Series 2015: | | | |
5% 6/1/29 (g) | | 335,000 | 337,459 |
5% 6/1/33 (g) | | 360,000 | 362,096 |
| (Morgan State Univ. Proj.) Series 2020, 5% 7/1/56 | | 1,900,000 | 1,944,444 |
| (Univ. of Maryland, College Park - Leonardtown Proj.) Series 2024: | | | |
5.125% 7/1/59 (Assured Guaranty Muni. Corp. Insured) | | 725,000 | 771,039 |
5.25% 7/1/64 (Assured Guaranty Muni. Corp. Insured) | | 990,000 | 1,058,190 |
| (Univ. of Maryland, College Park Projs.) Series 2016: | | | |
5% 6/1/35 (Assured Guaranty Muni. Corp. Insured) | | 645,000 | 658,413 |
5% 6/1/43 (Assured Guaranty Muni. Corp. Insured) | | 240,000 | 243,175 |
| Maryland Gen. Oblig. Series 2018 A, 5% 3/15/26 | | 1,000,000 | 1,028,241 |
| Maryland Health & Higher Edl.: | | | |
| Series 2021 A: | | | |
3% 7/1/51 | | 2,815,000 | 2,175,386 |
4% 6/1/38 | | 500,000 | 486,103 |
4% 6/1/46 | | 1,050,000 | 979,153 |
4% 6/1/51 | | 2,345,000 | 2,148,339 |
4% 6/1/55 | | 1,020,000 | 931,579 |
5% 6/1/29 | | 125,000 | 131,605 |
5% 6/1/31 | | 20,000 | 21,327 |
5% 6/1/33 | | 320,000 | 338,494 |
| Series 2021 B, 4% 1/1/51 | | 700,000 | 683,622 |
| Series 2023, 5.25% 7/1/33 (g) | | 400,000 | 416,772 |
| Maryland Health & Higher Edl. Facilities Auth. Rev.: | | | |
| (Medstar Health, Inc. Proj.) Series 2017 A, 5% 5/15/45 | | 1,550,000 | 1,589,446 |
| Series 2015: | | | |
5% 7/1/27 | | 900,000 | 907,909 |
5% 7/1/29 | | 370,000 | 373,292 |
5% 8/15/33 | | 1,325,000 | 1,328,736 |
5% 7/1/45 | | 1,915,000 | 1,921,225 |
5% 7/1/47 | | 2,610,000 | 2,623,646 |
| Series 2016 A: | | | |
4% 7/1/42 | | 255,000 | 238,747 |
5% 7/1/32 | | 85,000 | 86,769 |
5% 7/1/33 | | 215,000 | 219,351 |
5% 7/1/34 | | 255,000 | 260,006 |
5% 7/1/35 | | 225,000 | 229,245 |
5% 7/1/36 | | 210,000 | 213,639 |
5% 7/1/38 | | 65,000 | 65,923 |
5.5% 1/1/36 | | 2,475,000 | 2,542,598 |
5.5% 1/1/46 | | 4,680,000 | 4,756,901 |
| Series 2017 A: | | | |
5% 7/1/33 | | 365,000 | 374,307 |
5% 7/1/38 | | 1,030,000 | 1,050,111 |
| Series 2020 B, 5% 4/15/25 | | 60,000 | 60,375 |
| Maryland Stadium Auth. Series 2022 A: | | | |
| 5% 6/1/47 | | 5,050,000 | 5,464,699 |
| 5% 6/1/52 | | 1,195,000 | 1,283,866 |
| Maryland Stadium Auth. Built to Learn Rev.: | | | |
| Series 2021, 4% 6/1/46 | | 3,235,000 | 3,244,847 |
| Series 2022 A: | | | |
4% 6/1/35 | | 160,000 | 166,610 |
4% 6/1/37 | | 135,000 | 139,295 |
4% 6/1/38 | | 145,000 | 148,819 |
4% 6/1/47 | | 1,665,000 | 1,668,846 |
| Maryland Stadium Auth. Rev.: | | | |
| Series 2018 A: | | | |
5% 5/1/34 | | 530,000 | 560,618 |
5% 5/1/42 | | 1,710,000 | 1,782,939 |
| Series 2018 B, 5% 5/1/35 | | 1,180,000 | 1,246,291 |
| Series 2022 C: | | | |
0% 5/1/51 | | 1,355,000 | 410,695 |
0% 5/1/52 | | 2,040,000 | 589,859 |
0% 5/1/53 | | 1,010,000 | 278,315 |
0% 5/1/54 | | 1,490,000 | 391,057 |
0% 5/1/55 | | 925,000 | 231,288 |
| Maryland Trans. Auth. Passenger Facility Charge Rev. Series 2019, 4% 6/1/33 (e) | | 960,000 | 969,309 |
| Maryland Trans. Auth. Trans. Facility Projs. Rev. Series 2020, 5% 7/1/40 | | 315,000 | 340,984 |
| Montgomery County Econ. Dev. Rev. Series 2018 A, 5.375% 7/1/48 | | 915,000 | 833,205 |
| Montgomery County Gen. Oblig. Series 2021 A, 2% 8/1/41 | | 3,000,000 | 2,247,263 |
| Prince Georges County Ctfs. of Prtn. Series 2021, 5% 10/1/27 | | 1,740,000 | 1,849,207 |
| Prince Georges County Rev. Auth. Spl. Oblig. (Suitland-Naylor Road Proj.) Series 2016: | | | |
| 4.75% 7/1/36 (g) | | 245,000 | 246,216 |
| 5% 7/1/46 (g) | | 350,000 | 351,189 |
| Rockville Mayor & Council Econ. Dev.: | | | |
| (Ingleside at King Farm Proj.): | | | |
Series 2017 A1, 5% 11/1/31 | | 210,000 | 213,180 |
Series 2017 A2: | | | |
5% 11/1/29 | | 70,000 | 71,096 |
5% 11/1/31 | | 85,000 | 86,287 |
5% 11/1/32 | | 70,000 | 70,965 |
Series 2017 B: | | | |
4.25% 11/1/37 | | 55,000 | 51,675 |
4.5% 11/1/43 | | 275,000 | 256,573 |
5% 11/1/47 | | 1,005,000 | 973,775 |
| (Rfdg.-Ingleside King Farm Proj.) Series 2017: | | | |
5% 11/1/35 | | 140,000 | 141,743 |
5% 11/1/37 | | 315,000 | 318,076 |
5% 11/1/42 | | 1,280,000 | 1,280,150 |
| Univ. of Maryland Sys. Auxiliary Facility & Tuition Rev. Series 2024 A, 4% 4/1/43 | | 1,160,000 | 1,176,644 |
| Washington County Econ. Dev. Rev. (Homewood Maryland Obligated Group Proj.) Series 2021: | | | |
| 4% 5/1/26 | | 245,000 | 246,771 |
| 4% 5/1/27 | | 255,000 | 258,511 |
| 4% 5/1/30 | | 285,000 | 292,124 |
| 4% 5/1/31 | | 155,000 | 159,066 |
| 4% 5/1/36 | | 985,000 | 995,669 |
| 4% 5/1/42 | | 2,010,000 | 1,964,526 |
| Washington Metropolitan Area Transit Auth. Series 2021 A, 4% 7/15/39 | | 1,000,000 | 1,026,217 |
| Washington Suburban San. District: | | | |
| Series 2016, 5% 6/1/38 | | 2,485,000 | 2,551,204 |
| Series 2024: | | | |
4% 6/1/45 | | 1,475,000 | 1,500,612 |
4% 6/1/53 | | 4,120,000 | 4,149,771 |
| Westminster Proj. Rev. Series 2014 A, 6.25% 7/1/44 | | 510,000 | 510,185 |
TOTAL MARYLAND | | | 147,428,852 |
| Massachusetts - 1.4% | | | |
| Boston Gen. Oblig. Series 2023 A, 5% 11/1/38 | | 935,000 | 1,090,992 |
| Boston Wtr. & Swr. Commission Rev. Series 2016 B, 3% 11/1/41 | | 3,000,000 | 2,696,788 |
| Massachusetts Bay Trans. Auth. Sales Tax Rev.: | | | |
| Series 2015 A, 5% 7/1/45 | | 360,000 | 362,360 |
| Series 2016 A, 0% 7/1/31 | | 2,570,000 | 2,069,247 |
| Series 2021 A1, 5% 7/1/34 | | 2,640,000 | 2,957,038 |
| Series 2024 B, 5.25% 7/1/54 | | 4,400,000 | 4,904,200 |
| Massachusetts Clean Wtr. Trust: | | | |
| Series 2021 23A, 5% 2/1/39 | | 1,965,000 | 2,172,734 |
| Series 2023 2023: | | | |
5% 2/1/34 | | 1,800,000 | 2,093,077 |
5% 2/1/35 | | 1,200,000 | 1,391,070 |
| Massachusetts Commonwealth Trans. Fund Rev.: | | | |
| (Rail Enhancement Prog.) Series 2021 B, 5% 6/1/37 | | 3,900,000 | 4,147,316 |
| Series 2021 A, 5% 6/1/51 | | 6,265,000 | 6,627,971 |
| Massachusetts Dept. of Trans. Metropolitan Hwy. Sys. Rev. Series 2019 A, 5% 1/1/32 | | 2,315,000 | 2,517,028 |
| Massachusetts Dev. Fin. Agcy. Rev.: | | | |
| (Lesley Univ. Proj.) Series 2016, 5% 7/1/39 | | 255,000 | 257,656 |
| (Newbridge On The Charles Proj.) Series 2017: | | | |
5% 10/1/47 (g) | | 1,255,000 | 1,259,708 |
5% 10/1/57 (g) | | 2,460,000 | 2,458,252 |
| (Partners Healthcare Sys., Inc. Proj.): | | | |
Series 2017 S: | | | |
5% 7/1/32 | | 270,000 | 285,437 |
5% 7/1/34 | | 510,000 | 538,131 |
Series 2017, 4% 7/1/41 | | 1,215,000 | 1,218,321 |
| (UMass Memorial Health Care Proj.) Series K, 5% 7/1/38 | | 275,000 | 280,746 |
| (Univ. of Massachusetts Health Cr., Inc. Proj.) Series 2017 L: | | | |
4% 7/1/44 | | 680,000 | 631,196 |
5% 7/1/44 | | 350,000 | 355,439 |
| (Wentworth Institute of Technology Proj.) Series 2017: | | | |
5% 10/1/27 | | 125,000 | 127,805 |
5% 10/1/28 | | 125,000 | 127,731 |
5% 10/1/29 | | 135,000 | 137,832 |
5% 10/1/30 | | 65,000 | 66,297 |
5% 10/1/31 | | 150,000 | 152,793 |
5% 10/1/32 | | 155,000 | 157,678 |
5% 10/1/33 | | 75,000 | 76,211 |
5% 10/1/46 | | 240,000 | 241,013 |
| Series 1999 P, 5.45% 5/15/59 (Assured Guaranty, Inc. Insured) | | 355,000 | 393,012 |
| Series 2013 G, 5% 7/1/37 | | 570,000 | 570,184 |
| Series 2014 F: | | | |
5.625% 7/15/36 | | 85,000 | 85,121 |
5.75% 7/15/43 | | 920,000 | 921,030 |
| Series 2015 F, 5% 8/15/30 | | 210,000 | 211,992 |
| Series 2015: | | | |
5% 4/15/25 | | 20,000 | 20,008 |
5% 7/1/25 | | 25,000 | 25,246 |
5% 7/1/25 (Escrowed to Maturity) | | 65,000 | 65,658 |
5% 5/1/41 | | 300,000 | 300,862 |
| Series 2016 A, 5.25% 1/1/42 | | 50,000 | 50,720 |
| Series 2016 B, 4% 10/1/46 | | 165,000 | 141,984 |
| Series 2016: | | | |
5% 10/1/29 | | 120,000 | 124,033 |
5% 10/1/30 | | 185,000 | 191,189 |
5% 7/1/31 | | 205,000 | 209,316 |
5% 10/1/31 | | 200,000 | 206,449 |
5% 1/1/40 | | 530,000 | 541,157 |
5% 10/1/43 | | 1,810,000 | 1,814,642 |
5% 7/1/46 | | 465,000 | 469,125 |
5% 10/1/48 | | 2,100,000 | 2,106,007 |
| Series 2017 A, 5% 1/1/36 | | 155,000 | 159,311 |
| Series 2017 B: | | | |
5% 7/1/42 | | 580,000 | 582,828 |
5% 9/1/42 | | 2,135,000 | 2,210,402 |
| Series 2018 J1, 5% 7/1/48 | | 640,000 | 657,594 |
| Series 2018: | | | |
5% 11/15/38 (g) | | 380,000 | 394,895 |
5% 1/1/43 | | 85,000 | 86,260 |
5% 10/1/48 | | 350,000 | 352,023 |
5% 10/1/54 | | 600,000 | 601,388 |
5.125% 11/15/46 (g) | | 920,000 | 949,136 |
| Series 2019 A: | | | |
4% 7/1/44 | | 475,000 | 431,152 |
5% 7/1/39 | | 395,000 | 401,342 |
5% 7/1/44 | | 465,000 | 465,414 |
| Series 2019 K: | | | |
5% 7/1/25 | | 55,000 | 55,541 |
5% 7/1/26 | | 70,000 | 72,087 |
5% 7/1/27 | | 85,000 | 89,546 |
5% 7/1/31 | | 240,000 | 261,700 |
5% 7/1/32 | | 240,000 | 261,458 |
| Series 2019: | | | |
5% 7/1/25 | | 40,000 | 40,240 |
5% 7/1/26 | | 25,000 | 25,487 |
5% 7/1/28 | | 35,000 | 36,065 |
5% 7/1/29 | | 30,000 | 31,085 |
5% 9/1/59 | | 1,485,000 | 1,555,062 |
| Series 2020 A, 4% 7/1/45 | | 3,055,000 | 2,601,710 |
| Series 2020 C: | | | |
4% 10/1/45 (Assured Guaranty Muni. Corp. Insured) | | 400,000 | 393,908 |
5% 10/1/32 (Assured Guaranty Muni. Corp. Insured) | | 180,000 | 196,712 |
5% 10/1/33 (Assured Guaranty Muni. Corp. Insured) | | 110,000 | 119,464 |
| Series 2021 V, 5% 7/1/55 | | 4,180,000 | 5,039,538 |
| Series 2021: | | | |
4% 9/1/48 | | 335,000 | 309,591 |
4% 7/1/51 | | 1,110,000 | 898,715 |
5% 7/1/41 (g) | | 300,000 | 282,747 |
| Series 2022: | | | |
5.125% 1/1/40 | | 405,000 | 408,355 |
5.25% 1/1/50 | | 655,000 | 642,968 |
| Series 2023 G: | | | |
4.375% 7/1/52 | | 785,000 | 781,279 |
5.25% 7/1/52 | | 3,450,000 | 3,695,740 |
| Series BB1, 5% 10/1/46 | | 1,205,000 | 1,238,093 |
| Series J2, 5% 7/1/53 | | 7,175,000 | 7,346,591 |
| Series M: | | | |
4% 10/1/50 | | 3,070,000 | 2,470,659 |
5% 10/1/45 | | 2,315,000 | 2,267,740 |
| Series N 2016, 5% 12/1/41 | | 1,500,000 | 1,536,416 |
| Massachusetts Edl. Fing. Auth. Rev.: | | | |
| Series 2017 B, 4.25% 7/1/46 (e) | | 1,950,000 | 1,853,170 |
| Series 2018 C, 4.125% 7/1/46 (e) | | 2,180,000 | 2,026,307 |
| Series 2019 B: | | | |
3% 7/1/35 (e) | | 150,000 | 147,289 |
5% 7/1/27 (e) | | 475,000 | 491,414 |
| Series 2019 C, 3.75% 7/1/47 (e) | | 2,430,000 | 2,129,977 |
| Series 2020 B, 2.625% 7/1/36 (e) | | 55,000 | 54,500 |
| Series 2021 B, 2% 7/1/37 (e) | | 70,000 | 61,023 |
| Series 2021 C, 3% 7/1/51 (e) | | 950,000 | 687,406 |
| Series 2022 C, 4.125% 7/1/52 (e) | | 2,210,000 | 1,968,327 |
| Series 2024 B, 5% 7/1/30 (e) | | 500,000 | 535,269 |
| Series 2024 D, 5% 7/1/54 (e) | | 1,470,000 | 1,483,932 |
| Massachusetts Gen. Oblig.: | | | |
| Series 2019 A, 5% 1/1/49 | | 705,000 | 737,634 |
| Series 2019 C, 5% 5/1/49 | | 1,205,000 | 1,264,972 |
| Series 2020 C: | | | |
3% 3/1/47 | | 2,000,000 | 1,671,804 |
3% 3/1/49 | | 2,335,000 | 1,906,901 |
| Series 2021 B, 3% 4/1/49 | | 3,150,000 | 2,571,610 |
| Series 2022 B, 3% 2/1/48 | | 5,250,000 | 4,345,323 |
| Series 2022 C, 5% 10/1/52 | | 750,000 | 810,011 |
| Series E: | | | |
5% 11/1/45 | | 1,125,000 | 1,209,390 |
5% 11/1/50 | | 220,000 | 234,065 |
| Massachusetts Hsg. Fin. Auth. Series 2021 223, 3% 6/1/47 | | 1,830,000 | 1,801,327 |
| Massachusetts Muni. Wholesale Elec. Co. Series 2021 A, 4% 7/1/46 | | 480,000 | 478,912 |
| Massachusetts Port Auth. Rev.: | | | |
| Series 2016 A: | | | |
5% 7/1/33 | | 255,000 | 261,984 |
5% 7/1/34 | | 130,000 | 133,481 |
5% 7/1/38 | | 190,000 | 194,487 |
| Series 2016 B, 4% 7/1/46 (e) | | 2,500,000 | 2,413,440 |
| Series 2019 A: | | | |
5% 7/1/34 (e) | | 1,005,000 | 1,067,974 |
5% 7/1/35 (e) | | 1,000,000 | 1,060,501 |
5% 7/1/36 (e) | | 170,000 | 179,918 |
5% 7/1/37 (e) | | 835,000 | 881,832 |
5% 7/1/38 (e) | | 1,045,000 | 1,101,270 |
5% 7/1/39 (e) | | 1,700,000 | 1,786,304 |
5% 7/1/40 (e) | | 1,580,000 | 1,655,876 |
| Series 2019 C, 5% 7/1/49 (e) | | 1,500,000 | 1,550,391 |
| Series 2021 E: | | | |
5% 7/1/37 (e) | | 2,895,000 | 3,120,267 |
5% 7/1/41 (e) | | 4,915,000 | 5,224,175 |
5% 7/1/46 (e) | | 2,680,000 | 2,813,630 |
5% 7/1/51 (e) | | 6,355,000 | 6,625,342 |
| Massachusetts Port Auth. Spl. Facilities Rev.: | | | |
| (BOSfuel Proj.) Series 2019 A: | | | |
5% 7/1/35 (e) | | 105,000 | 110,450 |
5% 7/1/36 (e) | | 210,000 | 220,450 |
5% 7/1/37 (e) | | 305,000 | 319,497 |
| (Bosfuel Proj.) Series 2019 A, 5% 7/1/49 (e) | | 1,050,000 | 1,080,457 |
| Massachusetts School Bldg. Auth. Dedicated Sales Tax Rev. Series 2016 B, 5% 11/15/33 | | 1,625,000 | 1,687,434 |
| Massachusetts St Dev. Fin. Agcy. R Series 2024 A: | | | |
| 4.25% 7/1/34 (g) | | 500,000 | 506,077 |
| 5% 7/1/44 (g) | | 120,000 | 123,953 |
| 5% 7/1/54 (g) | | 500,000 | 509,859 |
| Massachusetts Wtr. Resources Auth. Wtr. & Swr. Rev. Series 2016 C, 4% 8/1/40 | | 2,710,000 | 2,715,695 |
| Somerville Gen. Oblig. Series 2020, 2.125% 10/15/39 | | 1,125,000 | 892,632 |
| Stoneham Gen. Oblig. Series 2022: | | | |
| 2.25% 1/15/40 | | 500,000 | 400,857 |
| 2.25% 1/15/41 | | 3,630,000 | 2,856,101 |
| Worcester Gen. Oblig. Series 2022, 3% 2/1/37 (Assured Guaranty Muni. Corp. Insured) | | 250,000 | 235,492 |
TOTAL MASSACHUSETTS | | | 160,000,433 |
| Michigan - 1.3% | | | |
| Calhoun County Hosp. Fin. Auth. Rev. Series 2016: | | | |
| 5% 2/15/37 | | 140,000 | 141,239 |
| 5% 2/15/41 | | 800,000 | 802,601 |
| 5% 2/15/47 | | 2,235,000 | 2,208,238 |
| Detroit Gen. Oblig.: | | | |
| Series 2018: | | | |
5% 4/1/27 | | 235,000 | 244,314 |
5% 4/1/37 | | 295,000 | 306,130 |
| Series 2020: | | | |
5.5% 4/1/32 | | 175,000 | 191,899 |
5.5% 4/1/34 | | 95,000 | 103,702 |
5.5% 4/1/36 | | 130,000 | 141,266 |
5.5% 4/1/38 | | 290,000 | 313,636 |
5.5% 4/1/40 | | 205,000 | 220,205 |
5.5% 4/1/45 | | 145,000 | 153,991 |
5.5% 4/1/50 | | 295,000 | 311,100 |
| Series 2021 A: | | | |
5% 4/1/46 | | 500,000 | 522,751 |
5% 4/1/50 | | 50,000 | 51,945 |
| Series 2023 C, 6% 5/1/43 | | 1,250,000 | 1,425,347 |
| Detroit School District School Bldg. and Site Impt. Series 2020 A: | | | |
| 5% 5/1/34 | | 745,000 | 811,567 |
| 5% 5/1/36 | | 210,000 | 227,255 |
| 5% 5/1/37 | | 230,000 | 247,641 |
| Detroit Svc. Learning Academy M Series 2021, 4% 7/1/41 | | 250,000 | 225,944 |
| Flint Hosp. Bldg. Auth. Rev. Series 2020: | | | |
| 4% 7/1/41 | | 70,000 | 63,775 |
| 5% 7/1/25 | | 30,000 | 30,060 |
| 5% 7/1/26 | | 25,000 | 25,113 |
| 5% 7/1/27 | | 40,000 | 40,778 |
| 5% 7/1/28 | | 60,000 | 61,616 |
| Gerald R. Ford Int'l. Arpt. Auth. Rev. Series 2021, 5% 1/1/51 (e) | | 895,000 | 944,000 |
| Grand Rapids Econ. Dev. Corp. Econ. Dev. Rev. (Beacon Hill at Eastgate Proj.) Series 2017 A: | | | |
| 5% 11/1/32 | | 300,000 | 304,707 |
| 5% 11/1/37 | | 165,000 | 166,790 |
| 5% 11/1/47 | | 390,000 | 382,989 |
| 5% 11/1/52 | | 165,000 | 158,658 |
| Grand Rapids Pub. Schools Series 2019, 5% 11/1/26 (Assured Guaranty Muni. Corp. Insured) | | 60,000 | 62,359 |
| Grand Traverse County Hosp. Fin. Auth. Series 2021, 3% 7/1/51 | | 1,625,000 | 1,301,278 |
| Great Lakes Wtr. Auth. Sew Disp. Sys.: | | | |
| Series 2016 C, 5% 7/1/36 | | 1,305,000 | 1,334,399 |
| Series 2018 A, 5% 7/1/48 | | 1,645,000 | 1,715,284 |
| Series 2022 A: | | | |
5.25% 7/1/47 | | 3,225,000 | 3,556,185 |
5.25% 7/1/52 | | 1,170,000 | 1,280,665 |
| Series 2023 C, 5.25% 7/1/48 | | 1,375,000 | 1,540,614 |
| Great Lakes Wtr. Auth. Wtr. Supply Sys. Rev.: | | | |
| Series 2016 A, 5% 7/1/46 | | 4,265,000 | 4,350,144 |
| Series 2016 B, 5% 7/1/46 | | 2,725,000 | 2,779,400 |
| Series 2016 C: | | | |
5% 7/1/35 | | 650,000 | 668,522 |
5.25% 7/1/33 | | 1,125,000 | 1,162,926 |
5.25% 7/1/35 | | 1,300,000 | 1,342,015 |
| Series 2016 D, 5% 7/1/36 | | 670,000 | 685,509 |
| Series 2022 A, 5.25% 7/1/47 | | 3,000,000 | 3,308,079 |
| Series 2022 B, 5.5% 7/1/52 | | 3,000,000 | 3,311,963 |
| Series 2023 B, 5.25% 7/1/48 | | 2,250,000 | 2,521,005 |
| Ivywood Classical Academy Series 2023, 5.875% 1/1/44 | | 1,970,000 | 2,014,741 |
| Jackson County Series 2019: | | | |
| 4% 5/1/32 (Build America Mutual Assurance Insured) | | 120,000 | 124,647 |
| 4% 5/1/33 (Build America Mutual Assurance Insured) | | 125,000 | 129,686 |
| Kalamazoo Hosp. Fin. Auth. Hosp. Facilities Rev. Series 2016, 5% 5/15/28 | | 365,000 | 374,081 |
| Kentwood Econ. Dev. Corp.: | | | |
| Series 2019, 5% 11/15/41 | | 250,000 | 251,693 |
| Series 2022: | | | |
4% 11/15/31 | | 240,000 | 235,301 |
4% 11/15/43 | | 365,000 | 322,506 |
| Michigan Bldg. Auth. Rev.: | | | |
| Series 2015 I, 5% 4/15/30 (Pre-Refunded to 10/15/25 @ 100) | | 30,000 | 30,497 |
| Series 2022 I, 4% 10/15/52 | | 370,000 | 362,800 |
| Michigan Fin. Auth. Act 38 Facss (The Henry Ford Health Detroit South Campus Central Util. Plant Proj.) Series 2024: | | | |
| 4.375% 2/28/54 | | 335,000 | 334,000 |
| 5.5% 2/28/57 | | 2,405,000 | 2,655,468 |
| Michigan Fin. Auth. Rev.: | | | |
| (Charter County of Wayne Criminal Justice Ctr. Proj.) Series 2018: | | | |
4% 11/1/48 | | 350,000 | 343,833 |
5% 11/1/43 | | 485,000 | 506,567 |
| (College for Creative Studies Proj.) Series 2015, 5% 12/1/45 | | 300,000 | 293,221 |
| (Henry Ford Health Sys. Proj.) Series 2016, 5% 11/15/25 | | 270,000 | 274,801 |
| (Lawrence Technological Univ. Proj.) Series 2017, 5.25% 2/1/32 | | 250,000 | 254,696 |
| (Trinity Health Proj.) Series 2017, 5% 12/1/37 | | 65,000 | 67,634 |
| Bonds: | | | |
Series 2015 D1, 1.2%, tender 4/13/28 (b) | | 540,000 | 491,593 |
Series 2015 D2, 1.2%, tender 4/13/28 (b) | | 680,000 | 619,043 |
| Series 2015 B, 5% 5/15/35 | | 1,475,000 | 1,483,081 |
| Series 2015 C: | | | |
5% 7/1/34 | | 580,000 | 584,510 |
5% 7/1/35 | | 4,535,000 | 4,572,086 |
| Series 2015 D1, 5% 7/1/34 | | 240,000 | 241,949 |
| Series 2015 D2, 5% 7/1/34 | | 1,040,000 | 1,048,146 |
| Series 2015 MI, 5% 12/1/24 | | 540,000 | 540,048 |
| Series 2015, 5% 11/15/28 (Pre-Refunded to 5/15/25 @ 100) | | 20,000 | 20,162 |
| Series 2016 MI, 4% 12/1/45 | | 1,000,000 | 995,416 |
| Series 2016: | | | |
5% 11/15/26 | | 55,000 | 56,793 |
5% 11/15/32 | | 270,000 | 278,315 |
5% 11/15/34 | | 950,000 | 976,590 |
5% 11/15/37 | | 1,030,000 | 1,054,381 |
5% 11/15/41 | | 520,000 | 529,609 |
| Series 2017 MI: | | | |
5% 12/1/30 | | 210,000 | 219,127 |
5% 12/1/31 | | 425,000 | 442,758 |
| Series 2019 A: | | | |
3% 12/1/49 | | 1,715,000 | 1,424,878 |
4% 2/15/44 | | 1,500,000 | 1,465,545 |
4% 12/1/49 | | 50,000 | 48,639 |
4% 11/15/50 | | 1,085,000 | 1,022,365 |
5% 2/15/37 | | 410,000 | 436,277 |
5% 2/15/38 | | 590,000 | 624,870 |
5% 2/15/39 | | 2,950,000 | 3,114,973 |
5% 12/1/41 | | 540,000 | 574,867 |
5% 11/15/48 | | 110,000 | 115,177 |
5% 5/15/54 | | 6,590,000 | 6,677,768 |
| Series 2020 A, 4% 6/1/49 | | 715,000 | 645,450 |
| Series 2020 B, 0% 6/1/45 | | 1,700,000 | 446,302 |
| Series 2020 B1, 5% 6/1/49 | | 475,000 | 485,089 |
| Series 2020 B2, 0% 6/1/65 | | 10,950,000 | 1,221,414 |
| Series 2020, 5% 6/1/40 | | 30,000 | 31,404 |
| Series 2021: | | | |
4% 9/1/39 | | 425,000 | 425,346 |
4% 9/1/40 | | 425,000 | 424,014 |
4% 9/1/41 | | 355,000 | 351,942 |
4% 9/1/46 | | 250,000 | 241,698 |
| Series 2022 A, 5% 12/1/32 | | 1,705,000 | 1,905,128 |
| Series 2023: | | | |
5.25% 11/1/39 | | 1,500,000 | 1,585,328 |
5.375% 11/1/43 | | 1,000,000 | 1,052,518 |
5.5% 11/1/48 | | 5,300,000 | 5,553,079 |
| Michigan Hosp. Fin. Auth. Rev. Series 2008 C: | | | |
| 5% 12/1/32 | | 175,000 | 183,171 |
| 5% 12/1/32 (Pre-Refunded to 12/1/27 @ 100) | | 20,000 | 21,305 |
| Michigan Hsg. Dev. Auth. Single Family Mtg. Rev.: | | | |
| Series 2023 B, 5% 6/1/54 | | 2,050,000 | 2,112,768 |
| Series 2024 D, 6.25% 6/1/55 | | 750,000 | 832,412 |
| Series A, 3.5% 12/1/50 | | 280,000 | 278,804 |
| Michigan State Hsg. Dev. Auth.: | | | |
| Series 2021 A, 2.45% 10/1/46 | | 1,710,000 | 1,227,408 |
| Series 2023 A, 5.15% 10/1/58 | | 2,945,000 | 3,079,889 |
| Series 2023, 3.75% 4/1/27 | | 1,415,000 | 1,414,956 |
| Series 2024 A, 4.75% 10/1/59 | | 5,480,000 | 5,618,830 |
| Michigan Strategic Fund Ltd. Oblig. Rev. (I-75 Impt. Proj.) Series 2018: | | | |
| 4.125% 6/30/35 (Assured Guaranty Muni. Corp. Insured) (e) | | 1,030,000 | 1,032,585 |
| 5% 12/31/43 (e) | | 1,855,000 | 1,900,256 |
| 5% 6/30/48 (e) | | 1,715,000 | 1,751,928 |
| Michigan Tobacco Settlement Fin. Auth. Tobacco Settlement Asset Rev.: | | | |
| Series 2007 B, 0% 6/1/52 | | 3,830,000 | 508,445 |
| Series 2008: | | | |
0% 6/1/46 | | 10,005,000 | 1,383,477 |
0% 6/1/58 | | 4,380,000 | 148,080 |
| Michigan Trunk Line Fund Rev.: | | | |
| (Rebuilding Michigan Prog.) Series 2023, 5.5% 11/15/49 | | 6,000,000 | 6,858,078 |
| Series 2020 B, 4% 11/15/37 | | 2,500,000 | 2,584,548 |
| Series 2021 A, 4% 11/15/44 | | 1,500,000 | 1,512,599 |
| Oakland Univ. Rev.: | | | |
| Series 2016, 5% 3/1/41 | | 50,000 | 50,690 |
| Series 2019 A, 5% 3/1/31 | | 35,000 | 37,590 |
| Series 2019: | | | |
5% 3/1/32 | | 40,000 | 42,943 |
5% 3/1/33 | | 40,000 | 42,874 |
5% 3/1/34 | | 45,000 | 48,223 |
5% 3/1/35 | | 45,000 | 48,137 |
5% 3/1/36 | | 50,000 | 53,467 |
5% 3/1/37 | | 60,000 | 64,033 |
5% 3/1/38 | | 85,000 | 90,570 |
5% 3/1/39 | | 60,000 | 63,780 |
5% 3/1/40 | | 720,000 | 762,930 |
5% 3/1/41 | | 760,000 | 802,745 |
5% 3/1/44 | | 1,485,000 | 1,554,326 |
5% 3/1/50 | | 2,400,000 | 2,494,708 |
| Portage Pub. Schools Series 2016: | | | |
| 5% 11/1/30 | | 345,000 | 354,178 |
| 5% 11/1/31 | | 305,000 | 312,730 |
| 5% 11/1/33 | | 55,000 | 56,325 |
| 5% 11/1/36 | | 100,000 | 102,269 |
| 5% 11/1/37 | | 55,000 | 56,210 |
| Univ. of Michigan Rev. Series 2020 A: | | | |
| 4% 4/1/45 | | 1,060,000 | 1,068,517 |
| 5% 4/1/50 | | 255,000 | 272,407 |
| Warren Consolidated School District Series 2016: | | | |
| 5% 5/1/28 | | 230,000 | 236,667 |
| 5% 5/1/29 | | 235,000 | 241,977 |
| Wayne County Arpt. Auth. Rev.: | | | |
| Series 2014 B: | | | |
5% 12/1/39 (Build America Mutual Assurance Insured) | | 130,000 | 130,078 |
5% 12/1/44 | | 525,000 | 525,177 |
| Series 2014 C: | | | |
5% 12/1/39 (e) | | 100,000 | 100,016 |
5% 12/1/44 (e) | | 215,000 | 215,035 |
| Series 2015 D: | | | |
5% 12/1/30 | | 75,000 | 76,149 |
5% 12/1/31 | | 130,000 | 131,930 |
5% 12/1/40 (Assured Guaranty Muni. Corp. Insured) | | 1,515,000 | 1,531,369 |
| Series 2015 G: | | | |
5% 12/1/31 | | 85,000 | 86,262 |
5% 12/1/32 | | 85,000 | 86,224 |
5% 12/1/33 | | 110,000 | 111,549 |
| Series 2015, 5% 12/1/29 | | 90,000 | 91,405 |
| Series 2017 A: | | | |
4% 12/1/33 (Assured Guaranty Muni. Corp. Insured) | | 180,000 | 182,539 |
4% 12/1/34 (Assured Guaranty Muni. Corp. Insured) | | 150,000 | 151,930 |
4% 12/1/35 (Assured Guaranty Muni. Corp. Insured) | | 145,000 | 146,643 |
4% 12/1/36 (Assured Guaranty Muni. Corp. Insured) | | 150,000 | 151,585 |
5% 12/1/28 | | 35,000 | 36,864 |
5% 12/1/29 | | 30,000 | 31,536 |
5% 12/1/30 | | 40,000 | 42,014 |
5% 12/1/31 | | 45,000 | 47,202 |
5% 12/1/32 | | 45,000 | 47,143 |
5% 12/1/33 | | 20,000 | 20,939 |
5% 12/1/34 | | 85,000 | 88,884 |
5% 12/1/35 | | 80,000 | 83,531 |
5% 12/1/37 | | 30,000 | 31,235 |
5% 12/1/37 | | 70,000 | 72,720 |
| Series 2017 B: | | | |
5% 12/1/29 (e) | | 75,000 | 77,969 |
5% 12/1/30 (e) | | 85,000 | 88,294 |
5% 12/1/31 (e) | | 100,000 | 103,735 |
5% 12/1/32 (e) | | 65,000 | 67,344 |
5% 12/1/32 (e) | | 80,000 | 82,885 |
5% 12/1/34 (e) | | 75,000 | 77,497 |
5% 12/1/35 (e) | | 80,000 | 82,586 |
5% 12/1/37 (e) | | 100,000 | 102,939 |
5% 12/1/42 (e) | | 120,000 | 122,414 |
| Series 2017 C, 5% 12/1/28 | | 60,000 | 63,336 |
| Series 2018 B, 5% 12/1/48 (e) | | 705,000 | 723,818 |
| Series 2018 D, 5% 12/1/29 (e) | | 565,000 | 595,393 |
| Series 2023 E, 5% 12/1/28 (Assured Guaranty Muni. Corp. Insured) (e) | | 3,000,000 | 3,173,957 |
| Wayne County Arpt. Rev. Series 2017 C, 5% 12/1/37 (Assured Guaranty Muni. Corp. Insured) (e)(g) | | 2,950,000 | 3,040,919 |
TOTAL MICHIGAN | | | 148,284,334 |
| Minnesota - 0.4% | | | |
| Apple Valley Sr. Living (Minnesota Sr. Living LLC Proj.): | | | |
| Series 2016 B, 5% 1/1/47 | | 565,000 | 337,612 |
| Series 2016 D, 7.25% 1/1/52 | | 610,000 | 342,768 |
| Bethel Minn Charter School Leaser (Spectrum High School Proj.) Series 2024, 5% 7/1/59 | | 750,000 | 754,031 |
| City of White Bear Lake (YMCA of Greater Twin Cities Proj.) Series 2018, 5% 6/1/27 | | 30,000 | 30,990 |
| Deephaven Charter School Lease Rev. (Seven Hills Preparatory Academy Proj.) Series 2024 A, 6.125% 6/15/61 (g) | | 1,200,000 | 1,223,789 |
| Duluth Econ. Dev. Auth. Series 2021 A: | | | |
| 4% 7/1/31 | | 215,000 | 207,754 |
| 4% 7/1/36 | | 355,000 | 328,562 |
| 4% 7/1/41 | | 145,000 | 126,935 |
| Duluth Econ. Dev. Auth. Health Care Facilities Rev.: | | | |
| Series 2018 A: | | | |
4.25% 2/15/43 | | 595,000 | 596,303 |
4.25% 2/15/48 | | 700,000 | 699,160 |
5% 2/15/43 | | 570,000 | 586,580 |
5% 2/15/48 | | 1,075,000 | 1,099,415 |
5% 2/15/53 | | 900,000 | 919,309 |
5% 2/15/58 | | 660,000 | 671,636 |
5.25% 2/15/53 | | 1,775,000 | 1,826,228 |
| Series 2018, 5.25% 2/15/58 | | 250,000 | 257,007 |
| Series 2022 B, 5.25% 6/15/52 | | 250,000 | 272,672 |
| Duluth Independent School District #709 Ctfs. of Prtn.: | | | |
| Series 2019 A, 4.2% 3/1/34 (Pre-Refunded to 3/1/27 @ 100) | | 65,000 | 66,951 |
| Series 2019 B, 5% 2/1/25 | | 50,000 | 50,142 |
| Elk River Independent School District #728 Series 2020 A: | | | |
| 2.25% 2/1/36 | | 750,000 | 640,187 |
| 2.5% 2/1/38 | | 1,735,000 | 1,482,208 |
| Ham Lake Minn Charter School Leas Series 2016 A, 5% 11/1/47 | | 250,000 | 250,747 |
| Maple Grove Health Care Sys. Rev.: | | | |
| Series 2015, 5% 9/1/27 | | 70,000 | 70,667 |
| Series 2017, 5% 5/1/25 | | 100,000 | 100,362 |
| Minneapolis & Saint Paul Hsg. & Redev. Auth. Health Care Sys. Rev. (Allina Health Sys. Proj.) Series 2017 A, 5% 11/15/25 | | 75,000 | 76,023 |
| Minneapolis & Saint Paul Metropolitan Arpts. Commission Arpt. Rev.: | | | |
| Series 2016 C: | | | |
5% 1/1/41 | | 320,000 | 329,443 |
5% 1/1/46 | | 640,000 | 655,261 |
| Series 2022 B: | | | |
5% 1/1/28 (e) | | 630,000 | 659,023 |
5% 1/1/35 (e) | | 645,000 | 695,613 |
5% 1/1/37 (e) | | 1,580,000 | 1,693,711 |
| Series 2024 B, 5.25% 1/1/49 (e) | | 1,310,000 | 1,416,532 |
| Minneapolis Gen. Oblig. Series 2023, 5.5% 12/1/27 | | 580,000 | 628,039 |
| Minneapolis Multi-family Rev. (Gateway Northeast Proj.) Series 2019, 2.46% 1/1/38 | | 1,174,137 | 945,889 |
| Minneapolis Taxable Charter Schools Lease Rev. (Twin cities Int'l. Schools Proj.) Series 2017 A, 5% 12/1/47 (g) | | 300,000 | 290,036 |
| Minnesota Agric. & Econ. Dev. Board Rev. Series 2024, 5.25% 1/1/54 | | 6,180,000 | 6,782,002 |
| Minnesota Gen. Oblig. Series 2023 B, 5% 8/1/26 | | 1,730,000 | 1,795,477 |
| Minnesota Higher Ed. Facilities Auth. Rev.: | | | |
| Series 2016 A, 5% 5/1/46 | | 95,000 | 69,343 |
| Series 2018 A: | | | |
5% 10/1/29 | | 55,000 | 57,210 |
5% 10/1/30 | | 90,000 | 93,333 |
5% 10/1/32 | | 40,000 | 41,236 |
5% 10/1/33 | | 50,000 | 51,430 |
5% 10/1/45 | | 260,000 | 260,901 |
| Minnesota Hsg. Fin. Agcy.: | | | |
| Series 2015 A, 4% 1/1/41 (e) | | 5,000 | 4,997 |
| Series 2023 E, 6.25% 7/1/54 | | 995,000 | 1,087,448 |
| Series 2023 F, 5.75% 7/1/53 | | 450,000 | 482,207 |
| Series 2024 A, 6.25% 1/1/54 | | 1,000,000 | 1,091,504 |
| Series B, 4% 8/1/41 | | 75,000 | 75,494 |
| Series D: | | | |
4% 8/1/38 | | 135,000 | 137,848 |
4% 8/1/40 | | 145,000 | 146,679 |
4% 8/1/41 | | 95,000 | 95,626 |
4% 8/1/43 | | 110,000 | 109,997 |
| Minnesota Office of Higher Ed. Series 2020, 2.65% 11/1/38 (e) | | 485,000 | 439,944 |
| Moorhead Edl. Facilities Rev. (The Concordia College Corp. Proj.) Series 2016, 5% 12/1/25 | | 75,000 | 75,023 |
| Moorhead ISD No. 152 (MN School District Cr. Enhancement Prog.) Series 2020 A, 2.5% 2/1/38 | | 1,780,000 | 1,521,756 |
| Rochester Health Cr.&Hsg. Rev. Series 2013 A, 6.875% 12/1/48 | | 290,000 | 290,228 |
| Saint Cloud Health Care Rev. Series 2019: | | | |
| 4% 5/1/49 | | 230,000 | 228,513 |
| 5% 5/1/48 | | 285,000 | 297,719 |
| Sauk Rapids Minn Independent School District # 47 Series 2020 A, 2.375% 2/1/36 | | 2,720,000 | 2,299,123 |
| Spring Lake Park Independent School District #16 (Minnesota School District Cr. Enhancement Prog.) Series 2024 A, 5% 2/1/28 | | 1,495,000 | 1,601,784 |
| St. Paul Hsg. & Redev. Auth. Health Care Facilities Rev. Series 2015 A, 5% 7/1/29 | | 145,000 | 146,115 |
| Washington County Gen. Oblig. Series 2017 A, 2.25% 2/1/28 | | 1,000,000 | 962,417 |
| West Saint Paul Independent School District #197 (Minnesota School District Cr. Enhancement Prog.) Series 2018 A: | | | |
| 3.6% 2/1/37 | | 645,000 | 647,049 |
| 3.65% 2/1/38 | | 675,000 | 677,078 |
| White Bear Lake Independent School District #624 Gen. Oblig. Series 2020 A: | | | |
| 2.5% 2/1/39 | | 1,345,000 | 1,127,953 |
| 3% 2/1/43 | | 750,000 | 668,474 |
| Woodbury Charter School Lease Rev. (Woodbury Leadership Academy Proj.) Series 2021 A: | | | |
| 4% 7/1/41 | | 120,000 | 102,321 |
| 4% 7/1/51 | | 95,000 | 73,558 |
| 4% 7/1/56 | | 80,000 | 60,084 |
TOTAL MINNESOTA | | | 43,933,456 |
| Mississippi - 0.1% | | | |
| Med. Ctr. Edl. Bld Corp. Rev. Series 2023 A: | | | |
| 4% 6/1/48 | | 2,820,000 | 2,795,907 |
| 4% 6/1/53 | | 2,145,000 | 2,118,105 |
| Mississippi Bus. Fin. Corp. Rev. (Sys. Energy Resources, Inc. Proj.) Series 2021, 2.375% 6/1/44 | | 300,000 | 196,279 |
| Mississippi Dev. Bank Series 2010 A, 5.25% 1/1/34 | | 520,000 | 585,165 |
| Mississippi Dev. Bank Spl. Oblig.: | | | |
| (City of Jackson, Mississippi Wtr. And Swr. Sys. Rev. Bond Proj.) Series 2013: | | | |
6.75% 12/1/30 (Assured Guaranty Muni. Corp. Insured) | | 240,000 | 243,502 |
6.875% 12/1/40 (Assured Guaranty Muni. Corp. Insured) | | 105,000 | 106,737 |
| (Jackson, Mississippi Sales Tax Rev. Infrastructure Proj.): | | | |
Series 2019 A, 5% 9/1/26 | | 205,000 | 208,754 |
Series 2020, 5% 9/1/25 | | 75,000 | 75,429 |
| (Vicksburg Warren School District Gen. Oblig. Bond Proj.) Series 2019, 5% 3/1/48 | | 850,000 | 876,235 |
| Mississippi Home Corp.: | | | |
| Series 2018 A, 4% 12/1/44 | | 160,000 | 160,662 |
| Series 2021 B: | | | |
3% 6/1/51 | | 950,000 | 934,346 |
5% 6/1/27 | | 510,000 | 533,509 |
5% 6/1/28 | | 40,000 | 42,407 |
| Series 2024 C, 5% 12/1/39 | | 1,125,000 | 1,227,310 |
| Mississippi Hosp. Equip. & Facilities Auth.: | | | |
| (Forest County Gen. Hosp. Rfdg. Proj.) Series 2019 A: | | | |
4% 1/1/39 | | 160,000 | 157,847 |
4% 1/1/40 | | 90,000 | 88,418 |
| Bonds Series II, 5%, tender 3/1/27 (b) | | 40,000 | 41,430 |
| Series 2016 A, 5% 9/1/46 | | 405,000 | 406,916 |
| Series 2020 IV, 5% 10/1/35 | | 255,000 | 271,960 |
| Series I: | | | |
5% 10/1/26 | | 40,000 | 41,142 |
5% 10/1/28 | | 65,000 | 68,860 |
| Series IV, 5% 10/1/39 | | 180,000 | 189,974 |
| Warren County Ctfs. Prtn. (Lease Purchase Jail Proj.) Series 2023, 6% 9/1/53 | | 1,020,000 | 1,159,715 |
TOTAL MISSISSIPPI | | | 12,530,609 |
| Missouri - 0.6% | | | |
| Cape Girardeau County Indl. Dev. Auth.: | | | |
| (Southeast Hosp. Proj.) Series 2017 A: | | | |
5% 3/1/30 | | 85,000 | 88,280 |
5% 3/1/31 | | 200,000 | 207,569 |
5% 3/1/36 | | 390,000 | 401,992 |
| Series 2017 A, 5% 3/1/29 | | 80,000 | 83,126 |
| Series 2021, 4% 3/1/46 | | 240,000 | 234,154 |
| Conley Road Trans. Dev. District Series 2017, 5.375% 5/1/47 | | 245,000 | 245,489 |
| Jackson County Spl. Oblig. Series 2023 A, 5.25% 12/1/58 | | 3,750,000 | 4,065,690 |
| Kansas City Indl. Dev. Auth. (Kansas City Int'l. Arpt. Term. Modernization Proj.): | | | |
| Series 2019 B: | | | |
5% 3/1/37 (e) | | 1,085,000 | 1,130,861 |
5% 3/1/38 (e) | | 355,000 | 369,243 |
5% 3/1/46 (e) | | 3,170,000 | 3,255,641 |
5% 3/1/55 (Assured Guaranty Muni. Corp. Insured) (e) | | 1,210,000 | 1,235,890 |
| Series 2020 A, 5% 3/1/57 (Assured Guaranty Muni. Corp. Insured) (e) | | 3,220,000 | 3,310,970 |
| Kansas City Land Clearance for Redev. Auth. Series 2018 B, 5% 2/1/40 (g) | | 300,000 | 297,154 |
| Kansas City San. Swr. Sys. Rev. Series 2018 B: | | | |
| 5% 1/1/26 | | 15,000 | 15,351 |
| 5% 1/1/28 | | 30,000 | 32,061 |
| 5% 1/1/33 | | 25,000 | 26,497 |
| Kansas City Wtr. Rev. Series 2020 A: | | | |
| 4% 12/1/32 | | 45,000 | 47,659 |
| 4% 12/1/34 | | 25,000 | 26,412 |
| 4% 12/1/36 | | 45,000 | 46,861 |
| 4% 12/1/37 | | 30,000 | 30,884 |
| 4% 12/1/39 | | 70,000 | 72,023 |
| 4% 12/1/40 | | 30,000 | 30,697 |
| 5% 12/1/28 | | 35,000 | 38,022 |
| 5% 12/1/29 | | 20,000 | 22,112 |
| 5% 12/1/30 | | 40,000 | 44,933 |
| 5% 12/1/35 | | 40,000 | 44,457 |
| Kirkwood Indl. Dev. Retirement Commission Series 2017 A: | | | |
| 5.25% 5/15/37 | | 280,000 | 276,060 |
| 5.25% 5/15/42 | | 240,000 | 226,781 |
| 5.25% 5/15/50 | | 565,000 | 505,047 |
| Maryland Heights Indl. Dev. Auth. Rev. (Saint Louis Cmnty. Ice Ctr. Proj.) Series 2018 A, 5% 3/15/49 | | 250,000 | 203,989 |
| Missouri Dev. Fin. Board Infrastructure Facilities Rev.: | | | |
| (City of Independence, Missouri - Crackerneck Creek Proj.) Series 2021: | | | |
4% 3/1/37 | | 80,000 | 76,947 |
4% 3/1/41 | | 100,000 | 93,398 |
| Series 2021: | | | |
4% 3/1/36 | | 255,000 | 248,064 |
4% 3/1/51 | | 290,000 | 250,318 |
| Missouri Envir. Impt. & Energy Resource Auth. Envir. Impt. Rev. (Union Elec. Co. Proj.): | | | |
| Series 1998 A, 2.9% 9/1/33 | | 1,070,000 | 976,736 |
| Series 1998 B, 2.9% 9/1/33 | | 1,000,000 | 912,837 |
| Series 1998 C, 2.75% 9/1/33 | | 1,000,000 | 906,509 |
| Missouri Health & Edl. Facilities Auth. Rev.: | | | |
| (Lutheran Sr. Svcs. Proj.) Series 2016 B, 5% 2/1/46 | | 915,000 | 919,210 |
| (Lutheran Sr. Svcs. Projs.): | | | |
Series 2016 B, 5% 2/1/35 | | 155,000 | 156,847 |
Series 2021, 4% 2/1/42 | | 250,000 | 236,469 |
| Series 2019 A, 5% 2/1/42 | | 675,000 | 686,721 |
| Missouri Health & Edl. Facilities Rev.: | | | |
| (Maryville Univ. of Saint Louis Proj.) Series 2019 A, 5% 6/15/45 | | 250,000 | 252,835 |
| Bonds Series 2018 A, 4%, tender 1/1/48 (b) | | 1,555,000 | 1,531,535 |
| Series 2015 B: | | | |
3.125% 2/1/27 | | 140,000 | 140,037 |
3.25% 2/1/28 | | 140,000 | 140,156 |
5% 2/1/29 | | 150,000 | 151,535 |
5% 2/1/34 | | 175,000 | 176,216 |
| Series 2018 A: | | | |
4% 11/15/48 | | 1,060,000 | 1,039,500 |
5% 6/1/31 | | 675,000 | 723,256 |
| Series 2019 A: | | | |
4% 2/15/44 | | 490,000 | 490,452 |
4% 10/1/48 | | 215,000 | 211,598 |
4% 2/15/49 | | 1,065,000 | 1,051,918 |
4% 2/15/54 | | 970,000 | 943,815 |
5% 10/1/46 | | 265,000 | 278,240 |
| Series 2020: | | | |
3% 6/1/53 | | 2,000,000 | 1,537,000 |
4% 6/1/53 | | 1,400,000 | 1,354,907 |
| Series 2022 A, 5% 6/1/52 (d) | | 5,000,000 | 5,694,866 |
| Series 2023: | | | |
5% 12/1/52 | | 1,400,000 | 1,489,710 |
5.5% 12/1/48 | | 4,505,000 | 5,080,931 |
| Missouri Hsg. Dev. Commission Single Family Mtg. Rev.: | | | |
| (First Place Homeownership Ln. Prog.): | | | |
Series 2018 A, 4.25% 5/1/49 | | 430,000 | 433,662 |
Series 2019 A, 4.25% 5/1/47 | | 395,000 | 399,216 |
Series 2023 E, 6.5% 5/1/54 | | 1,220,000 | 1,374,983 |
| Series 2015 A, 3.75% 5/1/38 | | 10,000 | 9,984 |
| Series 2019, 4% 5/1/50 | | 85,000 | 85,555 |
| Series 2021 A, 3% 5/1/52 | | 1,480,000 | 1,453,342 |
| Missouri Joint Muni. Elec. Util. Commission Pwr. Proj. Rev. (Plum Point Proj.) Series 2014 A, 5% 1/1/33 | | 1,475,000 | 1,476,951 |
| Orchard Farm R-V School District (Missouri Direct Deposit Prog.) Series 2024 A, 5.5% 3/1/44 | | 1,650,000 | 1,917,749 |
| Park Hill School District (Missouri Direct Deposit Prog.) Series 2017, 3.3% 3/1/35 | | 2,015,000 | 1,933,154 |
| Plaza at Noah's Ark Cmnty. Impt. District Series 2021: | | | |
| 3% 5/1/30 | | 65,000 | 61,470 |
| 3.125% 5/1/35 | | 45,000 | 39,757 |
| Poplar Bluff Reg'l. Transn De Series 2023 B, 4% 12/1/37 | | 295,000 | 291,826 |
| Saint Louis Arpt. Rev.: | | | |
| Series 2019 A: | | | |
5% 7/1/44 | | 80,000 | 84,234 |
5% 7/1/49 | | 65,000 | 67,736 |
| Series 2019 C, 5% 7/1/27 | | 155,000 | 163,219 |
| Series 2024 B, 5.25% 7/1/54 (Assured Guaranty Muni. Corp. Insured) (e) | | 480,000 | 517,833 |
| Series A, 5.25% 7/1/26 (Assured Guaranty Muni. Corp. Insured) | | 350,000 | 362,930 |
| Saint Louis County Indl. Dev. Auth. Sr. Living Facilities Rev.: | | | |
| Series 2015 A: | | | |
5% 12/1/35 | | 280,000 | 280,356 |
5.125% 12/1/45 | | 545,000 | 526,046 |
| Series 2017, 5% 9/1/48 | | 2,140,000 | 2,129,819 |
| Series 2018 A: | | | |
5% 9/1/38 | | 890,000 | 903,397 |
5.125% 9/1/48 | | 3,085,000 | 3,094,233 |
5.25% 9/1/53 | | 3,485,000 | 3,498,333 |
| Saint Louis Muni. Fin. Corp. Leasehold Rev. (Convention Ctr. Expansion And Impt. Projs.) Series 2020, 5% 10/1/49 (Assured Guaranty Muni. Corp. Insured) | | 635,000 | 659,961 |
| St Louis Indl. Dev. Auth. Taxi (Union Station Phase 2 Redev. Proj.) Series 2024 A, 5.75% 6/15/54 | | 305,000 | 313,829 |
| St Louis Indl. Dev. Auth. Dev. Fing. Rev. (Ballpark Village Dev. Proj.) Series 2017 A: | | | |
| 3.875% 11/15/29 | | 150,000 | 142,085 |
| 4.375% 11/15/35 | | 710,000 | 650,755 |
| 4.75% 11/15/47 | | 1,095,000 | 933,729 |
| St Louis Land Clearance Redev. Auth. Annual Appropriation Redev. Rev.: | | | |
| (Nat'l. Geospatial-Intelligence Agcy. Offsite Neighborhood Impts. Proj.) Series 2022 C, 5% 6/1/41 | | 1,750,000 | 1,793,499 |
| (Nat'l. Geospatial-Intelligence Agcy. Site Impt. Proj.) Series 2017 A: | | | |
5.125% 6/1/46 | | 715,000 | 720,516 |
5.375% 6/1/43 | | 2,060,000 | 2,091,703 |
| St. Louis County Indl. Dev. Auth. Health Facilities Rev. Series 2015 A: | | | |
| 5% 8/15/30 | | 165,000 | 165,147 |
| 5% 8/15/35 | | 95,000 | 94,622 |
| 5.125% 8/15/45 | | 295,000 | 277,446 |
| Taney County Indl. Dev. Auth. Sa (Big Cedar Infrastructure project) Series 2023, 6% 10/1/49 (g) | | 775,000 | 784,440 |
| Wentzville Scd # R 04 (Missouri Direct Deposit Prog.) Series 2020, 1.875% 3/1/40 | | 1,800,000 | 1,285,893 |
TOTAL MISSOURI | | | 75,387,878 |
| Montana - 0.1% | | | |
| Forsyth Poll. Cont. Rev. (Northwestern Corp. Colstrip Proj.) Series 2023, 3.875% 7/1/28 | | 560,000 | 570,205 |
| Gallatin County Indl. Dev. Rev. (Bozeman Fiber Proj.) Series 2021 A, 4% 10/15/51 (g) | | 250,000 | 182,545 |
| Kalispell Hsg. and Healthcare Facilities Rev. (Immanuel Lutheran Corp. Proj.) Series 2017 A: | | | |
| 5.25% 5/15/37 | | 95,000 | 90,195 |
| 5.25% 5/15/47 | | 1,020,000 | 896,188 |
| 5.25% 5/15/52 | | 1,060,000 | 911,303 |
| Montana Board Hsg. Single Family: | | | |
| Series 2017 B, 4% 12/1/48 (e) | | 15,000 | 14,976 |
| Series 2019 B, 4% 6/1/50 | | 65,000 | 65,513 |
| Series 2023, 6.25% 6/1/54 | | 1,000,000 | 1,093,766 |
| Montana Board of Hsg. Series 2014 A2, 3% 12/1/43 (e) | | 20,000 | 19,919 |
| Montana Board of Regents Higher Ed. Rev. Series 2022, 5.25% 11/15/52 (Assured Guaranty Muni. Corp. Insured) | | 3,800,000 | 4,164,883 |
| Montana Facility Fin. Auth.: | | | |
| Series 2018 B, 5% 7/1/48 | | 300,000 | 304,358 |
| Series 2018, 5% 6/1/48 | | 1,000,000 | 1,027,674 |
| Series 2021 A, 3% 6/1/50 | | 1,750,000 | 1,416,032 |
TOTAL MONTANA | | | 10,757,557 |
| Nebraska - 0.4% | | | |
| Central Plains Energy Proj. Rev.: | | | |
| (Proj. No. 3) Series 2017 A, 5% 9/1/33 | | 2,970,000 | 3,211,397 |
| Bonds: | | | |
(Proj. No. 4) Series 2023 A1, 5%, tender 11/1/29 (b) | | 6,950,000 | 7,389,403 |
Series 2019, 4%, tender 8/1/25 (b) | | 5,775,000 | 5,791,812 |
Series 2022 1, 5%, tender 10/1/29 (b) | | 4,255,000 | 4,490,204 |
| Series 2017 A: | | | |
5% 9/1/31 | | 345,000 | 368,519 |
5% 9/1/34 | | 180,000 | 195,995 |
5% 9/1/36 | | 985,000 | 1,080,915 |
| Douglas County Hosp. Auth. #2 Health Facilities Rev.: | | | |
| Series 2020 A: | | | |
4% 11/15/39 | | 290,000 | 291,827 |
4% 11/15/50 | | 240,000 | 236,782 |
| Series 2020, 4% 11/15/37 | | 255,000 | 256,746 |
| Douglas County Neb Edl. Facilities Rev.: | | | |
| (Creighton Univ. Proj.) Series 2017: | | | |
4% 7/1/34 | | 120,000 | 121,970 |
5% 7/1/36 | | 85,000 | 88,455 |
| (Creighton Univ. Projs.): | | | |
Series 2017, 4% 7/1/33 | | 45,000 | 45,859 |
Series 2021 A, 3% 7/1/51 | | 785,000 | 598,508 |
| Douglas County School District #1 Series 2021, 1.75% 12/15/37 | | 1,000,000 | 747,091 |
| Lincoln Elec. Sys. Rev. Series 2018: | | | |
| 5% 9/1/31 | | 110,000 | 114,860 |
| 5% 9/1/32 | | 210,000 | 218,878 |
| 5% 9/1/33 | | 125,000 | 130,186 |
| Nebraska Invt. Fin. Auth. Single Family Hsg. Rev.: | | | |
| Series 2014 A, 4% 9/1/44 | | 15,000 | 14,989 |
| Series 2019 B, 4% 9/1/49 (e) | | 190,000 | 189,251 |
| Series 2019 E, 3.75% 9/1/49 (e) | | 165,000 | 163,919 |
| Series 2020 A, 3.5% 9/1/50 | | 45,000 | 44,801 |
| Series 2024 C: | | | |
4.55% 9/1/44 | | 1,000,000 | 1,022,657 |
4.7% 9/1/49 | | 1,250,000 | 1,280,424 |
| Nebraska Pub. Pwr. District Rev.: | | | |
| Series 2016 A: | | | |
5% 1/1/32 | | 95,000 | 96,724 |
5% 1/1/34 | | 55,000 | 55,975 |
| Series 2016 B, 5% 1/1/37 | | 300,000 | 304,805 |
| Series 2016 D, 5% 1/1/46 | | 965,000 | 976,358 |
| Omaha Arpt. Auth. Arpt. Rev.: | | | |
| Series 2017 A: | | | |
5% 12/15/25 (e) | | 25,000 | 25,378 |
5% 12/15/25 (Escrowed to Maturity) (e) | | 25,000 | 25,401 |
5% 12/15/26 (e) | | 95,000 | 98,110 |
5% 12/15/26 (Escrowed to Maturity) (e) | | 80,000 | 82,777 |
5% 12/15/27 (e) | | 65,000 | 67,079 |
5% 12/15/27 (Pre-Refunded to 12/15/26 @ 100) (e) | | 55,000 | 56,909 |
5% 12/15/30 (e) | | 105,000 | 108,014 |
5% 12/15/30 (Pre-Refunded to 12/15/26 @ 100) (e) | | 80,000 | 82,777 |
5% 12/15/31 (e) | | 55,000 | 56,482 |
5% 12/15/31 (Pre-Refunded to 12/15/26 @ 100) (e) | | 40,000 | 41,388 |
5% 12/15/33 (e) | | 55,000 | 56,354 |
5% 12/15/33 (Pre-Refunded to 12/15/26 @ 100) (e) | | 45,000 | 46,562 |
5% 12/15/35 (e) | | 135,000 | 138,011 |
5% 12/15/35 (Pre-Refunded to 12/15/26 @ 100) (e) | | 110,000 | 113,818 |
5% 12/15/36 (e) | | 35,000 | 35,748 |
5% 12/15/36 (Pre-Refunded to 12/15/26 @ 100) (e) | | 25,000 | 25,868 |
| Series 2024, 5.25% 12/15/54 (Assured Guaranty Muni. Corp. Insured) (d)(e) | | 2,000,000 | 2,167,011 |
| Omaha Pub. Pwr. District Elec. Rev.: | | | |
| Series 2021 B, 4% 2/1/46 | | 2,000,000 | 2,010,594 |
| Series 2022 A: | | | |
5% 2/1/47 | | 3,250,000 | 3,533,927 |
5.25% 2/1/52 | | 1,050,000 | 1,151,238 |
| Series 2024 A, 5.5% 2/1/54 | | 2,000,000 | 2,256,653 |
| Sarpy County Nebraska Series 2021, 1.75% 6/1/37 | | 2,770,000 | 2,115,470 |
TOTAL NEBRASKA | | | 43,824,879 |
| Nevada - 0.5% | | | |
| Carson City Hosp. Rev. (Carson Tahoe Hosp. Proj.) Series 2017: | | | |
| 5% 9/1/37 | | 150,000 | 154,300 |
| 5% 9/1/42 | | 370,000 | 377,786 |
| City of Sparks Spl. Impr Series 2024, 5% 6/1/44 | | 400,000 | 410,968 |
| Clark County Arpt. Rev.: | | | |
| Series 2019 A, 5% 7/1/26 | | 1,445,000 | 1,492,841 |
| Series 2021 B, 5% 7/1/26 (e) | | 2,290,000 | 2,347,580 |
| Clark County Fuel Tax Series 2018 A, 5% 5/1/48 | | 4,820,000 | 5,017,792 |
| Clark County Hwy. Impt. Rev. Series 2022, 4% 7/1/40 (Assured Guaranty Muni. Corp. Insured) | | 3,500,000 | 3,587,397 |
| Clark County School District: | | | |
| Series 2017 A, 5% 6/15/26 | | 15,000 | 15,466 |
| Series 2019 A, 5% 6/15/25 | | 1,780,000 | 1,797,409 |
| Series 2020 A: | | | |
4% 6/15/37 (Assured Guaranty Muni. Corp. Insured) | | 190,000 | 195,114 |
4% 6/15/39 (Assured Guaranty Muni. Corp. Insured) | | 420,000 | 427,645 |
| Series 2021 B, 3% 6/15/36 | | 2,275,000 | 2,158,803 |
| Series 2024 B, 3% 6/15/42 | | 9,090,000 | 8,019,812 |
| Director of the State of Nevada Dept. of Bus. & Industry Charter School Lease Rev.: | | | |
| Series 2015 A: | | | |
5% 12/15/35 (g) | | 130,000 | 130,918 |
5.125% 12/15/45 (g) | | 160,000 | 160,387 |
| Series 2018 A: | | | |
5% 12/15/38 (g) | | 270,000 | 271,284 |
5% 12/15/48 (g) | | 1,015,000 | 1,014,988 |
| Las Vegas Convention & Visitors Auth.: | | | |
| Series 2018 B: | | | |
4% 7/1/49 | | 5,000,000 | 4,842,045 |
5% 7/1/43 | | 4,580,000 | 4,784,917 |
| Series 2019 B, 5% 7/1/33 | | 620,000 | 668,929 |
| Series 2022 B, 5.25% 7/1/49 | | 1,060,000 | 1,158,686 |
| Las Vegas Nev Spl. Impt. District # Series 2023, 5.5% 6/1/38 | | 400,000 | 423,358 |
| Las Vegas Redev. Agcy., Tax Increment Rev. Series 2016: | | | |
| 5% 6/15/30 | | 60,000 | 60,957 |
| 5% 6/15/40 | | 1,580,000 | 1,597,423 |
| 5% 6/15/45 | | 1,870,000 | 1,885,487 |
| Las Vegas Valley Wtr. District Wtr. Impt. Gen. Oblig.: | | | |
| Series 2015, 5% 6/1/33 | | 1,400,000 | 1,400,000 |
| Series 2016 A, 5% 6/1/46 | | 2,000,000 | 2,034,732 |
| Nevada Gen. Oblig. Series 2024 A: | | | |
| 3% 5/1/40 | | 1,050,000 | 966,540 |
| 3% 5/1/43 | | 1,735,000 | 1,522,292 |
| Nevada Hsg. Division Single Family Mtg. Rev.: | | | |
| Series 2019 A, 4% 4/1/49 | | 75,000 | 75,377 |
| Series 2019 B, 4% 10/1/49 | | 155,000 | 155,882 |
| Series 2021 A, 3% 4/1/51 | | 460,000 | 451,589 |
| Series 2021 B, 3% 10/1/51 | | 5,210,000 | 5,094,041 |
| Reno Cap. Impt. Rev. Series 2019 A1, 4% 6/1/46 (Assured Guaranty Muni. Corp. Insured) | | 250,000 | 248,280 |
| Reno Sales Tax Rev.: | | | |
| (ReTRAC-Reno Trans. Rail Access Corridor Proj.) Series 2018 B, 4% 6/1/48 (Assured Guaranty Muni. Corp. Insured) | | 95,000 | 93,435 |
| (Retrac-Reno Trans. Rail Access Corridor Proj.): | | | |
Series 2018 B, 4.125% 6/1/58 (Assured Guaranty Muni. Corp. Insured) | | 120,000 | 119,247 |
Series 2018 C, 0% 7/1/58 (g) | | 3,500,000 | 530,894 |
| Tahoe-Douglas Visitors Auth. Series 2020: | | | |
| 5% 7/1/45 | | 250,000 | 256,078 |
| 5% 7/1/51 | | 170,000 | 172,958 |
| Washoe County Gas Facilities Rev. Bonds (Sierra Pacific Pwr. Co. Projs.) Series 2016 C: | | | |
| 4.125%, tender 10/1/29 (b)(e) | | 355,000 | 359,571 |
| 4.125%, tender 10/1/29 (b)(e) | | 485,000 | 491,246 |
TOTAL NEVADA | | | 56,974,454 |
| New Hampshire - 0.8% | | | |
| Nat'l. Fin. Auth. Fed. Lease Rev.: | | | |
| Series 2023: | | | |
5.88% 12/15/38 | | 7,150,000 | 7,479,230 |
9.58% 12/15/38 | | 430,000 | 435,806 |
| Series 2024: | | | |
5% 5/15/34 (g) | | 4,220,000 | 4,290,163 |
8.33% 5/15/34 | | 305,000 | 311,616 |
| Nat'l. Fin. Auth. Hosp. Rev. (St. Luke's Univ. Health Network Proj.) Series 2021 B: | | | |
| 3% 8/15/51 (Assured Guaranty Muni. Corp. Insured) | | 1,755,000 | 1,431,690 |
| 5% 8/15/26 | | 465,000 | 478,518 |
| Nat'l. Fin. Auth. N H Affordab Bonds Series 2024 A, 4.15%, tender 10/1/34 (b) | | 625,000 | 625,994 |
| Nat'l. Fin. Auth. N H Util. Rev. (Wheeling Pwr. Co. Proj.) Series 2024 A, 6.89% 4/1/34 (g) | | 5,700,000 | 5,930,346 |
| Nat'l. Fin. Auth. NH Spl. Rev.: | | | |
| (Caldwell Ranch Proj., Brazoria and Fort Bend Counties, Texas) Series 2024, 4.875% 12/1/33 (g) | | 1,371,000 | 1,373,252 |
| (Tamarron Proj., Fort Bend County, Texas) Series 2024, 5.25% 12/1/35 (g) | | 1,835,000 | 1,835,882 |
| (Thomas Ranch Proj., Travis and Burnet Counties, Texas, Impt. Districts) Series 2024, 0% 12/1/34 (g) | | 5,975,000 | 3,189,502 |
| Nat'l. Fin. Auth. Rev.: | | | |
| (Covanta Proj.) Series 2018 B, 4.625% 11/1/42 (g) | | 470,000 | 457,676 |
| (Presbyterian Sr. Living Proj.) Series 2023 A, 5.25% 7/1/48 | | 290,000 | 308,539 |
| (The Lawrenceville School Proj.) Series 2021 A, 4% 7/1/51 | | 1,070,000 | 1,069,255 |
| (The Vista Proj.) Series 2019 A: | | | |
5.25% 7/1/39 (g) | | 220,000 | 221,029 |
5.625% 7/1/46 (g) | | 125,000 | 125,801 |
5.75% 7/1/54 (g) | | 1,235,000 | 1,241,505 |
| Bonds Series 2020 B, 3.75%, tender 7/2/40 (b)(e)(g) | | 1,195,000 | 1,041,140 |
| Series 2023, 11% 12/15/38 | | 235,000 | 238,003 |
| Nat'l. Fin. Auth. Sr. Living Rev. (Springpoint Sr. Living Proj.) Series 2021, 4% 1/1/41 | | 225,000 | 209,672 |
| Nat'l. Finacial Auththority N H Lease Re (NCCD - UNR Properties LLC - Univ. of Navada, Reno Proj.) Series 2023 A, 5.25% 6/1/51 | | 930,000 | 1,011,603 |
| Nat'l. Finnance Auth.: | | | |
| Series 2020 1, 4.125% 1/20/34 | | 5,265,854 | 5,344,306 |
| Series 2022 1, 4.375% 9/20/36 | | 2,544,831 | 2,568,064 |
| Series 2023 2A, 3.875% 1/20/38 | | 8,814,842 | 8,520,995 |
| Series 2024 3, 4.1635% 10/20/51 (b) | | 2,803,913 | 2,734,555 |
| Series 2024 A1, 4.25% 7/1/51 | | 2,821,250 | 2,801,825 |
| Series 2024 A2, 3.625% 8/20/39 | | 2,118,659 | 2,020,748 |
| New Hampshire Health & Ed. Facilities Auth.: | | | |
| (Dartmouth-Hitchcock Oblgtd Grp Proj.) Series 2018 A: | | | |
5% 8/1/28 | | 150,000 | 159,161 |
5% 8/1/29 | | 130,000 | 137,008 |
5% 8/1/30 | | 120,000 | 125,976 |
| (Dartmouth-Hitchcock Oblgtd Grp Proj.): | | | |
Series 2018 A: | | | |
5% 8/1/31 | | 75,000 | 78,633 |
5% 8/1/32 | | 15,000 | 15,707 |
5% 8/1/34 | | 190,000 | 198,450 |
5% 8/1/36 | | 110,000 | 114,580 |
5% 8/1/37 | | 135,000 | 140,418 |
Series 2018, 5% 8/1/35 | | 155,000 | 161,654 |
| (Partners Healthcare Sys., Inc. Proj.) Series 2017: | | | |
5% 7/1/33 | | 425,000 | 447,538 |
5% 7/1/34 | | 650,000 | 683,899 |
5% 7/1/35 | | 680,000 | 714,329 |
5% 7/1/36 | | 715,000 | 750,155 |
5% 7/1/37 | | 630,000 | 660,105 |
5% 7/1/41 | | 115,000 | 119,610 |
| Series 2017 A: | | | |
6.125% (f)(g)(j) | | 149,960 | 0 |
6.125% (f)(g)(j) | | 368,652 | 0 |
6.25% (f)(g)(j) | | 224,940 | 0 |
| Series 2017: | | | |
5% 7/1/36 | | 65,000 | 66,196 |
5% 7/1/44 | | 1,855,000 | 1,862,253 |
| Series 2023 B, 5% 11/1/43 (e) | | 1,665,000 | 1,742,801 |
| New Hampshire Health & Ed. Facilities Auth. Rev.: | | | |
| Series 2012: | | | |
4% 7/1/32 | | 385,000 | 382,263 |
5% 7/1/25 | | 145,000 | 145,032 |
5% 7/1/27 | | 60,000 | 60,024 |
| Series 2016: | | | |
4% 10/1/38 | | 360,000 | 348,015 |
5% 10/1/25 | | 255,000 | 258,192 |
5% 10/1/28 | | 170,000 | 174,121 |
5% 10/1/32 | | 290,000 | 294,760 |
5% 10/1/36 | | 115,000 | 117,642 |
5% 10/1/40 | | 545,000 | 555,328 |
5% 10/1/46 | | 860,000 | 872,035 |
| New Hampshire Nat'l. Fin. Auth. Series 2022 2, 4% 10/20/36 | | 9,969,347 | 9,777,586 |
| New Hampshire St Hsg. Fin. Series 2024 1, 4.45% 7/1/44 | | 3,510,000 | 3,564,399 |
| New Hampshire State Hsg. Fin. Rev. Series 2023 D, 6.5% 7/1/55 | | 7,495,000 | 8,269,678 |
| Portsmouth Tan Series 2021, 1.75% 4/1/36 | | 1,345,000 | 1,061,022 |
TOTAL NEW HAMPSHIRE | | | 91,355,285 |
| New Jersey - 3.2% | | | |
| Atlantic County Impt. Auth.: | | | |
| (Atlantic City Campus Phase II Proj.) Series 2021 A, 4% 7/1/47 (Assured Guaranty Muni. Corp. Insured) | | 810,000 | 809,703 |
| (Atlantic City Campus Proj.) Series 2016 A: | | | |
5% 7/1/28 (Assured Guaranty Muni. Corp. Insured) | | 125,000 | 128,614 |
5% 7/1/30 (Assured Guaranty Muni. Corp. Insured) | | 305,000 | 313,474 |
5% 7/1/32 (Assured Guaranty Muni. Corp. Insured) | | 150,000 | 154,039 |
5% 7/1/33 (Assured Guaranty Muni. Corp. Insured) | | 160,000 | 164,203 |
| Camden County Impt. Auth. (KIPP Cooper Norcross Academy 2022 Proj.) Series 2022: | | | |
| 6% 6/15/42 | | 60,000 | 65,654 |
| 6% 6/15/47 | | 165,000 | 179,128 |
| 6% 6/15/52 | | 155,000 | 167,295 |
| 6% 6/15/62 | | 510,000 | 547,612 |
| Camden County Impt. Auth. Charter School Rev. (Camden Prep High School Proj.) Series 2022: | | | |
| 5% 7/15/52 (g) | | 435,000 | 441,894 |
| 5% 7/15/62 (g) | | 480,000 | 485,196 |
| Edison Township Gen. Oblig. Series 2021, 2% 3/15/36 | | 950,000 | 764,440 |
| Essex County Impt. Auth. Charter School Rev.: | | | |
| (North Star Academy Charter School of Newark, Inc. - 2020 Proj.) Series 2020, 4% 7/15/60 (g) | | 250,000 | 223,956 |
| (North Star Academy Charter School of Newark, INC. - 2020 Proj.) Series 2020, 4% 7/15/50 (g) | | 300,000 | 276,462 |
| (North Star Academy Charter School of Newark, New Jersey Hazelwood & Broad Proj.) Series 2020 A, 4% 8/1/60 (g) | | 250,000 | 223,941 |
| (The Friends o Team Charter Schools, Inc. - 2021 Proj.) Series 2021, 4% 6/15/46 | | 275,000 | 264,131 |
| (The Friends of Team Charter Schools, Inc. - 2021 Proj.) Series 2021, 4% 6/15/56 | | 365,000 | 342,176 |
| Gloucester County Impt. Auth. Rev. (Rowan Univ. Projs.) Series 2024: | | | |
| 5% 7/1/35 (Build America Mutual Assurance Insured) | | 1,000,000 | 1,118,519 |
| 5% 7/1/41 (Build America Mutual Assurance Insured) | | 1,150,000 | 1,259,890 |
| Hudson County Impt. Auth. (Hudson County Courthouse Proj.) Series 2020, 4% 10/1/33 | | 590,000 | 618,453 |
| New Brunswick Parking Auth. Rev.: | | | |
| Series 2016 A, 5% 9/1/39 | | 965,000 | 987,846 |
| Series 2017, 5% 9/1/42 | | 540,000 | 559,817 |
| New Jersey Econ. Dev. Auth.: | | | |
| (Portal North Bridge Proj.) Series 2022 A, 5.25% 11/1/47 | | 1,905,000 | 2,095,254 |
| (White Horse HMT Urban Renewal LLC Proj.) Series 2020, 5% 1/1/40 (g) | | 160,000 | 107,133 |
| Series 2015, 5.25% 6/15/27 | | 955,000 | 964,350 |
| Series 2020 A: | | | |
4% 11/1/38 | | 295,000 | 298,406 |
4% 11/1/44 | | 3,270,000 | 3,278,556 |
| Series 2024 SSS, 5.25% 6/15/36 | | 500,000 | 581,616 |
| Series A: | | | |
5% 11/1/31 | | 1,775,000 | 1,929,599 |
5% 11/1/36 | | 2,075,000 | 2,225,484 |
| Series QQQ: | | | |
4% 6/15/34 | | 45,000 | 46,403 |
4% 6/15/36 | | 60,000 | 61,174 |
4% 6/15/39 | | 55,000 | 55,756 |
4% 6/15/41 | | 55,000 | 55,557 |
4% 6/15/46 | | 1,790,000 | 1,799,233 |
4% 6/15/50 | | 590,000 | 590,907 |
5% 6/15/31 | | 60,000 | 66,679 |
5% 6/15/33 | | 10,000 | 11,047 |
| Series WW, 5.25% 6/15/40 (Pre-Refunded to 6/15/25 @ 100) | | 3,100,000 | 3,136,826 |
| New Jersey Econ. Dev. Auth. Energy Facility Rev. (Umm Energy Partners, LLC Proj.) Series 2012 A: | | | |
| 5% 6/15/37 (e) | | 175,000 | 175,022 |
| 5.125% 6/15/43 (e) | | 245,000 | 245,028 |
| New Jersey Econ. Dev. Auth. Lease Rev.: | | | |
| (State House Proj.) Series 2017 B: | | | |
5% 6/15/26 | | 65,000 | 66,954 |
5% 6/15/35 | | 35,000 | 37,152 |
| (State House Proj.) Series 2017 B, 5% 6/15/43 | | 810,000 | 844,435 |
| Series 2018 A: | | | |
5% 6/15/33 | | 1,555,000 | 1,628,235 |
5% 6/15/42 | | 1,675,000 | 1,733,075 |
| Series 2018 C, 5% 6/15/42 | | 1,070,000 | 1,107,099 |
| New Jersey Econ. Dev. Auth. Rev.: | | | |
| (Black Horse EHT Urban Renewal LLC Proj.) Series 2019 A, 5% 10/1/39 (g) | | 130,000 | 104,484 |
| (Goethals Bridge Replacement Proj.) Series 2013: | | | |
5.125% 1/1/34 (e) | | 1,600,000 | 1,601,624 |
5.375% 1/1/43 (e) | | 1,945,000 | 1,946,563 |
| (Lions Gate Proj.) Series 2014: | | | |
4.875% 1/1/29 | | 145,000 | 145,005 |
5% 1/1/34 | | 280,000 | 280,048 |
5.25% 1/1/44 | | 685,000 | 683,006 |
| (Provident Group - Rowan Properties L.L.C. - Rowan Univ. Student Hsg. Proejct) Series 2015 A, 5% 1/1/48 | | 2,190,000 | 2,099,910 |
| (Provident Group - Rowan Properties L.L.C. - Rowan Univ. Student Hsg. Proj.) Series 2015 A, 5% 1/1/30 | | 510,000 | 510,055 |
| (Provident Group - Rowan Properties LLC - Rowan Univ. Student Hsg. Proj.) Series 2015 A, 5% 1/1/35 | | 335,000 | 335,015 |
| (Provident Montclair Proj.) Series 2017: | | | |
5% 6/1/25 (Assured Guaranty Muni. Corp. Insured) | | 65,000 | 65,509 |
5% 6/1/28 (Assured Guaranty Muni. Corp. Insured) | | 5,000 | 5,201 |
5% 6/1/29 (Assured Guaranty Muni. Corp. Insured) | | 5,000 | 5,199 |
| (The Goethals Bridge Replacement Proj.) Series 2013: | | | |
5% 1/1/28 (e) | | 100,000 | 100,091 |
5% 1/1/31 (Assured Guaranty Muni. Corp. Insured) (e) | | 1,015,000 | 1,016,173 |
5.125% 1/1/39 (Assured Guaranty Muni. Corp. Insured) (e) | | 360,000 | 360,346 |
5.125% 7/1/42 (Assured Guaranty Muni. Corp. Insured) (e) | | 655,000 | 655,543 |
5.5% 1/1/27 (e) | | 100,000 | 100,137 |
5.625% 1/1/52 (e) | | 3,240,000 | 3,242,705 |
| Series 1997 A, 0% 7/1/26 (Escrowed to Maturity) | | 350,000 | 333,548 |
| Series 2016 A, 5% 7/15/27 | | 65,000 | 66,743 |
| Series 2016 AAA, 5% 6/15/41 (Pre-Refunded to 12/15/26 @ 100) | | 140,000 | 146,409 |
| Series 2016 BBB, 5.5% 6/15/31 (Pre-Refunded to 12/15/26 @ 100) | | 940,000 | 992,286 |
| Series 2018 EEE, 5% 6/15/28 | | 40,000 | 42,791 |
| Series 2018, 5% 1/1/39 | | 495,000 | 499,997 |
| Series 2019 LLL: | | | |
5% 6/15/36 | | 300,000 | 323,542 |
5% 6/15/49 | | 300,000 | 313,761 |
| Series LLL: | | | |
4% 6/15/44 | | 190,000 | 190,706 |
5% 6/15/44 | | 805,000 | 848,974 |
| Series MMM: | | | |
4% 6/15/35 | | 75,000 | 76,584 |
4% 6/15/36 | | 75,000 | 76,246 |
| New Jersey Econ. Dev. Auth. School Rev. Series 2019 A, 5% 6/15/49 (g) | | 100,000 | 100,349 |
| New Jersey Econ. Dev. Auth. Spl. Facilities Rev.: | | | |
| (Continental Airlines, Inc. Proj.): | | | |
Series 2000 A, 5.625% 11/15/30 (e) | | 445,000 | 446,765 |
Series 2000 B, 5.625% 11/15/30 (e) | | 4,925,000 | 4,944,536 |
Series 2003, 5.5% 6/1/33 (e) | | 1,205,000 | 1,213,073 |
| (Port Newark Container Term. LLC. Proj.) Series 2017: | | | |
5% 10/1/37 (e) | | 4,240,000 | 4,354,535 |
5% 10/1/47 (e) | | 4,835,000 | 4,897,614 |
| Series 1999, 5.25% 9/15/29 (e) | | 1,270,000 | 1,271,370 |
| New Jersey Econ. Dev. Auth. Wtr. Facilities Rev.: | | | |
| (Middlesex Wtr. Co. Proj.) Series 2019, 5% 8/1/59 (e) | | 295,000 | 303,480 |
| (New Jersey-American Wtr. Co., Inc. Proj.) Series 2020 E, 0.85% 12/1/25 (e) | | 415,000 | 398,141 |
| Bonds: | | | |
(New Jersey - American Wtr. Compnay, INC. Proj.) Series 2020 D, 1.1%, tender 12/1/27 (b)(e) | | 3,145,000 | 2,832,871 |
(New Jersey American Wtr. Compnay, INC. Proj.) Series 2019 A, 2.2%, tender 12/3/29 (b)(e) | | 2,830,000 | 2,527,362 |
(New Jersey- American Wtr. Co., INC. Proj.) Series 2020 B, 3.75%, tender 6/1/28 (b)(e) | | 500,000 | 502,572 |
| New Jersey Edl. Facilities Auth. Rev. Series 2022 A, 5% 7/1/31 (Assured Guaranty Muni. Corp. Insured) | | 160,000 | 179,448 |
| New Jersey Edl. Facility: | | | |
| Series 2016 A: | | | |
5% 7/1/29 | | 145,000 | 148,593 |
5% 7/1/31 | | 255,000 | 261,148 |
5% 7/1/32 | | 295,000 | 301,835 |
| Series A: | | | |
5% 7/1/40 | | 1,000,000 | 1,044,841 |
5% 7/1/45 | | 845,000 | 875,408 |
| New Jersey Gen. Oblig.: | | | |
| Series 2020 A: | | | |
4% 6/1/31 | | 3,400,000 | 3,634,970 |
5% 6/1/25 | | 1,000,000 | 1,009,600 |
5% 6/1/27 | | 575,000 | 606,906 |
5% 6/1/28 | | 65,000 | 69,986 |
5% 6/1/29 | | 1,040,000 | 1,139,974 |
| Series 2021: | | | |
2% 6/1/32 | | 2,110,000 | 1,836,405 |
2% 6/1/34 | | 1,020,000 | 854,184 |
2% 6/1/37 | | 2,400,000 | 1,890,993 |
5% 6/1/40 | | 1,500,000 | 1,621,413 |
5% 6/1/41 | | 1,500,000 | 1,616,927 |
| New Jersey Health Care Facilities Fing. Auth. Rev.: | | | |
| (Hosp. Asset Transformation Prog.) Series 2017: | | | |
5% 10/1/32 | | 445,000 | 471,055 |
5% 10/1/37 | | 645,000 | 675,165 |
| Bonds: | | | |
Series 2019 B2, 5%, tender 7/1/25 (b) | | 105,000 | 105,985 |
Series 2019 B3, 5%, tender 7/1/26 (b) | | 110,000 | 112,940 |
| Series 2015 A, 5% 7/1/46 (Assured Guaranty Muni. Corp. Insured) | | 1,205,000 | 1,209,642 |
| Series 2016 A: | | | |
4% 7/1/36 | | 1,150,000 | 1,159,216 |
5% 7/1/25 (Escrowed to Maturity) | | 60,000 | 60,590 |
5% 7/1/27 | | 90,000 | 92,999 |
5% 7/1/28 | | 45,000 | 46,464 |
5% 7/1/29 (Pre-Refunded to 7/1/26 @ 100) | | 85,000 | 87,536 |
5% 7/1/30 | | 175,000 | 180,328 |
5% 7/1/43 | | 3,425,000 | 3,487,116 |
| Series 2016: | | | |
4% 7/1/48 | | 470,000 | 434,546 |
5% 7/1/28 | | 75,000 | 76,595 |
5% 7/1/41 | | 365,000 | 369,243 |
| Series 2017 A: | | | |
5% 7/1/37 | | 420,000 | 436,738 |
5% 7/1/39 | | 1,550,000 | 1,605,624 |
5.25% 7/1/57 | | 590,000 | 605,974 |
| Series 2019, 4% 7/1/35 | | 140,000 | 143,837 |
| Series 2021 A, 3% 7/1/51 | | 3,000,000 | 2,445,510 |
| Series 2021, 3% 7/1/39 | | 1,520,000 | 1,415,026 |
| New Jersey Higher Ed. Student Assistance Auth. Student Ln. Rev.: | | | |
| Series 2017 1A, 5% 12/1/26 (e) | | 645,000 | 664,544 |
| Series 2018 B: | | | |
5% 12/1/25 (e) | | 510,000 | 516,925 |
5% 12/1/26 (e) | | 740,000 | 762,422 |
| Series 2019 A, 5% 12/1/25 | | 310,000 | 315,307 |
| Series 2019 B, 3.25% 12/1/39 (e) | | 525,000 | 497,040 |
| Series 2020 B, 3.5% 12/1/39 (e) | | 1,040,000 | 1,004,396 |
| Series 2020: | | | |
5% 12/1/24 (e) | | 1,025,000 | 1,025,082 |
5% 12/1/24 (e) | | 485,000 | 485,039 |
5% 12/1/27 (e) | | 405,000 | 422,706 |
5% 12/1/28 (e) | | 705,000 | 746,092 |
| Series 2021 A: | | | |
5% 12/1/28 (e) | | 85,000 | 89,954 |
5% 12/1/29 (e) | | 115,000 | 122,322 |
| Series 2021 B: | | | |
2.5% 12/1/40 (e) | | 420,000 | 379,130 |
5% 12/1/28 (e) | | 305,000 | 322,778 |
5% 12/1/29 (e) | | 300,000 | 319,100 |
| Series 2021 C, 3.25% 12/1/51 (e) | | 185,000 | 139,690 |
| Series 2022 A, 5% 12/1/26 (e) | | 495,000 | 509,999 |
| Series 2022 B: | | | |
4% 12/1/41 (e) | | 2,980,000 | 2,960,014 |
5% 12/1/26 (e) | | 5,050,000 | 5,203,017 |
| Series 2023 A, 5% 12/1/30 (e) | | 1,250,000 | 1,337,700 |
| Series 2023 B, 5% 12/1/33 (e) | | 10,750,000 | 11,579,378 |
| Series 2024 B, 4.25% 12/1/45 (e) | | 4,105,000 | 4,096,136 |
| Series 2024 C, 5.25% 12/1/54 (e) | | 255,000 | 259,712 |
| New Jersey Hsg. & Mtg. Fin. Agcy. Series 2024 B, 5.25% 12/20/65 | | 2,250,000 | 2,370,473 |
| New Jersey Hsg. & Mtg. Fin. Agcy. Rev. Series 2021 H, 3% 10/1/52 | | 1,815,000 | 1,771,788 |
| New Jersey Institute of Technology Series 2015 A: | | | |
| 5% 7/1/40 | | 1,030,000 | 1,037,641 |
| 5% 7/1/45 | | 4,215,000 | 4,240,953 |
| New Jersey Tobacco Settlement Fing. Corp.: | | | |
| Series 2018 A: | | | |
5% 6/1/28 | | 65,000 | 68,682 |
5% 6/1/30 | | 750,000 | 790,305 |
5% 6/1/31 | | 605,000 | 635,760 |
5% 6/1/32 | | 640,000 | 671,259 |
5% 6/1/33 | | 2,265,000 | 2,371,891 |
5% 6/1/34 | | 640,000 | 669,151 |
5% 6/1/36 | | 1,050,000 | 1,093,429 |
5% 6/1/46 | | 12,715,000 | 12,971,846 |
5.25% 6/1/46 | | 3,610,000 | 3,717,797 |
| Series 2018 B, 5% 6/1/46 | | 12,905,000 | 12,965,493 |
| New Jersey Tpk. Auth. Tpk. Rev.: | | | |
| Series 2005 D3, 5.25% 1/1/26 (Assured Guaranty Muni. Corp. Insured) | | 1,225,000 | 1,242,125 |
| Series 2015 E: | | | |
5% 1/1/34 | | 605,000 | 605,850 |
5% 1/1/45 | | 1,070,000 | 1,071,503 |
| Series 2016 A, 5% 1/1/35 | | 1,180,000 | 1,202,234 |
| Series 2017 G, 5% 1/1/36 | | 5,365,000 | 5,655,269 |
| Series 2019 A, 5% 1/1/48 | | 1,205,000 | 1,269,063 |
| Series 2021 A, 4% 1/1/42 | | 3,000,000 | 3,036,977 |
| Series 2022 B, 5.25% 1/1/52 | | 8,600,000 | 9,565,972 |
| Series 2024 B, 5.25% 1/1/49 | | 2,500,000 | 2,825,324 |
| Series 2024 C: | | | |
5% 1/1/42 | | 2,000,000 | 2,245,072 |
5% 1/1/43 | | 2,100,000 | 2,349,868 |
5% 1/1/44 | | 2,800,000 | 3,123,685 |
5% 1/1/45 | | 2,500,000 | 2,783,020 |
| Series 2024, 5% 1/1/30 | | 2,550,000 | 2,824,318 |
| Series D, 5% 1/1/28 | | 595,000 | 610,444 |
| New Jersey Trans. Trust Fund Auth.: | | | |
| (Trans. Prog.) Series 2019 AA, 5.25% 6/15/43 | | 1,750,000 | 1,856,051 |
| Series 2006 C: | | | |
0% 12/15/27 (Nat'l. Pub. Fin. Guarantee Corp. Insured) | | 1,400,000 | 1,267,615 |
0% 12/15/28 | | 1,360,000 | 1,190,078 |
0% 12/15/30 (FGIC Insured) | | 2,925,000 | 2,388,647 |
0% 12/15/31 (FGIC Insured) | | 3,920,000 | 3,085,195 |
0% 12/15/32 (Assured Guaranty Muni. Corp. Insured) | | 710,000 | 542,040 |
0% 12/15/33 (Assured Guaranty Muni. Corp. Insured) | | 2,430,000 | 1,788,536 |
0% 12/15/34 | | 4,100,000 | 2,904,400 |
0% 12/15/35 | | 795,000 | 534,582 |
0% 12/15/36 (AMBAC Insured) | | 2,075,000 | 1,333,756 |
| Series 2008 A: | | | |
0% 12/15/37 | | 4,500,000 | 2,768,501 |
0% 12/15/38 (Build America Mutual Assurance Insured) | | 6,000,000 | 3,581,233 |
| Series 2010 A, 0% 12/15/27 | | 2,150,000 | 1,946,694 |
| Series 2014 BB2: | | | |
5% 6/15/33 | | 3,085,000 | 3,428,392 |
5% 6/15/34 | | 320,000 | 354,250 |
| Series 2016 A: | | | |
5% 6/15/27 | | 385,000 | 395,834 |
5% 6/15/29 | | 470,000 | 483,007 |
| Series 2018 A: | | | |
5% 6/15/29 | | 730,000 | 750,202 |
5% 6/15/31 | | 855,000 | 877,470 |
5% 12/15/32 | | 205,000 | 219,447 |
5% 12/15/34 | | 85,000 | 90,236 |
| Series 2019 AA: | | | |
5% 6/15/46 | | 860,000 | 894,902 |
5% 6/15/46 (Pre-Refunded to 12/15/28 @ 100) | | 465,000 | 506,870 |
| Series 2019 BB: | | | |
4% 6/15/36 | | 1,870,000 | 1,893,226 |
4% 6/15/38 | | 205,000 | 206,807 |
4% 6/15/50 | | 500,000 | 491,279 |
5% 6/15/44 | | 2,170,000 | 2,265,096 |
| Series 2020 AA: | | | |
5% 6/15/50 | | 405,000 | 427,980 |
5% 6/15/50 (Pre-Refunded to 12/15/30 @ 100) | | 110,000 | 123,794 |
| Series 2021 A: | | | |
4% 6/15/34 | | 440,000 | 455,517 |
4% 6/15/36 | | 1,530,000 | 1,559,461 |
4% 6/15/38 | | 1,795,000 | 1,825,122 |
5% 6/15/32 | | 200,000 | 223,144 |
5% 6/15/33 | | 345,000 | 383,402 |
| Series 2022 A: | | | |
4% 6/15/39 | | 140,000 | 141,973 |
4% 6/15/40 | | 745,000 | 753,780 |
4% 6/15/41 | | 3,250,000 | 3,275,150 |
4% 6/15/42 | | 675,000 | 678,050 |
| Series 2022 AA: | | | |
5% 6/15/29 | | 1,150,000 | 1,253,495 |
5% 6/15/30 | | 4,030,000 | 4,460,711 |
5% 6/15/31 | | 305,000 | 342,079 |
5% 6/15/32 | | 1,665,000 | 1,888,748 |
5% 6/15/33 | | 955,000 | 1,079,183 |
5% 6/15/35 | | 35,000 | 39,168 |
5% 6/15/36 | | 2,015,000 | 2,248,172 |
5% 6/15/37 | | 580,000 | 645,110 |
5% 6/15/38 | | 250,000 | 277,230 |
| Series 2022 BB: | | | |
4% 6/15/46 | | 4,770,000 | 4,733,835 |
4% 6/15/50 | | 2,885,000 | 2,843,665 |
| Series 2022 CC: | | | |
5% 6/15/38 | | 1,500,000 | 1,672,844 |
5.5% 6/15/50 (Pre-Refunded to 12/15/32 @ 100) | | 7,815,000 | 9,307,894 |
| Series 2023 A: | | | |
4.25% 6/15/40 | | 2,025,000 | 2,109,117 |
5% 6/15/37 | | 3,000,000 | 3,377,915 |
| Series 2023 AA: | | | |
4.25% 6/15/44 | | 495,000 | 507,192 |
5% 6/15/40 | | 3,480,000 | 3,876,297 |
| Series 2024 A, 5% 6/15/36 | | 2,500,000 | 2,873,190 |
| Series 2024 AA: | | | |
5% 6/15/40 | | 9,600,000 | 10,855,980 |
5% 6/15/42 | | 3,500,000 | 3,916,049 |
5.25% 6/15/41 | | 2,000,000 | 2,293,960 |
| Series A: | | | |
0% 12/15/31 | | 110,000 | 86,574 |
4% 12/15/39 | | 120,000 | 120,923 |
4.25% 12/15/38 | | 300,000 | 307,872 |
5% 12/15/25 | | 855,000 | 871,695 |
5% 12/15/26 | | 1,000,000 | 1,041,535 |
| Series AA: | | | |
4% 6/15/36 | | 670,000 | 682,018 |
4% 6/15/37 | | 1,120,000 | 1,137,118 |
4% 6/15/38 | | 555,000 | 562,061 |
4% 6/15/39 | | 65,000 | 65,683 |
4% 6/15/40 | | 250,000 | 251,887 |
4% 6/15/45 | | 10,035,000 | 10,006,688 |
4% 6/15/50 | | 4,975,000 | 4,903,720 |
5% 6/15/35 | | 225,000 | 246,963 |
5% 6/15/36 | | 75,000 | 82,115 |
5% 6/15/37 | | 170,000 | 185,651 |
5% 6/15/38 | | 1,075,000 | 1,171,060 |
5% 6/15/39 | | 725,000 | 788,093 |
5% 6/15/40 | | 225,000 | 243,875 |
| Series BB: | | | |
4% 6/15/44 | | 2,055,000 | 2,057,427 |
5% 6/15/33 | | 3,035,000 | 3,244,427 |
5% 6/15/50 (Pre-Refunded to 12/15/28 @ 100) | | 1,205,000 | 1,313,503 |
| Newark Port Auth. Hsg. Auth. Rev. Series 2007, 5.25% 1/1/26 (Nat'l. Pub. Fin. Guarantee Corp. Insured) | | 815,000 | 829,532 |
| Rutgers State Univ. Rev. Series 2016 M, 5% 5/1/33 | | 965,000 | 988,215 |
| South Jersey Port Corp. Rev.: | | | |
| (New Jersey Gen. Oblig. Proj.) Series 2017 B: | | | |
5% 1/1/42 (e) | | 1,880,000 | 1,926,430 |
5% 1/1/48 (e) | | 1,685,000 | 1,712,188 |
| Series 2017 A, 5% 1/1/49 | | 480,000 | 491,921 |
| South Jersey Trans. Auth. Trans. Sys. Rev.: | | | |
| Series 2019 A: | | | |
5% 11/1/31 (Assured Guaranty Muni. Corp. Insured) | | 275,000 | 297,079 |
5% 11/1/32 (Assured Guaranty Muni. Corp. Insured) | | 1,250,000 | 1,347,686 |
5% 11/1/33 (Assured Guaranty Muni. Corp. Insured) | | 150,000 | 161,413 |
| Series 2020 A, 5% 11/1/45 | | 350,000 | 374,138 |
| Series 2022 A: | | | |
4.625% 11/1/47 | | 500,000 | 511,687 |
5% 11/1/37 | | 500,000 | 557,034 |
5% 11/1/41 | | 1,355,000 | 1,453,229 |
5.25% 11/1/52 | | 740,000 | 807,550 |
| The Poll. Cont. Fin. Auth. of Gloucester County Poll. Cont. Rev. (Logan Proj.) Series 2014 A, 5% 12/1/24 (Escrowed to Maturity) (e) | | 80,000 | 80,007 |
| Union County Impt. Auth. Solid Waste Disp. Rev. (Aries Linden, LLC Proj.) Series 2019, 6.75% 12/1/41 (e)(g) | | 460,000 | 304,379 |
TOTAL NEW JERSEY | | | 375,765,656 |
| New Mexico - 0.1% | | | |
| Albuquerque School District #12 Series 2024, 5% 8/1/25 | | 1,250,000 | 1,266,062 |
| Albuquerque Wtr. Util. Auth. Series 2018, 5% 7/1/28 | | 65,000 | 67,255 |
| New Mexico Edl. Assistance Foundation Series 2021 1A: | | | |
| 5% 9/1/26 (e) | | 2,280,000 | 2,338,020 |
| 5% 9/1/27 (e) | | 1,075,000 | 1,116,385 |
| 5% 9/1/29 (e) | | 425,000 | 449,936 |
| New Mexico Hosp. Equip. Ln. Council Rev.: | | | |
| Bonds Series 2019 B, 5%, tender 8/1/25 (b) | | 95,000 | 95,939 |
| Series 2019 A, 5% 8/1/44 | | 1,250,000 | 1,316,958 |
| New Mexico Mtg. Fin. Auth.: | | | |
| Series 2018 A1, 4% 1/1/49 | | 125,000 | 125,535 |
| Series 2018 C, 4% 1/1/49 | | 290,000 | 290,883 |
| Series 2019 C, 4% 1/1/50 | | 35,000 | 35,172 |
| Series 2019 D, 3.75% 1/1/50 | | 250,000 | 249,703 |
| Series 2022 A, 3% 3/1/53 | | 1,600,000 | 1,563,065 |
| New Mexico Muni. Energy Acquisition Auth. Gas Supply Rev. Bonds Series 2019 A, 5%, tender 5/1/25 (b) | | 320,000 | 321,843 |
| Santa Fe Retirement Fac.: | | | |
| Series 2012, 5% 5/15/42 | | 30,000 | 30,007 |
| Series 2019 A: | | | |
5% 5/15/34 | | 185,000 | 192,101 |
5% 5/15/39 | | 90,000 | 92,255 |
5% 5/15/44 | | 95,000 | 96,040 |
5% 5/15/49 | | 215,000 | 215,385 |
TOTAL NEW MEXICO | | | 9,862,544 |
| New York - 7.6% | | | |
| Broome County Local Dev. Corp. Rev. (United Health Svcs. Hospitals, Inc. Proj.) Series 2020: | | | |
| 3% 4/1/36 (Assured Guaranty Muni. Corp. Insured) | | 380,000 | 355,364 |
| 3% 4/1/37 (Assured Guaranty Muni. Corp. Insured) | | 320,000 | 296,004 |
| 4% 4/1/34 (Assured Guaranty Muni. Corp. Insured) | | 210,000 | 214,577 |
| 4% 4/1/38 (Assured Guaranty Muni. Corp. Insured) | | 265,000 | 268,176 |
| 4% 4/1/39 (Assured Guaranty Muni. Corp. Insured) | | 285,000 | 287,868 |
| Build NYC Resource Corp. Rev.: | | | |
| (Albert Einstein School of Medicine, Inc. Proj.) Series 2015, 5.5% 9/1/45 (g) | | 3,970,000 | 3,979,539 |
| (Classical Charter School Proj.) Series 2023 A, 4.75% 6/15/58 | | 725,000 | 725,512 |
| (East Harlem Scholars Academy Charter School Proj.) Series 2022, 5.75% 6/1/52 (g) | | 600,000 | 634,349 |
| (Friends of Hellenic Classical Charter Schools, Inc. Proj.): | | | |
Series 2021 A: | | | |
5% 12/1/51 (g) | | 630,000 | 581,775 |
5% 12/1/55 (g) | | 100,000 | 91,078 |
Series 2021 A1, 5% 12/1/41 (g) | | 115,000 | 111,906 |
| (Grand Concourse Academy Charter School Proj.): | | | |
Series 2022 A, 5% 7/1/52 | | 80,000 | 81,104 |
Series 2022 B, 5% 7/1/62 | | 595,000 | 599,671 |
| (KIPP NYC Pub. School Facilities - Canal West Proj.) Series 2022, 5.25% 7/1/57 | | 440,000 | 460,492 |
| (Richmond Preparatory Charter School Proj.) Series 2021 A, 5% 6/1/51 (g) | | 350,000 | 326,642 |
| (Shefa School Proj.) Series 2021 A, 5% 6/15/51 (g) | | 2,910,000 | 2,882,078 |
| Series 2022, 5.25% 7/1/62 | | 545,000 | 568,605 |
| Build NYC Resource Corp. Solid Waste Disp. Rev. (Pratt Paper NY, Inc. Proj.) Series 2014, 5% 1/1/35 (e)(g) | | 2,200,000 | 2,201,560 |
| City of Long Beach Series 2022 B, 4.625% 7/15/52 | | 2,230,000 | 2,303,288 |
| Dorm. Auth. New York Univ. Rev.: | | | |
| (Fordham Univ. Proj.) Series 2017: | | | |
4% 7/1/33 | | 150,000 | 152,527 |
4% 7/1/34 | | 150,000 | 152,500 |
| Series 2011 A, 5% 10/1/25 | | 15,000 | 15,022 |
| Series 2016 A: | | | |
5% 7/1/25 | | 5,000 | 5,043 |
5% 7/1/32 | | 140,000 | 144,434 |
5% 7/1/37 | | 765,000 | 785,680 |
| Series 2017: | | | |
5% 12/1/24 (g) | | 100,000 | 99,999 |
5% 12/1/25 (g) | | 100,000 | 100,187 |
5% 12/1/27 (g) | | 2,200,000 | 2,214,223 |
5% 12/1/30 (g) | | 200,000 | 200,527 |
5% 12/1/31 (g) | | 200,000 | 200,068 |
5% 12/1/34 (g) | | 200,000 | 198,067 |
5% 12/1/36 (g) | | 200,000 | 196,367 |
5% 12/1/37 (g) | | 700,000 | 683,616 |
| Dutchess County Local Dev. Corp. Rev.: | | | |
| Series 2019 B, 4% 7/1/49 | | 1,000,000 | 928,662 |
| Series 2020 A, 5% 7/1/45 | | 400,000 | 412,391 |
| Erie County Tobacco Asset Securitization Corp.: | | | |
| Series 2005 B, 0% 6/1/47 | | 2,500,000 | 545,238 |
| Series 2006 A, 0% 6/1/60 (g) | | 10,070,000 | 487,143 |
| Genesee County Fdg. Corp. (Rochester Reg'l. Health Proj.) Series 2022 A, 5.25% 12/1/52 | | 250,000 | 264,018 |
| Glen Cove Local Econ. Assistance Corp. Rev. (Garvies Point Pub. Impt. Proj.): | | | |
| Series 2016 A, 5% 1/1/56 | | 1,255,000 | 1,079,252 |
| Series 2016 B, 0% 1/1/45 | | 6,515,000 | 1,855,103 |
| Series 2016 C, 5.625% 1/1/55 | | 2,395,000 | 2,248,696 |
| Hempstead Town N Y Loc Dev. Cor (The Academy Charter School Proj.) Series 2021 A, 4.6% 2/1/51 | | 500,000 | 400,855 |
| Hudson Yards Infrastructure Corp. New York Rev. Series 2017 A: | | | |
| 5% 2/15/33 | | 200,000 | 207,836 |
| 5% 2/15/35 | | 1,445,000 | 1,499,077 |
| 5% 2/15/39 | | 950,000 | 980,934 |
| Huntington Local Dev. Corp. Rev. (Gurwin Independent Hsg., Inc. / Fountaingate Gardens Proj.) Series 2021 B, 4% 7/1/27 | | 135,000 | 131,733 |
| Jefferson County Civic Facility Dev. Corp. Rev. (Samaritan Med. Ctr. Proj.) Series 2017 A, 4% 11/1/32 | | 100,000 | 94,624 |
| Liberty Dev. Corp. Rev. Series 2005, 5.25% 10/1/35 | | 2,045,000 | 2,385,533 |
| Long Island Pwr. Auth. Elec. Sys. Rev.: | | | |
| Bonds: | | | |
Series 2021 B, 1.5%, tender 9/1/26 (b) | | 1,510,000 | 1,448,870 |
Series 2024 B, 3%, tender 9/1/29 (b) | | 1,500,000 | 1,482,753 |
| Series 2016 B, 5% 9/1/35 | | 2,905,000 | 2,980,446 |
| Series 2017: | | | |
5% 9/1/33 | | 30,000 | 31,495 |
5% 9/1/35 | | 110,000 | 115,209 |
5% 9/1/36 | | 65,000 | 67,976 |
5% 9/1/42 | | 195,000 | 202,704 |
| Monroe County N Y Indl. Dev. Agcy. M (Keeler Park Cmnty. Partners, L.P. Proj.) Series 2022, 4.84% 11/1/40 | | 4,670,846 | 4,974,224 |
| MTA Hudson Rail Yards Trust Oblig. Series 2016 A, 5% 11/15/56 | | 4,090,000 | 4,095,996 |
| Nassau County Indl. Dev. Agcy.: | | | |
| Series 2021 A, 9% 1/1/41 (g) | | 1,580,000 | 1,580,000 |
| Series 2021 B, 5% 1/1/58 (h) | | 3,260,000 | 492,677 |
| New York City Edl. Construction Fund Series 2021 B, 5% 4/1/46 | | 2,235,000 | 2,394,160 |
| New York City Gen. Oblig.: | | | |
| Series 2017 B: | | | |
5% 12/1/33 | | 515,000 | 533,656 |
5% 12/1/41 | | 745,000 | 765,288 |
| Series 2018 B1: | | | |
5% 10/1/38 | | 750,000 | 785,758 |
5.25% 10/1/33 | | 1,300,000 | 1,381,096 |
| Series 2018 E1, 5% 3/1/44 | | 605,000 | 629,343 |
| Series 2018 F, 5% 4/1/45 | | 345,000 | 358,899 |
| Series 2019 A1, 3% 8/1/36 | | 1,950,000 | 1,831,930 |
| Series 2019 D1, 5% 12/1/42 | | 1,475,000 | 1,551,885 |
| Series 2020 A1, 5% 8/1/27 | | 1,575,000 | 1,670,905 |
| Series 2020 C, 5% 8/1/42 | | 750,000 | 808,570 |
| Series 2020 D1, 5% 3/1/43 | | 2,000,000 | 2,139,458 |
| Series 2021 F1, 5% 3/1/43 | | 1,000,000 | 1,082,800 |
| Series 2022 A1, 5% 8/1/47 | | 3,535,000 | 3,807,485 |
| Series 2022 D, 4.5% 5/1/49 | | 500,000 | 514,736 |
| Series 2022 D1: | | | |
4.25% 5/1/40 | | 750,000 | 774,265 |
5.5% 5/1/44 | | 925,000 | 1,043,418 |
5.5% 5/1/46 | | 625,000 | 700,508 |
| Series 2023 A, 5% 9/1/37 | | 750,000 | 845,923 |
| Series 2023 E1, 4% 4/1/42 | | 3,000,000 | 3,036,271 |
| Series A: | | | |
5% 8/1/26 | | 705,000 | 731,436 |
5% 8/1/39 | | 1,130,000 | 1,214,297 |
| Series B, 5% 10/1/42 | | 690,000 | 737,545 |
| New York City Hsg. Dev. Corp.: | | | |
| Bonds Series 2024 A2, 3.625%, tender 7/1/28 (b) | | 4,265,000 | 4,307,284 |
| Series 2019 A1, 4.15% 11/1/38 | | 1,975,000 | 1,979,685 |
| Series 2023 A, 4.8% 2/1/53 | | 4,345,000 | 4,476,753 |
| New York City Hsg. Dev. Corp. Multi-family Mtg. Rev.: | | | |
| Series 2014 E, 3.5% 2/15/48 | | 1,247,985 | 1,247,393 |
| Series 2014 F, 4.5% 2/15/48 | | 6,161,389 | 6,158,459 |
| New York City Hsg. Dev. Corp. Multifamily Hsg.: | | | |
| Bonds: | | | |
Series 2021 C2, 0.7%, tender 7/1/25 (b) | | 575,000 | 565,074 |
Series 2021 K2, 0.9%, tender 1/1/26 (b) | | 6,315,000 | 6,115,225 |
Series 2021, 0.6%, tender 7/1/25 (b) | | 1,290,000 | 1,263,960 |
| Series 2019 J, 3.05% 11/1/49 | | 880,000 | 733,284 |
| Series 2021 F1, 2.4% 11/1/46 | | 1,200,000 | 853,846 |
| Series 2022 G, 4.85% 11/1/53 | | 1,940,000 | 2,001,412 |
| New York City Indl. Dev. Agcy. Series 2012 A, 5% 7/1/28 (e) | | 370,000 | 371,976 |
| New York City Indl. Dev. Agcy. Rev.: | | | |
| (Queens Baseball Stadium Proj.) Series 2021 A, 3% 1/1/46 (Assured Guaranty Muni. Corp. Insured) (Assured Guaranty, Inc. Insured) | | 2,250,000 | 1,853,991 |
| (Yankee Stadium Proj.) Series 2020 A: | | | |
3% 3/1/40 (Assured Guaranty Muni. Corp. Insured) | | 845,000 | 763,959 |
3% 3/1/49 (Assured Guaranty Muni. Corp. Insured) | | 500,000 | 405,551 |
4% 3/1/45 | | 615,000 | 603,150 |
4% 3/1/45 (Assured Guaranty Muni. Corp. Insured) | | 1,265,000 | 1,256,945 |
| Series 2020 A, 3% 3/1/49 | | 450,000 | 364,996 |
| New York City Muni. Wtr. Fin. Auth. Wtr. & Swr. Sys. Rev.: | | | |
| Series 2016 CC1, 5.25% 6/15/46 | | 370,000 | 379,049 |
| Series 2017 AA, 5% 6/15/38 | | 250,000 | 261,459 |
| Series 2018 CC, 5% 6/15/48 | | 2,000,000 | 2,068,902 |
| Series 2018 EE, 5% 6/15/40 | | 1,400,000 | 1,471,334 |
| Series 2018 FF, 5% 6/15/38 | | 1,250,000 | 1,322,246 |
| Series 2020 DD 1, 3% 6/15/50 | �� | 250,000 | 206,260 |
| Series 2021 AA 1, 4% 6/15/51 | | 5,540,000 | 5,501,761 |
| Series 2021 AA1, 3% 6/15/50 | | 4,325,000 | 3,557,719 |
| Series 2021 BB1: | | | |
3% 6/15/44 | | 2,415,000 | 2,083,976 |
4% 6/15/45 | | 1,750,000 | 1,759,397 |
5% 6/15/44 | | 750,000 | 816,524 |
| Series 2021 CC1, 5% 6/15/51 | | 2,000,000 | 2,139,805 |
| Series 2021 DD, 4% 6/15/36 | | 1,285,000 | 1,342,986 |
| Series 2022 AA1, 5.25% 6/15/52 | | 12,150,000 | 13,397,289 |
| Series 2022 CC1, 5% 6/15/52 | | 1,060,000 | 1,137,868 |
| Series 2022 CC2, 5% 6/15/26 | | 395,000 | 395,242 |
| Series 2022 EE: | | | |
4% 6/15/39 | | 2,185,000 | 2,262,243 |
5% 6/15/45 | | 9,100,000 | 9,916,571 |
| Series 2023 DD: | | | |
4.125% 6/15/46 | | 2,000,000 | 2,028,192 |
5.25% 6/15/47 | | 300,000 | 334,620 |
| Series 2024 AA1, 5% 6/15/51 | | 1,200,000 | 1,321,242 |
| Series 2024 CC1, 5.25% 6/15/54 | | 1,910,000 | 2,133,044 |
| Series GG 1, 5% 6/15/48 | | 12,665,000 | 13,464,911 |
| New York City Transitional Fin. Auth.: | | | |
| Series 2023 B, 5% 5/1/42 | | 5,000,000 | 5,615,870 |
| Series 2024 B: | | | |
5% 5/1/40 | | 3,835,000 | 4,352,458 |
5% 5/1/41 | | 5,570,000 | 6,280,005 |
| Series 2024 F1, 5.25% 2/1/53 | | 2,500,000 | 2,782,646 |
| Series 2025 D, 5% 5/1/49 | | 2,510,000 | 2,762,291 |
| New York City Transitional Fin. Auth. Bldg. Aid Rev.: | | | |
| (New York State Gen. Oblig. Proj.) Series 2015 S-1, 5% 7/15/35 | | 450,000 | 450,817 |
| Series 2015 S2, 5% 7/15/35 | | 215,000 | 217,071 |
| Series 2018 S3, 5% 7/15/43 | | 1,475,000 | 1,552,795 |
| Series 2019 S1, 5% 7/15/45 | | 1,000,000 | 1,049,421 |
| Series 2020 S1, 3% 7/15/49 | | 3,000,000 | 2,443,621 |
| New York City Transitional Fin. Auth. Rev.: | | | |
| Series 2017 F1, 5% 5/1/42 | | 5,120,000 | 5,309,714 |
| Series 2018 A2, 5% 8/1/39 | | 1,530,000 | 1,591,784 |
| Series 2018 C3, 5% 5/1/41 | | 1,700,000 | 1,785,254 |
| Series 2019 B1: | | | |
5% 8/1/34 | | 110,000 | 116,758 |
5% 8/1/36 | | 2,050,000 | 2,173,039 |
5% 8/1/38 | | 1,475,000 | 1,560,694 |
| Series 2019 C, 4% 11/1/42 | | 1,500,000 | 1,502,832 |
| Series 2020 B 1, 3% 11/1/47 | | 1,000,000 | 836,990 |
| Series 2020 B1: | | | |
4% 11/1/41 | | 2,200,000 | 2,214,658 |
5% 11/1/36 | | 3,000,000 | 3,236,625 |
| Series 2020 C1: | | | |
4% 5/1/36 | | 425,000 | 441,675 |
4% 5/1/39 | | 745,000 | 765,591 |
4% 5/1/45 | | 845,000 | 846,843 |
| Series 2021 A, 4% 11/1/34 | | 210,000 | 219,348 |
| Series 2021 B1, 4% 8/1/45 | | 1,885,000 | 1,889,554 |
| Series 2021 C, 4% 5/1/45 | | 2,135,000 | 2,139,657 |
| Series 2021 C1, 4% 5/1/39 | | 1,475,000 | 1,515,767 |
| Series 2021 E1, 4% 2/1/46 | | 3,150,000 | 3,154,986 |
| Series 2021 F1: | | | |
4% 11/1/36 | | 145,000 | 150,922 |
4% 11/1/37 | | 440,000 | 456,036 |
| Series 2021, 4% 11/1/38 | | 790,000 | 817,349 |
| Series 2022 C1: | | | |
4% 2/1/41 | | 1,635,000 | 1,664,034 |
5% 2/1/47 | | 2,485,000 | 2,681,339 |
| Series 2022 F1: | | | |
5% 2/1/42 | | 1,000,000 | 1,102,013 |
5% 2/1/47 | | 6,000,000 | 6,474,059 |
| Series 2023 A1, 5.25% 8/1/42 | | 1,000,000 | 1,125,286 |
| Series 2023 D1, 5.5% 11/1/45 | | 2,000,000 | 2,271,293 |
| Series 2023 F1, 5.25% 2/1/40 | | 2,000,000 | 2,290,755 |
| Series 2024 A1, 5% 5/1/39 | | 2,000,000 | 2,260,551 |
| Series C1, 4% 5/1/44 | | 1,100,000 | 1,105,642 |
| Series E1, 4% 2/1/49 | | 575,000 | 572,203 |
| New York City Trust Cultural Resources Rev. Series 2021, 5% 7/1/31 | | 2,630,000 | 2,970,048 |
| New York Convention Ctr. Dev. Corp. Rev. Series 2015: | | | |
| 5% 11/15/28 | | 400,000 | 406,046 |
| 5% 11/15/29 | | 280,000 | 283,971 |
| New York Dorm. Auth. Personal Income Tax Rev.: | | | |
| Series 2015 E, 5% 3/15/34 | | 6,025,000 | 6,094,204 |
| Series 2017 B3, 5% 2/15/41 | | 2,265,000 | 2,356,236 |
| Series 2021 E, 4% 3/15/38 | | 3,815,000 | 3,941,668 |
| New York Dorm. Auth. Rev.: | | | |
| Bonds Series 2019 B3, 5%, tender 5/1/26 (b) | | 40,000 | 40,538 |
| Series 2015, 5% 12/1/40 (g) | | 1,200,000 | 1,151,220 |
| Series 2020 A: | | | |
3% 7/1/48 | | 2,500,000 | 2,041,089 |
4% 9/1/50 | | 250,000 | 233,225 |
4% 7/1/53 | | 250,000 | 245,988 |
5% 10/1/30 (Pre-Refunded to 10/1/28 @ 100) | | 5,000 | 5,412 |
5% 7/1/36 | | 235,000 | 253,397 |
5% 7/1/40 | | 270,000 | 288,789 |
| Series 2021 A, 3% 7/1/41 | | 1,500,000 | 1,374,550 |
| Series 2022 1B, 4% 7/1/51 | | 3,000,000 | 3,004,785 |
| Series 2022 A: | | | |
4% 5/1/45 | | 1,185,000 | 1,181,525 |
5% 7/1/33 | | 40,000 | 44,451 |
5% 7/1/34 | | 80,000 | 88,701 |
5% 7/1/36 | | 50,000 | 54,963 |
5% 10/1/36 | | 3,080,000 | 3,394,013 |
5% 7/15/37 | | 340,000 | 359,436 |
5% 7/1/38 | | 105,000 | 114,665 |
5% 7/1/40 | | 65,000 | 70,634 |
5% 7/1/41 | | 65,000 | 70,375 |
5% 7/1/42 | | 70,000 | 75,521 |
5% 7/15/42 | | 960,000 | 995,316 |
5% 7/15/50 | | 2,485,000 | 2,538,562 |
5% 5/1/52 | | 2,000,000 | 2,129,843 |
| Series 2022: | | | |
4% 7/1/36 | | 1,065,000 | 1,098,672 |
4% 7/1/38 | | 345,000 | 354,401 |
4% 7/1/40 | | 565,000 | 576,861 |
5% 7/1/30 | | 105,000 | 109,774 |
5% 7/1/31 | | 110,000 | 115,329 |
5% 7/1/34 | | 705,000 | 789,905 |
5% 7/1/35 | | 705,000 | 785,193 |
5% 7/1/37 | | 1,165,000 | 1,291,552 |
5% 7/1/38 | | 55,000 | 56,367 |
5% 7/1/39 | | 355,000 | 391,518 |
5% 7/1/39 | | 85,000 | 86,560 |
5% 7/1/40 | | 190,000 | 192,716 |
5% 7/1/41 | | 630,000 | 690,683 |
5% 7/1/41 | | 200,000 | 202,093 |
5% 7/1/42 | | 105,000 | 105,752 |
5% 7/1/57 | | 5,705,000 | 5,485,891 |
| Series 2024 A, 5.5% 7/1/54 | | 4,175,000 | 4,787,367 |
| Series 2024: | | | |
5.25% 10/1/49 | | 1,260,000 | 1,355,399 |
5.5% 11/1/44 | | 310,000 | 347,656 |
5.5% 10/1/54 | | 1,245,000 | 1,394,208 |
| New York Dorm. Auth. Sales Tax Rev.: | | | |
| Series 2016 A, 5% 3/15/35 | | 1,785,000 | 1,838,318 |
| Series 2017 A, 5% 3/15/38 | | 1,035,000 | 1,069,149 |
| Series 2018 A: | | | |
5% 3/15/42 | | 645,000 | 676,938 |
5% 3/15/43 | | 2,410,000 | 2,526,080 |
| Series 2018 C, 5% 3/15/38 | | 465,000 | 490,836 |
| Series 2018 E, 5% 3/15/44 | | 495,000 | 521,717 |
| Series 2023 A1, 5% 3/15/41 | | 11,945,000 | 13,365,006 |
| Series 2024 A, 5% 3/15/52 | | 8,000,000 | 8,813,871 |
| Series 2024, 5% 3/15/50 | | 1,875,000 | 2,071,430 |
| New York Envir. Facilities Corp. Clean Wtr. & Drinking Wtr. Series 2019 B, 3% 6/15/38 | | 915,000 | 868,619 |
| New York Liberty Dev. Corp.: | | | |
| (3 World Trade Ctr. Proj.) Series 2014: | | | |
5% 11/15/44 (g) | | 8,505,000 | 8,509,620 |
5.15% 11/15/34 (g) | | 1,840,000 | 1,841,507 |
5.375% 11/15/40 (g) | | 6,065,000 | 6,069,780 |
| (4 World Trade Ctr. Proj.) Series 2021 A, 2.875% 11/15/46 | | 2,000,000 | 1,548,525 |
| (7 World Trade Ctr. Proj.) Series 2022 A, 3.125% 9/15/50 | | 650,000 | 541,947 |
| (Bank of America Tower at One Bryant Park Proj.) Series 2019 1, 2.45% 9/15/69 | | 1,800,000 | 1,701,336 |
| (Bank of America Tower At One Bryant Park Proj.) Series 2019 3, 2.8% 9/15/69 | | 840,000 | 782,190 |
| (World Trade Ctr. Proj.) Series 2014, 7.25% 11/15/44 (g) | | 2,000,000 | 2,002,190 |
| Series 2021 1WTC, 3% 2/15/42 | | 2,000,000 | 1,752,911 |
| Series 2021 A: | | | |
2.875% 11/15/46 | | 1,500,000 | 1,171,655 |
3% 11/15/51 (Build America Mutual Assurance Insured) | | 250,000 | 203,022 |
| Series 2021: | | | |
2.75% 2/15/44 | | 2,400,000 | 1,922,409 |
3% 2/15/42 | | 4,000,000 | 3,533,840 |
4% 2/15/43 | | 750,000 | 750,621 |
4% 2/15/43 | | 1,325,000 | 1,321,334 |
| New York Metropolitan Trans. Auth. Dedicated Tax Fund Rev.: | | | |
| Series 2012 A, 0% 11/15/32 | | 355,000 | 268,468 |
| Series 2016 A, 5.25% 11/15/31 | | 1,475,000 | 1,539,050 |
| Series 2017 A, 5% 11/15/47 | | 1,805,000 | 1,850,267 |
| Series 2022 A, 5% 11/15/45 | | 250,000 | 271,774 |
| Series 2024 B1, 4% 11/15/54 | | 6,000,000 | 5,944,639 |
| New York Metropolitan Trans. Auth. Rev.: | | | |
| Bonds Series 2015 A2, 5%, tender 5/15/30 (b) | | 2,195,000 | 2,380,453 |
| Series 2006 B, 5.25% 11/15/26 (Assured Guaranty Muni. Corp. Insured) | | 1,180,000 | 1,237,831 |
| Series 2015 A1: | | | |
5% 11/15/29 | | 375,000 | 377,581 |
5% 11/15/40 | | 700,000 | 702,806 |
| Series 2015 C, 5% 11/15/35 | | 1,500,000 | 1,521,588 |
| Series 2015 D1, 5% 11/15/26 | | 500,000 | 508,054 |
| Series 2016 A1, 5% 11/15/41 | | 900,000 | 910,165 |
| Series 2016 A2, 5% 11/15/27 | | 250,000 | 258,417 |
| Series 2016 C 2A, 4% 11/15/38 | | 360,000 | 361,393 |
| Series 2016 D, 5% 11/15/27 | | 250,000 | 258,417 |
| Series 2017 A, 4% 11/15/37 | | 785,000 | 791,487 |
| Series 2017 A1, 5% 11/15/51 | | 480,000 | 491,277 |
| Series 2017 C-2: | | | |
0% 11/15/29 | | 125,000 | 105,354 |
0% 11/15/33 | | 315,000 | 225,717 |
| Series 2017 C1: | | | |
5% 11/15/27 | | 1,035,000 | 1,097,977 |
5% 11/15/30 | | 2,380,000 | 2,520,806 |
5% 11/15/34 | | 95,000 | 99,955 |
| Series 2017 D: | | | |
5% 11/15/33 | | 1,140,000 | 1,200,726 |
5% 11/15/35 | | 130,000 | 136,549 |
| Series 2017, 5% 11/15/34 | | 3,510,000 | 3,705,979 |
| Series 2019 C, 5% 11/15/42 | | 2,300,000 | 2,428,664 |
| Series 2020 A1: | | | |
4% 11/15/46 | | 750,000 | 738,226 |
4% 11/15/50 (Assured Guaranty Muni. Corp. Insured) | | 450,000 | 446,667 |
4% 11/15/51 | | 250,000 | 243,385 |
5% 11/15/49 | | 2,750,000 | 2,874,119 |
| Series 2020 C1: | | | |
5% 11/15/50 | | 1,500,000 | 1,559,668 |
5.25% 11/15/55 | | 600,000 | 630,902 |
| Series 2020 D: | | | |
4% 11/15/46 | | 11,005,000 | 10,832,242 |
4% 11/15/47 | | 130,000 | 127,568 |
4% 11/15/50 | | 2,600,000 | 2,535,814 |
5% 11/15/44 | | 2,650,000 | 2,802,720 |
| Series 2020 E: | | | |
4% 11/15/45 | | 2,550,000 | 2,516,394 |
5% 11/15/29 | | 725,000 | 793,776 |
5% 11/15/33 | | 540,000 | 590,985 |
| Series 2021 A1: | | | |
4% 11/15/45 | | 900,000 | 888,139 |
4% 11/15/46 | | 250,000 | 246,075 |
4% 11/15/49 | | 650,000 | 635,095 |
| Series 2024 A: | | | |
5% 11/15/32 | | 11,890,000 | 13,453,549 |
5.5% 11/15/47 | | 1,950,000 | 2,188,632 |
| New York Pwr. Auth.: | | | |
| Series 2022 A, 4% 11/15/47 (Assured Guaranty Muni. Corp. Insured) | | 420,000 | 420,948 |
| Series 2023 A, 5.25% 11/15/43 (Assured Guaranty Muni. Corp. Insured) | | 1,395,000 | 1,619,782 |
| New York State Dorm. Auth.: | | | |
| Series 2017 A, 5% 2/15/31 | | 65,000 | 67,449 |
| Series 2019 A: | | | |
5% 3/15/39 | | 1,000,000 | 1,067,648 |
5% 3/15/45 | | 2,450,000 | 2,592,397 |
| Series 2019 D: | | | |
3% 2/15/49 | | 3,295,000 | 2,736,990 |
4% 2/15/39 | | 1,000,000 | 1,019,452 |
4% 2/15/40 | | 4,085,000 | 4,145,768 |
4% 2/15/47 | | 7,485,000 | 7,430,777 |
| Series 2019 E, 5% 2/15/35 | | 655,000 | 718,167 |
| Series 2020 A: | | | |
3% 3/15/39 | | 1,750,000 | 1,628,033 |
3% 3/15/42 | | 1,000,000 | 894,003 |
| Series 2021 E: | | | |
3% 3/15/41 | | 1,000,000 | 912,023 |
3% 3/15/50 | | 3,275,000 | 2,689,723 |
4% 3/15/39 | | 2,500,000 | 2,563,101 |
4% 3/15/42 | | 3,925,000 | 3,954,400 |
4% 3/15/45 | | 5,890,000 | 5,909,393 |
4% 3/15/47 | | 260,000 | 260,415 |
4% 3/15/49 | | 2,000,000 | 1,996,220 |
| Series 2022 A: | | | |
4% 3/15/39 | | 2,745,000 | 2,814,284 |
4% 3/15/40 | | 2,900,000 | 2,952,248 |
5% 3/15/46 | | 3,430,000 | 3,711,039 |
| Series 2024 A, 5.25% 3/15/52 | | 2,495,000 | 2,772,020 |
| New York State Envir. Facilities Corp. Rev. (2010 Master Fing. Prog.) Series 2022 B, 5.25% 9/15/52 | | 2,000,000 | 2,215,875 |
| New York State Envir. Facilities Corp. Solid Waste Disp. Rev. Bonds (Casella Waste Systems, INC. Proj.) Series 2020 R2, 5.125%, tender 9/3/30 (b)(e)(g) | | 1,150,000 | 1,221,245 |
| New York State Hsg. Fin. Agcy. Rev.: | | | |
| Bonds Series 2021 J2: | | | |
1%, tender 11/1/26 (b) | | 915,000 | 868,031 |
1.1%, tender 5/1/27 (b) | | 3,395,000 | 3,169,698 |
| Series 2020 L2, 0.75% 11/1/25 | | 895,000 | 865,612 |
| Series 2020 M2, 0.75% 11/1/25 | | 40,000 | 38,687 |
| Series J, 0.75% 5/1/25 | | 360,000 | 354,231 |
| New York State Mtg. Agcy. Homeowner Mtg.: | | | |
| Series 2020 227, 2.3% 10/1/40 | | 750,000 | 584,166 |
| Series 221, 3.5% 10/1/32 (e) | | 80,000 | 79,015 |
| New York State Urban Dev. Corp.: | | | |
| Series 2020 A: | | | |
4% 3/15/39 | | 1,280,000 | 1,311,023 |
4% 3/15/45 | | 80,000 | 80,050 |
4% 3/15/49 | | 505,000 | 502,492 |
| Series 2020 C: | | | |
3% 3/15/48 | | 1,750,000 | 1,451,273 |
4% 3/15/42 | | 2,135,000 | 2,147,711 |
4% 3/15/49 | | 2,175,000 | 2,164,200 |
5% 3/15/47 | | 1,475,000 | 1,570,553 |
| Series 2020 E: | | | |
4% 3/15/39 | | 1,215,000 | 1,242,128 |
4% 3/15/43 | | 350,000 | 350,882 |
4% 3/15/44 | | 6,930,000 | 6,936,491 |
4% 3/15/45 | | 6,525,000 | 6,528,754 |
| Series 2022 A: | | | |
5% 3/15/42 | | 750,000 | 828,573 |
5% 3/15/43 | | 10,000,000 | 10,995,667 |
| Series 2023 A, 5% 3/15/57 | | 2,000,000 | 2,165,330 |
| New York State Urban Eev Corp.: | | | |
| Series 2019 A: | | | |
3% 3/15/49 | | 2,000,000 | 1,635,167 |
5% 3/15/37 | | 3,405,000 | 3,689,473 |
| Series 2021 A: | | | |
3% 3/15/40 | | 1,000,000 | 916,783 |
3% 3/15/50 | | 300,000 | 245,918 |
4% 3/15/37 | | 1,250,000 | 1,295,929 |
4% 3/15/38 | | 1,000,000 | 1,030,568 |
| Series 2023 A, 5% 3/15/49 | | 15,000,000 | 16,304,126 |
| New York Thruway Auth. Gen. Rev.: | | | |
| Series 2016 A, 5% 1/1/46 | | 2,760,000 | 2,794,205 |
| Series 2019 B: | | | |
4% 1/1/38 | | 3,400,000 | 3,464,862 |
4% 1/1/45 | | 1,465,000 | 1,450,619 |
4% 1/1/50 | | 250,000 | 246,273 |
| Series 2021, 3% 1/1/51 | | 1,500,000 | 1,213,944 |
| New York Thruway Auth. Personal Income Tax Rev.: | | | |
| Series 2021 A1: | | | |
3% 3/15/48 | | 500,000 | 410,866 |
3% 3/15/51 | | 1,950,000 | 1,566,703 |
4% 3/15/43 | | 750,000 | 752,749 |
4% 3/15/53 | | 2,200,000 | 2,170,186 |
| Series 2022 C, 5% 3/15/53 | | 2,210,000 | 2,381,942 |
| New York Trans. Dev. Corp.: | | | |
| (American Airlines, Inc. John F. Kennedy Int'l. Arpt. Proj.): | | | |
Series 2016: | | | |
5% 8/1/26 (e) | | 895,000 | 896,493 |
5% 8/1/31 (e) | | 2,635,000 | 2,638,295 |
Series 2020: | | | |
5.25% 8/1/31 (e) | | 475,000 | 497,832 |
5.375% 8/1/36 (e) | | 1,405,000 | 1,481,158 |
| (Delta Air Lines, Inc. - Laguardia Arpt. Terminals C&D Redev. Proj.): | | | |
Series 2020: | | | |
4.375% 10/1/45 (e) | | 4,735,000 | 4,607,674 |
5% 10/1/40 (e) | | 4,190,000 | 4,355,888 |
Series 2023: | | | |
5.625% 4/1/40 (e) | | 4,535,000 | 4,906,236 |
6% 4/1/35 (e) | | 3,800,000 | 4,272,981 |
| (Delta Air Lines, Inc. Laguardia Arpt. Terminals C&D Redev. Proj.) Series 2018: | | | |
4% 1/1/36 (e) | | 280,000 | 273,999 |
5% 1/1/27 (e) | | 4,000,000 | 4,112,184 |
| (Delta Air Lines, Inc. LaGuardia Arpt. Terminals C&D Redev. Proj.) Series 2018, 5% 1/1/30 (e) | | 435,000 | 450,983 |
| (Delta Air Lines, Inc. Laguardia Arpt. Terminals C&D Redev. Proj.) Series 2018: | | | |
5% 1/1/31 (e) | | 1,735,000 | 1,794,703 |
5% 1/1/32 (e) | | 3,510,000 | 3,625,220 |
5% 1/1/33 (e) | | 260,000 | 268,191 |
| (Delta Air Lines, Inc. LaGuardia Arpt. Terminals C&D Redev. Proj.) Series 2018, 5% 1/1/34 (e) | | 885,000 | 911,683 |
| (Delta Air Lines, Inc. Laguardia Arpt. Terminals C&D Redev. Proj.) Series 2018, 5% 1/1/36 (e) | | 710,000 | 729,346 |
| (Delta Air Lines, Inc. LaGuardia Arpt. Terminals C&D Redev. Proj.) Series 2020, 5% 10/1/35 (e) | | 2,610,000 | 2,739,310 |
| (JFK Arpt. Term. 6 Redev. Proj.): | | | |
Series 2024 A: | | | |
4.5% 12/31/54 (Assured Guaranty Muni. Corp. Insured) (e) | | 2,500,000 | 2,518,095 |
5.5% 12/31/54 (e) | | 3,555,000 | 3,852,453 |
Series 2024 B, 0% 12/31/54 (Assured Guaranty Muni. Corp. Insured) (e)(i) | | 2,205,000 | 1,477,198 |
Series 2024: | | | |
5.25% 12/31/54 (Assured Guaranty Muni. Corp. Insured) (e) | | 12,695,000 | 13,672,812 |
5.5% 12/31/60 (e) | | 10,630,000 | 11,447,825 |
| (John F. Kennedy Int'l. Arpt. New Term. One Proj.): | | | |
Series 2023: | | | |
5.125% 6/30/60 (Assured Guaranty Muni. Corp. Insured) (e) | | 15,815,000 | 16,426,663 |
5.375% 6/30/60 (e) | | 9,655,000 | 10,097,552 |
5.5% 6/30/42 (Assured Guaranty Muni. Corp. Insured) (e) | | 2,890,000 | 3,158,163 |
6% 6/30/54 (e) | | 11,655,000 | 12,716,633 |
Series 2024: | | | |
5% 6/30/49 (Assured Guaranty Muni. Corp. Insured) (e) | | 1,000,000 | 1,046,468 |
5% 6/30/54 (Assured Guaranty Muni. Corp. Insured) (e) | | 1,455,000 | 1,512,560 |
5% 6/30/60 (e) | | 1,100,000 | 1,129,296 |
5.25% 6/30/60 (Assured Guaranty Muni. Corp. Insured) (e) | | 6,730,000 | 7,149,700 |
5.5% 6/30/54 (e) | | 3,700,000 | 3,971,680 |
5.5% 6/30/60 (e) | | 5,800,000 | 6,196,036 |
| (Laguardia Arpt. Term. B Redev. Proj.) Series 2016 A: | | | |
5% 7/1/34 (e) | | 520,000 | 520,620 |
5% 7/1/46 (e) | | 12,910,000 | 12,910,160 |
| (Laguardia Arpt. Term. Redev. Proj.) Series 2016 A, 5% 7/1/41 (e) | | 1,525,000 | 1,525,043 |
| (New York State Thruway Svc. Areas Proj.) Series 2021: | | | |
4% 10/31/46 (e) | | 3,885,000 | 3,527,390 |
4% 4/30/53 (e) | | 825,000 | 726,904 |
| (Term. 4 JFK Int'l. Arpt. Proj.): | | | |
Series 2020 A, 4% 12/1/38 (e) | | 40,000 | 40,022 |
Series 2020 C: | | | |
4% 12/1/40 | | 480,000 | 480,143 |
5% 12/1/32 | | 375,000 | 407,990 |
5% 12/1/35 | | 480,000 | 518,153 |
5% 12/1/37 | | 290,000 | 311,393 |
| (Term. 4 John F. Kennedy Int'l. Arpt. Proj.): | | | |
Series 2020 A: | | | |
4% 12/1/39 (e) | | 105,000 | 104,522 |
5% 12/1/36 (e) | | 5,000 | 5,268 |
Series 2022: | | | |
5% 12/1/32 (e) | | 995,000 | 1,079,700 |
5% 12/1/33 (e) | | 1,545,000 | 1,672,858 |
5% 12/1/34 (e) | | 1,935,000 | 2,089,101 |
5% 12/1/35 (e) | | 845,000 | 909,038 |
5% 12/1/36 (e) | | 575,000 | 616,664 |
5% 12/1/37 (e) | | 1,535,000 | 1,640,203 |
5% 12/1/38 (e) | | 3,720,000 | 3,962,078 |
5% 12/1/39 (e) | | 5,550,000 | 5,891,258 |
5% 12/1/40 (e) | | 2,885,000 | 3,049,569 |
5% 12/1/41 (e) | | 2,665,000 | 2,805,824 |
5% 12/1/42 (e) | | 1,820,000 | 1,909,573 |
| Laguardia Arpt. Term. B Redev. Proj. Series 2016 A, 4% 7/1/37 (Assured Guaranty Muni. Corp. Insured) (e) | | 750,000 | 742,131 |
| Series 2016 A, 4% 7/1/35 (Assured Guaranty Muni. Corp. Insured) (e) | | 2,950,000 | 2,938,377 |
| Series 2021, 2.25% 8/1/26 (e) | | 75,000 | 73,309 |
| Series 2022: | | | |
5% 12/1/27 (e) | | 750,000 | 790,248 |
5% 12/1/28 (e) | | 750,000 | 802,427 |
5% 12/1/29 (e) | | 400,000 | 434,055 |
5% 12/1/30 (e) | | 2,145,000 | 2,300,394 |
5% 12/1/40 (e) | | 250,000 | 271,162 |
| New York Urban Dev. Corp. Rev. Series 2017 C: | | | |
| 4% 3/15/43 | | 3,440,000 | 3,415,248 |
| 4% 3/15/45 | | 3,155,000 | 3,104,493 |
| Niagara Area Dev. Corp. Rev. (Catholic Health Sys., Inc. Proj.) Series 2022: | | | |
| 4.5% 7/1/52 | | 610,000 | 554,010 |
| 5% 7/1/52 | | 325,000 | 325,586 |
| NY Payroll Mobility Tax: | | | |
| Series 2021 A1, 5% 5/15/51 | | 12,490,000 | 13,369,071 |
| Series 2021 B, 4% 5/15/56 | | 115,000 | 111,592 |
| Series 2021 C3, 3% 5/15/51 | | 3,000,000 | 2,421,413 |
| Series 2022 D2: | | | |
4.5% 5/15/47 | | 1,000,000 | 1,033,495 |
5.25% 5/15/47 | | 4,100,000 | 4,554,201 |
5.5% 5/15/52 | | 4,000,000 | 4,483,904 |
| Series 2024 B, 5% 3/15/27 | | 5,650,000 | 5,947,930 |
| Oneida County Local Dev. Corp. Rev. (Mohawk Valley Health Sys. Proj.) Series 2019 A: | | | |
| 3% 12/1/44 (Assured Guaranty Muni. Corp. Insured) | | 300,000 | 236,746 |
| 4% 12/1/32 (Assured Guaranty Muni. Corp. Insured) | | 55,000 | 56,430 |
| 4% 12/1/49 (Assured Guaranty Muni. Corp. Insured) | | 1,000,000 | 968,990 |
| 5% 12/1/25 (Assured Guaranty Muni. Corp. Insured) | | 35,000 | 35,030 |
| 5% 12/1/26 (Assured Guaranty Muni. Corp. Insured) | | 105,000 | 105,841 |
| 5% 12/1/30 (Assured Guaranty Muni. Corp. Insured) | | 85,000 | 91,462 |
| Oneida Indian Nation N Y Tax R Series 2024 B, 6% 9/1/43 (g) | | 1,200,000 | 1,325,554 |
| Onondaga Civic Dev. Corp. (Le Moyne College Proj.): | | | |
| Series 2015, 5% 7/1/45 | | 1,725,000 | 1,729,158 |
| Series 2018, 5% 1/1/43 | | 120,000 | 121,745 |
| Onondaga County Trust for Cultural Resources Rev. Series 2019: | | | |
| 4% 12/1/41 | | 800,000 | 811,394 |
| 4% 12/1/49 | | 2,250,000 | 2,256,598 |
| 5% 12/1/45 | | 800,000 | 851,148 |
| Port Auth. of New York & New Jersey: | | | |
| Series 2020 221, 4% 7/15/55 (e) | | 3,870,000 | 3,654,433 |
| Series 2021 226, 5% 10/15/38 (e) | | 635,000 | 684,552 |
| Series 2022 231, 5.5% 8/1/40 (e) | | 1,510,000 | 1,687,256 |
| Series 2022 236, 5% 1/15/52 (e) | | 725,000 | 767,701 |
| Riverhead N Y IDA Econ. Job (River Pointe Apts. Proj.) Series 2023, 4.5% 2/1/41 | | 4,726,723 | 4,910,334 |
| Sachem Central School District of Holbrook Series 2016, 3% 10/15/28 | | 915,000 | 912,472 |
| Schenectady County Cap. Resources Corp. Rev.: | | | |
| (Union College Proj.) Series 2017, 5% 1/1/40 | | 1,895,000 | 1,944,455 |
| Series 2022, 5.25% 7/1/52 | | 145,000 | 159,928 |
| Suffolk County Econ. Dev. Corp. Rev. Series 2021: | | | |
| 4.625% 11/1/31 (g) | | 150,000 | 142,291 |
| 5.375% 11/1/54 (g) | | 625,000 | 541,999 |
| Suffolk County Wtr. Auth. Wtrwks. Rev.: | | | |
| Series 2012 A, 3.75% 6/1/36 | | 1,000,000 | 1,000,009 |
| Series 2020 B, 3% 6/1/45 | | 250,000 | 217,625 |
| Suffolk Tobacco Asset Securitization Corp. Series 2021 B2, 0% 6/1/66 | | 2,700,000 | 277,319 |
| Syracuse Indl. Dev. Auth. Pilot Rev. (Carousel Ctr. Proj.) Series 2016 A: | | | |
| 5% 1/1/28 (e) | | 355,000 | 282,756 |
| 5% 1/1/29 (e) | | 520,000 | 408,449 |
| 5% 1/1/30 (e) | | 395,000 | 307,612 |
| 5% 1/1/31 (e) | | 490,000 | 379,797 |
| 5% 1/1/32 (e) | | 910,000 | 702,223 |
| 5% 1/1/33 (e) | | 805,000 | 619,710 |
| 5% 1/1/34 (e) | | 720,000 | 553,409 |
| 5% 1/1/35 (e) | | 960,000 | 737,152 |
| 5% 1/1/36 (e) | | 310,000 | 237,901 |
| Tobacco Settlement Asset Securitization Corp. Series 2017 A: | | | |
| 5% 6/1/33 | | 1,100,000 | 1,135,877 |
| 5% 6/1/35 | | 500,000 | 515,019 |
| 5% 6/1/41 | | 575,000 | 584,415 |
| Triborough Brdg & Tunl Auth.: | | | |
| Series 2022 A, 4% 5/15/52 | | 1,000,000 | 1,001,065 |
| Series 2023 A: | | | |
5% 5/15/48 | | 1,000,000 | 1,090,836 |
5% 5/15/53 | | 1,500,000 | 1,622,509 |
| Series 2024 A1, 5.25% 5/15/64 | | 2,500,000 | 2,756,360 |
| Triborough Bridge & Tunnel Auth. Revs.: | | | |
| Series 2017 B, 5% 11/15/37 | | 750,000 | 780,925 |
| Series 2017 C2, 5% 11/15/42 | | 2,730,000 | 2,848,786 |
| Series 2018 A, 5% 11/15/43 | | 1,000,000 | 1,049,110 |
| Series 2020 A, 5% 11/15/49 (l) | | 3,710,000 | 3,940,091 |
| Series 2021 A: | | | |
4% 11/15/56 | | 3,000,000 | 2,967,954 |
5% 11/15/51 | | 1,400,000 | 1,489,490 |
| Troy Cap. Resource Corp. Rev. (Rensselaer Polytechnic Institute Proj.) Series 2020 A: | | | |
| 5% 9/1/36 | | 240,000 | 261,611 |
| 5% 9/1/39 | | 800,000 | 862,799 |
| Westchester County Local Dev. Co.: | | | |
| (Kendal On Hudson Proj.) Series 2022 B, 5% 1/1/51 | | 500,000 | 515,459 |
| (Westchester Med. Ctr. Obligated Group Proj.) Series 2023: | | | |
5% 11/1/47 (Assured Guaranty Muni. Corp. Insured) | | 455,000 | 488,977 |
5% 11/1/51 | | 500,000 | 535,500 |
5.75% 11/1/48 (Assured Guaranty Muni. Corp. Insured) | | 805,000 | 911,092 |
5.75% 11/1/49 | | 1,000,000 | 1,129,530 |
TOTAL NEW YORK | | | 895,715,017 |
| New York And New Jersey - 0.5% | | | |
| New Jersey Edl. Facilities Auth. Rev. Series 2024 B, 5.25% 3/1/54 | | 9,435,000 | 10,713,412 |
| Port Auth. of New York & New Jersey: | | | |
| Series 198, 5% 11/15/46 | | 1,205,000 | 1,230,760 |
| Series 2014 183, 4% 12/15/39 | | 875,000 | 874,033 |
| Series 2015 189, 5% 5/1/45 | | 2,320,000 | 2,331,008 |
| Series 2015 193, 5% 10/15/30 (e) | | 1,325,000 | 1,339,085 |
| Series 2015 194: | | | |
5% 10/15/34 | | 2,410,000 | 2,444,343 |
5% 10/15/41 | | 7,625,000 | 7,708,122 |
| Series 2020 221, 4% 7/15/50 (e) | | 760,000 | 727,879 |
| Series 2021 223, 4% 7/15/46 (e) | | 7,460,000 | 7,232,998 |
| Series 2021 226: | | | |
5% 10/15/39 (e) | | 470,000 | 504,982 |
5% 10/15/40 (e) | | 725,000 | 776,034 |
5% 10/15/41 (e) | | 420,000 | 447,985 |
| Series 2022 231: | | | |
5.5% 8/1/42 (e) | | 250,000 | 277,714 |
5.5% 8/1/47 (e) | | 4,730,000 | 5,186,460 |
| Series 2022 234, 5.25% 8/1/47 (e) | | 2,100,000 | 2,275,535 |
| Series 2022 236, 5% 1/15/47 (e) | | 4,000,000 | 4,268,161 |
| Series 2023 238: | | | |
5% 7/15/38 (e) | | 945,000 | 1,035,653 |
5% 7/15/39 (e) | | 575,000 | 627,066 |
5% 7/15/40 (e) | | 505,000 | 548,225 |
| Series 2023 242, 5% 12/1/30 (e) | | 1,500,000 | 1,636,674 |
| Series 214, 4% 9/1/43 (e) | | 575,000 | 562,343 |
| Series 218, 4% 11/1/47 (e) | | 5,000,000 | 4,851,273 |
| Series 221, 4% 7/15/45 (e) | | 305,000 | 296,601 |
| Series 223, 4% 7/15/38 (e) | | 595,000 | 597,731 |
TOTAL NEW YORK AND NEW JERSEY | | | 58,494,077 |
| Non-State Specific - 0.1% | | | |
| Affordable Hsg. Opportunities T Series 2022, 3.528% 5/1/39 (g) | | 2,300,000 | 1,903,429 |
| Freddie Mac sequential payer: | | | |
| Series 2023-ML16 Class AUS, 4.632% 7/25/38 (b) | | 756,841 | 785,006 |
| Series 2024-ML21 Class A, 4.52% 8/25/41 (b)(g) | | 2,824,902 | 2,893,131 |
| Series 2024-ML22 Class AUS, 4.6834% 10/25/40 (b) | | 2,575,891 | 2,684,905 |
| Frete 2021-Ml12 Trust Series 2021, 1.2231% 7/25/41 (b)(g) | | 3,337,044 | 310,074 |
TOTAL NON-STATE SPECIFIC | | | 8,576,545 |
| North Carolina - 0.8% | | | |
| Atrium Health Bonds Series 2018 E, 0.8%, tender 10/31/25 (b) | | 2,020,000 | 1,964,854 |
| Charlotte Ctfs. of Prtn. (Convention Facility Projs.) Series 2019 A: | | | |
| 4% 6/1/39 | | 55,000 | 55,879 |
| 5% 6/1/46 | | 980,000 | 1,034,564 |
| Charlotte Gen. Oblig. Series 2021 A, 2% 6/1/39 | | 2,400,000 | 1,904,920 |
| Charlotte Int'l. Arpt. Rev.: | | | |
| Series 2017 A: | | | |
5% 7/1/30 | | 185,000 | 194,769 |
5% 7/1/33 | | 185,000 | 194,182 |
5% 7/1/35 | | 110,000 | 115,211 |
5% 7/1/37 | | 425,000 | 444,037 |
| Series 2017 B: | | | |
5% 7/1/25 (e) | | 10,000 | 10,087 |
5% 7/1/26 (e) | | 10,000 | 10,267 |
5% 7/1/27 (e) | | 25,000 | 26,034 |
5% 7/1/28 (e) | | 20,000 | 20,764 |
5% 7/1/29 (e) | | 30,000 | 31,073 |
5% 7/1/30 (e) | | 30,000 | 31,054 |
5% 7/1/31 (e) | | 60,000 | 62,047 |
5% 7/1/32 (e) | | 60,000 | 61,978 |
5% 7/1/33 (e) | | 65,000 | 67,082 |
5% 7/1/34 (e) | | 65,000 | 67,018 |
5% 7/1/35 (e) | | 45,000 | 46,342 |
5% 7/1/36 (e) | | 40,000 | 41,143 |
5% 7/1/37 (e) | | 45,000 | 46,228 |
5% 7/1/42 (e) | | 145,000 | 147,990 |
| Series 2017 C, 4% 7/1/32 | | 175,000 | 177,661 |
| Series 2019 A, 4% 7/1/44 | | 400,000 | 401,963 |
| Series 2019 B, 4% 7/1/44 (e) | | 550,000 | 544,719 |
| Charlotte Wtr. & Swr. Sys. Rev. Series 2024: | | | |
| 5% 7/1/29 | | 1,250,000 | 1,379,443 |
| 5% 7/1/49 | | 5,000,000 | 5,560,441 |
| Forsyth County Series 2021 B: | | | |
| 2% 3/1/38 | | 5,655,000 | 4,613,577 |
| 2% 3/1/39 | | 1,000,000 | 795,985 |
| Greater Asheville Reg'l. Arpt. Auth.: | | | |
| Series 2022 A, 5.5% 7/1/47 (Assured Guaranty Muni. Corp. Insured) (e) | | 4,170,000 | 4,568,765 |
| Series 2023, 5.25% 7/1/48 (Assured Guaranty Muni. Corp. Insured) (e) | | 190,000 | 205,286 |
| Mecklenburg County Gen. Oblig. Series 2016 A, 5% 9/1/25 | | 1,975,000 | 2,006,583 |
| New Hanover County Hosp. Rev. Series 2017, 5% 10/1/27 (Escrowed to Maturity) | | 65,000 | 69,086 |
| North Carolina Cap. Facilities Fin. Agcy. Edl. Facilities Rev. Series 2021, 4% 5/1/32 | | 210,000 | 214,289 |
| North Carolina Grant Anticipation Rev. Series 2021, 2% 3/1/36 | | 2,495,000 | 2,053,447 |
| North Carolina Hsg. Fin. Agcy. Home Ownership Rev.: | | | |
| Series 2018 39B, 4% 7/1/48 | | 540,000 | 541,591 |
| Series 2019 42, 4% 1/1/50 | | 495,000 | 497,203 |
| Series 2020 44, 4% 7/1/50 | | 205,000 | 206,239 |
| Series 2022 49: | | | |
5% 7/1/47 | | 320,000 | 330,972 |
6% 7/1/53 | | 1,420,000 | 1,518,047 |
| Series 2023 52A, 6.25% 1/1/55 | | 1,495,000 | 1,633,185 |
| Series 2024 53A, 6.25% 1/1/55 | | 2,350,000 | 2,580,257 |
| Series 2024 54A, 4.8% 1/1/55 | | 1,800,000 | 1,821,592 |
| North Carolina Med. Care Commission Health Care Facilities Rev.: | | | |
| Bonds Series 2019 C, 2.55%, tender 6/1/26 (b) | | 2,190,000 | 2,166,042 |
| Series 2015: | | | |
5% 10/1/25 | | 135,000 | 135,909 |
5% 10/1/30 | | 320,000 | 320,215 |
5% 10/1/35 | | 870,000 | 870,454 |
5% 6/1/40 | | 3,730,000 | 3,751,749 |
| Series 2019 A: | | | |
4% 11/1/52 | | 665,000 | 658,464 |
5% 12/1/29 | | 80,000 | 85,557 |
5% 12/1/30 | | 80,000 | 85,437 |
5% 12/1/32 | | 60,000 | 63,930 |
5% 12/1/33 | | 45,000 | 47,874 |
| Series 2020 A: | | | |
3% 7/1/45 | | 1,130,000 | 961,106 |
5% 10/1/40 | | 195,000 | 204,690 |
5% 10/1/45 | | 185,000 | 191,470 |
5% 10/1/50 | | 115,000 | 118,008 |
| Series 2021 A: | | | |
4% 3/1/29 | | 55,000 | 55,254 |
4% 3/1/36 | | 335,000 | 328,802 |
4% 3/1/41 | | 95,000 | 89,624 |
4% 3/1/51 | | 3,235,000 | 2,827,282 |
| Series 2021 C: | | | |
4% 3/1/30 | | 500,000 | 500,473 |
4% 3/1/36 | | 445,000 | 436,766 |
4% 3/1/42 | | 730,000 | 682,830 |
| North Carolina Med. Care Commission Retirement Facilities Rev.: | | | |
| (Penick Village Proj.) Series 2024 A, 5.5% 9/1/54 | | 340,000 | 347,849 |
| (Salemtowne Proj.) Series 2015: | | | |
5.25% 10/1/35 | | 295,000 | 295,018 |
5.25% 10/1/37 | | 130,000 | 130,119 |
5.375% 10/1/45 | | 1,655,000 | 1,614,576 |
| (The Forest at Duke Proj.) Series 2021: | | | |
4% 9/1/41 | | 150,000 | 140,831 |
4% 9/1/51 | | 555,000 | 479,913 |
| (The Pines at Davidson Proj.) Series 2019 A, 5% 1/1/49 | | 175,000 | 178,220 |
| (The United Methodist Retirement Homes Proj.) Series 2024 A, 5% 10/1/44 | | 180,000 | 188,638 |
| Series 2015: | | | |
4.7% 7/1/37 | | 385,000 | 334,544 |
4.875% 7/1/40 | | 755,000 | 639,563 |
5% 7/1/45 | | 625,000 | 506,399 |
| Series 2016: | | | |
5% 10/1/31 | | 245,000 | 247,721 |
5% 10/1/37 | | 220,000 | 221,528 |
| Series 2017 A, 5% 7/1/47 | | 165,000 | 130,899 |
| Series 2019 A: | | | |
5% 7/1/39 | | 420,000 | 429,567 |
5% 7/1/44 | | 615,000 | 621,642 |
5% 7/1/49 | | 295,000 | 296,137 |
| Series 2021 A: | | | |
4% 9/1/41 | | 150,000 | 141,674 |
4% 9/1/47 | | 135,000 | 120,588 |
4% 9/1/51 | | 135,000 | 117,826 |
4% 1/1/52 | | 370,000 | 311,354 |
| Series 2021, 4% 9/1/46 | | 300,000 | 269,153 |
| Series 2024 B, 5% 9/1/49 | | 500,000 | 514,187 |
| North Carolina Muni. Pwr. Agcy. #1 Catawba Elec. Rev.: | | | |
| Series 2015 A, 5% 1/1/28 | | 2,255,000 | 2,300,805 |
| Series 2015 C, 5% 1/1/29 | | 445,000 | 453,488 |
| North Carolina State Ed. Assistance Auth. Student Ln. Rev. Series 2023 A, 5% 6/1/43 (e) | | 910,000 | 927,275 |
| North Carolina Tpk. Auth. Monroe Expressway Toll Rev. Series 2016 A: | | | |
| 5% 7/1/42 | | 595,000 | 604,213 |
| 5% 7/1/47 | | 1,670,000 | 1,691,359 |
| 5% 7/1/51 | | 3,535,000 | 3,561,508 |
| 5% 7/1/54 | | 3,535,000 | 3,558,334 |
| North Carolina Tpk. Auth. Triangle Expressway Sys.: | | | |
| Series 2017: | | | |
5% 1/1/30 | | 205,000 | 212,245 |
5% 1/1/31 (Assured Guaranty Muni. Corp. Insured) | | 340,000 | 351,945 |
5% 1/1/32 | | 580,000 | 598,739 |
| Series 2018, 5% 1/1/40 | | 3,255,000 | 3,404,448 |
| Series 2019: | | | |
4% 1/1/55 | | 180,000 | 166,921 |
5% 1/1/43 | | 850,000 | 891,484 |
5% 1/1/44 | | 315,000 | 329,771 |
5% 1/1/49 | | 300,000 | 313,021 |
5% 1/1/49 | | 2,575,000 | 2,674,872 |
5% 1/1/49 (Assured Guaranty Muni. Corp. Insured) | | 250,000 | 260,851 |
| Series 2024 B, 5% 1/1/58 (Assured Guaranty Muni. Corp. Insured) | | 9,095,000 | 9,795,978 |
| Northern Hosp. District Surry County Series 2017: | | | |
| 5% 10/1/27 | | 320,000 | 323,922 |
| 5% 10/1/31 | | 265,000 | 263,086 |
| 5% 10/1/33 | | 290,000 | 285,798 |
| Pender County Gen. Oblig. Series 2024: | | | |
| 3% 3/1/41 | | 2,145,000 | 1,931,977 |
| 3% 3/1/42 | | 1,700,000 | 1,513,391 |
| Raleigh Durham Arpt. Auth. Arpt. Rev. Series 2020 A: | | | |
| 5% 5/1/30 (e) | | 265,000 | 285,569 |
| 5% 5/1/32 (e) | | 210,000 | 225,501 |
| 5% 5/1/33 (e) | | 210,000 | 225,077 |
| 5% 5/1/34 (e) | | 635,000 | 679,379 |
| 5% 5/1/35 (e) | | 295,000 | 314,899 |
| Union County Gen. Oblig. Series 2019 C, 2.5% 9/1/36 | | 590,000 | 524,469 |
TOTAL NORTH CAROLINA | | | 99,828,061 |
| North Dakota - 0.2% | | | |
| Cass County Health Care Facilities Rev. Series 2018 B, 5.25% 2/15/53 | | 400,000 | 411,544 |
| Cass County Joint Wtr. Resource District Series 2024 A, 3.45% 4/1/27 | | 1,750,000 | 1,752,278 |
| Grand Forks Health Care Sys. Rev.: | | | |
| Series 2021: | | | |
3% 12/1/46 (Assured Guaranty Muni. Corp. Insured) | | 5,650,000 | 4,540,750 |
4% 12/1/35 | | 1,270,000 | 1,241,368 |
4% 12/1/36 | | 1,095,000 | 1,063,912 |
4% 12/1/37 | | 970,000 | 936,497 |
4% 12/1/38 | | 885,000 | 847,424 |
5% 12/1/33 | | 1,325,000 | 1,404,202 |
5% 12/1/34 | | 1,590,000 | 1,680,705 |
| Series 2023 A: | | | |
5% 12/1/48 (Assured Guaranty Muni. Corp. Insured) | | 1,000,000 | 1,053,389 |
5% 12/1/53 (Assured Guaranty Muni. Corp. Insured) | | 3,715,000 | 3,884,634 |
| Horace Series 2024 C: | | | |
| 4.5% 5/1/39 | | 270,000 | 274,576 |
| 4.75% 5/1/44 | | 400,000 | 408,923 |
| North Dakota Hsg. Fin. Agcy.: | | | |
| Series 2021 A, 3% 1/1/52 | | 540,000 | 531,280 |
| Series 2021 B, 3% 7/1/52 | | 1,805,000 | 1,756,286 |
| Univ. of North Dakota Series 2021 A, 3% 6/1/61 (Assured Guaranty Muni. Corp. Insured) | | 2,395,000 | 1,753,033 |
| Univ. of North Dakota Hsg. and Auxiliary Facilities Rev. Series 2019 A, 4% 4/1/39 (Assured Guaranty Muni. Corp. Insured) | | 495,000 | 500,519 |
| Ward County Health Care Facility Rev. Series 2017 C: | | | |
| 5% 6/1/34 | | 830,000 | 850,715 |
| 5% 6/1/38 | | 770,000 | 783,879 |
| 5% 6/1/48 | | 40,000 | 40,114 |
| 5% 6/1/53 | | 1,340,000 | 1,337,548 |
TOTAL NORTH DAKOTA | | | 27,053,576 |
| Ohio - 2.0% | | | |
| Akron Bath Copley Hosp. District Rev.: | | | |
| Series 2016, 5.25% 11/15/46 | | 3,045,000 | 3,085,438 |
| Series 2020, 5% 11/15/31 | | 25,000 | 26,885 |
| Allen County Hosp. Facilities Rev.: | | | |
| (Mercy Health) Series 2017 A: | | | |
5% 8/1/25 | | 365,000 | 369,324 |
5% 8/1/26 | | 245,000 | 253,022 |
| Series 2020 A, 4% 12/1/40 | | 2,825,000 | 2,832,335 |
| American Muni. Pwr., Inc. (Solar Electricity Prepayment Proj.) Series 2019 A: | | | |
| 5% 2/15/38 | | 85,000 | 90,213 |
| 5% 2/15/39 | | 55,000 | 58,170 |
| 5% 2/15/44 | | 175,000 | 183,229 |
| American Muni. Pwr., Inc. Rev.: | | | |
| (Greenup Hydroelectric Proj.) Series 2016 A, 5% 2/15/41 | | 2,080,000 | 2,110,539 |
| Series 2021 A: | | | |
4% 2/15/34 | | 3,000,000 | 3,098,525 |
4% 2/15/36 | | 480,000 | 494,531 |
4% 2/15/38 | | 1,675,000 | 1,701,978 |
| Brunswick Ohio City School District Series 2023: | | | |
| 5.25% 12/1/53 | | 1,165,000 | 1,257,337 |
| 5.5% 12/1/60 | | 2,160,000 | 2,357,878 |
| Buckeye Tobacco Settlement Fing. Auth.: | | | |
| Series 2020 A2: | | | |
3% 6/1/48 | | 2,150,000 | 1,623,068 |
4% 6/1/37 | | 765,000 | 765,078 |
4% 6/1/38 | | 1,240,000 | 1,231,928 |
4% 6/1/39 | | 1,270,000 | 1,251,823 |
4% 6/1/48 | | 7,360,000 | 6,689,535 |
5% 6/1/27 | | 125,000 | 129,749 |
5% 6/1/29 | | 3,230,000 | 3,443,179 |
5% 6/1/32 | | 1,650,000 | 1,762,841 |
5% 6/1/33 | | 5,475,000 | 5,838,861 |
5% 6/1/34 | | 70,000 | 74,543 |
5% 6/1/36 | | 705,000 | 746,744 |
| Series 2020 B2, 5% 6/1/55 | | 47,060,000 | 43,087,228 |
| Chillicothe Hosp. Facilities Rev. (Adena Health Sys. Oblig. Group Proj.) Series 2017, 5% 12/1/47 | | 770,000 | 783,161 |
| Cleveland Arpt. Sys. Rev.: | | | |
| Series 2016 A: | | | |
5% 1/1/25 (Assured Guaranty Muni. Corp. Insured) | | 45,000 | 45,057 |
5% 1/1/26 (Assured Guaranty Muni. Corp. Insured) | | 30,000 | 30,041 |
5% 1/1/27 (Assured Guaranty Muni. Corp. Insured) | | 120,000 | 120,166 |
5% 1/1/31 (Assured Guaranty Muni. Corp. Insured) | | 55,000 | 55,066 |
| Series 2018 B, 5% 1/1/48 | | 1,750,000 | 1,810,350 |
| Cleveland Income Tax Rev. Series 2018 A: | | | |
| 5% 10/1/35 | | 110,000 | 116,246 |
| 5% 10/1/37 | | 70,000 | 73,780 |
| 5% 10/1/38 | | 85,000 | 89,484 |
| Cleveland-Cuyahoga County Port Auth.: | | | |
| (Centers for Dialysis Care Proj.) Series 2017 A, 5% 12/1/42 | | 300,000 | 302,143 |
| (Flats East Bank Proj.): | | | |
Series 2021 A, 4% 12/1/55 (g) | | 175,000 | 148,819 |
Series 2021 B, 4.5% 12/1/55 (g) | | 100,000 | 88,457 |
| (Playhouse Square Foundation Proj.) Series 2018: | | | |
5.5% 12/1/43 | | 240,000 | 246,413 |
5.5% 12/1/53 | | 1,370,000 | 1,390,380 |
| (The Cleveland Museum of Natural History Proj.) Series 2021: | | | |
4% 7/1/40 | | 85,000 | 85,835 |
4% 7/1/41 | | 105,000 | 105,715 |
4% 7/1/46 | | 220,000 | 214,266 |
4% 7/1/51 | | 295,000 | 281,583 |
| Cleveland-Cuyahoga County Port Auth. Rev. (Euclid Avenue Dev. Corp. Proj.): | | | |
| Series 2019, 4% 8/1/44 | | 450,000 | 445,686 |
| Series 2022 A: | | | |
5% 8/1/39 | | 1,145,000 | 1,227,628 |
5.25% 8/1/40 | | 1,205,000 | 1,307,292 |
5.25% 8/1/41 | | 1,270,000 | 1,372,542 |
5.25% 8/1/42 | | 1,340,000 | 1,443,396 |
| Columbus City School District Series 2016 A: | | | |
| 5% 12/1/29 | | 255,000 | 263,186 |
| 5% 12/1/32 | | 50,000 | 51,463 |
| 5% 12/1/32 (Pre-Refunded to 6/1/26 @ 100) | | 5,000 | 5,148 |
| Columbus Ohio Metropolitan Hsg. Auth. Aff (Cobblestone Manor Proj.) Series 2024, 4.625% 8/1/42 | | 145,000 | 149,457 |
| Cuyahoga County Hosp. Rev. Series 2017: | | | |
| 4.75% 2/15/47 | | 865,000 | 866,777 |
| 5% 2/15/37 | | 300,000 | 306,758 |
| 5% 2/15/42 | | 840,000 | 853,213 |
| 5% 2/15/52 | | 425,000 | 428,829 |
| 5% 2/15/57 | | 770,000 | 776,262 |
| 5.25% 2/15/47 | | 890,000 | 907,575 |
| 5.5% 2/15/52 | | 4,395,000 | 4,493,997 |
| 5.5% 2/15/57 | | 7,380,000 | 7,539,700 |
| Cuyahoga Metropolitan Hsg. Auth. (2045 Initiative Proj.) Series 2021, 2% 12/1/31 | | 620,000 | 534,562 |
| Fairfield County Hosp. Facilities Rev. (Fairfield Med. Ctr. Proj.) Series 2013: | | | |
| 5% 6/15/25 | | 5,000 | 5,000 |
| 5% 6/15/26 | | 5,000 | 5,000 |
| 5% 6/15/27 | | 5,000 | 5,001 |
| 5% 6/15/28 | | 5,000 | 5,001 |
| 5.25% 6/15/43 | | 280,000 | 263,010 |
| Franklin County Convention Facilities Auth. (Greater Columbus Convention Ctr. Hotel Expansion Proj.) Series 2019: | | | |
| 5% 12/1/44 | | 2,015,000 | 2,021,887 |
| 5% 12/1/46 | | 775,000 | 820,343 |
| 5% 12/1/51 | | 2,955,000 | 2,961,248 |
| 5% 12/1/51 | | 1,165,000 | 1,227,457 |
| Franklin County Hosp. Facilities Rev.: | | | |
| (Nationwide Children's Hosp. Proj.) Series 2019 A, 5% 11/1/48 | | 1,000,000 | 1,154,212 |
| (Ohiohealth Corp. Proj.) Series 2015, 5% 5/15/40 | | 1,000,000 | 1,006,080 |
| Series 2015, 5% 5/15/45 | | 1,500,000 | 1,506,363 |
| Series 2018 A, 4% 5/15/47 | | 880,000 | 862,655 |
| Franklin County Rev. Series 2017 OH, 5% 12/1/46 | | 1,410,000 | 1,442,266 |
| Greene County Port Auth. Series 2024 B, 5% 5/15/59 | | 1,650,000 | 1,689,416 |
| Hamilton County Healthcare Rev.: | | | |
| (Life Enriching Cmntys. Proj.): | | | |
Series 2016: | | | |
5% 1/1/36 | | 440,000 | 442,982 |
5% 1/1/51 | | 65,000 | 63,845 |
Series 2017 A, 5% 1/1/52 | | 295,000 | 288,816 |
| (Life Enriching Communitites Proj.) Series 2016, 5% 1/1/46 | | 1,240,000 | 1,240,413 |
| Series 2023 A, 5.75% 1/1/53 | | 610,000 | 645,730 |
| Hamilton County Hosp. Facilities Rev. (Trihealth, Inc. Obligated Group Proj.) Series 2017 A, 5% 8/15/33 | | 55,000 | 57,161 |
| Indian Creek Loc Scd Series 2018 A, 5% 11/1/45 | | 320,000 | 335,642 |
| Lake County Hosp. Facilities Rev. Series 2015, 5% 8/15/27 (Pre-Refunded to 8/15/25 @ 100) | | 5,000 | 5,059 |
| Marion County Health Care Rev. Series 2019: | | | |
| 5% 12/1/39 | | 230,000 | 204,661 |
| 5.125% 12/1/49 | | 255,000 | 212,397 |
| Miami County Hosp. Facilities Rev. (Kettering Health Network Obligated Group Proj.) Series 2019, 5% 8/1/49 | | 2,100,000 | 2,152,762 |
| Middleburg Heights Hosp. Rev.: | | | |
| Series 2020 A, 4% 8/1/47 | | 370,000 | 339,306 |
| Series 2021 A, 4% 8/1/41 | | 2,005,000 | 1,972,000 |
| Montgomery County Hosp. Rev.: | | | |
| (Kettering Health Network Obligated Group Proj.) Series 2021: | | | |
4% 8/1/51 | | 800,000 | 763,348 |
5% 8/1/30 | | 990,000 | 1,084,494 |
| Series 2019 A: | | | |
4% 11/15/38 | | 485,000 | 474,443 |
4% 11/15/45 | | 225,000 | 206,469 |
5% 11/15/34 | | 210,000 | 221,233 |
| Muskingum County Hosp. Facilities (Genesis Healthcare Sys. Obligated Group Proj.) Series 2013: | | | |
| 5% 2/15/27 | | 390,000 | 391,929 |
| 5% 2/15/44 | | 705,000 | 705,001 |
| Ohio Air Quality Dev. Auth. Exempt Facilities Rev.: | | | |
| (AMG Vanadium Proj.) Series 2019, 5% 7/1/49 (e)(g) | | 6,450,000 | 6,416,478 |
| (Pratt Paper (OH), LLC Proj.) Series 2017: | | | |
4.25% 1/15/38 (e)(g) | | 100,000 | 100,195 |
4.5% 1/15/48 (e)(g) | | 1,290,000 | 1,270,468 |
| Ohio Air Quality Dev. Auth. Rev.: | | | |
| (Ohio Valley Elec. Corp. Proj.) Series 2019 A, 3.25% 9/1/29 | | 1,800,000 | 1,766,252 |
| Bonds: | | | |
(American Elec. Co. Proj.): | | | |
Series 2007 B, 2.5%, tender 10/1/29 (b)(e) | | 360,000 | 335,882 |
Series 2014 B, 2.6%, tender 10/1/29 (b)(e) | | 985,000 | 923,293 |
(Duke Energy Corp. Proj.) Series 2022 B, 4%, tender 6/1/27 (b) | | 835,000 | 844,957 |
Series 2022 B, 4.25%, tender 6/1/27 (b)(e) | | 1,975,000 | 2,005,532 |
| Series 2005 A, 3.75% 1/1/29 (e) | | 3,345,000 | 3,327,388 |
| Series 2005 D, 3.7% 10/1/28 (e) | | 1,330,000 | 1,321,665 |
| Ohio Gen. Oblig.: | | | |
| Series 2021 A: | | | |
5% 3/1/29 | | 470,000 | 514,448 |
5% 3/1/29 | | 630,000 | 689,579 |
5% 3/1/30 | | 570,000 | 635,103 |
5% 3/1/30 | | 855,000 | 952,655 |
| Series 2021 B: | | | |
5% 2/1/29 | | 1,140,000 | 1,245,890 |
5% 2/1/30 | | 950,000 | 1,057,018 |
| Series 2021 C: | | | |
5% 3/15/29 | | 1,425,000 | 1,560,883 |
5% 3/15/30 | | 1,425,000 | 1,588,797 |
| Ohio Higher Edl. Facility Commission Rev.: | | | |
| (Kenyon College 2020 Proj.) Series 2020: | | | |
4% 7/1/40 | | 45,000 | 45,383 |
5% 7/1/35 | | 170,000 | 184,454 |
5% 7/1/42 | | 290,000 | 309,346 |
| (Tiffin Univ. 2019 Proj.) Series 2019, 4% 11/1/49 | | 300,000 | 239,279 |
| (Univ. of Dayton 2018 Proj.) Series 2018 B, 5% 12/1/34 | | 130,000 | 137,303 |
| (Univ. of Dayton Proj.) Series 2018 B, 5% 12/1/36 | | 1,070,000 | 1,127,549 |
| Series 2016, 5% 11/1/41 | | 640,000 | 651,862 |
| Series 2019, 4% 10/1/44 | | 100,000 | 97,987 |
| Series 2022: | | | |
5.125% 12/1/42 | | 305,000 | 319,873 |
5.375% 12/1/52 | | 485,000 | 506,123 |
| Ohio Hosp. Facilities Rev.: | | | |
| Series 2017 A: | | | |
5% 1/1/29 | | 760,000 | 809,936 |
5% 1/1/31 | | 10,000 | 10,633 |
| Series 2021 B: | | | |
5% 1/1/26 | | 990,000 | 1,013,387 |
5% 1/1/27 | | 2,295,000 | 2,399,006 |
| Ohio Hosp. Rev.: | | | |
| Bonds Series 2020 B, 5%, tender 1/15/25 (b) | | 1,050,000 | 1,051,867 |
| Series 2014 B, 3.15% 1/15/45 (b) | | 4,100,000 | 4,100,000 |
| Series 2020 A: | | | |
4% 1/15/38 | | 150,000 | 151,310 |
4% 1/15/39 | | 280,000 | 282,065 |
4% 1/15/50 | | 245,000 | 239,011 |
4% 1/15/50 | | 390,000 | 386,552 |
5% 1/15/50 | | 2,360,000 | 2,461,644 |
| Series 2020: | | | |
3% 1/15/45 | | 2,150,000 | 1,746,377 |
4% 11/15/36 | | 135,000 | 133,688 |
4% 11/15/38 | | 130,000 | 127,170 |
4% 11/15/40 | | 125,000 | 120,390 |
| Series 2021 A, 4% 1/15/46 | | 2,675,000 | 2,658,667 |
| Series 2021 E, 4% 1/15/41 | | 320,000 | 321,157 |
| Series 2024 A, 5% 1/1/32 | | 1,000,000 | 1,136,386 |
| Ohio Hsg. Fin. Agcy. Multi-family Hsg. Rev. (Sanctuary at Springboro Proj.) Series 2017, 5.45% 1/1/38 (g) | | 250,000 | 210,007 |
| Ohio Hsg. Fin. Agcy. Residential Mtg. Rev.: | | | |
| (Mtg. Backed Securities Prog.) Series 2019 B, 4.5% 3/1/50 | | 85,000 | 86,051 |
| (Mtg.-Backed Secrities Prog.) Series 2023 A: | | | |
4.8% 9/1/48 | | 2,240,000 | 2,314,722 |
4.9% 9/1/53 | | 1,070,000 | 1,096,733 |
| (Mtg.-Backed Securities Prog.) Series 2023 B, 6% 3/1/55 | | 1,145,000 | 1,259,924 |
| Ohio Major New State Infrastructure Rev. Series 2021 1A: | | | |
| 5% 12/15/29 | | 1,415,000 | 1,568,892 |
| 5% 12/15/30 | | 1,270,000 | 1,429,658 |
| 5% 12/15/31 | | 90,000 | 102,594 |
| Ohio Private Activity Rev. (Portsmouth Bypass Proj.): | | | |
| Series 2015 A, 5% 12/31/35 (Assured Guaranty Muni. Corp. Insured) (e) | | 1,650,000 | 1,659,829 |
| Series 2015: | | | |
5% 12/31/39 (e) | | 565,000 | 567,081 |
5% 6/30/53 (e) | | 400,000 | 401,224 |
| Ohio State Univ. Gen. Receipts Series 2023 C, 5.25% 12/1/46 | | 10,000,000 | 11,248,843 |
| Ohio Tpk. Commission Tpk. Rev.: | | | |
| (Infrastructure Proj.) Series 2005 A, 0% 2/15/42 | | 645,000 | 323,208 |
| (Infrastructure Projs.) Series 2022 A, 5% 2/15/39 | | 585,000 | 660,253 |
| Series A, 5% 2/15/51 | | 6,640,000 | 7,081,011 |
| Port Gtr Cincinnati Dev. Auth. O (RBM Phase 3 Garage Proj.) Series 2024, 5.125% 12/1/55 | | 1,200,000 | 1,226,960 |
| Port of Greater Cincinnati Dev. Auth. Rev. (Duke Energy Convention Ctr. Proj. - Transient Occupancy Tax): | | | |
| Series 2024 B, 4.375% 12/1/58 (Assured Guaranty Muni. Corp. Insured) | | 1,445,000 | 1,475,922 |
| Series 2024 C, 5.25% 12/1/53 (Assured Guaranty Muni. Corp. Insured) | | 285,000 | 310,590 |
| Ross County Hosp. Facilities Rev. (Adena Health Sys. Obligated Group Proj.) Series 2019: | | | |
| 5% 12/1/24 | | 35,000 | 35,002 |
| 5% 12/1/25 | | 30,000 | 30,464 |
| 5% 12/1/26 | | 40,000 | 41,167 |
| Scioto County Hosp. Facilities Rev.: | | | |
| Series 2016: | | | |
5% 2/15/26 | | 125,000 | 127,006 |
5% 2/15/27 | | 105,000 | 107,057 |
5% 2/15/29 | | 340,000 | 345,599 |
5% 2/15/34 | | 55,000 | 55,731 |
| Series 2019, 5% 2/15/29 | | 580,000 | 597,982 |
| Shaker Heights City School District Series 2024, 5.25% 12/15/54 | | 2,000,000 | 2,223,261 |
| Summit County Dev. Fin. Authp (Univ. of Akron Parking Proj.) Series 2023, 6% 12/1/58 | | 1,000,000 | 1,101,798 |
| Toledo Hosp. 6.015% 11/15/48 | | 600,000 | 550,182 |
| Toledo-Lucas County Port Auth.: | | | |
| (Univ. of Toledo Parking Proj.) Series 2021, 4% 1/1/57 | | 350,000 | 319,587 |
| Series 2014 A, 5% 7/1/46 | | 350,000 | 343,819 |
| Univ. of Akron Gen. Receipts Series 2019 A: | | | |
| 4% 1/1/28 | | 205,000 | 210,419 |
| 5% 1/1/30 | | 100,000 | 108,872 |
| Warren County Health Care Facilities Rev. Series 2024, 5% 7/1/49 | | 975,000 | 1,020,702 |
| Washington County Hosp. Rev. Series 2022: | | | |
| 6% 12/1/28 | | 660,000 | 689,534 |
| 6% 12/1/29 | | 700,000 | 737,669 |
| 6% 12/1/30 | | 740,000 | 787,578 |
| 6% 12/1/31 | | 790,000 | 846,579 |
| Worthington City School District Series 2023, 5.5% 12/1/54 | | 4,350,000 | 4,858,842 |
| Yellow Springs Ohio Exmp Vlg S (Yellow Springs Exempted Village School District Green and Clark Counties, Ohio School Facilities Proj.) Series 2024, 5.25% 12/1/49 | | 910,000 | 975,353 |
TOTAL OHIO | | | 238,769,637 |
| Oklahoma - 0.3% | | | |
| Edmond Pub. Works Auth. Sales Tax & Util. Sys. Rev. Series 2017, 5% 7/1/42 | | 1,595,000 | 1,649,454 |
| Lincoln County Edl. Facilities Rev. (Stroud Pub. Schools Proj.) Series 2016, 5% 9/1/28 | | 750,000 | 771,808 |
| Norman Reg'l. Hosp. Auth. Hosp. Rev. Series 2019: | | | |
| 4% 9/1/45 | | 1,165,000 | 993,048 |
| 5% 9/1/45 | | 730,000 | 714,493 |
| Oklahoma City Arpt. Trust Series 33, 5% 7/1/47 (e) | | 275,000 | 281,928 |
| Oklahoma City Pub. Property Auth. Hotel Tax Rev. Series 2015: | | | |
| 5% 10/1/28 | | 155,000 | 157,099 |
| 5% 10/1/29 | | 170,000 | 172,288 |
| 5% 10/1/32 | | 60,000 | 60,788 |
| 5% 10/1/36 | | 120,000 | 121,418 |
| 5% 10/1/39 | | 245,000 | 246,693 |
| Oklahoma County Fin. Auth. Rev. Series 2024: | | | |
| 2% 12/1/47 | | 289,013 | 16,371 |
| 5.875% 12/1/47 | | 1,404,574 | 1,100,750 |
| Oklahoma County Okla Fin. Auth. Ch (Astec Proj.) Series 2024, 6% 6/15/44 (g) | | 1,000,000 | 1,040,551 |
| Oklahoma Dev. Fin. Auth. Health Sys. Rev. (OU Medicine Proj.): | | | |
| Series 2018 B: | | | |
5% 8/15/38 | | 240,000 | 246,522 |
5.25% 8/15/43 | | 80,000 | 82,311 |
5.25% 8/15/48 | | 1,490,000 | 1,523,517 |
5.5% 8/15/52 | | 2,110,000 | 2,172,968 |
5.5% 8/15/57 | | 3,945,000 | 4,057,048 |
| Series 2018 C, 5.45% 8/15/28 | | 1,602,000 | 1,550,422 |
| Oklahoma Dev. Fin. Auth. Rev.: | | | |
| (Oklahoma City Univ. Proj.) Series 2019: | | | |
5% 8/1/26 | | 25,000 | 25,372 |
5% 8/1/44 | | 570,000 | 573,989 |
| Series 2015, 5% 7/1/42 | | 315,000 | 307,285 |
| Oklahoma Hsg. Fin. Agcy. Single Family Mtg. Rev. (Homeownership Ln. Prog.): | | | |
| Series 2018 A, 4.75% 9/1/48 | | 225,000 | 228,344 |
| Series 2019 A, 4% 9/1/49 | | 535,000 | 538,035 |
| Series 2023 C, 6% 3/1/54 | | 210,000 | 230,950 |
| Oklahoma Tpk. Auth. Tpk. Rev. Series 2023: | | | |
| 4.5% 1/1/53 | | 2,225,000 | 2,300,051 |
| 5.5% 1/1/53 | | 7,175,000 | 7,991,860 |
| Payne County Econ. Dev. Auth. Series 2016 A, 6.875% 11/1/46 (f) | | 455,845 | 934 |
| Tulsa Indl. Auth. Rev. (Montereau, Inc. Proj.) Series 2017, 5.25% 11/15/45 | | 1,455,000 | 1,473,028 |
| Tulsa Muni. Arpt. Trust Rev. Series 2001 B, 5.5% 12/1/35 (e) | | 1,550,000 | 1,552,749 |
TOTAL OKLAHOMA | | | 32,182,074 |
| Oregon - 0.5% | | | |
| Beaverton School District Series 2022 A: | | | |
| 0% 6/15/37 | | 8,000,000 | 4,710,407 |
| 0% 6/15/38 | | 5,000,000 | 2,795,037 |
| 0% 6/15/39 | | 5,000,000 | 2,641,859 |
| 0% 6/15/40 | | 5,000,000 | 2,495,247 |
| 0% 6/15/41 | | 1,250,000 | 589,325 |
| Clackamas County Hosp. Facility Auth.: | | | |
| (Willamette View, Inc.) Series 2017 A, 5% 11/15/47 | | 195,000 | 195,027 |
| (Williamette View Proj.) Series 2017 A, 5% 11/15/32 | | 135,000 | 137,784 |
| (Williamette View, Inc.) Series 2017 A: | | | |
5% 11/15/37 | | 70,000 | 70,944 |
5% 11/15/52 | | 210,000 | 206,454 |
| Medford Hosp. Facilities Auth. Rev. (Asante Projs.) Series 2020 A: | | | |
| 3% 8/15/50 (Assured Guaranty Muni. Corp. Insured) | | 1,000,000 | 793,709 |
| 4% 8/15/50 | | 320,000 | 309,387 |
| 5% 8/15/36 | | 85,000 | 91,554 |
| 5% 8/15/38 | | 235,000 | 251,812 |
| 5% 8/15/45 | | 725,000 | 765,348 |
| Multnomah County School District 40 Series 2023 B, 5.5% 6/15/53 | | 875,000 | 983,363 |
| Multnomah County Hosp. Facilities Auth. Rev.: | | | |
| Series 2021 A: | | | |
4% 12/1/41 | | 630,000 | 548,985 |
4% 12/1/51 | | 470,000 | 368,460 |
| Series 2021 B1, 1.2% 6/1/28 | | 20,000 | 18,300 |
| Multnomah County School District #1J Portland Series 2023, 5% 6/15/25 | | 1,500,000 | 1,515,631 |
| Oregon Bus. Dev. Commission Recovery Zone Facility Bonds (Intel Corp. Proj.) Series 2023 232, 3.8%, tender 6/15/28 (b) | | 3,500,000 | 3,539,703 |
| Oregon Dept. of Trans. Hwy. User Tax Rev. Series 2022 A, 5.25% 11/15/47 | | 750,000 | 833,708 |
| Oregon Facilities Auth. Rev.: | | | |
| (Legacy Health Proj.) Series 2016 A, 5% 6/1/46 | | 3,965,000 | 4,011,708 |
| (Samaritan Health Svcs. Proj.) Series 2016 A, 5% 10/1/46 | | 675,000 | 677,172 |
| Series 2022 A, 5% 6/1/52 | | 2,200,000 | 2,327,991 |
| Series 2022 B, 5% 6/1/30 | | 675,000 | 728,339 |
| Oregon St Facilities Auth. Lease Rent Series 2023, 4.9% 9/15/35 | | 3,545,000 | 3,722,479 |
| Oregon St Hsg. & Cmnty. Svcs. De Redmond Landing Apts. Proj.) Series 2024 K1, 4.33% 11/1/43 | | 577,000 | 586,499 |
| Oregon State Hsg. & Cmnty. Svcs. Dept.: | | | |
| (Single Family Mtg. Prog.) Series A, 3.5% 1/1/51 | | 465,000 | 462,991 |
| (Single-Family Mtg. Prog.) Series 2019 A, 2.65% 7/1/39 | | 485,000 | 409,767 |
| Series 2019 A, 4% 7/1/50 | | 1,225,000 | 1,229,345 |
| Oregon State Univ. Series 2024 A, 4.25% 4/1/52 | | 1,000,000 | 1,019,800 |
| Polk Marion & Benton School District # 13J Series B, 0% 12/15/38 | | 120,000 | 68,821 |
| Port of Portland Arpt. Rev.: | | | |
| Series 2017 24B, 5% 7/1/42 (e) | | 1,170,000 | 1,189,178 |
| Series 2020 26C, 5% 7/1/28 (e) | | 265,000 | 279,186 |
| Series 2020 27A: | | | |
4% 7/1/39 (e) | | 1,475,000 | 1,473,225 |
4% 7/1/50 (e) | | 1,580,000 | 1,525,226 |
5% 7/1/45 (e) | | 3,595,000 | 3,738,325 |
| Series 2022 28: | | | |
5% 7/1/41 (e) | | 4,240,000 | 4,507,587 |
5% 7/1/52 (e) | | 3,555,000 | 3,726,630 |
| Series 2023 29, 5.5% 7/1/48 (e) | | 1,750,000 | 1,931,448 |
| Series 2024 30A, 5.25% 7/1/54 (e) | | 1,365,000 | 1,470,359 |
| Salem Hosp. Facility Auth. Rev.: | | | |
| (Cap. Manor Proj.) Series 2022, 4% 5/15/47 | | 525,000 | 460,171 |
| (Salem Health Projs.) Series 2019 A, 3% 5/15/49 | | 2,605,000 | 2,084,823 |
| Series 2016 A, 4% 5/15/41 | | 620,000 | 620,163 |
| Washington, Multnomah & Yamhill County School District #1J Series 2017: | | | |
| 5% 6/15/33 | | 60,000 | 62,924 |
| 5% 6/15/36 | | 170,000 | 177,481 |
| 5% 6/15/38 | | 170,000 | 177,228 |
| Yamhill County Hosp. Auth. Rev.: | | | |
| Series 2016 A: | | | |
4% 11/15/26 | | 20,000 | 19,665 |
5% 11/15/31 | | 50,000 | 49,944 |
5% 11/15/36 | | 65,000 | 63,470 |
5% 11/15/46 | | 185,000 | 167,303 |
| Series 2021 A: | | | |
5% 11/15/36 | | 155,000 | 151,351 |
5% 11/15/46 | | 365,000 | 330,085 |
5% 11/15/51 | | 155,000 | 136,020 |
5% 11/15/56 | | 895,000 | 772,430 |
TOTAL OREGON | | | 64,221,178 |
| Pennsylvania - 3.3% | | | |
| Allegheny County Indl. Dev. Auth. Series 2013, 6% 7/15/38 | | 240,000 | 240,277 |
| Allegheny County Arpt. Auth. Rev.: | | | |
| Series 2021 A: | | | |
4% 1/1/38 (e) | | 500,000 | 499,759 |
4% 1/1/56 (e) | | 1,000,000 | 945,540 |
5% 1/1/51 (e) | | 6,560,000 | 6,771,051 |
5% 1/1/56 (e) | | 3,980,000 | 4,095,379 |
| Series 2021 B: | | | |
5% 1/1/51 | | 830,000 | 874,808 |
5% 1/1/56 | | 700,000 | 734,737 |
| Series 2023 A: | | | |
5.5% 1/1/48 (Assured Guaranty Muni. Corp. Insured) (e) | | 5,815,000 | 6,388,191 |
5.5% 1/1/53 (Assured Guaranty Muni. Corp. Insured) (e) | | 11,325,000 | 12,366,600 |
| Allegheny County Hosp. Dev. Auth. Rev.: | | | |
| Series 2018 A: | | | |
4% 4/1/44 | | 1,405,000 | 1,359,654 |
4% 4/1/44 | | 600,000 | 583,974 |
5% 4/1/47 | | 1,430,000 | 1,458,443 |
| Series 2019 A: | | | |
4% 7/15/36 | | 140,000 | 141,635 |
4% 7/15/37 | | 1,085,000 | 1,096,642 |
4% 7/15/39 | | 1,325,000 | 1,330,509 |
| Series 2021 B, 5% 10/15/28 | | 430,000 | 464,037 |
| Allegheny County Indl. Dev. Auth. Rev. Series 2021: | | | |
| 3.5% 12/1/31 | | 430,000 | 206,400 |
| 4% 12/1/41 | | 935,000 | 448,800 |
| 4.25% 12/1/50 | | 1,040,000 | 499,200 |
| Allentown Commercial & Indl. Dev. A: | | | |
| (Executive Ed. Academy Charter School Proj.) Series 2024, 5% 7/1/59 | | 355,000 | 356,229 |
| (Lincoln Leadership Academy Charter School Proj.) Series 2023, 5.75% 6/15/43 | | 270,000 | 289,112 |
| Allentown Neighborhood Impt. Zone Dev. Auth. Tax Rev.: | | | |
| (615 Waterfront Proj.) Series 2021, % (g) | | 250,000 | 265,308 |
| (City Ctr. Proj.): | | | |
Series 2018, % (g) | | 350,000 | 356,384 |
Series 2024, % (g) | | 2,220,000 | 2,275,703 |
| (City Ctr. Rfdg. Proj.): | | | |
Series 2017: | | | |
% (g) | | 1,005,000 | 1,031,007 |
% (g) | | 490,000 | 498,431 |
% (g) | | 1,765,000 | 1,771,451 |
Series 2018: | | | |
% (g) | | 1,350,000 | 1,361,063 |
% (g) | | 1,660,000 | 1,674,790 |
| Series 2022: | | | |
% (g) | | 1,420,000 | 1,433,308 |
% | | 2,420,000 | 2,541,234 |
% | | 25,000 | 26,886 |
% | | 25,000 | 26,299 |
% | | 500,000 | 502,984 |
| Armstrong School District Series 2019 A: | | | |
| 4% 3/15/35 | | 105,000 | 107,293 |
| 4% 3/15/36 | | 225,000 | 229,691 |
| 4% 3/15/37 | | 105,000 | 107,149 |
| 4% 3/15/38 | | 105,000 | 107,259 |
| 4% 3/15/41 | | 530,000 | 536,445 |
| Beaver County Econ. Dev. Auth. Series 2020: | | | |
| 4% 11/15/35 | | 485,000 | 491,085 |
| 4% 11/15/36 | | 180,000 | 182,080 |
| Berks County Muni. Auth. Rev.: | | | |
| (Tower Health Proj.): | | | |
Series 2024 A1, 8% 6/30/34 | | 787,000 | 816,162 |
Series 2024 A2, 6% 6/30/34 | | 528,000 | 572,179 |
| Series 2024 A3, 5% 6/30/39 | | 4,663,000 | 4,636,816 |
| Series 2024 B1, 3% 6/30/44 (h) | | 4,984,000 | 3,593,668 |
| Bucks County Indl. Dev. Auth. Hosp. Rev.: | | | |
| (Grand View Hosp. Proj.) Series 2021, 4% 7/1/51 | | 300,000 | 262,631 |
| (St. Luke's Univ. Health Network Proj.) Series 2019: | | | |
4% 8/15/44 | | 190,000 | 183,444 |
4% 8/15/50 | | 955,000 | 898,998 |
| Bucks County Wtr. & Swr. Auth. Sys. Rev. Series 2022 A, 5.25% 12/1/47 (Assured Guaranty Muni. Corp. Insured) | | 465,000 | 513,680 |
| Butler County Hosp. Auth. Hosp. Rev. (Butler Health Sys. Proj.) Series 2015 A: | | | |
| 5% 7/1/35 | | 2,935,000 | 2,935,885 |
| 5% 7/1/39 | | 670,000 | 659,031 |
| Canon McMillan School District Series 2019: | | | |
| 4% 6/1/46 | | 625,000 | 618,857 |
| 4% 6/1/48 | | 925,000 | 913,775 |
| Cap. Region Wtr. Wtr. Rev. Series 2018: | | | |
| 5% 7/15/26 | | 55,000 | 56,781 |
| 5% 7/15/27 | | 120,000 | 126,520 |
| 5% 7/15/29 | | 190,000 | 203,874 |
| 5% 7/15/32 | | 120,000 | 127,951 |
| 5% 7/15/38 | | 55,000 | 58,171 |
| Chambersburg Area Muni. Authe Series 2018, 5.75% 10/1/38 | | 250,000 | 250,007 |
| Chartiers Valley School District Series 2021 A, 3% 10/15/49 | | 3,585,000 | 2,922,521 |
| Chester County Health & Ed. Auth. Rev. (Simpson Sr. Svcs. Proj.) Series 2019, 5% 12/1/51 | | 420,000 | 289,251 |
| Chester County Indl. Dev. Auth. Rev.: | | | |
| (Collegium Charter School Proj.) Series 2022, 5.875% 10/15/47 (g) | | 1,560,000 | 1,647,760 |
| (Renaissance Academy Charter School Proj.) Series 2024: | | | |
4.5% 10/1/49 (g) | | 300,000 | 295,925 |
4.5% 10/1/54 (g) | | 645,000 | 632,809 |
| Series 2017 A: | | | |
4.75% 12/15/37 | | 235,000 | 237,839 |
5% 12/15/47 | | 110,000 | 110,488 |
5% 12/15/51 | | 135,000 | 135,231 |
| Chichester School District Series 2022: | | | |
| 4% 9/15/31 | | 105,000 | 108,722 |
| 4% 9/15/32 | | 105,000 | 108,365 |
| Commonwealth Fing. Auth. Rev.: | | | |
| Series 2019 B, 5% 6/1/26 | | 45,000 | 46,376 |
| Series 2020 A: | | | |
5% 6/1/26 | | 1,235,000 | 1,272,766 |
5% 6/1/28 | | 670,000 | 716,971 |
5% 6/1/29 | | 110,000 | 119,694 |
5% 6/1/32 | | 190,000 | 210,792 |
| Commonwealth Fing. Auth. Tobacco Series 2018: | | | |
| 4% 6/1/39 (Assured Guaranty Muni. Corp. Insured) | | 700,000 | 704,938 |
| 5% 6/1/31 | | 480,000 | 508,858 |
| 5% 6/1/32 | | 420,000 | 444,154 |
| 5% 6/1/34 | | 240,000 | 252,691 |
| Cumberland County Muni. Auth. Rev.: | | | |
| Series 2015: | | | |
4% 1/1/33 | | 165,000 | 164,108 |
4% 1/1/33 (Pre-Refunded to 1/1/25 @ 100) | | 65,000 | 65,034 |
4% 1/1/33 (Pre-Refunded to 1/1/25 @ 100) | | 225,000 | 225,119 |
5% 1/1/38 | | 1,230,000 | 1,230,414 |
5% 1/1/38 (Pre-Refunded to 1/1/25 @ 100) | | 240,000 | 240,317 |
5% 1/1/38 (Pre-Refunded to 1/1/25 @ 100) | | 25,000 | 25,033 |
| Series 2019: | | | |
4% 11/1/35 | | 240,000 | 243,054 |
4% 11/1/37 | | 480,000 | 484,334 |
4% 11/1/49 | | 910,000 | 878,498 |
| Series 2021 A: | | | |
4.5% 1/1/36 (g) | | 555,000 | 534,442 |
4.5% 1/1/40 (g) | | 1,945,000 | 1,799,217 |
4.5% 1/1/41 (g) | | 590,000 | 540,879 |
| Dauphin County Gen. Auth. (Pinnacle Health Sys. Proj.) Series 2016 A: | | | |
| 5% 6/1/28 | | 130,000 | 133,232 |
| 5% 6/1/29 | | 215,000 | 220,273 |
| 5% 6/1/34 | | 75,000 | 76,518 |
| Dauphin County Gen. Auth. Rev. (The Harrisburg Univ. of Science and Technology Proj.): | | | |
| Series 2017: | | | |
5% 10/15/34 (g) | | 200,000 | 166,041 |
5.125% 10/15/41 (g) | | 350,000 | 259,243 |
| Series 2020: | | | |
5.875% 10/15/40 (g) | | 300,000 | 243,692 |
6.25% 10/15/53 (g) | | 400,000 | 307,908 |
| Delaware County Auth. Rev. Series 2017: | | | |
| 5% 7/1/26 (Escrowed to Maturity) | | 65,000 | 66,939 |
| 5% 7/1/28 (Pre-Refunded to 7/1/27 @ 100) | | 250,000 | 262,691 |
| 5% 7/1/29 (Pre-Refunded to 7/1/27 @ 100) | | 965,000 | 1,013,987 |
| 5% 7/1/30 (Pre-Refunded to 7/1/27 @ 100) | | 90,000 | 94,569 |
| Delaware Valley Reg'l. Fin. Auth. Local Govt. Rev. Series 2007 C, 3 month U.S. LIBOR + 0.750% 4.314% 6/1/37 (b)(c) | | 1,560,000 | 1,470,390 |
| Doylestown Hosp. Auth. Hosp. Rev.: | | | |
| Series 2016 A, 5% 7/1/46 | | 180,000 | 181,831 |
| Series 2019 A: | | | |
4% 7/1/45 | | 110,000 | 103,724 |
4% 7/1/45 (Pre-Refunded to 7/1/29 @ 100) | | 10,000 | 10,449 |
5% 7/1/49 | | 1,770,000 | 1,820,585 |
5% 7/1/49 (Pre-Refunded to 7/1/29 @ 100) | | 195,000 | 212,050 |
| Series 2024, 5.375% 7/1/39 (g) | | 1,490,000 | 1,632,316 |
| Dubois Hosp. Auth. Hosp. Rev. (Penn Highlands Healthcare Proj.) Series 2018: | | | |
| 4% 7/15/33 | | 305,000 | 305,294 |
| 4% 7/15/35 | | 315,000 | 314,911 |
| 4% 7/15/37 | | 605,000 | 598,336 |
| 5% 7/15/25 | | 50,000 | 50,365 |
| 5% 7/15/26 | | 150,000 | 153,283 |
| 5% 7/15/27 | | 260,000 | 269,387 |
| 5% 7/15/28 | | 190,000 | 198,343 |
| 5% 7/15/29 | | 200,000 | 207,273 |
| 5% 7/15/30 | | 270,000 | 279,358 |
| 5% 7/15/31 | | 185,000 | 191,078 |
| 5% 7/15/32 | | 190,000 | 195,664 |
| 5% 7/15/34 | | 210,000 | 215,409 |
| 5% 7/15/36 | | 610,000 | 622,963 |
| 5% 7/15/38 | | 730,000 | 742,226 |
| East Hempfield Township Indl. Dev. Auth. Rev. Series 2015: | | | |
| 5% 7/1/30 (Pre-Refunded to 7/1/25 @ 100) | | 115,000 | 116,131 |
| 5% 7/1/35 (Pre-Refunded to 7/1/25 @ 100) | | 150,000 | 151,475 |
| 5% 7/1/47 (Pre-Refunded to 7/1/25 @ 100) | | 1,055,000 | 1,065,375 |
| Erie Higher Ed. Bldg. Auth. Series 2016: | | | |
| 5% 9/15/37 (g) | | 160,000 | 155,565 |
| 5% 9/15/37 (Pre-Refunded to 9/15/26 @ 100) (g) | | 35,000 | 36,133 |
| Erie Wtr. Auth. Rev. Series 2016, 5% 12/1/43 (Pre-Refunded to 12/1/26 @ 100) | | 480,000 | 501,094 |
| Franklin County Indl. Dev. Auth. (Menno-Haven, Inc. Proj.) Series 2018: | | | |
| 5% 12/1/38 | | 295,000 | 297,054 |
| 5% 12/1/43 | | 170,000 | 168,069 |
| 5% 12/1/48 | | 185,000 | 177,901 |
| 5% 12/1/53 | | 195,000 | 184,072 |
| Huntingdon County Gen. Auth. Rev. (Aicup Fing. Prog. - Juniata College Proj.) Series 2016 OO2, 5% 5/1/46 | | 300,000 | 300,016 |
| Interboro School District Delaware Series 2024, 5.5% 8/15/63 | | 200,000 | 222,205 |
| Lancaster County Hosp. Auth. Health Ctr. Rev.: | | | |
| Series 2015: | | | |
5.25% 7/1/35 | | 35,000 | 35,094 |
5.5% 7/1/45 | | 140,000 | 140,148 |
| Series 2021: | | | |
5% 11/1/46 | | 3,615,000 | 3,782,155 |
5% 11/1/51 | | 185,000 | 191,578 |
| Lancaster Muni. Auth. (Garden Spot Village Proj.) Series 2024 B, 5% 5/1/59 | | 255,000 | 263,618 |
| Lehigh County Auth. Wtr. and Swr. Rev. Series 2013 B, 0% 12/1/36 | | 2,580,000 | 1,555,268 |
| Lehigh County Gen. Purp. Auth. Rev. (Muhlenberg College Proj.): | | | |
| Series 2017, 5% 2/1/39 | | 315,000 | 322,535 |
| Series 2024, 5.25% 2/1/49 | | 565,000 | 598,470 |
| Lehigh County Gen. Purp. Hosp. Rev. Series 2019 A: | | | |
| 4% 7/1/37 | | 110,000 | 111,232 |
| 4% 7/1/38 | | 120,000 | 121,415 |
| 4% 7/1/39 | | 140,000 | 141,296 |
| 4% 7/1/49 | | 4,195,000 | 4,077,637 |
| 5% 7/1/26 | | 120,000 | 122,924 |
| 5% 7/1/27 | | 130,000 | 135,961 |
| 5% 7/1/28 | | 135,000 | 143,293 |
| 5% 7/1/44 | | 640,000 | 669,507 |
| Luzerne County Series 2017 A, 5% 12/15/24 (Assured Guaranty Muni. Corp. Insured) | | 145,000 | 145,095 |
| Maxatawny Township Muni. Auth. Rev. Series 2022 A: | | | |
| 4.5% 1/1/45 | | 545,000 | 533,410 |
| 5% 1/1/39 | | 60,000 | 62,375 |
| 5% 1/1/40 | | 205,000 | 212,104 |
| 5% 1/1/41 | | 150,000 | 154,738 |
| 5% 1/1/42 | | 155,000 | 159,422 |
| Monroe County Hosp. Auth. Rev. Series 2016: | | | |
| 5% 7/1/26 | | 120,000 | 122,924 |
| 5% 7/1/27 | | 120,000 | 123,369 |
| 5% 7/1/28 | | 120,000 | 123,150 |
| 5% 7/1/34 (Pre-Refunded to 7/1/26 @ 100) | | 450,000 | 464,836 |
| 5% 7/1/36 (Pre-Refunded to 7/1/26 @ 100) | | 655,000 | 676,594 |
| Monroeville Fin. Auth. UPMC Rev. Series 2012, 5% 2/15/26 | | 95,000 | 97,167 |
| Montgomery County Indl. Dev. Auth. Bonds Series 2023 A, 4.1%, tender 4/3/28 (b) | | 1,475,000 | 1,515,959 |
| Montgomery County Higher Ed. & Health Auth. Rev.: | | | |
| (Philadelphia Presbytery Homes, Inc. Proj.) Series 2017, 4% 12/1/48 | | 415,000 | 363,481 |
| Series 2014 A: | | | |
5% 10/1/25 | | 125,000 | 125,005 |
5% 10/1/27 | | 60,000 | 60,003 |
| Series 2016 A: | | | |
5% 10/1/28 | | 185,000 | 182,238 |
5% 10/1/29 | | 325,000 | 318,791 |
5% 10/1/30 | | 245,000 | 239,177 |
5% 10/1/31 | | 555,000 | 538,552 |
5% 10/1/32 | | 10,000 | 9,641 |
5% 10/1/36 | | 1,255,000 | 1,185,456 |
5% 10/1/40 | | 795,000 | 727,926 |
| Series 2018 A: | | | |
4% 9/1/49 | | 490,000 | 468,836 |
5% 9/1/32 | | 560,000 | 590,270 |
5% 9/1/33 | | 425,000 | 447,431 |
5% 9/1/34 | | 810,000 | 851,266 |
5% 9/1/37 | | 740,000 | 773,898 |
5% 9/1/43 | | 710,000 | 735,452 |
| Series 2019: | | | |
4% 9/1/36 | | 50,000 | 50,234 |
4% 9/1/37 | | 50,000 | 50,183 |
4% 9/1/38 | | 110,000 | 110,198 |
4% 9/1/39 | | 70,000 | 70,033 |
4% 9/1/44 | | 725,000 | 701,785 |
4% 9/1/49 | | 1,200,000 | 1,162,860 |
4% 9/1/49 | | 650,000 | 621,925 |
4% 9/1/51 | | 805,000 | 767,669 |
5% 9/1/31 | | 145,000 | 154,856 |
| Series 2020: | | | |
5% 4/1/25 | | 20,000 | 20,043 |
5% 4/1/26 | | 20,000 | 20,015 |
5% 4/1/27 | | 40,000 | 41,018 |
| Series 2022, 3.125% 5/1/53 (Assured Guaranty Muni. Corp. Insured) | | 650,000 | 516,488 |
| Montgomery County Indl. Dev. Auth. Series 2015 A, 5.25% 1/15/45 (Pre-Refunded to 1/15/25 @ 100) | | 1,510,000 | 1,513,137 |
| Montgomery County Indl. Dev. Auth. Rev.: | | | |
| Series 2015: | | | |
5% 1/1/30 | | 210,000 | 210,029 |
5.25% 1/1/40 | | 490,000 | 489,775 |
5.375% 1/1/50 | | 3,045,000 | 2,919,897 |
| Series 2020 C, 5% 11/15/45 | | 650,000 | 672,141 |
| Moon Indl. Dev. Auth. Rev. Series 2015, 6.125% 7/1/50 | | 580,000 | 401,541 |
| Northampton County Gen. Purp. Auth. Hosp. Rev.: | | | |
| (St. Luke's Univ. Health Network Proj.): | | | |
Series 2016 A, 5% 8/15/36 | | 90,000 | 91,751 |
Series 2018 A, 4% 8/15/48 | | 1,950,000 | 1,859,456 |
Series 2024 A1, 5.25% 8/15/53 (Assured Guaranty Muni. Corp. Insured) | | 3,440,000 | 3,843,192 |
| Series 2024 A2, 5% 8/15/34 | | 1,500,000 | 1,695,796 |
| Northeastern Pennsylvania Hosp. and Ed. Auth. (King's College Proj.) Series 2019: | | | |
| 5% 5/1/32 | | 95,000 | 96,995 |
| 5% 5/1/33 | | 125,000 | 127,327 |
| 5% 5/1/44 | | 275,000 | 267,691 |
| 5% 5/1/49 | | 170,000 | 162,116 |
| Pennsylvania Ctfs. Prtn. Series 2018 A: | | | |
| 5% 7/1/35 | | 40,000 | 42,287 |
| 5% 7/1/37 | | 45,000 | 47,445 |
| 5% 7/1/38 | | 40,000 | 42,006 |
| 5% 7/1/43 | | 110,000 | 113,959 |
| Pennsylvania Econ. Dev.: | | | |
| Series 2013 B2: | | | |
0% 1/1/35 | | 320,000 | 213,877 |
0% 1/1/36 | | 340,000 | 217,080 |
0% 1/1/37 | | 325,000 | 198,145 |
0% 1/1/38 | | 335,000 | 194,665 |
0% 1/1/39 | | 370,000 | 203,542 |
0% 1/1/40 | | 355,000 | 185,398 |
0% 1/1/41 | | 340,000 | 168,469 |
0% 1/1/42 | | 325,000 | 152,813 |
0% 1/1/43 | | 310,000 | 138,163 |
0% 1/1/46 | | 745,000 | 295,465 |
0% 1/1/47 | | 775,000 | 291,787 |
| Series 2013, 0% 1/1/49 | | 1,555,000 | 307,828 |
| Pennsylvania Econ. Dev. Fing. Auth.: | | | |
| (The Penndot Major Bridges Package One Proj.) Series 2022: | | | |
5% 12/31/57 (Assured Guaranty Muni. Corp. Insured) (e) | | 4,770,000 | 4,956,016 |
5.25% 6/30/53 (e) | | 11,600,000 | 12,087,720 |
5.75% 6/30/48 (e) | | 12,465,000 | 13,579,974 |
5.75% 12/31/62 (Assured Guaranty Muni. Corp. Insured) (e) | | 5,000,000 | 5,500,859 |
6% 6/30/61 (e) | | 4,925,000 | 5,448,454 |
| Series 2020 A: | | | |
4% 4/15/39 | | 1,500,000 | 1,506,812 |
5% 4/15/25 | | 50,000 | 50,312 |
| Series 2023 A2: | | | |
4% 5/15/48 | | 2,000,000 | 1,986,194 |
4% 5/15/53 | | 1,960,000 | 1,878,163 |
| Pennsylvania Econ. Dev. Fing. Auth. Indl. Dev. Rev.: | | | |
| (Presbyterian Sr. Living Proj.): | | | |
Series 2023 B1, 5.25% 7/1/49 | | 970,000 | 1,030,717 |
Series 2023 B2: | | | |
5% 7/1/38 | | 735,000 | 784,295 |
5% 7/1/42 | | 440,000 | 462,811 |
5.25% 7/1/46 | | 1,435,000 | 1,534,350 |
| (The Pennsylvania Rapid Bridge Replacement Proj.) Series 2015: | | | |
4.125% 12/31/38 (e) | | 355,000 | 355,044 |
5% 12/31/38 (e) | | 4,365,000 | 4,436,649 |
| Pennsylvania Econ. Dev. Fing. Auth. Solid Waste Disp. Rev.: | | | |
| (Covanta Proj.) Series 2019 A, 3.25% 8/1/39 (e)(g) | | 580,000 | 487,849 |
| Bonds: | | | |
(Consol Energy, Inc. Proj.) Series 2021 A, 9%, tender 4/13/28 (b)(e)(g) | | 1,620,000 | 1,848,870 |
(Waste Mgmt., Inc. Proj.) Series 2009, 0.95%, tender 12/1/26 (b) | | 250,000 | 237,841 |
Series 2011, 4.25%, tender 7/1/27 (b)(e) | | 990,000 | 998,938 |
| Pennsylvania Gen. Oblig. Series 2016, 3% 9/15/33 (Assured Guaranty Muni. Corp. Insured) | | 1,870,000 | 1,857,349 |
| Pennsylvania Higher Ed. Assistance Agcy. Rev.: | | | |
| Series 2021 A: | | | |
2.625% 6/1/42 (e) | | 240,000 | 217,504 |
5% 6/1/30 (e) | | 50,000 | 52,620 |
| Series 2022 A, 4.5% 6/1/43 (e) | | 180,000 | 182,208 |
| Series 2023 A, 4% 6/1/44 (e) | | 2,210,000 | 2,148,804 |
| Series 2023 B, 5% 6/1/50 (e) | | 1,275,000 | 1,282,646 |
| Series 2024 A1, 4.125% 6/1/45 (e) | | 2,907,000 | 2,872,541 |
| Series 2024 C1, 5% 6/1/51 (e) | | 1,380,000 | 1,391,170 |
| Pennsylvania Higher Edl. Facilities Auth. Rev.: | | | |
| (Drexel Univ. Proj.) Series 2017: | | | |
5% 5/1/35 | | 150,000 | 153,401 |
5% 5/1/37 | | 190,000 | 193,724 |
5% 5/1/41 | | 860,000 | 870,819 |
| Series 2007 A, CME Term SOFR 3 Month Index + 0.650% 3.903% 7/1/39 (XL Cap. Assurance, Inc. Insured) (b)(c) | | 1,180,000 | 1,090,613 |
| Series 2012, 5% 11/1/42 | | 90,000 | 89,998 |
| Series 2015 A, 5% 9/1/39 | | 440,000 | 441,705 |
| Series 2016: | | | |
5% 5/1/28 | | 60,000 | 61,026 |
5% 5/1/29 | | 55,000 | 55,905 |
5% 5/1/31 | | 55,000 | 55,821 |
5% 5/1/32 | | 150,000 | 152,100 |
5% 5/1/33 | | 210,000 | 212,739 |
5% 5/1/34 | | 105,000 | 106,272 |
| Series 2017 A, 4% 8/15/42 | | 1,260,000 | 1,260,210 |
| Series 2019 A, 5% 3/1/39 | | 50,000 | 52,743 |
| Series 2019, 4% 8/15/49 | | 1,000,000 | 969,201 |
| Series 2020: | | | |
5% 6/15/25 (Assured Guaranty Muni. Corp. Insured) | | 260,000 | 262,607 |
5% 6/15/25 (Assured Guaranty Muni. Corp. Insured) | | 2,240,000 | 2,263,796 |
| Series 2024 B1, 5% 11/1/51 (Assured Guaranty Muni. Corp. Insured) | | 2,000,000 | 2,151,947 |
| Series 2024 B2: | | | |
5% 11/1/54 (d) | | 2,000,000 | 2,118,583 |
5.5% 11/1/54 (d) | | 2,000,000 | 2,220,949 |
| Pennsylvania Hsg. Fin. Agcy.: | | | |
| Series 2020 13 2A, 3.5% 4/1/51 | | 145,000 | 144,190 |
| Series 2021 134B, 5% 4/1/27 (e) | | 945,000 | 976,467 |
| Series 2021 135A, 3% 10/1/51 | | 910,000 | 897,710 |
| Series 2021 135B: | | | |
5% 4/1/30 (e) | | 515,000 | 541,878 |
5% 10/1/30 (e) | | 295,000 | 311,458 |
| Series 2021 137, 3% 10/1/51 | | 2,695,000 | 2,623,487 |
| Series 2023 141A, 5.75% 10/1/53 | | 12,410,000 | 13,235,387 |
| Series 2024 144A, 6% 10/1/54 | | 1,660,000 | 1,811,120 |
| Pennsylvania Hsg. Fin. Agcy. Multifamily Hsg. Dev. Rev. Series 2023 A, 5.55% 11/1/42 | | 652,125 | 762,768 |
| Pennsylvania Hsg. Fin. Agcy. Single Family Mtg. Rev. Series 2016 121, 2.8% 10/1/31 | | 1,205,000 | 1,138,453 |
| Pennsylvania Pub. School Bldg. Auth. School Rev. (The School District of The City of Harrisburg Proj.) Series 2016 A: | | | |
| 5% 12/1/29 | | 270,000 | 279,357 |
| 5% 12/1/29 (Pre-Refunded to 12/1/26 @ 100) | | 45,000 | 46,933 |
| Pennsylvania Tpk. Commission Tpk. Rev.: | | | |
| Series 2015 A1, 5% 12/1/40 | | 2,000,000 | 2,009,293 |
| Series 2017 A1: | | | |
5% 12/1/42 | | 600,000 | 626,808 |
5% 12/1/47 | | 960,000 | 994,430 |
| Series 2017, 5% 12/1/41 | | 690,000 | 720,678 |
| Series 2018 A2, 5% 12/1/48 | | 2,590,000 | 2,713,301 |
| Series 2019 A: | | | |
4% 12/1/49 (Assured Guaranty Muni. Corp. Insured) | | 1,775,000 | 1,773,447 |
5% 12/1/34 | | 1,095,000 | 1,194,612 |
5% 12/1/44 | | 600,000 | 641,995 |
| Series 2020 B, 5% 12/1/45 | | 4,015,000 | 4,319,874 |
| Series 2021 A: | | | |
4% 12/1/46 | | 320,000 | 318,769 |
4% 12/1/50 | | 500,000 | 500,696 |
4% 12/1/50 | | 1,420,000 | 1,383,315 |
| Series 2021 B: | | | |
4% 12/1/46 | | 950,000 | 950,200 |
5% 12/1/46 | | 6,355,000 | 6,844,728 |
| Series 2021 C: | | | |
4% 12/1/51 | | 725,000 | 721,267 |
5% 12/1/27 | | 530,000 | 564,536 |
5% 12/1/28 | | 510,000 | 553,436 |
| Series 2022 B, 5.25% 12/1/52 | | 925,000 | 1,019,516 |
| Philadelphia Arpt. Rev.: | | | |
| Series 2017 A: | | | |
5% 7/1/25 | | 120,000 | 121,283 |
5% 7/1/26 | | 120,000 | 123,860 |
5% 7/1/27 | | 100,000 | 105,456 |
5% 7/1/28 | | 30,000 | 31,548 |
5% 7/1/29 | | 30,000 | 31,451 |
5% 7/1/30 | | 30,000 | 31,394 |
5% 7/1/31 | | 35,000 | 36,546 |
5% 7/1/32 | | 30,000 | 31,290 |
5% 7/1/33 | | 35,000 | 36,471 |
| Series 2017 B: | | | |
5% 7/1/26 (e) | | 365,000 | 374,973 |
5% 7/1/27 (e) | | 305,000 | 317,004 |
5% 7/1/28 (e) | | 365,000 | 378,217 |
5% 7/1/29 (e) | | 270,000 | 279,319 |
5% 7/1/32 (e) | | 365,000 | 375,670 |
5% 7/1/33 (e) | | 900,000 | 924,357 |
5% 7/1/34 (e) | | 535,000 | 548,959 |
5% 7/1/42 (e) | | 2,385,000 | 2,437,705 |
5% 7/1/47 (e) | | 1,545,000 | 1,567,955 |
| Series 2021: | | | |
5% 7/1/26 (e) | | 4,065,000 | 4,176,065 |
5% 7/1/27 (e) | | 12,490,000 | 12,981,593 |
5% 7/1/28 (e) | | 1,325,000 | 1,395,016 |
5% 7/1/34 (e) | | 2,650,000 | 2,837,424 |
5% 7/1/35 (e) | | 1,425,000 | 1,521,531 |
5% 7/1/51 (e) | | 2,400,000 | 2,491,043 |
| Philadelphia Auth. for Indl. Dev.: | | | |
| (Philadelphia Performing Arts: A String Theory Charter School Proj.) Series 2020, 5% 6/15/50 (g) | | 1,000,000 | 1,002,691 |
| (Saint Joseph's Univ. Proj.) Series 2022: | | | |
5.25% 11/1/52 | | 1,750,000 | 1,891,296 |
5.5% 11/1/60 | | 1,915,000 | 2,097,232 |
| Series 2015 1, 5% 4/1/33 | | 35,000 | 35,176 |
| Series 2016 2, 5% 4/1/34 | | 2,265,000 | 2,275,424 |
| Series 2016 A, 5.375% 8/1/51 | | 325,000 | 327,168 |
| Series 2016 B: | | | |
5.625% 8/1/36 | | 65,000 | 66,487 |
5.75% 8/1/46 | | 215,000 | 218,866 |
6% 8/1/51 | | 225,000 | 229,538 |
| Series 2017 A, 5% 9/1/42 | | 2,305,000 | 2,354,094 |
| Series 2017 I: | | | |
5% 12/1/37 | | 425,000 | 433,069 |
5% 12/1/58 | | 1,770,000 | 1,775,999 |
5.5% 12/1/58 (g) | | 105,000 | 102,415 |
| Series 2017: | | | |
5% 3/15/45 (g) | | 297,412 | 178,447 |
5% 3/15/45 (Pre-Refunded to 3/15/28 @ 100) (g) | | 25,000 | 26,778 |
5% 11/1/47 | | 1,645,000 | 1,658,921 |
| Series 2020 B, 4.875% 12/15/35 (b)(g) | | 500,000 | 498,157 |
| Series 2022 A: | | | |
5.25% 6/15/52 | | 100,000 | 101,337 |
5.375% 6/15/57 | | 145,000 | 147,106 |
| Philadelphia Auth. for Indl. Dev. Sr. Living Facilities Rev. Series 2017 A: | | | |
| 5% 7/1/37 | | 615,000 | 619,613 |
| 5% 7/1/42 | | 710,000 | 710,582 |
| 5% 7/1/49 | | 355,000 | 343,570 |
| Philadelphia Gas Works Rev. Series 16 A, 4% 8/1/45 (Assured Guaranty Muni. Corp. Insured) | | 130,000 | 129,722 |
| Philadelphia Gen. Oblig.: | | | |
| Series 2019 A, 5% 8/1/26 | | 75,000 | 77,615 |
| Series 2019 B: | | | |
5% 2/1/33 | | 90,000 | 97,395 |
5% 2/1/34 | | 145,000 | 156,686 |
5% 2/1/35 | | 175,000 | 188,746 |
5% 2/1/36 | | 720,000 | 774,580 |
5% 2/1/37 | | 685,000 | 735,385 |
5% 2/1/38 | | 540,000 | 578,444 |
| Philadelphia Hospitals & Higher Ed. Facilities Auth. Hosp. Rev. Series 2017: | | | |
| 5% 7/1/28 | | 705,000 | 726,437 |
| 5% 7/1/30 | | 140,000 | 143,969 |
| Philadelphia School District: | | | |
| Series 2015 A: | | | |
5% 9/1/30 | | 650,000 | 657,869 |
5% 9/1/35 | | 290,000 | 292,824 |
| Series 2016 D: | | | |
5% 9/1/25 | | 1,070,000 | 1,083,292 |
5% 9/1/27 | | 1,180,000 | 1,215,763 |
5% 9/1/28 | | 985,000 | 1,013,667 |
| Series 2016 F: | | | |
5% 9/1/28 | | 1,700,000 | 1,749,476 |
5% 9/1/29 | | 1,300,000 | 1,336,049 |
| Series 2016, 5% 9/1/38 | | 50,000 | 50,875 |
| Series 2018 A: | | | |
5% 9/1/26 | | 90,000 | 92,895 |
5% 9/1/34 | | 80,000 | 84,309 |
5% 9/1/35 | | 55,000 | 57,900 |
5% 9/1/36 | | 230,000 | 241,953 |
5% 9/1/37 | | 135,000 | 142,059 |
5% 9/1/38 | | 210,000 | 220,956 |
| Series 2018 B, 5% 9/1/43 | | 635,000 | 663,240 |
| Series 2019 A: | | | |
4% 9/1/35 | | 1,135,000 | 1,160,553 |
4% 9/1/36 | | 110,000 | 112,398 |
5% 9/1/26 | | 130,000 | 134,181 |
5% 9/1/30 | | 1,050,000 | 1,130,746 |
5% 9/1/31 | | 830,000 | 888,050 |
5% 9/1/32 | | 65,000 | 69,764 |
5% 9/1/33 | | 385,000 | 413,123 |
5% 9/1/33 (Assured Guaranty Muni. Corp. Insured) | | 115,000 | 124,451 |
5% 9/1/34 (Assured Guaranty Muni. Corp. Insured) | | 480,000 | 517,884 |
5% 9/1/44 | | 1,925,000 | 2,035,514 |
| Series 2019 B, 5% 9/1/26 | | 70,000 | 72,251 |
| Series 2023 A, 5.5% 9/1/48 | | 2,755,000 | 3,092,060 |
| Series F, 5% 9/1/30 | | 825,000 | 846,323 |
| Philadelphia Wtr. & Wastewtr. Rev.: | | | |
| Series 2018 A, 5% 10/1/43 | | 1,205,000 | 1,268,645 |
| Series 2020 A, 5% 11/1/45 | | 1,000,000 | 1,070,693 |
| Series 2022 C, 5.5% 6/1/47 | | 2,500,000 | 2,794,806 |
| Pittsburgh & Allegheny County Parking Sys. Series 2017: | | | |
| 5% 12/15/35 | | 65,000 | 67,879 |
| 5% 12/15/37 | | 30,000 | 31,283 |
| Pittsburgh Wtr. & Swr. Auth. Wtr. & Swr. Sys. Rev.: | | | |
| Series 2019 A: | | | |
5% 9/1/38 (Assured Guaranty Muni. Corp. Insured) | | 480,000 | 514,506 |
5% 9/1/44 (Assured Guaranty Muni. Corp. Insured) | | 30,000 | 31,776 |
| Series 2019 B, 5% 9/1/32 (Assured Guaranty Muni. Corp. Insured) | | 110,000 | 126,189 |
| Series 2023 A, 4.25% 9/1/53 (Assured Guaranty Muni. Corp. Insured) | | 740,000 | 750,419 |
| Pocono Mountains Indl. Park Auth. (St. Luke's Hosp. - Monroe Proj.) Series 2015 A, 5% 8/15/40 | | 100,000 | 100,195 |
| Scranton Redev. Auth. Series 2016 A, 5% 11/15/28 | | 215,000 | 215,102 |
| Scranton-Lackawanna Health & Welfare Auth. Rev. (Marywood Univ. Proj.) Series 2016, 5% 6/1/46 | | 250,000 | 225,151 |
| South Western School District York Series 2022, 4.25% 11/15/49 | | 3,000,000 | 3,038,551 |
| Southcentral Pennsylvania Gen. Auth. Rev.: | | | |
| (York Academy Reg'l. Charter School Proj.) Series 2018 A, 6.5% 7/15/48 (g) | | 350,000 | 363,288 |
| Series 2019 A: | | | |
4% 6/1/44 | | 435,000 | 428,165 |
4% 6/1/49 | | 2,170,000 | 2,130,902 |
5% 6/1/44 | | 755,000 | 785,538 |
5% 6/1/49 | | 1,205,000 | 1,241,763 |
| State Pub. School Bldg. Auth. (Northampton County Area Cmnty. College Proj.) Series 2022: | | | |
| 4% 6/15/31 | | 190,000 | 198,316 |
| 4% 6/15/32 | | 125,000 | 129,877 |
| 4% 6/15/33 | | 135,000 | 139,379 |
| 4% 6/15/34 | | 135,000 | 139,526 |
| State Pub. School Bldg. Auth. College Rev. (Cmnty. College of Philadelphia Proj.) Series 2015, 5% 6/15/28 | | 1,000,000 | 1,008,355 |
| State Pub. School Bldg. Auth. Lease Rev. (The School District of Philadelphia Proj.): | | | |
| Series 2015 A, 5% 6/1/26 | | 195,000 | 196,841 |
| Series 2016 A: | | | |
5% 6/1/31 | | 3,845,000 | 3,973,723 |
5% 6/1/32 (Assured Guaranty Muni. Corp. Insured) | | 1,530,000 | 1,579,723 |
5% 6/1/33 | | 2,530,000 | 2,610,242 |
| Susquehanna Area Reg'l. Arp Auth. Series 2017, 5% 1/1/35 (e) | | 300,000 | 305,825 |
| Trinity Area School District Series 2021, 4% 11/1/51 | | 320,000 | 320,120 |
| Union County Hosp. Auth. Rev. Series 2018 B: | | | |
| 5% 8/1/33 | | 55,000 | 56,302 |
| 5% 8/1/38 | | 180,000 | 186,597 |
| 5% 8/1/43 | | 680,000 | 699,770 |
| 5% 8/1/48 | | 1,010,000 | 1,032,389 |
| Univ. of Arts: | | | |
| 0% 3/13/25 (b)(d)(f) | | 60,815 | 60,815 |
| 0% 3/13/25 (b)(f)(g) | | 6,356 | 6,356 |
| 0% 3/13/25 (f) | | 23,110 | 23,110 |
| 0% 3/19/25 (b)(f) | | 18,244 | 18,244 |
| Upper Darby School District Series 2021 A, 4% 4/1/46 | | 125,000 | 125,177 |
| Washington Redev. Auth. (Victory Centre Tax Increment Fing. Proj.) Series 2018, 5% 7/1/35 | | 15,000 | 15,058 |
| West Shore Area Auth. Rev. (Messiah Village Proj.) Series 2015 A: | | | |
| 5% 7/1/30 | | 95,000 | 95,326 |
| 5% 7/1/35 | | 90,000 | 90,217 |
TOTAL PENNSYLVANIA | | | 389,305,669 |
| Pennsylvania, New Jersey - 0.0% | | | |
| Delaware River Port Auth. Pennsylvania & New Jersey Rev. Series 2013, 5% 1/1/37 | | 2,000,000 | 2,005,038 |
| Puerto Rico - 2.5% | | | |
| Children's Trust Fund Tobacco Settlement: | | | |
| Series 2002, 5.625% 5/15/43 | | 1,330,000 | 1,345,942 |
| Series 2005 A, 0% 5/15/50 | | 2,100,000 | 412,217 |
| Series 2008 B, 0% 5/15/57 | | 2,100,000 | 128,767 |
| GDB Debt Recovery Auth. Series 2018, 7.5% 8/20/40 | | 8,214,020 | 8,008,670 |
| Puerto Rico Commonwealth Aqueduct & Swr. Auth.: | | | |
| Series 2020 A: | | | |
5% 7/1/30 (g) | | 2,810,000 | 2,978,922 |
5% 7/1/35 (g) | | 5,880,000 | 6,158,165 |
5% 7/1/47 (g) | | 18,090,000 | 18,648,543 |
| Series 2021 A: | | | |
4% 7/1/42 (g) | | 1,705,000 | 1,644,835 |
5% 7/1/33 (g) | | 760,000 | 806,931 |
| Series 2021 B: | | | |
4% 7/1/47 (g) | | 3,885,000 | 3,653,393 |
5% 7/1/25 (g) | | 485,000 | 487,801 |
5% 7/1/29 (g) | | 1,560,000 | 1,643,655 |
5% 7/1/33 (g) | | 935,000 | 992,737 |
5% 7/1/37 (g) | | 7,465,000 | 7,820,212 |
| Series 2021 C, 3.5% 7/1/26 (g) | | 425,000 | 406,820 |
| Series 2022 A: | | | |
4% 7/1/42 (g) | | 10,320,000 | 9,955,837 |
4% 7/1/47 (g) | | 780,000 | 733,500 |
5% 7/1/25 (g) | | 760,000 | 764,389 |
5% 7/1/28 (g) | | 775,000 | 809,320 |
5% 7/1/29 (g) | | 540,000 | 568,957 |
5% 7/1/33 (g) | | 4,360,000 | 4,651,494 |
5% 7/1/37 (g) | | 9,555,000 | 10,062,277 |
| Puerto Rico Commonwealth Pub. Impt. Gen. Oblig.: | | | |
| Series 2021 A1: | | | |
0% 7/1/33 (i) | | 10,530,725 | 7,283,310 |
4% 7/1/33 | | 10,485,896 | 10,443,789 |
4% 7/1/35 | | 7,364,757 | 7,280,756 |
4% 7/1/37 | | 10,479,211 | 10,280,520 |
4% 7/1/46 | | 5,766,858 | 5,491,249 |
5.625% 7/1/27 | | 5,072,148 | 5,306,581 |
5.625% 7/1/29 | | 6,265,770 | 6,759,828 |
5.75% 7/1/31 | | 5,593,928 | 6,235,014 |
| Series 2022 A1: | | | |
4% 7/1/41 | | 3,603,018 | 3,466,623 |
5.375% 7/1/25 | | 3,231,539 | 3,267,677 |
| Series 2022: | | | |
0% 11/1/43 (b) | | 19,942,326 | 12,314,386 |
0% 11/1/51 (b) | | 1,250,000 | 293,750 |
0% 11/1/51 (b) | | 13,661,939 | 7,292,060 |
0% 11/1/51 | | 903,328 | 399,722 |
0% 11/1/51 | | 10,104,744 | 6,441,774 |
| Puerto Rico Elec. Pwr. Auth.: | | | |
| Series 2003, 4.75% 7/1/33 | | 155,000 | 153,750 |
| Series 2004, 5% 7/1/25 | | 40,000 | 40,010 |
| Series 2007: | | | |
5% 7/1/17 | | 10,000 | 4,575 |
5% 7/1/37 | | 945,000 | 432,338 |
5% 12/31/49 | | 30,000 | 13,725 |
5.25% 7/1/25 | | 55,000 | 54,899 |
5.25% 7/1/26 | | 495,000 | 491,464 |
5.25% 7/1/29 | | 625,000 | 617,842 |
5.25% 7/1/30 | | 655,000 | 649,235 |
5.25% 7/1/34 | | 95,000 | 94,820 |
| Series 2010: | | | |
3.3% 7/1/19 | | 5,000 | 2,288 |
3.625% 7/1/21 | | 105,000 | 48,038 |
4.625% 7/1/25 | | 5,000 | 2,288 |
5% 7/1/21 | | 10,000 | 4,575 |
5% 7/1/21 | | 855,000 | 391,163 |
5% 7/1/28 | | 150,000 | 68,625 |
5% 12/31/49 | | 240,000 | 109,800 |
5.25% 7/1/23 | | 195,000 | 89,213 |
5.25% 7/1/40 | | 3,385,000 | 1,548,638 |
| Series 2012: | | | |
5% 7/1/29 | | 1,155,000 | 528,413 |
5% 7/1/42 | | 2,520,000 | 1,152,900 |
5.05% 7/1/42 | | 470,000 | 215,025 |
| Puerto Rico Elec. Pwr. Auth. Pwr. Rev.: | | | |
| Series 2005 RR, 5% 7/1/28 (CIFG North America Insured) | | 90,000 | 89,944 |
| Series 2005 SS, 4.375% 7/1/30 | | 95,000 | 93,387 |
| Series 2007 UU: | | | |
CME Term SOFR 3 Month Index + 0.520% 3.772% 7/1/29 (Assured Guaranty Muni. Corp. Insured) (b)(c) | | 460,000 | 449,123 |
4.25% 7/1/27 (CIFG North America Insured) | | 295,000 | 290,056 |
| Series 2007: | | | |
5% | | 155,000 | 81,375 |
5% | | 415,000 | 217,875 |
5% 7/1/25 | | 195,000 | 101,888 |
5% 7/1/26 | | 240,000 | 125,400 |
5% 7/1/26 | | 5,000 | 5,003 |
5% 7/1/27 | | 670,000 | 350,075 |
5% 7/1/32 | | 1,045,000 | 546,013 |
5% 7/1/37 | | 1,320,000 | 689,700 |
5% 12/31/49 | | 360,000 | 189,000 |
5% 12/31/49 | | 595,000 | 312,375 |
| Series 2008 WW: | | | |
5% 7/1/28 | | 425,000 | 222,063 |
5.25% 7/1/33 | | 1,165,000 | 608,713 |
5.5% | | 130,000 | 68,250 |
5.5% 7/1/38 | | 1,250,000 | 653,125 |
| Series 2010 AAA: | | | |
5.25% 7/1/25 | | 15,000 | 7,838 |
5.25% 7/1/27 | | 205,000 | 107,113 |
5.25% 7/1/29 | | 705,000 | 368,363 |
| Series 2010 BBB, 5.4% 7/1/28 | | 250,000 | 130,625 |
| Series 2010 CCC: | | | |
5% | | 115,000 | 60,375 |
5% 7/1/27 | | 50,000 | 26,125 |
5.25% 7/1/26 | | 280,000 | 146,300 |
5.25% 7/1/27 | | 1,230,000 | 642,675 |
5.25% 7/1/28 | | 545,000 | 284,763 |
| Series 2010 DDD: | | | |
5% | | 850,000 | 446,250 |
5% | | 1,170,000 | 614,250 |
| Series 2010 EEE: | | | |
5.95% 7/1/30 | | 950,000 | 496,375 |
6.05% 7/1/32 | | 300,000 | 156,750 |
6.25% 7/1/40 | | 250,000 | 130,625 |
| Series 2010 XX: | | | |
4.75% 7/1/26 | | 60,000 | 31,350 |
5.25% 7/1/27 | | 55,000 | 28,738 |
5.25% 7/1/35 | | 640,000 | 334,400 |
5.25% 7/1/40 | | 1,745,000 | 911,763 |
5.75% 7/1/36 | | 355,000 | 185,488 |
| Series 2010 YY, 6.125% 7/1/40 | | 1,600,000 | 836,000 |
| Series 2010 ZZ: | | | |
3.7% | | 35,000 | 18,375 |
4.75% 7/1/27 | | 50,000 | 26,125 |
5% | | 520,000 | 273,000 |
5% | | 350,000 | 183,750 |
5% | | 65,000 | 34,125 |
5% 7/1/28 | | 50,000 | 26,125 |
5.25% | | 475,000 | 249,375 |
5.25% 7/1/26 | | 1,310,000 | 684,475 |
5.25% 12/31/49 | | 700,000 | 367,500 |
5.25% 12/31/49 | | 80,000 | 42,000 |
| Series 2012 A: | | | |
5% 7/1/29 | | 2,730,000 | 1,426,425 |
5% 7/1/42 | | 1,710,000 | 893,475 |
5.05% 7/1/42 | | 60,000 | 31,350 |
| Series 2013 A: | | | |
6.75% 7/1/36 | | 2,305,000 | 1,204,363 |
7% 7/1/43 | | 250,000 | 130,625 |
| Puerto Rico Indl. Tourist Edl., Med. and Envir. Fing. Auth. Series 2000 A, 5% 7/1/33 (Nat'l. Pub. Fin. Guarantee Corp. Insured) | | 480,000 | 480,087 |
| Puerto Rico Sales Tax Fing. Corp. Sales Tax Rev.: | | | |
| Series 2018 A1: | | | |
0% 7/1/27 | | 3,033,000 | 2,754,174 |
0% 7/1/29 | | 1,710,000 | 1,437,210 |
0% 7/1/33 | | 7,395,000 | 5,268,352 |
0% 7/1/46 | | 32,504,000 | 10,952,158 |
0% 7/1/51 | | 41,325,000 | 10,208,676 |
4.55% 7/1/40 | | 2,828,000 | 2,836,819 |
4.75% 7/1/53 | | 28,307,000 | 28,319,011 |
5% 7/1/58 | | 27,301,000 | 27,409,997 |
| Series 2019 A1, 4.5% 7/1/34 | | 84,000 | 84,265 |
| Series 2019 A2: | | | |
4.329% 7/1/40 | | 6,512,000 | 6,500,979 |
4.329% 7/1/40 | | 1,831,000 | 1,827,901 |
4.536% 7/1/53 | | 448,000 | 440,941 |
4.784% 7/1/58 | | 2,394,000 | 2,397,663 |
| Univ. of Puerto Rico Series 2006 P, 5% 6/1/25 | | 70,000 | 70,087 |
TOTAL PUERTO RICO | | | 299,572,986 |
| Rhode Island - 0.3% | | | |
| Providence Pub. Bldgs Auth. (Cap. Impt. Prog. Projs.) Series 2024 A, 5.25% 9/15/43 | | 380,000 | 422,993 |
| Rhode Island Health & Edl. Bldg. Corp. Higher Ed. Facilities Rev.: | | | |
| Series 2016 B: | | | |
5% 9/1/31 | | 270,000 | 271,894 |
5% 9/1/36 | | 2,760,000 | 2,769,097 |
| Series 2016: | | | |
5% 5/15/34 | | 385,000 | 391,551 |
5% 5/15/39 | | 965,000 | 976,775 |
| Series 2024, 5.25% 5/15/54 | | 600,000 | 643,787 |
| Rhode Island Health & Edl. Bldg. Corp. Pub. Schools Rev. Series 2024 F, 4.125% 5/15/54 | | 1,100,000 | 1,101,742 |
| Rhode Island Health and Edl. Bldg. Corp. Higher Ed. Facility Rev.: | | | |
| Series 2009 B, 5.25% 9/15/29 | | 285,000 | 285,180 |
| Series 2021 B: | | | |
4% 11/1/37 | | 140,000 | 144,287 |
4% 11/1/38 | | 145,000 | 149,721 |
4% 11/1/39 | | 180,000 | 185,177 |
4% 11/1/40 | | 190,000 | 195,075 |
| Series 2024: | | | |
5% 6/1/40 | | 1,000,000 | 1,111,899 |
5% 6/1/45 | | 2,870,000 | 3,139,707 |
5% 6/1/48 | | 3,295,000 | 3,574,793 |
| Rhode Island Hsg. & Mtg. Fin. Corp.: | | | |
| Series 2019 70, 4% 10/1/49 | | 160,000 | 160,655 |
| Series 2021 74, 3% 4/1/49 | | 1,345,000 | 1,325,976 |
| Series 2023 80A, 4.65% 10/1/53 | | 2,000,000 | 2,043,945 |
| Rhode Island Hsg. & Mtg. Fin. Corp. Rev. Series 72 A, 3.5% 10/1/50 | | 280,000 | 278,744 |
| Rhode Island Student Ln. Auth. Student Ln. Rev.: | | | |
| Series 2020 A, 3.625% 12/1/37 (e) | | 930,000 | 886,794 |
| Series 2021 A: | | | |
2.25% 12/1/39 (e) | | 355,000 | 303,344 |
5% 12/1/28 (e) | | 185,000 | 194,020 |
5% 12/1/29 (e) | | 145,000 | 153,959 |
5% 12/1/30 (e) | | 135,000 | 143,130 |
| Series 2022 1, 4.125% 12/1/41 (e) | | 1,145,000 | 1,116,456 |
| Series 2023 A: | | | |
4.125% 12/1/42 (e) | | 1,790,000 | 1,745,038 |
5% 12/1/30 (e) | | 2,355,000 | 2,496,815 |
| Series 2024 A, 4.125% 12/1/43 (e) | | 1,960,000 | 1,913,243 |
| Series A: | | | |
3.5% 12/1/34 (e) | | 420,000 | 398,565 |
5% 12/1/24 (e) | | 540,000 | 540,042 |
5% 12/1/28 (e) | | 1,200,000 | 1,258,509 |
| Tobacco Settlement Fing. Corp. Series 2007 A, 0% 6/1/52 | | 3,300,000 | 544,678 |
TOTAL RHODE ISLAND | | | 30,867,591 |
| South Carolina - 0.9% | | | |
| Charleston County Arpt. District: | | | |
| Series 2019: | | | |
5% 7/1/43 | | 445,000 | 469,340 |
5% 7/1/48 | | 790,000 | 825,548 |
| Series 2024 A: | | | |
5.25% 7/1/41 (e) | | 1,000,000 | 1,105,750 |
5.25% 7/1/42 (e) | | 1,400,000 | 1,543,065 |
5.25% 7/1/43 (e) | | 1,400,000 | 1,538,042 |
5.25% 7/1/49 (e) | | 3,465,000 | 3,759,447 |
| Connector 2000 Assoc., Inc. Toll Road Rev. Series 2011 A1: | | | |
| 0% 1/1/32 | | 1,668,837 | 1,003,780 |
| 0% 1/1/42 | | 6,087,835 | 1,839,795 |
| 0% 7/22/51 | | 14,645,923 | 2,063,975 |
| Ctsc Jobs-Eco Dev. Auth. (Beaufort Memorial Hosp. & South of Broad Healthcare Proj.) Series 2024, 5.5% 11/15/44 | | 155,000 | 166,767 |
| Horry County S C Ltd. Oblig. Series 2022, 4.5% 9/1/52 | | 3,500,000 | 3,573,768 |
| Lexington County Health Svcs. District, Inc. Hosp. Rev. Series 2017, 5% 11/1/28 | | 135,000 | 142,772 |
| North Charleston Ltd. Oblig. Series 2017 A, 5% 10/1/40 | | 825,000 | 841,048 |
| Patriots Energy Group Fing. Agcy.: | | | |
| Bonds: | | | |
Series 2023 A1, 5.25%, tender 8/1/31 (b) | | 1,005,000 | 1,097,823 |
Series 2023 B1, 5.25%, tender 3/1/31 (b) | | 4,725,000 | 5,150,123 |
| Series 2023 B3, 0.000% x U.S. Secured Overnight Fin. Rate (SOFR) Index 4.962% 2/1/54 (b)(c) | | 1,500,000 | 1,558,580 |
| South Carolina Hsg. Fin. & Dev. Auth. Mtg. Rev.: | | | |
| Series 2019 A, 4% 1/1/50 | | 285,000 | 287,008 |
| Series 2022 A: | | | |
5% 1/1/29 | | 15,000 | 16,074 |
5% 7/1/29 | | 30,000 | 32,380 |
5% 1/1/30 | | 30,000 | 32,225 |
5% 7/1/30 | | 30,000 | 32,401 |
5% 1/1/31 | | 30,000 | 32,740 |
5% 7/1/31 | | 30,000 | 32,896 |
| Series 2022 B, 5% 1/1/52 | | 2,890,000 | 3,012,231 |
| Series 2023 B, 6% 1/1/54 | | 690,000 | 759,535 |
| South Carolina Jobs-Econ. Series 2024 A: | | | |
| 4% 11/1/42 | | 1,675,000 | 1,690,749 |
| 4.5% 11/1/54 | | 500,000 | 508,372 |
| 5.5% 11/1/45 | | 1,750,000 | 1,989,126 |
| 5.5% 11/1/49 | | 750,000 | 844,619 |
| 5.5% 11/1/54 | | 810,000 | 905,745 |
| South Carolina Jobs-Econ. D Bonds (Int'l. Paper Co. Proj.) Series 2023 A, 4%, tender 4/1/26 (b)(e) | | 750,000 | 756,243 |
| South Carolina Jobs-Econ. Dev. Auth.: | | | |
| (Green Charter Schools Proj.) Series 2021 A, 4% 6/1/36 (g) | | 100,000 | 88,727 |
| Series 2016, 5.25% 7/1/47 | | 1,795,000 | 1,822,544 |
| Series 2017: | | | |
5% 4/1/47 | | 555,000 | 555,397 |
5% 4/1/52 | | 255,000 | 253,703 |
| Series 2018 A: | | | |
5% 5/1/35 | | 640,000 | 670,655 |
5% 4/1/48 | | 210,000 | 210,013 |
5% 5/1/48 | | 1,425,000 | 1,459,988 |
| Series 2019 C: | | | |
5% 7/1/32 | | 240,000 | 255,099 |
5% 7/1/33 | | 965,000 | 1,025,394 |
| Series 2023, 5.25% 2/1/53 | | 750,000 | 818,360 |
| South Carolina Jobs-Econ. Dev. Auth. Econ. Dev. Rev.: | | | |
| Series 2017, 5.25% 11/15/47 | | 350,000 | 353,186 |
| Series 2022 A, 4% 4/1/52 | | 200,000 | 199,558 |
| South Carolina Jobs-Econ. Dev. Auth. Hosp. Impt. Rev. Series 2020 A, 4% 12/1/44 | | 1,310,000 | 1,307,605 |
| South Carolina Jobs-Econ. Dev. Auth. Solid Waste Disp. Rev.: | | | |
| (Repower South Berkeley, LLC Proj.) Series 2017: | | | |
6% 2/1/35 (e)(f)(g) | | 890,000 | 89,000 |
6.25% 2/1/45 (e)(f)(g) | | 1,795,000 | 179,500 |
| Series 2019, 8% 12/6/29 (f) | | 280,000 | 224,000 |
| South Carolina Jobs-Economoc Dev. Auth. Retirement Cmnty. Rev. Series 2018 C, 5% 11/15/47 | | 570,000 | 581,774 |
| South Carolina Ports Auth. Ports Rev.: | | | |
| Series 2015: | | | |
5.25% 7/1/50 (Pre-Refunded to 7/1/25 @ 100) (e) | | 655,000 | 661,619 |
5.25% 7/1/55 (Pre-Refunded to 7/1/25 @ 100) (e) | | 135,000 | 136,364 |
| Series 2018: | | | |
5% 7/1/37 (e) | | 180,000 | 186,380 |
5% 7/1/38 (e) | | 385,000 | 397,971 |
5% 7/1/43 (e) | | 965,000 | 987,760 |
5% 7/1/48 (e) | | 665,000 | 676,577 |
| Series 2019 B: | | | |
4% 7/1/35 (e) | | 725,000 | 730,834 |
4% 7/1/37 (e) | | 1,125,000 | 1,130,199 |
4% 7/1/39 (e) | | 1,115,000 | 1,117,205 |
5% 7/1/44 (e) | | 1,705,000 | 1,760,355 |
| South Carolina Pub. Svc. Auth. Rev.: | | | |
| Series 2014 C, 5% 12/1/26 | | 5,000 | 5,002 |
| Series 2015 E, 5.25% 12/1/55 | | 745,000 | 751,185 |
| Series 2016 A: | | | |
5% 12/1/29 | | 365,000 | 374,824 |
5% 12/1/32 | | 1,500,000 | 1,538,109 |
5% 12/1/33 | | 15,000 | 15,369 |
5% 12/1/38 | | 35,000 | 35,734 |
| Series 2016 B: | | | |
5% 12/1/31 | | 135,000 | 139,605 |
5% 12/1/35 | | 205,000 | 211,289 |
5% 12/1/36 | | 305,000 | 314,078 |
| Series 2016 C: | | | |
5% 12/1/24 | | 30,000 | 30,002 |
5% 12/1/25 | | 35,000 | 35,541 |
5% 12/1/26 | | 55,000 | 57,187 |
| Series 2020 A, 5% 12/1/31 | | 600,000 | 662,204 |
| Series 2021 A, 4% 12/1/36 | | 2,000,000 | 2,031,128 |
| Series 2021 B: | | | |
4% 12/1/47 | | 1,000,000 | 995,043 |
5% 12/1/51 | | 1,475,000 | 1,557,737 |
| Series 2022 A, 5% 12/1/36 | | 2,250,000 | 2,496,684 |
| Series 2022 B: | | | |
4% 12/1/29 | | 741,000 | 770,068 |
4% 12/1/46 | | 250,000 | 250,070 |
4% 12/1/48 | | 250,000 | 247,466 |
4% 12/1/54 | | 250,000 | 241,936 |
4% 12/1/55 (Build America Mutual Assurance Insured) | | 250,000 | 241,804 |
| Series 2022 E: | | | |
5% 12/1/52 (Assured Guaranty Muni. Corp. Insured) | | 2,800,000 | 2,980,592 |
5.5% 12/1/42 (Assured Guaranty Muni. Corp. Insured) | | 1,250,000 | 1,413,108 |
| Series 2024 A: | | | |
5% 12/1/39 | | 3,480,000 | 3,901,315 |
5.25% 12/1/49 | | 1,090,000 | 1,203,753 |
5.5% 12/1/54 | | 1,505,000 | 1,677,717 |
| Series 2024 B: | | | |
4.125% 12/1/44 | | 375,000 | 379,110 |
5% 12/1/46 | | 555,000 | 603,436 |
5.25% 12/1/54 | | 4,645,000 | 5,091,552 |
| South Carolina Student Ln. Corp. Series 2020 A: | | | |
| 2.641% 12/1/26 | | 1,705,000 | 1,619,012 |
| 2.771% 12/1/27 | | 790,000 | 736,147 |
| 2.923% 12/1/28 | | 585,000 | 536,478 |
| 2.993% 12/1/29 | | 380,000 | 342,101 |
| 3.043% 12/1/30 | | 120,000 | 106,052 |
| 3.593% 12/1/39 | | 330,000 | 326,850 |
| South Carolina Trans. Infrastructure Bank Rev. Series 2017 A, 5% 10/1/36 | | 2,050,000 | 2,148,621 |
| Spartanburg County Reg'l. Health: | | | |
| Series 2017 A: | | | |
4% 4/15/43 | | 2,835,000 | 2,774,114 |
4% 4/15/48 | | 1,975,000 | 1,888,106 |
5% 4/15/48 | | 7,110,000 | 7,316,435 |
| Series 2020 A, 4% 4/15/45 (Assured Guaranty Muni. Corp. Insured) | | 230,000 | 226,830 |
TOTAL SOUTH CAROLINA | | | 103,765,128 |
| South Dakota - 0.1% | | | |
| Sioux Falls Health Facilities Rev. (Dow Rummel Village Proj.) Series 2017: | | | |
| 5% 11/1/28 | | 200,000 | 200,570 |
| 5% 11/1/30 | | 215,000 | 215,617 |
| 5% 11/1/32 | | 195,000 | 195,489 |
| 5% 11/1/42 | | 280,000 | 269,908 |
| South Dakota Edl. Enhancement Fdg. Corp. Rev. Series 2021: | | | |
| 1.245% 6/1/25 | | 745,000 | 733,034 |
| 1.495% 6/1/26 | | 530,000 | 506,912 |
| South Dakota Health & Edl. Facilities Auth. Rev.: | | | |
| (Avera Health Proj.) Series 2017, 5% 7/1/31 | | 80,000 | 83,873 |
| Series 2017: | | | |
5% 7/1/26 | | 35,000 | 36,071 |
5% 7/1/28 | | 35,000 | 36,915 |
5% 7/1/29 | | 70,000 | 73,727 |
5% 7/1/30 | | 45,000 | 47,236 |
5% 7/1/35 | | 40,000 | 41,424 |
5% 9/1/40 | | 670,000 | 692,323 |
| Series 2020 A, 3% 9/1/45 | | 1,465,000 | 1,203,020 |
| Series 2024 A: | | | |
4.25% 7/1/49 | | 4,400,000 | 4,438,183 |
5.25% 7/1/54 | | 4,250,000 | 4,693,581 |
| South Dakota Hsg. Dev. Auth.: | | | |
| Series 2022 B, 3% 11/1/52 | | 880,000 | 863,755 |
| Series 2024 C, 6.25% 11/1/55 | | 1,000,000 | 1,129,758 |
TOTAL SOUTH DAKOTA | | | 15,461,396 |
| Tennessee - 1.1% | | | |
| Chattanooga Health Ed. & Hsg. Facility Board Rev.: | | | |
| (CDFI Phase I, LLC - Univ. of Tennessee at Chattanooga Proj.) Series 2015, 5% 10/1/35 | | 535,000 | 538,160 |
| Series 2019 A1: | | | |
4% 8/1/44 | | 1,680,000 | 1,620,036 |
5% 8/1/25 | | 40,000 | 40,442 |
| Series 2019 A2: | | | |
5% 8/1/37 | | 50,000 | 53,036 |
5% 8/1/44 | | 710,000 | 739,494 |
| Clarksville Wtr. Swr. and Gas Rev. Series 2021 A, 4% 2/1/51 | | 4,000,000 | 3,986,512 |
| Cleveland Tenn Health & Edl. Fa (Horizon Square Apts. Proj.) Series 2024, 4.2% 5/1/40 | | 633,000 | 624,892 |
| Greeneville Health & Edl. Facilities Board Series 2018 A, 5% 7/1/36 | | 960,000 | 1,003,390 |
| Hamilton County & Chattanooga Series 2024 A, 6% 12/1/55 | | 645,000 | 762,710 |
| Indl. Dev. Board O Bonds (Domtar Proj.) Series 2024, 5.25%, tender 12/1/54 (b)(d)(e) | | 900,000 | 911,481 |
| Jackson Hosp. Rev. Series 2018 A: | | | |
| 5% 4/1/27 | | 40,000 | 41,195 |
| 5% 4/1/28 | | 25,000 | 26,075 |
| 5% 4/1/41 | | 1,375,000 | 1,422,957 |
| 5% 4/1/41 (Pre-Refunded to 10/1/28 @ 100) | | 65,000 | 70,205 |
| Knox County Health Edl. & Hsg. Facilities Series 2016 A, 5% 1/1/42 | | 1,495,000 | 1,525,712 |
| Knox County Health Edl. & Hsg. Facilities Board Rev.: | | | |
| Series 2017: | | | |
5% 4/1/30 | | 165,000 | 168,934 |
5% 4/1/36 | | 595,000 | 603,098 |
| Series 2020 A: | | | |
5% 9/1/30 | | 1,230,000 | 1,286,502 |
5% 9/1/40 | | 3,525,000 | 3,542,784 |
| Knox County Health Edl. & Hsg. Facility Board Student Hsg. Rev. (Provident Group - UTK Properties LLC - Univ. of Tennessee Proj.): | | | |
| Series 2024 A1, 5% 7/1/64 | | 895,000 | 936,919 |
| Series 2024 B1: | | | |
5% 7/1/49 (Build America Mutual Assurance Insured) | | 450,000 | 475,871 |
5.125% 7/1/54 (Build America Mutual Assurance Insured) | | 1,200,000 | 1,271,265 |
5.125% 7/1/59 (Build America Mutual Assurance Insured) | | 1,540,000 | 1,617,912 |
5.25% 7/1/64 (Build America Mutual Assurance Insured) | | 500,000 | 528,623 |
| Memphis-Shelby County Arpt. Auth. Arpt. Rev.: | | | |
| Series 2018, 5% 7/1/37 (e) | | 565,000 | 582,567 |
| Series 2021 A: | | | |
5% 7/1/34 (e) | | 785,000 | 840,520 |
5% 7/1/35 (e) | | 825,000 | 880,886 |
5% 7/1/36 (e) | | 870,000 | 926,339 |
5% 7/1/37 (e) | | 910,000 | 966,099 |
5% 7/1/38 (e) | | 960,000 | 1,016,220 |
5% 7/1/39 (e) | | 1,005,000 | 1,060,781 |
5% 7/1/40 (e) | | 415,000 | 436,465 |
| Metropolitan Govt. Nashville (Ben Allen Ridge Apts. Proj.) Series 2022 A, 4.75% 2/1/48 | | 2,287,883 | 2,315,616 |
| Metropolitan Govt. Nashville & Davidson County Elec. Rev. Series 2024 A: | | | |
| 5% 5/15/42 | | 2,240,000 | 2,522,310 |
| 5% 5/15/43 | | 1,340,000 | 1,502,803 |
| 5.25% 5/15/49 | | 5,900,000 | 6,626,386 |
| Metropolitan Govt. Nashville & Davidson County Sports Auth. Rev.: | | | |
| Series 2023 A: | | | |
5.25% 7/1/53 (Assured Guaranty Muni. Corp. Insured) | | 3,050,000 | 3,355,124 |
5.25% 7/1/56 (Assured Guaranty Muni. Corp. Insured) | | 3,250,000 | 3,559,093 |
| Series 2023 B: | | | |
5.25% 7/1/53 (Assured Guaranty Muni. Corp. Insured) | | 1,205,000 | 1,322,653 |
5.25% 7/1/56 (Assured Guaranty Muni. Corp. Insured) | | 1,395,000 | 1,524,338 |
| Metropolitan Govt. Nashville & Davidson County Wtr. & Swr. Sys. Rev.: | | | |
| Series 2017 A, 5% 7/1/42 | | 480,000 | 497,034 |
| Series 2017 B: | | | |
5% 7/1/42 | | 600,000 | 621,292 |
5% 7/1/46 | | 950,000 | 979,733 |
| Metropolitan Govt. of Nashville & Davidson County Series 2023: | | | |
| 5% 5/1/35 | | 1,000,000 | 1,110,097 |
| 5% 5/1/36 | | 1,055,000 | 1,168,999 |
| 5% 5/1/41 | | 1,000,000 | 1,093,915 |
| 5% 5/1/42 | | 1,315,000 | 1,433,409 |
| 5.25% 5/1/53 | | 2,000,000 | 2,177,521 |
| Metropolitan Nashville Arpt. Auth. Rev.: | | | |
| Series 2015 B, 4% 7/1/25 (e) | | 310,000 | 310,925 |
| Series 2019 A, 4% 7/1/49 | | 1,285,000 | 1,282,016 |
| Series 2019 B: | | | |
4% 7/1/49 (e) | | 2,500,000 | 2,407,106 |
5% 7/1/27 (e) | | 435,000 | 451,685 |
5% 7/1/28 (e) | | 675,000 | 710,203 |
5% 7/1/35 (e) | | 360,000 | 381,802 |
5% 7/1/38 (e) | | 2,325,000 | 2,447,416 |
5% 7/1/44 (e) | | 1,885,000 | 1,957,228 |
5% 7/1/54 (e) | | 4,300,000 | 4,424,166 |
| Series 2022 B: | | | |
5.5% 7/1/37 (e) | | 1,500,000 | 1,684,679 |
5.5% 7/1/41 (e) | | 625,000 | 691,132 |
5.5% 7/1/52 (e) | | 5,985,000 | 6,486,318 |
| Nashville and Davidson County Metropolitan Govt. Health & Edl. Facilities Board Rev.: | | | |
| (Lipscomb Univ. Proj.) Series 2019 A, 5.25% 10/1/58 | | 1,865,000 | 1,917,098 |
| Series 2016 A: | | | |
5% 7/1/35 | | 830,000 | 848,094 |
5% 7/1/40 | | 460,000 | 468,459 |
| New Memphis Arena Bldg. Auth. (City of Memphis Proj.) Series 2021: | | | |
| 0% 4/1/32 | | 120,000 | 89,853 |
| 0% 4/1/33 | | 170,000 | 121,460 |
| 0% 4/1/37 | | 150,000 | 88,212 |
| 0% 4/1/38 | | 125,000 | 69,740 |
| Rutherford County Gen. Oblig. Series 2020, 1.875% 4/1/39 | | 750,000 | 571,844 |
| Shelby County Health & Educati (Madrone Memphis Student Hsg., I LLC- Univ. of Memphis Proj.) Series 2024 A1, 5% 6/1/44 (g) | | 400,000 | 409,077 |
| Shelby County Health Edl. & Hsg. Facilities Board Rev. (Methodist Le Bonheur Health Proj.) Series 2017 A: | | | |
| 5% 5/1/27 | | 70,000 | 72,829 |
| 5% 5/1/29 | | 70,000 | 72,656 |
| 5% 5/1/30 | | 135,000 | 139,867 |
| 5% 5/1/31 | | 70,000 | 72,316 |
| Shelby County Health Edl. & Hsg. Facility Board Residential Care Facilitiy Mtg. Rev. Series 2014: | | | |
| 5% 12/1/34 | | 70,000 | 69,995 |
| 5.25% 12/1/44 | | 165,000 | 159,181 |
| 5.25% 12/1/49 | | 470,000 | 439,982 |
| Tennergy Corp. Gas Rev. Bonds: | | | |
| Series 2022 A, 5.5%, tender 12/1/30 (b) | | 5,150,000 | 5,573,416 |
| Series 2024 A, 5%, tender 12/1/29 (b) | | 3,760,000 | 3,997,781 |
| Tennessee Energy Acquisition Corp.: | | | |
| Bonds: | | | |
Series 2018, 4%, tender 11/1/25 (b) | | 8,265,000 | 8,298,949 |
Series 2021 A, 5%, tender 11/1/31 (b) | | 525,000 | 564,309 |
Series 2023 A1, 5%, tender 5/1/28 (b) | | 5,000,000 | 5,205,086 |
| Series 2006 A, 5.25% 9/1/26 | | 2,270,000 | 2,314,470 |
| Tennessee Gen. Oblig. Series 2023 A: | | | |
| 5% 5/1/40 | | 1,995,000 | 2,258,818 |
| 5% 5/1/42 | | 1,245,000 | 1,396,677 |
| Tennessee Hsg. Dev. Agcy. Series 2015 A, 3.5% 7/1/45 | | 405,000 | 403,337 |
| Tennessee Hsg. Dev. Agcy. Residential: | | | |
| Series 2014 2C, 4% 1/1/45 | | 20,000 | 19,995 |
| Series 2018 1, 4% 1/1/43 | | 200,000 | 200,428 |
| Series 2018 3, 4.25% 7/1/49 | | 225,000 | 226,285 |
| Series 2019 1, 3.75% 7/1/39 | | 180,000 | 176,284 |
| Series 2019 3: | | | |
2.6% 7/1/39 | | 190,000 | 159,198 |
2.8% 7/1/44 | | 230,000 | 180,385 |
| Series 2019 4, 2.9% 7/1/39 | | 440,000 | 374,009 |
| Series 2021 1, 3% 7/1/51 | | 1,700,000 | 1,674,285 |
| Series 2021 3A, 3% 1/1/52 | | 705,000 | 691,965 |
| Series 2022 1: | | | |
5% 7/1/28 | | 425,000 | 451,125 |
5% 1/1/29 | | 230,000 | 246,465 |
5% 7/1/29 | | 400,000 | 431,727 |
5% 1/1/30 | | 465,000 | 499,488 |
5% 7/1/30 | | 470,000 | 507,620 |
5% 1/1/31 | | 220,000 | 240,090 |
5% 7/1/31 | | 500,000 | 548,270 |
TOTAL TENNESSEE | | | 127,804,206 |
| Texas - 5.6% | | | |
| Aldine Independent School District: | | | |
| Series 2017 A, 5% 2/15/28 | | 1,500,000 | 1,572,359 |
| Series 2024, 4% 2/15/54 | | 1,500,000 | 1,483,681 |
| Anna Independent School District Series 2023, 4.125% 2/15/53 | | 205,000 | 206,362 |
| Arlington Higher Ed. Fin. Corp.: | | | |
| Bonds Series 2021, 4.5%, tender 6/15/26 (b)(g) | | 200,000 | 200,032 |
| Series 2017 A: | | | |
5% 12/1/47 | | 565,000 | 577,839 |
5% 8/15/48 | | 1,000,000 | 980,819 |
| Series 2022: | | | |
4% 8/15/41 | | 2,400,000 | 2,407,982 |
4.25% 8/15/47 | | 1,730,000 | 1,763,972 |
5% 8/15/47 | | 785,000 | 841,217 |
| Series 2023, 5% 8/15/48 | | 2,700,000 | 2,907,466 |
| Series 2024 A, 5% 8/15/49 | | 1,000,000 | 1,004,643 |
| Series 2024: | | | |
4.875% 6/15/59 (g) | | 1,280,000 | 1,280,114 |
5% 6/15/64 (g) | | 595,000 | 596,104 |
| Arlington Spl. Tax Rev. Series 2018 A: | | | |
| 5% 2/15/43 (Assured Guaranty Muni. Corp. Insured) | | 2,085,000 | 2,169,835 |
| 5% 2/15/48 (Assured Guaranty Muni. Corp. Insured) | | 1,760,000 | 1,816,031 |
| Austin Affordable Pfc, Inc. Multifamily Hsg. Rev. Series 2024-2024A Class PT, 4.45% 3/1/43 | | 430,000 | 436,415 |
| Austin Arpt. Sys. Rev.: | | | |
| Series 2014: | | | |
5% 11/15/26 (e) | | 1,625,000 | 1,628,225 |
5% 11/15/27 (e) | | 150,000 | 150,278 |
5% 11/15/28 (e) | | 185,000 | 185,341 |
5% 11/15/39 (e) | | 1,685,000 | 1,687,464 |
5% 11/15/44 (e) | | 2,050,000 | 2,052,558 |
| Series 2017 B: | | | |
5% 11/15/28 (e) | | 120,000 | 123,197 |
5% 11/15/30 (e) | | 185,000 | 189,759 |
5% 11/15/32 (e) | | 150,000 | 153,594 |
5% 11/15/35 (e) | | 150,000 | 153,225 |
5% 11/15/36 (e) | | 255,000 | 260,255 |
5% 11/15/37 (e) | | 175,000 | 178,424 |
5% 11/15/41 (e) | | 705,000 | 715,120 |
| Series 2019 B: | | | |
5% 11/15/32 (e) | | 1,700,000 | 1,805,816 |
5% 11/15/36 (e) | | 1,150,000 | 1,210,539 |
5% 11/15/44 (e) | | 845,000 | 874,109 |
| Series 2022: | | | |
5% 11/15/39 (e) | | 1,260,000 | 1,353,008 |
5% 11/15/52 (e) | | 825,000 | 861,958 |
5.25% 11/15/47 (e) | | 1,815,000 | 1,954,976 |
| Austin Convention Enterprises, Inc.: | | | |
| Series 2017 A: | | | |
5% 1/1/28 | | 125,000 | 126,760 |
5% 1/1/29 | | 150,000 | 152,037 |
5% 1/1/30 | | 390,000 | 395,063 |
5% 1/1/31 | | 630,000 | 637,670 |
5% 1/1/32 | | 470,000 | 475,086 |
5% 1/1/33 | | 440,000 | 444,464 |
5% 1/1/34 | | 885,000 | 893,209 |
| Series 2017 B: | | | |
5% 1/1/26 | | 410,000 | 409,569 |
5% 1/1/28 | | 135,000 | 135,302 |
5% 1/1/29 | | 160,000 | 160,278 |
5% 1/1/30 | | 95,000 | 95,110 |
5% 1/1/32 | | 315,000 | 314,099 |
5% 1/1/34 | | 490,000 | 485,545 |
| Austin Gen. Oblig. Series 2022, 5% 9/1/25 | | 5,635,000 | 5,723,145 |
| Bastrop Independent School District Series 2023, 5% 2/15/53 | | 250,000 | 269,623 |
| Belton Independent School District Series 2022, 4% 2/15/52 | | 605,000 | 603,674 |
| Bexar County Health Facilities Dev. Corp. Rev. Series 2016, 4% 7/15/36 | | 425,000 | 398,666 |
| Bexar County Hosp. District Series 2023: | | | |
| 5% 2/15/41 | | 1,400,000 | 1,535,591 |
| 5% 2/15/42 | | 1,000,000 | 1,093,420 |
| 5% 2/15/48 | | 1,000,000 | 1,079,344 |
| Board of Managers, Joint Guadalupe County, City of Seguin Hosp. Series 2015: | | | |
| 5% 12/1/28 | | 195,000 | 195,265 |
| 5% 12/1/29 | | 500,000 | 500,680 |
| 5% 12/1/30 | | 240,000 | 240,421 |
| 5% 12/1/40 | | 965,000 | 965,838 |
| 5% 12/1/45 | | 935,000 | 935,395 |
| 5.25% 12/1/35 | | 290,000 | 291,167 |
| Brazos County Gen. Oblig. Series 2020, 2.125% 9/1/40 | | 1,100,000 | 812,757 |
| Brazos Higher Ed. Auth.: | | | |
| Series 2020 1A, 2.35% 4/1/40 (e) | | 10,000 | 9,924 |
| Series 2020 1B, 3% 4/1/40 (e) | | 190,000 | 159,230 |
| Series 2021 1A, 5.125% 4/1/43 (e) | | 3,505,000 | 3,701,153 |
| Series 2021 A, 3.414% 4/1/40 | | 15,000 | 14,881 |
| Series 2024 A1, 4% 4/1/45 (e) | | 1,620,000 | 1,580,104 |
| Brock Independent School District Series 2023, 4% 8/15/48 | | 2,025,000 | 2,030,533 |
| Bryan Tex For Previous Issuess Series 2020, 2.125% 8/15/34 | | 525,000 | 455,077 |
| Calhoun County Navigation Indl. Dev. Auth. (Max Midstream Texas, LLC Proj.): | | | |
| Series 2021 A, 3.625% 7/1/26 (e)(g) | | 650,000 | 602,552 |
| Series 2021 B, 6.5% 7/1/26 (g) | | 550,000 | 534,892 |
| Castleberry Independent School District Series 2024, 4% 2/15/49 | | 1,200,000 | 1,201,665 |
| Cedar Park Series 2020, 1.125% 2/15/32 | | 1,570,000 | 1,259,548 |
| Cedar Port Nav & Impt. District Tex Series 2023: | | | |
| 4.5% 9/1/48 | | 1,245,000 | 1,261,075 |
| 4.5% 9/1/52 | | 505,000 | 509,908 |
| Celina Tex Series 2021, 1.75% 9/1/35 | | 3,340,000 | 2,635,284 |
| Celina Tex Spl. Assmt Rev. (Mosaic Pub. Impt. District #1B Proj.) Series 2024: | | | |
| 4.375% 9/1/31 (d) | | 150,000 | 150,572 |
| 5.125% 9/1/44 (d) | | 340,000 | 343,104 |
| 5.375% 9/1/53 (d) | | 250,000 | 254,288 |
| Central Reg'l. Mobility Auth.: | | | |
| Series 2015 A: | | | |
5% 1/1/28 | | 325,000 | 328,568 |
5% 1/1/31 (Pre-Refunded to 7/1/25 @ 100) | | 55,000 | 55,604 |
5% 1/1/40 (Pre-Refunded to 7/1/25 @ 100) | | 705,000 | 712,747 |
| Series 2016, 4% 1/1/41 | | 250,000 | 247,799 |
| Series 2020 A, 5% 1/1/49 | | 220,000 | 229,249 |
| Series 2020 B: | | | |
4% 1/1/34 | | 20,000 | 20,494 |
4% 1/1/35 | | 15,000 | 15,339 |
4% 1/1/36 | | 15,000 | 15,281 |
4% 1/1/37 | | 20,000 | 20,330 |
4% 1/1/38 | | 30,000 | 30,419 |
4% 1/1/39 | | 40,000 | 40,381 |
4% 1/1/40 | | 15,000 | 15,072 |
5% 1/1/27 | | 15,000 | 15,578 |
5% 1/1/28 | | 15,000 | 15,866 |
5% 1/1/29 | | 55,000 | 59,000 |
5% 1/1/30 | | 25,000 | 27,206 |
5% 1/1/31 | | 15,000 | 16,294 |
5% 1/1/32 | | 15,000 | 16,244 |
5% 1/1/33 | | 20,000 | 21,596 |
5% 1/1/45 | | 100,000 | 104,737 |
| Series 2020 F, 5% 1/1/25 | | 1,000,000 | 1,001,810 |
| Series 2020 G, 4% 1/1/45 | | 1,070,000 | 1,038,209 |
| Series 2021 B: | | | |
4% 1/1/51 | | 1,205,000 | 1,161,312 |
5% 1/1/30 | | 65,000 | 70,735 |
5% 1/1/32 | | 80,000 | 87,817 |
5% 1/1/39 | | 85,000 | 91,244 |
5% 1/1/46 | | 2,775,000 | 2,924,054 |
| Series 2021 C, 5% 1/1/27 | | 2,780,000 | 2,835,257 |
| Chambers County Tex Justice Ctrp (Justice Ctr. Proj.) Series 2024, 5.5% 6/1/55 | | 3,020,000 | 3,311,732 |
| City of Denton Series 2020, 2% 2/15/37 | | 2,215,000 | 1,748,007 |
| Clifton Higher Ed. Fin. Corp. Ed. Rev.: | | | |
| Series 2018 D, 6.125% 8/15/48 | | 4,450,000 | 4,509,190 |
| Series 2021 T, 4% 8/15/47 | | 250,000 | 238,822 |
| Series 2022, 4.25% 8/15/52 | | 750,000 | 756,508 |
| Series 2024 A: | | | |
4.125% 8/15/49 | | 200,000 | 200,290 |
4.25% 8/15/53 | | 2,200,000 | 2,219,927 |
5.75% 6/15/44 (g) | | 575,000 | 580,891 |
| College of the Mainland Series 2020, 4% 8/15/44 | | 475,000 | 475,715 |
| Collin County Cmnty. College District Series 2018, 3.5% 8/15/37 | | 750,000 | 724,882 |
| Comal Independent School District: | | | |
| Series 2022, 3% 2/1/40 | | 2,500,000 | 2,282,928 |
| Series 2024, 3% 2/15/39 | | 1,840,000 | 1,740,489 |
| Conroe Independent School District Series 2022, 3% 2/15/41 | | 5,000,000 | 4,486,320 |
| Conroe Local Govt. Corp. Hotel Rev. Series 2021 C, 4% 10/1/46 | | 70,000 | 67,477 |
| Conroe Local Govt. Hotel Rev.: | | | |
| Series 2021 A: | | | |
2.5% 10/1/31 | | 115,000 | 99,344 |
4% 10/1/50 | | 540,000 | 446,855 |
| Series 2021 B: | | | |
3.5% 10/1/31 (g) | | 45,000 | 37,500 |
5% 10/1/50 (g) | | 390,000 | 317,470 |
| Corpus Christi Util. Sys. Rev. Series 2024: | | | |
| 5% 7/15/33 | | 1,255,000 | 1,442,643 |
| 5% 7/15/35 | | 1,800,000 | 2,081,483 |
| 5% 7/15/49 | | 1,375,000 | 1,500,507 |
| Crowley Independent School Dis Series 2023, 5.25% 2/1/53 | | 3,505,000 | 3,840,079 |
| Cypress-Fairbanks Independent School District Series 2023, 4% 2/15/48 | | 545,000 | 546,442 |
| Dallas Area Rapid Transit Sales Tax Rev. Series 2020 A, 5% 12/1/45 | | 80,000 | 85,332 |
| Dallas Fort Worth Int'l. Arpt. Rev.: | | | |
| Series 2020 A, 4% 11/1/34 | | 3,550,000 | 3,665,059 |
| Series 2020 B: | | | |
4% 11/1/34 | | 280,000 | 289,075 |
4% 11/1/35 | | 250,000 | 257,384 |
| Dallas Gen. Oblig.: | | | |
| Series 2024 B, 5% 2/15/26 | | 3,000,000 | 3,075,674 |
| Series 2024 C, 5% 2/15/40 (d) | | 5,640,000 | 6,375,068 |
| Dallas Hotel Occupancy Tax Series 2021: | | | |
| 4% 8/15/29 | | 435,000 | 438,758 |
| 4% 8/15/31 | | 245,000 | 246,716 |
| 4% 8/15/32 | | 200,000 | 201,018 |
| 4% 8/15/33 | | 200,000 | 200,848 |
| 4% 8/15/36 | | 625,000 | 625,919 |
| 4% 8/15/38 | | 500,000 | 499,907 |
| Dallas Hsg. Fin. Corp. Multi-family Hsg. Rev. Series 2024 A, 4.35% 10/1/41 | | 760,000 | 779,623 |
| Dallas Independent School District: | | | |
| Series 2016 A, 3% 2/15/28 | | 1,000,000 | 1,000,075 |
| Series 2024, 4% 2/15/54 | | 2,500,000 | 2,472,802 |
| Dallas Tex Spl. Tax Rev. Bonds Series 2023, 6.25%, tender 8/15/28 (b)(g) | | 1,580,000 | 1,583,835 |
| Dallas Wtrwks. & Swr. Sys. Rev.: | | | |
| Series 2017, 5% 10/1/46 | | 3,375,000 | 3,503,828 |
| Series 2024, 5% 10/1/42 (d) | | 1,620,000 | 1,828,764 |
| Danbury Higher Ed. Auth., Inc. Series 2019 A, 4% 8/15/49 | | 115,000 | 92,364 |
| Denton Independent School District: | | | |
| Series 2016, 3% 8/15/28 | | 1,000,000 | 994,619 |
| Series 2020, 1.8% 8/15/37 | | 1,250,000 | 960,649 |
| Series 2023: | | | |
5% 8/15/48 | | 4,000,000 | 4,362,750 |
5% 8/15/53 | | 2,500,000 | 2,707,106 |
| East Montgomery County Impt. District Series 2024, 5.25% 8/15/49 (d) | | 4,260,000 | 4,695,858 |
| East Montgomery County Muni. Util. District No. 3 Series 2022, 4.375% 8/15/45 | | 1,325,000 | 1,326,933 |
| Ector County Hosp. District Series 2020: | | | |
| 5% 9/15/25 | | 90,000 | 90,478 |
| 5% 9/15/26 | | 135,000 | 137,072 |
| 5% 9/15/27 | | 210,000 | 215,396 |
| 5% 9/15/28 | | 225,000 | 232,710 |
| 5% 9/15/29 | | 145,000 | 150,920 |
| 5% 9/15/30 | | 170,000 | 177,998 |
| 5% 9/15/31 | | 230,000 | 239,562 |
| Ector County Tex Independent School District Series 2024 A, 5% 8/15/27 | | 1,000,000 | 1,059,866 |
| El Paso County Hosp. District Rev. Series 2024, 4.25% 2/15/54 | | 260,000 | 260,382 |
| El Paso County Hosp. District Series 2024, 5% 8/15/27 | | 1,225,000 | 1,294,032 |
| El Paso Gen. Oblig. Series 2016, 4% 8/15/42 | | 1,890,000 | 1,891,963 |
| El Paso Independent School District Series 2020: | | | |
| 5% 8/15/25 | | 530,000 | 537,390 |
| 5% 8/15/26 | | 920,000 | 954,063 |
| El Paso Wtr. & Swr. Rev. Series 2023, 5.25% 3/1/49 | | 2,000,000 | 2,194,089 |
| Elgin Combination Tax and Rev. Series 2021: | | | |
| 4% 7/15/32 (Assured Guaranty Muni. Corp. Insured) | | 45,000 | 46,802 |
| 4% 7/15/33 (Assured Guaranty Muni. Corp. Insured) | | 50,000 | 51,842 |
| 4% 7/15/34 (Assured Guaranty Muni. Corp. Insured) | | 85,000 | 87,637 |
| 4% 7/15/35 (Assured Guaranty Muni. Corp. Insured) | | 110,000 | 112,781 |
| 4% 7/15/36 (Assured Guaranty Muni. Corp. Insured) | | 70,000 | 71,357 |
| 4% 7/15/38 (Assured Guaranty Muni. Corp. Insured) | | 120,000 | 121,216 |
| Elgin Independent School District Series 2024, 4% 8/1/49 | | 4,200,000 | 4,214,666 |
| Ep Essential Hsg. Wf Pfc (Retreat At Mesa Hills Proj.) Series 2024, 4.25% 12/1/34 | | 2,685,000 | 2,696,080 |
| Forney Independent School District Series 2019, 5% 2/15/49 | | 395,000 | 404,557 |
| Fort Bend County Indl. Dev. Corp. (NRG Energy, Inc. Proj.) Series 2012 B, 4.75% 11/1/42 | | 705,000 | 705,138 |
| Fort Bend Independent School District: | | | |
| Bonds Series 2021 B, 0.72%, tender 8/1/26 (b) | | 1,210,000 | 1,143,476 |
| Series 2024 A, 4% 8/15/49 | | 2,000,000 | 2,006,573 |
| Series 2024 B, 4%, tender 8/1/27 (b) | | 2,500,000 | 2,554,876 |
| Fort Worth Gen. Oblig. Series 2021: | | | |
| 2% 3/1/38 | | 1,475,000 | 1,140,885 |
| 2% 3/1/41 | | 1,000,000 | 714,800 |
| Fort Worth Independent School District Series 2019 A, 2.375% 2/15/33 | | 365,000 | 326,937 |
| Fort Worth Wtr. & Swr. Rev. Series 2020 A, 2% 2/15/32 | | 2,000,000 | 1,771,679 |
| Fredericksburg Independent School District Series 2022, 4% 2/15/52 | | 1,080,000 | 1,077,632 |
| Friendswood Tex (Friendswood City Ctr. Pub. Impt. District Initial Major Impts. Proj.) Series 2024, 7% 9/15/54 | | 675,000 | 683,261 |
| Galveston Wharves &Term.: | | | |
| Series 2023, 5.25% 8/1/38 (e) | | 270,000 | 292,254 |
| Series 2024 A, 5.25% 8/1/36 (e) | | 785,000 | 855,046 |
| Galveston County Tex Muni. Util. Di Series 2022, 4.5% 6/1/44 (Assured Guaranty Muni. Corp. Insured) | | 1,550,000 | 1,562,196 |
| Garland Elec. Util. Sys. Rev.: | | | |
| Series 2021 A: | | | |
4% 3/1/46 | | 100,000 | 96,902 |
4% 3/1/51 | | 125,000 | 119,416 |
| Series 2023, 4.25% 3/1/48 (Assured Guaranty Muni. Corp. Insured) | | 1,655,000 | 1,665,309 |
| Georgetown Util. Sys. Rev. Series 2022, 5.25% 8/15/52 (Assured Guaranty Muni. Corp. Insured) | | 1,800,000 | 1,943,892 |
| Grand Parkway Trans. Corp.: | | | |
| Series 2013 A, 5.85% 10/1/47 | | 1,480,000 | 1,610,944 |
| Series 2013, 5.45% 10/1/34 | | 1,205,000 | 1,310,324 |
| Series 2018 A: | | | |
5% 10/1/36 | | 280,000 | 296,101 |
5% 10/1/37 | | 560,000 | 591,731 |
5% 10/1/38 | | 390,000 | 411,736 |
5% 10/1/43 | | 305,000 | 318,763 |
| Series 2020 C, 4% 10/1/49 | | 160,000 | 157,185 |
| Series 2020, 4% 10/1/49 | | 4,630,000 | 4,585,274 |
| Greater Texoma Util. Auth. Tex C (City of Sherman Proj.) Series 2023 A, 4.375% 10/1/53 (Build America Mutual Assurance Insured) | | 1,000,000 | 1,012,424 |
| Greenville Tex Elec. Util. Sys. R Series 2024, 5.25% 2/15/49 (Build America Mutual Assurance Insured) | | 2,200,000 | 2,385,972 |
| Greenville Tex Wtrwks. & Swr. Sy Series 2024, 5% 2/15/42 (Assured Guaranty Muni. Corp. Insured) | | 1,210,000 | 1,319,713 |
| Gulf Coast Indl. Dev. Auth. Solid Waste Disp. Rev.: | | | |
| (Citgo Petroleum Corp. Proj.) Series 1995, 4.875% 5/1/25 (e) | | 2,570,000 | 2,570,816 |
| Series 1998, 8% 4/1/28 (e) | | 1,205,000 | 1,206,615 |
| Harlingen Econ. Dev. Corp. Series 2019 A, 4% 2/15/30 | | 245,000 | 251,870 |
| Harris County Cultural Ed. Facilities Fin. Corp. Rev.: | | | |
| (Brazos Presbyterian Homes, Inc. Proj.) Series 2013 A: | | | |
5% 1/1/38 | | 70,000 | 70,039 |
5% 1/1/43 | | 70,000 | 70,021 |
| (Texas Childrens Hosp., Proj.) Series 2015-1 5% 10/1/29 | | 160,000 | 162,614 |
| Bonds Series 2024 C, 5%, tender 7/1/54 | | 750,000 | 808,689 |
| Series 2013 B, 6.375% 1/1/33 | | 45,000 | 45,092 |
| Series 2016 A, 5% 7/1/39 | | 5,000,000 | 5,098,945 |
| Series 2021 A: | | | |
3% 10/1/51 | | 500,000 | 392,411 |
4% 10/1/42 | | 2,410,000 | 2,388,337 |
| Series 2022 A, 4.125% 7/1/52 | | 2,125,000 | 2,116,013 |
| Series 2024 B: | | | |
5% 7/1/31 | | 2,500,000 | 2,795,840 |
5% 7/1/35 | | 2,510,000 | 2,876,340 |
| Harris County Cultural Ed. Facilities Fin. Corp. Thermal Util. Rev. (Teco Proj.) Series 2017: | | | |
| 5% 11/15/31 | | 195,000 | 203,975 |
| 5% 11/15/33 | | 1,940,000 | 2,021,054 |
| Harris County Flood Cont. District Series 2021 A: | | | |
| 5% 10/1/28 | | 1,200,000 | 1,300,963 |
| 5% 10/1/29 | | 1,200,000 | 1,322,882 |
| Harris County Gen. Oblig.: | | | |
| Series 2002: | | | |
0% 8/15/25 (Nat'l. Pub. Fin. Guarantee Corp. Insured) | | 365,000 | 356,690 |
0% 8/15/28 (Nat'l. Pub. Fin. Guarantee Corp. Insured) | | 605,000 | 538,315 |
| Series 2015 A, 5% 10/1/31 | | 555,000 | 562,383 |
| Series 2024, 4% 9/15/49 | | 6,500,000 | 6,439,242 |
| Harris County Health Facilities Dev. Corp. Rev. Series 1997 B, 5.75% 7/1/27 (Escrowed to Maturity) | | 310,000 | 321,156 |
| Harris County Toll Road Rev.: | | | |
| (Harris County Toll Road Auth. Proj.) Series 2018 A, 5% 8/15/33 | | 110,000 | 116,495 |
| Series 2018 A, 5% 8/15/43 | | 1,445,000 | 1,505,520 |
| Series 2024 A, 4% 8/15/49 | | 5,615,000 | 5,584,374 |
| Harris County-Houston Sports Auth. Rev.: | | | |
| Series 2001 A, 0% 11/15/38 (Nat'l. Pub. Fin. Guarantee Corp. Insured) | | 1,200,000 | 611,661 |
| Series 2001 G, 0% 11/15/41 | | 1,000,000 | 425,859 |
| Series 2014 A, 0% 11/15/41 (Assured Guaranty Muni. Corp. Insured) | | 190,000 | 88,115 |
| Series 2014, 0% 11/15/46 (Assured Guaranty Muni. Corp. Insured) | | 880,000 | 314,062 |
| Series 2024 B: | | | |
5% 11/15/43 | | 200,000 | 218,345 |
5% 11/15/44 | | 725,000 | 788,939 |
| Hays Consolidated Independent School District Series 2022, 4% 2/15/47 | | 1,500,000 | 1,507,748 |
| Hidalgo County Reginal Mobility Auth. Series 2022 A: | | | |
| 4% 12/1/38 | | 1,000,000 | 984,342 |
| 4% 12/1/39 | | 500,000 | 489,588 |
| 4% 12/1/40 | | 85,000 | 82,381 |
| 4% 12/1/41 | | 195,000 | 187,764 |
| Houston Arpt. Sys. Rev.: | | | |
| (United Airlines, Inc. Technical Operations Ctr. Proj.) Series 2018, 5% 7/15/28 (e) | | 1,785,000 | 1,841,358 |
| (United Airlines, Inc. Term. E Proj.): | | | |
Series 2020 A, 5% 7/1/27 (e) | | 140,000 | 143,194 |
Series 2021 A, 4% 7/1/41 (e) | | 1,495,000 | 1,426,229 |
| (United Airlines, Inc. Term. Impt. Projs.): | | | |
Series 2015 B1: | | | |
5% 7/15/30 (e) | | 995,000 | 1,000,325 |
5% 7/15/35 (e) | | 2,085,000 | 2,092,027 |
Series 2020 B2, 5% 7/15/27 (e) | | 190,000 | 194,386 |
Series 2021 B1, 4% 7/15/41 (e) | | 2,310,000 | 2,203,545 |
Series 2024 B: | | | |
5.5% 7/15/37 (d)(e) | | 2,100,000 | 2,275,338 |
5.5% 7/15/38 (d) | | 1,250,000 | 1,351,910 |
5.5% 7/15/39 (d) | | 2,450,000 | 2,643,867 |
| Series 2018 A: | | | |
5% 7/1/36 (e) | | 325,000 | 337,654 |
5% 7/1/37 (e) | | 630,000 | 653,416 |
5% 7/1/41 (e) | | 3,080,000 | 3,168,734 |
| Series 2018 C: | | | |
5% 7/1/29 (e) | | 245,000 | 257,542 |
5% 7/1/30 (e) | | 260,000 | 273,085 |
5% 7/1/31 (e) | | 1,070,000 | 1,122,360 |
5% 7/1/32 (e) | | 1,315,000 | 1,375,448 |
| Series 2018 D: | | | |
5% 7/1/29 | | 105,000 | 112,680 |
5% 7/1/30 | | 140,000 | 149,771 |
5% 7/1/31 | | 125,000 | 133,240 |
5% 7/1/32 | | 110,000 | 116,727 |
| Series 2021 A: | | | |
4% 7/1/37 (e) | | 420,000 | 421,020 |
4% 7/1/39 (e) | | 1,000,000 | 998,797 |
4% 7/1/41 (e) | | 480,000 | 479,687 |
| Series 2023 A: | | | |
5.25% 7/1/43 (Assured Guaranty Muni. Corp. Insured) (e) | | 3,050,000 | 3,319,776 |
5.25% 7/1/53 (Assured Guaranty Muni. Corp. Insured) (e) | | 1,770,000 | 1,888,461 |
| Houston City of Higher Ed. Fin. Corp. (Houston Baptist Univ. Proj.) Series 2021: | | | |
| 3.375% 10/1/37 | | 50,000 | 44,249 |
| 4% 10/1/51 | | 170,000 | 145,975 |
| Houston Convention and Entertainment Facilities Dept. Hotel Occupancy Tax and Spl. Rev.: | | | |
| Series 2014, 5% 9/1/31 | | 250,000 | 250,299 |
| Series 2019, 5% 9/1/33 | | 50,000 | 53,406 |
| Houston Gen. Oblig.: | | | |
| Series 2017 A: | | | |
5% 3/1/28 | | 905,000 | 944,670 |
5% 3/1/32 | | 240,000 | 249,259 |
| Series 2024 A, 4.125% 3/1/51 | | 1,500,000 | 1,500,999 |
| Houston Util. Sys. Rev.: | | | |
| Series 2014 D, 5% 11/15/44 | | 725,000 | 725,620 |
| Series 2015 A, 5% 11/15/36 | | 2,500,000 | 2,531,494 |
| Series 2020 C: | | | |
4% 11/15/43 | | 2,470,000 | 2,474,107 |
4% 11/15/49 | | 2,470,000 | 2,441,459 |
5% 11/15/45 | | 2,470,000 | 2,637,541 |
| Series 2021 A: | | | |
5% 11/15/26 | | 25,000 | 26,096 |
5% 11/15/28 | | 100,000 | 108,398 |
| Irving Hosp. Auth. Hosp. Rev. Series 2017 A: | | | |
| 5% 10/15/28 | | 55,000 | 56,212 |
| 5% 10/15/30 | | 230,000 | 234,832 |
| 5% 10/15/32 | | 120,000 | 122,273 |
| 5% 10/15/33 | | 60,000 | 61,049 |
| 5% 10/15/34 | | 95,000 | 96,539 |
| 5% 10/15/35 | | 95,000 | 96,431 |
| 5% 10/15/36 | | 80,000 | 81,096 |
| 5% 10/15/37 | | 140,000 | 141,714 |
| 5% 10/15/38 | | 195,000 | 197,146 |
| 5% 10/15/44 | | 565,000 | 569,657 |
| Irving Hotel Occupancy Tax Rev. Series 2019: | | | |
| 5% 8/15/38 | | 50,000 | 50,884 |
| 5% 8/15/43 | | 90,000 | 90,627 |
| Joshua Independent School District Series 2024, 4% 8/15/49 | | 1,800,000 | 1,801,969 |
| Kaufman County Tex Fresh Wtr. Sup Series 2022, 4.5% 9/1/45 | | 1,575,000 | 1,588,360 |
| Lakes Fresh Wtr. Supply District De Series 2023, 4% 9/1/48 | | 1,350,000 | 1,310,927 |
| Lamar Consolidated Independent School District Series 2023: | | | |
| 4% 2/15/48 | | 2,095,000 | 2,085,771 |
| 4% 2/15/53 | | 1,465,000 | 1,440,356 |
| 5.5% 2/15/58 | | 10,000,000 | 11,112,889 |
| Laredo Wtrwks. Swr. Sys. Rev. Series 2024, 5% 3/1/39 | | 1,100,000 | 1,215,620 |
| Lavon Tex Spl. Assmt Rev. (Elevon Pub. Impt. District Impt. Area #1 Proj.) Series 2024: | | | |
| 5% 9/15/44 (g) | | 429,000 | 436,394 |
| 5.375% 9/15/52 (g) | | 391,000 | 398,728 |
| Lewisville Independent School District Series 2024, 5% 8/15/26 | | 1,735,000 | 1,800,415 |
| Longview Independent School District Series 2024, 4% 2/15/49 | | 3,000,000 | 3,012,384 |
| Love Field Arpt. Modernization Corp. (Southwest Airlines Co. Love Field Modernization Prog. Proj.) Series 2012, 5% 11/1/28 (e) | | 675,000 | 675,204 |
| Love Field Arpt. Modernization Rev.: | | | |
| Series 2015: | | | |
5% 11/1/26 (e) | | 120,000 | 121,775 |
5% 11/1/27 (e) | | 260,000 | 263,436 |
5% 11/1/28 (e) | | 405,000 | 410,136 |
5% 11/1/29 (e) | | 245,000 | 248,064 |
5% 11/1/32 (e) | | 450,000 | 454,937 |
| Series 2017: | | | |
5% 11/1/25 (e) | | 120,000 | 121,785 |
5% 11/1/26 (e) | | 120,000 | 123,660 |
5% 11/1/27 (e) | | 120,000 | 123,493 |
5% 11/1/28 (e) | | 210,000 | 215,487 |
5% 11/1/29 (e) | | 150,000 | 153,865 |
5% 11/1/30 (e) | | 120,000 | 123,029 |
5% 11/1/31 (e) | | 270,000 | 276,578 |
5% 11/1/32 (e) | | 315,000 | 322,409 |
5% 11/1/33 (e) | | 290,000 | 296,640 |
5% 11/1/34 (e) | | 120,000 | 122,608 |
5% 11/1/36 (e) | | 170,000 | 173,440 |
| Lower Colorado River Auth. Rev.: | | | |
| (LCRA Transmission Svcs. Corp. Proj.): | | | |
Series 2018: | | | |
5% 5/15/33 | | 250,000 | 265,511 |
5% 5/15/35 | | 120,000 | 127,137 |
5% 5/15/43 | | 95,000 | 99,056 |
5% 5/15/48 | | 110,000 | 114,128 |
Series 2020 A, 5% 5/15/50 | | 3,125,000 | 3,299,696 |
Series 2020: | | | |
5% 5/15/25 | | 705,000 | 710,735 |
5% 5/15/26 | | 890,000 | 915,967 |
5% 5/15/27 | | 1,060,000 | 1,116,209 |
5% 5/15/28 | | 145,000 | 155,548 |
Series 2023, 5.5% 5/15/48 (Assured Guaranty Muni. Corp. Insured) | | 1,000,000 | 1,110,880 |
Series 2024, 5.25% 5/15/54 (Assured Guaranty Muni. Corp. Insured) | | 2,530,000 | 2,773,910 |
| Series 2015 B: | | | |
5% 5/15/30 | | 250,000 | 251,958 |
5% 5/15/31 | | 400,000 | 403,007 |
| Series 2015 D, 5% 5/15/28 | | 270,000 | 272,249 |
| Lubbock Cooper Independent School District (The Permanent School Fund Guarantee Prog.) Series 2023, 5% 2/15/46 | | 1,175,000 | 1,274,451 |
| Lubbock Elec. Lt. & Pwr. Sys. Rev. Series 2021, 4% 4/15/46 | | 1,350,000 | 1,350,184 |
| Mansfield Tex Series 2020, 2.375% 2/15/37 | | 1,450,000 | 1,217,651 |
| Matagorda County Navigation District No. 1 Poll. Cont. Rev.: | | | |
| (AEP Texas Central Co. Proj.) Series 2008 2, 4% 6/1/30 | | 845,000 | 845,121 |
| (Central Pwr. and Lt. Co. Proj.) Series 2001 A, 2.6% 11/1/29 | | 1,205,000 | 1,144,018 |
| Mc Kinney Tex Series 2019, 2.5% 8/15/36 | | 2,130,000 | 1,843,820 |
| Melissa Tex Independent School District Series 2024, 4% 2/1/54 | | 1,750,000 | 1,731,267 |
| Mesquite Tex Hsg. Fin. Corp. Mult Series 2024 A, 4.53% 2/1/44 | | 963,212 | 976,663 |
| Midland Independent School District Series 2024: | | | |
| 4% 2/15/54 | | 8,625,000 | 8,564,756 |
| 5% 2/15/47 | | 1,250,000 | 1,360,854 |
| Mission Econ. Dev. Corp. Rev. (Natgasoline Proj.) Series 2018, 4.625% 10/1/31 (e)(g) | | 5,065,000 | 5,079,296 |
| Montgomery County Toll Road Auth. Series 2018: | | | |
| 5% 9/15/32 | | 105,000 | 105,969 |
| 5% 9/15/33 | | 105,000 | 105,941 |
| 5% 9/15/34 | | 110,000 | 110,942 |
| 5% 9/15/35 | | 280,000 | 282,284 |
| 5% 9/15/36 | | 415,000 | 418,231 |
| 5% 9/15/38 | | 305,000 | 307,059 |
| 5% 9/15/43 | | 905,000 | 909,925 |
| 5% 9/15/48 | | 1,595,000 | 1,602,865 |
| New Caney Independent School District Series 2023, 5% 2/15/48 | | 1,000,000 | 1,090,687 |
| New Hope Cultural Ed. Facilities: | | | |
| (Cardinal Bay, Inc. - Village on the Park/Carriage Inn Proj.) Series 2016 A1, 5% 7/1/46 | | 30,000 | 24,106 |
| (Sanctuary LTC Proj.) Series 2021 A1, 5.5% 1/1/57 | | 1,000,000 | 993,386 |
| Series 2019 A1, 5% 12/1/39 | | 455,000 | 460,330 |
| New Hope Cultural Ed. Facilities Corp. Cap. Impt. Rev. (CHF - Collegiate Hsg. Denton, L.L.C. - Texas Woman's Univ. Hsg. Proj.) Series 2018 A1, 5% 7/1/58 (Assured Guaranty Municipal Corp. Insured) | | 800,000 | 815,661 |
| New Hope Cultural Ed. Facilities Fin. (Texas A&M Univ. Cain Hall Redev. Proj.) Series 2016 A1, 5% 4/1/46 | | 1,325,000 | 1,341,094 |
| New Hope Cultural Ed. Facilities Fin. Corp.: | | | |
| (CHF - Collegiate Hsg. Stephenville III, L.L.C. - Tarleton State Univ. Proj.) Series 2015 A: | | | |
5% 4/1/30 (Pre-Refunded to 4/1/25 @ 100) | | 70,000 | 70,395 |
5% 4/1/35 (Pre-Refunded to 4/1/25 @ 100) | | 335,000 | 336,888 |
5% 4/1/47 (Pre-Refunded to 4/1/25 @ 100) | | 1,455,000 | 1,463,201 |
| (CHF Collegiate Hsg. College Station I, LLC Texas A&M Univ. Proj.) Series 2014 A, 5% 4/1/29 | | 820,000 | 820,492 |
| (Childrens Med. Ctr. of Dallas) Series 2017 A: | | | |
5% 8/15/27 | | 90,000 | 94,759 |
5% 8/15/28 | | 85,000 | 89,469 |
5% 8/15/29 | | 245,000 | 256,981 |
| Series 2014, 5% 4/1/46 | | 2,200,000 | 2,200,352 |
| Series 2020 A, 5% 7/1/57 | | 1,405,000 | 974,060 |
| New Hope Cultural Ed. Facilities Fin. Corp. Retirement Facility Rev.: | | | |
| (MRC Sr. Living - The Langford Proj.) Series 2016 A: | | | |
5.375% 11/15/36 | | 70,000 | 64,685 |
5.5% 11/15/46 | | 140,000 | 121,485 |
5.5% 11/15/52 | | 140,000 | 117,754 |
| (Presbyterian Village North Proj.) Series 2018: | | | |
5% 10/1/31 | | 140,000 | 140,238 |
5% 10/1/32 | | 65,000 | 64,959 |
5% 10/1/33 | | 220,000 | 219,693 |
5% 10/1/34 | | 140,000 | 139,681 |
5% 10/1/35 | | 295,000 | 294,062 |
5% 10/1/39 | | 210,000 | 204,116 |
5.25% 10/1/49 | | 1,365,000 | 1,297,016 |
| Series 2018 A, 5.5% 7/1/54 | | 1,160,000 | 885,184 |
| Series 2021 B, 2% 11/15/61 (h) | | 1,357,630 | 500,401 |
| New Hope Cultural Edl. Facilities Fin. Corp.: | | | |
| Series 2020 A: | | | |
5% 8/15/40 (g) | | 300,000 | 300,242 |
5% 8/15/50 (g) | | 300,000 | 290,267 |
| Series 2021: | | | |
4% 8/15/41 (g) | | 325,000 | 298,112 |
4% 8/15/56 (g) | | 350,000 | 293,127 |
| Newark Higher Ed. Fin. Corp.: | | | |
| (Abilene Christian Univ. Proj.) Series 2016 A: | | | |
5% 4/1/27 | | 90,000 | 91,739 |
5% 4/1/28 | | 100,000 | 101,792 |
5% 4/1/29 | | 115,000 | 117,015 |
| Series 2021 A: | | | |
4% 8/15/31 | | 255,000 | 252,563 |
4% 8/15/41 | | 405,000 | 370,177 |
| Series 2022, 4% 6/15/52 | | 370,000 | 368,439 |
| North Muni. Wtr. District Rws Rev. Series 2022, 4.375% 6/1/52 (Assured Guaranty Muni. Corp. Insured) | | 290,000 | 291,395 |
| North East Texas Reg'l. Mobility Auth. Series 2016 B, 5% 1/1/46 | | 250,000 | 251,963 |
| North Texas Tollway Auth. Rev.: | | | |
| (Sr. Lien Proj.) Series 2017 A: | | | |
5% 1/1/31 | | 120,000 | 122,265 |
5% 1/1/33 | | 145,000 | 150,243 |
5% 1/1/34 | | 240,000 | 248,564 |
5% 1/1/34 | | 365,000 | 423,814 |
5% 1/1/35 | | 345,000 | 357,061 |
5% 1/1/37 | | 1,740,000 | 1,797,923 |
| (Sub Lien Proj.) Series 2017 B: | | | |
5% 1/1/30 | | 70,000 | 71,185 |
5% 1/1/31 | | 90,000 | 91,543 |
5% 1/1/33 | | 85,000 | 88,140 |
| Series 2015 A, 5% 1/1/32 | | 490,000 | 490,608 |
| Series 2016 A: | | | |
4% 1/1/39 | | 1,205,000 | 1,207,946 |
5% 1/1/30 | | 50,000 | 50,959 |
5% 1/1/36 | | 150,000 | 152,666 |
5% 1/1/39 | | 800,000 | 812,232 |
| Series 2017 A, 5% 1/1/39 | | 4,225,000 | 4,425,702 |
| Series 2018: | | | |
0% 1/1/29 (Assured Guaranty, Inc. Insured) | | 845,000 | 739,499 |
4% 1/1/37 | | 1,500,000 | 1,510,335 |
4% 1/1/38 | | 3,205,000 | 3,223,908 |
5% 1/1/35 | | 30,000 | 31,646 |
| Series 2019 B, 5% 1/1/25 | | 40,000 | 40,055 |
| Series 2021 B: | | | |
3% 1/1/46 | | 700,000 | 592,122 |
3% 1/1/51 | | 1,585,000 | 1,270,536 |
4% 1/1/33 | | 130,000 | 133,428 |
| Series 2022 A: | | | |
4.125% 1/1/39 | | 750,000 | 768,479 |
4.125% 1/1/40 | | 1,500,000 | 1,529,299 |
5% 1/1/40 | | 2,900,000 | 3,190,594 |
5.25% 1/1/38 | | 1,300,000 | 1,466,433 |
| Series 2024 A: | | | |
5% 1/1/41 | | 4,655,000 | 5,211,430 |
5.25% 1/1/44 | | 645,000 | 725,677 |
| Series 2024 B, 5% 1/1/37 | | 2,855,000 | 3,259,934 |
| Northlake Tex Muni. Mgmt. District # Series 2022: | | | |
| 4.125% 3/1/48 (Assured Guaranty Muni. Corp. Insured) | | 1,340,000 | 1,257,905 |
| 4.25% 3/1/46 (Assured Guaranty Muni. Corp. Insured) | | 1,230,000 | 1,194,105 |
| Northside Independent School District Series 2018: | | | |
| 3.35% 8/15/36 | | 1,340,000 | 1,317,837 |
| 3.45% 8/15/37 | | 750,000 | 736,592 |
| Pampa Independent School District Series 2024, 4.125% 8/15/58 | | 590,000 | 595,485 |
| Pasadena Independent School District Bonds Series 2015 B, 3.23%, tender 2/15/44 (b) | | 3,375,000 | 3,376,451 |
| Pearland Independent School District Series 2016: | | | |
| 5.25% 2/15/32 | | 665,000 | 680,908 |
| 5.25% 2/15/32 (Pre-Refunded to 2/15/26 @ 100) | | 135,000 | 138,512 |
| Peaster Tex Independent School District Series 2021, 3% 8/15/51 | | 710,000 | 570,833 |
| Pflugerville Gen. Oblig. Series 2023, 4% 8/1/49 | | 815,000 | 804,935 |
| Port Arthur Series 2021: | | | |
| 4% 2/15/39 | | 60,000 | 60,820 |
| 4% 2/15/40 | | 70,000 | 70,640 |
| 4% 2/15/41 | | 70,000 | 70,379 |
| Port Beaumont Indl. Dev. Auth. Facility Rev. (Jefferson Gulf Coast Energy Proj.) Series 2021 B, 4.1% 1/1/28 (g) | | 4,000,000 | 3,561,597 |
| Port Beaumont Navigation District (Jefferson Gulf Coast Energy Proj.): | | | |
| Series 2020 A: | | | |
3.625% 1/1/35 (e)(g) | | 2,170,000 | 2,022,411 |
4% 1/1/50 (e)(g) | | 1,080,000 | 938,367 |
| Series 2021 A: | | | |
2.75% 1/1/36 (e)(g) | | 100,000 | 85,493 |
3% 1/1/50 (e)(g) | | 1,335,000 | 968,689 |
| Series 2024 A: | | | |
5% 1/1/39 (e)(g) | | 750,000 | 779,431 |
5.125% 1/1/44 (e)(g) | | 275,000 | 285,293 |
| Series 2024 B, 10% 7/1/26 (g) | | 490,000 | 500,768 |
| Princeton Tex Spl. Assmt Rev. (Eastridge Pub. Impt. District Impt. Area NO. 3 Proj.) Series 2024, 5% 9/1/44 (g) | | 600,000 | 601,867 |
| Red River Ed. Fin. Corp. (Houston Baptist Univ. Proj.) Series 2017, 5.5% 10/1/46 | | 655,000 | 662,636 |
| Rockwall Independent School District Series 2023, 4% 2/15/53 | | 590,000 | 582,782 |
| Sabine-Neches Tex Nav District Series 2022, 5.25% 2/15/52 | | 5,000,000 | 5,364,098 |
| San Antonio Edl. Facilities Corp. Rev. Series 2021 A, 4% 4/1/51 | | 250,000 | 211,736 |
| San Antonio Elec. & Gas Sys. Rev.: | | | |
| Bonds Series 2020, 1.75%, tender 12/1/25 (b) | | 690,000 | 675,054 |
| Series 2017: | | | |
5% 2/1/32 | | 70,000 | 73,411 |
5% 2/1/34 | | 85,000 | 88,992 |
| Series 2023 A, 5.5% 2/1/50 | | 2,500,000 | 2,818,435 |
| Series 2024 A, 5% 2/1/35 | | 2,250,000 | 2,606,218 |
| Series 2024 D, 5.25% 2/1/54 | | 1,710,000 | 1,903,631 |
| San Antonio Hsg. Trust Publ Series 2024-2024A Class PT, 4.45% 4/1/43 | | 505,000 | 512,504 |
| San Antonio Independent School District: | | | |
| Series 2019, 5% 8/15/25 | | 5,400,000 | 5,479,080 |
| Series 2022, 5% 8/15/52 | | 1,285,000 | 1,386,736 |
| San Antonio Tex Hsg. Trust Pub. Facilities Series 2024-2024A Class PT, 4.55% 3/1/43 | | 920,000 | 933,514 |
| San Antonio Wtr. Sys. Rev.: | | | |
| Series 2020 A, 5% 5/15/50 | | 1,505,000 | 1,592,168 |
| Series 2022 B, 5.25% 5/15/52 | | 7,250,000 | 7,912,536 |
| Seagoville Tex Spl. Assmt Rev. (Santorini Pub. Impt. District improvement Area #1 Proj.) Series 2024, 6.25% 9/15/54 (g) | | 1,000,000 | 1,016,380 |
| Southwest Higher Ed. Auth. Rev. (Southern Methodist Univ., TX. Proj.) Series 2017: | | | |
| 5% 10/1/29 | | 55,000 | 58,036 |
| 5% 10/1/30 | | 85,000 | 89,385 |
| 5% 10/1/31 | | 80,000 | 84,006 |
| 5% 10/1/32 | | 40,000 | 41,953 |
| 5% 10/1/39 | | 150,000 | 156,157 |
| 5% 10/1/40 | | 120,000 | 124,857 |
| Spring Branch Independent School District Series 2022, 5% 2/1/42 | | 2,250,000 | 2,473,309 |
| Spring Tex Independent School District Series 2023, 5% 8/15/47 | | 485,000 | 530,991 |
| Tarrant County Cultural Ed. Facilities Fin. Corp. Hosp. Rev.: | | | |
| (Baylor Scott & White Health Proj.) Series 2022 D, 5% 11/15/51 | | 1,625,000 | 1,740,248 |
| Series 2020, 5% 12/1/24 | | 35,000 | 35,003 |
| Series 2022: | | | |
4% 10/1/41 | | 480,000 | 480,107 |
4% 10/1/42 | | 80,000 | 79,885 |
4% 10/1/47 | | 1,085,000 | 1,070,468 |
4% 10/1/52 | | 190,000 | 187,476 |
5% 10/1/36 | | 35,000 | 38,920 |
5% 10/1/40 | | 130,000 | 142,187 |
| Tarrant County Cultural Ed. Facilities Fin. Corp. Retirement Facility Rev.: | | | |
| (Barton Creek Sr. Living Ctr., Inc. Querencia Proj.) Series 2015: | | | |
5% 11/15/30 | | 245,000 | 246,036 |
5% 11/15/35 | | 290,000 | 290,506 |
| (Buckner Retirement Svcs., Inc. Proj.): | | | |
Series 2016 A: | | | |
5% 11/15/28 | | 170,000 | 172,620 |
5% 11/15/37 | | 675,000 | 680,737 |
Series 2016 B, 5% 11/15/46 | | 810,000 | 810,193 |
| (Buckner Retirement Svcs., Inc.) Series 2016 B, 5% 11/15/40 | | 1,665,000 | 1,674,042 |
| (Buckner Sr. Living - Ventana Proj.) Series 2017 A, 6.625% 11/15/37 | | 260,000 | 271,727 |
| (Northwest Sr. Hsg. Corp. Edgemere Proj.): | | | |
Series 2015 A, 5% (f)(j) | | 1,881,800 | 188 |
Series 2017, 5.25% 11/15/47 (f)(j) | | 228,532 | 23 |
| Series 2020, 5.75% 12/1/54 (f) | | 3,043,304 | 1,917,282 |
| Tarrant County Cultural Ed. Facilities Fin. Corp. Rev.: | | | |
| (Trinity Terrace Proj.) Series 2024, 5% 10/1/49 | | 380,000 | 403,187 |
| Bonds Series 2022 A, 5%, tender 7/1/32 (b) | | 1,100,000 | 1,229,591 |
| Series 2016 A: | | | |
4% 2/15/35 | | 605,000 | 607,352 |
5% 2/15/41 | | 1,235,000 | 1,259,878 |
| Series 2018 B, 5% 7/1/43 | | 80,000 | 83,778 |
| Series 2022 A, 4% 7/1/53 | | 2,455,000 | 2,450,148 |
| Tarrant County Tex Hosp. District Series 2023, 4.25% 8/15/53 | | 1,160,000 | 1,170,874 |
| Temple Reinvestment Zone # One Tax Increment Rev. Series 2021 A: | | | |
| 4% 8/1/33 | | 40,000 | 41,606 |
| 4% 8/1/34 | | 50,000 | 51,797 |
| 4% 8/1/37 | | 40,000 | 41,099 |
| 4% 8/1/38 | | 35,000 | 35,796 |
| 4% 8/1/41 | | 40,000 | 40,264 |
| Texas Affordable Hsg. Corp. Single Family Mtg. Rev. Series 2023 A, 5.5% 9/1/53 | | 3,800,000 | 4,009,696 |
| Texas Dept. of Hsg. & Cmnty. Affairs Residential Mtg. Rev. Series 2023 B, 6% 1/1/54 | | 2,915,000 | 3,212,028 |
| Texas Dept. of Hsg. & Cmnty. Affairs Single Family Mtg. Rev.: | | | |
| Series 2019 A, 4% 3/1/50 | | 615,000 | 620,658 |
| Series 2022 A, 5.5% 9/1/52 | | 1,225,000 | 1,304,926 |
| Series 2022 B, 6% 3/1/53 | | 2,100,000 | 2,293,918 |
| Series A, 3.5% 3/1/51 | | 650,000 | 645,982 |
| Texas Gen. Oblig.: | | | |
| Series 2013 B, 4% 8/1/26 (e) | | 2,000,000 | 2,000,720 |
| Series 2015: | | | |
4% 8/1/32 (e) | | 450,000 | 450,064 |
5% 8/1/27 (e) | | 2,000,000 | 2,028,840 |
| Series 2016: | | | |
5.5% 8/1/29 (e) | | 2,985,000 | 3,102,822 |
5.5% 8/1/32 (e) | | 1,130,000 | 1,168,086 |
| Series 2022 B, 5% 8/1/39 | | 855,000 | 862,086 |
| Series 2023 A, 4.125% 8/1/46 (e) | | 5,000,000 | 4,949,845 |
| Texas Muni. Gas Acquisitio Bonds Series 2024, 5%, tender 1/1/34 (b) | | 11,900,000 | 12,917,324 |
| Texas Muni. Gas Acquisition & Supply Corp. Bonds: | | | |
| Series 2023 A, 5.5%, tender 1/1/30 (b) | | 1,500,000 | 1,623,162 |
| Series 2023 B, 5.5%, tender 1/1/34 (b) | | 7,670,000 | 8,633,867 |
| Texas Muni. Gas Acquisition & Supply Corp. I Gas Supply Rev. Series 2008 D, 6.25% 12/15/26 | | 5,150,000 | 5,281,717 |
| Texas Muni. Gas Acquisition And Supply Corp. Series 2021: | | | |
| 5% 12/15/25 | | 595,000 | 602,154 |
| 5% 12/15/26 | | 1,155,000 | 1,185,647 |
| 5% 12/15/27 | | 500,000 | 519,912 |
| 5% 12/15/28 | | 250,000 | 262,384 |
| 5% 12/15/31 | | 815,000 | 876,629 |
| 5% 12/15/32 | | 1,780,000 | 1,925,304 |
| Texas Muni. Gas Acquisition and Supply Corp. II Gas Supply Rev. Series 2012 C, 4.117% 9/15/27 (b) | | 5,650,000 | 5,649,654 |
| Texas Muni. Pwr. Agcy. Rev. Series 2021, 3% 9/1/34 (Assured Guaranty Muni. Corp. Insured) | | 1,000,000 | 945,390 |
| Texas Private Activity Bond Surface Trans. Corp.: | | | |
| (LBJ Infrastructure Group LLC I-635 Managed Lanes Proj.) Series 2020 A: | | | |
4% 6/30/35 | | 270,000 | 273,532 |
4% 6/30/36 | | 555,000 | 560,166 |
4% 12/31/36 | | 115,000 | 115,982 |
4% 6/30/37 | | 410,000 | 412,668 |
4% 12/31/37 | | 225,000 | 226,133 |
4% 6/30/38 | | 135,000 | 135,575 |
4% 12/31/38 | | 125,000 | 125,366 |
4% 6/30/39 | | 1,270,000 | 1,271,208 |
4% 12/31/39 | | 110,000 | 110,105 |
4% 6/30/40 | | 1,060,000 | 1,056,983 |
| (LBJ Infrastucutre Group LLC I-635 Managed Lanes Proj.) Series 2020 A, 4% 12/31/35 | | 880,000 | 890,253 |
| (NTE Mobility Partners LLC North Tarrant Express Managed Lanes Proj.) Series 2019 A, 4% 12/31/38 | | 1,000,000 | 1,002,943 |
| (NTE Mobility Partners LLC North Tarrant Express Proj.) Series 2023, 5.5% 12/31/58 (e) | | 5,405,000 | 5,883,958 |
| (NTE Mobility Partners Segments 3 LLC Segment 3C Proj.) Series 2019, 5% 6/30/58 (e) | | 10,200,000 | 10,434,298 |
| Series 2023: | | | |
5% 6/30/34 (e) | | 450,000 | 486,273 |
5% 12/31/34 (e) | | 530,000 | 572,485 |
5.125% 6/30/35 (e) | | 455,000 | 493,015 |
5.125% 12/31/35 (e) | | 380,000 | 411,146 |
5.5% 6/30/40 (e) | | 1,000,000 | 1,082,029 |
5.5% 6/30/41 (e) | | 1,000,000 | 1,078,641 |
5.5% 6/30/42 (e) | | 3,775,000 | 4,065,247 |
| Texas Pub. Fin. Auth. Lease Rev. Series 2019: | | | |
| 4% 2/1/38 | | 1,205,000 | 1,229,857 |
| 5% 2/1/25 | | 75,000 | 75,211 |
| Texas Pub. Fin. Auth. Rev. Series 2016, 5% 5/1/28 | | 210,000 | 215,232 |
| Texas St Pub. Fin. Auth. Rev. 8827 Series 2023: | | | |
| 5.25% 5/1/36 | | 500,000 | 556,395 |
| 5.25% 5/1/37 | | 230,000 | 255,056 |
| Texas St Technical College Sys.: | | | |
| Series 2022 A: | | | |
5.75% 8/1/47 (Assured Guaranty Muni. Corp. Insured) | | 580,000 | 658,779 |
6% 8/1/54 (Assured Guaranty Muni. Corp. Insured) | | 555,000 | 632,724 |
| Series 2022, 5.5% 8/1/42 (Assured Guaranty Muni. Corp. Insured) | | 1,655,000 | 1,877,295 |
| Texas State Univ. Sys. Fing. Rev. Series 2019 A: | | | |
| 4% 3/15/34 | | 125,000 | 128,299 |
| 4% 3/15/35 | | 110,000 | 112,709 |
| Texas Trans. Commission: | | | |
| Series 2019 A: | | | |
0% 8/1/37 | | 95,000 | 54,977 |
0% 8/1/38 | | 70,000 | 38,398 |
0% 8/1/39 | | 80,000 | 41,493 |
0% 8/1/40 | | 80,000 | 39,200 |
0% 8/1/41 | | 250,000 | 115,839 |
0% 8/1/43 | | 175,000 | 72,719 |
5% 8/1/57 | | 4,100,000 | 4,201,851 |
| Series 2021 A, 0% 8/1/42 | | 215,000 | 94,264 |
| Texas Trans. Commission Central Texas Tpk. Sys. Rev.: | | | |
| Bonds Series 2024 B, 5%, tender 8/15/30 (b) | | 1,000,000 | 1,078,123 |
| Series 2020 A, 5% 8/15/39 | | 3,855,000 | 4,156,579 |
| Series 2024 C: | | | |
5% 8/15/31 | | 3,625,000 | 4,051,096 |
5% 8/15/42 | | 3,100,000 | 3,410,690 |
| Texas Trans. Commission Hwy. Impt. Gen. Oblig. Bonds Series 2014 B, 0.65%, tender 4/1/26 (b) | | 7,715,000 | 7,366,424 |
| Texas Trans. Commission State Hwy. Fund Rev. Series 2015, 5% 10/1/25 | | 1,000,000 | 1,016,959 |
| Texas Wtr. Dev. Board Rev.: | | | |
| Series 2018 A, 4% 4/15/48 | | 1,005,000 | 998,598 |
| Series 2020, 5% 8/1/30 | | 705,000 | 786,744 |
| Series 2022, 5% 10/15/47 | | 1,500,000 | 1,635,362 |
| Series 2023 A: | | | |
4.75% 10/15/43 | | 3,815,000 | 4,106,408 |
5% 10/15/58 | | 1,000,000 | 1,084,899 |
5.25% 10/15/51 | | 1,500,000 | 1,673,083 |
| Tomball Independent School District Series 2023, 5% 2/15/48 | | 250,000 | 271,487 |
| Univ. of Houston Univ. Revs. Series 2017 A, 5% 2/15/36 | | 365,000 | 371,802 |
| Univ. of North Texas Univ. Rev. Series 2017 A, 5% 4/15/32 | | 255,000 | 265,855 |
| Univ. of Texas Board of Regents Sys. Rev.: | | | |
| Series 2019 B, 5% 8/15/49 | | 1,355,000 | 1,603,136 |
| Series 2020 C, 5% 8/15/31 | | 2,120,000 | 2,407,365 |
| Series 2024 B, 4% 8/15/54 | | 4,075,000 | 4,080,789 |
| Univ. of Texas Permanent Univ. Fund Rev.: | | | |
| Series 2016 B, 5% 7/1/29 | | 300,000 | 309,731 |
| Series 2022 A, 4% 7/1/42 | | 1,300,000 | 1,313,041 |
| Upper Brushy Creek Wtr. Cont. & I Series 2022, 3% 8/15/47 | | 250,000 | 209,811 |
| Via Metropolitan Tran Advanced Transn D Series 2024, 4% 8/1/54 | | 2,000,000 | 1,929,175 |
| Waco Gen. Oblig. Series 2020: | | | |
| 2.375% 2/1/38 | | 1,000,000 | 819,673 |
| 2.375% 2/1/40 | | 1,020,000 | 795,097 |
| Weatherford Independent School District Series 2002, 0% 2/15/33 | | 850,000 | 650,229 |
| West Harris County Reg'l. Wtr. Auth. Wtr. Sys. Rev. Series 2019, 4% 12/15/49 | | 905,000 | 879,208 |
| White Settlement Independent School District Series 2022, 4% 8/15/52 | | 540,000 | 538,485 |
| Whitesboro Tex Independent School District Series 2024, 4% 2/15/54 | | 2,000,000 | 1,978,241 |
| Woodloch Health Facilities Dev. Corp. (Inspired Living at Lewisville Proj.): | | | |
| Series 2016 A1, 6.75% 12/1/51 (f)(g) | | 450,115 | 12,153 |
| Series 2016 B, 10% 12/1/51 (f) | | 205,000 | 2 |
TOTAL TEXAS | | | 658,422,938 |
| Utah - 0.9% | | | |
| Black Desert Pub. Infrastructur Series 2024, 5.625% 12/1/53 (g) | | 3,350,000 | 3,454,800 |
| Firefly Pub. Infrastructure Dis: | | | |
| Series 2024 A1, 6.625% 3/1/54 (g) | | 500,000 | 519,928 |
| Series 2024 A2, 5.625% 12/1/43 (g) | | 500,000 | 520,632 |
| Intermountain Pwr. Agcy. Pwr. Supply Rev.: | | | |
| Series 2022 A: | | | |
5% 7/1/33 | | 1,300,000 | 1,467,933 |
5% 7/1/45 | | 2,000,000 | 2,162,673 |
| Series 2023 A: | | | |
5% 7/1/42 | | 800,000 | 883,086 |
5.25% 7/1/43 | | 1,500,000 | 1,681,407 |
5.25% 7/1/44 | | 1,750,000 | 1,956,470 |
5.25% 7/1/45 | | 2,750,000 | 3,056,270 |
| Mida Golf & Equestrian Ctr. Pub. Infrastructure District Series 2021, 4.5% 6/1/51 (g) | | 500,000 | 408,450 |
| Mida Mountain Veterans Prog. Series 2024, 5.2% 6/1/54 (g) | | 500,000 | 508,434 |
| Mida Mountain Village Pub. Infrastructure Series 2020 A, 5% 8/1/50 (g) | | 250,000 | 249,366 |
| Military Installation Dev. Auth. Utah Tax Allocation Rev.: | | | |
| Series 2021 A1, 4% 6/1/52 | | 1,075,000 | 940,238 |
| Series 2021 A2, 4% 6/1/52 | | 1,805,000 | 1,551,700 |
| Ogden City Utah School District Series 2020, 1.75% 6/15/35 | | 500,000 | 395,471 |
| Salt Lake City Arpt. Rev.: | | | |
| Series 2017 A: | | | |
5% 7/1/25 (e) | | 245,000 | 246,844 |
5% 7/1/27 (e) | | 515,000 | 535,270 |
5% 7/1/29 (e) | | 450,000 | 466,093 |
5% 7/1/30 (e) | | 335,000 | 346,352 |
5% 7/1/31 (e) | | 640,000 | 661,041 |
5% 7/1/33 (e) | | 485,000 | 499,930 |
5% 7/1/35 (e) | | 485,000 | 498,859 |
5% 7/1/36 (e) | | 1,810,000 | 1,859,485 |
5% 7/1/37 (e) | | 2,500,000 | 2,565,128 |
5% 7/1/42 (e) | | 2,980,000 | 3,033,425 |
5% 7/1/47 (e) | | 4,860,000 | 4,929,839 |
| Series 2017 B: | | | |
5% 7/1/34 | | 90,000 | 93,604 |
5% 7/1/35 | | 85,000 | 88,298 |
5% 7/1/36 | | 85,000 | 88,192 |
5% 7/1/37 | | 55,000 | 56,993 |
5% 7/1/47 | | 380,000 | 389,749 |
| Series 2018 A: | | | |
5% 7/1/33 (e) | | 1,170,000 | 1,219,883 |
5% 7/1/43 (e) | | 1,300,000 | 1,335,046 |
5.25% 7/1/48 (e) | | 1,250,000 | 1,288,700 |
| Series 2021 A: | | | |
4% 7/1/41 (e) | | 1,250,000 | 1,249,184 |
5% 7/1/32 (e) | | 1,250,000 | 1,350,264 |
5% 7/1/34 (e) | | 1,000,000 | 1,075,552 |
5% 7/1/51 (e) | | 8,605,000 | 8,931,427 |
| Series 2021 B: | | | |
5% 7/1/46 | | 470,000 | 502,675 |
5% 7/1/51 | | 1,880,000 | 1,988,808 |
| Series 2023 A: | | | |
5.25% 7/1/38 (e) | | 1,490,000 | 1,660,844 |
5.25% 7/1/39 (e) | | 1,375,000 | 1,520,760 |
5.25% 7/1/41 (e) | | 2,000,000 | 2,192,906 |
5.25% 7/1/43 (e) | | 2,500,000 | 2,724,916 |
5.25% 7/1/48 (e) | | 500,000 | 539,852 |
5.25% 7/1/53 (e) | | 3,500,000 | 3,752,406 |
5.5% 7/1/53 (e) | | 4,850,000 | 5,330,141 |
| Skyridge Pegasus Infrastructur Series 2024, 5.25% 12/1/44 (g) | | 1,316,795 | 1,328,755 |
| State Board of Regents of the State of Utah Series 1998 A, 5.5% 4/1/29 (Nat'l. Pub. Fin. Guarantee Corp. Insured) | | 2,550,000 | 2,719,454 |
| UIPA Crossroad Pub. Infrastructure District Series 2021: | | | |
| 4.125% 6/1/41 (g) | | 1,000,000 | 981,342 |
| 4.375% 6/1/52 (g) | | 1,520,000 | 1,490,580 |
| Univ. of Utah Gen. Revs. Series 2023 B, 5.25% 8/1/53 | | 1,000,000 | 1,110,177 |
| Utah Charter School Fin. Auth.: | | | |
| (Syracuse Arts Academy Proj.) Series 2017: | | | |
5% 4/15/42 | | 1,165,000 | 1,177,759 |
5% 4/15/47 | | 905,000 | 912,568 |
| (Utah Charter Academies Proj.) Series 2018: | | | |
5% 10/15/43 | | 275,000 | 279,922 |
5% 10/15/48 | | 290,000 | 293,741 |
| Series 2017, 5% 4/15/37 | | 210,000 | 213,172 |
| Series 2019 A, 5% 4/15/49 | | 390,000 | 399,161 |
| Series 2020 A, 4% 10/15/54 | | 300,000 | 269,703 |
| Series 2020: | | | |
4% 4/15/45 | | 625,000 | 601,528 |
4% 4/15/50 | | 250,000 | 236,264 |
| Utah County Hosp. Rev.: | | | |
| Series 2016 B, 5% 5/15/46 | | 2,500,000 | 2,539,349 |
| Series 2020 A, 5% 5/15/50 | | 705,000 | 744,351 |
| Utah Gen. Oblig. Series 2010 B, 3.539% 7/1/25 | | 113,170 | 112,485 |
| Utah Hsg. Corp.: | | | |
| Series 2019 G, 4.5% 7/21/49 | | 134,495 | 133,121 |
| Series 2019 H, 4.5% 8/21/49 | | 84,231 | 83,478 |
| Series 2019 I, 4% 9/21/49 | | 129,734 | 123,894 |
| Series 2020 B, 3.5% 2/21/50 | | 194,781 | 182,107 |
| Series 2021 E, 2% 4/21/51 | | 355,408 | 294,785 |
| Series 2021 I, 2.5% 8/21/51 | | 675,197 | 561,534 |
| Series 2021 J, 2.5% 9/21/51 | | 2,572,203 | 2,074,615 |
| Series 2022 G, 5% 7/21/52 | | 669,383 | 668,996 |
| Series 2022 H, 5% 8/21/52 | | 1,117,882 | 1,118,459 |
| Utah Hsg. Corp. Multi-family Hsg. Rev. Series 2024 A, 4.69% 2/1/45 (d) | | 1,500,000 | 1,524,578 |
| Utah Infrastructure Agcy.: | | | |
| Series 2017 A: | | | |
5% 10/15/34 | | 300,000 | 308,768 |
5% 10/15/40 | | 350,000 | 357,038 |
| Series 2018 A, 5.375% 10/15/40 | | 350,000 | 361,312 |
| Series 2019: | | | |
4% 10/15/30 | | 490,000 | 494,673 |
4% 10/15/34 | | 240,000 | 239,573 |
4% 10/15/39 | | 420,000 | 407,066 |
4% 10/15/42 | | 250,000 | 235,659 |
5% 10/15/25 | | 270,000 | 272,670 |
| Series 2021, 3% 10/15/45 | | 490,000 | 372,222 |
| Series 2022, 5% 10/15/46 | | 460,000 | 472,409 |
| Series 2023, 6% 10/15/47 | | 550,000 | 614,217 |
| Weber School District Utah (Utah School District Bond Guaranty Prog.) Series 2019, 2.25% 6/15/34 | | 545,000 | 468,808 |
| Wood Ranch Pub. Infrastructured Series 2024, 5.625% 12/1/53 (g) | | 1,300,000 | 1,345,025 |
TOTAL UTAH | | | 100,904,642 |
| Vermont - 0.1% | | | |
| Univ. of Vermont and State Agricultural College Series 2019 A, 5% 10/1/49 | | 600,000 | 628,002 |
| Vermont Econ. Dev. Auth. Soli Bonds Series 2013, 4.625%, tender 4/3/28 (b)(e)(g) | | 220,000 | 225,844 |
| Vermont Edl. & Health Bldg. Fin. Agcy. Rev.: | | | |
| (Champlain College Proj.) Series 2016 A: | | | |
5% 10/15/41 | | 695,000 | 667,939 |
5% 10/15/46 | | 845,000 | 784,206 |
| (Middlebury College Proj.) Series 2020, 5% 11/1/49 | | 1,500,000 | 1,580,507 |
| (Saint Michael's College Proj.) Series 2023, 5.25% 10/1/52 (g) | | 275,000 | 244,357 |
| Vermont Hsg. Fin. Agcy.: | | | |
| Series 2021 B, 3% 11/1/51 | | 816,000 | 795,097 |
| Series 2023 A, 6% 11/1/53 | | 693,000 | 757,211 |
| Series A, 3.75% 11/1/50 | | 59,000 | 59,000 |
| Vermont Student Assistant Corp. Ed. Ln. Rev.: | | | |
| Series 2018 A: | | | |
3.625% 6/15/29 (e) | | 35,000 | 34,739 |
3.75% 6/15/30 (e) | | 35,000 | 34,753 |
4% 6/15/33 (e) | | 40,000 | 39,642 |
4% 6/15/34 (e) | | 40,000 | 39,642 |
| Series 2018 B, 4.375% 6/15/46 (e) | | 160,000 | 151,639 |
| Series 2019 A: | | | |
3% 6/15/35 (e) | | 930,000 | 885,825 |
5% 6/15/27 (e) | | 705,000 | 725,653 |
5% 6/15/29 (e) | | 1,200,000 | 1,242,886 |
| Series 2019 B, 4% 6/15/47 (e) | | 265,000 | 236,478 |
| Series 2019, 3.375% 6/15/36 (e) | | 795,000 | 757,609 |
| Series 2020 A, 5% 6/15/28 (e) | | 705,000 | 731,315 |
| Series 2021 A: | | | |
2.375% 6/15/39 (e) | | 150,000 | 138,545 |
5% 6/15/29 (e) | | 105,000 | 109,813 |
5% 6/15/31 (e) | | 120,000 | 126,476 |
| Series 2022 A, 4.375% 6/15/40 (e) | | 275,000 | 266,420 |
| Series 2024 A: | | | |
4% 6/15/35 (e) | | 430,000 | 420,417 |
5.25% 6/15/34 (e) | | 700,000 | 759,244 |
TOTAL VERMONT | | | 12,443,259 |
| Virgin Islands - 0.2% | | | |
| Matching Fund Spl. Purp. Securitization Corp. Series 2022 A: | | | |
| 5% 10/1/25 | | 75,000 | 75,756 |
| 5% 10/1/26 | | 365,000 | 373,595 |
| 5% 10/1/30 | | 3,250,000 | 3,448,348 |
| 5% 10/1/32 | | 4,385,000 | 4,601,655 |
| 5% 10/1/39 | | 13,505,000 | 14,053,527 |
| Virgin Islands Pub. Fin. Auth.: | | | |
| Series 2012 A, 5% 10/1/32 | | 500,000 | 493,364 |
| Series 2014 C: | | | |
5% 10/1/30 (g) | | 600,000 | 600,013 |
5% 10/1/39 (g) | | 300,000 | 295,562 |
5% 10/1/39 | | 1,500,000 | 1,501,005 |
| Series 2015, 5% 9/1/30 (g) | | 300,000 | 301,802 |
TOTAL VIRGIN ISLANDS | | | 25,744,627 |
| Virginia - 1.6% | | | |
| Alexandria Gen. Oblig. Series 2021 A: | | | |
| 1.875% 12/15/37 | | 4,085,000 | 3,129,480 |
| 2% 12/15/38 | | 4,160,000 | 3,211,799 |
| 2% 12/15/39 | | 605,000 | 457,553 |
| 2% 12/15/40 | | 1,000,000 | 743,731 |
| Arlington County IDA Hosp. Facilities: | | | |
| Bonds Series 2023 A, 5%, tender 7/1/31 (b) | | 4,900,000 | 5,301,854 |
| Series 2020: | | | |
3.75% 7/1/50 | | 2,500,000 | 2,376,872 |
4% 7/1/38 | | 205,000 | 207,585 |
4% 7/1/45 | | 1,250,000 | 1,250,687 |
5% 7/1/27 | | 240,000 | 252,407 |
5% 7/1/36 | | 480,000 | 518,948 |
| Arlington County Indl. Rev. (County Projs.) Series 2017, 5% 2/15/43 | | 400,000 | 414,162 |
| Charles City County Solid Wt Rev. Bonds Series 2002, 1.45%, tender 4/1/27 (b)(e) | | 85,000 | 80,249 |
| Chesapeake Bay Bridge and Tunnel District Gen. Resolution Rev. Series 2016: | | | |
| 5% 7/1/41 (Assured Guaranty Muni. Corp. Insured) | | 1,265,000 | 1,290,472 |
| 5% 7/1/46 | | 4,380,000 | 4,425,838 |
| 5% 7/1/51 | | 2,985,000 | 3,011,919 |
| Chesapeake Gen. Oblig. Series 2020 A: | | | |
| 5% 8/1/34 | | 65,000 | 72,334 |
| 5% 8/1/35 | | 75,000 | 83,198 |
| Chesapeake Trans. Sys. Toll Road Rev. Series 2012 B, 4.875% 7/15/40 | | 1,055,000 | 1,092,437 |
| Fairfax County Gen. Oblig. Series 2022 A, 2% 10/1/41 | | 7,000,000 | 5,159,112 |
| Fairfax County Indl. Dev. Auth. (Inova Health Sys. Proj.) Series 2016 A, 5% 5/15/31 | | 590,000 | 606,535 |
| Fairfax County Redev. & Hsg. Auth. Rev. Series 2019, 5% 10/1/35 | | 830,000 | 889,473 |
| Farmville Indl. Edl. Facilities Rev. (Longwood Univ. Student Hsg. Projs.): | | | |
| Series 2018 A: | | | |
5% 1/1/48 | | 300,000 | 299,704 |
5% 1/1/55 | | 900,000 | 882,087 |
| Series 2020 A, 5% 1/1/59 | | 350,000 | 340,482 |
| Fredericksburg Econ. Dev. Auth. Rev. Series 2014: | | | |
| 5% 6/15/26 | | 110,000 | 110,044 |
| 5% 6/15/30 | | 150,000 | 150,065 |
| Greater Richmond Convention Ctr. Auth. Hotel Tax Rev. Series 2015, 5% 6/15/31 (Pre-Refunded to 6/15/25 @ 100) | | 1,370,000 | 1,384,102 |
| Hampton Roads Trans. Accountability Commission Series 2018 A, 5.5% 7/1/57 (Pre-Refunded to 1/1/28 @ 100) | | 2,965,000 | 3,216,133 |
| Henrico County Econ. Dev. Auth. Residential Care Facility Rev. Series 2022 A: | | | |
| 5% 10/1/47 | | 575,000 | 607,624 |
| 5% 10/1/52 | | 1,590,000 | 1,667,786 |
| Isle Wight County Econ. Dev. Series 2023: | | | |
| 4.75% 7/1/53 (Assured Guaranty Muni. Corp. Insured) | | 1,500,000 | 1,581,929 |
| 5.25% 7/1/53 (Assured Guaranty Muni. Corp. Insured) | | 750,000 | 815,142 |
| James City County Econ. Dev. Auth. Residential Care Facility Rev. Series 2024 C1, 5.75% 12/1/28 | | 640,000 | 640,891 |
| Loudoun County Gen. Oblig. Series 2024 A, 5% 12/1/29 | | 1,125,000 | 1,252,171 |
| Louisa Indl. Dev. Auth. Poll. Cont. Rev. Bonds (Virginia Elec. and Pwr. Co. Proj.) Series 2008 B, 0.75%, tender 9/2/25 (b) | | 885,000 | 856,229 |
| Lynchburg Econ. Dev. Series 2021: | | | |
| 3% 1/1/51 | | 1,310,000 | 1,020,696 |
| 4% 1/1/55 | | 1,065,000 | 1,006,746 |
| Lynchburg Econ. Dev. Auth. (Randolph College Projs.) Series 2018, 5% 9/1/48 | | 250,000 | 252,244 |
| Newport News Wtr. Rev. Series 2021, 2% 7/15/40 | | 3,075,000 | 2,248,791 |
| Norfolk Econ. Dev. Auth. Hosp. Facilities Rev.: | | | |
| Bonds Series 2018 A, 5%, tender 11/1/28 (b) | | 745,000 | 797,999 |
| Series 2018 B, 4% 11/1/48 | | 2,655,000 | 2,599,941 |
| Norfolk Redev. & Hsg. Auth. Rev.: | | | |
| (Fort Norfolk Retirement Cmnty., Inc. Harbors Edge Proj.) Series 2014: | | | |
5% 1/1/35 | | 565,000 | 565,088 |
5% 1/1/46 | | 725,000 | 691,888 |
5.375% 1/1/35 | | 880,000 | 880,433 |
5.375% 1/1/46 | | 600,000 | 599,972 |
| Series 2019 A, 5% 1/1/49 | | 455,000 | 426,891 |
| Peninsula Ccda Spl. Oblig. Series 2018, 4.5% 9/1/45 (g) | | 205,000 | 191,845 |
| Roanoke Econ. Dev. Auth. Edl. Facilities Series 2018 A: | | | |
| 4% 9/1/48 | | 300,000 | 256,184 |
| 5% 9/1/27 | | 30,000 | 30,895 |
| Roanoke Econ. Dev. Authority. Series 2020 A, 3% 7/1/45 | | 1,000,000 | 869,545 |
| Rockingham County Econ. De Series 2021 A, 3% 11/1/46 | | 2,755,000 | 2,335,980 |
| Salem Econ. Dev. Auth. Series 2020: | | | |
| 4% 4/1/38 | | 20,000 | 19,385 |
| 4% 4/1/39 | | 15,000 | 14,384 |
| 4% 4/1/40 | | 20,000 | 19,001 |
| 4% 4/1/45 | | 50,000 | 45,644 |
| 5% 4/1/26 | | 20,000 | 20,296 |
| 5% 4/1/27 | | 20,000 | 20,631 |
| 5% 4/1/28 | | 30,000 | 31,312 |
| 5% 4/1/29 | | 35,000 | 36,861 |
| 5% 4/1/49 | | 65,000 | 65,900 |
| Stafford County Econ. Dev. Auth. Hosp. Facilities Rev.: | | | |
| (Mary Washington Hosp. Proj.) Series 2016, 3% 6/15/29 | | 100,000 | 98,554 |
| Series 2016: | | | |
4% 6/15/37 | | 110,000 | 109,116 |
5% 6/15/27 | | 185,000 | 189,763 |
5% 6/15/28 | | 55,000 | 56,349 |
5% 6/15/30 | | 80,000 | 81,899 |
5% 6/15/33 | | 70,000 | 71,464 |
5% 6/15/34 | | 100,000 | 101,996 |
5% 6/15/35 | | 270,000 | 275,211 |
5% 6/15/36 | | 665,000 | 677,389 |
| Tobacco Settlement Fing. Corp.: | | | |
| Series 2007 A1, 6.706% 6/1/46 | | 1,080,000 | 923,833 |
| Series 2007 B1, 5% 6/1/47 | | 1,000,000 | 953,167 |
| Series 2007 C1, 0% 6/1/47 | | 6,265,000 | 1,780,949 |
| Toll Road Investors Partnership II, LP: | | | |
| 0% 2/15/25 (g) | | 1,704,000 | 1,683,232 |
| 0% 2/15/26 (g) | | 1,295,000 | 1,197,049 |
| 0% 2/15/27 (g) | | 181,000 | 156,868 |
| 0% 2/15/28 (g) | | 528,000 | 422,421 |
| 0% 2/15/33 (g) | | 790,000 | 421,512 |
| 0% 2/15/43 (f)(g) | | 5,000,625 | 1,470,184 |
| Virginia Beach Dev. Auth. Resources Series 2023 A: | | | |
| 5.75% 9/1/33 | | 2,580,000 | 2,917,160 |
| 6.5% 9/1/43 | | 3,145,000 | 3,580,828 |
| Virginia College Bldg. Auth. Edl. Facilities Rev.: | | | |
| (21St Century Collage and Equip. Programs) Series 2021 A: | | | |
4% 2/1/34 | | 4,345,000 | 4,564,638 |
4% 2/1/35 | | 6,250,000 | 6,509,859 |
| (21st Century College and Equip. Programs) Series 2015 D, 3% 2/1/26 | | 1,000,000 | 998,632 |
| (Marymount Univ. Proj.): | | | |
Series 2015 A: | | | |
5% 7/1/25 (g) | | 215,000 | 213,396 |
5% 7/1/30 (g) | | 665,000 | 631,706 |
5% 7/1/35 (g) | | 200,000 | 181,280 |
5% 7/1/45 (g) | | 440,000 | 359,633 |
Series 2015 B: | | | |
5% 7/1/45 (g) | | 1,360,000 | 1,111,594 |
5.25% 7/1/30 (g) | | 380,000 | 365,415 |
5.25% 7/1/35 (g) | | 405,000 | 374,854 |
| (Regent Univ. Proj.) Series 2021, 5% 6/1/29 | | 25,000 | 26,258 |
| Virginia College Bldg. Auth. Edl. Facilities Rev. Rfdg. Pub. Higher Ed. Fing. Prog. Series 2023 A, 4% 9/1/42 | | 6,375,000 | 6,483,355 |
| Virginia Commonwealth Trans. Board Rev.: | | | |
| (Virginia Gen. Oblig. Proj.) Series 2017 A: | | | |
5% 5/15/32 | | 130,000 | 137,886 |
5% 5/15/33 | | 110,000 | 116,548 |
| Series 2019, 3% 5/15/37 | | 4,000,000 | 3,826,058 |
| Virginia Commonwealth Univ. Health Sys. Auth. Series 2017 A, 4% 7/1/40 | | 2,805,000 | 2,825,895 |
| Virginia Hsg. Dev. Auth. Series 2022 G, 5.15% 11/1/52 | | 1,350,000 | 1,403,500 |
| Virginia Hsg. Dev. Auth. Commonwealth Mtg. Rev. Series 2023 E2, 4.6% 10/1/54 | | 4,445,000 | 4,521,756 |
| Virginia Port Auth. Port Facilities Rev. Series 2016 B: | | | |
| 5% 7/1/41 (e) | | 1,530,000 | 1,540,440 |
| 5% 7/1/45 (e) | | 2,345,000 | 2,358,674 |
| Virginia Pub. Bldg. Auth. Pub. Facilities Rev. Series 2019 A, 4% 8/1/36 | | 1,625,000 | 1,670,962 |
| Virginia Pub. School Auth. School Fing. Series 2017 B, 2.25% 8/1/29 | | 1,205,000 | 1,139,158 |
| Virginia Small Bus. Fing. A: | | | |
| Series 2017 C, 5% 6/1/52 | | 685,000 | 686,231 |
| Series 2024 A, 5.5% 12/1/54 | | 300,000 | 318,708 |
| Virginia Small Bus. Fing. Auth.: | | | |
| (95 Express Lanes LLC Proj.) Series 2022: | | | |
4% 7/1/39 (e) | | 600,000 | 593,335 |
4% 1/1/40 (e) | | 440,000 | 430,492 |
4% 1/1/41 (e) | | 215,000 | 208,657 |
4% 1/1/48 (e) | | 9,985,000 | 9,277,166 |
5% 7/1/32 (e) | | 2,300,000 | 2,462,489 |
5% 7/1/33 (e) | | 820,000 | 875,421 |
5% 7/1/34 (e) | | 270,000 | 287,919 |
5% 1/1/36 (e) | | 335,000 | 356,680 |
5% 7/1/37 (e) | | 365,000 | 388,497 |
| (Elizabeth River Crossings OPCO, LLC Proj.) Series 2022: | | | |
3% 1/1/41 (e) | | 1,000,000 | 829,108 |
4% 7/1/32 (e) | | 785,000 | 793,673 |
| (Elizabeth River Crossings OpCo, LLC Proj.) Series 2022: | | | |
4% 1/1/35 (e) | | 2,635,000 | 2,649,490 |
4% 7/1/35 (e) | | 1,740,000 | 1,747,752 |
4% 1/1/37 (e) | | 4,355,000 | 4,354,596 |
4% 1/1/38 (e) | | 2,935,000 | 2,921,453 |
4% 1/1/39 (e) | | 1,180,000 | 1,161,021 |
4% 1/1/40 (e) | | 3,500,000 | 3,420,544 |
| (I-495 Hot Lanes Proj.) Series 2022: | | | |
5% 12/31/42 (e) | | 1,000,000 | 1,058,005 |
5% 12/31/47 (e) | | 3,485,000 | 3,661,265 |
5% 12/31/52 (e) | | 2,490,000 | 2,604,743 |
| (I-495 Hot Lanes Projs.) Series 2022, 5% 12/31/57 (e) | | 4,015,000 | 4,182,766 |
| (Transform 66 P3 Proj.) Series 2017: | | | |
5% 12/31/49 (e) | | 1,845,000 | 1,864,466 |
5% 12/31/52 (e) | | 3,640,000 | 3,673,117 |
5% 12/31/56 (e) | | 3,775,000 | 3,803,873 |
| Series 2014, 5.25% 10/1/29 | | 130,000 | 130,105 |
| Series 2020 A: | | | |
4% 1/1/45 | | 400,000 | 382,366 |
4% 1/1/51 | | 250,000 | 230,893 |
5% 1/1/33 | | 400,000 | 424,896 |
5% 1/1/35 | | 655,000 | 694,298 |
| Virginia Small Bus. Fing. Auth. Health Care Facilities Rev. Series 2020 A, 4% 12/1/49 | | 2,460,000 | 2,415,510 |
| Virginia St Hsg. Dev. Auth. Ho Series 2024 D, 4.7% 7/1/55 | | 1,300,000 | 1,323,866 |
| Williamsburg Econ. Dev. (Provident Group-Williamsburg Properties LLC - William & Mary Proj.): | | | |
| Series 2023 A: | | | |
4.125% 7/1/58 (Assured Guaranty Muni. Corp. Insured) | | 3,100,000 | 3,103,274 |
5.25% 7/1/53 (Assured Guaranty Muni. Corp. Insured) | | 205,000 | 224,570 |
| Series 2023 B, 4.375% 7/1/63 | | 1,025,000 | 1,031,909 |
| Winchester Econ. Dev. Auth. Series 2015: | | | |
| 5% 1/1/34 | | 185,000 | 187,486 |
| 5% 1/1/35 | | 185,000 | 187,342 |
| 5% 1/1/44 | | 260,000 | 262,072 |
TOTAL VIRGINIA | | | 187,170,081 |
| Washington - 1.4% | | | |
| Adams County Pub. Hosp. District No. 2 Series 2014, 5.125% 12/1/44 | | 375,000 | 374,998 |
| Central Puget Sound Reg'l. Trans. Auth. Sales & Use Tax Rev. Series 2016 S1, 5% 11/1/46 | | 2,000,000 | 2,379,390 |
| Chelan County Pub. Util. District #1 Columbia River-Rock Island Hydro-Elec. Sys. Rev. Series A, 0% 6/1/28 (Nat'l. Pub. Fin. Guarantee Corp. Insured) | | 85,000 | 76,236 |
| Douglas County Pub. Util. District #1 Wells Hydroelectric Rev. Series 2022 B, 5% 9/1/47 | | 2,000,000 | 2,155,722 |
| Energy Northwest Elec. Rev.: | | | |
| Series 2020 A: | | | |
5% 7/1/35 | | 750,000 | 828,513 |
5% 7/1/37 | | 700,000 | 769,114 |
| Series 2021 A, 4% 7/1/42 | | 2,360,000 | 2,395,987 |
| Series 2022 A, 5% 7/1/36 | | 2,875,000 | 3,261,150 |
| Everett Hsg. Auth. Rev. (Huntington Park Apts. Proj.) Series 2022, 4% 7/1/37 | | 2,700,000 | 2,697,242 |
| Grant County Wash Pub. Hosp. Distn Series 2023, 5.125% 12/1/48 | | 250,000 | 259,977 |
| Grays Hbr. County Gen. Oblig. Series 2018: | | | |
| 5% 12/15/33 | | 400,000 | 409,338 |
| 5% 12/15/38 | | 510,000 | 517,232 |
| 5% 12/15/48 | | 985,000 | 981,628 |
| Jefferson County Wash Pub. Hosp. D Series 2023 A, 6.875% 12/1/53 | | 1,500,000 | 1,592,326 |
| King County Hsg. Auth. Rev. Series 2021: | | | |
| 4% 6/1/26 | | 400,000 | 404,472 |
| 4% 6/1/28 | | 255,000 | 260,263 |
| 4% 12/1/29 | | 45,000 | 45,982 |
| Kitsap County School District #100C Series 2024, 5% 12/1/39 | | 1,125,000 | 1,279,767 |
| Pend Oreille Pub. Util. District Series 2018, 5% 1/1/48 | | 300,000 | 307,044 |
| Port of Seattle Rev.: | | | |
| Series 2016 B: | | | |
5% 10/1/28 (e) | | 425,000 | 433,996 |
5% 10/1/30 (e) | | 245,000 | 249,608 |
| Series 2016, 5% 2/1/28 | | 110,000 | 112,357 |
| Series 2017 C, 5% 5/1/42 (e) | | 2,050,000 | 2,079,626 |
| Series 2018 A, 5% 5/1/30 (e) | | 920,000 | 949,257 |
| Series 2019 A, 4% 4/1/44 (e) | | 1,040,000 | 1,009,728 |
| Series 2019: | | | |
5% 4/1/35 (e) | | 5,300,000 | 5,559,732 |
5% 4/1/38 (e) | | 2,135,000 | 2,226,182 |
5% 4/1/44 (e) | | 4,525,000 | 4,680,951 |
| Series 2021 C: | | | |
5% 8/1/25 (e) | | 1,120,000 | 1,130,391 |
5% 8/1/26 (e) | | 1,535,000 | 1,575,435 |
5% 8/1/27 (e) | | 950,000 | 990,121 |
5% 8/1/38 (e) | | 1,300,000 | 1,384,457 |
| Series 2022 B: | | | |
4% 8/1/47 (e) | | 320,000 | 306,921 |
5% 8/1/40 (e) | | 2,000,000 | 2,142,405 |
5% 8/1/41 (e) | | 1,000,000 | 1,067,080 |
| Seattle Hsg. Auth. Rev. (Northgate Plaza Proj.) Series 2021, 1% 6/1/26 | | 1,760,000 | 1,679,998 |
| Seattle Wtr. Sys. Rev. Series 2021, 5% 8/1/26 | | 740,000 | 768,170 |
| Skagit County Wash Pub. Hosp. District Series 2024, 5.5% 12/1/41 | | 500,000 | 546,835 |
| Spokane Pub. Facilities District Hotel/Motel Tax & Sales/Use Tax Rev. Series 2017, 5% 12/1/38 | | 75,000 | 77,086 |
| Tacoma Elec. Sys. Rev. Series 2017: | | | |
| 5% 1/1/37 | | 55,000 | 57,052 |
| 5% 1/1/38 | | 55,000 | 56,996 |
| Tacoma Gen. Oblig. Series 2021 A, 3% 12/1/35 | | 1,025,000 | 976,327 |
| Vancouver Hsg. Auth. Series 2024 B, 4.5% 10/1/42 | | 220,000 | 223,682 |
| Washington Convention Ctr. Pub. Facilities: | | | |
| Series 2018: | | | |
4% 7/1/58 | | 485,000 | 452,659 |
5% 7/1/58 | | 250,000 | 255,984 |
| Series 2021 B: | | | |
3% 7/1/43 | | 500,000 | 417,909 |
3% 7/1/43 | | 395,000 | 324,369 |
3% 7/1/58 | | 400,000 | 279,934 |
3% 7/1/58 (Assured Guaranty Muni. Corp. Insured) | | 5,615,000 | 4,274,205 |
| Series 2021: | | | |
3% 7/1/58 | | 250,000 | 190,303 |
4% 7/1/31 | | 8,980,000 | 9,207,748 |
| Washington Gen. Oblig.: | | | |
| Series 2017 D: | | | |
5% 2/1/33 | | 545,000 | 566,967 |
5% 2/1/35 | | 30,000 | 31,145 |
| Series 2020 C, 5% 2/1/29 | | 1,035,000 | 1,129,046 |
| Series 2021 C: | | | |
5% 2/1/41 | | 750,000 | 819,528 |
5% 2/1/44 | | 4,435,000 | 4,796,293 |
| Series 2021 F, 5% 6/1/36 | | 2,675,000 | 2,985,148 |
| Series 2022 A: | | | |
5% 8/1/35 | | 7,700,000 | 8,635,217 |
5% 8/1/42 | | 5,000,000 | 5,479,342 |
| Series 2022 C: | | | |
5% 7/1/25 | | 2,500,000 | 2,529,750 |
5% 2/1/47 | | 6,475,000 | 7,007,742 |
| Series 2022 D: | | | |
4% 7/1/36 | | 2,050,000 | 2,145,939 |
4% 7/1/37 | | 1,425,000 | 1,481,776 |
| Series 2022 RB, 5% 2/1/29 | | 780,000 | 850,875 |
| Series 2023 A: | | | |
5% 8/1/25 | | 1,500,000 | 1,520,632 |
5% 8/1/35 | | 1,500,000 | 1,706,568 |
| Series 2024 A: | | | |
5% 8/1/38 | | 1,140,000 | 1,300,332 |
5% 8/1/41 | | 1,150,000 | 1,293,901 |
| Series 2024 D, 5% 6/1/25 | | 1,920,000 | 1,939,383 |
| Series R 2020 A, 5% 1/1/25 | | 1,250,000 | 1,251,866 |
| Series R-2017 A: | | | |
5% 8/1/27 | | 55,000 | 56,917 |
5% 8/1/28 | | 55,000 | 56,862 |
5% 8/1/30 | | 300,000 | 309,317 |
| Washington Health Care Facilities Auth. Rev.: | | | |
| (Overlake Hosp. Med. Ctr., WA. Proj.) Series 2017 B: | | | |
5% 7/1/25 | | 100,000 | 100,468 |
5% 7/1/27 | | 185,000 | 190,884 |
5% 7/1/28 | | 230,000 | 238,074 |
5% 7/1/29 | | 115,000 | 118,807 |
5% 7/1/30 | | 105,000 | 108,399 |
5% 7/1/31 | | 180,000 | 185,613 |
5% 7/1/32 | | 245,000 | 252,305 |
5% 7/1/33 | | 345,000 | 354,903 |
5% 7/1/34 | | 230,000 | 236,339 |
5% 7/1/35 | | 130,000 | 133,394 |
5% 7/1/36 | | 125,000 | 128,082 |
5% 7/1/42 | | 1,715,000 | 1,739,787 |
| (Providence Health Systems Proj.): | | | |
Series 2012 A, 5% 10/1/25 | | 625,000 | 625,354 |
Series 2018 B: | | | |
5% 10/1/30 | | 65,000 | 68,376 |
5% 10/1/31 | | 85,000 | 89,256 |
5% 10/1/32 | | 60,000 | 62,951 |
5% 10/1/33 | | 140,000 | 146,506 |
| (Virginia Mason Med. Ctr. Proj.) Series 2017: | | | |
5% 8/15/25 | | 15,000 | 15,103 |
5% 8/15/26 | | 15,000 | 15,250 |
5% 8/15/27 | | 105,000 | 109,220 |
| (Virginia Mason Med. Ctr. Proj.) Series 2017: | | | |
5% 8/15/29 | | 125,000 | 129,620 |
5% 8/15/30 | | 55,000 | 56,952 |
| Bonds: | | | |
Series 2019 B2, 5%, tender 8/1/25 (b) | | 965,000 | 967,387 |
Series 2019 B3, 5%, tender 8/1/26 (b) | | 6,400,000 | 6,523,949 |
| Series 2017 A, 4% 7/1/42 | | 370,000 | 348,324 |
| Series 2017 B, 4% 8/15/41 | | 405,000 | 396,631 |
| Series 2017: | | | |
4% 8/15/42 | | 3,260,000 | 3,106,422 |
5% 8/15/36 | | 30,000 | 30,772 |
5% 8/15/37 | | 365,000 | 373,890 |
| Series 2019 A 1, 4% 8/1/44 | | 180,000 | 173,575 |
| Series 2019 A1: | | | |
5% 8/1/34 | | 105,000 | 112,132 |
5% 8/1/37 | | 55,000 | 58,339 |
| Series 2019 A2: | | | |
5% 8/1/35 | | 160,000 | 170,296 |
5% 8/1/39 | | 65,000 | 68,712 |
5% 8/1/44 | | 1,325,000 | 1,380,042 |
| Series 2020: | | | |
5% 9/1/38 | | 130,000 | 140,686 |
5% 9/1/45 | | 1,240,000 | 1,313,304 |
5% 9/1/50 | | 690,000 | 727,245 |
5% 9/1/55 | | 3,705,000 | 3,894,967 |
| Washington Higher Ed. Facilities Auth. Rev.: | | | |
| (Gonzaga Univ. Proj.) Series 2019 A, 3% 4/1/49 | | 2,180,000 | 1,747,739 |
| (Whitworth Univ. Proj.) Series 2016 A: | | | |
5% 10/1/25 | | 30,000 | 30,288 |
5% 10/1/26 | | 130,000 | 132,861 |
5% 10/1/27 | | 260,000 | 265,926 |
5% 10/1/28 | | 270,000 | 275,899 |
5% 10/1/34 | | 185,000 | 187,621 |
5% 10/1/35 | | 330,000 | 334,372 |
5% 10/1/36 | | 415,000 | 420,074 |
5% 10/1/40 | | 500,000 | 503,944 |
| Series 2023, 4% 4/1/41 | | 630,000 | 633,264 |
| Washington Hsg. Fin. Commission: | | | |
| sequential payer Series 2023-1 Class A, 3.375% 4/20/37 | | 3,469,479 | 3,174,804 |
| Series 2021 1, 3.5% 12/20/35 | | 4,653,227 | 4,366,704 |
| Washington Hsg. Fin. Commission Nonprofit Hsg. Rev.: | | | |
| (Eliseo Proj.) Series 2021 A: | | | |
4% 1/1/41 (g) | | 350,000 | 297,968 |
4% 1/1/57 (g) | | 300,000 | 223,709 |
| (Emerald Heights Proj.) Series 2023 A, 5% 7/1/48 | | 230,000 | 239,799 |
| (Emerald Hights Proj.) Series 2023 A, 5% 7/1/43 | | 260,000 | 274,343 |
| (Judson Park Proj.) Series 2018, 5% 7/1/48 (g) | | 295,000 | 274,378 |
| (Presbyterian Retirement Cmntys. Northwest Projs.) Series 2016 A: | | | |
5% 1/1/46 (g) | | 455,000 | 433,667 |
5% 1/1/51 (g) | | 1,735,000 | 1,612,335 |
| (The Hearthstone Proj.) Series 2018 A: | | | |
5% 7/1/48 (g) | | 405,000 | 311,953 |
5% 7/1/53 (g) | | 100,000 | 74,793 |
| (Transforming Age Projs.) Series 2019 A, 5% 1/1/55 (g) | | 2,350,000 | 2,157,391 |
| Eliseo Proj. Series 2021 A, 4% 1/1/51 (g) | | 300,000 | 232,051 |
| Series 2015 A, 7% 7/1/45 (Pre-Refunded to 7/1/25 @ 100) (g) | | 1,205,000 | 1,227,361 |
| Washington Hsg. Fin. Commission Nonprofit Rev.: | | | |
| (Radford Court and Nordheim Court) Series 2024: | | | |
5.5% 7/1/49 | | 1,710,000 | 1,863,766 |
5.5% 7/1/59 | | 3,660,000 | 3,957,298 |
| (Seattle Academy of Arts and Sciences Proj.) Series 2023, 6.25% 7/1/59 (g) | | 2,920,000 | 3,226,117 |
| Washington St Hsg. Fin. Commn Ho sequential payer Series 2024-1 Class A, 4.2207% 3/20/50 (b) | | 1,998,353 | 1,956,333 |
| Washington State Hsg. Fin. Commission Series 2024-09FN Class PT, 4.55% 8/1/43 | | 240,000 | 242,386 |
| Whidbey Island Pub. Hosp. District Series 2013, 5.375% 12/1/39 | | 400,000 | 351,714 |
TOTAL WASHINGTON | | | 170,501,605 |
| West Virginia - 0.3% | | | |
| City of Huntington (Downtown Proj. No. 3) Series 2024 A: | | | |
| 5% 6/1/39 | | 400,000 | 403,480 |
| 5.125% 6/1/39 | | 475,000 | 480,924 |
| 5.5% 6/1/49 | | 450,000 | 461,040 |
| 5.625% 5/1/50 | | 475,000 | 483,870 |
| Glenville St College W Brdg Series 2017, 5.25% 6/1/47 | | 250,000 | 232,073 |
| Monongalia County W Commn Tax Series 2023 A: | | | |
| 5% 6/1/33 (g) | | 1,000,000 | 1,049,945 |
| 5.75% 6/1/43 (g) | | 1,300,000 | 1,406,750 |
| 6% 6/1/53 (g) | | 1,950,000 | 2,109,289 |
| Monongalia County West Commission Spl. District Excise Tax Rev.: | | | |
| Series 2017 A: | | | |
5.5% 6/1/37 (g) | | 445,000 | 454,584 |
5.75% 6/1/43 (g) | | 445,000 | 455,122 |
| Series 2021 A, 4.125% 6/1/43 (g) | | 570,000 | 516,483 |
| Series 2021 B, 4.875% 6/1/43 (g) | | 780,000 | 768,057 |
| Series 2023 A, 7% 6/1/43 (g) | | 1,535,000 | 1,652,445 |
| Ohio County Comm Tax Increment Rev. (The Highlands Proj.) Series 2024, 5.25% 6/1/44 | | 90,000 | 94,635 |
| West Virginia Econ. Dev. Auth. Solid Waste Disp. Facilities Rev. Bonds: | | | |
| (Appalachian Pwr. Co. - Amos Proj.) Series 2015 A, 3.375%, tender 6/15/28 (b) | | 635,000 | 632,224 |
| (Appalachian Pwr. Co. Amos Proj.): | | | |
Series 2010 A, 0.625%, tender 12/15/25 (b) | | 710,000 | 679,607 |
Series 2011 A, 1%, tender 9/1/25 (b)(e) | | 910,000 | 884,730 |
| (Arch Resources Proj.) Series 2020, 5%, tender 7/1/25 (b)(e) | | 420,000 | 420,424 |
| (Kentucky Pwr. Compnay - Mitchell Proj.) Series 2014 A, 4.7%, tender 6/17/26 (b)(e) | | 1,350,000 | 1,365,809 |
| (Wheeling Pwr. Co. - Mitchell Proj.) Series 2013 A, 3%, tender 6/18/27 (b)(e) | | 975,000 | 957,571 |
| West Virginia Hosp. Fin. Auth. Hosp. Rev.: | | | |
| Series 2018 A: | | | |
4% 1/1/37 | | 300,000 | 296,883 |
4% 6/1/51 | | 1,495,000 | 1,471,340 |
4.125% 1/1/47 | | 450,000 | 430,163 |
5% 1/1/31 | | 200,000 | 209,450 |
5% 1/1/32 | | 160,000 | 167,262 |
5% 1/1/33 | | 105,000 | 109,588 |
5% 1/1/43 | | 700,000 | 718,043 |
5% 6/1/52 | | 2,625,000 | 2,695,987 |
| Series 2019 A: | | | |
5% 9/1/38 | | 175,000 | 180,960 |
5% 9/1/39 | | 50,000 | 51,565 |
| Series 2023: | | | |
5.375% 9/1/53 (Assured Guaranty Muni. Corp. Insured) | | 5,080,000 | 5,559,383 |
5.5% 9/1/48 (Assured Guaranty Muni. Corp. Insured) | | 5,810,000 | 6,457,138 |
6% 9/1/48 | | 1,000,000 | 1,140,080 |
| West Virginia Hsg. Dev. Fund Series 2018 A, 3.75% 11/1/38 | | 125,000 | 122,814 |
| West Virginia Parkways Auth. Series 2021: | | | |
| 5% 6/1/25 | | 705,000 | 711,455 |
| 5% 6/1/26 | | 705,000 | 726,559 |
| 5% 6/1/27 | | 705,000 | 742,548 |
| 5% 6/1/28 | | 1,060,000 | 1,138,738 |
| West Virginia St Hsg. Dev. Fund Series 2024 B, 3.8% 11/1/29 | | 1,505,000 | 1,524,763 |
| West Virginia Wtr. Dev. Auth. Series 2016 AII, 5% 11/1/33 | | 140,000 | 144,017 |
TOTAL WEST VIRGINIA | | | 40,107,798 |
| Wisconsin - 1.4% | | | |
| Blue Ridge Healthcare Pub. Fin. Auth. Series 2020 A, 4% 1/1/45 | | 220,000 | 214,545 |
| Howard Suamico Scd Series 2021: | | | |
| 2% 3/1/38 | | 810,000 | 626,520 |
| 2% 3/1/40 | | 500,000 | 368,943 |
| 2% 3/1/41 (Pre-Refunded to 3/1/28 @ 100) | | 875,000 | 854,948 |
| Kohler Wis School District Series 2021, 2% 3/1/38 | | 585,000 | 441,088 |
| Mount Pleasant Tax Increment Rev. Series 2018 A: | | | |
| 5% 4/1/43 | | 420,000 | 439,761 |
| 5% 4/1/48 | | 2,890,000 | 2,985,014 |
| Pub. Fin. Auth. Mulfa Hs Rev. Series 2024, 6.25% 2/1/39 (g) | | 975,000 | 1,012,802 |
| Pub. Fin. Auth. Charter School Rev.: | | | |
| (North East Carolina Preparatory School Proj.) Series 2024 A, 4.25% 6/15/34 | | 1,000,000 | 1,013,393 |
| Series 2020 A: | | | |
4% 7/1/30 (g) | | 55,000 | 53,195 |
5% 7/1/40 (g) | | 100,000 | 96,830 |
5% 7/1/55 (g) | | 205,000 | 184,590 |
| Series 2023 A, 6.75% 7/1/58 (g) | | 175,000 | 184,755 |
| Pub. Fin. Auth. Ed. Rev. Mountain Island Charter School: | | | |
| Series 2015: | | | |
4.95% 3/1/30 (g) | | 25,000 | 25,056 |
5.25% 3/1/35 (g) | | 25,000 | 25,069 |
| Series 2017 A, 5.125% 6/15/47 (g) | | 370,000 | 346,282 |
| Series 2017: | | | |
5% 7/1/37 | | 115,000 | 115,034 |
5% 7/1/47 | | 280,000 | 279,993 |
5% 7/1/52 | | 605,000 | 604,953 |
| Series 2019 A: | | | |
4% 6/15/29 (g) | | 105,000 | 102,384 |
5% 6/15/39 (g) | | 140,000 | 135,185 |
5% 6/15/49 (g) | | 245,000 | 223,073 |
| Series 2022: | | | |
5% 1/1/42 (g) | | 500,000 | 462,544 |
5% 6/15/42 | | 130,000 | 134,754 |
5.25% 6/15/52 | | 190,000 | 197,202 |
5.375% 6/15/57 | | 180,000 | 187,402 |
5.5% 6/15/62 | | 285,000 | 297,815 |
| Series 2023 A, 6.25% 6/15/48 (g) | | 705,000 | 732,813 |
| Pub. Fin. Auth. Edl. Facilities: | | | |
| Series 2016, 5.5% 1/1/47 | | 300,000 | 300,073 |
| Series 2018 A: | | | |
5.25% 10/1/43 | | 720,000 | 724,706 |
5.25% 10/1/48 | | 1,195,000 | 1,197,222 |
| Series 2021, 4% 3/1/27 (g) | | 795,000 | 776,221 |
| Series 2022 A: | | | |
5.25% 3/1/42 | | 1,050,000 | 1,091,242 |
5.25% 3/1/47 | | 5,650,000 | 5,800,039 |
| Series 2024, 5% 2/1/54 | | 400,000 | 409,475 |
| Pub. Fin. Auth. Edl. Rev. Series 2019: | | | |
| 5% 6/15/39 | | 40,000 | 40,797 |
| 5% 6/15/49 | | 250,000 | 251,487 |
| 5% 6/15/53 | | 85,000 | 85,254 |
| Pub. Fin. Auth. Health Care Sys. Rev. Series 2022 A: | | | |
| 4% 10/1/52 | | 2,030,000 | 1,948,052 |
| 5% 10/1/52 | | 2,000,000 | 2,130,890 |
| Pub. Fin. Auth. Higher Edcuational Faclities Rev. (Gannon Univ. Proj.) Series 2017: | | | |
| 5% 5/1/42 | | 235,000 | 237,087 |
| 5% 5/1/47 | | 125,000 | 125,529 |
| Pub. Fin. Auth. Hosp. Rev.: | | | |
| (Renown Reg'l. Med. Ctr. Proj.): | | | |
Series 2016 A, % | | 975,000 | 993,055 |
Series 2020 A: | | | |
4% 6/1/45 | | 960,000 | 915,034 |
5% 6/1/34 | | 420,000 | 451,388 |
5% 6/1/38 | | 600,000 | 637,497 |
| Series 2019 A: | | | |
4% 10/1/49 | | 1,680,000 | 1,609,619 |
5% 10/1/44 | | 2,100,000 | 2,189,558 |
| Series 2021 A, 4% 2/1/51 | | 180,000 | 146,471 |
| Pub. Fin. Auth. Hotel Rev. (Grand Hyatt San Antonio Hotel Acquisition Proj.) Series 2022 A: | | | |
| 5% 2/1/42 | | 795,000 | 829,047 |
| 5% 2/1/52 | | 1,545,000 | 1,587,113 |
| 5% 2/1/62 | | 1,755,000 | 1,795,079 |
| Pub. Fin. Auth. Hotel/Conference Ctr. Facilities Rev. Series 2021 A: | | | |
| 4% 9/1/36 (g) | | 400,000 | 360,971 |
| 4% 9/1/41 (g) | | 360,000 | 300,819 |
| 4% 9/1/51 (g) | | 1,240,000 | 938,243 |
| 4% 9/1/56 (g) | | 590,000 | 432,560 |
| Pub. Fin. Auth. Ltd. Oblig.: | | | |
| (American Dream @ Meadowlands Proj.) Series 2017 A, 6.25% 8/1/27 (g) | | 2,810,000 | 2,718,675 |
| Series 2017, 5.625% 12/31/49 (f)(g) | | 1,105,000 | 1,069,088 |
| Pub. Fin. Auth. Ltd. Oblig. Pilot Rev. (American Dream Meadowlands Proj.) Series 2017, 7% 12/1/50 (g) | | 510,000 | 522,785 |
| Pub. Fin. Auth. Retirement Cmntys. Rev.: | | | |
| Series 2019 A, 5% 11/15/49 | | 350,000 | 358,090 |
| Series 2020 A, 5% 11/15/41 | | 635,000 | 663,743 |
| Pub. Fin. Auth. Rev.: | | | |
| (CFP3 - Eastern Michigan Univ. Student Hsg. Proj.) Series 2022 A1: | | | |
5.25% 7/1/42 | | 1,775,000 | 1,931,245 |
5.375% 7/1/47 | | 1,350,000 | 1,463,578 |
5.5% 7/1/52 | | 1,490,000 | 1,615,812 |
5.625% 7/1/55 | | 1,140,000 | 1,236,034 |
| (Irving Convention Ctr. Hotel) Series 2017 A2, 7% 1/1/50 (g) | | 550,000 | 591,021 |
| Series 2016 B, 5% 12/1/25 (e) | | 1,140,000 | 1,153,204 |
| Series 2016 C, 4.3% 11/1/30 (e) | | 705,000 | 707,349 |
| Series 2016 D, 4.05% 11/1/30 | | 350,000 | 349,937 |
| Pub. Fin. Auth. Spl. Facilities Rev.: | | | |
| (Million Air Three LLC Gen. Aviation Facilities Proj.) Series 2024 A: | | | |
5.5% 9/1/30 (e) | | 100,000 | 102,375 |
5.75% 9/1/35 (e) | | 125,000 | 129,903 |
6.25% 9/1/46 (e) | | 250,000 | 258,889 |
| (Sky Harbour Cap. Llc Aviation Facilities Proj.) Series 2021, 4% 7/1/41 (e) | | 500,000 | 445,390 |
| Series 2021, 4.25% 7/1/54 (e) | | 3,285,000 | 2,734,213 |
| Pub. Fin. Auth. Sr. Living Rev.: | | | |
| (Mary's Woods At Marylhurst, Inc. Proj.) Series 2017 A: | | | |
5% 5/15/25 (g) | | 130,000 | 130,155 |
5% 5/15/28 (g) | | 190,000 | 192,619 |
5.25% 5/15/37 (g) | | 490,000 | 497,564 |
5.25% 5/15/42 (g) | | 310,000 | 312,656 |
5.25% 5/15/47 (g) | | 850,000 | 852,415 |
5.25% 5/15/52 (g) | | 1,075,000 | 1,074,347 |
| Series 2019 A, 4% 1/1/46 | | 650,000 | 583,576 |
| Pub. Fin. Auth. Student Hsg.: | | | |
| (Aggie Apt. Life Holding Corp. II, LLC Proj.) Series 2024 A, 5.25% 6/1/54 | | 700,000 | 728,662 |
| (Beyond Boone, LLC - Appalachian State Univ. Proj.) Series 2020 A: | | | |
4% 7/1/45 (Assured Guaranty Muni. Corp. Insured) | | 170,000 | 168,566 |
4% 7/1/50 (Assured Guaranty Muni. Corp. Insured) | | 145,000 | 142,424 |
4% 7/1/55 (Assured Guaranty Muni. Corp. Insured) | | 165,000 | 159,622 |
| (CHF - Wilmington, L.L.C. - Univ. of North Carolina at Wilmington Proj.) Series 2018: | | | |
5% 7/1/48 (Assured Guaranty Muni. Corp. Insured) | | 1,280,000 | 1,312,246 |
5% 7/1/53 (Assured Guaranty Muni. Corp. Insured) | | 760,000 | 777,448 |
5% 7/1/58 (Assured Guaranty Muni. Corp. Insured) | | 1,065,000 | 1,089,094 |
| (NC A&T Real Estate Estate Foundation, LLC Proj.) Series 2019 A, 5% 6/1/49 | | 350,000 | 352,306 |
| (Univ. of Hawai'i Foundation Proj.): | | | |
Series 2021 B, 5.25% 7/1/61 (g) | | 980,000 | 883,775 |
Series 2021, 4% 7/1/61 (g) | | 1,300,000 | 1,062,543 |
| Series 2018, 5% 7/1/36 (Assured Guaranty Muni. Corp. Insured) | | 105,000 | 109,723 |
| Series 2019 A, 5% 7/1/44 (Assured Guaranty Muni. Corp. Insured) | | 80,000 | 82,048 |
| Series 2021 A1, 4% 7/1/51 (g) | | 575,000 | 490,100 |
| Series 2021 A2, 5.35% 7/1/40 (g) | | 300,000 | 243,790 |
| Series 2022 A, 5% 5/1/60 (g) | | 250,000 | 168,141 |
| Series 2022 B, 9% 5/1/71 (g) | | 150,000 | 75,034 |
| Series 2023 A: | | | |
5.75% 7/1/53 (g) | | 1,485,000 | 1,612,717 |
5.75% 7/1/63 (g) | | 3,005,000 | 3,240,908 |
| Pub. Fin. Auth. WI Rev.: | | | |
| (Church Home of Hartford, Inc. Proj.) Series 2015 A: | | | |
5% 9/1/30 (g) | | 150,000 | 150,079 |
5% 9/1/38 (g) | | 290,000 | 290,060 |
| (Elevon Proj.) Series 2024, 5% 7/15/30 (g) | | 425,000 | 426,644 |
| (Fargo-Moorhead Metropolitan Area Flood Risk Mgmt. Proj.) Series 2021, 4% 9/30/51 (e) | | 750,000 | 665,079 |
| (Nolina & Sorella Projs.) Series 2024, 5.5% 12/15/32 (g) | | 750,000 | 747,557 |
| (Roseman Univ. of Health Sciences Proj.) Series 2015, 5.875% 4/1/45 | | 400,000 | 401,937 |
| (Searstone CCRC Proj.) Series 2023 A, 5% 6/1/52 (g) | | 1,140,000 | 1,127,564 |
| (Ultimate Med. Academy Proj.) Series 2019 A, 5% 10/1/39 (g) | | 700,000 | 708,031 |
| (Wonderful Foundations Charter School Portfolio Projs.): | | | |
Series 2020 A1, 5% 1/1/55 (g) | | 1,250,000 | 1,247,939 |
Series 2020 B, 0% 1/1/60 (g) | | 1,100,000 | 92,991 |
| Series 2020: | | | |
5% 1/1/40 | | 300,000 | 309,565 |
5% 4/1/40 (g) | | 410,000 | 423,972 |
5% 4/1/40 (Pre-Refunded to 4/1/30 @ 100) (g) | | 15,000 | 16,496 |
5% 1/1/45 | | 725,000 | 739,821 |
5% 4/1/50 (g) | | 295,000 | 299,028 |
| Series 2021 A: | | | |
3% 7/1/50 | | 1,150,000 | 897,849 |
4.5% 6/1/56 (g) | | 8,170,000 | 6,741,990 |
| Series 2021 B, 6.5% 6/1/56 (g) | | 1,870,000 | 1,605,374 |
| Series 2022: | | | |
4% 4/1/32 (g) | | 410,000 | 409,946 |
4% 1/1/47 | | 100,000 | 92,211 |
4% 1/1/52 | | 105,000 | 93,983 |
| Series 2023 A, 5% 6/1/37 (g) | | 1,160,000 | 1,198,537 |
| Series 2023, 5.5% 7/1/39 (e) | | 935,000 | 1,018,214 |
| Series 2024 B, 5.25% 7/1/44 | | 1,545,000 | 1,637,692 |
| Pub. Fin. Auth. Wis Affordable Series 2023 B1, 7.125% 7/25/34 (g) | | 1,695,000 | 1,781,957 |
| Pub. Fin. Auth. Wis Multifamil Series 2024 B1, 6.81% 4/28/36 (g) | | 2,225,000 | 2,293,538 |
| Pub. Fin. Auth. Wisconsin Arpt. Facilities Rev. Series 2012 B: | | | |
| 5% 7/1/42 (e) | | 385,000 | 385,060 |
| 5.25% 7/1/28 (e) | | 1,295,000 | 1,295,937 |
| Pub. Fin. Auth. Wisconsin Pooled Charter School Ctfs. Series 2023 1, 5.75% 7/1/62 | | 1,908,387 | 2,032,242 |
| Pub. Fin. Auth. Wisconsin Retirement Facility Rev.: | | | |
| Series 2018: | | | |
5% 10/1/43 (g) | | 1,520,000 | 1,531,267 |
5% 10/1/48 (g) | | 805,000 | 805,111 |
5% 10/1/53 (g) | | 1,685,000 | 1,658,577 |
| Series 2021 A: | | | |
4% 10/1/46 | | 65,000 | 59,963 |
4% 10/1/51 | | 195,000 | 173,915 |
| Series 2021 C, 4% 10/1/41 | | 50,000 | 48,133 |
| Series 2021, 4% 12/1/56 | | 500,000 | 430,566 |
| Sun Prairie Area School District Series 2021, 2% 3/1/41 | | 1,500,000 | 1,071,425 |
| Univ. of Wisconsin Hosp. & Clinics Auth. Series 2021 B, 4% 4/1/51 | | 2,890,000 | 2,857,125 |
| Waunakee Wis Cmnty. School District Series 2023, 3.25% 4/1/28 | | 850,000 | 850,007 |
| Westosha Cent High School District Series 2021, 2% 3/1/40 | | 1,490,000 | 1,072,422 |
| Wisconsin Ctr. District Tax Rev.: | | | |
| Series 2020 C: | | | |
0% 12/15/32 (Assured Guaranty Muni. Corp. Insured) | | 140,000 | 103,886 |
0% 12/15/33 (Assured Guaranty Muni. Corp. Insured) | | 135,000 | 95,897 |
0% 12/15/34 (Assured Guaranty Muni. Corp. Insured) | | 125,000 | 84,958 |
0% 12/15/35 (Assured Guaranty Muni. Corp. Insured) | | 160,000 | 103,811 |
0% 12/15/36 (Assured Guaranty Muni. Corp. Insured) | | 155,000 | 95,936 |
0% 12/15/37 (Assured Guaranty Muni. Corp. Insured) | | 155,000 | 91,537 |
0% 12/15/38 (Assured Guaranty Muni. Corp. Insured) | | 160,000 | 90,135 |
0% 12/15/39 (Assured Guaranty Muni. Corp. Insured) | | 150,000 | 80,531 |
0% 12/15/40 (Assured Guaranty Muni. Corp. Insured) | | 35,000 | 17,847 |
| Series 2020 D: | | | |
0% 12/15/32 (Assured Guaranty Muni. Corp. Insured) | | 135,000 | 100,651 |
0% 12/15/33 (Assured Guaranty Muni. Corp. Insured) | | 210,000 | 150,503 |
0% 12/15/34 (Assured Guaranty Muni. Corp. Insured) | | 200,000 | 136,739 |
0% 12/15/35 (Assured Guaranty Muni. Corp. Insured) | | 300,000 | 195,915 |
0% 12/15/36 (Assured Guaranty Muni. Corp. Insured) | | 310,000 | 193,007 |
0% 12/15/37 (Assured Guaranty Muni. Corp. Insured) | | 505,000 | 298,996 |
0% 12/15/38 (Assured Guaranty Muni. Corp. Insured) | | 545,000 | 307,866 |
0% 12/15/39 (Assured Guaranty Muni. Corp. Insured) | | 595,000 | 320,382 |
0% 12/15/40 (Assured Guaranty Muni. Corp. Insured) | | 255,000 | 130,438 |
| Wisconsin Gen. Oblig. Series 2021 A, 5% 5/1/36 | | 4,785,000 | 5,090,289 |
| Wisconsin Health & Edl. Facilities: | | | |
| (Ascension Health Cr. Group Proj.) Series 2016 A, 5% 11/15/36 | | 605,000 | 618,384 |
| Series 2016 A, 5% 2/15/28 | | 290,000 | 294,495 |
| Series 2016, 4% 12/1/46 | | 5,465,000 | 5,420,877 |
| Series 2017 A: | | | |
5% 9/1/29 (Pre-Refunded to 9/1/27 @ 100) | | 705,000 | 743,172 |
5% 9/1/30 (Pre-Refunded to 9/1/27 @ 100) | | 70,000 | 73,790 |
5% 9/1/31 (Pre-Refunded to 9/1/27 @ 100) | | 120,000 | 126,497 |
5% 9/1/32 (Pre-Refunded to 9/1/27 @ 100) | | 60,000 | 63,249 |
5% 9/1/33 (Pre-Refunded to 9/1/27 @ 100) | | 210,000 | 221,370 |
5% 9/1/35 (Pre-Refunded to 9/1/27 @ 100) | | 230,000 | 242,453 |
| Series 2017 C: | | | |
4% 2/15/42 | | 625,000 | 577,571 |
4% 2/15/50 | | 610,000 | 533,436 |
5% 2/15/47 | | 170,000 | 170,488 |
| Series 2017: | | | |
4% 8/15/42 | | 750,000 | 747,932 |
5% 6/1/37 | | 155,000 | 155,116 |
5% 6/1/41 | | 235,000 | 229,735 |
| Series 2018, 5% 4/1/34 | | 1,545,000 | 1,639,476 |
| Series 2019 A: | | | |
5% 11/1/25 | | 15,000 | 15,011 |
5% 11/1/26 | | 250,000 | 251,211 |
5% 11/1/29 | | 10,000 | 10,117 |
5% 12/1/30 | | 20,000 | 21,635 |
5% 12/1/31 | | 20,000 | 21,608 |
5% 12/1/32 | | 20,000 | 21,603 |
5% 12/1/33 | | 20,000 | 21,581 |
5% 12/1/34 | | 20,000 | 21,559 |
5% 12/1/35 | | 30,000 | 32,275 |
5% 11/1/39 | | 405,000 | 392,807 |
5% 7/1/44 | | 30,000 | 30,530 |
5% 11/1/46 | | 1,195,000 | 1,131,907 |
5% 7/1/49 | | 530,000 | 537,333 |
5% 11/1/54 | | 1,745,000 | 1,592,838 |
| Series 2019 B, 5% 7/1/38 | | 25,000 | 25,531 |
| Series 2019: | | | |
5% 10/1/26 | | 35,000 | 36,170 |
5% 10/1/30 | | 285,000 | 308,744 |
5% 10/1/32 | | 600,000 | 647,612 |
| Series 2020 A: | | | |
4% 2/15/36 (Assured Guaranty Muni. Corp. Insured) | | 255,000 | 257,666 |
4% 2/15/37 (Assured Guaranty Muni. Corp. Insured) | | 230,000 | 232,091 |
| Series 2022 A, 4% 4/1/40 | | 4,510,000 | 4,518,603 |
| Wisconsin Health & Edl. Facilities Auth. Rev.: | | | |
| (Dickson Hollow Phase II Proj.) Series 2024, 6% 10/1/44 | | 300,000 | 315,810 |
| Bonds Series 2024 B, 5%, tender 10/3/34 (b) | | 2,875,000 | 3,191,586 |
| Series 2012, 5% 6/1/39 | | 65,000 | 65,038 |
| Series 2021 A: | | | |
3% 10/15/38 | | 885,000 | 774,991 |
3% 10/15/39 | | 460,000 | 398,393 |
| Series 2021: | | | |
4% 1/1/37 | | 665,000 | 645,334 |
4% 8/15/46 | | 730,000 | 730,263 |
4% 1/1/47 | | 960,000 | 847,267 |
4% 1/1/57 | | 1,400,000 | 1,166,862 |
| Series 2022 A, 5.5% 12/1/52 | | 3,070,000 | 3,382,603 |
| Series 2022: | | | |
4% 9/15/36 | | 105,000 | 103,081 |
4% 9/15/41 | | 105,000 | 98,926 |
4% 9/15/45 | | 90,000 | 81,650 |
| Series 2023 A: | | | |
4.75% 3/15/43 | | 130,000 | 131,519 |
5% 3/15/53 | | 130,000 | 131,615 |
| Series 2024 A: | | | |
4.5% 2/15/54 (Build America Mutual Assurance Insured) | | 2,260,000 | 2,250,148 |
5.25% 2/15/54 | | 505,000 | 546,622 |
5.5% 2/15/54 | | 875,000 | 965,106 |
| Wisconsin Hsg. & Econ. Dev. Auth.: | | | |
| Series 2021 A, 3% 3/1/52 | | 40,000 | 39,245 |
| Series 2023 A, 5% 3/1/49 | | 5,765,000 | 5,934,756 |
| Series 2024 B, 5% 9/1/39 | | 1,000,000 | 1,090,035 |
| Wisconsin Hsg. & Econ. Dev. Auth. Hsg. Rev. Bonds Series 2021 C, 0.81%, tender 5/1/25 (b) | | 170,000 | 167,245 |
| Wisconsin Rapids School District Series 2021: | | | |
| 1.6% 4/1/31 | | 685,000 | 580,625 |
| 1.6% 4/1/31 (Pre-Refunded to 4/1/28 @ 100) | | 515,000 | 487,387 |
TOTAL WISCONSIN | | | 168,535,989 |
| Wyoming - 0.0% | | | |
| Sublette County Wyo Hosp. District Series 2023 A, 5% 6/15/26 | | 250,000 | 250,170 |
| Wyoming Cmnty. Dev. Auth. Hsg. Rev.: | | | |
| Series 2019 3, 3.75% 12/1/49 | | 75,000 | 74,826 |
| Series 2022 1, 3.5% 6/1/52 | | 930,000 | 925,731 |
TOTAL WYOMING | | | 1,250,727 |
| TOTAL MUNICIPAL BONDS (Cost $8,349,049,530) | | | 8,503,697,801 |
| | | | |
| Municipal Notes - 0.5% |
| | | Principal Amount (a) | Value ($) |
| Arizona - 0.0% | | | |
| Arizona Indl. Dev. Auth. Hosp. Rev. Series 2019 A, 2.85% 12/2/24, LOC TD Banknorth, NA, VRDN (b) | | 300,000 | 300,000 |
| Phoenix Indl. Dev. Auth. Health Care Facilities Series 2014 B, 2.7% 12/2/24 (Liquidity Facility Northern Trust Co.), VRDN (b) | | 630,000 | 630,000 |
TOTAL ARIZONA | | | 930,000 |
| California - 0.2% | | | |
| California Statewide Cmntys. Dev. Auth. Multi-family Hsg. Rev. Participating VRDN: | | | |
| Series MIZ 91 21, 3.5% 12/2/24 (Liquidity Facility Mizuho Cap. Markets LLC) (b)(e)(m)(n) | | 1,240,000 | 1,240,000 |
| Series MIZ 91 22, 3.5% 12/2/24 (Liquidity Facility Mizuho Cap. Markets LLC) (b)(e)(m)(n) | | 12,900,000 | 12,900,000 |
| Los Angeles Dept. of Wtr. & Pwr. Rev. Series 2001 B3, 2.3% 12/2/24 (Liquidity Facility Barclays Bank PLC), VRDN (b) | | 3,600,000 | 3,600,000 |
TOTAL CALIFORNIA | | | 17,740,000 |
| Colorado - 0.1% | | | |
| Colorado Health Facilities Auth. Rev. Bonds Series 2024 E, 3.15% 12/2/24 (Liquidity Facility TD Banknorth, NA), VRDN (b) | | 2,485,000 | 2,485,000 |
| Colorado Univ. Co. Hosp. Auth. Rev.: | | | |
| Series 2018 B, 2.85% 12/2/24, VRDN (b) | | 4,700,000 | 4,700,000 |
| Series 2018 C, 2.85% 12/2/24, VRDN (b) | | 700,000 | 700,000 |
TOTAL COLORADO | | | 7,885,000 |
| Florida - 0.0% | | | |
| Gainesville Indl. Dev. Rev. Series 2021, 2.8% 12/6/24, LOC TD Banknorth, NA, VRDN (b) | | 150,000 | 150,000 |
| Highlands County Health Facilities Auth. Rev. Series 2012 I, 2.8% 12/6/24, VRDN (b) | | 145,000 | 145,000 |
| Hillsborough County Indl. Dev. Auth.: | | | |
| Series 2020 B, 2.85% 12/2/24, LOC TD Banknorth, NA, VRDN (b) | | 1,200,000 | 1,200,000 |
| Series 2020 C, 2.8% 12/6/24, LOC TD Banknorth, NA, VRDN (b) | | 200,000 | 200,000 |
| Series 2024 D, 2.8% 12/2/24 (Liquidity Facility PNC Bank NA), VRDN (b) | | 500,000 | 500,000 |
TOTAL FLORIDA | | | 2,195,000 |
| Georgia - 0.0% | | | |
| Bartow County Dev. Auth. (Georgia Pwr. Co. Plant Bowen Proj.) Series 2022, 3.05% 12/2/24, VRDN (b)(e) | | 400,000 | 400,000 |
| Burke County Indl. Dev. Auth. Poll. Cont. Rev. (Georgia Pwr. Co. Plant Vogtle Proj.): | | | |
| First Series 2009, 3% 12/2/24, VRDN (b) | | 500,000 | 500,000 |
| Series 2008, 3.1% 12/2/24, VRDN (b) | | 2,500,000 | 2,500,000 |
TOTAL GEORGIA | | | 3,400,000 |
| Illinois - 0.1% | | | |
| Illinois Fin. Auth. Rev.: | | | |
| (The Univ. of Chicago Med. Ctr. Proj.) Series 2009 D2, 2.7% 12/2/24, LOC TD Banknorth, NA, VRDN (b) | | 1,900,000 | 1,900,000 |
| Series 2009 D1, 2.7% 12/2/24, LOC TD Banknorth, NA, VRDN (b) | | 2,800,000 | 2,800,000 |
TOTAL ILLINOIS | | | 4,700,000 |
| Massachusetts - 0.0% | | | |
| Massachusetts Dev. Fin. Agcy. Rev.: | | | |
| (Boston Univ. Proj.) Series U-6E, 2.8% 12/2/24, LOC TD Banknorth, NA, VRDN (b) | | 1,300,000 | 1,300,000 |
| Series 2024 U1, 2.8% 12/2/24, LOC TD Banknorth, NA, VRDN (b) | | 300,000 | 300,000 |
| Massachusetts Health & Edl. Facilities Auth. Rev. Series 2009 K1, 2.8% 12/2/24, LOC TD Banknorth, NA, VRDN (b) | | 1,450,000 | 1,450,000 |
TOTAL MASSACHUSETTS | | | 3,050,000 |
| Mississippi - 0.0% | | | |
| Mississippi Bus. Fin. Corp. (Chevron U.S.A., Inc. Proj.) Series 2010 L, 2.85% 12/2/24, VRDN (b) | | 2,535,000 | 2,535,000 |
| New York - 0.0% | | | |
| New York City Muni. Wtr. Fin. Auth. Wtr. & Swr. Sys. Rev. Series 2023 CC, 2.85% 12/2/24 (Liquidity Facility Barclays Bank PLC), VRDN (b) | | 1,400,000 | 1,400,000 |
| Non-State Specific - 0.0% | | | |
| Fed. Home Ln. Mtg. Corp. Series 2018 M46, 2.625% 12/6/24 (Liquidity Facility Freddie Mac), VRDN (b)(g) | | 3,530,000 | 3,090,252 |
| Oregon - 0.0% | | | |
| Oregon Facilities Auth. Rev. Series 2018 B, 2.85% 12/2/24, LOC TD Banknorth, NA, VRDN (b) | | 400,000 | 400,000 |
| Pennsylvania - 0.0% | | | |
| Philadelphia Auth. for Indl. Dev. (The Children's Hosp. of Philadelphia Proj.) Series 2024 B2, 2.8% 12/2/24 (Liquidity Facility JPMorgan Chase Bank), VRDN (b) | | 1,700,000 | 1,700,000 |
| Texas - 0.0% | | | |
| Harris County Cultural Ed. Facilities Fin. Corp. Rev. Series 2020 B, 2.9% 12/2/24, VRDN (b) | | 1,000,000 | 1,000,000 |
| Tarrant County Cultural Ed. Facilities Fin. Corp. Hosp. Rev. (Baylor Health Care Sys. Proj.) Series 2011 C, 2.85% 12/2/24, LOC TD Banknorth, NA, VRDN (b) | | 700,000 | 700,000 |
TOTAL TEXAS | | | 1,700,000 |
| Washington - 0.1% | | | |
| King County Gen. Oblig. Series 2019, 2.8% 12/2/24 (Liquidity Facility TD Banknorth, NA), VRDN (b) | | 6,300,000 | 6,300,000 |
| Wisconsin - 0.0% | | | |
| Univ. of Wisconsin Hosp. & Clinics Auth. Series B, 2.85% 12/2/24 (Liquidity Facility JPMorgan Chase Bank), VRDN (b) | | 1,200,000 | 1,200,000 |
| TOTAL MUNICIPAL NOTES (Cost $58,402,294) | | | 58,225,252 |
| | | | |
| Municipal Bond Funds - 24.8% |
| | | Shares | Value ($) |
| Allspring Municipal Bond Fund - Class Admin | | 59,372,709 | 586,008,634 |
| American High-Income Municipal Bond Fund Class F-2 | | 8,112,657 | 126,314,062 |
| BlackRock National Municipal Fund Investor A Shares | | 17,532,859 | 179,010,489 |
| DWS Managed Municipal Bond Fund - Class S | | 35,844,427 | 296,433,410 |
| DWS Strategic High Yield Tax-Free Fund Class S | | 84,384 | 923,159 |
| Eaton Vance National Municipal Income Fund Class I | | 17,626,441 | 165,688,546 |
| Franklin Federal Tax-Free Income Fund - Class R6 | | 48,372,764 | 533,067,859 |
| iShares National Municipal Bond ETF | | 1,876,685 | 203,695,390 |
| Vanguard Long-Term Tax-Exempt Fund Admiral Shares | | 57,215,922 | 631,091,576 |
| Vanguard Tax-Exempt Bond Index Fund ETF | | 3,887,408 | 198,452,178 |
| TOTAL MUNICIPAL BOND FUNDS (Cost $2,828,676,952) | | | 2,920,685,303 |
| | | | |
| Money Market Funds - 1.8% |
| | | Shares | Value ($) |
| Fidelity Investments Money Market Government Portfolio Institutional Class 4.55% (o)(p) | | 84,174,432 | 84,184,263 |
| Fidelity Municipal Cash Central Fund 2.98% (q)(r) | | 99,008,132 | 99,027,934 |
| Fidelity SAI Municipal Money Market Fund 2.87% (o)(p) | | 2,695 | 2,695 |
| Invesco Government & Agency Portfolio Institutional Class 4.57% (o) | | 25,824,216 | 25,824,216 |
| TOTAL MONEY MARKET FUNDS (Cost $209,039,109) | | | 209,039,108 |
| | | | |
| TOTAL INVESTMENT IN SECURITIES - 99.4% (Cost $11,445,167,885) | 11,691,647,464 |
NET OTHER ASSETS (LIABILITIES) - 0.6% | 64,916,081 |
| NET ASSETS - 100.0% | 11,756,563,545 |
| | |
| Futures Contracts |
| | Number of contracts | Expiration Date | Notional Amount ($) | Value ($) | Unrealized Appreciation/ (Depreciation) ($) |
| Purchased | | | | | |
| | | | | | |
| Treasury Contracts | | | | | |
| CBOT Ultra Long Term U.S. Treasury Bond Contracts (United States) | 224 | Mar 2025 | 28,490,000 | 586,808 | 586,808 |
| | | | | | |
| The notional amount of futures purchased as a percentage of Net Assets is 0.2% |
Security Type Abbreviations
| ETF | - | EXCHANGE-TRADED FUND |
| VRDN | - | VARIABLE RATE DEMAND NOTE (A debt instrument that is payable upon demand, either daily, weekly or monthly) |
Legend
| (a) | Amount is stated in United States dollars unless otherwise noted. |
| (b) | Coupon rates for floating and adjustable rate securities reflect the rates in effect at period end. |
| (c) | Coupon is indexed to a floating interest rate which may be multiplied by a specified factor and/or subject to caps or floors. |
| (d) | Security or a portion of the security purchased on a delayed delivery or when-issued basis. |
| (e) | Private activity obligations whose interest is subject to the federal alternative minimum tax for individuals. |
| (g) | Security exempt from registration under Rule 144A of the Securities Act of 1933. These securities may be resold in transactions exempt from registration, normally to qualified institutional buyers. At the end of the period, the value of these securities amounted to $540,944,861 or 4.6% of net assets. |
| (h) | Security initially issued at one coupon which converts to a higher coupon at a specified date. The rate shown is the rate at period end. |
| (i) | Security initially issued in zero coupon form which converts to coupon form at a specified rate and date. The rate shown is the rate at period end. |
| (j) | Non-income producing - Security is in default. |
| (k) | Interest Only (IO) security represents the right to receive only monthly interest payments on an underlying pool of mortgages or assets. Principal shown is the outstanding par amount of the pool as of the end of the period. |
| (l) | Security or a portion of the security was pledged to cover margin requirements for futures contracts. At period end, the value of securities pledged amounted to $2,570,040. |
| (m) | Provides evidence of ownership in one or more underlying municipal bonds. Coupon rates are determined by re-marketing agents based on current market conditions. |
| (n) | Coupon rates are determined by re-marketing agents based on current market conditions. |
| (o) | The rate quoted is the annualized seven-day yield of the fund at period end. |
| (q) | Information in this report regarding holdings by state and security types does not reflect the holdings of the Fidelity Municipal Cash Central Fund. |
| (r) | Affiliated fund that is generally available only to investment companies and other accounts managed by Fidelity Investments. The rate quoted is the annualized seven-day yield of the fund at period end. A complete unaudited listing of the fund's holdings as of its most recent quarter end is available upon request. In addition, each Fidelity Central Fund's financial statements are available on the SEC's website or upon request. |
Affiliated Central Funds
Fiscal year to date information regarding the Fund's investments in Fidelity Central Funds, including the ownership percentage, is presented below.
| Affiliate | Value, beginning of period ($) | Purchases ($) | Sales Proceeds ($) | Dividend Income ($) | Realized Gain (loss) ($) | Change in Unrealized appreciation (depreciation) ($) | Value, end of period ($) | % ownership, end of period |
| Fidelity Municipal Cash Central Fund 2.98% | 2,372,231 | 259,943,850 | 163,288,147 | 438,236 | - | - | 99,027,934 | 2.8% |
| Total | 2,372,231 | 259,943,850 | 163,288,147 | 438,236 | - | - | 99,027,934 | |
| | | | | | | | | |
Amounts in the dividend income column in the above table include any capital gain distributions from underlying funds, which are presented in the corresponding line item in the Statement of Operations, if applicable.
Amounts included in the purchases and sales proceeds columns may include in-kind transactions, if applicable.
Affiliated Underlying Funds
Fiscal year to date information regarding the Fund's investments in affiliated Underlying Funds is presented below. Exchanges between classes of the same affiliated Underlying Funds may occur. If an Underlying Funds changes its name, the name presented below is the name in effect at period end.
| Affiliate | Value, beginning of period ($) | Purchases ($) | Sales Proceeds ($) | Dividend Income ($) | Realized Gain (loss) ($) | Change in Unrealized appreciation (depreciation) ($) | Value, end of period ($) |
| Fidelity Investments Money Market Government Portfolio Class I 4.51% | - | 106,370 | 106,370 | 193 | - | - | - |
| Fidelity Investments Money Market Government Portfolio Institutional Class 4.55% | 125,729,973 | 683,637,150 | 725,192,691 | 1,923,346 | - | - | 84,174,432 |
| Fidelity SAI Municipal Money Market Fund 2.87% | 2,652 | 43 | - | 43 | - | - | 2,695 |
| | 125,732,625 | 683,743,563 | 725,299,061 | 1,923,582 | - | - | 84,177,127 |
Amounts in the dividend income column in the above table include any capital gain distributions from underlying funds, which are presented in the corresponding line item in the Statement of Operations, if applicable.
Amounts included in the purchases and sales proceeds columns may include in-kind transactions, if applicable.
Investment Valuation
The following is a summary of the inputs used, as of November 30, 2024, involving the Fund's assets and liabilities carried at fair value. The inputs or methodology used for valuing securities may not be an indication of the risk associated with investing in those securities. For more information on valuation inputs, and their aggregation into the levels used below, please refer to the Investment Valuation section in the accompanying Notes to Financial Statements.
| Valuation Inputs at Reporting Date: |
| Description | Total ($) | Level 1 ($) | Level 2 ($) | Level 3 ($) |
Investments in Securities: | | | | |
|
| Municipal Securities | 8,561,923,053 | - | 8,552,774,731 | 9,148,322 |
|
| Municipal Bond Funds | 2,920,685,303 | 2,920,685,303 | - | - |
|
| Money Market Funds | 209,039,108 | 209,039,108 | - | - |
| Total Investments in Securities: | 11,691,647,464 | 3,129,724,411 | 8,552,774,731 | 9,148,322 |
Derivative Instruments: Assets | | | | |
Futures Contracts | 586,808 | 586,808 | - | - |
| Total Assets | 586,808 | 586,808 | - | - |
| Total Derivative Instruments: | 586,808 | 586,808 | - | - |
Value of Derivative Instruments
The following table is a summary of the Fund's value of derivative instruments by primary risk exposure as of November 30, 2024. For additional information on derivative instruments, please refer to the Derivative Instruments section in the accompanying Notes to Financial Statements.
Primary Risk Exposure / Derivative Type | Value |
| Asset ($) | Liability ($) |
| Interest Rate Risk | | |
Futures Contracts (a) | 586,808 | 0 |
| Total Interest Rate Risk | 586,808 | 0 |
| Total Value of Derivatives | 586,808 | 0 |
(a)Reflects gross cumulative appreciation (depreciation) on futures contracts as presented in the Schedule of Investments. In the Statement of Assets and Liabilities, the period end daily variation margin is included in receivable or payable for daily variation margin on futures contracts, and the net cumulative appreciation (depreciation) is included in Total accumulated earnings (loss).
Financial Statements (Unaudited)
| Statement of Assets and Liabilities |
| As of November 30, 2024 (Unaudited) |
| Assets | | | | |
| Investment in securities, at value - See accompanying schedule: | | | | |
Unaffiliated issuers (cost $11,261,952,993) | $ | 11,508,432,572 | | |
Fidelity Central Funds (cost $99,027,934) | | 99,027,934 | | |
Other affiliated issuers (cost $84,186,958) | | 84,186,958 | | |
| | | | | |
| | | | | |
| Total Investment in Securities (cost $11,445,167,885) | | | $ | 11,691,647,464 |
| Cash | | | | 100,000 |
| Receivable for investments sold | | | | 42,971,017 |
| Receivable for fund shares sold | | | | 4,007,063 |
| Dividends receivable | | | | 461,006 |
| Interest receivable | | | | 115,636,311 |
| Distributions receivable from Fidelity Central Funds | | | | 188,816 |
| Receivable for daily variation margin on futures contracts | | | | 415,003 |
| Prepaid expenses | | | | 9,084 |
| Other receivables | | | | 10,295 |
Total assets | | | | 11,855,446,059 |
| Liabilities | | | | |
| Payable for investments purchased | | | | |
Regular delivery | $ | 2,968,759 | | |
Delayed delivery | | 54,671,705 | | |
| Payable for fund shares redeemed | | 4,275,448 | | |
| Distributions payable | | 35,999,930 | | |
| Accrued management fee | | 817,185 | | |
| Other payables and accrued expenses | | 149,487 | | |
| Total liabilities | | | | 98,882,514 |
| Net Assets | | | $ | 11,756,563,545 |
| Net Assets consist of: | | | | |
| Paid in capital | | | $ | 12,715,309,489 |
| Total accumulated earnings (loss) | | | | (958,745,944) |
| Net Assets | | | $ | 11,756,563,545 |
Net Asset Value, offering price and redemption price per share ($11,756,563,545 ÷ 1,305,117,972 shares) | | | $ | 9.01 |
| Statement of Operations |
Six months ended November 30, 2024 (Unaudited) |
| Investment Income | | | | |
| Dividends: | | | | |
| Unaffiliated issuers | | | $ | 54,078,201 |
| Affiliated issuers | | | | 1,923,582 |
| Interest | | | | 179,161,530 |
| Income from Fidelity Central Funds | | | | 438,236 |
| Total income | | | | 235,601,549 |
| Expenses | | | | |
| Management fee | $ | 20,094,574 | | |
| Custodian fees and expenses | | 51,811 | | |
| Independent trustees' fees and expenses | | 29,204 | | |
| Registration fees | | 90,048 | | |
| Audit fees | | 46,990 | | |
| Legal | | 7,242 | | |
| Miscellaneous | | 26,398 | | |
| Total expenses before reductions | | 20,346,267 | | |
| Expense reductions | | (15,190,515) | | |
| Total expenses after reductions | | | | 5,155,752 |
| Net Investment income (loss) | | | | 230,445,797 |
| Realized and Unrealized Gain (Loss) | | | | |
| Net realized gain (loss) on: | | | | |
| Investment Securities: | | | | |
| Unaffiliated issuers | | 17,596,441 | | |
| Futures contracts | | (1,499,789) | | |
| Total net realized gain (loss) | | | | 16,096,652 |
| Change in net unrealized appreciation (depreciation) on: | | | | |
| Investment Securities: | | | | |
| Unaffiliated issuers | | 334,714,293 | | |
| Futures contracts | | 1,304,526 | | |
| Total change in net unrealized appreciation (depreciation) | | | | 336,018,819 |
| Net gain (loss) | | | | 352,115,471 |
| Net increase (decrease) in net assets resulting from operations | | | $ | 582,561,268 |
| Statement of Changes in Net Assets |
| |
| | Six months ended November 30, 2024 (Unaudited) | | Year ended May 31, 2024 |
| Increase (Decrease) in Net Assets | | | | |
| Operations | | | | |
| Net investment income (loss) | $ | 230,445,797 | $ | 470,045,411 |
| Net realized gain (loss) | | 16,096,652 | | (222,995,016) |
| Change in net unrealized appreciation (depreciation) | | 336,018,819 | | 187,478,237 |
| Net increase (decrease) in net assets resulting from operations | | 582,561,268 | | 434,528,632 |
| Distributions to shareholders | | (224,332,102) | | (461,350,052) |
| | | | | |
| Share transactions | | | | |
| Proceeds from sales of shares | | 875,357,120 | | 6,218,932,448 |
| Reinvestment of distributions | | 8,454 | | 14,456 |
| Cost of shares redeemed | | (1,732,814,512) | | (6,931,684,441) |
| | | | | |
Net increase (decrease) in net assets resulting from share transactions | | (857,448,938) | | (712,737,537) |
| Total increase (decrease) in net assets | | (499,219,772) | | (739,558,957) |
| | | | | |
| Net Assets | | | | |
| Beginning of period | | 12,255,783,317 | | 12,995,342,274 |
| End of period | $ | 11,756,563,545 | $ | 12,255,783,317 |
| | | | | |
| Other Information | | | | |
| Shares | | | | |
| Sold | | 97,980,539 | | 727,263,758 |
| Issued in reinvestment of distributions | | 946 | | 1,655 |
| Redeemed | | (193,680,979) | | (815,554,456) |
| Net increase (decrease) | | (95,699,494) | | (88,289,043) |
| | | | | |
Financial Highlights
Strategic Advisers® Municipal Bond Fund |
| |
| | Six months ended (Unaudited) November 30, 2024 | | Years ended May 31, 2024 | | 2023 | | 2022 A |
Selected Per-Share Data | | | | | | | | |
| Net asset value, beginning of period | $ | 8.75 | $ | 8.73 | $ | 9.03 | $ | 10.00 |
| Income from Investment Operations | | | | | | | | |
Net investment income (loss) B,C | | .172 | | .328 | | .293 | | .202 |
| Net realized and unrealized gain (loss) | | .256 | | .015 | | (.305) | | (.984) |
| Total from investment operations | | .428 | | .343 | | (.012) | | (.782) |
| Distributions from net investment income | | (.168) | | (.323) | | (.288) | | (.187) |
| Distributions from net realized gain | | - | | - | | - | | (.001) |
| Total distributions | | (.168) | | (.323) | | (.288) | | (.188) |
| Net asset value, end of period | $ | 9.01 | $ | 8.75 | $ | 8.73 | $ | 9.03 |
Total Return D,E | | | | 4.00% | | (.07)% | | (7.92)% |
Ratios to Average Net Assets C,F,G | | | | | | | | |
| Expenses before reductions | | .34% H | | .33% | | .34% | | .31% H |
| Expenses net of fee waivers, if any | | | | .08% | | .09% | | .06% H |
| Expenses net of all reductions | | .09% H | | .08% | | .09% | | .06% H |
| Net investment income (loss) | | 3.84% H | | 3.76% | | 3.35% | | 2.27% H |
| Supplemental Data | | | | | | | | |
| Net assets, end of period (000 omitted) | $ | 11,756,564 | $ | 12,255,783 | $ | 12,995,342 | $ | 11,160,697 |
Portfolio turnover rate I | | | | 48% | | 117% | | 134% H |
AFor the period June 17, 2021 (commencement of operations) through May 31, 2022.
BCalculated based on average shares outstanding during the period.
CNet investment income (loss) is affected by the timing of the declaration of dividends by any underlying mutual funds or exchange-traded funds (ETFs). Net investment income (loss) of any mutual funds or ETFs is not included in the Fund's net investment income (loss) ratio.
DTotal returns for periods of less than one year are not annualized.
ETotal returns would have been lower if certain expenses had not been reduced during the applicable periods shown.
FFees and expenses of any underlying mutual funds or exchange-traded funds (ETFs) are not included in the Fund's expense ratio. The Fund indirectly bears its proportionate share of these expenses. For additional expense information related to investments in Fidelity Central Funds, please refer to the "Investments in Fidelity Central Funds" note found in the Notes to Financial Statements section of the most recent Annual or Semi-Annual report.
GExpense ratios reflect operating expenses of the class. Expenses before reductions do not reflect amounts reimbursed, waived, or reduced through arrangements with the investment adviser, brokerage services, or other offset arrangements, if applicable, and do not represent the amount paid by the class during periods when reimbursements, waivers or reductions occur.
HAnnualized.
IAmount does not include the portfolio activity of any underlying mutual funds or exchange-traded funds (ETFs), derivatives or securities that mature within one year from acquisition.
Notes to Financial Statements
(Unaudited)For the period ended November 30, 2024
1. Organization.
Strategic Advisers Municipal Bond Fund (the Fund) is a fund of Fidelity Rutland Square Trust II (the Trust), and is authorized to issue an unlimited number of shares. The Trust is registered under the Investment Company Act of 1940, as amended (the 1940 Act), as an open-end management investment company organized as a Delaware statutory trust. The Fund is offered exclusively to certain managed account clients of Strategic Advisers LLC (Strategic Advisers), an affiliate of Fidelity Management & Research Company LLC (FMR).
2. Significant Accounting Policies.
The Fund is an investment company and applies the accounting and reporting guidance of the Financial Accounting Standards Board (FASB) Accounting Standards Codification Topic 946 Financial Services - Investment Companies. The financial statements have been prepared in conformity with accounting principles generally accepted in the United States of America (GAAP), which require management to make certain estimates and assumptions at the date of the financial statements. Actual results could differ from those estimates. Subsequent events, if any, through the date that the financial statements were issued have been evaluated in the preparation of the financial statements. The Fund's Schedule of Investments lists any underlying mutual funds or exchange-traded funds (ETFs) but does not include the underlying holdings of these funds. The following summarizes the significant accounting policies of the Fund:
Investment Valuation. Investments are valued as of 4:00 p.m. Eastern time on the last calendar day of the period. The Board of Trustees (the Board) has designated the Fund's investment adviser as the valuation designee responsible for the fair valuation function and performing fair value determinations as needed. The investment adviser has established a Fair Value Committee (the Committee) to carry out the day-to-day fair valuation responsibilities and has adopted policies and procedures to govern the fair valuation process and the activities of the Committee. In accordance with these fair valuation policies and procedures, which have been approved by the Board, the Fund attempts to obtain prices from one or more third party pricing services or brokers to value its investments. When current market prices, quotations or currency exchange rates are not readily available or reliable, investments will be fair valued in good faith by the Committee, in accordance with the policies and procedures. Factors used in determining fair value vary by investment type and may include market or investment specific events, transaction data, estimated cash flows, and market observations of comparable investments. The frequency that the fair valuation procedures are used cannot be predicted and they may be utilized to a significant extent. The Committee manages the Fund's fair valuation practices and maintains the fair valuation policies and procedures. The Fund's investment adviser reports to the Board information regarding the fair valuation process and related material matters.
The Fund categorizes the inputs to valuation techniques used to value its investments into a disclosure hierarchy consisting of three levels as shown below:
Level 1 - unadjusted quoted prices in active markets for identical investments
Level 2 - other significant observable inputs (including quoted prices for similar investments, interest rates, prepayment speeds, etc.)
Level 3 - unobservable inputs (including the Fund's own assumptions based on the best information available)
Valuation techniques used to value the Fund's investments by major category are as follows:
Debt securities, including restricted securities, are valued based on evaluated prices received from third party pricing services or from brokers who make markets in such securities. Municipal securities are valued by pricing services who utilize matrix pricing which considers yield or price of bonds of comparable quality, coupon, maturity and type or by broker-supplied prices. When independent prices are unavailable or unreliable, debt securities may be valued utilizing pricing methodologies which consider similar factors that would be used by third party pricing services. Debt securities are generally categorized as Level 2 in the hierarchy but may be Level 3 depending on the circumstances.
Exchange-Traded Funds (ETFs) are valued at their last sale price or official closing price as reported by a third party pricing service on the primary market or exchange on which they are traded and are categorized as Level 1 in the hierarchy. In the event there were no sales during the day but the exchange reports a closing bid level, ETFs are valued at the closing bid and would be categorized as Level 1 in the hierarchy. In the event there was no closing bid, ETFs may be valued by another method that the Board believes reflects fair value in accordance with the Board's fair value pricing policies and may be categorized as Level 2 in the hierarchy.
Futures contracts are valued at the settlement price established each day by the board of trade or exchange on which they are traded and are categorized as Level 1 in the hierarchy. Investments in open-end mutual funds, including the Fidelity Central Funds, are valued at their closing net asset value (NAV) each business day and are categorized as Level 1 in the hierarchy. If an unaffiliated open-end mutual fund's NAV is unavailable, shares of that fund may be valued by another method that the Board believes reflects fair value in accordance with the Board's fair value pricing policies and is categorized as Level 2 in the hierarchy.
Changes in valuation techniques may result in transfers in or out of an assigned level within the disclosure hierarchy. The aggregate value of investments by input level as of November 30, 2024 is included at the end of the Fund's Schedule of Investments.
Investment Transactions and Income. For financial reporting purposes, the Fund's investment holdings and NAV include trades executed through the end of the last business day of the period. The NAV per share for processing shareholder transactions is calculated as of the close of business of the New York Stock Exchange (NYSE), normally 4:00 p.m. Eastern time and includes trades executed through the end of the prior business day. Gains and losses on securities sold are determined on the basis of identified cost. Dividend income is recorded on the ex-dividend date, except for certain dividends from foreign securities where the ex-dividend date may have passed, which are recorded as soon as the Fund is informed of the ex-dividend date. Non-cash dividends included in dividend income, if any, are recorded at the fair market value of the securities received. Income and capital gain distributions from Fidelity Central Funds, if any, are recorded on the ex-dividend date. Interest income is accrued as earned and includes coupon interest and amortization of premium and accretion of discount on debt securities as applicable.
Expenses. Expenses directly attributable to a fund are charged to that fund. Expenses attributable to more than one fund are allocated among the respective funds on the basis of relative net assets or other appropriate methods. Expenses included in the accompanying financial statements reflect the expenses of that fund and do not include any expenses associated with any underlying mutual funds or exchange-traded funds. Although not included in a fund's expenses, a fund indirectly bears its proportionate share of these expenses through the net asset value of each underlying mutual fund or exchange-traded fund. Expense estimates are accrued in the period to which they relate and adjustments are made when actual amounts are known.
Deferred Trustee Compensation. Under a Deferred Compensation Plan (the Plan) for certain Funds, certain independent Trustees have elected to defer receipt of a portion of their annual compensation. Deferred amounts are invested in affiliated mutual funds, are marked-to-market and remain in a fund until distributed in accordance with the Plan. The investment of deferred amounts and the offsetting payable to the Trustees presented below are included in the accompanying Statement of Assets and Liabilities in other receivables and other payables and accrued expenses, as applicable.
| Strategic Advisers Municipal Bond Fund | $7,612 |
Income Tax Information and Distributions to Shareholders. Each year, the Fund intends to qualify as a regulated investment company under Subchapter M of the Internal Revenue Code, including distributing substantially all of its taxable income and realized gains. As a result, no provision for U.S. Federal income taxes is required. The Fund files a U.S. federal tax return, in addition to state and local tax returns as required. The Fund's federal income tax returns are subject to examination by the Internal Revenue Service (IRS) for a period of three fiscal years after they are filed. State and local tax returns may be subject to examination for an additional fiscal year depending on the jurisdiction.
Distributions are declared and recorded daily and paid monthly from net investment income. Distributions from realized gains, if any, are declared and recorded on the ex-dividend date. Income and capital gain distributions are determined in accordance with income tax regulations, which may differ from GAAP.
Capital accounts within the financial statements are adjusted for permanent book-tax differences. These adjustments have no impact on net assets or the results of operations. Capital accounts are not adjusted for temporary book-tax differences which will reverse in a subsequent period.
Book-tax differences are primarily due to the short-term gain distributions from the underlying mutual funds or exchange-traded funds (ETFs), futures contracts, market discount, contingent interest, capital loss carryforwards and losses deferred due to wash sales.
The Fund purchases municipal securities whose interest, in the opinion of the issuer, is free from federal income tax. There is no assurance that the IRS will agree with this opinion. In the event the IRS determines that the issuer does not comply with relevant tax requirements, interest payments from a security could become federally taxable, possibly retroactively to the date the security was issued.
As of period end, the cost and unrealized appreciation (depreciation) in securities, and derivatives if applicable, for federal income tax purposes were as follows:
| Gross unrealized appreciation | $341,294,064 |
| Gross unrealized depreciation | (100,578,417) |
| Net unrealized appreciation (depreciation) | $240,715,647 |
| Tax cost | $11,451,516,383 |
Capital loss carryforwards are only available to offset future capital gains of the Fund to the extent provided by regulations and may be limited. The capital loss carryforward information presented below, including any applicable limitation, is estimated as of prior fiscal period end and is subject to adjustment.
Short-term | $(878,804,356) |
Long-term | (323,991,166) |
| Total capital loss carryforward | $(1,202,795,522) |
Delayed Delivery Transactions and When-Issued Securities. During the period, certain Funds transacted in securities on a delayed delivery or when-issued basis. Payment and delivery may take place after the customary settlement period for that security. The price of the underlying securities and the date when the securities will be delivered and paid for are fixed at the time the transaction is negotiated. Securities purchased on a delayed delivery or when-issued basis are identified as such in the Schedule of Investments. Compensation for interest forgone in the purchase of a delayed delivery or when-issued debt security may be received. With respect to purchase commitments, each applicable Fund identifies securities as segregated in its records with a value at least equal to the amount of the commitment. Payables and receivables associated with the purchases and sales of delayed delivery securities having the same coupon, settlement date and broker are offset. Delayed delivery or when-issued securities that have been purchased from and sold to different brokers are reflected as both payables and receivables in the Statement of Assets and Liabilities under the caption "Delayed delivery", as applicable. Losses may arise due to changes in the value of the underlying securities or if the counterparty does not perform under the contract's terms, or if the issuer does not issue the securities due to political, economic, or other factors.
Restricted Securities (including Private Placements). Funds may invest in securities that are subject to legal or contractual restrictions on resale. These securities generally may be resold in transactions exempt from registration or to the public if the securities are registered. Disposal of these securities may involve time-consuming negotiations and expense, and prompt sale at an acceptable price may be difficult. Information regarding restricted securities held at period end is included at the end of the Schedule of Investments, if applicable.
New Accounting Pronouncement. In November 2023, the FASB issued Accounting Standards Update (ASU) 2023-07 Segment Reporting (Topic 280): Improvements to Reportable Segment Disclosures. Effective for fiscal years beginning after December 15, 2023 and interim periods within fiscal years beginning after December 15, 2024, the amendments enhance required disclosures of segment information for public entities on an annual and interim basis. The ASU allows for early adoption with updates applied retrospectively. Management is currently evaluating the impact of the ASU but does not expect this guidance to materially impact the financial statements.
3. Derivative Instruments.
Risk Exposures and the Use of Derivative Instruments. The Fund's investment objectives allow for various types of derivative instruments, including futures contracts. Derivatives are investments whose value is primarily derived from underlying assets, indices or reference rates and may be transacted on an exchange or over-the-counter (OTC). Derivatives may involve a future commitment to buy or sell a specified asset based on specified terms, to exchange future cash flows at periodic intervals based on a notional principal amount, or for one party to make one or more payments upon the occurrence of specified events in exchange for periodic payments from the other party.
Derivatives were used to increase returns and to manage exposure to certain risks as defined below. The success of any strategy involving derivatives depends on analysis of numerous economic factors, and if the strategies for investment do not work as intended, the objectives may not be achieved.
Derivatives were used to increase or decrease exposure to the following risk(s):
| | |
| Interest Rate Risk | Interest rate risk relates to the fluctuations in the value of interest-bearing securities due to changes in the prevailing levels of market interest rates. |
Funds are also exposed to additional risks from investing in derivatives, such as liquidity risk and counterparty credit risk. Liquidity risk is the risk that a fund will be unable to close out the derivative in the open market in a timely manner. Counterparty credit risk is the risk that the counterparty will not be able to fulfill its obligation to a fund. Counterparty credit risk related to exchange-traded contracts may be mitigated by the protection provided by the exchange on which they trade.
Investing in derivatives may involve greater risks than investing in the underlying assets directly and, to varying degrees, may involve risk of loss in excess of any initial investment and collateral received and amounts recognized in the Statement of Assets and Liabilities. In addition, there may be the risk that the change in value of the derivative contract does not correspond to the change in value of the underlying instrument.
Futures Contracts. A futures contract is an agreement between two parties to buy or sell a specified underlying instrument for a fixed price at a specified future date. Futures contracts were used to manage exposure to the bond market and fluctuations in interest rates.
Upon entering into a futures contract, a fund is required to deposit either cash or securities (initial margin) with a clearing broker in an amount equal to a certain percentage of the face value of the contract. Futures contracts are marked-to-market daily and subsequent daily payments are made or received by a fund depending on the daily fluctuations in the value of the futures contracts and are recorded as unrealized appreciation or (depreciation). This receivable and/or payable, if any, is included in daily variation margin on futures contracts in the Statement of Assets and Liabilities. Realized gain or (loss) is recorded upon the expiration or closing of a futures contract. The net realized gain (loss) and change in net unrealized appreciation (depreciation) on futures contracts during the period is presented in the Statement of Operations.
Any open futures contracts at period end are presented in the Schedule of Investments under the caption "Futures Contracts". The notional amount at value reflects each contract's exposure to the underlying instrument or index at period end, and is representative of volume of activity during the period unless an average notional amount is presented. Any securities deposited to meet initial margin requirements are identified in the Schedule of Investments. Any cash deposited to meet initial margin requirements is presented as segregated cash with brokers for derivative instruments in the Statement of Assets and Liabilities.
4. Purchases and Sales of Investments.
Purchases and sales of securities, other than short-term securities and in-kind transactions, as applicable, are noted in the table below.
| | Purchases ($) | Sales ($) |
| Strategic Advisers Municipal Bond Fund | 1,559,338,027 | 2,430,953,806 |
Prior Fiscal Year Unaffiliated Exchanges In-Kind. During the prior period, the Fund redeemed shares of MainStay MacKay High Yield Municipal Bond Fund Class A in exchange for investments and cash, if any, as noted in the table below. The Fund had a net realized loss $2,448,977 on the Fund's redemptions of MainStay MacKay High Yield Municipal Bond Fund Class A, which is included in "Net Realized gain (loss) on Investment Securities " in the accompanying Statement of Changes in Net Assets. The Fund recognized a net loss on the exchanges for federal income tax purposes.| Fund Name | Value of Investments ($) | Net realized gain (loss) ($) | Shares redeemed |
| MainStay MacKay High Yield Municipal Bond Fund Class A | 89,218,096 | (2,448,977) | 8,037,956 |
5. Fees and Other Transactions with Affiliates.
Management Fee. Strategic Advisers (the investment adviser) provides the Fund with investment management related services. For these services, the Fund pays a monthly management fee to the investment adviser. The management fee is calculated by adding the annual management fee rate of .25% of the Fund's average net assets throughout the month to the aggregate of the fee rates, payable monthly by the investment adviser, to the Fund's sub-advisers. The Fund's maximum aggregate management fee will not exceed .60% of the Fund's average net assets. For the reporting period, the total annualized management fee rate was .33% of the Fund's average net assets.
During the period, the investment adviser waived a portion of its management fee as described in the Expense Reductions note.
Sub-Advisers. Delaware Investments Fund Advisers, FIAM LLC (an affiliate of the investment adviser), Mackay Shields LLC, Massachusetts Financial Services Company (MFS), T. Rowe Price Associates, Inc. and Western Asset Management Company, LLC each served as a sub-adviser for the Fund during the period. Sub-advisers provide discretionary investment advisory services for their allocated portion of the Fund's assets and are paid as described in the Management Fee note.
Effective January 1, 2025, the sub-subadvisory agreements between FIAM LLC (FIAM) and each of FMR Investment Management (UK) Limited, Fidelity Management & Research (Hong Kong) Limited, and Fidelity Management & Research (Japan) Limited (collectively, the Sub-Subadvisers) were amended. FIAM or an affiliate, and not the fund, pays the Sub-Subadvisers. Under the terms of the sub-subadvisory agreements, FIAM or an affiliate pays each Sub-Subadviser monthly fees equal to 110% of the Sub-Subadviser's costs for providing sub-subadvisory services.
Brokerage Commissions. A portion of portfolio transactions were placed with brokerage firms which are affiliates of the investment adviser. Brokerage commissions are included in net realized gain (loss) and change in net unrealized appreciation (depreciation) in the Statement of Operations. The commissions paid to these affiliated firms were as follows:
| | Amount ($) |
| Strategic Advisers Municipal Bond Fund | 469 |
Interfund Trades. Funds may purchase from or sell securities to other Fidelity Funds under procedures adopted by the Board. The procedures have been designed to ensure these interfund trades are executed in accordance with Rule 17a-7 of the 1940 Act. Any interfund trades are included within the respective purchases and sales amounts shown in the Purchases and Sales of Investments note. Interfund trades during the period are noted in the table below.
| | Purchases ($) | Sales ($) | Realized Gain (Loss)($) |
| Strategic Advisers Municipal Bond Fund | - | 39,009,962 | (1,172,669) |
6. Investments in Fidelity Central Funds.
Funds may invest in Fidelity Central Funds, which are open-end investment companies generally available only to other investment companies and accounts managed by the investment adviser and its affiliates. The Schedule of Investments lists any Fidelity Central Funds held as an investment as of period end, but does not include the underlying holdings of each Fidelity Central Fund. An investing fund indirectly bears its proportionate share of the expenses of the underlying Fidelity Central Funds.
Based on its investment objective, each Fidelity Central Fund may invest or participate in various investment vehicles or strategies that are similar to those of the investing fund. These strategies are consistent with the investment objectives of the investing fund and may involve certain economic risks which may cause a decline in value of each of the Fidelity Central Funds and thus a decline in the value of the investing fund.
| Fidelity Central Fund | Investment Manager | Investment Objective | Investment Practices | Expense RatioA |
| Fidelity Money Market Central Funds | Fidelity Management & Research Company LLC (FMR) | Each fund seeks to obtain a high level of current income consistent with the preservation of capital and liquidity. | Short-term Investments | Less than .005% |
A Expenses expressed as a percentage of average net assets and are as of each underlying Central Fund's most recent annual or semi-annual shareholder report.
A complete unaudited list of holdings for each Fidelity Central Fund is available upon request or at the Securities and Exchange Commission website at www.sec.gov. In addition, the financial statements of the Fidelity Central Funds, which are not covered by the Report of Independent Registered Public Accounting Firm, are available on the Securities and Exchange Commission website or upon request.
7. Committed Line of Credit.
Certain Funds participate with other funds managed by the investment adviser or an affiliate in a $4.25 billion credit facility (the "line of credit") to be utilized for temporary or emergency purposes to fund shareholder redemptions or for other short-term liquidity purposes. The participating funds have agreed to pay commitment fees on their pro-rata portion of the line of credit, which are reflected in Miscellaneous expenses on the Statement of Operations, and are listed below. During the period, there were no borrowings on this line of credit.
| | Amount ($) |
| Strategic Advisers Municipal Bond Fund | 8,163 |
8. Expense Reductions.
The investment adviser has contractually agreed to waive the Fund's management fee in an amount equal to .25% of the Fund's average net assets until September 30, 2027. During the period, this waiver reduced the Fund's management fee by $15,121,209. Expense reductions also include certain voluntary fee discount arrangements, which are currently in effect for the Fund. During the period, these voluntary arrangements amounted to $164,917.
Through arrangements with the Fund's custodian, credits realized as a result of certain uninvested cash balances were used to reduce the Fund's expenses by $69,306.
9. Other.
A fund's organizational documents provide former and current trustees and officers with a limited indemnification against liabilities arising in connection with the performance of their duties to the fund. In the normal course of business, a fund may also enter into contracts that provide general indemnifications. A fund's maximum exposure under these arrangements is unknown as this would be dependent on future claims that may be made against a fund. The risk of material loss from such claims is considered remote.
10. Risk and Uncertainties.
Many factors affect a fund's performance. Developments that disrupt global economies and financial markets, such as pandemics, epidemics, outbreaks of infectious diseases, war, terrorism, and environmental disasters, may significantly affect a fund's investment performance. The effects of these developments to a fund will be impacted by the types of securities in which a fund invests, the financial condition, industry, economic sector, and geographic location of an issuer, and a fund's level of investment in the securities of that issuer. Significant concentrations in security types, issuers, industries, sectors, and geographic locations may magnify the factors that affect a fund's performance.
Item 8: Changes in and Disagreements with Accountants for Open-End Management Investment Companies
(Unaudited)
Note: This is not applicable for any fund included in this document.
Item 9: Proxy Disclosures for Open-End Management Investment Companies
(Unaudited)
| A special meeting of shareholders was held on July 9, 2024. The results of votes taken among shareholders on the proposal before them are reported below. Each vote reported represents one dollar of net asset value held on the record date for the meeting. |
| Proposal 1 |
| To elect a Board of Trustees. |
| | # of Votes | % of Votes |
| Charles S. Morrison |
| Affirmative | 381,775,585,183.64 | 95.17 |
| Withheld | 19,363,639,577.49 | 4.83 |
| TOTAL | 401,139,224,761.13 | 100.00 |
| Nancy D. Prior |
| Affirmative | 381,252,305,731.53 | 95.04 |
| Withheld | 19,886,919,029.60 | 4.96 |
| TOTAL | 401,139,224,761.13 | 100.00 |
| Mary C. Farrell |
| Affirmative | 381,226,030,239.11 | 95.04 |
| Withheld | 19,913,194,522.02 | 4.96 |
| TOTAL | 401,139,224,761.13 | 100.00 |
| Karen Kaplan |
| Affirmative | 381,519,946,847.38 | 95.11 |
| Withheld | 19,619,277,913.75 | 4.89 |
| TOTAL | 401,139,224,761.13 | 100.00 |
| Christine Marcks |
| Affirmative | 380,186,327,029.51 | 94.78 |
| Withheld | 20,952,897,731.62 | 5.22 |
| TOTAL | 401,139,224,761.13 | 100.00 |
| Harold Singleton III |
| Affirmative | 382,499,458,473.65 | 95.35 |
| Withheld | 18,639,766,287.48 | 4.65 |
| TOTAL | 401,139,224,761.13 | 100.00 |
| Heidi L. Steiger |
| Affirmative | 380,661,676,515.00 | 94.90 |
| Withheld | 20,477,548,246.13 | 5.10 |
| TOTAL | 401,139,224,761.13 | 100.00 |
| | | |
| Proposal 1 reflects trust-wide proposal and voting results. |
Item 10: Remuneration Paid to Directors, Officers, and others of Open-End Management Investment Companies
(Unaudited)
Note: This information is disclosed as part of the financial statements for each Fund as part of Item 7: Financial Statements and Financial Highlights for Open-End Management Investment companies.
Item 11: Statement Regarding Basis for Approval of Investment Advisory Contract
(Unaudited)
Board Approval of Investment Advisory Contracts and Management Fees
Strategic Advisers Municipal Bond Fund
Each year, the Board of Trustees, including the Independent Trustees (together, the Board), considers the renewal of the fund's management contract with Strategic Advisers LLC (Strategic Advisers), the sub-advisory agreements with Delaware Investments Fund Advisers, FIAM LLC, MacKay Shields LLC, Massachusetts Financial Services Company, T. Rowe Price Associates, Inc., and Western Asset Management Company, LLC (each a Sub-Adviser and collectively, the Sub-Advisers) (collectively, the Sub-Advisory Agreements), and the sub-sub-advisory agreements with FMR Investment Management (UK) Limited, Fidelity Management & Research (Japan) Limited, and Fidelity Management & Research (Hong Kong) Limited (each a Sub-Sub-Adviser and collectively, the Sub-Sub-Advisers) (collectively, the Sub-Sub-Advisory Agreements and, together with the management contract and the Sub-Advisory Agreements, the Advisory Contracts) for the fund. Strategic Advisers and the Sub-Advisers and Sub-Sub-Advisers, as applicable, are referred to herein as the Investment Advisers. The Board, assisted by the advice of fund counsel and Independent Trustees' counsel, requests and considers a broad range of information relevant to the renewal of the Advisory Contracts throughout the year.
The Board meets at least four times per year and, at each of its meetings, covers an extensive agenda of topics and materials and considers factors that are relevant to its annual consideration of the renewal of the fund's Advisory Contracts, including the services and support provided to the fund and its shareholders. The full Board or the Independent Trustees, as appropriate, act on all major matters; however, a portion of the activities of the Board (including certain of those described herein) may be conducted through standing committees that have been established by the Board. The Board, acting directly and through its committees, requests and receives information concerning the annual consideration of the renewal of the fund's Advisory Contracts.
At its September 2024 meeting, the Board, including the Independent Trustees, unanimously determined to renew the fund's Advisory Contracts. The Board also approved updating the address for notice of Strategic Advisers LLC in each Sub-Advisory Agreement. In reaching its determination to renew the fund's Advisory Contracts, the Board considered all factors it believed relevant, including (i) the nature, extent, and quality of the services provided to the fund and its shareholders (including the investment performance of the fund); (ii) the competitiveness relative to peer funds of the fund's management fee and total expenses; (iii) the total costs of the services provided by and the profits, if any, realized by Strategic Advisers from its relationships with the fund; and (iv) the extent to which, if any, economies of scale exist and are realized as the fund grows and whether any economies of scale are appropriately shared with fund shareholders. The Board's decision to renew the Advisory Contracts was not based on any single factor, but rather was based on a comprehensive consideration of all the information provided to the Board throughout the year.
The Board reached a determination, with the assistance of fund counsel and Independent Trustees' counsel and through the exercise of its business judgment, that the renewal of the Advisory Contracts is in the best interests of the fund and its shareholders. In addition, the Board concluded that the renewal of each Sub-Advisory Agreement and Sub-Sub-Advisory Agreement does not involve a conflict of interest from which Strategic Advisers or its affiliates derive an inappropriate advantage. Also, the Board found that the advisory fees charged under the Advisory Contracts bear a reasonable relationship to the services rendered.
Nature, Extent, and Quality of Services Provided. The Board considered the staffing within the Investment Advisers, including the backgrounds of the fund's investment personnel and also considered the fund's investment objective, strategies, and related investment philosophy. The Independent Trustees also had discussions with senior management of Strategic Advisers' investment operations and investment groups. The Board considered the structure of each Investment Adviser's investment personnel compensation program and whether such structures provide appropriate incentives to act in the best interests of the fund.
The Trustees also discussed with representatives of Strategic Advisers, at meetings throughout the year, Strategic Advisers' role in, among other things, (i) setting, implementing and monitoring the investment strategies for the funds; (ii) identifying and recommending sub-advisers for the funds; (iii) overseeing compliance with federal securities laws by each sub-adviser with respect to the portion of fund assets allocated to the sub-adviser; (iv) monitoring and overseeing the performance and investment capabilities of each sub-adviser; and (v) recommending the replacement of a sub-adviser as appropriate. The Trustees considered that the Board had received from Strategic Advisers substantial information and periodic reports about Strategic Advisers' sub-adviser oversight and due diligence processes, as well as periodic reports regarding the performance of each sub-adviser.
The Board also considered the nature, extent and quality of services provided by each Sub-Adviser. The Trustees noted that under the Sub-Advisory Agreements subject to oversight by Strategic Advisers, each Sub-Adviser is responsible for, among other things, identifying investments for the portion of fund assets allocated to the Sub-Adviser, if any, and executing portfolio transactions to implement its investment strategy. In addition, the Trustees noted that each Sub-Adviser is responsible for providing such reporting as may be requested from Strategic Advisers to fulfill its oversight responsibilities discussed above.
Resources Dedicated to Investment Management and Support Services. The Board reviewed the general qualifications and capabilities of the Investment Advisers' investment staffs, their use of technology, and the Investment Advisers' approach to managing and compensating investment personnel. The Board noted that the Investment Advisers' analysts have extensive resources, tools, and capabilities that allow them to conduct sophisticated quantitative and/or fundamental analysis. Additionally, in its deliberations, the Board considered the Investment Advisers' trading capabilities and resources and global compliance infrastructure, which are integral parts of the investment management process.
Shareholder and Administrative Services. The Board considered (i) the nature, extent, quality, and cost of administrative and shareholder services performed by Strategic Advisers and its affiliates under the management contract and under separate agreements covering transfer agency and pricing and bookkeeping services for the fund; (ii) the nature and extent of Strategic Advisers' supervision of third party service providers, including sub-advisers, custodians and subcustodians; and (iii) the resources devoted to, and the record of compliance with, the fund's compliance policies and procedures.
Investment Performance. In connection with the renewal of the Advisory Contracts, the Board considered annualized return information for the fund over different time periods, measured against an appropriate securities market index (benchmark index) and a peer group of mutual funds with similar objectives (peer group).
The Board considered discussions that occur at Board meetings throughout the year with representatives of Strategic Advisers about fund investment performance and the performance of each Sub-Adviser as part of regularly scheduled fund reviews and other reports to the Board on fund performance, taking into account various factors including general market conditions. The Board also considered information about performance attribution. In its discussions with representatives of Strategic Advisers regarding fund performance, the Board gave particular attention to information indicating underperformance of certain funds over different time periods and discussed with Strategic Advisers the reasons for any such underperformance.
In addition to reviewing absolute and relative fund performance, the Independent Trustees periodically consider the appropriateness of fund performance metrics in evaluating the results achieved. The Independent Trustees generally give greater weight to fund performance over longer time periods than over shorter time periods. Depending on the circumstances, the Independent Trustees may be satisfied with the fund's performance notwithstanding that it lags its benchmark index peer group for certain periods.
Based on its review, the Board concluded that the nature, extent, and quality of services provided to the fund under the Advisory Contracts should continue to benefit the shareholders of the fund.
Competitiveness of Management Fee and Total Fund Expenses. The Board considered the amount and nature of fees paid to the Investment Advisers. The Board noted that the Sub-Sub-Advisers are compensated by the applicable Sub-Advisers and the Fund and Strategic Advisers are not responsible for any such fees or expenses. The Board also considered information comparing the management fees and total expenses of the fund to those of other registered investment companies with investment objectives similar to those of the fund, as discussed below. The Board also noted Strategic Advisers' proposal to extend the management fee waiver and considered the fund's contractual maximum aggregate annual management fee rate. In considering the fund's management fee and management fee waiver and comparisons to other registered investment companies with investment objectives similar to those of the fund, the Board noted that shares of the fund are offered only to clients that participate in the Fidelity Portfolio Advisory Service managed account program. In its review of the fund's total expenses, the Board considered the fund's management fee rate as well as other fund expenses, as applicable, such as expenses from holding Fidelity and non-Fidelity mutual funds and ETFs, pricing and bookkeeping fees, and custodial, legal, and audit fees.
Comparisons of Management Fees and Total Expense Ratios. Among other things, the Board reviewed data for selected groups of competitive funds and classes (referred to as "mapped groups") that were compiled by Fidelity based on combining similar investment objective categories (as classified by Lipper) that have comparable investment mandates. The data reviewed by the Board included (i) gross management fee comparisons (before taking into account expense reimbursements or caps) relative to the total universe of funds within the mapped group; (ii) gross management fee comparisons relative to a subset of non-Strategic Advisers funds in the mapped group that are similar in size and management fee structure to the fund (referred to as the "asset size peer group"); (iii) total expense comparisons of the fund relative to funds and classes in the mapped group that have a similar sales load structure to the fund (referred to as the "similar sales load structure group"); and (iv) total expense comparisons of the fund relative to funds and classes in the similar sales load structure group that are similar in size and management fee structure to each fund (referred to as the "total expense asset size peer group").
The information provided to the Board indicated that the fund's management fee rate ranked below the competitive median of the mapped group for the 12-month period ended December 31, 2023 and below the competitive median of the asset size peer group for the 12-month period ended December 31, 2023. Further, the information provided to the Board indicated that the total expense ratio of the fund ranked below the competitive median of the similar sales load structure group for the 12-month period ended December 31, 2023 and below the competitive median of the total expense asset size peer group for the 12-month period ended December 31, 2023.
Fees Charged to Other Clients. The Board also considered fee structures paid by the Investment Advisers' other clients, such as other funds advised or subadvised by the Investment Advisers, pension plan clients, and other institutional clients with similar investment mandates.
Based on its review, the Board concluded that the fund's management fee bears a reasonable relationship to the services rendered. Further, based on its review of the total expense ratios and fees charged to other clients of Strategic Advisers or its affiliates and each Sub-Adviser, the Board concluded that the total expenses of the fund were reasonable in light of the services that the fund and its shareholders receive and the other factors considered.
Costs of the Services and Profitability. The Board considered information regarding the revenues earned and the expenses incurred by Strategic Advisers and its affiliates in conducting the business of developing, marketing, distributing, managing, administering and servicing the fund and servicing the fund's shareholders.
On an annual basis, Strategic Advisers presents to the Board information about the profitability of its relationships with the fund. Strategic Advisers calculates profitability information for the fund using a series of detailed revenue and cost allocation methodologies. The Board reviews any significant changes from the prior year's methodologies. Strategic Advisers noted that, to the extent possible, it employs the same corporate reporting of revenues and expenses as those used by other Fidelity funds.
A public accounting firm has been engaged annually by the Board as part of the Board's assessment of Fidelity's profitability analysis. The engagement includes the review and assessment of the methodologies used by Fidelity in determining the revenues and expenses attributable to Fidelity's fund business. After considering the reports issued under the engagement and information provided by Fidelity, the Board concluded that while other allocation methods may also be reasonable, Fidelity's profitability methodologies are reasonable in all material respects.
The Board also reviewed Fidelity's non-fund businesses and potential indirect benefits such businesses may have received as a result of their association with Fidelity's fund business (i.e., fall-out benefits) as well as cases where Fidelity's affiliates may benefit from the fund's business. The Board noted that changes to fall-out benefits year-over-year reflect business developments at Fidelity's various businesses.
The Board considered the costs of the services provided by and the profits realized, if any, by Strategic Advisers and its affiliates in connection with the operation of the fund and was satisfied that the profitability was not excessive.
The Board also considered information regarding the profitability of the Sub-Advisers' respective relationships with the fund and the potential fall-out benefits, if any, that may accrue to the Sub-Advisers as a result of their respective relationships with the fund. The Board noted the difficulty in evaluating a Sub-Adviser's costs and the profitability of a Sub-Advisory Agreement to a Sub-Adviser because of, among other things, differences in the type and content of information provided by each Sub-Adviser due to differences in business models, cost accounting methods, and profitability calculation methodologies among the Sub-Advisers. Accordingly, the Board considered profitability information provided by the Sub-Advisers in light of the nature of the relationships between Strategic Advisers and the Sub-Advisers with respect to the negotiation of sub-advisory fees.
Possible Economies of Scale. The Board considered whether there have been economies of scale in respect of the management of the Strategic Advisers funds, whether the Strategic Advisers funds (including the fund) have appropriately benefited from any such economies of scale, and whether there is potential for realization of any further economies of scale as assets grow through increased services to the fund, through waivers or reimbursements, or through fee or expense ratio reductions. The Board considered that certain of the fund's Sub-Advisory Agreements provide for breakpoints as the fund's assets grow and noted that any potential decline in sub-advisory fees under such contracts would accrue directly to the fund. The Board also took Strategic Advisers' management fee waiver into consideration.
Conclusion. Based on its evaluation of all of the conclusions noted above, and after considering all factors it believed relevant, the Board concluded that the advisory fee arrangements bear a reasonable relationship to the services rendered and that the fund's Advisory Contracts should be renewed because each agreement is in the best interests of the fund and its shareholders. In addition, the Board concluded that the renewal of each Sub-Advisory Agreement and Sub-Sub-Advisory Agreement does not involve a conflict of interest from which Strategic Advisers or its affiliates derive an inappropriate advantage.
1.9903615.103
SAM-SANN-0125
Strategic Advisers® Tax-Sensitive Short Duration Fund
Offered exclusively to certain managed account clients of Strategic Advisers LLC or its affiliates - not available for sale to the general public
Semi-Annual Report
November 30, 2024
Contents
To view a fund's proxy voting guidelines and proxy voting record for the 12-month period ended June 30, visit http://www.fidelity.com/proxyvotingresults or visit the Securities and Exchange Commission's (SEC) web site at http://www.sec.gov.
You may also call 1-800-544-3455 to request a free copy of the proxy voting guidelines.
Standard & Poor's, S&P and S&P 500 are registered service marks of The McGraw-Hill Companies, Inc. and have been licensed for use by Fidelity Distributors Corporation.
Other third-party marks appearing herein are the property of their respective owners.
All other marks appearing herein are registered or unregistered trademarks or service marks of FMR LLC or an affiliated company. © 2025 FMR LLC. All rights reserved.
This report and the financial statements contained herein are submitted for the general information of the shareholders of the Fund. This report is not authorized for distribution to prospective investors in the Fund unless preceded or accompanied by an effective prospectus.
A fund files its complete schedule of portfolio holdings with the SEC for the first and third quarters of each fiscal year on Form N-PORT. Forms N-PORT are available on the SEC's web site at http://www.sec.gov. A fund's Forms N-PORT may be reviewed and copied at the SEC's Public Reference Room in Washington, DC. Information regarding the operation of the SEC's Public Reference Room may be obtained by calling 1-800-SEC-0330.
For a complete list of a fund's portfolio holdings, view the most recent holdings listing, semiannual report, or annual report on Fidelity's web site at http://www.fidelity.com, http://www.institutional.fidelity.com, or http://www.401k.com, as applicable.
NOT FDIC INSURED •MAY LOSE VALUE •NO BANK GUARANTEE
Neither the Fund nor Fidelity Distributors Corporation is a bank.
Item 7: Financial Statements and Financial Highlights for Open-End Management Investment Companies (Semi-Annual Report)
Strategic Advisers® Tax-Sensitive Short Duration Fund
Schedule of Investments November 30, 2024 (Unaudited)
Showing Percentage of Net Assets
| Municipal Bonds - 62.8% |
| | | Principal Amount (a) | Value ($) |
| Alabama - 2.4% | | | |
| Birmingham Arpt. Auth. Series 2020, 5% 7/1/25 (Build America Mutual Assurance Insured) | | 325,000 | 328,569 |
| Black Belt Energy Gas District: | | | |
| (Proj. No. 6) Series 2021 B, 4% 12/1/24 | | 1,250,000 | 1,250,008 |
| (Proj. No.7) Series 2021 C1: | | | |
4% 12/1/24 | | 3,000,000 | 3,000,019 |
4% 12/1/25 | | 4,000,000 | 4,017,425 |
| Bonds: | | | |
(Proj. No.7): | | | |
Series 2021 C1, 4%, tender 12/1/26 (b) | | 11,350,000 | 11,425,937 |
Series 2021 C2, SIFMA Municipal Swap Index + 0.350% 3.53%, tender 12/1/26 (b)(c) | | 2,350,000 | 2,290,698 |
Series 2019 A, 4%, tender 12/1/25 (b) | | 3,050,000 | 3,062,245 |
Series 2022 D1, 4%, tender 6/1/27 (b) | | 2,000,000 | 2,026,124 |
Series 2022 D2, U.S. Secured Overnight Fin. Rate (SOFR) Index + 1.400% 4.469%, tender 6/1/27 (b)(c) | | 5,000,000 | 5,065,062 |
Series 2022 E, 5%, tender 6/1/28 (b) | | 2,370,000 | 2,477,334 |
Series 2023 D1, 5.5%, tender 2/1/29 (b) | | 1,000,000 | 1,068,053 |
| Series 2022 C1: | | | |
5.25% 12/1/24 | | 2,025,000 | 2,025,134 |
5.25% 6/1/25 | | 695,000 | 699,948 |
5.25% 12/1/25 | | 1,125,000 | 1,142,454 |
5.25% 6/1/26 | | 575,000 | 588,378 |
| Series 2022 E: | | | |
5% 6/1/25 | | 825,000 | 830,191 |
5% 6/1/26 | | 1,140,000 | 1,162,740 |
| Series 2023 A, 5% 10/1/25 | | 2,125,000 | 2,149,989 |
| Series 2023 C, 5.5% 6/1/27 | | 685,000 | 715,155 |
| Series 2024 C: | | | |
5% 7/1/26 | | 1,750,000 | 1,788,785 |
5% 7/1/27 | | 1,250,000 | 1,296,935 |
| Series 2024 D: | | | |
5% 11/1/26 (d) | | 2,225,000 | 2,276,753 |
5% 11/1/29 (d) | | 4,500,000 | 4,742,506 |
| Health Care Auth. for Baptist Health Series 2023 A, 5% 11/15/25 | | 1,290,000 | 1,307,996 |
| Infirmary Health Systems Spl. Care Facilities Fing. Auth. Rev. Series 2016 A, 5% 2/1/26 | | 500,000 | 507,208 |
| Jefferson County Swr. Rev. Series 2024: | | | |
| 5% 10/1/25 | | 740,000 | 750,100 |
| 5% 10/1/26 | | 445,000 | 460,417 |
| 5% 10/1/27 | | 410,000 | 432,524 |
| Mobile County Board of School Commissioners Series 2016 A, 5% 3/1/25 | | 100,000 | 100,409 |
| Mobile Indl. Dev. Board Poll. Cont. Rev. Bonds: | | | |
| (Alabama Pwr. Co. Barry Plant Proj.): | | | |
Series 2007 C, 3.78%, tender 6/16/26 (b) | | 740,000 | 745,400 |
Series 2008, 3.65%, tender 1/10/25 (b) | | 12,050,000 | 12,047,347 |
| Series 2009 E, 1%, tender 6/26/25 (b) | | 600,000 | 590,653 |
| Southeast Alabama Gas Supply District (Proj. No. 1) Series 2024 A: | | | |
| 5% 4/1/25 | | 3,070,000 | 3,079,449 |
| 5% 4/1/26 | | 1,500,000 | 1,527,168 |
| Southeast Energy Auth. A C Series 2024 C: | | | |
| 5% 11/1/26 | | 395,000 | 405,995 |
| 5% 11/1/27 | | 895,000 | 933,204 |
| 5% 11/1/28 | | 1,000,000 | 1,055,671 |
| 5% 11/1/29 | | 1,000,000 | 1,066,910 |
| Southeast Energy Auth. Rev.: | | | |
| (Proj. No. 2) Series 2021 B1, 4% 6/1/25 | | 300,000 | 300,452 |
| (Proj. NO. 5) Series 2023 A: | | | |
5% 7/1/25 | | 650,000 | 654,697 |
5% 7/1/27 | | 1,185,000 | 1,223,870 |
5.25% 7/1/28 | | 1,945,000 | 2,049,797 |
| Univ. of South Alabama Univ. Rev. Series 2021, 4% 4/1/26 | | 500,000 | 507,128 |
TOTAL ALABAMA | | | 85,176,837 |
| Alaska - 0.3% | | | |
| Alaska Gen. Oblig. Series 2025 A: | | | |
| 5% 8/1/26 (d) | | 840,000 | 858,785 |
| 5% 8/1/27 (d) | | 465,000 | 484,166 |
| 5% 8/1/28 (d) | | 185,000 | 195,745 |
| Alaska Hsg. Fin. Corp. Mtg. Rev. Series 2022 A, 3% 6/1/51 | | 415,000 | 406,443 |
| Alaska Int'l. Arpts. Revs. Series 2021 C: | | | |
| 5% 10/1/25 (e) | | 1,980,000 | 2,006,411 |
| 5% 10/1/28 (e) | | 1,000,000 | 1,057,612 |
| Alaska Muni. Bond Bank Series 2023 TWO: | | | |
| 5% 12/1/24 (e) | | 460,000 | 460,028 |
| 5% 12/1/25 (e) | | 485,000 | 491,543 |
| 5% 12/1/26 (e) | | 510,000 | 524,469 |
| Northern Tobacco Securitization Corp. Tobacco Settlement Rev. Series 2021 A: | | | |
| 5% 6/1/25 | | 2,415,000 | 2,428,437 |
| 5% 6/1/26 | | 1,000,000 | 1,022,949 |
TOTAL ALASKA | | | 9,936,588 |
| Arizona - 2.5% | | | |
| Arizona Health Facilities Auth. Rev.: | | | |
| (Scottsdale Lincoln Hospitals Proj.) Series 2014 A: | | | |
5% 12/1/24 | | 45,000 | 45,003 |
5% 12/1/26 | | 110,000 | 110,000 |
| Bonds Series 2015 B: | | | |
SIFMA Municipal Swap Index + 0.250% 3.43%, tender 1/1/46 (b)(c) | | 395,000 | 393,792 |
3.43%, tender 12/5/24 (b) | | 80,000 | 79,502 |
3.43%, tender 11/4/26 (b) | | 2,025,000 | 1,998,591 |
| Arizona Indl. Dev. Auth. Hosp. Rev. Series 2020 A, 5% 2/1/26 | | 750,000 | 767,102 |
| Arizona St Indl. Dev. Auth. Multi Bonds: | | | |
| (Ironwood Ranch Apts. Proj.) Series 2024, 5%, tender 9/1/26 (b) | | 3,000,000 | 3,091,271 |
| (The Ranches at Gunsmoke Proj.) Series 2024, 5%, tender 11/1/26 (b) | | 3,000,000 | 3,099,836 |
| Bullhead City Excise Taxes Series 2021 2, 0.75% 7/1/25 | | 325,000 | 318,068 |
| Chandler Indl. Dev. Auth. Indl. Dev. Rev. Bonds: | | | |
| (Intel Corp. Proj.): | | | |
Series 2007, 4.1%, tender 6/15/28 (b)(e) | | 570,000 | 573,578 |
Series 2019, 4%, tender 6/1/29 (b)(e) | | 4,000,000 | 4,044,088 |
Series 2022 2, 5%, tender 9/1/27 (b)(e) | | 11,300,000 | 11,607,997 |
| Series 2022 1, 5%, tender 9/1/27 (b)(e) | | 7,400,000 | 7,600,688 |
| Coconino County Poll. Cont. Corp. Rev. Bonds (Navada Pwr. Co. Projs.) Series 2017 A, 4.125%, tender 3/31/26 (b)(e) | | 1,055,000 | 1,054,942 |
| Glendale Union School District 205 Series A, 5% 7/1/25 (Assured Guaranty Muni. Corp. Insured) | | 225,000 | 227,383 |
| Maricopa County Rev. Bonds: | | | |
| Series 2019 D, 5%, tender 5/15/26 (b) | | 9,600,000 | 9,840,095 |
| Series 2023 A1, 5%, tender 5/15/26 (b) | | 6,040,000 | 6,181,901 |
| Series 2023 A2, 5%, tender 5/15/28 (b) | | 2,120,000 | 2,255,531 |
| Northern Arizona Univ. Ctfs. of Prtn. (Northern Arizona Univeristy Projs.) Series 2024: | | | |
| 5% 9/1/25 (Assured Guaranty Muni. Corp. Insured) | | 860,000 | 871,712 |
| 5% 9/1/26 (Assured Guaranty Muni. Corp. Insured) | | 1,540,000 | 1,594,889 |
| Phoenix Civic Impt. Board Arpt. Rev. Series 2023, 5% 7/1/25 (e) | | 1,100,000 | 1,110,937 |
| Phoenix Civic Impt. Corp. Wtr. Sys. Rev. Series 2014 B, 5% 7/1/27 | | 400,000 | 400,720 |
| Phoenix Indl. Solid Waste Disp. Rev. Bonds (Republic Svc., Inc. Proj.) Series 2013, 4.25%, tender 2/3/25 (b)(e) | | 31,175,000 | 31,188,530 |
| Yuma Indl. Dev. Auth. Hosp. Rev. Series 2024 A: | | | |
| 5% 8/1/27 | | 750,000 | 788,481 |
| 5% 8/1/28 | | 700,000 | 747,654 |
| Yuma Pledged Rev. Series 2021, 4% 7/1/25 | | 505,000 | 507,554 |
TOTAL ARIZONA | | | 90,499,845 |
| California - 2.6% | | | |
| Bay Area Toll Auth. San Francisco Bay Toll Bridge Rev. Bonds: | | | |
| Series 2018 A, 2.625%, tender 4/1/26 (b) | | 290,000 | 286,701 |
| Series A, 2.95%, tender 4/1/26 (b) | | 105,000 | 104,245 |
| Series B, 2.85%, tender 4/1/25 (b) | | 6,090,000 | 6,080,160 |
| California Cmnty. Choice Fing. Auth. Clean Energy Proj. Rev.: | | | |
| Series 2023 C, 5% 10/1/26 | | 625,000 | 637,247 |
| Series 2024 E, 5% 9/1/27 | | 1,100,000 | 1,150,268 |
| California Gen. Oblig. Series 2015, 5% 3/1/28 | | 2,000,000 | 2,008,953 |
| California Health Facilities Fing. Auth. Rev. Bonds: | | | |
| (Providence St. Jospeh Health) Series 2016 B3, 2%, tender 10/1/25 (b) | | 1,250,000 | 1,237,978 |
| Series 2021 A, 3%, tender 8/15/25 (b) | | 5,915,000 | 5,913,454 |
| California Hsg. Fin. Agcy. Ltd. Obl Bonds Series 2023 V, 5%, tender 11/1/26 (b) | | 5,000,000 | 5,156,622 |
| California Infrastructure and Econ. Dev. Bank Rev. Bonds (Los Angeles County Museum of Art Proj.) Series 2021 A, 1.2%, tender 6/1/28 (b) | | 395,000 | 354,503 |
| California Muni. Fin. Auth. Solid Waste Disp. Rev. Bonds: | | | |
| (Republic Svcs., Inc. Proj.): | | | |
Series 2021 A, 3.8%, tender 4/1/25 (b)(e) | | 4,600,000 | 4,598,304 |
Series 2021 B, 4.15%, tender 1/15/25 (b)(e) | | 6,230,000 | 6,222,973 |
| (Waste Mgmt., Inc. Proj.): | | | |
Series 2017 A, 4.25%, tender 12/2/24 (b)(e) | | 8,750,000 | 8,769,765 |
Series 2020 B, 4.8%, tender 6/2/25 (b)(e) | | 5,250,000 | 5,255,188 |
Series 2024 A, 4.125%, tender 3/3/25 (b)(e) | | 2,100,000 | 2,100,955 |
| California Poll. Cont. Fing. Auth. Solid Waste Disp. Rev.: | | | |
| (Waste Mgmt., INC. Proj.) Series 2015 B1, 3% 11/1/25 (e) | | 3,500,000 | 3,472,683 |
| Bonds (Republic Svcs. INC. Proj.) Series 2023, 4.05%, tender 2/18/25 (b)(e)(f) | | 2,350,000 | 2,349,936 |
| California Pub. Works Board Lease Rev. Series 2014 B, 5% 10/1/25 | | 350,000 | 350,538 |
| California Statewide Cmntys. Dev. Auth. Series 2016, 5% 5/15/26 | | 1,500,000 | 1,540,197 |
| California Statewide Cmntys. Dev. Auth. Rev. Series 2007: | | | |
| 3%, tender 7/1/40 (Assured Guaranty Muni. Corp. Insured) (b) | | 8,275,000 | 8,275,000 |
| 3%, tender 7/1/41 (Assured Guaranty Muni. Corp. Insured) (b) | | 5,475,000 | 5,475,000 |
| 6%, tender 7/1/40 (Assured Guaranty Muni. Corp. Insured) (b) | | 2,175,000 | 2,175,000 |
| Castaic Lake Wtr. Agcy. Ctfs. of Prtn. Series 1999, 0% 8/1/28 (AMBAC Insured) | | 225,000 | 203,209 |
| Fresno Arpt. Rev. Series 2023 A, 5% 7/1/25 (Build America Mutual Assurance Insured) (e) | | 500,000 | 504,367 |
| Los Angeles County Dev. Authorities Bonds Series 2023 C, 3.75%, tender 12/1/26 (b) | | 3,000,000 | 3,023,438 |
| Los Angeles Dept. Arpt. Rev.: | | | |
| Series 2016 B, 5% 5/15/26 (e) | | 135,000 | 138,566 |
| Series 2016, 5% 5/15/26 (e) | | 550,000 | 564,528 |
| Series 2021 A, 5% 5/15/27 (e) | | 1,300,000 | 1,356,007 |
| Series 2022 C: | | | |
5% 5/15/25 (e) | | 455,000 | 458,307 |
5% 5/15/26 (e) | | 1,205,000 | 1,236,830 |
5% 5/15/27 (e) | | 440,000 | 458,956 |
| Series 2022 G, 5% 5/15/25 (e) | | 550,000 | 553,998 |
| Series 2023 A: | | | |
5% 5/15/25 (e) | | 255,000 | 256,854 |
5% 5/15/26 (e) | | 440,000 | 451,623 |
| Los Angeles Unified School District Ctfs. of Prtn. Series 2023 A, 5% 10/1/26 | | 3,910,000 | 4,076,316 |
| Northern California Energy Auth. Series 2024: | | | |
| 5% 8/1/25 | | 600,000 | 604,966 |
| 5% 8/1/26 | | 450,000 | 460,589 |
| San Diego County Reg'l. Arpt. Auth. Arpt. Rev. Series 2019 B, 5% 7/1/25 (e) | | 1,000,000 | 1,008,676 |
| San Francisco City & County Arpts. Commission Int'l. Arpt. Rev.: | | | |
| Series 2019 H, 5% 5/1/25 (e) | | 680,000 | 684,021 |
| Series 2022 A, 5% 5/1/26 (e) | | 2,000,000 | 2,046,751 |
| Series 2023 A, 5% 5/1/25 (e) | | 400,000 | 402,365 |
| Southern California Pub. Pwr. Auth. Series 2024 A, 5% 9/1/29 | | 650,000 | 689,295 |
| Southern California Pub. Pwr. Auth. Rev. Bonds Series 2020 C, 0.65%, tender 7/1/25 (b) | | 250,000 | 244,904 |
| West Contra Costa Unified School District Series 2004 C, 0% 8/1/25 (Nat'l. Pub. Fin. Guarantee Corp. Insured) | | 260,000 | 254,631 |
TOTAL CALIFORNIA | | | 93,194,867 |
| Colorado - 1.1% | | | |
| Baseline Metropolitan District # 1 Spl. Rev. Series 2024 A: | | | |
| 5% 12/1/25 (Assured Guaranty Muni. Corp. Insured) | | 435,000 | 441,828 |
| 5% 12/1/27 (Assured Guaranty Muni. Corp. Insured) | | 1,000,000 | 1,050,792 |
| Colorado Health Facilities Auth. Rev. Bonds: | | | |
| Bonds: | | | |
Series 2018 B, 5%, tender 11/20/25 (b) | | 8,060,000 | 8,203,541 |
Series 2019 B: | | | |
5%, tender 8/1/25 (b) | | 300,000 | 300,742 |
5%, tender 8/1/26 (b) | | 340,000 | 346,585 |
5%, tender 11/19/26 (b) | | 905,000 | 938,054 |
Series 2022 B, 5%, tender 8/17/26 (b) | | 2,155,000 | 2,221,584 |
Series 2023 A1, 5%, tender 11/15/28 (b) | | 3,060,000 | 3,285,809 |
| Series 2019 A, 5% 1/1/25 | | 1,205,000 | 1,206,781 |
| Series 2022 A, 5% 11/1/26 | | 400,000 | 414,459 |
| Colorado Hsg. & Fin. Auth.: | | | |
| Series 2019 F, 4.25% 11/1/49 | | 85,000 | 85,942 |
| Series 2019 H, 4.25% 11/1/49 | | 40,000 | 40,462 |
| Colorado Hsg. & Fin. Auth. Multi-family Hsg. Rev. Bonds (The Reserves at Eagle Point Proj.) Series 2024, 3.5%, tender 11/1/26 (b) | | 9,090,000 | 9,118,592 |
| Colorado Reg'l. Trans. District (Denver Transit Partners Eagle P3 Proj.) Series 2020, 5% 1/15/25 | | 650,000 | 650,896 |
| Denver City & County Arpt. Rev.: | | | |
| Series 2018 A: | | | |
5% 12/1/27 (e) | | 2,315,000 | 2,421,707 |
5% 12/1/29 (e) | | 185,000 | 195,588 |
| Series 2022 A, 5% 11/15/25 (e) | | 1,485,000 | 1,505,810 |
| Series 2022 C, 5% 11/15/26 | | 800,000 | 834,253 |
| Series 2022 D, 5.25% 11/15/26 (e) | | 775,000 | 801,814 |
| Series 2023 B, 5% 11/15/25 (e) | | 3,275,000 | 3,320,895 |
| E-470 Pub. Hwy. Auth. Rev. Series 2020 A, 5% 9/1/25 | | 300,000 | 304,268 |
| Maiker Hsg. Partners Colo Multi Bonds Series 2023, 4.5%, tender 5/1/26 (b) | | 1,175,000 | 1,175,940 |
| Univ. of Colorado Enterprise Sys. Rev. Bonds Series 2021 C3A, 2%, tender 10/15/25 (b) | | 1,360,000 | 1,340,489 |
TOTAL COLORADO | | | 40,206,831 |
| Connecticut - 1.2% | | | |
| Bridgeport Gen. Oblig. Series 2024 A: | | | |
| 5% 7/1/27 (Build America Mutual Assurance Insured) | | 200,000 | 210,753 |
| 5% 7/1/28 (Build America Mutual Assurance Insured) | | 1,250,000 | 1,340,411 |
| Connecticut Gen. Oblig.: | | | |
| Series 2013 A, 4.17% 3/1/25 (b) | | 510,000 | 510,558 |
| Series 2015 B, 3.375% 6/15/29 | | 150,000 | 150,240 |
| Series 2018 C, 5% 6/15/26 | | 3,125,000 | 3,229,998 |
| Series A, 4% 1/15/25 | | 3,500,000 | 3,503,497 |
| Connecticut Health & Edl. Facilities Auth. Rev.: | | | |
| Bonds: | | | |
Series 2010 A3, 2.95%, tender 7/1/27 (b) | | 3,140,000 | 3,131,136 |
Series 2010 A4, 1.1%, tender 2/11/25 (b) | | 5,440,000 | 5,409,716 |
Series 2014 A, 2.8%, tender 2/10/26 (b) | | 2,650,000 | 2,637,634 |
Series 2017 B2, 3.2%, tender 7/1/26 (b) | | 2,575,000 | 2,578,918 |
Series 2017 C2, 2.8%, tender 2/3/26 (b) | | 10,400,000 | 10,352,985 |
| Series 2019 A, 5% 7/1/26 | | 260,000 | 264,942 |
| Series 2022 M, 5% 7/1/26 | | 200,000 | 204,419 |
| Series L1, 4% 7/1/25 | | 600,000 | 600,089 |
| Connecticut Hsg. Fin. Auth. Series 2021, 0.45% 11/15/25 | | 700,000 | 679,173 |
| Connecticut Spl. Tax Oblig. Trans. Infrastructure Rev.: | | | |
| Series 2018 B, 5% 10/1/31 | | 500,000 | 538,629 |
| Series 2024 B, 5% 7/1/28 (d) | | 605,000 | 652,231 |
| Hartford Gen. Oblig. Series 2015 C, 5% 7/15/25 (Assured Guaranty Muni. Corp. Insured) | | 640,000 | 647,733 |
| New Haven Gen. Oblig. Series 2016 A, 5% 8/15/25 (Assured Guaranty Muni. Corp. Insured) | | 20,000 | 20,223 |
| Norwalk Conn Hsg. Auth. Multi-family Bonds Series 2024, 3.05%, tender 9/1/27 (b) | | 5,000,000 | 4,992,596 |
| Univ. of Connecticut Gen. Oblig. Series 2019 A, 5% 11/1/25 | | 225,000 | 229,183 |
| West Haven Gen. Oblig. Series 2021: | | | |
| 4% 9/15/25 | | 255,000 | 256,413 |
| 4% 9/15/26 | | 255,000 | 258,175 |
TOTAL CONNECTICUT | | | 42,399,652 |
| Delaware - 0.0% | | | |
| Delaware Econ. Dev. Auth. Rev. Bonds (Delmarva Pwr. & Lt. Co. Proj.) Series A, 1.05%, tender 7/1/25 (b) | | 565,000 | 554,629 |
| District Of Columbia - 0.5% | | | |
| District of Columbia Hsg. Fin. Agcy. Multi-family Hsg. Rev. Bonds (One Hawaii Avenue Proj.) Series 2024, 3.65%, tender 7/1/27 (b) | | 1,790,000 | 1,805,750 |
| Metropolitan Washington DC Arpts. Auth. Sys. Rev.: | | | |
| Series 2017 A, 5% 10/1/26 (e) | | 145,000 | 149,402 |
| Series 2018 A: | | | |
5% 10/1/26 (e) | | 325,000 | 334,866 |
5% 10/1/27 (e) | | 1,585,000 | 1,657,217 |
| Series 2019 A: | | | |
5% 10/1/25 (e) | | 155,000 | 156,915 |
5% 10/1/27 (e) | | 1,785,000 | 1,866,329 |
| Series 2020 A, 5% 10/1/25 (e) | | 530,000 | 536,547 |
| Series 2021 A, 5% 10/1/26 (e) | | 920,000 | 947,927 |
| Series 2023 A, 5% 10/1/25 (e) | | 1,750,000 | 1,771,617 |
| Series 2024 A: | | | |
5% 10/1/25 (e) | | 1,500,000 | 1,518,529 |
5% 10/1/26 (e) | | 1,695,000 | 1,746,453 |
5% 10/1/27 (e) | | 3,985,000 | 4,166,567 |
TOTAL DISTRICT OF COLUMBIA | | | 16,658,119 |
| Florida - 1.8% | | | |
| Brevard County Health Facilities Auth. Rev. Series 2023 A: | | | |
| 5% 4/1/26 | | 290,000 | 296,705 |
| 5% 4/1/28 | | 325,000 | 344,946 |
| Broward County Arpt. Sys. Rev.: | | | |
| Series 2012 P-1, 5% 10/1/25 (e) | | 1,000,000 | 1,001,065 |
| Series 2013 A, 5.25% 10/1/25 (e) | | 1,500,000 | 1,501,884 |
| Series 2013 C, 5.25% 10/1/25 | | 575,000 | 575,836 |
| Series 2017, 5% 10/1/25 (e) | | 1,000,000 | 1,012,517 |
| Series 2019 A, 5% 10/1/26 (e) | | 1,000,000 | 1,028,918 |
| Broward County Fin. Auth. Multi-family Hsg. Rev. Bonds Series 2023, 4.05%, tender 3/1/26 (b) | | 1,000,000 | 1,008,987 |
| Broward County School Board Ctfs. of Prtn. Series 2022 A, 5% 7/1/27 | | 1,015,000 | 1,071,676 |
| Citizens Property Ins. Corp. Series 2015 A1, 5% 6/1/25 (Pre-Refunded to 12/1/24 @ 100) | | 2,550,000 | 2,550,000 |
| Duval County School Board Ctfs. of Prtn. Series 2022 A, 5% 7/1/25 (Assured Guaranty Muni. Corp. Insured) | | 5,715,000 | 5,779,702 |
| Florida Dev. Fin. Corp. Edl. Facilities (Nova Southeastern Univ. Proj.) Series 2020 A, 5% 4/1/25 | | 200,000 | 200,795 |
| Florida Hsg. Fin. Corp. Multi-family Mtg. Rev. Bonds: | | | |
| Series 2023 B, 5%, tender 2/1/26 (b) | | 265,000 | 270,089 |
| Series 2023 C, 5%, tender 12/1/25 (b) | | 605,000 | 614,760 |
| Series 2024 B, 3.35%, tender 10/26/26 (b) | | 2,250,000 | 2,246,066 |
| Series 2024 E, 3.8%, tender 6/1/27 (b) | | 1,370,000 | 1,380,208 |
| Florida Mid-Bay Bridge Auth. Rev. Series 2015 A: | | | |
| 5% 10/1/25 | | 40,000 | 40,492 |
| 5% 10/1/26 | | 45,000 | 45,508 |
| Florida Muni. Pwr. Agcy. Rev.: | | | |
| Series 2016 A, 5% 10/1/28 | | 1,405,000 | 1,451,316 |
| Series 2021 A: | | | |
5% 10/1/25 | | 500,000 | 507,612 |
5% 10/1/26 | | 300,000 | 310,996 |
| Greater Orlando Aviation Auth. Arpt. Facilities Rev.: | | | |
| Series 2015 A: | | | |
5% 10/1/29 (Pre-Refunded to 10/1/25 @ 100) (e) | | 585,000 | 591,608 |
5% 10/1/30 (Pre-Refunded to 10/1/25 @ 100) (e) | | 1,165,000 | 1,178,159 |
| Series 2016 A, 5% 10/1/25 (Escrowed to Maturity) (e) | | 275,000 | 278,558 |
| Series 2017 A: | | | |
5% 10/1/25 (e) | | 30,000 | 30,376 |
5% 10/1/25 (Escrowed to Maturity) (e) | | 600,000 | 606,777 |
5% 10/1/26 (e) | | 10,000 | 10,307 |
5% 10/1/26 (Escrowed to Maturity) (e) | | 35,000 | 35,981 |
| Hillsborough County Aviation Auth. Rev. Series 2022 A, 5% 10/1/25 (e) | | 1,245,000 | 1,260,788 |
| Hillsborough County School Board Ctfs. of Prtn. Series 2015 A, 5% 7/1/26 | | 230,000 | 232,156 |
| Jacksonville Spl. Rev. Series 2022 A: | | | |
| 5% 10/1/25 | | 275,000 | 279,482 |
| 5% 10/1/26 | | 65,000 | 67,571 |
| 5% 10/1/27 | | 55,000 | 58,424 |
| Lakeland Hosp. Sys. Rev. Series 2016, 5% 11/15/26 | | 1,500,000 | 1,555,521 |
| Lee County Arpt. Rev.: | | | |
| Series 2021 A: | | | |
5% 10/1/25 (e) | | 1,375,000 | 1,390,518 |
5% 10/1/27 (e) | | 1,450,000 | 1,511,279 |
| Series 2021 B, 5% 10/1/25 (e) | | 925,000 | 935,440 |
| Miami Dade County Hsg. Multifamily Hsg. Rev.: | | | |
| Bonds: | | | |
Series 2023 B, 4.05%, tender 9/1/25 (b) | | 410,000 | 411,729 |
Series 2023: | | | |
3.55%, tender 1/1/26 (b) | | 1,690,000 | 1,691,994 |
5%, tender 9/1/25 (b) | | 775,000 | 783,989 |
5%, tender 9/1/25 (b) | | 1,445,000 | 1,461,760 |
5%, tender 10/1/25 (b) | | 2,445,000 | 2,476,963 |
| Series 2024, 3.4%, tender 1/1/28 (b)(d) | | 5,000,000 | 5,001,950 |
| Miami-Dade County Aviation Rev. Series 2024 A, 5% 10/1/28 (e) | | 4,100,000 | 4,328,661 |
| Miami-Dade County Health Facilities Auth. Hosp. Rev. (Nicklaus Children's Hosp. Proj.) Series 2021 A, 5% 8/1/25 | | 700,000 | 707,277 |
| Miami-Dade County School Board Ctfs. of Prtn. Series 2015 A, 5% 5/1/27 (Assured Guaranty Muni. Corp. Insured) | | 265,000 | 266,977 |
| Orange County Health Facilities Auth. Bonds Series 2021 C: | | | |
| 5%, tender 11/15/26 (b) | | 265,000 | 275,544 |
| 5%, tender 11/15/26 (b) | | 5,370,000 | 5,564,833 |
| Palm Beach County Arpt. Sys. Rev. Series 2024 B: | | | |
| 5% 10/1/26 (e) | | 105,000 | 107,980 |
| 5% 10/1/27 (e) | | 2,100,000 | 2,191,056 |
| 5% 10/1/28 (e) | | 1,250,000 | 1,320,174 |
| Palm Beach County Health Facilities Auth. Hosp. Rev. Series 2014, 5% 12/1/24 (Escrowed to Maturity) | | 10,000 | 10,001 |
| Pasco County Tax Alloc Series 2023 A, 5.25% 9/1/26 (Assured Guaranty Muni. Corp. Insured) | | 275,000 | 285,386 |
| Polk County Hsg. Fin. Auth. Multi-family Hsg. Rev. Bonds Series 2023, 4.15%, tender 6/1/26 (b) | | 760,000 | 769,816 |
| Seminole County School Board Ctfs. of Prtn. Series 2016 C: | | | |
| 5% 7/1/25 | | 20,000 | 20,230 |
| 5% 7/1/26 | | 25,000 | 25,827 |
| South Miami Health Facilities Auth. Hosp. Rev. (Baptist Med. Ctr., FL. Proj.) Series 2017, 5% 8/15/25 | | 1,000,000 | 1,010,648 |
| Tampa Hosp. Rev. (H. Lee Moffitt Cancer Ctr. Proj.) Series 2020 B: | | | |
| 5% 7/1/25 | | 100,000 | 100,839 |
| 5% 7/1/26 | | 175,000 | 179,400 |
| 5% 7/1/27 | | 150,000 | 157,068 |
| Tohopekaliga Wtr. Auth. Util. Sys. Rev. Series 2020, 5% 10/1/25 (f) | | 2,500,000 | 2,537,647 |
| Volusia County Edl. Facilities Auth. Rev. (Embry-Riddle Aeronautical Univ., Inc. Proj.) Series 2020 A: | | | |
| 5% 10/15/25 | | 1,000,000 | 1,012,765 |
| 5% 10/15/26 | | 750,000 | 773,619 |
| 5% 10/15/27 | | 165,000 | 173,215 |
TOTAL FLORIDA | | | 66,910,371 |
| Georgia - 2.8% | | | |
| Atlanta Arpt. Rev.: | | | |
| Series 2020 B, 5% 7/1/25 (e) | | 610,000 | 614,836 |
| Series 2022 B, 5% 7/1/26 (e) | | 1,000,000 | 1,024,678 |
| Series 2023 G: | | | |
5% 7/1/25 (e) | | 1,600,000 | 1,612,685 |
5% 7/1/26 (e) | | 2,250,000 | 2,305,526 |
5% 7/1/27 (e) | | 2,045,000 | 2,129,601 |
| Bartow County Dev. Auth. Poll. Cont. Rev. Bonds (Georgia Pwr. Co. Plant Bowen Proj.) Series 2013, 2.875%, tender 8/19/25 (b) | | 1,865,000 | 1,857,909 |
| Brookhaven Dev. Auth. Rev. Series 2019 A, 5% 7/1/25 | | 100,000 | 101,098 |
| Burke County Indl. Dev. Auth. Poll. Cont. Rev.: | | | |
| (Georgia Pwr. Co. Plant Vogtle Proj.) Series 1994, 3.7%, tender 6/13/28 (b) | | 1,165,000 | 1,190,268 |
| Bonds: | | | |
(Georgia Pwr. Co. Plant Vogtle Proj.): | | | |
Series 1994 4, 3.8%, tender 5/21/26 (b) | | 3,135,000 | 3,164,361 |
Series 1995 4, 3.8%, tender 5/21/26 (b) | | 2,875,000 | 2,901,926 |
Series 2012, 2.875%, tender 8/19/25 (b) | | 2,000,000 | 1,984,326 |
Series 2013 1, 3.375%, tender 3/12/27 (b) | | 1,385,000 | 1,392,382 |
Series 2024 2, 3.3%, tender 8/21/29 (b) | | 2,000,000 | 2,007,089 |
(Oglethorpe Pwr. Corp. Vogtle Proj.) Series 2017 E, 3.25%, tender 2/3/25 (b) | | 100,000 | 99,900 |
| Gainesville & Hall County Hosp. Auth. Rev. Series 2021 A, 5% 2/15/25 | | 675,000 | 677,215 |
| Georgia Muni. Elec. Auth. Pwr. Rev.: | | | |
| Series 2020 A: | | | |
4% 11/1/25 | | 800,000 | 806,201 |
5% 11/1/26 | | 870,000 | 903,259 |
| Series 2023 A: | | | |
5% 7/1/25 (Assured Guaranty Muni. Corp. Insured) | | 275,000 | 278,020 |
5% 7/1/25 (Assured Guaranty Muni. Corp. Insured) | | 270,000 | 272,965 |
5% 7/1/26 (Assured Guaranty Muni. Corp. Insured) | | 300,000 | 309,885 |
5% 7/1/26 (Assured Guaranty Muni. Corp. Insured) | | 310,000 | 320,215 |
| Series 2024 A: | | | |
5% 1/1/27 | | 1,500,000 | 1,563,074 |
5% 1/1/27 | | 420,000 | 437,661 |
5% 1/1/28 | | 375,000 | 398,245 |
| Main Street Natural Gas, Inc.: | | | |
| Bonds: | | | |
Series 2019 B, 4%, tender 12/1/24 (b) | | 11,275,000 | 11,275,000 |
Series 2019 C, 4%, tender 9/1/26 (b) | | 7,180,000 | 7,241,912 |
Series 2021 C, 4%, tender 12/1/28 (b) | | 5,000,000 | 5,070,198 |
Series 2022 C, 4%, tender 11/1/27 (b)(f) | | 6,500,000 | 6,512,312 |
Series 2024 D, 5%, tender 4/1/31 (b) | | 1,000,000 | 1,076,724 |
| Series 2021 A: | | | |
4% 3/1/25 | | 430,000 | 430,106 |
4% 9/1/25 | | 400,000 | 400,485 |
| Series 2021 C: | | | |
4% 12/1/24 | | 700,000 | 700,002 |
4% 12/1/26 | | 2,200,000 | 2,221,562 |
4% 12/1/27 | | 1,215,000 | 1,234,483 |
| Series 2022 A: | | | |
4% 12/1/25 | | 2,750,000 | 2,761,712 |
4% 12/1/26 | | 245,000 | 247,401 |
| Series 2022 B: | | | |
5% 6/1/25 | | 700,000 | 704,645 |
5% 6/1/26 | | 800,000 | 816,896 |
| Series 2023 A: | | | |
5% 6/1/25 | | 1,525,000 | 1,535,120 |
5% 6/1/26 | | 2,100,000 | 2,145,892 |
| Series 2023 B: | | | |
5% 3/1/25 | | 765,000 | 767,139 |
5% 9/1/25 | | 700,000 | 706,826 |
5% 3/1/26 | | 930,000 | 946,313 |
| Series 2023 D: | | | |
5% 12/1/24 | | 600,000 | 600,037 |
5% 12/1/25 | | 1,550,000 | 1,572,568 |
5% 12/1/26 | | 620,000 | 638,422 |
5% 12/1/27 | | 1,700,000 | 1,776,276 |
5% 12/1/28 | | 1,850,000 | 1,944,418 |
| Series 2024 A1: | | | |
5% 3/1/25 | | 740,000 | 742,069 |
5% 9/1/25 | | 500,000 | 504,876 |
5% 3/1/26 | | 680,000 | 691,928 |
5% 9/1/26 | | 550,000 | 564,277 |
5% 3/1/28 | | 1,025,000 | 1,076,396 |
5% 9/1/28 | | 900,000 | 951,410 |
| Series 2024 B, 5% 9/1/26 | | 275,000 | 282,139 |
| Series 2024 C: | | | |
5% 12/1/25 | | 1,000,000 | 1,014,560 |
5% 12/1/26 | | 875,000 | 900,998 |
| Monroe County Dev. Auth. Poll. Cont. Rev.: | | | |
| (Georgia Pwr. Co. Plant Scherer Proj.) Series 1995, 2.25% 7/1/25 | | 435,000 | 429,890 |
| Bonds: | | | |
(Georgia Pwr. Co. Plant Scherer Proj.): | | | |
Series 2009, 3.875%, tender 3/6/26 (b) | | 3,675,000 | 3,707,078 |
Series 2012, 3.875%, tender 3/6/26 (b) | | 1,250,000 | 1,260,911 |
Series 2023, 3.875%, tender 3/6/26 (b) | | 3,500,000 | 3,530,551 |
(Oglethorpe Pwr. Corp. Scherer Proj.) Series 2013 A, 1.5%, tender 2/3/25 (b) | | 1,500,000 | 1,490,274 |
| Warner Robins Hsg. Auth. Mult Bonds (Arbours at Wellston Proj.) Series 2024, 5%, tender 2/1/28 (b) | | 2,500,000 | 2,625,171 |
TOTAL GEORGIA | | | 101,452,302 |
| Guam - 0.0% | | | |
| Guam Pwr. Auth. Rev. Series 2022 A, 5% 10/1/25 | | 870,000 | 880,675 |
| Hawaii - 0.2% | | | |
| Hawaii Dept. of Budget & Fin. Spl. Purp. Rev. (Queens Health Sys. Proj.) Series 2015 B, SIFMA Municipal Swap Index + 0.140% 3.63%, tender 7/1/39 (b)(c) | | 425,000 | 425,000 |
| Hawaii Gen. Oblig. Series 2020 A, 5% 7/1/25 (e) | | 350,000 | 353,155 |
| Hawaii State Hsg. Fin. & Dev. Corp. Rev. Bonds Series 2024, 3.3%, tender 12/1/27 (b) | | 4,205,000 | 4,210,717 |
| Honolulu City & County Gen. Oblig. Series 2022 A, 5% 11/1/26 | | 815,000 | 851,146 |
| Honolulu City & County Multi-family housing Rev. Bonds Series 2023, 5%, tender 6/1/26 (b) | | 2,080,000 | 2,132,497 |
TOTAL HAWAII | | | 7,972,515 |
| Idaho - 0.1% | | | |
| Idaho Health Facilities Auth. Rev. Series 2021 A, 5% 3/1/32 | | 505,000 | 562,812 |
| Idaho Hsg. & Fin. Assn Sales Tax Series 2023 A, 5% 8/15/25 | | 1,465,000 | 1,486,113 |
| Idaho Hsg. & Fin. Assoc. Single Family Mtg. Series 2019 A, 4% 1/1/50 | | 25,000 | 25,138 |
TOTAL IDAHO | | | 2,074,063 |
| Illinois - 5.9% | | | |
| Champaign County Cmnty. Unit Series 2020 A, 0% 1/1/26 | | 800,000 | 768,098 |
| Chicago Board of Ed. Series 2017 F, 5% 12/1/24 | | 5,500,000 | 5,500,321 |
| Chicago Gen. Oblig.: | | | |
| Series 2002 B, 5% 1/1/25 | | 1,650,000 | 1,651,711 |
| Series 2015 C: | | | |
5% 1/1/25 | | 2,565,000 | 2,567,660 |
5% 1/1/28 | | 1,065,000 | 1,079,349 |
| Series 2020 A: | | | |
5% 1/1/25 | | 1,500,000 | 1,501,555 |
5% 1/1/27 | | 3,600,000 | 3,710,039 |
| Series 2021 B, 4% 1/1/30 | | 1,652,000 | 1,686,240 |
| Chicago Heights Multifamily Hsg. Rev. Bonds (Olympic Village Apts. Proj.) Series 2022, 2.875%, tender 8/1/25 (b) | | 3,000,000 | 2,980,959 |
| Chicago Midway Arpt. Rev.: | | | |
| Series 2016 A, 5% 1/1/25 (e) | | 7,255,000 | 7,261,252 |
| Series 2024 A: | | | |
5% 1/1/26 (e) | | 700,000 | 710,619 |
5% 1/1/27 (e) | | 1,000,000 | 1,029,599 |
| Series 2024, 5% 1/1/25 (e) | | 7,500,000 | 7,506,464 |
| Chicago O'Hare Int'l. Arpt. Rev.: | | | |
| Series 2015 A: | | | |
5% 1/1/27 (e) | | 2,000,000 | 2,002,234 |
5% 1/1/29 (e) | | 3,685,000 | 3,689,117 |
| Series 2015 B, 5% 1/1/31 | | 3,000,000 | 3,003,844 |
| Series 2017 D, 5% 1/1/27 (e) | | 85,000 | 87,758 |
| Series 2022 A, 5% 1/1/25 (e) | | 2,340,000 | 2,342,113 |
| Series 2022 C: | | | |
5% 1/1/25 (e) | | 2,000,000 | 2,001,806 |
5% 1/1/26 (e) | | 900,000 | 914,036 |
| Series 2024 C: | | | |
5% 1/1/25 (e) | | 2,000,000 | 2,001,806 |
5% 1/1/28 (e) | | 5,815,000 | 6,082,887 |
| Series 2024 D, 0% 1/1/25 (e) | | 2,000,000 | 2,002,955 |
| Series 2024 E, 5% 1/1/26 (e) | | 2,615,000 | 2,655,781 |
| Chicago Transit Auth. Cap. Grant Receipts Rev.: | | | |
| Series 2015, 5% 6/1/25 | | 2,500,000 | 2,516,850 |
| Series 2017: | | | |
5% 6/1/25 | | 25,000 | 25,176 |
5% 6/1/25 | | 4,200,000 | 4,228,308 |
| Chicago Wastewtr. Transmission Rev. Series 2024, 5% 1/1/30 (Build America Mutual Assurance Insured) (d) | | 1,825,000 | 2,006,586 |
| Chicago Wtr. Rev. Series 2014: | | | |
| 5% 11/1/26 | | 2,750,000 | 2,752,708 |
| 5% 11/1/27 | | 2,695,000 | 2,697,654 |
| 5% 11/1/28 | | 2,455,000 | 2,457,418 |
| Cook County Gen. Oblig.: | | | |
| Series 2021 A: | | | |
5% 11/15/25 | | 50,000 | 50,860 |
5% 11/15/26 | | 3,900,000 | 4,049,446 |
| Series 2021 B: | | | |
4% 11/15/25 | | 465,000 | 468,666 |
4% 11/15/26 | | 4,370,000 | 4,455,149 |
| Series 2022 A, 5% 11/15/25 | | 3,220,000 | 3,275,366 |
| Cook County Sales Tax Rev. Series 2024, 5% 11/15/27 | | 500,000 | 530,035 |
| Grundy, Kendall & Will County Cmnty. High School District #111 Gen. Oblig. Series 2024, 5% 12/1/29 (d) | | 7,000,000 | 7,015,128 |
| Illinois Dev. Fin. Auth. Retirement Hsg. Regency Park Rev. Series 1991 B, 0% 7/15/25 (Escrowed to Maturity) | | 2,350,000 | 2,301,985 |
| Illinois Fin. Auth.: | | | |
| Bonds: | | | |
Series 2022 B1, 5%, tender 8/15/25 (b) | | 4,770,000 | 4,804,287 |
Series 2022 B2, 5%, tender 8/15/27 (b) | | 3,000,000 | 3,130,453 |
| Series 2021 A, 5% 10/1/25 | | 2,000,000 | 2,034,930 |
| Series 2022 A, 5% 10/1/25 | | 260,000 | 261,498 |
| Series 2024 B, 5% 4/1/27 | | 2,190,000 | 2,298,963 |
| Illinois Fin. Auth. Rev.: | | | |
| (Bradley Univ. Proj.) Series 2017 C, 5% 8/1/26 | | 35,000 | 35,850 |
| (Edward-Elmhurst Healthcare) Series 2017 A, 5% 1/1/25 (Escrowed to Maturity) | | 100,000 | 100,145 |
| (Silver Cross Health Sys. Proj.) Series 2015 C, 5% 8/15/27 | | 1,000,000 | 1,010,475 |
| Bonds Series 2019, U.S. Secured Overnight Fin. Rate (SOFR) Index + 1.200% 4.406%, tender 12/2/24 (b)(c) | | 1,905,000 | 1,903,309 |
| Series 2015 A: | | | |
5% 11/15/25 | | 170,000 | 172,063 |
5% 11/15/26 | | 95,000 | 96,409 |
| Series 2016 A: | | | |
5% 7/1/25 (Escrowed to Maturity) | | 250,000 | 252,747 |
5% 8/15/35 (Pre-Refunded to 8/15/26 @ 100) | | 195,000 | 201,139 |
| Series 2016: | | | |
5% 5/15/25 | | 10,000 | 10,065 |
5% 12/1/25 | | 430,000 | 437,498 |
5% 5/15/26 | | 20,000 | 20,380 |
5% 5/15/27 | | 140,000 | 143,638 |
| Illinois Fin. Auth. Wtr. Facilities Rev. Bonds (American Wtr. Cap. Corp. Proj.) Series 2020, 3.875%, tender 9/1/28 (b) | | 1,500,000 | 1,503,008 |
| Illinois Gen. Oblig.: | | | |
| Series 2014, 5% 5/1/27 | | 500,000 | 500,930 |
| Series 2016: | | | |
5% 2/1/25 | | 4,775,000 | 4,787,376 |
5% 1/1/26 | | 300,000 | 305,973 |
5% 2/1/26 | | 1,235,000 | 1,261,479 |
| Series 2017 A, 5% 12/1/25 | | 710,000 | 723,053 |
| Series 2017 C, 5% 11/1/29 | | 1,000,000 | 1,045,980 |
| Series 2017 D: | | | |
5% 11/1/25 | | 920,000 | 935,398 |
5% 11/1/26 | | 1,755,000 | 1,817,402 |
| Series 2018 A: | | | |
5% 10/1/26 | | 1,340,000 | 1,385,165 |
6% 5/1/26 | | 880,000 | 915,552 |
| Series 2018 B, 5% 5/1/25 | | 2,500,000 | 2,517,895 |
| Series 2020 B, 5% 10/1/28 | | 1,030,000 | 1,099,595 |
| Series 2020 D, 5% 10/1/25 | | 5,000,000 | 5,076,536 |
| Series 2021 A, 5% 3/1/25 | | 1,700,000 | 1,706,814 |
| Series 2022 B: | | | |
5% 3/1/25 | | 6,080,000 | 6,104,369 |
5% 3/1/26 | | 3,185,000 | 3,258,208 |
| Series 2023 C: | | | |
5% 5/1/25 | | 1,810,000 | 1,822,956 |
5% 5/1/26 | | 1,500,000 | 1,538,957 |
5% 5/1/29 | | 1,005,000 | 1,081,315 |
| Series 2023 D: | | | |
5% 7/1/25 | | 3,885,000 | 3,923,952 |
5% 7/1/26 | | 5,000,000 | 5,143,777 |
| Series 2024 B: | | | |
5% 5/1/26 | | 1,500,000 | 1,538,957 |
5% 5/1/27 | | 2,920,000 | 3,048,830 |
5% 5/1/28 | | 625,000 | 662,974 |
5% 5/1/29 | | 1,000,000 | 1,075,935 |
| Series May 2014, 5% 5/1/39 (Pre-Refunded to 1/14/25 @ 100) | | 5,000,000 | 5,009,303 |
| Illinois Hsg. Dev. Auth. Multi-family Hsg. Rev. Bonds: | | | |
| Series 2015, 4.18%, tender 12/5/24, LOC Fed. Home Ln. Bank, San Francisco (b) | | 2,425,000 | 2,426,718 |
| Series 2023: | | | |
4%, tender 6/1/25 (b) | | 1,600,000 | 1,603,195 |
5%, tender 2/1/26 (b) | | 505,000 | 514,698 |
5%, tender 2/1/26 (b) | | 2,050,000 | 2,088,191 |
| Illinois Sales Tax Rev. Series 2021 C, 5% 6/15/25 | | 50,000 | 50,423 |
| Kane, Cook & DuPage Counties School District #46 Elgin Series 2024: | | | |
| 5% 1/1/27 | | 500,000 | 520,095 |
| 5% 1/1/30 | | 550,000 | 599,078 |
| Kane, Cook, DuPage, McHenry & DeKalb Counties Cmnty. College District #509 Elgin Series 2021 B, 4% 12/15/24 | | 450,000 | 450,130 |
| Kane, McHenry, Cook & DeKalb Counties Unit School District #300 Series 2015 5% 1/1/27 | | 395,000 | 395,485 |
| McHenry County Cmnty. School District #200 Series 2006 B: | | | |
| 0% 1/15/25 | | 110,000 | 109,507 |
| 0% 1/15/26 | | 80,000 | 76,898 |
| Metropolitan Pier & Exposition: | | | |
| Series 1994, 0% 6/15/29 (FGIC Insured) | | 1,000,000 | 859,179 |
| Series 2002, 0% 12/15/29 (Nat'l. Pub. Fin. Guarantee Corp. Insured) | | 575,000 | 485,586 |
| Series 2023 A, 5% 12/15/28 | | 1,000,000 | 1,049,663 |
| Series 2024 A, 5% 6/15/29 | | 1,675,000 | 1,757,710 |
| Metropolitan Pier & Exposition Auth. Hosp. Facilities Rev. Series 1996, 7% 7/1/26 (Escrowed to Maturity) | | 1,110,000 | 1,153,563 |
| Northern Illinois Univ. Revs. Series 2020 B, 5% 4/1/26 (Build America Mutual Assurance Insured) | | 650,000 | 662,557 |
| Railsplitter Tobacco Settlement Auth. Rev. Series 2017: | | | |
| 5% 6/1/26 (Escrowed to Maturity) | | 940,000 | 967,801 |
| 5% 6/1/27 (Pre-Refunded to 6/1/26 @ 100) | | 2,385,000 | 2,455,538 |
| 5% 6/1/28 (Pre-Refunded to 6/1/26 @ 100) | | 4,545,000 | 4,679,421 |
| Sales Tax Securitization Corp.: | | | |
| Series 2020 A, 5% 1/1/25 | | 2,000,000 | 2,002,889 |
| Series 2021 A, 5% 1/1/25 | | 550,000 | 550,795 |
| Springfield Elec. Rev. Series 2015: | | | |
| 5% 3/1/28 | | 1,000,000 | 1,004,374 |
| 5% 3/1/29 | | 4,500,000 | 4,519,683 |
| Upper Illinois River Valley Dev. Auth. Rev. Series 2018, 5% 12/1/24 | | 300,000 | 300,012 |
TOTAL ILLINOIS | | | 211,558,265 |
| Indiana - 2.1% | | | |
| East Allen County Schools Ind. Series 2024, 5% 7/15/25 | | 1,445,000 | 1,459,780 |
| East Chicago Ind. Multifamily H Bonds Series 2022, 3.69%, tender 8/1/25 (b) | | 10,000,000 | 9,996,237 |
| Fort Wayne Redev. Auth. (Grand Wayne Ctr. Proj.) Series 2022, 4% 8/1/26 | | 895,000 | 909,706 |
| Indiana Dev. Fin. Auth. Solid Waste Disp. Rev. Bonds (Waste Mgmt., Inc. Proj.) Series 2001, 4.6%, tender 10/1/26 (b)(e) | | 5,000,000 | 5,097,135 |
| Indiana Fin. Auth. Econ. Dev. Rev. Bonds (Republic Svcs., Inc. Proj.): | | | |
| Series 2012, 3.95%, tender 12/2/24 (b)(e) | | 3,750,000 | 3,750,000 |
| Series A, 3.95%, tender 12/2/24 (b)(e) | | 2,100,000 | 2,100,000 |
| Indiana Fin. Auth. Health Facilities Rev. Series 2024: | | | |
| 5% 3/1/27 | | 230,000 | 239,284 |
| 5% 3/1/28 | | 340,000 | 359,302 |
| 5% 3/1/29 | | 380,000 | 407,380 |
| 5% 3/1/30 | | 500,000 | 542,526 |
| Indiana Fin. Auth. Health Sys. Rev. Bonds Series 2019 B, 2.25%, tender 7/1/25 (b) | | 3,810,000 | 3,773,760 |
| Indiana Fin. Auth. Hosp. Rev. Bonds Series 2011 M, 0.7%, tender 1/1/26 (b) | | 3,680,000 | 3,568,937 |
| Indiana Fin. Auth. Rev.: | | | |
| (Butler Univ. Proj.) Series 2019, 4% 2/1/25 | | 275,000 | 275,159 |
| (Cmnty. Foundation of Northwest Indiana Obligated Group) Series 2016, 5% 9/1/25 | | 600,000 | 607,503 |
| Series 2016, 5% 9/1/26 | | 205,000 | 211,456 |
| Indiana Hsg. & Cmnty. Dev. Auth. Series 2021 C1, 3% 1/1/52 | | 825,000 | 807,526 |
| Indiana Muni. Pwr. Agcy. Pwr. Supply Sys. Rev. Series 2017 A, 5% 1/1/25 | | 705,000 | 705,908 |
| Indianapolis Local Pub. Impt.: | | | |
| (Indianapolis Arpt. Auth. Proj.): | | | |
Series 2016 A1, 5% 1/1/25 (e) | | 65,000 | 65,062 |
Series 2019 D, 5% 1/1/25 (e) | | 3,185,000 | 3,188,032 |
| Indianapolis Arpt. Auth. Proj. Series 2019 D, 5% 1/1/26 (e) | | 1,000,000 | 1,016,340 |
| Indianapolis Local Pub. Impt. Bond Bank (Indianapolis Arpt. Auth. Proj.) Series 2023 I2: | | | |
| 5% 1/1/25 (e) | | 3,125,000 | 3,127,975 |
| 5% 1/1/26 (e) | | 385,000 | 391,291 |
| 5% 1/1/27 (e) | | 760,000 | 783,884 |
| Marion High School Bldg. Corp. Series 2021 A: | | | |
| 4% 1/15/25 | | 250,000 | 250,189 |
| 4% 7/15/25 | | 255,000 | 256,309 |
| Posey County Redev. Auth. Leas Series 2023, 5% 7/15/25 | | 3,000,000 | 3,024,425 |
| Purdue Univ. Rev. Series 2024 GG, 5% 7/1/25 | | 1,650,000 | 1,670,506 |
| Vinton Tecumseh School Bldg. Corp. Series 2021, 3% 7/15/25 | | 515,000 | 513,663 |
| Westfield Ind. Redev. Auth. Loc I Series 2023: | | | |
| 5% 1/1/25 | | 485,000 | 485,568 |
| 5% 7/1/25 | | 345,000 | 348,346 |
| Whiting Envir. Facilities Rev. Bonds (BP Products North America, Inc. Proj.) Series 2019 A, 5%, tender 6/5/26 (b)(e) | | 24,500,000 | 24,931,710 |
TOTAL INDIANA | | | 74,864,899 |
| Iowa - 0.2% | | | |
| Iowa Higher Ed. Ln. Auth. Rev. (Grinnell College Proj.) Series 2017, 4% 12/1/24 | | 250,000 | 250,011 |
| Iowa Student Ln. Liquidity Corp. Student Ln. Rev.: | | | |
| Series 2015 A, 5% 12/1/24 (e) | | 540,000 | 540,041 |
| Series 2019 B, 5% 12/1/25 (e) | | 985,000 | 997,312 |
| Mahaska County Iowa Series 2024 A, 5% 12/1/25 | | 1,625,000 | 1,638,491 |
| Pefa, Inc. Iowa Gas Proj. Rev. Bonds Series 2019, 5%, tender 9/1/26 (b) | | 4,000,000 | 4,098,812 |
TOTAL IOWA | | | 7,524,667 |
| Kansas - 0.4% | | | |
| Manhattan Series 2024, 5% 6/15/28 (d) | | 6,000,000 | 6,145,831 |
| Park City Series 2024 1, 3.625% 10/1/27 | | 5,000,000 | 5,007,827 |
| Valley Ctr. Kans Series 2023 1, 4.375% 12/1/25 | | 2,890,000 | 2,890,808 |
| Wyandotte County/Kansas City Unified Govt. Util. Sys. Rev. Series 2016 A, 5% 9/1/25 | | 15,000 | 15,195 |
TOTAL KANSAS | | | 14,059,661 |
| Kentucky - 1.5% | | | |
| Ashland Med. Ctr. Rev.: | | | |
| (Ashland Hosp. Corp. D/B/A King's Daughters Med. Ctr. Proj.) Series 2016 A, 5% 2/1/25 | | 20,000 | 20,028 |
| Series 2019, 5% 2/1/26 | | 550,000 | 557,051 |
| Carroll County Poll. Ctlr Rev. Bonds (Kentucky Utils. Co. Proj.) Series 2016 A, 1.55%, tender 9/1/26 (b) | | 500,000 | 475,801 |
| Intloc Sct Cfts Prtn. Series 2023, 4% 3/1/26 | | 1,105,000 | 1,114,274 |
| Kentucky Bond Dev. Corp. Edl. Facilities (Transylvania Univ. Proj.) Series 2021 A, 4% 3/1/25 | | 340,000 | 340,246 |
| Kentucky Econ. Dev. Fin. Auth. Solid Waste Disp. Rev. Bonds (Republic Svcs., Inc. Proj.) Series A, 3.95%, tender 12/2/24 (b)(e) | | 2,800,000 | 2,800,000 |
| Kentucky State Property & Buildings Commission Rev.: | | | |
| Series 2015, 4% 8/1/25 | | 200,000 | 201,315 |
| Series B, 5% 8/1/25 | | 300,000 | 303,928 |
| Kentucky State Univ. Ctfs. of Prtn. (Kentucky State Univ. Proj.) Series 2021, 5% 11/1/25 | | 280,000 | 284,542 |
| Kentucky, Inc. Pub. Energy: | | | |
| Bonds: | | | |
Series A, 4%, tender 6/1/26 (b) | | 325,000 | 327,471 |
Series C1, 4%, tender 6/1/25 (b) | | 10,505,000 | 10,529,802 |
| Series 2024 A: | | | |
5% 7/1/25 | | 400,000 | 403,143 |
5% 7/1/26 | | 500,000 | 510,695 |
5% 7/1/27 | | 575,000 | 594,147 |
| Series 2024 B: | | | |
5% 8/1/25 | | 500,000 | 503,549 |
5% 2/1/26 | | 300,000 | 303,975 |
5% 8/1/26 | | 250,000 | 255,557 |
5% 2/1/27 | | 365,000 | 376,002 |
| Knott County Indl. Bldg. Rev. Bonds (Solid Waste Proj.) Series 2024, 4%, tender 4/1/25 (b)(e)(f) | | 8,500,000 | 8,503,211 |
| Louisville & Jefferson County: | | | |
| Bonds Series 2020 C, 5%, tender 10/1/26 (b) | | 2,015,000 | 2,077,690 |
| Series 2023 A: | | | |
5% 10/1/26 | | 700,000 | 722,762 |
5% 10/1/27 | | 1,700,000 | 1,792,425 |
| Rural Wtr. Fing. Agcy. Pub. Proj.: | | | |
| Series 2023 A, 3.9% 11/1/25 | | 2,500,000 | 2,499,992 |
| Series 2024 A, 3.7% 5/1/27 | | 5,000,000 | 5,020,259 |
| Series 2024 B, 3.05% 5/1/27 | | 5,000,000 | 4,952,703 |
| Trimble County Envirl Facilities Re Bonds Series 2023, 4.7%, tender 6/1/27 (b)(e) | | 8,980,000 | 9,173,889 |
TOTAL KENTUCKY | | | 54,644,457 |
| Louisiana - 0.8% | | | |
| Lake Charles Hbr. & Term. Rev. Bonds (Big Lake Fuels LLC Proj.) Series 2021, 1%, tender 12/1/24 (b)(e) | | 1,300,000 | 1,300,000 |
| Louisiana Gas & Fuel Tax Rev. Bonds Series 2022 A, U.S. Secured Overnight Fin. Rate (SOFR) Index + 0.500% 3.706%, tender 5/1/26 (b)(c) | | 3,895,000 | 3,882,334 |
| Louisiana Hsg. Corp. Single Fami (Home Ownership Prog.) Series 2023 C, 5.75% 12/1/53 | | 165,000 | 179,604 |
| Louisiana Local Govt. Envir. Facilities and Cmnty. Dev. Auth. Bonds (East Baton Rouge Sewerage Commission Proj.) Series 2020 B, 0.875%, tender 12/20/24 (b) | | 4,000,000 | 3,994,958 |
| Louisiana Pub. Facilities Auth. Rev. Bonds (Ochsner Clinic Foundation Proj.) Series 2020 B, 5%, tender 5/15/25 (b) | | 7,925,000 | 7,977,685 |
| New Orleans Aviation Board Rev.: | | | |
| (North Term. Proj.): | | | |
Series 2015 B, 5% 1/1/25 (e) | | 1,750,000 | 1,752,027 |
Series 2017 B: | | | |
5% 1/1/25 (e) | | 5,000 | 5,004 |
5% 1/1/26 (e) | | 215,000 | 218,261 |
| Series 2017 D2, 5% 1/1/25 (e) | | 115,000 | 115,099 |
| Series 2024 B: | | | |
5% 1/1/26 (e) | | 1,280,000 | 1,299,417 |
5% 1/1/27 (e) | | 1,430,000 | 1,475,230 |
5% 1/1/28 (e) | | 2,690,000 | 2,806,716 |
| St. John Baptist Parish Rev. Bonds (Marathon Oil Corp.) Series 2017, 4.05%, tender 7/1/26 (b) | | 3,045,000 | 3,071,798 |
TOTAL LOUISIANA | | | 28,078,133 |
| Maine - 0.0% | | | |
| Maine Health & Higher Edl. Facilities Auth. Rev. Series 2021 A: | | | |
| 5% 7/1/25 | | 500,000 | 504,338 |
| 5% 7/1/26 | | 975,000 | 1,001,032 |
| Maine Tpk. Auth. Tpk. Rev. Series 2015, 5% 7/1/26 | | 250,000 | 253,080 |
TOTAL MAINE | | | 1,758,450 |
| Maryland - 1.6% | | | |
| Baltimore Proj. Rev. Series 2017 A: | | | |
| 5% 7/1/28 | | 2,000,000 | 2,083,350 |
| 5% 7/1/29 | | 1,000,000 | 1,041,307 |
| 5% 7/1/29 | | 755,000 | 786,187 |
| Hsg. Opportunities Commission of Montgomery County Series 2021 C, 0.8% 7/1/25 | | 105,000 | 102,794 |
| Maryland Cmnty. Dev. Admin Dept. Hsg. & Cmnty. Dev.: | | | |
| Series 2019 B, 4% 9/1/49 | | 130,000 | 130,541 |
| Series 2022 I, 4.375% 1/1/25 (f) | | 12,000,000 | 11,999,587 |
| Series 2023 B: | | | |
2.75% 6/1/25 | | 3,055,000 | 3,038,273 |
2.75% 8/1/25 | | 1,160,000 | 1,152,005 |
| Series 2023 C: | | | |
3.4% 8/1/25 | | 9,015,000 | 9,024,217 |
5.25% 11/1/25 | | 6,000,000 | 6,045,869 |
| Series 2023 D, 3.5% 1/1/26 | | 2,805,000 | 2,816,607 |
| Maryland Dept. of Trans.: | | | |
| Series 2022 B, 5% 12/1/24 | | 220,000 | 220,023 |
| Series 2024 A, 5% 8/1/28 (Assured Guaranty Muni. Corp. Insured) (e) | | 1,450,000 | 1,531,276 |
| Maryland Econ. Dev. Corp. Rev. PRG - Towson Place Properties LLC Proj.) Series 2024 A1: | | | |
| 5% 6/1/25 | | 200,000 | 200,891 |
| 5% 6/1/26 | | 600,000 | 609,244 |
| Maryland Health & Higher Edl.: | | | |
| Bonds Series 2020, 5%, tender 7/1/25 (b) | | 4,005,000 | 4,008,655 |
| Series 2023, 5% 7/1/27 | | 1,360,000 | 1,416,870 |
| Maryland Health & Higher Edl. Facilities Auth. Rev. Series 2015, 5% 7/1/25 | | 40,000 | 40,301 |
| Maryland Stadium Auth. Built to Learn Rev.: | | | |
| Series 2021, 5% 6/1/27 | | 500,000 | 527,855 |
| Series 2022 A, 5% 6/1/26 | | 850,000 | 877,004 |
| Maryland Trans. Auth. Passenger Facility Charge Rev. Series 2012 B: | | | |
| 2.5% 6/1/26 (e) | | 670,000 | 659,375 |
| 2.625% 6/1/27 (e) | | 550,000 | 531,054 |
| Montgomery County Gen. Oblig.: | | | |
| Bonds Series 2013 MD, 3.35%, tender 12/2/24 (b) | | 7,500,000 | 7,500,000 |
| Series 2022 A, 5% 8/1/26 | | 1,000,000 | 1,037,516 |
TOTAL MARYLAND | | | 57,380,801 |
| Massachusetts - 1.5% | | | |
| Massachusetts Dev. Fin. Agcy. Rev.: | | | |
| Bonds Series 2011 N, 0.45%, tender 7/1/25 (b) | | 3,505,000 | 3,428,807 |
| Series 2016 I: | | | |
5% 7/1/25 | | 20,000 | 20,145 |
5% 7/1/26 | | 20,000 | 20,442 |
| Series 2019 O, 5% 12/1/24 | | 100,000 | 100,008 |
| Massachusetts Edl. Fing. Auth. Rev.: | | | |
| Series 2014 I: | | | |
5% 1/1/25 (e) | | 6,800,000 | 6,808,247 |
5% 1/1/26 (e) | | 7,000,000 | 7,008,203 |
| Series 2017 A, 5% 7/1/25 (e) | | 690,000 | 696,851 |
| Series 2021 B: | | | |
5% 7/1/25 (e) | | 1,575,000 | 1,590,638 |
5% 7/1/26 (e) | | 2,390,000 | 2,448,901 |
| Series 2022 B: | | | |
5% 7/1/25 (e) | | 585,000 | 590,808 |
5% 7/1/26 (e) | | 365,000 | 373,995 |
5% 7/1/28 (e) | | 1,775,000 | 1,859,511 |
| Massachusetts Health & Edl. Facilities Auth. Rev.: | | | |
| (Partners Healthcare Sys., Inc. Proj.) Series 2007 G2, 3%, tender 12/6/24 (Assured Guaranty Muni. Corp. Insured) (b) | | 8,815,000 | 8,815,000 |
| Bonds Series I, 0.7%, tender 7/1/25 (b) | | 296,000 | 289,557 |
| Massachusetts Hsg. Fin. Agcy.: | | | |
| Series 2023 C2, 4% 12/1/27 | | 1,000,000 | 1,006,666 |
| Series 2024 A3, 3.6% 12/1/26 | | 14,985,000 | 15,092,002 |
| Massachusetts Port Auth. Rev. Series 2017 A, 5% 7/1/25 (e) | | 25,000 | 25,197 |
| Massachusetts Port Auth. Spl. Facilities Rev. (Bosfuel Proj.) Series 2019 A, 5% 7/1/27 (e) | | 285,000 | 296,217 |
| Massachusetts School Bldg. Auth. Dedicated Sales Tax Rev. Series 2015 C, 5% 8/15/27 | | 2,400,000 | 2,438,460 |
TOTAL MASSACHUSETTS | | | 52,909,655 |
| Michigan - 1.0% | | | |
| Detroit Gen. Oblig. Series 2024: | | | |
| 5% 5/1/25 | | 1,240,000 | 1,246,495 |
| 5% 5/1/26 | | 1,130,000 | 1,154,477 |
| 5% 5/1/27 | | 1,190,000 | 1,238,658 |
| 5% 5/1/28 | | 650,000 | 687,582 |
| 5% 5/1/29 | | 290,000 | 311,145 |
| 5% 5/1/30 | | 305,000 | 331,501 |
| 5% 5/1/31 | | 320,000 | 350,933 |
| 5% 5/1/32 | | 335,000 | 370,289 |
| Grand Traverse County Hosp. Fin. Auth. Series 2021, 5% 7/1/25 | | 480,000 | 484,441 |
| Kalamazoo Hosp. Fin. Auth. Hosp. Facilities Rev. Series 2016: | | | |
| 5% 5/15/25 | | 15,000 | 15,102 |
| 5% 5/15/26 | | 15,000 | 15,353 |
| Kent Hosp. Fin. Auth. Hosp. Facilities Rev. (Spectrum Health Sys. Proj.) Series 2015 A, SIFMA Municipal Swap Index + 0.250% 3.43%, tender 6/27/25 (b)(c) | | 965,000 | 965,000 |
| Lansing Board of Wtr. & Lt. Util. Rev. Bonds Series 2021 B, 2%, tender 7/1/26 (b) | | 1,000,000 | 969,357 |
| Ludington Area School District (Michigan School Bond Qualification and Ln. Prog.) Series 2022 II, 5% 11/1/25 | | 1,230,000 | 1,254,075 |
| Michigan Bldg. Auth. Rev. Series 2023 I, 3.28% 4/15/58 (b) | | 10,000,000 | 10,000,000 |
| Michigan Fin. Auth. Rev.: | | | |
| Bonds Series 2019 MI2, 5%, tender 2/1/25 (b) | | 1,750,000 | 1,754,562 |
| Series 2015 D1, 0.75% 10/15/25 | | 250,000 | 244,868 |
| Series 2015 MI, 5% 12/1/24 | | 100,000 | 100,009 |
| Series 2024 A2, 5% 8/20/25 | | 4,500,000 | 4,557,848 |
| Michigan Hsg. Dev. Auth. Multi-family Hsg. Rev. Bonds Series 2024, 3.8%, tender 7/1/26 (b) | | 2,000,000 | 2,011,605 |
| Michigan Hsg. Dev. Auth. Single Family Mtg. Rev. Series 2022 A, 2.5% 6/1/25 | | 630,000 | 624,454 |
| Michigan Strategic Fund Ltd. Oblig. Rev. Bonds (Consumers Energy Co. Proj.) Series 2019, 3.35%, tender 10/1/27 (b)(e) | | 3,465,000 | 3,464,374 |
| Portage Pub. Schools Series 2016: | | | |
| 5% 5/1/25 | | 25,000 | 25,196 |
| 5% 11/1/28 | | 20,000 | 20,574 |
| Wayne County Arpt. Auth. Rev. Series 2015 F: | | | |
| 5% 12/1/25 (e) | | 2,735,000 | 2,774,615 |
| 5% 12/1/26 (e) | | 465,000 | 471,890 |
| Wayne State Univ. Revs. Series 2024 A, 5% 11/15/27 (Build America Mutual Assurance Insured) | | 500,000 | 531,776 |
TOTAL MICHIGAN | | | 35,976,179 |
| Minnesota - 0.9% | | | |
| Central Muni. Pwr. Agcy. Rev. Series 2021, 5% 1/1/25 (Assured Guaranty Muni. Corp. Insured) | | 265,000 | 265,374 |
| Maple Grove Health Care Sys. Rev. Series 2017, 5% 5/1/25 | | 800,000 | 802,900 |
| Minneapolis & Saint Paul Metropolitan Arpts. Commission Arpt. Rev.: | | | |
| Series 2016, 5% 1/1/25 | | 620,000 | 620,886 |
| Series 2019 B, 5% 1/1/25 (e) | | 1,000,000 | 1,000,952 |
| Series 2019 C, 5% 1/1/26 | | 380,000 | 387,630 |
| Series 2022 B: | | | |
5% 1/1/25 (e) | | 195,000 | 195,186 |
5% 1/1/26 (e) | | 470,000 | 477,680 |
5% 1/1/27 (e) | | 1,580,000 | 1,630,296 |
| Series 2024 B, 5% 1/1/27 (e) | | 4,755,000 | 4,906,364 |
| Minneapolis Health Care Sys. Rev. Bonds Series 2023 A, 5%, tender 11/15/28 (b) | | 6,470,000 | 6,897,226 |
| Minnesota Hsg. Fin. Agcy.: | | | |
| Series 2022 A: | | | |
5% 8/1/25 | | 1,155,000 | 1,169,655 |
5% 8/1/26 | | 1,300,000 | 1,342,305 |
| Series 2022 B, 5% 8/1/26 | | 100,000 | 103,254 |
| Series 2023 E, 3.875% 8/1/25 | | 700,000 | 700,327 |
| Series 2023 F, 5.75% 7/1/53 | | 110,000 | 117,873 |
| Minnesota Muni. Gas Agcy. Rev.: | | | |
| Bonds Series 2022 A, 4%, tender 12/1/27 (b) | | 1,725,000 | 1,749,851 |
| Series 2022 A, 4% 12/1/24 | | 2,700,000 | 2,700,077 |
| Minnesota Rural Wtr. Fin. Auth. Series 2023, 4.375% 4/1/25 | | 2,000,000 | 1,999,025 |
| Moorhead Edl. Facilities Rev. (The Concordia College Corp. Proj.) Series 2016, 5% 12/1/25 | | 35,000 | 35,011 |
| Northern Muni. Pwr. Agcy. Elec. Sys. Rev. Series 2024, 5% 1/1/25 | | 1,000,000 | 1,001,279 |
| Pelican Rapids Minn Series 2024 A, 4% 12/15/25 | | 2,515,000 | 2,521,199 |
| Saint Paul Hsg. & Redev. Auth. Hosp. Rev. (HealthEast Care Sys. Proj.) Series 2015 A, 5% 11/15/27 (Pre-Refunded to 11/15/25 @ 100) | | 400,000 | 407,342 |
TOTAL MINNESOTA | | | 31,031,692 |
| Mississippi - 0.1% | | | |
| Mississippi Bus. Fin. Corp. Solid Waste Disp. Rev. Bonds (Waste Mgmt., Inc. Proj.) Series 2002, 4.25%, tender 3/1/27 (b)(e) | | 5,000,000 | 5,028,020 |
| Missouri - 1.0% | | | |
| Barry County Ctfs. Prtn. Law Enforcement Ctr. Proj. Series 2023: | | | |
| 5% 10/1/25 | | 215,000 | 217,264 |
| 5% 10/1/26 | | 550,000 | 563,322 |
| Cape Girardeau County Indl. Dev. Auth. (Southeast Hosp. Proj.) Series 2017 A: | | | |
| 5% 3/1/25 | | 15,000 | 15,025 |
| 5% 3/1/26 | | 20,000 | 20,452 |
| Jackson County Spl. Oblig. Series 2023 A, 5% 12/1/28 | | 1,000,000 | 1,079,659 |
| Kansas City Planned Indl. Expansion Bonds Series 2023, 5%, tender 7/1/27 (b) | | 1,260,000 | 1,304,629 |
| Missouri Health & Edl. Facilities Rev.: | | | |
| Bonds: | | | |
Series 2021 B, 4%, tender 5/1/26 (b) | | 6,735,000 | 6,809,662 |
Series 2021 C, 5%, tender 5/1/28 (b) | | 10,000,000 | 10,617,680 |
| Series 2018 A, 5% 6/1/25 | | 1,435,000 | 1,446,588 |
| Series 2021 A, 4% 7/1/25 | | 500,000 | 502,265 |
| Missouri Hsg. Dev. Commission Single Family Mtg. Rev.: | | | |
| (First Place Homeownership Ln. Prog.) Series 2021 C, 3.25% 11/1/52 | | 90,000 | 88,939 |
| Series 2019, 4% 5/1/50 | | 50,000 | 50,326 |
| Missouri State Pub. Util. Commn Rev. Series 2023, 4% 12/1/24 | | 12,025,000 | 12,025,084 |
| Ozarks Technical Cmnty. College Series 2021, 5% 3/1/25 | | 225,000 | 225,926 |
| Saint Louis Arpt. Rev. Series 2019 B, 5% 7/1/25 (e) | | 420,000 | 423,644 |
TOTAL MISSOURI | | | 35,390,465 |
| Montana - 0.0% | | | |
| Montana Board Hsg. Single Family: | | | |
| Series 2019 B, 4% 6/1/50 | | 25,000 | 25,198 |
| Series 2022 A, 3% 6/1/52 | | 245,000 | 240,770 |
| Series A1, 3.5% 6/1/50 | | 260,000 | 258,416 |
TOTAL MONTANA | | | 524,384 |
| Nebraska - 0.7% | | | |
| Central Plains Energy Proj. Rev. Bonds: | | | |
| (Proj. No. 4) Series 2023 A1, 5%, tender 11/1/29 (b) | | 1,415,000 | 1,504,461 |
| Series 2019: | | | |
2.5%, tender 8/1/25 (b) | | 1,000,000 | 990,135 |
4%, tender 8/1/25 (b) | | 11,870,000 | 11,904,556 |
| Douglas County Hosp. Auth. #3 Health Facilities Rev. Series 2015, 5% 11/1/28 | | 1,250,000 | 1,267,901 |
| Gretna Ctfs. of Prtn.: | | | |
| Series 2021, 4% 12/15/25 | | 2,620,000 | 2,621,322 |
| Series 2022, 5% 12/15/25 | | 4,000,000 | 4,005,078 |
| Muni. Energy Agcy. of Nebraska Pwr. Swr. Rev. Series 2022 A, 5% 4/1/25 | | 2,835,000 | 2,851,135 |
| Nebraska Invt. Fin. Auth. Single Family Hsg. Rev. Series 2019 B, 4% 9/1/49 (e) | | 60,000 | 59,763 |
| Nebraska Pub. Pwr. District Rev. Series 2016 C, 5% 1/1/25 | | 200,000 | 200,266 |
| Omaha Arpt. Auth. Arpt. Rev. Series 2024, 5% 12/15/27 (Assured Guaranty Muni. Corp. Insured) (d)(e) | | 1,000,000 | 1,047,100 |
| Omaha Pub. Pwr. District Elec. Rev. Series A, 5% 2/1/25 | | 200,000 | 200,620 |
TOTAL NEBRASKA | | | 26,652,337 |
| Nevada - 0.4% | | | |
| Clark County McCarran Int'l. Arpt. Passenger Facility Charge Rev.: | | | |
| Series 2017 B, 5% 7/1/25 (e) | | 665,000 | 670,387 |
| Series 2019 E: | | | |
5% 7/1/25 | | 100,000 | 101,104 |
5% 7/1/27 | | 275,000 | 290,426 |
| Clark County Poll. Cont. Rev. Bonds (Nevada Pwr. Co. Proj.) Series 2017, 3.75%, tender 3/31/26 (b) | | 2,065,000 | 2,062,114 |
| Clark County School District: | | | |
| Series 2017 D, 5% 6/15/25 | | 350,000 | 350,809 |
| Series 2018 A, 5% 6/15/25 | | 315,000 | 317,947 |
| Series 2021 C, 5% 6/15/25 | | 2,655,000 | 2,679,836 |
| Humboldt County Nev Poll. Cont. Rev. (Sierra Pacific Co. Projs.) Series 2016 A, 3.55% 10/1/29 | | 335,000 | 340,328 |
| Nevada Dept. of Bus. & Industry Bonds (Republic Svcs., Inc. Proj.) Series 2001, 4.15%, tender 12/2/24 (b)(e)(f) | | 4,900,000 | 4,900,000 |
| Nevada Gen. Oblig. Series 2013 F1, 5% 3/1/25 | | 10,000 | 10,013 |
| Nevada Hsg. Division Bonds Series 2022, 5%, tender 12/1/24 (b) | | 1,375,000 | 1,375,000 |
| Reno-Tahoe Arpt. Auth. New Arpt. Rev. Series 2024 A: | | | |
| 5% 7/1/27 (e) | | 200,000 | 207,671 |
| 5% 7/1/28 (e) | | 225,000 | 236,502 |
| 5% 7/1/29 (e) | | 580,000 | 616,345 |
| Washoe County Gas Facilities Rev. Bonds (Sierra Pacific Pwr. Co. Projs.): | | | |
| Series 2016 C, 4.125%, tender 10/1/29 (b)(e) | | 370,000 | 374,765 |
| Series 2016 G, 3.625%, tender 10/1/29 (b) | | 270,000 | 273,404 |
TOTAL NEVADA | | | 14,806,651 |
| New Hampshire - 0.7% | | | |
| Nat'l. Fin. Auth. Hosp. Rev. (St. Luke's Univ. Health Network Proj.) Series 2021 B, 5% 8/15/25 | | 1,140,000 | 1,152,218 |
| New Hampshire Health & Ed. Facilities Auth. Bonds: | | | |
| Series 2015 A, 3.3%, tender 8/3/27 (b) | | 8,030,000 | 8,075,627 |
| Series 2015 C, 3.3%, tender 8/3/27 (b) | | 2,750,000 | 2,766,264 |
| Series 2015 D, 3.3%, tender 8/3/27 (b) | | 3,740,000 | 3,762,118 |
| New Hampshire Health & Ed. Facilities Auth. Rev. Series 2012, 5% 7/1/27 | | 120,000 | 120,048 |
| New Hampshire St Hsg. Fin.: | | | |
| Series 2023 3, 3.8% 7/1/26 | | 1,010,000 | 1,018,875 |
| Series 2023 4: | | | |
3.625% 4/1/26 | | 215,000 | 216,556 |
3.7% 1/1/27 | | 670,000 | 676,617 |
| New Hampshire State Hsg. Fin. Rev. Bonds Series 2024 D, 3.58%, tender 7/1/25 (b) | | 7,000,000 | 7,012,846 |
TOTAL NEW HAMPSHIRE | | | 24,801,169 |
| New Jersey - 1.8% | | | |
| New Brunswick Parking Auth. Rev. Series 2020 B, 5% 9/1/25 | | 850,000 | 862,263 |
| New Jersey Econ. Dev. Auth.: | | | |
| Series 2022 A: | | | |
5% 11/1/25 | | 1,000,000 | 1,017,039 |
5% 11/1/26 | | 1,100,000 | 1,138,285 |
| Series 2023 RRR: | | | |
5% 3/1/25 | | 2,680,000 | 2,690,453 |
5% 3/1/26 | | 5,300,000 | 5,426,120 |
| Series 2024 SSS: | | | |
5% 6/15/26 | | 1,970,000 | 2,029,220 |
5% 6/15/27 | | 155,000 | 162,906 |
| Series QQQ: | | | |
5% 6/15/25 | | 385,000 | 388,574 |
5% 6/15/26 | | 555,000 | 571,684 |
| New Jersey Econ. Dev. Auth. Rev.: | | | |
| (New Jersey Transit Corp. Projs.) Series 2017 B, 5% 11/1/25 | | 350,000 | 355,948 |
| Series 2015 B, 5.25% 7/1/25 | | 1,285,000 | 1,300,267 |
| Series 2016 AAA, 5% 6/15/26 | | 3,375,000 | 3,476,456 |
| Series 2019: | | | |
5.25% 9/1/25 (f) | | 3,000,000 | 3,045,864 |
5.25% 9/1/26 (f) | | 1,510,000 | 1,567,813 |
| New Jersey Econ. Dev. Auth. Wtr. Facilities Rev. (New Jersey-American Wtr. Co., Inc. Proj.) Series 2020 E, 0.85% 12/1/25 (e) | | 1,600,000 | 1,535,003 |
| New Jersey Edl. Facilities Auth. Rev. Series 2023 A: | | | |
| 5% 9/1/27 | | 400,000 | 421,842 |
| 5% 9/1/27 | | 200,000 | 210,921 |
| New Jersey Edl. Facility Series 2016 D, 5% 7/1/25 (Assured Guaranty Muni. Corp. Insured) | | 1,860,000 | 1,881,513 |
| New Jersey Gen. Oblig.: | | | |
| Series 2020 A, 4% 6/1/31 | | 1,895,000 | 2,025,961 |
| Series 2021, 2% 6/1/25 | | 840,000 | 832,268 |
| New Jersey Health Care Facilities Fing. Auth. Rev.: | | | |
| (Greystone Park Psychiatric Hosp. Proj.) Series 2024: | | | |
5% 9/15/27 | | 585,000 | 618,066 |
5% 9/15/28 | | 245,000 | 263,509 |
| (Marlboro Psychiatric Hosp. Proj.) Series 2024: | | | |
5% 9/15/26 | | 595,000 | 615,789 |
5% 9/15/29 | | 155,000 | 169,406 |
| Bonds Series 2019 B2, 5%, tender 7/1/25 (b) | | 150,000 | 151,407 |
| Series 2016 A, 5% 7/1/30 (Pre-Refunded to 7/1/26 @ 100) | | 1,000,000 | 1,029,055 |
| Series 2019, 5% 7/1/25 | | 600,000 | 606,346 |
| New Jersey Higher Ed. Student Assistance Auth. Student Ln. Rev.: | | | |
| Series 2016 1A, 5% 12/1/24 (e) | | 1,430,000 | 1,430,115 |
| Series 2017 1A, 5% 12/1/25 (e) | | 420,000 | 425,703 |
| Series 2018 B: | | | |
5% 12/1/24 (e) | | 5,500,000 | 5,500,442 |
5% 12/1/25 (e) | | 2,225,000 | 2,255,210 |
| Series 2020, 5% 12/1/24 (e) | | 675,000 | 675,054 |
| Series 2021 A: | | | |
5% 12/1/24 (e) | | 330,000 | 330,027 |
5% 12/1/25 (e) | | 700,000 | 709,504 |
| Series 2021 B: | | | |
5% 12/1/24 (e) | | 570,000 | 570,046 |
5% 12/1/26 (e) | | 1,425,000 | 1,468,178 |
| Series 2023 B: | | | |
5% 12/1/25 (e) | | 1,800,000 | 1,824,440 |
5% 12/1/28 (e) | | 1,000,000 | 1,058,287 |
| New Jersey Hsg. & Mtg. Fin. Agcy. Multi-family Rev. Series 2023 C, 5% 11/1/26 (e) | | 1,000,000 | 1,024,107 |
| New Jersey Hsg. & Mtg. Fin. Agcy. Rev. Series 2019 D, 4% 4/1/25 (e) | | 150,000 | 150,040 |
| New Jersey Tobacco Settlement Fing. Corp. Series 2018 A: | | | |
| 5% 6/1/25 | | 2,225,000 | 2,239,847 |
| 5% 6/1/26 | | 3,800,000 | 3,888,312 |
| New Jersey Tpk. Auth. Tpk. Rev. Series 2024, 5% 1/1/28 | | 455,000 | 486,811 |
| New Jersey Trans. Trust Fund Auth.: | | | |
| Series 2008 A, 0% 12/15/25 | | 1,000,000 | 966,364 |
| Series 2010 A: | | | |
0% 12/15/25 | | 355,000 | 343,059 |
0% 12/15/27 | | 145,000 | 131,289 |
| Series 2016 A, 5% 6/15/27 | | 90,000 | 92,533 |
| Series 2022 AA, 5% 6/15/25 | | 155,000 | 156,439 |
| Series 2023 AA: | | | |
5% 6/15/25 | | 2,250,000 | 2,270,889 |
5% 6/15/26 | | 895,000 | 922,069 |
| Series A, 5% 12/15/25 | | 200,000 | 203,905 |
| Newark Gen. Oblig. Series 2020 A, 5% 10/1/27 | | 2,200,000 | 2,329,572 |
| Piscataway Township Gen. Oblig. Series 2019, 2% 2/1/31 | | 500,000 | 456,068 |
| The Board of Ed. of Newark Series 2021: | | | |
| 5% 7/15/25 (Build America Mutual Assurance Insured) | | 250,000 | 252,728 |
| 5% 7/15/26 (Build America Mutual Assurance Insured) | | 300,000 | 309,236 |
TOTAL NEW JERSEY | | | 66,864,252 |
| New Mexico - 0.2% | | | |
| Farmington Poll. Cont. Rev. Bonds (Pub. Svc. Co. of New Mexico San Juan Proj.) Series 2010 D, 3.9%, tender 6/1/28 (b) | | 3,000,000 | 3,059,333 |
| New Mexico Mtg. Fin. Auth.: | | | |
| Series 2018 A1, 4% 1/1/49 | | 125,000 | 125,535 |
| Series 2019 C, 4% 1/1/50 | | 245,000 | 246,202 |
| Series 2023 C, I 5.75% 3/1/54 | | 295,000 | 318,174 |
| New Mexico Mtg. Fin. Auth. Multi-family Hsg. Rev. Bonds (Santa Fe Apts. and Sangre De Cristo Proj.) Series 2023, 5%, tender 6/1/25 (b) | | 5,000,000 | 5,006,235 |
TOTAL NEW MEXICO | | | 8,755,479 |
| New York - 2.8% | | | |
| Bellmore Union Free School District Series 2019 A, 2% 6/15/29 | | 530,000 | 488,682 |
| East Hampton Union Free School District Series 2017, 2.1% 6/1/27 | | 340,000 | 325,641 |
| Long Island Pwr. Auth. Elec. Sys. Rev. Bonds: | | | |
| Series 2020 B, 0.85%, tender 9/1/25 (b) | | 7,060,000 | 6,891,590 |
| Series 2021 B, 1.5%, tender 9/1/26 (b) | | 470,000 | 450,973 |
| Massapequa Union Free School District Series 2019, 2% 10/1/31 | | 530,000 | 468,579 |
| Monroe County Indl. Dev. Agcy. Bonds (Andrews Terrace Cmnty. Partners, L.P. Proj.) Series 2023 B1, 5%, tender 7/1/27 (b) | | 780,000 | 814,002 |
| Monroe County Indl. Dev. Corp.: | | | |
| (Rochester Reg'l. Health Proj.) Series 2020 A, 5% 12/1/28 | | 1,000,000 | 1,063,659 |
| (The Rochester Gen. Hosp. Proj.) Series 2017, 5% 12/1/26 | | 350,000 | 361,601 |
| New York City Gen. Oblig.: | | | |
| Series 2007 C-4, 2.99%, tender 1/1/32 (Assured Guaranty Muni. Corp. Insured) (b) | | 225,000 | 225,000 |
| Series 2007, 3%, tender 12/6/24 (Assured Guaranty Muni. Corp. Insured) (b) | | 1,500,000 | 1,500,000 |
| Series 2008 A-3, 2.582%, tender 8/1/26 (Assured Guaranty Muni. Corp. Insured) (b) | | 1,350,000 | 1,350,000 |
| Series 2008 J11, 5% 8/1/26 | | 260,000 | 269,750 |
| Series 2018 A, 5% 8/1/26 | | 565,000 | 586,186 |
| Series 2023 F1, 5% 8/1/26 | | 5,600,000 | 5,809,990 |
| Series 2024 A, 5% 8/1/28 | | 2,700,000 | 2,921,156 |
| Series C, 5% 8/1/26 | | 220,000 | 228,250 |
| New York City Health & Hosp. Corp. Rev. Series A, 4% 2/15/25 | | 1,440,000 | 1,443,237 |
| New York City Hsg. Dev. Corp. Bonds: | | | |
| Series 2023 E2, 3.8%, tender 1/3/28 (b) | | 115,000 | 116,607 |
| Series 2024 A2, 3.625%, tender 7/1/28 (b) | | 765,000 | 772,584 |
| New York City Hsg. Dev. Corp. Multifamily Hsg. Bonds: | | | |
| Series 2021 C2, 0.7%, tender 7/1/25 (b) | | 1,665,000 | 1,636,257 |
| Series 2021 K2, 0.9%, tender 1/1/26 (b) | | 1,820,000 | 1,762,424 |
| Series 2021, 0.6%, tender 7/1/25 (b) | | 425,000 | 416,421 |
| Series 2023 A2: | | | |
3.7%, tender 12/30/27 (b) | | 6,000,000 | 6,025,735 |
3.73%, tender 12/29/28 (b) | | 1,000,000 | 1,006,759 |
| Series 2023 D, 4.3%, tender 11/1/28 (b) | | 375,000 | 385,076 |
| New York City Indl. Dev. Agcy. Rev. Series 2021 A: | | | |
| 5% 1/1/25 (Assured Guaranty Muni. Corp. Insured) | | 1,000,000 | 1,001,329 |
| 5% 1/1/26 (Assured Guaranty Muni. Corp. Insured) | | 1,365,000 | 1,394,000 |
| New York City Muni. Wtr. Fin. Auth. Wtr. & Swr. Sys. Rev. Series 2022 DD, 3.3% 6/15/33 (b) | | 2,000,000 | 2,000,000 |
| New York City Transitional Fin. Auth. Bldg. Aid Rev. Series 2018 S1, 5% 7/15/25 (Escrowed to Maturity) | | 370,000 | 374,812 |
| New York City Transitional Fin. Auth. Rev.: | | | |
| Series 2015 C, 5% 11/1/27 | | 2,620,000 | 2,644,660 |
| Series 2021 F1, 5% 11/1/27 | | 775,000 | 827,927 |
| New York Dorm. Auth. Personal Income Tax Rev. Series 2014 E, 5% 2/15/26 (Pre-Refunded to 2/15/25 @ 100) | | 300,000 | 301,216 |
| New York Dorm. Auth. Rev. Series 2022 A: | | | |
| 5% 7/1/26 | | 200,000 | 205,278 |
| 5% 7/1/27 | | 500,000 | 522,918 |
| New York Metropolitan Trans. Auth. Dedicated Tax Fund Rev.: | | | |
| Series 2016 A: | | | |
4% 11/15/25 | | 350,000 | 353,607 |
5% 11/15/26 | | 1,055,000 | 1,101,513 |
| Series 2017 A, 3% 11/15/30 | | 425,000 | 421,634 |
| New York Metropolitan Trans. Auth. Rev.: | | | |
| Series 2015 A1, 5% 11/15/27 | | 1,000,000 | 1,007,114 |
| Series 2016 D, 5% 11/15/27 | | 1,070,000 | 1,106,024 |
| Series 2017 B, 5% 11/15/27 | | 1,185,000 | 1,257,104 |
| Series 2017 C1, 5% 11/15/28 | | 660,000 | 701,451 |
| New York St Mtg. Agcy. Homeowner Series 2015 194, 3.35% 4/1/25 (e) | | 2,490,000 | 2,487,556 |
| New York State Dorm. Auth.: | | | |
| Series 2017 A, 5% 2/15/25 (Escrowed to Maturity) | | 250,000 | 251,013 |
| Series 2018 A, 5% 3/15/25 (Escrowed to Maturity) | | 200,000 | 201,165 |
| New York State Energy Research & Dev. Auth. Poll. Cont. Rev. Series 1999, 4.05%, tender 12/6/24 (AMBAC Insured) (b) | | 300,000 | 300,000 |
| New York State Hsg. Fin. Agcy. Rev.: | | | |
| Bonds: | | | |
Series 2021 D2, 0.65%, tender 11/1/25 (b) | | 375,000 | 365,255 |
Series 2021 J2, 1.1%, tender 5/1/27 (b) | | 980,000 | 914,964 |
Series 2021 K2, 1%, tender 11/1/26 (b) | | 135,000 | 127,534 |
Series 2023 E2: | | | |
3.8%, tender 5/1/27 (b) | | 670,000 | 671,980 |
3.875%, tender 5/1/28 (b) | | 120,000 | 120,803 |
Series 2024 A, 3.375%, tender 11/1/27 (b) | | 7,285,000 | 7,296,751 |
| Series J, 0.75% 5/1/25 | | 130,000 | 127,917 |
| New York State Mtg. Agcy. Homeowner Mtg.: | | | |
| Series 2023 251: | | | |
3.65% 10/1/25 (e) | | 535,000 | 536,140 |
3.7% 4/1/26 (e) | | 955,000 | 946,995 |
| Series 2024 262: | | | |
3.7% 10/1/25 (e) | | 610,000 | 611,547 |
3.75% 4/1/26 (e) | | 295,000 | 295,526 |
3.8% 10/1/26 (e) | | 680,000 | 682,526 |
3.85% 4/1/27 (e) | | 775,000 | 778,789 |
| Series 221, 3.5% 10/1/32 (e) | | 30,000 | 29,631 |
| New York Trans. Dev. Corp.: | | | |
| (Delta Air Lines, Inc. Laguardia Arpt. Terminals C&D Redev. Proj.) Series 2018, 5% 1/1/27 (e) | | 2,500,000 | 2,570,115 |
| (Delta Airlines, Inc. Laguardia Arpt. Terminals C&D Redev. Proj.) Series 2018, 5% 1/1/26 (e) | | 2,500,000 | 2,535,997 |
| (Term. 4 JFK Int'l. Arpt. Proj.) Series 2020 A, 5% 12/1/25 (e) | | 3,050,000 | 3,092,944 |
| (Term. 4 John F. Kennedy Int'l. Arpt. Proj.): | | | |
Series 2020 A, 5% 12/1/27 (e) | | 1,025,000 | 1,069,549 |
Series 2022: | | | |
5% 12/1/26 (e) | | 5,870,000 | 6,047,998 |
5% 12/1/27 (e) | | 1,915,000 | 1,998,231 |
| New York Urban Dev. Corp. Rev.: | | | |
| Series 2016 A, 5% 3/15/29 (Pre-Refunded to 3/15/26 @ 100) | | 420,000 | 432,372 |
| Series 2017 C, 5% 3/15/26 | | 1,060,000 | 1,091,431 |
| NY Payroll Mobility Tax Bonds: | | | |
| Series 2021 A2: | | | |
2%, tender 5/15/26 (b) | | 1,285,000 | 1,253,077 |
2%, tender 5/15/28 (b) | | 450,000 | 424,504 |
| Series 2021 B, 5%, tender 5/15/26 (b) | | 5,000,000 | 5,148,764 |
| Series 2021 C, 5%, tender 5/15/26 (b) | | 4,200,000 | 4,324,961 |
| Suffolk County Gen. Oblig.: | | | |
| Series 2022 A, 5% 6/15/25 | | 295,000 | 298,258 |
| Series 2022 B: | | | |
5% 10/1/25 | | 340,000 | 346,019 |
5% 10/1/26 | | 175,000 | 182,370 |
| Tobacco Settlement Asset Securitization Corp. Series 2017 A, 5% 6/1/25 | | 1,680,000 | 1,692,275 |
| Yonkers Gen. Oblig.: | | | |
| Series 2021 A, 5% 2/15/26 (Assured Guaranty Muni. Corp. Insured) | | 400,000 | 410,506 |
| Series 2021 B, 5% 2/15/26 | | 320,000 | 328,596 |
TOTAL NEW YORK | | | 102,534,805 |
| New York And New Jersey - 0.8% | | | |
| Port Auth. of New York & New Jersey: | | | |
| Series 193, 5% 10/15/25 (e) | | 1,000,000 | 1,012,765 |
| Series 2015 193, 5% 10/15/27 (e) | | 1,130,000 | 1,142,206 |
| Series 2016 195: | | | |
5% 10/1/25 (e) | | 1,065,000 | 1,077,893 |
5% 10/1/26 (e) | | 525,000 | 540,654 |
| Series 2018, 5% 9/15/25 (e) | | 2,075,000 | 2,098,597 |
| Series 2023 242: | | | |
5% 12/1/24 (e) | | 2,430,000 | 2,430,154 |
5% 12/1/25 (e) | | 8,525,000 | 8,652,670 |
5% 12/1/26 (e) | | 4,640,000 | 4,782,493 |
5% 12/1/27 (e) | | 5,000,000 | 5,248,250 |
| Series 207, 5% 9/15/26 (e) | | 1,205,000 | 1,239,913 |
| Series 223, 5% 7/15/25 (e) | | 885,000 | 892,706 |
TOTAL NEW YORK AND NEW JERSEY | | | 29,118,301 |
| North Carolina - 1.1% | | | |
| Atrium Health Bonds: | | | |
| Series 2018 B, 1.95%, tender 11/1/29 (b) | | 3,075,000 | 2,809,657 |
| Series 2018 C, 3.45%, tender 10/31/25 (b) | | 2,805,000 | 2,810,998 |
| Series 2018 E, 0.8%, tender 10/31/25 (b) | | 1,500,000 | 1,459,050 |
| Series 2021 B, 5%, tender 12/2/24 (b) | | 4,285,000 | 4,290,286 |
| Series 2023 D, 3.625%, tender 6/15/27 (b) | | 2,350,000 | 2,374,201 |
| Charlotte Int'l. Arpt. Rev.: | | | |
| Series 2017 B, 5% 7/1/25 (e) | | 100,000 | 100,868 |
| Series 2023 B: | | | |
5% 7/1/26 (e) | | 455,000 | 467,148 |
5% 7/1/28 (e) | | 400,000 | 421,689 |
5% 7/1/29 (e) | | 1,150,000 | 1,227,583 |
| New Hanover County Hosp. Rev. Series 2017, 5% 10/1/26 (Escrowed to Maturity) | | 290,000 | 301,538 |
| North Carolina Cap. Facilities Fin. Agcy. Rev.: | | | |
| (Duke Univ. Proj.) Series 2015 B, 5% 10/1/55 (Pre-Refunded to 10/1/25 @ 100) | | 9,750,000 | 9,912,306 |
| Bonds (Republic Svcs., Inc. Proj.) Series 2013, 3.9%, tender 12/16/24 (b)(e) | | 5,000,000 | 4,999,928 |
| North Carolina Grant Anticipation Rev.: | | | |
| Series 2015, 5% 3/1/26 | | 1,850,000 | 1,858,657 |
| Series 2019, 5% 3/1/25 | | 335,000 | 336,597 |
| North Carolina Muni. Pwr. Agcy. #1 Catawba Elec. Rev.: | | | |
| Series 2015 A, 5% 1/1/25 | | 200,000 | 200,285 |
| Series 2015, 5% 1/1/30 (Pre-Refunded to 1/1/26 @ 100) | | 2,050,000 | 2,087,897 |
| North Carolina State Ed. Assistance Auth. Student Ln. Rev. Series 2020 A, 5% 6/1/26 (e) | | 1,000,000 | 1,022,296 |
| North Carolina Tpk. Auth. Triangle Expressway Sys. Series 2018, 5% 1/1/27 | | 2,460,000 | 2,553,279 |
| Raleigh Durham Arpt. Auth. Arpt. Rev.: | | | |
| Series 2017 A, 5% 5/1/27 (e) | | 745,000 | 773,743 |
| Series 2020 A, 5% 5/1/27 (e) | | 130,000 | 135,016 |
TOTAL NORTH CAROLINA | | | 40,143,022 |
| North Dakota - 0.0% | | | |
| North Dakota Hsg. Fin. Agcy. Series 2023 F, 6.25% 1/1/54 | | 70,000 | 76,552 |
| Ohio - 1.3% | | | |
| Allen County Hosp. Facilities Rev. Bonds Series 2022 B1, 5%, tender 8/3/27 (b) | | 5,000,000 | 5,229,088 |
| American Muni. Pwr., Inc. Rev. Series 2023 A: | | | |
| 5% 2/15/25 | | 320,000 | 321,174 |
| 5% 2/15/26 | | 1,775,000 | 1,817,371 |
| Butler County Hosp. Facilities Rev. Series 2017: | | | |
| 5% 11/15/25 | | 1,500,000 | 1,509,018 |
| 5% 11/15/27 | | 1,040,000 | 1,069,416 |
| Cleveland Arpt. Sys. Rev.: | | | |
| Series 2016 A: | | | |
5% 1/1/25 (Assured Guaranty Muni. Corp. Insured) | | 395,000 | 395,496 |
5% 1/1/26 (Assured Guaranty Muni. Corp. Insured) | | 10,000 | 10,014 |
| Series 2018 A: | | | |
5% 1/1/25 (e) | | 1,425,000 | 1,426,380 |
5% 1/1/26 (e) | | 290,000 | 294,801 |
5% 1/1/27 (e) | | 2,990,000 | 3,081,535 |
| Series 2019 B, 5% 1/1/27 (e) | | 350,000 | 360,715 |
| Columbus-Franklin County Fin. Auth. Bonds (Dering Family Homes Proj.) Series 2023, 5%, tender 2/1/27 (b) | | 765,000 | 788,685 |
| Dayton City School District Ctfs. Prtn. Series 2021, 3% 12/1/24 | | 165,000 | 164,993 |
| Franklin County Rev. Bonds Series 2013 OH, 3.55%, tender 2/3/25 (b) | | 1,000,000 | 1,000,485 |
| Hamilton County Swr. Sys. Rev. Series 2024 B: | | | |
| 5% 12/1/24 | | 1,560,000 | 1,560,149 |
| 5% 12/1/25 | | 700,000 | 714,413 |
| Lancaster Port Auth. Gas Rev. Bonds Series 2024 A, 5%, tender 8/1/30 (b) | | 2,765,000 | 2,964,312 |
| Miami County Hosp. Facilities Rev. (Kettering Health Network Obligated Group Proj.) Series 2019: | | | |
| 5% 8/1/25 | | 310,000 | 313,345 |
| 5% 8/1/26 | | 535,000 | 551,109 |
| Ohio Air Quality Dev. Auth. Rev.: | | | |
| (American Elec. Pwr. Co. Proj.) Series 2014 D, 3.2% 5/1/26 | | 3,275,000 | 3,252,261 |
| Bonds Series 2022 B, 4.25%, tender 6/1/27 (b)(e) | | 9,140,000 | 9,281,298 |
| Series 2014 C, 3.7% 12/1/27 (e) | | 3,575,000 | 3,560,513 |
| Ohio Higher Edl. Facility Commission Rev. Bonds (Case Western Reserve Univ. Proj.) Series 2019 C, 1.625%, tender 12/1/26 (b) | | 605,000 | 580,781 |
| Ohio Hosp. Facilities Rev. Series 2017 A, 5% 1/1/26 | | 500,000 | 511,811 |
| Ohio Hsg. Fin. Agcy. Residential Mtg. Rev.: | | | |
| (Mtg. Backed Securities Prog.) Series 2019 B, 4.5% 3/1/50 | | 25,000 | 25,309 |
| (Mtg.-Backed Securities Prog.) Series 2023 B, 6% 3/1/55 | | 255,000 | 280,594 |
| Ohio Tpk. Commission Tpk. Rev. (Infrastructure Projs.) Series 2022 A, 5% 2/15/25 | | 1,055,000 | 1,058,958 |
| Scioto County Hosp. Facilities Rev.: | | | |
| Series 2016: | | | |
5% 2/15/25 | | 35,000 | 35,085 |
5% 2/15/26 | | 405,000 | 411,498 |
| Series 2019, 5% 2/15/29 | | 600,000 | 618,602 |
| Toledo Gen. Oblig. Series 2020: | | | |
| 3% 12/1/24 | | 510,000 | 509,976 |
| 3% 12/1/24 | | 425,000 | 424,980 |
| Univ. of Cincinnati Gen. Receipts Series 2024 C, 5% 6/1/26 | | 1,250,000 | 1,287,876 |
TOTAL OHIO | | | 45,412,041 |
| Oklahoma - 1.1% | | | |
| Cleveland County Edl. Facilities Auth.: | | | |
| (Moore Pub. Schools Proj.) Series 2021, 4% 6/1/25 | | 295,000 | 295,922 |
| (Norman Pub. Schools Proj.) Series 2019, 5% 6/1/25 | | 3,500,000 | 3,528,052 |
| Creek County Okla Edl. Facilities Authe (Bristow Pub. Schools Proj.) Series 2024: | | | |
| 5% 9/1/27 | | 2,650,000 | 2,772,046 |
| 5% 9/1/29 | | 2,000,000 | 2,141,926 |
| Dewey County Okla Edl. Facilities Authe (Seiling Pub. Schools Proj.) Series 2016, 5% 9/1/26 | | 1,230,000 | 1,270,387 |
| Jackson County Facilities Auth. Rev. (Jackson County Courthouse Proj.) Series 2022, 3% 10/1/25 | | 730,000 | 725,755 |
| Mcintosh County Edl. Facilities Auth. (Checotah Pub. School Proj.) Series 2022, 2% 9/1/25 | | 650,000 | 640,142 |
| Oklahoma County Independent School District #89 Oklahoma City Series 2023 A, 3% 7/1/26 | | 5,990,000 | 6,008,883 |
| Oklahoma Dev. Fin. Auth. Health Sys. Rev.: | | | |
| Series 2015 A, 5% 8/15/27 | | 1,590,000 | 1,604,886 |
| Series 2020 C, 3.6% 8/15/31 (b) | | 7,115,000 | 7,115,000 |
| Oklahoma Hsg. Fin. Agcy. Collateralized Bonds Series 2024, 3.35%, tender 12/1/26 (b) | | 2,280,000 | 2,281,410 |
| Oklahoma Hsg. Fin. Agcy. Single Family Mtg. Rev.: | | | |
| (Homeownership Ln. Prog.) Series 2023 C, 6% 3/1/54 | | 50,000 | 54,988 |
| (Homeownership Load Prog.) Series 2023 D, 6.5% 9/1/54 | | 55,000 | 61,968 |
| Oklahoma St Inds. Auth. Edl. Facilities (Oklahoma City Pub. Schools Proj.) Series 2024: | | | |
| 5% 4/1/27 | | 3,230,000 | 3,384,213 |
| 5% 4/1/29 | | 3,000,000 | 3,254,470 |
| Payne County Econ. Dev. Auth. (Stillwater Pub. Schools Proj.) Series 2024, 5% 9/1/28 | | 3,000,000 | 3,213,211 |
| Tulsa County Indl. Auth. Edl. Facilities Lease Rev. (Berryhill Pub. School Proj.) Series 2020, 4% 9/1/25 | | 690,000 | 693,674 |
| Washington County Okla Edl. Facsa (Dewey Pub. Schools Proj.) Series 2023, 5% 9/1/27 | | 455,000 | 472,660 |
TOTAL OKLAHOMA | | | 39,519,593 |
| Oregon - 0.5% | | | |
| Marion & Polk Counties Salem-Keizer School District #24J Series 2020, 0% 6/15/28 | | 370,000 | 328,116 |
| Multnomah County Hosp. Facilities Auth. Rev. Bonds Series 2019, 5%, tender 3/1/25 (b) | | 6,185,000 | 6,187,919 |
| Oregon Bus. Dev. Commission Recovery Zone Facility Bonds (Intel Corp. Proj.) Series 2023 232, 3.8%, tender 6/15/28 (b) | | 2,000,000 | 2,022,687 |
| Oregon Facilities Auth. Rev. (Samaritan Health Svcs. Proj.) Series 2016 A, 5% 10/1/29 | | 1,000,000 | 1,020,892 |
| Oregon Gen. Oblig. Series 2024 D, 5% 6/1/28 | | 2,500,000 | 2,697,833 |
| Port of Morrow Full Faith and Cr. Obligations Series 2021 D: | | | |
| 4% 12/1/24 | | 150,000 | 150,003 |
| 4% 12/1/25 | | 150,000 | 151,114 |
| Port of Portland Arpt. Rev.: | | | |
| Series 2022, 5% 7/1/25 (e) | | 2,115,000 | 2,131,525 |
| Series 2024 30B: | | | |
5% 7/1/28 (e) | | 720,000 | 758,543 |
5% 7/1/29 (e) | | 2,860,000 | 3,050,445 |
| Series 26 C, 5% 7/1/26 (e) | | 1,150,000 | 1,178,023 |
| Salem Hosp. Facility Auth. Rev. (Cap. Manor Proj.) Series 2022, 5% 5/15/26 | | 135,000 | 136,219 |
TOTAL OREGON | | | 19,813,319 |
| Pennsylvania - 2.8% | | | |
| Allegheny County Arpt. Auth. Rev. Series 2023 A, 5% 1/1/27 (Assured Guaranty Muni. Corp. Insured) (e) | | 680,000 | 701,646 |
| Allegheny County Hosp. Dev. Auth. Rev.: | | | |
| Bonds Series 2017 E, 0.700% x SIFMA Municipal Swap Index 3.88%, tender 5/15/27 (b)(c) | | 4,000,000 | 3,966,604 |
| Series 2021 B, 5% 10/15/25 | | 740,000 | 751,803 |
| Commonwealth Fing. Auth. Tobacco Series 2018, 5% 6/1/25 | | 1,755,000 | 1,769,239 |
| Delaware River Port Auth. Pennsylvania & New Jersey Rev. Series 2022, 5% 1/1/25 | | 1,805,000 | 1,807,561 |
| Geisinger Auth. Health Sys. Rev. Bonds Series 2020 B, 5%, tender 2/15/27 (b) | | 4,975,000 | 5,145,288 |
| Lancaster Muni. Auth. (Garden Spot Village Proj.) Series 2024 A: | | | |
| 5% 5/1/27 | | 200,000 | 207,680 |
| 5% 5/1/28 | | 210,000 | 221,084 |
| Laurel Highlands School District Series 2021, 4% 2/1/25 | | 345,000 | 345,227 |
| Lycoming County Auth. Rev. Bonds Series 2013 S2, 3.85%, tender 11/1/35 (b) | | 2,000,000 | 2,003,316 |
| Montgomery County Higher Ed. & Health Auth. Rev. Series 2019, 5% 9/1/26 | | 1,250,000 | 1,282,925 |
| Pennsylvania Econ. Dev. Fing. Auth. Solid Waste Disp. Rev. Bonds: | | | |
| (Republic Svcs., Inc. Proj.) Series 2014, 3.8%, tender 1/2/25 (b)(e) | | 10,700,000 | 10,701,392 |
| (Waste Mgmt., Inc. Proj.) Series 2013, 4.25%, tender 2/3/25 (b)(e) | | 8,500,000 | 8,504,124 |
| (Waste Mgmt., Inc. Proj.): | | | |
Series 2017 A, 4.25%, tender 8/1/25 (b)(e) | | 11,300,000 | 11,304,475 |
Series 2021 A2, 4.6%, tender 10/1/26 (b)(e) | | 9,005,000 | 9,095,674 |
| Pennsylvania Gen. Oblig.: | | | |
| Series 2018: | | | |
3.2% 3/1/29 | | 640,000 | 643,297 |
3.35% 3/1/30 | | 950,000 | 956,559 |
5% 3/1/28 | | 1,215,000 | 1,303,053 |
| Series 2019, 5% 7/15/26 | | 1,650,000 | 1,706,095 |
| Series 2021, 5% 5/15/27 | | 2,300,000 | 2,425,762 |
| Series 2023: | | | |
5% 9/1/26 | | 6,590,000 | 6,840,755 |
5% 9/1/27 | | 1,000,000 | 1,061,426 |
| Pennsylvania Hsg. Fin. Agcy.: | | | |
| Series 2021 135 B, 5% 4/1/25 (e) | | 180,000 | 180,573 |
| Series 2021 137: | | | |
5% 4/1/25 | | 200,000 | 201,192 |
5% 10/1/26 | | 280,000 | 289,353 |
| Series 2022 138, 5% 4/1/25 | | 2,415,000 | 2,429,395 |
| Pennsylvania Tpk. Commission Registration Fee Rev. Bonds Series 2023, NULL 3.18%, tender 7/15/26 (b) | | 8,000,000 | 8,002,257 |
| Pennsylvania Tpk. Commission Tpk. Rev.: | | | |
| Series 2017 B2: | | | |
5% 6/1/28 | | 410,000 | 431,472 |
5% 6/1/29 | | 690,000 | 725,241 |
| Series 2022 B: | | | |
5% 12/1/24 | | 695,000 | 695,063 |
5% 12/1/25 | | 425,000 | 433,372 |
| Philadelphia Arpt. Rev.: | | | |
| Series 2015 A, 5% 6/15/26 (e) | | 1,000,000 | 1,009,377 |
| Series 2017 B: | | | |
5% 7/1/25 (e) | | 440,000 | 443,919 |
5% 7/1/26 (e) | | 3,360,000 | 3,451,803 |
| Series 2020 C, 5% 7/1/25 (e) | | 2,450,000 | 2,471,819 |
| Series 2021: | | | |
5% 7/1/25 (e) | | 4,245,000 | 4,282,805 |
5% 7/1/28 (e) | | 3,170,000 | 3,337,509 |
| Philadelphia Gas Works Rev. Series 2015 13, 5% 8/1/25 | | 420,000 | 425,138 |
| Reading School District Series 2017: | | | |
| 5% 3/1/25 (Assured Guaranty Muni. Corp. Insured) | | 5,000 | 5,022 |
| 5% 3/1/26 (Assured Guaranty Muni. Corp. Insured) | | 5,000 | 5,128 |
| 5% 3/1/27 (Assured Guaranty Muni. Corp. Insured) | | 5,000 | 5,205 |
| 5% 3/1/28 (Assured Guaranty Muni. Corp. Insured) | | 5,000 | 5,234 |
| Southcentral Pennsylvania Gen. Auth. Rev. Series 2021 TT2: | | | |
| 5% 5/1/25 | | 340,000 | 342,095 |
| 5% 5/1/26 | | 320,000 | 327,748 |
| Township of East Vincent Gen. Oblig. Series 2021, 3% 12/1/24 | | 250,000 | 249,990 |
TOTAL PENNSYLVANIA | | | 102,495,695 |
| Rhode Island - 0.2% | | | |
| Providence Pub. Bldgs Auth. (Cap. Impt. Prog. Projs.) Series 2024 A, 5% 9/15/27 | | 1,000,000 | 1,052,689 |
| Rhode Island Health & Edl. Bldg. Corp. Higher Ed. Facilities Rev. Series 2016, 5% 5/15/25 | | 120,000 | 120,631 |
| Rhode Island Health & Edl. Bldg. Corp. Pub. Schools Rev. Series 2015, 5% 5/15/25 (Assured Guaranty Muni. Corp. Insured) | | 130,000 | 131,009 |
| Rhode Island Health and Edl. Bldg. Corp. Higher Ed. Facility Rev. Series 2024: | | | |
| 5% 6/1/28 | | 350,000 | 374,631 |
| 5% 6/1/29 | | 350,000 | 380,506 |
| 5% 6/1/30 | | 335,000 | 369,403 |
| 5% 6/1/31 | | 350,000 | 390,156 |
| 5% 6/1/32 | | 465,000 | 523,457 |
| Rhode Island Health And Educat Series 2024 G: | | | |
| 5% 5/15/28 (Build America Mutual Assurance Insured) | | 900,000 | 962,034 |
| 5% 5/15/29 (Build America Mutual Assurance Insured) | | 800,000 | 869,517 |
| Rhode Island Hsg. & Mtg. Fin. Corp.: | | | |
| Series 2019 70, 4% 10/1/49 | | 45,000 | 45,184 |
| Series 2022 76 A: | | | |
5% 4/1/27 | | 35,000 | 36,605 |
5% 4/1/28 | | 250,000 | 266,414 |
5% 4/1/29 | | 300,000 | 323,775 |
| Rhode Island Student Ln. Auth. Student Ln. Rev.: | | | |
| Series 2018 A, 5% 12/1/25 (e) | | 855,000 | 866,357 |
| Series 2019 A: | | | |
5% 12/1/26 (e) | | 570,000 | 583,946 |
5% 12/1/28 (e) | | 490,000 | 512,408 |
| Series A, 4% 12/1/26 (e) | | 145,000 | 144,018 |
| Tobacco Settlement Fing. Corp. Series 2015 A: | | | |
| 5% 6/1/26 | | 75,000 | 75,541 |
| 5% 6/1/27 | | 20,000 | 20,150 |
TOTAL RHODE ISLAND | | | 8,048,431 |
| South Carolina - 0.4% | | | |
| Scago Edl. Facilities Corp. for Colleton School District (School District of Colleton County Proj.) Series 2015, 5% 12/1/26 | | 25,000 | 25,218 |
| South Carolina Hsg. Fin. & Dev. Auth. Mtg. Rev.: | | | |
| Series 2019 A, 4% 1/1/50 | | 65,000 | 65,458 |
| Series 2023 B, 6% 1/1/54 | | 145,000 | 159,612 |
| South Carolina Jobs-Econ. Dev. Auth. Hosp. Impt. Rev. Bonds Series 2020 B, 5%, tender 10/1/25 (b) | | 200,000 | 202,605 |
| South Carolina Ports Auth. Ports Rev.: | | | |
| Series 2015 (AMT), 5% 7/1/45 (Pre-Refunded to 7/1/25 @ 100) (e) | | 1,260,000 | 1,270,939 |
| Series 2015: | | | |
5.25% 7/1/50 (Pre-Refunded to 7/1/25 @ 100) (e) | | 7,470,000 | 7,545,485 |
5.25% 7/1/55 (Pre-Refunded to 7/1/25 @ 100) (e) | | 445,000 | 449,497 |
5.25% 7/1/55 (Pre-Refunded to 7/1/25 @ 100) (e) | | 1,075,000 | 1,085,863 |
| Series 2019 B, 5% 7/1/26 (e) | | 185,000 | 190,253 |
| South Carolina Pub. Svc. Auth. Rev.: | | | |
| Series 2014 C, 5% 12/1/25 | | 190,000 | 190,129 |
| Series 2015 A, 5% 12/1/25 | | 115,000 | 115,894 |
| Series 2020 A: | | | |
5% 12/1/24 | | 40,000 | 40,003 |
5% 12/1/24 (Escrowed to Maturity) | | 230,000 | 230,022 |
5% 12/1/24 (Escrowed to Maturity) | | 95,000 | 95,009 |
| Series 2021 A: | | | |
5% 12/1/24 | | 375,000 | 375,025 |
5% 12/1/25 | | 850,000 | 863,147 |
| Series 2022 C, 5% 12/1/25 | | 360,000 | 365,568 |
| Series 2022 E: | | | |
5% 12/1/25 | | 150,000 | 152,320 |
5% 12/1/26 | | 170,000 | 176,760 |
| Series 2024 A: | | | |
5% 12/1/27 | | 550,000 | 583,401 |
5% 12/1/28 | | 550,000 | 592,520 |
TOTAL SOUTH CAROLINA | | | 14,774,728 |
| South Dakota - 0.5% | | | |
| South Dakota Board of Regents Hsg. and Auxiliary Facilities Series 2021, 3% 4/1/25 | | 500,000 | 498,602 |
| South Dakota Hsg. Dev. Auth.: | | | |
| Bonds Series 2023 J, 3.875%, tender 12/12/24 (b) | | 17,800,000 | 17,802,707 |
| Series 2017 D, 4% 11/1/47 | | 290,000 | 290,295 |
| Series 2023 G, 6.25% 5/1/55 | | 100,000 | 109,365 |
TOTAL SOUTH DAKOTA | | | 18,700,969 |
| Tennessee - 1.3% | | | |
| Chattanooga Health Edl. & Hsg. Bonds: | | | |
| (One Westside Phase 1B Proj.) Series 2024, 3.6%, tender 6/1/28 (b) | | 4,090,000 | 4,128,637 |
| (Shallowford Proj.) Series 2023, 3.8%, tender 12/1/26 (b) | | 2,000,000 | 2,024,294 |
| Jackson Hosp. Rev. Series 2015, 5% 4/1/27 | | 5,750,000 | 5,776,735 |
| Johnson City Health & Edl. Hosp. Rev. Series 2023 A: | | | |
| 5% 7/1/25 | | 1,250,000 | 1,260,485 |
| 5% 7/1/26 | | 400,000 | 410,369 |
| Knoxville County Tenn Health Edl. Bonds (The Pine Apts. Proj.) Series 2024, 3.1%, tender 9/1/27 (b) | | 2,315,000 | 2,306,744 |
| Memphis Health, Edl. & Hsg. Facilities Board Series 2020, 4% 12/1/24 | | 9,500,000 | 9,500,249 |
| Memphis-Shelby County Arpt. Auth. Arpt. Rev.: | | | |
| Series 2020 B, 5% 7/1/25 (e) | | 2,200,000 | 2,219,086 |
| Series 2021 A, 5% 7/1/25 (e) | | 2,750,000 | 2,773,858 |
| Series 2021 C, 1.875% 7/1/25 (e) | | 675,000 | 663,967 |
| Metropolitan Nashville Arpt. Auth. Rev.: | | | |
| Series 2019 B: | | | |
5% 7/1/25 (e) | | 1,910,000 | 1,926,570 |
5% 7/1/26 (e) | | 1,695,000 | 1,740,255 |
| Series 2022 B, 5% 7/1/26 (e) | | 600,000 | 616,020 |
| Nashville and Davidson County Metropolitan Govt. Gen. Oblig. Series 2017, 4% 7/1/28 | | 1,440,000 | 1,482,354 |
| Tennessee Energy Acquisition Corp. Bonds: | | | |
| Series 2018, 4%, tender 11/1/25 (b) | | 3,500,000 | 3,514,377 |
| Series 2023 A1, 5%, tender 5/1/28 (b) | | 3,000,000 | 3,123,052 |
| Tennessee Hsg. Dev. Agcy.: | | | |
| Bonds Series 2024, 3.5%, tender 10/1/25 (b)(d) | | 1,500,000 | 1,500,167 |
| Series 2015 A, 3.5% 7/1/45 | | 95,000 | 94,610 |
| Tennessee Hsg. Dev. Agcy. Residential Series 2021 3A, 3% 1/1/52 | | 205,000 | 201,210 |
TOTAL TENNESSEE | | | 45,263,039 |
| Texas - 8.2% | | | |
| Alvin Independent School District Series 2024, 5% 2/15/29 | | 750,000 | 818,376 |
| Andrews County Hosp. District Series 2021, 5% 3/15/26 | | 1,430,000 | 1,459,505 |
| Atascosa County Indl. Dev. Corp. Poll. Cont. Rev. Series 2020, 5% 12/15/24 | | 550,000 | 550,311 |
| Austin Affordable Pfc, Inc. Multifamily Hsg. Rev. Bonds Series 2024 B, 5%, tender 9/1/27 (b) | | 1,050,000 | 1,097,994 |
| Austin Arpt. Sys. Rev.: | | | |
| Series 2014, 5% 11/15/26 (e) | | 715,000 | 716,419 |
| Series 2019, 5% 11/15/25 (e) | | 3,230,000 | 3,277,390 |
| Austin Elec. Util. Sys. Rev. Series 2024, 5% 11/15/28 (d) | | 1,750,000 | 1,900,684 |
| Bexar County Gen. Oblig. Series 2014, 5% 6/15/25 | | 960,000 | 961,501 |
| Boerne Independent School District Bonds: | | | |
| Series 2023, 3.125%, tender 2/1/27 (b) | | 6,945,000 | 6,926,637 |
| Series 2024, 4%, tender 2/1/28 (b) | | 1,295,000 | 1,330,701 |
| Cap. Area Hsg. Fin. Corp. Multi-family Hsg. Rev. Bonds: | | | |
| Series 2021, 3.48%, tender 6/1/25 (b) | | 2,000,000 | 1,999,891 |
| Series 2024, 3.125%, tender 9/1/27 (b) | | 2,660,000 | 2,652,940 |
| Central Reg'l. Mobility Auth.: | | | |
| Series 2016, 5% 1/1/26 | | 75,000 | 76,557 |
| Series 2020 B: | | | |
5% 1/1/25 | | 125,000 | 125,151 |
5% 1/1/26 | | 125,000 | 127,461 |
| Series 2020 F, 5% 1/1/25 | | 7,540,000 | 7,553,647 |
| Series 2021 C, 5% 1/1/27 | | 1,905,000 | 1,942,865 |
| Clear Creek Independent School District Bonds Series 2013 B, 3.6%, tender 8/15/25 (b) | | 5,785,000 | 5,798,197 |
| Clifton Higher Ed. Fin. Corp. Ed. Rev.: | | | |
| Series 2022 A, 5% 8/15/26 | | 475,000 | 486,453 |
| Series 2024: | | | |
5% 8/15/26 | | 325,000 | 335,759 |
5% 8/15/27 | | 340,000 | 358,528 |
| Dallas Fort Worth Int'l. Arpt. Rev.: | | | |
| Series 2023 B, 5% 11/1/25 | | 5,000,000 | 5,092,512 |
| Series 2023 C, 5% 11/1/26 (e) | | 1,800,000 | 1,854,901 |
| Dallas Gen. Oblig.: | | | |
| Series 2023 A: | | | |
5% 2/15/25 | | 1,170,000 | 1,174,349 |
5% 2/15/26 | | 3,250,000 | 3,331,981 |
| Series 2024 A: | | | |
5% 2/15/25 | | 7,800,000 | 7,828,994 |
5% 2/15/26 | | 7,800,000 | 7,996,753 |
| Dallas Hsg. Fin. Corp. Multi-family Hsg. Rev. Bonds: | | | |
| Series 2023: | | | |
5%, tender 12/1/25 (b) | | 400,000 | 406,453 |
5%, tender 3/1/26 (b) | | 1,080,000 | 1,093,865 |
| Series 2024, 5%, tender 8/1/26 (b) | | 1,785,000 | 1,836,340 |
| Dallas Tex Spl. Tax Rev. Bonds Series 2023, 6%, tender 8/15/28 (b)(f) | | 8,500,000 | 8,527,601 |
| Denton Independent School District Series 2016, 0% 8/15/25 | | 35,000 | 34,243 |
| East Downtown Redev. Auth. Series 2021, 5% 9/1/26 | | 300,000 | 304,755 |
| El Paso Gen. Oblig. Series 2024: | | | |
| 5% 8/15/26 | | 840,000 | 871,956 |
| 5% 8/15/27 | | 600,000 | 636,081 |
| El Paso Wtr. & Swr. Rev. Series 2017, 5% 3/1/30 | | 1,000,000 | 1,045,733 |
| Energy Acquisition Pub. Facility Corp. Series 2007, 5.5% 8/1/25 | | 1,075,000 | 1,085,338 |
| Forney Independent School District Series 2021 B, 5% 8/15/25 | | 1,010,000 | 1,024,296 |
| Fort Bend County Gen. Oblig. Series 2015 B, 5% 3/1/29 | | 3,455,000 | 3,468,388 |
| Fort Bend County Tex Muni. Util. Di Series 2022, 5.25% 9/1/26 | | 1,005,000 | 1,042,141 |
| Fort Bend Independent School District: | | | |
| Bonds: | | | |
Series 2020 B, 0.875%, tender 8/1/25 (b) | | 3,080,000 | 3,025,909 |
Series 2021 B, 0.72%, tender 8/1/26 (b) | | 2,080,000 | 1,965,644 |
| Series 2024 B, 4%, tender 8/1/27 (b) | | 10,000,000 | 10,219,504 |
| Garland Elec. Util. Sys. Rev. Series 2024, 5% 3/1/28 (Assured Guaranty Muni. Corp. Insured) (d) | | 1,400,000 | 1,492,307 |
| Goose Creek Consolidated Independent School District Bonds Series 2021 B, 0.6%, tender 8/17/26 (b) | | 500,000 | 479,148 |
| Hale Ctr. Ed. Facilities Corp. (Wayland Baptist Univ. Proj.) Series 2022, 5% 3/1/25 | | 475,000 | 475,863 |
| Harris County Cultural Ed. Facilities Fin. Corp. Rev.: | | | |
| Bonds Series 2020 A, 0.9%, tender 5/15/25 (b) | | 3,180,000 | 3,132,926 |
| Series 2014 A, 5% 12/1/26 | | 120,000 | 120,000 |
| Series 2020 A, 4% 7/1/25 | | 250,000 | 251,175 |
| Harris County-Houston Sports Auth. Rev. Series 2024 B, 5% 11/15/25 | | 4,000,000 | 4,065,845 |
| Houston Arpt. Sys. Rev.: | | | |
| Series 2018 C: | | | |
5% 7/1/25 (e) | | 1,900,000 | 1,914,845 |
5% 7/1/27 (e) | | 2,065,000 | 2,146,276 |
| Series 2021 A, 5% 7/1/26 (e) | | 1,250,000 | 1,280,460 |
| Series 2023 A: | | | |
5% 7/1/26 (Assured Guaranty Muni. Corp. Insured) (e) | | 2,000,000 | 2,051,843 |
5% 7/1/28 (Assured Guaranty Muni. Corp. Insured) (e) | | 4,000,000 | 4,216,890 |
| Houston Convention and Entertainment Facilities Dept. Hotel Occupancy Tax and Spl. Rev.: | | | |
| Series 2015, 5% 9/1/27 | | 1,215,000 | 1,216,704 |
| Series 2021: | | | |
4% 9/1/25 | | 215,000 | 216,231 |
4% 9/1/26 | | 275,000 | 279,596 |
| Houston Hsg. Fin. Corp. Multi-family Hsg. Rev. Bonds Series 2023, 5%, tender 8/1/26 (b) | | 3,940,000 | 4,019,690 |
| Houston Independent School District: | | | |
| Bonds: | | | |
Series 2014 A2, 3.5%, tender 6/1/25 (b) | | 4,775,000 | 4,783,728 |
Series 2023 C, 4%, tender 6/1/25 (b) | | 8,765,000 | 8,802,476 |
| Series 2017, 5% 2/15/27 | | 3,015,000 | 3,165,200 |
| Houston Util. Sys. Rev.: | | | |
| Series 2016 B, 5% 11/15/25 | | 1,750,000 | 1,784,798 |
| Series 2021 A, 5% 11/15/27 | | 1,000,000 | 1,064,808 |
| Series 2024 A, 5% 11/15/25 | | 4,000,000 | 4,079,538 |
| Katy Independent School District Bonds Series 2021 C, 4%, tender 8/15/26 (b) | | 6,000,000 | 6,088,005 |
| Kilgore Independent School District Bonds Series 2022, 2%, tender 8/15/25 (b) | | 4,000,000 | 3,961,792 |
| Las Varas Pub. Facilities Corp. Multi Fam Hsg. Rev. Series 2022, 3.75% 11/1/25 (b) | | 3,100,000 | 3,101,332 |
| Leander Independent School District Series 2023 A, 0% 2/15/27 | | 1,000,000 | 932,830 |
| Love Field Arpt. Modernization Rev.: | | | |
| Series 2015, 5% 11/1/25 (e) | | 1,000,000 | 1,014,876 |
| Series 2017, 5% 11/1/25 (e) | | 730,000 | 740,860 |
| Series 2021: | | | |
5% 11/1/25 (e) | | 5,125,000 | 5,201,240 |
5% 11/1/26 (e) | | 405,000 | 415,534 |
5% 11/1/27 (e) | | 415,000 | 433,092 |
| Lower Colorado River Auth. Rev.: | | | |
| (LCRA Transmission Servces Corp. Proj.) Series 2022, 5% 5/15/26 | | 700,000 | 720,423 |
| (LCRA Transmission Svcs. Corp. Proj.): | | | |
Series 2020: | | | |
5% 5/15/25 | | 510,000 | 514,148 |
5% 5/15/26 | | 1,250,000 | 1,286,470 |
Series 2021, 5% 5/15/26 | | 3,160,000 | 3,252,197 |
| Mc Kinney Tex Series 2023 A: | | | |
| 5% 8/15/27 | | 180,000 | 190,728 |
| 5% 8/15/28 | | 350,000 | 378,279 |
| Mission Econ. Dev. Corp. Solid Waste Disp. Rev. Bonds (Waste Mgmt., Inc. Proj.) Series 2020 A, 4%, tender 12/2/24 (b)(e) | | 9,300,000 | 9,300,000 |
| New Caney Independent School District Series 2024, 5% 2/15/29 (d) | | 1,400,000 | 1,527,636 |
| Newark Higher Ed. Fin. Corp. (Abilene Christian Univ. Proj.) Series 2016 A, 5% 4/1/26 | | 55,000 | 56,106 |
| North East Texas Independent School District: | | | |
| Bonds Series 2024, 3.75%, tender 8/1/27 (b) | | 4,070,000 | 4,122,168 |
| Series 2015, 3% 8/1/27 | | 920,000 | 919,491 |
| North Texas Tollway Auth. Rev.: | | | |
| Series 2017 A, 5% 1/1/26 | | 65,000 | 65,093 |
| Series 2019 B, 5% 1/1/25 | | 325,000 | 325,449 |
| Series 2020 A, 5% 1/1/25 | | 265,000 | 265,385 |
| Series 2021 B, 5% 1/1/26 | | 695,000 | 710,237 |
| Series 2023 A, 5% 1/1/27 | | 275,000 | 287,880 |
| Northside Independent School District Bonds: | | | |
| Series 2020, 0.7%, tender 6/1/25 (b) | | 820,000 | 806,389 |
| Series 2023 B, 3%, tender 8/1/26 (b) | | 5,220,000 | 5,193,524 |
| Series 2024 B, 3.45%, tender 8/1/27 (b) | | 8,835,000 | 8,903,454 |
| Pecos Barstow Toyah Independent School District Series 2023, 5% 2/15/25 | | 1,250,000 | 1,254,467 |
| Plainview Tex Independent School District Bonds Series 2020 B, 4%, tender 8/15/26 (b) | | 2,000,000 | 2,016,747 |
| Port of Houston Auth. Series 2023, 5% 10/1/26 | | 955,000 | 992,836 |
| Prosper Independent School District Bonds Series 2019 B, 4%, tender 8/15/26 (b) | | 2,900,000 | 2,929,072 |
| San Antonio Arpt. Sys. Rev. Series 2019 A: | | | |
| 5% 7/1/25 (e) | | 400,000 | 403,677 |
| 5% 7/1/26 (e) | | 500,000 | 514,051 |
| San Antonio Elec. & Gas Sys. Rev.: | | | |
| Bonds: | | | |
Series 2015 A, 1.75%, tender 12/1/24 (b) | | 2,000,000 | 2,000,000 |
Series 2018, SIFMA Municipal Swap Index + 0.870% 4.05%, tender 12/5/24 (b)(c) | | 4,065,000 | 4,061,257 |
Series 2022, 2%, tender 12/1/27 (b) | | 1,555,000 | 1,468,949 |
Series 2023, 3.65%, tender 12/1/26 (b) | | 4,000,000 | 4,034,304 |
| Series 2016, 5% 2/1/25 (Escrowed to Maturity) | | 330,000 | 330,937 |
| Series 2022, 5% 2/1/26 | | 545,000 | 557,818 |
| San Antonio Wtr. Sys. Rev. Bonds Series 2013 F, 1%, tender 11/1/26 (b) | | 4,250,000 | 3,992,833 |
| Sinton Tex Independent School District Bonds Series 2022, 4%, tender 8/15/25 (b) | | 4,000,000 | 4,017,088 |
| Smha Fin. Pub. Facilities Corp. Tex Mult Bonds Series 2024, 3.7%, tender 7/1/27 (b) | | 3,695,000 | 3,737,155 |
| Splendora Independent School District Series 2016 A, 5% 2/15/25 | | 200,000 | 200,678 |
| Tarrant County Cultural Ed. Facilities Fin. Corp. Hosp. Rev. Bonds (Baylor Scott & White Health Proj.) Series 2022 E, 5%, tender 5/15/26 (b) | | 10,725,000 | 10,965,495 |
| Tarrant County Cultural Ed. Facilities Fin. Corp. Rev. Series 2016 A: | | | |
| 5% 2/15/25 | | 535,000 | 537,008 |
| 5% 2/15/26 | | 35,000 | 35,895 |
| Texarkana Tex Independent School District Bonds Series 2024, 4%, tender 8/15/26 (b)(d) | | 2,835,000 | 2,830,404 |
| Texas A&M Univ. Rev. Series 2021 A, 5% 5/15/26 | | 725,000 | 747,806 |
| Texas Affordable Hsg. Corp. Multi-family Hsg. Rev. Bonds Series 2023, 3.625%, tender 1/1/27 (b) | | 1,120,000 | 1,127,628 |
| Texas Dept. of Hsg. & Cmnty. Affairs Residential Mtg. Rev. Series 2023 B, 6% 1/1/54 | | 645,000 | 710,723 |
| Texas Gen. Oblig.: | | | |
| Series 2015, 5% 8/1/26 (e) | | 7,875,000 | 7,951,927 |
| Series 2019: | | | |
4% 8/1/25 (e) | | 3,005,000 | 3,015,304 |
5% 8/1/25 (e) | | 2,805,000 | 2,832,845 |
| Texas Muni. Gas Acquisitio Series 2024: | | | |
| 5% 1/1/26 | | 1,000,000 | 1,015,890 |
| 5% 1/1/27 | | 500,000 | 516,810 |
| Texas Muni. Gas Acquisition & Supply Corp. Series 2023 B: | | | |
| 5.25% 1/1/25 | | 895,000 | 895,991 |
| 5.25% 1/1/27 | | 1,070,000 | 1,111,089 |
| Texas Trans. Commission Hwy. Impt. Gen. Oblig. Bonds Series 2014 B, 0.65%, tender 4/1/26 (b) | | 3,750,000 | 3,580,569 |
| Texas Trans. Commission State Hwy. Fund Rev. Series 2016 A, 5% 10/1/25 | | 3,210,000 | 3,264,437 |
| Univ. of Houston Univ. Revs. Series 2022 A, 5% 2/15/25 | | 1,620,000 | 1,625,982 |
| Waco Edl. Fin. Corp. Rev. Series 2021, 4% 3/1/25 | | 400,000 | 400,676 |
| Waco Gen. Oblig. Series 2022, 5% 2/1/26 | | 2,065,000 | 2,114,045 |
| Wise County Tex Lease Rev. Series 2021, 5% 8/15/27 | | 1,000,000 | 1,039,044 |
TOTAL TEXAS | | | 294,951,106 |
| Utah - 0.4% | | | |
| Salt Lake City Arpt. Rev.: | | | |
| Series 2018 A: | | | |
5% 7/1/25 (e) | | 3,500,000 | 3,526,341 |
5% 7/1/26 (e) | | 2,000,000 | 2,047,185 |
| Series 2023 A: | | | |
5% 7/1/25 (e) | | 700,000 | 705,268 |
5% 7/1/26 (e) | | 2,390,000 | 2,446,386 |
5% 7/1/28 (e) | | 1,000,000 | 1,052,497 |
| Utah County Hosp. Rev. Bonds Series 2020 B2, 5%, tender 8/1/26 (b) | | 2,430,000 | 2,494,339 |
| Utah Hsg. Corp. Multi-family Hsg. Rev. Series 2024 B, 3.4%, tender 8/1/27 (b)(d) | | 1,500,000 | 1,502,221 |
TOTAL UTAH | | | 13,774,237 |
| Vermont - 0.2% | | | |
| Vermont Hsg. Fin. Agcy. Series 2024 E2, 3.5% 11/1/26 | | 5,110,000 | 5,119,298 |
| Vermont Student Assistant Corp. Ed. Ln. Rev.: | | | |
| Series 2019 A, 5% 6/15/25 (e) | | 1,300,000 | 1,309,712 |
| Series 2020 A, 5% 6/15/27 (e) | | 665,000 | 684,482 |
TOTAL VERMONT | | | 7,113,492 |
| Virginia - 2.1% | | | |
| Arlington County Indl. Dev. Auth. Multi-family Hsg. Rev. Series 2023 A, 5% 1/1/26 | | 3,975,000 | 4,057,279 |
| Chesapeake Econ. Dev. Auth. Poll. Cont. Rev. Bonds (Virginia Elec. and Pwr. Compnay Proj.) Series 2008 A, 3.65%, tender 10/1/27 (b) | | 4,040,000 | 4,105,292 |
| Chesapeake Hosp. Auth. Hosp. Facility Rev. Series 2019, 5% 7/1/26 | | 2,000,000 | 2,057,451 |
| Chesterfield County Series 2015 B, 3% 1/1/26 | | 5,000,000 | 4,995,443 |
| Fairfax County Redev. & Hsg. Auth. Rev. Bonds (Dominion Square North Proj.) Series 2023, 5%, tender 1/1/28 (b) | | 170,000 | 176,222 |
| Halifax County Indl. Dev. Auth. Bonds (Virgina Elec. and Pwr. Co. Proj.) Series 2010 A, 3.8%, tender 5/28/27 (b) | | 1,015,000 | 1,033,169 |
| Loudoun County Gen. Oblig.: | | | |
| Series 2020 A, 5% 12/1/24 | | 1,470,000 | 1,470,155 |
| Series 2020 B, 5% 12/1/25 | | 305,000 | 311,795 |
| Louisa Indl. Dev. Auth. Poll. Cont. Rev. Bonds (Virginia Elec. and Pwr. Co. Proj.) Series 2008 B, 0.75%, tender 9/2/25 (b) | | 4,000,000 | 3,869,962 |
| Southampton County Indl. Bonds (PRTA-Virginia One, LLC Proj.) Series 2023, 4.875%, tender 12/12/24 (b)(e) | | 18,600,000 | 18,599,894 |
| Stafford County Econ. Dev. Auth. Hosp. Facilities Rev. Series 2016: | | | |
| 5% 6/15/25 | | 20,000 | 20,154 |
| 5% 6/15/26 | | 35,000 | 35,863 |
| Virginia Hsg. Dev. Auth. Commonwealth Mtg. Rev. Bonds Series 2023, 3.9%, tender 7/1/25 (b) | | 2,905,000 | 2,905,177 |
| Virginia Port Auth. Commonwealth Port Rev. Series 2015: | | | |
| 5% 7/1/28 (Pre-Refunded to 7/1/25 @ 100) (e) | | 4,230,000 | 4,267,941 |
| 5% 7/1/29 (Pre-Refunded to 7/1/25 @ 100) (e) | | 500,000 | 504,485 |
| 5% 7/1/38 (Pre-Refunded to 7/1/25 @ 100) (e) | | 500,000 | 504,485 |
| Virginia Port Auth. Port Facilities Rev. Series 2015 A, 5% 7/1/31 (Pre-Refunded to 7/1/25 @ 100) (e) | | 300,000 | 302,605 |
| Virginia Pub. Bldg. Auth. Pub. Facilities Rev.: | | | |
| Series 2016 C, 5% 8/1/25 (e) | | 4,500,000 | 4,552,972 |
| Series 2019 B: | | | |
5% 8/1/25 (e) | | 3,375,000 | 3,414,729 |
5% 8/1/26 (e) | | 2,410,000 | 2,484,498 |
| Virginia Small Bus. Fing. A Bonds (Pure Salmon Virginia LLC Proj.) Series 2022, 4%, tender 11/20/25 (b)(e) | | 6,300,000 | 6,304,839 |
| Virginia St Hsg. Dev. Auth. Ho Bonds Series 2024 F, 3.625%, tender 4/1/26 (b) | | 7,000,000 | 7,001,057 |
| Wise County Indl. Dev. Auth. Waste & Sewage Rev. Bonds (Virginia Elec. and Pwr. Co. Proj.) Series 2010 A, 3.8%, tender 5/28/27 (b) | | 2,000,000 | 2,035,801 |
TOTAL VIRGINIA | | | 75,011,268 |
| Washington - 1.2% | | | |
| King County Hsg. Auth. Rev.: | | | |
| Series 2020, 3% 6/1/25 | | 275,000 | 274,210 |
| Series 2021, 3% 12/1/25 | | 825,000 | 822,007 |
| King County Swr. Rev. Bonds Series 2020 B, 0.875%, tender 1/1/26 (b) | | 4,925,000 | 4,785,920 |
| King County Wash Hsg. Auth. Afford (Kirkland Heights Proj.): | | | |
| Series 2023 A1, 5% 1/1/28 | | 120,000 | 122,279 |
| Series 2023 A2, 5% 1/1/28 | | 65,000 | 67,367 |
| Port of Seattle Rev.: | | | |
| Series 2015 C, 5% 4/1/25 (e) | | 2,000,000 | 2,001,245 |
| Series 2016, 5% 2/1/25 | | 290,000 | 290,876 |
| Series 2018 A: | | | |
5% 5/1/26 (e) | | 455,000 | 464,939 |
5% 5/1/27 (e) | | 2,140,000 | 2,221,554 |
| Series 2019: | | | |
5% 4/1/25 (e) | | 280,000 | 281,188 |
5% 4/1/26 (e) | | 500,000 | 510,183 |
| Series 2021 C: | | | |
5% 8/1/25 (e) | | 390,000 | 393,618 |
5% 8/1/27 (e) | | 200,000 | 208,447 |
5% 8/1/29 (e) | | 645,000 | 688,326 |
| Series 2022 B: | | | |
5% 8/1/25 (e) | | 1,335,000 | 1,347,385 |
5% 8/1/26 (e) | | 835,000 | 856,995 |
| Seattle Hsg. Auth. Rev.: | | | |
| (Juniper Apts. Proj.) Series 2023, 5% 6/1/27 | | 650,000 | 668,688 |
| (Northgate Plaza Proj.) Series 2021, 1% 6/1/26 | | 1,740,000 | 1,660,907 |
| Skagit County Wash Pub. Hosp. District Series 2016, 4% 12/1/26 | | 1,300,000 | 1,309,383 |
| Snohomish Co. Wash 015 Edmds Series 2024, 5% 12/1/25 | | 5,100,000 | 5,207,197 |
| Tacoma Elec. Sys. Rev. Series 2017: | | | |
| 5% 1/1/25 | | 25,000 | 25,036 |
| 5% 1/1/26 | | 35,000 | 35,801 |
| Univ. of Washington Univ. Revs. Series 2021 C: | | | |
| 5% 4/1/26 | | 260,000 | 267,422 |
| 5% 4/1/26 | | 740,000 | 761,505 |
| Washington Gen. Oblig.: | | | |
| Series 2015 E, 5% 7/1/25 (Pre-Refunded to 1/1/25 @ 100) | | 2,230,000 | 2,233,224 |
| Series R 2020 A, 5% 1/1/25 | | 250,000 | 250,373 |
| Washington Health Care Facilities Auth. Rev.: | | | |
| (Virginia Mason Med. Ctr. Proj.) Series 2017: | | | |
5% 8/15/25 | | 205,000 | 206,405 |
5% 8/15/26 | | 115,000 | 116,915 |
5% 8/15/27 | | 50,000 | 52,009 |
| Bonds Series 2019 B2, 5%, tender 8/1/25 (b) | | 8,870,000 | 8,891,943 |
| Series 2015 B, 5% 8/15/27 | | 1,500,000 | 1,516,235 |
| Series 2015, 5% 7/1/27 | | 1,250,000 | 1,260,050 |
| Washington Hsg. Fin. Commission Series 2021 2N, 5% 6/1/25 | | 945,000 | 952,672 |
| Washington Hsg. Fin. Commission Multi-family Hsg. Rev. Bonds: | | | |
| (Ardea At Totem Lake Apts. Proj.) Series 2023, 5%, tender 2/1/27 (b) | | 805,000 | 825,166 |
| (Grata at Totem Lake Apts. Proj.) Series 2024, 3.83%, tender 3/1/25 (b) | | 1,300,000 | 1,300,621 |
TOTAL WASHINGTON | | | 42,878,091 |
| West Virginia - 0.1% | | | |
| West Virginia Econ. Dev. Auth. Solid Waste Disp. Facilities Rev. Bonds: | | | |
| (Appalachian Pwr. Co. - Amos Proj.): | | | |
Series 2009 B, 3.75%, tender 6/1/25 (b) | | 1,275,000 | 1,276,121 |
Series 2015 A, 3.375%, tender 6/15/28 (b) | | 2,000,000 | 1,991,258 |
| (Appalachian Pwr. Co. Amos Proj.) Series 2010 A, 0.625%, tender 12/15/25 (b) | | 2,000,000 | 1,914,385 |
TOTAL WEST VIRGINIA | | | 5,181,764 |
| Wisconsin - 1.4% | | | |
| Blue Ridge Healthcare Pub. Fin. Auth. Series 2020 A, 5% 1/1/25 | | 300,000 | 300,273 |
| Clayton Town Series 2021 B, 2% 6/1/26 | | 2,000,000 | 1,938,718 |
| Milwaukee County Arpt. Rev. Series 2023 A, 5% 12/1/24 (e) | | 700,000 | 700,057 |
| Milwaukee Gen. Oblig.: | | | |
| Series 2016, 2% 3/1/27 | | 1,610,000 | 1,542,710 |
| Series 2022 N3, 5% 4/1/25 (Assured Guaranty Muni. Corp. Insured) | | 3,220,000 | 3,236,619 |
| Series 2023 N3, 5% 4/1/28 (Assured Guaranty Muni. Corp. Insured) | | 1,690,000 | 1,801,512 |
| Oak Creek Gen. Oblig. Series 2024 A, 4% 4/1/26 | | 1,805,000 | 1,802,837 |
| PMA Levy & Aid Anticipation Nts Prog. Series 2024 A, 5% 9/24/25 | | 2,500,000 | 2,539,909 |
| Pub. Fin. Auth. Hosp. Rev. Series 2020 A: | | | |
| % | | 375,000 | 377,290 |
| 5% 6/1/26 | | 515,000 | 525,215 |
| Pub. Fin. Auth. Wis Pollutionc Bonds (Duke Energy Progress Proj.) Series 2022 A, 3.3%, tender 10/1/26 (b) | | 3,300,000 | 3,299,121 |
| Racine County Gen. Oblig. Series 2024, 6% 6/1/25 | | 1,000,000 | 1,013,103 |
| Racine Unified School District Series 2021, 2% 4/1/25 | | 600,000 | 595,960 |
| Sharon Wis Util. Sys. Rev. Series 2024 A, 5% 12/1/26 | | 2,150,000 | 2,190,732 |
| Univ. of Wisconsin Hosp. & Clinics Auth. Series 2024 A, 5% 4/1/26 | | 500,000 | 513,868 |
| Wisconsin Gen. Oblig. Series 2025 2, 5% 5/1/28 (d) | | 1,065,000 | 1,140,939 |
| Wisconsin Health & Edl. Facilities: | | | |
| Bonds Series 2018 B, 5%, tender 1/29/25 (b) | | 355,000 | 355,847 |
| Series 2018, 5% 4/1/26 | | 195,000 | 199,765 |
| Series 2019 A: | | | |
5% 12/1/24 | | 100,000 | 100,008 |
5% 12/1/25 | | 125,000 | 126,933 |
5% 12/1/26 | | 200,000 | 207,205 |
5% 11/15/28 | | 285,000 | 308,342 |
| Wisconsin Health & Edl. Facilities Auth. Series 2014 A: | | | |
| 5% 12/1/24 | | 775,000 | 775,051 |
| 5% 12/1/26 | | 2,175,000 | 2,176,537 |
| Wisconsin Health & Edl. Facilities Auth. Rev.: | | | |
| (Forensic Science and Protective Medicine Collaboration, Inc. Proj.) Series 2024, 5% 8/1/27 (f) | | 5,675,000 | 5,796,629 |
| Bonds Series 2018 C3, 5%, tender 6/24/26 (b) | | 3,825,000 | 3,927,033 |
| Series 2021 B, 4% 9/15/26 | | 220,000 | 219,726 |
| Series 2022, 5% 10/1/25 | | 3,635,000 | 3,686,480 |
| Series 2024 A: | | | |
5% 2/15/26 | | 400,000 | 406,386 |
5% 2/15/27 | | 790,000 | 817,317 |
5% 2/15/28 | | 515,000 | 540,654 |
5% 2/15/29 | | 1,910,000 | 2,029,328 |
| Wisconsin Hsg. & Econ. Dev. Auth. Hsg. Rev. Bonds: | | | |
| Series 2021 C, 0.81%, tender 5/1/25 (b) | | 50,000 | 49,190 |
| Series 2023 E, 3.875%, tender 5/1/27 (b) | | 985,000 | 990,780 |
| Wisconsin Hsg. and Econ. Dev. Auth. Multi-family Hsg. Rev. Bonds (The Intersect Proj.) Series 2024 I, 5%, tender 2/1/27 (b) | | 3,250,000 | 3,372,746 |
TOTAL WISCONSIN | | | 49,604,820 |
| Wyoming - 0.1% | | | |
| Laramie County Hosp. Rev. (Cheyenne Reg'l. Med. Ctr. Proj.) Series 2021, 4% 5/1/25 | | 260,000 | 260,704 |
| Sublette County Wyo Hosp. District Series 2023 A, 5% 6/15/26 | | 2,000,000 | 2,001,362 |
| Wyoming Cmnty. Dev. Auth. Hsg. Rev. Series 2022 1, 3.5% 6/1/52 | | 1,265,000 | 1,259,193 |
TOTAL WYOMING | | | 3,521,259 |
| TOTAL MUNICIPAL BONDS (Cost $2,267,511,086) | | | 2,268,463,442 |
| | | | |
| Municipal Notes - 20.7% |
| | | Principal Amount (a) | Value ($) |
| Alabama - 0.6% | | | |
| Black Belt Energy Gas District Participating VRDN: | | | |
| Series XF 30 73, 3.16% 12/6/24 (Liquidity Facility Morgan Stanley Bank, West Valley City Utah) (b)(g)(h) | | 6,800,000 | 6,800,000 |
| Series XM 10 80, 3.25% 12/2/24 (Liquidity Facility JPMorgan Chase Bank) (b)(g)(h) | | 2,280,000 | 2,280,000 |
| Columbia Indl. Dev. Board Poll. Cont. Rev. (Alabama Pwr. Co. Proj.) Series 2014 A, 3% 12/2/24, VRDN (b) | | 2,090,000 | 2,090,000 |
| Health Care Auth. for Baptist Health Series 2013 B, 4.28% 12/6/24, VRDN (b) | | 2,399,000 | 2,399,000 |
| Southeast Energy Auth. Rev. Participating VRDN Series XM 10 62, 3.16% 12/6/24 (Liquidity Facility Morgan Stanley Bank, West Valley City Utah) (b)(g)(h) | | 1,600,000 | 1,600,000 |
| Walker County Econ. & Indl. Dev. Auth. Solid Waste Disp. Rev. (Alabama Pwr. Co. Plant Gorgas Proj.) Series 2023, 3.05% 12/2/24, VRDN (b)(e) | | 3,400,000 | 3,400,000 |
| Wilsonville Indl. Dev. Board Poll. Cont. Rev. (Alabama Pwr. Co. Gaston Plant Proj.) Series 2008, 2.75% 12/2/24, VRDN (b)(e) | | 2,300,000 | 2,300,000 |
TOTAL ALABAMA | | | 20,869,000 |
| Arizona - 0.4% | | | |
| Arizona St Indl. Dev. Auth. Multi Participating VRDN: | | | |
| Series Floater 91 57, 3.18% 1/3/25 (Liquidity Facility Mizuho Cap. Markets LLC) (b)(g)(h) | | 1,500,000 | 1,500,000 |
| Series MIZ 91 49, 3.18% 1/3/25 (Liquidity Facility Mizuho Cap. Markets LLC) (b)(g)(h) | | 3,411,000 | 3,411,000 |
| Series XF 31 74, 3.18% 12/6/24 (Liquidity Facility Mizuho Cap. Markets LLC) (b)(g)(h) | | 3,915,000 | 3,915,000 |
| Maricopa County Poll. Cont. Rev.: | | | |
| Series 2009 C, 3.38% 12/6/24, VRDN (b) | | 2,600,000 | 2,600,000 |
| Series 2009 D, 3.38% 12/6/24, VRDN (b) | | 3,300,000 | 3,300,000 |
TOTAL ARIZONA | | | 14,726,000 |
| Arkansas - 0.2% | | | |
| Lowell Ark Indl. Dev. Series 1996, 2.95% 12/6/24, VRDN (b)(e) | | 5,800,000 | 5,800,000 |
| California - 0.5% | | | |
| California Hsg. Fin. Agcy. Ltd. Obl Participating VRDN Series XF 31 27, 3.5% 12/6/24 (Liquidity Facility Mizuho Cap. Markets LLC) (b)(g)(h) | | 1,500,000 | 1,500,000 |
| California Hsg. Fin. Agcy. Rev. Participating VRDN Series Floater MIZ 90 97, 3.5% 12/6/24, LOC Mizuho Cap. Markets LLC (b)(g)(h) | | 1,500,000 | 1,500,000 |
| California Statewide Cmntys. Dev. Auth. Multi-family Hsg. Rev. Participating VRDN: | | | |
| Series Floater MIZ 91 13, 3.5% 1/3/25 (Liquidity Facility Mizuho Cap. Markets LLC) (b)(g)(h)(i) | | 1,600,000 | 1,600,000 |
| Series Floater MIZ 91 62, 3.5% 1/3/25 (Liquidity Facility Mizuho Cap. Markets LLC) (b)(g)(h) | | 1,000,000 | 1,000,000 |
| Series MIZ 91 21, 3.5% 12/2/24 (Liquidity Facility Mizuho Cap. Markets LLC) (b)(e)(g)(h) | | 2,000,000 | 2,000,000 |
| Series MIZ 91 22, 3.5% 12/2/24 (Liquidity Facility Mizuho Cap. Markets LLC) (b)(e)(g)(h) | | 6,030,000 | 6,030,000 |
| Deutsche Bank Spears/Lifers Trust Participating VRDN Series 2021, 3.26% 12/6/24 (Liquidity Facility Deutsche Bank AG New York Branch) (b)(g)(h) | | 600,000 | 600,000 |
| Los Angeles Cmnty. Redev. Agcy. Multi-family Hsg. Rev. Participating VRDN Series 2022 MIZ 90 89, 3.5% 12/2/24 (Liquidity Facility Mizuho Cap. Markets LLC) (b)(e)(g)(h) | | 4,325,000 | 4,325,000 |
TOTAL CALIFORNIA | | | 18,555,000 |
| Colorado - 0.1% | | | |
| Colorado Edl. & Cultural Facilities Auth. Rev. (Mesivta of Greater Los Angeles Proj.) Series 2005, 3.53% 12/6/24, LOC Deutsche Bank AG, VRDN (b) | | 480,000 | 480,000 |
| Colorado Health Facilities Auth. Rev. Bonds Participating VRDN: | | | |
| Series XM 10 59, 3.33% 12/6/24 (Liquidity Facility JPMorgan Chase Bank) (b)(g)(h) | | 1,135,000 | 1,135,000 |
| Series XM 10 60, 3.33% 12/6/24 (Liquidity Facility JPMorgan Chase Bank) (b)(g)(h) | | 3,000,000 | 3,000,000 |
TOTAL COLORADO | | | 4,615,000 |
| Connecticut - 0.4% | | | |
| Connecticut Health & Edl. Facilities Auth. Rev. Series 2013 A, 2.45% 12/2/24, VRDN (b) | | 1,000,000 | 1,000,000 |
| Connecticut Hsg. Fin. Auth. Participating VRDN Series XX 13 46, 3.21% 12/6/24 (Liquidity Facility Barclays Bank PLC) (b)(g)(h) | | 3,000,000 | 3,000,000 |
| Danbury Gen. Oblig. BAN Series 2024 B, 5% 2/24/25 (f) | | 7,000,000 | 7,026,425 |
| West Haven Gen. Oblig. BAN Series 2024, 5% 2/13/25 (Build America Mutual Assurance Insured) | | 1,750,000 | 1,756,306 |
TOTAL CONNECTICUT | | | 12,782,731 |
| Florida - 1.5% | | | |
| Florida Ins. Assistance Interlo Series 2023 A2, 3.93% 12/6/24 (Liquidity Facility Florida Gen. Oblig.), VRDN (b) | | 17,000,000 | 17,000,000 |
| Florida Local Govt. Fin. Cmnty. Series 2024 A1, 3.18% 12/3/24, LOC JPMorgan Chase Bank, CP | | 5,500,000 | 5,500,081 |
| Greater Orlando Aviation Auth. Arpt. Facilities Rev. Participating VRDN Series XM 10 93, 3.75% 12/2/24 (Liquidity Facility JPMorgan Chase Bank) (b)(e)(g)(h) | | 280,000 | 280,000 |
| Jacksonville Gen. Oblig. Series 2024, 3.23% 1/13/25, LOC Bank of America NA, CP | | 3,500,000 | 3,499,764 |
| Jacksonville Health Care Facilities: | | | |
| Series 2019 D, 3.18% 12/6/24, VRDN (b) | | 190,000 | 190,000 |
| Series 2019 E, 3.18% 12/6/24, VRDN (b) | | 740,000 | 740,000 |
| Lee County Arpt. Rev. Participating VRDN Series XF 17 55, 3.43% 12/6/24 (Liquidity Facility JPMorgan Chase Bank) (b)(e)(g)(h) | | 6,425,000 | 6,425,000 |
| Lee County Indl. Developm Series 2019 B, 3.78% 12/6/24, VRDN (b) | | 9,800,000 | 9,800,000 |
| Miami Dade County Hsg. Multifamily Hsg. Rev. Participating VRDN Series Floater MIZ 90 87, 3.5% 1/3/25 (Liquidity Facility Mizuho Cap. Markets LLC) (b)(g)(h)(i) | | 920,000 | 920,000 |
| Miami-Dade County Aviation Rev.: | | | |
| Participating VRDN Series XM 11 86, 3.47% 12/2/24 (Liquidity Facility JPMorgan Chase Bank) (b)(e)(g)(h) | | 3,780,000 | 3,780,000 |
| Series 2024, 3.29% 1/10/25, LOC Bank of America NA, CP (e) | | 2,000,000 | 1,999,995 |
| Monroe County School District TAN Series 2024, 4% 5/29/25 | | 2,500,000 | 2,511,638 |
| Orlando Health Participating VRDN Series 026, 3.48% 1/10/25 (Liquidity Facility Barclays Bank PLC) (b)(g)(h) | | 500,000 | 500,000 |
TOTAL FLORIDA | | | 53,146,478 |
| Georgia - 1.1% | | | |
| Appling County Dev. Auth. Poll. Cont. Rev. (Georgia Pwr. Co. Plant Hatch Proj.) Series 2011 1, 3.1% 12/2/24, VRDN (b) | | 2,100,000 | 2,100,000 |
| Bartow County Dev. Auth. (Georgia Pwr. Co. Plant Bowen Proj.) Series 2022: | | | |
| 3.05% 12/2/24, VRDN (b)(e) | | 20,400,000 | 20,400,000 |
| 3.35% 12/2/24, VRDN (b)(e) | | 1,520,000 | 1,520,000 |
| Buford Hsg. Auth. Multifamily Participating VRDN Series XF 31 18, 3.5% 12/6/24 (Liquidity Facility Mizuho Cap. Markets LLC) (b)(g)(h) | | 1,600,000 | 1,600,000 |
| Burke County Indl. Dev. Auth. Poll. Cont. Rev. (Georgia Pwr. Co. Plant Vogtle Proj.): | | | |
| Series 2012, 3.05% 12/2/24, VRDN (b)(e) | | 1,975,000 | 1,975,000 |
| Series 2018, 3% 12/2/24, VRDN (b) | | 150,000 | 150,000 |
| Georgia Muni. Elec. Auth. Pwr. Rev. Series 2024 B: | | | |
| 3.3% 12/10/24, LOC PNC Bank NA, CP | | 3,500,000 | 3,500,235 |
| 3.35% 12/10/24, LOC TD Banknorth, NA, CP | | 8,500,000 | 8,500,567 |
TOTAL GEORGIA | | | 39,745,802 |
| Hawaii - 0.1% | | | |
| Hawaii Arpts. Sys. Rev. Participating VRDN Series XG 03 86, 3.48% 12/6/24 (Liquidity Facility Morgan Stanley Bank, West Valley City Utah) (b)(e)(g)(h) | | 2,200,000 | 2,200,000 |
| Idaho - 0.0% | | | |
| Idaho Hsg. & Fin. Assoc. Single Family Mtg. Series A, 3.36% 12/6/24 (Liquidity Facility Fannie Mae) (Liquidity Facility Freddie Mac), VRDN (b) | | 200,000 | 200,000 |
| Illinois - 1.1% | | | |
| Chicago O'Hare Int'l. Arpt. Rev. Participating VRDN Series XM 10 78, 3.36% 12/6/24 (Liquidity Facility JPMorgan Chase Bank) (b)(e)(g)(h) | | 13,700,000 | 13,700,000 |
| Chicago Wastewtr. Transmission Rev. Participating VRDN Series XL 04 56, 3.3% 12/6/24 (Liquidity Facility Barclays Bank PLC) (b)(g)(h) | | 760,000 | 760,000 |
| Illinois Edl. Facilities Auth. Rev. Series 2024, 3.22% 2/3/25, LOC Northern Trust Co., CP | | 7,400,000 | 7,401,217 |
| Illinois Fin. Auth. Series 2020 B, 2.1% 12/2/24 (Liquidity Facility JPMorgan Chase Bank), VRDN (b) | | 8,000,000 | 8,000,000 |
| Illinois Fin. Auth. Lease Rev. Participating VRDN Series Floater MIZ 91 67, 3.5% 1/3/25 (Liquidity Facility Mizuho Cap. Markets LLC) (b)(g)(h) | | 5,100,000 | 5,100,000 |
| Illinois Fin. Auth. Rev. Series 2024, 3.1% 5/20/25, CP | | 2,200,000 | 2,199,978 |
| Illinois Hsg. Dev. Auth. Multifamily Rev. Series 2024 A, 3.18% 12/6/24 (Liquidity Facility Fed. Home Ln. Bank Chicago), VRDN (b) | | 4,000,000 | 4,000,000 |
TOTAL ILLINOIS | | | 41,161,195 |
| Indiana - 0.9% | | | |
| Indiana Fin. Auth. Exempt Facilities Rev. Bonds Series MS 00 22, 3.68%, tender 12/12/24 (Liquidity Facility Morgan Stanley Bank, West Valley City Utah) (b)(e)(g)(h) | | 15,900,000 | 15,900,000 |
| Westfield Washington Multi-School Bldg. Corp. BAN Series 2024 A, 5% 12/15/24 | | 17,000,000 | 17,008,821 |
TOTAL INDIANA | | | 32,908,821 |
| Iowa - 0.2% | | | |
| Iowa Fin. Auth. Solid Disp. Waste Rev. (MidAmerican Energy Co. Proj.): | | | |
| Series 2008 A, 3.05% 12/6/24, VRDN (b)(e) | | 650,000 | 650,000 |
| Series 2016 B, 3.05% 12/6/24, VRDN (b)(e) | | 4,600,000 | 4,600,000 |
TOTAL IOWA | | | 5,250,000 |
| Kansas - 0.3% | | | |
| Burlington Envir. Impt. Rev. (Kansas City Pwr. and Lt. Co. Proj.) Series 2007 A, 3.2% 12/6/24, VRDN (b) | | 5,000,000 | 5,000,000 |
| Wichita Gen. Oblig. BAN Series 2024 318, 4% 10/15/25 | | 5,000,000 | 5,046,384 |
TOTAL KANSAS | | | 10,046,384 |
| Kentucky - 0.9% | | | |
| Kentucky Econ. Dev. Fin. Auth. (Catholic Health Initiatives Proj.) Series C, 3.15% 12/6/24, VRDN (b) | | 12,525,000 | 12,525,000 |
| Meade County Indl. Bldg. Rev. (Nucor Steel Brandenburg Proj.): | | | |
| Series 2020 A1, 3.45% 12/2/24, VRDN (b)(e) | | 6,820,000 | 6,820,000 |
| Series 2020 B1, 3.45% 12/2/24, VRDN (b)(e) | | 7,000,000 | 7,000,000 |
| Mercer County Poll. Cont. R Series 2024, 3.4% tender 12/5/24, CP mode | | 7,400,000 | 7,400,212 |
TOTAL KENTUCKY | | | 33,745,212 |
| Louisiana - 0.3% | | | |
| Saint James Parish Gen. Oblig. (Nucor Steel Louisiana LLC Proj.): | | | |
| Series 2010 A1, 3.08% 12/6/24, VRDN (b) | | 8,200,000 | 8,200,000 |
| Series 2010 B1, 3.05% 12/6/24, VRDN (b) | | 1,700,000 | 1,700,000 |
TOTAL LOUISIANA | | | 9,900,000 |
| Maine - 0.0% | | | |
| Maine Hsg. Auth. Mtg. Participating VRDN Series XX 13 48, 3.21% 12/6/24 (Liquidity Facility Barclays Bank PLC) (b)(g)(h) | | 1,000,000 | 1,000,000 |
| Maryland - 0.5% | | | |
| Baltimore County Gen. Oblig. Participating VRDN Series 2022 032, 3.53% 1/10/25 (Liquidity Facility Barclays Bank PLC) (b)(g)(h) | | 1,600,000 | 1,600,000 |
| Integrace Obligated Group Participating VRDN Series 2022 024, 3.53% 1/10/25 (Liquidity Facility Barclays Bank PLC) (b)(g)(h) | | 3,700,000 | 3,700,000 |
| Maryland Health & Higher Edl. Facilities Auth. Rev. Series 2024 B, 3.05% 2/4/25, CP | | 4,000,000 | 3,999,538 |
| Maryland St Econ. Dev. Corpm Participating VRDN Series XF 32 22, 3.5% 12/6/24 (Liquidity Facility Mizuho Cap. Markets LLC) (b)(g)(h) | | 2,600,000 | 2,600,000 |
| Maryland Stadium Auth. Built to Learn Rev. Participating VRDN Series XF 17 58, 3.23% 12/6/24 (Liquidity Facility JPMorgan Chase Bank) (b)(g)(h) | | 3,000,000 | 3,000,000 |
| Montgomery County Hsg. Opportunity Commission Single Family Mtg. Rev. Series 2018 B, 2.88% 12/6/24, LOC PNC Bank NA, VRDN (b)(e) | | 3,275,000 | 3,275,000 |
TOTAL MARYLAND | | | 18,174,538 |
| Massachusetts - 0.4% | | | |
| Massachusetts Bay Trans. Auth. Series 2024, 3.27% 12/2/24, CP | | 10,000,000 | 10,000,240 |
| Quincy Gen. Oblig. BAN Series 2024, 5% 7/25/25 | | 3,500,000 | 3,543,211 |
| Whitman Hanson Massachusetts Reg'l. School District BAN Series 2024, 5.875% 5/15/25 | | 2,500,000 | 2,521,976 |
TOTAL MASSACHUSETTS | | | 16,065,427 |
| Minnesota - 0.2% | | | |
| Saint Paul Hsg. & Redev. Auth. Rev. Participating VRDN Series Floater MIZ 91 45, 3.18% 1/3/25 (Liquidity Facility Mizuho Cap. Markets LLC) (b)(g)(h) | | 4,455,000 | 4,455,000 |
| Univ. of Minnesota Gen. Oblig. Series 2024 F, 3.23% 1/22/25, CP | | 3,000,000 | 2,999,980 |
TOTAL MINNESOTA | | | 7,454,980 |
| Mississippi - 0.4% | | | |
| Mississippi Bus. Fin. Corp. Mississippi Pwr. Co. Proj.) Series 2022, 2.9% 12/2/24, VRDN (b)(e) | | 6,270,000 | 6,270,000 |
| Mississippi Bus. Fin. Corp. Rev. (Mississippi Pwr. Co. Proj.) Series 1999, 2.75% 12/2/24, VRDN (b)(e) | | 2,500,000 | 2,500,000 |
| Mississippi Bus. Fin. Corp. Solid Waste Disp. Rev. (Mississippi Pwr. Co. Proj.): | | | |
| Series 1995, 3.5% 11/30/24, VRDN (b)(e) | | 800,000 | 800,000 |
| Series 1998, 3.5% 12/2/24, VRDN (b)(e) | | 2,900,000 | 2,900,000 |
TOTAL MISSISSIPPI | | | 12,470,000 |
| Missouri - 0.2% | | | |
| Kansas City Indl. Dev. Auth. Participating VRDN Series XM 11 08, 3.4% 12/2/24 (Liquidity Facility JPMorgan Chase Bank) (b)(e)(g)(h) | | 3,650,000 | 3,650,000 |
| Missouri Health & Edl. Facilities Auth. Health Facilities Rev. (BJC HealthCare Proj.) Series 2008 A, 3.15% 12/6/24, VRDN (b) | | 3,005,000 | 3,005,000 |
| St Louis County Ind. Dev. Auth. Multi Fam Hsg. Rev. Participating VRDN Series Floater MIZ 91 53, 3.18% 1/3/25 (Liquidity Facility Mizuho Cap. Markets LLC) (b)(g)(h) | | 1,700,000 | 1,700,000 |
TOTAL MISSOURI | | | 8,355,000 |
| Nebraska - 0.0% | | | |
| Stanton County Indl. Dev. Rev. (Nucor Corp. Proj.) Series 1996, 3.15% 12/6/24, VRDN (b)(e) | | 700,000 | 700,000 |
| New Hampshire - 0.1% | | | |
| Nat'l. Fin. Auth. N H Specialt Bonds Series MS 00 23, 3.16%, tender 1/9/25 (Liquidity Facility Morgan Stanley Bank, West Valley City Utah) (b)(g)(h)(i) | | 4,700,000 | 4,700,000 |
| New Jersey - 1.2% | | | |
| Essex County Impt. Auth. BAN (Essex County Family Court Bldg. Proj.) Series 2024, 5% 6/18/25 | | 7,000,000 | 7,078,284 |
| Jersey City N J Muni. Utils. Auth. BAN Series 2024 B, 5% 5/1/25 | | 2,500,000 | 2,516,317 |
| Lacey Township Gen. Oblig. BAN Series 2024, 4.5% 5/7/25 | | 4,700,000 | 4,726,502 |
| Manchester Township Gen. Oblig. BAN Series 2024 A, 4.5% 5/8/25 | | 2,200,000 | 2,211,724 |
| Monmouth County Impt. Auth. Rev. BAN Series 2024, 4% 3/14/25 | | 2,000,000 | 2,004,916 |
| New Jersey Hsg. & Mtg. Fin. Agcy. Multi-family Rev. Participating VRDN Series Floater 2024, 3.43% 1/3/25 (Liquidity Facility Barclays Bank PLC) (b)(g)(h) | | 5,000,000 | 5,000,000 |
| Newark Gen. Oblig. BAN: | | | |
| Series 2024 B, 5% 5/13/25 | | 6,200,000 | 6,241,802 |
| Series 2024 C, 4.25% 9/25/25 | | 8,900,000 | 8,965,875 |
| Pennsauken Township BAN Series 2024 A, 4.5% 5/28/25 | | 5,818,500 | 5,852,034 |
TOTAL NEW JERSEY | | | 44,597,454 |
| New Mexico - 0.1% | | | |
| New Mexico St Hosp. Equip. Ln. Co. Participating VRDN Series 2022 034, 3.53% 1/10/25 (Liquidity Facility Barclays Bank PLC) (b)(g)(h) | | 1,935,000 | 1,935,000 |
| New York - 1.3% | | | |
| Battery Park City Auth. Rev. Series 2019 D1, 2.8% 12/2/24 (Liquidity Facility TD Banknorth, NA), VRDN (b) | | 800,000 | 800,000 |
| City of Long Beach BAN Series 2024 B, 4% 9/26/25 | | 6,800,000 | 6,830,482 |
| Liberty Dev. Corp. Rev. Participating VRDN Series MS 1207, 3.53% 12/6/24 (Liquidity Facility Morgan Stanley Bank, West Valley City Utah) (b)(g)(h) | | 2,200,000 | 2,200,000 |
| Lowville N Y BAN Series 2024, 5.375% 8/21/25 | | 2,500,000 | 2,507,567 |
| New York City Muni. Wtr. Fin. Auth. Wtr. & Swr. Sys. Rev. Participating VRDN Series ZF 17 56, 2.89% 12/6/24 (Liquidity Facility Royal Bank of Canada) (b)(g)(h) | | 2,475,000 | 2,475,000 |
| New York Metropolitan Trans. Auth. Rev. Participating VRDN: | | | |
| Series XF 13 21, 3.5% 12/6/24 (Liquidity Facility JPMorgan Chase Bank) (b)(g)(h) | | 1,595,000 | 1,595,000 |
| Series XF 13 55, 3.18% 12/6/24 (Liquidity Facility JPMorgan Chase Bank) (b)(g)(h) | | 2,400,000 | 2,400,000 |
| New York State Hsg. Fin. Agcy. Rev. Participating VRDN: | | | |
| Series 2022, 3.53% 1/10/25 (Liquidity Facility Barclays Bank PLC) (b)(g)(h) | | 3,000,000 | 3,000,000 |
| Series Floater 2022 007, 3.63% 1/10/25 (Liquidity Facility Barclays Bank PLC) (b)(e)(g)(h) | | 23,500,000 | 23,500,000 |
| Olean BAN Series 2024, 4% 3/6/25 | | 1,500,000 | 1,499,513 |
TOTAL NEW YORK | | | 46,807,562 |
| North Carolina - 0.5% | | | |
| Atrium Health: | | | |
| Series 2018 G, 2.85% 12/2/24 (Liquidity Facility JPMorgan Chase Bank), VRDN (b) | | 4,000,000 | 4,000,000 |
| Series 2021 E, 2.86% 12/2/24, LOC Royal Bank of Canada, VRDN (b) | | 6,000,000 | 6,000,000 |
| Hertford County Indl. Facilities Poll. Cont. Fing. Auth. Series 2000 B, 3% 12/6/24, VRDN (b)(e) | | 9,100,000 | 9,100,000 |
TOTAL NORTH CAROLINA | | | 19,100,000 |
| North Dakota - 0.2% | | | |
| County of Mercer Series 2024, 3.5% 1/14/25 (Liquidity Facility Nat'l. Rural Utils. Coop. Fin. Corp.), CP | | 6,900,000 | 6,899,820 |
| Ohio - 0.9% | | | |
| Delaware Gen. Oblig. BAN Series 2024, 4.5% 7/1/25 | | 3,650,000 | 3,673,383 |
| Forest Park Gen. Oblig. BAN Series 2024, 4.5% 5/21/25 | | 2,650,000 | 2,663,651 |
| Lorain County Gen. Oblig. BAN: | | | |
| Series 2023 B, 5% 12/7/24 | | 1,025,000 | 1,025,201 |
| Series 2024 B, 4.375% 5/1/25 | | 3,000,000 | 3,011,596 |
| Montgomery Ohio BAN Series 2024, 4.5% 6/10/25 | | 2,000,000 | 2,012,640 |
| Newark Gen. Oblig. BAN Series 2024, 4.5% 3/20/25 | | 1,500,000 | 1,503,131 |
| Ohio Higher Edl. Facility Commission Rev. Series 2024, 3.11% tender 1/15/25, CP mode | | 4,900,000 | 4,899,903 |
| Ohio Hosp. Rev.: | | | |
| Series 2013 B, 3.71% 12/6/27, VRDN (b) | | 4,995,000 | 4,995,000 |
| Series 2021 B, 3.5% 12/2/24, VRDN (b) | | 3,000,000 | 3,000,000 |
| Ohio State Univ. Gen. Receipts (Multiyear Debt Issuance Prog. II) Series 2023 D2, 2.95% 12/6/24, VRDN (b) | | 4,150,000 | 4,150,000 |
TOTAL OHIO | | | 30,934,505 |
| Oklahoma - 0.3% | | | |
| Oklahoma Dev. Fin. Auth. Health Sys. Rev. Series 2020 B, 3.5% 12/6/24, VRDN (b) | | 10,465,000 | 10,465,000 |
| Steele Duncan Plaza, LLC Participating VRDN Series MIZ 91 03, 3.18% 1/3/25 (Liquidity Facility Mizuho Cap. Markets LLC) (b)(g)(h)(i) | | 1,291,415 | 1,291,415 |
TOTAL OKLAHOMA | | | 11,756,415 |
| Oregon - 0.1% | | | |
| Port of Portland Arpt. Rev. Participating VRDN Series XF 13 53, 3.1% 12/2/24 (Liquidity Facility JPMorgan Chase Bank) (b)(e)(g)(h) | | 4,800,000 | 4,800,000 |
| Pennsylvania - 0.5% | | | |
| Montgomery County Higher Ed. & Health Auth. Rev. Series 2018 D, 3.98% 12/6/24, VRDN (b) | | 6,700,000 | 6,700,000 |
| Pennsylvania Higher Edl. Facilities Auth. Rev. (Univ. of Pennsylvania Health Sys. Proj.) Series 2008 A, 2.8% 12/6/24, LOC Bank of America NA, VRDN (b) | | 2,670,000 | 2,670,000 |
| Philadelphia Auth. for Indl. Dev. Series 2017 B, 3.98% 12/6/24, VRDN (b) | | 7,895,000 | 7,895,000 |
TOTAL PENNSYLVANIA | | | 17,265,000 |
| Rhode Island - 0.1% | | | |
| Pawtucket R I BAN Series 2024, 4.5% 10/24/25 | | 4,700,000 | 4,738,401 |
| South Carolina - 0.1% | | | |
| South Carolina Pub. Svc. Auth. Rev.: | | | |
| Series 2024 A, 3.17% 12/17/24, LOC Barclays Bank PLC, CP | | 1,800,000 | 1,799,943 |
| Series 2024 B, 3.19% 1/7/25, LOC Barclays Bank PLC, CP | | 3,378,000 | 3,378,122 |
TOTAL SOUTH CAROLINA | | | 5,178,065 |
| Tennessee - 0.6% | | | |
| Chattanooga Health Ed. & Hsg. Facility Board Rev. (Catholic Health Initiatives Proj.) Series C, 3.15% 12/6/24, VRDN (b) | | 4,200,000 | 4,200,000 |
| Metropolitan Govt. Nashville & Davidson County Health & Edl. Facilities Board Participating VRDN Series Floater MIZ 91 63, 3.5% 1/3/25 (Liquidity Facility Mizuho Cap. Markets LLC) (b)(g)(h) | | 1,300,000 | 1,300,000 |
| Metropolitan Govt. Nashville & Davidson County Wtr. & Swr. Sys. Rev.: | | | |
| Series 2024 A, 3.25% 1/6/25, LOC TD Banknorth, NA, CP | | 8,700,000 | 8,700,390 |
| Series 2024, 3.23% 2/15/25, LOC TD Banknorth, NA, CP | | 3,200,000 | 3,199,981 |
| Nashville and Davidson County Metropolitan Govt. Gen. Oblig. Series 2024, 3.25% 12/11/24, CP | | 4,100,000 | 4,100,118 |
TOTAL TENNESSEE | | | 21,500,489 |
| Texas - 3.3% | | | |
| Arlington Higher Ed. Fin. Corp. Participating VRDN Series 2021 MS 00 02, 3.58% 12/6/24 (b)(g)(h) | | 12,570,000 | 12,570,000 |
| Board of Regents of The Texas A&M Univ. Sys. Permanent Univ. Fund Series 2024 A, 3.55% 1/7/25, CP | | 2,000,000 | 2,000,764 |
| Brazos County Tex Hsg. Fin. Corp. M Participating VRDN Series XF 31 29, 3.18% 12/6/24 (Liquidity Facility Mizuho Cap. Markets LLC) (b)(g)(h) | | 1,300,000 | 1,300,000 |
| Ep Machuca Lp Participating VRDN Series MIZ 91 04, 3.18% 1/3/25 (Liquidity Facility Mizuho Cap. Markets LLC) (b)(g)(h)(i) | | 1,900,000 | 1,900,000 |
| Fort Bend County Gen. Oblig. TAN Series 2024, 5% 3/1/25 | | 8,000,000 | 8,039,582 |
| Harris County Gen. Oblig.: | | | |
| Series 2024 D, 3.2% 3/10/25 (Liquidity Facility JPMorgan Chase Bank), CP | | 3,000,000 | 2,999,963 |
| Series 2024 D3: | | | |
3.18% 3/4/25 (Liquidity Facility Truist Bank), CP | | 2,140,000 | 2,139,962 |
3.25% 2/20/25 (Liquidity Facility Truist Bank), CP | | 380,000 | 380,036 |
| Harris County IAM Commercial Paper Series 2024, 3.21% 3/5/25, CP | | 6,120,000 | 6,119,878 |
| Houston Higher Ed. Fing. Corp. Series 2024, 3.22% 1/17/25, CP | | 615,000 | 614,990 |
| Jewett Econ. Dev. Corp. Indl. Dev. Rev. (Nucor Corp. Proj.) Series 2003, 3.15% 12/6/24, VRDN (b)(e) | | 1,025,000 | 1,025,000 |
| Lower Colorado River Auth. Rev. Series 2024, 3.25% 1/22/25 (Liquidity Facility JPMorgan Chase Bank), CP | | 1,400,000 | 1,399,995 |
| Port Arthur Navigation District Envir. Facilities Rev. (Motiva Enterprises LLC Proj.): | | | |
| Series 2004, 3.25% 12/6/24, VRDN (b)(e) | | 27,215,000 | 27,215,000 |
| Series 2010 C, 3.2% 12/2/24, VRDN (b) | | 1,900,000 | 1,900,000 |
| Series 2010 D: | | | |
3.15% 12/6/24, VRDN (b) | | 13,800,000 | 13,800,000 |
3.25% 12/6/24, VRDN (b) | | 1,000,000 | 1,000,000 |
| San Antonio Wtr. Sys. Rev. Series 2024, 3.25% 2/19/25 (Liquidity Facility JPMorgan Chase Bank), CP | | 10,000,000 | 9,999,935 |
| Texas A&M Univ. Rev. Series 2024 B, 3.18% 2/18/25, CP | | 3,000,000 | 2,999,985 |
| Texas Affordable Hsg. Corp. Multi-family Hsg. Rev. Participating VRDN Series MIZ 91 24, 3.18% 1/3/25 (Liquidity Facility Mizuho Cap. Markets LLC) (b)(g)(h)(i) | | 11,100,000 | 11,100,000 |
| Univ. of Texas Board of Regents Sys. Rev. Series 2024 A: | | | |
| 3.1% 5/7/25 (Liquidity Facility Univ. of Texas Invt. Mgmt. Co.), CP | | 8,500,000 | 8,497,802 |
| 3.18% 5/13/25 (Liquidity Facility Univ. of Texas Invt. Mgmt. Co.), CP | | 3,000,000 | 2,999,970 |
TOTAL TEXAS | | | 120,002,862 |
| Utah - 0.0% | | | |
| Box Elder County Poll. Cont. Rev. Series 2003, 3.07% 12/6/24, VRDN (b) | | 260,000 | 260,000 |
| Virginia - 0.3% | | | |
| Nat'l. Sr. Campuses Participating VRDN Series 2022 028, 3.53% 1/10/25 (Liquidity Facility Barclays Bank PLC) (b)(g)(h) | | 3,600,000 | 3,600,000 |
| Roanoke Econ. Dev. Authority. Series 2020 B, 3.24% 12/6/24 (Liquidity Facility PNC Bank NA), VRDN (b) | | 5,600,000 | 5,600,000 |
TOTAL VIRGINIA | | | 9,200,000 |
| Washington - 0.4% | | | |
| King County Swr. Rev. Series 2024, 3.1% 12/2/24 (Liquidity Facility Bank of America NA), VRDN (b) | | 13,000,000 | 13,000,000 |
| West Virginia - 0.1% | | | |
| West Virginia Hosp. Fin. Auth. Hosp. Rev. Series 2018 E, 3.47% 12/6/27, VRDN (b) | | 3,380,000 | 3,380,000 |
| Wisconsin - 0.1% | | | |
| Wisconsin Hsg. and Econ. Dev. Auth. Home Ownership Rev. Series 2004 E, 3.05% 12/6/24 (Liquidity Facility Fed. Home Ln. Bank Chicago), VRDN (b)(e) | | 3,310,000 | 3,310,000 |
| Wyoming - 0.2% | | | |
| Lincoln County Envir. (PacifiCorp Proj.) Series 1995, 3.25% 12/4/24, VRDN (b)(e) | | 7,200,000 | 7,200,000 |
| Sweetwater County Env Imp Rev. (Pacificorp Proj.) Series 1995, 3.35% 12/2/24, VRDN (b)(e) | | 1,100,000 | 1,100,000 |
TOTAL WYOMING | | | 8,300,000 |
| TOTAL MUNICIPAL NOTES (Cost $747,400,845) | | | 747,537,141 |
| | | | |
| Short-Term Funds - 10.7% |
| | | Shares | Value ($) |
| Federated Hermes Municipal Ultrashort Fund Institutional Shares | | 6,425,172 | 64,380,226 |
| JPMorgan Ultra-Short Municipal Income ETF | | 1,793,043 | 91,265,889 |
| Vanguard Ultra Short-Term Tax-Exempt Fund Admiral Shares | | 14,596,613 | 230,772,430 |
| TOTAL SHORT-TERM FUNDS (Cost $387,864,158) | | | 386,418,545 |
| | | | |
| Money Market Funds - 6.2% |
| | | Shares | Value ($) |
| Fidelity Investments Money Market Government Portfolio Institutional Class 4.55% (j)(k) | | 152,144,971 | 152,144,971 |
| Fidelity Municipal Cash Central Fund 2.98% (l)(m) | | 26,607,971 | 26,613,292 |
| Fidelity SAI Municipal Money Market Fund 2.87% (j)(k) | | 43,327,730 | 43,336,396 |
| State Street Institutional U.S. Government Money Market Fund Premier Class 4.59% (j) | | 2,156,512 | 2,156,512 |
| TOTAL MONEY MARKET FUNDS (Cost $224,238,319) | | | 224,251,171 |
| | | | |
| TOTAL INVESTMENT IN SECURITIES - 100.4% (Cost $3,627,014,408) | 3,626,670,299 |
NET OTHER ASSETS (LIABILITIES) - (0.4)% | (16,009,680) |
| NET ASSETS - 100.0% | 3,610,660,619 |
| | |
Security Type Abbreviations
| BAN | - | BOND ANTICIPATION NOTE |
| CP | - | COMMERCIAL PAPER |
| ETF | - | EXCHANGE-TRADED FUND |
| TAN | - | TAX ANTICIPATION NOTE |
| VRDN | - | VARIABLE RATE DEMAND NOTE (A debt instrument that is payable upon demand, either daily, weekly or monthly) |
Legend
| (a) | Amount is stated in United States dollars unless otherwise noted. |
| (b) | Coupon rates for floating and adjustable rate securities reflect the rates in effect at period end. |
| (c) | Coupon is indexed to a floating interest rate which may be multiplied by a specified factor and/or subject to caps or floors. |
| (d) | Security or a portion of the security purchased on a delayed delivery or when-issued basis. |
| (e) | Private activity obligations whose interest is subject to the federal alternative minimum tax for individuals. |
| (f) | Security exempt from registration under Rule 144A of the Securities Act of 1933. These securities may be resold in transactions exempt from registration, normally to qualified institutional buyers. At the end of the period, the value of these securities amounted to $62,767,025 or 1.7% of net assets. |
| (g) | Provides evidence of ownership in one or more underlying municipal bonds. Coupon rates are determined by re-marketing agents based on current market conditions. |
| (h) | Coupon rates are determined by re-marketing agents based on current market conditions. |
| (i) | Restricted securities (including private placements) - Investment in securities not registered under the Securities Act of 1933 (excluding 144A issues). At the end of the period, the value of restricted securities (excluding 144A issues) amounted to $21,511,415 or 0.6% of net assets. |
| (j) | The rate quoted is the annualized seven-day yield of the fund at period end. |
| (l) | Information in this report regarding holdings by state and security types does not reflect the holdings of the Fidelity Municipal Cash Central Fund. |
| (m) | Affiliated fund that is generally available only to investment companies and other accounts managed by Fidelity Investments. The rate quoted is the annualized seven-day yield of the fund at period end. A complete unaudited listing of the fund's holdings as of its most recent quarter end is available upon request. In addition, each Fidelity Central Fund's financial statements are available on the SEC's website or upon request. |
| Additional information on each restricted holding is as follows: |
| Security | Acquisition Date | Acquisition Cost ($) |
| California Statewide Cmntys. Dev. Auth. Multi-family Hsg. Rev. Participating VRDN Series Floater MIZ 91 13, 3.5% 1/3/25 (Liquidity Facility Mizuho Cap. Markets LLC) | 11/16/22 | 1,600,000 |
| | | |
| Ep Machuca Lp Participating VRDN Series MIZ 91 04, 3.18% 1/3/25 (Liquidity Facility Mizuho Cap. Markets LLC) | 8/05/22 | 1,900,000 |
| | | |
| Miami Dade County Hsg. Multifamily Hsg. Rev. Participating VRDN Series Floater MIZ 90 87, 3.5% 1/3/25 (Liquidity Facility Mizuho Cap. Markets LLC) | 1/27/22 | 920,000 |
| | | |
| Nat'l. Fin. Auth. N H Specialt Bonds Series MS 00 23, 3.16%, tender 1/9/25 (Liquidity Facility Morgan Stanley Bank, West Valley City Utah) | 4/16/24 | 4,700,000 |
| | | |
| Steele Duncan Plaza, LLC Participating VRDN Series MIZ 91 03, 3.18% 1/3/25 (Liquidity Facility Mizuho Cap. Markets LLC) | 8/11/22 | 1,291,415 |
| | | |
| Texas Affordable Hsg. Corp. Multi-family Hsg. Rev. Participating VRDN Series MIZ 91 24, 3.18% 1/3/25 (Liquidity Facility Mizuho Cap. Markets LLC) | 1/27/23 | 11,100,000 |
| | | |
Affiliated Central Funds
Fiscal year to date information regarding the Fund's investments in Fidelity Central Funds, including the ownership percentage, is presented below.
| Affiliate | Value, beginning of period ($) | Purchases ($) | Sales Proceeds ($) | Dividend Income ($) | Realized Gain (loss) ($) | Change in Unrealized appreciation (depreciation) ($) | Value, end of period ($) | % ownership, end of period |
| Fidelity Municipal Cash Central Fund 2.98% | 13,408,851 | 154,646,123 | 141,441,682 | 224,344 | 99 | (99) | 26,613,292 | 0.8% |
| Total | 13,408,851 | 154,646,123 | 141,441,682 | 224,344 | 99 | (99) | 26,613,292 | |
| | | | | | | | | |
Amounts in the dividend income column in the above table include any capital gain distributions from underlying funds, which are presented in the corresponding line item in the Statement of Operations, if applicable.
Amounts included in the purchases and sales proceeds columns may include in-kind transactions, if applicable.
Affiliated Underlying Funds
Fiscal year to date information regarding the Fund's investments in affiliated Underlying Funds is presented below. Exchanges between classes of the same affiliated Underlying Funds may occur. If an Underlying Funds changes its name, the name presented below is the name in effect at period end.
| Affiliate | Value, beginning of period ($) | Purchases ($) | Sales Proceeds ($) | Dividend Income ($) | Realized Gain (loss) ($) | Change in Unrealized appreciation (depreciation) ($) | Value, end of period ($) |
| Fidelity Investments Money Market Government Portfolio Institutional Class 4.55% | 95,265,336 | 408,162,827 | 351,283,192 | 2,024,624 | - | - | 152,144,971 |
| Fidelity SAI Municipal Money Market Fund 2.87% | 42,636,979 | 699,417 | - | 699,456 | - | - | 43,336,396 |
| | 137,902,315 | 408,862,244 | 351,283,192 | 2,724,080 | - | - | 195,481,367 |
Amounts in the dividend income column in the above table include any capital gain distributions from underlying funds, which are presented in the corresponding line item in the Statement of Operations, if applicable.
Amounts included in the purchases and sales proceeds columns may include in-kind transactions, if applicable.
Investment Valuation
The following is a summary of the inputs used, as of November 30, 2024, involving the Fund's assets and liabilities carried at fair value. The inputs or methodology used for valuing securities may not be an indication of the risk associated with investing in those securities. For more information on valuation inputs, and their aggregation into the levels used below, please refer to the Investment Valuation section in the accompanying Notes to Financial Statements.
| Valuation Inputs at Reporting Date: |
| Description | Total ($) | Level 1 ($) | Level 2 ($) | Level 3 ($) |
Investments in Securities: | | | | |
|
| Municipal Securities | 3,016,000,583 | - | 3,016,000,583 | - |
|
| Short-Term Funds | 386,418,545 | 386,418,545 | - | - |
|
| Money Market Funds | 224,251,171 | 224,251,171 | - | - |
| Total Investments in Securities: | 3,626,670,299 | 610,669,716 | 3,016,000,583 | - |
Financial Statements (Unaudited)
| Statement of Assets and Liabilities |
| As of November 30, 2024 (Unaudited) |
| Assets | | | | |
| Investment in securities, at value - See accompanying schedule: | | | | |
Unaffiliated issuers (cost $3,404,932,601) | $ | 3,404,575,640 | | |
Fidelity Central Funds (cost $26,613,271) | | 26,613,292 | | |
Other affiliated issuers (cost $195,468,536) | | 195,481,367 | | |
| | | | | |
| | | | | |
| Total Investment in Securities (cost $3,627,014,408) | | | $ | 3,626,670,299 |
| Cash | | | | 1,440,990 |
| Receivable for investments sold | | | | 10,111,668 |
| Receivable for fund shares sold | | | | 1,454,641 |
| Dividends receivable | | | | 620,125 |
| Interest receivable | | | | 33,005,896 |
| Distributions receivable from Fidelity Central Funds | | | | 46,266 |
| Prepaid expenses | | | | 2,958 |
| Other receivables | | | | 8,388 |
Total assets | | | | 3,673,361,231 |
| Liabilities | | | | |
| Payable for investments purchased | | | | |
Regular delivery | $ | 8,606,290 | | |
Delayed delivery | | 42,281,881 | | |
| Payable for fund shares redeemed | | 1,893,609 | | |
| Distributions payable | | 9,667,283 | | |
| Accrued management fee | | 198,433 | | |
| Other payables and accrued expenses | | 53,116 | | |
| Total liabilities | | | | 62,700,612 |
| Net Assets | | | $ | 3,610,660,619 |
| Net Assets consist of: | | | | |
| Paid in capital | | | $ | 3,625,630,506 |
| Total accumulated earnings (loss) | | | | (14,969,887) |
| Net Assets | | | $ | 3,610,660,619 |
Net Asset Value, offering price and redemption price per share ($3,610,660,619 ÷ 360,021,027 shares) | | | $ | 10.03 |
| Statement of Operations |
Six months ended November 30, 2024 (Unaudited) |
| Investment Income | | | | |
| Dividends: | | | | |
| Unaffiliated issuers | | | $ | 7,270,319 |
| Affiliated issuers | | | | 2,724,080 |
| Interest | | | | 52,754,446 |
| Income from Fidelity Central Funds | | | | 224,344 |
| Total income | | | | 62,973,189 |
| Expenses | | | | |
| Management fee | $ | 5,881,520 | | |
| Custodian fees and expenses | | 16,934 | | |
| Independent trustees' fees and expenses | | 9,068 | | |
| Registration fees | | 16,956 | | |
| Audit fees | | 35,359 | | |
| Legal | | 2,060 | | |
| Miscellaneous | | 8,512 | | |
| Total expenses before reductions | | 5,970,409 | | |
| Expense reductions | | (4,678,844) | | |
| Total expenses after reductions | | | | 1,291,565 |
| Net Investment income (loss) | | | | 61,681,624 |
| Realized and Unrealized Gain (Loss) | | | | |
| Net realized gain (loss) on: | | | | |
| Investment Securities: | | | | |
| Unaffiliated issuers | | 363,633 | | |
| Fidelity Central Funds | | 99 | | |
| Total net realized gain (loss) | | | | 363,732 |
| Change in net unrealized appreciation (depreciation) on: | | | | |
| Investment Securities: | | | | |
| Unaffiliated issuers | | 26,034,465 | | |
| Fidelity Central Funds | | (99) | | |
| Total change in net unrealized appreciation (depreciation) | | | | 26,034,366 |
| Net gain (loss) | | | | 26,398,098 |
| Net increase (decrease) in net assets resulting from operations | | | $ | 88,079,722 |
| Statement of Changes in Net Assets |
| |
| | Six months ended November 30, 2024 (Unaudited) | | Year ended May 31, 2024 |
| Increase (Decrease) in Net Assets | | | | |
| Operations | | | | |
| Net investment income (loss) | $ | 61,681,624 | $ | 129,085,336 |
| Net realized gain (loss) | | 363,732 | | (1,518,727) |
| Change in net unrealized appreciation (depreciation) | | 26,034,366 | | 18,877,023 |
| Net increase (decrease) in net assets resulting from operations | | 88,079,722 | | 146,443,632 |
| Distributions to shareholders | | (61,383,724) | | (129,072,565) |
| | | | | |
| Share transactions | | | | |
| Proceeds from sales of shares | | 481,489,372 | | 1,195,191,609 |
| Reinvestment of distributions | | 7,526 | | 20,843 |
| Cost of shares redeemed | | (802,198,081) | | (1,419,620,203) |
| | | | | |
Net increase (decrease) in net assets resulting from share transactions | | (320,701,183) | | (224,407,751) |
| Total increase (decrease) in net assets | | (294,005,185) | | (207,036,684) |
| | | | | |
| Net Assets | | | | |
| Beginning of period | | 3,904,665,804 | | 4,111,702,488 |
| End of period | $ | 3,610,660,619 | $ | 3,904,665,804 |
| | | | | |
| Other Information | | | | |
| Shares | | | | |
| Sold | | 48,052,708 | | 120,073,485 |
| Issued in reinvestment of distributions | | 751 | | 2,095 |
| Redeemed | | (80,066,811) | | (142,728,820) |
| Net increase (decrease) | | (32,013,352) | | (22,653,240) |
| | | | | |
Financial Highlights
Strategic Advisers® Tax-Sensitive Short Duration Fund |
| |
| | Six months ended (Unaudited) November 30, 2024 | | Years ended May 31, 2024 | | 2023 | | 2022 | | 2021 | | 2020 |
Selected Per-Share Data | | | | | | | | | | | | |
| Net asset value, beginning of period | $ | 9.96 | $ | 9.92 | $ | 9.92 | $ | 10.05 | $ | 10.02 | $ | 10.03 |
| Income from Investment Operations | | | | | | | | | | | | |
Net investment income (loss) A,B | | .168 | | .318 | | .190 | | .044 | | .067 | | .159 |
| Net realized and unrealized gain (loss) | | .068 | | .041 | | .001 C | | (.130) | | .034 | | (.006) |
| Total from investment operations | | .236 | | .359 | | .191 | | (.086) | | .101 | | .153 |
| Distributions from net investment income | | (.166) | | (.319) | | (.191) | | (.044) | | (.070) | | (.159) |
| Distributions from net realized gain | | - | | - | | - | | - | | (.001) | | (.004) |
| Total distributions | | (.166) | | (.319) | | (.191) | | (.044) | | (.071) | | (.163) |
| Net asset value, end of period | $ | 10.03 | $ | 9.96 | $ | 9.92 | $ | 9.92 | $ | 10.05 | $ | 10.02 |
Total Return D,E | | | | 3.67% | | 1.94% | | (.85)% | | 1.01% | | 1.53% |
Ratios to Average Net Assets B,F,G | | | | | | | | | | | | |
| Expenses before reductions | | .32% H | | .32% | | .32% | | .32% | | .33% | | .34% |
| Expenses net of fee waivers, if any | | | | .07% | | .07% | | .07% | | .08% | | .09% |
| Expenses net of all reductions | | .07% H | | .07% | | .07% | | .07% | | .08% | | .09% |
| Net investment income (loss) | | 3.33% H | | 3.20% | | 1.92% | | .44% | | .66% | | 1.59% |
| Supplemental Data | | | | | | | | | | | | |
| Net assets, end of period (000 omitted) | $ | 3,610,661 | $ | 3,904,666 | $ | 4,111,702 | $ | 4,559,412 | $ | 5,389,558 | $ | 3,368,491 |
Portfolio turnover rate I | | | | 68% | | 80% | | 53% | | 86% | | 81% |
ACalculated based on average shares outstanding during the period.
BNet investment income (loss) is affected by the timing of the declaration of dividends by any underlying mutual funds or exchange-traded funds (ETFs). Net investment income (loss) of any mutual funds or ETFs is not included in the Fund's net investment income (loss) ratio.
CThe amount shown for a share outstanding does not correspond with the aggregate net gain (loss) on investments for the period due to the timing of sales and repurchases of shares in relation to fluctuating market values of the investments of the Fund.
DTotal returns for periods of less than one year are not annualized.
ETotal returns would have been lower if certain expenses had not been reduced during the applicable periods shown.
FFees and expenses of any underlying mutual funds or exchange-traded funds (ETFs) are not included in the Fund's expense ratio. The Fund indirectly bears its proportionate share of these expenses.
GExpense ratios reflect operating expenses of the class. Expenses before reductions do not reflect amounts reimbursed, waived, or reduced through arrangements with the investment adviser, brokerage services, or other offset arrangements, if applicable, and do not represent the amount paid by the class during periods when reimbursements, waivers or reductions occur.
HAnnualized.
IAmount does not include the portfolio activity of any underlying mutual funds or exchange-traded funds (ETFs).
Notes to Financial Statements
(Unaudited)For the period ended November 30, 2024
1.Organization.
Strategic Advisers Tax-Sensitive Short Duration Fund (the Fund) is a fund of Fidelity Rutland Square Trust II (the Trust), and is authorized to issue an unlimited number of shares. The Trust is registered under the Investment Company Act of 1940, as amended (the 1940 Act), as an open-end management investment company organized as a Delaware statutory trust. The Fund is offered exclusively to certain managed account clients of Strategic Advisers LLC (Strategic Advisers), an affiliate of Fidelity Management & Research Company LLC (FMR).
2.Significant Accounting Policies.
The Fund is an investment company and applies the accounting and reporting guidance of the Financial Accounting Standards Board (FASB) Accounting Standards Codification Topic 946 Financial Services - Investment Companies. The financial statements have been prepared in conformity with accounting principles generally accepted in the United States of America (GAAP), which require management to make certain estimates and assumptions at the date of the financial statements. Actual results could differ from those estimates. Subsequent events, if any, through the date that the financial statements were issued have been evaluated in the preparation of the financial statements. The Fund's Schedule of Investments lists any underlying mutual funds or exchange-traded funds (ETFs) but does not include the underlying holdings of these funds. The following summarizes the significant accounting policies of the Fund:
Investment Valuation. Investments are valued as of 4:00 p.m. Eastern time on the last calendar day of the period. The Board of Trustees (the Board) has designated the Fund's investment adviser as the valuation designee responsible for the fair valuation function and performing fair value determinations as needed. The investment adviser has established a Fair Value Committee (the Committee) to carry out the day-to-day fair valuation responsibilities and has adopted policies and procedures to govern the fair valuation process and the activities of the Committee. In accordance with these fair valuation policies and procedures, which have been approved by the Board, the Fund attempts to obtain prices from one or more third party pricing services or brokers to value its investments. When current market prices, quotations or currency exchange rates are not readily available or reliable, investments will be fair valued in good faith by the Committee, in accordance with the policies and procedures. Factors used in determining fair value vary by investment type and may include market or investment specific events, transaction data, estimated cash flows, and market observations of comparable investments. The frequency that the fair valuation procedures are used cannot be predicted and they may be utilized to a significant extent. The Committee manages the Fund's fair valuation practices and maintains the fair valuation policies and procedures. The Fund's investment adviser reports to the Board information regarding the fair valuation process and related material matters.
The Fund categorizes the inputs to valuation techniques used to value its investments into a disclosure hierarchy consisting of three levels as shown below:
Level 1 - unadjusted quoted prices in active markets for identical investments
Level 2 - other significant observable inputs (including quoted prices for similar investments, interest rates, prepayment speeds, etc.)
Level 3 - unobservable inputs (including the Fund's own assumptions based on the best information available)
Valuation techniques used to value the Fund's investments by major category are as follows:
Debt securities, including restricted securities, are valued based on evaluated prices received from third party pricing services or from brokers who make markets in such securities. Municipal securities are valued by pricing services who utilize matrix pricing which considers yield or price of bonds of comparable quality, coupon, maturity and type or by broker-supplied prices. When independent prices are unavailable or unreliable, debt securities may be valued utilizing pricing methodologies which consider similar factors that would be used by third party pricing services. Debt securities are generally categorized as Level 2 in the hierarchy but may be Level 3 depending on the circumstances.
ETFs are valued at their last sale price or official closing price as reported by a third party pricing service on the primary market or exchange on which they are traded and are categorized as Level 1 in the hierarchy. In the event there were no sales during the day but the exchange reports a closing bid level, ETFs are valued at the closing bid and would be categorized as Level 1 in the hierarchy. In the event there was no closing bid, ETFs may be valued by another method that the Board believes reflects fair value in accordance with the Board's fair value pricing policies and may be categorized as Level 2 in the hierarchy.
Investments in open-end mutual funds, including the Fidelity Central Funds, are valued at their closing net asset value (NAV) each business day and are categorized as Level 1 in the hierarchy. If an unaffiliated open-end mutual fund's NAV is unavailable, shares of that fund may be valued by another method that the Board believes reflects fair value in accordance with the Board's fair value pricing policies and is categorized as Level 2 in the hierarchy.
Changes in valuation techniques may result in transfers in or out of an assigned level within the disclosure hierarchy. The aggregate value of investments by input level as of November 30, 2024 is included at the end of the Fund's Schedule of Investments.
Investment Transactions and Income. For financial reporting purposes, the Fund's investment holdings and NAV include trades executed through the end of the last business day of the period. The NAV per share for processing shareholder transactions is calculated as of the close of business of the New York Stock Exchange (NYSE), normally 4:00 p.m. Eastern time and includes trades executed through the end of the prior business day. Gains and losses on securities sold are determined on the basis of identified cost. Dividend income is recorded on the ex-dividend date, except for certain dividends from foreign securities where the ex-dividend date may have passed, which are recorded as soon as the Fund is informed of the ex-dividend date. Non-cash dividends included in dividend income, if any, are recorded at the fair market value of the securities received. Income and capital gain distributions from Fidelity Central Funds, if any, are recorded on the ex-dividend date. Income and capital gain distributions from any underlying mutual funds or exchange-traded funds (ETFs) are recorded on the ex-dividend date. Interest income is accrued as earned and includes coupon interest and amortization of premium and accretion of discount on debt securities as applicable. Debt obligations may be placed on non-accrual status and related interest income may be reduced by ceasing current accruals and writing off interest receivables when the collection of all or a portion of interest has become doubtful based on consistently applied procedures. A debt obligation is removed from non-accrual status when the issuer resumes interest payments or when collectability of interest is reasonably assured.
Expenses. Expenses directly attributable to a fund are charged to that fund. Expenses attributable to more than one fund are allocated among the respective funds on the basis of relative net assets or other appropriate methods. Expenses included in the accompanying financial statements reflect the expenses of that fund and do not include any expenses associated with any underlying mutual funds or exchange-traded funds. Although not included in a fund's expenses, a fund indirectly bears its proportionate share of these expenses through the net asset value of each underlying mutual fund or exchange-traded fund. Expense estimates are accrued in the period to which they relate and adjustments are made when actual amounts are known.
Deferred Trustee Compensation. Under a Deferred Compensation Plan (the Plan) for certain Funds, certain independent Trustees have elected to defer receipt of a portion of their annual compensation. Deferred amounts are invested in affiliated mutual funds, are marked-to-market and remain in a fund until distributed in accordance with the Plan. The investment of deferred amounts and the offsetting payable to the Trustees presented below are included in the accompanying Statement of Assets and Liabilities in other receivables and other payables and accrued expenses, as applicable.
| Strategic Advisers Tax-Sensitive Short Duration Fund | $8,384 |
Income Tax Information and Distributions to Shareholders. Each year, the Fund intends to qualify as a regulated investment company under Subchapter M of the Internal Revenue Code, including distributing substantially all of its taxable income and realized gains. As a result, no provision for U.S. Federal income taxes is required. The Fund files a U.S. federal tax return, in addition to state and local tax returns as required. The Fund's federal income tax returns are subject to examination by the Internal Revenue Service (IRS) for a period of three fiscal years after they are filed. State and local tax returns may be subject to examination for an additional fiscal year depending on the jurisdiction.
Distributions are declared and recorded daily and paid monthly from net investment income. Distributions from realized gains, if any, are declared and recorded on the ex-dividend date. Income and capital gain distributions are determined in accordance with income tax regulations, which may differ from GAAP.
Capital accounts within the financial statements are adjusted for permanent book-tax differences. These adjustments have no impact on net assets or the results of operations. Capital accounts are not adjusted for temporary book-tax differences which will reverse in a subsequent period.
Book-tax differences are primarily due to market discount, capital loss carryforwards and losses deferred due to wash sales.
As of period end, the cost and unrealized appreciation (depreciation) in securities, and derivatives if applicable, for federal income tax purposes were as follows:
| Gross unrealized appreciation | $8,721,566 |
| Gross unrealized depreciation | (8,849,661) |
| Net unrealized appreciation (depreciation) | $(128,095) |
| Tax cost | $3,626,798,394 |
Capital loss carryforwards are only available to offset future capital gains of the Fund to the extent provided by regulations and may be limited. The capital loss carryforward information presented below, including any applicable limitation, is estimated as of prior fiscal period end and is subject to adjustment.
Short-term | $(4,042,251) |
Long-term | (11,014,237) |
| Total capital loss carryforward | $(15,056,488) |
Delayed Delivery Transactions and When-Issued Securities. During the period, certain Funds transacted in securities on a delayed delivery or when-issued basis. Payment and delivery may take place after the customary settlement period for that security. The price of the underlying securities and the date when the securities will be delivered and paid for are fixed at the time the transaction is negotiated. Securities purchased on a delayed delivery or when-issued basis are identified as such in the Schedule of Investments. Compensation for interest forgone in the purchase of a delayed delivery or when-issued debt security may be received. With respect to purchase commitments, each applicable Fund identifies securities as segregated in its records with a value at least equal to the amount of the commitment. Payables and receivables associated with the purchases and sales of delayed delivery securities having the same coupon, settlement date and broker are offset. Delayed delivery or when-issued securities that have been purchased from and sold to different brokers are reflected as both payables and receivables in the Statement of Assets and Liabilities under the caption "Delayed delivery", as applicable. Losses may arise due to changes in the value of the underlying securities or if the counterparty does not perform under the contract's terms, or if the issuer does not issue the securities due to political, economic, or other factors.
Restricted Securities (including Private Placements). Funds may invest in securities that are subject to legal or contractual restrictions on resale. These securities generally may be resold in transactions exempt from registration or to the public if the securities are registered. Disposal of these securities may involve time-consuming negotiations and expense, and prompt sale at an acceptable price may be difficult. Information regarding restricted securities held at period end is included at the end of the Schedule of Investments, if applicable.
New Accounting Pronouncement. In November 2023, the FASB issued Accounting Standards Update (ASU) 2023-07 Segment Reporting (Topic 280): Improvements to Reportable Segment Disclosures. Effective for fiscal years beginning after December 15, 2023 and interim periods within fiscal years beginning after December 15, 2024, the amendments enhance required disclosures of segment information for public entities on an annual and interim basis. The ASU allows for early adoption with updates applied retrospectively. Management is currently evaluating the impact of the ASU but does not expect this guidance to materially impact the financial statements.
3.Purchases and Sales of Investments.
Purchases and sales of securities, other than short-term securities and in-kind transactions, as applicable, are noted in the table below.
| | Purchases ($) | Sales ($) |
| Strategic Advisers Tax-Sensitive Short Duration Fund | 1,123,271,962 | 1,319,524,176 |
4.Fees and Other Transactions with Affiliates.
Management Fee. Strategic Advisers (the investment adviser) provides the Fund with investment management related services. For these services, the Fund pays a monthly management fee to the investment adviser. The management fee is calculated by adding the annual management fee rate of .25% of the Fund's average net assets throughout the month to the aggregate of the fee rates, payable monthly by the investment adviser, to the Fund's sub-advisers. The Fund's maximum aggregate management fee will not exceed .55% of the Fund's average net assets. For the reporting period, the total annualized management fee rate was .32% of the Fund's average net assets.
During the period, the investment adviser waived a portion of its management fee as described in the Expense Reductions note.
Sub-Advisers. FIAM LLC (an affiliate of the investment adviser), T. Rowe Price Associates, Inc. and Allspring Global Investments, LLC each served as a sub-adviser for the Fund during the period. Sub-advisers provide discretionary investment advisory services for their allocated portion of the Fund's assets and are paid as described in the Management Fee note.
Effective January 1, 2025, the sub-subadvisory agreements between FIAM LLC (FIAM) and each of FMR Investment Management (UK) Limited, Fidelity Management & Research (Hong Kong) Limited, and Fidelity Management & Research (Japan) Limited (collectively, the Sub-Subadvisers) were amended. FIAM or an affiliate, and not the fund, pays the Sub-Subadvisers. Under the terms of the sub-subadvisory agreements, FIAM or an affiliate pays each Sub-Subadviser monthly fees equal to 110% of the Sub-Subadviser's costs for providing sub-subadvisory services.
Interfund Trades. Funds may purchase from or sell securities to other funds affiliated with each sub-adviser under procedures adopted by the Board. The procedures have been designed to ensure these interfund trades are executed in accordance with Rule 17a-7 of the 1940 Act. Any interfund trades are included within the respective purchases and sales amounts shown in the Purchases and Sales of Investments note. Interfund trades during the period are noted in the table below.
| | Purchases ($) | Sales ($) | Realized Gain (Loss)($) |
| Strategic Advisers Tax-Sensitive Short Duration Fund | 19,720,000 | 355,264 | (812) |
5.Investments in Fidelity Central Funds.
Funds may invest in Fidelity Central Funds, which are open-end investment companies generally available only to other investment companies and accounts managed by the investment adviser and its affiliates. The Schedule of Investments lists any Fidelity Central Funds held as an investment as of period end, but does not include the underlying holdings of each Fidelity Central Fund. An investing fund indirectly bears its proportionate share of the expenses of the underlying Fidelity Central Funds.
Based on its investment objective, each Fidelity Central Fund may invest or participate in various investment vehicles or strategies that are similar to those of the investing fund. These strategies are consistent with the investment objectives of the investing fund and may involve certain economic risks which may cause a decline in value of each of the Fidelity Central Funds and thus a decline in the value of the investing fund.
| Fidelity Central Fund | Investment Manager | Investment Objective | Investment Practices | Expense RatioA |
| Fidelity Money Market Central Funds | Fidelity Management & Research Company LLC (FMR) | Each fund seeks to obtain a high level of current income consistent with the preservation of capital and liquidity. | Short-term Investments | Less than .005% |
A Expenses expressed as a percentage of average net assets and are as of each underlying Central Fund's most recent annual or semi-annual shareholder report.
A complete unaudited list of holdings for each Fidelity Central Fund is available upon request or at the Securities and Exchange Commission website at www.sec.gov. In addition, the financial statements of the Fidelity Central Funds, which are not covered by the Report of Independent Registered Public Accounting Firm, are available on the Securities and Exchange Commission website or upon request.
6.Committed Line of Credit.
Certain Funds participate with other funds managed by the investment adviser or an affiliate in a $4.25 billion credit facility (the "line of credit") to be utilized for temporary or emergency purposes to fund shareholder redemptions or for other short-term liquidity purposes. The participating funds have agreed to pay commitment fees on their pro-rata portion of the line of credit, which are reflected in Miscellaneous expenses on the Statement of Operations, and are listed below. During the period, there were no borrowings on this line of credit.
| | Amount ($) |
| Strategic Advisers Tax-Sensitive Short Duration Fund | 2,551 |
7.Expense Reductions.
The investment adviser has contractually agreed to waive the Fund's management fee in an amount equal to .25% of the Fund's average net assets until September 30, 2027. During the period, this waiver reduced the Fund's management fee by $4,614,383. Expense reductions also include certain voluntary fee discount arrangements, which are currently in effect for the Fund. During the period, these voluntary arrangements amounted to $44,495.
Through arrangements with the Fund's custodian, credits realized as a result of certain uninvested cash balances were used to reduce the Fund's expenses by $19,966.
8.Other.
A fund's organizational documents provide former and current trustees and officers with a limited indemnification against liabilities arising in connection with the performance of their duties to the fund. In the normal course of business, a fund may also enter into contracts that provide general indemnifications. A fund's maximum exposure under these arrangements is unknown as this would be dependent on future claims that may be made against a fund. The risk of material loss from such claims is considered remote.
Funds do not invest in underlying mutual funds for the purpose of exercising management or control; however, investments by funds within their principal investment strategies may represent a significant portion of the underlying mutual fund's net assets. At the end of the period, certain Funds were the owners of record of 10% or more of the total outstanding shares of the following underlying mutual funds as shown below.
| | Strategic Advisers Tax-Sensitive Short Duration Fund |
| Fidelity SAI Municipal Money Market Fund | 100% |
9.Risk and Uncertainties.
Many factors affect a fund's performance. Developments that disrupt global economies and financial markets, such as pandemics, epidemics, outbreaks of infectious diseases, war, terrorism, and environmental disasters, may significantly affect a fund's investment performance. The effects of these developments to a fund will be impacted by the types of securities in which a fund invests, the financial condition, industry, economic sector, and geographic location of an issuer, and a fund's level of investment in the securities of that issuer. Significant concentrations in security types, issuers, industries, sectors, and geographic locations may magnify the factors that affect a fund's performance.
Item 8: Changes in and Disagreements with Accountants for Open-End Management Investment Companies
(Unaudited)
Note: This is not applicable for any fund included in this document.
Item 9: Proxy Disclosures for Open-End Management Investment Companies
(Unaudited)
| A special meeting of shareholders was held on July 9, 2024. The results of votes taken among shareholders on the proposal before them are reported below. Each vote reported represents one dollar of net asset value held on the record date for the meeting. |
| Proposal 1 |
| To elect a Board of Trustees. |
| | # of Votes | % of Votes |
| Charles S. Morrison |
| Affirmative | 381,775,585,183.64 | 95.17 |
| Withheld | 19,363,639,577.49 | 4.83 |
| TOTAL | 401,139,224,761.13 | 100.00 |
| Nancy D. Prior |
| Affirmative | 381,252,305,731.53 | 95.04 |
| Withheld | 19,886,919,029.60 | 4.96 |
| TOTAL | 401,139,224,761.13 | 100.00 |
| Mary C. Farrell |
| Affirmative | 381,226,030,239.11 | 95.04 |
| Withheld | 19,913,194,522.02 | 4.96 |
| TOTAL | 401,139,224,761.13 | 100.00 |
| Karen Kaplan |
| Affirmative | 381,519,946,847.38 | 95.11 |
| Withheld | 19,619,277,913.75 | 4.89 |
| TOTAL | 401,139,224,761.13 | 100.00 |
| Christine Marcks |
| Affirmative | 380,186,327,029.51 | 94.78 |
| Withheld | 20,952,897,731.62 | 5.22 |
| TOTAL | 401,139,224,761.13 | 100.00 |
| Harold Singleton III |
| Affirmative | 382,499,458,473.65 | 95.35 |
| Withheld | 18,639,766,287.48 | 4.65 |
| TOTAL | 401,139,224,761.13 | 100.00 |
| Heidi L. Steiger |
| Affirmative | 380,661,676,515.00 | 94.90 |
| Withheld | 20,477,548,246.13 | 5.10 |
| TOTAL | 401,139,224,761.13 | 100.00 |
| | | |
| Proposal 1 reflects trust-wide proposal and voting results. |
Item 10: Remuneration Paid to Directors, Officers, and others of Open-End Management Investment Companies
(Unaudited)
Note: This information is disclosed as part of the financial statements for each Fund as part of Item 7: Financial Statements and Financial Highlights for Open-End Management Investment companies.
Item 11: Statement Regarding Basis for Approval of Investment Advisory Contract
(Unaudited)
Board Approval of Investment Advisory Contracts and Management Fees
Strategic Advisers Tax-Sensitive Short Duration Fund
Each year, the Board of Trustees, including the Independent Trustees (together, the Board), considers the renewal of the fund's management contract with Strategic Advisers LLC (Strategic Advisers), the sub-advisory agreements with Allspring Global Investments, LLC, FIAM LLC, and T. Rowe Price Associates, Inc. (each a Sub-Adviser and collectively, the Sub-Advisers) (collectively, the Sub-Advisory Agreements), and the sub-sub-advisory agreements with FMR Investment Management (UK) Limited, Fidelity Management & Research (Japan) Limited, and Fidelity Management & Research (Hong Kong) Limited (each a Sub-Sub-Adviser and collectively, the Sub-Sub-Advisers) (collectively, the Sub-Sub-Advisory Agreements and, together with the management contract and the Sub-Advisory Agreements, the Advisory Contracts) for the fund. Strategic Advisers and the Sub-Advisers and Sub-Sub-Advisers, as applicable, are referred to herein as the Investment Advisers. The Board, assisted by the advice of fund counsel and Independent Trustees' counsel, requests and considers a broad range of information relevant to the renewal of the Advisory Contracts throughout the year.
The Board meets at least four times per year and, at each of its meetings, covers an extensive agenda of topics and materials and considers factors that are relevant to its annual consideration of the renewal of the fund's Advisory Contracts, including the services and support provided to the fund and its shareholders. The full Board or the Independent Trustees, as appropriate, act on all major matters; however, a portion of the activities of the Board (including certain of those described herein) may be conducted through standing committees that have been established by the Board. The Board, acting directly and through its committees, requests and receives information concerning the annual consideration of the renewal of the fund's Advisory Contracts.
At its September 2024 meeting, the Board, including the Independent Trustees, unanimously determined to renew the fund's Advisory Contracts. The Board also approved updating the address for notice of Strategic Advisers LLC in each Sub-Advisory Agreement. In reaching its determination to renew the fund's Advisory Contracts, the Board considered all factors it believed relevant, including (i) the nature, extent, and quality of the services provided to the fund and its shareholders (including the investment performance of the fund); (ii) the competitiveness relative to peer funds of the fund's management fee and total expenses; (iii) the total costs of the services provided by and the profits, if any, realized by Strategic Advisers from its relationships with the fund; and (iv) the extent to which, if any, economies of scale exist and are realized as the fund grows and whether any economies of scale are appropriately shared with fund shareholders. The Board's decision to renew the Advisory Contracts was not based on any single factor, but rather was based on a comprehensive consideration of all the information provided to the Board throughout the year.
The Board reached a determination, with the assistance of fund counsel and Independent Trustees' counsel and through the exercise of its business judgment, that the renewal of the Advisory Contracts is in the best interests of the fund and its shareholders. In addition, the Board concluded that the renewal of each Sub-Advisory Agreement and Sub-Sub-Advisory Agreement does not involve a conflict of interest from which Strategic Advisers or its affiliates derive an inappropriate advantage. Also, the Board found that the advisory fees charged under the Advisory Contracts bear a reasonable relationship to the services rendered.
Nature, Extent, and Quality of Services Provided. The Board considered the staffing within the Investment Advisers, including the backgrounds of the fund's investment personnel and also considered the fund's investment objective, strategies, and related investment philosophy. The Independent Trustees also had discussions with senior management of Strategic Advisers' investment operations and investment groups. The Board considered the structure of each Investment Adviser's investment personnel compensation program and whether such structures provide appropriate incentives to act in the best interests of the fund.
The Trustees also discussed with representatives of Strategic Advisers, at meetings throughout the year, Strategic Advisers' role in, among other things, (i) setting, implementing and monitoring the investment strategies for the funds; (ii) identifying and recommending sub-advisers for the funds; (iii) overseeing compliance with federal securities laws by each sub-adviser with respect to the portion of fund assets allocated to the sub-adviser; (iv) monitoring and overseeing the performance and investment capabilities of each sub-adviser; and (v) recommending the replacement of a sub-adviser as appropriate. The Trustees considered that the Board had received from Strategic Advisers substantial information and periodic reports about Strategic Advisers' sub-adviser oversight and due diligence processes, as well as periodic reports regarding the performance of each sub-adviser.
The Board also considered the nature, extent and quality of services provided by each Sub-Adviser. The Trustees noted that under the Sub-Advisory Agreements subject to oversight by Strategic Advisers, each Sub-Adviser is responsible for, among other things, identifying investments for the portion of fund assets allocated to the Sub-Adviser, if any, and executing portfolio transactions to implement its investment strategy. In addition, the Trustees noted that each Sub-Adviser is responsible for providing such reporting as may be requested from Strategic Advisers to fulfill its oversight responsibilities discussed above.
Resources Dedicated to Investment Management and Support Services. The Board reviewed the general qualifications and capabilities of the Investment Advisers' investment staffs, their use of technology, and the Investment Advisers' approach to managing and compensating investment personnel. The Board noted that the Investment Advisers' analysts have extensive resources, tools, and capabilities that allow them to conduct sophisticated quantitative and/or fundamental analysis. Additionally, in its deliberations, the Board considered the Investment Advisers' trading capabilities and resources and global compliance infrastructure, which are integral parts of the investment management process.
Shareholder and Administrative Services. The Board considered (i) the nature, extent, quality, and cost of administrative and shareholder services performed by Strategic Advisers and its affiliates under the management contract and under separate agreements covering transfer agency and pricing and bookkeeping services for the fund; (ii) the nature and extent of Strategic Advisers' supervision of third party service providers, including sub-advisers, custodians and subcustodians; and (iii) the resources devoted to, and the record of compliance with, the fund's compliance policies and procedures.
Investment Performance. In connection with the renewal of the Advisory Contracts, the Board considered annualized return information for the fund over different time periods, measured against an appropriate securities market index (benchmark index) and a peer group of mutual funds with similar objectives (peer group).
The Board considered discussions that occur at Board meetings throughout the year with representatives of Strategic Advisers about fund investment performance and the performance of each Sub-Adviser as part of regularly scheduled fund reviews and other reports to the Board on fund performance, taking into account various factors including general market conditions. The Board also considered information about performance attribution. In its discussions with representatives of Strategic Advisers regarding fund performance, the Board gave particular attention to information indicating underperformance of certain funds over different time periods and discussed with Strategic Advisers the reasons for any such underperformance.
In addition to reviewing absolute and relative fund performance, the Independent Trustees periodically consider the appropriateness of fund performance metrics in evaluating the results achieved. The Independent Trustees generally give greater weight to fund performance over longer time periods than over shorter time periods. Depending on the circumstances, the Independent Trustees may be satisfied with the fund's performance notwithstanding that it lags its benchmark index peer group for certain periods.
Based on its review, the Board concluded that the nature, extent, and quality of services provided to the fund under the Advisory Contracts should continue to benefit the shareholders of the fund.
Competitiveness of Management Fee and Total Fund Expenses. The Board considered the amount and nature of fees paid to the Investment Advisers. The Board noted that the Sub-Sub-Advisers are compensated by the applicable Sub-Advisers and the Fund and Strategic Advisers are not responsible for any such fees or expenses. The Board also considered information comparing the management fees and total expenses of the fund to those of other registered investment companies with investment objectives similar to those of the fund, as discussed below. The Board also noted Strategic Advisers' proposal to extend the management fee waiver and considered the fund's contractual maximum aggregate annual management fee rate. In considering the fund's management fee and management fee waiver and comparisons to other registered investment companies with investment objectives similar to those of the fund, the Board noted that shares of the fund are offered only to clients that participate in the Fidelity Portfolio Advisory Service managed account program. In its review of the fund's total expenses, the Board considered the fund's management fee rate as well as other fund expenses, as applicable, such as expenses from holding Fidelity and non-Fidelity mutual funds and ETFs, pricing and bookkeeping fees, and custodial, legal, and audit fees.
Comparisons of Management Fees and Total Expense Ratios. Among other things, the Board reviewed data for selected groups of competitive funds and classes (referred to as "mapped groups") that were compiled by Fidelity based on combining similar investment objective categories (as classified by Lipper) that have comparable investment mandates. The data reviewed by the Board included (i) gross management fee comparisons (before taking into account expense reimbursements or caps) relative to the total universe of funds within the mapped group; (ii) gross management fee comparisons relative to a subset of non-Strategic Advisers funds in the mapped group that are similar in size and management fee structure to the fund (referred to as the "asset size peer group"); (iii) total expense comparisons of the fund relative to funds and classes in the mapped group that have a similar sales load structure to the fund (referred to as the "similar sales load structure group"); and (iv) total expense comparisons of the fund relative to funds and classes in the similar sales load structure group that are similar in size and management fee structure to each fund (referred to as the "total expense asset size peer group").
The information provided to the Board indicated that the fund's management fee rate ranked below the competitive median of the mapped group for the 12-month period ended December 31, 2023 and below the competitive median of the asset size peer group for the 12-month period ended December 31, 2023. Further, the information provided to the Board indicated that the total expense ratio of the fund ranked below the competitive median of the similar sales load structure group for the 12-month period ended December 31, 2023 and below the competitive median of the total expense asset size peer group for the 12-month period ended December 31, 2023.
Fees Charged to Other Clients. The Board also considered fee structures paid by the Investment Advisers' other clients, such as other funds advised or subadvised by the Investment Advisers, pension plan clients, and other institutional clients with similar investment mandates.
Based on its review, the Board concluded that the fund's management fee bears a reasonable relationship to the services rendered. Further, based on its review of the total expense ratios and fees charged to other clients of Strategic Advisers or its affiliates and each Sub-Adviser, the Board concluded that the total expenses of the fund were reasonable in light of the services that the fund and its shareholders receive and the other factors considered.
Costs of the Services and Profitability. The Board considered information regarding the revenues earned and the expenses incurred by Strategic Advisers and its affiliates in conducting the business of developing, marketing, distributing, managing, administering and servicing the fund and servicing the fund's shareholders.
On an annual basis, Strategic Advisers presents to the Board information about the profitability of its relationships with the fund. Strategic Advisers calculates profitability information for the fund using a series of detailed revenue and cost allocation methodologies. The Board reviews any significant changes from the prior year's methodologies. Strategic Advisers noted that, to the extent possible, it employs the same corporate reporting of revenues and expenses as those used by other Fidelity funds.
A public accounting firm has been engaged annually by the Board as part of the Board's assessment of Fidelity's profitability analysis. The engagement includes the review and assessment of the methodologies used by Fidelity in determining the revenues and expenses attributable to Fidelity's fund business. After considering the reports issued under the engagement and information provided by Fidelity, the Board concluded that while other allocation methods may also be reasonable, Fidelity's profitability methodologies are reasonable in all material respects.
The Board also reviewed Fidelity's non-fund businesses and potential indirect benefits such businesses may have received as a result of their association with Fidelity's fund business (i.e., fall-out benefits) as well as cases where Fidelity's affiliates may benefit from the fund's business. The Board noted that changes to fall-out benefits year-over-year reflect business developments at Fidelity's various businesses.
The Board considered the costs of the services provided by and the profits realized, if any, by Strategic Advisers and its affiliates in connection with the operation of the fund and was satisfied that the profitability was not excessive.
The Board also considered information regarding the profitability of the Sub-Advisers' respective relationships with the fund and the potential fall-out benefits, if any, that may accrue to the Sub-Advisers as a result of their respective relationships with the fund. The Board noted the difficulty in evaluating a Sub-Adviser's costs and the profitability of a Sub-Advisory Agreement to a Sub-Adviser because of, among other things, differences in the type and content of information provided by each Sub-Adviser due to differences in business models, cost accounting methods, and profitability calculation methodologies among the Sub-Advisers. Accordingly, the Board considered profitability information provided by the Sub-Advisers in light of the nature of the relationships between Strategic Advisers and the Sub-Advisers with respect to the negotiation of sub-advisory fees.
Possible Economies of Scale. The Board considered whether there have been economies of scale in respect of the management of the Strategic Advisers funds, whether the Strategic Advisers funds (including the fund) have appropriately benefited from any such economies of scale, and whether there is potential for realization of any further economies of scale as assets grow through increased services to the fund, through waivers or reimbursements, or through fee or expense ratio reductions. The Board considered that the fund's Sub-Advisory Agreements provide for breakpoints as the fund's assets grow and noted that any potential decline in sub-advisory fees under such contracts would accrue directly to the fund. The Board also took Strategic Advisers' management fee waiver into consideration.
Conclusion. Based on its evaluation of all of the conclusions noted above, and after considering all factors it believed relevant, the Board concluded that the advisory fee arrangements bear a reasonable relationship to the services rendered and that the fund's Advisory Contracts should be renewed because each agreement is in the best interests of the fund and its shareholders. In addition, the Board concluded that the renewal of each Sub-Advisory Agreement and Sub-Sub-Advisory Agreement does not involve a conflict of interest from which Strategic Advisers or its affiliates derive an inappropriate advantage.
1.9885905.106
TSS-SANN-0125
Strategic Advisers® Fidelity® Core Income Fund
Offered exclusively to certain managed account clients of Strategic Advisers LLC or its affiliates - not available for sale to the general public
Semi-Annual Report
November 30, 2024
Contents
To view a fund's proxy voting guidelines and proxy voting record for the 12-month period ended June 30, visit http://www.fidelity.com/proxyvotingresults or visit the Securities and Exchange Commission's (SEC) web site at http://www.sec.gov.
You may also call 1-800-544-3455 to request a free copy of the proxy voting guidelines.
Standard & Poor's, S&P and S&P 500 are registered service marks of The McGraw-Hill Companies, Inc. and have been licensed for use by Fidelity Distributors Corporation.
Other third-party marks appearing herein are the property of their respective owners.
All other marks appearing herein are registered or unregistered trademarks or service marks of FMR LLC or an affiliated company. © 2025 FMR LLC. All rights reserved.
This report and the financial statements contained herein are submitted for the general information of the shareholders of the Fund. This report is not authorized for distribution to prospective investors in the Fund unless preceded or accompanied by an effective prospectus.
A fund files its complete schedule of portfolio holdings with the SEC for the first and third quarters of each fiscal year on Form N-PORT. Forms N-PORT are available on the SEC's web site at http://www.sec.gov. A fund's Forms N-PORT may be reviewed and copied at the SEC's Public Reference Room in Washington, DC. Information regarding the operation of the SEC's Public Reference Room may be obtained by calling 1-800-SEC-0330.
For a complete list of a fund's portfolio holdings, view the most recent holdings listing, semiannual report, or annual report on Fidelity's web site at http://www.fidelity.com, http://www.institutional.fidelity.com, or http://www.401k.com, as applicable.
NOT FDIC INSURED •MAY LOSE VALUE •NO BANK GUARANTEE
Neither the Fund nor Fidelity Distributors Corporation is a bank.
Item 7: Financial Statements and Financial Highlights for Open-End Management Investment Companies (Semi-Annual Report)
Strategic Advisers® Fidelity® Core Income Fund
Schedule of Investments November 30, 2024 (Unaudited)
Showing Percentage of Net Assets
| Nonconvertible Bonds - 13.3% |
| | | Principal Amount (a) | Value ($) |
| COMMUNICATION SERVICES - 0.9% | | | |
| Diversified Telecommunication Services - 0.3% | | | |
| Altice France SA 5.125% 7/15/29 (b) | | 1,325,000 | 1,009,751 |
| AT&T, Inc.: | | | |
| 1.65% 2/1/28 | | 2,253,000 | 2,056,621 |
| 2.25% 2/1/32 | | 8,095,000 | 6,820,556 |
| 2.55% 12/1/33 | | 18,825,000 | 15,513,599 |
| 2.75% 6/1/31 | | 7,200,000 | 6,388,143 |
| 3.55% 9/15/55 | | 11,426,000 | 8,119,714 |
| 3.65% 9/15/59 | | 2,396,000 | 1,694,931 |
| 3.8% 12/1/57 | | 49,962,000 | 36,768,708 |
| 4.3% 2/15/30 | | 7,106,000 | 6,964,564 |
| 4.5% 5/15/35 | | 2,388,000 | 2,269,167 |
| 4.75% 5/15/46 | | 41,310,000 | 37,561,129 |
| 5.4% 2/15/34 | | 5,000,000 | 5,140,115 |
| Cogent Communications Group, Inc. 7% 6/15/27 (b) | | 1,010,000 | 1,024,992 |
| Frontier Communications Holdings LLC 5.875% 10/15/27 (b) | | 435,000 | 435,520 |
| IHS Holding Ltd.: | | | |
| 7.875% 5/29/30 (b) | | 280,000 | 275,100 |
| 8.25% 11/29/31 (b) | | 280,000 | 275,187 |
| Iliad Holding SAS 7% 4/15/32 (b)(c) | | 275,000 | 277,966 |
| Koninklijke KPN NV 3.875% 2/16/36 (Reg. S) | EUR | 300,000 | 331,792 |
| Level 3 Financing, Inc.: | | | |
| 3.875% 10/15/30 (b) | | 85,000 | 67,788 |
| 10.5% 5/15/30 (b) | | 154,000 | 169,015 |
| 11% 11/15/29 (b) | | 46,903 | 53,295 |
| NTT Finance Corp.: | | | |
| 1.162% 4/3/26 (b) | | 2,595,000 | 2,479,953 |
| 1.591% 4/3/28 (b) | | 3,586,000 | 3,239,745 |
| Sable International Finance Ltd. 7.125% 10/15/32 (b) | | 690,000 | 690,090 |
| Sprint Capital Corp. 8.75% 3/15/32 | | 2,165,000 | 2,630,993 |
| Telenet Finance Luxembourg Notes SARL 5.5% 3/1/28 (b) | | 600,000 | 583,068 |
| Verizon Communications, Inc.: | | | |
| 2.1% 3/22/28 | | 2,703,000 | 2,493,741 |
| 2.355% 3/15/32 | | 21,895,000 | 18,476,021 |
| 2.55% 3/21/31 | | 3,016,000 | 2,637,103 |
| 2.987% 10/30/56 | | 1,378,000 | 872,032 |
| 3% 11/20/60 | | 5,215,000 | 3,231,694 |
| 3.15% 3/22/30 | | 449,000 | 415,519 |
| 3.7% 3/22/61 | | 7,473,000 | 5,425,757 |
| 3.75% 2/28/36 | EUR | 625,000 | 685,301 |
| 4.4% 11/1/34 | | 8,120,000 | 7,734,794 |
| 4.862% 8/21/46 | | 5,000,000 | 4,668,040 |
| Virgin Media Finance PLC 5% 7/15/30 (b) | | 1,336,000 | 1,139,495 |
| | | | 190,620,999 |
| Entertainment - 0.0% | | | |
| Roblox Corp. 3.875% 5/1/30 (b) | | 1,070,000 | 972,519 |
| The Walt Disney Co. 6.65% 11/15/37 | | 5,862,000 | 6,739,040 |
| Universal Music Group NV 4% 6/13/31 (Reg. S) | EUR | 600,000 | 668,592 |
| | | | 8,380,151 |
| Media - 0.5% | | | |
| Advantage Sales & Marketing, Inc. 6.5% 11/15/28 (b) | | 940,000 | 900,513 |
| CCO Holdings LLC/CCO Holdings Capital Corp.: | | | |
| 4.5% 8/15/30 (b) | | 8,220,000 | 7,480,403 |
| 4.5% 5/1/32 | | 4,180,000 | 3,693,215 |
| 5% 2/1/28 (b) | | 4,201,000 | 4,105,173 |
| Charter Communications Operating LLC/Charter Communications Operating Capital Corp.: | | | |
| 2.3% 2/1/32 | | 16,509,000 | 13,336,654 |
| 2.8% 4/1/31 | | 25,100,000 | 21,524,668 |
| 3.7% 4/1/51 | | 4,546,000 | 3,013,306 |
| 3.75% 2/15/28 | | 7,200,000 | 6,912,902 |
| 3.85% 4/1/61 | | 5,293,000 | 3,382,960 |
| 4.2% 3/15/28 | | 1,724,000 | 1,675,814 |
| 4.8% 3/1/50 | | 3,801,000 | 3,000,668 |
| 4.908% 7/23/25 | | 384,000 | 383,794 |
| 5.05% 3/30/29 | | 4,840,000 | 4,795,879 |
| 5.25% 4/1/53 | | 12,482,000 | 10,568,751 |
| 5.375% 5/1/47 | | 49,708,000 | 42,458,505 |
| 5.5% 4/1/63 | | 2,304,000 | 1,924,443 |
| 6.1% 6/1/29 | | 17,861,000 | 18,376,328 |
| 6.55% 6/1/34 | | 12,270,000 | 12,862,698 |
| Comcast Corp.: | | | |
| 2.937% 11/1/56 | | 1,612,000 | 1,011,632 |
| 2.987% 11/1/63 | | 6,248,000 | 3,791,289 |
| 3.75% 4/1/40 | | 1,000,000 | 838,405 |
| 3.999% 11/1/49 | | 889,000 | 716,425 |
| CSC Holdings LLC 6.5% 2/1/29 (b) | | 805,000 | 690,307 |
| Discovery Communications LLC: | | | |
| 3.625% 5/15/30 | | 6,977,000 | 6,310,273 |
| 3.95% 3/20/28 | | 8,095,000 | 7,741,537 |
| 4.125% 5/15/29 | | 524,000 | 495,300 |
| 4.65% 5/15/50 | | 2,079,000 | 1,561,809 |
| Gray Television, Inc. 4.75% 10/15/30 (b) | | 445,000 | 262,889 |
| Lamar Media Corp. 3.625% 1/15/31 | | 815,000 | 727,388 |
| LCPR Senior Secured Financing DAC 5.125% 7/15/29 (b) | | 1,910,000 | 1,567,809 |
| Nexstar Media, Inc. 5.625% 7/15/27 (b) | | 1,940,000 | 1,911,848 |
| Scripps Escrow II, Inc. 3.875% 1/15/29 (b) | | 425,000 | 304,649 |
| Sirius XM Radio, Inc.: | | | |
| 4.125% 7/1/30 (b) | | 10,000,000 | 9,022,397 |
| 5% 8/1/27 (b) | | 1,705,000 | 1,675,495 |
| TEGNA, Inc.: | | | |
| 4.625% 3/15/28 | | 1,615,000 | 1,535,230 |
| 5% 9/15/29 | | 115,000 | 108,688 |
| Time Warner Cable LLC: | | | |
| 4.5% 9/15/42 | | 886,000 | 692,410 |
| 5.5% 9/1/41 | | 13,379,000 | 11,780,694 |
| 5.875% 11/15/40 | | 12,748,000 | 11,769,768 |
| 6.55% 5/1/37 | | 7,048,000 | 7,003,084 |
| 6.75% 6/15/39 | | 5,390,000 | 5,455,557 |
| 7.3% 7/1/38 | | 8,091,000 | 8,523,449 |
| Univision Communications, Inc. 8% 8/15/28 (b) | | 650,000 | 663,280 |
| Virgin Media Secured Finance PLC 5.5% 5/15/29 (b) | | 415,000 | 393,933 |
| Warnermedia Holdings, Inc.: | | | |
| 3.755% 3/15/27 | | 17,094,000 | 16,555,692 |
| 4.054% 3/15/29 | | 6,141,000 | 5,809,168 |
| 4.279% 3/15/32 | | 52,515,000 | 47,388,254 |
| 4.693% 5/17/33 (Reg. S) | EUR | 1,100,000 | 1,201,853 |
| 5.05% 3/15/42 | | 9,304,000 | 7,860,823 |
| 5.141% 3/15/52 | | 41,687,000 | 33,510,323 |
| 5.391% 3/15/62 | | 3,419,000 | 2,725,700 |
| Ziggo Bond Co. BV 5.125% 2/28/30 (b) | | 745,000 | 673,212 |
| Ziggo BV 4.875% 1/15/30 (b) | | 265,000 | 244,763 |
| | | | 362,922,007 |
| Wireless Telecommunication Services - 0.1% | | | |
| C&W Senior Finance Ltd. 6.875% 9/15/27 (b) | | 1,232,000 | 1,222,176 |
| Millicom International Cellular SA: | | | |
| 4.5% 4/27/31 (b) | | 6,146,000 | 5,451,502 |
| 5.125% 1/15/28 (b) | | 1,170,000 | 1,128,325 |
| Rogers Communications, Inc.: | | | |
| 3.2% 3/15/27 | | 2,876,000 | 2,780,354 |
| 3.8% 3/15/32 | | 7,438,000 | 6,825,988 |
| 4.55% 3/15/52 | | 9,856,000 | 8,356,182 |
| T-Mobile U.S.A., Inc.: | | | |
| 2.4% 3/15/29 | | 1,208,000 | 1,096,713 |
| 2.625% 4/15/26 | | 2,931,000 | 2,850,224 |
| 2.7% 3/15/32 | | 13,401,000 | 11,574,467 |
| 2.875% 2/15/31 | | 1,445,000 | 1,281,882 |
| 3.5% 4/15/25 | | 1,448,000 | 1,440,365 |
| 3.75% 4/15/27 | | 10,840,000 | 10,619,303 |
| 3.875% 4/15/30 | | 22,877,000 | 21,857,426 |
| 4.2% 10/1/29 | | 6,000,000 | 5,871,134 |
| 5.65% 1/15/53 | | 2,491,000 | 2,541,274 |
| VMED O2 UK Financing I PLC 4.25% 1/31/31 (b) | | 1,895,000 | 1,642,769 |
| Vodafone Group PLC 4.875% 10/3/78 (Reg. S) (d) | GBP | 1,100,000 | 1,389,663 |
| | | | 87,929,747 |
TOTAL COMMUNICATION SERVICES | | | 649,852,904 |
| CONSUMER DISCRETIONARY - 0.6% | | | |
| Automobile Components - 0.0% | | | |
| Clarios Global LP / Clarios U.S. Finance Co. 6.75% 5/15/28 (b) | | 460,000 | 471,315 |
| Dana, Inc. 4.5% 2/15/32 | | 475,000 | 417,535 |
| Macquarie AirFinance Holdings: | | | |
| 6.4% 3/26/29 (b) | | 140,000 | 144,771 |
| 8.125% 3/30/29 (b) | | 635,000 | 669,970 |
| 8.375% 5/1/28 (b) | | 310,000 | 325,775 |
| Patrick Industries, Inc. 6.375% 11/1/32 (b) | | 685,000 | 677,683 |
| Phinia, Inc. 6.75% 4/15/29 (b) | | 330,000 | 338,725 |
| Robert Bosch GmbH 4.375% 6/2/43 (Reg. S) | EUR | 500,000 | 565,212 |
| Schaeffler AG 4.75% 8/14/29 (Reg. S) | EUR | 1,000,000 | 1,072,559 |
| ZF Finance GmbH 2% 5/6/27 (Reg. S) | EUR | 1,400,000 | 1,394,382 |
| ZF North America Capital, Inc. 6.875% 4/14/28 (b) | | 630,000 | 632,878 |
| | | | 6,710,805 |
| Automobiles - 0.2% | | | |
| Ford Motor Co.: | | | |
| 3.25% 2/12/32 | | 7,505,000 | 6,401,486 |
| 5.291% 12/8/46 | | 925,000 | 836,581 |
| General Motors Co.: | | | |
| 5% 4/1/35 | | 1,419,000 | 1,369,910 |
| 5.2% 4/1/45 | | 1,619,000 | 1,479,282 |
| 5.4% 4/1/48 | | 654,000 | 608,713 |
| 5.6% 10/15/32 | | 3,114,000 | 3,210,093 |
| 5.95% 4/1/49 | | 3,089,000 | 3,087,146 |
| 6.125% 10/1/25 | | 1,724,000 | 1,738,120 |
| General Motors Financial Co., Inc.: | | | |
| 1.25% 1/8/26 | | 5,114,000 | 4,917,585 |
| 2.35% 2/26/27 | | 1,414,000 | 1,340,681 |
| 3.1% 1/12/32 | | 7,510,000 | 6,543,892 |
| 4.3% 4/6/29 | | 6,975,000 | 6,788,656 |
| 4.35% 4/9/25 | | 2,069,000 | 2,064,428 |
| 5.4% 4/6/26 | | 7,700,000 | 7,753,285 |
| 5.4% 5/8/27 | | 12,300,000 | 12,467,137 |
| 5.55% 7/15/29 | | 8,500,000 | 8,689,818 |
| 5.85% 4/6/30 | | 10,453,000 | 10,830,766 |
| 6% 1/9/28 | | 1,900,000 | 1,962,992 |
| 6.4% 1/9/33 | | 5,000,000 | 5,304,170 |
| RCI Banque SA 5.5% 10/9/34 (Reg. S) (d) | EUR | 600,000 | 650,788 |
| Stellantis Finance U.S., Inc. 2.691% 9/15/31 (b) | | 6,943,000 | 5,768,893 |
| Thor Industries, Inc. 4% 10/15/29 (b) | | 555,000 | 509,520 |
| Volkswagen Group of America Finance LLC: | | | |
| 1.25% 11/24/25 (b) | | 4,238,000 | 4,095,661 |
| 4.35% 6/8/27 (b) | | 3,394,000 | 3,335,174 |
| 5.7% 9/12/26 (b) | | 8,400,000 | 8,490,569 |
| | | | 110,245,346 |
| Broadline Retail - 0.0% | | | |
| Alibaba Group Holding Ltd.: | | | |
| 2.125% 2/9/31 | | 2,350,000 | 2,015,736 |
| 2.7% 2/9/41 | | 12,255,000 | 8,743,820 |
| John Lewis PLC: | | | |
| 4.25% 12/18/34 (Reg. S) | GBP | 200,000 | 197,339 |
| 6.125% 1/21/25 | GBP | 2,887,000 | 3,675,047 |
| Kohl's Corp. 4.25% 7/17/25 | | 35,000 | 34,522 |
| Marks & Spencer PLC 4.5% 7/10/27 (Reg. S) (e) | GBP | 1,800,000 | 2,211,867 |
| Match Group Holdings II LLC: | | | |
| 3.625% 10/1/31 (b) | | 810,000 | 702,669 |
| 4.125% 8/1/30 (b) | | 170,000 | 153,861 |
| Nordstrom, Inc.: | | | |
| 4.25% 8/1/31 | | 10,000,000 | 8,801,614 |
| 4.375% 4/1/30 | | 1,935,000 | 1,768,001 |
| | | | 28,304,476 |
| Distributors - 0.0% | | | |
| Genuine Parts Co. 2.75% 2/1/32 | | 3,756,000 | 3,225,341 |
| Diversified Consumer Services - 0.0% | | | |
| Massachusetts Institute of Technology 3.885% 7/1/2116 | | 4,116,000 | 3,118,686 |
| Service Corp. International: | | | |
| 5.125% 6/1/29 | | 1,570,000 | 1,544,760 |
| 5.75% 10/15/32 | | 680,000 | 677,480 |
| Sotheby's 7.375% 10/15/27 (b) | | 430,000 | 425,202 |
| Trane Technologies Global Holding Co. Ltd. 5.75% 6/15/43 | | 223,000 | 234,923 |
| | | | 6,001,051 |
| Hotels, Restaurants & Leisure - 0.0% | | | |
| 1011778 BC Unlimited Liability Co./New Red Finance, Inc. 6.125% 6/15/29 (b) | | 2,190,000 | 2,226,188 |
| Aramark Services, Inc. 5% 2/1/28 (b) | | 975,000 | 954,593 |
| Caesars Entertainment, Inc.: | | | |
| 6% 10/15/32 (b) | | 920,000 | 904,316 |
| 6.5% 2/15/32 (b) | | 1,230,000 | 1,254,693 |
| Carnival Corp. 7.625% 3/1/26 (b) | | 915,000 | 920,939 |
| Churchill Downs, Inc. 6.75% 5/1/31 (b) | | 810,000 | 829,166 |
| Compass Group PLC 3.25% 9/16/33 (Reg. S) | EUR | 1,050,000 | 1,127,444 |
| Garden SpinCo Corp. 8.625% 7/20/30 (b) | | 110,000 | 118,492 |
| Hilton Domestic Operating Co., Inc.: | | | |
| 3.625% 2/15/32 (b) | | 660,000 | 581,925 |
| 5.875% 4/1/29 (b) | | 1,300,000 | 1,311,463 |
| Hilton Grand Vacations Borrower Escrow LLC 6.625% 1/15/32 (b) | | 850,000 | 860,158 |
| Hilton Worldwide Finance LLC/Hilton Worldwide Finance Corp. 4.875% 4/1/27 | | 164,000 | 163,091 |
| InterContinental Hotel Group PLC 3.375% 10/8/28 (Reg. S) | GBP | 875,000 | 1,046,949 |
| Life Time, Inc. 6% 11/15/31 (b) | | 915,000 | 915,296 |
| Melco Resorts Finance Ltd. 4.875% 6/6/25 (b) | | 1,200,000 | 1,189,649 |
| NCL Corp. Ltd.: | | | |
| 5.875% 2/15/27 (b) | | 765,000 | 765,797 |
| 8.375% 2/1/28 (b) | | 255,000 | 266,826 |
| Royal Caribbean Cruises Ltd.: | | | |
| 5.375% 7/15/27 (b) | | 245,000 | 244,631 |
| 5.5% 4/1/28 (b) | | 1,555,000 | 1,555,324 |
| 5.625% 9/30/31 (b) | | 910,000 | 911,588 |
| 6% 2/1/33 (b) | | 3,125,000 | 3,164,275 |
| 6.25% 3/15/32 (b) | | 430,000 | 439,308 |
| Station Casinos LLC 6.625% 3/15/32 (b) | | 645,000 | 646,636 |
| Whitbread PLC 2.375% 5/31/27 (Reg. S) | GBP | 1,260,000 | 1,496,553 |
| Wyndham Hotels & Resorts, Inc. 4.375% 8/15/28 (b) | | 490,000 | 469,531 |
| Wynn Resorts Finance LLC / Wynn Resorts Capital Corp.: | | | |
| 6.25% 3/15/33 (b) | | 1,820,000 | 1,815,433 |
| 7.125% 2/15/31 (b) | | 630,000 | 665,391 |
| Yum! Brands, Inc. 3.625% 3/15/31 | | 3,568,000 | 3,230,219 |
| | | | 30,075,874 |
| Household Durables - 0.0% | | | |
| Century Communities, Inc. 3.875% 8/15/29 (b) | | 525,000 | 478,653 |
| LGI Homes, Inc.: | | | |
| 7% 11/15/32 (b) | | 705,000 | 711,331 |
| 8.75% 12/15/28 (b) | | 405,000 | 429,667 |
| Newell Brands, Inc.: | | | |
| 6.375% 5/15/30 | | 455,000 | 463,466 |
| 6.625% 9/15/29 | | 1,995,000 | 2,048,075 |
| 6.625% 5/15/32 | | 390,000 | 396,846 |
| 6.875% 4/1/36 (e) | | 270,000 | 274,514 |
| Tempur Sealy International, Inc.: | | | |
| 3.875% 10/15/31 (b) | | 880,000 | 779,861 |
| 4% 4/15/29 (b) | | 590,000 | 548,580 |
| The Berkeley Group PLC 2.5% 8/11/31 (Reg. S) | GBP | 1,820,000 | 1,863,727 |
| Toll Brothers Finance Corp.: | | | |
| 4.875% 11/15/25 | | 1,517,000 | 1,517,067 |
| 4.875% 3/15/27 | | 739,000 | 740,332 |
| TopBuild Corp. 4.125% 2/15/32 (b) | | 930,000 | 836,003 |
| | | | 11,088,122 |
| Leisure Products - 0.1% | | | |
| Amer Sports Co. 6.75% 2/16/31 (b) | | 435,000 | 444,497 |
| Brunswick Corp. 5.85% 3/18/29 | | 34,500,000 | 35,402,996 |
| Mattel, Inc.: | | | |
| 3.75% 4/1/29 (b) | | 680,000 | 643,197 |
| 6.2% 10/1/40 | | 475,000 | 477,089 |
| | | | 36,967,779 |
| Specialty Retail - 0.2% | | | |
| Advance Auto Parts, Inc.: | | | |
| 1.75% 10/1/27 | | 3,120,000 | 2,783,607 |
| 5.95% 3/9/28 | | 5,301,000 | 5,374,671 |
| Asbury Automotive Group, Inc.: | | | |
| 4.625% 11/15/29 (b) | | 175,000 | 166,150 |
| 5% 2/15/32 (b) | | 390,000 | 362,828 |
| AutoNation, Inc.: | | | |
| 1.95% 8/1/28 | | 7,691,000 | 6,907,492 |
| 2.4% 8/1/31 | | 26,621,000 | 22,213,215 |
| 3.85% 3/1/32 | | 3,363,000 | 3,059,764 |
| 4.75% 6/1/30 | | 1,650,000 | 1,619,222 |
| AutoZone, Inc.: | | | |
| 3.625% 4/15/25 | | 187,000 | 186,056 |
| 4% 4/15/30 | | 19,121,000 | 18,421,858 |
| 6.25% 11/1/28 | | 12,000,000 | 12,662,534 |
| Bath & Body Works, Inc.: | | | |
| 6.625% 10/1/30 (b) | | 2,220,000 | 2,273,118 |
| 6.875% 11/1/35 | | 1,385,000 | 1,448,046 |
| Belron UK Finance PLC 5.75% 10/15/29 (b) | | 690,000 | 690,863 |
| Foot Locker, Inc. 4% 10/1/29 (b) | | 145,000 | 126,053 |
| Gap, Inc. 3.875% 10/1/31 (b) | | 475,000 | 417,698 |
| Group 1 Automotive, Inc. 6.375% 1/15/30 (b) | | 425,000 | 429,796 |
| Hudson Automotive Group 8% 5/15/32 (b) | | 265,000 | 278,019 |
| LCM Investments Holdings 8.25% 8/1/31 (b) | | 360,000 | 376,401 |
| Lowe's Companies, Inc.: | | | |
| 1.7% 9/15/28 | | 1,724,000 | 1,551,214 |
| 3% 10/15/50 | | 7,286,000 | 4,786,414 |
| 3.75% 4/1/32 | | 19,417,000 | 18,105,429 |
| 4.25% 4/1/52 | | 14,990,000 | 12,301,101 |
| 5.625% 4/15/53 | | 12,017,000 | 12,166,212 |
| O'Reilly Automotive, Inc. 4.2% 4/1/30 | | 193,000 | 187,782 |
| Sally Holdings LLC 6.75% 3/1/32 | | 450,000 | 459,512 |
| Specialty Building Products Holdings LLC 7.75% 10/15/29 (b) | | 180,000 | 184,913 |
| The Home Depot, Inc.: | | | |
| 2.5% 4/15/27 | | 123,000 | 117,952 |
| 4.95% 6/25/34 | | 15,500,000 | 15,652,674 |
| 5.95% 4/1/41 | | 527,000 | 572,677 |
| Wand NewCo 3, Inc. 7.625% 1/30/32 (b) | | 545,000 | 564,076 |
| | | | 146,447,347 |
| Textiles, Apparel & Luxury Goods - 0.1% | | | |
| Crocs, Inc. 4.125% 8/15/31 (b) | | 485,000 | 425,676 |
| Hanesbrands, Inc. 4.875% 5/15/26 (b) | | 1,015,000 | 1,001,112 |
| Kontoor Brands, Inc. 4.125% 11/15/29 (b) | | 95,000 | 87,980 |
| Levi Strauss & Co. 3.5% 3/1/31 (b) | | 555,000 | 492,622 |
| Tapestry, Inc. 3.05% 3/15/32 | | 45,138,000 | 38,991,546 |
| The William Carter Co. 5.625% 3/15/27 (b) | | 746,000 | 749,190 |
| | | | 41,748,126 |
TOTAL CONSUMER DISCRETIONARY | | | 420,814,267 |
| CONSUMER STAPLES - 0.2% | | | |
| Beverages - 0.0% | | | |
| Constellation Brands, Inc. 2.875% 5/1/30 | | 5,370,000 | 4,860,460 |
| Molson Coors Beverage Co. 3% 7/15/26 | | 1,552,000 | 1,510,624 |
| | | | 6,371,084 |
| Consumer Staples Distribution & Retail - 0.1% | | | |
| 7-Eleven, Inc. 0.95% 2/10/26 (b) | | 797,000 | 760,046 |
| Albertsons Companies LLC/Safeway, Inc./New Albertson's, Inc./Albertson's LLC: | | | |
| 3.5% 3/15/29 (b) | | 2,290,000 | 2,116,049 |
| 4.625% 1/15/27 (b) | | 925,000 | 906,529 |
| 6.5% 2/15/28 (b) | | 2,910,000 | 2,960,302 |
| Alimentation Couche-Tard, Inc. 2.95% 1/25/30 (b) | | 3,940,000 | 3,587,160 |
| C&S Group Enterprises LLC 5% 12/15/28 (b) | | 800,000 | 657,037 |
| Dollar General Corp.: | | | |
| 3.5% 4/3/30 | | 6,956,000 | 6,425,465 |
| 4.625% 11/1/27 | | 2,000,000 | 1,990,265 |
| Dollar Tree, Inc.: | | | |
| 2.65% 12/1/31 | | 7,473,000 | 6,356,542 |
| 4% 5/15/25 | | 4,207,000 | 4,186,753 |
| 4.2% 5/15/28 | | 3,971,000 | 3,881,566 |
| KeHE Distributor / Nextwave 9% 2/15/29 (b) | | 635,000 | 664,801 |
| Performance Food Group, Inc. 6.125% 9/15/32 (b) | | 680,000 | 686,030 |
| REWE International Finance 4.875% 9/13/30 (Reg. S) | EUR | 300,000 | 342,703 |
| Tesco Corporate Treasury Services PLC 2.75% 4/27/30 (Reg. S) | GBP | 1,140,000 | 1,299,393 |
| U.S. Foods, Inc.: | | | |
| 4.625% 6/1/30 (b) | | 130,000 | 123,837 |
| 5.75% 4/15/33 (b) | | 405,000 | 399,888 |
| 7.25% 1/15/32 (b) | | 560,000 | 584,536 |
| | | | 37,928,902 |
| Food Products - 0.0% | | | |
| Chobani Holdco II LLC 9.5% 10/1/29 pay-in-kind (b)(d) | | 345,000 | 364,417 |
| Chobani LLC/Finance Corp., Inc. 7.625% 7/1/29 (b) | | 490,000 | 515,787 |
| Darling Ingredients, Inc.: | | | |
| 5.25% 4/15/27 (b) | | 1,115,000 | 1,102,419 |
| 6% 6/15/30 (b) | | 160,000 | 159,442 |
| Fiesta Purchaser, Inc. 7.875% 3/1/31 (b) | | 395,000 | 414,309 |
| JDE Peet's BV: | | | |
| 1.375% 1/15/27 (b) | | 3,516,000 | 3,270,131 |
| 2.25% 9/24/31 (b) | | 3,962,000 | 3,273,541 |
| Lamb Weston Holdings, Inc.: | | | |
| 4.375% 1/31/32 (b) | | 855,000 | 782,900 |
| 4.875% 5/15/28 (b) | | 1,825,000 | 1,787,963 |
| Pilgrim's Pride Corp. 4.25% 4/15/31 | | 1,190,000 | 1,109,995 |
| Post Holdings, Inc.: | | | |
| 4.625% 4/15/30 (b) | | 1,455,000 | 1,364,307 |
| 6.25% 2/15/32 (b) | | 515,000 | 520,344 |
| 6.25% 10/15/34 (b) | | 415,000 | 410,096 |
| Smithfield Foods, Inc. 3% 10/15/30 (b) | | 1,317,000 | 1,148,522 |
| TreeHouse Foods, Inc. 4% 9/1/28 | | 640,000 | 579,063 |
| Viterra Finance BV 4.9% 4/21/27 (b) | | 8,282,000 | 8,228,599 |
| | | | 25,031,835 |
| Household Products - 0.0% | | | |
| Kronos Acquisition Holdings, Inc. 8.25% 6/30/31 (b) | | 435,000 | 421,365 |
| Reckitt Benckiser Treasury Services PLC 3.875% 9/14/33 (Reg. S) | EUR | 790,000 | 876,419 |
| Resideo Funding, Inc. 6.5% 7/15/32 (b) | | 685,000 | 695,812 |
| | | | 1,993,596 |
| Personal Care Products - 0.0% | | | |
| BellRing Brands, Inc. 7% 3/15/30 (b) | | 470,000 | 488,151 |
| HFC Prestige Products, Inc./HFC Prestige International U.S. LLC 6.625% 7/15/30 (b) | | 870,000 | 890,532 |
| Prestige Brands, Inc. 3.75% 4/1/31 (b) | | 540,000 | 484,272 |
| | | | 1,862,955 |
| Tobacco - 0.1% | | | |
| Altria Group, Inc.: | | | |
| 2.35% 5/6/25 | | 346,000 | 342,235 |
| 4.8% 2/14/29 | | 2,374,000 | 2,370,630 |
| BAT Capital Corp.: | | | |
| 2.125% 8/15/25 | GBP | 221,000 | 275,335 |
| 2.259% 3/25/28 | | 7,192,000 | 6,636,670 |
| 2.726% 3/25/31 | | 9,590,000 | 8,436,745 |
| 4.7% 4/2/27 | | 2,181,000 | 2,178,679 |
| 5.834% 2/20/31 | | 8,600,000 | 8,954,225 |
| 6.421% 8/2/33 | | 8,000,000 | 8,629,162 |
| 7.75% 10/19/32 | | 5,978,000 | 6,916,917 |
| BAT International Finance PLC: | | | |
| 1.668% 3/25/26 | | 4,276,000 | 4,106,356 |
| 4.125% 4/12/32 (Reg. S) | EUR | 2,615,000 | 2,856,652 |
| 4.448% 3/16/28 | | 4,764,000 | 4,724,895 |
| 5.931% 2/2/29 | | 6,000,000 | 6,239,895 |
| Imperial Brands Finance PLC: | | | |
| 3.5% 7/26/26 (b) | | 4,835,000 | 4,725,921 |
| 5.5% 2/1/30 (b) | | 8,000,000 | 8,147,144 |
| 6.125% 7/27/27 (b) | | 1,197,000 | 1,232,433 |
| Philip Morris International, Inc.: | | | |
| 4.375% 11/15/41 | | 1,174,000 | 1,040,887 |
| 5.125% 2/15/30 | | 6,162,000 | 6,273,896 |
| 5.125% 2/13/31 | | 5,200,000 | 5,286,553 |
| 5.75% 11/17/32 | | 5,790,000 | 6,072,137 |
| Reynolds American, Inc. 5.7% 8/15/35 | | 171,000 | 175,732 |
| Scandinavian Tobacco Group A/S 4.875% 9/12/29 (Reg. S) | EUR | 425,000 | 462,192 |
| | | | 96,085,291 |
TOTAL CONSUMER STAPLES | | | 169,273,663 |
| ENERGY - 1.4% | | | |
| Energy Equipment & Services - 0.0% | | | |
| Archrock Partners LP / Archrock Partners Finance Corp. 6.625% 9/1/32 (b) | | 670,000 | 679,159 |
| Baker Hughes Co. 2.061% 12/15/26 | | 656,000 | 624,996 |
| Kodiak Gas Services LLC 7.25% 2/15/29 (b) | | 640,000 | 661,576 |
| Nabors Industries, Inc. 8.875% 8/15/31 (b) | | 565,000 | 545,860 |
| Seadrill Finance Ltd. 8.375% 8/1/30 (b) | | 1,275,000 | 1,305,442 |
| Star Holding LLC 8.75% 8/1/31 (b) | | 445,000 | 437,586 |
| Transocean, Inc. 8.25% 5/15/29 (b) | | 860,000 | 867,881 |
| Valaris Ltd. 8.375% 4/30/30 (b) | | 805,000 | 819,861 |
| | | | 5,942,361 |
| Oil, Gas & Consumable Fuels - 1.4% | | | |
| 6297782 LLC 4.911% 9/1/27 (b) | | 8,200,000 | 8,191,399 |
| Aethon United BR LP / Aethon United Finance Corp. 7.5% 10/1/29 (b) | | 565,000 | 585,982 |
| Apache Corp.: | | | |
| 5.1% 9/1/40 | | 330,000 | 290,129 |
| 5.25% 2/1/42 | | 1,095,000 | 960,173 |
| 5.35% 7/1/49 | | 80,000 | 68,474 |
| Ascent Resources - Utica LLC/ARU Finance Corp. 6.625% 10/15/32 (b) | | 185,000 | 185,176 |
| Baytex Energy Corp. 7.375% 3/15/32 (b) | | 560,000 | 557,948 |
| California Resources Corp. 8.25% 6/15/29 (b) | | 1,310,000 | 1,344,386 |
| Canadian Natural Resources Ltd.: | | | |
| 2.95% 7/15/30 | | 8,571,000 | 7,721,734 |
| 3.9% 2/1/25 | | 1,172,000 | 1,168,981 |
| 5.85% 2/1/35 | | 296,000 | 304,946 |
| 6.25% 3/15/38 | | 2,434,000 | 2,561,817 |
| Cenovus Energy, Inc.: | | | |
| 2.65% 1/15/32 | | 768,000 | 653,189 |
| 3.75% 2/15/52 | | 2,379,000 | 1,746,001 |
| 4.25% 4/15/27 | | 5,693,000 | 5,626,516 |
| 5.25% 6/15/37 | | 657,000 | 635,589 |
| 5.4% 6/15/47 | | 1,485,000 | 1,396,475 |
| 6.75% 11/15/39 | | 3,025,000 | 3,354,076 |
| CNX Midstream Partners LP 4.75% 4/15/30 (b) | | 115,000 | 107,104 |
| Columbia Pipelines Holding Co. LLC: | | | |
| 5.097% 10/1/31 (b) | | 5,090,000 | 5,026,600 |
| 6.042% 8/15/28 (b) | | 5,000,000 | 5,161,309 |
| Columbia Pipelines Operating Co. LLC: | | | |
| 5.695% 10/1/54 (b) | | 5,090,000 | 5,078,330 |
| 5.927% 8/15/30 (b) | | 4,337,000 | 4,516,383 |
| 6.036% 11/15/33 (b) | | 11,691,000 | 12,322,989 |
| 6.497% 8/15/43 (b) | | 10,495,000 | 11,319,916 |
| 6.544% 11/15/53 (b) | | 6,291,000 | 6,956,332 |
| 6.714% 8/15/63 (b) | | 3,766,000 | 4,228,450 |
| CVR Energy, Inc.: | | | |
| 5.75% 2/15/28 (b) | | 105,000 | 99,353 |
| 8.5% 1/15/29 (b) | | 615,000 | 604,406 |
| DCP Midstream Operating LP: | | | |
| 5.125% 5/15/29 | | 5,091,000 | 5,137,842 |
| 5.375% 7/15/25 | | 1,661,000 | 1,663,757 |
| 5.6% 4/1/44 | | 2,939,000 | 2,835,957 |
| 6.45% 11/3/36 (b) | | 410,000 | 429,054 |
| 6.75% 9/15/37 (b) | | 1,198,000 | 1,293,931 |
| 8.125% 8/16/30 | | 15,000 | 17,219 |
| Delek Logistics Partners LP/Delek Logistics Finance Corp. 8.625% 3/15/29 (b) | | 860,000 | 896,671 |
| Eastern Gas Transmission & Storage, Inc.: | | | |
| 3% 11/15/29 | | 6,572,000 | 6,084,660 |
| 3.9% 11/15/49 | | 4,359,000 | 3,326,968 |
| EG Global Finance PLC 12% 11/30/28 (b) | | 1,280,000 | 1,434,868 |
| Enbridge, Inc.: | | | |
| 4.25% 12/1/26 | | 1,500,000 | 1,487,493 |
| 5.7% 3/8/33 | | 8,000,000 | 8,298,988 |
| 6% 11/15/28 | | 6,027,000 | 6,315,282 |
| 6.7% 11/15/53 | | 2,200,000 | 2,518,921 |
| 7.2% 6/27/54 (d) | | 5,400,000 | 5,606,852 |
| Energy Transfer LP: | | | |
| 2.9% 5/15/25 | | 2,069,000 | 2,049,239 |
| 3.75% 5/15/30 | | 40,278,000 | 38,005,328 |
| 4% 10/1/27 | | 2,525,000 | 2,478,454 |
| 4.95% 6/15/28 | | 8,476,000 | 8,535,216 |
| 5% 5/15/50 | | 42,639,000 | 38,033,936 |
| 5.25% 4/15/29 | | 2,564,000 | 2,601,932 |
| 5.25% 7/1/29 | | 7,622,000 | 7,735,065 |
| 5.4% 10/1/47 | | 3,324,000 | 3,127,292 |
| 5.6% 9/1/34 | | 2,230,000 | 2,274,066 |
| 5.625% 5/1/27 (b) | | 773,000 | 774,935 |
| 5.75% 2/15/33 | | 7,491,000 | 7,691,212 |
| 5.8% 6/15/38 | | 2,595,000 | 2,645,641 |
| 6% 6/15/48 | | 2,491,000 | 2,522,803 |
| 6.125% 12/15/45 | | 650,000 | 670,617 |
| 6.25% 4/15/49 | | 6,761,000 | 7,083,500 |
| 7.375% 2/1/31 (b) | | 275,000 | 289,606 |
| EnLink Midstream LLC: | | | |
| 5.625% 1/15/28 (b) | | 105,000 | 106,810 |
| 5.65% 9/1/34 | | 10,746,000 | 10,928,220 |
| EnLink Midstream Partners LP: | | | |
| 5.05% 4/1/45 | | 840,000 | 747,383 |
| 5.45% 6/1/47 | | 290,000 | 271,201 |
| 5.6% 4/1/44 | | 490,000 | 468,206 |
| EQM Midstream Partners LP: | | | |
| 5.5% 7/15/28 | | 1,440,000 | 1,463,545 |
| 6.5% 7/1/27 (b) | | 465,000 | 476,434 |
| 7.5% 6/1/27 (b) | | 515,000 | 529,116 |
| EQT Corp.: | | | |
| 3.9% 10/1/27 | | 1,690,000 | 1,651,743 |
| 5.7% 4/1/28 | | 2,186,000 | 2,235,638 |
| 5.75% 2/1/34 | | 21,624,000 | 22,125,647 |
| Equinor ASA 1.75% 1/22/26 | | 380,000 | 368,506 |
| Expand Energy Corp. 5.375% 2/1/29 | | 1,940,000 | 1,930,866 |
| Genesis Energy LP/Genesis Energy Finance Corp. 7.875% 5/15/32 | | 215,000 | 216,695 |
| Global Partners LP/GLP Finance Corp. 7% 8/1/27 | | 3,910,000 | 3,940,056 |
| Harvest Midstream I LP 7.5% 5/15/32 (b) | | 815,000 | 837,471 |
| Hess Corp.: | | | |
| 4.3% 4/1/27 | | 8,399,000 | 8,338,061 |
| 5.6% 2/15/41 | | 72,976,000 | 74,495,455 |
| 5.8% 4/1/47 | | 11,931,000 | 12,418,535 |
| 7.125% 3/15/33 | | 1,403,000 | 1,593,002 |
| 7.3% 8/15/31 | | 3,686,000 | 4,187,116 |
| 7.875% 10/1/29 | | 8,241,000 | 9,339,416 |
| Hess Midstream Operations LP: | | | |
| 5.5% 10/15/30 (b) | | 115,000 | 112,957 |
| 5.625% 2/15/26 (b) | | 4,262,000 | 4,256,661 |
| Hilcorp Energy I LP/Hilcorp Finance Co.: | | | |
| 6% 4/15/30 (b) | | 1,020,000 | 983,102 |
| 6.25% 11/1/28 (b) | | 185,000 | 183,553 |
| Howard Midstream Energy Partners LLC 7.375% 7/15/32 (b) | | 440,000 | 453,483 |
| Kinder Morgan, Inc. 3.6% 2/15/51 | | 26,000,000 | 18,651,166 |
| Kinetik Holdings LP: | | | |
| 5.875% 6/15/30 (b) | | 445,000 | 444,078 |
| 6.625% 12/15/28 (b) | | 820,000 | 839,596 |
| Kraken Oil & Gas Partners LLC 7.625% 8/15/29 (b) | | 355,000 | 352,508 |
| Matador Resources Co. 6.5% 4/15/32 (b) | | 730,000 | 731,815 |
| MPLX LP: | | | |
| 1.75% 3/1/26 | | 1,690,000 | 1,626,758 |
| 2.65% 8/15/30 | | 7,473,000 | 6,628,437 |
| 4% 2/15/25 | | 172,000 | 171,568 |
| 4% 3/15/28 | | 3,724,000 | 3,637,977 |
| 4.8% 2/15/29 | | 1,376,000 | 1,376,129 |
| 4.95% 9/1/32 | | 16,311,000 | 16,091,817 |
| 5% 3/1/33 | | 12,000,000 | 11,786,286 |
| 5.5% 2/15/49 | | 4,129,000 | 3,989,943 |
| 5.65% 3/1/53 | | 8,756,000 | 8,596,660 |
| Murphy Oil Corp. 6% 10/1/32 | | 460,000 | 450,356 |
| Murphy Oil U.S.A., Inc. 3.75% 2/15/31 (b) | | 110,000 | 98,444 |
| Occidental Petroleum Corp.: | | | |
| 3.5% 8/15/29 | | 465,000 | 429,931 |
| 5.2% 8/1/29 | | 21,326,000 | 21,399,980 |
| 5.375% 1/1/32 | | 23,900,000 | 23,777,551 |
| 5.55% 3/15/26 | | 1,295,000 | 1,301,810 |
| 5.55% 10/1/34 | | 7,000,000 | 6,960,389 |
| 6.125% 1/1/31 | | 30,000,000 | 31,108,151 |
| 6.45% 9/15/36 | | 4,300,000 | 4,517,992 |
| 6.6% 3/15/46 | | 4,886,000 | 5,146,165 |
| 7.5% 5/1/31 | | 7,400,000 | 8,242,305 |
| 7.875% 9/15/31 | | 100,000 | 112,839 |
| ONEOK, Inc.: | | | |
| 4.25% 9/24/27 | | 8,851,000 | 8,757,373 |
| 4.4% 10/15/29 | | 9,257,000 | 9,094,987 |
| 4.75% 10/15/31 | | 17,905,000 | 17,655,201 |
| Ovintiv, Inc.: | | | |
| 5.15% 11/15/41 | | 4,009,000 | 3,487,518 |
| 7.375% 11/1/31 | | 648,000 | 719,361 |
| 8.125% 9/15/30 | | 2,895,000 | 3,291,897 |
| Parkland Corp. 6.625% 8/15/32 (b) | | 1,120,000 | 1,126,917 |
| PBF Holding Co. LLC/PBF Finance Corp. 7.875% 9/15/30 (b) | | 1,735,000 | 1,780,824 |
| Permian Resources Operating LLC: | | | |
| 5.875% 7/1/29 (b) | | 445,000 | 442,773 |
| 6.25% 2/1/33 (b) | | 890,000 | 896,664 |
| 7% 1/15/32 (b) | | 1,100,000 | 1,132,514 |
| Petroleos Mexicanos: | | | |
| 4.5% 1/23/26 | | 4,359,000 | 4,228,230 |
| 5.95% 1/28/31 | | 17,450,000 | 14,985,100 |
| 6.35% 2/12/48 | | 1,560,000 | 1,071,720 |
| 6.49% 1/23/27 | | 4,247,000 | 4,168,184 |
| 6.5% 3/13/27 | | 9,594,000 | 9,360,194 |
| 6.7% 2/16/32 | | 8,760,000 | 7,762,236 |
| 6.75% 9/21/47 | | 22,490,000 | 16,078,101 |
| 6.84% 1/23/30 | | 13,434,000 | 12,434,846 |
| 6.95% 1/28/60 | | 32,166,000 | 22,921,652 |
| 7.69% 1/23/50 | | 75,606,000 | 59,215,375 |
| Plains All American Pipeline LP/PAA Finance Corp.: | | | |
| 3.55% 12/15/29 | | 6,968,000 | 6,552,931 |
| 3.8% 9/15/30 | | 1,055,000 | 993,582 |
| 5.7% 9/15/34 | | 17,170,000 | 17,619,657 |
| Rockies Express Pipeline LLC: | | | |
| 4.95% 7/15/29 (b) | | 276,000 | 263,984 |
| 6.875% 4/15/40 (b) | | 105,000 | 101,531 |
| Sabine Pass Liquefaction LLC 4.5% 5/15/30 | | 14,626,000 | 14,352,625 |
| Sitio Royalties OP / Sitio Finance Corp. 7.875% 11/1/28 (b) | | 783,000 | 817,495 |
| Spectra Energy Partners LP 4.5% 3/15/45 | | 543,000 | 465,675 |
| Summit Midstream Holdings LLC 8.625% 10/31/29 (b) | | 355,000 | 371,466 |
| Sunoco LP/Sunoco Finance Corp.: | | | |
| 4.5% 5/15/29 | | 635,000 | 605,780 |
| 5.875% 3/15/28 | | 1,335,000 | 1,336,533 |
| 6% 4/15/27 | | 1,005,000 | 1,006,327 |
| Tallgrass Energy Partners LP / Tallgrass Energy Finance Corp.: | | | |
| 5.5% 1/15/28 (b) | | 125,000 | 121,566 |
| 6% 12/31/30 (b) | | 1,355,000 | 1,282,534 |
| 6% 9/1/31 (b) | | 270,000 | 255,549 |
| Talos Production, Inc. 9% 2/1/29 (b) | | 185,000 | 193,554 |
| Targa Resources Corp. 5.5% 2/15/35 | | 10,286,000 | 10,437,973 |
| The Williams Companies, Inc.: | | | |
| 2.6% 3/15/31 | | 7,660,000 | 6,686,816 |
| 3.5% 11/15/30 | | 18,113,000 | 16,869,409 |
| 4.65% 8/15/32 | | 22,370,000 | 21,770,290 |
| 4.8% 11/15/29 | | 8,200,000 | 8,192,082 |
| 5.1% 9/15/45 | | 9,765,000 | 9,244,719 |
| 5.3% 8/15/52 | | 5,092,000 | 4,916,721 |
| 5.4% 3/2/26 | | 6,100,000 | 6,144,047 |
| 5.75% 6/24/44 | | 2,747,000 | 2,788,237 |
| Transcontinental Gas Pipe Line Co. LLC 3.25% 5/15/30 | | 279,000 | 257,620 |
| Venture Global Calcasieu Pass LLC: | | | |
| 3.875% 8/15/29 (b) | | 1,140,000 | 1,058,943 |
| 3.875% 11/1/33 (b) | | 675,000 | 587,358 |
| 4.125% 8/15/31 (b) | | 325,000 | 295,880 |
| 6.25% 1/15/30 (b) | | 380,000 | 389,026 |
| Venture Global LNG, Inc.: | | | |
| 7% 1/15/30 (b) | | 2,670,000 | 2,729,944 |
| 8.125% 6/1/28 (b) | | 505,000 | 527,749 |
| Western Midstream Operating LP: | | | |
| 4.05% 2/1/30 (e) | | 20,164,000 | 19,148,283 |
| 4.65% 7/1/26 | | 1,823,000 | 1,812,188 |
| 4.75% 8/15/28 | | 1,236,000 | 1,221,388 |
| 5.3% 3/1/48 | | 2,900,000 | 2,563,469 |
| 6.15% 4/1/33 | | 4,400,000 | 4,573,070 |
| 6.35% 1/15/29 | | 11,247,000 | 11,720,128 |
| | | | 990,658,793 |
TOTAL ENERGY | | | 996,601,154 |
| FINANCIALS - 6.1% | | | |
| Banks - 3.1% | | | |
| ABN AMRO Bank NV: | | | |
| 3.875% 1/15/32 (Reg. S) | EUR | 1,100,000 | 1,208,381 |
| 5.08% 12/3/28 (b)(d) | | 7,500,000 | 7,516,648 |
| 5.59% 12/3/35 (b)(d) | | 17,600,000 | 17,652,632 |
| AIB Group PLC: | | | |
| 4.625% 7/23/29 (Reg. S) (d) | EUR | 200,000 | 222,851 |
| 5.25% 10/23/31 (Reg. S) (d) | EUR | 630,000 | 737,925 |
| 5.871% 3/28/35 (b)(d) | | 5,000,000 | 5,115,429 |
| 6.608% 9/13/29 (b)(d) | | 10,500,000 | 11,075,340 |
| Banco Bilbao Vizcaya Argentaria SA 6.033% 3/13/35 (d) | | 1,400,000 | 1,427,867 |
| Banco Santander SA 2.749% 12/3/30 | | 10,800,000 | 9,321,625 |
| Bank of America Corp.: | | | |
| 1.197% 10/24/26 (d) | | 6,035,000 | 5,850,640 |
| 1.319% 6/19/26 (d) | | 1,966,000 | 1,928,779 |
| 1.734% 7/22/27 (d) | | 25,000,000 | 23,792,165 |
| 1.898% 7/23/31 (d) | | 6,975,000 | 5,951,529 |
| 2.299% 7/21/32 (d) | | 50,000,000 | 42,457,775 |
| 2.496% 2/13/31 (d) | | 6,724,000 | 5,988,838 |
| 2.592% 4/29/31 (d) | | 7,784,000 | 6,945,670 |
| 2.972% 2/4/33 (d) | | 38,682,000 | 33,888,570 |
| 3.194% 7/23/30 (d) | | 10,561,000 | 9,842,044 |
| 3.384% 4/2/26 (d) | | 3,052,000 | 3,036,276 |
| 3.95% 4/21/25 | | 1,724,000 | 1,716,969 |
| 3.97% 3/5/29 (d) | | 3,624,000 | 3,531,647 |
| 3.974% 2/7/30 (d) | | 2,345,000 | 2,267,607 |
| 4.183% 11/25/27 | | 6,909,000 | 6,798,859 |
| 4.25% 10/22/26 | | 40,217,000 | 39,855,358 |
| 4.271% 7/23/29 (d) | | 1,207,000 | 1,186,239 |
| 4.376% 4/27/28 (d) | | 3,650,000 | 3,619,679 |
| 4.45% 3/3/26 | | 1,202,000 | 1,196,763 |
| 4.571% 4/27/33 (d) | | 8,718,000 | 8,465,816 |
| 4.948% 7/22/28 (d) | | 5,000,000 | 5,024,560 |
| 5.015% 7/22/33 (d) | | 35,614,000 | 35,747,382 |
| 5.288% 4/25/34 (d) | | 17,000,000 | 17,263,740 |
| 5.468% 1/23/35 (d) | | 29,000,000 | 29,790,018 |
| 5.819% 9/15/29 (d) | | 24,000,000 | 24,848,410 |
| 6.11% 1/29/37 | | 1,340,000 | 1,431,431 |
| Bank of Ireland Group PLC 5.601% 3/20/30 (b)(d) | | 15,300,000 | 15,605,924 |
| Bank of Montreal 1.85% 5/1/25 | | 2,414,000 | 2,385,280 |
| Bank of Nova Scotia 4.5% 12/16/25 | | 2,207,000 | 2,194,458 |
| Barclays PLC: | | | |
| 2.279% 11/24/27 (d) | | 31,514,000 | 29,918,610 |
| 2.852% 5/7/26 (d) | | 18,341,000 | 18,165,565 |
| 3.811% 3/10/42 (d) | | 7,473,000 | 6,041,304 |
| 4.375% 1/12/26 | | 4,468,000 | 4,445,408 |
| 4.836% 5/9/28 | | 6,102,000 | 6,038,690 |
| 5.088% 6/20/30 (d) | | 35,939,000 | 35,460,447 |
| 5.2% 5/12/26 | | 1,556,000 | 1,557,362 |
| 5.262% 1/29/34 (Reg. S) (d) | EUR | 1,755,000 | 2,081,067 |
| 5.304% 8/9/26 (d) | | 1,387,000 | 1,389,345 |
| 5.501% 8/9/28 (d) | | 3,000,000 | 3,037,485 |
| 5.746% 8/9/33 (d) | | 2,074,000 | 2,121,461 |
| 5.829% 5/9/27 (d) | | 4,720,000 | 4,773,815 |
| 6.224% 5/9/34 (d) | | 5,000,000 | 5,268,835 |
| 6.49% 9/13/29 (d) | | 8,000,000 | 8,402,798 |
| 6.692% 9/13/34 (d) | | 12,500,000 | 13,588,910 |
| 8.407% 11/14/32 (Reg. S) (d) | GBP | 750,000 | 1,020,691 |
| BNP Paribas SA: | | | |
| 1.323% 1/13/27 (b)(d) | | 7,967,000 | 7,642,075 |
| 1.904% 9/30/28 (b)(d) | | 7,317,000 | 6,729,144 |
| 2.159% 9/15/29 (b)(d) | | 7,271,000 | 6,551,300 |
| 2.219% 6/9/26 (b)(d) | | 14,952,000 | 14,729,428 |
| 2.5% 3/31/32 (Reg. S) (d) | EUR | 1,600,000 | 1,654,164 |
| 2.591% 1/20/28 (b)(d) | | 2,740,000 | 2,611,138 |
| BPCE SA: | | | |
| 2.277% 1/20/32 (b)(d) | | 7,519,000 | 6,262,381 |
| 3.116% 10/19/32 (b)(d) | | 6,103,000 | 5,153,218 |
| 4.875% 4/1/26 (b) | | 7,383,000 | 7,350,251 |
| 5.716% 1/18/30 (b)(d) | | 750,000 | 761,761 |
| 7.003% 10/19/34 (b)(d) | | 1,150,000 | 1,253,824 |
| CaixaBank SA: | | | |
| 3.625% 9/19/32 (Reg. S) (d) | EUR | 3,100,000 | 3,325,817 |
| 5.673% 3/15/30 (b)(d) | | 8,900,000 | 9,055,144 |
| 6.037% 6/15/35 (b)(d) | | 9,000,000 | 9,267,356 |
| Canadian Imperial Bank of Commerce: | | | |
| 3.6% 4/7/32 | | 5,114,000 | 4,706,580 |
| 6.092% 10/3/33 | | 11,192,000 | 11,982,200 |
| Capital One NA 2.28% 1/28/26 (d) | | 1,962,000 | 1,952,973 |
| Citibank NA 5.803% 9/29/28 | | 8,000,000 | 8,331,580 |
| Citigroup, Inc.: | | | |
| 1.122% 1/28/27 (d) | | 2,000,000 | 1,915,819 |
| 3.07% 2/24/28 (d) | | 13,000,000 | 12,527,955 |
| 3.106% 4/8/26 (d) | | 1,931,000 | 1,919,065 |
| 4.075% 4/23/29 (d) | | 4,606,000 | 4,504,695 |
| 4.125% 7/25/28 | | 6,909,000 | 6,753,219 |
| 4.3% 11/20/26 | | 1,766,000 | 1,750,683 |
| 4.412% 3/31/31 (d) | | 40,428,000 | 39,386,793 |
| 4.45% 9/29/27 | | 21,445,000 | 21,215,439 |
| 4.6% 3/9/26 | | 18,593,000 | 18,534,253 |
| 5.3% 5/6/44 | | 9,501,000 | 9,393,520 |
| 6.174% 5/25/34 (d) | | 17,301,000 | 18,110,583 |
| 6.27% 11/17/33 (d) | | 17,166,000 | 18,444,421 |
| 8.125% 7/15/39 | | 1,076,000 | 1,368,263 |
| Citizens Financial Group, Inc.: | | | |
| 2.638% 9/30/32 | | 11,627,000 | 9,572,403 |
| 5.718% 7/23/32 (d) | | 15,200,000 | 15,509,040 |
| 5.841% 1/23/30 (d) | | 6,700,000 | 6,881,019 |
| 6.645% 4/25/35 (d) | | 12,968,000 | 14,045,535 |
| Commerzbank AG: | | | |
| 4.875% 10/16/34 (Reg. S) (d) | EUR | 900,000 | 987,640 |
| 8.625% 2/28/33 (Reg. S) (d) | GBP | 200,000 | 273,889 |
| Commonwealth Bank of Australia: | | | |
| 2.688% 3/11/31 (b) | | 3,046,000 | 2,647,937 |
| 3.61% 9/12/34 (b)(d) | | 3,723,000 | 3,464,215 |
| 3.784% 3/14/32 (b) | | 16,472,000 | 15,084,508 |
| Cooperatieve Rabobank UA: | | | |
| 1.98% 12/15/27 (b)(d) | | 3,614,000 | 3,414,037 |
| 3.649% 4/6/28 (b)(d) | | 6,943,000 | 6,757,325 |
| 3.75% 7/21/26 | | 4,206,000 | 4,116,959 |
| 3.822% 7/26/34 (Reg. S) | EUR | 400,000 | 443,725 |
| 4% 1/10/30 (Reg. S) | EUR | 800,000 | 889,009 |
| 4.375% 8/4/25 | | 4,789,000 | 4,757,567 |
| Credit Agricole SA: | | | |
| 2.811% 1/11/41 (b) | | 4,167,000 | 2,984,022 |
| 6.251% 1/10/35 (b)(d) | | 8,000,000 | 8,233,065 |
| Danske Bank A/S 3.875% 1/9/32 (Reg. S) (d) | EUR | 2,840,000 | 3,116,880 |
| DNB Bank ASA: | | | |
| 0.25% 2/23/29 (Reg. S) (d) | EUR | 500,000 | 486,293 |
| 1.535% 5/25/27 (b)(d) | | 51,990,000 | 49,502,620 |
| 1.605% 3/30/28 (b)(d) | | 3,208,000 | 2,982,606 |
| Fifth Third Bancorp 8.25% 3/1/38 | | 2,155,000 | 2,636,792 |
| First Citizens Bank & Trust Co. 6.125% 3/9/28 | | 40,920,000 | 42,409,852 |
| HAT Holdings I LLC/HAT Holdings II LLC: | | | |
| 3.375% 6/15/26 (b) | | 550,000 | 531,554 |
| 8% 6/15/27 (b) | | 500,000 | 521,323 |
| HSBC Holdings PLC: | | | |
| 1.645% 4/18/26 (d) | | 4,312,000 | 4,257,795 |
| 2.357% 8/18/31 (d) | | 15,444,000 | 13,317,446 |
| 2.848% 6/4/31 (d) | | 6,103,000 | 5,437,753 |
| 2.999% 3/10/26 (d) | | 2,759,000 | 2,743,452 |
| 4.292% 9/12/26 (d) | | 1,724,000 | 1,715,577 |
| 4.787% 3/10/32 (Reg. S) (d) | EUR | 1,270,000 | 1,460,984 |
| 4.856% 5/23/33 (Reg. S) (d) | EUR | 1,600,000 | 1,865,367 |
| 4.95% 3/31/30 | | 262,000 | 263,004 |
| 5.21% 8/11/28 (d) | | 8,310,000 | 8,365,518 |
| 6.254% 3/9/34 (d) | | 200,000 | 212,532 |
| 6.8% 9/14/31 (d) | GBP | 320,000 | 437,912 |
| 7.39% 11/3/28 (d) | | 900,000 | 958,943 |
| 8.201% 11/16/34 (Reg. S) (d) | GBP | 1,000,000 | 1,397,891 |
| Huntington Bancshares, Inc.: | | | |
| 2.487% 8/15/36 (d) | | 6,200,000 | 5,068,579 |
| 4.443% 8/4/28 (d) | | 6,438,000 | 6,372,992 |
| 6.208% 8/21/29 (d) | | 9,800,000 | 10,209,956 |
| ING Groep NV: | | | |
| 1.726% 4/1/27 (d) | | 1,250,000 | 1,197,716 |
| 4.5% 5/23/29 (Reg. S) (d) | EUR | 1,200,000 | 1,330,152 |
| 4.75% 5/23/34 (Reg. S) (d) | EUR | 2,600,000 | 3,024,379 |
| 5.335% 3/19/30 (d) | | 6,500,000 | 6,598,636 |
| Intesa Sanpaolo SpA: | | | |
| 4.198% 6/1/32 (b)(d) | | 17,320,000 | 15,341,316 |
| 5.71% 1/15/26 (b) | | 94,108,000 | 94,407,039 |
| 6.625% 6/20/33 (b) | | 805,000 | 857,899 |
| JPMorgan Chase & Co.: | | | |
| 1.47% 9/22/27 (d) | | 3,410,000 | 3,216,992 |
| 2.069% 6/1/29 (d) | | 7,286,000 | 6,661,066 |
| 2.083% 4/22/26 (d) | | 2,448,000 | 2,421,728 |
| 2.522% 4/22/31 (d) | | 4,724,000 | 4,204,322 |
| 2.58% 4/22/32 (d) | | 1,300,000 | 1,132,441 |
| 2.739% 10/15/30 (d) | | 9,341,000 | 8,499,448 |
| 2.947% 2/24/28 (d) | | 6,239,000 | 6,003,914 |
| 2.956% 5/13/31 (d) | | 11,536,000 | 10,428,590 |
| 2.963% 1/25/33 (d) | | 9,341,000 | 8,215,978 |
| 3.761% 3/21/34 (Reg. S) (d) | EUR | 750,000 | 825,211 |
| 4.125% 12/15/26 | | 1,748,000 | 1,732,077 |
| 4.25% 10/1/27 | | 3,379,000 | 3,362,300 |
| 4.586% 4/26/33 (d) | | 50,039,000 | 48,850,528 |
| 4.603% 10/22/30 (d) | | 17,730,000 | 17,573,821 |
| 4.912% 7/25/33 (d) | | 112,454,000 | 112,353,265 |
| 4.946% 10/22/35 (d) | | 13,540,000 | 13,429,400 |
| 5.012% 1/23/30 (d) | | 8,700,000 | 8,762,150 |
| 5.299% 7/24/29 (d) | | 19,000,000 | 19,326,797 |
| 5.35% 6/1/34 (d) | | 20,000,000 | 20,460,764 |
| 5.717% 9/14/33 (d) | | 65,636,000 | 68,020,762 |
| Jyske Bank A/S: | | | |
| 5% 10/26/28 (d) | EUR | 600,000 | 667,203 |
| 5.125% 5/1/35 (Reg. S) (d) | EUR | 385,000 | 431,603 |
| KBC Group NV: | | | |
| 4.932% 10/16/30 (b)(d) | | 22,400,000 | 22,244,554 |
| 5.796% 1/19/29 (b)(d) | | 6,314,000 | 6,469,469 |
| 6.324% 9/21/34 (b)(d) | | 11,310,000 | 11,998,525 |
| Lloyds Banking Group PLC: | | | |
| 1.985% 12/15/31 (d) | GBP | 1,195,000 | 1,427,153 |
| 2.438% 2/5/26 (d) | | 575,000 | 572,309 |
| 4.375% 3/22/28 | | 4,320,000 | 4,259,709 |
| 4.5% 1/11/29 (Reg. S) (d) | EUR | 630,000 | 697,442 |
| 4.75% 9/21/31 (Reg. S) (d) | EUR | 1,550,000 | 1,772,007 |
| 4.976% 8/11/33 (d) | | 6,227,000 | 6,131,520 |
| 5.087% 11/26/28 (d) | | 5,700,000 | 5,727,363 |
| 5.985% 8/7/27 (d) | | 4,700,000 | 4,777,246 |
| 7.953% 11/15/33 (d) | | 6,196,000 | 7,069,115 |
| Mitsubishi UFJ Financial Group, Inc.: | | | |
| 1.412% 7/17/25 | | 2,000,000 | 1,959,067 |
| 1.538% 7/20/27 (d) | | 3,276,000 | 3,111,322 |
| 1.64% 10/13/27 (d) | | 4,211,000 | 3,979,659 |
| 2.193% 2/25/25 | | 2,462,000 | 2,446,908 |
| 5.017% 7/20/28 (d) | | 4,690,000 | 4,728,049 |
| 5.258% 4/17/30 (d) | | 6,000,000 | 6,120,612 |
| Mizuho Financial Group, Inc.: | | | |
| 1.234% 5/22/27 (d) | | 5,448,000 | 5,173,259 |
| 1.554% 7/9/27 (d) | | 2,200,000 | 2,091,014 |
| 4.254% 9/11/29 (d) | | 1,035,000 | 1,014,327 |
| NatWest Group PLC: | | | |
| 1.642% 6/14/27 (d) | | 1,207,000 | 1,148,365 |
| 3.073% 5/22/28 (d) | | 9,914,000 | 9,500,131 |
| 3.622% 8/14/30 (Reg. S) (d) | GBP | 3,400,000 | 4,285,009 |
| 4.771% 2/16/29 (Reg. S) (d) | EUR | 500,000 | 557,287 |
| 4.8% 4/5/26 | | 19,815,000 | 19,817,397 |
| 4.964% 8/15/30 (d) | | 8,200,000 | 8,173,648 |
| 5.808% 9/13/29 (d) | | 30,000,000 | 30,839,177 |
| 5.847% 3/2/27 (d) | | 6,200,000 | 6,266,945 |
| 7.416% 6/6/33 (Reg. S) (d) | GBP | 850,000 | 1,138,251 |
| Nordea Bank Abp 4.125% 5/5/28 (Reg. S) | EUR | 1,700,000 | 1,872,220 |
| PNC Financial Services Group, Inc.: | | | |
| 4.812% 10/21/32 (d) | | 7,500,000 | 7,427,657 |
| 5.068% 1/24/34 (d) | | 15,132,000 | 15,066,706 |
| 5.582% 6/12/29 (d) | | 7,240,000 | 7,419,856 |
| Regions Financial Corp. 2.25% 5/18/25 | | 1,067,000 | 1,053,780 |
| Santander Holdings U.S.A., Inc. 2.49% 1/6/28 (d) | | 7,024,000 | 6,664,695 |
| Societe Generale: | | | |
| 1.488% 12/14/26 (b)(d) | | 21,416,000 | 20,612,851 |
| 1.792% 6/9/27 (b)(d) | | 2,160,000 | 2,051,193 |
| 4.25% 4/14/25 (b) | | 9,840,000 | 9,779,926 |
| 4.677% 6/15/27 (b) | | 4,831,000 | 4,830,021 |
| 4.75% 11/24/25 (b) | | 8,022,000 | 7,976,364 |
| 5.634% 1/19/30 (b)(d) | | 7,780,000 | 7,871,792 |
| 6.446% 1/10/29 (b)(d) | | 6,850,000 | 7,077,615 |
| 6.691% 1/10/34 (b)(d) | | 550,000 | 580,891 |
| Standard Chartered PLC 5.005% 10/15/30 (b)(d) | | 6,204,000 | 6,157,484 |
| Sumitomo Mitsui Financial Group, Inc. 1.402% 9/17/26 | | 3,035,000 | 2,866,184 |
| The Toronto-Dominion Bank 2.8% 3/10/27 | | 2,626,000 | 2,523,555 |
| Truist Financial Corp.: | | | |
| 4.123% 6/6/28 (d) | | 2,000,000 | 1,966,615 |
| 4.26% 7/28/26 (d) | | 3,031,000 | 3,021,401 |
| 5.122% 1/26/34 (d) | | 4,235,000 | 4,195,609 |
| 5.711% 1/24/35 (d) | | 15,000,000 | 15,475,207 |
| UniCredit SpA: | | | |
| 1.982% 6/3/27 (b)(d) | | 6,165,000 | 5,887,233 |
| 5.861% 6/19/32 (b)(d) | | 119,000 | 119,308 |
| 7.296% 4/2/34 (b)(d) | | 596,000 | 627,342 |
| Virgin Money UK PLC 7.625% 8/23/29 (Reg. S) (d) | GBP | 1,600,000 | 2,203,354 |
| Wells Fargo & Co.: | | | |
| 2.164% 2/11/26 (d) | | 2,935,000 | 2,919,137 |
| 2.188% 4/30/26 (d) | | 3,173,000 | 3,138,259 |
| 2.879% 10/30/30 (d) | | 2,200,000 | 2,010,061 |
| 3.068% 4/30/41 (d) | | 7,784,000 | 5,920,372 |
| 3.526% 3/24/28 (d) | | 25,667,000 | 24,950,631 |
| 4.3% 7/22/27 | | 28,701,000 | 28,418,644 |
| 4.478% 4/4/31 (d) | | 19,300,000 | 18,931,830 |
| 4.897% 7/25/33 (d) | | 106,510,000 | 105,298,537 |
| 5.389% 4/24/34 (d) | | 8,000,000 | 8,103,312 |
| 5.499% 1/23/35 (d) | | 25,000,000 | 25,621,255 |
| 5.557% 7/25/34 (d) | | 18,660,000 | 19,136,875 |
| 5.574% 7/25/29 (d) | | 25,500,000 | 26,142,149 |
| 6.303% 10/23/29 (d) | | 12,800,000 | 13,461,829 |
| Westpac Banking Corp.: | | | |
| 4.11% 7/24/34 (d) | | 5,791,000 | 5,513,552 |
| 5.405% 8/10/33 (d) | | 12,205,000 | 12,294,013 |
| | | | 2,193,707,126 |
| Capital Markets - 1.2% | | | |
| Ares Capital Corp.: | | | |
| 3.25% 7/15/25 | | 42,000,000 | 41,508,708 |
| 3.875% 1/15/26 | | 22,188,000 | 21,888,028 |
| Athene Global Funding: | | | |
| 1.73% 10/2/26 (b) | | 4,975,000 | 4,700,407 |
| 2.5% 3/24/28 (b) | | 6,975,000 | 6,466,962 |
| 2.646% 10/4/31 (b) | | 3,414,000 | 2,911,056 |
| 4.721% 10/8/29 (b) | | 7,000,000 | 6,910,282 |
| 5.339% 1/15/27 (b) | | 26,112,000 | 26,347,733 |
| 5.516% 3/25/27 (b) | | 7,800,000 | 7,909,534 |
| 5.583% 1/9/29 (b) | | 18,210,000 | 18,577,970 |
| Blackstone Holdings Finance Co. LLC: | | | |
| 2.8% 9/30/50 (b) | | 1,245,000 | 787,040 |
| 3.5% 9/10/49 (b) | | 4,614,000 | 3,381,280 |
| Blackstone Private Credit Fund: | | | |
| 4.7% 3/24/25 | | 31,043,000 | 30,966,154 |
| 4.875% 4/14/26 | GBP | 1,155,000 | 1,447,058 |
| 7.05% 9/29/25 | | 20,620,000 | 20,943,841 |
| Deutsche Bank AG: | | | |
| 3.25% 5/24/28 (Reg. S) (d) | EUR | 500,000 | 530,338 |
| 4.5% 4/1/25 | | 35,717,000 | 35,603,802 |
| 4.5% 7/12/35 (Reg. S) (d) | EUR | 500,000 | 555,735 |
| 6.125% 12/12/30 (Reg. S) (d) | GBP | 1,900,000 | 2,486,167 |
| Deutsche Bank AG New York Branch: | | | |
| 2.129% 11/24/26 (d) | | 3,386,000 | 3,292,246 |
| 2.311% 11/16/27 (d) | | 27,513,000 | 26,107,707 |
| 3.035% 5/28/32 (d) | | 4,028,000 | 3,488,231 |
| 3.729% 1/14/32 (d) | | 10,000,000 | 8,834,632 |
| 4.1% 1/13/26 | | 8,332,000 | 8,252,132 |
| 5.706% 2/8/28 (d) | | 11,000,000 | 11,139,969 |
| 6.72% 1/18/29 (d) | | 550,000 | 574,800 |
| 7.146% 7/13/27 (d) | | 11,860,000 | 12,246,665 |
| Goldman Sachs Group, Inc.: | | | |
| 2.383% 7/21/32 (d) | | 29,132,000 | 24,854,876 |
| 3.102% 2/24/33 (d) | | 40,000,000 | 35,270,341 |
| 4.25% 10/21/25 | | 12,215,000 | 12,153,633 |
| 4.482% 8/23/28 (d) | | 3,138,000 | 3,113,452 |
| 6.484% 10/24/29 (d) | | 12,000,000 | 12,696,057 |
| 6.75% 10/1/37 | | 59,592,000 | 65,992,861 |
| Hightower Holding LLC 6.75% 4/15/29 (b) | | 1,385,000 | 1,384,803 |
| Intercontinental Exchange, Inc.: | | | |
| 3.625% 9/1/28 | | 6,900,000 | 6,658,185 |
| 4.35% 6/15/29 | | 3,724,000 | 3,678,269 |
| Jane Street Group LLC/JSG Finance, Inc.: | | | |
| 4.5% 11/15/29 (b) | | 155,000 | 147,529 |
| 6.125% 11/1/32 (b) | | 625,000 | 627,528 |
| Jefferies Finance LLC/JFIN Co.-Issuer Corp. 6.625% 10/15/31 (b) | | 685,000 | 689,257 |
| LPL Holdings, Inc. 4% 3/15/29 (b) | | 1,720,000 | 1,634,267 |
| Moody's Corp. 3.75% 3/24/25 | | 1,371,000 | 1,366,059 |
| Morgan Stanley: | | | |
| 1.794% 2/13/32 (d) | | 7,317,000 | 6,089,925 |
| 2.188% 4/28/26 (d) | | 1,897,000 | 1,876,497 |
| 2.239% 7/21/32 (d) | | 4,900,000 | 4,138,445 |
| 2.475% 1/21/28 (d) | | 5,000,000 | 4,768,488 |
| 2.699% 1/22/31 (d) | | 6,227,000 | 5,609,601 |
| 3.622% 4/1/31 (d) | | 47,370,000 | 44,566,702 |
| 3.955% 3/21/35 (Reg. S) (d) | EUR | 800,000 | 887,344 |
| 4.21% 4/20/28 (d) | | 6,115,000 | 6,036,478 |
| 4.654% 10/18/30 (d) | | 29,950,000 | 29,684,605 |
| 4.889% 7/20/33 (d) | | 49,499,000 | 48,999,521 |
| 5.164% 4/20/29 (d) | | 16,000,000 | 16,171,542 |
| 5.424% 7/21/34 (d) | | 20,251,000 | 20,621,620 |
| 5.449% 7/20/29 (d) | | 16,012,000 | 16,358,269 |
| 6.342% 10/18/33 (d) | | 39,945,000 | 43,260,474 |
| NASDAQ, Inc.: | | | |
| 5.95% 8/15/53 | | 1,132,000 | 1,195,687 |
| 6.1% 6/28/63 | | 6,000,000 | 6,388,246 |
| Nuveen LLC 5.55% 1/15/30 (b) | | 16,339,000 | 16,850,011 |
| Peachtree Corners Funding Trust 3.976% 2/15/25 (b) | | 4,211,000 | 4,196,908 |
| S&P Global, Inc. 3.9% 3/1/62 | | 2,414,000 | 1,902,032 |
| State Street Corp. 2.901% 3/30/26 (d) | | 104,000 | 103,319 |
| UBS Group AG: | | | |
| 1.305% 2/2/27 (b)(d) | | 3,100,000 | 2,968,814 |
| 1.494% 8/10/27 (b)(d) | | 11,792,000 | 11,128,987 |
| 2.125% 11/15/29 (Reg. S) (d) | GBP | 1,300,000 | 1,483,744 |
| 3.091% 5/14/32 (b)(d) | | 5,293,000 | 4,696,712 |
| 3.126% 8/13/30 (b)(d) | | 5,359,000 | 4,935,649 |
| 3.75% 3/26/25 | | 9,717,000 | 9,680,936 |
| 4.125% 6/9/33 (Reg. S) (d) | EUR | 1,680,000 | 1,874,521 |
| 4.194% 4/1/31 (b)(d) | | 43,154,000 | 41,415,196 |
| 4.55% 4/17/26 | | 1,724,000 | 1,720,859 |
| 4.75% 3/17/32 (Reg. S) (d) | EUR | 3,450,000 | 3,962,081 |
| 4.988% 8/5/33 (b)(d) | | 10,462,000 | 10,373,630 |
| 6.246% 9/22/29 (b)(d) | | 8,000,000 | 8,367,267 |
| 6.373% 7/15/26 (b)(d) | | 2,345,000 | 2,363,553 |
| 6.537% 8/12/33 (b)(d) | | 11,161,000 | 12,077,753 |
| 9.016% 11/15/33 (b)(d) | | 2,086,000 | 2,572,459 |
| VFH Parent LLC / Valor Co-Issuer, Inc. 7.5% 6/15/31 (b) | | 515,000 | 531,139 |
| | | | 877,984,608 |
| Consumer Finance - 0.8% | | | |
| AerCap Ireland Capital Ltd./AerCap Global Aviation Trust: | | | |
| 1.75% 1/30/26 | | 16,619,000 | 16,046,000 |
| 2.45% 10/29/26 | | 14,854,000 | 14,199,214 |
| 3% 10/29/28 | | 28,306,000 | 26,432,088 |
| 3.3% 1/30/32 | | 15,939,000 | 14,143,237 |
| 3.4% 10/29/33 | | 2,691,000 | 2,339,578 |
| 3.85% 10/29/41 | | 4,396,000 | 3,590,587 |
| 4.45% 4/3/26 | | 4,254,000 | 4,229,953 |
| 4.95% 9/10/34 | | 8,350,000 | 8,123,411 |
| 5.1% 1/19/29 | | 5,200,000 | 5,246,679 |
| 5.75% 6/6/28 | | 16,700,000 | 17,218,617 |
| 6.1% 1/15/27 | | 4,800,000 | 4,918,977 |
| 6.15% 9/30/30 | | 10,400,000 | 10,984,072 |
| 6.45% 4/15/27 | | 1,866,000 | 1,933,331 |
| 6.5% 7/15/25 | | 7,188,000 | 7,243,309 |
| Ally Financial, Inc.: | | | |
| 2.2% 11/2/28 | | 8,669,000 | 7,813,402 |
| 4.625% 3/30/25 | | 4,630,000 | 4,621,114 |
| 4.75% 6/9/27 | | 3,759,000 | 3,751,104 |
| 5.75% 11/20/25 | | 5,507,000 | 5,530,707 |
| 5.8% 5/1/25 | | 9,417,000 | 9,434,685 |
| 6.992% 6/13/29 (d) | | 43,000,000 | 45,136,229 |
| 7.1% 11/15/27 | | 17,330,000 | 18,348,560 |
| 8% 11/1/31 | | 17,833,000 | 20,041,597 |
| Capital One Financial Corp.: | | | |
| 1.878% 11/2/27 (d) | | 5,931,000 | 5,600,780 |
| 2.359% 7/29/32 (d) | | 8,448,000 | 6,932,909 |
| 2.636% 3/3/26 (d) | | 13,528,000 | 13,444,622 |
| 3.2% 2/5/25 | | 1,207,000 | 1,203,295 |
| 3.273% 3/1/30 (d) | | 12,200,000 | 11,355,186 |
| 3.65% 5/11/27 | | 21,700,000 | 21,158,870 |
| 3.8% 1/31/28 | | 10,723,000 | 10,387,700 |
| 4.927% 5/10/28 (d) | | 6,900,000 | 6,901,471 |
| 4.985% 7/24/26 (d) | | 17,135,000 | 17,129,717 |
| 5.247% 7/26/30 (d) | | 19,853,000 | 19,959,586 |
| 5.7% 2/1/30 (d) | | 1,100,000 | 1,126,075 |
| 6.312% 6/8/29 (d) | | 12,000,000 | 12,465,710 |
| 7.624% 10/30/31 (d) | | 22,914,000 | 25,618,318 |
| Capstone Borrower, Inc. 8% 6/15/30 (b) | | 240,000 | 249,887 |
| Discover Financial Services: | | | |
| 4.1% 2/9/27 | | 13,375,000 | 13,196,532 |
| 4.5% 1/30/26 | | 6,750,000 | 6,720,260 |
| Encore Capital Group, Inc. 9.25% 4/1/29 (b) | | 315,000 | 338,462 |
| Ford Motor Credit Co. LLC: | | | |
| 2.3% 2/10/25 | | 1,654,000 | 1,644,594 |
| 2.7% 8/10/26 | | 5,665,000 | 5,427,480 |
| 2.9% 2/10/29 | | 275,000 | 248,625 |
| 3.375% 11/13/25 | | 9,760,000 | 9,593,047 |
| 3.625% 6/17/31 | | 5,000,000 | 4,415,058 |
| 4% 11/13/30 | | 16,400,000 | 15,018,470 |
| 4.125% 8/17/27 | | 19,335,000 | 18,783,404 |
| 4.445% 2/14/30 | EUR | 700,000 | 764,158 |
| 4.687% 6/9/25 | | 430,000 | 429,011 |
| 4.95% 5/28/27 | | 20,213,000 | 20,080,200 |
| 5.125% 6/16/25 | | 1,020,000 | 1,019,317 |
| 5.85% 5/17/27 | | 6,500,000 | 6,596,501 |
| 6.8% 5/12/28 | | 6,000,000 | 6,256,652 |
| 6.86% 6/5/26 | GBP | 1,150,000 | 1,488,633 |
| 6.95% 3/6/26 | | 195,000 | 198,623 |
| 6.95% 6/10/26 | | 9,500,000 | 9,725,026 |
| Navient Corp. 6.75% 6/15/26 | | 1,050,000 | 1,068,111 |
| OneMain Finance Corp.: | | | |
| 3.5% 1/15/27 | | 2,190,000 | 2,103,915 |
| 3.875% 9/15/28 | | 650,000 | 606,362 |
| 6.625% 5/15/29 | | 455,000 | 464,236 |
| Synchrony Financial: | | | |
| 3.95% 12/1/27 | | 8,239,000 | 7,955,968 |
| 5.15% 3/19/29 | | 8,060,000 | 7,996,565 |
| | | | 546,999,787 |
| Financial Services - 0.5% | | | |
| Aon Corp. / Aon Global Holdings PLC: | | | |
| 2.6% 12/2/31 | | 2,057,000 | 1,786,970 |
| 5.35% 2/28/33 | | 6,000,000 | 6,139,594 |
| Aviation Capital Group LLC: | | | |
| 6.25% 4/15/28 (b) | | 6,500,000 | 6,745,297 |
| 6.75% 10/25/28 (b) | | 6,500,000 | 6,871,393 |
| Azorra Finance Ltd. 7.75% 4/15/30 (b) | | 320,000 | 321,501 |
| Block, Inc.: | | | |
| 2.75% 6/1/26 | | 465,000 | 449,079 |
| 6.5% 5/15/32 (b) | | 870,000 | 892,598 |
| CBRE Global Investors Pan European Core Fund 4.75% 3/27/34 (Reg. S) | EUR | 450,000 | 511,455 |
| Corebridge Financial, Inc.: | | | |
| 3.65% 4/5/27 | | 1,888,000 | 1,841,629 |
| 3.85% 4/5/29 | | 1,514,000 | 1,460,945 |
| 3.9% 4/5/32 | | 27,561,000 | 25,584,647 |
| 4.35% 4/5/42 | | 2,247,000 | 1,945,426 |
| 4.4% 4/5/52 | | 12,648,000 | 10,613,099 |
| 6.05% 9/15/33 | | 9,870,000 | 10,431,636 |
| Corebridge Global Funding: | | | |
| 4.9% 12/3/29 (b) | | 1,750,000 | 1,753,588 |
| 5.9% 9/19/28 (b) | | 18,426,000 | 19,104,728 |
| Equitable Holdings, Inc.: | | | |
| 4.35% 4/20/28 | | 9,527,000 | 9,399,050 |
| 4.572% 2/15/29 (b) | | 1,989,000 | 1,951,790 |
| 5% 4/20/48 | | 10,215,000 | 9,553,189 |
| Essent Group Ltd. 6.25% 7/1/29 | | 8,400,000 | 8,650,255 |
| GGAM Finance Ltd.: | | | |
| 5.875% 3/15/30 (b) | | 455,000 | 450,308 |
| 6.875% 4/15/29 (b) | | 545,000 | 556,204 |
| 7.75% 5/15/26 (b) | | 1,335,000 | 1,360,701 |
| 8% 2/15/27 (b) | | 390,000 | 403,997 |
| Gn Bondco LLC 9.5% 10/15/31 (b) | | 872,000 | 928,062 |
| Icahn Enterprises LP/Icahn Enterprises Finance Corp.: | | | |
| 6.25% 5/15/26 | | 4,806,000 | 4,736,317 |
| 10% 11/15/29 (b) | | 230,000 | 235,885 |
| Jackson Financial, Inc.: | | | |
| 3.125% 11/23/31 | | 15,333,000 | 13,288,920 |
| 4% 11/23/51 | | 3,736,000 | 2,742,076 |
| 5.17% 6/8/27 | | 10,297,000 | 10,381,066 |
| 5.67% 6/8/32 | | 18,859,000 | 19,341,237 |
| JBS U.S.A. Holding Lux Sarl/ JBS U.S.A. Food Co./ JBS Lux Co. Sarl: | | | |
| 2.5% 1/15/27 | | 23,449,000 | 22,265,107 |
| 3% 2/2/29 | | 1,724,000 | 1,589,293 |
| 3% 5/15/32 | | 21,344,000 | 18,150,387 |
| 3.625% 1/15/32 | | 24,530,000 | 21,859,546 |
| 4.375% 2/2/52 | | 3,413,000 | 2,672,198 |
| 5.125% 2/1/28 | | 11,858,000 | 11,885,736 |
| 5.5% 1/15/30 | | 8,002,000 | 8,063,764 |
| 5.75% 4/1/33 | | 25,834,000 | 26,336,190 |
| 6.5% 12/1/52 | | 4,982,000 | 5,278,042 |
| KfW 0.75% 1/15/29 (Reg. S) | EUR | 3,240,000 | 3,223,259 |
| Leighton Finance U.S.A. Pty Ltd. 1.5% 5/28/29 (Reg. S) | EUR | 1,600,000 | 1,527,114 |
| Nationstar Mortgage Holdings, Inc. 6.5% 8/1/29 (b) | | 670,000 | 676,721 |
| Nationwide Building Society 6.557% 10/18/27 (b)(d) | | 6,000,000 | 6,170,052 |
| NFE Financing LLC 12% 11/15/29 (b) | | 969,599 | 972,023 |
| Pine Street Trust II 5.568% 2/15/49 (b) | | 7,700,000 | 7,497,088 |
| Rexford Industrial Realty LP 2.15% 9/1/31 | | 2,886,000 | 2,391,721 |
| Rocket Mortgage LLC / Rocket Mortgage Co-Issuer Inc 3.625% 3/1/29 (b) | | 1,055,000 | 973,569 |
| The Western Union Co. 2.85% 1/10/25 | | 433,000 | 432,008 |
| Titanium 2L BondCo SARL 6.25% 1/14/31 pay-in-kind | EUR | 6,558,500 | 2,391,783 |
| Voya Financial, Inc. 4.7% 1/23/48 (d) | | 3,132,000 | 2,914,748 |
| Windstream Services LLC / Wind 8.25% 10/1/31 (b) | | 455,000 | 475,056 |
| | | | 328,178,047 |
| Insurance - 0.5% | | | |
| Admiral Group PLC 8.5% 1/6/34 (Reg. S) | GBP | 800,000 | 1,147,377 |
| AFLAC, Inc. 3.6% 4/1/30 | | 387,000 | 368,686 |
| AIA Group Ltd.: | | | |
| 0.88% 9/9/33 (Reg. S) (d) | EUR | 705,000 | 678,176 |
| 3.2% 9/16/40 (b) | | 1,085,000 | 840,211 |
| 3.9% 4/6/28 (b) | | 2,931,000 | 2,864,152 |
| 5.375% 4/5/34 (b) | | 4,500,000 | 4,601,956 |
| Alliant Holdings Intermediate LLC/Alliant Holdings Co.-Issuer 4.25% 10/15/27 (b) | | 1,320,000 | 1,257,775 |
| Allianz SE 5.6% 9/3/54 (b)(d) | | 7,200,000 | 7,129,796 |
| American International Group, Inc. 5.75% 4/1/48 (d) | | 3,579,000 | 3,558,083 |
| AmFam Holdings, Inc. 2.805% 3/11/31 (b) | | 5,464,000 | 4,273,999 |
| Aon Corp. 6.25% 9/30/40 | | 142,000 | 153,278 |
| APH Somerset Investor 2 LLC / APH2 Somerset Investor 2 LLC / APH3 Somerset Investor 2 LLC 7.875% 11/1/29 (b) | | 455,000 | 460,119 |
| Argentum Netherlands BV 5.625% 8/15/52 (Reg. S) (d) | | 5,775,000 | 5,760,563 |
| Assurant, Inc. 2.65% 1/15/32 | | 7,753,000 | 6,617,895 |
| Athene Holding Ltd.: | | | |
| 3.45% 5/15/52 | | 6,850,000 | 4,623,012 |
| 3.95% 5/25/51 | | 1,604,000 | 1,223,880 |
| 5.875% 1/15/34 | | 5,040,000 | 5,222,648 |
| Brown & Brown, Inc. 4.2% 3/17/32 | | 3,550,000 | 3,337,434 |
| Empower Finance 2020 LP: | | | |
| 1.357% 9/17/27 (b) | | 1,474,000 | 1,340,823 |
| 3.075% 9/17/51 (b) | | 3,522,000 | 2,342,800 |
| Equitable Financial Life Global Funding: | | | |
| 1.3% 7/12/26 (b) | | 1,724,000 | 1,633,429 |
| 1.4% 8/27/27 (b) | | 1,724,000 | 1,581,151 |
| 1.7% 11/12/26 (b) | | 4,197,000 | 3,963,496 |
| Fairfax Financial Holdings Ltd.: | | | |
| 3.375% 3/3/31 | | 3,434,000 | 3,118,718 |
| 5.625% 8/16/32 | | 13,389,000 | 13,760,649 |
| Fidelidade-Companhia de Seguros SA 4.25% 9/4/31 (Reg. S) (d) | EUR | 800,000 | 845,950 |
| Five Corners Funding Trust II 2.85% 5/15/30 (b) | | 21,030,000 | 19,014,942 |
| Hartford Financial Services Group, Inc. 4.3% 4/15/43 | | 679,000 | 598,369 |
| Intact Financial Corp. 5.459% 9/22/32 (b) | | 7,368,000 | 7,553,132 |
| Jackson National Life Global Funding: | | | |
| 4.6% 10/1/29 (b) | | 7,200,000 | 7,092,644 |
| 5.55% 7/2/27 (b) | | 8,000,000 | 8,129,241 |
| Liberty Mutual Group, Inc.: | | | |
| 3.95% 5/15/60 (b) | | 12,820,000 | 9,034,231 |
| 5.5% 6/15/52 (b) | | 5,305,000 | 5,095,315 |
| Lincoln National Corp. 3.4% 1/15/31 | | 14,811,000 | 13,517,316 |
| Marsh & McLennan Companies, Inc.: | | | |
| 4.65% 3/15/30 | | 6,200,000 | 6,202,770 |
| 5.7% 9/15/53 | | 10,000,000 | 10,567,002 |
| Massachusetts Mutual Life Insurance Co.: | | | |
| 3.2% 12/1/61 (b) | | 6,056,000 | 3,834,547 |
| 3.729% 10/15/70 (b) | | 1,622,000 | 1,120,459 |
| MassMutual Global Funding II 4.85% 1/17/29 (b) | | 7,800,000 | 7,876,831 |
| MetLife, Inc. 5.375% 7/15/33 | | 27,000,000 | 28,098,677 |
| Pacific LifeCorp: | | | |
| 3.35% 9/15/50 (b) | | 7,037,000 | 4,988,417 |
| 5.125% 1/30/43 (b) | | 3,343,000 | 3,213,445 |
| Panther Escrow Issuer LLC 7.125% 6/1/31 (b) | | 715,000 | 732,398 |
| Pine Street Trust III 6.223% 5/15/54 (b) | | 12,000,000 | 12,717,849 |
| Pricoa Global Funding I 5.375% 5/15/45 (d) | | 3,148,000 | 3,141,476 |
| Principal Financial Group, Inc. 3.7% 5/15/29 | | 1,714,000 | 1,646,973 |
| Prudential Financial, Inc. 6% 9/1/52 (d) | | 31,987,000 | 32,369,565 |
| Prudential Funding Asia PLC 2.95% 11/3/33 (Reg. S) (d) | | 3,700,000 | 3,371,736 |
| QBE Insurance Group Ltd.: | | | |
| 2.5% 9/13/38 (Reg. S) (d) | GBP | 1,405,000 | 1,596,302 |
| 6.75% 12/2/44 (Reg. S) (d) | | 3,605,000 | 3,591,481 |
| Reinsurance Group of America, Inc. 5.75% 9/15/34 | | 14,700,000 | 15,107,138 |
| RGA Global Funding 5.448% 5/24/29 (b) | | 7,900,000 | 8,101,287 |
| Ryan Specialty Group LLC: | | | |
| 4.375% 2/1/30 (b) | | 650,000 | 616,994 |
| 5.875% 8/1/32 (b) | | 300,000 | 299,823 |
| Swiss Re Finance Luxembourg SA 5% 4/2/49 (b)(d) | | 1,000,000 | 992,770 |
| Teachers Insurance & Annuity Association of America 4.9% 9/15/44 (b) | | 1,484,000 | 1,385,948 |
| Unum Group: | | | |
| 4% 6/15/29 | | 6,130,000 | 5,954,452 |
| 4.125% 6/15/51 | | 14,274,000 | 11,205,236 |
| 5.75% 8/15/42 | | 3,718,000 | 3,761,602 |
| Willis Group North America, Inc.: | | | |
| 4.5% 9/15/28 | | 1,897,000 | 1,881,292 |
| 5.35% 5/15/33 | | 13,900,000 | 14,123,379 |
| Zurich Finance (Ireland) DAC 3.5% 5/2/52 (Reg. S) (d) | | 1,650,000 | 1,433,405 |
| | | | 342,674,500 |
TOTAL FINANCIALS | | | 4,289,544,068 |
| HEALTH CARE - 0.6% | | | |
| Biotechnology - 0.1% | | | |
| Amgen, Inc.: | | | |
| 4.663% 6/15/51 | | 3,736,000 | 3,308,511 |
| 5.15% 3/2/28 | | 1,959,000 | 1,988,399 |
| 5.25% 3/2/33 | | 22,305,000 | 22,667,295 |
| 5.6% 3/2/43 | | 14,041,000 | 14,251,996 |
| 5.65% 3/2/53 | | 7,733,000 | 7,887,647 |
| 5.75% 3/2/63 | | 1,373,000 | 1,397,782 |
| Emergent BioSolutions, Inc. 3.875% 8/15/28 (b) | | 342,000 | 275,321 |
| Gilead Sciences, Inc.: | | | |
| 5.5% 11/15/54 | | 9,000,000 | 9,226,470 |
| 5.6% 11/15/64 | | 9,000,000 | 9,228,729 |
| Grifols SA 4.75% 10/15/28 (b) | | 210,000 | 191,593 |
| | | | 70,423,743 |
| Health Care Equipment & Supplies - 0.0% | | | |
| Alcon Finance Corp. 2.75% 9/23/26 (b) | | 1,414,000 | 1,366,632 |
| Avantor Funding, Inc. 4.625% 7/15/28 (b) | | 1,515,000 | 1,463,710 |
| Hologic, Inc.: | | | |
| 3.25% 2/15/29 (b) | | 945,000 | 868,696 |
| 4.625% 2/1/28 (b) | | 65,000 | 63,735 |
| Medline Borrower LP / Medline Co. 6.25% 4/1/29 (b) | | 1,325,000 | 1,349,602 |
| Teleflex, Inc. 4.25% 6/1/28 (b) | | 145,000 | 138,798 |
| Werfenlife SA 4.625% 6/6/28 (Reg. S) | EUR | 700,000 | 775,609 |
| | | | 6,026,782 |
| Health Care Providers & Services - 0.4% | | | |
| 180 Medical, Inc. 3.875% 10/15/29 (b) | | 1,520,000 | 1,401,678 |
| Centene Corp.: | | | |
| 2.45% 7/15/28 | | 12,813,000 | 11,584,957 |
| 2.5% 3/1/31 | | 23,665,000 | 19,867,982 |
| 2.625% 8/1/31 | | 15,841,000 | 13,239,165 |
| 3% 10/15/30 | | 9,668,000 | 8,430,661 |
| 3.375% 2/15/30 | | 5,275,000 | 4,751,055 |
| 4.25% 12/15/27 | | 9,890,000 | 9,563,707 |
| 4.625% 12/15/29 | | 12,457,000 | 11,943,510 |
| Cigna Group: | | | |
| 3.4% 3/15/50 | | 4,359,000 | 3,085,777 |
| 4.375% 10/15/28 | | 3,698,000 | 3,663,491 |
| 4.8% 8/15/38 | | 2,697,000 | 2,553,177 |
| 4.9% 12/15/48 | | 517,000 | 470,459 |
| 5.25% 2/15/34 | | 7,000,000 | 7,067,642 |
| 5.4% 3/15/33 | | 8,000,000 | 8,185,505 |
| CVS Health Corp.: | | | |
| 4.78% 3/25/38 | | 2,165,000 | 1,966,550 |
| 5.125% 2/21/30 | | 14,148,000 | 14,155,167 |
| 5.25% 1/30/31 | | 5,087,000 | 5,099,359 |
| 5.3% 6/1/33 | | 14,500,000 | 14,389,158 |
| 5.875% 6/1/53 | | 5,000,000 | 4,928,475 |
| DaVita, Inc. 4.625% 6/1/30 (b) | | 505,000 | 473,024 |
| Elevance Health, Inc.: | | | |
| 2.25% 5/15/30 | | 5,433,000 | 4,774,807 |
| 3.35% 12/1/24 | | 1,379,000 | 1,379,000 |
| HAH Group Holding Co. LLC 9.75% 10/1/31 (b) | | 820,000 | 837,640 |
| HCA Holdings, Inc.: | | | |
| 3.125% 3/15/27 | | 4,517,000 | 4,350,609 |
| 3.375% 3/15/29 | | 2,198,000 | 2,064,950 |
| 3.5% 9/1/30 | | 12,405,000 | 11,442,545 |
| 3.625% 3/15/32 | | 10,363,000 | 9,342,525 |
| 4.625% 3/15/52 | | 3,307,000 | 2,744,412 |
| 5.125% 6/15/39 | | 1,878,000 | 1,782,699 |
| 5.25% 6/15/49 | | 2,069,000 | 1,898,165 |
| 5.45% 4/1/31 | | 4,500,000 | 4,563,551 |
| 5.625% 9/1/28 | | 9,085,000 | 9,277,855 |
| 5.875% 2/1/29 | | 9,796,000 | 10,077,830 |
| HealthEquity, Inc. 4.5% 10/1/29 (b) | | 110,000 | 104,222 |
| Humana, Inc.: | | | |
| 1.35% 2/3/27 | | 2,069,000 | 1,923,882 |
| 3.7% 3/23/29 | | 548,000 | 522,321 |
| 3.95% 3/15/27 | | 2,000,000 | 1,966,156 |
| 5.375% 4/15/31 | | 15,092,000 | 15,249,446 |
| ICON Investments Six Designated Activity: | | | |
| 5.849% 5/8/29 | | 7,434,000 | 7,636,044 |
| 6% 5/8/34 | | 5,732,000 | 5,892,647 |
| Molina Healthcare, Inc. 3.875% 11/15/30 (b) | | 1,400,000 | 1,273,894 |
| Pediatrix Medical Group, Inc. 5.375% 2/15/30 (b) | | 660,000 | 638,191 |
| Prime Healthcare Foundation, Inc. 7% 12/1/27 | | 2,736,000 | 2,800,346 |
| Radiology Partners, Inc. 7.775% 1/31/29 pay-in-kind (b)(d) | | 1,164,547 | 1,158,724 |
| Sabra Health Care LP: | | | |
| 3.2% 12/1/31 | | 26,025,000 | 22,783,115 |
| 3.9% 10/15/29 | | 7,857,000 | 7,398,361 |
| Surgery Center Holdings, Inc. 7.25% 4/15/32 (b) | | 630,000 | 647,597 |
| Tenet Healthcare Corp.: | | | |
| 4.625% 6/15/28 | | 3,410,000 | 3,308,864 |
| 5.125% 11/1/27 | | 1,000,000 | 990,804 |
| 6.125% 6/15/30 | | 425,000 | 427,175 |
| Toledo Hospital 5.325% 11/15/28 | | 2,395,000 | 2,353,016 |
| UnitedHealth Group, Inc.: | | | |
| 3.95% 10/15/42 | | 74,000 | 62,662 |
| 4.625% 7/15/35 | | 418,000 | 408,869 |
| 4.75% 7/15/45 | | 1,023,000 | 956,117 |
| Universal Health Services, Inc. 2.65% 1/15/32 | | 9,523,000 | 7,969,455 |
| | | | 297,828,995 |
| Health Care Technology - 0.0% | | | |
| IQVIA, Inc.: | | | |
| 5% 5/15/27 (b) | | 630,000 | 622,956 |
| 6.5% 5/15/30 (b) | | 1,310,000 | 1,344,753 |
| | | | 1,967,709 |
| Life Sciences Tools & Services - 0.0% | | | |
| Charles River Laboratories International, Inc.: | | | |
| 3.75% 3/15/29 (b) | | 1,700,000 | 1,574,827 |
| 4.25% 5/1/28 (b) | | 70,000 | 67,188 |
| | | | 1,642,015 |
| Pharmaceuticals - 0.1% | | | |
| Bayer AG 4.625% 5/26/33 (Reg. S) | EUR | 850,000 | 955,065 |
| Bayer U.S. Finance II LLC: | | | |
| 4.375% 12/15/28 (b) | | 5,293,000 | 5,110,051 |
| 4.875% 6/25/48 (b) | | 5,321,000 | 4,386,329 |
| Bayer U.S. Finance LLC: | | | |
| 6.375% 11/21/30 (b) | | 1,480,000 | 1,541,774 |
| 6.5% 11/21/33 (b) | | 9,800,000 | 10,214,779 |
| 6.875% 11/21/53 (b) | | 8,800,000 | 9,357,347 |
| Bristol-Myers Squibb Co.: | | | |
| 5.2% 2/22/34 | | 7,000,000 | 7,165,916 |
| 5.5% 2/22/44 | | 1,409,000 | 1,452,009 |
| 5.55% 2/22/54 | | 4,780,000 | 4,943,205 |
| 5.65% 2/22/64 | | 6,900,000 | 7,056,318 |
| Elanco Animal Health, Inc. 6.65% 8/28/28 (d) | | 8,545,000 | 8,819,901 |
| Jazz Securities DAC 4.375% 1/15/29 (b) | | 425,000 | 403,662 |
| Mylan NV 4.55% 4/15/28 | | 3,354,000 | 3,308,069 |
| Organon & Co. / Organon Foreign Debt Co-Issuer BV: | | | |
| 4.125% 4/30/28 (b) | | 1,105,000 | 1,047,250 |
| 5.125% 4/30/31 (b) | | 1,630,000 | 1,492,100 |
| Perrigo Finance PLC 4.9% 6/15/30 (e) | | 6,476,000 | 6,209,327 |
| Utah Acquisition Sub, Inc. 3.95% 6/15/26 | | 1,245,000 | 1,225,774 |
| Viatris, Inc. 2.7% 6/22/30 | | 4,524,000 | 3,969,258 |
| | | | 78,658,134 |
TOTAL HEALTH CARE | | | 456,547,378 |
| INDUSTRIALS - 0.7% | | | |
| Aerospace & Defense - 0.3% | | | |
| BAE Systems PLC: | | | |
| 3.4% 4/15/30 (b) | | 8,797,000 | 8,229,515 |
| 5.25% 3/26/31 (b) | | 7,319,000 | 7,463,986 |
| 5.3% 3/26/34 (b) | | 11,900,000 | 12,150,713 |
| 5.5% 3/26/54 (b) | | 1,703,000 | 1,752,676 |
| BWX Technologies, Inc. 4.125% 6/30/28 (b) | | 780,000 | 740,735 |
| Howmet Aerospace, Inc.: | | | |
| 5.95% 2/1/37 | | 675,000 | 715,898 |
| 6.75% 1/15/28 | | 615,000 | 649,720 |
| Moog, Inc. 4.25% 12/15/27 (b) | | 1,580,000 | 1,520,185 |
| Northrop Grumman Corp. 4.03% 10/15/47 | | 3,355,000 | 2,773,696 |
| Rolls-Royce PLC 5.75% 10/15/27 (b) | | 1,015,000 | 1,032,947 |
| RTX Corp.: | | | |
| 6.1% 3/15/34 | | 7,000,000 | 7,530,608 |
| 6.4% 3/15/54 | | 6,800,000 | 7,762,267 |
| The Boeing Co.: | | | |
| 2.7% 2/1/27 | | 1,724,000 | 1,638,336 |
| 2.75% 2/1/26 | | 2,071,000 | 2,014,530 |
| 3.25% 2/1/28 | | 4,359,000 | 4,120,332 |
| 3.625% 2/1/31 | | 14,000,000 | 12,764,303 |
| 5.04% 5/1/27 | | 19,675,000 | 19,681,346 |
| 5.15% 5/1/30 | | 55,693,000 | 55,453,616 |
| 5.805% 5/1/50 | | 9,895,000 | 9,461,122 |
| 6.259% 5/1/27 (b) | | 649,000 | 665,058 |
| 6.298% 5/1/29 (b) | | 9,431,000 | 9,823,069 |
| 6.388% 5/1/31 (b) | | 7,220,000 | 7,605,144 |
| 6.528% 5/1/34 (b) | | 7,701,000 | 8,188,435 |
| 6.858% 5/1/54 (b) | | 10,614,000 | 11,527,109 |
| 7.008% 5/1/64 (b) | | 10,499,000 | 11,432,340 |
| TransDigm, Inc.: | | | |
| 6% 1/15/33 (b) | | 2,725,000 | 2,724,741 |
| 6.375% 3/1/29 (b) | | 2,150,000 | 2,185,037 |
| | | | 211,607,464 |
| Air Freight & Logistics - 0.0% | | | |
| Rand Parent LLC 8.5% 2/15/30 (b) | | 875,000 | 886,484 |
| Building Products - 0.1% | | | |
| Advanced Drain Systems, Inc. 5% 9/30/27 (b) | | 2,565,000 | 2,524,158 |
| Builders FirstSource, Inc. 4.25% 2/1/32 (b) | | 1,415,000 | 1,288,972 |
| Carlisle Companies, Inc. 2.75% 3/1/30 | | 6,227,000 | 5,626,859 |
| Carrier Global Corp.: | | | |
| 2.493% 2/15/27 | | 518,000 | 495,571 |
| 2.7% 2/15/31 | | 6,352,000 | 5,615,860 |
| 4.5% 11/29/32 | EUR | 525,000 | 599,912 |
| 5.9% 3/15/34 | | 3,165,000 | 3,349,573 |
| 6.2% 3/15/54 | | 1,962,000 | 2,193,005 |
| EMRLD Borrower LP / Emerald Co. 6.625% 12/15/30 (b) | | 945,000 | 955,443 |
| Standard Industries, Inc./New Jersey 4.375% 7/15/30 (b) | | 1,165,000 | 1,083,708 |
| | | | 23,733,061 |
| Commercial Services & Supplies - 0.0% | | | |
| ADT Corp.: | | | |
| 4.125% 8/1/29 (b) | | 270,000 | 252,958 |
| 4.875% 7/15/32 (b) | | 1,270,000 | 1,182,063 |
| Allied Universal Holdco LLC 7.875% 2/15/31 (b) | | 640,000 | 655,357 |
| Artera Services LLC 8.5% 2/15/31 (b) | | 2,345,000 | 2,330,131 |
| Brand Industrial Services, Inc. 10.375% 8/1/30 (b) | | 640,000 | 678,984 |
| Cimpress PLC 7.375% 9/15/32 (b) | | 540,000 | 541,102 |
| Clean Harbors, Inc. 6.375% 2/1/31 (b) | | 110,000 | 111,971 |
| CoreCivic, Inc. 8.25% 4/15/29 | | 430,000 | 456,662 |
| GFL Environmental, Inc. 6.75% 1/15/31 (b) | | 310,000 | 321,484 |
| Madison IAQ LLC 4.125% 6/30/28 (b) | | 2,045,000 | 1,956,856 |
| Prime Securities Services Borrower LLC/Prime Finance, Inc. 3.375% 8/31/27 (b) | | 1,980,000 | 1,861,583 |
| The GEO Group, Inc. 8.625% 4/15/29 | | 490,000 | 518,282 |
| Waste Management, Inc. 3.875% 1/15/29 (b) | | 750,000 | 727,918 |
| Wrangler Holdco Corp. 6.625% 4/1/32 (b) | | 1,970,000 | 2,029,353 |
| | | | 13,624,704 |
| Construction & Engineering - 0.0% | | | |
| AECOM 5.125% 3/15/27 | | 1,777,000 | 1,764,162 |
| Electrical Equipment - 0.0% | | | |
| Sensata Technologies BV 4% 4/15/29 (b) | | 275,000 | 256,453 |
| Vertiv Group Corp. 4.125% 11/15/28 (b) | | 1,125,000 | 1,071,386 |
| | | | 1,327,839 |
| Ground Transportation - 0.0% | | | |
| Alpha Trains Finance SA 2.064% 6/30/30 | EUR | 1,740,000 | 1,820,082 |
| Burlington Northern Santa Fe LLC: | | | |
| 4.15% 4/1/45 | | 564,000 | 485,939 |
| 4.4% 3/15/42 | | 1,397,000 | 1,267,446 |
| CSX Corp.: | | | |
| 3.8% 4/15/50 | | 78,000 | 62,250 |
| 4.3% 3/1/48 | | 5,524,000 | 4,775,061 |
| Genesee & Wyoming, Inc. 6.25% 4/15/32 (b) | | 650,000 | 653,577 |
| Mobico Group PLC 4.875% 9/26/31 (Reg. S) | EUR | 1,300,000 | 1,379,038 |
| Norfolk Southern Corp. 5.35% 8/1/54 | | 5,400,000 | 5,398,509 |
| XPO, Inc.: | | | |
| 6.25% 6/1/28 (b) | | 630,000 | 639,238 |
| 7.125% 2/1/32 (b) | | 750,000 | 781,873 |
| | | | 17,263,013 |
| Industrial Conglomerates - 0.0% | | | |
| Ladder Capital Finance Holdings LLLP/Ladder Capital Finance Corp. 4.25% 2/1/27 (b) | | 800,000 | 778,702 |
| Trane Technologies Financing Ltd. 4.65% 11/1/44 | | 314,000 | 290,315 |
| | | | 1,069,017 |
| Machinery - 0.1% | | | |
| AGCO Corp. 5.8% 3/21/34 | | 7,687,000 | 7,890,442 |
| Allison Transmission, Inc. 3.75% 1/30/31 (b) | | 1,015,000 | 912,328 |
| ESAB Corp. 6.25% 4/15/29 (b) | | 780,000 | 793,512 |
| Ingersoll Rand, Inc.: | | | |
| 5.176% 6/15/29 | | 7,800,000 | 7,933,372 |
| 5.314% 6/15/31 | | 8,500,000 | 8,691,099 |
| 5.45% 6/15/34 | | 8,200,000 | 8,402,348 |
| 5.7% 8/14/33 | | 4,393,000 | 4,581,425 |
| Otis Worldwide Corp. 2.056% 4/5/25 | | 1,790,000 | 1,772,322 |
| TK Elevator U.S. Newco, Inc. 5.25% 7/15/27 (b) | | 1,715,000 | 1,689,062 |
| | | | 42,665,910 |
| Marine Transportation - 0.0% | | | |
| Seaspan Corp. 5.5% 8/1/29 (b) | | 200,000 | 188,858 |
| Passenger Airlines - 0.0% | | | |
| American Airlines 2019-1 Class B Pass Through Trust equipment trust certificate 3.85% 8/15/29 | | 2,246,939 | 2,108,270 |
| American Airlines, Inc.: | | | |
| 3.75% 4/15/27 | | 1,266,730 | 1,245,133 |
| 7.25% 2/15/28 (b) | | 195,000 | 199,726 |
| 8.5% 5/15/29 (b) | | 745,000 | 787,161 |
| American Airlines, Inc. / AAdvantage Loyalty IP Ltd. 5.5% 4/20/26 (b) | | 380,000 | 379,823 |
| British Airways 2021-1 Class A Pass Through Trust equipment trust certificate 2.9% 9/15/36 (b) | | 1,251,387 | 1,126,310 |
| SMBC Aviation Capital Finance 5.7% 7/25/33 (b) | | 6,000,000 | 6,196,827 |
| United Airlines 2019-2 Class B Pass Through Trust equipment trust certificate 3.5% 11/1/29 | | 1,390,900 | 1,318,781 |
| United Airlines, Inc.: | | | |
| equipment trust certificate 4.6% 9/1/27 | | 1,439,766 | 1,416,587 |
| 4.375% 4/15/26 (b) | | 2,840,000 | 2,799,267 |
| | | | 17,577,885 |
| Professional Services - 0.0% | | | |
| Amentum Holdings, Inc. 7.25% 8/1/32 (b) | | 530,000 | 544,447 |
| Booz Allen Hamilton, Inc.: | | | |
| 3.875% 9/1/28 (b) | | 1,365,000 | 1,306,693 |
| 4% 7/1/29 (b) | | 105,000 | 99,872 |
| 5.95% 8/4/33 | | 10,000,000 | 10,392,561 |
| TriNet Group, Inc.: | | | |
| 3.5% 3/1/29 (b) | | 805,000 | 739,029 |
| 7.125% 8/15/31 (b) | | 260,000 | 267,349 |
| | | | 13,349,951 |
| Trading Companies & Distributors - 0.1% | | | |
| Air Lease Corp.: | | | |
| 2.2% 1/15/27 | | 3,428,000 | 3,253,993 |
| 3.375% 7/1/25 | | 11,630,000 | 11,529,494 |
| 3.75% 6/1/26 | | 5,000,000 | 4,922,923 |
| Beacon Roofing Supply, Inc. 6.5% 8/1/30 (b) | | 480,000 | 491,892 |
| Ferguson Enterprises, Inc. 5% 10/3/34 | | 7,219,000 | 7,073,638 |
| Fortress Transportation & Infrastructure Investors LLC: | | | |
| 5.875% 4/15/33 (b) | | 690,000 | 681,546 |
| 7% 6/15/32 (b) | | 870,000 | 898,619 |
| 7.875% 12/1/30 (b) | | 645,000 | 684,876 |
| Travis Perkins PLC 3.75% 2/17/26 (Reg. S) | GBP | 1,100,000 | 1,366,452 |
| United Rentals North America, Inc. 6.125% 3/15/34 (b) | | 1,080,000 | 1,096,104 |
| | | | 31,999,537 |
| Transportation Infrastructure - 0.1% | | | |
| Avolon Holdings Funding Ltd.: | | | |
| 2.528% 11/18/27 (b) | | 5,500,000 | 5,114,193 |
| 2.875% 2/15/25 (b) | | 9,687,000 | 9,625,347 |
| 3.25% 2/15/27 (b) | | 11,688,000 | 11,225,963 |
| 4.25% 4/15/26 (b) | | 874,000 | 862,376 |
| 4.375% 5/1/26 (b) | | 8,375,000 | 8,271,620 |
| 5.5% 1/15/26 (b) | | 1,754,000 | 1,757,235 |
| 5.75% 3/1/29 (b) | | 14,000,000 | 14,329,404 |
| 6.375% 5/4/28 (b) | | 26,845,000 | 27,863,803 |
| DSV Panalpina Finance BV 3.25% 11/6/30 (Reg. S) | EUR | 1,125,000 | 1,209,410 |
| Heathrow Funding Ltd. 6% 3/5/32 (Reg. S) | GBP | 1,250,000 | 1,591,651 |
| Holding d'Infrastructures et des Metiers de l'Environnement 0.625% 9/16/28 (Reg. S) | EUR | 700,000 | 653,443 |
| Royal Schiphol Group NV 3.375% 9/17/36 (Reg. S) | EUR | 975,000 | 1,047,461 |
| | | | 83,551,906 |
TOTAL INDUSTRIALS | | | 460,609,791 |
| INFORMATION TECHNOLOGY - 0.5% | | | |
| Communications Equipment - 0.0% | | | |
| HTA Group Ltd. 7.5% 6/4/29 (b) | | 1,535,000 | 1,560,481 |
| ViaSat, Inc. 5.625% 9/15/25 (b) | | 680,000 | 675,427 |
| Viavi Solutions, Inc. 3.75% 10/1/29 (b) | | 895,000 | 817,457 |
| | | | 3,053,365 |
| Electronic Equipment, Instruments & Components - 0.0% | | | |
| Amphenol Corp. 5.25% 4/5/34 | | 4,400,000 | 4,497,853 |
| Coherent Corp. 5% 12/15/29 (b) | | 1,965,000 | 1,895,503 |
| CPI CG, Inc. 10% 7/15/29 (b) | | 235,000 | 248,627 |
| Dell International LLC/EMC Corp.: | | | |
| 3.375% 12/15/41 | | 3,736,000 | 2,856,021 |
| 3.45% 12/15/51 | | 1,801,000 | 1,293,014 |
| Insight Enterprises, Inc. 6.625% 5/15/32 (b) | | 360,000 | 368,259 |
| Lightning Power LLC 7.25% 8/15/32 (b) | | 415,000 | 432,607 |
| Sensata Technologies, Inc. 3.75% 2/15/31 (b) | | 2,410,000 | 2,153,502 |
| TTM Technologies, Inc. 4% 3/1/29 (b) | | 515,000 | 481,401 |
| Vontier Corp.: | | | |
| 2.4% 4/1/28 | | 7,691,000 | 7,019,292 |
| 2.95% 4/1/31 | | 8,630,000 | 7,482,953 |
| | | | 28,729,032 |
| IT Services - 0.1% | | | |
| Acuris Finance U.S.: | | | |
| 5% 5/1/28 (b) | | 225,000 | 204,462 |
| 9% 8/1/29 (b) | | 470,000 | 458,015 |
| ASGN, Inc. 4.625% 5/15/28 (b) | | 1,825,000 | 1,747,333 |
| CDW LLC/CDW Finance Corp.: | | | |
| 2.67% 12/1/26 | | 5,350,000 | 5,109,722 |
| 5.1% 3/1/30 | | 18,200,000 | 18,124,652 |
| 5.55% 8/22/34 | | 10,150,000 | 10,101,365 |
| Gartner, Inc.: | | | |
| 3.625% 6/15/29 (b) | | 655,000 | 611,867 |
| 3.75% 10/1/30 (b) | | 255,000 | 235,891 |
| 4.5% 7/1/28 (b) | | 395,000 | 385,604 |
| Go Daddy Operating Co. LLC / GD Finance Co., Inc. 3.5% 3/1/29 (b) | | 1,450,000 | 1,344,724 |
| | | | 38,323,635 |
| Semiconductors & Semiconductor Equipment - 0.3% | | | |
| Broadcom, Inc.: | | | |
| 1.95% 2/15/28 (b) | | 4,603,000 | 4,230,782 |
| 2.45% 2/15/31 (b) | | 65,196,000 | 56,863,920 |
| 2.6% 2/15/33 (b) | | 23,971,000 | 20,082,342 |
| 3.137% 11/15/35 (b) | | 6,850,000 | 5,698,321 |
| 3.187% 11/15/36 (b) | | 6,678,000 | 5,489,731 |
| 3.419% 4/15/33 (b) | | 8,000,000 | 7,113,420 |
| 3.5% 2/15/41 (b) | | 23,037,000 | 18,440,532 |
| 3.75% 2/15/51 (b) | | 1,693,000 | 1,300,797 |
| 5.05% 7/12/29 | | 16,700,000 | 16,888,057 |
| 5.15% 11/15/31 | | 16,700,000 | 16,961,923 |
| Entegris, Inc. 4.375% 4/15/28 (b) | | 1,255,000 | 1,202,597 |
| Marvell Technology, Inc.: | | | |
| 2.45% 4/15/28 | | 4,982,000 | 4,612,044 |
| 5.75% 2/15/29 | | 4,817,000 | 4,975,407 |
| 5.95% 9/15/33 | | 3,772,000 | 3,976,339 |
| Micron Technology, Inc.: | | | |
| 2.703% 4/15/32 | | 2,039,000 | 1,742,944 |
| 3.366% 11/1/41 | | 2,223,000 | 1,692,103 |
| 3.477% 11/1/51 | | 2,229,000 | 1,593,303 |
| 4.185% 2/15/27 | | 4,448,000 | 4,394,507 |
| 5.3% 1/15/31 | | 9,833,000 | 9,967,469 |
| ON Semiconductor Corp. 3.875% 9/1/28 (b) | | 500,000 | 473,559 |
| Qorvo, Inc. 4.375% 10/15/29 | | 1,155,000 | 1,089,982 |
| Wolfspeed, Inc. 4.2917% 6/23/30 pay-in-kind (b)(d)(f)(g) | | 800,000 | 770,000 |
| | | | 189,560,079 |
| Software - 0.1% | | | |
| AppLovin Corp.: | | | |
| 5.125% 12/1/29 (c) | | 3,600,000 | 3,624,786 |
| 5.375% 12/1/31 (c) | | 10,700,000 | 10,806,910 |
| Central Parent LLC/CDK GLO II/CDK Finance Co. 8% 6/15/29 (b) | | 505,000 | 518,284 |
| Central Parent, Inc./Central Merger Sub, Inc. 7.25% 6/15/29 (b) | | 825,000 | 829,240 |
| Cloud Software Group, Inc. 9% 9/30/29 (b) | | 520,000 | 526,444 |
| Crowdstrike Holdings, Inc. 3% 2/15/29 | | 495,000 | 452,110 |
| Elastic NV 4.125% 7/15/29 (b) | | 495,000 | 462,873 |
| Ellucian, Inc. 6.5% 12/1/29 (b) | | 200,000 | 203,539 |
| Fair Isaac Corp.: | | | |
| 4% 6/15/28 (b) | | 1,130,000 | 1,077,853 |
| 5.25% 5/15/26 (b) | | 793,000 | 794,004 |
| Open Text Corp.: | | | |
| 3.875% 2/15/28 (b) | | 420,000 | 396,433 |
| 3.875% 12/1/29 (b) | | 3,115,000 | 2,841,465 |
| Oracle Corp.: | | | |
| 2.875% 3/25/31 | | 7,473,000 | 6,666,528 |
| 3.85% 4/1/60 | | 8,300,000 | 6,056,441 |
| 5.375% 7/15/40 | | 135,000 | 134,562 |
| Roper Technologies, Inc.: | | | |
| 1.4% 9/15/27 | | 1,724,000 | 1,586,065 |
| 1.75% 2/15/31 | | 3,736,000 | 3,113,039 |
| 2% 6/30/30 | | 4,476,000 | 3,868,676 |
| 2.95% 9/15/29 | | 2,830,000 | 2,611,779 |
| 4.5% 10/15/29 | | 6,800,000 | 6,740,050 |
| VMware, Inc. 1.4% 8/15/26 | | 925,000 | 873,975 |
| | | | 54,185,056 |
| Technology Hardware, Storage & Peripherals - 0.0% | | | |
| Seagate HDD Cayman 8.25% 12/15/29 | | 2,865,000 | 3,073,718 |
TOTAL INFORMATION TECHNOLOGY | | | 316,924,885 |
| MATERIALS - 0.3% | | | |
| Chemicals - 0.2% | | | |
| Avient Corp. 6.25% 11/1/31 (b) | | 455,000 | 459,988 |
| Axalta Coating Systems/Dutch Holding BV 4.75% 6/15/27 (b) | | 935,000 | 917,003 |
| Celanese U.S. Holdings LLC: | | | |
| 6.165% 7/15/27 | | 11,832,000 | 12,071,839 |
| 6.33% 7/15/29 | | 3,736,000 | 3,861,143 |
| 6.6% 11/15/28 | | 15,274,000 | 15,814,846 |
| 6.8% 11/15/30 | | 18,481,000 | 19,461,952 |
| 6.95% 11/15/33 | | 19,180,000 | 20,514,849 |
| International Flavors & Fragrances, Inc.: | | | |
| 1.23% 10/1/25 (b) | | 345,000 | 334,530 |
| 1.832% 10/15/27 (b) | | 6,986,000 | 6,427,364 |
| 2.3% 11/1/30 (b) | | 5,293,000 | 4,539,572 |
| 3.468% 12/1/50 (b) | | 3,000,000 | 2,079,099 |
| Kobe U.S. Midco 2, Inc. 9.25% 11/1/26 pay-in-kind (b)(d) | | 534,712 | 450,495 |
| LSB Industries, Inc. 6.25% 10/15/28 (b) | | 460,000 | 447,045 |
| LYB International Finance III LLC: | | | |
| 1.25% 10/1/25 | | 1,661,000 | 1,613,514 |
| 2.25% 10/1/30 | | 3,241,000 | 2,806,978 |
| Methanex Corp.: | | | |
| 5.125% 10/15/27 | | 1,365,000 | 1,340,751 |
| 5.25% 12/15/29 | | 90,000 | 87,963 |
| 5.65% 12/1/44 | | 931,000 | 830,959 |
| Methanex U.S. Operations, Inc. 6.25% 3/15/32 (b) | | 595,000 | 593,732 |
| NOVA Chemicals Corp.: | | | |
| 5% 5/1/25 (b) | | 1,030,000 | 1,025,565 |
| 5.25% 6/1/27 (b) | | 949,000 | 932,398 |
| 8.5% 11/15/28 (b) | | 1,400,000 | 1,492,184 |
| Nufarm Australia Ltd. 5% 1/27/30 (b) | | 1,125,000 | 1,043,864 |
| Olin Corp.: | | | |
| 5% 2/1/30 | | 1,715,000 | 1,647,331 |
| 5.625% 8/1/29 | | 2,465,000 | 2,446,163 |
| Olympus Water U.S. Holding Corp. 9.75% 11/15/28 (b) | | 455,000 | 483,690 |
| SPCM SA 3.125% 3/15/27 (b) | | 485,000 | 462,171 |
| The Chemours Co. LLC: | | | |
| 5.375% 5/15/27 | | 2,015,000 | 1,980,632 |
| 5.75% 11/15/28 (b) | | 275,000 | 260,239 |
| The Dow Chemical Co. 5.15% 2/15/34 | | 12,200,000 | 12,246,443 |
| Tronox, Inc. 4.625% 3/15/29 (b) | | 1,145,000 | 1,054,749 |
| W.R. Grace Holding LLC: | | | |
| 4.875% 6/15/27 (b) | | 980,000 | 963,105 |
| 7.375% 3/1/31 (b) | | 95,000 | 98,388 |
| | | | 120,790,544 |
| Construction Materials - 0.0% | | | |
| Eco Material Technologies, Inc. 7.875% 1/31/27 (b) | | 250,000 | 252,948 |
| Smyrna Ready Mix Concrete LLC 8.875% 11/15/31 (b) | | 780,000 | 829,878 |
| Summit Materials LLC/Summit Materials Finance Corp. 7.25% 1/15/31 (b) | | 320,000 | 341,577 |
| VM Consolidated, Inc. 5.5% 4/15/29 (b) | | 675,000 | 653,962 |
| | | | 2,078,365 |
| Containers & Packaging - 0.1% | | | |
| Ardagh Metal Packaging Finance U.S.A. LLC/Ardagh Metal Packaging Finance PLC 3.25% 9/1/28 (b) | | 1,630,000 | 1,467,656 |
| Ball Corp.: | | | |
| 2.875% 8/15/30 | | 2,065,000 | 1,813,745 |
| 3.125% 9/15/31 | | 955,000 | 835,312 |
| 6% 6/15/29 | | 395,000 | 401,814 |
| Graphic Packaging International, Inc.: | | | |
| 3.75% 2/1/30 (b) | | 1,165,000 | 1,071,097 |
| 6.375% 7/15/32 (b) | | 870,000 | 886,186 |
| Mauser Packaging Solutions Holding Co. 7.875% 4/15/27 (b) | | 785,000 | 803,602 |
| OI European Group BV 4.75% 2/15/30 (b) | | 280,000 | 255,464 |
| Sealed Air Corp.: | | | |
| 5% 4/15/29 (b) | | 1,540,000 | 1,491,390 |
| 6.875% 7/15/33 (b) | | 1,105,000 | 1,171,699 |
| Sealed Air Corp./Sealed Air Corp. U.S.: | | | |
| 6.125% 2/1/28 (b) | | 270,000 | 272,646 |
| 7.25% 2/15/31 (b) | | 515,000 | 536,047 |
| Smurfit Kappa Treasury ULC 5.438% 4/3/34 (b) | | 10,500,000 | 10,716,124 |
| Smurfit Westrock Finance 5.418% 1/15/35 (b) | | 6,624,000 | 6,756,709 |
| Sonoco Products Co. 4.6% 9/1/29 | | 8,800,000 | 8,647,092 |
| Trivium Packaging Finance BV 5.5% 8/15/26 (b) | | 410,000 | 409,168 |
| | | | 37,535,751 |
| Metals & Mining - 0.0% | | | |
| Alcoa Nederland Holding BV 7.125% 3/15/31 (b) | | 170,000 | 177,862 |
| Anglo American Capital PLC 3.875% 3/16/29 (b) | | 6,227,000 | 5,954,569 |
| Arsenal AIC Parent LLC 8% 10/1/30 (b) | | 155,000 | 163,084 |
| Cleveland-Cliffs, Inc.: | | | |
| 4.875% 3/1/31 (b) | | 1,480,000 | 1,356,821 |
| 6.75% 4/15/30 (b) | | 510,000 | 512,697 |
| 7% 3/15/32 (b) | | 400,000 | 402,033 |
| Commercial Metals Co. 3.875% 2/15/31 | | 915,000 | 825,365 |
| ERO Copper Corp. 6.5% 2/15/30 (b) | | 1,445,000 | 1,421,519 |
| FMG Resources August 2006 Pty Ltd. 4.5% 9/15/27 (b) | | 2,215,000 | 2,156,143 |
| Glencore Funding LLC 6.125% 10/6/28 (b) | | 2,000,000 | 2,089,416 |
| HudBay Minerals, Inc. 4.5% 4/1/26 (b) | | 135,000 | 133,045 |
| Kaiser Aluminum Corp. 4.625% 3/1/28 (b) | | 1,655,000 | 1,586,223 |
| Mineral Resources Ltd. 8% 11/1/27 (b) | | 2,075,000 | 2,114,912 |
| Novelis Corp. 3.875% 8/15/31 (b) | | 470,000 | 412,895 |
| Roller Bearing Co. of America, Inc. 4.375% 10/15/29 (b) | | 75,000 | 70,671 |
| Vale Overseas Ltd. 6.4% 6/28/54 | | 2,975,000 | 3,006,386 |
| Vibrantz Technologies, Inc. 9% 2/15/30 (b) | | 675,000 | 638,633 |
| | | | 23,022,274 |
| Paper & Forest Products - 0.0% | | | |
| Magnera Corp. 7.25% 11/15/31 (b) | | 320,000 | 315,453 |
| Mercer International, Inc. 12.875% 10/1/28 (b) | | 45,000 | 48,246 |
| | | | 363,699 |
TOTAL MATERIALS | | | 183,790,633 |
| REAL ESTATE - 1.0% | | | |
| Equity Real Estate Investment Trusts (REITs) - 0.8% | | | |
| Agree LP: | | | |
| 4.8% 10/1/32 | | 6,806,000 | 6,642,154 |
| 5.625% 6/15/34 | | 13,770,000 | 14,123,874 |
| Alexandria Real Estate Equities, Inc.: | | | |
| 2% 5/18/32 | | 8,258,000 | 6,724,911 |
| 4.9% 12/15/30 | | 7,224,000 | 7,228,889 |
| American Homes 4 Rent LP: | | | |
| 2.375% 7/15/31 | | 1,482,000 | 1,257,709 |
| 3.375% 7/15/51 | | 2,291,000 | 1,594,366 |
| 3.625% 4/15/32 | | 8,742,000 | 7,952,878 |
| 4.3% 4/15/52 | | 5,604,000 | 4,596,582 |
| 5.5% 7/15/34 | | 10,177,000 | 10,320,659 |
| American Tower Corp. 2.1% 6/15/30 | | 3,550,000 | 3,077,823 |
| Boston Properties Ltd. Partnership: | | | |
| 2.9% 3/15/30 | | 6,500,000 | 5,799,318 |
| 3.2% 1/15/25 | | 1,035,000 | 1,032,095 |
| 4.5% 12/1/28 | | 4,766,000 | 4,668,136 |
| Brixmor Operating Partnership LP: | | | |
| 3.85% 2/1/25 | | 1,010,000 | 1,007,342 |
| 4.05% 7/1/30 | | 10,487,000 | 9,998,929 |
| 4.125% 6/15/26 | | 5,827,000 | 5,768,222 |
| 4.125% 5/15/29 | | 20,383,000 | 19,709,012 |
| 5.5% 2/15/34 | | 6,800,000 | 6,895,333 |
| Corporate Office Properties LP: | | | |
| 2% 1/15/29 | | 7,631,000 | 6,746,713 |
| 2.25% 3/15/26 | | 3,486,000 | 3,366,380 |
| 2.75% 4/15/31 | | 8,767,000 | 7,543,976 |
| 2.9% 12/1/33 | | 8,223,000 | 6,720,837 |
| GLP Capital LP/GLP Financing II, Inc. 5.625% 9/15/34 | | 14,650,000 | 14,736,534 |
| Great Portland Estates PLC 5.375% 9/25/31 (Reg. S) | GBP | 500,000 | 629,539 |
| Healthcare Realty Holdings LP: | | | |
| 3.1% 2/15/30 | | 1,868,000 | 1,693,011 |
| 3.5% 8/1/26 | | 1,945,000 | 1,901,557 |
| Hudson Pacific Properties LP: | | | |
| 3.95% 11/1/27 | | 2,573,000 | 2,281,823 |
| 4.65% 4/1/29 | | 12,862,000 | 10,470,462 |
| 5.95% 2/15/28 | | 17,949,000 | 16,068,954 |
| Invitation Homes Operating Partnership LP: | | | |
| 2% 8/15/31 | | 2,893,000 | 2,392,774 |
| 4.15% 4/15/32 | | 13,560,000 | 12,695,813 |
| 4.875% 2/1/35 | | 8,722,000 | 8,486,227 |
| Iron Mountain, Inc. 4.875% 9/15/29 (b) | | 2,715,000 | 2,614,988 |
| Kimco Realty OP, LLC: | | | |
| 2.25% 12/1/31 | | 15,265,000 | 12,915,644 |
| 6.4% 3/1/34 | | 20,000,000 | 21,880,351 |
| Kite Realty Group LP 5.5% 3/1/34 | | 5,568,000 | 5,653,722 |
| Kite Realty Group Trust: | | | |
| 4% 3/15/25 | | 11,618,000 | 11,578,957 |
| 4.75% 9/15/30 | | 20,325,000 | 20,128,805 |
| LXP Industrial Trust (REIT) 2.7% 9/15/30 | | 1,445,000 | 1,261,201 |
| MPT Operating Partnership LP/MPT Finance Corp.: | | | |
| 3.5% 3/15/31 | | 820,000 | 535,149 |
| 5.25% 8/1/26 | | 3,215,000 | 2,914,450 |
| NNN (REIT), Inc. 5.6% 10/15/33 | | 12,000,000 | 12,365,978 |
| Omega Healthcare Investors, Inc.: | | | |
| 3.25% 4/15/33 | | 27,105,000 | 23,285,578 |
| 3.375% 2/1/31 | | 13,114,000 | 11,810,023 |
| 3.625% 10/1/29 | | 8,376,000 | 7,815,367 |
| 4.5% 1/15/25 | | 2,396,000 | 2,392,713 |
| 4.5% 4/1/27 | | 5,129,000 | 5,073,015 |
| 4.75% 1/15/28 | | 14,408,000 | 14,308,949 |
| 5.25% 1/15/26 | | 6,569,000 | 6,577,779 |
| Park Intermediate Holdings LLC / PK Domestic Property LLC / PK Finance Co.-Issuer 7% 2/1/30 (b) | | 300,000 | 307,144 |
| Phillips Edison Grocery Center Operating Partnership I LP: | | | |
| 4.95% 1/15/35 | | 9,000,000 | 8,697,745 |
| 5.75% 7/15/34 | | 5,448,000 | 5,597,766 |
| Piedmont Operating Partnership LP: | | | |
| 2.75% 4/1/32 | | 3,748,000 | 3,010,527 |
| 6.875% 7/15/29 | | 10,020,000 | 10,333,240 |
| Prologis International Funding II SA 4.375% 7/1/36 (Reg. S) | EUR | 400,000 | 449,887 |
| Realty Income Corp.: | | | |
| 2.1% 3/15/28 | | 1,631,000 | 1,504,129 |
| 2.2% 6/15/28 | | 1,380,000 | 1,270,525 |
| 2.85% 12/15/32 | | 1,998,000 | 1,722,245 |
| 3.25% 1/15/31 | | 1,828,000 | 1,674,671 |
| 3.4% 1/15/28 | | 2,874,000 | 2,773,241 |
| Retail Opportunity Investments Partnership LP 4% 12/15/24 | | 641,000 | 640,592 |
| Safehold Operating Partnership LP 2.85% 1/15/32 | | 345,000 | 294,699 |
| SBA Communications Corp.: | | | |
| 3.125% 2/1/29 | | 2,395,000 | 2,191,143 |
| 3.875% 2/15/27 | | 515,000 | 500,271 |
| Service Properties Trust: | | | |
| 3.95% 1/15/28 | | 40,000 | 34,716 |
| 5.5% 12/15/27 | | 430,000 | 410,443 |
| Simon Property Group LP 2.45% 9/13/29 | | 3,008,000 | 2,728,243 |
| Store Capital LLC: | | | |
| 2.7% 12/1/31 | | 8,095,000 | 6,755,098 |
| 2.75% 11/18/30 | | 4,066,000 | 3,524,206 |
| 4.625% 3/15/29 | | 2,374,000 | 2,303,924 |
| Sun Communities Operating LP: | | | |
| 2.3% 11/1/28 | | 4,282,000 | 3,886,639 |
| 2.7% 7/15/31 | | 9,688,000 | 8,301,640 |
| 4.2% 4/15/32 | | 9,341,000 | 8,689,387 |
| 5.7% 1/15/33 | | 7,726,000 | 7,861,098 |
| UDR, Inc. 2.1% 8/1/32 | | 4,480,000 | 3,647,569 |
| Ventas Realty LP: | | | |
| 2.5% 9/1/31 | | 25,590,000 | 22,028,889 |
| 2.65% 1/15/25 | | 1,375,000 | 1,370,800 |
| 3% 1/15/30 | | 16,847,000 | 15,394,614 |
| 4% 3/1/28 | | 2,553,000 | 2,498,924 |
| 4.125% 1/15/26 | | 999,000 | 991,282 |
| 4.4% 1/15/29 | | 6,227,000 | 6,131,752 |
| 4.75% 11/15/30 | | 16,500,000 | 16,383,980 |
| VICI Properties LP: | | | |
| 4.375% 5/15/25 | | 2,145,000 | 2,136,079 |
| 4.75% 2/15/28 | | 14,680,000 | 14,593,811 |
| 4.95% 2/15/30 | | 21,594,000 | 21,351,031 |
| 5.125% 5/15/32 | | 14,187,000 | 14,015,737 |
| 5.75% 4/1/34 | | 4,314,000 | 4,404,547 |
| Vornado Realty LP: | | | |
| 2.15% 6/1/26 | | 4,402,000 | 4,193,677 |
| 3.4% 6/1/31 | | 14,755,000 | 12,760,253 |
| WP Carey, Inc.: | | | |
| 2.4% 2/1/31 | | 3,511,000 | 3,029,063 |
| 3.85% 7/15/29 | | 1,991,000 | 1,911,593 |
| 4.25% 7/23/32 | EUR | 300,000 | 332,913 |
| | | | 609,885,234 |
| Real Estate Management & Development - 0.2% | | | |
| Accentro 2 Wohneigentum GmbH 20% 12/31/24 (g) | EUR | 100,000 | 105,675 |
| ACCENTRO Real Estate AG 5.625% 2/13/26 (Reg. S) (e) | EUR | 1,314,000 | 638,464 |
| Blackstone Property Partners Europe LP: | | | |
| 1% 5/4/28 (Reg. S) | EUR | 4,220,000 | 4,107,186 |
| 2.625% 10/20/28 (Reg. S) | GBP | 650,000 | 747,778 |
| Brandywine Operating Partnership LP: | | | |
| 3.95% 11/15/27 | | 4,382,000 | 4,139,514 |
| 4.55% 10/1/29 | | 3,023,000 | 2,773,000 |
| 8.3% 3/15/28 | | 19,371,000 | 20,445,703 |
| 8.875% 4/12/29 | | 22,481,000 | 24,277,361 |
| CBRE Group, Inc.: | | | |
| 2.5% 4/1/31 | | 10,225,000 | 8,873,189 |
| 4.875% 3/1/26 | | 7,844,000 | 7,840,796 |
| CPI Property Group SA 1.5% 1/27/31 (Reg. S) | EUR | 400,000 | 326,367 |
| Essex Portfolio LP 5.5% 4/1/34 | | 4,442,000 | 4,536,450 |
| Greystar Real Estate Partners 7.75% 9/1/30 (b) | | 115,000 | 121,722 |
| GTC Aurora Luxembourg SA 2.25% 6/23/26 (Reg. S) | EUR | 1,390,000 | 1,333,613 |
| Heimstaden AB 4.375% 3/6/27 (Reg. S) | EUR | 1,400,000 | 1,379,587 |
| Kennedy-Wilson, Inc. 4.75% 2/1/30 | | 890,000 | 807,297 |
| Logicor Financing SARL: | | | |
| 0.875% 1/14/31 (Reg. S) | EUR | 600,000 | 541,374 |
| 4.25% 7/18/29 (Reg. S) | EUR | 1,200,000 | 1,305,054 |
| P3 Group SARL 4% 4/19/32 (Reg. S) | EUR | 800,000 | 860,512 |
| Samhallsbyggnadsbolaget I Norden AB 2.25% 8/12/27 (Reg. S) (e) | EUR | 650,000 | 537,132 |
| Sirius Real Estate Ltd. 1.125% 6/22/26 (Reg. S) | EUR | 700,000 | 716,791 |
| Tanger Properties LP: | | | |
| 2.75% 9/1/31 | | 16,949,000 | 14,459,432 |
| 3.125% 9/1/26 | | 2,628,000 | 2,541,520 |
| 3.875% 7/15/27 | | 11,191,000 | 10,865,810 |
| Taylor Morrison Communities, Inc./Monarch Communities, Inc. 5.75% 1/15/28 (b) | | 875,000 | 880,129 |
| Tritax EuroBox PLC 0.95% 6/2/26 (Reg. S) | EUR | 1,300,000 | 1,333,603 |
| | | | 116,495,059 |
TOTAL REAL ESTATE | | | 726,380,293 |
| UTILITIES - 1.0% | | | |
| Electric Utilities - 0.6% | | | |
| Alabama Power Co. 3.05% 3/15/32 | | 18,116,000 | 16,233,808 |
| American Transmission Systems, Inc. 2.65% 1/15/32 (b) | | 5,846,000 | 5,057,211 |
| Amprion GmbH: | | | |
| 3.125% 8/27/30 (Reg. S) | EUR | 1,200,000 | 1,273,667 |
| 3.625% 5/21/31 (Reg. S) | EUR | 300,000 | 326,441 |
| Clearway Energy Operating LLC: | | | |
| 3.75% 2/15/31 (b) | | 1,625,000 | 1,439,368 |
| 4.75% 3/15/28 (b) | | 140,000 | 135,868 |
| Cleco Corporate Holdings LLC: | | | |
| 3.375% 9/15/29 | | 11,796,000 | 10,696,278 |
| 3.743% 5/1/26 | | 19,755,000 | 19,352,897 |
| Cleveland Electric Illuminating Co.: | | | |
| 3.5% 4/1/28 (b) | | 5,498,000 | 5,253,358 |
| 5.95% 12/15/36 | | 2,055,000 | 2,139,843 |
| Consolidated Edison Co. of New York, Inc.: | | | |
| 5.125% 3/15/35 | | 9,000,000 | 9,151,383 |
| 5.2% 3/1/33 | | 8,097,000 | 8,311,548 |
| 5.5% 3/15/34 | | 5,000,000 | 5,219,757 |
| 5.5% 3/15/55 | | 9,000,000 | 9,184,254 |
| 5.9% 11/15/53 | | 5,000,000 | 5,382,493 |
| DPL, Inc. 4.35% 4/15/29 | | 7,785,000 | 7,323,575 |
| Duke Energy Carolinas LLC 4.95% 1/15/33 | | 8,000,000 | 8,052,174 |
| Duke Energy Corp.: | | | |
| 2.45% 6/1/30 | | 790,000 | 700,045 |
| 2.55% 6/15/31 | | 4,359,000 | 3,795,541 |
| 3.85% 6/15/34 | EUR | 1,450,000 | 1,556,053 |
| 4.3% 3/15/28 | | 2,316,000 | 2,291,929 |
| 4.5% 8/15/32 | | 12,535,000 | 12,167,445 |
| 5% 8/15/52 | | 17,535,000 | 16,097,984 |
| 6.1% 9/15/53 | | 8,700,000 | 9,281,808 |
| Duke Energy Indiana LLC 4.9% 7/15/43 | | 1,678,000 | 1,597,335 |
| Duquesne Light Holdings, Inc.: | | | |
| 2.532% 10/1/30 (b) | | 7,005,000 | 6,094,710 |
| 2.775% 1/7/32 (b) | | 11,501,000 | 9,767,241 |
| 3.616% 8/1/27 (b) | | 2,736,000 | 2,644,433 |
| Edison International 5.45% 6/15/29 | | 20,000,000 | 20,401,173 |
| Electricite de France SA 5.5% 1/25/35 (Reg. S) | GBP | 1,500,000 | 1,852,743 |
| EnBW International Finance BV: | | | |
| 3.5% 7/22/31 (Reg. S) | EUR | 1,400,000 | 1,519,369 |
| 3.75% 11/20/35 (Reg. S) | EUR | 1,525,000 | 1,644,938 |
| ENEL Finance International NV: | | | |
| 5.125% 6/26/29 (b) | | 9,300,000 | 9,384,526 |
| 5.5% 6/26/34 (b) | | 9,385,000 | 9,545,844 |
| 7.5% 10/14/32 (b) | | 1,105,000 | 1,261,169 |
| Enel SpA 3.375% (Reg. S) (d)(h) | EUR | 671,000 | 702,187 |
| Exelon Corp.: | | | |
| 2.75% 3/15/27 | | 269,000 | 257,743 |
| 3.35% 3/15/32 | | 20,066,000 | 18,131,148 |
| 4.05% 4/15/30 | | 4,724,000 | 4,548,858 |
| 4.1% 3/15/52 | | 3,609,000 | 2,915,804 |
| 5.15% 3/15/29 | | 6,500,000 | 6,602,855 |
| 5.3% 3/15/33 | | 9,000,000 | 9,189,203 |
| 5.45% 3/15/34 | | 7,200,000 | 7,378,540 |
| 5.6% 3/15/53 | | 6,800,000 | 6,916,678 |
| FirstEnergy Corp.: | | | |
| 1.6% 1/15/26 | | 199,000 | 191,321 |
| 2.05% 3/1/25 | | 1,118,000 | 1,109,290 |
| 2.25% 9/1/30 | | 7,286,000 | 6,294,207 |
| 2.65% 3/1/30 | | 11,794,000 | 10,557,910 |
| Firstenergy Pennsylvania Elect 5.2% 4/1/28 (b) | | 6,490,000 | 6,593,501 |
| Georgia Power Co.: | | | |
| 4.65% 5/16/28 | | 5,500,000 | 5,517,168 |
| 5.25% 3/15/34 | | 8,750,000 | 8,961,147 |
| IPALCO Enterprises, Inc.: | | | |
| 4.25% 5/1/30 | | 8,967,000 | 8,547,826 |
| 5.75% 4/1/34 | | 22,200,000 | 22,792,224 |
| ITC Holdings Corp. 5.65% 5/9/34 (b) | | 11,700,000 | 12,098,212 |
| Monongahela Power Co. 5.85% 2/15/34 (b) | | 6,875,000 | 7,210,475 |
| NextEra Energy Partners LP 7.25% 1/15/29 (b) | | 820,000 | 839,145 |
| NGG Finance PLC 2.125% 9/5/82 (Reg. S) (d) | EUR | 1,960,000 | 1,986,194 |
| NRG Energy, Inc.: | | | |
| 3.625% 2/15/31 (b) | | 1,785,000 | 1,590,644 |
| 5.25% 6/15/29 (b) | | 484,000 | 474,616 |
| 5.75% 1/15/28 | | 1,281,000 | 1,282,391 |
| 6.25% 11/1/34 (b) | | 455,000 | 454,948 |
| Pacific Gas & Electric Co. 5.9% 10/1/54 | | 8,600,000 | 8,828,720 |
| PG&E Corp. 5% 7/1/28 | | 2,715,000 | 2,665,530 |
| PPL Capital Funding, Inc. 5.25% 9/1/34 | | 7,291,000 | 7,372,833 |
| Scottish Hydro Electric Transmission PLC 3.375% 9/4/32 (Reg. S) | EUR | 1,050,000 | 1,127,731 |
| Southern Co.: | | | |
| 1.875% 9/15/81 (d) | EUR | 2,400,000 | 2,367,492 |
| 3.7% 4/30/30 | | 9,229,000 | 8,761,314 |
| 4.4% 7/1/46 | | 8,095,000 | 7,009,031 |
| 4.85% 3/15/35 | | 4,650,000 | 4,567,535 |
| 5.113% 8/1/27 (e) | | 1,724,000 | 1,746,758 |
| 5.5% 3/15/29 | | 7,200,000 | 7,423,088 |
| 5.7% 3/15/34 | | 11,450,000 | 11,997,128 |
| Tampa Electric Co. 6.55% 5/15/36 | | 280,000 | 302,659 |
| Virginia Electric & Power Co.: | | | |
| 2.3% 11/15/31 | | 2,300,000 | 1,964,716 |
| 2.4% 3/30/32 | | 1,724,000 | 1,475,650 |
| 3.75% 5/15/27 | | 2,000,000 | 1,961,040 |
| 5.55% 8/15/54 | | 2,334,000 | 2,392,771 |
| Vistra Operations Co. LLC: | | | |
| 5% 7/31/27 (b) | | 3,190,000 | 3,160,267 |
| 5.625% 2/15/27 (b) | | 665,000 | 665,009 |
| Xcel Energy, Inc.: | | | |
| 3.5% 12/1/49 | | 4,570,000 | 3,308,418 |
| 4.8% 9/15/41 | | 311,000 | 278,821 |
| | | | 458,658,955 |
| Gas Utilities - 0.0% | | | |
| Boston Gas Co. 4.487% 2/15/42 (b) | | 1,118,000 | 953,658 |
| Nakilat, Inc. 6.067% 12/31/33 (b) | | 972,559 | 1,016,635 |
| Southern Co. Gas Capital Corp. 3.15% 9/30/51 | | 3,046,000 | 2,074,663 |
| Southern Gas Networks PLC 3.5% 10/16/30 (Reg. S) | EUR | 1,075,000 | 1,144,140 |
| Superior Plus LP / Superior General Partner, Inc. 4.5% 3/15/29 (b) | | 185,000 | 170,434 |
| | | | 5,359,530 |
| Independent Power and Renewable Electricity Producers - 0.2% | | | |
| Alpha Generation LLC 6.75% 10/15/32 (b) | | 540,000 | 547,098 |
| Atlantica Sustainable Infrastructure PLC 4.125% 6/15/28 (b) | | 6,227,000 | 5,889,253 |
| California Buyer Ltd./Atlantica Sustainable Infrastructure PLC 6.375% 2/15/32 (b) | | 740,000 | 740,840 |
| Emera U.S. Finance LP: | | | |
| 2.639% 6/15/31 | | 7,893,000 | 6,796,215 |
| 3.55% 6/15/26 | | 9,123,000 | 8,939,026 |
| 4.75% 6/15/46 | | 5,449,000 | 4,741,254 |
| RWE Finance U.S. LLC 5.875% 4/16/34 (b) | | 2,235,000 | 2,298,094 |
| Sunnova Energy Corp. 11.75% 10/1/28 (b) | | 455,000 | 360,465 |
| TerraForm Power Operating LLC: | | | |
| 4.75% 1/15/30 (b) | | 75,000 | 70,322 |
| 5% 1/31/28 (b) | | 1,056,000 | 1,023,871 |
| The AES Corp.: | | | |
| 1.375% 1/15/26 | | 3,793,000 | 3,640,504 |
| 2.45% 1/15/31 | | 75,541,000 | 64,026,816 |
| 3.3% 7/15/25 (b) | | 18,060,000 | 17,841,180 |
| 3.95% 7/15/30 (b) | | 21,858,000 | 20,356,135 |
| TransAlta Corp. 6.5% 3/15/40 | | 655,000 | 667,450 |
| | | | 137,938,523 |
| Multi-Utilities - 0.2% | | | |
| Berkshire Hathaway Energy Co.: | | | |
| 3.25% 4/15/28 | | 2,069,000 | 1,986,174 |
| 3.7% 7/15/30 | | 161,000 | 153,763 |
| Engie SA: | | | |
| 3.875% 3/6/36 (Reg. S) | EUR | 800,000 | 876,827 |
| 4.25% 9/6/34 (Reg. S) | EUR | 600,000 | 675,161 |
| NiSource, Inc.: | | | |
| 0.95% 8/15/25 | | 829,000 | 806,384 |
| 1.7% 2/15/31 | | 3,114,000 | 2,588,418 |
| 2.95% 9/1/29 | | 15,395,000 | 14,228,682 |
| 3.6% 5/1/30 | | 21,588,000 | 20,380,742 |
| 4.375% 5/15/47 | | 3,114,000 | 2,682,993 |
| 4.8% 2/15/44 | | 4,982,000 | 4,597,385 |
| 5% 6/15/52 | | 2,180,000 | 2,035,214 |
| 5.25% 3/30/28 | | 4,400,000 | 4,478,048 |
| 5.25% 2/15/43 | | 132,000 | 129,339 |
| 5.35% 4/1/34 | | 4,500,000 | 4,578,397 |
| 5.4% 6/30/33 | | 5,000,000 | 5,102,500 |
| 5.95% 6/15/41 | | 2,375,000 | 2,490,395 |
| Puget Energy, Inc.: | | | |
| 2.379% 6/15/28 | | 6,588,000 | 6,046,099 |
| 3.65% 5/15/25 | | 1,035,000 | 1,027,883 |
| 4.1% 6/15/30 | | 7,982,000 | 7,574,470 |
| 4.224% 3/15/32 | | 27,701,000 | 25,775,159 |
| Sempra 6% 10/15/39 | | 2,744,000 | 2,891,748 |
| WEC Energy Group, Inc.: | | | |
| CME Term SOFR 3 Month Index + 2.110% 6.8976% 5/15/67 (d)(i) | | 3,075,000 | 3,077,131 |
| 2.2% 12/15/28 | | 3,114,000 | 2,839,183 |
| | | | 117,022,095 |
| Water Utilities - 0.0% | | | |
| Anglian Water Services Financing PLC: | | | |
| 5.875% 6/20/31 (Reg. S) | GBP | 565,000 | 722,759 |
| 6.25% 9/12/44 (Reg. S) | GBP | 825,000 | 1,032,867 |
| 6.293% 7/30/30 (Reg. S) | GBP | 1,000,000 | 1,299,779 |
| Severn Trent Utilities Finance PLC 4.625% 11/30/34 (Reg. S) | GBP | 380,000 | 454,026 |
| Southern Water Services Finance Ltd. 2.375% 5/28/28 (Reg. S) | GBP | 870,000 | 860,825 |
| SW Finance I PLC 7.375% 12/12/41 (Reg. S) | GBP | 431,000 | 461,348 |
| | | | 4,831,604 |
TOTAL UTILITIES | | | 723,810,707 |
| TOTAL NONCONVERTIBLE BONDS (Cost $9,443,991,066) | | | 9,394,149,743 |
| | | | |
| U.S. Treasury Obligations - 14.3% |
| | | Principal Amount (a) | Value ($) |
| U.S. Treasury Bonds: | | | |
| 1.125% 8/15/40 | | 3,500,000 | 2,203,496 |
| 1.75% 8/15/41 | | 13,264,000 | 9,057,343 |
| 1.875% 2/15/41 | | 7,454,500 | 5,262,120 |
| 2% 11/15/41 | | 19,304,500 | 13,664,720 |
| 2.25% 8/15/46 | | 830,000 | 568,226 |
| 2.25% 2/15/52 | | 70,500,000 | 46,059,082 |
| 2.375% 5/15/51 | | 520,726,000 | 351,754,480 |
| 2.875% 5/15/52 | | 409,400,000 | 307,417,821 |
| 3.625% 2/15/53 | | 244,816,000 | 213,353,320 |
| 3.625% 5/15/53 | | 2,100,000 | 1,831,922 |
| 4.125% 8/15/44 | | 60,560,000 | 57,645,550 |
| 4.125% 8/15/53 (j) | | 424,900,000 | 405,364,560 |
| 4.25% 2/15/54 | | 172,588,000 | 168,569,936 |
| 4.25% 8/15/54 | | 463,850,000 | 453,630,805 |
| 4.375% 8/15/43 | | 358,000 | 354,140 |
| 4.5% 2/15/44 | | 2,975,000 | 2,982,902 |
| 4.5% 11/15/54 | | 23,500,000 | 23,992,031 |
| 4.625% 5/15/44 | | 81,585,000 | 83,101,971 |
| 4.625% 5/15/54 | | 103,100,000 | 107,175,672 |
| 4.75% 11/15/53 | | 120,000,000 | 126,984,374 |
| 6.25% 5/15/30 (k) | | 5,440,000 | 6,005,250 |
| U.S. Treasury Notes: | | | |
| 1% 7/31/28 (l) | | 7,000,000 | 6,263,359 |
| 1.875% 2/28/29 | | 150,000,000 | 137,074,218 |
| 2.75% 8/15/32 | | 125,847,100 | 114,225,907 |
| 3.375% 9/15/27 | | 47,710,000 | 46,785,619 |
| 3.375% 5/15/33 | | 221,200,000 | 208,619,250 |
| 3.5% 1/31/30 | | 472,798,300 | 459,519,315 |
| 3.5% 4/30/30 | | 143,600,000 | 139,392,968 |
| 3.5% 2/15/33 | | 292,524,000 | 278,949,058 |
| 3.625% 3/31/30 | | 122,852,000 | 120,025,445 |
| 3.625% 9/30/31 | | 422,582,000 | 409,904,540 |
| 3.75% 8/15/27 | | 43,508,200 | 43,088,414 |
| 3.75% 12/31/28 | | 1,935,000 | 1,908,469 |
| 3.75% 5/31/30 | | 268,624,800 | 263,818,936 |
| 3.75% 8/31/31 | | 51,900,000 | 50,726,168 |
| 3.875% 12/31/27 (l) | | 207,578,700 | 206,135,135 |
| 3.875% 12/31/29 | | 135,000,000 | 133,576,171 |
| 3.875% 8/15/33 | | 71,115,500 | 69,507,067 |
| 3.875% 8/15/34 | | 1,056,840,000 | 1,029,841,331 |
| 4% 1/15/27 | | 73,370,000 | 73,109,192 |
| 4% 1/31/29 | | 5,950,000 | 5,923,504 |
| 4% 2/28/30 | | 420,900,000 | 418,746,175 |
| 4% 2/15/34 | | 39,379,200 | 38,785,436 |
| 4.125% 7/31/28 | | 233,500,000 | 233,509,121 |
| 4.125% 10/31/29 (m) | | 43,300,000 | 43,364,274 |
| 4.125% 8/31/30 | | 188,034,000 | 188,026,655 |
| 4.125% 7/31/31 | | 903,225,000 | 902,671,775 |
| 4.125% 10/31/31 | | 1,100,000 | 1,099,484 |
| 4.125% 11/15/32 | | 125,700,900 | 125,524,133 |
| 4.25% 3/15/27 | | 10,796,700 | 10,817,366 |
| 4.25% 2/28/29 | | 2,300,000 | 2,312,039 |
| 4.25% 6/30/29 | | 26,576,100 | 26,741,581 |
| 4.25% 2/28/31 | | 76,182,300 | 76,673,319 |
| 4.25% 6/30/31 | | 15,123,000 | 15,224,608 |
| 4.25% 11/15/34 | | 161,037,100 | 161,766,799 |
| 4.375% 8/31/28 | | 104,000,000 | 104,877,500 |
| 4.375% 11/30/30 | | 68,244,800 | 69,137,847 |
| 4.375% 5/15/34 | | 105,436,400 | 106,869,676 |
| 4.5% 5/15/27 | | 68,939,400 | 69,491,454 |
| 4.5% 5/31/29 | | 11,680,000 | 11,871,169 |
| 4.5% 11/15/33 | | 600,173,200 | 613,934,985 |
| 4.625% 9/15/26 | | 49,200,000 | 49,534,407 |
| 4.625% 10/15/26 | | 72,000,000 | 72,531,562 |
| 4.625% 9/30/28 | | 119,000,000 | 121,091,796 |
| 4.625% 4/30/29 | | 5,100,000 | 5,205,387 |
| 4.625% 9/30/30 | | 156,000,000 | 160,015,782 |
| 4.625% 5/31/31 | | 71,431,700 | 73,407,233 |
| 4.875% 10/31/30 | | 205,200,000 | 213,215,625 |
| TOTAL U.S. TREASURY OBLIGATIONS (Cost $10,433,480,404) | | | 10,101,820,975 |
| | | | |
| U.S. Government Agency - Mortgage Securities - 27.2% |
| | | Principal Amount (a) | Value ($) |
| Fannie Mae - 6.5% | | | |
| FTSE USD IBOR Consumer Cash Fallbacks Term 1Y + 1.440% 5.945% 4/1/37 (d)(i) | | 5,992 | 6,108 |
| FTSE USD IBOR Consumer Cash Fallbacks Term 1Y + 1.460% 6.085% 1/1/35 (d)(i) | | 1,673 | 1,706 |
| FTSE USD IBOR Consumer Cash Fallbacks Term 1Y + 1.480% 7.48% 7/1/34 (d)(i) | | 650 | 660 |
| FTSE USD IBOR Consumer Cash Fallbacks Term 1Y + 1.550% 7.428% 6/1/36 (d)(i) | | 5,782 | 5,889 |
| FTSE USD IBOR Consumer Cash Fallbacks Term 1Y + 1.560% 6.065% 3/1/37 (d)(i) | | 5,393 | 5,505 |
| FTSE USD IBOR Consumer Cash Fallbacks Term 1Y + 1.590% 5.971% 3/1/36 (d)(i) | | 1,085 | 1,110 |
| FTSE USD IBOR Consumer Cash Fallbacks Term 1Y + 1.600% 7.436% 8/1/35 (d)(i) | | 2,921 | 2,978 |
| FTSE USD IBOR Consumer Cash Fallbacks Term 1Y + 1.630% 6.887% 11/1/36 (d)(i) | | 2,077 | 2,116 |
| FTSE USD IBOR Consumer Cash Fallbacks Term 1Y + 1.630% 7.065% 9/1/36 (d)(i) | | 1,117 | 1,140 |
| FTSE USD IBOR Consumer Cash Fallbacks Term 1Y + 1.640% 7.389% 5/1/35 (d)(i) | | 8,543 | 8,702 |
| FTSE USD IBOR Consumer Cash Fallbacks Term 1Y + 1.670% 6.711% 3/1/33 (d)(i) | | 2,632 | 2,678 |
| FTSE USD IBOR Consumer Cash Fallbacks Term 1Y + 1.680% 7.062% 5/1/36 (d)(i) | | 3,692 | 3,766 |
| FTSE USD IBOR Consumer Cash Fallbacks Term 1Y + 1.690% 6.521% 7/1/43 (d)(i) | | 68,052 | 69,827 |
| FTSE USD IBOR Consumer Cash Fallbacks Term 1Y + 1.700% 7.177% 6/1/42 (d)(i) | | 7,319 | 7,488 |
| FTSE USD IBOR Consumer Cash Fallbacks Term 1Y + 1.730% 6.27% 3/1/40 (d)(i) | | 10,309 | 10,599 |
| FTSE USD IBOR Consumer Cash Fallbacks Term 1Y + 1.750% 6.556% 7/1/35 (d)(i) | | 2,427 | 2,479 |
| FTSE USD IBOR Consumer Cash Fallbacks Term 1Y + 1.750% 7.5% 8/1/41 (d)(i) | | 16,783 | 17,162 |
| FTSE USD IBOR Consumer Cash Fallbacks Term 1Y + 1.800% 6.05% 1/1/42 (d)(i) | | 21,976 | 22,594 |
| FTSE USD IBOR Consumer Cash Fallbacks Term 1Y + 1.800% 7.635% 7/1/41 (d)(i) | | 2,243 | 2,297 |
| FTSE USD IBOR Consumer Cash Fallbacks Term 1Y + 1.810% 6.06% 12/1/39 (d)(i) | | 3,157 | 3,246 |
| FTSE USD IBOR Consumer Cash Fallbacks Term 1Y + 1.810% 6.297% 2/1/42 (d)(i) | | 9,739 | 9,993 |
| FTSE USD IBOR Consumer Cash Fallbacks Term 1Y + 1.810% 7.073% 12/1/40 (d)(i) | | 277,267 | 284,646 |
| FTSE USD IBOR Consumer Cash Fallbacks Term 1Y + 1.810% 7.318% 9/1/41 (d)(i) | | 3,260 | 3,342 |
| FTSE USD IBOR Consumer Cash Fallbacks Term 1Y + 1.810% 7.639% 7/1/41 (d)(i) | | 4,313 | 4,419 |
| FTSE USD IBOR Consumer Cash Fallbacks Term 1Y + 1.820% 6.298% 2/1/35 (d)(i) | | 12,720 | 13,007 |
| FTSE USD IBOR Consumer Cash Fallbacks Term 1Y + 1.830% 7.004% 10/1/41 (d)(i) | | 2,838 | 2,888 |
| FTSE USD IBOR Consumer Cash Fallbacks Term 1Y + 1.950% 7.703% 7/1/37 (d)(i) | | 14,627 | 15,005 |
| FTSE USD IBOR Consumer Cash Fallbacks Term 6M + 1.500% 6.755% 1/1/35 (d)(i) | | 1,477 | 1,489 |
| FTSE USD IBOR Consumer Cash Fallbacks Term 6M + 1.530% 6.785% 12/1/34 (d)(i) | | 1,393 | 1,405 |
| FTSE USD IBOR Consumer Cash Fallbacks Term 6M + 1.530% 6.785% 3/1/35 (d)(i) | | 1,125 | 1,135 |
| FTSE USD IBOR Consumer Cash Fallbacks Term 6M + 1.550% 7.08% 10/1/33 (d)(i) | | 630 | 636 |
| FTSE USD IBOR Consumer Cash Fallbacks Term 6M + 1.560% 7.315% 7/1/35 (d)(i) | | 725 | 731 |
| FTSE USD IBOR Consumer Cash Fallbacks Term 6M + 1.960% 7.417% 9/1/35 (d)(i) | | 1,290 | 1,313 |
| U.S. TREASURY 1 YEAR INDEX + 2.200% 6.583% 3/1/35 (d)(i) | | 2,915 | 2,960 |
| U.S. TREASURY 1 YEAR INDEX + 2.270% 6.911% 6/1/36 (d)(i) | | 8,907 | 9,060 |
| U.S. TREASURY 1 YEAR INDEX + 2.280% 7.249% 10/1/33 (d)(i) | | 4,600 | 4,678 |
| U.S. TREASURY 1 YEAR INDEX + 2.460% 7.395% 7/1/34 (d)(i) | | 6,839 | 6,966 |
| 1% 12/1/36 | | 77,507,357 | 65,261,110 |
| 1.5% 9/1/35 to 8/1/51 | | 225,770,006 | 186,922,868 |
| 2% 2/1/28 to 6/1/52 | | 868,338,367 | 739,635,203 |
| 2.5% 5/1/31 to 7/1/53 | | 998,245,022 | 864,973,396 |
| 3% 12/1/28 to 8/1/52 (l)(n) | | 731,690,273 | 654,932,607 |
| 3.25% 12/1/41 | | 5,086 | 4,725 |
| 3.4% 7/1/42 to 9/1/42 | | 102,279 | 94,504 |
| 3.5% 9/1/33 to 8/1/52 (n) | | 554,250,816 | 510,551,345 |
| 3.65% 5/1/42 to 8/1/42 | | 24,019 | 22,531 |
| 3.9% 4/1/42 | | 8,728 | 8,310 |
| 4% 3/1/36 to 2/1/53 | | 302,863,040 | 288,757,791 |
| 4.25% 11/1/41 | | 16,312 | 15,863 |
| 4.5% to 4.5% 5/1/25 to 12/1/52 | | 105,381,311 | 102,742,199 |
| 5% 10/1/29 to 12/1/54 | | 216,372,001 | 213,874,152 |
| 5.3% 8/1/41 (d) | | 186,942 | 186,714 |
| 5.5% 9/1/32 to 10/1/54 | | 287,018,479 | 288,473,163 |
| 6% to 6% 9/1/29 to 11/1/54 | | 479,167,061 | 488,343,116 |
| 6.5% 7/1/32 to 7/1/54 | | 203,128,586 | 209,949,988 |
| 6.735% 2/1/39 (d) | | 74,000 | 76,007 |
| 7% to 7% 8/1/25 to 7/1/37 | | 56,993 | 59,249 |
| 7.5% to 7.5% 7/1/25 to 9/1/32 | | 31,476 | 32,680 |
| 8% 3/1/37 | | 2,726 | 2,883 |
| 9% 10/1/30 | | 2,722 | 2,891 |
TOTAL FANNIE MAE | | | 4,615,465,018 |
| Freddie Mac - 4.4% | | | |
| FTSE USD IBOR Consumer Cash Fallbacks Term 1Y + 1.320% 5.575% 1/1/36 (d)(i) | | 3,500 | 3,551 |
| FTSE USD IBOR Consumer Cash Fallbacks Term 1Y + 1.370% 6.227% 3/1/36 (d)(i) | | 14,248 | 14,478 |
| FTSE USD IBOR Consumer Cash Fallbacks Term 1Y + 1.500% 6.127% 3/1/36 (d)(i) | | 14,511 | 14,726 |
| FTSE USD IBOR Consumer Cash Fallbacks Term 1Y + 1.750% 6.466% 12/1/40 (d)(i) | | 112,217 | 115,080 |
| FTSE USD IBOR Consumer Cash Fallbacks Term 1Y + 1.750% 7.294% 9/1/41 (d)(i) | | 42,881 | 43,741 |
| FTSE USD IBOR Consumer Cash Fallbacks Term 1Y + 1.750% 7.567% 7/1/41 (d)(i) | | 25,272 | 25,769 |
| FTSE USD IBOR Consumer Cash Fallbacks Term 1Y + 1.860% 7.239% 4/1/36 (d)(i) | | 7,497 | 7,661 |
| FTSE USD IBOR Consumer Cash Fallbacks Term 1Y + 1.880% 7.255% 4/1/41 (d)(i) | | 1,078 | 1,101 |
| FTSE USD IBOR Consumer Cash Fallbacks Term 1Y + 1.880% 7.601% 9/1/41 (d)(i) | | 4,559 | 4,662 |
| FTSE USD IBOR Consumer Cash Fallbacks Term 1Y + 1.910% 7.155% 5/1/41 (d)(i) | | 8,530 | 8,733 |
| FTSE USD IBOR Consumer Cash Fallbacks Term 1Y + 1.910% 7.485% 5/1/41 (d)(i) | | 5,845 | 5,978 |
| FTSE USD IBOR Consumer Cash Fallbacks Term 1Y + 1.910% 7.628% 6/1/41 (d)(i) | | 8,220 | 8,403 |
| FTSE USD IBOR Consumer Cash Fallbacks Term 1Y + 1.910% 7.785% 6/1/41 (d)(i) | | 2,363 | 2,415 |
| FTSE USD IBOR Consumer Cash Fallbacks Term 1Y + 1.920% 7.17% 10/1/42 (d)(i) | | 15,696 | 16,101 |
| FTSE USD IBOR Consumer Cash Fallbacks Term 1Y + 1.960% 7.711% 6/1/33 (d)(i) | | 2,852 | 2,905 |
| FTSE USD IBOR Consumer Cash Fallbacks Term 1Y + 2.020% 6.936% 4/1/38 (d)(i) | | 6,252 | 6,401 |
| FTSE USD IBOR Consumer Cash Fallbacks Term 1Y + 2.030% 7.658% 3/1/33 (d)(i) | | 119 | 121 |
| FTSE USD IBOR Consumer Cash Fallbacks Term 1Y + 2.040% 7.905% 7/1/36 (d)(i) | | 6,377 | 6,523 |
| FTSE USD IBOR Consumer Cash Fallbacks Term 1Y + 2.200% 6.45% 12/1/36 (d)(i) | | 11,846 | 12,179 |
| FTSE USD IBOR Consumer Cash Fallbacks Term 6M + 1.120% 6.424% 8/1/37 (d)(i) | | 7,212 | 7,191 |
| FTSE USD IBOR Consumer Cash Fallbacks Term 6M + 1.860% 7.255% 10/1/36 (d)(i) | | 12,853 | 13,005 |
| FTSE USD IBOR Consumer Cash Fallbacks Term 6M + 1.990% 7.162% 10/1/35 (d)(i) | | 8,681 | 8,805 |
| FTSE USD IBOR Consumer Cash Fallbacks Term 6M + 2.020% 7.635% 6/1/37 (d)(i) | | 13,983 | 14,164 |
| FTSE USD IBOR Consumer Cash Fallbacks Term 6M + 3.040% 8.549% 10/1/35 (d)(i) | | 1,616 | 1,661 |
| U.S. TREASURY 1 YEAR INDEX + 2.030% 6.821% 6/1/33 (d)(i) | | 11,706 | 11,807 |
| U.S. TREASURY 1 YEAR INDEX + 2.240% 7.12% 6/1/33 (d)(i) | | 20,544 | 20,785 |
| U.S. TREASURY 1 YEAR INDEX + 2.370% 7.19% 3/1/35 (d)(i) | | 34,895 | 35,410 |
| 1.5% 8/1/35 to 6/1/51 | | 428,511,648 | 335,195,333 |
| 2% 6/1/35 to 4/1/52 | | 649,607,707 | 540,016,353 |
| 2.5% 6/1/31 to 6/1/52 (j) | | 487,956,543 | 419,598,037 |
| 3% 12/1/30 to 6/1/52 | | 255,666,566 | 226,377,249 |
| 3.5% 3/1/32 to 10/1/52 (n) | | 281,441,743 | 259,885,898 |
| 4% 5/1/33 to 3/1/53 | | 93,456,416 | 89,153,031 |
| 4% 4/1/48 | | 8,386 | 7,979 |
| 4.5% 6/1/25 to 7/1/49 | | 21,508,356 | 21,090,333 |
| 5% 7/1/33 to 12/1/54 | | 465,881,927 | 458,612,602 |
| 5.5% 3/1/34 to 12/1/54 (k)(l)(n) | | 444,175,078 | 445,950,826 |
| 6% 11/1/28 to 11/1/54 (k) | | 227,338,887 | 233,301,469 |
| 6.5% 5/1/31 to 9/1/54 (j)(k) | | 97,709,418 | 101,814,214 |
| 7% 3/1/26 to 1/1/36 | | 68,937 | 71,977 |
| 7.5% 1/1/27 to 7/1/34 | | 24,138 | 25,449 |
| 8% 7/1/25 to 4/1/32 | | 1,581 | 1,635 |
| 8.5% 8/1/26 to 1/1/28 | | 563 | 575 |
TOTAL FREDDIE MAC | | | 3,131,516,316 |
| Ginnie Mae - 10.8% | | | |
| 3.5% 9/20/40 to 11/20/54 | | 271,310,115 | 248,548,238 |
| 4% 7/20/33 to 10/20/52 | | 131,456,006 | 124,480,350 |
| 4.5% 6/20/33 to 7/20/54 | | 125,553,439 | 121,381,582 |
| 5.5% 8/15/33 to 9/15/39 | | 168,315 | 170,905 |
| 6% to 6% 10/15/30 to 5/15/40 | | 216,342 | 223,313 |
| 7% to 7% 8/15/25 to 11/15/32 | | 228,751 | 234,184 |
| 7.5% to 7.5% 9/15/25 to 9/15/31 | | 9,909 | 10,110 |
| 8% 6/15/25 to 1/15/28 | | 1,487 | 1,506 |
| 8.5% to 8.5% 11/15/27 to 1/15/31 | | 1,696 | 1,744 |
| 2% 9/20/50 to 1/20/54 | | 423,548,105 | 348,648,085 |
| 2% 12/1/54 (c) | | 61,425,000 | 50,502,867 |
| 2% 12/1/54 (c) | | 104,100,000 | 85,589,719 |
| 2% 12/1/54 (c) | | 185,175,000 | 152,248,570 |
| 2% 12/1/54 (c) | | 313,800,000 | 258,002,438 |
| 2% 12/1/54 (c) | | 4,300,000 | 3,535,406 |
| 2% 12/1/54 (c) | | 7,300,000 | 6,001,969 |
| 2% 12/1/54 (c) | | 5,325,000 | 4,378,148 |
| 2% 12/1/54 (c) | | 6,875,000 | 5,652,539 |
| 2% 12/1/54 (c) | | 275,000 | 226,102 |
| 2% 12/1/54 (c) | | 36,750,000 | 30,215,391 |
| 2% 12/1/54 (c) | | 47,450,000 | 39,012,797 |
| 2% 12/1/54 (c) | | 1,875,000 | 1,541,602 |
| 2% 1/1/55 (c) | | 61,300,000 | 50,447,987 |
| 2% 1/1/55 (c) | | 32,200,000 | 26,499,595 |
| 2% 1/1/55 (c) | | 184,800,000 | 152,084,634 |
| 2% 1/1/55 (c) | | 81,050,000 | 66,701,621 |
| 2% 1/1/55 (c) | | 4,300,000 | 3,538,766 |
| 2% 1/1/55 (c) | | 2,100,000 | 1,728,234 |
| 2% 1/1/55 (c) | | 32,075,000 | 26,396,724 |
| 2% 1/1/55 (c) | | 80,825,000 | 66,516,453 |
| 2% 1/1/55 (c) | | 2,075,000 | 1,707,660 |
| 2.5% 11/20/47 to 5/20/52 | | 576,020,966 | 490,986,550 |
| 2.5% 12/1/54 (c) | | 14,900,000 | 12,739,500 |
| 2.5% 12/1/54 (c) | | 25,000,000 | 21,375,000 |
| 3% 2/20/31 to 2/20/50 | | 27,650,319 | 26,110,851 |
| 3% 12/1/54 (c) | | 20,200,000 | 17,908,563 |
| 3% 12/1/54 (c) | | 181,725,000 | 161,110,570 |
| 3% 12/1/54 (c) | | 7,800,000 | 6,915,188 |
| 3% 12/1/54 (c) | | 16,875,000 | 14,960,742 |
| 3% 12/1/54 (c) | | 139,225,000 | 123,431,664 |
| 3% 12/1/54 (c) | | 5,125,000 | 4,543,633 |
| 3% 12/1/54 (c) | | 6,550,000 | 5,806,984 |
| 3% 12/1/54 (c) | | 53,950,000 | 47,830,047 |
| 3% 12/1/54 (c) | | 2,000,000 | 1,773,125 |
| 3% 12/1/54 (c) | | 43,600,000 | 38,654,125 |
| 3% 12/1/54 (c) | | 34,850,000 | 30,896,703 |
| 3% 12/1/54 (c) | | 1,275,000 | 1,130,367 |
| 3% 12/1/54 (c) | | 31,525,000 | 27,948,883 |
| 3% 12/1/54 (c) | | 6,550,000 | 5,806,984 |
| 3% 12/1/54 (c) | | 139,225,000 | 123,431,664 |
| 3% 12/1/54 (c) | | 39,700,000 | 35,196,531 |
| 3% 12/1/54 (c) | | 2,000,000 | 1,773,125 |
| 3% 12/1/54 (c) | | 5,075,000 | 4,499,305 |
| 3% 1/1/55 (c) | | 28,275,000 | 25,081,913 |
| 3% 1/1/55 (c) | | 132,825,000 | 117,825,113 |
| 3% 1/1/55 (c) | | 5,250,000 | 4,657,119 |
| 3% 1/1/55 (c) | | 38,075,000 | 33,775,202 |
| 3% 1/1/55 (c) | | 178,925,000 | 158,719,053 |
| 3% 1/1/55 (c) | | 7,075,000 | 6,276,022 |
| 3.5% 12/1/54 (c) | | 14,000,000 | 12,797,968 |
| 3.5% 12/1/54 (c) | | 22,800,000 | 20,842,406 |
| 3.5% 12/1/54 (c) | | 2,500,000 | 2,285,352 |
| 3.5% 12/1/54 (c) | | 38,950,000 | 35,605,776 |
| 3.5% 12/1/54 (c) | | 109,700,000 | 100,281,224 |
| 3.5% 12/1/54 (c) | | 6,900,000 | 6,307,570 |
| 3.5% 12/1/54 (c) | | 19,525,000 | 17,848,595 |
| 3.5% 12/1/54 (c) | | 109,550,000 | 100,144,103 |
| 3.5% 12/1/54 (c) | | 3,475,000 | 3,176,639 |
| 3.5% 1/1/55 (c) | | 31,000,000 | 28,352,891 |
| 3.5% 1/1/55 (c) | | 213,350,000 | 195,131,915 |
| 3.5% 1/1/55 (c) | | 5,900,000 | 5,396,195 |
| 3.5% 1/1/55 (c) | | 7,325,000 | 6,699,514 |
| 3.5% 1/1/55 (c) | | 50,400,000 | 46,096,314 |
| 3.5% 1/1/55 (c) | | 1,400,000 | 1,280,453 |
| 4% 12/1/54 (c) | | 20,000,000 | 18,812,500 |
| 4.5% 12/1/54 (c) | | 6,425,000 | 6,200,125 |
| 4.5% 12/1/54 (c) | | 81,000,000 | 78,165,000 |
| 4.5% 12/1/54 (c) | | 8,125,000 | 7,840,625 |
| 4.5% 12/1/54 (c) | | 102,350,000 | 98,767,750 |
| 5% 4/15/33 to 2/20/54 | | 8,483,811 | 8,514,520 |
| 5% 12/1/54 (c) | | 43,700,000 | 43,085,469 |
| 5% 12/1/54 (c) | | 8,750,000 | 8,626,953 |
| 5% 12/1/54 (c) | | 85,825,000 | 84,618,086 |
| 5% 12/1/54 (c) | | 3,875,000 | 3,820,508 |
| 5% 12/1/54 (c) | | 62,050,000 | 61,177,422 |
| 5% 12/1/54 (c) | | 4,500,000 | 4,436,719 |
| 5.5% 12/1/54 (c) | | 7,600,000 | 7,610,094 |
| 5.5% 12/1/54 (c) | | 74,400,000 | 74,498,811 |
| 5.5% 12/1/54 (c) | | 3,600,000 | 3,604,781 |
| 5.5% 12/1/54 (c) | | 9,475,000 | 9,487,584 |
| 5.5% 12/1/54 (c) | | 12,250,000 | 12,266,269 |
| 5.5% 12/1/54 (c) | | 24,025,000 | 24,056,908 |
| 5.5% 12/1/54 (c) | | 87,350,000 | 87,466,010 |
| 5.5% 12/1/54 (c) | | 4,550,000 | 4,556,043 |
| 5.5% 12/1/54 (c) | | 23,300,000 | 23,330,945 |
| 5.5% 12/1/54 (c) | | 64,300,000 | 64,385,397 |
| 5.5% 12/1/54 (c) | | 2,975,000 | 2,978,951 |
| 5.5% 12/1/54 (c) | | 12,300,000 | 12,316,336 |
| 5.5% 12/1/54 (c) | | 8,500,000 | 8,511,289 |
| 5.5% 12/1/54 (c) | | 79,000,000 | 79,104,920 |
| 5.5% 12/1/54 (c) | | 2,975,000 | 2,978,951 |
| 5.5% 12/1/54 (c) | | 1,600,000 | 1,602,125 |
| 5.5% 12/1/54 (c) | | 9,350,000 | 9,362,418 |
| 5.5% 12/1/54 (c) | | 91,950,000 | 92,072,119 |
| 5.5% 12/1/54 (c) | | 4,400,000 | 4,405,844 |
| 5.5% 12/1/54 (c) | | 4,725,000 | 4,731,275 |
| 5.5% 12/1/54 (c) | | 46,225,000 | 46,286,391 |
| 5.5% 12/1/54 (c) | | 2,225,000 | 2,227,955 |
| 5.5% 1/1/55 (c) | | 12,250,000 | 12,257,177 |
| 5.5% 1/1/55 (c) | | 87,350,000 | 87,401,178 |
| 5.5% 1/1/55 (c) | | 4,550,000 | 4,552,666 |
| 5.5% 1/1/55 (c) | | 12,300,000 | 12,307,207 |
| 5.5% 1/1/55 (c) | | 87,500,000 | 87,551,266 |
| 5.5% 1/1/55 (c) | | 4,575,000 | 4,577,680 |
| 6% 12/1/54 (c) | | 43,050,000 | 43,500,682 |
| 6% 12/1/54 (c) | | 184,400,000 | 186,330,447 |
| 6% 12/1/54 (c) | | 7,425,000 | 7,502,731 |
| 6% 12/1/54 (c) | | 10,750,000 | 10,862,540 |
| 6% 12/1/54 (c) | | 46,075,000 | 46,557,350 |
| 6% 12/1/54 (c) | | 1,850,000 | 1,869,367 |
| 6% 12/1/54 (c) | | 28,300,000 | 28,596,267 |
| 6% 12/1/54 (c) | | 183,950,000 | 185,875,736 |
| 6% 12/1/54 (c) | | 4,900,000 | 4,951,297 |
| 6% 12/1/54 (c) | | 24,150,000 | 24,402,822 |
| 6% 12/1/54 (c) | | 57,900,000 | 58,506,144 |
| 6% 12/1/54 (c) | | 1,550,000 | 1,566,227 |
| 6% 12/1/54 (c) | | 34,500,000 | 34,861,174 |
| 6% 12/1/54 (c) | | 82,750,000 | 83,616,293 |
| 6% 12/1/54 (c) | | 2,200,000 | 2,223,031 |
| 6% 12/1/54 (c) | | 10,650,000 | 10,761,493 |
| 6% 12/1/54 (c) | | 25,550,000 | 25,817,478 |
| 6% 12/1/54 (c) | | 675,000 | 682,066 |
| 6% 12/1/54 (c) | | 10,750,000 | 10,862,540 |
| 6% 12/1/54 (c) | | 10,700,000 | 10,812,016 |
| 6% 12/1/54 (c) | | 46,075,000 | 46,557,350 |
| 6% 12/1/54 (c) | | 31,400,000 | 31,728,720 |
| 6% 12/1/54 (c) | | 1,675,000 | 1,692,535 |
| 6% 12/1/54 (c) | | 6,250,000 | 6,315,430 |
| 6% 12/1/54 (c) | | 43,050,000 | 43,500,682 |
| 6% 12/1/54 (c) | | 42,600,000 | 43,045,971 |
| 6% 12/1/54 (c) | | 168,150,000 | 169,910,329 |
| 6% 12/1/54 (c) | | 182,200,000 | 184,107,415 |
| 6% 12/1/54 (c) | | 7,400,000 | 7,477,469 |
| 6% 12/1/54 (c) | | 5,925,000 | 5,987,028 |
| 6% 1/1/55 (c) | | 21,450,000 | 21,657,797 |
| 6% 1/1/55 (c) | | 93,725,000 | 94,632,961 |
| 6% 1/1/55 (c) | | 3,175,000 | 3,205,758 |
| 6% 1/1/55 (c) | | 47,525,000 | 47,985,398 |
| 6% 1/1/55 (c) | | 191,100,000 | 192,951,281 |
| 6% 1/1/55 (c) | | 6,575,000 | 6,638,695 |
| 6% 1/1/55 (c) | | 31,625,000 | 31,931,367 |
| 6% 1/1/55 (c) | | 138,200,000 | 139,538,813 |
| 6% 1/1/55 (c) | | 4,700,000 | 4,745,531 |
| 6% 1/1/55 (c) | | 44,350,000 | 44,779,641 |
| 6% 1/1/55 (c) | | 193,700,000 | 195,576,469 |
| 6% 1/1/55 (c) | | 6,600,000 | 6,663,938 |
| 6.5% 3/20/31 to 6/15/37 | | 36,900 | 37,959 |
| 6.5% 12/1/54 (c) | | 2,275,000 | 2,313,035 |
| 6.5% 12/1/54 (c) | | 6,850,000 | 6,964,524 |
| 6.5% 12/1/54 (c) | | 64,850,000 | 65,934,214 |
| 6.5% 12/1/54 (c) | | 3,050,000 | 3,100,992 |
| 6.5% 12/1/54 (c) | | 5,850,000 | 5,947,805 |
| 6.5% 12/1/54 (c) | | 725,000 | 737,121 |
| 6.5% 12/1/54 (c) | | 55,250,000 | 56,173,714 |
| 6.5% 12/1/54 (c) | | 6,875,000 | 6,989,942 |
| 6.5% 12/1/54 (c) | | 2,600,000 | 2,643,469 |
| 6.5% 12/1/54 (c) | | 325,000 | 330,434 |
| 6.5% 12/1/54 (c) | | 5,125,000 | 5,210,684 |
| 6.5% 12/1/54 (c) | | 48,275,000 | 49,082,100 |
| 6.5% 1/1/55 (c) | | 6,850,000 | 6,961,580 |
| 6.5% 1/1/55 (c) | | 64,850,000 | 65,906,348 |
| 6.5% 1/1/55 (c) | | 3,050,000 | 3,099,682 |
TOTAL GINNIE MAE | | | 7,612,416,829 |
| Uniform Mortgage Backed Securities - 5.5% | | | |
| 2% 12/1/39 (c) | | 13,700,000 | 12,283,976 |
| 2% 12/1/39 (c) | | 4,325,000 | 3,877,971 |
| 2% 12/1/39 (c) | | 1,200,000 | 1,075,969 |
| 2% 12/1/39 (c) | | 20,750,000 | 18,605,292 |
| 2% 12/1/39 (c) | | 17,700,000 | 15,870,539 |
| 2% 12/1/39 (c) | | 6,600,000 | 5,917,828 |
| 2% 12/1/54 (c) | | 35,600,000 | 28,541,189 |
| 2% 12/1/54 (c) | | 12,400,000 | 9,941,313 |
| 2% 12/1/54 (c) | | 1,425,000 | 1,142,449 |
| 2% 12/1/54 (c) | | 214,175,000 | 171,708,124 |
| 2% 12/1/54 (c) | | 60,100,000 | 48,183,300 |
| 2% 12/1/54 (c) | | 8,575,000 | 6,874,739 |
| 2% 12/1/54 (c) | | 13,400,000 | 10,743,032 |
| 2% 12/1/54 (c) | | 525,000 | 420,902 |
| 2% 12/1/54 (c) | | 38,600,000 | 30,946,346 |
| 2% 12/1/54 (c) | | 43,000,000 | 34,473,908 |
| 2% 12/1/54 (c) | | 258,725,000 | 207,424,697 |
| 2% 12/1/54 (c) | | 16,200,000 | 12,987,845 |
| 2% 12/1/54 (c) | | 68,100,000 | 54,597,050 |
| 2% 12/1/54 (c) | | 400,000 | 320,688 |
| 2% 12/1/54 (c) | | 14,550,000 | 11,665,009 |
| 2% 12/1/54 (c) | | 8,300,000 | 6,654,266 |
| 2% 12/1/54 (c) | | 7,300,000 | 5,852,547 |
| 2% 12/1/54 (c) | | 97,650,000 | 78,287,841 |
| 2% 12/1/54 (c) | | 48,850,000 | 39,163,963 |
| 2% 12/1/54 (c) | | 6,100,000 | 4,890,485 |
| 2% 12/1/54 (c) | | 3,050,000 | 2,445,242 |
| 2% 12/1/54 (c) | | 1,500,000 | 1,202,578 |
| 2% 12/1/54 (c) | | 60,200,000 | 48,263,472 |
| 2% 12/1/54 (c) | | 83,250,000 | 66,743,090 |
| 2% 12/1/54 (c) | | 84,125,000 | 67,444,594 |
| 2% 12/1/54 (c) | | 5,275,000 | 4,229,067 |
| 2% 12/1/54 (c) | | 1,300,000 | 1,042,234 |
| 2% 12/1/54 (c) | | 7,400,000 | 5,932,719 |
| 2% 12/1/54 (c) | | 3,500,000 | 2,806,016 |
| 2% 12/1/54 (c) | | 200,000 | 160,344 |
| 2% 12/1/54 (c) | | 2,700,000 | 2,164,641 |
| 2% 12/1/54 (c) | | 20,200,000 | 16,194,720 |
| 2% 12/1/54 (c) | | 37,150,000 | 29,783,853 |
| 2% 12/1/54 (c) | | 5,750,000 | 4,609,883 |
| 2% 12/1/54 (c) | | 6,800,000 | 5,451,688 |
| 2% 12/1/54 (c) | | 35,300,000 | 28,300,674 |
| 2% 12/1/54 (c) | | 10,050,000 | 8,057,274 |
| 2% 12/1/54 (c) | | 4,025,000 | 3,226,918 |
| 2% 12/1/54 (c) | | 7,075,000 | 5,672,161 |
| 2% 12/1/54 (c) | | 4,725,000 | 3,788,121 |
| 2% 12/1/54 (c) | | 57,100,000 | 45,778,143 |
| 2% 12/1/54 (c) | | 20,250,000 | 16,234,806 |
| 2% 12/1/54 (c) | | 188,200,000 | 150,883,478 |
| 2% 12/1/54 (c) | | 21,700,000 | 17,397,298 |
| 2% 12/1/54 (c) | | 131,275,000 | 105,245,635 |
| 2% 12/1/54 (c) | | 8,975,000 | 7,195,426 |
| 2% 12/1/54 (c) | | 10,675,000 | 8,558,348 |
| 2% 1/1/55 (c) | | 12,600,000 | 10,113,961 |
| 2% 1/1/55 (c) | | 86,400,000 | 69,352,874 |
| 2% 1/1/55 (c) | | 352,300,000 | 282,789,554 |
| 2% 1/1/55 (c) | | 22,350,000 | 17,940,240 |
| 2% 1/1/55 (c) | | 48,250,000 | 38,730,048 |
| 2% 1/1/55 (c) | | 181,350,000 | 145,568,793 |
| 2% 1/1/55 (c) | | 10,700,000 | 8,588,840 |
| 2% 1/1/55 (c) | | 33,450,000 | 26,850,158 |
| 2% 1/1/55 (c) | | 120,725,000 | 96,905,390 |
| 2% 1/1/55 (c) | | 6,700,000 | 5,378,059 |
| 2.5% 12/1/54 (c) | | 8,275,000 | 6,927,727 |
| 2.5% 12/1/54 (c) | | 6,675,000 | 5,588,227 |
| 2.5% 12/1/54 (c) | | 9,450,000 | 7,911,422 |
| 2.5% 12/1/54 (c) | | 14,900,000 | 12,474,094 |
| 2.5% 12/1/54 (c) | | 12,800,000 | 10,716,000 |
| 2.5% 12/1/54 (c) | | 10,300,000 | 8,623,031 |
| 2.5% 12/1/54 (c) | | 14,600,000 | 12,222,938 |
| 2.5% 12/1/54 (c) | | 2,900,000 | 2,427,844 |
| 2.5% 12/1/54 (c) | | 7,000,000 | 5,860,313 |
| 2.5% 12/1/54 (c) | | 9,800,000 | 8,204,438 |
| 2.5% 12/1/54 (c) | | 5,750,000 | 4,813,828 |
| 2.5% 12/1/54 (c) | | 4,025,000 | 3,369,680 |
| 2.5% 12/1/54 (c) | | 1,500,000 | 1,255,781 |
| 2.5% 12/1/54 (c) | | 25,000,000 | 20,929,688 |
| 2.5% 12/1/54 (c) | | 10,050,000 | 8,413,734 |
| 2.5% 12/1/54 (c) | | 9,900,000 | 8,288,156 |
| 2.5% 12/1/54 (c) | | 15,100,000 | 12,641,531 |
| 2.5% 12/1/54 (c) | | 7,075,000 | 5,923,102 |
| 2.5% 12/1/54 (c) | | 3,300,000 | 2,762,719 |
| 2.5% 1/1/55 (c) | | 20,750,000 | 17,387,041 |
| 3% 12/1/39 (c) | | 5,400,000 | 5,083,172 |
| 3% 12/1/39 (c) | | 26,400,000 | 24,851,062 |
| 3% 12/1/54 (c) | | 700,000 | 609,930 |
| 3% 12/1/54 (c) | | 6,300,000 | 5,489,367 |
| 3% 12/1/54 (c) | | 6,300,000 | 5,489,367 |
| 3% 12/1/54 (c) | | 31,250,000 | 27,229,003 |
| 3% 12/1/54 (c) | | 110,850,000 | 96,586,720 |
| 3% 12/1/54 (c) | | 31,200,000 | 27,185,437 |
| 3% 12/1/54 (c) | | 3,325,000 | 2,897,166 |
| 3% 12/1/54 (c) | | 110,750,000 | 96,499,587 |
| 3% 12/1/54 (c) | | 11,850,000 | 10,325,238 |
| 3% 1/1/55 (c) | | 7,800,000 | 6,801,843 |
| 3.5% 12/1/54 (c) | | 11,700,000 | 10,602,211 |
| 3.5% 12/1/54 (c) | | 13,300,000 | 12,052,086 |
| 3.5% 12/1/54 (c) | | 27,400,000 | 24,829,110 |
| 3.5% 12/1/54 (c) | | 37,900,000 | 34,343,915 |
| 3.5% 12/1/54 (c) | | 10,200,000 | 9,242,953 |
| 3.5% 12/1/54 (c) | | 58,150,000 | 52,693,896 |
| 3.5% 12/1/54 (c) | | 28,450,000 | 25,780,591 |
| 3.5% 12/1/54 (c) | | 15,600,000 | 14,136,282 |
| 3.5% 12/1/54 (c) | | 11,700,000 | 10,602,211 |
| 3.5% 12/1/54 (c) | | 11,950,000 | 10,828,754 |
| 3.5% 12/1/54 (c) | | 1,350,000 | 1,223,332 |
| 3.5% 12/1/54 (c) | | 37,900,000 | 34,343,915 |
| 3.5% 12/1/54 (c) | | 27,800,000 | 25,191,579 |
| 4.5% 12/1/54 (c) | | 42,700,000 | 41,012,018 |
| 4.5% 12/1/54 (c) | | 119,000,000 | 114,295,787 |
| 4.5% 12/1/54 (c) | | 4,350,000 | 4,178,039 |
| 4.5% 12/1/54 (c) | | 1,425,000 | 1,368,668 |
| 4.5% 12/1/54 (c) | | 150,000 | 144,070 |
| 5% 12/1/39 (c) | | 4,300,000 | 4,309,070 |
| 5% 12/1/39 (c) | | 21,200,000 | 21,244,719 |
| 5% 12/1/39 (c) | | 4,300,000 | 4,309,070 |
| 5% 12/1/39 (c) | | 17,500,000 | 17,536,915 |
| 5% 12/1/39 (c) | | 21,200,000 | 21,244,719 |
| 5% 12/1/39 (c) | | 6,400,000 | 6,413,500 |
| 5% 12/1/39 (c) | | 2,025,000 | 2,029,272 |
| 5% 12/1/39 (c) | | 25,000 | 25,053 |
| 6% 12/1/54 (c) | | 5,375,000 | 5,439,668 |
| 6% 12/1/54 (c) | | 49,625,000 | 50,222,048 |
| 6% 12/1/54 (c) | | 3,975,000 | 4,022,824 |
| 6% 12/1/54 (c) | | 15,600,000 | 15,787,687 |
| 6% 12/1/54 (c) | | 58,175,000 | 58,874,915 |
| 6% 12/1/54 (c) | | 218,575,000 | 221,204,720 |
| 6% 12/1/54 (c) | | 5,250,000 | 5,313,164 |
| 6% 12/1/54 (c) | | 15,600,000 | 15,787,687 |
| 6% 12/1/54 (c) | | 19,500,000 | 19,734,608 |
| 6% 12/1/54 (c) | | 600,000 | 607,219 |
| 6.5% 12/1/54 (c) | | 24,400,000 | 24,983,311 |
| 6.5% 12/1/54 (c) | | 42,800,000 | 43,823,185 |
| 6.5% 12/1/54 (c) | | 28,700,000 | 29,386,108 |
| 6.5% 12/1/54 (c) | | 19,200,000 | 19,658,999 |
| 6.5% 12/1/54 (c) | | 143,800,000 | 147,237,712 |
| 6.5% 12/1/54 (c) | | 600,000 | 614,344 |
| 6.5% 12/1/54 (c) | | 25,000 | 25,598 |
| 6.5% 12/1/54 (c) | | 41,300,000 | 42,287,326 |
| 6.5% 1/1/55 (c) | | 25,000 | 25,595 |
| 6.5% 1/1/55 (c) | | 25,525,000 | 26,132,217 |
TOTAL UNIFORM MORTGAGE BACKED SECURITIES | | | 3,894,421,464 |
| TOTAL U.S. GOVERNMENT AGENCY - MORTGAGE SECURITIES (Cost $19,609,203,692) | | | 19,253,819,627 |
| | | | |
| Asset-Backed Securities - 4.0% |
| | | Principal Amount (a) | Value ($) |
| Aaset 2024-1 U.S. Ltd. / Aaset 20 Series 2024-1A: | | | |
| Class A1, 6.261% 5/16/49 (b) | | 18,640,366 | 18,955,627 |
| Class A2, 6.261% 5/16/49 (b) | | 16,983,705 | 17,270,947 |
| AASET Trust: | | | |
| Series 2018-1A Class A, 3.844% 1/16/38 (b) | | 5,211,323 | 3,947,534 |
| Series 2019-1 Class A, 3.844% 5/15/39 (b) | | 321,687 | 312,028 |
| Series 2019-2: | | | |
Class A, 3.376% 10/16/39 (b) | | 5,221,340 | 5,012,679 |
Class B, 4.458% 10/16/39 (b) | | 1,488,945 | 893,638 |
| Series 2021-1A Class A, 2.95% 11/16/41 (b) | | 7,612,580 | 7,071,968 |
| Series 2021-2A Class A, 2.798% 1/15/47 (b) | | 16,428,372 | 15,016,107 |
| Achv Abs Trust 2024-3Alabama Series 2024-3AL Class A, 5.01% 12/26/31 (b) | | 4,535,000 | 4,534,454 |
| Affirm Asset Securitization Trust: | | | |
| Series 2023-X1 Class A, 7.11% 11/15/28 (b) | | 283,481 | 284,312 |
| Series 2024-A Class 1A, 5.61% 2/15/29 (b) | | 25,000,000 | 25,166,055 |
| Series 2024-X1 Class A, 6.27% 5/15/29 (b) | | 6,431,973 | 6,453,558 |
| Aimco Series 2024-BA Class ARR, CME Term SOFR 3 Month Index + 1.500% 6.1473% 4/16/37 (b)(d)(i) | | 18,732,000 | 18,848,607 |
| Aimco Clo 17 Ltd. / Aimco Clo 1 Series 2024-17A Class A1R, CME Term SOFR 3 Month Index + 1.350% 5.9816% 7/20/37 (b)(d)(i) | | 14,150,000 | 14,218,500 |
| Aimco Clo 22 Ltd. / Aimco Clo 2 Series 2024-22A Class A, CME Term SOFR 3 Month Index + 1.500% 6.1174% 4/19/37 (b)(d)(i) | | 23,550,000 | 23,704,582 |
| AIMCO CLO Ltd.: | | | |
| Series 2022-12A Class AR, CME Term SOFR 3 Month Index + 1.170% 5.8175% 1/17/32 (b)(d)(i) | | 3,797,449 | 3,805,043 |
| Series 2024-11A Class A1R2, CME Term SOFR 3 Month Index + 1.340% 5.9875% 7/17/37 (b)(d)(i) | | 25,100,000 | 25,160,190 |
| Allegro CLO XV, Ltd. / Allegro CLO VX LLC Series 2022-1A Class A, CME Term SOFR 3 Month Index + 1.500% 6.1174% 7/20/35 (b)(d)(i) | | 12,690,000 | 12,704,048 |
| Allegro CLO, Ltd. Series 2021-1A Class A, CME Term SOFR 3 Month Index + 1.400% 6.019% 7/20/34 (b)(d)(i) | | 8,250,000 | 8,263,703 |
| Ally Auto Receivables Trust Series 2024-1 Class A3, 5.08% 12/15/28 | | 16,200,000 | 16,316,843 |
| American Express Credit Account Master Trust: | | | |
| Series 2023-1 Class A, 4.87% 5/15/28 | | 32,320,000 | 32,489,101 |
| Series 2024-2 Class A, 5.24% 4/15/31 | | 7,800,000 | 8,055,758 |
| American Tower Trust I 5.49% 3/15/53 (b) | | 5,029,000 | 5,095,393 |
| Ammc Clo 24 Ltd. Series 2024-24A Class ER, CME Term SOFR 3 Month Index + 6.500% 11.0602% 1/20/35 (b)(d)(i) | | 150,000 | 150,000 |
| Apollo Aviation Securitization Equity Trust Series 2020-1A: | | | |
| Class A, 3.351% 1/16/40 (b) | | 1,838,146 | 1,764,637 |
| Class B, 4.335% 1/16/40 (b) | | 279,636 | 237,653 |
| Ares CLO Series 2024-54A Class AR, CME Term SOFR 3 Month Index + 1.270% 5.9259% 10/15/32 (b)(d)(i) | | 20,243,000 | 20,271,279 |
| Ares LII CLO Ltd. Series 2021-52A Class A1R, CME Term SOFR 3 Month Index + 1.310% 5.9432% 4/22/31 (b)(d)(i) | | 2,208,058 | 2,213,579 |
| Ares LV CLO Ltd. Series 2024-55A Class A1R2, CME Term SOFR 3 Month Index + 1.370% 6.0259% 10/15/37 (b)(d)(i) | | 7,566,000 | 7,600,879 |
| Ares LVIII CLO LLC Series 2022-58A Class AR, CME Term SOFR 3 Month Index + 1.330% 5.9859% 1/15/35 (b)(d)(i) | | 18,170,000 | 18,196,928 |
| Ares XLI CLO Ltd. / Ares XLI CLO LLC Series 2021-41A Class AR2, CME Term SOFR 3 Month Index + 1.330% 5.9875% 4/15/34 (b)(d)(i) | | 24,780,000 | 24,822,448 |
| Ares XXXIV CLO Ltd. Series 2024-2A Class AR3, CME Term SOFR 3 Month Index + 1.320% 5.9675% 4/17/33 (b)(d)(i) | | 12,800,000 | 12,828,864 |
| Ari Fleet Lease Trust 2024-B Series 2024-B: | | | |
| Class A2, 5.54% 4/15/33 (b) | | 7,184,000 | 7,237,925 |
| Class A3, 5.26% 4/15/33 (b) | | 7,820,000 | 7,938,845 |
| Babson CLO Ltd. Series 2021-1A Class AR, CME Term SOFR 3 Month Index + 1.410% 6.0675% 10/15/36 (b)(d)(i) | | 7,970,000 | 7,982,138 |
| Barings CLO Ltd. Series 2024-4A Class AR, 6.4518% 10/20/37 (b)(d) | | 11,089,000 | 11,134,975 |
| Barings CLO Ltd. 2023-IV Series 2024-4A Class A, CME Term SOFR 3 Month Index + 1.750% 6.3674% 1/20/37 (b)(d)(i) | | 21,860,000 | 22,005,653 |
| Bear Stearns Asset Backed Securities I Trust Series 2005-HE2 Class M2, CME Term SOFR 1 Month Index + 1.230% 5.8272% 2/25/35 (d)(i) | | 4,422 | 4,421 |
| Beechwood Park CLO Ltd. Series 2022-1A Class A1R, CME Term SOFR 3 Month Index + 1.300% 5.9475% 1/17/35 (b)(d)(i) | | 15,590,000 | 15,626,278 |
| BETHP Series 2021-1A Class A, CME Term SOFR 3 Month Index + 1.390% 6.0475% 1/15/35 (b)(d)(i) | | 11,380,000 | 11,393,292 |
| Blackbird Capital Aircraft: | | | |
| Series 2016-1A Class A, 6.5% 12/16/41 (b)(e) | | 3,997,485 | 3,989,330 |
| Series 2021-1A Class A, 2.443% 7/15/46 (b) | | 24,335,472 | 22,204,670 |
| Blueberry Park Clo Ltd. Series 2024-1A Class A, CME Term SOFR 3 Month Index + 1.350% 6.4761% 10/20/37 (b)(d)(i) | | 12,672,000 | 12,726,946 |
| BMW Vehicle Owner Trust Series 2023-A Class A3, 5.47% 2/25/28 | | 1,852,000 | 1,868,547 |
| Bofa Auto Trust 2024-1 Series 2024-1A Class A3, 5.35% 11/15/28 (b) | | 6,012,000 | 6,093,398 |
| Bristol Park CLO, Ltd. Series 2020-1A Class AR, CME Term SOFR 3 Month Index + 1.250% 5.9075% 4/15/29 (b)(d)(i) | | 1,020,679 | 1,021,584 |
| Buckhorn Park Clo Ltd. Series 2024-1A Class ARR, CME Term SOFR 3 Month Index + 1.070% 5.6277% 7/18/34 (b)(d)(i) | | 6,900,000 | 6,900,000 |
| Carlyle U.S. Clo 2024-6 Ltd. Series 2024-6A Class E, CME Term SOFR 3 Month Index + 5.750% 10.2066% 10/25/37 (b)(d)(i) | | 150,000 | 149,991 |
| CarMax Auto Owner Trust Series 2023 2 Class A2A, 5.5% 6/15/26 | | 664,300 | 664,965 |
| Carmax Auto Owner Trust Series 2024-2 Class A3, 5.5% 1/16/29 | | 11,479,000 | 11,680,141 |
| Carmax Auto Owner Trust 2023-4 Series 2023-4 Class A3, 6% 7/17/28 | | 14,679,000 | 14,960,749 |
| Carmax Select Receivables Trust Series 2024-A: | | | |
| Class A2A, 5.78% 9/15/27 | | 5,139,000 | 5,167,318 |
| Class A3, 5.4% 11/15/28 | | 4,084,000 | 4,134,472 |
| Castlelake Aircraft Securitization Trust: | | | |
| Series 2019-1A: | | | |
Class A, 3.967% 4/15/39 (b) | | 9,389,785 | 8,638,910 |
Class B, 5.095% 4/15/39 (b) | | 3,098,041 | 2,199,677 |
| Series 2021-1R Class A, 2.741% 8/15/41 (b) | | 10,052,209 | 9,463,267 |
| Castlelake Aircraft Structured Trust: | | | |
| Series 2018-1 Class A, 4.125% 6/15/43 (b) | | 1,073,006 | 1,011,326 |
| Series 2021-1A: | | | |
Class A, 3.474% 1/15/46 (b) | | 2,903,436 | 2,778,648 |
Class B, 6.656% 1/15/46 (b) | | 937,588 | 901,805 |
| Cedar Funding Ltd.: | | | |
| Series 2021-12A Class A1R, CME Term SOFR 3 Month Index + 1.390% 6.0175% 10/25/34 (b)(d)(i) | | 6,880,000 | 6,890,169 |
| Series 2022-15A Class A, CME Term SOFR 3 Month Index + 1.320% 5.9374% 4/20/35 (b)(d)(i) | | 14,430,000 | 14,436,494 |
| Series 2024-10A Class AR2, CME Term SOFR 3 Month Index + 1.360% 5.9069% 10/20/37 (b)(d)(i) | | 9,231,000 | 9,231,000 |
| Cedar Funding Xvii Clo Ltd. Series 2023-17A Class A, CME Term SOFR 3 Month Index + 1.850% 6.4674% 7/20/36 (b)(d)(i) | | 21,114,000 | 21,195,500 |
| Cent CLO LP Series 2021-21A Class A1R3, CME Term SOFR 3 Month Index + 1.230% 5.8488% 7/27/30 (b)(d)(i) | | 182,054 | 182,050 |
| CFMT LLC Series 2023 HB12 Class A, 4.25% 4/25/33 (b) | | 5,262,006 | 5,186,686 |
| Chase Auto Owner Trust Series 2024-1A Class A3, 5.13% 5/25/29 (b) | | 15,195,000 | 15,356,500 |
| Chase Issuance Trust Series 2023-A2 Class A, 5.08% 9/15/30 | | 11,940,000 | 12,211,017 |
| Chesapeake Funding II LLC: | | | |
| Series 2023-2A Class A1, 6.16% 10/15/35 (b) | | 5,496,020 | 5,571,985 |
| Series 2024-1A Class A1, 5.52% 5/15/36 (b) | | 15,710,389 | 15,863,416 |
| Citibank Credit Card Issuance Trust Series 2018-A7 Class A7, 3.96% 10/13/30 | | 9,000,000 | 8,852,028 |
| Citizens Auto Receivables Trust Series 2024-2 Class A3, 5.33% 8/15/28 (b) | | 14,161,000 | 14,308,018 |
| CNH Equipment Trust Series 2023 A Class A2, 5.34% 9/15/26 | | 4,572,711 | 4,577,379 |
| Columbia Cent CLO 29 Ltd./Columbia Cent CLO 29 Corp. Series 2021-29A Class AR, CME Term SOFR 3 Month Index + 1.430% 6.049% 10/20/34 (b)(d)(i) | | 11,410,000 | 11,423,167 |
| Columbia Cent CLO 31 Ltd. Series 2021-31A Class A1, CME Term SOFR 3 Month Index + 1.460% 6.079% 4/20/34 (b)(d)(i) | | 9,400,000 | 9,414,861 |
| DB Master Finance LLC: | | | |
| Series 2017-1A Class A2II, 4.03% 11/20/47 (b) | | 25,364,933 | 24,612,238 |
| Series 2019-1A: | | | |
Class A23, 4.352% 5/20/49 (b) | | 8,058,488 | 7,779,240 |
Class A2II, 4.021% 5/20/49 (b) | | 716,310 | 704,664 |
| Series 2021-1A: | | | |
Class A23, 2.791% 11/20/51 (b) | | 28,840,040 | 24,737,481 |
Class A2I, 2.045% 11/20/51 (b) | | 3,980,880 | 3,759,660 |
Class A2II, 2.493% 11/20/51 (b) | | 10,534,200 | 9,575,692 |
| Dell Equipment Finance Trust 2024-2 Series 2024-2 Class A3, 4.59% 8/22/30 (b) | | 13,000,000 | 13,004,627 |
| Dllaa 2023-1A Series 2023-1A: | | | |
| Class A2, 5.93% 7/20/26 (b) | | 3,826,690 | 3,841,804 |
| Class A3, 5.64% 2/22/28 (b) | | 6,112,000 | 6,206,070 |
| DLLAD: | | | |
| Series 2023-1A Class A3, 4.79% 1/20/28 (b) | | 10,995,000 | 11,010,213 |
| Series 2024-1A Class A3, 5.3% 7/20/29 (b) | | 4,988,000 | 5,070,649 |
| Dllmt 2024-1 LLC Series 2024-1A Class A3, 4.84% 8/21/28 (b) | | 25,989,000 | 26,075,335 |
| Dominos Pizza Master Issuer LLC: | | | |
| Series 2016-1A Class A2II, 4.474% 10/25/45 (b) | | 5,662,388 | 5,637,546 |
| Series 2017-1A Class A23, 4.118% 7/25/47 (b) | | 10,810,000 | 10,547,315 |
| Series 2018-1A Class A2I, 4.116% 7/25/48 (b) | | 2,552,565 | 2,532,517 |
| Series 2019-1A Class A2, 3.668% 10/25/49 (b) | | 34,443,840 | 32,199,838 |
| Series 2021-1A: | | | |
Class A2I, 2.662% 4/25/51 (b) | | 14,110,975 | 12,870,191 |
Class A2II, 3.151% 4/25/51 (b) | | 6,660,653 | 5,871,730 |
| Dryden 104 Clo Ltd. / Dryden 10 Series 2024-104A Class A1R, CME Term SOFR 3 Month Index + 1.290% 5.811% 8/20/34 (b)(d)(i) | | 6,800,000 | 6,816,306 |
| Dryden 68 CLO Ltd. Series 2024-68A Class ARR, CME Term SOFR 3 Month Index + 1.100% 0% 7/15/35 (b)(d)(i) | | 5,800,000 | 5,800,000 |
| Dryden 98 CLO Ltd. Series 2022-98A Class A, CME Term SOFR 3 Month Index + 1.300% 5.9174% 4/20/35 (b)(d)(i) | | 9,710,000 | 9,733,790 |
| Dryden CLO, Ltd. Series 2024-83A Class AR, CME Term SOFR 3 Month Index + 1.530% 6.1624% 4/18/37 (b)(d)(i) | | 12,450,000 | 12,529,531 |
| Dryden CLO, Ltd. / Dryden CLO, LLC Series 2021-86A Class A1R, CME Term SOFR 3 Month Index + 1.360% 6.0091% 7/17/34 (b)(d)(i) | | 40,316,000 | 40,389,174 |
| Dryden Senior Loan Fund: | | | |
| Series 2018-70A Class A1, CME Term SOFR 3 Month Index + 1.430% 6.0789% 1/16/32 (b)(d)(i) | | 2,563,434 | 2,569,953 |
| Series 2021-90A Class A1A, CME Term SOFR 3 Month Index + 1.390% 5.9126% 2/20/35 (b)(d)(i) | | 6,930,000 | 6,941,289 |
| Series 2024-85A Class A1R2, CME Term SOFR 3 Month Index + 1.380% 6.0359% 7/15/37 (b)(d)(i) | | 14,140,000 | 14,197,705 |
| Eaton Vance CLO, Ltd.: | | | |
| Series 2024-1A: | | | |
Class AR2, CME Term SOFR 3 Month Index + 1.510% 6.1659% 7/15/37 (b)(d)(i) | | 12,310,000 | 12,382,703 |
Class ARR, CME Term SOFR 3 Month Index + 1.390% 6.0459% 10/15/37 (b)(d)(i) | | 11,494,000 | 11,542,562 |
| Series 2024-2A Class AR2, CME Term SOFR 3 Month Index + 1.380% 6.0359% 10/15/37 (b)(d)(i) | | 11,970,000 | 12,029,658 |
| Eaton Vance CLO, Ltd. / Eaton Vance CLO LLC Series 2021-1A Class A13R, CME Term SOFR 3 Month Index + 1.510% 6.1675% 1/15/34 (b)(d)(i) | | 2,000,000 | 2,003,494 |
| Enterprise Fleet Financing Series 2024-2: | | | |
| Class A2, 5.74% 12/20/26 (b) | | 15,314,000 | 15,446,053 |
| Class A3, 5.61% 4/20/28 (b) | | 10,461,000 | 10,661,560 |
| Enterprise Fleet Financing 202: | | | |
| Series 2024-3 Class A3, 4.98% 8/21/28 (b) | | 8,040,000 | 8,106,283 |
| Series 2024-4 Class A3, 4.56% 11/20/28 (b) | | 17,233,000 | 17,223,348 |
| Enterprise Fleet Financing 2023-3 L Series 2023-3 Class A2, 6.4% 3/20/30 (b) | | 19,955,397 | 20,307,666 |
| Flatiron Clo 26 Ltd. / Flatiron Series 2024-4A Class A, CME Term SOFR 3 Month Index + 1.330% 0% 1/15/38 (b)(c)(d)(i) | | 11,218,000 | 11,218,000 |
| Flatiron Clo 28 Ltd. / Flatiron Series 2024-1A Class A1, CME Term SOFR 3 Month Index + 1.320% 6.5866% 7/15/36 (b)(d)(i) | | 9,000,000 | 9,027,306 |
| Flatiron CLO Ltd.: | | | |
| Series 2021-1A Class AR, CME Term SOFR 3 Month Index + 1.340% 5.827% 11/16/34 (b)(d)(i) | | 7,345,000 | 7,364,633 |
| Series 2024-1A Class A1R, CME Term SOFR 3 Month Index + 1.360% 5.9774% 10/19/37 (b)(d)(i) | | 15,193,000 | 15,268,798 |
| Flatiron CLO Ltd. / Flatiron CLO LLC Series 2024-1A Class AR, CME Term SOFR 3 Month Index + 1.380% 5.901% 5/20/36 (b)(d)(i) | | 31,066,000 | 31,163,765 |
| Ford Credit Auto Owner Trust: | | | |
| Series 2020-2 Class A, 1.06% 4/15/33 (b) | | 5,000,000 | 4,846,052 |
| Series 2021-1 Class A, 1.37% 10/17/33 (b) | | 5,000,000 | 4,783,906 |
| Series 2023-2 Class A, 5.28% 2/15/36 (b) | | 10,800,000 | 11,070,947 |
| Series 2024-1 Class A, 4.87% 8/15/36 (b) | | 7,820,000 | 7,901,827 |
| Ford Credit Auto Owner Trust 2: | | | |
| Series 2022-1 Class A, 3.88% 11/15/34 (b) | | 13,645,000 | 13,416,314 |
| Series 2023-1 Class A, 4.85% 8/15/35 (b) | | 2,600,000 | 2,624,113 |
| Ford Credit Floorplan Master Owner Trust: | | | |
| Series 2018-4 Class A, 4.06% 11/15/30 | | 5,400,000 | 5,296,359 |
| Series 2023-1 Class A1, 4.92% 5/15/28 (b) | | 44,930,000 | 45,132,297 |
| Series 2024-1: | | | |
Class A1, 5.29% 4/15/29 (b) | | 28,100,000 | 28,580,086 |
Class B, 5.48% 4/15/29 (b) | | 6,500,000 | 6,581,806 |
| Gm Financial Consumer Automobile Re Series 2023-3 Class A3, 5.45% 6/16/28 | | 12,689,000 | 12,814,138 |
| GM Financial Consumer Automobile Receivables Trust Series 2022-2 Class A3, 3.1% 2/16/27 | | 27,532,972 | 27,332,185 |
| Gm Financial Leasing Trust 202 Series 2023-3 Class A3, 5.38% 11/20/26 | | 6,253,000 | 6,283,560 |
| Gm Financial Revolving Receiva: | | | |
| Series 2021-1 Class A, 1.17% 6/12/34 (b) | | 5,000,000 | 4,706,314 |
| Series 2023-1 Class A, 5.12% 4/11/35 (b) | | 6,600,000 | 6,707,556 |
| Series 2023-2 Class A, 5.77% 8/11/36 (b) | | 9,800,000 | 10,223,253 |
| Series 2024-1 Class A, 4.98% 12/11/36 (b) | | 20,872,000 | 21,183,949 |
| GMF Floorplan Owner Revolving Trust: | | | |
| Series 2023-1: | | | |
Class A1, 5.34% 6/15/28 (b) | | 18,500,000 | 18,704,823 |
Class B, 5.73% 6/15/28 (b) | | 5,700,000 | 5,757,617 |
| Series 2024-1A: | | | |
Class A1, 5.13% 3/15/29 (b) | | 7,800,000 | 7,896,633 |
Class B, 5.33% 3/15/29 (b) | | 3,650,000 | 3,682,164 |
| Series 2024-2A: | | | |
Class A, 5.06% 3/15/31 (b) | | 9,100,000 | 9,271,150 |
Class B, 5.35% 3/15/31 (b) | | 2,600,000 | 2,631,485 |
| Series 2024-4A Class A1, 4.73% 11/15/29 (b) | | 20,800,000 | 20,876,203 |
| Greensky Home Improvement Trus Series 2024-2 Class A2, 5.25% 10/27/59 (b) | | 7,100,000 | 7,108,234 |
| Hamlin Pk Clo Ltd. / Hamlin Pk Series 2024-1A Class A, CME Term SOFR 3 Month Index + 1.340% 5.9013% 10/20/37 (b)(d)(i) | | 11,370,000 | 11,371,910 |
| Hartwick Park Clo Ltd. Series 2024-1A Class AR, CME Term SOFR 3 Month Index + 1.160% 0% 1/20/37 (b)(d)(i) | | 5,740,000 | 5,740,000 |
| Honda Auto Receivables 2023-3 Series 2023-3 Class A3, 5.41% 2/18/28 | | 11,100,000 | 11,213,250 |
| Horizon Aircraft Finance I Ltd. Series 2018-1 Class A, 4.458% 12/15/38 (b) | | 10,480,266 | 10,061,056 |
| Horizon Aircraft Finance Ltd. Series 2019-1 Class A, 3.721% 7/15/39 (b) | | 15,064,708 | 14,311,472 |
| HPEFS Equipment Trust Series 2024-2A Class A3, 5.36% 10/20/31 (b) | | 9,600,000 | 9,697,198 |
| Hyundai Auto Lease Securitizat Series 2024-B Class A3, 5.41% 5/17/27 (b) | | 7,243,000 | 7,327,992 |
| Hyundai Auto Receivables Trust: | | | |
| Series 2023-B Class A3, 5.48% 4/17/28 | | 2,138,000 | 2,160,155 |
| Series 2024-A Class A3, 4.99% 2/15/29 | | 1,845,000 | 1,859,660 |
| Invesco CLO Ltd. Series 2021-3A Class A, CME Term SOFR 3 Month Index + 1.390% 6.0232% 10/22/34 (b)(d)(i) | | 9,130,000 | 9,147,183 |
| Invesco U.S. Clo 2024-1 Ltd. Series 2024-1RA Class AR, CME Term SOFR 3 Month Index + 1.550% 6.2059% 4/15/37 (b)(d)(i) | | 10,990,000 | 11,037,400 |
| Invesco U.S. CLO Ltd. Series 2024-3A Class A, CME Term SOFR 3 Month Index + 1.510% 6.8292% 7/20/37 (b)(d)(i) | | 12,220,000 | 12,288,970 |
| KKR CLO Ltd. Series 2022-41A Class A1, CME Term SOFR 3 Month Index + 1.330% 5.9773% 4/15/35 (b)(d)(i) | | 19,170,000 | 19,196,953 |
| Kubota Credit Owner Trust Series 2024-2A Class A3, 5.26% 11/15/28 (b) | | 14,696,000 | 14,930,242 |
| Madison Park Funding Series 2024-19A Class AR3, CME Term SOFR 3 Month Index + 1.600% 6.2316% 1/22/37 (b)(d)(i) | | 1,913,000 | 1,926,360 |
| Madison Park Funding L Ltd. / Madison Park Funding L LLC Series 2021-50A Class A, CME Term SOFR 3 Month Index + 1.400% 6.019% 4/19/34 (b)(d)(i) | | 9,810,000 | 9,824,656 |
| Madison Park Funding LII Ltd. / Madison Park Funding LII LLC Series 2021-52A Class A, CME Term SOFR 3 Month Index + 1.360% 5.9932% 1/22/35 (b)(d)(i) | | 16,291,000 | 16,302,387 |
| Madison Park Funding XLV Ltd./Madison Park Funding XLV LLC Series 2021-45A Class AR, CME Term SOFR 3 Month Index + 1.380% 6.0375% 7/15/34 (b)(d)(i) | | 7,360,000 | 7,378,694 |
| Madison Park Funding XXIII, Ltd. Series 2021-23A Class AR, CME Term SOFR 3 Month Index + 1.230% 5.8488% 7/27/31 (b)(d)(i) | | 1,893,411 | 1,896,098 |
| Madison Pk Funding Lxvii Ltd. / Mad Series 2024-67A Class A1, CME Term SOFR 3 Month Index + 1.510% 6.1359% 4/25/37 (b)(d)(i) | | 21,830,000 | 21,988,268 |
| Magnetite CLO LTD Series 2023-36A Class A, CME Term SOFR 3 Month Index + 1.800% 6.4316% 4/22/36 (b)(d)(i) | | 10,440,000 | 10,487,304 |
| Magnetite CLO Ltd. Series 2021-27A Class AR, CME Term SOFR 3 Month Index + 1.400% 6.019% 10/20/34 (b)(d)(i) | | 3,092,000 | 3,097,015 |
| Magnetite Xli Ltd. Series 2024-41A Class A, CME Term SOFR 3 Month Index + 1.290% 0% 1/25/38 (b)(c)(d)(i) | | 9,690,000 | 9,690,000 |
| Magnetite XXIII, Ltd. Series 2021-23A Class AR, CME Term SOFR 3 Month Index + 1.390% 6.0175% 1/25/35 (b)(d)(i) | | 9,420,000 | 9,420,283 |
| Magnetite XXIX, Ltd. / Magnetite XXIX LLC Series 2024-29A Class AR, CME Term SOFR 3 Month Index + 1.350% 6.5917% 7/15/37 (b)(d)(i) | | 13,105,000 | 13,157,866 |
| MAPS Trust Series 2021-1A Class A, 2.521% 6/15/46 (b) | | 10,128,214 | 9,353,803 |
| Marlette Funding Trust 2023-3 Series 2023-3A Class A, 6.49% 9/15/33 (b) | | 63,006 | 63,034 |
| Marlette Funding Trust 2024-1 Series 2024-1A Class A, 5.95% 7/17/34 (b) | | 3,710,886 | 3,726,752 |
| Mercedes-Benz Auto Lease Trust: | | | |
| Series 2024-A: | | | |
Class A3, 5.32% 1/18/28 | | 17,761,000 | 17,989,643 |
Class A4, 5.32% 2/15/30 | | 7,800,000 | 7,910,978 |
| Series 2024-B Class A3, 4.23% 2/15/28 | | 33,100,000 | 32,942,861 |
| Mercedes-Benz Auto Receivables: | | | |
| Series 2023-1 Class A4, 4.31% 4/16/29 | | 4,500,000 | 4,469,752 |
| Series 2023-2 Class A3, 5.95% 11/15/28 | | 7,200,000 | 7,336,826 |
| Merchants Fleet Funding LLC: | | | |
| Series 2023-1A Class A, 7.21% 5/20/36 (b) | | 16,345,738 | 16,570,855 |
| Series 2024-1A Class A, 5.82% 4/20/37 (b) | | 15,895,000 | 16,032,713 |
| Metlife Securitization Trust Series 2019-1A Class A1A, 3.75% 4/25/58 (b) | | 82,216 | 80,450 |
| Milos CLO, Ltd. Series 2020-1A Class AR, CME Term SOFR 3 Month Index + 1.330% 5.949% 10/20/30 (b)(d)(i) | | 7,062,928 | 7,078,213 |
| Morgan Stanley ABS Capital I Trust Series 2004-HE7 Class B3, CME Term SOFR 1 Month Index + 5.360% 9.9522% 8/25/34 (d)(g)(i) | | 50,161 | 69,634 |
| Neuberger Berman Ln Advisers N Series 2024-50A Class AR, CME Term SOFR 3 Month Index + 1.250% 5.8763% 7/23/36 (b)(d)(i) | | 6,704,000 | 6,716,376 |
| Neuberger Berman Loan Advisers Series 2024-25A Class AR2, CME Term SOFR 3 Month Index + 1.400% 6.0324% 7/18/38 (b)(d)(i) | | 14,150,000 | 14,228,250 |
| Nissan Auto Receivables 2023-B Series 2023-B Class A3, 5.93% 3/15/28 | | 7,200,000 | 7,311,356 |
| Nissan Master Owner Trust Receiva Series 2024-B Class A, 5.05% 2/15/29 (b) | | 22,189,000 | 22,384,263 |
| Oak Hill Credit Partners Series 2024-18A: | | | |
| Class A1, CME Term SOFR 3 Month Index + 1.500% 6.1174% 4/20/37 (b)(d)(i) | | 18,840,000 | 18,963,873 |
| Class A2, CME Term SOFR 3 Month Index + 1.650% 6.2674% 4/20/37 (b)(d)(i) | | 1,300,000 | 1,304,423 |
| Oha Credit Funding 4 Ltd. / Oha Credit Funding Series 2024-4A Class AR2, CME Term SOFR 3 Month Index + 1.290% 1.29% 1/22/38 (b)(d)(i) | | 16,000,000 | 16,000,000 |
| Oha Credit Funding 6 Ltd. / Oha Credit Funding Series 2024-6A Class AR2, CME Term SOFR 3 Month Index + 1.330% 5.9218% 10/20/37 (b)(d)(i) | | 16,110,000 | 16,112,642 |
| Ohacp 2024-17A Series 2024-17A Class A, CME Term SOFR 3 Month Index + 1.320% 0% 1/18/38 (b)(c)(d)(i) | | 9,640,000 | 9,640,000 |
| Oportun Funding Trust Series 2024-3 Class A, 5.26% 8/15/29 (b) | | 8,128,798 | 8,130,867 |
| Palmer Square Ln Funding 2024-2 Lt Series 2024-2A Class D, CME Term SOFR 3 Month Index + 4.700% 6.2% 1/15/33 (b)(c)(d)(i) | | 250,000 | 250,000 |
| Palmer Square Loan Funding 202: | | | |
| Series 2024-2A Class A1N, CME Term SOFR 3 Month Index + 1.000% 0% 1/15/33 (b)(c)(d)(i) | | 14,044,000 | 14,044,000 |
| Series 2024-3A Class A1, CME Term SOFR 3 Month Index + 1.080% 5.6023% 8/8/32 (b)(d)(i) | | 9,664,987 | 9,675,415 |
| Palmer Square Loan Funding, Ltd. / Palmer Square Loan Funding LLC Series 2022-1A Class A1, CME Term SOFR 3 Month Index + 1.050% 5.6973% 4/15/30 (b)(d)(i) | | 1,735,142 | 1,735,923 |
| Park Place Securities, Inc. Series 2005-WCH1 Class M4, CME Term SOFR 1 Month Index + 1.350% 5.9472% 1/25/36 (d)(i) | | 17,381 | 17,250 |
| Peace Park CLO, Ltd. Series 2021-1A Class A, CME Term SOFR 3 Month Index + 1.390% 6.009% 10/20/34 (b)(d)(i) | | 14,148,000 | 14,173,099 |
| PK ALIFT Loan Funding 3 LP Series 2024-1 Class A1, 5.842% 9/15/39 (b) | | 5,213,215 | 5,261,547 |
| Planet Fitness Master Issuer LLC: | | | |
| Series 2019-1A Class A2, 3.858% 12/5/49 (b) | | 38,170,485 | 35,386,505 |
| Series 2022-1A: | | | |
Class A2I, 3.251% 12/5/51 (b) | | 9,477,000 | 9,098,973 |
Class A2II, 4.008% 12/5/51 (b) | | 9,477,000 | 8,747,299 |
| Project Silver Series 2019-1 Class A, 3.967% 7/15/44 (b) | | 4,835,263 | 4,477,599 |
| Prpm 2021-5, LLC Series 2021-5 Class A1, 4.793% 6/25/26 (b)(d) | | 1,347,077 | 1,334,245 |
| Prpm 2023-Rcf2 LLC Series 2023-RCF2 Class A1, 4% 11/25/53 (b) | | 10,853,595 | 10,596,676 |
| Rockland Park CLO Ltd. Series 2021-1A Class A, CME Term SOFR 3 Month Index + 1.380% 5.999% 4/20/34 (b)(d)(i) | | 12,190,000 | 12,224,510 |
| Rr 16 Ltd. Series 2021-16A Class A1, CME Term SOFR 3 Month Index + 1.370% 6.0275% 7/15/36 (b)(d)(i) | | 10,300,000 | 10,319,189 |
| Rr 34 Ltd. Series 2024-34RA Class A1R, CME Term SOFR 3 Month Index + 1.350% 5.9123% 10/15/39 (b)(d)(i) | | 13,007,000 | 13,007,000 |
| RR Ltd. Series 2022-7A Class A1AB, CME Term SOFR 3 Month Index + 1.340% 5.9959% 1/15/37 (b)(d)(i) | | 15,740,000 | 15,760,950 |
| Sapphire Aviation Finance Series 2020-1A: | | | |
| Class A, 3.228% 3/15/40 (b) | | 15,241,123 | 14,326,808 |
| Class B, 4.335% 3/15/40 (b) | | 673,145 | 538,927 |
| SBA Tower Trust: | | | |
| Series 2019, 2.836% 1/15/50 (b) | | 9,702,000 | 9,673,653 |
| 1.631% 5/15/51 (b) | | 5,173,000 | 4,833,891 |
| 1.884% 7/15/50 (b) | | 4,645,000 | 4,483,476 |
| 2.328% 7/15/52 (b) | | 3,269,000 | 2,990,466 |
| Sbna Auto Lease Trust Series 2024-B Class A3, 5.56% 11/22/27 (b) | | 15,775,000 | 15,971,165 |
| Sbna Auto Lease Trust 2024-C Series 2024-C Class A3, 4.56% 2/22/28 (b) | | 13,950,000 | 13,933,179 |
| Sfs Auto Receivables Securitiz Series 2023-1A Class A2A, 5.89% 3/22/27 (b) | | 2,964,252 | 2,971,771 |
| Sfs Auto Receivables Securitization Trust Series 2024-2A Class A3, 5.33% 11/20/29 (b) | | 8,985,000 | 9,100,649 |
| Store Master Funding Series 2021-1A Class A1, 2.12% 6/20/51 (b) | | 10,812,083 | 9,621,502 |
| Subway Funding LLC: | | | |
| Series 2024-1A: | | | |
Class A23, 6.505% 7/30/54 (b) | | 17,586,000 | 18,160,134 |
Class A2I, 6.028% 7/30/54 (b) | | 38,437,000 | 39,048,579 |
Class A2II, 6.268% 7/30/54 (b) | | 21,306,000 | 21,636,345 |
| Series 2024-3A: | | | |
Class A23, 5.914% 7/30/54 (b) | | 18,480,000 | 18,268,005 |
Class A2I, 5.246% 7/30/54 (b) | | 18,480,000 | 18,176,161 |
Class A2II, 5.566% 7/30/54 (b) | | 9,240,000 | 9,129,846 |
| SYMP Series 2022-32A Class A1, CME Term SOFR 3 Month Index + 1.320% 5.9463% 4/23/35 (b)(d)(i) | | 15,900,000 | 15,930,067 |
| Symphony Clo 43 Ltd. Series 2024-43A Class A1, CME Term SOFR 3 Month Index + 1.520% 6.1759% 4/15/37 (b)(d)(i) | | 14,100,000 | 14,219,159 |
| Symphony CLO XXI, Ltd. Series 2021-21A Class AR, CME Term SOFR 3 Month Index + 1.320% 5.9775% 7/15/32 (b)(d)(i) | | 4,239,920 | 4,243,177 |
| Symphony CLO XXIII Ltd. Series 2021-23A Class AR, CME Term SOFR 3 Month Index + 1.280% 5.9375% 1/15/34 (b)(d)(i) | | 2,844,955 | 2,848,824 |
| Symphony CLO XXVI Ltd. / Symphony CLO XXVI LLC Series 2021-26A Class AR, CME Term SOFR 3 Month Index + 1.340% 5.959% 4/20/33 (b)(d)(i) | | 12,798,644 | 12,816,664 |
| TCI-Flatiron CLO Ltd. / LLC Series 2021-1A Class AR, CME Term SOFR 3 Month Index + 1.220% 5.707% 11/18/30 (b)(d)(i) | | 625,204 | 625,977 |
| TCI-Symphony CLO Series 2021-1A Class AR, CME Term SOFR 3 Month Index + 1.190% 5.8475% 7/15/30 (b)(d)(i) | | 2,088,293 | 2,091,480 |
| Terwin Mortgage Trust Series 2003-4HE Class A1, CME Term SOFR 1 Month Index + 0.970% 5.5622% 9/25/34 (d)(i) | | 43,426 | 44,570 |
| Tesla Series 2024-A Class A2A, 5.37% 6/22/26 (b) | | 4,825,103 | 4,833,785 |
| Tesla Auto Lease Trust 23-A Series 2023-A Class A3, 5.89% 6/22/26 (b) | | 14,696,000 | 14,750,144 |
| Thunderbolt Aircraft Lease Ltd. Series 2018-A Class A, 4.147% 9/15/38 (b)(d) | | 5,251,368 | 5,049,715 |
| Thunderbolt III Aircraft Lease Ltd. Series 2019-1 Class A, 3.671% 11/15/39 (b) | | 20,274,016 | 19,260,315 |
| Toyota Auto Loan Extended Note Trust Series 2021-1A Class A, 1.07% 2/27/34 (b) | | 72,900,000 | 69,773,275 |
| Toyota Auto Receivables Owner Trust: | | | |
| Series 2022-C Class A3, 3.76% 4/15/27 | | 24,029,415 | 23,903,282 |
| Series 2023-A Class A4, 4.42% 8/15/28 | | 4,000,000 | 3,983,300 |
| Toyota Lease Owner Trust Series 2023 A Class A3, 4.93% 4/20/26 (b) | | 11,941,931 | 11,948,720 |
| Trapeza CDO XII Ltd./Trapeza CDO XII, Inc. Series 2007-12A Class B, CME Term SOFR 3 Month Index + 0.820% 5.4113% 4/6/42 (b)(d)(i) | | 1,380,000 | 1,027,091 |
| Upgrade Receivables Trust 2024 Series 2024-1A Class A, 5.37% 1/15/31 (b) | | 8,404,000 | 8,409,042 |
| Usaa Auto Owner Trust 2024-A Series 2024-A Class A3, 5.03% 3/15/29 (b) | | 17,100,000 | 17,271,836 |
| Valley Stream Park Clo Ltd. / Vy Series 2024-1A Class ARR, CME Term SOFR 3 Month Index + 1.190% 0% 1/20/37 (b)(d)(i) | | 8,500,000 | 8,500,000 |
| Verizon Master Trust: | | | |
| Series 2023-4 Class A1A, 5.16% 6/20/29 | | 6,500,000 | 6,563,503 |
| Series 2024-2 Class A, 4.83% 12/22/31 (b) | | 7,800,000 | 7,893,949 |
| Volkswagen Auto Lease Trust 2024- Series 2024-A Class A3, 5.21% 6/21/27 | | 1,577,000 | 1,593,982 |
| Volkswagen Auto Loan Enhanced: | | | |
| Series 2023-1 Class A3, 5.02% 6/20/28 | | 5,600,000 | 5,630,989 |
| Series 2023-2 Class A3, 5.48% 12/20/28 | | 7,500,000 | 7,624,997 |
| Volofin Finance Designated Act Series 2024-1A Class A, 5.935% 6/15/37 (b) | | 14,403,000 | 14,463,493 |
| Volvo Financial Equipment LLC Series 2024-1A Class A3, 4.29% 10/16/28 (b) | | 6,954,000 | 6,888,840 |
| Voya Clo 2022-1 Ltd. / Voya Clo Series 2024-1A Class A1R, CME Term SOFR 3 Month Index + 1.250% 5.8674% 4/20/35 (b)(d)(i) | | 8,170,000 | 8,175,531 |
| Voya Clo 2023-1 Ltd. Series 2023-1A Class A1, CME Term SOFR 3 Month Index + 1.800% 6.4174% 1/20/37 (b)(d)(i) | | 14,610,000 | 14,739,474 |
| Voya Clo Ltd. Series 2024-1A Class A1, CME Term SOFR 3 Month Index + 1.520% 6.1759% 4/15/37 (b)(d)(i) | | 6,280,000 | 6,312,895 |
| Voya CLO Ltd./Voya CLO LLC: | | | |
| Series 2021-2A Class A1R, CME Term SOFR 3 Month Index + 1.420% 6.039% 7/19/34 (b)(d)(i) | | 3,951,000 | 3,958,440 |
| Series 2021-3A Class AR, CME Term SOFR 3 Month Index + 1.410% 6.029% 10/20/34 (b)(d)(i) | | 13,570,000 | 13,608,932 |
| Wheels Fleet Lease Funding 1 L: | | | |
| Series 2023-2A Class A, 6.46% 8/18/38 (b) | | 11,707,873 | 11,922,678 |
| Series 2024-1A Class A1, 5.49% 2/18/39 (b) | | 21,300,000 | 21,523,582 |
| Series 2024-2A Class A1, 4.87% 6/21/39 (b) | | 23,983,000 | 24,040,305 |
| Series 2024-3A Class A1, 4.8% 9/19/39 (b) | | 8,600,000 | 8,587,240 |
| Willis Engine Structured Trust Vi Series 2023-A Class A, 8% 10/15/48 (b) | | 14,812,080 | 15,549,110 |
| World Omni Auto Receivables Trust: | | | |
| Series 2023 B Class A3, 4.66% 5/15/28 | | 15,076,000 | 15,081,379 |
| Series 2023-C Class A3, 5.15% 11/15/28 | | 7,684,000 | 7,733,865 |
| World Omni Automobile Lease Series 2023-A Class A2A, 5.47% 11/17/25 | | 1,194,907 | 1,195,378 |
| World Omni Automobile Lease Se Series 2024-A Class A3, 5.26% 10/15/27 | | 7,800,000 | 7,896,224 |
| TOTAL ASSET-BACKED SECURITIES (Cost $2,807,811,732) | | | 2,821,839,723 |
| | | | |
| Collateralized Mortgage Obligations - 1.4% |
| | | Principal Amount (a) | Value ($) |
| Private Sponsor - 0.4% | | | |
| Ajax Mortgage Loan Trust sequential payer: | | | |
| Series 2021-C Class A, 5.115% 1/25/61 (b) | | 2,337,249 | 2,304,796 |
| Series 2021-E Class A1, 1.74% 12/25/60 (b) | | 12,369,183 | 10,712,619 |
| Angel Oak Mortgage Trust Series 2021-8 Class A1, 1.82% 11/25/66 (b) | | 1,707,153 | 1,512,387 |
| Binom Securitization Trust 202 Series 2022-RPL1 Class A1, 3% 2/25/61 (b) | | 12,308,523 | 11,304,642 |
| Brass PLC Series 2021-10A Class A1, 0.669% 4/16/69 (b)(d) | | 335,604 | 333,792 |
| BRAVO Residential Funding Trust sequential payer: | | | |
| Series 2020-RPL2 Class A1, 2% 5/25/59 (b) | | 732,511 | 672,233 |
| Series 2022-RPL1 Class A1, 2.75% 9/25/61 (b) | | 15,631,816 | 14,211,112 |
| CFMT Series 2022-HB10 Class A, 3.25% 11/25/35 (b) | | 7,013,690 | 6,925,420 |
| Cfmt 2024-Hb15 LLC sequential payer Series 2024-HB15 Class A, 4% 8/25/34 (b)(d) | | 6,050,372 | 5,939,069 |
| Cfmt LLC floater sequential payer Series 2024-HB13 Class A, 3% 5/25/34 (b)(d) | | 11,057,757 | 10,756,445 |
| CFMT LLC sequential payer Series 2022-HB8 Class A, 3.75% 4/25/25 (b) | | 23,166,875 | 22,988,490 |
| CSMC: | | | |
| floater Series 2015-1R Class 6A1, CME Term SOFR 1 Month Index + 0.390% 4.3113% 5/27/37 (b)(d)(i) | | 17,982 | 17,776 |
| Series 2014-3R: | | | |
Class 2A1, CME Term SOFR 1 Month Index + 0.810% 0% 5/27/37 (b)(d)(i) | | 556,406 | 56 |
Class AA1, CME Term SOFR 1 Month Index + 0.390% 4.3113% 5/27/37 (b)(d)(i) | | 439,130 | 423,888 |
| CSMC Trust sequential payer Series 2020-RPL4 Class A1, 2% 1/25/60 (b) | | 222,829 | 196,942 |
| Csmc Trust sequential payer Series 2021-RPL9 Class A1, 2.4364% 2/25/61 (b) | | 2,889,169 | 2,879,076 |
| GCAT Trust sequential payer Series 2021-NQM7 Class A1, 1.915% 8/25/66 (b) | | 864,831 | 780,397 |
| Legacy Mortgage Asset Trust Series 2021-GS5 Class A1, 5.25% 7/25/67 (b)(d) | | 1,995,139 | 1,978,377 |
| MFA Trust sequential payer Series 2022-RPL1 Class A1, 3.3% 8/25/61 (b) | | 43,026,085 | 40,056,846 |
| Mfra Trst sequential payer Series 2024-RPL1 Class A1, 4.25% 2/25/66 (b)(d) | | 773,964 | 722,138 |
| New Residential Mortgage Loan Trust: | | | |
| Series 2019-5A Class A1B, 3.5% 8/25/59 (b) | | 319,561 | 296,015 |
| Series 2020-1A Class A1B, 3.5% 10/25/59 (b) | | 3,193,628 | 2,952,382 |
| New York Mortgage Trust sequential payer Series 2021-SP1 Class A1, 4.6696% 8/25/61 (b) | | 8,455,800 | 8,234,027 |
| NYMT Loan Trust sequential payer Series 2021-CP1 Class A1, 2.0424% 7/25/61 (b) | | 13,623,072 | 12,480,762 |
| Nymt Loan Trust 2024-Cp1 sequential payer Series 2024-CP1 Class A1, 3.75% 2/25/68 (b) | | 8,587,856 | 7,979,676 |
| Oceanview Mortgage Loan Trust sequential payer Series 2020-1 Class A1A, 1.7329% 5/28/50 (b) | | 34,380 | 31,954 |
| Ocwen Ln Investment Trust 2023-Hb1 Series 2023-HB1 Class A, 3% 6/25/36 (b) | | 1,689,599 | 1,657,353 |
| Ocwen Loan Invest Trust Series 2024-HB1 Class A, 3% 2/25/37 (b) | | 1,824,597 | 1,763,009 |
| Onity Loan Investment Trust 20 Series 2024-HB2 Class A, 5% 8/25/37 (b) | | 6,502,527 | 6,464,286 |
| Preston Ridge Partners Mortgage Trust: | | | |
| sequential payer Series 2021-8 Class A1, 4.743% 9/25/26 (b)(d) | | 1,555,772 | 1,535,368 |
| Series 2021-RPL1 Class A1, 1.319% 7/25/51 (b) | | 3,207,055 | 2,935,295 |
| Series 2021-RPL2 Class A1, 1.455% 10/25/51 (b)(d) | | 4,665,608 | 4,256,673 |
| Pret 2024-Rpl1 Trust sequential payer Series 2024-RPL1 Class A1, 3.9% 10/25/63 (b) | | 1,636,493 | 1,541,233 |
| PRET LLC Series 2022-RN1 Class A1, 3.721% 7/25/51 (b) | | 1,358,214 | 1,358,332 |
| Prmi Securitization Trust 2024-Cm floater Series 2024-CMG1 Class A1, U.S. 30-Day Avg. Secured Overnight Fin. Rate (SOFR) Index + 1.300% 6.3045% 7/25/54 (b)(d)(i) | | 1,562,491 | 1,561,875 |
| Prpm 2023-Rcf1 LLC Series 2023-RCF1 Class A1, 4% 6/25/53 (b) | | 5,986,365 | 5,860,133 |
| Prpm 2024-Rcf4 LLC Series 2024-RCF4 Class A1, 4% 7/25/54 (b) | | 4,656,328 | 4,518,035 |
| Prpm 2024-Rcf6 LLC Series 2024-RCF6 Class A1, 4% 10/25/54 (b)(d) | | 8,279,550 | 7,992,699 |
| Prpm 2024-Rpl2 LLC Series 2024-RPL2 Class A1, 3.5% 5/25/54 (b)(d) | | 21,975,660 | 21,065,866 |
| RMF Buyout Issuance Trust: | | | |
| sequential payer Series 2021-HB1 Class A, 1.2586% 11/25/31 (b) | | 1,567,537 | 1,556,679 |
| Series 2020-HB1 Class A1, 1.7188% 10/25/50 (b) | | 2,071,252 | 1,962,729 |
| Sequoia Mortgage Trust floater Series 2004-6 Class A3B, CME Term SOFR 6 Month Index + 1.300% 6.5772% 7/20/34 (d)(i) | | 1,489 | 1,376 |
| Thornburg Mortgage Securities Trust floater Series 2003-4 Class A1, CME Term SOFR 1 Month Index + 0.750% 5.3422% 9/25/43 (d)(i) | | 43,009 | 41,141 |
| Towd Point Mortgage Trust: | | | |
| sequential payer: | | | |
Series 2021-1 Class A1, 2.25% 11/25/61 (b)(d) | | 25,765,024 | 23,694,997 |
Series 2022-K147 Class A2, 3.75% 7/25/62 (b) | | 42,019,901 | 39,328,606 |
| Series 2020-1 Class A1, 2.71% 1/25/60 (b) | | 676,754 | 640,907 |
| Wells Fargo Mortgage Backed Securities Trust Series 2003-I Class A1, 7.413% 9/25/33 (d) | | 5,584 | 5,600 |
TOTAL PRIVATE SPONSOR | | | 296,433,509 |
| U.S. Government Agency - 1.0% | | | |
| Fannie Mae: | | | |
| floater: | | | |
Series 2002-18 Class FD, U.S. 30-Day Avg. Secured Overnight Fin. Rate (SOFR) Index + 0.910% 5.6485% 2/25/32 (d)(i) | | 1,553 | 1,558 |
Series 2002-39 Class FD, U.S. 30-Day Avg. Secured Overnight Fin. Rate (SOFR) Index + 1.110% 5.9128% 3/18/32 (d)(i) | | 2,805 | 2,830 |
Series 2002-60 Class FV, U.S. 30-Day Avg. Secured Overnight Fin. Rate (SOFR) Index + 1.110% 5.8485% 4/25/32 (d)(i) | | 3,023 | 3,049 |
Series 2002-63 Class FN, U.S. 30-Day Avg. Secured Overnight Fin. Rate (SOFR) Index + 1.110% 5.8485% 10/25/32 (d)(i) | | 3,641 | 3,672 |
Series 2002-7 Class FC, U.S. 30-Day Avg. Secured Overnight Fin. Rate (SOFR) Index + 0.860% 5.5985% 1/25/32 (d)(i) | | 1,424 | 1,427 |
Series 2003-118 Class S, 7.980% - U.S. 30-Day Avg. Secured Overnight Fin. Rate (SOFR) Index 3.2515% 12/25/33 (d)(o)(p) | | 60,658 | 6,943 |
Series 2006-104 Class GI, 6.560% - U.S. 30-Day Avg. Secured Overnight Fin. Rate (SOFR) Index 1.8315% 11/25/36 (d)(o)(p) | | 42,588 | 4,084 |
Series 2012-154 Class F, U.S. 30-Day Avg. Secured Overnight Fin. Rate (SOFR) Index + 0.410% 5.1485% 1/25/43 (d)(i) | | 425,684 | 416,914 |
Series 2017-36 Class FB, U.S. 30-Day Avg. Secured Overnight Fin. Rate (SOFR) Index + 0.460% 5.1985% 5/25/47 (d)(i) | | 889,769 | 866,107 |
Series 2018-32 Class FB, U.S. 30-Day Avg. Secured Overnight Fin. Rate (SOFR) Index + 0.410% 5.1485% 5/25/48 (d)(i) | | 485,385 | 470,724 |
Series 2018-38 Class FG, U.S. 30-Day Avg. Secured Overnight Fin. Rate (SOFR) Index + 0.410% 5.1485% 6/25/48 (d)(i) | | 1,148,267 | 1,111,690 |
Series 2019-23 Class FC, U.S. 30-Day Avg. Secured Overnight Fin. Rate (SOFR) Index + 0.560% 5.2985% 5/25/49 (d)(i) | | 7,550,686 | 7,421,276 |
| planned amortization class: | | | |
Series 1999-17 Class PG, 6% 4/25/29 | | 15,069 | 15,287 |
Series 1999-32 Class PL, 6% 7/25/29 | | 20,458 | 20,805 |
Series 1999-33 Class PK, 6% 7/25/29 | | 15,558 | 15,745 |
Series 2001-52 Class YZ, 6.5% 10/25/31 | | 2,865 | 2,959 |
Series 2005-102 Class CO 11/25/35 (q) | | 8,238 | 7,050 |
Series 2005-39 Class TE, 5% 5/25/35 | | 10,480 | 10,479 |
Series 2005-73 Class SA, 17.500% x U.S. 30-Day Avg. Secured Overnight Fin. Rate (SOFR) Index 4.9439% 8/25/35 (d)(i)(p) | | 1,870 | 1,916 |
Series 2005-81 Class PC, 5.5% 9/25/35 | | 28,438 | 28,781 |
Series 2006-12 Class BO 10/25/35 (q) | | 36,717 | 32,307 |
Series 2006-15 Class OP 3/25/36 (q) | | 55,751 | 46,951 |
Series 2006-37 Class OW 5/25/36 (q) | | 5,764 | 4,647 |
Series 2006-45 Class OP 6/25/36 (q) | | 17,686 | 14,562 |
Series 2006-62 Class KP 4/25/36 (q) | | 27,605 | 22,855 |
Series 2012-149: | | | |
Class DA, 1.75% 1/25/43 | | 70,274 | 64,620 |
Class GA, 1.75% 6/25/42 | | 87,818 | 80,551 |
Series 2013-100 Class PJ, 3% 3/25/43 | | 7,510,861 | 7,084,082 |
Series 2017-32 Class PA, 2.7% 5/25/47 | | 7,993,296 | 7,166,810 |
Series 2017-37 Class AB, 2.55% 9/25/46 | | 1,565,629 | 1,414,848 |
Series 2021-45 Class DA, 3% 7/25/51 | | 8,646,325 | 7,542,606 |
Series 2021-69 Class JK, 1.5% 10/25/51 | | 4,837,026 | 4,019,885 |
Series 2022-2 Class TH, 2.5% 2/25/52 | | 2,836,254 | 2,560,019 |
| sequential payer: | | | |
Series 1997-41 Class J, 7.5% 6/18/27 | | 1,763 | 1,805 |
Series 1999-25 Class Z, 6% 6/25/29 | | 13,063 | 13,092 |
Series 2001-20 Class Z, 6% 5/25/31 | | 20,244 | 20,528 |
Series 2001-31 Class ZC, 6.5% 7/25/31 | | 8,001 | 8,086 |
Series 2002-16 Class ZD, 6.5% 4/25/32 | | 8,612 | 8,831 |
Series 2002-74 Class SV, 7.430% - U.S. 30-Day Avg. Secured Overnight Fin. Rate (SOFR) Index 2.7015% 11/25/32 (d)(o)(p) | | 6,219 | 150 |
Series 2012-67 Class AI, 4.5% 7/25/27 (o) | | 2,400 | 29 |
Series 2013-123 Class PZ, 2.7% 3/25/43 | | 8,017,886 | 7,159,300 |
Series 2021-85 Class L, 2.5% 8/25/48 | | 5,329,096 | 4,643,669 |
Series 2021-95: | | | |
Class 0, 2.5% 9/25/48 | | 10,492,136 | 9,164,330 |
Class BA, 2.5% 6/25/49 | | 16,082,211 | 14,036,993 |
Series 2021-96: | | | |
Class AH, 2.5% 3/25/49 | | 22,084,026 | 19,397,316 |
Class HA, 2.5% 2/25/50 | | 8,639,772 | 7,486,942 |
Series 2022-1 Class KA, 3% 5/25/48 | | 5,562,620 | 5,050,074 |
Series 2022-11 Class B, 3% 6/25/49 | | 6,008,014 | 5,475,161 |
Series 2022-13: | | | |
Class HA, 3% 8/25/46 | | 7,922,481 | 7,326,490 |
Class JA, 3% 5/25/48 | | 4,194,514 | 3,845,202 |
Series 2022-15 Class GC, 3% 1/25/47 | | 6,900,656 | 6,378,019 |
Series 2022-17 Class BH, 3% 5/25/47 | | 7,536,734 | 7,024,498 |
Series 2022-3: | | | |
Class D, 2% 2/25/48 | | 15,864,247 | 13,948,994 |
Class N, 2% 10/25/47 | | 66,752,259 | 58,288,507 |
Series 2022-30 Class E, 4.5% 7/25/48 | | 15,654,321 | 15,326,197 |
Series 2022-4 Class B, 2.5% 5/25/49 | | 6,256,741 | 5,445,662 |
Series 2022-49 Class TC, 4% 12/25/48 | | 4,965,030 | 4,785,295 |
Series 2022-5 Class DA, 2.25% 11/25/47 | | 17,974,735 | 15,840,463 |
Series 2022-7: | | | |
Class A, 3% 5/25/48 | | 7,911,790 | 7,171,064 |
Class E, 2.5% 11/25/47 | | 15,505,742 | 13,836,256 |
Series 2022-9 Class BA, 3% 5/25/48 | | 6,571,311 | 5,960,417 |
| Series 06-116 Class SG, 6.520% - U.S. 30-Day Avg. Secured Overnight Fin. Rate (SOFR) Index 1.7915% 12/25/36 (d)(o)(p) | | 30,035 | 2,955 |
| Series 07-40 Class SE, 6.320% - U.S. 30-Day Avg. Secured Overnight Fin. Rate (SOFR) Index 1.5915% 5/25/37 (d)(o)(p) | | 15,939 | 1,721 |
| Series 2003-21 Class SK, 7.980% - U.S. 30-Day Avg. Secured Overnight Fin. Rate (SOFR) Index 3.2515% 3/25/33 (d)(o)(p) | | 3,926 | 402 |
| Series 2005-72 Class ZC, 5.5% 8/25/35 | | 227,181 | 228,038 |
| Series 2005-79 Class ZC, 5.9% 9/25/35 | | 148,994 | 150,318 |
| Series 2007-57 Class SA, 40.600% x U.S. 30-Day Avg. Secured Overnight Fin. Rate (SOFR) Index 11.5289% 6/25/37 (d)(i)(p) | | 16,773 | 20,323 |
| Series 2007-66: | | | |
Class SA, 38.910% x U.S. 30-Day Avg. Secured Overnight Fin. Rate (SOFR) Index 10.5089% 7/25/37 (d)(i)(p) | | 17,706 | 21,630 |
Class SB, 38.910% x U.S. 30-Day Avg. Secured Overnight Fin. Rate (SOFR) Index 10.5089% 7/25/37 (d)(i)(p) | | 3,836 | 4,218 |
| Series 2010-135 Class ZA, 4.5% 12/25/40 | | 64,298 | 63,973 |
| Series 2010-150 Class ZC, 4.75% 1/25/41 | | 593,820 | 586,737 |
| Series 2010-95 Class ZC, 5% 9/25/40 | | 1,244,465 | 1,243,053 |
| Series 2011-39 Class ZA, 6% 11/25/32 | | 65,378 | 67,305 |
| Series 2011-4 Class PZ, 5% 2/25/41 | | 211,813 | 204,708 |
| Series 2011-67 Class AI, 4% 7/25/26 (o) | | 1,491 | 18 |
| Series 2012-100 Class WI, 3% 9/25/27 (o) | | 135,139 | 3,710 |
| Series 2012-9 Class SH, 6.430% - U.S. 30-Day Avg. Secured Overnight Fin. Rate (SOFR) Index 1.7015% 6/25/41 (d)(o)(p) | | 4,906 | 24 |
| Series 2013-133 Class IB, 3% 4/25/32 (o) | | 25,556 | 224 |
| Series 2013-134 Class SA, 5.930% - U.S. 30-Day Avg. Secured Overnight Fin. Rate (SOFR) Index 1.2015% 1/25/44 (d)(o)(p) | | 68,134 | 7,239 |
| Series 2013-16 Class GP, 3% 3/25/33 | | 252,792 | 246,773 |
| Series 2013-44 Class DJ, 1.85% 5/25/33 | | 5,370,212 | 4,914,055 |
| Series 2013-51 Class GI, 3% 10/25/32 (o) | | 54,336 | 2,414 |
| Series 2013-N1 Class A, 6.600% - U.S. 30-Day Avg. Secured Overnight Fin. Rate (SOFR) Index 1.8715% 6/25/35 (d)(o)(p) | | 81,293 | 5,866 |
| Series 2015-42 Class IL, 6% 6/25/45 (o) | | 413,173 | 62,796 |
| Series 2015-70 Class JC, 3% 10/25/45 | | 479,805 | 451,965 |
| Series 2017-30 Class AI, 5.5% 5/25/47 (o) | | 215,630 | 32,539 |
| Series 2020-39 Class MG, 1.5% 6/25/40 | | 21,654,954 | 18,025,082 |
| Series 2020-45 Class JC, 1.5% 7/25/40 | | 22,170,320 | 18,453,927 |
| Series 2020-59 Class MC, 1.5% 8/25/40 | | 24,352,854 | 20,259,697 |
| Series 2021-21 Class HG, 2% 11/25/47 | | 5,381,691 | 4,737,808 |
| Series 2021-59 Class H, 2% 6/25/48 | | 5,680,355 | 4,663,075 |
| Series 2021-66: | | | |
Class DA, 2% 1/25/48 | | 6,011,886 | 4,967,533 |
Class DM, 2% 1/25/48 | | 6,388,912 | 5,279,064 |
| Series 2022-28 Class A, 2.5% 2/25/52 | | 14,273,105 | 13,303,783 |
| Fannie Mae Stripped Mortgage-Backed Securities: | | | |
| Series 339 Class 5, 5.5% 7/25/33 (o) | | 14,324 | 2,144 |
| Series 343 Class 16, 5.5% 5/25/34 (o) | | 13,420 | 2,032 |
| Series 348 Class 14, 6.5% 8/25/34 (d)(o) | | 11,234 | 2,087 |
| Series 351: | | | |
Class 12, 5.5% 4/25/34 (d)(o) | | 6,855 | 1,083 |
Class 13, 6% 3/25/34 (o) | | 10,471 | 1,830 |
| Series 359 Class 19, 6% 7/25/35 (d)(o) | | 6,177 | 1,123 |
| Series 384 Class 6, 5% 7/25/37 (o) | | 60,655 | 10,022 |
| Freddie Mac: | | | |
| floater: | | | |
Series 2412 Class FK, U.S. 30-Day Avg. Secured Overnight Fin. Rate (SOFR) Index + 0.910% 5.7201% 1/15/32 (d)(i) | | 1,099 | 1,103 |
Series 2423 Class FA, U.S. 30-Day Avg. Secured Overnight Fin. Rate (SOFR) Index + 1.010% 5.8201% 3/15/32 (d)(i) | | 1,613 | 1,623 |
Series 2424 Class FM, U.S. 30-Day Avg. Secured Overnight Fin. Rate (SOFR) Index + 1.110% 5.9201% 3/15/32 (d)(i) | | 1,517 | 1,529 |
Series 2432: | | | |
Class FE, U.S. 30-Day Avg. Secured Overnight Fin. Rate (SOFR) Index + 1.010% 5.8201% 6/15/31 (d)(i) | | 2,556 | 2,569 |
Class FG, U.S. 30-Day Avg. Secured Overnight Fin. Rate (SOFR) Index + 1.010% 5.8201% 3/15/32 (d)(i) | | 915 | 920 |
Series 4709 Class FE, U.S. 30-Day Avg. Secured Overnight Fin. Rate (SOFR) Index + 0.460% 5.2701% 8/15/47 (d)(i) | | 441,758 | 430,211 |
| planned amortization class: | | | |
Series 2012-4116 Class AP, 1.35% 8/15/42 | | 10,898,933 | 9,451,402 |
Series 2020-4954 Class KE, 1.5% 2/25/50 | | 2,737,800 | 2,185,549 |
Series 2021-5141 Class JM, 1.5% 4/25/51 | | 4,743,085 | 3,939,408 |
Series 2021-5148: | | | |
Class AD, 1.5% 10/25/51 | | 4,801,271 | 3,987,654 |
Class PC, 1.5% 10/25/51 | | 4,735,141 | 3,892,091 |
Series 2095 Class PE, 6% 11/15/28 | | 19,427 | 19,774 |
Series 2101 Class PD, 6% 11/15/28 | | 1,447 | 1,471 |
Series 2104 Class PG, 6% 12/15/28 | | 1,515 | 1,543 |
Series 2121 Class MG, 6% 2/15/29 | | 8,643 | 8,762 |
Series 2131 Class BG, 6% 3/15/29 | | 45,761 | 46,411 |
Series 2137 Class PG, 6% 3/15/29 | | 7,302 | 7,436 |
Series 2154 Class PT, 6% 5/15/29 | | 15,984 | 16,209 |
Series 2162 Class PH, 6% 6/15/29 | | 2,721 | 2,763 |
Series 2520 Class BE, 6% 11/15/32 | | 32,987 | 33,732 |
Series 2693 Class MD, 5.5% 10/15/33 | | 133,120 | 133,735 |
Series 2802 Class OB, 6% 5/15/34 | | 22,805 | 23,201 |
Series 3002 Class NE, 5% 7/15/35 | | 69,857 | 69,918 |
Series 3110 Class OP 9/15/35 (q) | | 6,703 | 6,491 |
Series 3119 Class PO 2/15/36 (q) | | 66,980 | 54,263 |
Series 3121 Class KO 3/15/36 (q) | | 10,040 | 8,596 |
Series 3123 Class LO 3/15/36 (q) | | 36,346 | 29,725 |
Series 3145 Class GO 4/15/36 (q) | | 40,194 | 33,108 |
Series 3189 Class PD, 6% 7/15/36 | | 67,894 | 70,342 |
Series 3225 Class EO 10/15/36 (q) | | 20,332 | 16,508 |
Series 3258 Class PM, 5.5% 12/15/36 | | 20,513 | 20,893 |
Series 3415 Class PC, 5% 12/15/37 | | 30,021 | 30,026 |
Series 3832 Class PE, 5% 3/15/41 | | 306,060 | 306,875 |
Series 4135 Class AB, 1.75% 6/15/42 | | 64,206 | 59,239 |
| sequential payer: | | | |
Series 2010-3711 Class B, 4% 8/15/25 | | 87,605 | 87,200 |
Series 2010-3720 Class EB, 4% 9/15/25 | | 135,895 | 135,230 |
Series 2012-4140 Class JW, 4% 3/15/25 | | 23,688 | 23,621 |
Series 2020-5018 Class LC, 3% 10/25/40 | | 2,663,611 | 2,403,637 |
Series 2020-5066 Class A, 1.5% 11/25/44 | | 3,530,443 | 3,073,928 |
Series 2021-5169 Class TP, 2.5% 6/25/49 | | 4,656,836 | 4,029,633 |
Series 2021-5175 Class CB, 2.5% 4/25/50 | | 31,065,813 | 26,855,370 |
Series 2021-5180 Class KA, 2.5% 10/25/47 | | 6,218,582 | 5,525,506 |
Series 2022-5189: | | | |
Class DA, 2.5% 5/25/49 | | 4,333,718 | 3,762,213 |
Class TP, 2.5% 5/25/49 | | 4,226,764 | 3,674,267 |
Series 2022-5190: | | | |
Class BA, 2.5% 11/25/47 | | 4,128,097 | 3,664,001 |
Class CA, 2.5% 5/25/49 | | 3,536,255 | 3,073,570 |
Series 2022-5191 Class CA, 2.5% 4/25/50 | | 7,295,129 | 6,263,094 |
Series 2022-5197: | | | |
Class A, 2.5% 6/25/49 | | 3,536,266 | 3,073,571 |
Class DA, 2.5% 11/25/47 | | 3,133,130 | 2,784,472 |
Series 2022-5198 Class BA, 2.5% 11/25/47 | | 15,106,872 | 13,529,923 |
Series 2022-5201 Class EB, 3% 2/25/48 | | 8,289,457 | 7,544,009 |
Series 2022-5202: | | | |
Class AG, 3% 1/25/49 | | 3,406,937 | 3,081,696 |
Class LB, 2.5% 10/25/47 | | 3,362,683 | 2,990,998 |
Class UA, 3% 4/25/50 | | 5,904,547 | 5,306,182 |
Series 2022-5210 Class TA, 3.5% 11/25/46 | | 4,522,486 | 4,223,534 |
Series 2114 Class ZM, 6% 1/15/29 | | 646 | 655 |
Series 2135 Class JE, 6% 3/15/29 | | 4,682 | 4,753 |
Series 2274 Class ZM, 6.5% 1/15/31 | | 5,854 | 5,917 |
Series 2281 Class ZB, 6% 3/15/30 | | 9,063 | 9,182 |
Series 2303 Class ZV, 6% 4/15/31 | | 4,361 | 4,430 |
Series 2357 Class ZB, 6.5% 9/15/31 | | 45,187 | 46,120 |
Series 2502 Class ZC, 6% 9/15/32 | | 14,414 | 14,738 |
Series 2519 Class ZD, 5.5% 11/15/32 | | 15,211 | 15,371 |
Series 2998 Class LY, 5.5% 7/15/25 | | 474 | 474 |
| Series 06-3115 Class SM, 6.480% - U.S. 30-Day Avg. Secured Overnight Fin. Rate (SOFR) Index 1.6799% 2/15/36 (d)(o)(p) | | 20,767 | 1,836 |
| Series 2013-4281 Class AI, 4% 12/15/28 (o) | | 670 | 4 |
| Series 2017-4683 Class LM, 3% 5/15/47 | | 587,315 | 559,556 |
| Series 2020-5000 Class BA, 2% 4/25/45 | | 13,735,767 | 12,449,871 |
| Series 2020-5041 Class LA, 1.5% 11/25/40 | | 3,297,281 | 2,738,615 |
| Series 2020-5046 Class PT, 1.5% 11/25/40 | | 2,510,355 | 2,083,291 |
| Series 2021-5077 Class ME, 2% 8/15/48 | | 4,407,700 | 3,717,641 |
| Series 2021-5083 Class VA, 1% 8/15/38 | | 13,330,820 | 12,597,373 |
| Series 2021-5182 Class A, 2.5% 10/25/48 | | 41,124,590 | 35,905,624 |
| Series 2022-5207 Class PA, 3% 6/25/51 | | 10,632,482 | 9,498,497 |
| Series 2022-5210 Class AB, 3% 1/25/42 | | 7,947,520 | 7,335,606 |
| Series 2022-5214 Class CB, 3.25% 4/25/52 | | 19,230,989 | 17,900,737 |
| Series 2022-5236 Class P, 5% 4/25/48 | | 6,191,517 | 6,161,441 |
| Series 2022-5266 Class CD, 4.5% 10/25/44 | | 11,427,079 | 11,280,877 |
| Series 2380 Class SY, 8.080% - U.S. 30-Day Avg. Secured Overnight Fin. Rate (SOFR) Index 3.2799% 11/15/31 (d)(o)(p) | | 2,490 | 110 |
| Series 2587 Class IM, 6.5% 3/15/33 (o) | | 1,771 | 277 |
| Series 2933 Class ZM, 5.75% 2/15/35 | | 322,187 | 330,130 |
| Series 2947 Class XZ, 6% 3/15/35 | | 134,355 | 137,732 |
| Series 2996 Class ZD, 5.5% 6/15/35 | | 212,476 | 216,312 |
| Series 3237 Class C, 5.5% 11/15/36 | | 284,251 | 289,064 |
| Series 3244 Class SG, 6.540% - U.S. 30-Day Avg. Secured Overnight Fin. Rate (SOFR) Index 1.7399% 11/15/36 (d)(o)(p) | | 96,039 | 8,274 |
| Series 3336 Class LI, 6.460% - U.S. 30-Day Avg. Secured Overnight Fin. Rate (SOFR) Index 1.6599% 6/15/37 (d)(o)(p) | | 62,968 | 6,964 |
| Series 3949 Class MK, 4.5% 10/15/34 | | 124,413 | 122,596 |
| Series 4055 Class BI, 3.5% 5/15/31 (o) | | 830 | 0 |
| Series 4149 Class IO, 3% 1/15/33 (o) | | 30,602 | 2,118 |
| Series 4314 Class AI, 5% 3/15/34 (o) | | 1,778 | 18 |
| Series 4427 Class LI, 3.5% 2/15/34 (o) | | 181,061 | 7,575 |
| Series 4471 Class PA 4% 12/15/40 | | 160,152 | 157,240 |
| target amortization class: | | | |
Series 2007-3366 Class FD, U.S. 30-Day Avg. Secured Overnight Fin. Rate (SOFR) Index + 0.360% 5.1701% 5/15/37 (d)(i) | | 69,267 | 67,513 |
Series 2156 Class TC, 6.25% 5/15/29 | | 1,485 | 1,484 |
| Freddie Mac Manufactured Housing participation certificates guaranteed: | | | |
| planned amortization class Series 2043 Class CJ, 6.5% 4/15/28 | | 1,744 | 1,760 |
| sequential payer: | | | |
Series 2043 Class ZH, 6% 4/15/28 | | 4,190 | 4,250 |
Series 2056 Class Z, 6% 5/15/28 | | 12,150 | 12,340 |
| Freddie Mac Multiclass Mortgage participation certificates: | | | |
| floater Series 4795 Class FA, U.S. 30-Day Avg. Secured Overnight Fin. Rate (SOFR) Index + 0.410% 5.2201% 5/15/48 (d)(i) | | 788,545 | 763,162 |
| planned amortization class Series 2021-5165 Class PC, 1.5% 11/25/51 | | 6,081,593 | 5,061,756 |
| sequential payer: | | | |
Series 2021-5159: | | | |
Class EA, 2.5% 8/25/48 | | 4,594,946 | 4,004,953 |
Class GC, 2% 11/25/47 | | 4,974,349 | 4,321,513 |
Series 2021-5164 Class M, 2.5% 7/25/48 | | 4,689,324 | 4,091,538 |
| Series 4386 Class AZ, 4.5% 11/15/40 | | 715,971 | 692,658 |
| Freddie Mac Seasoned Credit Risk Transfer Trust: | | | |
| sequential payer: | | | |
Series 2018-3 Class MA, 3.5% 8/25/57 | | 4,813,782 | 4,559,214 |
Series 2018-4 Class MA, 3.5% 3/25/58 | | 1,944,836 | 1,836,131 |
Series 2019-1 Class MA, 3.5% 7/25/58 | | 3,299,496 | 3,107,396 |
| Series 2018-3 Class M55D, 4% 8/25/57 | | 290,133 | 267,212 |
| Ginnie Mae guaranteed REMIC pass-thru certificates: | | | |
| floater: | | | |
Series 2007-37 Class TS, 6.570% - CME Term SOFR 1 Month Index 1.965% 6/16/37 (d)(o)(p) | | 39,981 | 3,887 |
Series 2010-H03 Class FA, CME Term SOFR 1 Month Index + 0.660% 5.3718% 3/20/60 (d)(i)(r) | | 145,045 | 144,913 |
Series 2010-H19 Class FG, CME Term SOFR 1 Month Index + 0.410% 5.271% 8/20/60 (d)(i)(r) | | 36,676 | 36,535 |
Series 2010-H27 Class FA, CME Term SOFR 1 Month Index + 0.380% 5.351% 12/20/60 (d)(i)(r) | | 80,345 | 80,042 |
Series 2011-H05 Class FA, CME Term SOFR 1 Month Index + 0.610% 5.471% 12/20/60 (d)(i)(r) | | 71,161 | 71,063 |
Series 2011-H07 Class FA, CME Term SOFR 1 Month Index + 0.610% 5.471% 2/20/61 (d)(i)(r) | | 72,901 | 72,783 |
Series 2011-H12 Class FA, CME Term SOFR 1 Month Index + 0.600% 5.461% 2/20/61 (d)(i)(r) | | 90,876 | 90,693 |
Series 2011-H13 Class FA, CME Term SOFR 1 Month Index + 0.610% 5.471% 4/20/61 (d)(i)(r) | | 79,363 | 79,259 |
Series 2011-H14: | | | |
Class FB, CME Term SOFR 1 Month Index + 0.610% 5.471% 5/20/61 (d)(i)(r) | | 81,400 | 81,256 |
Class FC, CME Term SOFR 1 Month Index + 0.610% 5.471% 5/20/61 (d)(i)(r) | | 74,381 | 74,273 |
Series 2011-H17 Class FA, CME Term SOFR 1 Month Index + 0.640% 5.501% 6/20/61 (d)(i)(r) | | 88,781 | 88,702 |
Series 2011-H20 Class FA, CME Term SOFR 1 Month Index + 0.660% 5.521% 9/20/61 (d)(i)(r) | | 237,394 | 237,234 |
Series 2011-H21 Class FA, CME Term SOFR 1 Month Index + 0.710% 5.571% 10/20/61 (d)(i)(r) | | 89,158 | 89,149 |
Series 2012-H01 Class FA, CME Term SOFR 1 Month Index + 0.810% 5.671% 11/20/61 (d)(i)(r) | | 117,261 | 117,392 |
Series 2012-H03 Class FA, CME Term SOFR 1 Month Index + 0.810% 5.671% 1/20/62 (d)(i)(r) | | 53,785 | 53,854 |
Series 2012-H06 Class FA, CME Term SOFR 1 Month Index + 0.740% 5.601% 1/20/62 (d)(i)(r) | | 104,297 | 104,331 |
Series 2012-H07 Class FA, CME Term SOFR 1 Month Index + 0.740% 5.601% 3/20/62 (d)(i)(r) | | 48,100 | 48,084 |
Series 2012-H21 Class DF, CME Term SOFR 1 Month Index + 0.760% 5.621% 5/20/61 (d)(i)(r) | | 4,541 | 4,535 |
Series 2014-H03 Class FA, CME Term SOFR 1 Month Index + 0.710% 5.571% 1/20/64 (d)(i)(r) | | 49,587 | 49,581 |
Series 2014-H05 Class FB, CME Term SOFR 1 Month Index + 0.710% 5.571% 12/20/63 (d)(i)(r) | | 81,355 | 81,338 |
Series 2014-H11 Class BA, CME Term SOFR 1 Month Index + 0.610% 5.471% 6/20/64 (d)(i)(r) | | 67,161 | 67,067 |
Series 2015-H13 Class FL, CME Term SOFR 1 Month Index + 0.390% 5.251% 5/20/63 (d)(i)(r) | | 2,787 | 2,758 |
Series 2015-H19 Class FA, CME Term SOFR 1 Month Index + 0.310% 5.171% 4/20/63 (d)(i)(r) | | 3,565 | 3,531 |
Series 2016-H20 Class FM, CME Term SOFR 1 Month Index + 0.510% 5.371% 12/20/62 (d)(i)(r) | | 10,562 | 10,485 |
Series 2019-23 Class NF, CME Term SOFR 1 Month Index + 0.560% 5.1707% 2/20/49 (d)(i) | | 1,798,654 | 1,772,124 |
| planned amortization class: | | | |
Series 2011-136 Class WI, 4.5% 5/20/40 (o) | | 9,558 | 491 |
Series 2016-69 Class WA, 3% 2/20/46 | | 258,168 | 237,646 |
Series 2017-134 Class BA, 2.5% 11/20/46 | | 98,771 | 88,759 |
Series 2017-153 Class GA, 3% 9/20/47 | | 863,589 | 774,450 |
Series 2017-182 Class KA, 3% 10/20/47 | | 691,594 | 624,981 |
Series 2018-13 Class Q, 3% 4/20/47 | | 801,540 | 742,457 |
| sequential payer: | | | |
Series 2004-24 Class ZM, 5% 4/20/34 | | 108,031 | 106,412 |
Series 2010-160 Class DY, 4% 12/20/40 | | 880,684 | 849,510 |
Series 2010-170 Class B, 4% 12/20/40 | | 194,344 | 187,283 |
Series 2017-139 Class BA, 3% 9/20/47 | | 2,640,741 | 2,363,484 |
| Series 2004-32 Class GS, 6.380% - CME Term SOFR 1 Month Index 1.775% 5/16/34 (d)(o)(p) | | 26,105 | 1,673 |
| Series 2004-73 Class AL, 7.080% - CME Term SOFR 1 Month Index 2.475% 8/17/34 (d)(o)(p) | | 19,965 | 1,681 |
| Series 2010-116 Class QB, 4% 9/16/40 | | 60,739 | 57,619 |
| Series 2010-H10 Class FA, CME Term SOFR 1 Month Index + 0.440% 5.1518% 5/20/60 (d)(i)(r) | | 114,574 | 114,259 |
| Series 2011-52 Class HI, 7% 4/16/41 (o) | | 20,305 | 2,668 |
| Series 2011-94 Class SA, 5.980% - CME Term SOFR 1 Month Index 1.3794% 7/20/41 (d)(o)(p) | | 75,358 | 7,012 |
| Series 2013-149 Class MA, 2.5% 5/20/40 | | 437,969 | 427,386 |
| Series 2014-2 Class BA, 3% 1/20/44 | | 1,621,409 | 1,473,686 |
| Series 2014-21 Class HA, 3% 2/20/44 | | 605,295 | 554,891 |
| Series 2014-25 Class HC, 3% 2/20/44 | | 1,021,897 | 925,238 |
| Series 2014-5 Class A, 3% 1/20/44 | | 833,004 | 757,061 |
| Series 2015-H13 Class HA, 2.5% 8/20/64 (r) | | 5,446 | 5,268 |
| Series 2016-H13 Class FB, U.S. TREASURY 1 YEAR INDEX + 0.500% 4.41% 5/20/66 (d)(i)(r) | | 178,821 | 177,774 |
| Series 2017-186 Class HK, 3% 11/16/45 | | 883,617 | 811,101 |
| Series 2017-H06 Class FA, U.S. TREASURY 1 YEAR INDEX + 0.350% 4.26% 8/20/66 (d)(i)(r) | | 343,378 | 341,290 |
| Ginnie Mae REMIC Trust Series 2015-H17 Class GZ, 4.2527% 5/20/65 (d)(r) | | 25,954 | 25,489 |
TOTAL U.S. GOVERNMENT AGENCY | | | 673,673,775 |
| TOTAL COLLATERALIZED MORTGAGE OBLIGATIONS (Cost $976,302,136) | | | 970,107,284 |
| | | | |
| Commercial Mortgage Securities - 4.1% |
| | | Principal Amount (a) | Value ($) |
| BAMLL Commercial Mortgage Securities Trust: | | | |
| floater Series 2022-DKLX: | | | |
Class A, CME Term SOFR 1 Month Index + 1.150% 5.76% 1/15/39 (b)(d)(i) | | 11,766,074 | 11,718,370 |
Class B, CME Term SOFR 1 Month Index + 1.550% 6.16% 1/15/39 (b)(d)(i) | | 1,871,854 | 1,856,676 |
Class C, CME Term SOFR 1 Month Index + 2.150% 6.76% 1/15/39 (b)(d)(i) | | 1,336,780 | 1,333,438 |
| sequential payer Series 2019-BPR Class ANM, 3.112% 11/5/32 (b) | | 6,380,000 | 5,869,600 |
| Series 2019-BPR: | | | |
Class BNM, 3.465% 11/5/32 (b) | | 1,295,000 | 1,104,014 |
Class CNM, 3.8425% 11/5/32 (b)(d) | | 536,000 | 384,616 |
| BANK: | | | |
| sequential payer: | | | |
Series 2017-BNK8 Class A3, 3.229% 11/15/50 | | 3,740,738 | 3,595,116 |
Series 2017-BNK9 Class A4, 3.538% 11/15/54 | | 11,067,000 | 10,655,936 |
Series 2018-BN10: | | | |
| Class A4, 3.428% 2/15/61 | | 7,271,931 | 6,975,514 |
| Class A5, 3.688% 2/15/61 | | 40,101,000 | 38,675,221 |
Series 2018-BN14: | | | |
| Class A4, 4.231% 9/15/60 | | 10,750,000 | 10,497,906 |
| Class ASB, 4.185% 9/15/60 | | 4,360,805 | 4,308,808 |
Series 2018-BN15 Class ASB, 4.285% 11/15/61 | | 968,279 | 957,452 |
Series 2019-BN21 Class A5, 2.851% 10/17/52 | | 1,112,000 | 1,000,641 |
Series 2019-BN23 Class ASB, 2.846% 12/15/52 | | 3,300,000 | 3,150,936 |
Series 2020-BN26 Class ASB, 2.313% 3/15/63 | | 19,800,000 | 18,568,454 |
Series 2021-BN35 Class ASB, 2.067% 6/15/64 | | 1,200,000 | 1,080,339 |
Series 2022-BNK44, Class A5, 5.9359% 11/15/55 (d) | | 4,700,000 | 4,954,130 |
Series 2023-5YR1 Class A2, 5.779% 4/15/56 | | 14,200,000 | 14,484,515 |
| Series 2017-BNK6 Class ASB, 3.289% 7/15/60 | | 1,978,275 | 1,952,721 |
| Series 2020-BN25 Class XB, 0.5292% 1/15/63 (d)(o) | | 30,600,000 | 608,695 |
| Series 2021-BN33 Class XA, 1.1611% 5/15/64 (d)(o) | | 102,313,733 | 4,729,565 |
| Bank 2018-Bnk13 sequential payer Series 2018-BN13 Class A4, 3.953% 8/15/61 | | 6,489,939 | 6,271,371 |
| BANK Trust sequential payer Series 2017-BNK5: | | | |
| Class A4, 3.131% 6/15/60 | | 2,699,975 | 2,589,914 |
| Class A5, 3.39% 6/15/60 | | 10,059,000 | 9,687,791 |
| Bayview Commercial Asset Trust floater: | | | |
| Series 2005-3A: | | | |
Class A2, CME Term SOFR 1 Month Index + 0.710% 5.3022% 11/25/35 (b)(d)(i) | | 20,514 | 19,955 |
Class M1, CME Term SOFR 1 Month Index + 0.770% 5.3622% 11/25/35 (b)(d)(i) | | 5,487 | 5,433 |
| Series 2005-4A: | | | |
Class A2, CME Term SOFR 1 Month Index + 0.690% 5.2872% 1/25/36 (b)(d)(i) | | 49,522 | 47,312 |
Class M1, CME Term SOFR 1 Month Index + 0.780% 5.3772% 1/25/36 (b)(d)(i) | | 15,987 | 15,212 |
Class M2, CME Term SOFR 1 Month Index + 0.810% 5.4072% 1/25/36 (b)(d)(i) | | 6,029 | 5,681 |
Class M3, CME Term SOFR 1 Month Index + 0.860% 5.4522% 1/25/36 (b)(d)(i) | | 8,774 | 8,138 |
| Series 2006-1: | | | |
Class A2, CME Term SOFR 1 Month Index + 0.650% 5.2422% 4/25/36 (b)(d)(i) | | 8,628 | 8,098 |
Class M1, CME Term SOFR 1 Month Index + 0.680% 5.2722% 4/25/36 (b)(d)(i) | | 5,217 | 4,844 |
Class M2, CME Term SOFR 1 Month Index + 0.710% 5.3022% 4/25/36 (b)(d)(i) | | 5,518 | 4,912 |
Class M6, CME Term SOFR 1 Month Index + 1.070% 5.6622% 4/25/36 (b)(d)(i) | | 5,217 | 4,726 |
| Series 2006-2A: | | | |
Class M1, CME Term SOFR 1 Month Index + 0.570% 5.1672% 7/25/36 (b)(d)(i) | | 7,603 | 7,135 |
Class M2, CME Term SOFR 1 Month Index + 0.600% 5.1972% 7/25/36 (b)(d)(i) | | 5,402 | 5,009 |
Class M4, CME Term SOFR 1 Month Index + 0.740% 5.3322% 7/25/36 (b)(d)(i) | | 5,102 | 4,800 |
| Series 2006-4A: | | | |
Class A2, CME Term SOFR 1 Month Index + 0.510% 5.1072% 12/25/36 (b)(d)(i) | | 107,099 | 100,210 |
Class M1, CME Term SOFR 1 Month Index + 0.540% 5.1372% 12/25/36 (b)(d)(i) | | 8,607 | 8,360 |
Class M3, CME Term SOFR 1 Month Index + 0.620% 5.2122% 12/25/36 (b)(d)(i) | | 5,834 | 5,595 |
| Series 2007-1 Class A2, CME Term SOFR 1 Month Index + 0.510% 5.1072% 3/25/37 (b)(d)(i) | | 26,251 | 24,865 |
| Series 2007-2A: | | | |
Class A1, CME Term SOFR 1 Month Index + 0.380% 5.1072% 7/25/37 (b)(d)(i) | | 88,812 | 82,649 |
Class A2, CME Term SOFR 1 Month Index + 0.430% 5.1822% 7/25/37 (b)(d)(i) | | 83,128 | 76,496 |
Class M1, CME Term SOFR 1 Month Index + 0.480% 5.2572% 7/25/37 (b)(d)(i) | | 28,317 | 26,429 |
Class M2, CME Term SOFR 1 Month Index + 0.520% 5.3172% 7/25/37 (b)(d)(i) | | 18,449 | 17,120 |
Class M3, CME Term SOFR 1 Month Index + 0.600% 5.4372% 7/25/37 (b)(d)(i) | | 26,923 | 22,770 |
| Series 2007-3: | | | |
Class A2, CME Term SOFR 1 Month Index + 0.540% 5.1372% 7/25/37 (b)(d)(i) | | 29,503 | 27,726 |
Class M1, CME Term SOFR 1 Month Index + 0.570% 5.1672% 7/25/37 (b)(d)(i) | | 15,650 | 14,357 |
Class M2, CME Term SOFR 1 Month Index + 0.620% 5.2122% 7/25/37 (b)(d)(i) | | 16,698 | 15,152 |
Class M3, CME Term SOFR 1 Month Index + 0.660% 5.2572% 7/25/37 (b)(d)(i) | | 26,957 | 24,256 |
Class M4, CME Term SOFR 1 Month Index + 0.860% 5.4522% 7/25/37 (b)(d)(i) | | 42,382 | 38,282 |
Class M5, CME Term SOFR 1 Month Index + 1.010% 5.6022% 7/25/37 (b)(d)(i) | | 25,730 | 27,868 |
| BBCMS Mortgage Trust sequential payer: | | | |
| Series 2019-C3 Class ASB, 3.458% 5/15/52 | | 3,893,326 | 3,800,964 |
| Series 2019-C5 Class ASB, 2.99% 11/15/52 | | 1,863,454 | 1,800,616 |
| Series 2023-C20 Class A5, 5.576% 7/15/56 | | 2,533,333 | 2,641,033 |
| Series 2023-C21 Class A3, 6.5066% 9/15/56 (d) | | 13,794,000 | 14,650,685 |
| BCP Trust floater Series 2021-330N Class A, CME Term SOFR 1 Month Index + 0.910% 5.5235% 6/15/38 (b)(d)(i) | | 4,207,067 | 3,896,019 |
| Benchmark 2024-V9 Mortgage Tru sequential payer Series 2024-V9 Class A3, 5.6019% 8/15/57 | | 15,300,000 | 15,685,753 |
| Benchmark Mortgage Trust: | | | |
| sequential payer: | | | |
Series 2018-B1 Class ASB, 3.602% 1/15/51 | | 2,190,395 | 2,148,841 |
Series 2018-B2 Class ASB, 3.7802% 2/15/51 | | 2,251,410 | 2,219,832 |
Series 2018-B4 Class A5, 4.121% 7/15/51 | | 1,260,000 | 1,224,747 |
Series 2018-B6 Class A3, 3.995% 10/10/51 | | 4,700,000 | 4,547,775 |
Series 2018-B7 Class A4, 4.51% 5/15/53 | | 3,112,512 | 3,044,431 |
Series 2019-B10: | | | |
| Class A4, 3.717% 3/15/62 | | 2,683,000 | 2,557,796 |
| Class ASB, 3.615% 3/15/62 | | 7,909,743 | 7,737,533 |
Series 2019-B13 Class A4, 2.952% 8/15/57 | | 12,263,000 | 11,242,905 |
Series 2023-V2 Class A3, 5.8118% 5/15/55 | | 7,200,000 | 7,376,025 |
| Series 2018-B7 Class A2, 4.377% 5/15/53 | | 889,396 | 880,426 |
| Series 2018-B8 Class A5, 4.2317% 1/15/52 | | 15,369,000 | 14,804,152 |
| Series 2019-B12 Class XA, 1.2064% 8/15/52 (d)(o) | | 78,244,201 | 2,545,730 |
| Series 2019-B14 Class XA, 0.8917% 12/15/62 (d)(o) | | 119,163,964 | 2,804,345 |
| Series 2020-B17 Class XA, 1.5341% 3/15/53 (d)(o) | | 28,755,538 | 1,200,627 |
| Series 2020-B18 Class XA, 1.9077% 7/15/53 (d)(o) | | 19,260,243 | 1,034,435 |
| Series 2020-B19 Class XA, 1.8704% 9/15/53 (d)(o) | | 10,952,657 | 590,760 |
| Series 2021-B27 Class XA, 1.3683% 7/15/54 (d)(o) | | 35,199,112 | 1,989,742 |
| BLOX Trust floater sequential payer Series 2021-BLOX Class A, CME Term SOFR 1 Month Index + 1.110% 5.7245% 9/15/26 (b)(d)(i) | | 21,008,136 | 20,498,063 |
| BLP Commercial Mortgage Trust sequential payer Series 2024-IND2 Class A, CME Term SOFR 1 Month Index + 1.340% 5.9514% 3/15/41 (b)(d)(i) | | 14,644,000 | 14,653,153 |
| Bmo 2024-5C5 Mtg Trust sequential payer Series 2024-5C5 Class A3, 5.8574% 2/15/57 | | 5,100,000 | 5,273,270 |
| Bmo 2024-5C6 Mtg Trust sequential payer Series 2024-5C6 Class A3, 5.3161% 9/15/57 | | 22,700,000 | 22,981,995 |
| BMO Mortgage Trust Series 2023-C6 Class XA, 0.982% 9/15/56 (d)(o) | | 224,850,991 | 12,356,754 |
| BMP floater Series 2024-MF23: | | | |
| Class A, CME Term SOFR 1 Month Index + 1.370% 5.9812% 6/15/41 (b)(d)(i) | | 19,211,000 | 19,235,014 |
| Class B, CME Term SOFR 1 Month Index + 1.640% 6.2509% 6/15/41 (b)(d)(i) | | 5,310,000 | 5,313,319 |
| Class C, CME Term SOFR 1 Month Index + 1.840% 6.4506% 6/15/41 (b)(d)(i) | | 3,540,000 | 3,540,000 |
| Bpr Commercial Mtg Trust 2024-Pk sequential payer Series 2024-PARK Class A, 5.218% 11/5/39 (b)(d) | | 5,000,000 | 5,034,414 |
| BPR Trust floater Series 2022-OANA: | | | |
| Class A, CME Term SOFR 1 Month Index + 1.890% 6.5073% 4/15/37 (b)(d)(i) | | 50,588,622 | 50,841,565 |
| Class B, CME Term SOFR 1 Month Index + 2.440% 7.0563% 4/15/37 (b)(d)(i) | | 11,281,000 | 11,344,456 |
| BX Commercial Mortgage Trust: | | | |
| floater: | | | |
Series 2019-IMC: | | | |
| Class B, CME Term SOFR 1 Month Index + 1.340% 5.9553% 4/15/34 (b)(d)(i) | | 4,437,000 | 4,387,084 |
| Class C, CME Term SOFR 1 Month Index + 1.640% 6.2553% 4/15/34 (b)(d)(i) | | 2,933,000 | 2,892,671 |
| Class D, CME Term SOFR 1 Month Index + 1.940% 6.5553% 4/15/34 (b)(d)(i) | | 3,079,000 | 3,028,966 |
Series 2021-BXMF Class A, CME Term SOFR 1 Month Index + 0.750% 5.3594% 10/15/26 (b)(d)(i) | | 4,415,129 | 4,393,053 |
Series 2021-LBA Class AJV, CME Term SOFR 1 Month Index + 0.910% 5.5245% 2/15/36 (b)(d)(i) | | 8,943,000 | 8,940,338 |
Series 2021-PAC: | | | |
| Class A, CME Term SOFR 1 Month Index + 0.800% 5.4126% 10/15/36 (b)(d)(i) | | 33,219,512 | 33,064,171 |
| Class B, CME Term SOFR 1 Month Index + 1.010% 5.6223% 10/15/36 (b)(d)(i) | | 9,701,000 | 9,625,394 |
| Class C, CME Term SOFR 1 Month Index + 1.210% 5.8221% 10/15/36 (b)(d)(i) | | 10,186,000 | 10,090,737 |
| Class D, CME Term SOFR 1 Month Index + 1.410% 6.0218% 10/15/36 (b)(d)(i) | | 3,579,000 | 3,538,833 |
| Class E, CME Term SOFR 1 Month Index + 2.060% 6.671% 10/15/36 (b)(d)(i) | | 11,390,000 | 11,340,286 |
Series 2021-SOAR Class E, CME Term SOFR 1 Month Index + 1.910% 6.5245% 6/15/38 (b)(d)(i) | | 3,331,604 | 3,325,357 |
Series 2021-VINO Class A, CME Term SOFR 1 Month Index + 0.760% 5.3758% 5/15/38 (b)(d)(i) | | 3,506,148 | 3,499,574 |
Series 2022-IND Class A, CME Term SOFR 1 Month Index + 1.490% 6.1003% 4/15/37 (b)(d)(i) | | 16,932,570 | 16,943,152 |
Series 2022-LP2: | | | |
| Class A, CME Term SOFR 1 Month Index + 1.010% 5.6222% 2/15/39 (b)(d)(i) | | 8,728,483 | 8,717,591 |
| Class B, CME Term SOFR 1 Month Index + 1.310% 5.9216% 2/15/39 (b)(d)(i) | | 7,547,463 | 7,521,567 |
| Class C, CME Term SOFR 1 Month Index + 1.560% 6.171% 2/15/39 (b)(d)(i) | | 5,089,515 | 5,072,052 |
| Class D, CME Term SOFR 1 Month Index + 1.960% 6.5701% 2/15/39 (b)(d)(i) | | 5,089,515 | 5,067,289 |
Series 2023-XL3: | | | |
| Class A, CME Term SOFR 1 Month Index + 1.760% 6.3707% 12/9/40 (b)(d)(i) | | 19,975,157 | 20,043,822 |
| Class B, CME Term SOFR 1 Month Index + 2.190% 6.8001% 12/9/40 (b)(d)(i) | | 3,879,927 | 3,882,350 |
| Class C, CME Term SOFR 1 Month Index + 2.640% 7.2495% 12/9/40 (b)(d)(i) | | 2,102,240 | 2,104,210 |
| floater sequential payer: | | | |
Series 2019-IMC Class A, CME Term SOFR 1 Month Index + 1.040% 5.6553% 4/15/34 (b)(d)(i) | | 6,654,469 | 6,592,083 |
Series 2021-SOAR Class A, CME Term SOFR 1 Month Index + 0.780% 5.3945% 6/15/38 (b)(d)(i) | | 23,708,038 | 23,663,585 |
Series 2024-XL5 Class A, CME Term SOFR 1 Month Index + 1.390% 6.0009% 3/15/41 (b)(d)(i) | | 89,545,050 | 89,796,895 |
| BX Commercial Mortgage Trust 2024-Xl4: | | | |
| floater: | | | |
Series 2024-XL4 Class B, CME Term SOFR 1 Month Index + 1.790% 6.4008% 2/15/39 (b)(d)(i) | | 4,201,997 | 4,201,993 |
Series 2024-XL5: | | | |
| Class B, CME Term SOFR 1 Month Index + 1.690% 6.3005% 3/15/41 (b)(d)(i) | | 12,638,032 | 12,634,059 |
| Class C, CME Term SOFR 1 Month Index + 1.940% 6.5502% 3/15/41 (b)(d)(i) | | 16,421,264 | 16,416,129 |
| floater sequential payer Series 2024-XL4 Class A, CME Term SOFR 1 Month Index + 1.440% 6.0513% 2/15/39 (b)(d)(i) | | 40,912,848 | 41,040,701 |
| BX Commercial Mtg Trust floater Series 2024-MDHS Class A, 6.2506% 5/15/41 (b)(d) | | 38,809,158 | 38,930,437 |
| BX Trust: | | | |
| floater: | | | |
Series 2021-ACNT Class A, CME Term SOFR 1 Month Index + 0.960% 5.5735% 11/15/38 (b)(d)(i) | | 1,342,117 | 1,339,601 |
Series 2021-XL2 Class A, CME Term SOFR 1 Month Index + 0.800% 5.412% 10/15/38 (b)(d)(i) | | 678,373 | 676,253 |
Series 2022-GPA Class A, CME Term SOFR 1 Month Index + 2.160% 6.7743% 8/15/39 (b)(d)(i) | | 11,323,489 | 11,334,095 |
Series 2022-IND: | | | |
| Class B, CME Term SOFR 1 Month Index + 1.940% 6.5493% 4/15/37 (b)(d)(i) | | 8,228,112 | 8,230,683 |
| Class C, CME Term SOFR 1 Month Index + 2.290% 6.8993% 4/15/37 (b)(d)(i) | | 2,304,015 | 2,304,015 |
| Class D, CME Term SOFR 1 Month Index + 2.830% 7.4483% 4/15/37 (b)(d)(i) | | 1,554,239 | 1,554,239 |
Series 2024-CNYN: | | | |
| Class A, CME Term SOFR 1 Month Index + 1.440% 6.0512% 4/15/41 (b)(d)(i) | | 49,307,039 | 49,368,258 |
| Class B, CME Term SOFR 1 Month Index + 1.690% 6.3008% 4/15/41 (b)(d)(i) | | 7,811,385 | 7,813,826 |
| Class C, CME Term SOFR 1 Month Index + 1.940% 6.5505% 4/15/41 (b)(d)(i) | | 6,523,668 | 6,527,745 |
| floater sequential payer Series 2021-MFM1 Class A, CME Term SOFR 1 Month Index + 0.810% 5.4235% 1/15/34 (b)(d)(i) | | 2,731,361 | 2,727,947 |
| CAMB Commercial Mortgage Trust floater Series 2019-LIFE Class A, CME Term SOFR 1 Month Index + 1.360% 5.977% 12/15/37 (b)(d)(i) | | 20,276,000 | 20,276,000 |
| CD Mortgage Trust sequential payer: | | | |
| Series 2017-CD5: | | | |
Class A3, 3.171% 8/15/50 | | 17,950,000 | 17,150,807 |
Class AAB, 3.22% 8/15/50 | | 451,649 | 442,452 |
| Series 2017-CD6 Class ASB, 3.332% 11/13/50 | | 10,115,762 | 9,914,398 |
| CF Hippolyta Issuer LLC sequential payer: | | | |
| Series 2020-1: | | | |
Class A1, 1.69% 7/15/60 (b) | | 28,296,507 | 27,520,224 |
Class A2, 1.99% 7/15/60 (b) | | 10,057,845 | 9,016,607 |
| Series 2021-1A Class A1, 1.53% 3/15/61 (b) | | 15,360,984 | 14,474,133 |
| CFCRE Commercial Mortgage Trust sequential payer: | | | |
| Series 2016-C7 Class A2, 3.5853% 12/10/54 | | 8,445,777 | 8,191,872 |
| Series 2017-C8 Class A3, 3.3048% 6/15/50 | | 17,489,806 | 16,725,059 |
| Cgms Commercial Mortgage Trust sequential payer Series 2017-B1: | | | |
| Class A3, 3.197% 8/15/50 | | 774,117 | 743,688 |
| Class A4, 3.458% 8/15/50 | | 2,800,000 | 2,673,060 |
| Citigroup Commercial Mortgage Trust: | | | |
| sequential payer: | | | |
Series 2016-GC37 Class AAB, 3.098% 4/10/49 | | 85,655 | 84,743 |
Series 2017-P7 Class AAB, 3.509% 4/14/50 | | 4,219,320 | 4,161,206 |
Series 2019-C7 Class A4, 3.102% 12/15/72 | | 9,335,374 | 8,601,946 |
Series 2020-GC46 Class AAB, 2.614% 2/15/53 | | 1,100,000 | 1,037,111 |
| Series 2015-GC33: | | | |
Class AAB, 3.522% 9/10/58 | | 1,410,585 | 1,403,610 |
Class XA, 1.0172% 9/10/58 (d)(o) | | 1,417,399 | 5,223 |
| Series 2016-P6 Class XA, 0.6905% 12/10/49 (d)(o) | | 1,150,887 | 9,820 |
| Series 2019-GC41 Class XA, 1.1607% 8/10/56 (d)(o) | | 18,971,322 | 668,043 |
| COMM Mortgage Trust: | | | |
| sequential payer: | | | |
Series 2015-CR24 Class A5, 3.696% 8/10/48 | | 9,464,000 | 9,373,719 |
Series 2015-LC21 Class A4, 3.708% 7/10/48 | | 2,085,000 | 2,069,295 |
| Series 2014-UBS6 Class XA, 0.641% 12/10/47 (d)(o) | | 283,272 | 3 |
| COMM Trust sequential payer Series 2017-COR2 Class ASB, 3.317% 9/10/50 | | 607,867 | 594,332 |
| Computershare Corporate Trust Series 2018-C48 Class A5, 4.302% 1/15/52 | | 3,836,000 | 3,749,509 |
| Credit Suisse Mortgage Trust sequential payer Series 2020-NET Class A, 2.2569% 8/15/37 (b) | | 2,066,374 | 1,994,209 |
| CSAIL Commercial Mortgage Trust sequential payer: | | | |
| Series 2015-C4 Class A3, 3.5438% 11/15/48 | | 4,302,081 | 4,261,606 |
| Series 2016-C6 Class A5, 3.0898% 1/15/49 | | 2,625,000 | 2,551,793 |
| Series 2020-C19 Class ASB, 2.5501% 3/15/53 | | 6,551,300 | 6,210,336 |
| DBJPM Mortgage Trust sequential payer Series 2017-C6 Class ASB, 3.121% 6/10/50 | | 2,363,345 | 2,313,700 |
| DTP Commercial Mortgage Trust 2023-Ste2 sequential payer Series 2023-STE2 Class A, 6.038% 1/15/41 (b)(d) | | 9,373,000 | 9,561,819 |
| ELP Commercial Mortgage Trust floater Series 2021-ELP: | | | |
| Class A, CME Term SOFR 1 Month Index + 0.810% 5.4255% 11/15/38 (b)(d)(i) | | 66,059,127 | 65,811,405 |
| Class B, CME Term SOFR 1 Month Index + 1.230% 5.8447% 11/15/38 (b)(d)(i) | | 27,242,291 | 27,089,053 |
| EQT Trust sequential payer Series 2024-EXTR Class A, 5.3308% 7/5/41 (b)(d) | | 31,885,000 | 32,097,214 |
| Extended Stay America Trust floater Series 2021-ESH: | | | |
| Class A, CME Term SOFR 1 Month Index + 1.190% 5.8035% 7/15/38 (b)(d)(i) | | 8,637,502 | 8,642,901 |
| Class B, CME Term SOFR 1 Month Index + 1.490% 6.1035% 7/15/38 (b)(d)(i) | | 3,741,558 | 3,745,066 |
| Class C, CME Term SOFR 1 Month Index + 1.810% 6.4235% 7/15/38 (b)(d)(i) | | 2,801,735 | 2,807,864 |
| Class D, CME Term SOFR 1 Month Index + 2.360% 6.9735% 7/15/38 (b)(d)(i) | | 19,491,567 | 19,546,387 |
| Fannie Mae sequential payer Series 2018-M10 Class A2, 3.4668% 7/25/28 (d) | | 982,305 | 949,572 |
| Freddie Mac: | | | |
| sequential payer: | | | |
Series 2015-K049 Class A2, 3.01% 7/25/25 | | 2,506,573 | 2,479,347 |
Series 2016-K054 Class A2, 2.745% 1/25/26 | | 26,020,748 | 25,508,254 |
Series 2017-K066 Class A2, 3.117% 6/25/27 | | 6,381,000 | 6,178,507 |
Series 2017-K067 Class A2, 3.194% 7/25/27 | | 6,723,000 | 6,510,546 |
Series 2017-K070 Class A2, 3.303% 11/25/27 | | 27,454,000 | 26,599,813 |
Series 2018-K074 Class A2, 3.6% 1/25/28 | | 51,490,000 | 50,195,701 |
Series 2019-K087 Class A2, 3.771% 12/25/28 | | 1,125,000 | 1,097,084 |
Series 2019-K091 Class A2, 3.505% 3/25/29 | | 21,885,000 | 21,091,371 |
Series 2019-K092 Class A2, 3.298% 4/25/29 | | 1,250,000 | 1,193,129 |
Series 2019-K095 Class A2, 2.785% 6/25/29 | | 1,250,000 | 1,165,792 |
Series 2019-K098 Class A2, 2.425% 8/25/29 | | 5,100,000 | 4,669,467 |
Series 2020-K740 Class A2, 1.47% 9/25/27 | | 19,600,000 | 18,071,147 |
Series 2021-K744 Class A2, 1.712% 7/25/28 | | 11,320,977 | 10,329,119 |
Series 2021-K745 Class A2, 1.657% 8/25/28 | | 12,625,000 | 11,436,916 |
Series 2021-K746 Class A2, 2.031% 9/25/28 | | 3,140,000 | 2,874,727 |
Series 2022-151 Class A2, 3.8% 10/25/32 | | 5,950,000 | 5,648,894 |
Series 2022-K140 Class A2, 2.25% 1/25/32 | | 9,899,000 | 8,530,727 |
Series 2023-156 Class A2, 4.43% 2/25/33 | | 9,042,000 | 8,954,150 |
Series 2023-K751 Class A2, 4.412% 3/25/30 | | 15,910,000 | 15,853,397 |
Series 2023-K752 Class A2, 4.284% 7/25/30 | | 20,900,000 | 20,675,687 |
Series 2024-164 Class A2, 5% 5/25/34 | | 4,100,000 | 4,224,613 |
Series 2024-165 Class A2, 4.489% 9/25/34 | | 4,119,563 | 4,080,786 |
Series 2024-K517 Class A2, 5.355% 1/25/29 | | 58,400,000 | 60,177,970 |
Series 2024-K755 Class A2, 5.203% 2/25/31 | | 65,900,000 | 68,165,767 |
Series 2024-K758 Class A2, 4.68% 10/25/31 | | 6,500,000 | 6,543,500 |
Series K069 Class A2, 3.187% 9/25/27 | | 12,386,247 | 11,991,216 |
Series K071 Class A2, 3.286% 11/25/27 | | 13,265,000 | 12,833,734 |
Series K072 Class A2, 3.444% 12/25/27 | | 28,327,000 | 27,508,908 |
Series K073 Class A2, 3.35% 1/25/28 | | 22,090,000 | 21,386,794 |
| Series 2017-K068 Class A2, 3.244% 8/25/27 | | 8,900,000 | 8,623,983 |
| Series 2018-K075 Class A2, 3.65% 2/25/28 | | 61,500,000 | 59,994,585 |
| Series 2018-K081 Class A2, 3.9% 8/25/28 | | 7,532,000 | 7,386,621 |
| Series 2022 K748 Class A2, 2.26% 1/25/29 | | 80,223,000 | 73,658,440 |
| Series 2022-K139 Class A2, 2.59% 1/25/32 | | 8,565,000 | 7,560,411 |
| Series K047 Class A2, 3.329% 5/25/25 | | 41,451,214 | 41,143,033 |
| Series K063 Class A2, 3.43% 1/25/27 | | 6,124,002 | 5,994,671 |
| Series K076 Class A2, 3.9% 4/25/28 | | 9,900,000 | 9,723,113 |
| Series K077 Class A2, 3.85% 5/25/28 | | 33,650,000 | 32,985,530 |
| Series K083 Class A2, 4.05% 9/25/28 | | 9,405,000 | 9,268,583 |
| Series K084 Class A2, 3.78% 10/25/28 | | 34,913,669 | 34,029,840 |
| Series K085 Class A2, 4.06% 10/25/28 | | 18,000,000 | 17,717,740 |
| Freddie Mac Multiclass Mortgage participation certificates: | | | |
| sequential payer Series 2015 K045 Class A2, 3.023% 1/25/25 | | 16,110,242 | 16,035,459 |
| Series K044 Class A2, 2.811% 1/25/25 | | 35,939,877 | 35,786,396 |
| GS Mortgage Securities Trust: | | | |
| floater: | | | |
Series 2018-3PCK Class A, CME Term SOFR 1 Month Index + 2.060% 6.6745% 9/15/31 (b)(d)(i) | | 6,901,197 | 6,833,840 |
Series 2021-IP: | | | |
| Class A, CME Term SOFR 1 Month Index + 1.060% 5.6745% 10/15/36 (b)(d)(i) | | 24,627,106 | 24,442,403 |
| Class B, CME Term SOFR 1 Month Index + 1.260% 5.8745% 10/15/36 (b)(d)(i) | | 1,654,000 | 1,630,441 |
| Class C, CME Term SOFR 1 Month Index + 1.660% 6.2745% 10/15/36 (b)(d)(i) | | 1,363,000 | 1,341,052 |
| sequential payer: | | | |
Series 2015-GC34 Class A3, 3.244% 10/10/48 | | 2,226,376 | 2,200,608 |
Series 2016-GC34 Class AAB, 3.278% 10/10/48 | | 592,621 | 587,780 |
Series 2017-GS6 Class A2, 3.164% 5/10/50 | | 3,972,643 | 3,796,381 |
Series 2018-GS10: | | | |
| Class A4, 3.89% 7/10/51 | | 15,685,681 | 15,000,264 |
| Class A5, 4.155% 7/10/51 | | 5,912,000 | 5,677,361 |
| Class AAB, 4.106% 7/10/51 | | 1,421,955 | 1,404,784 |
Series 2018-GS9 Class A4, 3.992% 3/10/51 | | 20,920,000 | 20,215,396 |
Series 2019-GSA1 Class A4, 3.0479% 11/10/52 | | 1,000,000 | 921,178 |
Series 2020-GC45 Class AAB, 2.8428% 2/13/53 | | 6,400,000 | 6,092,093 |
| Series 2011-GC5 Class A/S, 5.209% 8/10/44 (b)(d) | | 6,960,819 | 6,674,590 |
| Series 2013-GC13 Class A/S, 3.9996% 7/10/46 (b)(d) | | 1,648,359 | 1,580,776 |
| Series 2015-GC30 Class A/S, 3.777% 5/10/50 | | 2,860,805 | 2,791,956 |
| Ilpt Trust 2019-Surf sequential payer Series 2019-SURF Class A, 4.145% 2/11/41 (b) | | 7,494,000 | 7,191,904 |
| Intown Mortgage Trust floater sequential payer Series 2022-STAY Class A, CME Term SOFR 1 Month Index + 2.480% 7.0976% 8/15/39 (b)(d)(i) | | 53,036,000 | 53,234,752 |
| J.P. Morgan Chase Commercial Mortgage Securities Trust floater Series 2012-NLP Class A, CME Term SOFR 1 Month Index + 0.590% 5.2058% 4/15/37 (b)(d)(i) | | 18,158,800 | 17,710,408 |
| JP Morgan Chase Commercial Mortgage Securities Trust sequential payer Series 2021-2NU Class A, 1.9739% 1/5/40 (b) | | 24,200,000 | 21,113,087 |
| JPMBB Commercial Mortgage Securities Trust sequential payer Series 2015-C29 Class A4, 3.6108% 5/15/48 | | 5,409,013 | 5,374,231 |
| JPMDB Commercial Mortgage Securities Trust sequential payer: | | | |
| Series 2016-C4 Class ASB, 2.9941% 12/15/49 | | 707,571 | 694,131 |
| Series 2017-C5 Class ASB, 3.4919% 3/15/50 | | 1,860,672 | 1,830,487 |
| Series 2018-C8 Class ASB, 4.145% 6/15/51 | | 6,185,204 | 6,104,068 |
| Series 2019-COR6 Class A4, 3.0565% 11/13/52 | | 2,872,000 | 2,508,542 |
| Series 2020-COR7 Class A5, 2.1798% 5/13/53 | | 1,500,000 | 1,219,255 |
| JPMorgan Chase Commercial Mortgage Securities Trust: | | | |
| floater Series 2019-BKWD Class A, CME Term SOFR 1 Month Index + 1.610% 6.2245% 9/15/29 (b)(d)(i) | | 2,822,445 | 2,653,098 |
| Series 2013-LC11 Class A/S, 3.216% 4/15/46 | | 1,527,265 | 1,392,768 |
| Series 2018-AON Class D, 4.767% 7/5/31 (b)(d) | | 1,846,000 | 1,126,060 |
| Series 2018-WPT: | | | |
Class AFX, 4.2475% 7/5/33 (b) | | 1,167,147 | 1,090,786 |
Class CFX, 4.9498% 7/5/33 (b) | | 767,000 | 608,595 |
Class DFX, 5.3503% 7/5/33 (b) | | 1,370,000 | 1,013,217 |
| Ksl Commercial Mtg Trust 2023-Ht floater Series 2023-HT Class A, CME Term SOFR 1 Month Index + 2.290% 6.8995% 12/15/36 (b)(d)(i) | | 10,090,861 | 10,094,011 |
| LCCM Mortgage Loan Trust sequential payer Series 2017-LC26 Class A3, 3.289% 7/12/50 (b) | | 5,098,050 | 4,903,868 |
| Life Financial Services Trust floater Series 2022-BMR2: | | | |
| Class A1, CME Term SOFR 1 Month Index + 1.290% 5.9045% 5/15/39 (b)(d)(i) | | 41,080,997 | 40,079,648 |
| Class B, CME Term SOFR 1 Month Index + 1.790% 6.4032% 5/15/39 (b)(d)(i) | | 22,757,000 | 21,699,132 |
| Class C, CME Term SOFR 1 Month Index + 2.090% 6.7024% 5/15/39 (b)(d)(i) | | 8,790,000 | 8,306,550 |
| Class D, CME Term SOFR 1 Month Index + 2.540% 7.1512% 5/15/39 (b)(d)(i) | | 8,790,000 | 8,122,456 |
| LIFE Mortgage Trust floater Series 2021-BMR: | | | |
| Class A, CME Term SOFR 1 Month Index + 0.810% 5.4235% 3/15/38 (b)(d)(i) | | 7,330,459 | 7,238,828 |
| Class B, CME Term SOFR 1 Month Index + 0.990% 5.6035% 3/15/38 (b)(d)(i) | | 2,331,815 | 2,301,210 |
| Class C, CME Term SOFR 1 Month Index + 1.210% 5.8235% 3/15/38 (b)(d)(i) | | 1,616,408 | 1,593,172 |
| Class D, CME Term SOFR 1 Month Index + 1.510% 6.1235% 3/15/38 (b)(d)(i) | | 2,247,742 | 2,209,812 |
| Class E, CME Term SOFR 1 Month Index + 1.860% 6.4735% 3/15/38 (b)(d)(i) | | 1,963,800 | 1,907,341 |
| MHC Commercial Mortgage Trust floater sequential payer Series 2021-MHC Class A, CME Term SOFR 1 Month Index + 0.910% 5.5244% 4/15/38 (b)(d)(i) | | 2,260,037 | 2,257,212 |
| MHP Commercial Mortgage Trust floater Series 2021-STOR Class A, CME Term SOFR 1 Month Index + 0.810% 5.4245% 7/15/38 (b)(d)(i) | | 11,210,236 | 11,175,204 |
| Morgan Stanley BAML Trust: | | | |
| sequential payer Series 2016-C28 Class A3, 3.272% 1/15/49 | | 5,124,962 | 5,048,144 |
| Series 2015-C25 Class XA, 1.1742% 10/15/48 (d)(o) | | 795,198 | 2,823 |
| Morgan Stanley Capital I Trust: | | | |
| floater Series 2018-BOP Class A, CME Term SOFR 1 Month Index + 0.890% 5.507% 8/15/33 (b)(d)(i) | | 134,441 | 109,705 |
| floater sequential payer Series 2019-NUGS Class A, CME Term SOFR 1 Month Index + 1.060% 5.6745% 12/15/36 (b)(d)(i) | | 9,700,000 | 7,924,603 |
| sequential payer: | | | |
Series 2017-H1 Class A4, 3.259% 6/15/50 | | 15,100,000 | 14,677,102 |
Series 2017-HR2: | | | |
| Class A3, 3.33% 12/15/50 | | 6,537,815 | 6,252,609 |
| Class A4, 3.587% 12/15/50 | | 7,467,886 | 7,168,146 |
Series 2019-L2 Class A3, 3.806% 3/15/52 | | 19,512,202 | 18,591,255 |
| Series 2018-H4 Class A4, 4.31% 12/15/51 | | 4,191,000 | 4,074,236 |
| Series 2021-L6 Class XA, 1.2892% 6/15/54 (d)(o) | | 27,759,751 | 1,344,213 |
| Morgan Stanley Capital I Trust 2024-N sequential payer Series 2024-NSTB Class A, 3.9% 9/24/57 (b)(d) | | 41,010,003 | 39,538,297 |
| MSWF Commercial Mortgage Trust Series 2023-2 Class XD, 3.2521% 12/15/56 (b)(d)(o) | | 12,148,000 | 2,449,093 |
| Natixis Commercial Mortgage Securities Trust sequential payer Series 2020-2PAC Class A, 2.966% 12/15/38 (b) | | 10,362,382 | 9,591,680 |
| NYT Mortgage Trust floater Series 2019-NYT Class A, CME Term SOFR 1 Month Index + 1.490% 6.107% 12/15/35 (b)(d)(i) | | 20,822,000 | 20,518,632 |
| OPEN Trust sequential payer Series 2023-AIR: | | | |
| Class A, CME Term SOFR 1 Month Index + 3.080% 7.6984% 10/15/28 (b)(d)(i) | | 16,895,328 | 17,053,646 |
| Class B, CME Term SOFR 1 Month Index + 3.830% 8.4473% 10/15/28 (b)(d)(i) | | 10,180,002 | 10,255,932 |
| OPG Trust floater Series 2021-PORT Class A, CME Term SOFR 1 Month Index + 0.590% 5.2085% 10/15/36 (b)(d)(i) | | 30,412,413 | 30,260,351 |
| RLGH Trust floater Series 2021-TROT Class A, CME Term SOFR 1 Month Index + 0.910% 5.5245% 4/15/36 (b)(d)(i) | | 23,000,000 | 22,843,163 |
| SLG Office Trust Series 2021-OVA Class X, 0.258% 7/15/41 (b)(d)(o) | | 213,942,750 | 2,849,011 |
| SPGN Mortgage Trust floater Series 2022-TFLM: | | | |
| Class B, CME Term SOFR 1 Month Index + 2.000% 6.6093% 2/15/39 (b)(d)(i) | | 4,954,000 | 4,868,226 |
| Class C, CME Term SOFR 1 Month Index + 2.650% 7.2593% 2/15/39 (b)(d)(i) | | 2,576,000 | 2,525,021 |
| SREIT Trust floater: | | | |
| Series 2021-FLWR Class A, CME Term SOFR 1 Month Index + 0.690% 5.3% 7/15/36 (b)(d)(i) | | 13,499,928 | 13,474,616 |
| Series 2021-MFP: | | | |
Class A, CME Term SOFR 1 Month Index + 0.840% 5.4546% 11/15/38 (b)(d)(i) | | 40,009,431 | 39,979,840 |
Class B, CME Term SOFR 1 Month Index + 1.190% 5.8036% 11/15/38 (b)(d)(i) | | 24,252,646 | 24,176,857 |
Class C, CME Term SOFR 1 Month Index + 1.440% 6.0528% 11/15/38 (b)(d)(i) | | 5,961,256 | 5,939,211 |
Class D, CME Term SOFR 1 Month Index + 1.690% 6.302% 11/15/38 (b)(d)(i) | | 4,114,511 | 4,104,225 |
| UBS Commercial Mortgage Trust: | | | |
| sequential payer: | | | |
Series 2017-C1 Class ASB, 3.462% 11/15/50 | | 815,564 | 803,339 |
Series 2017-C5 Class ASB, 3.345% 11/15/50 | | 1,350,255 | 1,321,775 |
Series 2017-C7 Class ASB, 3.586% 12/15/50 | | 594,724 | 585,160 |
Series 2018-C12 Class ASB, 4.1945% 8/15/51 | | 1,059,497 | 1,049,230 |
Series 2018-C8 Class ASB, 3.903% 2/15/51 | | 1,659,761 | 1,639,544 |
Series 2018-C9 Class A4, 4.117% 3/15/51 | | 9,714,061 | 9,386,176 |
Series 2019-C17 Class ASB, 2.8655% 10/15/52 | | 11,339,600 | 10,843,949 |
| Series 2017-C7 Class XA, 1.1254% 12/15/50 (d)(o) | | 25,544,981 | 641,182 |
| VLS Commercial Mortgage Trust: | | | |
| sequential payer Series 2020-LAB Class A, 2.13% 10/10/42 (b) | | 14,678,994 | 11,929,482 |
| Series 2020-LAB: | | | |
Class B, 2.453% 10/10/42 (b) | | 470,000 | 374,601 |
Class X, 0.5162% 10/10/42 (b)(d)(o) | | 58,746,457 | 1,226,074 |
| Wells Fargo Commercial Mortage Trust 20 floater Series 2024-MGP: | | | |
| Class A11, CME Term SOFR 1 Month Index + 1.990% 6.6% 8/15/41 (b)(d)(i) | | 8,200,000 | 8,213,839 |
| Class A12, CME Term SOFR 1 Month Index + 1.690% 6.3004% 8/15/41 (b)(d)(i) | | 20,000,000 | 20,034,356 |
| Wells Fargo Commercial Mortgage Trust: | | | |
| floater: | | | |
Series 2016-C32 Class A3FL, CME Term SOFR 1 Month Index + 1.530% 6.145% 1/15/59 (d)(i) | | 4,981,881 | 4,991,189 |
Series 2016-C35 Class A4FL, CME Term SOFR 1 Month Index + 1.160% 5.775% 7/15/48 (b)(d)(i) | | 5,200,000 | 5,200,722 |
Series 2021-FCMT Class A, CME Term SOFR 1 Month Index + 1.310% 5.9245% 5/15/31 (b)(d)(i) | | 16,435,000 | 16,136,621 |
| sequential payer: | | | |
Series 2015-C26 Class A4, 3.166% 2/15/48 | | 3,995,015 | 3,980,391 |
Series 2015-C29 Class ASB, 3.4% 6/15/48 | | 125,058 | 124,783 |
Series 2016-C32 Class A3, 3.294% 1/15/59 | | 4,017,646 | 3,959,279 |
Series 2016-C35 Class A4, 2.931% 7/15/48 | | 4,200,000 | 4,062,179 |
Series 2016-LC25 Class A3, 3.374% 12/15/59 | | 16,050,081 | 15,647,344 |
Series 2017-C40 Class ASB, 3.395% 10/15/50 | | 565,104 | 555,423 |
Series 2017-C41 Class ASB, 3.39% 11/15/50 | | 95,800 | 94,134 |
Series 2017-RC1 Class ASB, 3.453% 1/15/60 | | 386,617 | 381,898 |
Series 2018-C44 Class ASB, 4.167% 5/15/51 | | 696,356 | 688,784 |
Series 2018-C47 Class ASB, 4.365% 9/15/61 | | 7,037,053 | 6,973,666 |
Series 2019-C52 Class A5, 2.892% 8/15/52 | | 3,829,000 | 3,480,767 |
Series 2019-C54: | | | |
| Class A4, 3.146% 12/15/52 | | 2,390,000 | 2,197,782 |
| Class ASB, 3.063% 12/15/52 | | 1,869,750 | 1,796,901 |
Series 2020-C55 Class ASB, 2.651% 2/15/53 | | 800,000 | 758,377 |
Series 2021-C61 Class ASB, 2.525% 11/15/54 | | 4,475,000 | 4,064,377 |
Series 2024-5C1 Class A3, 5.928% 7/15/57 | | 11,703,000 | 12,137,701 |
| Series 2015-SG1 Class ASB, 3.556% 9/15/48 | | 13,955 | 13,925 |
| Series 2017-C42 Class XA, 1.0012% 12/15/50 (d)(o) | | 1,364,332 | 29,220 |
| Series 2018-C46 Class XA, 1.0773% 8/15/51 (d)(o) | | 28,562,099 | 620,846 |
| Series 2019-C54 Class XA, 0.9668% 12/15/52 (d)(o) | | 58,689,016 | 2,063,465 |
| Wells Fargo Commercial Mtg Trust 2024-G floater Series 2024-GRP: | | | |
| Class A, CME Term SOFR 1 Month Index + 1.790% 6.4006% 10/15/41 (b)(d)(i) | | 7,200,000 | 7,197,258 |
| Class B, CME Term SOFR 1 Month Index + 2.290% 6.8999% 10/15/41 (b)(d)(i) | | 3,750,000 | 3,748,471 |
| TOTAL COMMERCIAL MORTGAGE SECURITIES (Cost $2,959,188,941) | | | 2,946,668,181 |
| | | | |
| Municipal Securities - 0.0% |
| | | Principal Amount (a) | Value ($) |
| American Muni. Pwr., Inc. Rev. (Combined Hydroelectric Proj.) Series 2010 B, 8.084% 2/15/50 | | 870,000 | 1,151,652 |
| California Gen. Oblig. Series 2010, 7.625% 3/1/40 | | 190,000 | 231,462 |
| Chicago Board of Ed. Series 2009 G, 1.75% 12/15/25 | | 15,640,000 | 15,061,250 |
| TOTAL MUNICIPAL SECURITIES (Cost $16,623,648) | | | 16,444,364 |
| | | | |
| Foreign Government and Government Agency Obligations - 0.1% |
| | | Principal Amount (a) | Value ($) |
| Canadian Government: | | | |
| 2.75% 6/1/33 | CAD | 690,000 | 479,153 |
| 3% 6/1/34 | CAD | 435,000 | 308,935 |
| 3.25% 12/1/33 | CAD | 5,700,000 | 4,131,298 |
| Colombian Republic: | | | |
| 8% 11/14/35 | | 4,590,000 | 4,736,880 |
| 8.75% 11/14/53 | | 6,175,000 | 6,474,488 |
| German Federal Republic: | | | |
| 0% 8/15/31 | EUR | 300,000 | 279,269 |
| 1.7% 8/15/32(Reg. S) | EUR | 35,000 | 36,289 |
| 2.5% 10/11/29(Reg. S) | EUR | 920,000 | 997,668 |
| 2.5% 7/4/44 | EUR | 3,535,000 | 3,840,395 |
| 2.6% 8/15/33(Reg. S) | EUR | 1,760,000 | 1,942,087 |
| 2.6% 5/15/41(Reg. S) | EUR | 860,000 | 941,664 |
| 3.25% 7/4/42 | EUR | 5,200,000 | 6,222,794 |
| Japan Government: | | | |
| 0.005% 2/1/25 | JPY | 638,600,000 | 4,267,264 |
| 0.9% 9/20/34 | JPY | 170,000,000 | 1,120,444 |
| Panamanian Republic 3.298% 1/19/33 | | 18,075,000 | 14,378,663 |
| United Mexican States: | | | |
| 3.25% 4/16/30 | | 1,247,000 | 1,111,778 |
| 3.5% 2/12/34 | | 1,035,000 | 851,288 |
| 4.5% 4/22/29 | | 3,114,000 | 3,012,795 |
| TOTAL FOREIGN GOVERNMENT AND GOVERNMENT AGENCY OBLIGATIONS (Cost $58,681,539) | | | 55,133,152 |
| | | | |
| Supranational Obligations - 0.0% |
| | | Principal Amount (a) | Value ($) |
| European Investment Bank: | | | |
| 0.625% 1/22/29 (Reg. S) | EUR | 4,100,000 | 4,054,678 |
| 3% 11/15/28 (Reg. S) | EUR | 2,800,000 | 3,040,802 |
| European Union: | | | |
| 0% 10/4/28 (Reg. S) | EUR | 2,000,000 | 1,941,529 |
| 0% 10/4/30 (Reg. S) | EUR | 1,000,000 | 921,845 |
| TOTAL SUPRANATIONAL OBLIGATIONS (Cost $9,974,262) | | | 9,958,854 |
| | | | |
| Common Stocks - 0.0% |
| | | Shares | Value ($) |
| ENERGY - 0.0% | | | |
| Oil, Gas & Consumable Fuels - 0.0% | | | |
| New Fortress Energy, Inc. (Aa) | | 6,205 | 66,207 |
| HEALTH CARE - 0.0% | | | |
| Health Care Providers & Services - 0.0% | | | |
| Cano Health, Inc. (g) | | 22,175 | 270,979 |
| Cano Health, Inc. warrants (g)(s) | | 681 | 2,676 |
| | | | 273,655 |
| TOTAL COMMON STOCKS (Cost $495,886) | | | 339,862 |
| | | | |
| Bank Loan Obligations - 0.0% |
| | | Principal Amount (a) | Value ($) |
| CONSUMER DISCRETIONARY - 0.0% | | | |
| Diversified Consumer Services - 0.0% | | | |
| Spin Holdco, Inc. Tranche B 1LN, term loan CME Term SOFR 3 Month Index + 4.000% 9.256% 3/4/28 (d)(i)(t) | | 807,907 | 681,373 |
| Hotels, Restaurants & Leisure - 0.0% | | | |
| United PF Holdings LLC 1LN, term loan CME Term SOFR 3 Month Index + 4.000% 8.847% 12/30/26 (d)(i)(t) | | 982,428 | 942,640 |
| Household Durables - 0.0% | | | |
| TGP Holdings III LLC Tranche B 1LN, term loan CME Term SOFR 1 Month Index + 3.250% 7.9226% 6/29/28 (d)(i)(t) | | 295,000 | 278,197 |
| Specialty Retail - 0.0% | | | |
| Kodiak BP LLC Tranche B 1LN, term loan CME Term SOFR 1 Month Index + 4.000% 0% 11/26/31 (d)(i)(t)(u) | | 90,000 | 90,075 |
TOTAL CONSUMER DISCRETIONARY | | | 1,992,285 |
| FINANCIALS - 0.0% | | | |
| Financial Services - 0.0% | | | |
| Dragon Buyer, Inc. 1LN, term loan CME Term SOFR 1 Month Index + 3.250% 7.8537% 9/30/31 (d)(i)(t) | | 50,000 | 50,125 |
| Nexus Buyer LLC Tranche B 1LN, term loan CME Term SOFR 1 Month Index + 4.000% 8.5726% 7/18/31 (d)(i)(t) | | 660,000 | 661,056 |
| | | | 711,181 |
| HEALTH CARE - 0.0% | | | |
| Health Care Providers & Services - 0.0% | | | |
| Cano Health, Inc. 1LN, term loan CME Term SOFR 1 Month Index + 8.000% 12.6037% 6/28/29 (d)(i)(t) | | 132,940 | 131,611 |
| INDUSTRIALS - 0.0% | | | |
| Commercial Services & Supplies - 0.0% | | | |
| Ensemble RCM LLC Tranche B 1LN, term loan CME Term SOFR 3 Month Index + 3.000% 7.5854% 8/1/29 (d)(i)(t) | | 59,850 | 60,423 |
| INFORMATION TECHNOLOGY - 0.0% | | | |
| IT Services - 0.0% | | | |
| Constant Contact, Inc. Tranche B 1LN, term loan CME Term SOFR 3 Month Index + 4.000% 8.9175% 2/10/28 (d)(i)(t) | | 360,000 | 345,600 |
| Software - 0.0% | | | |
| Applied Systems, Inc. Tranche 2LN, term loan CME Term SOFR 3 Month Index + 5.250% 9.8537% 2/23/32 (d)(i)(t) | | 10,000 | 10,279 |
| Ellucian, Inc. 2LN, term loan CME Term SOFR 1 Month Index + 4.750% 0% 11/15/32 (d)(i)(t)(u) | | 200,000 | 201,000 |
| Leia Finco U.S. LLC 1LN, term loan CME Term SOFR 1 Month Index + 3.250% 7.8867% 10/9/31 (d)(i)(t) | | 880,000 | 880,044 |
| | | | 1,091,323 |
TOTAL INFORMATION TECHNOLOGY | | | 1,436,923 |
| MATERIALS - 0.0% | | | |
| Chemicals - 0.0% | | | |
| American Rock Salt Co. LLC: | | | |
| 1LN, term loan: | | | |
| CME Term SOFR 3 Month Index + 4.000% 8.7755% 6/4/28 (d)(i)(t) | | 1,039,672 | 879,636 |
| CME Term SOFR 3 Month Index + 6.500% 4.4374% 6/12/28 (d)(f)(i)(t) | | 326,317 | 328,764 |
| Tranche B 1LN, term loan CME Term SOFR 3 Month Index + 6.500% 11.7755% 6/12/28 (d)(i)(t) | | 305,047 | 307,335 |
| Olympus Water U.S. Holding Corp. Tranche B 1LN, term loan CME Term SOFR 3 Month Index + 3.500% 8.1037% 6/23/31 (d)(i)(t) | | 1,525,953 | 1,537,642 |
| | | | 3,053,377 |
| Containers & Packaging - 0.0% | | | |
| Clydesdale Acquisition Holdings, Inc. 1LN, term loan CME Term SOFR 1 Month Index + 3.670% 7.7476% 4/13/29 (d)(i)(t) | | 1,127,576 | 1,133,756 |
TOTAL MATERIALS | | | 4,187,133 |
| UTILITIES - 0.0% | | | |
| Electric Utilities - 0.0% | | | |
| WEC U.S. Holdings Ltd. Tranche B 1LN, term loan CME Term SOFR 1 Month Index + 2.750% 6.9217% 1/20/31 (d)(i)(t) | | 236,408 | 237,216 |
| TOTAL BANK LOAN OBLIGATIONS (Cost $8,672,113) | | | 8,756,772 |
| | | | |
| Bank Notes - 0.0% |
| | | Principal Amount (a) | Value ($) |
| Discover Bank ICE IBA - USD SOFR SPREAD-ADJ + 1.730% 5.974% 8/9/28 (d)(i) | | 2,954,000 | 2,995,328 |
| KeyBank NA 6.95% 2/1/28 | | 619,000 | 646,020 |
| Regions Bank 6.45% 6/26/37 | | 5,877,000 | 6,171,890 |
| TOTAL BANK NOTES (Cost $10,033,235) | | | 9,813,238 |
| | | | |
| Fixed-Income Funds - 46.3% |
| | | Shares | Value ($) |
| Bank Loan Funds - 1.3% | | | |
| Fidelity Advisor Floating Rate High Income Fund Class Z (v) | | 99,876,942 | 931,851,865 |
| High Yield Fixed-Income Funds - 1.9% | | | |
| Fidelity Advisor New Markets Income Fund Class Z (v) | | 91,996,831 | 1,183,999,221 |
| Fidelity SAI High Income Fund (v) | | 18,557,116 | 172,395,611 |
TOTAL HIGH YIELD FIXED-INCOME FUNDS | | | 1,356,394,832 |
| Inflation-Protected Bond Funds - 0.4% | | | |
| Fidelity SAI Inflation-Protected Bond Index Fund (v) | | 28,496,381 | 286,388,629 |
| Intermediate Government Funds - 8.6% | | | |
| Fidelity SAI U.S. Treasury Bond Index Fund (v) | | 694,925,426 | 6,122,293,004 |
| Intermediate-Term Bond Funds - 24.7% | | | |
| Fidelity SAI International Credit Fund (v) | | 61,573,080 | 662,526,344 |
| Fidelity SAI Total Bond Fund (v) | | 1,806,616,785 | 16,440,212,686 |
| Fidelity Sustainability Bond Index Fund (v) | | 2,584,545 | 24,062,118 |
| Fidelity U.S. Bond Index Fund (v) | | 33,026,440 | 344,135,509 |
TOTAL INTERMEDIATE-TERM BOND FUNDS | | | 17,470,936,657 |
| Long Government Bond Funds - 7.6% | | | |
| Fidelity SAI Intermediate Treasury Bond Index Fund (v) | | 287,660,579 | 2,790,307,615 |
| Fidelity SAI Long-Term Treasury Bond Index Fund (v) | | 356,763,628 | 2,561,562,850 |
TOTAL LONG GOVERNMENT BOND FUNDS | | | 5,351,870,465 |
| Sector Funds - 1.8% | | | |
| Fidelity Advisor Real Estate Income Fund Class Z (v) | | 102,324,167 | 1,257,564,012 |
| TOTAL FIXED-INCOME FUNDS (Cost $35,252,150,273) | | | 32,777,299,464 |
| | | | |
| Short-Term Funds - 0.8% |
| | | Shares | Value ($) |
| Short-Term Funds - 0.8% | | | |
| Fidelity SAI Short-Term Bond Fund (v) | | 50,303,226 | 488,444,320 |
| Fidelity SAI Short-Term Treasury Bond Index Fund (v) | | 7,996,308 | 79,003,526 |
| | | | |
| TOTAL SHORT-TERM FUNDS (Cost $559,602,440) | | | 567,447,846 |
| | | | |
| Preferred Securities - 0.1% |
| | | Principal Amount (a) | Value ($) |
| CONSUMER DISCRETIONARY - 0.0% | | | |
| Automobiles - 0.0% | | | |
| Volkswagen International Finance NV: | | | |
| 3.748% (Reg. S) (d)(h) | | 500,000 | 527,627 |
| 3.875% (Reg. S) (d)(h) | | 2,300,000 | 2,301,564 |
| | | | 2,829,191 |
| CONSUMER STAPLES - 0.0% | | | |
| Tobacco - 0.0% | | | |
| British American Tobacco PLC 3% (Reg. S) (d)(h) | | 3,000,000 | 3,188,375 |
| ENERGY - 0.0% | | | |
| Oil, Gas & Consumable Fuels - 0.0% | | | |
| Enbridge, Inc. 5.75% 7/15/80 (d) | | 3,553,000 | 3,529,310 |
| FINANCIALS - 0.1% | | | |
| Banks - 0.1% | | | |
| AIB Group PLC 6.25% (Reg. S) (d)(h) | | 1,235,000 | 1,352,164 |
| Bank of Nova Scotia: | | | |
| CME Term SOFR 3 Month Index + 2.900% 7.5655% (d)(h)(i) | | 19,859,000 | 19,972,566 |
| 4.9% (d)(h) | | 9,500,000 | 9,514,718 |
| Barclays PLC 8.875% (d)(h) | | 500,000 | 672,604 |
| Citigroup, Inc.: | | | |
| 6.75% (d)(h) | | 1,035,000 | 1,031,445 |
| 7.125% (d)(h) | | 810,000 | 835,829 |
| Lloyds Banking Group PLC 5.125% (d)(h) | | 200,000 | 256,679 |
| Wells Fargo & Co. 7.625% (d)(h) | | 640,000 | 691,970 |
| | | | 34,327,975 |
| Capital Markets - 0.0% | | | |
| Charles Schwab Corp.: | | | |
| 4% (d)(h) | | 1,030,000 | 913,240 |
| 5.375% (d)(h) | | 260,000 | 262,445 |
| Credit Suisse Group AG Claim USD Swap Semi-annual 30/360 5Y Index + 4.590% 0% (Reg. S) (d)(g)(h)(i)(w) | | 4,925,000 | 492,500 |
| UBS Group AG: | | | |
| 4.375% (b)(d)(h) | | 2,239,000 | 1,936,421 |
| 4.875% (b)(d)(h) | | 4,770,000 | 4,585,546 |
| | | | 8,190,152 |
| Consumer Finance - 0.0% | | | |
| Ally Financial, Inc. 4.7% (d)(h) | | 2,940,000 | 2,776,798 |
TOTAL FINANCIALS | | | 45,294,925 |
| INDUSTRIALS - 0.0% | | | |
| Ground Transportation - 0.0% | | | |
| Mobico Group PLC 4.25% (Reg. S) (d)(h) | | 570,000 | 717,244 |
| REAL ESTATE - 0.0% | | | |
| Real Estate Management & Development - 0.0% | | | |
| Aroundtown Finance Sarl 7.875% (d)(h) | | 4,750,000 | 4,363,749 |
| Aroundtown SA 3.375% (Reg. S) (d)(h) | | 3,900,000 | 3,689,444 |
| Citycon Oyj 7.875% (Reg. S) (d)(h) | | 850,000 | 873,216 |
| CPI Property Group SA 3.75% (Reg. S) (d)(h) | | 2,370,000 | 2,061,232 |
| Grand City Properties SA 1.5% (Reg. S) (d)(h) | | 4,300,000 | 4,291,005 |
| Heimstaden Bostad AB: | | | |
| 3.248% (Reg. S) (d)(h) | | 3,735,000 | 4,036,920 |
| 3.625% (Reg. S) (d)(h) | | 195,000 | 203,020 |
| Samhallsbyggnadsbolaget I Norden AB 2.624% (Reg. S) (d)(h)(w) | | 1,385,000 | 570,804 |
| | | | 20,089,390 |
| UTILITIES - 0.0% | | | |
| Electric Utilities - 0.0% | | | |
| SSE PLC 3.74% (Reg. S) (d)(h) | | 1,135,000 | 1,444,154 |
| Multi-Utilities - 0.0% | | | |
| ELM BV for Firmenich International SA 3.75% (Reg. S) (d)(h) | | 520,000 | 553,559 |
TOTAL UTILITIES | | | 1,997,713 |
| TOTAL PREFERRED SECURITIES (Cost $86,084,186) | | | 77,646,148 |
| | | | |
| Money Market Funds - 2.7% |
| | | Shares | Value ($) |
| Fidelity Cash Central Fund 4.64% (x) | | 1,398,377,695 | 1,398,657,370 |
| Fidelity Investments Money Market Government Portfolio Institutional Class 4.55% (v)(y) | | 453,858,989 | 453,858,989 |
| Fidelity Securities Lending Cash Central Fund 4.64% (x)(z) | | 43,073,651 | 43,077,959 |
| TOTAL MONEY MARKET FUNDS (Cost $1,895,594,279) | | | 1,895,594,318 |
| | | | |
| Purchased Swaptions - 0.1% |
| | Expiration Date | Notional Amount (a) | Value ($) |
| Put Options - 0.1% | | | | |
| Option on an interest rate swap with Bank of America N.A. to pay annually a fixed rate of 3.14% and receive annually a floating rate based on the U.S. Secured Overnight Fin. Rate (SOFR) Index, expiring September 2035. | 9/12/25 | | 78,300,000 | 4,323,753 |
| Option on an interest rate swap with Bank of America N.A. to pay annually a fixed rate of 3.69% and receive annually a floating rate based on the U.S. Secured Overnight Fin. Rate (SOFR) Index, expiring March 2034. | 3/27/29 | | 102,000,000 | 3,737,516 |
| Option on an interest rate swap with Bank of America N.A. to pay annually a fixed rate of 3.7375% and receive annually a floating rate based on the U.S. Secured Overnight Fin. Rate (SOFR) Index, expiring February 2035. | 2/26/25 | | 61,100,000 | 875,849 |
| Option on an interest rate swap with Bank of America N.A. to pay annually a fixed rate of 3.805% and receive annually a floating rate based on the U.S. Secured Overnight Fin. Rate (SOFR) Index, expiring November 2034. | 11/05/29 | | 77,600,000 | 2,884,433 |
| Option on an interest rate swap with Bank of America N.A. to pay annually a fixed rate of 3.845% and receive annually a floating rate based on the U.S. Secured Overnight Fin. Rate (SOFR) Index, expiring October 2034. | 10/29/29 | | 147,400,000 | 5,363,749 |
| Option on an interest rate swap with Bank of America N.A. to pay annually a fixed rate of 4.05% and receive annually a floating rate based on the U.S. Secured Overnight Fin. Rate (SOFR) Index, expiring April 2034. | 4/23/29 | | 7,900,000 | 250,741 |
| Option on an interest rate swap with Citibank N.A. to pay annually a fixed rate of 3.753% and receive annually a floating rate based on the U.S. Secured Overnight Fin. Rate (SOFR) Index, expiring November 2034. | 10/31/29 | | 67,800,000 | 2,570,552 |
| Option on an interest rate swap with Citibank N.A. to pay annually a fixed rate of 3.755% and receive annually a floating rate based on the U.S. Secured Overnight Fin. Rate (SOFR) Index, expiring March 2034. | 3/19/29 | | 95,900,000 | 3,426,939 |
| Option on an interest rate swap with Citibank N.A. to pay annually a fixed rate of 3.778% and receive annually a floating rate based on the U.S. Secured Overnight Fin. Rate (SOFR) Index, expiring February 2035. | 2/24/25 | | 49,700,000 | 631,277 |
| Option on an interest rate swap with Citibank N.A. to pay annually a fixed rate of 3.79% and receive annually a floating rate based on the U.S. Secured Overnight Fin. Rate (SOFR) Index, expiring November 2034. | 11/05/29 | | 78,100,000 | 2,917,147 |
| Option on an interest rate swap with Citibank N.A. to pay annually a fixed rate of 3.795% and receive annually a floating rate based on the U.S. Secured Overnight Fin. Rate (SOFR) Index, expiring November 2034. | 10/30/29 | | 61,400,000 | 2,284,047 |
| Option on an interest rate swap with Goldman Sachs Bank U.S.A. to pay annually a fixed rate of 3.1415% and receive annually a floating rate based on the U.S. Secured Overnight Fin. Rate (SOFR) Index, expiring September 2035. | 9/15/25 | | 81,800,000 | 4,519,332 |
| Option on an interest rate swap with Goldman Sachs Bank U.S.A. to pay annually a fixed rate of 3.386% and receive annually a floating rate based on the U.S. Secured Overnight Fin. Rate (SOFR) Index, expiring August 2035. | 8/18/25 | | 91,900,000 | 3,746,270 |
| Option on an interest rate swap with Goldman Sachs Bank U.S.A. to pay annually a fixed rate of 3.53% and receive annually a floating rate based on the U.S. Secured Overnight Fin. Rate (SOFR) Index, expiring August 2034. | 8/01/29 | | 67,400,000 | 2,742,954 |
| Option on an interest rate swap with JPMorgan Chase Bank N.A. to pay annually a fixed rate of 3.92% and receive annually a floating rate based on the U.S. Secured Overnight Fin. Rate (SOFR) Index, expiring November 2034. | 11/20/29 | | 14,100,000 | 501,238 |
| Option on an interest rate swap with Morgan Stanley Capital Services LLC to pay annually a fixed rate of 3.17% and receive annually a floating rate based on the U.S. Secured Overnight Fin. Rate (SOFR) Index, expiring September 2035. | 9/18/25 | | 34,300,000 | 1,841,769 |
| Option on an interest rate swap with Morgan Stanley Capital Services LLC to pay annually a fixed rate of 3.87% and receive annually a floating rate based on the U.S. Secured Overnight Fin. Rate (SOFR) Index, expiring November 2034. | 11/07/29 | | 59,000,000 | 2,127,971 |
| | | | | |
| TOTAL PUT OPTIONS | | | | 44,745,537 |
| Call Options - 0.0% | | | | |
| Option on an interest rate swap with Bank of America N.A. to receive annually a fixed rate of 3.14% and pay annually a floating rate based on the U.S. Secured Overnight Fin. Rate (SOFR) Index, expiring September 2035. | 9/12/25 | | 78,300,000 | 1,037,462 |
| Option on an interest rate swap with Bank of America N.A. to receive annually a fixed rate of 3.69% and pay annually a floating rate based on the U.S. Secured Overnight Fin. Rate (SOFR) Index, expiring March 2034. | 3/27/29 | | 102,000,000 | 3,969,033 |
| Option on an interest rate swap with Bank of America N.A. to receive annually a fixed rate of 3.7375% and pay annually a floating rate based on the U.S. Secured Overnight Fin. Rate (SOFR) Index, expiring February 2035. | 2/26/25 | | 61,100,000 | 1,133,783 |
| Option on an interest rate swap with Bank of America N.A. to receive annually a fixed rate of 3.805% and pay annually a floating rate based on the U.S. Secured Overnight Fin. Rate (SOFR) Index, expiring November 2034. | 11/05/29 | | 77,600,000 | 3,301,072 |
| Option on an interest rate swap with Bank of America N.A. to receive annually a fixed rate of 3.845% and pay annually a floating rate based on the U.S. Secured Overnight Fin. Rate (SOFR) Index, expiring October 2034. | 10/29/29 | | 147,400,000 | 6,385,482 |
| Option on an interest rate swap with Bank of America N.A. to receive annually a fixed rate of 4.05% and pay annually a floating rate based on the U.S. Secured Overnight Fin. Rate (SOFR) Index, expiring April 2034. | 4/23/29 | | 7,900,000 | 377,648 |
| Option on an interest rate swap with Citibank N.A. to receive annually a fixed rate of 3.753% and pay annually a floating rate based on the U.S. Secured Overnight Fin. Rate (SOFR) Index, expiring November 2034. | 10/31/29 | | 67,800,000 | 2,802,655 |
| Option on an interest rate swap with Citibank N.A. to receive annually a fixed rate of 3.755% and pay annually a floating rate based on the U.S. Secured Overnight Fin. Rate (SOFR) Index, expiring March 2034. | 3/19/29 | | 95,900,000 | 3,890,870 |
| Option on an interest rate swap with Citibank N.A. to receive annually a fixed rate of 3.778% and pay annually a floating rate based on the U.S. Secured Overnight Fin. Rate (SOFR) Index, expiring February 2035. | 2/24/25 | | 49,700,000 | 1,005,182 |
| Option on an interest rate swap with Citibank N.A. to receive annually a fixed rate of 3.79% and pay annually a floating rate based on the U.S. Secured Overnight Fin. Rate (SOFR) Index, expiring November 2034. | 11/05/29 | | 78,100,000 | 3,291,980 |
| Option on an interest rate swap with Citibank N.A. to receive annually a fixed rate of 3.795% and pay annually a floating rate based on the U.S. Secured Overnight Fin. Rate (SOFR) Index, expiring November 2034. | 10/30/29 | | 61,400,000 | 2,592,599 |
| Option on an interest rate swap with Goldman Sachs Bank U.S.A. to receive annually a fixed rate of 3.1415% and pay annually a floating rate based on the U.S. Secured Overnight Fin. Rate (SOFR) Index, expiring September 2035. | 9/15/25 | | 81,800,000 | 1,097,996 |
| Option on an interest rate swap with Goldman Sachs Bank U.S.A. to receive annually a fixed rate of 3.386% and pay annually a floating rate based on the U.S. Secured Overnight Fin. Rate (SOFR) Index, expiring August 2035. | 8/18/25 | | 91,900,000 | 1,695,157 |
| Option on an interest rate swap with Goldman Sachs Bank U.S.A. to receive annually a fixed rate of 3.53% and pay annually a floating rate based on the U.S. Secured Overnight Fin. Rate (SOFR) Index, expiring August 2034. | 8/01/29 | | 67,400,000 | 2,434,803 |
| Option on an interest rate swap with JPMorgan Chase Bank N.A. to receive annually a fixed rate of 3.92% and pay annually a floating rate based on the U.S. Secured Overnight Fin. Rate (SOFR) Index, expiring November 2034. | 11/20/29 | | 14,100,000 | 637,118 |
| Option on an interest rate swap with Morgan Stanley Capital Services LLC to receive annually a fixed rate of 3.17% and pay annually a floating rate based on the U.S. Secured Overnight Fin. Rate (SOFR) Index, expiring September 2035. | 9/18/25 | | 34,300,000 | 486,681 |
| Option on an interest rate swap with Morgan Stanley Capital Services LLC to receive annually a fixed rate of 3.87% and pay annually a floating rate based on the U.S. Secured Overnight Fin. Rate (SOFR) Index, expiring November 2034. | 11/07/29 | | 59,000,000 | 2,589,649 |
| | | | | |
| TOTAL CALL OPTIONS | | | | 38,729,170 |
TOTAL PURCHASED SWAPTIONS (Cost $89,652,646) | | | | 83,474,707 |
| TOTAL INVESTMENT IN SECURITIES - 114.4% (Cost $84,217,542,478) | 80,990,314,258 |
NET OTHER ASSETS (LIABILITIES) - (14.4)% | (10,216,660,527) |
| NET ASSETS - 100.0% | 70,773,653,731 |
| | |
| TBA Sale Commitments |
| | Principal Amount (a) | Value ($) |
| Ginnie Mae | | |
| 2% 12/1/54 | (61,300,000) | (50,400,086) |
| 2% 12/1/54 | (32,200,000) | (26,474,438) |
| 2% 12/1/54 | (184,800,000) | (151,940,250) |
| 2% 12/1/54 | (81,050,000) | (66,638,297) |
| 2% 12/1/54 | (4,300,000) | (3,535,406) |
| 2% 12/1/54 | (2,100,000) | (1,726,594) |
| 2% 12/1/54 | (32,075,000) | (26,371,664) |
| 2% 12/1/54 | (80,825,000) | (66,453,305) |
| 2% 12/1/54 | (2,075,000) | (1,706,039) |
| 3% 12/1/54 | (5,075,000) | (4,499,305) |
| 3% 12/1/54 | (2,000,000) | (1,773,125) |
| 3% 12/1/54 | (28,275,000) | (25,067,555) |
| 3% 12/1/54 | (132,825,000) | (117,757,664) |
| 3% 12/1/54 | (5,250,000) | (4,654,453) |
| 3% 12/1/54 | (38,075,000) | (33,755,867) |
| 3% 12/1/54 | (178,925,000) | (158,628,195) |
| 3% 12/1/54 | (7,075,000) | (6,272,430) |
| 3% 12/1/54 | (31,525,000) | (27,948,883) |
| 3% 12/1/54 | (6,550,000) | (5,806,984) |
| 3% 12/1/54 | (139,225,000) | (123,431,664) |
| 3% 12/1/54 | (39,700,000) | (35,196,531) |
| 3.5% 12/1/54 | (15,100,000) | (13,803,523) |
| 3.5% 12/1/54 | (10,900,000) | (9,964,133) |
| 3.5% 12/1/54 | (2,300,000) | (2,102,523) |
| 3.5% 12/1/54 | (24,550,000) | (22,442,152) |
| 3.5% 12/1/54 | (17,750,000) | (16,225,996) |
| 3.5% 12/1/54 | (3,700,000) | (3,382,320) |
| 3.5% 12/1/54 | (2,700,000) | (2,468,180) |
| 3.5% 12/1/54 | (1,950,000) | (1,782,574) |
| 3.5% 12/1/54 | (400,000) | (365,656) |
| 3.5% 12/1/54 | (800,000) | (731,312) |
| 3.5% 12/1/54 | (14,000,000) | (12,797,968) |
| 3.5% 12/1/54 | (1,350,000) | (1,234,090) |
| 3.5% 12/1/54 | (22,800,000) | (20,842,406) |
| 3.5% 12/1/54 | (150,000) | (137,121) |
| 3.5% 12/1/54 | (2,500,000) | (2,285,352) |
| 3.5% 12/1/54 | (31,000,000) | (28,338,359) |
| 3.5% 12/1/54 | (213,350,000) | (195,031,897) |
| 3.5% 12/1/54 | (5,900,000) | (5,393,430) |
| 3.5% 12/1/54 | (7,325,000) | (6,696,080) |
| 3.5% 12/1/54 | (50,400,000) | (46,072,686) |
| 3.5% 12/1/54 | (1,400,000) | (1,279,797) |
| 5.5% 12/1/54 | (9,475,000) | (9,487,584) |
| 5.5% 12/1/54 | (24,025,000) | (24,056,908) |
| 5.5% 12/1/54 | (12,250,000) | (12,266,269) |
| 5.5% 12/1/54 | (87,350,000) | (87,466,010) |
| 5.5% 12/1/54 | (4,550,000) | (4,556,043) |
| 5.5% 12/1/54 | (9,475,000) | (9,487,584) |
| 5.5% 12/1/54 | (12,250,000) | (12,266,269) |
| 5.5% 12/1/54 | (24,025,000) | (24,056,908) |
| 5.5% 12/1/54 | (87,350,000) | (87,466,010) |
| 5.5% 12/1/54 | (4,550,000) | (4,556,043) |
| 5.5% 12/1/54 | (12,300,000) | (12,316,336) |
| 5.5% 12/1/54 | (87,500,000) | (87,616,209) |
| 5.5% 12/1/54 | (4,575,000) | (4,581,076) |
| 5.5% 12/1/54 | (12,300,000) | (12,316,336) |
| 5.5% 12/1/54 | (79,000,000) | (79,104,920) |
| 5.5% 12/1/54 | (8,500,000) | (8,511,289) |
| 5.5% 12/1/54 | (1,600,000) | (1,602,125) |
| 5.5% 12/1/54 | (2,975,000) | (2,978,951) |
| 6% 12/1/54 | (5,925,000) | (5,987,028) |
| 6% 12/1/54 | (21,450,000) | (21,674,556) |
| 6% 12/1/54 | (93,725,000) | (94,706,188) |
| 6% 12/1/54 | (3,175,000) | (3,208,238) |
| 6% 12/1/54 | (47,525,000) | (48,022,530) |
| 6% 12/1/54 | (191,100,000) | (193,100,588) |
| 6% 12/1/54 | (6,575,000) | (6,643,832) |
| 6% 12/1/54 | (15,600,000) | (15,763,313) |
| 6% 12/1/54 | (31,625,000) | (31,956,076) |
| 6% 12/1/54 | (138,200,000) | (139,646,788) |
| 6% 12/1/54 | (4,700,000) | (4,749,203) |
| 6% 12/1/54 | (10,750,000) | (10,862,540) |
| 6% 12/1/54 | (10,700,000) | (10,812,016) |
| 6% 12/1/54 | (46,075,000) | (46,557,350) |
| 6% 12/1/54 | (31,400,000) | (31,728,720) |
| 6% 12/1/54 | (1,675,000) | (1,692,535) |
| 6% 12/1/54 | (44,350,000) | (44,814,291) |
| 6% 12/1/54 | (193,700,000) | (195,727,807) |
| 6% 12/1/54 | (6,600,000) | (6,669,094) |
| 6% 12/1/54 | (6,250,000) | (6,315,430) |
| 6% 12/1/54 | (43,050,000) | (43,500,682) |
| 6% 12/1/54 | (168,150,000) | (169,910,329) |
| 6.5% 12/1/54 | (6,850,000) | (6,964,524) |
| 6.5% 12/1/54 | (64,850,000) | (65,934,214) |
| 6.5% 12/1/54 | (3,050,000) | (3,100,992) |
| 6.5% 12/1/54 | (6,850,000) | (6,964,524) |
| 6.5% 12/1/54 | (64,850,000) | (65,934,214) |
| 6.5% 12/1/54 | (3,050,000) | (3,100,992) |
| | | |
| TOTAL GINNIE MAE | | (3,104,157,754) |
| | | |
| Uniform Mortgage Backed Securities | | |
| 2% 12/1/39 | (31,400,000) | (28,154,515) |
| 2% 12/1/39 | (25,075,000) | (22,483,263) |
| 2% 12/1/54 | (6,700,000) | (5,371,516) |
| 2% 12/1/54 | (10,675,000) | (8,558,348) |
| 2% 12/1/54 | (86,400,000) | (69,268,504) |
| 2% 12/1/54 | (352,300,000) | (282,445,533) |
| 2% 12/1/54 | (22,350,000) | (17,918,415) |
| 2% 12/1/54 | (48,250,000) | (38,682,932) |
| 2% 12/1/54 | (181,350,000) | (145,391,704) |
| 2% 12/1/54 | (10,700,000) | (8,578,391) |
| 2% 12/1/54 | (33,450,000) | (26,817,494) |
| 2% 12/1/54 | (57,100,000) | (45,778,143) |
| 2% 12/1/54 | (20,250,000) | (16,234,806) |
| 2% 12/1/54 | (120,725,000) | (96,787,502) |
| 2% 12/1/54 | (188,200,000) | (150,883,478) |
| 2.5% 12/1/54 | (14,900,000) | (12,474,094) |
| 2.5% 12/1/54 | (20,750,000) | (17,371,641) |
| 2.5% 12/1/54 | (9,800,000) | (8,204,438) |
| 2.5% 12/1/54 | (1,500,000) | (1,255,781) |
| 2.5% 12/1/54 | (2,750,000) | (2,302,266) |
| 2.5% 12/1/54 | (3,300,000) | (2,762,719) |
| 2.5% 12/1/54 | (7,000,000) | (5,860,313) |
| 2.5% 12/1/54 | (5,750,000) | (4,813,828) |
| 2.5% 12/1/54 | (10,050,000) | (8,413,734) |
| 2.5% 12/1/54 | (4,025,000) | (3,369,680) |
| 2.5% 12/1/54 | (9,800,000) | (8,204,438) |
| 2.5% 12/1/54 | (5,750,000) | (4,813,828) |
| 2.5% 12/1/54 | (4,025,000) | (3,369,680) |
| 2.5% 12/1/54 | (1,500,000) | (1,255,781) |
| 2.5% 12/1/54 | (7,075,000) | (5,923,102) |
| 2.5% 12/1/54 | (25,000,000) | (20,929,688) |
| 2.5% 12/1/54 | (10,050,000) | (8,413,734) |
| 2.5% 12/1/54 | (15,100,000) | (12,641,531) |
| 2.5% 12/1/54 | (9,900,000) | (8,288,156) |
| 2.5% 12/1/54 | (7,075,000) | (5,923,102) |
| 2.5% 12/1/54 | (3,300,000) | (2,762,719) |
| 2.5% 1/1/55 | (7,000,000) | (5,865,508) |
| 3% 12/1/54 | (6,600,000) | (5,750,765) |
| 3% 12/1/54 | (3,900,000) | (3,398,180) |
| 3% 12/1/54 | (31,800,000) | (27,708,234) |
| 3% 12/1/54 | (38,300,000) | (33,371,866) |
| 3% 12/1/54 | (9,900,000) | (8,626,148) |
| 3.5% 12/1/54 | (10,200,000) | (9,242,953) |
| 3.5% 12/1/54 | (27,800,000) | (25,191,579) |
| 3.5% 12/1/54 | (15,600,000) | (14,136,282) |
| 3.5% 12/1/54 | (11,700,000) | (10,602,211) |
| 3.5% 12/1/54 | (39,250,000) | (35,567,247) |
| 3.5% 12/1/54 | (11,950,000) | (10,828,754) |
| 3.5% 12/1/54 | (15,600,000) | (14,136,282) |
| 3.5% 12/1/54 | (11,700,000) | (10,602,211) |
| 3.5% 12/1/54 | (11,950,000) | (10,828,754) |
| 3.5% 12/1/54 | (1,350,000) | (1,223,332) |
| 3.5% 12/1/54 | (37,900,000) | (34,343,915) |
| 3.5% 12/1/54 | (27,800,000) | (25,191,579) |
| 3.5% 12/1/54 | (30,350,000) | (27,502,317) |
| 4% 12/1/54 | (19,000,000) | (17,776,875) |
| 4.5% 12/1/54 | (73,175,000) | (70,282,304) |
| 4.5% 12/1/54 | (4,800,000) | (4,610,250) |
| 4.5% 12/1/54 | (45,825,000) | (44,013,483) |
| 5% 12/1/39 | (5,400,000) | (5,411,391) |
| 5% 12/1/39 | (26,400,000) | (26,455,688) |
| 5% 12/1/39 | (175,000) | (175,369) |
| 5% 12/1/39 | (2,275,000) | (2,279,799) |
| 5% 12/1/54 | (69,100,000) | (67,798,978) |
| 5% 12/1/54 | (30,600,000) | (30,023,860) |
| 5% 12/1/54 | (1,600,000) | (1,569,875) |
| 5% 12/1/54 | (4,200,000) | (4,120,922) |
| 5% 12/1/54 | (12,100,000) | (11,872,180) |
| 5% 12/1/54 | (17,400,000) | (17,072,391) |
| 5.5% 12/1/54 | (22,200,000) | (22,168,782) |
| 5.5% 12/1/54 | (14,800,000) | (14,779,188) |
| 5.5% 12/1/54 | (87,700,000) | (87,576,676) |
| 5.5% 12/1/54 | (36,100,000) | (36,049,236) |
| 5.5% 12/1/54 | (2,500,000) | (2,496,485) |
| 5.5% 12/1/54 | (114,200,000) | (114,039,412) |
| 6% 12/1/54 | (600,000) | (607,219) |
| 6% 12/1/54 | (15,600,000) | (15,787,687) |
| 6% 12/1/54 | (19,500,000) | (19,734,608) |
| 6% 12/1/54 | (4,300,000) | (4,351,734) |
| 6% 12/1/54 | (15,600,000) | (15,787,687) |
| 6% 12/1/54 | (19,500,000) | (19,734,608) |
| 6% 12/1/54 | (600,000) | (607,219) |
| 6.5% 12/1/54 | (1,100,000) | (1,126,297) |
| 6.5% 12/1/54 | (2,600,000) | (2,662,156) |
| 6.5% 12/1/54 | (17,350,000) | (17,764,773) |
| 6.5% 12/1/54 | (41,750,000) | (42,748,084) |
| 6.5% 12/1/54 | (175,000) | (179,184) |
| 6.5% 12/1/54 | (425,000) | (435,160) |
| 6.5% 12/1/54 | (25,000) | (25,598) |
| 6.5% 12/1/54 | (25,525,000) | (26,135,206) |
| | | |
| TOTAL UNIFORM MORTGAGE BACKED SECURITIES | | (2,175,087,278) |
| | | |
TOTAL TBA SALE COMMITMENTS (Proceeds $5,223,925,768) | | (5,279,245,032) |
| Futures Contracts |
| | Number of contracts | Expiration Date | Notional Amount ($) | Value ($) | Unrealized Appreciation/ (Depreciation) ($) |
| Purchased | | | | | |
| | | | | | |
| Bond Index Contracts | | | | | |
| Eurex Euro-Bobl Contracts (Germany) | 21 | Dec 2024 | 2,659,681 | 12,837 | 12,837 |
| Eurex Euro-Bund Contracts (Germany) | 15 | Dec 2024 | 2,136,431 | 50,371 | 50,371 |
| TME 10 Year Canadian Note Contracts (Canada) | 57 | Mar 2025 | 5,015,007 | 105,128 | 105,128 |
| | | | | | |
| TOTAL BOND INDEX CONTRACTS | | | | | 168,336 |
| | | | | | |
| Treasury Contracts | | | | | |
| ASX 10 Year Treasury Bond Index Contracts (Australia) | 35 | Dec 2024 | 2,585,695 | (80,162) | (80,162) |
| CBOT 10-Year U.S. Treasury Note Contracts (United States) | 122 | Mar 2025 | 13,564,875 | 184,730 | 184,730 |
| CBOT 2-Year U.S. Treasury Note Contracts (United States) | 6,691 | Mar 2025 | 1,379,077,828 | 3,436,398 | 3,436,398 |
| CBOT 5-Year U.S. Treasury Note Contracts (United States) | 920 | Mar 2025 | 98,993,438 | 808,476 | 808,476 |
| CBOT Long Term U.S. Treasury Bond Contracts (United States) | 302 | Mar 2025 | 36,089,000 | 967,871 | 967,871 |
| CBOT Ultra 10-Year U.S. Treasury Note Contracts (United States) | 35 | Mar 2025 | 4,017,891 | 75,950 | 75,950 |
| | | | | | |
| TOTAL TREASURY CONTRACTS | | | | | 5,393,263 |
| | | | | | |
| TOTAL PURCHASED | | | | | 5,561,599 |
| | | | | | |
| Sold | | | | | |
| | | | | | |
| Bond Index Contracts | | | | | |
| ICE Long Gilt Contracts (United Kingdom) | 22 | Mar 2025 | 2,684,335 | (39,615) | (39,615) |
| | | | | | |
| Treasury Contracts | | | | | |
| CBOT 10-Year U.S. Treasury Note Contracts (United States) | 503 | Mar 2025 | 55,927,313 | (317,219) | (317,219) |
| CBOT 5-Year U.S. Treasury Note Contracts (United States) | 1,847 | Mar 2025 | 198,740,086 | (1,647,676) | (1,647,676) |
| | | | | | |
| TOTAL TREASURY CONTRACTS | | | | | (1,964,895) |
| | | | | | |
| TOTAL SOLD | | | | | (2,004,510) |
| | | | | | |
| TOTAL FUTURES CONTRACTS | | | | | 3,557,089 |
| The notional amount of futures purchased as a percentage of Net Assets is 2.1% |
| The notional amount of futures sold as a percentage of Net Assets is 0.4% |
| Forward Foreign Currency Contracts |
Currency Purchased
| Currency Sold | Counterparty | Settlement Date | Unrealized Appreciation/ (Depreciation) ($) |
| | | | | | | |
| CAD | 350,000 | USD | 251,445 | JPMorgan Chase Bank, N.A. | 12/05/24 | (1,433) |
| EUR | 2,344,000 | USD | 2,561,532 | BNP Paribas S.A. | 12/05/24 | (84,282) |
| EUR | 551,000 | USD | 612,044 | Bank of America, N.A. | 12/05/24 | (29,722) |
| EUR | 210,000 | USD | 227,960 | Bank of America, N.A. | 12/05/24 | (6,022) |
| EUR | 1,374,000 | USD | 1,499,948 | Brown Brothers Harriman & Co | 12/05/24 | (47,839) |
| EUR | 821,000 | USD | 892,567 | JPMorgan Chase Bank, N.A. | 12/05/24 | (24,895) |
| EUR | 389,000 | USD | 411,721 | JPMorgan Chase Bank, N.A. | 12/05/24 | (607) |
| GBP | 190,000 | USD | 240,132 | Bank of America, N.A. | 12/05/24 | 1,633 |
| GBP | 198,000 | USD | 257,137 | Brown Brothers Harriman & Co | 12/05/24 | (5,192) |
| GBP | 166,000 | USD | 213,737 | Citibank, N. A. | 12/05/24 | (2,511) |
| JPY | 227,050,000 | USD | 1,600,637 | BNP Paribas S.A. | 12/05/24 | (82,604) |
| USD | 55,848 | AUD | 83,000 | Bank of America, N.A. | 12/05/24 | 1,710 |
| USD | 121,228 | AUD | 175,000 | Royal Bank of Canada | 12/05/24 | 7,082 |
| USD | 5,220,268 | CAD | 7,023,000 | BNP Paribas S.A. | 12/05/24 | 203,611 |
| USD | 214,980 | CAD | 290,000 | BNP Paribas S.A. | 12/05/24 | 7,828 |
| USD | 86,833 | CAD | 118,000 | BNP Paribas S.A. | 12/05/24 | 2,544 |
| USD | 80,737 | CAD | 113,000 | JPMorgan Chase Bank, N.A. | 12/05/24 | 19 |
| USD | 1,243,318 | EUR | 1,177,000 | BNP Paribas S.A. | 12/05/24 | (591) |
| USD | 2,655,876 | EUR | 2,374,000 | BNP Paribas S.A. | 12/05/24 | 146,920 |
| USD | 415,575 | EUR | 383,000 | BNP Paribas S.A. | 12/05/24 | 10,802 |
| USD | 188,959 | EUR | 175,000 | BNP Paribas S.A. | 12/05/24 | 4,011 |
| USD | 133,538 | EUR | 126,000 | BNP Paribas S.A. | 12/05/24 | 375 |
| USD | 477,020 | EUR | 451,000 | Bank of America, N.A. | 12/05/24 | 382 |
| USD | 152,470,531 | EUR | 136,020,000 | Citibank, N. A. | 12/05/24 | 8,718,138 |
| USD | 188,344 | EUR | 170,000 | Citibank, N. A. | 12/05/24 | 8,680 |
| USD | 571,810 | EUR | 543,000 | Citibank, N. A. | 12/05/24 | (2,058) |
| USD | 292,613 | EUR | 266,000 | JPMorgan Chase Bank, N.A. | 12/05/24 | 11,492 |
| USD | 251,330 | EUR | 232,000 | JPMorgan Chase Bank, N.A. | 12/05/24 | 6,141 |
| USD | 368,533 | EUR | 349,000 | JPMorgan Chase Bank, N.A. | 12/05/24 | (307) |
| USD | 162,472 | GBP | 125,000 | BNP Paribas S.A. | 12/05/24 | 3,415 |
| USD | 53,870,232 | GBP | 40,214,000 | Goldman Sachs Bank USA | 12/05/24 | 2,699,980 |
| USD | 6,106,842 | JPY | 865,700,000 | Bank of America, N.A. | 12/05/24 | 318,859 |
| USD | 1,099,885 | JPY | 170,300,000 | Royal Bank of Canada | 12/05/24 | (38,723) |
| | | | | | | |
| TOTAL FORWARD FOREIGN CURRENCY CONTRACTS | | 11,826,836 |
| Unrealized Appreciation | | | 12,153,622 |
| Unrealized Depreciation | | | (326,786) |
| Credit Default Swaps |
| Underlying Reference | Rating(1) | Maturity Date | Clearinghouse / Counterparty | Fixed Payment Received/ (Paid) | Payment Frequency | Notional Amount(2)(3) | Value ($)(1) | Upfront Premium Received/ (Paid) ($) | Unrealized Appreciation/ (Depreciation) ($) |
| Buy Protection | | | | | | | | | | |
| AXA SA | | Dec 2029 | BNP Paribas S.A. | (1%) | Quarterly | EUR | 2,550,000 | (19,403) | 16,808 | (2,595) |
| BMW Finance NV | | Dec 2029 | BNP Paribas S.A. | (1%) | Quarterly | EUR | 4,150,000 | (86,402) | 82,929 | (3,473) |
| CMBX N.A. AAA Index Series 13 | | Dec 2072 | Citigroup Global Markets Ltd. | (0.5%) | Monthly | | 6,830,000 | 12,394 | (89,626) | (77,232) |
| CMBX N.A. AAA Index Series 13 | | Dec 2072 | Citigroup Global Markets Ltd. | (0.5%) | Monthly | | 2,780,000 | 5,045 | (24,664) | (19,619) |
| CMBX N.A. AAA Index Series 13 | | Dec 2072 | Citigroup Global Markets Ltd. | (0.5%) | Monthly | | 16,080,000 | 29,179 | (170,898) | (141,719) |
| CMBX N.A. AAA Index Series 13 | | Dec 2072 | Morgan Stanley Capital Services LLC | (0.5%) | Monthly | | 19,040,000 | 34,550 | (301,379) | (266,829) |
| CMBX N.A. AAA Index Series 13 | | Dec 2072 | Morgan Stanley Capital Services LLC | (0.5%) | Monthly | | 17,700,000 | 32,118 | (116,786) | (84,668) |
| CMBX N.A. BBB Index Series 15 | | Nov 2064 | Citigroup Global Markets Ltd. | (3%) | Monthly | | 200,000 | 29,683 | (29,954) | (271) |
| CMBX N.A. BBB Index Series 15 | | Nov 2064 | Citigroup Global Markets Ltd. | (3%) | Monthly | | 2,500,000 | 371,041 | (379,663) | (8,622) |
| CMBX N.A. BBB- Index Series 16 | | Apr 2065 | Citigroup Global Markets Ltd. | (3%) | Monthly | | 2,990,000 | 462,545 | (682,023) | (219,478) |
| CMBX N.A. BBB- Index Series 16 | | Apr 2065 | Citigroup Global Markets Ltd. | (3%) | Monthly | | 1,590,000 | 245,969 | (350,670) | (104,701) |
| CMBX N.A. BBB- Index Series 16 | | Apr 2065 | Citigroup Global Markets Ltd. | (3%) | Monthly | | 3,640,000 | 563,098 | (946,227) | (383,129) |
| CMBX N.A. BBB- Index Series 16 | | Apr 2065 | Citigroup Global Markets Ltd. | (3%) | Monthly | | 3,200,000 | 495,031 | (869,275) | (374,244) |
| CMBX N.A. BBB- Index Series 16 | | Apr 2065 | Citigroup Global Markets Ltd. | (3%) | Monthly | | 10,030,000 | 1,551,614 | (2,986,981) | (1,435,367) |
| CMBX N.A. BBB- Index Series 16 | | Apr 2065 | Citigroup Global Markets Ltd. | (3%) | Monthly | | 1,640,000 | 253,704 | (463,079) | (209,375) |
| CMBX N.A. BBB- Index Series 16 | | Apr 2065 | Goldman Sachs & Co. LLC | (3%) | Monthly | | 4,576,000 | 707,895 | (1,054,827) | (346,932) |
| CMBX N.A. BBB- Index Series 16 | | Apr 2065 | Goldman Sachs & Co. LLC | (3%) | Monthly | | 3,220,000 | 498,125 | (836,610) | (338,485) |
| CMBX N.A. BBB- Index Series 16 | | Apr 2065 | Goldman Sachs & Co. LLC | (3%) | Monthly | | 980,000 | 151,603 | (247,940) | (96,337) |
| CMBX N.A. BBB- Index Series 16 | | Apr 2065 | Goldman Sachs & Co. LLC | (3%) | Monthly | | 3,930,000 | 607,960 | (1,121,522) | (513,562) |
| CMBX N.A. BBB- Index Series 16 | | Apr 2065 | Goldman Sachs & Co. LLC | (3%) | Monthly | | 3,500,000 | 541,441 | (544,475) | (3,034) |
| CMBX N.A. BBB- Index Series 16 | | Apr 2065 | Goldman Sachs & Co. LLC | (3%) | Monthly | | 2,600,000 | 402,213 | (498,553) | (96,340) |
| CMBX N.A. BBB- Index Series 16 | | Apr 2065 | Goldman Sachs & Co. LLC | (3%) | Monthly | | 360,000 | 55,691 | (101,660) | (45,969) |
| CMBX N.A. BBB- Index Series 16 | | Apr 2065 | Goldman Sachs & Co. LLC | (3%) | Monthly | | 600,000 | 92,818 | (97,696) | (4,878) |
| CMBX N.A. BBB- Index Series 16 | | Apr 2065 | Goldman Sachs & Co. LLC | (3%) | Monthly | | 200,000 | 30,939 | (48,364) | (17,425) |
| CMBX N.A. BBB- Index Series 16 | | Apr 2065 | Goldman Sachs & Co. LLC | (3%) | Monthly | | 3,970,000 | 614,148 | (941,556) | (327,408) |
| CMBX N.A. BBB- Index Series 16 | | Apr 2065 | JPMorgan Securities LLC | (3%) | Monthly | | 4,580,000 | 708,514 | (1,293,833) | (585,319) |
| CMBX N.A. BBB- Index Series 16 | | Apr 2065 | JPMorgan Securities LLC | (3%) | Monthly | | 2,290,000 | 354,257 | (633,725) | (279,468) |
| CMBX N.A. BBB- Index Series 16 | | Apr 2065 | JPMorgan Securities LLC | (3%) | Monthly | | 2,190,000 | 338,787 | (571,797) | (233,010) |
| CMBX N.A. BBB- Index Series 16 | | Apr 2065 | Morgan Stanley Capital Services LLC | (3%) | Monthly | | 5,830,000 | 901,885 | (1,457,088) | (555,203) |
| CMBX N.A. BBB- Index Series 16 | | Apr 2065 | Morgan Stanley Capital Services LLC | (3%) | Monthly | | 190,000 | 29,392 | (44,402) | (15,010) |
| CMBX N.A. BBB- Index Series 16 | | Apr 2065 | Morgan Stanley Capital Services LLC | (3%) | Monthly | | 1,920,000 | 297,019 | (436,648) | (139,629) |
| CMBX N.A. BBB- Index Series 16 | | Apr 2065 | Morgan Stanley Capital Services LLC | (3%) | Monthly | | 1,900,000 | 293,925 | (316,329) | (22,404) |
| CMBX N.A. BBB- Index Series 16 | | Apr 2065 | Morgan Stanley Capital Services LLC | (3%) | Monthly | | 4,646,000 | 718,724 | (1,134,995) | (416,271) |
| CMBX N.A. BBB- Index Series 16 | | Apr 2065 | Morgan Stanley Capital Services LLC | (3%) | Monthly | | 2,330,000 | 360,445 | (572,018) | (211,573) |
| CMBX N.A. BBB- Index Series 17 | | Dec 2056 | Citigroup Global Markets Ltd. | (3%) | Monthly | | 600,000 | 68,759 | (70,652) | (1,893) |
| CMBX N.A. BBB- Index Series 17 | | Dec 2056 | Citigroup Global Markets Ltd. | (3%) | Monthly | | 2,595,000 | 297,382 | (416,446) | (119,064) |
| CMBX N.A. BBB- Index Series 17 | | Dec 2056 | Goldman Sachs & Co. LLC | (3%) | Monthly | | 1,400,000 | 160,437 | (162,285) | (1,848) |
| CMBX N.A. BBB- Index Series 17 | | Dec 2056 | Goldman Sachs & Co. LLC | (3%) | Monthly | | 900,000 | 103,138 | (125,199) | (22,061) |
| CMBX N.A. BBB- Index Series 17 | | Dec 2056 | JPMorgan Securities LLC | (3%) | Monthly | | 2,200,000 | 252,116 | (287,422) | (35,306) |
| CMBX N.A. BBB- Index Series 17 | | Dec 2056 | Morgan Stanley Capital Services LLC | (3%) | Monthly | | 1,300,000 | 148,977 | (179,644) | (30,667) |
| Generali SpA | | Dec 2029 | BNP Paribas S.A. | (1%) | Quarterly | EUR | 1,700,000 | 6,450 | (19,091) | (12,641) |
| Heidelberg Materials AG | | Dec 2029 | BNP Paribas S.A. | (5%) | Quarterly | EUR | 1,920,000 | (430,715) | 413,720 | (16,995) |
| Intesa Sanpaolo SpA | | Dec 2029 | JPMorgan Chase Bank, N.A. | (1%) | Quarterly | EUR | 1,750,000 | 18,983 | (40,320) | (21,337) |
| Societe Generale | | Dec 2029 | BNP Paribas S.A. | (1%) | Quarterly | EUR | 1,700,000 | 29,005 | (47,386) | (18,381) |
| UniCredit SpA | | Dec 2029 | Goldman Sachs Bank USA | (1%) | Quarterly | EUR | 1,450,000 | 16,436 | (34,518) | (18,082) |
| | | | | | | | | | | |
| TOTAL BUY PROTECTION | | | | | | | | 12,356,915 | (20,234,769) | (7,877,854) |
| Sell Protection | | | | | | | | | | |
| CMBX N.A. AAA Index Series 12 | NR | Aug 2061 | JPMorgan Securities LLC | 0.5% | Monthly | | 2,000,000 | (177) | 8,589 | 8,412 |
| CMBX N.A. AAA Index Series 13 | NR | Dec 2072 | Morgan Stanley Capital Services LLC | 0.5% | Monthly | | 29,580,000 | (53,676) | 663,418 | 609,742 |
| CMBX N.A. AAA Index Series 13 | NR | Dec 2072 | Morgan Stanley Capital Services LLC | 0.5% | Monthly | | 32,850,000 | (59,610) | 757,690 | 698,080 |
| CMBX N.A. AAA Index Series 15 | NR | Nov 2064 | Citigroup Global Markets Ltd. | 0.5% | Monthly | | 5,750,000 | (45,517) | 62,493 | 16,976 |
| CMBX N.A. AAA Index Series 15 | NR | Nov 2064 | Citigroup Global Markets Ltd. | 0.5% | Monthly | | 10,420,000 | (82,485) | 103,001 | 20,516 |
| CMBX N.A. AAA Index Series 15 | NR | Nov 2064 | Citigroup Global Markets Ltd. | 0.5% | Monthly | | 19,300,000 | (152,779) | 261,417 | 108,638 |
| CMBX N.A. AAA Index Series 15 | NR | Nov 2064 | Goldman Sachs & Co. LLC | 0.5% | Monthly | | 5,650,000 | (44,725) | 149,028 | 104,303 |
| CMBX N.A. AAA Index Series 16 | NR | Apr 2065 | Citigroup Global Markets Ltd. | 0.5% | Monthly | | 32,100,000 | (413,740) | 502,747 | 89,007 |
| CMBX N.A. AAA Index Series 16 | NR | Apr 2065 | Citigroup Global Markets Ltd. | 0.5% | Monthly | | 25,000,000 | (322,228) | 500,271 | 178,043 |
| CMBX N.A. AAA Index Series 16 | NR | Apr 2065 | Citigroup Global Markets Ltd. | 0.5% | Monthly | | 12,600,000 | (162,403) | 159,727 | (2,676) |
| CMBX N.A. AAA Index Series 16 | NR | Apr 2065 | Goldman Sachs & Co. LLC | 0.5% | Monthly | | 14,745,000 | (190,050) | 193,023 | 2,973 |
| CMBX N.A. AAA Index Series 17 | NR | Dec 2056 | Citigroup Global Markets Ltd. | 0.5% | Monthly | | 700,000 | (12,101) | 14,526 | 2,425 |
| CMBX N.A. AAA Index Series 17 | NR | Dec 2056 | Citigroup Global Markets Ltd. | 0.5% | Monthly | | 9,400,000 | (162,494) | 191,534 | 29,040 |
| CMBX N.A. AAA Index Series 17 | NR | Dec 2056 | Citigroup Global Markets Ltd. | 0.5% | Monthly | | 15,300,000 | (264,485) | 378,976 | 114,491 |
| CMBX N.A. AAA Index Series 17 | NR | Dec 2056 | Citigroup Global Markets Ltd. | 0.5% | Monthly | | 29,400,000 | (508,226) | 732,888 | 224,662 |
| CMBX N.A. AAA Index Series 17 | NR | Dec 2056 | Citigroup Global Markets Ltd. | 0.5% | Monthly | | 24,800,000 | (428,708) | 428,704 | (4) |
| CMBX N.A. AAA Index Series 17 | NR | Dec 2056 | Goldman Sachs & Co. LLC | 0.5% | Monthly | | 5,400,000 | (93,348) | 120,966 | 27,618 |
| CMBX N.A. AAA Index Series 17 | NR | Dec 2056 | Goldman Sachs & Co. LLC | 0.5% | Monthly | | 23,400,000 | (404,506) | 583,736 | 179,230 |
| CMBX N.A. AAA Index Series 17 | NR | Dec 2056 | Morgan Stanley Capital Services LLC | 0.5% | Monthly | | 6,000,000 | (103,720) | 125,944 | 22,224 |
| CMBX N.A. AAA Index Series 17 | NR | Dec 2056 | Morgan Stanley Capital Services LLC | 0.5% | Monthly | | 5,200,000 | (89,890) | 88,899 | (991) |
| | | | | | | | | | | |
| TOTAL SELL PROTECTION | | | | | | | | (3,594,868) | 6,027,577 | 2,432,709 |
| TOTAL CREDIT DEFAULT SWAPS | | | | | | | | 8,762,047 | (14,207,192) | (5,445,145) |
(1)Ratings are presented for credit default swaps in which the Fund has sold protection on the underlying referenced debt. Ratings for an underlying index represent a weighted average of the ratings of all securities included in the index. The credit rating or value can be measures of the current payment/performance risk. Ratings are from Moody's Investors Service, Inc. Where Moody's® ratings are not available, S&P® ratings are disclosed and are indicated as such. All ratings are as of the report date and do not reflect subsequent changes.
(2)The notional amount of each credit default swap where the Fund has sold protection approximates the maximum potential amount of future payments that the Fund could be required to make if a credit event were to occur.
(3)Notional amount is stated in U.S. Dollars unless otherwise noted.
| Interest Rate Swaps |
| Payment Received | Payment Frequency | Payment Paid | Payment Frequency | Clearinghouse / Counterparty(1) | Maturity Date | Notional Amount(2) | Value ($) | Upfront Premium Received/ (Paid) ($)(3) | Unrealized Appreciation/ (Depreciation) ($) |
| 4% | Annual | U.S. Secured Overnight Fin. Rate (SOFR) Index(4) | Annual | LCH | Dec 2025 | | 101,000 | (805) | 0 | (805) |
U.S. Secured Overnight Fin. Rate (SOFR) Index(4) | Annual | 3.75% | Annual | LCH | Dec 2026 | | 435,158,000 | 7,373,217 | 0 | 7,373,217 |
U.S. Secured Overnight Fin. Rate (SOFR) Index(4) | Annual | 3.75% | Annual | LCH | Dec 2027 | | 734,463,000 | 17,120,795 | 0 | 17,120,795 |
| 3.75% | Annual | U.S. Secured Overnight Fin. Rate (SOFR) Index(4) | Annual | LCH | Dec 2028 | | 5,000 | 15 | 0 | 15 |
U.S. Secured Overnight Fin. Rate (SOFR) Index(4) | Annual | 3.75% | Annual | LCH | Dec 2028 | | 25,580,000 | 717,631 | 0 | 717,631 |
U.S. Secured Overnight Fin. Rate (SOFR) Index(4) | Annual | 3.75% | Annual | LCH | Dec 2029 | | 50,500,000 | 678,612 | 0 | 678,612 |
U.S. Secured Overnight Fin. Rate (SOFR) Index(4) | Annual | 3.75% | Annual | LCH | Dec 2031 | | 313,366,000 | 12,460,040 | 0 | 12,460,040 |
U.S. Secured Overnight Fin. Rate (SOFR) Index(4) | Annual | 3.75% | Annual | LCH | Dec 2033 | | 101,000 | 4,665 | 0 | 4,665 |
| 3.75% | Annual | U.S. Secured Overnight Fin. Rate (SOFR) Index(4) | Annual | LCH | Dec 2034 | | 14,931,000 | (694,144) | 0 | (694,144) |
U.S. Secured Overnight Fin. Rate (SOFR) Index(4) | Annual | 3.75% | Annual | LCH | Dec 2036 | | 101,000 | 5,330 | 0 | 5,330 |
U.S. Secured Overnight Fin. Rate (SOFR) Index(4) | Annual | 3.75% | Annual | LCH | Dec 2039 | | 101,000 | 6,058 | 0 | 6,058 |
U.S. Secured Overnight Fin. Rate (SOFR) Index(4) | Annual | 3.75% | Annual | LCH | Dec 2044 | | 100,247,000 | 6,316,475 | 0 | 6,316,475 |
| 3.5% | Annual | U.S. Secured Overnight Fin. Rate (SOFR) Index(4) | Annual | LCH | Dec 2054 | | 10,202,000 | (170,305) | 0 | (170,305) |
| TOTAL INTEREST RATE SWAPS | | | | | | | | 43,817,584 | 0 | 43,817,584 |
| | | | | | | | | | | |
(1)Swaps with LCH Clearnet Group (LCH) are centrally cleared swaps.
(2)Notional amount is stated in U.S. Dollars unless otherwise noted.
(3)Any premiums for centrally cleared swaps are recorded periodically throughout the term of the swap to variation margin and included in unrealized appreciation (depreciation).
(4)Represents floating rate.
Currency Abbreviations
| AUD | - | Australian dollar |
| CAD | - | Canadian dollar |
| EUR | - | European Monetary Unit |
| GBP | - | British pound sterling |
| JPY | - | Japanese yen |
| USD | - | U.S. dollar |
Legend
| (a) | Amount is stated in United States dollars unless otherwise noted. |
| (b) | Security exempt from registration under Rule 144A of the Securities Act of 1933. These securities may be resold in transactions exempt from registration, normally to qualified institutional buyers. At the end of the period, the value of these securities amounted to $6,010,934,959 or 8.5% of net assets. |
| (c) | Security or a portion of the security purchased on a delayed delivery or when-issued basis. |
| (d) | Coupon rates for floating and adjustable rate securities reflect the rates in effect at period end. |
| (e) | Security initially issued at one coupon which converts to a higher coupon at a specified date. The rate shown is the rate at period end. |
| (f) | Position or a portion of the position represents an unfunded loan commitment. At period end, the total principal amount and market value of unfunded commitments totaled $777,655 and $759,487, respectively. |
| (h) | Security is perpetual in nature with no stated maturity date. |
| (i) | Coupon is indexed to a floating interest rate which may be multiplied by a specified factor and/or subject to caps or floors. |
| (j) | Security or a portion of the security has been segregated as collateral for mortgage-backed or asset-backed securities purchased on a delayed delivery or when-issued basis. At period end, the value of securities pledged amounted to $2,301,055. |
| (k) | Security or a portion of the security has been segregated as collateral for open forward foreign currency contracts, options and bi-lateral over the counter (OTC) swaps. At period end, the value of securities pledged amounted to $6,558,688. |
| (l) | Security or a portion of the security was pledged to cover margin requirements for futures contracts. At period end, the value of securities pledged amounted to $10,472,527. |
| (m) | Security or a portion of the security is on loan at period end. |
| (n) | Security or a portion of the security was pledged to cover margin requirements for centrally cleared swaps. At period end, the value of securities pledged amounted to $44,441,445. |
| (o) | Interest Only (IO) security represents the right to receive only monthly interest payments on an underlying pool of mortgages or assets. Principal shown is the outstanding par amount of the pool as of the end of the period. |
| (p) | Coupon is inversely indexed to a floating interest rate multiplied by a specified factor. The price may be considerably more volatile than the price of a comparable fixed rate security. |
| (q) | Principal Only Strips represent the right to receive the monthly principal payments on an underlying pool of mortgage loans. |
| (r) | Represents an investment in an underlying pool of reverse mortgages which typically do not require regular principal and interest payments as repayment is deferred until a maturity event. |
| (t) | Remaining maturities of bank loan obligations may be less than the stated maturities shown as a result of contractual or optional prepayments by the borrower. Such prepayments cannot be predicted with certainty. |
| (u) | A coupon rate of 0% signifies an unsettled loan. The coupon rate will be determined upon settlement of the loan after period end. |
| (w) | Non-income producing - Security is in default. |
| (x) | Affiliated fund that is generally available only to investment companies and other accounts managed by Fidelity Investments. The rate quoted is the annualized seven-day yield of the fund at period end. A complete unaudited listing of the fund's holdings as of its most recent quarter end is available upon request. In addition, each Fidelity Central Fund's financial statements are available on the SEC's website or upon request. |
| (y) | The rate quoted is the annualized seven-day yield of the fund at period end. |
| (z) | Investment made with cash collateral received from securities on loan. |
| (Aa) | Equity security is subject to lock-up or market standoff agreement and valued at a discount to the market price of the equivalent equity security. As of period end, the total fair value of equity securities discounted due to contractual sale restrictions is $66,207 and all restrictions are set to expire on or before May 31, 2025. Under normal market conditions, there are no circumstances that could cause the restrictions to lapse. |
Affiliated Central Funds
Fiscal year to date information regarding the Fund's investments in Fidelity Central Funds, including the ownership percentage, is presented below.
| Affiliate | Value, beginning of period ($) | Purchases ($) | Sales Proceeds ($) | Dividend Income ($) | Realized Gain (loss) ($) | Change in Unrealized appreciation (depreciation) ($) | Value, end of period ($) | % ownership, end of period |
| Fidelity Cash Central Fund 4.64% | 2,417,719,055 | 5,346,380,868 | 6,365,446,231 | 40,309,959 | 3,678 | - | 1,398,657,370 | 2.6% |
| Fidelity Securities Lending Cash Central Fund 4.64% | - | 1,892,633,893 | 1,849,555,934 | 54,250 | - | - | 43,077,959 | 0.2% |
| Total | 2,417,719,055 | 7,239,014,761 | 8,215,002,165 | 40,364,209 | 3,678 | - | 1,441,735,329 | |
| | | | | | | | | |
Amounts in the dividend income column in the above table include any capital gain distributions from underlying funds, which are presented in the corresponding line item in the Statement of Operations, if applicable.
Amounts in the dividend income column for Fidelity Securities Lending Cash Central Fund represents the income earned on investing cash collateral, less rebates paid to borrowers and any lending agent fees associated with the loan, plus any premium payments received for lending certain types of securities.
Amounts included in the purchases and sales proceeds columns may include in-kind transactions, if applicable.
Affiliated Underlying Funds
Fiscal year to date information regarding the Fund's investments in affiliated Underlying Funds is presented below. Exchanges between classes of the same affiliated Underlying Funds may occur. If an Underlying Funds changes its name, the name presented below is the name in effect at period end.
| Affiliate | Value, beginning of period ($) | Purchases ($) | Sales Proceeds ($) | Dividend Income ($) | Realized Gain (loss) ($) | Change in Unrealized appreciation (depreciation) ($) | Value, end of period ($) |
| Fidelity Advisor Floating Rate High Income Fund Class Z | 941,126,140 | 37,892,679 | 50,000,000 | 37,892,679 | (633,430) | 3,466,476 | 931,851,865 |
| Fidelity Advisor Government Income Fund Class Z | 208,482,828 | 1,681,541 | 221,127,503 | 1,868,939 | (4,220,283) | 15,183,417 | - |
| Fidelity Advisor New Markets Income Fund Class Z | 1,127,039,687 | 49,061,864 | 25,000,000 | 24,061,864 | (3,609,438) | 36,507,108 | 1,183,999,221 |
| Fidelity Advisor Real Estate Income Fund Class Z | 1,134,293,162 | 52,591,991 | - | 27,591,991 | - | 70,678,859 | 1,257,564,012 |
| Fidelity Inflation-Protected Bond Index Fund | 228,697,730 | 2,403,349 | 237,483,980 | 2,403,350 | 2,544,993 | 3,837,908 | - |
| Fidelity Intermediate Treasury Bond Index Fund | 2,433,864,790 | 119,237,452 | 2,703,810,977 | 23,776,056 | 101,816,604 | 48,892,131 | - |
| Fidelity Investments Money Market Government Portfolio Institutional Class 4.55% | 264,514,102 | 2,640,079,703 | 2,450,734,816 | 5,383,432 | - | - | 453,858,989 |
| Fidelity SAI High Income Fund | 199,286,275 | 5,379,283 | 40,000,000 | 5,379,283 | (1,579,092) | 9,309,145 | 172,395,611 |
| Fidelity SAI Inflation-Protected Bond Index Fund | - | 287,578,126 | - | 94,146 | - | (1,189,497) | 286,388,629 |
| Fidelity SAI Intermediate Treasury Bond Index Fund | - | 2,868,738,790 | - | 14,927,812 | - | (78,431,175) | 2,790,307,615 |
| Fidelity SAI International Credit Fund | 385,689,313 | 256,875,913 | - | 6,875,913 | - | 19,961,118 | 662,526,344 |
| Fidelity SAI Long-Term Treasury Bond Index Fund | 2,531,514,847 | 97,155,398 | 175,000,000 | 47,155,397 | (82,121,961) | 190,014,566 | 2,561,562,850 |
| Fidelity SAI Short-Term Bond Fund | 472,289,166 | 10,243,808 | - | 10,243,809 | - | 5,911,346 | 488,444,320 |
| Fidelity SAI Short-Term Treasury Bond Index Fund | - | 130,362,107 | 50,000,000 | 361,431 | (403,226) | (955,355) | 79,003,526 |
| Fidelity SAI Total Bond Fund | 15,621,818,369 | 833,650,729 | 475,018,831 | 358,631,898 | (20,924,687) | 480,687,106 | 16,440,212,686 |
| Fidelity SAI U.S. Treasury Bond Index Fund | 6,090,373,182 | 629,241,674 | 773,000,000 | 79,241,674 | (84,479,953) | 260,158,101 | 6,122,293,004 |
| Fidelity Short-Term Treasury Bond Index Fund | 413,148,934 | 2,371,812 | 430,303,916 | 2,371,869 | 23,865,206 | (9,082,036) | - |
| Fidelity Sustainability Bond Index Fund | 23,006,458 | 421,154 | - | 421,208 | - | 634,506 | 24,062,118 |
| Fidelity U.S. Bond Index Fund | 103,262,800 | 312,504,319 | 75,000,000 | 3,272,991 | 437,743 | 2,930,647 | 344,135,509 |
| | 32,178,407,783 | 8,337,471,692 | 7,706,480,023 | 651,955,742 | (69,307,524) | 1,058,514,371 | 33,798,606,299 |
Amounts in the dividend income column in the above table include any capital gain distributions from underlying funds, which are presented in the corresponding line item in the Statement of Operations, if applicable.
Amounts included in the purchases and sales proceeds columns may include in-kind transactions, if applicable.
Investment Valuation
The following is a summary of the inputs used, as of November 30, 2024, involving the Fund's assets and liabilities carried at fair value. The inputs or methodology used for valuing securities may not be an indication of the risk associated with investing in those securities. For more information on valuation inputs, and their aggregation into the levels used below, please refer to the Investment Valuation section in the accompanying Notes to Financial Statements.
| Valuation Inputs at Reporting Date: |
| Description | Total ($) | Level 1 ($) | Level 2 ($) | Level 3 ($) |
Investments in Securities: | | | | |
|
| Equities: | | | | |
Energy | 66,207 | 66,207 | - | - |
Health Care | 273,655 | - | - | 273,655 |
|
| Corporate Bonds | 9,394,149,743 | - | 9,393,274,068 | 875,675 |
|
| U.S. Government and Government Agency Obligations | 10,101,820,975 | - | 10,101,820,975 | - |
|
| U.S. Government Agency - Mortgage Securities | 19,253,819,627 | - | 19,253,819,627 | - |
|
| Asset-Backed Securities | 2,821,839,723 | - | 2,821,770,089 | 69,634 |
|
| Collateralized Mortgage Obligations | 970,107,284 | - | 970,107,284 | - |
|
| Commercial Mortgage Securities | 2,946,668,181 | - | 2,946,668,181 | - |
|
| Municipal Securities | 16,444,364 | - | 16,444,364 | - |
|
| Foreign Government and Government Agency Obligations | 55,133,152 | - | 55,133,152 | - |
|
| Supranational Obligations | 9,958,854 | - | 9,958,854 | - |
|
| Bank Loan Obligations | 8,756,772 | - | 8,756,772 | - |
|
| Bank Notes | 9,813,238 | - | 9,813,238 | - |
|
| Fixed-Income Funds | 32,777,299,464 | 32,777,299,464 | - | - |
|
| Short-Term Funds | 567,447,846 | 567,447,846 | - | - |
|
| Preferred Securities | 77,646,148 | - | 77,153,648 | 492,500 |
|
| Money Market Funds | 1,895,594,318 | 1,895,594,318 | - | - |
|
| Purchased Swaptions | 83,474,707 | - | 83,474,707 | - |
| Total Investments in Securities: | 80,990,314,258 | 35,240,407,835 | 45,748,194,959 | 1,711,464 |
Derivative Instruments: Assets | | | | |
Futures Contracts | 5,641,761 | 5,641,761 | - | - |
Forward Foreign Currency Contracts | 12,153,622 | - | 12,153,622 | - |
Swaps | 57,576,273 | - | 57,576,273 | - |
| Total Assets | 75,371,656 | 5,641,761 | 69,729,895 | - |
| Liabilities | | | | |
Futures Contracts | (2,084,672) | (2,084,672) | - | - |
Forward Foreign Currency Contracts | (326,786) | - | (326,786) | - |
Swaps | (4,996,642) | - | (4,996,642) | - |
| Total Liabilities | (7,408,100) | (2,084,672) | (5,323,428) | - |
| Total Derivative Instruments: | 67,963,556 | 3,557,089 | 64,406,467 | - |
Other Financial Instruments: | | | | |
| TBA Sale Commitments | (5,279,245,032) | - | (5,279,245,032) | - |
| Total Other Financial Instruments: | (5,279,245,032) | - | (5,279,245,032) | - |
Value of Derivative Instruments
The following table is a summary of the Fund's value of derivative instruments by primary risk exposure as of November 30, 2024. For additional information on derivative instruments, please refer to the Derivative Instruments section in the accompanying Notes to Financial Statements.
Primary Risk Exposure / Derivative Type | Value |
| Asset ($) | Liability ($) |
| Credit Risk | | |
Swaps (a) | 12,893,435 | (4,131,388) |
| Total Credit Risk | 12,893,435 | (4,131,388) |
| Foreign Exchange Risk | | |
Forward Foreign Currency Contracts (b) | 12,153,622 | (326,786) |
| Total Foreign Exchange Risk | 12,153,622 | (326,786) |
| Interest Rate Risk | | |
Futures Contracts (c) | 5,641,761 | (2,084,672) |
Purchased Swaptions (d) | 83,474,707 | 0 |
Swaps (e) | 44,682,838 | (865,254) |
| Total Interest Rate Risk | 133,799,306 | (2,949,926) |
| Total Value of Derivatives | 158,846,363 | (7,408,100) |
(a)For bi-lateral over-the-counter (OTC) swaps, reflects gross value which is presented in the Statement of Assets and Liabilities in the bi-lateral OTC swaps, at value line-items.
(b)Gross value is presented in the Statement of Assets and Liabilities in the unrealized appreciation/depreciation on forward foreign currency contracts line-items.
(c)Reflects gross cumulative appreciation (depreciation) on futures contracts as presented in the Schedule of Investments. In the Statement of Assets and Liabilities, the period end daily variation margin is included in receivable or payable for daily variation margin on futures contracts, and the net cumulative appreciation (depreciation) is included in Total accumulated earnings (loss).
(d)Gross value is presented in the Statement of Assets and Liabilities in the Investments in Securities at value line-item.
(e)For centrally cleared swaps, reflects gross cumulative appreciation (depreciation) as presented in the Schedule of Investments. In the Statement of Assets and Liabilities, the period end daily variation margin for centrally cleared swaps is included in receivable or payable for daily variation margin on centrally cleared swaps, and the net cumulative appreciation (depreciation) for centrally cleared swaps is included in Total accumulated earnings (loss).
Financial Statements (Unaudited)
| Statement of Assets and Liabilities |
| As of November 30, 2024 (Unaudited) |
| Assets | | | | |
| Investment in securities, at value (including securities loaned of $42,163,817) - See accompanying schedule: | | | | |
Unaffiliated issuers (cost $46,510,195,464) | $ | 45,749,972,630 | | |
Fidelity Central Funds (cost $1,441,735,290) | | 1,441,735,329 | | |
Other affiliated issuers (cost $36,265,611,724) | | 33,798,606,299 | | |
| | | | | |
| | | | | |
| Total Investment in Securities (cost $84,217,542,478) | | | $ | 80,990,314,258 |
| Cash | | | | 2,001,006 |
| Foreign currency held at value (cost $1,319,929) | | | | 1,316,375 |
| Receivable for investments sold | | | | 115,078,640 |
| Receivable for TBA sale commitments | | | | 5,223,925,768 |
| Unrealized appreciation on forward foreign currency contracts | | | | 12,153,622 |
| Receivable for fund shares sold | | | | 92,273,053 |
| Dividends receivable | | | | 68,038 |
| Interest receivable | | | | 257,517,404 |
| Distributions receivable from Fidelity Central Funds | | | | 5,872,058 |
| Receivable for daily variation margin on futures contracts | | | | 874,240 |
| Bi-lateral OTC swaps, at value | | | | 12,893,435 |
| Prepaid expenses | | | | 49,633 |
| Other receivables | | | | 44,984 |
Total assets | | | | 86,714,382,514 |
| Liabilities | | | | |
| Payable for investments purchased | | | | |
Regular delivery | $ | 448,957,642 | | |
Delayed delivery | | 10,108,993,785 | | |
| TBA sale commitments, at value | | 5,279,245,032 | | |
| Unrealized depreciation on forward foreign currency contracts | | 326,786 | | |
| Payable for fund shares redeemed | | 48,859,914 | | |
| Distributions payable | | 576,460 | | |
| Bi-lateral OTC swaps, at value | | 4,131,388 | | |
| Accrued management fee | | 2,468,677 | | |
| Payable for daily variation margin on centrally cleared swaps | | 2,730,904 | | |
| Other payables and accrued expenses | | 1,360,236 | | |
| Collateral on securities loaned | | 43,077,959 | | |
| Total liabilities | | | | 15,940,728,783 |
| Net Assets | | | $ | 70,773,653,731 |
| Net Assets consist of: | | | | |
| Paid in capital | | | $ | 76,894,604,934 |
| Total accumulated earnings (loss) | | | | (6,120,951,203) |
| Net Assets | | | $ | 70,773,653,731 |
Net Asset Value, offering price and redemption price per share ($70,773,653,731 ÷ 7,689,870,104 shares) | | | $ | 9.20 |
| Statement of Operations |
Six months ended November 30, 2024 (Unaudited) |
| Investment Income | | | | |
| Dividends: | | | | |
| Unaffiliated issuers | | | $ | 2,064,085 |
| Affiliated issuers | | | | 651,955,742 |
| Interest | | | | 793,287,578 |
| Income from Fidelity Central Funds (including $54,250 from security lending) | | | | 40,364,209 |
| Total income | | | | 1,487,671,614 |
| Expenses | | | | |
| Management fee | $ | 99,932,187 | | |
| Custodian fees and expenses | | 240,203 | | |
| Independent trustees' fees and expenses | | 163,315 | | |
| Registration fees | | 2,188,241 | | |
| Audit fees | | 42,469 | | |
| Legal | | 35,717 | | |
| Miscellaneous | | 300,418 | | |
| Total expenses before reductions | | 102,902,550 | | |
| Expense reductions | | (85,442,800) | | |
| Total expenses after reductions | | | | 17,459,750 |
| Net Investment income (loss) | | | | 1,470,211,864 |
| Realized and Unrealized Gain (Loss) | | | | |
| Net realized gain (loss) on: | | | | |
| Investment Securities: | | | | |
| Unaffiliated issuers | | 15,688,462 | | |
| Fidelity Central Funds | | 3,678 | | |
| Other affiliated issuers | | (69,307,524) | | |
| Forward foreign currency contracts | | (8,597,742) | | |
| Foreign currency transactions | | 41,813 | | |
| Futures contracts | | (27,573,057) | | |
| Swaps | | (21,562,076) | | |
| Total net realized gain (loss) | | | | (111,306,446) |
| Change in net unrealized appreciation (depreciation) on: | | | | |
| Investment Securities: | | | | |
| Unaffiliated issuers | | 1,020,731,488 | | |
| Affiliated issuers | | 1,058,514,371 | | |
| Forward foreign currency contracts | | 13,696,181 | | |
| Assets and liabilities in foreign currencies | | (102,785) | | |
| Futures contracts | | 408,386 | | |
| Swaps | | 28,707,783 | | |
| TBA Sale commitments | | (73,047,972) | | |
| Total change in net unrealized appreciation (depreciation) | | | | 2,048,907,452 |
| Net gain (loss) | | | | 1,937,601,006 |
| Net increase (decrease) in net assets resulting from operations | | | $ | 3,407,812,870 |
| Statement of Changes in Net Assets |
| |
| | Six months ended November 30, 2024 (Unaudited) | | Year ended May 31, 2024 |
| Increase (Decrease) in Net Assets | | | | |
| Operations | | | | |
| Net investment income (loss) | $ | 1,470,211,864 | $ | 2,804,666,734 |
| Net realized gain (loss) | | (111,306,446) | | (1,432,385,718) |
| Change in net unrealized appreciation (depreciation) | | 2,048,907,452 | | 231,267,851 |
| Net increase (decrease) in net assets resulting from operations | | 3,407,812,870 | | 1,603,548,867 |
| Distributions to shareholders | | (1,382,418,034) | | (2,691,323,803) |
| | | | | |
| Share transactions | | | | |
| Proceeds from sales of shares | | 12,963,119,876 | | 21,087,767,799 |
| Reinvestment of distributions | | 1,378,582,172 | | 2,599,304,812 |
| Cost of shares redeemed | | (12,092,884,004) | | (20,461,282,796) |
| | | | | |
Net increase (decrease) in net assets resulting from share transactions | | 2,248,818,044 | | 3,225,789,815 |
| Total increase (decrease) in net assets | | 4,274,212,880 | | 2,138,014,879 |
| | | | | |
| Net Assets | | | | |
| Beginning of period | | 66,499,440,851 | | 64,361,425,972 |
| End of period | $ | 70,773,653,731 | $ | 66,499,440,851 |
| | | | | |
| Other Information | | | | |
| Shares | | | | |
| Sold | | 1,409,227,023 | | 2,359,503,963 |
| Issued in reinvestment of distributions | | 149,954,300 | | 290,814,279 |
| Redeemed | | (1,312,077,762) | | (2,291,309,084) |
| Net increase (decrease) | | 247,103,561 | | 359,009,158 |
| | | | | |
Financial Highlights
Strategic Advisers® Fidelity® Core Income Fund |
| |
| | Six months ended (Unaudited) November 30, 2024 | | Years ended May 31, 2024 | | 2023 | | 2022 | | 2021 | | 2020 |
Selected Per-Share Data | | | | | | | | | | | | |
| Net asset value, beginning of period | $ | 8.93 | $ | 9.09 | $ | 9.60 | $ | 10.60 | $ | 10.95 | $ | 10.47 |
| Income from Investment Operations | | | | | | | | | | | | |
Net investment income (loss) A,B | | .198 | | .378 | | .322 | | .222 | | .239 | | .302 |
| Net realized and unrealized gain (loss) | | .258 | | (.175) | | (.519) | | (.993) | | .106 | | .613 |
| Total from investment operations | | .456 | | .203 | | (.197) | | (.771) | | .345 | | .915 |
| Distributions from net investment income | | (.186) | | (.363) | | (.313) | | (.223) | | (.245) | | (.299) |
| Distributions from net realized gain | | - | | - | | - | | (.006) | | (.450) | | (.136) |
| Total distributions | | (.186) | | (.363) | | (.313) | | (.229) | | (.695) | | (.435) |
| Net asset value, end of period | $ | 9.20 | $ | 8.93 | $ | 9.09 | $ | 9.60 | $ | 10.60 | $ | 10.95 |
Total Return C,D | | | | 2.30% | | (2.02)% | | (7.41)% | | 3.10% | | 8.94% |
Ratios to Average Net Assets B,E,F | | | | | | | | | | | | |
| Expenses before reductions | | .30% G | | .30% | | .30% | | .30% | | .31% | | .32% |
| Expenses net of fee waivers, if any | | | | .05% | | .05% | | .05% | | .06% | | .07% |
| Expenses net of all reductions | | .05% G | | .05% | | .05% | | .05% | | .06% | | .07% |
| Net investment income (loss) | | 4.29% G | | 4.23% | | 3.52% | | 2.14% | | 2.18% | | 2.83% |
| Supplemental Data | | | | | | | | | | | | |
| Net assets, end of period (000 omitted) | $ | 70,773,654 | $ | 66,499,441 | $ | 64,361,426 | $ | 47,891,014 | $ | 35,955,537 | $ | 24,774,315 |
Portfolio turnover rate H | | | | 207% | | 202% | | 201% | | 191% | | 247% |
ACalculated based on average shares outstanding during the period.
BNet investment income (loss) is affected by the timing of the declaration of dividends by any underlying mutual funds or exchange-traded funds (ETFs). Net investment income (loss) of any mutual funds or ETFs is not included in the Fund's net investment income (loss) ratio.
CTotal returns for periods of less than one year are not annualized.
DTotal returns would have been lower if certain expenses had not been reduced during the applicable periods shown.
EFees and expenses of any underlying mutual funds or exchange-traded funds (ETFs) are not included in the Fund's expense ratio. The Fund indirectly bears its proportionate share of these expenses. For additional expense information related to investments in Fidelity Central Funds, please refer to the "Investments in Fidelity Central Funds" note found in the Notes to Financial Statements section of the most recent Annual or Semi-Annual report.
FExpense ratios reflect operating expenses of the class. Expenses before reductions do not reflect amounts reimbursed, waived, or reduced through arrangements with the investment adviser, brokerage services, or other offset arrangements, if applicable, and do not represent the amount paid by the class during periods when reimbursements, waivers or reductions occur.
GAnnualized.
HAmount does not include the portfolio activity of any underlying mutual funds or exchange-traded funds (ETFs), derivatives or securities that mature within one year from acquisition.
Notes to Financial Statements
(Unaudited)For the period ended November 30, 2024
1. Organization.
Strategic Advisers Fidelity Core Income Fund (the Fund) is a fund of Fidelity Rutland Square Trust II (the Trust), and is authorized to issue an unlimited number of shares. The Trust is registered under the Investment Company Act of 1940, as amended (the 1940 Act), as an open-end management investment company organized as a Delaware statutory trust. The Fund is offered exclusively to certain managed account clients of Strategic Advisers LLC (Strategic Advisers), an affiliate of Fidelity Management & Research Company LLC (FMR).
2. Significant Accounting Policies.
The Fund is an investment company and applies the accounting and reporting guidance of the Financial Accounting Standards Board (FASB) Accounting Standards Codification Topic 946 Financial Services - Investment Companies. The financial statements have been prepared in conformity with accounting principles generally accepted in the United States of America (GAAP), which require management to make certain estimates and assumptions at the date of the financial statements. Actual results could differ from those estimates. Subsequent events, if any, through the date that the financial statements were issued have been evaluated in the preparation of the financial statements. The Fund's Schedule of Investments lists any underlying mutual funds or exchange-traded funds (ETFs) but does not include the underlying holdings of these funds. The following summarizes the significant accounting policies of the Fund:
Investment Valuation. Investments are valued as of 4:00 p.m. Eastern time on the last calendar day of the period. The Board of Trustees (the Board) has designated the Fund's investment adviser as the valuation designee responsible for the fair valuation function and performing fair value determinations as needed. The investment adviser has established a Fair Value Committee (the Committee) to carry out the day-to-day fair valuation responsibilities and has adopted policies and procedures to govern the fair valuation process and the activities of the Committee. In accordance with these fair valuation policies and procedures, which have been approved by the Board, the Fund attempts to obtain prices from one or more third party pricing services or brokers to value its investments. When current market prices, quotations or currency exchange rates are not readily available or reliable, investments will be fair valued in good faith by the Committee, in accordance with the policies and procedures. Factors used in determining fair value vary by investment type and may include market or investment specific events, transaction data, estimated cash flows, and market observations of comparable investments. The frequency that the fair valuation procedures are used cannot be predicted and they may be utilized to a significant extent. The Committee manages the Fund's fair valuation practices and maintains the fair valuation policies and procedures. The Fund's investment adviser reports to the Board information regarding the fair valuation process and related material matters.
The Fund categorizes the inputs to valuation techniques used to value its investments into a disclosure hierarchy consisting of three levels as shown below:
Level 1 - unadjusted quoted prices in active markets for identical investments
Level 2 - other significant observable inputs (including quoted prices for similar investments, interest rates, prepayment speeds, etc.)
Level 3 - unobservable inputs (including the Fund's own assumptions based on the best information available)
Valuation techniques used to value the Fund's investments by major category are as follows:
Debt securities, including restricted securities, are valued based on evaluated prices received from third party pricing services or from brokers who make markets in such securities. Corporate bonds, bank notes, bank loan obligations, foreign government and government agency obligations, municipal securities, preferred securities, supranational obligations and U.S. government and government agency obligations are valued by pricing services who utilize matrix pricing which considers yield or price of bonds of comparable quality, coupon, maturity and type or by broker-supplied prices. Asset backed securities, collateralized mortgage obligations, commercial mortgage securities and U.S. government agency mortgage securities are valued by pricing services who utilize matrix pricing which considers prepayment speed assumptions, attributes of the collateral, yield or price of bonds of comparable quality, coupon, maturity and type or by broker-supplied prices. Swaps are marked-to-market daily based on valuations from third party pricing services, registered derivatives clearing organizations (clearinghouses) or broker-supplied valuations. These pricing sources may utilize inputs such as interest rate curves, credit spread curves, default possibilities and recovery rates. When independent prices are unavailable or unreliable, debt securities and swaps may be valued utilizing pricing methodologies which consider similar factors that would be used by third party pricing services. For foreign debt securities, when significant market or security specific events arise, valuations may be determined in good faith in accordance with procedures adopted by the Board. Debt securities and swaps are generally categorized as Level 2 in the hierarchy but may be Level 3 depending on the circumstances.
Equity securities, including restricted securities, for which market quotations are readily available, are valued at the last reported sale price or official closing price as reported by a third party pricing service on the primary market or exchange on which they are traded and are categorized as Level 1 in the hierarchy. In the event there were no sales during the day or closing prices are not available, securities are valued at the last quoted bid price or may be valued using the last available price and are generally categorized as Level 2 in the hierarchy. For equity securities, including restricted securities, where observable inputs are limited, assumptions about market activity and risk are used and these securities may be categorized as Level 3 in the hierarchy.
The U.S. dollar value of forward foreign currency contracts is determined using currency exchange rates supplied by a pricing service and are categorized as Level 2 in the hierarchy. Futures contracts are valued at the settlement price established each day by the board of trade or exchange on which they are traded and are categorized as Level 1 in the hierarchy. Options traded over-the-counter are valued using service or broker-supplied valuations and are categorized as Level 2 in the hierarchy. Investments in open-end mutual funds, including the Fidelity Central Funds, are valued at their closing net asset value (NAV) each business day and are categorized as Level 1 in the hierarchy. Short-term securities with remaining maturities of sixty days or less may be valued at amortized cost, which approximates fair value, and are categorized as Level 2 in the hierarchy.
Changes in valuation techniques may result in transfers in or out of an assigned level within the disclosure hierarchy. The aggregate value of investments by input level as of November 30, 2024 is included at the end of the Fund's Schedule of Investments.
Foreign Currency. Foreign-denominated assets, including investment securities, and liabilities are translated into U.S. dollars at the exchange rates at period end. Purchases and sales of investment securities, income and dividends received, and expenses denominated in foreign currencies are translated into U.S. dollars at the exchange rate in effect on the transaction date.
The effects of exchange rate fluctuations on investments are included with the net realized and unrealized gain (loss) on investment securities. Other foreign currency transactions resulting in realized and unrealized gain (loss) are disclosed separately.
Realized gains and losses on foreign currency transactions arise from the disposition of foreign currency, realized changes in the value of foreign currency between the trade and settlement dates on security transactions, and the difference between the amounts of dividends, interest and foreign withholding taxes recorded on transaction date and the U.S. dollar equivalent of the amounts actually received or paid. Unrealized gains and losses on assets and liabilities in foreign currencies arise from changes in the value of foreign currency, and from assets and liabilities denominated in foreign currencies, other than investments, which are held at period end.
Investment Transactions and Income. For financial reporting purposes, the Fund's investment holdings and NAV include trades executed through the end of the last business day of the period. The NAV per share for processing shareholder transactions is calculated as of the close of business of the New York Stock Exchange (NYSE), normally 4:00 p.m. Eastern time and includes trades executed through the end of the prior business day. Gains and losses on securities sold are determined on the basis of identified cost. Commissions paid to certain brokers with whom the investment adviser, or its affiliates, places trades on behalf of a fund include an amount in addition to trade execution, which may be rebated back to a fund. Any such rebates are included in net realized gain (loss) on investments in the Statement of Operations. Dividend income is recorded on the ex-dividend date. Income and capital gain distributions from Fidelity Central Funds, if any, are recorded on the ex-dividend date. Income and capital gain distributions from any underlying mutual funds or exchange-traded funds (ETFs) are recorded on the ex-dividend date. Interest income is accrued as earned and includes coupon interest and amortization of premium and accretion of discount on debt securities as applicable. Paid in Kind (PIK) income is recorded at the fair market value of the securities received. Investment income is recorded net of foreign taxes withheld where recovery of such taxes is uncertain. Debt obligations may be placed on non-accrual status and related interest income may be reduced by ceasing current accruals and writing off interest receivables when the collection of all or a portion of interest has become doubtful based on consistently applied procedures. A debt obligation is removed from non-accrual status when the issuer resumes interest payments or when collectability of interest is reasonably assured. Funds may file withholding tax reclaims in certain jurisdictions to recover a portion of amounts previously withheld. Any withholding tax reclaims income is included in the Statement of Operations in interest. Any receivables for withholding tax reclaims are included in the Statement of Assets and Liabilities in interest receivable.
Expenses. Expenses directly attributable to a fund are charged to that fund. Expenses attributable to more than one fund are allocated among the respective funds on the basis of relative net assets or other appropriate methods. Expenses included in the accompanying financial statements reflect the expenses of that fund and do not include any expenses associated with any underlying mutual funds or exchange-traded funds. Although not included in a fund's expenses, a fund indirectly bears its proportionate share of these expenses through the net asset value of each underlying mutual fund or exchange-traded fund. Expense estimates are accrued in the period to which they relate and adjustments are made when actual amounts are known.
Deferred Trustee Compensation. Under a Deferred Compensation Plan (the Plan) for certain Funds, certain independent Trustees have elected to defer receipt of a portion of their annual compensation. Deferred amounts are invested in affiliated mutual funds, are marked-to-market and remain in a fund until distributed in accordance with the Plan. The investment of deferred amounts and the offsetting payable to the Trustees presented below are included in the accompanying Statement of Assets and Liabilities in other receivables and other payables and accrued expenses, as applicable.
| Strategic Advisers Fidelity Core Income Fund | $44,980 |
Income Tax Information and Distributions to Shareholders. Each year, the Fund intends to qualify as a regulated investment company under Subchapter M of the Internal Revenue Code, including distributing substantially all of its taxable income and realized gains. As a result, no provision for U.S. Federal income taxes is required. The Fund files a U.S. federal tax return, in addition to state and local tax returns as required. The Fund's federal income tax returns are subject to examination by the Internal Revenue Service (IRS) for a period of three fiscal years after they are filed. State and local tax returns may be subject to examination for an additional fiscal year depending on the jurisdiction. Foreign taxes are provided for based on the Fund's understanding of the tax rules and rates that exist in the foreign markets in which it invests.
Distributions are declared and recorded daily and paid monthly from net investment income. Distributions from realized gains, if any, are declared and recorded on the ex-dividend date. Income and capital gain distributions are determined in accordance with income tax regulations, which may differ from GAAP.
Capital accounts within the financial statements are adjusted for permanent book-tax differences. These adjustments have no impact on net assets or the results of operations. Capital accounts are not adjusted for temporary book-tax differences which will reverse in a subsequent period.
Book-tax differences are primarily due to futures contracts, foreign currency transactions, swaps, market discount, partnerships, capital loss carryforwards and losses deferred due to wash sales and future contracts.
As of period end, the cost and unrealized appreciation (depreciation) in securities, and derivatives if applicable, for federal income tax purposes were as follows:
| Gross unrealized appreciation | $820,111,431 |
| Gross unrealized depreciation | (4,027,119,022) |
| Net unrealized appreciation (depreciation) | $(3,207,007,591) |
| Tax cost | $84,197,321,849 |
Capital loss carryforwards are only available to offset future capital gains of the Fund to the extent provided by regulations and may be limited. The capital loss carryforward information presented below, including any applicable limitation, is estimated as of prior fiscal period end and is subject to adjustment.
Short-term | $(1,041,818,903) |
Long-term | (1,876,619,758) |
| Total capital loss carryforward | $(2,918,438,661) |
Delayed Delivery Transactions and When-Issued Securities. During the period, certain Funds transacted in securities on a delayed delivery or when-issued basis. Payment and delivery may take place after the customary settlement period for that security. The price of the underlying securities and the date when the securities will be delivered and paid for are fixed at the time the transaction is negotiated. Securities purchased on a delayed delivery or when-issued basis are identified as such in the Schedule of Investments. Compensation for interest forgone in the purchase of a delayed delivery or when-issued debt security may be received. With respect to purchase commitments, each applicable Fund identifies securities as segregated in its records with a value at least equal to the amount of the commitment. Payables and receivables associated with the purchases and sales of delayed delivery securities having the same coupon, settlement date and broker are offset. Delayed delivery or when-issued securities that have been purchased from and sold to different brokers are reflected as both payables and receivables in the Statement of Assets and Liabilities under the caption "Delayed delivery", as applicable. Losses may arise due to changes in the value of the underlying securities or if the counterparty does not perform under the contract's terms, or if the issuer does not issue the securities due to political, economic, or other factors.
To-Be-Announced (TBA) Securities and Mortgage Dollar Rolls. TBA securities involve buying or selling mortgage-backed securities (MBS) on a forward commitment basis. A TBA transaction typically does not designate the actual security to be delivered and only includes an approximate principal amount; however delivered securities must meet specified terms defined by industry guidelines, including issuer, rate and current principal amount outstanding on underlying mortgage pools. Funds may enter into a TBA transaction with the intent to take possession of or deliver the underlying MBS, or a fund may elect to extend the settlement by entering into either a mortgage or reverse mortgage dollar roll. Mortgage dollar rolls are transactions where a fund sells TBA securities and simultaneously agrees to repurchase MBS on a later date at a lower price and with the same counterparty. Reverse mortgage dollar rolls involve the purchase and simultaneous agreement to sell TBA securities on a later date at a lower price. Transactions in mortgage dollar rolls and reverse mortgage dollar rolls are accounted for as purchases and sales and may result in an increase to a fund's portfolio turnover rate.
Purchases and sales of TBA securities involve risks similar to those discussed above for delayed delivery and when-issued securities. Also, if the counterparty in a mortgage dollar roll or a reverse mortgage dollar roll transaction files for bankruptcy or becomes insolvent, a fund's right to repurchase or sell securities may be limited. Additionally, when a fund sells TBA securities without already owning or having the right to obtain the deliverable securities (an uncovered forward commitment to sell), it incurs a risk of loss because it could have to purchase the securities at a price that is higher than the price at which it sold them. A fund may be unable to purchase the deliverable securities if the corresponding market is illiquid.
TBA securities subject to a forward commitment to sell at period end are included at the end of the Schedule of Investments under the caption "TBA Sale Commitments." The value of these commitments and proceeds to be received at contractual settlement date are reflected in the Statement of Assets and Liabilities as "TBA sale commitments, at value" and "Receivable for TBA sale commitments," respectively. If the TBA sale commitment is closed through the acquisition of an offsetting TBA purchase commitment, a fund realizes a gain or loss. If a fund delivers securities under the commitment, a fund realizes a gain or loss from the sale of the securities based upon the price established at the date the commitment was entered into.
Restricted Securities (including Private Placements). Funds may invest in securities that are subject to legal or contractual restrictions on resale. These securities generally may be resold in transactions exempt from registration or to the public if the securities are registered. Disposal of these securities may involve time-consuming negotiations and expense, and prompt sale at an acceptable price may be difficult. Information regarding restricted securities held at period end is included at the end of the Schedule of Investments, if applicable.
Loans and Other Direct Debt Instruments. Direct debt instruments are interests in amounts owed to lenders by corporate or other borrowers. These instruments may be in the form of loans, trade claims or other receivables and may include standby financing commitments such as revolving credit facilities that obligate a fund to supply additional cash to the borrower on demand. Loans may be acquired through assignment, participation, or may be made directly to a borrower. Such instruments are presented in the Bank Loan Obligations section in the Schedule of Investments. Certain funds may also invest in unfunded loan commitments, which are contractual obligations for future funding. Information regarding unfunded commitments is included at the end of the Schedule of Investments, if applicable.
New Accounting Pronouncement. In November 2023, the FASB issued Accounting Standards Update (ASU) 2023-07 Segment Reporting (Topic 280): Improvements to Reportable Segment Disclosures. Effective for fiscal years beginning after December 15, 2023 and interim periods within fiscal years beginning after December 15, 2024, the amendments enhance required disclosures of segment information for public entities on an annual and interim basis. The ASU allows for early adoption with updates applied retrospectively. Management is currently evaluating the impact of the ASU but does not expect this guidance to materially impact the financial statements.
3. Derivative Instruments.
Risk Exposures and the Use of Derivative Instruments. The Fund's investment objectives allow for various types of derivative instruments, including futures contracts, forward foreign currency contracts, options and swaps. Derivatives are investments whose value is primarily derived from underlying assets, indices or reference rates and may be transacted on an exchange or over-the-counter (OTC). Derivatives may involve a future commitment to buy or sell a specified asset based on specified terms, to exchange future cash flows at periodic intervals based on a notional principal amount, or for one party to make one or more payments upon the occurrence of specified events in exchange for periodic payments from the other party.
Derivatives were used to increase returns, to gain exposure to certain types of assets, to facilitate transactions in foreign-denominated securities and to manage exposure to certain risks as defined below. The success of any strategy involving derivatives depends on analysis of numerous economic factors, and if the strategies for investment do not work as intended, the objectives may not be achieved.
Derivatives were used to increase or decrease exposure to the following risk(s):
| Credit Risk | Credit risk relates to the ability of the issuer of a financial instrument to make further principal or interest payments on an obligation or commitment that it has to a fund. |
| Foreign Exchange Risk | Foreign exchange rate risk relates to fluctuations in the value of an asset or liability due to changes in currency exchange rates. |
| Interest Rate Risk | Interest rate risk relates to the fluctuations in the value of interest-bearing securities due to changes in the prevailing levels of market interest rates. |
Funds are also exposed to additional risks from investing in derivatives, such as liquidity risk and counterparty credit risk. Liquidity risk is the risk that a fund will be unable to close out the derivative in the open market in a timely manner. Counterparty credit risk is the risk that the counterparty will not be able to fulfill its obligation to a fund. Derivative counterparty credit risk is managed through formal evaluation of the creditworthiness of all potential counterparties. On certain OTC derivatives such as forward foreign currency contracts, options and bi-lateral swaps, a fund attempts to reduce its exposure to counterparty credit risk by entering into an International Swaps and Derivatives Association, Inc. (ISDA) Master Agreement with each of its counterparties. The ISDA Master Agreement gives a fund the right to terminate all transactions traded under such agreement upon the deterioration in the credit quality of the counterparty beyond specified levels. The ISDA Master Agreement gives each party the right, upon an event of default by the other party or a termination of the agreement, to close out all transactions traded under such agreement and to net amounts owed under each transaction to one net payable by one party to the other. To mitigate counterparty credit risk on bi-lateral OTC derivatives, a fund receives collateral in the form of cash or securities once net unrealized appreciation on outstanding derivative contracts under an ISDA Master Agreement exceeds certain applicable thresholds, subject to certain minimum transfer provisions. The collateral received is held in segregated accounts with the custodian bank in accordance with the collateral agreements entered into between a fund, the counterparty and the custodian bank. A fund could experience delays and costs in gaining access to the collateral even though it is held by the custodian bank. The maximum risk of loss to a fund from counterparty credit risk related to bi-lateral OTC derivatives is generally the aggregate unrealized appreciation and unpaid counterparty payments in excess of any collateral pledged by the counterparty to a fund. A fund may be required to pledge collateral for the benefit of the counterparties on bi-lateral OTC derivatives in an amount not less than each counterparty's unrealized appreciation on outstanding derivative contracts, subject to certain minimum transfer provisions, and any such pledged collateral is identified in the Schedule of Investments. Exchange-traded contracts are not covered by the ISDA Master Agreement; however counterparty credit risk related to these contracts may be mitigated by the protection provided by the exchange on which they trade. Counterparty credit risk related to centrally cleared swaps may be mitigated by the protection provided by the clearinghouse.
Investing in derivatives may involve greater risks than investing in the underlying assets directly and, to varying degrees, may involve risk of loss in excess of any initial investment and collateral received and amounts recognized in the Statement of Assets and Liabilities. In addition, there may be the risk that the change in value of the derivative contract does not correspond to the change in value of the underlying instrument.
Net Realized Gain (Loss) and Change in Net Unrealized Appreciation (Depreciation) on Derivatives. The table below, which reflects the impacts of derivatives on the financial performance, summarizes the net realized gain (loss) and change in net unrealized appreciation (depreciation) for derivatives during the period as presented in the Statement of Operations.
| Primary Risk Exposure / Derivative Type | Net Realized Gain (Loss)($) | Change in Net Unrealized Appreciation (Depreciation)($) |
| Strategic Advisers Fidelity Core Income Fund | | |
| Credit Risk | | |
| Swaps | (334,963) | 1,719,701 |
| Total Credit Risk | (334,963) | 1,719,701 |
| Foreign Exchange Risk | | |
| Forward Foreign Currency Contracts | (8,597,742) | 13,696,181 |
| Total Foreign Exchange Risk | (8,597,742) | 13,696,181 |
| Interest Rate Risk | | |
| Futures Contracts | (27,573,057) | 408,386 |
| Purchased Options | (1,075,888) | (4,147,191) |
| Swaps | (21,227,113) | 26,988,082 |
| Total Interest Rate Risk | (49,876,058) | 23,249,277 |
| Totals | (58,808,763) | 38,665,159 |
If there are any open positions at period end, a summary of the value of derivatives by primary risk exposure is included at the end of the Schedule of Investments.
Forward Foreign Currency Contracts. Forward foreign currency contracts represent obligations to purchase or sell foreign currency on a specified future date at a price fixed at the time the contracts are entered into. Forward foreign currency contracts were used to facilitate transactions in foreign-denominated securities and to manage exposure to certain foreign currencies.
Forward foreign currency contracts are valued daily and fluctuations in exchange rates on open contracts are recorded as unrealized appreciation or (depreciation) and reflected in total accumulated earnings (loss) in the Statement of Assets and Liabilities. When the contract is closed, a gain or loss is realized equal to the difference between the closing value and the value at the time it was opened. Non-deliverable forward foreign currency exchange contracts are settled with the counterparty in cash without the delivery of foreign currency. The net realized gain (loss) and change in net unrealized appreciation (depreciation) on forward foreign currency contracts during the period is presented in the Statement of Operations.
Any open forward foreign currency contracts at period end are presented in the Schedule of Investments under the caption "Forward Foreign Currency Contracts." The contract amount and unrealized appreciation (depreciation) reflects each contract's exposure to the underlying currency at period end, and is representative of volume of activity during the period unless an average contract value is presented.
Futures Contracts. A futures contract is an agreement between two parties to buy or sell a specified underlying instrument for a fixed price at a specified future date. Futures contracts were used to manage exposure to the bond market and fluctuations in interest rates.
Upon entering into a futures contract, a fund is required to deposit either cash or securities (initial margin) with a clearing broker in an amount equal to a certain percentage of the face value of the contract. Futures contracts are marked-to-market daily and subsequent daily payments are made or received by a fund depending on the daily fluctuations in the value of the futures contracts and are recorded as unrealized appreciation or (depreciation). This receivable and/or payable, if any, is included in daily variation margin on futures contracts in the Statement of Assets and Liabilities. Realized gain or (loss) is recorded upon the expiration or closing of a futures contract. The net realized gain (loss) and change in net unrealized appreciation (depreciation) on futures contracts during the period is presented in the Statement of Operations.
Any open futures contracts at period end are presented in the Schedule of Investments under the caption "Futures Contracts". The notional amount at value reflects each contract's exposure to the underlying instrument or index at period end, and is representative of volume of activity during the period unless an average notional amount is presented. Any securities deposited to meet initial margin requirements are identified in the Schedule of Investments. Any cash deposited to meet initial margin requirements is presented as segregated cash with brokers for derivative instruments in the Statement of Assets and Liabilities.
Options. Options give the purchaser the right, but not the obligation, to buy (call) or sell (put) an underlying security or financial instrument at an agreed exercise or strike price between or on certain dates. Options obligate the seller (writer) to buy (put) or sell (call) an underlying instrument at the exercise or strike price or cash settle an underlying derivative instrument if the holder exercises the option on or before the expiration date. OTC options, such as swaptions, which are options where the underlying instrument is a swap, were used to manage exposure to fluctuations in interest rates.
Upon entering into an options contract, a fund will pay or receive a premium. Premiums paid on purchased options are reflected as cost of investments and premiums received on written options are reflected as a liability on the Statement of Assets and Liabilities. Certain options may be purchased or written with premiums to be paid or received on a future date. Options are valued daily and any unrealized appreciation (depreciation) is reflected in total accumulated earnings (loss) in the Statement of Assets and Liabilities. When an option is exercised, the cost or proceeds of the underlying instrument purchased or sold is adjusted by the amount of the premium. When an option is closed, a gain or loss is realized depending on whether the proceeds or amount paid for the closing sale transaction is greater or less than the premium received or paid. When an option expires, gains and losses are realized to the extent of premiums received and paid, respectively. The net realized and unrealized gains (losses) on purchased options are included in the Statement of Operations in net realized gain (loss) and change in net unrealized appreciation (depreciation) on investment securities. The net realized gain (loss) and change in net unrealized appreciation (depreciation) on written options are presented in the Statement of Operations.
Any open options at period end are presented in the Schedule of Investments under the captions "Purchased Options," "Purchased Swaptions," "Written Options" and "Written Swaptions," as applicable, and are representative of volume of activity during the period unless an average notional amount is presented.
Writing puts and buying calls tend to increase exposure to the underlying instrument while buying puts and writing calls tend to decrease exposure to the underlying instrument. For purchased options, risk of loss is limited to the premium paid, and for written options, risk of loss is the change in value in excess of the premium received.
Swaps. A swap is a contract between two parties to exchange future cash flows at periodic intervals based on a notional principal amount. A bi-lateral OTC swap is a transaction between a fund and a dealer counterparty where cash flows are exchanged between the two parties for the life of the swap. A centrally cleared swap is a transaction executed between a fund and a dealer counterparty, then cleared by a futures commission merchant (FCM) through a clearinghouse. Once cleared, the clearinghouse serves as a central counterparty, with whom a fund exchanges cash flows for the life of the transaction, similar to transactions in futures contracts.
Bi-lateral OTC swaps are marked-to-market daily and changes in value are reflected in the Statement of Assets and Liabilities in the bi-lateral OTC swaps at value line items. Any upfront premiums paid or received upon entering a bi-lateral OTC swap to compensate for differences between stated terms of the swap and prevailing market conditions (e.g. credit spreads, interest rates or other factors) are recorded in total accumulated earnings (loss) in the Statement of Assets and Liabilities and amortized to realized gain or (loss) ratably over the term of the swap. Any unamortized upfront premiums are presented in the Schedule of Investments.
Centrally cleared swaps require a fund to deposit either cash or securities (initial margin) with the FCM, at the instruction of and for the benefit of the clearinghouse. Any securities deposited to meet initial margin requirements are identified in the Schedule of Investments. Any cash deposited to meet initial margin requirements is presented in segregated cash with brokers for derivative instruments in the Statement of Assets and Liabilities. Centrally cleared swaps are marked-to-market daily and subsequent payments (variation margin) are made or received depending on the daily fluctuations in the value of the swaps and are recorded as unrealized appreciation or (depreciation). These daily payments, if any, are included in receivable or payable for daily variation margin on centrally cleared swaps in the Statement of Assets and Liabilities. Any premiums for centrally cleared swaps are recorded periodically throughout the term of the swap to variation margin and included in total accumulated earnings (loss) in the Statement of Assets and Liabilities. Any premiums are recognized as realized gain (loss) upon termination or maturity of the swap.
For both bi-lateral and centrally cleared swaps, payments are exchanged at specified intervals, accrued daily commencing with the effective date of the contract and recorded as realized gain or (loss). Some swaps may be terminated prior to the effective date and realize a gain or loss upon termination. The net realized gain (loss) and change in net unrealized appreciation (depreciation) on swaps during the period is presented in the Statement of Operations.
Any open swaps at period end are included in the Schedule of Investments under the caption "Swaps", and are representative of volume of activity during the period unless an average notional amount is presented.
Credit Default Swaps. Credit default swaps enable a fund to buy or sell protection against specified credit events on a single-name issuer or a traded credit index. Under the terms of a credit default swap the buyer of protection (buyer) receives credit protection in exchange for making periodic payments to the seller of protection (seller) based on a fixed percentage applied to a notional principal amount. In return for these payments, the seller will be required to make a payment upon the occurrence of one or more specified credit events. A fund enters into credit default swaps as a seller to gain credit exposure to an issuer and/or as a buyer to obtain a measure of protection against defaults of an issuer. Periodic payments are made over the life of the contract by the buyer provided that no credit event occurs.
For credit default swaps on most corporate and sovereign issuers, credit events include bankruptcy, failure to pay or repudiation/moratorium. For credit default swaps on corporate or sovereign issuers, the obligation that may be put to the seller is not limited to the specific reference obligation described in the Schedule of Investments. For credit default swaps on asset-backed securities, a credit event may be triggered by events such as failure to pay principal, maturity extension, rating downgrade or write-down. For credit default swaps on asset-backed securities, the reference obligation described represents the security that may be put to the seller. For credit default swaps on a traded credit index, a specified credit event may affect all or individual underlying securities included in the index.
As a seller, if an underlying credit event occurs, a fund will pay a net settlement amount of cash equal to the notional amount of the swap less the recovery value of the reference obligation or underlying securities comprising an index. Only in the event of the industry's inability to value the underlying asset will a fund be required to take delivery of the reference obligation or underlying securities comprising an index and pay an amount equal to the notional amount of the swap.
As a buyer, if an underlying credit event occurs, a fund will receive a net settlement amount of cash equal to the notional amount of the swap less the recovery value of the reference obligation or underlying securities comprising an index. Only in the event of the industry's inability to value the underlying asset will a fund be required to deliver the reference obligation or underlying securities comprising an index in exchange for payment of an amount equal to the notional amount of the swap.
Typically, the value of each credit default swap and credit rating disclosed for each reference obligation in the Schedule of Investments, where a fund is the seller, can be used as measures of the current payment/performance risk of the swap. As the value of the swap changes as a positive or negative percentage of the total notional amount, the payment/performance risk may decrease or increase, respectively. In addition to these measures, the investment adviser monitors a variety of factors including cash flow assumptions, market activity and market sentiment as part of its ongoing process of assessing payment/performance risk.
Interest Rate Swaps. Interest rate swaps are agreements between counterparties to exchange cash flows, one based on a fixed rate, and the other on a floating rate. A fund enters into interest rate swaps to manage its exposure to interest rate changes. Changes in interest rates can have an effect on both the value of bond holdings as well as the amount of interest income earned. In general, the value of bonds can fall when interest rates rise and can rise when interest rates fall.
4. Purchases and Sales of Investments.
Purchases and sales of securities, other than short-term securities, U.S. government securities and in-kind transactions, as applicable, are noted in the table below.
| | Purchases ($) | Sales ($) |
| Strategic Advisers Fidelity Core Income Fund | 44,424,202,782 | 46,832,194,876 |
5. Fees and Other Transactions with Affiliates.
Management Fee. Strategic Advisers (the investment adviser) provides the Fund with investment management related services. For these services, the Fund pays a monthly management fee to the investment adviser. The management fee is calculated by adding the annual management fee rate of .25% of the Fund's average net assets throughout the month to the aggregate of the fee rates, payable monthly by the investment adviser, to the Fund's sub-advisers. The Fund's maximum aggregate management fee will not exceed .60% of the Fund's average net assets. For the reporting period, the total annualized management fee rate was .29% of the Fund's average net assets.
During the period, the investment adviser waived a portion of its management fee as described in the Expense Reductions note.
Sub-Adviser. FIAM LLC (an affiliate of the investment adviser) served as a sub-adviser for the Fund during the period. Sub-advisers provide discretionary investment advisory services for their allocated portion of the Fund's assets and are paid as described in the Management Fee note.
Effective January 1, 2025, the sub-subadvisory agreements between FIAM LLC (FIAM) and each of FMR Investment Management (UK) Limited, Fidelity Management & Research (Hong Kong) Limited, and Fidelity Management & Research (Japan) Limited (collectively, the Sub-Subadvisers) were amended. FIAM or an affiliate, and not the fund, pays the Sub-Subadvisers. Under the terms of the sub-subadvisory agreements, FIAM or an affiliate pays each Sub-Subadviser monthly fees equal to 110% of the Sub-Subadviser's costs for providing sub-subadvisory services.
Interfund Trades. Funds may purchase from or sell securities to other funds affiliated with each sub-adviser under procedures adopted by the Board. The procedures have been designed to ensure these interfund trades are executed in accordance with Rule 17a-7 of the 1940 Act. Any interfund trades are included within the respective purchases and sales amounts shown in the Purchases and Sales of Investments note. During the period, there were no interfund trades.
Affiliated Exchanges In-Kind. During the period, the Fund redeemed shares of Fidelity Inflation-Protected Bond Index Fund, Fidelity Short-Term Treasury Bond Index Fund and Fidelity Intermediate Treasury Bond Index Fund, in exchange for investments and cash, if any, as noted in the table below. The Fund had a net realized gain of $110,469,109 on the Fund's redemptions of Fidelity Inflation-Protected Bond Index Fund, Fidelity Short-Term Treasury Bond Index Fund and Fidelity Intermediate Treasury Bond Index Fund, which is included in "Net Realized gain (loss) - Affiliated Issuers" in the accompanying Statement of Operations. The Fund recognized a net gain on the exchanges for federal income tax purposes.
| Fund Name | Value of Investments ($) | Net realized gain (loss) ($) | Shares redeemed |
| Fidelity Inflation-Protected Bond Index Fund | 237,483,980 | 2,544,993 | 25,563,399 |
| Fidelity Short-Term Treasury Bond Index Fund | 130,000,683 | 7,987,613 | 12,488,058 |
| Fidelity Intermediate Treasury Bond Index Fund | 2,528,810,977 | 99,936,503 | 252,881,098 |
Other. During the period, the investment adviser reimbursed the Fund for certain losses as follows:
| | Amount ($) |
| Strategic Advisers Fidelity Core Income Fund | 4,840 |
6. Investments in Fidelity Central Funds.
Funds may invest in Fidelity Central Funds, which are open-end investment companies generally available only to other investment companies and accounts managed by the investment adviser and its affiliates. The Schedule of Investments lists any Fidelity Central Funds held as an investment as of period end, but does not include the underlying holdings of each Fidelity Central Fund. An investing fund indirectly bears its proportionate share of the expenses of the underlying Fidelity Central Funds.
Based on its investment objective, each Fidelity Central Fund may invest or participate in various investment vehicles or strategies that are similar to those of the investing fund. These strategies are consistent with the investment objectives of the investing fund and may involve certain economic risks which may cause a decline in value of each of the Fidelity Central Funds and thus a decline in the value of the investing fund.
| Fidelity Central Fund | Investment Manager | Investment Objective | Investment Practices | Expense RatioA |
| Fidelity Money Market Central Funds | Fidelity Management & Research Company LLC (FMR) | Each fund seeks to obtain a high level of current income consistent with the preservation of capital and liquidity. | Short-term Investments | Less than .005% |
A Expenses expressed as a percentage of average net assets and are as of each underlying Central Fund's most recent annual or semi-annual shareholder report.
A complete unaudited list of holdings for each Fidelity Central Fund is available upon request or at the Securities and Exchange Commission website at www.sec.gov. In addition, the financial statements of the Fidelity Central Funds, which are not covered by the Report of Independent Registered Public Accounting Firm, are available on the Securities and Exchange Commission website or upon request.
7. Committed Line of Credit.
Certain Funds participate with other funds managed by the investment adviser or an affiliate in a $4.25 billion credit facility (the "line of credit") to be utilized for temporary or emergency purposes to fund shareholder redemptions or for other short-term liquidity purposes. The participating funds have agreed to pay commitment fees on their pro-rata portion of the line of credit, which are reflected in Miscellaneous expenses on the Statement of Operations, and are listed below. During the period, there were no borrowings on this line of credit.
| | Amount ($) |
| Strategic Advisers Fidelity Core Income Fund | 44,873 |
8. Security Lending.
Funds lend portfolio securities from time to time in order to earn additional income. Lending agents are used, including National Financial Services (NFS), an affiliate of the investment adviser. Pursuant to a securities lending agreement, NFS will receive a fee, which is capped at 9.9% of a fund's daily lending revenue, for its services as lending agent. A fund may lend securities to certain qualified borrowers, including NFS. On the settlement date of the loan, a fund receives collateral (in the form of U.S. Treasury obligations, letters of credit and/or cash) against the loaned securities and maintains collateral in an amount not less than 100% of the market value of the loaned securities during the period of the loan. The market value of the loaned securities is determined at the close of business of a fund and any additional required collateral is delivered to a fund on the next business day. A fund or borrower may terminate the loan at any time, and if the borrower defaults on its obligation to return the securities loaned because of insolvency or other reasons, a fund may apply collateral received from the borrower against the obligation. A fund may experience delays and costs in recovering the securities loaned. Any cash collateral received is invested in the Fidelity Securities Lending Cash Central Fund. Any loaned securities are identified as such in the Schedule of Investments, and the value of loaned securities and cash collateral at period end, as applicable, are presented in the Statement of Assets and Liabilities. Security lending income represents the income earned on investing cash collateral, less rebates paid to borrowers and any lending agent fees associated with the loan, plus any premium payments received for lending certain types of securities. Security lending income is presented in the Statement of Operations as a component of income from Fidelity Central Funds. Affiliated security lending activity, if any, was as follows:
| | Total Security Lending Fees Paid to NFS ($) | Security Lending Income From Securities Loaned to NFS ($) | Value of Securities Loaned to NFS at Period End ($) |
| Strategic Advisers Fidelity Core Income Fund | 6,030 | - | - |
9. Expense Reductions.
The investment adviser has contractually agreed to waive the Fund's management fee in an amount equal to .25% of the Fund's average net assets until September 30, 2027. During the period, this waiver reduced the Fund's management fee by $85,429,780.
Through arrangements with the Fund's custodian, credits realized as a result of certain uninvested cash balances were used to reduce the Fund's expenses by $13,020.
10. Other.
A fund's organizational documents provide former and current trustees and officers with a limited indemnification against liabilities arising in connection with the performance of their duties to the fund. In the normal course of business, a fund may also enter into contracts that provide general indemnifications. A fund's maximum exposure under these arrangements is unknown as this would be dependent on future claims that may be made against a fund. The risk of material loss from such claims is considered remote.
Funds do not invest in underlying mutual funds for the purpose of exercising management or control; however, investments by funds within their principal investment strategies may represent a significant portion of the underlying mutual fund's net assets. At the end of the period, certain Funds were the owners of record of 10% or more of the total outstanding shares of the following underlying mutual funds as shown below.
| Fund | Strategic Advisers Fidelity Core Income Fund |
| Fidelity SAI Intermediate Treasury Bond Index Fund | 100% |
| Fidelity New Markets Income Fund | 25% |
| Fidelity Real Estate Income Fund | 25% |
| Fidelity SAI High Income Fund | 11% |
| Fidelity SAI International Credit Fund | 100% |
| Fidelity SAI Long-Term Treasury Bond Index Fund | 83% |
| Fidelity SAI Short-Term Bond Fund | 12% |
| Fidelity SAI Total Bond Fund | 83% |
| Fidelity SAI U.S. Treasury Bond Index Fund | 58% |
| Fidelity SAI Short-Term Treasury Bond Index Fund | 99% |
11. Risk and Uncertainties.
Many factors affect a fund's performance. Developments that disrupt global economies and financial markets, such as pandemics, epidemics, outbreaks of infectious diseases, war, terrorism, and environmental disasters, may significantly affect a fund's investment performance. The effects of these developments to a fund will be impacted by the types of securities in which a fund invests, the financial condition, industry, economic sector, and geographic location of an issuer, and a fund's level of investment in the securities of that issuer. Significant concentrations in security types, issuers, industries, sectors, and geographic locations may magnify the factors that affect a fund's performance.
Item 8: Changes in and Disagreements with Accountants for Open-End Management Investment Companies
(Unaudited)
Note: This is not applicable for any fund included in this document.
Item 9: Proxy Disclosures for Open-End Management Investment Companies
(Unaudited)
| A special meeting of shareholders was held on July 9, 2024. The results of votes taken among shareholders on the proposal before them are reported below. Each vote reported represents one dollar of net asset value held on the record date for the meeting. |
| Proposal 1 |
| To elect a Board of Trustees. |
| | # of Votes | % of Votes |
| Charles S. Morrison |
| Affirmative | 381,775,585,183.64 | 95.17 |
| Withheld | 19,363,639,577.49 | 4.83 |
| TOTAL | 401,139,224,761.13 | 100.00 |
| Nancy D. Prior |
| Affirmative | 381,252,305,731.53 | 95.04 |
| Withheld | 19,886,919,029.60 | 4.96 |
| TOTAL | 401,139,224,761.13 | 100.00 |
| Mary C. Farrell |
| Affirmative | 381,226,030,239.11 | 95.04 |
| Withheld | 19,913,194,522.02 | 4.96 |
| TOTAL | 401,139,224,761.13 | 100.00 |
| Karen Kaplan |
| Affirmative | 381,519,946,847.38 | 95.11 |
| Withheld | 19,619,277,913.75 | 4.89 |
| TOTAL | 401,139,224,761.13 | 100.00 |
| Christine Marcks |
| Affirmative | 380,186,327,029.51 | 94.78 |
| Withheld | 20,952,897,731.62 | 5.22 |
| TOTAL | 401,139,224,761.13 | 100.00 |
| Harold Singleton III |
| Affirmative | 382,499,458,473.65 | 95.35 |
| Withheld | 18,639,766,287.48 | 4.65 |
| TOTAL | 401,139,224,761.13 | 100.00 |
| Heidi L. Steiger |
| Affirmative | 380,661,676,515.00 | 94.90 |
| Withheld | 20,477,548,246.13 | 5.10 |
| TOTAL | 401,139,224,761.13 | 100.00 |
| | | |
| Proposal 1 reflects trust-wide proposal and voting results. |
Item 10: Remuneration Paid to Directors, Officers, and others of Open-End Management Investment Companies
(Unaudited)
Note: This information is disclosed as part of the financial statements for each Fund as part of Item 7: Financial Statements and Financial Highlights for Open-End Management Investment companies.
Item 11: Statement Regarding Basis for Approval of Investment Advisory Contract
(Unaudited)
Board Approval of Investment Advisory Contracts and Management Fees
Strategic Advisers Fidelity Core Income Fund
Each year, the Board of Trustees, including the Independent Trustees (together, the Board), considers the renewal of the fund's management contract with Strategic Advisers LLC (Strategic Advisers), the sub-advisory agreement with FIAM LLC (FIAM or the Sub-Adviser) (the Sub-Advisory Agreement), and the sub-sub-advisory agreements with FMR Investment Management (UK) Limited, Fidelity Management & Research (Japan) Limited, and Fidelity Management & Research (Hong Kong) Limited (each a Sub-Sub-Adviser and collectively, the Sub-Sub-Advisers) (collectively, the Sub-Sub-Advisory Agreements and, together with the management contract and the Sub-Advisory Agreement, the Advisory Contracts) for the fund. Strategic Advisers and the Sub-Adviser and Sub-Sub-Advisers, as applicable, are referred to herein as the Investment Advisers. The Board, assisted by the advice of fund counsel and Independent Trustees' counsel, requests and considers a broad range of information relevant to the renewal of the Advisory Contracts throughout the year.
The Board meets at least four times per year and, at each of its meetings, covers an extensive agenda of topics and materials and considers factors that are relevant to its annual consideration of the renewal of the fund's Advisory Contracts, including the services and support provided to the fund and its shareholders. The full Board or the Independent Trustees, as appropriate, act on all major matters; however, a portion of the activities of the Board (including certain of those described herein) may be conducted through standing committees that have been established by the Board. The Board, acting directly and through its committees, requests and receives information concerning the annual consideration of the renewal of the fund's Advisory Contracts.
At its September 2024 meeting, the Board, including the Independent Trustees, unanimously determined to renew the fund's Advisory Contracts. The Board also approved updating the address for notice of Strategic Advisers LLC in each Sub-Advisory Agreement. In reaching its determination to renew the fund's Advisory Contracts, the Board considered all factors it believed relevant, including (i) the nature, extent, and quality of the services provided to the fund and its shareholders (including the investment performance of the fund); (ii) the competitiveness relative to peer funds of the fund's management fee and total expenses; (iii) the total costs of the services provided by and the profits, if any, realized by Strategic Advisers from its relationships with the fund; and (iv) the extent to which, if any, economies of scale exist and are realized as the fund grows and whether any economies of scale are appropriately shared with fund shareholders. The Board's decision to renew the Advisory Contracts was not based on any single factor, but rather was based on a comprehensive consideration of all the information provided to the Board throughout the year.
The Board reached a determination, with the assistance of fund counsel and Independent Trustees' counsel and through the exercise of its business judgment, that the renewal of the Advisory Contracts is in the best interests of the fund and its shareholders. In addition, the Board concluded that the renewal of the Sub-Advisory Agreement and Sub-Sub-Advisory Agreements do not involve a conflict of interest from which Strategic Advisers or its affiliates derive an inappropriate advantage. Also, the Board found that the advisory fees charged under the Advisory Contracts bear a reasonable relationship to the services rendered.
Nature, Extent, and Quality of Services Provided. The Board considered the staffing within the Investment Advisers, including the backgrounds of the fund's investment personnel and also considered the fund's investment objective, strategies, and related investment philosophy. The Independent Trustees also had discussions with senior management of Strategic Advisers' investment operations and investment groups. The Board considered the structure of each Investment Adviser's investment personnel compensation program and whether such structures provide appropriate incentives to act in the best interests of the fund.
The Trustees also discussed with representatives of Strategic Advisers, at meetings throughout the year, Strategic Advisers' role in, among other things, (i) setting, implementing and monitoring the investment strategies for the funds; (ii) identifying and recommending sub-advisers for the funds; (iii) overseeing compliance with federal securities laws by each sub-adviser with respect to the portion of fund assets allocated to the sub-adviser; (iv) monitoring and overseeing the performance and investment capabilities of each sub-adviser; and (v) recommending the replacement of a sub-adviser as appropriate. The Trustees considered that the Board had received from Strategic Advisers substantial information and periodic reports about Strategic Advisers' sub-adviser oversight and due diligence processes, as well as periodic reports regarding the performance of each sub-adviser.
The Board also considered the nature, extent and quality of services provided by the Sub-Adviser. The Trustees noted that under the Sub-Advisory Agreement subject to oversight by Strategic Advisers, the Sub-Adviser is responsible for, among other things, identifying investments for the portion of fund assets allocated to the Sub-Adviser, if any, and executing portfolio transactions to implement its investment strategy. In addition, the Trustees noted that the Sub-Adviser is responsible for providing such reporting as may be requested from Strategic Advisers to fulfill its oversight responsibilities discussed above.
Resources Dedicated to Investment Management and Support Services. The Board reviewed the general qualifications and capabilities of the Investment Advisers' investment staffs, their use of technology, and the Investment Advisers' approach to managing and compensating investment personnel. The Board noted that the Investment Advisers' analysts have extensive resources, tools, and capabilities that allow them to conduct sophisticated quantitative and/or fundamental analysis. Additionally, in its deliberations, the Board considered the Investment Advisers' trading capabilities and resources and global compliance infrastructure, which are integral parts of the investment management process.
Shareholder and Administrative Services. The Board considered (i) the nature, extent, quality, and cost of administrative and shareholder services performed by Strategic Advisers and its affiliates under the management contract and under separate agreements covering transfer agency, pricing and bookkeeping, and securities lending services for the fund; (ii) the nature and extent of Strategic Advisers' supervision of third party service providers, including sub-advisers, custodians and subcustodians; and (iii) the resources devoted to, and the record of compliance with, the fund's compliance policies and procedures.
Investment Performance. In connection with the renewal of the Advisory Contracts, the Board considered annualized return information for the fund over different time periods, measured against an appropriate securities market index (benchmark index) and a peer group of mutual funds with similar objectives (peer group).
The Board considered discussions that occur at Board meetings throughout the year with representatives of Strategic Advisers about fund investment performance and the performance of each Sub-Adviser as part of regularly scheduled fund reviews and other reports to the Board on fund performance, taking into account various factors including general market conditions. The Board also considered information about
performance attribution. In its discussions with representatives of Strategic Advisers regarding fund performance, the Board gave particular attention to information indicating underperformance of certain funds over different time periods and discussed with Strategic Advisers the reasons for any such underperformance.
In addition to reviewing absolute and relative fund performance, the Independent Trustees periodically
consider the appropriateness of fund performance metrics in evaluating the results achieved. The
Independent Trustees generally give greater weight to fund performance over longer time periods than
over shorter time periods. Depending on the circumstances, the Independent Trustees may be satisfied
with the fund's performance notwithstanding that it lags its benchmark index peer group for certain
periods.
Based on its review, the Board concluded that the nature, extent, and quality of services provided to the fund under the Advisory Contracts should continue to benefit the shareholders of the fund.
Competitiveness of Management Fee and Total Fund Expenses. The Board considered the amount and nature of fees paid to the Investment Advisers. The Board noted that the Sub-Sub-Advisers are compensated by the Sub-Adviser and the Fund and Strategic Advisers are not responsible for any such fees or expenses. The Board also considered information comparing the management fees and total expenses of the fund to those of other registered investment companies with investment objectives similar to those of the fund, as discussed below. The Board also noted Strategic Advisers' proposal to extend the management fee waiver and considered the fund's contractual maximum aggregate annual management fee rate. In considering the fund's management fee and management fee waiver and comparisons to other registered investment companies with investment objectives similar to those of the fund, the Board noted that shares of the fund are offered only to clients that participate in the Fidelity Portfolio Advisory Service managed account program.
In its review of the fund's total expenses, the Board considered the fund's management fee rate as well as other fund expenses, as applicable, such as expenses from holding Fidelity and non-Fidelity mutual funds and ETFs, pricing and bookkeeping fees, and custodial, legal, and audit fees.
Comparisons of Management Fees and Total Expense Ratios. Among other things, the Board reviewed data for selected groups of competitive funds and classes (referred to as "mapped groups") that were compiled by Fidelity based on combining similar investment objective categories (as classified by Lipper) that have comparable investment mandates. The data reviewed by the Board included (i) gross management fee comparisons (before taking into account expense reimbursements or caps) relative to the total universe of funds within the mapped group; (ii) gross management fee comparisons relative to a subset of non-Strategic Advisers funds in the mapped group that are similar in size and management fee structure to the fund (referred to as the "asset size peer group"); (iii) total expense comparisons of the fund relative to funds and classes in the mapped group that have a similar sales load structure to the fund (referred to as the "similar sales load structure group"); and (iv) total expense comparisons of the fund relative to funds and classes in the similar sales load structure group that are similar in size and management fee structure to each fund (referred to as the "total expense asset size peer group").
The information provided to the Board indicated that the fund's management fee rate ranked below the competitive median of the mapped group for the 12-month period ended December 31, 2023 and below the competitive median of the asset size peer group for the 12-month period ended December 31, 2023. Further, the information provided to the Board indicated that the total expense ratio of the fund ranked below the competitive median of the similar sales load structure group for the 12-month period ended December 31, 2023 and below the competitive median of the total expense asset size peer group for the 12-month period ended December 31, 2023.
Fees Charged to Other Clients. The Board also considered fee structures paid by the Investment Advisers' other clients, such as other funds advised or subadvised by the Investment Advisers, pension plan clients, and other institutional clients with similar investment mandates.
Based on its review, the Board concluded that the fund's management fee bears a reasonable relationship to the services rendered. Further, based on its review of the total expense ratios and fees charged to other clients of Strategic Advisers or its affiliates and the Sub-Adviser, the Board concluded that the total expenses of the fund were reasonable in light of the services that the fund and its shareholders receive and the other factors considered.
Costs of the Services and Profitability. The Board considered information regarding the revenues earned and the expenses incurred by Strategic Advisers and its affiliates in conducting the business of developing, marketing, distributing, managing, administering and servicing the fund and servicing the fund's shareholders.
On an annual basis, Strategic Advisers presents to the Board information about the profitability of its relationships with the fund. Strategic Advisers calculates profitability information for the fund using a series of detailed revenue and cost allocation methodologies. The Board reviews any significant changes from the prior year's methodologies. Strategic Advisers noted that, to the extent possible, it employs the same corporate reporting of revenues and expenses as those used by other Fidelity funds.
A public accounting firm has been engaged annually by the Board as part of the Board's assessment of Fidelity's profitability analysis. The engagement includes the review and assessment of the methodologies used by Fidelity in determining the revenues and expenses attributable to Fidelity's fund business. After considering the reports issued under the engagement and information provided by Fidelity, the Board concluded that while other allocation methods may also be reasonable, Fidelity's profitability methodologies are reasonable in all material respects.
The Board also reviewed Fidelity's non-fund businesses and potential indirect benefits such businesses may have received as a result of their association with Fidelity's fund business (i.e., fall-out benefits) as well as cases where Fidelity's affiliates may benefit from the fund's business. The Board noted that changes to fall-out benefits year-over-year reflect business developments at Fidelity's various businesses.
The Board considered the costs of the services provided by and the profits realized, if any, by Strategic Advisers and its affiliates in connection with the operation of the fund and was satisfied that the profitability was not excessive.
The Board also considered information regarding the profitability of the Sub-Adviser's relationship with the fund and the potential fall-out benefits, if any, that may accrue to the Sub-Adviser as a result of its relationship with the fund. The Board considered profitability information provided by the Sub-Adviser in light of the nature of the relationship between Strategic Advisers and the Sub-Adviser with respect to the negotiation of sub-advisory fees.
Possible Economies of Scale. The Board considered whether there have been economies of scale in respect of the management of the Strategic Advisers funds, whether the Strategic Advisers funds (including the fund) have appropriately benefited from any such economies of scale, and whether there is potential for realization of any further economies of scale as assets grow through increased services to the fund, through waivers or reimbursements, or through fee or expense ratio reductions. The Board considered that certain of the mandates in the fund's Sub-Advisory Agreement provide for breakpoints as the fund's assets grow and noted that any potential decline in sub-advisory fees under such contract would accrue directly to the fund. The Board also took Strategic Advisers' management fee waiver into consideration.
Conclusion. Based on its evaluation of all of the conclusions noted above, and after considering all factors it believed relevant, the Board concluded that the advisory fee arrangements bear a reasonable relationship to the services rendered and that the fund's Advisory Contracts should be renewed because each agreement is in the best interests of the fund and its shareholders. In addition, the Board concluded that the renewal of the Sub-Advisory Agreement and Sub-Sub-Advisory Agreements do not involve a conflict of interest from which Strategic Advisers or its affiliates derive an inappropriate advantage.
1.9887940.106
COI-SANN-0125
Strategic Advisers® Alternatives Fund
Offered exclusively to certain managed account clients of Strategic Advisers LLC or its affiliates - not available for sale to the general public
Semi-Annual Report
November 30, 2024
Contents
To view a fund's proxy voting guidelines and proxy voting record for the 12-month period ended June 30, visit http://www.fidelity.com/proxyvotingresults or visit the Securities and Exchange Commission's (SEC) web site at http://www.sec.gov.
You may also call 1-800-544-3455 to request a free copy of the proxy voting guidelines.
Standard & Poor's, S&P and S&P 500 are registered service marks of The McGraw-Hill Companies, Inc. and have been licensed for use by Fidelity Distributors Corporation.
Other third-party marks appearing herein are the property of their respective owners.
All other marks appearing herein are registered or unregistered trademarks or service marks of FMR LLC or an affiliated company. © 2025 FMR LLC. All rights reserved.
This report and the financial statements contained herein are submitted for the general information of the shareholders of the Fund. This report is not authorized for distribution to prospective investors in the Fund unless preceded or accompanied by an effective prospectus.
A fund files its complete schedule of portfolio holdings with the SEC for the first and third quarters of each fiscal year on Form N-PORT. Forms N-PORT are available on the SEC's web site at http://www.sec.gov. A fund's Forms N-PORT may be reviewed and copied at the SEC's Public Reference Room in Washington, DC. Information regarding the operation of the SEC's Public Reference Room may be obtained by calling 1-800-SEC-0330.
For a complete list of a fund's portfolio holdings, view the most recent holdings listing, semiannual report, or annual report on Fidelity's web site at http://www.fidelity.com, http://www.institutional.fidelity.com, or http://www.401k.com, as applicable.
NOT FDIC INSURED •MAY LOSE VALUE •NO BANK GUARANTEE
Neither the Fund nor Fidelity Distributors Corporation is a bank.
Item 7: Consolidated Financial Statements and Consolidated Financial Highlights for Open-End Management Investment Companies (Semi-Annual Report)
Strategic Advisers® Alternatives Fund
Consolidated Schedule of Investments November 30, 2024 (Unaudited)
Showing Percentage of Net Assets
| Nonconvertible Bonds - 1.2% |
| | | Principal Amount (a) | Value ($) |
| COMMUNICATION SERVICES - 0.1% | | | |
| Wireless Telecommunication Services - 0.1% | | | |
| Rogers Communications, Inc. 2.95% 3/15/25 | | 1,000,000 | 993,962 |
| CONSUMER DISCRETIONARY - 0.1% | | | |
| Automobiles - 0.1% | | | |
| BMW U.S. Capital LLC U.S. Secured Overnight Fin. Rate (SOFR) Averages Index + 0.800% 5.3849% 8/13/26 (b)(c)(d) | | 700,000 | 704,246 |
| General Motors Financial Co., Inc. 2.9% 2/26/25 | | 700,000 | 696,296 |
| Hyundai Capital America U.S. Secured Overnight Fin. Rate (SOFR) Index + 1.150% 5.8157% 8/4/25 (b)(c)(d) | | 300,000 | 301,314 |
| | | | 1,701,856 |
| ENERGY - 0.0% | | | |
| Oil, Gas & Consumable Fuels - 0.0% | | | |
| Energy Transfer LP: | | | |
| 2.9% 5/15/25 | | 400,000 | 396,180 |
| 5.95% 12/1/25 | | 500,000 | 503,915 |
| | | | 900,095 |
| FINANCIALS - 0.7% | | | |
| Banks - 0.3% | | | |
| Bank of Queensland Ltd. Australian Bank Bill 3 Months Rate + 0.870% 5.2931% 12/18/24 (Reg. S) (c)(d) | AUD | 1,600,000 | 1,043,817 |
| Barclays PLC 3.65% 3/16/25 | | 615,000 | 612,614 |
| BNP Paribas SA 3.375% 1/9/25 (b) | | 600,000 | 598,988 |
| Citigroup, Inc. CME Term SOFR 3 Month Index + 1.510% 6.105% 7/1/26 (c)(d) | | 1,000,000 | 1,005,843 |
| Cooperatieve Rabobank UA/NY U.S. Secured Overnight Fin. Rate (SOFR) Averages Index + 0.620% 5.1998% 8/28/26 (c)(d) | | 700,000 | 702,193 |
| DBS Group Holdings Ltd. U.S. Secured Overnight Fin. Rate (SOFR) Index + 0.610% 5.52% 9/12/25 (b)(c)(d) | | 400,000 | 401,036 |
| ING Groep NV U.S. Secured Overnight Fin. Rate (SOFR) Averages Index + 1.640% 6.4217% 3/28/26 (c)(d) | | 500,000 | 501,851 |
| Lloyds Banking Group PLC 3.511% 3/18/26 (c) | | 200,000 | 199,052 |
| Mitsubishi UFJ Financial Group, Inc. 5.541% 4/17/26 (c) | | 400,000 | 400,749 |
| NatWest Markets PLC 3.479% 3/22/25 (b) | | 500,000 | 497,944 |
| Standard Chartered Bank/New York 4.853% 12/3/27 | | 250,000 | 250,881 |
| Sumitomo Mitsui Financial Group, Inc. U.S. Secured Overnight Fin. Rate (SOFR) Index + 1.300% 6.0598% 7/13/26 (c)(d) | | 500,000 | 507,608 |
| Swedbank AB 5.337% 9/20/27 (Reg. S) | | 600,000 | 608,101 |
| | | | 7,330,677 |
| Capital Markets - 0.3% | | | |
| CPPIB Capital, Inc. U.S. Secured Overnight Fin. Rate (SOFR) Index + 1.250% 6.1663% 3/11/26 (c)(d) | | 3,000,000 | 3,037,367 |
| Deutsche Bank AG New York Branch 2.129% 11/24/26 (c) | | 700,000 | 680,618 |
| Morgan Stanley 2.188% 4/28/26 (c) | | 800,000 | 791,353 |
| Nomura Holdings, Inc. 2.648% 1/16/25 | | 500,000 | 498,492 |
| PSP Capital, Inc. U.S. Secured Overnight Fin. Rate (SOFR) Averages Index + 0.240% 5.2171% 3/3/25 (b)(c)(d) | | 1,500,000 | 1,500,238 |
| | | | 6,508,068 |
| Consumer Finance - 0.1% | | | |
| AerCap Ireland Capital Ltd./AerCap Global Aviation Trust 3.5% 1/15/25 | | 800,000 | 798,516 |
| Ford Motor Credit Co. LLC 4.687% 6/9/25 | | 700,000 | 698,389 |
| | | | 1,496,905 |
| Insurance - 0.0% | | | |
| New York Life Global Funding U.S. Secured Overnight Fin. Rate (SOFR) Averages Index + 0.580% 5.3248% 1/16/26 (b)(c)(d) | | 1,000,000 | 1,003,873 |
TOTAL FINANCIALS | | | 16,339,523 |
| HEALTH CARE - 0.0% | | | |
| Health Care Providers & Services - 0.0% | | | |
| HCA Holdings, Inc.: | | | |
| 5.25% 4/15/25 | | 300,000 | 300,269 |
| 5.375% 2/1/25 | | 500,000 | 499,936 |
| | | | 800,205 |
| INDUSTRIALS - 0.2% | | | |
| Building Products - 0.1% | | | |
| Carrier Global Corp. 2.242% 2/15/25 | | 1,000,000 | 994,044 |
| Machinery - 0.1% | | | |
| Daimler Trucks Finance North America LLC U.S. Secured Overnight Fin. Rate (SOFR) Index + 0.750% 5.6536% 12/13/24 (b)(c)(d) | | 1,000,000 | 1,000,166 |
| Westinghouse Air Brake Tech Co. 3.2% 6/15/25 | | 800,000 | 792,342 |
| | | | 1,792,508 |
| Passenger Airlines - 0.0% | | | |
| Southwest Airlines Co. 5.25% 5/4/25 | | 700,000 | 700,108 |
TOTAL INDUSTRIALS | | | 3,486,660 |
| MATERIALS - 0.1% | | | |
| Containers & Packaging - 0.1% | | | |
| Berry Global, Inc. 1.57% 1/15/26 | | 1,000,000 | 963,905 |
| UTILITIES - 0.0% | | | |
| Electric Utilities - 0.0% | | | |
| Georgia Power Co. U.S. Secured Overnight Fin. Rate (SOFR) Averages Index + 0.750% 5.3579% 5/8/25 (c)(d) | | 723,000 | 724,855 |
| TOTAL NONCONVERTIBLE BONDS (Cost $25,853,508) | | | 25,911,061 |
| | | | |
| U.S. Treasury Obligations - 0.3% |
| | | Principal Amount (a) | Value ($) |
U.S. Treasury Bills, yield at date of purchase 4.44% to 5% 12/3/24 to 2/20/25 (e) (Cost $5,640,549) | | 5,681,000 | 5,641,393 |
| | | | |
| U.S. Government Agency - Mortgage Securities - 0.3% |
| | | Principal Amount (a) | Value ($) |
| Ginnie Mae - 0.1% | | | |
| 6% 12/1/54 (f) | | 200,000 | 202,094 |
| 6% 12/1/54 (f) | | 400,000 | 404,188 |
| 6% 12/1/54 (f) | | 800,000 | 808,375 |
| 6% 12/1/54 (f) | | 800,000 | 808,375 |
TOTAL GINNIE MAE | | | 2,223,032 |
| Uniform Mortgage Backed Securities - 0.2% | | | |
| 5% 12/1/39 (f) | | 1,600,000 | 1,603,375 |
| 6% 12/1/54 (f) | | 300,000 | 303,609 |
| 6% 12/1/54 (f) | | 500,000 | 506,016 |
| 6% 12/1/54 (f) | | 1,400,000 | 1,416,844 |
TOTAL UNIFORM MORTGAGE BACKED SECURITIES | | | 3,829,844 |
| TOTAL U.S. GOVERNMENT AGENCY - MORTGAGE SECURITIES (Cost $6,035,684) | | | 6,052,876 |
| | | | |
| Asset-Backed Securities - 0.7% |
| | | Principal Amount (a) | Value ($) |
| Allegro Clo Xi Ltd. Series 2024-2A Class A1AR, CME Term SOFR 3 Month Index + 1.250% 5.8674% 1/19/33 (b)(c)(d) | | 1,000,000 | 1,001,000 |
| Anchorage Capital Clo 2018-10 Series 2024-10A Class A1AR, CME Term SOFR 3 Month Index + 1.100% 5.7559% 10/15/31 (b)(c)(d) | | 375,580 | 375,703 |
| Apex Credit Clo 2018-Ii Ltd. Series 2024-2A Class A1RR, CME Term SOFR 3 Month Index + 1.240% 5.8574% 10/20/31 (b)(c)(d) | | 440,157 | 440,758 |
| Carlyle Global Market Strategi Series 2024-4A Class A1RR, CME Term SOFR 3 Month Index + 1.220% 5.8374% 7/20/32 (b)(c)(d) | | 364,853 | 365,197 |
| Carmax Series 2023-3 Class A2A, 5.72% 11/16/26 | | 113,812 | 114,121 |
| Carval Clo I Ltd. / Carval Clo Series 2024-1A Class AR, CME Term SOFR 3 Month Index + 1.230% 5.8773% 7/16/31 (b)(c)(d) | | 956,349 | 957,410 |
| Citibank Credit Card Issuance Trust: | | | |
| Series 2017-A6 Class A6, CME Term SOFR 1 Month Index + 0.880% 5.4922% 5/14/29 (c)(d) | | 900,000 | 911,252 |
| Series 2023-A1 Class A1, 5.23% 12/8/27 | | 500,000 | 503,413 |
| Citizens Auto Receivables Trus Series 2023-2 Class A2B, U.S. 30-Day Avg. Secured Overnight Fin. Rate (SOFR) Index + 0.730% 5.5356% 10/15/26 (b)(c)(d) | | 237,655 | 237,895 |
| Cumulus Static CLO Series 2024-1A Class A, 3 month EURIBOR EURO INTER + 1.200% 4.223% 11/15/33 (b)(c)(d) | EUR | 294,535 | 311,577 |
| Dell Equipment Finance Trust 2023-2 Series 2023-2 Class A2, 5.84% 1/22/29 (b) | | 96,731 | 96,853 |
| Fifth Third Auto Trust Series 2023-1 Class A2B, U.S. 30-Day Avg. Secured Overnight Fin. Rate (SOFR) Index + 0.530% 5.3356% 11/16/26 (c)(d) | | 69,511 | 69,532 |
| Ford Credit Auto Lease Trust Series 2023-B Class A2B, U.S. 30-Day Avg. Secured Overnight Fin. Rate (SOFR) Index + 0.590% 5.3956% 2/15/26 (c)(d) | | 216,315 | 216,384 |
| Lcm 31 Ltd. Series 2024-31A Class AR, CME Term SOFR 3 Month Index + 1.280% 5.8974% 7/20/34 (b)(c)(d) | | 300,000 | 300,245 |
| Master Credit Card Trust Ii Series 2023-2A Class A, U.S. 30-Day Avg. Secured Overnight Fin. Rate (SOFR) Index + 0.850% 5.6483% 1/21/27 (b)(c)(d) | | 1,200,000 | 1,203,784 |
| MF1 Multifamily Housing Mortgage Loan Trust Series 2021-FL7 Class A, CME Term SOFR 1 Month Index + 1.190% 5.8049% 10/16/36 (b)(c)(d) | | 444,818 | 442,713 |
| Mountain View Clo Xvi Ltd. Series 2024-1A Class A1R, CME Term SOFR 3 Month Index + 1.460% 6.1159% 4/15/34 (b)(c)(d) | | 1,000,000 | 1,002,202 |
| Ofsi Bsl Xi Ltd. Series 2024-10A Class AR, CME Term SOFR 3 Month Index + 1.270% 5.8243% 4/20/34 (b)(c)(d) | | 500,000 | 500,039 |
| Ozlm Xvii Ltd. Series 2024-17A Class A1RR, CME Term SOFR 3 Month Index + 1.150% 5.7674% 7/20/30 (b)(c)(d) | | 609,308 | 609,352 |
| Rad Clo 4 Ltd. Series 2024-4A Class AR, CME Term SOFR 3 Month Index + 1.230% 5.8559% 4/25/32 (b)(c)(d) | | 702,528 | 704,111 |
| Sccu Auto Receivables Trust 20 Series 2024-1A Class A2, 5.45% 12/15/27 (b) | | 474,757 | 476,085 |
| Sound Point Clo Xxviii Ltd. Series 2024-3A Class A1R, CME Term SOFR 3 Month Index + 1.280% 5.9059% 1/25/32 (b)(c)(d) | | 1,000,000 | 1,001,300 |
| Toyota Auto Receivables Owner Trust Series 2023-C Class A2B, U.S. 30-Day Avg. Secured Overnight Fin. Rate (SOFR) Index + 0.400% 5.2056% 8/17/26 (c)(d) | | 307,543 | 307,774 |
| Tralee Clo Vi Ltd. Series 2024-6A Class A1RR, CME Term SOFR 3 Month Index + 1.220% 5.8459% 10/25/32 (b)(c)(d) | | 400,000 | 400,087 |
| Trillium Credit Card Trust Ii Series 2023-3A Class A, U.S. Secured Overnight Fin. Rate (SOFR) Index + 0.850% 5.4285% 8/26/28 (b)(c)(d) | | 1,200,000 | 1,203,772 |
| Verdelite Static Clo 2024-1 Lt Series 2024-1A Class A, CME Term SOFR 3 Month Index + 1.130% 5.7474% 7/20/32 (b)(c)(d) | | 484,615 | 485,084 |
| Volkswagen Auto Loan Enhanced Series 2023-1 Class A2B, U.S. 30-Day Avg. Secured Overnight Fin. Rate (SOFR) Index + 0.520% 5.2718% 12/21/26 (c)(d) | | 328,433 | 328,772 |
| WOART Series 2023-A Class A2B, U.S. 30-Day Avg. Secured Overnight Fin. Rate (SOFR) Index + 0.430% 5.2356% 7/15/26 (c)(d) | | 32,239 | 32,240 |
| World Omni Auto Receivables Trust Series 2023-C Class A2B, U.S. 30-Day Avg. Secured Overnight Fin. Rate (SOFR) Index + 0.410% 5.2156% 12/15/26 (c)(d) | | 219,392 | 219,507 |
| World Omni Automobile Lease Series 2023-A Class A2B, U.S. 30-Day Avg. Secured Overnight Fin. Rate (SOFR) Index + 0.760% 5.5656% 11/17/25 (c)(d) | | 15,581 | 15,586 |
| TOTAL ASSET-BACKED SECURITIES (Cost $14,796,688) | | | 14,833,748 |
| | | | |
| Collateralized Mortgage Obligations - 0.1% |
| | | Principal Amount (a) | Value ($) |
| Private Sponsor - 0.0% | | | |
| Fannie Mae floater Series 2024-54 Class FC, U.S. 30-Day Avg. Secured Overnight Fin. Rate (SOFR) Index + 0.970% 5.704% 8/25/54 (c)(d) | | 363,386 | 363,119 |
| Ginnie Mae guaranteed REMIC pass-thru certificates floater: | | | |
| Series 2023-H20 Class FL, U.S. 30-Day Avg. Secured Overnight Fin. Rate (SOFR) Index + 1.100% 5.8608% 5/20/73 (c)(d) | | 177,411 | 178,429 |
| Series 2024-H12 Class FC, U.S. 30-Day Avg. Secured Overnight Fin. Rate (SOFR) Index + 0.900% 5.6608% 7/20/74 (c)(d) | | 405,334 | 406,516 |
TOTAL PRIVATE SPONSOR | | | 948,064 |
| U.S. Government Agency - 0.1% | | | |
| Fannie Mae floater Series 2024-10 Class AF, U.S. 30-Day Avg. Secured Overnight Fin. Rate (SOFR) Index + 0.900% 6.1129% 12/25/50 (c)(d) | | 77,296 | 77,459 |
| Freddie Mac floater: | | | |
| Series 2024-5383 Class AF, U.S. 30-Day Avg. Secured Overnight Fin. Rate (SOFR) Index + 1.000% 6.2129% 8/15/48 (c)(d) | | 72,241 | 72,546 |
| Series 2024-5442 Class FB, U.S. 30-Day Avg. Secured Overnight Fin. Rate (SOFR) Index + 0.970% 5.704% 8/25/54 (c)(d) | | 380,432 | 380,151 |
| Series 2024-5480 Class FG, U.S. 30-Day Avg. Secured Overnight Fin. Rate (SOFR) Index + 1.150% 5.8927% 12/25/54 (c)(d) | | 300,000 | 301,050 |
| Ginnie Mae guaranteed REMIC pass-thru certificates floater Series 2017-H05 Class FC, CME Term SOFR 1 Month Index + 0.860% 5.721% 2/20/67 (c)(d) | | 1,097,635 | 1,101,434 |
TOTAL U.S. GOVERNMENT AGENCY | | | 1,932,640 |
| TOTAL COLLATERALIZED MORTGAGE OBLIGATIONS (Cost $2,868,857) | | | 2,880,704 |
| | | | |
| Foreign Government and Government Agency Obligations - 0.0% |
| | | Principal Amount (a) | Value ($) |
| Brazil Letras Do Tesouro Nacio, yield at date of purchase 10.4265% to 10.5114% 4/1/25 | BRL | 4,900,000 | 782,804 |
| Israel Treasury Bills Mof, yield at date of purchase 4.0982% 5/30/25 | ILS | 1,100,000 | 296,276 |
| TOTAL FOREIGN GOVERNMENT AND GOVERNMENT AGENCY OBLIGATIONS (Cost $1,165,373) | | | 1,079,080 |
| | | | |
| Certificates of Deposit - 0.1% |
| | | Principal Amount (a) | Value ($) |
| Bank of Tokyo-Mitsubishi Ufj Australian Bank Bill 3 Months Rate + 0.870% 5.2963% 2/17/26 (c)(d) | | 500,000 | 327,488 |
| Mizuho Bank Ltd. Australian Bank Bill 3 Months Rate + 0.540% 4.9627% 2/21/25 (c)(d) | | 1,500,000 | 978,655 |
| TOTAL CERTIFICATES OF DEPOSIT (Cost $1,327,737) | | | 1,306,143 |
| | | | |
| Alternative Funds - 86.6% |
| | | Shares | Value ($) |
| Alternative Funds - 86.6% | | | |
| Absolute Convertible Arbitrage Fund Investor Shares | | 14,037,697 | 161,433,511 |
| American Beacon AHL Managed Futures Strategy Fund A Class | | 6,723,856 | 65,288,644 |
| BlackRock Global Equity Market Neutral Fund Investor A Shares | | 13,309,872 | 183,809,326 |
| BlackRock Systematic Multi-Strategy Fund Investor A Shares | | 21,915,345 | 233,836,731 |
| Eaton Vance Global Macro Absolute Return Advantage Fund Class A | | 20,558,611 | 218,949,211 |
| Federated Hermes MDT Market Neutral Fund A Shares | | 6,810,517 | 137,708,644 |
| Fidelity SAI Alternative Risk Premia Commodity Strategy Fund (g) | | 8,544,997 | 80,237,524 |
| Fidelity SAI Alternative Risk Premia Strategy Fund (g) | | 3,969,402 | 39,416,167 |
| Fidelity SAI Convertible Arbitrage Fund (g) | | 29,403,302 | 322,260,196 |
| First Trust Merger Arbitrage Fund Class I | | 13,145,098 | 146,830,747 |
| Fulcrum Diversified Absolute Return Fund Super Institutional Class | | 5,439,078 | 53,792,482 |
| JHancock Diversified Macro Fund Class A | | 567 | 5,051 |
| Stone Ridge Diversified Alternatives Fund Class I | | 13,760,342 | 155,767,069 |
| The Merger Fund Class A | | 7,882,500 | 138,495,523 |
| | | | |
| TOTAL ALTERNATIVE FUNDS (Cost $1,852,415,131) | | | 1,937,830,826 |
| | | | |
| Money Market Funds - 7.8% |
| | | Shares | Value ($) |
| Fidelity Cash Central Fund 4.64% (h) | | 1,947,821 | 1,948,211 |
| Fidelity Investments Money Market Government Portfolio Institutional Class 4.55% (g)(i) | | 53,146,485 | 53,146,485 |
| State Street Institutional U.S. Government Money Market Fund Investor Class 4.51% (i) | | 180,533 | 180,533 |
| State Street Institutional U.S. Government Money Market Fund Premier Class 4.59% (i) | | 120,478,704 | 120,478,704 |
| TOTAL MONEY MARKET FUNDS (Cost $175,753,933) | | | 175,753,933 |
| | | | |
| Repurchase Agreements - 1.3% |
| | | Maturity Amount ($) | Value ($) |
| With Bank of America NA at 4.64%, dated 11/29/24 due 12/2/24 (Collateralized by U.S. Treasury Bills valued at $15,005,800, 4.50%, 11/15/33) | | 15,005,800 | 15,000,000 |
| With BNP Paribas, S.A. at 4.67%, dated 12/2/24 due 12/3/24 (j) | | 14,701,907 | 14,700,000 |
| TOTAL REPURCHASE AGREEMENTS (Cost $29,700,000) | | | 29,700,000 |
| | | | |
| Purchased Options - 0.0% |
| | Counterparty | Number of Contracts | Notional Amount ($) | Exercise Price ($) | Expiration Date | Value ($) |
| Put Options | | | | | | |
| S&P 500 Index | Chicago Board Options Exchange | 57 | 34,384,566 | 5,700 | 12/20/24 | 45,030 |
| S&P 500 Index | Chicago Board Options Exchange | 53 | 31,971,614 | 5,760 | 02/21/25 | 278,250 |
| S&P 500 Index | Chicago Board Options Exchange | 84 | 50,671,992 | 4,100 | 11/21/25 | 293,580 |
| S&P 500 Index | Chicago Board Options Exchange | 101 | 60,927,038 | 3,800 | 09/19/25 | 208,565 |
| S&P 500 Index | Chicago Board Options Exchange | 84 | 50,671,992 | 3,900 | 10/17/25 | 213,360 |
| S&P 500 Index | Chicago Board Options Exchange | 55 | 33,178,090 | 5,550 | 01/17/25 | 86,625 |
| | | | | | | |
| | | | | | | 1,125,410 |
TOTAL PURCHASED OPTIONS (Cost $2,100,298) | | | | | | 1,125,410 |
For the period, the average monthly notional amount at value for purchased options in the aggregate was $255,951,069.
| TOTAL INVESTMENT IN SECURITIES - 98.4% (Cost $2,117,657,758) | 2,202,115,174 |
NET OTHER ASSETS (LIABILITIES) - 1.6% | 36,386,125 |
| NET ASSETS - 100.0% | 2,238,501,299 |
| | |
| TBA Sale Commitments |
| | Principal Amount (a) | Value ($) |
| Ginnie Mae | | |
| 6% 12/1/54 | (3,600,000) | (3,637,688) |
| 6% 12/1/54 | (1,500,000) | (1,515,703) |
| 6% 12/1/54 | (2,900,000) | (2,930,360) |
| 6% 1/1/55 | (1,000,000) | (1,009,688) |
| | | |
| TOTAL GINNIE MAE | | (9,093,439) |
| | | |
| Uniform Mortgage Backed Securities | | |
| 5% 12/1/39 | (1,300,000) | (1,302,742) |
| 5% 12/1/39 | (1,300,000) | (1,302,742) |
| 5% 12/1/39 | (1,100,000) | (1,102,320) |
| 5% 12/1/39 | (2,800,000) | (2,805,906) |
| 6% 12/1/54 | (1,400,000) | (1,416,844) |
| 6% 12/1/54 | (2,100,000) | (2,125,266) |
| 6% 12/1/54 | (800,000) | (809,625) |
| 6% 1/1/55 | (1,900,000) | (1,922,043) |
| 6.5% 12/1/54 | (700,000) | (716,734) |
| 6.5% 12/1/54 | (1,300,000) | (1,331,078) |
| 6.5% 12/1/54 | (1,300,000) | (1,331,078) |
| 6.5% 12/1/54 | (2,300,000) | (2,354,984) |
| | | |
| TOTAL UNIFORM MORTGAGE BACKED SECURITIES | | (18,521,362) |
| | | |
TOTAL TBA SALE COMMITMENTS (Proceeds $27,554,641) | | (27,614,801) |
| Futures Contracts |
| | Number of contracts | Expiration Date | Notional Amount ($) | Value ($) | Unrealized Appreciation/ (Depreciation) ($) |
| Purchased | | | | | |
| | | | | | |
| Bond Index Contracts | | | | | |
| CME Three-Month SOFR Index Contracts (United States) | 4 | Mar 2025 | 955,725 | (5,430) | (5,430) |
| CME Three-Month SOFR Index Contracts (United States) | 4 | Jun 2026 | 962,850 | 619 | 619 |
| CME Three-Month SOFR Index Contracts (United States) | 4 | Dec 2025 | 961,100 | (44) | (44) |
| CME Three-Month SOFR Index Contracts (United States) | 17 | Sep 2025 | 4,078,938 | (9,677) | (9,677) |
| Eurex Euro-Bobl Contracts (Germany) | 186 | Dec 2024 | 23,557,177 | 197,357 | 197,357 |
| Eurex Euro-BTP Contracts (Germany) | 361 | Dec 2024 | 46,858,017 | 1,130,023 | 1,130,023 |
| Eurex Euro-BTP Contracts (Germany) | 8 | Mar 2025 | 1,033,502 | 8,023 | 8,023 |
| Eurex Euro-Bund Contracts (Germany) | 442 | Dec 2024 | 62,953,514 | 682,838 | 682,838 |
| Eurex Euro-Oat Contracts (Germany) | 93 | Dec 2024 | 12,452,774 | 112,365 | 112,365 |
| Eurex Euro-Schatz Contracts (Germany) | 29 | Dec 2024 | 3,281,240 | 9,385 | 9,385 |
| Eurex Euro-Schatz Contracts (Germany) | 10 | Mar 2025 | 1,134,474 | 999 | 999 |
| Eurex Short-Term Euro-BTP Contracts (Germany) | 103 | Dec 2024 | 11,733,518 | 70,960 | 70,960 |
| Eurex Short-Term Euro-BTP Contracts (Germany) | 16 | Mar 2025 | 1,823,021 | 2,605 | 2,605 |
| ICE Long Gilt Contracts (United Kingdom) | 48 | Mar 2025 | 5,856,731 | 63,004 | 63,004 |
| ICE Three-Month EURIBOR Index Contracts (United Kingdom) | 40 | Mar 2025 | 10,336,072 | 68,664 | 68,664 |
| ICE Three-Month EURIBOR Index Contracts (United Kingdom) | 34 | Jun 2025 | 8,813,057 | 80,472 | 80,472 |
| ICE Three-Month EURIBOR Index Contracts (United Kingdom) | 29 | Sep 2025 | 7,524,298 | 66,299 | 66,299 |
| ICE Three-Month EURIBOR Index Contracts (United Kingdom) | 89 | Dec 2025 | 23,097,689 | 82,972 | 82,972 |
| ICE Three-Month EURIBOR Index Contracts (United Kingdom) | 17 | Mar 2026 | 4,411,244 | 27,142 | 27,142 |
| ICE Three-Month EURIBOR Index Contracts (United Kingdom) | 16 | Jun 2026 | 4,150,491 | 23,137 | 23,137 |
| ICE Three-Month EURIBOR Index Contracts (United Kingdom) | 11 | Sep 2026 | 2,852,591 | 11,711 | 11,711 |
| ICE Three-Month EURIBOR Index Contracts (United Kingdom) | 8 | Dec 2026 | 2,073,872 | 2,711 | 2,711 |
| OSE Japan 10Y Bond Contracts (Japan) | 6 | Dec 2024 | 5,737,125 | (45,796) | (45,796) |
| SFE 90 Day Bill Contract (Australia) | 31 | Jun 2025 | 20,018,360 | (14,403) | (14,403) |
| SFE 90 Day Bill Contract (Australia) | 10 | Mar 2026 | 6,462,268 | (2,896) | (2,896) |
| SFE 90 Day Bill Contract (Australia) | 18 | Dec 2025 | 11,630,378 | (5,891) | (5,891) |
| SFE 90 Day Bill Contract (Australia) | 19 | Sep 2025 | 12,273,512 | (4,320) | (4,320) |
| SFE 90 Day Bill Contract (Australia) | 39 | Mar 2025 | 25,172,098 | (11,967) | (11,967) |
| TME 10 Year Canadian Note Contracts (Canada) | 91 | Mar 2025 | 8,006,414 | 91,661 | 91,661 |
| TME 5 Year Bond Contracts (Canada) | 2 | Mar 2025 | 161,766 | 1,154 | 1,154 |
| TME Three-Month CORRA Contracts (Canada) | 2 | Mar 2026 | 347,041 | 83 | 83 |
| TME Three-Month CORRA Contracts (Canada) | 1 | Jun 2026 | 173,521 | (211) | (211) |
| TME Three-Month CORRA Contracts (Canada) | 2 | Sep 2025 | 346,863 | (96) | (96) |
| TME Three-Month CORRA Contracts (Canada) | 2 | Dec 2025 | 347,005 | (322) | (322) |
| TME Three-Month CORRA Contracts (Canada) | 2 | Jun 2025 | 346,452 | (202) | (202) |
| | | | | | |
| TOTAL BOND INDEX CONTRACTS | | | | | 2,632,929 |
| | | | | | |
| Commodity Futures Contracts | | | | | |
| CBOT Corn Contracts (United States) | 47 | Mar 2025 | 1,017,550 | (9,243) | (9,243) |
| CME Lean Hogs Contracts (United States) | 26 | Feb 2025 | 897,780 | 40,330 | 40,330 |
| CME Live Cattle Contracts (United States) | 9 | Feb 2025 | 679,050 | 173 | 173 |
| COMEX Gold 100 oz. Contracts (United States) | 72 | Feb 2025 | 19,303,200 | (69,308) | (69,308) |
| COMEX Silver Contracts (United States) | 2 | Mar 2025 | 311,080 | (5,496) | (5,496) |
| EEX Phelix-DE Base Contracts (Germany) | 4 | Dec 2024 | 998,395 | (29,155) | (29,155) |
| ENDEX Dutch TTF Natural Gas Contracts (Netherlands) | 35 | Jan 2025 | 1,188,381 | 165,814 | 165,814 |
| ENDEX Dutch TTF Natural Gas Contracts (Netherlands) | 10 | Feb 2025 | 372,608 | 2,498 | 2,498 |
| ENDEX Dutch TTF Natural Gas Contracts (Netherlands) | 35 | Dec 2024 | 1,315,652 | 87,059 | 87,059 |
| Euronext Mill Wheat Contracts (France) | 22 | Mar 2025 | 257,477 | (11,614) | (11,614) |
| ICE Brent Crude Contracts (United Kingdom) | 81 | Dec 2024 | 5,819,040 | (97,452) | (97,452) |
| ICE Brent Crude Contracts (United States) | 13 | Jan 2025 | 929,500 | (19,375) | (19,375) |
| ICE Canola Contracts (United States) | 1 | Jul 2025 | 8,565 | (993) | (993) |
| ICE Canola Contracts (United States) | 54 | Jan 2025 | 442,862 | (39,976) | (39,976) |
| ICE Canola Contracts (United States) | 17 | Mar 2025 | 142,285 | (12,884) | (12,884) |
| ICE Canola Contracts (United States) | 7 | May 2025 | 59,618 | (7,619) | (7,619) |
| ICE Cocoa Contracts (United Kingdom) | 2 | Mar 2025 | 196,161 | 46,426 | 46,426 |
| ICE Cocoa Contracts (United States) | 2 | Mar 2025 | 188,500 | 62,780 | 62,780 |
| ICE Coffee 'C' Contracts (United States) | 19 | Mar 2025 | 2,266,106 | 362,253 | 362,253 |
| ICE Cotton No. 2 Contracts (United States) | 18 | Mar 2025 | 647,370 | 7,140 | 7,140 |
| ICE Cotton No. 2 Contracts (United States) | 5 | May 2025 | 182,450 | 307 | 307 |
| ICE Cotton No. 2 Contracts (United States) | 3 | Jul 2025 | 110,895 | 287 | 287 |
| ICE ENDEX ECX Emissions Contracts (Netherlands) | 16 | Dec 2024 | 1,156,507 | 11,298 | 11,298 |
| ICE FCOJ-A Contracts (United States) | 1 | Mar 2025 | 71,940 | (250) | (250) |
| ICE FCOJ-A Contracts (United States) | 3 | Jan 2025 | 225,338 | 21,510 | 21,510 |
| ICE Low Sulphur Gasoil Contracts (United States) | 1 | Mar 2025 | 66,900 | 174 | 174 |
| ICE Low Sulphur Gasoil Contracts (United States) | 21 | Dec 2024 | 1,421,700 | 55,726 | 55,726 |
| ICE Low Sulphur Gasoil Contracts (United States) | 9 | Feb 2025 | 603,225 | (4,235) | (4,235) |
| ICE Low Sulphur Gasoil Contracts (United States) | 30 | Jan 2025 | 2,015,250 | 6,791 | 6,791 |
| ICE Natural Gas Contracts (United Kingdom) | 25 | Dec 2024 | 1,179,039 | 20,191 | 20,191 |
| ICE Robusta Coffee 10-T Contracts (United Kingdom) | 4 | Jan 2025 | 216,360 | 50,227 | 50,227 |
| ICE Robusta Coffee 10-T Contracts (United Kingdom) | 17 | Mar 2025 | 914,090 | 190,669 | 190,669 |
| ICE Robusta Coffee 10-T Contracts (United Kingdom) | 2 | May 2025 | 106,200 | 22,578 | 22,578 |
| ICE Sugar No. 11 Contracts (United States) | 53 | Feb 2025 | 1,251,309 | (76,587) | (76,587) |
| ICE WIT Crude Contracts (United Kingdom) | 1 | Feb 2025 | 67,480 | (81) | (81) |
| ICE WIT Crude Contracts (United Kingdom) | 2 | Jan 2025 | 135,440 | (882) | (882) |
| ICE WTI Crude Contracts (United Kingdom) | 3 | Dec 2024 | 204,000 | (443) | (443) |
| LME Aluminum Contracts (United Kingdom) | 38 | Jan 2025 | 2,464,756 | 18,803 | 18,803 |
| LME Aluminum Contracts (United Kingdom) | 23 | Feb 2025 | 1,492,522 | (28,066) | (28,066) |
| LME Lead Contracts (United Kingdom) | 64 | Jan 2025 | 3,314,512 | 46,722 | 46,722 |
| LME Nickel Contracts (United Kingdom) | 42 | Jan 2025 | 3,980,660 | (194,101) | (194,101) |
| LME Zinc Contracts (United Kingdom) | 29 | Jan 2025 | 2,253,481 | 55,671 | 55,671 |
| LME Zinc Contracts (United Kingdom) | 18 | Feb 2025 | 1,399,793 | 71,843 | 71,843 |
| NYMEX Gasoline Contracts (United States) | 17 | Mar 2025 | 494,190 | 30,157 | 30,157 |
| NYMEX Gasoline Contracts (United States) | 2 | May 2025 | 63,160 | 886 | 886 |
| NYMEX Gasoline RBOB Contracts (United States) | 17 | Dec 2024 | 1,355,743 | (60,411) | (60,411) |
| NYMEX Gasoline RBOB Contracts (United States) | 5 | Jan 2025 | 400,428 | (17,838) | (17,838) |
| NYMEX Gasoline RBOB Contracts (United States) | 3 | Feb 2025 | 242,827 | (9,594) | (9,594) |
| NYMEX Gasoline RBOB Contracts (United States) | 1 | Mar 2025 | 88,985 | (2,534) | (2,534) |
| NYMEX Natural Gas Contracts (United States) | 9 | Apr 2025 | 270,450 | 13,552 | 13,552 |
| NYMEX Natural Gas Contracts (United States) | 20 | Feb 2025 | 588,600 | 19,771 | 19,771 |
| NYMEX Natural Gas Contracts (United States) | 95 | Dec 2024 | 3,194,850 | 209,783 | 209,783 |
| NYMEX Natural Gas Contracts (United States) | 30 | Jan 2025 | 961,200 | 36,186 | 36,186 |
| NYMEX NY Harbor ULSD Contracts (United States) | 6 | Jan 2025 | 551,930 | (9,680) | (9,680) |
| NYMEX NY Harbor ULSD Contracts (United States) | 23 | Dec 2024 | 2,117,858 | (40,359) | (40,359) |
| NYMEX NY Harbor ULSD Contracts (United States) | 3 | Feb 2025 | 274,504 | (9,645) | (9,645) |
| NYMEX Palladium Contracts (United States) | 13 | Mar 2025 | 1,294,150 | (68,694) | (68,694) |
| NYMEX WTI Crude Oil Contracts (United States) | 5 | Jan 2025 | 338,600 | 2,661 | 2,661 |
| NYMEX WTI Crude Oil Contracts (United States) | 34 | Dec 2024 | 2,312,000 | (13,794) | (13,794) |
| NYMEX WTI Crude Oil Contracts (United States) | 2 | Feb 2025 | 134,960 | 6 | 6 |
| | | | | | |
| TOTAL COMMODITY FUTURES CONTRACTS | | | | | 819,963 |
| | | | | | |
| Currency Futures Contract | | | | | |
| CME British Pound Contracts | 287 | Dec 2024 | 22,823,675 | (873,595) | (873,595) |
| CME Euro/Czech Koruna Cross Contracts | 11 | Dec 2024 | 1,841,002 | (10,872) | (10,872) |
| CME Euro/Hungarian Forint Cross Contracts | 41 | Dec 2024 | 3,143,702 | (103,878) | (103,878) |
| CME Euro/Norwegian Krone Cross Contracts | 79 | Dec 2024 | 10,442,093 | (226,082) | (226,082) |
| CME Euro/Polish Zloty Cross Contracts | 38 | Dec 2024 | 4,673,815 | 19,331 | 19,331 |
| CME Euro/Swedish Krona Cross Contract | 4 | Dec 2024 | 528,191 | (1,997) | (1,997) |
| CME Japanese Yen Contracts | 15 | Dec 2024 | 1,255,688 | 22,746 | 22,746 |
| CME Mexican Peso Contracts | 720 | Dec 2024 | 17,686,800 | (150,201) | (150,201) |
| | | | | | |
| TOTAL CURRENCY FUTURES CONTRACT | | | | | (1,324,548) |
| | | | | | |
| Equity Index Contracts | | | | | |
| ASX SPI 200 Index Contracts (Australia) | 16 | Dec 2024 | 2,206,692 | 62,662 | 62,662 |
| CBOE VIX Index Contracts (United States) | 92 | Dec 2024 | 1,366,356 | (199,711) | (199,711) |
| CBOE VIX Index Contracts (United States) | 39 | Jan 2025 | 626,063 | (57,058) | (57,058) |
| CBOE VIX Index Contracts (United States) | 10 | Feb 2025 | 166,009 | (8,359) | (8,359) |
| CBOT Dow Jones E-Mini Index Contract (United States) | 27 | Dec 2024 | 6,082,425 | 408,850 | 408,850 |
| CME E-mini NASDAQ 100 Index Contracts (United States) | 9 | Dec 2024 | 3,778,830 | 123,575 | 123,575 |
| CME E-mini Russell 2000 Index Contracts (United States) | 7 | Dec 2024 | 855,610 | 62,962 | 62,962 |
| CME E-mini S&P 500 Index Contracts (United States) | 224 | Dec 2024 | 67,776,800 | 3,640,868 | 3,640,868 |
| Eurex Dax Index Contracts (Germany) | 32 | Dec 2024 | 16,628,172 | 282,478 | 282,478 |
| Eurex Euro Stoxx 50 Index Contracts (Germany) | 428 | Dec 2024 | 21,786,761 | (300,278) | (300,278) |
| Eurex Euro Stoxx Bank Index Contracts (Germany) | 119 | Dec 2024 | 876,500 | (19,724) | (19,724) |
| Eurex Swiss Market Index Contracts (Germany) | 90 | Dec 2024 | 12,009,195 | (312,894) | (312,894) |
| HKFE Hang Seng China Enterprises Index Contracts (Hong Kong) | 34 | Dec 2024 | 1,525,848 | 22,254 | 22,254 |
| HKFE Hang Seng Index Contracts (Hong Kong) | 2 | Dec 2024 | 250,707 | 969 | 969 |
| ICE E-mini MSCI Emerging Markets Index Contracts (United States) | 66 | Dec 2024 | 3,598,980 | (34,297) | (34,297) |
| ICE FTSE 100 Index Contracts (United Kingdom) | 7 | Dec 2024 | 740,051 | 8,000 | 8,000 |
| IDEM FTSE MIB Index Contracts (Italy) | 22 | Dec 2024 | 3,891,799 | (18,692) | (18,692) |
| JPX TOPIX Index Contracts (Japan) | 53 | Dec 2024 | 9,490,158 | 372,306 | 372,306 |
| MEFF IBEX 35 Index Contracts (Spain) | 12 | Dec 2024 | 1,478,846 | 18,961 | 18,961 |
| MSCI Sing IX ET Index Contracts (Singapore) | 164 | Dec 2024 | 4,579,706 | 21,723 | 21,723 |
| NSE IFSC Nifty 50 Contract (India) | 4 | Dec 2024 | 194,428 | (974) | (974) |
| SAF FTSE JSE TOP 40 Index Contracts (South Africa) | 17 | Dec 2024 | 720,046 | 10,649 | 10,649 |
| SGX FTSE Index Contracts (Taiwan) | 717 | Dec 2024 | 9,452,211 | 134,342 | 134,342 |
| SGX FTSE Taiwan Index Contracts (Singapore) | 79 | Dec 2024 | 5,879,180 | (149,969) | (149,969) |
| SGX Nifty 225 Index Contracts (Singapore) | 1 | Dec 2024 | 127,577 | (4,494) | (4,494) |
| TME S&P/TSX 60 Index Contracts (Canada) | 61 | Dec 2024 | 13,410,807 | 895,172 | 895,172 |
| | | | | | |
| TOTAL EQUITY INDEX CONTRACTS | | | | | 4,959,321 |
| | | | | | |
| Treasury Contracts | | | | | |
| CBOT 2-Year U.S. Treasury Note Contracts (United States) | 106 | Mar 2025 | 21,847,594 | 50,925 | 50,925 |
| CBOT Ultra 10-Year U.S. Treasury Note Contracts (United States) | 19 | Mar 2025 | 2,181,141 | 36,934 | 36,934 |
| SFE 3-Year Treasury Bond Contracts (Australia) | 146 | Dec 2024 | 10,081,118 | (119,149) | (119,149) |
| | | | | | |
| TOTAL TREASURY CONTRACTS | | | | | (31,290) |
| | | | | | |
| TOTAL PURCHASED | | | | | 7,056,375 |
| | | | | | |
| Sold | | | | | |
| | | | | | |
| Bond Index Contracts | | | | | |
| CME Three-Month SOFR Index Contracts (United States) | 237 | Mar 2026 | 57,004,425 | 18,002 | 18,002 |
| CME Three-Month SOFR Index Contracts (United States) | 75 | Jun 2026 | 18,053,438 | (22,827) | (22,827) |
| CME Three-Month SOFR Index Contracts (United States) | 77 | Dec 2025 | 18,501,175 | (5,424) | (5,424) |
| CME Three-Month SOFR Index Contracts (United States) | 98 | Sep 2025 | 23,513,875 | 25,327 | 25,327 |
| CME Three-Month SOFR Index Contracts (United States) | 66 | Sep 2026 | 15,895,275 | (20,718) | (20,718) |
| CME Three-Month SOFR Index Contracts (United States) | 72 | Jun 2025 | 17,243,100 | (7,124) | (7,124) |
| CME Three-Month SOFR Index Contracts (United States) | 61 | Dec 2026 | 14,695,663 | (19,585) | (19,585) |
| CME Three-Month SOFR Index Contracts (United States) | 57 | Mar 2027 | 13,733,438 | (18,377) | (18,377) |
| Eurex Euro-Buxl 30 Year Bond Contracts (Germany) | 30 | Dec 2024 | 4,432,010 | (153,301) | (153,301) |
| Eurex Euro-Oat Contracts (Germany) | 5 | Mar 2025 | 666,175 | (1,749) | (1,749) |
| ICE Three Month SONIA Index Contracts (United Kingdom) | 71 | Mar 2026 | 21,707,392 | 49,379 | 49,379 |
| ICE Three Month SONIA Index Contracts (United Kingdom) | 28 | Dec 2025 | 8,552,200 | 26,071 | 26,071 |
| ICE Three Month SONIA Index Contracts (United Kingdom) | 26 | Sep 2025 | 7,929,749 | 15,444 | 15,444 |
| ICE Three Month SONIA Index Contracts (United Kingdom) | 25 | Jun 2025 | 7,607,263 | 20,058 | 20,058 |
| SFE 90 Day Bill Contract (Australia) | 2 | Mar 2025 | 1,290,877 | (66) | (66) |
| TME 2 Year Bond Contracts (Canada) | 2 | Mar 2025 | 149,838 | (198) | (198) |
| | | | | | |
| TOTAL BOND INDEX CONTRACTS | | | | | (95,088) |
| | | | | | |
| Commodity Futures Contracts | | | | | |
| CBOT Corn Contracts (United States) | 216 | Mar 2025 | 4,676,400 | 20,012 | 20,012 |
| CBOT Corn Contracts (United States) | 37 | May 2025 | 813,538 | 2,566 | 2,566 |
| CBOT Corn Contracts (United States) | 20 | Dec 2025 | 431,500 | 11,301 | 11,301 |
| CBOT Corn Contracts (United States) | 5 | Sep 2025 | 107,000 | 3,388 | 3,388 |
| CBOT Corn Contracts (United States) | 29 | Jul 2025 | 641,263 | 5,399 | 5,399 |
| CBOT HRW Wheat Contracts (United States) | 8 | Jul 2025 | 225,500 | 13,257 | 13,257 |
| CBOT KC HRW Wheat Contracts (United States) | 185 | Mar 2025 | 5,001,938 | 423,208 | 423,208 |
| CBOT KC HRW Wheat Contracts (United States) | 15 | May 2025 | 411,375 | 30,542 | 30,542 |
| CBOT KC HRW Wheat Contracts (United States) | 11 | Jul 2025 | 305,800 | 19,461 | 19,461 |
| CBOT Soybean Contracts (United States) | 73 | Mar 2025 | 3,635,400 | 54,138 | 54,138 |
| CBOT Soybean Contracts (United States) | 91 | Jan 2025 | 4,502,225 | 46,266 | 46,266 |
| CBOT Soybean Contracts (United States) | 12 | May 2025 | 605,100 | 8,383 | 8,383 |
| CBOT Soybean Contracts (United States) | 10 | Jul 2025 | 510,250 | 7,601 | 7,601 |
| CBOT Soybean Meal Contracts (United States) | 82 | Mar 2025 | 2,440,320 | 180,929 | 180,929 |
| CBOT Soybean Meal Contracts (United States) | 4 | Jul 2025 | 122,840 | 2,870 | 2,870 |
| CBOT Soybean Meal Contracts (United States) | 22 | Jan 2025 | 642,180 | 22,488 | 22,488 |
| CBOT Soybean Meal Contracts (United States) | 6 | May 2025 | 181,440 | 5,265 | 5,265 |
| CBOT Soybean Meal Contracts (United States) | 1 | Aug 2025 | 30,780 | (412) | (412) |
| CBOT Soybean Oil Contracts (United States) | 48 | Mar 2025 | 1,211,616 | 28,084 | 28,084 |
| CBOT Soybean Oil Contracts (United States) | 42 | Jan 2025 | 1,051,848 | 49,307 | 49,307 |
| CBOT Soybean Oil Contracts (United States) | 5 | May 2025 | 127,110 | (1,534) | (1,534) |
| CBOT Soybean Oil Contracts (United States) | 1 | Aug 2025 | 25,488 | (218) | (218) |
| CBOT Soybean Oil Contracts (United States) | 3 | Jul 2025 | 76,680 | (133) | (133) |
| CBOT Wheat Contracts (United States) | 102 | Mar 2025 | 2,794,800 | 113,618 | 113,618 |
| CBOT Wheat Contracts (United States) | 10 | May 2025 | 278,500 | 17,352 | 17,352 |
| CBOT Wheat Contracts (United States) | 1 | Sep 2025 | 28,825 | 448 | 448 |
| CME Cattle Feeder Contracts (United States) | 1 | Mar 2025 | 129,313 | (8,927) | (8,927) |
| CME Cattle Feeder Contracts (United States) | 3 | Jan 2025 | 389,213 | (23,182) | (23,182) |
| CME Lean Hogs Contracts (United States) | 21 | Apr 2025 | 762,300 | (47,851) | (47,851) |
| CME Lean Hogs Contracts (United States) | 58 | Feb 2025 | 2,002,740 | (103,040) | (103,040) |
| CME Lean Hogs Contracts (United States) | 16 | Dec 2024 | 525,280 | (29,039) | (29,039) |
| CME Lean Hogs Contracts (United States) | 6 | Jun 2025 | 243,120 | (9,725) | (9,725) |
| CME Live Cattle Contracts (United States) | 16 | Dec 2024 | 1,203,040 | 2,772 | 2,772 |
| CME Live Cattle Contracts (United States) | 22 | Apr 2025 | 1,678,820 | (38,491) | (38,491) |
| CME Live Cattle Contracts (United States) | 55 | Feb 2025 | 4,149,750 | (25,533) | (25,533) |
| CME Live Cattle Contracts (United States) | 9 | Jun 2025 | 672,120 | (14,282) | (14,282) |
| COMEX Copper Contracts (United States) | 133 | Mar 2025 | 13,765,500 | 216,289 | 216,289 |
| COMEX Copper Contracts (United States) | 15 | May 2025 | 1,563,000 | 6,271 | 6,271 |
| COMEX Gold 100 oz. Contracts (United States) | 2 | Feb 2025 | 536,200 | (3,444) | (3,444) |
| COMEX Silver Contracts (United States) | 75 | Mar 2025 | 11,665,500 | 100,766 | 100,766 |
| Euronext Mill Wheat Contracts (France) | 33 | May 2025 | 393,626 | 14,272 | 14,272 |
| Euronext Mill Wheat Contracts (France) | 9 | Dec 2025 | 105,688 | 4,408 | 4,408 |
| Euronext Mill Wheat Contracts (France) | 12 | Sep 2025 | 137,430 | 7,428 | 7,428 |
| Euronext Mill Wheat Contracts (France) | 90 | Mar 2025 | 1,053,316 | 38,914 | 38,914 |
| Euronext Rapeseed Contracts (France) | 1 | Apr 2025 | 26,590 | 846 | 846 |
| Euronext Rapeseed Contracts (France) | 3 | Jan 2025 | 80,485 | 776 | 776 |
| ICE Brent Crude Contracts (United States) | 9 | Jan 2025 | 643,500 | 20,483 | 20,483 |
| ICE Cocoa Contracts (United Kingdom) | 1 | Mar 2025 | 98,080 | (1,465) | (1,465) |
| ICE Coffee 'C' Contracts (United States) | 6 | Mar 2025 | 715,613 | (12,446) | (12,446) |
| ICE Coffee 'C' Contracts (United States) | 1 | May 2025 | 118,313 | (78) | (78) |
| ICE Cotton No. 2 Contracts (United States) | 65 | Mar 2025 | 2,337,725 | 70,930 | 70,930 |
| ICE Low Sulphur Gasoil Contracts (United States) | 23 | Mar 2025 | 1,538,700 | 20,085 | 20,085 |
| ICE Robusta Coffee 10-T Contracts (United Kingdom) | 2 | Jan 2025 | 108,180 | (21,520) | (21,520) |
| ICE Sugar No. 11 Contracts (United States) | 24 | Apr 2025 | 533,030 | (12,916) | (12,916) |
| ICE Sugar No. 11 Contracts (United States) | 10 | Jun 2025 | 214,256 | 10,301 | 10,301 |
| ICE Sugar No. 11 Contracts (United States) | 142 | Feb 2025 | 3,352,563 | (6,552) | (6,552) |
| ICE White Sugar Contracts (United Kingdom) | 10 | Apr 2025 | 272,700 | 9,253 | 9,253 |
| ICE White Sugar Contracts (United Kingdom) | 36 | Feb 2025 | 985,860 | 32,064 | 32,064 |
| ICE White Sugar Contracts (United Kingdom) | 3 | Jul 2025 | 80,220 | 1,086 | 1,086 |
| LME Aluminum Contracts (United Kingdom) | 38 | Jan 2025 | 2,464,756 | 27,339 | 27,339 |
| LME Lead Contracts (United Kingdom) | 37 | Feb 2025 | 1,918,515 | (54,948) | (54,948) |
| LME Lead Contracts (United Kingdom) | 64 | Jan 2025 | 3,314,512 | 14,517 | 14,517 |
| LME Nickel Contracts (United Kingdom) | 42 | Jan 2025 | 3,980,660 | 27,831 | 27,831 |
| LME Nickel Contracts (United Kingdom) | 20 | Feb 2025 | 1,906,112 | (2,192) | (2,192) |
| LME Zinc Contracts (United Kingdom) | 29 | Jan 2025 | 2,253,481 | (105,669) | (105,669) |
| MGEX Hard Red Spring Wheat Contracts (United States) | 30 | Mar 2025 | 887,625 | 38,219 | 38,219 |
| NYMEX Gasoline RBOB Contracts (United States) | 11 | Jan 2025 | 880,942 | 38,464 | 38,464 |
| NYMEX NY Harbor ULSD Contracts (United States) | 15 | Jan 2025 | 1,379,826 | 28,080 | 28,080 |
| NYMEX Palladium Contracts (United States) | 6 | Mar 2025 | 597,300 | (34,719) | (34,719) |
| NYMEX Platinum Contracts (United States) | 19 | Jan 2025 | 906,395 | (11,106) | (11,106) |
| NYMEX WTI Crude Oil Contracts (United States) | 8 | Feb 2025 | 539,840 | 11,207 | 11,207 |
| SGX Iron Ore Index Contracts (Singapore) | 181 | Jan 2025 | 1,882,762 | (58,055) | (58,055) |
| | | | | | |
| TOTAL COMMODITY FUTURES CONTRACTS | | | | | 1,181,007 |
| | | | | | |
| Currency Futures Contract | | | | | |
| CME Australian Dollar Contracts | 150 | Dec 2024 | 9,783,750 | 288,622 | 288,622 |
| CME Canadian Dollar Contracts | 888 | Dec 2024 | 63,465,360 | 1,850,915 | 1,850,915 |
| CME Euro Contracts | 63 | Dec 2024 | 8,326,631 | 173,667 | 173,667 |
| CME Israeli Shekel Contracts | 13 | Dec 2024 | 3,579,550 | (100,453) | (100,453) |
| CME New Zealand Dollar Contracts | 139 | Dec 2024 | 8,233,665 | 286,125 | 286,125 |
| CME South African Rand Contracts | 300 | Dec 2024 | 8,310,000 | 59,862 | 59,862 |
| CME Swiss Franc Contracts | 340 | Dec 2024 | 48,318,250 | 2,203,641 | 2,203,641 |
| | | | | | |
| TOTAL CURRENCY FUTURES CONTRACT | | | | | 4,762,379 |
| | | | | | |
| Equity Index Contracts | | | | | |
| ASX SPI 200 Index Contracts (Australia) | 3 | Dec 2024 | 413,755 | (8,283) | (8,283) |
| CME E-mini Russell 2000 Index Contracts (United States) | 200 | Dec 2024 | 24,446,000 | (2,279,123) | (2,279,123) |
| CME E-mini S&P MidCap 400 Index Contracts (United States) | 7 | Dec 2024 | 2,364,460 | (207,782) | (207,782) |
| Euronext CAC 40 Index Contracts (France) | 22 | Dec 2024 | 1,683,889 | 15,802 | 15,802 |
| HKFE Hang Seng Index Contracts (Hong Kong) | 3 | Dec 2024 | 376,060 | (4,242) | (4,242) |
| ICE BIST 30 Index Contracts (United Kingdom) | 336 | Dec 2024 | 1,059,232 | (57,640) | (57,640) |
| ICE FTSE 100 Index Contracts (United Kingdom) | 20 | Dec 2024 | 2,114,430 | (4,044) | (4,044) |
| MEFF IBEX 35 Index Contracts (Spain) | 54 | Dec 2024 | 6,654,805 | (120,264) | (120,264) |
| NSE IFSC Nifty 50 Contract (India) | 77 | Dec 2024 | 3,742,739 | 20,997 | 20,997 |
| OMX Stockholm 30 Index Contracts (Sweden) | 13 | Dec 2024 | 300,664 | (2,587) | (2,587) |
| OSE Nikkei 225 Index Contracts (Japan) | 4 | Dec 2024 | 1,020,486 | (44,605) | (44,605) |
| OSE Nikkei 225 Index Contracts (Japan) | 51 | Dec 2024 | 1,301,120 | (50,193) | (50,193) |
| SAF FTSE JSE TOP 40 Index Contracts (South Africa) | 64 | Dec 2024 | 2,710,762 | 1,954 | 1,954 |
| SGX Nifty 225 Index Contracts (Singapore) | 3 | Dec 2024 | 382,732 | (7,735) | (7,735) |
| WSE WIG20 Index Contracts (Poland) | 84 | Dec 2024 | 910,222 | 9,732 | 9,732 |
| | | | | | |
| TOTAL EQUITY INDEX CONTRACTS | | | | | (2,738,013) |
| | | | | | |
| Treasury Contracts | | | | | |
| ASX 10 Year Treasury Bond Index Contracts (Australia) | 202 | Dec 2024 | 14,923,155 | 316,826 | 316,826 |
| CBOT 10-Year U.S. Treasury Note Contracts (United States) | 329 | Mar 2025 | 36,580,688 | (263,317) | (263,317) |
| CBOT 5-Year U.S. Treasury Note Contracts (United States) | 182 | Mar 2025 | 19,583,484 | (88,681) | (88,681) |
| CBOT Long Term U.S. Treasury Bond Contracts (United States) | 154 | Mar 2025 | 18,403,000 | (266,653) | (266,653) |
| CBOT Ultra 10-Year U.S. Treasury Note Contracts (United States) | 91 | Mar 2025 | 10,446,516 | (113,134) | (113,134) |
| CBOT Ultra Long Term U.S. Treasury Bond Contracts (United States) | 44 | Mar 2025 | 5,596,250 | (137,752) | (137,752) |
| SFE 3-Year Treasury Bond Contracts (Australia) | 113 | Dec 2024 | 7,802,509 | 14,873 | 14,873 |
| | | | | | |
| TOTAL TREASURY CONTRACTS | | | | | (537,838) |
| | | | | | |
| TOTAL SOLD | | | | | 2,572,447 |
| | | | | | |
| TOTAL FUTURES CONTRACTS | | | | | 9,628,822 |
| The notional amount of futures purchased as a percentage of Net Assets is 30.7% |
| The notional amount of futures sold as a percentage of Net Assets is 28.4% |
For the period, the average monthly notional amount at value for futures contracts in the aggregate was $996,491,362.
| Forward Foreign Currency Contracts |
Currency Purchased
| Currency Sold | Counterparty | Settlement Date | Unrealized Appreciation/ (Depreciation) ($) |
| | | | | | | |
| EUR | 8,804 | CAD | 9,303 | Barclays Bank PLC | 12/02/24 | 18 |
| EUR | 89,000 | USD | 94,001 | Bank of America, N.A. | 12/02/24 | 50 |
| GBP | 156,000 | USD | 197,960 | JPMorgan Chase Bank, N.A. | 12/02/24 | 543 |
| TRY | 459,115 | USD | 13,069 | Barclays Bank PLC | 12/02/24 | 164 |
| USD | 9,794 | TRY | 340,146 | Barclays Bank PLC | 12/02/24 | (10) |
| AUD | 178,000 | USD | 115,011 | Bank of America, N.A. | 12/03/24 | 1,089 |
| AUD | 465,000 | USD | 301,925 | Deutsche Bank AG | 12/03/24 | 1,372 |
| CAD | 147,000 | USD | 105,107 | Bank of America, N.A. | 12/03/24 | (110) |
| CAD | 130,000 | USD | 93,690 | Barclays Bank PLC | 12/03/24 | (836) |
| CAD | 340,916 | USD | 242,892 | Royal Bank of Canada | 12/03/24 | 611 |
| CHF | 45,691 | USD | 52,855 | Barclays Bank PLC | 12/03/24 | (990) |
| EUR | 16,000 | USD | 17,010 | BNP Paribas S.A. | 12/03/24 | (102) |
| EUR | 10,000 | USD | 10,623 | BNP Paribas S.A. | 12/03/24 | (56) |
| EUR | 60,000 | USD | 62,556 | BNP Paribas S.A. | 12/03/24 | 849 |
| EUR | 104,000 | USD | 113,602 | Bank of America, N.A. | 12/03/24 | (3,700) |
| EUR | 157,000 | USD | 171,205 | Bank of America, N.A. | 12/03/24 | (5,295) |
| EUR | 7,000 | USD | 7,646 | Bank of America, N.A. | 12/03/24 | (249) |
| EUR | 18,000 | USD | 19,293 | Bank of America, N.A. | 12/03/24 | (271) |
| EUR | 586,000 | USD | 619,543 | Barclays Bank PLC | 12/03/24 | (287) |
| EUR | 90,000 | USD | 97,896 | Barclays Bank PLC | 12/03/24 | (2,789) |
| EUR | 504,633 | USD | 532,741 | Barclays Bank PLC | 12/03/24 | 530 |
| EUR | 28,000 | USD | 29,457 | Citibank, N.A. | 12/03/24 | 133 |
| EUR | 55,000 | USD | 58,181 | JPMorgan Chase Bank, N.A. | 12/03/24 | (60) |
| GBP | 78,000 | USD | 100,932 | BNP Paribas S.A. | 12/03/24 | (1,681) |
| GBP | 32,000 | USD | 41,408 | BNP Paribas S.A. | 12/03/24 | (690) |
| GBP | 117,000 | USD | 151,881 | Bank of America, N.A. | 12/03/24 | (3,004) |
| GBP | 83,000 | USD | 107,105 | Bank of America, N.A. | 12/03/24 | (1,491) |
| GBP | 1,403,000 | USD | 1,822,695 | Bank of America, N.A. | 12/03/24 | (37,447) |
| GBP | 39,000 | USD | 50,257 | Bank of America, N.A. | 12/03/24 | (632) |
| GBP | 25,000 | USD | 32,053 | Bank of America, N.A. | 12/03/24 | (242) |
| GBP | 17,000 | USD | 21,657 | Bank of America, N.A. | 12/03/24 | (25) |
| GBP | 9,000 | USD | 11,354 | Bank of America, N.A. | 12/03/24 | 98 |
| GBP | 8,000 | USD | 10,112 | Barclays Bank PLC | 12/03/24 | 68 |
| GBP | 23,000 | USD | 28,813 | Barclays Bank PLC | 12/03/24 | 453 |
| GBP | 39,000 | USD | 49,450 | Citibank, N.A. | 12/03/24 | 175 |
| JPY | 75,881,129 | USD | 499,954 | Barclays Bank PLC | 12/03/24 | 7,222 |
| JPY | 200,248,251 | USD | 1,314,077 | Goldman Sachs Bank USA | 12/03/24 | 24,347 |
| JPY | 58,954,316 | USD | 388,429 | Royal Bank of Canada | 12/03/24 | 5,611 |
| JPY | 163,742,659 | USD | 1,072,335 | UBS AG | 12/03/24 | 22,092 |
| JPY | 100,030,717 | USD | 656,594 | UBS AG | 12/03/24 | 11,993 |
| NZD | 7,600,000 | USD | 4,538,420 | Bank of America, N.A. | 12/03/24 | (37,320) |
| SEK | 33,958,840 | USD | 3,179,594 | Bank of America, N.A. | 12/03/24 | (63,547) |
| SEK | 5,440,052 | USD | 509,935 | Barclays Bank PLC | 12/03/24 | (10,758) |
| SEK | 495,000 | USD | 46,332 | Citibank, N.A. | 12/03/24 | (911) |
| SGD | 393,991 | USD | 298,414 | Bank of America, N.A. | 12/03/24 | (4,238) |
| SGD | 4,159,368 | USD | 3,147,491 | Citibank, N.A. | 12/03/24 | (41,862) |
| SGD | 151,000 | USD | 112,419 | Goldman Sachs Bank USA | 12/03/24 | 326 |
| USD | 139,865 | AUD | 212,700 | Deutsche Bank AG | 12/03/24 | 1,131 |
| USD | 282,365 | AUD | 430,300 | UBS AG | 12/03/24 | 1,702 |
| USD | 235,683 | CAD | 328,000 | Bank of America, N.A. | 12/03/24 | 1,406 |
| USD | 206,367 | CAD | 289,000 | Citibank, N.A. | 12/03/24 | (54) |
| USD | 51,857 | CHF | 45,691 | Barclays Bank PLC | 12/03/24 | (9) |
| USD | 921,228 | EUR | 847,000 | BNP Paribas S.A. | 12/03/24 | 26,160 |
| USD | 27,744 | EUR | 26,000 | BNP Paribas S.A. | 12/03/24 | 268 |
| USD | 12,653 | EUR | 12,000 | BNP Paribas S.A. | 12/03/24 | (28) |
| USD | 97,845 | EUR | 93,000 | BNP Paribas S.A. | 12/03/24 | (432) |
| USD | 46,345 | EUR | 43,000 | Bank of America, N.A. | 12/03/24 | 905 |
| USD | 33,778 | EUR | 32,000 | Bank of America, N.A. | 12/03/24 | (38) |
| USD | 23,992 | EUR | 22,000 | Barclays Bank PLC | 12/03/24 | 744 |
| USD | 603,619 | EUR | 557,000 | JPMorgan Chase Bank, N.A. | 12/03/24 | 15,009 |
| USD | 137,022 | GBP | 108,000 | Barclays Bank PLC | 12/03/24 | (403) |
| USD | 1,926,270 | GBP | 1,530,000 | Barclays Bank PLC | 12/03/24 | (20,578) |
| USD | 219,079 | GBP | 170,000 | Citibank, N.A. | 12/03/24 | 2,763 |
| USD | 83,928 | GBP | 65,000 | Citibank, N.A. | 12/03/24 | 1,219 |
| USD | 900,831 | JPY | 138,151,442 | Bank of America, N.A. | 12/03/24 | (22,549) |
| USD | 3,070,347 | JPY | 461,120,127 | Barclays Bank PLC | 12/03/24 | (11,697) |
| USD | 4,494,640 | NZD | 7,600,000 | Barclays Bank PLC | 12/03/24 | (6,460) |
| USD | 3,548,312 | SEK | 38,666,986 | Barclays Bank PLC | 12/03/24 | 247 |
| USD | 110,879 | SEK | 1,185,000 | Citibank, N.A. | 12/03/24 | 2,144 |
| USD | 2,298,417 | SGD | 3,077,327 | Bank of America, N.A. | 12/03/24 | 704 |
| USD | 1,203,424 | SGD | 1,624,021 | Bank of America, N.A. | 12/03/24 | (9,165) |
| INR | 147,259,512 | USD | 1,749,283 | Citibank, N.A. | 12/04/24 | (8,517) |
| USD | 537,414 | INR | 45,265,575 | Citibank, N.A. | 12/04/24 | 2,326 |
| USD | 580,763 | INR | 48,901,987 | Citibank, N.A. | 12/04/24 | 2,689 |
| USD | 630,733 | INR | 53,091,950 | JPMorgan Chase Bank, N.A. | 12/04/24 | 3,129 |
| USD | 31,130 | TRY | 1,104,733 | Barclays Bank PLC | 12/05/24 | (645) |
| TRY | 521,260 | USD | 13,810 | JPMorgan Chase Bank, N.A. | 12/11/24 | 1,091 |
| USD | 313,532 | MXN | 6,318,015 | BNP Paribas S.A. | 12/11/24 | 2,630 |
| USD | 124,953 | TRY | 4,687,737 | Barclays Bank PLC | 12/13/24 | (8,775) |
| USD | 43,397 | TRY | 1,608,904 | Citibank, N.A. | 12/13/24 | (2,501) |
| CZK | 2,463,000 | USD | 105,206 | Barclays Bank PLC | 12/16/24 | (2,088) |
| CZK | 77,125,775 | USD | 3,333,584 | JPMorgan Chase Bank, N.A. | 12/16/24 | (104,582) |
| HKD | 1,001,000 | USD | 128,924 | BNP Paribas S.A. | 12/16/24 | (242) |
| ILS | 572,095 | USD | 152,754 | Barclays Bank PLC | 12/16/24 | 4,783 |
| ILS | 9,644,051 | USD | 2,562,930 | Citibank, N.A. | 12/16/24 | 92,729 |
| ILS | 16,000 | USD | 4,299 | Goldman Sachs Bank USA | 12/16/24 | 107 |
| ILS | 2,307,844 | USD | 614,540 | UBS AG | 12/16/24 | 20,965 |
| PLN | 2,661,000 | USD | 661,182 | BNP Paribas S.A. | 12/16/24 | (6,340) |
| PLN | 450,000 | USD | 113,129 | Bank of America, N.A. | 12/16/24 | (2,389) |
| PLN | 66,000 | USD | 16,376 | Bank of America, N.A. | 12/16/24 | (134) |
| PLN | 84,000 | USD | 20,524 | Barclays Bank PLC | 12/16/24 | 147 |
| PLN | 2,483,184 | USD | 628,042 | Barclays Bank PLC | 12/16/24 | (16,959) |
| PLN | 2,940,421 | USD | 745,080 | Citibank, N.A. | 12/16/24 | (21,477) |
| PLN | 3,157,594 | USD | 800,047 | Deutsche Bank AG | 12/16/24 | (23,000) |
| PLN | 2,192,219 | USD | 557,549 | UBS AG | 12/16/24 | (18,069) |
| THB | 209,453,278 | USD | 6,297,377 | Barclays Bank PLC | 12/16/24 | (184,682) |
| TRY | 1,172,216 | USD | 31,300 | Barclays Bank PLC | 12/16/24 | 2,036 |
| USD | 118,910 | CZK | 2,869,000 | Barclays Bank PLC | 12/16/24 | (1,205) |
| USD | 164,790 | CZK | 3,804,000 | Morgan Stanley International | 12/16/24 | 5,529 |
| USD | 975,800 | HKD | 7,571,884 | BNP Paribas S.A. | 12/16/24 | 2,412 |
| USD | 142,732 | HKD | 1,108,000 | Royal Bank of Canada | 12/16/24 | 295 |
| USD | 202,573 | HKD | 1,575,000 | Royal Bank of Canada | 12/16/24 | 102 |
| USD | 157,831 | HUF | 58,030,460 | Bank of America, N.A. | 12/16/24 | 9,415 |
| USD | 243,354 | HUF | 93,650,000 | JPMorgan Chase Bank, N.A. | 12/16/24 | 3,840 |
| USD | 10,414 | ILS | 39,000 | Barclays Bank PLC | 12/16/24 | (326) |
| USD | 21,688 | ILS | 81,000 | Morgan Stanley International | 12/16/24 | (616) |
| USD | 58,137 | PLN | 234,000 | Bank of America, N.A. | 12/16/24 | 552 |
| USD | 63,843 | PLN | 266,000 | JPMorgan Chase Bank, N.A. | 12/16/24 | (1,617) |
| USD | 60,277 | PLN | 245,000 | Morgan Stanley International | 12/16/24 | (14) |
| USD | 7,031 | THB | 233,000 | BNP Paribas S.A. | 12/16/24 | 231 |
| USD | 23,669 | TRY | 887,587 | JPMorgan Chase Bank, N.A. | 12/17/24 | (1,547) |
| ZAR | 71,629,229 | USD | 4,057,876 | Morgan Stanley International | 12/17/24 | (87,362) |
| AUD | 800,000 | USD | 538,958 | BNP Paribas S.A. | 12/18/24 | (17,085) |
| AUD | 1,400,000 | USD | 917,698 | Citibank, N.A. | 12/18/24 | (4,421) |
| AUD | 1,000,000 | USD | 672,143 | Citibank, N.A. | 12/18/24 | (19,802) |
| AUD | 1,000,000 | USD | 693,594 | Morgan Stanley International | 12/18/24 | (41,253) |
| AUD | 1,700,000 | USD | 1,169,053 | State Street Bank And Trust Co | 12/18/24 | (60,073) |
| BRL | 5,171,410 | USD | 900,000 | BNP Paribas S.A. | 12/18/24 | (42,071) |
| BRL | 14,398,959 | USD | 2,600,000 | BNP Paribas S.A. | 12/18/24 | (211,234) |
| BRL | 2,311,078 | USD | 400,000 | BNP Paribas S.A. | 12/18/24 | (16,596) |
| BRL | 5,621,147 | USD | 1,000,000 | BNP Paribas S.A. | 12/18/24 | (67,460) |
| BRL | 5,230,080 | USD | 900,000 | Canadian Imperial Bk. of Comm. | 12/18/24 | (32,337) |
| BRL | 2,312,352 | USD | 400,000 | Citibank, N.A. | 12/18/24 | (16,384) |
| BRL | 1,659,696 | USD | 300,000 | Goldman Sachs Bank USA | 12/18/24 | (24,659) |
| CAD | 11,600,000 | USD | 8,390,032 | Barclays Bank PLC | 12/18/24 | (99,569) |
| CAD | 5,136,774 | USD | 3,700,000 | Canadian Imperial Bk. of Comm. | 12/18/24 | (28,773) |
| CHF | 4,400,000 | USD | 5,104,992 | Barclays Bank PLC | 12/18/24 | (101,041) |
| CHF | 1,463,020 | USD | 1,700,000 | Barclays Bank PLC | 12/18/24 | (36,163) |
| CHF | 334,279 | USD | 400,000 | Canadian Imperial Bk. of Comm. | 12/18/24 | (19,837) |
| CLP | 462,226,150 | USD | 500,000 | BNP Paribas S.A. | 12/18/24 | (25,572) |
| CLP | 539,190,000 | USD | 600,000 | Citibank, N.A. | 12/18/24 | (46,576) |
| CLP | 1,337,428,372 | USD | 1,400,000 | Goldman Sachs Bank USA | 12/18/24 | (27,265) |
| CLP | 3,161,187,944 | USD | 3,357,822 | JPMorgan Chase Bank, N.A. | 12/18/24 | (113,182) |
| CLP | 497,973,750 | USD | 555,000 | JPMorgan Chase Bank, N.A. | 12/18/24 | (43,880) |
| CLP | 1,894,830,000 | USD | 2,100,000 | State Street Bank And Trust Co | 12/18/24 | (155,148) |
| CLP | 668,563,000 | USD | 745,000 | State Street Bank And Trust Co | 12/18/24 | (58,788) |
| CLP | 3,892,623,899 | USD | 3,989,162 | State Street Bank And Trust Co | 12/18/24 | 6,224 |
| CNY | 10,575,791 | USD | 1,500,000 | BNP Paribas S.A. | 12/18/24 | (38,102) |
| CNY | 1,355,140 | USD | 190,650 | Bank of America, N.A. | 12/18/24 | (3,328) |
| CNY | 11,999,850 | USD | 1,700,000 | Bank of America, N.A. | 12/18/24 | (41,254) |
| CNY | 1,380,406 | USD | 194,085 | Citibank, N.A. | 12/18/24 | (3,271) |
| CNY | 13,505,044 | USD | 1,900,000 | Morgan Stanley International | 12/18/24 | (33,190) |
| COP | 2,128,750,000 | USD | 500,000 | BNP Paribas S.A. | 12/18/24 | (20,855) |
| COP | 3,548,800,000 | USD | 800,000 | BNP Paribas S.A. | 12/18/24 | (1,225) |
| COP | 1,801,288,000 | USD | 400,000 | Barclays Bank PLC | 12/18/24 | 5,439 |
| COP | 897,500,000 | USD | 200,000 | JPMorgan Chase Bank, N.A. | 12/18/24 | 2,012 |
| COP | 2,248,500,000 | USD | 500,000 | State Street Bank And Trust Co | 12/18/24 | 6,099 |
| CZK | 18,765,186 | USD | 800,000 | BNP Paribas S.A. | 12/18/24 | (14,310) |
| CZK | 13,501,234 | USD | 600,000 | BNP Paribas S.A. | 12/18/24 | (34,709) |
| CZK | 30,255,355 | USD | 1,300,000 | Barclays Bank PLC | 12/18/24 | (33,221) |
| CZK | 9,539,720 | USD | 400,000 | Citibank, N.A. | 12/18/24 | (576) |
| EUR | 2,000,000 | USD | 2,177,048 | Canadian Imperial Bk. of Comm. | 12/18/24 | (62,086) |
| EUR | 5,810,000 | USD | 6,277,129 | Citibank, N.A. | 12/18/24 | (133,165) |
| EUR | 1,750,000 | USD | 1,860,482 | JPMorgan Chase Bank, N.A. | 12/18/24 | (9,890) |
| GBP | 1,437,500 | USD | 1,879,981 | BNP Paribas S.A. | 12/18/24 | (50,848) |
| GBP | 937,500 | USD | 1,245,335 | Bank of America, N.A. | 12/18/24 | (52,423) |
| GBP | 8,700,000 | USD | 11,270,353 | Barclays Bank PLC | 12/18/24 | (200,123) |
| GBP | 375,000 | USD | 482,305 | Barclays Bank PLC | 12/18/24 | (5,139) |
| GBP | 625,000 | USD | 818,718 | Morgan Stanley International | 12/18/24 | (23,443) |
| GBP | 750,000 | USD | 982,878 | Morgan Stanley International | 12/18/24 | (28,548) |
| GBP | 562,500 | USD | 735,416 | State Street Bank And Trust Co | 12/18/24 | (19,668) |
| HUF | 180,640,725 | USD | 500,000 | BNP Paribas S.A. | 12/18/24 | (38,035) |
| HUF | 300,905,511 | USD | 800,000 | BNP Paribas S.A. | 12/18/24 | (30,474) |
| HUF | 302,788,948 | USD | 800,000 | BNP Paribas S.A. | 12/18/24 | (25,658) |
| HUF | 1,711,508,653 | USD | 4,742,041 | BNP Paribas S.A. | 12/18/24 | (365,085) |
| HUF | 189,136,326 | USD | 500,000 | BNP Paribas S.A. | 12/18/24 | (16,309) |
| HUF | 440,041,426 | USD | 1,138,342 | BNP Paribas S.A. | 12/18/24 | (12,995) |
| HUF | 7,723,860 | USD | 20,002 | Bank of America, N.A. | 12/18/24 | (249) |
| HUF | 16,111,487 | USD | 41,656 | JPMorgan Chase Bank, N.A. | 12/18/24 | (453) |
| HUF | 602,213,920 | USD | 1,600,000 | Morgan Stanley International | 12/18/24 | (59,918) |
| IDR | 11,014,500,000 | USD | 700,000 | BNP Paribas S.A. | 12/18/24 | (5,139) |
| IDR | 9,188,663,700 | USD | 600,000 | BNP Paribas S.A. | 12/18/24 | (20,324) |
| IDR | 9,414,960,000 | USD | 600,000 | JPMorgan Chase Bank, N.A. | 12/18/24 | (6,048) |
| ILS | 4,119,728 | USD | 1,100,000 | BNP Paribas S.A. | 12/18/24 | 34,489 |
| ILS | 5,198,673 | USD | 1,400,000 | Morgan Stanley International | 12/18/24 | 31,609 |
| ILS | 10,598,050 | USD | 2,900,000 | State Street Bank And Trust Co | 12/18/24 | 18,488 |
| INR | 218,652,533 | USD | 2,600,000 | BNP Paribas S.A. | 12/18/24 | (17,285) |
| INR | 445,113,621 | USD | 5,300,000 | BNP Paribas S.A. | 12/18/24 | (42,335) |
| INR | 167,680,388 | USD | 2,000,000 | BNP Paribas S.A. | 12/18/24 | (19,366) |
| INR | 436,122,492 | USD | 5,200,000 | BNP Paribas S.A. | 12/18/24 | (48,538) |
| INR | 93,114,888 | USD | 1,100,000 | BNP Paribas S.A. | 12/18/24 | (131) |
| INR | 92,641,340 | USD | 1,100,000 | Barclays Bank PLC | 12/18/24 | (5,724) |
| INR | 160,041,750 | USD | 1,900,000 | Citibank, N.A. | 12/18/24 | (9,593) |
| JPY | 70,445,800 | USD | 500,000 | BNP Paribas S.A. | 12/18/24 | (28,056) |
| JPY | 70,859,910 | USD | 500,000 | State Street Bank And Trust Co | 12/18/24 | (25,281) |
| KRW | 5,208,800,000 | USD | 4,000,000 | BNP Paribas S.A. | 12/18/24 | (263,238) |
| KRW | 1,845,247,740 | USD | 1,400,000 | BNP Paribas S.A. | 12/18/24 | (76,230) |
| KRW | 698,965,000 | USD | 500,000 | Deutsche Bank AG | 12/18/24 | 1,433 |
| KRW | 1,788,147,400 | USD | 1,300,000 | Morgan Stanley International | 12/18/24 | (17,194) |
| KRW | 1,075,350,640 | USD | 800,000 | Royal Bank of Canada | 12/18/24 | (28,550) |
| KRW | 1,101,736,000 | USD | 800,000 | State Street Bank And Trust Co | 12/18/24 | (9,621) |
| MXN | 46,957,181 | USD | 2,400,000 | BNP Paribas S.A. | 12/18/24 | (92,193) |
| MXN | 12,135,611 | USD | 600,000 | Morgan Stanley International | 12/18/24 | (3,571) |
| MXN | 11,907,583 | USD | 600,000 | Morgan Stanley International | 12/18/24 | (14,777) |
| MYR | 15,056,637 | USD | 3,426,246 | Barclays Bank PLC | 12/18/24 | (36,560) |
| NOK | 11,019,117 | USD | 1,050,000 | BNP Paribas S.A. | 12/18/24 | (51,935) |
| NOK | 9,904,265 | USD | 900,000 | Canadian Imperial Bk. of Comm. | 12/18/24 | (2,914) |
| NOK | 11,032,534 | USD | 1,050,000 | JPMorgan Chase Bank, N.A. | 12/18/24 | (50,720) |
| NOK | 33,800,000 | USD | 3,082,633 | Royal Bank of Canada | 12/18/24 | (21,172) |
| NZD | 1,700,000 | USD | 1,071,746 | BNP Paribas S.A. | 12/18/24 | (64,705) |
| NZD | 800,000 | USD | 489,437 | BNP Paribas S.A. | 12/18/24 | (15,536) |
| NZD | 1,700,000 | USD | 1,012,105 | Morgan Stanley International | 12/18/24 | (5,064) |
| PEN | 4,479,476 | USD | 1,178,639 | Citibank, N.A. | 12/18/24 | 16,868 |
| PEN | 1,934,140 | USD | 520,000 | Citibank, N.A. | 12/18/24 | (3,806) |
| PEN | 2,157,310 | USD | 580,000 | Citibank, N.A. | 12/18/24 | (4,245) |
| PEN | 6,694,200 | USD | 1,800,000 | Citibank, N.A. | 12/18/24 | (13,415) |
| PEN | 5,605,500 | USD | 1,500,000 | Citibank, N.A. | 12/18/24 | (3,973) |
| PEN | 4,826,801 | USD | 1,269,910 | Deutsche Bank AG | 12/18/24 | 18,293 |
| PEN | 6,301,900 | USD | 1,700,000 | State Street Bank And Trust Co | 12/18/24 | (18,114) |
| PHP | 180,573,275 | USD | 3,118,009 | BNP Paribas S.A. | 12/18/24 | (40,046) |
| PHP | 55,791,221 | USD | 1,000,000 | BNP Paribas S.A. | 12/18/24 | (49,010) |
| PHP | 47,194,400 | USD | 800,000 | Bank of America, N.A. | 12/18/24 | 4,452 |
| PLN | 2,713,737 | USD | 673,047 | BNP Paribas S.A. | 12/18/24 | (5,304) |
| PLN | 2,119,023 | USD | 526,953 | BNP Paribas S.A. | 12/18/24 | (5,546) |
| PLN | 2,345,680 | USD | 600,000 | Barclays Bank PLC | 12/18/24 | (22,822) |
| PLN | 2,346,369 | USD | 600,000 | JPMorgan Chase Bank, N.A. | 12/18/24 | (22,652) |
| PLN | 2,011,247 | USD | 500,000 | Morgan Stanley International | 12/18/24 | (5,112) |
| PLN | 2,805,740 | USD | 700,000 | Morgan Stanley International | 12/18/24 | (9,619) |
| SEK | 10,098,092 | USD | 1,000,000 | BNP Paribas S.A. | 12/18/24 | (72,509) |
| SEK | 11,729,857 | USD | 1,100,000 | Barclays Bank PLC | 12/18/24 | (22,635) |
| SGD | 1,718,573 | USD | 1,300,000 | BNP Paribas S.A. | 12/18/24 | (15,912) |
| SGD | 1,952,750 | USD | 1,500,000 | BNP Paribas S.A. | 12/18/24 | (40,939) |
| THB | 39,839,681 | USD | 1,200,000 | BNP Paribas S.A. | 12/18/24 | (37,110) |
| THB | 60,066,000 | USD | 1,800,000 | Morgan Stanley International | 12/18/24 | (46,719) |
| TWD | 47,198,670 | USD | 1,500,000 | BNP Paribas S.A. | 12/18/24 | (44,304) |
| TWD | 82,710,376 | USD | 2,600,000 | BNP Paribas S.A. | 12/18/24 | (49,055) |
| USD | 2,208,433 | AUD | 3,300,000 | BNP Paribas S.A. | 12/18/24 | 55,707 |
| USD | 1,114,742 | AUD | 1,700,000 | BNP Paribas S.A. | 12/18/24 | 5,762 |
| USD | 657,240 | AUD | 1,000,000 | BNP Paribas S.A. | 12/18/24 | 4,899 |
| USD | 693,704 | AUD | 1,000,000 | BNP Paribas S.A. | 12/18/24 | 41,363 |
| USD | 3,692,013 | AUD | 5,500,000 | Barclays Bank PLC | 12/18/24 | 104,137 |
| USD | 648,010 | AUD | 1,000,000 | Goldman Sachs Bank USA | 12/18/24 | (4,331) |
| USD | 1,127,860 | AUD | 1,700,000 | Morgan Stanley International | 12/18/24 | 18,880 |
| USD | 2,400,000 | BRL | 13,730,390 | BNP Paribas S.A. | 12/18/24 | 122,148 |
| USD | 700,000 | BRL | 4,075,233 | BNP Paribas S.A. | 12/18/24 | 23,925 |
| USD | 600,000 | BRL | 3,488,428 | BNP Paribas S.A. | 12/18/24 | 21,275 |
| USD | 3,600,000 | BRL | 20,455,348 | BNP Paribas S.A. | 12/18/24 | 206,487 |
| USD | 500,000 | BRL | 2,760,300 | Canadian Imperial Bk. of Comm. | 12/18/24 | 42,070 |
| USD | 3,800,000 | CAD | 5,226,512 | BNP Paribas S.A. | 12/18/24 | 64,637 |
| USD | 4,000,000 | CAD | 5,535,452 | BNP Paribas S.A. | 12/18/24 | 43,839 |
| USD | 1,000,000 | CAD | 1,345,434 | BNP Paribas S.A. | 12/18/24 | 38,425 |
| USD | 5,800,000 | CAD | 7,923,879 | Barclays Bank PLC | 12/18/24 | 136,842 |
| USD | 900,000 | CAD | 1,252,480 | Citibank, N.A. | 12/18/24 | 4,859 |
| USD | 7,100,000 | CAD | 9,749,846 | JPMorgan Chase Bank, N.A. | 12/18/24 | 131,832 |
| USD | 1,000,000 | CAD | 1,342,347 | Morgan Stanley International | 12/18/24 | 40,631 |
| USD | 3,000,000 | CHF | 2,581,797 | BNP Paribas S.A. | 12/18/24 | 63,821 |
| USD | 1,100,000 | CHF | 943,812 | BNP Paribas S.A. | 12/18/24 | 26,639 |
| USD | 4,700,000 | CHF | 3,984,463 | BNP Paribas S.A. | 12/18/24 | 168,624 |
| USD | 900,000 | CHF | 790,770 | Barclays Bank PLC | 12/18/24 | 688 |
| USD | 400,000 | CHF | 353,973 | Canadian Imperial Bk. of Comm. | 12/18/24 | (2,560) |
| USD | 4,500,000 | CHF | 3,849,411 | JPMorgan Chase Bank, N.A. | 12/18/24 | 122,213 |
| USD | 900,000 | CHF | 773,929 | Morgan Stanley International | 12/18/24 | 19,841 |
| USD | 600,000 | CHF | 500,674 | State Street Bank And Trust Co | 12/18/24 | 30,602 |
| USD | 520,000 | CLP | 501,221,116 | BNP Paribas S.A. | 12/18/24 | 5,547 |
| USD | 965,000 | CLP | 928,786,601 | BNP Paribas S.A. | 12/18/24 | 11,694 |
| USD | 15,000 | CLP | 14,432,731 | BNP Paribas S.A. | 12/18/24 | 186 |
| USD | 412,000 | CLP | 394,510,600 | Barclays Bank PLC | 12/18/24 | 7,075 |
| USD | 1,606,000 | CLP | 1,525,700,000 | Goldman Sachs Bank USA | 12/18/24 | 40,023 |
| USD | 3,473,128 | CLP | 3,294,991,265 | Goldman Sachs Bank USA | 12/18/24 | 91,152 |
| USD | 700,000 | CLP | 655,830,000 | Goldman Sachs Bank USA | 12/18/24 | 26,857 |
| USD | 2,965,000 | CLP | 2,760,415,000 | Goldman Sachs Bank USA | 12/18/24 | 131,713 |
| USD | 635,000 | CLP | 590,486,500 | JPMorgan Chase Bank, N.A. | 12/18/24 | 28,925 |
| USD | 1,501,000 | CLP | 1,425,349,600 | State Street Bank And Trust Co | 12/18/24 | 38,023 |
| USD | 381,000 | CLP | 364,693,200 | State Street Bank And Trust Co | 12/18/24 | 6,679 |
| USD | 3,600,000 | CNY | 25,579,580 | JPMorgan Chase Bank, N.A. | 12/18/24 | 64,120 |
| USD | 6,400,000 | CNY | 45,541,152 | JPMorgan Chase Bank, N.A. | 12/18/24 | 104,821 |
| USD | 26,842 | CNY | 190,753 | Morgan Stanley International | 12/18/24 | 474 |
| USD | 570,000 | COP | 2,473,230,000 | BNP Paribas S.A. | 12/18/24 | 13,318 |
| USD | 669,000 | COP | 2,932,561,500 | BNP Paribas S.A. | 12/18/24 | 8,930 |
| USD | 100,000 | COP | 435,800,000 | Barclays Bank PLC | 12/18/24 | 1,909 |
| USD | 500,000 | COP | 2,130,125,000 | Barclays Bank PLC | 12/18/24 | 20,545 |
| USD | 175,482 | COP | 745,973,982 | Citibank, N.A. | 12/18/24 | 7,576 |
| USD | 421,197 | COP | 1,784,527,450 | Citibank, N.A. | 12/18/24 | 19,530 |
| USD | 1,300,000 | COP | 5,596,500,000 | Citibank, N.A. | 12/18/24 | 40,323 |
| USD | 331,000 | COP | 1,450,524,750 | Citibank, N.A. | 12/18/24 | 4,512 |
| USD | 1,130,000 | COP | 4,921,150,000 | State Street Bank And Trust Co | 12/18/24 | 22,333 |
| USD | 700,000 | CZK | 16,306,668 | BNP Paribas S.A. | 12/18/24 | 17,247 |
| USD | 1,000,000 | CZK | 23,344,371 | BNP Paribas S.A. | 12/18/24 | 22,581 |
| USD | 600,000 | CZK | 13,986,021 | BNP Paribas S.A. | 12/18/24 | 14,411 |
| USD | 500,000 | CZK | 11,214,423 | BNP Paribas S.A. | 12/18/24 | 30,457 |
| USD | 500,000 | CZK | 11,224,106 | BNP Paribas S.A. | 12/18/24 | 30,052 |
| USD | 800,000 | CZK | 18,372,988 | BNP Paribas S.A. | 12/18/24 | 30,731 |
| USD | 2,300,000 | CZK | 53,049,010 | BNP Paribas S.A. | 12/18/24 | 78,861 |
| USD | 500,000 | CZK | 11,955,672 | BNP Paribas S.A. | 12/18/24 | (579) |
| USD | 700,000 | CZK | 16,127,070 | BNP Paribas S.A. | 12/18/24 | 24,766 |
| USD | 500,000 | CZK | 11,401,665 | Bank of America, N.A. | 12/18/24 | 22,617 |
| USD | 1,690,000 | CZK | 39,021,373 | Bank of America, N.A. | 12/18/24 | 56,192 |
| USD | 510,000 | CZK | 11,771,744 | Goldman Sachs Bank USA | 12/18/24 | 17,122 |
| USD | 500,000 | CZK | 11,262,145 | Morgan Stanley International | 12/18/24 | 28,459 |
| USD | 1,632,552 | EUR | 1,500,000 | BNP Paribas S.A. | 12/18/24 | 46,331 |
| USD | 3,714,161 | EUR | 3,375,000 | BNP Paribas S.A. | 12/18/24 | 145,162 |
| USD | 1,233,430 | EUR | 1,125,000 | BNP Paribas S.A. | 12/18/24 | 43,763 |
| USD | 1,639,314 | EUR | 1,500,000 | BNP Paribas S.A. | 12/18/24 | 53,093 |
| USD | 948,644 | EUR | 875,000 | Barclays Bank PLC | 12/18/24 | 23,348 |
| USD | 2,752,465 | EUR | 2,500,000 | Barclays Bank PLC | 12/18/24 | 108,763 |
| USD | 529,016 | EUR | 500,000 | Barclays Bank PLC | 12/18/24 | 276 |
| USD | 2,028,854 | EUR | 1,875,000 | Morgan Stanley International | 12/18/24 | 46,077 |
| USD | 837,805 | EUR | 750,000 | State Street Bank And Trust Co | 12/18/24 | 44,694 |
| USD | 4,940,100 | GBP | 3,812,500 | BNP Paribas S.A. | 12/18/24 | 88,922 |
| USD | 581,553 | GBP | 437,500 | BNP Paribas S.A. | 12/18/24 | 24,861 |
| USD | 944,087 | GBP | 750,000 | BNP Paribas S.A. | 12/18/24 | (10,243) |
| USD | 413,600 | GBP | 312,500 | Barclays Bank PLC | 12/18/24 | 15,963 |
| USD | 1,519,325 | GBP | 1,187,500 | Barclays Bank PLC | 12/18/24 | 8,302 |
| USD | 11,006,756 | GBP | 8,437,500 | Deutsche Bank AG | 12/18/24 | 270,541 |
| USD | 413,539 | GBP | 312,500 | JPMorgan Chase Bank, N.A. | 12/18/24 | 15,902 |
| USD | 1,588,525 | GBP | 1,187,500 | JPMorgan Chase Bank, N.A. | 12/18/24 | 77,502 |
| USD | 4,207,733 | GBP | 3,312,500 | JPMorgan Chase Bank, N.A. | 12/18/24 | (7,225) |
| USD | 2,841,785 | GBP | 2,250,000 | JPMorgan Chase Bank, N.A. | 12/18/24 | (21,205) |
| USD | 1,257,335 | GBP | 937,500 | Morgan Stanley International | 12/18/24 | 64,423 |
| USD | 1,900,000 | HUF | 703,450,513 | BNP Paribas S.A. | 12/18/24 | 101,019 |
| USD | 400,000 | HUF | 147,609,340 | BNP Paribas S.A. | 12/18/24 | 22,509 |
| USD | 1,800,000 | HUF | 674,849,891 | BNP Paribas S.A. | 12/18/24 | 74,161 |
| USD | 900,000 | HUF | 318,701,805 | BNP Paribas S.A. | 12/18/24 | 84,963 |
| USD | 1,000,000 | HUF | 354,409,012 | BNP Paribas S.A. | 12/18/24 | 93,646 |
| USD | 400,000 | HUF | 145,422,688 | BNP Paribas S.A. | 12/18/24 | 28,101 |
| USD | 736,145 | HUF | 269,197,729 | BNP Paribas S.A. | 12/18/24 | 47,708 |
| USD | 388,476 | HUF | 142,010,649 | BNP Paribas S.A. | 12/18/24 | 25,302 |
| USD | 2,130,944 | HUF | 782,893,562 | BNP Paribas S.A. | 12/18/24 | 128,798 |
| USD | 500,000 | HUF | 182,504,150 | BNP Paribas S.A. | 12/18/24 | 33,270 |
| USD | 700,000 | HUF | 255,646,392 | BNP Paribas S.A. | 12/18/24 | 46,218 |
| USD | 969,054 | HUF | 355,975,107 | Bank of America, N.A. | 12/18/24 | 58,695 |
| USD | 2 | HUF | 734 | Bank of America, N.A. | 12/18/24 | 0 |
| USD | 1,675,380 | HUF | 613,339,787 | Citibank, N.A. | 12/18/24 | 106,845 |
| USD | 600,000 | HUF | 214,131,438 | JPMorgan Chase Bank, N.A. | 12/18/24 | 52,387 |
| USD | 900,000 | HUF | 330,152,589 | JPMorgan Chase Bank, N.A. | 12/18/24 | 55,679 |
| USD | 700,000 | IDR | 10,678,069,780 | BNP Paribas S.A. | 12/18/24 | 26,363 |
| USD | 1,034,000 | IDR | 16,253,293,795 | BNP Paribas S.A. | 12/18/24 | 8,645 |
| USD | 466,000 | IDR | 7,323,005,091 | BNP Paribas S.A. | 12/18/24 | 4,021 |
| USD | 600,000 | IDR | 9,109,858,800 | BNP Paribas S.A. | 12/18/24 | 25,295 |
| USD | 600,000 | IDR | 9,151,200,000 | Citibank, N.A. | 12/18/24 | 22,687 |
| USD | 800,000 | IDR | 12,572,640,000 | Citibank, N.A. | 12/18/24 | 6,842 |
| USD | 800,000 | IDR | 12,618,400,000 | Deutsche Bank AG | 12/18/24 | 3,956 |
| USD | 2,665,000 | ILS | 10,019,638 | BNP Paribas S.A. | 12/18/24 | (94,205) |
| USD | 3,160,500 | ILS | 11,788,248 | BNP Paribas S.A. | 12/18/24 | (85,744) |
| USD | 839,500 | ILS | 3,135,385 | Bank of America, N.A. | 12/18/24 | (23,921) |
| USD | 700,000 | ILS | 2,608,826 | Citibank, N.A. | 12/18/24 | (18,418) |
| USD | 735,000 | ILS | 2,768,428 | JPMorgan Chase Bank, N.A. | 12/18/24 | (27,369) |
| USD | 1,300,000 | INR | 109,171,680 | BNP Paribas S.A. | 12/18/24 | 10,468 |
| USD | 1,600,000 | INR | 135,218,677 | BNP Paribas S.A. | 12/18/24 | 2,802 |
| USD | 1,000,000 | INR | 84,492,834 | BNP Paribas S.A. | 12/18/24 | 1,974 |
| USD | 2,496,000 | INR | 210,443,735 | BNP Paribas S.A. | 12/18/24 | 10,247 |
| USD | 7,957,306 | INR | 670,335,414 | Citibank, N.A. | 12/18/24 | 39,330 |
| USD | 1,198,000 | INR | 101,029,616 | Goldman Sachs Bank USA | 12/18/24 | 4,642 |
| USD | 900,000 | INR | 76,095,000 | JPMorgan Chase Bank, N.A. | 12/18/24 | 1,169 |
| USD | 5,206,000 | INR | 438,964,714 | JPMorgan Chase Bank, N.A. | 12/18/24 | 20,966 |
| USD | 3,400,000 | JPY | 512,881,258 | BNP Paribas S.A. | 12/18/24 | (35,995) |
| USD | 5,200,000 | JPY | 755,843,452 | BNP Paribas S.A. | 12/18/24 | 136,305 |
| USD | 2,902,400 | JPY | 429,502,585 | BNP Paribas S.A. | 12/18/24 | 24,992 |
| USD | 397,600 | JPY | 58,842,692 | Barclays Bank PLC | 12/18/24 | 3,390 |
| USD | 600,000 | JPY | 91,023,276 | JPMorgan Chase Bank, N.A. | 12/18/24 | (9,801) |
| USD | 3,800,000 | JPY | 557,245,718 | JPMorgan Chase Bank, N.A. | 12/18/24 | 66,790 |
| USD | 2,100,000 | KRW | 2,867,876,285 | BNP Paribas S.A. | 12/18/24 | 42,603 |
| USD | 3,175,000 | KRW | 4,318,206,413 | BNP Paribas S.A. | 12/18/24 | 77,145 |
| USD | 2,900,000 | KRW | 3,888,030,000 | Citibank, N.A. | 12/18/24 | 110,751 |
| USD | 1,125,000 | KRW | 1,528,200,000 | Citibank, N.A. | 12/18/24 | 28,678 |
| USD | 59,491 | MXN | 1,169,000 | Barclays Bank PLC | 12/18/24 | 2,038 |
| USD | 49,533 | MXN | 1,014,000 | Goldman Sachs Bank USA | 12/18/24 | (303) |
| USD | 1,200,000 | MXN | 24,251,697 | JPMorgan Chase Bank, N.A. | 12/18/24 | 8,101 |
| USD | 2,263,057 | MXN | 44,374,000 | Morgan Stanley International | 12/18/24 | 82,206 |
| USD | 800,000 | MXN | 15,880,331 | Morgan Stanley International | 12/18/24 | 19,529 |
| USD | 26,363 | MXN | 517,000 | UBS AG | 12/18/24 | 954 |
| USD | 1,372 | MXN | 26,823 | UBS AG | 12/18/24 | 53 |
| USD | 1,200,000 | MYR | 5,247,600 | Barclays Bank PLC | 12/18/24 | 18,613 |
| USD | 1,000,000 | MYR | 4,185,660 | Goldman Sachs Bank USA | 12/18/24 | 57,687 |
| USD | 2,600,000 | NOK | 28,359,425 | BNP Paribas S.A. | 12/18/24 | 31,324 |
| USD | 1,300,000 | NOK | 14,214,881 | BNP Paribas S.A. | 12/18/24 | 12,476 |
| USD | 3,300,000 | NOK | 35,836,541 | BNP Paribas S.A. | 12/18/24 | 54,078 |
| USD | 900,000 | NOK | 9,866,027 | BNP Paribas S.A. | 12/18/24 | 6,377 |
| USD | 693,000 | NOK | 7,478,963 | BNP Paribas S.A. | 12/18/24 | 15,587 |
| USD | 900,000 | NOK | 9,993,435 | BNP Paribas S.A. | 12/18/24 | (5,163) |
| USD | 714,000 | NOK | 7,700,904 | JPMorgan Chase Bank, N.A. | 12/18/24 | 16,485 |
| USD | 693,000 | NOK | 7,481,601 | Morgan Stanley International | 12/18/24 | 15,348 |
| USD | 1,395,399 | NZD | 2,300,000 | BNP Paribas S.A. | 12/18/24 | 32,931 |
| USD | 2,425,324 | NZD | 4,000,000 | BNP Paribas S.A. | 12/18/24 | 55,816 |
| USD | 1,442,498 | NZD | 2,400,000 | BNP Paribas S.A. | 12/18/24 | 20,794 |
| USD | 572,758 | NZD | 900,000 | BNP Paribas S.A. | 12/18/24 | 39,619 |
| USD | 1,859,303 | NZD | 3,100,000 | BNP Paribas S.A. | 12/18/24 | 22,934 |
| USD | 1,175,936 | NZD | 2,000,000 | BNP Paribas S.A. | 12/18/24 | (8,818) |
| USD | 4,186,265 | NZD | 6,900,000 | BNP Paribas S.A. | 12/18/24 | 98,863 |
| USD | 761,432 | NZD | 1,300,000 | JPMorgan Chase Bank, N.A. | 12/18/24 | (8,658) |
| USD | 781,187 | NZD | 1,300,000 | Morgan Stanley International | 12/18/24 | 11,097 |
| USD | 386,384 | PEN | 1,466,018 | BNP Paribas S.A. | 12/18/24 | (4,875) |
| USD | 332,759 | PEN | 1,262,854 | Bank of America, N.A. | 12/18/24 | (4,278) |
| USD | 85,389 | PEN | 324,077 | Barclays Bank PLC | 12/18/24 | (1,102) |
| USD | 2,800,000 | PEN | 10,691,800 | Citibank, N.A. | 12/18/24 | (53,487) |
| USD | 683,000 | PEN | 2,594,717 | Citibank, N.A. | 12/18/24 | (9,492) |
| USD | 817,000 | PEN | 3,108,277 | Citibank, N.A. | 12/18/24 | (12,554) |
| USD | 1,700,000 | PEN | 6,395,400 | Citibank, N.A. | 12/18/24 | (6,840) |
| USD | 145,267 | PEN | 551,448 | JPMorgan Chase Bank, N.A. | 12/18/24 | (1,907) |
| USD | 1,000,000 | PHP | 57,613,752 | BNP Paribas S.A. | 12/18/24 | 17,944 |
| USD | 1,100,000 | PHP | 61,500,614 | BNP Paribas S.A. | 12/18/24 | 51,691 |
| USD | 3,200,000 | PHP | 184,179,200 | BNP Paribas S.A. | 12/18/24 | 60,572 |
| USD | 1,179,000 | PHP | 68,161,802 | BNP Paribas S.A. | 12/18/24 | 17,148 |
| USD | 235,000 | PHP | 13,594,257 | Goldman Sachs Bank USA | 12/18/24 | 3,279 |
| USD | 886,000 | PHP | 51,201,940 | Morgan Stanley International | 12/18/24 | 13,237 |
| USD | 1,400,000 | PLN | 5,557,313 | BNP Paribas S.A. | 12/18/24 | 32,567 |
| USD | 1,600,000 | PLN | 6,457,608 | BNP Paribas S.A. | 12/18/24 | 11,040 |
| USD | 1,100,000 | PLN | 4,432,981 | BNP Paribas S.A. | 12/18/24 | 9,220 |
| USD | 800,000 | PLN | 3,076,711 | BNP Paribas S.A. | 12/18/24 | 42,944 |
| USD | 500,000 | PLN | 1,922,410 | BNP Paribas S.A. | 12/18/24 | 26,972 |
| USD | 700,000 | PLN | 2,717,801 | BNP Paribas S.A. | 12/18/24 | 31,257 |
| USD | 2,159,372 | PLN | 8,511,156 | BNP Paribas S.A. | 12/18/24 | 65,116 |
| USD | 1,500,000 | PLN | 5,898,513 | BNP Paribas S.A. | 12/18/24 | 48,611 |
| USD | 1,340,628 | PLN | 5,295,076 | JPMorgan Chase Bank, N.A. | 12/18/24 | 37,721 |
| USD | 2,300,000 | SEK | 24,278,736 | BNP Paribas S.A. | 12/18/24 | 70,044 |
| USD | 1,300,000 | SEK | 13,887,744 | BNP Paribas S.A. | 12/18/24 | 24,437 |
| USD | 600,000 | SEK | 6,054,483 | BNP Paribas S.A. | 12/18/24 | 43,907 |
| USD | 1,500,000 | SEK | 16,026,524 | BNP Paribas S.A. | 12/18/24 | 27,994 |
| USD | 3,300,000 | SEK | 34,047,371 | BNP Paribas S.A. | 12/18/24 | 172,813 |
| USD | 3,600,000 | SEK | 37,796,105 | Bank of America, N.A. | 12/18/24 | 128,499 |
| USD | 2,700,000 | SGD | 3,540,081 | BNP Paribas S.A. | 12/18/24 | 54,912 |
| USD | 1,200,000 | SGD | 1,580,786 | BNP Paribas S.A. | 12/18/24 | 18,864 |
| USD | 1,400,000 | SGD | 1,792,750 | BNP Paribas S.A. | 12/18/24 | 60,488 |
| USD | 3,600,000 | SGD | 4,697,784 | BNP Paribas S.A. | 12/18/24 | 89,896 |
| USD | 2,200,000 | THB | 74,104,217 | BNP Paribas S.A. | 12/18/24 | 36,953 |
| USD | 1,300,000 | THB | 43,794,677 | BNP Paribas S.A. | 12/18/24 | 21,666 |
| USD | 1,300,000 | THB | 42,640,000 | Goldman Sachs Bank USA | 12/18/24 | 55,370 |
| USD | 1,000,000 | THB | 33,808,000 | Goldman Sachs Bank USA | 12/18/24 | 13,170 |
| USD | 949,382 | TWD | 30,062,181 | Goldman Sachs Bank USA | 12/18/24 | 22,207 |
| USD | 1,600,000 | TWD | 51,241,920 | JPMorgan Chase Bank, N.A. | 12/18/24 | 19,602 |
| USD | 974,000 | ZAR | 17,305,290 | BNP Paribas S.A. | 12/18/24 | 14,834 |
| USD | 3,126,000 | ZAR | 55,564,347 | BNP Paribas S.A. | 12/18/24 | 46,279 |
| USD | 800,000 | ZAR | 14,115,867 | BNP Paribas S.A. | 12/18/24 | 17,611 |
| USD | 400,000 | ZAR | 6,928,776 | BNP Paribas S.A. | 12/18/24 | 15,964 |
| USD | 400,000 | ZAR | 6,922,588 | Citibank, N.A. | 12/18/24 | 16,307 |
| USD | 1,000,000 | ZAR | 18,252,467 | JPMorgan Chase Bank, N.A. | 12/18/24 | (11,665) |
| USD | 500,000 | ZAR | 8,671,159 | State Street Bank And Trust Co | 12/18/24 | 19,391 |
| ZAR | 26,598,275 | USD | 1,500,000 | BNP Paribas S.A. | 12/18/24 | (25,759) |
| ZAR | 8,803,597 | USD | 500,000 | Bank of America, N.A. | 12/18/24 | (12,050) |
| ZAR | 7,106,969 | USD | 400,000 | Citibank, N.A. | 12/18/24 | (6,088) |
| ZAR | 7,061,621 | USD | 400,000 | Morgan Stanley International | 12/18/24 | (8,601) |
| USD | 71,301 | TRY | 2,686,985 | JPMorgan Chase Bank, N.A. | 12/19/24 | (4,875) |
| PLN | 1,633,480 | USD | 409,218 | Deutsche Bank AG | 12/20/24 | (7,330) |
| PLN | 796,073 | USD | 199,634 | JPMorgan Chase Bank, N.A. | 12/20/24 | (3,775) |
| USD | 39,184 | TRY | 1,471,171 | Barclays Bank PLC | 12/20/24 | (2,480) |
| USD | 35,750 | TRY | 1,339,335 | Barclays Bank PLC | 12/20/24 | (2,181) |
| BRL | 27,176,218 | USD | 4,834,379 | BNP Paribas S.A. | 1/03/25 | (334,698) |
| USD | 6,247,341 | BRL | 34,528,927 | Deutsche Bank AG | 1/03/25 | 530,242 |
| TRY | 4,605,802 | USD | 122,152 | Barclays Bank PLC | 1/06/25 | 5,973 |
| JPY | 458,923,480 | USD | 3,070,347 | Barclays Bank PLC | 1/07/25 | 13,014 |
| IDR | 1,959,129,906 | USD | 123,914 | BNP Paribas S.A. | 1/08/25 | (393) |
| IDR | 12,129,517,800 | USD | 767,691 | Citibank, N.A. | 1/08/25 | (2,937) |
| IDR | 10,082,457,728 | USD | 637,888 | Morgan Stanley International | 1/08/25 | (2,199) |
| USD | 230,015 | KRW | 313,712,858 | Citibank, N.A. | 1/08/25 | 4,761 |
| USD | 27,040 | KRW | 37,194,302 | Citibank, N.A. | 1/08/25 | 334 |
| USD | 89,339 | KRW | 125,262,212 | Deutsche Bank AG | 1/08/25 | (603) |
| USD | 184,698 | KRW | 253,802,757 | Goldman Sachs Bank USA | 1/08/25 | 2,461 |
| TRY | 714,129 | USD | 18,943 | Barclays Bank PLC | 1/09/25 | 859 |
| TRY | 305,498 | USD | 8,250 | Barclays Bank PLC | 1/13/25 | 185 |
| CHF | 45,460 | USD | 51,857 | Barclays Bank PLC | 1/15/25 | 18 |
| CNY | 6,631,266 | USD | 916,566 | Bank of America, N.A. | 1/15/25 | 2,178 |
| GBP | 108,000 | USD | 137,012 | Barclays Bank PLC | 1/15/25 | 401 |
| GBP | 1,530,000 | USD | 1,926,074 | Barclays Bank PLC | 1/15/25 | 20,604 |
| JPY | 137,354,206 | USD | 900,831 | Bank of America, N.A. | 1/15/25 | 22,825 |
| NZD | 7,600,000 | USD | 4,497,182 | Barclays Bank PLC | 1/15/25 | 6,420 |
| SEK | 38,566,970 | USD | 3,548,312 | Barclays Bank PLC | 1/15/25 | 133 |
| SGD | 3,071,299 | USD | 2,298,417 | Bank of America, N.A. | 1/15/25 | (583) |
| SGD | 1,621,043 | USD | 1,203,424 | Bank of America, N.A. | 1/15/25 | 9,382 |
| USD | 302,018 | AUD | 465,000 | Deutsche Bank AG | 1/15/25 | (1,378) |
| USD | 242,892 | CAD | 340,356 | Royal Bank of Canada | 1/15/25 | (628) |
| USD | 94,183 | EUR | 89,000 | Bank of America, N.A. | 1/15/25 | (54) |
| USD | 620,723 | EUR | 586,000 | Barclays Bank PLC | 1/15/25 | 246 |
| USD | 533,761 | EUR | 504,633 | Barclays Bank PLC | 1/15/25 | (562) |
| USD | 197,949 | GBP | 156,000 | JPMorgan Chase Bank, N.A. | 1/15/25 | (536) |
| USD | 1,451,204 | KRW | 2,024,618,237 | BNP Paribas S.A. | 1/15/25 | (2,990) |
| USD | 96,329 | KRW | 134,284,553 | Citibank, N.A. | 1/15/25 | (122) |
| USD | 381,001 | KRW | 522,942,923 | Deutsche Bank AG | 1/15/25 | 5,394 |
| TRY | 864,376 | USD | 22,953 | Barclays Bank PLC | 1/16/25 | 834 |
| USD | 64,722 | TRY | 2,366,885 | Barclays Bank PLC | 1/17/25 | (344) |
| TRY | 824,932 | USD | 22,397 | Barclays Bank PLC | 1/21/25 | 182 |
| IDR | 6,386,974,191 | USD | 399,698 | Bank of America, N.A. | 1/22/25 | 2,822 |
| IDR | 1,435,009,066 | USD | 89,499 | Barclays Bank PLC | 1/22/25 | 938 |
| IDR | 52,788,795,488 | USD | 3,310,784 | Goldman Sachs Bank USA | 1/22/25 | 16,071 |
| USD | 11,295 | IDR | 180,156,380 | Barclays Bank PLC | 1/22/25 | (59) |
| USD | 176,888 | KRW | 248,382,592 | Citibank, N.A. | 1/22/25 | (1,571) |
| USD | 183,030 | KRW | 256,598,909 | Deutsche Bank AG | 1/22/25 | (1,332) |
| USD | 480,470 | TWD | 15,266,454 | Citibank, N.A. | 1/22/25 | 8,038 |
| USD | 480,470 | TWD | 15,265,973 | Citibank, N.A. | 1/22/25 | 8,053 |
| USD | 493,008 | TWD | 15,579,053 | Citibank, N.A. | 1/22/25 | 10,902 |
| USD | 496,786 | TWD | 15,713,838 | Citibank, N.A. | 1/22/25 | 10,509 |
| USD | 486,395 | TWD | 15,319,983 | Citibank, N.A. | 1/22/25 | 12,307 |
| USD | 596,465 | TWD | 19,112,409 | Citibank, N.A. | 1/22/25 | 5,017 |
| USD | 596,090 | TWD | 19,000,369 | Citibank, N.A. | 1/22/25 | 8,109 |
| USD | 613,846 | TWD | 19,840,850 | Citibank, N.A. | 1/22/25 | (144) |
| USD | 1,111,984 | TWD | 35,714,702 | Goldman Sachs Bank USA | 1/22/25 | 6,766 |
| USD | 29,509 | TRY | 1,111,002 | Barclays Bank PLC | 1/23/25 | (834) |
| TRY | 1,331,392 | USD | 35,375 | Barclays Bank PLC | 1/24/25 | 946 |
| USD | 3,989,162 | CLP | 3,893,900,431 | State Street Bank And Trust Co | 1/27/25 | (5,326) |
| TRY | 777,167 | USD | 20,626 | Barclays Bank PLC | 1/30/25 | 437 |
| USD | 382,350 | MXN | 7,784,608 | Goldman Sachs Bank USA | 2/11/25 | 3,187 |
| USD | 51,280 | TRY | 1,923,804 | Barclays Bank PLC | 2/12/25 | (215) |
| USD | 848,836 | MXN | 17,173,225 | Deutsche Bank AG | 2/13/25 | 12,610 |
| TRY | 3,592,797 | USD | 94,535 | Barclays Bank PLC | 2/24/25 | 556 |
| USD | 4,549 | TRY | 172,794 | Barclays Bank PLC | 2/25/25 | (20) |
| USD | 8,147 | TRY | 309,525 | Barclays Bank PLC | 2/25/25 | (37) |
| USD | 30,153 | TRY | 1,144,186 | Barclays Bank PLC | 2/26/25 | (73) |
| TRY | 1,208,233 | USD | 31,753 | Barclays Bank PLC | 2/28/25 | 104 |
| TRY | 848,438 | USD | 22,293 | Barclays Bank PLC | 2/28/25 | 78 |
| TRY | 373,455 | USD | 9,794 | Barclays Bank PLC | 3/03/25 | 25 |
| USD | 1,269,910 | PEN | 4,830,992 | Deutsche Bank AG | 3/19/25 | (18,208) |
| USD | 90,358 | BRL | 500,000 | Goldman Sachs Bank USA | 4/02/25 | 8,720 |
| USD | 108,061 | BRL | 600,000 | Goldman Sachs Bank USA | 4/02/25 | 10,095 |
| USD | 162,167 | BRL | 900,000 | Goldman Sachs Bank USA | 4/02/25 | 15,217 |
| USD | 107,311 | BRL | 600,000 | Goldman Sachs Bank USA | 4/02/25 | 9,345 |
| USD | 196,188 | BRL | 1,100,000 | Goldman Sachs Bank USA | 4/02/25 | 16,584 |
| USD | 214,656 | BRL | 1,200,000 | Goldman Sachs Bank USA | 4/02/25 | 18,724 |
| TRY | 1,530,863 | USD | 34,444 | JPMorgan Chase Bank, N.A. | 5/08/25 | 3,477 |
| USD | 292,506 | ILS | 1,068,100 | Citibank, N.A. | 5/30/25 | (3,074) |
| | | | | | | |
| TOTAL FORWARD FOREIGN CURRENCY CONTRACTS | | 2,771,006 |
| Unrealized Appreciation | | | 8,659,272 |
| Unrealized Depreciation | | | (5,888,266) |
For the period, the average contract value for forward foreign currency contracts was $568,871,089. Contract value represents contract amount in United States dollars plus or minus unrealized appreciation or depreciation, respectively.
| Credit Default Swaps |
| Underlying Reference | Rating(1) | Maturity Date | Clearinghouse / Counterparty(2) | Fixed Payment Received/ (Paid) | Payment Frequency | Notional Amount(3)(4) | Value ($)(1) | Upfront Premium Received/ (Paid) ($)(5) | Unrealized Appreciation/ (Depreciation) ($) |
| Sell Protection | | | | | | | | | | |
| 5-Year CDX N.A. EM Series 40 | NR | Dec 2028 | ICE | 1% | Quarterly | | 7,300,000 | 258,232 | 0 | 258,232 |
| 5-Year CDX N.A. EM Series 41 | NR | Jun 2029 | ICE | 1% | Quarterly | | 900,000 | 6,782 | 0 | 6,782 |
| 5-Year CDX N.A. EM Series 42 | NR | Dec 2029 | Bank of America, N.A. | 1% | Quarterly | | 2,000,000 | (45,857) | 57,505 | 11,648 |
| 5-Year CDX N.A. EM Series 42 | NR | Dec 2029 | ICE | 1% | Quarterly | | 4,100,000 | 22,018 | 0 | 22,018 |
| 5-Year CDX N.A. HY Series 43 | NR | Dec 2029 | Barclays Bank PLC | 5% | Quarterly | | 8,000,000 | 766,848 | (564,202) | 202,646 |
| 5-Year CDX N.A. IG Series 43 | NR | Dec 2029 | ICE | 1% | Quarterly | | 28,600,000 | 63,575 | 0 | 63,575 |
| 5-Year CDX N.A. IG Series 43 | NR | Dec 2029 | ICE | 5% | Quarterly | | 4,300,000 | 87,073 | 0 | 87,073 |
| 5-Year CDX N.A. IG Series 43 | NR | Dec 2029 | JPMorgan Securities LLC | 1% | Quarterly | | 66,000,000 | 1,706,978 | (1,467,208) | 239,770 |
| 5-Year iTraxx Europe Crossover Series 42 | NR | Dec 2029 | Bank of America, N.A. | 1% | Quarterly | EUR | 76,000,000 | 1,838,525 | (1,642,367) | 196,158 |
| 5-Year iTraxx Europe Crossover Series 42 | NR | Dec 2029 | Bank of America, N.A. | 5% | Quarterly | EUR | 24,000,000 | 2,440,699 | (2,145,006) | 295,693 |
| 5-Year iTraxx Europe Crossover Series 42 | NR | Dec 2029 | ICE | 5% | Quarterly | EUR | 3,100,000 | 24,648 | 0 | 24,648 |
| 5-Year iTraxx Europe Crossover Series 42 | NR | Dec 2029 | ICE | 1% | Quarterly | EUR | 29,900,000 | 26,403 | 0 | 26,403 |
| | | | | | | | | | | |
| TOTAL CREDIT DEFAULT SWAPS | | | | | | | | 7,195,924 | (5,761,278) | 1,434,646 |
(1)Ratings are presented for credit default swaps in which the Fund has sold protection on the underlying referenced debt. Ratings for an underlying index represent a weighted average of the ratings of all securities included in the index. The credit rating or value can be measures of the current payment/performance risk. Ratings are from Moody's Investors Service, Inc. Where Moody's® ratings are not available, S&P® ratings are disclosed and are indicated as such. All ratings are as of the report date and do not reflect subsequent changes.
(2)Swaps with Intercontinental Exchange (ICE) are centrally cleared swaps.
(3)The notional amount of each credit default swap where the Fund has sold protection approximates the maximum potential amount of future payments that the Fund could be required to make if a credit event were to occur.
(4)Notional amount is stated in U.S. Dollars unless otherwise noted.
(5)Any premiums for centrally cleared swaps are recorded periodically throughout the term of the swap to variation margin and included in unrealized appreciation (depreciation).
| Interest Rate Swaps |
| Payment Received | Payment Frequency | Payment Paid | Payment Frequency | Clearinghouse / Counterparty(1) | Maturity Date | Notional Amount(2) | Value ($) | Upfront Premium Received/ (Paid) ($)(3) | Unrealized Appreciation/ (Depreciation) ($) |
Mexico Interbank TIIE 28 Day Rate(4) | Monthly | 9.39% | Monthly | CME | Dec 2025 | MXN | 36,200,000 | 5,694 | 0 | 5,694 |
Mexico Interbank TIIE 28 Day Rate(4) | Monthly | 9.48% | Monthly | CME | Dec 2025 | MXN | 25,100,000 | 2,392 | 0 | 2,392 |
Mexico Interbank TIIE 28 Day Rate(4) | Monthly | 9.43% | Monthly | CME | Dec 2025 | MXN | 25,000,000 | 3,024 | 0 | 3,024 |
| 9.42% | Monthly | Mexico Interbank TIIE 28 Day Rate(4) | Monthly | CME | Dec 2025 | MXN | 24,600,000 | (3,589) | 0 | (3,589) |
| 4.25% | Annual | SONIA Interest Rate Benchmark(4) | Annual | LCH | Sep 2026 | GBP | 4,000,000 | (45,301) | 0 | (45,301) |
Brazil Cetip DI Interbank Deposit Rate(4) | At Maturity | 13.72% | At Maturity | CME | Jan 2027 | BRL | 20,200,000 | (11,340) | 0 | (11,340) |
Brazil Cetip DI Interbank Deposit Overnight Rate(4) | At Maturity | 13.19% | At Maturity | CME | Jan 2027 | BRL | 18,500,000 | (41,977) | 0 | (41,977) |
| 12.26% | At Maturity | Brazil Cetip DI Interbank Deposit Rate(4) | At Maturity | CME | Jan 2027 | BRL | 13,600,000 | (38,349) | 0 | (38,349) |
Brazil Cetip DI Interbank Deposit Rate(4) | At Maturity | 13.17% | At Maturity | CME | Jan 2027 | BRL | 7,000,000 | (5,627) | 0 | (5,627) |
Brazil Cetip DI Interbank Deposit Rate(4) | At Maturity | 12.71% | At Maturity | CME | Jan 2027 | BRL | 6,800,000 | 48 | 0 | 48 |
| 12.16% | At Maturity | Brazil Cetip DI Interbank Deposit Rate(4) | At Maturity | CME | Jan 2027 | BRL | 6,500,000 | (21,681) | 0 | (21,681) |
Brazil Cetip DI Interbank Deposit Overnight Rate(4) | At Maturity | 13.08% | At Maturity | CME | Jan 2027 | BRL | 4,700,000 | 4,141 | 0 | 4,141 |
Australian Financial Markets Association 6m Rate(4) | Quarterly | 3.5% | Quarterly | LCH | Mar 2027 | AUD | 37,800,000 | 244,783 | 0 | 244,783 |
U.S. Secured Overnight Fin. Rate (SOFR) Index(4) | Annual | 4.25% | Annual | LCH | Mar 2027 | | 19,200,000 | (8,224) | 0 | (8,224) |
SONIA Interest Rate Benchmark(4) | Annual | 3.75% | Annual | LCH | Mar 2027 | GBP | 14,600,000 | (38,618) | 0 | (38,618) |
| 3.75% | Annual | Canadian Overnight Repo Rate Average(4) | Annual | LCH | Mar 2027 | CAD | 12,000,000 | 5,391 | 0 | 5,391 |
6 month EURIBOR(4) | Semi - annual | 2.5% | Annual | LCH | Mar 2027 | EUR | 2,400,000 | (3,456) | 0 | (3,456) |
SAFE South Africa Johannesburg Interbank Agreed 3 Month Rate(4) | Quarterly | 8.06% | Quarterly | CME | Nov 2027 | ZAR | 44,800,000 | (59,725) | 0 | (59,725) |
Bank of Israel Tel Aviv Interbank Offered 3 Month(4) | Quarterly | 3.29% | Annual | LCH | Nov 2027 | ILS | 26,400,000 | 186,937 | 0 | 186,937 |
National Bank of Hungary Budapest Interbank Offered Rates 6 Month Index(4) | Semi - annual | 9.05% | Annual | CME | Dec 2027 | HUF | 1,832,500,000 | (874,278) | 0 | (874,278) |
| 5.61% | Semi - annual | GPW Benchmark WIBOR PLN 6M Rate(4) | Semi - annual | CME | Dec 2027 | PLN | 7,100,000 | 103,953 | 0 | 103,953 |
| 8.5% | Annual | National Bank of Hungary Budapest Interbank Offered Rates 6 Month Index(4) | Semi - annual | CME | Jan 2028 | HUF | 1,825,400,000 | 682,271 | 0 | 682,271 |
| 8.65% | Semi - annual | National Bank of Hungary Budapest Interbank Offered Rates 6 Month Index(4) | Semi - annual | CME | Jan 2028 | HUF | 174,100,000 | 63,904 | 0 | 63,904 |
| 7.71% | Quarterly | SAFE South Africa Johannesburg Interbank Agreed 3 Month Rate(4) | Quarterly | CME | Jan 2028 | ZAR | 86,300,000 | 61,871 | 0 | 61,871 |
| 7.73% | At Maturity | SAFE South Africa Johannesburg Interbank Agreed 3 Month Rate(4) | At Maturity | CME | Jan 2028 | ZAR | 58,000,000 | 32,671 | 0 | 32,671 |
| 7.9% | Quarterly | SAFE South Africa Johannesburg Interbank Agreed 3 Month Rate(4) | Quarterly | CME | Jan 2028 | ZAR | 31,600,000 | 33,554 | 0 | 33,554 |
| 5.3% | Annual | GPW Benchmark WIBD/WIBOR PLN 6m Rate(4) | Semi - annual | CME | Jan 2028 | PLN | 6,000,000 | 82,383 | 0 | 82,383 |
Bank of Israel Tel Aviv Interbank Offered 3 Month(4) | Quarterly | 3.49% | Annual | LCH | Jan 2028 | ILS | 3,700,000 | 15,939 | 0 | 15,939 |
Colombia IBR Overnight Interbank Reference Rate(4) | Quarterly | 10.24% | Quarterly | CME | Feb 2028 | COP | 12,000,000,000 | (191,699) | 0 | (191,699) |
Chile Indice de Camara Promedio Interbank Overnight Index Rate(4) | Semi - annual | 5.94% | Semi - annual | CME | Feb 2028 | CLP | 2,185,200,000 | (93,438) | 0 | (93,438) |
Prague Interbank Offered Rate 6-month(4) | Semi - annual | 5.22% | Annual | CME | Feb 2028 | CZK | 87,200,000 | (363,682) | 0 | (363,682) |
SAFE South Africa Johannesburg Interbank Agreed 3 Month Rate(4) | Quarterly | 8.43% | Quarterly | CME | Feb 2028 | ZAR | 85,300,000 | (163,442) | 0 | (163,442) |
SAFE South Africa Johannesburg Interbank Agreed 3 Month Rate(4) | Quarterly | 8.21% | Quarterly | CME | Feb 2028 | ZAR | 56,800,000 | (87,394) | 0 | (87,394) |
GPW Benchmark WIBD/WIBOR PLN 6m Rate(4) | Semi - annual | 6.04% | Annual | CME | Feb 2028 | PLN | 13,500,000 | (248,014) | 0 | (248,014) |
Bank of Israel Tel Aviv Interbank Offered 3 Month(4) | Quarterly | 4.04% | Annual | LCH | Feb 2028 | ILS | 76,800,000 | (15,028) | 0 | (15,028) |
| 4.03% | Quarterly | Bank of Israel Tel Aviv Interbank Offered 3 Month(4) | Quarterly | LCH | Feb 2028 | ILS | 66,600,000 | 196,734 | 0 | 196,734 |
Bank of Israel Tel Aviv Interbank Offered 3 Month(4) | Quarterly | 3.98% | Annual | LCH | Feb 2028 | ILS | 9,500,000 | 7,887 | 0 | 7,887 |
| 9.05% | Quarterly | Colombia IBR Overnight Interbank Reference Rate(4) | Quarterly | CME | Mar 2028 | COP | 10,329,000,000 | 95,801 | 0 | 95,801 |
| 8.75% | Quarterly | Colombia IBR Overnight Interbank Reference Rate(4) | Quarterly | CME | Mar 2028 | COP | 6,718,000,000 | 50,239 | 0 | 50,239 |
Colombia IBR Overnight Interbank Reference Rate(4) | Quarterly | 9.83% | Quarterly | CME | Mar 2028 | COP | 6,277,100,000 | (87,049) | 0 | (87,049) |
| 5.38% | Semi - annual | Chile Indice de Camara Promedio Interbank Overnight Index Rate(4) | Semi - annual | CME | Mar 2028 | CLP | 5,416,600,000 | 105,640 | 0 | 105,640 |
| 5.3% | Semi - annual | Chile Indice de Camara Promedio Interbank Overnight Index Rate(4) | Semi - annual | CME | Mar 2028 | CLP | 2,179,800,000 | 35,929 | 0 | 35,929 |
Chile Indice de Camara Promedio Interbank Overnight Index Rate(4) | Semi - annual | 6.49% | Semi - annual | CME | Mar 2028 | CLP | 2,011,100,000 | (133,436) | 0 | (133,436) |
Chile Indice de Camara Promedio Interbank Overnight Index Rate(4) | Semi - annual | 6.39% | Semi - annual | CME | Mar 2028 | CLP | 1,683,100,000 | (90,029) | 0 | (90,029) |
Chile Indice de Camara Promedio Interbank Overnight Index Rate(4) | Semi - annual | 6.38% | Semi - annual | CME | Mar 2028 | CLP | 992,300,000 | (61,317) | 0 | (61,317) |
Chile Indice de Camara Promedio Interbank Overnight Index Rate(4) | Semi - annual | 6.37% | Semi - annual | CME | Mar 2028 | CLP | 936,200,000 | (57,456) | 0 | (57,456) |
| 4.51% | Annual | Prague Interbank Offered Rate 6-month(4) | Semi - annual | CME | Mar 2028 | CZK | 85,800,000 | 258,177 | 0 | 258,177 |
SAFE South Africa Johannesburg Interbank Agreed 3 Month Rate(4) | Quarterly | 8.12% | Quarterly | CME | Mar 2028 | ZAR | 23,700,000 | (49,903) | 0 | (49,903) |
GPW Benchmark WIBD/WIBOR PLN 6m Rate(4) | Semi - annual | 5.43% | Annual | CME | Mar 2028 | PLN | 3,100,000 | (38,635) | 0 | (38,635) |
| 3.87% | Annual | Bank of Israel Tel Aviv Interbank Offered 3 Month(4) | Quarterly | LCH | Mar 2028 | ILS | 7,800,000 | (34,082) | 0 | (34,082) |
| 3.59% | Annual | Bank of Israel Tel Aviv Interbank Offered 3 Month(4) | Quarterly | LCH | Mar 2028 | ILS | 5,300,000 | (19,622) | 0 | (19,622) |
| 8.7% | Quarterly | Colombia IBR Overnight Interbank Reference Rate(4) | Quarterly | CME | Apr 2028 | COP | 8,197,300,000 | 59,136 | 0 | 59,136 |
| 8.71% | Annual | National Bank of Hungary Budapest Interbank Offered Rates 6 Month Index(4) | Semi - annual | CME | Apr 2028 | HUF | 2,932,600,000 | 352,278 | 0 | 352,278 |
| 8.74% | Annual | National Bank of Hungary Budapest Interbank Offered Rates 6 Month Index(4) | Semi - annual | CME | Apr 2028 | HUF | 785,400,000 | 280,286 | 0 | 280,286 |
National Bank of Hungary Budapest Interbank Offered Rates 6 Month Index(4) | Semi - annual | 9.51% | Semi - annual | CME | Apr 2028 | HUF | 757,400,000 | (329,819) | 0 | (329,819) |
National Bank of Hungary Budapest Interbank Offered Rates 6 Month Index(4) | Semi - annual | 9.49% | Annual | CME | Apr 2028 | HUF | 611,500,000 | (266,453) | 0 | (266,453) |
| 8.8% | Annual | National Bank of Hungary Budapest Interbank Offered Rates 6 Month Index(4) | Semi - annual | CME | Apr 2028 | HUF | 414,900,000 | 150,330 | 0 | 150,330 |
National Bank of Hungary Budapest Interbank Offered Rates 6 Month Index(4) | Semi - annual | 9.5% | Annual | CME | Apr 2028 | HUF | 250,700,000 | (109,503) | 0 | (109,503) |
SAFE South Africa Johannesburg Interbank Agreed 3 Month Rate(4) | Quarterly | 8.51% | Quarterly | CME | Apr 2028 | ZAR | 76,200,000 | (161,712) | 0 | (161,712) |
Prague Interbank Offered Rate 6-month(4) | Semi - annual | 5.09% | Semi - annual | CME | Apr 2028 | CZK | 50,200,000 | (174,407) | 0 | (174,407) |
| 3.53% | Annual | Bank of Israel Tel Aviv Interbank Offered 3 Month(4) | Quarterly | LCH | Apr 2028 | ILS | 6,300,000 | (26,605) | 0 | (26,605) |
BNP Paribas Sinacofi Chile Interbank Rate Avg.(4) | Semi - annual | 5.8% | Semi - annual | CME | May 2028 | CLP | 2,024,600,000 | (85,195) | 0 | (85,195) |
SAFE South Africa Johannesburg Interbank Agreed 3 Month Rate(4) | Quarterly | 9.35% | Quarterly | CME | May 2028 | ZAR | 129,700,000 | (439,247) | 0 | (439,247) |
| 4.7% | Annual | Prague Interbank Offered Rate 6-month(4) | Semi - annual | CME | May 2028 | CZK | 50,000,000 | 156,897 | 0 | 156,897 |
Bank of Israel Tel Aviv Interbank Offered 3 Month(4) | Quarterly | 3.59% | Annual | LCH | May 2028 | ILS | 16,900,000 | 24,722 | 0 | 24,722 |
| 8.11% | Quarterly | Colombia IBR Overnight Interbank Reference Rate(4) | Quarterly | CME | Jun 2028 | COP | 14,886,400,000 | 34,988 | 0 | 34,988 |
| 5.16% | Semi - annual | BNP Paribas Sinacofi Chile Interbank Rate Avg.(4) | Semi - annual | CME | Jun 2028 | CLP | 6,635,800,000 | 93,050 | 0 | 93,050 |
BNP Paribas Sinacofi Chile Interbank Rate Avg.(4) | Semi - annual | 5.62% | Semi - annual | CME | Jun 2028 | CLP | 2,772,000,000 | (97,061) | 0 | (97,061) |
BNP Paribas Sinacofi Chile Interbank Rate Avg.(4) | Semi - annual | 5.7% | Semi - annual | CME | Jun 2028 | CLP | 1,688,700,000 | (63,855) | 0 | (63,855) |
| 5.24% | Semi - annual | BNP Paribas Sinacofi Chile Interbank Rate Avg.(4) | Semi - annual | CME | Jun 2028 | CLP | 1,316,000,000 | 21,997 | 0 | 21,997 |
BNP Paribas Sinacofi Chile Interbank Rate Avg.(4) | Semi - annual | 5.65% | Semi - annual | CME | Jun 2028 | CLP | 1,071,300,000 | (38,340) | 0 | (38,340) |
| 5.23% | Semi - annual | BNP Paribas Sinacofi Chile Interbank Rate Avg.(4) | Semi - annual | CME | Jun 2028 | CLP | 967,400,000 | 15,863 | 0 | 15,863 |
| 5.29% | Semi - annual | BNP Paribas Sinacofi Chile Interbank Rate Avg.(4) | Semi - annual | CME | Jun 2028 | CLP | 953,800,000 | 18,168 | 0 | 18,168 |
| 9.19% | Quarterly | SAFE South Africa Johannesburg Interbank Agreed 3 Month Rate(4) | Quarterly | CME | Jun 2028 | ZAR | 86,900,000 | 191,733 | 0 | 191,733 |
| 4.61% | Annual | Prague Interbank Offered Rate 6-month(4) | Semi - annual | CME | Jun 2028 | CZK | 71,600,000 | 93,411 | 0 | 93,411 |
| 5.54% | Annual | GPW Benchmark WIBD/WIBOR PLN 6m Rate(4) | Semi - annual | CME | Jun 2028 | PLN | 27,600,000 | 300,059 | 0 | 300,059 |
| 4.93% | Annual | GPW Benchmark WIBD/WIBOR PLN 6m Rate(4) | Semi - annual | CME | Jun 2028 | PLN | 18,600,000 | 56,814 | 0 | 56,814 |
| 5.28% | Quarterly | BNP Paribas Sinacofi Chile Interbank Rate Avg.(4) | Quarterly | CME | Jul 2028 | CLP | 1,843,000,000 | 18,215 | 0 | 18,215 |
Prague Interbank Offered Rate 6-month(4) | Semi - annual | 4.62% | Semi - annual | CME | Jul 2028 | CZK | 113,100,000 | (214,208) | 0 | (214,208) |
| 8.37% | Quarterly | SAFE South Africa Johannesburg Interbank Agreed 3 Month Rate(4) | Quarterly | CME | Jul 2028 | ZAR | 104,100,000 | 197,599 | 0 | 197,599 |
| 8.41% | Quarterly | SAFE South Africa Johannesburg Interbank Agreed 3 Month Rate(4) | Quarterly | CME | Jul 2028 | ZAR | 84,300,000 | 164,849 | 0 | 164,849 |
| 8.31% | Quarterly | SAFE South Africa Johannesburg Interbank Agreed 3 Month Rate(4) | Quarterly | CME | Jul 2028 | ZAR | 46,400,000 | 81,246 | 0 | 81,246 |
| 8.33% | Quarterly | SAFE South Africa Johannesburg Interbank Agreed 3 Month Rate(4) | Quarterly | CME | Jul 2028 | ZAR | 29,700,000 | 53,378 | 0 | 53,378 |
| 8.29% | Quarterly | SAFE South Africa Johannesburg Interbank Agreed 3 Month Rate(4) | Quarterly | CME | Jul 2028 | ZAR | 26,300,000 | 45,289 | 0 | 45,289 |
| 8.31% | Quarterly | SAFE South Africa Johannesburg Interbank Agreed 3 Month Rate(4) | Quarterly | CME | Jul 2028 | ZAR | 26,300,000 | 46,232 | 0 | 46,232 |
Bank of Israel Tel Aviv Interbank Offered 3 Month(4) | Quarterly | 3.49% | Annual | LCH | Jul 2028 | ILS | 12,900,000 | (30,387) | 0 | (30,387) |
Colombia IBR Overnight Interbank Reference Rate(4) | Quarterly | 8.13% | Quarterly | CME | Aug 2028 | COP | 7,433,900,000 | (33,850) | 0 | (33,850) |
BNP Paribas Sinacofi Chile Interbank Rate Avg.(4) | Semi - annual | 5.63% | Semi - annual | CME | Aug 2028 | CLP | 3,778,500,000 | (130,492) | 0 | (130,492) |
BNP Paribas Sinacofi Chile Interbank Rate Avg.(4) | Semi - annual | 5.46% | Semi - annual | CME | Aug 2028 | CLP | 3,347,300,000 | (88,729) | 0 | (88,729) |
BNP Paribas Sinacofi Chile Interbank Rate Avg.(4) | Semi - annual | 5.59% | Semi - annual | CME | Aug 2028 | CLP | 2,929,500,000 | (96,608) | 0 | (96,608) |
BNP Paribas Sinacofi Chile Interbank Rate Avg.(4) | Semi - annual | 5.54% | Semi - annual | CME | Aug 2028 | CLP | 2,555,300,000 | (78,201) | 0 | (78,201) |
BNP Paribas Sinacofi Chile Interbank Rate Avg.(4) | Semi - annual | 5.55% | Semi - annual | CME | Aug 2028 | CLP | 2,555,300,000 | (79,321) | 0 | (79,321) |
BNP Paribas Sinacofi Chile Interbank Rate Avg.(4) | Semi - annual | 5.53% | Semi - annual | CME | Aug 2028 | CLP | 1,578,900,000 | (47,871) | 0 | (47,871) |
BNP Paribas Sinacofi Chile Interbank Rate Avg.(4) | Semi - annual | 5.49% | Semi - annual | CME | Aug 2028 | CLP | 1,468,400,000 | (41,762) | 0 | (41,762) |
Prague Interbank Offered Rate 6-month(4) | Semi - annual | 4.35% | Annual | CME | Aug 2028 | CZK | 113,200,000 | (237,688) | 0 | (237,688) |
SAFE South Africa Johannesburg Interbank Agreed 3 Month Rate(4) | Quarterly | 8.55% | Quarterly | CME | Aug 2028 | ZAR | 75,100,000 | (164,482) | 0 | (164,482) |
SAFE South Africa Johannesburg Interbank Agreed 3 Month Rate(4) | Quarterly | 8.22% | Quarterly | CME | Aug 2028 | ZAR | 66,200,000 | (192,130) | 0 | (192,130) |
SAFE South Africa Johannesburg Interbank Agreed 3 Month Rate(4) | Quarterly | 8.7% | Quarterly | CME | Aug 2028 | ZAR | 63,200,000 | (155,319) | 0 | (155,319) |
SAFE South Africa Johannesburg Interbank Agreed 3 Month Rate(4) | Quarterly | 8.63% | Quarterly | CME | Aug 2028 | ZAR | 63,100,000 | (146,314) | 0 | (146,314) |
| 8.22% | Quarterly | SAFE South Africa Johannesburg Interbank Agreed 3 Month Rate(4) | Quarterly | CME | Aug 2028 | ZAR | 60,200,000 | 97,559 | 0 | 97,559 |
GPW Benchmark WIBD/WIBOR PLN 6m Rate(4) | Semi - annual | 4.84% | Semi - annual | CME | Aug 2028 | PLN | 1,800,000 | (5,730) | 0 | (5,730) |
Colombia IBR Overnight Interbank Reference Rate(4) | Quarterly | 7.96% | Quarterly | CME | Sep 2028 | COP | 8,428,900,000 | (65,969) | 0 | (65,969) |
| 5.75% | Semi - annual | BNP Paribas Sinacofi Chile Interbank Rate Avg.(4) | Semi - annual | CME | Sep 2028 | CLP | 4,763,400,000 | 107,851 | 0 | 107,851 |
SAFE South Africa Johannesburg Interbank Agreed 3 Month Rate(4) | Quarterly | 9.09% | Quarterly | CME | Sep 2028 | ZAR | 83,300,000 | (217,920) | 0 | (217,920) |
Colombia IBR Overnight Interbank Reference Rate(4) | Quarterly | 9.37% | Quarterly | CME | Oct 2028 | COP | 27,630,000,000 | (369,036) | 0 | (369,036) |
| 9.22% | Quarterly | Colombia IBR Overnight Interbank Reference Rate(4) | Quarterly | CME | Oct 2028 | COP | 15,865,400,000 | 119,343 | 0 | 119,343 |
Colombia IBR Overnight Interbank Reference Rate(4) | Quarterly | 9.65% | Quarterly | CME | Oct 2028 | COP | 12,050,000,000 | (187,465) | 0 | (187,465) |
Colombia IBR Overnight Interbank Reference Rate(4) | Quarterly | 9.19% | Quarterly | CME | Oct 2028 | COP | 8,320,000,000 | (99,101) | 0 | (99,101) |
Colombia IBR Overnight Interbank Reference Rate(4) | Quarterly | 9.26% | Quarterly | CME | Oct 2028 | COP | 2,980,000,000 | (37,213) | 0 | (37,213) |
National Bank of Hungary Budapest Interbank Offered Rates 6 Month Index(4) | Semi - annual | 7.74% | Semi - annual | CME | Oct 2028 | HUF | 1,451,000,000 | (236,118) | 0 | (236,118) |
| 7.77% | Annual | National Bank of Hungary Budapest Interbank Offered Rates 6 Month Index(4) | Semi - annual | CME | Oct 2028 | HUF | 1,190,500,000 | 41,905 | 0 | 41,905 |
| 4.73% | Annual | Prague Interbank Offered Rate 6-month(4) | Semi - annual | CME | Oct 2028 | CZK | 220,700,000 | 255,192 | 0 | 255,192 |
GPW Benchmark WIBOR PLN 6M Rate(4) | Semi - annual | 4.74% | Semi - annual | CME | Oct 2028 | PLN | 6,100,000 | 2,945 | 0 | 2,945 |
| 3.92% | Annual | Bank of Israel Tel Aviv Interbank Offered 3 Month(4) | Quarterly | LCH | Oct 2028 | ILS | 18,400,000 | (18,128) | 0 | (18,128) |
| 3.77% | Annual | Bank of Israel Tel Aviv Interbank Offered 3 Month(4) | Quarterly | LCH | Oct 2028 | ILS | 7,000,000 | (15,664) | 0 | (15,664) |
Bank of Israel Tel Aviv Interbank Offered 3 Month(4) | Quarterly | 4.46% | Annual | LCH | Oct 2028 | ILS | 4,300,000 | (16,342) | 0 | (16,342) |
| 8.07% | Quarterly | Colombia IBR Overnight Interbank Reference Rate(4) | Quarterly | CME | Nov 2028 | COP | 13,692,000,000 | 35,789 | 0 | 35,789 |
| 8.34% | Quarterly | Colombia IBR Overnight Interbank Reference Rate(4) | Quarterly | CME | Nov 2028 | COP | 7,604,900,000 | 36,739 | 0 | 36,739 |
| 8.19% | Quarterly | Colombia IBR Overnight Interbank Reference Rate(4) | Quarterly | CME | Nov 2028 | COP | 6,317,200,000 | 23,086 | 0 | 23,086 |
| 8.13% | Quarterly | Colombia IBR Overnight Interbank Reference Rate(4) | Quarterly | CME | Nov 2028 | COP | 5,156,900,000 | 16,001 | 0 | 16,001 |
| 5.48% | Semi - annual | BNP Paribas Sinacofi Chile Interbank Rate Avg.(4) | Semi - annual | CME | Nov 2028 | CLP | 2,748,000,000 | 79,939 | 0 | 79,939 |
| 5.54% | Semi - annual | BNP Paribas Sinacofi Chile Interbank Rate Avg.(4) | Semi - annual | CME | Nov 2028 | CLP | 1,049,000,000 | 33,261 | 0 | 33,261 |
Prague Interbank Offered Rate 6-month(4) | Semi - annual | 4.19% | Annual | CME | Nov 2028 | CZK | 168,600,000 | (268,684) | 0 | (268,684) |
| 8.35% | Quarterly | SAFE South Africa Johannesburg Interbank Agreed 3 Month Rate(4) | Quarterly | CME | Nov 2028 | ZAR | 133,700,000 | 212,432 | 0 | 212,432 |
SAFE South Africa Johannesburg Interbank Agreed 3 Month Rate(4) | Quarterly | 8.25% | Quarterly | CME | Nov 2028 | ZAR | 110,200,000 | (281,101) | 0 | (281,101) |
| 8.36% | Quarterly | SAFE South Africa Johannesburg Interbank Agreed 3 Month Rate(4) | Quarterly | CME | Nov 2028 | ZAR | 73,600,000 | 137,742 | 0 | 137,742 |
| 8.36% | Quarterly | SAFE South Africa Johannesburg Interbank Agreed 3 Month Rate(4) | Quarterly | CME | Nov 2028 | ZAR | 72,400,000 | 134,755 | 0 | 134,755 |
| 3.46% | Annual | Bank of Israel Tel Aviv Interbank Offered 3 Month(4) | Quarterly | LCH | Nov 2028 | ILS | 12,600,000 | (66,189) | 0 | (66,189) |
| 3.44% | Annual | Bank of Israel Tel Aviv Interbank Offered 3 Month(4) | Quarterly | LCH | Nov 2028 | ILS | 12,100,000 | (65,942) | 0 | (65,942) |
| 3.52% | Annual | Bank of Israel Tel Aviv Interbank Offered 3 Month(4) | Quarterly | LCH | Nov 2028 | ILS | 11,700,000 | (55,207) | 0 | (55,207) |
| 7.9% | Quarterly | Colombia IBR Overnight Interbank Reference Rate(4) | Quarterly | CME | Dec 2028 | COP | 9,132,300,000 | 2,582 | 0 | 2,582 |
| 5.01% | Semi - annual | BNP Paribas Sinacofi Chile Interbank Rate Avg.(4) | Semi - annual | CME | Dec 2028 | CLP | 4,796,800,000 | 31,434 | 0 | 31,434 |
| 4.9% | Semi - annual | BNP Paribas Sinacofi Chile Interbank Rate Avg.(4) | Semi - annual | CME | Dec 2028 | CLP | 4,651,400,000 | 5,925 | 0 | 5,925 |
| 4.65% | Semi - annual | BNP Paribas Sinacofi Chile Interbank Rate Avg.(4) | Semi - annual | CME | Dec 2028 | CLP | 2,802,900,000 | (37,295) | 0 | (37,295) |
National Bank of Hungary Budapest Interbank Offered Rates 6 Month Index(4) | Semi - annual | 6.07% | Annual | CME | Dec 2028 | HUF | 1,037,500,000 | (53,458) | 0 | (53,458) |
GPW Benchmark WIBD/WIBOR PLN 6m Rate(4) | Semi - annual | 4.26% | Annual | CME | Dec 2028 | PLN | 29,200,000 | (253,833) | 0 | (253,833) |
Colombia IBR Overnight Interbank Reference Rate(4) | Quarterly | 7.53% | Quarterly | CME | Jan 2029 | COP | 833,600,000 | (6,976) | 0 | (6,976) |
Brazil Cetip DI Interbank Deposit Rate(4) | At Maturity | 10.69% | At Maturity | CME | Jan 2029 | BRL | 55,000,000 | 721,883 | 0 | 721,883 |
| 11.08% | At Maturity | Brazil Cetip DI Interbank Deposit Rate(4) | At Maturity | CME | Jan 2029 | BRL | 50,700,000 | (603,142) | 0 | (603,142) |
| 10.9% | At Maturity | Brazil Cetip DI Interbank Deposit Rate(4) | At Maturity | CME | Jan 2029 | BRL | 29,200,000 | (345,119) | 0 | (345,119) |
| 12.06% | At Maturity | Brazil Cetip DI Interbank Deposit Rate(4) | At Maturity | CME | Jan 2029 | BRL | 28,700,000 | (147,304) | 0 | (147,304) |
Brazil Cetip DI Interbank Deposit Rate(4) | At Maturity | 10.96% | At Maturity | CME | Jan 2029 | BRL | 26,100,000 | 300,919 | 0 | 300,919 |
Brazil Cetip DI Interbank Deposit Rate(4) | At Maturity | 9.87% | At Maturity | CME | Jan 2029 | BRL | 25,900,000 | 369,471 | 0 | 369,471 |
Brazil Cetip DI Interbank Deposit Rate(4) | At Maturity | 11.84% | At Maturity | CME | Jan 2029 | BRL | 23,400,000 | 109,358 | 0 | 109,358 |
Colombia IBR Overnight Interbank Reference Rate(4) | Quarterly | 7.53% | Quarterly | CME | Jan 2029 | BRL | 20,300,000 | 343,558 | 0 | 343,558 |
| 11.84% | At Maturity | Brazil Cetip DI Interbank Deposit Rate(4) | At Maturity | CME | Jan 2029 | BRL | 18,600,000 | (123,151) | 0 | (123,151) |
Brazil Cetip DI Interbank Deposit Rate(4) | At Maturity | 10.48% | At Maturity | CME | Jan 2029 | BRL | 17,400,000 | 272,731 | 0 | 272,731 |
Brazil Cetip DI Interbank Deposit Rate(4) | At Maturity | 10.23% | At Maturity | CME | Jan 2029 | BRL | 17,100,000 | 275,153 | 0 | 275,153 |
Brazil Cetip DI Interbank Deposit Rate(4) | At Maturity | 10.77% | At Maturity | CME | Jan 2029 | BRL | 16,700,000 | 218,877 | 0 | 218,877 |
| 11.31% | At Maturity | Brazil Cetip DI Interbank Deposit Rate(4) | At Maturity | CME | Jan 2029 | BRL | 16,300,000 | (164,790) | 0 | (164,790) |
Brazil Cetip DI Interbank Deposit Rate(4) | At Maturity | 11.03% | At Maturity | CME | Jan 2029 | BRL | 15,600,000 | 177,334 | 0 | 177,334 |
| 8.13% | Quarterly | SAFE South Africa Johannesburg Interbank Agreed 3 Month Rate(4) | Quarterly | CME | Jan 2029 | ZAR | 15,300,000 | 26,259 | 0 | 26,259 |
| 7.91% | Quarterly | Colombia IBR Overnight Interbank Reference Rate(4) | Quarterly | CME | Jan 2029 | BRL | 14,100,000 | (121,261) | 0 | (121,261) |
| 10.53% | At Maturity | Brazil Cetip DI Interbank Deposit Rate(4) | At Maturity | CME | Jan 2029 | BRL | 13,600,000 | (198,795) | 0 | (198,795) |
Brazil Cetip DI Interbank Deposit Rate(4) | At Maturity | 10.55% | At Maturity | CME | Jan 2029 | BRL | 13,300,000 | 194,951 | 0 | 194,951 |
| 12.49% | At Maturity | Brazil Cetip DI Interbank Deposit Rate(4) | At Maturity | CME | Jan 2029 | BRL | 12,100,000 | (36,806) | 0 | (36,806) |
| 11.66% | At Maturity | Brazil Cetip DI Interbank Deposit Rate(4) | At Maturity | CME | Jan 2029 | BRL | 12,100,000 | (89,256) | 0 | (89,256) |
| 11.11% | At Maturity | Brazil Cetip DI Interbank Deposit Rate(4) | At Maturity | CME | Jan 2029 | BRL | 11,800,000 | (135,069) | 0 | (135,069) |
| 12.03% | At Maturity | Brazil Cetip DI Interbank Deposit Rate(4) | At Maturity | CME | Jan 2029 | BRL | 10,400,000 | (62,714) | 0 | (62,714) |
| 10.21% | At Maturity | Brazil Cetip DI Interbank Deposit Rate(4) | At Maturity | CME | Jan 2029 | BRL | 8,502,000 | (138,306) | 0 | (138,306) |
Brazil Cetip DI Interbank Deposit Rate(4) | At Maturity | 10.25% | At Maturity | CME | Jan 2029 | BRL | 7,900,000 | 131,894 | 0 | 131,894 |
Brazil Cetip DI Interbank Deposit Rate(4) | At Maturity | 10.29% | At Maturity | CME | Jan 2029 | BRL | 7,800,000 | 116,385 | 0 | 116,385 |
| 12.75% | At Maturity | Brazil Cetip DI Interbank Deposit Rate(4) | At Maturity | CME | Jan 2029 | BRL | 7,700,000 | (2,861) | 0 | (2,861) |
| 12.56% | At Maturity | Brazil Cetip DI Interbank Deposit Rate(4) | At Maturity | CME | Jan 2029 | BRL | 7,700,000 | (14,277) | 0 | (14,277) |
Brazil Cetip DI Interbank Deposit Rate(4) | At Maturity | 12.24% | At Maturity | CME | Jan 2029 | BRL | 6,900,000 | 39,452 | 0 | 39,452 |
Brazil Cetip DI Interbank Deposit Rate(4) | At Maturity | 10.04% | At Maturity | CME | Jan 2029 | BRL | 6,600,000 | 115,318 | 0 | 115,318 |
| 11.94% | At Maturity | Brazil Cetip DI Interbank Deposit Rate(4) | At Maturity | CME | Jan 2029 | BRL | 5,300,000 | (31,363) | 0 | (31,363) |
| 11.72% | At Maturity | Brazil Cetip DI Interbank Deposit Rate(4) | At Maturity | CME | Jan 2029 | BRL | 4,300,000 | (36,954) | 0 | (36,954) |
Bank of Israel Tel Aviv Interbank Offered 3 Month(4) | Quarterly | 3.7% | Annual | LCH | Jan 2029 | ILS | 20,000,000 | 61,157 | 0 | 61,157 |
Bank of Israel Tel Aviv Interbank Offered 3 Month(4) | Quarterly | 3.68% | Annual | LCH | Jan 2029 | ILS | 13,800,000 | 45,255 | 0 | 45,255 |
Bank of Israel Tel Aviv Interbank Offered 3 Month(4) | Quarterly | 3.74% | At Maturity | LCH | Jan 2029 | ILS | 8,200,000 | 21,995 | 0 | 21,995 |
BNP Paribas Sinacofi Chile Interbank Rate Avg.(4) | Semi - annual | 4.81% | Semi - annual | CME | Feb 2029 | CLP | 5,190,500,000 | 13,149 | 0 | 13,149 |
| 4.44% | Quarterly | BNP Paribas Sinacofi Chile Interbank Rate Avg.(4) | Quarterly | CME | Feb 2029 | CLP | 3,071,000,000 | (57,721) | 0 | (57,721) |
| 4.52% | Semi - annual | BNP Paribas Sinacofi Chile Interbank Rate Avg.(4) | Semi - annual | CME | Feb 2029 | CLP | 1,798,000,000 | (27,388) | 0 | (27,388) |
GPW Benchmark WIBD/WIBOR PLN 6m Rate(4) | Semi - annual | 4.85% | Annual | CME | Feb 2029 | PLN | 14,700,000 | (132,657) | 0 | (132,657) |
GPW Benchmark WIBD/WIBOR PLN 6m Rate(4) | Semi - annual | 4.87% | Annual | CME | Feb 2029 | PLN | 14,700,000 | (134,689) | 0 | (134,689) |
GPW Benchmark WIBD/WIBOR PLN 6m Rate(4) | Semi - annual | 4.89% | Annual | CME | Feb 2029 | PLN | 10,400,000 | (98,212) | 0 | (98,212) |
Colombia IBR Overnight Interbank Reference Rate(4) | Quarterly | 7.52% | Quarterly | CME | Mar 2029 | COP | 10,983,300,000 | 25,631 | 0 | 25,631 |
BNP Paribas Sinacofi Chile Interbank Rate Avg.(4) | Semi - annual | 4.97% | Semi - annual | CME | Mar 2029 | CLP | 8,817,300,000 | (37,666) | 0 | (37,666) |
BNP Paribas Sinacofi Chile Interbank Rate Avg.(4) | Semi - annual | 4.97% | Semi - annual | CME | Mar 2029 | CLP | 5,345,000,000 | (28,561) | 0 | (28,561) |
BNP Paribas Sinacofi Chile Interbank Rate Avg.(4) | Semi - annual | 5% | Semi - annual | CME | Mar 2029 | CLP | 1,709,200,000 | (9,991) | 0 | (9,991) |
GPW Benchmark WIBD/WIBOR PLN 6m Rate(4) | Semi - annual | 4.98% | Annual | CME | Mar 2029 | PLN | 24,200,000 | (268,366) | 0 | (268,366) |
GPW Benchmark WIBD/WIBOR PLN 6m Rate(4) | Semi - annual | 4.83% | Annual | CME | Mar 2029 | PLN | 22,400,000 | (203,114) | 0 | (203,114) |
Bank of Israel Tel Aviv Interbank Offered 3 Month(4) | Quarterly | 3.92% | Annual | LCH | Mar 2029 | ILS | 19,100,000 | 17,194 | 0 | 17,194 |
Bank of Israel Tel Aviv Interbank Offered 3 Month(4) | Quarterly | 3.93% | Annual | LCH | Mar 2029 | ILS | 9,600,000 | 7,625 | 0 | 7,625 |
Colombia IBR Overnight Interbank(4) | Semi - annual | 8.44% | Semi - annual | CME | Apr 2029 | COP | 9,530,800,000 | (58,231) | 0 | (58,231) |
Colombia IBR Overnight Interbank(4) | Quarterly | 8.45% | Quarterly | CME | Apr 2029 | COP | 7,334,200,000 | (46,009) | 0 | (46,009) |
Colombia IBR Overnight Interbank Reference Rate(4) | Quarterly | 7.89% | Quarterly | CME | Apr 2029 | COP | 6,562,100,000 | (3,030) | 0 | (3,030) |
Colombia IBR Overnight Interbank Reference Rate(4) | Quarterly | 8.57% | Quarterly | CME | Apr 2029 | COP | 6,493,300,000 | (48,341) | 0 | (48,341) |
Colombia IBR Overnight Interbank Reference Rate(4) | Quarterly | 8.08% | Quarterly | CME | Apr 2029 | COP | 5,480,900,000 | (13,915) | 0 | (13,915) |
Colombia IBR Overnight Interbank Reference Rate(4) | Quarterly | 7.95% | Quarterly | CME | Apr 2029 | COP | 4,464,700,000 | (4,994) | 0 | (4,994) |
Colombia IBR Overnight Interbank(4) | Quarterly | 8.15% | Quarterly | CME | Apr 2029 | COP | 4,394,900,000 | (14,224) | 0 | (14,224) |
Chile Indice de Camara Promedio Interbank Overnight Index Rate(4) | Semi - annual | 5.16% | Semi - annual | CME | Apr 2029 | CLP | 3,518,200,000 | (46,787) | 0 | (46,787) |
Colombia IBR Overnight Interbank Reference Rate(4) | Quarterly | 7.93% | Quarterly | CME | Apr 2029 | COP | 3,348,500,000 | (3,062) | 0 | (3,062) |
National Bank of Hungary Budapest Interbank Offered Rates 6 Month Index(4) | Semi - annual | 7% | Annual | CME | Apr 2029 | HUF | 3,211,000,000 | (115,609) | 0 | (115,609) |
Colombia IBR Overnight Interbank Reference Rate(4) | Quarterly | 8.12% | Quarterly | CME | Apr 2029 | COP | 2,604,400,000 | (7,530) | 0 | (7,530) |
National Bank of Hungary Budapest Interbank Offered Rates 6 Month Index(4) | Semi - annual | 6.59% | Annual | CME | Apr 2029 | HUF | 876,700,000 | (122,515) | 0 | (122,515) |
National Bank of Hungary Budapest Interbank Offered Rates 6 Month Index(4) | Semi - annual | 6.56% | Annual | CME | Apr 2029 | HUF | 851,500,000 | (114,957) | 0 | (114,957) |
National Bank of Hungary Budapest Interbank Offered Rates 6 Month Index(4) | Semi - annual | 6.55% | Annual | CME | Apr 2029 | HUF | 626,000,000 | (84,415) | 0 | (84,415) |
National Bank of Hungary Budapest Interbank Offered Rates 6 Month Index(4) | Semi - annual | 6.8% | Semi - annual | CME | Apr 2029 | HUF | 527,500,000 | (85,629) | 0 | (85,629) |
National Bank of Hungary Budapest Interbank Offered Rates 6 Month Index(4) | Semi - annual | 6.83% | Annual | CME | Apr 2029 | HUF | 520,600,000 | (86,279) | 0 | (86,279) |
National Bank of Hungary Budapest Interbank Offered Rates 6 Month Index(4) | Semi - annual | 6.53% | Annual | CME | Apr 2029 | HUF | 510,300,000 | (67,801) | 0 | (67,801) |
National Bank of Hungary Budapest Interbank Offered Rates 6 Month Index(4) | Semi - annual | 7.1% | Annual | CME | Apr 2029 | HUF | 475,200,000 | (93,943) | 0 | (93,943) |
| 4.25% | Annual | Prague Interbank Offered Rate 6-month(4) | Semi - annual | CME | Apr 2029 | CZK | 76,500,000 | 64,509 | 0 | 64,509 |
SAFE South Africa Johannesburg Interbank Agreed 3 Month Rate(4) | Quarterly | 8.67% | Quarterly | CME | Apr 2029 | ZAR | 52,300,000 | (132,438) | 0 | (132,438) |
SAFE South Africa Johannesburg Interbank Agreed 3 Month Rate(4) | Quarterly | 8.65% | Quarterly | CME | Apr 2029 | ZAR | 52,000,000 | (129,027) | 0 | (129,027) |
SAFE South Africa Johannesburg Interbank Agreed 3 Month Rate(4) | Quarterly | 8.88% | Quarterly | CME | Apr 2029 | ZAR | 46,600,000 | (137,614) | 0 | (137,614) |
SAFE South Africa Johannesburg Interbank Agreed 3 Month Rate(4) | Quarterly | 8.65% | Quarterly | CME | Apr 2029 | ZAR | 37,500,000 | (93,325) | 0 | (93,325) |
| 8.82% | Quarterly | SAFE South Africa Johannesburg Interbank Agreed 3 Month Rate(4) | Quarterly | CME | Apr 2029 | ZAR | 30,500,000 | 5,037 | 0 | 5,037 |
SAFE South Africa Johannesburg Interbank Agreed 3 Month Rate(4) | Quarterly | 8.65% | Quarterly | CME | Apr 2029 | ZAR | 26,200,000 | (65,277) | 0 | (65,277) |
| 5.27% | Annual | GPW Benchmark WIBD/WIBOR PLN 6m Rate(4) | Semi - annual | CME | Apr 2029 | PLN | 8,300,000 | 117,141 | 0 | 117,141 |
| 5.36% | Annual | GPW Benchmark WIBD/WIBOR PLN 6m Rate(4) | Semi - annual | CME | Apr 2029 | PLN | 5,700,000 | 87,037 | 0 | 87,037 |
| 4.43% | Annual | Bank of Israel Tel Aviv Interbank Offered 3 Month(4) | Quarterly | LCH | Apr 2029 | ILS | 11,400,000 | 50,551 | 0 | 50,551 |
| 4.52% | Annual | Bank of Israel Tel Aviv Interbank Offered 3 Month(4) | Quarterly | LCH | Apr 2029 | ILS | 3,300,000 | 17,560 | 0 | 17,560 |
| 7.91% | Quarterly | Colombia IBR Overnight Interbank Reference Rate(4) | Quarterly | CME | May 2029 | COP | 9,013,400,000 | 12,076 | 0 | 12,076 |
| 8.04% | Quarterly | Colombia IBR Overnight Interbank Reference Rate(4) | Quarterly | CME | May 2029 | COP | 4,574,000,000 | 11,639 | 0 | 11,639 |
| 4.96% | Semi - annual | Chile Indice de Camara Promedio Interbank Overnight Index Rate(4) | Semi - annual | CME | May 2029 | CLP | 3,595,600,000 | 15,850 | 0 | 15,850 |
| 6.27% | Annual | National Bank of Hungary Budapest Interbank Offered Rates 6 Month Index(4) | Semi - annual | CME | May 2029 | HUF | 894,500,000 | 80,817 | 0 | 80,817 |
| 6.25% | Annual | National Bank of Hungary Budapest Interbank Offered Rates 6 Month Index(4) | Semi - annual | CME | May 2029 | HUF | 512,800,000 | 45,449 | 0 | 45,449 |
| 8.46% | Quarterly | SAFE South Africa Johannesburg Interbank Agreed 3 Month Rate(4) | Quarterly | CME | May 2029 | ZAR | 120,900,000 | 249,780 | 0 | 249,780 |
| 8.51% | Quarterly | SAFE South Africa Johannesburg Interbank Agreed 3 Month Rate(4) | Quarterly | CME | May 2029 | ZAR | 91,200,000 | 196,794 | 0 | 196,794 |
| 8.53% | Quarterly | SAFE South Africa Johannesburg Interbank Agreed 3 Month Rate(4) | Quarterly | CME | May 2029 | ZAR | 60,600,000 | 133,342 | 0 | 133,342 |
| 5.06% | Annual | GPW Benchmark WIBOR PLN 6M Rate(4) | Semi - annual | CME | May 2029 | PLN | 20,700,000 | 245,404 | 0 | 245,404 |
| 5.05% | Annual | GPW Benchmark WIBOR PLN 6M Rate(4) | Semi - annual | CME | May 2029 | PLN | 6,100,000 | 60,736 | 0 | 60,736 |
| 4.36% | Annual | Bank of Israel Tel Aviv Interbank Offered 3 Month(4) | Quarterly | LCH | May 2029 | ILS | 25,000,000 | 92,849 | 0 | 92,849 |
| 4.37% | Annual | Bank of Israel Tel Aviv Interbank Offered 3 Month(4) | Quarterly | LCH | May 2029 | ILS | 23,700,000 | 64,085 | 0 | 64,085 |
| 4.87% | Semi - annual | Chile Indice de Camara Promedio Interbank Overnight Index Rate(4) | Semi - annual | CME | Jun 2029 | CLP | 1,249,600,000 | (4,157) | 0 | (4,157) |
| 5.27% | Semi - annual | BNP Paribas Sinacofi Chile Interbank Rate Avg.(4) | Semi - annual | CME | Jun 2029 | CLP | 959,500,000 | 6,898 | 0 | 6,898 |
| 8.28% | Quarterly | SAFE South Africa Johannesburg Interbank Agreed 3 Month Rate(4) | Quarterly | CME | Jun 2029 | ZAR | 62,000,000 | 104,280 | 0 | 104,280 |
Chile Indice de Camara Promedio Interbank Overnight Index Rate(4) | Semi - annual | 5.28% | Semi - annual | CME | Jul 2029 | CLP | 3,663,800,000 | (62,835) | 0 | (62,835) |
| 5.84% | Annual | National Bank of Hungary Budapest Interbank Offered Rates 6 Month Index(4) | Semi - annual | CME | Jul 2029 | HUF | 1,145,100,000 | (52,964) | 0 | (52,964) |
| 5.82% | Annual | National Bank of Hungary Budapest Interbank Offered Rates 6 Month Index(4) | Semi - annual | CME | Jul 2029 | HUF | 803,900,000 | (38,459) | 0 | (38,459) |
| 5.7% | Annual | National Bank of Hungary Budapest Interbank Offered Rates 6 Month Index(4) | Semi - annual | CME | Jul 2029 | HUF | 606,100,000 | (38,737) | 0 | (38,737) |
| 5.83% | Annual | National Bank of Hungary Budapest Interbank Offered Rates 6 Month Index(4) | Semi - annual | CME | Jul 2029 | HUF | 605,500,000 | (29,764) | 0 | (29,764) |
| 5.79% | Annual | National Bank of Hungary Budapest Interbank Offered Rates 6 Month Index(4) | Semi - annual | CME | Jul 2029 | HUF | 605,500,000 | (32,289) | 0 | (32,289) |
| 5.85% | Semi - annual | National Bank of Hungary Budapest Interbank Offered Rates 6 Month Index(4) | Semi - annual | CME | Jul 2029 | HUF | 537,300,000 | (24,315) | 0 | (24,315) |
| 5.72% | Annual | National Bank of Hungary Budapest Interbank Offered Rates 6 Month Index(4) | Semi - annual | CME | Jul 2029 | HUF | 408,700,000 | (25,043) | 0 | (25,043) |
| 3.48% | Annual | Prague Interbank Offered Rate 6-month(4) | Semi - annual | CME | Jul 2029 | CZK | 109,000,000 | (25,584) | 0 | (25,584) |
Mexico Interbank TIIE 1 Day Rate(4) | Monthly | 9.39% | Monthly | CME | Jul 2029 | MXN | 36,200,000 | (6,060) | 0 | (6,060) |
| 7.06% | Quarterly | Colombia IBR Overnight Interbank Reference Rate(4) | Quarterly | CME | Aug 2029 | COP | 12,497,100,000 | (89,083) | 0 | (89,083) |
| 7.37% | Quarterly | Colombia IBR Overnight Interbank Reference Rate(4) | Quarterly | CME | Aug 2029 | COP | 7,116,300,000 | (29,502) | 0 | (29,502) |
| 7.36% | Quarterly | Colombia IBR Overnight Interbank Reference Rate(4) | Quarterly | CME | Aug 2029 | COP | 7,046,500,000 | (29,688) | 0 | (29,688) |
| 4.84% | Semi - annual | Chile Indice de Camara Promedio Interbank Overnight Index Rate(4) | Semi - annual | CME | Aug 2029 | CLP | 4,693,700,000 | (16,192) | 0 | (16,192) |
| 7.4% | Quarterly | Colombia IBR Overnight Interbank Reference Rate(4) | Quarterly | CME | Aug 2029 | COP | 4,681,400,000 | (17,949) | 0 | (17,949) |
| 7.34% | Quarterly | Colombia IBR Overnight Interbank Reference Rate(4) | Quarterly | CME | Aug 2029 | COP | 4,651,200,000 | (20,698) | 0 | (20,698) |
| 7.44% | Quarterly | Colombia IBR Overnight Interbank Reference Rate(4) | Quarterly | CME | Aug 2029 | COP | 4,283,900,000 | (15,050) | 0 | (15,050) |
| 7.28% | Quarterly | Colombia IBR Overnight Interbank Reference Rate(4) | Quarterly | CME | Aug 2029 | COP | 3,212,800,000 | (16,367) | 0 | (16,367) |
| 4.8% | Semi - annual | BNP Paribas Sinacofi Chile Interbank Rate Avg.(4) | Semi - annual | CME | Aug 2029 | CLP | 2,797,700,000 | (15,339) | 0 | (15,339) |
| 4.76% | Semi - annual | BNP Paribas Sinacofi Chile Interbank Rate Avg.(4) | Semi - annual | CME | Aug 2029 | CLP | 2,436,300,000 | (17,920) | 0 | (17,920) |
| 7.34% | Quarterly | Colombia IBR Overnight Interbank Reference Rate(4) | Quarterly | CME | Aug 2029 | COP | 2,325,600,000 | (10,239) | 0 | (10,239) |
| 4.8% | Semi - annual | Chile Indice de Camara Promedio Interbank Overnight Index Rate(4) | Semi - annual | CME | Aug 2029 | CLP | 1,630,800,000 | (8,859) | 0 | (8,859) |
| 5.55% | Annual | National Bank of Hungary Budapest Interbank Offered Rates 6 Month Index(4) | Semi - annual | CME | Aug 2029 | HUF | 1,008,500,000 | (78,371) | 0 | (78,371) |
| 4.74% | Semi - annual | BNP Paribas Sinacofi Chile Interbank Rate Avg.(4) | Semi - annual | CME | Aug 2029 | CLP | 986,400,000 | (8,222) | 0 | (8,222) |
| 4.92% | Semi - annual | BNP Paribas Sinacofi Chile Interbank Rate Avg.(4) | Semi - annual | CME | Aug 2029 | CLP | 938,800,000 | 411 | 0 | 411 |
SAFE South Africa Johannesburg Interbank Agreed 3 Month Rate(4) | Quarterly | 7.56% | Quarterly | CME | Aug 2029 | ZAR | 31,200,000 | (29,370) | 0 | (29,370) |
| 4.31% | Semi - annual | GPW Benchmark WIBD/WIBOR PLN 6m Rate(4) | Semi - annual | CME | Aug 2029 | PLN | 17,300,000 | (49,761) | 0 | (49,761) |
| 4.27% | Annual | GPW Benchmark WIBD/WIBOR PLN 6m Rate(4) | Semi - annual | CME | Aug 2029 | PLN | 10,400,000 | (35,243) | 0 | (35,243) |
| 4.28% | Annual | GPW Benchmark WIBD/WIBOR PLN 6m Rate(4) | Semi - annual | CME | Aug 2029 | PLN | 10,400,000 | (33,787) | 0 | (33,787) |
| 4.65% | Annual | GPW Benchmark WIBD/WIBOR PLN 6m Rate(4) | Semi - annual | CME | Aug 2029 | PLN | 8,500,000 | (10,928) | 0 | (10,928) |
| 6.99% | Quarterly | Colombia IBR Overnight Interbank Reference Rate(4) | Quarterly | CME | Sep 2029 | COP | 5,143,800,000 | (45,392) | 0 | (45,392) |
| 4.43% | Semi - annual | BNP Paribas Sinacofi Chile Interbank Rate Avg.(4) | Semi - annual | CME | Sep 2029 | CLP | 3,785,000,000 | (85,193) | 0 | (85,193) |
South Korean Won 3 Month Certificate of Deposit Rates(4) | Quarterly | 3.25% | Quarterly | LCH | Sep 2029 | KRW | 1,700,600,000 | (9,025) | 0 | (9,025) |
Colombia IBR Overnight Interbank Reference Rate(4) | Quarterly | 8.11% | Quarterly | CME | Oct 2029 | COP | 9,875,700,000 | (24,156) | 0 | (24,156) |
Colombia IBR Overnight Interbank Reference Rate(4) | Quarterly | 8.11% | Quarterly | CME | Oct 2029 | COP | 8,369,000,000 | (20,678) | 0 | (20,678) |
Colombia IBR Overnight Interbank Reference Rate(4) | Quarterly | 7.55% | Quarterly | CME | Oct 2029 | COP | 5,415,500,000 | 16,292 | 0 | 16,292 |
Colombia IBR Overnight Interbank Reference Rate(4) | Quarterly | 7.93% | Quarterly | CME | Oct 2029 | COP | 5,014,000,000 | (3,806) | 0 | (3,806) |
Colombia IBR Overnight Interbank Reference Rate(4) | Quarterly | 7.75% | Quarterly | CME | Oct 2029 | COP | 4,888,700,000 | 5,030 | 0 | 5,030 |
Colombia IBR Overnight Interbank Reference Rate(4) | Quarterly | 7.81% | Quarterly | CME | Oct 2029 | COP | 3,666,600,000 | 1,662 | 0 | 1,662 |
Colombia IBR Overnight Interbank Reference Rate(4) | Quarterly | 8.25% | Quarterly | CME | Oct 2029 | COP | 3,268,800,000 | (12,618) | 0 | (12,618) |
Colombia IBR Overnight Interbank Reference Rate(4) | Quarterly | 7.65% | Quarterly | CME | Oct 2029 | COP | 2,740,400,000 | 5,450 | 0 | 5,450 |
Colombia IBR Overnight Interbank Reference Rate(4) | Quarterly | 7.6% | Quarterly | CME | Oct 2029 | COP | 2,714,300,000 | 6,841 | 0 | 6,841 |
BNP Paribas Sinacofi Chile Interbank Rate Avg.(4) | Semi - annual | 4.86% | Semi - annual | CME | Oct 2029 | CLP | 2,638,400,000 | 2,840 | 0 | 2,840 |
National Bank of Hungary Budapest Interbank Offered Rates 6 Month Index(4) | Semi - annual | 6.08% | Annual | CME | Oct 2029 | HUF | 2,009,900,000 | (52,384) | 0 | (52,384) |
BNP Paribas Sinacofi Chile Interbank Rate Avg.(4) | Semi - annual | 4.94% | Semi - annual | CME | Oct 2029 | CLP | 1,824,600,000 | (5,735) | 0 | (5,735) |
| 4.66% | Semi - annual | BNP Paribas Sinacofi Chile Interbank Rate Avg.(4) | Semi - annual | CME | Oct 2029 | CLP | 1,753,700,000 | (18,619) | 0 | (18,619) |
Chile Indice de Camara Promedio Interbank Overnight Index Rate(4) | Semi - annual | 4.87% | Semi - annual | CME | Oct 2029 | CLP | 1,306,800,000 | 770 | 0 | 770 |
National Bank of Hungary Budapest Interbank Offered Rates 6 Month Index(4) | Semi - annual | 6.12% | Annual | CME | Oct 2029 | HUF | 860,700,000 | 5,777 | 0 | 5,777 |
National Bank of Hungary Budapest Interbank Offered Rates 6 Month Index(4) | Semi - annual | 6.09% | Annual | CME | Oct 2029 | HUF | 645,500,000 | 6,185 | 0 | 6,185 |
National Bank of Hungary Budapest Interbank Offered Rates 6 Month Index(4) | Semi - annual | 6.55% | Annual | CME | Oct 2029 | HUF | 542,400,000 | (22,580) | 0 | (22,580) |
National Bank of Hungary Budapest Interbank Offered Rates 6 Month Index(4) | Semi - annual | 6.31% | Annual | CME | Oct 2029 | HUF | 500,000,000 | (7,464) | 0 | (7,464) |
Prague Interbank Offered Rate 6-month(4) | Semi - annual | 3.49% | Annual | CME | Oct 2029 | CZK | 71,000,000 | (5,629) | 0 | (5,629) |
Prague Interbank Offered Rate 6-month(4) | Semi - annual | 3.52% | Annual | CME | Oct 2029 | CZK | 66,500,000 | (9,674) | 0 | (9,674) |
| 9.43% | Monthly | Mexico Interbank TIIE 1 Day Rate(4) | Monthly | CME | Oct 2029 | MXN | 25,000,000 | (30,566) | 0 | (30,566) |
| 9.42% | Monthly | Mexico Interbank TIIE 1 Day Rate(4) | Monthly | CME | Oct 2029 | MXN | 24,600,000 | 6,275 | 0 | 6,275 |
GPW Benchmark WIBD/WIBOR PLN 6m Rate(4) | Semi - annual | 4.71% | Annual | CME | Oct 2029 | PLN | 12,700,000 | (29,153) | 0 | (29,153) |
GPW Benchmark WIBD/WIBOR PLN 6m Rate(4) | Semi - annual | 4.77% | Annual | CME | Oct 2029 | PLN | 11,700,000 | (34,122) | 0 | (34,122) |
GPW Benchmark WIBD/WIBOR PLN 6m Rate(4) | Semi - annual | 4.72% | Annual | CME | Oct 2029 | PLN | 8,300,000 | (18,604) | 0 | (18,604) |
Bank of Israel Tel Aviv Interbank Offered 3 Month(4) | Quarterly | 4.44% | Annual | LCH | Oct 2029 | ILS | 11,300,000 | (52,820) | 0 | (52,820) |
| 8.23% | Quarterly | Colombia IBR Overnight Interbank Reference Rate(4) | Quarterly | CME | Nov 2029 | COP | 11,545,500,000 | 43,237 | 0 | 43,237 |
Colombia IBR Overnight Interbank Reference Rate(4) | Quarterly | 8.18% | Quarterly | CME | Nov 2029 | COP | 9,538,200,000 | (30,742) | 0 | (30,742) |
Colombia IBR Overnight Interbank Reference Rate(4) | Quarterly | 8.24% | Quarterly | CME | Nov 2029 | COP | 9,494,400,000 | (36,098) | 0 | (36,098) |
BNP Paribas Sinacofi Chile Interbank Rate Avg.(4) | Semi - annual | 5.01% | Semi - annual | CME | Nov 2029 | CLP | 3,399,800,000 | (20,616) | 0 | (20,616) |
BNP Paribas Sinacofi Chile Interbank Rate Avg.(4) | Semi - annual | 5.01% | Semi - annual | CME | Nov 2029 | CLP | 2,583,400,000 | (15,938) | 0 | (15,938) |
BNP Paribas Sinacofi Chile Interbank Rate Avg.(4) | Semi - annual | 4.98% | Semi - annual | CME | Nov 2029 | CLP | 1,147,400,000 | (5,084) | 0 | (5,084) |
BNP Paribas Sinacofi Chile Interbank Rate Avg.(4) | Semi - annual | 5% | Semi - annual | CME | Nov 2029 | CLP | 1,015,700,000 | (5,674) | 0 | (5,674) |
| 3.37% | Annual | Prague Interbank Offered Rate 6-month(4) | Semi - annual | CME | Nov 2029 | CZK | 41,300,000 | 299 | 0 | 299 |
| 4.5% | Annual | GPW Benchmark WIBD/WIBOR PLN 6m Rate(4) | Semi - annual | CME | Nov 2029 | PLN | 15,800,000 | 5,208 | 0 | 5,208 |
| 4.51% | Annual | GPW Benchmark WIBD/WIBOR PLN 6m Rate(4) | Semi - annual | CME | Nov 2029 | PLN | 8,000,000 | 4,037 | 0 | 4,037 |
Klibor Interbank Offered Rate(4) | Quarterly | 3.5% | Quarterly | BNP Paribas S.A. | Mar 2030 | MYR | 9,000,000 | (2,228) | 633 | (1,595) |
| 3.5% | Quarterly | Klibor Interbank Offered Rate(4) | Quarterly | Goldman Sachs Intl. | Mar 2030 | MYR | 42,100,000 | 10,424 | (45,804) | (35,380) |
Klibor Interbank Offered Rate(4) | Quarterly | 3.5% | Quarterly | JPMorgan Chase Bank, N.A. | Mar 2030 | MYR | 5,700,000 | (1,411) | (6,326) | (7,737) |
| 3% | Quarterly | Korea Federation of Banks (KORIBOR) 3 Month Rate(4) | Quarterly | LCH | Mar 2030 | KRW | 9,211,700,000 | 50,125 | 0 | 50,125 |
| 2% | Quarterly | Thailand Thai Overnight Repurchase Rate(4) | Quarterly | LCH | Mar 2030 | THB | 291,000,000 | 65,336 | 0 | 65,336 |
Taiwan Interbank Money Center TAIBOR Fixing Rates 3 Month Index(4) | Quarterly | 1.75% | Quarterly | LCH | Mar 2030 | TWD | 117,700,000 | (16,150) | 0 | (16,150) |
| 1.75% | Quarterly | CFETS China Fixing Repo Rates 7 Day(4) | Quarterly | LCH | Mar 2030 | CNY | 75,200,000 | 50,105 | 0 | 50,105 |
Financial Benchmarks India Overnight Mumbai Interbank Outright Rate(4) | Semi - annual | 6% | Semi - annual | LCH | Mar 2030 | INR | 21,400,000 | (1,630) | 0 | (1,630) |
| 2.5% | At Maturity | Singapore Domestic Interbank O/N Index(4) | At Maturity | LCH | Mar 2030 | SGD | 15,220,000 | (128,098) | 0 | (128,098) |
HK Assoc. of Banks Hong Kong Dollar (HIBOR) Fixings 3 Month(4) | Quarterly | 3% | Quarterly | LCH | Mar 2030 | HKD | 6,800,000 | (8,507) | 0 | (8,507) |
Canadian Overnight Repo Rate Average(4) | Annual | 3.25% | Annual | LCH | Mar 2030 | CAD | 4,900,000 | (34,725) | 0 | (34,725) |
U.S. Secured Overnight Fin. Rate (SOFR) Index(4) | Annual | 4% | Annual | LCH | Mar 2030 | | 3,100,000 | (7,827) | 0 | (7,827) |
Prague Interbank Offered Rate 6-month(4) | Semi - annual | 3.34% | Annual | CME | Jan 2032 | CZK | 35,700,000 | (204,144) | 0 | (204,144) |
| 4.22% | Annual | Prague Interbank Offered Rate 6-month(4) | Semi - annual | CME | Mar 2033 | CZK | 49,700,000 | 180,347 | 0 | 180,347 |
| 2.5% | At Maturity | US CPI Urban Consumer NSA Index(4) | At Maturity | LCH | Mar 2033 | | 3,800,000 | 6,048 | 0 | 6,048 |
Prague Interbank Offered Rate 6-month(4) | Semi - annual | 4.42% | Annual | CME | Jun 2033 | CZK | 83,500,000 | (326,257) | 0 | (326,257) |
| 4.46% | Annual | Prague Interbank Offered Rate 6-month(4) | Annual | CME | Jun 2033 | CZK | 34,700,000 | 81,609 | 0 | 81,609 |
US CPI Urban Consumer NSA Index(4) | At Maturity | 2.53% | At Maturity | LCH | Jun 2033 | | 900,000 | (6,421) | 0 | (6,421) |
US CPI Urban Consumer NSA Index(4) | At Maturity | 2.6% | At Maturity | LCH | Jul 2033 | | 2,900,000 | (25,649) | 0 | (25,649) |
Prague Interbank Offered Rate 6-month(4) | Semi - annual | 4.64% | Semi - annual | CME | Oct 2033 | CZK | 53,600,000 | (159,482) | 0 | (159,482) |
| 4.28% | Annual | Prague Interbank Offered Rate 6-month(4) | Semi - annual | CME | Nov 2033 | CZK | 78,000,000 | 171,160 | 0 | 171,160 |
Prague Interbank Offered Rate 6-month(4) | Semi - annual | 4.02% | Annual | CME | Nov 2033 | CZK | 4,200,000 | (9,770) | 0 | (9,770) |
Prague Interbank Offered Rate 6-month(4) | Semi - annual | 4.06% | Annual | CME | Apr 2034 | CZK | 48,100,000 | (126,648) | 0 | (126,648) |
Prague Interbank Offered Rate 6-month(4) | Semi - annual | 4.29% | Annual | CME | Apr 2034 | CZK | 40,700,000 | (32,861) | 0 | (32,861) |
| 3.55% | Annual | Prague Interbank Offered Rate 6-month(4) | Semi - annual | CME | Jul 2034 | CZK | 79,600,000 | (7,838) | 0 | (7,838) |
SONIA Interest Rate Benchmark(4) | Annual | 3.75% | Annual | LCH | Sep 2034 | GBP | 900,000 | 37,694 | 0 | 37,694 |
Mexico Interbank TIIE 1 Day Rate(4) | Monthly | 9.48% | Monthly | CME | Oct 2034 | MXN | 25,100,000 | (9,422) | 0 | (9,422) |
| 1% | Annual | Bank of Japan Final Result: Unsecured Overnight Call Rate TONAR(4) | Annual | LCH | Mar 2035 | JPY | 540,400,000 | (17,567) | 0 | (17,567) |
U.S. Secured Overnight Fin. Rate (SOFR) Index(4) | Annual | 4% | Annual | LCH | Mar 2035 | | 10,100,000 | (43,645) | 0 | (43,645) |
| 4% | Semi - annual | Australian Financial Markets Association 6m Rate(4) | Semi - annual | LCH | Mar 2035 | AUD | 8,300,000 | (164,018) | 0 | (164,018) |
SONIA Interest Rate Benchmark(4) | Annual | 3.5% | Annual | LCH | Mar 2035 | GBP | 7,600,000 | (107,819) | 0 | (107,819) |
6 month EURIBOR(4) | Semi - annual | 2.5% | Annual | LCH | Mar 2035 | EUR | 2,813,000 | (76,317) | 0 | (76,317) |
Canadian Overnight Repo Rate Average(4) | Annual | 3.5% | Annual | LCH | Mar 2035 | CAD | 900,000 | (12,268) | 0 | (12,268) |
| 3.75% | Annual | SONIA Interest Rate Benchmark(4) | Annual | LCH | Sep 2054 | GBP | 600,000 | (43,046) | 0 | (43,046) |
Bank of Japan Final Result: Unsecured Overnight Call Rate TONAR(4) | Annual | 1.5% | Annual | LCH | Mar 2055 | JPY | 1,553,200,000 | 208,396 | 0 | 208,396 |
| 3.75% | Annual | U.S. Secured Overnight Fin. Rate (SOFR) Index(4) | Annual | LCH | Mar 2055 | | 4,900,000 | 73,590 | 0 | 73,590 |
Canadian Overnight Repo Rate Average(4) | Annual | 3.5% | Annual | LCH | Mar 2055 | CAD | 3,700,000 | 50,801 | 0 | 50,801 |
| 2.25% | Annual | 6 month EURIBOR(4) | Semi - annual | LCH | Mar 2055 | EUR | 2,800,000 | 115,483 | 0 | 115,483 |
| 3.75% | Annual | SONIA Interest Rate Benchmark(4) | Annual | LCH | Mar 2055 | GBP | 0 | 186 | 0 | 186 |
| TOTAL INTEREST RATE SWAPS | | | | | | | | (4,057,315) | (51,497) | (4,108,812) |
| | | | | | | | | | | |
(1)Swaps with CME Group (CME) and LCH Clearnet Group (LCH) are centrally cleared swaps.
(2)Notional amount is stated in U.S. Dollars unless otherwise noted.
(3)Any premiums for centrally cleared swaps are recorded periodically throughout the term of the swap to variation margin and included in unrealized appreciation (depreciation).
(4)Represents floating rate.
| Total Return Swaps |
| Underlying Reference | Pay/ Receive Reference | Reference Payment Frequency | Financing Rate | Financing Frequency | Counterparty | Maturity Date | Units | Notional Amount | Value ($) | Upfront Premium Received/ (Paid) ($) | Unrealized Appreciation/ (Depreciation) ($) |
| KOSPI 200 Futures | Pays | At Maturity | None | At Maturity | Goldman Sachs Intl. | Dec 2024 | 1,750,000 | KRW | 571,025,007 | 19,761 | 0 | 19,761 |
| KOSPI 200 Futures | Pays | At Maturity | None | At Maturity | Goldman Sachs Intl. | Dec 2024 | 1,250,000 | KRW | 407,874,997 | (5,870) | 0 | (5,870) |
| KOSPI 200 Futures | Pays | At Maturity | None | At Maturity | Goldman Sachs Intl. | Dec 2024 | 1,000,000 | KRW | 326,300,006 | 968 | 0 | 968 |
| SET50 Index Futures | Receives | At Maturity | None | At Maturity | Goldman Sachs Intl. | Dec 2024 | 38,600 | THB | 35,453,756 | 2,035 | 0 | 2,035 |
| SET50 Index Futures | Receives | At Maturity | None | At Maturity | Goldman Sachs Intl. | Dec 2024 | 22,400 | THB | 20,726,861 | (3,269) | (146) | (3,415) |
| SET50 Index Futures | Receives | At Maturity | None | At Maturity | Goldman Sachs Intl. | Dec 2024 | 16,800 | THB | 16,008,720 | (15,965) | (125) | (16,090) |
| iBovespa Index Futures | Pays | At Maturity | None | At Maturity | Goldman Sachs Intl. | Dec 2024 | 86 | BRL | 10,849,760 | 93,735 | (150) | 93,585 |
| iBovespa Index Futures | Pays | At Maturity | None | At Maturity | Goldman Sachs Intl. | Dec 2024 | 43 | BRL | 5,424,880 | 17,337 | 0 | 17,337 |
| iBovespa Index Futures | Pays | At Maturity | None | At Maturity | Goldman Sachs Intl. | Dec 2024 | 28 | BRL | 3,532,480 | 23,175 | (80) | 23,095 |
| iBovespa Index Futures | Pays | At Maturity | None | At Maturity | Goldman Sachs Intl. | Dec 2024 | 9 | BRL | 1,135,440 | 9,398 | 0 | 9,398 |
| TOTAL RETURN SWAPS | | | | | | | | | | 141,305 | 0 | 140,804 |
For the period, the average monthly notional amount at value for swaps in the aggregate was $1,297,112,132.
Currency Abbreviations
| AUD | - | Australian dollar |
| BRL | - | Brazilian real |
| CAD | - | Canadian dollar |
| CHF | - | Swiss franc |
| CLP | - | Chilean peso |
| CNY | - | Chinese yuan |
| COP | - | Colombian peso |
| CZK | - | Czech koruna |
| EUR | - | European Monetary Unit |
| GBP | - | British pound sterling |
| HKD | - | Hong Kong dollar |
| HUF | - | Hungarian forint |
| IDR | - | Indonesian rupiah |
| ILS | - | Israeli shekel |
| INR | - | Indian rupee |
| JPY | - | Japanese yen |
| KRW | - | Korean won |
| MXN | - | Mexican peso |
| MYR | - | Malaysian ringgit |
| NOK | - | Norwegian krone |
| NZD | - | New Zealand dollar |
| PEN | - | Peruvian new sol |
| PHP | - | Philippine peso |
| PLN | - | Polish zloty |
| SEK | - | Swedish krona |
| SGD | - | Singapore dollar |
| THB | - | Thai baht |
| TRY | - | Turkish Lira |
| TWD | - | Taiwanese dollar |
| USD | - | U.S. dollar |
| ZAR | - | South African rand |
Legend
| (a) | Amount is stated in United States dollars unless otherwise noted. |
| (b) | Security exempt from registration under Rule 144A of the Securities Act of 1933. These securities may be resold in transactions exempt from registration, normally to qualified institutional buyers. At the end of the period, the value of these securities amounted to $18,122,972 or 0.8% of net assets. |
| (c) | Coupon rates for floating and adjustable rate securities reflect the rates in effect at period end. |
| (d) | Coupon is indexed to a floating interest rate which may be multiplied by a specified factor and/or subject to caps or floors. |
| (e) | Security or a portion of the security has been segregated as collateral for open forward foreign currency contracts and bi-lateral over the counter (OTC) swaps. At period end, the value of securities pledged amounted to $720,657. |
| (f) | Security or a portion of the security purchased on a delayed delivery or when-issued basis. |
| (h) | Affiliated fund that is generally available only to investment companies and other accounts managed by Fidelity Investments. The rate quoted is the annualized seven-day yield of the fund at period end. A complete unaudited listing of the fund's holdings as of its most recent quarter end is available upon request. In addition, each Fidelity Central Fund's financial statements are available on the SEC's website or upon request. |
| (i) | The rate quoted is the annualized seven-day yield of the fund at period end. |
| (j) | Represents a forward settling transaction and therefore no collateral securities had been allocated as of period end. The agreement contemplated the delivery of U.S. Treasury Obligations as collateral on settlement date. |
Affiliated Central Funds
Fiscal year to date information regarding the Fund's investments in Fidelity Central Funds, including the ownership percentage, is presented below.
| Affiliate | Value, beginning of period ($) | Purchases ($) | Sales Proceeds ($) | Dividend Income ($) | Realized Gain (loss) ($) | Change in Unrealized appreciation (depreciation) ($) | Value, end of period ($) | % ownership, end of period |
| Fidelity Cash Central Fund 4.64% | 4,764,215 | 578,661 | 3,394,665 | 91,985 | - | - | 1,948,211 | 0.0% |
| Total | 4,764,215 | 578,661 | 3,394,665 | 91,985 | - | - | 1,948,211 | |
| | | | | | | | | |
Amounts in the dividend income column in the above table include any capital gain distributions from underlying funds, which are presented in the corresponding line item in the Consolidated Statement of Operations, if applicable.
Amounts included in the purchases and sales proceeds columns may include in-kind transactions, if applicable.
Affiliated Underlying Funds
Fiscal year to date information regarding the Fund's investments in affiliated Underlying Funds is presented below. Exchanges between classes of the same affiliated Underlying Funds may occur. If an Underlying Funds changes its name, the name presented below is the name in effect at period end.
| Affiliate | Value, beginning of period ($) | Purchases ($) | Sales Proceeds ($) | Dividend Income ($) | Realized Gain (loss) ($) | Change in Unrealized appreciation (depreciation) ($) | Value, end of period ($) |
| Fidelity Investments Money Market Government Portfolio Class I 4.51% | - | 4,000,000 | 4,000,000 | - | - | - | - |
| Fidelity Investments Money Market Government Portfolio Institutional Class 4.55% | 112,099,976 | 371,244,832 | 430,198,323 | 2,819,718 | - | - | 53,146,485 |
| Fidelity SAI Alternative Risk Premia Commodity Strategy Fund | 122,133,571 | 2,110,488 | 40,000,000 | 2,110,488 | (1,785,714) | (2,220,821) | 80,237,524 |
| Fidelity SAI Alternative Risk Premia Strategy Fund | 39,495,555 | - | - | - | - | (79,388) | 39,416,167 |
| Fidelity SAI Convertible Arbitrage Fund | 232,097,672 | 75,000,000 | - | - | - | 15,162,524 | 322,260,196 |
| | 505,826,774 | 452,355,320 | 474,198,323 | 4,930,206 | (1,785,714) | 12,862,315 | 495,060,372 |
Amounts in the dividend income column in the above table include any capital gain distributions from underlying funds, which are presented in the corresponding line item in the Consolidated Statement of Operations, if applicable.
Amounts included in the purchases and sales proceeds columns may include in-kind transactions, if applicable.
Investment Valuation
The following is a summary of the inputs used, as of November 30, 2024, involving the Fund's assets and liabilities carried at fair value. The inputs or methodology used for valuing securities may not be an indication of the risk associated with investing in those securities. For more information on valuation inputs, and their aggregation into the levels used below, please refer to the Investment Valuation section in the accompanying Notes to Consolidated Financial Statements.
| Valuation Inputs at Reporting Date: |
| Description | Total ($) | Level 1 ($) | Level 2 ($) | Level 3 ($) |
Investments in Securities: | | | | |
|
| Corporate Bonds | 25,911,061 | - | 25,911,061 | - |
|
| U.S. Government and Government Agency Obligations | 5,641,393 | - | 5,641,393 | - |
|
| U.S. Government Agency - Mortgage Securities | 6,052,876 | - | 6,052,876 | - |
|
| Asset-Backed Securities | 14,833,748 | - | 14,833,748 | - |
|
| Collateralized Mortgage Obligations | 2,880,704 | - | 2,880,704 | - |
|
| Foreign Government and Government Agency Obligations | 1,079,080 | - | 1,079,080 | - |
|
| Certificates of Deposit | 1,306,143 | - | 1,306,143 | - |
|
| Alternative Funds | 1,937,830,826 | 1,937,830,826 | - | - |
|
| Money Market Funds | 175,753,933 | 175,753,933 | - | - |
|
| Repurchase Agreements | 29,700,000 | - | 29,700,000 | - |
|
| Purchased Options | 1,125,410 | 1,125,410 | - | - |
| Total Investments in Securities: | 2,202,115,174 | 2,114,710,169 | 87,405,005 | - |
Derivative Instruments: Assets | | | | |
Futures Contracts | 17,795,944 | 17,795,944 | - | - |
Forward Foreign Currency Contracts | 8,659,272 | - | 8,659,272 | - |
Swaps | 19,997,574 | - | 19,997,574 | - |
| Total Assets | 46,452,790 | 17,795,944 | 28,656,846 | - |
| Liabilities | | | | |
Futures Contracts | (8,167,122) | (8,167,122) | - | - |
Forward Foreign Currency Contracts | (5,888,266) | - | (5,888,266) | - |
Swaps | (16,717,660) | - | (16,717,660) | - |
| Total Liabilities | (30,773,048) | (8,167,122) | (22,605,926) | - |
| Total Derivative Instruments: | 15,679,742 | 9,628,822 | 6,050,920 | - |
Other Financial Instruments: | | | | |
| TBA Sale Commitments | (27,614,801) | - | (27,614,801) | - |
| Total Other Financial Instruments: | (27,614,801) | - | (27,614,801) | - |
Value of Derivative Instruments
The following table is a summary of the Fund's value of derivative instruments by primary risk exposure as of November 30, 2024. For additional information on derivative instruments, please refer to the Derivative Instruments section in the accompanying Notes to Consolidated Financial Statements.
Primary Risk Exposure / Derivative Type | Value |
| Asset ($) | Liability ($) |
| Commodity Risk | | |
Futures Contracts (a) | 3,468,756 | (1,467,786) |
| Total Commodity Risk | 3,468,756 | (1,467,786) |
| Credit Risk | | |
Swaps (b)(c) | 7,241,781 | (45,857) |
| Total Credit Risk | 7,241,781 | (45,857) |
| Equity Risk | | |
Futures Contracts (a) | 6,114,256 | (3,892,948) |
Purchased Options (d) | 1,125,410 | 0 |
Swaps (c) | 166,409 | (25,104) |
| Total Equity Risk | 7,406,075 | (3,918,052) |
| Foreign Exchange Risk | | |
Futures Contracts (a) | 4,904,909 | (1,467,078) |
Forward Foreign Currency Contracts (e) | 8,659,272 | (5,888,266) |
| Total Foreign Exchange Risk | 13,564,181 | (7,355,344) |
| Interest Rate Risk | | |
Futures Contracts (a) | 3,308,023 | (1,339,310) |
Swaps (b)(c) | 12,589,384 | (16,646,699) |
| Total Interest Rate Risk | 15,897,407 | (17,986,009) |
| Total Value of Derivatives | 47,578,200 | (30,773,048) |
(a)Reflects gross cumulative appreciation (depreciation) on futures contracts as presented in the Consolidated Schedule of Investments. In the Consolidated Statement of Assets and Liabilities, the period end daily variation margin is included in receivable or payable for daily variation margin on futures contracts, and the net cumulative appreciation (depreciation) is included in Total accumulated earnings (loss).
(b)For centrally cleared swaps, reflects gross cumulative appreciation (depreciation) as presented in the Consolidated Schedule of Investments. In the Consolidated Statement of Assets and Liabilities, the period end daily variation margin for centrally cleared swaps is included in receivable or payable for daily variation margin on centrally cleared swaps, and the net cumulative appreciation (depreciation) for centrally cleared swaps is included in Total accumulated earnings (loss).
(c)For bi-lateral over-the-counter (OTC) swaps, reflects gross value which is presented in the Consolidated Statement of Assets and Liabilities in the bi-lateral OTC swaps, at value line-items.
(d)Gross value is presented in the Consolidated Statement of Assets and Liabilities in the Investments in Securities at value line-item.
(e)Gross value is presented in the Consolidated Statement of Assets and Liabilities in the unrealized appreciation/depreciation on forward foreign currency contracts line-items.
Consolidated Financial Statements (Unaudited)
| Consolidated Statement of Assets and Liabilities |
| As of November 30, 2024 (Unaudited) |
| Assets | | | | |
| Investment in securities, at value (including repurchase agreements of $29,700,000) - See accompanying schedule: | | | | |
Unaffiliated issuers (cost $1,634,772,862) | $ | 1,705,106,591 | | |
Fidelity Central Funds (cost $1,948,211) | | 1,948,211 | | |
Other affiliated issuers (cost $480,936,685) | | 495,060,372 | | |
| | | | | |
| | | | | |
| Total Investment in Securities (cost $2,117,657,758) | | | $ | 2,202,115,174 |
| Segregated cash with brokers for derivative instruments | | | | 48,434,859 |
| Restricted cash | | | | 2,188,808 |
| Foreign currency held at value (cost $1,771,775) | | | | 1,778,768 |
| Receivable for investments sold | | | | |
Regular delivery | | | | 1,008,124 |
Delayed delivery | | | | 5,638,617 |
| Receivable for TBA sale commitments | | | | 27,554,641 |
| Unrealized appreciation on forward foreign currency contracts | | | | 8,659,272 |
| Receivable for fund shares sold | | | | 1,066,008 |
| Interest receivable | | | | 652,502 |
| Distributions receivable from Fidelity Central Funds | | | | 8,393 |
| Receivable for daily variation margin on futures contracts | | | | 2,902,061 |
| Bi-lateral OTC swaps, at value | | | | 6,929,883 |
| Prepaid expenses | | | | 1,548 |
| Other receivables | | | | 52,574 |
Total assets | | | | 2,308,991,232 |
| Liabilities | | | | |
| Payable to custodian bank | $ | 3,842,565 | | |
| Segregated cash from brokers for derivative instruments | | 3,816,000 | | |
| Payable for investments purchased | | | | |
Regular delivery | | 15,071,790 | | |
Delayed delivery | | 11,668,156 | | |
| TBA sale commitments, at value | | 27,614,801 | | |
| Unrealized depreciation on forward foreign currency contracts | | 5,888,266 | | |
| Payable for fund shares redeemed | | 2,066,722 | | |
| Bi-lateral OTC swaps, at value | | 74,600 | | |
| Accrued management fee | | 263,852 | | |
| Payable for daily variation margin on centrally cleared swaps | | 53,476 | | |
| Other payables and accrued expenses | | 129,705 | | |
| Total liabilities | | | | 70,489,933 |
| Net Assets | | | $ | 2,238,501,299 |
| Net Assets consist of: | | | | |
| Paid in capital | | | $ | 2,242,814,022 |
| Total accumulated earnings (loss) | | | | (4,312,723) |
| Net Assets | | | $ | 2,238,501,299 |
Net Asset Value, offering price and redemption price per share ($2,238,501,299 ÷ 225,175,528 shares) | | | $ | 9.94 |
| Consolidated Statement of Operations |
Six months ended November 30, 2024 (Unaudited) |
| Investment Income | | | | |
| Dividends: | | | | |
| Unaffiliated issuers | | | $ | 12,423,999 |
| Affiliated issuers | | | | 4,930,206 |
| Interest | | | | 4,500,784 |
| Income from Fidelity Central Funds | | | | 91,985 |
| Total income | | | | 21,946,974 |
| Expenses | | | | |
| Management fee | $ | 4,239,751 | | |
| Custodian fees and expenses | | 19,809 | | |
| Independent trustees' fees and expenses | | 5,714 | | |
| Registration fees | | 80,208 | | |
| Audit fees | | 60,298 | | |
| Subsidiary directors' fees | | 10,496 | | |
| Legal | | 21,726 | | |
| Interest | | 153 | | |
| Miscellaneous | | 4,163 | | |
| Total expenses before reductions | | 4,442,318 | | |
| Expense reductions | | (2,918,351) | | |
| Total expenses after reductions | | | | 1,523,967 |
| Net Investment income (loss) | | | | 20,423,007 |
| Realized and Unrealized Gain (Loss) | | | | |
| Net realized gain (loss) on: | | | | |
| Investment Securities: | | | | |
| Unaffiliated issuers | | (16,454,807) | | |
| Affiliated issuers | | (1,785,714) | | |
| Forward foreign currency contracts | | (6,216,043) | | |
| Foreign currency transactions | | (264,499) | | |
| Futures contracts | | (4,736,453) | | |
| Swaps | | (1,060,286) | | |
| Total net realized gain (loss) | | | | (30,517,802) |
| Change in net unrealized appreciation (depreciation) on: | | | | |
| Investment Securities: | | | | |
| Unaffiliated issuers | | 40,795,037 | | |
| Affiliated issuers | | 12,862,315 | | |
| Forward foreign currency contracts | | 3,284,001 | | |
| Assets and liabilities in foreign currencies | | 98,298 | | |
| Futures contracts | | 8,315,186 | | |
| Swaps | | (2,004,631) | | |
| TBA Sale commitments | | (26,176) | | |
| Total change in net unrealized appreciation (depreciation) | | | | 63,324,030 |
| Net gain (loss) | | | | 32,806,228 |
| Net increase (decrease) in net assets resulting from operations | | | $ | 53,229,235 |
| Consolidated Statement of Changes in Net Assets |
| |
| | Six months ended November 30, 2024 (Unaudited) | | Year ended May 31, 2024 |
| Increase (Decrease) in Net Assets | | | | |
| Operations | | | | |
| Net investment income (loss) | $ | 20,423,007 | $ | 70,005,324 |
| Net realized gain (loss) | | (30,517,802) | | (64,534,726) |
| Change in net unrealized appreciation (depreciation) | | 63,324,030 | | 109,701,718 |
| Net increase (decrease) in net assets resulting from operations | | 53,229,235 | | 115,172,316 |
| Distributions to shareholders | | - | | (81,454,739) |
| | | | | |
| Share transactions | | | | |
| Proceeds from sales of shares | | 261,365,113 | | 1,130,961,331 |
| Reinvestment of distributions | | - | | 80,897,291 |
| Cost of shares redeemed | | (496,773,522) | | (1,203,347,842) |
| | | | | |
Net increase (decrease) in net assets resulting from share transactions | | (235,408,409) | | 8,510,780 |
| Total increase (decrease) in net assets | | (182,179,174) | | 42,228,357 |
| | | | | |
| Net Assets | | | | |
| Beginning of period | | 2,420,680,473 | | 2,378,452,116 |
| End of period | $ | 2,238,501,299 | $ | 2,420,680,473 |
| | | | | |
| Other Information | | | | |
| Shares | | | | |
| Sold | | 26,725,607 | | 116,686,401 |
| Issued in reinvestment of distributions | | - | | 8,549,062 |
| Redeemed | | (50,687,635) | | (124,570,257) |
| Net increase (decrease) | | (23,962,028) | | 665,206 |
| | | | | |
Consolidated Financial Highlights
Strategic Advisers® Alternatives Fund |
| |
| | Six months ended (Unaudited) November 30, 2024 | | Years ended May 31, 2024 | | 2023 A |
Selected Per-Share Data | | | | | | |
| Net asset value, beginning of period | $ | 9.72 | $ | 9.57 | $ | 10.00 |
| Income from Investment Operations | | | | | | |
Net investment income (loss) B,C | | .09 | | .30 | | .40 |
| Net realized and unrealized gain (loss) | | .13 | | .22 | | (.41) |
| Total from investment operations | | .22 | | .52 | | (.01) |
| Distributions from net investment income | | - | | (.34) | | (.29) |
| Distributions from net realized gain | | - | | (.03) | | (.14) |
| Total distributions | | - | | (.37) | | (.42) D |
| Net asset value, end of period | $ | 9.94 | $ | 9.72 | $ | 9.57 |
Total Return E,F | | | | 5.58% | | (.11)% |
Ratios to Average Net Assets C,G,H | | | | | | |
| Expenses before reductions | | .38% I | | .36% | | .33% I,J |
| Expenses net of fee waivers, if any | | | | .11% | | .08% I,J |
| Expenses net of all reductions | | .13% I | | .11% | | .08% I,J |
| Net investment income (loss) | | 1.75% I | | 3.12% | | 4.62% I |
| Supplemental Data | | | | | | |
| Net assets, end of period (000 omitted) | $ | 2,238,501 | $ | 2,420,680 | $ | 2,378,452 |
Portfolio turnover rate K | | | | 106% | | 64% I |
AFor the period July 12, 2022 (commencement of operations) through May 31, 2023.
BCalculated based on average shares outstanding during the period.
CNet investment income (loss) is affected by the timing of the declaration of dividends by any underlying mutual funds or exchange-traded funds (ETFs). Net investment income (loss) of any mutual funds or ETFs is not included in the Fund's net investment income (loss) ratio.
DTotal distributions per share do not sum due to rounding.
ETotal returns for periods of less than one year are not annualized.
FTotal returns would have been lower if certain expenses had not been reduced during the applicable periods shown.
GFees and expenses of any underlying mutual funds or exchange-traded funds (ETFs) are not included in the Fund's expense ratio. The Fund indirectly bears its proportionate share of these expenses. For additional expense information related to investments in Fidelity Central Funds, please refer to the "Investments in Fidelity Central Funds" note found in the Notes to Consolidated Financial Statements section of the most recent Annual or Semi-Annual report.
HExpense ratios reflect operating expenses of the class. Expenses before reductions do not reflect amounts reimbursed, waived, or reduced through arrangements with the investment adviser, brokerage services, or other offset arrangements, if applicable, and do not represent the amount paid by the class during periods when reimbursements, waivers or reductions occur.
IAnnualized.
JAudit fees are not annualized.
KAmount does not include the portfolio activity of any underlying mutual funds or exchange-traded funds (ETFs), derivatives or securities that mature within one year from acquisition.
Notes to Consolidated Financial Statements
(Unaudited)For the period ended November 30, 2024
1. Organization.
Strategic Advisers Alternatives Fund (the Fund) is a non-diversified fund of Fidelity Rutland Square Trust II (the Trust), and is authorized to issue an unlimited number of shares. The Trust is registered under the Investment Company Act of 1940, as amended (the 1940 Act), as an open-end management investment company organized as a Delaware statutory trust. The Fund is offered exclusively to certain managed account clients of Strategic Advisers LLC (Strategic Advisers), an affiliate of Fidelity Management & Research Company LLC (FMR).
2. Consolidated Subsidiary.
The Funds included in the table below hold certain commodity-related investments through a wholly owned subsidiary (the "Subsidiary"). As of period end, the investments in the Subsidiaries, were as follows:
| | Subsidiary Name | Net Assets of Subsidiary | % of Fund's Net Assets |
| Strategic Advisers Alternatives Fund | Strategic Advisers Alternatives Fund Cayman Ltd. | 7,320,617 | .3 |
| Strategic Advisers Alternatives Fund | Strategic Advisers Alternatives Fund Cayman Ltd. 2 | 10,943,039 | .5 |
The financial statements have been consolidated to include the Subsidiary accounts where applicable. Accordingly, all inter-company transactions and balances have been eliminated.
3. Significant Accounting Policies.
The Fund is an investment company and applies the accounting and reporting guidance of the Financial Accounting Standards Board (FASB) Accounting Standards Codification Topic 946 Financial Services - Investment Companies. The consolidated financial statements have been prepared in conformity with accounting principles generally accepted in the United States of America (GAAP), which require management to make certain estimates and assumptions at the date of the consolidated financial statements. Actual results could differ from those estimates. Subsequent events, if any, through the date that the consolidated financial statements were issued have been evaluated in the preparation of the consolidated financial statements. The Fund's Consolidated Schedule of Investments lists any underlying mutual funds or exchange-traded funds (ETFs) but does not include the underlying holdings of these funds. The following summarizes the significant accounting policies of the Fund:
Investment Valuation. Investments are valued as of 4:00 p.m. Eastern time on the last calendar day of the period. The Board of Trustees (the Board) has designated the Fund's investment adviser as the valuation designee responsible for the fair valuation function and performing fair value determinations as needed. The investment adviser has established a Fair Value Committee (the Committee) to carry out the day-to-day fair valuation responsibilities and has adopted policies and procedures to govern the fair valuation process and the activities of the Committee. In accordance with these fair valuation policies and procedures, which have been approved by the Board, the Fund attempts to obtain prices from one or more third party pricing services or brokers to value its investments. When current market prices, quotations or currency exchange rates are not readily available or reliable, investments will be fair valued in good faith by the Committee, in accordance with the policies and procedures. Factors used in determining fair value vary by investment type and may include market or investment specific events, transaction data, estimated cash flows, and market observations of comparable investments. The frequency that the fair valuation procedures are used cannot be predicted and they may be utilized to a significant extent. The Committee manages the Fund's fair valuation practices and maintains the fair valuation policies and procedures. The Fund's investment adviser reports to the Board information regarding the fair valuation process and related material matters.
The Fund categorizes the inputs to valuation techniques used to value its investments into a disclosure hierarchy consisting of three levels as shown below:
Level 1 - unadjusted quoted prices in active markets for identical investments
Level 2 - other significant observable inputs (including quoted prices for similar investments, interest rates, prepayment speeds, etc.)
Level 3 - unobservable inputs (including the Fund's own assumptions based on the best information available)
Valuation techniques used to value the Fund's investments by major category are as follows:
Equity securities, including restricted securities, for which market quotations are readily available, are valued at the last reported sale price or official closing price as reported by a third party pricing service on the primary market or exchange on which they are traded and are categorized as Level 1 in the hierarchy. In the event there were no sales during the day or closing prices are not available, securities are valued at the last quoted bid price or may be valued using the last available price and are generally categorized as Level 2 in the hierarchy. For foreign equity securities, when market or security specific events arise, comparisons to the valuation of American Depositary Receipts (ADRs), futures contracts, Exchange-Traded Funds (ETFs) and certain indexes as well as quoted prices for similar securities may be used and would be categorized as Level 2 in the hierarchy. For equity securities, including restricted securities, where observable inputs are limited, assumptions about market activity and risk are used and these securities may be categorized as Level 3 in the hierarchy.
Debt securities, including restricted securities, are valued based on evaluated prices received from third party pricing services or from brokers who make markets in such securities. Corporate bonds, foreign government and government agency obligations, U.S. government and government agency obligations, and certificates of deposit are valued by pricing services who utilize matrix pricing which considers yield or price of bonds of comparable quality, coupon, maturity and type or by broker-supplied prices. Asset backed securities, collateralized mortgage obligations, and U.S. government agency mortgage securities are valued by pricing services who utilize matrix pricing which considers prepayment speed assumptions, attributes of the collateral, yield or price of bonds of comparable quality, coupon, maturity and type or by broker-supplied prices. Swaps are marked-to-market daily based on valuations from third party pricing services, registered derivatives clearing organizations (clearinghouses) or broker-supplied valuations. These pricing sources may utilize inputs such as interest rate curves, credit spread curves, default possibilities and recovery rates. When independent prices are unavailable or unreliable, debt securities and swaps may be valued utilizing pricing methodologies which consider similar factors that would be used by third party pricing services. Debt securities and swaps are generally categorized as Level 2 in the hierarchy but may be Level 3 depending on the circumstances.
The U.S. dollar value of forward foreign currency contracts is determined using currency exchange rates supplied by a pricing service and are categorized as Level 2 in the hierarchy. Futures contracts are valued at the settlement price established each day by the board of trade or exchange on which they are traded and are categorized as Level 1 in the hierarchy. Exchange-traded options are valued using the last sale price or, in the absence of a sale, the last offering price and are categorized as Level 1 in the hierarchy. Investments in commodities are valued at their last traded price at 4:00 p.m. Eastern time each business day and are categorized as Level 1 in the hierarchy. Investments in open-end mutual funds, including the Fidelity Central Funds, are valued at their closing net asset value (NAV) each business day and are categorized as Level 1 in the hierarchy. If an unaffiliated open-end mutual fund's NAV is unavailable, shares of that fund may be valued by another method that the Board believes reflects fair value in accordance with the Board's fair value pricing policies and is categorized as Level 2 in the hierarchy. Short-term securities with remaining maturities of sixty days or less may be valued at amortized cost, which approximates fair value, and are categorized as Level 2 in the hierarchy.
Changes in valuation techniques may result in transfers in or out of an assigned level within the disclosure hierarchy. The aggregate value of investments by input level as of November 30, 2024 is included at the end of the Fund's Consolidated Schedule of Investments.
Foreign Currency. Certain Funds may use foreign currency contracts to facilitate transactions in foreign-denominated securities. Gains and losses from these transactions may arise from changes in the value of the foreign currency or if the counterparties do not perform under the contracts' terms.
Foreign-denominated assets, including investment securities, and liabilities are translated into U.S. dollars at the exchange rates at period end. Purchases and sales of investment securities, income and dividends received, and expenses denominated in foreign currencies are translated into U.S. dollars at the exchange rate in effect on the transaction date.
The effects of exchange rate fluctuations on investments are included with the net realized and unrealized gain (loss) on investment securities. Other foreign currency transactions resulting in realized and unrealized gain (loss) are disclosed separately.
Investment Transactions and Income. For financial reporting purposes, the Fund's investment holdings and NAV include trades executed through the end of the last business day of the period. The NAV per share for processing shareholder transactions is calculated as of the close of business of the New York Stock Exchange (NYSE), normally 4:00 p.m. Eastern time and includes trades executed through the end of the prior business day. Gains and losses on securities sold are determined on the basis of identified cost. Commissions paid to certain brokers with whom the investment adviser, or its affiliates, places trades on behalf of a fund include an amount in addition to trade execution, which may be rebated back to a fund. Any such rebates are included in net realized gain (loss) on investments in the Consolidated Statement of Operations. Dividend income is recorded on the ex-dividend date, except for certain dividends from foreign securities where the ex-dividend date may have passed, which are recorded as soon as the Fund is informed of the ex-dividend date. Non-cash dividends included in dividend income, if any, are recorded at the fair market value of the securities received. Income and capital gain distributions from Fidelity Central Funds, if any, are recorded on the ex-dividend date. Certain distributions received by the Fund represent a return of capital or capital gain. The Fund determines the components of these distributions subsequent to the ex-dividend date, based upon receipt of tax filings or other correspondence relating to the underlying investment. These distributions are recorded as a reduction of cost of investments and/or as a realized gain. Interest income is accrued as earned and includes coupon interest and amortization of premium and accretion of discount on debt securities as applicable. Investment income is recorded net of foreign taxes withheld where recovery of such taxes is uncertain.
Expenses. Expenses directly attributable to a fund are charged to that fund. Expenses attributable to more than one fund are allocated among the respective funds on the basis of relative net assets or other appropriate methods. Expenses included in the accompanying consolidated financial statements reflect the expenses of that fund and do not include any expenses associated with any underlying mutual funds or exchange-traded funds. Although not included in a fund's expenses, a fund indirectly bears its proportionate share of these expenses through the net asset value of each underlying mutual fund or exchange-traded fund. Expense estimates are accrued in the period to which they relate and adjustments are made when actual amounts are known.
Deferred Trustee Compensation. Under a Deferred Compensation Plan (the Plan) for certain Funds, certain independent Trustees have elected to defer receipt of a portion of their annual compensation. Deferred amounts are invested in affiliated mutual funds, are marked-to-market and remain in a fund until distributed in accordance with the Plan. The investment of deferred amounts and the offsetting payable to the Trustees presented below are included in the accompanying Consolidated Statement of Assets and Liabilities in other receivables and other payables and accrued expenses, as applicable.
| Strategic Advisers Alternatives Fund | $1,268 |
Income Tax Information and Distributions to Shareholders. Each year, the Fund intends to qualify as a regulated investment company under Subchapter M of the Internal Revenue Code, including distributing substantially all of its taxable income and realized gains. As a result, no provision for U.S. Federal income taxes is required. The Fund files a U.S. federal tax return, in addition to state and local tax returns as required. The Fund's federal income tax returns are subject to examination by the Internal Revenue Service (IRS) for a period of three fiscal years after they are filed. State and local tax returns may be subject to examination for an additional fiscal year depending on the jurisdiction. Foreign taxes are provided for based on the Fund's understanding of the tax rules and rates that exist in the foreign markets in which it invests.
The Subsidiary is classified as a controlled foreign corporation under Subchapter N of the Internal Revenue Code. Therefore, the Fund is required to increase its taxable income by its share of the Subsidiary's income. Net investment losses of the Subsidiary cannot be deducted by the Fund in the current period nor carried forward to offset taxable income in future periods.
Distributions are declared and recorded on the ex-dividend date. Income and capital gain distributions are determined in accordance with income tax regulations, which may differ from GAAP.
Capital accounts within the consolidated financial statements are adjusted for permanent book-tax differences. These adjustments have no impact on net assets or the results of operations. Capital accounts are not adjusted for temporary book-tax differences which will reverse in a subsequent period.
Book-tax differences are primarily due to the short-term gain distributions from the underlying funds, swaps, futures and options transactions, market discount, controlled foreign corporations, capital loss carryforwards and losses deferred due to wash sales, futures transactions and excise tax regulations.
As of period end, the cost and unrealized appreciation (depreciation) in securities, and derivatives if applicable, for federal income tax purposes were as follows:
| Gross unrealized appreciation | $155,434,322 |
| Gross unrealized depreciation | (61,282,523) |
| Net unrealized appreciation (depreciation) | $94,151,799 |
| Tax cost | $2,117,769,681 |
Capital loss carryforwards are only available to offset future capital gains of the Fund to the extent provided by regulations and may be limited. The capital loss carryforward information presented below, including any applicable limitation, is estimated as of prior fiscal period end and is subject to adjustment.
| Short-term | $(56,360,112) |
| Long-term | (30,570,156) |
| Total capital loss carryforward | $(86,930,268) |
The Fund elected to defer to its next fiscal year approximately $2,467,704 of ordinary losses recognized during the period January 1, 2024 to May 31, 2024.
Repurchase Agreements. Pursuant to an Exemptive Order issued by the Securities and Exchange Commission, funds and other registered investment companies having management contracts with Fidelity Management and Research Company LLC, or its affiliates are permitted to transfer uninvested cash balances into joint trading accounts which are then invested in repurchase agreements. Funds may also invest directly with institutions in repurchase agreements. Repurchase agreements may be collateralized by government or non-government securities. Upon settlement date, collateral is held in segregated accounts with custodian banks and may be obtained in the event of a default of the counterparty. The collateral balance is monitored on a daily basis to ensure it is at least equal to the principal amount of the repurchase agreement (including accrued interest). In the event of a default by the counterparty, realization of the collateral proceeds could be delayed, during which time the value of the collateral may decline.
Reverse Repurchase Agreements. To enhance their yield, funds may enter into reverse repurchase transactions under master repurchase agreements whereby a fund delivers securities to a counterparty in return for cash and agrees to repurchase those securities at a future date and agreed upon price. During the period that reverse repurchase transactions are outstanding, a fund identifies the securities as pledged in its records with an initial value at least equal to its principal obligation under the agreement. The cash proceeds received by a fund may be invested in other securities. To the extent cash proceeds received from the counterparty exceed the value of the securities delivered, the counterparty may request additional collateral from a fund. If the counterparty defaults on its obligation, because of insolvency or other reasons, a fund could experience delays and costs in recovering the securities delivered. If a fund has any open reverse repurchase agreements at period end, information regarding securities delivered under a reverse repurchase agreement is included at the end of the Consolidated Schedule of Investments, and the cash proceeds are recorded as a liability in the Consolidated Statement of Assets and Liabilities. A fund continues to receive interest and dividend payments on the securities delivered during the term of the reverse repurchase agreement. During the period, the average principal balance of reverse repurchase transactions and the weighted average interest rate with payments included in the Consolidated Statement of Operations as a component of interest expense is as follows:
| | Average Loan Balance ($) | Weighted Average Interest Rate |
| Strategic Advisers Alternatives Fund | 1,007,500 | 5.45 |
Delayed Delivery Transactions and When-Issued Securities. During the period, certain Funds transacted in securities on a delayed delivery or when-issued basis. Payment and delivery may take place after the customary settlement period for that security. The price of the underlying securities and the date when the securities will be delivered and paid for are fixed at the time the transaction is negotiated. Securities purchased on a delayed delivery or when-issued basis are identified as such in the Consolidated Schedule of Investments. Compensation for interest forgone in the purchase of a delayed delivery or when-issued debt security may be received. With respect to purchase commitments, each applicable Fund identifies securities as segregated in its records with a value at least equal to the amount of the commitment. Payables and receivables associated with the purchases and sales of delayed delivery securities having the same coupon, settlement date and broker are offset. Delayed delivery or when-issued securities that have been purchased from and sold to different brokers are reflected as both payables and receivables in the Consolidated Statement of Assets and Liabilities under the caption "Delayed delivery", as applicable. Losses may arise due to changes in the value of the underlying securities or if the counterparty does not perform under the contract's terms, or if the issuer does not issue the securities due to political, economic, or other factors.
To-Be-Announced (TBA) Securities and Mortgage Dollar Rolls. TBA securities involve buying or selling mortgage-backed securities (MBS) on a forward commitment basis. A TBA transaction typically does not designate the actual security to be delivered and only includes an approximate principal amount; however delivered securities must meet specified terms defined by industry guidelines, including issuer, rate and current principal amount outstanding on underlying mortgage pools. Funds may enter into a TBA transaction with the intent to take possession of or deliver the underlying MBS, or a fund may elect to extend the settlement by entering into either a mortgage or reverse mortgage dollar roll. Mortgage dollar rolls are transactions where a fund sells TBA securities and simultaneously agrees to repurchase MBS on a later date at a lower price and with the same counterparty. Reverse mortgage dollar rolls involve the purchase and simultaneous agreement to sell TBA securities on a later date at a lower price. Transactions in mortgage dollar rolls and reverse mortgage dollar rolls are accounted for as purchases and sales and may result in an increase to a fund's portfolio turnover rate.
Purchases and sales of TBA securities involve risks similar to those discussed above for delayed delivery and when-issued securities. Also, if the counterparty in a mortgage dollar roll or a reverse mortgage dollar roll transaction files for bankruptcy or becomes insolvent, a fund's right to repurchase or sell securities may be limited. Additionally, when a fund sells TBA securities without already owning or having the right to obtain the deliverable securities (an uncovered forward commitment to sell), it incurs a risk of loss because it could have to purchase the securities at a price that is higher than the price at which it sold them. A fund may be unable to purchase the deliverable securities if the corresponding market is illiquid.
TBA securities subject to a forward commitment to sell at period end are included at the end of the Consolidated Schedule of Investments under the caption "TBA Sale Commitments." The value of these commitments and proceeds to be received at contractual settlement date are reflected in the Consolidated Statement of Assets and Liabilities as "TBA sale commitments, at value" and "Receivable for TBA sale commitments," respectively. If the TBA sale commitment is closed through the acquisition of an offsetting TBA purchase commitment, a fund realizes a gain or loss. If a fund delivers securities under the commitment, a fund realizes a gain or loss from the sale of the securities based upon the price established at the date the commitment was entered into.
Restricted Securities (including Private Placements). Funds may invest in securities that are subject to legal or contractual restrictions on resale. These securities generally may be resold in transactions exempt from registration or to the public if the securities are registered. Disposal of these securities may involve time-consuming negotiations and expense, and prompt sale at an acceptable price may be difficult. Information regarding restricted securities held at period end is included at the end of the Consolidated Schedule of Investments, if applicable.
New Accounting Pronouncement. In November 2023, the FASB issued Accounting Standards Update (ASU) 2023-07 Segment Reporting (Topic 280): Improvements to Reportable Segment Disclosures. Effective for fiscal years beginning after December 15, 2023 and interim periods within fiscal years beginning after December 15, 2024, the amendments enhance required disclosures of segment information for public entities on an annual and interim basis. The ASU allows for early adoption with updates applied retrospectively. Management is currently evaluating the impact of the ASU but does not expect this guidance to materially impact the consolidated financial statements.
4. Derivative Instruments.
Risk Exposures and the Use of Derivative Instruments. The Fund's investment objectives allow for various types of derivative instruments, including futures contracts, forward foreign currency contracts, options and swaps. Derivatives are investments whose value is primarily derived from underlying assets, indices or reference rates and may be transacted on an exchange or over-the-counter (OTC). Derivatives may involve a future commitment to buy or sell a specified asset based on specified terms, to exchange future cash flows at periodic intervals based on a notional principal amount, or for one party to make one or more payments upon the occurrence of specified events in exchange for periodic payments from the other party.
Derivatives were used to increase returns, to gain exposure to certain types of assets, to facilitate transactions in foreign-denominated securities and to manage exposure to certain risks as defined below. The success of any strategy involving derivatives depends on analysis of numerous economic factors, and if the strategies for investment do not work as intended, the objectives may not be achieved.
Derivatives were used to increase or decrease exposure to the following risk(s):
| | |
| Commodity Risk | Commodity risk is the risk that the value of a commodity will fluctuate as a result of changes in market prices. |
| Credit Risk | Credit risk relates to the ability of the issuer of a financial instrument to make further principal or interest payments on an obligation or commitment that it has to a fund. |
| Equity Risk | Equity risk relates to the fluctuations in the value of financial instruments as a result of changes in market prices (other than those arising from interest rate risk or foreign exchange risk), whether caused by factors specific to an individual investment, its issuer, or all factors affecting all instruments traded in a market or market segment. |
| Foreign Exchange Risk | Foreign exchange rate risk relates to fluctuations in the value of an asset or liability due to changes in currency exchange rates. |
| Interest Rate Risk | Interest rate risk relates to the fluctuations in the value of interest-bearing securities due to changes in the prevailing levels of market interest rates. |
Funds are also exposed to additional risks from investing in derivatives, such as liquidity risk and counterparty credit risk. Liquidity risk is the risk that a fund will be unable to close out the derivative in the open market in a timely manner. Counterparty credit risk is the risk that the counterparty will not be able to fulfill its obligation to a fund. Derivative counterparty credit risk is managed through formal evaluation of the creditworthiness of all potential counterparties. On certain OTC derivatives such as forward foreign currency contracts and bi-lateral swaps, a fund attempts to reduce its exposure to counterparty credit risk by entering into an International Swaps and Derivatives Association, Inc. (ISDA) Master Agreement with each of its counterparties. The ISDA Master Agreement gives a fund the right to terminate all transactions traded under such agreement upon the deterioration in the credit quality of the counterparty beyond specified levels. The ISDA Master Agreement gives each party the right, upon an event of default by the other party or a termination of the agreement, to close out all transactions traded under such agreement and to net amounts owed under each transaction to one net payable by one party to the other. To mitigate counterparty credit risk on bi-lateral OTC derivatives, a fund receives collateral in the form of cash or securities once net unrealized appreciation on outstanding derivative contracts under an ISDA Master Agreement exceeds certain applicable thresholds, subject to certain minimum transfer provisions. The collateral received is held in segregated accounts with the custodian bank in accordance with the collateral agreements entered into between a fund, the counterparty and the custodian bank. A fund could experience delays and costs in gaining access to the collateral even though it is held by the custodian bank. The maximum risk of loss to a fund from counterparty credit risk related to bi-lateral OTC derivatives is generally the aggregate unrealized appreciation and unpaid counterparty payments in excess of any collateral pledged by the counterparty to a fund. A fund may be required to pledge collateral for the benefit of the counterparties on bi-lateral OTC derivatives in an amount not less than each counterparty's unrealized appreciation on outstanding derivative contracts, subject to certain minimum transfer provisions, and any such pledged collateral is identified in the Consolidated Schedule of Investments. Exchange-traded contracts are not covered by the ISDA Master Agreement; however counterparty credit risk related to these contracts may be mitigated by the protection provided by the exchange on which they trade. Counterparty credit risk related to centrally cleared swaps may be mitigated by the protection provided by the clearinghouse.
Investing in derivatives may involve greater risks than investing in the underlying assets directly and, to varying degrees, may involve risk of loss in excess of any initial investment and collateral received and amounts recognized in the Consolidated Statement of Assets and Liabilities. In addition, there may be the risk that the change in value of the derivative contract does not correspond to the change in value of the underlying instrument.
Net Realized Gain (Loss) and Change in Net Unrealized Appreciation (Depreciation) on Derivatives. The table below, which reflects the impacts of derivatives on the financial performance, summarizes the net realized gain (loss) and change in net unrealized appreciation (depreciation) for derivatives during the period as presented in the Consolidated Statement of Operations.
| Primary Risk Exposure / Derivative Type | Net Realized Gain (Loss)($) | Change in Net Unrealized Appreciation (Depreciation)($) |
| Strategic Advisers Alternatives Fund | | |
| Commodity Risk | | |
| Futures Contracts | (2,973,805) | 1,048,728 |
| Total Commodity Risk | (2,973,805) | 1,048,728 |
| Credit Risk | | |
| Swaps | (421,201) | 1,014,433 |
| Total Credit Risk | (421,201) | 1,014,433 |
| Equity Risk | | |
| Futures Contracts | 1,658,161 | 2,247,191 |
| Purchased Options | (2,986,513) | 203,268 |
| Swaps | (143,274) | 119,658 |
| Total Equity Risk | (1,471,626) | 2,570,117 |
| Foreign Exchange Risk | | |
| Futures | (3,519,595) | 3,437,831 |
| Forward Foreign Currency Contracts | (6,216,043) | 3,284,001 |
| Total Foreign Exchange Risk | (9,735,638) | 6,721,832 |
| Interest Rate Risk | | |
| Futures Contracts | 98,786 | 1,581,436 |
| Swaps | (495,811) | (3,138,722) |
| Total Interest Rate Risk | (397,025) | (1,557,286) |
| Totals | (14,999,295) | 9,797,824 |
If there are any open positions at period end, a summary of the value of derivatives by primary risk exposure is included at the end of the Consolidated Schedule of Investments.
Forward Foreign Currency Contracts. Forward foreign currency contracts represent obligations to purchase or sell foreign currency on a specified future date at a price fixed at the time the contracts are entered into. Forward foreign currency contracts were used to facilitate transactions in foreign-denominated securities and to manage exposure to certain foreign currencies.
Forward foreign currency contracts are valued daily and fluctuations in exchange rates on open contracts are recorded as unrealized appreciation or (depreciation) and reflected in total accumulated earnings (loss) in the Consolidated Statement of Assets and Liabilities. When the contract is closed, a gain or loss is realized equal to the difference between the closing value and the value at the time it was opened. Non-deliverable forward foreign currency exchange contracts are settled with the counterparty in cash without the delivery of foreign currency. The net realized gain (loss) and change in net unrealized appreciation (depreciation) on forward foreign currency contracts during the period is presented in the Consolidated Statement of Operations.
Any open forward foreign currency contracts at period end are presented in the Consolidated Schedule of Investments under the caption "Forward Foreign Currency Contracts." The contract amount and unrealized appreciation (depreciation) reflects each contract's exposure to the underlying currency at period end, and is representative of volume of activity during the period unless an average contract value is presented.
Futures Contracts. A futures contract is an agreement between two parties to buy or sell a specified underlying instrument for a fixed price at a specified future date. Futures contracts were used to manage exposure to the stock market, commodities market, bond market, fluctuations in interest rates and certain foreign currencies.
Upon entering into a futures contract, a fund is required to deposit either cash or securities (initial margin) with a clearing broker in an amount equal to a certain percentage of the face value of the contract. Futures contracts are marked-to-market daily and subsequent daily payments are made or received by a fund depending on the daily fluctuations in the value of the futures contracts and are recorded as unrealized appreciation or (depreciation). This receivable and/or payable, if any, is included in daily variation margin on futures contracts in the Consolidated Statement of Assets and Liabilities. Realized gain or (loss) is recorded upon the expiration or closing of a futures contract. The net realized gain (loss) and change in net unrealized appreciation (depreciation) on futures contracts during the period is presented in the Consolidated Statement of Operations.
Any open futures contracts at period end are presented in the Consolidated Schedule of Investments under the caption "Futures Contracts". The notional amount at value reflects each contract's exposure to the underlying instrument or index at period end, and is representative of volume of activity during the period unless an average notional amount is presented. Any securities deposited to meet initial margin requirements are identified in the Consolidated Schedule of Investments. Any cash deposited to meet initial margin requirements is presented as segregated cash with brokers for derivative instruments in the Consolidated Statement of Assets and Liabilities.
Options. Options give the purchaser the right, but not the obligation, to buy (call) or sell (put) an underlying security or financial instrument at an agreed exercise or strike price between or on certain dates. Options obligate the seller (writer) to buy (put) or sell (call) an underlying instrument at the exercise or strike price or cash settle an underlying derivative instrument if the holder exercises the option on or before the expiration date. Exchange-traded options were used to manage exposure to the market.
Upon entering into an options contract, a fund will pay or receive a premium. Premiums paid on purchased options are reflected as cost of investments and premiums received on written options are reflected as a liability on the Consolidated Statement of Assets and Liabilities. Certain options may be purchased or written with premiums to be paid or received on a future date. Options are valued daily and any unrealized appreciation (depreciation) is reflected in total accumulated earnings (loss) in the Consolidated Statement of Assets and Liabilities. When an option is exercised, the cost or proceeds of the underlying instrument purchased or sold is adjusted by the amount of the premium. When an option is closed, a gain or loss is realized depending on whether the proceeds or amount paid for the closing sale transaction is greater or less than the premium received or paid. When an option expires, gains and losses are realized to the extent of premiums received and paid, respectively. The net realized and unrealized gains (losses) on purchased options are included in the Consolidated Statement of Operations in net realized gain (loss) and change in net unrealized appreciation (depreciation) on investment securities. The net realized gain (loss) and change in net unrealized appreciation (depreciation) on written options are presented in the Consolidated Statement of Operations.
Any open options at period end are presented in the Consolidated Schedule of Investments under the captions "Purchased Options," "Purchased Swaptions," "Written Options" and "Written Swaptions," as applicable, and are representative of volume of activity during the period unless an average notional amount is presented.
Writing puts and buying calls tend to increase exposure to the underlying instrument while buying puts and writing calls tend to decrease exposure to the underlying instrument. For purchased options, risk of loss is limited to the premium paid, and for written options, risk of loss is the change in value in excess of the premium received.
Swaps. A swap is a contract between two parties to exchange future cash flows at periodic intervals based on a notional principal amount. A bi-lateral OTC swap is a transaction between a fund and a dealer counterparty where cash flows are exchanged between the two parties for the life of the swap. A centrally cleared swap is a transaction executed between a fund and a dealer counterparty, then cleared by a futures commission merchant (FCM) through a clearinghouse. Once cleared, the clearinghouse serves as a central counterparty, with whom a fund exchanges cash flows for the life of the transaction, similar to transactions in futures contracts.
Bi-lateral OTC swaps are marked-to-market daily and changes in value are reflected in the Consolidated Statement of Assets and Liabilities in the bi-lateral OTC swaps at value line items. Any upfront premiums paid or received upon entering a bi-lateral OTC swap to compensate for differences between stated terms of the swap and prevailing market conditions (e.g. credit spreads, interest rates or other factors) are recorded in total accumulated earnings (loss) in the Consolidated Statement of Assets and Liabilities and amortized to realized gain or (loss) ratably over the term of the swap. Any unamortized upfront premiums are presented in the Consolidated Schedule of Investments.
Centrally cleared swaps require a fund to deposit either cash or securities (initial margin) with the FCM, at the instruction of and for the benefit of the clearinghouse. Any securities deposited to meet initial margin requirements are identified in the Consolidated Schedule of Investments. Any cash deposited to meet initial margin requirements is presented in segregated cash with brokers for derivative instruments in the Consolidated Statement of Assets and Liabilities. Centrally cleared swaps are marked-to-market daily and subsequent payments (variation margin) are made or received depending on the daily fluctuations in the value of the swaps and are recorded as unrealized appreciation or (depreciation). These daily payments, if any, are included in receivable or payable for daily variation margin on centrally cleared swaps in the Consolidated Statement of Assets and Liabilities. Any premiums for centrally cleared swaps are recorded periodically throughout the term of the swap to variation margin and included in total accumulated earnings (loss) in the Consolidated Statement of Assets and Liabilities. Any premiums are recognized as realized gain (loss) upon termination or maturity of the swap.
For both bi-lateral and centrally cleared swaps, payments are exchanged at specified intervals, accrued daily commencing with the effective date of the contract and recorded as realized gain or (loss). Some swaps may be terminated prior to the effective date and realize a gain or loss upon termination. The net realized gain (loss) and change in net unrealized appreciation (depreciation) on swaps during the period is presented in the Consolidated Statement of Operations.
Any open swaps at period end are included in the Consolidated Schedule of Investments under the caption "Swaps", and are representative of volume of activity during the period unless an average notional amount is presented.
Credit Default Swaps. Credit default swaps enable a fund to buy or sell protection against specified credit events on a single-name issuer or a traded credit index. Under the terms of a credit default swap the buyer of protection (buyer) receives credit protection in exchange for making periodic payments to the seller of protection (seller) based on a fixed percentage applied to a notional principal amount. In return for these payments, the seller will be required to make a payment upon the occurrence of one or more specified credit events. A fund enters into credit default swaps as a seller to gain credit exposure to an issuer and/or as a buyer to obtain a measure of protection against defaults of an issuer. Periodic payments are made over the life of the contract by the buyer provided that no credit event occurs.
For credit default swaps on most corporate and sovereign issuers, credit events include bankruptcy, failure to pay or repudiation/moratorium. For credit default swaps on corporate or sovereign issuers, the obligation that may be put to the seller is not limited to the specific reference obligation described in the Consolidated Schedule of Investments. For credit default swaps on asset-backed securities, a credit event may be triggered by events such as failure to pay principal, maturity extension, rating downgrade or write-down. For credit default swaps on asset-backed securities, the reference obligation described represents the security that may be put to the seller. For credit default swaps on a traded credit index, a specified credit event may affect all or individual underlying securities included in the index.
As a seller, if an underlying credit event occurs, a fund will pay a net settlement amount of cash equal to the notional amount of the swap less the recovery value of the reference obligation or underlying securities comprising an index. Only in the event of the industry's inability to value the underlying asset will a fund be required to take delivery of the reference obligation or underlying securities comprising an index and pay an amount equal to the notional amount of the swap.
As a buyer, if an underlying credit event occurs, a fund will receive a net settlement amount of cash equal to the notional amount of the swap less the recovery value of the reference obligation or underlying securities comprising an index. Only in the event of the industry's inability to value the underlying asset will a fund be required to deliver the reference obligation or underlying securities comprising an index in exchange for payment of an amount equal to the notional amount of the swap.
Typically, the value of each credit default swap and credit rating disclosed for each reference obligation in the Consolidated Schedule of Investments, where a fund is the seller, can be used as measures of the current payment/performance risk of the swap. As the value of the swap changes as a positive or negative percentage of the total notional amount, the payment/performance risk may decrease or increase, respectively. In addition to these measures, the investment adviser monitors a variety of factors including cash flow assumptions, market activity and market sentiment as part of its ongoing process of assessing payment/performance risk.
Interest Rate Swaps. Interest rate swaps are agreements between counterparties to exchange cash flows, one based on a fixed rate, and the other on a floating rate. A fund enters into interest rate swaps to manage its exposure to interest rate changes. Changes in interest rates can have an effect on both the value of bond holdings as well as the amount of interest income earned. In general, the value of bonds can fall when interest rates rise and can rise when interest rates fall.
Total Return Swaps. Total return swaps are agreements between counterparties to exchange cash flows, one based on a market-linked return of an individual asset or a basket of assets (i.e., an index), and the other on a fixed or floating rate. To the extent the total return of the instrument or index underlying the transaction exceeds or falls short of the offsetting payment obligation, a fund will receive a payment from or make a payment to the counterparty. A fund enters into total return swaps to manage its market exposure.
5. Purchases and Sales of Investments.
Purchases and sales of securities, other than short-term securities, U.S. government securities and in-kind transactions, as applicable, are noted in the table below.
| | Purchases ($) | Sales ($) |
| Strategic Advisers Alternatives Fund | 857,678,155 | 1,210,622,876 |
6. Fees and Other Transactions with Affiliates.
Management Fee. Strategic Advisers (the investment adviser) provides the Fund with investment management related services. For these services, the Fund pays a monthly management fee to the investment adviser. The management fee is calculated by adding the annual management fee rate of .25% of the Fund's average net assets throughout the month to the aggregate of the fee rates, payable monthly by the investment adviser, to the Fund's sub-advisers. The Fund's maximum aggregate management fee will not exceed 2.00% of the Fund's average net assets. For the reporting period, the total annualized management fee rate was .36% of the Fund's average net assets.
During the period, the investment adviser waived a portion of its management fee as described in the Expense Reductions note.
Sub-Advisers. Capital Fund Management S.A., Fidelity Diversifying Solutions LLC and Pacific Investment Management Company LLC each served as a sub-adviser for the Fund during the period. Sub-advisers provide discretionary investment advisory services for their allocated portion of the Fund's assets and are paid as described in the Management Fee note.
FIL Investment Advisers (FIL) has been retained to serve as a sub-adviser for the Fund. As of the date of this report, however, FIL has not been allocated any portion of the Fund's assets. FIL in the future may provide discretionary investment advisory services for an allocated portion of the Fund's assets and will be paid by the investment adviser for providing these services.
Effective January 1, 2025, the sub-subadvisory agreements between Fidelity Diversifying Solutions LLC (FDS) and each of FMR Investment Management (UK) Limited, Fidelity Management & Research (Hong Kong) Limited, and Fidelity Management & Research (Japan) Limited (collectively, the Sub-Subadvisers) were amended. FDS or an affiliate, and not the fund, pays the Sub-Subadvisers. Under the terms of the sub-subadvisory agreements, FDS or an affiliate pays each Sub-Subadviser monthly fees equal to 110% of the Sub-Subadviser's costs for providing sub-subadvisory services.
Interfund Trades. Funds may purchase from or sell securities to other Fidelity Funds under procedures adopted by the Board. The procedures have been designed to ensure these interfund trades are executed in accordance with Rule 17a-7 of the 1940 Act. Any interfund trades are included within the respective purchases and sales amounts shown in the Purchases and Sales of Investments note. During the period, there were no interfund trades.
7. Investments in Fidelity Central Funds.
Funds may invest in Fidelity Central Funds, which are open-end investment companies generally available only to other investment companies and accounts managed by the investment adviser and its affiliates. The Consolidated Schedule of Investments lists any Fidelity Central Funds held as an investment as of period end, but does not include the underlying holdings of each Fidelity Central Fund. An investing fund indirectly bears its proportionate share of the expenses of the underlying Fidelity Central Funds.
Based on its investment objective, each Fidelity Central Fund may invest or participate in various investment vehicles or strategies that are similar to those of the investing fund. These strategies are consistent with the investment objectives of the investing fund and may involve certain economic risks which may cause a decline in value of each of the Fidelity Central Funds and thus a decline in the value of the investing fund.
| Fidelity Central Fund | Investment Manager | Investment Objective | Investment Practices | Expense RatioA |
| Fidelity Money Market Central Funds | Fidelity Management & Research Company LLC (FMR) | Each fund seeks to obtain a high level of current income consistent with the preservation of capital and liquidity. | Short-term Investments | Less than .005% |
A Expenses expressed as a percentage of average net assets and are as of each underlying Central Fund's most recent annual or semi-annual shareholder report.
A complete unaudited list of holdings for each Fidelity Central Fund is available upon request or at the Securities and Exchange Commission website at www.sec.gov. In addition, the financial statements of the Fidelity Central Funds, which are not covered by the Report of Independent Registered Public Accounting Firm, are available on the Securities and Exchange Commission website or upon request.
8. Committed Line of Credit.
Certain Funds participate with other funds managed by the investment adviser or an affiliate in a $4.25 billion credit facility (the "line of credit") to be utilized for temporary or emergency purposes to fund shareholder redemptions or for other short-term liquidity purposes. The participating funds have agreed to pay commitment fees on their pro-rata portion of the line of credit, which are reflected in Miscellaneous expenses on the Consolidated Statement of Operations, and are listed below. During the period, there were no borrowings on this line of credit.
| | Amount ($) |
| Strategic Advisers Alternatives Fund | 959 |
9. Expense Reductions.
The investment adviser has contractually agreed to waive the Fund's management fee in an amount equal to .25% of the Fund's average net assets until September 30, 2027. During the period, this waiver reduced the Fund's management fee by $ 2,918,351.
10. Other.
A fund's organizational documents provide former and current trustees and officers with a limited indemnification against liabilities arising in connection with the performance of their duties to the fund. In the normal course of business, a fund may also enter into contracts that provide general indemnifications. A fund's maximum exposure under these arrangements is unknown as this would be dependent on future claims that may be made against a fund. The risk of material loss from such claims is considered remote.
Funds do not invest in underlying mutual funds for the purpose of exercising management or control; however, investments by funds within their principal investment strategies may represent a significant portion of the underlying mutual fund's net assets. At the end of the period, certain Funds were the owners of record of 10% or more of the total outstanding shares of the following underlying mutual funds as shown below.
| Fund | Strategic Advisers Alternatives Fund |
| Fidelity SAI Alternative Risk Premia Commodity Strategy Fund | 98% |
| Fidelity SAI Alternative Risk Premia Strategy Fund | 95% |
| Fidelity SAI Convertible Arbitrage Fund | 100% |
11. Risk and Uncertainties.
Many factors affect a fund's performance. Developments that disrupt global economies and financial markets, such as pandemics, epidemics, outbreaks of infectious diseases, war, terrorism, and environmental disasters, may significantly affect a fund's investment performance. The effects of these developments to a fund will be impacted by the types of securities in which a fund invests, the financial condition, industry, economic sector, and geographic location of an issuer, and a fund's level of investment in the securities of that issuer. Significant concentrations in security types, issuers, industries, sectors, and geographic locations may magnify the factors that affect a fund's performance.
Item 8: Changes in and Disagreements with Accountants for Open-End Management Investment Companies
(Unaudited)
Note: This is not applicable for any fund included in this document.
Item 9: Proxy Disclosures for Open-End Management Investment Companies
(Unaudited)
| A special meeting of shareholders was held on July 9, 2024. The results of votes taken among shareholders on the proposal before them are reported below. Each vote reported represents one dollar of net asset value held on the record date for the meeting. |
| Proposal 1 |
| To elect a Board of Trustees. |
| | # of Votes | % of Votes |
| Charles S. Morrison |
| Affirmative | 381,775,585,183.64 | 95.17 |
| Withheld | 19,363,639,577.49 | 4.83 |
| TOTAL | 401,139,224,761.13 | 100.00 |
| Nancy D. Prior |
| Affirmative | 381,252,305,731.53 | 95.04 |
| Withheld | 19,886,919,029.60 | 4.96 |
| TOTAL | 401,139,224,761.13 | 100.00 |
| Mary C. Farrell |
| Affirmative | 381,226,030,239.11 | 95.04 |
| Withheld | 19,913,194,522.02 | 4.96 |
| TOTAL | 401,139,224,761.13 | 100.00 |
| Karen Kaplan |
| Affirmative | 381,519,946,847.38 | 95.11 |
| Withheld | 19,619,277,913.75 | 4.89 |
| TOTAL | 401,139,224,761.13 | 100.00 |
| Christine Marcks |
| Affirmative | 380,186,327,029.51 | 94.78 |
| Withheld | 20,952,897,731.62 | 5.22 |
| TOTAL | 401,139,224,761.13 | 100.00 |
| Harold Singleton III |
| Affirmative | 382,499,458,473.65 | 95.35 |
| Withheld | 18,639,766,287.48 | 4.65 |
| TOTAL | 401,139,224,761.13 | 100.00 |
| Heidi L. Steiger |
| Affirmative | 380,661,676,515.00 | 94.90 |
| Withheld | 20,477,548,246.13 | 5.10 |
| TOTAL | 401,139,224,761.13 | 100.00 |
| | | |
| Proposal 2 |
| To approve a sub-advisory agreement among Strategic Advisers, FIL Investment Advisors (FIA), and the trust and a sub-subadvisory agreement between FIA and FIL Investment Advisors (UK) Limited (FIA (UK)). |
| | # of Votes | % of Votes |
| Affirmative | 2,290,814,974.83 | 93.39 |
| Against | 70,839,534.12 | 2.89 |
| Abstain | 91,384,593.69 | 3.73 |
| TOTAL | 2,453,039,102.64 | 100.00 |
| | | |
| Proposal 1 reflects trust-wide proposal and voting results. |
Item 10: Remuneration Paid to Directors, Officers, and others of Open-End Management Investment Companies
(Unaudited)
Note: This information is disclosed as part of the consolidated financial statements for each Fund as part of Item 7: Consolidated Financial Statements and Consolidated Financial Highlights for Open-End Management Investment companies.
Item 11: Statement Regarding Basis for Approval of Investment Advisory Contract
(Unaudited)
Board Approval of Investment Advisory Contracts and Management Fees
Strategic Advisers Alternatives Fund
Each year, the Board of Trustees, including the Independent Trustees (together, the Board), considers the renewal of the fund's management contract with Strategic Advisers LLC (Strategic Advisers), the sub-advisory agreements with Fidelity Diversifying Solutions LLC and Pacific Investment Management Company LLC (each a Sub-Adviser and collectively, the Sub-Advisers) (collectively, the Sub-Advisory Agreements), and the sub-sub-advisory agreements with FMR Investment Management (UK) Limited, Fidelity Management & Research (Japan) Limited, and Fidelity Management & Research (Hong Kong) Limited (each a Sub-Sub-Adviser and collectively, the Sub-Sub-Advisers) (collectively, the Sub-Sub-Advisory Agreements and, together with the management contract and the Sub-Advisory Agreements, the Advisory Contracts) for the fund. Strategic Advisers and the Sub-Advisers and Sub-Sub-Advisers, as applicable, are referred to herein as the Investment Advisers. The Board, assisted by the advice of fund counsel and Independent Trustees' counsel, requests and considers a broad range of information relevant to the renewal of the Advisory Contracts throughout the year.
The Board meets at least four times per year and, at each of its meetings, covers an extensive agenda of topics and materials and considers factors that are relevant to its annual consideration of the renewal of the fund's Advisory Contracts, including the services and support provided to the fund and its shareholders. The full Board or the Independent Trustees, as appropriate, act on all major matters; however, a portion of the activities of the Board (including certain of those described herein) may be conducted through standing committees that have been established by the Board. The Board, acting directly and through its committees, requests and receives information concerning the annual consideration of the renewal of the fund's Advisory Contracts.
At its September 2024 meeting, the Board, including the Independent Trustees, unanimously determined to renew the fund's Advisory Contracts. The Board also approved updating the address for notice of Strategic Advisers LLC in each Sub-Advisory Agreement. In reaching its determination to renew the fund's Advisory Contracts, the Board considered all factors it believed relevant, including (i) the nature, extent, and quality of the services provided to the fund and its shareholders (including the investment performance of the fund); (ii) the competitiveness relative to peer funds of the fund's management fee and total expenses; (iii) the total costs of the services provided by and the profits, if any, realized by Strategic Advisers from its relationships with the fund; and (iv) the extent to which, if any, economies of scale exist and are realized as the fund grows and whether any economies of scale are appropriately shared with fund shareholders. The Board's decision to renew the Advisory Contracts was not based on any single factor, but rather was based on a comprehensive consideration of all the information provided to the Board throughout the year.
The Board reached a determination, with the assistance of fund counsel and Independent Trustees' counsel and through the exercise of its business judgment, that the renewal of the Advisory Contracts is in the best interests of the fund and its shareholders. In addition, the Board concluded that the renewal of each Sub-Advisory Agreement and Sub-Sub-Advisory Agreement does not involve a conflict of interest from which Strategic Advisers or its affiliates derive an inappropriate advantage. Also, the Board found that the advisory fees charged under the Advisory Contracts bear a reasonable relationship to the services rendered.
Nature, Extent, and Quality of Services Provided. The Board considered the staffing within the Investment Advisers, including the backgrounds of the fund's investment personnel and also considered the fund's investment objective, strategies, and related investment philosophy. The Independent Trustees also had discussions with senior management of Strategic Advisers' investment operations and investment groups. The Board considered the structure of each Investment Adviser's investment personnel compensation program and whether such structures provide appropriate incentives to act in the best interests of the fund.
The Trustees also discussed with representatives of Strategic Advisers, at meetings throughout the year, Strategic Advisers' role in, among other things, (i) setting, implementing and monitoring the investment strategies for the funds; (ii) identifying and recommending sub-advisers for the funds; (iii) overseeing compliance with federal securities laws by each sub-adviser with respect to the portion of fund assets allocated to the sub-adviser; (iv) monitoring and overseeing the performance and investment capabilities of each sub-adviser; and (v) recommending the replacement of a sub-adviser as appropriate. The Trustees considered that the Board had received from Strategic Advisers substantial information and periodic reports about Strategic Advisers' sub-adviser oversight and due diligence processes, as well as periodic reports regarding the performance of each sub-adviser.
The Board also considered the nature, extent and quality of services provided by each Sub-Adviser. The Trustees noted that under the Sub-Advisory Agreements subject to oversight by Strategic Advisers, each Sub-Adviser is responsible for, among other things, identifying investments for the portion of fund assets allocated to the Sub-Adviser, if any, and executing portfolio transactions to implement its investment strategy. In addition, the Trustees noted that each Sub-Adviser is responsible for providing such reporting as may be requested from Strategic Advisers to fulfill its oversight responsibilities discussed above.
Resources Dedicated to Investment Management and Support Services. The Board reviewed the general qualifications and capabilities of the Investment Advisers' investment staffs, their use of technology, and the Investment Advisers' approach to managing and compensating investment personnel. The Board noted that the Investment Advisers' analysts have extensive resources, tools, and capabilities that allow them to conduct sophisticated quantitative and/or fundamental analysis. Additionally, in its deliberations, the Board considered the Investment Advisers' trading capabilities and resources and global compliance infrastructure, which are integral parts of the investment management process.
Shareholder and Administrative Services. The Board considered (i) the nature, extent, quality, and cost of administrative and shareholder services performed by Strategic Advisers and its affiliates under the management contract and under separate agreements covering transfer agency, pricing and bookkeeping, and securities lending services for the fund; (ii) the nature and extent of Strategic Advisers' supervision of third party service providers, including sub-advisers, custodians and subcustodians; and (iii) the resources devoted to, and the record of compliance with, the fund's compliance policies and procedures.
Investment Performance. In connection with the renewal of the Advisory Contracts, the Board considered annualized return information for the fund over different time periods, measured against an appropriate securities market index (benchmark index) and a peer group of mutual funds with similar objectives (peer group).
The Board considered discussions that occur at Board meetings throughout the year with representatives of Strategic Advisers about fund investment performance and the performance of each Sub-Adviser as part of regularly scheduled fund reviews and other reports to the Board on fund performance, taking into account various factors including general market conditions. The Board also considered information about performance attribution. In its discussions with representatives of Strategic Advisers regarding fund performance, the Board gave particular attention to information indicating underperformance of certain funds over different time periods and discussed with Strategic Advisers the reasons for any such underperformance.
In addition to reviewing absolute and relative fund performance, the Independent Trustees periodically consider the appropriateness of fund performance metrics in evaluating the results achieved. The Independent Trustees generally give greater weight to fund performance over longer time periods than over shorter time periods. Depending on the circumstances, the Independent Trustees may be satisfied with the fund's performance notwithstanding that it lags its benchmark index peer group for certain periods.
Based on its review, the Board concluded that the nature, extent, and quality of services provided to the fund under the Advisory Contracts should continue to benefit the shareholders of the fund.
Competitiveness of Management Fee and Total Fund Expenses. The Board considered the amount and nature of fees paid to the Investment Advisers. The Board noted that the Sub-Sub-Advisers are compensated by the applicable Sub-Advisers and the Fund and Strategic Advisers are not responsible for any such fees or expenses. The Board also considered information comparing the management fees and total expenses of the fund to those of other registered investment companies with investment objectives similar to those of the fund, as discussed below. The Board also noted Strategic Advisers' proposal to extend the management fee waiver and considered the fund's contractual maximum aggregate annual management fee rate. In considering the fund's management fee and management fee waiver and comparisons to other registered investment companies with investment objectives similar to those of the fund, the Board noted that shares of the fund are offered only to clients that participate in the Fidelity Portfolio Advisory Service managed account program. In its review of the fund's total expenses, the Board considered the fund's management fee rate as well as other fund expenses, as applicable, such as expenses from holding Fidelity and non-Fidelity mutual funds and ETFs, pricing and bookkeeping fees, and custodial, legal, and audit fees.
Comparisons of Management Fees and Total Expense Ratios. Among other things, the Board reviewed data for selected groups of competitive funds and classes (referred to as "mapped groups") that were compiled by Fidelity based on combining similar investment objective categories (as classified by Lipper) that have comparable investment mandates. The data reviewed by the Board included (i) gross management fee comparisons (before taking into account expense reimbursements or caps) relative to the total universe of funds within the mapped group; (ii) gross management fee comparisons relative to a subset of non-Strategic Advisers funds in the mapped group that are similar in size and management fee structure to the fund (referred to as the "asset size peer group"); (iii) total expense comparisons of the fund relative to funds and classes in the mapped group that have a similar sales load structure to the fund (referred to as the "similar sales load structure group"); and (iv) total expense comparisons of the fund relative to funds and classes in the similar sales load structure group that are similar in size and management fee structure to each fund (referred to as the "total expense asset size peer group").
The information provided to the Board indicated that the fund's management fee rate ranked above the competitive median of the mapped group for the 12-month period ended December 31, 2023 and above the competitive median of the asset size peer group for the 12-month period ended December 31, 2023. The Board noted that the fund's effective management fee rate includes Strategic Advisers' management fee plus sub-advisory fees as a percentage of sub-advised assets only, which is higher because of the construct of the fee schedule for one of the fund's mandates, which is not charged on sub-portfolio assets. The effective management fee would be below median if the calculation was based on the assets on which all fees were charged.
Further, the information provided to the Board indicated that the total expense ratio of the fund ranked equal to the competitive median of the similar sales load structure group for the 12-month period ended December 31, 2023 and above the competitive median of the total expense asset size peer group for the 12-month period ended December 31, 2023. The Board noted that the fund ranked above the competitive median of the total expense asset size peer group primarily due to its greater exposure to underlying funds, resulting in higher fund fees and expenses.
Fees Charged to Other Clients. The Board also considered fee structures paid by the Investment Advisers' other clients, such as other funds advised or subadvised by the Investment Advisers, pension plan clients, and other institutional clients with similar investment mandates.
Based on its review, the Board concluded that the fund's management fee bears a reasonable relationship to the services rendered. Further, based on its review of the total expense ratios and fees charged to other clients of Strategic Advisers or its affiliates and each Sub-Adviser, the Board concluded that the total expenses of the fund were reasonable in light of the services that the fund and its shareholders receive and the other factors considered.
Costs of the Services and Profitability. The Board considered information regarding the revenues earned and the expenses incurred by Strategic Advisers and its affiliates in conducting the business of developing, marketing, distributing, managing, administering and servicing the fund and servicing the fund's shareholders.
On an annual basis, Strategic Advisers presents to the Board information about the profitability of its relationships with the fund. Strategic Advisers calculates profitability information for the fund using a series of detailed revenue and cost allocation methodologies. The Board reviews any significant changes from the prior year's methodologies. Strategic Advisers noted that, to the extent possible, it employs the same corporate reporting of revenues and expenses as those used by other Fidelity funds.
A public accounting firm has been engaged annually by the Board as part of the Board's assessment of Fidelity's profitability analysis. The engagement includes the review and assessment of the methodologies used by Fidelity in determining the revenues and expenses attributable to Fidelity's fund business. After considering the reports issued under the engagement and information provided by Fidelity, the Board concluded that while other allocation methods may also be reasonable, Fidelity's profitability methodologies are reasonable in all material respects.
The Board also reviewed Fidelity's non-fund businesses and potential indirect benefits such businesses may have received as a result of their association with Fidelity's fund business (i.e., fall-out benefits) as well as cases where Fidelity's affiliates may benefit from the fund's business. The Board noted that changes to fall-out benefits year-over-year reflect business developments at Fidelity's various businesses.
The Board considered the costs of the services provided by and the profits realized, if any, by Strategic Advisers and its affiliates in connection with the operation of the fund and was satisfied that the profitability was not excessive.
The Board also considered information regarding the profitability of the Sub-Advisers' respective relationships with the fund and the potential fall-out benefits, if any, that may accrue to the Sub-Advisers as a result of their respective relationships with the fund. The Board noted the difficulty in evaluating a Sub-Adviser's costs and the profitability of a Sub-Advisory Agreement to a Sub-Adviser because of, among other things, differences in the type and content of information provided by each Sub-Adviser due to differences in business models, cost accounting methods, and profitability calculation methodologies among the Sub-Advisers. Accordingly, the Board considered profitability information provided by the Sub-Advisers in light of the nature of the relationships between Strategic Advisers and the Sub-Advisers with respect to the negotiation of sub-advisory fees.
Possible Economies of Scale. The Board considered whether there have been economies of scale in respect of the management of the Strategic Advisers funds, whether the Strategic Advisers funds (including the fund) have appropriately benefited from any such economies of scale, and whether there is potential for realization of any further economies of scale as assets grow through increased services to the fund, through waivers or reimbursements, or through fee or expense ratio reductions. The Board considered that certain of the fund's Sub-Advisory Agreements provide for breakpoints as the fund's assets grow and noted that any potential decline in sub-advisory fees under such contracts would accrue directly to the fund. The Board also took Strategic Advisers' management fee waiver into consideration.
Conclusion. Based on its evaluation of all of the conclusions noted above, and after considering all factors it believed relevant, the Board concluded that the advisory fee arrangements bear a reasonable relationship to the services rendered and that the fund's Advisory Contracts should be renewed because each agreement is in the best interests of the fund and its shareholders. In addition, the Board concluded that the renewal of each Sub-Advisory Agreement and Sub-Sub-Advisory Agreement does not involve a conflict of interest from which Strategic Advisers or its affiliates derive an inappropriate advantage.
1.9905801.102
SAA-SANN-0125
Strategic Advisers® U.S. Total Stock Fund
Offered exclusively to certain managed account clients of Strategic Advisers LLC or its affiliates - not available for sale to the general public
Semi-Annual Report
November 30, 2024
Contents
To view a fund's proxy voting guidelines and proxy voting record for the 12-month period ended June 30, visit http://www.fidelity.com/proxyvotingresults or visit the Securities and Exchange Commission's (SEC) web site at http://www.sec.gov.
You may also call 1-800-544-3455 to request a free copy of the proxy voting guidelines.
Standard & Poor's, S&P and S&P 500 are registered service marks of The McGraw-Hill Companies, Inc. and have been licensed for use by Fidelity Distributors Corporation.
Other third-party marks appearing herein are the property of their respective owners.
All other marks appearing herein are registered or unregistered trademarks or service marks of FMR LLC or an affiliated company. © 2025 FMR LLC. All rights reserved.
This report and the financial statements contained herein are submitted for the general information of the shareholders of the Fund. This report is not authorized for distribution to prospective investors in the Fund unless preceded or accompanied by an effective prospectus.
A fund files its complete schedule of portfolio holdings with the SEC for the first and third quarters of each fiscal year on Form N-PORT. Forms N-PORT are available on the SEC's web site at http://www.sec.gov. A fund's Forms N-PORT may be reviewed and copied at the SEC's Public Reference Room in Washington, DC. Information regarding the operation of the SEC's Public Reference Room may be obtained by calling 1-800-SEC-0330.
For a complete list of a fund's portfolio holdings, view the most recent holdings listing, semiannual report, or annual report on Fidelity's web site at http://www.fidelity.com, http://www.institutional.fidelity.com, or http://www.401k.com, as applicable.
NOT FDIC INSURED •MAY LOSE VALUE •NO BANK GUARANTEE
Neither the Fund nor Fidelity Distributors Corporation is a bank.
Item 7: Financial Statements and Financial Highlights for Open-End Management Investment Companies (Semi-Annual Report)
Strategic Advisers® U.S. Total Stock Fund
Schedule of Investments November 30, 2024 (Unaudited)
Showing Percentage of Net Assets
| Common Stocks - 83.5% |
| | | Shares | Value ($) |
| COMMUNICATION SERVICES - 7.2% | | | |
| Diversified Telecommunication Services - 0.6% | | | |
| AT&T, Inc. | | 13,182,091 | 305,297,228 |
| ATN International, Inc. | | 24,206 | 478,795 |
| Bandwidth, Inc. Class A, (a) | | 14,245 | 299,572 |
| Cellnex Telecom SA (b) | | 34,500 | 1,238,839 |
| Deutsche Telekom AG | | 599,100 | 19,170,235 |
| GCI Liberty, Inc. Class A (Escrow) (a)(c)(d) | | 105,502 | 1 |
| Globalstar, Inc. (a) | | 171,900 | 335,205 |
| IDT Corp. Class B | | 201 | 10,380 |
| Iridium Communications, Inc. | | 120,202 | 3,572,403 |
| Verizon Communications, Inc. | | 2,574,935 | 114,172,618 |
| | | | 444,575,276 |
| Entertainment - 1.3% | | | |
| Cinemark Holdings, Inc. (a) | | 7,400 | 255,448 |
| Electronic Arts, Inc. | | 356,846 | 58,404,985 |
| Eventbrite, Inc. (a) | | 199,324 | 701,620 |
| IMAX Corp. (a) | | 51,300 | 1,350,216 |
| Lions Gate Entertainment Corp. Class B (a) | | 14,021 | 103,335 |
| Live Nation Entertainment, Inc. (a) | | 101,300 | 14,004,725 |
| Madison Square Garden Entertainment Corp. Class A (a) | | 1,608 | 59,480 |
| Madison Square Garden Sports Corp. (a) | | 500 | 114,975 |
| Marcus Corp. | | 55,919 | 1,266,006 |
| Netflix, Inc. (a) | | 607,938 | 539,125,498 |
| Playstudios, Inc. Class A (a) | | 17,112 | 32,855 |
| Roblox Corp. Class A (a) | | 37,768 | 1,893,310 |
| Roku, Inc. Class A (a) | | 85,840 | 5,925,535 |
| Sea Ltd. ADR Class A (a) | | 28,700 | 3,266,060 |
| Spotify Technology SA (a) | | 63,808 | 30,433,864 |
| Take-Two Interactive Software, Inc. (a) | | 21,476 | 4,045,649 |
| The Walt Disney Co. | | 2,949,389 | 346,464,726 |
| TKO Group Holdings, Inc. (a) | | 22,508 | 3,105,204 |
| Warner Bros Discovery, Inc. (a) | | 14,007 | 146,793 |
| Warner Music Group Corp. Class A | | 6,000 | 195,120 |
| | | | 1,010,895,404 |
| Interactive Media & Services - 4.4% | | | |
| Alphabet, Inc.: | | | |
| Class A | | 5,300,807 | 895,571,343 |
| Class C | | 6,116,040 | 1,042,723,660 |
| Angi, Inc. Class A, (a) | | 6,331 | 11,776 |
| Bumble, Inc. Class A (a) | | 175,800 | 1,527,702 |
| Cars.com, Inc. (a) | | 15,737 | 312,694 |
| EverQuote, Inc. Class A (a) | | 99,902 | 1,917,119 |
| Match Group, Inc. (a) | | 34,500 | 1,129,530 |
| MediaAlpha, Inc. Class A (a) | | 41,957 | 529,917 |
| Meta Platforms, Inc. Class A | | 2,576,217 | 1,479,572,947 |
| Nebius Group NV Series A (a)(e) | | 141,497 | 3,111,519 |
| Nextdoor Holdings, Inc. Class A (a) | | 87,707 | 213,128 |
| Pinterest, Inc. Class A (a) | | 693,600 | 21,029,952 |
| QuinStreet, Inc. (a) | | 493,410 | 11,239,880 |
| Reddit, Inc. Class A | | 104,915 | 14,760,491 |
| Snap, Inc. Class A (a) | | 875,642 | 10,341,332 |
| Taboola.com Ltd. (a) | | 96,667 | 344,135 |
| TripAdvisor, Inc. Class A (a) | | 335,405 | 4,806,354 |
| Yelp, Inc. Class A (a)(e) | | 253,063 | 9,672,068 |
| Ziff Davis, Inc. (a) | | 73,305 | 4,313,999 |
| ZipRecruiter, Inc. (a) | | 758,947 | 6,724,270 |
| | | | 3,509,853,816 |
| Media - 0.6% | | | |
| Altice U.S.A., Inc. Class A (a) | | 85,200 | 205,332 |
| AMC Networks, Inc. Class A (a) | | 6,800 | 64,056 |
| Cable One, Inc. (e) | | 6,383 | 2,682,264 |
| Charter Communications, Inc. Class A (a) | | 295,704 | 117,384,138 |
| Comcast Corp. Class A | | 4,310,391 | 186,165,787 |
| Criteo SA sponsored ADR (a) | | 196,599 | 8,017,307 |
| E.W. Scripps Co. Class A (a) | | 78,600 | 157,200 |
| EchoStar Corp. Class A (a) | | 2,146 | 54,272 |
| Entravision Communication Corp. Class A | | 6,400 | 15,616 |
| Fox Corp.: | | | |
| Class A | | 622,500 | 29,332,200 |
| Class B | | 72,463 | 3,241,270 |
| Gannett Co., Inc. (a) | | 484,851 | 2,516,377 |
| Gray Television, Inc. | | 7,370 | 31,470 |
| Integral Ad Science Holding Corp. (a) | | 15,928 | 178,075 |
| Interpublic Group of Companies, Inc. | | 115,400 | 3,555,474 |
| John Wiley & Sons, Inc. Class A | | 1,000 | 52,180 |
| Liberty Broadband Corp.: | | | |
| Class A (a) | | 53,378 | 4,519,515 |
| Class C (a) | | 136,800 | 11,647,152 |
| National CineMedia, Inc. (a) | | 200 | 1,390 |
| News Corp.: | | | |
| Class A | | 28,500 | 836,475 |
| Class B | | 12,256 | 393,295 |
| Nexstar Media Group, Inc. | | 85,552 | 14,594,316 |
| Omnicom Group, Inc. | | 229,541 | 24,060,488 |
| Paramount Global Class B | | 81,989 | 889,581 |
| Scholastic Corp. (e) | | 11,700 | 308,646 |
| Sinclair, Inc. Class A | | 3,000 | 54,960 |
| Sirius XM Holdings, Inc. (e) | | 1,578,620 | 42,543,809 |
| TechTarget, Inc. (a) | | 2,353 | 75,555 |
| TEGNA, Inc. (e) | | 607,599 | 11,404,633 |
| The New York Times Co. Class A | | 560,451 | 30,410,071 |
| The Trade Desk, Inc. Class A (a) | | 1,500 | 192,825 |
| Thryv Holdings, Inc. (a)(e) | | 18,844 | 298,112 |
| WideOpenWest, Inc. (a) | | 4,400 | 23,364 |
| | | | 495,907,205 |
| Wireless Telecommunication Services - 0.3% | | | |
| T-Mobile U.S., Inc. | | 1,137,547 | 280,905,856 |
| Telephone & Data Systems, Inc. | | 55,565 | 1,899,212 |
| U.S. Cellular Corp. (a) | | 3,900 | 247,494 |
| | | | 283,052,562 |
TOTAL COMMUNICATION SERVICES | | | 5,744,284,263 |
| CONSUMER DISCRETIONARY - 9.4% | | | |
| Automobile Components - 0.2% | | | |
| Adient PLC (a) | | 567,560 | 10,914,179 |
| American Axle & Manufacturing Holdings, Inc. (a) | | 3,900 | 25,779 |
| Aptiv PLC (a) | | 56,000 | 3,109,680 |
| Autoliv, Inc. | | 33,573 | 3,327,756 |
| BorgWarner, Inc. | | 1,175,283 | 40,335,713 |
| Cooper-Standard Holding, Inc. (a) | | 3,931 | 60,695 |
| Dana, Inc. (e) | | 49,080 | 490,800 |
| Fox Factory Holding Corp. (a) | | 114,741 | 3,726,788 |
| Garrett Motion, Inc. (a)(e) | | 1,513,085 | 12,830,961 |
| Gentex Corp. | | 479,192 | 14,644,108 |
| Holley, Inc. (a) | | 1,200 | 3,408 |
| Lear Corp. | | 89,665 | 8,772,824 |
| Mobileye Global, Inc. Class A (a)(e) | | 130,570 | 2,356,789 |
| Modine Manufacturing Co. (a) | | 213,251 | 28,957,353 |
| Motorcar Parts of America, Inc. (a) | | 3,210 | 23,401 |
| Patrick Industries, Inc. | | 4,952 | 665,499 |
| Phinia, Inc. | | 78,075 | 4,378,446 |
| Stoneridge, Inc. (a) | | 10,700 | 73,402 |
| The Goodyear Tire & Rubber Co. (a)(e) | | 612,231 | 6,575,361 |
| Visteon Corp. (a) | | 11,417 | 1,066,005 |
| | | | 142,338,947 |
| Automobiles - 1.2% | | | |
| Ford Motor Co. | | 2,497,300 | 27,794,949 |
| General Motors Co. | | 909,200 | 50,542,428 |
| Harley-Davidson, Inc. | | 358,600 | 12,059,718 |
| Tesla, Inc. (a) | | 2,414,527 | 833,398,139 |
| | | | 923,795,234 |
| Broadline Retail - 3.1% | | | |
| 1stDibs.com, Inc. (a) | | 110,208 | 428,709 |
| Alibaba Group Holding Ltd. sponsored ADR | | 112,409 | 9,821,174 |
| Amazon.com, Inc. (a) | | 11,706,884 | 2,433,744,115 |
| Coupang, Inc. Class A (a) | | 177,722 | 4,507,030 |
| Dillard's, Inc. Class A (e) | | 5,849 | 2,591,809 |
| eBay, Inc. | | 610,726 | 38,652,849 |
| Etsy, Inc. (a) | | 68,085 | 3,735,143 |
| Kohl's Corp. (e) | | 232,700 | 3,483,519 |
| Macy's, Inc. | | 367,305 | 5,965,033 |
| MercadoLibre, Inc. (a) | | 1,800 | 3,573,306 |
| Nordstrom, Inc. | | 15,800 | 358,818 |
| PDD Holdings, Inc. ADR (a) | | 21,600 | 2,085,696 |
| Qurate Retail, Inc. Series A (a) | | 71,800 | 33,559 |
| | | | 2,508,980,760 |
| Distributors - 0.1% | | | |
| Genuine Parts Co. | | 33,000 | 4,182,090 |
| LKQ Corp. | | 639,402 | 25,122,105 |
| Pool Corp. | | 91,772 | 34,606,303 |
| | | | 63,910,498 |
| Diversified Consumer Services - 0.1% | | | |
| ADT, Inc. | | 2,884,996 | 21,983,670 |
| Adtalem Global Education, Inc. (a) | | 1,800 | 164,538 |
| Bright Horizons Family Solutions, Inc. (a) | | 214,957 | 24,855,478 |
| Chegg, Inc. (a) | | 63,900 | 134,829 |
| Coursera, Inc. (a)(e) | | 82,445 | 655,438 |
| Duolingo, Inc. Class A (a) | | 9,310 | 3,242,394 |
| Frontdoor, Inc. (a) | | 138,696 | 8,127,586 |
| Grand Canyon Education, Inc. (a) | | 94,053 | 15,480,183 |
| H&R Block, Inc. | | 78,639 | 4,661,720 |
| Laureate Education, Inc. | | 204,027 | 3,876,513 |
| Perdoceo Education Corp. | | 116,967 | 3,210,744 |
| Service Corp. International | | 293,247 | 25,978,752 |
| Strategic Education, Inc. | | 1,874 | 185,170 |
| Stride, Inc. (a) | | 98,397 | 10,515,687 |
| | | | 123,072,702 |
| Hotels, Restaurants & Leisure - 2.0% | | | |
| Airbnb, Inc. Class A (a) | | 213,311 | 29,033,760 |
| Aramark | | 337 | 13,713 |
| Bally's Corp. (a) | | 116 | 2,057 |
| Bloomin' Brands, Inc. | | 6,600 | 92,004 |
| Booking Holdings, Inc. | | 34,312 | 178,490,338 |
| Bowlero Corp. Class A (e) | | 433,443 | 5,335,683 |
| Brinker International, Inc. (a) | | 4,178 | 552,624 |
| Caesars Entertainment, Inc. (a) | | 55,100 | 2,120,799 |
| Carnival Corp. (a) | | 520,261 | 13,230,237 |
| Cava Group, Inc. (a) | | 1,800 | 253,620 |
| Chipotle Mexican Grill, Inc. (a) | | 2,813,138 | 173,064,250 |
| Churchill Downs, Inc. | | 122,983 | 17,477,114 |
| Darden Restaurants, Inc. | | 35,500 | 6,257,585 |
| Dine Brands Global, Inc. (e) | | 194,308 | 6,979,543 |
| Domino's Pizza, Inc. | | 70,313 | 33,482,347 |
| Doordash, Inc. (a) | | 44,600 | 8,049,408 |
| Draftkings Holdings, Inc. Class A (a) | | 290,907 | 12,698,091 |
| Dutch Bros, Inc. Class A (a) | | 91,000 | 4,889,430 |
| Everi Holdings, Inc. (a) | | 10,353 | 139,455 |
| Expedia Group, Inc. Class A (a) | | 50,714 | 9,362,819 |
| Flutter Entertainment PLC (a) | | 38,749 | 10,707,124 |
| Flutter Entertainment PLC (a) | | 12,700 | 3,492,201 |
| GEN Restaurant Group, Inc. (a) | | 172,633 | 1,463,928 |
| Genius Sports Ltd. (a) | | 1,770,217 | 17,772,979 |
| Golden Entertainment, Inc. (e) | | 38,711 | 1,306,109 |
| Hilton Worldwide Holdings, Inc. | | 807,569 | 204,670,287 |
| Hyatt Hotels Corp. Class A (e) | | 79,044 | 12,484,209 |
| Krispy Kreme, Inc. (e) | | 421,038 | 4,639,839 |
| Kura Sushi U.S.A., Inc. Class A (a)(e) | | 197,785 | 21,147,172 |
| Las Vegas Sands Corp. | | 482,534 | 25,603,254 |
| Life Time Group Holdings, Inc. (a) | | 31,268 | 758,874 |
| Lindblad Expeditions Holdings (a) | | 210,760 | 2,794,678 |
| Marriott International, Inc. Class A | | 278,878 | 80,620,841 |
| Marriott Vacations Worldwide Corp. | | 25,584 | 2,539,212 |
| McDonald's Corp. | | 839,098 | 248,381,399 |
| MGM Resorts International (a) | | 276,700 | 10,608,678 |
| Monarch Casino & Resort, Inc. | | 200 | 16,802 |
| Noodles & Co. Class A (a) | | 13,800 | 9,385 |
| Norwegian Cruise Line Holdings Ltd. (a) | | 438,444 | 11,789,759 |
| Papa John's International, Inc. (e) | | 174,033 | 8,672,064 |
| PlayAGS, Inc. (a) | | 12,754 | 148,201 |
| Potbelly Corp. (a) | | 522,789 | 5,437,006 |
| Red Robin Gourmet Burgers, Inc. (a) | | 9,900 | 53,361 |
| Red Rock Resorts, Inc. | | 26,100 | 1,307,349 |
| Restaurant Brands International, Inc. | | 82,000 | 5,711,975 |
| Royal Caribbean Cruises Ltd. | | 278,201 | 67,897,736 |
| Rush Street Interactive, Inc. (a) | | 130,593 | 1,883,151 |
| Shake Shack, Inc. Class A (a) | | 100 | 13,373 |
| Sportradar Holding AG (a) | | 722,690 | 12,531,445 |
| Starbucks Corp. | | 738,975 | 75,715,379 |
| Sweetgreen, Inc. Class A (a) | | 83,943 | 3,439,984 |
| Target Hospitality Corp. (a) | | 3,600 | 29,772 |
| Texas Roadhouse, Inc. | | 126,894 | 26,047,531 |
| Travel+Leisure Co. | | 72,118 | 4,029,233 |
| United Parks & Resorts, Inc. (a)(e) | | 179,786 | 10,542,651 |
| Vail Resorts, Inc. | | 74,997 | 13,442,462 |
| Viking Holdings Ltd. | | 175,749 | 8,163,541 |
| Wingstop, Inc. | | 55,122 | 18,122,460 |
| Wynn Resorts Ltd. | | 258,464 | 24,393,832 |
| Yum China Holdings, Inc. | | 109,946 | 5,117,986 |
| Yum! Brands, Inc. | | 1,048,703 | 145,706,795 |
| | | | 1,600,738,894 |
| Household Durables - 0.5% | | | |
| Cavco Industries, Inc. (a) | | 13,733 | 7,065,629 |
| Century Communities, Inc. | | 6,583 | 594,840 |
| Champion Homes, Inc. (a) | | 255,785 | 26,532,578 |
| Cricut, Inc. | | 400 | 2,076 |
| D.R. Horton, Inc. | | 148,400 | 25,046,952 |
| GoPro, Inc. Class A (a) | | 62,800 | 77,244 |
| Installed Building Products, Inc. (e) | | 41,853 | 9,573,455 |
| KB Home | | 129,888 | 10,746,933 |
| Leggett & Platt, Inc. | | 162,600 | 2,047,134 |
| Lennar Corp.: | | | |
| Class A | | 329,340 | 57,433,603 |
| Class B | | 302 | 49,779 |
| LGI Homes, Inc. (a) | | 85,137 | 9,321,650 |
| M/I Homes, Inc. (a) | | 54,403 | 8,978,127 |
| Mohawk Industries, Inc. (a) | | 19,100 | 2,651,653 |
| Newell Brands, Inc. | | 270,566 | 2,594,728 |
| NVR, Inc. (a) | | 6,036 | 55,745,961 |
| PulteGroup, Inc. | | 337,036 | 45,590,860 |
| SharkNinja, Inc. | | 185,175 | 18,619,346 |
| Taylor Morrison Home Corp. (a) | | 128,895 | 9,521,474 |
| Toll Brothers, Inc. | | 283,948 | 46,899,691 |
| TopBuild Corp. (a) | | 59,911 | 23,403,633 |
| Traeger, Inc. (a) | | 565 | 1,814 |
| TRI Pointe Homes, Inc. (a) | | 186,043 | 8,098,452 |
| Universal Electronics, Inc. (a) | | 1,400 | 16,212 |
| Whirlpool Corp. (e) | | 76,305 | 8,501,903 |
| Worthington Enterprises, Inc. | | 53,952 | 2,207,716 |
| | | | 381,323,443 |
| Leisure Products - 0.0% | | | |
| Acushnet Holdings Corp. (e) | | 1,600 | 116,976 |
| Brunswick Corp. | | 144,950 | 11,669,925 |
| Clarus Corp. | | 13 | 59 |
| Hasbro, Inc. | | 42,900 | 2,794,935 |
| JAKKS Pacific, Inc. (a) | | 4,721 | 137,523 |
| Latham Group, Inc. (a) | | 264 | 1,750 |
| Malibu Boats, Inc. Class A (a)(e) | | 36,145 | 1,566,886 |
| Polaris, Inc. (e) | | 56,148 | 3,874,212 |
| YETI Holdings, Inc. (a)(e) | | 72,472 | 2,925,695 |
| | | | 23,087,961 |
| Specialty Retail - 1.9% | | | |
| Abercrombie & Fitch Co. Class A (a) | | 65,827 | 9,853,644 |
| Academy Sports & Outdoors, Inc. | | 237,852 | 11,714,211 |
| American Eagle Outfitters, Inc. | | 10,216 | 196,556 |
| Asbury Automotive Group, Inc. (a)(e) | | 35,300 | 9,171,999 |
| AutoNation, Inc. (a)(e) | | 141,667 | 25,342,810 |
| AutoZone, Inc. (a) | | 14,847 | 47,058,160 |
| Bath & Body Works, Inc. | | 461,015 | 16,707,184 |
| Best Buy Co., Inc. | | 226,386 | 20,374,740 |
| Big 5 Sporting Goods Corp. | | 100 | 177 |
| Boot Barn Holdings, Inc. (a)(e) | | 60,972 | 8,361,700 |
| Burlington Stores, Inc. (a) | | 555,165 | 156,489,910 |
| CarMax, Inc. (a) | | 48,000 | 4,030,560 |
| CarParts.com, Inc. (a) | | 120,211 | 115,835 |
| Carvana Co. Class A (a) | | 65,862 | 17,151,782 |
| Chewy, Inc. Class A (a) | | 44,247 | 1,478,292 |
| Dick's Sporting Goods, Inc. | | 82,410 | 17,078,648 |
| Duluth Holdings, Inc. (a) | | 257 | 984 |
| Five Below, Inc. (a) | | 1,821 | 168,807 |
| Foot Locker, Inc. (a) | | 130,496 | 3,281,974 |
| Gap, Inc. | | 55,501 | 1,345,899 |
| Genesco, Inc. (a) | | 296,190 | 9,949,022 |
| Group 1 Automotive, Inc. (e) | | 33,280 | 14,170,624 |
| GrowGeneration Corp. (a) | | 4,076 | 7,907 |
| J. Jill, Inc. | | 2,500 | 69,000 |
| Lands' End, Inc. (a) | | 400 | 6,380 |
| Lithia Motors, Inc. Class A (sub. vtg.) | | 56,162 | 21,729,078 |
| LL Flooring Holdings, Inc. (a) | | 7,900 | 2 |
| Lowe's Companies, Inc. | | 1,249,742 | 340,467,213 |
| MarineMax, Inc. (a) | | 109,766 | 3,767,169 |
| Monro, Inc. (e) | | 53,313 | 1,499,162 |
| Murphy U.S.A., Inc. | | 85,985 | 47,102,583 |
| MYT Netherlands Parent BV ADR (a)(e) | | 1,629,558 | 10,918,039 |
| National Vision Holdings, Inc. (a) | | 137,554 | 1,664,403 |
| O'Reilly Automotive, Inc. (a) | | 53,263 | 66,217,627 |
| Penske Automotive Group, Inc. (e) | | 99,234 | 16,526,430 |
| Petco Health & Wellness Co., Inc. Class A (a) | | 127,776 | 545,604 |
| Revolve Group, Inc. (a)(e) | | 435,142 | 15,699,923 |
| RH (a) | | 11,448 | 4,409,083 |
| Ross Stores, Inc. | | 429,743 | 66,554,298 |
| Sally Beauty Holdings, Inc. (a) | | 253,600 | 3,532,648 |
| Signet Jewelers Ltd. | | 66,362 | 6,649,472 |
| Sleep Number Corp. (a)(e) | | 19,700 | 295,500 |
| Sportsman's Warehouse Holdings, Inc. (a) | | 893,016 | 1,911,054 |
| Stitch Fix, Inc. (a)(e) | | 99,534 | 473,782 |
| The Buckle, Inc. (e) | | 48,148 | 2,508,029 |
| The Cato Corp. Class A (sub. vtg.) | | 3,218 | 10,265 |
| The Home Depot, Inc. | | 742,398 | 318,585,254 |
| The ODP Corp. (a) | | 66,070 | 1,696,678 |
| TJX Companies, Inc. | | 1,175,874 | 147,795,603 |
| Ulta Beauty, Inc. (a) | | 24,300 | 9,395,352 |
| Upbound Group, Inc. | | 32,004 | 1,100,618 |
| Urban Outfitters, Inc. (a) | | 300 | 14,619 |
| Victoria's Secret & Co. (a) | | 497 | 19,303 |
| Warby Parker, Inc. (a) | | 198,652 | 4,477,616 |
| Wayfair LLC Class A (a)(e) | | 37,963 | 1,755,409 |
| Williams-Sonoma, Inc. | | 57,500 | 9,891,150 |
| Winmark Corp. | | 90 | 37,073 |
| Zumiez, Inc. (a)(e) | | 43,608 | 962,429 |
| | | | 1,482,339,273 |
| Textiles, Apparel & Luxury Goods - 0.3% | | | |
| Carter's, Inc. | | 100 | 5,457 |
| Crocs, Inc. (a) | | 116,575 | 12,310,320 |
| Deckers Outdoor Corp. (a) | | 107,334 | 21,033,171 |
| G-III Apparel Group Ltd. (a) | | 54,171 | 1,605,087 |
| Hanesbrands, Inc. (a) | | 939 | 8,169 |
| Levi Strauss & Co. Class A | | 30,900 | 539,514 |
| lululemon athletica, Inc. (a) | | 112,547 | 36,089,321 |
| Movado Group, Inc. | | 1,700 | 34,595 |
| NIKE, Inc. Class B | | 439,628 | 34,629,498 |
| PVH Corp. | | 119,482 | 12,948,264 |
| Ralph Lauren Corp. Class A | | 93,823 | 21,710,642 |
| Skechers U.S.A., Inc. Class A (sub. vtg.) (a) | | 266,726 | 17,022,453 |
| Tapestry, Inc. | | 793,758 | 49,435,248 |
| Unifi, Inc. (a) | | 5,600 | 31,136 |
| VF Corp. | | 11,900 | 240,737 |
| | | | 207,643,612 |
TOTAL CONSUMER DISCRETIONARY | | | 7,457,231,324 |
| CONSUMER STAPLES - 4.1% | | | |
| Beverages - 1.2% | | | |
| Boston Beer Co., Inc. Class A (a) | | 8,900 | 2,814,536 |
| Brown-Forman Corp. Class B (non-vtg.) (e) | | 349,768 | 14,718,237 |
| Coca-Cola Consolidated, Inc. | | 14,882 | 19,410,444 |
| Constellation Brands, Inc. Class A (sub. vtg.) | | 146,183 | 35,222,794 |
| Keurig Dr. Pepper, Inc. | | 2,357,225 | 76,963,396 |
| Molson Coors Beverage Co. Class B | | 565,489 | 35,094,247 |
| Monster Beverage Corp. (a) | | 1,981,063 | 109,216,003 |
| National Beverage Corp. | | 48,895 | 2,414,924 |
| PepsiCo, Inc. | | 1,960,093 | 320,377,201 |
| Primo Brands Corp. Class A | | 515,159 | 14,692,335 |
| The Coca-Cola Co. | | 4,480,636 | 287,119,155 |
| The Vita Coco Co., Inc. (a)(e) | | 142,809 | 5,075,432 |
| | | | 923,118,704 |
| Consumer Staples Distribution & Retail - 1.2% | | | |
| Albertsons Companies, Inc. | | 45,830 | 909,726 |
| Alimentation Couche-Tard, Inc. (multi-vtg.) | | 39,600 | 2,323,023 |
| Andersons, Inc. | | 200 | 9,548 |
| BJ's Wholesale Club Holdings, Inc. (a) | | 410,757 | 39,555,899 |
| Costco Wholesale Corp. | | 324,597 | 315,469,332 |
| Dollar General Corp. | | 208,246 | 16,091,168 |
| Ingles Markets, Inc. Class A | | 104,315 | 7,708,879 |
| Kroger Co. | | 1,349,678 | 82,438,332 |
| Performance Food Group Co. (a) | | 244,013 | 21,531,707 |
| PriceSmart, Inc. | | 47,918 | 4,300,161 |
| SpartanNash Co. | | 10,869 | 206,294 |
| Sprouts Farmers Market LLC (a) | | 33,077 | 5,109,735 |
| Sysco Corp. | | 667,605 | 51,479,022 |
| Target Corp. | | 274,646 | 36,338,412 |
| U.S. Foods Holding Corp. (a) | | 436,983 | 30,488,304 |
| United Natural Foods, Inc. (a) | | 117,700 | 2,922,491 |
| Walgreens Boots Alliance, Inc. (e) | | 173,900 | 1,568,578 |
| Walmart, Inc. | | 3,253,600 | 300,958,000 |
| Weis Markets, Inc. (e) | | 28,066 | 2,044,047 |
| | | | 921,452,658 |
| Food Products - 0.4% | | | |
| Archer Daniels Midland Co. | | 82,758 | 4,518,587 |
| Bunge Global SA | | 242,008 | 21,717,798 |
| Calavo Growers, Inc. | | 1,500 | 41,565 |
| Campbell Soup Co. | | 397,300 | 18,355,260 |
| Conagra Brands, Inc. | | 444,700 | 12,251,485 |
| Dole PLC | | 274,031 | 4,129,647 |
| Flowers Foods, Inc. | | 349,206 | 7,899,040 |
| Fresh Del Monte Produce, Inc. | | 15,324 | 517,185 |
| Freshpet, Inc. (a) | | 110,756 | 16,951,206 |
| General Mills, Inc. | | 436,997 | 28,955,421 |
| Hormel Foods Corp. | | 140,800 | 4,566,144 |
| Ingredion, Inc. | | 157,913 | 23,266,901 |
| John B. Sanfilippo & Son, Inc. | | 524 | 45,247 |
| Lancaster Colony Corp. | | 90,449 | 16,809,042 |
| Lifeway Foods, Inc. (a) | | 4,200 | 102,690 |
| Mama's Creations, Inc. (a)(e) | | 677,717 | 6,621,295 |
| McCormick & Co., Inc. (non-vtg.) | | 2,500 | 196,025 |
| Mondelez International, Inc. | | 1,928,155 | 125,233,667 |
| Nomad Foods Ltd. | | 983,344 | 18,005,029 |
| Oatly Group AB ADR (a)(e) | | 4,644,697 | 3,247,572 |
| Pilgrim's Pride Corp. (a) | | 400 | 20,644 |
| Post Holdings, Inc. (a) | | 300 | 36,144 |
| Seaboard Corp. | | 16 | 41,824 |
| SunOpta, Inc. (a) | | 806,499 | 6,250,367 |
| The Hain Celestial Group, Inc. (a) | | 6,300 | 52,101 |
| The Hershey Co. | | 10,860 | 1,912,772 |
| The Kraft Heinz Co. | | 865,330 | 27,664,600 |
| The Simply Good Foods Co. (a) | | 166,500 | 6,625,035 |
| Tootsie Roll Industries, Inc. | | 29,217 | 967,083 |
| Tyson Foods, Inc. Class A | | 5,400 | 348,300 |
| Utz Brands, Inc. Class A | | 7,500 | 130,575 |
| Vital Farms, Inc. (a)(e) | | 33,233 | 1,103,336 |
| WK Kellogg Co. (e) | | 224,600 | 4,671,680 |
| | | | 363,255,267 |
| Household Products - 0.6% | | | |
| Central Garden & Pet Co. Class A (non-vtg.) | | 29,707 | 1,003,800 |
| Church & Dwight Co., Inc. | | 4,135 | 455,388 |
| Colgate-Palmolive Co. | | 915,593 | 88,473,752 |
| Energizer Holdings, Inc. | | 248,600 | 9,474,146 |
| Kimberly-Clark Corp. | | 512,094 | 71,360,299 |
| Procter & Gamble Co. | | 1,660,672 | 297,692,063 |
| Reynolds Consumer Products, Inc. | | 17,800 | 492,882 |
| Spectrum Brands Holdings, Inc. | | 62,829 | 5,777,127 |
| The Clorox Co. | | 46,000 | 7,689,820 |
| WD-40 Co. (e) | | 24,164 | 6,695,603 |
| | | | 489,114,880 |
| Personal Care Products - 0.2% | | | |
| BellRing Brands, Inc. (a) | | 257,117 | 20,173,400 |
| Coty, Inc. Class A (a) | | 10,600 | 78,334 |
| elf Beauty, Inc. (a)(e) | | 208,602 | 27,018,131 |
| Estee Lauder Companies, Inc. Class A | | 54,900 | 3,959,388 |
| Haleon PLC ADR | | 1,801,962 | 17,406,953 |
| Herbalife Ltd. (a) | | 169,667 | 1,318,313 |
| Interparfums, Inc. | | 66,876 | 9,206,150 |
| Kenvue, Inc. | | 3,005,901 | 72,382,096 |
| MediFast, Inc. | | 16,000 | 314,720 |
| Nu Skin Enterprises, Inc. Class A (e) | | 72,617 | 530,104 |
| The Honest Co., Inc. (a) | | 2,694,812 | 22,339,991 |
| Unilever PLC sponsored ADR | | 312,742 | 18,714,481 |
| USANA Health Sciences, Inc. (a) | | 19,701 | 759,080 |
| | | | 194,201,141 |
| Tobacco - 0.5% | | | |
| Altria Group, Inc. | | 1,965,443 | 113,484,679 |
| Philip Morris International, Inc. | | 1,994,577 | 265,398,416 |
| Turning Point Brands, Inc. | | 218 | 13,494 |
| | | | 378,896,589 |
TOTAL CONSUMER STAPLES | | | 3,270,039,239 |
| ENERGY - 3.2% | | | |
| Energy Equipment & Services - 0.3% | | | |
| Baker Hughes Co. Class A | | 2,516,346 | 110,593,407 |
| Cactus, Inc. Class A | | 115,565 | 7,934,693 |
| Championx Corp. | | 197,939 | 6,126,212 |
| DMC Global, Inc. (a) | | 589 | 4,741 |
| Halliburton Co. | | 475,284 | 15,142,548 |
| Helix Energy Solutions Group, Inc. (a) | | 300 | 3,207 |
| Liberty Energy, Inc. Class A (e) | | 70,519 | 1,297,550 |
| NOV, Inc. | | 59,462 | 952,581 |
| Oceaneering International, Inc. (a) | | 3,340 | 100,133 |
| Oil States International, Inc. (a) | | 110,600 | 608,300 |
| Patterson-UTI Energy, Inc. | | 170,277 | 1,430,327 |
| ProPetro Holding Corp. (a)(e) | | 28,394 | 238,510 |
| RPC, Inc. | | 15,848 | 102,061 |
| Schlumberger Ltd. | | 1,244,590 | 54,687,285 |
| TechnipFMC PLC | | 189,957 | 5,958,951 |
| TETRA Technologies, Inc. (a) | | 58,500 | 225,225 |
| Tidewater, Inc. (a) | | 11,104 | 574,299 |
| Transocean Ltd. (United States) (a)(e) | | 39,956 | 175,806 |
| Weatherford International PLC | | 62,469 | 5,141,199 |
| | | | 211,297,035 |
| Oil, Gas & Consumable Fuels - 2.9% | | | |
| Africa Oil Corp. | | 1,420,400 | 1,988,489 |
| Antero Midstream GP LP | | 192,404 | 3,072,692 |
| Antero Resources Corp. (a) | | 334,960 | 10,949,842 |
| APA Corp. | | 227,322 | 5,148,843 |
| Athabasca Oil Corp. (a) | | 1,111,500 | 4,068,739 |
| Berry Corp. | | 6,500 | 26,520 |
| Cameco Corp. | | 419,076 | 24,914,068 |
| Cheniere Energy, Inc. | | 335,473 | 75,149,307 |
| Chevron Corp. | | 1,312,765 | 212,576,036 |
| Chord Energy Corp. | | 100 | 12,752 |
| Civitas Resources, Inc. | | 27,547 | 1,429,138 |
| Clean Energy Fuels Corp. (a) | | 185,492 | 571,315 |
| CNX Resources Corp. (a)(e) | | 111,500 | 4,517,980 |
| Comstock Resources, Inc. (e) | | 2,600 | 40,482 |
| ConocoPhillips Co. | | 2,125,297 | 230,254,677 |
| CONSOL Energy, Inc. | | 47,134 | 6,160,414 |
| Coterra Energy, Inc. | | 308,700 | 8,248,464 |
| CVR Energy, Inc. | | 100 | 1,935 |
| Delek U.S. Holdings, Inc. | | 344,182 | 6,556,667 |
| Devon Energy Corp. | | 299,199 | 11,354,602 |
| Diamondback Energy, Inc. | | 132,104 | 23,460,349 |
| Dorian LPG Ltd. | | 60,796 | 1,487,678 |
| DT Midstream, Inc. | | 145,841 | 15,476,647 |
| EOG Resources, Inc. | | 1,170,161 | 155,935,655 |
| EQT Corp. | | 1,588,388 | 72,176,351 |
| Expand Energy Corp. | | 85,037 | 8,415,262 |
| Exxon Mobil Corp. | | 6,611,133 | 779,849,249 |
| FutureFuel Corp. | | 72,353 | 376,959 |
| Galp Energia SGPS SA | | 272,500 | 4,480,144 |
| Green Plains, Inc. (a) | | 26,300 | 284,040 |
| Gulfport Energy Corp. (a) | | 11,400 | 2,004,120 |
| Hess Corp. | | 86,730 | 12,764,921 |
| HF Sinclair Corp. (e) | | 543,834 | 22,259,126 |
| Imperial Oil Ltd. | | 138,900 | 10,244,501 |
| International Seaways, Inc. | | 1,089 | 42,471 |
| Kinder Morgan, Inc. | | 764,700 | 21,618,069 |
| Magnolia Oil & Gas Corp. Class A (e) | | 394,581 | 10,945,677 |
| Marathon Petroleum Corp. | | 548,976 | 85,722,602 |
| Matador Resources Co. | | 493,102 | 29,591,051 |
| MEG Energy Corp. | | 357,500 | 6,442,431 |
| Murphy Oil Corp. | | 374,802 | 12,169,821 |
| Navigator Holdings Ltd. | | 156,037 | 2,443,539 |
| New Fortress Energy, Inc. Class A (e) | | 764,321 | 8,155,305 |
| Northern Oil & Gas, Inc. (e) | | 368,353 | 16,019,672 |
| Occidental Petroleum Corp. | | 55,496 | 2,806,988 |
| ONEOK, Inc. | | 322 | 36,579 |
| Ovintiv, Inc. | | 523,405 | 23,773,055 |
| Par Pacific Holdings, Inc. (a) | | 121,025 | 2,109,466 |
| PBF Energy, Inc. Class A | | 46,177 | 1,454,114 |
| Peabody Energy Corp. | | 600 | 14,310 |
| Permian Resource Corp. Class A | | 1,296,529 | 20,303,644 |
| Phillips 66 Co. | | 316,700 | 42,431,466 |
| Plains GP Holdings LP Class A | | 123,510 | 2,472,670 |
| Range Resources Corp. | | 93,000 | 3,323,820 |
| Rex American Resources Corp. (a) | | 31,705 | 1,373,144 |
| Scorpio Tankers, Inc. | | 160,252 | 8,118,366 |
| Shell PLC ADR | | 606,461 | 39,262,285 |
| SM Energy Co. | | 169,415 | 7,655,864 |
| Suncor Energy, Inc. | | 197,000 | 7,777,560 |
| Targa Resources Corp. | | 296,180 | 60,509,574 |
| Texas Pacific Land Corp. (e) | | 33,202 | 53,126,188 |
| The Williams Companies, Inc. | | 815,832 | 47,742,489 |
| Valero Energy Corp. | | 446,274 | 62,067,788 |
| Whitecap Resources, Inc. | | 1,183,116 | 8,601,253 |
| | | | 2,304,369,225 |
TOTAL ENERGY | | | 2,515,666,260 |
| FINANCIALS - 13.6% | | | |
| Banks - 3.7% | | | |
| 1st Source Corp. | | 8,574 | 556,367 |
| AIB Group PLC | | 465,328 | 2,532,437 |
| Amalgamated Financial Corp. | | 6,124 | 218,198 |
| Associated Banc-Corp. | | 255,305 | 6,814,090 |
| Axos Financial, Inc. (a) | | 90,397 | 7,489,391 |
| Bancorp, Inc., Delaware (a)(e) | | 93,495 | 5,462,913 |
| Bank of America Corp. | | 12,071,659 | 573,524,519 |
| Bank OZK (e) | | 58,199 | 2,908,204 |
| Bank7 Corp. | | 3,615 | 172,291 |
| BankUnited, Inc. (e) | | 377,935 | 15,899,725 |
| Banner Corp. | | 156,399 | 11,665,801 |
| Berkshire Hills Bancorp, Inc. | | 1,500 | 45,720 |
| BOK Financial Corp. | | 2,800 | 332,836 |
| Brookline Bancorp, Inc., Delaware | | 1,243 | 15,649 |
| Byline Bancorp, Inc. | | 600 | 18,852 |
| Capitol Federal Financial, Inc. | | 30,723 | 205,230 |
| Citigroup, Inc. | | 2,644,512 | 187,416,565 |
| Citizens Financial Group, Inc. | | 1,129,572 | 54,377,596 |
| Coastal Financial Corp. of Washington (a) | | 2,668 | 204,235 |
| Comerica, Inc. | | 162,117 | 11,712,953 |
| Commerce Bancshares, Inc. | | 69,942 | 5,158,223 |
| ConnectOne Bancorp, Inc. | | 34,099 | 937,723 |
| CrossFirst Bankshares, Inc. (a) | | 9,397 | 162,662 |
| Cullen/Frost Bankers, Inc. | | 57,348 | 8,064,276 |
| Customers Bancorp, Inc. (a) | | 5,300 | 299,185 |
| CVB Financial Corp. | | 800 | 18,736 |
| Dime Community Bancshares, Inc. | | 1,233 | 44,240 |
| East West Bancorp, Inc. | | 151,815 | 16,651,069 |
| Enterprise Financial Services Corp. | | 12,896 | 781,369 |
| Esquire Financial Holdings, Inc. (e) | | 11,401 | 885,744 |
| Eurobank Ergasias Services and Holdings SA | | 1,656,562 | 3,512,981 |
| FB Financial Corp. (e) | | 12,408 | 700,432 |
| Fifth Third Bancorp | | 3,880,356 | 186,489,909 |
| First Bancorp, Puerto Rico (e) | | 751,031 | 15,531,321 |
| First Bancshares, Inc. | | 3,250 | 120,705 |
| First Business Finance Services, Inc. | | 1,362 | 68,263 |
| First Citizens Bancshares, Inc. | | 9,118 | 20,925,810 |
| First Financial Bankshares, Inc. | | 6,208 | 258,749 |
| First Foundation, Inc. | | 1,497 | 11,901 |
| First Hawaiian, Inc. | | 423,600 | 11,695,596 |
| First Horizon National Corp. | | 992,677 | 20,975,265 |
| First Internet Bancorp | | 6,617 | 277,451 |
| First of Long Island Corp. | | 2,353 | 34,048 |
| Flushing Financial Corp. | | 1,452 | 25,758 |
| FNB Corp., Pennsylvania | | 321,828 | 5,519,350 |
| Glacier Bancorp, Inc. | | 25,548 | 1,478,974 |
| Hancock Whitney Corp. | | 81,004 | 4,810,018 |
| HarborOne Bancorp, Inc. | | 15,198 | 195,750 |
| HDFC Bank Ltd. sponsored ADR | | 27,300 | 1,822,548 |
| Heritage Commerce Corp. | | 12,009 | 127,536 |
| Hilltop Holdings, Inc. | | 3,300 | 104,445 |
| Home Bancshares, Inc. | | 4,400 | 139,744 |
| HomeStreet, Inc. | | 1,820 | 21,622 |
| HomeTrust Bancshares, Inc. | | 3,891 | 144,317 |
| Horizon Bancorp, Inc. Indiana | | 13,357 | 244,300 |
| Huntington Bancshares, Inc. | | 1,867,219 | 33,628,614 |
| Independent Bank Corp. | | 4,299 | 161,771 |
| Independent Bank Group, Inc. | | 3,386 | 226,591 |
| JPMorgan Chase & Co. | | 2,842,499 | 709,828,850 |
| Kearny Financial Corp. | | 126,624 | 1,002,862 |
| KeyCorp | | 1,040,623 | 20,271,336 |
| Live Oak Bancshares, Inc. | | 3,100 | 146,940 |
| M&T Bank Corp. | | 74,542 | 16,398,495 |
| Mercantile Bank Corp. | | 1,540 | 77,077 |
| Metropolitan Bank Holding Corp. (a) | | 9,613 | 624,268 |
| Midland States Bancorp, Inc. | | 6,274 | 168,457 |
| MVB Financial Corp. | | 402 | 8,675 |
| NB Bancorp, Inc. | | 57,846 | 1,165,018 |
| Northfield Bancorp, Inc. | | 93,326 | 1,248,702 |
| Northwest Bancshares, Inc. | | 2,200 | 32,296 |
| OceanFirst Financial Corp. | | 77,011 | 1,592,587 |
| Old National Bancorp, Indiana | | 670,247 | 15,522,921 |
| Pathward Financial, Inc. | | 81,657 | 6,849,389 |
| Pinnacle Financial Partners, Inc. | | 96,754 | 12,298,401 |
| Piraeus Financial Holdings SA | | 552,800 | 2,032,696 |
| PNC Financial Services Group, Inc. | | 155,149 | 33,313,593 |
| Popular, Inc. | | 89,700 | 8,912,592 |
| Preferred Bank, Los Angeles | | 21,969 | 2,072,336 |
| Premier Financial Corp. | | 19,659 | 544,751 |
| Prosperity Bancshares, Inc. | | 28,405 | 2,378,351 |
| Provident Financial Services, Inc. | | 31,432 | 663,844 |
| RBB Bancorp | | 3,616 | 86,278 |
| Regions Financial Corp. | | 1,463,040 | 39,882,470 |
| ServisFirst Bancshares, Inc. (e) | | 6,501 | 622,666 |
| Southside Bancshares, Inc. | | 368 | 12,924 |
| Texas Capital Bancshares, Inc. (a) | | 104,409 | 9,234,976 |
| Tompkins Financial Corp. | | 854 | 65,169 |
| Truist Financial Corp. | | 2,352,979 | 112,190,039 |
| U.S. Bancorp | | 576,620 | 30,728,080 |
| UMB Financial Corp. | | 23,215 | 2,913,250 |
| United Bankshares, Inc., West Virginia | | 200 | 8,454 |
| Univest Corp. of Pennsylvania | | 3,494 | 110,969 |
| Valley National Bancorp | | 347,271 | 3,694,963 |
| Webster Financial Corp. | | 247,527 | 15,292,218 |
| Wells Fargo & Co. | | 7,896,943 | 601,510,148 |
| Westamerica Bancorp. | | 47,184 | 2,700,340 |
| Western Alliance Bancorp. (e) | | 314,073 | 29,400,374 |
| Wintrust Financial Corp. | | 115,181 | 15,896,130 |
| Zions Bancorporation NA | | 410,735 | 24,857,682 |
| | | | 2,950,192,135 |
| Capital Markets - 2.8% | | | |
| Ameriprise Financial, Inc. | | 94,309 | 54,130,537 |
| Ares Management Corp. Class A, | | 352,581 | 62,311,640 |
| Artisan Partners Asset Management, Inc. Class A, (e) | | 124,641 | 6,081,234 |
| Bank of New York Mellon Corp. | | 1,173,760 | 96,095,731 |
| BGC Group, Inc. Class A | | 333,408 | 3,247,394 |
| BlackRock, Inc. | | 53,899 | 55,127,897 |
| Blackstone, Inc. | | 221,997 | 42,421,407 |
| BrightSphere Investment Group, Inc. | | 6,505 | 202,826 |
| Brookfield Asset Management Ltd. Class A | | 80,906 | 4,624,587 |
| Brookfield Corp. Class A | | 1,178,477 | 72,346,703 |
| Carlyle Group LP | | 439,793 | 23,410,181 |
| Cboe Global Markets, Inc. | | 286,369 | 61,812,749 |
| Charles Schwab Corp. | | 3,653,080 | 302,328,901 |
| CME Group, Inc. | | 133,807 | 31,846,066 |
| Cohen & Steers, Inc. (e) | | 46,858 | 4,904,158 |
| Coinshares International Ltd. | | 377,846 | 2,940,099 |
| Diamond Hill Investment Group, Inc. | | 4,944 | 817,490 |
| Digitalbridge Group, Inc. Class A | | 754,254 | 9,880,727 |
| Donnelley Financial Solutions, Inc. (a) | | 4,309 | 259,617 |
| Evercore, Inc. Class A | | 121,963 | 37,552,408 |
| FactSet Research Systems, Inc. | | 35,761 | 17,546,850 |
| Federated Hermes, Inc. Class B | | 228,423 | 9,765,083 |
| Franklin Resources, Inc. | | 94,200 | 2,143,992 |
| GCM Grosvenor, Inc. Class A | | 1,900 | 23,579 |
| Goldman Sachs Group, Inc. | | 551,252 | 335,475,430 |
| Hamilton Lane, Inc. Class A (e) | | 68,537 | 13,186,519 |
| Houlihan Lokey Class A | | 113,758 | 21,510,500 |
| Interactive Brokers Group, Inc. | | 136,318 | 26,049,007 |
| Intercontinental Exchange, Inc. | | 303,140 | 48,793,414 |
| Invesco Ltd. | | 939,748 | 17,000,041 |
| Jefferies Financial Group, Inc. | | 552,600 | 43,732,764 |
| KKR & Co., Inc. Class A | | 755,114 | 122,985,417 |
| London Stock Exchange Group PLC | | 26,104 | 3,741,192 |
| LPL Financial | | 44,260 | 14,391,139 |
| Marex Group PLC | | 560,436 | 16,409,566 |
| MarketAxess Holdings, Inc. | | 137,155 | 35,480,627 |
| Moelis & Co. Class A | | 7,113 | 547,559 |
| Moody's Corp. | | 97,265 | 48,630,555 |
| Morgan Stanley | | 1,104,828 | 145,406,413 |
| Morningstar, Inc. | | 380 | 134,577 |
| MSCI, Inc. | | 15,101 | 9,206,023 |
| NASDAQ, Inc. | | 299,444 | 24,850,858 |
| Northern Trust Corp. | | 316,180 | 35,146,569 |
| P10, Inc. Class A | | 613,180 | 8,645,838 |
| Patria Investments Ltd. | | 12,678 | 151,629 |
| PJT Partners, Inc. Class A (e) | | 39,343 | 6,584,444 |
| Raymond James Financial, Inc. | | 54,900 | 9,293,472 |
| Robinhood Markets, Inc. (a) | | 75,734 | 2,843,054 |
| S&P Global, Inc. | | 124,039 | 64,811,618 |
| SEI Investments Co. | | 513,047 | 42,393,074 |
| State Street Corp. | | 713,900 | 70,326,289 |
| StepStone Group, Inc. Class A | | 53,217 | 3,506,468 |
| Stifel Financial Corp. | | 228,530 | 26,463,774 |
| T. Rowe Price Group, Inc. | | 142,143 | 17,602,989 |
| TPG, Inc. Class A | | 114,300 | 7,996,428 |
| Tradeweb Markets, Inc. Class A | | 160,561 | 21,756,016 |
| UBS Group AG (e) | | 203,341 | 6,576,048 |
| Virtu Financial, Inc. Class A | | 708,081 | 26,418,502 |
| XP, Inc. Class A | | 54,098 | 732,487 |
| | | | 2,180,602,156 |
| Consumer Finance - 0.7% | | | |
| Ally Financial, Inc. | | 74,985 | 2,997,900 |
| American Express Co. | | 672,330 | 204,845,504 |
| Atlanticus Holdings Corp. (a) | | 685 | 39,908 |
| Capital One Financial Corp. | | 759,709 | 145,871,725 |
| Discover Financial Services | | 257,222 | 46,925,009 |
| Encore Capital Group, Inc. (a) | | 138,587 | 6,816,402 |
| Enova International, Inc. (a) | | 131,177 | 13,840,485 |
| EZCORP, Inc. (non-vtg.) Class A (a)(e) | | 106,485 | 1,363,008 |
| FirstCash Holdings, Inc. | | 45,740 | 4,979,256 |
| Green Dot Corp. Class A (a) | | 3,000 | 30,810 |
| LendingClub Corp. (a) | | 3,700 | 61,568 |
| LendingTree, Inc. (a) | | 7,438 | 328,834 |
| MoneyLion, Inc. Class A (a) | | 81,773 | 7,498,584 |
| Navient Corp. (e) | | 431,000 | 6,714,980 |
| Nelnet, Inc. Class A | | 2,400 | 261,408 |
| NerdWallet, Inc. (a) | | 2,000 | 28,000 |
| OneMain Holdings, Inc. | | 187,700 | 10,764,595 |
| PRA Group, Inc. (a) | | 8,313 | 176,236 |
| PROG Holdings, Inc. | | 35,333 | 1,719,304 |
| Regional Management Corp. (e) | | 3,003 | 91,682 |
| SLM Corp. (e) | | 927,850 | 25,404,533 |
| Synchrony Financial | | 483,700 | 32,659,424 |
| World Acceptance Corp. (a) | | 300 | 36,276 |
| | | | 513,455,431 |
| Financial Services - 4.0% | | | |
| Affirm Holdings, Inc. Class A, (a) | | 91,578 | 6,411,376 |
| Apollo Global Management, Inc. | | 971,267 | 170,000,863 |
| AvidXchange Holdings, Inc. (a) | | 433,800 | 4,962,672 |
| Banco Latinoamericano de Comer Series E | | 6,362 | 216,753 |
| Berkshire Hathaway, Inc.: | | | |
| Class A (a) | | 8 | 5,792,320 |
| Class B (a) | | 1,310,415 | 632,956,653 |
| Block, Inc. Class A (a) | | 1,817,694 | 160,956,804 |
| Cannae Holdings, Inc. | | 666,794 | 14,469,430 |
| Cass Information Systems, Inc. | | 18,886 | 847,415 |
| Corebridge Financial, Inc. | | 1,351,059 | 43,733,780 |
| Corpay, Inc. (a) | | 511,172 | 194,848,543 |
| Enact Holdings, Inc. | | 28,800 | 1,014,048 |
| Equitable Holdings, Inc. | | 607,826 | 29,315,448 |
| Essent Group Ltd. | | 46,927 | 2,711,442 |
| Euronet Worldwide, Inc. (a) | | 73,320 | 7,708,132 |
| EVERTEC, Inc. (e) | | 198,324 | 7,139,664 |
| Federal Agricultural Mortgage Corp. Class C (non-vtg.) | | 1,400 | 298,858 |
| Fidelity National Information Services, Inc. | | 1,426,029 | 121,640,274 |
| Fiserv, Inc. (a) | | 566,436 | 125,159,699 |
| Flywire Corp. (a) | | 349,890 | 7,946,002 |
| Global Payments, Inc. | | 302,181 | 35,947,452 |
| i3 Verticals, Inc. Class A (a) | | 279,404 | 6,929,219 |
| International Money Express, Inc. (a) | | 69,310 | 1,460,362 |
| Jack Henry & Associates, Inc. | | 69,480 | 12,240,986 |
| MasterCard, Inc. Class A | | 1,283,246 | 683,893,123 |
| MGIC Investment Corp. | | 21,973 | 577,011 |
| Mr. Cooper Group, Inc. (a) | | 19,460 | 1,920,118 |
| NCR Atleos Corp. (a) | | 463,013 | 15,191,457 |
| NMI Holdings, Inc. (a) | | 7,721 | 308,763 |
| PagSeguro Digital Ltd. (a) | | 165,314 | 1,213,405 |
| Payoneer Global, Inc. (a) | | 991,557 | 10,817,887 |
| PayPal Holdings, Inc. (a) | | 1,149,735 | 99,762,506 |
| Radian Group, Inc. | | 604,619 | 21,639,314 |
| Remitly Global, Inc. (a) | | 299,478 | 6,157,268 |
| Rocket Companies, Inc. Class A (a)(e) | | 1,100 | 15,983 |
| Sezzle, Inc. (a)(e) | | 5,153 | 2,185,027 |
| Shift4 Payments, Inc. Class A (a)(e) | | 87,285 | 9,957,473 |
| The Western Union Co. | | 205,800 | 2,265,858 |
| Toast, Inc. (a) | | 100,019 | 4,354,827 |
| UWM Holdings Corp. Class A | | 408,639 | 2,660,240 |
| Velocity Financial, Inc. (a) | | 4,356 | 89,124 |
| Visa, Inc. Class A | | 1,917,370 | 604,124,940 |
| Voya Financial, Inc. | | 482,032 | 40,008,656 |
| Walker & Dunlop, Inc. | | 81,509 | 8,980,662 |
| WEX, Inc. (a) | | 424,230 | 80,035,232 |
| | | | 3,190,867,069 |
| Insurance - 2.4% | | | |
| AFLAC, Inc. | | 335,867 | 38,288,838 |
| Allstate Corp. | | 343,479 | 71,234,110 |
| AMBAC Financial Group, Inc. (a) | | 671,330 | 8,619,877 |
| American Financial Group, Inc. | | 267,019 | 39,214,410 |
| American International Group, Inc. | | 1,333,727 | 102,536,932 |
| Amerisafe, Inc. | | 46,167 | 2,724,776 |
| Aon PLC | | 353,869 | 138,553,868 |
| Arch Capital Group Ltd. | | 341,744 | 34,420,456 |
| Arthur J. Gallagher & Co. | | 404,215 | 126,212,092 |
| Assurant, Inc. | | 13,800 | 3,133,980 |
| Assured Guaranty Ltd. | | 177,104 | 16,520,261 |
| Axis Capital Holdings Ltd. | | 505,587 | 47,039,814 |
| Brighthouse Financial, Inc. (a) | | 25,417 | 1,328,547 |
| Brookfield Wealth Solutions Lt (e) | | 6,648 | 408,121 |
| Chubb Ltd. | | 518,599 | 149,735,089 |
| Cincinnati Financial Corp. | | 142,077 | 22,708,167 |
| CNA Financial Corp. | | 147,983 | 7,464,263 |
| CNO Financial Group, Inc. | | 12,887 | 514,191 |
| Direct Line Insurance Group PLC | | 956,053 | 2,856,412 |
| Donegal Group, Inc. Class A | | 400 | 6,656 |
| eHealth, Inc. (a) | | 3,207 | 18,120 |
| Erie Indemnity Co. Class A | | 61,586 | 27,132,328 |
| Everest Re Group Ltd. | | 127,593 | 49,449,943 |
| Fairfax Financial Holdings Ltd. (sub. vtg.) | | 5,017 | 7,107,402 |
| Fidelis Insurance Holdings Ltd. | | 34,409 | 706,417 |
| Fidelity National Financial, Inc. | | 72,300 | 4,583,097 |
| First American Financial Corp. | | 12,900 | 904,935 |
| Genworth Financial, Inc. Class A (a) | | 1,822,749 | 14,217,442 |
| Globe Life, Inc. | | 173,707 | 19,323,167 |
| Goosehead Insurance Class A (a)(e) | | 44,998 | 5,675,148 |
| Hamilton Insurance Group Ltd. | | 248,993 | 4,750,786 |
| Hanover Insurance Group, Inc. | | 67,096 | 11,071,511 |
| Hartford Financial Services Group, Inc. | | 992,162 | 122,343,496 |
| HCI Group, Inc. (e) | | 14,490 | 1,765,896 |
| Kemper Corp. | | 221,456 | 15,831,889 |
| Kinsale Capital Group, Inc. (e) | | 44,158 | 22,451,694 |
| Lemonade, Inc. (a)(e) | | 10,600 | 549,186 |
| Lincoln National Corp. | | 387,140 | 13,758,956 |
| Loews Corp. | | 66,100 | 5,732,853 |
| Markel Group, Inc. (a) | | 3,040 | 5,420,077 |
| Marsh & McLennan Companies, Inc. | | 309,759 | 72,245,092 |
| MBIA, Inc. (e) | | 6,400 | 44,096 |
| MetLife, Inc. | | 1,916,495 | 169,092,354 |
| Old Republic International Corp. | | 76,100 | 2,965,617 |
| Oscar Health, Inc. Class A (a) | | 75,585 | 1,309,888 |
| Palomar Holdings, Inc. (a) | | 5,575 | 603,773 |
| Primerica, Inc. | | 70,454 | 21,329,949 |
| Principal Financial Group, Inc. | | 89,500 | 7,794,555 |
| Progressive Corp. | | 726,696 | 195,394,020 |
| Prudential Financial, Inc. | | 304,428 | 39,396,027 |
| Prudential PLC | | 120,496 | 987,548 |
| Reinsurance Group of America, Inc. | | 72,614 | 16,585,038 |
| RenaissanceRe Holdings Ltd. | | 108,531 | 31,056,146 |
| RLI Corp. (e) | | 121,699 | 21,406,854 |
| Selective Insurance Group, Inc. | | 3,442 | 351,394 |
| Siriuspoint Ltd. (a) | | 258,007 | 3,978,468 |
| The Baldwin Insurance Group, Inc. Class A, (a) | | 335,466 | 16,424,415 |
| The Travelers Companies, Inc. | | 342,110 | 91,014,944 |
| Universal Insurance Holdings, Inc. | | 46,867 | 1,060,600 |
| Unum Group | | 529,509 | 40,719,242 |
| W.R. Berkley Corp. | | 130,150 | 8,401,183 |
| White Mountains Insurance Group Ltd. | | 12,811 | 25,749,982 |
| Willis Towers Watson PLC | | 50,399 | 16,228,478 |
| | | | 1,930,454,866 |
| Mortgage Real Estate Investment Trusts - 0.0% | | | |
| AGNC Investment Corp. | | 8,900 | 85,974 |
| Angel Oak Mortgage (REIT), Inc. | | 4,100 | 40,221 |
| Annaly Capital Management, Inc. | | 806,064 | 16,064,856 |
| BrightSpire Capital, Inc. | | 2,500 | 15,850 |
| Cherry Hill Mortgage Investment Corp. | | 2,172 | 6,016 |
| Chimera Investment Corp. | | 41,872 | 621,380 |
| Granite Point Mortgage Trust, Inc. | | 81,008 | 287,578 |
| KKR Real Estate Finance Trust, Inc. | | 27,952 | 325,082 |
| Ladder Capital Corp. Class A | | 52,000 | 616,720 |
| Nexpoint Real Estate Finance, Inc. | | 100 | 1,777 |
| Rithm Capital Corp. | | 23,400 | 263,250 |
| Rithm Property Trust, Inc. | | 7,216 | 21,937 |
| Starwood Property Trust, Inc. | | 300 | 6,111 |
| TPG RE Finance Trust, Inc. | | 22,985 | 209,853 |
| | | | 18,566,605 |
TOTAL FINANCIALS | | | 10,784,138,262 |
| HEALTH CARE - 9.4% | | | |
| Biotechnology - 1.9% | | | |
| 4D Molecular Therapeutics, Inc. (a)(e) | | 13,493 | 105,785 |
| AbbVie, Inc. | | 2,700,638 | 494,027,709 |
| ACADIA Pharmaceuticals, Inc. (a) | | 188,944 | 3,083,566 |
| ADMA Biologics, Inc. (a) | | 51,621 | 1,038,098 |
| Agios Pharmaceuticals, Inc. (a) | | 241,659 | 14,352,128 |
| Akero Therapeutics, Inc. (a) | | 3,272 | 105,031 |
| Alnylam Pharmaceuticals, Inc. (a)(e) | | 43,685 | 11,055,363 |
| ALX Oncology Holdings, Inc. (a) | | 2,500 | 3,700 |
| Amgen, Inc. | | 434,966 | 123,038,832 |
| Amicus Therapeutics, Inc. (a) | | 199,499 | 1,991,000 |
| AnaptysBio, Inc. (a)(e) | | 44,293 | 1,105,553 |
| Apellis Pharmaceuticals, Inc. (a) | | 66,998 | 2,273,242 |
| Arcellx, Inc. (a) | | 1,085 | 95,556 |
| Arcturus Therapeutics Holdings, Inc. (a)(e) | | 42,484 | 779,157 |
| Arcus Biosciences, Inc. (a) | | 7,160 | 110,550 |
| Arcutis Biotherapeutics, Inc. (a) | | 200 | 2,608 |
| Ardelyx, Inc. (a) | | 90,800 | 514,836 |
| Argenx SE ADR (a) | | 15,400 | 9,494,870 |
| Ascendis Pharma A/S sponsored ADR (a) | | 36,425 | 4,956,714 |
| Avid Bioservices, Inc. (a) | | 371 | 4,556 |
| Avidity Biosciences, Inc. (a) | | 51,268 | 2,206,062 |
| BeiGene Ltd. ADR (a) | | 45,200 | 9,718,000 |
| BioCryst Pharmaceuticals, Inc. (a) | | 129,699 | 972,743 |
| Biogen, Inc. (a) | | 290,151 | 46,606,955 |
| BioMarin Pharmaceutical, Inc. (a) | | 403,841 | 26,665,621 |
| Biomea Fusion, Inc. (a)(e) | | 200 | 1,448 |
| BioNTech SE ADR (a) | | 14,000 | 1,657,460 |
| Blueprint Medicines Corp. (a) | | 54,052 | 5,209,532 |
| BridgeBio Pharma, Inc. (a) | | 12,427 | 336,647 |
| CareDx, Inc. (a) | | 8,870 | 217,670 |
| Cargo Therapeutics, Inc. (a)(e) | | 68,800 | 1,250,784 |
| Catalyst Pharmaceutical Partners, Inc. (a) | | 84,866 | 1,872,993 |
| Celldex Therapeutics, Inc. (a)(e) | | 56,219 | 1,542,649 |
| Crinetics Pharmaceuticals, Inc. (a) | | 262,156 | 14,995,323 |
| CRISPR Therapeutics AG (a)(e) | | 16,658 | 852,390 |
| Cytokinetics, Inc. (a)(f) | | 163,834 | 8,496,431 |
| Day One Biopharmaceuticals, Inc. (a)(e) | | 57,569 | 801,936 |
| Denali Therapeutics, Inc. (a)(e) | | 63,708 | 1,592,700 |
| Design Therapeutics, Inc. (a) | | 6,500 | 39,000 |
| Dynavax Technologies Corp. (a) | | 35,324 | 454,267 |
| Dyne Therapeutics, Inc. (a) | | 31,891 | 976,184 |
| Enanta Pharmaceuticals, Inc. (a) | | 25,007 | 215,060 |
| Exact Sciences Corp. (a)(e) | | 326,866 | 20,291,841 |
| Exelixis, Inc. (a) | | 281,525 | 10,264,402 |
| Fate Therapeutics, Inc. (a) | | 10,571 | 33,510 |
| Foghorn Therapeutics, Inc. (a) | | 565 | 4,514 |
| Generation Bio Co. (a) | | 600 | 912 |
| Gilead Sciences, Inc. | | 1,180,484 | 109,289,209 |
| Halozyme Therapeutics, Inc. (a) | | 211,965 | 10,216,713 |
| Heron Therapeutics, Inc. (a) | | 10,171 | 12,103 |
| Ideaya Biosciences, Inc. (a) | | 47,390 | 1,296,590 |
| Incyte Corp. (a) | | 97,700 | 7,287,443 |
| Insmed, Inc. (a) | | 173,694 | 13,054,841 |
| Intellia Therapeutics, Inc. (a)(e) | | 67,765 | 1,058,489 |
| Ionis Pharmaceuticals, Inc. (a)(e) | | 70,210 | 2,508,603 |
| iTeos Therapeutics, Inc. (a) | | 51,670 | 441,779 |
| Keros Therapeutics, Inc. (a) | | 36,500 | 2,107,510 |
| Kiniksa Pharmaceuticals Intern (a)(e) | | 45,012 | 993,865 |
| Kodiak Sciences, Inc. (a) | | 13,374 | 89,205 |
| Kura Oncology, Inc. (a) | | 18,329 | 202,352 |
| Kymera Therapeutics, Inc. (a) | | 8,334 | 390,448 |
| Legend Biotech Corp. ADR (a) | | 140,000 | 5,889,800 |
| MannKind Corp. (a) | | 25,000 | 169,500 |
| Mersana Therapeutics, Inc. (a) | | 27,500 | 62,700 |
| Merus BV (a) | | 82,413 | 3,695,399 |
| MiMedx Group, Inc. (a) | | 16,000 | 148,000 |
| Mirum Pharmaceuticals, Inc. (a) | | 100 | 4,622 |
| Moderna, Inc. (a) | | 13,862 | 596,898 |
| Moonlake Immunotherapeutics Class A (a)(e) | | 35,000 | 1,905,050 |
| Myriad Genetics, Inc. (a) | | 45,161 | 734,769 |
| Natera, Inc. (a) | | 99,301 | 16,660,722 |
| Neurocrine Biosciences, Inc. (a) | | 110,827 | 14,047,322 |
| Novavax, Inc. (a)(e) | | 41,100 | 358,392 |
| Nurix Therapeutics, Inc. (a) | | 75,390 | 1,666,873 |
| Nuvalent, Inc. Class A (a) | | 5,622 | 543,535 |
| PMV Pharmaceuticals, Inc. (a) | | 13,869 | 22,468 |
| Protagonist Therapeutics, Inc. (a) | | 2,400 | 105,120 |
| PTC Therapeutics, Inc. (a) | | 45,285 | 1,987,106 |
| Puma Biotechnology, Inc. (a) | | 2,500 | 8,475 |
| PureTech Health PLC (a) | | 2,048,481 | 4,347,792 |
| RAPT Therapeutics, Inc. (a) | | 26,125 | 32,918 |
| Regeneron Pharmaceuticals, Inc. (a) | | 240,437 | 180,380,646 |
| REGENXBIO, Inc. (a) | | 12,606 | 125,052 |
| Relay Therapeutics, Inc. (a) | | 59,192 | 278,202 |
| Repare Therapeutics, Inc. (a) | | 3,460 | 11,349 |
| Repligen Corp. (a) | | 135,965 | 20,468,171 |
| Replimune Group, Inc. (a) | | 3,700 | 52,096 |
| Revolution Medicines, Inc. (a) | | 38,921 | 2,251,580 |
| Sage Therapeutics, Inc. (a) | | 25,500 | 139,485 |
| Sarepta Therapeutics, Inc. (a) | | 347,536 | 46,340,450 |
| Solid Biosciences, Inc. (a) | | 700 | 3,990 |
| SpringWorks Therapeutics, Inc. (a)(e) | | 292,144 | 12,118,133 |
| Sutro Biopharma, Inc. (a) | | 200 | 530 |
| Syndax Pharmaceuticals, Inc. (a) | | 28,052 | 469,029 |
| Tango Therapeutics, Inc. (a) | | 5,187 | 20,437 |
| Tenaya Therapeutics, Inc. (a) | | 2,502 | 8,932 |
| TG Therapeutics, Inc. (a)(e) | | 60,221 | 2,095,691 |
| Travere Therapeutics, Inc. (a) | | 11,787 | 221,713 |
| Twist Bioscience Corp. (a) | | 2,488 | 122,360 |
| Ultragenyx Pharmaceutical, Inc. (a) | | 294,421 | 14,023,272 |
| United Therapeutics Corp. (a) | | 135,799 | 50,312,172 |
| Vanda Pharmaceuticals, Inc. (a) | | 150,275 | 773,916 |
| Vaxcyte, Inc. (a)(e) | | 59,926 | 5,653,419 |
| Veracyte, Inc. (a)(e) | | 285,088 | 12,244,530 |
| Vericel Corp. (a) | | 9,093 | 528,667 |
| Vertex Pharmaceuticals, Inc. (a) | | 338,869 | 158,634,745 |
| Verve Therapeutics, Inc. (a)(e) | | 15,057 | 84,470 |
| Viking Therapeutics, Inc. (a)(e) | | 24,232 | 1,282,842 |
| Vir Biotechnology, Inc. (a)(e) | | 38,494 | 306,412 |
| Voyager Therapeutics, Inc. (a) | | 9,892 | 67,859 |
| Xenon Pharmaceuticals, Inc. (a) | | 50,000 | 2,131,500 |
| | | | 1,538,504,149 |
| Health Care Equipment & Supplies - 1.7% | | | |
| Abbott Laboratories | | 961,879 | 114,242,369 |
| Abiomed, Inc. (a)(d) | | 14,700 | 31,752 |
| Align Technology, Inc. (a) | | 7,714 | 1,795,588 |
| Angiodynamics, Inc. (a) | | 55,330 | 383,437 |
| Atricure, Inc. (a) | | 831 | 30,049 |
| Avanos Medical, Inc. (a) | | 600 | 11,496 |
| Bausch + Lomb Corp. (a) | | 225,488 | 4,469,172 |
| Baxter International, Inc. | | 222,000 | 7,483,620 |
| Becton, Dickinson & Co. | | 354,991 | 78,772,503 |
| Boston Scientific Corp. (a) | | 2,252,063 | 204,172,032 |
| Cerus Corp. (a) | | 27,600 | 51,060 |
| ClearPoint Neuro, Inc. (a) | | 100 | 1,237 |
| CVRx, Inc. (a) | | 660 | 10,111 |
| Dentsply Sirona, Inc. | | 41,256 | 810,680 |
| DexCom, Inc. (a) | | 91,900 | 7,167,281 |
| Edwards Lifesciences Corp. (a) | | 255,130 | 18,203,526 |
| Embecta Corp. | | 385,759 | 8,035,360 |
| Enovis Corp. (a) | | 102,061 | 4,981,597 |
| Envista Holdings Corp. (a) | | 53,390 | 1,190,063 |
| Establishment Labs Holdings, Inc. (a)(e) | | 94,145 | 4,320,314 |
| GE Healthcare Technologies, Inc. | | 191,897 | 15,969,668 |
| Glaukos Corp. (a) | | 34,000 | 4,884,100 |
| Globus Medical, Inc. Class A (a) | | 251,956 | 21,569,953 |
| Hologic, Inc. (a) | | 505,940 | 40,222,230 |
| IDEXX Laboratories, Inc. (a) | | 27,730 | 11,695,128 |
| InMode Ltd. (a) | | 199,694 | 3,900,024 |
| Inspire Medical Systems, Inc. (a) | | 24,934 | 4,806,278 |
| Insulet Corp. (a) | | 80,693 | 21,527,279 |
| Integra LifeSciences Holdings Corp. (a) | | 339,009 | 8,332,841 |
| Intuitive Surgical, Inc. (a) | | 316,794 | 171,702,348 |
| IRadimed Corp. | | 1,788 | 96,427 |
| Lantheus Holdings, Inc. (a) | | 403,612 | 36,030,443 |
| LeMaitre Vascular, Inc. | | 47,518 | 5,083,951 |
| Masimo Corp. (a)(e) | | 65,000 | 11,215,100 |
| Medtronic PLC | | 772,779 | 66,876,295 |
| Merit Medical Systems, Inc. (a) | | 67,258 | 6,988,106 |
| Neogen Corp. (a)(e) | | 603,020 | 8,550,824 |
| Nevro Corp. (a) | | 90,600 | 416,760 |
| Novocure Ltd. (a) | | 114,133 | 2,287,225 |
| Omnicell, Inc. (a) | | 54,453 | 2,536,965 |
| OraSure Technologies, Inc. (a) | | 36,900 | 140,220 |
| OrthoPediatrics Corp. (a) | | 173,826 | 4,515,999 |
| Penumbra, Inc. (a) | | 98,806 | 24,120,521 |
| Pulmonx Corp. (a) | | 9,262 | 59,740 |
| QuidelOrtho Corp. (a) | | 31,373 | 1,286,293 |
| ResMed, Inc. | | 69,779 | 17,376,367 |
| Sight Sciences, Inc. (a) | | 644 | 2,570 |
| Smith & Nephew PLC sponsored ADR (e) | | 337,782 | 8,708,020 |
| Solventum Corp. | | 141,113 | 10,090,991 |
| Staar Surgical Co. (a) | | 4,247 | 123,588 |
| STERIS PLC | | 55,014 | 12,051,367 |
| Stryker Corp. | | 794,047 | 311,385,531 |
| SurModics, Inc. (a) | | 9,100 | 358,995 |
| Tandem Diabetes Care, Inc. (a) | | 39,969 | 1,224,250 |
| Teleflex, Inc. | | 47,860 | 9,229,801 |
| The Cooper Companies, Inc. (a) | | 232,797 | 24,317,975 |
| Utah Medical Products, Inc. | | 5,913 | 385,823 |
| Varex Imaging Corp. (a) | | 12,100 | 201,828 |
| Zimmer Biomet Holdings, Inc. | | 371,640 | 41,660,844 |
| Zimvie, Inc. (a) | | 6,900 | 101,844 |
| | | | 1,368,197,759 |
| Health Care Providers & Services - 2.3% | | | |
| Acadia Healthcare Co., Inc. (a) | | 448,276 | 18,213,454 |
| Accolade, Inc. (a) | | 17,200 | 66,392 |
| Addus HomeCare Corp. (a) | | 9,090 | 1,116,616 |
| agilon health, Inc. (a)(e) | | 901,666 | 1,884,482 |
| AMN Healthcare Services, Inc. (a) | | 108,213 | 2,816,784 |
| Brookdale Senior Living, Inc. (a) | | 10,492 | 59,595 |
| Cardinal Health, Inc. | | 366,429 | 44,792,281 |
| Castle Biosciences, Inc. (a)(e) | | 448,016 | 13,565,924 |
| Cencora, Inc. | | 355,023 | 89,306,036 |
| Centene Corp. (a) | | 438,548 | 26,312,880 |
| Chemed Corp. | | 70,452 | 40,326,020 |
| Cigna Group | | 442,813 | 149,582,231 |
| Clover Health Investments Corp. (a) | | 23,315 | 81,136 |
| Community Health Systems, Inc. (a) | | 8,400 | 28,896 |
| Concentra Group Holdings Parent, Inc. (e) | | 5,282 | 115,253 |
| Corvel Corp. (a) | | 16,300 | 5,956,020 |
| Cross Country Healthcare, Inc. (a) | | 48,017 | 516,663 |
| CVS Health Corp. | | 857,100 | 51,297,435 |
| DaVita, Inc. (a) | | 140,189 | 23,295,206 |
| Elevance Health, Inc. | | 154,992 | 63,075,544 |
| Encompass Health Corp. | | 243,188 | 25,033,773 |
| Enhabit Home Health & Hospice (a) | | 1,698 | 13,126 |
| GeneDx Holdings Corp. Class A (a) | | 85,222 | 6,680,553 |
| Guardant Health, Inc. (a) | | 55,128 | 1,963,108 |
| HCA Holdings, Inc. | | 347,894 | 113,837,875 |
| HealthEquity, Inc. (a) | | 112,330 | 11,405,988 |
| Henry Schein, Inc. (a) | | 39,300 | 3,028,065 |
| Hims & Hers Health, Inc. Class A (a)(e) | | 8,791 | 283,246 |
| Humana, Inc. | | 64,896 | 19,233,876 |
| Labcorp Holdings, Inc. | | 30,200 | 7,283,032 |
| LifeStance Health Group, Inc. (a) | | 340,000 | 2,556,800 |
| McKesson Corp. | | 277,740 | 174,559,590 |
| Modivcare, Inc. (a) | | 26 | 489 |
| Molina Healthcare, Inc. (a) | | 90,642 | 27,002,252 |
| Nano-X Imaging Ltd. (a)(e) | | 26,798 | 173,115 |
| National Research Corp. Class A | | 25,111 | 493,682 |
| Owens & Minor, Inc. (a) | | 26,148 | 352,214 |
| Patterson Companies, Inc. | | 236,765 | 5,088,080 |
| Pediatrix Medical Group, Inc. (a)(e) | | 449,361 | 6,722,441 |
| Privia Health Group, Inc. (a) | | 222,882 | 4,787,505 |
| Progyny, Inc. (a) | | 30,940 | 481,736 |
| Quest Diagnostics, Inc. | | 145,800 | 23,715,828 |
| RadNet, Inc. (a) | | 223,924 | 18,308,026 |
| Select Medical Holdings Corp. (e) | | 6,546 | 138,186 |
| Surgery Partners, Inc. (a)(e) | | 231,730 | 5,524,443 |
| Tenet Healthcare Corp. (a) | | 368,813 | 52,622,239 |
| UnitedHealth Group, Inc. | | 1,242,909 | 758,423,072 |
| Universal Health Services, Inc. Class B | | 275,719 | 56,522,395 |
| | | | 1,858,643,583 |
| Health Care Technology - 0.1% | | | |
| Definitive Healthcare Corp. (a) | | 2,400 | 11,352 |
| Doximity, Inc. Class A (a) | | 515,839 | 27,339,467 |
| Health Catalyst, Inc. (a) | | 570,246 | 5,035,272 |
| HealthStream, Inc. (e) | | 42,817 | 1,417,243 |
| Lifemd, Inc. (a) | | 3,400 | 22,406 |
| OptimizeRx Corp. (a) | | 1,464 | 7,979 |
| Phreesia, Inc. (a) | | 106,359 | 2,236,730 |
| Simulations Plus, Inc. (e) | | 26,156 | 830,976 |
| Teladoc Health, Inc. (a) | | 100,483 | 1,203,786 |
| Veeva Systems, Inc. Class A (a) | | 20,000 | 4,557,000 |
| | | | 42,662,211 |
| Life Sciences Tools & Services - 1.1% | | | |
| 10X Genomics, Inc. Class A (a) | | 220,300 | 3,502,770 |
| Agilent Technologies, Inc. | | 251,084 | 34,642,059 |
| Avantor, Inc. (a) | | 671,925 | 14,150,741 |
| Azenta, Inc. (a)(e) | | 227,779 | 10,525,668 |
| Bio-Rad Laboratories, Inc. Class A (a) | | 48,229 | 16,423,421 |
| Bio-Techne Corp. | | 7,687 | 579,292 |
| Bruker Corp. | | 73,363 | 4,251,386 |
| Charles River Laboratories International, Inc. (a) | | 17,946 | 3,572,331 |
| ChromaDex, Inc. (a) | | 68,797 | 531,113 |
| CryoPort, Inc. (a) | | 1,900 | 13,452 |
| Danaher Corp. | | 774,339 | 185,601,315 |
| Gerresheimer AG | | 91,817 | 7,247,963 |
| ICON PLC (a) | | 144,766 | 30,437,052 |
| Illumina, Inc. (a) | | 100,848 | 14,537,239 |
| Inotiv, Inc. (a) | | 6,100 | 22,326 |
| IQVIA Holdings, Inc. (a) | | 3,200 | 642,688 |
| Lonza Group AG ADR (e) | | 91,100 | 5,455,068 |
| Maravai LifeSciences Holdings, Inc. Class A (a) | | 559,077 | 3,169,967 |
| MaxCyte, Inc. (a) | | 669,236 | 2,375,788 |
| Medpace Holdings, Inc. (a) | | 93,566 | 31,871,387 |
| Mettler-Toledo International, Inc. (a) | | 25,747 | 32,214,646 |
| QIAGEN NV | | 11,294 | 490,498 |
| Quanterix Corp. (a) | | 1,558,499 | 19,216,293 |
| Revvity, Inc. | | 69,610 | 8,084,505 |
| Seer, Inc. (a) | | 53,794 | 132,871 |
| Sotera Health Co. (a) | | 322,735 | 4,250,420 |
| Thermo Fisher Scientific, Inc. | | 814,314 | 431,285,124 |
| Waters Corp. (a) | | 1,690 | 650,177 |
| West Pharmaceutical Services, Inc. | | 2,000 | 651,360 |
| | | | 866,528,920 |
| Pharmaceuticals - 2.3% | | | |
| Amneal Intermediate, Inc. Class A, (a) | | 3,244 | 26,828 |
| Amphastar Pharmaceuticals, Inc. (a) | | 165,599 | 7,483,419 |
| Amylyx Pharmaceuticals, Inc. (a) | | 1,200 | 6,648 |
| Arvinas Holding Co. LLC (a) | | 57,586 | 1,538,698 |
| AstraZeneca PLC sponsored ADR | | 482,079 | 32,598,182 |
| Atea Pharmaceuticals, Inc. (a) | | 112,612 | 385,133 |
| Axsome Therapeutics, Inc. (a) | | 200 | 19,644 |
| Bristol-Myers Squibb Co. | | 2,887,700 | 171,009,594 |
| Corcept Therapeutics, Inc. (a)(e) | | 267,369 | 15,421,844 |
| CorMedix, Inc. (a)(e) | | 20,000 | 197,200 |
| Edgewise Therapeutics, Inc. (a) | | 10,182 | 336,006 |
| Elanco Animal Health, Inc. (a) | | 2,463,635 | 32,544,618 |
| Eli Lilly & Co. | | 849,377 | 675,551,997 |
| Evolus, Inc. (a) | | 3,800 | 52,022 |
| Fulcrum Therapeutics, Inc. (a)(e) | | 58,935 | 226,900 |
| GSK PLC sponsored ADR | | 206,829 | 7,059,074 |
| Harmony Biosciences Holdings, Inc. (a) | | 22,809 | 790,788 |
| Innoviva, Inc. (a) | | 800 | 15,192 |
| Intra-Cellular Therapies, Inc. (a) | | 151,792 | 13,000,985 |
| Jazz Pharmaceuticals PLC (a) | | 161,348 | 19,618,303 |
| Johnson & Johnson | | 2,222,330 | 344,483,373 |
| Merck & Co., Inc. | | 2,304,592 | 234,238,731 |
| Novartis AG sponsored ADR | | 135,726 | 14,355,739 |
| Novo Nordisk A/S Series B sponsored ADR | | 286,997 | 30,651,280 |
| Nuvation Bio, Inc. Class A (a)(e) | | 42,169 | 122,290 |
| Organon & Co. | | 184,800 | 2,932,776 |
| Pacira Biosciences, Inc. (a) | | 8,900 | 150,499 |
| Paratek Pharmaceuticals, Inc. rights (a)(d) | | 2,400 | 0 |
| Pfizer, Inc. | | 2,619,983 | 68,669,754 |
| Phathom Pharmaceuticals, Inc. (a)(e) | | 786,345 | 6,974,880 |
| Phibro Animal Health Corp. Class A | | 4,917 | 114,910 |
| Prestige Consumer Healthcare, Inc. (a)(e) | | 124,776 | 10,577,262 |
| Roche Holding AG sponsored ADR | | 308,747 | 11,188,991 |
| Royalty Pharma PLC Class A | | 313,405 | 8,355,377 |
| Sanofi SA sponsored ADR | | 271,900 | 13,184,431 |
| Septerna, Inc. | | 28,767 | 727,517 |
| Structure Therapeutics, Inc. ADR (a) | | 36,709 | 1,216,903 |
| Supernus Pharmaceuticals, Inc. (a) | | 150,064 | 5,487,840 |
| Tarsus Pharmaceuticals, Inc. (a) | | 3,400 | 178,330 |
| Terns Pharmaceuticals, Inc. (a) | | 129 | 805 |
| Third Harmonics Bio, Inc. (a) | | 100 | 1,276 |
| UCB SA | | 41,500 | 8,128,547 |
| Verona Pharma PLC ADR (a) | | 269,095 | 10,664,235 |
| Viatris, Inc. | | 1,818,486 | 23,803,982 |
| Zoetis, Inc. Class A | | 322,691 | 56,551,598 |
| | | | 1,830,644,401 |
TOTAL HEALTH CARE | | | 7,505,181,023 |
| INDUSTRIALS - 8.4% | | | |
| Aerospace & Defense - 1.6% | | | |
| AerSale Corp. (a)(e) | | 500 | 3,150 |
| Astronics Corp. (a) | | 1,000 | 16,150 |
| Axon Enterprise, Inc. (a) | | 4,355 | 2,817,511 |
| BWX Technologies, Inc. | | 136,855 | 17,907,477 |
| Curtiss-Wright Corp. | | 74,222 | 27,731,566 |
| Ducommun, Inc. (a) | | 6,168 | 413,256 |
| GE Aerospace | | 769,783 | 140,223,671 |
| General Dynamics Corp. | | 38,151 | 10,835,266 |
| HEICO Corp. Class A | | 106,737 | 22,535,383 |
| Hexcel Corp. | | 53,900 | 3,416,721 |
| Howmet Aerospace, Inc. | | 1,199,316 | 141,975,028 |
| Huntington Ingalls Industries, Inc. | | 55,076 | 10,900,642 |
| Kratos Defense & Security Solutions, Inc. (a) | | 667,877 | 18,092,788 |
| L3Harris Technologies, Inc. | | 191,343 | 47,118,214 |
| Lockheed Martin Corp. | | 225,087 | 119,163,309 |
| Mercury Systems, Inc. (a) | | 347,378 | 14,287,657 |
| Moog, Inc. Class A | | 3,802 | 841,269 |
| Northrop Grumman Corp. | | 226,999 | 111,150,060 |
| Park Aerospace Corp. | | 2,759 | 42,240 |
| Rheinmetall AG ADR | | 32,032 | 4,207,083 |
| RTX Corp. | | 1,217,368 | 148,311,943 |
| StandardAero, Inc. | | 20,629 | 591,227 |
| Textron, Inc. | | 335,354 | 28,716,363 |
| Thales SA ADR | | 37,328 | 1,114,987 |
| The Boeing Co. (a) | | 1,514,247 | 235,374,554 |
| TransDigm Group, Inc. | | 131,676 | 164,986,078 |
| Triumph Group, Inc. (a) | | 5,500 | 105,875 |
| V2X, Inc. (a) | | 11,138 | 671,065 |
| Woodward, Inc. | | 108,618 | 19,585,998 |
| | | | 1,293,136,531 |
| Air Freight & Logistics - 0.3% | | | |
| Air Transport Services Group, Inc. (a) | | 807,891 | 17,741,286 |
| C.H. Robinson Worldwide, Inc. | | 293,745 | 31,013,597 |
| Expeditors International of Washington, Inc. | | 191,736 | 23,322,767 |
| FedEx Corp. | | 247,728 | 74,979,834 |
| GXO Logistics, Inc. (a) | | 259,442 | 15,781,857 |
| Hub Group, Inc. Class A | | 1,100 | 56,804 |
| United Parcel Service, Inc. Class B | | 254,110 | 34,487,809 |
| | | | 197,383,954 |
| Building Products - 0.8% | | | |
| A.O. Smith Corp. | | 469,302 | 34,958,306 |
| Advanced Drain Systems, Inc. | | 36,622 | 4,954,590 |
| Allegion PLC | | 190,446 | 26,822,415 |
| American Woodmark Corp. (a) | | 1,528 | 138,712 |
| Armstrong World Industries, Inc. | | 112,698 | 18,012,521 |
| Builders FirstSource, Inc. (a) | | 104,847 | 19,550,820 |
| Carrier Global Corp. | | 1,782,937 | 137,945,836 |
| Daikin Industries Ltd. ADR | | 97,831 | 1,180,820 |
| Fortune Brands Innovations, Inc. | | 159,422 | 12,482,743 |
| Gibraltar Industries, Inc. (a) | | 61,388 | 4,446,947 |
| Griffon Corp. | | 3,700 | 311,910 |
| Janus International Group, Inc. (a) | | 113,009 | 845,307 |
| Johnson Controls International PLC | | 451,384 | 37,853,062 |
| Masco Corp. | | 306,639 | 24,702,838 |
| MasterBrand, Inc. (a) | | 233,401 | 4,037,837 |
| Owens Corning | | 180,886 | 37,193,779 |
| Resideo Technologies, Inc. (a) | | 460 | 12,503 |
| Tecnoglass, Inc. (e) | | 87,777 | 7,114,326 |
| The AZEK Co., Inc. Class A, (a) | | 528,585 | 28,078,435 |
| Trane Technologies PLC | | 563,583 | 234,574,516 |
| Trex Co., Inc. (a) | | 130,671 | 9,804,245 |
| UFP Industries, Inc. | | 19,000 | 2,582,100 |
| Zurn Elkay Water Solutions Cor (e) | | 131,003 | 5,216,539 |
| | | | 652,821,107 |
| Commercial Services & Supplies - 0.5% | | | |
| ABM Industries, Inc. | | 182,655 | 10,442,386 |
| ACV Auctions, Inc. Class A (a) | | 679,394 | 15,367,892 |
| Brady Corp. Class A | | 86,664 | 6,490,267 |
| BrightView Holdings, Inc. (a) | | 205,398 | 3,512,306 |
| Casella Waste Systems, Inc. Class A (a) | | 131,292 | 14,863,567 |
| Cintas Corp. | | 202,574 | 45,739,183 |
| Civeo Corp. | | 2,473 | 57,819 |
| Clean Harbors, Inc. (a) | | 67,333 | 17,512,640 |
| Copart, Inc. (a) | | 936,019 | 59,334,244 |
| CoreCivic, Inc. (a) | | 834,541 | 18,635,301 |
| Deluxe Corp. | | 215,300 | 4,988,501 |
| Ennis, Inc. | | 46,329 | 988,198 |
| Enviri Corp. (a) | | 50,100 | 370,740 |
| Healthcare Services Group, Inc. (a) | | 28,912 | 356,774 |
| Interface, Inc. (e) | | 275,759 | 7,321,401 |
| Millerknoll, Inc. (e) | | 384,213 | 9,659,115 |
| MSA Safety, Inc. | | 69,654 | 12,106,562 |
| OpenLane, Inc. (a) | | 518,115 | 10,465,923 |
| Rentokil Initial PLC ADR | | 377,579 | 9,643,368 |
| Republic Services, Inc. | | 40,478 | 8,836,347 |
| Rollins, Inc. | | 7,367 | 370,781 |
| Steelcase, Inc. Class A | | 400 | 5,388 |
| Tetra Tech, Inc. | | 51,861 | 2,152,750 |
| The Brink's Co. | | 127,742 | 12,353,929 |
| UniFirst Corp. | | 94,740 | 19,030,424 |
| Veralto Corp. | | 88,414 | 9,565,511 |
| Vestis Corp. | | 4,168 | 67,021 |
| Viad Corp. (a) | | 128,400 | 5,742,048 |
| Waste Connections, Inc. (United States) | | 183,044 | 35,230,479 |
| Waste Management, Inc. | | 213,294 | 48,677,957 |
| | | | 389,888,822 |
| Construction & Engineering - 0.3% | | | |
| AECOM | | 3,500 | 409,395 |
| API Group Corp. (a) | | 407,103 | 15,380,351 |
| Argan, Inc. | | 30,848 | 4,810,437 |
| Comfort Systems U.S.A., Inc. (e) | | 85,352 | 42,101,581 |
| Dycom Industries, Inc. (a) | | 15,554 | 2,817,763 |
| EMCOR Group, Inc. | | 108,832 | 55,517,380 |
| Everus Construction Group, Inc. | | 24,695 | 1,572,084 |
| Fluor Corp. (a) | | 236,321 | 13,264,698 |
| IES Holdings, Inc. (a) | | 11,222 | 3,477,193 |
| Limbach Holdings, Inc. (a) | | 42,390 | 4,217,381 |
| MasTec, Inc. (a) | | 101,886 | 14,677,697 |
| Matrix Service Co. (a) | | 145,810 | 1,933,441 |
| MYR Group, Inc. (a) | | 20,533 | 3,242,161 |
| Orion Group Holdings, Inc. (a) | | 411,267 | 3,586,248 |
| Primoris Services Corp. | | 139,070 | 11,641,550 |
| Quanta Services, Inc. | | 21,600 | 7,441,632 |
| Sterling Construction Co., Inc. (a) | | 64,329 | 12,508,774 |
| Willscot Holdings Corp. (a) | | 869,247 | 33,240,005 |
| | | | 231,839,771 |
| Electrical Equipment - 0.5% | | | |
| Acuity Brands, Inc. | | 137,617 | 44,132,396 |
| Allient, Inc. | | 4,400 | 114,268 |
| AMETEK, Inc. | | 492,311 | 95,695,412 |
| Atkore, Inc. | | 122,685 | 11,570,422 |
| Eaton Corp. PLC | | 41,600 | 15,617,472 |
| Emerson Electric Co. | | 213,745 | 28,342,587 |
| EnerSys | | 19,690 | 1,903,235 |
| Fluence Energy, Inc. Class A (a) | | 100 | 1,881 |
| GE Vernova LLC | | 250,185 | 83,591,812 |
| Generac Holdings, Inc. (a) | | 91,582 | 17,235,732 |
| Hubbell, Inc. | | 64,700 | 29,767,823 |
| Nextracker, Inc. Class A (a) | | 19,400 | 740,304 |
| nVent Electric PLC | | 89,584 | 7,015,323 |
| Powell Industries, Inc. (e) | | 17,835 | 4,768,722 |
| Power Solutions International, Inc. (a)(e) | | 170,050 | 5,229,038 |
| Regal Rexnord Corp. | | 64,930 | 11,214,060 |
| Rockwell Automation, Inc. | | 128,929 | 38,052,105 |
| Sensata Technologies PLC | | 85,100 | 2,735,114 |
| SES AI Corp. Class A (a) | | 18,000 | 6,304 |
| Vertiv Holdings Co. | | 254,729 | 32,503,420 |
| Vicor Corp. (a) | | 700 | 37,247 |
| | | | 430,274,677 |
| Ground Transportation - 1.0% | | | |
| ArcBest Corp. | | 102,243 | 11,786,573 |
| Covenant Transport Group, Inc. Class A | | 3,654 | 212,224 |
| CSX Corp. | | 8,225,663 | 300,647,983 |
| Heartland Express, Inc. | | 900 | 11,493 |
| J.B. Hunt Transport Services, Inc. | | 1,500 | 283,665 |
| Knight-Swift Transportation Holdings, Inc. | | 489,119 | 29,034,104 |
| Landstar System, Inc. | | 63,762 | 11,854,631 |
| Lyft, Inc. (a) | | 119,311 | 2,071,239 |
| Marten Transport Ltd. | | 4,700 | 81,686 |
| Norfolk Southern Corp. | | 303,269 | 83,656,754 |
| Old Dominion Freight Lines, Inc. | | 288,792 | 65,018,631 |
| Ryder System, Inc. | | 868 | 146,553 |
| Saia, Inc. (a) | | 50,788 | 28,902,435 |
| U-Haul Holding Co. (a)(e) | | 5,200 | 367,484 |
| U-Haul Holding Co. Class N | | 60,600 | 3,783,864 |
| Uber Technologies, Inc. (a) | | 2,248,531 | 161,804,291 |
| Union Pacific Corp. | | 404,837 | 99,047,420 |
| XPO, Inc. (a) | | 21,297 | 3,245,876 |
| | | | 801,956,906 |
| Industrial Conglomerates - 0.5% | | | |
| 3M Co. | | 773,819 | 103,328,051 |
| Honeywell International, Inc. | | 1,085,164 | 252,767,251 |
| | | | 356,095,302 |
| Machinery - 1.9% | | | |
| AGCO Corp. | | 193,500 | 19,584,135 |
| Albany International Corp. Class A | | 300 | 24,870 |
| Allison Transmission Holdings, Inc. | | 406,445 | 48,163,733 |
| Atmus Filtration Technologies, Inc. | | 32,145 | 1,391,557 |
| Blue Bird Corp. (a) | | 89,585 | 3,641,630 |
| Caterpillar, Inc. | | 348,105 | 141,368,922 |
| Chart Industries, Inc. (a)(e) | | 140,111 | 27,076,451 |
| CNH Industrial NV Class A (e) | | 1,425,054 | 17,898,678 |
| Commercial Vehicle Group, Inc. (a) | | 3,700 | 8,917 |
| Cummins, Inc. | | 285,360 | 107,021,414 |
| Deere & Co. | | 219,335 | 102,188,177 |
| Donaldson Co., Inc. | | 275,319 | 21,488,648 |
| Dover Corp. | | 253,177 | 52,129,144 |
| Energy Recovery, Inc. (a) | | 19,323 | 300,666 |
| Enerpac Tool Group Corp. Class A | | 9,600 | 463,296 |
| ESAB Corp. | | 211,419 | 27,289,965 |
| Federal Signal Corp. | | 122,724 | 11,954,545 |
| Flowserve Corp. | | 225,764 | 13,776,119 |
| Fortive Corp. | | 600,918 | 47,670,825 |
| Franklin Electric Co., Inc. | | 400 | 43,320 |
| Gates Industrial Corp. PLC (a) | | 813,912 | 18,036,290 |
| Graco, Inc. | | 398,368 | 36,283,357 |
| Hillenbrand, Inc. | | 300 | 10,209 |
| Hyliion Holdings Corp. Class A (a) | | 7,788 | 28,738 |
| Hyster-Yale Materials Handling, Inc. Class A | | 900 | 50,616 |
| IDEX Corp. | | 211,469 | 48,771,095 |
| Illinois Tool Works, Inc. | | 188,597 | 52,339,439 |
| Ingersoll Rand, Inc. | | 1,632,100 | 170,015,857 |
| ITT, Inc. | | 115,227 | 17,989,239 |
| John Bean Technologies Corp. (e) | | 87,796 | 11,064,052 |
| Kennametal, Inc. (e) | | 51,955 | 1,491,109 |
| Lincoln Electric Holdings, Inc. | | 101,465 | 22,168,073 |
| Luxfer Holdings PLC sponsored | | 5,726 | 82,225 |
| Manitowoc Co., Inc. (a) | | 47,307 | 502,873 |
| Middleby Corp. (a) | | 173,749 | 24,913,869 |
| Miller Industries, Inc. | | 69,513 | 5,117,547 |
| Mueller Industries, Inc. | | 178,700 | 14,433,599 |
| Mueller Water Products, Inc. | | 27,220 | 681,589 |
| Nordson Corp. | | 29,000 | 7,568,710 |
| Oshkosh Corp. | | 256,439 | 29,134,035 |
| Otis Worldwide Corp. | | 1,038,542 | 106,949,055 |
| PACCAR, Inc. | | 360,730 | 42,205,410 |
| Parker Hannifin Corp. | | 100,135 | 70,384,892 |
| Pentair PLC | | 125,870 | 13,718,571 |
| Proto Labs, Inc. (a) | | 2,624 | 108,083 |
| RBC Bearings, Inc. (a) | | 45,039 | 15,093,019 |
| REV Group, Inc. (e) | | 69,390 | 2,152,478 |
| Shyft Group, Inc. (The) | | 34,541 | 487,028 |
| Snap-On, Inc. | | 178,670 | 66,052,512 |
| Standex International Corp. | | 20,371 | 4,234,927 |
| Stanley Black & Decker, Inc. | | 663,604 | 59,359,378 |
| Taylor Devices, Inc. (a) | | 200 | 9,616 |
| Tennant Co. | | 827 | 73,082 |
| Timken Co. | | 90,600 | 7,016,970 |
| Toro Co. | | 88,598 | 7,715,114 |
| Trinity Industries, Inc. | | 9,192 | 346,538 |
| Wabash National Corp. | | 75,400 | 1,495,182 |
| Watts Water Technologies, Inc. Class A | | 46,851 | 10,109,977 |
| Westinghouse Air Brake Tech Co. | | 17,126 | 3,435,818 |
| Xylem, Inc. | | 29,500 | 3,739,125 |
| | | | 1,518,854,308 |
| Marine Transportation - 0.0% | | | |
| Kirby Corp. (a) | | 39,637 | 5,014,477 |
| Passenger Airlines - 0.1% | | | |
| Alaska Air Group, Inc. (a) | | 4,754 | 250,060 |
| Delta Air Lines, Inc. | | 1,078,062 | 68,801,917 |
| JetBlue Airways Corp. (a) | | 62,873 | 375,352 |
| SkyWest, Inc. (a) | | 21,008 | 2,410,458 |
| Southwest Airlines Co. (e) | | 100 | 3,236 |
| United Airlines Holdings, Inc. (a) | | 432,090 | 41,839,275 |
| | | | 113,680,298 |
| Professional Services - 0.6% | | | |
| Alight, Inc. Class A (e) | | 1,183,144 | 9,465,152 |
| Amentum Holdings, Inc. | | 285,485 | 6,951,560 |
| Automatic Data Processing, Inc. | | 28,293 | 8,683,970 |
| Barrett Business Services, Inc. | | 43,257 | 1,856,158 |
| Booz Allen Hamilton Holding Corp. Class A | | 119,746 | 17,743,962 |
| Broadridge Financial Solutions, Inc. | | 57,700 | 13,618,354 |
| CACI International, Inc. (a) | | 74,686 | 34,346,598 |
| CSG Systems International, Inc. | | 144,500 | 7,920,045 |
| Dayforce, Inc. (a)(e) | | 285,844 | 22,864,662 |
| Dun & Bradstreet Holdings, Inc. | | 1,053,517 | 13,379,666 |
| Equifax, Inc. | | 91,126 | 23,834,917 |
| ExlService Holdings, Inc. (a) | | 631,008 | 29,253,531 |
| Exponent, Inc. (e) | | 90,343 | 8,917,758 |
| Forrester Research, Inc. (a) | | 172,011 | 2,967,190 |
| Franklin Covey Co. (a) | | 20,341 | 740,006 |
| FTI Consulting, Inc. (a) | | 5,443 | 1,102,316 |
| Genpact Ltd. (e) | | 315,188 | 14,549,078 |
| IBEX Ltd. (a) | | 11,697 | 239,789 |
| ICF International, Inc. | | 2,000 | 277,140 |
| Insperity, Inc. | | 89,253 | 7,037,599 |
| KBR, Inc. | | 58,484 | 3,557,582 |
| Kforce, Inc. | | 31,351 | 1,880,746 |
| LegalZoom.com, Inc. (a) | | 54,500 | 432,185 |
| Leidos Holdings, Inc. | | 137,547 | 22,750,274 |
| ManpowerGroup, Inc. | | 181,672 | 11,694,227 |
| Maximus, Inc. | | 100,641 | 7,497,755 |
| Parsons Corp. (a)(e) | | 54,200 | 5,198,322 |
| Paycom Software, Inc. | | 85,716 | 19,879,255 |
| Paylocity Holding Corp. (a) | | 218,501 | 45,347,698 |
| Planet Labs PBC Class A (a)(e) | | 84,400 | 331,692 |
| Robert Half, Inc. | | 373,419 | 27,860,792 |
| Science Applications International Corp. | | 56,330 | 6,999,003 |
| SS&C Technologies Holdings, Inc. | | 79,863 | 6,176,604 |
| TransUnion | | 160,197 | 16,259,996 |
| TriNet Group, Inc. | | 8,438 | 788,362 |
| TrueBlue, Inc. (a) | | 29,655 | 223,006 |
| Ttec Holdings, Inc. | | 7,200 | 37,296 |
| Verisk Analytics, Inc. | | 74,500 | 21,918,645 |
| Verra Mobility Corp. Class A (a) | | 350,063 | 8,282,491 |
| Willdan Group, Inc. (a) | | 11,842 | 517,614 |
| WNS Holdings Ltd. | | 131,436 | 7,127,774 |
| | | | 440,510,770 |
| Trading Companies & Distributors - 0.3% | | | |
| AerCap Holdings NV | | 43,394 | 4,311,628 |
| Alta Equipment Group, Inc. (e) | | 461,249 | 3,648,480 |
| Applied Industrial Technologies, Inc. | | 116,342 | 31,961,474 |
| BlueLinx Corp. (a) | | 25,867 | 3,251,482 |
| Boise Cascade Co. | | 29,473 | 4,350,215 |
| Core & Main, Inc. Class A (a) | | 193,320 | 9,385,686 |
| Custom Truck One Source, Inc. Class A (a)(e) | | 808,696 | 4,836,002 |
| DNOW, Inc. (a) | | 156,640 | 2,357,432 |
| Fastenal Co. | | 212,443 | 17,751,737 |
| Ferguson Enterprises, Inc. | | 500 | 107,965 |
| FTAI Aviation Ltd. | | 1,131 | 190,935 |
| Global Industrial Co. | | 1,600 | 45,200 |
| GMS, Inc. (a) | | 66,800 | 6,703,380 |
| Herc Holdings, Inc. | | 30,364 | 7,044,448 |
| Hudson Technologies, Inc. (a) | | 56,800 | 337,392 |
| McGrath RentCorp. | | 176,225 | 21,473,016 |
| MSC Industrial Direct Co., Inc. Class A | | 81,310 | 6,982,903 |
| SiteOne Landscape Supply, Inc. (a) | | 190,885 | 29,253,126 |
| United Rentals, Inc. | | 25,161 | 21,789,426 |
| W.W. Grainger, Inc. | | 10,734 | 12,938,120 |
| Watsco, Inc. (e) | | 51,669 | 28,500,620 |
| WESCO International, Inc. | | 88,400 | 18,702,788 |
| | | | 235,923,455 |
TOTAL INDUSTRIALS | | | 6,667,380,378 |
| INFORMATION TECHNOLOGY - 22.6% | | | |
| Communications Equipment - 0.5% | | | |
| Applied Optoelectronics, Inc. (a)(e) | | 210,596 | 8,680,767 |
| Arista Networks, Inc. (a) | | 150,628 | 61,127,855 |
| Calix, Inc. (a) | | 181,603 | 5,907,546 |
| Cisco Systems, Inc. | | 3,882,794 | 229,900,233 |
| CommScope Holding Co., Inc. (a) | | 13,200 | 62,964 |
| Extreme Networks, Inc. (a) | | 212,897 | 3,534,090 |
| F5, Inc. (a) | | 126,699 | 31,719,095 |
| Juniper Networks, Inc. | | 552,148 | 19,833,156 |
| KVH Industries, Inc. (a) | | 1,756 | 9,676 |
| Lumentum Holdings, Inc. (a)(e) | | 125,918 | 10,951,088 |
| Motorola Solutions, Inc. | | 120,094 | 60,010,972 |
| NETGEAR, Inc. (a)(e) | | 69,933 | 1,720,352 |
| NetScout Systems, Inc. (a) | | 130,526 | 2,855,909 |
| Viavi Solutions, Inc. (a) | | 1,700 | 16,898 |
| | | | 436,330,601 |
| Electronic Equipment, Instruments & Components - 0.7% | | | |
| Amphenol Corp. Class A | | 1,091,061 | 79,265,582 |
| Arrow Electronics, Inc. (a) | | 99,200 | 11,919,872 |
| Avnet, Inc. | | 320,938 | 17,558,518 |
| Badger Meter, Inc. (e) | | 57,463 | 12,459,128 |
| Bel Fuse, Inc. Class B (non-vtg.) | | 81,388 | 6,525,690 |
| Belden, Inc. | | 59,890 | 7,330,536 |
| Benchmark Electronics, Inc. | | 1,787 | 86,652 |
| CDW Corp. | | 15,400 | 2,709,322 |
| Celestica, Inc. (a) | | 229,662 | 19,576,389 |
| Cognex Corp. | | 768,246 | 30,714,475 |
| Crane NXT Co. | | 85,409 | 5,353,436 |
| CTS Corp. | | 52,220 | 2,867,400 |
| Daktronics, Inc. (a) | | 10,700 | 164,780 |
| ePlus, Inc. (a) | | 76,937 | 6,221,126 |
| Fabrinet (a) | | 84,182 | 19,747,414 |
| FARO Technologies, Inc. (a) | | 1,700 | 44,625 |
| Flex Ltd. (a) | | 1,199,107 | 46,729,200 |
| Identiv, Inc. (a) | | 666,297 | 2,651,862 |
| Insight Enterprises, Inc. (a)(e) | | 18,744 | 2,932,499 |
| IPG Photonics Corp. (a) | | 51,185 | 3,994,477 |
| Jabil, Inc. | | 103,500 | 14,058,405 |
| Keysight Technologies, Inc. (a) | | 250,615 | 42,815,067 |
| Kimball Electronics, Inc. (a) | | 997 | 19,551 |
| Methode Electronics, Inc. | | 38,500 | 420,420 |
| Mirion Technologies, Inc. Class A (a)(e) | | 470,802 | 7,942,430 |
| Napco Security Technologies, Inc. | | 51,937 | 2,037,489 |
| Ouster, Inc. Class A (a)(e) | | 38,800 | 383,344 |
| PC Connection, Inc. | | 26,140 | 1,897,241 |
| Plexus Corp. (a) | | 5,700 | 937,080 |
| Sanmina Corp. (a) | | 149,190 | 11,847,178 |
| TD SYNNEX Corp. | | 285,287 | 33,946,300 |
| TE Connectivity PLC | | 272,235 | 41,140,153 |
| Teledyne Technologies, Inc. (a) | | 72,935 | 35,392,438 |
| Trimble, Inc. (a) | | 287,587 | 20,985,223 |
| TTM Technologies, Inc. (a) | | 648,202 | 15,803,165 |
| Vishay Precision Group, Inc. (a) | | 20,822 | 478,281 |
| Vontier Corp. | | 242,593 | 9,524,201 |
| Zebra Technologies Corp. Class A (a) | | 158,156 | 64,369,492 |
| | | | 582,850,441 |
| IT Services - 0.8% | | | |
| Accenture PLC Class A | | 362,665 | 131,418,916 |
| Amdocs Ltd. | | 317,345 | 27,520,158 |
| Applied Digital Corp. (a)(e) | | 309,590 | 3,126,859 |
| ASGN, Inc. (a)(e) | | 81,838 | 7,492,269 |
| Brightcove, Inc. (a) | | 7,509 | 32,063 |
| Capgemini SA | | 31,400 | 5,047,556 |
| Cognizant Technology Solutions Corp. Class A | | 1,069,680 | 86,098,543 |
| Core Scientific, Inc. (e) | | 1,024,496 | 18,317,988 |
| Couchbase, Inc. (a) | | 203,508 | 4,173,949 |
| DXC Technology Co. (a) | | 184,632 | 4,154,220 |
| EPAM Systems, Inc. (a) | | 44,243 | 10,791,753 |
| Gartner, Inc. (a) | | 54,669 | 28,314,715 |
| Globant SA (a) | | 70,828 | 16,131,785 |
| GoDaddy, Inc. Class A (a) | | 38,507 | 7,607,828 |
| Hackett Group, Inc. | | 44,804 | 1,404,157 |
| IBM Corp. | | 710,733 | 161,627,792 |
| Kyndryl Holdings, Inc. (a) | | 127,855 | 4,437,847 |
| MongoDB, Inc. Class A (a) | | 78,436 | 25,294,826 |
| Okta, Inc. Class A (a) | | 24,100 | 1,869,196 |
| Shopify, Inc. Class A (a) | | 380,671 | 44,005,568 |
| Twilio, Inc. Class A (a) | | 21,700 | 2,268,518 |
| Unisys Corp. (a) | | 12,006 | 95,808 |
| VeriSign, Inc. (a) | | 37,193 | 6,961,786 |
| | | | 598,194,100 |
| Semiconductors & Semiconductor Equipment - 7.9% | | | |
| ACM Research, Inc. Class A, (a) | | 569,305 | 9,786,353 |
| Advanced Micro Devices, Inc. (a) | | 831,429 | 114,051,273 |
| Ambarella, Inc. (a) | | 113,301 | 8,106,687 |
| Amkor Technology, Inc. | | 393,030 | 10,391,713 |
| Analog Devices, Inc. | | 623,335 | 135,918,197 |
| Applied Materials, Inc. | | 328,372 | 57,369,872 |
| ASML Holding NV: | | | |
| (depository receipt) | | 112,975 | 77,569,765 |
| (Netherlands) | | 20,700 | 14,144,500 |
| Astera Labs, Inc. (a) | | 5,600 | 578,200 |
| Axcelis Technologies, Inc. (a) | | 59,315 | 4,403,546 |
| AXT, Inc. (a) | | 1,725 | 3,692 |
| Broadcom, Inc. | | 3,679,587 | 596,387,461 |
| Cirrus Logic, Inc. (a) | | 151,885 | 15,864,388 |
| Credo Technology Group Holding Ltd. (a) | | 23,387 | 1,145,028 |
| Diodes, Inc. (a) | | 83,931 | 5,455,515 |
| Enphase Energy, Inc. (a) | | 105,989 | 7,562,315 |
| Entegris, Inc. | | 143,375 | 15,144,701 |
| Everspin Technologies, Inc. (a) | | 19,958 | 122,542 |
| First Solar, Inc. (a) | | 56,221 | 11,203,159 |
| FormFactor, Inc. (a) | | 328,525 | 13,160,712 |
| Impinj, Inc. (a) | | 2,329 | 447,657 |
| indie Semiconductor, Inc. (a)(e) | | 753,452 | 3,940,554 |
| Intel Corp. | | 274,800 | 6,608,940 |
| Intest Corp. (a) | | 1,587 | 12,029 |
| KLA Corp. | | 82,857 | 53,610,965 |
| Kulicke & Soffa Industries, Inc. | | 400 | 19,368 |
| Lam Research Corp. | | 367,828 | 27,175,133 |
| Lattice Semiconductor Corp. (a) | | 383,080 | 21,739,790 |
| MACOM Technology Solutions Holdings, Inc. (a) | | 126,865 | 16,850,209 |
| Marvell Technology, Inc. | | 919,889 | 85,264,511 |
| Maxeon Solar Technologies Ltd. (a)(e) | | 232 | 1,879 |
| MaxLinear, Inc. Class A (a)(e) | | 26,320 | 398,222 |
| Microchip Technology, Inc. | | 1,138,541 | 77,614,340 |
| Micron Technology, Inc. | | 1,829,574 | 179,206,773 |
| Monolithic Power Systems, Inc. | | 5,598 | 3,177,649 |
| NVE Corp. (e) | | 8,619 | 666,076 |
| NVIDIA Corp. | | 27,719,201 | 3,832,179,515 |
| NXP Semiconductors NV | | 799,747 | 183,437,969 |
| ON Semiconductor Corp. (a) | | 291,800 | 20,752,816 |
| Onto Innovation, Inc. (a) | | 16,704 | 2,742,463 |
| PDF Solutions, Inc. (a) | | 2,500 | 79,000 |
| Photronics, Inc. (a) | | 133,191 | 3,317,788 |
| Power Integrations, Inc. (e) | | 180,179 | 11,803,526 |
| Qorvo, Inc. (a) | | 102,336 | 7,066,301 |
| Qualcomm, Inc. | | 1,495,427 | 237,070,042 |
| Rambus, Inc. (a) | | 12,000 | 693,720 |
| Renesas Electronics Corp. | | 328,300 | 4,306,013 |
| Semtech Corp. (a) | | 288,913 | 18,501,989 |
| Silicon Laboratories, Inc. (a)(e) | | 96,978 | 10,730,616 |
| SkyWater Technology, Inc. (a) | | 1,354 | 10,751 |
| Skyworks Solutions, Inc. | | 100,598 | 8,811,379 |
| SolarEdge Technologies, Inc. (a)(e) | | 58,200 | 919,560 |
| Synaptics, Inc. (a)(e) | | 179,679 | 14,417,443 |
| Taiwan Semiconductor Manufacturing Co. Ltd. sponsored ADR | | 692,402 | 127,858,953 |
| Teradyne, Inc. | | 10,100 | 1,111,000 |
| Texas Instruments, Inc. | | 1,080,613 | 217,235,631 |
| Ultra Clean Holdings, Inc. (a)(e) | | 7,217 | 277,349 |
| | | | 6,278,427,538 |
| Software - 7.9% | | | |
| 8x8, Inc. (a) | | 47,865 | 148,382 |
| ACI Worldwide, Inc. (a) | | 258,542 | 14,690,356 |
| Adobe, Inc. (a) | | 487,834 | 251,688,196 |
| Agilysys, Inc. (a) | | 58,138 | 7,807,933 |
| Alarm.com Holdings, Inc. (a) | | 5,029 | 327,589 |
| ANSYS, Inc. (a) | | 32,644 | 11,461,308 |
| AppFolio, Inc. Class A, (a) | | 1,625 | 412,344 |
| Atlassian Corp. PLC Class A, (a) | | 60,766 | 16,016,702 |
| Aurora Innovation, Inc. Class A, (a)(e) | | 61,400 | 397,258 |
| Autodesk, Inc. (a) | | 299,444 | 87,407,704 |
| AvePoint, Inc. (a) | | 439 | 7,748 |
| Bill Holdings, Inc. (a) | | 82,709 | 7,462,006 |
| Bit Digital, Inc. (a)(e) | | 49,817 | 229,656 |
| Box, Inc. Class A (a) | | 30,912 | 1,084,702 |
| Braze, Inc. (a) | | 90,460 | 3,593,071 |
| C3.ai, Inc. (a) | | 12,490 | 464,378 |
| Cadence Design Systems, Inc. (a) | | 337,093 | 103,423,503 |
| CCC Intelligent Solutions Holdings, Inc. (a)(c) | | 35,655 | 449,253 |
| CCC Intelligent Solutions Holdings, Inc. Class A (a) | | 1,021,747 | 12,874,012 |
| Cellebrite DI Ltd. (a) | | 397,299 | 8,017,494 |
| Cleanspark, Inc. (a)(e) | | 541,968 | 7,777,241 |
| Clear Secure, Inc. | | 354,038 | 9,162,503 |
| Clearwater Analytics Holdings, Inc. Class A (a) | | 348,129 | 10,805,924 |
| CommVault Systems, Inc. (a) | | 110,531 | 18,966,014 |
| Confluent, Inc. Class A (a)(e) | | 555,214 | 17,122,800 |
| Consensus Cloud Solutions, Inc. (a) | | 21,900 | 546,405 |
| Constellation Software, Inc. | | 2,474 | 8,296,021 |
| Crowdstrike Holdings, Inc. Class A (a) | | 108,958 | 37,696,199 |
| CyberArk Software Ltd. (a) | | 71,094 | 22,999,620 |
| Descartes Systems Group, Inc. (a) | | 281,692 | 32,921,344 |
| Digital Turbine, Inc. (a) | | 4,600 | 6,624 |
| DocuSign, Inc. (a) | | 18,800 | 1,498,172 |
| Dolby Laboratories, Inc. Class A | | 106,532 | 8,343,586 |
| Domo, Inc. Class B (a) | | 13,300 | 124,488 |
| DoubleVerify Holdings, Inc. (a) | | 91,296 | 1,856,048 |
| Dropbox, Inc. Class A (a) | | 69,800 | 1,930,668 |
| Dynatrace, Inc. (a) | | 428,067 | 24,053,085 |
| Elastic NV (a) | | 58,600 | 6,414,356 |
| Expensify, Inc. (a) | | 1,938 | 6,318 |
| Fair Isaac Corp. (a) | | 14,753 | 35,038,818 |
| Five9, Inc. (a)(e) | | 127,817 | 5,276,286 |
| Fortinet, Inc. (a) | | 1,011,125 | 96,107,431 |
| Gen Digital, Inc. | | 1,940,022 | 59,849,679 |
| GitLab, Inc. Class A (a) | | 154,543 | 9,852,116 |
| Guidewire Software, Inc. (a) | | 21,635 | 4,389,525 |
| HashiCorp, Inc. Class A (a) | | 12,728 | 427,915 |
| HubSpot, Inc. (a)(e) | | 59,331 | 42,780,618 |
| Informatica, Inc. Class A (a) | | 65,239 | 1,730,138 |
| Intapp, Inc. (a) | | 4,396 | 274,970 |
| Intuit, Inc. | | 203,989 | 130,905,861 |
| JFrog Ltd. (a) | | 24,235 | 754,920 |
| Klaviyo, Inc. Class A (a) | | 900 | 33,426 |
| Liveramp Holdings, Inc. (a) | | 73,892 | 2,243,361 |
| Manhattan Associates, Inc. (a) | | 188,363 | 53,766,335 |
| Microsoft Corp. | | 8,672,065 | 3,672,272,645 |
| Mitek Systems, Inc. (a)(e) | | 235,141 | 2,191,514 |
| N-able, Inc. (a) | | 17,000 | 177,480 |
| NCR Voyix Corp. (a)(e) | | 285,888 | 4,148,235 |
| NICE Ltd. sponsored ADR (a) | | 44,159 | 8,056,368 |
| Nutanix, Inc. Class A (a) | | 85,645 | 5,590,906 |
| Ooma, Inc. (a) | | 22,185 | 328,338 |
| Opera Ltd. ADR (e) | | 435,552 | 8,715,396 |
| Oracle Corp. | | 2,230,846 | 412,349,575 |
| Pagaya Technologies Ltd. Class A (a)(e) | | 233,129 | 2,548,100 |
| Palantir Technologies, Inc. Class A (a) | | 378,605 | 25,396,823 |
| Palo Alto Networks, Inc. (a) | | 100,755 | 39,074,804 |
| Pegasystems, Inc. | | 49,936 | 4,742,422 |
| Porch Group, Inc. (a)(e) | | 814,979 | 2,982,823 |
| Procore Technologies, Inc. (a) | | 161,100 | 13,081,320 |
| PROS Holdings, Inc. (a) | | 5,000 | 115,850 |
| Qualys, Inc. (a) | | 74,330 | 11,417,088 |
| Rimini Street, Inc. (a) | | 2,300 | 4,968 |
| RingCentral, Inc. Class A (a) | | 39,911 | 1,501,851 |
| Roper Technologies, Inc. | | 170,531 | 96,595,580 |
| Salesforce, Inc. | | 1,461,306 | 482,216,367 |
| Sapiens International Corp. NV | | 1,281 | 35,010 |
| Semrush Holdings, Inc. Class A (a) | | 1,100 | 14,960 |
| SentinelOne, Inc. Class A (a) | | 24,583 | 687,095 |
| ServiceNow, Inc. (a) | | 117,621 | 123,436,182 |
| Smartsheet, Inc. Class A (a) | | 41,673 | 2,331,604 |
| SoundThinking, Inc. (a) | | 5,100 | 66,198 |
| Synopsys, Inc. (a) | | 168,510 | 94,111,150 |
| Tenable Holdings, Inc. (a) | | 60,900 | 2,556,582 |
| Teradata Corp. (a) | | 47,005 | 1,452,455 |
| TeraWulf, Inc. (a)(e) | | 984,802 | 7,770,088 |
| Tyler Technologies, Inc. (a) | | 57,012 | 35,870,240 |
| UiPath, Inc. Class A (a) | | 286,800 | 4,075,428 |
| Upland Software, Inc. (a) | | 22,388 | 82,164 |
| Varonis Systems, Inc. (a) | | 46,907 | 2,343,474 |
| Verint Systems, Inc. (a) | | 19,736 | 497,347 |
| Viant Technology, Inc. (a) | | 200 | 3,776 |
| Weave Communications, Inc. (a) | | 204,295 | 2,792,713 |
| Workday, Inc. Class A (a) | | 72,081 | 18,019,529 |
| Workiva, Inc. Class A (a) | | 30,766 | 2,991,994 |
| Xperi, Inc. (a) | | 50,100 | 474,447 |
| Yext, Inc. (a) | | 103,714 | 856,678 |
| Zeta Global Holdings Corp. (a) | | 241,611 | 5,146,314 |
| Zscaler, Inc. (a) | | 44,200 | 9,131,278 |
| Zuora, Inc. (a) | | 8,555 | 84,951 |
| | | | 6,290,262,520 |
| Technology Hardware, Storage & Peripherals - 4.8% | | | |
| Apple, Inc. | | 14,358,930 | 3,407,804,857 |
| Dell Technologies, Inc. Class C | | 645,926 | 82,413,698 |
| Diebold Nixdorf, Inc. (a) | | 222,372 | 10,278,034 |
| Hewlett Packard Enterprise Co. | | 1,267,800 | 26,902,716 |
| HP, Inc. | | 1,002,700 | 35,525,661 |
| NetApp, Inc. | | 101,398 | 12,435,451 |
| Pure Storage, Inc. Class A (a) | | 224,110 | 11,875,589 |
| Seagate Technology Holdings PLC | | 670,283 | 67,919,776 |
| Super Micro Computer, Inc. (a)(e) | | 222,085 | 7,248,854 |
| Western Digital Corp. (a) | | 1,681,458 | 122,729,619 |
| Xerox Holdings Corp. (e) | | 207,500 | 1,896,550 |
| | | | 3,787,030,805 |
TOTAL INFORMATION TECHNOLOGY | | | 17,973,096,005 |
| MATERIALS - 1.9% | | | |
| Chemicals - 1.0% | | | |
| Air Products & Chemicals, Inc. | | 20,370 | 6,810,302 |
| Alto Ingredients, Inc. (a) | | 52,744 | 76,479 |
| American Vanguard Corp. | | 34,406 | 206,780 |
| Arcadium Lithium PLC (e) | | 304,188 | 1,596,987 |
| Avient Corp. | | 393,335 | 20,158,419 |
| Axalta Coating Systems Ltd. (a) | | 72,216 | 2,921,859 |
| Balchem Corp. | | 64,393 | 11,624,224 |
| Cabot Corp. | | 74,458 | 8,162,086 |
| Celanese Corp. | | 68,490 | 5,014,153 |
| CF Industries Holdings, Inc. | | 464,026 | 41,604,571 |
| Corteva, Inc. | | 74,015 | 4,606,694 |
| Dow, Inc. | | 68,571 | 3,031,524 |
| DuPont de Nemours, Inc. | | 8,700 | 727,233 |
| Eastman Chemical Co. | | 111,259 | 11,651,042 |
| Ecolab, Inc. | | 186,445 | 46,381,923 |
| Element Solutions, Inc. | | 330,594 | 9,481,436 |
| FMC Corp. | | 122,905 | 7,262,456 |
| Hawkins, Inc. | | 32,095 | 4,317,098 |
| Huntsman Corp. | | 378,513 | 7,411,285 |
| Ingevity Corp. (a) | | 180,273 | 8,755,860 |
| Innospec, Inc. | | 41,562 | 4,929,669 |
| International Flavors & Fragrances, Inc. | | 202,028 | 18,457,278 |
| Intrepid Potash, Inc. (a) | | 9,600 | 260,256 |
| Koppers Holdings, Inc. | | 1,950 | 74,997 |
| Linde PLC | | 719,339 | 331,608,086 |
| LSB Industries, Inc. (a) | | 5,400 | 47,682 |
| LyondellBasell Industries NV Class A | | 191,817 | 15,986,029 |
| Mativ Holdings, Inc. | | 10,600 | 139,390 |
| Minerals Technologies, Inc. | | 83,549 | 6,815,092 |
| Perimeter Solutions, Inc. | | 12,469 | 159,603 |
| PPG Industries, Inc. | | 425,370 | 52,903,267 |
| Quaker Chemical Corp. | | 2,475 | 390,308 |
| Rayonier Advanced Materials, Inc. (a) | | 22,683 | 199,837 |
| RPM International, Inc. | | 350,333 | 48,619,214 |
| Sherwin-Williams Co. | | 321,491 | 127,760,523 |
| The Chemours Co. LLC | | 78,271 | 1,701,612 |
| The Mosaic Co. | | 751,838 | 19,893,633 |
| Tronox Holdings PLC | | 117,300 | 1,419,330 |
| Westlake Corp. | | 200 | 25,680 |
| | | | 833,193,897 |
| Construction Materials - 0.3% | | | |
| Eagle Materials, Inc. | | 133,732 | 41,312,489 |
| Martin Marietta Materials, Inc. | | 165,975 | 99,585,000 |
| Summit Materials, Inc. Class A (a) | | 219,256 | 11,168,901 |
| United States Lime & Minerals, Inc. | | 18,264 | 2,794,392 |
| Vulcan Materials Co. | | 148,903 | 42,903,421 |
| | | | 197,764,203 |
| Containers & Packaging - 0.3% | | | |
| Amcor PLC | | 444,200 | 4,726,288 |
| Aptargroup, Inc. | | 189,574 | 32,788,719 |
| Avery Dennison Corp. | | 47,634 | 9,810,222 |
| Ball Corp. | | 353,289 | 21,960,444 |
| Berry Global Group, Inc. | | 399,877 | 28,915,106 |
| Crown Holdings, Inc. | | 224,878 | 20,709,015 |
| Graphic Packaging Holding Co. (e) | | 773,080 | 23,261,977 |
| International Paper Co. | | 349,179 | 20,542,201 |
| Myers Industries, Inc. | | 400 | 4,640 |
| O-I Glass, Inc. (a) | | 481,784 | 6,070,478 |
| Packaging Corp. of America | | 154,239 | 38,382,375 |
| Ranpak Holdings Corp. (A Shares) (a) | | 3,800 | 29,602 |
| Smurfit Westrock PLC | | 527,075 | 28,999,667 |
| Sonoco Products Co. | | 38,663 | 2,005,836 |
| TriMas Corp. | | 119,463 | 3,156,212 |
| | | | 241,362,782 |
| Metals & Mining - 0.2% | | | |
| Alcoa Corp. | | 56,406 | 2,618,931 |
| Alpha Metallurgical Resources | | 13,669 | 3,356,696 |
| ATI, Inc. (a) | | 58,152 | 3,499,006 |
| Carpenter Technology Corp. | | 2,766 | 536,715 |
| Century Aluminum Co. (a) | | 42,085 | 960,801 |
| Cleveland-Cliffs, Inc. (a) | | 369,781 | 4,603,773 |
| Commercial Metals Co. | | 12,300 | 758,787 |
| Compass Minerals International, Inc. | | 35,721 | 551,175 |
| First Quantum Minerals Ltd. (a) | | 129,722 | 1,775,275 |
| Franco-Nevada Corp. | | 163,295 | 20,023,233 |
| Freeport-McMoRan, Inc. | | 1,098,518 | 48,554,496 |
| Gatos Silver, Inc. (a) | | 2,200 | 34,012 |
| Hecla Mining Co. | | 44,500 | 245,640 |
| Ivanhoe Mines Ltd. (a)(f) | | 116,566 | 1,581,078 |
| Kaiser Aluminum Corp. | | 6,001 | 487,761 |
| Materion Corp. | | 8,294 | 958,952 |
| McEwen Mining, Inc. (a) | | 196 | 1,639 |
| Metallus, Inc. (a) | | 1,900 | 31,673 |
| Newmont Corp. | | 36,076 | 1,513,027 |
| Nucor Corp. | | 109,566 | 16,948,765 |
| Olympic Steel, Inc. | | 29,786 | 1,259,352 |
| Piedmont Lithium, Inc. (a)(e) | | 7,442 | 93,472 |
| Radius Recycling, Inc. Class A | | 64,256 | 1,273,554 |
| Reliance, Inc. | | 18,700 | 6,007,188 |
| Royal Gold, Inc. | | 100 | 14,626 |
| Ryerson Holding Corp. | | 11,393 | 292,800 |
| Southern Copper Corp. | | 31,191 | 3,130,017 |
| SSR Mining, Inc. | | 6,929 | 40,257 |
| Steel Dynamics, Inc. | | 367,995 | 53,458,634 |
| SunCoke Energy, Inc. | | 30,700 | 382,522 |
| Teck Resources Ltd. Class B | | 25,862 | 1,207,238 |
| United States Steel Corp. (e) | | 29,403 | 1,198,760 |
| Warrior Metropolitan Coal, Inc. | | 83,435 | 5,867,149 |
| Wheaton Precious Metals Corp. | | 33,707 | 2,100,957 |
| | | | 185,367,961 |
| Paper & Forest Products - 0.1% | | | |
| Clearwater Paper Corp. (a) | | 2,800 | 75,936 |
| Louisiana-Pacific Corp. | | 109,738 | 12,971,032 |
| Magnera Corp. (a) | | 69,050 | 1,414,144 |
| Mercer International, Inc. (SBI) | | 10,518 | 64,896 |
| Sylvamo Corp. | | 129,426 | 11,944,726 |
| West Fraser Timber Co. Ltd. (e) | | 216,679 | 21,446,887 |
| | | | 47,917,621 |
TOTAL MATERIALS | | | 1,505,606,464 |
| REAL ESTATE - 1.6% | | | |
| Equity Real Estate Investment Trusts (REITs) - 1.5% | | | |
| Agree Realty Corp. | | 200,256 | 15,379,661 |
| Alexander & Baldwin, Inc. | | 2,718 | 53,490 |
| Alexandria Real Estate Equities, Inc. | | 681,648 | 75,138,059 |
| Alpine Income Property Trust, Inc. | | 5,400 | 96,606 |
| American Assets Trust, Inc. | | 7,018 | 199,592 |
| American Homes 4 Rent Class A (e) | | 202,000 | 7,734,580 |
| American Tower Corp. | | 428,290 | 89,512,610 |
| Americold Realty Trust | | 454,019 | 10,832,893 |
| Apartment Investment & Management Co. Class A (a) | | 15,185 | 134,235 |
| Armada Hoffler Properties, Inc. Class A, | | 3,467 | 38,310 |
| AvalonBay Communities, Inc. | | 52,183 | 12,281,269 |
| Brandywine Realty Trust (SBI) | | 787,114 | 4,407,838 |
| Brixmor Property Group, Inc. | | 117,002 | 3,518,250 |
| Broadstone Net Lease, Inc. | | 269,993 | 4,727,577 |
| Camden Property Trust (SBI) | | 142,691 | 17,950,528 |
| CareTrust (REIT), Inc. | | 37,520 | 1,117,721 |
| Chatham Lodging Trust | | 19,665 | 181,115 |
| City Office REIT, Inc. | | 20,760 | 120,408 |
| Community Healthcare Trust, Inc. | | 11,167 | 211,056 |
| COPT Defense Properties (SBI) | | 324,585 | 10,695,076 |
| Cousins Properties, Inc. | | 22,700 | 720,498 |
| Crown Castle, Inc. | | 1,900 | 201,875 |
| CTO Realty Growth, Inc. | | 118,235 | 2,413,176 |
| CubeSmart | | 372,550 | 18,463,578 |
| Curbline Properties Corp. | | 63,400 | 1,538,084 |
| Digital Realty Trust, Inc. | | 602,100 | 117,824,949 |
| EastGroup Properties, Inc. | | 57,668 | 9,931,006 |
| Equinix, Inc. | | 77,415 | 75,981,274 |
| Equity Commonwealth | | 45,800 | 931,572 |
| Equity Lifestyle Properties, Inc. | | 165,802 | 11,826,657 |
| Equity Residential (SBI) | | 25,800 | 1,977,828 |
| Essex Property Trust, Inc. | | 64,904 | 20,150,096 |
| Extra Space Storage, Inc. | | 984 | 168,225 |
| Federal Realty Investment Trust (SBI) | | 9,600 | 1,119,840 |
| First Industrial Realty Trust, Inc. | | 431,406 | 23,058,651 |
| Four Corners Property Trust, Inc. | | 31,100 | 923,981 |
| Franklin Street Properties Corp. | | 39,619 | 75,672 |
| Gaming & Leisure Properties | | 65,889 | 3,400,531 |
| Gladstone Commercial Corp. | | 12,002 | 211,355 |
| Healthcare Realty Trust, Inc. | | 560,811 | 10,274,058 |
| Healthpeak Properties, Inc. | | 3,800 | 83,562 |
| Host Hotels & Resorts, Inc. | | 416,600 | 7,673,772 |
| Hudson Pacific Properties, Inc. | | 2,500 | 9,625 |
| Independence Realty Trust, Inc. | | 489,975 | 10,701,054 |
| Industrial Logistics Properties Trust | | 48,300 | 186,921 |
| InvenTrust Properties Corp. | | 27,700 | 857,869 |
| Invitation Homes, Inc. | | 131,600 | 4,507,300 |
| Iron Mountain, Inc. | | 442 | 54,662 |
| Kilroy Realty Corp. | | 82,391 | 3,421,698 |
| Kimco Realty Corp. | | 2,191,993 | 56,049,261 |
| Kite Realty Group Trust | | 444,253 | 12,248,055 |
| Lamar Advertising Co. Class A | | 243,403 | 32,620,870 |
| LTC Properties, Inc. | | 5,700 | 219,963 |
| LXP Industrial Trust (REIT) | | 35,700 | 333,795 |
| Medical Properties Trust, Inc. (e) | | 21,146 | 92,831 |
| Mid-America Apartment Communities, Inc. | | 19,700 | 3,233,952 |
| NexPoint Residential Trust, Inc. | | 34,022 | 1,601,416 |
| NNN (REIT), Inc. | | 43,900 | 1,930,722 |
| Office Properties Income Trust | | 83,977 | 138,562 |
| Omega Healthcare Investors, Inc. | | 216,500 | 8,792,065 |
| Orion Office (REIT), Inc. | | 23,444 | 99,168 |
| Paramount Group, Inc. | | 48,888 | 237,596 |
| Park Hotels & Resorts, Inc. | | 428,396 | 6,661,558 |
| Pebblebrook Hotel Trust | | 10,083 | 139,650 |
| Phillips Edison & Co., Inc. | | 554 | 21,883 |
| Piedmont Office Realty Trust, Inc. Class A | | 784,400 | 7,467,488 |
| Plymouth Industrial REIT, Inc. | | 6,791 | 127,263 |
| PotlatchDeltic Corp. | | 2,681 | 120,216 |
| Prologis, Inc. | | 451,942 | 52,777,787 |
| Public Storage Operating Co. | | 96,247 | 33,498,768 |
| Regency Centers Corp. | | 136,400 | 10,310,476 |
| Retail Opportunity Investments Corp. | | 3,564 | 62,014 |
| Rexford Industrial Realty, Inc. | | 866,588 | 36,466,023 |
| RLJ Lodging Trust | | 9,871 | 100,783 |
| Ryman Hospitality Properties, Inc. | | 163,038 | 19,114,575 |
| Sabra Health Care REIT, Inc. | | 17,500 | 327,775 |
| Saul Centers, Inc. | | 2,500 | 102,775 |
| Service Properties Trust | | 340,500 | 946,590 |
| Simon Property Group, Inc. | | 264,408 | 48,545,309 |
| SITE Centers Corp. | | 10,501 | 162,976 |
| STAG Industrial, Inc. | | 246,718 | 9,076,755 |
| Summit Hotel Properties, Inc. | | 13,412 | 88,251 |
| Sun Communities, Inc. | | 200,413 | 25,318,174 |
| Tanger, Inc. | | 5,229 | 193,316 |
| Terreno Realty Corp. | | 35,800 | 2,170,554 |
| The Macerich Co. | | 95,600 | 2,027,676 |
| Uniti Group, Inc. | | 1,500 | 8,865 |
| Ventas, Inc. | | 1,424,739 | 91,283,028 |
| Veris Residential, Inc. | | 24,426 | 445,775 |
| VICI Properties, Inc. | | 914,855 | 29,833,422 |
| Vornado Realty Trust | | 10,600 | 456,330 |
| Welltower, Inc. | | 551,686 | 76,231,971 |
| Weyerhaeuser Co. | | 15,681 | 505,869 |
| | | | 1,155,212,394 |
| Real Estate Management & Development - 0.1% | | | |
| Anywhere Real Estate, Inc. (a) | | 317,469 | 1,555,598 |
| CBRE Group, Inc. (a) | | 181,763 | 25,445,002 |
| Compass, Inc. Class A (a) | | 571,247 | 4,050,141 |
| CoStar Group, Inc. (a) | | 425,656 | 34,622,859 |
| Douglas Elliman, Inc. (a) | | 2,198,305 | 5,583,695 |
| Forestar Group, Inc. (a) | | 3,200 | 95,520 |
| Jones Lang LaSalle, Inc. (a) | | 48,728 | 13,673,077 |
| Newmark Group, Inc. Class A | | 6,654 | 103,004 |
| RE/MAX Holdings, Inc. Class A (a) | | 22,000 | 289,520 |
| Real Matters, Inc. (a) | | 430,209 | 2,111,023 |
| Seritage Growth Properties Class A (a)(e) | | 29,900 | 136,344 |
| The Real Brokerage, Inc. (a)(e) | | 14,485 | 76,191 |
| The St. Joe Co. | | 15,374 | 785,304 |
| Zillow Group, Inc. Class A (a) | | 44,084 | 3,594,169 |
| | | | 92,121,447 |
TOTAL REAL ESTATE | | | 1,247,333,841 |
| UTILITIES - 2.1% | | | |
| Electric Utilities - 1.4% | | | |
| Allete, Inc. | | 5,477 | 355,348 |
| Alliant Energy Corp. | | 1,401 | 88,543 |
| American Electric Power Co., Inc. | | 12,000 | 1,198,320 |
| Constellation Energy Corp. | | 434,400 | 111,449,664 |
| Duke Energy Corp. | | 475,150 | 55,616,308 |
| Edison International | | 321,000 | 28,167,750 |
| Entergy Corp. | | 204,011 | 31,860,398 |
| Evergy, Inc. | | 275,155 | 17,783,268 |
| Eversource Energy | | 58,500 | 3,772,665 |
| Exelon Corp. | | 1,037,498 | 41,043,421 |
| FirstEnergy Corp. | | 422,931 | 17,995,714 |
| Genie Energy Ltd. Class B | | 412 | 6,287 |
| IDACORP, Inc. | | 212,772 | 25,207,099 |
| MGE Energy, Inc. | | 600 | 62,568 |
| NextEra Energy, Inc. | | 3,420,207 | 269,067,685 |
| NRG Energy, Inc. | | 413,149 | 41,980,070 |
| OGE Energy Corp. | | 68,747 | 3,022,118 |
| PG&E Corp. | | 8,243,542 | 178,307,813 |
| Pinnacle West Capital Corp. | | 57,486 | 5,386,438 |
| Portland General Electric Co. | | 185,753 | 8,901,284 |
| PPL Corp. | | 2,355,923 | 82,292,390 |
| Southern Co. | | 1,513,514 | 134,899,503 |
| TXNM Energy, Inc. | | 304,867 | 14,953,726 |
| Xcel Energy, Inc. | | 643,800 | 46,714,128 |
| | | | 1,120,132,508 |
| Gas Utilities - 0.1% | | | |
| Atmos Energy Corp. | | 321,644 | 48,671,170 |
| Brookfield Infrastructure Corp. A Shares (e) | | 6,080 | 272,931 |
| National Fuel Gas Co. | | 1,600 | 102,352 |
| New Jersey Resources Corp. | | 76,290 | 3,935,038 |
| ONE Gas, Inc. | | 8,365 | 652,219 |
| Southwest Gas Holdings, Inc. | | 173,683 | 13,575,063 |
| UGI Corp. | | 346,817 | 10,532,832 |
| | | | 77,741,605 |
| Independent Power and Renewable Electricity Producers - 0.2% | | | |
| Clearway Energy, Inc. Class C | | 6,400 | 188,736 |
| Montauk Renewables, Inc. (a)(e) | | 15,779 | 69,743 |
| Ormat Technologies, Inc. | | 548 | 44,728 |
| Sunnova Energy International, Inc. (a)(e) | | 6,900 | 38,226 |
| Talen Energy Corp. (a) | | 253,958 | 54,451,135 |
| The AES Corp. | | 993,877 | 12,960,156 |
| Vistra Corp. | | 364,887 | 58,323,538 |
| | | | 126,076,262 |
| Multi-Utilities - 0.4% | | | |
| Ameren Corp. | | 482,115 | 45,506,835 |
| Avista Corp. | | 13,092 | 506,529 |
| Black Hills Corp. | | 3,523 | 225,719 |
| CenterPoint Energy, Inc. | | 189,747 | 6,189,547 |
| CMS Energy Corp. | | 277,400 | 19,337,554 |
| Consolidated Edison, Inc. | | 282,800 | 28,446,852 |
| Dominion Energy, Inc. | | 1,565,709 | 91,985,404 |
| DTE Energy Co. | | 200,631 | 25,235,367 |
| NiSource, Inc. | | 101,936 | 3,882,742 |
| NorthWestern Energy Corp. | | 223,632 | 12,353,432 |
| Public Service Enterprise Group, Inc. | | 225,607 | 21,274,740 |
| Sempra | | 685,051 | 64,168,727 |
| WEC Energy Group, Inc. | | 54,410 | 5,498,131 |
| | | | 324,611,579 |
| Water Utilities - 0.0% | | | |
| American States Water Co. | | 400 | 34,124 |
| Consolidated Water Co., Inc. | | 23,418 | 630,647 |
| SJW Group | | 14,655 | 816,577 |
| | | | 1,481,348 |
TOTAL UTILITIES | | | 1,650,043,302 |
| TOTAL COMMON STOCKS (Cost $30,181,123,344) | | | 66,320,000,361 |
| | | | |
| Nonconvertible Bonds - 0.1% |
| | | Principal Amount (g) | Value ($) |
| COMMUNICATION SERVICES - 0.0% | | | |
| Wireless Telecommunication Services - 0.0% | | | |
| T-Mobile U.S.A., Inc. 5.75% 1/15/34 | | 800,000 | 839,455 |
| CONSUMER DISCRETIONARY - 0.0% | | | |
| Hotels, Restaurants & Leisure - 0.0% | | | |
| Las Vegas Sands Corp. 6.2% 8/15/34 | | 400,000 | 410,889 |
| FINANCIALS - 0.1% | | | |
| Banks - 0.1% | | | |
| Bank of America Corp.: | | | |
| 2.592% 4/29/31 (h) | | 5,160,000 | 4,604,272 |
| 5.288% 4/25/34 (h) | | 4,550,000 | 4,620,589 |
| Barclays PLC 6.224% 5/9/34 (h) | | 4,380,000 | 4,615,499 |
| Intesa Sanpaolo SpA 6.625% 6/20/33 (b) | | 300,000 | 319,714 |
| JPMorgan Chase & Co.: | | | |
| 4.946% 10/22/35 (h) | | 600,000 | 595,099 |
| 4.995% 7/22/30 (h) | | 4,560,000 | 4,592,909 |
| 5.766% 4/22/35 (h) | | 4,410,000 | 4,616,819 |
| Norinchukin Bank 5.094% 10/16/29 (b) | | 900,000 | 903,354 |
| Wells Fargo & Co.: | | | |
| 5.198% 1/23/30 (h) | | 4,530,000 | 4,592,969 |
| 5.557% 7/25/34 (h) | | 4,500,000 | 4,615,002 |
| | | | 34,076,226 |
| Capital Markets - 0.0% | | | |
| Goldman Sachs Group, Inc. 5.851% 4/25/35 (h) | | 8,830,000 | 9,255,121 |
| Morgan Stanley: | | | |
| 5.042% 7/19/30 (h) | | 4,560,000 | 4,593,188 |
| 5.424% 7/21/34 (h) | | 4,530,000 | 4,612,905 |
| UBS Group AG 6.537% 8/12/33 (b)(h) | | 8,530,000 | 9,230,646 |
| | | | 27,691,860 |
TOTAL FINANCIALS | | | 61,768,086 |
| HEALTH CARE - 0.0% | | | |
| Health Care Providers & Services - 0.0% | | | |
| HCA Holdings, Inc. 5.45% 9/15/34 | | 900,000 | 899,083 |
| INFORMATION TECHNOLOGY - 0.0% | | | |
| IT Services - 0.0% | | | |
| CDW LLC/CDW Finance Corp. 5.55% 8/22/34 | | 900,000 | 895,688 |
| Semiconductors & Semiconductor Equipment - 0.0% | | | |
| Broadcom, Inc. 3.419% 4/15/33 (b) | | 1,000,000 | 889,178 |
TOTAL INFORMATION TECHNOLOGY | | | 1,784,866 |
| UTILITIES - 0.0% | | | |
| Electric Utilities - 0.0% | | | |
| Pacific Gas & Electric Co. 6.15% 1/15/33 | | 800,000 | 844,697 |
| Southern California Edison Co. 5.2% 6/1/34 | | 900,000 | 911,096 |
| | | | 1,755,793 |
| TOTAL NONCONVERTIBLE BONDS (Cost $67,871,436) | | | 67,458,172 |
| | | | |
| U.S. Government and Government Agency Obligations - 0.0% |
| | | Principal Amount (g) | Value ($) |
| U.S. Treasury Inflation-Protected Obligations - 0.0% | | | |
| U.S. Treasury Inflation-Indexed Bonds 1% 2/15/46 (i)(j)(k) | | 8,463,252 | 6,758,887 |
| U.S. Treasury Inflation-Indexed Notes: | | | |
| 1.375% 7/15/33 (i)(j) | | 16,828,736 | 16,137,157 |
| 1.875% 7/15/34 | | 9,847,432 | 9,803,123 |
TOTAL U.S. TREASURY INFLATION-PROTECTED OBLIGATIONS | | | 32,699,167 |
| U.S. Treasury Obligations - 0.0% | | | |
| U.S. Treasury Bills, yield at date of purchase 4.44% to 4.69% 12/12/24 to 3/13/25 (i)(k) | | 10,898,000 | 10,813,677 |
| TOTAL U.S. GOVERNMENT AND GOVERNMENT AGENCY OBLIGATIONS (Cost $43,736,899) | | | 43,512,844 |
| | | | |
| U.S. Government Agency - Mortgage Securities - 0.3% |
| | | Principal Amount (g) | Value ($) |
| Fannie Mae - 0.1% | | | |
| 0% 3/1/42 (d)(h)(l) | | 2,000,000 | 1,957,500 |
| 4.01% 11/1/29 | | 2,000,000 | 1,954,636 |
| 4.3% 11/1/29 | | 2,000,000 | 1,980,498 |
| 4.3% 12/1/54 (d) | | 1,700,000 | 1,683,531 |
| 4.705% 9/1/31 (h) | | 3,900,000 | 3,912,505 |
| 4.72% 10/1/28 to 8/1/30 | | 1,689,979 | 1,698,753 |
| 4.77% 10/1/28 | | 500,000 | 503,383 |
| 4.86% 8/1/30 | | 600,000 | 604,865 |
| 5.24% 1/1/55 (d)(l) | | 5,816,000 | 5,910,510 |
| 5.34% 12/1/54 (d) | | 3,125,000 | 3,205,078 |
| 5.5% 8/1/54 to 12/1/54 | | 10,199,992 | 10,188,480 |
| 5.73% 12/1/54 (d)(l) | | 1,998,000 | 1,998,000 |
| 6.5% 2/1/54 to 8/1/54 | | 4,000,001 | 4,098,556 |
TOTAL FANNIE MAE | | | 39,696,295 |
| Freddie Mac - 0.0% | | | |
| 4% 11/1/54 | | 1,529,999 | 1,431,534 |
| 4.5% 12/1/54 | | 1,610,000 | 1,546,463 |
| 6% 12/1/53 to 11/1/54 | | 26,638,354 | 26,964,073 |
| 6.5% 9/1/54 | | 460,000 | 471,103 |
TOTAL FREDDIE MAC | | | 30,413,173 |
| Ginnie Mae - 0.0% | | | |
| 4.5% 12/1/54 (l) | | 1,800,000 | 1,737,000 |
| 4.5% 12/1/54 (l) | | 1,420,000 | 1,370,300 |
TOTAL GINNIE MAE | | | 3,107,300 |
| Uniform Mortgage Backed Securities - 0.2% | | | |
| 4% 12/1/54 (l) | | 2,474,894 | 2,315,573 |
| 4% 12/1/54 (l) | | 1,690,549 | 1,581,720 |
| 4% 12/1/54 (l) | | 2,800,000 | 2,619,750 |
| 4% 12/1/54 (l) | | 575,106 | 538,084 |
| 4% 12/1/54 (l) | | 3,020,000 | 2,825,588 |
| 4% 12/1/54 (l) | | 3,190,000 | 2,984,644 |
| 4% 1/1/55 (l) | | 2,474,894 | 2,316,346 |
| 4% 1/1/55 (l) | | 9,844,557 | 9,213,890 |
| 4.5% 12/1/54 (l) | | 3,200,000 | 3,073,500 |
| 4.5% 12/1/54 (l) | | 8,110,000 | 7,789,402 |
| 4.5% 12/1/54 (l) | | 2,330,000 | 2,237,892 |
| 4.5% 1/1/55 (l) | | 10,910,000 | 10,480,419 |
| 6% 12/1/54 (l) | | 3,850,000 | 3,896,320 |
| 6% 12/1/54 (l) | | 5,080,000 | 5,141,119 |
| 6.5% 12/1/54 (l) | | 6,710,000 | 6,870,411 |
| 6.5% 12/1/54 (l) | | 1,350,000 | 1,382,273 |
| 6.5% 12/1/54 (l) | | 170,000 | 174,064 |
| 6.5% 12/1/54 (l) | | 24,000,000 | 24,573,749 |
| 6.5% 12/1/54 (l) | | 7,000,000 | 7,167,343 |
| 6.5% 12/1/54 (l) | | 8,200,000 | 8,396,031 |
| 6.5% 12/1/54 (l) | | 6,970,000 | 7,136,626 |
| 6.5% 1/1/55 (l) | | 15,200,000 | 15,561,594 |
TOTAL UNIFORM MORTGAGE BACKED SECURITIES | | | 128,276,338 |
| TOTAL U.S. GOVERNMENT AGENCY - MORTGAGE SECURITIES (Cost $200,762,385) | | | 201,493,106 |
| | | | |
| Asset-Backed Securities - 0.3% |
| | | Principal Amount (g) | Value ($) |
| 522 Funding Clo 2020-6 Ltd. Series 2024-6A Class A1R2, CME Term SOFR 3 Month Index + 1.200% 5.7583% 10/23/34 (b)(h)(m) | | 3,250,000 | 3,250,000 |
| Accredited Mortgage Loan Trust Series 2004-4 Class A2D, CME Term SOFR 1 Month Index + 0.700% 4.6589% 1/25/35 (h)(m) | | 784,287 | 772,883 |
| Affirm Asset Securitization Trust Series 2024-X2 Class A, 5.22% 12/17/29 (b) | | 3,100,000 | 3,101,000 |
| Agl Clo 5 Ltd. / Agl Clo 5 LLC Series 2024-5A Class BRR, CME Term SOFR 3 Month Index + 1.650% 6.2674% 7/20/34 (b)(h)(m) | | 3,000,000 | 2,991,981 |
| Ally Auto Receivables Trust 20 Series 2024-2 Class A3, 4.14% 7/16/29 | | 1,500,000 | 1,490,511 |
| Ameriquest Mortgage Securities, Inc.: | | | |
| Series 2004-R5 Class M2, CME Term SOFR 1 Month Index + 1.980% 6.5772% 7/25/34 (m) | | 1,488,647 | 1,467,404 |
| Series 2004-R6 Class M4, CME Term SOFR 1 Month Index + 5.360% 4.518% 7/25/34 (m) | | 1,370,754 | 1,140,328 |
| Ammc Cdo Series 2024-24A Class AR, CME Term SOFR 3 Month Index + 1.200% 5.7602% 1/20/35 (b)(h)(m) | | 3,500,000 | 3,500,000 |
| Apidos Clo Xxx Series 2024-XXXA Class A2R, CME Term SOFR 3 Month Index + 1.500% 6.1324% 10/18/31 (b)(h)(m) | | 1,550,000 | 1,551,025 |
| Arbour Clo Vii Designated Acti Series 2024-7A Class B1R, 3 month EURIBOR EURO INTER + 2.050% 4.996% 12/15/38 (b)(h)(m) | EUR | 3,200,000 | 3,381,580 |
| Ares European Clo Xiv Dac Series 2024-14A Class AR, 3 month EURIBOR EURO INTER + 1.030% 4.128% 10/21/34 (b)(h)(m) | EUR | 4,500,000 | 4,755,247 |
| Ares Xxvii Clo Ltd. Series 2024-2A Class AR3, CME Term SOFR 3 Month Index + 1.150% 5.7025% 10/28/34 (b)(h)(m) | | 3,000,000 | 3,000,000 |
| Ares XXXIV CLO Ltd. Series 2024-2A Class AR3, CME Term SOFR 3 Month Index + 1.320% 5.9675% 4/17/33 (b)(h)(m) | | 500,000 | 501,128 |
| ArrowMark Colorado Holdings LLC Series 2024-3A: | | | |
| Class A2R2, CME Term SOFR 3 Month Index + 1.600% 6.2259% 1/25/35 (b)(h)(m) | | 2,000,000 | 2,000,692 |
| Class BR2, CME Term SOFR 3 Month Index + 1.850% 6.4759% 1/25/35 (b)(h)(m) | | 2,000,000 | 2,000,952 |
| Asset Bckd Corp. He Amq 07-He2 Series 2007-HE2 Class A4, CME Term SOFR 1 Month Index + 0.340% 4.9322% 5/25/37 (m) | | 1,289,316 | 907,967 |
| Atlantic Ave 2024-3 Ltd. / Atla Series 2024-3A Class A, CME Term SOFR 3 Month Index + 1.260% 0% 1/20/35 (b)(h)(l)(m) | | 2,500,000 | 2,500,000 |
| Atlas Senior Loan Fund Xv Ltd. Series 2024-15A Class A1R, CME Term SOFR 3 Month Index + 1.220% 5.8463% 10/23/32 (b)(h)(m) | | 500,000 | 500,277 |
| Avoca Static Clo I Designated Series 2024-1A Class BR, 3 month EURIBOR EURO INTER + 1.700% 4.541% 1/15/35 (b)(h)(m) | EUR | 2,700,000 | 2,853,225 |
| Bain Capital Credit CLO Series 2024-2A: | | | |
| Class A2R, CME Term SOFR 3 Month Index + 1.480% 6.1273% 7/16/34 (b)(h)(m) | | 2,000,000 | 2,002,246 |
| Class BR, CME Term SOFR 3 Month Index + 1.650% 6.2973% 7/16/34 (b)(h)(m) | | 2,000,000 | 1,993,464 |
| Bain Capital Credit Clo 2020-3 Series 2024-3A: | | | |
| Class A1RR, CME Term SOFR 3 Month Index + 1.210% 5.8363% 10/23/34 (b)(h)(m) | | 4,300,000 | 4,301,221 |
| Class BRR, CME Term SOFR 3 Month Index + 1.600% 6.2263% 10/23/34 (b)(h)(m) | | 2,000,000 | 2,000,776 |
| Bain Capital Credit Clo 2021-4 Ltd. / B Series 2024-4A: | | | |
| Class A2R, CME Term SOFR 3 Month Index + 1.450% 6.0092% 10/20/34 (b)(h)(m) | | 800,000 | 800,057 |
| Class BR, CME Term SOFR 3 Month Index + 1.650% 6.2092% 10/20/34 (b)(h)(m) | | 800,000 | 800,055 |
| Bain Capital Credit Clo 2021-5 Series 2024-5A Class A1R, CME Term SOFR 3 Month Index + 1.150% 5.6709% 10/23/34 (b)(h)(m) | | 4,000,000 | 4,000,000 |
| Bbam European Clo Series 2022-3A Class A, 3 month EURIBOR EURO INTER + 0.920% 4.104% 1/15/36 (b)(h)(m) | EUR | 1,500,000 | 1,575,613 |
| Bbam European Clo I Dac Series 2021-1A Class AR, 3 month EURIBOR EURO INTER + 0.870% 4.071% 7/22/34 (b)(h)(m) | EUR | 1,000,000 | 1,049,542 |
| Bear Stearns Asset Backed Securities I Trust: | | | |
| Series 2005-EC1 Class M4, CME Term SOFR 1 Month Index + 1.160% 4.6694% 11/25/35 (h)(m) | | 2,750,402 | 2,594,894 |
| Series 2006-EC2 Class M4, CME Term SOFR 1 Month Index + 0.980% 5.398% 2/25/36 (m) | | 6,244,096 | 5,739,069 |
| Series 2007-HE3 Class 1A4, CME Term SOFR 1 Month Index + 0.350% 5.0522% 4/25/37 (h)(m) | | 3,654,479 | 3,419,545 |
| Benefit Str Partners Clo Xix L Series 2024-19A Class BR, CME Term SOFR 3 Month Index + 1.600% 6.2559% 1/15/33 (b)(h)(m) | | 1,500,000 | 1,500,524 |
| Bridgecrest Lending Auto Secur Series 2024-4 Class A3, 4.72% 9/15/28 | | 3,100,000 | 3,097,784 |
| Carlyle Global Market Strategies CLO, Ltd. Series 2024-3A Class ARRR, CME Term SOFR 3 Month Index + 1.090% 0% 7/20/34 (b)(h)(m) | | 4,600,000 | 4,600,000 |
| Cascade Mh Asset Trust 2024-Mh Series 2024-MH1 Class A1, 5.695% 11/25/56 (b) | | 988,625 | 1,000,623 |
| Centex Home Equity Loan Trust Series 2004-D Class MV5, CME Term SOFR 1 Month Index + 1.910% 6.5022% 9/25/34 (m) | | 573,882 | 513,555 |
| CIFC Funding Ltd. Series 2018-4A Class A1RR, CME Term SOFR 3 Month Index + 1.320% 5.9388% 4/27/31 (b)(h)(m) | | 97,458 | 97,682 |
| Cps Auto Receivables Trust 202 Series 2022-A Class D, 2.84% 4/16/29 (b) | | 5,815,000 | 5,691,950 |
| Crown Point Clo 7 Ltd. Series 2024-7A Class AR, CME Term SOFR 3 Month Index + 1.230% 5.8474% 10/20/31 (b)(h)(m) | | 410,873 | 411,243 |
| Cvc Cordatus Loan Fund Xiv Dac Series 2021-14A Class A1R, 3 month EURIBOR EURO INTER + 0.850% 3.85% 5/22/32 (b)(h)(m) | EUR | 3,796,023 | 3,995,401 |
| Dryden 55 Clo Ltd. Series 2018-55A Class A1, CME Term SOFR 3 Month Index + 1.280% 5.9375% 4/15/31 (b)(h)(m) | | 327,935 | 327,971 |
| Dryden Euro Clo Series 2020-74A Class A, 3 month EURIBOR EURO INTER + 1.000% 4.208% 4/18/33 (b)(h)(m) | EUR | 1,500,000 | 1,581,869 |
| Exeter Automobile Receivables Series 2024-5A: | | | |
| Class A2, 4.79% 4/15/27 | | 750,000 | 749,909 |
| Class A3, 4.45% 3/15/28 | | 750,000 | 747,479 |
| Class B, 4.48% 4/16/29 | | 750,000 | 745,682 |
| Class C, 4.64% 1/15/30 | | 750,000 | 744,890 |
| FHF Issuer Trust Series 2024-3A: | | | |
| Class A1, 4.941% 10/15/25 (b) | | 634,382 | 634,504 |
| Class A2, 4.94% 11/15/30 (b) | | 1,000,000 | 997,729 |
| Fhf Issuer Trust 2024-1 Series 2024-1A Class A2, 5.69% 2/15/30 (b) | | 3,166,722 | 3,193,102 |
| First Franklin Mortgage Loan Trust Series 2004-FFH3 Class M3, CME Term SOFR 1 Month Index + 1.160% 5.7522% 10/25/34 (m) | | 1,162,404 | 1,031,468 |
| Flagship Credit Auto Trust Series 2023-2 Class B, 5.21% 5/15/28 (b) | | 2,354,000 | 2,356,645 |
| Fortress Credit Bsl Vii Ltd. Series 2024-1A Class A1R, CME Term SOFR 3 Month Index + 1.090% 5.6495% 7/23/32 (b)(h)(m) | | 2,900,000 | 2,900,380 |
| Gls Auto Receivables Issuer Trust Series 2024-3A: | | | |
| Class B, 5.08% 1/16/29 (b) | | 1,500,000 | 1,507,796 |
| Class C, 5.21% 2/18/31 (b) | | 1,500,000 | 1,509,768 |
| Gls Auto Select Receivables Trust Series 2024-4A: | | | |
| Class A2, 4.43% 12/17/29 (b) | | 4,100,000 | 4,078,083 |
| Class B, 4.5% 11/15/30 (b) | | 2,000,000 | 1,974,797 |
| Gm Financial Consumer Automobile Re: | | | |
| Series 2023-1 Class A3, 4.66% 2/16/28 | | 2,500,000 | 2,500,457 |
| Series 2024-4 Class A3, 4.4% 8/16/29 | | 3,000,000 | 2,994,600 |
| Greensky Home Improvement Trus Series 2024-2 Class A4, 5.15% 10/27/59 (b) | | 2,000,000 | 1,999,739 |
| Greywolf Clo Iii Ltd. Series 2024-3RA Class A2R2, CME Term SOFR 3 Month Index + 1.850% 6.7432% 4/22/33 (b)(h)(m) | | 1,200,000 | 1,200,180 |
| Grosvenor Place Clo 2024-2 Dac Series 2024-2A Class A, 3 month EURIBOR EURO INTER + 1.240% 0% 1/15/39 (b)(h)(l)(m) | EUR | 2,200,000 | 2,324,850 |
| GSAMP Trust Series 2007-FM1 Class A1, CME Term SOFR 1 Month Index + 0.250% 4.8422% 12/25/36 (m) | | 768,118 | 409,571 |
| Hayfin Emerald Clo V Dac Series 2024-5A Class AR, 3 month EURIBOR EURO INTER + 1.210% 3.975% 11/17/37 (b)(h)(m) | EUR | 1,400,000 | 1,478,919 |
| Honda Auto Receivables 2024-4 Series 2024-4 Class A2, 4.56% 3/15/27 | | 2,000,000 | 1,999,013 |
| Hsi Asset Secutzn Corp. Trust07 North Carolina1 Series 2007-NC1 Class A3, CME Term SOFR 1 Month Index + 0.180% 5.0622% 4/25/37 (h)(m) | | 247,246 | 165,929 |
| Hyundai Auto Receivables Trust Series 2024-C Class A3, 4.41% 5/15/29 | | 4,000,000 | 3,993,706 |
| Indigo Credit Management Ii Da Series 2024-2A Class B, 3 month EURIBOR EURO INTER + 2.100% 2.1% 7/15/38 (b)(h)(l)(m) | EUR | 2,500,000 | 2,641,875 |
| Jamestown Clo Xvi Ltd. Series 2024-16A Class AR, CME Term SOFR 3 Month Index + 1.120% 0% 7/25/34 (b)(h)(m) | | 4,800,000 | 4,800,000 |
| Kkr Clo 28 Ltd. Series 2024-28A Class AR, CME Term SOFR 3 Month Index + 1.440% 6.0873% 2/9/35 (b)(h)(m) | | 2,100,000 | 2,101,035 |
| Lad Auto Receivables Trust 202 Series 2024-3A Class A1, 4.865% 11/17/25 (b) | | 2,974,055 | 2,975,055 |
| Lcm Loan Income Fund I Ltd. Series 2018-1A Class B, CME Term SOFR 3 Month Index + 1.710% 6.329% 4/20/31 (b)(h)(m) | | 2,325,000 | 2,329,569 |
| Lendmark Funding Trust 2024-2 Series 2024-2A Class A, 4.47% 2/21/34 (b) | | 700,000 | 688,412 |
| Marathon Static CLO Ltd. Series 2024-18A Class A1R2, CME Term SOFR 3 Month Index + 1.150% 5.7674% 7/20/30 (b)(h)(m) | | 529,767 | 529,816 |
| Marlette Funding Trust 2022-3 Series 2022-3A: | | | |
| Class B, 5.95% 11/15/32 (b) | | 599,667 | 600,283 |
| Class C, 6.89% 11/15/32 (b) | | 1,151,000 | 1,164,202 |
| Marlette Funding Trust 2023-3 Series 2023-3A Class B, 6.71% 9/15/33 (b) | | 6,877,000 | 6,910,364 |
| Merrill Lynch Mortgage Investors Trust Series 2004-WMC3 Class M3, CME Term SOFR 1 Month Index + 2.210% 6.8022% 1/25/35 (m) | | 3,334,542 | 2,965,141 |
| Morgan Stanley ABS Capital I Trust: | | | |
| Series 2004-HE8 Class A4, CME Term SOFR 1 Month Index + 0.870% 5.4622% 9/25/34 (h)(m) | | 715,454 | 711,726 |
| Series 2004-NC8 Class M1, CME Term SOFR 1 Month Index + 1.020% 5.6172% 9/25/34 (m) | | 330,407 | 323,485 |
| Morgan Stanley Abs Capital I, Inc. T Series 2007-HE3 Class A2A, CME Term SOFR 1 Month Index + 0.170% 4.7622% 12/25/36 (d)(m) | | 246,943 | 124,541 |
| Navient Student Loan Trust: | | | |
| Series 2017-A Class B, 3.91% 12/16/58 (b) | | 1,791,352 | 1,764,931 |
| Series 2021-DA Class C, 3.48% 4/15/60 (b) | | 2,000,000 | 1,835,848 |
| Octagon Investment Partners Xv Series 2018-1A Class A1R2, CME Term SOFR 3 Month Index + 1.260% 5.8875% 1/25/31 (b)(h)(m) | | 75,525 | 75,646 |
| Ofsi Bsl Xi Ltd. Series 2024-10A Class AR, CME Term SOFR 3 Month Index + 1.270% 5.8243% 4/20/34 (b)(h)(m) | | 1,100,000 | 1,100,086 |
| Pagaya Ai Dbt Selection Trust Series 2023-7: | | | |
| Class B, 7.549% 7/15/31 (b) | | 9,096,610 | 9,147,316 |
| Class C, 8.798% 7/15/31 (b) | | 3,998,510 | 4,094,441 |
| Pagaya Ai Debt Grantor Trust 2024 Series 2024-8 Class A, 5.331% 1/15/32 (b) | | 2,363,298 | 2,365,734 |
| Pagaya Ai Debt Selection Trust Series 2024-1 Class B, 7.109% 7/15/31 (b) | | 3,820,210 | 3,868,050 |
| Pagaya Ai Debt Trust 2022-1 Series 2022-1 Class B, 3.344% 10/15/29 (b) | | 3,072,377 | 3,062,864 |
| Pagaya Ai Debt Trust 2023-1 Series 2023-1 Class B, 9.435% 7/15/30 (b) | | 2,497,653 | 2,521,761 |
| Pagaya Ai Debt Trust 2023-3 Series 2023-3 Class B, 9.57% 12/16/30 (b) | | 1,999,601 | 2,027,708 |
| Pagaya Ai Debt Trust 2023-5 Series 2023-5 Class C, 9.099% 4/15/31 (b) | | 4,999,958 | 5,110,711 |
| Pagaya Ai Debt Trust 2024-2 Series 2024-2 Class A, 6.319% 8/15/31 (b) | | 2,651,675 | 2,675,750 |
| Pagaya Ai Debt Trust 2024-3 Series 2024-3 Class A, 6.258% 10/15/31 (b) | | 3,629,610 | 3,649,349 |
| Palmer Square European Ln Funding Series 2024-3A: | | | |
| Class B, 3 month EURIBOR EURO INTER + 1.850% 0% 5/15/34 (b)(h)(l)(m) | EUR | 2,000,000 | 2,113,906 |
| Class BR, 3 month EURIBOR EURO INTER + 1.650% 0% 5/15/33 (b)(h)(m) | EUR | 3,000,000 | 3,170,250 |
| Pikes Peak Clo 4 Series 2024-4A Class ARR, CME Term SOFR 3 Month Index + 1.210% 5.8659% 7/15/34 (b)(h)(m) | | 4,500,000 | 4,501,238 |
| Pret 2021-Npl5 LLC Series 2021-NPL5 Class A1, 5.487% 10/25/51 (b)(h) | | 2,515,213 | 2,513,113 |
| PRET LLC Series 2021-RN2 Class A1, 4.7436% 7/25/51 (b) | | 866,595 | 859,235 |
| Prpm 2021-11 LLC Series 2021-11 Class A1, 5.487% 11/25/26 (b)(h) | | 2,173,240 | 2,170,055 |
| Research-Driven Pagaya Motor A Series 2023-3A Class A, 7.13% 1/26/32 (b) | | 859,364 | 867,419 |
| Residential Asset Securities Corp. Series 2004-KS5 Class MII2, CME Term SOFR 1 Month Index + 1.210% 5.6944% 6/25/34 (m) | | 2,521,707 | 2,330,217 |
| Sandstone Peak Ltd. Series 2024-1A: | | | |
| Class A1R, CME Term SOFR 3 Month Index + 1.280% 5.9359% 10/15/34 (b)(h)(m) | | 1,500,000 | 1,500,515 |
| Class B1R, CME Term SOFR 3 Month Index + 1.830% 6.4859% 10/15/34 (b)(h)(m) | | 4,000,000 | 4,005,580 |
| Santander Drive Auto Receivabl Series 2024-5 Class A3, 4.62% 11/15/28 | | 1,500,000 | 1,497,118 |
| Saxon Asset Securities Trust Series 2004-2 Class MF2, 0.4261% 8/25/35 | | 1,978,080 | 1,718,770 |
| Securitized Asset Backed Receivables LLC Trust Series 2006-WM4 Class A2C, CME Term SOFR 1 Month Index + 0.160% 5.0222% 11/25/36 (h)(m) | | 6,589,521 | 1,849,976 |
| Smb Private Ed Ln Trust Series 2024-C Class A1A, 5.5% 6/17/52 (b) | | 2,922,408 | 2,970,667 |
| Smb Private Ed Ln Trust 2015-B Series 2015-B Class B, 3.5% 12/17/40 (b) | | 1,737,792 | 1,718,083 |
| Smb Private Ed Ln Trust 2015-C Series 2015-C Class B, 3.5% 9/15/43 (b) | | 4,051,641 | 4,005,644 |
| Smb Private Ed Ln Trust 2024-E Series 2024-E Class A1A, 5.09% 10/16/56 (b) | | 4,846,128 | 4,859,014 |
| Smb Private Education Loan Tru Series 2024-F Class A1A, 5.06% 3/16/54 (b) | | 600,000 | 600,361 |
| SMB Private Education Loan Trust: | | | |
| Series 2016-C Class B, 3.25% 11/15/40 (b) | | 700,000 | 683,375 |
| Series 2021-D Class A1A, 1.34% 3/17/53 (b) | | 815,502 | 753,539 |
| Sound Point Clo Xxviii Ltd. Series 2024-3A Class A1R, CME Term SOFR 3 Month Index + 1.280% 5.9059% 1/25/32 (b)(h)(m) | | 500,000 | 500,650 |
| Specialty Underwriting & Residential Finance Trust Series 2004-BC1 Class M1, CME Term SOFR 1 Month Index + 0.870% 5.4672% 2/25/35 (m) | | 492,082 | 499,610 |
| Tikehau Clo Ix Dac Series 2024-9A Class AR, 3 month EURIBOR EURO INTER + 1.220% 0% 1/20/37 (b)(h)(m) | EUR | 900,000 | 951,075 |
| Towd Point Mortgage Trust: | | | |
| Series 2017-3 Class B2, 3.9072% 7/25/57 (b)(h) | | 2,000,000 | 1,783,997 |
| Series 2017-6 Class A2, 3% 10/25/57 (b) | | 2,300,000 | 2,142,993 |
| Trysail Clo 2022-1 Ltd. Series 2022-1A Class A, CME Term SOFR 3 Month Index + 1.230% 7.2674% 10/20/33 (b)(h)(m) | | 4,000,000 | 4,010,748 |
| Upstart Securitization Trust Series 2023-2 Class B, 7.92% 6/20/33 (b) | | 4,700,000 | 4,807,762 |
| Ventr 2017-29A Series 2021-17-29A Class AR, CME Term SOFR 3 Month Index + 1.250% 5.7751% 9/7/30 (b)(h)(m) | | 158,512 | 158,782 |
| Voya Clo 2014-2 Ltd. Series 2020-2A Class A1RR, CME Term SOFR 3 Month Index + 1.280% 5.9291% 4/17/30 (b)(h)(m) | | 43,998 | 44,015 |
| WaMu Asset-Backed Certificates Series 2006-HE3 Class 2A3, CME Term SOFR 1 Month Index + 0.430% 5.0222% 8/25/36 (m) | | 2,827,215 | 1,773,753 |
| Westlake Automobile Receivable: | | | |
| Series 2023-2A Class D, 7.01% 11/15/28 (b) | | 475,000 | 487,821 |
| Series 2024-3A Class A3, 4.71% 4/17/28 (b) | | 3,000,000 | 2,997,194 |
| TOTAL ASSET-BACKED SECURITIES (Cost $275,265,647) | | | 274,012,654 |
| | | | |
| Collateralized Mortgage Obligations - 0.1% |
| | | Principal Amount (g) | Value ($) |
| Private Sponsor - 0.1% | | | |
| Acra Trust 2024-Nqm1 Series 2024-NQM1 Class A1, 5.608% 10/25/64 (b) | | 497,664 | 496,457 |
| Chase Home Lending Mortgage Trust Series 2024-RPL4 Class A1A, 3.375% 12/25/64 (b) | | 2,952,971 | 2,652,511 |
| CIM Trust Series 2023 R3, Class A1A, 4.5% 1/25/63 (b) | | 533,495 | 495,041 |
| Citimortgage Alternative Loan floater Series 2007-A7 Class 2A1, CME Term SOFR 1 Month Index + 0.510% 5.1022% 7/25/37 (h)(m) | | 2,771,537 | 2,197,326 |
| Credit Suisse Mortgage Trust 2 Series 2017-RPL3 Class B1, 4.5% 8/1/57 (b)(h) | | 659,087 | 639,431 |
| Greenpoint Mtg Funding Trust floater Series 2005-AR4: | | | |
| Class 3A1, NULL 6.3273% 10/25/45 (h) | | 8,109,891 | 6,079,798 |
| Class 4A1A, CME Term SOFR 1 Month Index + 0.730% 5.3222% 10/25/45 (m) | | 1,316,870 | 1,213,969 |
| Harborview Mortgage Loan Trust floater Series 2005-9 Class 2A1A, CME Term SOFR 1 Month Index + 0.790% 5.4007% 6/20/35 (h)(m) | | 525,052 | 481,513 |
| J P Morgan Mtg Trust 2024-10 floater Series 2024-10 Class A11, NULL 5.984% 3/25/55 (b)(h) | | 2,761,708 | 2,763,981 |
| Jp Morgan Resecur Trust Ser 14 floater Series 2014-6 Class 1A2, CME Term SOFR 1 Month Index + 0.320% 3.3367% 7/27/36 (b)(h)(m) | | 5,282,554 | 4,789,675 |
| Kinbn 2024-Rpl2A A floater Series 2024-RPL2A Class A, EURIBOR (1 MO) RATE + 1.100% 4.1886% 1/24/63 (b)(m) | EUR | 3,800,000 | 4,014,457 |
| Legacy Mortgage Asset Trust 20 sequential payer Series 2021-SL2 Class A, 4.875% 10/25/68 (b)(h) | | 549,226 | 544,683 |
| Lugo Funding Dac floater Series 2024-1A Class A, 3 month EURIBOR EURO INTER + 0.000% 3.9923% 5/26/66 (b)(h)(m) | EUR | 1,400,000 | 1,471,138 |
| Mill City Mortgage Loan Trust Series 2017-1 Class M3, 3.25% 11/25/58 (b) | | 4,560,000 | 4,303,400 |
| Morgan Stanley Resecuritizatio sequential payer Series 2015-R6 Class 1A2, CME Term SOFR 1 Month Index + 0.370% 4.4073% 7/26/45 (b)(m) | | 2,903,994 | 2,857,899 |
| Morgan Stanley Residential Mtg: | | | |
| sequential payer Series 2024-NQM3 Class A1, 5.044% 7/25/69 (b)(h) | | 2,903,832 | 2,876,611 |
| Series 2024-RPL1 Class A1, 4% 6/25/64 | | 3,056,000 | 2,945,067 |
| Nymt Loan Trust 2024-Investment1 Series 2024-INV1 Class A1, 5.379% 6/25/69 (b) | | 1,995,736 | 1,985,527 |
| Pret 2024-Npl6 LLC Series 2024-NPL6 Class A1, 5.9256% 10/25/54 (b)(h) | | 2,400,000 | 2,409,082 |
| Pret 2024-Npl7 LLC Series 2024-NPL7 Class A1, 5.9251% 10/25/54 (b)(h) | | 1,088,155 | 1,092,253 |
| Pret 2024-Npl8 LLC Series 2024-NPL8 Class A1, 5.9632% 11/25/54 (b) | | 4,500,000 | 4,516,650 |
| PRET LLC: | | | |
| sequential payer Series 2022-RN2 Class A1, 5% 6/25/52 (b) | | 250,159 | 248,719 |
| Series 2022-RN1 Class A1, 3.721% 7/25/51 (b) | | 569,480 | 569,529 |
| Prpm 2024-7 LLC Series 2024-7 Class A1, 5.87% 11/25/29 (b)(h) | | 2,900,000 | 2,913,630 |
| Prpm 2024-8 LLC Series 2024-8 Class A1, 5.897% 12/25/29 (b)(d) | | 4,000,000 | 3,999,968 |
| Prpm 2024-Rpl3 LLC Series 2024-RPL3 Class A1, 4% 11/25/54 (b) | | 3,100,000 | 3,008,550 |
| Sequoia Mortgage Trust 2024-Hy Series 2024-HYB1 Class A1A, 4.4972% 11/25/63 (b)(h) | | 1,363,086 | 1,348,888 |
| Towd Point Mortgage Trust 2024 Series 2024-CES6 Class A1, 5.725% 11/25/64 (b) | | 3,600,000 | 3,621,600 |
| Towd PT Mtg Trust 2024-5 sequential payer Series 2024-5 Class A1A, 4.4666% 10/25/64 (b)(h) | | 3,536,166 | 3,488,712 |
| Verus Securitization Trust 202: | | | |
| sequential payer Series 2024-R1 Class A1, 5.218% 9/25/69 (b) | | 1,984,142 | 1,996,175 |
| Series 2024-8 Class A1, 5.364% 10/25/69 (b)(h) | | 984,095 | 980,281 |
TOTAL PRIVATE SPONSOR | | | 73,002,521 |
| U.S. Government Agency - 0.0% | | | |
| Freddie Mac floater: | | | |
| Series 2024-5473 Class FA, U.S. 30-Day Avg. Secured Overnight Fin. Rate (SOFR) Index + 1.100% 5.834% 11/25/54 (h)(m) | | 575,315 | 574,723 |
| Series 2024-5480 Class FG, U.S. 30-Day Avg. Secured Overnight Fin. Rate (SOFR) Index + 1.150% 5.8927% 12/25/54 (h)(m) | | 2,000,000 | 2,006,999 |
| Series 2024-5484 Class FD, U.S. 30-Day Avg. Secured Overnight Fin. Rate (SOFR) Index + 1.150% 6.0065% 12/25/54 (h)(m) | | 5,200,000 | 5,216,890 |
TOTAL U.S. GOVERNMENT AGENCY | | | 7,798,612 |
| TOTAL COLLATERALIZED MORTGAGE OBLIGATIONS (Cost $80,675,324) | | | 80,801,133 |
| | | | |
| Foreign Government and Government Agency Obligations - 0.0% |
| | | Principal Amount (g) | Value ($) |
| Brazil Letras Do Tesouro Nacio, yield at date of purchase 12.7983% 10/1/25 | BRL | 117,300,000 | 17,514,874 |
| Peruvian Republic: | | | |
| 5.4% 8/12/34(Reg. S) | PEN | 23,900,000 | 5,842,383 |
| 6.15% 8/12/32 (b) | PEN | 11,600,000 | 3,072,585 |
| 6.9% 8/12/37 (b) | PEN | 9,300,000 | 2,475,058 |
| 6.95% 8/12/31 (Reg. S) | PEN | 4,100,000 | 1,150,466 |
| 7.3% 8/12/33(Reg. S) (b) | PEN | 1,000,000 | 281,809 |
| Polish Government 4.75% 7/25/29 | PLN | 6,800,000 | 1,638,017 |
| United Mexican States 8% 11/7/47 | MXN | 21,200,000 | 834,319 |
| TOTAL FOREIGN GOVERNMENT AND GOVERNMENT AGENCY OBLIGATIONS (Cost $33,519,090) | | | 32,809,511 |
| | | | |
| Commercial Paper - 0.1% |
| | | Principal Amount (g) | Value ($) |
| AutoNation, Inc. 0% 12/3/24 | | 4,620,000 | 4,617,343 |
| Bacardi Martini BV yankee: | | | |
| 0% 12/12/24 | | 410,000 | 409,263 |
| 0% 12/19/24 | | 3,300,000 | 3,290,890 |
| 0% 12/23/24 (b) | | 490,000 | 488,378 |
| 0% 12/27/24 | | 450,000 | 448,263 |
| Conagra Brands, Inc. 0% 12/10/24 | | 4,640,000 | 4,633,029 |
| Constellation Brands, Inc.: | | | |
| 0% 12/3/24 | | 1,150,000 | 1,149,366 |
| 0% 12/11/24 | | 740,000 | 738,773 |
| 0% 12/17/24 (b) | | 490,000 | 488,782 |
| 0% 12/20/24 | | 2,200,000 | 2,193,624 |
| Enbridge U.S., Inc. 0% 12/2/24 | | 2,960,000 | 2,958,825 |
| Harley-Davidson Financial Services, Inc. 0% 12/5/24 | | 2,040,000 | 2,038,379 |
| Jones Lang Lasalle yankee 0% 12/6/24 | | 3,300,000 | 3,297,003 |
| L3Harris Technologies, Inc. 0% 12/2/24 | | 2,800,000 | 2,798,912 |
| Quanta Services, Inc. 0% 12/9/24 | | 4,640,000 | 4,633,585 |
| Reckitt Benckiser Treasury Services PLC 0% 12/13/24 | | 2,030,000 | 2,026,314 |
| Rogers Communications, Inc. yankee 0% 12/19/24 | | 4,300,000 | 4,288,791 |
| Southern California Edison Co. 0% 1/6/25 | | 1,610,000 | 1,601,518 |
| The AES Corp. 0% 12/6/24 | | 4,620,000 | 4,615,481 |
| TOTAL COMMERCIAL PAPER (Cost $46,728,082) | | | 46,716,519 |
| | | | |
| Other - 0.0% |
| | | Shares | Value ($) |
| Commodity Funds - Broad Basket - 0.0% | | | |
Fidelity SAI Inflation-Focused Fund (n) (Cost $1,082) | | 14 | 1,178 |
| | | | |
| Money Market Funds - 1.5% |
| | | Shares | Value ($) |
| Fidelity Cash Central Fund 4.64% (o) | | 41,042,393 | 41,050,602 |
| Fidelity Securities Lending Cash Central Fund 4.64% (o)(p) | | 572,619,415 | 572,676,677 |
| Invesco Government & Agency Portfolio Institutional Class 4.57% (q) | | 617,376,255 | 617,376,255 |
| TOTAL MONEY MARKET FUNDS (Cost $1,231,103,534) | | | 1,231,103,534 |
| | | | |
| Repurchase Agreements - 0.3% |
| | | Maturity Amount ($) | Value ($) |
| With Bank of America NA at 4.64%, dated 11/29/24 due 12/2/24 (Collateralized by U.S. Treasury Obligations valued at $107,141,412, 4.50%, 11/15/33) | | 107,141,412 | 107,100,000 |
| With Citigroup Global Markets, Inc. at 4.64%, dated 12/2/24 due 12/3/24 (r) | | 94,412,167 | 94,400,000 |
| TOTAL REPURCHASE AGREEMENTS (Cost $201,500,000) | | | 201,500,000 |
| | | | |
| Equity Funds - 14.9% |
| | | Shares | Value ($) |
| Large Blend Funds - 3.1% | | | |
| Fidelity SAI U.S. Large Cap Index Fund (n) | | 19,490,397 | 486,870,106 |
| Fidelity SAI U.S. Low Volatility Index Fund (n) | | 43,397,509 | 1,001,180,526 |
| iShares Core S&P 500 ETF | | 1,512,426 | 915,123,600 |
| PIMCO StocksPLUS Absolute Return Fund Institutional Class | | 493,358 | 6,749,142 |
| SPDR S&P 500 ETF Trust (e) | | 48,200 | 29,042,910 |
TOTAL LARGE BLEND FUNDS | | | 2,438,966,284 |
| Large Growth Funds - 6.8% | | | |
| Fidelity Blue Chip Growth Fund (n) | | 40,718 | 9,208,691 |
| Fidelity Growth Company Fund (n) | | 84,292,373 | 3,661,660,702 |
| Fidelity SAI U.S. Momentum Index Fund (n) | | 600,288 | 10,673,122 |
| Fidelity SAI U.S. Quality Index Fund (n) | | 77,767,666 | 1,741,218,041 |
TOTAL LARGE GROWTH FUNDS | | | 5,422,760,556 |
| Mid-Cap Blend Funds - 0.0% | | | |
| Fidelity Mid Cap Index Fund (n) | | 86,994 | 3,231,829 |
| Mid-Cap Growth Funds - 4.1% | | | |
| Fidelity Extended Market Index Fund (n) | | 32,859,495 | 3,227,459,555 |
| Sector Funds - 0.0% | | | |
| Fidelity SAI Real Estate Index Fund (n) | | 439,445 | 2,447,711 |
| Small Blend Funds - 0.1% | | | |
| PIMCO StocksPLUS Small Fund Institutional Class | | 10,059,672 | 87,519,150 |
| Small Growth Funds - 0.8% | | | |
| Fidelity Advisor Small Cap Growth Fund Class Z (n) | | 17,535,423 | 647,933,868 |
| TOTAL EQUITY FUNDS (Cost $7,476,074,436) | | | 11,830,318,953 |
| | | | |
| Purchased Swaptions - 0.0% |
| | Expiration Date | Notional Amount (g) | Value ($) |
| Put Options - 0.0% | | | | |
| Option on an interest rate swap with Barclays Bank PLC to receive at maturity a fixed rate of 3.75% and pay at maturity a floating rate based on the U.S. Secured Overnight Fin. Rate (SOFR) Index, expiring November 2026. | 10/30/25 | | 64,400,000 | 261,923 |
| | | | | |
| Call Options - 0.0% | | | | |
| Option on an interest rate swap with Citibank N.A. to receive at maturity a fixed rate of 5.85% and pay at maturity a floating rate based on the U.S. Secured Overnight Fin. Rate (SOFR) Index, expiring November 2026. | 11/25/26 | | 20,900,000 | 5,585 |
| Option on an interest rate swap with Citibank N.A. to receive at maturity a fixed rate of 5.85% and pay at maturity a floating rate based on the U.S. Secured Overnight Fin. Rate (SOFR) Index, expiring November 2026. | 11/24/25 | | 8,000,000 | 2,192 |
| | | | | |
| TOTAL CALL OPTIONS | | | | 7,777 |
TOTAL PURCHASED SWAPTIONS (Cost $320,820) | | | | 269,700 |
| Purchased Options - 0.0% |
| | Counterparty | Number of Contracts | Notional Amount ($) | Exercise Price ($) | Expiration Date | Value ($) |
| Put Options | | | | | | |
| S&P 500 Index | Chicago Board Options Exchange | 65 | 39,210,470 | 5,375 | 12/04/24 | 975 |
| S&P 500 Index | Chicago Board Options Exchange | 53 | 31,971,614 | 5,400 | 12/04/24 | 795 |
| S&P 500 Index | Chicago Board Options Exchange | 59 | 35,591,042 | 5,400 | 12/11/24 | 5,605 |
| S&P 500 Index | Chicago Board Options Exchange | 54 | 32,574,852 | 5,350 | 12/04/24 | 810 |
| S&P 500 Index | Chicago Board Options Exchange | 58 | 34,987,804 | 5,350 | 12/11/24 | 4,930 |
| S&P 500 Index | Chicago Board Options Exchange | 58 | 34,987,804 | 5,350 | 12/18/24 | 16,385 |
| S&P 500 Index | Chicago Board Options Exchange | 57 | 34,384,566 | 5,425 | 12/11/24 | 5,700 |
| S&P 500 Index | Chicago Board Options Exchange | 59 | 35,591,042 | 5,425 | 12/18/24 | 18,880 |
| S&P 500 Index | Chicago Board Options Exchange | 64 | 38,607,232 | 5,450 | 12/24/24 | 31,360 |
| | | | | | | |
| | | | | | | 85,440 |
TOTAL PURCHASED OPTIONS (Cost $229,480) | | | | | | 85,440 |
| TOTAL INVESTMENT IN SECURITIES - 101.1% (Cost $39,838,911,559) | 80,330,083,105 |
NET OTHER ASSETS (LIABILITIES) - (1.1)% | (865,335,324) |
| NET ASSETS - 100.0% | 79,464,747,781 |
| | |
| TBA Sale Commitments |
| | Principal Amount (g) | Value ($) |
| Uniform Mortgage Backed Securities | | |
| 5.5% 12/1/54 | (10,200,000) | (10,185,656) |
| 6% 1/1/55 | (13,900,000) | (14,061,262) |
| | | |
TOTAL TBA SALE COMMITMENTS (Proceeds $24,177,246) | | (24,246,918) |
| Written Swaptions |
| | Expiration Date | Notional Amount (g) | Value ($) |
| Put Swaptions | | | | |
| Option on an interest rate swap with Barclays Bank PLC to receive at maturity a fixed rate of 2.83% and pay at maturity a floating rate based on the U.S. Secured Overnight Fin. Rate (SOFR) Index, expiring November 2026. | 10/30/25 | | 64,400,000 | (89,808) |
| Option on an interest rate swap with Barclays Bank PLC to receive at maturity a fixed rate of 3.29% and pay at maturity a floating rate based on the U.S. Secured Overnight Fin. Rate (SOFR) Index, expiring November 2026. | 10/30/25 | | 64,400,000 | (155,311) |
| Option on an interest rate swap with Goldman Sachs Bank U.S.A. to receive annually a fixed rate of 3.615% and pay annually a floating rate based on the U.S. Secured Overnight Fin. Rate (SOFR) Index, expiring December 2034. | 12/26/26 | | 2,600,000 | (13,383) |
| | | | | |
| TOTAL PUT SWAPTIONS | | | | (258,502) |
| Call Swaptions | | | | |
| Option on an interest rate swap with Goldman Sachs Bank U.S.A. to receive annually a fixed rate of 4.015% and pay annually a floating rate based on the U.S. Secured Overnight Fin. Rate (SOFR) Index, expiring December 2034. | 12/26/24 | | 2,600,000 | (3,053) |
| | | | | |
| TOTAL WRITTEN SWAPTIONS | | | | (261,555) |
| Futures Contracts |
| | Number of contracts | Expiration Date | Notional Amount ($) | Value ($) | Unrealized Appreciation/ (Depreciation) ($) |
| Purchased | | | | | |
| | | | | | |
| Equity Index Contracts | | | | | |
| CME E-mini Russell 2000 Index Contracts (United States) | 39 | Dec 2024 | 4,766,970 | 371,050 | 371,050 |
| CME E-mini S&P 500 Index Contracts (United States) | 1,192 | Dec 2024 | 360,669,400 | 14,661,343 | 14,661,343 |
| CME E-mini S&P MidCap 400 Index Contracts (United States) | 10 | Dec 2024 | 3,377,800 | 223,789 | 223,789 |
| | | | | | |
| TOTAL EQUITY INDEX CONTRACTS | | | | | 15,256,182 |
| | | | | | |
| Treasury Contracts | | | | | |
| CBOT 2-Year U.S. Treasury Note Contracts (United States) | 503 | Mar 2025 | 103,673,016 | 241,846 | 241,846 |
| CBOT 5-Year U.S. Treasury Note Contracts (United States) | 1,440 | Mar 2025 | 154,946,250 | 1,165,270 | 1,165,270 |
| | | | | | |
| TOTAL TREASURY CONTRACTS | | | | | 1,407,116 |
| | | | | | |
| TOTAL PURCHASED | | | | | 16,663,298 |
| | | | | | |
| Sold | | | | | |
| | | | | | |
| Equity Index Contracts | | | | | |
| CBOT Dow Jones E-Mini Index Contract (United States) | 1,055 | Dec 2024 | 237,665,125 | (10,970,940) | (10,970,940) |
| | | | | | |
| Treasury Contracts | | | | | |
| CBOT 10-Year U.S. Treasury Note Contracts (United States) | 668 | Mar 2025 | 74,273,250 | (904,998) | (904,998) |
| CBOT Ultra 10-Year U.S. Treasury Note Contracts (United States) | 26 | Mar 2025 | 2,984,719 | (50,411) | (50,411) |
| CBOT Ultra Long Term U.S. Treasury Bond Contracts (United States) | 272 | Mar 2025 | 34,595,000 | (1,097,258) | (1,097,258) |
| | | | | | |
| TOTAL TREASURY CONTRACTS | | | | | (2,052,667) |
| | | | | | |
| TOTAL SOLD | | | | | (13,023,607) |
| | | | | | |
| TOTAL FUTURES CONTRACTS | | | | | 3,639,691 |
| The notional amount of futures purchased as a percentage of Net Assets is 0.8% |
| The notional amount of futures sold as a percentage of Net Assets is 0.4% |
| Written Options |
| | Counterparty | Number of Contracts | Notional Amount ($) | Exercise Price ($) | Expiration Date | Value ($) |
| Put Options | | | | | | |
| S&P 500 Index | Chicago Board Options Exchange | 65 | 39,210,470 | 5,830.00 | 12/04/24 | (2,600) |
| S&P 500 Index | Chicago Board Options Exchange | 53 | 31,971,614 | 5,870.00 | 12/04/24 | (3,180) |
| S&P 500 Index | Chicago Board Options Exchange | 59 | 35,591,042 | 5,850.00 | 12/11/24 | (33,040) |
| S&P 500 Index | Chicago Board Options Exchange | 54 | 32,574,852 | 5,835.00 | 12/04/24 | (2,160) |
| S&P 500 Index | Chicago Board Options Exchange | 58 | 34,987,804 | 5,820.00 | 12/11/24 | (25,230) |
| S&P 500 Index | Chicago Board Options Exchange | 58 | 34,987,804 | 5,805.00 | 12/18/24 | (61,480) |
| S&P 500 Index | Chicago Board Options Exchange | 57 | 34,384,566 | 5,925.00 | 12/11/24 | (65,835) |
| S&P 500 Index | Chicago Board Options Exchange | 59 | 35,591,042 | 5,910.00 | 12/18/24 | (117,115) |
| S&P 500 Index | Chicago Board Options Exchange | 64 | 38,607,232 | 5,895.00 | 12/24/24 | (149,120) |
| | | | | | | |
| TOTAL WRITTEN OPTIONS | | | | | | (459,760) |
| Forward Foreign Currency Contracts |
Currency Purchased
| Currency Sold | Counterparty | Settlement Date | Unrealized Appreciation/ (Depreciation) ($) |
| | | | | | | |
| EUR | 4,535,055 | USD | 4,785,966 | UBS AG | 12/02/24 | 6,453 |
| AUD | 13,494,000 | USD | 8,748,430 | BNP Paribas S.A. | 12/03/24 | 53,031 |
| CAD | 17,933,476 | USD | 12,716,523 | Barclays Bank PLC | 12/03/24 | 92,646 |
| CHF | 11,310,790 | USD | 12,836,978 | Barclays Bank PLC | 12/03/24 | 2,331 |
| EUR | 6,451,474 | USD | 6,820,756 | Deutsche Bank AG | 12/03/24 | (3,161) |
| EUR | 27,039,000 | USD | 28,593,743 | Deutsche Bank AG | 12/03/24 | (20,279) |
| GBP | 2,578,000 | USD | 3,348,654 | BNP Paribas S.A. | 12/03/24 | (68,278) |
| GBP | 954,000 | USD | 1,231,059 | Bank of America, N.A. | 12/03/24 | (17,141) |
| GBP | 729,000 | USD | 921,328 | Barclays Bank PLC | 12/03/24 | 6,289 |
| JPY | 111,300,000 | USD | 725,525 | Citibank, N.A. | 12/03/24 | 18,384 |
| JPY | 106,100,000 | USD | 690,667 | Goldman Sachs Bank USA | 12/03/24 | 18,486 |
| JPY | 141,000,000 | USD | 928,282 | Goldman Sachs Bank USA | 12/03/24 | 14,137 |
| NZD | 5,287,000 | USD | 3,157,188 | Bank of America, N.A. | 12/03/24 | (25,962) |
| NZD | 1,099,000 | USD | 655,941 | Barclays Bank PLC | 12/03/24 | (5,058) |
| SGD | 1,676,000 | USD | 1,243,976 | Barclays Bank PLC | 12/03/24 | 7,424 |
| SGD | 1,259,000 | USD | 953,597 | Goldman Sachs Bank USA | 12/03/24 | (13,553) |
| USD | 803,164 | AUD | 1,223,000 | Bank of America, N.A. | 12/03/24 | 5,462 |
| USD | 207,423 | AUD | 315,000 | Bank of America, N.A. | 12/03/24 | 1,965 |
| USD | 247,931 | AUD | 380,000 | Bank of America, N.A. | 12/03/24 | 76 |
| USD | 801,218 | AUD | 1,220,000 | Barclays Bank PLC | 12/03/24 | 5,473 |
| USD | 851,315 | AUD | 1,307,000 | Barclays Bank PLC | 12/03/24 | (1,176) |
| USD | 783,730 | AUD | 1,182,000 | Citibank, N.A. | 12/03/24 | 12,770 |
| USD | 3,663,971 | AUD | 5,572,000 | Deutsche Bank AG | 12/03/24 | 29,634 |
| USD | 1,482,804 | AUD | 2,295,000 | Goldman Sachs Bank USA | 12/03/24 | (14,110) |
| USD | 7,079,465 | CAD | 9,826,177 | BNP Paribas S.A. | 12/03/24 | 61,018 |
| USD | 1,824,494 | CAD | 2,555,000 | BNP Paribas S.A. | 12/03/24 | (441) |
| USD | 1,440,098 | CAD | 2,000,479 | Bank of America, N.A. | 12/03/24 | 11,236 |
| USD | 1,259,765 | CAD | 1,748,000 | Barclays Bank PLC | 12/03/24 | 11,238 |
| USD | 1,293,824 | CAD | 1,807,000 | Royal Bank of Canada | 12/03/24 | 3,156 |
| USD | 1,400,362 | CHF | 1,208,846 | Bank of America, N.A. | 12/03/24 | 28,155 |
| USD | 1,278,595 | CHF | 1,118,000 | Bank of America, N.A. | 12/03/24 | 9,510 |
| USD | 1,950,475 | CHF | 1,733,000 | Bank of America, N.A. | 12/03/24 | (16,719) |
| USD | 7,094,430 | CHF | 6,132,815 | Barclays Bank PLC | 12/03/24 | 132,837 |
| USD | 1,266,478 | CHF | 1,118,000 | Royal Bank of Canada | 12/03/24 | (2,606) |
| USD | 3,994,169 | EUR | 3,831,000 | BNP Paribas S.A. | 12/03/24 | (54,240) |
| USD | 3,856,741 | EUR | 3,677,000 | BNP Paribas S.A. | 12/03/24 | (28,929) |
| USD | 945,299 | EUR | 899,000 | BNP Paribas S.A. | 12/03/24 | (4,719) |
| USD | 1,482,152 | EUR | 1,401,000 | Bank of America, N.A. | 12/03/24 | 1,645 |
| USD | 2,856,019 | EUR | 2,702,000 | Bank of America, N.A. | 12/03/24 | 681 |
| USD | 1,468,298 | EUR | 1,391,000 | Bank of America, N.A. | 12/03/24 | (1,641) |
| USD | 102,247 | EUR | 94,000 | Barclays Bank PLC | 12/03/24 | 2,913 |
| USD | 10,778,159 | EUR | 9,966,000 | Citibank, N.A. | 12/03/24 | 246,589 |
| USD | 3,238,110 | EUR | 3,078,000 | Citibank, N.A. | 12/03/24 | (14,566) |
| USD | 5,406,016 | GBP | 4,261,000 | Barclays Bank PLC | 12/03/24 | (15,894) |
| USD | 327,024 | JPY | 50,152,400 | Bank of America, N.A. | 12/03/24 | (8,186) |
| USD | 2,054,299 | JPY | 308,524,929 | Barclays Bank PLC | 12/03/24 | (7,826) |
| USD | 634,477 | NZD | 1,063,000 | BNP Paribas S.A. | 12/03/24 | 4,915 |
| USD | 595,526 | NZD | 1,005,000 | BNP Paribas S.A. | 12/03/24 | 314 |
| USD | 233,554 | NZD | 393,076 | Bank of America, N.A. | 12/03/24 | 755 |
| USD | 1,166,787 | NZD | 1,972,924 | Barclays Bank PLC | 12/03/24 | (1,677) |
| USD | 765,618 | NZD | 1,307,000 | Citibank, N.A. | 12/03/24 | (8,453) |
| USD | 383,683 | NZD | 645,000 | Deutsche Bank AG | 12/03/24 | 1,682 |
| USD | 101,010 | SEK | 1,090,000 | Barclays Bank PLC | 12/03/24 | 992 |
| USD | 101,878 | SEK | 1,110,000 | Citibank, N.A. | 12/03/24 | 25 |
| USD | 44,147 | SGD | 59,488 | BNP Paribas S.A. | 12/03/24 | (270) |
| USD | 76,950 | SGD | 103,362 | BNP Paribas S.A. | 12/03/24 | (226) |
| USD | 481,333 | SGD | 635,494 | Bank of America, N.A. | 12/03/24 | 6,836 |
| USD | 69,617 | SGD | 93,948 | Bank of America, N.A. | 12/03/24 | (530) |
| USD | 11,451 | SGD | 15,332 | Bank of America, N.A. | 12/03/24 | 4 |
| USD | 1,534,151 | SGD | 2,027,361 | Citibank, N.A. | 12/03/24 | 20,405 |
| INR | 38,734,327 | USD | 460,167 | BNP Paribas S.A. | 12/04/24 | (2,286) |
| INR | 253,708,833 | USD | 3,011,738 | BNP Paribas S.A. | 12/04/24 | (12,627) |
| INR | 183,016,579 | USD | 2,173,000 | Bank of America, N.A. | 12/04/24 | (9,547) |
| INR | 162,395,028 | USD | 1,924,000 | Barclays Bank PLC | 12/04/24 | (4,316) |
| INR | 229,664,016 | USD | 2,720,000 | Canadian Imperial Bk. of Comm. | 12/04/24 | (5,124) |
| INR | 17,917,508 | USD | 212,725 | Citibank, N.A. | 12/04/24 | (921) |
| INR | 33,057,929 | USD | 392,598 | Citibank, N.A. | 12/04/24 | (1,818) |
| INR | 65,878,182 | USD | 781,691 | Citibank, N.A. | 12/04/24 | (2,940) |
| INR | 211,746,910 | USD | 2,514,152 | Citibank, N.A. | 12/04/24 | (11,075) |
| INR | 172,909,828 | USD | 2,054,000 | Goldman Sachs Bank USA | 12/04/24 | (10,020) |
| INR | 97,527,339 | USD | 1,158,000 | Royal Bank of Canada | 12/04/24 | (5,122) |
| INR | 188,978,989 | USD | 2,239,000 | Royal Bank of Canada | 12/04/24 | (5,065) |
| USD | 301,000 | INR | 25,330,474 | BNP Paribas S.A. | 12/04/24 | 1,567 |
| USD | 1,061,939 | INR | 89,698,802 | BNP Paribas S.A. | 12/04/24 | 1,603 |
| USD | 1,743,834 | INR | 147,063,625 | BNP Paribas S.A. | 12/04/24 | 5,384 |
| USD | 1,116,837 | INR | 94,048,844 | Citibank, N.A. | 12/04/24 | 5,078 |
| USD | 1,017,239 | INR | 85,905,834 | Citibank, N.A. | 12/04/24 | 1,740 |
| USD | 1,103,304 | INR | 93,162,990 | Citibank, N.A. | 12/04/24 | 2,017 |
| USD | 1,561,150 | INR | 131,885,952 | Citibank, N.A. | 12/04/24 | 2,116 |
| USD | 1,562,977 | INR | 131,977,778 | Citibank, N.A. | 12/04/24 | 2,858 |
| USD | 1,556,771 | INR | 131,516,014 | Citibank, N.A. | 12/04/24 | 2,110 |
| USD | 1,557,578 | INR | 131,506,311 | Citibank, N.A. | 12/04/24 | 3,032 |
| USD | 1,998,355 | INR | 168,940,932 | Citibank, N.A. | 12/04/24 | 1,291 |
| USD | 1,988,300 | INR | 167,941,760 | Citibank, N.A. | 12/04/24 | 3,048 |
| USD | 1,371,606 | INR | 115,923,876 | Citibank, N.A. | 12/04/24 | 1,261 |
| USD | 1,665,786 | INR | 140,662,301 | Deutsche Bank AG | 12/04/24 | 3,006 |
| TRY | 16,712,775 | USD | 470,948 | Barclays Bank PLC | 12/05/24 | 9,761 |
| IDR | 35,653,342,500 | USD | 2,250,000 | Citibank, N.A. | 12/09/24 | (238) |
| PLN | 5,644,931 | USD | 1,408,040 | Bank of America, N.A. | 12/09/24 | (18,329) |
| IDR | 6,262,360,000 | USD | 400,000 | Citibank, N.A. | 12/12/24 | (4,870) |
| KRW | 622,264,500 | USD | 450,000 | Barclays Bank PLC | 12/12/24 | (3,700) |
| IDR | 15,819,000,000 | USD | 1,000,000 | Goldman Sachs Bank USA | 12/16/24 | (1,995) |
| ILS | 689,000 | USD | 184,627 | Bank of America, N.A. | 12/16/24 | 5,101 |
| ILS | 309,000 | USD | 82,889 | Citibank, N.A. | 12/16/24 | 2,200 |
| KRW | 913,263,000 | USD | 650,000 | Bank of America, N.A. | 12/16/24 | 5,116 |
| PLN | 4,278,000 | USD | 1,075,605 | BNP Paribas S.A. | 12/16/24 | (22,839) |
| PLN | 6,151,000 | USD | 1,528,346 | BNP Paribas S.A. | 12/16/24 | (14,656) |
| PLN | 5,640,000 | USD | 1,397,711 | Bank of America, N.A. | 12/16/24 | (9,772) |
| PLN | 5,059,000 | USD | 1,223,684 | Bank of America, N.A. | 12/16/24 | 21,277 |
| PLN | 6,271,530 | USD | 1,586,183 | Barclays Bank PLC | 12/16/24 | (42,832) |
| PLN | 3,956,079 | USD | 1,002,440 | Citibank, N.A. | 12/16/24 | (28,895) |
| PLN | 7,974,827 | USD | 2,020,601 | Deutsche Bank AG | 12/16/24 | (58,089) |
| PLN | 8,278,000 | USD | 1,999,974 | Goldman Sachs Bank USA | 12/16/24 | 37,145 |
| USD | 272,501 | ILS | 1,021,000 | Barclays Bank PLC | 12/16/24 | (8,650) |
| USD | 80,863 | ILS | 301,000 | Barclays Bank PLC | 12/16/24 | (2,022) |
| USD | 367,965 | ILS | 1,384,615 | Citibank, N.A. | 12/16/24 | (13,313) |
| USD | 200,084 | ILS | 751,000 | Citibank, N.A. | 12/16/24 | (6,717) |
| USD | 428,718 | ILS | 1,609,000 | Citibank, N.A. | 12/16/24 | (14,349) |
| USD | 232,146 | ILS | 873,000 | Goldman Sachs Bank USA | 12/16/24 | (8,250) |
| USD | 226,834 | PLN | 906,000 | Bank of America, N.A. | 12/16/24 | 3,878 |
| USD | 1,666,596 | PLN | 6,697,000 | Barclays Bank PLC | 12/16/24 | 18,542 |
| USD | 198,796 | ZAR | 3,500,000 | Citibank, N.A. | 12/17/24 | 4,786 |
| ZAR | 24,887,000 | USD | 1,402,567 | BNP Paribas S.A. | 12/17/24 | (23,043) |
| ZAR | 14,126,000 | USD | 793,749 | Bank of America, N.A. | 12/17/24 | (10,723) |
| ZAR | 86,999,751 | USD | 4,955,274 | Barclays Bank PLC | 12/17/24 | (132,749) |
| ZAR | 38,685,000 | USD | 2,098,979 | Barclays Bank PLC | 12/17/24 | 45,388 |
| ZAR | 22,148,000 | USD | 1,218,433 | Barclays Bank PLC | 12/17/24 | 9,264 |
| ZAR | 23,920,000 | USD | 1,368,914 | Citibank, N.A. | 12/17/24 | (42,993) |
| ZAR | 25,223,000 | USD | 1,419,002 | Goldman Sachs Bank USA | 12/17/24 | (20,854) |
| MXN | 4,038,000 | USD | 194,305 | Barclays Bank PLC | 12/18/24 | 4,151 |
| PEN | 10,010,419 | USD | 2,633,697 | Deutsche Bank AG | 12/18/24 | 37,939 |
| USD | 1,358,985 | CNY | 9,641,523 | BNP Paribas S.A. | 12/18/24 | 26,232 |
| USD | 1,350,873 | CNY | 9,602,005 | Bank of America, N.A. | 12/18/24 | 23,582 |
| USD | 2,928,468 | CNY | 21,225,000 | Barclays Bank PLC | 12/18/24 | (5,476) |
| USD | 1,375,209 | CNY | 9,781,009 | Citibank, N.A. | 12/18/24 | 23,175 |
| USD | 100,000 | IDR | 1,593,900,000 | Goldman Sachs Bank USA | 12/18/24 | (553) |
| USD | 50,000 | KRW | 70,027,000 | Citibank, N.A. | 12/18/24 | (237) |
| USD | 411,990 | MXN | 8,331,000 | Bank of America, N.A. | 12/18/24 | 2,546 |
| USD | 456,812 | MXN | 9,394,000 | Citibank, N.A. | 12/18/24 | (4,876) |
| USD | 240,137 | MXN | 4,862,000 | Goldman Sachs Bank USA | 12/18/24 | 1,184 |
| USD | 2,654,689 | PEN | 10,012,000 | BNP Paribas S.A. | 12/18/24 | (17,369) |
| USD | 1,725,034 | TWD | 54,623,202 | Goldman Sachs Bank USA | 12/18/24 | 40,351 |
| IDR | 794,632,960 | USD | 50,000 | Citibank, N.A. | 12/31/24 | 113 |
| GBP | 4,261,000 | USD | 5,405,631 | Barclays Bank PLC | 1/05/25 | 15,805 |
| TRY | 9,474,640 | USD | 248,940 | Barclays Bank PLC | 1/06/25 | 14,627 |
| TRY | 18,668,559 | USD | 495,115 | Barclays Bank PLC | 1/06/25 | 24,209 |
| JPY | 307,055,203 | USD | 2,054,299 | Barclays Bank PLC | 1/07/25 | 8,708 |
| IDR | 1,339,567,761 | USD | 84,727 | BNP Paribas S.A. | 1/08/25 | (269) |
| IDR | 8,280,211,200 | USD | 524,064 | Citibank, N.A. | 1/08/25 | (2,005) |
| USD | 98,575 | KRW | 135,535,311 | Barclays Bank PLC | 1/08/25 | 1,257 |
| USD | 838,498 | KRW | 1,143,610,652 | Citibank, N.A. | 1/08/25 | 17,355 |
| USD | 3,187,761 | KRW | 4,469,559,698 | Deutsche Bank AG | 1/08/25 | (21,504) |
| USD | 673,299 | KRW | 925,213,821 | Goldman Sachs Bank USA | 1/08/25 | 8,971 |
| IDR | 9,830,133,463 | USD | 626,662 | Barclays Bank PLC | 1/15/25 | (7,020) |
| IDR | 23,219,194,690 | USD | 1,456,000 | Citibank, N.A. | 1/15/25 | 7,622 |
| IDR | 6,805,038,923 | USD | 433,511 | Goldman Sachs Bank USA | 1/15/25 | (4,555) |
| JPY | 49,862,984 | USD | 327,024 | Bank of America, N.A. | 1/15/25 | 8,286 |
| KRW | 1,228,849,196 | USD | 884,000 | Royal Bank of Canada | 1/15/25 | (1,372) |
| NZD | 1,972,924 | USD | 1,167,447 | Barclays Bank PLC | 1/15/25 | 1,666 |
| SGD | 59,377 | USD | 44,147 | BNP Paribas S.A. | 1/15/25 | 277 |
| SGD | 103,172 | USD | 76,950 | BNP Paribas S.A. | 1/15/25 | 239 |
| SGD | 93,776 | USD | 69,617 | Bank of America, N.A. | 1/15/25 | 543 |
| SGD | 15,302 | USD | 11,451 | Bank of America, N.A. | 1/15/25 | (3) |
| USD | 8,751,196 | AUD | 13,494,000 | BNP Paribas S.A. | 1/15/25 | (53,165) |
| USD | 12,716,523 | CAD | 17,904,101 | Barclays Bank PLC | 1/15/25 | (93,580) |
| USD | 12,836,978 | CHF | 11,253,582 | Barclays Bank PLC | 1/15/25 | (4,576) |
| USD | 10,398,418 | CNY | 75,254,392 | BNP Paribas S.A. | 1/15/25 | (27,880) |
| USD | 1,961,692 | CNY | 14,190,000 | BNP Paribas S.A. | 1/15/25 | (4,295) |
| USD | 2,766 | CNY | 20,000 | Barclays Bank PLC | 1/15/25 | (5) |
| USD | 28,648,280 | EUR | 27,039,000 | Deutsche Bank AG | 1/15/25 | 18,425 |
| USD | 1,297,452 | KRW | 1,810,114,209 | BNP Paribas S.A. | 1/15/25 | (2,673) |
| USD | 1,982,000 | KRW | 2,766,059,380 | Barclays Bank PLC | 1/15/25 | (4,739) |
| USD | 86,123 | KRW | 120,057,184 | Citibank, N.A. | 1/15/25 | (109) |
| USD | 340,635 | KRW | 467,538,569 | Deutsche Bank AG | 1/15/25 | 4,823 |
| INR | 89,856,393 | USD | 1,061,939 | BNP Paribas S.A. | 1/17/25 | (2,311) |
| INR | 147,385,013 | USD | 1,743,834 | BNP Paribas S.A. | 1/17/25 | (5,802) |
| INR | 94,243,173 | USD | 1,116,837 | Citibank, N.A. | 1/17/25 | (5,478) |
| INR | 86,065,540 | USD | 1,017,239 | Citibank, N.A. | 1/17/25 | (2,314) |
| INR | 93,330,140 | USD | 1,103,304 | Citibank, N.A. | 1/17/25 | (2,712) |
| INR | 132,132,770 | USD | 1,561,150 | Citibank, N.A. | 1/17/25 | (2,979) |
| INR | 132,230,980 | USD | 1,562,977 | Citibank, N.A. | 1/17/25 | (3,648) |
| INR | 131,787,671 | USD | 1,556,771 | Citibank, N.A. | 1/17/25 | (2,670) |
| INR | 131,778,887 | USD | 1,557,578 | Citibank, N.A. | 1/17/25 | (3,581) |
| INR | 169,298,637 | USD | 1,998,355 | Citibank, N.A. | 1/17/25 | (1,907) |
| INR | 168,294,683 | USD | 1,988,300 | Citibank, N.A. | 1/17/25 | (3,692) |
| INR | 116,187,828 | USD | 1,371,606 | Citibank, N.A. | 1/17/25 | (1,466) |
| INR | 140,977,135 | USD | 1,665,786 | Deutsche Bank AG | 1/17/25 | (3,319) |
| IDR | 26,765,776,938 | USD | 1,691,371 | BNP Paribas S.A. | 1/22/25 | (4,538) |
| IDR | 5,405,832,891 | USD | 338,298 | Bank of America, N.A. | 1/22/25 | 2,388 |
| IDR | 20,342,358,788 | USD | 1,275,375 | Barclays Bank PLC | 1/22/25 | 6,641 |
| IDR | 44,679,550,344 | USD | 2,802,192 | Goldman Sachs Bank USA | 1/22/25 | 13,603 |
| USD | 4,742,822 | KRW | 6,659,775,796 | Citibank, N.A. | 1/22/25 | (42,127) |
| USD | 6,530,827 | KRW | 9,155,892,913 | Deutsche Bank AG | 1/22/25 | (47,545) |
| USD | 713,665 | TWD | 22,650,300 | BNP Paribas S.A. | 1/22/25 | 12,734 |
| USD | 714,976 | TWD | 22,711,213 | BNP Paribas S.A. | 1/22/25 | 12,160 |
| USD | 2,977,000 | TWD | 96,068,981 | BNP Paribas S.A. | 1/22/25 | 4,073 |
| USD | 704,292 | TWD | 22,378,174 | Citibank, N.A. | 1/22/25 | 11,782 |
| USD | 704,292 | TWD | 22,377,470 | Citibank, N.A. | 1/22/25 | 11,804 |
| USD | 722,671 | TWD | 22,836,404 | Citibank, N.A. | 1/22/25 | 15,981 |
| USD | 942,034 | TWD | 29,797,477 | Citibank, N.A. | 1/22/25 | 19,929 |
| USD | 883,784 | TWD | 27,836,545 | Citibank, N.A. | 1/22/25 | 22,361 |
| USD | 1,083,783 | TWD | 34,727,442 | Citibank, N.A. | 1/22/25 | 9,116 |
| USD | 1,083,100 | TWD | 34,523,813 | Citibank, N.A. | 1/22/25 | 14,735 |
| USD | 1,115,362 | TWD | 36,050,965 | Citibank, N.A. | 1/22/25 | (262) |
| USD | 1,875,000 | TWD | 60,715,288 | Citibank, N.A. | 1/22/25 | (3,880) |
| USD | 2,020,483 | TWD | 64,893,873 | Goldman Sachs Bank USA | 1/22/25 | 12,293 |
| USD | 2,240,000 | TWD | 71,985,424 | Royal Bank of Canada | 1/22/25 | 12,357 |
| USD | 1,177,912 | PEN | 4,424,003 | Citibank, N.A. | 1/28/25 | (2,211) |
| USD | 634,985 | PEN | 2,386,337 | Citibank, N.A. | 1/29/25 | (1,574) |
| TRY | 16,627,019 | USD | 443,198 | Barclays Bank PLC | 2/12/25 | 1,862 |
| TRY | 20,087,462 | USD | 532,333 | BNP Paribas S.A. | 2/18/25 | 2,338 |
| TRY | 62,215,463 | USD | 1,651,110 | Barclays Bank PLC | 2/18/25 | 4,888 |
| TRY | 9,976,724 | USD | 264,319 | Goldman Sachs Bank USA | 2/18/25 | 1,233 |
| USD | 3,709,680 | PEN | 14,087,140 | Bank of America, N.A. | 2/21/25 | (47,341) |
| TRY | 18,265,949 | USD | 480,620 | Barclays Bank PLC | 2/24/25 | 2,825 |
| USD | 2,633,697 | PEN | 10,019,110 | Deutsche Bank AG | 3/19/25 | (37,761) |
| USD | 445,643 | PEN | 1,693,710 | Citibank, N.A. | 3/24/25 | (5,940) |
| USD | 1,245,162 | PEN | 4,732,798 | Citibank, N.A. | 4/21/25 | (16,373) |
| USD | 626,558 | PEN | 2,381,517 | Citibank, N.A. | 4/21/25 | (8,239) |
| USD | 1,497,004 | PEN | 5,680,457 | Citibank, N.A. | 5/14/25 | (16,796) |
| USD | 825,644 | PEN | 3,139,098 | Deutsche Bank AG | 5/27/25 | (10,798) |
| USD | 19,067,187 | BRL | 117,300,000 | Goldman Sachs Bank USA | 10/02/25 | 87,372 |
| | | | | | | |
| TOTAL FORWARD FOREIGN CURRENCY CONTRACTS | | 152,692 |
| Unrealized Appreciation | | | 1,592,597 |
| Unrealized Depreciation | | | (1,439,905) |
| Credit Default Swaps |
| Underlying Reference | Rating(1) | Maturity Date | Clearinghouse / Counterparty(2) | Fixed Payment Received/ (Paid) | Payment Frequency | Notional Amount(3)(4) | Value ($)(1) | Upfront Premium Received/ (Paid) ($)(5) | Unrealized Appreciation/ (Depreciation) ($) |
| Sell Protection | | | | | | | | | | |
| 10-Year CDX N.A. IG Series 43 | NR | Dec 2034 | ICE | 1% | Quarterly | | 17,610,000 | 90,232 | 0 | 90,232 |
| 5-Year CDX N.A. IG Series 43 | NR | Dec 2029 | ICE | 1% | Quarterly | | 314,280,000 | 611,413 | 0 | 611,413 |
| 5-Year CDX N.A. IG Series 43 | NR | Dec 2029 | ICE | 5% | Quarterly | | 6,860,000 | 97,783 | 0 | 97,783 |
| 5-Year iTraxx Europe Crossover Series 42 | NR | Dec 2029 | BNP Paribas S.A. | 5% | Quarterly | EUR | 6,700,000 | 1,446,469 | (1,407,940) | 38,529 |
| | | | | | | | | | | |
| TOTAL CREDIT DEFAULT SWAPS | | | | | | | | 2,245,897 | (1,407,940) | 837,957 |
(1)Ratings are presented for credit default swaps in which the Fund has sold protection on the underlying referenced debt. Ratings for an underlying index represent a weighted average of the ratings of all securities included in the index. The credit rating or value can be measures of the current payment/performance risk. Ratings are from Moody's Investors Service, Inc. Where Moody's® ratings are not available, S&P® ratings are disclosed and are indicated as such. All ratings are as of the report date and do not reflect subsequent changes.
(2)Swaps with Intercontinental Exchange (ICE) are centrally cleared swaps.
(3)The notional amount of each credit default swap where the Fund has sold protection approximates the maximum potential amount of future payments that the Fund could be required to make if a credit event were to occur.
(4)Notional amount is stated in U.S. Dollars unless otherwise noted.
(5)Any premiums for centrally cleared swaps are recorded periodically throughout the term of the swap to variation margin and included in unrealized appreciation (depreciation).
| Interest Rate Swaps |
| Payment Received | Payment Frequency | Payment Paid | Payment Frequency | Clearinghouse / Counterparty(1) | Maturity Date | Notional Amount(2) | Value ($) | Upfront Premium Received/ (Paid) ($)(3) | Unrealized Appreciation/ (Depreciation) ($) |
Mexico Interbank TIIE 28 Day Rate(4) | Monthly | 9.39% | Monthly | CME | Dec 2025 | MXN | 12,200,000 | 2,004 | 0 | 2,004 |
Mexico Interbank TIIE 28 Day Rate(4) | Monthly | 9.43% | Monthly | CME | Dec 2025 | MXN | 10,700,000 | 1,475 | 0 | 1,475 |
U.S. Secured Overnight Fin. Rate (SOFR) Index(4) | Annual | 3.75% | Annual | CME | Dec 2026 | | 11,690,000 | 184,708 | 0 | 184,708 |
GPW Benchmark WIBD/WIBOR PLN 6m Rate(4) | Semi - annual | 4.93% | Annual | CME | Jul 2029 | PLN | 6,800,000 | (31,771) | 0 | (31,771) |
| 4% | Annual | SONIA Interest Rate Benchmark(4) | Annual | LCH | Sep 2029 | GBP | 43,770,000 | 106,709 | 0 | 106,709 |
U.S. Secured Overnight Fin. Rate (SOFR) Index(4) | Annual | 3.75% | Annual | CME | Dec 2029 | | 100,590,000 | 737,901 | 0 | 737,901 |
| 2.5% | Annual | 6 month EURIBOR(4) | Semi - annual | LCH | Mar 2030 | EUR | 19,040,000 | 196,236 | 0 | 196,236 |
| 4.5% | Semi-annual | ASX Australian Bank Bill Short Term Rates 6 month(4) | Semi-annual | LCH | Sep 2033 | AUD | 22,990,000 | 23,004 | 0 | 23,004 |
Mexico Interbank TIIE 1 Day Rate(4) | Monthly | 9.43% | Monthly | CME | Oct 2034 | MXN | 10,700,000 | (10,205) | 0 | (10,205) |
| 3.48% | Annual | U.S. Secured Overnight Fin. Rate (SOFR) Index(4) | Annual | LCH | Oct 2034 | | 900,000 | (16,391) | 0 | (16,391) |
| 3.47% | Annual | U.S. Secured Overnight Fin. Rate (SOFR) Index(4) | Annual | LCH | Oct 2034 | | 200,000 | (3,906) | 0 | (3,906) |
Mexico Interbank TIIE 1 Day Rate(4) | Monthly | 9.39% | Monthly | CME | Nov 2034 | MXN | 12,200,000 | (10,303) | 0 | (10,303) |
| 3.87% | Annual | U.S. Secured Overnight Fin. Rate (SOFR) Index(4) | Annual | LCH | Nov 2034 | | 2,000,000 | 27,100 | 0 | 27,100 |
| 3.52% | Annual | U.S. Secured Overnight Fin. Rate (SOFR) Index(4) | Annual | LCH | Nov 2034 | | 1,600,000 | (24,682) | 0 | (24,682) |
U.S. Secured Overnight Fin. Rate (SOFR) Index(4) | Annual | 3.75% | Annual | CME | Dec 2034 | | 35,090,000 | 664,712 | 0 | 664,712 |
| 2.5% | Annual | 6 month EURIBOR(4) | Semi - annual | LCH | Mar 2035 | EUR | 13,990,000 | 290,264 | 0 | 290,264 |
U.S. Secured Overnight Fin. Rate (SOFR) Index(4) | Annual | 3.75% | Annual | CME | Dec 2044 | | 260,000 | 14,425 | 0 | 14,425 |
U.S. Secured Overnight Fin. Rate (SOFR) Index(4) | Annual | 3.5% | Annual | CME | Dec 2054 | | 4,790,000 | 272,966 | 0 | 272,966 |
6 month EURIBOR(4) | Semi - annual | 2.25% | Annual | LCH | Mar 2055 | EUR | 6,000,000 | (379,358) | 0 | (379,358) |
| TOTAL INTEREST RATE SWAPS | | | | | | | | 2,044,888 | 0 | 2,044,888 |
| | | | | | | | | | | |
(1)Swaps with CME Group (CME) and LCH Clearnet Group (LCH) are centrally cleared swaps.
(2)Notional amount is stated in U.S. Dollars unless otherwise noted.
(3)Any premiums for centrally cleared swaps are recorded periodically throughout the term of the swap to variation margin and included in unrealized appreciation (depreciation).
(4)Represents floating rate.
| Total Return Swaps |
| Underlying Reference | Pay/ Receive Reference | Reference Payment Frequency | Financing Rate | Financing Frequency | Counterparty | Maturity Date | Units | Notional Amount | Value ($) | Upfront Premium Received/ (Paid) ($) | Unrealized Appreciation/ (Depreciation) ($) |
| S&P 500 Total Return | Receives | Monthly | Federal Funds Daily Rate plus 120 basis points | Monthly | Canadian Imperial Bank Of Commerce | Jan 2025 | 6,524 | | 85,073,501 | 1,124,658 | 0 | 1,124,658 |
| S&P 500 Total Return | Receives | Monthly | Federal Funds Daily Rate plus 75 basis points | Monthly | Canadian Imperial Bank Of Commerce | Jun 2025 | 7,827 | | 102,603,767 | 696,951 | 0 | 696,951 |
| S&P 500 Total Return | Receives | Monthly | Federal Funds Daily Rate plus 75 basis points | Monthly | Canadian Imperial Bank Of Commerce | Jun 2025 | 7,786 | | 98,604,427 | 4,059,796 | 0 | 4,059,796 |
| S&P 500 Total Return | Receives | Monthly | Federal Funds Daily Rate plus 75 basis points | Monthly | Canadian Imperial Bank Of Commerce | Jun 2025 | 5,999 | | 74,949,922 | 4,072,543 | 0 | 4,072,543 |
| S&P 500 Total Return | Receives | Monthly | Federal Funds Daily Rate plus 75 basis points | Monthly | Canadian Imperial Bank Of Commerce | Jun 2025 | 4,003 | | 50,012,425 | 2,717,988 | 0 | 2,717,988 |
| S&P 500 Total Return | Receives | Monthly | Federal Funds Daily Rate plus 75 basis points | Monthly | Canadian Imperial Bank Of Commerce | Jun 2025 | 3,972 | | 49,625,119 | 2,695,272 | 0 | 2,695,272 |
| S&P 500 Total Return | Receives | Monthly | Federal Funds Daily Rate plus 90 basis points | Monthly | Royal Bank of Canada | Oct 2025 | 7,767 | | 99,198,594 | 3,092,461 | 0 | 3,092,461 |
| S&P 500 Total Return | Receives | Monthly | Federal Funds Daily Rate plus 82 basis points | Monthly | Royal Bank of Canada | Oct 2025 | 3,998 | | 49,949,957 | 2,707,540 | 0 | 2,707,540 |
| S&P 500 Total Return | Receives | Monthly | Federal Funds Daily Rate plus 82 basis points | Monthly | Royal Bank of Canada | Oct 2025 | 3,903 | | 48,763,052 | 2,641,821 | 0 | 2,641,821 |
| TOTAL RETURN SWAPS | | | | | | | | | | 23,809,030 | 0 | 23,809,030 |
Currency Abbreviations
| AUD | - | Australian dollar |
| BRL | - | Brazilian real |
| CAD | - | Canadian dollar |
| CHF | - | Swiss franc |
| CNY | - | Chinese yuan |
| EUR | - | European Monetary Unit |
| GBP | - | British pound sterling |
| IDR | - | Indonesian rupiah |
| ILS | - | Israeli shekel |
| INR | - | Indian rupee |
| JPY | - | Japanese yen |
| KRW | - | Korean won |
| MXN | - | Mexican peso |
| NZD | - | New Zealand dollar |
| PEN | - | Peruvian new sol |
| PLN | - | Polish zloty |
| SEK | - | Swedish krona |
| SGD | - | Singapore dollar |
| TRY | - | Turkish Lira |
| TWD | - | Taiwanese dollar |
| USD | - | U.S. dollar |
| ZAR | - | South African rand |
Security Type Abbreviations
Legend
| (b) | Security exempt from registration under Rule 144A of the Securities Act of 1933. These securities may be resold in transactions exempt from registration, normally to qualified institutional buyers. At the end of the period, the value of these securities amounted to $302,464,864 or 0.4% of net assets. |
| (c) | Restricted securities (including private placements) - Investment in securities not registered under the Securities Act of 1933 (excluding 144A issues). At the end of the period, the value of restricted securities (excluding 144A issues) amounted to $449,254 or 0.0% of net assets. |
| (e) | Security or a portion of the security is on loan at period end. |
| (f) | Security is perpetual in nature with no stated maturity date. |
| (g) | Amount is stated in United States dollars unless otherwise noted. |
| (h) | Coupon rates for floating and adjustable rate securities reflect the rates in effect at period end. |
| (i) | Security or a portion of the security was pledged to cover margin requirements for futures contracts. At period end, the value of securities pledged amounted to $12,565,509. |
| (j) | Security or a portion of the security was pledged to cover margin requirements for centrally cleared swaps. At period end, the value of securities pledged amounted to $9,367,000. |
| (k) | Security or a portion of the security has been segregated as collateral for mortgage-backed or asset-backed securities purchased on a delayed delivery or when-issued basis. At period end, the value of securities pledged amounted to $143,299. |
| (l) | Security or a portion of the security purchased on a delayed delivery or when-issued basis. |
| (m) | Coupon is indexed to a floating interest rate which may be multiplied by a specified factor and/or subject to caps or floors. |
| (o) | Affiliated fund that is generally available only to investment companies and other accounts managed by Fidelity Investments. The rate quoted is the annualized seven-day yield of the fund at period end. A complete unaudited listing of the fund's holdings as of its most recent quarter end is available upon request. In addition, each Fidelity Central Fund's financial statements are available on the SEC's website or upon request. |
| (p) | Investment made with cash collateral received from securities on loan. |
| (q) | The rate quoted is the annualized seven-day yield of the fund at period end. |
| (r) | Represents a forward settling transaction and therefore no collateral securities had been allocated as of period end. The agreement contemplated the delivery of U.S. Treasury Obligations as collateral on settlement date. |
| Additional information on each restricted holding is as follows: |
| Security | Acquisition Date | Acquisition Cost ($) |
| CCC Intelligent Solutions Holdings, Inc. | 2/02/21 | 356,550 |
| | | |
| GCI Liberty, Inc. Class A (Escrow) | 5/23/23 | 0 |
| | | |
Affiliated Central Funds
Fiscal year to date information regarding the Fund's investments in Fidelity Central Funds, including the ownership percentage, is presented below.
| Affiliate | Value, beginning of period ($) | Purchases ($) | Sales Proceeds ($) | Dividend Income ($) | Realized Gain (loss) ($) | Change in Unrealized appreciation (depreciation) ($) | Value, end of period ($) | % ownership, end of period |
| Fidelity Cash Central Fund 4.64% | 43,574,257 | 215,111,723 | 219,035,926 | 1,113,352 | 190 | - | 41,050,602 | 0.1% |
| Fidelity Securities Lending Cash Central Fund 4.64% | 196,003,648 | 1,242,850,596 | 866,177,567 | 503,024 | - | - | 572,676,677 | 2.2% |
| Total | 239,577,905 | 1,457,962,319 | 1,085,213,493 | 1,616,376 | 190 | - | 613,727,279 | |
| | | | | | | | | |
Amounts in the dividend income column in the above table include any capital gain distributions from underlying funds, which are presented in the corresponding line item in the Statement of Operations, if applicable.
Amounts in the dividend income column for Fidelity Securities Lending Cash Central Fund represents the income earned on investing cash collateral, less rebates paid to borrowers and any lending agent fees associated with the loan, plus any premium payments received for lending certain types of securities.
Amounts included in the purchases and sales proceeds columns may include in-kind transactions, if applicable.
Purchases and sales proceeds exclude the value of securities received and delivered through reorganization transactions, if applicable.
Affiliated Underlying Funds
Fiscal year to date information regarding the Fund's investments in affiliated Underlying Funds is presented below. Exchanges between classes of the same affiliated Underlying Funds may occur. If an Underlying Funds changes its name, the name presented below is the name in effect at period end.
| Affiliate | Value, beginning of period ($) | Purchases ($) | Sales Proceeds ($) | Dividend Income ($) | Realized Gain (loss) ($) | Change in Unrealized appreciation (depreciation) ($) | Value, end of period ($) |
| Fidelity Advisor Small Cap Growth Fund Class Z | - | 7,886,510 | - | 7,886,511 | - | 69,716,169 | 647,933,868 |
| Fidelity Blue Chip Growth Fund | 13,284,245 | 443,941 | 5,000,000 | 443,941 | 1,940,255 | (1,459,750) | 9,208,691 |
| Fidelity Extended Market Index Fund | - | 60,067,567 | 228,877,789 | - | 6,163,334 | 512,252,162 | 3,227,459,555 |
| Fidelity Growth Company Fund | 3,454,782,809 | 6,587,353 | 306,100,368 | - | 165,018,485 | 341,372,423 | 3,661,660,702 |
| Fidelity Mid Cap Index Fund | 849,271,975 | 280,398 | 845,580,580 | 269,445 | 29,494,271 | (30,234,235) | 3,231,829 |
| Fidelity SAI Inflation-Focused Fund | 1,222 | 28 | - | 28 | - | (72) | 1,178 |
| Fidelity SAI Real Estate Index Fund | - | 757,263 | - | 757,264 | - | (287,614) | 2,447,711 |
| Fidelity SAI U.S. Large Cap Index Fund | 1,875,967,702 | 1,143,274,533 | 2,687,659,806 | 16,234,737 | 207,477,607 | (52,189,930) | 486,870,106 |
| Fidelity SAI U.S. Low Volatility Index Fund | 1,827,748,091 | - | 1,073,824,504 | - | 218,057,553 | 29,199,386 | 1,001,180,526 |
| Fidelity SAI U.S. Momentum Index Fund | 9,225,278 | 273,666 | - | 273,666 | - | 1,174,178 | 10,673,122 |
| Fidelity SAI U.S. Quality Index Fund | 729,949,523 | 1,060,028,437 | 100,000,000 | 107,304,796 | (4,425,274) | 55,665,355 | 1,741,218,041 |
| | 8,760,230,845 | 2,279,599,696 | 5,247,043,047 | 133,170,388 | 623,726,231 | 925,208,072 | 10,791,885,329 |
Amounts in the dividend income column in the above table include any capital gain distributions from underlying funds, which are presented in the corresponding line item in the Statement of Operations, if applicable.
Amounts included in the purchases and sales proceeds columns may include in-kind transactions, if applicable.
Purchases and sales proceeds exclude the value of securities received and delivered through reorganization transactions, if applicable.
Investment Valuation
The following is a summary of the inputs used, as of November 30, 2024, involving the Fund's assets and liabilities carried at fair value. The inputs or methodology used for valuing securities may not be an indication of the risk associated with investing in those securities. For more information on valuation inputs, and their aggregation into the levels used below, please refer to the Investment Valuation section in the accompanying Notes to Financial Statements.
| Valuation Inputs at Reporting Date: |
| Description | Total ($) | Level 1 ($) | Level 2 ($) | Level 3 ($) |
Investments in Securities: | | | | |
|
| Equities: | | | | |
Communication Services | 5,744,284,263 | 5,744,284,262 | - | 1 |
Consumer Discretionary | 7,457,231,324 | 7,457,231,324 | - | - |
Consumer Staples | 3,270,039,239 | 3,270,039,239 | - | - |
Energy | 2,515,666,260 | 2,511,186,116 | 4,480,144 | - |
Financials | 10,784,138,262 | 10,773,863,845 | 10,274,417 | - |
Health Care | 7,505,181,023 | 7,505,149,271 | - | 31,752 |
Industrials | 6,667,380,378 | 6,667,380,378 | - | - |
Information Technology | 17,973,096,005 | 17,949,597,936 | 23,498,069 | - |
Materials | 1,505,606,464 | 1,505,606,464 | - | - |
Real Estate | 1,247,333,841 | 1,247,333,841 | - | - |
Utilities | 1,650,043,302 | 1,650,043,302 | - | - |
|
| Corporate Bonds | 67,458,172 | - | 67,458,172 | - |
|
| U.S. Government and Government Agency Obligations | 43,512,844 | - | 43,512,844 | - |
|
| U.S. Government Agency - Mortgage Securities | 201,493,106 | - | 186,738,487 | 14,754,619 |
|
| Asset-Backed Securities | 274,012,654 | - | 273,888,113 | 124,541 |
|
| Collateralized Mortgage Obligations | 80,801,133 | - | 76,801,165 | 3,999,968 |
|
| Foreign Government and Government Agency Obligations | 32,809,511 | - | 32,809,511 | - |
|
| Commercial Paper | 46,716,519 | - | 46,716,519 | - |
|
| Other | 1,178 | 1,178 | - | - |
|
| Money Market Funds | 1,231,103,534 | 1,231,103,534 | - | - |
|
| Repurchase Agreements | 201,500,000 | - | 201,500,000 | - |
|
| Equity Funds | 11,830,318,953 | 11,830,318,953 | - | - |
|
| Purchased Options | 85,440 | 85,440 | - | - |
|
| Purchased Swaptions | 269,700 | - | 269,700 | - |
| Total Investments in Securities: | 80,330,083,105 | 79,343,225,083 | 967,947,141 | 18,910,881 |
Derivative Instruments: Assets | | | | |
Futures Contracts | 16,663,298 | 16,663,298 | - | - |
Forward Foreign Currency Contracts | 1,592,597 | - | 1,592,597 | - |
Swaps | 28,576,431 | - | 28,576,431 | - |
| Total Assets | 46,832,326 | 16,663,298 | 30,169,028 | - |
| Liabilities | | | | |
Futures Contracts | (13,023,607) | (13,023,607) | - | - |
Forward Foreign Currency Contracts | (1,439,905) | - | (1,439,905) | - |
Swaps | (476,616) | - | (476,616) | - |
Written Options | (459,760) | (459,760) | - | - |
Written Swaptions | (261,555) | - | (261,555) | - |
| Total Liabilities | (15,661,443) | (13,483,367) | (2,178,076) | - |
| Total Derivative Instruments: | 31,170,883 | 3,179,931 | 27,990,952 | - |
Other Financial Instruments: | | | | |
| TBA Sale Commitments | (24,246,918) | - | (24,246,918) | - |
| Total Other Financial Instruments: | (24,246,918) | - | (24,246,918) | - |
Value of Derivative Instruments
The following table is a summary of the Fund's value of derivative instruments by primary risk exposure as of November 30, 2024. For additional information on derivative instruments, please refer to the Derivative Instruments section in the accompanying Notes to Financial Statements.
Primary Risk Exposure / Derivative Type | Value |
| Asset ($) | Liability ($) |
| Credit Risk | | |
Swaps (a)(b) | 2,245,897 | 0 |
| Total Credit Risk | 2,245,897 | 0 |
| Equity Risk | | |
Futures Contracts (c) | 15,256,182 | (10,970,940) |
Purchased Options (d) | 85,440 | 0 |
Swaps (b) | 23,809,030 | 0 |
Written Options (e) | 0 | (459,760) |
| Total Equity Risk | 39,150,652 | (11,430,700) |
| Foreign Exchange Risk | | |
Forward Foreign Currency Contracts (f) | 1,592,597 | (1,439,905) |
| Total Foreign Exchange Risk | 1,592,597 | (1,439,905) |
| Interest Rate Risk | | |
Futures Contracts (c) | 1,407,116 | (2,052,667) |
Purchased Swaptions (d) | 269,700 | 0 |
Swaps (a) | 2,521,504 | (476,616) |
Written Swaptions (e) | 0 | (261,555) |
| Total Interest Rate Risk | 4,198,320 | (2,790,838) |
| Total Value of Derivatives | 47,187,466 | (15,661,443) |
(a)For centrally cleared swaps, reflects gross cumulative appreciation (depreciation) as presented in the Schedule of Investments. In the Statement of Assets and Liabilities, the period end daily variation margin for centrally cleared swaps is included in receivable or payable for daily variation margin on centrally cleared swaps, and the net cumulative appreciation (depreciation) for centrally cleared swaps is included in Total accumulated earnings (loss).
(b)For bi-lateral over-the-counter (OTC) swaps, reflects gross value which is presented in the Statement of Assets and Liabilities in the bi-lateral OTC swaps, at value line-items.
(c)Reflects gross cumulative appreciation (depreciation) on futures contracts as presented in the Schedule of Investments. In the Statement of Assets and Liabilities, the period end daily variation margin is included in receivable or payable for daily variation margin on futures contracts, and the net cumulative appreciation (depreciation) is included in Total accumulated earnings (loss).
(d)Gross value is presented in the Statement of Assets and Liabilities in the Investments in Securities at value line-item.
(e)Gross value is presented in the Statement of Assets and Liabilities in the written options, at value line-item.
(f)Gross value is presented in the Statement of Assets and Liabilities in the unrealized appreciation/depreciation on forward foreign currency contracts line-items.
Financial Statements (Unaudited)
| Statement of Assets and Liabilities |
| As of November 30, 2024 (Unaudited) |
| Assets | | | | |
| Investment in securities, at value (including securities loaned of $560,308,388 and repurchase agreements of $201,500,000) - See accompanying schedule: | | | | |
Unaffiliated issuers (cost $32,459,888,187) | $ | 68,924,470,497 | | |
Fidelity Central Funds (cost $613,727,279) | | 613,727,279 | | |
Other affiliated issuers (cost $6,765,296,093) | | 10,791,885,329 | | |
| | | | | |
| | | | | |
| Total Investment in Securities (cost $39,838,911,559) | | | $ | 80,330,083,105 |
| Segregated cash with brokers for derivative instruments | | | | 10,786,545 |
| Restricted cash | | | | 1,260,850 |
| Foreign currency held at value (cost $2,897,530) | | | | 2,910,196 |
| Receivable for investments sold | | | | |
Regular delivery | | | | 22,648,761 |
Delayed delivery | | | | 72,362,459 |
| Receivable for TBA sale commitments | | | | 24,177,246 |
| Unrealized appreciation on forward foreign currency contracts | | | | 1,592,597 |
| Receivable for fund shares sold | | | | 49,095,474 |
| Dividends receivable | | | | 74,562,828 |
| Interest receivable | | | | 26,158,136 |
| Distributions receivable from Fidelity Central Funds | | | | 258,051 |
| Receivable for daily variation margin on futures contracts | | | | 4,232,953 |
| Bi-lateral OTC swaps, at value | | | | 25,255,499 |
| Prepaid expenses | | | | 39,928 |
| Other receivables | | | | 934,628 |
Total assets | | | | 80,646,359,256 |
| Liabilities | | | | |
| Payable to custodian bank | $ | 90,516,936 | | |
| Segregated cash from brokers for derivative instruments | | 19,957,000 | | |
| Payable for investments purchased | | | | |
Regular delivery | | 188,283,891 | | |
Delayed delivery | | 224,426,344 | | |
| TBA sale commitments, at value | | 24,246,918 | | |
| Unrealized depreciation on forward foreign currency contracts | | 1,439,905 | | |
| Payable for fund shares redeemed | | 39,501,253 | | |
| Accrued management fee | | 11,158,750 | | |
| Payable for daily variation margin on centrally cleared swaps | | 1,279,653 | | |
| Written options, at value (premium received $1,891,496) | | 721,315 | | |
| Other payables and accrued expenses | | 7,402,833 | | |
| Collateral on securities loaned | | 572,676,677 | | |
| Total liabilities | | | | 1,181,611,475 |
| Net Assets | | | $ | 79,464,747,781 |
| Net Assets consist of: | | | | |
| Paid in capital | | | $ | 36,843,257,465 |
| Total accumulated earnings (loss) | | | | 42,621,490,316 |
| Net Assets | | | $ | 79,464,747,781 |
Net Asset Value, offering price and redemption price per share ($79,464,747,781 ÷ 7,297,670,905 shares) | | | $ | 10.89 |
| Statement of Operations |
Six months ended November 30, 2024 (Unaudited) |
| Investment Income | | | | |
| Dividends: | | | | |
| Unaffiliated issuers | | | $ | 413,401,713 |
| Affiliated issuers | | | | 22,786,650 |
| Interest | | | | 3,771,127 |
| Income from Fidelity Central Funds (including $503,024 from security lending) | | | | 1,616,376 |
| Total income | | | | 441,575,866 |
| Expenses | | | | |
| Management fee | $ | 151,065,476 | | |
| Custodian fees and expenses | | 383,645 | | |
| Independent trustees' fees and expenses | | 151,339 | | |
| Registration fees | | 3,817,712 | | |
| Audit fees | | 74,061 | | |
| Legal | | 77,316 | | |
| Miscellaneous | | 144,137 | | |
| Total expenses before reductions | | 155,713,686 | | |
| Expense reductions | | (92,365,432) | | |
| Total expenses after reductions | | | | 63,348,254 |
| Net Investment income (loss) | | | | 378,227,612 |
| Realized and Unrealized Gain (Loss) | | | | |
| Net realized gain (loss) on: | | | | |
| Investment Securities: | | | | |
| Unaffiliated issuers (net of foreign taxes of $9,535) | | 2,057,200,963 | | |
| Affiliated issuers | | 576,913,385 | | |
| Forward foreign currency contracts | | 1,358,805 | | |
| Foreign currency transactions | | 54,432 | | |
| Futures contracts | | 8,507,273 | | |
| Swaps | | 19,763,368 | | |
| Written options | | 9,052,986 | | |
| Capital gain distributions from underlying funds: | | | | |
| Affiliated issuers | | 110,114,293 | | |
| Total net realized gain (loss) | | | | 2,782,965,505 |
| Change in net unrealized appreciation (depreciation) on: | | | | |
| Investment Securities: | | | | |
| Unaffiliated issuers (net of decrease in deferred foreign taxes of $2,063) | | 3,515,343,131 | | |
| Affiliated issuers | | 4,026,589,236 | | |
| Forward foreign currency contracts | | 152,692 | | |
| Assets and liabilities in foreign currencies | | 73,749 | | |
| Futures contracts | | 2,736,405 | | |
| Swaps | | 26,691,875 | | |
| Written options | | 742,515 | | |
| TBA Sale commitments | | (69,672) | | |
| Total change in net unrealized appreciation (depreciation) | | | | 7,572,259,931 |
| Net gain (loss) | | | | 10,355,225,436 |
| Net increase (decrease) in net assets resulting from operations | | | $ | 10,733,453,048 |
See Organization and Reorganization information notes regarding reorganization.
| Statement of Changes in Net Assets |
| |
| | Six months ended November 30, 2024 (Unaudited) | | Year ended May 31, 2024 |
| Increase (Decrease) in Net Assets | | | | |
| Operations | | | | |
| Net investment income (loss) | $ | 378,227,612 | $ | 687,462,380 |
| Net realized gain (loss) | | 2,782,965,505 | | 3,365,082,715 |
| Change in net unrealized appreciation (depreciation) | | 7,572,259,931 | | 10,675,645,127 |
| Net increase (decrease) in net assets resulting from operations | | 10,733,453,048 | | 14,728,190,222 |
| Distributions to shareholders | | (3,406,132,679) | | (2,409,925,982) |
| | | | | |
| Share transactions | | | | |
| Proceeds from sales of shares | | 7,410,115,241 | | 11,250,343,159 |
| Net asset value of shares issued in exchange for the net assets of the Acquired Fund(s) (see Reorganization Information note) | | 10,121,024,443 | | - |
| Reinvestment of distributions | | 3,282,401,939 | | 2,206,709,434 |
| Cost of shares redeemed | | (11,998,320,179) | | (12,884,136,586) |
| | | | | |
Net increase (decrease) in net assets resulting from share transactions | | 8,815,221,444 | | 572,916,007 |
| Total increase (decrease) in net assets | | 16,142,541,813 | | 12,891,180,247 |
| | | | | |
| Net Assets | | | | |
| Beginning of period | | 63,322,205,968 | | 50,431,025,721 |
| End of period | $ | 79,464,747,781 | $ | 63,322,205,968 |
| | | | | |
| Other Information | | | | |
| Shares | | | | |
| Sold | | 718,150,955 | | 1,254,170,990 |
| Issued in exchange for the shares of the Acquired Fund(s) (see Reorganization Information note) | | 1,022,328,897 | | - |
| Issued in reinvestment of distributions | | 338,861,828 | | 257,258,386 |
| Redeemed | | (1,155,656,908) | | (1,456,819,189) |
| Net increase (decrease) | | 923,684,772 | | 54,610,187 |
| | | | | |
See Organization and Reorganization information notes regarding reorganization.
Share activity is further described in Organization and Reorganization information notes. Amounts have been adjusted to reflect the impact of the change in capital structure associated with the reorganization. All financial information prior to the reorganization is that of the Predecessor Fund.
Financial Highlights
Strategic Advisers® U.S. Total Stock Fund |
| |
| | Six months ended (Unaudited) November 30, 2024 A | | Years ended May 31, 2024 A | | 2023 A | | 2022 A | | 2021 B | | 2020 B |
Selected Per-Share Data | | | | | | | | | | | | |
| Net asset value, beginning of period | $ | 9.93 | $ | 7.98 | $ | 8.12 | $ | 9.14 | $ | 6.63 | $ | 6.27 |
| Income from Investment Operations | | | | | | | | | | | | |
Net investment income (loss) C,D | | .05 | | .11 | | .11 | | .11 | | .11 | | .11 |
| Net realized and unrealized gain (loss) | | 1.46 | | 2.23 | | .15 | | (.25) | | 2.77 | | .67 |
| Total from investment operations | | 1.51 | | 2.34 | | .26 | | (.14) | | 2.88 | | .78 |
| Distributions from net investment income | | (.07) | | (.11) | | (.11) | | (.11) | | (.11) | | (.11) |
| Distributions from net realized gain | | (.48) | | (.28) | | (.29) | | (.77) | | (.26) | | (.32) |
| Total distributions | | (.55) | | (.39) | | (.40) | | (.88) | | (.37) | | (.42) E |
| Net asset value, end of period | $ | 10.89 | $ | 9.93 | $ | 7.98 | $ | 8.12 | $ | 9.14 | $ | 6.63 |
Total Return F,G,H | | | | 30.24% | | 3.57% | | (2.43)% | | 44.55% | | 12.17% |
Ratios to Average Net Assets D,I,J | | | | | | | | | | | | |
| Expenses before reductions | | .43% K | | .43% | | .43% | | .43% | | .44% | | .45% |
| Expenses net of fee waivers, if any | | | | .18% | | .18% | | .18% | | .19% | | .20% |
| Expenses net of all reductions | | .18% K | | .18% | | .18% | | .18% | | .19% | | .20% |
| Net investment income (loss) | | 1.05% K | | 1.23% | | 1.44% | | 1.21% | | 1.29% | | 1.74% |
| Supplemental Data | | | | | | | | | | | | |
| Net assets, end of period (000 omitted) | $ | 79,464,748 | $ | 63,322,206 | $ | 50,431,026 | $ | 55,747,821 | $ | 60,191,843 | $ | 27,026,081 |
Portfolio turnover rate L | | | | 61% | | 67% | | 59% | | 74% | | 90% |
APer share amounts have been adjusted to reflect the impact of the change in capital structure associated with the reorganization that occurred on August 16, 2024. All financial information prior to the reorganization is that of the Strategic Advisers Large Cap Fund. See Organization and Reorganization Information note.
BPer share amounts have been adjusted to reflect the impact of the change in capital structure associated with the reorganizations that occurred on August 16, 2024 and November 20, 2020. All financial information prior to the November 20, 2020 reorganization is that of the Strategic Advisers Core Fund. See Organization and Reorganization Information note regarding the August 16, 2024 reorganization.
CCalculated based on average shares outstanding during the period.
DNet investment income (loss) is affected by the timing of the declaration of dividends by any underlying mutual funds or exchange-traded funds (ETFs). Net investment income (loss) of any mutual funds or ETFs is not included in the Fund's net investment income (loss) ratio.
ETotal distributions per share do not sum due to rounding.
FTotal returns for periods of less than one year are not annualized.
GTotal returns would have been lower if certain expenses had not been reduced during the applicable periods shown.
HTotal returns are that of the Predecessor Fund for all periods prior to the reorganization that occurred on August 16, 2024. The Predecessor Fund's total returns includes the total returns of Strategic Advisers Core Fund for periods prior to November 20, 2020.
IFees and expenses of any underlying mutual funds or exchange-traded funds (ETFs) are not included in the Fund's expense ratio. The Fund indirectly bears its proportionate share of these expenses. For additional expense information related to investments in Fidelity Central Funds, please refer to the "Investments in Fidelity Central Funds" note found in the Notes to Financial Statements section of the most recent Annual or Semi-Annual report.
JExpense ratios reflect operating expenses of the class. Expenses before reductions do not reflect amounts reimbursed, waived, or reduced through arrangements with the investment adviser, brokerage services, or other offset arrangements, if applicable, and do not represent the amount paid by the class during periods when reimbursements, waivers or reductions occur.
KAnnualized.
LAmount does not include the portfolio activity of any underlying mutual funds or exchange-traded funds (ETFs), derivatives or securities that mature within one year from acquisition.
MThe portfolio turnover rate does not include the assets acquired in the reorganization.
Notes to Financial Statements
(Unaudited)For the period ended November 30, 2024
1. Organization.
Strategic Advisers U.S. Total Stock Fund (the Fund) is a fund of Fidelity Rutland Square Trust II (the Trust), and is authorized to issue an unlimited number of shares. The Trust is registered under the Investment Company Act of 1940, as amended (the 1940 Act), as an open-end management investment company organized as a Delaware statutory trust. The Fund is offered exclusively to certain managed account clients of Strategic Advisers LLC (Strategic Advisers), an affiliate of Fidelity Management & Research Company LLC (FMR).
Effective August 16, 2024, Strategic Advisers Large Cap Fund (Predecessor Fund) and Strategic Advisers Small-Mid Cap Fund (Acquired Fund) were reorganized into the Fund (see Reorganization Information note).
2. Reorganization Information.
On August 16, 2024 the Predecessor Fund and Acquired Fund reorganized into a newly created Strategic Advisers U.S. Total Stock Fund pursuant to an Agreement and Plan of Reorganization (the Agreement) approved by its Board of Trustees. Per the Agreement, shareholders of the Predecessor Fund and the Acquired Fund received the Fund shares equal in value to the shares of the Predecessor Fund and Acquired Fund, respectively, they owned on the day the reorganization was effective. The Predecessor Fund was the accounting survivor after the reorganization. As such, performance and financial history prior to the reorganization is that of the Predecessor Fund. Historical share transactions and per share information for the Predecessor Fund was retroactively adjusted to reflect the change in capital structure due to the reorganization.
For financial reporting purposes, the assets and liabilities of the Predecessor Fund and the Acquired Fund and shares issued by the Fund were recorded at fair value; however, the cost basis of the investments received from the Predecessor Fund and the Acquired Fund were carried forward and will be utilized for purposes of the Fund's ongoing reporting of realized and unrealized gains and losses to more closely align subsequent reporting of realized gains with amounts distributable to shareholders for tax purposes. The reorganization qualified as a tax-free reorganization for federal income tax purposes with no gain or loss recognized to the funds or their shareholders. Costs incurred in connection with the reorganization were paid by the Predecessor Fund.
| Predecessor and Acquired Funds | Investments ($) | Unrealized appreciation (depreciation) ($) | Net Assets ($) | Shares Exchanged | Shares Exchanged Ratio |
Strategic Advisers Large Cap Fund A | 65,753,727,217 | 34,126,932,117 | 65,820,837,914 | 6,648,568,417 | 1.3286464646 |
| Strategic Advisers Small-Mid Cap Fund | 10,119,126,927 | 1,239,000,727 | 10,121,024,443 | 1,022,328,897 | 1.4731919192 |
A Predecessor Fund/Accounting Survivor
| Legal Acquiring Fund | Net Assets ($) | Total net assets after the acquisition ($) |
| Strategic Advisers U.S. Total Stock Fund | 495,100 | 75,942,357,457 |
Pro forma results of operations of the combined entity for the entire period ended November 30, 2024, as though each acquisition had occurred as of the beginning of the year (rather than on the actual acquisition date), are as follows:
| Net investment income (loss) | $395,910,376 |
| Total net realized gain (loss) | 3,572,777,778 |
| Total change in net unrealized appreciation (depreciation) | 6,950,899,776 |
| Net increase (decrease) in net assets resulting from operations | $10,919,587,930 |
Because the combined investment portfolios have been managed as a single portfolio since each acquisition was completed, it is not practicable to separate the amounts of revenue and earnings of the Acquired Fund that has been included in the Fund's Statement of Operations since August 16, 2024.
3. Investments in Fidelity Central Funds.
Funds may invest in Fidelity Central Funds, which are open-end investment companies generally available only to other investment companies and accounts managed by the investment adviser and its affiliates. The Schedule of Investments lists any Fidelity Central Funds held as an investment as of period end, but does not include the underlying holdings of each Fidelity Central Fund. An investing fund indirectly bears its proportionate share of the expenses of the underlying Fidelity Central Funds.
Based on its investment objective, each Fidelity Central Fund may invest or participate in various investment vehicles or strategies that are similar to those of the investing fund. These strategies are consistent with the investment objectives of the investing fund and may involve certain economic risks which may cause a decline in value of each of the Fidelity Central Funds and thus a decline in the value of the investing fund.
| Fidelity Central Fund | Investment Manager | Investment Objective | Investment Practices | Expense RatioA |
| Fidelity Money Market Central Funds | Fidelity Management & Research Company LLC (FMR) | Each fund seeks to obtain a high level of current income consistent with the preservation of capital and liquidity. | Short-term Investments | Less than .005% |
A Expenses expressed as a percentage of average net assets and are as of each underlying Central Fund's most recent annual or semi-annual shareholder report.
A complete unaudited list of holdings for each Fidelity Central Fund is available upon request or at the Securities and Exchange Commission website at www.sec.gov. In addition, the financial statements of the Fidelity Central Funds which contain the significant accounting policies (including investment valuation policies) of those funds, and are not covered by the Report of Independent Registered Public Accounting Firm, are available on the Securities and Exchange Commission website or upon request.
4. Significant Accounting Policies.
The Fund is an investment company and applies the accounting and reporting guidance of the Financial Accounting Standards Board (FASB) Accounting Standards Codification Topic 946 Financial Services - Investment Companies. The financial statements have been prepared in conformity with accounting principles generally accepted in the United States of America (GAAP), which require management to make certain estimates and assumptions at the date of the financial statements. Actual results could differ from those estimates. Subsequent events, if any, through the date that the financial statements were issued have been evaluated in the preparation of the financial statements. The Fund's Schedule of Investments lists any underlying mutual funds or exchange-traded funds (ETFs) but does not include the underlying holdings of these funds. The following summarizes the significant accounting policies of the Fund:
Investment Valuation. Investments are valued as of 4:00 p.m. Eastern time on the last calendar day of the period. The Board of Trustees (the Board) has designated the Fund's investment adviser as the valuation designee responsible for the fair valuation function and performing fair value determinations as needed. The investment adviser has established a Fair Value Committee (the Committee) to carry out the day-to-day fair valuation responsibilities and has adopted policies and procedures to govern the fair valuation process and the activities of the Committee. In accordance with these fair valuation policies and procedures, which have been approved by the Board, the Fund attempts to obtain prices from one or more third party pricing services or brokers to value its investments. When current market prices, quotations or currency exchange rates are not readily available or reliable, investments will be fair valued in good faith by the Committee, in accordance with the policies and procedures. Factors used in determining fair value vary by investment type and may include market or investment specific events, transaction data, estimated cash flows, and market observations of comparable investments. The frequency that the fair valuation procedures are used cannot be predicted and they may be utilized to a significant extent. The Committee manages the Fund's fair valuation practices and maintains the fair valuation policies and procedures. The Fund's investment adviser reports to the Board information regarding the fair valuation process and related material matters.
The Fund categorizes the inputs to valuation techniques used to value its investments into a disclosure hierarchy consisting of three levels as shown below:
Level 1 - unadjusted quoted prices in active markets for identical investments
Level 2 - other significant observable inputs (including quoted prices for similar investments, interest rates, prepayment speeds, etc.)
Level 3 - unobservable inputs (including the Fund's own assumptions based on the best information available)
Valuation techniques used to value the Fund's investments by major category are as follows:
Equity securities, including restricted securities, for which market quotations are readily available, are valued at the last reported sale price or official closing price as reported by a third party pricing service on the primary market or exchange on which they are traded and are categorized as Level 1 in the hierarchy. In the event there were no sales during the day or closing prices are not available, securities are valued at the last quoted bid price or may be valued using the last available price and are generally categorized as Level 2 in the hierarchy. For foreign equity securities, when market or security specific events arise, comparisons to the valuation of American Depositary Receipts (ADRs), futures contracts, Exchange-Traded Funds (ETFs) and certain indexes as well as quoted prices for similar securities may be used and would be categorized as Level 2 in the hierarchy. For equity securities, including restricted securities, where observable inputs are limited, assumptions about market activity and risk are used and these securities may be categorized as Level 3 in the hierarchy.
Debt securities, including restricted securities, are valued based on evaluated prices received from third party pricing services or from brokers who make markets in such securities. Corporate bonds, foreign government and government agency obligations and U.S. government and government agency obligations are valued by pricing services who utilize matrix pricing which considers yield or price of bonds of comparable quality, coupon, maturity and type or by broker-supplied prices. Asset backed securities, collateralized mortgage obligations and U.S. government agency mortgage securities, are valued by pricing services who utilize matrix pricing which considers prepayment speed assumptions, attributes of the collateral, yield or price of bonds of comparable quality, coupon, maturity and type or by broker-supplied prices. Swaps are marked-to-market daily based on valuations from third party pricing services, registered derivatives clearing organizations (clearinghouses) or broker-supplied valuations. These pricing sources may utilize inputs such as interest rate curves, credit spread curves, default possibilities and recovery rates. Independent prices obtained from a single source or broker are evaluated by management and may be categorized as Level 3 in the hierarchy. When independent prices are unavailable or unreliable, debt securities and swaps may be valued utilizing pricing methodologies which consider similar factors that would be used by third party pricing services. Debt securities and swaps are generally categorized as Level 2 in the hierarchy but may be Level 3 depending on the circumstances. Exchange-Traded Funds (ETFs) are valued at their last sale price or official closing price as reported by a third party pricing service on the primary market or exchange on which they are traded and are categorized as Level 1 in the hierarchy. In the event there were no sales during the day but the exchange reports a closing bid level, ETFs are valued at the closing bid and would be categorized as Level 1 in the hierarchy. In the event there was no closing bid, ETFs may be valued by another method that the Board believes reflects fair value in accordance with the Board's fair value pricing policies and may be categorized as Level 2 in the hierarchy.
The U.S. dollar value of forward foreign currency contracts is determined using currency exchange rates supplied by a pricing service and are categorized as Level 2 in the hierarchy. Futures contracts are valued at the settlement price established each day by the board of trade or exchange on which they are traded and are categorized as Level 1 in the hierarchy. Exchange-traded options are valued using the last sale price or, in the absence of a sale, the last offering price and are categorized as Level 1 in the hierarchy. Options traded over-the-counter are valued using service or broker-supplied valuations and are categorized as Level 2 in the hierarchy. Investments in open-end mutual funds, including the Fidelity Central Funds, are valued at their closing net asset value (NAV) each business day and are categorized as Level 1 in the hierarchy. If an unaffiliated open-end mutual fund's NAV is unavailable, shares of that fund may be valued by another method that the Board believes reflects fair value in accordance with the Board's fair value pricing policies and is categorized as Level 2 in the hierarchy.
Changes in valuation techniques may result in transfers in or out of an assigned level within the disclosure hierarchy. The aggregate value of investments by input level as of November 30, 2024, is included at the end of the Fund's Schedule of Investments.
Foreign Currency. Certain Funds may use foreign currency contracts to facilitate transactions in foreign-denominated securities. Gains and losses from these transactions may arise from changes in the value of the foreign currency or if the counterparties do not perform under the contracts' terms.
Foreign-denominated assets, including investment securities, and liabilities are translated into U.S. dollars at the exchange rates at period end. Purchases and sales of investment securities, income and dividends received, and expenses denominated in foreign currencies are translated into U.S. dollars at the exchange rate in effect on the transaction date.
The effects of exchange rate fluctuations on investments are included with the net realized and unrealized gain (loss) on investment securities. Other foreign currency transactions resulting in realized and unrealized gain (loss) are disclosed separately.
Investment Transactions and Income. For financial reporting purposes, the Fund's investment holdings and NAV include trades executed through the end of the last business day of the period. The NAV per share for processing shareholder transactions is calculated as of the close of business of the New York Stock Exchange (NYSE), normally 4:00 p.m. Eastern time and includes trades executed through the end of the prior business day. Gains and losses on securities sold are determined on the basis of identified cost and include proceeds received from litigation. Commissions paid to certain brokers with whom the investment adviser, or its affiliates, places trades on behalf of a fund include an amount in addition to trade execution, which may be rebated back to a fund. Any such rebates are included in net realized gain (loss) on investments in the Statement of Operations. Dividend income is recorded on the ex-dividend date, except for certain dividends from foreign securities where the ex-dividend date may have passed, which are recorded as soon as the Fund is informed of the ex-dividend date. Non-cash dividends included in dividend income, if any, are recorded at the fair market value of the securities received. Income and capital gain distributions from Fidelity Central Funds, if any, are recorded on the ex-dividend date. Certain distributions received by the Fund represent a return of capital or capital gain. The Fund determines the components of these distributions subsequent to the ex-dividend date, based upon receipt of tax filings or other correspondence relating to the underlying investment. These distributions are recorded as a reduction of cost of investments and/or as a realized gain. Interest income is accrued as earned and includes coupon interest and amortization of premium and accretion of discount on debt securities as applicable. Investment income is recorded net of foreign taxes withheld where recovery of such taxes is uncertain. Funds may file withholding tax reclaims in certain jurisdictions to recover a portion of amounts previously withheld. Any withholding tax reclaims income is included in the Statement of Operations in dividends. Any receivables for withholding tax reclaims are included in the Statement of Assets and Liabilities in dividends receivable.
Expenses. Expenses directly attributable to a fund are charged to that fund. Expenses attributable to more than one fund are allocated among the respective funds on the basis of relative net assets or other appropriate methods. Expenses included in the accompanying financial statements reflect the expenses of that fund and do not include any expenses associated with any underlying mutual funds or exchange-traded funds. Although not included in a fund's expenses, a fund indirectly bears its proportionate share of these expenses through the net asset value of each underlying mutual fund or exchange-traded fund. Expense estimates are accrued in the period to which they relate and adjustments are made when actual amounts are known.
Deferred Trustee Compensation. Under a Deferred Compensation Plan (the Plan) for certain Funds, certain independent Trustees have elected to defer receipt of a portion of their annual compensation. Deferred amounts are invested in affiliated mutual funds, are marked-to-market and remain in a fund until distributed in accordance with the Plan. The investment of deferred amounts and the offsetting payable to the Trustees presented below are included in the accompanying Statement of Assets and Liabilities in other receivables and other payables and accrued expenses, as applicable.
| Strategic Advisers U.S. Total Stock Fund | $797,604 |
Income Tax Information and Distributions to Shareholders. Each year, the Fund intends to qualify as a regulated investment company under Subchapter M of the Internal Revenue Code, including distributing substantially all of its taxable income and realized gains. As a result, no provision for U.S. Federal income taxes is required. The Fund files a U.S. federal tax return, in addition to state and local tax returns as required. The Fund's federal income tax returns are subject to examination by the Internal Revenue Service (IRS) for a period of three fiscal years after they are filed. State and local tax returns may be subject to examination for an additional fiscal year depending on the jurisdiction. Foreign taxes are provided for based on the Fund's understanding of the tax rules and rates that exist in the foreign markets in which it invests. The Fund is subject to a tax imposed on capital gains by certain countries in which it invests.
Distributions are declared and recorded on the ex-dividend date. Income and capital gain distributions are determined in accordance with income tax regulations, which may differ from GAAP.
Capital accounts within the financial statements are adjusted for permanent book-tax differences. These adjustments have no impact on net assets or the results of operations. Capital accounts are not adjusted for temporary book-tax differences which will reverse in a subsequent period.
Book-tax differences are primarily due to futures contracts, foreign currency transactions, certain foreign taxes, passive foreign investment companies (PFIC), options contracts and losses deferred due to wash sales.
As of period end, the cost and unrealized appreciation (depreciation) in securities, and derivatives if applicable, for federal income tax purposes were as follows:
| Gross unrealized appreciation | $40,960,981,544 |
| Gross unrealized depreciation | (680,654,831) |
| Net unrealized appreciation (depreciation) | $40,280,326,713 |
| Tax cost | $40,081,341,159 |
Repurchase Agreements. Pursuant to an Exemptive Order issued by the Securities and Exchange Commission, funds and other registered investment companies having management contracts with Fidelity Management and Research Company LLC, or its affiliates are permitted to transfer uninvested cash balances into joint trading accounts which are then invested in repurchase agreements. Funds may also invest directly with institutions in repurchase agreements. Upon settlement date, collateral is held in segregated accounts with custodian banks and may be obtained in the event of a default of the counterparty. The collateral balance is monitored on a daily basis to ensure it is at least equal to the principal amount of the repurchase agreement (including accrued interest). In the event of a default by the counterparty, realization of the collateral proceeds could be delayed, during which time the value of the collateral may decline.
Delayed Delivery Transactions and When-Issued Securities. During the period, certain Funds transacted in securities on a delayed delivery or when-issued basis. Payment and delivery may take place after the customary settlement period for that security. The price of the underlying securities and the date when the securities will be delivered and paid for are fixed at the time the transaction is negotiated. Securities purchased on a delayed delivery or when-issued basis are identified as such in the Schedule of Investments. Compensation for interest forgone in the purchase of a delayed delivery or when-issued debt security may be received. With respect to purchase commitments, each applicable Fund identifies securities as segregated in its records with a value at least equal to the amount of the commitment. Payables and receivables associated with the purchases and sales of delayed delivery securities having the same coupon, settlement date and broker are offset. Delayed delivery or when-issued securities that have been purchased from and sold to different brokers are reflected as both payables and receivables in the Statement of Assets and Liabilities under the caption "Delayed delivery", as applicable. Losses may arise due to changes in the value of the underlying securities or if the counterparty does not perform under the contract's terms, or if the issuer does not issue the securities due to political, economic, or other factors.
Restricted Securities (including Private Placements). Funds may invest in securities that are subject to legal or contractual restrictions on resale. These securities generally may be resold in transactions exempt from registration or to the public if the securities are registered. Disposal of these securities may involve time-consuming negotiations and expense, and prompt sale at an acceptable price may be difficult. Information regarding restricted securities held at period end is included at the end of the Schedule of Investments, if applicable.
New Accounting Pronouncement. In November 2023, the FASB issued Accounting Standards Update (ASU) 2023-07 Segment Reporting (Topic 280): Improvements to Reportable Segment Disclosures. Effective for fiscal years beginning after December 15, 2023 and interim periods within fiscal years beginning after December 15, 2024, the amendments enhance required disclosures of segment information for public entities on an annual and interim basis. The ASU allows for early adoption with updates applied retrospectively. Management is currently evaluating the impact of the ASU but does not expect this guidance to materially impact the financial statements.
5. Derivative Instruments.
Risk Exposures and the Use of Derivative Instruments. The Fund's investment objectives allow for various types of derivative instruments, including futures contracts, forward foreign currency contracts, options and swaps. Derivatives are investments whose value is primarily derived from underlying assets, indices or reference rates and may be transacted on an exchange or over-the-counter (OTC). Derivatives may involve a future commitment to buy or sell a specified asset based on specified terms, to exchange future cash flows at periodic intervals based on a notional principal amount, or for one party to make one or more payments upon the occurrence of specified events in exchange for periodic payments from the other party.
Derivatives were used to increase returns, to gain exposure to certain types of assets, to facilitate transactions in foreign-denominated securities and to manage exposure to certain risks as defined below. The success of any strategy involving derivatives depends on analysis of numerous economic factors, and if the strategies for investment do not work as intended, the objectives may not be achieved.
Derivatives were used to increase or decrease exposure to the following risk(s):
| | |
| Credit Risk | Credit risk relates to the ability of the issuer of a financial instrument to make further principal or interest payments on an obligation or commitment that it has to a fund. |
| Equity Risk | Equity risk relates to the fluctuations in the value of financial instruments as a result of changes in market prices (other than those arising from interest rate risk or foreign exchange risk), whether caused by factors specific to an individual investment, its issuer, or all factors affecting all instruments traded in a market or market segment. |
| Foreign Exchange Risk | Foreign exchange rate risk relates to fluctuations in the value of an asset or liability due to changes in currency exchange rates. |
| Interest Rate Risk | Interest rate risk relates to the fluctuations in the value of interest-bearing securities due to changes in the prevailing levels of market interest rates. |
Funds are also exposed to additional risks from investing in derivatives, such as liquidity risk and counterparty credit risk. Liquidity risk is the risk that a fund will be unable to close out the derivative in the open market in a timely manner. Counterparty credit risk is the risk that the counterparty will not be able to fulfill its obligation to a fund. Derivative counterparty credit risk is managed through formal evaluation of the creditworthiness of all potential counterparties. On certain OTC derivatives such as forward foreign currency contracts, options and bi-lateral swaps, a fund attempts to reduce its exposure to counterparty credit risk by entering into an International Swaps and Derivatives Association, Inc. (ISDA) Master Agreement with each of its counterparties. The ISDA Master Agreement gives a fund the right to terminate all transactions traded under such agreement upon the deterioration in the credit quality of the counterparty beyond specified levels. The ISDA Master Agreement gives each party the right, upon an event of default by the other party or a termination of the agreement, to close out all transactions traded under such agreement and to net amounts owed under each transaction to one net payable by one party to the other. To mitigate counterparty credit risk on bi-lateral OTC derivatives, a fund receives collateral in the form of cash or securities once net unrealized appreciation on outstanding derivative contracts under an ISDA Master Agreement exceeds certain applicable thresholds, subject to certain minimum transfer provisions. The collateral received is held in segregated accounts with the custodian bank in accordance with the collateral agreements entered into between a fund, the counterparty and the custodian bank. A fund could experience delays and costs in gaining access to the collateral even though it is held by the custodian bank. The maximum risk of loss to a fund from counterparty credit risk related to bi-lateral OTC derivatives is generally the aggregate unrealized appreciation and unpaid counterparty payments in excess of any collateral pledged by the counterparty to a fund. For OTC written options with upfront premiums received, a fund is obligated to perform and therefore does not have counterparty risk. For OTC written options with premiums to be received at a future date, the maximum risk of loss from counterparty credit risk is the amount of the premium in excess of any collateral pledged by the counterparty. A fund may be required to pledge collateral for the benefit of the counterparties on bi-lateral OTC derivatives in an amount not less than each counterparty's unrealized appreciation on outstanding derivative contracts, subject to certain minimum transfer provisions, and any such pledged collateral is identified in the Schedule of Investments. Exchange-traded contracts are not covered by the ISDA Master Agreement; however counterparty credit risk related to these contracts may be mitigated by the protection provided by the exchange on which they trade. Counterparty credit risk related to centrally cleared swaps may be mitigated by the protection provided by the clearinghouse.
Investing in derivatives may involve greater risks than investing in the underlying assets directly and, to varying degrees, may involve risk of loss in excess of any initial investment and collateral received and amounts recognized in the Statement of Assets and Liabilities. In addition, there may be the risk that the change in value of the derivative contract does not correspond to the change in value of the underlying instrument.
Net Realized Gain (Loss) and Change in Net Unrealized Appreciation (Depreciation) on Derivatives. The table below, which reflects the impacts of derivatives on the financial performance, summarizes the net realized gain (loss) and change in net unrealized appreciation (depreciation) for derivatives during the period as presented in the Statement of Operations.
| Primary Risk Exposure / Derivative Type | Net Realized Gain (Loss)($) | Change in Net Unrealized Appreciation (Depreciation)($) |
| Strategic Advisers U.S. Total Stock Fund | | |
| Credit Risk | | |
| Swaps | (28,584) | 837,957 |
| Total Credit Risk | (28,584) | 837,957 |
| Equity Risk | | |
| Futures Contracts | 9,072,624 | 3,381,956 |
| Purchased Options | (2,076,604) | (80,035) |
| Written Options | 8,995,378 | 680,763 |
| Swaps | 19,781,910 | 23,809,030 |
| Total Equity Risk | 35,773,308 | 27,791,714 |
| Foreign Exchange Risk | | |
| Forward Foreign Currency Contracts | 1,358,805 | 152,692 |
| Total Foreign Exchange Risk | 1,358,805 | 152,692 |
| Interest Rate Risk | | |
| Futures Contracts | (565,351) | (645,551) |
| Purchased Options | - | (49,104) |
| Written Options | 57,608 | 61,752 |
| Swaps | 10,042 | 2,044,888 |
| Total Interest Rate Risk | (497,701) | 1,411,985 |
| Totals | 36,605,828 | 30,194,348 |
If there are any open positions at period end, a summary of the value of derivatives by primary risk exposure is included at the end of the Schedule of Investments.
Forward Foreign Currency Contracts. Forward foreign currency contracts represent obligations to purchase or sell foreign currency on a specified future date at a price fixed at the time the contracts are entered into. Forward foreign currency contracts were used to facilitate transactions in foreign-denominated securities and to manage exposure to certain foreign currencies.
Forward foreign currency contracts are valued daily and fluctuations in exchange rates on open contracts are recorded as unrealized appreciation or (depreciation) and reflected in total accumulated earnings (loss) in the Statement of Assets and Liabilities. When the contract is closed, a gain or loss is realized equal to the difference between the closing value and the value at the time it was opened. Non-deliverable forward foreign currency exchange contracts are settled with the counterparty in cash without the delivery of foreign currency. The net realized gain (loss) and change in net unrealized appreciation (depreciation) on forward foreign currency contracts during the period is presented in the Statement of Operations.
Any open forward foreign currency contracts at period end are presented in the Schedule of Investments under the caption "Forward Foreign Currency Contracts." The contract amount and unrealized appreciation (depreciation) reflects each contract's exposure to the underlying currency at period end, and is representative of volume of activity during the period unless an average contract value is presented.
Futures Contracts. A futures contract is an agreement between two parties to buy or sell a specified underlying instrument for a fixed price at a specified future date. Futures contracts were used to manage exposure to the stock market, bond market and fluctuations in interest rates.
Upon entering into a futures contract, a fund is required to deposit either cash or securities (initial margin) with a clearing broker in an amount equal to a certain percentage of the face value of the contract. Futures contracts are marked-to-market daily and subsequent daily payments are made or received by a fund depending on the daily fluctuations in the value of the futures contracts and are recorded as unrealized appreciation or (depreciation). This receivable and/or payable, if any, is included in daily variation margin on futures contracts in the Statement of Assets and Liabilities. Realized gain or (loss) is recorded upon the expiration or closing of a futures contract. The net realized gain (loss) and change in net unrealized appreciation (depreciation) on futures contracts during the period is presented in the Statement of Operations.
Any open futures contracts at period end are presented in the Schedule of Investments under the caption "Futures Contracts". The notional amount at value reflects each contract's exposure to the underlying instrument or index at period end, and is representative of volume of activity during the period unless an average notional amount is presented. Any securities deposited to meet initial margin requirements are identified in the Schedule of Investments. Any cash deposited to meet initial margin requirements is presented as segregated cash with brokers for derivative instruments in the Statement of Assets and Liabilities.
Options. Options give the purchaser the right, but not the obligation, to buy (call) or sell (put) an underlying security or financial instrument at an agreed exercise or strike price between or on certain dates. Options obligate the seller (writer) to buy (put) or sell (call) an underlying instrument at the exercise or strike price or cash settle an underlying derivative instrument if the holder exercises the option on or before the expiration date. OTC options, such as swaptions, which are options where the underlying instrument is a swap, were used to manage exposure to fluctuations in interest rates.
Upon entering into an options contract, a fund will pay or receive a premium. Premiums paid on purchased options are reflected as cost of investments and premiums received on written options are reflected as a liability on the Statement of Assets and Liabilities. Certain options may be purchased or written with premiums to be paid or received on a future date. Options are valued daily and any unrealized appreciation (depreciation) is reflected in total accumulated earnings (loss) in the Statement of Assets and Liabilities. When an option is exercised, the cost or proceeds of the underlying instrument purchased or sold is adjusted by the amount of the premium. When an option is closed, a gain or loss is realized depending on whether the proceeds or amount paid for the closing sale transaction is greater or less than the premium received or paid. When an option expires, gains and losses are realized to the extent of premiums received and paid, respectively. The net realized and unrealized gains (losses) on purchased options are included in the Statement of Operations in net realized gain (loss) and change in net unrealized appreciation (depreciation) on investment securities. The net realized gain (loss) and change in net unrealized appreciation (depreciation) on written options are presented in the Statement of Operations.
Any open options at period end are presented in the Schedule of Investments under the captions "Purchased Options," "Purchased Swaptions," "Written Options" and "Written Swaptions," as applicable, and are representative of volume of activity during the period unless an average notional amount is presented.
Writing puts and buying calls tend to increase exposure to the underlying instrument while buying puts and writing calls tend to decrease exposure to the underlying instrument. For purchased options, risk of loss is limited to the premium paid, and for written options, risk of loss is the change in value in excess of the premium received.
Swaps. A swap is a contract between two parties to exchange future cash flows at periodic intervals based on a notional principal amount. A bi-lateral OTC swap is a transaction between a fund and a dealer counterparty where cash flows are exchanged between the two parties for the life of the swap. A centrally cleared swap is a transaction executed between a fund and a dealer counterparty, then cleared by a futures commission merchant (FCM) through a clearinghouse. Once cleared, the clearinghouse serves as a central counterparty, with whom a fund exchanges cash flows for the life of the transaction, similar to transactions in futures contracts.
Bi-lateral OTC swaps are marked-to-market daily and changes in value are reflected in the Statement of Assets and Liabilities in the bi-lateral OTC swaps at value line items. Any upfront premiums paid or received upon entering a bi-lateral OTC swap to compensate for differences between stated terms of the swap and prevailing market conditions (e.g. credit spreads, interest rates or other factors) are recorded in total accumulated earnings (loss) in the Statement of Assets and Liabilities and amortized to realized gain or (loss) ratably over the term of the swap. Any unamortized upfront premiums are presented in the Schedule of Investments.
Centrally cleared swaps require a fund to deposit either cash or securities (initial margin) with the FCM, at the instruction of and for the benefit of the clearinghouse. Any securities deposited to meet initial margin requirements are identified in the Schedule of Investments. Any cash deposited to meet initial margin requirements is presented in segregated cash with brokers for derivative instruments in the Statement of Assets and Liabilities. Centrally cleared swaps are marked-to-market daily and subsequent payments (variation margin) are made or received depending on the daily fluctuations in the value of the swaps and are recorded as unrealized appreciation or (depreciation). These daily payments, if any, are included in receivable or payable for daily variation margin on centrally cleared swaps in the Statement of Assets and Liabilities. Any premiums for centrally cleared swaps are recorded periodically throughout the term of the swap to variation margin and included in total accumulated earnings (loss) in the Statement of Assets and Liabilities. Any premiums are recognized as realized gain (loss) upon termination or maturity of the swap.
For both bi-lateral and centrally cleared swaps, payments are exchanged at specified intervals, accrued daily commencing with the effective date of the contract and recorded as realized gain or (loss). Some swaps may be terminated prior to the effective date and realize a gain or loss upon termination. The net realized gain (loss) and change in net unrealized appreciation (depreciation) on swaps during the period is presented in the Statement of Operations.
Any open swaps at period end are included in the Schedule of Investments under the caption "Swaps", and are representative of volume of activity during the period unless an average notional amount is presented.
Credit Default Swaps. Credit default swaps enable a fund to buy or sell protection against specified credit events on a single-name issuer or a traded credit index. Under the terms of a credit default swap the buyer of protection (buyer) receives credit protection in exchange for making periodic payments to the seller of protection (seller) based on a fixed percentage applied to a notional principal amount. In return for these payments, the seller will be required to make a payment upon the occurrence of one or more specified credit events. A fund enters into credit default swaps as a seller to gain credit exposure to an issuer and/or as a buyer to obtain a measure of protection against defaults of an issuer. Periodic payments are made over the life of the contract by the buyer provided that no credit event occurs.
For credit default swaps on most corporate and sovereign issuers, credit events include bankruptcy, failure to pay or repudiation/moratorium. For credit default swaps on corporate or sovereign issuers, the obligation that may be put to the seller is not limited to the specific reference obligation described in the Schedule of Investments. For credit default swaps on asset-backed securities, a credit event may be triggered by events such as failure to pay principal, maturity extension, rating downgrade or write-down. For credit default swaps on asset-backed securities, the reference obligation described represents the security that may be put to the seller. For credit default swaps on a traded credit index, a specified credit event may affect all or individual underlying securities included in the index.
As a seller, if an underlying credit event occurs, a fund will pay a net settlement amount of cash equal to the notional amount of the swap less the recovery value of the reference obligation or underlying securities comprising an index. Only in the event of the industry's inability to value the underlying asset will a fund be required to take delivery of the reference obligation or underlying securities comprising an index and pay an amount equal to the notional amount of the swap.
As a buyer, if an underlying credit event occurs, a fund will receive a net settlement amount of cash equal to the notional amount of the swap less the recovery value of the reference obligation or underlying securities comprising an index. Only in the event of the industry's inability to value the underlying asset will a fund be required to deliver the reference obligation or underlying securities comprising an index in exchange for payment of an amount equal to the notional amount of the swap.
Typically, the value of each credit default swap and credit rating disclosed for each reference obligation in the Schedule of Investments, where a fund is the seller, can be used as measures of the current payment/performance risk of the swap. As the value of the swap changes as a positive or negative percentage of the total notional amount, the payment/performance risk may decrease or increase, respectively. In addition to these measures, the investment adviser monitors a variety of factors including cash flow assumptions, market activity and market sentiment as part of its ongoing process of assessing payment/performance risk.
Interest Rate Swaps. Interest rate swaps are agreements between counterparties to exchange cash flows, one based on a fixed rate, and the other on a floating rate. A fund enters into interest rate swaps to manage its exposure to interest rate changes. Changes in interest rates can have an effect on both the value of bond holdings as well as the amount of interest income earned. In general, the value of bonds can fall when interest rates rise and can rise when interest rates fall.
Total Return Swaps. Total return swaps are agreements between counterparties to exchange cash flows, one based on a market-linked return of an individual asset or a basket of assets (i.e., an index), and the other on a fixed or floating rate. To the extent the total return of the instrument or index underlying the transaction exceeds or falls short of the offsetting payment obligation, a fund will receive a payment from or make a payment to the counterparty. A fund enters into total return swaps to manage its market exposure.
6. Purchases and Sales of Investments.
Purchases and sales of securities, other than short-term securities, U.S. government securities, securities acquired in the reorganization and in-kind transactions, as applicable, are noted in the table below.
| | Purchases ($) | Sales ($) |
| Strategic Advisers U.S. Total Stock Fund | 22,726,608,850 | 26,936,530,211 |
7. Fees and Other Transactions with Affiliates.
Management Fee. Strategic Advisers (the investment adviser) provides the Fund with investment management related services. For these services, the Fund pays a monthly management fee to the investment adviser.
Effective August 17, 2024, the management fee is calculated by adding the annual management fee rate of .25% of the Fund's average net assets throughout the month to the aggregate of the fee rates, payable monthly by the investment adviser, to the Fund's sub-advisers. The Fund's maximum aggregate management fee will not exceed .65% of the Fund's average net assets. For the period August 17, 2024 through November 30, 2024, the total annualized management fee rate was .42% of the Fund's average net assets, and the investment adviser waived a portion of its management fee as described in the Expense Reductions note.
During the period June 1, 2024 through August 16, 2024, the management fee was calculated by adding the annual management fee rate of .25% of the Predecessor Fund's average net assets throughout the month payable to the investment adviser to the aggregate of the fee rates, payable monthly, to the Predecessor Fund's sub-advisers (not to exceed .65%). For the period June 1, 2024 through August 16, 2024, the total annualized management fee rate was .42% of the Predecessor Fund's average net assets, and the investment adviser waived a portion of its management fee as described in the Expense Reductions note.
Sub-Advisers. AllianceBernstein, L.P. (AB), BlackRock Investment Management, LLC, Brandywine Global Investment Management, LLC, D.E. Shaw Investment Management LLC, FIAM LLC (an affiliate of the investment adviser), Geode Capital Management, LLC, GW&K Investment Management, LLC, J.P. Morgan Investment Management, Inc., Loomis Sayles & Company, L.P., LSV Asset Management, Neuberger Berman Investment Management, LLC, Pacific Investment Management Company LLC, PineBridge Investments LLC, Portolan Capital Management, LLC, Principal Global Investors, LLC, River Road Asset Management LLC, T. Rowe Price Associates, Inc., Wellington Management Company LLP and William Blair Investment Management, LLC each served as a sub-adviser for the Fund during the period. Sub-advisers provide discretionary investment advisory services for their allocated portion of the Fund's assets and are paid as described in the Management Fee note.
Fidelity Diversifying Solutions LLC and FIL Investment Advisors (FIL) have been retained to serve as a sub-adviser for the Fund. As of the date of this report, however, these sub-advisers have not been allocated any portion of the Fund's assets. These sub-advisers in the future may provide discretionary investment advisory services for an allocated portion of the Fund's assets and will be paid by the investment adviser for providing these services.
Effective January 1, 2025, the sub-subadvisory agreements between FIAM LLC (FIAM) or Fidelity Diversifying Solutions LLC (FDS) and each of FMR Investment Management (UK) Limited, Fidelity Management & Research (Hong Kong) Limited, and Fidelity Management & Research (Japan) Limited (collectively, the Sub-Subadvisers) were amended. FIAM, FDS, or an affiliate, as applicable, and not the fund, pays the Sub-Subadvisers. Under the terms of the sub-subadvisory agreements, FIAM, FDS, or an affiliate, as applicable, pays each Sub-Subadviser monthly fees equal to 110% of the Sub-Subadviser's costs for providing sub-subadvisory services.
Brokerage Commissions. A portion of portfolio transactions were placed with brokerage firms which are affiliates of the investment adviser. Brokerage commissions are included in net realized gain (loss) and change in net unrealized appreciation (depreciation) in the Statement of Operations. The commissions paid to these affiliated firms were as follows:
| | Amount ($) |
| Strategic Advisers U.S. Total Stock Fund | 23,360 |
Interfund Trades. Funds may purchase from or sell securities to other Fidelity Funds under procedures adopted by the Board. The procedures have been designed to ensure these interfund trades are executed in accordance with Rule 17a-7 of the 1940 Act. Any interfund trades are included within the respective purchases and sales amounts shown in the Purchases and Sales of Investments note. Interfund trades during the period are noted in the table below.
| | Purchases ($) | Sales ($) | Realized Gain (Loss)($) |
| Strategic Advisers U.S. Total Stock Fund | 40,916,529 | 55,968,129 | 4,618,167 |
8. Security Lending.
Funds lend portfolio securities from time to time in order to earn additional income. Lending agents are used, including National Financial Services (NFS), an affiliate of the investment adviser. Pursuant to a securities lending agreement, NFS will receive a fee, which is capped at 9.9% of a fund's daily lending revenue, for its services as lending agent. A fund may lend securities to certain qualified borrowers, including NFS. On the settlement date of the loan, a fund receives collateral (in the form of U.S. Treasury obligations, letters of credit and/or cash) against the loaned securities and maintains collateral in an amount not less than 100% of the market value of the loaned securities during the period of the loan. The market value of the loaned securities is determined at the close of business of a fund and any additional required collateral is delivered to a fund on the next business day. A fund or borrower may terminate the loan at any time, and if the borrower defaults on its obligation to return the securities loaned because of insolvency or other reasons, a fund may apply collateral received from the borrower against the obligation. A fund may experience delays and costs in recovering the securities loaned. Any cash collateral received is invested in the Fidelity Securities Lending Cash Central Fund. Any loaned securities are identified as such in the Schedule of Investments, and the value of loaned securities and cash collateral at period end, as applicable, are presented in the Statement of Assets and Liabilities. Security lending income represents the income earned on investing cash collateral, less rebates paid to borrowers and any lending agent fees associated with the loan, plus any premium payments received for lending certain types of securities. Security lending income is presented in the Statement of Operations as a component of income from Fidelity Central Funds. Affiliated security lending activity, if any, was as follows:
| | Total Security Lending Fees Paid to NFS ($) | Security Lending Income From Securities Loaned to NFS ($) | Value of Securities Loaned to NFS at Period End ($) |
| Strategic Advisers U.S. Total Stock Fund | 59,420 | - | - |
9. Expense Reductions.
The investment adviser has contractually agreed to waive the Fund's management fee in an amount equal to .25% of the Fund's average net assets until September 30, 2027. During the period August 17, 2024 through November 30, 2024, this waiver reduced the Fund's management fee by $56,096,445. Expense reductions also include certain voluntary fee discount arrangements, which are currently in effect for the Fund. During the period, these voluntary arrangements amounted to $1,137,184.
The investment adviser contractually waived the Predecessor Fund's management fee in an amount equal to .25% of the Predecessor Fund's average net assets. During the period June 1, 2024 through August 16, 2024, this waiver reduced the Predecessor Fund's management fee by $34,267,505. Expense reductions also include certain voluntary fee discount arrangements, which were in effect for the Predecessor Fund. During the period, these voluntary arrangements amounted to $790,264.
Through arrangements with the Fund's custodian, credits realized as a result of certain uninvested cash balances were used to reduce the Fund's expenses by $74,034.
10. Other.
A fund's organizational documents provide former and current trustees and officers with a limited indemnification against liabilities arising in connection with the performance of their duties to the fund. In the normal course of business, a fund may also enter into contracts that provide general indemnifications. A fund's maximum exposure under these arrangements is unknown as this would be dependent on future claims that may be made against a fund. The risk of material loss from such claims is considered remote.
11. Risk and Uncertainties.
Many factors affect a fund's performance. Developments that disrupt global economies and financial markets, such as pandemics, epidemics, outbreaks of infectious diseases, war, terrorism, and environmental disasters, may significantly affect a fund's investment performance. The effects of these developments to a fund will be impacted by the types of securities in which a fund invests, the financial condition, industry, economic sector, and geographic location of an issuer, and a fund's level of investment in the securities of that issuer. Significant concentrations in security types, issuers, industries, sectors, and geographic locations may magnify the factors that affect a fund's performance.
Item 8: Changes in and Disagreements with Accountants for Open-End Management Investment Companies
(Unaudited)
Note: This is not applicable for any fund included in this document.
Item 9: Proxy Disclosures for Open-End Management Investment Companies
(Unaudited)
Note: This is not applicable for any fund included in this document.
Item 10: Remuneration Paid to Directors, Officers, and others of Open-End Management Investment Companies
(Unaudited)
Note: This information is disclosed as part of the financial statements for each Fund as part of Item 7: Financial Statements and Financial Highlights for Open-End Management Investment companies.
Item 11: Statement Regarding Basis for Approval of Investment Advisory Contract
(Unaudited)
Board Approval of Investment Advisory Contracts and Management Fees
Strategic Advisers U.S. Total Stock Fund
In March 2024, the Board of Trustees, including the Independent Trustees (together, the Board) voted to approve (i) the management contract between Strategic Advisers LLC (Strategic Advisers) and Fidelity Rutland Square Trust II (Trust) on behalf of the fund (Management Contract); (ii) the sub-advisory agreements among Strategic Advisers, each of AllianceBernstein L.P. (AllianceBernstein), ArrowMark Colorado Holdings, LLC (ArrowMark), BlackRock Investment Management, LLC (BlackRock), Boston Partners Global Investors, Inc. (Boston Partners), Brandywine Global Investment Management, LLC (Brandywine), D.E. Shaw Investment Management, L.L.C. (D.E. Shaw), Fidelity Diversifying Solutions LLC (FDS), FIAM LLC (FIAM), FIL Investment Advisors (FIL), Geode Capital Management, LLC (Geode), GW&K Investment Management, LLC (GW&K), J.P. Morgan Investment Management Inc. (J.P. Morgan), Loomis, Sayles & Company, L.P. (Loomis Sayles), LSV Asset Management (LSV), Neuberger Berman Investment Advisers LLC (Neuberger Berman), Pacific Investment Management Company LLC (PIMCO), PineBridge Investments LLC (PineBridge), Portolan Capital Management, LLC (Portolan), Principal Global Investors, LLC (Principal), River Road Asset Management, LLC (River Road), T. Rowe Price Associates, Inc. (T. Rowe Price), Wellington Management Company LLP (Wellington), and William Blair Investment Management, LLC (William Blair), and the Trust on behalf of the fund (each respective agreement, a Sub-Advisory Agreement and collectively, the Sub-Advisory Agreements); and (iii) the sub-subadvisory agreements among FDS and each of FMR Investment Management (UK) Limited, Fidelity Management & Research (Japan) Limited and Fidelity Management & Research (Hong Kong) Limited, the sub-subadvisory agreements among FIAM and each of FMR Investment Management (UK) Limited, Fidelity Management & Research (Japan) Limited and Fidelity Management & Research (Hong Kong) Limited and the sub-subadvisory agreement between FIL and FIL Investment Advisers (UK) Limited, with respect to the fund (Sub-Subadvisory Agreements and together with the Management Contract and Sub-Advisory Agreements, the Advisory Contracts). Strategic Advisers and the sub-advisers are referred to herein as the Investment Advisers. The Board, assisted by the advice of fund counsel and Independent Trustees' counsel, considered a broad range of information it believed relevant to the approval of the Advisory Contracts.
In considering whether to approve each Advisory Contract, the Board reached a determination, with the assistance of fund counsel and Independent Trustees' counsel and through the exercise of its business judgment, that the approval of each Advisory Contract is in the best interests of the fund and its shareholders and that the approval of such agreement does not involve a conflict of interest from which Strategic Advisers or its affiliates derive an inappropriate advantage. Also, the Board found that the advisory fees to be charged under each Advisory Contract bear a reasonable relationship to the services to be rendered. The Board's decision to approve each Advisory Contract was not based on any single factor, but rather was based on a comprehensive consideration of all the information provided to the Board. In addition, individual Trustees did not necessarily attribute the same weight or importance to each factor.
Nature, Extent, and Quality of Services Provided. The Board considered the backgrounds of the investment personnel that will provide services to the fund, and also took into consideration the fund's investment objective, strategies and related investment philosophy and the proposed sub-adviser line-up. The Board considered the structure of each Investment Adviser's investment personnel compensation program and whether such structures provide appropriate incentives to act in the best interests of the fund.
The Board noted Strategic Advisers' role in, among other things, (i) setting, implementing and monitoring the investment strategy for the fund; (ii) identifying and recommending to the Board the sub-advisers for the fund; (iii) overseeing compliance with federal securities laws by each sub-adviser with respect to fund assets; (iv) monitoring and overseeing the performance and investment capabilities of each sub-adviser; and (v) recommending the replacement of a sub-adviser as appropriate. The Board also noted that it receives from Strategic Advisers substantial information and periodic reports about Strategic Advisers' sub-adviser oversight and due diligence processes, as well as periodic reports regarding the performance of each sub-adviser.
The Board noted that under the Sub-Advisory Agreements, and subject to oversight by Strategic Advisers, each sub-adviser will be responsible for, among other things, identifying investments for the portion of fund assets allocated to the sub-adviser, if any, and executing portfolio transactions to implement its investment strategy. In addition, the Board noted that each sub-adviser will be responsible for providing such reporting as may be requested from Strategic Advisers to fulfill its oversight responsibilities discussed above.
Resources Dedicated to Investment Management and Support Services. The Board reviewed the general qualifications and capabilities of the Investment Advisers' investment staff that will provide services to the fund, their use of technology, and the Investment Advisers' approach to managing and compensating its investment personnel. The Board noted that the Investment Advisers' analysts have extensive resources, tools and capabilities which allow them to conduct sophisticated fundamental and/or quantitative analysis. Additionally, in their deliberations, the Board considered the Investment Advisers' trading capabilities and resources which are integral parts of the investment management process.
Shareholder and Administrative Services. The Board considered (i) the nature, extent, quality, and cost of administrative, and shareholder services to be performed by Strategic Advisers and its affiliates under the Management Contract and under separate agreements covering transfer agency and pricing and bookkeeping services for the fund; (ii) the nature and extent of Strategic Advisers' supervision of third party service providers, including the sub-advisers; and (iii) the resources to be devoted to the fund's compliance policies and procedures.
The Board noted that the growth of fund assets over time across the complex allows Strategic Advisers to reinvest in the development of services designed to enhance the value or convenience of the Strategic Advisers funds as investment vehicles. These services include 24-hour access to account information and market information through telephone representatives and over the Internet, investor education materials and asset allocation tools, and the expanded availability of Fidelity Investor Centers.
Investment Performance. The fund is a new fund and therefore had no historical performance for the Board to review at the time it approved the fund's Advisory Contracts. Instead, the Board considered the historical investment performance of the portfolio managers in managing accounts under a similar investment mandate to the extent available. Once the fund has been in operation for at least one calendar year, the Board will review the fund's absolute investment performance, as well as the fund's relative investment performance measured against a broad-based securities market index.
Based on its review, the Board concluded that the nature, extent, and quality of services that will be provided to the fund under the Advisory Contracts should benefit the fund's shareholders.
Competitiveness of Management Fee and Total Fund Expenses. In reviewing the Advisory Contracts, the Board considered the amount and nature of fees to be paid by the fund to the fund's investment adviser, Strategic Advisers, the amount and nature of fees to be paid by Strategic Advisers to the sub-advisers, and the projected total management fee rate and operating expenses of the fund.
The Board noted that the fund's maximum aggregate annual management fee rate may not exceed 0.65% of the fund's average daily net assets and that Strategic Advisers has contractually agreed to waive its 0.25% portion of the fund's management fee through September 30, 2027 The Board considered that the proposed maximum aggregate annual management fee rate and estimated effective and total management fee rates rank below the median of the fund's total mapped group. The Board noted that FDS,FIAM and FIL, and not the fund, will compensate the sub-subadvisers under the terms of each Sub-Subadvisory Agreement and that the fund and Strategic Advisers are not responsible for any such fees or expenses. The Board also considered that the fund's projected total net expenses, including acquired fund fees and expenses, if any, rank below the competitive median.
Based on its review, the Board concluded that the fund's management fee structure and projected total expenses bear a reasonable relationship to the services that the fund and its shareholders will receive and the other factors considered.
Costs of the Services and Profitability. The fund is a new fund and therefore no revenue, cost, or profitability data were available for the Board to review in respect of the fund at the time it approved the Advisory Contracts. The Board noted that it will consider costs of services and the profitability of Strategic Advisers and each sub-adviser as a result of their relationship with the fund in connection with future renewals of the Advisory Contracts.
Potential Fall-Out Benefits. The fund is a new fund and therefore the Board was unable to consider any direct and indirect benefits to Strategic Advisers and its affiliates from their relationships with the fund. The Board noted that it will review information regarding the potential of direct and indirect benefits accruing to Strategic Advisers and its affiliates from their relationships with the fund, including non-advisory fee compensation paid to affiliates of Strategic Advisers, if any, as well as information regarding potential fall-out benefits accruing to each sub-adviser, if any, as a result of its relationship with the fund, in connection with future renewals of the Advisory Contracts.
Possible Economies of Scale. The Board noted that because the fund is a new fund a determination of economies of scale was premature until the fund has assets. The Board noted that, in certain cases, breakpoints included in the Sub-Advisory Agreements have the potential to reduce sub-advisory fees paid to the sub-adviser as assets allocated to the sub-adviser grow.
Conclusion. Based on its evaluation of all of the conclusions noted above, and after considering all factors it believed relevant, the Board ultimately concluded that the advisory fee structures proposed on behalf of the fund bear a reasonable relationship to the services to be rendered and that each Advisory Contract should be approved because each agreement is in the best interests of the fund and its shareholders. In addition, the Board concluded that the approval of each Sub-Advisory Agreement and Sub-Subadvisory Agreement does not involve a conflict of interest from which Strategic Advisers or its affiliates derive an inappropriate advantage.
Board Approval of Amended Sub-Advisory Agreements
Strategic Advisers U.S. Total Stock Fund
In September 2024, the Board of Trustees, including the Independent Trustees (together, the Board) voted to approve (i) an amendment to each of the existing sub-advisory agreements among Strategic Advisers LLC (Strategic Advisers), Fidelity Rutland Square Trust II (Trust) on behalf of the fund, and each of AllianceBernstein L.P. (AllianceBernstein), LSV Asset Management (LSV), and J.P. Morgan Investment Management Inc. (J.P. Morgan), to remove one or more investment mandates (each such agreement, an Amended Sub-Advisory Agreement), and (ii) an amendment to the fee schedule in the existing sub-advisory agreement among Strategic Advisers, GW&K Investment Management, LLC (GW&K, and together with AllianceBernstein, J.P. Morgan, and LSV, the Sub-Advisers), and the Trust on behalf of the fund (the Amended GW&K Agreement and, together with the Amended Sub-Advisory Agreements, the Amended Agreements). The Board noted that the updated fee schedule in the Amended GW&K Agreement became effective as of September 1, 2024 and will result in the same or lower fees at all asset levels. The Board also approved updating the address for notice of Strategic Advisers LLC in each Amended Agreement. The Board noted that no other material contract terms are impacted by the Amended Agreements. The Board, assisted by the advice of fund counsel and Independent Trustees' counsel, considered a broad range of information.
In considering whether to approve each Amended Agreement, the Board reached a determination, with the assistance of fund counsel and Independent Trustees' counsel and through the exercise of its business judgment, that the approval of each Amended Agreement is in the best interests of the fund and its shareholders and that the approval of such agreement does not involve a conflict of interest from which Strategic Advisers or its affiliates derive an inappropriate advantage. The Board's decision to approve each Amended Agreement was not based on any single factor, but rather was based on a comprehensive consideration of all the information provided to the Board. In addition, individual Trustees did not necessarily attribute the same weight or importance to each factor.
Nature, Extent, and Quality of Services Provided. The Board considered the backgrounds of the investment personnel that provide services to the fund, the fund's investment objective, strategies and related investment philosophy, the proposed sub-adviser line-up, and the structure of the investment personnel compensation programs and whether such structure provides appropriate incentives to act in the best interests of the fund in connection with its initial approval of the fund's management contract, sub-advisory agreements and sub-subadvisory agreements at its March 2024 meeting.
The Board noted that it had initially approved the existing sub-advisory agreements with the Sub-Advisers at its March 2024 meeting and that except with respect to the removal of the investment mandates which were not funded, the Amended Agreements will not result in any changes to (i) the nature, extent and quality of the sub-advisory services provided, (ii) the investment process or strategies employed in the management of the fund's assets, or (iii) the day-to-day management of the fund or the persons primarily responsible for such management.
Based on its review, the Board concluded that the nature, extent, and quality of services that will be provided to the fund under the Amended Agreements should continue to benefit the fund's shareholders.
Competitiveness of Management Fee and Total Fund Expenses. The Board noted that the Amended Agreements will not result in changes to the maximum aggregate annual management fee payable by the fund or Strategic Advisers' portion of the management fee. The Board considered Strategic Advisers' contractual agreement to waive its portion of the fund's management fee.
The Board considered that the Amended GW&K Agreement is expected to result in a slight decrease in the total management fee rate of the fund. The Board also considered that because the removed investment mandates were not funded, the Amended Sub-Advisory Agreements will have no impact on the total management fee rate of the fund. Based on its review, the Board concluded that the fund's management fee structure and projected total expenses bear a reasonable relationship to the services that the fund and its shareholders will receive and the other factors considered.
Costs of the Services and Profitability. Because the Amended Agreements were negotiated at arm's length and will have no impact on the maximum management fees payable by the fund or Strategic Advisers' portion of the management fee, the Board did not consider the costs of services and profitability to be significant factors in its decision to approve the Amended Agreements.
Potential Fall-Out Benefits. The Board considered that it will review information regarding the potential of direct and indirect benefits to Strategic Advisers and its affiliates from their relationships with the fund, including non-advisory fee compensation paid to affiliates of Strategic Advisers, if any, as well as information regarding potential fall-out benefits accruing to each sub-adviser, if any, as a result of its relationship with the fund, during its future annual renewal of the fund's management contract, sub-advisory agreements, and sub-subadvisory agreements. The Board considered Strategic Advisers' representation that it does not anticipate that the approval of the Amended Agreements will have a significant impact on the profitability of, or potential fall-out benefits to, Strategic Advisers or its affiliates.
Possible Economies of Scale. The Board considered that it will review whether there have been economies of scale in connection with the management of the fund during its future annual renewal of the fund's management contract, sub-advisory agreements, and sub-subadvisory agreements. The Board considered that each Amended Agreement will continue to provide for breakpoints that have the potential to reduce sub-advisory fees paid to the Sub-Adviser as assets allocated to the Sub-Adviser grow. The Board also noted that it did not consider the possible realization of economies of scale to be a significant factor in its decision to approve each Amended Agreement because the fund will not bear any additional expenses as a direct result of the amendments.
Conclusion. Based on its evaluation of all of the conclusions noted above, and after considering all factors it believed relevant, the Board concluded that each Amended Agreement's fee structure bears a reasonable relationship to the services to be rendered and each Amended Agreement is in the best interests of the fund and its shareholders and should be approved. In addition, the Board concluded that the approval of each Amended Agreement does not involve a conflict of interest from which Strategic Advisers or its affiliates derive an inappropriate advantage.
1.9911783.100
STS-SANN-0125
Item 8.
Changes in and Disagreements with Accountants for Open-End Management Investment Companies
See Item 7.
Item 9.
Proxy Disclosures for Open-End Management Investment Companies
See Item 7.
Item 10.
Remuneration Paid to Directors, Officers, and Others of Open-End Management Investment Companies
See Item 7.
Item 11.
Statement Regarding Basis for Approval of Investment Advisory Contract
See Item 7.
Item 12.
Disclosure of Proxy Voting Policies and Procedures for Closed-End Management Investment Companies
Not applicable.
Item 13.
Portfolio Managers of Closed-End Management Investment Companies
Not applicable.
Item 14.
Purchases of Equity Securities by Closed-End Management Investment Company and Affiliated Purchasers
Not applicable.
Item 15.
Submission of Matters to a Vote of Security Holders
There were no material changes to the procedures by which shareholders may recommend nominees to the Fidelity Rutland Square Trust II’s Board of Trustees.
Item 16.
Controls and Procedures
(a)(i) The President and Treasurer and the Chief Financial Officer have concluded that the Fidelity Rutland Square Trust II’s (the “Trust”) disclosure controls and procedures (as defined in Rule 30a-3(c) under the Investment Company Act) provide reasonable assurances that material information relating to the Trust is made known to them by the appropriate persons, based on their evaluation of these controls and procedures as of a date within 90 days of the filing date of this report.
(a)(ii) There was no change in the Trust’s internal control over financial reporting (as defined in Rule 30a-3(d) under the Investment Company Act) that occurred during the period covered by this report that has materially affected, or is reasonably likely to materially affect, the Trust’s internal control over financial reporting.
Item 17.
Disclosure of Securities Lending Activities for Closed-End Management Investment Companies
Not applicable.
Item 18.
Recovery of Erroneously Awarded Compensation
(a)
Not applicable.
(b)
Not applicable.
Item 19.
Exhibits
SIGNATURES
Pursuant to the requirements of the Securities Exchange Act of 1934 and the Investment Company Act of 1940, the registrant has duly caused this report to be signed on its behalf by the undersigned, thereunto duly authorized.
Fidelity Rutland Square Trust II
|
By: | /s/Heather Bonner |
| Heather Bonner |
| President and Treasurer (Principal Executive Officer) |
|
|
Date: | January 22, 2025 |
Pursuant to the requirements of the Securities Exchange Act of 1934 and the Investment Company Act of 1940, this report has been signed below by the following persons on behalf of the registrant and in the capacities and on the dates indicated.
|
By: | /s/Heather Bonner |
| Heather Bonner |
| President and Treasurer (Principal Executive Officer) |
|
|
Date: | January 22, 2025 |
|
By: | /s/Stephanie Caron |
| Stephanie Caron |
| Chief Financial Officer (Principal Financial Officer) |
|
|
Date: | January 22, 2025 |