UNITED STATES
SECURITIES AND EXCHANGE COMMISSION
Washington, D.C. 20549
FORM N-CSR
CERTIFIED SHAREHOLDER REPORT OF REGISTERED
MANAGEMENT INVESTMENT COMPANIES
Investment Company Act file number 811-21991
Fidelity Rutland Square Trust II
(Exact name of registrant as specified in charter)
245 Summer St., Boston, MA 02210
(Address of principal executive offices) (Zip code)
Christina H. Lee, Secretary
245 Summer St.
Boston, Massachusetts 02210
(Name and address of agent for service)
Registrant's telephone number, including area code:
617-563-7000
| |
Date of fiscal year end: | February 28 |
|
|
Date of reporting period: | August 31, 2023 |
Item 1.
Reports to Stockholders
Strategic Advisers® Core Income Fund
Offered exclusively to certain managed account clients of Strategic Advisers LLC or its affiliates - not available for sale to the general public
Semi-Annual Report
August 31, 2023
Contents
To view a fund's proxy voting guidelines and proxy voting record for the 12-month period ended June 30, visit http://www.fidelity.com/proxyvotingresults or visit the Securities and Exchange Commission's (SEC) web site at http://www.sec.gov.
You may also call 1-800-544-3455 to request a free copy of the proxy voting guidelines.
Standard & Poor's, S&P and S&P 500 are registered service marks of The McGraw-Hill Companies, Inc. and have been licensed for use by Fidelity Distributors Corporation.
Other third-party marks appearing herein are the property of their respective owners.
All other marks appearing herein are registered or unregistered trademarks or service marks of FMR LLC or an affiliated company. © 2023 FMR LLC. All rights reserved.
This report and the financial statements contained herein are submitted for the general information of the shareholders of the Fund. This report is not authorized for distribution to prospective investors in the Fund unless preceded or accompanied by an effective prospectus.
A fund files its complete schedule of portfolio holdings with the SEC for the first and third quarters of each fiscal year on Form N-PORT. Forms N-PORT are available on the SEC's web site at http://www.sec.gov. A fund's Forms N-PORT may be reviewed and copied at the SEC's Public Reference Room in Washington, DC. Information regarding the operation of the SEC's Public Reference Room may be obtained by calling 1-800-SEC-0330.
For a complete list of a fund's portfolio holdings, view the most recent holdings listing, semiannual report, or annual report on Fidelity's web site at http://www.fidelity.com, http://www.institutional.fidelity.com, or http://www.401k.com, as applicable.
NOT FDIC INSURED •MAY LOSE VALUE •NO BANK GUARANTEE
Neither the Fund nor Fidelity Distributors Corporation is a bank.
The information in the following tables is based on the direct Investments of the Fund.
Top Holdings (% of Fund's net assets) |
| (excluding cash equivalents) |
| PIMCO Total Return Fund Institutional Class | 11.7 | |
| Fidelity SAI Total Bond Fund | 10.2 | |
| U.S. Treasury Obligations | 9.2 | |
| Western Asset Core Bond Fund Class I | 7.1 | |
| Fidelity SAI U.S. Treasury Bond Index Fund | 4.6 | |
| Fannie Mae | 3.7 | |
| iShares 7-10 Year Treasury Bond ETF | 3.7 | |
| DoubleLine Total Return Bond Fund Class N | 3.7 | |
| PIMCO Mortgage Opportunities Fund Institutional Class | 3.3 | |
| Western Asset Core Plus Bond Fund Class I | 3.2 | |
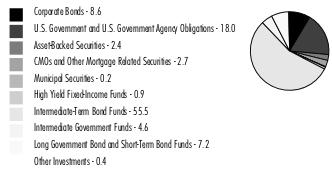
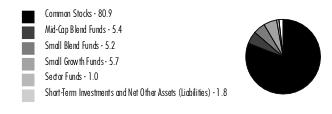
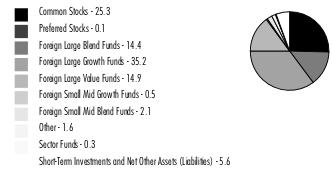
Asset Allocation (% of Fund's net assets) |
|
Short-Term Investments and Net Other Assets (Liabilities) - (0.5)% |
Percentages in the above tables are adjusted for the effect of TBA Sale Commitments. |
|
Asset Allocation of funds in the pie chart reflect the categorizations of the asset as defined by Morningstar as of the reporting date.
Showing Percentage of Net Assets
| Nonconvertible Bonds - 8.6% |
| | | Principal Amount (a) | Value ($) |
| COMMUNICATION SERVICES - 0.7% | | | |
| Diversified Telecommunication Services - 0.2% | | | |
| AT&T, Inc.: | | | |
| 1.65% 2/1/28 | | 563,000 | 481,372 |
| 2.55% 12/1/33 | | 6,985,000 | 5,329,738 |
| 3.5% 6/1/41 | | 5,306,000 | 3,891,596 |
| 3.5% 9/15/53 | | 1,712,000 | 1,126,847 |
| 3.55% 9/15/55 | | 1,440,000 | 939,843 |
| 3.65% 6/1/51 | | 50,000 | 34,294 |
| 3.65% 9/15/59 | | 9,815,000 | 6,351,982 |
| 3.8% 12/1/57 | | 26,833,000 | 18,096,178 |
| 4.3% 2/15/30 | | 3,709,000 | 3,458,142 |
| 4.5% 5/15/35 | | 1,980,000 | 1,759,641 |
| 4.5% 3/9/48 | | 1,650,000 | 1,316,982 |
| 4.75% 5/15/46 | | 5,288,000 | 4,414,611 |
| 5.4% 2/15/34 | | 787,000 | 764,255 |
| C&W Senior Financing Designated Activity Co. 6.875% 9/15/27 (b) | | 305,000 | 280,600 |
| Cablevision Lightpath LLC 3.875% 9/15/27 (b) | | 10,000 | 8,349 |
| Cellnex Telecom SA 1.75% 10/23/30 (Reg. S) | EUR | 5,500,000 | 4,892,566 |
| Cogent Communications Group, Inc.: | | | |
| 3.5% 5/1/26 (b) | | 165,000 | 152,756 |
| 7% 6/15/27 (b) | | 255,000 | 247,529 |
| Embarq Corp. 7.995% 6/1/36 | | 119,000 | 72,490 |
| Frontier Communications Holdings LLC: | | | |
| 5.875% 10/15/27 (b) | | 397,000 | 361,588 |
| 8.625% 3/15/31 (b) | | 2,358,000 | 2,270,872 |
| Holdco SASU: | | | |
| 6.5% 10/15/26 (b) | | 475,000 | 453,178 |
| 7% 10/15/28 (b) | | 450,000 | 418,637 |
| Level 3 Financing, Inc.: | | | |
| 3.625% 1/15/29 (b) | | 35,000 | 20,843 |
| 4.625% 9/15/27 (b) | | 166,000 | 124,838 |
| 10.5% 5/15/30 (b) | | 1,017,000 | 1,033,059 |
| Lumen Technologies, Inc.: | | | |
| 4% 2/15/27 (b) | | 672,000 | 423,508 |
| 5.125% 12/15/26 (b) | | 319,000 | 165,248 |
| Northwest Fiber LLC/Northwest Fiber Finance Sub, Inc. 4.75% 4/30/27 (b) | | 471,000 | 414,376 |
| Qwest Corp. 7.25% 9/15/25 | | 203,000 | 192,985 |
| Sable International Finance Ltd. 5.75% 9/7/27 (b) | | 526,000 | 486,808 |
| Sitios Latinoamerica S.A.B. de CV 5.375% 4/4/32 (b) | | 200,000 | 178,225 |
| Sprint Capital Corp.: | | | |
| 6.875% 11/15/28 | | 304,000 | 321,146 |
| 8.75% 3/15/32 | | 712,000 | 848,604 |
| Sprint Spectrum Co. LLC 5.152% 9/20/29 (b) | | 12,022,250 | 11,919,836 |
| Telecom Italia Capital SA: | | | |
| 6% 9/30/34 | | 89,000 | 73,884 |
| 6.375% 11/15/33 | | 191,000 | 167,889 |
| 7.721% 6/4/38 | | 5,000 | 4,623 |
| Telecom Italia SpA 5.303% 5/30/24 (b) | | 370,000 | 365,196 |
| Telenet Finance Luxembourg Notes SARL 5.5% 3/1/28 (b) | | 200,000 | 182,600 |
| Verizon Communications, Inc.: | | | |
| 1.75% 1/20/31 | | 559,000 | 435,100 |
| 2.1% 3/22/28 | | 48,000 | 41,947 |
| 2.355% 3/15/32 | | 5,980,000 | 4,729,811 |
| 2.65% 11/20/40 | | 1,883,000 | 1,257,333 |
| 2.875% 11/20/50 | | 35,000 | 21,464 |
| 3.15% 3/22/30 | | 239,000 | 209,626 |
| 3.4% 3/22/41 | | 5,565,000 | 4,132,387 |
| 3.7% 3/22/61 | | 419,000 | 285,457 |
| 4.016% 12/3/29 | | 1,412,000 | 1,312,735 |
| 4.329% 9/21/28 | | 35,000 | 33,521 |
| 5.05% 5/9/33 | | 2,295,000 | 2,226,881 |
| Virgin Media Finance PLC 5% 7/15/30 (b) | | 270,000 | 219,053 |
| Zayo Group Holdings, Inc. 4% 3/1/27 (b) | | 1,436,000 | 1,076,192 |
| | | | 90,029,221 |
| Entertainment - 0.0% | | | |
| Activision Blizzard, Inc. 2.5% 9/15/50 | | 1,298,000 | 825,399 |
| Cinemark U.S.A., Inc.: | | | |
| 5.25% 7/15/28 (b) | | 79,000 | 70,171 |
| 5.875% 3/15/26 (b) | | 174,000 | 167,042 |
| 8.75% 5/1/25 (b) | | 7,000 | 7,071 |
| Live Nation Entertainment, Inc.: | | | |
| 4.75% 10/15/27 (b) | | 432,000 | 402,451 |
| 5.625% 3/15/26 (b) | | 49,000 | 47,527 |
| 6.5% 5/15/27 (b) | | 403,000 | 403,312 |
| Netflix, Inc.: | | | |
| 4.375% 11/15/26 | | 165,000 | 160,319 |
| 5.375% 11/15/29 (b) | | 518,000 | 515,135 |
| Roblox Corp. 3.875% 5/1/30 (b) | | 280,000 | 231,001 |
| Take-Two Interactive Software, Inc. 3.7% 4/14/27 | | 180,000 | 170,572 |
| The Walt Disney Co.: | | | |
| 3.5% 5/13/40 | | 165,000 | 132,307 |
| 3.6% 1/13/51 | | 341,000 | 256,604 |
| 3.8% 3/22/30 | | 365,000 | 341,787 |
| Universal Music Group NV 4% 6/13/31 (Reg. S) | EUR | 300,000 | 323,809 |
| WMG Acquisition Corp.: | | | |
| 3% 2/15/31 (b) | | 32,000 | 26,093 |
| 3.875% 7/15/30 (b) | | 262,000 | 227,364 |
| | | | 4,307,964 |
| Interactive Media & Services - 0.0% | | | |
| Meta Platforms, Inc.: | | | |
| 4.45% 8/15/52 | | 1,285,000 | 1,090,552 |
| 4.6% 5/15/28 | | 280,000 | 277,555 |
| 4.65% 8/15/62 | | 247,000 | 210,112 |
| 4.8% 5/15/30 | | 100,000 | 99,600 |
| 5.6% 5/15/53 | | 1,163,000 | 1,167,781 |
| 5.75% 5/15/63 | | 102,000 | 103,006 |
| Tencent Holdings Ltd. 3.84% 4/22/51 (b) | | 2,435,000 | 1,660,767 |
| | | | 4,609,373 |
| Media - 0.4% | | | |
| Adria Bidco BV 5.25% 2/1/30 (b) | EUR | 5,200,000 | 4,658,381 |
| Advantage Sales & Marketing, Inc. 6.5% 11/15/28 (b) | | 555,000 | 483,827 |
| Altice France Holding SA 8% 5/15/27 (Reg. S) | EUR | 8,625,000 | 4,433,861 |
| Cable One, Inc. 4% 11/15/30 (b) | | 919,000 | 716,790 |
| CCO Holdings LLC/CCO Holdings Capital Corp.: | | | |
| 4.25% 2/1/31 (b) | | 95,000 | 77,927 |
| 4.25% 1/15/34 (b) | | 88,000 | 67,390 |
| 4.5% 8/15/30 (b) | | 619,000 | 520,701 |
| 4.5% 5/1/32 | | 3,891,000 | 3,154,414 |
| 4.5% 6/1/33 (b) | | 2,110,000 | 1,665,571 |
| 4.75% 3/1/30 (b) | | 2,575,000 | 2,213,966 |
| 4.75% 2/1/32 (b) | | 695,000 | 575,113 |
| 5% 2/1/28 (b) | | 702,000 | 646,890 |
| 5.125% 5/1/27 (b) | | 247,000 | 232,202 |
| 5.375% 6/1/29 (b) | | 275,000 | 250,291 |
| Charter Communications Operating LLC/Charter Communications Operating Capital Corp.: | | | |
| 2.25% 1/15/29 | | 448,000 | 372,159 |
| 2.3% 2/1/32 | | 1,000,000 | 754,686 |
| 2.8% 4/1/31 | | 125,000 | 100,725 |
| 3.5% 6/1/41 | | 144,000 | 95,438 |
| 3.5% 3/1/42 | | 408,000 | 266,732 |
| 3.7% 4/1/51 | | 2,698,000 | 1,676,611 |
| 3.85% 4/1/61 | | 585,000 | 349,493 |
| 3.9% 6/1/52 | | 12,412,000 | 7,942,043 |
| 4.8% 3/1/50 | | 2,827,000 | 2,094,488 |
| 4.908% 7/23/25 | | 6,460,000 | 6,344,119 |
| 5.25% 4/1/53 | | 1,556,000 | 1,231,670 |
| 5.375% 4/1/38 | | 450,000 | 381,081 |
| 5.375% 5/1/47 | | 26,274,000 | 20,994,869 |
| 6.384% 10/23/35 | | 3,210,000 | 3,113,950 |
| 6.484% 10/23/45 | | 3,553,000 | 3,268,583 |
| Clear Channel Outdoor Holdings, Inc.: | | | |
| 5.125% 8/15/27 (b) | | 540,000 | 483,647 |
| 7.75% 4/15/28 (b) | | 59,000 | 46,406 |
| Comcast Corp.: | | | |
| 1.5% 2/15/31 | | 210,000 | 164,312 |
| 1.95% 1/15/31 | | 119,000 | 96,219 |
| 2.45% 8/15/52 | | 199,000 | 116,462 |
| 2.8% 1/15/51 | | 115,000 | 72,945 |
| 2.887% 11/1/51 | | 998,000 | 639,969 |
| 2.937% 11/1/56 | | 2,507,000 | 1,560,048 |
| 2.987% 11/1/63 | | 34,000 | 20,555 |
| 3.25% 11/1/39 | | 538,000 | 414,310 |
| 3.45% 2/1/50 | | 123,000 | 89,769 |
| 3.75% 4/1/40 | | 770,000 | 633,303 |
| 3.9% 3/1/38 | | 435,000 | 371,120 |
| 3.969% 11/1/47 | | 32,000 | 25,656 |
| 3.999% 11/1/49 | | 13,000 | 10,373 |
| 4% 3/1/48 | | 150,000 | 120,706 |
| 4.25% 10/15/30 | | 435,000 | 413,862 |
| 4.4% 8/15/35 | | 112,000 | 103,810 |
| 4.65% 2/15/33 | | 81,000 | 79,009 |
| 4.65% 7/15/42 | | 119,000 | 106,257 |
| 4.8% 5/15/33 | | 114,000 | 111,450 |
| 5.35% 5/15/53 | | 2,002,000 | 1,959,100 |
| 5.5% 11/15/32 | | 181,000 | 185,704 |
| 5.5% 5/15/64 | | 1,935,000 | 1,890,542 |
| COX Communications, Inc. 2.95% 10/1/50 (b) | | 81,000 | 48,107 |
| Cox Enterprises, Inc. 7.375% 7/15/27 (b) | | 3,445,000 | 3,595,182 |
| CSC Holdings LLC: | | | |
| 4.125% 12/1/30 (b) | | 215,000 | 153,311 |
| 4.5% 11/15/31 (b) | | 220,000 | 156,435 |
| 5.25% 6/1/24 | | 69,000 | 65,444 |
| 5.375% 2/1/28 (b) | | 744,000 | 609,907 |
| 5.75% 1/15/30 (b) | | 358,000 | 197,967 |
| 6.5% 2/1/29 (b) | | 3,650,000 | 3,015,464 |
| 7.5% 4/1/28 (b) | | 350,000 | 222,472 |
| Diamond Sports Group LLC/Diamond Sports Finance Co. 5.375% (b)(c) | | 5,704,000 | 134,386 |
| DIRECTV Financing LLC / DIRECTV Financing Co-Obligor, Inc. 5.875% 8/15/27 (b) | | 385,000 | 341,194 |
| Discovery Communications LLC: | | | |
| 3.625% 5/15/30 | | 4,338,000 | 3,809,979 |
| 4% 9/15/55 | | 89,000 | 58,044 |
| 4.65% 5/15/50 | | 11,727,000 | 8,741,026 |
| 5.3% 5/15/49 | | 7,695,000 | 6,275,823 |
| DISH DBS Corp.: | | | |
| 5.125% 6/1/29 | | 1,100,000 | 594,770 |
| 5.25% 12/1/26 (b) | | 526,000 | 443,389 |
| 5.75% 12/1/28 (b) | | 53,000 | 41,142 |
| 5.875% 11/15/24 | | 523,000 | 486,461 |
| 7.75% 7/1/26 | | 550,000 | 411,345 |
| DISH Network Corp. 11.75% 11/15/27 (b) | | 4,143,000 | 4,203,658 |
| Fox Corp.: | | | |
| 5.476% 1/25/39 | | 2,474,000 | 2,245,273 |
| 5.576% 1/25/49 | | 1,641,000 | 1,465,752 |
| Gannett Holdings LLC 6% 11/1/26 (b) | | 105,000 | 90,069 |
| Gray Escrow II, Inc. 5.375% 11/15/31 (b) | | 63,000 | 43,983 |
| Gray Television, Inc.: | | | |
| 4.75% 10/15/30 (b) | | 161,000 | 112,415 |
| 7% 5/15/27 (b) | | 175,000 | 157,073 |
| iHeartCommunications, Inc.: | | | |
| 4.75% 1/15/28 (b) | | 180,000 | 138,726 |
| 5.25% 8/15/27 (b) | | 127,000 | 100,422 |
| 6.375% 5/1/26 | | 384,414 | 335,405 |
| 8.375% 5/1/27 | | 166,361 | 115,193 |
| Lagardere S.C.A. 2.125% 10/16/26 (Reg. S) | EUR | 800,000 | 851,794 |
| Lamar Media Corp.: | | | |
| 3.75% 2/15/28 | | 27,000 | 24,527 |
| 4% 2/15/30 | | 157,000 | 137,375 |
| 4.875% 1/15/29 | | 195,000 | 181,350 |
| LCPR Senior Secured Financing DAC 5.125% 7/15/29 (b) | | 200,000 | 168,600 |
| Magallanes, Inc.: | | | |
| 3.755% 3/15/27 | | 3,690,000 | 3,460,916 |
| 4.054% 3/15/29 | | 1,378,000 | 1,267,204 |
| 4.279% 3/15/32 | | 5,640,000 | 4,976,959 |
| 5.05% 3/15/42 | | 11,171,000 | 9,182,918 |
| 5.141% 3/15/52 | | 11,129,000 | 8,871,032 |
| Midas Opco Holdings LLC 5.625% 8/15/29 (b) | | 340,000 | 283,947 |
| News Corp. 3.875% 5/15/29 (b) | | 390,000 | 342,494 |
| Nexstar Media, Inc.: | | | |
| 4.75% 11/1/28 (b) | | 196,000 | 171,933 |
| 5.625% 7/15/27 (b) | | 784,000 | 736,915 |
| Outfront Media Capital LLC / Corp.: | | | |
| 5% 8/15/27 (b) | | 112,000 | 101,360 |
| 6.25% 6/15/25 (b) | | 60,000 | 58,950 |
| Paramount Global: | | | |
| 3.7% 6/1/28 | | 150,000 | 134,394 |
| 4.6% 1/15/45 | | 5,565,000 | 3,840,319 |
| 4.95% 1/15/31 | | 25,000 | 22,300 |
| Radiate Holdco LLC/Radiate Financial Service Ltd. 4.5% 9/15/26 (b) | | 345,000 | 268,887 |
| Scripps Escrow II, Inc. 3.875% 1/15/29 (b) | | 347,000 | 278,585 |
| Scripps Escrow, Inc. 5.875% 7/15/27 (b) | | 36,000 | 29,087 |
| SES Global Americas Holdings GP 5.3% 3/25/44 (b) | | 2,000,000 | 1,424,806 |
| Sinclair Television Group, Inc. 4.125% 12/1/30 (b) | | 163,000 | 105,044 |
| Sirius XM Radio, Inc.: | | | |
| 3.875% 9/1/31 (b) | | 370,000 | 287,975 |
| 4% 7/15/28 (b) | | 492,000 | 426,033 |
| 4.125% 7/1/30 (b) | | 855,000 | 697,022 |
| 5% 8/1/27 (b) | | 788,000 | 728,569 |
| 5.5% 7/1/29 (b) | | 1,283,000 | 1,155,028 |
| TEGNA, Inc.: | | | |
| 4.625% 3/15/28 | | 416,000 | 371,556 |
| 4.75% 3/15/26 (b) | | 225,000 | 214,387 |
| 5% 9/15/29 | | 189,000 | 166,320 |
| Time Warner Cable LLC: | | | |
| 5.5% 9/1/41 | | 8,936,000 | 7,341,422 |
| 5.875% 11/15/40 | | 7,708,000 | 6,706,633 |
| 6.55% 5/1/37 | | 8,522,000 | 8,097,458 |
| 7.3% 7/1/38 | | 6,402,000 | 6,485,537 |
| Univision Communications, Inc. 4.5% 5/1/29 (b) | | 415,000 | 357,206 |
| Videotron Ltd.: | | | |
| 3.625% 6/15/29 (b) | | 130,000 | 111,639 |
| 5.125% 4/15/27 (b) | | 120,000 | 114,900 |
| 5.375% 6/15/24 (b) | | 88,000 | 87,336 |
| Virgin Media Secured Finance PLC: | | | |
| 4.25% 1/15/30 (Reg. S) | GBP | 1,500,000 | 1,508,284 |
| 5.5% 5/15/29 (b) | | 175,000 | 159,967 |
| VZ Secured Financing BV 5% 1/15/32 (b) | | 2,441,000 | 1,990,047 |
| Ziggo BV: | | | |
| 2.875% 1/15/30 (Reg. S) | EUR | 1,100,000 | 979,575 |
| 4.875% 1/15/30 (b) | | 115,000 | 96,663 |
| | | | 191,814,575 |
| Wireless Telecommunication Services - 0.1% | | | |
| Digicel Group Holdings Ltd. 8% pay-in-kind (b)(c)(d) | | 225,974 | 51,974 |
| Digicel Group Ltd. 6.75% (b)(c) | | 500,000 | 24,375 |
| Digicel International Finance Ltd. / Digicel International Holdings Ltd.: | | | |
| 8% (b)(c) | | 2,650,000 | 129,188 |
| 8.75% 5/25/24 (b) | | 300,000 | 272,469 |
| 8.75% 5/25/24 (b) | | 400,000 | 363,476 |
| 13% pay-in-kind (b)(c)(d) | | 2,295,045 | 1,623,744 |
| Intelsat Jackson Holdings SA: | | | |
| 5.5% (c)(e) | | 2,500,000 | 0 |
| 6.5% 3/15/30 (b) | | 510,000 | 467,625 |
| 9.75% (b)(c)(e) | | 5,500,000 | 1 |
| Kenbourne Invest SA 6.875% 11/26/24 (Reg. S) | | 200,000 | 167,718 |
| Millicom International Cellular SA: | | | |
| 4.5% 4/27/31 (b) | | 200,000 | 157,068 |
| 5.125% 1/15/28 (b) | | 346,500 | 310,551 |
| Rogers Communications, Inc.: | | | |
| 3.2% 3/15/27 | | 4,297,000 | 3,972,236 |
| 3.8% 3/15/32 | | 3,750,000 | 3,207,277 |
| 4.55% 3/15/52 | | 20,000 | 15,497 |
| Sprint Corp.: | | | |
| 7.125% 6/15/24 | | 2,950,000 | 2,973,399 |
| 7.625% 2/15/25 | | 3,132,000 | 3,193,638 |
| 7.625% 3/1/26 | | 596,000 | 617,771 |
| 7.875% 9/15/23 | | 3,220,000 | 3,221,385 |
| T-Mobile U.S.A., Inc.: | | | |
| 2.625% 4/15/26 | | 220,000 | 204,132 |
| 2.625% 2/15/29 | | 275,000 | 238,033 |
| 3% 2/15/41 | | 3,775,000 | 2,666,432 |
| 3.375% 4/15/29 | | 3,475,000 | 3,113,957 |
| 3.75% 4/15/27 | | 7,970,000 | 7,553,921 |
| 3.875% 4/15/30 | | 28,346,000 | 25,872,108 |
| 5.05% 7/15/33 | | 165,000 | 159,215 |
| 5.2% 1/15/33 | | 215,000 | 210,687 |
| Vodafone Group PLC: | | | |
| 4.875% 10/3/78 (Reg. S) (d) | GBP | 600,000 | 710,743 |
| 6.25% 10/3/78 (Reg. S) (d) | | 595,000 | 584,647 |
| | | | 62,083,267 |
TOTAL COMMUNICATION SERVICES | | | 352,844,400 |
| CONSUMER DISCRETIONARY - 0.5% | | | |
| Automobile Components - 0.0% | | | |
| Adient Global Holdings Ltd.: | | | |
| 4.875% 8/15/26 (b) | | 2,000,000 | 1,923,279 |
| 7% 4/15/28 (b) | | 293,000 | 296,015 |
| Allison Transmission, Inc.: | | | |
| 3.75% 1/30/31 (b) | | 86,000 | 71,833 |
| 4.75% 10/1/27 (b) | | 7,000 | 6,572 |
| 5.875% 6/1/29 (b) | | 326,000 | 314,859 |
| American Axle & Manufacturing, Inc.: | | | |
| 5% 10/1/29 | | 160,000 | 131,719 |
| 6.5% 4/1/27 | | 59,000 | 55,917 |
| 6.875% 7/1/28 | | 346,000 | 317,358 |
| Aptiv PLC / Aptiv Corp. 3.25% 3/1/32 | | 1,115,000 | 945,493 |
| Clarios Global LP 6.75% 5/15/25 (b) | | 87,000 | 86,967 |
| Clarios Global LP / Clarios U.S. Finance Co.: | | | |
| 6.25% 5/15/26 (b) | | 382,000 | 378,323 |
| 6.75% 5/15/28 (b) | | 105,000 | 104,723 |
| Cooper Standard Auto, Inc.: | | | |
| 10.625% 5/15/27 pay-in-kind (b)(d) | | 136,706 | 89,002 |
| 13.5% 3/31/27 pay-in-kind (b)(d) | | 193,752 | 198,692 |
| Dana Financing Luxembourg SARL 5.75% 4/15/25 (b) | | 60,000 | 58,789 |
| Dana, Inc.: | | | |
| 4.5% 2/15/32 | | 115,000 | 92,850 |
| 5.625% 6/15/28 | | 637,000 | 599,646 |
| Hertz Corp. 4.625% 12/1/26 (b) | | 372,000 | 336,805 |
| Lear Corp. 2.6% 1/15/32 | | 5,000 | 3,898 |
| Macquarie AirFinance Holdings 8.375% 5/1/28 (b) | | 130,000 | 132,733 |
| Patrick Industries, Inc. 4.75% 5/1/29 (b) | | 110,000 | 94,050 |
| Robert Bosch GmbH 4.375% 6/2/43 (Reg. S) | EUR | 300,000 | 325,946 |
| Tenneco, Inc. 8% 11/17/28 (b) | | 1,375,000 | 1,129,219 |
| The Goodyear Tire & Rubber Co.: | | | |
| 5% 7/15/29 | | 340,000 | 301,749 |
| 5.25% 4/30/31 | | 482,000 | 422,822 |
| 5.25% 7/15/31 | | 117,000 | 100,766 |
| 9.5% 5/31/25 | | 10,000 | 10,212 |
| ZF Finance GmbH 2% 5/6/27 (Reg. S) | EUR | 800,000 | 768,804 |
| | | | 9,299,041 |
| Automobiles - 0.1% | | | |
| American Honda Finance Corp. 2.3% 9/9/26 | | 9,000 | 8,271 |
| Ford Motor Co.: | | | |
| 3.25% 2/12/32 | | 1,945,000 | 1,518,161 |
| 4.75% 1/15/43 | | 2,340,000 | 1,749,174 |
| 5.291% 12/8/46 | | 2,060,000 | 1,617,643 |
| 6.1% 8/19/32 | | 6,525,000 | 6,235,734 |
| 9.625% 4/22/30 | | 481,000 | 558,485 |
| General Motors Co.: | | | |
| 5.95% 4/1/49 | | 10,000 | 8,967 |
| 6.25% 10/2/43 | | 9,020,000 | 8,481,485 |
| 6.6% 4/1/36 | | 775,000 | 778,980 |
| 6.75% 4/1/46 | | 1,775,000 | 1,751,397 |
| General Motors Financial Co., Inc.: | | | |
| 2.4% 4/10/28 | | 1,895,000 | 1,638,106 |
| 2.7% 6/10/31 | | 70,000 | 55,186 |
| 3.6% 6/21/30 | | 303,000 | 260,089 |
| 3.8% 4/7/25 | | 15,000 | 14,489 |
| 4% 1/15/25 | | 5,695,000 | 5,536,052 |
| 5.15% 8/15/26 (Reg. S) | GBP | 250,000 | 307,822 |
| 5.85% 4/6/30 | | 2,471,000 | 2,420,000 |
| Thor Industries, Inc. 4% 10/15/29 (b) | | 150,000 | 126,013 |
| | | | 33,066,054 |
| Broadline Retail - 0.0% | | | |
| Amazon.com, Inc.: | | | |
| 2.5% 6/3/50 | | 250,000 | 159,294 |
| 3.1% 5/12/51 | | 112,000 | 79,994 |
| 3.6% 4/13/32 | | 335,000 | 308,257 |
| 3.95% 4/13/52 | | 1,001,000 | 834,990 |
| John Lewis PLC 6.125% 1/21/25 | GBP | 1,616,000 | 1,993,571 |
| Macy's Retail Holdings LLC 5.875% 4/1/29 (b) | | 282,000 | 254,923 |
| Marks & Spencer PLC 4.5% 7/10/27 (Reg. S) | GBP | 1,000,000 | 1,150,138 |
| Match Group Holdings II LLC: | | | |
| 3.625% 10/1/31 (b) | | 170,000 | 138,586 |
| 4.125% 8/1/30 (b) | | 70,000 | 60,033 |
| Nordstrom, Inc.: | | | |
| 2.3% 4/8/24 | | 12,000 | 11,610 |
| 4.375% 4/1/30 | | 718,000 | 573,664 |
| Shutterfly Finance LLC: | | | |
| 8.5% 10/1/27 pay-in-kind (b)(d) | | 38,441 | 25,371 |
| 9.75% 10/1/27 (b) | | 4,660 | 4,613 |
| | | | 5,595,044 |
| Distributors - 0.0% | | | |
| American Builders & Contractors Supply Co., Inc.: | | | |
| 3.875% 11/15/29 (b) | | 70,000 | 60,345 |
| 4% 1/15/28 (b) | | 262,000 | 237,205 |
| Inchcape PLC 6.5% 6/9/28 (Reg. S) | GBP | 500,000 | 632,002 |
| Ritchie Bros. Holdings, Inc.: | | | |
| 6.75% 3/15/28 (b) | | 200,000 | 202,450 |
| 7.75% 3/15/31 (b) | | 204,000 | 210,991 |
| | | | 1,342,993 |
| Diversified Consumer Services - 0.1% | | | |
| Adtalem Global Education, Inc. 5.5% 3/1/28 (b) | | 445,000 | 414,739 |
| California Institute of Technology 3.65% 9/1/19 | | 535,000 | 347,264 |
| ERAC U.S.A. Finance LLC: | | | |
| 2.7% 11/1/23 (b) | | 13,000 | 12,932 |
| 3.3% 12/1/26 (b) | | 8,865,000 | 8,270,872 |
| 7% 10/15/37 (b) | | 8,000 | 9,003 |
| Massachusetts Institute of Technology: | | | |
| 2.989% 7/1/50 | | 1,340,000 | 961,803 |
| 5.6% 7/1/11 | | 400,000 | 429,176 |
| President and Fellows of Harvard College: | | | |
| 3.15% 7/15/46 | | 315,000 | 233,434 |
| 3.3% 7/15/56 | | 190,000 | 136,974 |
| 3.745% 11/15/52 | | 720,000 | 590,393 |
| Service Corp. International 5.125% 6/1/29 | | 565,000 | 531,806 |
| Thomas Jefferson University 3.847% 11/1/57 | | 2,575,000 | 1,818,150 |
| Trustees of Boston University 4.061% 10/1/48 | | 450,000 | 382,633 |
| University of Miami 4.063% 4/1/52 | | 102,000 | 83,796 |
| University of Pennsylvania Trustees: | | | |
| 2.396% 10/1/50 | | 495,000 | 306,685 |
| 3.61% 2/15/2119 | | 285,000 | 198,382 |
| University of Southern California: | | | |
| 3.226% 10/1/20 | | 23,000 | 13,440 |
| 3.841% 10/1/47 | | 715,000 | 589,420 |
| 4.976% 10/1/53 | | 1,207,000 | 1,184,898 |
| WASH Multifamily Acquisition, Inc. 5.75% 4/15/26 (b) | | 159,000 | 147,456 |
| Washington University: | | | |
| 3.524% 4/15/54 | | 2,630,000 | 2,023,473 |
| 4.349% 4/15/22 | | 2,340,000 | 1,898,671 |
| Yale University 2.402% 4/15/50 | | 2,140,000 | 1,336,805 |
| | | | 21,922,205 |
| Hotels, Restaurants & Leisure - 0.1% | | | |
| 1011778 BC Unlimited Liability Co./New Red Finance, Inc.: | | | |
| 3.875% 1/15/28 (b) | | 186,000 | 169,175 |
| 4% 10/15/30 (b) | | 5,257,000 | 4,453,474 |
| 4.375% 1/15/28 (b) | | 280,000 | 256,999 |
| 5.75% 4/15/25 (b) | | 90,000 | 89,335 |
| Aramark Services, Inc.: | | | |
| 5% 4/1/25 (b) | | 32,000 | 31,609 |
| 5% 2/1/28 (b) | | 2,110,000 | 1,968,452 |
| Boyd Gaming Corp. 4.75% 12/1/27 | | 443,000 | 414,737 |
| Boyne U.S.A., Inc. 4.75% 5/15/29 (b) | | 325,000 | 293,315 |
| Brinker International, Inc. 8.25% 7/15/30 (b) | | 1,825,000 | 1,793,063 |
| Caesars Entertainment, Inc.: | | | |
| 6.25% 7/1/25 (b) | | 911,000 | 903,928 |
| 7% 2/15/30 (b) | | 2,625,000 | 2,635,046 |
| Carnival Corp.: | | | |
| 4% 8/1/28 (b) | | 530,000 | 474,210 |
| 5.75% 3/1/27 (b) | | 1,100,000 | 1,033,432 |
| 7.625% 3/1/26 (b) | | 1,050,000 | 1,046,812 |
| 9.875% 8/1/27 (b) | | 319,000 | 336,834 |
| Carnival Holdings (Bermuda) Ltd. 10.375% 5/1/28 (b) | | 241,000 | 262,108 |
| CCM Merger, Inc. 6.375% 5/1/26 (b) | | 420,000 | 408,152 |
| Cedar Fair LP 5.25% 7/15/29 | | 456,000 | 410,478 |
| Cedar Fair LP/Canada's Wonderland Co.: | | | |
| 5.5% 5/1/25 (b) | | 17,000 | 16,866 |
| 6.5% 10/1/28 | | 160,000 | 154,675 |
| Churchill Downs, Inc.: | | | |
| 4.75% 1/15/28 (b) | | 170,000 | 156,787 |
| 6.75% 5/1/31 (b) | | 73,000 | 71,414 |
| Fertitta Entertainment LLC / Fertitta Entertainment Finance Co., Inc.: | | | |
| 4.625% 1/15/29 (b) | | 1,318,000 | 1,140,162 |
| 6.75% 1/15/30 (b) | | 351,000 | 289,847 |
| Garden SpinCo Corp. 8.625% 7/20/30 (b) | | 45,000 | 48,043 |
| Golden Entertainment, Inc. 7.625% 4/15/26 (b) | | 1,200,000 | 1,191,000 |
| Hilton Domestic Operating Co., Inc.: | | | |
| 3.625% 2/15/32 (b) | | 367,000 | 306,920 |
| 3.75% 5/1/29 (b) | | 688,000 | 606,125 |
| 4% 5/1/31 (b) | | 1,156,000 | 1,004,802 |
| 4.875% 1/15/30 | | 63,000 | 58,773 |
| 5.375% 5/1/25 (b) | | 41,000 | 40,553 |
| 5.75% 5/1/28 (b) | | 25,000 | 24,529 |
| Hilton Worldwide Finance LLC/Hilton Worldwide Finance Corp. 4.875% 4/1/27 | | 40,000 | 38,551 |
| Hyatt Hotels Corp. 5.75% 1/30/27 | | 1,245,000 | 1,246,216 |
| InterContinental Hotel Group PLC 3.375% 10/8/28 (Reg. S) | GBP | 655,000 | 725,398 |
| International Game Technology PLC: | | | |
| 5.25% 1/15/29 (b) | | 200,000 | 188,069 |
| 6.25% 1/15/27 (b) | | 200,000 | 198,041 |
| 6.5% 2/15/25 (b) | | 428,000 | 428,380 |
| Marriott International, Inc.: | | | |
| 3.125% 6/15/26 | | 1,390,000 | 1,306,063 |
| 4.9% 4/15/29 | | 925,000 | 900,715 |
| Marriott Ownership Resorts, Inc.: | | | |
| 4.5% 6/15/29 (b) | | 74,000 | 62,532 |
| 4.75% 1/15/28 | | 129,000 | 115,133 |
| McDonald's Corp. 5.45% 8/14/53 | | 500,000 | 500,332 |
| MGM Resorts International: | | | |
| 4.625% 9/1/26 | | 500,000 | 470,933 |
| 4.75% 10/15/28 | | 230,000 | 208,729 |
| 5.5% 4/15/27 | | 371,000 | 354,457 |
| 5.75% 6/15/25 | | 118,000 | 116,381 |
| 6.75% 5/1/25 | | 127,000 | 127,211 |
| Midwest Gaming Borrower LLC / Midwest Gaming Financial Corp. 4.875% 5/1/29 (b) | | 19,000 | 16,530 |
| NCL Corp. Ltd.: | | | |
| 5.875% 3/15/26 (b) | | 650,000 | 612,871 |
| 5.875% 2/15/27 (b) | | 155,000 | 150,147 |
| 8.375% 2/1/28 (b) | | 105,000 | 108,227 |
| NCL Finance Ltd. 6.125% 3/15/28 (b) | | 40,000 | 36,064 |
| Ontario Gaming GTA LP 8% 8/1/30 (b) | | 60,000 | 60,647 |
| Premier Entertainment Sub LLC 5.875% 9/1/31 (b) | | 1,200,000 | 927,840 |
| Royal Caribbean Cruises Ltd.: | | | |
| 5.375% 7/15/27 (b) | | 100,000 | 94,102 |
| 5.5% 8/31/26 (b) | | 1,330,000 | 1,274,429 |
| 7.25% 1/15/30 (b) | | 370,000 | 375,623 |
| 8.25% 1/15/29 (b) | | 272,000 | 284,257 |
| 9.25% 1/15/29 (b) | | 519,000 | 552,797 |
| 11.5% 6/1/25 (b) | | 4,000 | 4,220 |
| 11.625% 8/15/27 (b) | | 205,000 | 223,273 |
| Sands China Ltd.: | | | |
| 5.375% 8/8/25 | | 425,000 | 410,837 |
| 5.65% 8/8/28 | | 224,000 | 211,110 |
| SeaWorld Parks & Entertainment, Inc. 5.25% 8/15/29 (b) | | 50,000 | 44,893 |
| Six Flags Entertainment Corp. 5.5% 4/15/27 (b) | | 182,000 | 171,308 |
| Six Flags Theme Park, Inc. 7% 7/1/25 (b) | | 29,000 | 28,993 |
| Starbucks Corp. 4.8% 2/15/33 | | 93,000 | 90,843 |
| Station Casinos LLC 4.5% 2/15/28 (b) | | 292,000 | 261,340 |
| Travel+Leisure Co. 6% 4/1/27 | | 30,000 | 29,171 |
| Vail Resorts, Inc. 6.25% 5/15/25 (b) | | 114,000 | 113,600 |
| Viking Cruises Ltd. 5.875% 9/15/27 (b) | | 1,350,000 | 1,262,250 |
| Whitbread PLC: | | | |
| 2.375% 5/31/27 (Reg. S) | GBP | 720,000 | 779,745 |
| 3.375% 10/16/25 (Reg. S) | GBP | 1,870,000 | 2,217,519 |
| Wynn Las Vegas LLC/Wynn Las Vegas Capital Corp.: | | | |
| 5.25% 5/15/27 (b) | | 249,000 | 235,684 |
| 5.5% 3/1/25 (b) | | 80,000 | 79,031 |
| Wynn Resorts Finance LLC / Wynn Resorts Capital Corp.: | | | |
| 5.125% 10/1/29 (b) | | 555,000 | 496,839 |
| 7.125% 2/15/31 (b) | | 315,000 | 309,552 |
| Yum! Brands, Inc.: | | | |
| 3.625% 3/15/31 | | 430,000 | 364,651 |
| 4.625% 1/31/32 | | 310,000 | 277,374 |
| 4.75% 1/15/30 (b) | | 283,000 | 260,606 |
| 5.35% 11/1/43 | | 50,000 | 44,017 |
| | | | 41,489,186 |
| Household Durables - 0.1% | | | |
| Ashton Woods U.S.A. LLC/Ashton Woods Finance Co. 6.625% 1/15/28 (b) | | 31,000 | 29,620 |
| Brookfield Residential Properties, Inc./Brookfield Residential U.S. Corp.: | | | |
| 4.875% 2/15/30 (b) | | 500,000 | 412,946 |
| 6.25% 9/15/27 (b) | | 25,000 | 22,944 |
| CD&R Smokey Buyer, Inc. 6.75% 7/15/25 (b) | | 181,000 | 175,166 |
| Century Communities, Inc.: | | | |
| 3.875% 8/15/29 (b) | | 135,000 | 116,312 |
| 6.75% 6/1/27 | | 250,000 | 249,224 |
| Lennar Corp.: | | | |
| 4.75% 11/29/27 | | 9,350,000 | 9,065,976 |
| 5% 6/15/27 | | 12,100,000 | 11,915,786 |
| M.D.C. Holdings, Inc.: | | | |
| 2.5% 1/15/31 | | 87,000 | 67,478 |
| 3.85% 1/15/30 | | 89,000 | 76,958 |
| Newell Brands, Inc.: | | | |
| 4.7% 4/1/26 | | 156,000 | 149,465 |
| 5.875% 4/1/36 (f) | | 301,000 | 267,539 |
| 6.625% 9/15/29 | | 296,000 | 292,941 |
| SWF Escrow Issuer Corp. 6.5% 10/1/29 (b) | | 850,000 | 552,245 |
| Tempur Sealy International, Inc.: | | | |
| 3.875% 10/15/31 (b) | | 120,000 | 96,437 |
| 4% 4/15/29 (b) | | 1,716,000 | 1,474,012 |
| The Berkeley Group PLC 2.5% 8/11/31 (Reg. S) | GBP | 1,015,000 | 862,444 |
| Toll Brothers Finance Corp.: | | | |
| 4.35% 2/15/28 | | 29,675,000 | 27,847,400 |
| 4.875% 3/15/27 | | 7,917,000 | 7,685,032 |
| TopBuild Corp. 4.125% 2/15/32 (b) | | 815,000 | 678,488 |
| | | | 62,038,413 |
| Leisure Products - 0.0% | | | |
| Hasbro, Inc. 3.9% 11/19/29 | | 5,000 | 4,534 |
| Mattel, Inc. 6.2% 10/1/40 | | 115,000 | 107,491 |
| | | | 112,025 |
| Specialty Retail - 0.1% | | | |
| Asbury Automotive Group, Inc.: | | | |
| 4.5% 3/1/28 | | 108,000 | 98,520 |
| 4.625% 11/15/29 (b) | | 285,000 | 251,422 |
| 4.75% 3/1/30 | | 36,000 | 31,560 |
| 5% 2/15/32 (b) | | 80,000 | 68,631 |
| AutoNation, Inc. 4.75% 6/1/30 | | 953,000 | 887,595 |
| AutoZone, Inc.: | | | |
| 1.65% 1/15/31 | | 505,000 | 392,195 |
| 3.75% 4/18/29 | | 1,400,000 | 1,290,163 |
| 4% 4/15/30 | | 7,024,000 | 6,499,299 |
| Bath & Body Works, Inc.: | | | |
| 5.25% 2/1/28 | | 22,000 | 21,108 |
| 6.625% 10/1/30 (b) | | 910,000 | 887,543 |
| 6.75% 7/1/36 | | 200,000 | 184,623 |
| 6.875% 11/1/35 | | 52,000 | 48,622 |
| 7.5% 6/15/29 | | 682,000 | 687,506 |
| Foot Locker, Inc. 4% 10/1/29 (b) | | 60,000 | 45,160 |
| Gap, Inc.: | | | |
| 3.625% 10/1/29 (b) | | 353,000 | 268,733 |
| 3.875% 10/1/31 (b) | | 1,490,000 | 1,079,736 |
| Group 1 Automotive, Inc. 4% 8/15/28 (b) | | 315,000 | 279,689 |
| LCM Investments Holdings: | | | |
| 4.875% 5/1/29 (b) | | 50,000 | 43,400 |
| 8.25% 8/1/31 (b) | | 65,000 | 65,042 |
| Lithia Motors, Inc.: | | | |
| 3.875% 6/1/29 (b) | | 245,000 | 210,346 |
| 4.375% 1/15/31 (b) | | 48,000 | 40,840 |
| 4.625% 12/15/27 (b) | | 11,000 | 10,160 |
| Lowe's Companies, Inc.: | | | |
| 2.8% 9/15/41 | | 785,000 | 539,164 |
| 3.65% 4/5/29 | | 160,000 | 148,607 |
| 3.75% 4/1/32 | | 1,904,000 | 1,705,929 |
| 4.25% 4/1/52 | | 7,251,000 | 5,736,181 |
| 4.45% 4/1/62 | | 6,910,000 | 5,388,999 |
| 5.625% 4/15/53 | | 572,000 | 555,515 |
| Michaels Companies, Inc.: | | | |
| 5.25% 5/1/28 (b) | | 110,000 | 91,713 |
| 7.875% 5/1/29 (b) | | 771,000 | 534,457 |
| O'Reilly Automotive, Inc.: | | | |
| 1.75% 3/15/31 | | 938,000 | 738,696 |
| 3.6% 9/1/27 | | 5,000 | 4,736 |
| 3.9% 6/1/29 | | 600,000 | 562,953 |
| 4.7% 6/15/32 | | 495,000 | 473,288 |
| Penske Automotive Group, Inc. 3.75% 6/15/29 | | 312,000 | 267,719 |
| PetSmart, Inc. / PetSmart Finance Corp. 4.75% 2/15/28 (b) | | 537,000 | 481,705 |
| Sonic Automotive, Inc. 4.625% 11/15/29 (b) | | 268,000 | 229,112 |
| Staples, Inc.: | | | |
| 7.5% 4/15/26 (b) | | 187,000 | 154,723 |
| 10.75% 4/15/27 (b) | | 174,000 | 94,901 |
| The Home Depot, Inc.: | | | |
| 1.875% 9/15/31 | | 178,000 | 143,168 |
| 3.5% 9/15/56 | | 152,000 | 111,510 |
| 3.625% 4/15/52 | | 100,000 | 76,146 |
| 4.25% 4/1/46 | | 140,000 | 120,037 |
| 4.5% 9/15/32 | | 265,000 | 258,807 |
| 4.875% 2/15/44 | | 1,150,000 | 1,085,547 |
| 4.95% 9/15/52 | | 253,000 | 241,173 |
| 5.875% 12/16/36 | | 300,000 | 321,857 |
| Triton Container International Ltd. 1.15% 6/7/24 (b) | | 277,000 | 265,203 |
| Valvoline, Inc. 4.25% 2/15/30 (b) | | 357,000 | 350,907 |
| VIA Outlets 1.75% 11/15/28 (Reg. S) | EUR | 600,000 | 548,121 |
| | | | 34,622,767 |
| Textiles, Apparel & Luxury Goods - 0.0% | | | |
| Crocs, Inc. 4.125% 8/15/31 (b) | | 120,000 | 95,100 |
| Hanesbrands, Inc. 4.875% 5/15/26 (b) | | 55,000 | 51,414 |
| Kering SA 3.875% 9/5/35 (Reg. S) | EUR | 400,000 | 433,081 |
| Kontoor Brands, Inc. 4.125% 11/15/29 (b) | | 40,000 | 33,975 |
| Levi Strauss & Co. 3.5% 3/1/31 (b) | | 170,000 | 138,130 |
| Tapestry, Inc. 3.05% 3/15/32 | | 14,311,000 | 11,008,916 |
| The William Carter Co. 5.625% 3/15/27 (b) | | 1,103,000 | 1,069,292 |
| Wolverine World Wide, Inc. 4% 8/15/29 (b) | | 170,000 | 127,332 |
| | | | 12,957,240 |
TOTAL CONSUMER DISCRETIONARY | | | 222,444,968 |
| CONSUMER STAPLES - 0.4% | | | |
| Beverages - 0.1% | | | |
| Anheuser-Busch Companies LLC / Anheuser-Busch InBev Worldwide, Inc.: | | | |
| 4.7% 2/1/36 | | 3,923,000 | 3,754,740 |
| 4.9% 2/1/46 | | 11,275,000 | 10,488,558 |
| Anheuser-Busch InBev Finance, Inc. 4.7% 2/1/36 | | 9,871,000 | 9,447,628 |
| Anheuser-Busch InBev Worldwide, Inc.: | | | |
| 3.5% 6/1/30 | | 200,000 | 183,942 |
| 4.35% 6/1/40 | | 4,618,000 | 4,131,290 |
| 4.375% 4/15/38 | | 641,000 | 586,924 |
| 5.45% 1/23/39 | | 5,390,000 | 5,471,483 |
| 5.8% 1/23/59 (Reg. S) | | 6,509,000 | 6,825,292 |
| Bacardi Ltd. 4.45% 5/15/25 (b) | | 6,230,000 | 6,059,861 |
| Central American Bottling Corp. 5.25% 4/27/29 (b) | | 66,000 | 60,060 |
| Constellation Brands, Inc.: | | | |
| 2.25% 8/1/31 | | 1,285,000 | 1,032,749 |
| 3.7% 12/6/26 | | 1,200,000 | 1,143,405 |
| 4.4% 11/15/25 | | 805,000 | 787,649 |
| 4.5% 5/9/47 | | 55,000 | 45,870 |
| 4.65% 11/15/28 | | 292,000 | 283,866 |
| Diageo Capital PLC 3.875% 4/29/43 | | 200,000 | 164,329 |
| Dr. Pepper Snapple Group, Inc.: | | | |
| 2.55% 9/15/26 | | 14,000 | 12,924 |
| 3.4% 11/15/25 | | 49,000 | 46,865 |
| 3.43% 6/15/27 | | 6,000 | 5,640 |
| Molson Coors Beverage Co. 4.2% 7/15/46 | | 92,000 | 72,910 |
| PepsiCo, Inc. 2.75% 10/21/51 | | 360,000 | 243,380 |
| Primo Water Holdings, Inc. 4.375% 4/30/29 (b) | | 220,000 | 193,050 |
| The Coca-Cola Co.: | | | |
| 2.5% 3/15/51 | | 380,000 | 245,883 |
| 2.6% 6/1/50 | | 95,000 | 63,204 |
| Triton Water Holdings, Inc. 6.25% 4/1/29 (b) | | 1,873,000 | 1,592,152 |
| | | | 52,943,654 |
| Consumer Staples Distribution & Retail - 0.0% | | | |
| 7-Eleven, Inc.: | | | |
| 0.95% 2/10/26 (b) | | 70,000 | 62,856 |
| 1.8% 2/10/31 (b) | | 257,000 | 201,565 |
| 2.5% 2/10/41 (b) | | 102,000 | 65,973 |
| 2.8% 2/10/51 (b) | | 124,000 | 75,565 |
| Albertsons Companies LLC/Safeway, Inc./New Albertson's, Inc./Albertson's LLC: | | | |
| 3.5% 3/15/29 (b) | | 954,000 | 825,230 |
| 4.625% 1/15/27 (b) | | 1,120,000 | 1,057,757 |
| 4.875% 2/15/30 (b) | | 644,000 | 590,876 |
| 5.875% 2/15/28 (b) | | 32,000 | 31,057 |
| 6.5% 2/15/28 (b) | | 1,110,000 | 1,104,870 |
| Alimentation Couche-Tard, Inc.: | | | |
| 3.439% 5/13/41 (b) | | 13,000 | 9,074 |
| 3.625% 5/13/51 (b) | | 14,000 | 9,220 |
| Bellis Acquisition Co. PLC 4.5% 2/16/26 (b) | GBP | 975,000 | 1,080,739 |
| Bellis Finco PLC 4% 2/16/27 (b) | GBP | 9,000,000 | 8,788,205 |
| C&S Group Enterprises LLC 5% 12/15/28 (b) | | 2,000,000 | 1,543,287 |
| CVS Lease-Backed Pass-Through Certificates 8.353% 7/10/31 (b) | | 6,224 | 6,703 |
| Kroger Co.: | | | |
| 2.65% 10/15/26 | | 430,000 | 397,731 |
| 7.7% 6/1/29 | | 26,000 | 28,919 |
| Market Bidco Finco PLC 5.5% 11/4/27 (b) | GBP | 800,000 | 791,902 |
| Mars, Inc. 0.875% 7/16/26 (b) | | 67,000 | 59,559 |
| Nestle Holdings, Inc. 4.85% 3/14/33 (b) | | 193,000 | 193,320 |
| Performance Food Group, Inc.: | | | |
| 4.25% 8/1/29 (b) | | 205,000 | 180,412 |
| 5.5% 10/15/27 (b) | | 157,000 | 151,177 |
| Sysco Corp. 2.4% 2/15/30 | | 277,000 | 234,033 |
| Target Corp.: | | | |
| 4% 7/1/42 | | 100,000 | 86,846 |
| 4.8% 1/15/53 | | 399,000 | 367,676 |
| Tesco Corporate Treasury Services PLC 5.5% 2/27/35 (Reg. S) | GBP | 850,000 | 1,003,908 |
| U.S. Foods, Inc.: | | | |
| 4.625% 6/1/30 (b) | | 55,000 | 48,885 |
| 6.25% 4/15/25 (b) | | 185,000 | 185,484 |
| | | | 19,182,829 |
| Food Products - 0.2% | | | |
| Archer Daniels Midland Co. 4.5% 3/15/49 | | 35,000 | 31,403 |
| Bunge Ltd. Finance Corp. 2.75% 5/14/31 | | 310,000 | 259,284 |
| Campbell Soup Co. 4.15% 3/15/28 | | 129,000 | 122,815 |
| Cargill, Inc. 4.375% 4/22/52 (b) | | 220,000 | 189,474 |
| Darling Ingredients, Inc.: | | | |
| 5.25% 4/15/27 (b) | | 442,000 | 429,768 |
| 6% 6/15/30 (b) | | 255,000 | 249,221 |
| JBS U.S.A. Lux SA / JBS Food Co.: | | | |
| 2.5% 1/15/27 | | 6,705,000 | 6,027,091 |
| 3% 2/2/29 | | 390,000 | 334,623 |
| 3% 5/15/32 | | 6,735,000 | 5,318,586 |
| 3.625% 1/15/32 | | 1,194,000 | 979,894 |
| 3.75% 12/1/31 | | 1,040,000 | 864,554 |
| 4.375% 2/2/52 | | 1,620,000 | 1,148,342 |
| 5.125% 2/1/28 | | 8,005,000 | 7,779,933 |
| 5.5% 1/15/30 | | 16,270,000 | 15,753,338 |
| 5.75% 4/1/33 | | 6,505,000 | 6,191,032 |
| 6.5% 12/1/52 | | 1,000,000 | 958,377 |
| JDE Peet's BV 2.25% 9/24/31 (b) | | 1,400,000 | 1,076,519 |
| Kraft Heinz Foods Co.: | | | |
| 4.375% 6/1/46 | | 1,780,000 | 1,473,592 |
| 7.125% 8/1/39 (b) | | 9,093,000 | 9,974,258 |
| Lamb Weston Holdings, Inc.: | | | |
| 4.125% 1/31/30 (b) | | 560,000 | 492,485 |
| 4.375% 1/31/32 (b) | | 1,258,000 | 1,091,850 |
| 4.875% 5/15/28 (b) | | 405,000 | 382,494 |
| Mead Johnson Nutrition Co.: | | | |
| 4.125% 11/15/25 | | 14,000 | 13,629 |
| 4.6% 6/1/44 | | 29,000 | 25,668 |
| Pilgrim's Pride Corp.: | | | |
| 3.5% 3/1/32 | | 3,025,000 | 2,436,063 |
| 4.25% 4/15/31 | | 3,130,000 | 2,707,816 |
| 5.875% 9/30/27 (b) | | 1,313,000 | 1,298,775 |
| 6.25% 7/1/33 | | 415,000 | 411,824 |
| Post Holdings, Inc.: | | | |
| 4.625% 4/15/30 (b) | | 611,000 | 541,335 |
| 5.5% 12/15/29 (b) | | 1,595,000 | 1,475,461 |
| 5.75% 3/1/27 (b) | | 90,000 | 87,957 |
| Simmons Foods, Inc. 4.625% 3/1/29 (b) | | 1,310,000 | 1,090,234 |
| TreeHouse Foods, Inc. 4% 9/1/28 | | 505,000 | 432,245 |
| Tyson Foods, Inc. 4% 3/1/26 | | 2,520,000 | 2,436,110 |
| | | | 74,086,050 |
| Household Products - 0.0% | | | |
| Central Garden & Pet Co.: | | | |
| 4.125% 10/15/30 | | 256,000 | 220,335 |
| 4.125% 4/30/31 (b) | | 621,000 | 527,352 |
| 5.125% 2/1/28 | | 15,000 | 14,029 |
| Energizer Holdings, Inc.: | | | |
| 4.375% 3/31/29 (b) | | 393,000 | 336,601 |
| 4.75% 6/15/28 (b) | | 150,000 | 132,442 |
| Spectrum Brands Holdings, Inc.: | | | |
| 5% 10/1/29 (b) | | 389,000 | 356,751 |
| 5.5% 7/15/30 (b) | | 110,000 | 102,323 |
| | | | 1,689,833 |
| Personal Care Products - 0.0% | | | |
| BellRing Brands, Inc. 7% 3/15/30 (b) | | 110,000 | 110,046 |
| Edgewell Personal Care Co.: | | | |
| 4.125% 4/1/29 (b) | | 61,000 | 52,865 |
| 5.5% 6/1/28 (b) | | 313,000 | 295,003 |
| Estee Lauder Companies, Inc.: | | | |
| 2.6% 4/15/30 | | 120,000 | 103,556 |
| 3.125% 12/1/49 | | 52,000 | 36,006 |
| HFC Prestige Products, Inc./HFC Prestige International U.S. LLC 6.625% 7/15/30 (b) | | 215,000 | 214,596 |
| Kenvue, Inc.: | | | |
| 4.9% 3/22/33 (b) | | 874,000 | 869,146 |
| 5.05% 3/22/53 (b) | | 125,000 | 122,404 |
| 5.1% 3/22/43 (b) | | 140,000 | 137,319 |
| Prestige Brands, Inc. 5.125% 1/15/28 (b) | | 125,000 | 118,132 |
| | | | 2,059,073 |
| Tobacco - 0.1% | | | |
| Altria Group, Inc.: | | | |
| 2.45% 2/4/32 | | 6,157,000 | 4,805,521 |
| 3.4% 2/4/41 | | 7,354,000 | 5,010,768 |
| 3.875% 9/16/46 | | 163,000 | 112,241 |
| 4.25% 8/9/42 | | 490,000 | 371,182 |
| 4.5% 5/2/43 | | 127,000 | 98,974 |
| 5.8% 2/14/39 | | 295,000 | 287,433 |
| BAT Capital Corp.: | | | |
| 2.125% 8/15/25 | GBP | 124,000 | 145,438 |
| 2.259% 3/25/28 | | 1,008,000 | 866,685 |
| 3.557% 8/15/27 | | 871,000 | 808,009 |
| 4.39% 8/15/37 | | 2,890,000 | 2,288,626 |
| 4.54% 8/15/47 | | 8,757,000 | 6,368,025 |
| 4.7% 4/2/27 | | 425,000 | 412,185 |
| 4.758% 9/6/49 | | 1,055,000 | 781,934 |
| 6.343% 8/2/30 | | 1,270,000 | 1,278,079 |
| 6.421% 8/2/33 | | 3,690,000 | 3,683,434 |
| 7.081% 8/2/53 | | 997,000 | 981,556 |
| BAT International Finance PLC: | | | |
| 4.448% 3/16/28 | | 8,700,000 | 8,247,859 |
| 5.931% 2/2/29 | | 395,000 | 393,442 |
| Imperial Tobacco Finance PLC 6.125% 7/27/27 (b) | | 348,000 | 351,810 |
| Philip Morris International, Inc.: | | | |
| 3.125% 3/2/28 | | 25,000 | 22,954 |
| 3.875% 8/21/42 | | 830,000 | 648,120 |
| 4.125% 3/4/43 | | 146,000 | 115,978 |
| 4.375% 11/15/41 | | 692,000 | 572,300 |
| 5.125% 11/17/27 | | 171,000 | 170,679 |
| 5.125% 2/15/30 | | 14,955,000 | 14,781,342 |
| 5.375% 2/15/33 | | 2,067,000 | 2,041,087 |
| 5.625% 11/17/29 | | 525,000 | 530,825 |
| | | | 56,176,486 |
TOTAL CONSUMER STAPLES | | | 206,137,925 |
| ENERGY - 0.9% | | | |
| Energy Equipment & Services - 0.0% | | | |
| Baker Hughes Co.: | | | |
| 2.061% 12/15/26 | | 35,000 | 31,658 |
| 4.08% 12/15/47 | | 56,000 | 44,561 |
| 5.125% 9/15/40 | | 26,000 | 24,570 |
| Guara Norte SARL 5.198% 6/15/34 (b) | | 176,852 | 154,746 |
| Halliburton Co.: | | | |
| 4.75% 8/1/43 | | 467,000 | 403,339 |
| 6.7% 9/15/38 | | 170,000 | 187,063 |
| 7.6% 8/15/96 (b) | | 8,000 | 8,474 |
| Nabors Industries, Inc. 7.375% 5/15/27 (b) | | 175,000 | 170,783 |
| NuStar Logistics LP: | | | |
| 5.625% 4/28/27 | | 58,000 | 56,275 |
| 5.75% 10/1/25 | | 60,000 | 58,839 |
| 6% 6/1/26 | | 324,000 | 317,546 |
| 6.375% 10/1/30 | | 19,000 | 18,288 |
| Oceaneering International, Inc. 4.65% 11/15/24 | | 115,000 | 112,597 |
| Precision Drilling Corp. 7.125% 1/15/26 (b) | | 369,000 | 365,771 |
| Schlumberger Holdings Corp. 3.9% 5/17/28 (b) | | 172,000 | 163,104 |
| Seadrill Finance Ltd. 8.375% 8/1/30 (b) | | 200,000 | 205,000 |
| Technip Energies NV 1.125% 5/28/28 | EUR | 480,000 | 451,620 |
| Transocean Poseidon Ltd. 6.875% 2/1/27 (b) | | 90,000 | 89,442 |
| Transocean, Inc.: | | | |
| 8.75% 2/15/30 (b) | | 223,250 | 228,388 |
| 11.5% 1/30/27 (b) | | 140,000 | 147,441 |
| U.S.A. Compression Partners LP: | | | |
| 6.875% 4/1/26 | | 115,000 | 113,709 |
| 6.875% 9/1/27 | | 102,000 | 99,432 |
| Valaris Ltd. 8.375% 4/30/30 (b) | | 170,000 | 173,154 |
| | | | 3,625,800 |
| Oil, Gas & Consumable Fuels - 0.9% | | | |
| Aethon United BR LP / Aethon United Finance Corp. 8.25% 2/15/26 (b) | | 125,000 | 125,625 |
| Aker BP ASA: | | | |
| 3.1% 7/15/31 (b) | | 2,295,000 | 1,893,293 |
| 6% 6/13/33 (b) | | 250,000 | 249,927 |
| Antero Midstream Partners LP/Antero Midstream Finance Corp.: | | | |
| 5.375% 6/15/29 (b) | | 85,000 | 79,649 |
| 5.75% 3/1/27 (b) | | 1,250,000 | 1,211,518 |
| 5.75% 1/15/28 (b) | | 435,000 | 416,547 |
| 7.875% 5/15/26 (b) | | 1,348,000 | 1,371,439 |
| Antero Resources Corp.: | | | |
| 5.375% 3/1/30 (b) | | 64,000 | 59,838 |
| 7.625% 2/1/29 (b) | | 318,000 | 325,889 |
| Apache Corp.: | | | |
| 4.25% 1/15/30 | | 575,000 | 524,059 |
| 5.25% 2/1/42 | | 210,000 | 172,318 |
| Ascent Resources - Utica LLC/ARU Finance Corp. 7% 11/1/26 (b) | | 1,530,000 | 1,521,014 |
| Baytex Energy Corp.: | | | |
| 8.5% 4/30/30 (b) | | 134,000 | 135,869 |
| 8.75% 4/1/27 (b) | | 271,000 | 277,334 |
| Blue Racer Midstream LLC/Blue Racer Finance Corp. 6.625% 7/15/26 (b) | | 215,000 | 211,304 |
| BP Capital Markets PLC 3.279% 9/19/27 | | 87,000 | 81,930 |
| Buckeye Partners LP: | | | |
| 4.125% 12/1/27 | | 534,000 | 485,561 |
| 4.5% 3/1/28 (b) | | 135,000 | 122,513 |
| California Resources Corp. 7.125% 2/1/26 (b) | | 228,000 | 228,586 |
| Cenovus Energy, Inc.: | | | |
| 3.75% 2/15/52 | | 3,795,000 | 2,663,348 |
| 5.25% 6/15/37 | | 3,195,000 | 2,913,156 |
| Centennial Resource Production LLC: | | | |
| 5.375% 1/15/26 (b) | | 95,000 | 91,663 |
| 5.875% 7/1/29 (b) | | 60,000 | 57,600 |
| Cheniere Corpus Christi Holdings LLC: | | | |
| 2.742% 12/31/39 | | 489,000 | 378,483 |
| 5.125% 6/30/27 | | 1,130,000 | 1,117,988 |
| 5.875% 3/31/25 | | 958,000 | 954,742 |
| Cheniere Energy Partners LP: | | | |
| 3.25% 1/31/32 | | 1,580,000 | 1,305,601 |
| 4% 3/1/31 | | 1,710,000 | 1,509,681 |
| 4.5% 10/1/29 | | 1,427,000 | 1,316,688 |
| 5.95% 6/30/33 (b) | | 685,000 | 683,607 |
| Cheniere Energy, Inc. 4.625% 10/15/28 | | 156,000 | 146,844 |
| Chesapeake Energy Corp.: | | | |
| 5.5% 2/1/26 (b) | | 330,000 | 322,193 |
| 5.875% 2/1/29 (b) | | 124,000 | 118,677 |
| 6.75% 4/15/29 (b) | | 351,000 | 348,445 |
| Chord Energy Corp. 6.375% 6/1/26 (b) | | 115,000 | 113,346 |
| Citgo Petroleum Corp. 7% 6/15/25 (b) | | 1,275,000 | 1,262,250 |
| Civitas Resources, Inc.: | | | |
| 8.375% 7/1/28 (b) | | 727,000 | 748,810 |
| 8.75% 7/1/31 (b) | | 233,000 | 241,155 |
| CNX Midstream Partners LP 4.75% 4/15/30 (b) | | 45,000 | 38,832 |
| CNX Resources Corp. 7.25% 3/14/27 (b) | | 1,433,000 | 1,431,533 |
| Columbia Pipelines Operating Co. LLC: | | | |
| 5.927% 8/15/30 (b) | | 957,000 | 965,361 |
| 6.036% 11/15/33 (b) | | 5,180,000 | 5,233,096 |
| 6.497% 8/15/43 (b) | | 971,000 | 984,199 |
| 6.544% 11/15/53 (b) | | 1,389,000 | 1,419,843 |
| 6.714% 8/15/63 (b) | | 831,000 | 849,451 |
| Comstock Resources, Inc.: | | | |
| 5.875% 1/15/30 (b) | | 32,000 | 28,263 |
| 6.75% 3/1/29 (b) | | 591,000 | 552,985 |
| ConocoPhillips Co.: | | | |
| 3.758% 3/15/42 | | 525,000 | 425,776 |
| 3.8% 3/15/52 | | 390,000 | 300,298 |
| 4.025% 3/15/62 | | 578,000 | 442,215 |
| 5.05% 9/15/33 | | 3,225,000 | 3,205,024 |
| 5.55% 3/15/54 | | 710,000 | 711,754 |
| Continental Resources, Inc. 5.75% 1/15/31 (b) | | 770,000 | 735,968 |
| Coterra Energy, Inc. 3.9% 5/15/27 | | 100,000 | 95,075 |
| Crestwood Midstream Partners LP/Crestwood Midstream Finance Corp.: | | | |
| 5.625% 5/1/27 (b) | | 26,000 | 25,220 |
| 5.75% 4/1/25 | | 1,747,000 | 1,732,203 |
| 6% 2/1/29 (b) | | 316,000 | 310,224 |
| 7.375% 2/1/31 (b) | | 595,000 | 612,945 |
| 8% 4/1/29 (b) | | 69,000 | 71,299 |
| CrownRock LP/CrownRock Finance, Inc. 5% 5/1/29 (b) | | 40,000 | 37,148 |
| CVR Energy, Inc.: | | | |
| 5.25% 2/15/25 (b) | | 330,000 | 320,115 |
| 5.75% 2/15/28 (b) | | 40,000 | 36,413 |
| DCP Midstream Operating LP: | | | |
| 5.125% 5/15/29 | | 355,000 | 346,160 |
| 5.375% 7/15/25 | | 345,000 | 341,555 |
| 5.6% 4/1/44 | | 3,773,000 | 3,519,760 |
| 5.625% 7/15/27 | | 260,000 | 260,277 |
| Devon Energy Corp.: | | | |
| 5.6% 7/15/41 | | 1,000,000 | 928,767 |
| 5.875% 6/15/28 | | 476,000 | 476,668 |
| Diamondback Energy, Inc.: | | | |
| 3.125% 3/24/31 | | 5,057,000 | 4,348,049 |
| 3.25% 12/1/26 | | 7,678,000 | 7,221,708 |
| 3.5% 12/1/29 | | 2,870,000 | 2,595,842 |
| DT Midstream, Inc.: | | | |
| 4.125% 6/15/29 (b) | | 327,000 | 289,696 |
| 4.3% 4/15/32 (b) | | 40,000 | 34,998 |
| 4.375% 6/15/31 (b) | | 148,000 | 128,126 |
| Earthstone Energy Holdings LLC 8% 4/15/27 (b) | | 50,000 | 51,035 |
| Ecopetrol SA: | | | |
| 6.875% 4/29/30 | | 1,534,000 | 1,428,538 |
| 8.625% 1/19/29 | | 3,555,000 | 3,617,213 |
| 8.875% 1/13/33 | | 1,200,000 | 1,213,230 |
| EG Global Finance PLC: | | | |
| 4.375% 2/7/25 (Reg. S) | EUR | 3,699,104 | 3,879,896 |
| 6.25% 10/30/25 (Reg. S) | EUR | 5,178,400 | 5,454,536 |
| 6.75% 2/7/25 (b) | | 202,000 | 199,035 |
| 8.5% 10/30/25 (b) | | 351,000 | 347,492 |
| Enbridge, Inc. 5.7% 3/8/33 | | 1,375,000 | 1,375,634 |
| Encino Acquisition Partners Holdings LLC 8.5% 5/1/28 (b) | | 124,000 | 117,577 |
| Endeavor Energy Resources LP/EER Finance, Inc. 5.75% 1/30/28 (b) | | 1,455,000 | 1,423,281 |
| Energean Israel Finance Ltd.: | | | |
| 4.5% 3/30/24 (Reg. S) (b) | | 971,031 | 960,301 |
| 4.875% 3/30/26 (Reg. S) (b) | | 1,411,438 | 1,323,435 |
| 5.375% 3/30/28 (Reg. S) (b) | | 1,726,000 | 1,568,244 |
| Energy Transfer LP: | | | |
| 3.75% 5/15/30 | | 2,964,000 | 2,647,227 |
| 3.9% 7/15/26 | | 955,000 | 913,020 |
| 4.75% 1/15/26 | | 850,000 | 832,233 |
| 4.95% 6/15/28 | | 4,954,000 | 4,797,909 |
| 5% 5/15/50 | | 9,930,000 | 8,173,726 |
| 5.15% 3/15/45 | | 2,260,000 | 1,905,378 |
| 5.25% 4/15/29 | | 2,803,000 | 2,738,613 |
| 5.3% 4/15/47 | | 225,000 | 190,810 |
| 5.35% 5/15/45 | | 3,003,000 | 2,566,573 |
| 5.4% 10/1/47 | | 10,046,000 | 8,653,108 |
| 5.75% 2/15/33 | | 201,000 | 199,841 |
| 5.8% 6/15/38 | | 3,282,000 | 3,111,018 |
| 6% 6/15/48 | | 2,369,000 | 2,189,870 |
| 6.125% 12/15/45 | | 2,635,000 | 2,474,593 |
| 6.25% 4/15/49 | | 1,925,000 | 1,842,813 |
| 6.5% 2/1/42 | | 184,000 | 183,261 |
| 6.625% 10/15/36 | | 900,000 | 920,372 |
| Eni U.S.A., Inc. 7.3% 11/15/27 | | 14,000 | 15,026 |
| EnLink Midstream LLC 5.625% 1/15/28 (b) | | 595,000 | 575,585 |
| EnLink Midstream Partners LP: | | | |
| 4.15% 6/1/25 | | 22,000 | 21,292 |
| 4.85% 7/15/26 | | 48,000 | 46,080 |
| 5.6% 4/1/44 | | 56,000 | 47,751 |
| Enterprise Products Operating LP: | | | |
| 2.8% 1/31/30 | | 115,000 | 99,661 |
| 3.125% 7/31/29 | | 2,580,000 | 2,311,242 |
| 3.3% 2/15/53 | | 71,000 | 48,551 |
| 4.85% 3/15/44 | | 3,215,000 | 2,870,085 |
| 4.95% 10/15/54 | | 9,000 | 7,988 |
| 5.25% 8/16/77 (d) | | 43,000 | 37,833 |
| 5.35% 1/31/33 | | 50,000 | 50,278 |
| 5.75% 3/1/35 | | 23,000 | 22,393 |
| 6.45% 9/1/40 | | 10,000 | 10,657 |
| EOG Resources, Inc. 3.9% 4/1/35 | | 205,000 | 181,204 |
| EQM Midstream Partners LP: | | | |
| 4% 8/1/24 | | 65,000 | 63,406 |
| 4.125% 12/1/26 | | 35,000 | 32,860 |
| 4.5% 1/15/29 (b) | | 147,000 | 133,562 |
| 4.75% 1/15/31 (b) | | 298,000 | 263,336 |
| 5.5% 7/15/28 | | 204,000 | 194,898 |
| 6% 7/1/25 (b) | | 12,000 | 11,891 |
| 6.5% 7/1/27 (b) | | 518,000 | 514,723 |
| 6.5% 7/15/48 | | 220,000 | 199,704 |
| 7.5% 6/1/27 (b) | | 290,000 | 292,701 |
| 7.5% 6/1/30 (b) | | 255,000 | 261,504 |
| EQT Corp.: | | | |
| 3.9% 10/1/27 | | 1,073,000 | 1,001,886 |
| 5% 1/15/29 | | 595,000 | 564,427 |
| 5.7% 4/1/28 | | 231,000 | 229,975 |
| 7% 2/1/30 | | 1,205,000 | 1,260,781 |
| Equinor ASA: | | | |
| 3.7% 4/6/50 | | 920,000 | 710,422 |
| 3.95% 5/15/43 | | 300,000 | 251,289 |
| 7.15% 11/15/25 | | 17,000 | 17,479 |
| Exxon Mobil Corp.: | | | |
| 2.995% 8/16/39 | | 262,000 | 201,594 |
| 3.095% 8/16/49 | | 125,000 | 87,929 |
| 4.114% 3/1/46 | | 805,000 | 684,354 |
| 4.227% 3/19/40 | | 490,000 | 437,933 |
| FEL Energy VI SARL 5.75% 12/1/40 (b) | | 182,793 | 154,278 |
| FLEX Intermediate Holdco, LLC: | | | |
| 3.363% 6/30/31 (b) | | 110,000 | 87,080 |
| 4.317% 12/30/39 (b) | | 47,000 | 33,624 |
| Galaxy Pipeline Assets BidCo Ltd. 2.16% 3/31/34 | | 532,260 | 448,615 |
| Genesis Energy LP/Genesis Energy Finance Corp.: | | | |
| 6.25% 5/15/26 | | 31,000 | 30,046 |
| 7.75% 2/1/28 | | 38,000 | 36,976 |
| 8% 1/15/27 | | 283,000 | 278,990 |
| Global Partners LP/GLP Finance Corp. 7% 8/1/27 | | 505,000 | 497,425 |
| Gray Oak Pipeline LLC: | | | |
| 2% 9/15/23 (b) | | 31,000 | 30,966 |
| 2.6% 10/15/25 (b) | | 109,000 | 100,796 |
| 3.45% 10/15/27 (b) | | 42,000 | 37,568 |
| Gulfport Energy Corp.: | | | |
| 8% 5/17/26 (b) | | 77,982 | 79,193 |
| 8% 5/17/26 | | 273,555 | 277,803 |
| Gulfstream Natural Gas System LLC 6.19% 11/1/25 (b) | | 3,640,000 | 3,626,714 |
| Hess Corp.: | | | |
| 5.6% 2/15/41 | | 3,136,000 | 2,948,455 |
| 5.8% 4/1/47 | | 4,517,000 | 4,310,829 |
| 7.125% 3/15/33 | | 1,335,000 | 1,454,843 |
| 7.3% 8/15/31 | | 1,849,000 | 2,018,607 |
| 7.875% 10/1/29 | | 5,583,000 | 6,169,867 |
| Hess Midstream Partners LP: | | | |
| 5.125% 6/15/28 (b) | | 280,000 | 262,646 |
| 5.5% 10/15/30 (b) | | 50,000 | 46,809 |
| 5.625% 2/15/26 (b) | | 848,000 | 829,793 |
| HF Sinclair Corp. 5.875% 4/1/26 | | 103,000 | 103,503 |
| Hilcorp Energy I LP/Hilcorp Finance Co.: | | | |
| 5.75% 2/1/29 (b) | | 580,000 | 537,950 |
| 6% 4/15/30 (b) | | 965,000 | 897,166 |
| 6.25% 11/1/28 (b) | | 15,000 | 14,470 |
| 6.25% 4/15/32 (b) | | 2,075,000 | 1,904,154 |
| Holly Energy Partners LP/Holly Energy Finance Corp.: | | | |
| 5% 2/1/28 (b) | | 375,000 | 351,775 |
| 6.375% 4/15/27 (b) | | 231,000 | 229,791 |
| Independence Energy Finance LLC: | | | |
| 7.25% 5/1/26 (b) | | 277,000 | 272,878 |
| 9.25% 2/15/28 (b) | | 800,000 | 818,376 |
| KazMunaiGaz National Co.: | | | |
| 3.5% 4/14/33 (b) | | 670,000 | 503,043 |
| 5.375% 4/24/30 (Reg. S) | | 400,000 | 363,776 |
| Kinder Morgan, Inc.: | | | |
| 3.25% 8/1/50 | | 351,000 | 220,959 |
| 5.55% 6/1/45 | | 525,000 | 474,470 |
| Leviathan Bond Ltd.: | | | |
| 6.125% 6/30/25 (Reg. S) (b) | | 31,888 | 31,144 |
| 6.5% 6/30/27 (Reg. S) (b) | | 34,579 | 33,369 |
| 6.75% 6/30/30 (Reg. S) (b) | | 19,893 | 18,620 |
| Magellan Midstream Partners LP: | | | |
| 4.2% 10/3/47 | | 795,000 | 584,978 |
| 4.25% 9/15/46 | | 190,000 | 140,079 |
| Marathon Petroleum Corp. 3.8% 4/1/28 | | 5,590,000 | 5,221,278 |
| MEG Energy Corp.: | | | |
| 5.875% 2/1/29 (b) | | 341,000 | 325,768 |
| 7.125% 2/1/27 (b) | | 220,000 | 222,775 |
| MPLX LP: | | | |
| 2.65% 8/15/30 | | 1,960,000 | 1,626,671 |
| 4.125% 3/1/27 | | 505,000 | 483,510 |
| 4.5% 4/15/38 | | 1,125,000 | 953,115 |
| 4.7% 4/15/48 | | 2,335,000 | 1,873,812 |
| 4.8% 2/15/29 | | 2,965,000 | 2,856,928 |
| 4.95% 3/14/52 | | 606,000 | 499,389 |
| 5.2% 3/1/47 | | 3,284,000 | 2,827,103 |
| 5.5% 2/15/49 | | 4,516,000 | 4,023,835 |
| MV24 Capital BV 6.748% 6/1/34 (b) | | 168,118 | 151,160 |
| New Fortress Energy, Inc.: | | | |
| 6.5% 9/30/26 (b) | | 535,000 | 497,295 |
| 6.75% 9/15/25 (b) | | 540,000 | 521,899 |
| NGL Energy Operating LLC/NGL Energy Finance Corp. 7.5% 2/1/26 (b) | | 99,000 | 98,562 |
| NGPL PipeCo LLC: | | | |
| 3.25% 7/15/31 (b) | | 1,197,000 | 981,944 |
| 4.875% 8/15/27 (b) | | 113,000 | 108,246 |
| 7.768% 12/15/37 (b) | | 17,000 | 17,918 |
| Northwest Pipeline Corp. 4% 4/1/27 | | 1,085,000 | 1,032,033 |
| Occidental Petroleum Corp.: | | | |
| 3.5% 8/15/29 | | 195,000 | 168,418 |
| 4.3% 8/15/39 | | 70,000 | 53,463 |
| 5.55% 3/15/26 | | 7,558,000 | 7,494,362 |
| 6.45% 9/15/36 | | 4,350,000 | 4,448,027 |
| 6.6% 3/15/46 | | 6,475,000 | 6,663,876 |
| 6.625% 9/1/30 | | 137,000 | 141,425 |
| 7.5% 5/1/31 | | 8,296,000 | 8,988,728 |
| 7.875% 9/15/31 | | 265,000 | 293,504 |
| 8.875% 7/15/30 | | 225,000 | 257,951 |
| ONEOK Partners LP 6.65% 10/1/36 | | 442,000 | 456,206 |
| ONEOK, Inc.: | | | |
| 3.1% 3/15/30 | | 3,705,000 | 3,180,893 |
| 4.45% 9/1/49 | | 8,550,000 | 6,424,757 |
| 4.95% 7/13/47 | | 1,765,000 | 1,451,010 |
| 5.2% 7/15/48 | | 1,375,000 | 1,175,846 |
| 6.05% 9/1/33 | | 4,345,000 | 4,378,511 |
| 6.625% 9/1/53 | | 192,000 | 193,635 |
| Ovintiv, Inc.: | | | |
| 5.15% 11/15/41 | | 3,000,000 | 2,453,740 |
| 5.375% 1/1/26 | | 310,000 | 307,660 |
| 8.125% 9/15/30 | | 6,179,000 | 6,858,322 |
| PBF Holding Co. LLC/PBF Finance Corp. 6% 2/15/28 | | 190,000 | 179,723 |
| Petrobras Global Finance BV 6.25% 12/14/26 | GBP | 800,000 | 968,068 |
| Petroleos Del Peru Petroperu SA 4.75% 6/19/32 (Reg. S) | | 200,000 | 147,956 |
| Petroleos Mexicanos: | | | |
| 3.625% 11/24/25 (Reg. S) | EUR | 860,000 | 831,789 |
| 3.75% 2/21/24 (Reg. S) | EUR | 1,267,000 | 1,350,832 |
| 4.25% 1/15/25 | | 300,000 | 282,225 |
| 4.75% 2/26/29 (Reg. S) | EUR | 3,000,000 | 2,448,733 |
| 4.875% 1/18/24 | | 100,000 | 98,720 |
| 5.35% 2/12/28 | | 343,000 | 274,306 |
| 5.95% 1/28/31 | | 8,512,000 | 6,148,558 |
| 6.5% 3/13/27 | | 36,667,000 | 32,013,041 |
| 6.5% 1/23/29 | | 990,000 | 802,138 |
| 6.625% 6/15/35 | | 614,000 | 419,439 |
| 6.75% 9/21/47 | | 11,150,000 | 6,844,874 |
| 6.84% 1/23/30 | | 9,812,000 | 7,725,969 |
| 6.875% 8/4/26 | | 176,000 | 159,958 |
| 7.69% 1/23/50 | | 79,110,000 | 52,671,438 |
| 10% 2/7/33 (b) | | 488,000 | 441,542 |
| Phillips 66 Co.: | | | |
| 2.15% 12/15/30 | | 385,000 | 311,753 |
| 3.75% 3/1/28 | | 695,000 | 654,146 |
| 4.65% 11/15/34 | | 29,000 | 27,210 |
| 4.9% 10/1/46 | | 750,000 | 655,015 |
| Pioneer Natural Resources Co.: | | | |
| 1.125% 1/15/26 | | 83,000 | 75,240 |
| 1.9% 8/15/30 | | 1,070,000 | 863,280 |
| 2.15% 1/15/31 | | 285,000 | 230,963 |
| 5.1% 3/29/26 | | 2,975,000 | 2,951,870 |
| Plains All American Pipeline LP/PAA Finance Corp. 3.55% 12/15/29 | | 3,784,000 | 3,326,671 |
| PT Pertamina Persero 3.1% 8/27/30 (b) | | 600,000 | 515,220 |
| Qatar Petroleum 2.25% 7/12/31 (Reg. S) | | 620,000 | 509,795 |
| Range Resources Corp.: | | | |
| 4.75% 2/15/30 (b) | | 24,000 | 21,671 |
| 4.875% 5/15/25 | | 46,000 | 44,965 |
| 8.25% 1/15/29 | | 394,000 | 409,031 |
| Rockies Express Pipeline LLC 4.95% 7/15/29 (b) | | 245,000 | 224,244 |
| Sabine Pass Liquefaction LLC: | | | |
| 4.2% 3/15/28 | | 100,000 | 94,701 |
| 4.5% 5/15/30 | | 11,365,000 | 10,695,068 |
| 5.625% 3/1/25 | | 1,844,000 | 1,837,993 |
| 5.875% 6/30/26 | | 1,387,000 | 1,393,429 |
| 5.9% 9/15/37 | | 394,000 | 395,428 |
| Santos Finance Ltd. 3.649% 4/29/31 (b) | | 4,800,000 | 3,950,995 |
| Shell International Finance BV: | | | |
| 2.875% 11/26/41 | | 165,000 | 118,294 |
| 3% 11/26/51 | | 95,000 | 63,595 |
| 3.25% 5/11/25 | | 1,465,000 | 1,418,201 |
| 3.625% 8/21/42 | | 343,000 | 275,595 |
| 3.75% 9/12/46 | | 65,000 | 51,129 |
| 4% 5/10/46 | | 87,000 | 71,525 |
| SM Energy Co.: | | | |
| 5.625% 6/1/25 | | 43,000 | 42,349 |
| 6.625% 1/15/27 | | 397,000 | 392,038 |
| 6.75% 9/15/26 | | 371,000 | 369,442 |
| Southwestern Energy Co.: | | | |
| 4.75% 2/1/32 | | 1,192,000 | 1,055,940 |
| 5.375% 2/1/29 | | 589,000 | 558,831 |
| 5.375% 3/15/30 | | 106,000 | 99,236 |
| 5.7% 1/23/25 (f) | | 5,000 | 4,951 |
| 8.375% 9/15/28 | | 49,000 | 51,002 |
| Suncor Energy, Inc.: | | | |
| 3.75% 3/4/51 | | 695,000 | 491,950 |
| 6.8% 5/15/38 | | 390,000 | 407,340 |
| Sunoco LP/Sunoco Finance Corp.: | | | |
| 4.5% 5/15/29 | | 455,000 | 411,479 |
| 5.875% 3/15/28 | | 215,000 | 208,830 |
| 6% 4/15/27 | | 464,000 | 459,148 |
| Tallgrass Energy Partners LP / Tallgrass Energy Finance Corp.: | | | |
| 5.5% 1/15/28 (b) | | 145,000 | 134,670 |
| 6% 3/1/27 (b) | | 413,000 | 395,753 |
| 6% 12/31/30 (b) | | 2,497,000 | 2,233,801 |
| 6% 9/1/31 (b) | | 225,000 | 199,827 |
| 7.5% 10/1/25 (b) | | 59,000 | 59,359 |
| Targa Resources Corp.: | | | |
| 4.2% 2/1/33 | | 1,275,000 | 1,124,238 |
| 6.125% 3/15/33 | | 1,683,000 | 1,713,652 |
| 6.5% 2/15/53 | | 6,500,000 | 6,503,288 |
| Targa Resources Partners LP/Targa Resources Partners Finance Corp.: | | | |
| 4% 1/15/32 | | 30,000 | 25,882 |
| 4.875% 2/1/31 | | 794,000 | 729,273 |
| 5% 1/15/28 | | 548,000 | 527,326 |
| 5.5% 3/1/30 | | 101,000 | 96,820 |
| 6.5% 7/15/27 | | 50,000 | 50,258 |
| The Williams Companies, Inc.: | | | |
| 3.5% 11/15/30 | | 10,592,000 | 9,381,679 |
| 3.75% 6/15/27 | | 1,635,000 | 1,539,061 |
| 4.65% 8/15/32 | | 6,660,000 | 6,253,961 |
| 4.9% 1/15/45 | | 1,460,000 | 1,245,565 |
| 5.1% 9/15/45 | | 105,000 | 92,503 |
| 5.3% 8/15/52 | | 1,511,000 | 1,360,486 |
| 5.4% 3/4/44 | | 95,000 | 85,633 |
| Total Capital International SA: | | | |
| 2.829% 1/10/30 | | 800,000 | 710,464 |
| 3.127% 5/29/50 | | 347,000 | 239,850 |
| 3.461% 7/12/49 | | 300,000 | 223,306 |
| TransCanada PipeLines Ltd. 5.1% 3/15/49 | | 25,000 | 21,951 |
| Transcontinental Gas Pipe Line Co. LLC: | | | |
| 3.25% 5/15/30 | | 3,285,000 | 2,895,376 |
| 4% 3/15/28 | | 608,000 | 573,584 |
| 4.6% 3/15/48 | | 751,000 | 626,706 |
| 7.85% 2/1/26 | | 293,000 | 306,228 |
| TransMontaigne Partners LP 6.125% 2/15/26 | | 776,000 | 666,390 |
| Valero Energy Corp. 2.15% 9/15/27 | | 36,000 | 32,056 |
| Var Energi ASA 5% 5/18/27 (b) | | 5,410,000 | 5,168,269 |
| Venture Global Calcasieu Pass LLC: | | | |
| 3.875% 8/15/29 (b) | | 736,000 | 636,657 |
| 3.875% 11/1/33 (b) | | 115,000 | 93,436 |
| 4.125% 8/15/31 (b) | | 285,000 | 241,753 |
| 6.25% 1/15/30 (b) | | 160,000 | 155,866 |
| Venture Global LNG, Inc.: | | | |
| 8.125% 6/1/28 (b) | | 975,000 | 983,525 |
| 8.375% 6/1/31 (b) | | 296,000 | 298,573 |
| Viper Energy Partners LP 5.375% 11/1/27 (b) | | 1,545,000 | 1,488,700 |
| Vital Energy, Inc. 9.5% 1/15/25 | | 85,000 | 85,425 |
| Western Gas Partners LP: | | | |
| 4.05% 2/1/30 | | 785,000 | 700,224 |
| 4.65% 7/1/26 | | 2,085,000 | 2,016,511 |
| 4.75% 8/15/28 | | 1,465,000 | 1,386,848 |
| | | | 461,737,032 |
TOTAL ENERGY | | | 465,362,832 |
| FINANCIALS - 3.1% | | | |
| Banks - 1.5% | | | |
| ABN AMRO Bank NV: | | | |
| 2.47% 12/13/29 (b)(d) | | 3,600,000 | 3,035,819 |
| 4.75% 7/28/25 (b) | | 737,000 | 715,600 |
| AIB Group PLC: | | | |
| 2.25% 4/4/28 (Reg. S) (d) | EUR | 1,900,000 | 1,898,135 |
| 4.625% 7/23/29 (Reg. S) (d) | EUR | 100,000 | 108,128 |
| Alpha Bank SA 4.25% 2/13/30 (Reg. S) (d) | EUR | 390,000 | 379,928 |
| ANZ New Zealand International Ltd. London Branch 5.355% 8/14/28 (b) | | 550,000 | 548,030 |
| ASB Bank Ltd. 2.375% 10/22/31 (b) | | 200,000 | 158,801 |
| Banco Santander SA: | | | |
| 2.746% 5/28/25 | | 200,000 | 189,220 |
| 3.49% 5/28/30 | | 1,000,000 | 865,032 |
| 5.588% 8/8/28 | | 1,400,000 | 1,387,459 |
| Bank of America Corp.: | | | |
| U.S. Secured Overnight Fin. Rate (SOFR) Index + 0.410% 5.6068% 6/14/24 (d)(g) | | 532,000 | 530,311 |
| 1.197% 10/24/26 (d) | | 1,743,000 | 1,579,534 |
| 1.658% 3/11/27 (d) | | 4,227,000 | 3,819,507 |
| 1.734% 7/22/27 (d) | | 155,000 | 138,692 |
| 1.898% 7/23/31 (d) | | 718,000 | 566,784 |
| 1.922% 10/24/31 (d) | | 5,945,000 | 4,657,475 |
| 2.087% 6/14/29 (d) | | 8,307,000 | 7,087,568 |
| 2.299% 7/21/32 (d) | | 3,678,000 | 2,900,665 |
| 2.456% 10/22/25 (d) | | 58,000 | 55,750 |
| 2.496% 2/13/31 (d) | | 16,112,000 | 13,398,176 |
| 2.572% 10/20/32 (d) | | 5,255,000 | 4,212,234 |
| 2.592% 4/29/31 (d) | | 2,295,000 | 1,908,999 |
| 2.651% 3/11/32 (d) | | 16,511,000 | 13,496,500 |
| 2.676% 6/19/41 (d) | | 4,333,000 | 2,983,668 |
| 2.687% 4/22/32 (d) | | 4,511,000 | 3,690,952 |
| 2.972% 7/21/52 (d) | | 58,000 | 38,252 |
| 3.093% 10/1/25 (d) | | 15,000 | 14,530 |
| 3.366% 1/23/26 (d) | | 175,000 | 168,768 |
| 3.384% 4/2/26 (d) | | 363,000 | 348,856 |
| 3.419% 12/20/28 (d) | | 255,000 | 233,837 |
| 3.559% 4/23/27 (d) | | 1,536,000 | 1,455,234 |
| 3.593% 7/21/28 (d) | | 120,000 | 111,693 |
| 3.705% 4/24/28 (d) | | 29,000 | 27,146 |
| 3.824% 1/20/28 (d) | | 525,000 | 494,945 |
| 3.95% 4/21/25 | | 5,511,000 | 5,334,351 |
| 3.97% 3/5/29 (d) | | 10,572,000 | 9,879,678 |
| 4.078% 4/23/40 (d) | | 7,964,000 | 6,693,765 |
| 4.083% 3/20/51 (d) | | 102,000 | 81,969 |
| 4.25% 10/22/26 | | 10,727,000 | 10,301,764 |
| 4.271% 7/23/29 (d) | | 3,660,000 | 3,453,978 |
| 4.75% 4/21/45 | | 58,000 | 52,036 |
| 5.202% 4/25/29 (d) | | 2,477,000 | 2,439,550 |
| 5.288% 4/25/34 (d) | | 6,645,000 | 6,484,243 |
| 6.204% 11/10/28 (d) | | 97,000 | 99,230 |
| 6.975% 3/7/37 | | 43,000 | 46,293 |
| Bank of Ireland Group PLC: | | | |
| 1.375% 8/11/31 (Reg. S) (d) | EUR | 2,365,000 | 2,277,778 |
| 2.029% 9/30/27 (b)(d) | | 1,400,000 | 1,231,748 |
| 6.253% 9/16/26 (b)(d) | | 285,000 | 284,321 |
| Bank of Montreal: | | | |
| 1.5% 1/10/25 | | 175,000 | 165,548 |
| 3.803% 12/15/32 (d) | | 10,000 | 8,854 |
| 5.3% 6/5/26 | | 253,000 | 252,125 |
| Bank of Nova Scotia: | | | |
| 1.3% 9/15/26 | | 43,000 | 38,102 |
| 2.2% 2/3/25 | | 55,000 | 52,379 |
| 2.7% 8/3/26 | | 48,000 | 44,568 |
| 3.45% 4/11/25 | | 140,000 | 135,234 |
| Banque Federative du Credit Mutuel SA: | | | |
| 1.604% 10/4/26 (b) | | 800,000 | 708,154 |
| 4.524% 7/13/25 (b) | | 363,000 | 354,599 |
| 5.79% 7/13/28 (b) | | 200,000 | 200,884 |
| Barclays PLC: | | | |
| 2.645% 6/24/31 (d) | | 2,865,000 | 2,286,042 |
| 2.667% 3/10/32 (d) | | 10,165,000 | 7,976,169 |
| 2.852% 5/7/26 (d) | | 10,143,000 | 9,586,373 |
| 4.836% 5/9/28 | | 6,667,000 | 6,177,898 |
| 4.972% 5/16/29 (d) | | 15,000,000 | 14,255,889 |
| 5.088% 6/20/30 (d) | | 13,438,000 | 12,312,037 |
| 5.2% 5/12/26 | | 1,701,000 | 1,650,554 |
| 5.262% 1/29/34 (Reg. S) (d) | EUR | 280,000 | 304,006 |
| 5.501% 8/9/28 (d) | | 445,000 | 434,105 |
| 5.746% 8/9/33 (d) | | 326,000 | 312,381 |
| 5.829% 5/9/27 (d) | | 2,670,000 | 2,645,519 |
| 6.224% 5/9/34 (d) | | 759,000 | 749,588 |
| 7.385% 11/2/28 (d) | | 620,000 | 645,441 |
| 7.437% 11/2/33 (d) | | 2,720,000 | 2,911,125 |
| 8.407% 11/14/32 (Reg. S) (d) | GBP | 400,000 | 512,364 |
| BNP Paribas SA: | | | |
| 1.904% 9/30/28 (b)(d) | | 400,000 | 343,204 |
| 2.159% 9/15/29 (b)(d) | | 7,570,000 | 6,333,191 |
| 2.219% 6/9/26 (b)(d) | | 9,163,000 | 8,560,425 |
| 2.5% 3/31/32 (Reg. S) (d) | EUR | 900,000 | 878,833 |
| 3.132% 1/20/33 (b)(d) | | 3,670,000 | 2,991,172 |
| 4.125% 5/24/33 (Reg. S) | EUR | 700,000 | 762,289 |
| BPCE SA: | | | |
| 1.5% 1/13/42 (Reg. S) (d) | EUR | 1,200,000 | 1,129,360 |
| 3.116% 10/19/32 (b)(d) | | 500,000 | 386,540 |
| 3.5% 10/23/27 (b) | | 750,000 | 684,828 |
| 5.125% 1/18/28 (b) | | 541,000 | 530,565 |
| 5.15% 7/21/24 (b) | | 1,024,000 | 1,011,388 |
| Canadian Imperial Bank of Commerce: | | | |
| 2.25% 1/28/25 | | 90,000 | 85,776 |
| 3.1% 4/2/24 | | 26,000 | 25,590 |
| 3.3% 4/7/25 | | 108,000 | 104,092 |
| Cassa Depositi e Prestiti SpA 5.75% 5/5/26 (b) | | 1,200,000 | 1,182,444 |
| Citigroup, Inc.: | | | |
| 1.462% 6/9/27 (d) | | 360,000 | 320,566 |
| 2.014% 1/25/26 (d) | | 271,000 | 256,373 |
| 2.52% 11/3/32 (d) | | 845,000 | 670,553 |
| 2.561% 5/1/32 (d) | | 6,396,000 | 5,153,170 |
| 2.572% 6/3/31 (d) | | 7,856,000 | 6,487,805 |
| 2.666% 1/29/31 (d) | | 16,956,000 | 14,210,493 |
| 2.904% 11/3/42 (d) | | 495,000 | 339,978 |
| 2.976% 11/5/30 (d) | | 240,000 | 206,392 |
| 3.07% 2/24/28 (d) | | 663,000 | 608,608 |
| 3.106% 4/8/26 (d) | | 73,000 | 69,862 |
| 3.52% 10/27/28 (d) | | 3,913,000 | 3,611,204 |
| 3.668% 7/24/28 (d) | | 163,000 | 151,586 |
| 3.887% 1/10/28 (d) | | 615,000 | 580,978 |
| 3.98% 3/20/30 (d) | | 105,000 | 96,699 |
| 4.075% 4/23/29 (d) | | 22,865,000 | 21,437,965 |
| 4.3% 11/20/26 | | 2,202,000 | 2,115,563 |
| 4.4% 6/10/25 | | 7,498,000 | 7,311,310 |
| 4.412% 3/31/31 (d) | | 15,729,000 | 14,604,605 |
| 4.45% 9/29/27 | | 4,630,000 | 4,425,641 |
| 4.6% 3/9/26 | | 3,500,000 | 3,407,871 |
| 4.65% 7/30/45 | | 350,000 | 301,432 |
| 4.75% 5/18/46 | | 10,000,000 | 8,386,998 |
| 5.316% 3/26/41 (d) | | 244,000 | 231,802 |
| 5.61% 9/29/26 (d) | | 447,000 | 444,959 |
| 5.875% 7/1/24 (Reg. S) | GBP | 615,000 | 774,395 |
| 6.174% 5/25/34 (d) | | 1,070,000 | 1,066,265 |
| 6.27% 11/17/33 (d) | | 1,561,000 | 1,627,742 |
| 6.625% 1/15/28 | | 24,000 | 25,303 |
| 6.875% 6/1/25 | | 18,000 | 18,308 |
| 7% 12/1/25 | | 32,000 | 32,588 |
| Citizens Financial Group, Inc. 2.638% 9/30/32 | | 9,574,000 | 6,982,950 |
| Commerzbank AG 8.625% 2/28/33 (Reg. S) (d) | GBP | 100,000 | 124,982 |
| Commonwealth Bank of Australia 3.61% 9/12/34 (b)(d) | | 3,419,000 | 2,899,388 |
| Credit Agricole SA: | | | |
| UK Government Bonds 1 Year + 2.180% 6.375% 6/14/31 (Reg. S) (d)(g) | GBP | 700,000 | 886,590 |
| 1.25% 10/2/24 (Reg. S) | GBP | 300,000 | 361,170 |
| 1.907% 6/16/26 (b)(d) | | 1,929,000 | 1,795,662 |
| 4% 1/10/33 (b)(d) | | 261,000 | 234,077 |
| 4.875% 10/23/29 (Reg. S) | GBP | 200,000 | 238,974 |
| 5.301% 7/12/28 (b) | | 725,000 | 723,655 |
| 5.589% 7/5/26 (b) | | 500,000 | 499,839 |
| Danske Bank A/S: | | | |
| 2.25% 1/14/28 (Reg. S) (d) | GBP | 980,000 | 1,070,440 |
| 3.244% 12/20/25 (b)(d) | | 200,000 | 191,597 |
| 4.625% 4/13/27 (Reg. S) (d) | GBP | 300,000 | 364,846 |
| 4.75% 6/21/30 (Reg. S) (d) | EUR | 1,300,000 | 1,423,475 |
| 6.466% 1/9/26 (b)(d) | | 1,404,000 | 1,404,643 |
| Export Credit Bank of Turkey 9.375% 1/31/26 (b) | | 200,000 | 203,884 |
| Export-Import Bank of Korea 5.125% 1/11/33 | | 515,000 | 520,151 |
| Fifth Third Bancorp 6.339% 7/27/29 (d) | | 2,815,000 | 2,849,502 |
| First Citizens Bank & Trust Co. 6.125% 3/9/28 | | 4,840,000 | 4,861,908 |
| HAT Holdings I LLC/HAT Holdings II LLC 3.375% 6/15/26 (b) | | 145,000 | 130,215 |
| HSBC Holdings PLC: | | | |
| U.S. Secured Overnight Fin. Rate (SOFR) Index + 2.650% 6.332% 3/9/44 (d)(g) | | 3,340,000 | 3,367,964 |
| 0.976% 5/24/25 (d) | | 835,000 | 802,556 |
| 1.645% 4/18/26 (d) | | 507,000 | 472,250 |
| 2.013% 9/22/28 (d) | | 3,543,000 | 3,044,915 |
| 2.206% 8/17/29 (d) | | 214,000 | 179,280 |
| 2.251% 11/22/27 (d) | | 444,000 | 395,935 |
| 2.804% 5/24/32 (d) | | 5,626,000 | 4,493,677 |
| 2.871% 11/22/32 (d) | | 288,000 | 229,191 |
| 3.973% 5/22/30 (d) | | 491,000 | 442,002 |
| 4.041% 3/13/28 (d) | | 826,000 | 775,765 |
| 4.25% 3/14/24 | | 1,872,000 | 1,851,765 |
| 4.787% 3/10/32 (Reg. S) (d) | EUR | 710,000 | 773,575 |
| 4.856% 5/23/33 (Reg. S) (d) | EUR | 900,000 | 982,661 |
| 4.95% 3/31/30 | | 1,855,000 | 1,784,750 |
| 5.21% 8/11/28 (d) | | 358,000 | 349,337 |
| 5.887% 8/14/27 (d) | | 2,285,000 | 2,277,835 |
| 6.1% 1/14/42 | | 130,000 | 136,060 |
| 6.161% 3/9/29 (d) | | 3,380,000 | 3,402,882 |
| 6.254% 3/9/34 (d) | | 1,323,000 | 1,337,391 |
| 7.39% 11/3/28 (d) | | 900,000 | 945,560 |
| 8.201% 11/16/34 (Reg. S) (d) | GBP | 550,000 | 716,884 |
| Huntington Bancshares, Inc. 6.208% 8/21/29 (d) | | 1,370,000 | 1,378,994 |
| ING Groep NV: | | | |
| 1.726% 4/1/27 (d) | | 6,135,000 | 5,516,942 |
| 4.75% 5/23/34 (Reg. S) (d) | EUR | 1,400,000 | 1,520,458 |
| Intesa Sanpaolo SpA: | | | |
| 4.95% 6/1/42 (b)(d) | | 468,000 | 311,883 |
| 5.017% 6/26/24 (b) | | 31,005,000 | 30,315,851 |
| 5.71% 1/15/26 (b) | | 10,048,000 | 9,639,093 |
| JPMorgan Chase & Co.: | | | |
| 1.04% 2/4/27 (d) | | 3,885,000 | 3,477,325 |
| 1.578% 4/22/27 (d) | | 1,395,000 | 1,252,634 |
| 1.953% 2/4/32 (d) | | 9,540,000 | 7,519,183 |
| 2.069% 6/1/29 (d) | | 2,035,000 | 1,745,464 |
| 2.522% 4/22/31 (d) | | 4,525,000 | 3,795,250 |
| 2.525% 11/19/41 (d) | | 22,775,000 | 15,357,633 |
| 2.58% 4/22/32 (d) | | 6,175,000 | 5,054,918 |
| 2.739% 10/15/30 (d) | | 9,595,000 | 8,225,293 |
| 2.956% 5/13/31 (d) | | 5,386,000 | 4,578,211 |
| 3.509% 1/23/29 (d) | | 6,550,000 | 6,038,315 |
| 3.882% 7/24/38 (d) | | 4,300,000 | 3,625,515 |
| 4.565% 6/14/30 (d) | | 525,000 | 501,806 |
| 5.35% 6/1/34 (d) | | 1,087,000 | 1,074,068 |
| Jyske Bank A/S 5% 10/26/28 (d) | EUR | 275,000 | 298,988 |
| Lloyds Bank Corporate Markets PLC 1.75% 7/11/24 (Reg. S) | GBP | 275,000 | 335,765 |
| Lloyds Banking Group PLC: | | | |
| 1.627% 5/11/27 (d) | | 2,520,000 | 2,247,817 |
| 1.985% 12/15/31 (d) | GBP | 665,000 | 715,257 |
| 3.511% 3/18/26 (d) | | 200,000 | 192,187 |
| 3.574% 11/7/28 (d) | | 875,000 | 794,843 |
| 4.5% 1/11/29 (Reg. S) (d) | EUR | 350,000 | 378,729 |
| 4.976% 8/11/33 (d) | | 1,030,000 | 953,397 |
| 5.871% 3/6/29 (d) | | 1,365,000 | 1,354,493 |
| Magyar Export-Import Bank 6.125% 12/4/27 (b) | | 200,000 | 198,562 |
| Mitsubishi UFJ Financial Group, Inc.: | | | |
| 1.538% 7/20/27 (d) | | 465,000 | 414,542 |
| 2.852% 1/19/33 (d) | | 670,000 | 548,095 |
| 3.777% 3/2/25 | | 125,000 | 121,386 |
| 5.063% 9/12/25 (d) | | 1,353,000 | 1,340,368 |
| 5.422% 2/22/29 (d) | | 2,350,000 | 2,340,049 |
| 5.475% 2/22/31 (d) | | 400,000 | 396,771 |
| Mizuho Financial Group, Inc.: | | | |
| 2.172% 5/22/32 (d) | | 444,000 | 343,271 |
| 5.748% 7/6/34 (d) | | 5,810,000 | 5,753,461 |
| 5.778% 7/6/29 (d) | | 1,765,000 | 1,767,864 |
| Morgan Stanley Bank, West Valley City Utah 4.754% 4/21/26 | | 1,131,000 | 1,116,354 |
| National Australia Bank Ltd. 2.332% 8/21/30 (b) | | 450,000 | 350,681 |
| NatWest Group PLC: | | | |
| 3.073% 5/22/28 (d) | | 5,999,000 | 5,408,968 |
| 3.619% 3/29/29 (Reg. S) (d) | GBP | 580,000 | 647,412 |
| 3.622% 8/14/30 (Reg. S) (d) | GBP | 1,900,000 | 2,247,052 |
| 4.269% 3/22/25 (d) | | 1,935,000 | 1,913,174 |
| 4.771% 2/16/29 (Reg. S) (d) | EUR | 300,000 | 326,314 |
| 4.8% 4/5/26 | | 15,856,000 | 15,437,642 |
| 5.076% 1/27/30 (d) | | 400,000 | 380,988 |
| 5.125% 5/28/24 | | 25,198,000 | 24,972,227 |
| 5.808% 9/13/29 (d) | | 240,000 | 238,012 |
| 5.847% 3/2/27 (d) | | 500,000 | 497,032 |
| 7.416% 6/6/33 (Reg. S) (d) | GBP | 450,000 | 561,588 |
| 7.472% 11/10/26 (d) | | 623,000 | 641,428 |
| Nordea Bank Abp: | | | |
| 4.125% 5/5/28 (Reg. S) | EUR | 1,000,000 | 1,085,374 |
| 5.375% 9/22/27 (b) | | 400,000 | 396,460 |
| PNC Financial Services Group, Inc.: | | | |
| 2.307% 4/23/32 (d) | | 54,000 | 43,486 |
| 2.55% 1/22/30 | | 427,000 | 358,153 |
| 2.6% 7/23/26 | | 58,000 | 53,855 |
| 5.068% 1/24/34 (d) | | 1,910,000 | 1,809,148 |
| 5.582% 6/12/29 (d) | | 1,050,000 | 1,041,395 |
| 5.939% 8/18/34 (d) | | 300,000 | 303,442 |
| 6.037% 10/28/33 (d) | | 2,880,000 | 2,925,685 |
| Rabobank Nederland: | | | |
| 3.649% 4/6/28 (b)(d) | | 665,000 | 617,370 |
| 4% 1/10/30 (Reg. S) | EUR | 500,000 | 535,864 |
| 4.375% 8/4/25 | | 7,713,000 | 7,476,042 |
| Royal Bank of Canada: | | | |
| 2.25% 11/1/24 | | 76,000 | 73,072 |
| 4.24% 8/3/27 | | 506,000 | 487,005 |
| 4.65% 1/27/26 | | 127,000 | 124,563 |
| Santander UK Group Holdings PLC: | | | |
| 1.673% 6/14/27 (d) | | 7,160,000 | 6,301,884 |
| 2.469% 1/11/28 (d) | | 515,000 | 453,069 |
| 6.534% 1/10/29 (d) | | 2,282,000 | 2,299,972 |
| 6.833% 11/21/26 (d) | | 400,000 | 405,023 |
| Societe Generale: | | | |
| 1.488% 12/14/26 (b)(d) | | 10,614,000 | 9,511,038 |
| 1.792% 6/9/27 (b)(d) | | 1,500,000 | 1,330,589 |
| 2.797% 1/19/28 (b)(d) | | 3,156,000 | 2,827,054 |
| 2.889% 6/9/32 (b)(d) | | 210,000 | 165,261 |
| 3.337% 1/21/33 (b)(d) | | 1,105,000 | 891,324 |
| 4.25% 4/14/25 (b) | | 22,306,000 | 21,498,981 |
| 4.75% 11/24/25 (b) | | 830,000 | 798,546 |
| 6.447% 1/12/27 (b)(d) | | 200,000 | 200,936 |
| 6.691% 1/10/34 (b)(d) | | 300,000 | 305,564 |
| Standard Chartered PLC: | | | |
| 1.456% 1/14/27 (b)(d) | | 200,000 | 178,990 |
| 6.187% 7/6/27 (b)(d) | | 700,000 | 701,463 |
| 6.301% 1/9/29 (b)(d) | | 1,363,000 | 1,376,095 |
| 7.767% 11/16/28 (b)(d) | | 641,000 | 678,863 |
| Sumitomo Mitsui Financial Group, Inc.: | | | |
| 3.936% 10/16/23 | | 19,000 | 18,956 |
| 5.52% 1/13/28 | | 200,000 | 199,924 |
| 5.71% 1/13/30 | | 200,000 | 201,094 |
| 5.766% 1/13/33 | | 200,000 | 202,863 |
| Sumitomo Mitsui Trust Bank Ltd. 5.65% 3/9/26 (b) | | 1,820,000 | 1,822,125 |
| Svenska Handelsbanken AB 5.5% 6/15/28 (b) | | 943,000 | 929,061 |
| The Toronto-Dominion Bank: | | | |
| 1.15% 6/12/25 | | 58,000 | 53,787 |
| 2% 9/10/31 | | 180,000 | 142,649 |
| 4.456% 6/8/32 | | 305,000 | 284,101 |
| 5.103% 1/9/26 | | 125,000 | 124,010 |
| 5.523% 7/17/28 | | 51,000 | 51,252 |
| 5.532% 7/17/26 | | 135,000 | 135,298 |
| Truist Financial Corp.: | | | |
| 4% 5/1/25 | | 54,000 | 52,299 |
| 5.122% 1/26/34 (d) | | 185,000 | 173,529 |
| 5.867% 6/8/34 (d) | | 1,855,000 | 1,837,965 |
| 6.047% 6/8/27 (d) | | 194,000 | 193,864 |
| U.S. Bancorp: | | | |
| 4.839% 2/1/34 (d) | | 5,405,000 | 5,012,861 |
| 5.836% 6/12/34 (d) | | 915,000 | 914,149 |
| 5.85% 10/21/33 (d) | | 1,425,000 | 1,419,265 |
| UniCredit SpA: | | | |
| 1.982% 6/3/27 (b)(d) | | 200,000 | 177,658 |
| 2.731% 1/15/32 (Reg. S) (d) | EUR | 806,000 | 775,407 |
| 3.127% 6/3/32 (b)(d) | | 2,515,000 | 1,988,468 |
| 7.296% 4/2/34 (b)(d) | | 272,000 | 261,638 |
| Virgin Money UK PLC: | | | |
| 5.125% 12/11/30 (Reg. S) (d) | GBP | 190,000 | 222,978 |
| 7.625% 8/23/29 (Reg. S) (d) | GBP | 620,000 | 790,732 |
| Wachovia Corp.: | | | |
| 6.605% 10/1/25 | | 48,000 | 48,385 |
| 7.574% 8/1/26 | | 15,000 | 15,688 |
| Wells Fargo & Co.: | | | |
| 2.125% 12/20/23 (Reg. S) | GBP | 265,000 | 331,681 |
| 2.164% 2/11/26 (d) | | 2,544,000 | 2,405,265 |
| 2.393% 6/2/28 (d) | | 58,000 | 51,608 |
| 2.572% 2/11/31 (d) | | 3,439,000 | 2,870,378 |
| 2.879% 10/30/30 (d) | | 24,150,000 | 20,666,309 |
| 3% 10/23/26 | | 376,000 | 348,268 |
| 3.068% 4/30/41 (d) | | 410,000 | 293,476 |
| 3.35% 3/2/33 (d) | | 10,955,000 | 9,225,360 |
| 3.55% 9/29/25 | | 105,000 | 100,737 |
| 3.584% 5/22/28 (d) | | 4,507,000 | 4,184,230 |
| 3.908% 4/25/26 (d) | | 335,000 | 323,871 |
| 4.3% 7/22/27 | | 21,885,000 | 20,956,774 |
| 4.4% 6/14/46 | | 88,000 | 69,756 |
| 4.478% 4/4/31 (d) | | 15,500,000 | 14,501,086 |
| 4.65% 11/4/44 | | 1,335,000 | 1,104,414 |
| 5.013% 4/4/51 (d) | | 2,285,000 | 2,063,299 |
| 5.375% 11/2/43 | | 24,000 | 22,101 |
| 5.389% 4/24/34 (d) | | 1,134,000 | 1,104,525 |
| 5.557% 7/25/34 (d) | | 4,366,000 | 4,308,573 |
| 5.574% 7/25/29 (d) | | 9,908,000 | 9,866,967 |
| Westpac Banking Corp.: | | | |
| 1.953% 11/20/28 | | 15,000 | 12,902 |
| 2.894% 2/4/30 (d) | | 58,000 | 54,775 |
| 4.11% 7/24/34 (d) | | 4,937,000 | 4,325,130 |
| 4.322% 11/23/31 (d) | | 491,000 | 458,533 |
| | | | 738,222,907 |
| Capital Markets - 0.8% | | | |
| Ares Capital Corp. 3.875% 1/15/26 | | 13,816,000 | 12,922,893 |
| Bank of New York Mellon Corp.: | | | |
| 1.6% 4/24/25 | | 525,000 | 493,279 |
| 3.25% 5/16/27 | | 110,000 | 103,144 |
| 4.289% 6/13/33 (d) | | 85,000 | 78,206 |
| 4.947% 4/26/27 (d) | | 138,000 | 135,839 |
| Blackstone Holdings Finance Co. LLC 4.45% 7/15/45 (b) | | 4,000 | 3,129 |
| Brookfield Finance, Inc.: | | | |
| 3.9% 1/25/28 | | 37,000 | 34,568 |
| 4.7% 9/20/47 | | 3,000 | 2,463 |
| 4.85% 3/29/29 | | 8,000 | 7,653 |
| Charles Schwab Corp.: | | | |
| 0.9% 3/11/26 | | 15,000 | 13,396 |
| 2.75% 10/1/29 | | 43,000 | 36,982 |
| 5.853% 5/19/34 (d) | | 299,000 | 299,233 |
| 6.136% 8/24/34 (d) | | 416,000 | 423,113 |
| Credit Suisse AG: | | | |
| 4.75% 8/9/24 | | 634,000 | 625,118 |
| 5% 7/9/27 | | 953,000 | 928,517 |
| 7.5% 2/15/28 | | 523,000 | 559,350 |
| 7.95% 1/9/25 | | 2,500,000 | 2,548,877 |
| Credit Suisse U.S.A., Inc. 7.125% 7/15/32 | | 25,000 | 27,896 |
| Deutsche Bank AG: | | | |
| 3.25% 5/24/28 (Reg. S) (d) | EUR | 600,000 | 609,287 |
| 4% 6/24/32 (Reg. S) (d) | EUR | 1,300,000 | 1,264,469 |
| 4.5% 4/1/25 | | 13,996,000 | 13,484,885 |
| 6.125% 12/12/30 (Reg. S) (d) | GBP | 1,100,000 | 1,295,504 |
| Deutsche Bank AG New York Branch: | | | |
| 2.222% 9/18/24 (d) | | 150,000 | 149,765 |
| 5.371% 9/9/27 | | 972,000 | 963,853 |
| 6.72% 1/18/29 (d) | | 531,000 | 537,615 |
| 7.079% 2/10/34 (d) | | 1,760,000 | 1,674,011 |
| 7.146% 7/13/27 (d) | | 945,000 | 959,136 |
| FactSet Research Systems, Inc. 3.45% 3/1/32 | | 591,000 | 500,813 |
| Goldman Sachs Group, Inc.: | | | |
| 1.093% 12/9/26 (d) | | 91,000 | 81,683 |
| 1.431% 3/9/27 (d) | | 9,911,000 | 8,886,619 |
| 1.948% 10/21/27 (d) | | 1,235,000 | 1,099,045 |
| 1.992% 1/27/32 (d) | | 9,693,000 | 7,549,046 |
| 2.383% 7/21/32 (d) | | 12,642,000 | 9,992,867 |
| 2.615% 4/22/32 (d) | | 1,077,000 | 871,451 |
| 2.64% 2/24/28 (d) | | 2,453,000 | 2,219,994 |
| 3.102% 2/24/33 (d) | | 1,619,000 | 1,346,589 |
| 3.21% 4/22/42 (d) | | 141,000 | 101,632 |
| 3.272% 9/29/25 (d) | | 142,000 | 137,710 |
| 3.436% 2/24/43 (d) | | 42,000 | 30,920 |
| 3.5% 1/23/25 | | 75,000 | 72,628 |
| 3.5% 11/16/26 | | 752,000 | 706,828 |
| 3.615% 3/15/28 (d) | | 269,000 | 251,521 |
| 3.691% 6/5/28 (d) | | 667,000 | 624,415 |
| 3.75% 5/22/25 | | 140,000 | 135,323 |
| 3.814% 4/23/29 (d) | | 7,695,000 | 7,120,220 |
| 3.85% 1/26/27 | | 113,000 | 107,249 |
| 4.017% 10/31/38 (d) | | 5,487,000 | 4,562,658 |
| 4.223% 5/1/29 (d) | | 4,095,000 | 3,858,124 |
| 4.25% 10/21/25 | | 10,000 | 9,704 |
| 4.387% 6/15/27 (d) | | 55,000 | 53,378 |
| 4.482% 8/23/28 (d) | | 936,000 | 900,599 |
| 5.798% 8/10/26 (d) | | 1,000,000 | 996,918 |
| 6.75% 10/1/37 | | 50,954,000 | 54,019,316 |
| Hightower Holding LLC 6.75% 4/15/29 (b) | | 350,000 | 304,644 |
| Jane Street Group LLC/JSG Finance, Inc. 4.5% 11/15/29 (b) | | 326,000 | 286,070 |
| Jefferies Financial Group, Inc.: | | | |
| 2.625% 10/15/31 | | 5,530,000 | 4,310,535 |
| 2.75% 10/15/32 | | 1,355,000 | 1,037,597 |
| 5.875% 7/21/28 | | 6,730,000 | 6,654,732 |
| 6.25% 1/15/36 | | 27,000 | 27,353 |
| LPL Holdings, Inc. 4% 3/15/29 (b) | | 547,000 | 486,246 |
| Macquarie Group Ltd.: | | | |
| 2.691% 6/23/32 (b)(d) | | 166,000 | 130,069 |
| 5.033% 1/15/30 (b)(d) | | 23,000 | 22,413 |
| Moody's Corp. 3.1% 11/29/61 | | 115,000 | 72,764 |
| Morgan Stanley: | | | |
| 1.593% 5/4/27 (d) | | 648,000 | 581,346 |
| 1.794% 2/13/32 (d) | | 6,747,000 | 5,188,472 |
| 1.928% 4/28/32 (d) | | 11,033,000 | 8,507,276 |
| 2.188% 4/28/26 (d) | | 36,000 | 33,928 |
| 2.239% 7/21/32 (d) | | 1,771,000 | 1,393,123 |
| 2.475% 1/21/28 (d) | | 400,000 | 360,847 |
| 2.484% 9/16/36 (d) | | 1,650,000 | 1,244,372 |
| 2.511% 10/20/32 (d) | | 3,820,000 | 3,041,882 |
| 2.699% 1/22/31 (d) | | 31,022,000 | 26,110,467 |
| 2.72% 7/22/25 (d) | | 36,000 | 34,936 |
| 2.802% 1/25/52 (d) | | 105,000 | 66,591 |
| 2.943% 1/21/33 (d) | | 3,423,000 | 2,803,880 |
| 3.125% 7/27/26 | | 20,810,000 | 19,473,746 |
| 3.217% 4/22/42 (d) | | 350,000 | 257,797 |
| 3.591% 7/22/28 (d) | | 470,000 | 434,807 |
| 3.62% 4/17/25 (d) | | 325,000 | 320,023 |
| 3.622% 4/1/31 (d) | | 13,084,000 | 11,626,802 |
| 3.625% 1/20/27 | | 90,000 | 85,037 |
| 3.772% 1/24/29 (d) | | 40,000 | 37,101 |
| 3.875% 1/27/26 | | 874,000 | 841,214 |
| 4% 7/23/25 | | 1,078,000 | 1,045,643 |
| 4.35% 9/8/26 | | 2,070,000 | 1,993,311 |
| 4.431% 1/23/30 (d) | | 2,961,000 | 2,811,922 |
| 4.457% 4/22/39 (d) | | 158,000 | 139,111 |
| 4.656% 3/2/29 (d) | EUR | 400,000 | 438,818 |
| 5% 11/24/25 | | 29,026,000 | 28,586,432 |
| 5.123% 2/1/29 (d) | | 5,526,000 | 5,416,202 |
| 5.164% 4/20/29 (d) | | 2,234,000 | 2,191,174 |
| 5.424% 7/21/34 (d) | | 3,654,000 | 3,592,689 |
| 5.449% 7/20/29 (d) | | 5,929,000 | 5,894,201 |
| 5.948% 1/19/38 (d) | | 97,000 | 94,322 |
| MSCI, Inc.: | | | |
| 3.25% 8/15/33 (b) | | 704,000 | 566,394 |
| 3.625% 9/1/30 (b) | | 78,000 | 67,452 |
| 4% 11/15/29 (b) | | 781,000 | 702,615 |
| NASDAQ, Inc.: | | | |
| 5.55% 2/15/34 | | 180,000 | 179,686 |
| 6.1% 6/28/63 | | 287,000 | 283,190 |
| Nomura Holdings, Inc.: | | | |
| 2.608% 7/14/31 | | 1,155,000 | 907,378 |
| 2.648% 1/16/25 | | 1,075,000 | 1,026,455 |
| Northern Trust Corp.: | | | |
| 3.375% 5/8/32 (d) | | 29,000 | 25,906 |
| 3.95% 10/30/25 | | 30,000 | 29,044 |
| Nuveen LLC 4% 11/1/28 (b) | | 20,000 | 18,803 |
| S&P Global, Inc.: | | | |
| 2.7% 3/1/29 | | 255,000 | 227,926 |
| 2.9% 3/1/32 | | 415,000 | 355,438 |
| 3.25% 12/1/49 | | 315,000 | 225,841 |
| State Street Corp. U.S. Secured Overnight Fin. Rate (SOFR) Index + 1.710% 5.82% 11/4/28 (d)(g) | | 313,000 | 317,809 |
| UBS Group AG: | | | |
| 1.305% 2/2/27 (b)(d) | | 7,385,000 | 6,565,739 |
| 1.494% 8/10/27 (b)(d) | | 2,580,000 | 2,268,691 |
| 2.125% 11/15/29 (Reg. S) (d) | GBP | 700,000 | 729,637 |
| 2.593% 9/11/25 (b)(d) | | 13,060,000 | 12,592,629 |
| 2.746% 2/11/33 (b)(d) | | 400,000 | 315,110 |
| 3.091% 5/14/32 (b)(d) | | 10,760,000 | 8,867,160 |
| 3.126% 8/13/30 (b)(d) | | 2,640,000 | 2,263,053 |
| 3.75% 3/26/25 | | 16,453,000 | 15,894,069 |
| 3.869% 1/12/29 (b)(d) | | 250,000 | 229,828 |
| 4.194% 4/1/31 (b)(d) | | 13,355,000 | 12,025,205 |
| 4.253% 3/23/28 (b) | | 200,000 | 187,115 |
| 4.282% 1/9/28 (b) | | 2,180,000 | 2,039,311 |
| 4.55% 4/17/26 | | 3,490,000 | 3,377,533 |
| 4.75% 3/17/32 (Reg. S) (d) | EUR | 580,000 | 636,574 |
| 4.751% 5/12/28 (b)(d) | | 337,000 | 323,559 |
| 4.875% 5/15/45 | | 500,000 | 445,461 |
| 4.988% 8/5/33 (Reg. S) (d) | | 200,000 | 186,384 |
| 6.373% 7/15/26 (b)(d) | | 1,790,000 | 1,797,448 |
| 6.537% 8/12/33 (b)(d) | | 7,900,000 | 8,204,678 |
| 9.016% 11/15/33 (b)(d) | | 4,689,000 | 5,677,856 |
| VistaJet Malta Finance PLC / XO Management Holding, Inc. 9.5% 6/1/28 (b) | | 182,000 | 167,950 |
| | | | 384,128,253 |
| Consumer Finance - 0.3% | | | |
| AerCap Ireland Capital Ltd./AerCap Global Aviation Trust: | | | |
| 1.15% 10/29/23 | | 413,000 | 409,835 |
| 1.65% 10/29/24 | | 10,272,000 | 9,765,772 |
| 2.45% 10/29/26 | | 3,899,000 | 3,508,112 |
| 2.875% 8/14/24 | | 7,954,000 | 7,711,844 |
| 3% 10/29/28 | | 12,830,000 | 11,117,993 |
| 3.3% 1/30/32 | | 4,200,000 | 3,413,072 |
| 4.45% 4/3/26 | | 4,282,000 | 4,125,062 |
| 5.75% 6/6/28 | | 190,000 | 188,341 |
| 6.5% 7/15/25 | | 4,320,000 | 4,340,571 |
| Ally Financial, Inc.: | | | |
| 5.75% 11/20/25 | | 216,000 | 209,513 |
| 5.8% 5/1/25 | | 6,894,000 | 6,790,571 |
| 7.1% 11/15/27 | | 6,180,000 | 6,261,040 |
| American Express Co.: | | | |
| 1.65% 11/4/26 | | 60,000 | 53,526 |
| 2.55% 3/4/27 | | 373,000 | 339,168 |
| 3.625% 12/5/24 | | 8,000 | 7,789 |
| 4.2% 11/6/25 | | 87,000 | 84,711 |
| 5.282% 7/27/29 (d) | | 546,000 | 540,079 |
| 5.389% 7/28/27 (d) | | 1,187,000 | 1,179,959 |
| 5.85% 11/5/27 | | 403,000 | 411,664 |
| Capital One Financial Corp.: | | | |
| 1.878% 11/2/27 (d) | | 63,000 | 55,229 |
| 2.618% 11/2/32 (d) | | 45,000 | 34,278 |
| 3.2% 2/5/25 | | 5,000 | 4,802 |
| 3.65% 5/11/27 | | 15,820,000 | 14,712,542 |
| 3.8% 1/31/28 | | 7,795,000 | 7,147,663 |
| 4.166% 5/9/25 (d) | | 66,000 | 64,755 |
| 4.985% 7/24/26 (d) | | 6,515,000 | 6,367,965 |
| 5.247% 7/26/30 (d) | | 6,880,000 | 6,544,856 |
| 6.377% 6/8/34 (d) | | 344,000 | 339,795 |
| Capstone Borrower, Inc. 8% 6/15/30 (b) | | 18,000 | 17,703 |
| Discover Financial Services: | | | |
| 3.95% 11/6/24 | | 2,567,000 | 2,499,956 |
| 4.5% 1/30/26 | | 6,463,000 | 6,208,426 |
| 6.7% 11/29/32 | | 1,592,000 | 1,584,452 |
| Ford Motor Credit Co. LLC: | | | |
| 2.9% 2/16/28 | | 275,000 | 234,675 |
| 2.9% 2/10/29 | | 200,000 | 165,045 |
| 4% 11/13/30 | | 610,000 | 516,151 |
| 4.063% 11/1/24 | | 22,139,000 | 21,450,293 |
| 4.125% 8/17/27 | | 895,000 | 812,095 |
| 4.271% 1/9/27 | | 1,045,000 | 966,194 |
| 4.542% 8/1/26 | | 238,000 | 224,365 |
| 4.687% 6/9/25 | | 180,000 | 173,269 |
| 5.113% 5/3/29 | | 400,000 | 367,925 |
| 5.125% 6/16/25 | | 135,000 | 131,424 |
| 5.584% 3/18/24 | | 8,575,000 | 8,528,519 |
| 6.86% 6/5/26 | GBP | 640,000 | 789,908 |
| Hyundai Capital America: | | | |
| 1.5% 6/15/26 (b) | | 367,000 | 328,264 |
| 1.8% 10/15/25 (b) | | 120,000 | 110,684 |
| 2.375% 10/15/27 (b) | | 32,000 | 28,038 |
| 3% 2/10/27 (b) | | 252,000 | 230,397 |
| Navient Corp.: | | | |
| 4.875% 3/15/28 | | 15,000 | 13,065 |
| 5.875% 10/25/24 | | 125,000 | 123,125 |
| 6.75% 6/25/25 | | 57,000 | 56,605 |
| OneMain Finance Corp.: | | | |
| 3.875% 9/15/28 | | 850,000 | 697,000 |
| 4% 9/15/30 | | 425,000 | 330,922 |
| 5.375% 11/15/29 | | 94,000 | 81,197 |
| 6.625% 1/15/28 | | 115,000 | 107,525 |
| 6.875% 3/15/25 | | 1,241,000 | 1,234,766 |
| 7.125% 3/15/26 | | 704,000 | 692,523 |
| Synchrony Financial: | | | |
| 3.95% 12/1/27 | | 8,719,000 | 7,789,891 |
| 4.25% 8/15/24 | | 6,050,000 | 5,892,811 |
| 4.375% 3/19/24 | | 7,165,000 | 7,078,497 |
| 5.15% 3/19/29 | | 13,451,000 | 12,336,831 |
| | | | 177,533,048 |
| Financial Services - 0.3% | | | |
| AGPS BondCo PLC: | | | |
| 4.625% 1/14/26 (Reg. S) (d) | EUR | 300,000 | 108,164 |
| 5% 4/27/27 (Reg. S) (d) | EUR | 3,100,000 | 1,008,351 |
| Altus Midstream LP 5.875% 6/15/30 (b) | | 407,000 | 394,184 |
| Aon Corp. / Aon Global Holdings PLC 5.35% 2/28/33 | | 770,000 | 768,759 |
| Athene Global Funding: | | | |
| 1.45% 1/8/26 (b) | | 61,000 | 54,377 |
| 1.608% 6/29/26 (b) | | 3,350,000 | 2,908,857 |
| 2.717% 1/7/29 (b) | | 4,805,000 | 4,007,067 |
| 2.95% 11/12/26 (b) | | 131,000 | 118,432 |
| Aviation Capital Group LLC: | | | |
| 4.125% 8/1/25 (b) | | 107,000 | 101,917 |
| 4.875% 10/1/25 (b) | | 122,000 | 117,529 |
| 5.5% 12/15/24 (b) | | 16,000 | 15,756 |
| Blackstone Private Credit Fund: | | | |
| 4.875% 4/14/26 | GBP | 1,200,000 | 1,373,218 |
| 7.05% 9/29/25 | | 8,015,000 | 8,070,458 |
| Block, Inc.: | | | |
| 2.75% 6/1/26 | | 360,000 | 327,369 |
| 3.5% 6/1/31 | | 233,000 | 191,052 |
| BP Capital Markets America, Inc.: | | | |
| 2.721% 1/12/32 | | 629,000 | 526,460 |
| 2.772% 11/10/50 | | 119,000 | 75,041 |
| 2.939% 6/4/51 | | 186,000 | 121,440 |
| 3% 2/24/50 | | 278,000 | 185,196 |
| 3.001% 3/17/52 | | 373,000 | 244,765 |
| 3.017% 1/16/27 | | 38,000 | 35,644 |
| 4.812% 2/13/33 | | 2,809,000 | 2,718,933 |
| 4.893% 9/11/33 | | 1,909,000 | 1,857,197 |
| British Airways Pass Through Trust 2018-1AA equipment trust certificate 3.8% 3/20/33 (b) | | 15,649 | 14,544 |
| Brixmor Operating Partnership LP: | | | |
| 2.5% 8/16/31 | | 3,020,000 | 2,375,310 |
| 4.05% 7/1/30 | | 12,288,000 | 11,101,111 |
| 4.125% 6/15/26 | | 5,706,000 | 5,415,032 |
| 4.125% 5/15/29 | | 6,724,000 | 6,116,370 |
| Corebridge Financial, Inc.: | | | |
| 3.85% 4/5/29 | | 2,590,000 | 2,370,241 |
| 3.9% 4/5/32 | | 6,908,000 | 6,040,282 |
| 4.35% 4/5/42 | | 701,000 | 554,584 |
| 4.4% 4/5/52 | | 2,074,000 | 1,604,186 |
| Crown Castle Towers LLC/Crown Atlantic Holdings Sub LLC/Crown Communication, Inc. 3.663% 5/15/45 (b) | | 82,000 | 78,348 |
| DH Europe Finance II SARL 3.25% 11/15/39 | | 305,000 | 242,014 |
| Emerald Debt Merger Sub LLC 6.625% 12/15/30 (b) | | 777,000 | 764,894 |
| Fidelity National Information Services, Inc.: | | | |
| 2.25% 3/1/31 | | 190,000 | 153,375 |
| 3.1% 3/1/41 | | 3,540,000 | 2,458,739 |
| 4.5% 8/15/46 | | 58,000 | 45,744 |
| Fiserv, Inc.: | | | |
| 3.2% 7/1/26 | | 80,000 | 75,410 |
| 3.5% 7/1/29 | | 7,395,000 | 6,749,225 |
| 3.85% 6/1/25 | | 1,540,000 | 1,494,668 |
| 5.45% 3/2/28 | | 1,260,000 | 1,267,403 |
| GGAM Finance Ltd.: | | | |
| 7.75% 5/15/26 (b) | | 265,000 | 264,996 |
| 8% 6/15/28 (b) | | 297,000 | 301,203 |
| Global Payments, Inc.: | | | |
| 2.9% 5/15/30 | | 575,000 | 485,728 |
| 2.9% 11/15/31 | | 464,000 | 380,177 |
| 3.2% 8/15/29 | | 175,000 | 152,343 |
| 4.45% 6/1/28 | | 1,635,000 | 1,540,952 |
| Greystone Commercial Capital Trust 1 month U.S. LIBOR + 2.270% 7.6982% 5/31/25 (b)(d)(e)(g) | | 7,700,000 | 7,276,500 |
| Icahn Enterprises LP/Icahn Enterprises Finance Corp.: | | | |
| 4.75% 9/15/24 | | 190,000 | 183,630 |
| 5.25% 5/15/27 | | 1,580,000 | 1,386,450 |
| 6.25% 5/15/26 | | 1,594,000 | 1,478,181 |
| 6.375% 12/15/25 | | 323,000 | 307,950 |
| ILFC E-Capital Trust I 3 month U.S. LIBOR + 1.550% 7.0643% 12/21/65 (b)(d)(g) | | 156,000 | 112,850 |
| Indian Railway Finance Corp. Ltd. 3.57% 1/21/32 (b) | | 1,010,000 | 864,611 |
| Jackson Financial, Inc.: | | | |
| 3.125% 11/23/31 | | 750,000 | 589,511 |
| 5.17% 6/8/27 | | 2,958,000 | 2,899,327 |
| 5.67% 6/8/32 | | 3,183,000 | 3,031,723 |
| KfW: | | | |
| 0% 9/17/30 (Reg. S) | EUR | 1,500,000 | 1,322,238 |
| 0.75% 1/15/29 (Reg. S) | EUR | 100,000 | 96,518 |
| 2.875% 5/29/26 (Reg. S) | EUR | 1,400,000 | 1,506,698 |
| Leighton Finance U.S.A. Pty Ltd. 1.5% 5/28/29 (Reg. S) | EUR | 1,145,000 | 979,893 |
| LSEGA Financing PLC 2% 4/6/28 (b) | | 200,000 | 172,786 |
| MasterCard, Inc. 3.65% 6/1/49 | | 200,000 | 160,271 |
| Nationstar Mortgage Holdings, Inc. 6% 1/15/27 (b) | | 828,000 | 788,670 |
| Nationwide Building Society 6.178% 12/7/27 (Reg. S) (d) | GBP | 400,000 | 499,081 |
| Park Aerospace Holdings Ltd. 5.5% 2/15/24 (b) | | 7,287,000 | 7,238,369 |
| PennyMac Financial Services, Inc.: | | | |
| 4.25% 2/15/29 (b) | | 1,200,000 | 993,318 |
| 5.75% 9/15/31 (b) | | 18,000 | 15,129 |
| Penske Truck Leasing Co. LP: | | | |
| 1.2% 11/15/25 (b) | | 83,000 | 74,723 |
| 5.55% 5/1/28 (b) | | 5,455,000 | 5,351,502 |
| 6.05% 8/1/28 (b) | | 825,000 | 825,717 |
| Pine Street Trust I 4.572% 2/15/29 (b) | | 7,798,000 | 7,147,068 |
| Pine Street Trust II 5.568% 2/15/49 (b) | | 7,800,000 | 6,828,690 |
| Power Finance Corp. Ltd.: | | | |
| 1.841% 9/21/28 (Reg. S) | EUR | 2,400,000 | 2,183,733 |
| 6.15% 12/6/28 (b) | | 3,050,000 | 3,082,269 |
| Quicken Loans LLC/Quicken Loans Co-Issuer, Inc.: | | | |
| 3.625% 3/1/29 (b) | | 265,000 | 225,550 |
| 3.875% 3/1/31 (b) | | 71,000 | 57,792 |
| Quicken Loans LLC/Quicken Loans Co.-Issuer, Inc.: | | | |
| 2.875% 10/15/26 (b) | | 310,000 | 275,513 |
| 4% 10/15/33 (b) | | 17,000 | 13,441 |
| United Shore Financial Services LLC 5.75% 6/15/27 (b) | | 18,000 | 16,584 |
| Visa, Inc.: | | | |
| 2.7% 4/15/40 | | 183,000 | 136,289 |
| 4.15% 12/14/35 | | 44,000 | 41,514 |
| VMED O2 UK Financing I PLC 4.25% 1/31/31 (b) | | 495,000 | 404,961 |
| Voya Financial, Inc. 5.7% 7/15/43 | | 8,000 | 7,374 |
| | | | 135,953,469 |
| Insurance - 0.2% | | | |
| ACE INA Holdings, Inc. 3.15% 3/15/25 | | 1,765,000 | 1,706,405 |
| Admiral Group PLC 8.5% 1/6/34 (Reg. S) | GBP | 200,000 | 257,916 |
| AFLAC, Inc. 3.6% 4/1/30 | | 73,000 | 66,544 |
| AIA Group Ltd. 0.88% 9/9/33 (Reg. S) (d) | EUR | 395,000 | 344,849 |
| Alleghany Corp. 3.25% 8/15/51 | | 25,000 | 17,470 |
| Alliant Holdings Intermediate LLC 4.25% 10/15/27 (b) | | 340,000 | 308,696 |
| Aon Corp.: | | | |
| 2.8% 5/15/30 | | 114,000 | 97,887 |
| 6.25% 9/30/40 | | 7,000 | 7,253 |
| Arch Capital Finance LLC 4.011% 12/15/26 | | 4,745,000 | 4,527,958 |
| Arthur J. Gallagher & Co. 3.05% 3/9/52 | | 3,030,000 | 1,900,869 |
| Baylor Scott & White Holdings: | | | |
| Series 2021, 2.839% 11/15/50 | | 120,000 | 78,897 |
| 1.777% 11/15/30 | | 870,000 | 696,526 |
| Berkshire Hathaway Finance Corp.: | | | |
| 2.5% 1/15/51 | | 355,000 | 221,132 |
| 2.85% 10/15/50 | | 138,000 | 92,781 |
| 3.85% 3/15/52 | | 596,000 | 474,785 |
| Cincinnati Financial Corp. 6.125% 11/1/34 | | 32,000 | 32,966 |
| CNA Financial Corp.: | | | |
| 3.9% 5/1/29 | | 1,400,000 | 1,302,963 |
| 3.95% 5/15/24 | | 10,000 | 9,869 |
| Demeter Investments BV 5.625% 8/15/52 (Reg. S) (d) | | 3,225,000 | 3,031,500 |
| Equitable Financial Life Global Funding 1.7% 11/12/26 (b) | | 10,000 | 8,766 |
| Everest Reinsurance Holdings, Inc. 3.5% 10/15/50 | | 2,100,000 | 1,438,981 |
| F&G Global Funding 1.75% 6/30/26 (b) | | 23,000 | 20,453 |
| Fairfax Financial Holdings Ltd.: | | | |
| 3.375% 3/3/31 | | 4,595,000 | 3,851,450 |
| 5.625% 8/16/32 | | 6,100,000 | 5,887,378 |
| Farmers Exchange Capital II 6.151% 11/1/53 (b)(d) | | 1,500,000 | 1,443,049 |
| Farmers Exchange Capital III 5.454% 10/15/54 (b)(d) | | 3,335,000 | 2,889,677 |
| Fidelidade-Companhia de Seguros SA 4.25% 9/4/31 (Reg. S) (d) | EUR | 500,000 | 466,699 |
| Five Corners Funding Trust II 2.85% 5/15/30 (b) | | 12,846,000 | 10,997,658 |
| Great-West Lifeco Finance 2018, LP 4.581% 5/17/48 (b) | | 21,000 | 17,978 |
| Guardian Life Insurance Co. of America 4.85% 1/24/77 (b) | | 7,000 | 5,631 |
| Jackson National Life Global Funding 3.875% 6/11/25 (b) | | 77,000 | 73,501 |
| Liberty Mutual Group, Inc.: | | | |
| 3.951% 10/15/50 (b) | | 13,000 | 9,255 |
| 4.569% 2/1/29 (b) | | 9,380,000 | 9,053,533 |
| Lincoln National Corp.: | | | |
| 3.05% 1/15/30 | | 280,000 | 235,697 |
| 3.4% 1/15/31 | | 315,000 | 265,897 |
| 6.3% 10/9/37 | | 110,000 | 108,458 |
| Manulife Financial Corp. 4.15% 3/4/26 | | 55,000 | 53,427 |
| Markel Group, Inc.: | | | |
| 3.45% 5/7/52 | | 840,000 | 569,750 |
| 4.15% 9/17/50 | | 445,000 | 336,896 |
| 4.3% 11/1/47 | | 900,000 | 692,696 |
| Marsh & McLennan Companies, Inc. 5.45% 3/15/53 | | 232,000 | 229,001 |
| MetLife, Inc.: | | | |
| 4.125% 8/13/42 | | 49,000 | 40,617 |
| 5% 7/15/52 | | 270,000 | 246,862 |
| 6.5% 12/15/32 | | 20,000 | 21,681 |
| Metropolitan Life Global Funding I: | | | |
| 4.3% 8/25/29 (b) | | 3,500,000 | 3,331,964 |
| 5.15% 3/28/33 (b) | | 920,000 | 899,526 |
| Nationwide Mutual Insurance Co. 3 month U.S. LIBOR + 2.290% 7.842% 12/15/24 (b)(d)(g) | | 5,490,000 | 5,483,556 |
| New York Life Global Funding 3% 1/10/28 (b) | | 107,000 | 97,919 |
| New York Life Insurance Co. 6.75% 11/15/39 (b) | | 8,000 | 8,788 |
| Pacific Life Global Funding II 5.5% 8/28/26 (b) | | 125,000 | 125,425 |
| Pacific Life Insurance Co. 4.3% 10/24/67 (b)(d) | | 79,000 | 59,114 |
| Pricoa Global Funding I 5.375% 5/15/45 (d) | | 5,278,000 | 5,160,475 |
| Principal Financial Group, Inc. 3.7% 5/15/29 | | 37,000 | 33,867 |
| Principal Life Global Funding II 3% 4/18/26 (b) | | 17,000 | 15,857 |
| Progressive Corp.: | | | |
| 3% 3/15/32 | | 95,000 | 82,554 |
| 4.35% 4/25/44 | | 20,000 | 16,829 |
| Protective Life Global Funding 1.9% 7/6/28 (b) | | 1,595,000 | 1,371,653 |
| Prudential Financial, Inc.: | | | |
| 3.878% 3/27/28 | | 15,000 | 14,284 |
| 3.905% 12/7/47 | | 251,000 | 194,630 |
| Prudential Funding Asia PLC 2.95% 11/3/33 (Reg. S) (d) | | 2,100,000 | 1,754,726 |
| QBE Insurance Group Ltd.: | | | |
| 2.5% 9/13/38 (Reg. S) (d) | GBP | 950,000 | 945,684 |
| 6.75% 12/2/44 (Reg. S) (d) | | 2,025,000 | 1,999,688 |
| Ryan Specialty Group LLC 4.375% 2/1/30 (b) | | 165,000 | 147,475 |
| Swiss Re Finance Luxembourg SA 5% 4/2/49 (b)(d) | | 3,200,000 | 3,024,000 |
| Teachers Insurance & Annuity Association of America: | | | |
| 3.3% 5/15/50 (b) | | 2,310,000 | 1,562,992 |
| 4.27% 5/15/47 (b) | | 43,000 | 34,793 |
| 4.375% 9/15/54 (b)(d) | | 2,100,000 | 2,042,869 |
| 4.9% 9/15/44 (b) | | 14,000 | 12,570 |
| The Chubb Corp. 6% 5/11/37 | | 130,000 | 138,162 |
| The Travelers Companies, Inc. 5.35% 11/1/40 | | 10,000 | 9,941 |
| Travelers Property Casualty Corp. 7.75% 4/15/26 | | 20,000 | 21,293 |
| Unum Group: | | | |
| 4% 6/15/29 | | 5,961,000 | 5,463,898 |
| 4.125% 6/15/51 | | 1,330,000 | 939,967 |
| 5.75% 8/15/42 | | 2,238,000 | 2,037,429 |
| W.R. Berkley Corp. 3.55% 3/30/52 | | 94,000 | 64,093 |
| Willis Group North America, Inc. 5.35% 5/15/33 | | 935,000 | 902,562 |
| Zurich Finance (Ireland) DAC 3.5% 5/2/52 (Reg. S) (d) | | 900,000 | 705,375 |
| | | | 92,846,215 |
| Mortgage Real Estate Investment Trusts - 0.0% | | | |
| Arbor Realty Trust, Inc.: | | | |
| 4.5% 9/1/26 (b) | | 570,000 | 505,572 |
| 4.5% 3/15/27 (b) | | 877,000 | 752,898 |
| 5% 4/30/26 | | 146,000 | 132,823 |
| Great Ajax Operating Partnership LP 8.875% 9/1/27 (b) | | 672,000 | 638,805 |
| | | | 2,030,098 |
TOTAL FINANCIALS | | | 1,530,713,990 |
| HEALTH CARE - 0.7% | | | |
| Biotechnology - 0.1% | | | |
| AbbVie, Inc.: | | | |
| 2.95% 11/21/26 | | 35,000 | 32,763 |
| 3.2% 11/21/29 | | 529,000 | 476,815 |
| 4.05% 11/21/39 | | 17,573,000 | 15,062,051 |
| 4.55% 3/15/35 | | 1,449,000 | 1,370,596 |
| 4.7% 5/14/45 | | 5,975,000 | 5,373,453 |
| 4.875% 11/14/48 | | 578,000 | 533,612 |
| Amgen, Inc.: | | | |
| 2.6% 8/19/26 | | 3,835,000 | 3,565,579 |
| 2.8% 8/15/41 | | 2,130,000 | 1,469,144 |
| 3.15% 2/21/40 | | 155,000 | 115,643 |
| 5.25% 3/2/30 | | 9,442,000 | 9,455,072 |
| 5.25% 3/2/33 | | 3,916,000 | 3,895,638 |
| 5.6% 3/2/43 | | 8,292,000 | 8,136,282 |
| 5.65% 3/2/53 | | 1,849,000 | 1,832,998 |
| 5.75% 3/2/63 | | 4,633,000 | 4,575,294 |
| Emergent BioSolutions, Inc. 3.875% 8/15/28 (b) | | 194,000 | 93,120 |
| Gilead Sciences, Inc.: | | | |
| 1.65% 10/1/30 | | 172,000 | 138,182 |
| 2.6% 10/1/40 | | 1,466,000 | 1,024,197 |
| 4.5% 2/1/45 | | 190,000 | 167,033 |
| Grifols SA 4.75% 10/15/28 (b) | | 200,000 | 175,466 |
| Regeneron Pharmaceuticals, Inc. 1.75% 9/15/30 | | 195,000 | 155,190 |
| | | | 57,648,128 |
| Health Care Equipment & Supplies - 0.0% | | | |
| Abbott Laboratories 4.75% 11/30/36 | | 240,000 | 238,264 |
| AdaptHealth LLC 4.625% 8/1/29 (b) | | 128,000 | 104,589 |
| Avantor Funding, Inc.: | | | |
| 3.875% 7/15/28 (Reg. S) | EUR | 2,500,000 | 2,490,790 |
| 4.625% 7/15/28 (b) | | 753,000 | 698,998 |
| Becton, Dickinson & Co. 3.7% 6/6/27 | | 168,000 | 159,289 |
| Hologic, Inc.: | | | |
| 3.25% 2/15/29 (b) | | 511,000 | 443,847 |
| 4.625% 2/1/28 (b) | | 33,000 | 30,873 |
| Mozart Borrower LP: | | | |
| 3.875% 4/1/29 (b) | | 2,751,000 | 2,401,555 |
| 5.25% 10/1/29 (b) | | 523,000 | 464,438 |
| Stryker Corp.: | | | |
| 3.375% 11/1/25 | | 430,000 | 412,473 |
| 3.5% 3/15/26 | | 775,000 | 744,311 |
| Teleflex, Inc. 4.25% 6/1/28 (b) | | 210,000 | 192,910 |
| Varex Imaging Corp. 7.875% 10/15/27 (b) | | 32,000 | 31,840 |
| Werfenlife SA 4.625% 6/6/28 (Reg. S) | EUR | 400,000 | 431,520 |
| | | | 8,845,697 |
| Health Care Providers & Services - 0.4% | | | |
| 180 Medical, Inc. 3.875% 10/15/29 (b) | | 500,000 | 434,800 |
| Acadia Healthcare Co., Inc.: | | | |
| 5% 4/15/29 (b) | | 273,000 | 251,155 |
| 5.5% 7/1/28 (b) | | 118,000 | 111,787 |
| Aetna, Inc.: | | | |
| 3.875% 8/15/47 | | 426,000 | 319,614 |
| 4.125% 11/15/42 | | 51,000 | 40,478 |
| 4.5% 5/15/42 | | 6,000 | 5,000 |
| 4.75% 3/15/44 | | 95,000 | 81,815 |
| AHS Hospital Corp. 2.78% 7/1/51 | | 315,000 | 197,656 |
| Ascension Health: | | | |
| 2.532% 11/15/29 | | 295,000 | 255,085 |
| 3.106% 11/15/39 | | 610,000 | 462,812 |
| 3.945% 11/15/46 | | 20,000 | 16,289 |
| Banner Health 1.897% 1/1/31 | | 71,000 | 56,944 |
| BayCare Health System, Inc. 3.831% 11/15/50 | | 2,320,000 | 1,804,919 |
| Cencora, Inc. 2.7% 3/15/31 | | 5,980,000 | 5,030,210 |
| Centene Corp.: | | | |
| 2.45% 7/15/28 | | 6,335,000 | 5,423,281 |
| 2.625% 8/1/31 | | 2,980,000 | 2,370,675 |
| 3% 10/15/30 | | 7,638,000 | 6,388,881 |
| 3.375% 2/15/30 | | 5,670,000 | 4,852,367 |
| 4.25% 12/15/27 | | 5,825,000 | 5,448,753 |
| 4.625% 12/15/29 | | 8,604,000 | 7,911,378 |
| Children's Health System of Texas 2.511% 8/15/50 | | 360,000 | 215,820 |
| Children's Hospital District of Columbia 2.928% 7/15/50 | | 22,000 | 13,907 |
| Childrens Hospital Corp. 4.115% 1/1/47 | | 265,000 | 224,921 |
| Cigna Group: | | | |
| 2.375% 3/15/31 | | 65,000 | 53,490 |
| 2.4% 3/15/30 | | 4,245,000 | 3,573,278 |
| 3.25% 4/15/25 | | 355,000 | 341,799 |
| 4.375% 10/15/28 | | 6,825,000 | 6,572,751 |
| 4.5% 2/25/26 | | 3,894,000 | 3,815,027 |
| CommonSpirit Health: | | | |
| 1.547% 10/1/25 | | 37,000 | 34,045 |
| 2.76% 10/1/24 | | 575,000 | 557,147 |
| 2.782% 10/1/30 | | 37,000 | 31,077 |
| 3.91% 10/1/50 | | 36,000 | 27,058 |
| Community Health Systems, Inc.: | | | |
| 4.75% 2/15/31 (b) | | 744,000 | 554,280 |
| 5.625% 3/15/27 (b) | | 564,000 | 496,288 |
| 6% 1/15/29 (b) | | 78,000 | 65,325 |
| 6.875% 4/15/29 (b) | | 140,000 | 85,865 |
| Cottage Health Obligated Group 3.304% 11/1/49 | | 14,000 | 9,945 |
| CVS Health Corp.: | | | |
| 2.7% 8/21/40 | | 9,385,000 | 6,302,994 |
| 4.3% 3/25/28 | | 152,000 | 145,990 |
| 4.78% 3/25/38 | | 1,320,000 | 1,182,136 |
| 5.05% 3/25/48 | | 3,000,000 | 2,631,333 |
| 5.125% 2/21/30 | | 1,368,000 | 1,347,436 |
| 5.125% 7/20/45 | | 1,965,000 | 1,750,452 |
| 5.25% 1/30/31 | | 138,000 | 136,366 |
| 5.25% 2/21/33 | | 70,000 | 68,455 |
| 5.773% 1/10/33 (b) | | 8,146 | 7,996 |
| 5.875% 6/1/53 | | 1,125,000 | 1,098,979 |
| DaVita HealthCare Partners, Inc.: | | | |
| 3.75% 2/15/31 (b) | | 1,956,000 | 1,557,647 |
| 4.625% 6/1/30 (b) | | 737,000 | 632,164 |
| Elevance Health, Inc.: | | | |
| 3.65% 12/1/27 | | 1,260,000 | 1,187,642 |
| 4.101% 3/1/28 | | 1,570,000 | 1,503,489 |
| 4.625% 5/15/42 | | 1,770,000 | 1,572,414 |
| 5.125% 2/15/53 | | 392,000 | 368,554 |
| Encompass Health Corp.: | | | |
| 4.5% 2/1/28 | | 150,000 | 139,332 |
| 4.625% 4/1/31 | | 41,000 | 35,954 |
| 4.75% 2/1/30 | | 486,000 | 442,670 |
| Fresenius Medical Care U.S. Finance III, Inc. 1.875% 12/1/26 (b) | | 660,000 | 576,918 |
| Hartford Healthcare 3.447% 7/1/54 | | 68,000 | 45,258 |
| HCA Holdings, Inc.: | | | |
| 2.375% 7/15/31 | | 1,937,000 | 1,529,086 |
| 3.5% 9/1/30 | | 3,318,000 | 2,898,026 |
| 3.5% 7/15/51 | | 53,000 | 35,332 |
| 3.625% 3/15/32 | | 1,631,000 | 1,402,777 |
| 4.125% 6/15/29 | | 4,917,000 | 4,541,866 |
| 4.5% 2/15/27 | | 709,000 | 685,605 |
| 5.25% 4/15/25 | | 746,000 | 738,917 |
| 5.25% 6/15/26 | | 532,000 | 525,535 |
| 5.25% 6/15/49 | | 1,000,000 | 872,783 |
| 5.375% 2/1/25 | | 305,000 | 302,961 |
| 5.375% 9/1/26 | | 272,000 | 270,027 |
| 5.5% 6/15/47 | | 590,000 | 537,144 |
| 5.625% 9/1/28 | | 1,212,000 | 1,209,390 |
| 5.875% 2/15/26 | | 1,135,000 | 1,136,548 |
| 5.875% 2/1/29 | | 143,000 | 143,882 |
| 7.75% 7/15/36 | | 2,700,000 | 2,946,843 |
| HealthEquity, Inc. 4.5% 10/1/29 (b) | | 45,000 | 39,905 |
| Humana, Inc. 3.7% 3/23/29 | | 2,425,000 | 2,245,175 |
| Kaiser Foundation Hospitals: | | | |
| 2.81% 6/1/41 | | 6,820,000 | 4,845,951 |
| 3.002% 6/1/51 | | 975,000 | 656,512 |
| 4.15% 5/1/47 | | 200,000 | 170,681 |
| Kedrion SpA 6.5% 9/1/29 (b) | | 1,859,000 | 1,580,150 |
| Laboratory Corp. of America Holdings 3.6% 2/1/25 | | 1,410,000 | 1,367,681 |
| McKesson Corp. 0.9% 12/3/25 | | 79,000 | 71,548 |
| Memorial Health Services 3.447% 11/1/49 | | 18,000 | 13,064 |
| Memorial Sloan-Kettring Cancer Center: | | | |
| 2.955% 1/1/50 | | 290,000 | 195,422 |
| 4.125% 7/1/52 | | 6,000 | 4,967 |
| 4.2% 7/1/55 | | 162,000 | 133,489 |
| 5% 7/1/42 | | 350,000 | 335,620 |
| Methodist Hospital 2.705% 12/1/50 | | 820,000 | 519,713 |
| MidMichigan Health 3.409% 6/1/50 | | 27,000 | 18,570 |
| ModivCare Escrow Issuer, Inc. 5% 10/1/29 (b) | | 1,955,000 | 1,441,813 |
| Molina Healthcare, Inc.: | | | |
| 3.875% 11/15/30 (b) | | 100,000 | 85,326 |
| 3.875% 5/15/32 (b) | | 155,000 | 128,607 |
| Mount Sinai Hospital: | | | |
| 3.737% 7/1/49 | | 460,000 | 343,946 |
| 3.981% 7/1/48 | | 19,000 | 14,814 |
| Multicare Health System 2.803% 8/15/50 | | 10,000 | 6,008 |
| New York & Presbyterian Hospital: | | | |
| 2.606% 8/1/60 | | 20,000 | 11,160 |
| 4.024% 8/1/45 | | 600,000 | 497,346 |
| 4.063% 8/1/56 | | 390,000 | 315,924 |
| NYU Hospitals Center: | | | |
| 3.38% 7/1/55 | | 32,000 | 21,702 |
| 4.368% 7/1/47 | | 810,000 | 684,482 |
| OhioHealth Corp. 2.297% 11/15/31 | | 8,505,000 | 6,942,733 |
| Owens & Minor, Inc.: | | | |
| 4.375% 12/15/24 | | 35,000 | 33,974 |
| 4.5% 3/31/29 (b) | | 320,000 | 271,200 |
| 6.625% 4/1/30 (b) | | 134,000 | 121,901 |
| PeaceHealth Obligated Group 1.375% 11/15/25 | | 165,000 | 150,353 |
| Pediatrix Medical Group, Inc. 5.375% 2/15/30 (b) | | 170,000 | 155,032 |
| Piedmont Healthcare, Inc.: | | | |
| 2.719% 1/1/42 | | 1,780,000 | 1,181,227 |
| 2.864% 1/1/52 | | 1,055,000 | 669,101 |
| Prime Healthcare Services 7.25% 11/1/25 (b) | | 1,325,000 | 1,241,309 |
| Providence St. Joseph Health Obligated Group: | | | |
| 2.532% 10/1/29 | | 2,405,000 | 2,041,331 |
| 2.746% 10/1/26 | | 180,000 | 165,498 |
| Quest Diagnostics, Inc.: | | | |
| 2.95% 6/30/30 | | 54,000 | 46,893 |
| 4.7% 3/30/45 | | 150,000 | 130,775 |
| 5.75% 1/30/40 | | 93,000 | 86,954 |
| RP Escrow Issuer LLC 5.25% 12/15/25 (b) | | 325,000 | 250,322 |
| Sabra Health Care LP 3.2% 12/1/31 | | 8,620,000 | 6,583,934 |
| Select Medical Corp. 6.25% 8/15/26 (b) | | 20,000 | 19,810 |
| Sentara Healthcare 2.927% 11/1/51 | | 565,000 | 367,975 |
| Stanford Health Care 3.027% 8/15/51 | | 680,000 | 457,981 |
| Surgery Center Holdings, Inc. 6.75% 7/1/25 (b) | | 108,000 | 107,460 |
| Sutter Health 4.091% 8/15/48 | | 1,240,000 | 998,100 |
| Tenet Healthcare Corp.: | | | |
| 4.25% 6/1/29 | | 1,613,000 | 1,440,097 |
| 4.375% 1/15/30 | | 300,000 | 266,501 |
| 4.625% 6/15/28 | | 1,384,000 | 1,274,412 |
| 4.875% 1/1/26 | | 1,412,000 | 1,368,768 |
| 5.125% 11/1/27 | | 3,870,000 | 3,679,733 |
| 6.125% 6/15/30 | | 741,000 | 718,021 |
| 6.25% 2/1/27 | | 14,000 | 13,786 |
| Texas Health Resources: | | | |
| 2.328% 11/15/50 | | 14,000 | 7,936 |
| 4.33% 11/15/55 | | 31,000 | 26,401 |
| Toledo Hospital 5.325% 11/15/28 | | 2,792,000 | 2,232,762 |
| UnitedHealth Group, Inc.: | | | |
| 3.05% 5/15/41 | | 2,030,000 | 1,515,861 |
| 3.25% 5/15/51 | | 3,742,000 | 2,657,488 |
| 3.7% 8/15/49 | | 115,000 | 89,280 |
| 3.75% 10/15/47 | | 32,000 | 25,282 |
| 3.875% 8/15/59 | | 23,000 | 17,790 |
| 3.95% 10/15/42 | | 17,000 | 14,118 |
| 4.25% 4/15/47 | | 770,000 | 654,558 |
| 4.25% 6/15/48 | | 575,000 | 487,623 |
| 4.5% 4/15/33 | | 5,670,000 | 5,461,480 |
| 4.625% 7/15/35 | | 2,000 | 1,936 |
| 4.625% 11/15/41 | | 110,000 | 100,796 |
| 4.95% 5/15/62 | | 275,000 | 254,065 |
| 5.05% 4/15/53 | | 1,087,000 | 1,037,583 |
| 5.2% 4/15/63 | | 11,209,000 | 10,743,905 |
| 5.8% 3/15/36 | | 820,000 | 868,863 |
| 5.875% 2/15/53 | | 828,000 | 885,548 |
| 6.05% 2/15/63 | | 126,000 | 137,256 |
| UPMC Health System: | | | |
| 5.035% 5/15/33 | | 800,000 | 787,872 |
| 5.377% 5/15/43 | | 655,000 | 635,054 |
| Yale-New Haven Health Services 2.496% 7/1/50 | | 28,000 | 16,224 |
| | | | 175,841,261 |
| Health Care Technology - 0.0% | | | |
| IQVIA, Inc.: | | | |
| 5% 10/15/26 (b) | | 230,000 | 222,163 |
| 5% 5/15/27 (b) | | 200,000 | 192,518 |
| 5.7% 5/15/28 (b) | | 3,150,000 | 3,138,304 |
| 6.5% 5/15/30 (b) | | 210,000 | 211,124 |
| | | | 3,764,109 |
| Life Sciences Tools & Services - 0.0% | | | |
| Agilent Technologies, Inc. 2.3% 3/12/31 | | 1,245,000 | 1,019,157 |
| Charles River Laboratories International, Inc.: | | | |
| 3.75% 3/15/29 (b) | | 347,000 | 306,273 |
| 4.25% 5/1/28 (b) | | 330,000 | 302,924 |
| Thermo Fisher Scientific, Inc.: | | | |
| 2% 10/15/31 | | 189,000 | 152,401 |
| 2.8% 10/15/41 | | 620,000 | 446,579 |
| 4.977% 8/10/30 | | 500,000 | 498,793 |
| 5.086% 8/10/33 | | 1,031,000 | 1,036,278 |
| | | | 3,762,405 |
| Pharmaceuticals - 0.2% | | | |
| AstraZeneca Finance LLC: | | | |
| 2.25% 5/28/31 | | 635,000 | 528,301 |
| 4.875% 3/3/33 | | 430,000 | 430,128 |
| 4.9% 3/3/30 | | 319,000 | 317,316 |
| Bausch Health Companies, Inc.: | | | |
| 4.875% 6/1/28 (b) | | 345,000 | 204,721 |
| 5% 1/30/28 (b) | | 81,000 | 35,196 |
| 5% 2/15/29 (b) | | 483,000 | 200,445 |
| 5.25% 1/30/30 (b) | | 825,000 | 348,225 |
| 5.25% 2/15/31 (b) | | 4,832,000 | 2,032,717 |
| 5.5% 11/1/25 (b) | | 596,000 | 536,734 |
| 5.75% 8/15/27 (b) | | 178,000 | 111,438 |
| 6.25% 2/15/29 (b) | | 1,500,000 | 656,250 |
| Bayer AG 4.625% 5/26/33 (Reg. S) | EUR | 450,000 | 494,912 |
| Bayer U.S. Finance II LLC: | | | |
| 4.25% 12/15/25 (b) | | 51,454,000 | 49,832,257 |
| 4.4% 7/15/44 (b) | | 3,231,000 | 2,548,136 |
| 4.625% 6/25/38 (b) | | 570,000 | 491,547 |
| 4.875% 6/25/48 (b) | | 930,000 | 792,691 |
| Bristol-Myers Squibb Co.: | | | |
| 2.35% 11/13/40 | | 407,000 | 274,992 |
| 3.7% 3/15/52 | | 164,000 | 126,126 |
| 4.125% 6/15/39 | | 300,000 | 264,955 |
| Catalent Pharma Solutions: | | | |
| 3.5% 4/1/30 (b) | | 1,302,000 | 1,094,887 |
| 5% 7/15/27 (b) | | 135,000 | 126,056 |
| Elanco Animal Health, Inc. 6.65% 8/28/28 (d) | | 1,808,000 | 1,783,140 |
| Eli Lilly & Co.: | | | |
| 2.25% 5/15/50 | | 60,000 | 37,034 |
| 4.95% 2/27/63 | | 320,000 | 312,588 |
| GSK Consumer Healthcare Capital U.S. LLC 3.625% 3/24/32 | | 1,305,000 | 1,159,277 |
| Jazz Securities DAC 4.375% 1/15/29 (b) | | 295,000 | 264,302 |
| Johnson & Johnson 3.625% 3/3/37 | | 695,000 | 614,822 |
| Merck & Co., Inc.: | | | |
| 2.75% 12/10/51 | | 139,000 | 91,217 |
| 3.4% 3/7/29 | | 1,400,000 | 1,303,803 |
| 5% 5/17/53 | | 203,000 | 198,274 |
| 5.15% 5/17/63 | | 99,000 | 96,636 |
| Mylan NV: | | | |
| 5.2% 4/15/48 | | 1,415,000 | 1,101,187 |
| 5.4% 11/29/43 | | 1,480,000 | 1,228,927 |
| Organon & Co. / Organon Foreign Debt Co-Issuer BV: | | | |
| 4.125% 4/30/28 (b) | | 290,000 | 262,439 |
| 5.125% 4/30/31 (b) | | 1,210,000 | 1,030,924 |
| Pfizer Investment Enterprises: | | | |
| 4.75% 5/19/33 | | 1,257,000 | 1,236,955 |
| 5.3% 5/19/53 | | 1,362,000 | 1,362,496 |
| 5.34% 5/19/63 | | 339,000 | 334,025 |
| Pfizer, Inc.: | | | |
| 3.9% 3/15/39 | | 86,000 | 74,574 |
| 4.1% 9/15/38 | | 87,000 | 77,979 |
| 4.3% 6/15/43 | | 117,000 | 105,473 |
| 4.4% 5/15/44 | | 280,000 | 254,932 |
| Royalty Pharma PLC 1.2% 9/2/25 | | 80,000 | 72,873 |
| Shire Acquisitions Investments Ireland DAC 3.2% 9/23/26 | | 84,000 | 78,902 |
| Takeda Pharmaceutical Co. Ltd.: | | | |
| 2.05% 3/31/30 | | 3,544,000 | 2,915,845 |
| 3.025% 7/9/40 | | 2,010,000 | 1,460,935 |
| Utah Acquisition Sub, Inc.: | | | |
| 3.95% 6/15/26 | | 4,024,000 | 3,803,524 |
| 5.25% 6/15/46 | | 190,000 | 150,126 |
| Valeant Pharmaceuticals International, Inc.: | | | |
| 8.5% 1/31/27 (b) | | 171,000 | 95,119 |
| 9.25% 4/1/26 (b) | | 136,000 | 123,186 |
| Viatris, Inc.: | | | |
| 2.3% 6/22/27 | | 120,000 | 104,933 |
| 2.7% 6/22/30 | | 5,898,000 | 4,789,955 |
| 3.85% 6/22/40 | | 13,139,000 | 9,196,061 |
| 4% 6/22/50 | | 6,222,000 | 4,121,468 |
| Wyeth LLC 5.95% 4/1/37 | | 32,000 | 34,304 |
| Zoetis, Inc.: | | | |
| 2% 5/15/30 | | 173,000 | 142,412 |
| 5.6% 11/16/32 | | 141,000 | 145,461 |
| | | | 101,614,138 |
TOTAL HEALTH CARE | | | 351,475,738 |
| INDUSTRIALS - 0.4% | | | |
| Aerospace & Defense - 0.2% | | | |
| BAE Systems PLC 3.4% 4/15/30 (b) | | 4,284,000 | 3,826,829 |
| Bombardier, Inc.: | | | |
| 6% 2/15/28 (b) | | 3,890,000 | 3,635,701 |
| 7.125% 6/15/26 (b) | | 2,780,000 | 2,733,263 |
| 7.875% 4/15/27 (b) | | 4,360,000 | 4,351,851 |
| BWX Technologies, Inc.: | | | |
| 4.125% 6/30/28 (b) | | 220,000 | 200,192 |
| 4.125% 4/15/29 (b) | | 602,000 | 535,690 |
| HEICO Corp. 5.25% 8/1/28 | | 1,220,000 | 1,210,242 |
| Howmet Aerospace, Inc.: | | | |
| 5.95% 2/1/37 | | 871,000 | 857,499 |
| 6.75% 1/15/28 | | 345,000 | 352,972 |
| Huntington Ingalls Industries, Inc.: | | | |
| 2.043% 8/16/28 | | 1,417,000 | 1,201,760 |
| 4.2% 5/1/30 | | 266,000 | 245,676 |
| L3Harris Technologies, Inc.: | | | |
| 2.9% 12/15/29 | | 1,062,000 | 923,975 |
| 4.4% 6/15/28 | | 757,000 | 727,839 |
| 5.4% 1/15/27 | | 3,505,000 | 3,513,514 |
| 5.4% 7/31/33 | | 115,000 | 115,193 |
| 5.6% 7/31/53 | | 120,000 | 120,764 |
| Lockheed Martin Corp.: | | | |
| 1.85% 6/15/30 | | 111,000 | 91,958 |
| 3.6% 3/1/35 | | 245,000 | 215,655 |
| 4.07% 12/15/42 | | 128,000 | 111,095 |
| 4.15% 6/15/53 | | 290,000 | 244,440 |
| 4.5% 5/15/36 | | 146,000 | 138,386 |
| 4.7% 5/15/46 | | 145,000 | 135,606 |
| 4.75% 2/15/34 | | 133,000 | 131,206 |
| Moog, Inc. 4.25% 12/15/27 (b) | | 360,000 | 327,602 |
| Northrop Grumman Corp.: | | | |
| 4.7% 3/15/33 | | 891,000 | 863,709 |
| 4.75% 6/1/43 | | 545,000 | 495,030 |
| 4.95% 3/15/53 | | 1,103,000 | 1,033,163 |
| 5.25% 5/1/50 | | 169,000 | 166,079 |
| Precision Castparts Corp. 4.375% 6/15/45 | | 70,000 | 60,347 |
| Rolls-Royce PLC: | | | |
| 3.375% 6/18/26 | GBP | 1,085,000 | 1,246,762 |
| 5.75% 10/15/27 (b) | | 165,000 | 160,179 |
| RTX Corp.: | | | |
| 1.9% 9/1/31 | | 210,000 | 164,442 |
| 2.375% 3/15/32 | | 1,000,000 | 804,691 |
| 3.03% 3/15/52 | | 2,026,000 | 1,332,132 |
| 4.125% 11/16/28 | | 1,666,000 | 1,589,938 |
| 4.35% 4/15/47 | | 4,000 | 3,365 |
| 4.5% 6/1/42 | | 138,000 | 120,355 |
| 5.15% 2/27/33 | | 186,000 | 183,879 |
| 5.375% 2/27/53 | | 126,000 | 122,817 |
| Spirit Aerosystems, Inc.: | | | |
| 7.5% 4/15/25 (b) | | 24,000 | 23,703 |
| 9.375% 11/30/29 (b) | | 211,000 | 219,886 |
| Textron, Inc. 2.45% 3/15/31 | | 3,899,000 | 3,204,808 |
| The Boeing Co.: | | | |
| 2.196% 2/4/26 | | 5,759,000 | 5,312,709 |
| 2.25% 6/15/26 | | 810,000 | 742,504 |
| 2.7% 2/1/27 | | 246,000 | 224,951 |
| 2.75% 2/1/26 | | 50,000 | 46,923 |
| 2.95% 2/1/30 | | 200,000 | 173,137 |
| 3.1% 5/1/26 | | 53,000 | 49,921 |
| 3.6% 5/1/34 | | 2,400,000 | 2,031,259 |
| 3.625% 2/1/31 | | 12,650,000 | 11,292,976 |
| 3.95% 8/1/59 | | 199,000 | 142,647 |
| 5.04% 5/1/27 | | 1,048,000 | 1,036,464 |
| 5.15% 5/1/30 | | 4,430,000 | 4,358,387 |
| 5.805% 5/1/50 | | 6,375,000 | 6,202,147 |
| 5.93% 5/1/60 | | 6,437,000 | 6,213,490 |
| TransDigm, Inc.: | | | |
| 4.875% 5/1/29 | | 220,000 | 197,953 |
| 6.25% 3/15/26 (b) | | 1,332,000 | 1,319,305 |
| 7.5% 3/15/27 | | 40,000 | 40,077 |
| Triumph Group, Inc. 7.75% 8/15/25 | | 69,000 | 65,102 |
| Wesco Aircraft Holdings, Inc. 9% (b)(c) | | 238,000 | 22,610 |
| | | | 77,216,755 |
| Air Freight & Logistics - 0.0% | | | |
| Cargo Aircraft Management, Inc. 4.75% 2/1/28 (b) | | 160,000 | 144,000 |
| Rand Parent LLC 8.5% 2/15/30 (b) | | 215,000 | 204,681 |
| | | | 348,681 |
| Building Products - 0.0% | | | |
| Advanced Drain Systems, Inc. 5% 9/30/27 (b) | | 500,000 | 477,500 |
| Builders FirstSource, Inc. 4.25% 2/1/32 (b) | | 915,000 | 777,905 |
| Carlisle Companies, Inc. 2.2% 3/1/32 | | 1,890,000 | 1,487,462 |
| Griffon Corp. 5.75% 3/1/28 | | 431,000 | 401,694 |
| Jeld-Wen, Inc.: | | | |
| 4.625% 12/15/25 (b) | | 275,000 | 266,599 |
| 4.875% 12/15/27 (b) | | 219,000 | 194,905 |
| Masco Corp. 1.5% 2/15/28 | | 60,000 | 51,063 |
| Owens Corning: | | | |
| 3.95% 8/15/29 | | 235,000 | 218,602 |
| 4.3% 7/15/47 | | 5,310,000 | 4,263,946 |
| PGT Innovations, Inc. 4.375% 10/1/29 (b) | | 237,000 | 219,922 |
| Standard Industries, Inc./New Jersey: | | | |
| 3.375% 1/15/31 (b) | | 92,000 | 73,371 |
| 4.375% 7/15/30 (b) | | 381,000 | 326,599 |
| 4.75% 1/15/28 (b) | | 3,794,000 | 3,494,272 |
| 5% 2/15/27 (b) | | 10,000 | 9,480 |
| | | | 12,263,320 |
| Commercial Services & Supplies - 0.0% | | | |
| ACCO Brands Corp. 4.25% 3/15/29 (b) | | 347,000 | 296,449 |
| ADT Corp.: | | | |
| 4.125% 8/1/29 (b) | | 348,000 | 303,741 |
| 4.875% 7/15/32 (b) | | 853,000 | 735,798 |
| Advocate Health & Hospitals Corp. 3.387% 10/15/49 | | 510,000 | 369,486 |
| Allied Universal Holdco LLC / Allied Universal Finance Corp.: | | | |
| 6% 6/1/29 (b) | | 1,175,000 | 898,617 |
| 6.625% 7/15/26 (b) | | 1,500,000 | 1,426,716 |
| Atlas Luxco 4 SARL / Allied Universal Holdco LLC / Allied Universal Finance Corp.: | | | |
| 4.625% 6/1/28 (b) | | 1,030,000 | 875,500 |
| 4.625% 6/1/28 (b) | | 520,000 | 439,616 |
| Brand Energy & Infrastructure Services, Inc. 10.375% 8/1/30 (b) | | 160,000 | 165,005 |
| Clean Harbors, Inc.: | | | |
| 5.125% 7/15/29 (b) | | 95,000 | 89,919 |
| 6.375% 2/1/31 (b) | | 45,000 | 44,749 |
| Enviri Corp. 5.75% 7/31/27 (b) | | 32,000 | 27,750 |
| Garda World Security Corp.: | | | |
| 4.625% 2/15/27 (b) | | 54,000 | 49,956 |
| 9.5% 11/1/27 (b) | | 24,000 | 23,213 |
| GFL Environmental, Inc.: | | | |
| 3.5% 9/1/28 (b) | | 16,000 | 14,134 |
| 3.75% 8/1/25 (b) | | 118,000 | 112,343 |
| 4% 8/1/28 (b) | | 155,000 | 138,371 |
| 4.75% 6/15/29 (b) | | 463,000 | 419,439 |
| Legends Hospitality Holding Co. LLC/Legends Hospitality Co-Issuer, Inc. 5% 2/1/26 (b) | | 60,000 | 56,382 |
| Madison IAQ LLC 4.125% 6/30/28 (b) | | 1,142,000 | 1,010,365 |
| Neptune BidCo U.S., Inc. 9.29% 4/15/29 (b) | | 210,000 | 196,102 |
| Pitney Bowes, Inc.: | | | |
| 6.875% 3/15/27 (b) | | 55,000 | 41,528 |
| 7.25% 3/15/29 (b) | | 110,000 | 79,783 |
| PowerTeam Services LLC 9.033% 12/4/25 (b) | | 756,000 | 703,358 |
| Prime Securities Services Borrower LLC/Prime Finance, Inc.: | | | |
| 3.375% 8/31/27 (b) | | 385,000 | 342,420 |
| 5.75% 4/15/26 (b) | | 203,000 | 199,213 |
| 6.25% 1/15/28 (b) | | 18,000 | 17,143 |
| Republic Services, Inc.: | | | |
| 1.45% 2/15/31 | | 58,000 | 44,887 |
| 2.375% 3/15/33 | | 3,000 | 2,386 |
| 5% 4/1/34 | | 133,000 | 130,616 |
| Stericycle, Inc.: | | | |
| 3.875% 1/15/29 (b) | | 834,000 | 726,148 |
| 5.375% 7/15/24 (b) | | 36,000 | 35,874 |
| The Brink's Co. 4.625% 10/15/27 (b) | | 95,000 | 88,338 |
| The Ford Foundation 2.815% 6/1/70 | | 85,000 | 50,669 |
| Waste Management, Inc.: | | | |
| 1.5% 3/15/31 | | 80,000 | 62,357 |
| 4.625% 2/15/33 | | 56,000 | 53,855 |
| 4.875% 2/15/34 | | 186,000 | 181,572 |
| Waste Pro U.S.A., Inc. 5.5% 2/15/26 (b) | | 808,000 | 761,529 |
| | | | 11,215,327 |
| Construction & Engineering - 0.0% | | | |
| AECOM 5.125% 3/15/27 | | 1,175,000 | 1,127,337 |
| Arcosa, Inc. 4.375% 4/15/29 (b) | | 65,000 | 58,466 |
| Bioceanico Sovereign Certificate Ltd. 0% 6/5/34 (b) | | 133,582 | 93,313 |
| Cloud Crane LLC 11.5% 9/1/28 (b) | | 900,000 | 902,340 |
| Dycom Industries, Inc. 4.5% 4/15/29 (b) | | 492,000 | 439,297 |
| Greensaif Pipelines Bidco SARL 6.51% 2/23/42 (b) | | 200,000 | 201,946 |
| MasTec, Inc.: | | | |
| 4.5% 8/15/28 (b) | | 297,000 | 270,980 |
| 6.625% 8/15/29 (b) | | 43,000 | 41,138 |
| SRS Distribution, Inc. 4.625% 7/1/28 (b) | | 343,000 | 305,278 |
| TMS Issuer SARL 5.78% 8/23/32 (Reg. S) | | 1,160,000 | 1,176,112 |
| | | | 4,616,207 |
| Electrical Equipment - 0.0% | | | |
| EnerSys 4.375% 12/15/27 (b) | | 31,000 | 28,365 |
| Regal Rexnord Corp.: | | | |
| 6.05% 2/15/26 (b) | | 41,000 | 40,779 |
| 6.05% 4/15/28 (b) | | 83,000 | 82,121 |
| 6.3% 2/15/30 (b) | | 35,000 | 34,846 |
| 6.4% 4/15/33 (b) | | 49,000 | 48,540 |
| Sensata Technologies BV: | | | |
| 4% 4/15/29 (b) | | 370,000 | 324,900 |
| 5% 10/1/25 (b) | | 16,000 | 15,594 |
| 5.625% 11/1/24 (b) | | 74,000 | 73,334 |
| Vertiv Group Corp. 4.125% 11/15/28 (b) | | 526,000 | 472,223 |
| Wesco Distribution, Inc.: | | | |
| 7.125% 6/15/25 (b) | | 1,692,000 | 1,699,474 |
| 7.25% 6/15/28 (b) | | 1,733,000 | 1,763,735 |
| | | | 4,583,911 |
| Ground Transportation - 0.0% | | | |
| Alpha Trains Finance SA 2.064% 6/30/30 | EUR | 950,000 | 970,653 |
| Avis Budget Car Rental LLC/Avis Budget Finance, Inc.: | | | |
| 5.375% 3/1/29 (b) | | 58,000 | 53,244 |
| 5.75% 7/15/27 (b) | | 379,000 | 361,862 |
| Burlington Northern Santa Fe LLC: | | | |
| 3.55% 2/15/50 | | 166,000 | 127,022 |
| 4.375% 9/1/42 | | 73,000 | 64,112 |
| 4.45% 1/15/53 | | 194,000 | 172,867 |
| 4.55% 9/1/44 | | 166,000 | 148,682 |
| 5.2% 4/15/54 | | 1,420,000 | 1,397,159 |
| 5.4% 6/1/41 | | 150,000 | 149,757 |
| 6.15% 5/1/37 | | 21,000 | 22,856 |
| 7.082% 5/13/29 | | 2,000 | 2,143 |
| Canadian Pacific Railway Co.: | | | |
| 2.875% 11/15/29 | | 265,000 | 233,177 |
| 3.1% 12/2/51 | | 115,000 | 78,065 |
| CSX Corp.: | | | |
| 2.5% 5/15/51 | | 295,000 | 179,055 |
| 3.25% 6/1/27 | | 37,000 | 34,823 |
| 4.25% 11/1/66 | | 90,000 | 72,163 |
| 4.5% 11/15/52 | | 45,000 | 39,127 |
| 6.15% 5/1/37 | | 1,475,000 | 1,571,901 |
| Norfolk Southern Corp.: | | | |
| 3.155% 5/15/55 | | 317,000 | 208,987 |
| 3.7% 3/15/53 | | 108,000 | 80,257 |
| 3.942% 11/1/47 | | 121,000 | 95,898 |
| 3.95% 10/1/42 | | 105,000 | 84,229 |
| 4.05% 8/15/52 | | 145,000 | 115,123 |
| 4.55% 6/1/53 | | 243,000 | 210,077 |
| Ryder System, Inc. 5.25% 6/1/28 | | 60,000 | 59,247 |
| Uber Technologies, Inc.: | | | |
| 4.5% 8/15/29 (b) | | 407,000 | 372,654 |
| 7.5% 5/15/25 (b) | | 79,000 | 79,763 |
| Union Pacific Corp.: | | | |
| 2.4% 2/5/30 | | 95,000 | 81,771 |
| 2.973% 9/16/62 | | 200,000 | 122,982 |
| 3.6% 9/15/37 | | 1,015,000 | 848,968 |
| 3.799% 4/6/71 | | 315,000 | 231,336 |
| 3.839% 3/20/60 | | 909,000 | 696,255 |
| 4.95% 5/15/53 | | 135,000 | 129,645 |
| XPO, Inc.: | | | |
| 6.25% 5/1/25 (b) | | 154,000 | 151,553 |
| 6.25% 6/1/28 (b) | | 213,000 | 208,714 |
| 7.125% 6/1/31 (b) | | 645,000 | 648,429 |
| XPO Escrow Sub LLC 7.5% 11/15/27 (b) | | 150,000 | 152,514 |
| | | | 10,257,070 |
| Machinery - 0.0% | | | |
| Caterpillar, Inc. 3.803% 8/15/42 | | 19,000 | 16,105 |
| Chart Industries, Inc. 7.5% 1/1/30 (b) | | 899,000 | 921,155 |
| Deere & Co.: | | | |
| 3.1% 4/15/30 | | 200,000 | 181,257 |
| 3.9% 6/9/42 | | 55,000 | 48,328 |
| Eaton Corp.: | | | |
| 4.15% 3/15/33 | | 95,000 | 89,570 |
| 4.15% 11/2/42 | | 73,000 | 63,369 |
| 4.7% 8/23/52 | | 595,000 | 553,028 |
| Flowserve Corp. 2.8% 1/15/32 | | 405,000 | 321,620 |
| Hillenbrand, Inc. 3.75% 3/1/31 | | 291,000 | 244,367 |
| OT Merger Corp. 7.875% 10/15/29 (b) | | 1,000,000 | 654,603 |
| Otis Worldwide Corp.: | | | |
| 2.056% 4/5/25 | | 73,000 | 69,172 |
| 5.25% 8/16/28 | | 735,000 | 739,758 |
| Parker Hannifin Corp.: | | | |
| 3.25% 3/1/27 | | 45,000 | 42,339 |
| 4.25% 9/15/27 | | 160,000 | 155,211 |
| 6.25% 5/15/38 | | 12,000 | 12,692 |
| Pentair Finance SA 4.5% 7/1/29 | | 8,070,000 | 7,544,712 |
| Terex Corp. 5% 5/15/29 (b) | | 180,000 | 165,267 |
| Trinity Industries, Inc. 7.75% 7/15/28 (b) | | 165,000 | 167,877 |
| Westinghouse Air Brake Tech Co.: | | | |
| 3.45% 11/15/26 | | 1,490,000 | 1,400,843 |
| 4.95% 9/15/28 | | 9,085,000 | 8,762,883 |
| Xylem, Inc. 1.95% 1/30/28 | | 15,000 | 13,160 |
| | | | 22,167,316 |
| Marine Transportation - 0.0% | | | |
| Seaspan Corp. 5.5% 8/1/29 (b) | | 115,000 | 89,385 |
| Passenger Airlines - 0.1% | | | |
| Air Canada 2013-1 Pass Through Trust equipment trust certificate 4.125% 11/15/26 (b) | | 97,896 | 93,421 |
| Air Canada 2015-1 Pass Through Trust equipment trust certificate 3.6% 9/15/28 (b) | | 78,242 | 72,923 |
| Air Canada 2015-2 Class AA equipment trust certificate 3.75% 6/15/29 (b) | | 21,198 | 19,584 |
| Air Canada 2017-1 Pass-Through Trust: | | | |
| 2017-1, 3.3% 7/15/31 (b) | | 435,240 | 383,497 |
| equipment trust certificate: | | | |
| 3.55% 7/15/31 (b) | | 26,040 | 22,520 |
| 3.7% 7/15/27 (b) | | 59,738 | 56,863 |
| American Airlines 2015-2 Pass Through Trust equipment trust certificate 4% 3/22/29 | | 58,151 | 52,846 |
| American Airlines, Inc.: | | | |
| equipment trust certificate 3.2% 12/15/29 | | 396,593 | 360,304 |
| 3% 4/15/30 | | 27,194 | 24,244 |
| 7.25% 2/15/28 (b) | | 80,000 | 78,585 |
| 11.75% 7/15/25 (b) | | 68,000 | 74,429 |
| American Airlines, Inc. / AAdvantage Loyalty IP Ltd.: | | | |
| 5.5% 4/20/26 (b) | | 318,103 | 312,149 |
| 5.75% 4/20/29 (b) | | 990,520 | 947,314 |
| British Airways 2013-1 Class A Pass Through Trust equipment trust certificate 4.625% 12/20/25 (b) | | 21,762 | 21,509 |
| British Airways 2018-1 Class A Pass Through Trust equipment trust certificate 4.125% 3/20/33 (b) | | 46,567 | 41,872 |
| British Airways 2019-1 Class AA Pass Through Trust equipment trust certificate: | | | |
| 3.3% 6/15/34 (b) | | 13,825 | 12,096 |
| 3.35% 12/15/30 (b) | | 30,228 | 26,877 |
| Delta Air Lines Pass Through Trust 3.204% 10/25/25 | | 183,000 | 179,630 |
| Delta Air Lines Pass Through Trust 2015-1AA equipment trust certificate 3.625% 1/30/29 | | 80,805 | 75,930 |
| Delta Air Lines, Inc. 4.375% 4/19/28 | | 160,000 | 151,120 |
| Mexico City Airport Trust: | | | |
| 4.25% 10/31/26 (b) | | 4,270,000 | 4,060,023 |
| 5.5% 10/31/46 (b) | | 1,092,000 | 900,354 |
| 5.5% 7/31/47 (b) | | 3,767,000 | 3,117,193 |
| Mileage Plus Holdings LLC 6.5% 6/20/27 (b) | | 193,330 | 192,655 |
| Southwest Airlines Co.: | | | |
| 2.625% 2/10/30 | | 735,000 | 620,900 |
| 5.125% 6/15/27 | | 5,340,000 | 5,276,645 |
| Spirit Airlines 2017-1AA Pass Through Trust equipment trust certificate 3.375% 8/15/31 | | 16,727 | 14,736 |
| United Airlines 2014-1 Pass Through Trust equipment trust certificate 4% 10/11/27 | | 61,237 | 58,355 |
| United Airlines 2014-2 Pass Through Trust equipment trust certificate 3.75% 3/3/28 | | 9,870 | 9,290 |
| United Airlines 2016-2 Class A Pass Through Trust 3.1% 4/7/30 | | 20,569 | 17,840 |
| United Airlines 2016-2 Class AA Pass Through Trust 2.875% 4/7/30 | | 36,881 | 32,905 |
| United Airlines 2016-2 Class B Pass Through Trust 3.65% 4/7/27 | | 30,678 | 28,913 |
| United Airlines 2019-1 Class AA Pass Through Trust 4.15% 2/25/33 | | 35,621 | 33,152 |
| United Airlines Pass-Through Trust: | | | |
| Series 2018-1, 3.5% 9/1/31 | | 796,880 | 714,883 |
| Series 2023-1 Class A, 5.8% 7/15/37 | | 6,000,000 | 5,979,016 |
| United Airlines pass-thru trust equipment trust certificate 3.1% 1/7/30 | | 26,653 | 24,323 |
| United Airlines pass-thru Trust Series 2013-1A Class O, 4.3% 2/15/27 | | 124,482 | 119,292 |
| United Airlines, Inc.: | | | |
| equipment trust certificate: | | | |
| Series 2012-2B 4% 4/29/26 | | 109,635 | 106,937 |
| 4.15% 10/11/25 | | 2,539 | 2,508 |
| 4.375% 4/15/26 (b) | | 2,258,000 | 2,128,011 |
| 4.55% 2/25/33 | | 42,222 | 37,980 |
| 4.625% 4/15/29 (b) | | 595,000 | 529,045 |
| United Airlines, Inc. 2018-1A Pass Through Trust 3.7% 9/1/31 | | 29,020 | 25,150 |
| United Airlines, Inc. 2019-2AA Pass Through Trust 2.7% 11/1/33 | | 46,386 | 39,075 |
| United Continental Holdings, Inc. 4.875% 1/15/25 | | 65,000 | 63,410 |
| | | | 27,140,304 |
| Professional Services - 0.0% | | | |
| ASGN, Inc. 4.625% 5/15/28 (b) | | 110,000 | 98,855 |
| Booz Allen Hamilton, Inc.: | | | |
| 3.875% 9/1/28 (b) | | 320,000 | 290,557 |
| 4% 7/1/29 (b) | | 45,000 | 40,386 |
| 5.95% 8/4/33 | | 468,000 | 473,345 |
| Equifax, Inc.: | | | |
| 2.35% 9/15/31 | | 250,000 | 195,931 |
| 2.6% 12/1/24 | | 2,095,000 | 2,013,628 |
| TriNet Group, Inc.: | | | |
| 3.5% 3/1/29 (b) | | 165,000 | 142,062 |
| 7.125% 8/15/31 (b) | | 110,000 | 110,618 |
| | | | 3,365,382 |
| Trading Companies & Distributors - 0.0% | | | |
| Air Lease Corp.: | | | |
| 1.875% 8/15/26 | | 93,000 | 83,217 |
| 2.3% 2/1/25 | | 29,000 | 27,445 |
| 2.875% 1/15/26 | | 76,000 | 71,035 |
| 3.25% 3/1/25 | | 7,000 | 6,699 |
| 3.25% 10/1/29 | | 29,000 | 25,279 |
| 3.375% 7/1/25 | | 7,765,000 | 7,397,970 |
| 5.85% 12/15/27 | | 1,023,000 | 1,022,983 |
| Beacon Roofing Supply, Inc. 6.5% 8/1/30 (b) | | 115,000 | 113,602 |
| Herc Holdings, Inc. 5.5% 7/15/27 (b) | | 372,000 | 357,706 |
| Travis Perkins PLC 3.75% 2/17/26 (Reg. S) | GBP | 600,000 | 682,540 |
| United Rentals North America, Inc.: | | | |
| 3.75% 1/15/32 | | 825,000 | 693,759 |
| 3.875% 2/15/31 | | 238,000 | 203,577 |
| 4% 7/15/30 | | 175,000 | 153,356 |
| 4.875% 1/15/28 | | 2,625,000 | 2,497,559 |
| 5.25% 1/15/30 | | 195,000 | 185,312 |
| W.W. Grainger, Inc. 4.6% 6/15/45 | | 15,000 | 13,720 |
| | | | 13,535,759 |
| Transportation Infrastructure - 0.1% | | | |
| Avolon Holdings Funding Ltd.: | | | |
| 2.125% 2/21/26 (b) | | 655,000 | 588,528 |
| 2.528% 11/18/27 (b) | | 6,873,000 | 5,867,321 |
| 2.875% 2/15/25 (b) | | 262,000 | 247,210 |
| 3.95% 7/1/24 (b) | | 2,862,000 | 2,791,664 |
| 4.25% 4/15/26 (b) | | 314,000 | 296,121 |
| 4.375% 5/1/26 (b) | | 3,477,000 | 3,277,753 |
| 5.125% 10/1/23 (b) | | 104,000 | 103,832 |
| 5.25% 5/15/24 (b) | | 4,602,000 | 4,543,216 |
| 5.5% 1/15/26 (b) | | 93,000 | 90,540 |
| 6.375% 5/4/28 (b) | | 6,246,000 | 6,195,764 |
| DP World Ltd. 2.375% 9/25/26 (b) | EUR | 1,430,000 | 1,454,854 |
| First Student Bidco, Inc./First Transit Parent, Inc. 4% 7/31/29 (b) | | 159,000 | 135,151 |
| Heathrow Funding Ltd. 2.625% 3/16/28 (Reg. S) | GBP | 735,000 | 777,891 |
| Holding d'Infrastructures et des Metiers de l'Environnement 0.625% 9/16/28 (Reg. S) | EUR | 300,000 | 269,896 |
| Sydney Airport Finance Co. Property Ltd. 3.375% 4/30/25 (b) | | 38,000 | 36,540 |
| Transurban Finance Co. Pty Ltd. 2.45% 3/16/31 (b) | | 118,000 | 96,082 |
| | | | 26,772,363 |
TOTAL INDUSTRIALS | | | 213,571,780 |
| INFORMATION TECHNOLOGY - 0.3% | | | |
| Communications Equipment - 0.0% | | | |
| Bank of America NA 5.526% 8/18/26 | | 400,000 | 401,946 |
| Ciena Corp. 4% 1/31/30 (b) | | 100,000 | 86,250 |
| Commscope Technologies LLC 5% 3/15/27 (b) | | 43,000 | 23,907 |
| CommScope, Inc.: | | | |
| 4.75% 9/1/29 (b) | | 84,000 | 62,424 |
| 6% 3/1/26 (b) | | 483,000 | 438,934 |
| Hughes Satellite Systems Corp. 6.625% 8/1/26 | | 300,000 | 260,250 |
| Motorola Solutions, Inc.: | | | |
| 5.5% 9/1/44 | | 108,000 | 99,123 |
| 5.6% 6/1/32 | | 971,000 | 958,433 |
| Viavi Solutions, Inc. 3.75% 10/1/29 (b) | | 230,000 | 191,456 |
| | | | 2,522,723 |
| Electronic Equipment, Instruments & Components - 0.1% | | | |
| Arrow Electronics, Inc.: | | | |
| 2.95% 2/15/32 | | 10,000 | 8,026 |
| 3.875% 1/12/28 | | 6,000 | 5,554 |
| 4% 4/1/25 | | 19,000 | 18,448 |
| Coherent Corp. 5% 12/15/29 (b) | | 833,000 | 739,871 |
| Corning, Inc.: | | | |
| 3.9% 11/15/49 | | 35,000 | 26,281 |
| 5.35% 11/15/48 | | 146,000 | 137,240 |
| Dell International LLC/EMC Corp.: | | | |
| 4.9% 10/1/26 | | 303,000 | 297,578 |
| 5.25% 2/1/28 | | 371,000 | 370,129 |
| 5.3% 10/1/29 | | 275,000 | 271,514 |
| Imola Merger Corp. 4.75% 5/15/29 (b) | | 517,000 | 459,539 |
| Sensata Technologies, Inc.: | | | |
| 3.75% 2/15/31 (b) | | 621,000 | 520,357 |
| 4.375% 2/15/30 (b) | | 200,000 | 176,895 |
| TD SYNNEX Corp. 1.75% 8/9/26 | | 6,930,000 | 6,108,658 |
| Teledyne Technologies, Inc.: | | | |
| 2.25% 4/1/28 | | 1,675,000 | 1,460,341 |
| 2.75% 4/1/31 | | 4,505,000 | 3,759,448 |
| TTM Technologies, Inc. 4% 3/1/29 (b) | | 130,000 | 112,918 |
| | | | 14,472,797 |
| IT Services - 0.0% | | | |
| Arches Buyer, Inc. 4.25% 6/1/28 (b) | | 323,000 | 280,961 |
| CGI, Inc. 1.45% 9/14/26 | | 109,000 | 96,427 |
| Gartner, Inc.: | | | |
| 3.625% 6/15/29 (b) | | 365,000 | 320,598 |
| 3.75% 10/1/30 (b) | | 260,000 | 224,525 |
| 4.5% 7/1/28 (b) | | 165,000 | 153,869 |
| Genpact Luxembourg SARL / Genpact U.S.A., Inc. 1.75% 4/10/26 | | 960,000 | 868,502 |
| Go Daddy Operating Co. LLC / GD Finance Co., Inc. 3.5% 3/1/29 (b) | | 435,000 | 373,901 |
| Presidio Holdings, Inc. 4.875% 2/1/27 (b) | | 306,000 | 286,095 |
| Tempo Acquisition LLC 5.75% 6/1/25 (b) | | 5,000,000 | 4,914,000 |
| Twilio, Inc.: | | | |
| 3.625% 3/15/29 | | 210,000 | 180,163 |
| 3.875% 3/15/31 | | 85,000 | 71,187 |
| Virtusa Corp. 7.125% 12/15/28 (b) | | 60,000 | 49,125 |
| | | | 7,819,353 |
| Semiconductors & Semiconductor Equipment - 0.1% | | | |
| Amkor Technology, Inc. 6.625% 9/15/27 (b) | | 346,000 | 345,785 |
| Analog Devices, Inc. 2.95% 10/1/51 | | 172,000 | 115,592 |
| Broadcom, Inc.: | | | |
| 1.95% 2/15/28 (b) | | 1,620,000 | 1,404,885 |
| 2.45% 2/15/31 (b) | | 12,454,000 | 10,040,334 |
| 2.6% 2/15/33 (b) | | 12,129,000 | 9,377,318 |
| 3.137% 11/15/35 (b) | | 2,520,000 | 1,923,379 |
| 3.419% 4/15/33 (b) | | 5,657,000 | 4,687,539 |
| 3.5% 2/15/41 (b) | | 19,586,000 | 14,348,232 |
| 3.75% 2/15/51 (b) | | 5,224,000 | 3,746,397 |
| 4% 4/15/29 (b) | | 1,410,000 | 1,300,388 |
| 4.15% 4/15/32 (b) | | 1,983,000 | 1,776,199 |
| 4.926% 5/15/37 (b) | | 2,410,000 | 2,170,997 |
| Entegris Escrow Corp. 5.95% 6/15/30 (b) | | 543,000 | 519,985 |
| Entegris, Inc.: | | | |
| 3.625% 5/1/29 (b) | | 324,000 | 278,472 |
| 4.375% 4/15/28 (b) | | 359,000 | 327,302 |
| Intel Corp.: | | | |
| 3.1% 2/15/60 | | 20,000 | 12,452 |
| 3.25% 11/15/49 | | 49,000 | 33,426 |
| 5.2% 2/10/33 | | 401,000 | 400,674 |
| 5.625% 2/10/43 | | 892,000 | 887,822 |
| 5.7% 2/10/53 | | 938,000 | 928,896 |
| 5.9% 2/10/63 | | 2,375,000 | 2,387,267 |
| KLA Corp.: | | | |
| 3.3% 3/1/50 | | 252,000 | 181,116 |
| 4.65% 7/15/32 | | 130,000 | 127,741 |
| 4.95% 7/15/52 | | 277,000 | 261,738 |
| 5.25% 7/15/62 | | 112,000 | 108,707 |
| Marvell Technology, Inc. 2.95% 4/15/31 | | 100,000 | 83,441 |
| NVIDIA Corp.: | | | |
| 2% 6/15/31 | | 215,000 | 178,117 |
| 3.5% 4/1/40 | | 100,000 | 83,240 |
| NXP BV/NXP Funding LLC/NXP U.S.A., Inc.: | | | |
| 3.125% 2/15/42 | | 85,000 | 58,188 |
| 3.25% 5/11/41 | | 146,000 | 103,708 |
| 3.4% 5/1/30 | | 442,000 | 386,909 |
| 5% 1/15/33 | | 43,000 | 40,690 |
| ON Semiconductor Corp. 3.875% 9/1/28 (b) | | 571,000 | 508,293 |
| Qorvo, Inc. 4.375% 10/15/29 | | 290,000 | 262,744 |
| Qualcomm, Inc.: | | | |
| 4.25% 5/20/32 | | 25,000 | 24,042 |
| 4.5% 5/20/52 | | 65,000 | 56,726 |
| Synaptics, Inc. 4% 6/15/29 (b) | | 110,000 | 93,575 |
| Teledyne FLIR LLC 2.5% 8/1/30 | | 445,000 | 367,198 |
| Texas Instruments, Inc.: | | | |
| 3.875% 3/15/39 | | 47,000 | 40,722 |
| 4.15% 5/15/48 | | 8,000 | 6,932 |
| 5.05% 5/18/63 | | 256,000 | 245,269 |
| TSMC Arizona Corp. 2.5% 10/25/31 | | 702,000 | 580,077 |
| Xilinx, Inc. 2.375% 6/1/30 | | 110,000 | 94,072 |
| | | | 60,906,586 |
| Software - 0.1% | | | |
| Autodesk, Inc. 3.5% 6/15/27 | | 53,000 | 50,049 |
| Black Knight InfoServ LLC 3.625% 9/1/28 (b) | | 299,000 | 275,080 |
| Central Parent, Inc./Central Merger Sub, Inc. 7.25% 6/15/29 (b) | | 135,000 | 133,146 |
| Clarivate Science Holdings Corp. 3.875% 7/1/28 (b) | | 282,000 | 248,484 |
| Cloud Software Group, Inc. 6.5% 3/31/29 (b) | | 52,000 | 46,512 |
| CNT PRNT/CDK GLO II/FIN 8% 6/15/29 (b) | | 210,000 | 211,365 |
| Crowdstrike Holdings, Inc. 3% 2/15/29 | | 125,000 | 107,475 |
| Fair Isaac Corp. 4% 6/15/28 (b) | | 500,000 | 457,224 |
| Gen Digital, Inc.: | | | |
| 5% 4/15/25 (b) | | 370,000 | 362,707 |
| 6.75% 9/30/27 (b) | | 27,000 | 27,068 |
| Intuit, Inc. 1.35% 7/15/27 | | 200,000 | 175,541 |
| Microsoft Corp.: | | | |
| 2.675% 6/1/60 | | 200,000 | 128,650 |
| 2.921% 3/17/52 | | 3,696,000 | 2,620,939 |
| NCR Corp.: | | | |
| 5% 10/1/28 (b) | | 382,000 | 350,598 |
| 5.125% 4/15/29 (b) | | 103,000 | 93,672 |
| 5.75% 9/1/27 (b) | | 58,000 | 58,561 |
| 6.125% 9/1/29 (b) | | 285,000 | 293,531 |
| Open Text Corp.: | | | |
| 3.875% 2/15/28 (b) | | 490,000 | 436,061 |
| 3.875% 12/1/29 (b) | | 370,000 | 313,768 |
| 6.9% 12/1/27 (b) | | 500,000 | 506,518 |
| Oracle Corp.: | | | |
| 2.3% 3/25/28 | | 178,000 | 156,636 |
| 2.5% 4/1/25 | | 80,000 | 76,171 |
| 2.65% 7/15/26 | | 325,000 | 301,849 |
| 2.8% 4/1/27 | | 7,964,000 | 7,315,136 |
| 2.95% 5/15/25 | | 1,185,000 | 1,134,872 |
| 3.6% 4/1/40 | | 2,735,000 | 2,069,829 |
| 3.6% 4/1/50 | | 3,480,000 | 2,405,251 |
| 3.65% 3/25/41 | | 2,082,000 | 1,571,895 |
| 3.8% 11/15/37 | | 230,000 | 185,481 |
| 3.85% 7/15/36 | | 51,000 | 42,187 |
| 3.85% 4/1/60 | | 6,500,000 | 4,417,558 |
| 3.9% 5/15/35 | | 45,000 | 38,424 |
| 3.95% 3/25/51 | | 47,000 | 34,351 |
| 4% 11/15/47 | | 930,000 | 693,740 |
| 4.125% 5/15/45 | | 3,525,000 | 2,724,706 |
| 4.3% 7/8/34 | | 16,000 | 14,347 |
| 4.375% 5/15/55 | | 25,000 | 19,207 |
| 4.9% 2/6/33 | | 1,179,000 | 1,126,231 |
| 5.55% 2/6/53 | | 2,997,000 | 2,785,969 |
| 6.9% 11/9/52 | | 1,315,000 | 1,432,155 |
| RingCentral, Inc. 8.5% 8/15/30 (b) | | 115,000 | 113,275 |
| Roper Technologies, Inc. 1.75% 2/15/31 | | 200,000 | 156,987 |
| ServiceNow, Inc. 1.4% 9/1/30 | | 1,005,000 | 790,449 |
| SS&C Technologies, Inc. 5.5% 9/30/27 (b) | | 1,151,000 | 1,108,068 |
| VMware, Inc. 4.65% 5/15/27 | | 141,000 | 137,065 |
| Workday, Inc.: | | | |
| 3.5% 4/1/27 | | 405,000 | 382,761 |
| 3.7% 4/1/29 | | 1,400,000 | 1,293,632 |
| | | | 39,425,181 |
| Technology Hardware, Storage & Peripherals - 0.0% | | | |
| Apple, Inc.: | | | |
| 2.65% 2/8/51 | | 497,000 | 330,420 |
| 2.85% 8/5/61 | | 580,000 | 377,581 |
| 3.25% 2/23/26 | | 7,485,000 | 7,196,980 |
| 3.45% 2/9/45 | | 82,000 | 66,531 |
| 3.75% 9/12/47 | | 190,000 | 158,519 |
| 3.75% 11/13/47 | | 29,000 | 24,133 |
| 3.85% 8/4/46 | | 1,570,000 | 1,330,559 |
| 4.375% 5/13/45 | | 450,000 | 414,261 |
| 4.85% 5/10/53 | | 565,000 | 557,517 |
| Hewlett Packard Enterprise Co. 5.25% 7/1/28 | | 210,000 | 208,221 |
| Seagate HDD Cayman: | | | |
| 3.125% 7/15/29 | | 64,000 | 48,699 |
| 4.091% 6/1/29 | | 96,000 | 84,032 |
| 4.125% 1/15/31 | | 106,000 | 86,576 |
| 8.25% 12/15/29 (b) | | 443,000 | 464,707 |
| 8.5% 7/15/31 (b) | | 12,000 | 12,572 |
| 9.625% 12/1/32 (b) | | 102,965 | 114,049 |
| | | | 11,475,357 |
TOTAL INFORMATION TECHNOLOGY | | | 136,621,997 |
| MATERIALS - 0.3% | | | |
| Chemicals - 0.1% | | | |
| Air Products & Chemicals, Inc. 2.7% 5/15/40 | | 23,000 | 16,736 |
| Avient Corp. 7.125% 8/1/30 (b) | | 307,000 | 306,706 |
| Axalta Coating Systems/Dutch Holding BV 4.75% 6/15/27 (b) | | 543,000 | 511,043 |
| Braskem Idesa SAPI 6.99% 2/20/32 (b) | | 200,000 | 119,174 |
| Celanese U.S. Holdings LLC: | | | |
| 6.35% 11/15/28 | | 3,358,000 | 3,366,655 |
| 6.55% 11/15/30 | | 3,406,000 | 3,407,678 |
| 6.7% 11/15/33 | | 1,991,000 | 1,999,372 |
| CF Industries Holdings, Inc.: | | | |
| 4.95% 6/1/43 | | 624,000 | 527,441 |
| 5.15% 3/15/34 | | 82,000 | 77,407 |
| E.I. du Pont de Nemours & Co. 4.8% 5/15/33 | | 255,000 | 245,195 |
| Ecolab, Inc. 2.125% 2/1/32 | | 35,000 | 28,497 |
| Element Solutions, Inc. 3.875% 9/1/28 (b) | | 311,000 | 273,406 |
| FMC Corp.: | | | |
| 4.5% 10/1/49 | | 1,495,000 | 1,117,262 |
| 5.65% 5/18/33 | | 1,210,000 | 1,153,695 |
| INEOS Quattro Finance 2 PLC 3.375% 1/15/26 (b) | | 475,000 | 434,167 |
| International Flavors & Fragrances, Inc.: | | | |
| 1.832% 10/15/27 (b) | | 110,000 | 92,520 |
| 2.3% 11/1/30 (b) | | 4,922,000 | 3,818,986 |
| 3.268% 11/15/40 (b) | | 57,000 | 37,916 |
| 3.468% 12/1/50 (b) | | 1,475,000 | 916,973 |
| Invictus U.S. Newco LLC 5% 10/30/29 (b) | | 350,000 | 284,822 |
| LSB Industries, Inc. 6.25% 10/15/28 (b) | | 235,000 | 214,920 |
| LYB International Finance BV: | | | |
| 4.875% 3/15/44 | | 1,000,000 | 846,996 |
| 5.25% 7/15/43 | | 5,455,000 | 4,840,014 |
| LYB International Finance III LLC 3.375% 10/1/40 | | 668,000 | 480,094 |
| Methanex Corp.: | | | |
| 5.125% 10/15/27 | | 320,000 | 300,166 |
| 5.25% 12/15/29 | | 155,000 | 141,199 |
| 5.65% 12/1/44 | | 105,000 | 85,881 |
| NOVA Chemicals Corp.: | | | |
| 4.25% 5/15/29 (b) | | 27,000 | 21,894 |
| 4.875% 6/1/24 (b) | | 67,000 | 65,899 |
| 5% 5/1/25 (b) | | 1,246,000 | 1,185,878 |
| 5.25% 6/1/27 (b) | | 279,000 | 248,047 |
| Nufarm Australia Ltd. 5% 1/27/30 (b) | | 280,000 | 249,059 |
| Nutrien Ltd.: | | | |
| 2.95% 5/13/30 | | 81,000 | 69,832 |
| 3.95% 5/13/50 | | 90,000 | 67,277 |
| 4.125% 3/15/35 | | 14,000 | 12,155 |
| 4.9% 3/27/28 | | 1,090,000 | 1,065,158 |
| 4.9% 6/1/43 | | 1,325,000 | 1,157,756 |
| OCI NV 3.625% 10/15/25 (Reg. S) | EUR | 2,773,800 | 2,926,500 |
| Olin Corp.: | | | |
| 5% 2/1/30 | | 195,000 | 178,556 |
| 5.125% 9/15/27 | | 700,000 | 670,166 |
| 5.625% 8/1/29 | | 320,000 | 306,289 |
| Olympus Water U.S. Holding Corp. 9.75% 11/15/28 (b) | | 200,000 | 201,465 |
| Rain Carbon, Inc. 12.25% 9/1/29 (b) | | 875,000 | 902,545 |
| RPM International, Inc.: | | | |
| 2.95% 1/15/32 | | 40,000 | 32,110 |
| 3.75% 3/15/27 | | 88,000 | 82,566 |
| Sasol Financing U.S.A. LLC: | | | |
| 4.375% 9/18/26 | | 810,000 | 722,763 |
| 5.875% 3/27/24 | | 1,500,000 | 1,479,660 |
| Sherwin-Williams Co. 4.5% 6/1/47 | | 210,000 | 179,037 |
| SPCM SA 3.125% 3/15/27 (b) | | 115,000 | 102,047 |
| The Chemours Co. LLC: | | | |
| 4.625% 11/15/29 (b) | | 1,114,000 | 926,118 |
| 5.375% 5/15/27 | | 27,000 | 25,417 |
| 5.75% 11/15/28 (b) | | 413,000 | 371,006 |
| The Dow Chemical Co. 4.625% 10/1/44 | | 395,000 | 331,344 |
| The Scotts Miracle-Gro Co.: | | | |
| 4% 4/1/31 | | 2,921,000 | 2,295,848 |
| 4.375% 2/1/32 | | 625,000 | 494,875 |
| 4.5% 10/15/29 | | 525,000 | 439,068 |
| 5.25% 12/15/26 | | 59,000 | 55,884 |
| Trinseo Materials Operating SCA/Trinseo Materials Finance, Inc. 5.375% 9/1/25 (b) | | 147,000 | 136,814 |
| Tronox, Inc. 4.625% 3/15/29 (b) | | 195,000 | 160,687 |
| Union Carbide Corp. 7.75% 10/1/96 | | 38,000 | 42,968 |
| W.R. Grace Holding LLC: | | | |
| 4.875% 6/15/27 (b) | | 410,000 | 382,383 |
| 7.375% 3/1/31 (b) | | 40,000 | 39,390 |
| | | | 43,273,382 |
| Construction Materials - 0.0% | | | |
| Global Infrastructure Solutions, Inc. 5.625% 6/1/29 (b) | | 385,000 | 323,325 |
| Knife River Holding Co. 7.75% 5/1/31 (b) | | 233,000 | 238,494 |
| Martin Marietta Materials, Inc.: | | | |
| 2.4% 7/15/31 | | 1,490,000 | 1,205,265 |
| 2.5% 3/15/30 | | 400,000 | 336,101 |
| Summit Materials LLC/Summit Materials Finance Corp. 5.25% 1/15/29 (b) | | 352,000 | 329,734 |
| Vulcan Materials Co. 4.5% 6/15/47 | | 350,000 | 296,467 |
| | | | 2,729,386 |
| Containers & Packaging - 0.1% | | | |
| Ardagh Metal Packaging Finance U.S.A. LLC/Ardagh Metal Packaging Finance PLC 6% 6/15/27 (b) | | 200,000 | 195,023 |
| Ardagh Packaging Finance PLC/Ardagh MP Holdings U.S.A., Inc.: | | | |
| 4.125% 8/15/26 (b) | | 844,000 | 788,429 |
| 5.25% 8/15/27 (b) | | 1,260,000 | 1,071,897 |
| 5.25% 8/15/27 (b) | | 797,000 | 678,017 |
| Ball Corp.: | | | |
| 2.875% 8/15/30 | | 55,000 | 44,855 |
| 3.125% 9/15/31 | | 395,000 | 319,799 |
| 6% 6/15/29 | | 2,129,000 | 2,097,293 |
| Berry Global, Inc.: | | | |
| 1.57% 1/15/26 | | 1,675,000 | 1,523,353 |
| 4.875% 7/15/26 (b) | | 7,055,000 | 6,809,406 |
| 5.5% 4/15/28 (b) | | 3,240,000 | 3,185,290 |
| BWAY Holding Co. 7.875% 8/15/26 (b) | | 692,000 | 681,444 |
| Crown Americas LLC/Crown Americas Capital Corp. IV 4.75% 2/1/26 | | 54,000 | 52,070 |
| Graphic Packaging International, Inc.: | | | |
| 3.5% 3/15/28 (b) | | 49,000 | 43,651 |
| 3.5% 3/1/29 (b) | | 175,000 | 150,016 |
| 3.75% 2/1/30 (b) | | 295,000 | 251,445 |
| 4.75% 7/15/27 (b) | | 64,000 | 60,793 |
| Intelligent Packaging Ltd. Finco, Inc. 6% 9/15/28 (b) | | 40,000 | 36,006 |
| Owens-Brockway Glass Container, Inc.: | | | |
| 6.625% 5/13/27 (b) | | 411,000 | 406,265 |
| 7.25% 5/15/31 (b) | | 176,000 | 177,575 |
| Packaging Corp. of America 3.05% 10/1/51 | | 108,000 | 68,837 |
| Pactiv Evergreen Group Issuer, Inc. 4.375% 10/15/28 (b) | | 2,068,000 | 1,835,355 |
| Reynolds Group Issuer, Inc./Reynolds Group Issuer LLC/Reynolds Group Issuer (Luxembourg) SA 4% 10/15/27 (b) | | 1,266,000 | 1,138,666 |
| Sealed Air Corp.: | | | |
| 1.573% 10/15/26 (b) | | 2,750,000 | 2,417,210 |
| 4% 12/1/27 (b) | | 229,000 | 209,581 |
| 6.875% 7/15/33 (b) | | 210,000 | 211,197 |
| Sealed Air Corp./Sealed Air Cor 6.125% 2/1/28 (b) | | 340,000 | 334,076 |
| TriMas Corp. 4.125% 4/15/29 (b) | | 131,000 | 114,298 |
| Trivium Packaging Finance BV 5.5% 8/15/26 (b) | | 430,000 | 405,603 |
| WRKCo, Inc. 4.65% 3/15/26 | | 88,000 | 85,656 |
| | | | 25,393,106 |
| Metals & Mining - 0.1% | | | |
| Alcoa Nederland Holding BV: | | | |
| 4.125% 3/31/29 (b) | | 110,000 | 98,998 |
| 6.125% 5/15/28 (b) | | 200,000 | 197,672 |
| Anglo American Capital PLC: | | | |
| 2.25% 3/17/28 (b) | | 236,000 | 203,394 |
| 4.75% 4/10/27 (b) | | 200,000 | 193,298 |
| 5.5% 5/2/33 (b) | | 526,000 | 505,533 |
| 5.625% 4/1/30 (b) | | 200,000 | 197,350 |
| Arsenal AIC Parent LLC 8% 10/1/30 (b) | | 65,000 | 66,381 |
| ATI, Inc.: | | | |
| 4.875% 10/1/29 | | 70,000 | 63,198 |
| 5.875% 12/1/27 | | 348,000 | 338,430 |
| Barrick North America Finance LLC: | | | |
| 5.7% 5/30/41 | | 2,830,000 | 2,811,649 |
| 5.75% 5/1/43 | | 475,000 | 475,003 |
| Barrick PD Australia Finance Pty Ltd. 5.95% 10/15/39 | | 1,340,000 | 1,359,701 |
| BHP Billiton Financial (U.S.A.) Ltd. 4.9% 2/28/33 | | 103,000 | 101,633 |
| Big River Steel LLC/BRS Finance Corp. 6.625% 1/31/29 (b) | | 162,000 | 161,055 |
| Carpenter Technology Corp. 6.375% 7/15/28 | | 209,000 | 204,194 |
| Cleveland-Cliffs, Inc.: | | | |
| 4.625% 3/1/29 (b) | | 194,000 | 172,003 |
| 4.875% 3/1/31 (b) | | 110,000 | 95,976 |
| 5.875% 6/1/27 | | 318,000 | 306,239 |
| 6.75% 3/15/26 (b) | | 86,000 | 86,026 |
| 6.75% 4/15/30 (b) | | 335,000 | 319,363 |
| Commercial Metals Co. 3.875% 2/15/31 | | 235,000 | 200,309 |
| Compass Minerals International, Inc. 6.75% 12/1/27 (b) | | 120,000 | 116,364 |
| Corporacion Nacional del Cobre de Chile (Codelco) 5.125% 2/2/33 (b) | | 200,000 | 191,516 |
| FMG Resources Pty Ltd. 4.5% 9/15/27 (b) | | 252,000 | 232,495 |
| Freeport-McMoRan, Inc.: | | | |
| 4.125% 3/1/28 | | 960,000 | 890,440 |
| 4.375% 8/1/28 | | 6,105,000 | 5,663,975 |
| 4.625% 8/1/30 | | 1,069,000 | 987,964 |
| 5.25% 9/1/29 | | 305,000 | 295,624 |
| 5.4% 11/14/34 | | 632,000 | 598,906 |
| Glencore Finance Canada Ltd. 6.9% 11/15/37 (b) | | 2,000 | 2,118 |
| Glencore Funding LLC: | | | |
| 2.5% 9/1/30 (b) | | 40,000 | 32,534 |
| 2.625% 9/23/31 (b) | | 260,000 | 206,931 |
| 2.85% 4/27/31 (b) | | 269,000 | 219,247 |
| 3.875% 10/27/27 (b) | | 137,000 | 128,259 |
| 4.625% 4/29/24 (b) | | 8,000 | 7,930 |
| 5.7% 5/8/33 (b) | | 1,672,000 | 1,638,235 |
| Hecla Mining Co. 7.25% 2/15/28 | | 775,000 | 760,992 |
| HudBay Minerals, Inc. 4.5% 4/1/26 (b) | | 55,000 | 51,913 |
| Kaiser Aluminum Corp. 4.625% 3/1/28 (b) | | 512,000 | 452,775 |
| Kinross Gold Corp.: | | | |
| 4.5% 7/15/27 | | 8,460,000 | 8,161,284 |
| 6.25% 7/15/33 (b) | | 4,835,000 | 4,765,826 |
| Mineral Resources Ltd.: | | | |
| 8% 11/1/27 (b) | | 150,000 | 149,476 |
| 8.125% 5/1/27 (b) | | 16,000 | 15,965 |
| Newmont Corp.: | | | |
| 2.25% 10/1/30 | | 3,612,000 | 2,935,079 |
| 2.8% 10/1/29 | | 3,297,000 | 2,846,211 |
| 5.45% 6/9/44 | | 185,000 | 175,697 |
| Novelis Corp.: | | | |
| 3.25% 11/15/26 (b) | | 245,000 | 221,973 |
| 3.875% 8/15/31 (b) | | 137,000 | 113,431 |
| 4.75% 1/30/30 (b) | | 134,000 | 119,922 |
| Nucor Corp. 2.979% 12/15/55 | | 80,000 | 48,785 |
| PMHC II, Inc. 9% 2/15/30 (b) | | 175,000 | 144,341 |
| PT Indonesia Asahan Aluminium 6.53% 11/15/28 (b) | | 1,950,000 | 1,982,916 |
| Rio Tinto Finance (U.S.A.) Ltd. 5.2% 11/2/40 | | 68,000 | 66,784 |
| Rio Tinto Finance (U.S.A.) PLC 4.125% 8/21/42 | | 160,000 | 136,892 |
| Roller Bearing Co. of America, Inc. 4.375% 10/15/29 (b) | | 30,000 | 26,840 |
| Southern Copper Corp. 5.875% 4/23/45 | | 455,000 | 444,640 |
| Steel Dynamics, Inc. 3.45% 4/15/30 | | 9,595,000 | 8,507,355 |
| Teck Resources Ltd.: | | | |
| 5.4% 2/1/43 | | 56,000 | 48,914 |
| 6% 8/15/40 | | 1,193,000 | 1,128,987 |
| United States Steel Corp. 6.875% 3/1/29 | | 167,000 | 166,357 |
| | | | 52,843,298 |
| Paper & Forest Products - 0.0% | | | |
| Celulosa Arauco y Constitucion SA 4.5% 8/1/24 | | 1,850,000 | 1,813,925 |
| LABL, Inc. 6.75% 7/15/26 (b) | | 224,000 | 218,945 |
| Suzano Austria GmbH 6% 1/15/29 | | 1,263,000 | 1,249,044 |
| | | | 3,281,914 |
TOTAL MATERIALS | | | 127,521,086 |
| MULTI SECTOR - 0.0% | | | |
| Multi Sector - 0.0% | | | |
| Quebec Province 6.35% 1/30/26 | | 8,000 | 8,188 |
| REAL ESTATE - 0.7% | | | |
| Equity Real Estate Investment Trusts (REITs) - 0.6% | | | |
| Alexandria Real Estate Equities, Inc.: | | | |
| 1.875% 2/1/33 | | 33,000 | 24,350 |
| 2.95% 3/15/34 | | 1,105,000 | 874,548 |
| 4.9% 12/15/30 | | 5,395,000 | 5,221,970 |
| 5.15% 4/15/53 | | 31,000 | 27,605 |
| American Assets Trust LP 3.375% 2/1/31 | | 3,370,000 | 2,616,279 |
| American Homes 4 Rent LP: | | | |
| 2.375% 7/15/31 | | 704,000 | 557,446 |
| 3.375% 7/15/51 | | 1,089,000 | 695,671 |
| 3.625% 4/15/32 | | 2,835,000 | 2,428,817 |
| 4.3% 4/15/52 | | 4,065,000 | 3,140,463 |
| American Tower Corp.: | | | |
| 1.45% 9/15/26 | | 82,000 | 72,658 |
| 2.7% 4/15/31 | | 2,423,000 | 1,980,991 |
| 2.95% 1/15/51 | | 25,000 | 15,132 |
| 3.1% 6/15/50 | | 3,000 | 1,872 |
| 3.95% 3/15/29 | | 1,696,000 | 1,560,437 |
| 5.55% 7/15/33 | | 3,537,000 | 3,501,202 |
| 5.65% 3/15/33 | | 131,000 | 130,486 |
| AvalonBay Communities, Inc. 3.35% 5/15/27 | | 15,000 | 14,024 |
| Boston Properties, Inc. 4.5% 12/1/28 | | 5,210,000 | 4,807,567 |
| Camden Property Trust 3.15% 7/1/29 | | 146,000 | 131,216 |
| Corporate Office Properties LP: | | | |
| 2% 1/15/29 | | 600,000 | 472,469 |
| 2.25% 3/15/26 | | 1,820,000 | 1,643,748 |
| 2.75% 4/15/31 | | 6,209,000 | 4,785,484 |
| 2.9% 12/1/33 | | 490,000 | 353,927 |
| Crown Castle International Corp.: | | | |
| 2.1% 4/1/31 | | 3,029,000 | 2,388,015 |
| 2.9% 3/15/27 | | 125,000 | 114,746 |
| CubeSmart LP 2.25% 12/15/28 | | 2,653,000 | 2,246,647 |
| Equinix, Inc.: | | | |
| 3.2% 11/18/29 | | 253,000 | 221,640 |
| 3.9% 4/15/32 | | 40,000 | 35,602 |
| ERP Operating LP: | | | |
| 2.85% 11/1/26 | | 87,000 | 81,141 |
| 3.25% 8/1/27 | | 15,000 | 13,847 |
| GLP Capital LP/GLP Financing II, Inc.: | | | |
| 3.25% 1/15/32 | | 3,439,000 | 2,772,809 |
| 4% 1/15/30 | | 874,000 | 762,524 |
| 4% 1/15/31 | | 714,000 | 612,448 |
| 5.25% 6/1/25 | | 200,000 | 196,315 |
| 5.375% 4/15/26 | | 8,390,000 | 8,215,159 |
| 5.75% 6/1/28 | | 587,000 | 570,426 |
| Goodman U.S. Finance Three, LLC 3.7% 3/15/28 (b) | | 57,000 | 51,733 |
| Healthcare Trust of America Holdings LP: | | | |
| 2.05% 3/15/31 | | 265,000 | 197,664 |
| 3.1% 2/15/30 | | 1,715,000 | 1,460,901 |
| 3.5% 8/1/26 | | 2,311,000 | 2,157,380 |
| 3.625% 1/15/28 | | 1,692,000 | 1,526,329 |
| 3.875% 5/1/25 | | 2,215,000 | 2,089,894 |
| Healthpeak OP, LLC: | | | |
| 2.125% 12/1/28 | | 30,000 | 25,633 |
| 3% 1/15/30 | | 1,679,000 | 1,452,842 |
| Hudson Pacific Properties LP: | | | |
| 3.25% 1/15/30 | | 2,705,000 | 1,832,321 |
| 3.95% 11/1/27 | | 385,000 | 302,628 |
| 4.65% 4/1/29 | | 13,738,000 | 10,468,158 |
| Invitation Homes Operating Partnership LP: | | | |
| 2% 8/15/31 | | 3,991,000 | 3,053,871 |
| 4.15% 4/15/32 | | 4,260,000 | 3,791,394 |
| Iron Mountain, Inc.: | | | |
| 4.5% 2/15/31 (b) | | 39,000 | 33,503 |
| 4.875% 9/15/27 (b) | | 506,000 | 476,363 |
| 4.875% 9/15/29 (b) | | 1,243,000 | 1,123,261 |
| 5.25% 3/15/28 (b) | | 223,000 | 209,077 |
| 5.25% 7/15/30 (b) | | 75,000 | 67,674 |
| Kilroy Realty LP 2.65% 11/15/33 | | 2,010,000 | 1,395,570 |
| Kimco Realty Op LLC: | | | |
| 1.9% 3/1/28 | | 3,540,000 | 2,997,764 |
| 3.2% 4/1/32 | | 1,340,000 | 1,111,624 |
| 4.6% 2/1/33 | | 3,535,000 | 3,248,902 |
| Kite Realty Group Trust: | | | |
| 4% 3/15/25 | | 6,865,000 | 6,595,218 |
| 4.75% 9/15/30 | | 10,799,000 | 9,885,145 |
| LXP Industrial Trust (REIT): | | | |
| 2.7% 9/15/30 | | 894,000 | 708,419 |
| 4.4% 6/15/24 | | 1,319,000 | 1,292,842 |
| MPT Operating Partnership LP/MPT Finance Corp.: | | | |
| 0.993% 10/15/26 | EUR | 200,000 | 157,231 |
| 2.5% 3/24/26 | GBP | 4,400,000 | 4,356,297 |
| 3.5% 3/15/31 | | 1,190,000 | 772,754 |
| 4.625% 8/1/29 | | 41,000 | 29,609 |
| 5% 10/15/27 | | 2,450,000 | 1,935,444 |
| NNN (REIT), Inc.: | | | |
| 3% 4/15/52 | | 432,000 | 261,712 |
| 3.6% 12/15/26 | | 47,000 | 43,847 |
| 4.3% 10/15/28 | | 23,000 | 21,579 |
| 5.6% 10/15/33 | | 50,000 | 48,996 |
| Omega Healthcare Investors, Inc.: | | | |
| 3.25% 4/15/33 | | 5,977,000 | 4,461,042 |
| 3.375% 2/1/31 | | 3,399,000 | 2,745,404 |
| 3.625% 10/1/29 | | 7,647,000 | 6,479,572 |
| 4.5% 1/15/25 | | 2,793,000 | 2,723,467 |
| 4.5% 4/1/27 | | 1,500,000 | 1,418,805 |
| 4.75% 1/15/28 | | 7,569,000 | 7,107,924 |
| 4.95% 4/1/24 | | 1,152,000 | 1,145,738 |
| 5.25% 1/15/26 | | 5,841,000 | 5,742,979 |
| Park Intermediate Holdings LLC 4.875% 5/15/29 (b) | | 16,000 | 13,880 |
| Physicians Realty LP: | | | |
| 2.625% 11/1/31 | | 1,940,000 | 1,507,029 |
| 3.95% 1/15/28 | | 136,000 | 124,560 |
| Piedmont Operating Partnership LP 2.75% 4/1/32 | | 1,374,000 | 928,026 |
| Prologis LP: | | | |
| 1.75% 7/1/30 | | 143,000 | 114,177 |
| 2.125% 10/15/50 | | 43,000 | 23,200 |
| 3% 4/15/50 | | 150,000 | 98,603 |
| 3.25% 6/30/26 | | 5,000 | 4,740 |
| 4.75% 6/15/33 | | 165,000 | 158,129 |
| Public Storage: | | | |
| 1.5% 11/9/26 | | 79,000 | 71,101 |
| 2.25% 11/9/31 | | 40,000 | 32,358 |
| 5.1% 8/1/33 | | 171,000 | 169,547 |
| Realty Income Corp.: | | | |
| 1.8% 3/15/33 | | 32,000 | 23,408 |
| 2.2% 6/15/28 | | 791,000 | 686,488 |
| 2.85% 12/15/32 | | 1,553,000 | 1,258,668 |
| 3.1% 12/15/29 | | 6,510,000 | 5,748,393 |
| 3.25% 1/15/31 | | 1,193,000 | 1,031,621 |
| 3.4% 1/15/28 | | 5,340,000 | 4,952,676 |
| 3.875% 7/15/24 | | 59,000 | 58,018 |
| 3.875% 4/15/25 | | 24,000 | 23,366 |
| 4.125% 10/15/26 | | 20,000 | 19,328 |
| Regency Centers LP 3.7% 6/15/30 | | 177,000 | 158,657 |
| Retail Opportunity Investments Partnership LP: | | | |
| 4% 12/15/24 | | 877,000 | 851,328 |
| 5% 12/15/23 | | 626,000 | 620,104 |
| RHP Hotel Properties LP/RHP Finance Corp.: | | | |
| 4.75% 10/15/27 | | 213,000 | 198,034 |
| 7.25% 7/15/28 (b) | | 334,000 | 335,669 |
| Safehold Operating Partnership LP 2.8% 6/15/31 | | 146,000 | 112,448 |
| SBA Communications Corp.: | | | |
| 3.125% 2/1/29 | | 956,000 | 818,517 |
| 3.875% 2/15/27 | | 400,000 | 369,828 |
| Scentre Management Ltd./ RE1 Ltd.: | | | |
| 3.25% 10/28/25 (b) | | 29,000 | 27,440 |
| 3.5% 2/12/25 (b) | | 41,000 | 39,590 |
| Senior Housing Properties Trust: | | | |
| 4.375% 3/1/31 | | 350,000 | 264,079 |
| 4.75% 5/1/24 | | 275,000 | 261,014 |
| 4.75% 2/15/28 | | 2,792,000 | 2,132,101 |
| 9.75% 6/15/25 | | 250,000 | 245,829 |
| Service Properties Trust: | | | |
| 5.5% 12/15/27 | | 100,000 | 88,509 |
| 7.5% 9/15/25 | | 18,000 | 17,785 |
| Simon Property Group LP: | | | |
| 2.45% 9/13/29 | | 2,680,000 | 2,268,317 |
| 3.25% 9/13/49 | | 168,000 | 109,766 |
| SITE Centers Corp.: | | | |
| 3.625% 2/1/25 | | 2,396,000 | 2,279,617 |
| 4.25% 2/1/26 | | 5,582,000 | 5,226,233 |
| Spirit Realty LP 2.7% 2/15/32 | | 7,905,000 | 6,196,363 |
| Store Capital Corp.: | | | |
| 2.75% 11/18/30 | | 1,957,000 | 1,435,679 |
| 4.625% 3/15/29 | | 2,475,000 | 2,130,237 |
| Sun Communities Operating LP: | | | |
| 2.3% 11/1/28 | | 1,550,000 | 1,303,105 |
| 2.7% 7/15/31 | | 11,527,000 | 9,152,254 |
| UDR, Inc.: | | | |
| 1.9% 3/15/33 | | 14,000 | 10,214 |
| 2.1% 8/1/32 | | 47,000 | 35,254 |
| Uniti Group LP / Uniti Group Finance, Inc. 4.75% 4/15/28 (b) | | 585,000 | 493,121 |
| Ventas Realty LP: | | | |
| 3% 1/15/30 | | 10,008,000 | 8,526,735 |
| 3.25% 10/15/26 | | 6,000 | 5,549 |
| 3.5% 2/1/25 | | 13,000 | 12,504 |
| 3.75% 5/1/24 | | 17,000 | 16,744 |
| 3.85% 4/1/27 | | 518,000 | 485,284 |
| 4% 3/1/28 | | 2,712,000 | 2,519,335 |
| 4.125% 1/15/26 | | 1,630,000 | 1,567,573 |
| 4.75% 11/15/30 | | 13,000,000 | 12,191,497 |
| VICI Properties LP: | | | |
| 4.375% 5/15/25 | | 749,000 | 728,185 |
| 4.75% 2/15/28 | | 6,736,000 | 6,405,513 |
| 4.95% 2/15/30 | | 6,670,000 | 6,273,802 |
| 5.125% 5/15/32 | | 4,086,000 | 3,786,983 |
| VICI Properties LP / VICI Note Co.: | | | |
| 3.5% 2/15/25 (b) | | 125,000 | 119,743 |
| 3.75% 2/15/27 (b) | | 52,000 | 47,737 |
| 3.875% 2/15/29 (b) | | 1,460,000 | 1,289,049 |
| 4.125% 8/15/30 (b) | | 668,000 | 584,891 |
| 4.25% 12/1/26 (b) | | 2,608,000 | 2,456,928 |
| 4.5% 9/1/26 (b) | | 400,000 | 378,608 |
| 4.5% 1/15/28 (b) | | 539,000 | 500,181 |
| 4.625% 6/15/25 (b) | | 85,000 | 82,266 |
| 4.625% 12/1/29 (b) | | 2,909,000 | 2,627,845 |
| 5.625% 5/1/24 (b) | | 1,344,000 | 1,333,490 |
| 5.75% 2/1/27 (b) | | 21,000 | 20,581 |
| Vornado Realty LP: | | | |
| 2.15% 6/1/26 | | 1,762,000 | 1,523,044 |
| 3.4% 6/1/31 | | 6,373,000 | 4,702,988 |
| Welltower OP LLC: | | | |
| 2.7% 2/15/27 | | 1,090,000 | 999,811 |
| 2.75% 1/15/31 | | 6,560,000 | 5,412,275 |
| 2.8% 6/1/31 | | 2,305,000 | 1,901,315 |
| Weyerhaeuser Co. 4% 4/15/30 | | 1,400,000 | 1,279,317 |
| WP Carey, Inc.: | | | |
| 2.25% 4/1/33 | | 3,969,000 | 2,948,274 |
| 2.4% 2/1/31 | | 2,070,000 | 1,654,483 |
| 3.85% 7/15/29 | | 1,725,000 | 1,553,003 |
| 4% 2/1/25 | | 4,482,000 | 4,363,474 |
| 4.25% 10/1/26 | | 63,000 | 60,545 |
| 4.6% 4/1/24 | | 7,436,000 | 7,377,586 |
| | | | 290,263,737 |
| Real Estate Management & Development - 0.1% | | | |
| ACCENTRO Real Estate AG 5.625% 2/13/26 (Reg. S) | EUR | 733,500 | 477,222 |
| Blackstone Property Partners Europe LP: | | | |
| 1% 5/4/28 (Reg. S) | EUR | 2,355,000 | 2,000,678 |
| 2.625% 10/20/28 (Reg. S) | GBP | 350,000 | 338,618 |
| Brandywine Operating Partnership LP: | | | |
| 3.95% 11/15/27 | | 5,608,000 | 4,616,196 |
| 4.1% 10/1/24 | | 4,892,000 | 4,670,761 |
| 4.55% 10/1/29 | | 1,707,000 | 1,333,854 |
| 7.55% 3/15/28 | | 6,570,000 | 6,160,416 |
| CBRE Group, Inc. 4.875% 3/1/26 | | 12,670,000 | 12,394,447 |
| Essex Portfolio LP: | | | |
| 1.7% 3/1/28 | | 515,000 | 436,385 |
| 2.65% 3/15/32 | | 115,000 | 91,605 |
| Extra Space Storage LP: | | | |
| 2.2% 10/15/30 | | 2,308,000 | 1,841,430 |
| 2.35% 3/15/32 | | 4,011,000 | 3,120,157 |
| 2.4% 10/15/31 | | 645,000 | 506,359 |
| 3.9% 4/1/29 | | 610,000 | 558,628 |
| 5.5% 7/1/30 | | 100,000 | 99,161 |
| Global Towers Partners Acquisition Partners I LLC 3.482% 6/15/50 (b) | | 105,000 | 100,418 |
| Greystar Real Estate Partners 7.75% 9/1/30 (b) | | 50,000 | 50,503 |
| GTC Aurora Luxembourg SA 2.25% 6/23/26 (Reg. S) | EUR | 775,000 | 605,067 |
| Heimstaden AB 4.375% 3/6/27 (Reg. S) | EUR | 800,000 | 450,916 |
| Host Hotels & Resorts LP 2.9% 12/15/31 | | 840,000 | 662,335 |
| Howard Hughes Corp.: | | | |
| 4.125% 2/1/29 (b) | | 300,000 | 247,500 |
| 4.375% 2/1/31 (b) | | 385,000 | 306,826 |
| 5.375% 8/1/28 (b) | | 850,000 | 765,291 |
| Kennedy-Wilson, Inc.: | | | |
| 4.75% 3/1/29 | | 90,000 | 72,317 |
| 4.75% 2/1/30 | | 225,000 | 173,333 |
| 5% 3/1/31 | | 38,000 | 28,745 |
| Mattamy Group Corp. 4.625% 3/1/30 (b) | | 1,500,000 | 1,325,747 |
| Mid-America Apartments LP 4.2% 6/15/28 | | 82,000 | 77,951 |
| Samhallsbyggnadsbolaget I Norden AB: | | | |
| 1.75% 1/14/25 (Reg. S) | EUR | 200,000 | 161,390 |
| 2.25% 8/12/27 (Reg. S) | EUR | 400,000 | 258,015 |
| Sirius Real Estate Ltd. 1.125% 6/22/26 (Reg. S) | EUR | 400,000 | 371,906 |
| Tanger Properties LP: | | | |
| 2.75% 9/1/31 | | 4,140,000 | 3,079,781 |
| 3.125% 9/1/26 | | 3,497,000 | 3,173,432 |
| 3.875% 7/15/27 | | 13,369,000 | 11,934,638 |
| Taylor Morrison Communities, Inc./Monarch Communities, Inc.: | | | |
| 5.125% 8/1/30 (b) | | 1,400,000 | 1,284,001 |
| 5.75% 1/15/28 (b) | | 280,000 | 271,393 |
| 5.875% 6/15/27 (b) | | 1,500,000 | 1,473,795 |
| Tritax EuroBox PLC 0.95% 6/2/26 (Reg. S) | EUR | 780,000 | 734,815 |
| Weekley Homes LLC/Weekley Finance Corp. 4.875% 9/15/28 (b) | | 328,000 | 289,460 |
| | | | 66,545,492 |
TOTAL REAL ESTATE | | | 356,809,229 |
| UTILITIES - 0.6% | | | |
| Electric Utilities - 0.4% | | | |
| AEP Texas, Inc.: | | | |
| 2.1% 7/1/30 | | 2,550,000 | 2,067,503 |
| 3.45% 5/15/51 | | 560,000 | 378,154 |
| 3.8% 10/1/47 | | 845,000 | 610,800 |
| 3.95% 6/1/28 | | 505,000 | 474,523 |
| 5.25% 5/15/52 | | 494,000 | 454,709 |
| 5.4% 6/1/33 | | 1,019,000 | 1,007,499 |
| 6.65% 2/15/33 | | 21,000 | 22,298 |
| AEP Transmission Co. LLC: | | | |
| 2.75% 8/15/51 | | 807,000 | 499,590 |
| 3.15% 9/15/49 | | 122,000 | 83,122 |
| 3.65% 4/1/50 | | 58,000 | 43,739 |
| 3.75% 12/1/47 | | 850,000 | 659,269 |
| 4% 12/1/46 | | 375,000 | 307,252 |
| Alabama Power Co.: | | | |
| 3% 3/15/52 | | 171,000 | 110,752 |
| 3.05% 3/15/32 | | 95,000 | 81,519 |
| 3.75% 3/1/45 | | 1,015,000 | 774,343 |
| 3.85% 12/1/42 | | 700,000 | 556,785 |
| 4.1% 1/15/42 | | 225,000 | 180,955 |
| 4.3% 7/15/48 | | 10,000 | 8,224 |
| 5.5% 3/15/41 | | 36,000 | 34,395 |
| 6.125% 5/15/38 | | 861,000 | 902,799 |
| Alliant Energy Finance LLC 1.4% 3/15/26 (b) | | 2,300,000 | 2,047,618 |
| American Electric Power Co., Inc. 2.031% 3/15/24 | | 51,000 | 49,898 |
| American Transmission Systems, Inc. 2.65% 1/15/32 (b) | | 567,000 | 464,336 |
| Arizona Public Service Co.: | | | |
| 2.6% 8/15/29 | | 340,000 | 294,433 |
| 3.5% 12/1/49 | | 1,100,000 | 743,524 |
| 3.75% 5/15/46 | | 825,000 | 597,275 |
| 4.25% 3/1/49 | | 29,000 | 22,125 |
| 4.7% 1/15/44 | | 4,000 | 3,271 |
| 6.35% 12/15/32 | | 3,735,000 | 3,932,729 |
| Atlantic City Electric Co. 2.3% 3/15/31 | | 425,000 | 347,818 |
| AusNet Services Holdings Pty Ltd. 1.625% 3/11/81 (Reg. S) (d) | EUR | 760,000 | 714,673 |
| Baltimore Gas & Electric Co.: | | | |
| 2.9% 6/15/50 | | 49,000 | 31,409 |
| 3.2% 9/15/49 | | 183,000 | 123,878 |
| 3.75% 8/15/47 | | 190,000 | 143,552 |
| 4.25% 9/15/48 | | 40,000 | 32,734 |
| 5.4% 6/1/53 | | 583,000 | 574,936 |
| CenterPoint Energy Houston Electric LLC: | | | |
| 2.9% 7/1/50 | | 58,000 | 37,755 |
| 3.95% 3/1/48 | | 1,205,000 | 966,774 |
| 5.3% 4/1/53 | | 366,000 | 363,549 |
| Cincinnati Gas & Electric Co.: | | | |
| 4.3% 2/1/49 | | 43,000 | 34,870 |
| 5.25% 4/1/33 | | 1,287,000 | 1,290,102 |
| Clearway Energy Operating LLC: | | | |
| 3.75% 2/15/31 (b) | | 225,000 | 184,990 |
| 4.75% 3/15/28 (b) | | 60,000 | 55,479 |
| Cleco Corporate Holdings LLC 3.375% 9/15/29 | | 4,448,000 | 3,767,999 |
| Cleveland Electric Illuminating Co. 5.5% 8/15/24 | | 5,000 | 4,980 |
| Comision Federal de Electricidad: | | | |
| 3.348% 2/9/31 (b) | | 549,000 | 434,989 |
| 4.688% 5/15/29 (b) | | 2,277,000 | 2,064,806 |
| Commonwealth Edison Co.: | | | |
| 3.2% 11/15/49 | | 239,000 | 163,557 |
| 3.7% 8/15/28 | | 250,000 | 236,054 |
| 3.7% 3/1/45 | | 1,190,000 | 917,002 |
| 4% 3/1/48 | | 8,000 | 6,442 |
| 4.35% 11/15/45 | | 415,000 | 349,251 |
| 4.9% 2/1/33 | | 945,000 | 927,569 |
| 5.3% 2/1/53 | | 717,000 | 702,061 |
| Connecticut Light & Power Co.: | | | |
| 4% 4/1/48 | | 69,000 | 56,174 |
| 4.9% 7/1/33 | | 581,000 | 572,501 |
| 5.25% 1/15/53 | | 670,000 | 654,367 |
| Dominion Energy South Carolina: | | | |
| 5.1% 6/1/65 | | 275,000 | 255,397 |
| 5.45% 2/1/41 | | 285,000 | 275,868 |
| DPL, Inc. 4.35% 4/15/29 | | 2,480,000 | 2,135,913 |
| DTE Electric Co.: | | | |
| 2.25% 3/1/30 | | 625,000 | 530,448 |
| 3.75% 8/15/47 | | 1,050,000 | 800,132 |
| 3.95% 6/15/42 | | 11,000 | 8,893 |
| 3.95% 3/1/49 | | 265,000 | 209,850 |
| 4% 4/1/43 | | 142,000 | 114,681 |
| 5.4% 4/1/53 | | 492,000 | 489,277 |
| Duke Energy Carolinas LLC: | | | |
| 2.95% 12/1/26 | | 370,000 | 348,217 |
| 3.2% 8/15/49 | | 15,000 | 10,309 |
| 3.7% 12/1/47 | | 29,000 | 21,916 |
| 3.95% 3/15/48 | | 197,000 | 154,718 |
| 4% 9/30/42 | | 2,000,000 | 1,622,242 |
| 4.25% 12/15/41 | | 2,545,000 | 2,154,258 |
| 5.35% 1/15/53 | | 1,710,000 | 1,662,075 |
| 6.1% 6/1/37 | | 775,000 | 800,308 |
| Duke Energy Corp. 3.85% 6/15/34 | EUR | 800,000 | 794,520 |
| Duke Energy Florida LLC: | | | |
| 1.75% 6/15/30 | | 217,000 | 174,800 |
| 2.4% 12/15/31 | | 1,010,000 | 824,274 |
| 2.5% 12/1/29 | | 511,000 | 440,685 |
| 3% 12/15/51 | | 827,000 | 541,492 |
| 4.2% 7/15/48 | | 104,000 | 85,153 |
| 5.9% 3/1/33 | | 12,000 | 12,201 |
| 6.35% 9/15/37 | | 675,000 | 717,816 |
| Duke Energy Industries, Inc.: | | | |
| 2.75% 4/1/50 | | 298,000 | 181,723 |
| 3.25% 10/1/49 | | 125,000 | 85,142 |
| 5.4% 4/1/53 | | 436,000 | 423,779 |
| Duke Energy Progress LLC: | | | |
| 3.45% 3/15/29 | | 434,000 | 398,679 |
| 3.7% 10/15/46 | | 5,000 | 3,733 |
| 4% 4/1/52 | | 815,000 | 636,814 |
| 4.1% 5/15/42 | | 8,000 | 6,592 |
| 5.25% 3/15/33 | | 208,000 | 208,157 |
| 5.35% 3/15/53 | | 679,000 | 658,509 |
| Duquesne Light Holdings, Inc.: | | | |
| 2.532% 10/1/30 (b) | | 70,000 | 55,788 |
| 2.775% 1/7/32 (b) | | 4,273,000 | 3,297,009 |
| Edison International: | | | |
| 5.25% 11/15/28 | | 1,162,000 | 1,134,440 |
| 6.95% 11/15/29 | | 626,000 | 659,919 |
| EDP Finance BV 1.71% 1/24/28 (b) | | 264,000 | 225,236 |
| Electricite de France SA 5.5% 1/25/35 (Reg. S) | GBP | 800,000 | 926,998 |
| Enel Chile SA 4.875% 6/12/28 | | 25,000 | 23,775 |
| ENEL Finance International NV 2.25% 7/12/31 (b) | | 6,263,000 | 4,869,290 |
| Enel SpA 3.375% (Reg. S) (d)(h) | EUR | 335,000 | 336,921 |
| Entergy Louisiana LLC: | | | |
| 1.6% 12/15/30 | | 218,000 | 168,800 |
| 2.4% 10/1/26 | | 1,070,000 | 981,001 |
| 2.9% 3/15/51 | | 118,000 | 73,776 |
| 3.12% 9/1/27 | | 21,000 | 19,438 |
| 4.2% 4/1/50 | | 40,000 | 32,026 |
| Entergy Mississippi LLC: | | | |
| 3.5% 6/1/51 | | 96,000 | 66,691 |
| 3.85% 6/1/49 | | 14,000 | 10,454 |
| 5% 9/1/33 | | 323,000 | 312,878 |
| Entergy Texas Restoration Funding II LLC 3.697% 12/15/36 | | 85,000 | 76,559 |
| Entergy, Inc.: | | | |
| 1.75% 3/15/31 | | 3,109,000 | 2,434,688 |
| 2.65% 6/15/51 | | 130,000 | 77,606 |
| 3.55% 9/30/49 | | 22,000 | 15,570 |
| 4% 6/1/28 | | 81,000 | 77,280 |
| Evergy Kansas Central: | | | |
| 4.125% 3/1/42 | | 655,000 | 533,220 |
| 5.7% 3/15/53 | | 650,000 | 649,540 |
| Evergy Kansas Metro 4.2% 6/15/47 | | 21,000 | 16,948 |
| Eversource Energy: | | | |
| 1.65% 8/15/30 | | 895,000 | 704,134 |
| 4.6% 7/1/27 | | 15,000 | 14,598 |
| 5.125% 5/15/33 | | 170,000 | 164,491 |
| 5.45% 3/1/28 | | 336,000 | 337,127 |
| Exelon Corp.: | | | |
| 4.95% 6/15/35 | | 3,000 | 2,801 |
| 5.6% 3/15/53 | | 97,000 | 93,587 |
| Fells Point Funding Trust 3.046% 1/31/27 (b) | | 496,073 | 453,632 |
| FirstEnergy Corp.: | | | |
| 2.25% 9/1/30 | | 385,000 | 309,005 |
| 3.4% 3/1/50 | | 694,000 | 459,342 |
| FirstEnergy Transmission LLC: | | | |
| 4.55% 4/1/49 (b) | | 631,000 | 509,950 |
| 5.45% 7/15/44 (b) | | 23,000 | 20,850 |
| Florida Power & Light Co.: | | | |
| 3.7% 12/1/47 | | 164,000 | 127,852 |
| 3.8% 12/15/42 | | 1,280,000 | 1,045,392 |
| 3.95% 3/1/48 | | 19,000 | 15,428 |
| 4.8% 5/15/33 | | 128,000 | 125,040 |
| 5.1% 4/1/33 | | 680,000 | 680,004 |
| 5.25% 2/1/41 | | 500,000 | 487,408 |
| 5.3% 4/1/53 | | 366,000 | 362,674 |
| 5.4% 9/1/35 | | 17,000 | 16,926 |
| Fortis, Inc. 3.055% 10/4/26 | | 301,000 | 279,185 |
| Georgia Power Co. 4.3% 3/15/42 | | 525,000 | 439,378 |
| Hydro-Quebec 8.05% 7/7/24 | | 1,455,000 | 1,489,134 |
| Iberdrola Finanzas SAU 7.375% 1/29/24 | GBP | 250,000 | 318,384 |
| Indiana Michigan Power Co.: | | | |
| 4.55% 3/15/46 | | 30,000 | 26,071 |
| 5.625% 4/1/53 | | 155,000 | 156,254 |
| Interstate Power and Light Co. 4.1% 9/26/28 | | 23,000 | 21,896 |
| ITC Holdings Corp.: | | | |
| 2.95% 5/14/30 (b) | | 262,000 | 223,928 |
| 3.65% 6/15/24 | | 16,000 | 15,710 |
| 4.95% 9/22/27 (b) | | 456,000 | 448,601 |
| 5.4% 6/1/33 (b) | | 637,000 | 625,855 |
| Jersey Central Power & Light Co.: | | | |
| 2.75% 3/1/32 (b) | | 2,060,000 | 1,677,259 |
| 6.15% 6/1/37 | | 23,000 | 23,508 |
| Kentucky Utilities Co. 5.125% 11/1/40 | | 35,000 | 32,786 |
| Louisville Gas & Electric Co. 5.125% 11/15/40 | | 345,000 | 311,214 |
| Massachusetts Electric Co. 5.9% 11/15/39 (b) | | 28,000 | 27,552 |
| Metropolitan Edison Co. 4.3% 1/15/29 (b) | | 2,755,000 | 2,608,359 |
| Mid-Atlantic Interstate Transmission LLC 4.1% 5/15/28 (b) | | 584,000 | 553,196 |
| MidAmerican Energy Co.: | | | |
| 3.65% 4/15/29 | | 20,000 | 18,637 |
| 3.65% 8/1/48 | | 58,000 | 43,201 |
| Mississippi Power Co. 3.95% 3/30/28 | | 16,000 | 15,074 |
| Mong Duong Finance Holdings BV 5.125% 5/7/29 (Reg. S) | | 250,000 | 225,640 |
| Monongahela Power Co. 4.1% 4/15/24 (b) | | 20,000 | 19,795 |
| Nevada Power Co.: | | | |
| 5.375% 9/15/40 | | 18,000 | 17,214 |
| 6.65% 4/1/36 | | 1,550,000 | 1,642,491 |
| NextEra Energy Capital Holdings, Inc.: | | | |
| 2.25% 6/1/30 | | 970,000 | 797,354 |
| 2.75% 11/1/29 | | 1,660,000 | 1,434,608 |
| 3.55% 5/1/27 | | 15,000 | 14,138 |
| 5% 7/15/32 | | 30,000 | 28,987 |
| 5.05% 2/28/33 | | 231,000 | 223,572 |
| 5.25% 2/28/53 | | 81,000 | 74,997 |
| 5.749% 9/1/25 | | 1,979,000 | 1,983,688 |
| 6.051% 3/1/25 | | 1,510,000 | 1,515,953 |
| NextEra Energy Partners LP: | | | |
| 4.25% 9/15/24 (b) | | 29,000 | 27,768 |
| 4.5% 9/15/27 (b) | | 31,000 | 28,775 |
| NGG Finance PLC 2.125% 9/5/82 (Reg. S) (d) | EUR | 1,050,000 | 990,670 |
| Niagara Mohawk Power Corp. 4.278% 12/15/28 (b) | | 19,000 | 17,831 |
| Northern States Power Co.: | | | |
| 2.6% 6/1/51 | | 68,000 | 41,546 |
| 4.5% 6/1/52 | | 78,000 | 67,299 |
| 5.1% 5/15/53 | | 649,000 | 613,521 |
| 6.2% 7/1/37 | | 5,000 | 5,315 |
| 6.25% 6/1/36 | | 370,000 | 396,802 |
| NRG Energy, Inc.: | | | |
| 2% 12/2/25 (b) | | 3,120,000 | 2,834,612 |
| 2.45% 12/2/27 (b) | | 106,000 | 89,982 |
| 3.375% 2/15/29 (b) | | 173,000 | 142,598 |
| 3.625% 2/15/31 (b) | | 913,000 | 712,532 |
| 3.875% 2/15/32 (b) | | 794,000 | 613,590 |
| 5.25% 6/15/29 (b) | | 447,000 | 402,345 |
| 5.75% 1/15/28 | | 630,000 | 596,027 |
| 6.625% 1/15/27 | | 141,000 | 139,248 |
| Ohio Power Co.: | | | |
| 1.625% 1/15/31 | | 456,000 | 357,287 |
| 2.6% 4/1/30 | �� | 101,000 | 85,521 |
| 2.9% 10/1/51 | | 799,000 | 505,275 |
| 4% 6/1/49 | | 17,000 | 13,283 |
| 5% 6/1/33 | | 522,000 | 508,706 |
| Oklahoma Gas & Electric Co. 5.4% 1/15/33 | | 45,000 | 45,003 |
| Oncor Electric Delivery Co. LLC: | | | |
| 2.7% 11/15/51 | | 175,000 | 107,385 |
| 3.1% 9/15/49 | | 54,000 | 36,672 |
| 4.95% 9/15/52 (b) | | 190,000 | 176,245 |
| 5.35% 10/1/52 | | 16,000 | 15,663 |
| Pacific Gas & Electric Co.: | | | |
| 1.7% 11/15/23 | | 58,000 | 57,464 |
| 2.95% 3/1/26 | | 80,000 | 73,811 |
| 3.25% 2/16/24 | | 128,000 | 126,379 |
| 3.45% 7/1/25 | | 97,686 | 92,736 |
| 3.5% 8/1/50 | | 128,000 | 80,544 |
| 3.95% 12/1/47 | | 1,700,000 | 1,133,073 |
| 4% 12/1/46 | | 1,045,000 | 691,469 |
| 4.2% 6/1/41 | | 63,000 | 45,583 |
| 4.25% 3/15/46 | | 540,000 | 368,588 |
| 4.5% 7/1/40 | | 2,295,000 | 1,767,387 |
| 4.55% 7/1/30 | | 3,080,000 | 2,769,731 |
| 4.6% 6/15/43 | | 57,000 | 42,773 |
| 4.65% 8/1/28 | | 2,319,000 | 2,164,184 |
| 4.95% 7/1/50 | | 4,503,000 | 3,481,834 |
| 6.1% 1/15/29 | | 383,000 | 378,502 |
| 6.4% 6/15/33 | | 382,000 | 376,789 |
| 6.75% 1/15/53 | | 700,000 | 680,362 |
| PacifiCorp: | | | |
| 2.9% 6/15/52 | | 1,000,000 | 589,695 |
| 3.3% 3/15/51 | | 112,000 | 71,381 |
| 4.125% 1/15/49 | | 884,000 | 646,329 |
| 4.15% 2/15/50 | | 738,000 | 541,358 |
| 5.25% 6/15/35 | | 1,320,000 | 1,221,916 |
| 5.35% 12/1/53 | | 1,240,000 | 1,068,647 |
| 5.5% 5/15/54 | | 3,000 | 2,657 |
| 5.75% 4/1/37 | | 925,000 | 908,822 |
| Pattern Energy Operations LP 4.5% 8/15/28 (b) | | 90,000 | 81,937 |
| PECO Energy Co.: | | | |
| 2.8% 6/15/50 | | 401,000 | 253,879 |
| 3.9% 3/1/48 | | 231,000 | 183,731 |
| 4.375% 8/15/52 | | 827,000 | 704,389 |
| 4.9% 6/15/33 | | 2,130,000 | 2,093,762 |
| Pennsylvania Electric Co. 4.15% 4/15/25 (b) | | 330,000 | 319,058 |
| Pepco Holdings LLC 7.45% 8/15/32 | | 29,000 | 30,929 |
| PG&E Corp.: | | | |
| 5% 7/1/28 | | 1,547,000 | 1,423,097 |
| 5.25% 7/1/30 | | 979,000 | 869,765 |
| PG&E Recovery Funding LLC 5.536% 7/15/49 | | 119,000 | 119,306 |
| PG&E Wildfire Recovery: | | | |
| 4.263% 6/1/38 | | 31,000 | 28,822 |
| 5.099% 6/1/54 | | 85,000 | 82,025 |
| 5.212% 12/1/49 | | 23,000 | 22,152 |
| Pinnacle West Capital Corp. 1.3% 6/15/25 | | 23,000 | 21,232 |
| Potomac Electric Power Co. 6.5% 11/15/37 | | 10,000 | 10,910 |
| PPL Electric Utilities Corp.: | | | |
| 4.125% 6/15/44 | | 925,000 | 761,916 |
| 4.15% 10/1/45 | | 790,000 | 653,506 |
| 5.25% 5/15/53 | | 876,000 | 850,779 |
| 6.25% 5/15/39 | | 350,000 | 373,373 |
| PT Perusahaan Listrik Negara 1.875% 11/5/31 (b) | EUR | 1,500,000 | 1,247,203 |
| Public Service Co. of Colorado: | | | |
| 2.7% 1/15/51 | | 198,000 | 119,348 |
| 4.05% 9/15/49 | | 77,000 | 59,761 |
| 5.25% 4/1/53 | | 2,956,000 | 2,729,713 |
| Public Service Co. of New Hampshire 5.15% 1/15/53 | | 244,000 | 236,735 |
| Public Service Co. of Oklahoma: | | | |
| 3.15% 8/15/51 | | 70,000 | 45,726 |
| 5.25% 1/15/33 | | 113,000 | 110,886 |
| 6.625% 11/15/37 | | 32,000 | 33,644 |
| Public Service Electric & Gas Co.: | | | |
| 2.05% 8/1/50 | | 88,000 | 49,472 |
| 2.25% 9/15/26 | | 28,000 | 25,841 |
| 3.2% 8/1/49 | | 180,000 | 126,874 |
| 3.6% 12/1/47 | | 410,000 | 311,736 |
| 3.65% 9/1/28 | | 960,000 | 902,112 |
| 3.65% 9/1/42 | | 625,000 | 492,528 |
| 3.95% 5/1/42 | | 505,000 | 419,895 |
| 4.65% 3/15/33 | | 3,840,000 | 3,721,574 |
| 5.125% 3/15/53 | | 273,000 | 266,189 |
| 5.375% 11/1/39 | | 12,000 | 11,391 |
| 5.8% 5/1/37 | | 24,000 | 24,498 |
| Puget Sound Energy, Inc.: | | | |
| 2.893% 9/15/51 | | 38,000 | 23,772 |
| 5.448% 6/1/53 | | 15,000 | 14,655 |
| 5.764% 7/15/40 | | 311,000 | 296,498 |
| SCE Recovery Funding LLC: | | | |
| 4.697% 6/15/42 | | 31,000 | 29,966 |
| 5.112% 12/14/49 | | 9,000 | 8,496 |
| SIGECO Securitization I LLC: | | | |
| 5.026% 11/15/38 | | 22,000 | 21,655 |
| 5.172% 5/15/43 | | 8,000 | 7,660 |
| Southern California Edison Co.: | | | |
| 2.25% 6/1/30 | | 1,225,000 | 1,017,576 |
| 2.5% 6/1/31 | | 190,000 | 156,252 |
| 2.85% 8/1/29 | | 52,000 | 45,748 |
| 2.95% 2/1/51 | | 257,000 | 163,210 |
| 3.6% 2/1/45 | | 2,937,000 | 2,130,452 |
| 3.65% 3/1/28 | | 29,000 | 27,102 |
| 3.7% 8/1/25 | | 58,000 | 56,058 |
| 3.9% 12/1/41 | | 595,000 | 451,626 |
| 4.125% 3/1/48 | | 139,000 | 109,549 |
| 4.9% 6/1/26 | | 2,295,000 | 2,280,726 |
| 5.3% 3/1/28 | | 4,374,000 | 4,390,338 |
| 5.55% 1/15/37 | | 443,000 | 430,708 |
| 5.875% 12/1/53 | | 1,079,000 | 1,073,589 |
| 5.95% 11/1/32 | | 740,000 | 767,009 |
| 5.95% 2/1/38 | | 8,000 | 8,125 |
| Southern Co. 1.875% 9/15/81 (d) | EUR | 1,600,000 | 1,367,357 |
| Southwestern Electric Power Co.: | | | |
| 1.65% 3/15/26 | | 91,000 | 82,772 |
| 3.25% 11/1/51 | | 100,000 | 64,670 |
| 3.9% 4/1/45 | | 36,000 | 26,486 |
| 4.1% 9/15/28 | | 11,000 | 10,421 |
| 5.3% 4/1/33 | | 126,000 | 123,342 |
| Southwestern Public Service Co.: | | | |
| 4.5% 8/15/41 | | 35,000 | 29,387 |
| 5.15% 6/1/52 | | 3,000,000 | 2,632,896 |
| Systems Energy Resource, Inc. 6% 4/15/28 | | 335,000 | 329,299 |
| Tampa Electric Co. 4.45% 6/15/49 | | 800,000 | 658,275 |
| Tucson Electric Power Co.: | | | |
| 3.05% 3/15/25 | | 17,000 | 16,371 |
| 3.25% 5/15/32 | | 1,200,000 | 1,030,198 |
| 4.85% 12/1/48 | | 127,000 | 108,661 |
| 5.5% 4/15/53 | | 133,000 | 127,963 |
| Union Electric Co.: | | | |
| 2.95% 6/15/27 | | 18,000 | 16,725 |
| 3.9% 4/1/52 | | 38,000 | 29,859 |
| 4% 4/1/48 | | 59,000 | 45,869 |
| 5.45% 3/15/53 | | 348,000 | 342,024 |
| Virginia Electric & Power Co.: | | | |
| 3.45% 2/15/24 | | 14,000 | 13,846 |
| 4% 1/15/43 | | 352,000 | 285,867 |
| 5.7% 8/15/53 | | 250,000 | 248,171 |
| 6% 1/15/36 | | 470,000 | 485,721 |
| 6% 5/15/37 | | 930,000 | 954,856 |
| 6.35% 11/30/37 | | 6,000 | 6,278 |
| 8.875% 11/15/38 | | 19,000 | 24,639 |
| Vistra Operations Co. LLC: | | | |
| 3.7% 1/30/27 (b) | | 2,900,000 | 2,667,123 |
| 4.3% 7/15/29 (b) | | 146,000 | 129,508 |
| 4.375% 5/1/29 (b) | | 1,091,000 | 961,872 |
| 5% 7/31/27 (b) | | 383,000 | 360,215 |
| 5.5% 9/1/26 (b) | | 888,000 | 856,535 |
| 5.625% 2/15/27 (b) | | 6,294,000 | 6,059,295 |
| Western Power Distribution PLC 3.625% 11/6/23 (Reg. S) | GBP | 250,000 | 315,196 |
| Wisconsin Power & Light Co.: | | | |
| 4.1% 10/15/44 | | 240,000 | 184,759 |
| 4.95% 4/1/33 | | 2,405,000 | 2,330,072 |
| Wisconsin Public Service Corp. 4.752% 11/1/44 | | 30,000 | 26,162 |
| Xcel Energy, Inc.: | | | |
| 1.75% 3/15/27 | | 880,000 | 780,430 |
| 3.4% 6/1/30 | | 65,000 | 57,618 |
| 4% 6/15/28 | | 1,700,000 | 1,610,817 |
| | | | 178,987,526 |
| Gas Utilities - 0.0% | | | |
| AmeriGas Partners LP/AmeriGas Finance Corp.: | | | |
| 5.75% 5/20/27 | | 568,000 | 525,236 |
| 5.875% 8/20/26 | | 5,338,000 | 5,064,155 |
| APT Pipelines Ltd. 4.25% 7/15/27 (b) | | 17,000 | 16,206 |
| Atmos Energy Corp.: | | | |
| 1.5% 1/15/31 | | 95,000 | 74,110 |
| 2.85% 2/15/52 | | 27,000 | 17,460 |
| 4.15% 1/15/43 | | 17,000 | 14,234 |
| 5.5% 6/15/41 | | 57,000 | 55,624 |
| 5.75% 10/15/52 | | 193,000 | 201,101 |
| Boston Gas Co. 3.001% 8/1/29 (b) | | 15,000 | 12,926 |
| Brooklyn Union Gas Co.: | | | |
| 3.865% 3/4/29 (b) | | 30,000 | 27,510 |
| 4.273% 3/15/48 (b) | | 29,000 | 21,327 |
| Cameron LNG LLC: | | | |
| 3.302% 1/15/35 (b) | | 914,000 | 756,566 |
| 3.402% 1/15/38 (b) | | 134,000 | 109,622 |
| 3.701% 1/15/39 (b) | | 28,000 | 22,519 |
| CenterPoint Energy Resources Corp.: | | | |
| 5.25% 3/1/28 | | 3,312,000 | 3,304,305 |
| 5.4% 3/1/33 | | 785,000 | 785,286 |
| Ferrellgas LP/Ferrellgas Finance Corp. 5.375% 4/1/26 (b) | | 15,000 | 14,100 |
| Keyspan Gas East Corp. 5.994% 3/6/33 (b) | | 2,860,000 | 2,839,087 |
| Nakilat, Inc. 6.067% 12/31/33 (b) | | 574,552 | 592,035 |
| ONE Gas, Inc. 4.5% 11/1/48 | | 11,000 | 9,027 |
| Piedmont Natural Gas Co., Inc.: | | | |
| 3.5% 6/1/29 | | 138,000 | 125,120 |
| 5.05% 5/15/52 | | 45,000 | 39,683 |
| Southern California Gas Co.: | | | |
| 2.55% 2/1/30 | | 35,000 | 29,760 |
| 2.6% 6/15/26 | | 32,000 | 29,849 |
| Southern Co. Gas Capital Corp.: | | | |
| 3.15% 9/30/51 | | 527,000 | 340,560 |
| 4.4% 6/1/43 | | 870,000 | 697,640 |
| 4.4% 5/30/47 | | 45,000 | 36,043 |
| 5.875% 3/15/41 | | 1,270,000 | 1,253,454 |
| Southern Natural Gas Co. LLC: | | | |
| 4.8% 3/15/47 (b) | | 5,000 | 4,063 |
| 8% 3/1/32 | | 10,000 | 11,293 |
| Superior Plus LP / Superior General Partner, Inc. 4.5% 3/15/29 (b) | | 216,000 | 190,076 |
| Texas Eastern Transmission LP 3.5% 1/15/28 (b) | | 941,000 | 868,924 |
| | | | 18,088,901 |
| Independent Power and Renewable Electricity Producers - 0.1% | | | |
| Calpine Corp.: | | | |
| 4.5% 2/15/28 (b) | | 317,000 | 293,455 |
| 5% 2/1/31 (b) | | 3,365,000 | 2,847,037 |
| 5.125% 3/15/28 (b) | | 2,835,000 | 2,582,912 |
| 5.25% 6/1/26 (b) | | 95,000 | 93,212 |
| Constellation Energy Generation, LLC: | | | |
| 3.25% 6/1/25 | | 32,000 | 30,629 |
| 5.6% 6/15/42 | | 269,000 | 253,589 |
| 5.75% 10/1/41 | | 80,000 | 76,270 |
| 5.8% 3/1/33 | | 914,000 | 931,071 |
| 6.25% 10/1/39 | | 45,000 | 45,570 |
| Emera U.S. Finance LP: | | | |
| 2.639% 6/15/31 | | 995,000 | 793,010 |
| 4.75% 6/15/46 | | 25,000 | 19,567 |
| Greenko Dutch BV 3.85% 3/29/26 (b) | | 188,000 | 169,480 |
| TerraForm Power Operating LLC 5% 1/31/28 (b) | | 687,000 | 623,899 |
| The AES Corp.: | | | |
| 3.3% 7/15/25 (b) | | 10,741,000 | 10,213,290 |
| 3.95% 7/15/30 (b) | | 9,327,000 | 8,290,326 |
| TransAlta Corp. 6.5% 3/15/40 | | 165,000 | 157,717 |
| | | | 27,421,034 |
| Multi-Utilities - 0.1% | | | |
| Ameren Corp.: | | | |
| 1.95% 3/15/27 | | 10,000 | 8,989 |
| 3.5% 1/15/31 | | 119,000 | 105,040 |
| Ameren Illinois Co.: | | | |
| 3.25% 3/15/50 | | 115,000 | 80,789 |
| 3.8% 5/15/28 | | 309,000 | 294,385 |
| 4.15% 3/15/46 | | 1,135,000 | 920,193 |
| 4.5% 3/15/49 | | 520,000 | 456,766 |
| 4.95% 6/1/33 | | 744,000 | 728,690 |
| 5.9% 12/1/52 | | 223,000 | 234,859 |
| Berkshire Hathaway Energy Co.: | | | |
| 2.85% 5/15/51 | | 271,000 | 167,815 |
| 4.6% 5/1/53 | | 34,000 | 28,013 |
| 5.15% 11/15/43 | | 90,000 | 82,738 |
| 6.125% 4/1/36 | | 1,429,000 | 1,495,572 |
| Consolidated Edison Co. of New York, Inc.: | | | |
| 3.875% 6/15/47 | | 37,000 | 28,322 |
| 4.125% 5/15/49 | | 20,000 | 15,828 |
| 4.3% 12/1/56 | | 300,000 | 236,822 |
| 4.5% 5/15/58 | | 23,000 | 18,737 |
| 4.65% 12/1/48 | | 139,000 | 119,522 |
| 5.7% 12/1/36 | | 11,000 | 10,927 |
| 6.15% 11/15/52 | | 341,000 | 365,569 |
| Consumers Energy Co.: | | | |
| 2.65% 8/15/52 | | 447,000 | 277,298 |
| 3.75% 2/15/50 | | 197,000 | 152,344 |
| 4.2% 9/1/52 | | 137,000 | 113,090 |
| 4.35% 4/15/49 | | 14,000 | 11,983 |
| 4.35% 8/31/64 | | 14,000 | 10,994 |
| ��4.625% 5/15/33 | | 688,000 | 667,072 |
| Dominion Energy, Inc.: | | | |
| 4.9% 8/1/41 | | 1,000 | 877 |
| 5.25% 8/1/33 | | 22,000 | 21,214 |
| 7% 6/15/38 | | 161,000 | 174,240 |
| DTE Energy Co. 4.875% 6/1/28 | | 280,000 | 273,786 |
| Engie SA 4.25% 9/6/34 (Reg. S) | EUR | 400,000 | 437,297 |
| NiSource, Inc.: | | | |
| 2.95% 9/1/29 | | 11,346,000 | 9,983,887 |
| 4.8% 2/15/44 | | 550,000 | 480,422 |
| 5.25% 3/30/28 | | 1,673,000 | 1,665,988 |
| 5.4% 6/30/33 | | 103,000 | 102,016 |
| 5.95% 6/15/41 | | 640,000 | 643,856 |
| Puget Energy, Inc.: | | | |
| 2.379% 6/15/28 | | 815,000 | 703,287 |
| 3.65% 5/15/25 | | 1,014,000 | 973,298 |
| 4.1% 6/15/30 | | 6,189,000 | 5,535,498 |
| 4.224% 3/15/32 | | 5,488,000 | 4,835,763 |
| San Diego Gas & Electric Co.: | | | |
| 1.7% 10/1/30 | | 3,975,000 | 3,164,665 |
| 2.95% 8/15/51 | | 80,000 | 52,216 |
| 3% 3/15/32 | | 311,000 | 264,821 |
| 3.32% 4/15/50 | | 1,049,000 | 719,752 |
| 3.75% 6/1/47 | | 1,210,000 | 915,727 |
| 4.5% 8/15/40 | | 7,000 | 6,204 |
| 4.95% 8/15/28 | | 320,000 | 316,756 |
| 5.35% 4/1/53 | | 1,652,000 | 1,600,076 |
| 6% 6/1/26 | | 20,000 | 20,340 |
| 6% 6/1/39 | | 14,000 | 14,359 |
| Sempra: | | | |
| 3.3% 4/1/25 | | 1,255,000 | 1,209,044 |
| 4% 2/1/48 | | 965,000 | 738,493 |
| 4.125% 4/1/52 (d) | | 3,845,000 | 3,109,035 |
| WEC Energy Group, Inc.: | | | |
| CME Term SOFR 3 Month Index + 2.110% 7.7387% 5/15/67 (d)(g) | | 1,012,000 | 885,390 |
| 1.8% 10/15/30 | | 850,000 | 666,349 |
| | | | 46,147,013 |
| Water Utilities - 0.0% | | | |
| American Water Capital Corp.: | | | |
| 3.45% 6/1/29 | | 18,000 | 16,508 |
| 3.85% 3/1/24 | | 19,000 | 18,805 |
| Severn Trent Utilities Finance PLC: | | | |
| 4.625% 11/30/34 (Reg. S) | GBP | 210,000 | 238,241 |
| 6.125% 2/26/24 | GBP | 135,000 | 171,018 |
| Thames Water Utility Finance PLC 1.875% 1/24/24 (Reg. S) | GBP | 270,000 | 332,983 |
| | | | 777,555 |
TOTAL UTILITIES | | | 271,422,029 |
| TOTAL NONCONVERTIBLE BONDS (Cost $4,737,051,966) | | | 4,234,934,162 |
| | | | |
| U.S. Government and Government Agency Obligations - 9.3% |
| | | Principal Amount (a) | Value ($) |
| U.S. Government Agency Obligations - 0.0% | | | |
| Fannie Mae: | | | |
| 0% 3/17/31 | | 515,000 | 365,571 |
| 0.5% 6/17/25 | | 1,685,000 | 1,556,925 |
| 0.875% 8/5/30 | | 125,000 | 99,148 |
| 2.5% 2/5/24 | | 440,000 | 434,542 |
| 2.875% 9/12/23 | | 505,000 | 504,603 |
| 6.625% 11/15/30 | | 1,290,000 | 1,468,401 |
| Federal Farm Credit Bank 2.35% 3/10/36 | | 1,825,000 | 1,379,673 |
| Federal Home Loan Bank: | | | |
| 2.09% 2/22/36 | | 1,760,000 | 1,291,145 |
| 3.5% 6/11/32 | | 610,000 | 565,890 |
| Freddie Mac: | | | |
| 6.25% 7/15/32 | | 1,460,000 | 1,669,759 |
| 6.75% 3/15/31 | | 2,560,000 | 2,949,245 |
| Resolution Funding Corp.: | | | |
| 0% 4/15/30 | | 599,000 | 439,985 |
| 0% 4/15/30 | | 4,081,000 | 2,997,630 |
| Tennessee Valley Authority: | | | |
| 0.75% 5/15/25 | | 845,000 | 784,740 |
| 1.5% 9/15/31 | | 780,000 | 623,045 |
| 2.875% 2/1/27 | | 1,060,000 | 1,003,079 |
| 5.25% 9/15/39 | | 150,000 | 154,193 |
| 7.125% 5/1/30 | | 460,000 | 526,485 |
TOTAL U.S. GOVERNMENT AGENCY OBLIGATIONS | | | 18,814,059 |
| U.S. Treasury Inflation-Protected Obligations - 0.1% | | | |
| U.S. Treasury Inflation-Indexed Notes: | | | |
| 1.125% 1/15/33 | | 5,644,807 | 5,267,030 |
| 1.5% 2/15/53 | | 598,409 | 537,426 |
| U.S. Treasury Notes U.S. Treasury Inflation-Indexed Notes: | | | |
| 1.25% 4/15/28 | | 21,563,623 | 20,764,723 |
| 1.375% 7/15/33 | | 19,350,798 | 18,536,348 |
TOTAL U.S. TREASURY INFLATION-PROTECTED OBLIGATIONS | | | 45,105,527 |
| U.S. Treasury Obligations - 9.2% | | | |
| U.S. Treasury Bills, yield at date of purchase 5.3% to 5.32% 10/24/23 | | 63,770,000 | 63,274,764 |
| U.S. Treasury Bonds: | | | |
| 1.125% 5/15/40 | | 13,343,000 | 8,263,799 |
| 1.125% 8/15/40 | | 9,634,200 | 5,914,872 |
| 1.25% 5/15/50 | | 58,595,000 | 30,627,332 |
| 1.375% 11/15/40 | | 55,623,400 | 35,509,892 |
| 1.375% 8/15/50 | | 5,618,000 | 3,036,573 |
| 1.625% 11/15/50 | | 3,454,000 | 1,997,923 |
| 1.75% 8/15/41 | | 71,361,200 | 47,948,594 |
| 1.875% 2/15/41 | | 62,580,000 | 43,429,543 |
| 1.875% 2/15/51 | | 911,000 | 562,009 |
| 2% 11/15/41 | | 28,528,000 | 19,961,799 |
| 2% 2/15/50 | | 47,383,500 | 30,342,098 |
| 2% 8/15/51 | | 8,849,000 | 5,618,078 |
| 2.25% 5/15/41 | | 104,226,300 | 76,797,684 |
| 2.25% 8/15/49 | | 6,286,000 | 4,276,199 |
| 2.25% 2/15/52 | | 72,472,600 | 48,890,696 |
| 2.375% 2/15/42 | | 11,861,000 | 8,817,893 |
| 2.375% 11/15/49 | | 9,494,200 | 6,639,635 |
| 2.375% 5/15/51 | | 325,115,600 | 225,968,041 |
| 2.5% 2/15/45 | | 4,887,500 | 3,589,067 |
| 2.5% 2/15/46 | | 8,070,000 | 5,867,142 |
| 2.75% 11/15/42 | | 1,357,900 | 1,064,678 |
| 2.75% 8/15/47 | | 11,200,000 | 8,488,813 |
| 2.75% 11/15/47 | | 6,321,000 | 4,786,182 |
| 2.875% 8/15/45 | | 4,692,900 | 3,672,011 |
| 2.875% 5/15/52 | | 249,200,000 | 193,451,234 |
| 3% 5/15/45 | | 342,500 | 274,455 |
| 3% 5/15/47 | | 3,564,000 | 2,832,405 |
| 3% 2/15/48 | | 8,849,000 | 7,024,239 |
| 3% 8/15/52 | | 994,000 | 792,133 |
| 3.125% 11/15/41 | | 4,804,100 | 4,052,896 |
| 3.125% 2/15/42 | | 3,727,700 | 3,132,433 |
| 3.125% 8/15/44 | | 3,480,000 | 2,863,388 |
| 3.375% 8/15/42 | | 11,640,000 | 10,100,883 |
| 3.375% 11/15/48 | | 17,060,000 | 14,498,334 |
| 3.625% 8/15/43 | | 4,576,300 | 4,090,247 |
| 3.625% 2/15/53 | | 104,671,000 | 94,302,029 |
| 3.625% 5/15/53 | | 16,310,000 | 14,709,581 |
| 3.75% 11/15/43 | | 3,648,600 | 3,318,943 |
| 3.875% 2/15/43 | | 5,289,000 | 4,921,249 |
| 3.875% 5/15/43 | | 139,252,500 | 129,476,724 |
| 4% 11/15/42 | | 20,316,700 | 19,276,263 |
| 4% 11/15/52 | | 19,918,000 | 19,218,536 |
| 4.125% 8/15/53 | | 258,000 | 254,533 |
| 4.375% 5/15/40 | | 3,493,900 | 3,536,209 |
| 4.375% 5/15/41 | | 4,047,100 | 4,077,928 |
| 4.375% 8/15/43 | | 7,827,000 | 7,806,210 |
| 4.5% 8/15/39 | | 7,848,800 | 8,089,783 |
| 4.75% 2/15/41 | | 4,051,700 | 4,280,558 |
| stripped coupon: | | | |
0% 5/15/32 | | 2,893,759 | 2,005,154 |
0% 8/15/32 | | 1,560,353 | 1,069,300 |
0% 5/15/33 | | 10,630,831 | 7,040,576 |
0% 11/15/33 | | 6,402,933 | 4,144,571 |
0% 2/15/36 | | 2,700,000 | 1,581,811 |
0% 11/15/36 | | 1,975,000 | 1,113,594 |
0% 5/15/39 (k) | | 66,910,000 | 33,209,039 |
0% 8/15/39 | | 75,692,286 | 37,173,123 |
0% 8/15/40 (i) | | 33,992,494 | 15,848,283 |
0% 2/15/41 | | 1,890,000 | 857,250 |
0% 5/15/41 | | 41,450,000 | 18,589,319 |
0% 8/15/41 | | 5,739,205 | 2,535,758 |
0% 11/15/41 | | 850,000 | 369,434 |
0% 2/15/42 | | 7,328,646 | 3,165,104 |
0% 5/15/42 | | 3,192,284 | 1,361,907 |
0% 8/15/42 | | 490,000 | 206,444 |
0% 11/15/42 | | 1,509,800 | 626,851 |
0% 11/15/43 | | 1,570,738 | 623,760 |
0% 5/15/44 | | 7,670,000 | 2,989,797 |
| U.S. Treasury Notes: | | | |
| 0.25% 6/30/25 | | 1,883,000 | 1,730,448 |
| 0.375% 4/30/25 | | 54,319,000 | 50,336,314 |
| 0.375% 1/31/26 | | 8,470,000 | 7,644,506 |
| 0.375% 9/30/27 | | 3,454,000 | 2,944,265 |
| 0.5% 4/30/27 | | 11,936,000 | 10,369,400 |
| 0.5% 5/31/27 | | 16,867,400 | 14,611,385 |
| 0.5% 8/31/27 | | 22,734,000 | 19,533,479 |
| 0.625% 7/31/26 | | 1,256,000 | 1,123,188 |
| 0.75% 4/30/26 | | 80,016,200 | 72,364,651 |
| 0.75% 5/31/26 | | 7,580,000 | 6,836,213 |
| 0.75% 8/31/26 | | 4,420,000 | 3,957,109 |
| 0.875% 6/30/26 | | 41,590,000 | 37,595,085 |
| 1% 7/31/28 | | 4,700,000 | 4,022,172 |
| 1.125% 10/31/26 (i) | | 15,938,500 | 14,368,309 |
| 1.25% 11/30/26 | | 207,200,000 | 187,135,593 |
| 1.25% 12/31/26 | | 29,355,000 | 26,474,541 |
| 1.25% 4/30/28 | | 188,000,000 | 163,956,563 |
| 1.25% 9/30/28 | | 20,609,200 | 17,785,901 |
| 1.25% 8/15/31 | | 17,459,000 | 14,098,143 |
| 1.5% 2/15/25 | | 6,132,000 | 5,822,047 |
| 1.5% 11/30/28 | | 40,035,000 | 34,872,675 |
| 1.5% 2/15/30 | | 3,646,000 | 3,092,976 |
| 1.625% 5/15/26 | | 319,100 | 295,093 |
| 1.625% 11/30/26 | | 2,510,000 | 2,294,885 |
| 1.625% 5/15/31 | | 10,552,000 | 8,838,537 |
| 1.75% 3/15/25 | | 27,425,000 | 26,079,003 |
| 1.875% 2/28/27 | | 11,936,000 | 10,949,881 |
| 1.875% 2/15/32 | | 3,096,300 | 2,601,870 |
| 2% 8/15/25 | | 349,600 | 330,946 |
| 2.125% 5/15/25 | | 22,900,000 | 21,831,035 |
| 2.5% 3/31/27 | | 25,550,000 | 23,941,148 |
| 2.625% 4/15/25 | | 6,959,000 | 6,698,581 |
| 2.75% 5/15/25 | | 5,762,000 | 5,552,002 |
| 2.75% 7/31/27 | | 68,470,000 | 64,455,412 |
| 2.75% 5/31/29 | | 87,320,000 | 80,661,850 |
| 2.75% 8/15/32 | | 70,020,400 | 62,851,515 |
| 2.875% 6/15/25 | | 6,132,000 | 5,914,745 |
| 2.875% 5/15/28 | | 39,690,000 | 37,300,848 |
| 2.875% 5/15/32 | | 447,601,000 | 406,774,892 |
| 3% 7/15/25 | | 15,015,000 | 14,502,379 |
| 3.125% 11/15/28 | | 6,448,500 | 6,105,672 |
| 3.125% 8/31/29 | | 29,280,000 | 27,558,656 |
| 3.375% 5/15/33 | | 93,816,000 | 88,377,604 |
| 3.5% 1/31/30 | | 63,400,000 | 60,816,945 |
| 3.5% 4/30/30 | | 45,200,000 | 43,335,500 |
| 3.5% 2/15/33 | | 248,100,000 | 236,276,484 |
| 3.625% 3/31/28 | | 24,800,000 | 24,108,313 |
| 3.625% 3/31/30 | | 43,700,000 | 42,211,469 |
| 3.75% 4/15/26 | | 12,855,000 | 12,577,312 |
| 3.75% 5/31/30 | | 95,207,000 | 92,637,155 |
| 3.75% 6/30/30 | | 169,000,000 | 164,431,719 |
| 3.875% 3/31/25 | | 16,668,000 | 16,366,544 |
| 3.875% 1/15/26 | | 2,700,000 | 2,648,953 |
| 3.875% 11/30/27 | | 6,142,000 | 6,029,237 |
| 3.875% 9/30/29 | | 8,449,000 | 8,279,690 |
| 3.875% 12/31/29 | | 66,823,000 | 65,478,709 |
| 3.875% 8/15/33 | | 46,685,000 | 45,853,423 |
| 4% 2/15/26 | | 1,900,000 | 1,870,016 |
| 4% 6/30/28 | | 97,950,000 | 96,779,192 |
| 4% 10/31/29 | | 12,674,000 | 12,504,188 |
| 4% 2/28/30 | | 57,900,000 | 57,162,679 |
| 4% 7/31/30 | | 14,693,000 | 14,518,521 |
| 4.125% 7/31/28 | | 141,948,000 | 141,116,273 |
| 4.125% 8/31/30 | | 9,115,500 | 9,077,044 |
| 4.125% 11/15/32 | | 135,383,800 | 135,320,339 |
| 4.25% 9/30/24 | | 62,470,000 | 61,769,653 |
| 4.25% 12/31/24 | | 21,145,000 | 20,886,469 |
| 4.25% 5/31/25 | | 44,453,000 | 43,909,493 |
| 4.375% 10/31/24 | | 6,800,000 | 6,729,609 |
| 4.375% 8/15/26 | | 1,478,000 | 1,471,303 |
| 4.375% 8/31/28 | | 18,910,000 | 19,026,710 |
| 4.625% 6/30/25 | | 10,506,700 | 10,448,421 |
| 4.75% 7/31/25 | | 21,062,000 | 21,005,231 |
| 5% 8/31/25 | | 84,300,000 | 84,540,387 |
TOTAL U.S. TREASURY OBLIGATIONS | | | 4,550,016,083 |
| Other Government Related - 0.0% | | | |
| Private Export Funding Corp. Secured: | | | |
| 1.4% 7/15/28 | | 2,605,000 | 2,252,721 |
| 3.55% 1/15/24 | | 755,000 | 749,016 |
TOTAL OTHER GOVERNMENT RELATED | | | 3,001,737 |
| TOTAL U.S. GOVERNMENT AND GOVERNMENT AGENCY OBLIGATIONS (Cost $4,953,484,050) | | | 4,616,937,406 |
| | | | |
| U.S. Government Agency - Mortgage Securities - 9.0% |
| | | Principal Amount (a) | Value ($) |
| Connecticut Avenue Securities - 0.0% | | | |
| U.S. 30-Day Avg. Secured Overnight Fin. Rate (SOFR) Index + 3.110% 8.4021% 1/25/40 (b)(d)(g) | | 400,000 | 393,323 |
| Fannie Mae - 3.7% | | | |
| 12 month U.S. LIBOR + 1.550% 5.803% 6/1/36 (d)(g) | | 2,383 | 2,408 |
| 12 month U.S. LIBOR + 1.590% 5.136% 5/1/35 (d)(g) | | 1,438 | 1,447 |
| 12 month U.S. LIBOR + 1.820% 4.295% 2/1/35 (d)(g) | | 22,077 | 22,240 |
| 12 month U.S. LIBOR + 1.950% 5.771% 7/1/37 (d)(g) | | 6,964 | 7,082 |
| 1.5% 11/1/35 to 10/1/51 (j) | | 107,548,837 | 84,328,960 |
| 1.56% 10/1/35 | | 3,297,184 | 2,403,458 |
| 1.73% 11/1/31 | | 4,370,000 | 3,505,721 |
| 1.82% 4/1/32 | | 1,046,699 | 840,239 |
| 1.93% 1/1/32 | | 6,000,000 | 4,844,733 |
| 1.96% 9/1/33 | | 248,670 | 190,685 |
| 2% 2/1/28 to 4/1/52 | | 449,024,675 | 366,334,027 |
| 2.02% 1/1/32 | | 4,000,000 | 3,254,962 |
| 2.07% 5/1/32 | | 443,451 | 356,358 |
| 2.11% 1/1/32 | | 5,000,000 | 4,098,491 |
| 2.14% 8/1/36 | | 368,972 | 279,945 |
| 2.2% 10/1/26 | | 172,846 | 159,149 |
| 2.25% 4/1/33 | | 1,272,605 | 1,021,733 |
| 2.39% 3/1/32 | | 230,721 | 194,496 |
| 2.49% 5/1/26 | | 270,187 | 253,587 |
| 2.5% 1/1/28 to 3/1/62 (j) | | 493,561,930 | 418,394,749 |
| 2.51% 10/1/30 | | 737,087 | 633,607 |
| 2.6% 9/1/27 to 9/1/28 | | 694,028 | 629,586 |
| 2.61% 6/1/26 | | 296,122 | 277,546 |
| 2.62% 5/1/26 | | 152,332 | 143,555 |
| 2.64% 6/1/25 | | 549,326 | 524,635 |
| 2.66% 8/1/29 | | 656,840 | 587,611 |
| 2.67% 4/1/34 | | 585,106 | 477,441 |
| 2.69% 12/1/28 | | 441,052 | 398,305 |
| 2.73% 4/1/25 to 7/1/28 | | 829,224 | 781,944 |
| 2.78% 4/1/26 | | 204,787 | 193,705 |
| 2.83% 10/1/27 to 4/1/30 | | 1,249,756 | 1,125,339 |
| 2.835% to 2.84% 8/1/29 to 11/1/31 | | 596,076 | 524,051 |
| 2.86% 12/1/29 | | 594,703 | 528,751 |
| 2.87% 8/1/31 | | 236,296 | 210,560 |
| 2.9% 5/1/29 | | 103,079 | 93,479 |
| 2.93% 1/1/25 | | 111,108 | 106,553 |
| 2.97% 4/1/28 | | 182,242 | 168,902 |
| 3% 12/1/26 to 6/1/62 (i)(k) | | 236,556,281 | 206,989,931 |
| 3.09% 10/1/25 to 5/1/32 | | 1,198,559 | 1,078,234 |
| 3.12% 3/1/31 | | 2,078,420 | 1,876,683 |
| 3.13% 2/1/26 to 7/1/36 | | 1,311,802 | 1,203,000 |
| 3.16% 8/1/33 | | 429,760 | 369,232 |
| 3.17% 1/1/29 | | 492,542 | 454,909 |
| 3.19% 11/1/27 | | 250,000 | 232,744 |
| 3.25% 6/1/29 | | 267,647 | 248,125 |
| 3.26% 5/1/32 | | 429,906 | 383,040 |
| 3.27% 12/1/28 | | 249,696 | 232,620 |
| 3.32% 3/1/29 | | 943,008 | 875,372 |
| 3.35% 1/1/29 | | 249,460 | 233,188 |
| 3.37% 1/1/29 | | 471,690 | 441,725 |
| 3.42% 5/1/30 | | 386,985 | 356,657 |
| 3.5% 5/1/29 to 6/1/62 (i)(k) | | 180,308,482 | 162,855,015 |
| 3.55% 8/1/28 | | 335,002 | 317,354 |
| 3.67% 7/1/33 | | 2,000,000 | 1,833,384 |
| 3.71% 9/1/30 | | 733,284 | 683,991 |
| 3.75% 7/1/33 to 9/1/34 | | 4,389,300 | 4,024,874 |
| 3.77% 9/1/32 | | 2,000,000 | 1,836,544 |
| 3.78% 8/1/30 | | 478,883 | 450,566 |
| 3.803% 12/1/26 (d) | | 61,944 | 60,387 |
| 3.81% 12/1/28 | | 468,084 | 446,031 |
| 3.83% 9/1/32 | | 6,000,000 | 5,540,198 |
| 3.84% 10/1/27 | | 135,935 | 130,253 |
| 3.88% 12/1/28 | | 8,484 | 8,114 |
| 3.895% 2/1/33 | | 559,653 | 519,423 |
| 4% 7/1/37 to 9/1/62 | | 129,212,152 | 120,943,676 |
| 4.11% 4/1/33 | | 3,436,169 | 3,255,326 |
| 4.21% 2/1/33 | | 936,169 | 889,347 |
| 4.24% 3/1/33 | | 5,469,314 | 5,233,648 |
| 4.33% 1/1/33 | | 731,382 | 702,319 |
| 4.37% 10/1/30 to 5/1/33 | | 2,987,100 | 2,880,238 |
| 4.42% 2/1/33 | | 383,712 | 372,345 |
| 4.48% 4/1/33 | | 446,114 | 432,933 |
| 4.5% 6/1/24 to 12/1/61 | | 153,990,823 | 147,000,571 |
| 4.51% 7/1/33 | | 2,938,829 | 2,850,322 |
| 4.56% 1/1/33 | | 1,452,438 | 1,417,106 |
| 4.73% 10/1/32 | | 536,805 | 528,474 |
| 4.8% 12/1/30 | | 2,000,000 | 1,976,581 |
| 4.81% 9/1/29 | | 2,981,314 | 2,957,503 |
| 4.88% 12/1/32 | | 234,042 | 233,719 |
| 4.97% 1/1/32 | | 871,511 | 869,855 |
| 5% 6/1/24 to 8/1/53 | | 100,323,109 | 98,141,352 |
| 5.17% 8/1/28 | | 2,360,000 | 2,381,419 |
| 5.279% 8/1/41 (d) | | 184,585 | 183,228 |
| 5.5% 9/1/34 to 8/1/53 (i) | | 77,438,833 | 76,715,789 |
| 6% to 6% 2/1/34 to 7/1/53 (k) | | 46,130,893 | 46,602,000 |
| 6.5% 2/1/36 to 6/1/53 | | 4,646,607 | 4,743,363 |
| 6.688% 2/1/39 (d) | | 89,062 | 90,241 |
| 7% 6/1/33 | | 2,201 | 2,279 |
| 8% 12/1/36 | | 14,828 | 15,434 |
| 2.81% 4/1/25 to 5/1/26 | | 662,339 | 633,740 |
| 4.32% 7/1/33 | | 518,776 | 496,555 |
TOTAL FANNIE MAE | | | 1,814,130,997 |
| Freddie Mac - 1.8% | | | |
| 12 month U.S. LIBOR + 1.810% 4.248% 10/1/37 (d)(g) | | 1,695 | 1,720 |
| REFINITIV USD IBOR CONSUMER CA + 2.680% 7.524% 10/1/35 (d)(g) | | 2,125 | 2,185 |
| 1.5% 8/1/35 to 6/1/51 | | 81,301,631 | 62,757,726 |
| 2% 1/1/32 to 4/1/52 (i) | | 199,277,059 | 165,149,849 |
| 2.5% 1/1/28 to 4/1/52 | | 156,603,176 | 133,474,373 |
| 3% 10/1/28 to 6/1/52 | | 148,355,492 | 130,046,575 |
| 3.05% 10/1/32 | | 6,301,000 | 5,458,023 |
| 3.19% 7/1/33 | | 6,000,000 | 5,282,586 |
| 3.5% 2/1/29 to 2/1/53 | | 140,483,564 | 127,997,021 |
| 3.55% 11/1/32 | | 442,569 | 404,083 |
| 3.85% 9/1/32 | | 509,042 | 473,234 |
| 4% 2/1/26 to 10/1/52 | | 83,462,142 | 78,189,756 |
| 4.17% 10/1/34 | | 585,106 | 549,168 |
| 4.5% 7/1/25 to 5/1/53 | | 43,060,537 | 41,269,719 |
| 5% 10/1/33 to 8/1/53 | | 56,896,322 | 55,417,292 |
| 5.5% 12/1/38 to 8/1/53 (j) | | 75,580,662 | 75,039,050 |
| 6% 2/1/28 to 7/1/53 | | 10,824,394 | 10,942,701 |
| 6.5% 3/1/32 to 1/1/53 | | 6,655,372 | 6,775,730 |
| 7.5% 1/1/32 to 12/1/36 | | 5,450 | 5,607 |
TOTAL FREDDIE MAC | | | 899,236,398 |
| Ginnie Mae - 1.7% | | | |
| U.S. TREASURY 1 YEAR INDEX + 1.560% 6.702% 3/20/72 (d)(g)(l) | | 640,145 | 654,469 |
| U.S. TREASURY 1 YEAR INDEX + 1.660% 6.807% 3/20/72 (d)(g)(l) | | 571,733 | 587,903 |
| U.S. TREASURY 1 YEAR INDEX + 1.680% 6.829% 4/20/72 (d)(g)(l) | | 979,188 | 1,008,019 |
| U.S. TREASURY 1 YEAR INDEX + 1.700% 6.841% 2/20/72 (d)(g)(l) | | 1,051,915 | 1,082,952 |
| U.S. TREASURY 1 YEAR INDEX + 1.700% 6.846% 3/20/72 (d)(g)(l) | | 1,359,837 | 1,400,297 |
| U.S. TREASURY 1 YEAR INDEX + 1.730% 6.866% 4/20/72 (d)(g)(l) | | 598,258 | 617,968 |
| U.S. TREASURY 1 YEAR INDEX + 1.730% 6.874% 3/20/72 (d)(g)(l) | | 413,993 | 426,736 |
| U.S. TREASURY 1 YEAR INDEX + 1.730% 6.89% 3/20/72 (d)(g)(l) | | 843,855 | 871,204 |
| U.S. TREASURY 1 YEAR INDEX + 1.740% 6.882% 3/20/72 (d)(g)(l) | | 363,613 | 374,809 |
| U.S. TREASURY 1 YEAR INDEX + 1.750% 6.882% 3/20/72 (d)(g)(l) | | 952,220 | 983,507 |
| 2.966% 6/20/71 (d) | | 595,594 | 515,807 |
| 3% 7/20/71 (d)(l) | | 1,428,063 | 1,240,453 |
| 3.5% 9/20/40 to 5/20/53 | | 66,235,134 | 60,695,833 |
| 4.5% 5/15/39 to 4/20/53 (m) | | 43,585,075 | 41,889,504 |
| 5.5% 6/15/36 to 6/20/63 (m) | | 9,123,468 | 9,040,629 |
| 2% 11/20/50 to 12/20/51 | | 54,140,310 | 44,784,706 |
| 2% 9/1/53 (m) | | 1,800,000 | 1,485,001 |
| 2% 9/1/53 (m) | | 4,400,000 | 3,630,002 |
| 2% 9/1/53 (m) | | 2,500,000 | 2,062,501 |
| 2% 9/1/53 (m) | | 6,050,000 | 4,991,252 |
| 2% 9/1/53 (m) | | 4,000,000 | 3,300,002 |
| 2% 9/1/53 (m) | | 9,700,000 | 8,002,504 |
| 2% 9/1/53 (m) | | 3,600,000 | 2,970,001 |
| 2% 9/1/53 (m) | | 8,825,000 | 7,280,629 |
| 2% 9/1/53 (m) | | 3,888,000 | 3,207,602 |
| 2% 9/1/53 (m) | | 2,825,000 | 2,330,626 |
| 2% 9/1/53 (m) | | 7,900,000 | 6,517,503 |
| 2% 9/1/53 (m) | | 19,250,000 | 15,881,258 |
| 2% 9/1/53 (m) | | 9,303,000 | 7,674,979 |
| 2% 9/1/53 (m) | | 25,500,000 | 21,037,510 |
| 2% 10/1/53 (m) | | 1,050,000 | 867,153 |
| 2% 10/1/53 (m) | | 2,550,000 | 2,105,942 |
| 2% 10/1/53 (m) | | 13,050,000 | 10,777,469 |
| 2% 10/1/53 (m) | | 31,750,000 | 26,221,045 |
| 2.5% 8/20/46 to 6/20/52 | | 82,621,838 | 70,427,646 |
| 2.5% 9/1/53 (m) | | 65,000 | 55,326 |
| 2.5% 9/1/53 (m) | | 4,900,000 | 4,170,751 |
| 2.5% 9/1/53 (m) | | 14,000,000 | 11,916,430 |
| 2.5% 9/1/53 (m) | | 3,850,000 | 3,277,018 |
| 2.5% 9/1/53 (m) | | 10,900,000 | 9,277,792 |
| 2.5% 9/1/53 (m) | | 2,625,000 | 2,234,331 |
| 2.5% 9/1/53 (m) | | 7,450,000 | 6,341,243 |
| 2.5% 9/1/53 (m) | | 1,000,000 | 851,174 |
| 2.5% 9/1/53 (m) | | 10,100,000 | 8,596,853 |
| 2.5% 9/1/53 (m) | | 19,750,000 | 16,810,679 |
| 2.5% 9/1/53 (m) | | 1,901,000 | 1,618,081 |
| 2.5% 9/1/53 (m) | | 2,854,000 | 2,429,249 |
| 2.5% 9/1/53 (m) | | 1,605,000 | 1,366,134 |
| 2.5% 9/1/53 (m) | | 13,500,000 | 11,490,844 |
| 2.5% 9/1/53 (m) | | 4,750,000 | 4,043,075 |
| 2.5% 9/1/53 (m) | | 13,500,000 | 11,490,844 |
| 2.5% 10/1/53 (m) | | 2,300,000 | 1,959,586 |
| 2.5% 10/1/53 (m) | | 6,500,000 | 5,537,960 |
| 2.843% 7/20/71 (d)(l) | | 3,091,597 | 2,668,052 |
| 2.893% 8/20/71 (d)(l) | | 1,019,027 | 879,230 |
| 2.939% 5/20/71 (d)(l) | | 1,359,958 | 1,176,804 |
| 3% 8/20/42 to 4/20/53 | | 75,736,198 | 67,032,326 |
| 3% 9/1/53 (m) | | 21,400,000 | 18,816,885 |
| 3% 9/1/53 (m) | | 5,000,000 | 4,396,469 |
| 3% 9/1/53 (m) | | 2,376,000 | 2,089,202 |
| 3% 9/1/53 (m) | | 14,275,000 | 12,551,918 |
| 3% 9/1/53 (m) | | 3,400,000 | 2,989,599 |
| 3% 9/1/53 (m) | | 14,700,000 | 12,925,617 |
| 3% 9/1/53 (m) | | 1,250,000 | 1,099,117 |
| 3% 9/1/53 (m) | | 175,000 | 153,876 |
| 3% 9/1/53 (m) | | 5,400,000 | 4,748,186 |
| 3% 9/1/53 (m) | | 725,000 | 637,488 |
| 3% 9/1/53 (m) | | 2,944,000 | 2,588,641 |
| 3% 9/1/53 (m) | | 2,153,000 | 1,893,119 |
| 3% 10/1/53 (m) | | 4,850,000 | 4,267,417 |
| 3% 10/1/53 (m) | | 20,750,000 | 18,257,504 |
| 3.5% 9/1/53 (m) | | 50,000 | 45,398 |
| 3.5% 9/1/53 (m) | | 200,000 | 181,591 |
| 3.5% 9/1/53 (m) | | 275,000 | 249,687 |
| 3.5% 9/1/53 (m) | | 850,000 | 771,761 |
| 3.5% 9/1/53 (m) | | 750,000 | 680,966 |
| 3.5% 9/1/53 (m) | | 550,000 | 499,375 |
| 3.5% 9/1/53 (m) | | 2,250,000 | 2,042,898 |
| 3.5% 9/1/53 (m) | | 1,700,000 | 1,543,523 |
| 3.5% 9/1/53 (m) | | 2,092,000 | 1,899,441 |
| 3.5% 9/1/53 (m) | | 575,000 | 522,074 |
| 3.5% 9/1/53 (m) | | 1,750,000 | 1,588,920 |
| 3.5% 9/1/53 (m) | | 1,900,000 | 1,725,114 |
| 3.5% 9/1/53 (m) | | 550,000 | 499,375 |
| 3.5% 9/1/53 (m) | | 13,900,000 | 12,620,568 |
| 3.5% 9/1/53 (m) | | 1,750,000 | 1,588,920 |
| 3.5% 9/1/53 (m) | | 1,721,000 | 1,562,590 |
| 3.5% 9/1/53 (m) | | 950,000 | 862,557 |
| 3.5% 9/1/53 (m) | | 2,950,000 | 2,678,466 |
| 3.5% 10/1/53 (m) | | 750,000 | 681,112 |
| 3.5% 10/1/53 (m) | | 3,400,000 | 3,087,710 |
| 3.75% 6/20/46 to 7/20/46 | | 108,421 | 100,726 |
| 4% 5/20/40 to 8/20/52 | | 51,331,982 | 48,662,256 |
| 4% 9/1/53 (m) | | 1,450,000 | 1,351,239 |
| 4% 9/1/53 (m) | | 1,615,000 | 1,505,001 |
| 4% 9/1/53 (m) | | 1,150,000 | 1,071,672 |
| 4% 9/1/53 (m) | | 1,094,000 | 1,019,486 |
| 4.5% 9/1/53 (m) | | 2,000,000 | 1,905,965 |
| 4.5% 9/1/53 (m) | | 77,000 | 73,380 |
| 4.5% 9/1/53 (m) | | 16,675,000 | 15,890,987 |
| 4.5% 9/1/53 (m) | | 1,245,000 | 1,186,463 |
| 4.5% 9/1/53 (m) | | 11,500,000 | 10,959,301 |
| 4.5% 9/1/53 (m) | | 4,300,000 | 4,097,826 |
| 4.5% 9/1/53 (m) | | 1,078,000 | 1,027,315 |
| 5% 6/20/34 to 6/20/63 | | 16,697,693 | 16,434,364 |
| 5% 9/1/53 (m) | | 10,600,000 | 10,314,836 |
| 5% 9/1/53 (m) | | 208,000 | 202,404 |
| 5% 9/1/53 (m) | | 3,300,000 | 3,211,222 |
| 5% 9/1/53 (m) | | 7,925,000 | 7,711,799 |
| 5% 9/1/53 (m) | | 1,644,000 | 1,599,773 |
| 5% 9/1/53 (m) | | 300,000 | 291,929 |
| 5% 9/1/53 (m) | | 1,000,000 | 973,098 |
| 5% 9/1/53 (m) | | 690,000 | 671,437 |
| 5.5% 9/1/53 (m) | | 222,000 | 219,815 |
| 5.5% 9/1/53 (m) | | 20,064,000 | 19,866,494 |
| 5.5% 9/1/53 (m) | | 2,550,000 | 2,524,898 |
| 5.5% 9/1/53 (m) | | 6,100,000 | 6,039,953 |
| 5.5% 9/1/53 (m) | | 2,450,000 | 2,425,883 |
| 5.5% 9/1/53 (m) | | 6,000,000 | 5,940,937 |
| 5.5% 9/1/53 (m) | | 445,000 | 440,620 |
| 6% 11/20/32 to 6/20/63 | | 2,619,022 | 2,628,888 |
| 6% 7/20/53 | | 1,136,014 | 1,147,530 |
| 6% 9/1/53 (m) | | 149,000 | 149,471 |
| 6% 9/1/53 (m) | | 571,000 | 572,804 |
| 6% 9/1/53 (m) | | 238,000 | 238,752 |
| 6.5% 10/20/39 | | 4,687 | 4,853 |
| 6.5% 6/20/53 | | 1,263,922 | 1,292,855 |
| 6.5% 7/20/53 | | 1,481,934 | 1,515,858 |
| 6.5% 9/1/53 (m) | | 112,000 | 113,456 |
| 6.5% 9/1/53 (m) | | 296,000 | 299,847 |
| 6.5% 9/1/53 (m) | | 114,000 | 115,482 |
| 7% 6/20/32 to 1/20/39 | | 17,598 | 18,124 |
| 7.5% 5/20/32 | | 2,509 | 2,602 |
| 8% 9/20/31 | | 4,483 | 4,668 |
TOTAL GINNIE MAE | | | 840,742,556 |
| Home Re - Ltd. - 0.0% | | | |
| U.S. 30-Day Avg. Secured Overnight Fin. Rate (SOFR) Index + 5.500% 10.7876% 10/25/34 (b)(d)(g) | | 563,164 | 582,068 |
| Uniform Mortgage Backed Securities - 1.8% | | | |
| 1.5% 9/1/38 (m) | | 1,479,000 | 1,261,057 |
| 1.5% 9/1/53 (m) | | 597,000 | 450,060 |
| 1.5% 9/1/53 (m) | | 11,400,000 | 8,594,115 |
| 1.5% 9/1/53 (m) | | 1,025,000 | 772,716 |
| 1.5% 9/1/53 (m) | | 7,798,000 | 5,878,676 |
| 1.5% 9/1/53 (m) | | 875,000 | 659,636 |
| 1.5% 9/1/53 (m) | | 1,380,000 | 1,040,340 |
| 1.5% 9/1/53 (m) | | 1,676,000 | 1,263,486 |
| 2% 9/1/38 (m) | | 53,000 | 46,482 |
| 2% 9/1/38 (m) | | 648,000 | 568,312 |
| 2% 9/1/38 (m) | | 2,676,000 | 2,346,920 |
| 2% 9/1/53 (m) | | 21,905,000 | 17,437,793 |
| 2% 9/1/53 (m) | | 1,950,000 | 1,552,326 |
| 2% 9/1/53 (m) | | 3,300,000 | 2,627,013 |
| 2% 9/1/53 (m) | | 33,475,000 | 26,648,259 |
| 2% 9/1/53 (m) | | 13,650,000 | 10,866,280 |
| 2% 9/1/53 (m) | | 201,000 | 160,009 |
| 2% 9/1/53 (m) | | 6,950,000 | 5,532,648 |
| 2% 9/1/53 (m) | | 2,725,000 | 2,169,276 |
| 2% 9/1/53 (m) | | 250,000 | 199,016 |
| 2% 9/1/53 (m) | | 10,625,000 | 8,458,185 |
| 2% 9/1/53 (m) | | 19,975,000 | 15,901,388 |
| 2% 9/1/53 (m) | | 7,500,000 | 5,970,484 |
| 2% 9/1/53 (m) | | 14,100,000 | 11,224,509 |
| 2% 9/1/53 (m) | | 7,120,000 | 5,667,979 |
| 2% 9/1/53 (m) | | 4,775,000 | 3,801,208 |
| 2% 9/1/53 (m) | | 8,975,000 | 7,144,679 |
| 2% 9/1/53 (m) | | 3,650,000 | 2,905,635 |
| 2% 9/1/53 (m) | | 1,900,000 | 1,512,523 |
| 2% 9/1/53 (m) | | 1,375,000 | 1,094,589 |
| 2% 9/1/53 (m) | | 6,800,000 | 5,413,239 |
| 2% 9/1/53 (m) | | 3,625,000 | 2,885,734 |
| 2% 9/1/53 (m) | | 2,575,000 | 2,049,866 |
| 2% 9/1/53 (m) | | 776,000 | 617,746 |
| 2% 9/1/53 (m) | | 4,000,000 | 3,184,258 |
| 2% 9/1/53 (m) | | 12,023,000 | 9,571,083 |
| 2% 9/1/53 (m) | | 11,550,000 | 9,194,545 |
| 2% 9/1/53 (m) | | 19,300,000 | 15,364,045 |
| 2% 9/1/53 (m) | | 7,500,000 | 5,970,484 |
| 2% 9/1/53 (m) | | 2,300,000 | 1,830,948 |
| 2% 9/1/53 (m) | | 8,150,000 | 6,487,926 |
| 2% 9/1/53 (m) | | 13,750,000 | 10,945,887 |
| 2% 10/1/53 (m) | | 19,000,000 | 15,146,749 |
| 2% 10/1/53 (m) | | 31,750,000 | 25,311,014 |
| 2% 10/1/53 (m) | | 7,600,000 | 6,058,699 |
| 2% 10/1/53 (m) | | 12,700,000 | 10,124,406 |
| 2% 10/1/53 (m) | | 7,600,000 | 6,058,699 |
| 2% 10/1/53 (m) | | 12,700,000 | 10,124,406 |
| 2% 10/1/53 (m) | | 11,400,000 | 9,088,049 |
| 2% 10/1/53 (m) | | 19,050,000 | 15,186,609 |
| 2% 10/1/53 (m) | | 11,475,000 | 9,147,839 |
| 2% 10/1/53 (m) | | 1,000,000 | 797,197 |
| 2.5% 9/1/38 (m) | | 1,022,000 | 920,319 |
| 2.5% 9/1/53 (m) | | 6,500,000 | 5,387,129 |
| 2.5% 9/1/53 (m) | | 8,050,000 | 6,671,752 |
| 2.5% 9/1/53 (m) | | 14,500,000 | 12,017,442 |
| 2.5% 9/1/53 (m) | | 145,000 | 120,174 |
| 2.5% 9/1/53 (m) | | 27,250,000 | 22,584,503 |
| 2.5% 9/1/53 (m) | | 20,400,000 | 16,907,298 |
| 2.5% 9/1/53 (m) | | 3,375,000 | 2,797,163 |
| 2.5% 9/1/53 (m) | | 5,624,000 | 4,661,110 |
| 2.5% 9/1/53 (m) | | 2,172,000 | 1,800,130 |
| 2.5% 9/1/53 (m) | | 3,875,000 | 3,211,558 |
| 2.5% 9/1/53 (m) | | 824,000 | 682,922 |
| 2.5% 9/1/53 (m) | | 8,766,000 | 7,265,165 |
| 2.5% 9/1/53 (m) | | 1,400,000 | 1,160,305 |
| 2.5% 9/1/53 (m) | | 1,000,000 | 828,789 |
| 2.5% 10/1/53 (m) | | 1,000,000 | 829,805 |
| 2.5% 10/1/53 (m) | | 13,110,000 | 10,878,740 |
| 2.5% 10/1/53 (m) | | 1,168,018 | 969,227 |
| 3% 9/1/38 (m) | | 525,000 | 485,092 |
| 3% 9/1/53 (m) | | 92,000 | 79,260 |
| 3% 9/1/53 (m) | | 1,500,000 | 1,292,285 |
| 3% 9/1/53 (m) | | 12,550,000 | 10,812,119 |
| 3% 9/1/53 (m) | | 1,850,000 | 1,593,818 |
| 3% 9/1/53 (m) | | 8,175,000 | 7,042,954 |
| 3% 9/1/53 (m) | | 3,072,000 | 2,646,600 |
| 3% 9/1/53 (m) | | 5,086,000 | 4,381,708 |
| 3% 9/1/53 (m) | | 4,550,000 | 3,919,931 |
| 3% 9/1/53 (m) | | 3,600,000 | 3,101,484 |
| 3% 9/1/53 (m) | | 5,335,000 | 4,596,227 |
| 3% 9/1/53 (m) | | 4,700,000 | 4,049,160 |
| 3% 10/1/53 (m) | | 1,000,000 | 862,461 |
| 3% 10/1/53 (m) | | 12,425,000 | 10,716,078 |
| 3.5% 9/1/38 (m) | | 210,000 | 198,007 |
| 3.5% 9/1/38 (m) | | 220,000 | 207,436 |
| 3.5% 9/1/53 (m) | | 111,000 | 99,185 |
| 3.5% 9/1/53 (m) | | 25,700,000 | 22,964,356 |
| 3.5% 9/1/53 (m) | | 5,000,000 | 4,467,774 |
| 3.5% 9/1/53 (m) | | 1,980,000 | 1,769,238 |
| 3.5% 9/1/53 (m) | | 4,000 | 3,574 |
| 3.5% 9/1/53 (m) | | 3,749,000 | 3,349,937 |
| 4% 9/1/38 (m) | | 110,000 | 105,548 |
| 4% 9/1/38 (m) | | 97,000 | 93,075 |
| 4% 9/1/53 (m) | | 2,950,000 | 2,723,219 |
| 4% 9/1/53 (m) | | 1,793,000 | 1,655,163 |
| 4% 9/1/53 (m) | | 1,000,000 | 923,125 |
| 4% 9/1/53 (m) | | 3,206,000 | 2,959,539 |
| 4% 10/1/53 (m) | | 28,800,000 | 26,608,493 |
| 4.5% 9/1/38 (m) | | 56,000 | 54,530 |
| 4.5% 9/1/38 (m) | | 184,000 | 179,170 |
| 4.5% 9/1/38 (m) | | 104,000 | 101,270 |
| 4.5% 9/1/38 (m) | | 4,500,000 | 4,381,875 |
| 4.5% 9/1/53 (m) | | 74,000 | 70,173 |
| 4.5% 9/1/53 (m) | | 14,695,000 | 13,934,992 |
| 4.5% 9/1/53 (m) | | 1,935,000 | 1,834,924 |
| 4.5% 10/1/53 (m) | | 11,675,000 | 11,077,113 |
| 4.5% 10/1/53 (m) | | 3,975,000 | 3,771,437 |
| 4.5% 10/1/53 (m) | | 17,625,000 | 16,722,408 |
| 5% 9/1/38 (m) | | 1,150,000 | 1,135,895 |
| 5% 9/1/38 (m) | | 3,750,000 | 3,704,004 |
| 5% 9/1/38 (m) | | 1,550,000 | 1,530,988 |
| 5% 9/1/38 (m) | | 450,000 | 444,480 |
| 5% 9/1/53 (m) | | 336,000 | 325,802 |
| 5% 9/1/53 (m) | | 21,000,000 | 20,362,616 |
| 5% 9/1/53 (m) | | 30,400,000 | 29,477,311 |
| 5% 9/1/53 (m) | | 3,825,000 | 3,708,905 |
| 5% 9/1/53 (m) | | 14,124,617 | 13,695,912 |
| 5% 9/1/53 (m) | | 2,593,000 | 2,514,298 |
| 5% 9/1/53 (m) | | 2,000,000 | 1,939,297 |
| 5% 9/1/53 (m) | | 2,500,000 | 2,424,121 |
| 5% 9/1/53 (m) | | 5,991,047 | 5,809,209 |
| 5% 9/1/53 (m) | | 1,635,000 | 1,585,375 |
| 5% 9/1/53 (m) | | 1,644,000 | 1,594,102 |
| 5% 9/1/53 (m) | | 167,000 | 161,931 |
| 5% 9/1/53 (m) | | 338,000 | 327,741 |
| 5% 10/1/53 (m) | | 25,125,000 | 24,373,712 |
| 5.5% 9/1/53 (m) | | 14,500,000 | 14,323,281 |
| 5.5% 9/1/53 (m) | | 534,000 | 527,492 |
| 5.5% 9/1/53 (m) | | 19,825,000 | 19,583,383 |
| 5.5% 9/1/53 (m) | | 25,025,000 | 24,720,008 |
| 5.5% 9/1/53 (m) | | 19,450,703 | 19,213,648 |
| 5.5% 9/1/53 (m) | | 2,425,000 | 2,395,445 |
| 5.5% 9/1/53 (m) | | 1,000,000 | 987,813 |
| 5.5% 9/1/53 (m) | | 2,546,000 | 2,514,971 |
| 5.5% 9/1/53 (m) | | 8,321,881 | 8,220,458 |
| 5.5% 9/1/53 (m) | | 1,108,000 | 1,094,496 |
| 5.5% 9/1/53 (m) | | 7,600,000 | 7,507,375 |
| 5.5% 9/1/53 (m) | | 27,500,000 | 27,164,844 |
| 5.5% 9/1/53 (m) | | 1,773,000 | 1,751,392 |
| 5.5% 9/1/53 (m) | | 5,504,000 | 5,436,920 |
| 5.5% 9/1/53 (m) | | 13,250,000 | 13,088,516 |
| 6% 9/1/53 (m) | | 372,000 | 373,003 |
| 6% 9/1/53 (m) | | 617,000 | 618,663 |
| 6.5% 9/1/53 (m) | | 187,000 | 189,913 |
| 6.5% 9/1/53 (m) | | 373,000 | 378,811 |
| 6.5% 9/1/53 (m) | | 559,000 | 567,708 |
| 6.5% 9/1/53 (m) | | 250,000 | 253,894 |
TOTAL UNIFORM MORTGAGE BACKED SECURITIES | | | 875,871,029 |
| TOTAL U.S. GOVERNMENT AGENCY - MORTGAGE SECURITIES (Cost $4,686,390,748) | | | 4,430,956,371 |
| | | | |
| Asset-Backed Securities - 2.4% |
| | | Principal Amount (a) | Value ($) |
| AASET Trust: | | | |
| Series 2018-1A Class A, 3.844% 1/16/38 (b) | | 2,236,345 | 1,386,534 |
| Series 2019-1 Class A, 3.844% 5/15/39 (b) | | 2,138,879 | 1,497,215 |
| Series 2019-2: | | | |
Class A, 3.376% 10/16/39 (b) | | 5,542,533 | 4,649,520 |
Class B, 4.458% 10/16/39 (b) | | 1,333,003 | 508,341 |
| Series 2021-1A Class A, 2.95% 11/16/41 (b) | | 4,671,104 | 4,115,336 |
| Acc Trust 2021-1 Series 2021-1 Class C, 2.08% 12/20/24 (b) | | 184,258 | 181,546 |
| Acc Trust 2022-1 Series 2022-1 Class C, 3.24% 10/20/25 (b)(e) | | 303,000 | 214,844 |
| Accelerated 2021-1H LLC Series 2021-1H Class D, 3.58% 10/20/40 (b) | | 133,444 | 118,912 |
| Accredited Mortgage Loan Trust Series 2006-1 Class M1, CME Term SOFR 1 Month Index + 0.440% 1.0075% 4/25/36 (d)(g) | | 2,096,326 | 1,928,176 |
| Ace Securities Corp. Mortgage L Series 2007-D1 Class A4, 6.93% 2/25/38 (b) | | 985,981 | 754,908 |
| Achv Abs Trust 2023-3Pl Series 2023-3PL Class C, 7.35% 8/19/30 (b) | | 1,750,000 | 1,765,757 |
| AIG CLO LLC Series 2021-1A Class A1R, CME Term SOFR 3 Month Index + 1.380% 6.7078% 4/20/32 (b)(d)(g) | | 350,000 | 349,041 |
| Aimco Series 2018-BA Class AR, CME Term SOFR 3 Month Index + 1.360% 6.6696% 1/15/32 (b)(d)(g) | | 1,584,000 | 1,579,023 |
| AIMCO CLO Series 2021-AA Class AR2, CME Term SOFR 3 Month Index + 1.400% 6.7096% 10/17/34 (b)(d)(g) | | 4,150,000 | 4,112,127 |
| AIMCO CLO Ltd. Series 2021-11A Class AR, CME Term SOFR 3 Month Index + 1.390% 6.6996% 10/17/34 (b)(d)(g) | | 3,880,000 | 3,854,082 |
| Allegro CLO X, Ltd. / Allegro CLO X LLC Series 2021-1A Class AR, CME Term SOFR 3 Month Index + 1.410% 6.7378% 7/20/32 (b)(d)(g) | | 16,000,000 | 15,935,248 |
| Allegro CLO XV, Ltd. / Allegro CLO VX LLC Series 2022-1A Class A, CME Term SOFR 3 Month Index + 1.500% 6.8261% 7/20/35 (b)(d)(g) | | 5,071,000 | 5,015,731 |
| Allegro CLO, Ltd. Series 2021-1A Class A, CME Term SOFR 3 Month Index + 1.400% 6.7278% 7/20/34 (b)(d)(g) | | 4,673,000 | 4,620,041 |
| Alm 2020 Ltd. Series 2020-1A Class A2, CME Term SOFR 3 Month Index + 2.110% 7.4196% 10/15/29 (b)(d)(g) | | 350,000 | 347,978 |
| Altamonte 4.55% 10/1/33 (e)(m) | | 3,000,000 | 3,017,813 |
| American Credit Acceptance Rec: | | | |
| Series 2020-2 Class C, 3.88% 4/13/26 (b) | | 4,869 | 4,860 |
| Series 2023-2 Class D, 6.47% 8/13/29 (b) | | 1,000,000 | 988,547 |
| American Credit Acceptance Receivables Series 2023-3 Class D, 6.82% 10/12/29 (b) | | 2,180,000 | 2,181,639 |
| American Express Credit Account Master Trust Series 2023-1 Class A, 4.87% 5/15/28 | | 5,180,000 | 5,150,052 |
| American Homes 4 Rent: | | | |
| Series 2014-SFR3: | | | |
Class D, 5.04% 12/17/36 (b) | | 146,000 | 142,655 |
Class E, 6.418% 12/17/36 (b) | | 519,000 | 515,259 |
| Series 2015-SFR2 Class E, 6.07% 10/17/52 (b) | | 545,000 | 535,334 |
| Ameriquest Mortgage Securities, Inc. Series 2004-R10 Class M3, CME Term SOFR 1 Month Index + 1.310% 6.6294% 11/25/34 (d)(g) | | 3,108,480 | 2,840,503 |
| Amsr 2020-Sfr1 Series 2020-SFR1: | | | |
| Class E, 3.218% 4/17/37 (b) | | 877,659 | 821,557 |
| Class H, 5.302% 4/17/37 (b) | | 175,531 | 165,104 |
| Amsr 2020-Sfr2 Trust Series 2020-SFR2: | | | |
| Class E1, 4.028% 7/17/37 (b) | | 1,000,000 | 945,553 |
| Class E2, 4.277% 7/17/37 (b) | | 469,108 | 444,086 |
| Class G, 4% 7/17/37 (b) | | 160,904 | 148,578 |
| Class H, 5.25% 7/17/37 (b) | | 577,704 | 541,690 |
| Amsr 2020-Sfr3 Trust Series 2020-SFR3 Class F, 3.553% 9/17/37 (b) | | 356,300 | 329,857 |
| Amsr 2020-Sfr4 Trust Series 2020-SFR4: | | | |
| Class E2, 2.456% 11/17/37 (b) | | 672,872 | 610,952 |
| Class F, 2.856% 11/17/37 (b) | | 1,055,106 | 955,505 |
| Amsr 2021-Sfr1 Trust Series 2021-SFR1 Class B, 2.153% 6/17/38 (b) | | 4,000,000 | 3,365,017 |
| Amsr 2021-Sfr2 Trust Series 2021-SFR2: | | | |
| Class D, 2.278% 8/17/38 (b) | | 1,150,000 | 1,009,324 |
| Class F1, 3.275% 8/17/38 (b) | | 380,318 | 332,184 |
| Amsr 2021-Sfr3 Trust Series 2021-SFR3 Class E2, 2.427% 10/17/38 (b) | | 178,896 | 151,649 |
| Amsr 2022-Sfr1 Trust Series 2022-SFR1 Class F, 6.021% 3/17/39 (b) | | 373,005 | 335,528 |
| Amsr 2022-Sfr3 Trust Series 2022-SFR3 Class D, 4% 10/17/39 (b) | | 2,115,000 | 1,899,629 |
| Amsr 2023-Sfr1 Trust Series 2023-SFR1 Class F, 4% 4/17/40 (b) | | 394,946 | 322,107 |
| Amsr 2023-Sfr2 Trust Series 2023-SFR2 Class E2, 3.95% 6/17/40 (b) | | 3,100,000 | 2,563,423 |
| AMSR Trust Series 2019-SFR1: | | | |
| Class F, 3.867% 1/19/39 (b) | | 576,000 | 511,575 |
| Class G, 4.857% 1/19/39 (b) | | 230,000 | 208,680 |
| Class H, 6.04% 1/19/39 (b) | | 230,000 | 215,488 |
| Anchorage Capital CLO 17, Ltd. Series 2021-17A Class A1, CME Term SOFR 3 Month Index + 1.430% 6.7396% 7/15/34 (b)(d)(g) | | 10,500,000 | 10,394,328 |
| Apidos Clo Xxiv Series 2021-24A Class A1AL, CME Term SOFR 3 Month Index + 1.210% 6.5378% 10/20/30 (b)(d)(g) | | 500,000 | 497,224 |
| Apidos Clo Xxxiii Series 2021-33A Class BR, CME Term SOFR 3 Month Index + 1.860% 7.2072% 10/24/34 (b)(d)(g) | | 1,000,000 | 982,625 |
| Apollo Aviation Securitization Equity Trust Series 2020-1A: | | | |
| Class A, 3.351% 1/16/40 (b) | | 1,800,238 | 1,510,418 |
| Class B, 4.335% 1/16/40 (b) | | 345,680 | 178,031 |
| Aqua Finance Trust 2017-A Series 2017-A Class A, 3.72% 11/15/35 (b) | | 16,183 | 16,021 |
| Aqua Finance Trust 2019-A Series 2019-A Class B, 3.47% 7/16/40 (b) | | 465,411 | 429,549 |
| Aqua Finance Trust 2020-A Series 2020-AA: | | | |
| Class B, 2.79% 7/17/46 (b) | | 1,690,000 | 1,473,812 |
| Class C, 3.97% 7/17/46 (b) | | 124,000 | 104,525 |
| Areit 2021-Cre5 Trust Series 2021-CRE5 Class D, CME Term SOFR 1 Month Index + 2.760% 8.0782% 11/17/38 (b)(d)(g) | | 263,000 | 243,897 |
| Ares CLO Series 2019-54A Class A, CME Term SOFR 3 Month Index + 1.580% 6.8896% 10/15/32 (b)(d)(g) | | 7,102,000 | 7,091,489 |
| Ares LV CLO Ltd. Series 2021-55A Class A1R, CME Term SOFR 3 Month Index + 1.390% 6.6996% 7/15/34 (b)(d)(g) | | 5,889,000 | 5,849,520 |
| Ares LVIII CLO LLC Series 2022-58A Class AR, CME Term SOFR 3 Month Index + 1.330% 6.638% 1/15/35 (b)(d)(g) | | 7,506,000 | 7,407,867 |
| Ares XXXIV CLO Ltd. Series 2020-2A Class AR2, CME Term SOFR 3 Month Index + 1.510% 6.8196% 4/17/33 (b)(d)(g) | | 15,169,000 | 15,130,076 |
| Argent Securities, Inc. pass-thru certificates Series 2005-W5 Class A2D, CME Term SOFR 1 Month Index + 0.750% 6.0694% 1/25/36 (d)(g) | | 2,445,459 | 2,076,197 |
| ArrowMark Colorado Holdings LLC Series 2021-3A Class A1R, CME Term SOFR 3 Month Index + 1.470% 6.8228% 1/25/35 (b)(d)(g) | | 9,500,000 | 9,356,427 |
| Asset Backed Securities Corp. Home Equity Loan Trust Series 2004-HE9 Class M1, CME Term SOFR 1 Month Index + 1.080% 6.4044% 12/25/34 (g) | | 1,118,260 | 987,678 |
| Atlas Senior Loan Fund XVI, Ltd. / Atlas Senior Loan Fund XVI LLC Series 2021-16A Class A, CME Term SOFR 3 Month Index + 1.530% 6.8578% 1/20/34 (b)(d)(g) | | 2,000,000 | 1,988,684 |
| Babson CLO Ltd. Series 2021-1A Class AR, CME Term SOFR 3 Month Index + 1.410% 6.7196% 10/15/36 (b)(d)(g) | | 3,908,000 | 3,874,313 |
| Bain Capital Credit CLO, Ltd. Series 2021-2A Class AR, 3 month U.S. LIBOR + 1.100% 6.6696% 10/17/32 (b)(d)(g) | | 7,500,000 | 7,446,923 |
| Bank of America Credit Card Master Trust Series 2023-A1 Class A1, 4.79% 5/15/28 | | 4,500,000 | 4,461,883 |
| Battalion CLO X Ltd. / Battalion CLO X LLC Series 2021-10A Class A1R2, CME Term SOFR 3 Month Index + 1.430% 6.7772% 1/25/35 (b)(d)(g) | | 12,000,000 | 11,840,208 |
| Battalion CLO XI Ltd. / Battalion CLO XI LLC Series 2021-11A Class AR, CME Term SOFR 3 Month Index + 1.410% 6.7572% 4/24/34 (b)(d)(g) | | 22,750,000 | 22,417,486 |
| Bear Stearns Asset Backed Sec Trust Series 2003-SD2 Class 2A, 5.1906% 6/25/43 (d) | | 3,633 | 3,265 |
| Beechwood Park CLO Ltd. Series 2022-1A Class A1R, CME Term SOFR 3 Month Index + 1.300% 6.608% 1/17/35 (b)(d)(g) | | 7,708,000 | 7,628,492 |
| Bellemeade Re Ltd. Series 2021-1A: | | | |
| Class M1A, U.S. 30-Day Avg. Secured Overnight Fin. Rate (SOFR) Index + 1.750% 7.0376% 3/25/31 (b)(d)(g) | | 365,633 | 365,788 |
| Class M1C, U.S. 30-Day Avg. Secured Overnight Fin. Rate (SOFR) Index + 2.950% 8.2376% 3/25/31 (b)(d)(g) | | 2,550,000 | 2,587,648 |
| BETHP Series 2021-1A Class A, CME Term SOFR 3 Month Index + 1.390% 6.6996% 1/15/35 (b)(d)(g) | | 5,907,000 | 5,847,960 |
| Blackbird Capital Aircraft: | | | |
| Series 2016-1A: | | | |
Class A, 4.213% 12/16/41 (b) | | 6,892,045 | 6,344,816 |
Class AA, 2.487% 12/16/41 (b)(d) | | 447,181 | 430,975 |
| Series 2021-1A Class A, 2.443% 7/15/46 (b) | | 6,769,407 | 5,819,930 |
| BlackRock Rainier CLO VI, Ltd. / BlackRock Rainier CLO VI LLC Series 2021-6A Class A, CME Term SOFR 3 Month Index + 1.960% 7.2878% 4/20/33 (b)(d)(g) | | 8,500,000 | 8,374,608 |
| BlueMountain CLO XXVIII, Ltd. / BlueMountain CLO XXVIII LLC Series 2021-28A Class A, CME Term SOFR 3 Month Index + 1.520% 6.8296% 4/15/34 (b)(d)(g) | | 3,000,000 | 2,976,837 |
| Bridge 2022-Sfr1 Trust Series 2022-SFR1 Class A, 3.4% 11/17/37 (b) | | 5,475,000 | 5,124,085 |
| Bristol Park CLO, Ltd. Series 2020-1A Class AR, CME Term SOFR 3 Month Index + 1.250% 6.5596% 4/15/29 (b)(d)(g) | | 7,552,086 | 7,525,480 |
| Business Jet Securities 2020-1 Series 2020-1A Class B, 3.967% 11/15/35 (b) | | 145,380 | 135,872 |
| Business Jet Securities 2021-1 LLC Series 2021-1A Class A, 2.162% 4/15/36 (b) | | 179,113 | 162,099 |
| Business Jet Securities 2022-1 Series 2022-1A Class C, 6.413% 6/15/37 (b) | | 519,265 | 474,193 |
| Bxg Receivables Nt Trust 2018-A Series 2018-A Class C, 4.44% 2/2/34 (b) | | 33,647 | 31,769 |
| Bxg Receivables Nt Trust 2020-A Series 2020-A Class B, 2.49% 2/28/36 (b) | | 1,643,635 | 1,487,199 |
| Bxg Receivables Nt Trust 2022-A Series 2022-A Class A, 4.12% 9/28/37 (b) | | 4,591,944 | 4,369,336 |
| Bxg Receivables Nt Trust 2023-A Series 2023-A Class C, 7.38% 11/15/38 (b) | | 890,224 | 864,529 |
| Carlyle Global Market Strategi Series 2018-2RA Class A1, CME Term SOFR 3 Month Index + 1.310% 6.6762% 5/15/31 (b)(d)(g) | | 491,047 | 489,294 |
| Carlyle U.S. Clo 2020-1 Series 2021-1A Class A2R, CME Term SOFR 3 Month Index + 1.910% 7.2378% 7/20/34 (b)(d)(g) | | 250,000 | 246,931 |
| CarMax Auto Owner Trust Series 2021-1 Class D, 1.28% 7/15/27 | | 200,000 | 183,928 |
| Carmax Auto Owner Trust Series 2023 2 Class A2A, 5.5% 6/15/26 | | 7,600,000 | 7,579,299 |
| Carnow Auto Receivables Trust Series 2022-1A Class E, 8.29% 8/15/28 (b) | | 351,000 | 334,654 |
| Carrington Mortgage Loan Trust Series 2005-FRE1 Class M2, CME Term SOFR 1 Month Index + 0.840% 6.1644% 12/25/35 (g) | | 9,525,324 | 8,876,200 |
| Cars Mti-1 L P / Cars Mti-2 L Series 2020-1A Class A3, 3.1% 12/15/50 (b) | | 167,418 | 137,131 |
| Cars-Db4 LP Series 2020-1A: | | | |
| Class A6, 3.81% 2/15/50 (b) | | 137,428 | 111,974 |
| Class B2, 4.52% 2/15/50 (b) | | 262,127 | 231,506 |
| Class B3, 4.95% 2/15/50 (b) | | 292,260 | 242,847 |
| Carvana Auto Receivables Series 2023-P3 Class A4, 5.71% 7/10/29 (b) | | 1,418,000 | 1,417,046 |
| Cascade Mh Asset Trust 2019-Mh Series 2019-MH1 Class B, 5% 11/25/44 (b) | | 497,340 | 458,668 |
| Castlelake Aircraft Securitization Trust Series 2019-1A: | | | |
| Class A, 3.967% 4/15/39 (b) | | 5,230,650 | 4,651,408 |
| Class B, 5.095% 4/15/39 (b) | | 2,927,377 | 1,873,580 |
| Castlelake Aircraft Structured Trust Series 2018-1 Class A, 4.125% 6/15/43 (b) | | 2,657,468 | 2,416,010 |
| Cedar Funding Ltd.: | | | |
| Series 2021-10A Class AR, CME Term SOFR 3 Month Index + 1.360% 6.6878% 10/20/32 (b)(d)(g) | | 4,327,000 | 4,309,190 |
| Series 2022-15A Class A, CME Term SOFR 3 Month Index + 1.320% 6.6461% 4/20/35 (b)(d)(g) | | 7,060,000 | 6,967,803 |
| Cedar Funding Vii Clo Ltd. / Cedar Series 2018-7A Class A1, CME Term SOFR 3 Month Index + 1.260% 6.5878% 1/20/31 (b)(d)(g) | | 591,614 | 589,948 |
| Cedar Funding XII CLO Ltd. / Cedar Funding XII CLO LLC Series 2021-12A Class A1R, CME Term SOFR 3 Month Index + 1.390% 6.7428% 10/25/34 (b)(d)(g) | | 3,624,000 | 3,571,274 |
| Cedar Funding Xvii Clo Ltd. Series 2023-17A Class A, CME Term SOFR 3 Month Index + 1.850% 7.2758% 7/20/36 (b)(d)(g) | | 4,739,000 | 4,738,303 |
| Cent CLO Ltd. / Cent CLO Series 2021-29A Class AR, CME Term SOFR 3 Month Index + 1.430% 6.7578% 10/20/34 (b)(d)(g) | | 5,895,000 | 5,803,981 |
| Centex Home Equity Loan Trust Series 2021-B Class A6, 6.36% 7/25/32 | | 436 | 415 |
| Cfin 2022-Rtl1 Issuer LLC Series 2022-RTL1 Class AA, 3.25% 2/16/26 (b) | | 481,423 | 448,782 |
| CFMT LLC Series 2023 HB12 Class A, 4.25% 4/25/33 (b) | | 2,640,640 | 2,527,761 |
| Chase Auto Credit Linked Notes Series 2021-3 Class E, 2.102% 2/26/29 (b) | | 256,879 | 243,657 |
| Cifc Funding 2019-Ii Ltd. Series 2021-2A Class DR, CME Term SOFR 3 Month Index + 3.260% 8.5696% 4/17/34 (b)(d)(g) | | 550,000 | 527,115 |
| Cifc Funding 2021-1 Ltd. Series 2021-1A: | | | |
| Class A1, CME Term SOFR 3 Month Index + 1.370% 6.7228% 4/25/33 (b)(d)(g) | | 500,000 | 498,284 |
| Class B, CME Term SOFR 3 Month Index + 1.810% 7.1628% 4/25/33 (b)(d)(g) | | 960,000 | 948,814 |
| CIFC Funding Ltd. Series 2021-7A Class B, CME Term SOFR 3 Month Index + 1.860% 7.2072% 1/23/35 (b)(d)(g) | | 7,600,000 | 7,471,438 |
| Citi Mortgage Loan Trust Series 2007-1 Class 1A, CME Term SOFR 1 Month Index + 1.460% 6.7794% 10/25/37 (b)(d)(g) | | 159,504 | 159,126 |
| Citibank Credit Card Issuance Trust Series 2018-A7 Class A7, 3.96% 10/13/30 | | 5,400,000 | 5,163,140 |
| CNH Equipment Trust Series 2023 A Class A2, 5.34% 9/15/26 | | 2,805,000 | 2,792,818 |
| College Ave Student Lns 2021-C Series 2021-C Class B, 7/26/55 (b) | | 449,000 | 388,266 |
| Columbia Cent Clo 32 Ltd. / Coliseum Series 2022-32A Class A1, CME Term SOFR 3 Month Index + 1.700% 7.0456% 7/24/34 (b)(d)(g) | | 7,340,000 | 7,305,142 |
| Connecticut Avenue Securities Trust Series 2022-R01 Class 1M2, U.S. 30-Day Avg. Secured Overnight Fin. Rate (SOFR) Index + 1.900% 7.1876% 12/25/41 (b)(d)(g) | | 1,500,000 | 1,471,091 |
| Coof Securitization Trust 2014 Series 2014-1 Class A, 2.8471% 6/25/40 (b)(d)(n) | | 49,905 | 3,690 |
| Corevest American Finance Series 2018-1 Class E, 6.1352% 6/15/51 (b)(d) | | 3,034,000 | 2,804,872 |
| CoreVest American Finance Trust Series 2020-2: | | | |
| Class A, 3.376% 5/15/52 (b) | | 60,104 | 57,514 |
| Class B, 4.244% 5/15/52 (b) | | 3,444,135 | 3,269,652 |
| Countrywide Home Loans, Inc.: | | | |
| Series 2004-1 Class 3A, CME Term SOFR 1 Month Index + 0.670% 5.9894% 4/25/34 (d)(g) | | 8,675 | 8,520 |
| Series 2004-6 Class M1, CME Term SOFR 1 Month Index + 1.010% 6.3294% 10/25/34 (d)(g) | | 4,538 | 4,380 |
| Credit Acceptance Auto Ln Trust 2023-3 Series 2023-3A Class C, 7.62% 12/15/33 (b) | | 4,000,000 | 4,004,538 |
| Credit Acceptance Auto Loan Trust: | | | |
| Series 2021-3A Class C, 1.63% 9/16/30 (b) | | 250,000 | 233,004 |
| Series 2022-3A: | | | |
Class A, 6.57% 10/15/32 (b) | | 2,748,000 | 2,757,690 |
Class D, 9% 4/18/33 (b) | | 292,000 | 290,654 |
| Series 2023-1A Class C, 7.71% 7/15/33 (b) | | 1,008,000 | 1,016,981 |
| Series 2023-2A Class C, 7.15% 9/15/33 (b) | | 658,000 | 650,272 |
| Crestline Denali CLO XVII, LLC Series 2018-1A Class AR, CME Term SOFR 3 Month Index + 1.320% 6.6296% 10/15/31 (b)(d)(g) | | 25,000,000 | 24,858,400 |
| Crown Point CLO, Ltd. / Crown Point CLO LLC Series 2021-11A Class A, CME Term SOFR 3 Month Index + 1.380% 6.6896% 1/17/34 (b)(d)(g) | | 1,000,000 | 991,118 |
| DataBank Issuer, LLC Series 2021-1A Class A2, 2.06% 2/27/51 (b) | | 564,627 | 498,100 |
| DB Master Finance LLC Series 2017-1A Class A2II, 4.03% 11/20/47 (b) | | 6,909,840 | 6,360,736 |
| Discover Card Execution Note Trust Series 2023-A2 Class A, 4.93% 6/15/28 | | 2,900,000 | 2,883,657 |
| Diversified Abs Phase Iii LLC Series 2022-1 Class A2, 4.875% 4/28/39 (b) | | 1,066,752 | 949,729 |
| Dllaa 2023-1A Series 2023-1A: | | | |
| Class A2, 5.93% 7/20/26 (b) | | 1,100,000 | 1,100,886 |
| Class A3, 5.64% 2/22/28 (b) | | 2,091,000 | 2,099,437 |
| Drive Auto Receivables Trust Series 2019-4 Class D, 2.7% 2/16/27 | | 145,218 | 143,709 |
| Dryden 104 Clo Ltd. / Dryden 10 Series 2022-104A Class B1, CME Term SOFR 3 Month Index + 3.100% 8.4798% 8/20/34 (b)(d)(g) | | 300,000 | 303,233 |
| Dryden 98 CLO Ltd. Series 2022-98A Class A, CME Term SOFR 3 Month Index + 1.300% 6.6261% 4/20/35 (b)(d)(g) | | 4,007,000 | 3,950,213 |
| Dryden CLO, Ltd. Series 2021-76A Class A1R, CME Term SOFR 3 Month Index + 1.410% 6.7378% 10/20/34 (b)(d)(g) | | 3,910,000 | 3,880,292 |
| Dryden Senior Loan Fund: | | | |
| Series 2020-78A Class A, CME Term SOFR 3 Month Index + 1.440% 6.7496% 4/17/33 (b)(d)(g) | | 5,400,000 | 5,378,762 |
| Series 2021-72A Class BR, CME Term SOFR 3 Month Index + 1.910% 7.2762% 5/15/32 (b)(d)(g) | | 6,000,000 | 5,931,288 |
| Series 2021-85A Class AR, CME Term SOFR 3 Month Index + 1.410% 6.7196% 10/15/35 (b)(d)(g) | | 5,160,000 | 5,112,353 |
| Series 2021-90A Class A1A, CME Term SOFR 3 Month Index + 1.390% 6.7714% 2/20/35 (b)(d)(g) | | 3,054,000 | 3,018,943 |
| DT Auto Owner Trust Series 2019-4A Class D, 2.85% 7/15/25 (b) | | 32,797 | 32,472 |
| Dt Auto Owner Trust 2020-2 Series 2020-2A Class C, 3.28% 3/16/26 (b) | | 39,924 | 39,710 |
| Dt Auto Owner Trust 2020-3 Series 2020-3A Class D, 1.84% 6/15/26 (b) | | 207,000 | 196,563 |
| Dt Auto Owner Trust 2023-3 Series 2023-3A Class D, 7.12% 5/15/29 (b) | | 3,936,000 | 3,967,596 |
| E3 2019-1 Series 2019-1: | | | |
| Class A, 3.1% 9/20/55 (b) | | 160,143 | 133,356 |
| Class C, 5% 9/20/55 (b) | | 40,442 | 38,299 |
| Eaton Vance CLO, Ltd.: | | | |
| Series 2021-1A Class AR, CME Term SOFR 3 Month Index + 1.360% 6.6696% 4/15/31 (b)(d)(g) | | 2,460,000 | 2,445,176 |
| Series 2021-2A Class AR, CME Term SOFR 3 Month Index + 1.410% 6.7196% 1/15/35 (b)(d)(g) | | 6,200,000 | 6,149,284 |
| Eaton Vance CLO, Ltd. / Eaton Vance CLO LLC Series 2021-1A Class A13R, CME Term SOFR 3 Month Index + 1.510% 6.8196% 1/15/34 (b)(d)(g) | | 7,240,000 | 7,188,060 |
| ECMC Group Student Loan Trust Series 2021-1A Class A1B, U.S. 30-Day Avg. Secured Overnight Fin. Rate (SOFR) Index + 0.680% 5.9721% 11/25/70 (b)(d)(g) | | 698,772 | 680,529 |
| Elara Hgv Timeshare Issuer 201 Series 2019-A Class C, 3.45% 1/25/34 (b) | | 36,605 | 33,608 |
| Elara HGV Timeshare Issuer LLC Series 2017-A Class A, 2.69% 3/25/30 (b) | | 107,126 | 103,040 |
| Elevation CLO, Ltd. Series 2021-13A Class A1, CME Term SOFR 3 Month Index + 1.450% 6.7596% 7/15/34 (b)(d)(g) | | 8,500,000 | 8,366,703 |
| Elmwood CLO II Ltd. Series 2021-2A Class AR, CME Term SOFR 3 Month Index + 1.410% 6.7378% 4/20/34 (b)(d)(g) | | 30,000,000 | 29,838,690 |
| Exeter Automobile Receivables: | | | |
| Series 2020-2A Class D, 4.73% 4/15/26 (b) | | 77,089 | 76,620 |
| Series 2020-3A Class D, 1.73% 7/15/26 | | 242,644 | 237,935 |
| Series 2023-4A: | | | |
Class D, 6.95% 12/17/29 | | 1,205,000 | 1,215,728 |
Class E, 9.57% 2/18/31 (b) | | 1,015,000 | 1,025,478 |
| Firstkey Homes 2020-Sfr2 Series 2020-SFR2: | | | |
| Class F1, 3.017% 10/19/37 (b) | | 638,000 | 580,792 |
| Class F2, 3.117% 10/19/37 (b) | | 570,000 | 520,976 |
| Firstkey Homes 2022-Sfr2 Trust Series 2022-SFR2 Class E2, 4.5% 7/17/39 (b) | | 497,000 | 442,490 |
| Firstkey Homes 2022-Sfr3 Trust Series 2022-SFR3 Class E1, 3.5% 7/17/38 (b) | | 3,500,000 | 3,127,360 |
| FirstKey Homes Trust: | | | |
| Series 2020-SFR1 Class F1, 3.638% 8/17/37 (b) | | 111,000 | 103,056 |
| Series 2021-SFR1: | | | |
Class E2, 2.489% 8/17/38 (b) | | 292,000 | 252,420 |
Class F1, 3.238% 8/17/38 (b) | | 300,000 | 259,554 |
| Series 2021-SFR2 Class E2, 2.358% 9/17/38 (b) | | 1,763,000 | 1,513,473 |
| Flagship Credit Auto Trust 201 Series 2019-2 Class D, 3.53% 5/15/25 (b) | | 208,400 | 205,731 |
| Flagship Credit Auto Trust 202 Series 2023-2 Class C, 5.81% 5/15/29 (b) | | 180,000 | 176,815 |
| Flagship Credit Auto Trust 2023-3 Series 2023-3 Class D, 6.58% 8/15/29 (b) | | 1,091,000 | 1,088,480 |
| Flatiron Clo 18 Ltd. Series 2018-1A Class A, CME Term SOFR 3 Month Index + 1.210% 6.5196% 4/17/31 (b)(d)(g) | | 325,947 | 324,796 |
| Flatiron CLO Ltd. Series 2021-1A: | | | |
| Class A1, 3 month U.S. LIBOR + 1.110% 6.6917% 7/19/34 (b)(d)(g) | | 4,210,000 | 4,183,410 |
| Class AR, CME Term SOFR 3 Month Index + 1.340% 6.7134% 11/16/34 (b)(d)(g) | | 5,750,000 | 5,703,626 |
| Flatiron CLO Ltd. / Flatiron CLO LLC Series 2020-1A Class A, CME Term SOFR 3 Month Index + 1.560% 6.9414% 11/20/33 (b)(d)(g) | | 7,413,000 | 7,404,112 |
| Fmc Gmsr Issuer Trust: | | | |
| Series 2020-GT1 Class A, 4.45% 1/25/26 (b) | | 438,000 | 383,191 |
| Series 2021-GT1 Class B, 4.36% 7/25/26 (b) | | 234,042 | 181,531 |
| Series 2021-GT2: | | | |
Class A, 3.85% 10/25/26 (b) | | 4,000,000 | 3,325,363 |
Class B, 4.44% 10/25/26 (b) | | 661,257 | 510,438 |
| Series 2021-SAT1 Class A, 3.65% 2/25/24 (b) | | 1,536,342 | 1,463,366 |
| Series 2022-GT1: | | | |
Class A, 6.19% 4/25/27 (b) | | 4,292,553 | 4,014,315 |
Class B, 7.17% 4/25/27 (b) | | 675,797 | 606,553 |
| Series 2022-GT2: | | | |
Class A, 7.9% 7/25/27 (b) | | 373,005 | 365,896 |
Class B, 10.07% 7/25/27 (b) | | 672,872 | 636,213 |
| Fn Redwood-Noble 4.8375% 6/15/29 (e)(m) | | 2,430,000 | 2,467,969 |
| Ford Credit Auto Owner Trust Series 2021-1 Class C, 1.91% 10/17/33 (b) | | 1,190,000 | 1,064,647 |
| Ford Credit Floorplan Master Owner Trust Series 2023-1 Class A1, 4.92% 5/15/28 (b) | | 5,800,000 | 5,730,534 |
| Foundation Finance Trust 2020-1 Series 2020-1A Class C, 5.75% 7/16/40 (b) | | 136,000 | 126,348 |
| Freddie Mac STACR REMIC Trust Series 2022-DNA7 Class M1B, U.S. 30-Day Avg. Secured Overnight Fin. Rate (SOFR) Index + 5.000% 10.2876% 3/25/52 (b)(d)(g) | | 3,150,000 | 3,425,625 |
| Freed Abs Trust 2021-3Fp Series 2021-3FP Class D, 2.37% 11/20/28 (b) | | 2,300,000 | 2,162,791 |
| FRTKL Series 2021-SFR1 Class F, 3.171% 9/17/38 (b) | | 128,000 | 108,859 |
| Galaxy Xviii Clo Ltd. Series 2018-28A Class A1, CME Term SOFR 3 Month Index + 1.360% 6.6696% 7/15/31 (b)(d)(g) | | 700,000 | 699,017 |
| Galaxy Xxvi Clo Ltd. / Galaxy X Series 2018-26A Class B, CME Term SOFR 3 Month Index + 1.960% 7.3448% 11/22/31 (b)(d)(g) | | 600,000 | 592,589 |
| GE Capital Mortgage Services, Inc. Series 1999-HE1 Class A6, 6.7% 4/25/29 | | 4,209 | 4,163 |
| Gls Auto Receivables Issuer Trust: | | | |
| Series 2022-1A Class D, 3.97% 1/18/28 (b) | | 4,619,000 | 4,370,808 |
| Series 2023-2A Class C, 5.69% 3/15/29 (b) | | 341,000 | 334,720 |
| Gls Auto Receivables Trust 202 Series 2023-3A: | | | |
| Class D, 6.44% 5/15/29 (b) | | 1,407,000 | 1,402,810 |
| Class E, 9.27% 8/15/30 (b) | | 1,000,000 | 1,001,662 |
| Gls Auto Select Receivables Trust Series 2023-1A Class B, 6.09% 3/15/29 (b) | | 175,000 | 173,427 |
| GM Financial Automobile Leasing Series 2023-2 Class A2A, 5.44% 10/20/25 | | 1,844,000 | 1,838,371 |
| GM Financial Consumer Automobile Re Series 2023 2 Class A3, 4.47% 2/16/28 | | 4,381,000 | 4,306,892 |
| Gm Financial Consumer Automobile Re Series 2023-3 Class A3, 5.45% 6/16/28 | | 2,830,000 | 2,845,126 |
| Gm Financial Leasing Trust 202 Series 2023-3 Class A3, 5.38% 11/20/26 | | 1,377,000 | 1,376,317 |
| Goodgreen 2017-2 Trust Series 2017-2A Class A, 3.26% 10/15/53 (b) | | 147,631 | 130,291 |
| Goodgreen 2018-1 Series 2018-1A Class A, 3.93% 10/15/53 (b)(d) | | 128,564 | 114,749 |
| Goodgreen 2023-1 Series 2023-1A Class A, 5.9% 1/17/61 (b) | | 702,228 | 667,499 |
| Goodleap Sustainable Home Solu Series 2023-3C Class A, 6.5% 7/20/55 (b) | | 1,000,000 | 997,570 |
| Greywolf CLO II, Ltd. Series 2021-1A Class A1SR, CME Term SOFR 3 Month Index + 1.400% 6.708% 4/15/34 (b)(d)(g) | | 35,000,000 | 34,764,135 |
| Harriman Park Clo Ltd. Series 2021-1A Class A1R, CME Term SOFR 3 Month Index + 1.380% 6.7078% 4/20/34 (b)(d)(g) | | 500,000 | 496,292 |
| Harvest Sba Loan Trust 2021-1 Series 2021-1 Class A, CME Term SOFR 1 Month Index + 2.110% 7.355% 4/25/48 (b)(d)(g) | | 61,646 | 60,163 |
| Henley CLO IV DAC Series 2021-4A Class A, 3 month EURIBOR EURO INTER + 0.900% 4.621% 4/25/34 (b)(d)(g) | EUR | 2,000,000 | 2,110,915 |
| Hero Funding 2017-2 Series 2017-2A Class A2, 4.07% 9/20/48 (b) | | 63,494 | 55,896 |
| Hero Funding 2017-3 Series 2017-3A: | | | |
| Class A1, 3.19% 9/20/48 (b) | | 66,954 | 57,333 |
| Class A2, 3.95% 9/20/48 (b) | | 55,263 | 48,383 |
| Hero Funding Ii 2016-4B Series 2016-4B Class B, 4.99% 9/20/47 (b) | | 27,944 | 27,146 |
| Hero Funding Iii Series 2017-1A Class A, 3.5% 9/21/43 (b) | | 73,657 | 67,183 |
| Hero Funding Trust 2015-3 Series 2015-3A Class A, 4.28% 9/20/41 (b) | | 39,753 | 36,319 |
| Hero Funding Trust 2016-3 Series 2016-3A Class A1, 3.08% 9/20/42 (b) | | 17,557 | 15,356 |
| Hero Funding Trust 2017-1A Series 2017-1A Class A2, 4.46% 9/20/47 (b) | | 59,328 | 53,316 |
| Hertz Vehicle Financing LLC 20 Series 2023-3A Class A, 5.94% 2/25/28 (b) | | 1,197,000 | 1,197,703 |
| Hgi Cre Clo 2021-Florida3 Ltd. Series 2022-FL3 Class D, U.S. 30-Day Avg. Secured Overnight Fin. Rate (SOFR) Index + 3.750% 8.9633% 4/20/37 (b)(d)(g) | | 320,500 | 312,630 |
| Hilton Grand Vacations Trust Series 2020-AA Class C, 6.42% 2/25/39 (b) | | 97,607 | 95,331 |
| Hilton Grand Vacations Trust 2 Series 2023-1A Class C, 6.94% 1/25/38 (b) | | 4,300,000 | 4,337,727 |
| Home Partners of America Trust: | | | |
| Series 2019-2 Class E, 3.32% 10/19/39 (b) | | 271,863 | 229,852 |
| Series 2021-3 Class E2, 3.347% 1/17/41 (b) | | 397,862 | 328,914 |
| Home Re, Ltd.: | | | |
| Series 2021-1: | | | |
Class M1B, 1 month U.S. LIBOR + 1.550% 6.9794% 7/25/33 (b)(d)(g) | | 12,846 | 12,842 |
Class M1C, 1 month U.S. LIBOR + 2.300% 7.7294% 7/25/33 (b)(d)(g) | | 745,000 | 746,870 |
| Series 2021-2: | | | |
Class M1B, U.S. 30-Day Avg. Secured Overnight Fin. Rate (SOFR) Index + 1.600% 6.8876% 1/25/34 (b)(d)(g) | | 603,086 | 602,780 |
Class M1C, U.S. 30-Day Avg. Secured Overnight Fin. Rate (SOFR) Index + 2.800% 8.0876% 1/25/34 (b)(d)(g) | | 990,000 | 997,712 |
| Horizon Aircraft Finance I Ltd. Series 2018-1 Class A, 4.458% 12/15/38 (b) | | 3,115,140 | 2,667,482 |
| Horizon Aircraft Finance Ltd. Series 2019-1 Class A, 3.721% 7/15/39 (b) | | 3,489,018 | 2,973,097 |
| HSI Asset Securitization Corp. Trust Series 2007-HE1 Class 1A1, CME Term SOFR 1 Month Index + 0.250% 5.5694% 1/25/37 (d)(g) | | 2,435,804 | 1,819,267 |
| Hyundai Auto Receivables Trust Series 2023-B Class A3, 5.48% 4/17/28 | | 1,443,000 | 1,450,293 |
| Invesco CLO Ltd. Series 2021-3A Class A, CME Term SOFR 3 Month Index + 1.390% 6.7372% 10/22/34 (b)(d)(g) | | 4,148,000 | 4,121,552 |
| Invesco Euro CLO I DAC Series 2021-1A Class A1R, 3 month EURIBOR EURO INTER + 0.650% 4.313% 7/15/31 (b)(d)(g) | EUR | 10,000,000 | 10,605,182 |
| Jamestown CLO XIV Ltd. Series 2021-14A: | | | |
| Class A1AR, CME Term SOFR 3 Month Index + 1.460% 6.7878% 10/20/34 (b)(d)(g) | | 13,000,000 | 12,879,360 |
| Class A2R, CME Term SOFR 3 Month Index + 2.010% 7.3378% 10/20/34 (b)(d)(g) | | 10,600,000 | 10,336,442 |
| JMP Credit Advisors CLO IV, Ltd. / JMP Credit Advisors CLO IV LLC Series 2019-1A Class AR, CME Term SOFR 3 Month Index + 1.540% 6.8496% 7/17/29 (b)(d)(g) | | 98,367 | 98,308 |
| Jonah Energy Abs I LLC Series 2022-1 Class A1, 7.2% 12/10/37 (b) | | 489,291 | 478,976 |
| JPMorgan Chase Bank NA - CACLN Series 2021-2 Class E, 2.28% 12/26/28 (b) | | 256,153 | 249,347 |
| Kgs-Alpha Sba Coof Trust 2013- Series 2013-2 Class A, 1.8934% 3/25/39 (b)(d)(n) | | 61,470 | 1,897 |
| Kgs-Alpha Sba Coof Trust Ser 2012 Series 2012-2 Class A, 0.8748% 8/25/38 (b)(d)(n) | | 68,387 | 1,220 |
| Kgs-Alpha Sba Coof Trust Serie Series 2012-4 Class A, 0.9315% 9/25/37 (b)(d)(n) | | 69,857 | 1,315 |
| KKR CLO Ltd. Series 2022-41A Class A1, CME Term SOFR 3 Month Index + 1.330% 6.638% 4/15/35 (b)(d)(g) | | 9,327,000 | 9,168,180 |
| KKR Financial CLO Ltd. Series 2021-33A Class A, CME Term SOFR 3 Month Index + 1.430% 6.7578% 7/20/34 (b)(d)(g) | | 13,000,000 | 12,917,840 |
| LCM XXIV Ltd. / LCM XXIV LLC Series 2021-24A Class AR, CME Term SOFR 3 Month Index + 1.240% 6.5678% 3/20/30 (b)(d)(g) | | 5,823,699 | 5,796,048 |
| Lending Funding Trust 2020-2 Series 2020-2A Class A, 2.32% 4/21/31 (b) | | 3,750,000 | 3,354,465 |
| Lendmark Funding Trust Series 2021-1A: | | | |
| Class A, 1.9% 11/20/31 (b) | | 4,200,000 | 3,654,863 |
| Class B, 2.47% 11/20/31 (b) | | 150,000 | 126,506 |
| Lendmark Funding Trust 2022-1 Series 2022-1A Class C, 6.6% 7/20/32 (b) | | 400,000 | 397,373 |
| Lendmark Funding Trust 2023-1 Series 2023-1A Class D, 8.69% 5/20/33 (b) | | 1,750,000 | 1,794,181 |
| Lft Cre 2021-Florida1 Ltd. / Lft Cre Series 2021-FL1: | | | |
| Class D, CME Term SOFR 1 Month Index + 2.560% 7.875% 6/15/39 (b)(d)(g) | | 416,500 | 393,013 |
| Class E, CME Term SOFR 1 Month Index + 3.060% 8.375% 6/15/39 (b)(d)(g) | | 365,500 | 344,259 |
| Louisiana Local Government Environment and Community Dev. Auth. Series 2022-2022A Class A2, 4.145% 2/1/33 | | 260,000 | 250,881 |
| LP Lms 2021-1 Asset Securitiza 0% 10/15/28 (b) | | 216,000 | 213,264 |
| Madison Park Funding LII Ltd. / Madison Park Funding LII LLC Series 2021-52A Class A, CME Term SOFR 3 Month Index + 1.360% 6.7072% 1/22/35 (b)(d)(g) | | 6,180,000 | 6,097,448 |
| Madison Park Funding XLV Ltd./Madison Park Funding XLV LLC Series 2021-45A Class AR, CME Term SOFR 3 Month Index + 1.380% 6.6896% 7/15/34 (b)(d)(g) | | 4,233,000 | 4,198,759 |
| Madison Park Funding Xxxi Ltd. Series 2018-31A Class B, CME Term SOFR 3 Month Index + 1.960% 7.3072% 1/23/31 (b)(d)(g) | | 1,000,000 | 988,794 |
| Madison Park Funding XXXIV, Ltd. Series 2021-34A Class AR, CME Term SOFR 3 Month Index + 1.380% 6.7328% 4/25/32 (b)(d)(g) | | 20,000,000 | 19,940,940 |
| Madison Park Funding XXXVIII, Ltd. Series 2021-38A Class A, CME Term SOFR 3 Month Index + 1.380% 6.6896% 7/17/34 (b)(d)(g) | | 12,500,000 | 12,387,138 |
| Madison Pk Funding Xxx Ltd. / LLC Series 2018-30A Class A, CME Term SOFR 3 Month Index + 1.010% 6.3196% 4/15/29 (b)(d)(g) | | 566,969 | 563,092 |
| Magnetite CLO LTD Series 2023-36A Class A, CME Term SOFR 3 Month Index + 1.800% 6.9585% 4/22/36 (b)(d)(g) | | 3,249,000 | 3,256,440 |
| Magnetite CLO Ltd. Series 2021-27A Class AR, CME Term SOFR 3 Month Index + 1.400% 6.7278% 10/20/34 (b)(d)(g) | | 1,417,000 | 1,406,320 |
| Magnetite VII Ltd. Series 2018-7A Class A1R2, CME Term SOFR 3 Month Index + 1.060% 6.3696% 1/15/28 (b)(d)(g) | | 4,443,711 | 4,430,238 |
| Magnetite XXIII, Ltd. Series 2021-23A Class AR, CME Term SOFR 3 Month Index + 1.390% 6.7428% 1/25/35 (b)(d)(g) | | 4,904,000 | 4,881,383 |
| Mansion Baml (The) 4.51% 10/1/35 (e)(m) | | 3,000,000 | 2,960,625 |
| Mariner Finance Issuance Trust Series 2022-AA Class D, 9.1% 10/20/37 (b) | | 337,000 | 337,550 |
| Marlette Funding Trust Series 2022-1A Class A, 1.36% 4/15/32 (b) | | 111,648 | 111,435 |
| Marlette Funding Trust 2023-2 Series 2023-2A Class C, 6.96% 6/15/33 (b) | | 193,000 | 192,398 |
| MASTR Asset Backed Securities Trust Series 2005-WF1 Class M7, CME Term SOFR 1 Month Index + 1.830% 7.1544% 6/25/35 (d)(g) | | 1,816,559 | 1,801,792 |
| Mastr Asset Backed South Carolina 2007-Ncw Series 2007-NCW Class A1, CME Term SOFR 1 Month Index + 0.410% 5.7294% 5/25/37 (Assured Guaranty Municipal Corp. Insured) (b)(d)(g) | | 1,174,796 | 981,065 |
| Mercury Financial Credit Card Series 2023-1A Class A, 8.04% 9/20/27 (b) | | 4,463,000 | 4,481,510 |
| Mid State Capital Corp. 05 1 Trust Series 2005-1 Class M1, 6.106% 1/15/40 | | 28,456 | 27,838 |
| Mid-State Capital Corp. 2006-1 Trust Series 2006-1: | | | |
| Class A, 5.787% 10/15/40 (b) | | 21,541 | 20,642 |
| Class M1, 6.083% 10/15/40 (b) | | 26,136 | 25,094 |
| Milos CLO, Ltd. Series 2020-1A Class AR, CME Term SOFR 3 Month Index + 1.330% 6.6578% 10/20/30 (b)(d)(g) | | 7,755,894 | 7,746,409 |
| Morgan Stanley ABS Capital I Trust: | | | |
| Series 2003-SD1 Class M1, CME Term SOFR 1 Month Index + 2.360% 7.6794% 3/25/33 (g) | | 4,009 | 3,844 |
| Series 2006-HE4 Class A4, CME Term SOFR 1 Month Index + 0.590% 5.9094% 6/25/36 (g) | | 3,537,860 | 1,847,980 |
| Series 2007-NC3 Class A2D, CME Term SOFR 1 Month Index + 0.370% 5.6894% 5/25/37 (d)(g) | | 2,009,400 | 1,471,886 |
| Mvw 2019-1 LLC Series 2019-1A: | | | |
| Class B, 3% 11/20/36 (b) | | 104,992 | 99,402 |
| Class C, 3.33% 11/20/36 (b) | | 44,343 | 41,738 |
| Mvw 2022-2 LLC Series 2022-2A Class D, 9% 10/21/41 (b) | | 443,610 | 437,068 |
| Navient Student Loan Trust: | | | |
| Series 2015-1 Class A2, U.S. 30-Day Avg. Secured Overnight Fin. Rate (SOFR) Index + 0.710% 6.0021% 4/25/40 (d)(g) | | 2,248,649 | 2,173,302 |
| Series 2016-2A Class A3, U.S. 30-Day Avg. Secured Overnight Fin. Rate (SOFR) Index + 1.610% 6.9021% 6/25/65 (b)(d)(g) | | 1,198,161 | 1,199,788 |
| Series 2017-3A Class A3, U.S. 30-Day Avg. Secured Overnight Fin. Rate (SOFR) Index + 1.160% 6.4521% 7/26/66 (b)(d)(g) | | 8,289,678 | 8,155,800 |
| Nelnet Student Loan Trust Series 2013-1 Class A6, CME Term SOFR 3 Month Index + 0.710% 6.089% 8/23/36 (b)(d)(g) | | 5,379,483 | 5,218,271 |
| Neuberger Berman Loan Advisers: | | | |
| Series 2019-35A Class A1, CME Term SOFR 3 Month Index + 1.600% 6.9217% 1/19/33 (b)(d)(g) | | 2,000,000 | 1,998,102 |
| Series 2020-39A Class B, CME Term SOFR 3 Month Index + 1.860% 7.1877% 1/20/32 (b)(d)(g) | | 600,000 | 595,662 |
| Neuberger Berman Loan Advisers CLO, Ltd. Series 2021-26A Class AR, CME Term SOFR 3 Month Index + 1.180% 6.4915% 10/18/30 (b)(d)(g) | | 584,464 | 581,447 |
| New Century Home Equity Loan Trust Series 2003-5 Class AI6, 4.7978% 11/25/33 | | 6,130 | 5,825 |
| Newcastle Mortgage Securities Trust Series 2007-1 Class 2A3, CME Term SOFR 1 Month Index + 0.340% 5.6594% 4/25/37 (g) | | 2,174,483 | 2,099,994 |
| Newrez LLC / Newres Gmsr Exces Series 2021-GNT1 Class A, 3.474% 11/25/26 (b) | | 4,460,434 | 4,022,959 |
| Nissan Auto Lease Trust 2023-B Series 2023-B Class A4, 5.61% 11/15/27 | | 270,000 | 270,557 |
| Northwoods Capital XV, Ltd. Series 2021-15A Class A1R, 3 month U.S. LIBOR + 1.210% 6.72% 6/20/34 (b)(d)(g) | | 23,750,000 | 23,427,879 |
| Nrz Excess Spread-Collateraliz Series 2020-PLS1 Class A, 3.844% 12/25/25 (b) | | 181,126 | 168,870 |
| Nrz Fht Excess LLC Series 2020-FHT1 Class A, 4.212% 11/25/25 (b) | | 207,687 | 192,814 |
| Oak Hill Credit Partners X-R, Ltd. Series 2021-10RA, Class BR, CME Term SOFR 3 Month Index + 1.810% 7.1378% 4/20/34 (b)(d)(g) | | 2,000,000 | 1,976,482 |
| OCP CLO Ltd. / OCP CLO LLC Series 2021-18A Class AR, CME Term SOFR 3 Month Index + 1.350% 6.6778% 7/20/32 (b)(d)(g) | | 18,000,000 | 17,881,704 |
| Octagon Investment Partners 20-R, Ltd. Series 2021-4A Class BR, CME Term SOFR 3 Month Index + 1.960% 7.3308% 5/12/31 (b)(d)(g) | | 2,500,000 | 2,475,380 |
| Octagon Investment Partners 31, Ltd. / Octagon Investment Partners 31 LLC Series 2021-1A Class AR, CME Term SOFR 3 Month Index + 1.310% 6.6378% 7/20/30 (b)(d)(g) | | 2,621,346 | 2,610,661 |
| Octane Receivables Trust 2023 Series 2023-2A Class C, 6.24% 6/20/31 (b) | | 2,589,000 | 2,547,065 |
| Onemain Financial Issuance Tru Series 2023-2A: | | | |
| Class B, 6.17% 9/15/36 (b) | | 5,714,000 | 5,741,688 |
| Class C, 6.74% 9/15/36 (b) | | 1,300,000 | 1,306,180 |
| Class D, 7.52% 9/15/36 (b) | | 1,400,000 | 1,411,250 |
| Oportun Funding Xiii LLC Series 2019-A Class B, 3.87% 8/8/25 (b) | | 69,239 | 68,301 |
| Oportun Funding XIV, LLC Series 2021-A Class A, 1.21% 3/8/28 (b) | | 559,098 | 536,585 |
| Oportun Issuance Trust 2021-B Series 2021-B: | | | |
| Class B, 1.96% 5/8/31 (b) | | 184,000 | 166,828 |
| Class C, 3.65% 5/8/31 (b) | | 247,000 | 227,792 |
| Oportun Issuance Trust 2021-C Series 2021-C Class A, 2.18% 10/8/31 (b) | | 5,000,000 | 4,548,086 |
| Oportun Issuance Trust 2022-2 Series 2022-2 Class C, 9.36% 10/9/29 (b) | | 235,000 | 235,323 |
| Oportun Issuance Trust 2022-3 Series 2022-3 Class C, 10.147% 1/8/30 (b) | | 228,000 | 233,098 |
| Oportun Issuance Trust 2022-A Series 2022-A: | | | |
| Class A, 5.05% 6/9/31 (b) | | 351,000 | 341,630 |
| Class C, 7.4% 6/9/31 (b) | | 160,000 | 152,485 |
| Palmer Square CLO, Ltd. Series 2021-1A Class A1, CME Term SOFR 3 Month Index + 1.450% 6.7778% 4/20/34 (b)(d)(g) | | 3,000,000 | 2,988,321 |
| Park Avenue Institutional Advisers CLO Ltd. / Park Avenue Institutional Advisers CLO LLC Series 2021-1A Class A1AR, CME Term SOFR 3 Month Index + 1.260% 6.5878% 10/20/31 (b)(d)(g) | | 12,750,000 | 12,670,121 |
| Park Avenue Institutional Advisers CLO, Ltd. Series 2021-1A Class A1R, CME Term SOFR 3 Month Index + 1.500% 6.8708% 2/14/34 (b)(d)(g) | | 2,000,000 | 1,985,522 |
| Peace Park CLO, Ltd. Series 2021-1A Class A, 3 month U.S. LIBOR + 1.130% 6.7178% 10/20/34 (b)(d)(g) | | 5,651,000 | 5,606,741 |
| Planet Fitness Master Issuer LLC: | | | |
| Series 2019-1A Class A2, 3.858% 12/5/49 (b) | | 5,997,475 | 5,076,077 |
| Series 2022-1A: | | | |
Class A2I, 3.251% 12/5/51 (b) | | 4,627,425 | 4,152,790 |
Class A2II, 4.008% 12/5/51 (b) | | 4,135,650 | 3,410,224 |
| PMT Credit Risk Transfer Trust Series 2021-1R Class A, CME Term SOFR 1 Month Index + 3.010% 8.3433% 2/27/24 (b)(d)(g) | | 3,341,936 | 3,322,604 |
| Pret 2021-Npl6 LLC Series 2021-NPL6 Class A1, 2.4871% 7/25/51 (b)(d) | | 345,621 | 330,184 |
| Pretium Mtg Credit Partners I 2021: | | | |
| Series 2021-NPL1: | | | |
Class A1, 2.2395% 9/27/60 (b) | | 487,626 | 471,040 |
Class A2, 4.2128% 9/27/60 (b) | | 453,457 | 389,171 |
| Series 2021-NPL4 Class A1, 2.3633% 10/27/60 (b)(d) | | 258,919 | 243,714 |
| Progress Residential: | | | |
| Series 2020-SFR2: | | | |
Class B, 2.578% 6/17/37 (b) | | 353,000 | 331,590 |
Class C, 3.077% 6/17/37 (b) | | 266,000 | 251,075 |
Class D, 3.874% 6/17/37 (b) | | 282,000 | 268,158 |
| Series 2021-SFR2 Class GREG, 0% 6/17/37 (b)(o) | | 568,000 | 488,178 |
| Series 2022-SFR3: | | | |
Class D, 4.45% 4/17/39 (b) | | 4,705,000 | 4,340,083 |
Class E2, 5.6% 4/17/39 (b) | | 588,000 | 544,440 |
Class F, 6.6% 4/17/39 (b) | | 335,000 | 312,260 |
| Progress Residential 2021-Sfr1 Series 2021-SFR1 Class F, 2.757% 4/17/38 (b) | | 351,000 | 305,339 |
| Progress Residential 2022-Sfr1 Series 2022-SFR1 Class E1, 3.93% 2/17/41 (b) | | 379,000 | 322,414 |
| Progress Residential Trust: | | | |
| Series 2019-SFR4 Class E, 3.435% 10/17/36 (b) | | 239,308 | 228,901 |
| Series 2020-SFR3: | | | |
Class F, 2.796% 10/17/27 (b) | | 292,000 | 265,963 |
Class G, 4.105% 10/17/27 (b) | | 204,000 | 188,032 |
| Series 2021-SFR11 Class E1, 3.378% 1/17/39 (b) | | 4,000,000 | 3,347,110 |
| Series 2021-SFR2 Class E2, 2.647% 4/19/38 (b) | | 443,000 | 389,432 |
| Series 2021-SFR3: | | | |
Class E2, 2.688% 5/17/26 (b) | | 281,728 | 246,210 |
Class F, 3.436% 5/17/26 (b) | | 1,500,000 | 1,306,507 |
| Series 2021-SFR8: | | | |
Class E1, 2.382% 10/17/38 (b) | | 722,000 | 623,996 |
Class F, 3.181% 10/17/38 (b) | | 4,000,000 | 3,404,058 |
| Series 2022-SFR2 Class E2, 4.8% 4/17/27 (b) | | 643,616 | 591,284 |
| Rco Vii Mortgage LLC 2021-2 Series 2021-2 Class A2, 3.8441% 9/25/26 (b) | | 157,978 | 146,308 |
| Recette CLO, Ltd. Series 2021-1A Class ARR, 3 month U.S. LIBOR + 1.080% 6.6678% 4/20/34 (b)(d)(g) | | 4,700,000 | 4,652,450 |
| Regional Management Issuance T Series 2021-1: | | | |
| Class B, 2.42% 3/17/31 (b) | | 239,000 | 212,591 |
| Class D, 5.07% 3/17/31 (b) | | 800,000 | 677,060 |
| Regional Management Issuance Trust 2022 Series 2022-1 Class A, 3.07% 3/15/32 (b) | | 193,000 | 180,160 |
| Renew 2017-1 Series 2017-1A: | | | |
| Class A, 3.67% 9/20/52 (b) | | 28,353 | 25,295 |
| Class B, 5.75% 9/20/52 (b) | | 24,012 | 22,523 |
| Renew 2017-2 Series 2017-2A Class A, 3.22% 9/22/53 (b) | | 306,177 | 265,875 |
| Renew 2023-1 Series 2023-1A Class A, 5.9% 11/20/58 (b) | | 745,504 | 703,411 |
| Republic At Alamo Heights 4.7% 10/1/33 (e)(m) | | 4,000,000 | 4,005,000 |
| Rockland Park CLO Ltd. Series 2021-1A Class A, CME Term SOFR 3 Month Index + 1.380% 6.7078% 4/20/34 (b)(d)(g) | | 7,250,000 | 7,198,648 |
| Romark CLO-IV Ltd. / Romark CLO-IV LLC Series 2021-4A Class A1, CME Term SOFR 3 Month Index + 1.430% 6.7125% 7/10/34 (b)(d)(g) | | 13,250,000 | 13,117,023 |
| RR 7 Ltd. Series 2022-7A Class A1AB, CME Term SOFR 3 Month Index + 1.340% 6.648% 1/15/37 (b)(d)(g) | | 7,731,000 | 7,629,592 |
| Santander Drive Auto Receivabl Series 2023-2 Class C, 5.47% 12/16/30 | | 740,000 | 728,899 |
| Santander Drive Auto Receivables Trust: | | | |
| Series 2019-2 Class D, 3.22% 7/15/25 | | 36,789 | 36,747 |
| Series 2021-1 Class D, 1.13% 11/16/26 | | 2,800,000 | 2,690,515 |
| Santander Revolving Auto Loan Series 2019-A: | | | |
| Class A, 2.51% 1/26/32 (b) | | 957,000 | 913,813 |
| Class C, 3% 1/26/32 (b) | | 314,000 | 298,225 |
| Class D, 3.45% 1/26/32 (b) | | 219,000 | 206,651 |
| Sapphire Aviation Finance Series 2020-1A: | | | |
| Class A, 3.228% 3/15/40 (b) | | 5,381,156 | 4,553,211 |
| Class B, 4.335% 3/15/40 (b) | | 652,182 | 466,336 |
| Saratoga Investment Corp. CLO, Ltd. / Saratoga Investment Corp. CLO, Inc. Series 2021-1A Class AR3, CME Term SOFR 3 Month Index + 1.580% 6.9078% 4/20/33 (b)(d)(g) | | 12,000,000 | 11,974,392 |
| SBA Tower Trust: | | | |
| Series 2019, 2.836% 1/15/50 (b) | | 8,004,000 | 7,636,152 |
| 1.884% 7/15/50 (b) | | 2,753,000 | 2,485,507 |
| 2.328% 7/15/52 (b) | | 2,105,000 | 1,809,748 |
| Securitized Asset Backed Receivables LLC Trust Series 2006-CB5 Class A3, CME Term SOFR 1 Month Index + 0.390% 5.7094% 6/25/36 (d)(g) | | 2,259,398 | 1,438,742 |
| Sierra Timeshare 2022-1 Receiv Series 2022-1A Class D, 6% 10/20/38 (b) | | 257,835 | 242,943 |
| Sierra Timeshare 2023-2 Receiv Series 2023-2A Class D, 9.72% 4/20/40 (b) | | 1,159,824 | 1,168,060 |
| Sixth Street CLO XVII, Ltd. / Sixth Street CLO XVII LLC Series 2021-17A Class A, CME Term SOFR 3 Month Index + 1.500% 6.8278% 1/20/34 (b)(d)(g) | | 5,000,000 | 4,985,840 |
| Sound Point CLO VII-R, Ltd. Series 2021-3RA Class A1R, CME Term SOFR 3 Month Index + 1.330% 6.6772% 10/23/31 (b)(d)(g) | | 10,250,000 | 10,166,237 |
| Soundview Home Equity Loan Trust Series 2007-OPT1 Class 2A1, CME Term SOFR 1 Month Index + 0.190% 5.5094% 6/25/37 (d)(g) | | 22,110 | 14,789 |
| Store Master Funding Series 2021-1A Class A1, 2.12% 6/20/51 (b) | | 1,483,750 | 1,237,363 |
| Stratus CLO, Ltd. Series 2022-1A Class A, CME Term SOFR 3 Month Index + 1.750% 7.0761% 7/20/30 (b)(d)(g) | | 1,075,254 | 1,075,362 |
| SYMP Series 2022-32A Class A1, CME Term SOFR 3 Month Index + 1.320% 6.6656% 4/23/35 (b)(d)(g) | | 7,640,000 | 7,543,935 |
| Symphony CLO XIX, Ltd. / Symphony CLO XIX LLC Series 2018-19A Class A, CME Term SOFR 3 Month Index + 1.220% 6.5296% 4/16/31 (b)(d)(g) | | 2,711,533 | 2,694,209 |
| Symphony CLO XXI, Ltd. Series 2021-21A Class AR, CME Term SOFR 3 Month Index + 1.320% 6.6296% 7/15/32 (b)(d)(g) | | 768,000 | 763,466 |
| TCI-Symphony CLO Series 2021-1A Class AR, CME Term SOFR 3 Month Index + 1.190% 6.4996% 7/15/30 (b)(d)(g) | | 554,971 | 552,205 |
| TCW CLO, Ltd. / TCW CLO, LLC Series 2021-1A Class A1RR, CME Term SOFR 3 Month Index + 1.420% 6.7478% 4/20/34 (b)(d)(g) | | 5,500,000 | 5,459,421 |
| Terwin Mortgage Trust Series 2003-4HE Class A1, CME Term SOFR 1 Month Index + 0.970% 6.2894% 9/25/34 (d)(g) | | 3,163 | 3,015 |
| Tesla Auto Lease Trust 23-A Series 2023-A Class A3, 5.89% 6/22/26 (b) | | 3,262,000 | 3,253,583 |
| TH MSR Issuer Trust Series 2019-FT1 Class A, CME Term SOFR 1 Month Index + 2.910% 8.2294% 6/25/24 (b)(d)(g) | | 650,000 | 630,477 |
| Theorem Funding Trust 2022-2 Series 2022-2A Class A, 6.06% 12/15/28 (b) | | 329,680 | 326,742 |
| Thunderbolt Aircraft Lease Ltd. Series 2018-A Class A, 4.147% 9/15/38 (b)(d) | | 7,369,296 | 6,264,049 |
| Thunderbolt III Aircraft Lease Ltd. Series 2019-1 Class A, 3.671% 11/15/39 (b) | | 8,244,030 | 6,843,040 |
| Towd Point Mortgage Trust Series 2019-MH1 Class A1, 3% 11/25/58 (b) | | 949,266 | 939,568 |
| Toyota Lease Owner Trust Series 2023 A: | | | |
| Class A2, 5.3% 8/20/25 (b) | | 3,656,000 | 3,639,479 |
| Class A3, 4.93% 4/20/26 (b) | | 3,341,000 | 3,306,409 |
| Tralee CLO VII Ltd. / Tralee CLO VII LLC Series 2021-7A Class A1, CME Term SOFR 3 Month Index + 1.580% 6.9328% 4/25/34 (b)(d)(g) | | 12,000,000 | 11,859,048 |
| Tricolor Auto Securitization T Series 2020-1A Class C, 8.25% 11/15/26 (b) | | 575,030 | 575,720 |
| Tricon American Homes: | | | |
| Series 2019-SFR1 Class F, 3.745% 3/17/38 (b) | | 204,000 | 186,590 |
| Series 2020-SFR1 Class E, 3.544% 7/17/38 (b) | | 800,000 | 734,503 |
| Trimaran Cavu 2019-1 Ltd. / Tri Series 2019-1A Class A1, CME Term SOFR 3 Month Index + 1.720% 7.0478% 7/20/32 (b)(d)(g) | | 1,000,000 | 997,949 |
| Upstart Securitization Trust: | | | |
| Series 2021-3 Class A, 0.83% 7/20/31 (b) | | 545,664 | 542,976 |
| Series 2021-4 Class A, 0.84% 9/20/31 (b) | | 1,429,005 | 1,411,324 |
| 3.12% 3/20/32 (b) | | 1,895,485 | 1,866,092 |
| Valley Stream Park Clo Ltd. / Vy Series 2022-1A Class A, CME Term SOFR 3 Month Index + 2.400% 7.7261% 10/20/34 (b)(d)(g) | | 6,967,000 | 6,973,389 |
| VCAT Asset Securitization, LLC Series 2021-NPL3 Class A1, 1.743% 5/25/51 (b)(d) | | 99,668 | 91,652 |
| Venture 43 CLO, Ltd. Series 2021-43A Class A1, CME Term SOFR 3 Month Index + 1.500% 6.8096% 4/15/34 (b)(d)(g) | | 15,200,000 | 15,097,430 |
| Verdant Receivables 2023-1 LLC Series 2023-1A Class A2, 6.24% 1/13/31 (b) | | 2,657,000 | 2,652,001 |
| Vericrest Opportunity Loan Transferee Series 2021-NP11 Class A1, 1.8678% 8/25/51 (b) | | 4,317,764 | 3,955,753 |
| Verizon Master Trust Series 2023 2 Class A, 4.89% 4/13/28 | | 2,100,000 | 2,079,671 |
| Volt 2021-Npl5 Series 2021-NPL5 Class A1, 2.1157% 3/27/51 (b) | | 634,098 | 599,862 |
| Volt C LLC Series 2021-NPL9 Class A1, 1.9918% 5/25/51 (b) | | 433,718 | 398,331 |
| Volt Ci LLC Series 2021-NP10 Class A1, 1.9918% 5/25/51 (b) | | 1,535,531 | 1,407,001 |
| Volt Xciii LLC Series 2021-NPL2 Class A1, 1.8925% 2/27/51 (b) | | 1,800,445 | 1,673,581 |
| VOLT XCIV LLC Series 2021-NPL3 Class A1, 2.2395% 2/27/51 (b) | | 7,547,791 | 7,123,604 |
| Volt Xcix LLC Series 2021-NPL8 Class A1, 2.1157% 4/25/51 (b) | | 323,359 | 301,297 |
| Volt Xcv LLC Series 2021-NPL4 Class A1, 2.2396% 3/27/51 (b) | | 159,771 | 153,243 |
| Volt Xcvii LLC Series 2021-NPL6 Class A1, 2.2395% 4/25/51 (b) | | 382,008 | 356,607 |
| Voya Clo 2018-3 Ltd. Series 2018-3A Class A1A, CME Term SOFR 3 Month Index + 1.410% 6.7196% 10/15/31 (b)(d)(g) | | 500,000 | 497,946 |
| Voya CLO Ltd. Series 2019-2A Class A, CME Term SOFR 3 Month Index + 1.530% 6.8578% 7/20/32 (b)(d)(g) | | 8,868,000 | 8,854,538 |
| Voya CLO Ltd./Voya CLO LLC: | | | |
| Series 2021-2A Class A1R, CME Term SOFR 3 Month Index + 1.420% 6.7417% 7/19/34 (b)(d)(g) | | 15,930,000 | 15,817,821 |
| Series 2021-3A Class AR, CME Term SOFR 3 Month Index + 1.410% 6.7378% 10/20/34 (b)(d)(g) | | 7,430,000 | 7,374,357 |
| Voya CLO, Ltd. Series 2021-1A Class AR, 3 month U.S. LIBOR + 1.150% 6.7196% 7/16/34 (b)(d)(g) | | 3,924,000 | 3,887,114 |
| WaMu Asset-Backed Certificates Series 2007-HE2 Class 2A2, CME Term SOFR 1 Month Index + 0.300% 5.6194% 4/25/37 (g) | | 2,465,185 | 919,091 |
| Wamu Asset-Backed Ctfs 07-He1 Series 2007-HE1 Class 2A3, CME Term SOFR 1 Month Index + 0.260% 5.5794% 1/25/37 (d)(g) | | 1,676,076 | 762,862 |
| WaMu Mortgage pass-thru certificates Series 2006-HE1 Class 2A4, CME Term SOFR 1 Month Index + 0.670% 5.9894% 4/25/36 (g) | | 569,617 | 562,783 |
| Welk Resorts 2019-A LLC Series 2019-AA Class C, 3.34% 6/15/38 (b) | | 58,306 | 54,685 |
| Westgate Resorts 2020-1 LLC Series 2020-1A Class C, 6.213% 3/20/34 (b) | | 117,119 | 115,578 |
| Westlake Automobile Receivable Series 2023-3A: | | | |
| Class C, 6.02% 9/15/28 (b) | | 1,900,000 | 1,896,844 |
| Class D, 6.47% 3/15/29 (b) | | 2,169,000 | 2,160,002 |
| World Omni Auto Receivables Trust: | | | |
| Series 2023 B: | | | |
Class A2A, 5.25% 11/16/26 | | 1,926,000 | 1,916,705 |
Class A3, 4.66% 5/15/28 | | 3,538,000 | 3,488,135 |
| Series 2023-C Class A3, 5.15% 11/15/28 | | 1,693,000 | 1,690,239 |
| TOTAL ASSET-BACKED SECURITIES (Cost $1,201,938,976) | | | 1,174,010,579 |
| | | | |
| Collateralized Mortgage Obligations - 0.8% |
| | | Principal Amount (a) | Value ($) |
| Private Sponsor - 0.5% | | | |
| Ajax Mortgage Loan Trust sequential payer: | | | |
| Series 2021-B Class A, 2.239% 6/25/66 (b)(d) | | 453,820 | 430,483 |
| Series 2021-E Class A1, 1.74% 12/25/60 (b) | | 1,547,487 | 1,288,473 |
| Alternative Loan Trust floater Series 2007-OH3 Class A1B, CME Term SOFR 1 Month Index + 0.550% 5.8694% 9/25/47 (g) | | 1,809,420 | 1,607,405 |
| Alternative Loan Trust 2007-Oa floater Series 2007-OA10 Class 2A1, CME Term SOFR 1 Month Index + 0.610% 5.9294% 9/25/47 (g) | | 5,331,640 | 829,741 |
| Anchor Mtg Trust 2021-Rtl1 sequential payer Series 2021-1 Class A2, 3.65% 10/25/26 (b) | | 376,000 | 359,142 |
| Angel Oak Mortgage Trust Series 2021-6 Class A1, 1.458% 9/25/66 (b) | | 3,478,646 | 2,714,547 |
| Banc America Funding 2007-3 Trust floater Series 2007-3 Class TA8, CME Term SOFR 1 Month Index + 0.290% 5.6094% 4/25/37 (d)(g) | | 1,443,534 | 1,158,653 |
| Banc of America Alternative Loan Trust Series 2004-6 Class 4A1, 5% 5/25/48 | | 279 | 228 |
| Banc of America Funding Corp.: | | | |
| planned amortization class Series 2005-5 Class 3A5, 5.5% 8/25/35 | | 34,372 | 31,995 |
| Series 2005-7 Class 30PO, 0% 11/25/35 (e)(o) | | 670 | 502 |
| Banc of America Mortgage Securities, Inc. Series 2004-F Class 1A1, 5.2715% 7/25/34 (d) | | 1,608 | 1,504 |
| BCAP LLC Trust sequential payer Series 2010-RR4 Class 31A6, 5.8464% 1/26/37 (b)(d) | | 3,019,982 | 2,234,412 |
| Bear Stearns Adjustable Rate Mortgage Trust Series 2003-7 Class 3A, 4.6615% 10/25/33 (d) | | 398 | 372 |
| Binom Securitization Trust 202 Series 2022-RPL1 Class A1, 3% 2/25/61 (b) | | 4,394,911 | 3,928,073 |
| Brass PLC Series 2021-10A Class A1, 0.669% 4/16/69 (b)(d) | | 1,396,149 | 1,335,157 |
| BRAVO Residential Funding Trust sequential payer Series 2022-RPL1 Class A1, 2.75% 9/25/61 (b) | | 7,330,521 | 6,450,003 |
| Bravo Residential Funding Trust 2023- Series 2023-NQM6 Class A2, 6.956% 9/25/63 | | 1,000,000 | 999,983 |
| BVEBO sequential payer Series 2022-3 Class A, 3.242% 5/29/52 (b) | | 2,765,921 | 2,689,667 |
| Cascade Funding Mortgage Trust: | | | |
| Series 2021-EBO1 Class A, 0.9849% 11/25/50 (b)(d) | | 2,669,707 | 2,464,636 |
| Series 2021-HB5 Class A, 0.8006% 2/25/31 (b) | | 1,706,640 | 1,662,281 |
| Series 2021-HB6 Class A, 0.8983% 6/25/36 (b) | | 1,806,701 | 1,747,202 |
| Series 2021-HB7 Class A, 1.1512% 10/27/31 (b) | | 3,483,353 | 3,314,337 |
| Cascade Mh Asset Trust 2022-Mh1 Series 2022-MH1 Class M, 4.25% 8/25/54 (b) | | 456,436 | 359,848 |
| CFMT Series 2022-HB10 Class A, 3.25% 11/25/35 (b) | | 4,361,246 | 4,162,639 |
| Cfmt 2022-Ebo2 sequential payer Series 2022-EBO2 Class A, 3.169% 7/25/54 (b) | | 1,462,217 | 1,437,782 |
| CFMT 2022-Hb8 LLC sequential payer Series 2022-HB8 Class A, 3.75% 4/25/25 (b) | | 5,566,734 | 5,453,830 |
| Chase Mortgage Finance Trust Series 2007-A2 Class 2A1, 4.7961% 6/25/35 (d) | | 8,490 | 7,894 |
| Chl Mtg Pass-Through Trust 2007-3 Series 2007-3 Class A17, 6% 4/25/37 | | 962,832 | 485,408 |
| Chl Mtg Pass-Through Trust 2007-8 sequential payer Series 2007-8 Class 1A12, 5.875% 1/25/38 | | 846,466 | 396,103 |
| CIM Trust: | | | |
| sequential payer: | | | |
Series 2021-R1 Class A2, 2.4% 8/25/56 (b) | | 5,325,672 | 4,529,978 |
Series 2021-R3 Class A1A, 1.951% 6/25/57 (b) | | 6,787,574 | 5,865,591 |
Series 2021-R4 Class A1A, 2% 5/1/61 (b) | | 7,063,641 | 6,056,836 |
| Series 2021-R5 Class A1A, 2% 8/25/61 (b)(d) | | 6,502,956 | 5,296,032 |
| Series 2022-NR1 Class A1, 5% 7/25/62 (b) | | 3,733,944 | 3,470,860 |
| Citigroup Mortgage Loan Trust: | | | |
| floater Series 2004-HYB4 Class AA, CME Term SOFR 1 Month Index + 0.440% 5.7594% 12/25/34 (d)(g) | | 590 | 540 |
| Series 2004-UST1 Class A3, 4.0981% 8/25/34 (d) | | 826 | 764 |
| Series 2005-9 Class 22A1, 6% 11/25/35 | | 1,106,976 | 1,030,159 |
| Connecticut Ave Securities Trust 2019-R floater Series 2019-R07 Class 1B1, U.S. 30-Day Avg. Secured Overnight Fin. Rate (SOFR) Index + 3.510% 8.8021% 10/25/39 (b)(d)(g) | | 3,500,000 | 3,554,727 |
| Connecticut Ave Securities Trust 2023-R Series 2023-R06 Class 1M2, U.S. 30-Day Avg. Secured Overnight Fin. Rate (SOFR) Index + 2.700% 7.9876% 7/25/43 (b)(d)(g) | | 2,500,000 | 2,512,869 |
| Connecticut Avenue Securities floater: | | | |
| Series 2022-R03 Class 1B1, U.S. 30-Day Avg. Secured Overnight Fin. Rate (SOFR) Index + 6.250% 11.5376% 3/25/42 (b)(d)(g) | | 130,000 | 141,878 |
| Series 2023-R01 Class 1M1, U.S. 30-Day Avg. Secured Overnight Fin. Rate (SOFR) Index + 2.400% 7.696% 12/25/42 (b)(d)(g) | | 907,282 | 920,870 |
| Connecticut Avenue Securities Trust floater: | | | |
| Series 2020-R01 Class 1M2, U.S. 30-Day Avg. Secured Overnight Fin. Rate (SOFR) Index + 2.160% 7.4521% 1/25/40 (b)(d)(g) | | 280,990 | 283,012 |
| Series 2022-R08 Class 1B1, U.S. 30-Day Avg. Secured Overnight Fin. Rate (SOFR) Index + 5.600% 10.8876% 7/25/42 (b)(d)(g) | | 1,500,000 | 1,602,501 |
| Countrywide Home Loans, Inc. Series 2005-22 Class 2A1, 3.6524% 11/25/35 (d) | | 4,918 | 3,993 |
| Countrywide Home Loans, Inc.: | | | |
| sequential payer Series 2003-J3 Class 2A1, 6.25% 12/25/33 | | 273 | 270 |
| Series 2004-3 Class A25, 5.75% 4/25/34 | | 1,937 | 1,802 |
| Series 2004-5 Class 2A9, 5.25% 5/25/34 | | 2,254 | 2,132 |
| Credit Suisse First Boston Mortgage Securities Corp.: | | | |
| planned amortization class: | | | |
Series 2005-10 Class 10A4, 6% 11/25/35 | | 5,879 | 1,642 |
Series 2016-1 Class 1A16, 5.5% 2/25/35 | | 146 | 144 |
| sequential payer Series 2005-10 Class 6A13, 5.5% 11/25/35 | | 5,873 | 2,613 |
| Series 2005-12 Class 2A1, 6.5% 1/25/36 | | 2,056,245 | 1,257,545 |
| Credit Suisse Mortgage Trust Series 2021-RP11 Class PT, 3.7831% 10/25/61 (b)(d) | | 7,909,554 | 5,816,984 |
| CSMC floater Series 2015-1R Class 6A1, 1 month U.S. LIBOR + 0.280% 4.2795% 5/27/37 (b)(d)(g) | | 124,926 | 119,226 |
| Csmc 2021-Jr1 Trust sequential payer Series 2021-JR1 Class A1, 2.465% 9/27/66 (b)(d) | | 223,180 | 214,102 |
| Csmc 2022-Jr1 Trust sequential payer Series 2022-JR1 Class A1, 4.267% 10/25/66 (b)(d) | | 567,077 | 548,556 |
| Csmc Mtg Backed Trust 2006-6 sequential payer Series 2006-6 Class 1A8, 6% 7/25/36 | | 1,836,208 | 928,404 |
| CSMC Trust: | | | |
| sequential payer: | | | |
Series 2020-RPL2 Class A12, 3.5114% 2/25/60 (b)(d) | | 453,100 | 453,342 |
Series 2020-RPL3 Class A1, 2.691% 3/25/60 (b)(d) | | 1,200,072 | 1,184,220 |
Series 2022-RPL1 Class A1, 4.15% 4/25/61 (b)(d) | | 7,264,248 | 6,280,871 |
Series 2022-RPL3 Class A1, 3.7162% 3/25/61 (b)(d) | | 11,399,253 | 11,053,884 |
| Series 2021-RP11 Class CERT, 3.7778% 10/27/61 (b) | | 334,569 | 246,163 |
| Series 2022-RPL1 Class PT, 4.5379% 4/25/61 (b)(d) | | 8,924,389 | 7,135,448 |
| Csmcm 2022-Rpl1 Trust Series 2022-RPL1 Class CERT, 4.231% 4/25/61 (b) | | 375,121 | 296,077 |
| CWALT, Inc.: | | | |
| planned amortization class: | | | |
Series 2005-54CB Class 1A11, 5.5% 11/25/35 | | 15,446 | 11,818 |
Series 2005-86CB Class A11, 5.5% 2/25/36 | | 8,993 | 5,503 |
| sequential payer: | | | |
Series 2004-22CB Class 1A1, 6% 10/25/34 | | 7,438 | 7,321 |
Series 2005-23CB Class A2, 5.5% 7/25/35 | | 4,084 | 3,414 |
| Series 2005-13CB Class A8, 5.5% 5/25/35 | | 1,824,255 | 1,530,840 |
| Fannie Mae: | | | |
| planned amortization class Series 2011-126 Class KB, 4% 12/25/41 | | 250,063 | 242,172 |
| Series 2003-64 Class SX, 13.460% x U.S. 30-Day Avg. Secured Overnight Fin. Rate (SOFR) Index 0.7679% 7/25/33 (d)(g)(p) | | 357 | 338 |
| Finance of America HECM Buyout sequential payer Series 2022-HB1 Class A, 2.6948% 2/25/32 (b)(d) | | 5,139,203 | 4,839,729 |
| First Horizon Mortgage pass-thru Trust: | | | |
| Series 2004-AA3 Class A1, 3.5338% 9/25/34 (d) | | 1,434 | 1,378 |
| Series 2004-AR6 Class 2A1, 4.151% 12/25/34 (d) | | 1,303 | 1,240 |
| Freddie Mac: | | | |
| REMIC planned amortization class Series 1608 Class L, 6.5% 9/15/23 | | 69 | 69 |
| Series 262 Class 35, 3.5% 7/15/42 | | 51,366 | 48,140 |
| Ginnie Mae guaranteed REMIC pass-thru certificates: | | | |
| Series 2007-9 Class CI, 6.080% - CME Term SOFR 1 Month Index 0.7715% 3/20/37 (d)(n)(p) | | 8,819 | 738 |
| Series 2008-40 Class SA, 6.280% - CME Term SOFR 1 Month Index 0.9729% 5/16/38 (d)(n)(p) | | 10,570 | 605 |
| GMAC Mortgage Loan Trust: | | | |
| sequential payer Series 2003-J10 Class A1, 4.75% 1/25/19 | | 319 | 319 |
| Series 2005-AR6 Class 2A1, 3.3519% 11/19/35 (d)(e) | | 1,672,130 | 1,318,092 |
| GSAMP Trust Series 2004-6F: | | | |
| Class 2A4, 5.5% 5/25/34 | | 1,312 | 1,223 |
| Class 3A4, 6.5% 5/25/34 | | 1,679 | 1,614 |
| GSR Mortgage Loan Trust: | | | |
| floater: | | | |
Series 2005-5F: | | | |
Class 8A1, CME Term SOFR 1 Month Index + 0.610% 5.5% 6/25/35 (d)(g) | | 283 | 266 |
Class 8A3, CME Term SOFR 1 Month Index + 0.610% 5.5% 6/25/35 (d)(g) | | 164 | 154 |
Series 2006-OA1 Class 1A1, CME Term SOFR 1 Month Index + 0.550% 5.8694% 8/25/46 (d)(g) | | 18,144,712 | 4,181,148 |
| planned amortization class Series 2004-8F Class 2A3, 6% 9/25/34 | | 710 | 677 |
| Headlands Residential 2021-Rpl Series 2021-RPL1 Class NOTE, 2.487% 9/25/26 (b) | | 438,829 | 414,537 |
| Impac CMB Trust floater Series 2004-10: | | | |
| Class 3A1, CME Term SOFR 1 Month Index + 0.810% 6.1294% 3/25/35 (d)(g) | | 4,023 | 3,828 |
| Class 3A2, CME Term SOFR 1 Month Index + 0.910% 6.2294% 3/25/35 (g) | | 2,529 | 2,412 |
| J.P. Morgan Mortgage Trust Series 2021-13 Class A3, 2.5% 4/25/52 (b) | | 12,287,598 | 9,743,682 |
| JPMorgan Mortgage Trust: | | | |
| sequential payer Series 2004-S2: | | | |
Class 4A5, 6% 11/25/34 | | 6,588 | 5,848 |
Class 5A1, 5.5% 12/25/19 | | 653 | 566 |
| Series 2004-S1 Class 3A1, 5.5% 9/25/34 (e) | | 523 | 497 |
| Series 2006-A2: | | | |
Class 4A1, 5.5949% 8/25/34 (d) | | 2,141 | 2,145 |
Class 5A3, 4.5937% 11/25/33 (d) | | 959 | 922 |
| Legacy Mortgage Asset Trust sequential payer Series 2021-SL1 Class A, 1.991% 9/25/60 (b) | | 510,927 | 504,308 |
| Lhome Mortgage Trust 2023-Rtl2 Series 2023-RTL2 Class A1, 8% 6/25/28 (b) | | 3,000,000 | 2,993,363 |
| Lhome Mtg Trust 2023-Rtl1 Series 2023-RTL1 Class A1, 7.869% 1/25/28 (b)(d) | | 3,059,000 | 3,046,753 |
| MASTR Adjustable Rate Mortgages Trust Series 2004-13 Class 2A1, 4.7075% 4/21/34 (d) | | 506 | 481 |
| MASTR Alternative Loan Trust Series 2004-6: | | | |
| Class 6A1, 6.5% 7/25/34 | | 7,227 | 6,928 |
| Class 7A1, 6% 7/25/34 | | 5,744 | 5,275 |
| Mastr Resecuritization Trust Series 2005-PO Class 3PO, 0% 5/28/35 (b)(e)(o) | | 283 | 213 |
| Merrill Lynch Mortgage Investors Trust: | | | |
| floater: | | | |
Series 2004-C Class A2, 6 month U.S. LIBOR + 0.600% 6.2826% 7/25/29 (d)(g) | | 1,174 | 1,115 |
Series 2006-A2 Class 1A, CME Term SOFR 1 Month Index + 0.470% 5.7894% 2/25/36 (g) | | 5,925,482 | 3,483,001 |
| Series 2004-D Class A3, 7.2455% 9/25/29 (d) | | 1,284 | 1,194 |
| Mill City Securities 2021-Rs1 Series 2021-RS1 Class A2, 3.9512% 4/28/66 (b) | | 351,063 | 299,818 |
| Morgan Stanley Capital I Trust Series 2004-3 Class 4A, 5.648% 4/25/34 (d) | | 3,480 | 3,271 |
| Morgan Stanley Mortgage Loan Trust Series 2004-7AR Class 2A6, 5.5214% 9/25/34 (d) | | 1,202 | 1,148 |
| Naac Reperforming Ln Remic Trust sequential payer Series 2004-R2 Class A1, 6.5% 10/25/34 (b)(d) | | 2,147 | 1,860 |
| New Residential Mortgage Loan Trust Series 2020-1A Class A1B, 3.5% 10/25/59 (b) | | 1,819,000 | 1,650,981 |
| New York Mortgage Trust sequential payer Series 2021-SP1 Class A1, 1.6696% 8/25/61 (b) | | 4,155,611 | 3,784,452 |
| NMLT Trust Series 2021-INV3 2.2769% 11/25/56 (b) | | 5,835,435 | 5,271,188 |
| Nomura Ast Corp. Alt Mptc 06Af1 Series 2006-AF1 Class 1A3, 6.408% 5/25/36 | | 2,857,947 | 553,137 |
| NYMT Loan Trust sequential payer Series 2021-CP1 Class A1, 2.0424% 7/25/61 (b) | | 3,913,283 | 3,475,569 |
| OBX Trust sequential payer Series 2021-NQM3 Class A1, 1.054% 7/25/61 (b) | | 13,136,406 | 9,785,692 |
| Ocwen Ln Investment Trust 2023-Hb1 Series 2023-HB1 Class A, 3% 6/25/36 (b) | | 1,199,431 | 1,130,710 |
| Onslow Bay Mortgage Loan Trust sequential payer Series 2021-NQM4 Class A2, 2.162% 10/25/61 (b)(d) | | 8,279,533 | 6,606,090 |
| Phh Mortgage Trust Series 2008 Series 2008-CIM2 Class 5A1, 6% 7/25/38 | | 1,140 | 1,037 |
| Pmc Pls Esr Issuer LLC Series 2022-PLS1 Class A, 5.114% 2/25/27 (b)(d) | | 347,521 | 329,203 |
| Pmt Credit Risk Transfer Trust Series 2019-2R Class A, CME Term SOFR 1 Month Index + 3.860% 9.1933% 5/30/25 (b)(d)(g) | | 3,628,087 | 3,609,008 |
| Preston Ridge Partners Mortgage Trust: | | | |
| Series 2021-2 Class A1, 2.115% 3/25/26 (b) | | 9,207,080 | 8,716,491 |
| Series 2021-RPL1 Class A1, 1.319% 7/25/51 (b) | | 1,709,897 | 1,505,274 |
| Series 2021-RPL2 Class A1, 1.455% 10/25/51 (b)(d) | | 2,283,897 | 1,996,379 |
| PRET LLC sequential payer Series 2022-RN2 Class A1, 5% 6/25/52 (b) | | 8,861,652 | 8,398,836 |
| Prime Mtg Trust sequential payer Series 2004-CL1 Class 1A1, 6% 2/25/34 | | 1,220 | 1,156 |
| Prkcm 2023-Afc3 Trust Series 2023-AFC3 Class A2, 6.987% 9/25/58 (b) | | 1,000,000 | 1,000,030 |
| Prpm 2021-10 LLC Series 2021-10 Class A1, 2.487% 10/25/26 (b) | | 2,146,804 | 1,994,135 |
| Prpm 2022-Investment1 Trust Series 2022-INV1 Class A2, 4.4429% 4/25/67 (b)(d) | | 765,492 | 706,275 |
| Radnor Re 2022-1 Ltd. floater Series 2022-1 Class M1B, U.S. 30-Day Avg. Secured Overnight Fin. Rate (SOFR) Index + 6.750% 12.0376% 9/25/32 (b)(d)(g) | | 368,616 | 390,736 |
| RALI Trust: | | | |
| Series 2006-QS4 Class A4, 6% 4/25/36 | | 1,428,758 | 1,100,766 |
| Series 2007-QS3 Class A5, 6.25% 2/25/37 | | 2,214,196 | 1,719,321 |
| Series 2007-QS8 Class A5, 6% 6/25/37 | | 851,418 | 662,359 |
| Rco Vi Mortgage LLC 2022-1 Series 2022-1 Class A1, 3% 1/25/27 (b) | | 471,160 | 452,610 |
| Residential Accredit Loans, Inc. sequential payer Series 2005-QS5 Class A4, 5.75% 4/25/35 | | 22,843 | 19,207 |
| Residential Asset Securitization Trust sequential payer Series 2003-A8 Class A1, 3.75% 10/25/18 | | 232 | 231 |
| Retiro Mortgage Securities floater Series 2021-1A Class A1, 2.000% x 3 month EURIBOR EURO INTER 5% 7/30/75 (b)(d)(g) | EUR | 350,182 | 374,444 |
| RMF Buyout Issuance Trust: | | | |
| sequential payer Series 2022-HB1 Class A, 4.272% 4/25/32 (b) | | 1,641,046 | 1,547,970 |
| Series 2020-HB1 Class A1, 1.7188% 10/25/50 (b) | | 869,154 | 799,159 |
| Saco I, Inc. sequential payer Series 1997-2 Class 1A5, 7% 8/25/36 (b) | | 254 | 252 |
| Sequoia Mortgage Trust floater: | | | |
| Series 2004-6 Class A3B, 6 month U.S. LIBOR + 0.880% 6.546% 7/20/34 (d)(g) | | 642 | 568 |
| Series 2004-8 Class A2, CME TERM SOFR 6 MONTH INDEX + 1.160% 6.2401% 9/20/34 (d)(g) | | 5,475 | 4,981 |
| Sequoia Mtg Trust 2007-3 Series 2007-3 Class 2AA1, 3.922% 7/20/37 (d) | | 424,794 | 336,911 |
| Structured Adjustable Rate Mor Series 2007-6 Class 3A1, 4.3479% 7/25/37 (d) | | 1,435,152 | 952,355 |
| Structured Adjustable Rate Mortgage Loan Trust Series 2004-14 Class 1A, 5.1674% 10/25/34 (d) | | 782 | 750 |
| Structured Asset Securities Corp.: | | | |
| sequential payer: | | | |
Series 2003-26A Class 3A5, 6.3328% 9/25/33 (d) | | 9,449 | 8,876 |
Series 2003-37A Class 1A, 5.036% 12/25/33 (d) | | 13,285 | 12,467 |
| Series 2003-37A Class 2A, 4.6323% 12/25/33 (d) | | 1,512 | 1,420 |
| Thornburg Mortgage Securities Trust floater Series 2003-4 Class A1, CME Term SOFR 1 Month Index + 0.750% 6.0694% 9/25/43 (d)(g) | | 1,180,445 | 1,105,231 |
| Towd PT Mtg Trust 2017-Fre2 Series 2017-FRE2 Class M6, 4% 11/25/47 (b) | | 124,166 | 117,427 |
| Towd PT Mtg Trust 2021-R1 Series 2021-R1: | | | |
| Class A1, 2.9181% 11/30/60 (b)(d) | | 1,097,095 | 886,588 |
| Class A2C, 3.3072% 11/30/60 (b)(d)(e) | | 877,659 | 671,942 |
| Vm Master Issuer LLC Series 2022-1 Class B, 6.877% 5/24/25 (b) | | 706,000 | 633,387 |
| WaMu Mortgage pass-thru certificates: | | | |
| floater Series 2005-AR2: | | | |
Class 2A1B, CME Term SOFR 1 Month Index + 0.850% 6.1694% 1/25/45 (g) | | 1,065,464 | 1,034,299 |
Class 2A21, CME Term SOFR 1 Month Index + 0.770% 6.0894% 1/25/45 (d)(g) | | 506 | 490 |
| sequential payer Series 2004-RA1 Class 2A, 7% 3/25/34 | | 2,590 | 2,463 |
| Series 2003-AR8 Class A, 5.626% 8/25/33 (d) | | 1,800 | 1,687 |
| Series 2003-AR9 Class 1A6, 4.8546% 9/25/33 (d) | | 1,338 | 1,242 |
| Series 2004-AR11 Class A, 5.2748% 10/25/34 (d) | | 3,881 | 3,644 |
| Series 2004-AR3: | | | |
Class A1, 4.518% 6/25/34 (d) | | 501 | 461 |
Class A2, 4.518% 6/25/34 (d) | | 4,625 | 4,171 |
| Series 2004-S2 Class 2A4, 5.5% 6/25/34 (e) | | 3,848 | 3,498 |
| Series 2005-4 Class CB7, 5.5% 6/25/35 | | 7,764 | 6,665 |
| Series 2006-2 Class 3CB, 6% 3/25/36 | | 1,157,712 | 882,114 |
| Wells Fargo Mortgage Backed Securities Trust Series 2004-K Class 1A2, 5.615% 7/25/34 (d)(e) | | 1,252 | 1,171 |
| Wells Fargo Mtg Bank Sec 04 U Trust Series 2021-U Class A1, 4.5167% 10/25/34 (d) | | 2,300 | 2,181 |
TOTAL PRIVATE SPONSOR | | | 225,345,985 |
| U.S. Government Agency - 0.3% | | | |
| Fannie Mae: | | | |
| floater: | | | |
Series 2004-72 Class F, U.S. 30-Day Avg. Secured Overnight Fin. Rate (SOFR) Index + 0.610% 5.9021% 9/25/34 (d)(g) | | 1,228 | 1,221 |
Series 2022-R04 Class 1B1, U.S. 30-Day Avg. Secured Overnight Fin. Rate (SOFR) Index + 5.250% 10.5376% 3/25/42 (b)(d)(g) | | 240,000 | 253,200 |
| planned amortization class: | | | |
Series 1994-29 Class Z, 6.5% 2/25/24 | | 128 | 128 |
Series 2002-56 Class PE, 6% 9/25/32 | | 9,696 | 9,862 |
Series 2002-86 Class PG, 6% 12/25/32 | | 6,225 | 6,303 |
Series 2003-25 Class KP, 5% 4/25/33 | | 19,625 | 19,226 |
Series 2003-47 Class PE, 5.75% 6/25/33 | | 6,339 | 6,399 |
Series 2005-19 Class PB, 5.5% 3/25/35 | | 38,515 | 38,692 |
Series 2005-84 Class XM, 5.75% 10/25/35 | | 1,311 | 1,326 |
Series 2006-77 Class PC, 6.5% 8/25/36 | | 2,594 | 2,663 |
Series 2010-10 Class NT, 5% 2/25/40 | | 15,023 | 14,805 |
Series 2012-149: | | | |
Class DA, 1.75% 1/25/43 | | 545,640 | 490,056 |
Class GA, 1.75% 6/25/42 | | 597,270 | 535,097 |
Series 2016-33 Class JA, 3% 7/25/45 | | 249,105 | 227,145 |
Series 2016-38 Class 0, 3% 1/25/46 | | 190,659 | 171,685 |
| sequential payer: | | | |
Series 1995-19 Class Z, 6.5% 11/25/23 | | 76 | 76 |
Series 1997-11 Class E, 7% 3/18/27 | | 139 | 140 |
Series 1997-20 Class D, 7% 3/17/27 | | 543 | 547 |
Series 1997-63 Class ZA, 6.5% 9/18/27 (n) | | 393 | 394 |
Series 1999-47 Class JZ, 8% 9/18/29 | | 2,345 | 2,421 |
Series 2000-8 Class Z, 7.5% 2/20/30 | | 1,379 | 1,414 |
Series 2001-14 Class Z, 6% 5/25/31 | | 1,019 | 1,008 |
Series 2001-16 Class Z, 6% 5/25/31 | | 1,246 | 1,250 |
Series 2001-81 Class HE, 6.5% 1/25/32 | | 7,609 | 7,809 |
Series 2003-22 Class Z, 6% 4/25/33 | | 5,058 | 5,128 |
Series 2003-W3 Class 2A5, 5.356% 6/25/42 | | 206 | 202 |
Series 2003-W4 Class 2A, 5.0975% 10/25/42 (d) | | 1,664 | 1,690 |
Series 2003-W6 Class 1A41, 5.398% 10/25/42 | | 2,465 | 2,419 |
Series 2004-W9 Class 1A3, 6.05% 2/25/44 | | 5,453 | 5,495 |
Series 2006-9 Class KZ, 6% 3/25/36 | | 3,945 | 4,035 |
Series 2007-71 Class GZ, 6% 7/25/47 | | 2,996 | 3,102 |
Series 2020-101 Class BA, 1.5% 9/25/45 | | 1,798,063 | 1,501,131 |
Series 2020-43 Class MA, 2% 1/25/45 | | 1,625,800 | 1,423,786 |
Series 2020-49 Class JA, 2% 8/25/44 | | 193,775 | 172,066 |
Series 2020-80 Class BA, 1.5% 3/25/45 | | 2,428,345 | 2,037,614 |
Series 2021-68 Class A, 2% 7/25/49 | | 383,105 | 307,251 |
Series 2021-85 Class L, 2.5% 8/25/48 | | 209,408 | 180,645 |
Series 2021-95: | | | |
Class 0, 2.5% 9/25/48 | | 2,369,621 | 2,034,894 |
Class BA, 2.5% 6/25/49 | | 3,547,739 | 3,050,611 |
Series 2021-96 Class HA, 2.5% 2/25/50 | | 345,426 | 299,855 |
Series 2021-W3 Class A, 7% 9/25/41 (d) | | 3,284 | 3,169 |
Series 2022-1 Class KA, 3% 5/25/48 | | 1,195,101 | 1,062,449 |
Series 2022-11 Class B, 3% 6/25/49 | | 958,701 | 860,235 |
Series 2022-13 Class HA, 3% 8/25/46 | | 808,309 | 737,652 |
Series 2022-3: | | | |
Class D, 2% 2/25/48 | | 3,507,309 | 3,007,210 |
Class N, 2% 10/25/47 | | 9,636,658 | 8,057,426 |
Series 2022-30 Class E, 4.5% 7/25/48 | | 3,451,174 | 3,316,656 |
Series 2022-4 Class B, 2.5% 5/25/49 | | 252,286 | 216,576 |
Series 2022-42 Class BA, 4% 6/25/50 | | 1,178,997 | 1,103,168 |
Series 2022-49 Class TC, 4% 12/25/48 | | 1,113,435 | 1,063,605 |
Series 2022-7: | | | |
Class A, 3% 5/25/48 | | 1,701,964 | 1,513,235 |
Class E, 2.5% 11/25/47 | | 3,521,962 | 3,084,590 |
Series 2022-9 Class BA, 3% 5/25/48 | | 608,499 | 542,528 |
Series 20XX-10 Class Z, 6% 2/25/37 | | 524 | 547 |
| Series 1997-42 Class EG, 8% 7/18/27 | | 731 | 747 |
| Series 2001-36 Class ST, 8.380% - U.S. 30-Day Avg. Secured Overnight Fin. Rate (SOFR) Index 3.0979% 11/25/30 (d)(n)(p) | | 1,753 | 174 |
| Series 2001-72 Class SB, 7.380% - U.S. 30-Day Avg. Secured Overnight Fin. Rate (SOFR) Index 2.0979% 12/25/31 (d)(n)(p) | | 4,313 | 386 |
| Series 2001-T12 Class IO, 0.4874% 8/25/41 (d)(n) | | 210,608 | 2,082 |
| Series 2002-19 Class SC, 13.970% x U.S. 30-Day Avg. Secured Overnight Fin. Rate (SOFR) Index 4.8368% 3/17/32 (d)(g) | | 356 | 352 |
| Series 2002-T16 Class A2, 7% 7/25/42 | | 9,799 | 10,118 |
| Series 2002-T19 Class A1, 6.5% 7/25/42 | | 8,463 | 8,605 |
| Series 2002-T4: | | | |
Class A2, 7% 12/25/41 | | 5,659 | 5,797 |
Class A4, 9.5% 12/25/41 | | 10,048 | 11,168 |
Class IO, 0.4004% 12/25/41 (d)(n) | | 498,403 | 4,330 |
| Series 2002-W10 Class IO, 0.9154% 8/25/42 (d)(n) | | 44,667 | 670 |
| Series 2002-W7 Class IO1, 0.8775% 6/25/29 (d)(n) | | 77,926 | 1,470 |
| Series 2003-130 Class HZ, 6% 1/25/34 | | 167,856 | 170,411 |
| Series 2004-T1 Class 1A1, 6% 1/25/44 | | 3,948 | 3,955 |
| Series 2004-T2: | | | |
Class 1A3, 7% 11/25/43 | | 3,080 | 3,128 |
Class 1A4, 7.5% 11/25/43 | | 3,283 | 3,331 |
| Series 2004-T3 Class 1IO4, 0.6029% 2/25/44 (d)(n) | | 75,169 | 741 |
| Series 2004-W11 Class 1IO1, 0.3487% 5/25/44 (d)(n) | | 229,080 | 1,560 |
| Series 2004-W2: | | | |
Class 1A, 6% 2/25/44 | | 2,825 | 2,818 |
Class 2A2, 7% 2/25/44 | | 762 | 777 |
| Series 2004-W8 Class 3A, 7.5% 6/25/44 | | 1,727 | 1,770 |
| Series 2005-51 Class MO, 0% 6/25/35 (o) | | 469 | 308 |
| Series 2005-53 Class CS, 6.580% - U.S. 30-Day Avg. Secured Overnight Fin. Rate (SOFR) Index 1.2979% 6/25/35 (d)(n)(p) | | 5,543 | 385 |
| Series 2005-72 Class WS, 6.630% - U.S. 30-Day Avg. Secured Overnight Fin. Rate (SOFR) Index 1.3479% 8/25/35 (d)(n)(p) | | 2,359 | 131 |
| Series 2005-79 Class ZC, 5.9% 9/25/35 | | 163,559 | 163,690 |
| Series 2005-W4 Class 1A1, 6% 8/25/45 | | 3,129 | 3,108 |
| Series 2006-20 Class IB, 6.470% - U.S. 30-Day Avg. Secured Overnight Fin. Rate (SOFR) Index 1.1879% 4/25/36 (d)(n)(p) | | 3,661 | 294 |
| Series 2007-109 Class YI, 6.330% - U.S. 30-Day Avg. Secured Overnight Fin. Rate (SOFR) Index 1.0479% 12/25/37 (d)(n)(p) | | 35,012 | 3,485 |
| Series 2007-54 Class IB, 6.290% - U.S. 30-Day Avg. Secured Overnight Fin. Rate (SOFR) Index 1.0079% 6/25/37 (d)(n)(p) | | 64,301 | 5,171 |
| Series 2007-75 Class JI, 6.430% - U.S. 30-Day Avg. Secured Overnight Fin. Rate (SOFR) Index 1.1429% 8/25/37 (d)(n)(p) | | 517,402 | 47,933 |
| Series 2008-62 Class SM, 6.080% - U.S. 30-Day Avg. Secured Overnight Fin. Rate (SOFR) Index 0.7979% 7/25/38 (d)(n)(p) | | 11,344 | 934 |
| Series 2008-91 Class SI, 5.880% - U.S. 30-Day Avg. Secured Overnight Fin. Rate (SOFR) Index 0.5979% 3/25/38 (d)(n)(p) | | 7,264 | 236 |
| Series 2009-112: | | | |
Class ST, 6.130% - U.S. 30-Day Avg. Secured Overnight Fin. Rate (SOFR) Index 0.8479% 1/25/40 (d)(n)(p) | | 6,643 | 513 |
Class SW, 6.130% - U.S. 30-Day Avg. Secured Overnight Fin. Rate (SOFR) Index 0.8479% 1/25/40 (d)(n)(p) | | 4,367 | 378 |
| Series 2009-52 Class PI, 5% 7/25/39 (n) | | 3,953 | 613 |
| Series 2009-89 Class A1, 5.41% 5/25/35 | | 1,308 | 1,297 |
| Series 2010-129 Class PZ, 4.5% 11/25/40 | | 33,194 | 31,029 |
| Series 2010-135 Class ZA, 4.5% 12/25/40 | | 348,175 | 343,142 |
| Series 2010-150 Class ZC, 4.75% 1/25/41 | | 544,571 | 532,249 |
| Series 2010-35 Class SB, 6.300% - U.S. 30-Day Avg. Secured Overnight Fin. Rate (SOFR) Index 1.0179% 4/25/40 (d)(n)(p) | | 6,676 | 547 |
| Series 2010-70 Class SA, 91.220% x U.S. 30-Day Avg. Secured Overnight Fin. Rate (SOFR) Index 6% 4/25/38 (d)(g)(n) | | 12,926 | 2,302 |
| Series 2010-95 Class ZC, 5% 9/25/40 | | 1,194,083 | 1,180,877 |
| Series 2011-19 Class ZY, 6.5% 7/25/36 | | 3,529 | 3,617 |
| Series 2011-4 Class PZ, 5% 2/25/41 | | 182,391 | 173,583 |
| Series 2012-100 Class WI, 3% 9/25/27 (n) | | 188,948 | 7,265 |
| Series 2012-14 Class JS, 6.530% - U.S. 30-Day Avg. Secured Overnight Fin. Rate (SOFR) Index 1.2479% 12/25/30 (d)(n)(p) | | 8,039 | 13 |
| Series 2012-148 Class IE, 3% 1/25/33 (n) | | 73,740 | 6,122 |
| Series 2012-46 Class KI, 3.5% 5/25/27 (n) | | 14,173 | 578 |
| Series 2012-9 Class SH, 6.430% - U.S. 30-Day Avg. Secured Overnight Fin. Rate (SOFR) Index 1.1479% 6/25/41 (d)(n)(p) | | 17,635 | 112 |
| Series 2013-13 Class IK, 2.5% 3/25/28 (n) | | 62,051 | 2,095 |
| Series 2013-133 Class IB, 3% 4/25/32 (n) | | 62,251 | 1,466 |
| Series 2013-134 Class SA, 5.930% - U.S. 30-Day Avg. Secured Overnight Fin. Rate (SOFR) Index 0.6479% 1/25/44 (d)(n)(p) | | 78,389 | 7,357 |
| Series 2013-44 Class DJ, 1.85% 5/25/33 | | 5,323,925 | 4,752,382 |
| Series 2013-51 Class GI, 3% 10/25/32 (n) | | 356,850 | 19,990 |
| Series 2015-42 Class IL, 6% 6/25/45 (n) | | 493,722 | 83,233 |
| Series 2015-70 Class JC, 3% 10/25/45 | | 417,455 | 389,133 |
| Series 2017-30 Class AI, 5.5% 5/25/47 (n) | | 292,506 | 49,788 |
| Series 2019-20 Class H, 3.5% 5/25/49 | | 190,304 | 174,505 |
| Series 2020-45 Class JL, 3% 7/25/40 | | 66,029 | 59,449 |
| Series 2021-59 Class H, 2% 6/25/48 | | 217,227 | 177,080 |
| Series 2021-66: | | | |
Class DA, 2% 1/25/48 | | 234,663 | 191,919 |
Class DM, 2% 1/25/48 | | 249,379 | 203,955 |
| target amortization class Series 2006-27 Class OB, 0% 4/25/36 (o) | | 16,403 | 12,792 |
| Fannie Mae Stripped Mortgage-Backed Securities: | | | |
| Series 2001-313 Class 1, 0% 6/25/31 (o) | | 7,649 | 6,450 |
| Series 2007-380 Class S36, 7.780% - U.S. 30-Day Avg. Secured Overnight Fin. Rate (SOFR) Index 2.4979% 7/25/37 (d)(n)(p) | | 2,193 | 310 |
| Series 2007-383: | | | |
Class 68, 6.5% 9/25/37 (n) | | 1,342 | 302 |
Class 69, 6.5% 10/25/37 (d)(n) | | 1,895 | 424 |
| Freddie Mac: | | | |
| floater Series 2005-2995 Class FT, U.S. 30-Day Avg. Secured Overnight Fin. Rate (SOFR) Index + 0.360% 5.553% 5/15/29 (d)(g) | | 1,203 | 1,189 |
| planned amortization class: | | | |
Series 1998-2022 Class PE, 6.5% 1/15/28 | | 136 | 136 |
Series 1998-2091 Class PG, 6% 11/15/28 | | 3,152 | 3,161 |
Series 2001-2325 Class JO, 0% 6/15/31 (o) | | 821 | 683 |
Series 2001-2330 Class PE, 6.5% 6/15/31 | | 1,953 | 1,990 |
Series 2002-2410 Class QB, 6.25% 2/15/32 | | 4,906 | 4,926 |
Series 2002-2427 Class GE, 6% 3/15/32 | | 9,372 | 9,494 |
Series 2002-2430 Class WF, 6.5% 3/15/32 | | 6,248 | 6,398 |
Series 2002-2466 Class DH, 6.5% 6/15/32 | | 654 | 681 |
Series 2002-2543 Class YX, 6% 12/15/32 | | 3,989 | 4,047 |
Series 2003-2699 Class W, 5.5% 11/15/33 | | 3,320 | 3,345 |
Series 2004-2733 Class SB, 7.900% - U.S. 30-Day Avg. Secured Overnight Fin. Rate (SOFR) Index 3.2373% 10/15/33 (d)(p) | | 4,445 | 4,263 |
Series 2004-2845 Class QH, 5% 8/15/34 | | 2,495 | 2,478 |
Series 2005-2912 Class EH, 5.5% 1/15/35 | | 13,495 | 13,661 |
Series 2006-3202 Class HI, 6.530% - U.S. 30-Day Avg. Secured Overnight Fin. Rate (SOFR) Index 1.347% 8/15/36 (d)(n)(p) | | 12,367 | 1,085 |
Series 2009-3605 Class NC, 5.5% 6/15/37 | | 8,938 | 9,010 |
Series 2009-3610 Class CA, 4.5% 12/15/39 | | 3,366 | 3,287 |
Series 2010-3653 Class HJ, 5% 4/15/40 | | 1,689 | 1,675 |
Series 2010-3677 Class PB, 4.5% 5/15/40 | | 22,758 | 22,196 |
Series 2010-3737 Class DG, 5% 10/15/30 | | 1,121 | 1,111 |
Series 2020-4960 Class PB, 1.5% 10/25/49 | | 2,107,063 | 1,702,766 |
Series 4135 Class AB, 1.75% 6/15/42 | | 445,921 | 399,173 |
| sequential payer: | | | |
Series 1999-2116 Class ZA, 6% 1/15/29 | | 754 | 759 |
Series 1999-2148 Class ZA, 6% 4/15/29 | | 218 | 219 |
Series 1999-2201 Class C, 8% 11/15/29 | | 505 | 520 |
Series 2001-2293 Class ZA, 6% 3/15/31 | | 1,057 | 1,061 |
Series 2001-2310 Class Z, 6% 4/15/31 | | 164 | 165 |
Series 2003-2643 Class SA, 44.750% x U.S. 30-Day Avg. Secured Overnight Fin. Rate (SOFR) Index 11.0306% 3/15/32 (d)(g) | | 168 | 217 |
Series 2004-2756 Class 0, 5% 2/15/24 | | 82 | 82 |
Series 2005-2989 Class TG, 5% 6/15/25 | | 634 | 629 |
Series 2005-3005 Class ED, 5% 7/15/25 | | 1,136 | 1,126 |
Series 2006-3187 Class Z, 5% 7/15/36 | | 16,627 | 16,596 |
Series 2006-3201 Class IN, 6.130% - U.S. 30-Day Avg. Secured Overnight Fin. Rate (SOFR) Index 0.947% 8/15/36 (d)(n)(p) | | 2,861 | 161 |
Series 2007-3274 Class B, 6% 2/15/37 | | 1,580 | 1,657 |
Series 2008-3409 Class DB, 6% 1/15/38 | | 8,568 | 8,649 |
Series 2009-3592 Class BZ, 5% 10/15/39 | | 38,882 | 38,776 |
Series 2010-3648 Class CY, 4.5% 3/15/30 | | 5,871 | 5,728 |
Series 2012-4060 Class TB, 2.5% 6/15/27 | | 117,021 | 110,547 |
Series 2018-4796 Class CZ, 4% 5/15/48 | | 359,148 | 336,414 |
Series 2018-4830 Class WZ, 4% 9/15/48 | | 352,523 | 330,042 |
Series 2020-4993 Class LA, 2% 8/25/44 | | 1,557,964 | 1,376,429 |
Series 2020-5018: | | | |
Class LC, 3% 10/25/40 | | 442,934 | 398,844 |
Class LY, 3% 10/25/40 | | 335,613 | 302,267 |
Series 2021-5175 Class CB, 2.5% 4/25/50 | | 1,234,386 | 1,057,079 |
Series 2021-5180 Class KA, 2.5% 10/25/47 | | 249,268 | 218,529 |
Series 2022-5189: | | | |
Class DA, 2.5% 5/25/49 | | 885,145 | 756,821 |
Class TP, 2.5% 5/25/49 | | 771,121 | 666,567 |
Series 2022-5190: | | | |
Class BA, 2.5% 11/25/47 | | 870,377 | 751,793 |
Class CA, 2.5% 5/25/49 | | 644,893 | 550,967 |
Series 2022-5191 Class CA, 2.5% 4/25/50 | | 293,457 | 251,742 |
Series 2022-5197: | | | |
Class A, 2.5% 6/25/49 | | 644,894 | 557,293 |
Class DA, 2.5% 11/25/47 | | 661,045 | 571,126 |
Series 2022-5198 Class BA, 2.5% 11/25/47 | | 3,343,502 | 2,924,785 |
Series 2022-5202: | | | |
Class AG, 3% 1/25/49 | | 459,679 | 409,412 |
Class LB, 2.5% 10/25/47 | | 705,778 | 608,289 |
Series 3871 Class KB, 5.5% 6/15/41 | | 367,902 | 375,362 |
| Series 1997-186 Class PO, 0% 8/1/27 (o) | | 1,409 | 1,272 |
| Series 2002-2530 Class SK, 7.980% - U.S. 30-Day Avg. Secured Overnight Fin. Rate (SOFR) Index 2.797% 6/15/29 (d)(n)(p) | | 3,677 | 288 |
| Series 2002-2534 Class SI, 20.760% x U.S. 30-Day Avg. Secured Overnight Fin. Rate (SOFR) Index 7.2722% 2/15/32 (d)(g) | | 553 | 596 |
| Series 2003-2586 Class IO, 6.5% 3/15/33 (n) | | 4,042 | 777 |
| Series 2003-2594 Class IV, 7% 3/15/32 (n) | | 1,103 | 209 |
| Series 2003-2610 Class UI, 6.5% 5/15/33 (n) | | 3,230 | 642 |
| Series 2003-2656 Class AC, 6% 8/15/33 | | 1,334 | 1,335 |
| Series 2004-2764 Class S, 13.460% x U.S. 30-Day Avg. Secured Overnight Fin. Rate (SOFR) Index 0.4925% 7/15/33 (d)(g) | | 464 | 406 |
| Series 2005-2980 Class QB, 6.5% 5/15/35 | | 460 | 472 |
| Series 2006-3184 Class YO, 0% 3/15/36 (o) | | 7,314 | 5,754 |
| Series 2007-3305 Class IW, 6.330% - U.S. 30-Day Avg. Secured Overnight Fin. Rate (SOFR) Index 1.147% 4/15/37 (d)(n)(p) | | 4,474 | 390 |
| Series 2007-76 Class 2A, 2.2551% 10/25/37 (d) | | 5,727 | 4,846 |
| Series 2009-3546 Class A, 4.3421% 2/15/39 (d) | | 1,187 | 1,174 |
| Series 2009-3609 Class SA, 6.220% - U.S. 30-Day Avg. Secured Overnight Fin. Rate (SOFR) Index 1.037% 12/15/39 (d)(n)(p) | | 7,985 | 420 |
| Series 2011-3855 Class AM, 6.5% 11/15/36 | | 2,489 | 2,513 |
| Series 2012-279 Class 35, 3.5% 9/15/42 | | 13,272 | 12,189 |
| Series 2012-4030 Class IL, 3.5% 4/15/27 (n) | | 7,136 | 215 |
| Series 2012-4146 Class KI, 3% 12/15/32 (n) | | 73,161 | 6,795 |
| Series 2014-323 Class 300, 3% 1/15/44 | | 49,514 | 44,256 |
| Series 2014-334 Class 300, 3% 8/15/44 | | 49,061 | 43,950 |
| Series 2017-4683 Class LM, 3% 5/15/47 | | 599,702 | 558,875 |
| Series 2020-5041 Class LB, 3% 11/25/40 | | 752,922 | 677,801 |
| Series 2021-5083 Class VA, 1% 8/15/38 | | 4,322,309 | 3,992,092 |
| Series 2021-5176 Class AG, 2% 1/25/47 | | 937,418 | 798,896 |
| Series 2021-5182 Class A, 2.5% 10/25/48 | | 1,614,686 | 1,385,339 |
| Series 2933 Class ZM, 5.75% 2/15/35 | | 340,033 | 345,732 |
| Series 2996 Class ZD, 5.5% 6/15/35 | | 219,111 | 221,254 |
| Series 3237 Class C, 5.5% 11/15/36 | | 282,127 | 280,961 |
| Series 3980 Class EP, 5% 1/15/42 | | 1,557,244 | 1,545,393 |
| Series 4055 Class BI, 3.5% 5/15/31 (n) | | 53,799 | 1,026 |
| Series 4149 Class IO, 3% 1/15/33 (n) | | 197,902 | 15,180 |
| Series 4314 Class AI, 5% 3/15/34 (n) | | 14,845 | 375 |
| Series 4427 Class LI, 3.5% 2/15/34 (n) | | 214,747 | 12,024 |
| Series 4471 Class PA 4% 12/15/40 | | 169,541 | 163,911 |
| target amortization class Series 2003-2557 Class HL, 5.3% 1/15/33 | | 2,236 | 2,224 |
| Freddie Mac Manufactured Housing participation certificates guaranteed planned amortization class Series 1998-2036 Class PG, 6.5% 1/15/28 | | 1,114 | 1,118 |
| Freddie Mac Multi-family Structured pass-thru certificates: | | | |
| sequential payer Series 2021-5159 Class GC, 2% 11/25/47 | | 200,170 | 171,153 |
| Series 4386 Class AZ, 4.5% 11/15/40 | | 456,729 | 438,726 |
| Freddie Mac Seasoned Credit Risk Transfer Trust: | | | |
| sequential payer: | | | |
Series 2017-4 Class MT, 3.5% 6/25/57 | | 267,300 | 237,521 |
Series 2019-4 Class MB, 3% 2/25/59 | | 1,256,223 | 918,102 |
| Series 2018-4 Class HT, 3% 3/25/58 | | 2,170,009 | 1,851,157 |
| Series 2019-3 Class M55D, 4% 10/25/58 | | 350,105 | 315,627 |
| Series 2021-1 Class BXS, 13.2802% 9/25/60 (b)(d) | | 306,206 | 214,098 |
| Series 2021-2 Class BXS, 13.6361% 11/25/60 (b)(d) | | 146,146 | 115,184 |
| Series 2022-1 Class MTU, 3.25% 11/25/61 | | 885,223 | 771,689 |
| Series 2023-1 Class MT, 3% 10/25/62 | | 5,647,853 | 4,743,381 |
| Freddie Mac STACR REMIC Trust floater: | | | |
| Series 2019-DNA4 Class B1, U.S. 30-Day Avg. Secured Overnight Fin. Rate (SOFR) Index + 2.810% 8.1021% 10/25/49 (b)(d)(g) | | 9,700,000 | 9,821,250 |
| Series 2020-DNA2 Class B1, U.S. 30-Day Avg. Secured Overnight Fin. Rate (SOFR) Index + 2.610% 7.9021% 2/25/50 (b)(d)(g) | | 1,000,000 | 1,005,005 |
| Series 2020-DNA6 Class B1, U.S. 30-Day Avg. Secured Overnight Fin. Rate (SOFR) Index + 3.000% 8.2876% 12/25/50 (b)(d)(g) | | 3,910,000 | 3,880,381 |
| Series 2021-DNA2 Class B1, U.S. 30-Day Avg. Secured Overnight Fin. Rate (SOFR) Index + 3.400% 8.6876% 8/25/33 (b)(d)(g) | | 4,380,000 | 4,443,458 |
| Series 2021-DNA6 Class M2, U.S. 30-Day Avg. Secured Overnight Fin. Rate (SOFR) Index + 1.500% 6.7876% 10/25/41 (b)(d)(g) | | 1,799,396 | 1,762,085 |
| Series 2021-HQA1: | | | |
Class B1, U.S. 30-Day Avg. Secured Overnight Fin. Rate (SOFR) Index + 3.000% 8.2876% 8/25/33 (b)(d)(g) | | 2,700,000 | 2,663,025 |
Class M2, U.S. 30-Day Avg. Secured Overnight Fin. Rate (SOFR) Index + 2.250% 7.5376% 8/25/33 (b)(d)(g) | | 3,636,388 | 3,607,153 |
| Series 2022-DNA1 Class M1B, U.S. 30-Day Avg. Secured Overnight Fin. Rate (SOFR) Index + 1.850% 7.1376% 1/25/42 (b)(d)(g) | | 11,800,000 | 11,578,028 |
| Series 2022-DNA2 Class M1B, U.S. 30-Day Avg. Secured Overnight Fin. Rate (SOFR) Index + 2.400% 7.6876% 2/25/42 (b)(d)(g) | | 2,240,000 | 2,234,624 |
| Series 2022-DNA3 Class M1B, U.S. 30-Day Avg. Secured Overnight Fin. Rate (SOFR) Index + 2.900% 8.1876% 4/25/42 (b)(d)(g) | | 12,545,000 | 12,720,191 |
| Freddie Mac. STACR REMIC Trust floater Series 2020-DNA1 Class B1, U.S. 30-Day Avg. Secured Overnight Fin. Rate (SOFR) Index + 2.410% 7.7021% 1/25/50 (b)(d)(g) | | 6,600,000 | 6,553,320 |
| Ginnie Mae guaranteed Multi-family REMIC pass-thru securities Series 2017-16 Class KU, 6.530% - CME Term SOFR 1 Month Index 1.2215% 4/20/37 (d)(n)(p) | | 9,631 | 792 |
| Ginnie Mae guaranteed REMIC pass-thru certificates: | | | |
| floater: | | | |
Series 2010-H27 Class FA, CME Term SOFR 1 Month Index + 0.380% 5.6353% 12/20/60 (d)(g)(l) | | 566,250 | 562,444 |
Series 2011-H20 Class FA, CME Term SOFR 1 Month Index + 0.660% 5.8053% 9/20/61 (d)(g)(l) | | 1,937,036 | 1,928,595 |
Series 2012-H11 Class FA, CME Term SOFR 1 Month Index + 0.810% 5.9553% 2/20/62 (d)(g) | | 49,073 | 48,932 |
Series 2012-H18 Class NA, CME Term SOFR 1 Month Index + 0.630% 5.7753% 8/20/62 (d)(g)(l) | | 265,016 | 263,521 |
Series 2012-H21 Class DF, CME Term SOFR 1 Month Index + 0.760% 4.8711% 5/20/61 (d)(g)(l) | | 3,578 | 3,525 |
Series 2013-H19 Class FC, CME Term SOFR 1 Month Index + 0.600% 5.8553% 8/20/63 (d)(g)(l) | | 416,796 | 415,577 |
Series 2013-H20 Class FB, CME Term SOFR 1 Month Index + 1.110% 6.2553% 8/20/63 (d)(g) | | 15,903 | 15,915 |
Series 2013-H23 Class FA, CME Term SOFR 1 Month Index + 1.410% 6.5553% 9/20/63 (d)(g) | | 33,119 | 33,206 |
Series 2015-H04 Class FL, CME Term SOFR 1 Month Index + 0.580% 5.633% 2/20/65 (d)(g) | | 115,353 | 114,514 |
Series 2015-H23 Class FB, CME Term SOFR 1 Month Index + 0.630% 5.7377% 9/20/65 (d)(g) | | 122,855 | 122,135 |
Series 2016-H16 Class FD, CME TERM SOFR 12 MONTH INDEX + 1.090% 6.1054% 6/20/66 (d)(g) | | 177,860 | 177,146 |
Series 2016-H17 Class FC, CME Term SOFR 1 Month Index + 0.940% 5.6364% 8/20/66 (d)(g) | | 112,328 | 112,023 |
Series 2017-H23 Class FA, CME Term SOFR 1 Month Index + 0.590% 5.6977% 10/20/67 (d)(g) | | 519,710 | 515,977 |
Series 2019-128 Class FH, CME Term SOFR 1 Month Index + 0.610% 5.9285% 10/20/49 (d)(g) | | 235,051 | 227,372 |
Series 2019-23 Class NF, CME Term SOFR 1 Month Index + 0.560% 5.8785% 2/20/49 (d)(g) | | 1,083,970 | 1,056,932 |
Series 2019-H09 Class FA, CME Term SOFR 1 Month Index + 0.610% 5.7177% 5/20/69 (d)(g) | | 354,138 | 351,082 |
Series 2021-H10 Class AF, U.S. 30-Day Avg. Secured Overnight Fin. Rate (SOFR) Index + 1.500% 6.7381% 6/20/71 (d)(g) | | 692,350 | 703,658 |
| planned amortization class: | | | |
Series 2003-18 Class PG, 5.5% 3/20/33 | | 7,876 | 7,926 |
Series 2004-19 Class KE, 5% 3/16/34 | | 31,661 | 31,502 |
Series 2006-26 Class S, 6.380% - CME Term SOFR 1 Month Index 1.0715% 6/20/36 (d)(n)(p) | | 9,634 | 801 |
Series 2006-33 Class PK, 6% 7/20/36 | | 3,168 | 3,201 |
Series 2007-22 Class PK, 5.5% 4/20/37 | | 15,224 | 15,356 |
Series 2007-24 Class SA, 6.390% - CME Term SOFR 1 Month Index 1.0815% 5/20/37 (d)(n)(p) | | 14,293 | 1,277 |
Series 2008-49 Class PH, 5.25% 6/20/38 | | 15,479 | 15,411 |
Series 2008-55 Class PL, 5.5% 6/20/38 | | 14,241 | 14,388 |
Series 2009-72 Class SM, 6.130% - CME Term SOFR 1 Month Index 0.8229% 8/16/39 (d)(n)(p) | | 5,242 | 391 |
Series 2010-158 Class MS, 9.770% - CME Term SOFR 1 Month Index 0% 12/20/40 (d)(p) | | 457,906 | 359,612 |
Series 2015-157 Class GA, 3% 1/20/45 | | 9,040 | 8,509 |
Series 2016-69 Class WA, 3% 2/20/46 | | 280,196 | 254,270 |
Series 2017-134 Class BA, 2.5% 11/20/46 | | 661,773 | 584,477 |
| sequential payer: | | | |
Series 2009-81 Class A, 5.75% 9/20/36 | | 1,753 | 1,759 |
Series 2010-160 Class DY, 4% 12/20/40 | | 941,304 | 899,610 |
Series 2010-170 Class B, 4% 12/20/40 | | 208,324 | 199,072 |
Series 2017-139 Class BA, 3% 9/20/47 | | 2,790,602 | 2,490,789 |
Series 2022-22 Class UH, 3% 12/20/50 | | 728,364 | 653,143 |
| Series 2003-52 Class SB, 11.340% x CME Term SOFR 1 Month Index 2.0526% 6/16/33 (d)(g) | | 931 | 875 |
| Series 2007-7 Class EI, 6.080% - CME Term SOFR 1 Month Index 0.7715% 2/20/37 (d)(n)(p) | | 14,914 | 1,204 |
| Series 2008-50 Class SA, 6.110% - CME Term SOFR 1 Month Index 0.8015% 6/20/38 (d)(n)(p) | | 20,641 | 1,838 |
| Series 2009-106 Class XL, 6.630% - CME Term SOFR 1 Month Index 1.3215% 6/20/37 (d)(n)(p) | | 4,745 | 369 |
| Series 2009-16 Class SJ, 6.680% - CME Term SOFR 1 Month Index 1.3715% 5/20/37 (d)(n)(p) | | 14,552 | 1,589 |
| Series 2010-116 Class QB, 4% 9/16/40 | | 1,579,516 | 1,515,237 |
| Series 2010-14 Class SN, 5.830% - CME Term SOFR 1 Month Index 0.5229% 2/16/40 (d)(n)(p) | | 259,650 | 12,678 |
| Series 2011-94 Class SA, 5.980% - CME Term SOFR 1 Month Index 0.6715% 7/20/41 (d)(n)(p) | | 69,232 | 5,824 |
| Series 2013-149 Class MA, 2.5% 5/20/40 | | 653,075 | 620,984 |
| Series 2013-H04 Class BA, 1.65% 2/20/63 (l) | | 230 | 208 |
| Series 2014-105 Class SN, 5.980% - CME Term SOFR 1 Month Index 0.6715% 12/20/34 (d)(n)(p) | | 13,755 | 1,065 |
| Series 2014-60 Class W, 4.1247% 2/20/29 (d) | | 9,731 | 9,476 |
| Series 2015-H02 Class HA, 2.5% 1/20/65 | | 40,133 | 38,794 |
| Series 2015-H13 Class HA, 2.5% 8/20/64 (l) | | 6,663 | 6,199 |
| Series 2017-H06 Class FA, U.S. TREASURY 1 YEAR INDEX + 0.350% 5.7% 8/20/66 (d)(g)(l) | | 1,120,913 | 1,115,801 |
| Series 2017-H08 Class XI, 0.0726% 3/20/67 (d)(n) | | 370,013 | 15,383 |
| Series 2017-H11 Class XI, 0.341% 5/20/67 (d)(n) | | 970,770 | 38,126 |
| Series 2017-H14: | | | |
Class AI, 0.8299% 6/20/67 (d)(n) | | 514,400 | 29,123 |
Class XI, 0.4279% 6/20/67 (d)(n) | | 373,682 | 11,701 |
| Series 2021-125 Class HA, 1.5% 4/20/51 | | 841,318 | 726,562 |
| Series 2021-155 Class PD, 1.25% 9/20/51 | | 868,443 | 754,521 |
| Series 2021-175 Class PB, 1% 3/20/50 | | 360,209 | 285,481 |
| Series 2021-215 Class LG, 1.75% 12/20/51 | | 1,244,709 | 1,029,600 |
| target amortization class Series 2004-90 Class SI, 5.980% - CME Term SOFR 1 Month Index 0.6715% 10/20/34 (d)(n)(p) | | 5,865 | 384 |
| United States Department of Veterans Affairs guaranteed REMIC pass thru certificates: | | | |
| sequential payer Series 1998-1 Class 2E, 7% 3/15/28 | | 7,939 | 7,915 |
| Series 1996-2 Class 1Z, 6.75% 6/15/26 | | 2,244 | 2,265 |
| Series 1999-1 Class 2Z, 6.5% 1/15/29 | | 1,274 | 1,279 |
TOTAL U.S. GOVERNMENT AGENCY | | | 159,701,356 |
| TOTAL COLLATERALIZED MORTGAGE OBLIGATIONS (Cost $412,072,433) | | | 385,047,341 |
| | | | |
| Commercial Mortgage Securities - 2.3% |
| | | Principal Amount (a) | Value ($) |
| 20 Times Square Trust 2018-20Ts Series 2018-20TS Class F, 3.2032% 5/15/35 (b)(d) | | 3,016,196 | 2,051,279 |
| 3650R Commercial Mortgage Trust sequential payer Series 2021-PF1 Class A4, 2.253% 11/15/54 | | 4,200,000 | 3,285,473 |
| Acre Commercial Mtg 2021-Florida4 Ltd. / A floater Series 2021-FL4 Class C, CME Term SOFR 1 Month Index + 1.860% 7.1764% 12/18/37 (b)(d)(g) | | 263,000 | 247,908 |
| Amalfi At Tuscan Lakes 4.45% 6/1/33 (e)(m) | | 2,000,000 | 1,986,250 |
| Arbor Multifamily Mortgage Securities Trust sequential payer Series 2021-MF2 Class A4, 2.2515% 6/15/54 (b) | | 9,500,000 | 7,649,312 |
| Areit 2021-Cre5 Trust floater sequential payer Series 2021-CRE5 Class C, CME Term SOFR 1 Month Index + 2.360% 7.6782% 11/17/38 (b)(d)(g) | | 146,000 | 138,141 |
| Ashford Hospitality Trust floater Series 2018-ASHF Class A, CME Term SOFR 1 Month Index + 1.070% 6.383% 4/15/35 (b)(d)(g) | | 2,892,924 | 2,838,246 |
| BAMLL Commercial Mortgage Securities Trust: | | | |
| floater Series 2022-DKLX: | | | |
Class A, CME Term SOFR 1 Month Index + 1.150% 6.461% 1/15/39 (b)(d)(g) | | 4,172,000 | 4,058,504 |
Class B, CME Term SOFR 1 Month Index + 1.550% 6.861% 1/15/39 (b)(d)(g) | | 789,000 | 763,363 |
Class C, CME Term SOFR 1 Month Index + 2.150% 7.461% 1/15/39 (b)(d)(g) | | 562,000 | 540,541 |
| sequential payer Series 2019-BPR: | | | |
Class AMP, 3.287% 11/5/32 (b) | | 6,500,000 | 5,998,483 |
Class ANM, 3.112% 11/5/32 (b) | | 4,963,000 | 4,520,574 |
| Series 2019-BPR: | | | |
Class BNM, 3.465% 11/5/32 (b) | | 1,113,000 | 908,325 |
Class CNM, 3.8425% 11/5/32 (b)(d)(e) | | 461,000 | 348,564 |
| Bamll Re-Remic Trust 2014-Frr5 Series 2014-FRR5: | | | |
| Class AK37, 1.9908% 1/27/47 (b)(d) | | 455,505 | 438,019 |
| Class BK37, 1/27/47 (b)(o) | | 292,553 | 282,888 |
| Bamll Re-Remic Trust 2014-Frr8 Series 2014-FRR8 Class A, 1.9266% 11/26/47 (b)(d) | | 351,063 | 326,456 |
| BANK: | | | |
| sequential payer: | | | |
Series 2018-BN14 Class A4, 4.231% 9/15/60 | | 7,200,000 | 6,773,070 |
Series 2019-BN19 Class A3, 3.183% 8/15/61 | | 292,553 | 252,109 |
Series 2019-BN21: | | | |
| Class A4, 2.6% 10/17/52 | | 4,389,252 | 3,803,952 |
| Class A5, 2.851% 10/17/52 | | 838,000 | 721,590 |
Series 2020-BN28 Class A3, 1.584% 3/15/63 | | 9,000,000 | 7,147,868 |
Series 2021-BN31 Class A3, 1.771% 2/15/54 | | 2,000,000 | 1,567,951 |
Series 2021-BN32 Class A4, 2.349% 4/15/54 | | 20,000,000 | 16,399,268 |
Series 2021-BN33 Class A4, 2.27% 5/15/64 | | 9,000,000 | 7,309,540 |
| Series 2020-BN25 Class XB, 0.532% 1/15/63 (d)(n) | | 5,200,000 | 121,432 |
| Series 2021-BN31 Class XB, 0.9782% 2/15/54 (d)(n) | | 7,000,000 | 349,738 |
| Series 2021-BN33 Class XA, 1.1682% 5/15/64 (d)(n) | | 13,429,473 | 725,893 |
| Series 2021-BN34 Class XB, 0.6264% 6/15/63 (d)(n) | | 171,794,000 | 5,511,667 |
| Bank5 2023-5Yr2 sequential payer Series 2023-5YR2 Class A3, 6.656% 6/15/28 | | 15,000,000 | 15,505,457 |
| Bayview Commercial Asset Trust floater: | | | |
| Series 2005-3A Class A2, CME Term SOFR 1 Month Index + 0.710% 5.8294% 11/25/35 (b)(d)(g) | | 14,179 | 12,914 |
| Series 2005-4A: | | | |
Class A2, CME Term SOFR 1 Month Index + 0.690% 6.0144% 1/25/36 (b)(d)(g) | | 33,589 | 30,682 |
Class M1, CME Term SOFR 1 Month Index + 0.780% 6.1044% 1/25/36 (b)(d)(g) | | 10,842 | 9,872 |
| Series 2006-4A Class A2, CME Term SOFR 1 Month Index + 0.510% 5.8344% 12/25/36 (b)(d)(g) | | 75,942 | 69,479 |
| Series 2007-1 Class A2, CME Term SOFR 1 Month Index + 0.510% 5.8344% 3/25/37 (b)(d)(g) | | 19,238 | 17,276 |
| Series 2007-2A: | | | |
Class A1, CME Term SOFR 1 Month Index + 0.380% 5.6994% 7/25/37 (b)(d)(g) | | 59,462 | 52,468 |
Class A2, CME Term SOFR 1 Month Index + 0.430% 5.7494% 7/25/37 (b)(d)(g) | | 55,672 | 49,233 |
Class M1, CME Term SOFR 1 Month Index + 0.480% 5.7994% 7/25/37 (b)(d)(g) | | 18,949 | 16,850 |
| Series 2007-3: | | | |
Class A2, CME Term SOFR 1 Month Index + 0.540% 5.8644% 7/25/37 (b)(d)(g) | | 20,595 | 18,125 |
Class M1, CME Term SOFR 1 Month Index + 0.570% 5.8944% 7/25/37 (b)(d)(g) | | 10,915 | 9,793 |
Class M2, CME Term SOFR 1 Month Index + 0.620% 5.9394% 7/25/37 (b)(d)(g) | | 11,674 | 10,431 |
Class M3, CME Term SOFR 1 Month Index + 0.660% 5.9844% 7/25/37 (b)(d)(g) | | 18,697 | 15,815 |
Class M4, CME Term SOFR 1 Month Index + 0.860% 6.1794% 7/25/37 (b)(d)(g) | | 29,517 | 25,061 |
Class M5, CME Term SOFR 1 Month Index + 1.010% 6.3294% 7/25/37 (b)(d)(g) | | 16,244 | 18,811 |
| BB-UBS Trust: | | | |
| sequential payer Series 2012-SHOW Class A, 3.4302% 11/5/36 (b) | | 407,000 | 370,888 |
| Series 2012-SHOW Class E, 4.1602% 11/5/36 (b)(d) | | 437,000 | 376,376 |
| Bbccre Trust 2015-Gtp sequential payer Series 2015-GTP Class A, 3.966% 8/10/33 (b) | | 274,000 | 254,084 |
| BBCMS Mortgage Trust: | | | |
| sequential payer: | | | |
Series 2019-C4 Class A4, 2.661% 8/15/52 | | 4,000,000 | 3,529,111 |
Series 2021-C9 Class A4, 2.021% 2/15/54 | | 10,000,000 | 7,999,034 |
| Series 2016-ETC Class E, 3.7292% 8/14/36 (b)(d) | | 4,500,000 | 3,247,785 |
| Benchmark 2023-V3 Mtg Trust sequential payer Series 2023-V3 Class A3, 6.3629% 7/15/56 | | 10,000,000 | 10,249,070 |
| Benchmark Commercial Mortgage Trust Series 2018-B3 Class A3, 3.746% 4/10/51 | | 1,700,000 | 1,632,427 |
| Benchmark Mortgage Trust: | | | |
| sequential payer: | | | |
Series 2018 B2 Class A4, 3.6147% 2/15/51 | | 3,500,000 | 3,183,891 |
Series 2018-B4 Class A5, 4.121% 7/15/51 | | 949,000 | 883,123 |
Series 2019-B10 Class A4, 3.717% 3/15/62 | | 1,673,000 | 1,514,889 |
Series 2019-B13 Class A4, 2.952% 8/15/57 | | 7,629,000 | 6,609,454 |
Series 2020-B18 Class A4, 1.672% 7/15/53 | | 10,000,000 | 7,780,655 |
Series 2020-B19: | | | |
| Class A3, 1.787% 9/15/53 | | 5,800,000 | 5,002,329 |
| Class A4, 1.546% 9/15/53 | | 12,500,000 | 9,755,440 |
Series 2020-B22 Class A4, 1.685% 1/15/54 | | 3,175,000 | 2,494,951 |
Series 2021-B23 Class A4A1, 1.823% 2/15/54 | | 2,000,000 | 1,522,686 |
Series 2021-B24 Class A4, 2.2638% 3/15/54 | | 17,600,000 | 14,026,070 |
Series 2021-B26 Class A4, 2.295% 6/15/54 | | 8,800,000 | 7,015,048 |
Series 2023-C5 Class A2, 6.5176% 6/15/56 | | 8,500,000 | 8,658,035 |
Series 2023-V2 Class A3, 5.8118% 5/15/55 | | 13,000,000 | 12,994,883 |
| Series 2019-B12 Class XA, 1.1616% 8/15/52 (d)(n) | | 38,406,994 | 1,399,624 |
| Series 2019-B14 Class XA, 0.8991% 12/15/62 (d)(n) | | 22,622,774 | 643,202 |
| BFLD Trust floater sequential payer Series 2020-OBRK Class A, CME Term SOFR 1 Month Index + 2.160% 7.4745% 11/15/28 (b)(d)(g) | | 7,501,000 | 7,479,402 |
| BHMS floater Series 2018-ATLS Class A, CME Term SOFR 1 Month Index + 1.290% 6.8575% 7/15/35 (b)(d)(g) | | 10,931,821 | 10,737,875 |
| BLOX Trust floater sequential payer Series 2021-BLOX Class A, CME Term SOFR 1 Month Index + 0.860% 6.1755% 9/15/26 (b)(d)(g) | | 8,921,000 | 8,530,514 |
| Blp Commercial Mortgage Trust floater sequential payer Series 2023-IND Class A, CME Term SOFR 1 Month Index + 1.690% 7.0025% 3/15/40 (b)(d)(g) | | 500,000 | 498,433 |
| Bmd2 Re-Remic Trust 2019-Frr1: | | | |
| floater Series 2019-FRR1: | | | |
Class 1A1, U.S. 30-Day Avg. Secured Overnight Fin. Rate (SOFR) Index + 2.610% 7.9021% 5/25/52 (b)(d)(g) | | 100,821 | 100,564 |
Class 1A5, U.S. 30-Day Avg. Secured Overnight Fin. Rate (SOFR) Index + 4.310% 9.6021% 5/25/52 (b)(d)(g) | | 55,690 | 54,830 |
| Series 2019-FRR1 Class 5B13, 2.2008% 5/25/52 (b)(d) | | 4,000,000 | 2,868,260 |
| Bmo 2023-5C1 Mtg Trust sequential payer Series 2023-5C1 Class A3, 6.534% 8/15/56 | | 11,800,000 | 12,144,960 |
| BMO Mortgage Trust sequential payer Series 2022-C1 Class A4, 3.119% 2/17/55 | | 6,200,000 | 5,236,535 |
| BPR Trust floater Series 2022-OANA: | | | |
| Class A, CME Term SOFR 1 Month Index + 1.890% 7.2085% 4/15/37 (b)(d)(g) | | 15,784,000 | 15,498,815 |
| Class B, CME Term SOFR 1 Month Index + 2.440% 7.7575% 4/15/37 (b)(d)(g) | | 4,626,000 | 4,507,107 |
| Bsst 2021-Sscp Mtg Trust floater Series 2021-SSCP: | | | |
| Class A, CME Term SOFR 1 Month Index + 0.860% 6.1745% 4/15/36 (b)(d)(g) | | 450,000 | 438,414 |
| Class E, CME Term SOFR 1 Month Index + 2.210% 7.5245% 4/15/36 (b)(d)(g) | | 87,000 | 81,088 |
| Bway 2013-1515 Mtg Trust Series 2013-1515 Class F, 4.0578% 3/10/33 (b)(d) | | 146,276 | 123,583 |
| BX Commercial Mortgage Trust: | | | |
| floater: | | | |
Series 2021-CIP Class E, CME Term SOFR 1 Month Index + 2.930% 8.2445% 12/15/38 (b)(d)(g) | | 10,350,000 | 9,908,573 |
Series 2021-PAC: | | | |
| Class A, CME Term SOFR 1 Month Index + 0.800% 6.1136% 10/15/36 (b)(d)(g) | | 8,026,000 | 7,839,669 |
| Class B, CME Term SOFR 1 Month Index + 1.010% 6.3233% 10/15/36 (b)(d)(g) | | 1,201,000 | 1,164,076 |
| Class C, CME Term SOFR 1 Month Index + 1.210% 6.5231% 10/15/36 (b)(d)(g) | | 1,607,000 | 1,552,577 |
| Class D, CME Term SOFR 1 Month Index + 1.410% 6.7228% 10/15/36 (b)(d)(g) | | 1,560,000 | 1,494,452 |
| Class E, CME Term SOFR 1 Month Index + 2.060% 7.372% 10/15/36 (b)(d)(g) | | 5,425,000 | 5,210,577 |
Series 2021-VINO Class A, CME Term SOFR 1 Month Index + 0.760% 6.0768% 5/15/38 (b)(d)(g) | | 3,930,308 | 3,853,805 |
Series 2022-CSMO: | | | |
| Class A, CME Term SOFR 1 Month Index + 2.110% 7.4253% 6/15/27 (b)(d)(g) | | 6,438,000 | 6,442,028 |
| Class B, CME Term SOFR 1 Month Index + 3.140% 8.4512% 6/15/27 (b)(d)(g) | | 3,795,000 | 3,786,667 |
| floater sequential payer: | | | |
Series 2019-CALM Class A, CME Term SOFR 1 Month Index + 0.990% 6.3005% 11/15/32 (b)(d)(g) | | 2,389,891 | 2,375,543 |
Series 2020-VKNG Class A, CME Term SOFR 1 Month Index + 1.040% 6.355% 10/15/37 (b)(d)(g) | | 596,338 | 590,151 |
| Bx Commercial Mortgage Trust 2: | | | |
| floater Series 2019-IMC: | | | |
Class B, CME Term SOFR 1 Month Index + 1.410% 6.7245% 4/15/34 (b)(d)(g) | | 4,464,000 | 4,439,085 |
Class C, CME Term SOFR 1 Month Index + 1.710% 7.0245% 4/15/34 (b)(d)(g) | | 2,952,000 | 2,931,917 |
Class D, CME Term SOFR 1 Month Index + 2.010% 7.3245% 4/15/34 (b)(d)(g) | | 3,099,000 | 3,071,303 |
| floater sequential payer Series 2019-IMC Class A, CME Term SOFR 1 Month Index + 1.110% 6.4245% 4/15/34 (b)(d)(g) | | 7,500,000 | 7,470,643 |
| BX Trust: | | | |
| floater: | | | |
Series 2019-XL: | | | |
| Class B, CME Term SOFR 1 Month Index + 1.190% 6.505% 10/15/36 (b)(d)(g) | | 4,429,350 | 4,401,335 |
| Class C, CME Term SOFR 1 Month Index + 1.360% 6.675% 10/15/36 (b)(d)(g) | | 4,286,550 | 4,254,017 |
| Class D, CME Term SOFR 1 Month Index + 1.560% 6.875% 10/15/36 (b)(d)(g) | | 7,863,350 | 7,793,726 |
| Class E, CME Term SOFR 1 Month Index + 1.910% 7.225% 10/15/36 (b)(d)(g) | | 8,530,600 | 8,444,281 |
| Class G, CME Term SOFR 1 Month Index + 2.410% 7.725% 10/15/36 (b)(d)(g) | | 15,725,000 | 15,466,459 |
| Class J, CME Term SOFR 1 Month Index + 2.760% 8.075% 10/15/36 (b)(d)(g) | | 6,162,500 | 5,978,858 |
Series 2021-BXMF Class A, CME Term SOFR 1 Month Index + 0.750% 6.0604% 10/15/26 (b)(d)(g) | | 2,200,000 | 2,149,615 |
Series 2021-MFM1: | | | |
| Class E, CME Term SOFR 1 Month Index + 2.360% 7.6745% 1/15/34 (b)(d)(g) | | 85,975 | 83,166 |
| Class F, CME Term SOFR 1 Month Index + 3.110% 8.4245% 1/15/34 (b)(d)(g) | | 52,907 | 50,780 |
Series 2021-SOAR Class F, CME Term SOFR 1 Month Index + 2.460% 7.7755% 6/15/38 (b)(d)(g) | | 3,713,619 | 3,573,757 |
Series 2022-GPA Class A, CME Term SOFR 1 Month Index + 2.160% 7.4755% 8/15/39 (b)(d)(g) | | 4,233,000 | 4,232,995 |
Series 2022-IND: | | | |
| Class A, CME Term SOFR 1 Month Index + 1.490% 6.8015% 4/15/37 (b)(d)(g) | | 6,266,290 | 6,236,814 |
| Class B, CME Term SOFR 1 Month Index + 1.940% 7.2505% 4/15/37 (b)(d)(g) | | 3,194,910 | 3,141,834 |
| Class C, CME Term SOFR 1 Month Index + 2.290% 7.6005% 4/15/37 (b)(d)(g) | | 721,121 | 701,290 |
| Class D, CME Term SOFR 1 Month Index + 2.830% 8.1495% 4/15/37 (b)(d)(g) | | 603,207 | 582,978 |
Series 20XX-GPA Class B, CME Term SOFR 1 Month Index + 2.660% 7.9745% 8/15/41 (b)(d)(g) | | 500,000 | 499,686 |
| floater sequential payer: | | | |
Series 2019-XL Class A, CME Term SOFR 1 Month Index + 1.030% 6.345% 10/15/36 (b)(d)(g) | | 13,978,741 | 13,943,368 |
Series 2021-MFM1 Class A, CME Term SOFR 1 Month Index + 0.810% 6.1245% 1/15/34 (b)(d)(g) | | 3,220,922 | 3,170,325 |
| BXMT, Ltd. floater Series 2020-FL3 Class A, CME Term SOFR 1 Month Index + 1.510% 6.8282% 11/15/37 (b)(g) | | 3,215,579 | 3,092,272 |
| BXSC Commercial Mortgage Trust floater Series 2022-WSS Class D, CME Term SOFR 1 Month Index + 3.180% 8.499% 3/15/35 (b)(d)(g) | | 8,167,000 | 8,023,601 |
| CAMB Commercial Mortgage Trust floater Series 2019-LIFE Class A, CME Term SOFR 1 Month Index + 1.180% 6.4955% 12/15/37 (b)(d)(g) | | 3,800,000 | 3,780,777 |
| Camb Commercial Mortgage Trust sequential payer Series 2021-CX2 Class A, 2.7% 11/10/46 (b) | | 7,000,000 | 5,551,148 |
| CD Commercial Mortgage Trust Series 2017-CD6 Class A3, 3.104% 11/13/50 | | 2,500,000 | 2,404,413 |
| CD Mortgage Trust sequential payer Series 2017-CD5 Class A3, 3.171% 8/15/50 | | 2,700,000 | 2,472,035 |
| Cent Trust 2023-City floater sequential payer Series 2023-CITY Class A, CME Term SOFR 1 Month Index + 2.620% 7.87% 9/15/28 (b)(d)(g) | | 733,100 | 734,708 |
| CF Hippolyta Issuer LLC sequential payer: | | | |
| Series 2020-1: | | | |
Class A1, 1.69% 7/15/60 (b) | | 16,578,699 | 14,987,348 |
Class A2, 1.99% 7/15/60 (b) | | 6,519,894 | 5,492,283 |
| Series 2021-1A Class A1, 1.53% 3/15/61 (b) | | 8,434,906 | 7,409,456 |
| CF Mortgage Trust sequential payer Series 2019-CF2 Class A4, 2.6236% 11/15/52 | | 850,000 | 716,214 |
| CFCRE Commercial Mortgage Trust Series 2011-C2 Class D, 5.2492% 12/15/47 (b)(d) | | 81,243 | 74,863 |
| CFCRE Mortgage Trust sequential payer Series 2016-C6 Class A2, 2.95% 11/10/49 | | 923,168 | 857,363 |
| Cfmt 2021-Frr1 Trust: | | | |
| sequential payer Series 2021-FRR1 Class AK99, 0% 9/29/29 (b) | | 5,353,696 | 3,389,379 |
| Series 2021-FRR1: | | | |
Class BK54, 0% 2/28/26 (b) | | 659,122 | 535,416 |
Class BK58, 2.4659% 9/29/29 (b)(d) | | 327,366 | 267,825 |
Class BK98, 0% 8/29/29 (b) | | 368,616 | 220,278 |
Class BK99, 0% 9/29/29 (b) | | 447,606 | 241,006 |
Class CK45, 1.3812% 2/28/25 (b)(d) | | 384,122 | 339,549 |
Class CK54, 0% 2/28/26 (b) | | 204,787 | 161,187 |
Class CKW1, 0% 1/29/26 (b) | | 263,297 | 214,321 |
Class DK45, 0% 2/28/25 (b) | | 321,808 | 269,850 |
| CGDB Commercial Mortgage Trust floater Series 2019-MOB: | | | |
| Class A, CME Term SOFR 1 Month Index + 1.060% 6.375% 11/15/36 (b)(d)(g) | | 3,687,000 | 3,624,348 |
| Class B, CME Term SOFR 1 Month Index + 1.360% 6.675% 11/15/36 (b)(d)(g) | | 1,400,000 | 1,362,612 |
| Cgms Commercial Mortgage Trust sequential payer Series 2017-B1 Class A3, 3.197% 8/15/50 | | 870,938 | 796,383 |
| Citigroup Commercial Mortgage Trust: | | | |
| sequential payer: | | | |
Series 2013-GC17 Class A4, 4.131% 11/10/46 | | 7,804,437 | 7,770,601 |
Series 2014-GC19 Class A4, 4.023% 3/11/47 | | 14,398,000 | 14,296,631 |
Series 2015-GC33 Class A3, 3.515% 9/10/58 | | 1,551,420 | 1,486,293 |
Series 2016-GC37 Class A3, 3.05% 4/10/49 | | 2,190,826 | 2,080,144 |
Series 2020-GC46 Class A5, 2.717% 2/15/53 | | 1,393,927 | 1,171,153 |
| Series 2013-GC17 Class A/S, 4.544% 11/10/46 | | 2,300,000 | 2,281,429 |
| Series 2014-GC25 Class A/S, 4.017% 10/10/47 | | 1,183,000 | 1,128,531 |
| Series 2015-GC29 Class XA, 1.1518% 4/10/48 (d)(n) | | 28,464,474 | 352,373 |
| Series 2015-GC33: | | | |
Class AAB, 3.522% 9/10/58 | | 410,604 | 397,055 |
Class XA, 1.0226% 9/10/58 (d)(n) | | 16,968,788 | 241,339 |
| Series 2016-C2 Class A3, 2.575% 8/10/49 | | 2,705,173 | 2,481,273 |
| Series 2016-GC36 Class A4, 3.349% 2/10/49 | | 2,500,000 | 2,357,472 |
| Series 2016-P6 Class XA, 0.6977% 12/10/49 (d)(n) | | 12,449,466 | 179,236 |
| COMM Mortgage Trust: | | | |
| sequential payer: | | | |
Series 2014-CR18 Class A5, 3.828% 7/15/47 | | 1,610,000 | 1,577,812 |
Series 2015 LC19 Class A3, 2.922% 2/10/48 | | 5,576,268 | 5,390,446 |
Series 2015-CR24 Class A5, 3.696% 8/10/48 | | 234,981 | 224,844 |
Series 2015-CR25 Class A4, 3.759% 8/10/48 | | 200,574 | 191,724 |
Series 2016-COR1 Class A3, 2.826% 10/10/49 | | 7,520,414 | 6,907,023 |
| Series 2013-LC13 Class AM, 4.557% 8/10/46 (b) | | 419,570 | 418,521 |
| Series 2014-CR17 Class XA, 1.1036% 5/10/47 (d)(n) | | 17,070,702 | 43,667 |
| Series 2014-CR20 Class XA, 1.0744% 11/10/47 (d)(n) | | 15,393,945 | 98,567 |
| Series 2014-LC17 Class XA, 0.8075% 10/10/47 (d)(n) | | 30,238,963 | 137,019 |
| Series 2014-UBS6: | | | |
Class A5, 3.644% 12/10/47 | | 3,900,000 | 3,749,283 |
Class XA, 0.9784% 12/10/47 (d)(n) | | 8,938,106 | 59,362 |
| Series 2015-CR23 Class A3, 3.23% 5/10/48 | | 2,206,864 | 2,139,881 |
| Series 2015-CR24 Class A4, 3.432% 8/10/48 | | 924,844 | 883,341 |
| Series 2015-PC1 Class A4, 3.62% 7/10/50 | | 489,065 | 476,713 |
| Series 2020-CMB Class D, 3.7538% 2/10/37 (b)(d) | | 255,983 | 235,249 |
| COMM Trust sequential payer Series 2017-COR2 Class A3, 3.51% 9/10/50 | | 11,380,000 | 10,414,225 |
| Communication 2018-Home Mortgage Trust sequential payer Series 2018-HOME Class A, 3.9422% 4/10/33 (b)(d) | | 699,201 | 629,121 |
| Credit Suisse Mortgage Trust: | | | |
| floater Series 2019-ICE4: | | | |
Class A, CME Term SOFR 1 Month Index + 1.020% 6.338% 5/15/36 (b)(d)(g) | | 7,973,164 | 7,964,030 |
Class C, CME Term SOFR 1 Month Index + 1.470% 6.788% 5/15/36 (b)(d)(g) | | 1,517,225 | 1,506,592 |
| sequential payer Series 2020-NET Class A, 2.2569% 8/15/37 (b) | | 2,186,959 | 1,970,690 |
| Series 2018-SITE: | | | |
Class A, 4.284% 4/15/36 (b) | | 5,237,000 | 5,085,009 |
Class B, 4.5349% 4/15/36 (b) | | 1,543,000 | 1,487,446 |
Class C, 4.9414% 4/15/36 (b)(d) | | 1,033,000 | 993,839 |
Class D, 4.9414% 4/15/36 (b)(d) | | 2,066,000 | 1,970,814 |
| Series 2020-NET Class B, 2.8159% 8/15/37 (b) | | 500,000 | 449,701 |
| CSAIL Commercial Mortgage Trust: | | | |
| sequential payer: | | | |
Series 2015-C3 Class A4, 3.7182% 8/15/48 | | 359,957 | 343,124 |
Series 2021-C20 Class A2, 2.4862% 3/15/54 | | 15,246,436 | 12,525,940 |
| Series 2016-C7 Class A4, 3.21% 11/15/49 | | 3,186,022 | 2,981,323 |
| CSMC Commercial Mortgage Trust sequential payer Series 2016-NXSR Class A4, 3.7948% 12/15/49 | | 2,000,000 | 1,854,833 |
| CSMC Trust: | | | |
| sequential payer Series 2014-U.S.A. Class A2, 3.953% 9/15/37 (b) | | 5,001,000 | 4,351,664 |
| Series 2014-U.S.A. Class D, 4.3733% 9/15/37 (b) | | 444,000 | 327,057 |
| DBJPM Mortgage Trust sequential payer Series 2017-C6 Class A3, 3.269% 6/10/50 | | 1,100,607 | 1,048,044 |
| DOLP Trust sequential payer Series 2021-NYC Class A, 2.956% 5/10/41 (b) | | 13,500,000 | 10,613,510 |
| ELP Commercial Mortgage Trust floater Series 2021-ELP: | | | |
| Class A, CME Term SOFR 1 Month Index + 0.810% 6.1265% 11/15/38 (b)(d)(g) | | 10,980,000 | 10,745,783 |
| Class B, CME Term SOFR 1 Month Index + 1.230% 6.5457% 11/15/38 (b)(d)(g) | | 975,000 | 952,979 |
| Class F, CME Term SOFR 1 Month Index + 2.780% 8.0925% 11/15/38 (b)(d)(g) | | 1,000,000 | 959,854 |
| Extended Stay America Trust floater Series 2021-ESH: | | | |
| Class A, CME Term SOFR 1 Month Index + 1.190% 6.5045% 7/15/38 (b)(d)(g) | | 5,121,774 | 5,072,417 |
| Class B, CME Term SOFR 1 Month Index + 1.490% 6.8045% 7/15/38 (b)(d)(g) | | 2,008,820 | 1,981,079 |
| Class C, CME Term SOFR 1 Month Index + 1.810% 7.1245% 7/15/38 (b)(d)(g) | | 1,481,087 | 1,458,775 |
| Class D, CME Term SOFR 1 Month Index + 2.360% 7.6745% 7/15/38 (b)(d)(g) | | 2,992,712 | 2,943,872 |
| Fannie Mae: | | | |
| sequential payer: | | | |
Series 2014-M13 Class A2, 3.021% 8/25/24 | | 121,868 | 118,825 |
Series 2014-M3 Class A2, 3.501% 1/25/24 (d) | | 15,687 | 15,515 |
Series 2015-M1 Class A2, 2.532% 9/25/24 | | 247,850 | 239,578 |
Series 2015-M10 Class A2, 3.092% 4/25/27 | | 165,967 | 156,690 |
Series 2015-M13 Class A2, 2.7884% 6/25/25 (d) | | 35,589 | 34,045 |
Series 2015-M7 Class A2, 2.59% 12/25/24 | | 228,705 | 220,351 |
Series 2016-M6 Class A2, 2.488% 5/25/26 | | 217,014 | 203,199 |
Series 2016-M7 Class A2, 2.4994% 9/25/26 | | 165,881 | 154,681 |
Series 2017-M3 Class A2, 2.5475% 12/25/26 (d) | | 370,774 | 344,120 |
Series 2017-M5 Class A2, 3.1719% 4/25/29 (d) | | 624,131 | 577,932 |
Series 2017-M8 Class A2, 3.061% 5/25/27 | | 240,571 | 225,712 |
Series 2018-M10 Class A2, 3.4693% 7/25/28 (d) | | 610,060 | 575,234 |
Series 2018-M2 Class A2, 3.0025% 1/25/28 (d) | | 829,471 | 767,099 |
Series 2018-M4 Class A2, 3.1661% 3/25/28 (d) | | 251,730 | 234,764 |
Series 2018-M7 Class A2, 3.1298% 3/25/28 (d) | | 810,156 | 755,338 |
Series 2019-M1 Class A2, 3.6652% 9/25/28 (d) | | 1,476,121 | 1,400,070 |
Series 2019-M12 Class A2, 2.885% 6/25/29 (d) | | 799,783 | 728,641 |
Series 2019-M7 Class A2, 3.143% 4/25/29 | | 497,425 | 458,673 |
Series 2020-M38 Class 2A1, 1.594% 11/25/28 | | 167,747 | 147,008 |
Series 2020-M50 Class A2, 1.2% 10/25/30 | | 172,434 | 152,356 |
Series 2022-M2S Class A2, 3.8759% 8/25/32 (d) | | 412,499 | 383,203 |
| Series 2015-M5 Class A1, 2.9596% 3/25/25 (d) | | 386,611 | 370,421 |
| Series 2017-M1 Class A2, 2.4955% 10/25/26 (d) | | 235,094 | 218,537 |
| Series 2017-T1 Class A, 2.898% 6/25/27 | | 2,893,203 | 2,674,647 |
| Series 2018-M14 Class A2, 3.7007% 8/25/28 (d) | | 1,011,550 | 960,566 |
| Series 2018-M3 Class A2, 3.1713% 2/25/30 (d) | | 1,064,967 | 971,101 |
| Series 2020-M38 Class X2, 2.1001% 11/25/28 (d)(n) | | 1,058,705 | 68,626 |
| Series 2020-M50 Class X1, 1.9328% 10/25/30 (d)(n) | | 2,446,138 | 181,905 |
| Series 2022-M10 Class A2, 2.0025% 1/25/32 (d) | | 9,000,000 | 7,229,622 |
| Freddie Mac: | | | |
| sequential payer: | | | |
Series 2015-K049 Class A2, 3.01% 7/25/25 | | 601,000 | 576,724 |
Series 2015-K051 Class A2, 3.308% 9/25/25 | | 951,000 | 915,329 |
Series 2016-K054 Class A2, 2.745% 1/25/26 | | 4,968,992 | 4,705,762 |
Series 2016-K058 Class AM, 2.724% 8/25/26 | | 585,106 | 546,289 |
Series 2016-K152 Class A2, 3.08% 1/25/31 | | 258,704 | 231,407 |
Series 2016-KS06 Class A2, 2.72% 7/25/26 | | 294,893 | 276,408 |
Series 2016-KS07 Class A2, 2.735% 9/25/25 | | 631,914 | 601,016 |
Series 2017-K061 Class AM, 3.439% 11/25/26 | | 292,904 | 278,406 |
Series 2017-K063 Class AM, 3.513% 1/25/27 | | 749,228 | 712,082 |
Series 2017-K065 Class AM, 3.326% 5/25/27 | | 104,061 | 97,932 |
Series 2017-K070 Class A2, 3.303% 11/25/27 | | 176,848 | 166,651 |
Series 2017-KJ17 Class A2, 2.982% 11/25/25 | | 191,715 | 185,132 |
Series 2018-KC02 Class A2, 3.37% 7/25/25 | | 820,852 | 790,959 |
Series 2018-W5FX Class AFX, 3.3361% 4/25/28 (d) | | 289,920 | 270,472 |
Series 2019-KJ26 Class A2, 2.606% 7/25/27 | | 469,042 | 440,948 |
Series 2019-KS11 Class AFX2, 2.654% 6/25/29 | | 1,462,765 | 1,303,340 |
Series 2020-1515 Class A2, 1.94% 2/25/35 | | 1,053,190 | 791,422 |
Series 2021-K126 Class A2, 2.074% 1/25/31 | | 6,000,000 | 4,987,909 |
Series 2021-K127 Class A2, 2.108% 1/25/31 | | 6,800,000 | 5,660,276 |
Series 2021-K136 Class A2, 2.127% 11/25/31 | | 900,000 | 737,452 |
Series 2022-150 Class A2, 3.71% 9/25/32 | | 3,500,000 | 3,218,323 |
Series 2022-5250 Class NH, 3% 8/25/52 | | 12,570,000 | 10,663,557 |
Series 2022-K140 Class A2, 2.25% 1/25/32 | | 800,000 | 659,202 |
Series 2022-K141 Class A2, 2.25% 2/25/32 | | 2,772,000 | 2,284,498 |
Series 2022-K142: | | | |
| Class A2, 2.4% 3/25/32 | | 8,032,000 | 6,689,038 |
| Class AM, 2.4% 3/25/32 | | 643,616 | 532,225 |
Series 2022-K143 Class A2, 2.35% 3/25/32 | | 900,000 | 745,997 |
Series 2022-K144 Class A2, 2.45% 4/25/32 | | 7,843,000 | 6,546,800 |
Series 2022-K145 Class A2, 2.58% 5/25/32 | | 2,466,050 | 2,076,526 |
Series 2022-K146: | | | |
| Class A2, 2.92% 6/25/32 | | 4,673,946 | 4,044,463 |
| Class AM, 2.92% 6/25/54 | | 380,318 | 325,854 |
Series 2022-K147 Class A2, 3% 6/25/32 | | 5,354,000 | 4,661,185 |
Series 2022-K149 Class A2, 3.53% 8/25/32 | | 2,000,000 | 1,815,441 |
Series 2022-K750 Class A2, 3% 9/25/29 | | 5,500,000 | 4,993,507 |
Series 2023-154 Class A2, 4.35% 1/25/33 | | 1,330,000 | 1,283,631 |
Series 2023-155 Class A2, 4.25% 4/25/33 | | 900,000 | 861,779 |
Series 2023-158 Class A2, 4.05% 7/25/33 | | 2,660,000 | 2,505,545 |
Series 2023-K-153 Class A2, 3.82% 12/25/32 | | 5,101,382 | 4,724,239 |
Series 2023-K751 Class A2, 4.412% 3/25/30 | | 3,057,000 | 2,982,030 |
Series K065 Class A2, 3.243% 4/25/27 | | 194,050 | 183,069 |
| Series 2019-K095 Class X1, 1.0835% 6/25/29 (d)(n) | | 13,868,522 | 606,530 |
| Series 2019-KC03 Class X1, 0.6297% 11/25/24 (d) | | 54,231,991 | 259,126 |
| Series 2019-KL05 Class X1P, 1.0243% 6/25/29 (d)(n) | | 5,143,082 | 226,589 |
| Series 2020-K106 Class X1, 1.4767% 1/25/30 (d)(n) | | 60,579,371 | 4,144,095 |
| Series 2020-KX04 Class XFX, 1.8071% 1/25/34 (d)(n) | | 5,093,417 | 314,187 |
| Series 2020-Q014 Class X, 2.7888% 10/25/55 (d)(n) | | 653,729 | 115,060 |
| Series 2021-1520 Class X3, 3.1989% 4/25/39 (d)(n) | | 130,186 | 31,342 |
| Series 2021-K124 Class X1, 0.81% 12/25/30 (d)(n) | | 6,475,420 | 263,611 |
| Series 2021-K128 Class X3, 2.8776% 4/25/31 (d)(n) | | 375,930 | 58,509 |
| Series 2021-K741 Class X1, 0.653% 12/25/27 (d)(n) | | 140,281,420 | 2,775,089 |
| Series 2022 K748 Class A2, 2.26% 1/25/29 | | 6,871,000 | 6,047,117 |
| Series K047 Class A2, 3.329% 5/25/25 | | 8,088,501 | 7,820,616 |
| Freddie Mac Multifamily Struct floater Series 2021-MN1 Class M2, U.S. 30-Day Avg. Secured Overnight Fin. Rate (SOFR) Index + 3.750% 9.0376% 1/25/51 (b)(d)(g) | | 893,281 | 855,767 |
| Fremf 17-K68 Mortgage Trust Series 2017-K68 Class B, 3.9734% 10/25/49 (b)(d) | | 275,672 | 255,152 |
| Fremf 2014-K38 Mtg Trust Series 2014-K38 Class C, 4.7879% 6/25/47 (b)(d) | | 138,962 | 136,539 |
| Fremf 2014-K40 Mtg Trust Series 2014-K40 Class C, 4.1878% 11/25/47 (b)(d) | | 249,898 | 242,164 |
| Fremf 2015-K45 Mtg Trust Series 2015-K45 Class B, 3.733% 4/25/48 (b)(d) | | 260,957 | 250,583 |
| Fremf 2015-K46 Mtg Trust Series 2015-K46 Class C, 3.8211% 4/25/48 (b)(d) | | 103,710 | 99,008 |
| Fremf 2015-K48 Mtg Trust Series 2015-K48: | | | |
| Class B, 3.7706% 8/25/48 (b)(d) | | 470,571 | 449,362 |
| Class C, 3.7706% 8/25/48 (b)(d) | | 515,000 | 489,271 |
| Fremf 2015-K51 Mtg Trust Series 2015-K51 Class B, 4.0858% 10/25/48 (b)(d) | | 80,452 | 77,031 |
| Fremf 2016-K55 Mortgage Trust Series 2016-K55 Class B, 4.3013% 4/25/49 (b)(d) | | 292,553 | 278,578 |
| Fremf 2016-K56 Mortgage Trust Series 2016-K56 Class B, 4.0844% 6/25/49 (b)(d) | | 103,827 | 98,658 |
| Fremf 2016-K58 Mortgage Trust Series 2016-K58 Class C, 3.8656% 9/25/49 (b)(d) | | 1,090,000 | 1,017,518 |
| Fremf 2016-K59 Mtg Trust Series 2016-K59 Class B, 3.7002% 11/25/49 (b)(d) | | 137,909 | 128,491 |
| Fremf 2017-K61 Mortgage Trust Series 2017-K61 Class C, 3.8214% 12/25/49 (b)(d) | | 156,369 | 144,428 |
| Fremf 2017-K63 Mortgage Trust Series 2017-K63: | | | |
| Class B, 4.0109% 2/25/50 (b)(d) | | 347,991 | 324,933 |
| Class C, 4.0109% 2/25/50 (b)(d) | | 146,276 | 135,741 |
| Fremf 2017-K727 Mortgage Trust Series 2017-K727 Class C, 3.8731% 7/25/24 (b)(d) | | 93,616 | 90,839 |
| Fremf 2017-Kl1P Mortgage Trust Series 2017-KL1P Class BP, 3.4805% 10/25/25 (b)(d) | | 388,576 | 352,929 |
| Fremf 2018-K733 Mtg Trust Series 2018-K733 Class B, 4.224% 9/25/25 (b)(d) | | 384,000 | 368,658 |
| Fremf 2018-K74 Mortgage Trust Series 2018-K74 Class B, 4.2299% 2/25/51 (b)(d) | | 292,553 | 271,619 |
| Fremf 2018-K85 Mortgage Trust Series 2018-K85 Class C, 4.464% 12/25/50 (b)(d) | | 1,000,000 | 921,893 |
| Fremf 2018-Kbx1 Mtg Trust Series 2018-KBX1 Class C, 3.6927% 1/25/26 (b)(d) | | 219,414 | 181,330 |
| Fremf 2018-Khg1 Mortgage Trust Series 2018-KHG1 Class C, 3.9464% 12/25/27 (b)(d) | | 971,831 | 850,149 |
| Fremf 2018-Kl02 Mtg Trust Series 2018-KL2B Class CB, 3.8328% 1/25/25 (b)(d) | | 255,463 | 228,171 |
| Fremf 2018-Kl03 Mortgage Trust Series 2018-KL3W Class CW, 4.2349% 8/25/25 (b)(d) | | 585,106 | 537,076 |
| Fremf 2018-Ksl1 Mtg Trust Series 2018-KSL1 Class C, 3.9841% 11/25/25 (b)(d) | | 498,334 | 445,751 |
| Fremf 2018-Kw06 Mtg Trust Series 2018-KW06: | | | |
| Class C, 0% 6/25/28 (b) | | 365,011 | 255,004 |
| Class X2A, 0.1% 6/25/28 (b)(n) | | 3,847,288 | 11,695 |
| Class X2B, 0.1% 6/25/28 (b)(n) | | 486,684 | 1,838 |
| Fremf 2018-Kw07 Mtg Trust Series 2018-KW07: | | | |
| Class C, 10/25/31 (b)(e)(o) | | 380,318 | 216,480 |
| Class X2A, 0.1% 10/25/31 (b)(n) | | 4,378,563 | 13,074 |
| Class X2B, 0.1% 10/25/31 (b)(n) | | 495,949 | 1,996 |
| Fremf 2019-K736 Mtg Trust Series 2019-K736 Class B, 3.8853% 7/25/26 (b)(d) | | 905,000 | 849,560 |
| Fremf 2019-K98 Mtg Trust Series 2019-K98 Class B, 3.8627% 10/25/52 (b)(d) | | 321,808 | 287,572 |
| Fremf 2019-Kbf3 Mortgage Trust floater Series 2019-KBF3 Class C, U.S. 30-Day Avg. Secured Overnight Fin. Rate (SOFR) Index + 4.750% 9.9659% 1/25/29 (b)(d)(g) | | 694,387 | 643,378 |
| Fremf 2019-Kl05 Mtg Trust Series 2019-KL05: | | | |
| Class BHG, 4.5163% 2/25/29 (b)(d) | | 105,465 | 91,171 |
| Class CHG, 4.37% 2/25/29 (b) | | 339,771 | 290,183 |
| Fremf 2019-Kw10 Mortgage Trust Series 2019-KW10 Class B, 3.7554% 10/25/32 (b)(d) | | 268,271 | 233,392 |
| FREMF Mortgage Trust floater Series 2018-KSW4 Class B, U.S. 30-Day Avg. Secured Overnight Fin. Rate (SOFR) Index + 2.450% 7.6659% 10/25/28 (d)(g) | | 3,957,130 | 3,667,352 |
| Fremf Mortgage Trust 2014 K39 Series 2014-K39 Class C, 4.2826% 8/25/47 (b)(d) | | 204,787 | 199,776 |
| Frr Re-Remic Trust 2018-C1: | | | |
| sequential payer Series 2018-C1 Class AK43, 2.8742% 2/27/48 (b)(d) | | 146,276 | 136,317 |
| Series 2018-C1: | | | |
Class B725, 2.8221% 2/27/50 (b)(d) | | 195,425 | 187,527 |
Class BK43, 2.764% 2/27/48 (b)(d) | | 234,042 | 216,025 |
| Gam Re-Remic Trust 2021-Frr1 Series 2021-FRR1 Class 1B, 0% 11/29/50 (b) | | 5,000,000 | 3,523,598 |
| Gam Re-Remic Trust 2022-Frr3 Series 2022-FRR3 Class BK89, 1/27/52 (b)(o) | | 6,000,000 | 3,689,117 |
| Ginnie Mae guaranteed Multi-family REMIC pass-thru securities: | | | |
| Series 2020-193 Class AC, 1.25% 9/16/62 | | 1,452,921 | 1,072,604 |
| Series 2021-14 Class AB, 1.34% 6/16/63 | | 1,737,635 | 1,296,593 |
| Series 2021-2 Class AH, 1.5% 6/16/63 | | 4,085,633 | 3,044,066 |
| Series 2021-21 Class AH, 1.4% 6/16/63 | | 2,790,714 | 2,106,628 |
| Series 2021-31 Class B, 1.25% 1/16/61 | | 3,032,523 | 2,238,987 |
| Series 2021-36 Class IO, 1.2619% 3/16/63 (d) | | 15,175,106 | 1,246,533 |
| Greystone Commercial Capital Trust floater Series 2021-3 Class A, CME Term SOFR 1 Month Index + 2.340% 7.6582% 8/1/24 (b)(d)(g) | | 7,000,000 | 6,919,028 |
| GS Mortgage Securities Trust: | | | |
| floater: | | | |
Series 2018-3PCK Class A, CME Term SOFR 1 Month Index + 2.060% 7.3745% 9/15/31 (b)(d)(g) | | 6,884,098 | 6,789,742 |
Series 2018-HART Class A, CME Term SOFR 1 Month Index + 1.140% 6.463% 10/15/31 (b)(d)(g) | | 3,460,569 | 3,183,723 |
Series 2021-IP: | | | |
| Class A, CME Term SOFR 1 Month Index + 1.060% 6.3755% 10/15/36 (b)(d)(g) | | 7,945,000 | 7,556,359 |
| Class B, CME Term SOFR 1 Month Index + 1.260% 6.5755% 10/15/36 (b)(d)(g) | | 730,000 | 679,644 |
| Class C, CME Term SOFR 1 Month Index + 1.660% 6.9755% 10/15/36 (b)(d)(g) | | 601,000 | 553,564 |
Series 2021-RENT Class C, CME Term SOFR 1 Month Index + 1.660% 6.975% 11/21/35 (b)(d)(g) | | 3,488,852 | 3,197,480 |
| sequential payer: | | | |
Series 2015-GS1 Class A3, 3.734% 11/10/48 | | 11,384,000 | 10,763,532 |
Series 2017-GS6 Class A2, 3.164% 5/10/50 | | 476,294 | 439,492 |
Series 2019-GC38 Class A4, 3.968% 2/10/52 | | 909,839 | 837,604 |
Series 2020-GSA2 Class A4, 1.721% 12/12/53 | | 4,940,000 | 3,871,729 |
| Series 2011-GC5 Class A/S, 5.209% 8/10/44 (b)(d) | | 8,806,331 | 8,272,450 |
| Series 2015-GC30 Class A3, 3.119% 5/10/50 | | 1,883,924 | 1,805,275 |
| Series 2015-GC34 Class XA, 1.3558% 10/10/48 (d)(n) | | 5,134,095 | 102,150 |
| Series 2019-GC40 Class A3, 2.904% 7/10/52 | | 2,000,000 | 1,742,773 |
| Series 2021-RENT Class D, CME Term SOFR 1 Month Index + 1.960% 7.275% 11/21/35 (b)(d)(g) | | 2,152,696 | 1,905,211 |
| Gs Mtg Securities Corp. Trust 2023-Fun floater sequential payer Series 2023-FUN Class B, CME Term SOFR 1 Month Index + 2.790% 8.1007% 3/15/28 (b)(d)(g) | | 500,000 | 493,108 |
| Gs Mtg Securities Corp. Trust 2023-Ship sequential payer Series 2023-SHIP Class A, 4.4664% 9/15/38 (b)(d) | | 4,140,000 | 3,981,761 |
| Independence Plaza Trust sequential payer Series 2018-INDP Class A, 3.763% 7/10/35 (b) | | 475,983 | 446,502 |
| Intown Mortgage Trust floater sequential payer Series 2022-STAY Class A, CME Term SOFR 1 Month Index + 2.480% 7.7986% 8/15/39 (b)(d)(g) | | 8,682,000 | 8,687,430 |
| J P Morgan Chase Commercial Mtg Securities floater Series 2022-CGSS Class A, CME Term SOFR 1 Month Index + 2.470% 7.7825% 12/15/36 (b)(d)(g) | | 750,000 | 750,677 |
| J.P. Morgan Chase Commercial Mortgage Securities Trust floater Series 2012-NLP Class A, CME Term SOFR 1 Month Index + 0.590% 5.907% 4/15/37 (b)(d)(g) | | 4,686,142 | 4,362,675 |
| Jp Morgan Chase Commercial Mor Series 2016-NINE Class B, 2.9492% 9/6/38 (b)(d) | | 300,000 | 252,540 |
| JPMBB Commercial Mortgage Securities Trust: | | | |
| sequential payer: | | | |
Series 2014-C21 Class A4, 3.4927% 8/15/47 | | 1,451,598 | 1,429,138 |
Series 2015-C14 Class A5, 3.8218% 7/15/48 | | 3,600,000 | 3,398,102 |
Series 2015-C29 Class A3A2, 3.3423% 5/15/48 (b) | | 785,208 | 749,703 |
| Series 2014-C19 Class XA, 0.7157% 4/15/47 (d)(n) | | 2,020,161 | 3,891 |
| Series 2015-C30 Class A4, 3.5508% 7/15/48 | | 1,209,268 | 1,146,987 |
| Jpmcc Commercial Mortgage Security sequential payer Series 2017-JP6 Class A5, 3.4898% 7/15/50 | | 5,000,000 | 4,518,490 |
| Jpmcc Re-Remic Trust 2015-Frr2 Series 2015-FRR2: | | | |
| Class AK36, 1.7109% 12/27/46 (b)(d) | | 146,276 | 143,726 |
| Class AK39, 2.7043% 8/27/47 (b)(d) | | 310,106 | 290,026 |
| Class BK39, 8/27/47 (b)(o) | | 118,331 | 108,812 |
| JPMDB Commercial Mortgage Securities Trust sequential payer Series 2017 C5 Class A4, 3.414% 3/15/50 | | 3,783,902 | 3,525,815 |
| JPMorgan Chase Commercial Mortgage Securities Trust: | | | |
| floater Series 2019-BKWD Class A, CME Term SOFR 1 Month Index + 1.360% 6.6755% 9/15/29 (b)(d)(g) | | 4,768,386 | 4,423,539 |
| Series 2013-C16 Class A/S, 4.5169% 12/15/46 | | 560,000 | 556,771 |
| Series 2018-WPT: | | | |
Class AFX, 4.2475% 7/5/33 (b) | | 2,700,000 | 2,441,287 |
Class CFX, 4.9498% 7/5/33 (b) | | 919,000 | 767,999 |
Class DFX, 5.3503% 7/5/33 (b) | | 1,414,000 | 1,153,394 |
Class EFX, 5.3635% 7/5/33 (b)(d) | | 1,934,000 | 1,548,539 |
Class XAFX, 1.2948% 7/5/33 (b)(d)(n) | | 10,000,000 | 197,445 |
| Series 2019-COR4 Class A3, 3.7629% 3/10/52 | | 5,400,000 | 4,904,977 |
| Series 2021-MHC Class XCP, 0% 4/15/38 (b)(d)(e)(n) | | 164,060,500 | 164 |
| KKR Industrial Portfolio Trust floater Series 2021-KDIP Class F, CME Term SOFR 1 Month Index + 2.160% 7.475% 12/15/37 (b)(d)(g) | | 114,750 | 110,604 |
| Life Financial Services Trust floater Series 2022-BMR2: | | | |
| Class A1, CME Term SOFR 1 Month Index + 1.290% 6.6057% 5/15/39 (b)(d)(g) | | 12,656,000 | 12,434,362 |
| Class B, CME Term SOFR 1 Month Index + 1.790% 7.1044% 5/15/39 (b)(d)(g) | | 6,596,000 | 6,453,355 |
| Class C, CME Term SOFR 1 Month Index + 2.090% 7.4036% 5/15/39 (b)(d)(g) | | 3,893,000 | 3,785,605 |
| Class D, CME Term SOFR 1 Month Index + 2.540% 7.8524% 5/15/39 (b)(d)(g) | | 3,460,000 | 3,300,567 |
| LIFE Mortgage Trust floater Series 2021-BMR: | | | |
| Class A, CME Term SOFR 1 Month Index + 0.810% 6.1245% 3/15/38 (b)(d)(g) | | 4,672,057 | 4,578,152 |
| Class B, CME Term SOFR 1 Month Index + 0.990% 6.3045% 3/15/38 (b)(d)(g) | | 1,643,526 | 1,604,300 |
| Class C, CME Term SOFR 1 Month Index + 1.210% 6.5245% 3/15/38 (b)(d)(g) | | 1,034,085 | 1,004,209 |
| MED Trust floater Series 2021-MDLN: | | | |
| Class A, CME Term SOFR 1 Month Index + 1.060% 6.3745% 11/15/38 (b)(d)(g) | | 995,224 | 970,249 |
| Class E, CME Term SOFR 1 Month Index + 3.260% 8.5745% 11/15/38 (b)(d)(g) | | 1,229,101 | 1,169,375 |
| MHC Commercial Mortgage Trust floater Series 2021-MHC: | | | |
| Class E, CME Term SOFR 1 Month Index + 2.210% 7.5254% 4/15/38 (b)(d)(g) | | 5,425,000 | 5,304,241 |
| Class F, CME Term SOFR 1 Month Index + 2.710% 8.0254% 4/15/38 (b)(d)(g) | | 713,829 | 694,136 |
| Morgan Stanley BAML Trust: | | | |
| sequential payer: | | | |
Series 2015-C21 Class A3, 3.077% 3/15/48 | | 3,280,337 | 3,134,219 |
Series 2016-C28 Class A3, 3.272% 1/15/49 | | 3,302,603 | 3,101,605 |
| Series 2015-C25: | | | |
Class A4, 3.372% 10/15/48 | | 2,800,000 | 2,664,176 |
Class XA, 1.1795% 10/15/48 (d)(n) | | 9,147,733 | 126,442 |
| Series 2015-C26 Class A4, 3.252% 10/15/48 | | 3,200,000 | 3,072,104 |
| Series 2016-C32 Class A3, 3.459% 12/15/49 | | 8,677,804 | 8,099,083 |
| Morgan Stanley Capital sequential payer Series 2016-UB11 Class A4, 2.782% 8/15/49 | | 13,840,000 | 12,591,474 |
| Morgan Stanley Capital I Trust: | | | |
| floater Series 2018-BOP Class A, CME Term SOFR 1 Month Index + 0.890% 6.208% 8/15/33 (b)(d)(g) | | 4,512,912 | 3,796,487 |
| floater sequential payer Series 2019-NUGS Class A, CME Term SOFR 1 Month Index + 1.060% 6.3755% 12/15/36 (b)(d)(g) | | 5,200,000 | 4,290,000 |
| sequential payer: | | | |
Series 2019-MEAD Class A, 3.17% 11/10/36 (b) | | 13,482,000 | 12,332,999 |
Series 2021-L6 Class A3, 2.196% 6/15/54 | | 7,000,000 | 5,491,626 |
| Series 2015-UBS8 Class A3, 3.54% 12/15/48 | | 2,594,480 | 2,462,415 |
| Series 2016-UB12 Class A3, 3.337% 12/15/49 | | 1,966,999 | 1,815,572 |
| Series 2018-H4 Class A4, 4.31% 12/15/51 | | 3,837,000 | 3,581,740 |
| Series 2019-MEAD: | | | |
Class B, 3.283% 11/10/36 (b)(d) | | 1,558,000 | 1,373,505 |
Class C, 3.283% 11/10/36 (b)(d) | | 1,495,000 | 1,276,989 |
Class D, 3.283% 11/10/36 (b)(d) | | 2,340,000 | 1,931,704 |
| Series 2021-L6 Class XA, 1.328% 6/15/54 (d)(n) | | 12,415,301 | 715,680 |
| MRCD Mortgage Trust Series 2019-PARK: | | | |
| Class E, 2.7175% 12/15/36 (b) | | 600,000 | 371,300 |
| Class F, 2.7175% 12/15/36 (b) | | 1,228,000 | 710,808 |
| Mscr 2021-Minnesota3 M1 floater Series 2021-MN3: | | | |
| Class M1, U.S. 30-Day Avg. Secured Overnight Fin. Rate (SOFR) Index + 2.300% 7.5876% 11/25/51 (b)(d)(g) | | 112,857 | 109,103 |
| Class M2, U.S. 30-Day Avg. Secured Overnight Fin. Rate (SOFR) Index + 4.000% 9.2876% 11/25/51 (b)(d)(g) | | 105,728 | 100,879 |
| Mscr 2022-Minnesota4 M2 floater Series 2022-MN4 Class M2, U.S. 30-Day Avg. Secured Overnight Fin. Rate (SOFR) Index + 6.500% 11.7876% 5/25/52 (b)(d)(g) | | 182,845 | 187,032 |
| MTN Commercial Mortgage Trust floater Series 2022-LPFL Class F, CME Term SOFR 1 Month Index + 4.280% 9.6091% 3/15/39 (b)(d)(g) | | 7,000,000 | 6,610,501 |
| Multi-family1 2021-W10X floater Series 2021-W10 Class A, CME Term SOFR 1 Month Index + 1.070% 6.3803% 12/15/34 (b)(d)(g) | | 480,000 | 468,713 |
| Multifamily Conn Ave Securities Trust 2: | | | |
| floater Series 2020-01 Class M10, U.S. 30-Day Avg. Secured Overnight Fin. Rate (SOFR) Index + 3.860% 9.1521% 3/25/50 (b)(d)(g) | | 3,873,390 | 3,767,290 |
| Series 2019-01 Class M10, U.S. 30-Day Avg. Secured Overnight Fin. Rate (SOFR) Index + 3.360% 8.6521% 10/25/49 (b)(d)(g) | | 4,479,593 | 4,361,736 |
| Nw Re-Remic Trust 2021-Frr1 Series 2021-FRR1 Class BK88, 2.6601% 12/18/51 (b)(d) | | 267,686 | 205,272 |
| ONE Mortgage Trust floater Series 2021-PARK Class E, CME Term SOFR 1 Month Index + 1.860% 7.1745% 3/15/36 (b)(d)(g) | | 6,459,000 | 5,867,301 |
| Pfp 2021-7 Ltd. floater Series 2021-7: | | | |
| Class C, CME Term SOFR 1 Month Index + 1.760% 7.0771% 4/14/38 (b)(d)(g) | | 245,988 | 227,336 |
| Class D, CME Term SOFR 1 Month Index + 2.510% 7.8271% 4/14/38 (b)(d)(g) | | 424,979 | 383,826 |
| Prima Capital Ltd. floater Series 2021-9A Class B, CME Term SOFR 1 Month Index + 1.910% 7.2285% 12/15/37 (b)(d)(g) | | 2,053,000 | 2,000,827 |
| Rfm Reremic Trust 2022-Frr1 Series 2022-FRR1 Class BK64, 1.73% 3/1/50 (b)(d) | | 4,000,000 | 3,169,017 |
| RLGH Trust floater Series 2021-TROT Class A, CME Term SOFR 1 Month Index + 0.910% 6.2255% 4/15/36 (b)(d)(g) | | 1,900,000 | 1,846,318 |
| Sbalr Commercial Mortgage 2020: | | | |
| sequential payer Series 2020-RR1 Class A3, 2.825% 2/13/53 (b) | | 1,119,149 | 893,023 |
| Series 2020-RR1 Class XA, 1.3611% 2/13/53 (b)(d)(n) | | 1,849,902 | 107,161 |
| Series Rr 2015-1 Trust Series 2015-1 Class B, 4/26/48 (b)(o) | | 555,850 | 491,337 |
| SFAVE Commercial Mortgage Securities Trust Series 2015-5AVE: | | | |
| Class A1, 3.872% 1/5/43 (b)(d) | | 740,000 | 510,357 |
| Class A2A, 3.659% 1/5/43 (b)(d) | | 9,930,000 | 6,980,161 |
| SMRT Commercial Mortgage Trust floater Series 2022 MINI Class D, CME Term SOFR 1 Month Index + 1.950% 7.261% 1/15/39 (b)(d)(g) | | 1,820,000 | 1,737,816 |
| SPGN Mortgage Trust floater Series 2022-TFLM: | | | |
| Class B, CME Term SOFR 1 Month Index + 2.000% 7.3105% 2/15/39 (b)(d)(g) | | 1,890,000 | 1,779,785 |
| Class C, CME Term SOFR 1 Month Index + 2.650% 7.9605% 2/15/39 (b)(d)(g) | | 983,000 | 917,164 |
| SREIT Trust floater: | | | |
| Series 2021-FLWR Class A, CME Term SOFR 1 Month Index + 0.690% 6.001% 7/15/36 (b)(d)(g) | | 3,180,000 | 3,108,141 |
| Series 2021-MFP: | | | |
Class A, CME Term SOFR 1 Month Index + 0.840% 6.1558% 11/15/38 (b)(d)(g) | | 10,194,000 | 9,989,340 |
Class B, CME Term SOFR 1 Month Index + 1.190% 6.5048% 11/15/38 (b)(d)(g) | | 4,235,000 | 4,154,677 |
Class C, CME Term SOFR 1 Month Index + 1.440% 6.754% 11/15/38 (b)(d)(g) | | 2,630,000 | 2,565,652 |
Class D, CME Term SOFR 1 Month Index + 1.690% 7.0032% 11/15/38 (b)(d)(g) | | 1,728,000 | 1,680,175 |
| Series 2021-MFP2: | | | |
Class A, CME Term SOFR 1 Month Index + 0.930% 6.2463% 11/15/36 (b)(d)(g) | | 100,000 | 98,212 |
Class C, CME Term SOFR 1 Month Index + 1.480% 6.7952% 11/15/36 (b)(d)(g) | | 235,000 | 229,324 |
| Taubman Centers Commercial Mor floater Series 2022-DPM Class A, CME Term SOFR 1 Month Index + 2.180% 7.4965% 5/15/37 (b)(d)(g) | | 1,300,000 | 1,269,027 |
| TPGI Trust floater sequential payer Series 2021-DGWD Class A, CME Term SOFR 1 Month Index + 0.810% 6.1245% 6/15/26 (b)(d)(g) | | 838,981 | 822,916 |
| UBS Commercial Mortgage Trust: | | | |
| sequential payer: | | | |
Series 2018-C12: | | | |
| Class A2, 4.1519% 8/15/51 | | 805,625 | 803,266 |
| Class A5, 4.2962% 8/15/51 | | 3,000,000 | 2,766,656 |
Series 2019-C17 Class A3, 2.6686% 10/15/52 | | 1,065,000 | 905,060 |
| Series 2017-C1 Class A3, 3.283% 11/15/50 | | 5,500,000 | 4,986,894 |
| Series 2017-C7 Class XA, 1.1548% 12/15/50 (d)(n) | | 14,906,745 | 476,856 |
| Series 2018-C13 Class A3, 4.0694% 10/15/51 | | 6,000,000 | 5,660,944 |
| Series 2018-C9 Class ASB, 4.09% 3/15/51 | | 2,992,604 | 2,875,764 |
| VLS Commercial Mortgage Trust: | | | |
| sequential payer Series 2020-LAB Class A, 2.13% 10/10/42 (b) | | 3,760,000 | 2,933,670 |
| Series 2020-LAB: | | | |
Class B, 2.453% 10/10/42 (b) | | 300,000 | 231,565 |
Class X, 0.5162% 10/10/42 (b)(d)(n) | | 8,700,000 | 213,929 |
| Wells Fargo Commercial Mortgage Trust: | | | |
| floater Series 2021-FCMT Class A, CME Term SOFR 1 Month Index + 1.310% 6.6255% 5/15/31 (b)(d)(g) | | 4,470,000 | 4,278,344 |
| sequential payer: | | | |
Series 2015-C30 Class A4, 3.664% 9/15/58 | | 222,281 | 212,211 |
Series 2016-C34 Class A4, 3.096% 6/15/49 | | 6,124,000 | 5,638,951 |
Series 2019-C54 Class ASB, 3.063% 12/15/52 | | 2,700,000 | 2,471,808 |
Series 2021-C59 Class A4, 2.343% 4/15/54 | | 5,000,000 | 4,049,804 |
Series 2021-C61 Class A3, 2.406% 11/15/54 | | 7,300,000 | 5,961,196 |
| Series 2015-C31 Class XA, 1.1045% 11/15/48 (d)(n) | | 6,254,320 | 98,332 |
| Series 2017-C38 Class A/S, 3.665% 7/15/50 | | 1,110,000 | 1,000,211 |
| Series 2017-C42 Class XA, 1.0056% 12/15/50 (d)(n) | | 34,366,833 | 1,020,272 |
| Series 2018-C46 Class XA, 1.0822% 8/15/51 (d)(n) | | 11,761,075 | 284,583 |
| Series 2018-C48 Class A5, 4.302% 1/15/52 | | 3,181,000 | 2,981,315 |
| WF-RBS Commercial Mortgage Trust: | | | |
| Series 2013-C11 Class D, 4.1349% 3/15/45 (b)(d) | | 194,255 | 136,060 |
| Series 2014-C24 Class XA, 0.9821% 11/15/47 (d)(n) | | 5,893,066 | 36,025 |
| Series 2014-LC14 Class XA, 1.3973% 3/15/47 (d)(n) | | 6,675,238 | 3,040 |
| Worldwide Plaza Trust sequential payer Series 2017-WWP Class A, 3.5263% 11/10/36 (b) | | 609,592 | 511,527 |
| TOTAL COMMERCIAL MORTGAGE SECURITIES (Cost $1,233,896,326) | | | 1,150,101,093 |
| | | | |
| Municipal Securities - 0.2% |
| | | Principal Amount (a) | Value ($) |
| American Muni. Pwr., Inc. Rev. (Combined Hydroelectric Proj.) Series 2010 B, 8.084% 2/15/50 | | 90,000 | 119,565 |
| Bay Area Toll Auth. San Francisco Bay Toll Bridge Rev.: | | | |
| Series 2009 F2, 6.263% 4/1/49 | | 3,265,000 | 3,744,457 |
| Series 2010 S1, 7.043% 4/1/50 | | 230,000 | 284,120 |
| California Gen. Oblig.: | | | |
| Series 2009: | | | |
7.5% 4/1/34 | | 205,000 | 246,139 |
7.55% 4/1/39 | | 220,000 | 271,451 |
| Series 2018, 4.6% 4/1/38 | | 420,000 | 394,920 |
| Colorado Reg'l. Trans. District Sales Tax Rev. (Fastracks Proj.) Series 2010 B, 5.844% 11/1/50 | | 45,000 | 49,530 |
| Dallas Fort Worth Int'l. Arpt. Rev. Series 2022 A, 4.087% 11/1/51 | | 1,010,000 | 855,027 |
| District of Columbia Income Tax Rev. Series 2010 F, 5.582% 12/1/35 | | 75,000 | 77,423 |
| Illinois Gen. Oblig.: | | | |
| Series 2003, 5.1% 6/1/33 | | 23,590,000 | 22,889,363 |
| Series 2010-1, 6.63% 2/1/35 | | 3,549,231 | 3,663,588 |
| Series 2010-3: | | | |
6.725% 4/1/35 | | 2,316,923 | 2,402,957 |
7.35% 7/1/35 | | 3,990,000 | 4,253,506 |
| Jobsohio Beverage Sys. Statewide Series 2020 A, 2.833% 1/1/38 | | 325,000 | 255,055 |
| Los Angeles Dept. Arpt. Rev. Series C: | | | |
| 2.063% 5/15/34 | | 500,000 | 376,172 |
| 2.163% 5/15/35 | | 500,000 | 370,265 |
| Los Angeles Dept. of Wtr. & Pwr. Rev. Series 2010 A, 5.716% 7/1/39 | | 190,000 | 199,031 |
| Los Angeles Unified School District: | | | |
| Series 2010 RY, 6.758% 7/1/34 | | 250,000 | 278,577 |
| Series KRY, 5.75% 7/1/34 | | 180,000 | 187,978 |
| Louisiana Gas & Fuel Tax Rev. Series 2022 A, 2.952% 5/1/41 | | 5,270,000 | 3,976,665 |
| Massachusetts Commonwealth Trans. Fund Rev. (Accelerated Bridge Prog.) Series 2010 A, 5.731% 6/1/40 | | 150,000 | 157,160 |
| Michigan Fin. Auth. Rev. Series 2019 T, 3.384% 12/1/40 | | 545,000 | 428,621 |
| Michigan State Univ. Revs. Series 2022 A, 4.165% 8/15/22 | | 2,810,000 | 2,120,435 |
| New Jersey Econ. Dev. Auth. State Pension Fdg. Rev. Series 1997, 7.425% 2/15/29 (Nat'l. Pub. Fin. Guarantee Corp. Insured) | | 9,315,000 | 9,973,472 |
| New Jersey Tpk. Auth. Tpk. Rev.: | | | |
| Series 2009 E, 7.414% 1/1/40 | | 2,115,000 | 2,592,204 |
| Series 2010 A, 7.102% 1/1/41 | | 855,000 | 1,021,060 |
| Series 2021 B: | | | |
1.963% 1/1/32 | | 1,000,000 | 793,474 |
2.113% 1/1/33 | | 1,050,000 | 822,199 |
| New York City Muni. Wtr. Fin. Auth. Wtr. & Swr. Sys. Rev.: | | | |
| Series 2010 EE, 6.011% 6/15/42 | | 70,000 | 76,835 |
| Series 2011 CC, 5.882% 6/15/44 | | 100,000 | 107,906 |
| New York City Transitional Fin. Auth. Rev.: | | | |
| Series 2010 C2, 5.767% 8/1/36 | | 815,000 | 840,496 |
| Series 2021 E3, 1.97% 2/1/33 | | 2,015,000 | 1,564,764 |
| Series 2023 F3: | | | |
5.13% 2/1/35 | | 750,000 | 746,190 |
5.15% 2/1/36 | | 750,000 | 744,002 |
| Series A5, 2.69% 5/1/33 | | 2,015,000 | 1,660,461 |
| New York Metropolitan Trans. Auth. Rev.: | | | |
| Series 2009 A1, 5.871% 11/15/39 | | 20,000 | 20,100 |
| Series 2010 A, 6.668% 11/15/39 | | 300,000 | 323,653 |
| Series 2010 E, 6.814% 11/15/40 | | 30,000 | 32,451 |
| New York State Dorm. Auth.: | | | |
| Series 2009 F, 5.628% 3/15/39 | | 990,000 | 1,023,706 |
| Series 2021 C, 2.202% 3/15/34 | | 945,000 | 743,777 |
| Ohio State Univ. Gen. Receipts: | | | |
| Series 2010 C, 4.91% 6/1/40 | | 140,000 | 135,013 |
| Series 2011 A, 4.8% 6/1/11 | | 1,503,000 | 1,309,087 |
| Port Auth. of New York & New Jersey: | | | |
| 174th Series, 4.458% 10/1/62 | | 515,000 | 457,905 |
| Series 165, 5.647% 11/1/40 | | 240,000 | 251,108 |
| Series 180, 4.96% 8/1/46 | | 80,000 | 76,196 |
| Series 68, 4.926% 10/1/51 | | 70,000 | 67,373 |
| Salt River Proj. Agricultural Impt. & Pwr. District Elec. Sys. Rev. Series 2010 A, 4.839% 1/1/41 | | 750,000 | 717,001 |
| San Antonio Elec. & Gas Sys. Rev. Series 2010 A, 5.808% 2/1/41 | | 230,000 | 243,404 |
| Texas Gen. Oblig. Series 2009 A, 5.517% 4/1/39 | | 260,000 | 271,387 |
| Texas Private Activity Bond Surface Trans. Corp. (NTE Mobility Partners LLC North Tarrant Express Managed Lanes Proj.) Series 2019 B, 3.922% 12/31/49 | | 555,000 | 447,775 |
| Univ. of California Revs.: | | | |
| Series 2012 AD, 4.858% 5/15/12 | | 130,000 | 114,164 |
| Series 2015 J, 4.131% 5/15/45 | | 1,750,000 | 1,541,002 |
| Univ. of Michigan Rev.: | | | |
| Series 2020 B, 2.437% 4/1/40 | | 1,050,000 | 764,860 |
| Series 2022 A, 4.454% 4/1/22 | | 4,790,000 | 3,956,948 |
| Series 2022 B, 3.504% 4/1/52 | | 1,080,000 | 832,140 |
| Univ. of Minnesota Gen. Oblig. Series 2022, 4.048% 4/1/52 | | 3,060,000 | 2,650,593 |
| Univ. of Virginia Gen. Rev. Series 2021 B, 2.584% 11/1/51 | | 1,520,000 | 993,850 |
| TOTAL MUNICIPAL SECURITIES (Cost $96,191,474) | | | 85,518,561 |
| | | | |
| Foreign Government and Government Agency Obligations - 0.2% |
| | | Principal Amount (a) | Value ($) |
| Alberta Province 3.3% 3/15/28 | | 716,000 | 677,100 |
| Angola Republic: | | | |
| 8.25% 5/9/28 (b) | | 200,000 | 174,540 |
| 9.5% 11/12/25(Reg. S) | | 200,000 | 196,374 |
| Bahrain Kingdom 5.45% 9/16/32 (b) | | 200,000 | 178,960 |
| Bank Gospodarstwa Krajowego 5.375% 5/22/33 (b) | | 2,545,000 | 2,487,738 |
| Brazil Minas SPE 5.333% 2/15/28 (Reg. S) | | 1,990,000 | 1,947,892 |
| Brazilian Federative Republic: | | | |
| 4.75% 1/14/50 | | 200,000 | 146,728 |
| 6% 10/20/33 | | 500,000 | 486,500 |
| Chilean Republic 2.55% 7/27/33 | | 350,000 | 280,809 |
| Colombian Republic: | | | |
| 4.5% 3/15/29 | | 209,000 | 186,204 |
| 8% 4/20/33 | | 200,000 | 206,764 |
| 10.375% 1/28/33 | | 1,360,000 | 1,566,720 |
| Costa Rican Republic 6.55% 4/3/34 (b) | | 200,000 | 201,188 |
| Dominican Republic: | | | |
| 4.5% 1/30/30 (b) | | 600,000 | 521,754 |
| 5.5% 2/22/29 (b) | | 2,505,000 | 2,339,244 |
| 5.5% 2/22/29(Reg. S) | | 161,000 | 150,347 |
| 5.95% 1/25/27 (b) | | 1,100,000 | 1,074,733 |
| 6% 7/19/28 (b) | | 1,250,000 | 1,206,213 |
| 6% 2/22/33 (Reg. S) | | 157,000 | 144,741 |
| 6.4% 6/5/49(Reg. S) | | 450,000 | 375,912 |
| 7.05% 2/3/31(Reg. S) | | 500,000 | 496,025 |
| 7.45% 4/30/44 | | 100,000 | 96,056 |
| Finance Department Government of Sharjah 6.5% 11/23/32 (b) | | 202,000 | 205,343 |
| German Federal Republic: | | | |
| 0% 10/9/26 (Reg. S) | EUR | 3,000,000 | 2,997,360 |
| 1% 5/15/38(Reg. S) | EUR | 4,400,000 | 3,843,039 |
| 1.25% 8/15/48 (i) | EUR | 2,055,000 | 1,699,866 |
| 2.1% 11/15/29(Reg. S) | EUR | 4,100,000 | 4,362,173 |
| 2.2% 12/12/24(Reg. S) | EUR | 310,000 | 331,779 |
| Guatemalan Republic: | | | |
| 3.7% 10/7/33 (Reg. S) | | 747,000 | 600,334 |
| 4.9% 6/1/30(Reg. S) | | 200,000 | 186,886 |
| 6.6% 6/13/36 (b) | | 200,000 | 200,500 |
| Hungarian Republic: | | | |
| 1.75% 6/5/35 (Reg. S) | EUR | 1,370,000 | 1,034,796 |
| 2.125% 9/22/31 (b) | | 580,000 | 445,823 |
| Indonesian Republic: | | | |
| 1.1% 3/12/33 | EUR | 3,500,000 | 2,769,641 |
| 2.8% 6/23/30 (b) | | 670,000 | 580,522 |
| 2.8% 6/23/30(Reg. S) | | 200,000 | 173,290 |
| 3.05% 3/12/51 | | 670,000 | 475,801 |
| 3.4% 9/18/29 | | 420,000 | 380,671 |
| 3.5% 1/11/28 | | 6,300,000 | 5,873,616 |
| 3.75% 6/14/28 (Reg. S) | EUR | 2,000,000 | 2,128,297 |
| 4.65% 9/20/32 | | 1,975,000 | 1,905,283 |
| Italian Republic 2.375% 10/17/24 | | 3,800,000 | 3,649,938 |
| Ivory Coast 6.125% 6/15/33(Reg. S) | | 600,000 | 511,152 |
| Jordanian Kingdom 7.375% 10/10/47(Reg. S) | | 200,000 | 174,442 |
| Mongolia Government 8.65% 1/19/28(Reg. S) | | 200,000 | 199,388 |
| Moroccan Kingdom 6.5% 9/8/33(Reg. S) | | 200,000 | 200,462 |
| Panamanian Republic: | | | |
| 2.252% 9/29/32 | | 480,000 | 364,037 |
| 3.16% 1/23/30 | | 1,020,000 | 887,726 |
| 3.298% 1/19/33 | | 8,600,000 | 7,072,984 |
| 3.875% 3/17/28 | | 720,000 | 677,009 |
| 4.3% 4/29/53 | | 615,000 | 442,376 |
| 4.5% 4/16/50 | | 400,000 | 298,516 |
| 4.5% 4/1/56 | | 480,000 | 346,973 |
| 6.4% 2/14/35 | | 300,000 | 307,713 |
| 6.853% 3/28/54 | | 200,000 | 204,378 |
| Peruvian Republic: | | | |
| 2.783% 1/23/31 | | 772,000 | 653,760 |
| 2.844% 6/20/30 | | 1,220,000 | 1,056,630 |
| 3.55% 3/10/51 | | 400,000 | 287,496 |
| 4.125% 8/25/27 | | 200,000 | 193,306 |
| Philippine Republic: | | | |
| 3% 2/1/28 | | 920,000 | 846,455 |
| 3.2% 7/6/46 | | 390,000 | 277,813 |
| Polish Government: | | | |
| 4.875% 10/4/33 | | 267,000 | 258,811 |
| 5.5% 4/4/53 | | 56,000 | 54,401 |
| 5.75% 11/16/32 | | 800,000 | 831,064 |
| Quebec Province yankee 7.125% 2/9/24 | | 645,000 | 650,231 |
| Republic of Kenya 6.3% 1/23/34(Reg. S) | | 200,000 | 144,256 |
| Republic of Nigeria: | | | |
| 6.5% 11/28/27(Reg. S) | | 500,000 | 428,410 |
| 7.143% 2/23/30(Reg. S) | | 200,000 | 162,670 |
| 7.375% 9/28/33 (b) | | 500,000 | 381,235 |
| 7.625% 11/21/25(Reg. S) | | 200,000 | 189,872 |
| Republic of Paraguay: | | | |
| 4.95% 4/28/31 (Reg. S) | | 650,000 | 613,529 |
| 5.4% 3/30/50(Reg. S) | | 419,000 | 349,626 |
| 5.6% 3/13/48(Reg. S) | | 400,000 | 342,872 |
| Republic of Senegal 6.75% 3/13/48(Reg. S) | | 200,000 | 138,884 |
| Republic of Serbia: | | | |
| 1.5% 6/26/29 (Reg. S) | EUR | 2,722,000 | 2,316,033 |
| 1.65% 3/3/33 (b) | EUR | 569,000 | 416,484 |
| 3.125% 5/15/27 (Reg. S) | EUR | 5,088,000 | 5,028,462 |
| 6.25% 5/26/28 (b) | | 995,000 | 988,125 |
| Romanian Republic: | | | |
| 3% 2/14/31 (b) | | 60,000 | 49,462 |
| 3% 2/14/31 (Reg. S) | | 814,000 | 671,029 |
| 3.875% 10/29/35 (b) | EUR | 289,000 | 251,611 |
| 5% 9/27/26 (b) | EUR | 2,800,000 | 3,055,035 |
| 7.125% 1/17/33(Reg. S) | | 100,000 | 104,982 |
| South African Republic: | | | |
| 4.85% 9/30/29 | | 211,000 | 185,678 |
| 5.875% 4/20/32 | | 700,000 | 618,156 |
| 7.3% 4/20/52 | | 500,000 | 421,345 |
| Sultanate of Oman: | | | |
| 5.625% 1/17/28 (Reg. S) | | 575,000 | 567,675 |
| 7% 1/25/51(Reg. S) | | 200,000 | 198,112 |
| Turkish Republic 9.875% 1/15/28 | | 200,000 | 211,282 |
| Ukraine Government: | | | |
| 4.375% 1/27/32 (b) | EUR | 1,365,000 | 345,612 |
| 6.75% 6/20/28 (Reg. S) | EUR | 1,450,000 | 416,661 |
| 7.75% 9/1/24 (b) | | 2,800,000 | 932,400 |
| 8.994% 2/1/26 (Reg. S) | | 1,800,000 | 540,000 |
| United Kingdom, Great Britain and Northern Ireland: | | | |
| 1% 4/22/24(Reg. S) | GBP | 2,105,000 | 2,598,815 |
| 2.25% 9/7/23 | GBP | 3,145,000 | 3,981,656 |
| United Mexican States: | | | |
| 2.659% 5/24/31 | | 4,055,000 | 3,357,378 |
| 3.5% 2/12/34 | | 1,420,000 | 1,177,265 |
| 4.15% 3/28/27 | | 275,000 | 268,989 |
| 4.28% 8/14/41 | | 400,000 | 322,560 |
| 4.5% 4/22/29 | | 2,920,000 | 2,817,537 |
| 4.5% 1/31/50 | | 650,000 | 516,230 |
| 4.75% 3/8/44 | | 2,366,000 | 1,984,412 |
| 6.05% 1/11/40 | | 1,600,000 | 1,596,096 |
| 6.338% 5/4/53 | | 200,000 | 199,400 |
| 6.35% 2/9/35 | | 1,250,000 | 1,293,150 |
| Uruguay Republic: | | | |
| 4.375% 10/27/27 | | 150,000 | 149,457 |
| 5.1% 6/18/50 | | 160,000 | 154,306 |
| TOTAL FOREIGN GOVERNMENT AND GOVERNMENT AGENCY OBLIGATIONS (Cost $117,379,381) | | | 106,271,372 |
| | | | |
| Supranational Obligations - 0.0% |
| | | Principal Amount (a) | Value ($) |
| European Union: | | | |
| 0% 10/4/28 (Reg. S) | EUR | 125,000 | 116,522 |
| 2.75% 10/5/26 (Reg. S) | EUR | 500,000 | 535,881 |
| TOTAL SUPRANATIONAL OBLIGATIONS (Cost $652,227) | | | 652,403 |
| | | | |
| Common Stocks - 0.0% |
| | | Shares | Value ($) |
| COMMUNICATION SERVICES - 0.0% | | | |
| Wireless Telecommunication Services - 0.0% | | | |
| Intelsat Emergence SA (e)(q) | | 75,805 | 3,479,450 |
| Intelsat Jackson Holdings SA: | | | |
| Series A rights (e)(q) | | 7,937 | 73,338 |
| Series B rights (e)(q) | | 7,937 | 270,255 |
| TOTAL COMMON STOCKS (Cost $2,960,195) | | | 3,823,043 |
| | | | |
| Bank Loan Obligations - 0.1% |
| | | Principal Amount (a) | Value ($) |
| COMMUNICATION SERVICES - 0.0% | | | |
| Diversified Telecommunication Services - 0.0% | | | |
| Frontier Communications Holdings LLC Tranche B 1LN, term loan CME Term SOFR 1 Month Index + 3.750% 9.1831% 5/1/28 (d)(g)(r) | | 236,513 | 229,614 |
| Zayo Group Holdings, Inc. 1LN, term loan CME Term SOFR 1 Month Index + 4.320% 9.6561% 3/9/27 (d)(g)(r) | | 1,030,917 | 824,476 |
| | | | 1,054,090 |
| Media - 0.0% | | | |
| CSC Holdings LLC: | | | |
| Tranche B 5LN, term loan CME Term SOFR 1 Month Index + 2.500% 7.925% 4/15/27 (d)(g)(r) | | 1,081,629 | 977,523 |
| Tranche B6 LN, term loan CME Term SOFR 1 Month Index + 4.500% 9.8105% 1/18/28 (d)(g)(r) | | 99,500 | 93,696 |
| Diamond Sports Group LLC 2LN, term loan CME Term SOFR 1 Month Index + 3.250% 10.6625% 8/24/26 (c)(d)(g)(r) | | 3,283,417 | 79,163 |
| DIRECTV Financing LLC 1LN, term loan 1 month U.S. LIBOR + 5.000% 10.4455% 8/2/27 (d)(g)(r) | | 421,250 | 415,887 |
| Virgin Media Bristol LLC Tranche N, term loan 1 month U.S. LIBOR + 2.500% 7.925% 1/31/28 (d)(g)(r) | | 500,000 | 485,750 |
| | | | 2,052,019 |
| Wireless Telecommunication Services - 0.0% | | | |
| Digicel International Finance Ltd. Tranche B, term loan 3 month U.S. LIBOR + 3.250% 5.96% 5/25/24 (d)(g)(r) | | 880,933 | 800,178 |
| Intelsat Jackson Holdings SA 1LN, term loan CME TERM SOFR 6 MONTH INDEX + 4.250% 9.7719% 2/1/29 (d)(g)(r) | | 1,775,927 | 1,774,950 |
| SBA Senior Finance II, LLC Tranche B, term loan 3 month U.S. LIBOR + 1.750% 7.19% 4/11/25 (d)(g)(r) | | 695,744 | 695,786 |
| | | | 3,270,914 |
TOTAL COMMUNICATION SERVICES | | | 6,377,023 |
| CONSUMER DISCRETIONARY - 0.0% | | | |
| Broadline Retail - 0.0% | | | |
| Bass Pro Group LLC Tranche B 1LN, term loan 1 month U.S. LIBOR + 3.750% 9.1955% 3/5/28 (d)(g)(r) | | 1,172,018 | 1,167,259 |
| Diversified Consumer Services - 0.0% | | | |
| Adtalem Global Education, Inc. Tranche B 1LN, term loan CME Term SOFR 1 Month Index + 4.000% 9.4455% 8/12/28 (d)(g)(r) | | 562,125 | 561,951 |
| AI Aqua Merger Sub, Inc. Tranche B 1LN, term loan 1 month U.S. LIBOR + 3.750% 9.0625% 7/30/28 (d)(g)(r) | | 383,637 | 382,060 |
| Pre-Paid Legal Services, Inc. 1LN, term loan 3 month U.S. LIBOR + 3.750% 12/15/28 (g)(r)(s) | | 411,885 | 404,549 |
| Spin Holdco, Inc. Tranche B 1LN, term loan 3 month U.S. LIBOR + 4.000% 9.2303% 3/4/28 (d)(g)(r) | | 968,093 | 808,358 |
| William Morris Endeavor Entertainment, LLC. Tranche B 1LN, term loan CME Term SOFR 1 Month Index + 2.750% 5/29/25 (g)(r)(s) | | 292,609 | 291,924 |
| | | | 2,448,842 |
| Hotels, Restaurants & Leisure - 0.0% | | | |
| Delta 2 SARL Tranche B 1LN, term loan CME Term SOFR 1 Month Index + 3.000% 8.3311% 1/15/30 (d)(g)(r) | | 57,740 | 57,885 |
| Fertitta Entertainment LLC NV Tranche B 1LN, term loan CME Term SOFR 1 Month Index + 4.000% 9.3311% 1/27/29 (d)(g)(r) | | 609,482 | 602,967 |
| Hilton Worldwide Finance LLC Tranche B 1LN, term loan CME Term SOFR 3 Month Index + 1.750% 7.165% 6/21/26 (d)(g)(r) | | 128,675 | 128,548 |
| KFC Holding Co. Tranche B 1LN, term loan CME Term SOFR 1 Month Index + 1.750% 7.1764% 3/15/28 (d)(g)(r) | | 411,759 | 411,071 |
| Penn Entertainment, Inc. Tranche B 1LN, term loan CME Term SOFR 1 Month Index + 2.750% 8.1811% 5/3/29 (d)(g)(r) | | 211,226 | 211,182 |
| Scientific Games Corp. 1LN, term loan CME Term SOFR 1 Month Index + 3.000% 8.4125% 4/14/29 (d)(g)(r) | | 424,854 | 424,400 |
| | | | 1,836,053 |
| Specialty Retail - 0.0% | | | |
| Michaels Companies, Inc. 1LN, term loan CME Term SOFR 3 Month Index + 4.250% 9.7535% 4/15/28 (d)(g)(r) | | 1,215,000 | 1,124,288 |
TOTAL CONSUMER DISCRETIONARY | | | 6,576,442 |
| CONSUMER STAPLES - 0.0% | | | |
| Beverages - 0.0% | | | |
| Bengal Debt Merger Sub LLC: | | | |
| 1LN, term loan CME Term SOFR 3 Month Index + 3.250% 8.5921% 1/24/29 (d)(g)(r) | | 1,560,623 | 1,476,740 |
| 2LN, term loan CME Term SOFR 3 Month Index + 6.000% 11.3419% 1/24/30 (d)(g)(r) | | 274,373 | 220,085 |
| City Brewing Co. LLC Tranche B 1LN, term loan 1 month U.S. LIBOR + 3.500% 4.25% 4/5/28 (d)(g)(r) | | 300,663 | 194,358 |
| | | | 1,891,183 |
| Consumer Staples Distribution & Retail - 0.0% | | | |
| H-Food Holdings LLC 1LN, term loan 1 month U.S. LIBOR + 3.000% 5/25/25 (g)(r)(s) | | 124,757 | 112,641 |
| Food Products - 0.0% | | | |
| Hostess Brands LLC 1LN, term loan CME Term SOFR 1 Month Index + 2.750% 6/30/30 (g)(r)(s) | | 488,769 | 487,547 |
| Personal Care Products - 0.0% | | | |
| Prestige Brands, Inc. Tranche B5 1LN, term loan CME Term SOFR 1 Month Index + 2.000% 2.5% 7/1/28 (d)(g)(r) | | 335,227 | 334,704 |
TOTAL CONSUMER STAPLES | | | 2,826,075 |
| FINANCIALS - 0.0% | | | |
| Capital Markets - 0.0% | | | |
| Deerfield Dakota Holding LLC Tranche B 1LN, term loan CME Term SOFR 3 Month Index + 3.750% 8.9919% 4/9/27 (d)(g)(r) | | 559,187 | 538,995 |
| Hudson River Trading LLC Tranche B 1LN, term loan CME Term SOFR 1 Month Index + 3.000% 3/18/28 (g)(r)(s) | | 349,107 | 343,871 |
| | | | 882,866 |
| Financial Services - 0.0% | | | |
| Avolon TLB Borrower 1 (U.S.) LLC: | | | |
| Tranche B3 1LN, term loan 3 month U.S. LIBOR + 1.750% 6.8984% 1/15/25 (d)(g)(r) | | 725,000 | 725,181 |
| Tranche B4 1LN, term loan 1 month U.S. LIBOR + 1.500% 2.25% 2/12/27 (d)(g)(r) | | 828,760 | 827,417 |
| Delos Finance SARL Tranche B, term loan 3 month U.S. LIBOR + 1.750% 3.2001% 10/6/23 (d)(g)(r) | | 164,798 | 164,720 |
| Setanta Aircraft Leasing DAC Tranche B 1LN, term loan 3 month U.S. LIBOR + 2.250% 11/5/28 (g)(r)(s) | | 485,000 | 484,544 |
| TransUnion LLC Tranche B6 1LN, term loan CME Term SOFR 1 Month Index + 2.250% 7.6955% 12/1/28 (d)(g)(r) | | 527,314 | 526,803 |
| | | | 2,728,665 |
| Insurance - 0.0% | | | |
| Acrisure LLC Tranche B 1LN, term loan 1 month U.S. LIBOR + 3.500% 8.9455% 2/15/27 (d)(g)(r) | | 630,916 | 617,736 |
| Asurion LLC Tranche B8 1LN, term loan 1 month U.S. LIBOR + 3.250% 8.7879% 12/23/26 (d)(g)(r) | | 591,432 | 574,428 |
| | | | 1,192,164 |
| Mortgage Real Estate Investment Trusts - 0.0% | | | |
| Blackstone Mortgage Trust, Inc. Tranche B, term loan CME Term SOFR 1 Month Index + 2.250% 2.6536% 4/23/26 (d)(g)(r) | | 488,579 | 475,753 |
TOTAL FINANCIALS | | | 5,279,448 |
| HEALTH CARE - 0.0% | | | |
| Health Care Equipment & Supplies - 0.0% | | | |
| Bausch + Lomb Corp. Tranche B 1LN, term loan CME Term SOFR 1 Month Index + 3.250% 5/10/27 (g)(r)(s) | | 552,702 | 539,647 |
| Health Care Providers & Services - 0.0% | | | |
| Cano Health, Inc. Tranche B 1LN, term loan CME Term SOFR 1 Month Index + 4.000% 9.4311% 11/23/27 (d)(g)(r) | | 203,965 | 127,478 |
| Gainwell Acquisition Corp. Tranche B 1LN, term loan CME Term SOFR 3 Month Index + 4.000% 9.3419% 10/1/27 (d)(g)(r) | | 738,636 | 726,405 |
| Horizon Pharma U.S.A., Inc. Tranche B 1LN, term loan CME Term SOFR 1 Month Index + 1.750% 7.1798% 3/15/28 (d)(g)(r) | | 1,080,700 | 1,079,198 |
| Icon Luxembourg Sarl Tranche B 1LN, term loan CME Term SOFR 3 Month Index + 2.250% 7.7535% 7/3/28 (d)(g)(r) | | 261,023 | 261,052 |
| Phoenix Newco, Inc. Tranche B 1LN, term loan CME Term SOFR 1 Month Index + 3.250% 8.6955% 11/15/28 (d)(g)(r) | | 488,763 | 486,993 |
| | | | 2,681,126 |
| Health Care Technology - 0.0% | | | |
| Athenahealth Group, Inc.: | | | |
| Tranche B 1LN, term loan CME Term SOFR 1 Month Index + 3.500% 8.8202% 2/15/29 (d)(g)(r) | | 189,190 | 186,745 |
| Tranche DD 1LN, term loan CME Term SOFR 1 Month Index + 3.500% 3.5% 2/15/29 (d)(g)(r) | | 171,090 | 168,149 |
| IQVIA, Inc. Tranche B 3LN, term loan CME Term SOFR 1 Month Index + 1.750% 7.2879% 6/11/25 (d)(g)(r) | | 252,273 | 252,604 |
| | | | 607,498 |
| Life Sciences Tools & Services - 0.0% | | | |
| PRA Health Sciences, Inc. Tranche B 1LN, term loan CME Term SOFR 3 Month Index + 2.250% 7.7535% 7/3/28 (d)(g)(r) | | 65,034 | 65,041 |
| Pharmaceuticals - 0.0% | | | |
| Grifols, S.A. Tranche B 1LN, term loan 1 month U.S. LIBOR + 2.000% 7.4311% 11/15/27 (d)(g)(r) | | 1,336,083 | 1,318,380 |
| Jazz Financing Lux SARL Tranche B 1LN, term loan CME Term SOFR 1 Month Index + 3.500% 8.9455% 5/5/28 (d)(g)(r) | | 1,099,616 | 1,099,616 |
| Sunshine Luxembourg VII SARL Tranche B 1LN, term loan CME Term SOFR 3 Month Index + 3.750% 10/2/26 (g)(r)(s) | | 449,050 | 449,301 |
| | | | 2,867,297 |
TOTAL HEALTH CARE | | | 6,760,609 |
| INDUSTRIALS - 0.0% | | | |
| Aerospace & Defense - 0.0% | | | |
| TransDigm, Inc. 1LN, term loan CME Term SOFR 1 Month Index + 3.250% 8.4919% 8/24/28 (d)(g)(r) | | 800,806 | 801,167 |
| Building Products - 0.0% | | | |
| AZZ, Inc. Tranche B 1LN, term loan CME Term SOFR 1 Month Index + 4.250% 9.0811% 5/13/29 (d)(g)(r) | | 93,444 | 93,585 |
| Commercial Services & Supplies - 0.0% | | | |
| Filtration Group Corp. 1LN, term loan CME Term SOFR 1 Month Index + 4.250% 9.6955% 10/19/28 (d)(g)(r) | | 216,053 | 216,548 |
| Maverick Purchaser Sub LLC Tranche B 1LN, term loan CME Term SOFR 1 Month Index + 4.000% 9.4455% 1/23/27 (d)(g)(r) | | 274,191 | 271,449 |
| Neptune BidCo U.S., Inc. Tranche B 1LN, term loan CME Term SOFR 1 Month Index + 5.000% 10.3985% 4/11/29 (d)(g)(r) | | 249,375 | 226,827 |
| Prime Security Services Borrower LLC Tranche B 1LN, term loan CME Term SOFR 1 Month Index + 2.750% 8.1816% 9/23/26 (d)(g)(r) | | 437,250 | 437,158 |
| Trugreen LP Tranche B 1LN, term loan CME Term SOFR 1 Month Index + 4.000% 10/30/27 (g)(r)(s) | | 225,286 | 214,116 |
| | | | 1,366,098 |
| Ground Transportation - 0.0% | | | |
| Genesee & Wyoming, Inc. 1LN, term loan CME Term SOFR 3 Month Index + 2.000% 7.3419% 12/30/26 (d)(g)(r) | | 1,292,810 | 1,292,577 |
| Passenger Airlines - 0.0% | | | |
| AAdvantage Loyalty IP Ltd. Tranche B 1LN, term loan CME Term SOFR 1 Month Index + 4.750% 10.3378% 4/20/28 (d)(g)(r) | | 192,998 | 200,267 |
| United Airlines, Inc. Tranche B 1LN, term loan 3 month U.S. LIBOR + 3.750% 9.2919% 4/21/28 (d)(g)(r) | | 1,258,394 | 1,259,967 |
| | | | 1,460,234 |
| Professional Services - 0.0% | | | |
| DTI Holdco, Inc. 1LN, term loan CME Term SOFR 1 Month Index + 4.750% 4/26/29 (g)(r)(s) | | 94,886 | 91,633 |
| Element Materials Technology Group: | | | |
| Tranche B 1LN, term loan CME Term SOFR 3 Month Index + 4.250% 9.5919% 6/24/29 (d)(g)(r) | | 192,988 | 188,645 |
| Tranche DD 1LN, term loan CME Term SOFR 3 Month Index + 4.250% 9.5919% 6/24/29 (d)(g)(r) | | 89,071 | 87,067 |
| | | | 367,345 |
TOTAL INDUSTRIALS | | | 5,381,006 |
| INFORMATION TECHNOLOGY - 0.1% | | | |
| Communications Equipment - 0.0% | | | |
| CommScope, Inc. Tranche B 1LN, term loan CME Term SOFR 1 Month Index + 3.250% 8.6955% 4/4/26 (d)(g)(r) | | 1,561,967 | 1,432,324 |
| Electronic Equipment, Instruments & Components - 0.0% | | | |
| Coherent Corp. Tranche B 1LN, term loan CME Term SOFR 1 Month Index + 2.750% 8.1955% 7/1/29 (d)(g)(r) | | 402,712 | 401,302 |
| IT Services - 0.0% | | | |
| Arches Buyer, Inc. Tranche B 1LN, term loan CME Term SOFR 1 Month Index + 3.250% 8.6811% 12/4/27 (d)(g)(r) | | 261,622 | 254,059 |
| Peraton Corp. Tranche B 1LN, term loan CME Term SOFR 1 Month Index + 3.750% 9.1811% 2/1/28 (d)(g)(r) | | 308,613 | 305,286 |
| | | | 559,345 |
| Semiconductors & Semiconductor Equipment - 0.0% | | | |
| Entegris, Inc. Tranche B 1LN, term loan CME Term SOFR 1 Month Index + 2.750% 8.0176% 7/6/29 (d)(g)(r) | | 260,930 | 261,257 |
| Software - 0.1% | | | |
| Central Parent, Inc. 1LN, term loan CME Term SOFR 3 Month Index + 4.250% 9.4919% 7/6/29 (d)(g)(r) | | 322,963 | 323,041 |
| Finastra U.S.A., Inc.: | | | |
| Tranche 2LN, term loan 3 month U.S. LIBOR + 7.250% 12.981% 6/13/25 (d)(g)(r) | | 25,000 | 24,964 |
| Tranche B 1LN, term loan CME TERM SOFR 6 MONTH INDEX + 3.500% 9.231% 6/13/24 (d)(g)(r) | | 224,370 | 224,068 |
| Gen Digital, Inc. Tranche A2 1LN, term loan CME Term SOFR 1 Month Index + 1.750% 9/12/27 (g)(r)(s) | | 1,012,490 | 999,206 |
| McAfee Corp. Tranche B 1LN, term loan CME Term SOFR 1 Month Index + 3.750% 9.1681% 3/1/29 (d)(g)(r) | | 2,821,500 | 2,765,070 |
| MH Sub I LLC Tranche B 1LN, term loan CME Term SOFR 1 Month Index + 4.250% 9.5811% 5/3/28 (d)(g)(r) | | 317,764 | 305,123 |
| Open Text Corp.: | | | |
| Tranche B 1LN, term loan CME Term SOFR 1 Month Index + 2.750% 8.1811% 1/31/30 (d)(g)(r) | | 177,705 | 177,805 |
| Tranche B, term loan CME Term SOFR 1 Month Index + 1.750% 1.855% 5/30/25 (d)(g)(r) | | 254,745 | 254,745 |
| Proofpoint, Inc. Tranche B 1LN, term loan 3 month U.S. LIBOR + 3.250% 8.6955% 8/31/28 (d)(g)(r) | | 106,392 | 105,245 |
| RealPage, Inc. Tranche B 1LN, term loan CME Term SOFR 1 Month Index + 3.000% 8.4455% 4/22/28 (d)(g)(r) | | 146,509 | 144,727 |
| Renaissance Holdings Corp. Tranche B 1LN, term loan 3 month U.S. LIBOR + 3.250% 8.0903% 5/31/25 (d)(g)(r) | | 403,068 | 403,257 |
| Sophia LP Tranche B 1LN, term loan 3 month U.S. LIBOR + 3.500% 9.0379% 10/7/27 (d)(g)(r) | | 262,956 | 262,354 |
| | | | 5,989,605 |
TOTAL INFORMATION TECHNOLOGY | | | 8,643,833 |
| MATERIALS - 0.0% | | | |
| Chemicals - 0.0% | | | |
| Zep, Inc. Tranche B 1LN, term loan 3 month U.S. LIBOR + 4.000% 8/11/24 (g)(r)(s) | | 540,248 | 497,029 |
| Containers & Packaging - 0.0% | | | |
| Berry Global, Inc. Tranche Z 1LN, term loan 1 month U.S. LIBOR + 1.750% 7.2925% 7/1/26 (d)(g)(r) | | 481,617 | 481,410 |
TOTAL MATERIALS | | | 978,439 |
| UTILITIES - 0.0% | | | |
| Electric Utilities - 0.0% | | | |
| Brookfield WEC Holdings, Inc. 1LN, term loan CME Term SOFR 1 Month Index + 3.750% 9.0811% 8/1/25 (d)(g)(r) | | 99,250 | 99,313 |
| TOTAL BANK LOAN OBLIGATIONS (Cost $44,213,769) | | | 42,922,188 |
| | | | |
| Bank Notes - 0.0% |
| | | Principal Amount (a) | Value ($) |
| Discover Bank: | | | |
| 3.45% 7/27/26 | | 435,000 | 398,303 |
| 4.65% 9/13/28 | | 500,000 | 459,467 |
| 5.974% 8/9/28 (d) | | 3,503,000 | 3,232,179 |
| Regions Bank 6.45% 6/26/37 | | 2,533,000 | 2,489,708 |
| Wells Fargo Bank NA 5.45% 8/7/26 | | 1,210,000 | 1,213,836 |
| TOTAL BANK NOTES (Cost $7,999,818) | | | 7,793,493 |
| | | | |
| Fixed-Income Funds - 68.2% |
| | | Shares | Value ($) |
| High Yield Fixed-Income Funds - 0.9% | | | |
| T. Rowe Price Emerging Markets Bond Fund Class I | | 19,710,095 | 169,112,614 |
| TCW Emerging Markets Income Fund Class N | | 34,051,878 | 267,307,241 |
TOTAL HIGH YIELD FIXED-INCOME FUNDS | | | 436,419,855 |
| Intermediate Government Funds - 4.6% | | | |
| Fidelity SAI U.S. Treasury Bond Index Fund (t) | | 264,815,304 | 2,282,707,919 |
| Intermediate-Term Bond Funds - 55.5% | | | |
| American Funds The Bond Fund of America Class F2 | | 106,937,495 | 1,196,630,568 |
| Baird Aggregate Bond Fund Class Institutional | | 110,586,070 | 1,058,308,692 |
| Baird Core Plus Bond Fund - Institutional Class | | 91,494,813 | 903,053,803 |
| Columbia Mortgage Opportunities Fund Class A | | 31,300,166 | 245,393,298 |
| DoubleLine Total Return Bond Fund Class N | | 207,836,579 | 1,799,864,775 |
| Fidelity SAI Total Bond Fund (t) | | 569,331,086 | 5,027,193,494 |
| Fidelity U.S. Bond Index Fund (t) | | 55,080,167 | 558,512,888 |
| iShares Core U.S. Aggregate Bond ETF (u) | | 5,099,457 | 493,627,438 |
| iShares iBoxx $ Investment Grade Corporate Bond ETF (u) | | 1,399,906 | 148,614,021 |
| John Hancock Bond Fund Class R6 | | 45,640,998 | 605,199,630 |
| JPMorgan Core Bond Fund Class R6 | | 49,751,244 | 500,497,512 |
| PIMCO Income Fund Institutional Class | | 90,153,287 | 936,692,647 |
| PIMCO Mortgage Opportunities Fund Institutional Class | | 173,745,342 | 1,626,256,396 |
| PIMCO Total Return Fund Institutional Class | | 686,609,195 | 5,774,383,246 |
| Voya Intermediate Bond Fund Class I | | 167,937,141 | 1,434,183,186 |
| Western Asset Core Bond Fund Class I | | 332,270,084 | 3,485,513,183 |
| Western Asset Core Plus Bond Fund Class I | | 167,795,719 | 1,557,144,268 |
TOTAL INTERMEDIATE-TERM BOND FUNDS | | | 27,351,069,045 |
| Long Government Bond Funds - 6.5% | | | |
| Fidelity SAI Long-Term Treasury Bond Index Fund (t) | | 60,501,044 | 445,287,685 |
| iShares 20+ Year Treasury Bond ETF | | 2,387,098 | 230,689,151 |
| iShares 7-10 Year Treasury Bond ETF (u) | | 19,481,965 | 1,846,890,282 |
| SPDR Portfolio Long Term Treasury ETF (u) | | 23,955,757 | 677,708,366 |
TOTAL LONG GOVERNMENT BOND FUNDS | | | 3,200,575,484 |
| Short-Term Bond - 0.7% | | | |
| iShares 1-5 Year Investment Grade Corporate Bond ETF | | 7,080,695 | 355,734,117 |
| TOTAL FIXED-INCOME FUNDS (Cost $38,483,565,793) | | | 33,626,506,420 |
| | | | |
| Preferred Securities - 0.1% |
| | | Principal Amount (a) | Value ($) |
| CONSUMER DISCRETIONARY - 0.0% | | | |
| Automobiles - 0.0% | | | |
| Volkswagen International Finance NV: | | | |
| 3.5% (Reg. S) (d)(h) | | 5,100,000 | 5,245,589 |
| 3.748% (Reg. S) (d)(h) | | 300,000 | 289,852 |
| | | | 5,535,441 |
| CONSUMER STAPLES - 0.0% | | | |
| Tobacco - 0.0% | | | |
| British American Tobacco PLC 3% (Reg. S) (d)(h) | | 2,600,000 | 2,418,640 |
| ENERGY - 0.0% | | | |
| Oil, Gas & Consumable Fuels - 0.0% | | | |
| BP Capital Markets PLC: | | | |
| 4.375% (d)(h) | | 7,022,000 | 6,854,374 |
| 4.875% (d)(h) | | 405,000 | 370,583 |
| Energy Transfer LP: | | | |
| 3 month U.S. LIBOR + 4.020% 9.6542% (d)(g)(h) | | 240,000 | 221,894 |
| 6.5% (d)(h) | | 3,770,000 | 3,511,011 |
| 6.625% (d)(h) | | 730,000 | 588,337 |
| 7.125% (d)(h) | | 2,520,000 | 2,283,080 |
| | | | 13,829,279 |
| FINANCIALS - 0.1% | | | |
| Banks - 0.1% | | | |
| AIB Group PLC 6.25% (Reg. S) (d)(h) | | 690,000 | 721,124 |
| Banco Bilbao Vizcaya Argentaria SA 5.875% (Reg. S) (d)(h) | | 800,000 | 877,302 |
| Bank of America Corp. 6.25% (d)(h) | | 57,000 | 58,448 |
| Bank of Nova Scotia CME Term SOFR 3 Month Index + 2.900% 8.2091% (d)(g)(h) | | 13,092,000 | 11,804,222 |
| Barclays PLC: | | | |
| 5.875% (Reg. S) (d)(h) | | 650,000 | 770,972 |
| 8.875% (d)(h) | | 300,000 | 357,320 |
| BNP Paribas SA 6.625% (Reg. S) (d)(h) | | 830,000 | 843,228 |
| Citigroup, Inc.: | | | |
| 3.875% (d)(h) | | 4,320,000 | 3,786,544 |
| 5.95% (d)(h) | | 62,000 | 60,868 |
| 9.6987% (d)(g)(h) | | 16,000 | 16,142 |
| JPMorgan Chase & Co. 4.6% (d)(h) | | 7,120,000 | 6,707,574 |
| Societe Generale 7.875% (Reg. S) (d)(h) | | 415,000 | 419,885 |
| U.S. Bancorp 3.7% (d)(h) | | 4,850,000 | 3,675,785 |
| Wells Fargo & Co. 7.625% (d)(h) | | 335,000 | 345,619 |
| | | | 30,445,033 |
| Capital Markets - 0.0% | | | |
| Charles Schwab Corp.: | | | |
| 4% (d)(h) | | 220,000 | 168,309 |
| 5.375% (d)(h) | | 110,000 | 107,628 |
| Credit Suisse Group AG 7.5% (Reg. S) (c)(d)(h) | | 2,750,000 | 137,500 |
| Goldman Sachs Group, Inc.: | | | |
| 3.65% (d)(h) | | 1,750,000 | 1,433,570 |
| 4.125% (d)(h) | | 2,505,000 | 2,135,947 |
| | | | 3,982,954 |
| Consumer Finance - 0.0% | | | |
| Ally Financial, Inc.: | | | |
| 4.7% (d)(h) | | 530,000 | 373,451 |
| 4.7% (d)(h) | | 45,000 | 29,064 |
| American Express Co. 3.55% (d)(h) | | 770,000 | 646,948 |
| | | | 1,049,463 |
| Financial Services - 0.0% | | | |
| Fannie Mae Series 2015-M8 Class A2, 2.9% 1/25/25 | | 289,444 | 279,021 |
| Insurance - 0.0% | | | |
| QBE Insurance Group Ltd. 5.25% (Reg. S) (d)(h) | | 2,650,000 | 2,492,558 |
TOTAL FINANCIALS | | | 38,249,029 |
| INDUSTRIALS - 0.0% | | | |
| Ground Transportation - 0.0% | | | |
| Mobico Group PLC 4.25% (Reg. S) (d)(h) | | 320,000 | 360,612 |
| REAL ESTATE - 0.0% | | | |
| Real Estate Management & Development - 0.0% | | | |
| Aroundtown SA 3.375% (Reg. S) (d)(h) | | 2,200,000 | 1,039,635 |
| AT Securities BV USD SWAP SEMI 30/360 5Y INDX + 3.540% 7.747% (Reg. S) (d)(g)(h) | | 2,750,000 | 1,237,885 |
| Citycon Oyj 4.496% (Reg. S) (d)(h) | | 450,000 | 338,782 |
| CPI Property Group SA 3.75% (Reg. S) (d)(h) | | 1,325,000 | 406,933 |
| Grand City Properties SA 1.5% (Reg. S) (d)(h) | | 2,400,000 | 1,126,836 |
| Heimstaden Bostad AB: | | | |
| 3.248% (Reg. S) (d)(h) | | 2,085,000 | 1,284,388 |
| 3.625% (Reg. S) (d)(h) | | 185,000 | 95,039 |
| Samhallsbyggnadsbolaget I Norden AB 2.624% (Reg. S) (d)(h) | | 770,000 | 85,668 |
| | | | 5,615,166 |
| UTILITIES - 0.0% | | | |
| Electric Utilities - 0.0% | | | |
| Electricite de France SA 5.625% (Reg. S) (d)(h) | | 1,555,000 | 1,544,830 |
| SSE PLC 3.74% (Reg. S) (d)(h) | | 635,000 | 740,690 |
| | | | 2,285,520 |
| Independent Power and Renewable Electricity Producers - 0.0% | | | |
| Vistra Corp. 7% (b)(d)(h) | | 2,575,000 | 2,421,732 |
| Multi-Utilities - 0.0% | | | |
| ELM BV for Firmenich International SA 3.75% (Reg. S) (d)(h) | | 290,000 | 312,834 |
| Veolia Environnement SA 2% (Reg. S) (d)(h) | | 500,000 | 462,665 |
| | | | 775,499 |
TOTAL UTILITIES | | | 5,482,751 |
| TOTAL PREFERRED SECURITIES (Cost $92,164,210) | | | 71,490,918 |
| | | | |
| Money Market Funds - 2.1% |
| | | Shares | Value ($) |
| Fidelity Cash Central Fund 5.43% (v) | | 178,609,106 | 178,644,828 |
| Fidelity Investments Money Market Government Portfolio Class I 5.21% (t)(w) | | 239,483,240 | 239,483,240 |
| Fidelity Investments Money Market Government Portfolio Institutional Class 5.25% (t)(w) | | 188,822,827 | 188,822,827 |
| Fidelity Securities Lending Cash Central Fund 5.44% (v)(x) | | 337,289,346 | 337,323,075 |
| State Street Institutional U.S. Government Money Market Fund Premier Class 5.28% (w) | | 72,428,680 | 72,428,680 |
| TOTAL MONEY MARKET FUNDS (Cost $1,016,699,004) | | | 1,016,702,650 |
| | | | |
| Purchased Swaptions - 0.0% |
| | Expiration Date | Notional Amount (a) | Value ($) |
| Put Options - 0.0% | | | | |
| Option on an interest rate swap with JPMorgan Chase Bank N.A. to pay annually a fixed rate of 3.07% and receive annually a floating rate based on the U.S. Secured Overnight Fin. Rate (SOFR) Index, expiring April 2033 | 4/21/28 | | 4,200,000 | 201,087 |
| | | | | |
| Call Options - 0.0% | | | | |
| Option on an interest rate swap with JPMorgan Chase Bank N.A. to receive annually a fixed rate of 3.07% and pay annually a floating rate based on the U.S. Secured Overnight Fin. Rate (SOFR) Index, expiring April 2033 | 4/21/28 | | 4,200,000 | 138,816 |
| | | | | |
TOTAL PURCHASED SWAPTIONS (Cost $348,180) | | | | 339,903 |
| TOTAL INVESTMENT IN SECURITIES - 103.3% (Cost $57,087,008,550) | 50,954,007,903 |
NET OTHER ASSETS (LIABILITIES) - (3.3)% | (1,618,472,783) |
| NET ASSETS - 100.0% | 49,335,535,120 |
| | |
| TBA Sale Commitments |
| | Principal Amount (a) | Value ($) |
| Ginnie Mae | | |
| 2% 9/1/53 | (1,050,000) | (866,253) |
| 2% 9/1/53 | (2,550,000) | (2,103,751) |
| 2% 9/1/53 | (13,050,000) | (10,766,255) |
| 2% 9/1/53 | (31,750,000) | (26,193,763) |
| 2% 9/1/53 | (8,100,000) | (6,682,503) |
| 2% 9/1/53 | (2,500,000) | (2,062,501) |
| 2.5% 9/1/53 | (2,300,000) | (1,957,699) |
| 2.5% 9/1/53 | (6,500,000) | (5,532,628) |
| 3% 9/1/53 | (4,850,000) | (4,264,574) |
| 3% 9/1/53 | (20,750,000) | (18,245,344) |
| 3% 9/1/53 | (6,400,000) | (5,627,480) |
| 3.5% 9/1/53 | (750,000) | (680,966) |
| 3.5% 9/1/53 | (3,400,000) | (3,087,045) |
| | | |
| TOTAL GINNIE MAE | | (88,070,762) |
| | | |
| Uniform Mortgage Backed Securities | | |
| 1.5% 9/1/38 | (1,602,000) | (1,365,932) |
| 1.5% 9/1/53 | (4,000,000) | (3,015,479) |
| 2% 9/1/38 | (876,000) | (768,274) |
| 2% 9/1/53 | (700,000) | (557,245) |
| 2% 9/1/53 | (19,000,000) | (15,125,226) |
| 2% 9/1/53 | (31,750,000) | (25,275,048) |
| 2% 9/1/53 | (7,600,000) | (6,050,090) |
| 2% 9/1/53 | (12,700,000) | (10,110,019) |
| 2% 9/1/53 | (7,600,000) | (6,050,090) |
| 2% 9/1/53 | (12,700,000) | (10,110,019) |
| 2% 9/1/53 | (11,550,000) | (9,194,545) |
| 2% 9/1/53 | (19,300,000) | (15,364,045) |
| 2% 9/1/53 | (11,400,000) | (9,075,135) |
| 2% 9/1/53 | (19,050,000) | (15,165,029) |
| 2.5% 9/1/53 | (1,200,000) | (994,547) |
| 2.5% 9/1/53 | (1,000,000) | (828,789) |
| 2.5% 9/1/53 | (3,200,000) | (2,652,125) |
| 3% 9/1/53 | (1,500,000) | (1,292,285) |
| 3.5% 9/1/53 | (6,250,000) | (5,584,717) |
| 3.5% 9/1/53 | (2,400,000) | (2,144,531) |
| 4% 9/1/53 | (6,175,000) | (5,700,297) |
| 4.5% 9/1/53 | (600,000) | (568,969) |
| 4.5% 9/1/53 | (1,000,000) | (948,281) |
| 4.5% 10/1/53 | (1,000,000) | (948,789) |
| 5% 9/1/53 | (2,900,000) | (2,811,980) |
| 5% 9/1/53 | (2,775,000) | (2,690,774) |
| 5% 9/1/53 | (1,300,000) | (1,260,543) |
| 5.5% 9/1/53 | (14,500,000) | (14,323,281) |
| 5.5% 9/1/53 | (5,400,000) | (5,334,188) |
| 5.5% 9/1/53 | (1,200,000) | (1,185,375) |
| 5.5% 9/1/53 | (600,000) | (592,688) |
| 5.5% 9/1/53 | (1,800,000) | (1,778,063) |
| 5.5% 10/1/53 | (14,500,000) | (14,323,281) |
| 6% 9/1/53 | (2,947,000) | (2,954,943) |
| | | |
| TOTAL UNIFORM MORTGAGE BACKED SECURITIES | | (196,144,622) |
| | | |
TOTAL TBA SALE COMMITMENTS (Proceeds $281,977,043) | | (284,215,384) |
| Futures Contracts |
| | Number of contracts | Expiration Date | Notional Amount ($) | Value ($) | Unrealized Appreciation/ (Depreciation) ($) |
| Purchased | | | | | |
| | | | | | |
| Bond Index Contracts | | | | | |
| Eurex Euro-Bund Contracts (Germany) | 14 | Dec 2023 | 2,013,443 | 18,396 | 18,396 |
| Eurex Euro-Buxl 30 Year Bond Contracts (Germany) | 1 | Dec 2023 | 145,043 | 129 | 129 |
| TME 10 Year Canadian Note Contracts (Canada) | 55 | Dec 2023 | 4,856,461 | 43,450 | 43,450 |
| | | | | | |
| TOTAL BOND INDEX CONTRACTS | | | | | 61,975 |
| | | | | | |
| Treasury Contracts | | | | | |
| ASX 10 Year Treasury Bond Index Contracts (Australia) | 30 | Sep 2023 | 2,258,215 | (11,686) | (11,686) |
| CBOT 10-Year U.S. Treasury Note Contracts (United States) | 1,269 | Dec 2023 | 140,898,656 | 1,185,788 | 1,185,788 |
| CBOT 2-Year U.S. Treasury Note Contracts (United States) | 2,368 | Dec 2023 | 482,609,500 | 1,152,760 | 1,152,760 |
| CBOT 5-Year U.S. Treasury Note Contracts (United States) | 2,744 | Dec 2023 | 293,393,625 | 1,758,683 | 1,758,683 |
| CBOT Long Term U.S. Treasury Bond Contracts (United States) | 179 | Dec 2023 | 21,782,063 | 281,187 | 281,187 |
| CBOT Ultra Long Term U.S. Treasury Bond Contracts (United States) | 557 | Dec 2023 | 72,114,094 | 1,868,871 | 1,868,871 |
| | | | | | |
| TOTAL TREASURY CONTRACTS | | | | | 6,235,603 |
| | | | | | |
| TOTAL PURCHASED | | | | | 6,297,578 |
| | | | | | |
| Sold | | | | | |
| | | | | | |
| Bond Index Contracts | | | | | |
| Eurex Euro-Buxl 30 Year Bond Contracts (Germany) | 4 | Dec 2023 | 580,171 | (5,902) | (5,902) |
| ICE Long Gilt Contracts (United Kingdom) | 42 | Dec 2023 | 5,084,859 | (101,697) | (101,697) |
| JPN 10Y BOND(OSE) Contracts (Japan) | 4 | Sep 2023 | 4,036,427 | (10,954) | (10,954) |
| | | | | | |
| TOTAL BOND INDEX CONTRACTS | | | | | (118,553) |
| | | | | | |
| Treasury Contracts | | | | | |
| CBOT 10-Year U.S. Treasury Note Contracts (United States) | 1,311 | Dec 2023 | 145,561,969 | (1,356,898) | (1,356,898) |
| CBOT 5-Year U.S. Treasury Note Contracts (United States) | 881 | Dec 2023 | 94,198,172 | (653,774) | (653,774) |
| CBOT Long Term U.S. Treasury Bond Contracts (United States) | 371 | Dec 2023 | 45,146,063 | (644,279) | (644,279) |
| CBOT Ultra 10-Year U.S. Treasury Note Contracts (United States) | 724 | Dec 2023 | 84,063,188 | (836,268) | (836,268) |
| CBOT Ultra Long Term U.S. Treasury Bond Contracts (United States) | 39 | Dec 2023 | 5,049,281 | (69,327) | (69,327) |
| SFE 3-Year Treasury Bond Contracts (Australia) | 51 | Sep 2023 | 3,515,596 | 4,744 | 4,744 |
| | | | | | |
| TOTAL TREASURY CONTRACTS | | | | | (3,555,802) |
| | | | | | |
| TOTAL SOLD | | | | | (3,674,355) |
| | | | | | |
| TOTAL FUTURES CONTRACTS | | | | | 2,623,223 |
| The notional amount of futures purchased as a percentage of Net Assets is 2.0% |
| The notional amount of futures sold as a percentage of Net Assets is 0.8% |
| Forward Foreign Currency Contracts |
Currency Purchased
| Currency Sold | Counterparty | Settlement Date | Unrealized Appreciation/ (Depreciation) ($) |
| | | | | | | |
| GBP | 169,000 | USD | 214,887 | Barclays Bank PLC | 9/01/23 | (798) |
| USD | 450,996 | EUR | 413,000 | BNP Paribas S.A. | 9/01/23 | 3,160 |
| EUR | 345,000 | USD | 374,512 | BNP Paribas S.A. | 9/05/23 | (411) |
| EUR | 67,460,007 | USD | 72,772,483 | BTIG, LLC | 9/05/23 | 377,776 |
| GBP | 13,088,392 | USD | 16,519,093 | JPMorgan Chase Bank, N.A. | 9/05/23 | 61,282 |
| USD | 74,614,748 | EUR | 67,460,007 | BTIG, LLC | 9/05/23 | 1,464,489 |
| USD | 16,825,057 | GBP | 13,088,392 | Barclays Bank PLC | 9/05/23 | 244,682 |
| EUR | 405,000 | USD | 443,488 | BNP Paribas S.A. | 9/15/23 | (4,115) |
| EUR | 488,000 | USD | 537,978 | BNP Paribas S.A. | 9/15/23 | (8,561) |
| EUR | 467,000 | USD | 520,714 | BNP Paribas S.A. | 9/15/23 | (14,078) |
| EUR | 450,000 | USD | 491,717 | BNP Paribas S.A. | 9/15/23 | (3,525) |
| EUR | 449,000 | USD | 491,516 | Bank of America, N.A. | 9/15/23 | (4,408) |
| EUR | 40,000 | USD | 43,514 | Bank of America, N.A. | 9/15/23 | (119) |
| EUR | 133,000 | USD | 146,334 | Brown Brothers Harriman & Co | 9/15/23 | (2,046) |
| EUR | 80,000 | USD | 87,326 | Brown Brothers Harriman & Co | 9/15/23 | (536) |
| EUR | 1,057,000 | USD | 1,162,475 | Brown Brothers Harriman & Co | 9/15/23 | (15,765) |
| EUR | 381,000 | USD | 422,567 | Brown Brothers Harriman & Co | 9/15/23 | (9,231) |
| EUR | 50,000 | USD | 54,778 | Canadian Imperial Bk. of Comm. | 9/15/23 | (534) |
| EUR | 867,000 | USD | 957,931 | Canadian Imperial Bk. of Comm. | 9/15/23 | (17,347) |
| EUR | 60,000 | USD | 65,804 | Goldman Sachs Bank USA | 9/15/23 | (712) |
| EUR | 40,000 | USD | 44,144 | JPMorgan Chase Bank, N.A. | 9/15/23 | (749) |
| EUR | 367,000 | USD | 397,014 | JPMorgan Chase Bank, N.A. | 9/15/23 | 1,134 |
| EUR | 1,002,000 | USD | 1,092,726 | Royal Bank of Canada | 9/15/23 | (5,684) |
| EUR | 55,000 | USD | 60,077 | State Street Bank and Trust Co | 9/15/23 | (409) |
| GBP | 142,000 | USD | 181,364 | BNP Paribas S.A. | 9/15/23 | (1,470) |
| GBP | 1,047,000 | USD | 1,317,909 | BNP Paribas S.A. | 9/15/23 | 8,492 |
| GBP | 90,000 | USD | 114,004 | BNP Paribas S.A. | 9/15/23 | 13 |
| GBP | 28,000 | USD | 35,575 | JPMorgan Chase Bank, N.A. | 9/15/23 | (103) |
| GBP | 135,000 | USD | 171,688 | JPMorgan Chase Bank, N.A. | 9/15/23 | (662) |
| GBP | 84,000 | USD | 107,136 | Royal Bank of Canada | 9/15/23 | (719) |
| USD | 166,835 | AUD | 242,000 | Bank of America, N.A. | 9/15/23 | 9,973 |
| USD | 27,991 | CAD | 37,000 | Brown Brothers Harriman & Co | 9/15/23 | 604 |
| USD | 182,602 | CAD | 241,000 | Royal Bank of Canada | 9/15/23 | 4,214 |
| USD | 1,573,405 | EUR | 1,432,000 | BNP Paribas S.A. | 9/15/23 | 19,868 |
| USD | 85,797 | EUR | 79,000 | BNP Paribas S.A. | 9/15/23 | 92 |
| USD | 74,845,634 | EUR | 68,078,000 | Bank of America, N.A. | 9/15/23 | 989,695 |
| USD | 260,728 | EUR | 236,000 | Canadian Imperial Bk. of Comm. | 9/15/23 | 4,698 |
| USD | 109,478 | EUR | 100,000 | JPMorgan Chase Bank, N.A. | 9/15/23 | 991 |
| USD | 87,582 | EUR | 80,000 | JPMorgan Chase Bank, N.A. | 9/15/23 | 792 |
| USD | 43,801,132 | GBP | 34,150,000 | BNP Paribas S.A. | 9/15/23 | 537,885 |
| USD | 211,049 | GBP | 161,000 | BNP Paribas S.A. | 9/15/23 | 7,085 |
| USD | 227,777 | GBP | 177,000 | Bank of America, N.A. | 9/15/23 | 3,543 |
| USD | 226,348 | GBP | 178,000 | Barclays Bank PLC | 9/15/23 | 847 |
| USD | 228,819 | GBP | 178,000 | Canadian Imperial Bk. of Comm. | 9/15/23 | 3,318 |
| USD | 137,013 | GBP | 108,000 | JPMorgan Chase Bank, N.A. | 9/15/23 | 192 |
| USD | 11,028 | EUR | 10,000 | Morgan Stanley Cap. Group, Inc | 9/20/23 | 177 |
| USD | 147,016 | EUR | 133,000 | Morgan Stanley Cap. Group, Inc | 9/20/23 | 2,693 |
| USD | 72,872,998 | EUR | 67,460,007 | BTIG, LLC | 10/03/23 | (375,923) |
| USD | 16,521,376 | GBP | 13,088,392 | JPMorgan Chase Bank, N.A. | 10/03/23 | (61,173) |
| | | | | | | |
| TOTAL FORWARD FOREIGN CURRENCY CONTRACTS | | 3,218,617 |
| Unrealized Appreciation | | | 3,747,695 |
| Unrealized Depreciation | | | (529,078) |
| Credit Default Swaps |
| Underlying Reference | Rating(1) | Maturity Date | Clearinghouse / Counterparty(2) | Fixed Payment Received/ (Paid) | Payment Frequency | Notional Amount(3)(4) | Value ($)(1) | Upfront Premium Received/ (Paid) ($)(5) | Unrealized Appreciation/ (Depreciation) ($) |
| Buy Protection | | | | | | | | | | |
| American Electric Power, Inc. | | Jun 2028 | Bank of America, N.A. | (1%) | Quarterly | | 540,000 | (15,429) | 13,650 | (1,779) |
| American Express Co. | | Jun 2028 | Goldman Sachs Intl. | (1%) | Quarterly | | 166,086 | (4,320) | 4,198 | (122) |
| American Express Co. | | Jun 2028 | Goldman Sachs Intl. | (1%) | Quarterly | | 110,724 | (2,880) | 2,811 | (69) |
| CMBX N.A. AAA Index Series 13 | | Dec 2072 | Citigroup Global Markets Ltd. | (0.5%) | Monthly | | 2,140,000 | 37,180 | (23,336) | 13,844 |
| CMBX N.A. AAA Index Series 13 | | Dec 2072 | Citigroup Global Markets Ltd. | (0.5%) | Monthly | | 720,000 | 12,509 | (6,554) | 5,955 |
| CMBX N.A. AAA Index Series 13 | | Dec 2072 | Morgan Stanley Capital Services LLC | (0.5%) | Monthly | | 9,000,000 | 156,365 | (146,169) | 10,196 |
| CMBX N.A. AAA Index Series 13 | | Dec 2072 | Morgan Stanley Capital Services LLC | (0.5%) | Monthly | | 6,000,000 | 104,243 | (40,620) | 63,623 |
| CMBX N.A. BBB- Index Series 16 | | Apr 2065 | Citigroup Global Markets Ltd. | (3%) | Monthly | | 470,000 | 113,049 | (125,964) | (12,915) |
| CMBX N.A. BBB- Index Series 16 | | Apr 2065 | Citigroup Global Markets Ltd. | (3%) | Monthly | | 710,000 | 170,776 | (217,994) | (47,218) |
| CMBX N.A. BBB- Index Series 16 | | Apr 2065 | Goldman Sachs & Co. LLC | (3%) | Monthly | | 410,000 | 98,617 | (102,218) | (3,601) |
| CMBX N.A. BBB- Index Series 16 | | Apr 2065 | Goldman Sachs & Co. LLC | (3%) | Monthly | | 320,000 | 76,969 | (78,246) | (1,277) |
| CMBX N.A. BBB- Index Series 16 | | Apr 2065 | Goldman Sachs & Co. LLC | (3%) | Monthly | | 550,000 | 132,291 | (161,820) | (29,529) |
| CMBX N.A. BBB- Index Series 16 | | Apr 2065 | Goldman Sachs & Co. LLC | (3%) | Monthly | | 330,000 | 79,375 | (82,262) | (2,887) |
| CMBX N.A. BBB- Index Series 16 | | Apr 2065 | Goldman Sachs & Co. LLC | (3%) | Monthly | | 780,000 | 187,613 | (208,937) | (21,324) |
| CMBX N.A. BBB- Index Series 16 | | Apr 2065 | JPMorgan Securities LLC | (3%) | Monthly | | 110,000 | 26,458 | (32,038) | (5,580) |
| CMBX N.A. BBB- Index Series 16 | | Apr 2065 | JPMorgan Securities LLC | (3%) | Monthly | | 1,770,000 | 425,736 | (545,828) | (120,092) |
| CMBX N.A. BBB- Index Series 16 | | Apr 2065 | JPMorgan Securities LLC | (3%) | Monthly | | 120,000 | 28,863 | (32,302) | (3,439) |
| CMBX N.A. BBB- Index Series 16 | | Apr 2065 | Morgan Stanley Capital Services LLC | (3%) | Monthly | | 70,000 | 16,837 | (17,631) | (794) |
| CMBX N.A. BBB- Index Series 16 | | Apr 2065 | Morgan Stanley Capital Services LLC | (3%) | Monthly | | 670,000 | 161,154 | (169,583) | (8,429) |
| CMBX N.A. BBB- Index Series 16 | | Apr 2065 | Morgan Stanley Capital Services LLC | (3%) | Monthly | | 880,000 | 211,665 | (226,754) | (15,089) |
| Intesa Sanpaolo SpA | | Jun 2028 | JPMorgan Chase Bank, N.A. | (1%) | Quarterly | EUR | 1,430,000 | (5,925) | 1,989 | (3,936) |
| | | | | | | | | | | |
| TOTAL BUY PROTECTION | | | | | | | | 2,011,146 | (2,195,608) | (184,462) |
| Sell Protection | | | | | | | | | | |
| 5-Year CDX N.A. HY Series 40 | NR | Jun 2028 | ICE | 5% | Quarterly | | 36,410,000 | 43,657 | 0 | 43,657 |
| CMBX N.A. AAA Index Series 13 | NR | Dec 2072 | Morgan Stanley Capital Services LLC | 0.5% | Monthly | | 13,540,000 | (235,243) | 311,583 | 76,340 |
| CMBX N.A. AAA Index Series 13 | NR | Dec 2072 | Morgan Stanley Capital Services LLC | 0.5% | Monthly | | 10,830,000 | (188,159) | 256,301 | 68,142 |
| CMBX N.A. AAA Index Series 15 | NR | Nov 2064 | Goldman Sachs & Co. LLC | 0.5% | Monthly | | 2,960,000 | (81,907) | 80,519 | (1,388) |
| CMBX N.A. AAA Index Series 15 | NR | Nov 2064 | Goldman Sachs & Co. LLC | 0.5% | Monthly | | 6,600,000 | (182,631) | 172,871 | (9,760) |
| | | | | | | | | | | |
| TOTAL SELL PROTECTION | | | | | | | | (644,283) | 821,274 | 176,991 |
| TOTAL CREDIT DEFAULT SWAPS | | | | | | | | 1,366,863 | (1,374,334) | (7,471) |
(1)Ratings are presented for credit default swaps in which the Fund has sold protection on the underlying referenced debt. Ratings for an underlying index represent a weighted average of the ratings of all securities included in the index. The credit rating or value can be measures of the current payment/performance risk. Ratings are from Moody's Investors Service, Inc. Where Moody's® ratings are not available, S&P® ratings are disclosed and are indicated as such. All ratings are as of the report date and do not reflect subsequent changes.
(2)Swaps with Intercontinental Exchange (ICE) are centrally cleared over-the-counter (OTC) swaps.
(3)The notional amount of each credit default swap where the Fund has sold protection approximates the maximum potential amount of future payments that the Fund could be required to make if a credit event were to occur.
(4)Notional amount is stated in U.S. Dollars unless otherwise noted.
(5)Any premiums for centrally cleared over-the-counter (OTC) swaps are recorded periodically throughout the term of the swap to variation margin and included in unrealized appreciation (depreciation).
| Interest Rate Swaps |
| Payment Received | Payment Frequency | Payment Paid | Payment Frequency | Clearinghouse / Counterparty(1) | Maturity Date | Notional Amount(2) | Value ($) | Upfront Premium Received/ (Paid) ($)(3) | Unrealized Appreciation/ (Depreciation) ($) |
| 4.75% | At Maturity | U.S. Secured Overnight Fin. Rate (SOFR) Index(4) | At Maturity | CME | Feb 2025 | | 18,842,000 | (31,210) | 0 | (31,210) |
| 4.87% | At Maturity | U.S. Secured Overnight Fin. Rate (SOFR) Index(4) | At Maturity | CME | Feb 2025 | | 7,536,800 | (308) | 0 | (308) |
| 3.99% | At Maturity | U.S. Secured Overnight Fin. Rate (SOFR) Index(4) | At Maturity | CME | Aug 2025 | | 5,427,500 | (13,424) | 0 | (13,424) |
ESTR Volume Weighted Trimmed Mean Rate(4) | At Maturity | 3.05% | At Maturity | LCH | Aug 2025 | EUR | 4,802,500 | 320 | 0 | 320 |
| 4.36% | Semi-Annual | Canadian Overnight Repo Rate Average (CORRA)(4) | Semi-Annual | LCH | Aug 2026 | CAD | 4,800,000 | (9,701) | 0 | (9,701) |
| 3.75% | Annual | U.S. Secured Overnight Fin. Rate (SOFR) Index(4) | Annual | LCH | Sep 2028 | | 38,447,000 | (703,553) | 0 | (703,553) |
| 3.5% | Annual | U.S. Secured Overnight Fin. Rate (SOFR) Index(4) | Annual | LCH | Sep 2030 | | 5,157,000 | (109,279) | 0 | (109,279) |
Bank of Japan Final Result Unsecured Overnight Call Rate TONAR(4) | Annual | 0.84% | Annual | LCH | Aug 2033 | JPY | 350,000,000 | (5,768) | 0 | (5,768) |
Bank of Japan Final Result Unsecured Overnight Call Rate TONAR(4) | Annual | 0.85% | Annual | LCH | Aug 2033 | JPY | 140,000,000 | (3,128) | 0 | (3,128) |
| 3.64% | Semi-Annual | Canadian Overnight Repo Rate Average (CORRA)(4) | Semi-Annual | LCH | Aug 2033 | CAD | 1,600,000 | (11,032) | 0 | (11,032) |
Canadian Overnight Repo Rate Average (CORRA)(4) | Semi-Annual | 3.64% | Semi-Annual | LCH | Aug 2033 | CAD | 1,572,000 | 10,390 | 0 | 10,390 |
| 3.5% | Annual | U.S. Secured Overnight Fin. Rate (SOFR) Index(4) | Annual | LCH | Sep 2033 | | 2,669,000 | (81,138) | 0 | (81,138) |
Canadian Overnight Repo Rate Average (CORRA)(4) | Semi-Annual | 3.5% | Semi-Annual | LCH | Aug 2053 | CAD | 708,000 | (2,565) | 0 | (2,565) |
| 2.82% | At Maturity | Eurostat Eurozone HICP Ex. Tobacco Unrevised NSA(4) | At Maturity | LCH | Aug 2053 | EUR | 180,500 | 5,027 | 0 | 5,027 |
| 2.81% | At Maturity | Eurostat Eurozone HICP Ex. Tobacco Unrevised NSA(4) | At Maturity | LCH | Aug 2053 | EUR | 180,500 | 5,303 | 0 | 5,303 |
| 3.25% | Annual | U.S. Secured Overnight Fin. Rate (SOFR) Index(4) | Annual | LCH | Sep 2053 | | 581,000 | (35,467) | 0 | (35,467) |
| 3.52% | Annual | U.S. Secured Overnight Fin. Rate (SOFR) Index(4) | Annual | CME | Dec 2053 | | 15,755,000 | (82,426) | 0 | (82,426) |
| TOTAL INTEREST RATE SWAPS | | | | | | | | (1,067,959) | 0 | (1,067,959) |
(1)Swaps with CME Group (CME) and LCH Clearnet Group (LCH) are centrally cleared over-the-counter (OTC) swaps.
(2)Notional amount is stated in U.S. Dollars unless otherwise noted.
(3)Any premiums for centrally cleared over-the-counter (OTC) swaps are recorded periodically throughout the term of the swap to variation margin and included in unrealized appreciation (depreciation).
(4)Represents floating rate.
Currency Abbreviations
| AUD | - | Australian dollar |
| CAD | - | Canadian dollar |
| EUR | - | European Monetary Unit |
| GBP | - | British pound sterling |
| JPY | - | Japanese yen |
| USD | - | U.S. dollar |
Security Type Abbreviations
Legend
| (a) | Amount is stated in United States dollars unless otherwise noted. |
| (b) | Security exempt from registration under Rule 144A of the Securities Act of 1933. These securities may be resold in transactions exempt from registration, normally to qualified institutional buyers. At the end of the period, the value of these securities amounted to $2,830,485,932 or 5.7% of net assets. |
| (c) | Non-income producing - Security is in default. |
| (d) | Coupon rates for floating and adjustable rate securities reflect the rates in effect at period end. |
| (f) | Security initially issued at one coupon which converts to a higher coupon at a specified date. The rate shown is the rate at period end. |
| (g) | Coupon is indexed to a floating interest rate which may be multiplied by a specified factor and/or subject to caps or floors. |
| (h) | Security is perpetual in nature with no stated maturity date. |
| (i) | Security or a portion of the security was pledged to cover margin requirements for futures contracts. At period end, the value of securities pledged amounted to $13,028,313. |
| (j) | Security or a portion of the security has been segregated as collateral for mortgage-backed or asset-backed securities purchased on a delayed delivery or when-issued basis. At period end, the value of securities pledged amounted to $6,465,343. |
| (k) | Security or a portion of the security was pledged to cover margin requirements for centrally cleared OTC swaps. At period end, the value of securities pledged amounted to $5,043,808. |
| (l) | Represents an investment in an underlying pool of reverse mortgages which typically do not require regular principal and interest payments as repayment is deferred until a maturity event. |
| (m) | Security or a portion of the security purchased on a delayed delivery or when-issued basis. |
| (n) | Interest Only (IO) security represents the right to receive only monthly interest payments on an underlying pool of mortgages or assets. Principal shown is the outstanding par amount of the pool as of the end of the period. |
| (o) | Principal Only Strips represent the right to receive the monthly principal payments on an underlying pool of mortgage loans. |
| (p) | Coupon is inversely indexed to a floating interest rate multiplied by a specified factor. The price may be considerably more volatile than the price of a comparable fixed rate security. |
| (r) | Remaining maturities of bank loan obligations may be less than the stated maturities shown as a result of contractual or optional prepayments by the borrower. Such prepayments cannot be predicted with certainty. |
| (s) | The coupon rate will be determined upon settlement of the loan after period end. |
| (u) | Security or a portion of the security is on loan at period end. |
| (v) | Affiliated fund that is generally available only to investment companies and other accounts managed by Fidelity Investments. The rate quoted is the annualized seven-day yield of the fund at period end. A complete unaudited listing of the fund's holdings as of its most recent quarter end is available upon request. In addition, each Fidelity Central Fund's financial statements are available on the SEC's website or upon request. |
| (w) | The rate quoted is the annualized seven-day yield of the fund at period end. |
| (x) | Investment made with cash collateral received from securities on loan. |
Affiliated Central Funds
Fiscal year to date information regarding the Fund's investments in Fidelity Central Funds, including the ownership percentage, is presented below.
| Affiliate | Value, beginning of period ($) | Purchases ($) | Sales Proceeds ($) | Dividend Income ($) | Realized Gain (loss) ($) | Change in Unrealized appreciation (depreciation) ($) | Value, end of period ($) | % ownership, end of period |
| Fidelity Cash Central Fund 5.43% | 425,431,980 | 924,043,769 | 1,170,830,922 | 4,835,871 | - | 1 | 178,644,828 | 0.5% |
| Fidelity Securities Lending Cash Central Fund 5.44% | 55,923,273 | 1,659,670,435 | 1,378,270,633 | 51,891 | - | - | 337,323,075 | 1.2% |
| Total | 481,355,253 | 2,583,714,204 | 2,549,101,555 | 4,887,762 | - | 1 | 515,967,903 | |
| | | | | | | | | |
Amounts in the dividend income column in the above table include any capital gain distributions from underlying funds, which are presented in the corresponding line item in the Statement of Operations, if applicable.
Amounts in the dividend income column for Fidelity Securities Lending Cash Central Fund represents the income earned on investing cash collateral, less rebates paid to borrowers and any lending agent fees associated with the loan, plus any premium payments received for lending certain types of securities.
Amounts included in the purchases and sales proceeds columns may include in-kind transactions, if applicable.
Affiliated Underlying Funds
Fiscal year to date information regarding the Fund's investments in affiliated Underlying Funds is presented below. Exchanges between classes of the same affiliated Underlying Funds may occur. If an Underlying Funds changes its name, the name presented below is the name in effect at period end.
| Affiliate | Value, beginning of period ($) | Purchases ($) | Sales Proceeds ($) | Dividend Income ($) | Realized Gain (loss) ($) | Change in Unrealized appreciation (depreciation) ($) | Value, end of period ($) |
| Fidelity Investments Money Market Government Portfolio Class I 5.21% | - | 1,342,726,376 | 1,103,243,136 | 2,289,434 | - | - | 239,483,240 |
| Fidelity Investments Money Market Government Portfolio Institutional Class 5.25% | 126,976,060 | 1,944,768,366 | 1,882,921,608 | 4,808,023 | 9 | - | 188,822,827 |
| Fidelity SAI Long-Term Treasury Bond Index Fund | 460,248,664 | 7,483,246 | - | 7,483,245 | - | (22,444,225) | 445,287,685 |
| Fidelity SAI Total Bond Fund | 5,340,793,933 | 113,527,069 | 395,714,993 | 113,526,476 | (34,186,750) | 2,774,235 | 5,027,193,494 |
| Fidelity SAI U.S. Treasury Bond Index Fund | 1,805,048,282 | 523,066,791 | 25,000,000 | 23,055,877 | (1,863,181) | (18,543,973) | 2,282,707,919 |
| Fidelity Short-Term Treasury Bond Index Fund | 713,436 | 4,242 | 722,733 | 11,823 | 10,351 | (5,296) | - |
| Fidelity U.S. Bond Index Fund | 701,219,597 | 10,121,667 | 150,004,159 | 10,117,510 | (7,389,285) | 4,565,068 | 558,512,888 |
| | 8,434,999,972 | 3,941,697,757 | 3,557,606,629 | 161,292,388 | (43,428,856) | (33,654,191) | 8,742,008,053 |
Amounts in the dividend income column in the above table include any capital gain distributions from underlying funds, which are presented in the corresponding line item in the Statement of Operations, if applicable.
Amounts included in the purchases and sales proceeds columns may include in-kind transactions, if applicable.
Investment Valuation
The following is a summary of the inputs used, as of August 31, 2023, involving the Fund's assets and liabilities carried at fair value. The inputs or methodology used for valuing securities may not be an indication of the risk associated with investing in those securities. For more information on valuation inputs, and their aggregation into the levels used below, please refer to the Investment Valuation section in the accompanying Notes to Financial Statements.
| Valuation Inputs at Reporting Date: |
| Description | Total ($) | Level 1 ($) | Level 2 ($) | Level 3 ($) |
Investments in Securities: | | | | |
|
| Equities: | | | | |
Communication Services | 3,823,043 | - | - | 3,823,043 |
|
| Corporate Bonds | 4,234,934,162 | - | 4,227,657,661 | 7,276,501 |
|
| U.S. Government and Government Agency Obligations | 4,616,937,406 | - | 4,616,937,406 | - |
|
| U.S. Government Agency - Mortgage Securities | 4,430,956,371 | - | 4,430,956,371 | - |
|
| Asset-Backed Securities | 1,174,010,579 | - | 1,160,882,395 | 13,128,184 |
|
| Collateralized Mortgage Obligations | 385,047,341 | - | 384,373,016 | 674,325 |
|
| Commercial Mortgage Securities | 1,150,101,093 | - | 1,147,898,199 | 2,202,894 |
|
| Municipal Securities | 85,518,561 | - | 85,518,561 | - |
|
| Foreign Government and Government Agency Obligations | 106,271,372 | - | 106,271,372 | - |
|
| Supranational Obligations | 652,403 | - | 652,403 | - |
|
| Bank Loan Obligations | 42,922,188 | - | 42,922,188 | - |
|
| Bank Notes | 7,793,493 | - | 7,793,493 | - |
|
| Fixed-Income Funds | 33,626,506,420 | 33,626,506,420 | - | - |
|
| Preferred Securities | 71,490,918 | - | 71,490,918 | - |
|
| Money Market Funds | 1,016,702,650 | 1,016,702,650 | - | - |
|
| Purchased Swaptions | 339,903 | - | 339,903 | - |
| Total Investments in Securities: | 50,954,007,903 | 34,643,209,070 | 16,283,693,886 | 27,104,947 |
Derivative Instruments: | | | | |
|
| Assets | | | | |
Forward Foreign Currency Contracts | 3,747,695 | - | 3,747,695 | - |
Futures Contracts | 6,314,008 | 6,314,008 | - | - |
Swaps | 2,104,397 | - | 2,104,397 | - |
| Total Assets | 12,166,100 | 6,314,008 | 5,852,092 | - |
|
| Liabilities | | | | |
Forward Foreign Currency Contracts | (529,078) | - | (529,078) | - |
Futures Contracts | (3,690,785) | (3,690,785) | - | - |
Swaps | (1,805,493) | - | (1,805,493) | - |
| Total Liabilities | (6,025,356) | (3,690,785) | (2,334,571) | - |
| Total Derivative Instruments: | 6,140,744 | 2,623,223 | 3,517,521 | - |
Other Financial Instruments: | | | | |
|
| TBA Sale Commitments | (284,215,384) | - | (284,215,384) | - |
| Total Other Financial Instruments: | (284,215,384) | - | (284,215,384) | - |
Value of Derivative Instruments
The following table is a summary of the Fund's value of derivative instruments by primary risk exposure as of August 31, 2023. For additional information on derivative instruments, please refer to the Derivative Instruments section in the accompanying Notes to Financial Statements.
Primary Risk Exposure / Derivative Type | Value |
| Asset ($) | Liability ($) |
| Credit Risk | | |
Swaps (b) | 43,657 | 0 |
Swaps (a) | 2,039,700 | (716,494) |
| Total Credit Risk | 2,083,357 | (716,494) |
| Foreign Exchange Risk | | |
Forward Foreign Currency Contracts (c) | 3,747,695 | (529,078) |
| Total Foreign Exchange Risk | 3,747,695 | (529,078) |
| Interest Rate Risk | | |
Futures Contracts (d) | 6,314,008 | (3,690,785) |
Purchased Swaptions (e) | 339,903 | 0 |
Swaps (b) | 21,040 | (1,088,999) |
| Total Interest Rate Risk | 6,674,951 | (4,779,784) |
| Total Value of Derivatives | 12,506,003 | (6,025,356) |
(a)For bi-lateral over-the-counter (OTC) swaps, reflects gross value which is presented in the Statement of Assets and Liabilities in the bi-lateral OTC swaps, at value line-items.
(b)For centrally cleared over-the-counter (OTC) swaps, reflects gross cumulative appreciation (depreciation) as presented in the Schedule of Investments. In the Statement of Assets and Liabilities, the period end daily variation margin for centrally cleared OTC swaps is included in receivable or payable for daily variation margin on centrally cleared OTC swaps, and the net cumulative appreciation (depreciation) for centrally cleared OTC swaps is included in Total accumulated earnings (loss).
(c)Gross value is presented in the Statement of Assets and Liabilities in the unrealized appreciation/depreciation on forward foreign currency contracts line-items.
(d)Reflects gross cumulative appreciation (depreciation) on futures contracts as presented in the Schedule of Investments. In the Statement of Assets and Liabilities, the period end daily variation margin is included in receivable or payable for daily variation margin on futures contracts, and the net cumulative appreciation (depreciation) is included in Total accumulated earnings (loss).
(e)Gross value is included in the Statement of Assets and Liabilities in the investments in securities, at value line-item.
| Statement of Assets and Liabilities |
| | | | August 31, 2023 (Unaudited) |
| | | | | |
| Assets | | | | |
| Investment in securities, at value (including securities loaned of $330,789,412) - See accompanying schedule: | | | | |
Unaffiliated issuers (cost $46,794,325,761) | $ | 41,696,031,947 | | |
Fidelity Central Funds (cost $515,964,257) | | 515,967,903 | | |
Other affiliated issuers (cost $9,776,718,532) | | 8,742,008,053 | | |
| | | | | |
| | | | | |
| Total Investment in Securities (cost $57,087,008,550) | | | $ | 50,954,007,903 |
| Segregated cash with brokers for derivative instruments | | | | 9,876,630 |
| Segregated cash with brokers for mortgage/asset-backed securities | | | | 360,000 |
| Cash | | | | 2,819,160 |
| Foreign currency held at value (cost $2,518,664) | | | | 2,508,271 |
| Receivable for investments sold | | | | |
Regular delivery | | | | 53,007,828 |
Delayed delivery | | | | 291,465,123 |
| Receivable for TBA sale commitments | | | | 281,977,043 |
| Unrealized appreciation on forward foreign currency contracts | | | | 3,747,695 |
| Receivable for fund shares sold | | | | 16,122,989 |
| Dividends receivable | | | | 17,548,709 |
| Interest receivable | | | | 110,708,858 |
| Distributions receivable from Fidelity Central Funds | | | | 667,110 |
| Receivable for daily variation margin on futures contracts | | | | 3,886,907 |
| Receivable for daily variation margin on centrally cleared OTC swaps | | | | 417,068 |
| Bi-lateral OTC swaps, at value | | | | 2,039,700 |
| Prepaid expenses | | | | 83,480 |
| Other receivables | | | | 391,737 |
Total assets | | | | 51,751,636,211 |
| Liabilities | | | | |
| Payable for investments purchased | | | | |
Regular delivery | $ | 107,031,826 | | |
Delayed delivery | | 1,645,678,088 | | |
| TBA sale commitments, at value | | 284,215,384 | | |
| Unrealized depreciation on forward foreign currency contracts | | 529,078 | | |
| Payable for fund shares redeemed | | 24,314,376 | | |
| Distributions payable | | 14,209,917 | | |
| Bi-lateral OTC swaps, at value | | 716,494 | | |
| Accrued management fee | | 1,223,304 | | |
| Other payables and accrued expenses | | 859,549 | | |
| Collateral on securities loaned | | 337,323,075 | | |
| Total Liabilities | | | | 2,416,101,091 |
| Net Assets | | | $ | 49,335,535,120 |
| Net Assets consist of: | | | | |
| Paid in capital | | | $ | 57,615,353,296 |
| Total accumulated earnings (loss) | | | | (8,279,818,176) |
| Net Assets | | | $ | 49,335,535,120 |
Net Asset Value, offering price and redemption price per share ($49,335,535,120 ÷ 5,514,528,648 shares) | | | $ | 8.95 |
| Statement of Operations |
| | | | Six months ended August 31, 2023 (Unaudited) |
| Investment Income | | | | |
| Dividends: | | | | |
| Unaffiliated issuers | | | $ | 518,628,503 |
| Affiliated issuers | | | | 161,292,388 |
| Interest | | | | 317,761,989 |
| Income from Fidelity Central Funds (including $51,891 from security lending) | | | | 4,887,762 |
| Total Income | | | | 1,002,570,642 |
| Expenses | | | | |
| Management fee | $ | 68,833,486 | | |
| Custodian fees and expenses | | 139,417 | | |
| Independent trustees' fees and expenses | | 152,047 | | |
| Registration fees | | 198,988 | | |
| Audit | | 37,975 | | |
| Legal | | 41,573 | | |
| Miscellaneous | | 261,782 | | |
| Total expenses before reductions | | 69,665,268 | | |
| Expense reductions | | (62,040,383) | | |
| Total expenses after reductions | | | | 7,624,885 |
| Net Investment income (loss) | | | | 994,945,757 |
| Realized and Unrealized Gain (Loss) | | | | |
| Net realized gain (loss) on: | | | | |
| Investment Securities: | | | | |
| Unaffiliated issuers | | (985,865,118) | | |
| Affiliated issuers | | (43,428,856) | | |
| Forward foreign currency contracts | | (3,351,126) | | |
| Foreign currency transactions | | 15,637 | | |
| Futures contracts | | (13,007,716) | | |
| Swaps | | (6,343,054) | | |
| Total net realized gain (loss) | | | | (1,051,980,233) |
| Change in net unrealized appreciation (depreciation) on: | | | | |
| Investment Securities: | | | | |
| Unaffiliated issuers | | 584,205,314 | | |
| Fidelity Central Funds | | 1 | | |
| Other affiliated issuers | | (33,654,191) | | |
| Forward foreign currency contracts | | (1,685,550) | | |
| Assets and liabilities in foreign currencies | | (5,074) | | |
| Futures contracts | | 5,118,849 | | |
| Swaps | | 10,623,823 | | |
| TBA Sale commitments | | (6,426,456) | | |
| Total change in net unrealized appreciation (depreciation) | | | | 558,176,716 |
| Net gain (loss) | | | | (493,803,517) |
| Net increase (decrease) in net assets resulting from operations | | | $ | 501,142,240 |
| Statement of Changes in Net Assets |
| |
| | Six months ended August 31, 2023 (Unaudited) | | Year ended February 28, 2023 |
| Increase (Decrease) in Net Assets | | | | |
| Operations | | | | |
| Net investment income (loss) | $ | 994,945,757 | $ | 1,648,309,634 |
| Net realized gain (loss) | | (1,051,980,233) | | (984,805,656) |
| Change in net unrealized appreciation (depreciation) | | 558,176,716 | | (5,651,598,336) |
| Net increase (decrease) in net assets resulting from operations | | 501,142,240 | | (4,988,094,358) |
| Distributions to shareholders | | (961,549,781) | | (1,652,396,379) |
| | | | | |
| Share transactions | | | | |
| Proceeds from sales of shares | | 4,245,394,952 | | 16,370,236,785 |
| Reinvestment of distributions | | 883,314,533 | | 1,544,313,693 |
| Cost of shares redeemed | | (4,763,418,927) | | (7,925,964,137) |
| | | | | |
Net increase (decrease) in net assets resulting from share transactions | | 365,290,558 | | 9,988,586,341 |
| Total increase (decrease) in net assets | | (95,116,983) | | 3,348,095,604 |
| | | | | |
| Net Assets | | | | |
| Beginning of period | | 49,430,652,103 | | 46,082,556,499 |
| End of period | $ | 49,335,535,120 | $ | 49,430,652,103 |
| | | | | |
| Other Information | | | | |
| Shares | | | | |
| Sold | | 468,204,100 | | 1,722,462,706 |
| Issued in reinvestment of distributions | | 97,140,610 | | 166,781,936 |
| Redeemed | | (521,649,384) | | (842,985,612) |
| Net increase (decrease) | | 43,695,326 | | 1,046,259,030 |
| | | | | |
Financial Highlights
| Strategic Advisers® Core Income Fund |
| |
| | Six months ended (Unaudited) August 31, 2023 | | Years ended February 28, 2023 | | 2022 | | 2021 | | 2020 A | | 2019 |
Selected Per-Share Data | | | | | | | | | | | | |
| Net asset value, beginning of period | $ | 9.04 | $ | 10.42 | $ | 10.98 | $ | 11.13 | $ | 10.38 | $ | 10.38 |
| Income from Investment Operations | | | | | | | | | | | | |
Net investment income (loss) B,C | | .182 | | .331 | | .250 | | .286 | | .354 | | .324 |
| Net realized and unrealized gain (loss) | | (.096) | | (1.382) | | (.468) | | .116 | | .796 | | (.009) |
| Total from investment operations | | .086 | | (1.051) | | (.218) | | .402 | | 1.150 | | .315 |
| Distributions from net investment income | | (.176) | | (.329) | | (.252) | | (.292) | | (.350) | | (.309) |
| Distributions from net realized gain | | - | | - | | (.090) | | (.260) | | (.050) | | (.006) |
| Total distributions | | (.176) | | (.329) | | (.342) | | (.552) | | (.400) | | (.315) |
| Net asset value, end of period | $ | 8.95 | $ | 9.04 | $ | 10.42 | $ | 10.98 | $ | 11.13 | $ | 10.38 |
Total Return D,E | | .94% | | (10.12)% | | (2.06)% | | 3.59% | | 11.25% | | 3.10% |
Ratios to Average Net Assets C,F,G | | | | | | | | | | | | |
| Expenses before reductions | | .28% H,I | | .28% | | .28% | | .28% | | .28% | | .30% |
| Expenses net of fee waivers, if any | | .03% H,I | | .03% | | .03% | | .03% | | .03% | | .05% |
| Expenses net of all reductions | | .03% H,I | | .03% | | .03% | | .03% | | .03% | | .05% |
| Net investment income (loss) | | 3.99% H,I | | 3.53% | | 2.31% | | 2.54% | | 3.28% | | 3.15% |
| Supplemental Data | | | | | | | | | | | | |
| Net assets, end of period (000 omitted) | $ | 49,335,535 | $ | 49,430,652 | $ | 46,082,556 | $ | 41,506,260 | $ | 46,341,080 | $ | 38,032,654 |
Portfolio turnover rate J | | 123% H | | 116% | | 110% | | 109% | | 65% | | 78% |
AFor the year ended February 29.
BCalculated based on average shares outstanding during the period.
CNet investment income (loss) is affected by the timing of the declaration of dividends by any underlying mutual funds or exchange-traded funds (ETFs). Net investment income (loss) of any mutual funds or ETFs is not included in the Fund's net investment income (loss) ratio.
DTotal returns for periods of less than one year are not annualized.
ETotal returns would have been lower if certain expenses had not been reduced during the applicable periods shown.
FFees and expenses of any underlying mutual funds or exchange-traded funds (ETFs) are not included in the Fund's expense ratio. The Fund indirectly bears its proportionate share of these expenses. For additional expense information related to investments in Fidelity Central Funds, please refer to the "Investments in Fidelity Central Funds" note found in the Notes to Financial Statements section of the most recent Annual or Semi-Annual report.
GExpense ratios reflect operating expenses of the class. Expenses before reductions do not reflect amounts reimbursed, waived, or reduced through arrangements with the investment adviser, brokerage services, or other offset arrangements, if applicable, and do not represent the amount paid by the class during periods when reimbursements, waivers or reductions occur.
HAnnualized.
IProxy expenses are not annualized.
JAmount does not include the portfolio activity of any underlying mutual funds or exchange-traded funds (ETFs).
For the period ended August 31, 2023
1. Organization.
Strategic Advisers Core Income Fund (the Fund) is a fund of Fidelity Rutland Square Trust II (the Trust), and is authorized to issue an unlimited number of shares. The Trust is registered under the Investment Company Act of 1940, as amended (the 1940 Act), as an open-end management investment company organized as a Delaware statutory trust. The Fund is offered exclusively to certain managed account clients of Strategic Advisers LLC (Strategic Advisers), an affiliate of Fidelity Management & Research Company LLC (FMR).
2. Significant Accounting Policies.
The Fund is an investment company and applies the accounting and reporting guidance of the Financial Accounting Standards Board (FASB) Accounting Standards Codification Topic 946 Financial Services - Investment Companies. The financial statements have been prepared in conformity with accounting principles generally accepted in the United States of America (GAAP), which require management to make certain estimates and assumptions at the date of the financial statements. Actual results could differ from those estimates. Subsequent events, if any, through the date that the financial statements were issued have been evaluated in the preparation of the financial statements. The Fund's Schedule of Investments lists any underlying mutual funds or exchange-traded funds (ETFs) but does not include the underlying holdings of these funds. The following summarizes the significant accounting policies of the Fund:
Investment Valuation. Investments are valued as of 4:00 p.m. Eastern time on the last calendar day of the period. The Board of Trustees (the Board) has designated the Fund's investment adviser as the valuation designee responsible for the fair valuation function and performing fair value determinations as needed. The investment adviser has established a Fair Value Committee (the Committee) to carry out the day-to-day fair valuation responsibilities and has adopted policies and procedures to govern the fair valuation process and the activities of the Committee. In accordance with these fair valuation policies and procedures, which have been approved by the Board, the Fund attempts to obtain prices from one or more third party pricing services or brokers to value its investments. When current market prices, quotations or currency exchange rates are not readily available or reliable, investments will be fair valued in good faith by the Committee, in accordance with the policies and procedures. Factors used in determining fair value vary by investment type and may include market or investment specific events, transaction data, estimated cash flows, and market observations of comparable investments. The frequency that the fair valuation procedures are used cannot be predicted and they may be utilized to a significant extent. The Committee manages the Fund's fair valuation practices and maintains the fair valuation policies and procedures. The Fund's investment adviser reports to the Board information regarding the fair valuation process and related material matters.
The Fund categorizes the inputs to valuation techniques used to value its investments into a disclosure hierarchy consisting of three levels as shown below:
Level 1 - unadjusted quoted prices in active markets for identical investments
Level 2 - other significant observable inputs (including quoted prices for similar investments, interest rates, prepayment speeds, etc.)
Level 3 - unobservable inputs (including the Fund's own assumptions based on the best information available)
Valuation techniques used to value the Fund's investments by major category are as follows:
Debt securities, including restricted securities, are valued based on evaluated prices received from third party pricing services or from brokers who make markets in such securities. Corporate bonds, bank notes, bank loan obligations, foreign government and government agency obligations, municipal securities, preferred securities, supranational obligations and U.S. government and government agency obligations, are valued by pricing services who utilize matrix pricing which considers yield or price of bonds of comparable quality, coupon, maturity and type or by broker-supplied prices. Asset backed securities, collateralized mortgage obligations, commercial mortgage securities and U.S. government agency mortgage securities are valued by pricing services who utilize matrix pricing which considers prepayment speed assumptions, attributes of the collateral, yield or price of bonds of comparable quality, coupon, maturity and type or by broker-supplied prices. Swaps are marked-to-market daily based on valuations from third party pricing services, registered derivatives clearing organizations (clearinghouses) or broker-supplied valuations. These pricing sources may utilize inputs such as interest rate curves, credit spread curves, default possibilities and recovery rates. When independent prices are unavailable or unreliable, debt securities and swaps may be valued utilizing pricing methodologies which consider similar factors that would be used by third party pricing services. For foreign debt securities, when significant market or security specific events arise, valuations may be determined in good faith in accordance with procedures adopted by the Board. Debt securities and swaps are generally categorized as Level 2 in the hierarchy but may be Level 3 depending on the circumstances.
Equity securities, including restricted securities, for which market quotations are readily available, are valued at the last reported sale price or official closing price as reported by a third party pricing service on the primary market or exchange on which they are traded and are categorized as Level 1 in the hierarchy. In the event there were no sales during the day or closing prices are not available, securities are valued at the last quoted bid price or may be valued using the last available price and are generally categorized as Level 2 in the hierarchy. For equity securities, including restricted securities, where observable inputs are limited, assumptions about market activity and risk are used and these securities may be categorized as Level 3 in the hierarchy.
ETFs are valued at their last sale price or official closing price as reported by a third party pricing service on the primary market or exchange on which they are traded and are categorized as Level 1 in the hierarchy. In the event there were no sales during the day but the exchange reports a closing bid level, ETFs are valued at the closing bid and would be categorized as Level 1 in the hierarchy. In the event there was no closing bid, ETFs may be valued by another method that the Board believes reflects fair value in accordance with the Board's fair value pricing policies and may be categorized as Level 2 in the hierarchy.
The U.S. dollar value of forward foreign currency contracts is determined using currency exchange rates supplied by a pricing service and are categorized as Level 2 in the hierarchy. Futures contracts are valued at the settlement price established each day by the board of trade or exchange on which they are traded and are categorized as Level 1 in the hierarchy. Options traded over-the-counter are valued using service or broker-supplied valuations and are categorized as Level 2 in the hierarchy. Investments in open-end mutual funds, including the Fidelity Central Funds, are valued at their closing net asset value (NAV) each business day and are categorized as Level 1 in the hierarchy. If an unaffiliated open-end mutual fund's NAV is unavailable, shares of that fund may be valued by another method that the Board believes reflects fair value in accordance with the Board's fair value pricing policies and is categorized as Level 2 in the hierarchy.
Changes in valuation techniques may result in transfers in or out of an assigned level within the disclosure hierarchy. The aggregate value of investments by input level as of August 31, 2023 is included at the end of the Fund's Schedule of Investments.
Foreign Currency. Foreign-denominated assets, including investment securities, and liabilities are translated into U.S. dollars at the exchange rates at period end. Purchases and sales of investment securities, income and dividends received, and expenses denominated in foreign currencies are translated into U.S. dollars at the exchange rate in effect on the transaction date.
The effects of exchange rate fluctuations on investments are included with the net realized and unrealized gain (loss) on investment securities. Other foreign currency transactions resulting in realized and unrealized gain (loss) are disclosed separately.
Realized gains and losses on foreign currency transactions arise from the disposition of foreign currency, realized changes in the value of foreign currency between the trade and settlement dates on security transactions, and the difference between the amounts of dividends, interest and foreign withholding taxes recorded on transaction date and the U.S. dollar equivalent of the amounts actually received or paid. Unrealized gains and losses on assets and liabilities in foreign currencies arise from changes in the value of foreign currency, and from assets and liabilities denominated in foreign currencies, other than investments, which are held at period end.
Investment Transactions and Income. For financial reporting purposes, the Fund's investment holdings and NAV include trades executed through the end of the last business day of the period. The NAV per share for processing shareholder transactions is calculated as of the close of business of the New York Stock Exchange (NYSE), normally 4:00 p.m. Eastern time and includes trades executed through the end of the prior business day. Gains and losses on securities sold are determined on the basis of identified cost. Commissions paid to certain brokers with whom the investment adviser, or its affiliates, places trades on behalf of a fund include an amount in addition to trade execution, which may be rebated back to a fund. Any such rebates are included in net realized gain (loss) on investments in the Statement of Operations. Dividend income is recorded on the ex-dividend date, except for certain dividends from foreign securities where the ex-dividend date may have passed, which are recorded as soon as the Fund is informed of the ex-dividend date. Non-cash dividends included in dividend income, if any, are recorded at the fair market value of the securities received. Income and capital gain distributions from Fidelity Central Funds, if any, are recorded on the ex-dividend date. Income and capital gain distributions from any underlying mutual funds or exchange-traded funds (ETFs) are recorded on the ex-dividend date. Certain distributions received by the Fund represent a return of capital or capital gain. The Fund determines the components of these distributions subsequent to the ex-dividend date, based upon receipt of tax filings or other correspondence relating to the underlying investment. These distributions are recorded as a reduction of cost of investments and/or as a realized gain. Interest income is accrued as earned and includes coupon interest and amortization of premium and accretion of discount on debt securities as applicable. Paid in Kind (PIK) income is recorded at the fair market value of the securities received. The principal amount on inflation-indexed securities is periodically adjusted to the rate of inflation and interest is accrued based on the principal amount. The adjustments to principal due to inflation are reflected as increases or decreases to Interest in the accompanying Statement of Operations. Investment income is recorded net of foreign taxes withheld where recovery of such taxes is uncertain. Debt obligations may be placed on non-accrual status and related interest income may be reduced by ceasing current accruals and writing off interest receivables when the collection of all or a portion of interest has become doubtful based on consistently applied procedures. A debt obligation is removed from non-accrual status when the issuer resumes interest payments or when collectability of interest is reasonably assured.
Expenses. Expenses directly attributable to a fund are charged to that fund. Expenses attributable to more than one fund are allocated among the respective funds on the basis of relative net assets or other appropriate methods. Expenses included in the accompanying financial statements reflect the expenses of that fund and do not include any expenses associated with any underlying mutual funds or exchange-traded funds. Although not included in a fund's expenses, a fund indirectly bears its proportionate share of these expenses through the net asset value of each underlying mutual fund or exchange-traded fund. Expense estimates are accrued in the period to which they relate and adjustments are made when actual amounts are known.
Deferred Trustee Compensation. Under a Deferred Compensation Plan (the Plan) for certain Funds, certain independent Trustees have elected to defer receipt of a portion of their annual compensation. Deferred amounts are invested in affiliated mutual funds, are marked-to-market and remain in a fund until distributed in accordance with the Plan. The investment of deferred amounts and the offsetting payable to the Trustees presented below are included in the accompanying Statement of Assets and Liabilities in other receivables and other payables and accrued expenses, as applicable.
| Strategic Advisers Core Income Fund | $391,737 |
Income Tax Information and Distributions to Shareholders. Each year, the Fund intends to qualify as a regulated investment company under Subchapter M of the Internal Revenue Code, including distributing substantially all of its taxable income and realized gains. As a result, no provision for U.S. Federal income taxes is required. The Fund files a U.S. federal tax return, in addition to state and local tax returns as required. The Fund's federal income tax returns are subject to examination by the Internal Revenue Service (IRS) for a period of three fiscal years after they are filed. State and local tax returns may be subject to examination for an additional fiscal year depending on the jurisdiction. Foreign taxes are provided for based on the Fund's understanding of the tax rules and rates that exist in the foreign markets in which it invests.
Distributions are declared and recorded daily and paid monthly from net investment income. Distributions from realized gains, if any, are declared and recorded on the ex-dividend date. Income and capital gain distributions are determined in accordance with income tax regulations, which may differ from GAAP.
Capital accounts within the financial statements are adjusted for permanent book-tax differences. These adjustments have no impact on net assets or the results of operations. Capital accounts are not adjusted for temporary book-tax differences which will reverse in a subsequent period.
Book-tax differences are primarily due to the futures contracts, swaps, foreign currency transactions, market discount, partnerships, capital loss carryforwards and losses deferred due to wash sales and futures contracts.
As of period end, the cost and unrealized appreciation (depreciation) in securities, and derivatives if applicable, for federal income tax purposes were as follows:
| Gross unrealized appreciation | $57,083,517 |
| Gross unrealized depreciation | (6,297,513,335) |
| Net unrealized appreciation (depreciation) | $(6,240,429,818) |
| Tax cost | $57,196,965,790 |
Capital loss carryforwards are only available to offset future capital gains of the Fund to the extent provided by regulations and may be limited. The capital loss carryforward information presented below, including any applicable limitation, is estimated as of prior fiscal period end and is subject to adjustment.
Short-term | $(610,993,050) |
Long-term | (389,216,143) |
| Total capital loss carryforward | $(1,000,209,193) |
Delayed Delivery Transactions and When-Issued Securities. During the period, certain Funds transacted in securities on a delayed delivery or when-issued basis. Payment and delivery may take place after the customary settlement period for that security. The price of the underlying securities and the date when the securities will be delivered and paid for are fixed at the time the transaction is negotiated. Securities purchased on a delayed delivery or when-issued basis are identified as such in the Schedule of Investments. Compensation for interest forgone in the purchase of a delayed delivery or when-issued debt security may be received. With respect to purchase commitments, each applicable Fund identifies securities as segregated in its records with a value at least equal to the amount of the commitment. Payables and receivables associated with the purchases and sales of delayed delivery securities having the same coupon, settlement date and broker are offset. Delayed delivery or when-issued securities that have been purchased from and sold to different brokers are reflected as both payables and receivables in the Statement of Assets and Liabilities under the caption "Delayed delivery", as applicable. Losses may arise due to changes in the value of the underlying securities or if the counterparty does not perform under the contract's terms, or if the issuer does not issue the securities due to political, economic, or other factors.
To-Be-Announced (TBA) Securities and Mortgage Dollar Rolls. TBA securities involve buying or selling mortgage-backed securities (MBS) on a forward commitment basis. A TBA transaction typically does not designate the actual security to be delivered and only includes an approximate principal amount; however delivered securities must meet specified terms defined by industry guidelines, including issuer, rate and current principal amount outstanding on underlying mortgage pools. Funds may enter into a TBA transaction with the intent to take possession of or deliver the underlying MBS, or a fund may elect to extend the settlement by entering into either a mortgage or reverse mortgage dollar roll. Mortgage dollar rolls are transactions where a fund sells TBA securities and simultaneously agrees to repurchase MBS on a later date at a lower price and with the same counterparty. Reverse mortgage dollar rolls involve the purchase and simultaneous agreement to sell TBA securities on a later date at a lower price. Transactions in mortgage dollar rolls and reverse mortgage dollar rolls are accounted for as purchases and sales and may result in an increase to a fund's portfolio turnover rate.
Purchases and sales of TBA securities involve risks similar to those discussed above for delayed delivery and when-issued securities. Also, if the counterparty in a mortgage dollar roll or a reverse mortgage dollar roll transaction files for bankruptcy or becomes insolvent, a fund's right to repurchase or sell securities may be limited. Additionally, when a fund sells TBA securities without already owning or having the right to obtain the deliverable securities (an uncovered forward commitment to sell), it incurs a risk of loss because it could have to purchase the securities at a price that is higher than the price at which it sold them. A fund may be unable to purchase the deliverable securities if the corresponding market is illiquid.
TBA securities subject to a forward commitment to sell at period end are included at the end of the Schedule of Investments under the caption "TBA Sale Commitments." The proceeds and value of these commitments are reflected in the Statement of Assets and Liabilities as "Receivable for TBA sale commitments" and "TBA sale commitments, at value," respectively.
Restricted Securities (including Private Placements). Funds may invest in securities that are subject to legal or contractual restrictions on resale. These securities generally may be resold in transactions exempt from registration or to the public if the securities are registered. Disposal of these securities may involve time-consuming negotiations and expense, and prompt sale at an acceptable price may be difficult. Information regarding restricted securities held at period end is included at the end of the Schedule of Investments, if applicable.
Loans and Other Direct Debt Instruments. Direct debt instruments are interests in amounts owed to lenders by corporate or other borrowers. These instruments may be in the form of loans, trade claims or other receivables and may include standby financing commitments such as revolving credit facilities that obligate a fund to supply additional cash to the borrower on demand. Loans may be acquired through assignment, participation, or may be made directly to a borrower. Such instruments are presented in the Bank Loan Obligations section in the Schedule of Investments. Certain funds may also invest in unfunded loan commitments, which are contractual obligations for future funding. Information regarding unfunded commitments is included at the end of the Schedule of Investments, if applicable.
3. Derivative Instruments.
Risk Exposures and the Use of Derivative Instruments. The Fund's investment objectives allow for various types of derivative instruments, including futures contracts, forward foreign currency contracts, options and swaps. Derivatives are investments whose value is primarily derived from underlying assets, indices or reference rates and may be transacted on an exchange or over-the-counter (OTC). Derivatives may involve a future commitment to buy or sell a specified asset based on specified terms, to exchange future cash flows at periodic intervals based on a notional principal amount, or for one party to make one or more payments upon the occurrence of specified events in exchange for periodic payments from the other party.
Derivatives were used to increase returns, to gain exposure to certain types of assets, to facilitate transactions in foreign-denominated securities and to manage exposure to certain risks as defined below. The success of any strategy involving derivatives depends on analysis of numerous economic factors, and if the strategies for investment do not work as intended, the objectives may not be achieved.
Derivatives were used to increase or decrease exposure to the following risk(s):
| | |
| Credit Risk | Credit risk relates to the ability of the issuer of a financial instrument to make further principal or interest payments on an obligation or commitment that it has to a fund. |
| Foreign Exchange Risk | Foreign exchange rate risk relates to fluctuations in the value of an asset or liability due to changes in currency exchange rates. |
| Interest Rate Risk | Interest rate risk relates to the fluctuations in the value of interest-bearing securities due to changes in the prevailing levels of market interest rates. |
Funds are also exposed to additional risks from investing in derivatives, such as liquidity risk and counterparty credit risk. Liquidity risk is the risk that a fund will be unable to close out the derivative in the open market in a timely manner. Counterparty credit risk is the risk that the counterparty will not be able to fulfill its obligation to a fund. Derivative counterparty credit risk is managed through formal evaluation of the creditworthiness of all potential counterparties. On certain OTC derivatives such as forward foreign currency contracts, options and bi-lateral swaps, a fund attempts to reduce its exposure to counterparty credit risk by entering into an International Swaps and Derivatives Association, Inc. (ISDA) Master Agreement with each of its counterparties. The ISDA Master Agreement gives a fund the right to terminate all transactions traded under such agreement upon the deterioration in the credit quality of the counterparty beyond specified levels. The ISDA Master Agreement gives each party the right, upon an event of default by the other party or a termination of the agreement, to close out all transactions traded under such agreement and to net amounts owed under each transaction to one net payable by one party to the other. To mitigate counterparty credit risk on bi-lateral OTC derivatives, a fund receives collateral in the form of cash or securities once net unrealized appreciation on outstanding derivative contracts under an ISDA Master Agreement exceeds certain applicable thresholds, subject to certain minimum transfer provisions. The collateral received is held in segregated accounts with the custodian bank in accordance with the collateral agreements entered into between a fund, the counterparty and the custodian bank. A fund could experience delays and costs in gaining access to the collateral even though it is held by the custodian bank. The maximum risk of loss to a fund from counterparty credit risk related to bi-lateral OTC derivatives is generally the aggregate unrealized appreciation and unpaid counterparty payments in excess of any collateral pledged by the counterparty to a fund. A fund may be required to pledge collateral for the benefit of the counterparties on bi-lateral OTC derivatives in an amount not less than each counterparty's unrealized appreciation on outstanding derivative contracts, subject to certain minimum transfer provisions, and any such pledged collateral is identified in the Schedule of Investments. Exchange-traded contracts are not covered by the ISDA Master Agreement; however counterparty credit risk related to these contracts may be mitigated by the protection provided by the exchange on which they trade. Counterparty credit risk related to centrally cleared OTC swaps may be mitigated by the protection provided by the clearinghouse.
Investing in derivatives may involve greater risks than investing in the underlying assets directly and, to varying degrees, may involve risk of loss in excess of any initial investment and collateral received and amounts recognized in the Statement of Assets and Liabilities. In addition, there may be the risk that the change in value of the derivative contract does not correspond to the change in value of the underlying instrument.
Net Realized Gain (Loss) and Change in Net Unrealized Appreciation (Depreciation) on Derivatives. The table below, which reflects the impacts of derivatives on the financial performance, summarizes the net realized gain (loss) and change in net unrealized appreciation (depreciation) for derivatives during the period as presented in the Statement of Operations.
| Primary Risk Exposure / Derivative Type | Net Realized Gain (Loss)($) | Change in Net Unrealized Appreciation (Depreciation)($) |
| Strategic Advisers Core Income Fund | | |
| Credit Risk | | |
| Purchased Options | (405,465) | 252,047 |
| Swaps | 694,416 | (155,626) |
| Total Credit Risk | 288,951 | 96,421 |
| Foreign Exchange Risk | | |
| Forward Foreign Currency Contracts | (3,351,126) | (1,685,550) |
| Total Foreign Exchange Risk | (3,351,126) | (1,685,550) |
| Interest Rate Risk | | |
| Futures Contracts | (13,007,716) | 5,118,849 |
| Purchased Options | - | (8,277) |
| Swaps | (7,037,470) | 10,779,449 |
| Total Interest Rate Risk | (20,045,186) | 15,890,021 |
| Totals | (23,107,361) | 14,300,892 |
If there are any open positions at period end, a summary of the value of derivatives by primary risk exposure is included at the end of the Schedule of Investments.
Forward Foreign Currency Contracts. Forward foreign currency contracts represent obligations to purchase or sell foreign currency on a specified future date at a price fixed at the time the contracts are entered into. Forward foreign currency contracts were used to facilitate transactions in foreign-denominated securities and to manage exposure to certain foreign currencies.
Forward foreign currency contracts are valued daily and fluctuations in exchange rates on open contracts are recorded as unrealized appreciation or (depreciation) and reflected in total accumulated earnings (loss) in the Statement of Assets and Liabilities. When the contract is closed, a gain or loss is realized equal to the difference between the closing value and the value at the time it was opened. Non-deliverable forward foreign currency exchange contracts are settled with the counterparty in cash without the delivery of foreign currency. The net realized gain (loss) and change in net unrealized appreciation (depreciation) on forward foreign currency contracts during the period is presented in the Statement of Operations.
Any open forward foreign currency contracts at period end are presented in the Schedule of Investments under the caption "Forward Foreign Currency Contracts." The contract amount and unrealized appreciation (depreciation) reflects each contract's exposure to the underlying currency at period end, and is representative of volume of activity during the period unless an average contract value is presented.
Futures Contracts. A futures contract is an agreement between two parties to buy or sell a specified underlying instrument for a fixed price at a specified future date. Futures contracts were used to manage exposure to the bond market and fluctuations in interest rates.
Upon entering into a futures contract, a fund is required to deposit either cash or securities (initial margin) with a clearing broker in an amount equal to a certain percentage of the face value of the contract. Futures contracts are marked-to-market daily and subsequent daily payments are made or received by a fund depending on the daily fluctuations in the value of the futures contracts and are recorded as unrealized appreciation or (depreciation). This receivable and/or payable, if any, is included in daily variation margin on futures contracts in the Statement of Assets and Liabilities. Realized gain or (loss) is recorded upon the expiration or closing of a futures contract. The net realized gain (loss) and change in net unrealized appreciation (depreciation) on futures contracts during the period is presented in the Statement of Operations.
Any open futures contracts at period end are presented in the Schedule of Investments under the caption "Futures Contracts". The notional amount at value reflects each contract's exposure to the underlying instrument or index at period end, and is representative of volume of activity during the period unless an average notional amount is presented. Any securities deposited to meet initial margin requirements are identified in the Schedule of Investments. Any cash deposited to meet initial margin requirements is presented as segregated cash with brokers for derivative instruments in the Statement of Assets and Liabilities.
Options. Options give the purchaser the right, but not the obligation, to buy (call) or sell (put) an underlying security or financial instrument at an agreed exercise or strike price between or on certain dates. Options obligate the seller (writer) to buy (put) or sell (call) an underlying instrument at the exercise or strike price or cash settle an underlying derivative instrument if the holder exercises the option on or before the expiration date. OTC options, such as swaptions, which are options where the underlying instrument is a swap, were used to manage exposure to fluctuations in interest rates and potential credit events.
Upon entering into an options contract, a fund will pay or receive a premium. Premiums paid on purchased options are reflected as cost of investments and premiums received on written options are reflected as a liability on the Statement of Assets and Liabilities. Certain options may be purchased or written with premiums to be paid or received on a future date. Options are valued daily and any unrealized appreciation (depreciation) is reflected in total accumulated earnings (loss) in the Statement of Assets and Liabilities. When an option is exercised, the cost or proceeds of the underlying instrument purchased or sold is adjusted by the amount of the premium. When an option is closed, a gain or loss is realized depending on whether the proceeds or amount paid for the closing sale transaction is greater or less than the premium received or paid. When an option expires, gains and losses are realized to the extent of premiums received and paid, respectively. The net realized and unrealized gains (losses) on purchased options are included in the Statement of Operations in net realized gain (loss) and change in net unrealized appreciation (depreciation) on investment securities. The net realized gain (loss) and change in net unrealized appreciation (depreciation) on written options are presented in the Statement of Operations.
Any open options at period end are presented in the Schedule of Investments under the captions "Purchased Options," "Purchased Swaptions," "Written Options" and "Written Swaptions," as applicable, and are representative of volume of activity during the period unless an average notional amount is presented.
Writing puts and buying calls tend to increase exposure to the underlying instrument while buying puts and writing calls tend to decrease exposure to the underlying instrument. For purchased options, risk of loss is limited to the premium paid, and for written options, risk of loss is the change in value in excess of the premium received.
Swaps. A swap is a contract between two parties to exchange future cash flows at periodic intervals based on a notional principal amount. A bi-lateral OTC swap is a transaction between a fund and a dealer counterparty where cash flows are exchanged between the two parties for the life of the swap. A centrally cleared OTC swap is a transaction executed between a fund and a dealer counterparty, then cleared by a futures commission merchant (FCM) through a clearinghouse. Once cleared, the clearinghouse serves as a central counterparty, with whom a fund exchanges cash flows for the life of the transaction, similar to transactions in futures contracts.
Bi-lateral OTC swaps are marked-to-market daily and changes in value are reflected in the Statement of Assets and Liabilities in the bi-lateral OTC swaps at value line items. Any upfront premiums paid or received upon entering a bi-lateral OTC swap to compensate for differences between stated terms of the swap and prevailing market conditions (e.g. credit spreads, interest rates or other factors) are recorded in total accumulated earnings (loss) in the Statement of Assets and Liabilities and amortized to realized gain or (loss) ratably over the term of the swap. Any unamortized upfront premiums are presented in the Schedule of Investments.
Centrally cleared OTC swaps require a fund to deposit either cash or securities (initial margin) with the FCM, at the instruction of and for the benefit of the clearinghouse. Any securities deposited to meet initial margin requirements are identified in the Schedule of Investments. Any cash deposited to meet initial margin requirements is presented in segregated cash with brokers for derivative instruments in the Statement of Assets and Liabilities. Centrally cleared OTC swaps are marked-to-market daily and subsequent payments (variation margin) are made or received depending on the daily fluctuations in the value of the swaps and are recorded as unrealized appreciation or (depreciation). These daily payments, if any, are included in receivable or payable for daily variation margin on centrally cleared OTC swaps in the Statement of Assets and Liabilities. Any premiums for centrally cleared OTC swaps are recorded periodically throughout the term of the swap to variation margin and included in total accumulated earnings (loss) in the Statement of Assets and Liabilities. Any premiums are recognized as realized gain (loss) upon termination or maturity of the swap.
For both bi-lateral and centrally cleared OTC swaps, payments are exchanged at specified intervals, accrued daily commencing with the effective date of the contract and recorded as realized gain or (loss). Some swaps may be terminated prior to the effective date and realize a gain or loss upon termination. The net realized gain (loss) and change in net unrealized appreciation (depreciation) on swaps during the period is presented in the Statement of Operations.
Any open swaps at period end are included in the Schedule of Investments under the caption "Swaps", and are representative of volume of activity during the period unless an average notional amount is presented.
Credit Default Swaps. Credit default swaps enable a fund to buy or sell protection against specified credit events on a single-name issuer or a traded credit index. Under the terms of a credit default swap the buyer of protection (buyer) receives credit protection in exchange for making periodic payments to the seller of protection (seller) based on a fixed percentage applied to a notional principal amount. In return for these payments, the seller will be required to make a payment upon the occurrence of one or more specified credit events. A fund enters into credit default swaps as a seller to gain credit exposure to an issuer and/or as a buyer to obtain a measure of protection against defaults of an issuer. Periodic payments are made over the life of the contract by the buyer provided that no credit event occurs.
For credit default swaps on most corporate and sovereign issuers, credit events include bankruptcy, failure to pay or repudiation/moratorium. For credit default swaps on corporate or sovereign issuers, the obligation that may be put to the seller is not limited to the specific reference obligation described in the Schedule of Investments. For credit default swaps on asset-backed securities, a credit event may be triggered by events such as failure to pay principal, maturity extension, rating downgrade or write-down. For credit default swaps on asset-backed securities, the reference obligation described represents the security that may be put to the seller. For credit default swaps on a traded credit index, a specified credit event may affect all or individual underlying securities included in the index.
As a seller, if an underlying credit event occurs, a fund will pay a net settlement amount of cash equal to the notional amount of the swap less the recovery value of the reference obligation or underlying securities comprising an index. Only in the event of the industry's inability to value the underlying asset will a fund be required to take delivery of the reference obligation or underlying securities comprising an index and pay an amount equal to the notional amount of the swap.
As a buyer, if an underlying credit event occurs, a fund will receive a net settlement amount of cash equal to the notional amount of the swap less the recovery value of the reference obligation or underlying securities comprising an index. Only in the event of the industry's inability to value the underlying asset will a fund be required to deliver the reference obligation or underlying securities comprising an index in exchange for payment of an amount equal to the notional amount of the swap.
Typically, the value of each credit default swap and credit rating disclosed for each reference obligation in the Schedule of Investments, where a fund is the seller, can be used as measures of the current payment/performance risk of the swap. As the value of the swap changes as a positive or negative percentage of the total notional amount, the payment/performance risk may decrease or increase, respectively. In addition to these measures, the investment adviser monitors a variety of factors including cash flow assumptions, market activity and market sentiment as part of its ongoing process of assessing payment/performance risk.
Interest Rate Swaps. Interest rate swaps are agreements between counterparties to exchange cash flows, one based on a fixed rate, and the other on a floating rate. A fund enters into interest rate swaps to manage its exposure to interest rate changes. Changes in interest rates can have an effect on both the value of bond holdings as well as the amount of interest income earned. In general, the value of bonds can fall when interest rates rise and can rise when interest rates fall.
4. Purchases and Sales of Investments.
Purchases and sales of securities, other than short-term securities, U.S. government securities and in-kind transactions, as applicable, are noted in the table below.
| | Purchases ($) | Sales ($) |
| Strategic Advisers Core Income Fund | 20,477,375,009 | 20,925,102,710 |
Unaffiliated Exchanges In-Kind. During the period, the Fund redeemed shares of JPMorgan Core Plus Bond Fund Class A in exchange for investments and cash, if any, as noted in the following table. The Fund had a net realized loss on the Fund's redemptions of JPMorgan Core Plus Bond Fund Class A, which is included in "Net Realized gain (loss): Unaffiliated Issuers" in the accompanying Statement of Operations. The Fund recognized a net loss on the exchanges for federal income tax purposes.
| Fund Name | Value of Investments ($) | Net realized gain (loss) ($) | Shares redeemed |
| JPMorgan Core Plus Bond Fund Class A | 511,583,135 | (87,099,159) | 71,750,790 |
5. Fees and Other Transactions with Affiliates.
Management Fee. Strategic Advisers (the investment adviser) provides the Fund with investment management related services. For these services, the Fund pays a monthly management fee to the investment adviser. The management fee is calculated by adding the annual management fee rate of .25% of the Fund's average net assets throughout the month to the aggregate of the fee rates, payable monthly by the investment adviser, to the Fund's sub-advisers. The Fund's maximum aggregate management fee will not exceed .60% of the Fund's average net assets. For the reporting period, the total annualized management fee rate was .28% of the Fund's average net assets.
During the period, the investment adviser waived a portion of its management fee as described in the Expense Reductions note.
Sub-Advisers. BlackRock Investment Management, LLC, FIAM LLC (an affiliate of the investment adviser), J.P. Morgan Investment Management, Inc., PGIM, Inc. and TCW Investment Management LLC each served as a sub-adviser for the Fund during the period. Sub-advisers provide discretionary investment advisory services for their allocated portion of the Fund's assets and are paid as described in the Management Fee note.
Brokerage Commissions. A portion of portfolio transactions were placed with brokerage firms which are affiliates of the investment adviser. Brokerage commissions are included in net realized gain (loss) and change in net unrealized appreciation (depreciation) in the Statement of Operations. The commissions paid to these affiliated firms were as follows:
| | Amount |
| Strategic Advisers Core Income Fund | $1,174 |
Interfund Trades. Funds may purchase from or sell securities to other funds affiliated with each sub-adviser under procedures adopted by the Board. The procedures have been designed to ensure these interfund trades are executed in accordance with Rule 17a-7 of the 1940 Act. Any interfund trades are included within the respective purchases and sales amounts shown in the Purchases and Sales of Investments note. During the period, there were no interfund trades.
Other. During the period, the investment adviser reimbursed the Fund for certain losses as follows:
| | Amount ($) |
| Strategic Advisers Core Income Fund | 8,988 |
6. Investments in Fidelity Central Funds.
Funds may invest in Fidelity Central Funds, which are open-end investment companies generally available only to other investment companies and accounts managed by the investment adviser and its affiliates. The Schedule of Investments lists any Fidelity Central Funds held as an investment as of period end, but does not include the underlying holdings of each Fidelity Central Fund. An investing fund indirectly bears its proportionate share of the expenses of the underlying Fidelity Central Funds.
Based on its investment objective, each Fidelity Central Fund may invest or participate in various investment vehicles or strategies that are similar to those of the investing fund. These strategies are consistent with the investment objectives of the investing fund and may involve certain economic risks which may cause a decline in value of each of the Fidelity Central Funds and thus a decline in the value of the investing fund.
| Fidelity Central Fund | Investment Manager | Investment Objective | Investment Practices | Expense RatioA |
| Fidelity Money Market Central Funds | Fidelity Management & Research Company LLC (FMR) | Each fund seeks to obtain a high level of current income consistent with the preservation of capital and liquidity. | Short-term Investments | Less than .005% |
A Expenses expressed as a percentage of average net assets and are as of each underlying Central Fund's most recent annual or semi-annual shareholder report.
A complete unaudited list of holdings for each Fidelity Central Fund is available upon request or at the Securities and Exchange Commission website at www.sec.gov. In addition, the financial statements of the Fidelity Central Funds, which are not covered by the Report of Independent Registered Public Accounting Firm, are available on the Securities and Exchange Commission website or upon request.
7. Committed Line of Credit.
Certain Funds participate with other funds managed by the investment adviser or an affiliate in a $4.25 billion credit facility (the "line of credit") to be utilized for temporary or emergency purposes to fund shareholder redemptions or for other short-term liquidity purposes. The participating funds have agreed to pay commitment fees on their pro-rata portion of the line of credit, which are reflected in Miscellaneous expenses on the Statement of Operations, and are listed below. During the period, there were no borrowings on this line of credit.
| | Amount |
| Strategic Advisers Core Income Fund | $47,188 |
8. Security Lending.
Funds lend portfolio securities from time to time in order to earn additional income. Lending agents are used, including National Financial Services (NFS), an affiliate of the investment adviser. Pursuant to a securities lending agreement, NFS will receive a fee, which is capped at 9.9% of a fund's daily lending revenue, for its services as lending agent. A fund may lend securities to certain qualified borrowers, including NFS. On the settlement date of the loan, a fund receives collateral (in the form of U.S. Treasury obligations, letters of credit and/or cash) against the loaned securities and maintains collateral in an amount not less than 100% of the market value of the loaned securities during the period of the loan. The market value of the loaned securities is determined at the close of business of a fund and any additional required collateral is delivered to a fund on the next business day. A fund or borrower may terminate the loan at any time, and if the borrower defaults on its obligation to return the securities loaned because of insolvency or other reasons, a fund may apply collateral received from the borrower against the obligation. A fund may experience delays and costs in recovering the securities loaned. Any cash collateral received is invested in the Fidelity Securities Lending Cash Central Fund. Any loaned securities are identified as such in the Schedule of Investments, and the value of loaned securities and cash collateral at period end, as applicable, are presented in the Statement of Assets and Liabilities. Security lending income represents the income earned on investing cash collateral, less rebates paid to borrowers and any lending agent fees associated with the loan, plus any premium payments received for lending certain types of securities. Security lending income is presented in the Statement of Operations as a component of income from Fidelity Central Funds. Affiliated security lending activity, if any, was as follows:
| | Total Security Lending Fees Paid to NFS | Security Lending Income From Securities Loaned to NFS | Value of Securities Loaned to NFS at Period End |
| Strategic Advisers Core Income Fund | $5,847 | $- | $- |
9. Expense Reductions.
The investment adviser has contractually agreed to waive the Fund's management fee in an amount equal to .25% of the Fund's average net assets until September 30, 2026. During the period, this waiver reduced the Fund's management fee by $61,969,967.
Through arrangements with the Fund's custodian, credits realized as a result of certain uninvested cash balances were used to reduce the Fund's expenses by $70,416.
10. Other.
A fund's organizational documents provide former and current trustees and officers with a limited indemnification against liabilities arising in connection with the performance of their duties to the fund. In the normal course of business, a fund may also enter into contracts that provide general indemnifications. A fund's maximum exposure under these arrangements is unknown as this would be dependent on future claims that may be made against a fund. The risk of material loss from such claims is considered remote.
Funds do not invest in underlying mutual funds for the purpose of exercising management or control; however, investments by funds within their principal investment strategies may represent a significant portion of the underlying mutual fund's net assets. At the end of the period, certain Funds were the owners of record of 10% or more of the total outstanding shares of the following underlying mutual funds as shown below.
| Fund | Strategic Advisers Core Income Fund |
| Fidelity SAI Long-Term Treasury Bond Index Fund | 13% |
| Fidelity SAI Total Bond Fund | 25% |
| Fidelity SAI U.S. Treasury Bond Index Fund | 15% |
11. Risk and Uncertainties.
Many factors affect a fund's performance. Developments that disrupt global economies and financial markets, such as pandemics, epidemics, outbreaks of infectious diseases, war, terrorism, and environmental disasters, may significantly affect a fund's investment performance. The effects of these developments to a fund will be impacted by the types of securities in which a fund invests, the financial condition, industry, economic sector, and geographic location of an issuer, and a fund's level of investment in the securities of that issuer. Significant concentrations in security types, issuers, industries, sectors, and geographic locations may magnify the factors that affect a fund's performance.
As a shareholder, you incur two types of costs: (1) transaction costs, which may include sales charges (loads) on purchase payments or redemption proceeds, as applicable and (2) ongoing costs, which generally include management fees, distribution and/or service (12b-1) fees and other Fund expenses. This Example is intended to help you understand your ongoing costs (in dollars) of investing in a fund and to compare these costs with the ongoing costs of investing in other mutual funds.
| The Example is based on an investment of $1,000 invested at the beginning of the period and held for the entire period (March 1, 2023 to August 31, 2023). |
Actual Expenses
The first line of the accompanying table provides information about actual account values and actual expenses. You may use the information in this line, together with the amount you invested, to estimate the expenses that you paid over the period. Simply divide your account value by $1,000.00 (for example, an $8,600 account value divided by $1,000.00 = 8.6), then multiply the result by the number in the first line for a class/Fund under the heading entitled "Expenses Paid During Period" to estimate the expenses you paid on your account during this period. If any fund is a shareholder of any underlying mutual funds or exchange-traded funds (ETFs) (the Underlying Funds), such fund indirectly bears its proportional share of the expenses of the Underlying Funds in addition to the direct expenses incurred presented in the table. These fees and expenses are not included in the annualized expense ratio used to calculate the expense estimate in the table below.
Hypothetical Example for Comparison Purposes
The second line of the accompanying table provides information about hypothetical account values and hypothetical expenses based on the actual expense ratio and an assumed rate of return of 5% per year before expenses, which is not the actual return. The hypothetical account values and expenses may not be used to estimate the actual ending account balance or expenses you paid for the period. You may use this information to compare the ongoing costs of investing in the Fund and other funds. To do so, compare this 5% hypothetical example with the 5% hypothetical examples that appear in the shareholder reports of the other funds. If any fund is a shareholder of any Underlying Funds, such fund indirectly bears its proportional share of the expenses of the Underlying Funds in addition to the direct expenses as presented in the table. These fees and expenses are not included in the annualized expense ratio used to calculate the expense estimate in the table below.
Please note that the expenses shown in the table are meant to highlight your ongoing costs only and do not reflect any transaction costs. Therefore, the second line of the table is useful in comparing ongoing costs only, and will not help you determine the relative total costs of owning different funds. In addition, if these transactional costs were included, your costs would have been higher.
| | | | | Annualized Expense Ratio- A | | Beginning Account Value March 1, 2023 | | Ending Account Value August 31, 2023 | | Expenses Paid During Period- C March 1, 2023 to August 31, 2023 |
| | | | | | | | | | |
| Strategic Advisers® Core Income Fund | | | | .03% | | | | | | |
| Actual | | | | | | $ 1,000 | | $ 1,009.40 | | $ .15 |
Hypothetical-B | | | | | | $ 1,000 | | $ 1,024.99 | | $ .15 |
| |
A Annualized expense ratio reflects expenses net of applicable fee waivers.
B 5% return per year before expenses
C Expenses are equal to the annualized expense ratio, multiplied by the average account value over the period, multiplied by 184/ 366 (to reflect the one-half year period). The fees and expenses of any Underlying Funds are not included in each annualized expense ratio.
Board Approval of New and Amended Sub-Advisory Agreements
Strategic Advisers Core Income Fund
In March 2023, the Board of Trustees, including the Independent Trustees (together, the Board) voted to approve (i) a new sub-advisory agreement among Strategic Advisers LLC (Strategic Advisers), J.P. Morgan Investment Management Inc. (J.P. Morgan or New Sub-Adviser), and Fidelity Rutland Square Trust II (Trust) on behalf of the fund (New Sub-Advisory Agreement), (ii) an amendment to add a new investment mandate to the existing sub-advisory agreement among Strategic Advisers, FIAM LLC (FIAM), and the Trust on behalf of the fund (Amended FIAM Sub-Advisory Agreement), and (iii) an amendment to the fee schedule in the existing sub-advisory agreement among Strategic Advisers, PGIM, Inc. (PGIM, and together with J.P. Morgan and FIAM, the Sub-Advisers), and the Trust on behalf of the fund (Amended PGIM Sub-Advisory Agreement and, together with the Amended FIAM Sub-Advisory Agreement, the Amended Sub-Advisory Agreements; and together with the New Sub-Advisory Agreement, the Agreements). The Board noted that the updated fee schedule in the Amended PGIM Sub-Advisory Agreement became effective as of November 1, 2022 and will result in the same or lower fees at all asset levels. The Board also noted that no other material contract terms are impacted by the Amended Sub-Advisory Agreements. The Board, assisted by the advice of fund counsel and Independent Trustees' counsel, considered a broad range of information.
In considering whether to approve the Agreements, the Board reached a determination, with the assistance of fund counsel and Independent Trustees' counsel and through the exercise of its business judgment, that the approval of the Agreements is in the best interests of the fund and its shareholders and that the approval of such agreements does not involve a conflict of interest from which Strategic Advisers or its affiliates derive an inappropriate advantage. The Board's decision to approve the Agreements was not based on any single factor, but rather was based on a comprehensive consideration of all the information provided to the Board. In addition, individual Trustees did not necessarily attribute the same weight or importance to each factor.
Nature, Extent, and Quality of Services Provided. With respect to the New Sub-Advisory Agreement and the new mandate for the Amended FIAM Sub-Advisory Agreement, the Board considered the backgrounds of the investment personnel that will provide services to the fund, the fund's investment objective, strategies and related investment philosophy, the current sub-adviser line-up, and the structure of the investment personnel compensation programs and whether such structure provides appropriate incentives to act in the best interests of the fund. The Board also considered that it reviewed this information regarding PGIM in connection with the annual renewal of the of the fund's management contract, sub-advisory agreements and sub-subadvisory agreements at its September 2022 meeting. The Board noted its familiarity with the nature, extent and quality of services provided by the Sub-Advisers to other Strategic Advisers funds with different investment mandates, and that the same support staff, including compliance personnel, that currently provides services to other Strategic Advisers funds will also provide services to the fund. The Board also took into consideration additional information regarding the new investment mandates provided by Strategic Advisers, J.P. Morgan, and FIAM.
Resources Dedicated to Investment Management and Support Services. With respect to the New Sub-Advisory Agreement and Amended FIAM Sub-Advisory Agreement, the Board reviewed the general qualifications and capabilities of the J.P. Morgan's and FIAM's respective investment staff, use of technology, and approach to managing and compensating investment personnel. The Board noted that J.P. Morgan's and FIAM's respective analysts have extensive resources, tools and capabilities which allow them to conduct sophisticated fundamental and/or quantitative analysis. Additionally, in its deliberations, the Board considered J.P. Morgan's and FIAM's respective trading capabilities and resources and compliance infrastructure, which are integral parts of the investment management process, and their respective investments in business continuity planning, including in connection with the COVID-19 pandemic.
With respect to the Amended PGIM Sub-Advisory Agreement, the Board noted that it had approved the existing sub-advisory agreement with PGIM at its September 2022 meeting and the Amended PGIM Sub-Advisory Agreement will not result in any changes to: (i) the nature, extent and quality of the sub-advisory services provided; (ii) the investment process or strategies employed in the management of the fund's assets; or (iii) the day-to-day management of the fund or the persons primarily responsible for such management.
Shareholder and Administrative Services. The Board considered (i) the nature, extent, quality, and cost of advisory services to be performed by J.P. Morgan under the New Sub-Advisory Agreement and by FIAM under the Amended FIAM Sub-Advisory Agreement; and (ii) the resources to be devoted to the fund's compliance policies and procedures.
Investment Performance. The Board considered the historical investment performance of each of J.P. Morgan and FIAM and their respective portfolio managers in managing accounts under a similar investment mandate. The Board did not consider performance to be a material factor in its decision to approve the Amended PGIM Sub-Advisory Agreement because the approval of the Amended PGIM Sub-Advisory Agreement will not result in any changes (i) to the fund's investment processes or strategies; or (ii) in the persons primarily responsible for the day-to-day management of the fund.
Based on its review, the Board concluded that the nature, extent, and quality of services that will be provided to the fund under the New Sub-Advisory Agreement should benefit the fund's shareholders and, with respect to each Amended Sub-Advisory Agreement, should continue to benefit the fund's shareholders.
Competitiveness of Management Fee and Total Fund Expenses. With respect to the New Sub-Advisory Agreement and the Amended FIAM Sub-Advisory Agreement, the Board considered the amount and nature of the fees to be paid by the fund to Strategic Advisers and by Strategic Advisers to J.P. Morgan and FIAM. The Board also considered the projected change in the fund's management fee and total operating expenses, if any, as a result of hiring J.P. Morgan and adding the new investment mandate for FIAM.
The Board noted that none of the Agreements will result in changes to the maximum aggregate annual management fee payable by the fund or Strategic Advisers' portion of the management fee. The Board considered Strategic Advisers' contractual agreement to waive its portion of the fund's management fee. With respect to the New Sub-Advisory Agreement, the Board considered that after allocating assets to the New Sub-Adviser, the fund's management fee is expected to increase but the fund's total net expenses are expected to decrease, and each is expected to continue to rank below the competitive peer group median reported in the 2022 management contract renewal materials for the fund. Additionally, the Board considered that approval of the Amended FIAM Sub-Advisory Agreement will not initially result in any changes to the fund's management fee or total net expenses because Strategic Advisers does not expect to allocate assets to the new mandate at this time. The Board also considered that Amended PGIM Sub-Advisory Agreement is expected to result in a decrease in the total management fee rate of the fund.
Based on its review, the Board concluded that the fund's management fee structure and projected total expenses bear a reasonable relationship to the services that the fund and its shareholders will receive and the other factors considered.
Costs of the Services and Profitability. Because the Agreements were each negotiated at arm's length and will have no impact on the maximum management fees payable by the fund or Strategic Advisers' portion of the management fee, the Board did not consider the costs of services and profitability to be significant factors in its decision to approve the Agreements.
Potential Fall-Out Benefits. The Board considered that it reviews information regarding the potential of direct and indirect benefits to Strategic Advisers and its affiliates from their relationships with the fund, including non-advisory fee compensation paid to affiliates of Strategic Advisers, if any, as well as information regarding potential fall-out benefits accruing to each sub-adviser, if any, as a result of its relationship with the fund, during its annual renewal of the fund's management contract, sub-advisory agreements, and sub-subadvisory agreements. The Board considered Strategic Advisers' representation that it does not anticipate that the approval of the Agreements will have a significant impact on the profitability of, or potential fall-out benefits to, Strategic Advisers or its affiliates.
Possible Economies of Scale. The Board considered that it reviews whether there have been economies of scale in connection with the management of the fund during its annual renewal of the fund's management contract, sub-advisory agreements, and sub-subadvisory agreements. The Board noted that the New Sub-Advisory Agreement and, with respect to the new investment mandate, the Amended FIAM Sub-Advisory Agreement, each provide, and the Amended PGIM Sub-Advisory Agreement will continue to provide, for breakpoints that have the potential to reduce sub-advisory fees paid to the sub-adviser as assets allocated to the sub-adviser grow. The Board also noted that it did not consider the possible realization of economies of scale to be a significant factor in its decision to approve the Amended PGIM Sub-Advisory Agreement because the fund is not expected to bear any additional expenses as a result of the Amended PGIM Sub-Advisory Agreement.
Conclusion. Based on its evaluation of all of the conclusions noted above, and after considering all factors it believed relevant, the Board concluded that each Agreement's fee structure bears a reasonable relationship to the services to be rendered and that each Agreement is in the best interests of the fund and its shareholders and should be approved. In addition, the Board concluded that the approval of each Agreement does not involve a conflict of interest from which Strategic Advisers or its affiliates derive an inappropriate advantage.
1.912889.113
SSC-SANN-1023
Strategic Advisers® Emerging Markets Fund
Offered exclusively to certain managed account clients of Strategic Advisers LLC or its affiliates - not available for sale to the general public
Semi-Annual Report
August 31, 2023
Contents
To view a fund's proxy voting guidelines and proxy voting record for the 12-month period ended June 30, visit http://www.fidelity.com/proxyvotingresults or visit the Securities and Exchange Commission's (SEC) web site at http://www.sec.gov.
You may also call 1-800-544-3455 to request a free copy of the proxy voting guidelines.
Standard & Poor's, S&P and S&P 500 are registered service marks of The McGraw-Hill Companies, Inc. and have been licensed for use by Fidelity Distributors Corporation.
Other third-party marks appearing herein are the property of their respective owners.
All other marks appearing herein are registered or unregistered trademarks or service marks of FMR LLC or an affiliated company. © 2023 FMR LLC. All rights reserved.
This report and the financial statements contained herein are submitted for the general information of the shareholders of the Fund. This report is not authorized for distribution to prospective investors in the Fund unless preceded or accompanied by an effective prospectus.
A fund files its complete schedule of portfolio holdings with the SEC for the first and third quarters of each fiscal year on Form N-PORT. Forms N-PORT are available on the SEC's web site at http://www.sec.gov. A fund's Forms N-PORT may be reviewed and copied at the SEC's Public Reference Room in Washington, DC. Information regarding the operation of the SEC's Public Reference Room may be obtained by calling 1-800-SEC-0330.
For a complete list of a fund's portfolio holdings, view the most recent holdings listing, semiannual report, or annual report on Fidelity's web site at http://www.fidelity.com, http://www.institutional.fidelity.com, or http://www.401k.com, as applicable.
NOT FDIC INSURED •MAY LOSE VALUE •NO BANK GUARANTEE
Neither the Fund nor Fidelity Distributors Corporation is a bank.
The information in the following tables is based on the direct Investments of the Fund.
Top Holdings (% of Fund's net assets) |
| (excluding cash equivalents) |
| Fidelity SAI Emerging Markets Value Index Fund | 10.7 | |
| Fidelity SAI Emerging Markets Low Volatility Index Fund | 8.3 | |
| Fidelity Advisor Emerging Markets Fund Class Z | 7.0 | |
| Taiwan Semiconductor Manufacturing Co. Ltd. | 4.5 | |
| Goldman Sachs Emerging Markets Equity Fund Institutional Shares | 3.2 | |
| Tencent Holdings Ltd. | 2.9 | |
| Fidelity SAI Emerging Markets Index Fund | 2.9 | |
| Samsung Electronics Co. Ltd. | 2.6 | |
| Invesco Developing Markets Fund Class R6 | 2.2 | |
| Aberdeen Emerging Markets Fund Institutional Service Class | 2.0 | |
| | 46.3 | |
| |
| Market Sectors (% of Fund's net assets) |
| (Stocks Only) |
| Information Technology | 13.0 | |
| Financials | 12.0 | |
| Consumer Discretionary | 9.3 | |
| Communication Services | 5.3 | |
| Industrials | 4.4 | |
| Consumer Staples | 3.7 | |
| Materials | 3.1 | |
| Energy | 2.3 | |
| Investment Companies | 2.0 | |
| Health Care | 1.6 | |
| Real Estate | 0.6 | |
| Utilities | 0.5 | |
| |
Asset Allocation (% of Fund's net assets) |
|
|
Asset Allocation of funds in the pie chart reflect the categorizations of the asset as defined by Morningstar as of the reporting date.
Geographic Diversification (% of Fund's net assets) |
|
* Includes Short-Term investments and Net Other Assets (Liabilities). Percentages are adjusted for the effect of derivatives, if applicable. |
| |
Showing Percentage of Net Assets
| Common Stocks - 54.0% |
| | | Shares | Value ($) |
| COMMUNICATION SERVICES - 5.3% | | | |
| Diversified Telecommunication Services - 0.3% | | | |
| Chunghwa Telecom Co. Ltd. | | 370,000 | 1,348,266 |
| KT Corp. | | 149,855 | 3,728,932 |
| LG Uplus Corp. | | 460,835 | 3,634,743 |
| Ooredoo QSC | | 339,274 | 1,006,637 |
| PT Telkom Indonesia Persero Tbk | | 13,513,483 | 3,303,220 |
| Saudi Telecom Co. | | 583,548 | 6,192,316 |
| | | | 19,214,114 |
| Entertainment - 0.8% | | | |
| 37 Interactive Entertainment Network Technology Group Co. Ltd. (A Shares) (a) | | 989,686 | 3,364,920 |
| Bilibili, Inc. Class Z (a) | | 12,000 | 181,323 |
| FriendTimes, Inc. | | 125,932 | 12,043 |
| G-bits Network Technology Xiamen Co. Ltd. (A Shares) | | 57,917 | 3,332,750 |
| Gravity Co. Ltd. ADR (a) | | 279 | 20,872 |
| IGG, Inc. (a) | | 421,000 | 197,553 |
| International Games Systems Co. Ltd. | | 417,056 | 7,526,197 |
| iQIYI, Inc. ADR (a) | | 289,807 | 1,460,627 |
| JYP Entertainment Corp. | | 61,093 | 5,173,641 |
| Kingnet Network Co. Ltd. (A Shares) (a) | | 1,228,500 | 2,562,319 |
| Kingsoft Corp. Ltd. | | 236,200 | 942,710 |
| Mgame Corp. (a) | | 34,930 | 180,329 |
| NetDragon WebSoft, Inc. | | 85,000 | 164,963 |
| NetEase, Inc. | | 794,900 | 16,468,311 |
| NetEase, Inc. ADR | | 122,562 | 12,682,716 |
| Nexon Games Co. Ltd. (a) | | 42,395 | 563,170 |
| Perfect World Co. Ltd. (A Shares) | | 1,038,355 | 1,978,337 |
| Sea Ltd. ADR (a) | | 33,929 | 1,276,748 |
| Tencent Music Entertainment Group ADR (a) | | 357,612 | 2,438,914 |
| UserJoy Technology Co. Ltd. | | 19,950 | 48,274 |
| | | | 60,576,717 |
| Interactive Media & Services - 3.5% | | | |
| Autohome, Inc. ADR Class A | | 121,347 | 3,506,928 |
| Baidu, Inc.: | | | |
| Class A (a) | | 390,006 | 6,965,211 |
| sponsored ADR (a) | | 44,286 | 6,325,369 |
| Focus Technology Co. Ltd. (A Shares) | | 46,100 | 215,040 |
| Hello Group, Inc. ADR | | 133,109 | 1,148,731 |
| JOYY, Inc. ADR | | 36,090 | 1,238,609 |
| NAVER Corp. | | 76,726 | 12,421,723 |
| Tencent Holdings Ltd. | | 5,119,592 | 212,157,770 |
| Weibo Corp. sponsored ADR | | 39,681 | 511,885 |
| Yandex NV: | | | |
| Class A (a)(b) | | 99,306 | 1,191,672 |
| Series A (a)(b) | | 503,691 | 5,278,682 |
| | | | 250,961,620 |
| Media - 0.2% | | | |
| Arabian Contracting Services Co. | | 94,241 | 5,266,531 |
| Changjiang Publishing & Media Co. Ltd. (A Shares) | | 303,860 | 349,955 |
| Cheil Worldwide, Inc. | | 5,436 | 77,340 |
| Chinese Universe Publishing and Media Group Co. Ltd. (A Shares) | | 1,812,741 | 3,164,059 |
| Focus Media Information Technology Co. Ltd. (A Shares) | | 5,408,800 | 5,737,515 |
| Jagran Prakashan Ltd. | | 30,888 | 40,258 |
| Korea Business News Co. Ltd. | | 6,677 | 32,001 |
| LG HelloVision Co. Ltd. | | 10,601 | 31,885 |
| Media Prima Bhd | | 336,800 | 32,301 |
| Navneet Education Ltd. | | 28,567 | 53,311 |
| Shandong Publishing & Media Co. Ltd. (A Shares) | | 1,516,200 | 1,986,411 |
| Wasu Media Holding Co. Ltd. (A Shares) | | 332,600 | 398,175 |
| Woongjin Holdings Co. Ltd. | | 19,424 | 35,992 |
| | | | 17,205,734 |
| Wireless Telecommunication Services - 0.5% | | | |
| America Movil S.A.B. de CV Series L | | 2,578,523 | 2,427,219 |
| Bharti Airtel Ltd. | | 1,213,395 | 12,563,856 |
| Etihad Etisalat Co. | | 312,261 | 3,758,971 |
| Far EasTone Telecommunications Co. Ltd. | | 245,000 | 542,855 |
| Mobile Telecommunication Co. | | 388,660 | 643,038 |
| Mobile Telecommunications Co. Saudi Arabia | | 425,380 | 1,531,103 |
| MTN Group Ltd. | | 1,974,069 | 12,577,177 |
| TIM SA | | 1,115,933 | 3,247,260 |
| Vodafone Qatar QSC (a) | | 93,166 | 47,351 |
| | | | 37,338,830 |
TOTAL COMMUNICATION SERVICES | | | 385,297,015 |
| CONSUMER DISCRETIONARY - 9.3% | | | |
| Automobile Components - 0.2% | | | |
| Ajin Industrial Co. Ltd. (a) | | 75,616 | 259,394 |
| CEAT Ltd. | | 10,604 | 288,865 |
| Chongqing Zongshe Power Machinery Co. Ltd. (A Shares) | | 731,800 | 680,500 |
| FIEM Industries Ltd. | | 6,009 | 138,333 |
| Fuyao Glass Industries Group Co. Ltd. (A Shares) | | 1,314,700 | 6,882,440 |
| Hankook Tire Co. Ltd. | | 20,143 | 589,126 |
| HDC Hyundai Engineering Plastics Co. Ltd. | | 9,827 | 30,855 |
| Hwa Shin Co. Ltd. | | 32,204 | 315,741 |
| JK Tyre & Industries Ltd. | | 32,078 | 105,143 |
| MAHLE Metal Leve SA | | 47,165 | 456,502 |
| Sandhar Technologies Ltd. | | 11,178 | 52,579 |
| Sejong Industrial Co. Ltd. | | 11,274 | 57,863 |
| Seoyon Co. Ltd. | | 15,754 | 90,725 |
| Shenzhen Kedali Industry Co. Ltd. | | 283,990 | 4,552,776 |
| Somboon Advance Technology PCL NVDR unit | | 71,100 | 38,578 |
| Tianneng Power International Ltd. | | 511,826 | 545,610 |
| Yoosung Enterprise Co. Ltd. | | 12,624 | 29,013 |
| | | | 15,114,043 |
| Automobiles - 1.4% | | | |
| Bajaj Auto Ltd. | | 128,742 | 7,181,631 |
| Brilliance China Automotive Holdings Ltd. | | 1,904,000 | 774,482 |
| BYD Co. Ltd. (H Shares) | | 612,183 | 19,229,083 |
| Dongfeng Motor Group Co. Ltd. (H Shares) | | 1,226,000 | 450,232 |
| Eicher Motors Ltd. | | 37,661 | 1,519,288 |
| Guangzhou Automobile Group Co. Ltd. (H Shares) | | 10,922,742 | 5,752,220 |
| Hyundai Motor Co. Ltd. | | 112,914 | 16,115,779 |
| Kia Corp. | | 277,560 | 16,801,313 |
| Li Auto, Inc.: | | | |
| ADR (a) | | 430,430 | 17,927,410 |
| Class A (a) | | 16,400 | 341,446 |
| Loncin Motor Co. Ltd. | | 2,186,900 | 1,626,878 |
| Mahindra & Mahindra Ltd. | | 641,662 | 12,221,971 |
| Maruti Suzuki India Ltd. | | 18,137 | 2,193,686 |
| Tata Motors Ltd. | | 262,420 | 1,906,845 |
| UMW Holdings Bhd | | 40,100 | 41,223 |
| | | | 104,083,487 |
| Broadline Retail - 3.7% | | | |
| Alibaba Group Holding Ltd. (a) | | 9,785,204 | 113,568,505 |
| Alibaba Group Holding Ltd. sponsored ADR (a) | | 313,999 | 29,170,507 |
| JD.com, Inc.: | | | |
| Class A | | 1,165,022 | 19,348,807 |
| sponsored ADR | | 215,839 | 7,168,013 |
| MercadoLibre, Inc. (a) | | 9,147 | 12,552,977 |
| MINISO Group Holding Ltd. ADR | | 155,427 | 4,025,559 |
| Naspers Ltd. Class N | | 110,086 | 18,752,744 |
| Ozon Holdings PLC ADR (a)(b)(c) | | 52,200 | 542,880 |
| PDD Holdings, Inc. ADR (a) | | 428,758 | 42,434,179 |
| Pepco Group NV (a) | | 629,189 | 4,935,055 |
| Prosus NV | | 29,343 | 2,023,916 |
| PT Mitra Adiperkasa Tbk | | 6,036,308 | 766,924 |
| Savezon I&C Corp. | | 11,337 | 22,932 |
| Vipshop Holdings Ltd. ADR (a) | | 749,745 | 11,838,474 |
| Woolworths Holdings Ltd. | | 384,279 | 1,509,442 |
| | | | 268,660,914 |
| Distributors - 0.0% | | | |
| Xinhua Winshare Publishing and Media Co. Ltd. | | 18,795 | 14,044 |
| Diversified Consumer Services - 0.2% | | | |
| Human Soft Holding Co. KSCC | | 32,403 | 339,220 |
| Multicampus Co. Ltd. | | 955 | 23,498 |
| New Oriental Education & Technology Group, Inc. (a) | | 589,500 | 3,198,190 |
| New Oriental Education & Technology Group, Inc. sponsored ADR (a) | | 243,967 | 13,232,770 |
| TAL Education Group ADR (a) | | 37,036 | 261,104 |
| Visang Education, Inc. | | 8,025 | 27,559 |
| | | | 17,082,341 |
| Hotels, Restaurants & Leisure - 2.1% | | | |
| Americana Restaurants International PLC | | 4,752,425 | 5,739,934 |
| AmRest Holdings NV (a) | | 6,459 | 42,974 |
| Arcos Dorados Holdings, Inc. Class A | | 71,348 | 704,205 |
| Atour Lifestyle Holdings Ltd. ADR (c) | | 64,929 | 1,260,921 |
| DOUBLEUGAMES Co. Ltd. | | 3,485 | 112,316 |
| EIH Associated Hotels | | 4,034 | 23,867 |
| Famous Brands Ltd. | | 971 | 3,095 |
| Gourmet Master Co. Ltd. | | 44,000 | 156,043 |
| H World Group Ltd. ADR (a) | | 176,735 | 7,118,886 |
| HJ Magnolia Yongpyong Hotel & Resort Corp. (a) | | 9,677 | 23,993 |
| Jiumaojiu International Holdings Ltd. (d) | | 1,511,000 | 2,423,812 |
| Jollibee Food Corp. | | 673,240 | 2,817,550 |
| La Kaffa International Co. Ltd. | | 44,000 | 168,471 |
| Las Vegas Sands Corp. | | 107,483 | 5,896,517 |
| Leejam Sports Co. JSC | | 21,416 | 874,763 |
| MakeMyTrip Ltd. (a) | | 46,773 | 1,855,017 |
| Meituan Class B (a)(d) | | 3,243,046 | 53,669,672 |
| Minor International PCL NVDR | | 362,400 | 344,108 |
| MK Restaurants Group PCL NVDR unit | | 29,200 | 39,609 |
| OPAP SA | | 40,266 | 680,261 |
| Sands China Ltd. (a) | | 621,600 | 2,104,405 |
| Shangri-La Asia Ltd. (a) | | 5,578,000 | 3,812,388 |
| Tongcheng Travel Holdings Ltd. (a) | | 1,732,800 | 3,884,374 |
| TravelSky Technology Ltd. (H Shares) | | 79,000 | 141,634 |
| Trip.com Group Ltd. (a) | | 4,000 | 157,544 |
| Trip.com Group Ltd. ADR (a) | | 634,550 | 24,944,161 |
| Wonderla Holidays Ltd. | | 9,374 | 71,702 |
| Wowprime Corp. | | 238,000 | 2,076,515 |
| Yum China Holdings, Inc. | | 515,446 | 27,674,296 |
| Yum China Holdings, Inc. (Hong Kong) | | 86,286 | 4,599,074 |
| Zomato Ltd. (a) | | 491,201 | 579,633 |
| | | | 154,001,740 |
| Household Durables - 0.7% | | | |
| Cury Construtora e Incorporado SA | | 9,100 | 29,972 |
| Daewon Co. Ltd. | | 1,576 | 7,137 |
| Guangdong Homa Appliances Co. Ltd. (A Shares) (a) | | 141,700 | 151,678 |
| Haier Smart Home Co. Ltd. | | 1,425,066 | 4,413,829 |
| Haier Smart Home Co. Ltd. (A Shares) | | 4,328,141 | 14,018,005 |
| Hisense Home Appliances Group Co. Ltd. (H Shares) | | 75,000 | 197,964 |
| La Opala RG Ltd. | | 10,026 | 53,136 |
| LG Electronics, Inc. | | 109,811 | 8,163,832 |
| Midea Group Co. Ltd. (A Shares) | | 2,400,067 | 18,684,473 |
| Skyworth Group Ltd. | | 2,109,457 | 771,981 |
| TCL Electronics Holdings Ltd. | | 591,000 | 231,355 |
| Vatti Corp. Ltd. (A Shares) | | 856,200 | 698,279 |
| Viomi Technology Co. Ltd. ADR Class A (a) | | 71,922 | 61,278 |
| | | | 47,482,919 |
| Leisure Products - 0.0% | | | |
| CoCreation Grass Co. Ltd. (A Shares) | | 205,400 | 653,366 |
| Goodbaby International Holdings Ltd. (a) | | 96 | 7 |
| Xiamen Comfort Science & Technology Group Co. Ltd. (A Shares) | | 371,000 | 402,236 |
| | | | 1,055,609 |
| Specialty Retail - 0.3% | | | |
| Bermaz Auto Bhd | | 80,700 | 38,959 |
| China Harmony Auto Holding Ltd. | | 514,500 | 53,796 |
| China Tourism Group Duty Free Corp. Ltd. (H Shares) (d) | | 109,100 | 1,464,896 |
| Dogus Otomotiv Servis ve Ticaret A/S | | 120,532 | 1,287,407 |
| Fawaz Abdulaziz Al Hokair & Co. (a) | | 38,594 | 217,530 |
| Foschini Group Ltd./The | | 425,378 | 2,352,925 |
| Grand Baoxin Auto Group Ltd. (a) | | 235,000 | 7,012 |
| HLA Group Corp. Ltd. (A Shares) | | 447,700 | 465,040 |
| Index Living Mall PCL NVDR | | 230,500 | 146,788 |
| Jumbo SA | | 20,010 | 618,823 |
| Lewis Group Ltd. | | 11,913 | 23,416 |
| LOTTE Hi-Mart Co. Ltd. | | 125 | 933 |
| Motus Holdings Ltd. | | 79,673 | 428,002 |
| Pou Sheng International (Holdings) Ltd. | | 265,273 | 22,325 |
| Shan-Loong Transportation Co. Ltd. | | 32,000 | 30,983 |
| SSI Group, Inc. | | 136,000 | 7,253 |
| Truworths International Ltd. | | 196,174 | 752,702 |
| Zhongsheng Group Holdings Ltd. Class H | | 3,165,500 | 9,647,038 |
| | | | 17,565,828 |
| Textiles, Apparel & Luxury Goods - 0.7% | | | |
| Anta Sports Products Ltd. | | 475,000 | 5,351,234 |
| Arezzo Industria e Comercio SA | | 176,436 | 2,517,893 |
| Arvind Mills Ltd. | | 81,229 | 172,800 |
| Baoxiniao Holding Co. Ltd. (A Shares) | | 1,493,200 | 1,326,813 |
| Cabbeen Fashion Ltd. | | 79,891 | 7,742 |
| CECEP COSTIN New Materials Group Ltd. (a)(b) | | 741,000 | 1 |
| Century Enka Ltd. | | 5,958 | 30,838 |
| ECLAT Textile Co. Ltd. | | 460,000 | 7,348,335 |
| GHCL Textiles Ltd. | | 29,260 | 27,010 |
| Kddl Ltd. | | 299 | 6,842 |
| Kewal Kiran Clothing Ltd. | | 12,217 | 101,528 |
| LF Corp. | | 5,316 | 58,500 |
| Li Ning Co. Ltd. | | 3,253,879 | 15,372,461 |
| Pou Chen Corp. | | 1,287,000 | 1,155,202 |
| Sabina Public Co. Ltd. NVDR | | 10,600 | 8,022 |
| Safari Industries India Ltd. | | 4,234 | 188,619 |
| Samsonite International SA (a)(d) | | 1,068,000 | 3,574,821 |
| Shenzhou International Group Holdings Ltd. | | 1,202,100 | 12,339,292 |
| Sutlej Textiles & Industries Ltd. | | 10,634 | 7,361 |
| Titan Co. Ltd. | | 33,576 | 1,260,253 |
| Vardhman Textiles Ltd. (a) | | 19,291 | 91,721 |
| Weiqiao Textile Co. Ltd. (H Shares) (a) | | 121,056 | 17,289 |
| Welspun India Ltd. | | 65,932 | 99,524 |
| Youngone Corp. | | 27,746 | 1,124,570 |
| Zhejiang Semir Garment Co. Ltd. (A Shares) | | 948,000 | 797,961 |
| | | | 52,986,632 |
TOTAL CONSUMER DISCRETIONARY | | | 678,047,557 |
| CONSUMER STAPLES - 3.7% | | | |
| Beverages - 1.4% | | | |
| Ambev SA | | 1,202,558 | 3,360,912 |
| Anadolu Efes Biracilik Ve Malt Sanayii A/S | | 8,132 | 32,838 |
| Arca Continental S.A.B. de CV | | 43,243 | 421,005 |
| Becle S.A.B. de CV | | 515,671 | 1,392,422 |
| Budweiser Brewing Co. APAC Ltd. (d) | | 4,967,200 | 10,767,487 |
| China Resources Beer Holdings Co. Ltd. | | 334,000 | 1,963,366 |
| Coca-Cola FEMSA S.A.B. de CV sponsored ADR | | 14,942 | 1,266,185 |
| Fomento Economico Mexicano S.A.B. de CV sponsored ADR | | 222,125 | 24,993,505 |
| Fraser & Neave Holdings Bhd | | 2,200 | 12,091 |
| Haad Thip Co. Ltd. NVDR | | 97,000 | 103,184 |
| Heineken Malaysia Bhd | | 6,000 | 30,776 |
| Heineken NV (Bearer) | | 14,201 | 1,380,485 |
| Kweichow Moutai Co. Ltd. (A Shares) | | 119,724 | 30,463,535 |
| Nongfu Spring Co. Ltd. (H Shares) (d) | | 402,000 | 2,258,009 |
| Power Root Bhd | | 59,000 | 27,211 |
| Tsingtao Brewery Co. Ltd. (H Shares) | | 551,000 | 4,591,462 |
| Varun Beverages Ltd. | | 267,712 | 2,911,475 |
| Wuliangye Yibin Co. Ltd. (A Shares) | | 802,383 | 17,234,071 |
| | | | 103,210,019 |
| Consumer Staples Distribution & Retail - 1.3% | | | |
| Abdullah Al Othaim Markets Co. | | 16,430 | 63,781 |
| AEON Co. (M) Bhd | | 272,600 | 62,275 |
| Al-Dawaa Medical Services Co. | | 9,758 | 248,721 |
| Bid Corp. Ltd. | | 308,973 | 6,950,543 |
| CarrefourSA Carrefour Sabanci Ticaret Merkezi A/S (a) | | 9,671 | 31,905 |
| Clicks Group Ltd. | | 294,796 | 4,269,352 |
| CP ALL PCL (For. Reg.) | | 1,138,610 | 2,121,634 |
| Jeronimo Martins SGPS SA | | 133,102 | 3,391,735 |
| Magnit OJSC (b) | | 45,493 | 907 |
| Migros Turk Ticaret A/S | | 224,035 | 2,908,571 |
| Nahdi Medical Co. | | 110,138 | 4,457,614 |
| PT Sumber Alfaria Trijaya Tbk | | 9,855,200 | 1,876,565 |
| PUREGOLD Price Club, Inc. | | 8,136,900 | 4,008,821 |
| Raia Drogasil SA | | 4,241,078 | 23,534,662 |
| Sendas Distribuidora SA | | 2,036,000 | 4,773,369 |
| Shoprite Holdings Ltd. | | 958,958 | 13,396,976 |
| Sok Marketler Ticaret A/S | | 522,885 | 1,216,205 |
| Wal-Mart de Mexico SA de CV Series V | | 4,389,508 | 17,292,352 |
| X5 Retail Group NV GDR (Reg. S) (a)(b) | | 10,262 | 103,441 |
| Yifeng Pharmacy Chain Co. Ltd. | | 1,032,329 | 5,057,222 |
| | | | 95,766,651 |
| Food Products - 0.6% | | | |
| AVI Ltd. | | 360,936 | 1,386,407 |
| Bombay Burmah Trading Co. | | 4,995 | 60,262 |
| Brasilagro Coia Brasileira de | | 40,800 | 196,006 |
| Chacha Food Co. Ltd. (A Shares) | | 509,980 | 2,321,971 |
| Cheng de Lolo Co. Ltd. Class A | | 20,900 | 24,646 |
| China Mengniu Dairy Co. Ltd. | | 5,921,496 | 19,933,756 |
| Dhampur Bio Organics Ltd. | | 28,099 | 56,124 |
| Dhampur Sugar Mills Ltd. | | 42,112 | 129,198 |
| Dwarikesh Sugar Industries Ltd. | | 32,054 | 34,627 |
| Gruma S.A.B. de CV Series B | | 467,705 | 7,807,564 |
| Indofood Sukses Makmur Tbk PT | | 3,264,300 | 1,521,768 |
| JBS SA | | 623,882 | 2,318,117 |
| Kaveri Seed Co. Ltd. | | 17,362 | 114,729 |
| Maeil Dairies Co. Ltd. | | 702 | 23,631 |
| Minerva SA | | 238,200 | 404,051 |
| Nestle India Ltd. | | 4,143 | 1,101,319 |
| NongShim Co. Ltd. | | 2,293 | 793,515 |
| PT Indofood CBP Sukses Makmur Tbk | | 1,286,900 | 946,374 |
| PT Mayora Indah Tbk | | 116,490 | 20,040 |
| PT Perusahaan Perkebunan London Sumatra Indonesia Tbk | | 1,725,600 | 115,569 |
| PT Triputra Agro Persada | | 990,800 | 37,732 |
| Saudi Dairy & Foodstuffs Co. | | 505 | 43,086 |
| SKM Egg Products Export Ltd. | | 9,149 | 53,555 |
| SLC Agricola SA | | 118,403 | 961,656 |
| The National Agriculture Development Co. (a) | | 25,343 | 330,415 |
| Three-A Resources Bhd | | 93,000 | 16,435 |
| Uni-President China Holdings Ltd. | | 105,000 | 77,655 |
| Uni-President Enterprises Corp. | | 1,523,000 | 3,379,346 |
| Universal Robina Corp. | | 813,450 | 1,604,492 |
| Xiangpiaopiao Food Co. Ltd. | | 74,605 | 173,284 |
| | | | 45,987,330 |
| Household Products - 0.0% | | | |
| Kimberly-Clark de Mexico SA de CV Series A | | 445,500 | 1,002,280 |
| Opple Lighting Co. Ltd. (A Shares) | | 87,400 | 258,148 |
| | | | 1,260,428 |
| Personal Care Products - 0.2% | | | |
| Able C&C Ltd. (a) | | 5,949 | 36,280 |
| Colgate-Palmolive Ltd. | | 52,324 | 1,228,586 |
| Emami Ltd. | | 35,733 | 226,621 |
| Gillette India Ltd. | | 254 | 17,121 |
| Hindustan Unilever Ltd. | | 186,964 | 5,662,634 |
| LG H & H Co. Ltd. | | 3,860 | 1,353,272 |
| Natura & Co. Holding SA | | 649,000 | 1,989,443 |
| Procter & Gamble Hygiene & Hea | | 182 | 35,112 |
| | | | 10,549,069 |
| Tobacco - 0.2% | | | |
| Godfrey Phillips India Ltd. | | 5,107 | 132,831 |
| ITC Ltd. | | 3,080,127 | 16,374,542 |
| PT Gudang Garam Tbk | | 229,700 | 362,724 |
| | | | 16,870,097 |
TOTAL CONSUMER STAPLES | | | 273,643,594 |
| ENERGY - 1.8% | | | |
| Energy Equipment & Services - 0.0% | | | |
| China Oilfield Services Ltd. (H Shares) | | 664,000 | 752,703 |
| Deep Industries Ltd. | | 26,757 | 79,453 |
| | | | 832,156 |
| Oil, Gas & Consumable Fuels - 1.8% | | | |
| 3R Petroleum Oleo e Gas SA (a) | | 10,283 | 68,359 |
| Adnoc Gas PLC | | 2,506,300 | 2,347,311 |
| Bangchak Corp. PCL: | | | |
| (For. Reg.) | | 560,500 | 620,243 |
| NVDR | | 174,200 | 192,768 |
| Bharat Petroleum Corp. Ltd. | | 196,546 | 809,262 |
| Chennai Petroleum Corp. Ltd. | | 22,307 | 113,181 |
| China Coal Energy Co. Ltd. (H Shares) | | 2,291,000 | 1,562,905 |
| China Merchants Energy Shipping Co. Ltd. (A Shares) | | 2,591,560 | 2,102,852 |
| China Petroleum & Chemical Corp. (H Shares) | | 6,278,000 | 3,674,411 |
| Coal India Ltd. | | 2,702,039 | 7,515,501 |
| Esso Thailand PCL NVDR | | 1,042,600 | 291,782 |
| Exxaro Resources Ltd. | | 166,842 | 1,482,716 |
| Gazprom OAO (b) | | 1,235,592 | 125,481 |
| Gazprom OAO sponsored ADR (Reg. S) (a)(b) | | 968,777 | 221,307 |
| Hindustan Petroleum Corp. Ltd. (a) | | 398,578 | 1,195,595 |
| Indian Oil Corp. Ltd. | | 1,864,316 | 2,008,359 |
| Lanna Resources PCL NVDR | | 81,200 | 39,652 |
| LUKOIL PJSC (b) | | 165,638 | 49,757 |
| LUKOIL PJSC sponsored ADR (a)(b) | | 220,355 | 62,336 |
| MOL Hungarian Oil and Gas PLC Series A (For. Reg.) | | 210,073 | 1,590,307 |
| Oil & Natural Gas Corp. Ltd. | | 2,024,815 | 4,263,369 |
| Oil India Ltd. | | 77,714 | 256,605 |
| OMV AG | | 43,352 | 2,010,564 |
| Orlen SA | | 71,998 | 1,100,292 |
| PetroChina Co. Ltd. (H Shares) | | 29,080,000 | 20,987,689 |
| Petronet LNG Ltd. | | 111,563 | 290,408 |
| Prio SA (a) | | 2,079,784 | 19,495,678 |
| PT Adaro Energy Indonesia Tbk | | 47,674,300 | 8,357,871 |
| PT Baramulti Suksessarana Tbk | | 28,475 | 7,628 |
| PT Bukit Asam Tbk | | 5,256,626 | 987,127 |
| PT Indika Energy Tbk | | 1,227,841 | 161,240 |
| PT Indo Tambangraya Megah Tbk | | 614,200 | 1,166,496 |
| PT TBS Energi Utama Tbk | | 536,600 | 12,402 |
| PT United Tractors Tbk | | 1,466,500 | 2,503,546 |
| PTT Exploration and Production PCL NVDR | | 190,100 | 860,451 |
| Qatar Gas Transport Co. Ltd. (Nakilat) (a) | | 147,901 | 150,623 |
| Reliance Industries Ltd. | | 1,050,795 | 30,580,048 |
| Rosneft Oil Co. OJSC (b) | | 634,013 | 102,906 |
| Saudi Arabian Oil Co. (d) | | 578,508 | 5,383,048 |
| Susco Public Co. Ltd. NVDR unit | | 49,300 | 5,603 |
| Tatneft PAO sponsored ADR (a)(b) | | 28,136 | 25,979 |
| TotalEnergies SE | | 34,653 | 2,173,744 |
| Vista Energy S.A.B. de CV ADR (a) | | 44,929 | 1,204,097 |
| YPF SA Class D sponsored ADR (a) | | 57,222 | 826,286 |
| | | | 128,987,785 |
TOTAL ENERGY | | | 129,819,941 |
| FINANCIALS - 11.4% | | | |
| Banks - 8.0% | | | |
| Absa Group Ltd. | | 1,593,256 | 15,379,118 |
| Agricultural Bank of China Ltd. (H Shares) | | 18,412,980 | 6,315,826 |
| Al Rajhi Bank | | 901,425 | 17,352,428 |
| Alinma Bank | | 720,681 | 7,090,272 |
| Alliance Bank Malaysia Bhd | | 59,900 | 44,538 |
| Arab National Bank | | 725 | 4,987 |
| Axis Bank Ltd. | | 3,237,748 | 38,108,607 |
| Axis Bank Ltd. sponsored GDR (Reg. S) | | 81,179 | 4,773,325 |
| Banco de Chile | | 20,342,743 | 2,219,039 |
| Banco do Brasil SA | | 1,149,359 | 10,931,798 |
| Banco Santander Chile sponsored ADR | | 245,385 | 4,694,215 |
| Bangkok Bank PCL: | | | |
| (For. Reg.) | | 1,306,585 | 6,324,442 |
| NVDR | | 1,559,100 | 7,546,725 |
| Bank of Baroda | | 1,357,189 | 3,070,961 |
| Bank of China Ltd. (H Shares) | | 6,205,000 | 2,102,981 |
| Bank of Communications Co. Ltd. (H Shares) | | 1,827,703 | 1,046,419 |
| Bank Polska Kasa Opieki SA | | 124,756 | 3,262,761 |
| BDO Unibank, Inc. | | 1,308,626 | 3,218,994 |
| BNK Financial Group, Inc. | | 85,128 | 438,196 |
| Capitec Bank Holdings Ltd. | | 258,714 | 21,709,509 |
| China CITIC Bank Corp. Ltd. (H Shares) | | 4,853,000 | 2,159,680 |
| China Construction Bank Corp. (H Shares) | | 47,089,871 | 25,195,477 |
| China Merchants Bank Co. Ltd. (H Shares) | | 2,769,000 | 10,945,571 |
| China Minsheng Banking Corp. Ltd. (H Shares) | | 1,024,000 | 329,044 |
| Credicorp Ltd. (United States) | | 134,482 | 19,019,789 |
| CTBC Financial Holding Co. Ltd. | | 5,629,000 | 4,213,403 |
| Dcb Bank Ltd. | | 51,533 | 72,680 |
| DGB Financial Group Co. Ltd. | | 53,351 | 302,006 |
| Emirates NBD Bank PJSC (a) | | 296,459 | 1,319,658 |
| Eurobank Ergasias Services and Holdings SA (a) | | 1,888,361 | 3,282,374 |
| First Abu Dhabi Bank PJSC | | 574,940 | 2,141,350 |
| Grupo Financiero Banorte S.A.B. de CV Series O | | 4,183,171 | 35,432,014 |
| Gulf Bank | | 499,480 | 408,334 |
| Hana Financial Group, Inc. | | 290,218 | 8,663,289 |
| HDFC Bank Ltd. (a) | | 3,446,428 | 65,321,971 |
| HDFC Bank Ltd. sponsored ADR | | 114,443 | 7,130,943 |
| Hong Leong Credit Bhd | | 3,000 | 11,780 |
| ICICI Bank Ltd. | | 2,911,345 | 33,639,552 |
| ICICI Bank Ltd. sponsored ADR | | 894,875 | 20,734,254 |
| Indian Bank | | 69,287 | 317,200 |
| Industrial & Commercial Bank of China Ltd. (H Shares) | | 38,958,970 | 17,861,808 |
| Itausa-Investimentos Itau SA rights 9/22/23 (a) | | 560 | 313 |
| KB Financial Group, Inc. | | 339,144 | 13,782,441 |
| Kotak Mahindra Bank Ltd. | | 174,471 | 3,709,979 |
| Krung Thai Bank PCL: | | | |
| (For. Reg.) | | 2,078,800 | 1,145,737 |
| NVDR | | 3,506,600 | 1,932,673 |
| National Bank of Greece SA (a) | | 3,964,485 | 26,971,232 |
| Nova Ljubljanska banka d.d. GDR | | 358,945 | 6,013,480 |
| Nu Holdings Ltd. (a) | | 513,000 | 3,514,050 |
| OTP Bank PLC | | 403,925 | 16,500,950 |
| Piraeus Financial Holdings SA (a) | | 580,902 | 2,010,644 |
| Powszechna Kasa Oszczednosci Bank SA | | 227,996 | 2,064,050 |
| PT Bank Central Asia Tbk | | 42,795,444 | 25,781,234 |
| PT Bank Danamon Indonesia Tbk Series A | | 355,601 | 68,412 |
| PT Bank Mandiri (Persero) Tbk | | 15,437,824 | 6,107,215 |
| PT Bank Negara Indonesia (Persero) Tbk | | 3,982,200 | 2,398,994 |
| PT Bank Rakyat Indonesia (Persero) Tbk | | 33,297,221 | 12,133,918 |
| Qatar National Bank SAQ (a) | | 1,023,408 | 4,386,034 |
| Saudi Awwal Bank | | 77,053 | 736,499 |
| Sberbank of Russia (b) | | 2,908,251 | 17,354 |
| Sberbank of Russia: | | | |
| (RTSX) (b) | | 328,709 | 1,961 |
| sponsored ADR (a)(b) | | 1,288,149 | 22,929 |
| SCB X PCL: | | | |
| (For. Reg.) | | 1,033,200 | 3,481,619 |
| NVDR | | 124,400 | 419,196 |
| Sharjah Islamic Bank | | 49,446 | 33,790 |
| Shinhan Financial Group Co. Ltd. | | 186,517 | 4,998,182 |
| Standard Bank Group Ltd. | | 439,613 | 4,497,624 |
| State Bank of India | | 228,469 | 1,550,619 |
| TCS Group Holding PLC GDR (a)(b) | | 56,354 | 676,248 |
| The Karnataka Bank Ltd. | | 396,111 | 1,058,887 |
| The Karur Vysya Bank Ltd. | | 528,830 | 777,168 |
| The Saudi National Bank | | 1,820,106 | 17,348,670 |
| Union Bank of India Ltd. | | 898,780 | 933,449 |
| Woori Financial Group, Inc. | | 124,823 | 1,122,066 |
| | | | 580,334,935 |
| Capital Markets - 0.6% | | | |
| Alexander Forbes Group Holdings Ltd. | | 888 | 273 |
| B3 SA - Brasil Bolsa Balcao | | 2,263,800 | 5,910,872 |
| Banco BTG Pactual SA unit | | 1,662,158 | 10,898,571 |
| Bursa Malaysia Bhd | | 88,200 | 131,159 |
| China Galaxy Securities Co. Ltd. (H Shares) | | 2,619,000 | 1,409,294 |
| Daishin Securities Co. Ltd. | | 3,234 | 35,149 |
| East Money Information Co. Ltd. (A Shares) | | 91,262 | 199,526 |
| HDFC Asset Management Co. Ltd. (d) | | 65,051 | 1,985,280 |
| Hong Kong Exchanges and Clearing Ltd. | | 214,200 | 8,303,225 |
| IIFL Securities Ltd. | | 31,762 | 30,875 |
| Kiwoom Securities Co. Ltd. | | 7,743 | 603,701 |
| Korea Investment Holdings Co. Ltd. | | 16,726 | 656,459 |
| Motilal Oswal Financial Services Ltd. | | 2,593 | 28,841 |
| Nahar Capital & Finance Services Ltd. | | 1,596 | 5,536 |
| Noah Holdings Ltd. sponsored ADR (c) | | 30,266 | 421,000 |
| Prudent Corporate Advisory Services Ltd. | | 1,292 | 16,824 |
| Samsung Securities Co. Ltd. | | 28,763 | 810,843 |
| VLS Finance Ltd. | | 24,557 | 63,033 |
| XP, Inc. Class A | | 378,637 | 9,594,662 |
| | | | 41,105,123 |
| Consumer Finance - 0.3% | | | |
| Bajaj Finance Ltd. | | 67,864 | 5,877,308 |
| FinVolution Group ADR | | 144,801 | 726,901 |
| Fusion Micro Finance Ltd. | | 10,485 | 79,896 |
| Gentera S.A.B. de CV | | 3,069,835 | 3,761,113 |
| Kaspi.KZ JSC GDR (Reg. S) | | 58,996 | 6,005,793 |
| Manappuram General Finance & Leasing Ltd. | | 654,076 | 1,222,593 |
| Muthoot Finance Ltd. | | 46,137 | 703,047 |
| Qifu Technology, Inc. ADR | | 93,678 | 1,592,526 |
| Repco Home Finance Ltd. | | 17,748 | 83,258 |
| Shriram Transport Finance Co. Ltd. | | 79,738 | 1,859,020 |
| Ujjivan Financial Services Ltd. | | 44,080 | 258,907 |
| | | | 22,170,362 |
| Financial Services - 0.6% | | | |
| Chailease Holding Co. Ltd. | | 3,804,930 | 21,196,217 |
| FirstRand Ltd. | | 3,298,980 | 12,822,088 |
| Jio Financial Services Ltd. | | 898,661 | 2,537,037 |
| Power Finance Corp. Ltd. | | 776,960 | 2,444,275 |
| REC Ltd. | | 1,346,082 | 3,883,980 |
| Yuanta Financial Holding Co. Ltd. | | 1,115,642 | 854,335 |
| | | | 43,737,932 |
| Insurance - 1.9% | | | |
| AIA Group Ltd. | | 4,239,584 | 38,360,858 |
| Caixa Seguridade Participacoes | | 62,300 | 135,871 |
| Cathay Financial Holding Co. Ltd. | | 2,830,286 | 4,050,499 |
| China Life Insurance Co. Ltd. (H Shares) | | 15,340,559 | 23,277,800 |
| China Pacific Insurance (Group) Co. Ltd. (H Shares) | | 6,429,400 | 14,724,161 |
| China Taiping Insurance Group Ltd. | | 1,756,234 | 1,849,764 |
| Db Insurance Co. Ltd. | | 30,189 | 1,861,585 |
| Hanwha Life Insurance Co. Ltd. (a) | | 130,319 | 247,376 |
| HDFC Standard Life Insurance Co. Ltd. (d) | | 1,588,309 | 12,381,419 |
| Hyundai Fire & Marine Insurance Co. Ltd. | | 33,666 | 768,650 |
| Momentum Metropolitan Holdings | | 150,789 | 160,730 |
| New China Life Insurance Co. Ltd. (H Shares) | | 290,200 | 726,763 |
| Old Mutual Ltd. | | 527,907 | 354,733 |
| OUTsurance Group Ltd. | | 254,415 | 538,872 |
| PICC Property & Casualty Co. Ltd. (H Shares) | | 5,906,000 | 6,792,877 |
| Ping An Insurance Group Co. of China Ltd. (H Shares) | | 2,578,055 | 15,435,198 |
| Powszechny Zaklad Ubezpieczen SA | | 1,031,008 | 10,328,323 |
| PT Panin Financial Tbk | | 2,868,938 | 55,005 |
| Samsung Fire & Marine Insurance Co. Ltd. | | 45,551 | 8,474,749 |
| Samsung Life Insurance Co. Ltd. | | 18,155 | 926,307 |
| Tong Yang Life Insurance Co. Ltd. (a) | | 6,771 | 22,563 |
| | | | 141,474,103 |
TOTAL FINANCIALS | | | 828,822,455 |
| HEALTH CARE - 1.6% | | | |
| Biotechnology - 0.2% | | | |
| BeiGene Ltd. ADR (a) | | 48,776 | 10,123,459 |
| Innovent Biologics, Inc. (a)(d) | | 788,500 | 3,529,089 |
| | | | 13,652,548 |
| Health Care Equipment & Supplies - 0.1% | | | |
| Cofoe Medical Technology Co. Ltd. (A Shares) | | 69,310 | 366,847 |
| Edan Instruments, Inc. (A Shares) | | 307,100 | 470,031 |
| Peijia Medical Ltd. (a)(d) | | 738,000 | 683,198 |
| Poly Medicure Ltd. | | 7,797 | 138,067 |
| Rayence Co. Ltd. | | 12,372 | 94,500 |
| Shanghai Kindly Enterprise Development Group Co. Ltd. (A Shares) | | 384,500 | 525,990 |
| Shenzhen Mindray Bio-Medical Electronics Co. Ltd. (A Shares) | | 190,825 | 7,097,922 |
| Xiangyu Medical Co. Ltd. (A Shares) | | 67,261 | 378,334 |
| | | | 9,754,889 |
| Health Care Providers & Services - 0.5% | | | |
| Apollo Hospitals Enterprise Ltd. | | 96,323 | 5,606,466 |
| Bangkok Dusit Medical Services PCL: | | | |
| (For. Reg.) | | 1,478,200 | 1,181,969 |
| NVDR | | 1,260,200 | 1,007,656 |
| Bumrungrad Hospital PCL: | | | |
| (For. Reg.) | | 239,200 | 1,769,195 |
| NVDR | | 79,400 | 587,266 |
| Dr Sulaiman Al Habib Medical Services Group Co. | | 17,180 | 1,113,071 |
| Ekachai Medical Care PCL NVDR | | 585,070 | 135,334 |
| Hapvida Participacoes e Investimentos SA (a)(d) | | 12,391,352 | 10,659,658 |
| Indraprastha Medical Corp. Ltd. | | 22,405 | 48,773 |
| Max Healthcare Institute Ltd. | | 91,875 | 654,881 |
| Netcare Ltd. | | 5,879,466 | 4,122,008 |
| Rede D'Oregon Sao Luiz SA (d) | | 453,061 | 2,622,092 |
| Shalby Ltd. | | 6,366 | 18,734 |
| Shanghai Pharmaceuticals Holding Co. Ltd. (H Shares) | | 451,900 | 743,337 |
| Sinopharm Group Co. Ltd. (H Shares) | | 495,200 | 1,436,534 |
| | | | 31,706,974 |
| Health Care Technology - 0.0% | | | |
| Medlive Technology Co. Ltd. (d) | | 159,500 | 142,368 |
| Life Sciences Tools & Services - 0.2% | | | |
| WuXi AppTec Co. Ltd. (H Shares) (d) | | 206,696 | 2,264,014 |
| Wuxi Biologics (Cayman), Inc. (a)(d) | | 1,977,037 | 11,145,753 |
| | | | 13,409,767 |
| Pharmaceuticals - 0.6% | | | |
| Alembic Pharmaceuticals Ltd. | | 18,248 | 171,361 |
| Aspen Pharmacare Holdings Ltd. | | 305,882 | 2,789,138 |
| Aurobindo Pharma Ltd. | | 200,529 | 2,012,331 |
| Bora Pharmaceuticals Co. Ltd. | | 20,266 | 454,765 |
| Caplin Point Laboratories Ltd. | | 16,529 | 211,155 |
| China Resources Pharmaceutical Group Ltd. (d) | | 1,015,500 | 678,524 |
| Dr. Reddy's Laboratories Ltd. | | 27,087 | 1,833,989 |
| Glenmark Life Sciences Ltd. | | 14,763 | 113,458 |
| Glenmark Pharmaceuticals Ltd. | | 72,974 | 676,585 |
| Hansoh Pharmaceutical Group Co. Ltd. (d) | | 5,468,000 | 7,111,848 |
| Hypera SA | | 301,800 | 2,376,224 |
| Jiangsu Jibeier Pharmaceutical Co. Ltd. (A Shares) | | 73,507 | 274,632 |
| Jiangsu Kanion Pharmaceutical Co. Ltd. Class A | | 80,600 | 201,754 |
| JW Holdings Corp. | | 10,771 | 34,795 |
| Lotus Pharmaceutical Co. Ltd. | | 193,000 | 1,535,496 |
| Mankind Pharma Ltd. | | 116,000 | 2,528,563 |
| Natco Pharma Ltd. | | 37,198 | 410,907 |
| Neuland Laboratories Ltd. | | 3,097 | 145,263 |
| Richter Gedeon PLC | | 846,027 | 21,232,519 |
| Tasly Pharmaceutical Group Co. Ltd. (A Shares) | | 392,000 | 750,642 |
| Youcare Pharmaceutical Group Co. Ltd. (A Shares) | | 32,379 | 75,251 |
| Zydus Lifesciences Ltd. | | 51,101 | 386,673 |
| | | | 46,005,873 |
TOTAL HEALTH CARE | | | 114,672,419 |
| INDUSTRIALS - 4.4% | | | |
| Aerospace & Defense - 0.5% | | | |
| Bharat Electronics Ltd. | | 716,468 | 1,153,839 |
| Embraer SA (a) | | 627,269 | 2,468,770 |
| Hanwha Aerospace Co. Ltd. | | 44,660 | 3,849,433 |
| Hindustan Aeronautics Ltd. | | 287,867 | 13,574,817 |
| Korea Aerospace Industries Ltd. | | 339,786 | 12,976,811 |
| Mazagon Dock Shipbuilders Ltd. | | 46,043 | 1,029,278 |
| | | | 35,052,948 |
| Air Freight & Logistics - 0.2% | | | |
| Dimerco Express Corp. | | 179,558 | 432,229 |
| Hyundai Glovis Co. Ltd. | | 17,418 | 2,267,772 |
| Milkyway Chemical Supply Chain Service Co. Ltd. (A Shares) | | 226,086 | 2,564,894 |
| SF Holding Co. Ltd. (A Shares) | | 347,791 | 2,083,244 |
| Transport Corp. of India Ltd. | | 11,277 | 110,541 |
| ZTO Express, Inc. sponsored ADR | | 161,217 | 4,052,995 |
| | | | 11,511,675 |
| Building Products - 0.1% | | | |
| Bawan Co. | | 56,000 | 524,069 |
| Beijing New Building Materials PLC (A Shares) | | 157,593 | 649,143 |
| Cera Sanitaryware Ltd. | | 3,493 | 401,509 |
| China Liansu Group Holdings Ltd. | | 83,000 | 45,721 |
| Ege Profil Ticaret ve Sanayi A/S | | 9,918 | 49,590 |
| KCC Glass Corp. | | 1,282 | 40,494 |
| LX Hausys Ltd. | | 1,397 | 53,986 |
| Prince Pipes & Fittings Ltd. | | 12,590 | 109,058 |
| PT Mulia Industrindo Tbk | | 3,988,500 | 114,182 |
| Zhejiang Weixing New Building Materials Co. Ltd. (A Shares) | | 761,209 | 2,119,349 |
| | | | 4,107,101 |
| Commercial Services & Supplies - 0.0% | | | |
| Ion Exchange (INDIA) Ltd. | | 15,350 | 105,201 |
| L&K Engineering Co. Ltd. | | 59,000 | 171,651 |
| Radiant Cash Management Services Ltd. | | 49,853 | 58,075 |
| S1 Corp. | | 2,980 | 125,505 |
| | | | 460,432 |
| Construction & Engineering - 0.5% | | | |
| Ahluwalia Contracts (India) Ltd. | | 6,288 | 55,209 |
| Budimex SA | | 65 | 7,090 |
| China Railway Group Ltd. (H Shares) | | 4,557,993 | 2,411,990 |
| China State Construction International Holdings Ltd. | | 434,000 | 483,123 |
| Daewoo Engineering & Construction Co. Ltd. (a) | | 167,640 | 582,033 |
| Dl Construction Co. Ltd. | | 829 | 7,465 |
| DL E&C Co. Ltd. | | 20,982 | 490,931 |
| Hyundai Engineering & Construction Co. Ltd. | | 22,127 | 592,875 |
| ITD Cementation India Ltd. | | 215,032 | 565,076 |
| Kumhoe&C Co. Ltd. | | 7,308 | 29,399 |
| Larsen & Toubro Ltd. | | 680,394 | 22,233,222 |
| Metallurgical Corp. China Ltd. (H Shares) | | 4,236,882 | 923,839 |
| Orascom Construction PLC | | 1,460 | 5,462 |
| Power Mech Projects Ltd. | | 2,662 | 136,001 |
| Samsung Engineering Co. Ltd. (a) | | 54,556 | 1,400,017 |
| Shanghai Pudong Construction Co. Ltd. (A Shares) | | 1,159,658 | 1,087,951 |
| Sinopec Engineering Group Co. Ltd. (H Shares) | | 574,738 | 266,030 |
| Voltas Ltd. | | 441,387 | 4,642,297 |
| Welspun Enterprises Ltd. | | 46,513 | 156,422 |
| | | | 36,076,432 |
| Electrical Equipment - 0.7% | | | |
| ABB India Ltd. | | 21,802 | 1,154,963 |
| Bharat Heavy Electricals Ltd. | | 5,568,600 | 8,163,415 |
| Cg Power & Industrial Soluti | | 161,725 | 839,523 |
| China High Speed Transmission Equipment Group Co. Ltd. (a) | | 378 | 123 |
| Contemporary Amperex Technology Co. Ltd. | | 682,632 | 22,245,480 |
| CyberPower Systems, Inc. | | 55,650 | 411,310 |
| DONGYANG E&P, Inc. | | 21,665 | 392,448 |
| Elecon Engineering Co. Ltd. | | 41,736 | 445,570 |
| Electrical Industries Co. | | 41,786 | 496,558 |
| Harbin Electric Machinery Co. Ltd.(H Shares) | | 565,906 | 173,185 |
| HD Hyundai Electric Co. Ltd. | | 12,951 | 688,158 |
| Hongfa Technology Co. Ltd. (A Shares) | | 599,141 | 2,898,783 |
| LS Corp. | | 17,443 | 1,410,011 |
| Middle East Specialized Cables Co. (a) | | 16,751 | 76,282 |
| NARI Technology Co. Ltd. (A Shares) | | 1,311,292 | 4,303,020 |
| Polycab India Ltd. | | 18,371 | 1,137,904 |
| Riyadh Cables Group Co. | | 26,483 | 547,220 |
| Sieyuan Electric Co. Ltd. (A Shares) | | 337,555 | 2,380,000 |
| TD Power Systems Ltd. | | 42,075 | 134,808 |
| Triveni Turbine Ltd. | | 167,479 | 792,649 |
| Weg SA | | 359,321 | 2,603,455 |
| | | | 51,294,865 |
| Ground Transportation - 0.6% | | | |
| Globaltrans Investment PLC GDR (Reg. S) (a)(b) | | 13,245 | 4,580 |
| Localiza Rent a Car SA | | 2,809,931 | 35,889,810 |
| PT Rmk Energy Tbk | | 2,594,800 | 136,299 |
| United International Transportation Co. | | 164,165 | 3,221,453 |
| Vamos Locacao de Caminhoes Maquinas e Equipamentos SA | | 1,323,915 | 3,130,632 |
| | | | 42,382,774 |
| Industrial Conglomerates - 0.2% | | | |
| Aamal Co. (a) | | 177,954 | 41,213 |
| AK Holdings, Inc. | | 1,601 | 23,358 |
| Alfa SA de CV Series A | | 467,100 | 308,743 |
| Apar Industries Ltd. | | 2,300 | 139,276 |
| Astra Industrial Group | | 28,377 | 696,062 |
| Bidvest Group Ltd./The | | 50,333 | 759,459 |
| CITIC Pacific Ltd. | | 2,512,000 | 2,495,232 |
| CITIC Resources Holdings Ltd. | | 590,000 | 27,836 |
| CJ Corp. | | 15,268 | 810,120 |
| GS Holdings Corp. | | 28,871 | 818,246 |
| Hanwha Corp. | | 49,284 | 929,946 |
| Industries Qatar QSC (a) | | 142,329 | 483,293 |
| Koc Holding A/S | | 330,027 | 1,751,399 |
| Kolon Corp. | | 8,285 | 115,622 |
| Multiply Group (a) | | 1,050,206 | 1,089,378 |
| Mytilineos SA | | 23,136 | 939,277 |
| Nava Bharat Ventures Ltd. | | 157,633 | 809,991 |
| PT Astra International Tbk | | 6,588,700 | 2,790,356 |
| SM Investments Corp. | | 51,230 | 753,569 |
| Thoresen Thai Agencies PCL NVDR | | 685,000 | 121,282 |
| | | | 15,903,658 |
| Machinery - 1.1% | | | |
| Action Construction Equipment Ltd. | | 17,882 | 165,416 |
| AIA Engineering Ltd. | | 2,974 | 132,867 |
| Airtac International Group | | 276,279 | 7,977,174 |
| China International Marine Containers Group Co. Ltd. (H Shares) | | 663,903 | 369,101 |
| Craftsman Automation Ltd. | | 1,665 | 99,005 |
| Doosan Bobcat, Inc. | | 25,469 | 1,034,204 |
| DY POWER Corp. | | 5,260 | 53,358 |
| Force Motors Ltd. | | 3,197 | 132,654 |
| Haitian International Holdings Ltd. | | 44,000 | 94,482 |
| Hangcha Group Co. Ltd. (A Shares) | | 214,000 | 686,913 |
| HD Hyundai Construction Equipment Co. Ltd. | | 13,504 | 725,695 |
| Hd Hyundai Infracore Co. Ltd. | | 19,930 | 158,397 |
| HIWIN Technologies Corp. | | 1,234,490 | 7,942,455 |
| Huaming Power Equipement Co. Ltd. | | 416,095 | 703,346 |
| Hyundai Mipo Dockyard Co. Ltd. (a) | | 139,200 | 9,560,764 |
| ISGEC Heavy Engineering Ltd. | | 5,093 | 42,808 |
| JVM Co. Ltd. | | 2,148 | 54,960 |
| Kirloskar Brothers Ltd. | | 22,844 | 234,656 |
| Nova Technology Corp. | | 9,000 | 35,025 |
| NRB Bearings Ltd. | | 52,129 | 170,329 |
| Roto Pumps Ltd. | | 13,214 | 57,116 |
| Sany Heavy Equipment International Holdings Co. Ltd. | | 93,000 | 145,150 |
| Sany Heavy Industry Co. Ltd. (A Shares) | | 4,452,900 | 9,502,252 |
| Shenzhen Inovance Technology Co. Ltd. (A Shares) | | 2,398,733 | 22,563,559 |
| Sinoseal Holding Co. Ltd. (a) | | 109,497 | 582,568 |
| Sinotruk Hong Kong Ltd. | | 6,026,559 | 11,173,458 |
| SNT Energy Co. Ltd. | | 3,136 | 51,008 |
| Techtronic Industries Co. Ltd. | | 545,500 | 5,390,763 |
| Tega Industries Ltd. | | 11,269 | 135,621 |
| Tian Di Science & Technology Co. Ltd. (A Shares) | | 1,570,000 | 1,137,673 |
| Turk Traktor ve Ziraat Makinalari A/S | | 10,429 | 355,254 |
| Weichai Power Co. Ltd.: | | | |
| (A Shares) (a) | | 102 | 166 |
| (H Shares) | | 158,000 | 205,097 |
| Zhejiang Sanhua Intelligent Controls Co. Ltd. (A Shares) | | 373,730 | 1,529,138 |
| | | | 83,202,432 |
| Marine Transportation - 0.2% | | | |
| COSCO SHIPPING Holdings Co. Ltd. (H Shares) | | 3,047,800 | 3,128,500 |
| Danaos Corp. (c) | | 16,274 | 1,092,311 |
| Evergreen Marine Corp. (Taiwan) | | 2,087,400 | 6,976,998 |
| HMM Co. Ltd. | | 38,986 | 490,225 |
| Orient Overseas International Ltd. | | 10,042 | 134,707 |
| Pacific Basin Shipping Ltd. | | 9,155,000 | 2,486,519 |
| PT Temas Tbk | | 2,278,462 | 26,480 |
| Qatar Navigation QPSC | | 6,188 | 16,278 |
| | | | 14,352,018 |
| Passenger Airlines - 0.1% | | | |
| Air Arabia PJSC | | 603,829 | 484,970 |
| China Airlines Ltd. | | 246,000 | 174,485 |
| EVA Airways Corp. | | 1,474,000 | 1,457,207 |
| InterGlobe Aviation Ltd. (a)(d) | | 10,064 | 296,288 |
| Korean Air Lines Co. Ltd. | | 162,253 | 2,792,155 |
| Turk Hava Yollari AO (a) | | 246,766 | 2,262,616 |
| | | | 7,467,721 |
| Professional Services - 0.1% | | | |
| Centre Testing International Group Co. Ltd. (A Shares) | | 1,130,637 | 3,029,528 |
| Headhunter Group PLC ADR (a)(b) | | 18,283 | 49,762 |
| Pony Testing International Group Co. Ltd. | | 603,096 | 1,794,619 |
| SaraminHR Co. Ltd. | | 3,640 | 54,947 |
| WNS Holdings Ltd. sponsored ADR (a) | | 34,653 | 2,264,574 |
| | | | 7,193,430 |
| Trading Companies & Distributors - 0.1% | | | |
| Asia Green Energy PCL NVDR | | 1,783,870 | 118,186 |
| BOC Aviation Ltd. Class A (d) | | 548,100 | 4,113,013 |
| LX International Corp. | | 38,006 | 870,608 |
| MSTC Ltd. | | 41,855 | 197,890 |
| Sanghvi Movers Ltd. | | 11,349 | 101,855 |
| | | | 5,401,552 |
| Transportation Infrastructure - 0.0% | | | |
| Cosco Shipping Ports Ltd. | | 149,051 | 91,799 |
| Grupo Aeroportuario del Pacifico S.A.B. de CV Series B | | 153,165 | 2,814,021 |
| Grupo Aeroportuario Norte S.A.B. de CV | | 54,400 | 629,681 |
| | | | 3,535,501 |
TOTAL INDUSTRIALS | | | 317,942,539 |
| INFORMATION TECHNOLOGY - 12.7% | | | |
| Communications Equipment - 0.2% | | | |
| Accton Technology Corp. | | 532,000 | 7,980,918 |
| Arcadyan Technology Corp. | | 164,000 | 764,335 |
| BYD Electronic International Co. Ltd. | | 66,000 | 305,916 |
| D-Link Corp. | | 310,000 | 243,715 |
| Gemtek Technology Corp. | | 25,000 | 29,266 |
| SerComm Corp. | | 400,000 | 1,525,280 |
| Wistron NeWeb Corp. | | 303,000 | 1,274,268 |
| ZTE Corp. (H Shares) | | 62,800 | 202,197 |
| Zyxel Group Corp. | | 215,000 | 319,838 |
| | | | 12,645,733 |
| Electronic Equipment, Instruments & Components - 1.3% | | | |
| AAC Technology Holdings, Inc. | | 62,000 | 120,168 |
| Alltop Technology Co. Ltd. | | 6,000 | 32,295 |
| Chin-Poon Industrial Co. Ltd. | | 164,000 | 202,279 |
| Chroma ATE, Inc. | | 214,000 | 1,880,551 |
| Control Print Ltd. | | 3,370 | 31,223 |
| Daeduck Electronics Co. Ltd. | | 4,988 | 24,546 |
| Delta Electronics, Inc. | | 380,000 | 4,126,416 |
| E Ink Holdings, Inc. | | 440,000 | 2,520,164 |
| Elite Material Co. Ltd. | | 157,000 | 2,155,714 |
| FIH Mobile Ltd. (a) | | 2,442,000 | 214,857 |
| FLEXium Interconnect, Inc. | | 118,000 | 336,635 |
| General Interface Solution Holding Ltd. | | 90,000 | 174,842 |
| Gold Circuit Electronics Ltd. | | 453,000 | 3,063,789 |
| HannStar Board Corp. | | 494,000 | 855,814 |
| Hitevision Co. Ltd. (A Shares) | | 138,500 | 448,575 |
| Hon Hai Precision Industry Co. Ltd. (Foxconn) | | 7,818,256 | 26,132,011 |
| Innolux Corp. | | 1,035,500 | 469,603 |
| Kingboard Chemical Holdings Ltd. | | 55,500 | 125,970 |
| LG Innotek Co. Ltd. | | 25,699 | 5,237,113 |
| Lotes Co. Ltd. | | 71,000 | 1,927,471 |
| Nexcom International Co. Ltd. | | 83,000 | 130,766 |
| Primax Electronics Ltd. | | 69,917 | 145,482 |
| Samsung Electro-Mechanics Co. Ltd. | | 74,345 | 7,597,705 |
| Samsung SDI Co. Ltd. | | 28,658 | 13,280,861 |
| Sea Sonic Electronics Co. Ltd. | | 24,000 | 74,946 |
| Shenzhen Laibao Hi-Tech Co. Ltd. (A Shares) | | 392,300 | 501,532 |
| Shilchar Technologies Ltd. | | 1,134 | 44,332 |
| Simplo Technology Co. Ltd. | | 123,000 | 1,187,035 |
| SINBON Electronics Co. Ltd. | | 258,000 | 2,510,121 |
| Sirtec International Co. Ltd. | | 1,000 | 868 |
| Sunny Optical Technology Group Co. Ltd. | | 905,700 | 7,402,803 |
| Suprema, Inc. (a) | | 5,353 | 87,472 |
| Supreme Electronics Co. Ltd. | | 107,800 | 163,072 |
| Tripod Technology Corp. | | 100,000 | 593,164 |
| Unimicron Technology Corp. | | 649,010 | 3,778,406 |
| Universal Scientific Industrial Shanghai Co. Ltd. (A Shares) | | 479,100 | 973,532 |
| Ventec International Group Co. Ltd. | | 36,000 | 107,786 |
| WebLink International, Inc. | | 22,000 | 37,354 |
| Xiamen Faratronic Co. Ltd. (A Shares) | | 60,800 | 951,930 |
| Yageo Corp. | | 551,704 | 8,397,716 |
| Zen Technologies Ltd. | | 13,227 | 134,414 |
| | | | 98,181,333 |
| IT Services - 1.1% | | | |
| Arabian Internet and Communications Services Co. Ltd. | | 43,542 | 4,098,043 |
| ChinaSoft International Ltd. | | 210,000 | 139,244 |
| Cigniti Technologies Ltd. | | 8,166 | 79,306 |
| Digital China Holdings Ltd. (H Shares) | | 151,000 | 48,906 |
| Elm Co. | | 43,185 | 9,786,904 |
| Gabia, Inc. | | 5,261 | 56,942 |
| Globant SA (a)(c) | | 58,217 | 11,903,630 |
| HCL Technologies Ltd. | | 880,726 | 12,481,538 |
| Infosys Ltd. | | 794,386 | 13,778,798 |
| Infosys Ltd. sponsored ADR (c) | | 639,225 | 11,103,338 |
| Lotte Data Communication Co. | | 2,071 | 42,048 |
| Presight AI Holding PLC | | 127,135 | 111,801 |
| Saksoft Ltd. | | 28,035 | 108,415 |
| Samsung SDS Co. Ltd. | | 5,073 | 543,707 |
| Tata Consultancy Services Ltd. | | 335,753 | 13,626,661 |
| Wipro Ltd. | | 66,508 | 328,400 |
| Zensar Technologies Ltd. | | 155,428 | 990,245 |
| | | | 79,227,926 |
| Semiconductors & Semiconductor Equipment - 6.7% | | | |
| Advanced Analog Technology, Inc. | | 33,000 | 66,594 |
| Advanced Micro-Fabrication Equipment, Inc., China (A Shares) (a) | | 157,200 | 3,299,124 |
| Advanced Process Systems Corp. | | 2,751 | 37,935 |
| Alchip Technologies Ltd. | | 115,000 | 8,914,729 |
| ASE Technology Holding Co. Ltd. | | 2,025,000 | 7,491,192 |
| ASML Holding NV (Netherlands) | | 8,832 | 5,807,289 |
| ASMPT Ltd. | | 367,600 | 3,681,930 |
| ChipMOS TECHNOLOGIES, Inc. | | 216,000 | 259,976 |
| Contrel Technology Co. Ltd. | | 122,000 | 67,771 |
| Daqo New Energy Corp. ADR (a)(c) | | 84,651 | 3,129,547 |
| DB HiTek Co. Ltd. | | 32,115 | 1,296,802 |
| eGalax_eMPIA Technology, Inc. | | 309,826 | 590,228 |
| eMemory Technology, Inc. | | 70,853 | 4,035,973 |
| Eugene Technology Co. Ltd. | | 4,905 | 127,353 |
| Everlight Electronics Co. Ltd. | | 73,000 | 105,160 |
| Fitipower Integrated Technology, Inc. | | 238,000 | 1,071,870 |
| Flat Glass Group Co. Ltd. | | 1,999,000 | 4,965,415 |
| Generalplus Technology, Inc. | | 41,000 | 64,724 |
| ITE Tech, Inc. | | 193,000 | 869,206 |
| KC Tech Co. Ltd. | | 2,576 | 42,482 |
| King Yuan Electronics Co. Ltd. | | 2,042,000 | 4,921,872 |
| Lx Semicon Co. Ltd. | | 15,742 | 1,058,643 |
| Machvision, Inc. | | 9,000 | 56,633 |
| Macroblock, Inc. | | 39,000 | 111,995 |
| MediaTek, Inc. | | 1,304,528 | 28,863,956 |
| MPI Corp. | | 46,000 | 284,405 |
| Nanya Technology Corp. | | 739,000 | 1,544,657 |
| Novatek Microelectronics Corp. | | 749,000 | 9,391,002 |
| Phison Electronics Corp. | | 28,000 | 372,156 |
| Powertech Technology, Inc. | | 189,000 | 591,385 |
| PSK, Inc. | | 12,113 | 171,421 |
| Radiant Opto-Electronics Corp. | | 844,000 | 3,165,364 |
| Raydium Semiconductor Corp. | | 53,572 | 541,386 |
| Realtek Semiconductor Corp. | | 612,000 | 8,028,623 |
| Silergy Corp. | | 427,000 | 3,846,122 |
| Sitronix Technology Corp. | | 200,000 | 1,569,218 |
| SK Hynix, Inc. | | 420,236 | 38,632,474 |
| Sonix Technology Co. Ltd. | | 10,000 | 13,872 |
| Sunplus Innovation Technology, Inc. | | 18,000 | 77,111 |
| Taiwan Semiconductor Manufacturing Co. Ltd. | | 18,237,576 | 313,213,221 |
| Taiwan Semiconductor Manufacturing Co. Ltd. sponsored ADR | | 163,827 | 15,329,292 |
| Taiwan Surface Mounting Technology Co. Ltd. | | 82,000 | 235,992 |
| United Microelectronics Corp. | | 2,178,000 | 3,108,028 |
| Vanguard International Semiconductor Corp. | | 1,046,000 | 2,242,155 |
| Winbond Electronics Corp. | | 2,697,000 | 2,230,360 |
| YoungTek Electronics Corp. | | 13,000 | 23,256 |
| | | | 485,549,899 |
| Software - 0.1% | | | |
| Aurionpro Solutions Ltd. | | 5,213 | 63,939 |
| Birlasoft Ltd. | | 34,299 | 211,368 |
| Cyient Ltd. | | 27,413 | 542,678 |
| Genesis Technology, Inc. | | 24,833 | 53,854 |
| Glodon Co. Ltd. (A Shares) | | 362,980 | 1,227,127 |
| Intellect Design Arena Ltd. | | 15,138 | 134,524 |
| KPIT Technologies Ltd. | | 254,305 | 3,615,508 |
| Newgen Software Technologies Ltd. | | 5,657 | 58,749 |
| Nucleus Software Exports Ltd. | | 29,906 | 363,766 |
| Oracle Financial Services Soft | | 3,355 | 166,688 |
| Rategain Travel Technologies Ltd. (a) | | 42,866 | 311,792 |
| Sangfor Technologies, Inc. (a) | | 58,200 | 874,582 |
| Tanla Solutions Ltd. | | 13,556 | 159,924 |
| ZWSOFT Co. Ltd. Guangzhou (A Shares) | | 109,121 | 2,032,588 |
| | | | 9,817,087 |
| Technology Hardware, Storage & Peripherals - 3.3% | | | |
| Acer, Inc. | | 1,897,000 | 2,179,023 |
| Asia Vital Components Co. Ltd. | | 189,760 | 1,992,114 |
| ASUSTeK Computer, Inc. | | 364,000 | 4,598,123 |
| Avalue Technology, Inc. | | 71,000 | 225,057 |
| Axiomtek Co. Ltd. | | 43,973 | 125,034 |
| Compal Electronics, Inc. | | 3,007,000 | 3,010,492 |
| Getac Holdings Corp. | | 288,000 | 636,324 |
| Gigabyte Technology Co. Ltd. | | 183,000 | 1,958,478 |
| Inventec Corp. | | 501,000 | 886,809 |
| Jess-Link Products Co. Ltd. | | 29,000 | 59,797 |
| Lenovo Group Ltd. | | 9,814,000 | 11,100,012 |
| Lite-On Technology Corp. | | 1,275,000 | 5,482,064 |
| Micro-Star International Co. Ltd. | | 429,000 | 2,147,491 |
| Pegatron Corp. | | 85,000 | 208,078 |
| Quanta Computer, Inc. | | 1,344,000 | 10,692,778 |
| Samsung Electronics Co. Ltd. | | 3,704,827 | 187,070,813 |
| Wistron Corp. | | 938,000 | 3,444,308 |
| Wiwynn Corp. | | 39,000 | 1,909,425 |
| Xiaomi Corp. Class B (a)(d) | | 1,249,000 | 1,968,497 |
| | | | 239,694,717 |
TOTAL INFORMATION TECHNOLOGY | | | 925,116,695 |
| MATERIALS - 2.7% | | | |
| Chemicals - 0.9% | | | |
| Abou Kir Fertilizers & Chemical Industries | | 68,315 | 116,622 |
| Aeci Ltd. | | 18,422 | 105,099 |
| Akzo Nobel India Ltd. | | 2,484 | 82,515 |
| Andhra Sugars Ltd. | | 60,735 | 84,042 |
| Asian Paints Ltd. | | 79,950 | 3,147,460 |
| Castrol India Ltd. | | 14,099 | 24,675 |
| China BlueChemical Ltd. (H Shares) | | 151,629 | 37,703 |
| China Risun Group Ltd. Class H | | 70,116 | 31,114 |
| China Sanjiang Fine Chemicals Ltd. (a) | | 112,866 | 15,255 |
| Era Co. Ltd. (A Shares) | | 306,400 | 243,133 |
| Fufeng Group Ltd. | | 703,992 | 374,333 |
| GHCL Ltd. | | 29,260 | 219,867 |
| Grauer & Weil (INDIA) Ltd. | | 32,473 | 53,219 |
| Guangdong Huate Gas Co. Ltd. (A Shares) | | 32,453 | 296,058 |
| Gujarat State Fertilizers & Chemicals Ltd. | | 97,251 | 206,120 |
| Hansol Chemical Co. Ltd. | | 17,913 | 2,183,498 |
| Indorama Ventures PCL NVDR | | 3,431,300 | 2,841,656 |
| KCC Corp. | | 400 | 65,967 |
| Kukdong Oil & Chemicals Co. Ltd. | | 16,695 | 53,742 |
| LG Chemical Ltd. | | 33,864 | 14,901,116 |
| Luberef | | 35,758 | 1,395,750 |
| NOROO Paint & Coatings Co. Ltd. | | 11,018 | 76,258 |
| Oci Holdings Co. Ltd. | | 17,925 | 1,246,037 |
| Panama Petrochem Ltd. | | 7,418 | 29,234 |
| Pcbl Ltd. /India | | 330,339 | 696,347 |
| PhosAgro PJSC (b) | | 18,583 | 1,110 |
| PhosAgro PJSC: | | | |
| GDR (Reg. S) (a)(b) | | 1 | 0 |
| sponsored GDR (Reg. S) (a)(b) | | 359 | 7 |
| Sabic Agriculture-Nutrients Co. | | 44,133 | 1,619,106 |
| Satellite Chemical Co. Ltd. (A Shares) | | 2,075,040 | 4,373,711 |
| Saudi Basic Industries Corp. | | 446,157 | 10,515,585 |
| Shandong Sinocera Functional Material Co. Ltd. (A Shares) | | 280,183 | 1,152,175 |
| Solar Industries India Ltd. | | 113,100 | 6,616,061 |
| Sree Rayalaseema Hi-Strength Hypo Ltd. | | 5,061 | 36,992 |
| SRF Ltd. | | 199,378 | 5,680,529 |
| Taekwang Industrial Co. Ltd. | | 155 | 70,895 |
| Tamilnadu Petroproducts Ltd. | | 29,740 | 32,182 |
| TGV SRAAC Ltd. | | 4,174 | 5,195 |
| Unipar Carbocloro SA | | 4,950 | 72,280 |
| Wanhua Chemical Group Co. Ltd. (A Shares) | | 282,100 | 3,643,397 |
| | | | 62,346,045 |
| Construction Materials - 0.6% | | | |
| Anhui Conch Cement Co. Ltd. (H Shares) | | 201,500 | 560,125 |
| Asia Cement (China) Holdings Corp. | | 145,027 | 56,588 |
| Beijing Oriental Yuhong Waterproof Technology Co. Ltd. (A Shares) | | 1,256,391 | 4,970,973 |
| CEMEX S.A.B. de CV sponsored ADR (a) | | 1,713,381 | 13,655,647 |
| China National Building Materials Co. Ltd. (H Shares) | | 1,408,000 | 716,357 |
| JK Cement Ltd. | | 188,000 | 7,491,169 |
| NCL Industries Ltd. | | 21,490 | 61,617 |
| Qatar National Cement Co. QSC (a) | | 18,192 | 17,492 |
| Qatari Investors Group QSC (a) | | 62,258 | 29,761 |
| Shree Digvijay Cement Co. Ltd. | | 100,212 | 115,951 |
| Siam Cement PCL (For. Reg.) | | 173,900 | 1,554,386 |
| Tipco Asphalt NVDR | | 391,100 | 192,102 |
| Ultratech Cement Ltd. | | 103,418 | 10,374,922 |
| | | | 39,797,090 |
| Containers & Packaging - 0.0% | | | |
| AGI Greenpac Ltd. | | 1,027 | 9,142 |
| CPMC Holdings Ltd. | | 87,456 | 64,457 |
| Klabin SA unit | | 469,088 | 2,155,964 |
| Time Technoplast Ltd. | | 50,359 | 90,416 |
| | | | 2,319,979 |
| Metals & Mining - 1.2% | | | |
| African Rainbow Minerals Ltd. | | 104,885 | 994,144 |
| Ann Joo Resources Bhd (a) | | 500 | 125 |
| Antofagasta PLC | | 443,348 | 8,132,449 |
| Arabian Pipes Co. (a) | | 11,192 | 237,528 |
| Barrick Gold Corp. | | 614,400 | 9,959,424 |
| China Zhongwang Holdings Ltd. (b) | | 350,800 | 0 |
| Endeavour Mining PLC | | 43,241 | 894,454 |
| First Quantum Minerals Ltd. (c) | | 124,873 | 3,354,714 |
| Freeport-McMoRan, Inc. | | 120,600 | 4,813,146 |
| Godawari Power & Ispat Ltd. | | 8,450 | 63,271 |
| Gold Fields Ltd. | | 356,928 | 4,566,421 |
| Gold Fields Ltd. sponsored ADR (c) | | 126,932 | 1,603,151 |
| Grupo Mexico SA de CV Series B | | 1,630,243 | 7,764,701 |
| Impala Platinum Holdings Ltd. | | 1,473,968 | 7,588,177 |
| Indian Metals & Ferro Alloys Ltd. | | 6,075 | 28,003 |
| Jastrzebska Spolka Weglowa SA (a) | | 49,616 | 435,464 |
| Jiangsu Changbao Steeltube Co. Ltd. (A Shares) | | 472,800 | 418,162 |
| Jindal Saw Ltd. | | 59,724 | 252,877 |
| Korea Zinc Co. Ltd. | | 7,060 | 2,808,195 |
| Kumba Iron Ore Ltd. | | 77,499 | 1,704,609 |
| Maharashtra Seamless Ltd. | | 32,556 | 211,668 |
| MOIL Ltd. | | 25,877 | 74,634 |
| National Aluminium Co. Ltd. | | 39,774 | 45,276 |
| NMDC Ltd. | | 221,865 | 330,076 |
| Novolipetsk Steel OJSC (a)(b) | | 355,140 | 3,309 |
| Novolipetsk Steel OJSC GDR (Reg. S) (a)(b) | | 56,576 | 7,029 |
| Polyus PJSC (a)(b) | | 2,468 | 5,633 |
| POSCO | | 12,660 | 5,522,279 |
| Prakash Industries Ltd. (a) | | 177,356 | 246,168 |
| Ramkrishna Forgings Ltd. | | 17,312 | 149,301 |
| Southern Copper Corp. | | 2,344 | 189,067 |
| Tata Steel Ltd. | | 1,528,067 | 2,270,588 |
| Ternium SA sponsored ADR | | 94,674 | 3,955,480 |
| Vale SA sponsored ADR | | 786,488 | 10,358,047 |
| Zamil Industrial Investment Co. (a) | | 60,484 | 405,576 |
| Zijin Mining Group Co. Ltd. (H Shares) | | 5,460,926 | 8,592,810 |
| | | | 87,985,956 |
| Paper & Forest Products - 0.0% | | | |
| Empresas CMPC SA | | 21,752 | 39,495 |
| Evergreen Fibreboard Bhd | | 265,100 | 16,283 |
| Hansol Paper Co. Ltd. | | 14,690 | 117,195 |
| Kuantam Papers Ltd. (a) | | 51,505 | 119,749 |
| PT Indah Kiat Pulp & Paper Tbk | | 320,210 | 191,327 |
| Sappi Ltd. | | 123,207 | 261,680 |
| Satia Industries Ltd. | | 51,942 | 81,201 |
| Seshasayee Paper & Boards Ltd. | | 7,875 | 29,754 |
| West Coast Paper Mills Ltd. | | 36,114 | 256,284 |
| | | | 1,112,968 |
TOTAL MATERIALS | | | 193,562,038 |
| REAL ESTATE - 0.6% | | | |
| Equity Real Estate Investment Trusts (REITs) - 0.0% | | | |
| Fibra Uno Administracion SA de CV | | 603,400 | 879,063 |
| LH Hotel Leasehold (REIT) | | 29,000 | 9,524 |
| | | | 888,587 |
| Real Estate Management & Development - 0.6% | | | |
| AP Thailand PCL (For. Reg.) | | 1,778,100 | 644,874 |
| Arabian Centres Co. Ltd. | | 30,908 | 184,592 |
| Ayala Land, Inc. | | 8,276,100 | 3,967,793 |
| China Overseas Land and Investment Ltd. | | 2,147,500 | 4,529,210 |
| China Resources Land Ltd. | | 1,614,000 | 6,822,458 |
| China Resources Mixc Lifestyle Services Ltd. (d) | | 22,400 | 96,685 |
| China World Trade Center Co. Ltd. (A Shares) | | 225,200 | 595,975 |
| Corporacion Inmobiliaria Vesta S.A.B. de CV ADR (c) | | 157,700 | 5,856,978 |
| Dar Al Arkan Real Estate Development Co. (a) | | 550,419 | 2,732,540 |
| Emaar Development PJSC (a) | | 2,812,233 | 5,015,008 |
| Emaar Properties PJSC | | 4,504,674 | 8,658,589 |
| Greentown China Holdings Ltd. | | 374,000 | 444,469 |
| IOI Properties Group Bhd | | 131,800 | 46,300 |
| KE Holdings, Inc. ADR | | 378,560 | 6,511,232 |
| Megaworld Corp. | | 2,065,000 | 72,565 |
| PT Ciputra Development Tbk | | 1,816,000 | 135,932 |
| SP Setia Bhd | | 1,482,000 | 293,845 |
| | | | 46,609,045 |
TOTAL REAL ESTATE | | | 47,497,632 |
| UTILITIES - 0.5% | | | |
| Electric Utilities - 0.1% | | | |
| CESC Ltd. GDR | | 197,774 | 198,947 |
| Energisa SA unit | | 201,757 | 1,878,212 |
| Equatorial Energia SA | | 353,830 | 2,262,146 |
| PGE Polska Grupa Energetyczna SA (a) | | 359,323 | 739,078 |
| Power Grid Corp. of India Ltd. | | 766,654 | 2,266,789 |
| Saudi Electricity Co. | | 871,862 | 4,811,844 |
| | | | 12,157,016 |
| Gas Utilities - 0.2% | | | |
| Beijing Enterprises Holdings Ltd. | | 5,254 | 19,697 |
| ENN Energy Holdings Ltd. | | 643,484 | 5,046,225 |
| GAIL India Ltd. | | 3,141,481 | 4,367,937 |
| Indraprastha Gas Ltd. | | 16,777 | 94,869 |
| Kunlun Energy Co. Ltd. | | 1,560,000 | 1,141,801 |
| Mahanagar Gas Ltd. | | 11,865 | 146,897 |
| PT Perusahaan Gas Negara Tbk Series B | | 16,565,400 | 1,495,563 |
| | | | 12,312,989 |
| Independent Power and Renewable Electricity Producers - 0.2% | | | |
| Gujarat Industries Power Co. Ltd. | | 75,470 | 109,953 |
| NTPC Ltd. | | 5,146,402 | 13,707,627 |
| | | | 13,817,580 |
| Multi-Utilities - 0.0% | | | |
| YTL Corp. Bhd | | 264,900 | 89,632 |
| YTL Power International Bhd | | 162,400 | 74,900 |
| | | | 164,532 |
| Water Utilities - 0.0% | | | |
| Companhia de Saneamento de Minas Gerais - COPASA | | 204,800 | 741,110 |
| VA Tech Wabag Ltd. (a) | | 32,270 | 192,973 |
| | | | 934,083 |
TOTAL UTILITIES | | | 39,386,200 |
| TOTAL COMMON STOCKS (Cost $3,342,292,474) | | | 3,933,808,085 |
| | | | |
| Nonconvertible Preferred Stocks - 1.8% |
| | | Shares | Value ($) |
| ENERGY - 0.5% | | | |
| Oil, Gas & Consumable Fuels - 0.5% | | | |
| Petroleo Brasileiro SA - Petrobras: | | | |
| (PN) (non-vtg.) | | 1,852,500 | 11,948,355 |
| (PN) sponsored ADR (non-vtg.) | | 124,700 | 1,613,618 |
| sponsored ADR | | 1,819,746 | 25,567,431 |
| | | | 39,129,404 |
| FINANCIALS - 0.6% | | | |
| Banks - 0.6% | | | |
| Banco Bradesco SA (PN) | | 5,875,680 | 17,738,394 |
| Itau Unibanco Holding SA | | 2,408,350 | 13,340,140 |
| Itau Unibanco Holding SA sponsored ADR (c) | | 1,853,799 | 10,195,895 |
| Itausa-Investimentos Itau SA (PN) | | 2,683,888 | 5,007,850 |
| Sberbank of Russia (b) | | 145,250 | 873 |
| Sberbank of Russia (Russia) (b) | | 128,031 | 770 |
| | | | 46,283,922 |
| INDUSTRIALS - 0.0% | | | |
| Machinery - 0.0% | | | |
| Marcopolo SA (PN) | | 156,700 | 191,759 |
| INFORMATION TECHNOLOGY - 0.3% | | | |
| Technology Hardware, Storage & Peripherals - 0.3% | | | |
| Samsung Electronics Co. Ltd. | | 473,162 | 19,284,821 |
| MATERIALS - 0.4% | | | |
| Chemicals - 0.0% | | | |
| Unipar Carbocloro SA | | 34,540 | 539,159 |
| Metals & Mining - 0.4% | | | |
| Bradespar SA (PN) | | 288,100 | 1,309,003 |
| Cia Ferro Ligas da Bahia - Ferbasa | | 18,043 | 168,623 |
| Gerdau SA | | 3,269,246 | 17,065,662 |
| Gerdau SA sponsored ADR | | 1,431,774 | 7,459,543 |
| Metalurgica Gerdau SA (PN) | | 574,600 | 1,371,507 |
| | | | 27,374,338 |
TOTAL MATERIALS | | | 27,913,497 |
| UTILITIES - 0.0% | | | |
| Electric Utilities - 0.0% | | | |
| Companhia Energetica de Minas Gerais (CEMIG) (PN) | | 1,035,088 | 2,577,243 |
| Water Utilities - 0.0% | | | |
| Cia de Saneamento do Parana | | 38,776 | 35,706 |
TOTAL UTILITIES | | | 2,612,949 |
| TOTAL NONCONVERTIBLE PREFERRED STOCKS (Cost $110,015,027) | | | 135,416,352 |
| | | | |
| Equity Funds - 40.8% |
| | | Shares | Value ($) |
| Diversified Emerging Markets Funds - 40.8% | | | |
| Aberdeen Emerging Markets Fund Institutional Service Class | | 11,140,011 | 143,260,542 |
| Artisan Developing World Fund Investor Shares | | 4,589,539 | 71,459,127 |
| Brandes Emerging Markets Value Fund Class A | | 12,041,321 | 96,571,396 |
| Calvert Emerging Markets Equity Fund Class A | | 46 | 726 |
| Fidelity Advisor Emerging Markets Fund Class Z (e) | | 14,677,561 | 509,604,912 |
| Fidelity SAI Emerging Markets Index Fund (e) | | 16,330,203 | 208,046,791 |
| Fidelity SAI Emerging Markets Low Volatility Index Fund (e) | | 57,023,370 | 602,737,022 |
| Fidelity SAI Emerging Markets Value Index Fund (e) | | 66,463,995 | 782,945,865 |
| Goldman Sachs Emerging Markets Equity Fund Institutional Shares | | 11,089,113 | 233,425,835 |
| Invesco Developing Markets Fund Class R6 | | 4,241,348 | 160,195,719 |
| iShares MSCI China ETF (c) | | 2,137,525 | 95,996,248 |
| iShares MSCI EM ESG Optimized ETF (c) | | 209,609 | 6,548,185 |
| iShares MSCI South Korea Index ETF (c) | | 511,975 | 31,972,839 |
| Lazard Emerging Markets Equity Portfolio Open Shares | | 842,137 | 14,291,072 |
| Matthews Pacific Tiger Fund Investor Class | | 178 | 3,483 |
| Xtrackers Harvest CSI 300 China ETF Class A (c) | | 492,848 | 13,016,116 |
| | | | |
| TOTAL EQUITY FUNDS (Cost $2,904,731,946) | | | 2,970,075,878 |
| | | | |
| Other - 0.0% |
| | | Shares | Value ($) |
| Commodity Funds - Broad Basket - 0.0% | | | |
Fidelity SAI Inflation-Focused Fund (e) (Cost $1,027) | | 131 | 1,240 |
| | | | |
| U.S. Treasury Obligations - 0.1% |
| | | Principal Amount (f) | Value ($) |
U.S. Treasury Bills, yield at date of purchase 5.14% to 5.39% 9/7/23 to 11/30/23 (g) (Cost $4,766,152) | | 4,810,000 | 4,766,040 |
| | | | |
| Money Market Funds - 4.2% |
| | | Shares | Value ($) |
| Fidelity Cash Central Fund 5.43% (h) | | 31,611,930 | 31,618,252 |
| Fidelity Securities Lending Cash Central Fund 5.44% (h)(i) | | 67,781,402 | 67,788,180 |
| State Street Institutional U.S. Government Money Market Fund Premier Class 5.28% (j) | | 206,863,923 | 206,863,923 |
| TOTAL MONEY MARKET FUNDS (Cost $306,270,355) | | | 306,270,355 |
| | | | |
| TOTAL INVESTMENT IN SECURITIES - 100.9% (Cost $6,668,076,981) | 7,350,337,950 |
NET OTHER ASSETS (LIABILITIES) - (0.9)% | (64,242,503) |
| NET ASSETS - 100.0% | 7,286,095,447 |
| | |
| Futures Contracts |
| | Number of contracts | Expiration Date | Notional Amount ($) | Value ($) | Unrealized Appreciation/ (Depreciation) ($) |
| Purchased | | | | | |
| | | | | | |
| Equity Index Contracts | | | | | |
| ICE MSCI Emerging Markets Index Contracts (United States) | 3,204 | Sep 2023 | 156,883,860 | (3,532,728) | (3,532,728) |
| | | | | | |
| The notional amount of futures purchased as a percentage of Net Assets is 2.2% |
Security Type Abbreviations
Legend
| (c) | Security or a portion of the security is on loan at period end. |
| (d) | Security exempt from registration under Rule 144A of the Securities Act of 1933. These securities may be resold in transactions exempt from registration, normally to qualified institutional buyers. At the end of the period, the value of these securities amounted to $139,219,471 or 1.9% of net assets. |
| (f) | Amount is stated in United States dollars unless otherwise noted. |
| (g) | Security or a portion of the security was pledged to cover margin requirements for futures contracts. At period end, the value of securities pledged amounted to $4,696,463. |
| (h) | Affiliated fund that is generally available only to investment companies and other accounts managed by Fidelity Investments. The rate quoted is the annualized seven-day yield of the fund at period end. A complete unaudited listing of the fund's holdings as of its most recent quarter end is available upon request. In addition, each Fidelity Central Fund's financial statements are available on the SEC's website or upon request. |
| (i) | Investment made with cash collateral received from securities on loan. |
| (j) | The rate quoted is the annualized seven-day yield of the fund at period end. |
Affiliated Central Funds
Fiscal year to date information regarding the Fund's investments in Fidelity Central Funds, including the ownership percentage, is presented below.
| Affiliate | Value, beginning of period ($) | Purchases ($) | Sales Proceeds ($) | Dividend Income ($) | Realized Gain (loss) ($) | Change in Unrealized appreciation (depreciation) ($) | Value, end of period ($) | % ownership, end of period |
| Fidelity Cash Central Fund 5.43% | 69,148,197 | 205,256,024 | 242,785,969 | 1,210,715 | - | - | 31,618,252 | 0.1% |
| Fidelity Securities Lending Cash Central Fund 5.44% | 164,183,752 | 632,621,275 | 729,016,847 | 281,538 | - | - | 67,788,180 | 0.2% |
| Total | 233,331,949 | 837,877,299 | 971,802,816 | 1,492,253 | - | - | 99,406,432 | |
| | | | | | | | | |
Amounts in the dividend income column in the above table include any capital gain distributions from underlying funds, which are presented in the corresponding line item in the Statement of Operations, if applicable.
Amounts in the dividend income column for Fidelity Securities Lending Cash Central Fund represents the income earned on investing cash collateral, less rebates paid to borrowers and any lending agent fees associated with the loan, plus any premium payments received for lending certain types of securities.
Amounts included in the purchases and sales proceeds columns may include in-kind transactions, if applicable.
Affiliated Underlying Funds
Fiscal year to date information regarding the Fund's investments in affiliated Underlying Funds is presented below. Exchanges between classes of the same affiliated Underlying Funds may occur. If an Underlying Funds changes its name, the name presented below is the name in effect at period end.
| Affiliate | Value, beginning of period ($) | Purchases ($) | Sales Proceeds ($) | Dividend Income ($) | Realized Gain (loss) ($) | Change in Unrealized appreciation (depreciation) ($) | Value, end of period ($) |
| Fidelity Advisor Emerging Markets Fund Class Z | 482,304,648 | - | - | - | - | 27,300,264 | 509,604,912 |
| Fidelity SAI Emerging Markets Index Fund | 218,175,605 | - | 17,900,001 | - | 2,797,264 | 4,973,923 | 208,046,791 |
| Fidelity SAI Emerging Markets Low Volatility Index Fund | 558,829,027 | - | - | - | - | 43,907,995 | 602,737,022 |
| Fidelity SAI Emerging Markets Value Index Fund | 792,656,750 | - | 59,999,999 | - | (17,149,894) | 67,439,008 | 782,945,865 |
| Fidelity SAI Inflation-Focused Fund | 12,162,626 | - | 12,003,811 | - | 513,226 | (670,801) | 1,240 |
| | 2,064,128,656 | - | 89,903,811 | - | (13,839,404) | 142,950,389 | 2,103,335,830 |
Amounts in the dividend income column in the above table include any capital gain distributions from underlying funds, which are presented in the corresponding line item in the Statement of Operations, if applicable.
Amounts included in the purchases and sales proceeds columns may include in-kind transactions, if applicable.
Investment Valuation
The following is a summary of the inputs used, as of August 31, 2023, involving the Fund's assets and liabilities carried at fair value. The inputs or methodology used for valuing securities may not be an indication of the risk associated with investing in those securities. For more information on valuation inputs, and their aggregation into the levels used below, please refer to the Investment Valuation section in the accompanying Notes to Financial Statements.
| Valuation Inputs at Reporting Date: |
| Description | Total ($) | Level 1 ($) | Level 2 ($) | Level 3 ($) |
Investments in Securities: | | | | |
|
| Equities: | | | | |
Communication Services | 385,297,015 | 134,673,628 | 244,153,033 | 6,470,354 |
Consumer Discretionary | 678,047,557 | 461,553,684 | 215,950,992 | 542,881 |
Consumer Staples | 273,643,594 | 272,158,761 | 1,380,485 | 104,348 |
Energy | 168,949,345 | 166,187,835 | 2,173,744 | 587,766 |
Financials | 875,106,377 | 657,687,774 | 216,698,468 | 720,135 |
Health Care | 114,672,419 | 101,692,677 | 12,979,742 | - |
Industrials | 318,134,298 | 318,079,956 | - | 54,342 |
Information Technology | 944,401,516 | 601,002,988 | 343,398,528 | - |
Materials | 221,475,535 | 203,781,570 | 17,676,877 | 17,088 |
Real Estate | 47,497,632 | 47,497,632 | - | - |
Utilities | 41,999,149 | 41,999,149 | - | - |
|
| Equity Funds | 2,970,075,878 | 2,970,075,878 | - | - |
|
| Other | 1,240 | 1,240 | - | - |
|
| Other Short-Term Investments | 4,766,040 | - | 4,766,040 | - |
|
| Money Market Funds | 306,270,355 | 306,270,355 | - | - |
| Total Investments in Securities: | 7,350,337,950 | 6,282,663,127 | 1,059,177,909 | 8,496,914 |
Derivative Instruments: | | | | |
|
| Liabilities | | | | |
Futures Contracts | (3,532,728) | (3,532,728) | - | - |
| Total Liabilities | (3,532,728) | (3,532,728) | - | - |
| Total Derivative Instruments: | (3,532,728) | (3,532,728) | - | - |
Value of Derivative Instruments
The following table is a summary of the Fund's value of derivative instruments by primary risk exposure as of August 31, 2023. For additional information on derivative instruments, please refer to the Derivative Instruments section in the accompanying Notes to Financial Statements.
Primary Risk Exposure / Derivative Type | Value |
| Asset ($) | Liability ($) |
| Equity Risk | | |
Futures Contracts (a) | 0 | (3,532,728) |
| Total Equity Risk | 0 | (3,532,728) |
| Total Value of Derivatives | 0 | (3,532,728) |
(a)Reflects gross cumulative appreciation (depreciation) on futures contracts as presented in the Schedule of Investments. In the Statement of Assets and Liabilities, the period end daily variation margin is included in receivable or payable for daily variation margin on futures contracts, and the net cumulative appreciation (depreciation) is included in Total accumulated earnings (loss).
| Statement of Assets and Liabilities |
| | | | August 31, 2023 (Unaudited) |
| | | | | |
| Assets | | | | |
| Investment in securities, at value (including securities loaned of $65,425,966) - See accompanying schedule: | | | | |
Unaffiliated issuers (cost $4,582,550,934) | $ | 5,147,595,688 | | |
Fidelity Central Funds (cost $99,406,432) | | 99,406,432 | | |
Other affiliated issuers (cost $1,986,119,615) | | 2,103,335,830 | | |
| | | | | |
| | | | | |
| Total Investment in Securities (cost $6,668,076,981) | | | $ | 7,350,337,950 |
| Cash | | | | 1,267,297 |
| Foreign currency held at value (cost $13,254,042) | | | | 13,253,063 |
| Receivable for investments sold | | | | 21,952,401 |
| Receivable for fund shares sold | | | | 3,582,843 |
| Dividends receivable | | | | 6,748,140 |
| Interest receivable | | | | 731,064 |
| Distributions receivable from Fidelity Central Funds | | | | 226,736 |
| Prepaid expenses | | | | 13,002 |
| Other receivables | | | | 148,147 |
Total assets | | | | 7,398,260,643 |
| Liabilities | | | | |
| Payable for investments purchased | $ | 25,900,571 | | |
| Payable for fund shares redeemed | | 2,733,456 | | |
| Accrued management fee | | 1,639,136 | | |
| Payable for daily variation margin on futures contracts | | 2,098,620 | | |
| Deferred taxes | | 11,312,510 | | |
| Other payables and accrued expenses | | 743,292 | | |
| Collateral on securities loaned | | 67,737,611 | | |
| Total Liabilities | | | | 112,165,196 |
| Net Assets | | | $ | 7,286,095,447 |
| Net Assets consist of: | | | | |
| Paid in capital | | | $ | 7,277,099,430 |
| Total accumulated earnings (loss) | | | | 8,996,017 |
| Net Assets | | | $ | 7,286,095,447 |
Net Asset Value, offering price and redemption price per share ($7,286,095,447 ÷ 715,545,271 shares) | | | $ | 10.18 |
| Statement of Operations |
| | | | Six months ended August 31, 2023 (Unaudited) |
| Investment Income | | | | |
| Dividends: | | | | |
| Unaffiliated issuers | | | $ | 91,155,910 |
| Interest | | | | 5,631,482 |
| Income from Fidelity Central Funds (including $281,538 from security lending) | | | | 1,492,253 |
| Income before foreign taxes withheld | | | $ | 98,279,645 |
| Less foreign taxes withheld | | | | (10,137,897) |
| Total Income | | | | 88,141,748 |
| Expenses | | | | |
| Management fee | $ | 19,793,624 | | |
| Custodian fees and expenses | | 847,112 | | |
| Independent trustees' fees and expenses | | 23,129 | | |
| Registration fees | | 34,313 | | |
| Audit | | 114,470 | | |
| Legal | | 9,234 | | |
| Miscellaneous | | 25,905 | | |
| Total expenses before reductions | | 20,847,787 | | |
| Expense reductions | | (9,324,121) | | |
| Total expenses after reductions | | | | 11,523,666 |
| Net Investment income (loss) | | | | 76,618,082 |
| Realized and Unrealized Gain (Loss) | | | | |
| Net realized gain (loss) on: | | | | |
| Investment Securities: | | | | |
| Unaffiliated issuers (net of foreign taxes of $3,054,018) | | (106,030,405) | | |
| Affiliated issuers | | (13,839,404) | | |
| Foreign currency transactions | | (2,065,644) | | |
| Futures contracts | | (10,304,214) | | |
| Total net realized gain (loss) | | | | (132,239,667) |
| Change in net unrealized appreciation (depreciation) on: | | | | |
| Investment Securities: | | | | |
| Unaffiliated issuers(net of increase in deferred foreign taxes of $5,056,463) | | 208,237,747 | | |
| Affiliated issuers | | 142,950,389 | | |
| Assets and liabilities in foreign currencies | | 293,755 | | |
| Futures contracts | | 8,576,347 | | |
| Total change in net unrealized appreciation (depreciation) | | | | 360,058,238 |
| Net gain (loss) | | | | 227,818,571 |
| Net increase (decrease) in net assets resulting from operations | | | $ | 304,436,653 |
| Statement of Changes in Net Assets |
| |
| | Six months ended August 31, 2023 (Unaudited) | | Year ended February 28, 2023 |
| Increase (Decrease) in Net Assets | | | | |
| Operations | | | | |
| Net investment income (loss) | $ | 76,618,082 | $ | 210,650,253 |
| Net realized gain (loss) | | (132,239,667) | | (544,910,554) |
| Change in net unrealized appreciation (depreciation) | | 360,058,238 | | (1,129,493,905) |
| Net increase (decrease) in net assets resulting from operations | | 304,436,653 | | (1,463,754,206) |
| Distributions to shareholders | | - | | (190,211,815) |
| | | | | |
| Share transactions | | | | |
| Proceeds from sales of shares | | 556,786,638 | | 2,219,233,596 |
| Reinvestment of distributions | | - | | 165,990,631 |
| Cost of shares redeemed | | (1,053,437,386) | | (3,010,880,251) |
| | | | | |
Net increase (decrease) in net assets resulting from share transactions | | (496,650,748) | | (625,656,024) |
| Total increase (decrease) in net assets | | (192,214,095) | | (2,279,622,045) |
| | | | | |
| Net Assets | | | | |
| Beginning of period | | 7,478,309,542 | | 9,757,931,587 |
| End of period | $ | 7,286,095,447 | $ | 7,478,309,542 |
| | | | | |
| Other Information | | | | |
| Shares | | | | |
| Sold | | 54,879,795 | | 221,205,781 |
| Issued in reinvestment of distributions | | - | | 17,201,102 |
| Redeemed | | (105,091,547) | | (296,986,009) |
| Net increase (decrease) | | (50,211,752) | | (58,579,126) |
| | | | | |
Financial Highlights
| Strategic Advisers® Emerging Markets Fund |
| |
| | Six months ended (Unaudited) August 31, 2023 | | Years ended February 28, 2023 | | 2022 | | 2021 | | 2020 A | | 2019 |
Selected Per-Share Data | | | | | | | | | | | | |
| Net asset value, beginning of period | $ | 9.77 | $ | 11.84 | $ | 13.88 | $ | 10.20 | $ | 10.23 | $ | 11.75 |
| Income from Investment Operations | | | | | | | | | | | | |
Net investment income (loss) B,C | | .10 | | .26 | | .24 | | .15 | | .23 D | | .17 |
| Net realized and unrealized gain (loss) | | .31 | | (2.08) | | (1.90) | | 3.66 | | (.03) | | (1.53) |
| Total from investment operations | | .41 | | (1.82) | | (1.66) | | 3.81 | | .20 | | (1.36) |
| Distributions from net investment income | | - | | (.25) | | (.25) | | (.13) | | (.23) | | (.16) |
| Distributions from net realized gain | | - | | - | | (.13) | | - | | - | | - |
| Total distributions | | - | | (.25) | | (.38) | | (.13) | | (.23) | | (.16) |
| Net asset value, end of period | $ | 10.18 | $ | 9.77 | $ | 11.84 | $ | 13.88 | $ | 10.20 | $ | 10.23 |
Total Return E,F | | 4.20% | | (15.33)% | | (12.12)% | | 37.42% | | 1.80% | | (11.48)% |
Ratios to Average Net Assets C,G,H | | | | | | | | | | | | |
| Expenses before reductions | | .56% I | | .57% | | .58% | | .59% | | .64% | | .66% |
| Expenses net of fee waivers, if any | | .31% I | | .32% | | .33% | | .34% | | .39% | | .41% |
| Expenses net of all reductions | | .31% I | | .32% | | .33% | | .34% | | .39% | | .40% |
| Net investment income (loss) | | 2.06% I | | 2.59% | | 1.78% | | 1.28% | | 2.20% D | | 1.60% |
| Supplemental Data | | | | | | | | | | | | |
| Net assets, end of period (000 omitted) | $ | 7,286,095 | $ | 7,478,310 | $ | 9,757,932 | $ | 9,214,231 | $ | 4,818,245 | $ | 4,660,765 |
Portfolio turnover rate J | | 38% I | | 39% | | 31% | | 43% | | 39% | | 57% |
AFor the year ended February 29.
BCalculated based on average shares outstanding during the period.
CNet investment income (loss) is affected by the timing of the declaration of dividends by any underlying mutual funds or exchange-traded funds (ETFs). Net investment income (loss) of any mutual funds or ETFs is not included in the Fund's net investment income (loss) ratio.
DNet investment income per share reflects one or more large, non-recurring dividend(s) which amounted to $.03 per share. Excluding such non-recurring dividend(s), the ratio of net investment income (loss) to average net assets would have been 1.87%.
ETotal returns for periods of less than one year are not annualized.
FTotal returns would have been lower if certain expenses had not been reduced during the applicable periods shown.
GFees and expenses of any underlying mutual funds or exchange-traded funds (ETFs) are not included in the Fund's expense ratio. The Fund indirectly bears its proportionate share of these expenses. For additional expense information related to investments in Fidelity Central Funds, please refer to the "Investments in Fidelity Central Funds" note found in the Notes to Financial Statements section of the most recent Annual or Semi-Annual report.
HExpense ratios reflect operating expenses of the class. Expenses before reductions do not reflect amounts reimbursed, waived, or reduced through arrangements with the investment adviser, brokerage services, or other offset arrangements, if applicable, and do not represent the amount paid by the class during periods when reimbursements, waivers or reductions occur.
IAnnualized.
JAmount does not include the portfolio activity of any underlying mutual funds or exchange-traded funds (ETFs).
For the period ended August 31, 2023
1. Organization.
Strategic Advisers Emerging Markets Fund (the Fund) is a fund of Fidelity Rutland Square Trust II (the Trust), and is authorized to issue an unlimited number of shares. The Trust is registered under the Investment Company Act of 1940, as amended (the 1940 Act), as an open-end management investment company organized as a Delaware statutory trust. The Fund is offered exclusively to certain managed account clients of Strategic Advisers LLC (Strategic Advisers), an affiliate of Fidelity Management & Research Company LLC (FMR). The Fund's investments in emerging markets can be subject to social, economic, regulatory, and political uncertainties and can be extremely volatile.
2. Significant Accounting Policies.
The Fund is an investment company and applies the accounting and reporting guidance of the Financial Accounting Standards Board (FASB) Accounting Standards Codification Topic 946 Financial Services - Investment Companies. The financial statements have been prepared in conformity with accounting principles generally accepted in the United States of America (GAAP), which require management to make certain estimates and assumptions at the date of the financial statements. Actual results could differ from those estimates. Subsequent events, if any, through the date that the financial statements were issued have been evaluated in the preparation of the financial statements. The Fund's Schedule of Investments lists any underlying mutual funds or exchange-traded funds (ETFs) but does not include the underlying holdings of these funds. The following summarizes the significant accounting policies of the Fund:
Investment Valuation. Investments are valued as of 4:00 p.m. Eastern time on the last calendar day of the period. The Board of Trustees (the Board) has designated the Fund's investment adviser as the valuation designee responsible for the fair valuation function and performing fair value determinations as needed. The investment adviser has established a Fair Value Committee (the Committee) to carry out the day-to-day fair valuation responsibilities and has adopted policies and procedures to govern the fair valuation process and the activities of the Committee. In accordance with these fair valuation policies and procedures, which have been approved by the Board, the Fund attempts to obtain prices from one or more third party pricing services or brokers to value its investments. When current market prices, quotations or currency exchange rates are not readily available or reliable, investments will be fair valued in good faith by the Committee, in accordance with the policies and procedures. Factors used in determining fair value vary by investment type and may include market or investment specific events, transaction data, estimated cash flows, and market observations of comparable investments. The frequency that the fair valuation procedures are used cannot be predicted and they may be utilized to a significant extent. The Committee manages the Fund's fair valuation practices and maintains the fair valuation policies and procedures. The Fund's investment adviser reports to the Board information regarding the fair valuation process and related material matters.
The Fund categorizes the inputs to valuation techniques used to value its investments into a disclosure hierarchy consisting of three levels as shown below:
Level 1 - unadjusted quoted prices in active markets for identical investments
Level 2 - other significant observable inputs (including quoted prices for similar investments, interest rates, prepayment speeds, etc.)
Level 3 - unobservable inputs (including the Fund's own assumptions based on the best information available)
Valuation techniques used to value the Fund's investments by major category are as follows:
Equity securities, including restricted securities, for which market quotations are readily available, are valued at the last reported sale price or official closing price as reported by a third party pricing service on the primary market or exchange on which they are traded and are categorized as Level 1 in the hierarchy. In the event there were no sales during the day or closing prices are not available, securities are valued at the last quoted bid price or may be valued using the last available price and are generally categorized as Level 2 in the hierarchy. For foreign equity securities, when market or security specific events arise, comparisons to the valuation of American Depositary Receipts (ADRs), futures contracts, ETFs and certain indexes as well as quoted prices for similar securities may be used and would be categorized as Level 2 in the hierarchy. For equity securities, including restricted securities, where observable inputs are limited, assumptions about market activity and risk are used and these securities may be categorized as Level 3 in the hierarchy.
Debt securities, including restricted securities, are valued based on evaluated prices received from third party pricing services or from brokers who make markets in such securities. U.S. government and government agency obligations are valued by pricing services who utilize matrix pricing which considers yield or price of bonds of comparable quality, coupon, maturity and type or by broker-supplied prices. When independent prices are unavailable or unreliable, debt securities may be valued utilizing pricing methodologies which consider similar factors that would be used by third party pricing services. Debt securities are generally categorized as Level 2 in the hierarchy but may be Level 3 depending on the circumstances. ETFs are valued at their last sale price or official closing price as reported by a third party pricing service on the primary market or exchange on which they are traded and are categorized as Level 1 in the hierarchy. In the event there were no sales during the day but the exchange reports a closing bid level, ETFs are valued at the closing bid and would be categorized as Level 1 in the hierarchy. In the event there was no closing bid, ETFs may be valued by another method that the Board believes reflects fair value in accordance with the Board's fair value pricing policies and may be categorized as Level 2 in the hierarchy.
Futures contracts are valued at the settlement price established each day by the board of trade or exchange on which they are traded and are categorized as Level 1 in the hierarchy. Investments in open-end mutual funds, including the Fidelity Central Funds, are valued at their closing net asset value (NAV) each business day and are categorized as Level 1 in the hierarchy. If an unaffiliated open-end mutual fund's NAV is unavailable, shares of that fund may be valued by another method that the Board believes reflects fair value in accordance with the Board's fair value pricing policies and is categorized as Level 2 in the hierarchy.
Changes in valuation techniques may result in transfers in or out of an assigned level within the disclosure hierarchy. The aggregate value of investments by input level as of August 31, 2023 is included at the end of the Fund's Schedule of Investments.
Foreign Currency. Certain Funds may use foreign currency contracts to facilitate transactions in foreign-denominated securities. Gains and losses from these transactions may arise from changes in the value of the foreign currency or if the counterparties do not perform under the contracts' terms.
Foreign-denominated assets, including investment securities, and liabilities are translated into U.S. dollars at the exchange rates at period end. Purchases and sales of investment securities, income and dividends received, and expenses denominated in foreign currencies are translated into U.S. dollars at the exchange rate in effect on the transaction date.
The effects of exchange rate fluctuations on investments are included with the net realized and unrealized gain (loss) on investment securities. Other foreign currency transactions resulting in realized and unrealized gain (loss) are disclosed separately.
Investment Transactions and Income. For financial reporting purposes, the Fund's investment holdings and NAV include trades executed through the end of the last business day of the period. The NAV per share for processing shareholder transactions is calculated as of the close of business of the New York Stock Exchange (NYSE), normally 4:00 p.m. Eastern time and includes trades executed through the end of the prior business day. Gains and losses on securities sold are determined on the basis of identified cost and include proceeds received from litigation. Commissions paid to certain brokers with whom the investment adviser, or its affiliates, places trades on behalf of a fund include an amount in addition to trade execution, which may be rebated back to a fund. Any such rebates are included in net realized gain (loss) on investments in the Statement of Operations. Dividend income is recorded on the ex-dividend date, except for certain dividends from foreign securities where the ex-dividend date may have passed, which are recorded as soon as the Fund is informed of the ex-dividend date. Non-cash dividends included in dividend income, if any, are recorded at the fair market value of the securities received. Income and capital gain distributions from Fidelity Central Funds, if any, are recorded on the ex-dividend date. Income and capital gain distributions from any underlying mutual funds or exchange-traded funds (ETFs) are recorded on the ex-dividend date. Interest income is accrued as earned and includes coupon interest and amortization of premium and accretion of discount on debt securities as applicable. Investment income is recorded net of foreign taxes withheld where recovery of such taxes is uncertain. Funds may file withholding tax reclaims in certain jurisdictions to recover a portion of amounts previously withheld. Any withholding tax reclaims income is included in the Statement of Operations in foreign taxes withheld. Any receivables for withholding tax reclaims are included in the Statement of Assets and Liabilities in dividends receivable.
Expenses. Expenses directly attributable to a fund are charged to that fund. Expenses attributable to more than one fund are allocated among the respective funds on the basis of relative net assets or other appropriate methods. Expenses included in the accompanying financial statements reflect the expenses of that fund and do not include any expenses associated with any underlying mutual funds or exchange-traded funds. Although not included in a fund's expenses, a fund indirectly bears its proportionate share of these expenses through the net asset value of each underlying mutual fund or exchange-traded fund. Expense estimates are accrued in the period to which they relate and adjustments are made when actual amounts are known.
Deferred Trustee Compensation. Under a Deferred Compensation Plan (the Plan) for certain Funds, certain independent Trustees have elected to defer receipt of a portion of their annual compensation. Deferred amounts are invested in affiliated mutual funds, are marked-to-market and remain in a fund until distributed in accordance with the Plan. The investment of deferred amounts and the offsetting payable to the Trustees presented below are included in the accompanying Statement of Assets and Liabilities in other receivables and other payables and accrued expenses, as applicable.
| Strategic Advisers Emerging Markets Fund | $56,397 |
Income Tax Information and Distributions to Shareholders. Each year, the Fund intends to qualify as a regulated investment company under Subchapter M of the Internal Revenue Code, including distributing substantially all of its taxable income and realized gains. As a result, no provision for U.S. Federal income taxes is required. The Fund files a U.S. federal tax return, in addition to state and local tax returns as required. The Fund's federal income tax returns are subject to examination by the Internal Revenue Service (IRS) for a period of three fiscal years after they are filed. State and local tax returns may be subject to examination for an additional fiscal year depending on the jurisdiction. Foreign taxes are provided for based on the Fund's understanding of the tax rules and rates that exist in the foreign markets in which it invests. The Fund is subject to a tax imposed on capital gains by certain countries in which it invests. An estimated deferred tax liability for net unrealized appreciation on the applicable securities is included in Deferred taxes on the Statement of Assets & Liabilities. Funds may file withholding tax reclaims in certain jurisdictions to recover a portion of amounts previously withheld. Any withholding tax reclaims income is included in the Statement of Operations in foreign taxes withheld. Any receivables for withholding tax reclaims are included in the Statement of Assets and Liabilities in dividends receivable.
Distributions are declared and recorded on the ex-dividend date. Income and capital gain distributions are determined in accordance with income tax regulations, which may differ from GAAP.
Capital accounts within the financial statements are adjusted for permanent book-tax differences. These adjustments have no impact on net assets or the results of operations. Capital accounts are not adjusted for temporary book-tax differences which will reverse in a subsequent period.
Book-tax differences are primarily due to futures contracts, foreign currency transactions, certain foreign taxes, passive foreign investment companies (PFIC), capital loss carryforwards, and losses deferred due to wash sales and excise tax regulations.
As of period end, the cost and unrealized appreciation (depreciation) in securities, and derivatives if applicable, for federal income tax purposes were as follows:
| Gross unrealized appreciation | $1,220,464,275 |
| Gross unrealized depreciation | (605,069,411) |
| Net unrealized appreciation (depreciation) | $615,394,864 |
| Tax cost | $6,731,410,358 |
Capital loss carryforwards are only available to offset future capital gains of the Fund to the extent provided by regulations and may be limited. The capital loss carryforward information presented below, including any applicable limitation, is estimated as of prior fiscal period end and is subject to adjustment.
| Short-term | $(303,472,528) |
| Long-term | (214,356,069) |
| Total capital loss carryforward | $(517,828,597) |
Restricted Securities (including Private Placements). Funds may invest in securities that are subject to legal or contractual restrictions on resale. These securities generally may be resold in transactions exempt from registration or to the public if the securities are registered. Disposal of these securities may involve time-consuming negotiations and expense, and prompt sale at an acceptable price may be difficult. Information regarding restricted securities held at period end is included at the end of the Schedule of Investments, if applicable.
3. Derivative Instruments.
Risk Exposures and the Use of Derivative Instruments. The Fund's investment objectives allow for various types of derivative instruments, including futures contracts. Derivatives are investments whose value is primarily derived from underlying assets, indices or reference rates and may be transacted on an exchange or over-the-counter (OTC). Derivatives may involve a future commitment to buy or sell a specified asset based on specified terms, to exchange future cash flows at periodic intervals based on a notional principal amount, or for one party to make one or more payments upon the occurrence of specified events in exchange for periodic payments from the other party.
Derivatives were used to increase returns and to manage exposure to certain risks as defined below. The success of any strategy involving derivatives depends on analysis of numerous economic factors, and if the strategies for investment do not work as intended, the objectives may not be achieved.
Derivatives were used to increase or decrease exposure to the following risk(s):
| | |
| Equity Risk | Equity risk relates to the fluctuations in the value of financial instruments as a result of changes in market prices (other than those arising from interest rate risk or foreign exchange risk), whether caused by factors specific to an individual investment, its issuer, or all factors affecting all instruments traded in a market or market segment. |
Funds are also exposed to additional risks from investing in derivatives, such as liquidity risk and counterparty credit risk. Liquidity risk is the risk that a fund will be unable to close out the derivative in the open market in a timely manner. Counterparty credit risk is the risk that the counterparty will not be able to fulfill its obligation to a fund. Counterparty credit risk related to exchange-traded contracts may be mitigated by the protection provided by the exchange on which they trade.
Investing in derivatives may involve greater risks than investing in the underlying assets directly and, to varying degrees, may involve risk of loss in excess of any initial investment and collateral received and amounts recognized in the Statement of Assets and Liabilities. In addition, there may be the risk that the change in value of the derivative contract does not correspond to the change in value of the underlying instrument.
Futures Contracts. A futures contract is an agreement between two parties to buy or sell a specified underlying instrument for a fixed price at a specified future date. Futures contracts were used to manage exposure to the stock market.
Upon entering into a futures contract, a fund is required to deposit either cash or securities (initial margin) with a clearing broker in an amount equal to a certain percentage of the face value of the contract. Futures contracts are marked-to-market daily and subsequent daily payments are made or received by a fund depending on the daily fluctuations in the value of the futures contracts and are recorded as unrealized appreciation or (depreciation). This receivable and/or payable, if any, is included in daily variation margin on futures contracts in the Statement of Assets and Liabilities. Realized gain or (loss) is recorded upon the expiration or closing of a futures contract. The net realized gain (loss) and change in net unrealized appreciation (depreciation) on futures contracts during the period is presented in the Statement of Operations.
Any open futures contracts at period end are presented in the Schedule of Investments under the caption "Futures Contracts". The notional amount at value reflects each contract's exposure to the underlying instrument or index at period end, and is representative of volume of activity during the period unless an average notional amount is presented. Any securities deposited to meet initial margin requirements are identified in the Schedule of Investments. Any cash deposited to meet initial margin requirements is presented as segregated cash with brokers for derivative instruments in the Statement of Assets and Liabilities.
4. Purchases and Sales of Investments.
Purchases and sales of securities, other than short-term securities and in-kind transactions, as applicable, are noted in the table below.
| | Purchases ($) | Sales ($) |
| Strategic Advisers Emerging Markets Fund | 1,341,276,322 | 1,615,313,993 |
5. Fees and Other Transactions with Affiliates.
Management Fee. Strategic Advisers (the investment adviser) provides the Fund with investment management related services. For these services, the Fund pays a monthly management fee to the investment adviser. The management fee is calculated by adding the annual management fee rate of .25% of the Fund's average net assets throughout the month to the aggregate of the fee rates, payable monthly by the investment adviser, to the Fund's sub-advisers. The Fund's maximum aggregate management fee will not exceed 1.20% of the Fund's average net assets. For the reporting period, the total annualized management fee rate was .53% of the Fund's average net assets.
During the period, the investment adviser waived a portion of its management fee as described in the Expense Reductions note.
Sub-Advisers. Acadian Asset Management LLC, Causeway Capital Management, LLC, FIAM LLC (an affiliate of the investment adviser), FIL Investment Advisors, Schroder Investment Management North America, Inc., Somerset Capital Management LLP and T. Rowe Price Associates, Inc. each served as a sub-adviser for the Fund during the period. Sub-advisers provide discretionary investment advisory services for their allocated portion of the Fund's assets and are paid as described in the Management Fee note.
Geode Capital Management, LLC (Geode) has been retained to serve as a sub-adviser for the Fund. As of the date of this report, however, Geode has not been allocated any portion of the Fund's assets. Geode in the future may provide discretionary investment advisory services for an allocated portion of the Fund's assets and will be paid by the investment adviser for providing these services.
Brokerage Commissions. A portion of portfolio transactions were placed with brokerage firms which are affiliates of the investment adviser. Brokerage commissions are included in net realized gain (loss) and change in net unrealized appreciation (depreciation) in the Statement of Operations. The commissions paid to these affiliated firms were as follows:
| | Amount |
| Strategic Advisers Emerging Markets Fund | $1,001 |
Interfund Trades. Funds may purchase from or sell securities to other funds affiliated with each sub-adviser under procedures adopted by the Board. The procedures have been designed to ensure these interfund trades are executed in accordance with Rule 17a-7 of the 1940 Act. Any interfund trades are included within the respective purchases and sales amounts shown in the Purchases and Sales of Investments note. Interfund trades during the period are noted in the table below.
| | Purchases ($) | Sales ($) | Realized Gain (Loss) ($) |
| Strategic Advisers Emerging Markets Fund | 7,505,396 | 4,387,258 | (426,435) |
6. Investments in Fidelity Central Funds.
Funds may invest in Fidelity Central Funds, which are open-end investment companies generally available only to other investment companies and accounts managed by the investment adviser and its affiliates. The Schedule of Investments lists any Fidelity Central Funds held as an investment as of period end, but does not include the underlying holdings of each Fidelity Central Fund. An investing fund indirectly bears its proportionate share of the expenses of the underlying Fidelity Central Funds.
Based on its investment objective, each Fidelity Central Fund may invest or participate in various investment vehicles or strategies that are similar to those of the investing fund. These strategies are consistent with the investment objectives of the investing fund and may involve certain economic risks which may cause a decline in value of each of the Fidelity Central Funds and thus a decline in the value of the investing fund.
| Fidelity Central Fund | Investment Manager | Investment Objective | Investment Practices | Expense RatioA |
| Fidelity Money Market Central Funds | Fidelity Management & Research Company LLC (FMR) | Each fund seeks to obtain a high level of current income consistent with the preservation of capital and liquidity. | Short-term Investments | Less than .005% |
A Expenses expressed as a percentage of average net assets and are as of each underlying Central Fund's most recent annual or semi-annual shareholder report.
A complete unaudited list of holdings for each Fidelity Central Fund is available upon request or at the Securities and Exchange Commission website at www.sec.gov. In addition, the financial statements of the Fidelity Central Funds, which are not covered by the Report of Independent Registered Public Accounting Firm, are available on the Securities and Exchange Commission website or upon request.
7. Committed Line of Credit.
Certain Funds participate with other funds managed by the investment adviser or an affiliate in a $4.25 billion credit facility (the "line of credit") to be utilized for temporary or emergency purposes to fund shareholder redemptions or for other short-term liquidity purposes. The participating funds have agreed to pay commitment fees on their pro-rata portion of the line of credit, which are reflected in Miscellaneous expenses on the Statement of Operations, and are listed below. During the period, there were no borrowings on this line of credit.
| | Amount |
| Strategic Advisers Emerging Markets Fund | $7,284 |
8. Security Lending.
Funds lend portfolio securities from time to time in order to earn additional income. Lending agents are used, including National Financial Services (NFS), an affiliate of the investment adviser. Pursuant to a securities lending agreement, NFS will receive a fee, which is capped at 9.9% of a fund's daily lending revenue, for its services as lending agent. A fund may lend securities to certain qualified borrowers, including NFS. On the settlement date of the loan, a fund receives collateral (in the form of U.S. Treasury obligations, letters of credit and/or cash) against the loaned securities and maintains collateral in an amount not less than 100% of the market value of the loaned securities during the period of the loan. The market value of the loaned securities is determined at the close of business of a fund and any additional required collateral is delivered to a fund on the next business day. A fund or borrower may terminate the loan at any time, and if the borrower defaults on its obligation to return the securities loaned because of insolvency or other reasons, a fund may apply collateral received from the borrower against the obligation. A fund may experience delays and costs in recovering the securities loaned. Any cash collateral received is invested in the Fidelity Securities Lending Cash Central Fund. Any loaned securities are identified as such in the Schedule of Investments, and the value of loaned securities and cash collateral at period end, as applicable, are presented in the Statement of Assets and Liabilities. Security lending income represents the income earned on investing cash collateral, less rebates paid to borrowers and any lending agent fees associated with the loan, plus any premium payments received for lending certain types of securities. Security lending income is presented in the Statement of Operations as a component of income from Fidelity Central Funds. Affiliated security lending activity, if any, was as follows:
| | Total Security Lending Fees Paid to NFS | Security Lending Income From Securities Loaned to NFS | Value of Securities Loaned to NFS at Period End |
| Strategic Advisers Emerging Markets Fund | $30,424 | $- | $- |
9. Expense Reductions.
The investment adviser has contractually agreed to waive the Fund's management fee in an amount equal to .25% of the Fund's average net assets until September 30, 2026. During the period, this waiver reduced the Fund's management fee by $9,320,507.
Through arrangements with the Fund's custodian, credits realized as a result of certain uninvested cash balances were used to reduce the Fund's expenses by $3,614.
10. Other.
A fund's organizational documents provide former and current trustees and officers with a limited indemnification against liabilities arising in connection with the performance of their duties to the fund. In the normal course of business, a fund may also enter into contracts that provide general indemnifications. A fund's maximum exposure under these arrangements is unknown as this would be dependent on future claims that may be made against a fund. The risk of material loss from such claims is considered remote.
Funds do not invest in underlying mutual funds for the purpose of exercising management or control; however, investments by funds within their principal investment strategies may represent a significant portion of the underlying mutual fund's net assets. At the end of the period, certain Funds were the owners of record of 10% or more of the total outstanding shares of the following underlying mutual funds as shown below.
| Fund | Strategic Advisers Emerging Markets Fund |
| Fidelity SAI Emerging Markets Low Volatility Index Fund | 18% |
| Fidelity SAI Emerging Markets Value Index Fund | 27% |
11. Risk and Uncertainties.
Many factors affect a fund's performance. Developments that disrupt global economies and financial markets, such as pandemics, epidemics, outbreaks of infectious diseases, war, terrorism, and environmental disasters, may significantly affect a fund's investment performance. The effects of these developments to a fund will be impacted by the types of securities in which a fund invests, the financial condition, industry, economic sector, and geographic location of an issuer, and a fund's level of investment in the securities of that issuer. Significant concentrations in security types, issuers, industries, sectors, and geographic locations may magnify the factors that affect a fund's performance.
As a shareholder, you incur two types of costs: (1) transaction costs, which may include sales charges (loads) on purchase payments or redemption proceeds, as applicable and (2) ongoing costs, which generally include management fees, distribution and/or service (12b-1) fees and other Fund expenses. This Example is intended to help you understand your ongoing costs (in dollars) of investing in a fund and to compare these costs with the ongoing costs of investing in other mutual funds.
| The Example is based on an investment of $1,000 invested at the beginning of the period and held for the entire period (March 1, 2023 to August 31, 2023). |
Actual Expenses
The first line of the accompanying table provides information about actual account values and actual expenses. You may use the information in this line, together with the amount you invested, to estimate the expenses that you paid over the period. Simply divide your account value by $1,000.00 (for example, an $8,600 account value divided by $1,000.00 = 8.6), then multiply the result by the number in the first line for a class/Fund under the heading entitled "Expenses Paid During Period" to estimate the expenses you paid on your account during this period. If any fund is a shareholder of any underlying mutual funds or exchange-traded funds (ETFs) (the Underlying Funds), such fund indirectly bears its proportional share of the expenses of the Underlying Funds in addition to the direct expenses incurred presented in the table. These fees and expenses are not included in the annualized expense ratio used to calculate the expense estimate in the table below.
Hypothetical Example for Comparison Purposes
The second line of the accompanying table provides information about hypothetical account values and hypothetical expenses based on the actual expense ratio and an assumed rate of return of 5% per year before expenses, which is not the actual return. The hypothetical account values and expenses may not be used to estimate the actual ending account balance or expenses you paid for the period. You may use this information to compare the ongoing costs of investing in the Fund and other funds. To do so, compare this 5% hypothetical example with the 5% hypothetical examples that appear in the shareholder reports of the other funds. If any fund is a shareholder of any Underlying Funds, such fund indirectly bears its proportional share of the expenses of the Underlying Funds in addition to the direct expenses as presented in the table. These fees and expenses are not included in the annualized expense ratio used to calculate the expense estimate in the table below.
Please note that the expenses shown in the table are meant to highlight your ongoing costs only and do not reflect any transaction costs. Therefore, the second line of the table is useful in comparing ongoing costs only, and will not help you determine the relative total costs of owning different funds. In addition, if these transactional costs were included, your costs would have been higher.
| | | | | Annualized Expense Ratio- A | | Beginning Account Value March 1, 2023 | | Ending Account Value August 31, 2023 | | Expenses Paid During Period- C March 1, 2023 to August 31, 2023 |
| | | | | | | | | | |
| Strategic Advisers® Emerging Markets Fund | | | | .31% | | | | | | |
| Actual | | | | | | $ 1,000 | | $ 1,042.00 | | $ 1.59 |
Hypothetical-B | | | | | | $ 1,000 | | $ 1,023.58 | | $ 1.58 |
| |
A Annualized expense ratio reflects expenses net of applicable fee waivers.
B 5% return per year before expenses
C Expenses are equal to the annualized expense ratio, multiplied by the average account value over the period, multiplied by 184/ 366 (to reflect the one-half year period). The fees and expenses of any Underlying Funds are not included in each annualized expense ratio.
Board Approval of Amended Sub-Advisory Agreement
Strategic Advisers Emerging Markets Fund
In March 2023, the Board of Trustees, including the Independent Trustees (together, the Board) voted to approve an amendment to the fee schedule for one investment mandate in the existing sub-advisory agreement among Strategic Advisers, FIAM LLC (the Sub-Adviser), and Fidelity Rutland Square Trust II (Trust) on behalf of the fund (Amended Sub-Advisory Agreement). The Board noted that the updated fee schedule in the Amended Sub-Advisory Agreement became effective as of February 1, 2023 and will result in a lower fee at all asset levels. The Board also noted that no other material contract terms are impacted by the Amended Sub-Advisory Agreement. The Board, assisted by the advice of fund counsel and Independent Trustees' counsel, considered a broad range of information.
In considering whether to approve the Amended Sub-Advisory Agreement, the Board reached a determination, with the assistance of fund counsel and Independent Trustees' counsel and through the exercise of its business judgment, that the approval of the Amended Sub-Advisory Agreement is in the best interests of the fund and its shareholders and that the approval of such agreements does not involve a conflict of interest from which Strategic Advisers or its affiliates derive an inappropriate advantage. The Board's decision to approve the Amended Sub-Advisory Agreements was not based on any single factor, but rather was based on a comprehensive consideration of all the information provided to the Board. In addition, individual Trustees did not necessarily attribute the same weight or importance to each factor.
Nature, Extent, and Quality of Services Provided. The Board considered the backgrounds of the investment personnel that provide services to the fund, the fund's investment objective, strategies and related investment philosophy, the current sub-adviser line-up, and the structure of the investment personnel compensation programs and whether such structure provides appropriate incentives to act in the best interests of the fund in connection with its annual renewal of the fund's management contract, sub-advisory agreements and sub-subadvisory agreements at its September 2022 meeting.
The Board noted that it had approved the existing sub-advisory agreement with the Sub-Adviser at its September 2022 meeting and the Amended Sub-Advisory Agreement will not result in any changes to: (i) the nature, extent and quality of the sub-advisory services provided; (ii) the investment process or strategies employed in the management of the fund's assets; or (iii) the day-to-day management of the fund or the persons primarily responsible for such management.
The Board did not consider performance to be a material factor in its decision to approve the Amended Sub-Advisory Agreement because the approval of the Amended Sub-Advisory Agreement will not result in any changes (i) to the fund's investment processes or strategies; or (ii) in the persons primarily responsible for the day-to-day management of the fund.
Based on its review, the Board concluded that the nature, extent, and quality of services that will be provided to the fund under the Amended Sub-Advisory Agreement should continue to benefit the fund's shareholders.
Competitiveness of Management Fee and Total Fund Expenses. The Board noted that the Amended Sub-Advisory Agreement will not result in changes to the maximum aggregate annual management fee payable by the fund or Strategic Advisers' portion of the management fee. The Board considered Strategic Advisers' contractual agreement to waive its portion of the fund's management fee.
The Board also considered that the Amended Sub-Advisory Agreement is expected to result in a decrease in the total management fee rate of the fund.
Based on its review, the Board concluded that the fund's management fee structure and projected total expenses bear a reasonable relationship to the services that the fund and its shareholders will receive and the other factors considered.
Costs of the Services and Profitability. Because the Amended Sub-Advisory Agreement was negotiated at arm's length and will have no impact on the maximum management fees payable by the fund or Strategic Advisers' portion of the management fee, the Board did not consider the costs of services and profitability to be significant factors in its decision to approve the Amended Sub-Advisory Agreement.
Potential Fall-Out Benefits. The Board considered that it reviews information regarding the potential of direct and indirect benefits to Strategic Advisers and its affiliates from their relationships with the fund, including non-advisory fee compensation paid to affiliates of Strategic Advisers, if any, as well as information regarding potential fall-out benefits accruing to each sub-adviser, if any, as a result of its relationship with the fund, during its annual renewal of the fund's management contract, sub-advisory agreements, and sub-subadvisory agreements. The Board considered Strategic Advisers' representation that it does not anticipate that the approval of the Amended Sub-Advisory Agreement will have a significant impact on the profitability of, or potential fall-out benefits to, Strategic Advisers or its affiliates.
Possible Economies of Scale. The Board considered that it reviews whether there have been economies of scale in connection with the management of the fund during its annual renewal of the fund's management contract, sub-advisory agreements, and sub-subadvisory agreements. The Board also noted that it did not consider the possible realization of economies of scale to be a significant factor in its decision to approve the Amended Sub-Advisory Agreement because the fund is not expected to bear any additional expenses as a result of the Amended Sub-Advisory Agreement.
Conclusion. Based on its evaluation of all of the conclusions noted above, and after considering all factors it believed relevant, the Board concluded that the Amended Sub-Advisory Agreement's fee structure bears a reasonable relationship to the services to be rendered and that the Amended Sub-Advisory Agreement is in the best interests of the fund and its shareholders and should be approved. In addition, the Board concluded that the approval of the Amended Sub-Advisory Agreement does not involve a conflict of interest from which Strategic Advisers or its affiliates derive an inappropriate advantage.
1.918361.113
SAE-SANN-1023
Strategic Advisers® Income Opportunities Fund
Offered exclusively to certain managed account clients of Strategic Advisers LLC or its affiliates - not available for sale to the general public
Semi-Annual Report
August 31, 2023
Contents
To view a fund's proxy voting guidelines and proxy voting record for the 12-month period ended June 30, visit http://www.fidelity.com/proxyvotingresults or visit the Securities and Exchange Commission's (SEC) web site at http://www.sec.gov.
You may also call 1-800-544-3455 to request a free copy of the proxy voting guidelines.
Standard & Poor's, S&P and S&P 500 are registered service marks of The McGraw-Hill Companies, Inc. and have been licensed for use by Fidelity Distributors Corporation.
Other third-party marks appearing herein are the property of their respective owners.
All other marks appearing herein are registered or unregistered trademarks or service marks of FMR LLC or an affiliated company. © 2023 FMR LLC. All rights reserved.
This report and the financial statements contained herein are submitted for the general information of the shareholders of the Fund. This report is not authorized for distribution to prospective investors in the Fund unless preceded or accompanied by an effective prospectus.
A fund files its complete schedule of portfolio holdings with the SEC for the first and third quarters of each fiscal year on Form N-PORT. Forms N-PORT are available on the SEC's web site at http://www.sec.gov. A fund's Forms N-PORT may be reviewed and copied at the SEC's Public Reference Room in Washington, DC. Information regarding the operation of the SEC's Public Reference Room may be obtained by calling 1-800-SEC-0330.
For a complete list of a fund's portfolio holdings, view the most recent holdings listing, semiannual report, or annual report on Fidelity's web site at http://www.fidelity.com, http://www.institutional.fidelity.com, or http://www.401k.com, as applicable.
NOT FDIC INSURED •MAY LOSE VALUE •NO BANK GUARANTEE
Neither the Fund nor Fidelity Distributors Corporation is a bank.
The information in the following tables is based on the direct Investments of the Fund.
Top Holdings (% of Fund's net assets) |
| (excluding cash equivalents) |
| Artisan High Income Fund Investor Shares | 14.1 | |
| Fidelity Capital & Income Fund | 8.8 | |
| MainStay High Yield Corporate Bond Fund Class A | 8.3 | |
| Eaton Vance Income Fund of Boston Class A | 7.9 | |
| BlackRock High Yield Bond Portfolio Class K | 6.7 | |
| Vanguard High-Yield Corporate Fund Admiral Shares | 4.7 | |
| U.S. Treasury Obligations | 1.6 | |
| CCO Holdings LLC/CCO Holdings Capital Corp. | 1.0 | |
| Tenet Healthcare Corp. | 0.7 | |
| TransDigm, Inc. | 0.7 | |
Asset Allocation (% of Fund's net assets) |
|
|
Asset Allocation of funds in the pie chart reflect the categorizations of the asset as defined by Morningstar as of the reporting date.
Showing Percentage of Net Assets
| Corporate Bonds - 41.9% |
| | | Principal Amount (a) | Value ($) |
| Convertible Bonds - 0.1% | | | |
| COMMUNICATION SERVICES - 0.1% | | | |
| Media - 0.1% | | | |
| DISH Network Corp.: | | | |
| 2.375% 3/15/24 | | 828,000 | 782,460 |
| 3.375% 8/15/26 | | 1,784,000 | 1,079,320 |
| | | | 1,861,780 |
| CONSUMER DISCRETIONARY - 0.0% | | | |
| Automobiles - 0.0% | | | |
| Rivian Automotive, Inc. 4.625% 3/15/29 (b) | | 285,000 | 393,728 |
| | | | |
| REAL ESTATE - 0.0% | | | |
| Real Estate Management & Development - 0.0% | | | |
| Redfin Corp. 0.5% 4/1/27 | | 373,000 | 236,855 |
| | | | |
| TOTAL CONVERTIBLE BONDS | | | 2,492,363 |
| Nonconvertible Bonds - 41.8% | | | |
| COMMUNICATION SERVICES - 5.4% | | | |
| Diversified Telecommunication Services - 0.9% | | | |
| Altice France SA: | | | |
| 5.125% 1/15/29(b) | | 867,000 | 617,717 |
| 5.125% 7/15/29(b) | | 575,000 | 406,456 |
| 5.5% 10/15/29(b) | | 800,000 | 575,614 |
| 8.125% 2/1/27(b) | | 1,200,000 | 1,014,166 |
| C&W Senior Financing Designated Activity Co. 6.875% 9/15/27 (b) | | 1,470,000 | 1,352,400 |
| Cablevision Lightpath LLC: | | | |
| 3.875% 9/15/27(b) | | 825,000 | 688,765 |
| 5.625% 9/15/28(b) | | 300,000 | 230,438 |
| Connect Finco SARL / Connect U.S. Finco LLC 6.75% 10/1/26 (b) | | 1,490,000 | 1,413,479 |
| Consolidated Communications, Inc. 5% 10/1/28 (b) | | 190,000 | 142,390 |
| Frontier Communications Holdings LLC: | | | |
| 5% 5/1/28(b) | | 315,000 | 269,909 |
| 5.875% 10/15/27(b) | | 274,000 | 249,560 |
| 5.875% 11/1/29 | | 235,000 | 174,037 |
| Holdco SASU 6.5% 10/15/26 (b) | | 1,840,000 | 1,755,470 |
| Level 3 Financing, Inc.: | | | |
| 3.4% 3/1/27(b) | | 700,000 | 646,063 |
| 3.625% 1/15/29(b) | | 557,000 | 331,701 |
| 3.75% 7/15/29(b) | | 795,000 | 474,226 |
| 4.25% 7/1/28(b) | | 600,000 | 393,394 |
| 4.625% 9/15/27(b) | | 350,000 | 263,212 |
| 10.5% 5/15/30(b) | | 379,000 | 384,985 |
| Telecom Italia Capital SA: | | | |
| 6% 9/30/34 | | 242,000 | 200,898 |
| 7.2% 7/18/36 | | 98,000 | 88,566 |
| 7.721% 6/4/38 | | 200,000 | 184,935 |
| Telenet Finance Luxembourg Notes SARL 5.5% 3/1/28 (b) | | 200,000 | 182,600 |
| Windstream Escrow LLC 7.75% 8/15/28 (b) | | 460,000 | 372,928 |
| Zayo Group Holdings, Inc.: | | | |
| 4% 3/1/27(b) | | 480,000 | 359,730 |
| 6.125% 3/1/28(b) | | 588,000 | 382,200 |
| | | | 13,155,839 |
| Entertainment - 0.2% | | | |
| AMC Entertainment Holdings, Inc. 10% 6/15/26 pay-in-kind (b)(c) | | 177,120 | 122,924 |
| Cinemark U.S.A., Inc. 5.25% 7/15/28 (b) | | 1,450,000 | 1,287,948 |
| Live Nation Entertainment, Inc. 4.75% 10/15/27 (b) | | 665,000 | 619,514 |
| Playtika Holding Corp. 4.25% 3/15/29 (b) | | 605,000 | 523,325 |
| Roblox Corp. 3.875% 5/1/30 (b) | | 1,055,000 | 870,379 |
| | | | 3,424,090 |
| Media - 4.0% | | | |
| Advantage Sales & Marketing, Inc. 6.5% 11/15/28 (b) | | 804,000 | 700,895 |
| Altice Financing SA: | | | |
| 5% 1/15/28(b) | | 950,000 | 772,454 |
| 5.75% 8/15/29(b) | | 2,485,000 | 1,968,534 |
| Altice France Holding SA: | | | |
| 6% 2/15/28(b) | | 3,070,000 | 1,343,125 |
| 10.5% 5/15/27(b) | | 1,565,000 | 849,169 |
| AMC Networks, Inc. 5% 4/1/24 | | 535,000 | 529,268 |
| CCO Holdings LLC/CCO Holdings Capital Corp.: | | | |
| 4.25% 2/1/31(b) | | 1,535,000 | 1,259,136 |
| 4.25% 1/15/34(b) | | 375,000 | 287,174 |
| 4.5% 8/15/30(b) | | 1,793,000 | 1,508,266 |
| 4.5% 5/1/32 | | 4,850,000 | 3,931,870 |
| 4.5% 6/1/33(b) | | 1,725,000 | 1,361,664 |
| 4.75% 2/1/32(b) | | 240,000 | 198,600 |
| 5% 2/1/28(b) | | 1,000,000 | 921,496 |
| 6.375% 9/1/29(b) | | 3,090,000 | 2,925,325 |
| 7.375% 3/1/31(b) | | 1,530,000 | 1,521,195 |
| Clear Channel Outdoor Holdings, Inc.: | | | |
| 5.125% 8/15/27(b) | | 130,000 | 116,433 |
| 7.5% 6/1/29(b) | | 680,000 | 506,798 |
| 7.75% 4/15/28(b) | | 995,000 | 782,610 |
| 9% 9/15/28(b) | | 1,100,000 | 1,105,500 |
| CSC Holdings LLC: | | | |
| 4.125% 12/1/30(b) | | 1,152,000 | 821,460 |
| 4.625% 12/1/30(b) | | 2,737,000 | 1,431,947 |
| 5.375% 2/1/28(b) | | 676,000 | 554,163 |
| 5.75% 1/15/30(b) | | 4,090,000 | 2,261,688 |
| 6.5% 2/1/29(b) | | 1,530,000 | 1,264,016 |
| 7.5% 4/1/28(b) | | 935,000 | 594,319 |
| Diamond Sports Group LLC/Diamond Sports Finance Co.: | | | |
| 5.375%(b)(d) | | 6,605,000 | 155,614 |
| 6.625%(b)(d) | | 13,785,000 | 275,700 |
| DIRECTV Financing LLC / DIRECTV Financing Co-Obligor, Inc. 5.875% 8/15/27 (b) | | 770,000 | 682,388 |
| DISH DBS Corp.: | | | |
| 5.125% 6/1/29 | | 2,946,000 | 1,592,902 |
| 5.25% 12/1/26(b) | | 500,000 | 421,473 |
| 5.75% 12/1/28(b) | | 1,110,000 | 861,660 |
| 7.375% 7/1/28 | | 1,420,000 | 889,488 |
| 7.75% 7/1/26 | | 2,219,000 | 1,659,590 |
| DISH Network Corp. 11.75% 11/15/27 (b) | | 2,129,000 | 2,160,171 |
| Gray Escrow II, Inc. 5.375% 11/15/31 (b) | | 940,000 | 656,259 |
| Gray Television, Inc.: | | | |
| 5.875% 7/15/26(b) | | 525,000 | 480,301 |
| 7% 5/15/27(b) | | 700,000 | 628,292 |
| iHeartCommunications, Inc.: | | | |
| 5.25% 8/15/27(b) | | 467,000 | 369,269 |
| 6.375% 5/1/26 | | 465,000 | 405,717 |
| 8.375% 5/1/27 | | 2,509,567 | 1,737,695 |
| Lamar Media Corp. 4.875% 1/15/29 | | 897,000 | 834,210 |
| LCPR Senior Secured Financing DAC: | | | |
| 5.125% 7/15/29(b) | | 185,000 | 155,955 |
| 6.75% 10/15/27(b) | | 310,000 | 291,788 |
| Midas Opco Holdings LLC 5.625% 8/15/29 (b) | | 1,645,000 | 1,373,802 |
| Midcontinent Communications & Midcontinent Finance Corp. 5.375% 8/15/27 (b) | | 200,000 | 189,249 |
| News Corp.: | | | |
| 3.875% 5/15/29(b) | | 375,000 | 329,321 |
| 5.125% 2/15/32(b) | | 305,000 | 276,025 |
| Nexstar Media, Inc. 5.625% 7/15/27 (b) | | 500,000 | 469,971 |
| Radiate Holdco LLC/Radiate Financial Service Ltd.: | | | |
| 4.5% 9/15/26(b) | | 1,197,000 | 932,920 |
| 6.5% 9/15/28(b) | | 3,125,000 | 1,687,616 |
| Scripps Escrow, Inc. 5.875% 7/15/27 (b) | | 525,000 | 424,190 |
| Sinclair Television Group, Inc. 5.125% 2/15/27 (b) | | 865,000 | 709,353 |
| Sirius XM Radio, Inc.: | | | |
| 4% 7/15/28(b) | | 2,385,000 | 2,065,221 |
| 4.125% 7/1/30(b) | | 1,730,000 | 1,410,348 |
| 5% 8/1/27(b) | | 630,000 | 582,485 |
| 5.5% 7/1/29(b) | | 605,000 | 544,655 |
| TEGNA, Inc. 5% 9/15/29 | | 130,000 | 114,400 |
| Townsquare Media, Inc. 6.875% 2/1/26 (b) | | 870,000 | 837,375 |
| Univision Communications, Inc.: | | | |
| 4.5% 5/1/29(b) | | 145,000 | 124,807 |
| 5.125% 2/15/25(b) | | 985,000 | 971,456 |
| 6.625% 6/1/27(b) | | 2,110,000 | 2,042,728 |
| 7.375% 6/30/30(b) | | 790,000 | 764,585 |
| 8% 8/15/28(b) | | 605,000 | 604,667 |
| Virgin Media Secured Finance PLC 4.5% 8/15/30 (b) | | 150,000 | 126,654 |
| VZ Secured Financing BV 5% 1/15/32 (b) | | 1,190,000 | 970,158 |
| Ziggo BV 4.875% 1/15/30 (b) | | 170,000 | 142,894 |
| | | | 61,470,457 |
| Wireless Telecommunication Services - 0.3% | | | |
| Digicel Group Holdings Ltd. 8% pay-in-kind (b)(d)(e) | | 51,863 | 11,928 |
| Digicel Group Ltd. 6.75% (b)(d) | | 7,925,000 | 386,344 |
| Digicel International Finance Ltd. / Digicel International Holdings Ltd.: | | | |
| 8%(b)(d) | | 1,250,000 | 60,938 |
| 8.75% 5/25/24(b) | | 200,000 | 181,738 |
| 13% pay-in-kind(b)(d)(e) | | 20,000 | 14,150 |
| Intelsat Jackson Holdings SA: | | | |
| 5.5%(d)(f) | | 3,685,000 | 0 |
| 6.5% 3/15/30(b) | | 2,835,000 | 2,599,446 |
| 8.5%(b)(d)(f) | | 7,200,000 | 1 |
| 9.75%(b)(d)(f) | | 50,000 | 0 |
| Millicom International Cellular SA: | | | |
| 4.5% 4/27/31(b) | | 235,000 | 184,555 |
| 5.125% 1/15/28(b) | | 36,000 | 32,265 |
| Sprint Corp.: | | | |
| 7.625% 3/1/26 | | 590,000 | 611,552 |
| 7.875% 9/15/23 | | 195,000 | 195,084 |
| Telesat Canada/Telesat LLC 6.5% 10/15/27 (b) | | 865,000 | 428,175 |
| U.S. Cellular Corp. 6.7% 12/15/33 | | 58,000 | 56,515 |
| | | | 4,762,691 |
TOTAL COMMUNICATION SERVICES | | | 82,813,077 |
| | | | |
| CONSUMER DISCRETIONARY - 8.4% | | | |
| Automobile Components - 1.0% | | | |
| Adient Global Holdings Ltd.: | | | |
| 4.875% 8/15/26(b) | | 800,000 | 769,311 |
| 7% 4/15/28(b) | | 255,000 | 257,624 |
| 8.25% 4/15/31(b) | | 860,000 | 881,660 |
| Albion Financing 1 SARL 6.125% 10/15/26 (b) | | 605,000 | 572,481 |
| Albion Financing 2 SARL 8.75% 4/15/27 (b) | | 370,000 | 342,999 |
| American Axle & Manufacturing, Inc. 6.25% 3/15/26 | | 225,000 | 218,886 |
| Clarios Global LP / Clarios U.S. Finance Co.: | | | |
| 6.75% 5/15/28(b) | | 126,000 | 125,667 |
| 8.5% 5/15/27(b) | | 1,450,000 | 1,464,597 |
| Dana Financing Luxembourg SARL 8.5% 7/15/31 (b) | EUR | 601,000 | 667,776 |
| Dana, Inc.: | | | |
| 4.25% 9/1/30 | | 1,105,000 | 908,608 |
| 5.375% 11/15/27 | | 50,000 | 47,301 |
| 5.625% 6/15/28 | | 1,565,000 | 1,473,228 |
| Dornoch Debt Merger Sub, Inc. 6.625% 10/15/29 (b) | | 427,000 | 368,114 |
| Gates Global LLC/Gates Global Co. 6.25% 1/15/26 (b) | | 480,000 | 475,217 |
| Hertz Corp.: | | | |
| 4.625% 12/1/26(b) | | 125,000 | 113,174 |
| 5% 12/1/29(b) | | 640,000 | 526,204 |
| IHO Verwaltungs GmbH 4.75% 9/15/26 pay-in-kind (b)(e) | | 40,000 | 37,336 |
| Macquarie AirFinance Holdings 8.375% 5/1/28 (b) | | 320,000 | 326,726 |
| Nesco Holdings II, Inc. 5.5% 4/15/29 (b) | | 346,000 | 313,771 |
| Patrick Industries, Inc.: | | | |
| 4.75% 5/1/29(b) | | 500,000 | 427,500 |
| 7.5% 10/15/27(b) | | 175,000 | 170,625 |
| PECF USS Intermediate Holding III Corp. 8% 11/15/29 (b) | | 145,000 | 92,476 |
| Tenneco, Inc. 8% 11/17/28 (b) | | 1,230,000 | 1,010,138 |
| The Goodyear Tire & Rubber Co.: | | | |
| 5% 7/15/29 | | 15,000 | 13,312 |
| 5.25% 4/30/31 | | 1,150,000 | 1,008,809 |
| 5.25% 7/15/31 | | 1,620,000 | 1,395,225 |
| 5.625% 4/30/33 | | 270,000 | 231,711 |
| ZF North America Capital, Inc.: | | | |
| 4.75% 4/29/25(b) | | 235,000 | 228,314 |
| 6.875% 4/14/28(b) | | 335,000 | 333,920 |
| 7.125% 4/14/30(b) | | 390,000 | 395,088 |
| | | | 15,197,798 |
| Automobiles - 0.8% | | | |
| Ford Motor Co.: | | | |
| 3.25% 2/12/32 | | 195,000 | 152,206 |
| 4.75% 1/15/43 | | 3,708,000 | 2,771,768 |
| 5.291% 12/8/46 | | 35,000 | 27,484 |
| 6.1% 8/19/32 | | 2,990,000 | 2,857,447 |
| 7.4% 11/1/46 | | 75,000 | 76,384 |
| 9.625% 4/22/30 | | 700,000 | 812,764 |
| Nissan Motor Co. Ltd. 4.81% 9/17/30 (b) | | 425,000 | 375,085 |
| PM General Purchaser LLC 9.5% 10/1/28 (b) | | 880,000 | 847,167 |
| Rivian Holdco & Rivian LLC & Rivian Automotive LLC 6 month U.S. LIBOR + 5.620% 10.9311% 10/15/26 (b)(e)(g) | | 4,195,000 | 4,181,129 |
| | | | 12,101,434 |
| Broadline Retail - 0.4% | | | |
| Cmg Media Corp. 8.875% 12/15/27 (b) | | 2,980,000 | 2,340,611 |
| LSF9 Atlantis Holdings LLC / Victra Finance Corp. 7.75% 2/15/26 (b) | | 407,000 | 370,882 |
| Match Group Holdings II LLC: | | | |
| 3.625% 10/1/31(b) | | 435,000 | 354,616 |
| 4.125% 8/1/30(b) | | 1,544,000 | 1,324,165 |
| 4.625% 6/1/28(b) | | 500,000 | 461,310 |
| 5% 12/15/27(b) | | 175,000 | 164,210 |
| 5.625% 2/15/29(b) | | 160,000 | 150,820 |
| Nordstrom, Inc.: | | | |
| 4.25% 8/1/31 | | 340,000 | 255,775 |
| 4.375% 4/1/30 | | 295,000 | 235,698 |
| | | | 5,658,087 |
| Distributors - 0.2% | | | |
| Ritchie Bros. Holdings, Inc.: | | | |
| 6.75% 3/15/28(b) | | 385,000 | 389,716 |
| 7.75% 3/15/31(b) | | 670,000 | 692,961 |
| Windsor Holdings III, LLC 8.5% 6/15/30 (b) | | 1,590,000 | 1,596,936 |
| | | | 2,679,613 |
| Diversified Consumer Services - 0.1% | | | |
| Adtalem Global Education, Inc. 5.5% 3/1/28 (b) | | 927,000 | 863,962 |
| GEMS MENASA Cayman Ltd. 7.125% 7/31/26 (b) | | 675,000 | 654,230 |
| Service Corp. International: | | | |
| 4% 5/15/31 | | 460,000 | 390,011 |
| 5.125% 6/1/29 | | 105,000 | 98,831 |
| Sotheby's 7.375% 10/15/27 (b) | | 230,000 | 209,382 |
| WASH Multifamily Acquisition, Inc. 5.75% 4/15/26 (b) | | 375,000 | 347,773 |
| | | | 2,564,189 |
| Hotels, Restaurants & Leisure - 4.1% | | | |
| 1011778 BC Unlimited Liability Co./New Red Finance, Inc.: | | | |
| 3.875% 1/15/28(b) | | 160,000 | 145,527 |
| 4% 10/15/30(b) | | 1,984,000 | 1,680,748 |
| Affinity Gaming LLC 6.875% 12/15/27 (b) | | 645,000 | 571,117 |
| Aramark Services, Inc. 6.375% 5/1/25 (b) | | 200,000 | 200,337 |
| Brinker International, Inc. 8.25% 7/15/30 (b) | | 600,000 | 589,500 |
| Caesars Entertainment, Inc.: | | | |
| 4.625% 10/15/29(b) | | 1,850,000 | 1,619,366 |
| 7% 2/15/30(b) | | 1,690,000 | 1,696,468 |
| 8.125% 7/1/27(b) | | 2,505,000 | 2,543,407 |
| Carnival Corp.: | | | |
| 5.75% 3/1/27(b) | | 1,530,000 | 1,437,411 |
| 6% 5/1/29(b) | | 470,000 | 425,403 |
| 6.65% 1/15/28 | | 110,000 | 101,936 |
| 7% 8/15/29(b) | | 615,000 | 624,003 |
| 7.625% 3/1/26(b) | | 3,380,000 | 3,369,738 |
| 10.5% 6/1/30(b) | | 1,430,000 | 1,523,136 |
| Carrols Restaurant Group, Inc. 5.875% 7/1/29 (b) | | 400,000 | 344,240 |
| CCM Merger, Inc. 6.375% 5/1/26 (b) | | 1,200,000 | 1,166,149 |
| CDI Escrow Issuer, Inc. 5.75% 4/1/30 (b) | | 1,260,000 | 1,171,808 |
| Cedar Fair LP 5.25% 7/15/29 | | 735,000 | 661,625 |
| Churchill Downs, Inc. 6.75% 5/1/31 (b) | | 755,000 | 738,594 |
| Cirsa Finance International SARL: | | | |
| 4.5% 3/15/27(b) | EUR | 515,000 | 512,933 |
| 10.375% 11/30/27(b) | EUR | 100,000 | 116,703 |
| Constellation Merger Sub, Inc. 8.5% 9/15/25 (b) | | 45,000 | 37,575 |
| Dave & Buster's, Inc. 7.625% 11/1/25 (b) | | 700,000 | 706,950 |
| Everi Holdings, Inc. 5% 7/15/29 (b) | | 149,000 | 132,960 |
| Fertitta Entertainment LLC / Fertitta Entertainment Finance Co., Inc. 6.75% 1/15/30 (b) | | 1,810,000 | 1,494,653 |
| Garden SpinCo Corp. 8.625% 7/20/30 (b) | | 115,000 | 122,776 |
| Golden Entertainment, Inc. 7.625% 4/15/26 (b) | | 686,000 | 680,855 |
| Hilton Domestic Operating Co., Inc.: | | | |
| 3.625% 2/15/32(b) | | 1,750,000 | 1,463,517 |
| 4% 5/1/31(b) | | 410,000 | 356,374 |
| International Game Technology PLC: | | | |
| 5.25% 1/15/29(b) | | 985,000 | 926,242 |
| 6.25% 1/15/27(b) | | 1,610,000 | 1,594,230 |
| Jacobs Entertainment, Inc.: | | | |
| 6.75% 2/15/29(b) | | 325,000 | 293,764 |
| 6.75% 2/15/29(b) | | 815,000 | 738,602 |
| Life Time, Inc.: | | | |
| 5.75% 1/15/26(b) | | 612,000 | 597,095 |
| 8% 4/15/26(b) | | 775,000 | 769,188 |
| Lindblad Expeditions Holdings 9% 5/15/28 (b) | | 250,000 | 256,679 |
| Lindblad Expeditions LLC 6.75% 2/15/27 (b) | | 40,000 | 38,632 |
| Lottomatica SpA 7.125% 6/1/28 (b) | EUR | 130,000 | 144,137 |
| MajorDrive Holdings IV LLC 6.375% 6/1/29 (b) | | 265,000 | 218,376 |
| MGM Resorts International: | | | |
| 4.75% 10/15/28 | | 1,626,000 | 1,475,626 |
| 5.5% 4/15/27 | | 337,000 | 321,973 |
| Midwest Gaming Borrower LLC / Midwest Gaming Financial Corp. 4.875% 5/1/29 (b) | | 1,540,000 | 1,339,800 |
| NCL Corp. Ltd.: | | | |
| 5.875% 3/15/26(b) | | 1,785,000 | 1,683,039 |
| 5.875% 2/15/27(b) | | 730,000 | 707,142 |
| 7.75% 2/15/29(b) | | 1,220,000 | 1,159,002 |
| 8.375% 2/1/28(b) | | 275,000 | 283,451 |
| NCL Finance Ltd. 6.125% 3/15/28 (b) | | 845,000 | 761,852 |
| Ontario Gaming GTA LP 8% 8/1/30 (b) | | 310,000 | 313,345 |
| Penn Entertainment, Inc. 5.625% 1/15/27 (b) | | 1,650,000 | 1,569,761 |
| Premier Entertainment Sub LLC 5.875% 9/1/31 (b) | | 675,000 | 521,910 |
| Royal Caribbean Cruises Ltd.: | | | |
| 4.25% 7/1/26(b) | | 640,000 | 596,698 |
| 5.375% 7/15/27(b) | | 770,000 | 724,582 |
| 5.5% 8/31/26(b) | | 825,000 | 790,529 |
| 5.5% 4/1/28(b) | | 1,480,000 | 1,385,057 |
| 7.25% 1/15/30(b) | | 375,000 | 380,699 |
| 8.25% 1/15/29(b) | | 875,000 | 914,430 |
| 9.25% 1/15/29(b) | | 900,000 | 958,607 |
| 11.625% 8/15/27(b) | | 1,375,000 | 1,497,561 |
| Scientific Games Corp.: | | | |
| 7.25% 11/15/29(b) | | 2,200,000 | 2,209,284 |
| 7.5% 9/1/31(b) | | 560,000 | 567,822 |
| SeaWorld Parks & Entertainment, Inc. 5.25% 8/15/29 (b) | | 1,175,000 | 1,054,976 |
| Six Flags Entertainment Corp.: | | | |
| 5.5% 4/15/27(b) | | 770,000 | 724,763 |
| 7.25% 5/15/31(b) | | 1,205,000 | 1,155,491 |
| Sugarhouse HSP Gaming Prop Mezz LP/Sugarhouse HSP Gaming Finance Corp. 5.875% 5/15/25 (b) | | 505,000 | 488,607 |
| Viking Cruises Ltd.: | | | |
| 5.875% 9/15/27(b) | | 880,000 | 822,800 |
| 9.125% 7/15/31(b) | | 55,000 | 56,823 |
| Viking Ocean Cruises Ship VII Ltd. 5.625% 2/15/29 (b) | | 400,000 | 371,872 |
| Wyndham Hotels & Resorts, Inc. 4.375% 8/15/28 (b) | | 215,000 | 196,080 |
| Wynn Macau Ltd.: | | | |
| 5.125% 12/15/29(b) | | 875,000 | 713,248 |
| 5.5% 1/15/26(b) | | 945,000 | 883,707 |
| 5.5% 10/1/27(b) | | 2,265,000 | 2,033,823 |
| 5.625% 8/26/28(b) | | 200,000 | 175,250 |
| Wynn Resorts Finance LLC / Wynn Resorts Capital Corp.: | | | |
| 5.125% 10/1/29(b) | | 725,000 | 649,024 |
| 7.125% 2/15/31(b) | | 125,000 | 122,838 |
| Yum! Brands, Inc.: | | | |
| 3.625% 3/15/31 | | 95,000 | 80,562 |
| 4.625% 1/31/32 | | 430,000 | 384,745 |
| 5.35% 11/1/43 | | 845,000 | 743,882 |
| 5.375% 4/1/32 | | 80,000 | 75,080 |
| 6.875% 11/15/37 | | 1,170,000 | 1,232,774 |
| | | | 63,941,269 |
| Household Durables - 0.6% | | | |
| Ashton Woods U.S.A. LLC/Ashton Woods Finance Co.: | | | |
| 4.625% 4/1/30(b) | | 790,000 | 680,391 |
| 6.625% 1/15/28(b) | | 25,000 | 23,887 |
| Beazer Homes U.S.A., Inc.: | | | |
| 5.875% 10/15/27 | | 125,000 | 117,800 |
| 7.25% 10/15/29 | | 1,475,000 | 1,429,113 |
| Brookfield Residential Properties, Inc./Brookfield Residential U.S. Corp.: | | | |
| 4.875% 2/15/30(b) | | 1,079,000 | 891,137 |
| 6.25% 9/15/27(b) | | 563,000 | 516,699 |
| Castle UK Finco PLC 7% 5/15/29 (b) | GBP | 295,000 | 288,479 |
| Empire Communities Corp. 7% 12/15/25 (b) | | 175,000 | 168,892 |
| KB Home 4.8% 11/15/29 | | 875,000 | 789,250 |
| M/I Homes, Inc. 4.95% 2/1/28 | | 485,000 | 450,010 |
| Newell Brands, Inc.: | | | |
| 4.7% 4/1/26 | | 100,000 | 95,811 |
| 6% 4/1/46(c) | | 80,000 | 64,921 |
| 6.375% 9/15/27 | | 100,000 | 97,964 |
| 6.625% 9/15/29 | | 100,000 | 98,966 |
| STL Holding Co. LLC 7.5% 2/15/26 (b) | | 1,250,000 | 1,168,750 |
| SWF Escrow Issuer Corp. 6.5% 10/1/29 (b) | | 1,925,000 | 1,250,673 |
| Taylor Morrison Communities, Inc./Monarch Communities, Inc. 5.625% 3/1/24 (b) | | 100,000 | 99,916 |
| TopBuild Corp. 4.125% 2/15/32 (b) | | 235,000 | 195,638 |
| TRI Pointe Group, Inc./TRI Pointe Holdings, Inc. 5.875% 6/15/24 | | 5,000 | 4,988 |
| TRI Pointe Homes, Inc. 5.7% 6/15/28 | | 620,000 | 587,785 |
| | | | 9,021,070 |
| Leisure Products - 0.0% | | | |
| Mattel, Inc.: | | | |
| 3.75% 4/1/29(b) | | 570,000 | 506,680 |
| 5.45% 11/1/41 | | 80,000 | 68,863 |
| Vista Outdoor, Inc. 4.5% 3/15/29 (b) | | 145,000 | 120,853 |
| | | | 696,396 |
| Specialty Retail - 1.0% | | | |
| Arko Corp. 5.125% 11/15/29 (b) | | 225,000 | 184,790 |
| At Home Group, Inc.: | | | |
| 4.875% 7/15/28(b) | | 505,000 | 242,854 |
| 7.125% 5/12/28 pay-in-kind(b)(e) | | 304,642 | 169,076 |
| 7.125% 7/15/29(b) | | 550,000 | 278,019 |
| Bath & Body Works, Inc.: | | | |
| 6.625% 10/1/30(b) | | 1,550,000 | 1,511,749 |
| 6.95% 3/1/33 | | 440,000 | 411,236 |
| 7.5% 6/15/29 | | 230,000 | 231,857 |
| Carvana Co.: | | | |
| 4.875% 9/1/29(b) | | 292,000 | 174,267 |
| 5.5% 4/15/27(b) | | 220,000 | 160,600 |
| 5.875% 10/1/28(b) | | 160,000 | 98,400 |
| 9% 12/1/28 pay-in-kind | | 108,000 | 92,880 |
| 9% 6/1/30 pay-in-kind | | 162,000 | 139,320 |
| 9% 6/1/31 pay-in-kind | | 193,000 | 165,980 |
| Foot Locker, Inc. 4% 10/1/29 (b) | | 125,000 | 94,084 |
| Gap, Inc. 3.875% 10/1/31 (b) | | 1,125,000 | 815,237 |
| Jaguar Land Rover Automotive PLC: | | | |
| 5.875% 1/15/28(b) | | 845,000 | 778,312 |
| 7.75% 10/15/25(b) | | 550,000 | 551,910 |
| LBM Acquisition LLC 6.25% 1/15/29 (b) | | 1,165,000 | 1,016,557 |
| LCM Investments Holdings: | | | |
| 4.875% 5/1/29(b) | | 1,310,000 | 1,137,068 |
| 8.25% 8/1/31(b) | | 305,000 | 305,195 |
| Metis Merger Sub LLC 6.5% 5/15/29 (b) | | 2,325,000 | 2,019,165 |
| Michaels Companies, Inc. 7.875% 5/1/29 (b) | | 220,000 | 152,504 |
| Park River Holdings, Inc.: | | | |
| 5.625% 2/1/29(b) | | 1,750,000 | 1,369,375 |
| 6.75% 8/1/29(b) | | 150,000 | 120,041 |
| PetSmart, Inc. / PetSmart Finance Corp. 7.75% 2/15/29 (b) | | 1,000,000 | 955,012 |
| QVC, Inc. 4.45% 2/15/25 | | 705,000 | 633,819 |
| Sally Holdings LLC 5.625% 12/1/25 | | 615,000 | 610,838 |
| Specialty Building Products Holdings LLC 6.375% 9/30/26 (b) | | 665,000 | 636,698 |
| Staples, Inc. 10.75% 4/15/27 (b) | | 340,000 | 185,439 |
| Victoria's Secret & Co. 4.625% 7/15/29 (b) | | 130,000 | 94,124 |
| | | | 15,336,406 |
| Textiles, Apparel & Luxury Goods - 0.2% | | | |
| Crocs, Inc. 4.125% 8/15/31 (b) | | 130,000 | 103,025 |
| Hanesbrands, Inc. 4.875% 5/15/26 (b) | | 55,000 | 51,414 |
| Kontoor Brands, Inc. 4.125% 11/15/29 (b) | | 695,000 | 590,319 |
| Levi Strauss & Co. 3.5% 3/1/31 (b) | | 130,000 | 105,629 |
| Wolverine World Wide, Inc. 4% 8/15/29 (b) | | 2,330,000 | 1,745,193 |
| | | | 2,595,580 |
TOTAL CONSUMER DISCRETIONARY | | | 129,791,842 |
| | | | |
| CONSUMER STAPLES - 0.8% | | | |
| Beverages - 0.1% | | | |
| Primo Water Holdings, Inc. 4.375% 4/30/29 (b) | | 400,000 | 351,000 |
| Triton Water Holdings, Inc. 6.25% 4/1/29 (b) | | 1,485,000 | 1,262,331 |
| | | | 1,613,331 |
| Consumer Staples Distribution & Retail - 0.2% | | | |
| Albertsons Companies LLC/Safeway, Inc./New Albertson's, Inc./Albertson's LLC: | | | |
| 3.5% 3/15/29(b) | | 865,000 | 748,243 |
| 4.875% 2/15/30(b) | | 705,000 | 646,844 |
| C&S Group Enterprises LLC 5% 12/15/28 (b) | | 770,000 | 594,165 |
| Iceland Bondco PLC: | | | |
| 3 month EURIBOR + 5.500% 9.254% 12/15/27(b)(e)(g) | EUR | 100,000 | 106,537 |
| 4.625% 3/15/25 (Reg. S) | GBP | 100,000 | 124,970 |
| 10.875% 12/15/27(b) | GBP | 100,000 | 127,807 |
| New Albertsons LP 7.45% 8/1/29 | | 260,000 | 266,500 |
| Performance Food Group, Inc. 5.5% 10/15/27 (b) | | 124,000 | 119,401 |
| SEG Holding LLC/SEG Finance Corp. 5.625% 10/15/28 (b) | | 20,000 | 19,300 |
| United Natural Foods, Inc. 6.75% 10/15/28 (b) | | 40,000 | 33,300 |
| | | | 2,787,067 |
| Food Products - 0.4% | | | |
| B&G Foods, Inc.: | | | |
| 5.25% 4/1/25 | | 310,000 | 303,204 |
| 5.25% 9/15/27 | | 1,665,000 | 1,475,126 |
| Chobani LLC/Finance Corp., Inc.: | | | |
| 4.625% 11/15/28(b) | | 105,000 | 94,223 |
| 7.5% 4/15/25(b) | | 575,000 | 573,563 |
| Darling Ingredients, Inc. 6% 6/15/30 (b) | | 950,000 | 928,469 |
| Lamb Weston Holdings, Inc.: | | | |
| 4.125% 1/31/30(b) | | 565,000 | 496,882 |
| 4.375% 1/31/32(b) | | 95,000 | 82,453 |
| Pilgrim's Pride Corp.: | | | |
| 3.5% 3/1/32 | | 100,000 | 80,531 |
| 4.25% 4/15/31 | | 115,000 | 99,488 |
| Post Holdings, Inc.: | | | |
| 4.5% 9/15/31(b) | | 875,000 | 753,801 |
| 4.625% 4/15/30(b) | | 849,000 | 752,199 |
| | | | 5,639,939 |
| Household Products - 0.0% | | | |
| Energizer Holdings, Inc.: | | | |
| 4.375% 3/31/29(b) | | 25,000 | 21,412 |
| 4.75% 6/15/28(b) | | 559,000 | 493,567 |
| Spectrum Brands Holdings, Inc. 5.5% 7/15/30 (b) | | 10,000 | 9,302 |
| | | | 524,281 |
| Personal Care Products - 0.1% | | | |
| BellRing Brands, Inc. 7% 3/15/30 (b) | | 860,000 | 860,358 |
| | | | |
| Tobacco - 0.0% | | | |
| Vector Group Ltd. 5.75% 2/1/29 (b) | | 781,000 | 679,894 |
| | | | |
TOTAL CONSUMER STAPLES | | | 12,104,870 |
| | | | |
| ENERGY - 5.7% | | | |
| Energy Equipment & Services - 0.6% | | | |
| Archrock Partners LP / Archrock Partners Finance Corp. 6.875% 4/1/27 (b) | | 295,000 | 290,029 |
| CGG SA 8.75% 4/1/27 (b) | | 330,000 | 283,996 |
| Jonah Energy Parent LLC 12% 11/5/25 (f)(h) | | 645,029 | 657,929 |
| Nabors Industries Ltd. 7.5% 1/15/28 (b) | | 330,000 | 304,415 |
| Nabors Industries, Inc.: | | | |
| 5.75% 2/1/25 | | 2,000,000 | 1,958,400 |
| 7.375% 5/15/27(b) | | 75,000 | 73,193 |
| Noble Finance II LLC 8% 4/15/30 (b) | | 125,000 | 129,251 |
| NuStar Logistics LP: | | | |
| 5.625% 4/28/27 | | 665,000 | 645,216 |
| 5.75% 10/1/25 | | 90,000 | 88,258 |
| Precision Drilling Corp.: | | | |
| 6.875% 1/15/29(b) | | 25,000 | 23,766 |
| 7.125% 1/15/26(b) | | 475,000 | 470,844 |
| Seadrill Finance Ltd.: | | | |
| 8.375% 8/1/30(b) | | 975,000 | 999,375 |
| 8.375% 8/1/30(b) | | 280,000 | 287,000 |
| Transocean, Inc.: | | | |
| 7.25% 11/1/25(b) | | 95,000 | 93,338 |
| 7.5% 1/15/26(b) | | 216,000 | 212,526 |
| 8% 2/1/27(b) | | 475,000 | 463,372 |
| 8.75% 2/15/30(b) | | 849,300 | 868,847 |
| 11.5% 1/30/27(b) | | 522,000 | 549,744 |
| Valaris Ltd. 8.375% 4/30/30 (b) | | 920,000 | 937,066 |
| | | | 9,336,565 |
| Oil, Gas & Consumable Fuels - 5.1% | | | |
| Aethon United BR LP / Aethon United Finance Corp. 8.25% 2/15/26 (b) | | 1,307,000 | 1,313,535 |
| Antero Midstream Partners LP/Antero Midstream Finance Corp.: | | | |
| 5.375% 6/15/29(b) | | 1,021,000 | 956,724 |
| 5.75% 3/1/27(b) | | 100,000 | 96,921 |
| 5.75% 1/15/28(b) | | 800,000 | 766,063 |
| 7.875% 5/15/26(b) | | 100,000 | 101,739 |
| Antero Resources Corp.: | | | |
| 5.375% 3/1/30(b) | | 1,150,000 | 1,075,219 |
| 7.625% 2/1/29(b) | | 140,000 | 143,473 |
| Ascent Resources - Utica LLC/ARU Finance Corp.: | | | |
| 7% 11/1/26(b) | | 411,000 | 408,586 |
| 8.25% 12/31/28(b) | | 250,000 | 250,264 |
| 9% 11/1/27(b) | | 450,000 | 565,875 |
| Athabasca Oil Corp. 9.75% 11/1/26 (b) | | 767,000 | 787,013 |
| California Resources Corp. 7.125% 2/1/26 (b) | | 140,000 | 140,360 |
| Calumet Specialty Products Partners LP/Calumet Finance Corp. 9.75% 7/15/28 (b) | | 120,000 | 119,284 |
| Centennial Resource Production LLC: | | | |
| 5.875% 7/1/29(b) | | 270,000 | 259,200 |
| 7.75% 2/15/26(b) | | 25,000 | 25,206 |
| Chesapeake Energy Corp.: | | | |
| 5.875% 2/1/29(b) | | 500,000 | 478,536 |
| 6.75% 4/15/29(b) | | 2,160,000 | 2,144,274 |
| Citgo Petroleum Corp.: | | | |
| 6.375% 6/15/26(b) | | 721,000 | 704,100 |
| 7% 6/15/25(b) | | 1,610,000 | 1,593,900 |
| Civitas Resources, Inc.: | | | |
| 8.375% 7/1/28(b) | | 670,000 | 690,100 |
| 8.75% 7/1/31(b) | | 445,000 | 460,575 |
| CNX Midstream Partners LP 4.75% 4/15/30 (b) | | 25,000 | 21,573 |
| CNX Resources Corp.: | | | |
| 7.25% 3/14/27(b) | | 1,021,000 | 1,019,955 |
| 7.375% 1/15/31(b) | | 115,000 | 114,786 |
| Comstock Resources, Inc.: | | | |
| 5.875% 1/15/30(b) | | 795,000 | 702,169 |
| 6.75% 3/1/29(b) | | 1,125,000 | 1,052,637 |
| Conuma Resources Ltd. 13.125% 5/1/28 (b) | | 300,000 | 277,592 |
| Coronado Finance Pty Ltd. 10.75% 5/15/26 (b) | | 820,000 | 848,585 |
| Crestwood Midstream Partners LP/Crestwood Midstream Finance Corp.: | | | |
| 5.625% 5/1/27(b) | | 979,000 | 949,630 |
| 5.75% 4/1/25 | | 73,000 | 72,382 |
| 6% 2/1/29(b) | | 600,000 | 589,032 |
| 7.375% 2/1/31(b) | | 755,000 | 777,771 |
| CrownRock LP/CrownRock Finance, Inc.: | | | |
| 5% 5/1/29(b) | | 630,000 | 585,087 |
| 5.625% 10/15/25(b) | | 60,000 | 59,053 |
| CVR Energy, Inc.: | | | |
| 5.25% 2/15/25(b) | | 374,000 | 362,797 |
| 5.75% 2/15/28(b) | | 537,000 | 488,842 |
| DCP Midstream Operating LP: | | | |
| 5.625% 7/15/27 | | 10,000 | 10,011 |
| 6.75% 9/15/37(b) | | 590,000 | 622,714 |
| 8.125% 8/16/30 | | 570,000 | 646,804 |
| Delek Logistics Partners LP 7.125% 6/1/28 (b) | | 540,000 | 501,973 |
| DT Midstream, Inc.: | | | |
| 4.125% 6/15/29(b) | | 285,000 | 252,487 |
| 4.375% 6/15/31(b) | | 100,000 | 86,571 |
| EG Global Finance PLC: | | | |
| 6.25% 10/30/25 (Reg. S) | EUR | 92,471 | 97,402 |
| 6.75% 2/7/25(b) | | 1,468,000 | 1,446,450 |
| 8.5% 10/30/25(b) | | 1,754,000 | 1,736,470 |
| Endeavor Energy Resources LP/EER Finance, Inc. 5.75% 1/30/28 (b) | | 615,000 | 601,593 |
| EnLink Midstream LLC: | | | |
| 5.625% 1/15/28(b) | | 335,000 | 324,069 |
| 6.5% 9/1/30(b) | | 330,000 | 330,843 |
| EnLink Midstream Partners LP 4.85% 7/15/26 | | 180,000 | 172,800 |
| EQM Midstream Partners LP: | | | |
| 6% 7/1/25(b) | | 25,000 | 24,772 |
| 6.5% 7/1/27(b) | | 325,000 | 322,944 |
| 7.5% 6/1/27(b) | | 250,000 | 252,329 |
| 7.5% 6/1/30(b) | | 350,000 | 358,926 |
| Global Partners LP/GLP Finance Corp.: | | | |
| 6.875% 1/15/29 | | 253,000 | 239,085 |
| 7% 8/1/27 | | 437,000 | 430,445 |
| Golar LNG Ltd. 7% 10/20/25 (b) | | 335,000 | 329,610 |
| Gulfport Energy Corp. 8% 5/17/26 (b) | | 405,000 | 411,290 |
| Harvest Midstream I LP 7.5% 9/1/28 (b) | | 425,000 | 425,931 |
| Hess Midstream Partners LP: | | | |
| 5.125% 6/15/28(b) | | 620,000 | 581,573 |
| 5.5% 10/15/30(b) | | 100,000 | 93,617 |
| Hilcorp Energy I LP/Hilcorp Finance Co.: | | | |
| 5.75% 2/1/29(b) | | 200,000 | 185,500 |
| 6% 4/15/30(b) | | 275,000 | 255,669 |
| 6% 2/1/31(b) | | 1,255,000 | 1,149,624 |
| 6.25% 11/1/28(b) | | 2,050,000 | 1,977,585 |
| 6.25% 4/15/32(b) | | 525,000 | 481,774 |
| Holly Energy Partners LP/Holly Energy Finance Corp. 5% 2/1/28 (b) | | 335,000 | 314,252 |
| Howard Midstream Energy Partners LLC 8.875% 7/15/28 (b) | | 448,000 | 463,944 |
| Independence Energy Finance LLC: | | | |
| 7.25% 5/1/26(b) | | 1,190,000 | 1,172,292 |
| 9.25% 2/15/28(b) | | 1,030,000 | 1,053,659 |
| Magnolia Oil & Gas Operating LLC 6% 8/1/26 (b) | | 1,845,000 | 1,787,338 |
| MEG Energy Corp. 5.875% 2/1/29 (b) | | 306,000 | 292,331 |
| Mesquite Energy, Inc. 7.25% (b)(d)(f) | | 3,242,000 | 0 |
| Murphy Oil U.S.A., Inc. 3.75% 2/15/31 (b) | | 290,000 | 243,948 |
| New Fortress Energy, Inc.: | | | |
| 6.5% 9/30/26(b) | | 2,405,000 | 2,235,502 |
| 6.75% 9/15/25(b) | | 1,044,000 | 1,009,005 |
| NGL Energy Operating LLC/NGL Energy Finance Corp. 7.5% 2/1/26 (b) | | 1,750,000 | 1,742,257 |
| Northern Oil & Gas, Inc.: | | | |
| 8.125% 3/1/28(b) | | 290,000 | 290,699 |
| 8.75% 6/15/31(b) | | 90,000 | 91,937 |
| Occidental Petroleum Corp.: | | | |
| 4.2% 3/15/48 | | 95,000 | 69,746 |
| 4.4% 4/15/46 | | 295,000 | 226,359 |
| 4.4% 8/15/49 | | 130,000 | 92,637 |
| 4.5% 7/15/44 | | 240,000 | 173,942 |
| 5.55% 3/15/26 | | 60,000 | 59,495 |
| 6.125% 1/1/31 | | 320,000 | 322,432 |
| 6.2% 3/15/40 | | 1,225,000 | 1,209,957 |
| 6.45% 9/15/36 | | 235,000 | 240,296 |
| 6.625% 9/1/30 | | 400,000 | 412,919 |
| 7.5% 5/1/31 | | 1,315,000 | 1,424,804 |
| 7.875% 9/15/31 | | 700,000 | 775,293 |
| 7.95% 6/15/39 | | 1,275,000 | 1,430,182 |
| 8.875% 7/15/30 | | 1,155,000 | 1,324,150 |
| Parkland Corp.: | | | |
| 4.5% 10/1/29(b) | | 550,000 | 484,615 |
| 4.625% 5/1/30(b) | | 1,280,000 | 1,128,410 |
| PBF Holding Co. LLC/PBF Finance Corp. 7.875% 9/15/30 (b) | | 395,000 | 393,045 |
| Petroleos Mexicanos 6.625% 6/15/35 | | 800,000 | 546,500 |
| Range Resources Corp.: | | | |
| 4.75% 2/15/30(b) | | 910,000 | 821,703 |
| 8.25% 1/15/29 | | 260,000 | 269,919 |
| Rockcliff Energy II LLC 5.5% 10/15/29 (b) | | 640,000 | 589,968 |
| Rockies Express Pipeline LLC: | | | |
| 6.875% 4/15/40(b) | | 135,000 | 121,440 |
| 7.5% 7/15/38(b) | | 1,550,000 | 1,465,429 |
| Southwestern Energy Co.: | | | |
| 4.75% 2/1/32 | | 3,290,000 | 2,914,466 |
| 5.375% 3/15/30 | | 900,000 | 842,567 |
| Sunoco LP/Sunoco Finance Corp.: | | | |
| 4.5% 5/15/29 | | 635,000 | 574,262 |
| 4.5% 4/30/30 | | 850,000 | 757,852 |
| 5.875% 3/15/28 | | 140,000 | 135,982 |
| Tallgrass Energy Partners LP / Tallgrass Energy Finance Corp.: | | | |
| 5.5% 1/15/28(b) | | 603,000 | 560,042 |
| 6% 3/1/27(b) | | 1,460,000 | 1,399,030 |
| 6% 12/31/30(b) | | 2,490,000 | 2,227,539 |
| 6% 9/1/31(b) | | 2,035,000 | 1,807,324 |
| Teine Energy Ltd. 6.875% 4/15/29 (b) | | 50,000 | 46,375 |
| Venture Global Calcasieu Pass LLC: | | | |
| 4.125% 8/15/31(b) | | 500,000 | 424,128 |
| 6.25% 1/15/30(b) | | 1,620,000 | 1,578,141 |
| Venture Global LNG, Inc.: | | | |
| 8.125% 6/1/28(b) | | 725,000 | 731,339 |
| 8.375% 6/1/31(b) | | 2,325,000 | 2,345,214 |
| Vermilion Energy, Inc. 6.875% 5/1/30 (b) | | 785,000 | 743,214 |
| Western Gas Partners LP: | | | |
| 3.95% 6/1/25 | | 100,000 | 96,497 |
| 5.25% 2/1/50 | | 1,135,000 | 918,578 |
| 5.3% 3/1/48 | | 95,000 | 77,869 |
| 5.5% 8/15/48 | | 55,000 | 45,752 |
| | | | 77,860,275 |
TOTAL ENERGY | | | 87,196,840 |
| | | | |
| FINANCIALS - 3.9% | | | |
| Banks - 0.0% | | | |
| Intesa Sanpaolo SpA: | | | |
| 4.198% 6/1/32(b)(e) | | 200,000 | 152,421 |
| 5.71% 1/15/26(b) | | 350,000 | 335,757 |
| Western Alliance Bancorp. 3% 6/15/31 (e) | | 20,000 | 15,817 |
| | | | 503,995 |
| Capital Markets - 0.4% | | | |
| Broadstreet Partners, Inc. 5.875% 4/15/29 (b) | | 575,000 | 506,017 |
| Coinbase Global, Inc. 3.625% 10/1/31 (b) | | 375,000 | 252,465 |
| Hightower Holding LLC 6.75% 4/15/29 (b) | | 300,000 | 261,124 |
| Jane Street Group LLC/JSG Finance, Inc. 4.5% 11/15/29 (b) | | 700,000 | 614,261 |
| Jefferies Finance LLC/JFIN Co-Issuer Corp. 5% 8/15/28 (b) | | 920,000 | 785,561 |
| LPL Holdings, Inc.: | | | |
| 4% 3/15/29(b) | | 1,030,000 | 915,601 |
| 4.375% 5/15/31(b) | | 340,000 | 298,690 |
| MSCI, Inc.: | | | |
| 3.25% 8/15/33(b) | | 1,225,000 | 985,558 |
| 4% 11/15/29(b) | | 555,000 | 499,298 |
| VistaJet Malta Finance PLC / XO Management Holding, Inc.: | | | |
| 6.375% 2/1/30(b) | | 715,000 | 586,287 |
| 7.875% 5/1/27(b) | | 600,000 | 543,000 |
| 9.5% 6/1/28(b) | | 245,000 | 226,086 |
| | | | 6,473,948 |
| Consumer Finance - 1.4% | | | |
| Ally Financial, Inc.: | | | |
| 5.75% 11/20/25 | | 19,000 | 18,429 |
| 6.7% 2/14/33 | | 390,000 | 353,062 |
| Bread Financial Holdings, Inc. 4.75% 12/15/24 (b) | | 450,000 | 439,214 |
| Capstone Borrower, Inc. 8% 6/15/30 (b) | | 885,000 | 870,398 |
| Cobra AcquisitionCo LLC 6.375% 11/1/29 (b) | | 630,000 | 436,275 |
| Ford Motor Credit Co. LLC: | | | |
| 2.3% 2/10/25 | | 885,000 | 831,436 |
| 2.9% 2/10/29 | | 670,000 | 552,901 |
| 3.375% 11/13/25 | | 100,000 | 93,229 |
| 3.625% 6/17/31 | | 280,000 | 226,860 |
| 3.815% 11/2/27 | | 330,000 | 293,552 |
| 4% 11/13/30 | | 95,000 | 80,384 |
| 4.389% 1/8/26 | | 195,000 | 184,297 |
| 4.95% 5/28/27 | | 815,000 | 764,757 |
| 5.125% 6/16/25 | | 95,000 | 92,484 |
| 6.8% 5/12/28 | | 200,000 | 199,920 |
| 7.35% 11/4/27 | | 1,170,000 | 1,188,860 |
| 7.35% 3/6/30 | | 700,000 | 712,443 |
| goeasy Ltd. 4.375% 5/1/26 (b) | | 475,000 | 436,093 |
| LFS Topco LLC 5.875% 10/15/26 (b) | | 775,000 | 670,383 |
| Navient Corp.: | | | |
| 4.875% 3/15/28 | | 630,000 | 548,711 |
| 5% 3/15/27 | | 950,000 | 864,101 |
| 5.5% 3/15/29 | | 1,845,000 | 1,577,052 |
| 6.75% 6/15/26 | | 835,000 | 820,170 |
| 9.375% 7/25/30 | | 980,000 | 984,381 |
| OneMain Finance Corp.: | | | |
| 3.5% 1/15/27 | | 1,160,000 | 1,009,490 |
| 3.875% 9/15/28 | | 600,000 | 492,000 |
| 5.375% 11/15/29 | | 1,655,000 | 1,429,589 |
| 6.625% 1/15/28 | | 1,401,000 | 1,309,935 |
| 6.875% 3/15/25 | | 390,000 | 388,041 |
| 7.125% 3/15/26 | | 1,245,000 | 1,224,704 |
| 9% 1/15/29 | | 405,000 | 410,569 |
| PROG Holdings, Inc. 6% 11/15/29 (b) | | 1,000,000 | 897,500 |
| SLM Corp. 4.2% 10/29/25 | | 495,000 | 465,528 |
| | | | 20,866,748 |
| Financial Services - 1.4% | | | |
| Altus Midstream LP 5.875% 6/15/30 (b) | | 1,740,000 | 1,685,207 |
| At Home Cayman 11.5% 5/12/28 (b) | | 147,691 | 141,783 |
| Block, Inc.: | | | |
| 2.75% 6/1/26 | | 100,000 | 90,936 |
| 3.5% 6/1/31 | | 495,000 | 405,883 |
| Emerald Debt Merger Sub LLC 6.625% 12/15/30 (b) | | 785,000 | 772,770 |
| Enact Holdings, Inc. 6.5% 8/15/25 (b) | | 1,795,000 | 1,778,789 |
| Freedom Mortgage Corp. 7.625% 5/1/26 (b) | | 225,000 | 206,949 |
| GGAM Finance Ltd.: | | | |
| 7.75% 5/15/26(b) | | 175,000 | 174,997 |
| 8% 6/15/28(b) | | 335,000 | 339,740 |
| Icahn Enterprises LP/Icahn Enterprises Finance Corp.: | | | |
| 4.375% 2/1/29 | | 1,045,000 | 824,866 |
| 5.25% 5/15/27 | | 1,106,000 | 970,515 |
| 6.25% 5/15/26 | | 1,465,000 | 1,358,554 |
| LD Holdings Group LLC 6.125% 4/1/28 (b) | | 550,000 | 357,768 |
| MidCap Financial Issuer Trust: | | | |
| 5.625% 1/15/30(b) | | 465,000 | 374,325 |
| 6.5% 5/1/28(b) | | 1,020,000 | 907,800 |
| Motion Finco SARL 7.375% 6/15/30 (b) | EUR | 405,000 | 434,770 |
| MPH Acquisition Holdings LLC 5.5% 9/1/28 (b) | | 1,000,000 | 849,234 |
| Nationstar Mortgage Holdings, Inc.: | | | |
| 5.125% 12/15/30(b) | | 940,000 | 796,247 |
| 5.5% 8/15/28(b) | | 693,000 | 627,985 |
| P&L Development LLC/PLD Finance Corp. 7.75% 11/15/25 (b) | | 665,000 | 574,793 |
| PennyMac Financial Services, Inc.: | | | |
| 4.25% 2/15/29(b) | | 1,640,000 | 1,357,534 |
| 5.375% 10/15/25(b) | | 880,000 | 851,690 |
| Quicken Loans LLC/Quicken Loans Co.-Issuer, Inc. 4% 10/15/33 (b) | | 580,000 | 458,580 |
| Scientific Games Holdings LP/Scientific Games U.S. Finco, Inc. 6.625% 3/1/30 (b) | | 625,000 | 550,944 |
| United Shore Financial Services LLC: | | | |
| 5.5% 4/15/29(b) | | 525,000 | 455,438 |
| 5.75% 6/15/27(b) | | 740,000 | 681,782 |
| Venator Finance SARL/Venator Capital Management Ltd.: | | | |
| 5.75%(b)(d) | | 625,000 | 21,881 |
| 9.5%(b)(d) | | 825,000 | 655,875 |
| Verscend Escrow Corp. 9.75% 8/15/26 (b) | | 1,490,000 | 1,482,321 |
| VMED O2 UK Financing I PLC: | | | |
| 4.25% 1/31/31(b) | | 127,000 | 103,899 |
| 4.75% 7/15/31(b) | | 1,850,000 | 1,546,430 |
| | | | 21,840,285 |
| Insurance - 0.7% | | | |
| Acrisure LLC / Acrisure Finance, Inc.: | | | |
| 4.25% 2/15/29(b) | | 80,000 | 69,182 |
| 7% 11/15/25(b) | | 955,000 | 922,908 |
| 10.125% 8/1/26(b) | | 1,440,000 | 1,484,542 |
| Alliant Holdings Intermediate LLC: | | | |
| 5.875% 11/1/29(b) | | 620,000 | 542,929 |
| 6.75% 10/15/27(b) | | 1,601,000 | 1,513,297 |
| 6.75% 4/15/28(b) | | 100,000 | 98,521 |
| AmWINS Group, Inc. 4.875% 6/30/29 (b) | | 235,000 | 210,853 |
| GTCR AP Finance, Inc. 8% 5/15/27 (b) | | 795,000 | 785,794 |
| HUB International Ltd.: | | | |
| 5.625% 12/1/29(b) | | 695,000 | 614,595 |
| 7% 5/1/26(b) | | 900,000 | 898,314 |
| 7.25% 6/15/30(b) | | 1,980,000 | 2,015,422 |
| Jones DesLauriers Insurance Management, Inc. 8.5% 3/15/30 (b) | | 845,000 | 862,407 |
| Ryan Specialty Group LLC 4.375% 2/1/30 (b) | | 390,000 | 348,578 |
| | | | 10,367,342 |
| Mortgage Real Estate Investment Trusts - 0.0% | | | |
| Starwood Property Trust, Inc.: | | | |
| 3.75% 12/31/24(b) | | 10,000 | 9,613 |
| 4.375% 1/15/27(b) | | 765,000 | 683,191 |
| | | | 692,804 |
TOTAL FINANCIALS | | | 60,745,122 |
| | | | |
| HEALTH CARE - 3.2% | | | |
| Biotechnology - 0.1% | | | |
| Amgen, Inc. 5.6% 3/2/43 | | 85,000 | 83,404 |
| Emergent BioSolutions, Inc. 3.875% 8/15/28 (b) | | 912,000 | 437,760 |
| Grifols SA 4.75% 10/15/28 (b) | | 220,000 | 193,013 |
| | | | 714,177 |
| Health Care Equipment & Supplies - 0.5% | | | |
| AdaptHealth LLC: | | | |
| 4.625% 8/1/29(b) | | 1,713,000 | 1,399,692 |
| 5.125% 3/1/30(b) | | 805,000 | 660,331 |
| Avantor Funding, Inc.: | | | |
| 3.875% 11/1/29(b) | | 235,000 | 206,098 |
| 4.625% 7/15/28(b) | | 1,475,000 | 1,369,219 |
| Embecta Corp.: | | | |
| 5% 2/15/30(b) | | 840,000 | 682,500 |
| 6.75% 2/15/30(b) | | 25,000 | 22,062 |
| Hologic, Inc. 3.25% 2/15/29 (b) | | 120,000 | 104,230 |
| Mozart Borrower LP: | | | |
| 3.875% 4/1/29(b) | | 300,000 | 261,893 |
| 5.25% 10/1/29(b) | | 3,365,000 | 2,988,208 |
| Teleflex, Inc. 4.25% 6/1/28 (b) | | 20,000 | 18,372 |
| | | | 7,712,605 |
| Health Care Providers & Services - 1.8% | | | |
| 180 Medical, Inc. 3.875% 10/15/29 (b) | | 180,000 | 156,528 |
| AMN Healthcare 4% 4/15/29 (b) | | 967,000 | 827,064 |
| Cano Health, Inc. 6.25% 10/1/28 (b) | | 160,000 | 54,400 |
| Centene Corp.: | | | |
| 2.5% 3/1/31 | | 265,000 | 211,059 |
| 3% 10/15/30 | | 255,000 | 213,297 |
| Community Health Systems, Inc.: | | | |
| 4.75% 2/15/31(b) | | 710,000 | 528,950 |
| 5.25% 5/15/30(b) | | 2,245,000 | 1,770,470 |
| 5.625% 3/15/27(b) | | 515,000 | 453,171 |
| 6% 1/15/29(b) | | 990,000 | 829,125 |
| 6.125% 4/1/30(b) | | 1,880,000 | 1,081,846 |
| 6.875% 4/15/29(b) | | 610,000 | 374,125 |
| 8% 12/15/27(b) | | 1,030,000 | 989,964 |
| DaVita HealthCare Partners, Inc.: | | | |
| 3.75% 2/15/31(b) | | 2,850,000 | 2,269,577 |
| 4.625% 6/1/30(b) | | 1,682,000 | 1,442,741 |
| HCA Holdings, Inc. 5.5% 6/15/47 | | 185,000 | 168,427 |
| LifePoint Health, Inc. 4.375% 2/15/27 (b) | | 425,000 | 367,880 |
| Molina Healthcare, Inc.: | | | |
| 3.875% 5/15/32(b) | | 105,000 | 87,121 |
| 4.375% 6/15/28(b) | | 590,000 | 541,389 |
| Option Care Health, Inc. 4.375% 10/31/29 (b) | | 45,000 | 39,590 |
| Pediatrix Medical Group, Inc. 5.375% 2/15/30 (b) | | 700,000 | 638,365 |
| Prime Healthcare Services 7.25% 11/1/25 (b) | | 1,050,000 | 983,679 |
| Regionalcare Hospital Partners 9.75% 12/1/26 (b) | | 1,433,000 | 1,339,660 |
| RegionalCare Hospital Partners Holdings, Inc.: | | | |
| 5.375% 1/15/29(b) | | 1,290,000 | 891,820 |
| 9.875% 8/15/30(b) | | 185,000 | 182,688 |
| RP Escrow Issuer LLC 5.25% 12/15/25 (b) | | 390,000 | 300,386 |
| Select Medical Corp. 6.25% 8/15/26 (b) | | 855,000 | 846,896 |
| Tenet Healthcare Corp.: | | | |
| 4.25% 6/1/29 | | 3,550,000 | 3,169,464 |
| 4.375% 1/15/30 | | 2,050,000 | 1,821,092 |
| 4.625% 6/15/28 | | 119,000 | 109,577 |
| 6.125% 10/1/28 | | 2,330,000 | 2,244,093 |
| 6.125% 6/15/30 | | 1,705,000 | 1,652,127 |
| 6.75% 5/15/31(b) | | 930,000 | 925,397 |
| 6.875% 11/15/31 | | 840,000 | 839,827 |
| | | | 28,351,795 |
| Health Care Technology - 0.1% | | | |
| Athenahealth Group, Inc. 6.5% 2/15/30 (b) | | 1,505,000 | 1,307,049 |
| IQVIA, Inc. 6.5% 5/15/30 (b) | | 500,000 | 502,676 |
| | | | 1,809,725 |
| Life Sciences Tools & Services - 0.0% | | | |
| Charles River Laboratories International, Inc.: | | | |
| 3.75% 3/15/29(b) | | 225,000 | 198,592 |
| 4% 3/15/31(b) | | 180,000 | 155,442 |
| 4.25% 5/1/28(b) | | 70,000 | 64,257 |
| | | | 418,291 |
| Pharmaceuticals - 0.7% | | | |
| 1375209 BC Ltd. 9% 1/30/28 (b) | | 250,000 | 250,300 |
| Bausch Health Companies, Inc.: | | | |
| 5% 1/30/28(b) | | 3,350,000 | 1,455,630 |
| 5.25% 1/30/30(b) | | 2,497,000 | 1,053,962 |
| 5.5% 11/1/25(b) | | 255,000 | 229,643 |
| 6.25% 2/15/29(b) | | 1,860,000 | 813,750 |
| 9% 12/15/25(b) | | 140,000 | 128,105 |
| Jazz Securities DAC 4.375% 1/15/29 (b) | | 350,000 | 313,579 |
| Organon & Co. / Organon Foreign Debt Co-Issuer BV: | | | |
| 4.125% 4/30/28(b) | | 590,000 | 533,928 |
| 5.125% 4/30/31(b) | | 2,385,000 | 2,032,028 |
| Teva Pharmaceutical Finance Netherlands III BV: | | | |
| 5.125% 5/9/29 | | 1,585,000 | 1,466,125 |
| 6.75% 3/1/28 | | 1,145,000 | 1,143,654 |
| 7.875% 9/15/29 | | 435,000 | 453,123 |
| 8.125% 9/15/31 | | 265,000 | 280,765 |
| Valeant Pharmaceuticals International, Inc. 8.5% 1/31/27 (b) | | 24,000 | 13,350 |
| | | | 10,167,942 |
TOTAL HEALTH CARE | | | 49,174,535 |
| | | | |
| INDUSTRIALS - 5.2% | | | |
| Aerospace & Defense - 1.1% | | | |
| Bombardier, Inc.: | | | |
| 7.5% 3/15/25(b) | | 1,453,000 | 1,453,859 |
| 7.5% 2/1/29(b) | | 2,675,000 | 2,621,194 |
| 7.875% 4/15/27(b) | | 694,000 | 692,703 |
| Howmet Aerospace, Inc.: | | | |
| 5.9% 2/1/27 | | 100,000 | 99,296 |
| 5.95% 2/1/37 | | 80,000 | 78,760 |
| 6.875% 5/1/25 | | 100,000 | 100,694 |
| Moog, Inc. 4.25% 12/15/27 (b) | | 30,000 | 27,300 |
| Spirit Aerosystems, Inc. 7.5% 4/15/25 (b) | | 300,000 | 296,282 |
| The Boeing Co.: | | | |
| 5.805% 5/1/50 | | 800,000 | 778,309 |
| 5.93% 5/1/60 | | 625,000 | 603,298 |
| TransDigm, Inc.: | | | |
| 4.625% 1/15/29 | | 950,000 | 851,780 |
| 5.5% 11/15/27 | | 2,004,000 | 1,898,790 |
| 6.25% 3/15/26(b) | | 2,545,000 | 2,520,745 |
| 6.375% 6/15/26 | | 200,000 | 199,977 |
| 6.75% 8/15/28(b) | | 795,000 | 797,787 |
| 6.875% 12/15/30(b) | | 1,905,000 | 1,917,573 |
| 7.5% 3/15/27 | | 1,125,000 | 1,127,170 |
| | | | 16,065,517 |
| Air Freight & Logistics - 0.1% | | | |
| Aercap Global Aviation Trust 6.5% 6/15/45 (b)(e) | | 155,000 | 152,837 |
| Rand Parent LLC 8.5% 2/15/30 (b) | | 705,000 | 671,165 |
| | | | 824,002 |
| Building Products - 0.5% | | | |
| Advanced Drain Systems, Inc.: | | | |
| 5% 9/30/27(b) | | 40,000 | 38,200 |
| 6.375% 6/15/30(b) | | 435,000 | 428,492 |
| APi Group DE, Inc. 4.75% 10/15/29 (b) | | 25,000 | 22,656 |
| BCPE Ulysses Intermediate, Inc. 7.75% 4/1/27 pay-in-kind (b)(e) | | 225,000 | 205,951 |
| Builders FirstSource, Inc. 4.25% 2/1/32 (b) | | 275,000 | 233,797 |
| Cornerstone Building Brands, Inc. 6.125% 1/15/29 (b) | | 900,000 | 730,661 |
| Griffon Corp. 5.75% 3/1/28 | | 400,000 | 372,802 |
| Jeld-Wen, Inc. 4.625% 12/15/25 (b) | | 225,000 | 218,126 |
| Masonite International Corp.: | | | |
| 3.5% 2/15/30(b) | | 250,000 | 209,335 |
| 5.375% 2/1/28(b) | | 48,000 | 45,480 |
| MIWD Holdco II LLC / MIWD Finance Corp. 5.5% 2/1/30 (b) | | 500,000 | 423,810 |
| New Enterprise Stone & Lime Co., Inc. 5.25% 7/15/28 (b) | | 840,000 | 775,049 |
| Oscar Acquisition Co. LLC / Oscar Finance, Inc. 9.5% 4/15/30 (b) | | 180,000 | 168,481 |
| PGT Innovations, Inc. 4.375% 10/1/29 (b) | | 885,000 | 821,227 |
| Shea Homes Ltd. Partnership/Corp. 4.75% 2/15/28 | | 1,200,000 | 1,104,276 |
| Standard Industries, Inc./New Jersey 4.375% 7/15/30 (b) | | 2,120,000 | 1,817,295 |
| | | | 7,615,638 |
| Commercial Services & Supplies - 1.1% | | | |
| ACCO Brands Corp. 4.25% 3/15/29 (b) | | 710,000 | 606,567 |
| Allied Universal Holdco LLC / Allied Universal Finance Corp.: | | | |
| 6% 6/1/29(b) | | 1,760,000 | 1,346,014 |
| 6.625% 7/15/26(b) | | 1,789,000 | 1,701,596 |
| 9.75% 7/15/27(b) | | 1,860,000 | 1,708,306 |
| APX Group, Inc. 5.75% 7/15/29 (b) | | 375,000 | 323,060 |
| Atlas Luxco 4 SARL / Allied Universal Holdco LLC / Allied Universal Finance Corp.: | | | |
| 4.625% 6/1/28(b) | | 1,185,000 | 1,007,250 |
| 4.625% 6/1/28(b) | | 715,000 | 604,472 |
| Brand Energy & Infrastructure Services, Inc. 10.375% 8/1/30 (b) | | 855,000 | 881,744 |
| Cimpress PLC 7% 6/15/26 | | 40,000 | 37,500 |
| Clean Harbors, Inc. 6.375% 2/1/31 (b) | | 95,000 | 94,471 |
| CoreCivic, Inc.: | | | |
| 4.75% 10/15/27 | | 90,000 | 80,250 |
| 8.25% 4/15/26 | | 660,000 | 662,619 |
| Covanta Holding Corp.: | | | |
| 4.875% 12/1/29(b) | | 430,000 | 369,800 |
| 5% 9/1/30 | | 100,000 | 84,710 |
| GFL Environmental, Inc.: | | | |
| 3.75% 8/1/25(b) | | 195,000 | 185,652 |
| 4% 8/1/28(b) | | 100,000 | 89,272 |
| 4.375% 8/15/29(b) | | 750,000 | 663,392 |
| 4.75% 6/15/29(b) | | 50,000 | 45,296 |
| 5.125% 12/15/26(b) | | 195,000 | 188,685 |
| Legends Hospitality Holding Co. LLC/Legends Hospitality Co-Issuer, Inc. 5% 2/1/26 (b) | | 270,000 | 253,719 |
| Madison IAQ LLC: | | | |
| 4.125% 6/30/28(b) | | 1,200,000 | 1,061,679 |
| 5.875% 6/30/29(b) | | 835,000 | 703,069 |
| Neptune BidCo U.S., Inc. 9.29% 4/15/29 (b) | | 1,230,000 | 1,148,595 |
| NorthRiver Midstream Finance LP 5.625% 2/15/26 (b) | | 470,000 | 451,788 |
| PowerTeam Services LLC 9.033% 12/4/25 (b) | | 300,000 | 279,110 |
| Prime Securities Services Borrower LLC/Prime Finance, Inc.: | | | |
| 5.75% 4/15/26(b) | | 695,000 | 682,035 |
| 6.25% 1/15/28(b) | | 900,000 | 857,161 |
| Stericycle, Inc.: | | | |
| 3.875% 1/15/29(b) | | 480,000 | 417,927 |
| 5.375% 7/15/24(b) | | 155,000 | 154,456 |
| The GEO Group, Inc.: | | | |
| 6% 4/15/26 | | 50,000 | 45,250 |
| 9.5% 12/31/28(b) | | 650,000 | 637,000 |
| VT Topco, Inc. 8.5% 8/15/30 (b) | | 175,000 | 177,625 |
| | | | 17,550,070 |
| Construction & Engineering - 0.4% | | | |
| AECOM 5.125% 3/15/27 | | 130,000 | 124,727 |
| Amsted Industries, Inc. 4.625% 5/15/30 (b) | | 965,000 | 847,590 |
| Cloud Crane LLC: | | | |
| 10.125% 8/1/24(b) | | 1,812,000 | 1,813,600 |
| 11.5% 9/1/28(b) | | 500,000 | 501,300 |
| Great Lakes Dredge & Dock Corp. 5.25% 6/1/29 (b) | | 125,000 | 107,054 |
| Pike Corp. 5.5% 9/1/28 (b) | | 1,149,000 | 1,033,993 |
| Railworks Holdings LP 8.25% 11/15/28 (b) | | 410,000 | 391,544 |
| SRS Distribution, Inc. 6% 12/1/29 (b) | | 1,605,000 | 1,372,275 |
| | | | 6,192,083 |
| Electrical Equipment - 0.2% | | | |
| GrafTech Global Enterprises, Inc. 9.875% 12/15/28 (b) | | 510,000 | 497,250 |
| Regal Rexnord Corp.: | | | |
| 6.05% 2/15/26(b) | | 300,000 | 298,382 |
| 6.05% 4/15/28(b) | | 195,000 | 192,935 |
| 6.3% 2/15/30(b) | | 195,000 | 194,141 |
| Sensata Technologies BV: | | | |
| 4% 4/15/29(b) | | 760,000 | 667,363 |
| 5% 10/1/25(b) | | 40,000 | 38,984 |
| 5.875% 9/1/30(b) | | 785,000 | 742,697 |
| Wesco Distribution, Inc.: | | | |
| 7.125% 6/15/25(b) | | 150,000 | 150,663 |
| 7.25% 6/15/28(b) | | 540,000 | 549,577 |
| | | | 3,331,992 |
| Ground Transportation - 0.2% | | | |
| Avis Budget Car Rental LLC/Avis Budget Finance, Inc.: | | | |
| 4.75% 4/1/28(b) | | 650,000 | 591,141 |
| 5.375% 3/1/29(b) | | 150,000 | 137,699 |
| Uber Technologies, Inc.: | | | |
| 4.5% 8/15/29(b) | | 25,000 | 22,890 |
| 7.5% 5/15/25(b) | | 510,000 | 514,923 |
| 8% 11/1/26(b) | | 765,000 | 778,921 |
| Watco Companies LLC / Watco Finance Corp. 6.5% 6/15/27 (b) | | 890,000 | 858,850 |
| XPO, Inc.: | | | |
| 6.25% 6/1/28(b) | | 380,000 | 372,353 |
| 7.125% 6/1/31(b) | | 140,000 | 140,744 |
| XPO Escrow Sub LLC 7.5% 11/15/27 (b) | | 125,000 | 127,095 |
| | | | 3,544,616 |
| Industrial Conglomerates - 0.0% | | | |
| Benteler International AG 10.5% 5/15/28 (b) | | 295,000 | 297,156 |
| Ladder Capital Finance Holdings LLLP/Ladder Capital Finance Corp. 4.75% 6/15/29 (b) | | 360,000 | 302,656 |
| | | | 599,812 |
| Machinery - 0.4% | | | |
| Chart Industries, Inc.: | | | |
| 7.5% 1/1/30(b) | | 475,000 | 486,706 |
| 9.5% 1/1/31(b) | | 200,000 | 215,342 |
| Hillenbrand, Inc.: | | | |
| 3.75% 3/1/31 | | 590,000 | 495,451 |
| 5% 9/15/26(e) | | 25,000 | 24,321 |
| Mueller Water Products, Inc. 4% 6/15/29 (b) | | 1,305,000 | 1,155,799 |
| Stevens Holding Co., Inc. 6.125% 10/1/26 (b) | | 335,000 | 335,838 |
| Terex Corp. 5% 5/15/29 (b) | | 435,000 | 399,395 |
| Titan International, Inc. 7% 4/30/28 | | 550,000 | 524,016 |
| Trinity Industries, Inc. 7.75% 7/15/28 (b) | | 275,000 | 279,794 |
| Vertical Holdco GmbH 7.625% 7/15/28 (b) | | 1,581,000 | 1,465,178 |
| Vertical U.S. Newco, Inc. 5.25% 7/15/27 (b) | | 1,435,000 | 1,345,170 |
| | | | 6,727,010 |
| Marine Transportation - 0.0% | | | |
| Navios South American Logistics, Inc./Navios Logistics Finance U.S., Inc. 10.75% 7/1/25 (b) | | 65,000 | 62,843 |
| Seaspan Corp. 5.5% 8/1/29 (b) | | 645,000 | 501,332 |
| | | | 564,175 |
| Passenger Airlines - 0.6% | | | |
| Air Canada 3.875% 8/15/26 (b) | | 145,000 | 133,896 |
| American Airlines, Inc.: | | | |
| 7.25% 2/15/28(b) | | 300,000 | 294,696 |
| 11.75% 7/15/25(b) | | 2,385,000 | 2,610,486 |
| American Airlines, Inc. / AAdvantage Loyalty IP Ltd.: | | | |
| 5.5% 4/20/26(b) | | 1,342,917 | 1,317,782 |
| 5.75% 4/20/29(b) | | 1,995,000 | 1,907,980 |
| Hawaiian Brand Intellectual Property Ltd. / HawaiianMiles Loyalty Ltd. 5.75% 1/20/26 (b) | | 250,000 | 231,341 |
| Mileage Plus Holdings LLC 6.5% 6/20/27 (b) | | 264,000 | 263,079 |
| Spirit Loyalty Cayman Ltd. / Spirit IP Cayman Ltd. 8% 9/20/25 (b) | | 485,000 | 485,565 |
| United Airlines, Inc.: | | | |
| 4.375% 4/15/26(b) | | 975,000 | 918,871 |
| 4.625% 4/15/29(b) | | 1,455,000 | 1,293,715 |
| | | | 9,457,411 |
| Professional Services - 0.1% | | | |
| ASGN, Inc. 4.625% 5/15/28 (b) | | 175,000 | 157,269 |
| Booz Allen Hamilton, Inc. 3.875% 9/1/28 (b) | | 570,000 | 517,554 |
| CoreLogic, Inc. 4.5% 5/1/28 (b) | | 265,000 | 216,638 |
| Korn Ferry 4.625% 12/15/27 (b) | | 75,000 | 69,755 |
| TriNet Group, Inc.: | | | |
| 3.5% 3/1/29(b) | | 250,000 | 215,245 |
| 7.125% 8/15/31(b) | | 90,000 | 90,506 |
| | | | 1,266,967 |
| Trading Companies & Distributors - 0.5% | | | |
| Alta Equipment Group, Inc. 5.625% 4/15/26 (b) | | 500,000 | 462,755 |
| Beacon Roofing Supply, Inc. 6.5% 8/1/30 (b) | | 480,000 | 474,163 |
| Fortress Transportation & Infrastructure Investors LLC 5.5% 5/1/28 (b) | | 500,000 | 464,457 |
| Foundation Building Materials, Inc. 6% 3/1/29 (b) | | 675,000 | 571,218 |
| H&E Equipment Services, Inc. 3.875% 12/15/28 (b) | | 2,280,000 | 1,990,786 |
| Herc Holdings, Inc. 5.5% 7/15/27 (b) | | 200,000 | 192,315 |
| United Rentals North America, Inc.: | | | |
| 3.75% 1/15/32 | | 500,000 | 420,460 |
| 3.875% 2/15/31 | | 945,000 | 808,319 |
| 4% 7/15/30 | | 877,000 | 768,531 |
| 4.875% 1/15/28 | | 525,000 | 499,512 |
| 5.25% 1/15/30 | | 100,000 | 95,032 |
| 6% 12/15/29(b) | | 100,000 | 99,369 |
| | | | 6,846,917 |
| Transportation Infrastructure - 0.0% | | | |
| First Student Bidco, Inc./First Transit Parent, Inc. 4% 7/31/29 (b) | | 185,000 | 157,251 |
| | | | |
TOTAL INDUSTRIALS | | | 80,743,461 |
| | | | |
| INFORMATION TECHNOLOGY - 2.3% | | | |
| Communications Equipment - 0.3% | | | |
| CommScope, Inc. 4.75% 9/1/29 (b) | | 345,000 | 256,383 |
| HTA Group Ltd. 7% 12/18/25 (b) | | 525,000 | 496,136 |
| Hughes Satellite Systems Corp. 6.625% 8/1/26 | | 1,155,000 | 1,001,963 |
| IHS Netherlands Holdco BV 8% 9/18/27 (b) | | 95,000 | 84,898 |
| ViaSat, Inc.: | | | |
| 5.625% 9/15/25(b) | | 1,350,000 | 1,277,438 |
| 5.625% 4/15/27(b) | | 775,000 | 692,366 |
| Viavi Solutions, Inc. 3.75% 10/1/29 (b) | | 347,000 | 288,848 |
| | | | 4,098,032 |
| Electronic Equipment, Instruments & Components - 0.2% | | | |
| Coherent Corp. 5% 12/15/29 (b) | | 500,000 | 444,100 |
| Likewize Corp. 9.75% 10/15/25 (b) | | 1,310,000 | 1,283,859 |
| Sensata Technologies, Inc. 3.75% 2/15/31 (b) | | 95,000 | 79,604 |
| TTM Technologies, Inc. 4% 3/1/29 (b) | | 885,000 | 768,711 |
| | | | 2,576,274 |
| IT Services - 0.4% | | | |
| Acuris Finance U.S. 5% 5/1/28 (b) | | 580,000 | 469,800 |
| Gartner, Inc.: | | | |
| 3.625% 6/15/29(b) | | 1,199,000 | 1,053,142 |
| 3.75% 10/1/30(b) | | 80,000 | 69,084 |
| 4.5% 7/1/28(b) | | 610,000 | 568,847 |
| GCI LLC 4.75% 10/15/28 (b) | | 720,000 | 624,600 |
| Go Daddy Operating Co. LLC / GD Finance Co., Inc.: | | | |
| 3.5% 3/1/29(b) | | 760,000 | 653,253 |
| 5.25% 12/1/27(b) | | 440,000 | 421,300 |
| Presidio Holdings, Inc. 8.25% 2/1/28 (b) | | 845,000 | 818,613 |
| Rackspace Hosting, Inc.: | | | |
| 3.5% 2/15/28(b) | | 475,000 | 225,461 |
| 5.375% 12/1/28(b) | | 1,515,000 | 434,540 |
| Tempo Acquisition LLC 5.75% 6/1/25 (b) | | 260,000 | 255,528 |
| Twilio, Inc.: | | | |
| 3.625% 3/15/29 | | 181,000 | 155,284 |
| 3.875% 3/15/31 | | 540,000 | 452,245 |
| Virtusa Corp. 7.125% 12/15/28 (b) | | 80,000 | 65,500 |
| | | | 6,267,197 |
| Semiconductors & Semiconductor Equipment - 0.2% | | | |
| Entegris Escrow Corp.: | | | |
| 4.75% 4/15/29(b) | | 515,000 | 479,130 |
| 5.95% 6/15/30(b) | | 2,510,000 | 2,403,616 |
| Entegris, Inc. 3.625% 5/1/29 (b) | | 175,000 | 150,409 |
| | | | 3,033,155 |
| Software - 1.2% | | | |
| Black Knight InfoServ LLC 3.625% 9/1/28 (b) | | 1,020,000 | 938,400 |
| Boxer Parent Co., Inc.: | | | |
| 7.125% 10/2/25(b) | | 745,000 | 745,931 |
| 9.125% 3/1/26(b) | | 605,000 | 603,493 |
| Central Parent, Inc./Central Merger Sub, Inc. 7.25% 6/15/29 (b) | | 1,920,000 | 1,893,634 |
| Clarivate Science Holdings Corp.: | | | |
| 3.875% 7/1/28(b) | | 755,000 | 665,268 |
| 4.875% 7/1/29(b) | | 935,000 | 815,374 |
| Cloud Software Group, Inc.: | | | |
| 6.5% 3/31/29(b) | | 1,155,000 | 1,033,095 |
| 9% 9/30/29(b) | | 2,015,000 | 1,801,164 |
| CNT PRNT/CDK GLO II/FIN 8% 6/15/29 (b) | | 765,000 | 769,973 |
| Elastic NV 4.125% 7/15/29 (b) | | 170,000 | 146,137 |
| Fair Isaac Corp.: | | | |
| 4% 6/15/28(b) | | 1,070,000 | 978,460 |
| 5.25% 5/15/26(b) | | 575,000 | 557,750 |
| Gen Digital, Inc.: | | | |
| 5% 4/15/25(b) | | 815,000 | 798,936 |
| 6.75% 9/30/27(b) | | 765,000 | 766,928 |
| 7.125% 9/30/30(b) | | 840,000 | 845,649 |
| ION Trading Technologies Ltd. 5.75% 5/15/28 (b) | | 405,000 | 354,170 |
| McAfee Corp. 7.375% 2/15/30 (b) | | 1,910,000 | 1,671,074 |
| MicroStrategy, Inc. 6.125% 6/15/28 (b) | | 545,000 | 487,897 |
| NCR Corp.: | | | |
| 5.125% 4/15/29(b) | | 1,425,000 | 1,295,950 |
| 5.25% 10/1/30(b) | | 155,000 | 139,106 |
| Open Text Corp. 3.875% 2/15/28 (b) | | 225,000 | 200,232 |
| Open Text Holdings, Inc.: | | | |
| 4.125% 2/15/30(b) | | 345,000 | 297,299 |
| 4.125% 12/1/31(b) | | 385,000 | 319,580 |
| SS&C Technologies, Inc. 5.5% 9/30/27 (b) | | 75,000 | 72,203 |
| ZoomInfo Technologies LLC/ZoomInfo Finance Corp. 3.875% 2/1/29 (b) | | 804,000 | 683,494 |
| | | | 18,881,197 |
| Technology Hardware, Storage & Peripherals - 0.0% | | | |
| Seagate HDD Cayman: | | | |
| 5.75% 12/1/34 | | 245,000 | 216,979 |
| 8.25% 12/15/29(b) | | 85,000 | 89,165 |
| 8.5% 7/15/31(b) | | 105,000 | 110,009 |
| | | | 416,153 |
TOTAL INFORMATION TECHNOLOGY | | | 35,272,008 |
| | | | |
| MATERIALS - 3.6% | | | |
| Chemicals - 1.2% | | | |
| ASP Unifrax Holdings, Inc. 5.25% 9/30/28 (b) | | 575,000 | 388,845 |
| Avient Corp. 7.125% 8/1/30 (b) | | 700,000 | 699,330 |
| Celanese U.S. Holdings LLC: | | | |
| 6.55% 11/15/30 | | 290,000 | 290,143 |
| 6.7% 11/15/33 | | 355,000 | 356,493 |
| CVR Partners LP 6.125% 6/15/28 (b) | | 1,005,000 | 899,746 |
| Element Solutions, Inc. 3.875% 9/1/28 (b) | | 182,000 | 160,000 |
| Gpd Companies, Inc. 10.125% 4/1/26 (b) | | 545,000 | 511,171 |
| GrafTech Finance, Inc. 4.625% 12/15/28 (b) | | 625,000 | 490,625 |
| Invictus U.S. Newco LLC 5% 10/30/29 (b) | | 950,000 | 773,088 |
| Iris Holding, Inc. 10% 12/15/28 (b) | | 800,000 | 636,000 |
| Itelyum Regeneration SpA 4.625% 10/1/26 (b) | EUR | 215,000 | 218,005 |
| Kobe U.S. Midco 2, Inc. 9.25% 11/1/26 pay-in-kind (b)(e) | | 190,000 | 138,700 |
| Kronos Acquisition Holdings, Inc. / KIK Custom Products, Inc. 7% 12/31/27 (b) | | 1,125,000 | 990,000 |
| LSB Industries, Inc. 6.25% 10/15/28 (b) | | 160,000 | 146,328 |
| Methanex Corp.: | | | |
| 5.125% 10/15/27 | | 1,041,000 | 976,478 |
| 5.25% 12/15/29 | | 565,000 | 514,694 |
| 5.65% 12/1/44 | | 602,000 | 492,384 |
| NOVA Chemicals Corp.: | | | |
| 4.25% 5/15/29(b) | | 435,000 | 352,744 |
| 4.875% 6/1/24(b) | | 230,000 | 226,219 |
| 5% 5/1/25(b) | | 200,000 | 190,350 |
| 5.25% 6/1/27(b) | | 122,000 | 108,465 |
| Nufarm Australia Ltd. 5% 1/27/30 (b) | | 510,000 | 453,642 |
| Olin Corp. 5% 2/1/30 | | 375,000 | 343,376 |
| Olympus Water U.S. Holding Corp.: | | | |
| 4.25% 10/1/28(b) | | 380,000 | 311,972 |
| 6.25% 10/1/29(b) | | 405,000 | 326,053 |
| 9.75% 11/15/28(b) | | 985,000 | 992,217 |
| Rain Carbon, Inc. 12.25% 9/1/29 (b) | | 525,000 | 541,527 |
| Rain CII Carbon LLC/CII Carbon Corp. 7.25% 4/1/25 (b) | | 17,000 | 16,701 |
| SCIH Salt Holdings, Inc.: | | | |
| 4.875% 5/1/28(b) | | 80,000 | 71,986 |
| 6.625% 5/1/29(b) | | 225,000 | 198,548 |
| The Chemours Co. LLC: | | | |
| 4.625% 11/15/29(b) | | 500,000 | 415,672 |
| 5.375% 5/15/27 | | 215,000 | 202,392 |
| 5.75% 11/15/28(b) | | 450,000 | 404,244 |
| The Scotts Miracle-Gro Co.: | | | |
| 4% 4/1/31 | | 1,465,000 | 1,151,461 |
| 4.375% 2/1/32 | | 60,000 | 47,508 |
| Tronox, Inc. 4.625% 3/15/29 (b) | | 1,150,000 | 947,641 |
| W.R. Grace Holding LLC: | | | |
| 5.625% 8/15/29(b) | | 1,670,000 | 1,412,319 |
| 7.375% 3/1/31(b) | | 180,000 | 177,257 |
| | | | 17,574,324 |
| Construction Materials - 0.2% | | | |
| Eco Material Technologies, Inc. 7.875% 1/31/27 (b) | | 650,000 | 633,744 |
| Knife River Holding Co. 7.75% 5/1/31 (b) | | 150,000 | 153,537 |
| Smyrna Ready Mix LLC 6% 11/1/28 (b) | | 720,000 | 691,297 |
| Summit Materials LLC/Summit Materials Finance Corp.: | | | |
| 5.25% 1/15/29(b) | | 730,000 | 683,824 |
| 6.5% 3/15/27(b) | | 1,000,000 | 991,700 |
| White Cap Buyer LLC 6.875% 10/15/28 (b) | | 425,000 | 389,950 |
| | | | 3,544,052 |
| Containers & Packaging - 1.0% | | | |
| ARD Finance SA 6.5% 6/30/27 pay-in-kind (b)(e) | | 1,898,279 | 1,525,689 |
| Ardagh Metal Packaging Finance U.S.A. LLC/Ardagh Metal Packaging Finance PLC: | | | |
| 4% 9/1/29(b) | | 735,000 | 597,516 |
| 6% 6/15/27(b) | | 805,000 | 784,968 |
| Ardagh Packaging Finance PLC/Ardagh MP Holdings U.S.A., Inc.: | | | |
| 5.25% 8/15/27(b) | | 310,000 | 263,721 |
| 5.25% 8/15/27(b) | | 640,000 | 544,455 |
| Ball Corp.: | | | |
| 2.875% 8/15/30 | | 100,000 | 81,554 |
| 4.875% 3/15/26 | | 295,000 | 286,578 |
| 6% 6/15/29 | | 1,280,000 | 1,260,937 |
| 6.875% 3/15/28 | | 950,000 | 964,240 |
| Berry Global, Inc. 4.875% 7/15/26 (b) | | 160,000 | 154,430 |
| BWAY Holding Co. 7.875% 8/15/26 (b) | | 645,000 | 635,161 |
| Cascades, Inc. 5.375% 1/15/28 (b) | | 475,000 | 447,094 |
| Clydesdale Acquisition Holdings, Inc.: | | | |
| 6.625% 4/15/29(b) | | 220,000 | 209,341 |
| 8.75% 4/15/30(b) | | 285,000 | 257,736 |
| Graham Packaging Co., Inc. 7.125% 8/15/28 (b) | | 965,000 | 841,533 |
| Graphic Packaging International, Inc. 3.75% 2/1/30 (b) | | 550,000 | 468,796 |
| Intelligent Packaging Holdco I 9% 1/15/26 pay-in-kind (b)(e) | | 1,066,000 | 875,128 |
| Intelligent Packaging Ltd. Finco, Inc. 6% 9/15/28 (b) | | 712,000 | 640,900 |
| Owens-Brockway Glass Container, Inc.: | | | |
| 6.375% 8/15/25(b) | | 650,000 | 648,463 |
| 7.25% 5/15/31(b) | | 240,000 | 242,148 |
| Pactiv Evergreen Group Issuer, Inc. 4.375% 10/15/28 (b) | | 375,000 | 332,813 |
| Sealed Air Corp.: | | | |
| 5% 4/15/29(b) | | 720,000 | 668,088 |
| 6.875% 7/15/33(b) | | 425,000 | 427,423 |
| Sealed Air Corp./Sealed Air Cor 6.125% 2/1/28 (b) | | 510,000 | 501,114 |
| Trident Holdings, Inc. 12.75% 12/31/28 (b) | | 870,000 | 904,889 |
| TriMas Corp. 4.125% 4/15/29 (b) | | 75,000 | 65,438 |
| Trivium Packaging Finance BV: | | | |
| 5.5% 8/15/26(b) | | 319,000 | 300,901 |
| 8.5% 8/15/27(b) | | 227,000 | 215,320 |
| | | | 15,146,374 |
| Metals & Mining - 1.0% | | | |
| Alcoa Nederland Holding BV 6.125% 5/15/28 (b) | | 580,000 | 573,250 |
| Arsenal AIC Parent LLC 8% 10/1/30 (b) | | 580,000 | 592,319 |
| ATI, Inc.: | | | |
| 4.875% 10/1/29 | | 80,000 | 72,227 |
| 5.125% 10/1/31 | | 495,000 | 439,080 |
| 7.25% 8/15/30 | | 630,000 | 636,426 |
| Big River Steel LLC/BRS Finance Corp. 6.625% 1/31/29 (b) | | 1,706,000 | 1,696,052 |
| Cleveland-Cliffs, Inc. 6.75% 4/15/30 (b) | | 400,000 | 381,329 |
| Commercial Metals Co.: | | | |
| 3.875% 2/15/31 | | 120,000 | 102,286 |
| 4.125% 1/15/30 | | 360,000 | 318,454 |
| Compass Minerals International, Inc. 6.75% 12/1/27 (b) | | 210,000 | 203,637 |
| Constellium NV 5.875% 2/15/26 (b) | | 145,000 | 142,285 |
| Eldorado Gold Corp. 6.25% 9/1/29 (b) | | 505,000 | 430,482 |
| ERO Copper Corp. 6.5% 2/15/30 (b) | | 972,000 | 844,240 |
| First Quantum Minerals Ltd.: | | | |
| 6.875% 10/15/27(b) | | 1,135,000 | 1,096,785 |
| 7.5% 4/1/25(b) | | 393,000 | 391,379 |
| 8.625% 6/1/31(b) | | 475,000 | 483,371 |
| FMG Resources Pty Ltd.: | | | |
| 4.375% 4/1/31(b) | | 100,000 | 83,807 |
| 4.5% 9/15/27(b) | | 325,000 | 299,845 |
| 5.875% 4/15/30(b) | | 725,000 | 672,995 |
| Hecla Mining Co. 7.25% 2/15/28 | | 1,925,000 | 1,890,206 |
| HudBay Minerals, Inc.: | | | |
| 4.5% 4/1/26(b) | | 420,000 | 396,423 |
| 6.125% 4/1/29(b) | | 1,674,000 | 1,573,835 |
| Kaiser Aluminum Corp.: | | | |
| 4.5% 6/1/31(b) | | 310,000 | 250,486 |
| 4.625% 3/1/28(b) | | 479,000 | 423,592 |
| Mineral Resources Ltd. 8.5% 5/1/30 (b) | | 345,000 | 346,234 |
| New Gold, Inc. 7.5% 7/15/27 (b) | | 320,000 | 305,497 |
| Novelis Corp.: | | | |
| 3.25% 11/15/26(b) | | 55,000 | 49,831 |
| 3.875% 8/15/31(b) | | 95,000 | 78,656 |
| 4.75% 1/30/30(b) | | 755,000 | 675,681 |
| PMHC II, Inc. 9% 2/15/30 (b) | | 365,000 | 301,054 |
| Roller Bearing Co. of America, Inc. 4.375% 10/15/29 (b) | | 255,000 | 228,141 |
| | | | 15,979,885 |
| Paper & Forest Products - 0.2% | | | |
| LABL, Inc.: | | | |
| 5.875% 11/1/28(b) | | 455,000 | 413,481 |
| 6.75% 7/15/26(b) | | 35,000 | 34,210 |
| 8.25% 11/1/29(b) | | 1,050,000 | 878,546 |
| 9.5% 11/1/28(b) | | 160,000 | 164,683 |
| 10.5% 7/15/27(b) | | 778,000 | 744,636 |
| Mercer International, Inc. 5.125% 2/1/29 | | 125,000 | 102,257 |
| SPA Holdings 3 OY 4.875% 2/4/28 (b) | | 380,000 | 315,555 |
| | | | 2,653,368 |
TOTAL MATERIALS | | | 54,898,003 |
| | | | |
| REAL ESTATE - 1.4% | | | |
| Equity Real Estate Investment Trusts (REITs) - 0.8% | | | |
| CTR Partnership LP/CareTrust Capital Corp. 3.875% 6/30/28 (b) | | 175,000 | 152,470 |
| Iron Mountain, Inc. 4.5% 2/15/31 (b) | | 100,000 | 85,905 |
| MGM Growth Properties Operating Partnership LP: | | | |
| 3.875% 2/15/29(b) | | 950,000 | 800,375 |
| 5.75% 2/1/27 | | 660,000 | 644,325 |
| MPT Operating Partnership LP/MPT Finance Corp.: | | | |
| 3.5% 3/15/31 | | 1,370,000 | 889,641 |
| 4.625% 8/1/29 | | 430,000 | 310,528 |
| 5% 10/15/27 | | 2,195,000 | 1,734,000 |
| 5.25% 8/1/26 | | 80,000 | 67,965 |
| Omega Healthcare Investors, Inc. 3.25% 4/15/33 | | 360,000 | 268,693 |
| Park Intermediate Holdings LLC 4.875% 5/15/29 (b) | | 565,000 | 490,138 |
| RHP Hotel Properties LP/RHP Finance Corp.: | | | |
| 4.5% 2/15/29(b) | | 685,000 | 601,293 |
| 7.25% 7/15/28(b) | | 85,000 | 85,425 |
| SBA Communications Corp. 3.125% 2/1/29 | | 215,000 | 184,081 |
| Senior Housing Properties Trust: | | | |
| 4.375% 3/1/31 | | 950,000 | 716,786 |
| 4.75% 5/1/24 | | 825,000 | 783,042 |
| 9.75% 6/15/25 | | 565,000 | 555,574 |
| Uniti Group LP / Uniti Group Finance, Inc.: | | | |
| 6.5% 2/15/29(b) | | 3,130,000 | 2,136,227 |
| 10.5% 2/15/28(b) | | 390,000 | 389,077 |
| Uniti Group, Inc. 6% 1/15/30 (b) | | 1,125,000 | 743,141 |
| VICI Properties LP / VICI Note Co.: | | | |
| 4.125% 8/15/30(b) | | 195,000 | 170,739 |
| 4.5% 1/15/28(b) | | 975,000 | 904,781 |
| | | | 12,714,206 |
| Real Estate Management & Development - 0.6% | | | |
| Anywhere Real Estate Group LLC 7% 4/15/30 (b) | | 143,200 | 129,059 |
| DTZ U.S. Borrower LLC 6.75% 5/15/28 (b) | | 805,000 | 766,348 |
| Five Point Operation Co. LP 7.875% 11/15/25 (b) | | 694,000 | 647,165 |
| Forestar Group, Inc. 3.85% 5/15/26 (b) | | 1,025,000 | 949,041 |
| Greystar Real Estate Partners 7.75% 9/1/30 (b) | | 200,000 | 202,010 |
| Howard Hughes Corp.: | | | |
| 4.125% 2/1/29(b) | | 855,000 | 705,375 |
| 4.375% 2/1/31(b) | | 928,000 | 739,570 |
| 5.375% 8/1/28(b) | | 1,730,000 | 1,557,593 |
| Hunt Companies, Inc. 5.25% 4/15/29 (b) | | 975,000 | 744,743 |
| Kennedy-Wilson, Inc. 4.75% 2/1/30 | | 275,000 | 211,852 |
| Mattamy Group Corp. 4.625% 3/1/30 (b) | | 1,900,000 | 1,679,280 |
| Realogy Group LLC/Realogy Co-Issuer Corp. 5.75% 1/15/29 (b) | | 6,000 | 4,290 |
| Realogy Group LLC/Realogy Co.-Issuer Corp. 5.25% 4/15/30 (b) | | 5,000 | 3,471 |
| Taylor Morrison Communities, Inc./Monarch Communities, Inc. 5.125% 8/1/30 (b) | | 1,408,000 | 1,291,338 |
| | | | 9,631,135 |
TOTAL REAL ESTATE | | | 22,345,341 |
| | | | |
| UTILITIES - 1.9% | | | |
| Electric Utilities - 0.9% | | | |
| Clearway Energy Operating LLC: | | | |
| 3.75% 2/15/31(b) | | 365,000 | 300,095 |
| 3.75% 1/15/32(b) | | 45,000 | 36,841 |
| 4.75% 3/15/28(b) | | 165,000 | 152,567 |
| DPL, Inc.: | | | |
| 4.125% 7/1/25 | | 250,000 | 237,824 |
| 4.35% 4/15/29 | | 35,000 | 30,144 |
| FirstEnergy Corp. 3.4% 3/1/50 | | 380,000 | 251,513 |
| NRG Energy, Inc.: | | | |
| 3.375% 2/15/29(b) | | 195,000 | 160,732 |
| 3.625% 2/15/31(b) | | 1,540,000 | 1,201,862 |
| 3.875% 2/15/32(b) | | 750,000 | 579,588 |
| 5.25% 6/15/29(b) | | 922,000 | 829,893 |
| Pattern Energy Operations LP 4.5% 8/15/28 (b) | | 220,000 | 200,290 |
| PG&E Corp.: | | | |
| 5% 7/1/28 | | 1,310,000 | 1,205,079 |
| 5.25% 7/1/30 | | 4,050,000 | 3,598,108 |
| Vistra Operations Co. LLC: | | | |
| 4.375% 5/1/29(b) | | 1,225,000 | 1,080,012 |
| 5% 7/31/27(b) | | 1,627,000 | 1,530,208 |
| 5.5% 9/1/26(b) | | 205,000 | 197,736 |
| 5.625% 2/15/27(b) | | 2,147,000 | 2,066,938 |
| | | | 13,659,430 |
| Gas Utilities - 0.3% | | | |
| AmeriGas Partners LP/AmeriGas Finance Corp.: | | | |
| 5.5% 5/20/25 | | 210,000 | 206,096 |
| 5.875% 8/20/26 | | 375,000 | 355,762 |
| 9.375% 6/1/28(b) | | 230,000 | 235,757 |
| Ferrellgas LP/Ferrellgas Finance Corp.: | | | |
| 5.375% 4/1/26(b) | | 810,000 | 761,425 |
| 5.875% 4/1/29(b) | | 1,575,000 | 1,389,629 |
| Suburban Propane Partners LP/Suburban Energy Finance Corp.: | | | |
| 5% 6/1/31(b) | | 1,050,000 | 902,559 |
| 5.875% 3/1/27 | | 210,000 | 204,850 |
| Superior Plus LP / Superior General Partner, Inc. 4.5% 3/15/29 (b) | | 975,000 | 857,981 |
| | | | 4,914,059 |
| Independent Power and Renewable Electricity Producers - 0.7% | | | |
| Atlantica Sustainable Infrastructure PLC 4.125% 6/15/28 (b) | | 515,000 | 459,223 |
| Calpine Corp.: | | | |
| 3.75% 3/1/31(b) | | 50,000 | 41,686 |
| 4.5% 2/15/28(b) | | 540,000 | 499,892 |
| 5% 2/1/31(b) | | 685,000 | 579,560 |
| 5.125% 3/15/28(b) | | 6,424,000 | 5,852,778 |
| Sunnova Energy Corp. 5.875% 9/1/26 (b) | | 230,000 | 202,390 |
| Talen Energy Supply LLC 8.625% 6/1/30 (b) | | 1,210,000 | 1,259,863 |
| TerraForm Global, Inc. 6.125% 3/1/26 (b) | | 755,000 | 725,744 |
| TransAlta Corp. 7.75% 11/15/29 | | 205,000 | 212,261 |
| | | | 9,833,397 |
| Water Utilities - 0.0% | | | |
| Solaris Midstream Holdings LLC 7.625% 4/1/26 (b) | | 515,000 | 506,128 |
| | | | |
TOTAL UTILITIES | | | 28,913,014 |
| | | | |
| TOTAL NONCONVERTIBLE BONDS | | | 643,998,113 |
| TOTAL CORPORATE BONDS (Cost $727,723,728) | | | 646,490,476 |
| | | | |
| U.S. Treasury Obligations - 1.6% |
| | | Principal Amount (a) | Value ($) |
| U.S. Treasury Notes: | | | |
| 2.5% 3/31/27 (i)(j) | | 2,570,000 | 2,408,170 |
| 2.625% 5/31/27 | | 10,130,000 | 9,508,746 |
| 2.75% 4/30/27 | | 2,175,000 | 2,052,911 |
| 3.875% 3/31/25 | | 2,965,000 | 2,911,375 |
| 4.25% 5/31/25 | | 5,930,000 | 5,857,497 |
| 4.5% 11/30/24 | | 1,615,000 | 1,600,490 |
| 4.625% 2/28/25 | | 1,240,000 | 1,231,427 |
| TOTAL U.S. TREASURY OBLIGATIONS (Cost $26,356,574) | | | 25,570,616 |
| | | | |
| Municipal Securities - 0.1% |
| | | Principal Amount (a) | Value ($) |
Puerto Rico Commonwealth Pub. Impt. Gen. Oblig. Series 2022, 0% 11/1/43 (e) (Cost $1,151,364) | | 2,068,482 | 1,065,268 |
| | | | |
| Common Stocks - 1.2% |
| | | Shares | Value ($) |
| COMMUNICATION SERVICES - 0.3% | | | |
| Wireless Telecommunication Services - 0.3% | | | |
| Intelsat Emergence SA (f)(k) | | 104,734 | 4,807,291 |
| Intelsat Jackson Holdings SA: | | | |
| Series A rights (f)(k) | | 10,966 | 101,326 |
| Series B rights (f)(k) | | 10,966 | 373,392 |
| | | | 5,282,009 |
| ENERGY - 0.4% | | | |
| Oil, Gas & Consumable Fuels - 0.4% | | | |
| Chesapeake Energy Corp. | | 16,177 | 1,426,973 |
| Mesquite Energy, Inc. (f)(k) | | 46,770 | 3,994,188 |
| | | | 5,421,161 |
| HEALTH CARE - 0.1% | | | |
| Health Care Equipment & Supplies - 0.0% | | | |
| Becton, Dickinson & Co. | | 2,461 | 687,726 |
| Life Sciences Tools & Services - 0.1% | | | |
| Avantor, Inc. (k) | | 34,812 | 753,680 |
| Danaher Corp. | | 2,132 | 564,980 |
| | | | 1,318,660 |
TOTAL HEALTH CARE | | | 2,006,386 |
| INFORMATION TECHNOLOGY - 0.0% | | | |
| Electronic Equipment, Instruments & Components - 0.0% | | | |
| TE Connectivity Ltd. | | 2,300 | 304,497 |
| IT Services - 0.0% | | | |
| GTT Communications, Inc. (f) | | 24,499 | 304,523 |
TOTAL INFORMATION TECHNOLOGY | | | 609,020 |
| MATERIALS - 0.3% | | | |
| Chemicals - 0.2% | | | |
| TPC Group, Inc. (f)(h) | | 164,025 | 3,654,477 |
| Metals & Mining - 0.1% | | | |
| Constellium NV (k) | | 41,600 | 748,800 |
TOTAL MATERIALS | | | 4,403,277 |
| UTILITIES - 0.1% | | | |
| Gas Utilities - 0.1% | | | |
| Ferrellgas Partners LP Class B (k) | | 5,547 | 887,528 |
| TOTAL COMMON STOCKS (Cost $11,657,270) | | | 18,609,381 |
| | | | |
| Bank Loan Obligations - 2.4% |
| | | Principal Amount (a) | Value ($) |
| COMMUNICATION SERVICES - 0.2% | | | |
| Diversified Telecommunication Services - 0.0% | | | |
| Gtt Remainco LLC 1LN, term loan CME Term SOFR 1 Month Index + 7.000% 12.4311% 12/30/27 (e)(g)(l) | | 475,137 | 394,958 |
| Media - 0.1% | | | |
| Diamond Sports Group LLC: | | | |
| 1LN, term loan CME Term SOFR 1 Month Index + 8.000% 15.4181% 8/24/26 (e)(g)(l) | | 1,034,743 | 646,714 |
| 2LN, term loan CME Term SOFR 1 Month Index + 3.250% 10.6625% 8/24/26 (d)(e)(g)(l) | | 1,706,869 | 41,153 |
| | | | 687,867 |
| Wireless Telecommunication Services - 0.1% | | | |
| Digicel International Finance Ltd. Tranche B, term loan 3 month U.S. LIBOR + 3.250% 5.96% 5/25/24 (e)(g)(l) | | 44,763 | 40,659 |
| Xplornet Communications, Inc.: | | | |
| 1LN, term loan CME Term SOFR 1 Month Index + 4.000% 10/1/28 (g)(l)(m) | | 1,569,045 | 1,256,633 |
| 2LN, term loan CME Term SOFR 1 Month Index + 7.000% 9/30/29 (g)(l)(m) | | 375,000 | 179,063 |
| | | | 1,476,355 |
TOTAL COMMUNICATION SERVICES | | | 2,559,180 |
| CONSUMER DISCRETIONARY - 0.4% | | | |
| Broadline Retail - 0.0% | | | |
| Bass Pro Group LLC Tranche B 1LN, term loan 1 month U.S. LIBOR + 3.750% 9.1955% 3/5/28 (e)(g)(l) | | 439,410 | 437,626 |
| Diversified Consumer Services - 0.1% | | | |
| Spin Holdco, Inc. Tranche B 1LN, term loan 3 month U.S. LIBOR + 4.000% 9.2303% 3/4/28 (e)(g)(l) | | 609,209 | 508,690 |
| Hotels, Restaurants & Leisure - 0.1% | | | |
| City Football Group Ltd. Tranche B 1LN, term loan 1 month U.S. LIBOR + 3.000% 8.4285% 7/21/28 (e)(g)(l) | | 1,103,001 | 1,093,350 |
| ClubCorp Holdings, Inc. Tranche B 1LN, term loan 3 month U.S. LIBOR + 2.750% 8.2879% 9/18/24 (e)(g)(l) | | 658,823 | 649,296 |
| Ontario Gaming GTA LP Tranche B 1LN, term loan CME Term SOFR 1 Month Index + 4.250% 8/1/30 (g)(l)(m) | | 15,000 | 15,028 |
| | | | 1,757,674 |
| Household Durables - 0.1% | | | |
| Mattress Firm, Inc. Tranche B 1LN, term loan 6 month U.S. LIBOR + 4.250% 9.95% 9/24/28 (e)(g)(l) | | 234,381 | 232,037 |
| Sunset Debt Merger Sub, Inc. Tranche B 1LN, term loan 3 month U.S. LIBOR + 4.000% 10/6/28 (g)(l)(m) | | 1,698,500 | 1,409,755 |
| | | | 1,641,792 |
| Specialty Retail - 0.1% | | | |
| LBM Acquisition LLC Tranche B 1LN, term loan CME Term SOFR 1 Month Index + 3.750% 9.1811% 12/18/27 (e)(g)(l) | | 1,086,102 | 1,055,365 |
| Wand NewCo 3, Inc. Tranche B 1LN, term loan 1 month U.S. LIBOR + 2.750% 8.1723% 2/5/26 (e)(g)(l) | | 590,897 | 589,668 |
| | | | 1,645,033 |
TOTAL CONSUMER DISCRETIONARY | | | 5,990,815 |
| ENERGY - 0.1% | | | |
| Oil, Gas & Consumable Fuels - 0.1% | | | |
| EG America LLC: | | | |
| term loan CME Term SOFR 1 Month Index + 5.500% 9.1645% 2/7/28 (e)(f)(g)(l) | | 680,346 | 646,328 |
| Tranche BB 1LN, term loan: | | | |
| 6 month U.S. LIBOR + 4.000% 9.1645% 2/5/25 (e)(g)(l) | | 152,725 | 152,534 |
| CME Term SOFR 1 Month Index + 4.000% 9.1645% 2/5/25 (e)(g)(l) | | 321,942 | 320,735 |
| Tranche BC 1LN, term loan CME Term SOFR 1 Month Index + 5.500% 9.1645% 2/7/28 (e)(f)(g)(l) | | 355,057 | 337,304 |
| Mesquite Energy, Inc.: | | | |
| 1LN, term loan 3 month U.S. LIBOR + 8.000% 0% (d)(f)(g)(l) | | 864,602 | 0 |
| term loan 3 month U.S. LIBOR + 0.000% 0% (d)(f)(g)(l) | | 373,000 | 0 |
| Prairie ECI Acquiror LP 1LN, term loan 1 month U.S. LIBOR + 4.750% 3/11/26 (g)(l)(m) | | 685,000 | 682,863 |
| | | | 2,139,764 |
| FINANCIALS - 0.4% | | | |
| Financial Services - 0.0% | | | |
| Venator Finance SARL/Venator Capital Management Ltd. 1LN, term loan 0% 9/14/23 (e)(l) | | 560,369 | 581,383 |
| Insurance - 0.4% | | | |
| Acrisure LLC Tranche B-2 1LN, term loan 1 month U.S. LIBOR + 3.750% 9.1955% 2/15/27 (e)(g)(l) | | 324,175 | 317,150 |
| Alliant Holdings Intermediate LLC Tranche B5 1LN, term loan CME Term SOFR 1 Month Index + 3.500% 8.8138% 11/6/27 (e)(g)(l) | | 35,448 | 35,420 |
| Asurion LLC Tranche B4 2LN, term loan CME Term SOFR 1 Month Index + 5.250% 10.6955% 1/20/29 (e)(g)(l) | | 6,595,000 | 5,765,151 |
| | | | 6,117,721 |
TOTAL FINANCIALS | | | 6,699,104 |
| HEALTH CARE - 0.1% | | | |
| Health Care Providers & Services - 0.1% | | | |
| Cano Health, Inc. Tranche B 1LN, term loan CME Term SOFR 1 Month Index + 4.000% 9.4311% 11/23/27 (e)(g)(l) | | 392,632 | 245,395 |
| Da Vinci Purchaser Corp. Tranche B 1LN, term loan CME Term SOFR 1 Month Index + 4.000% 9.4455% 1/8/27 (e)(g)(l) | | 54,026 | 53,472 |
| Gainwell Acquisition Corp. Tranche B 1LN, term loan CME Term SOFR 3 Month Index + 4.000% 9.3419% 10/1/27 (e)(g)(l) | | 144,260 | 141,871 |
| | | | 440,738 |
| Health Care Technology - 0.0% | | | |
| Athenahealth Group, Inc. Tranche B 1LN, term loan CME Term SOFR 1 Month Index + 3.500% 8.8202% 2/15/29 (e)(g)(l) | | 269,258 | 265,779 |
TOTAL HEALTH CARE | | | 706,517 |
| INDUSTRIALS - 0.2% | | | |
| Building Products - 0.0% | | | |
| Acproducts Holdings, Inc. Tranche B 1LN, term loan 1 month U.S. LIBOR + 4.250% 9.7535% 5/17/28 (e)(g)(l) | | 435,954 | 372,196 |
| Commercial Services & Supplies - 0.0% | | | |
| ABG Intermediate Holdings 2 LLC: | | | |
| Tranche B2 1LN, term loan CME Term SOFR 1 Month Index + 4.000% 9.4187% 12/21/28 (e)(g)(l) | | 124,259 | 124,282 |
| Tranche DD 1LN, term loan CME Term SOFR 1 Month Index + 4.000% 5.9018% 12/21/28 (e)(g)(l)(n) | | 40,741 | 40,748 |
| Brand Energy & Infrastructure Services, Inc. Tranche B 1LN, term loan CME Term SOFR 1 Month Index + 5.500% 10.8719% 8/1/30 (e)(g)(l) | | 180,000 | 173,668 |
| Neptune BidCo U.S., Inc. Tranche B 1LN, term loan CME Term SOFR 1 Month Index + 5.000% 10.3985% 4/11/29 (e)(g)(l) | | 438,900 | 399,215 |
| | | | 737,913 |
| Construction & Engineering - 0.0% | | | |
| Breakwater Energy Partners LLC Tranche B 1LN, term loan 11.25% 9/1/26 (e)(f)(l) | | 82,741 | 79,953 |
| Passenger Airlines - 0.1% | | | |
| Mileage Plus Holdings LLC Tranche B 1LN, term loan 3 month U.S. LIBOR + 5.250% 10.7637% 7/2/27 (e)(g)(l) | | 808,000 | 841,694 |
| Professional Services - 0.1% | | | |
| CoreLogic, Inc.: | | | |
| 2LN, term loan 1 month U.S. LIBOR + 0.000% 4/13/29 (g)(l)(m) | | 203,676 | 169,815 |
| Tranche B 1LN, term loan 1 month U.S. LIBOR + 3.500% 8.9455% 6/2/28 (e)(g)(l) | | 432,797 | 402,657 |
| Nielsen Holdings PLC 2LN, term loan 3 month U.S. LIBOR + 0.000% 10/11/29 (f)(g)(l)(m) | | 415,000 | 406,700 |
| Verscend Holding Corp. Tranche B 1LN, term loan CME Term SOFR 1 Month Index + 4.000% 9.4455% 8/27/25 (e)(g)(l) | | 173,141 | 172,924 |
| | | | 1,152,096 |
TOTAL INDUSTRIALS | | | 3,183,852 |
| INFORMATION TECHNOLOGY - 0.9% | | | |
| Communications Equipment - 0.0% | | | |
| Radiate Holdco LLC Tranche B 1LN, term loan CME Term SOFR 1 Month Index + 3.250% 9/25/26 (g)(l)(m) | | 176,552 | 144,195 |
| IT Services - 0.1% | | | |
| GTT Communications, Inc. 1LN, term loan CME Term SOFR 3 Month Index + 9.000% 14.3419% 6/30/28 (e)(g)(l) | | 995,186 | 568,918 |
| Software - 0.8% | | | |
| Ascend Learning LLC: | | | |
| 2LN, term loan CME Term SOFR 1 Month Index + 5.750% 11.1811% 12/10/29 (e)(g)(l) | | 1,687,000 | 1,438,876 |
| Tranche B 1LN, term loan CME Term SOFR 1 Month Index + 3.500% 8.9311% 12/10/28 (e)(g)(l) | | 391,030 | 375,530 |
| Boxer Parent Co., Inc. Tranche B 2LN, term loan CME Term SOFR 1 Month Index + 5.500% 10/2/25 (g)(l)(m) | | 440,000 | 434,188 |
| Finastra U.S.A., Inc.: | | | |
| Tranche 2LN, term loan 3 month U.S. LIBOR + 7.250% 12.981% 6/13/25 (e)(g)(l) | | 1,517,000 | 1,514,785 |
| Tranche B 1LN, term loan CME TERM SOFR 6 MONTH INDEX + 3.500% 9.231% 6/13/24 (e)(g)(l) | | 1,508,300 | 1,506,264 |
| McAfee Corp. Tranche B 1LN, term loan CME Term SOFR 1 Month Index + 3.750% 9.1681% 3/1/29 (e)(g)(l) | | 208,945 | 204,766 |
| RealPage, Inc. 2LN, term loan 1 month U.S. LIBOR + 0.000% 2/17/29 (g)(l)(m) | | 750,000 | 750,623 |
| Skillsoft Tranche B 1LN, term loan CME Term SOFR 1 Month Index + 4.750% 7/16/28 (g)(l)(m) | | 1,890,300 | 1,741,779 |
| Sophia LP Tranche B 1LN, term loan 3 month U.S. LIBOR + 3.500% 9.0379% 10/7/27 (e)(g)(l) | | 114,418 | 114,156 |
| Ultimate Software Group, Inc.: | | | |
| 1LN, term loan 1 month U.S. LIBOR + 3.250% 8.6184% 5/3/26 (e)(g)(l) | | 1,918,080 | 1,915,875 |
| 2LN, term loan CME Term SOFR 3 Month Index + 5.250% 10.6184% 5/3/27 (e)(g)(l) | | 2,874,807 | 2,854,799 |
| | | | 12,851,641 |
TOTAL INFORMATION TECHNOLOGY | | | 13,564,754 |
| MATERIALS - 0.0% | | | |
| Chemicals - 0.0% | | | |
| Discovery Purchaser Corp. 1LN, term loan CME Term SOFR 3 Month Index + 4.370% 9.6169% 10/4/29 (e)(g)(l) | | 338,300 | 324,135 |
| Olympus Water U.S. Holding Corp. Tranche B 1LN, term loan CME Term SOFR 3 Month Index + 3.750% 9.2535% 11/9/28 (e)(g)(l) | | 93,000 | 91,547 |
| Venator Materials LLC Tranche B, term loan 3 month U.S. LIBOR + 3.000% 5.2422% 8/8/24 (e)(g)(l) | | 440,000 | 205,150 |
| | | | 620,832 |
| Containers & Packaging - 0.0% | | | |
| Clydesdale Acquisition Holdings, Inc. 1LN, term loan CME Term SOFR 1 Month Index + 4.170% 9.6061% 4/13/29 (e)(g)(l) | | 77,285 | 76,705 |
TOTAL MATERIALS | | | 697,537 |
| UTILITIES - 0.1% | | | |
| Electric Utilities - 0.1% | | | |
| Heritage Power LLC Tranche B 1LN, term loan 3 month U.S. LIBOR + 4.750% 6/28/26 (g)(l)(m) | | 1,651,509 | 350,946 |
| PG&E Corp. Tranche B 1LN, term loan CME Term SOFR 1 Month Index + 3.000% 8.4455% 6/23/25 (e)(g)(l) | | 881,421 | 879,711 |
| | | | 1,230,657 |
| TOTAL BANK LOAN OBLIGATIONS (Cost $42,523,575) | | | 36,772,180 |
| | | | |
| Fixed-Income Funds - 50.5% |
| | | Shares | Value ($) |
| High Yield Fixed-Income Funds - 50.5% | | | |
| Artisan High Income Fund Investor Shares | | 24,902,133 | 217,893,643 |
| BlackRock High Yield Bond Portfolio Class K | | 15,220,089 | 103,801,010 |
| Eaton Vance Income Fund of Boston Class A | | 24,340,321 | 121,701,607 |
| Fidelity Capital & Income Fund (o) | | 14,410,101 | 135,310,853 |
| MainStay High Yield Corporate Bond Fund Class A | | 25,388,771 | 127,959,408 |
| Vanguard High-Yield Corporate Fund Admiral Shares | | 13,723,880 | 71,775,894 |
| | | | |
| TOTAL FIXED-INCOME FUNDS (Cost $770,827,603) | | | 778,442,415 |
| | | | |
| Preferred Securities - 0.6% |
| | | Principal Amount (a) | Value ($) |
| COMMUNICATION SERVICES - 0.0% | | | |
| Wireless Telecommunication Services - 0.0% | | | |
| Digicel Group Holdings Ltd. 7% 12/31/99 (b)(e) | | 25,875 | 3,215 |
| ENERGY - 0.1% | | | |
| Oil, Gas & Consumable Fuels - 0.1% | | | |
| Energy Transfer LP 3 month U.S. LIBOR + 4.020% 9.6542% (e)(g)(p) | | 737,000 | 681,400 |
| EnLink Midstream Partners LP 3 month U.S. LIBOR + 4.110% 9.6184% 12/31/99 (e)(g)(p) | | 55,000 | 49,956 |
| Plains All American Pipeline LP CME Term SOFR 3 Month Index + 4.110% 9.7362% (e)(g)(p) | | 295,000 | 272,017 |
| | | | 1,003,373 |
| FINANCIALS - 0.1% | | | |
| Banks - 0.1% | | | |
| Bank of America Corp. 5.875% (e)(p) | | 380,000 | 361,015 |
| Citigroup, Inc. 3.875% (e)(p) | | 25,000 | 21,913 |
| JPMorgan Chase & Co.: | | | |
| 4.6% (e)(p) | | 275,000 | 259,071 |
| 6.1% (e)(p) | | 380,000 | 387,789 |
| Wells Fargo & Co. 5.9% (e)(p) | | 205,000 | 205,456 |
| | | | 1,235,244 |
| Capital Markets - 0.0% | | | |
| Charles Schwab Corp. 4% (e)(p) | | 240,000 | 183,610 |
| Consumer Finance - 0.0% | | | |
| Ally Financial, Inc.: | | | |
| 4.7% (e)(p) | | 240,000 | 169,110 |
| 4.7% (e)(p) | | 255,000 | 164,696 |
| | | | 333,806 |
TOTAL FINANCIALS | | | 1,752,660 |
| INDUSTRIALS - 0.0% | | | |
| Trading Companies & Distributors - 0.0% | | | |
| AerCap Holdings NV 5.875% 10/10/79 (e) | | 410,000 | 405,334 |
| Air Lease Corp. 4.125% 12/31/99 (e)(p) | | 120,000 | 87,563 |
| Aircastle Ltd. 5.25% 12/31/99 (b)(e)(p) | | 191,000 | 152,657 |
| | | | 645,554 |
| UTILITIES - 0.4% | | | |
| Electric Utilities - 0.1% | | | |
| NRG Energy, Inc. 10.25% (b)(e)(p) | | 550,000 | 567,250 |
| Independent Power and Renewable Electricity Producers - 0.3% | | | |
| Vistra Corp.: | | | |
| 7% (b)(e)(p) | | 1,775,000 | 1,669,349 |
| 8% (b)(e)(p) | | 3,520,000 | 3,469,325 |
| | | | 5,138,674 |
TOTAL UTILITIES | | | 5,705,924 |
| TOTAL PREFERRED SECURITIES (Cost $9,145,186) | | | 9,110,726 |
| | | | |
| Money Market Funds - 0.9% |
| | | Shares | Value ($) |
| Fidelity Cash Central Fund 5.43% (q) | | 4,407,439 | 4,408,320 |
| State Street Institutional U.S. Government Money Market Fund Premier Class 5.28% (r) | | 9,748,750 | 9,748,750 |
| TOTAL MONEY MARKET FUNDS (Cost $14,156,923) | | | 14,157,070 |
| | | | |
| TOTAL INVESTMENT IN SECURITIES - 99.2% (Cost $1,603,542,223) | 1,530,218,132 |
NET OTHER ASSETS (LIABILITIES) - 0.8% | 11,587,210 |
| NET ASSETS - 100.0% | 1,541,805,342 |
| | |
| Futures Contracts |
| | Number of contracts | Expiration Date | Notional Amount ($) | Value ($) | Unrealized Appreciation/ (Depreciation) ($) |
| Purchased | | | | | |
| | | | | | |
| Treasury Contracts | | | | | |
| CBOT 10-Year U.S. Treasury Note Contracts (United States) | 13 | Dec 2023 | 1,443,406 | 14,459 | 14,459 |
| CBOT 2-Year U.S. Treasury Note Contracts (United States) | 50 | Dec 2023 | 10,190,234 | 22,384 | 22,384 |
| CBOT 5-Year U.S. Treasury Note Contracts (United States) | 100 | Dec 2023 | 10,692,188 | 53,872 | 53,872 |
| | | | | | |
| TOTAL PURCHASED | | | | | 90,715 |
| | | | | | |
| Sold | | | | | |
| | | | | | |
| Treasury Contracts | | | | | |
| CBOT Long Term U.S. Treasury Bond Contracts (United States) | 10 | Dec 2023 | 1,216,875 | (20,265) | (20,265) |
| CBOT Ultra Long Term U.S. Treasury Bond Contracts (United States) | 6 | Dec 2023 | 776,813 | (9,572) | (9,572) |
| | | | | | |
| TOTAL SOLD | | | | | (29,837) |
| | | | | | |
| TOTAL FUTURES CONTRACTS | | | | | 60,878 |
| The notional amount of futures purchased as a percentage of Net Assets is 1.5% |
| The notional amount of futures sold as a percentage of Net Assets is 0.2% |
| Forward Foreign Currency Contracts |
Currency Purchased
| Currency Sold | Counterparty | Settlement Date | Unrealized Appreciation/ (Depreciation) ($) |
| | | | | | | |
| GBP | 13,350 | USD | 16,974 | Bank of America, N.A. | 10/20/23 | (59) |
| GBP | 303,840 | USD | 387,530 | Deutsche Bank AG | 10/20/23 | (2,567) |
| USD | 962,686 | GBP | 734,513 | Goldman Sachs Intl London | 10/20/23 | 32,063 |
| USD | 859,661 | EUR | 786,085 | Bank of America, N.A. | 11/24/23 | 3,920 |
| USD | 574,697 | EUR | 524,057 | HSBC Bank | 11/24/23 | 4,202 |
| | | | | | | |
| TOTAL FORWARD FOREIGN CURRENCY CONTRACTS | | 37,559 |
| Unrealized Appreciation | | | 40,185 |
| Unrealized Depreciation | | | (2,626) |
| Credit Default Swaps |
| Underlying Reference | Rating(1) | Maturity Date | Clearinghouse / Counterparty(2) | Fixed Payment Received/ (Paid) | Payment Frequency | Notional Amount(3)(4) | Value ($)(1) | Upfront Premium Received/ (Paid) ($)(5) | Unrealized Appreciation/ (Depreciation) ($) |
| Buy Protection | | | | | | | | | | |
| 5-Year CDX N.A. HY Series 40 | | Jun 2028 | ICE | (5%) | Quarterly | | 16,163,000 | (530,322) | 0 | (530,322) |
| | | | | | | | | | | |
| Sell Protection | | | | | | | | | | |
| Community Health Systems, Inc. | Caa2 | Dec 2026 | ICE | 5% | Quarterly | | 484,000 | (112,583) | 0 | (112,583) |
| | | | | | | | | | | |
| TOTAL CREDIT DEFAULT SWAPS | | | | | | | | (642,905) | 0 | (642,905) |
(1)Ratings are presented for credit default swaps in which the Fund has sold protection on the underlying referenced debt. Ratings for an underlying index represent a weighted average of the ratings of all securities included in the index. The credit rating or value can be measures of the current payment/performance risk. Ratings are from Moody's Investors Service, Inc. Where Moody's® ratings are not available, S&P® ratings are disclosed and are indicated as such. All ratings are as of the report date and do not reflect subsequent changes.
(2)Swaps with Intercontinental Exchange (ICE) are centrally cleared over-the-counter (OTC) swaps.
(3)The notional amount of each credit default swap where the Fund has sold protection approximates the maximum potential amount of future payments that the Fund could be required to make if a credit event were to occur.
(4)Notional amount is stated in U.S. Dollars unless otherwise noted.
(5)Any premiums for centrally cleared over-the-counter (OTC) swaps are recorded periodically throughout the term of the swap to variation margin and included in unrealized appreciation (depreciation).
Currency Abbreviations
| EUR | - | European Monetary Unit |
| GBP | - | British pound sterling |
| USD | - | U.S. dollar |
Legend
| (a) | Amount is stated in United States dollars unless otherwise noted. |
| (b) | Security exempt from registration under Rule 144A of the Securities Act of 1933. These securities may be resold in transactions exempt from registration, normally to qualified institutional buyers. At the end of the period, the value of these securities amounted to $519,041,742 or 33.7% of net assets. |
| (c) | Security initially issued at one coupon which converts to a higher coupon at a specified date. The rate shown is the rate at period end. |
| (d) | Non-income producing - Security is in default. |
| (e) | Coupon rates for floating and adjustable rate securities reflect the rates in effect at period end. |
| (g) | Coupon is indexed to a floating interest rate which may be multiplied by a specified factor and/or subject to caps or floors. |
| (h) | Restricted securities (including private placements) - Investment in securities not registered under the Securities Act of 1933 (excluding 144A issues). At the end of the period, the value of restricted securities (excluding 144A issues) amounted to $4,312,406 or 0.3% of net assets. |
| (i) | Security or a portion of the security was pledged to cover margin requirements for futures contracts. At period end, the value of securities pledged amounted to $407,338. |
| (j) | Security or a portion of the security was pledged to cover margin requirements for centrally cleared OTC swaps. At period end, the value of securities pledged amounted to $1,705,909. |
| (l) | Remaining maturities of bank loan obligations may be less than the stated maturities shown as a result of contractual or optional prepayments by the borrower. Such prepayments cannot be predicted with certainty. |
| (m) | The coupon rate will be determined upon settlement of the loan after period end. |
| (n) | Position or a portion of the position represents an unfunded loan commitment. At period end, the total principal amount and market value of unfunded commitments totaled $26,481 and $26,486, respectively. |
| (p) | Security is perpetual in nature with no stated maturity date. |
| (q) | Affiliated fund that is generally available only to investment companies and other accounts managed by Fidelity Investments. The rate quoted is the annualized seven-day yield of the fund at period end. A complete unaudited listing of the fund's holdings as of its most recent quarter end is available upon request. In addition, each Fidelity Central Fund's financial statements are available on the SEC's website or upon request. |
| (r) | The rate quoted is the annualized seven-day yield of the fund at period end. |
| Additional information on each restricted holding is as follows: |
| Security | Acquisition Date | Acquisition Cost ($) |
| Jonah Energy Parent LLC 12% 11/5/25 | 5/05/23 | 632,128 |
| | | |
| TPC Group, Inc. | 12/16/22 | 1,776,472 |
| | | |
Affiliated Central Funds
Fiscal year to date information regarding the Fund's investments in Fidelity Central Funds, including the ownership percentage, is presented below.
| Affiliate | Value, beginning of period ($) | Purchases ($) | Sales Proceeds ($) | Dividend Income ($) | Realized Gain (loss) ($) | Change in Unrealized appreciation (depreciation) ($) | Value, end of period ($) | % ownership, end of period |
| Fidelity Cash Central Fund 5.43% | 4,863,615 | 43,927,936 | 44,383,230 | 129,697 | - | (1) | 4,408,320 | 0.0% |
| Total | 4,863,615 | 43,927,936 | 44,383,230 | 129,697 | - | (1) | 4,408,320 | |
| | | | | | | | | |
Amounts in the dividend income column in the above table include any capital gain distributions from underlying funds, which are presented in the corresponding line item in the Statement of Operations, if applicable.
Amounts included in the purchases and sales proceeds columns may include in-kind transactions, if applicable.
Affiliated Underlying Funds
Fiscal year to date information regarding the Fund's investments in affiliated Underlying Funds is presented below. Exchanges between classes of the same affiliated Underlying Funds may occur. If an Underlying Funds changes its name, the name presented below is the name in effect at period end.
| Affiliate | Value, beginning of period ($) | Purchases ($) | Sales Proceeds ($) | Dividend Income ($) | Realized Gain (loss) ($) | Change in Unrealized appreciation (depreciation) ($) | Value, end of period ($) |
| Fidelity Capital & Income Fund | 154,562,357 | 3,522,211 | 25,548,155 | 3,522,211 | (502,903) | 3,277,343 | 135,310,853 |
| | 154,562,357 | 3,522,211 | 25,548,155 | 3,522,211 | (502,903) | 3,277,343 | 135,310,853 |
Amounts in the dividend income column in the above table include any capital gain distributions from underlying funds, which are presented in the corresponding line item in the Statement of Operations, if applicable.
Amounts included in the purchases and sales proceeds columns may include in-kind transactions, if applicable.
Investment Valuation
The following is a summary of the inputs used, as of August 31, 2023, involving the Fund's assets and liabilities carried at fair value. The inputs or methodology used for valuing securities may not be an indication of the risk associated with investing in those securities. For more information on valuation inputs, and their aggregation into the levels used below, please refer to the Investment Valuation section in the accompanying Notes to Financial Statements.
| Valuation Inputs at Reporting Date: |
| Description | Total ($) | Level 1 ($) | Level 2 ($) | Level 3 ($) |
Investments in Securities: | | | | |
|
| Equities: | | | | |
Communication Services | 5,282,009 | - | - | 5,282,009 |
Energy | 5,421,161 | 1,426,973 | - | 3,994,188 |
Health Care | 2,006,386 | 2,006,386 | - | - |
Information Technology | 609,020 | 304,497 | - | 304,523 |
Materials | 4,403,277 | 748,800 | - | 3,654,477 |
Utilities | 887,528 | 887,528 | - | - |
|
| Corporate Bonds | 646,490,476 | - | 645,832,546 | 657,930 |
|
| U.S. Government and Government Agency Obligations | 25,570,616 | - | 25,570,616 | - |
|
| Municipal Securities | 1,065,268 | - | 1,065,268 | - |
|
| Bank Loan Obligations | 36,772,180 | - | 35,301,895 | 1,470,285 |
|
| Fixed-Income Funds | 778,442,415 | 778,442,415 | - | - |
|
| Preferred Securities | 9,110,726 | - | 9,110,726 | - |
|
| Money Market Funds | 14,157,070 | 14,157,070 | - | - |
| Total Investments in Securities: | 1,530,218,132 | 797,973,669 | 716,881,051 | 15,363,412 |
Derivative Instruments: | | | | |
|
| Assets | | | | |
Futures Contracts | 90,715 | 90,715 | - | - |
Forward Foreign Currency Contracts | 40,185 | - | 40,185 | - |
| Total Assets | 130,900 | 90,715 | 40,185 | - |
|
| Liabilities | | | | |
Futures Contracts | (29,837) | (29,837) | - | - |
Forward Foreign Currency Contracts | (2,626) | - | (2,626) | - |
Swaps | (642,905) | - | (642,905) | - |
| Total Liabilities | (675,368) | (29,837) | (645,531) | - |
| Total Derivative Instruments: | (544,468) | 60,878 | (605,346) | - |
The following is a reconciliation of Investments in Securities for which Level 3 inputs were used in determining value:
| |
| Investments in Securities: | |
| Beginning Balance | $ | 20,713,321 | |
| Net Realized Gain (Loss) on Investment Securities | | 917,074 | |
| Net Unrealized Gain (Loss) on Investment Securities | | (4,987,818) | |
| Cost of Purchases | | 1,817,122 | |
| Proceeds of Sales | | (2,860,530) | |
| Amortization/Accretion | | 4,243 | |
| Transfers into Level 3 | | - | |
| Transfers out of Level 3 | | (240,000) | |
| Ending Balance | $ | 15,363,412 | |
| The change in unrealized gain (loss) for the period attributable to Level 3 securities held at August 31, 2023 | $ | 1,089,802 | |
| The information used in the above reconciliation represents fiscal year to date activity for any Investments in Securities identified as using Level 3 inputs at either the beginning or the end of the current fiscal period. Cost of purchases and proceeds of sales may include securities received and/or delivered through in-kind transactions, corporate actions or exchanges. Transfers into Level 3 were attributable to a lack of observable market data resulting from decreases in market activity, decreases in liquidity, security restructurings or corporate actions. Transfers out of Level 3 were attributable to observable market data becoming available for those securities. Transfers in or out of Level 3 represent the beginning value of any Security or Instrument where a change in the pricing level occurred from the beginning to the end of the period. Realized and unrealized gains (losses) disclosed in the reconciliation are included in Net Gain (Loss) on the Fund's Statement of Operations. | |
Value of Derivative Instruments
The following table is a summary of the Fund's value of derivative instruments by primary risk exposure as of August 31, 2023. For additional information on derivative instruments, please refer to the Derivative Instruments section in the accompanying Notes to Financial Statements.
Primary Risk Exposure / Derivative Type | Value |
| Asset ($) | Liability ($) |
| Credit Risk | | |
Swaps (a) | 0 | (642,905) |
| Total Credit Risk | 0 | (642,905) |
| Foreign Exchange Risk | | |
Forward Foreign Currency Contracts (b) | 40,185 | (2,626) |
| Total Foreign Exchange Risk | 40,185 | (2,626) |
| Interest Rate Risk | | |
Futures Contracts (c) | 90,715 | (29,837) |
| Total Interest Rate Risk | 90,715 | (29,837) |
| Total Value of Derivatives | 130,900 | (675,368) |
(a)For centrally cleared over-the-counter (OTC) swaps, reflects gross cumulative appreciation (depreciation) as presented in the Schedule of Investments. In the Statement of Assets and Liabilities, the period end daily variation margin for centrally cleared OTC swaps is included in receivable or payable for daily variation margin on centrally cleared OTC swaps, and the net cumulative appreciation (depreciation) for centrally cleared OTC swaps is included in Total accumulated earnings (loss).
(b)Gross value is presented in the Statement of Assets and Liabilities in the unrealized appreciation/depreciation on forward foreign currency contracts line-items.
(c)Reflects gross cumulative appreciation (depreciation) on futures contracts as presented in the Schedule of Investments. In the Statement of Assets and Liabilities, the period end daily variation margin is included in receivable or payable for daily variation margin on futures contracts, and the net cumulative appreciation (depreciation) is included in Total accumulated earnings (loss).
| Statement of Assets and Liabilities |
| | | | August 31, 2023 (Unaudited) |
| | | | | |
| Assets | | | | |
| Investment in securities, at value - See accompanying schedule: | | | | |
Unaffiliated issuers (cost $1,488,115,409) | $ | 1,390,498,959 | | |
Fidelity Central Funds (cost $4,408,176) | | 4,408,320 | | |
Other affiliated issuers (cost $111,018,638) | | 135,310,853 | | |
| | | | | |
| | | | | |
| Total Investment in Securities (cost $1,603,542,223) | | | $ | 1,530,218,132 |
| Segregated cash with brokers for derivative instruments | | | | 264,500 |
| Cash | | | | 150,716 |
| Foreign currency held at value (cost $8,968) | | | | 8,938 |
| Receivable for investments sold | | | | 708,665 |
| Unrealized appreciation on forward foreign currency contracts | | | | 40,185 |
| Receivable for fund shares sold | | | | 404,521 |
| Dividends receivable | | | | 1,000,563 |
| Interest receivable | | | | 11,743,491 |
| Distributions receivable from Fidelity Central Funds | | | | 26,550 |
| Receivable for daily variation margin on futures contracts | | | | 35,586 |
| Prepaid expenses | | | | 2,816 |
| Other receivables | | | | 52,485 |
Total assets | | | | 1,544,657,148 |
| Liabilities | | | | |
| Payable for investments purchased | $ | 1,659,074 | | |
| Unrealized depreciation on forward foreign currency contracts | | 2,626 | | |
| Payable for fund shares redeemed | | 840,925 | | |
| Distributions payable | | 53,964 | | |
| Accrued management fee | | 212,098 | | |
| Payable for daily variation margin on centrally cleared OTC swaps | | 495 | | |
| Other payables and accrued expenses | | 82,624 | | |
| Total Liabilities | | | | 2,851,806 |
| Commitments and contingent liabilities (see Commitments note) | | | | |
| Net Assets | | | $ | 1,541,805,342 |
| Net Assets consist of: | | | | |
| Paid in capital | | | $ | 1,808,826,628 |
| Total accumulated earnings (loss) | | | | (267,021,286) |
| Net Assets | | | $ | 1,541,805,342 |
Net Asset Value, offering price and redemption price per share ($1,541,805,342 ÷ 184,603,276 shares) | | | $ | 8.35 |
| Statement of Operations |
| | | | Six months ended August 31, 2023 (Unaudited) |
| Investment Income | | | | |
| Dividends: | | | | |
| Unaffiliated issuers | | | $ | 22,326,751 |
| Affiliated issuers | | | | 3,522,211 |
| Interest | | | | 24,549,792 |
| Income from Fidelity Central Funds | | | | 129,697 |
| Total Income | | | | 50,528,451 |
| Expenses | | | | |
| Management fee | $ | 3,259,665 | | |
| Custodian fees and expenses | | 13,365 | | |
| Independent trustees' fees and expenses | | 4,910 | | |
| Registration fees | | 20,298 | | |
| Audit | | 22,820 | | |
| Legal | | 64,995 | | |
| Miscellaneous | | 6,084 | | |
| Total expenses before reductions | | 3,392,137 | | |
| Expense reductions | | (1,973,463) | | |
| Total expenses after reductions | | | | 1,418,674 |
| Net Investment income (loss) | | | | 49,109,777 |
| Realized and Unrealized Gain (Loss) | | | | |
| Net realized gain (loss) on: | | | | |
| Investment Securities: | | | | |
| Unaffiliated issuers | | (15,816,089) | | |
| Affiliated issuers | | (502,903) | | |
| Forward foreign currency contracts | | (82,085) | | |
| Foreign currency transactions | | 23,812 | | |
| Futures contracts | | (225,900) | | |
| Swaps | | (1,151,014) | | |
| Total net realized gain (loss) | | | | (17,754,179) |
| Change in net unrealized appreciation (depreciation) on: | | | | |
| Investment Securities: | | | | |
| Unaffiliated issuers | | 28,520,138 | | |
| Fidelity Central Funds | | (1) | | |
| Other affiliated issuers | | 3,277,343 | | |
| Forward foreign currency contracts | | 21,805 | | |
| Assets and liabilities in foreign currencies | | (645) | | |
| Futures contracts | | 193,134 | | |
| Swaps | | 812,965 | | |
| Total change in net unrealized appreciation (depreciation) | | | | 32,824,739 |
| Net gain (loss) | | | | 15,070,560 |
| Net increase (decrease) in net assets resulting from operations | | | $ | 64,180,337 |
| Statement of Changes in Net Assets |
| |
| | Six months ended August 31, 2023 (Unaudited) | | Year ended February 28, 2023 |
| Increase (Decrease) in Net Assets | | | | |
| Operations | | | | |
| Net investment income (loss) | $ | 49,109,777 | $ | 130,688,286 |
| Net realized gain (loss) | | (17,754,179) | | (138,632,726) |
| Change in net unrealized appreciation (depreciation) | | 32,824,739 | | (199,330,307) |
| Net increase (decrease) in net assets resulting from operations | | 64,180,337 | | (207,274,747) |
| Distributions to shareholders | | (48,815,729) | | (124,387,863) |
| | | | | |
| Share transactions | | | | |
| Proceeds from sales of shares | | 64,920,701 | | 183,183,822 |
| Reinvestment of distributions | | 48,480,159 | | 123,643,674 |
| Cost of shares redeemed | | (234,760,409) | | (2,485,776,576) |
| | | | | |
Net increase (decrease) in net assets resulting from share transactions | | (121,359,549) | | (2,178,949,080) |
| Total increase (decrease) in net assets | | (105,994,941) | | (2,510,611,690) |
| | | | | |
| Net Assets | | | | |
| Beginning of period | | 1,647,800,283 | | 4,158,411,973 |
| End of period | $ | 1,541,805,342 | $ | 1,647,800,283 |
| | | | | |
| Other Information | | | | |
| Shares | | | | |
| Sold | | 7,829,617 | | 21,455,480 |
| Issued in reinvestment of distributions | | 5,825,906 | | 14,620,666 |
| Redeemed | | (28,322,925) | | (286,484,971) |
| Net increase (decrease) | | (14,667,402) | | (250,408,825) |
| | | | | |
Financial Highlights
| Strategic Advisers® Income Opportunities Fund |
| |
| | Six months ended (Unaudited) August 31, 2023 | | Years ended February 28, 2023 | | 2022 | | 2021 | | 2020 A | | 2019 |
Selected Per-Share Data | | | | | | | | | | | | |
| Net asset value, beginning of period | $ | 8.27 | $ | 9.25 | $ | 9.58 | $ | 9.32 | $ | 9.34 | $ | 9.53 |
| Income from Investment Operations | | | | | | | | | | | | |
Net investment income (loss) B,C | | .259 | | .508 | | .440 | | .473 | | .515 | | .513 |
| Net realized and unrealized gain (loss) | | .078 | | (1.000) | | (.279) | | .241 | | (.001) | | (.222) |
| Total from investment operations | | .337 | | (.492) | | .161 | | .714 | | .514 | | .291 |
| Distributions from net investment income | | (.257) | | (.488) | | (.461) | | (.454) | | (.530) | | (.469) |
| Distributions from net realized gain | | - | | - | | (.030) | | - | | (.004) | | (.012) |
| Total distributions | | (.257) | | (.488) | | (.491) | | (.454) | | (.534) | | (.481) |
| Net asset value, end of period | $ | 8.35 | $ | 8.27 | $ | 9.25 | $ | 9.58 | $ | 9.32 | $ | 9.34 |
Total Return D,E | | 4.12% | | (5.25)% | | 1.61% | | 8.05% | | 5.57% | | 3.21% |
Ratios to Average Net Assets C,F,G | | | | | | | | | | | | |
| Expenses before reductions | | .43% H | | .42% | | .38% | | .39% | | .34% | | .36% |
| Expenses net of fee waivers, if any | | .18% H | | .17% | | .13% | | .14% | | .09% | | .11% |
| Expenses net of all reductions | | .18% H | | .17% | | .13% | | .14% | | .09% | | .11% |
| Net investment income (loss) | | 6.20% H | | 5.96% | | 4.57% | | 5.10% | | 5.44% | | 5.49% |
| Supplemental Data | | | | | | | | | | | | |
| Net assets, end of period (000 omitted) | $ | 1,541,805 | $ | 1,647,800 | $ | 4,158,412 | $ | 7,204,043 | $ | 2,042,054 | $ | 2,642,485 |
Portfolio turnover rate I | | 19% H | | 21% | | 33% | | 43% | | 40% | | 22% |
AFor the year ended February 29.
BCalculated based on average shares outstanding during the period.
CNet investment income (loss) is affected by the timing of the declaration of dividends by any underlying mutual funds or exchange-traded funds (ETFs). Net investment income (loss) of any mutual funds or ETFs is not included in the Fund's net investment income (loss) ratio.
DTotal returns for periods of less than one year are not annualized.
ETotal returns would have been lower if certain expenses had not been reduced during the applicable periods shown.
FFees and expenses of any underlying mutual funds or exchange-traded funds (ETFs) are not included in the Fund's expense ratio. The Fund indirectly bears its proportionate share of these expenses. For additional expense information related to investments in Fidelity Central Funds, please refer to the "Investments in Fidelity Central Funds" note found in the Notes to Financial Statements section of the most recent Annual or Semi-Annual report.
GExpense ratios reflect operating expenses of the class. Expenses before reductions do not reflect amounts reimbursed, waived, or reduced through arrangements with the investment adviser, brokerage services, or other offset arrangements, if applicable, and do not represent the amount paid by the class during periods when reimbursements, waivers or reductions occur.
HAnnualized.
IAmount does not include the portfolio activity of any underlying mutual funds or exchange-traded funds (ETFs).
For the period ended August 31, 2023
1. Organization.
Strategic Advisers Income Opportunities Fund (the Fund) is a fund of Fidelity Rutland Square Trust II (the Trust), and is authorized to issue an unlimited number of shares. The Trust is registered under the Investment Company Act of 1940, as amended (the 1940 Act), as an open-end management investment company organized as a Delaware statutory trust. The Fund is offered exclusively to certain managed account clients of Strategic Advisers LLC (Strategic Advisers), an affiliate of Fidelity Management & Research Company LLC (FMR).
2. Significant Accounting Policies.
The Fund is an investment company and applies the accounting and reporting guidance of the Financial Accounting Standards Board (FASB) Accounting Standards Codification Topic 946 Financial Services - Investment Companies. The financial statements have been prepared in conformity with accounting principles generally accepted in the United States of America (GAAP), which require management to make certain estimates and assumptions at the date of the financial statements. Actual results could differ from those estimates. Subsequent events, if any, through the date that the financial statements were issued have been evaluated in the preparation of the financial statements. The Fund's Schedule of Investments lists any underlying mutual funds or exchange-traded funds (ETFs) but does not include the underlying holdings of these funds. The following summarizes the significant accounting policies of the Fund:
Investment Valuation. Investments are valued as of 4:00 p.m. Eastern time on the last calendar day of the period. The Board of Trustees (the Board) has designated the Fund's investment adviser as the valuation designee responsible for the fair valuation function and performing fair value determinations as needed. The investment adviser has established a Fair Value Committee (the Committee) to carry out the day-to-day fair valuation responsibilities and has adopted policies and procedures to govern the fair valuation process and the activities of the Committee. In accordance with these fair valuation policies and procedures, which have been approved by the Board, the Fund attempts to obtain prices from one or more third party pricing services or brokers to value its investments. When current market prices, quotations or currency exchange rates are not readily available or reliable, investments will be fair valued in good faith by the Committee, in accordance with the policies and procedures. Factors used in determining fair value vary by investment type and may include market or investment specific events, transaction data, estimated cash flows, and market observations of comparable investments. The frequency that the fair valuation procedures are used cannot be predicted and they may be utilized to a significant extent. The Committee manages the Fund's fair valuation practices and maintains the fair valuation policies and procedures. The Fund's investment adviser reports to the Board information regarding the fair valuation process and related material matters.
The Fund categorizes the inputs to valuation techniques used to value its investments into a disclosure hierarchy consisting of three levels as shown below:
Level 1 - unadjusted quoted prices in active markets for identical investments
Level 2 - other significant observable inputs (including quoted prices for similar investments, interest rates, prepayment speeds, etc.)
Level 3 - unobservable inputs (including the Fund's own assumptions based on the best information available)
Valuation techniques used to value the Fund's investments by major category are as follows:
Debt securities, including restricted securities, are valued based on evaluated prices received from third party pricing services or from brokers who make markets in such securities. Corporate bonds, bank loan obligations, municipal securities, preferred securities and U.S. government and government agency obligations are valued by pricing services who utilize matrix pricing which considers yield or price of bonds of comparable quality, coupon, maturity and type or by broker-supplied prices. Swaps are marked-to-market daily based on valuations from third party pricing services, registered derivatives clearing organizations (clearinghouses) or broker-supplied valuations. These pricing sources may utilize inputs such as interest rate curves, credit spread curves, default possibilities and recovery rates. When independent prices are unavailable or unreliable, debt securities and swaps may be valued utilizing pricing methodologies which consider similar factors that would be used by third party pricing services. For foreign debt securities, when significant market or security specific events arise, valuations may be determined in good faith in accordance with procedures adopted by the Board. Debt securities and swaps are generally categorized as Level 2 in the hierarchy but may be Level 3 depending on the circumstances. The Fund invests a significant portion of its assets in below investment grade securities. The value of these securities can be more volatile due to changes in the credit quality of the issuer and is sensitive to changes in economic, market and regulatory conditions.
Equity securities, including restricted securities, for which market quotations are readily available, are valued at the last reported sale price or official closing price as reported by a third party pricing service on the primary market or exchange on which they are traded and are categorized as Level 1 in the hierarchy. In the event there were no sales during the day or closing prices are not available, securities are valued at the last quoted bid price or may be valued using the last available price and are generally categorized as Level 2 in the hierarchy. For foreign equity securities, when market or security specific events arise, comparisons to the valuation of American Depositary Receipts (ADRs), futures contracts, ETFs and certain indexes as well as quoted prices for similar securities may be used and would be categorized as Level 2 in the hierarchy. For equity securities, including restricted securities, where observable inputs are limited, assumptions about market activity and risk are used and these securities may be categorized as Level 3 in the hierarchy.
The U.S. dollar value of forward foreign currency contracts is determined using currency exchange rates supplied by a pricing service and are categorized as Level 2 in the hierarchy. Futures contracts are valued at the settlement price established each day by the board of trade or exchange on which they are traded and are categorized as Level 1 in the hierarchy. Investments in open-end mutual funds, including the Fidelity Central Funds, are valued at their closing net asset value (NAV) each business day and are categorized as Level 1 in the hierarchy. If an unaffiliated open-end mutual fund's NAV is unavailable, shares of that fund may be valued by another method that the Board believes reflects fair value in accordance with the Board's fair value pricing policies and is categorized as Level 2 in the hierarchy.
The following provides information on Level 3 securities held by the Fund that were valued at period end based on unobservable inputs. These amounts exclude valuations provided by a broker.
| Asset Type | Fair Value | Valuation Technique(s) | Unobservable Input | Amount or Range/Weighted Average | Impact to Valuation from an Increase in InputA |
| Equities | $13,235,197 | Market comparable | Enterprise value/EBITDA multiple (EV/EBITDA) | 4.6 - 6.5 / 5.2 | Increase |
| | | | Discount for lack of marketability (DLOM) | 15.0% | Decrease |
| | | Market approach | Transaction price | $85.40 | Increase |
| | | Discounted cash flow | Discount rate | 5.6% | Decrease |
| | | | Term | 0.6 | Increase |
| Corporate Bonds | $657,930 | Market comparable | Enterprise value/EBITDA multiple (EV/EBITDA) | 6.5 | Increase |
| | | | Enterprise Value/Proved reserves multiple (EV/PR) | 0.8 | Increase |
| | | | Enterprise Value/PV-10 multiple (EV/PV-10) | 0.4 | Increase |
| | | | Daily production multiple ($/Million cubic feet per day) | $4,050.00 | Increase |
| | | Recovery value | Recovery value | $0.00 | Increase |
| | | Discounted cash flow | Yield | 18.6% | Decrease |
| Bank Loan Obligations | $1,470,285 | Market comparable | Enterprise value/EBITDA multiple (EV/EBITDA) | 2.5 | Increase |
| | | Recovery value | Recovery value | $0.00 | Increase |
| | | Discounted cash flow | Yield | 14.7% | Decrease |
| | | Indicative market price | Evaluated bid | $95.00 - $98.00 / $95.88 | Increase |
A Represents the directional change in the fair value of the Level 3 investments that could have resulted from an increase in the corresponding input as of period end. A decrease to the unobservable input would have had the opposite effect. Significant changes in these inputs may have resulted in a significantly higher or lower fair value measurement at period end.
Changes in valuation techniques may result in transfers in or out of an assigned level within the disclosure hierarchy. The aggregate value of investments by input level as of August 31, 2023, as well as a roll forward of Level 3 investments, is included at the end of the Fund's Schedule of Investments.
Foreign Currency. Foreign-denominated assets, including investment securities, and liabilities are translated into U.S. dollars at the exchange rates at period end. Purchases and sales of investment securities, income and dividends received, and expenses denominated in foreign currencies are translated into U.S. dollars at the exchange rate in effect on the transaction date.
The effects of exchange rate fluctuations on investments are included with the net realized and unrealized gain (loss) on investment securities. Other foreign currency transactions resulting in realized and unrealized gain (loss) are disclosed separately.
Realized gains and losses on foreign currency transactions arise from the disposition of foreign currency, realized changes in the value of foreign currency between the trade and settlement dates on security transactions, and the difference between the amounts of dividends, interest and foreign withholding taxes recorded on transaction date and the U.S. dollar equivalent of the amounts actually received or paid. Unrealized gains and losses on assets and liabilities in foreign currencies arise from changes in the value of foreign currency, and from assets and liabilities denominated in foreign currencies, other than investments, which are held at period end.
Investment Transactions and Income. For financial reporting purposes, the Fund's investment holdings and NAV include trades executed through the end of the last business day of the period. The NAV per share for processing shareholder transactions is calculated as of the close of business of the New York Stock Exchange (NYSE), normally 4:00 p.m. Eastern time and includes trades executed through the end of the prior business day. Gains and losses on securities sold are determined on the basis of identified cost. Commissions paid to certain brokers with whom the investment adviser, or its affiliates, places trades on behalf of a fund include an amount in addition to trade execution, which may be rebated back to a fund. Any such rebates are included in net realized gain (loss) on investments in the Statement of Operations. Dividend income is recorded on the ex-dividend date, except for certain dividends from foreign securities where the ex-dividend date may have passed, which are recorded as soon as the Fund is informed of the ex-dividend date. Non-cash dividends included in dividend income, if any, are recorded at the fair market value of the securities received. Income and capital gain distributions from Fidelity Central Funds, if any, are recorded on the ex-dividend date. Income and capital gain distributions from any underlying mutual funds or exchange-traded funds (ETFs) are recorded on the ex-dividend date. Certain distributions received by the Fund represent a return of capital or capital gain. The Fund determines the components of these distributions subsequent to the ex-dividend date, based upon receipt of tax filings or other correspondence relating to the underlying investment. These distributions are recorded as a reduction of cost of investments and/or as a realized gain. Interest income is accrued as earned and includes coupon interest and amortization of premium and accretion of discount on debt securities as applicable. Paid in Kind (PIK) income is recorded at the fair market value of the securities received. Investment income is recorded net of foreign taxes withheld where recovery of such taxes is uncertain. Debt obligations may be placed on non-accrual status and related interest income may be reduced by ceasing current accruals and writing off interest receivables when the collection of all or a portion of interest has become doubtful based on consistently applied procedures. A debt obligation is removed from non-accrual status when the issuer resumes interest payments or when collectability of interest is reasonably assured.
Expenses. Expenses directly attributable to a fund are charged to that fund. Expenses attributable to more than one fund are allocated among the respective funds on the basis of relative net assets or other appropriate methods. Expenses included in the accompanying financial statements reflect the expenses of that fund and do not include any expenses associated with any underlying mutual funds or exchange-traded funds. Although not included in a fund's expenses, a fund indirectly bears its proportionate share of these expenses through the net asset value of each underlying mutual fund or exchange-traded fund. Expense estimates are accrued in the period to which they relate and adjustments are made when actual amounts are known.
Deferred Trustee Compensation. Under a Deferred Compensation Plan (the Plan) for certain Funds, certain independent Trustees have elected to defer receipt of a portion of their annual compensation. Deferred amounts are invested in affiliated mutual funds, are marked-to-market and remain in a fund until distributed in accordance with the Plan. The investment of deferred amounts and the offsetting payable to the Trustees presented below are included in the accompanying Statement of Assets and Liabilities in other receivables and other payables and accrued expenses, as applicable.
| Strategic Advisers Income Opportunities Fund | $52,485 |
Income Tax Information and Distributions to Shareholders. Each year, the Fund intends to qualify as a regulated investment company under Subchapter M of the Internal Revenue Code, including distributing substantially all of its taxable income and realized gains. As a result, no provision for U.S. Federal income taxes is required. The Fund files a U.S. federal tax return, in addition to state and local tax returns as required. The Fund's federal income tax returns are subject to examination by the Internal Revenue Service (IRS) for a period of three fiscal years after they are filed. State and local tax returns may be subject to examination for an additional fiscal year depending on the jurisdiction. Foreign taxes are provided for based on the Fund's understanding of the tax rules and rates that exist in the foreign markets in which it invests.
Distributions are declared and recorded daily and paid monthly from net investment income. Distributions from realized gains, if any, are declared and recorded on the ex-dividend date. Income and capital gain distributions are determined in accordance with income tax regulations, which may differ from GAAP.
Capital accounts within the financial statements are adjusted for permanent book-tax differences. These adjustments have no impact on net assets or the results of operations. Capital accounts are not adjusted for temporary book-tax differences which will reverse in a subsequent period.
Book-tax differences are primarily due to futures contracts, swaps, foreign currency transactions, market discount, partnerships, equity-debt classifications, contingent interest, capital loss carryforwards and losses deferred due to wash sales.
As of period end, the cost and unrealized appreciation (depreciation) in securities, and derivatives if applicable, for federal income tax purposes were as follows:
| Gross unrealized appreciation | $49,073,256 |
| Gross unrealized depreciation | (118,297,056) |
| Net unrealized appreciation (depreciation) | $(69,223,800) |
| Tax cost | $1,598,897,464 |
Capital loss carryforwards are only available to offset future capital gains of the Fund to the extent provided by regulations and may be limited. The capital loss carryforward information presented below, including any applicable limitation, is estimated as of prior fiscal period end and is subject to adjustment.
| Short-term | $(43,005,176) |
| Long-term | (131,673,845) |
| Total capital loss carryforward | $(174,679,021) |
Restricted Securities (including Private Placements). Funds may invest in securities that are subject to legal or contractual restrictions on resale. These securities generally may be resold in transactions exempt from registration or to the public if the securities are registered. Disposal of these securities may involve time-consuming negotiations and expense, and prompt sale at an acceptable price may be difficult. Information regarding restricted securities held at period end is included at the end of the Schedule of Investments, if applicable.
Loans and Other Direct Debt Instruments. Direct debt instruments are interests in amounts owed to lenders by corporate or other borrowers. These instruments may be in the form of loans, trade claims or other receivables and may include standby financing commitments such as revolving credit facilities that obligate a fund to supply additional cash to the borrower on demand. Loans may be acquired through assignment, participation, or may be made directly to a borrower. Such instruments are presented in the Bank Loan Obligations section in the Schedule of Investments. Certain funds may also invest in unfunded loan commitments, which are contractual obligations for future funding. Information regarding unfunded commitments is included at the end of the Schedule of Investments, if applicable.
Commitments. A commitment is an agreement to acquire an investment at a future date (subject to conditions) in connection with a potential public or non-public offering. Commitments outstanding at period end are presented in the table below. Unrealized appreciation (depreciation) on any commitments outstanding at period end is separately presented in the Statements of Assets and Liabilities as Unrealized appreciation (depreciation) on unfunded commitments, and any change in unrealized appreciation (depreciation) on unfunded commitments during the period is separately presented in the Statement of Operations, as applicable based on contractual conditions of each commitment.
| | Investment to be Acquired | Commitment Amount | Unrealized Appreciation (Depreciation) |
| Strategic Advisers Income Opportunities Fund | SilverBow Resources, Inc. | $755,000 | $ - |
3. Derivative Instruments.
Risk Exposures and the Use of Derivative Instruments. The Fund's investment objectives allow for various types of derivative instruments, including futures contracts, forward foreign currency contracts and swaps. Derivatives are investments whose value is primarily derived from underlying assets, indices or reference rates and may be transacted on an exchange or over-the-counter (OTC). Derivatives may involve a future commitment to buy or sell a specified asset based on specified terms, to exchange future cash flows at periodic intervals based on a notional principal amount, or for one party to make one or more payments upon the occurrence of specified events in exchange for periodic payments from the other party.
Derivatives were used to increase returns, to gain exposure to certain types of assets, to facilitate transactions in foreign-denominated securities and to manage exposure to certain risks as defined below. The success of any strategy involving derivatives depends on analysis of numerous economic factors, and if the strategies for investment do not work as intended, the objectives may not be achieved.
Derivatives were used to increase or decrease exposure to the following risk(s):
| | |
| Credit Risk | Credit risk relates to the ability of the issuer of a financial instrument to make further principal or interest payments on an obligation or commitment that it has to a fund. |
| Foreign Exchange Risk | Foreign exchange rate risk relates to fluctuations in the value of an asset or liability due to changes in currency exchange rates. |
| Interest Rate Risk | Interest rate risk relates to the fluctuations in the value of interest-bearing securities due to changes in the prevailing levels of market interest rates. |
Funds are also exposed to additional risks from investing in derivatives, such as liquidity risk and counterparty credit risk. Liquidity risk is the risk that a fund will be unable to close out the derivative in the open market in a timely manner. Counterparty credit risk is the risk that the counterparty will not be able to fulfill its obligation to a fund. Derivative counterparty credit risk is managed through formal evaluation of the creditworthiness of all potential counterparties. On certain OTC derivatives such as forward foreign currency contracts, a fund attempts to reduce its exposure to counterparty credit risk by entering into an International Swaps and Derivatives Association, Inc. (ISDA) Master Agreement with each of its counterparties. The ISDA Master Agreement gives a fund the right to terminate all transactions traded under such agreement upon the deterioration in the credit quality of the counterparty beyond specified levels. The ISDA Master Agreement gives each party the right, upon an event of default by the other party or a termination of the agreement, to close out all transactions traded under such agreement and to net amounts owed under each transaction to one net payable by one party to the other. To mitigate counterparty credit risk on bi-lateral OTC derivatives, a fund receives collateral in the form of cash or securities once net unrealized appreciation on outstanding derivative contracts under an ISDA Master Agreement exceeds certain applicable thresholds, subject to certain minimum transfer provisions. The collateral received is held in segregated accounts with the custodian bank in accordance with the collateral agreements entered into between a fund, the counterparty and the custodian bank. A fund could experience delays and costs in gaining access to the collateral even though it is held by the custodian bank. The maximum risk of loss to a fund from counterparty credit risk related to bi-lateral OTC derivatives is generally the aggregate unrealized appreciation and unpaid counterparty payments in excess of any collateral pledged by the counterparty to a fund. A fund may be required to pledge collateral for the benefit of the counterparties on bi-lateral OTC derivatives in an amount not less than each counterparty's unrealized appreciation on outstanding derivative contracts, subject to certain minimum transfer provisions, and any such pledged collateral is identified in the Schedule of Investments. Exchange-traded contracts are not covered by the ISDA Master Agreement; however counterparty credit risk related to these contracts may be mitigated by the protection provided by the exchange on which they trade. Counterparty credit risk related to centrally cleared OTC swaps may be mitigated by the protection provided by the clearinghouse.
Investing in derivatives may involve greater risks than investing in the underlying assets directly and, to varying degrees, may involve risk of loss in excess of any initial investment and collateral received and amounts recognized in the Statement of Assets and Liabilities. In addition, there may be the risk that the change in value of the derivative contract does not correspond to the change in value of the underlying instrument.
Net Realized Gain (Loss) and Change in Net Unrealized Appreciation (Depreciation) on Derivatives. The table below, which reflects the impacts of derivatives on the financial performance, summarizes the net realized gain (loss) and change in net unrealized appreciation (depreciation) for derivatives during the period as presented in the Statement of Operations.
| Primary Risk Exposure / Derivative Type | Net Realized Gain (Loss)($) | Change in Net Unrealized Appreciation (Depreciation)($) |
| Strategic Advisers Income Opportunities Fund | | |
| Credit Risk | | |
| Swaps | (1,151,014) | 812,965 |
| Total Credit Risk | (1,151,014) | 812,965 |
| Foreign Exchange Risk | | |
| Forward Foreign Currency Contracts | (82,085) | 21,805 |
| Total Foreign Exchange Risk | (82,085) | 21,805 |
| Interest Rate Risk | | |
| Futures Contracts | (225,900) | 193,134 |
| Total Interest Rate Risk | (225,900) | 193,134 |
| Totals | (1,458,999) | 1,027,904 |
If there are any open positions at period end, a summary of the value of derivatives by primary risk exposure is included at the end of the Schedule of Investments.
Forward Foreign Currency Contracts. Forward foreign currency contracts represent obligations to purchase or sell foreign currency on a specified future date at a price fixed at the time the contracts are entered into. Forward foreign currency contracts were used to facilitate transactions in foreign-denominated securities and to manage exposure to certain foreign currencies.
Forward foreign currency contracts are valued daily and fluctuations in exchange rates on open contracts are recorded as unrealized appreciation or (depreciation) and reflected in total accumulated earnings (loss) in the Statement of Assets and Liabilities. When the contract is closed, a gain or loss is realized equal to the difference between the closing value and the value at the time it was opened. Non-deliverable forward foreign currency exchange contracts are settled with the counterparty in cash without the delivery of foreign currency. The net realized gain (loss) and change in net unrealized appreciation (depreciation) on forward foreign currency contracts during the period is presented in the Statement of Operations.
Any open forward foreign currency contracts at period end are presented in the Schedule of Investments under the caption "Forward Foreign Currency Contracts." The contract amount and unrealized appreciation (depreciation) reflects each contract's exposure to the underlying currency at period end, and is representative of volume of activity during the period unless an average contract value is presented.
Futures Contracts. A futures contract is an agreement between two parties to buy or sell a specified underlying instrument for a fixed price at a specified future date. Futures contracts were used to manage exposure to the bond market and fluctuations in interest rates.
Upon entering into a futures contract, a fund is required to deposit either cash or securities (initial margin) with a clearing broker in an amount equal to a certain percentage of the face value of the contract. Futures contracts are marked-to-market daily and subsequent daily payments are made or received by a fund depending on the daily fluctuations in the value of the futures contracts and are recorded as unrealized appreciation or (depreciation). This receivable and/or payable, if any, is included in daily variation margin on futures contracts in the Statement of Assets and Liabilities. Realized gain or (loss) is recorded upon the expiration or closing of a futures contract. The net realized gain (loss) and change in net unrealized appreciation (depreciation) on futures contracts during the period is presented in the Statement of Operations.
Any open futures contracts at period end are presented in the Schedule of Investments under the caption "Futures Contracts". The notional amount at value reflects each contract's exposure to the underlying instrument or index at period end, and is representative of volume of activity during the period unless an average notional amount is presented. Any securities deposited to meet initial margin requirements are identified in the Schedule of Investments. Any cash deposited to meet initial margin requirements is presented as segregated cash with brokers for derivative instruments in the Statement of Assets and Liabilities.
Swaps. A swap is a contract between two parties to exchange future cash flows at periodic intervals based on a notional principal amount. A centrally cleared OTC swap is a transaction executed between a fund and a dealer counterparty, then cleared by a futures commission merchant (FCM) through a clearinghouse. Once cleared, the clearinghouse serves as a central counterparty, with whom a fund exchanges cash flows for the life of the transaction, similar to transactions in futures contracts.
Centrally cleared OTC swaps require a fund to deposit either cash or securities (initial margin) with the FCM, at the instruction of and for the benefit of the clearinghouse. Any securities deposited to meet initial margin requirements are identified in the Schedule of Investments. Any cash deposited to meet initial margin requirements is presented in segregated cash with brokers for derivative instruments in the Statement of Assets and Liabilities. Centrally cleared OTC swaps are marked-to-market daily and subsequent payments (variation margin) are made or received depending on the daily fluctuations in the value of the swaps and are recorded as unrealized appreciation or (depreciation). These daily payments, if any, are included in receivable or payable for daily variation margin on centrally cleared OTC swaps in the Statement of Assets and Liabilities. Any premiums for centrally cleared OTC swaps are recorded periodically throughout the term of the swap to variation margin and included in total accumulated earnings (loss) in the Statement of Assets and Liabilities. Any premiums are recognized as realized gain (loss) upon termination or maturity of the swap.
Payments are exchanged at specified intervals, accrued daily commencing with the effective date of the contract and recorded as realized gain or (loss). Some swaps may be terminated prior to the effective date and realize a gain or loss upon termination. The net realized gain (loss) and change in net unrealized appreciation (depreciation) on swaps during the period is presented in the Statement of Operations.
Any open swaps at period end are included in the Schedule of Investments under the caption "Swaps", and are representative of volume of activity during the period unless an average notional amount is presented.
Credit Default Swaps. Credit default swaps enable a fund to buy or sell protection against specified credit events on a single-name issuer or a traded credit index. Under the terms of a credit default swap the buyer of protection (buyer) receives credit protection in exchange for making periodic payments to the seller of protection (seller) based on a fixed percentage applied to a notional principal amount. In return for these payments, the seller will be required to make a payment upon the occurrence of one or more specified credit events. A fund enters into credit default swaps as a seller to gain credit exposure to an issuer and/or as a buyer to obtain a measure of protection against defaults of an issuer. Periodic payments are made over the life of the contract by the buyer provided that no credit event occurs.
For credit default swaps on most corporate and sovereign issuers, credit events include bankruptcy, failure to pay or repudiation/moratorium. For credit default swaps on corporate or sovereign issuers, the obligation that may be put to the seller is not limited to the specific reference obligation described in the Schedule of Investments. For credit default swaps on asset-backed securities, a credit event may be triggered by events such as failure to pay principal, maturity extension, rating downgrade or write-down. For credit default swaps on asset-backed securities, the reference obligation described represents the security that may be put to the seller. For credit default swaps on a traded credit index, a specified credit event may affect all or individual underlying securities included in the index.
As a seller, if an underlying credit event occurs, a fund will pay a net settlement amount of cash equal to the notional amount of the swap less the recovery value of the reference obligation or underlying securities comprising an index. Only in the event of the industry's inability to value the underlying asset will a fund be required to take delivery of the reference obligation or underlying securities comprising an index and pay an amount equal to the notional amount of the swap.
As a buyer, if an underlying credit event occurs, a fund will receive a net settlement amount of cash equal to the notional amount of the swap less the recovery value of the reference obligation or underlying securities comprising an index. Only in the event of the industry's inability to value the underlying asset will a fund be required to deliver the reference obligation or underlying securities comprising an index in exchange for payment of an amount equal to the notional amount of the swap.
Typically, the value of each credit default swap and credit rating disclosed for each reference obligation in the Schedule of Investments, where a fund is the seller, can be used as measures of the current payment/performance risk of the swap. As the value of the swap changes as a positive or negative percentage of the total notional amount, the payment/performance risk may decrease or increase, respectively. In addition to these measures, the investment adviser monitors a variety of factors including cash flow assumptions, market activity and market sentiment as part of its ongoing process of assessing payment/performance risk.
4. Purchases and Sales of Investments.
Purchases and sales of securities, other than short-term securities and in-kind transactions, as applicable, are noted in the table below.
| | Purchases ($) | Sales ($) |
| Strategic Advisers Income Opportunities Fund | 140,862,947 | 262,181,451 |
5. Fees and Other Transactions with Affiliates.
Management Fee. Strategic Advisers (the investment adviser) provides the Fund with investment management related services. For these services, the Fund pays a monthly management fee to the investment adviser. The management fee is calculated by adding the annual management fee rate of .25% of the Fund's average net assets throughout the month to the aggregate of the fee rates, payable monthly by the investment adviser, to the Fund's sub-advisers. The Fund's maximum aggregate management fee will not exceed .75% of the Fund's average net assets. For the reporting period, the total annualized management fee rate was .41% of the Fund's average net assets.
During the period, the investment adviser waived a portion of its management fee as described in the Expense Reductions note.
Sub-Adviser. FIAM LLC (an affiliate of the investment adviser), PGIM, Inc. and T. Rowe Price Associates, Inc. each served as a sub-adviser for the Fund during the period. Sub-advisers provide discretionary investment advisory services for their allocated portion of the Fund's assets and are paid as described in the Management Fee note.
Interfund Trades. Funds may purchase from or sell securities to other funds affiliated with each sub-adviser under procedures adopted by the Board. The procedures have been designed to ensure these interfund trades are executed in accordance with Rule 17a-7 of the 1940 Act. Any interfund trades are included within the respective purchases and sales amounts shown in the Purchases and Sales of Investments note. During the period, there were no interfund trades.
6. Investments in Fidelity Central Funds.
Funds may invest in Fidelity Central Funds, which are open-end investment companies generally available only to other investment companies and accounts managed by the investment adviser and its affiliates. The Schedule of Investments lists any Fidelity Central Funds held as an investment as of period end, but does not include the underlying holdings of each Fidelity Central Fund. An investing fund indirectly bears its proportionate share of the expenses of the underlying Fidelity Central Funds.
Based on its investment objective, each Fidelity Central Fund may invest or participate in various investment vehicles or strategies that are similar to those of the investing fund. These strategies are consistent with the investment objectives of the investing fund and may involve certain economic risks which may cause a decline in value of each of the Fidelity Central Funds and thus a decline in the value of the investing fund.
| Fidelity Central Fund | Investment Manager | Investment Objective | Investment Practices | Expense RatioA |
| Fidelity Money Market Central Funds | Fidelity Management & Research Company LLC (FMR) | Each fund seeks to obtain a high level of current income consistent with the preservation of capital and liquidity. | Short-term Investments | Less than .005% |
A Expenses expressed as a percentage of average net assets and are as of each underlying Central Fund's most recent annual or semi-annual shareholder report.
A complete unaudited list of holdings for each Fidelity Central Fund is available upon request or at the Securities and Exchange Commission website at www.sec.gov. In addition, the financial statements of the Fidelity Central Funds, which are not covered by the Report of Independent Registered Public Accounting Firm, are available on the Securities and Exchange Commission website or upon request.
7. Committed Line of Credit.
Certain Funds participate with other funds managed by the investment adviser or an affiliate in a $4.25 billion credit facility (the "line of credit") to be utilized for temporary or emergency purposes to fund shareholder redemptions or for other short-term liquidity purposes. The participating funds have agreed to pay commitment fees on their pro-rata portion of the line of credit, which are reflected in Miscellaneous expenses on the Statement of Operations, and are listed below. During the period, there were no borrowings on this line of credit.
| | Amount |
| Strategic Advisers Income Opportunities Fund | $1,564 |
8. Expense Reductions.
The investment adviser has contractually agreed to waive the Fund's management fee in an amount equal to .25% of the Fund's average net assets until September 30, 2026. During the period, this waiver reduced the Fund's management fee by $1,969,270.
Through arrangements with the Fund's custodian, credits realized as a result of certain uninvested cash balances were used to reduce the Fund's expenses by $4,193.
9. Other.
A fund's organizational documents provide former and current trustees and officers with a limited indemnification against liabilities arising in connection with the performance of their duties to the fund. In the normal course of business, a fund may also enter into contracts that provide general indemnifications. A fund's maximum exposure under these arrangements is unknown as this would be dependent on future claims that may be made against a fund. The risk of material loss from such claims is considered remote.
10. Risk and Uncertainties.
Many factors affect a fund's performance. Developments that disrupt global economies and financial markets, such as pandemics, epidemics, outbreaks of infectious diseases, war, terrorism, and environmental disasters, may significantly affect a fund's investment performance. The effects of these developments to a fund will be impacted by the types of securities in which a fund invests, the financial condition, industry, economic sector, and geographic location of an issuer, and a fund's level of investment in the securities of that issuer. Significant concentrations in security types, issuers, industries, sectors, and geographic locations may magnify the factors that affect a fund's performance.
As a shareholder, you incur two types of costs: (1) transaction costs, which may include sales charges (loads) on purchase payments or redemption proceeds, as applicable and (2) ongoing costs, which generally include management fees, distribution and/or service (12b-1) fees and other Fund expenses. This Example is intended to help you understand your ongoing costs (in dollars) of investing in a fund and to compare these costs with the ongoing costs of investing in other mutual funds.
| The Example is based on an investment of $1,000 invested at the beginning of the period and held for the entire period (March 1, 2023 to August 31, 2023). |
Actual Expenses
The first line of the accompanying table provides information about actual account values and actual expenses. You may use the information in this line, together with the amount you invested, to estimate the expenses that you paid over the period. Simply divide your account value by $1,000.00 (for example, an $8,600 account value divided by $1,000.00 = 8.6), then multiply the result by the number in the first line for a class/Fund under the heading entitled "Expenses Paid During Period" to estimate the expenses you paid on your account during this period. If any fund is a shareholder of any underlying mutual funds or exchange-traded funds (ETFs) (the Underlying Funds), such fund indirectly bears its proportional share of the expenses of the Underlying Funds in addition to the direct expenses incurred presented in the table. These fees and expenses are not included in the annualized expense ratio used to calculate the expense estimate in the table below.
Hypothetical Example for Comparison Purposes
The second line of the accompanying table provides information about hypothetical account values and hypothetical expenses based on the actual expense ratio and an assumed rate of return of 5% per year before expenses, which is not the actual return. The hypothetical account values and expenses may not be used to estimate the actual ending account balance or expenses you paid for the period. You may use this information to compare the ongoing costs of investing in the Fund and other funds. To do so, compare this 5% hypothetical example with the 5% hypothetical examples that appear in the shareholder reports of the other funds. If any fund is a shareholder of any Underlying Funds, such fund indirectly bears its proportional share of the expenses of the Underlying Funds in addition to the direct expenses as presented in the table. These fees and expenses are not included in the annualized expense ratio used to calculate the expense estimate in the table below.
Please note that the expenses shown in the table are meant to highlight your ongoing costs only and do not reflect any transaction costs. Therefore, the second line of the table is useful in comparing ongoing costs only, and will not help you determine the relative total costs of owning different funds. In addition, if these transactional costs were included, your costs would have been higher.
| | | | | Annualized Expense Ratio- A | | Beginning Account Value March 1, 2023 | | Ending Account Value August 31, 2023 | | Expenses Paid During Period- C March 1, 2023 to August 31, 2023 |
| | | | | | | | | | |
| Strategic Advisers® Income Opportunities Fund | | | | .18% | | | | | | |
| Actual | | | | | | $ 1,000 | | $ 1,041.20 | | $ .92 |
Hypothetical-B | | | | | | $ 1,000 | | $ 1,024.23 | | $ .92 |
| |
A Annualized expense ratio reflects expenses net of applicable fee waivers.
B 5% return per year before expenses
C Expenses are equal to the annualized expense ratio, multiplied by the average account value over the period, multiplied by 184/ 366 (to reflect the one-half year period). The fees and expenses of any Underlying Funds are not included in each annualized expense ratio.
Board Approval of Amended Sub-Advisory Agreement
Strategic Advisers Income Opportunities Fund
In March 2023, the Board of Trustees, including the Independent Trustees (together, the Board) voted to approve an amendment to the fee schedule in the existing sub-advisory agreement among Strategic Advisers, T. Rowe Price Associates, Inc. (the Sub-Adviser), and Fidelity Rutland Square Trust II (Trust) on behalf of the fund (Amended Sub-Advisory Agreement). The Board noted that the updated fee schedule in the Amended Sub-Advisory Agreement became effective as of January 1, 2023 and will result in the same or lower fees at all asset levels. The Board also noted that no other material contract terms are impacted by the Amended Sub-Advisory Agreement. The Board, assisted by the advice of fund counsel and Independent Trustees' counsel, considered a broad range of information.
In considering whether to approve the Amended Sub-Advisory Agreement, the Board reached a determination, with the assistance of fund counsel and Independent Trustees' counsel and through the exercise of its business judgment, that the approval of the Amended Sub-Advisory Agreement is in the best interests of the fund and its shareholders and that the approval of such agreements does not involve a conflict of interest from which Strategic Advisers or its affiliates derive an inappropriate advantage. The Board's decision to approve the Amended Sub-Advisory Agreements was not based on any single factor, but rather was based on a comprehensive consideration of all the information provided to the Board. In addition, individual Trustees did not necessarily attribute the same weight or importance to each factor.
Nature, Extent, and Quality of Services Provided. The Board considered the backgrounds of the investment personnel that provide services to the fund, the fund's investment objective, strategies and related investment philosophy, the current sub-adviser line-up, and the structure of the investment personnel compensation programs and whether such structure provides appropriate incentives to act in the best interests of the fund in connection with its annual renewal of the fund's management contract, sub-advisory agreements and sub-subadvisory agreements at its September 2022 meeting.
The Board noted that it had approved the existing sub-advisory agreement with the Sub-Adviser at its September 2022 meeting and the Amended Sub-Advisory Agreement will not result in any changes to: (i) the nature, extent and quality of the sub-advisory services provided; (ii) the investment process or strategies employed in the management of the fund's assets; or (iii) the day-to-day management of the fund or the persons primarily responsible for such management.
The Board did not consider performance to be a material factor in its decision to approve the Amended Sub-Advisory Agreement because the approval of the Amended Sub-Advisory Agreement will not result in any changes (i) to the fund's investment processes or strategies; or (ii) in the persons primarily responsible for the day-to-day management of the fund.
Based on its review, the Board concluded that the nature, extent, and quality of services that will be provided to the fund under the Amended Sub-Advisory Agreement should continue to benefit the fund's shareholders.
Competitiveness of Management Fee and Total Fund Expenses. The Board noted that the Amended Sub-Advisory Agreement will not result in changes to the maximum aggregate annual management fee payable by the fund or Strategic Advisers' portion of the management fee. The Board considered Strategic Advisers' contractual agreement to waive its portion of the fund's management fee. The Board also considered that Amended Sub-Advisory Agreement will not impact the fund's management fee at current asset levels. Based on its review, the Board concluded that the fund's management fee structure and projected total expenses bear a reasonable relationship to the services that the fund and its shareholders will receive and the other factors considered.
Costs of the Services and Profitability. Because the Amended Sub-Advisory Agreement was negotiated at arm's length and will have no impact on the maximum management fees payable by the fund or Strategic Advisers' portion of the management fee, the Board did not consider the costs of services and profitability to be significant factors in its decision to approve the Amended Sub-Advisory Agreement.
Potential Fall-Out Benefits. The Board considered that it reviews information regarding the potential of direct and indirect benefits to Strategic Advisers and its affiliates from their relationships with the fund, including non-advisory fee compensation paid to affiliates of Strategic Advisers, if any, as well as information regarding potential fall-out benefits accruing to each sub-adviser, if any, as a result of its relationship with the fund, during its annual renewal of the fund's management contract, sub-advisory agreements, and sub-subadvisory agreements. The Board considered Strategic Advisers' representation that it does not anticipate that the approval of the Amended Sub-Advisory Agreement will have a significant impact on the profitability of, or potential fall-out benefits to, Strategic Advisers or its affiliates.
Possible Economies of Scale. The Board considered that it reviews whether there have been economies of scale in connection with the management of the fund during its annual renewal of the fund's management contract, sub-advisory agreements, and sub-subadvisory agreements. The Board noted that the Amended Sub-Advisory Agreement will continue to provide for breakpoints that have the potential to reduce sub-advisory fees paid to the sub-adviser as assets allocated to the sub-adviser grow. The Board also noted that it did not consider the possible realization of economies of scale to be a significant factor in its decision to approve the Amended Sub-Advisory Agreement because the fund is not expected to bear any additional expenses as a result of the Amended Sub-Advisory Agreement.
Conclusion. Based on its evaluation of all of the conclusions noted above, and after considering all factors it believed relevant, the Board concluded that the Amended Sub-Advisory Agreement's fee structure bears a reasonable relationship to the services to be rendered and that the Amended Sub-Advisory Agreement is in the best interests of the fund and its shareholders and should be approved. In addition, the Board concluded that the approval of the Amended Sub-Advisory Agreement does not involve a conflict of interest from which Strategic Advisers or its affiliates derive an inappropriate advantage.
1.912883.113
SRQ-SANN-1023
Strategic Advisers® Small-Mid Cap Fund
Offered exclusively to certain managed account clients of Strategic Advisers LLC or its affiliates - not available for sale to the general public
Semi-Annual Report
August 31, 2023
Contents
To view a fund's proxy voting guidelines and proxy voting record for the 12-month period ended June 30, visit http://www.fidelity.com/proxyvotingresults or visit the Securities and Exchange Commission's (SEC) web site at http://www.sec.gov.
You may also call 1-800-544-3455 to request a free copy of the proxy voting guidelines.
Standard & Poor's, S&P and S&P 500 are registered service marks of The McGraw-Hill Companies, Inc. and have been licensed for use by Fidelity Distributors Corporation.
Other third-party marks appearing herein are the property of their respective owners.
All other marks appearing herein are registered or unregistered trademarks or service marks of FMR LLC or an affiliated company. © 2023 FMR LLC. All rights reserved.
This report and the financial statements contained herein are submitted for the general information of the shareholders of the Fund. This report is not authorized for distribution to prospective investors in the Fund unless preceded or accompanied by an effective prospectus.
A fund files its complete schedule of portfolio holdings with the SEC for the first and third quarters of each fiscal year on Form N-PORT. Forms N-PORT are available on the SEC's web site at http://www.sec.gov. A fund's Forms N-PORT may be reviewed and copied at the SEC's Public Reference Room in Washington, DC. Information regarding the operation of the SEC's Public Reference Room may be obtained by calling 1-800-SEC-0330.
For a complete list of a fund's portfolio holdings, view the most recent holdings listing, semiannual report, or annual report on Fidelity's web site at http://www.fidelity.com, http://www.institutional.fidelity.com, or http://www.401k.com, as applicable.
NOT FDIC INSURED •MAY LOSE VALUE •NO BANK GUARANTEE
Neither the Fund nor Fidelity Distributors Corporation is a bank.
The information in the following tables is based on the direct Investments of the Fund.
Top Holdings (% of Fund's net assets) |
| (excluding cash equivalents) |
| Fidelity Advisor Small Cap Growth Fund Class Z | 5.7 | |
| Fidelity SAI Small-Mid Cap 500 Index Fund | 5.4 | |
| Fidelity Small Cap Index Fund | 3.1 | |
| PIMCO StocksPLUS Small Fund Institutional Class | 2.1 | |
| Fidelity SAI Real Estate Index Fund | 1.0 | |
| Alight, Inc. Class A | 0.6 | |
| Berry Global Group, Inc. | 0.6 | |
| Atkore, Inc. | 0.6 | |
| Henry Schein, Inc. | 0.6 | |
| QuidelOrtho Corp. | 0.5 | |
| | 20.2 | |
| |
| Market Sectors (% of Fund's net assets) |
| (Stocks Only) |
| Industrials | 19.2 | |
| Financials | 12.0 | |
| Information Technology | 11.6 | |
| Health Care | 10.5 | |
| Consumer Discretionary | 10.0 | |
| Consumer Staples | 4.2 | |
| Materials | 3.8 | |
| Energy | 3.6 | |
| Real Estate | 2.8 | |
| Communication Services | 2.2 | |
| Utilities | 1.0 | |
| |
Asset Allocation (% of Fund's net assets) |
|
|
Asset Allocation of funds in the pie chart reflect the categorizations of the asset as defined by Morningstar as of the reporting date.
Showing Percentage of Net Assets
| Common Stocks - 80.9% |
| | | Shares | Value ($) |
| COMMUNICATION SERVICES - 2.2% | | | |
| Diversified Telecommunication Services - 0.3% | | | |
| Cogent Communications Group, Inc. | | 128,607 | 9,077,082 |
| EchoStar Holding Corp. Class A (a) | | 28,980 | 503,672 |
| Iridium Communications, Inc. | | 111,784 | 5,471,827 |
| Liberty Latin America Ltd.: | | | |
| Class A (a) | | 249,772 | 2,232,962 |
| Class C (a) | | 114,804 | 1,028,644 |
| | | | 18,314,187 |
| Entertainment - 0.1% | | | |
| Live Nation Entertainment, Inc. (a) | | 58,448 | 4,940,609 |
| Playtika Holding Corp. (a) | | 113,824 | 1,110,922 |
| Sciplay Corp. (A Shares) (a) | | 20,032 | 454,726 |
| Take-Two Interactive Software, Inc. (a) | | 21,589 | 3,069,956 |
| | | | 9,576,213 |
| Interactive Media & Services - 1.2% | | | |
| Baidu, Inc. sponsored ADR (a) | | 37,252 | 5,320,703 |
| CarGurus, Inc. Class A (a) | | 724,194 | 13,115,153 |
| Eventbrite, Inc. (a) | | 352,882 | 3,574,695 |
| IAC, Inc. (a) | | 111,404 | 6,163,983 |
| Meta Platforms, Inc. Class A (a) | | 23,975 | 7,093,963 |
| Shutterstock, Inc. (b) | | 49,989 | 2,105,037 |
| TripAdvisor, Inc. (a)(b) | | 351,460 | 5,310,561 |
| TrueCar, Inc. (a) | | 92,952 | 222,155 |
| Yelp, Inc. (a) | | 143,711 | 6,158,016 |
| Ziff Davis, Inc. (a) | | 525,668 | 35,035,772 |
| ZipRecruiter, Inc. (a)(b) | | 902,511 | 13,709,142 |
| | | | 97,809,180 |
| Media - 0.6% | | | |
| AMC Networks, Inc. Class A (a) | | 69,600 | 810,144 |
| Cable One, Inc. | | 8,046 | 5,234,486 |
| Criteo SA sponsored ADR (a) | | 198,212 | 5,846,263 |
| Integral Ad Science Holding Corp. (a) | | 174,960 | 2,496,679 |
| Interpublic Group of Companies, Inc. | | 110,604 | 3,606,796 |
| Nexstar Broadcasting Group, Inc. Class A | | 125,942 | 20,503,358 |
| Paramount Global Class B (b) | | 68,600 | 1,035,174 |
| TEGNA, Inc. | | 564,327 | 9,328,325 |
| Thryv Holdings, Inc. (a) | | 27,142 | 553,425 |
| | | | 49,414,650 |
TOTAL COMMUNICATION SERVICES | | | 175,114,230 |
| CONSUMER DISCRETIONARY - 10.0% | | | |
| Automobile Components - 0.8% | | | |
| Autoliv, Inc. | | 18,216 | 1,777,882 |
| BorgWarner, Inc. (b) | | 133,700 | 5,448,275 |
| Dana, Inc. | | 280,154 | 4,513,281 |
| Fox Factory Holding Corp. (a) | | 60,886 | 6,746,778 |
| Gentex Corp. | | 207,350 | 6,772,051 |
| LCI Industries (b) | | 98,744 | 12,370,648 |
| Lear Corp. | | 54,002 | 7,781,148 |
| Modine Manufacturing Co. (a) | | 221,850 | 10,557,842 |
| Phinia, Inc. (b) | | 26,740 | 743,372 |
| Standard Motor Products, Inc. | | 41,592 | 1,540,152 |
| The Goodyear Tire & Rubber Co. (a) | | 622,429 | 8,035,558 |
| | | | 66,286,987 |
| Automobiles - 0.1% | | | |
| Harley-Davidson, Inc. | | 132,600 | 4,475,250 |
| Winnebago Industries, Inc. (b) | | 34,600 | 2,243,810 |
| | | | 6,719,060 |
| Broadline Retail - 0.1% | | | |
| 1stDibs.com, Inc. (a) | | 290,873 | 1,303,111 |
| Dillard's, Inc. Class A (b) | | 3,020 | 1,042,262 |
| Global-e Online Ltd. (a) | | 33,940 | 1,345,042 |
| Kohl's Corp. (b) | | 83,700 | 2,229,768 |
| Macy's, Inc. (b) | | 125,000 | 1,528,750 |
| Qurate Retail, Inc. Series A (a) | | 261,800 | 202,895 |
| | | | 7,651,828 |
| Distributors - 0.8% | | | |
| LKQ Corp. | | 635,147 | 33,364,272 |
| Pool Corp. (b) | | 91,278 | 33,371,237 |
| | | | 66,735,509 |
| Diversified Consumer Services - 1.1% | | | |
| ADT, Inc. (b) | | 1,873,592 | 12,028,461 |
| Bright Horizons Family Solutions, Inc. (a)(b) | | 304,155 | 28,718,315 |
| Frontdoor, Inc. (a) | | 150,987 | 4,955,393 |
| Grand Canyon Education, Inc. (a) | | 166,971 | 19,577,350 |
| Laureate Education, Inc. Class A | | 493,722 | 6,877,547 |
| Nerdy, Inc. Class A (a)(b) | | 1,180,143 | 5,523,069 |
| Perdoceo Education Corp. | | 59,376 | 983,860 |
| Service Corp. International | | 176,108 | 11,114,176 |
| Stride, Inc. (a) | | 42,542 | 1,807,610 |
| WW International, Inc. (a) | | 47,308 | 459,361 |
| | | | 92,045,142 |
| Hotels, Restaurants & Leisure - 2.0% | | | |
| Bloomin' Brands, Inc. | | 257,105 | 7,214,366 |
| Bowlero Corp. Class A (a)(b) | | 957,376 | 10,531,136 |
| Boyd Gaming Corp. | | 61,698 | 4,125,745 |
| Carrols Restaurant Group, Inc. (a) | | 377,159 | 2,632,570 |
| Cava Group, Inc. (b) | | 27,374 | 1,215,679 |
| Churchill Downs, Inc. | | 175,460 | 21,981,629 |
| Dave & Buster's Entertainment, Inc. (a)(b) | | 54,154 | 2,126,628 |
| Dine Brands Global, Inc. (b) | | 87,438 | 4,789,854 |
| Expedia, Inc. (a) | | 17,631 | 1,911,024 |
| Genius Sports Ltd. (a) | | 1,388,969 | 9,222,754 |
| Hilton Grand Vacations, Inc. (a) | | 134,232 | 5,868,623 |
| International Game Technology PLC | | 78,201 | 2,503,996 |
| Jack in the Box, Inc. | | 17,400 | 1,398,438 |
| Krispy Kreme, Inc. (b) | | 271,738 | 3,638,572 |
| Kura Sushi U.S.A., Inc. Class A (a)(b) | | 144,884 | 12,658,515 |
| MGM Resorts International | | 57,508 | 2,529,202 |
| Papa John's International, Inc. (b) | | 69,555 | 5,265,314 |
| Planet Fitness, Inc. (a) | | 225,253 | 13,695,382 |
| Sportradar Holding AG (a)(b) | | 370,881 | 4,272,549 |
| Sweetgreen, Inc. Class A (a) | | 220,838 | 3,171,234 |
| Texas Roadhouse, Inc. Class A | | 80,666 | 8,397,331 |
| TH International Ltd. (b) | | 1,386,629 | 3,050,584 |
| Vail Resorts, Inc. | | 73,680 | 16,675,258 |
| Wendy's Co. (b) | | 471,990 | 9,340,682 |
| Wingstop, Inc. | | 15,666 | 2,516,586 |
| | | | 160,733,651 |
| Household Durables - 1.2% | | | |
| Cavco Industries, Inc. (a) | | 7,147 | 1,997,729 |
| Ethan Allen Interiors, Inc. (b) | | 16,432 | 515,636 |
| Installed Building Products, Inc. | | 52,171 | 7,550,709 |
| La-Z-Boy, Inc. (b) | | 123,103 | 3,797,728 |
| Mohawk Industries, Inc. (a) | | 76,892 | 7,796,080 |
| NVR, Inc. (a) | | 308 | 1,964,218 |
| PulteGroup, Inc. | | 194,020 | 15,921,281 |
| Skyline Champion Corp. (a) | | 222,380 | 15,849,023 |
| Taylor Morrison Home Corp. (a) | | 212,842 | 10,088,711 |
| Tempur Sealy International, Inc. | | 174,935 | 8,172,963 |
| Toll Brothers, Inc. | | 123,040 | 10,080,667 |
| TopBuild Corp. (a) | | 28,260 | 8,197,661 |
| TRI Pointe Homes, Inc. (a) | | 50,508 | 1,570,799 |
| Whirlpool Corp. (b) | | 28,700 | 4,016,852 |
| | | | 97,520,057 |
| Leisure Products - 0.4% | | | |
| Brunswick Corp. | | 173,097 | 13,695,435 |
| JAKKS Pacific, Inc. (a) | | 20,244 | 398,402 |
| Malibu Boats, Inc. Class A (a) | | 55,000 | 2,670,800 |
| MasterCraft Boat Holdings, Inc. (a) | | 15,689 | 341,393 |
| Polaris, Inc. (b) | | 54,571 | 6,116,863 |
| Sturm, Ruger & Co., Inc. | | 14,896 | 768,336 |
| Topgolf Callaway Brands Corp. (a)(b) | | 282,603 | 4,928,596 |
| | | | 28,919,825 |
| Specialty Retail - 2.5% | | | |
| Academy Sports & Outdoors, Inc. | | 69,073 | 3,769,314 |
| Advance Auto Parts, Inc. | | 60,844 | 4,187,284 |
| America's Car Mart, Inc. (a) | | 14,933 | 1,662,192 |
| Bath & Body Works, Inc. | | 176,165 | 6,495,204 |
| Boot Barn Holdings, Inc. (a) | | 45,777 | 4,200,040 |
| Burlington Stores, Inc. (a) | | 96,519 | 15,661,173 |
| Caleres, Inc. (b) | | 69,266 | 1,985,856 |
| CarParts.com, Inc. (a) | | 255,175 | 1,232,495 |
| Five Below, Inc. (a) | | 68,017 | 11,696,203 |
| Floor & Decor Holdings, Inc. Class A (a)(b) | | 23,869 | 2,379,739 |
| Foot Locker, Inc. (b) | | 202,464 | 3,972,344 |
| Group 1 Automotive, Inc. (b) | | 18,026 | 4,766,435 |
| Haverty Furniture Companies, Inc. (b) | | 97,079 | 3,038,573 |
| Leslie's, Inc. (a) | | 412,926 | 2,584,917 |
| Lithia Motors, Inc. Class A (sub. vtg.) (b) | | 45,057 | 13,878,457 |
| Monro, Inc. | | 27,753 | 908,633 |
| Murphy U.S.A., Inc. | | 88,895 | 28,236,608 |
| National Vision Holdings, Inc. (a) | | 550,779 | 10,084,763 |
| Overstock.com, Inc. (a)(b) | | 76,088 | 1,986,658 |
| Penske Automotive Group, Inc. (b) | | 63,033 | 10,356,322 |
| PetMed Express, Inc. | | 15,617 | 176,004 |
| Revolve Group, Inc. (a)(b) | | 307,197 | 4,500,436 |
| RH (a) | | 4,348 | 1,587,846 |
| Sally Beauty Holdings, Inc. (a) | | 896,160 | 9,104,986 |
| Signet Jewelers Ltd. | | 67,510 | 5,063,250 |
| The Aaron's Co., Inc. | | 128,600 | 1,552,202 |
| The Buckle, Inc. | | 76,720 | 2,803,349 |
| The Children's Place, Inc. (a)(b) | | 86,141 | 2,283,598 |
| The ODP Corp. (a) | | 66,800 | 3,294,576 |
| Valvoline, Inc. | | 565,371 | 19,471,377 |
| Warby Parker, Inc. (a) | | 165,031 | 1,982,022 |
| Williams-Sonoma, Inc. (b) | | 98,080 | 13,848,896 |
| | | | 198,751,752 |
| Textiles, Apparel & Luxury Goods - 1.0% | | | |
| Canada Goose Holdings, Inc. (a)(b) | | 311,161 | 4,894,563 |
| Capri Holdings Ltd. (a) | | 49,100 | 2,577,259 |
| Crocs, Inc. (a) | | 130,014 | 12,655,563 |
| Deckers Outdoor Corp. (a) | | 5,872 | 3,106,816 |
| Hanesbrands, Inc. (b) | | 560,331 | 2,941,738 |
| PVH Corp. | | 133,112 | 11,128,163 |
| Ralph Lauren Corp. | | 59,256 | 6,911,027 |
| Samsonite International SA (a)(c) | | 813,100 | 2,721,617 |
| Skechers U.S.A., Inc. Class A (sub. vtg.) (a) | | 290,408 | 14,610,426 |
| Steven Madden Ltd. (b) | | 139,374 | 4,808,403 |
| Tapestry, Inc. | | 222,597 | 7,416,932 |
| Under Armour, Inc. Class C (non-vtg.) (a)(b) | | 859,401 | 5,921,273 |
| | | | 79,693,780 |
TOTAL CONSUMER DISCRETIONARY | | | 805,057,591 |
| CONSUMER STAPLES - 4.2% | | | |
| Beverages - 0.6% | | | |
| Celsius Holdings, Inc. (a) | | 125,487 | 24,600,471 |
| Coca-Cola Bottling Co. Consolidated | | 4,069 | 2,843,824 |
| Duckhorn Portfolio, Inc. (a) | | 37,615 | 467,931 |
| Molson Coors Beverage Co. Class B | | 215,418 | 13,676,889 |
| National Beverage Corp. (a)(b) | | 20,630 | 1,058,525 |
| Primo Water Corp. | | 570,963 | 8,712,895 |
| | | | 51,360,535 |
| Consumer Staples Distribution & Retail - 1.3% | | | |
| Albertsons Companies, Inc. | | 284,640 | 6,375,936 |
| BJ's Wholesale Club Holdings, Inc. (a) | | 514,066 | 34,642,908 |
| Casey's General Stores, Inc. | | 46,707 | 11,415,658 |
| Grocery Outlet Holding Corp. (a) | | 73,740 | 2,274,879 |
| Ingles Markets, Inc. Class A | | 100,731 | 7,870,113 |
| Performance Food Group Co. (a) | | 457,468 | 28,422,487 |
| PriceSmart, Inc. | | 22,231 | 1,766,920 |
| SpartanNash Co. | | 71,900 | 1,564,544 |
| Sprouts Farmers Market LLC (a) | | 124,700 | 5,086,513 |
| U.S. Foods Holding Corp. (a) | | 104,162 | 4,211,270 |
| Weis Markets, Inc. (b) | | 14,504 | 940,874 |
| | | | 104,572,102 |
| Food Products - 1.2% | | | |
| Conagra Brands, Inc. | | 106,200 | 3,173,256 |
| Darling Ingredients, Inc. (a) | | 100,281 | 6,193,355 |
| Flowers Foods, Inc. | | 158,915 | 3,744,037 |
| Fresh Del Monte Produce, Inc. | | 61,994 | 1,583,947 |
| Freshpet, Inc. (a)(b) | | 32,597 | 2,461,399 |
| Hostess Brands, Inc. Class A (a) | | 376,413 | 10,720,242 |
| Ingredion, Inc. | | 148,696 | 15,302,305 |
| John B. Sanfilippo & Son, Inc. | | 7,920 | 794,772 |
| Lamb Weston Holdings, Inc. | | 155,875 | 15,183,784 |
| Lancaster Colony Corp. | | 59,825 | 9,882,492 |
| Nomad Foods Ltd. (a) | | 983,763 | 18,042,213 |
| SunOpta, Inc. (a)(b) | | 1,275,094 | 5,597,663 |
| The Hain Celestial Group, Inc. (a) | | 356,708 | 3,777,538 |
| Tootsie Roll Industries, Inc. | | 15,368 | 494,081 |
| | | | 96,951,084 |
| Household Products - 0.3% | | | |
| Reynolds Consumer Products, Inc. (b) | | 275,500 | 7,518,395 |
| Spectrum Brands Holdings, Inc. (b) | | 165,532 | 13,767,296 |
| WD-40 Co. (b) | | 12,010 | 2,580,589 |
| | | | 23,866,280 |
| Personal Care Products - 0.5% | | | |
| BellRing Brands, Inc. (a) | | 55,691 | 2,311,177 |
| elf Beauty, Inc. (a) | | 132,443 | 18,371,169 |
| Herbalife Ltd. (a)(b) | | 262,207 | 3,938,349 |
| Inter Parfums, Inc. | | 51,272 | 7,164,237 |
| MediFast, Inc. (b) | | 9,660 | 814,724 |
| Nu Skin Enterprises, Inc. Class A | | 41,491 | 991,220 |
| The Honest Co., Inc. (a)(b) | | 2,788,602 | 4,127,131 |
| USANA Health Sciences, Inc. (a) | | 9,855 | 633,578 |
| | | | 38,351,585 |
| Tobacco - 0.3% | | | |
| Turning Point Brands, Inc. | | 272,240 | 6,702,549 |
| Vector Group Ltd. | | 1,654,283 | 17,717,371 |
| | | | 24,419,920 |
TOTAL CONSUMER STAPLES | | | 339,521,506 |
| ENERGY - 3.6% | | | |
| Energy Equipment & Services - 0.7% | | | |
| Borr Drilling Ltd. (a) | | 673,041 | 4,704,557 |
| Cactus, Inc. | | 41,792 | 2,229,185 |
| Championx Corp. | | 495,816 | 17,893,999 |
| Expro Group Holdings NV (a) | | 139,623 | 3,282,537 |
| Nextier Oilfield Solutions, Inc. (a) | | 158,314 | 1,679,712 |
| Noble Corp. PLC | | 59,286 | 3,126,744 |
| ProPetro Holding Corp. (a) | | 202,679 | 1,953,826 |
| Select Water Solutions, Inc. Class A (b) | | 211,864 | 1,705,505 |
| TechnipFMC PLC | | 629,302 | 11,981,910 |
| U.S. Silica Holdings, Inc. (a) | | 137,537 | 1,695,831 |
| Weatherford International PLC (a) | | 47,175 | 4,175,931 |
| | | | 54,429,737 |
| Oil, Gas & Consumable Fuels - 2.9% | | | |
| APA Corp. | | 107,977 | 4,733,712 |
| Ardmore Shipping Corp. | | 32,210 | 400,692 |
| Berry Corp. | | 177,200 | 1,518,604 |
| California Resources Corp. (b) | | 62,900 | 3,512,336 |
| Cameco Corp. (b) | | 665,531 | 24,624,647 |
| Chesapeake Energy Corp. (b) | | 27,858 | 2,457,354 |
| Civitas Resources, Inc. (b) | | 39,600 | 3,255,912 |
| CONSOL Energy, Inc. (b) | | 68,941 | 5,931,684 |
| Delek U.S. Holdings, Inc. | | 51,132 | 1,316,649 |
| DT Midstream, Inc. | | 139,040 | 7,270,402 |
| Enerplus Corp. (b) | | 130,668 | 2,235,729 |
| Green Plains, Inc. (a) | | 214,378 | 6,654,293 |
| HF Sinclair Corp. | | 490,595 | 27,026,879 |
| International Seaways, Inc. | | 135,140 | 5,806,966 |
| Kosmos Energy Ltd. (a) | | 1,173,138 | 8,540,445 |
| Magnolia Oil & Gas Corp. Class A | | 329,721 | 7,517,639 |
| Matador Resources Co. (b) | | 132,006 | 8,382,381 |
| National Energy Services Reunited Corp. (a) | | 249,594 | 1,135,653 |
| New Fortress Energy, Inc. | | 264,644 | 8,214,550 |
| Northern Oil & Gas, Inc. | | 131,789 | 5,512,734 |
| Overseas Shipholding Group, Inc. (a) | | 423,293 | 1,862,489 |
| Ovintiv, Inc. | | 125,443 | 5,890,803 |
| Par Pacific Holdings, Inc. (a) | | 117,969 | 4,052,235 |
| PBF Energy, Inc. Class A (b) | | 226,576 | 10,624,149 |
| Peabody Energy Corp. (b) | | 95,222 | 2,054,891 |
| Permian Resource Corp. Class A (b) | | 886,723 | 12,573,732 |
| Scorpio Tankers, Inc. | | 48,368 | 2,443,068 |
| SFL Corp. Ltd. | | 142,000 | 1,604,600 |
| SM Energy Co. | | 239,709 | 10,142,088 |
| Southwestern Energy Co. (a) | | 412,212 | 2,794,797 |
| Talos Energy, Inc. (a) | | 275,707 | 4,747,675 |
| Viper Energy Partners LP | | 783,476 | 21,796,302 |
| Vital Energy, Inc. (a)(b) | | 64,568 | 3,892,805 |
| Vitesse Energy, Inc. (b) | | 13,405 | 311,532 |
| Whitecap Resources, Inc. | | 828,796 | 6,796,127 |
| World Kinect Corp. (b) | | 322,033 | 7,052,523 |
| | | | 234,689,077 |
TOTAL ENERGY | | | 289,118,814 |
| FINANCIALS - 12.0% | | | |
| Banks - 3.0% | | | |
| Ameris Bancorp | | 49,293 | 2,008,690 |
| BankUnited, Inc. | | 187,614 | 4,924,868 |
| Berkshire Hills Bancorp, Inc. | | 50,258 | 1,050,392 |
| Cathay General Bancorp | | 102,900 | 3,666,327 |
| Citizens Financial Group, Inc. | | 86,200 | 2,424,806 |
| Coastal Financial Corp. of Washington (a) | | 9,525 | 419,576 |
| Columbia Banking Systems, Inc. | | 316,771 | 6,487,470 |
| Comerica, Inc. | | 221,917 | 10,676,427 |
| Commerce Bancshares, Inc. | | 148,000 | 7,265,320 |
| Cullen/Frost Bankers, Inc. | | 91,999 | 8,696,665 |
| Dime Community Bancshares, Inc. | | 64,991 | 1,384,958 |
| East West Bancorp, Inc. | | 264,016 | 14,610,645 |
| Esquire Financial Holdings, Inc. | | 6,076 | 284,114 |
| Fifth Third Bancorp | | 94,000 | 2,495,700 |
| First Bancorp, Puerto Rico | | 486,770 | 6,746,632 |
| First Citizens Bancshares, Inc. | | 18,316 | 24,917,086 |
| First Hawaiian, Inc. | | 380,500 | 7,195,255 |
| First Interstate Bancsystem, Inc. | | 237,242 | 6,146,940 |
| First Merchants Corp. | | 68,213 | 2,035,476 |
| Fulton Financial Corp. | | 203,500 | 2,712,655 |
| Hancock Whitney Corp. | | 134,340 | 5,541,525 |
| Hanmi Financial Corp. | | 108,800 | 1,884,416 |
| HomeStreet, Inc. | | 66,800 | 631,260 |
| Hope Bancorp, Inc. | | 278,100 | 2,689,227 |
| Huntington Bancshares, Inc. | | 280,531 | 3,111,089 |
| KeyCorp | | 239,300 | 2,711,269 |
| New York Community Bancorp, Inc. | | 176,164 | 2,163,294 |
| OFG Bancorp | | 100,700 | 3,037,112 |
| Old National Bancorp, Indiana | | 235,777 | 3,597,957 |
| PacWest Bancorp | | 108,800 | 864,960 |
| Peapack-Gladstone Financial Corp. | | 52,343 | 1,427,394 |
| Peoples Bancorp, Inc. | | 40,051 | 1,032,114 |
| Pinnacle Financial Partners, Inc. | | 62,454 | 4,156,938 |
| Preferred Bank, Los Angeles | | 51,863 | 3,221,211 |
| Regions Financial Corp. | | 259,200 | 4,753,728 |
| ServisFirst Bancshares, Inc. (b) | | 127,627 | 7,152,217 |
| Southstate Corp. | | 56,450 | 4,081,335 |
| Synovus Financial Corp. | | 74,653 | 2,311,257 |
| Texas Capital Bancshares, Inc. (a) | | 111,489 | 6,961,373 |
| Veritex Holdings, Inc. | | 102,500 | 1,928,025 |
| Webster Financial Corp. | | 160,929 | 6,824,999 |
| WesBanco, Inc. | | 48,800 | 1,237,568 |
| Westamerica Bancorp. | | 23,792 | 1,047,562 |
| Western Alliance Bancorp. | | 264,610 | 13,233,146 |
| Wintrust Financial Corp. | | 360,205 | 27,955,510 |
| Zions Bancorp NA | | 253,475 | 8,998,363 |
| | | | 238,704,851 |
| Capital Markets - 3.1% | | | |
| Affiliated Managers Group, Inc. | | 49,796 | 6,673,162 |
| Ares Management Corp. | | 22,651 | 2,343,019 |
| Artisan Partners Asset Management, Inc. (b) | | 60,028 | 2,306,276 |
| BGC Group, Inc. Class A | | 493,935 | 2,440,039 |
| Blue Owl Capital, Inc. Class A (b) | | 144,204 | 1,723,238 |
| Carlyle Group LP | | 288,970 | 9,348,180 |
| Cboe Global Markets, Inc. | | 166,652 | 24,949,471 |
| Cohen & Steers, Inc. (b) | | 21,957 | 1,431,157 |
| Diamond Hill Investment Group, Inc. | | 2,662 | 449,239 |
| Donnelley Financial Solutions, Inc. (a) | | 70,448 | 3,470,973 |
| Evercore, Inc. Class A | | 179,231 | 25,101,302 |
| FactSet Research Systems, Inc. | | 32,937 | 14,374,036 |
| Federated Hermes, Inc. | | 74,724 | 2,597,406 |
| Houlihan Lokey | | 61,258 | 6,452,918 |
| Jefferies Financial Group, Inc. | | 119,803 | 4,275,769 |
| Lazard Ltd. Class A | | 95,039 | 3,301,655 |
| LPL Financial | | 154,302 | 35,580,498 |
| MarketAxess Holdings, Inc. | | 46,252 | 11,143,494 |
| Moelis & Co. Class A | | 274,555 | 13,016,653 |
| Morningstar, Inc. | | 38,983 | 9,070,175 |
| P10, Inc. (b) | | 807,497 | 9,730,339 |
| PJT Partners, Inc. (b) | | 45,573 | 3,599,811 |
| SEI Investments Co. | | 90,127 | 5,593,282 |
| Sprott, Inc. (b) | | 255,695 | 8,512,087 |
| StepStone Group, Inc. Class A | | 321,882 | 9,936,497 |
| Stifel Financial Corp. | | 121,389 | 7,892,713 |
| Tradeweb Markets, Inc. Class A | | 95,848 | 8,284,143 |
| Victory Capital Holdings, Inc. | | 66,514 | 2,289,412 |
| Virtu Financial, Inc. Class A | | 400,950 | 7,513,803 |
| WisdomTree Investments, Inc. (b) | | 1,208,972 | 8,825,496 |
| | | | 252,226,243 |
| Consumer Finance - 0.4% | | | |
| Ally Financial, Inc. | | 137,800 | 3,815,682 |
| Enova International, Inc. (a) | | 94,081 | 4,746,386 |
| FirstCash Holdings, Inc. | | 48,859 | 4,364,086 |
| Navient Corp. (b) | | 326,000 | 5,753,900 |
| PRA Group, Inc. (a) | | 73,807 | 1,437,760 |
| PROG Holdings, Inc. (a) | | 67,700 | 2,322,110 |
| Regional Management Corp. | | 71,100 | 1,953,828 |
| SLM Corp. (b) | | 762,715 | 10,861,062 |
| | | | 35,254,814 |
| Financial Services - 2.5% | | | |
| Acacia Research Corp. (a) | | 2,758,823 | 10,511,116 |
| Banco Latinoamericano de Comer Series E | | 75,700 | 1,786,520 |
| Cannae Holdings, Inc. (a) | | 500,938 | 9,833,413 |
| Cass Information Systems, Inc. (b) | | 10,232 | 392,295 |
| Essent Group Ltd. | | 82,572 | 4,146,766 |
| Euronet Worldwide, Inc. (a) | | 244,224 | 21,335,409 |
| EVERTEC, Inc. (b) | | 221,303 | 8,756,960 |
| Federal Agricultural Mortgage Corp. Class C (non-vtg.) | | 34,125 | 5,743,920 |
| FleetCor Technologies, Inc. (a) | | 47,262 | 12,842,503 |
| Flywire Corp. (a) | | 74,689 | 2,582,746 |
| i3 Verticals, Inc. Class A (a) | | 274,833 | 6,499,800 |
| International Money Express, Inc. (a) | | 29,198 | 505,125 |
| Jack Henry & Associates, Inc. | | 119,945 | 18,804,977 |
| Jackson Financial, Inc. (b) | | 49,688 | 1,868,269 |
| Marqeta, Inc. Class A (a) | | 383,769 | 2,360,179 |
| MGIC Investment Corp. | | 261,047 | 4,589,206 |
| NMI Holdings, Inc. (a) | | 149,364 | 4,274,798 |
| Payoneer Global, Inc. (a) | | 1,545,800 | 9,568,502 |
| Radian Group, Inc. | | 373,403 | 10,111,753 |
| Repay Holdings Corp. (a) | | 497,698 | 4,588,776 |
| Shift4 Payments, Inc. (a) | | 89,819 | 5,100,821 |
| The Western Union Co. | | 480,161 | 5,929,988 |
| Voya Financial, Inc. | | 68,937 | 4,803,530 |
| Walker & Dunlop, Inc. | | 25,194 | 2,150,056 |
| WEX, Inc. (a) | | 207,842 | 40,774,444 |
| | | | 199,861,872 |
| Insurance - 2.9% | | | |
| American Equity Investment Life Holding Co. | | 148,001 | 7,944,694 |
| American Financial Group, Inc. | | 113,480 | 13,154,602 |
| Assurant, Inc. | | 15,757 | 2,195,423 |
| Assured Guaranty Ltd. | | 65,104 | 3,830,719 |
| Axis Capital Holdings Ltd. | | 249,994 | 13,714,671 |
| Brown & Brown, Inc. | | 237,586 | 17,605,123 |
| CNA Financial Corp. | | 148,634 | 5,845,775 |
| CNO Financial Group, Inc. | | 268,600 | 6,285,240 |
| Crawford & Co.: | | | |
| Class A | | 246,767 | 2,642,875 |
| Class B | | 124,426 | 1,223,108 |
| Erie Indemnity Co. Class A | | 22,047 | 6,145,160 |
| Everest Re Group Ltd. | | 41,180 | 14,852,802 |
| Fidelity National Financial, Inc. | | 200,610 | 8,305,254 |
| First American Financial Corp. | | 62,800 | 3,873,504 |
| Genworth Financial, Inc. Class A (a) | | 1,903,678 | 11,022,296 |
| Goosehead Insurance (a)(b) | | 105,766 | 7,388,813 |
| Hanover Insurance Group, Inc. | | 42,262 | 4,510,201 |
| Kemper Corp. | | 89,480 | 4,202,876 |
| Kinsale Capital Group, Inc. (b) | | 49,760 | 19,835,829 |
| Lincoln National Corp. | | 80,400 | 2,063,064 |
| Old Republic International Corp. | | 209,200 | 5,721,620 |
| Primerica, Inc. | | 32,614 | 6,554,109 |
| Reinsurance Group of America, Inc. | | 30,869 | 4,279,061 |
| RenaissanceRe Holdings Ltd. | | 31,633 | 5,943,524 |
| RLI Corp. | | 143,372 | 18,856,285 |
| Ryan Specialty Group Holdings, Inc. (a) | | 11,620 | 566,475 |
| Selective Insurance Group, Inc. | | 47,188 | 4,681,521 |
| Universal Insurance Holdings, Inc. | | 16,100 | 203,826 |
| Unum Group | | 121,200 | 5,961,828 |
| W.R. Berkley Corp. | | 27,308 | 1,689,273 |
| White Mountains Insurance Group Ltd. (b) | | 13,558 | 21,539,459 |
| | | | 232,639,010 |
| Mortgage Real Estate Investment Trusts - 0.1% | | | |
| Annaly Capital Management, Inc. | | 93,300 | 1,891,191 |
| Hannon Armstrong Sustainable Infrastructure Capital, Inc. | | 211,080 | 4,721,860 |
| Redwood Trust, Inc. (b) | | 266,700 | 2,136,267 |
| | | | 8,749,318 |
TOTAL FINANCIALS | | | 967,436,108 |
| HEALTH CARE - 10.5% | | | |
| Biotechnology - 1.5% | | | |
| Acelyrin, Inc. | | 20,789 | 526,585 |
| Agios Pharmaceuticals, Inc. (a)(b) | | 154,673 | 4,242,680 |
| Arcturus Therapeutics Holdings, Inc. (a) | | 132,940 | 4,034,729 |
| Arcus Biosciences, Inc. (a) | | 26,667 | 546,674 |
| Ascendis Pharma A/S sponsored ADR (a)(b) | | 6,735 | 660,165 |
| Blueprint Medicines Corp. (a) | | 15,996 | 797,561 |
| BridgeBio Pharma, Inc. (a) | | 22,520 | 673,573 |
| Crinetics Pharmaceuticals, Inc. (a) | | 256,962 | 4,450,582 |
| Exelixis, Inc. (a) | | 70,700 | 1,582,973 |
| Halozyme Therapeutics, Inc. (a) | | 357,540 | 15,216,902 |
| Incyte Corp. (a) | | 30,300 | 1,955,259 |
| Insmed, Inc. (a) | | 257,061 | 5,627,065 |
| Intellia Therapeutics, Inc. (a) | | 17,168 | 643,457 |
| Ironwood Pharmaceuticals, Inc. Class A (a) | | 459,600 | 4,044,480 |
| Karuna Therapeutics, Inc. (a) | | 5,826 | 1,093,890 |
| Legend Biotech Corp. ADR (a) | | 97,737 | 6,779,038 |
| Madrigal Pharmaceuticals, Inc. (a) | | 3,815 | 686,700 |
| Morphic Holding, Inc. (a) | | 13,878 | 764,400 |
| Natera, Inc. (a) | | 135,618 | 7,964,845 |
| Neurocrine Biosciences, Inc. (a) | | 53,531 | 5,828,991 |
| Oyster Point Pharma, Inc. rights (a)(d) | | 203,167 | 2 |
| PureTech Health PLC (a) | | 466,716 | 1,171,829 |
| Relay Therapeutics, Inc. (a)(b) | | 226,912 | 2,319,041 |
| Repligen Corp. (a) | | 34,897 | 6,068,937 |
| Sarepta Therapeutics, Inc. (a) | | 13,382 | 1,619,356 |
| SpringWorks Therapeutics, Inc. (a)(b) | | 155,421 | 4,379,764 |
| Ultragenyx Pharmaceutical, Inc. (a)(b) | | 123,055 | 4,527,193 |
| United Therapeutics Corp. (a) | | 99,816 | 22,394,718 |
| Vaxcyte, Inc. (a) | | 19,909 | 1,033,675 |
| Veracyte, Inc. (a) | | 400,208 | 10,565,491 |
| Viking Therapeutics, Inc. (a) | | 38,464 | 531,188 |
| Vir Biotechnology, Inc. (a) | | 32,310 | 409,045 |
| | | | 123,140,788 |
| Health Care Equipment & Supplies - 2.9% | | | |
| Abiomed, Inc. (d) | | 14,700 | 41,013 |
| Atricure, Inc. (a) | | 40,785 | 1,841,443 |
| Atrion Corp. | | 1,192 | 554,399 |
| AxoGen, Inc. (a) | | 967,140 | 6,054,296 |
| Bausch + Lomb Corp. (a)(b) | | 193,514 | 3,469,706 |
| Embecta Corp. | | 204,737 | 3,752,829 |
| Enovis Corp. (a) | | 36,563 | 2,048,991 |
| Envista Holdings Corp. (a) | | 453,846 | 14,532,149 |
| Globus Medical, Inc. (a)(b) | | 289,800 | 15,678,180 |
| Haemonetics Corp. (a) | | 72,146 | 6,473,661 |
| ICU Medical, Inc. (a) | | 60,097 | 8,715,868 |
| Inari Medical, Inc. (a) | | 29,420 | 1,959,960 |
| Insulet Corp. (a) | | 7,433 | 1,424,980 |
| Integra LifeSciences Holdings Corp. (a) | | 235,618 | 10,023,190 |
| iRhythm Technologies, Inc. (a) | | 13,337 | 1,378,646 |
| Lantheus Holdings, Inc. (a) | | 271,815 | 18,603,019 |
| LeMaitre Vascular, Inc. | | 14,356 | 829,920 |
| Masimo Corp. (a) | | 30,015 | 3,430,114 |
| Merit Medical Systems, Inc. (a) | | 287,870 | 18,792,154 |
| Neogen Corp. (a) | | 450,536 | 10,416,392 |
| Nevro Corp. (a) | | 210,233 | 4,213,069 |
| Omnicell, Inc. (a) | | 46,503 | 2,644,161 |
| QuidelOrtho Corp. (a) | | 528,537 | 43,530,307 |
| Shockwave Medical, Inc. (a) | | 2,130 | 469,431 |
| STERIS PLC | | 135,287 | 31,060,542 |
| Tandem Diabetes Care, Inc. (a)(b) | | 109,696 | 3,001,283 |
| Teleflex, Inc. | | 32,044 | 6,817,041 |
| The Cooper Companies, Inc. | | 30,200 | 11,173,698 |
| TransMedics Group, Inc. (a) | | 49,782 | 3,267,193 |
| | | | 236,197,635 |
| Health Care Providers & Services - 3.3% | | | |
| Acadia Healthcare Co., Inc. (a) | | 264,859 | 20,420,629 |
| Amedisys, Inc. (a) | | 19,766 | 1,853,063 |
| AMN Healthcare Services, Inc. (a) | | 128,324 | 11,341,275 |
| Castle Biosciences, Inc. (a) | | 114,322 | 2,278,437 |
| Chemed Corp. | | 69,310 | 35,447,906 |
| Corvel Corp. (a) | | 8,038 | 1,739,825 |
| DaVita HealthCare Partners, Inc. (a) | | 35,500 | 3,635,910 |
| dentalcorp Holdings Ltd. (a) | | 2,458,915 | 12,119,874 |
| DocGo, Inc. Class A (a)(b) | | 1,371,406 | 12,274,084 |
| Encompass Health Corp. | | 508,557 | 36,127,889 |
| Guardant Health, Inc. (a) | | 56,239 | 2,197,820 |
| HealthEquity, Inc. (a) | | 388,465 | 26,240,811 |
| Henry Schein, Inc. (a) | | 605,239 | 46,324,993 |
| Molina Healthcare, Inc. (a) | | 63,615 | 19,728,284 |
| National Research Corp. Class A | | 12,457 | 520,703 |
| Patterson Companies, Inc. | | 141,670 | 4,255,767 |
| Pediatrix Medical Group, Inc. (a) | | 535,591 | 7,567,901 |
| Premier, Inc. | | 75,382 | 1,622,974 |
| Quest Diagnostics, Inc. | | 23,900 | 3,142,850 |
| RadNet, Inc. (a) | | 98,028 | 3,275,115 |
| Select Medical Holdings Corp. | | 84,800 | 2,477,008 |
| Universal Health Services, Inc. Class B | | 94,959 | 12,790,977 |
| | | | 267,384,095 |
| Health Care Technology - 0.5% | | | |
| Certara, Inc. (a) | | 947,777 | 15,316,076 |
| Definitive Healthcare Corp. (a)(b) | | 402,270 | 3,781,338 |
| Doximity, Inc. (a)(b) | | 316,784 | 7,552,131 |
| HealthStream, Inc. | | 21,317 | 448,297 |
| iCAD, Inc. (a)(b) | | 678,124 | 1,546,123 |
| Simulations Plus, Inc. (b) | | 14,206 | 632,025 |
| Veradigm, Inc. (a) | | 507,656 | 6,792,437 |
| | | | 36,068,427 |
| Life Sciences Tools & Services - 1.7% | | | |
| Avantor, Inc. (a)(b) | | 596,389 | 12,911,822 |
| Azenta, Inc. (a) | | 147,061 | 8,298,652 |
| Bio-Rad Laboratories, Inc. Class A (a) | | 30,142 | 12,062,828 |
| Bio-Techne Corp. | | 183,460 | 14,383,264 |
| Bruker Corp. | | 75,877 | 4,977,531 |
| CryoPort, Inc. (a) | | 88,242 | 1,244,212 |
| Fortrea Holdings, Inc. | | 232,538 | 6,406,422 |
| Gerresheimer AG | | 11,275 | 1,465,903 |
| Harvard Bioscience, Inc. (a) | | 292,974 | 1,292,015 |
| ICON PLC (a) | | 53,453 | 13,894,573 |
| Maravai LifeSciences Holdings, Inc. (a) | | 56,857 | 587,901 |
| MaxCyte, Inc. (a) | | 953,460 | 3,489,664 |
| Medpace Holdings, Inc. (a) | | 45,970 | 12,424,312 |
| Quanterix Corp. (a) | | 704,541 | 18,881,699 |
| Sotera Health Co. (a)(b) | | 854,667 | 13,794,325 |
| West Pharmaceutical Services, Inc. | | 31,431 | 12,789,274 |
| | | | 138,904,397 |
| Pharmaceuticals - 0.6% | | | |
| Amphastar Pharmaceuticals, Inc. (a) | | 69,348 | 3,696,942 |
| Arvinas Holding Co. LLC (a) | | 160,315 | 4,522,486 |
| Catalent, Inc. (a) | | 131,775 | 6,584,797 |
| Harrow Health, Inc. (a)(b) | | 632,900 | 9,601,093 |
| Intra-Cellular Therapies, Inc. (a) | | 118,583 | 6,583,728 |
| Jazz Pharmaceuticals PLC (a) | | 51,800 | 7,426,048 |
| Phathom Pharmaceuticals, Inc. (a)(b) | | 229,213 | 3,298,375 |
| Prestige Brands Holdings, Inc. (a) | | 43,919 | 2,561,795 |
| Revance Therapeutics, Inc. (a) | | 31,044 | 547,306 |
| Royalty Pharma PLC | | 55,062 | 1,641,949 |
| Viatris, Inc. | | 235,900 | 2,535,925 |
| | | | 49,000,444 |
TOTAL HEALTH CARE | | | 850,695,786 |
| INDUSTRIALS - 19.2% | | | |
| Aerospace & Defense - 1.3% | | | |
| Axon Enterprise, Inc. (a) | | 71,530 | 15,229,452 |
| BWX Technologies, Inc. | | 208,184 | 15,355,652 |
| Curtiss-Wright Corp. | | 57,428 | 11,944,450 |
| Hexcel Corp. | | 28,533 | 2,091,469 |
| Howmet Aerospace, Inc. | | 235,867 | 11,668,340 |
| Huntington Ingalls Industries, Inc. | | 14,266 | 3,143,085 |
| Kratos Defense & Security Solutions, Inc. (a) | | 205,485 | 3,306,254 |
| Leonardo DRS, Inc. (a)(b) | | 203,277 | 3,480,102 |
| Mercury Systems, Inc. (a) | | 308,539 | 12,110,156 |
| Moog, Inc. Class A | | 38,400 | 4,460,544 |
| Rheinmetall AG ADR | | 107,123 | 5,826,420 |
| Rocket Lab U.S.A., Inc. Class A (a)(b) | | 228,296 | 1,440,548 |
| Spirit AeroSystems Holdings, Inc. Class A | | 163,270 | 3,480,916 |
| Textron, Inc. | | 90,916 | 7,065,082 |
| | | | 100,602,470 |
| Air Freight & Logistics - 0.4% | | | |
| Air Transport Services Group, Inc. (a) | | 667,400 | 14,389,144 |
| Forward Air Corp. | | 56,018 | 3,967,195 |
| GXO Logistics, Inc. (a) | | 158,883 | 10,163,746 |
| Hub Group, Inc. Class A (a) | | 38,794 | 3,027,484 |
| | | | 31,547,569 |
| Building Products - 1.8% | | | |
| A.O. Smith Corp. | | 106,924 | 7,751,990 |
| Apogee Enterprises, Inc. | | 70,192 | 3,541,888 |
| Armstrong World Industries, Inc. | | 111,654 | 8,551,580 |
| Builders FirstSource, Inc. (a) | | 155,770 | 22,592,881 |
| Carlisle Companies, Inc. | | 61,886 | 16,277,256 |
| Fortune Brands Home & Security, Inc. (b) | | 170,080 | 11,738,922 |
| Gibraltar Industries, Inc. (a) | | 79,861 | 5,991,971 |
| Hayward Holdings, Inc. (a) | | 772,890 | 11,438,772 |
| Lennox International, Inc. (b) | | 27,829 | 10,486,245 |
| Masonite International Corp. (a) | | 70,304 | 7,220,924 |
| Owens Corning | | 67,100 | 9,656,361 |
| Simpson Manufacturing Co. Ltd. | | 71,307 | 11,392,006 |
| Tecnoglass, Inc. | | 284,125 | 11,072,351 |
| The AZEK Co., Inc. (a) | | 49,083 | 1,669,313 |
| Trex Co., Inc. (a) | | 75,407 | 5,381,798 |
| | | | 144,764,258 |
| Commercial Services & Supplies - 2.8% | | | |
| ABM Industries, Inc. | | 159,486 | 7,243,854 |
| ACCO Brands Corp. | | 96,400 | 513,812 |
| ACV Auctions, Inc. Class A (a) | | 1,562,373 | 26,263,490 |
| Brady Corp. Class A | | 39,089 | 1,971,649 |
| Casella Waste Systems, Inc. Class A (a) | | 194,244 | 15,300,600 |
| Cimpress PLC (a) | | 112,522 | 7,270,046 |
| Clean Harbors, Inc. (a) | | 6,445 | 1,091,396 |
| CoreCivic, Inc. (a) | | 1,162,151 | 12,504,745 |
| Deluxe Corp. (b) | | 56,100 | 1,134,342 |
| Driven Brands Holdings, Inc. (a) | | 535,919 | 8,065,581 |
| Ennis, Inc. | | 21,810 | 464,553 |
| GFL Environmental, Inc. | | 98,122 | 3,179,153 |
| Heritage-Crystal Clean, Inc. (a) | | 271,872 | 12,261,427 |
| Matthews International Corp. Class A | | 197,713 | 8,339,534 |
| Millerknoll, Inc. | | 84,175 | 1,607,743 |
| MSA Safety, Inc. | | 87,893 | 16,056,293 |
| RB Global, Inc. (b) | | 555,147 | 34,263,673 |
| Rollins, Inc. | | 195,070 | 7,718,920 |
| Stericycle, Inc. (a) | | 214,831 | 9,497,679 |
| Tetra Tech, Inc. | | 14,007 | 2,204,001 |
| The Brink's Co. | | 235,542 | 17,856,439 |
| UniFirst Corp. | | 77,355 | 13,624,536 |
| Viad Corp. (a) | | 102,482 | 2,909,464 |
| Waste Connections, Inc. (United States) | | 103,194 | 14,136,546 |
| | | | 225,479,476 |
| Construction & Engineering - 1.0% | | | |
| Argan, Inc. | | 146,258 | 6,213,040 |
| Dycom Industries, Inc. (a) | | 83,448 | 8,338,959 |
| EMCOR Group, Inc. | | 83,545 | 18,734,966 |
| Fluor Corp. (a) | | 257,371 | 9,005,411 |
| Granite Construction, Inc. | | 76,292 | 3,150,097 |
| MasTec, Inc. (a) | | 72,760 | 7,238,892 |
| MDU Resources Group, Inc. | | 237,733 | 4,840,244 |
| Valmont Industries, Inc. | | 7,915 | 2,006,453 |
| Willscot Mobile Mini Holdings (a) | | 583,546 | 23,937,057 |
| | | | 83,465,119 |
| Electrical Equipment - 2.0% | | | |
| Acuity Brands, Inc. | | 64,654 | 10,427,397 |
| Atkore, Inc. (a) | | 304,375 | 46,864,619 |
| Encore Wire Corp. (b) | | 20,600 | 3,395,086 |
| EnerSys | | 32,805 | 3,443,869 |
| Generac Holdings, Inc. (a) | | 116,306 | 13,818,316 |
| Hubbell, Inc. Class B | | 44,207 | 14,413,692 |
| Nextracker, Inc. Class A | | 139,215 | 5,863,736 |
| nVent Electric PLC | | 195,334 | 11,044,184 |
| Regal Rexnord Corp. | | 39,045 | 6,332,709 |
| Sensata Technologies, Inc. PLC | | 656,029 | 24,679,811 |
| Shoals Technologies Group, Inc. (a) | | 316,380 | 6,226,358 |
| Vertiv Holdings Co. | | 301,848 | 11,889,793 |
| Vicor Corp. (a) | | 66,039 | 4,475,463 |
| | | | 162,875,033 |
| Ground Transportation - 0.8% | | | |
| ArcBest Corp. | | 64,245 | 6,783,630 |
| Heartland Express, Inc. | | 187,523 | 2,829,722 |
| Knight-Swift Transportation Holdings, Inc. Class A | | 381,244 | 20,899,796 |
| Landstar System, Inc. | | 88,643 | 16,825,328 |
| Ryder System, Inc. | | 42,000 | 4,229,400 |
| Saia, Inc. (a) | | 5,053 | 2,153,589 |
| TFI International, Inc. | | 15,302 | 2,086,581 |
| Werner Enterprises, Inc. | | 29,206 | 1,215,262 |
| XPO, Inc. (a) | | 88,701 | 6,619,756 |
| | | | 63,643,064 |
| Machinery - 3.6% | | | |
| AGCO Corp. | | 90,566 | 11,731,014 |
| Albany International Corp. Class A (b) | | 17,009 | 1,577,074 |
| Allison Transmission Holdings, Inc. | | 291,221 | 17,604,309 |
| Barnes Group, Inc. | | 41,606 | 1,635,116 |
| Chart Industries, Inc. (a)(b) | | 83,270 | 15,036,897 |
| Donaldson Co., Inc. | | 103,209 | 6,591,959 |
| Energy Recovery, Inc. (a) | | 258,260 | 7,019,507 |
| Graco, Inc. | | 202,883 | 16,015,584 |
| Hillenbrand, Inc. | | 36,500 | 1,768,060 |
| Hillman Solutions Corp. Class A (a) | | 802,687 | 7,264,317 |
| IDEX Corp. | | 71,552 | 16,199,373 |
| Ingersoll Rand, Inc. | | 146,301 | 10,184,013 |
| ITT, Inc. | | 68,756 | 7,032,364 |
| John Bean Technologies Corp. | | 43,591 | 4,791,087 |
| Kadant, Inc. | | 9,830 | 2,160,044 |
| Lincoln Electric Holdings, Inc. | | 137,628 | 26,487,885 |
| Middleby Corp. (a) | | 117,330 | 17,082,075 |
| Mueller Industries, Inc. | | 105,925 | 8,173,173 |
| Nordson Corp. | | 90,018 | 21,976,995 |
| Omega Flex, Inc. (b) | | 2,548 | 213,268 |
| Oshkosh Corp. | | 79,933 | 8,299,443 |
| RBC Bearings, Inc. (a)(b) | | 102,528 | 23,636,805 |
| Snap-On, Inc. | | 67,098 | 18,022,523 |
| Tennant Co. | | 82,363 | 6,789,182 |
| Terex Corp. | | 61,920 | 3,752,971 |
| Timken Co. | | 26,700 | 2,040,414 |
| Titan International, Inc. (a) | | 109,800 | 1,382,382 |
| Toro Co. | | 242,194 | 24,781,290 |
| Watts Water Technologies, Inc. Class A | | 22,487 | 4,244,871 |
| | | | 293,493,995 |
| Marine Transportation - 0.5% | | | |
| Kirby Corp. (a) | | 139,947 | 11,591,810 |
| Matson, Inc. | | 248,963 | 21,878,868 |
| Star Bulk Carriers Corp. (b) | | 279,382 | 4,914,329 |
| | | | 38,385,007 |
| Passenger Airlines - 0.1% | | | |
| Alaska Air Group, Inc. (a) | | 206,527 | 8,667,938 |
| United Airlines Holdings, Inc. (a) | | 49,900 | 2,485,519 |
| | | | 11,153,457 |
| Professional Services - 3.7% | | | |
| Alight, Inc. Class A (a) | | 6,655,339 | 50,846,790 |
| ASGN, Inc. (a) | | 25,175 | 2,068,378 |
| Barrett Business Services, Inc. | | 5,875 | 562,120 |
| Booz Allen Hamilton Holding Corp. Class A (b) | | 45,146 | 5,115,493 |
| Broadridge Financial Solutions, Inc. | | 46,222 | 8,606,999 |
| CACI International, Inc. Class A (a) | | 62,525 | 20,508,825 |
| CBIZ, Inc. (a) | | 440,230 | 24,701,305 |
| Clarivate Analytics PLC (a)(b) | | 562,355 | 4,178,298 |
| Concentrix Corp. | | 34,759 | 2,774,811 |
| CSG Systems International, Inc. | | 24,199 | 1,314,248 |
| Dun & Bradstreet Holdings, Inc. | | 564,900 | 6,157,410 |
| ExlService Holdings, Inc. (a) | | 124,348 | 3,634,692 |
| Exponent, Inc. | | 42,677 | 3,834,955 |
| First Advantage Corp. (b) | | 787,287 | 10,982,654 |
| Franklin Covey Co. (a) | | 9,915 | 423,073 |
| FTI Consulting, Inc. (a) | | 34,183 | 6,351,885 |
| Genpact Ltd. | | 290,081 | 10,828,724 |
| Heidrick & Struggles International, Inc. | | 62,635 | 1,659,201 |
| Insperity, Inc. | | 26,739 | 2,709,463 |
| Jacobs Solutions, Inc. | | 19,003 | 2,561,984 |
| Kforce, Inc. (b) | | 16,442 | 1,030,091 |
| Korn Ferry | | 110,192 | 5,617,588 |
| LegalZoom.com, Inc. (a) | | 264,510 | 3,018,059 |
| Manpower, Inc. | | 56,200 | 4,432,494 |
| Marlowe PLC (a) | | 1,873,683 | 14,194,018 |
| Paycor HCM, Inc. (a)(b) | | 172,517 | 4,048,974 |
| Paylocity Holding Corp. (a) | | 122,545 | 24,570,273 |
| Robert Half, Inc. | | 171,291 | 12,668,682 |
| Science Applications International Corp. | | 69,675 | 8,197,961 |
| SS&C Technologies Holdings, Inc. | | 375,476 | 21,559,832 |
| TaskUs, Inc. (a) | | 375,974 | 3,722,143 |
| TransUnion Holding Co., Inc. | | 184,240 | 14,963,973 |
| Verra Mobility Corp. (a) | | 641,394 | 11,410,399 |
| | | | 299,255,795 |
| Trading Companies & Distributors - 1.2% | | | |
| Alta Equipment Group, Inc. (b) | | 109,445 | 1,557,402 |
| Applied Industrial Technologies, Inc. | | 47,459 | 7,326,246 |
| Beacon Roofing Supply, Inc. (a) | | 46,886 | 3,743,847 |
| BlueLinx Corp. (a) | | 4,272 | 381,319 |
| Boise Cascade Co. | | 17,608 | 1,925,787 |
| Core & Main, Inc. (a)(b) | | 139,190 | 4,571,000 |
| Custom Truck One Source, Inc. Class A (a) | | 536,319 | 3,598,700 |
| EVI Industries, Inc. (a) | | 294,052 | 7,768,854 |
| Herc Holdings, Inc. (b) | | 61,370 | 7,986,692 |
| Hudson Technologies, Inc. (a) | | 631,561 | 7,616,626 |
| McGrath RentCorp. | | 18,930 | 1,913,823 |
| MSC Industrial Direct Co., Inc. Class A | | 65,447 | 6,679,521 |
| NOW, Inc. (a) | | 147,128 | 1,643,420 |
| SiteOne Landscape Supply, Inc. (a)(b) | | 73,044 | 12,504,402 |
| Veritiv Corp. | | 8,211 | 1,382,158 |
| Watsco, Inc. (b) | | 28,034 | 10,219,795 |
| WESCO International, Inc. | | 76,929 | 12,450,959 |
| | | | 93,270,551 |
TOTAL INDUSTRIALS | | | 1,547,935,794 |
| INFORMATION TECHNOLOGY - 11.6% | | | |
| Communications Equipment - 0.4% | | | |
| Applied Optoelectronics, Inc. (a)(b) | | 517,533 | 7,126,429 |
| Ciena Corp. (a) | | 69,137 | 3,455,467 |
| Clearfield, Inc. (a)(b) | | 37,496 | 1,317,984 |
| EMCORE Corp. (a) | | 365,700 | 219,420 |
| Extreme Networks, Inc. (a) | | 161,012 | 4,419,779 |
| Juniper Networks, Inc. | | 363,444 | 10,583,489 |
| Lumentum Holdings, Inc. (a) | | 118,280 | 6,402,496 |
| NetScout Systems, Inc. (a) | | 59,588 | 1,706,004 |
| | | | 35,231,068 |
| Electronic Equipment, Instruments & Components - 3.2% | | | |
| Arrow Electronics, Inc. (a) | | 75,592 | 10,086,241 |
| Avnet, Inc. | | 204,758 | 10,391,469 |
| Badger Meter, Inc. (b) | | 25,871 | 4,296,656 |
| Bel Fuse, Inc. Class B (non-vtg.) | | 299,863 | 15,682,835 |
| Belden, Inc. | | 183,209 | 17,203,325 |
| Celestica, Inc. (a) | | 747,894 | 17,433,409 |
| Cognex Corp. | | 627,845 | 29,558,943 |
| Crane Nxt Co. (b) | | 185,293 | 10,998,992 |
| CTS Corp. (b) | | 24,066 | 1,074,547 |
| ePlus, Inc. (a) | | 166,126 | 11,027,444 |
| Fabrinet (a) | | 32,359 | 5,202,356 |
| Flex Ltd. (a) | | 378,125 | 10,432,469 |
| Identiv, Inc. (a) | | 465,941 | 3,848,673 |
| Insight Enterprises, Inc. (a) | | 35,087 | 5,617,078 |
| IPG Photonics Corp. (a) | | 28,419 | 3,079,483 |
| Jabil, Inc. | | 104,825 | 11,994,077 |
| Littelfuse, Inc. | | 7,869 | 2,101,653 |
| Methode Electronics, Inc. Class A | | 28,600 | 922,350 |
| Napco Security Technologies, Inc. (b) | | 22,578 | 559,483 |
| Novanta, Inc. (a) | | 13,709 | 2,289,129 |
| Par Technology Corp. (a)(b) | | 169,005 | 7,348,337 |
| Powerfleet, Inc. (a) | | 1,588,444 | 3,907,572 |
| Richardson Electronics Ltd. (b) | | 141,509 | 1,781,598 |
| Sanmina Corp. (a) | | 117,683 | 6,554,943 |
| ScanSource, Inc. (a) | | 54,100 | 1,773,398 |
| TD SYNNEX Corp. | | 212,365 | 21,608,139 |
| Trimble, Inc. (a) | | 455,311 | 24,946,490 |
| Vishay Intertechnology, Inc. | | 130,300 | 3,575,432 |
| Vishay Precision Group, Inc. (a) | | 11,078 | 399,030 |
| Vontier Corp. | | 273,695 | 8,596,760 |
| Zebra Technologies Corp. Class A (a) | | 19,009 | 5,227,665 |
| | | | 259,519,976 |
| IT Services - 0.5% | | | |
| Amdocs Ltd. | | 129,391 | 11,541,677 |
| Digitalocean Holdings, Inc. (a)(b) | | 22,722 | 614,630 |
| DXC Technology Co. (a) | | 124,243 | 2,576,800 |
| Globant SA (a)(b) | | 45,728 | 9,350,004 |
| Hackett Group, Inc. (b) | | 20,415 | 481,182 |
| MongoDB, Inc. Class A (a) | | 4,372 | 1,667,044 |
| Okta, Inc. (a) | | 211,481 | 17,660,778 |
| | | | 43,892,115 |
| Semiconductors & Semiconductor Equipment - 2.7% | | | |
| Allegro MicroSystems LLC (a)(b) | | 188,542 | 7,211,732 |
| Ambarella, Inc. (a) | | 53,539 | 3,327,449 |
| Amkor Technology, Inc. | | 750,925 | 20,995,863 |
| Axcelis Technologies, Inc. (a) | | 28,970 | 5,566,586 |
| AXT, Inc. (a) | | 292,916 | 761,582 |
| Cirrus Logic, Inc. (a) | | 48,843 | 4,007,080 |
| Diodes, Inc. (a) | | 35,800 | 2,930,230 |
| Entegris, Inc. | | 247,200 | 25,033,944 |
| FormFactor, Inc. (a) | | 256,656 | 9,065,090 |
| GlobalFoundries, Inc. (a)(b) | | 187,296 | 10,348,104 |
| indie Semiconductor, Inc. (a)(b) | | 720,884 | 4,829,923 |
| Kulicke & Soffa Industries, Inc. | | 122,506 | 6,337,235 |
| Lattice Semiconductor Corp. (a) | | 213,391 | 20,754,409 |
| MACOM Technology Solutions Holdings, Inc. (a) | | 111,250 | 9,407,300 |
| MaxLinear, Inc. Class A (a) | | 64,037 | 1,504,870 |
| Monolithic Power Systems, Inc. | | 3,357 | 1,749,702 |
| NVE Corp. (b) | | 3,752 | 331,864 |
| ON Semiconductor Corp. (a) | | 82,855 | 8,157,903 |
| Onto Innovation, Inc. (a) | | 58,817 | 8,174,387 |
| Photronics, Inc. (a) | | 54,572 | 1,296,631 |
| Power Integrations, Inc. (b) | | 256,276 | 21,532,310 |
| Qorvo, Inc. (a) | | 22,916 | 2,460,949 |
| Semtech Corp. (a) | | 53,531 | 1,399,836 |
| Silicon Laboratories, Inc. (a) | | 26,855 | 3,621,665 |
| Skyworks Solutions, Inc. | | 26,985 | 2,934,349 |
| SMART Global Holdings, Inc. (a) | | 328,510 | 8,485,413 |
| Synaptics, Inc. (a) | | 62,056 | 5,432,382 |
| Teradyne, Inc. | | 75,003 | 8,090,574 |
| Universal Display Corp. | | 50,621 | 8,228,950 |
| Wolfspeed, Inc. (a)(b) | | 95,973 | 4,589,429 |
| | | | 218,567,741 |
| Software - 4.1% | | | |
| 8x8, Inc. (a)(b) | | 1,131,594 | 3,677,681 |
| ACI Worldwide, Inc. (a) | | 537,018 | 13,038,797 |
| Alarm.com Holdings, Inc. (a) | | 71,169 | 4,168,368 |
| American Software, Inc. Class A | | 26,824 | 309,281 |
| Applied Digital Corp. (a)(b) | | 676,119 | 4,083,759 |
| AppLovin Corp. (a)(b) | | 72,421 | 3,130,036 |
| Box, Inc. Class A (a) | | 74,893 | 1,983,167 |
| Check Point Software Technologies Ltd. (a) | | 41,316 | 5,560,720 |
| Clearwater Analytics Holdings, Inc. (a) | | 513,897 | 9,327,231 |
| CommVault Systems, Inc. (a) | | 136,903 | 9,351,844 |
| Consensus Cloud Solutions, Inc. (a) | | 343,232 | 10,959,398 |
| Couchbase, Inc. (a) | | 479,157 | 8,193,585 |
| CyberArk Software Ltd. (a) | | 45,894 | 7,620,240 |
| Descartes Systems Group, Inc. (a) | | 71,695 | 5,374,257 |
| Digital Turbine, Inc. (a) | | 423,907 | 3,777,011 |
| Dolby Laboratories, Inc. Class A (b) | | 53,045 | 4,480,711 |
| Domo, Inc. Class B (a) | | 99,182 | 1,057,280 |
| Dropbox, Inc. Class A (a) | | 161,340 | 4,483,639 |
| Dynatrace, Inc. (a) | | 431,141 | 20,780,996 |
| EngageSmart, Inc. (a) | | 26,290 | 465,596 |
| Fair Isaac Corp. (a) | | 2,659 | 2,405,305 |
| Five9, Inc. (a) | | 37,346 | 2,702,730 |
| Freshworks, Inc. (a) | | 117,695 | 2,573,990 |
| Gen Digital, Inc. | | 557,824 | 11,295,936 |
| Guidewire Software, Inc. (a) | | 110,578 | 9,557,257 |
| HubSpot, Inc. (a) | | 26,040 | 14,231,381 |
| Informatica, Inc. (a)(b) | | 33,931 | 710,854 |
| InterDigital, Inc. (b) | | 45,639 | 3,957,358 |
| JFrog Ltd. (a) | | 162,694 | 4,667,691 |
| Manhattan Associates, Inc. (a) | | 193,673 | 39,242,023 |
| Monday.com Ltd. (a) | | 38,737 | 6,873,493 |
| N-able, Inc. (a) | | 347,653 | 4,648,121 |
| nCino, Inc. (a)(b) | | 240,875 | 7,917,561 |
| NCR Corp. (a) | | 381,809 | 11,744,445 |
| NICE Ltd. sponsored ADR (a) | | 43,651 | 8,503,215 |
| Nutanix, Inc. Class A (a) | | 86,020 | 2,675,222 |
| Oracle Corp. | | 57,587 | 6,932,899 |
| Progress Software Corp. | | 36,239 | 2,204,781 |
| PTC, Inc. (a) | | 21,175 | 3,116,325 |
| Qualys, Inc. (a) | | 30,557 | 4,756,197 |
| Rapid7, Inc. (a) | | 61,927 | 3,120,502 |
| Similarweb Ltd. (a)(b) | | 1,197,876 | 8,193,472 |
| Smartsheet, Inc. (a)(b) | | 244,960 | 10,222,181 |
| Telos Corp. (a) | | 664,342 | 1,733,933 |
| Tenable Holdings, Inc. (a) | | 180,101 | 8,171,182 |
| Tyler Technologies, Inc. (a) | | 40,802 | 16,256,741 |
| WalkMe Ltd. (a)(b) | | 364,720 | 3,687,319 |
| Zeta Global Holdings Corp. (a) | | 451,141 | 3,667,776 |
| | | | 327,593,487 |
| Technology Hardware, Storage & Peripherals - 0.7% | | | |
| Dell Technologies, Inc. | | 112,852 | 6,346,796 |
| Hewlett Packard Enterprise Co. | | 277,982 | 4,722,914 |
| Immersion Corp. | | 245,723 | 1,724,975 |
| NetApp, Inc. | | 40,494 | 3,105,890 |
| Pure Storage, Inc. Class A (a) | | 113,322 | 4,146,452 |
| Super Micro Computer, Inc. (a) | | 123,686 | 34,023,545 |
| Xerox Holdings Corp. | | 164,200 | 2,609,138 |
| | | | 56,679,710 |
TOTAL INFORMATION TECHNOLOGY | | | 941,484,097 |
| MATERIALS - 3.8% | | | |
| Chemicals - 1.0% | | | |
| Ashland, Inc. | | 39,869 | 3,453,851 |
| Avient Corp. | | 153,221 | 6,145,694 |
| Axalta Coating Systems Ltd. (a) | | 357,436 | 10,115,439 |
| CF Industries Holdings, Inc. | | 98,944 | 7,625,614 |
| Eastman Chemical Co. | | 25,800 | 2,193,258 |
| Ecovyst, Inc. (a) | | 319,376 | 3,270,410 |
| Element Solutions, Inc. | | 160,890 | 3,317,552 |
| FMC Corp. | | 80,207 | 6,916,250 |
| Huntsman Corp. | | 272,960 | 7,607,395 |
| Ingevity Corp. (a) | | 49,988 | 2,693,853 |
| Innospec, Inc. | | 21,891 | 2,351,531 |
| Koppers Holdings, Inc. | | 68,000 | 2,603,720 |
| LSB Industries, Inc. (a) | | 44,870 | 454,084 |
| Mativ, Inc. (b) | | 23,775 | 389,910 |
| Methanex Corp. | | 41,244 | 1,754,932 |
| Minerals Technologies, Inc. | | 28,684 | 1,752,592 |
| NewMarket Corp. | | 5,917 | 2,778,860 |
| Perimeter Solutions SA (a)(b) | | 698,418 | 4,127,650 |
| RPM International, Inc. | | 56,540 | 5,639,300 |
| The Chemours Co. LLC | | 71,000 | 2,415,420 |
| The Mosaic Co. | | 81,800 | 3,177,930 |
| Trinseo PLC | | 37,300 | 392,769 |
| Tronox Holdings PLC (b) | | 125,000 | 1,705,000 |
| | | | 82,883,014 |
| Construction Materials - 0.2% | | | |
| Eagle Materials, Inc. | | 88,564 | 16,766,936 |
| Containers & Packaging - 2.0% | | | |
| Aptargroup, Inc. | | 191,969 | 25,447,411 |
| Avery Dennison Corp. | | 37,949 | 7,148,833 |
| Berry Global Group, Inc. | | 751,323 | 49,091,445 |
| CCL Industries, Inc. Class B | | 368,811 | 16,483,493 |
| Crown Holdings, Inc. | | 244,067 | 22,615,248 |
| Graphic Packaging Holding Co. | | 888,029 | 19,749,765 |
| Greif, Inc. Class A | | 49,400 | 3,585,946 |
| O-I Glass, Inc. (a) | | 138,600 | 2,752,596 |
| Ranpak Holdings Corp. (A Shares) (a) | | 1,052,281 | 6,660,939 |
| Silgan Holdings, Inc. | | 52,500 | 2,369,325 |
| TriMas Corp. | | 88,331 | 2,314,272 |
| WestRock Co. | | 68,600 | 2,243,906 |
| | | | 160,463,179 |
| Metals & Mining - 0.4% | | | |
| Arch Resources, Inc. (b) | | 36,992 | 4,831,155 |
| ATI, Inc. (a)(b) | | 134,720 | 6,106,858 |
| Materion Corp. | | 29,277 | 3,185,045 |
| Reliance Steel & Aluminum Co. (b) | | 27,800 | 7,921,888 |
| Ryerson Holding Corp. | | 34,400 | 1,071,216 |
| Steel Dynamics, Inc. | | 62,600 | 6,672,534 |
| Teck Resources Ltd. Class B (b) | | 60,505 | 2,500,067 |
| | | | 32,288,763 |
| Paper & Forest Products - 0.2% | | | |
| Sylvamo Corp. | | 287,023 | 11,988,951 |
TOTAL MATERIALS | | | 304,390,843 |
| REAL ESTATE - 2.8% | | | |
| Equity Real Estate Investment Trusts (REITs) - 2.5% | | | |
| Agree Realty Corp. | | 118,344 | 7,316,026 |
| American Assets Trust, Inc. | | 48,500 | 1,038,385 |
| Americold Realty Trust | | 434,509 | 14,621,228 |
| Apartment Income (REIT) Corp. | | 319,594 | 10,885,372 |
| Apartment Investment & Management Co. Class A | | 95,865 | 729,533 |
| Apple Hospitality (REIT), Inc. | | 206,500 | 3,101,630 |
| Brandywine Realty Trust (SBI) | | 307,700 | 1,538,500 |
| Brixmor Property Group, Inc. | | 140,900 | 3,096,982 |
| Broadstone Net Lease, Inc. | | 279,310 | 4,516,443 |
| City Office REIT, Inc. | | 261,000 | 1,315,440 |
| CorEnergy Infrastructure Trust, Inc. (b) | | 3,080 | 2,741 |
| Cousins Properties, Inc. | | 71,597 | 1,682,530 |
| CubeSmart | | 402,539 | 16,789,902 |
| EastGroup Properties, Inc. | | 103,871 | 18,658,348 |
| EPR Properties | | 72,200 | 3,233,116 |
| Equity Commonwealth | | 398,002 | 7,573,978 |
| Equity Lifestyle Properties, Inc. | | 147,265 | 9,860,864 |
| Essex Property Trust, Inc. | | 9,751 | 2,324,541 |
| First Industrial Realty Trust, Inc. | | 105,639 | 5,486,890 |
| Franklin Street Properties Corp. | | 275,093 | 528,179 |
| Global Net Lease, Inc. | | 190,184 | 2,158,588 |
| Healthcare Trust of America, Inc. | | 492,072 | 8,621,101 |
| Host Hotels & Resorts, Inc. | | 162,500 | 2,565,875 |
| Industrial Logistics Properties Trust | | 121,900 | 479,067 |
| Medical Properties Trust, Inc. (b) | | 218,700 | 1,579,014 |
| Mid-America Apartment Communities, Inc. | | 69,617 | 10,110,477 |
| NNN (REIT), Inc. | | 213,519 | 8,410,513 |
| Office Properties Income Trust | | 132,285 | 978,909 |
| Omega Healthcare Investors, Inc. | | 122,600 | 3,901,132 |
| Outfront Media, Inc. | | 523,486 | 5,941,566 |
| Pebblebrook Hotel Trust | | 304,437 | 4,405,203 |
| Physicians Realty Trust (b) | | 415,959 | 5,785,990 |
| Piedmont Office Realty Trust, Inc. Class A | | 252,400 | 1,733,988 |
| Ryman Hospitality Properties, Inc. | | 93,940 | 7,987,718 |
| Sabra Health Care REIT, Inc. | | 203,900 | 2,554,867 |
| Service Properties Trust | | 254,722 | 2,104,004 |
| Spirit Realty Capital, Inc. | | 58,150 | 2,245,172 |
| Stag Industrial, Inc. | | 205,028 | 7,489,673 |
| Sun Communities, Inc. | | 35,027 | 4,288,005 |
| Tanger Factory Outlet Centers, Inc. | | 158,900 | 3,694,425 |
| Uniti Group, Inc. | | 315,720 | 1,695,416 |
| Universal Health Realty Income Trust (SBI) | | 10,686 | 498,288 |
| | | | 203,529,619 |
| Real Estate Management & Development - 0.3% | | | |
| Cushman & Wakefield PLC (a) | | 691,099 | 6,351,200 |
| Douglas Elliman, Inc. | | 648,570 | 1,627,911 |
| Jones Lang LaSalle, Inc. (a) | | 20,326 | 3,512,333 |
| Kennedy-Wilson Holdings, Inc. (b) | | 109,844 | 1,754,209 |
| Newmark Group, Inc. | | 974,485 | 6,909,099 |
| | | | 20,154,752 |
TOTAL REAL ESTATE | | | 223,684,371 |
| UTILITIES - 1.0% | | | |
| Electric Utilities - 0.5% | | | |
| IDACORP, Inc. | | 217,490 | 20,844,242 |
| NRG Energy, Inc. | | 167,000 | 6,270,850 |
| Pinnacle West Capital Corp. | | 31,117 | 2,404,411 |
| Portland General Electric Co. | | 190,113 | 8,338,356 |
| | | | 37,857,859 |
| Gas Utilities - 0.2% | | | |
| Atmos Energy Corp. | | 97,750 | 11,334,113 |
| National Fuel Gas Co. | | 38,900 | 2,090,486 |
| Southwest Gas Holdings, Inc. (b) | | 100,234 | 6,207,492 |
| UGI Corp. | | 78,300 | 1,971,594 |
| | | | 21,603,685 |
| Independent Power and Renewable Electricity Producers - 0.2% | | | |
| The AES Corp. | | 125,560 | 2,251,291 |
| Vistra Corp. | | 494,830 | 15,547,559 |
| | | | 17,798,850 |
| Multi-Utilities - 0.1% | | | |
| NorthWestern Energy Corp. | | 132,487 | 6,677,345 |
| Water Utilities - 0.0% | | | |
| Consolidated Water Co., Inc. | | 12,687 | 337,982 |
TOTAL UTILITIES | | | 84,275,721 |
| TOTAL COMMON STOCKS (Cost $5,231,234,111) | | | 6,528,714,861 |
| | | | |
| Equity Funds - 17.3% |
| | | Shares | Value ($) |
| Mid-Cap Blend Funds - 5.4% | | | |
| Fidelity SAI Small-Mid Cap 500 Index Fund (e) | | 74,880,723 | 440,298,652 |
| Sector Funds - 1.0% | | | |
| Fidelity SAI Real Estate Index Fund (e) | | 11,589,841 | 79,854,002 |
| Small Blend Funds - 5.2% | | | |
| Fidelity Small Cap Discovery Fund (e) | | 50,073 | 1,286,386 |
| Fidelity Small Cap Index Fund (e) | | 10,635,430 | 250,889,798 |
| PIMCO StocksPLUS Small Fund Institutional Class | | 23,504,983 | 164,534,880 |
TOTAL SMALL BLEND FUNDS | | | 416,711,064 |
| Small Growth Funds - 5.7% | | | |
| Fidelity Advisor Small Cap Growth Fund Class Z (e) | | 17,294,980 | 460,565,282 |
| TOTAL EQUITY FUNDS (Cost $1,529,316,305) | | | 1,397,429,000 |
| | | | |
| Money Market Funds - 7.4% |
| | | Shares | Value ($) |
| Fidelity Cash Central Fund 5.43% (f) | | 796,982 | 797,142 |
| Fidelity Securities Lending Cash Central Fund 5.44% (f)(g) | | 454,963,420 | 455,008,917 |
| State Street Institutional U.S. Government Money Market Fund Premier Class 5.28% (h) | | 144,804,610 | 144,804,610 |
| TOTAL MONEY MARKET FUNDS (Cost $600,610,669) | | | 600,610,669 |
| | | | |
| TOTAL INVESTMENT IN SECURITIES - 105.6% (Cost $7,361,161,085) | 8,526,754,530 |
NET OTHER ASSETS (LIABILITIES) - (5.6)% | (451,221,013) |
| NET ASSETS - 100.0% | 8,075,533,517 |
| | |
| Futures Contracts |
| | Number of contracts | Expiration Date | Notional Amount ($) | Value ($) | Unrealized Appreciation/ (Depreciation) ($) |
| Purchased | | | | | |
| | | | | | |
| Equity Index Contracts | | | | | |
| CME E-mini Russell 2000 Index Contracts (United States) | 13 | Sep 2023 | 1,236,040 | 18,741 | 18,741 |
| CME E-mini S&P MidCap 400 Index Contracts (United States) | 2 | Sep 2023 | 529,740 | 16,220 | 16,220 |
| | | | | | |
| TOTAL FUTURES CONTRACTS | | | | | 34,961 |
| The notional amount of futures purchased as a percentage of Net Assets is 0.0% |
Legend
| (b) | Security or a portion of the security is on loan at period end. |
| (c) | Security exempt from registration under Rule 144A of the Securities Act of 1933. These securities may be resold in transactions exempt from registration, normally to qualified institutional buyers. At the end of the period, the value of these securities amounted to $2,721,617 or 0.0% of net assets. |
| (f) | Affiliated fund that is generally available only to investment companies and other accounts managed by Fidelity Investments. The rate quoted is the annualized seven-day yield of the fund at period end. A complete unaudited listing of the fund's holdings as of its most recent quarter end is available upon request. In addition, each Fidelity Central Fund's financial statements are available on the SEC's website or upon request. |
| (g) | Investment made with cash collateral received from securities on loan. |
| (h) | The rate quoted is the annualized seven-day yield of the fund at period end. |
Affiliated Central Funds
Fiscal year to date information regarding the Fund's investments in Fidelity Central Funds, including the ownership percentage, is presented below.
| Affiliate | Value, beginning of period ($) | Purchases ($) | Sales Proceeds ($) | Dividend Income ($) | Realized Gain (loss) ($) | Change in Unrealized appreciation (depreciation) ($) | Value, end of period ($) | % ownership, end of period |
| Fidelity Cash Central Fund 5.43% | 3,637,066 | 13,515,705 | 16,355,629 | 35,730 | - | - | 797,142 | 0.0% |
| Fidelity Securities Lending Cash Central Fund 5.44% | 608,507,105 | 898,485,397 | 1,051,983,585 | 1,057,916 | - | - | 455,008,917 | 1.6% |
| Total | 612,144,171 | 912,001,102 | 1,068,339,214 | 1,093,646 | - | - | 455,806,059 | |
| | | | | | | | | |
Amounts in the dividend income column in the above table include any capital gain distributions from underlying funds, which are presented in the corresponding line item in the Statement of Operations, if applicable.
Amounts in the dividend income column for Fidelity Securities Lending Cash Central Fund represents the income earned on investing cash collateral, less rebates paid to borrowers and any lending agent fees associated with the loan, plus any premium payments received for lending certain types of securities.
Amounts included in the purchases and sales proceeds columns may include in-kind transactions, if applicable.
Affiliated Underlying Funds
Fiscal year to date information regarding the Fund's investments in affiliated Underlying Funds is presented below. Exchanges between classes of the same affiliated Underlying Funds may occur. If an Underlying Funds changes its name, the name presented below is the name in effect at period end.
| Affiliate | Value, beginning of period ($) | Purchases ($) | Sales Proceeds ($) | Dividend Income ($) | Realized Gain (loss) ($) | Change in Unrealized appreciation (depreciation) ($) | Value, end of period ($) |
| Fidelity Advisor Small Cap Growth Fund Class Z | 447,939,948 | - | - | - | - | 12,625,334 | 460,565,282 |
| Fidelity SAI Real Estate Index Fund | 81,244,783 | - | - | - | - | (1,390,781) | 79,854,002 |
| Fidelity SAI Small-Mid Cap 500 Index Fund | 445,974,380 | 292,130,267 | 308,872,873 | - | (30,602,529) | 41,669,407 | 440,298,652 |
| Fidelity Small Cap Discovery Fund | 1,236,850 | 14,935 | - | 14,935 | - | 34,601 | 1,286,386 |
| Fidelity Small Cap Index Fund | 84,935,420 | 398,487,486 | 228,512,360 | 156,193 | 2,184,790 | (6,205,538) | 250,889,798 |
| | 1,061,331,381 | 690,632,688 | 537,385,233 | 171,128 | (28,417,739) | 46,733,023 | 1,232,894,120 |
Amounts in the dividend income column in the above table include any capital gain distributions from underlying funds, which are presented in the corresponding line item in the Statement of Operations, if applicable.
Amounts included in the purchases and sales proceeds columns may include in-kind transactions, if applicable.
Other Affiliated Issuers
An affiliated company is a company in which the Fund has ownership of at least 5% of the voting securities. Fiscal year to date transactions with companies which are or were affiliates are presented in the table below. Certain corporate actions, such as mergers, are excluded from the amounts in this table if applicable. A dash in the Value end of period ($) column means either the issuer is no longer held at period end, or the issuer is held at period end but is no longer an affiliate.
| Affiliate | Value, beginning of period ($) | Purchases ($) | Sales Proceeds ($) | Dividend Income ($) | Realized Gain (loss) ($) | Change in Unrealized appreciation (depreciation) ($) | Value, end of period ($) |
| Acacia Research Corp. | 11,063,676 | 1,863,174 | 939,988 | - | (137,968) | (1,337,778) | - |
| Acacia Research Corp. rights 3/1/23 | 6 | - | - | - | - | (6) | - |
| Total | 11,063,682 | 1,863,174 | 939,988 | - | (137,968) | (1,337,784) | - |
Amounts included in the purchases and sales proceeds columns may include in-kind transactions, if applicable.
Investment Valuation
The following is a summary of the inputs used, as of August 31, 2023, involving the Fund's assets and liabilities carried at fair value. The inputs or methodology used for valuing securities may not be an indication of the risk associated with investing in those securities. For more information on valuation inputs, and their aggregation into the levels used below, please refer to the Investment Valuation section in the accompanying Notes to Financial Statements.
| Valuation Inputs at Reporting Date: |
| Description | Total ($) | Level 1 ($) | Level 2 ($) | Level 3 ($) |
Investments in Securities: | | | | |
|
| Equities: | | | | |
Communication Services | 175,114,230 | 175,114,230 | - | - |
Consumer Discretionary | 805,057,591 | 805,057,591 | - | - |
Consumer Staples | 339,521,506 | 339,521,506 | - | - |
Energy | 289,118,814 | 289,118,814 | - | - |
Financials | 967,436,108 | 967,436,108 | - | - |
Health Care | 850,695,786 | 850,654,771 | - | 41,015 |
Industrials | 1,547,935,794 | 1,547,935,794 | - | - |
Information Technology | 941,484,097 | 941,484,097 | - | - |
Materials | 304,390,843 | 304,390,843 | - | - |
Real Estate | 223,684,371 | 223,684,371 | - | - |
Utilities | 84,275,721 | 84,275,721 | - | - |
|
| Equity Funds | 1,397,429,000 | 1,397,429,000 | - | - |
|
| Money Market Funds | 600,610,669 | 600,610,669 | - | - |
| Total Investments in Securities: | 8,526,754,530 | 8,526,713,515 | - | 41,015 |
Derivative Instruments: | | | | |
|
| Assets | | | | |
Futures Contracts | 34,961 | 34,961 | - | - |
| Total Assets | 34,961 | 34,961 | - | - |
| Total Derivative Instruments: | 34,961 | 34,961 | - | - |
Value of Derivative Instruments
The following table is a summary of the Fund's value of derivative instruments by primary risk exposure as of August 31, 2023. For additional information on derivative instruments, please refer to the Derivative Instruments section in the accompanying Notes to Financial Statements.
Primary Risk Exposure / Derivative Type | Value |
| Asset ($) | Liability ($) |
| Equity Risk | | |
Futures Contracts (a) | 34,961 | 0 |
| Total Equity Risk | 34,961 | 0 |
| Total Value of Derivatives | 34,961 | 0 |
(a)Reflects gross cumulative appreciation (depreciation) on futures contracts as presented in the Schedule of Investments. In the Statement of Assets and Liabilities, the period end daily variation margin is included in receivable or payable for daily variation margin on futures contracts, and the net cumulative appreciation (depreciation) is included in Total accumulated earnings (loss).
| Statement of Assets and Liabilities |
| | | | August 31, 2023 (Unaudited) |
| | | | | |
| Assets | | | | |
| Investment in securities, at value (including securities loaned of $441,810,971) - See accompanying schedule: | | | | |
Unaffiliated issuers (cost $5,555,459,292) | $ | 6,838,054,351 | | |
Fidelity Central Funds (cost $455,806,059) | | 455,806,059 | | |
Other affiliated issuers (cost $1,349,895,734) | | 1,232,894,120 | | |
| | | | | |
| | | | | |
| Total Investment in Securities (cost $7,361,161,085) | | | $ | 8,526,754,530 |
| Segregated cash with brokers for derivative instruments | | | | 97,000 |
| Cash | | | | 713,888 |
| Foreign currency held at value (cost $175,039) | | | | 174,674 |
| Receivable for investments sold | | | | 14,865,440 |
| Receivable for fund shares sold | | | | 3,579,376 |
| Dividends receivable | | | | 6,442,970 |
| Interest receivable | | | | 699,385 |
| Distributions receivable from Fidelity Central Funds | | | | 148,411 |
| Prepaid expenses | | | | 13,945 |
| Other receivables | | | | 220,674 |
Total assets | | | | 8,553,710,293 |
| Liabilities | | | | |
| Payable for investments purchased | $ | 17,494,643 | | |
| Payable for fund shares redeemed | | 3,480,210 | | |
| Accrued management fee | | 2,002,603 | | |
| Payable for daily variation margin on futures contracts | | 2,834 | | |
| Other payables and accrued expenses | | 195,002 | | |
| Collateral on securities loaned | | 455,001,484 | | |
| Total Liabilities | | | | 478,176,776 |
| Net Assets | | | $ | 8,075,533,517 |
| Net Assets consist of: | | | | |
| Paid in capital | | | $ | 7,016,813,237 |
| Total accumulated earnings (loss) | | | | 1,058,720,280 |
| Net Assets | | | $ | 8,075,533,517 |
Net Asset Value, offering price and redemption price per share ($8,075,533,517 ÷ 566,716,289 shares) | | | $ | 14.25 |
| Statement of Operations |
| | | | Six months ended August 31, 2023 (Unaudited) |
| Investment Income | | | | |
| Dividends: | | | | |
| Unaffiliated issuers | | | $ | 42,049,557 |
| Affiliated issuers | | | | 156,193 |
| Interest | | | | 3,582,696 |
| Income from Fidelity Central Funds (including $1,057,916 from security lending) | | | | 1,093,646 |
| Total Income | | | | 46,882,092 |
| Expenses | | | | |
| Management fee | $ | 21,063,637 | | |
| Custodian fees and expenses | | 71,192 | | |
| Independent trustees' fees and expenses | | 23,680 | | |
| Registration fees | | 59,297 | | |
| Audit | | 35,300 | | |
| Legal | | 19,449 | | |
| Miscellaneous | | 140,965 | | |
| Total expenses before reductions | | 21,413,520 | | |
| Expense reductions | | (9,566,405) | | |
| Total expenses after reductions | | | | 11,847,115 |
| Net Investment income (loss) | | | | 35,034,977 |
| Realized and Unrealized Gain (Loss) | | | | |
| Net realized gain (loss) on: | | | | |
| Investment Securities: | | | | |
| Unaffiliated issuers | | 59,433,612 | | |
| Affiliated issuers | | (28,555,707) | | |
| Foreign currency transactions | | 83,046 | | |
| Futures contracts | | 46,051 | | |
| Capital gain distributions from underlying funds: | | | | |
| Affiliated issuers | | 14,935 | | |
| Total net realized gain (loss) | | | | 31,021,937 |
| Change in net unrealized appreciation (depreciation) on: | | | | |
| Investment Securities: | | | | |
| Unaffiliated issuers | | 52,607,046 | | |
| Affiliated issuers | | 45,395,239 | | |
| Assets and liabilities in foreign currencies | | (36,088) | | |
| Futures contracts | | 10,458 | | |
| Total change in net unrealized appreciation (depreciation) | | | | 97,976,655 |
| Net gain (loss) | | | | 128,998,592 |
| Net increase (decrease) in net assets resulting from operations | | | $ | 164,033,569 |
| Statement of Changes in Net Assets |
| |
| | Six months ended August 31, 2023 (Unaudited) | | Year ended February 28, 2023 |
| Increase (Decrease) in Net Assets | | | | |
| Operations | | | | |
| Net investment income (loss) | $ | 35,034,977 | $ | 76,153,897 |
| Net realized gain (loss) | | 31,021,937 | | 120,157,860 |
| Change in net unrealized appreciation (depreciation) | | 97,976,655 | | (811,474,372) |
| Net increase (decrease) in net assets resulting from operations | | 164,033,569 | | (615,162,615) |
| Distributions to shareholders | | (86,003,537) | | (468,095,077) |
| | | | | |
| Share transactions | | | | |
| Proceeds from sales of shares | | 873,234,466 | | 1,519,191,608 |
| Reinvestment of distributions | | 79,408,071 | | 449,566,228 |
| Cost of shares redeemed | | (965,921,454) | | (2,646,106,935) |
| | | | | |
Net increase (decrease) in net assets resulting from share transactions | | (13,278,917) | | (677,349,099) |
| Total increase (decrease) in net assets | | 64,751,115 | | (1,760,606,791) |
| | | | | |
| Net Assets | | | | |
| Beginning of period | | 8,010,782,402 | | 9,771,389,193 |
| End of period | $ | 8,075,533,517 | $ | 8,010,782,402 |
| | | | | |
| Other Information | | | | |
| Shares | | | | |
| Sold | | 62,701,277 | | 109,890,523 |
| Issued in reinvestment of distributions | | 5,943,718 | | 31,691,128 |
| Redeemed | | (71,198,724) | | (189,244,531) |
| Net increase (decrease) | | (2,553,729) | | (47,662,880) |
| | | | | |
Financial Highlights
| Strategic Advisers® Small-Mid Cap Fund |
| |
| | Six months ended (Unaudited) August 31, 2023 | | Years ended February 28, 2023 | | 2022 | | 2021 | | 2020 A | | 2019 |
Selected Per-Share Data | | | | | | | | | | | | |
| Net asset value, beginning of period | $ | 14.07 | $ | 15.84 | $ | 18.08 | $ | 12.87 | $ | 13.62 | $ | 14.86 |
| Income from Investment Operations | | | | | | | | | | | | |
Net investment income (loss) B,C | | .06 | | .13 | | .17 | | .14 | | .13 | | .11 |
| Net realized and unrealized gain (loss) | | .27 | | (1.12) | | .61 | | 5.63 | | (.41) | | .11 |
| Total from investment operations | | .33 | | (.99) | | .78 | | 5.77 | | (.28) | | .22 |
| Distributions from net investment income | | (.01) | | (.12) | | (.19) | | (.16) | | (.13) | | (.11) |
| Distributions from net realized gain | | (.14) | | (.67) | | (2.84) | | (.40) | | (.34) | | (1.35) |
| Total distributions | | (.15) | | (.78) D | | (3.02) D | | (.56) | | (.47) | | (1.46) |
| Net asset value, end of period | $ | 14.25 | $ | 14.07 | $ | 15.84 | $ | 18.08 | $ | 12.87 | $ | 13.62 |
Total Return E,F | | 2.45% | | (6.19)% | | 3.45% | | 46.31% | | (2.40)% | | 2.64% |
Ratios to Average Net Assets C,G,H | | | | | | | | | | | | |
| Expenses before reductions | | .56% I,J | | .58% | | .60% | | .62% | | .65% | | .73% |
| Expenses net of fee waivers, if any | | .31% I,J | | .33% | | .35% | | .37% | | .40% | | .48% |
| Expenses net of all reductions | | .31% I,J | | .33% | | .35% | | .37% | | .40% | | .48% |
| Net investment income (loss) | | .92% I,J | | .92% | | .96% | | 1.02% | | .96% | | .77% |
| Supplemental Data | | | | | | | | | | | | |
| Net assets, end of period (000 omitted) | $ | 8,075,534 | $ | 8,010,782 | $ | 9,771,389 | $ | 9,026,250 | $ | 6,975,346 | $ | 8,081,562 |
Portfolio turnover rate K | | 82% I | | 80% | | 61% | | 104% | | 67% | | 82% |
AFor the year ended February 29.
BCalculated based on average shares outstanding during the period.
CNet investment income (loss) is affected by the timing of the declaration of dividends by any underlying mutual funds or exchange-traded funds (ETFs). Net investment income (loss) of any mutual funds or ETFs is not included in the Fund's net investment income (loss) ratio.
DTotal distributions per share do not sum due to rounding.
ETotal returns for periods of less than one year are not annualized.
FTotal returns would have been lower if certain expenses had not been reduced during the applicable periods shown.
GFees and expenses of any underlying mutual funds or exchange-traded funds (ETFs) are not included in the Fund's expense ratio. The Fund indirectly bears its proportionate share of these expenses. For additional expense information related to investments in Fidelity Central Funds, please refer to the "Investments in Fidelity Central Funds" note found in the Notes to Financial Statements section of the most recent Annual or Semi-Annual report.
HExpense ratios reflect operating expenses of the class. Expenses before reductions do not reflect amounts reimbursed, waived, or reduced through arrangements with the investment adviser, brokerage services, or other offset arrangements, if applicable, and do not represent the amount paid by the class during periods when reimbursements, waivers or reductions occur.
IAnnualized.
JProxy expenses are not annualized.
KAmount does not include the portfolio activity of any underlying mutual funds or exchange-traded funds (ETFs).
For the period ended August 31, 2023
1. Organization.
Strategic Advisers Small-Mid Cap Fund (the Fund) is a fund of Fidelity Rutland Square Trust II (the Trust), and is authorized to issue an unlimited number of shares. The Trust is registered under the Investment Company Act of 1940, as amended (the 1940 Act), as an open-end management investment company organized as a Delaware statutory trust. The Fund is offered exclusively to certain managed account clients of Strategic Advisers LLC (Strategic Advisers), an affiliate of Fidelity Management & Research Company LLC (FMR).
2. Significant Accounting Policies.
The Fund is an investment company and applies the accounting and reporting guidance of the Financial Accounting Standards Board (FASB) Accounting Standards Codification Topic 946 Financial Services - Investment Companies. The financial statements have been prepared in conformity with accounting principles generally accepted in the United States of America (GAAP), which require management to make certain estimates and assumptions at the date of the financial statements. Actual results could differ from those estimates. Subsequent events, if any, through the date that the financial statements were issued have been evaluated in the preparation of the financial statements. The Fund's Schedule of Investments lists any underlying mutual funds or exchange-traded funds (ETFs) but does not include the underlying holdings of these funds. The following summarizes the significant accounting policies of the Fund:
Investment Valuation. Investments are valued as of 4:00 p.m. Eastern time on the last calendar day of the period. The Board of Trustees (the Board) has designated the Fund's investment adviser as the valuation designee responsible for the fair valuation function and performing fair value determinations as needed. The investment adviser has established a Fair Value Committee (the Committee) to carry out the day-to-day fair valuation responsibilities and has adopted policies and procedures to govern the fair valuation process and the activities of the Committee. In accordance with these fair valuation policies and procedures, which have been approved by the Board, the Fund attempts to obtain prices from one or more third party pricing services or brokers to value its investments. When current market prices, quotations or currency exchange rates are not readily available or reliable, investments will be fair valued in good faith by the Committee, in accordance with the policies and procedures. Factors used in determining fair value vary by investment type and may include market or investment specific events, transaction data, estimated cash flows, and market observations of comparable investments. The frequency that the fair valuation procedures are used cannot be predicted and they may be utilized to a significant extent. The Committee manages the Fund's fair valuation practices and maintains the fair valuation policies and procedures. The Fund's investment adviser reports to the Board information regarding the fair valuation process and related material matters.
The Fund categorizes the inputs to valuation techniques used to value its investments into a disclosure hierarchy consisting of three levels as shown below:
Level 1 - unadjusted quoted prices in active markets for identical investments
Level 2 - other significant observable inputs (including quoted prices for similar investments, interest rates, prepayment speeds, etc.)
Level 3 - unobservable inputs (including the Fund's own assumptions based on the best information available)
Valuation techniques used to value the Fund's investments by major category are as follows:
Equity securities, including restricted securities, for which market quotations are readily available, are valued at the last reported sale price or official closing price as reported by a third party pricing service on the primary market or exchange on which they are traded and are categorized as Level 1 in the hierarchy. In the event there were no sales during the day or closing prices are not available, securities are valued at the last quoted bid price or may be valued using the last available price and are generally categorized as Level 2 in the hierarchy. For foreign equity securities, when market or security specific events arise, comparisons to the valuation of American Depositary Receipts (ADRs), futures contracts, ETFs and certain indexes as well as quoted prices for similar securities may be used and would be categorized as Level 2 in the hierarchy. For equity securities, including restricted securities, where observable inputs are limited, assumptions about market activity and risk are used and these securities may be categorized as Level 3 in the hierarchy.
Futures contracts are valued at the settlement price established each day by the board of trade or exchange on which they are traded and are categorized as Level 1 in the hierarchy. Investments in open-end mutual funds, including the Fidelity Central Funds, are valued at their closing net asset value (NAV) each business day and are categorized as Level 1 in the hierarchy. If an unaffiliated open-end mutual fund's NAV is unavailable, shares of that fund may be valued by another method that the Board believes reflects fair value in accordance with the Board's fair value pricing policies and is categorized as Level 2 in the hierarchy.
Changes in valuation techniques may result in transfers in or out of an assigned level within the disclosure hierarchy. The aggregate value of investments by input level as of August 31, 2023 is included at the end of the Fund's Schedule of Investments.
Foreign Currency. Certain Funds may use foreign currency contracts to facilitate transactions in foreign-denominated securities. Gains and losses from these transactions may arise from changes in the value of the foreign currency or if the counterparties do not perform under the contracts' terms.
Foreign-denominated assets, including investment securities, and liabilities are translated into U.S. dollars at the exchange rates at period end. Purchases and sales of investment securities, income and dividends received, and expenses denominated in foreign currencies are translated into U.S. dollars at the exchange rate in effect on the transaction date.
The effects of exchange rate fluctuations on investments are included with the net realized and unrealized gain (loss) on investment securities. Other foreign currency transactions resulting in realized and unrealized gain (loss) are disclosed separately.
Investment Transactions and Income. For financial reporting purposes, the Fund's investment holdings and NAV include trades executed through the end of the last business day of the period. The NAV per share for processing shareholder transactions is calculated as of the close of business of the New York Stock Exchange (NYSE), normally 4:00 p.m. Eastern time and includes trades executed through the end of the prior business day. Gains and losses on securities sold are determined on the basis of identified cost and include proceeds received from litigation. Commissions paid to certain brokers with whom the investment adviser, or its affiliates, places trades on behalf of a fund include an amount in addition to trade execution, which may be rebated back to a fund. Any such rebates are included in net realized gain (loss) on investments in the Statement of Operations. Dividend income is recorded on the ex-dividend date, except for certain dividends from foreign securities where the ex-dividend date may have passed, which are recorded as soon as the Fund is informed of the ex-dividend date. Non-cash dividends included in dividend income, if any, are recorded at the fair market value of the securities received. Income and capital gain distributions from Fidelity Central Funds, if any, are recorded on the ex-dividend date. Income and capital gain distributions from any underlying mutual funds or exchange-traded funds (ETFs) are recorded on the ex-dividend date. Certain distributions received by the Fund represent a return of capital or capital gain. The Fund determines the components of these distributions subsequent to the ex-dividend date, based upon receipt of tax filings or other correspondence relating to the underlying investment. These distributions are recorded as a reduction of cost of investments and/or as a realized gain. Interest income is accrued as earned and includes coupon interest and amortization of premium and accretion of discount on debt securities as applicable. Investment income is recorded net of foreign taxes withheld where recovery of such taxes is uncertain. Funds may file withholding tax reclaims in certain jurisdictions to recover a portion of amounts previously withheld. Any withholding tax reclaims income is included in the Statement of Operations in dividends. Any receivables for withholding tax reclaims are included in the Statement of Assets and Liabilities in dividends receivable.
Expenses. Expenses directly attributable to a fund are charged to that fund. Expenses attributable to more than one fund are allocated among the respective funds on the basis of relative net assets or other appropriate methods. Expenses included in the accompanying financial statements reflect the expenses of that fund and do not include any expenses associated with any underlying mutual funds or exchange-traded funds. Although not included in a fund's expenses, a fund indirectly bears its proportionate share of these expenses through the net asset value of each underlying mutual fund or exchange-traded fund. Expense estimates are accrued in the period to which they relate and adjustments are made when actual amounts are known.
Deferred Trustee Compensation. Under a Deferred Compensation Plan (the Plan) for certain Funds, certain independent Trustees have elected to defer receipt of a portion of their annual compensation. Deferred amounts are invested in affiliated mutual funds, are marked-to-market and remain in a fund until distributed in accordance with the Plan. The investment of deferred amounts and the offsetting payable to the Trustees presented below are included in the accompanying Statement of Assets and Liabilities in other receivables and other payables and accrued expenses, as applicable.
| Strategic Advisers Small-Mid Cap Fund | $96,730 |
Income Tax Information and Distributions to Shareholders. Each year, the Fund intends to qualify as a regulated investment company under Subchapter M of the Internal Revenue Code, including distributing substantially all of its taxable income and realized gains. As a result, no provision for U.S. Federal income taxes is required. The Fund files a U.S. federal tax return, in addition to state and local tax returns as required. The Fund's federal income tax returns are subject to examination by the Internal Revenue Service (IRS) for a period of three fiscal years after they are filed. State and local tax returns may be subject to examination for an additional fiscal year depending on the jurisdiction. Foreign taxes are provided for based on the Fund's understanding of the tax rules and rates that exist in the foreign markets in which it invests.
Distributions are declared and recorded on the ex-dividend date. Income and capital gain distributions are determined in accordance with income tax regulations, which may differ from GAAP.
Capital accounts within the financial statements are adjusted for permanent book-tax differences. These adjustments have no impact on net assets or the results of operations. Capital accounts are not adjusted for temporary book-tax differences which will reverse in a subsequent period.
Book-tax differences are primarily due to the short-term gain distributions from the underlying mutual funds or exchange-traded funds (ETFs), futures contracts, foreign currency transactions, passive foreign investment companies (PFIC), partnerships and losses deferred due to wash sales and excise tax regulations.
As of period end, the cost and unrealized appreciation (depreciation) in securities, and derivatives if applicable, for federal income tax purposes were as follows:
| Gross unrealized appreciation | $1,695,365,941 |
| Gross unrealized depreciation | (616,802,131) |
| Net unrealized appreciation (depreciation) | $1,078,563,810 |
| Tax cost | $7,448,225,681 |
Restricted Securities (including Private Placements). Funds may invest in securities that are subject to legal or contractual restrictions on resale. These securities generally may be resold in transactions exempt from registration or to the public if the securities are registered. Disposal of these securities may involve time-consuming negotiations and expense, and prompt sale at an acceptable price may be difficult. Information regarding restricted securities held at period end is included at the end of the Schedule of Investments, if applicable.
3. Derivative Instruments.
Risk Exposures and the Use of Derivative Instruments. The Fund's investment objectives allow for various types of derivative instruments, including futures contracts. Derivatives are investments whose value is primarily derived from underlying assets, indices or reference rates and may be transacted on an exchange or over-the-counter (OTC). Derivatives may involve a future commitment to buy or sell a specified asset based on specified terms, to exchange future cash flows at periodic intervals based on a notional principal amount, or for one party to make one or more payments upon the occurrence of specified events in exchange for periodic payments from the other party.
Derivatives were used to increase returns and to manage exposure to certain risks as defined below. The success of any strategy involving derivatives depends on analysis of numerous economic factors, and if the strategies for investment do not work as intended, the objectives may not be achieved.
Derivatives were used to increase or decrease exposure to the following risk(s):
| Equity Risk | Equity risk relates to the fluctuations in the value of financial instruments as a result of changes in market prices (other than those arising from interest rate risk or foreign exchange risk), whether caused by factors specific to an individual investment, its issuer, or all factors affecting all instruments traded in a market or market segment. |
Funds are also exposed to additional risks from investing in derivatives, such as liquidity risk and counterparty credit risk. Liquidity risk is the risk that a fund will be unable to close out the derivative in the open market in a timely manner. Counterparty credit risk is the risk that the counterparty will not be able to fulfill its obligation to a fund. Counterparty credit risk related to exchange-traded contracts may be mitigated by the protection provided by the exchange on which they trade.
Investing in derivatives may involve greater risks than investing in the underlying assets directly and, to varying degrees, may involve risk of loss in excess of any initial investment and collateral received and amounts recognized in the Statement of Assets and Liabilities. In addition, there may be the risk that the change in value of the derivative contract does not correspond to the change in value of the underlying instrument.
Futures Contracts. A futures contract is an agreement between two parties to buy or sell a specified underlying instrument for a fixed price at a specified future date. Futures contracts were used to manage exposure to the stock market.
Upon entering into a futures contract, a fund is required to deposit either cash or securities (initial margin) with a clearing broker in an amount equal to a certain percentage of the face value of the contract. Futures contracts are marked-to-market daily and subsequent daily payments are made or received by a fund depending on the daily fluctuations in the value of the futures contracts and are recorded as unrealized appreciation or (depreciation). This receivable and/or payable, if any, is included in daily variation margin on futures contracts in the Statement of Assets and Liabilities. Realized gain or (loss) is recorded upon the expiration or closing of a futures contract. The net realized gain (loss) and change in net unrealized appreciation (depreciation) on futures contracts during the period is presented in the Statement of Operations.
Any open futures contracts at period end are presented in the Schedule of Investments under the caption "Futures Contracts". The notional amount at value reflects each contract's exposure to the underlying instrument or index at period end, and is representative of volume of activity during the period unless an average notional amount is presented. Any securities deposited to meet initial margin requirements are identified in the Schedule of Investments. Any cash deposited to meet initial margin requirements is presented as segregated cash with brokers for derivative instruments in the Statement of Assets and Liabilities.
4. Purchases and Sales of Investments.
Purchases and sales of securities, other than short-term securities and in-kind transactions, as applicable, are noted in the table below.
| | Purchases ($) | Sales ($) |
| Strategic Advisers Small-Mid Cap Fund | 3,133,425,561 | 3,178,996,166 |
5. Fees and Other Transactions with Affiliates.
Management Fee. Strategic Advisers (the investment adviser) provides the Fund with investment management related services. For these services, the Fund pays a monthly management fee to the investment adviser. The management fee is calculated by adding the annual management fee rate of .25% of the Fund's average net assets throughout the month to the aggregate of the fee rates, payable monthly by the investment adviser, to the Fund's sub-advisers. The Fund's maximum aggregate management fee will not exceed 1.10% of the Fund's average net assets. For the reporting period, the total annualized management fee rate was .55% of the Fund's average net assets.
During the period, the investment adviser waived a portion of its management fee as described in the Expense Reductions note.
Sub-Advisers. AllianceBernstein, L.P. (AB), ArrowMark Colorado Holdings, LLC (d/b/a ArrowMark Partners), Boston Partners Global Investors, Inc., FIAM LLC (an affiliate of the investment adviser)(managed a portion of the Fund's assets through April 28, 2023), Geode Capital Management, LLC, GW&K Investment Management, LLC, J.P. Morgan Investment Management, Inc., LSV Asset Management, Portolan Capital Management, LLC, River Road Asset Management LLC and William Blair Investment Management, LLC each served as a sub-adviser for the Fund during the period. Sub-advisers provide discretionary investment advisory services for their allocated portion of the Fund's assets and are paid as described in the Management Fee note.
FIAM LLC (an affiliate of the investment adviser) and FIL Investment Advisors (FIL) have been retained to serve as a sub-adviser for the Fund. As of the date of this report, however, these sub-advisers have not been allocated any portion of the Fund's assets. These sub-advisers in the future may provide discretionary investment advisory services for an allocated portion of the Fund's assets and will be paid by the investment adviser for providing these services.
In September 2023, the Board approved the appointment of BlackRock Investment Management, LLC as an additional sub-adviser for the Fund.
Brokerage Commissions. A portion of portfolio transactions were placed with brokerage firms which are affiliates of the investment adviser. Brokerage commissions are included in net realized gain (loss) and change in net unrealized appreciation (depreciation) in the Statement of Operations. The commissions paid to these affiliated firms were as follows:
| | Amount |
| Strategic Advisers Small-Mid Cap Fund | $3,997 |
Interfund Trades. Funds may purchase from or sell securities to other funds affiliated with each sub-adviser under procedures adopted by the Board. The procedures have been designed to ensure these interfund trades are executed in accordance with Rule 17a-7 of the 1940 Act. Any interfund trades are included within the respective purchases and sales amounts shown in the Purchases and Sales of Investments note. Interfund trades during the period are noted in the table below.
| | Purchases ($) | Sales ($) | Realized Gain (Loss) ($) |
| Strategic Advisers Small-Mid Cap Fund | 257,864 | 9,320,469 | 644,369 |
6. Investments in Fidelity Central Funds.
Funds may invest in Fidelity Central Funds, which are open-end investment companies generally available only to other investment companies and accounts managed by the investment adviser and its affiliates. The Schedule of Investments lists any Fidelity Central Funds held as an investment as of period end, but does not include the underlying holdings of each Fidelity Central Fund. An investing fund indirectly bears its proportionate share of the expenses of the underlying Fidelity Central Funds.
Based on its investment objective, each Fidelity Central Fund may invest or participate in various investment vehicles or strategies that are similar to those of the investing fund. These strategies are consistent with the investment objectives of the investing fund and may involve certain economic risks which may cause a decline in value of each of the Fidelity Central Funds and thus a decline in the value of the investing fund.
| Fidelity Central Fund | Investment Manager | Investment Objective | Investment Practices | Expense RatioA |
| Fidelity Money Market Central Funds | Fidelity Management & Research Company LLC (FMR) | Each fund seeks to obtain a high level of current income consistent with the preservation of capital and liquidity. | Short-term Investments | Less than .005% |
A Expenses expressed as a percentage of average net assets and are as of each underlying Central Fund's most recent annual or semi-annual shareholder report.
A complete unaudited list of holdings for each Fidelity Central Fund is available upon request or at the Securities and Exchange Commission website at www.sec.gov. In addition, the financial statements of the Fidelity Central Funds, which are not covered by the Report of Independent Registered Public Accounting Firm, are available on the Securities and Exchange Commission website or upon request.
7. Committed Line of Credit.
Certain Funds participate with other funds managed by the investment adviser or an affiliate in a $4.25 billion credit facility (the "line of credit") to be utilized for temporary or emergency purposes to fund shareholder redemptions or for other short-term liquidity purposes. The participating funds have agreed to pay commitment fees on their pro-rata portion of the line of credit, which are reflected in Miscellaneous expenses on the Statement of Operations, and are listed below. During the period, there were no borrowings on this line of credit.
| | Amount |
| Strategic Advisers Small-Mid Cap Fund | $7,475 |
8. Security Lending.
Funds lend portfolio securities from time to time in order to earn additional income. Lending agents are used, including National Financial Services (NFS), an affiliate of the investment adviser. Pursuant to a securities lending agreement, NFS will receive a fee, which is capped at 9.9% of a fund's daily lending revenue, for its services as lending agent. A fund may lend securities to certain qualified borrowers, including NFS. On the settlement date of the loan, a fund receives collateral (in the form of U.S. Treasury obligations, letters of credit and/or cash) against the loaned securities and maintains collateral in an amount not less than 100% of the market value of the loaned securities during the period of the loan. The market value of the loaned securities is determined at the close of business of a fund and any additional required collateral is delivered to a fund on the next business day. A fund or borrower may terminate the loan at any time, and if the borrower defaults on its obligation to return the securities loaned because of insolvency or other reasons, a fund may apply collateral received from the borrower against the obligation. A fund may experience delays and costs in recovering the securities loaned. Any cash collateral received is invested in the Fidelity Securities Lending Cash Central Fund. Any loaned securities are identified as such in the Schedule of Investments, and the value of loaned securities and cash collateral at period end, as applicable, are presented in the Statement of Assets and Liabilities. Security lending income represents the income earned on investing cash collateral, less rebates paid to borrowers and any lending agent fees associated with the loan, plus any premium payments received for lending certain types of securities. Security lending income is presented in the Statement of Operations as a component of income from Fidelity Central Funds. Affiliated security lending activity, if any, was as follows:
| | Total Security Lending Fees Paid to NFS | Security Lending Income From Securities Loaned to NFS | Value of Securities Loaned to NFS at Period End |
| Strategic Advisers Small-Mid Cap Fund | $113,111 | $- | $- |
9. Expense Reductions.
The investment adviser has contractually agreed to waive the Fund's management fee in an amount equal to .25% of the Fund's average net assets until September 30, 2026. During the period, this waiver reduced the Fund's management fee by $ 9,548,472.
Through arrangements with the Fund's custodian, credits realized as a result of certain uninvested cash balances were used to reduce the Fund's expenses by $17,933.
10. Other.
A fund's organizational documents provide former and current trustees and officers with a limited indemnification against liabilities arising in connection with the performance of their duties to the fund. In the normal course of business, a fund may also enter into contracts that provide general indemnifications. A fund's maximum exposure under these arrangements is unknown as this would be dependent on future claims that may be made against a fund. The risk of material loss from such claims is considered remote.
Funds do not invest in underlying mutual funds for the purpose of exercising management or control; however, investments by funds within their principal investment strategies may represent a significant portion of the underlying mutual fund's net assets. At the end of the period, certain Funds were the owners of record of 10% or more of the total outstanding shares of the following underlying mutual funds as shown below.
| Fund | Strategic Advisers Small-Mid Cap Fund |
| Fidelity SAI Real Estate Index Fund | 99% |
| Fidelity SAI Small-Mid Cap 500 Index Fund | 28% |
11. Risk and Uncertainties.
Many factors affect a fund's performance. Developments that disrupt global economies and financial markets, such as pandemics, epidemics, outbreaks of infectious diseases, war, terrorism, and environmental disasters, may significantly affect a fund's investment performance. The effects of these developments to a fund will be impacted by the types of securities in which a fund invests, the financial condition, industry, economic sector, and geographic location of an issuer, and a fund's level of investment in the securities of that issuer. Significant concentrations in security types, issuers, industries, sectors, and geographic locations may magnify the factors that affect a fund's performance.
As a shareholder, you incur two types of costs: (1) transaction costs, which may include sales charges (loads) on purchase payments or redemption proceeds, as applicable and (2) ongoing costs, which generally include management fees, distribution and/or service (12b-1) fees and other Fund expenses. This Example is intended to help you understand your ongoing costs (in dollars) of investing in a fund and to compare these costs with the ongoing costs of investing in other mutual funds.
| The Example is based on an investment of $1,000 invested at the beginning of the period and held for the entire period (March 1, 2023 to August 31, 2023). |
Actual Expenses
The first line of the accompanying table provides information about actual account values and actual expenses. You may use the information in this line, together with the amount you invested, to estimate the expenses that you paid over the period. Simply divide your account value by $1,000.00 (for example, an $8,600 account value divided by $1,000.00 = 8.6), then multiply the result by the number in the first line for a class/Fund under the heading entitled "Expenses Paid During Period" to estimate the expenses you paid on your account during this period. If any fund is a shareholder of any underlying mutual funds or exchange-traded funds (ETFs) (the Underlying Funds), such fund indirectly bears its proportional share of the expenses of the Underlying Funds in addition to the direct expenses incurred presented in the table. These fees and expenses are not included in the annualized expense ratio used to calculate the expense estimate in the table below.
Hypothetical Example for Comparison Purposes
The second line of the accompanying table provides information about hypothetical account values and hypothetical expenses based on the actual expense ratio and an assumed rate of return of 5% per year before expenses, which is not the actual return. The hypothetical account values and expenses may not be used to estimate the actual ending account balance or expenses you paid for the period. You may use this information to compare the ongoing costs of investing in the Fund and other funds. To do so, compare this 5% hypothetical example with the 5% hypothetical examples that appear in the shareholder reports of the other funds. If any fund is a shareholder of any Underlying Funds, such fund indirectly bears its proportional share of the expenses of the Underlying Funds in addition to the direct expenses as presented in the table. These fees and expenses are not included in the annualized expense ratio used to calculate the expense estimate in the table below.
Please note that the expenses shown in the table are meant to highlight your ongoing costs only and do not reflect any transaction costs. Therefore, the second line of the table is useful in comparing ongoing costs only, and will not help you determine the relative total costs of owning different funds. In addition, if these transactional costs were included, your costs would have been higher.
| | | | | Annualized Expense Ratio- A | | Beginning Account Value March 1, 2023 | | Ending Account Value August 31, 2023 | | Expenses Paid During Period- C March 1, 2023 to August 31, 2023 |
| | | | | | | | | | |
| Strategic Advisers® Small-Mid Cap Fund | | | | .31% | | | | | | |
| Actual | | | | | | $ 1,000 | | $ 1,024.50 | | $ 1.58 |
Hypothetical-B | | | | | | $ 1,000 | | $ 1,023.58 | | $ 1.58 |
| |
A Annualized expense ratio reflects expenses net of applicable fee waivers.
B 5% return per year before expenses
C Expenses are equal to the annualized expense ratio, multiplied by the average account value over the period, multiplied by 184/ 366 (to reflect the one-half year period). The fees and expenses of any Underlying Funds are not included in each annualized expense ratio.
Board Approval of New and Amended Sub-Advisory Agreements
Strategic Advisers Small-Mid Cap Fund
In March 2023, the Board of Trustees, including the Independent Trustees (together, the Board) voted to approve (i) a new sub-advisory agreement among Strategic Advisers LLC (Strategic Advisers), William Blair Investment Management, LLC (William Blair or New Sub-Adviser), and Fidelity Rutland Square Trust II (Trust) on behalf of the fund (New Sub-Advisory Agreement), and (ii) amendments to the fee schedules for two investment mandates in the existing sub-advisory agreement among Strategic Advisers, ArrowMark Colorado Holdings, LLC (dba ArrowMark Partners) (ArrowMark), and the Trust on behalf of the fund (Amended Sub-Advisory Agreement and, together with the New Sub-Advisory Agreement, the Agreements). The Board noted that each updated fee schedule in the Amended Sub-Advisory Agreement became effective as of March 1, 2023 and will result in the same or lower fees at all asset levels. The Board also noted that no other material contract terms are impacted by the Amended Sub-Advisory Agreement. The Board, assisted by the advice of fund counsel and Independent Trustees' counsel, considered a broad range of information.
In considering whether to approve the Agreements, the Board reached a determination, with the assistance of fund counsel and Independent Trustees' counsel and through the exercise of its business judgment, that the approval of the Agreements is in the best interests of the fund and its shareholders and that the approval of such agreements does not involve a conflict of interest from which Strategic Advisers or its affiliates derive an inappropriate advantage. The Board's decision to approve the Agreements was not based on any single factor, but rather was based on a comprehensive consideration of all the information provided to the Board. In addition, individual Trustees did not necessarily attribute the same weight or importance to each factor.
Nature, Extent, and Quality of Services Provided. With respect to the New Sub-Advisory Agreement, the Board considered the backgrounds of the investment personnel that will provide services to the fund, the fund's investment objective, strategies and related investment philosophy, the current sub-adviser line-up, and the structure of the investment personnel compensation programs and whether such structure provides appropriate incentives to act in the best interests of the fund. The Board also considered that it reviewed this information regarding ArrowMark in connection with the annual renewal of the of the fund's management contract, sub-advisory agreements and sub-subadvisory agreements at its September 2022 meeting. The Board noted its familiarity with the nature, extent and quality of services provided by the New Sub-Adviser to another Strategic Advisers fund with a different investment mandate, and that the same support staff, including compliance personnel, that currently provides services to the other Strategic Advisers fund will also provide services to the fund. The Board also took into consideration additional information regarding the new investment mandate provided by Strategic Advisers and the New Sub-Adviser.
Resources Dedicated to Investment Management and Support Services. With respect to the New Sub-Advisory Agreement, the Board reviewed the general qualifications and capabilities of the New Sub-Adviser's investment staff, use of technology, and approach to managing and compensating investment personnel. The Board noted that the New Sub-Adviser's analysts have extensive resources, tools and capabilities which allow them to conduct sophisticated fundamental and/or quantitative analysis. Additionally, in its deliberations, the Board considered the New Sub-Adviser's trading capabilities and resources and compliance infrastructure, which are integral parts of the investment management process, and their respective investments in business continuity planning, including in connection with the COVID-19 pandemic.
With respect to the Amended Sub-Advisory Agreement, the Board noted that it had approved the existing sub-advisory agreement with ArrowMark at its September 2022 meeting and the Amended Sub-Advisory Agreement will not result in any changes to: (i) the nature, extent and quality of the sub-advisory services provided; (ii) the investment process or strategies employed in the management of the fund's assets; or (iii) the day-to-day management of the fund or the persons primarily responsible for such management.
Shareholder and Administrative Services. The Board considered (i) the nature, extent, quality, and cost of advisory services to be performed by the New Sub-Adviser under the New Sub-Advisory Agreement; and (ii) the resources to be devoted to the fund's compliance policies and procedures.
Investment Performance. The Board considered the historical investment performance of the New Sub-Adviser and its portfolio managers in managing accounts under a similar investment mandate. The Board did not consider performance to be a material factor in its decision to approve the Amended Sub-Advisory Agreement because the approval of the Amended Sub-Advisory Agreement will not result in any changes (i) to the fund's investment processes or strategies; or (ii) in the persons primarily responsible for the day-to-day management of the fund.
Based on its review, the Board concluded that the nature, extent, and quality of services that will be provided to the fund under the New Sub-Advisory Agreement should benefit the fund's shareholders and, with respect to the Amended Sub-Advisory Agreement, should continue to benefit the fund's shareholders.
Competitiveness of Management Fee and Total Fund Expenses. With respect to the New Sub-Advisory Agreement, the Board considered the amount and nature of the fees to be paid by the fund to Strategic Advisers and by Strategic Advisers to the New Sub-Adviser. The Board also considered the projected change in the fund's management fee and total operating expenses, if any, as a result of hiring the New Sub-Adviser.
The Board noted that neither Agreement will result in changes to the maximum aggregate annual management fee payable by the fund or Strategic Advisers' portion of the management fee. The Board considered Strategic Advisers' contractual agreement to waive its portion of the fund's management fee. With respect to the New Sub-Advisory Agreement, the Board considered that after allocating assets to the New Sub-Adviser, the fund's management fee and total net expenses are each expected to increase slightly, but each is expected to continue to rank below the competitive peer group median reported in the 2022 management contract renewal materials for the fund. The Board also considered that Amended Sub-Advisory Agreement is expected to result in a decrease in the total management fee rate of the fund, with respect to each mandate individually and also on a combined basis.
Based on its review, the Board concluded that the fund's management fee structure and projected total expenses bear a reasonable relationship to the services that the fund and its shareholders will receive and the other factors considered.
Costs of the Services and Profitability. Because the Agreements were each negotiated at arm's length and will have no impact on the maximum management fees payable by the fund or Strategic Advisers' portion of the management fee, the Board did not consider the costs of services and profitability to be significant factors in its decision to approve the Agreements.
Potential Fall-Out Benefits. The Board considered that it reviews information regarding the potential of direct and indirect benefits to Strategic Advisers and its affiliates from their relationships with the fund, including non-advisory fee compensation paid to affiliates of Strategic Advisers, if any, as well as information regarding potential fall-out benefits accruing to each sub-adviser, if any, as a result of its relationship with the fund, during its annual renewal of the fund's management contract, sub-advisory agreements, and sub-subadvisory agreements. The Board considered Strategic Advisers' representation that it does not anticipate that the approval of the Agreements will have a significant impact on the profitability of, or potential fall-out benefits to, Strategic Advisers or its affiliates.
Possible Economies of Scale. The Board considered that it reviews whether there have been economies of scale in connection with the management of the fund during its annual renewal of the fund's management contract, sub-advisory agreements, and sub-subadvisory agreements. The Board noted that the New Sub-Advisory Agreement provides for breakpoints, and the Amended Sub-Advisory Agreement will continue to provide for breakpoints for each investment mandate, that have the potential to reduce sub-advisory fees paid to the New Sub-Adviser as assets allocated to the sub-adviser grow. The Board also noted that it did not consider the possible realization of economies of scale to be a significant factor in its decision to approve the Amended Sub-Advisory Agreement because the fund is not expected to bear any additional expenses as a result of the Amended Sub-Advisory Agreement.
Conclusion. Based on its evaluation of all of the conclusions noted above, and after considering all factors it believed relevant, the Board concluded that each Agreement's fee structure bears a reasonable relationship to the services to be rendered and that each Agreement is in the best interests of the fund and its shareholders and should be approved. In addition, the Board concluded that the approval of each Agreement does not involve a conflict of interest from which Strategic Advisers or its affiliates derive an inappropriate advantage.
Board Approval of Amended Sub-Advisory Agreement
Strategic Advisers Small-Mid Cap Fund
In June 2023, the Board of Trustees, including the Independent Trustees (together, the Board) voted to approve an amendment to the fee schedule for the existing sub-advisory agreement among Strategic Advisers, Portolan Capital Management, LLC (the Sub-Adviser) and Fidelity Rutland Square Trust II (Trust) on behalf of the fund. The Board noted that the updated fee schedule in the Amended Sub-Advisory Agreement became effective as of April 1, 2023 and will result in the same or lower fees at all asset levels. The Board also noted that no other material contract terms are impacted by the Amended Sub-Advisory Agreement. The Board, assisted by the advice of fund counsel and Independent Trustees' counsel, considered a broad range of information.
In considering whether to approve the Amended Sub-Advisory Agreement, the Board reached a determination, with the assistance of fund counsel and Independent Trustees' counsel and through the exercise of its business judgment, that the approval of the Amended Sub-Advisory Agreement is in the best interests of the fund and its shareholders and that the approval of such agreement does not involve a conflict of interest from which Strategic Advisers or its affiliates derive an inappropriate advantage. The Board's decision to approve the Amended Sub-Advisory Agreement was not based on any single factor, but rather was based on a comprehensive consideration of all the information provided to the Board. In addition, individual Trustees did not necessarily attribute the same weight or importance to each factor.
Nature, Extent, and Quality of Services Provided. The Board considered the backgrounds of the investment personnel that provide services to the fund, the fund's investment objective, strategies and related investment philosophy, the current sub-adviser line-up, and the structure of the investment personnel compensation programs and whether such structure provides appropriate incentives to act in the best interests of the fund in connection with its annual renewal of the fund's management contract, sub-advisory agreements and sub-subadvisory agreements at its September 2022 meeting. The Board considered the detailed information provided by Strategic Advisers and the Sub-Adviser with respect to the fund in the June 2023 annual contract renewal materials.
The Board noted that it had approved the existing sub-advisory agreement with the Sub-Adviser at its September 2022 meeting and that the Amended Sub-Advisory Agreement will not result in any changes to: (i) the nature, extent and quality of the sub-advisory services provided; (ii) the investment process or strategies employed in the management of the fund's assets; or (iii) the day-to-day management of the fund or the persons primarily responsible for such management.
Investment Performance. The Board did not consider performance to be a material factor in its decision to approve the Amended Sub-Advisory Agreement because the approval of the Amended Sub-Advisory Agreement will not result in any changes (i) to the fund's investment processes or strategies; or (ii) in the persons primarily responsible for the day-to-day management of the fund.
Based on its review, the Board concluded that the nature, extent, and quality of services that will be provided to the fund under the Amended Sub-Advisory Agreement should continue to benefit the fund's shareholders.
Competitiveness of Management Fee and Total Fund Expenses. The Board noted that the Amended Sub-Advisory Agreement will not result in changes to the maximum aggregate annual management fee payable by the fund or Strategic Advisers' portion of the management fee. The Board considered Strategic Advisers' contractual agreement to waive its portion of the fund's management fee.
The Board also considered that the Amended Sub-Advisory Agreement is expected to result in a decrease in the total management fee rate of the fund. Based on its review, the Board concluded that the fund's management fee structure and projected total expenses bear a reasonable relationship to the services that the fund and its shareholders will receive and the other factors considered.
Costs of the Services and Profitability. Because the Amended Sub-Advisory Agreement was negotiated at arm's length and will have no impact on the maximum management fees payable by the fund or Strategic Advisers' portion of the management fee, the Board did not consider the costs of services and profitability to be significant factors in its decision to approve the Amended Sub-Advisory Agreement.
Potential Fall-Out Benefits. The Board considered that it reviews information regarding the potential of direct and indirect benefits to Strategic Advisers and its affiliates from their relationships with the fund, including non-advisory fee compensation paid to affiliates of Strategic Advisers, if any, as well as information regarding potential fall-out benefits accruing to each sub-adviser, if any, as a result of its relationship with the fund, during its annual renewal of the fund's management contract, sub-advisory agreements, and sub-subadvisory agreements. The Board considered Strategic Advisers' representation that it does not anticipate that the approval of the Amended Sub-Advisory Agreement will have a significant impact on the profitability of, or potential fall-out benefits to, Strategic Advisers or its affiliates.
Possible Economies of Scale. The Board considered that it reviews whether there have been economies of scale in connection with the management of the fund during its annual renewal of the fund's management contract, sub-advisory agreements, and sub-subadvisory agreements. The Board noted that the Amended Sub-Advisory Agreement will continue to provide for breakpoints with respect to the mandate that have the potential to reduce sub-advisory fees paid to the sub-adviser as assets allocated to the sub-adviser grow. The Board also noted that it did not consider the possible realization of economies of scale to be a significant factor in its decision to approve the Amended Sub-Advisory Agreement because the fund is not expected to bear any additional expenses as a result of the Amended Sub-Advisory Agreement.
Conclusion. Based on its evaluation of all of the conclusions noted above, and after considering all factors it believed relevant, the Board concluded that the Amended Sub-Advisory Agreement's fee structure bears a reasonable relationship to the services to be rendered and that the Amended Sub-Advisory Agreement is in the best interests of the fund and its shareholders and should be approved. In addition, the Board concluded that the approval of the Amended Sub-Advisory Agreement does not involve a conflict of interest from which Strategic Advisers or its affiliates derive an inappropriate advantage.
1.912859.113
SMC-SANN-1023
Strategic Advisers® Fidelity® International Fund
Offered exclusively to certain managed account clients of Strategic Advisers LLC or its affiliates - not available for sale to the general public
Semi-Annual Report
August 31, 2023
Contents
To view a fund's proxy voting guidelines and proxy voting record for the 12-month period ended June 30, visit http://www.fidelity.com/proxyvotingresults or visit the Securities and Exchange Commission's (SEC) web site at http://www.sec.gov.
You may also call 1-800-544-3455 to request a free copy of the proxy voting guidelines.
Standard & Poor's, S&P and S&P 500 are registered service marks of The McGraw-Hill Companies, Inc. and have been licensed for use by Fidelity Distributors Corporation.
Other third-party marks appearing herein are the property of their respective owners.
All other marks appearing herein are registered or unregistered trademarks or service marks of FMR LLC or an affiliated company. © 2023 FMR LLC. All rights reserved.
This report and the financial statements contained herein are submitted for the general information of the shareholders of the Fund. This report is not authorized for distribution to prospective investors in the Fund unless preceded or accompanied by an effective prospectus.
A fund files its complete schedule of portfolio holdings with the SEC for the first and third quarters of each fiscal year on Form N-PORT. Forms N-PORT are available on the SEC's web site at http://www.sec.gov. A fund's Forms N-PORT may be reviewed and copied at the SEC's Public Reference Room in Washington, DC. Information regarding the operation of the SEC's Public Reference Room may be obtained by calling 1-800-SEC-0330.
For a complete list of a fund's portfolio holdings, view the most recent holdings listing, semiannual report, or annual report on Fidelity's web site at http://www.fidelity.com, http://www.institutional.fidelity.com, or http://www.401k.com, as applicable.
NOT FDIC INSURED •MAY LOSE VALUE •NO BANK GUARANTEE
Neither the Fund nor Fidelity Distributors Corporation is a bank.
The information in the following tables is based on the direct Investments of the Fund.
Top Holdings (% of Fund's net assets) |
| (excluding cash equivalents) |
| Fidelity SAI International Value Index Fund | 14.9 | |
| Fidelity Overseas Fund | 10.0 | |
| Fidelity Advisor International Discovery Fund Class Z | 8.8 | |
| Fidelity SAI International Low Volatility Index Fund | 8.2 | |
| Fidelity Diversified International Fund | 7.7 | |
| Fidelity International Capital Appreciation Fund | 6.9 | |
| Fidelity SAI International Index Fund | 5.7 | |
| Fidelity SAI International Small Cap Index Fund | 2.1 | |
| Fidelity Advisor Japan Fund Class Z | 1.4 | |
| Fidelity SAI International Momentum Index Fund | 1.3 | |
| | 67.0 | |
| |
Asset Allocation (% of Fund's net assets) |
|
Futures - 4.9% |
|
Asset Allocation of funds in the pie chart reflect the categorizations of the asset as defined by Morningstar as of the reporting date.
Geographic Diversification (% of Fund's net assets) |
|
* Includes Short-Term investments and Net Other Assets (Liabilities). Percentages are adjusted for the effect of derivatives, if applicable. |
| |
Showing Percentage of Net Assets
| Common Stocks - 25.3% |
| | | Shares | Value ($) |
| COMMUNICATION SERVICES - 0.9% | | | |
| Diversified Telecommunication Services - 0.3% | | | |
| Cellnex Telecom SA (a) | | 757,497 | 28,995,133 |
| Deutsche Telekom AG | | 1,721,617 | 36,848,674 |
| Elisa Corp. (A Shares) | | 150,341 | 7,380,018 |
| | | | 73,223,825 |
| Entertainment - 0.1% | | | |
| Capcom Co. Ltd. | | 377,800 | 15,951,238 |
| Sea Ltd. ADR (b) | | 256,150 | 9,638,925 |
| Universal Music Group NV | | 248,942 | 6,172,062 |
| | | | 31,762,225 |
| Interactive Media & Services - 0.3% | | | |
| carsales.com Ltd. | | 1,848,469 | 34,422,343 |
| Z Holdings Corp. | | 7,751,700 | 23,325,161 |
| | | | 57,747,504 |
| Media - 0.1% | | | |
| Vivendi SA | | 1,200,100 | 10,944,172 |
| WPP PLC | | 2,135,162 | 20,696,990 |
| | | | 31,641,162 |
| Wireless Telecommunication Services - 0.1% | | | |
| SoftBank Group Corp. | | 466,100 | 20,888,960 |
TOTAL COMMUNICATION SERVICES | | | 215,263,676 |
| CONSUMER DISCRETIONARY - 2.7% | | | |
| Automobile Components - 0.2% | | | |
| DENSO Corp. | | 760,800 | 52,076,066 |
| Automobiles - 0.9% | | | |
| Ferrari NV (Italy) | | 33,302 | 10,580,530 |
| Mercedes-Benz Group AG (Germany) | | 465,930 | 34,094,314 |
| Suzuki Motor Corp. | | 1,121,000 | 44,186,639 |
| Toyota Motor Corp. | | 6,469,300 | 111,460,301 |
| | | | 200,321,784 |
| Broadline Retail - 0.2% | | | |
| B&M European Value Retail SA | | 2,471,881 | 18,086,844 |
| Pan Pacific International Holdings Ltd. | | 546,600 | 10,911,713 |
| Prosus NV | | 186,883 | 12,890,141 |
| | | | 41,888,698 |
| Hotels, Restaurants & Leisure - 0.2% | | | |
| Compass Group PLC | | 498,359 | 12,566,992 |
| Deliveroo PLC Class A (a)(b) | | 3,996,371 | 5,725,804 |
| Flight Centre Travel Group Ltd. (c) | | 1,625,828 | 22,248,975 |
| Flutter Entertainment PLC (b) | | 38,600 | 7,046,271 |
| Flutter Entertainment PLC (Ireland) (b) | | 58,142 | 10,585,470 |
| | | | 58,173,512 |
| Household Durables - 0.3% | | | |
| Barratt Developments PLC | | 3,203,179 | 18,393,949 |
| Berkeley Group Holdings PLC | | 228,237 | 11,741,595 |
| Sony Group Corp. | | 459,700 | 38,243,597 |
| | | | 68,379,141 |
| Leisure Products - 0.1% | | | |
| Bandai Namco Holdings, Inc. | | 573,000 | 13,319,262 |
| Specialty Retail - 0.2% | | | |
| Fast Retailing Co. Ltd. | | 131,100 | 30,167,552 |
| JD Sports Fashion PLC | | 6,517,770 | 11,992,873 |
| | | | 42,160,425 |
| Textiles, Apparel & Luxury Goods - 0.6% | | | |
| Compagnie Financiere Richemont SA Series A | | 374,870 | 53,172,164 |
| Hermes International SCA | | 10,282 | 21,192,564 |
| LVMH Moet Hennessy Louis Vuitton SE | | 89,872 | 76,000,941 |
| | | | 150,365,669 |
TOTAL CONSUMER DISCRETIONARY | | | 626,684,557 |
| CONSUMER STAPLES - 1.6% | | | |
| Beverages - 0.5% | | | |
| Carlsberg A/S Series B | | 143,209 | 20,752,814 |
| Coca-Cola HBC AG | | 456,540 | 13,174,696 |
| Davide Campari Milano NV | | 789,175 | 10,328,805 |
| Diageo PLC | | 1,123,354 | 46,004,739 |
| Pernod Ricard SA | | 96,612 | 18,982,734 |
| | | | 109,243,788 |
| Consumer Staples Distribution & Retail - 0.0% | | | |
| Kobe Bussan Co. Ltd. | | 354,500 | 8,829,912 |
| Food Products - 0.7% | | | |
| Ajinomoto Co., Inc. | | 605,800 | 25,702,625 |
| Nestle SA (Reg. S) | | 924,367 | 111,145,352 |
| Tate & Lyle PLC | | 2,255,092 | 20,182,943 |
| | | | 157,030,920 |
| Personal Care Products - 0.4% | | | |
| Haleon PLC | | 4,034,022 | 16,517,483 |
| L'Oreal SA | | 101,604 | 44,708,730 |
| Unilever PLC | | 565,005 | 28,854,391 |
| | | | 90,080,604 |
| Tobacco - 0.0% | | | |
| Imperial Brands PLC | | 367,535 | 8,321,578 |
TOTAL CONSUMER STAPLES | | | 373,506,802 |
| ENERGY - 1.9% | | | |
| Energy Equipment & Services - 0.0% | | | |
| John Wood Group PLC (b) | | 2,857,261 | 5,784,086 |
| Oil, Gas & Consumable Fuels - 1.9% | | | |
| Eni SpA | | 1,832,200 | 28,329,481 |
| Equinor ASA | | 804,517 | 24,707,710 |
| INPEX Corp. | | 2,952,700 | 41,298,632 |
| Reliance Industries Ltd. GDR (a) | | 201,900 | 11,730,390 |
| Santos Ltd. | | 6,949,917 | 34,388,448 |
| Shell PLC: | | | |
| ADR | | 1,269,900 | 78,848,091 |
| (London) | | 1,005,349 | 30,738,823 |
| rights (b)(d) | | 948,349 | 313,904 |
| Thungela Resources Ltd. (c) | | 106,900 | 843,943 |
| TotalEnergies SE | | 1,951,295 | 122,402,565 |
| Woodside Energy Group Ltd. | | 2,127,451 | 51,031,399 |
| | | | 424,633,386 |
TOTAL ENERGY | | | 430,417,472 |
| FINANCIALS - 6.2% | | | |
| Banks - 3.1% | | | |
| Banco Santander SA (Spain) | | 12,931,376 | 50,479,046 |
| Bank of Ireland Group PLC | | 3,482,259 | 34,731,534 |
| Bank of Kyoto Ltd. | | 173,200 | 10,025,708 |
| Bankinter SA | | 1,324,825 | 8,498,772 |
| BNP Paribas SA | | 1,159,532 | 74,984,211 |
| CaixaBank SA | | 8,606,518 | 34,858,449 |
| FinecoBank SpA | | 856,314 | 11,755,368 |
| HSBC Holdings PLC (United Kingdom) | | 1,286,400 | 9,490,052 |
| ING Groep NV (Certificaten Van Aandelen) | | 1,122,699 | 15,947,923 |
| KBC Group NV | | 579,721 | 38,069,256 |
| Lloyds Banking Group PLC | | 39,807,759 | 21,267,829 |
| Mediobanca SpA | | 1,423,600 | 18,632,226 |
| Mitsubishi UFJ Financial Group, Inc. | | 4,710,700 | 37,580,459 |
| Mizuho Financial Group, Inc. | | 2,319,800 | 38,228,046 |
| NatWest Group PLC | | 5,182,187 | 15,070,230 |
| Nordea Bank Abp | | 2,724,915 | 29,910,973 |
| PT Bank Rakyat Indonesia (Persero) Tbk | | 29,517,900 | 10,756,687 |
| Standard Chartered PLC (United Kingdom) | | 7,288,010 | 65,698,122 |
| Sumitomo Mitsui Financial Group, Inc. | | 1,658,500 | 75,820,769 |
| Unicaja Banco SA (a) | | 3,571,800 | 3,950,543 |
| UniCredit SpA | | 2,313,660 | 56,367,969 |
| United Overseas Bank Ltd. | | 1,601,703 | 33,706,340 |
| Westpac Banking Corp. | | 1,121,656 | 15,952,755 |
| | | | 711,783,267 |
| Capital Markets - 0.9% | | | |
| 3i Group PLC | | 414,829 | 10,475,950 |
| London Stock Exchange Group PLC | | 103,086 | 10,664,680 |
| Macquarie Group Ltd. | | 547,167 | 62,940,928 |
| Nordnet AB | | 475,741 | 6,174,617 |
| Partners Group Holding AG | | 17,600 | 19,031,550 |
| UBS Group AG | | 1,945,507 | 51,756,851 |
| UBS Group AG | | 1,618,100 | 43,219,451 |
| | | | 204,264,027 |
| Financial Services - 0.4% | | | |
| Adyen BV (a)(b) | | 7,135 | 5,957,878 |
| Edenred SA | | 179,342 | 11,442,585 |
| Investor AB (B Shares) | | 2,954,842 | 56,972,841 |
| ORIX Corp. | | 1,108,200 | 20,717,578 |
| Worldline SA (a)(b) | | 119,401 | 3,894,532 |
| | | | 98,985,414 |
| Insurance - 1.8% | | | |
| AIA Group Ltd. | | 4,707,800 | 42,597,398 |
| Allianz SE | | 183,937 | 44,711,247 |
| AXA SA | | 2,143,170 | 64,391,290 |
| Beazley PLC | | 1,222,700 | 8,457,083 |
| Hannover Reuck SE | | 103,800 | 22,089,023 |
| Hiscox Ltd. | | 811,788 | 10,258,021 |
| Muenchener Rueckversicherungs-Gesellschaft AG in Muenchen | | 161,304 | 62,652,759 |
| Prudential PLC | | 3,363,872 | 40,968,818 |
| Sampo Oyj (A Shares) | | 367,000 | 16,129,175 |
| Steadfast Group Ltd. | | 3,030,280 | 11,073,970 |
| Swiss Life Holding AG | | 21,020 | 13,197,138 |
| Tokio Marine Holdings, Inc. | | 1,209,800 | 26,698,476 |
| Zurich Insurance Group Ltd. | | 99,681 | 46,830,379 |
| | | | 410,054,777 |
TOTAL FINANCIALS | | | 1,425,087,485 |
| HEALTH CARE - 2.8% | | | |
| Biotechnology - 0.1% | | | |
| Argenx SE (b) | | 68,843 | 34,599,399 |
| Health Care Equipment & Supplies - 0.3% | | | |
| EssilorLuxottica SA | | 129,491 | 24,417,919 |
| Hoya Corp. | | 296,000 | 32,866,284 |
| Siemens Healthineers AG (a) | | 243,786 | 12,226,157 |
| | | | 69,510,360 |
| Health Care Providers & Services - 0.1% | | | |
| Fresenius SE & Co. KGaA | | 971,137 | 31,180,882 |
| Pharmaceuticals - 2.3% | | | |
| AstraZeneca PLC (United Kingdom) | | 816,199 | 109,634,078 |
| Bayer AG | | 301,500 | 16,495,826 |
| Daiichi Sankyo Kabushiki Kaisha | | 1,094,300 | 32,231,142 |
| Eisai Co. Ltd. | | 410,500 | 26,120,547 |
| Euroapi SASU (b) | | 17,269 | 235,100 |
| Merck KGaA | | 150,475 | 27,085,816 |
| Novo Nordisk A/S Series B | | 594,599 | 109,676,009 |
| Roche Holding AG (participation certificate) | | 189,693 | 55,672,699 |
| Sanofi SA | | 1,005,967 | 107,139,480 |
| UCB SA | | 411,539 | 36,949,692 |
| | | | 521,240,389 |
TOTAL HEALTH CARE | | | 656,531,030 |
| INDUSTRIALS - 4.0% | | | |
| Aerospace & Defense - 0.8% | | | |
| Airbus Group NV | | 233,489 | 34,161,092 |
| BAE Systems PLC | | 5,412,475 | 68,888,744 |
| Dassault Aviation SA | | 96,072 | 18,918,302 |
| Rheinmetall AG | | 181,199 | 49,376,212 |
| Rolls-Royce Holdings PLC (b) | | 2,334,100 | 6,547,907 |
| Thales SA | | 56,795 | 8,301,747 |
| | | | 186,194,004 |
| Air Freight & Logistics - 0.4% | | | |
| DHL Group | | 1,638,628 | 76,555,422 |
| DSV A/S | | 152,198 | 28,953,294 |
| | | | 105,508,716 |
| Building Products - 0.1% | | | |
| ASSA ABLOY AB (B Shares) | | 530,805 | 11,946,264 |
| Kingspan Group PLC (Ireland) | | 134,126 | 11,355,918 |
| | | | 23,302,182 |
| Commercial Services & Supplies - 0.1% | | | |
| Rentokil Initial PLC | | 2,836,158 | 21,593,008 |
| Construction & Engineering - 0.2% | | | |
| Ferrovial SE | | 343,677 | 10,900,485 |
| VINCI SA | | 258,844 | 28,832,137 |
| | | | 39,732,622 |
| Electrical Equipment - 0.2% | | | |
| Fuji Electric Co. Ltd. | | 263,800 | 12,465,205 |
| Legrand SA | | 129,510 | 12,793,553 |
| Prysmian SpA | | 527,995 | 21,635,961 |
| | | | 46,894,719 |
| Industrial Conglomerates - 0.8% | | | |
| Hitachi Ltd. | | 1,656,100 | 110,342,166 |
| Siemens AG | | 538,842 | 80,950,680 |
| | | | 191,292,846 |
| Machinery - 0.5% | | | |
| Indutrade AB | | 595,319 | 11,456,703 |
| Kawasaki Heavy Industries Ltd. | | 755,700 | 19,420,340 |
| Minebea Mitsumi, Inc. | | 1,306,000 | 22,220,715 |
| Misumi Group, Inc. | | 464,623 | 8,122,400 |
| Mitsubishi Heavy Industries Ltd. | | 310,200 | 17,631,905 |
| Sandvik AB | | 1,091,210 | 20,636,764 |
| SMC Corp. | | 19,100 | 9,284,912 |
| Techtronic Industries Co. Ltd. | | 1,182,000 | 11,680,810 |
| | | | 120,454,549 |
| Passenger Airlines - 0.1% | | | |
| Ryanair Holdings PLC sponsored ADR (b) | | 137,600 | 13,656,800 |
| Professional Services - 0.2% | | | |
| Experian PLC | | 244,405 | 8,551,490 |
| Recruit Holdings Co. Ltd. | | 255,300 | 9,094,424 |
| RELX PLC (London Stock Exchange) | | 548,746 | 17,886,250 |
| Teleperformance | | 33,900 | 4,699,698 |
| | | | 40,231,862 |
| Trading Companies & Distributors - 0.5% | | | |
| Bunzl PLC | | 650,820 | 23,332,183 |
| Ferguson PLC | | 71,900 | 11,699,601 |
| IMCD NV | | 85,666 | 11,820,498 |
| Itochu Corp. | | 1,246,700 | 46,887,813 |
| Mitsubishi Corp. | | 539,500 | 26,682,993 |
| | | | 120,423,088 |
| Transportation Infrastructure - 0.1% | | | |
| Aena SME SA (a) | | 110,319 | 17,345,539 |
TOTAL INDUSTRIALS | | | 926,629,935 |
| INFORMATION TECHNOLOGY - 1.9% | | | |
| Electronic Equipment, Instruments & Components - 0.2% | | | |
| Azbil Corp. | | 205,864 | 6,876,518 |
| Ibiden Co. Ltd. | | 161,200 | 9,741,025 |
| Keyence Corp. | | 67,200 | 27,952,466 |
| | | | 44,570,009 |
| IT Services - 0.4% | | | |
| ALTEN | | 58,400 | 8,314,709 |
| Capgemini SA | | 188,576 | 35,192,294 |
| Fujitsu Ltd. | | 265,000 | 33,158,012 |
| Net One Systems Co. Ltd. | | 355,100 | 6,968,009 |
| TIS, Inc. | | 253,900 | 5,997,830 |
| | | | 89,630,854 |
| Semiconductors & Semiconductor Equipment - 0.8% | | | |
| Advantest Corp. | | 75,100 | 9,451,053 |
| ASML Holding NV (Netherlands) | | 116,602 | 76,669,099 |
| Infineon Technologies AG | | 669,714 | 23,932,678 |
| Renesas Electronics Corp. (b) | | 3,431,400 | 57,165,990 |
| Sumco Corp. | | 788,600 | 10,552,969 |
| Tokyo Electron Ltd. | | 111,300 | 16,530,907 |
| | | | 194,302,696 |
| Software - 0.2% | | | |
| Sage Group PLC | | 1,482,526 | 18,236,001 |
| SAP SE | | 155,214 | 21,653,039 |
| | | | 39,889,040 |
| Technology Hardware, Storage & Peripherals - 0.3% | | | |
| FUJIFILM Holdings Corp. | | 837,600 | 49,589,927 |
| Samsung Electronics Co. Ltd. | | 280,600 | 14,168,562 |
| | | | 63,758,489 |
TOTAL INFORMATION TECHNOLOGY | | | 432,151,088 |
| MATERIALS - 2.2% | | | |
| Chemicals - 0.9% | | | |
| Air Liquide SA | | 370,692 | 66,975,220 |
| Covestro AG (a)(b) | | 115,300 | 6,135,004 |
| Linde PLC | | 62,300 | 24,112,592 |
| NOF Corp. | | 352,700 | 15,931,437 |
| Nutrien Ltd. | | 93,800 | 5,941,639 |
| Shin-Etsu Chemical Co. Ltd. | | 2,148,900 | 68,493,535 |
| Sika AG | | 115,573 | 32,761,056 |
| | | | 220,350,483 |
| Construction Materials - 0.4% | | | |
| CRH PLC | | 1,269,029 | 73,011,890 |
| Holcim AG | | 172,909 | 11,462,672 |
| | | | 84,474,562 |
| Metals & Mining - 0.9% | | | |
| Alleima AB | | 67,120 | 307,875 |
| Anglo American PLC (United Kingdom) | | 1,498,262 | 39,841,313 |
| ArcelorMittal SA (Netherlands) | | 695,122 | 18,489,623 |
| BHP Group Ltd. | | 2,078,549 | 60,403,793 |
| Glencore PLC | | 13,833,500 | 73,856,069 |
| Newcrest Mining Ltd. | | 1,291,419 | 21,523,636 |
| | | | 214,422,309 |
TOTAL MATERIALS | | | 519,247,354 |
| REAL ESTATE - 0.5% | | | |
| Equity Real Estate Investment Trusts (REITs) - 0.2% | | | |
| Goodman Group unit | | 627,881 | 9,503,677 |
| National Storage REIT unit | | 11,398,075 | 17,134,088 |
| Unibail-Rodamco-Westfield NV (b) | | 187,855 | 10,060,771 |
| Warehouses de Pauw | | 612,526 | 17,534,684 |
| | | | 54,233,220 |
| Real Estate Management & Development - 0.3% | | | |
| CK Asset Holdings Ltd. | | 3,273,000 | 18,071,229 |
| Kerry Properties Ltd. | | 4,751,500 | 8,785,217 |
| Mitsubishi Estate Co. Ltd. | | 774,300 | 9,862,265 |
| Sino Land Ltd. | | 10,950,327 | 12,552,799 |
| Vonovia SE | | 321,460 | 7,712,879 |
| | | | 56,984,389 |
TOTAL REAL ESTATE | | | 111,217,609 |
| UTILITIES - 0.6% | | | |
| Electric Utilities - 0.3% | | | |
| Iberdrola SA | | 1,128,360 | 13,385,434 |
| Kansai Electric Power Co., Inc. | | 3,429,300 | 48,883,936 |
| ORSTED A/S (a) | | 143,134 | 9,215,171 |
| | | | 71,484,541 |
| Independent Power and Renewable Electricity Producers - 0.2% | | | |
| RWE AG | | 1,154,359 | 47,640,813 |
| Multi-Utilities - 0.1% | | | |
| National Grid PLC | | 1,888,707 | 23,575,608 |
TOTAL UTILITIES | | | 142,700,962 |
| TOTAL COMMON STOCKS (Cost $5,352,125,866) | | | 5,859,437,970 |
| | | | |
| Nonconvertible Preferred Stocks - 0.1% |
| | | Shares | Value ($) |
| CONSUMER DISCRETIONARY - 0.1% | | | |
| Automobiles - 0.1% | | | |
Porsche Automobil Holding SE (Germany) (Cost $43,949,874) | | 623,254 | 33,429,490 |
| | | | |
| Equity Funds - 69.0% |
| | | Shares | Value ($) |
| Foreign Large Blend Funds - 14.4% | | | |
| Fidelity Pacific Basin Fund (e) | | 3,631,096 | 108,351,919 |
| Fidelity SAI International Index Fund (e) | | 100,771,937 | 1,312,050,622 |
| Fidelity SAI International Low Volatility Index Fund (e) | | 181,029,176 | 1,911,668,103 |
TOTAL FOREIGN LARGE BLEND FUNDS | | | 3,332,070,644 |
| Foreign Large Growth Funds - 35.2% | | | |
| Fidelity Advisor International Discovery Fund Class Z (e) | | 47,845,841 | 2,041,103,596 |
| Fidelity Diversified International Fund (e) | | 43,859,439 | 1,784,201,992 |
| Fidelity International Capital Appreciation Fund (e) | | 66,221,018 | 1,598,575,382 |
| Fidelity Overseas Fund (e) | | 40,641,310 | 2,296,233,993 |
| Fidelity SAI International Momentum Index Fund (e) | | 24,309,817 | 303,386,510 |
| Fidelity SAI International Quality Index Fund (e) | | 8,942,764 | 103,825,492 |
TOTAL FOREIGN LARGE GROWTH FUNDS | | | 8,127,326,965 |
| Foreign Large Value Funds - 14.9% | | | |
| Fidelity SAI International Value Index Fund (e) | | 368,227,263 | 3,450,289,447 |
| Foreign Small Mid Blend Funds - 2.1% | | | |
| Fidelity SAI International Small Cap Index Fund (e) | | 58,897,441 | 472,357,475 |
| Foreign Small Mid Growth Funds - 0.5% | | | |
| Fidelity Advisor International Small Cap Opportunities Fund Class Z (e) | | 5,604,985 | 105,934,216 |
| Sector Funds - 0.3% | | | |
| Fidelity Advisor International Real Estate Fund Class Z (e) | | 7,653,374 | 75,156,129 |
| Other - 1.6% | | | |
| Fidelity Advisor Japan Fund Class Z (e) | | 20,234,268 | 322,534,239 |
| Fidelity Japan Smaller Companies Fund (e) | | 2,899,753 | 43,670,284 |
| Fidelity SAI Japan Stock Index Fund (e) | | 1,194,554 | 11,049,626 |
TOTAL OTHER | | | 377,254,149 |
| TOTAL EQUITY FUNDS (Cost $15,133,934,815) | | | 15,940,389,025 |
| | | | |
| Other - 0.0% |
| | | Shares | Value ($) |
| Commodity Funds - Broad Basket - 0.0% | | | |
Fidelity SAI Inflation-Focused Fund (e) (Cost $1,027) | | 131 | 1,240 |
| | | | |
| U.S. Treasury Obligations - 0.2% |
| | | Principal Amount (f) | Value ($) |
U.S. Treasury Bills, yield at date of purchase 5.12% to 5.39% 9/7/23 to 11/30/23 (g) (Cost $35,811,747) | | 35,950,000 | 35,810,900 |
| | | | |
| Money Market Funds - 5.3% |
| | | Shares | Value ($) |
| Fidelity Cash Central Fund 5.43% (h) | | 93,164,939 | 93,183,572 |
| Fidelity Securities Lending Cash Central Fund 5.44% (h)(i) | | 16,477,540 | 16,479,188 |
| State Street Institutional U.S. Government Money Market Fund Premier Class 5.28% (j) | | 1,122,208,985 | 1,122,208,985 |
| TOTAL MONEY MARKET FUNDS (Cost $1,231,871,745) | | | 1,231,871,745 |
| | | | |
| TOTAL INVESTMENT IN SECURITIES - 99.9% (Cost $21,797,695,074) | 23,100,940,370 |
NET OTHER ASSETS (LIABILITIES) - 0.1% | 19,051,665 |
| NET ASSETS - 100.0% | 23,119,992,035 |
| | |
| Futures Contracts |
| | Number of contracts | Expiration Date | Notional Amount ($) | Value ($) | Unrealized Appreciation/ (Depreciation) ($) |
| Purchased | | | | | |
| | | | | | |
| Equity Index Contracts | | | | | |
| CME Nikkei 225 Index Contracts (United States) | 250 | Sep 2023 | 40,625,000 | 576,901 | 576,901 |
| ICE MSCI EAFE Index Contracts (United States) | 10,310 | Sep 2023 | 1,087,344,150 | (16,729,164) | (16,729,164) |
| | | | | | |
| TOTAL FUTURES CONTRACTS | | | | | (16,152,263) |
| The notional amount of futures purchased as a percentage of Net Assets is 4.9% |
Legend
| (a) | Security exempt from registration under Rule 144A of the Securities Act of 1933. These securities may be resold in transactions exempt from registration, normally to qualified institutional buyers. At the end of the period, the value of these securities amounted to $105,176,151 or 0.5% of net assets. |
| (c) | Security or a portion of the security is on loan at period end. |
| (d) | Security or a portion of the security purchased on a delayed delivery or when-issued basis. |
| (f) | Amount is stated in United States dollars unless otherwise noted. |
| (g) | Security or a portion of the security was pledged to cover margin requirements for futures contracts. At period end, the value of securities pledged amounted to $35,810,900. |
| (h) | Affiliated fund that is generally available only to investment companies and other accounts managed by Fidelity Investments. The rate quoted is the annualized seven-day yield of the fund at period end. A complete unaudited listing of the fund's holdings as of its most recent quarter end is available upon request. In addition, each Fidelity Central Fund's financial statements are available on the SEC's website or upon request. |
| (i) | Investment made with cash collateral received from securities on loan. |
| (j) | The rate quoted is the annualized seven-day yield of the fund at period end. |
Affiliated Central Funds
Fiscal year to date information regarding the Fund's investments in Fidelity Central Funds, including the ownership percentage, is presented below.
| Affiliate | Value, beginning of period ($) | Purchases ($) | Sales Proceeds ($) | Dividend Income ($) | Realized Gain (loss) ($) | Change in Unrealized appreciation (depreciation) ($) | Value, end of period ($) | % ownership, end of period |
| Fidelity Cash Central Fund 5.43% | 81,228,114 | 800,347,238 | 788,391,780 | 1,908,458 | - | - | 93,183,572 | 0.2% |
| Fidelity Securities Lending Cash Central Fund 5.44% | 63,065,474 | 404,342,022 | 450,928,308 | 542,346 | - | - | 16,479,188 | 0.1% |
| Total | 144,293,588 | 1,204,689,260 | 1,239,320,088 | 2,450,804 | - | - | 109,662,760 | |
| | | | | | | | | |
Amounts in the dividend income column in the above table include any capital gain distributions from underlying funds, which are presented in the corresponding line item in the Statement of Operations, if applicable.
Amounts in the dividend income column for Fidelity Securities Lending Cash Central Fund represents the income earned on investing cash collateral, less rebates paid to borrowers and any lending agent fees associated with the loan, plus any premium payments received for lending certain types of securities.
Amounts included in the purchases and sales proceeds columns may include in-kind transactions, if applicable.
Affiliated Underlying Funds
Fiscal year to date information regarding the Fund's investments in affiliated Underlying Funds is presented below. Exchanges between classes of the same affiliated Underlying Funds may occur. If an Underlying Funds changes its name, the name presented below is the name in effect at period end.
| Affiliate | Value, beginning of period ($) | Purchases ($) | Sales Proceeds ($) | Dividend Income ($) | Realized Gain (loss) ($) | Change in Unrealized appreciation (depreciation) ($) | Value, end of period ($) |
| Fidelity Advisor International Discovery Fund Class Z | 1,956,894,915 | - | - | - | - | 84,208,681 | 2,041,103,596 |
| Fidelity Advisor International Real Estate Fund Class Z | 78,676,681 | - | - | - | - | (3,520,552) | 75,156,129 |
| Fidelity Advisor International Small Cap Opportunities Fund - Class Z | 104,645,069 | - | - | - | - | 1,289,147 | 105,934,216 |
| Fidelity Advisor Japan Fund Class Z | 369,028,981 | - | 75,000,000 | - | (10,843,037) | 39,348,295 | 322,534,239 |
| Fidelity Diversified International Fund | 1,685,079,660 | - | - | - | - | 99,122,332 | 1,784,201,992 |
| Fidelity International Capital Appreciation Fund | 1,484,013,020 | - | - | - | - | 114,562,362 | 1,598,575,382 |
| Fidelity Japan Smaller Companies Fund | 39,465,642 | - | - | - | - | 4,204,642 | 43,670,284 |
| Fidelity Overseas Fund | 2,184,876,804 | - | - | - | - | 111,357,189 | 2,296,233,993 |
| Fidelity Pacific Basin Fund | 136,555,327 | - | 32,000,000 | - | (2,651,129) | 6,447,721 | 108,351,919 |
| Fidelity SAI Inflation-Focused Fund | 12,162,626 | - | 12,003,811 | - | 513,226 | (670,801) | 1,240 |
| Fidelity SAI International Index Fund | 165,378,810 | 1,144,222,401 | - | - | - | 2,449,411 | 1,312,050,622 |
| Fidelity SAI International Low Volatility Index Fund | 1,179,763,482 | 654,999,999 | - | - | - | 76,904,622 | 1,911,668,103 |
| Fidelity SAI International Momentum Index Fund | 282,723,166 | - | - | - | - | 20,663,344 | 303,386,510 |
| Fidelity SAI International Quality Index Fund | 98,012,695 | - | - | - | - | 5,812,797 | 103,825,492 |
| Fidelity SAI International Small Cap Index Fund | 464,111,834 | - | - | - | - | 8,245,641 | 472,357,475 |
| Fidelity SAI International Value Index Fund | 3,864,706,011 | - | 602,500,000 | - | (51,895,502) | 239,978,938 | 3,450,289,447 |
| Fidelity SAI Japan Stock Index Fund | 89,132,420 | - | 85,000,006 | - | (10,593,817) | 17,511,029 | 11,049,626 |
| | 14,195,227,143 | 1,799,222,400 | 806,503,817 | - | (75,470,259) | 827,914,798 | 15,940,390,265 |
Amounts in the dividend income column in the above table include any capital gain distributions from underlying funds, which are presented in the corresponding line item in the Statement of Operations, if applicable.
Amounts included in the purchases and sales proceeds columns may include in-kind transactions, if applicable.
Investment Valuation
The following is a summary of the inputs used, as of August 31, 2023, involving the Fund's assets and liabilities carried at fair value. The inputs or methodology used for valuing securities may not be an indication of the risk associated with investing in those securities. For more information on valuation inputs, and their aggregation into the levels used below, please refer to the Investment Valuation section in the accompanying Notes to Financial Statements.
| Valuation Inputs at Reporting Date: |
| Description | Total ($) | Level 1 ($) | Level 2 ($) | Level 3 ($) |
Investments in Securities: | | | | |
|
| Equities: | | | | |
Communication Services | 215,263,676 | 130,656,990 | 84,606,686 | - |
Consumer Discretionary | 660,114,047 | 288,256,107 | 371,857,940 | - |
Consumer Staples | 373,506,802 | 162,663,259 | 210,843,543 | - |
Energy | 430,417,472 | 189,536,541 | 240,880,931 | - |
Financials | 1,425,087,485 | 774,950,638 | 650,136,847 | - |
Health Care | 656,531,030 | 191,082,397 | 465,448,633 | - |
Industrials | 926,629,935 | 616,807,753 | 309,822,182 | - |
Information Technology | 432,151,088 | 201,007,081 | 231,144,007 | - |
Materials | 519,247,354 | 249,401,760 | 269,845,594 | - |
Real Estate | 111,217,609 | 93,642,465 | 17,575,144 | - |
Utilities | 142,700,962 | 105,739,920 | 36,961,042 | - |
|
| Equity Funds | 15,940,389,025 | 15,940,389,025 | - | - |
|
| Other | 1,240 | 1,240 | - | - |
|
| Other Short-Term Investments and Net Other Assets | 35,810,900 | - | 35,810,900 | - |
|
| Money Market Funds | 1,231,871,745 | 1,231,871,745 | - | - |
| Total Investments in Securities: | 23,100,940,370 | 20,176,006,921 | 2,924,933,449 | - |
Derivative Instruments: | | | | |
|
| Assets | | | | |
Futures Contracts | 576,901 | 576,901 | - | - |
| Total Assets | 576,901 | 576,901 | - | - |
|
| Liabilities | | | | |
Futures Contracts | (16,729,164) | (16,729,164) | - | - |
| Total Liabilities | (16,729,164) | (16,729,164) | - | - |
| Total Derivative Instruments: | (16,152,263) | (16,152,263) | - | - |
Value of Derivative Instruments
The following table is a summary of the Fund's value of derivative instruments by primary risk exposure as of August 31, 2023. For additional information on derivative instruments, please refer to the Derivative Instruments section in the accompanying Notes to Financial Statements.
Primary Risk Exposure / Derivative Type | Value |
| Asset ($) | Liability ($) |
| Equity Risk | | |
Futures Contracts (a) | 576,901 | (16,729,164) |
| Total Equity Risk | 576,901 | (16,729,164) |
| Total Value of Derivatives | 576,901 | (16,729,164) |
(a)Reflects gross cumulative appreciation (depreciation) on futures contracts as presented in the Schedule of Investments. In the Statement of Assets and Liabilities, the period end daily variation margin is included in receivable or payable for daily variation margin on futures contracts, and the net cumulative appreciation (depreciation) is included in Total accumulated earnings (loss).
| Statement of Assets and Liabilities |
| | | | August 31, 2023 (Unaudited) |
| | | | | |
| Assets | | | | |
| Investment in securities, at value (including securities loaned of $15,124,158) - See accompanying schedule: | | | | |
Unaffiliated issuers (cost $6,554,096,472) | $ | 7,050,887,345 | | |
Fidelity Central Funds (cost $109,662,760) | | 109,662,760 | | |
Other affiliated issuers (cost $15,133,935,842) | | 15,940,390,265 | | |
| | | | | |
| | | | | |
| Total Investment in Securities (cost $21,797,695,074) | | | $ | 23,100,940,370 |
| Foreign currency held at value (cost $298,056) | | | | 298,062 |
| Receivable for investments sold | | | | 12,596,006 |
| Receivable for fund shares sold | | | | 25,432,334 |
| Dividends receivable | | | | 22,164,068 |
| Interest receivable | | | | 5,827,786 |
| Distributions receivable from Fidelity Central Funds | | | | 462,481 |
| Prepaid expenses | | | | 34,635 |
| Other receivables | | | | 79,153 |
Total assets | | | | 23,167,834,895 |
| Liabilities | | | | |
| Payable for investments purchased | | | | |
Regular delivery | $ | 14,648,374 | | |
Delayed delivery | | 313,904 | | |
| Payable for fund shares redeemed | | 9,722,042 | | |
| Accrued management fee | | 1,302,840 | | |
| Payable for daily variation margin on futures contracts | | 5,200,244 | | |
| Other payables and accrued expenses | | 176,268 | | |
| Collateral on securities loaned | | 16,479,188 | | |
| Total Liabilities | | | | 47,842,860 |
| Net Assets | | | $ | 23,119,992,035 |
| Net Assets consist of: | | | | |
| Paid in capital | | | $ | 22,908,831,633 |
| Total accumulated earnings (loss) | | | | 211,160,402 |
| Net Assets | | | $ | 23,119,992,035 |
Net Asset Value, offering price and redemption price per share ($23,119,992,035 ÷ 2,076,211,950 shares) | | | $ | 11.14 |
| Statement of Operations |
| | | | Six months ended August 31, 2023 (Unaudited) |
| Investment Income | | | | |
| Dividends: | | | | |
| Unaffiliated issuers | | | $ | 129,362,539 |
| Interest | | | | 32,313,134 |
| Income from Fidelity Central Funds (including $542,346 from security lending) | | | | 2,450,804 |
| Income before foreign taxes withheld | | | $ | 164,126,477 |
| Less foreign taxes withheld | | | | (12,675,815) |
| Total Income | | | | 151,450,662 |
| Expenses | | | | |
| Management fee | $ | 34,842,065 | | |
| Custodian fees and expenses | | 185,019 | | |
| Independent trustees' fees and expenses | | 65,677 | | |
| Registration fees | | 337,585 | | |
| Audit | | 45,172 | | |
| Legal | | 17,993 | | |
| Miscellaneous | | 69,004 | | |
| Total expenses before reductions | | 35,562,515 | | |
| Expense reductions | | (27,335,348) | | |
| Total expenses after reductions | | | | 8,227,167 |
| Net Investment income (loss) | | | | 143,223,495 |
| Realized and Unrealized Gain (Loss) | | | | |
| Net realized gain (loss) on: | | | | |
| Investment Securities: | | | | |
| Unaffiliated issuers | | (80,771,666) | | |
| Affiliated issuers | | (75,470,259) | | |
| Foreign currency transactions | | (557,521) | | |
| Futures contracts | | 33,252,277 | | |
| Total net realized gain (loss) | | | | (123,547,169) |
| Change in net unrealized appreciation (depreciation) on: | | | | |
| Investment Securities: | | | | |
| Unaffiliated issuers | | 270,980,902 | | |
| Affiliated issuers | | 827,914,798 | | |
| Assets and liabilities in foreign currencies | | 284,754 | | |
| Futures contracts | | (16,247,647) | | |
| Total change in net unrealized appreciation (depreciation) | | | | 1,082,932,807 |
| Net gain (loss) | | | | 959,385,638 |
| Net increase (decrease) in net assets resulting from operations | | | $ | 1,102,609,133 |
| Statement of Changes in Net Assets |
| |
| | Six months ended August 31, 2023 (Unaudited) | | Year ended February 28, 2023 |
| Increase (Decrease) in Net Assets | | | | |
| Operations | | | | |
| Net investment income (loss) | $ | 143,223,495 | $ | 411,623,331 |
| Net realized gain (loss) | | (123,547,169) | | (1,055,181,421) |
| Change in net unrealized appreciation (depreciation) | | 1,082,932,807 | | (893,194,304) |
| Net increase (decrease) in net assets resulting from operations | | 1,102,609,133 | | (1,536,752,394) |
| Distributions to shareholders | | - | | (932,369,267) |
| | | | | |
| Share transactions | | | | |
| Proceeds from sales of shares | | 3,636,206,397 | | 6,042,249,354 |
| Reinvestment of distributions | | - | | 908,934,682 |
| Cost of shares redeemed | | (1,948,508,572) | | (8,739,005,114) |
| | | | | |
Net increase (decrease) in net assets resulting from share transactions | | 1,687,697,825 | | (1,787,821,078) |
| Total increase (decrease) in net assets | | 2,790,306,958 | | (4,256,942,739) |
| | | | | |
| Net Assets | | | | |
| Beginning of period | | 20,329,685,077 | | 24,586,627,816 |
| End of period | $ | 23,119,992,035 | $ | 20,329,685,077 |
| | | | | |
| Other Information | | | | |
| Shares | | | | |
| Sold | | 329,138,459 | | 582,743,564 |
| Issued in reinvestment of distributions | | - | | 84,478,706 |
| Redeemed | | (177,360,050) | | (851,489,717) |
| Net increase (decrease) | | 151,778,409 | | (184,267,447) |
| | | | | |
Financial Highlights
| Strategic Advisers® Fidelity® International Fund |
| |
| | Six months ended (Unaudited) August 31, 2023 | | Years ended February 28, 2023 | | 2022 | | 2021 | | 2020 A | | 2019 |
Selected Per-Share Data | | | | | | | | | | | | |
| Net asset value, beginning of period | $ | 10.56 | $ | 11.66 | $ | 12.16 | $ | 9.84 | $ | 9.66 | $ | 10.69 |
| Income from Investment Operations | | | | | | | | | | | | |
Net investment income (loss) B,C | | .07 | | .21 | | .27 | | .10 | | .20 | | .16 |
| Net realized and unrealized gain (loss) | | .51 | | (.84) | | (.03) | | 2.37 | | .31 | | (.85) |
| Total from investment operations | | .58 | | (.63) | | .24 | | 2.47 | | .51 | | (.69) |
| Distributions from net investment income | | - | | (.21) | | (.25) | | (.08) | | (.19) | | (.15) |
| Distributions from net realized gain | | - | | (.26) | | (.49) | | (.07) | | (.14) | | (.20) |
| Total distributions | | - | | (.47) | | (.74) | | (.15) | | (.33) | | (.34) D |
| Net asset value, end of period | $ | 11.14 | $ | 10.56 | $ | 11.66 | $ | 12.16 | $ | 9.84 | $ | 9.66 |
Total Return E,F | | 5.49% | | (5.41)% | | 1.59% | | 25.35% | | 5.10% | | (6.41)% |
Ratios to Average Net Assets C,G,H | | | | | | | | | | | | |
| Expenses before reductions | | .33% I | | .32% | | .30% | | .28% | | .29% | | .35% |
| Expenses net of fee waivers, if any | | .08% I | | .07% | | .05% | | .03% | | .04% | | .10% |
| Expenses net of all reductions | | .08% I | | .07% | | .05% | | .03% | | .04% | | .09% |
| Net investment income (loss) | | 1.31% I | | 2.02% | | 2.09% | | .93% | | 1.97% | | 1.65% |
| Supplemental Data | | | | | | | | | | | | |
| Net assets, end of period (000 omitted) | $ | 23,119,992 | $ | 20,329,685 | $ | 24,586,628 | $ | 16,450,240 | $ | 8,776,005 | $ | 6,342,369 |
Portfolio turnover rate J | | 18% I | | 16% | | 17% | | 6% | | 6% | | 9% |
AFor the year ended February 29.
BCalculated based on average shares outstanding during the period.
CNet investment income (loss) is affected by the timing of the declaration of dividends by any underlying mutual funds or exchange-traded funds (ETFs). Net investment income (loss) of any mutual funds or ETFs is not included in the Fund's net investment income (loss) ratio.
DTotal distributions per share do not sum due to rounding.
ETotal returns for periods of less than one year are not annualized.
FTotal returns would have been lower if certain expenses had not been reduced during the applicable periods shown.
GFees and expenses of any underlying mutual funds or exchange-traded funds (ETFs) are not included in the Fund's expense ratio. The Fund indirectly bears its proportionate share of these expenses. For additional expense information related to investments in Fidelity Central Funds, please refer to the "Investments in Fidelity Central Funds" note found in the Notes to Financial Statements section of the most recent Annual or Semi-Annual report.
HExpense ratios reflect operating expenses of the class. Expenses before reductions do not reflect amounts reimbursed, waived, or reduced through arrangements with the investment adviser, brokerage services, or other offset arrangements, if applicable, and do not represent the amount paid by the class during periods when reimbursements, waivers or reductions occur.
IAnnualized.
JAmount does not include the portfolio activity of any underlying mutual funds or exchange-traded funds (ETFs).
For the period ended August 31, 2023
1. Organization.
Strategic Advisers Fidelity International Fund (the Fund) is a fund of Fidelity Rutland Square Trust II (the Trust), and is authorized to issue an unlimited number of shares. The Trust is registered under the Investment Company Act of 1940, as amended (the 1940 Act), as an open-end management investment company organized as a Delaware statutory trust. The Fund is offered exclusively to certain managed account clients of Strategic Advisers LLC (Strategic Advisers), an affiliate of Fidelity Management & Research Company LLC (FMR).
2. Significant Accounting Policies.
The Fund is an investment company and applies the accounting and reporting guidance of the Financial Accounting Standards Board (FASB) Accounting Standards Codification Topic 946 Financial Services - Investment Companies. The financial statements have been prepared in conformity with accounting principles generally accepted in the United States of America (GAAP), which require management to make certain estimates and assumptions at the date of the financial statements. Actual results could differ from those estimates. Subsequent events, if any, through the date that the financial statements were issued have been evaluated in the preparation of the financial statements. The Fund's Schedule of Investments lists any underlying mutual funds or exchange-traded funds (ETFs) but does not include the underlying holdings of these funds. The following summarizes the significant accounting policies of the Fund:
Investment Valuation. Investments are valued as of 4:00 p.m. Eastern time on the last calendar day of the period. The Board of Trustees (the Board) has designated the Fund's investment adviser as the valuation designee responsible for the fair valuation function and performing fair value determinations as needed. The investment adviser has established a Fair Value Committee (the Committee) to carry out the day-to-day fair valuation responsibilities and has adopted policies and procedures to govern the fair valuation process and the activities of the Committee. In accordance with these fair valuation policies and procedures, which have been approved by the Board, the Fund attempts to obtain prices from one or more third party pricing services or brokers to value its investments. When current market prices, quotations or currency exchange rates are not readily available or reliable, investments will be fair valued in good faith by the Committee, in accordance with the policies and procedures. Factors used in determining fair value vary by investment type and may include market or investment specific events, transaction data, estimated cash flows, and market observations of comparable investments. The frequency that the fair valuation procedures are used cannot be predicted and they may be utilized to a significant extent. The Committee manages the Fund's fair valuation practices and maintains the fair valuation policies and procedures. The Fund's investment adviser reports to the Board information regarding the fair valuation process and related material matters.
The Fund categorizes the inputs to valuation techniques used to value its investments into a disclosure hierarchy consisting of three levels as shown below:
Level 1 - unadjusted quoted prices in active markets for identical investments
Level 2 - other significant observable inputs (including quoted prices for similar investments, interest rates, prepayment speeds, etc.)
Level 3 - unobservable inputs (including the Fund's own assumptions based on the best information available)
Valuation techniques used to value the Fund's investments by major category are as follows:
Equity securities, including restricted securities, for which market quotations are readily available, are valued at the last reported sale price or official closing price as reported by a third party pricing service on the primary market or exchange on which they are traded and are categorized as Level 1 in the hierarchy. In the event there were no sales during the day or closing prices are not available, securities are valued at the last quoted bid price or may be valued using the last available price and are generally categorized as Level 2 in the hierarchy. For foreign equity securities, when market or security specific events arise, comparisons to the valuation of American Depositary Receipts (ADRs), futures contracts, ETFs and certain indexes as well as quoted prices for similar securities may be used and would be categorized as Level 2 in the hierarchy. For equity securities, including restricted securities, where observable inputs are limited, assumptions about market activity and risk are used and these securities may be categorized as Level 3 in the hierarchy.
Debt securities, including restricted securities, are valued based on evaluated prices received from third party pricing services or from brokers who make markets in such securities. U.S. government and government agency obligations are valued by pricing services who utilize matrix pricing which considers yield or price of bonds of comparable quality, coupon, maturity and type or by broker-supplied prices. When independent prices are unavailable or unreliable, debt securities may be valued utilizing pricing methodologies which consider similar factors that would be used by third party pricing services. Debt securities are generally categorized as Level 2 in the hierarchy but may be Level 3 depending on the circumstances.
Futures contracts are valued at the settlement price established each day by the board of trade or exchange on which they are traded and are categorized as Level 1 in the hierarchy. Investments in open-end mutual funds, including the Fidelity Central Funds, are valued at their closing net asset value (NAV) each business day and are categorized as Level 1 in the hierarchy. If an unaffiliated open-end mutual fund's NAV is unavailable, shares of that fund may be valued by another method that the Board believes reflects fair value in accordance with the Board's fair value pricing policies and is categorized as Level 2 in the hierarchy.
Changes in valuation techniques may result in transfers in or out of an assigned level within the disclosure hierarchy. The aggregate value of investments by input level as of August 31, 2023 is included at the end of the Fund's Schedule of Investments.
Foreign Currency. Certain Funds may use foreign currency contracts to facilitate transactions in foreign-denominated securities. Gains and losses from these transactions may arise from changes in the value of the foreign currency or if the counterparties do not perform under the contracts' terms.
Foreign-denominated assets, including investment securities, and liabilities are translated into U.S. dollars at the exchange rates at period end. Purchases and sales of investment securities, income and dividends received, and expenses denominated in foreign currencies are translated into U.S. dollars at the exchange rate in effect on the transaction date.
The effects of exchange rate fluctuations on investments are included with the net realized and unrealized gain (loss) on investment securities. Other foreign currency transactions resulting in realized and unrealized gain (loss) are disclosed separately.
Investment Transactions and Income. For financial reporting purposes, the Fund's investment holdings and NAV include trades executed through the end of the last business day of the period. The NAV per share for processing shareholder transactions is calculated as of the close of business of the New York Stock Exchange (NYSE), normally 4:00 p.m. Eastern time and includes trades executed through the end of the prior business day. Gains and losses on securities sold are determined on the basis of identified cost and include proceeds received from litigation. Commissions paid to certain brokers with whom the investment adviser, or its affiliates, places trades on behalf of a fund include an amount in addition to trade execution, which may be rebated back to a fund. Any such rebates are included in net realized gain (loss) on investments in the Statement of Operations. Dividend income is recorded on the ex-dividend date, except for certain dividends from foreign securities where the ex-dividend date may have passed, which are recorded as soon as the Fund is informed of the ex-dividend date. Non-cash dividends included in dividend income, if any, are recorded at the fair market value of the securities received. Income and capital gain distributions from Fidelity Central Funds, if any, are recorded on the ex-dividend date. Income and capital gain distributions from any underlying mutual funds or exchange-traded funds (ETFs) are recorded on the ex-dividend date. Interest income is accrued as earned and includes coupon interest and amortization of premium and accretion of discount on debt securities as applicable. Investment income is recorded net of foreign taxes withheld where recovery of such taxes is uncertain. Funds may file withholding tax reclaims in certain jurisdictions to recover a portion of amounts previously withheld. Any withholding tax reclaims income is included in the Statement of Operations in foreign taxes withheld. Any receivables for withholding tax reclaims are included in the Statement of Assets and Liabilities in dividends receivable.
Expenses. Expenses directly attributable to a fund are charged to that fund. Expenses attributable to more than one fund are allocated among the respective funds on the basis of relative net assets or other appropriate methods. Expenses included in the accompanying financial statements reflect the expenses of that fund and do not include any expenses associated with any underlying mutual funds or exchange-traded funds. Although not included in a fund's expenses, a fund indirectly bears its proportionate share of these expenses through the net asset value of each underlying mutual fund or exchange-traded fund. Expense estimates are accrued in the period to which they relate and adjustments are made when actual amounts are known.
Deferred Trustee Compensation. Under a Deferred Compensation Plan (the Plan) for certain Funds, certain independent Trustees have elected to defer receipt of a portion of their annual compensation. Deferred amounts are invested in affiliated mutual funds, are marked-to-market and remain in a fund until distributed in accordance with the Plan. The investment of deferred amounts and the offsetting payable to the Trustees presented below are included in the accompanying Statement of Assets and Liabilities in other receivables and other payables and accrued expenses, as applicable.
| Strategic Advisers Fidelity International Fund | $42,386 |
Income Tax Information and Distributions to Shareholders. Each year, the Fund intends to qualify as a regulated investment company under Subchapter M of the Internal Revenue Code, including distributing substantially all of its taxable income and realized gains. As a result, no provision for U.S. Federal income taxes is required. The Fund files a U.S. federal tax return, in addition to state and local tax returns as required. The Fund's federal income tax returns are subject to examination by the Internal Revenue Service (IRS) for a period of three fiscal years after they are filed. State and local tax returns may be subject to examination for an additional fiscal year depending on the jurisdiction. Foreign taxes are provided for based on the Fund's understanding of the tax rules and rates that exist in the foreign markets in which it invests.
Distributions are declared and recorded on the ex-dividend date. Income and capital gain distributions are determined in accordance with income tax regulations, which may differ from GAAP.
Capital accounts within the financial statements are adjusted for permanent book-tax differences. These adjustments have no impact on net assets or the results of operations. Capital accounts are not adjusted for temporary book-tax differences which will reverse in a subsequent period.
Book-tax differences are primarily due to futures contracts, foreign currency transactions, passive foreign investment companies (PFIC), capital loss carryforwards and losses deferred due to wash sales and excise tax regulations.
As of period end, the cost and unrealized appreciation (depreciation) in securities, and derivatives if applicable, for federal income tax purposes were as follows:
| Gross unrealized appreciation | $2,085,919,001 |
| Gross unrealized depreciation | (865,103,486) |
| Net unrealized appreciation (depreciation) | $1,220,815,515 |
| Tax cost | $21,863,972,592 |
Capital loss carryforwards are only available to offset future capital gains of the Fund to the extent provided by regulations and may be limited. The capital loss carryforward information presented below, including any applicable limitation, is estimated as of prior fiscal period end and is subject to adjustment.
Short-term | $(661,486,173) |
Long-term | (350,255,675) |
| Total capital loss carryforward | $(1,011,741,848) |
Delayed Delivery Transactions and When-Issued Securities. During the period, certain Funds transacted in securities on a delayed delivery or when-issued basis. Payment and delivery may take place after the customary settlement period for that security. The price of the underlying securities and the date when the securities will be delivered and paid for are fixed at the time the transaction is negotiated. Securities purchased on a delayed delivery or when-issued basis are identified as such in the Schedule of Investments. Compensation for interest forgone in the purchase of a delayed delivery or when-issued debt security may be received. With respect to purchase commitments, each applicable Fund identifies securities as segregated in its records with a value at least equal to the amount of the commitment. Payables and receivables associated with the purchases and sales of delayed delivery securities having the same coupon, settlement date and broker are offset. Delayed delivery or when-issued securities that have been purchased from and sold to different brokers are reflected as both payables and receivables in the Statement of Assets and Liabilities under the caption "Delayed delivery", as applicable. Losses may arise due to changes in the value of the underlying securities or if the counterparty does not perform under the contract's terms, or if the issuer does not issue the securities due to political, economic, or other factors.
Restricted Securities (including Private Placements). Funds may invest in securities that are subject to legal or contractual restrictions on resale. These securities generally may be resold in transactions exempt from registration or to the public if the securities are registered. Disposal of these securities may involve time-consuming negotiations and expense, and prompt sale at an acceptable price may be difficult. Information regarding restricted securities held at period end is included at the end of the Schedule of Investments, if applicable.
3. Derivative Instruments.
Risk Exposures and the Use of Derivative Instruments. The Fund's investment objectives allow for various types of derivative instruments, including futures contracts. Derivatives are investments whose value is primarily derived from underlying assets, indices or reference rates and may be transacted on an exchange or over-the-counter (OTC). Derivatives may involve a future commitment to buy or sell a specified asset based on specified terms, to exchange future cash flows at periodic intervals based on a notional principal amount, or for one party to make one or more payments upon the occurrence of specified events in exchange for periodic payments from the other party.
Derivatives were used to increase returns and to manage exposure to certain risks as defined below. The success of any strategy involving derivatives depends on analysis of numerous economic factors, and if the strategies for investment do not work as intended, the objectives may not be achieved.
Derivatives were used to increase or decrease exposure to the following risk(s):
| | |
| Equity Risk | Equity risk relates to the fluctuations in the value of financial instruments as a result of changes in market prices (other than those arising from interest rate risk or foreign exchange risk), whether caused by factors specific to an individual investment, its issuer, or all factors affecting all instruments traded in a market or market segment. |
Funds are also exposed to additional risks from investing in derivatives, such as liquidity risk and counterparty credit risk. Liquidity risk is the risk that a fund will be unable to close out the derivative in the open market in a timely manner. Counterparty credit risk is the risk that the counterparty will not be able to fulfill its obligation to a fund. Counterparty credit risk related to exchange-traded contracts may be mitigated by the protection provided by the exchange on which they trade.
Investing in derivatives may involve greater risks than investing in the underlying assets directly and, to varying degrees, may involve risk of loss in excess of any initial investment and collateral received and amounts recognized in the Statement of Assets and Liabilities. In addition, there may be the risk that the change in value of the derivative contract does not correspond to the change in value of the underlying instrument.
Futures Contracts. A futures contract is an agreement between two parties to buy or sell a specified underlying instrument for a fixed price at a specified future date. Futures contracts were used to manage exposure to the stock market.
Upon entering into a futures contract, a fund is required to deposit either cash or securities (initial margin) with a clearing broker in an amount equal to a certain percentage of the face value of the contract. Futures contracts are marked-to-market daily and subsequent daily payments are made or received by a fund depending on the daily fluctuations in the value of the futures contracts and are recorded as unrealized appreciation or (depreciation). This receivable and/or payable, if any, is included in daily variation margin on futures contracts in the Statement of Assets and Liabilities. Realized gain or (loss) is recorded upon the expiration or closing of a futures contract. The net realized gain (loss) and change in net unrealized appreciation (depreciation) on futures contracts during the period is presented in the Statement of Operations.
Any open futures contracts at period end are presented in the Schedule of Investments under the caption "Futures Contracts". The notional amount at value reflects each contract's exposure to the underlying instrument or index at period end, and is representative of volume of activity during the period unless an average notional amount is presented. Any securities deposited to meet initial margin requirements are identified in the Schedule of Investments. Any cash deposited to meet initial margin requirements is presented as segregated cash with brokers for derivative instruments in the Statement of Assets and Liabilities.
4. Purchases and Sales of Investments.
Purchases and sales of securities, other than short-term securities, U.S. government securities and in-kind transactions, as applicable, are noted in the table below.
| | Purchases ($) | Sales ($) |
| Strategic Advisers Fidelity International Fund | 3,361,527,684 | 1,829,867,330 |
5. Fees and Other Transactions with Affiliates.
Management Fee. Strategic Advisers (the investment adviser) provides the Fund with investment management related services. For these services, the Fund pays a monthly management fee to the investment adviser. The management fee is calculated by adding the annual management fee rate of .25% of the Fund's average net assets throughout the month to the aggregate of the fee rates, payable monthly by the investment adviser, to the Fund's sub-advisers. The Fund's maximum aggregate management fee will not exceed 1.00% of the Fund's average net assets. For the reporting period, the total annualized management fee rate was .32% of the Fund's average net assets.
During the period, the investment adviser waived a portion of its management fee as described in the Expense Reductions note.
Sub-Advisers. FIAM LLC (an affiliate of the investment adviser) served as a sub-adviser for the Fund during the period. Sub-advisers provide discretionary investment advisory services for their allocated portion of the Fund's assets and are paid as described in the Management Fee note.
FIL Investment Advisors and Geode Capital Management, LLC have been retained to serve as a sub-adviser for the Fund. As of the date of this report, however, these sub-advisers have not been allocated any portion of the Fund's assets. These sub-advisers in the future may provide discretionary investment advisory services for an allocated portion of the Fund's assets and will be paid by the investment adviser for providing these services.
Brokerage Commissions. A portion of portfolio transactions were placed with brokerage firms which are affiliates of the investment adviser. Brokerage commissions are included in net realized gain (loss) and change in net unrealized appreciation (depreciation) in the Statement of Operations. The commissions paid to these affiliated firms were as follows:
| | Amount |
| Strategic Advisers Fidelity International Fund | $ 371 |
Interfund Trades. Funds may purchase from or sell securities to other funds affiliated with each sub-adviser under procedures adopted by the Board. The procedures have been designed to ensure these interfund trades are executed in accordance with Rule 17a-7 of the 1940 Act. Any interfund trades are included within the respective purchases and sales amounts shown in the Purchases and Sales of Investments note. Interfund trades during the period are noted in the table below.
| | Purchases ($) | Sales ($) | Realized Gain (Loss) ($) |
| Strategic Advisers Fidelity International Fund | 17,141,321 | 26,030,225 | (4,633,757) |
6. Investments in Fidelity Central Funds.
Funds may invest in Fidelity Central Funds, which are open-end investment companies generally available only to other investment companies and accounts managed by the investment adviser and its affiliates. The Schedule of Investments lists any Fidelity Central Funds held as an investment as of period end, but does not include the underlying holdings of each Fidelity Central Fund. An investing fund indirectly bears its proportionate share of the expenses of the underlying Fidelity Central Funds.
Based on its investment objective, each Fidelity Central Fund may invest or participate in various investment vehicles or strategies that are similar to those of the investing fund. These strategies are consistent with the investment objectives of the investing fund and may involve certain economic risks which may cause a decline in value of each of the Fidelity Central Funds and thus a decline in the value of the investing fund.
| Fidelity Central Fund | Investment Manager | Investment Objective | Investment Practices | Expense RatioA |
| Fidelity Money Market Central Funds | Fidelity Management & Research Company LLC (FMR) | Each fund seeks to obtain a high level of current income consistent with the preservation of capital and liquidity. | Short-term Investments | Less than .005% |
A Expenses expressed as a percentage of average net assets and are as of each underlying Central Fund's most recent annual or semi-annual shareholder report.
A complete unaudited list of holdings for each Fidelity Central Fund is available upon request or at the Securities and Exchange Commission website at www.sec.gov. In addition, the financial statements of the Fidelity Central Funds, which are not covered by the Report of Independent Registered Public Accounting Firm, are available on the Securities and Exchange Commission website or upon request.
7. Committed Line of Credit.
Certain Funds participate with other funds managed by the investment adviser or an affiliate in a $4.25 billion credit facility (the "line of credit") to be utilized for temporary or emergency purposes to fund shareholder redemptions or for other short-term liquidity purposes. The participating funds have agreed to pay commitment fees on their pro-rata portion of the line of credit, which are reflected in Miscellaneous expenses on the Statement of Operations, and are listed below. During the period, there were no borrowings on this line of credit.
| | Amount |
| Strategic Advisers Fidelity International Fund | $20,015 |
8. Security Lending.
Funds lend portfolio securities from time to time in order to earn additional income. Lending agents are used, including National Financial Services (NFS), an affiliate of the investment adviser. Pursuant to a securities lending agreement, NFS will receive a fee, which is capped at 9.9% of a fund's daily lending revenue, for its services as lending agent. A fund may lend securities to certain qualified borrowers, including NFS. On the settlement date of the loan, a fund receives collateral (in the form of U.S. Treasury obligations, letters of credit and/or cash) against the loaned securities and maintains collateral in an amount not less than 100% of the market value of the loaned securities during the period of the loan. The market value of the loaned securities is determined at the close of business of a fund and any additional required collateral is delivered to a fund on the next business day. A fund or borrower may terminate the loan at any time, and if the borrower defaults on its obligation to return the securities loaned because of insolvency or other reasons, a fund may apply collateral received from the borrower against the obligation. A fund may experience delays and costs in recovering the securities loaned. Any cash collateral received is invested in the Fidelity Securities Lending Cash Central Fund. Any loaned securities are identified as such in the Schedule of Investments, and the value of loaned securities and cash collateral at period end, as applicable, are presented in the Statement of Assets and Liabilities. Security lending income represents the income earned on investing cash collateral, less rebates paid to borrowers and any lending agent fees associated with the loan, plus any premium payments received for lending certain types of securities. Security lending income is presented in the Statement of Operations as a component of income from Fidelity Central Funds. Affiliated security lending activity, if any, was as follows:
| | Total Security Lending Fees Paid to NFS | Security Lending Income From Securities Loaned to NFS | Value of Securities Loaned to NFS at Period End |
| Strategic Advisers Fidelity International Fund | $58,783 | $ - | $- |
9. Expense Reductions.
The investment adviser has contractually agreed to waive the Fund's management fee in an amount equal to .25% of the Fund's average net assets until September 30, 2026. During the period, this waiver reduced the Fund's management fee by $ 27,333,619.
Through arrangements with the Fund's custodian, credits realized as a result of certain uninvested cash balances were used to reduce the Fund's expenses by $1,729.
10. Other.
A fund's organizational documents provide former and current trustees and officers with a limited indemnification against liabilities arising in connection with the performance of their duties to the fund. In the normal course of business, a fund may also enter into contracts that provide general indemnifications. A fund's maximum exposure under these arrangements is unknown as this would be dependent on future claims that may be made against a fund. The risk of material loss from such claims is considered remote.
Funds do not invest in underlying mutual funds for the purpose of exercising management or control; however, investments by funds within their principal investment strategies may represent a significant portion of the underlying mutual fund's net assets. At the end of the period, certain Funds were the owners of record of 10% or more of the total outstanding shares of the following underlying mutual funds as shown below.
| Fund | Strategic Advisers Fidelity International Fund |
| Fidelity Diversified International Fund | 19% |
| Fidelity International Capital Appreciation Fund | 36% |
| Fidelity International Discovery Fund | 26% |
| Fidelity International Real Estate Fund | 14% |
| Fidelity Japan Fund | 46% |
| Fidelity Overseas Fund | 28% |
| Fidelity Pacific Basin Fund | 15% |
| Fidelity SAI International Index Fund | 28% |
| Fidelity SAI International Low Volatility Index Fund | 31% |
| Fidelity SAI International Momentum Index Fund | 47% |
| Fidelity SAI International Quality Index Fund | 36% |
| Fidelity SAI International Small Cap Index Fund | 69% |
| Fidelity SAI International Value Index Fund | 84% |
11. Risk and Uncertainties.
Many factors affect a fund's performance. Developments that disrupt global economies and financial markets, such as pandemics, epidemics, outbreaks of infectious diseases, war, terrorism, and environmental disasters, may significantly affect a fund's investment performance. The effects of these developments to a fund will be impacted by the types of securities in which a fund invests, the financial condition, industry, economic sector, and geographic location of an issuer, and a fund's level of investment in the securities of that issuer. Significant concentrations in security types, issuers, industries, sectors, and geographic locations may magnify the factors that affect a fund's performance.
As a shareholder, you incur two types of costs: (1) transaction costs, which may include sales charges (loads) on purchase payments or redemption proceeds, as applicable and (2) ongoing costs, which generally include management fees, distribution and/or service (12b-1) fees and other Fund expenses. This Example is intended to help you understand your ongoing costs (in dollars) of investing in a fund and to compare these costs with the ongoing costs of investing in other mutual funds.
| The Example is based on an investment of $1,000 invested at the beginning of the period and held for the entire period (March 1, 2023 to August 31, 2023). |
Actual Expenses
The first line of the accompanying table provides information about actual account values and actual expenses. You may use the information in this line, together with the amount you invested, to estimate the expenses that you paid over the period. Simply divide your account value by $1,000.00 (for example, an $8,600 account value divided by $1,000.00 = 8.6), then multiply the result by the number in the first line for a class/Fund under the heading entitled "Expenses Paid During Period" to estimate the expenses you paid on your account during this period. If any fund is a shareholder of any underlying mutual funds or exchange-traded funds (ETFs) (the Underlying Funds), such fund indirectly bears its proportional share of the expenses of the Underlying Funds in addition to the direct expenses incurred presented in the table. These fees and expenses are not included in the annualized expense ratio used to calculate the expense estimate in the table below.
Hypothetical Example for Comparison Purposes
The second line of the accompanying table provides information about hypothetical account values and hypothetical expenses based on the actual expense ratio and an assumed rate of return of 5% per year before expenses, which is not the actual return. The hypothetical account values and expenses may not be used to estimate the actual ending account balance or expenses you paid for the period. You may use this information to compare the ongoing costs of investing in the Fund and other funds. To do so, compare this 5% hypothetical example with the 5% hypothetical examples that appear in the shareholder reports of the other funds. If any fund is a shareholder of any Underlying Funds, such fund indirectly bears its proportional share of the expenses of the Underlying Funds in addition to the direct expenses as presented in the table. These fees and expenses are not included in the annualized expense ratio used to calculate the expense estimate in the table below.
Please note that the expenses shown in the table are meant to highlight your ongoing costs only and do not reflect any transaction costs. Therefore, the second line of the table is useful in comparing ongoing costs only, and will not help you determine the relative total costs of owning different funds. In addition, if these transactional costs were included, your costs would have been higher.
| | | | | Annualized Expense Ratio- A | | Beginning Account Value March 1, 2023 | | Ending Account Value August 31, 2023 | | Expenses Paid During Period- C March 1, 2023 to August 31, 2023 |
| | | | | | | | | | |
| Strategic Advisers® Fidelity® International Fund | | | | .08% | | | | | | |
| Actual | | | | | | $ 1,000 | | $ 1,054.90 | | $ .41 |
Hypothetical-B | | | | | | $ 1,000 | | $ 1,024.73 | | $ .41 |
| |
A Annualized expense ratio reflects expenses net of applicable fee waivers.
B 5% return per year before expenses
C Expenses are equal to the annualized expense ratio, multiplied by the average account value over the period, multiplied by 184/ 366 (to reflect the one-half year period). The fees and expenses of any Underlying Funds are not included in each annualized expense ratio.
Board Approval of Amended Sub-Advisory Agreement
Strategic Advisers Fidelity International Fund
In March 2023, the Board of Trustees, including the Independent Trustees (together, the Board) voted to approve an amendment to the fee schedule for one investment mandate in the existing sub-advisory agreement among Strategic Advisers, FIAM LLC (the Sub-Adviser), and Fidelity Rutland Square Trust II (Trust) on behalf of the fund (Amended Sub-Advisory Agreement). The Board noted that the updated fee schedule in the Amended Sub-Advisory Agreement became effective as of February 1, 2023 and will result in a lower fee at all asset levels. The Board also noted that no other material contract terms are impacted by the Amended Sub-Advisory Agreement. The Board, assisted by the advice of fund counsel and Independent Trustees' counsel, considered a broad range of information.
In considering whether to approve the Amended Sub-Advisory Agreement, the Board reached a determination, with the assistance of fund counsel and Independent Trustees' counsel and through the exercise of its business judgment, that the approval of the Amended Sub-Advisory Agreement is in the best interests of the fund and its shareholders and that the approval of such agreements does not involve a conflict of interest from which Strategic Advisers or its affiliates derive an inappropriate advantage. The Board's decision to approve the Amended Sub-Advisory Agreements was not based on any single factor, but rather was based on a comprehensive consideration of all the information provided to the Board. In addition, individual Trustees did not necessarily attribute the same weight or importance to each factor.
Nature, Extent, and Quality of Services Provided. The Board considered the backgrounds of the investment personnel that provide services to the fund, the fund's investment objective, strategies and related investment philosophy, the current sub-adviser line-up, and the structure of the investment personnel compensation programs and whether such structure provides appropriate incentives to act in the best interests of the fund in connection with its annual renewal of the fund's management contract, sub-advisory agreements and sub-subadvisory agreements at its September 2022 meeting.
The Board noted that it had approved the existing sub-advisory agreement with the Sub-Adviser at its September 2022 meeting and the Amended Sub-Advisory Agreement will not result in any changes to: (i) the nature, extent and quality of the sub-advisory services provided; (ii) the investment process or strategies employed in the management of the fund's assets; or (iii) the day-to-day management of the fund or the persons primarily responsible for such management.
The Board did not consider performance to be a material factor in its decision to approve the Amended Sub-Advisory Agreement because the approval of the Amended Sub-Advisory Agreement will not result in any changes (i) to the fund's investment processes or strategies; or (ii) in the persons primarily responsible for the day-to-day management of the fund.
Based on its review, the Board concluded that the nature, extent, and quality of services that will be provided to the fund under the Amended Sub-Advisory Agreement should continue to benefit the fund's shareholders.
Competitiveness of Management Fee and Total Fund Expenses. The Board noted that the Amended Sub-Advisory Agreement will not result in changes to the maximum aggregate annual management fee payable by the fund or Strategic Advisers' portion of the management fee. The Board considered Strategic Advisers' contractual agreement to waive its portion of the fund's management fee.
The Board also considered that the Amended Sub-Advisory Agreement will not change the fund's total management fee rate because Strategic Advisers has not allocated assets of the fund to the Sub-Adviser for this investment mandate at this time.
Based on its review, the Board concluded that the fund's management fee structure and projected total expenses bear a reasonable relationship to the services that the fund and its shareholders will receive and the other factors considered.
Costs of the Services and Profitability. Because the Amended Sub-Advisory Agreement was negotiated at arm's length and will have no impact on the maximum management fees payable by the fund or Strategic Advisers' portion of the management fee, the Board did not consider the costs of services and profitability to be significant factors in its decision to approve the Amended Sub-Advisory Agreement.
Potential Fall-Out Benefits. The Board considered that it reviews information regarding the potential of direct and indirect benefits to Strategic Advisers and its affiliates from their relationships with the fund, including non-advisory fee compensation paid to affiliates of Strategic Advisers, if any, as well as information regarding potential fall-out benefits accruing to each sub-adviser, if any, as a result of its relationship with the fund, during its annual renewal of the fund's management contract, sub-advisory agreements, and sub-subadvisory agreements. The Board considered Strategic Advisers' representation that it does not anticipate that the approval of the Amended Sub-Advisory Agreement will have a significant impact on the profitability of, or potential fall-out benefits to, Strategic Advisers or its affiliates.
Possible Economies of Scale. The Board considered that it reviews whether there have been economies of scale in connection with the management of the fund during its annual renewal of the fund's management contract, sub-advisory agreements, and sub-subadvisory agreements. The Board also noted that it did not consider the possible realization of economies of scale to be a significant factor in its decision to approve the Amended Sub-Advisory Agreement because the fund is not expected to bear any additional expenses as a result of the Amended Sub-Advisory Agreement.
Conclusion. Based on its evaluation of all of the conclusions noted above, and after considering all factors it believed relevant, the Board concluded that the Amended Sub-Advisory Agreement's fee structure bears a reasonable relationship to the services to be rendered and that the Amended Sub-Advisory Agreement is in the best interests of the fund and its shareholders and should be approved. In addition, the Board concluded that the approval of the Amended Sub-Advisory Agreement does not involve a conflict of interest from which Strategic Advisers or its affiliates derive an inappropriate advantage.
1.912841.113
SIL-SANN-1023
Strategic Advisers® International Fund
Offered exclusively to certain managed account clients of Strategic Advisers LLC or its affiliates - not available for sale to the general public
Semi-Annual Report
August 31, 2023
Contents
To view a fund's proxy voting guidelines and proxy voting record for the 12-month period ended June 30, visit http://www.fidelity.com/proxyvotingresults or visit the Securities and Exchange Commission's (SEC) web site at http://www.sec.gov.
You may also call 1-800-544-3455 to request a free copy of the proxy voting guidelines.
Standard & Poor's, S&P and S&P 500 are registered service marks of The McGraw-Hill Companies, Inc. and have been licensed for use by Fidelity Distributors Corporation.
Other third-party marks appearing herein are the property of their respective owners.
All other marks appearing herein are registered or unregistered trademarks or service marks of FMR LLC or an affiliated company. © 2023 FMR LLC. All rights reserved.
This report and the financial statements contained herein are submitted for the general information of the shareholders of the Fund. This report is not authorized for distribution to prospective investors in the Fund unless preceded or accompanied by an effective prospectus.
A fund files its complete schedule of portfolio holdings with the SEC for the first and third quarters of each fiscal year on Form N-PORT. Forms N-PORT are available on the SEC's web site at http://www.sec.gov. A fund's Forms N-PORT may be reviewed and copied at the SEC's Public Reference Room in Washington, DC. Information regarding the operation of the SEC's Public Reference Room may be obtained by calling 1-800-SEC-0330.
For a complete list of a fund's portfolio holdings, view the most recent holdings listing, semiannual report, or annual report on Fidelity's web site at http://www.fidelity.com, http://www.institutional.fidelity.com, or http://www.401k.com, as applicable.
NOT FDIC INSURED •MAY LOSE VALUE •NO BANK GUARANTEE
Neither the Fund nor Fidelity Distributors Corporation is a bank.
The information in the following tables is based on the direct Investments of the Fund.
Top Holdings (% of Fund's net assets) |
| (excluding cash equivalents) |
| Fidelity SAI International Low Volatility Index Fund | 5.5 | |
| Artisan International Value Fund Investor Class | 5.0 | |
| Fidelity Advisor International Discovery Fund Class Z | 4.9 | |
| Fidelity SAI Japan Stock Index Fund | 4.8 | |
| Fidelity Overseas Fund | 3.9 | |
| Oakmark International Fund Investor Class | 3.4 | |
| Fidelity Diversified International Fund | 3.0 | |
| Fidelity SAI International Value Index Fund | 2.8 | |
| iShares MSCI EAFE Value ETF | 2.6 | |
| JOHCM International Select Fund Investor Shares | 2.0 | |
| | 37.9 | |
| |
Asset Allocation (% of Fund's net assets) |
|
|
Asset Allocation of funds in the pie chart reflect the categorizations of the asset as defined by Morningstar as of the reporting date.
Geographic Diversification (% of Fund's net assets) |
|
* Includes Short-Term investments and Net Other Assets (Liabilities). Percentages are adjusted for the effect of derivatives, if applicable. |
| |
Showing Percentage of Net Assets
| Common Stocks - 44.8% |
| | | Shares | Value ($) |
| COMMUNICATION SERVICES - 1.3% | | | |
| Diversified Telecommunication Services - 0.7% | | | |
| Bezeq The Israel Telecommunication Corp. Ltd. | | 145,093 | 196,405 |
| BT Group PLC | | 1,123,566 | 1,645,373 |
| Cellnex Telecom SA (a) | | 205,707 | 7,873,961 |
| Deutsche Telekom AG | | 2,018,042 | 43,193,214 |
| Hellenic Telecommunications Organization SA | | 231,573 | 3,465,265 |
| KT Corp. | | 152,087 | 3,784,472 |
| Liberty Global PLC Class C (b) | | 369,100 | 7,322,944 |
| Nippon Telegraph & Telephone Corp. | | 19,413,400 | 22,415,412 |
| Orange SA | | 1,619,241 | 18,178,661 |
| Proximus | | 292,378 | 2,212,306 |
| PT Telkom Indonesia Persero Tbk | | 12,831,100 | 3,136,419 |
| Singapore Telecommunications Ltd. | | 1,110,200 | 1,950,664 |
| Telenor ASA | | 26,089 | 279,498 |
| United Internet AG | | 8,906 | 171,416 |
| | | | 115,826,010 |
| Entertainment - 0.1% | | | |
| Boat Rocker Media, Inc. (b) | | 118,285 | 175,081 |
| CTS Eventim AG | | 39,229 | 2,445,933 |
| GungHo Online Entertainment, Inc. | | 7,600 | 125,339 |
| MIXI, Inc. | | 19,700 | 329,157 |
| Nintendo Co. Ltd. | | 312,100 | 13,381,877 |
| Square Enix Holdings Co. Ltd. | | 123,060 | 4,677,287 |
| | | | 21,134,674 |
| Interactive Media & Services - 0.2% | | | |
| carsales.com Ltd. | | 224,450 | 4,179,727 |
| Hemnet Group AB | | 57,643 | 1,045,087 |
| NAVER Corp. | | 21,407 | 3,465,733 |
| SEEK Ltd. | | 149,355 | 2,236,460 |
| Tencent Holdings Ltd. | | 363,500 | 15,063,573 |
| Z Holdings Corp. | | 951,000 | 2,861,595 |
| | | | 28,852,175 |
| Media - 0.1% | | | |
| Changjiang Publishing & Media Co. Ltd. (A Shares) | | 321,500 | 370,271 |
| CyberAgent, Inc. | | 411,900 | 2,627,191 |
| Hakuhodo DY Holdings, Inc. | | 125,900 | 1,197,173 |
| Informa PLC | | 817,169 | 7,565,166 |
| JCDecaux SA (b) | | 97,916 | 1,819,843 |
| WPP PLC | | 910,960 | 8,830,304 |
| | | | 22,409,948 |
| Wireless Telecommunication Services - 0.2% | | | |
| Advanced Info Service PCL (For. Reg.) | | 896,300 | 5,528,687 |
| KDDI Corp. | | 355,900 | 10,579,993 |
| SoftBank Corp. | | 38,600 | 442,692 |
| SoftBank Group Corp. | | 98,600 | 4,418,905 |
| Vodafone Group PLC sponsored ADR | | 458,176 | 4,270,200 |
| | | | 25,240,477 |
TOTAL COMMUNICATION SERVICES | | | 213,463,284 |
| CONSUMER DISCRETIONARY - 4.2% | | | |
| Automobile Components - 0.4% | | | |
| Aisin Seiki Co. Ltd. | | 12,500 | 418,142 |
| Autoliv, Inc. (depository receipt) | | 62,603 | 6,126,786 |
| Brembo SpA | | 59,166 | 823,771 |
| Bridgestone Corp. | | 131,700 | 5,124,257 |
| Compagnie Generale des Etablissements Michelin SCA Series B | | 187,147 | 5,855,074 |
| Continental AG | | 8,647 | 641,419 |
| DENSO Corp. | | 225,300 | 15,421,579 |
| Dowlais Group PLC | | 2,149,863 | 3,093,835 |
| Eagle Industry Co. Ltd. | | 2,700 | 31,139 |
| FCC Co. Ltd. | | 12,400 | 163,890 |
| JTEKT Corp. | | 72,300 | 655,692 |
| Koito Manufacturing Co. Ltd. | | 393,000 | 6,686,632 |
| Magna International, Inc. Class A (c) | | 120,682 | 7,098,515 |
| Musashi Seimitsu Industry Co. Ltd. | | 117,900 | 1,405,935 |
| Niterra Co. Ltd. | | 15,100 | 351,308 |
| Nokian Tyres PLC | | 101,783 | 883,609 |
| Stanley Electric Co. Ltd. | | 132,000 | 2,321,193 |
| Sumitomo Electric Industries Ltd. | | 137,200 | 1,683,705 |
| Tokai Rika Co. Ltd. | | 27,400 | 429,564 |
| Toyoda Gosei Co. Ltd. | | 8,100 | 175,311 |
| TPR Co. Ltd. | | 19,100 | 240,235 |
| Valeo SA | | 372,817 | 7,276,754 |
| | | | 66,908,345 |
| Automobiles - 0.8% | | | |
| Bayerische Motoren Werke AG (BMW) | | 82,163 | 8,657,210 |
| Bayerische Motoren Werke AG (BMW) ADR (c) | | 95,589 | 3,358,997 |
| Ferrari NV | | 15,760 | 5,007,582 |
| Ferrari NV (Italy) | | 11,139 | 3,539,022 |
| Honda Motor Co. Ltd. | | 707,300 | 22,857,385 |
| Honda Motor Co. Ltd. sponsored ADR | | 35,644 | 1,152,371 |
| Isuzu Motors Ltd. | | 375,500 | 4,826,180 |
| Mazda Motor Corp. | | 39,800 | 414,673 |
| Mercedes-Benz Group AG (Germany) | | 180,251 | 13,189,823 |
| Nissan Motor Co. Ltd. | | 167,800 | 713,522 |
| Renault SA | | 61,676 | 2,496,904 |
| Stellantis NV | | 105,122 | 1,950,013 |
| Stellantis NV | | 423,878 | 7,880,852 |
| Stellantis NV (Italy) | | 1,023,892 | 19,069,779 |
| Subaru Corp. | | 70,800 | 1,367,144 |
| Suzuki Motor Corp. | | 274,200 | 10,808,186 |
| Toyota Motor Corp. | | 714,200 | 12,305,033 |
| Volkswagen AG | | 4,566 | 652,505 |
| Yamaha Motor Co. Ltd. | | 218,500 | 5,675,188 |
| | | | 125,922,369 |
| Broadline Retail - 0.2% | | | |
| Alibaba Group Holding Ltd. sponsored ADR (b) | | 22,716 | 2,110,316 |
| Dollarama, Inc. | | 106,410 | 6,899,482 |
| MercadoLibre, Inc. (b) | | 3,122 | 4,284,508 |
| Next PLC | | 65,228 | 5,774,242 |
| Pan Pacific International Holdings Ltd. | | 42,100 | 840,437 |
| Prosus NV | | 82,552 | 5,693,974 |
| Rakuten Group, Inc. | | 1,597,600 | 6,216,328 |
| | | | 31,819,287 |
| Distributors - 0.0% | | | |
| Inchcape PLC | | 570,543 | 5,518,302 |
| Diversified Consumer Services - 0.0% | | | |
| Global Kids Co. Corp. | | 60,800 | 272,460 |
| Hotels, Restaurants & Leisure - 0.8% | | | |
| Accor SA | | 168,400 | 6,042,384 |
| Amadeus IT Holding SA Class A | | 680,421 | 46,703,659 |
| Aristocrat Leisure Ltd. | | 224,358 | 5,945,746 |
| Compass Group PLC | | 1,271,164 | 32,054,618 |
| Entain PLC | | 483,100 | 7,083,797 |
| Evolution AB (a) | | 33,237 | 3,601,017 |
| Flutter Entertainment PLC (b) | | 15,438 | 2,818,143 |
| Food & Life Companies Ltd. | | 43,500 | 827,724 |
| Genting Singapore Ltd. | | 438,600 | 283,973 |
| Greggs PLC | | 53,914 | 1,684,235 |
| Oriental Land Co. Ltd. | | 100,000 | 3,607,684 |
| Sands China Ltd. (b) | | 1,270,800 | 4,302,249 |
| Sodexo SA | | 77,800 | 8,353,568 |
| Whitbread PLC | | 141,212 | 6,153,725 |
| Yum China Holdings, Inc. | | 83,957 | 4,507,651 |
| | | | 133,970,173 |
| Household Durables - 0.5% | | | |
| Barratt Developments PLC | | 697,300 | 4,004,179 |
| Berkeley Group Holdings PLC | | 111,712 | 5,746,996 |
| Hisense Electric Co. Ltd. | | 215,400 | 620,189 |
| Midea Group Co. Ltd. (A Shares) | | 1,296,466 | 10,092,962 |
| Panasonic Holdings Corp. | | 734,700 | 8,456,439 |
| Persimmon PLC | | 545,553 | 7,367,196 |
| SEB SA | | 8,517 | 937,394 |
| Sekisui Chemical Co. Ltd. | | 18,600 | 285,849 |
| Sony Group Corp. | | 394,200 | 32,794,488 |
| Tama Home Co. Ltd. | | 25,400 | 619,746 |
| | | | 70,925,438 |
| Leisure Products - 0.1% | | | |
| Bandai Namco Holdings, Inc. | | 149,074 | 3,465,193 |
| Sega Sammy Holdings, Inc. | | 78,800 | 1,575,242 |
| Yamaha Corp. | | 98,900 | 3,058,188 |
| | | | 8,098,623 |
| Specialty Retail - 0.3% | | | |
| EDION Corp. | | 24,700 | 248,706 |
| Fast Retailing Co. Ltd. | | 20,400 | 4,694,264 |
| H&M Hennes & Mauritz AB (B Shares) | | 565,149 | 8,645,125 |
| Industria de Diseno Textil SA | | 57,125 | 2,188,536 |
| Kingfisher PLC | | 5,223,403 | 15,479,529 |
| Premier Investments Ltd. | | 21,951 | 365,393 |
| Super Retail Group Ltd. | | 62,280 | 523,799 |
| WH Smith PLC | | 629,024 | 11,689,754 |
| Zalando SE (a)(b) | | 268,109 | 8,352,500 |
| ZOZO, Inc. | | 127,200 | 2,543,650 |
| | | | 54,731,256 |
| Textiles, Apparel & Luxury Goods - 1.1% | | | |
| adidas AG | | 65,388 | 13,076,019 |
| Asics Corp. | | 22,200 | 810,366 |
| Brunello Cucinelli SpA | | 24,613 | 2,039,048 |
| Burberry Group PLC | | 245,764 | 6,799,531 |
| Compagnie Financiere Richemont SA: | | | |
| warrants 11/22/23 (b) | | 253,505 | 242,499 |
| Series A | | 306,484 | 43,472,183 |
| Dr. Martens Ltd. | | 596,877 | 1,188,627 |
| Hermes International SCA | | 3,707 | 7,640,618 |
| Kering SA | | 32,247 | 17,243,434 |
| lululemon athletica, Inc. (b) | | 12,601 | 4,804,257 |
| LVMH Moet Hennessy Louis Vuitton SE | | 58,387 | 49,375,411 |
| Moncler SpA | | 141,170 | 9,588,787 |
| NIKE, Inc. Class B | | 36,014 | 3,662,984 |
| Samsonite International SA (a)(b) | | 974,400 | 3,261,522 |
| Swatch Group AG (Bearer) | | 9,758 | 2,747,285 |
| Swatch Group AG (Bearer): | | | |
| ADR (c) | | 33,506 | 469,084 |
| (Reg.) | | 36,553 | 1,951,066 |
| Titan Co. Ltd. | | 42,276 | 1,586,802 |
| | | | 169,959,523 |
TOTAL CONSUMER DISCRETIONARY | | | 668,125,776 |
| CONSUMER STAPLES - 4.6% | | | |
| Beverages - 1.2% | | | |
| Anheuser-Busch InBev SA NV | | 695,399 | 39,472,239 |
| Asahi Group Holdings | | 64,700 | 2,524,054 |
| Coca-Cola HBC AG | | 49,761 | 1,435,988 |
| Diageo PLC | | 1,707,376 | 69,922,204 |
| Heineken Holding NV | | 128,796 | 10,320,870 |
| Heineken NV (Bearer) | | 158,241 | 15,382,677 |
| Kirin Holdings Co. Ltd. | | 873,400 | 12,282,047 |
| Kweichow Moutai Co. Ltd. (A Shares) | | 17,300 | 4,401,951 |
| Pernod Ricard SA | | 149,665 | 29,406,811 |
| Remy Cointreau SA | | 7,532 | 1,167,519 |
| Suntory Beverage & Food Ltd. | | 107,500 | 3,482,972 |
| Varun Beverages Ltd. | | 96,791 | 1,052,641 |
| | | | 190,851,973 |
| Consumer Staples Distribution & Retail - 0.6% | | | |
| Alimentation Couche-Tard, Inc. Class A (multi-vtg.) | | 289,206 | 15,123,813 |
| Bid Corp. Ltd. | | 101,116 | 2,274,668 |
| Carrefour SA | | 591,657 | 11,308,767 |
| Coles Group Ltd. | | 186,634 | 1,967,523 |
| GrainCorp Ltd. | | 246,841 | 1,167,567 |
| Jeronimo Martins SGPS SA | | 24,797 | 631,883 |
| Koninklijke Ahold Delhaize NV | | 100,607 | 3,290,854 |
| Metro, Inc. | | 87,649 | 4,517,374 |
| Ocado Group PLC (b) | | 357,674 | 3,949,232 |
| Qol Holdings Co. Ltd. | | 56,400 | 745,436 |
| Raia Drogasil SA | | 318,384 | 1,766,782 |
| Seven & i Holdings Co. Ltd. | | 623,500 | 25,582,934 |
| Sundrug Co. Ltd. | | 40,700 | 1,203,698 |
| Tesco PLC | | 3,993,252 | 13,434,436 |
| Wal-Mart de Mexico SA de CV Series V | | 1,531,300 | 6,032,516 |
| Welcia Holdings Co. Ltd. (c) | | 85,100 | 1,566,069 |
| Woolworths Group Ltd. | | 48,123 | 1,188,943 |
| | | | 95,752,495 |
| Food Products - 1.1% | | | |
| Ajinomoto Co., Inc. | | 101,500 | 4,306,399 |
| Barry Callebaut AG | | 2,163 | 3,775,792 |
| Britannia Industries Ltd. | | 21,699 | 1,172,122 |
| Danone SA | | 560,650 | 32,681,858 |
| Ezaki Glico Co. Ltd. | | 136,800 | 3,612,396 |
| Itoham Yonekyu Holdings, Inc. | | 149,000 | 829,513 |
| JDE Peet's BV | | 43,929 | 1,223,252 |
| Kewpie Corp. | | 17,200 | 286,854 |
| Lindt & Spruengli AG (participation certificate) | | 284 | 3,398,291 |
| Megmilk Snow Brand Co. Ltd. | | 126,700 | 2,076,036 |
| Nestle India Ltd. | | 3,453 | 917,899 |
| Nestle SA (Reg. S) | | 905,989 | 108,935,592 |
| Toyo Suisan Kaisha Ltd. | | 264,900 | 10,945,935 |
| WH Group Ltd. (a) | | 649,500 | 334,489 |
| Wilmar International Ltd. | | 2,271,200 | 6,352,537 |
| Yakult Honsha Co. Ltd. | | 9,400 | 493,210 |
| Yamazaki Baking Co. Ltd. | | 9,600 | 182,076 |
| | | | 181,524,251 |
| Household Products - 0.5% | | | |
| Essity AB (B Shares) | | 626,739 | 14,637,362 |
| Henkel AG & Co. KGaA | | 19,212 | 1,328,699 |
| Lion Corp. | | 269,100 | 2,932,459 |
| Niitaka Co. Ltd. | | 53,400 | 728,541 |
| Reckitt Benckiser Group PLC | | 729,326 | 52,632,354 |
| | | | 72,259,415 |
| Personal Care Products - 1.0% | | | |
| Beiersdorf AG | | 97,714 | 12,794,201 |
| Haleon PLC | | 4,513,341 | 18,480,076 |
| Hindustan Unilever Ltd. | | 99,212 | 3,004,863 |
| Kao Corp. | | 333,700 | 12,890,047 |
| Kose Corp. | | 20,500 | 1,703,461 |
| L'Oreal SA | | 60,383 | 26,570,285 |
| Proya Cosmetics Co. Ltd. (A Shares) | | 48,944 | 753,493 |
| Rohto Pharmaceutical Co. Ltd. | | 568,300 | 14,830,991 |
| Unilever PLC | | 1,160,560 | 59,268,948 |
| | | | 150,296,365 |
| Tobacco - 0.2% | | | |
| British American Tobacco PLC (United Kingdom) | | 1,006,116 | 33,326,976 |
TOTAL CONSUMER STAPLES | | | 724,011,475 |
| ENERGY - 2.9% | | | |
| Energy Equipment & Services - 0.0% | | | |
| Tenaris SA | | 159,262 | 2,543,387 |
| Oil, Gas & Consumable Fuels - 2.9% | | | |
| Aker BP ASA | | 376,707 | 10,225,800 |
| BP PLC | | 10,457,386 | 64,619,194 |
| BP PLC sponsored ADR | | 537,866 | 19,997,858 |
| ENEOS Holdings, Inc. | | 1,032,500 | 3,876,798 |
| Eni SpA | | 2,510,626 | 38,819,305 |
| Eni SpA sponsored ADR | | 6,480 | 200,621 |
| Equinor ASA | | 529,305 | 16,255,610 |
| Equinor ASA sponsored ADR | | 44,438 | 1,358,470 |
| Galp Energia SGPS SA Class B | | 1,084,466 | 14,940,327 |
| Gazprom OAO (d) | | 3,670,010 | 372,709 |
| Gazprom OAO sponsored ADR (Reg. S) (b)(d) | | 33,845 | 7,732 |
| Idemitsu Kosan Co. Ltd. | | 18,100 | 385,027 |
| INPEX Corp. | | 534,400 | 7,474,511 |
| Japan Petroleum Exploration Co. Ltd. | | 18,600 | 611,073 |
| LUKOIL PJSC (d) | | 35,755 | 10,741 |
| OMV AG | | 123,777 | 5,740,486 |
| Parkland Corp. | | 63,476 | 1,679,446 |
| Petroleo Brasileiro SA - Petrobras (ON) | | 232,900 | 1,624,452 |
| Petronet LNG Ltd. | | 487,938 | 1,270,143 |
| Reliance Industries Ltd. | | 436,016 | 12,688,860 |
| Repsol SA | | 539,539 | 8,339,173 |
| Rosneft Oil Co. OJSC (d) | | 420,640 | 68,273 |
| San-Ai Obbli Co. Ltd. | | 55,400 | 638,169 |
| Santos Ltd. | | 2,385,500 | 11,803,543 |
| Shell PLC: | | | |
| ADR | | 302,954 | 18,810,414 |
| (Amsterdam) | | 1,413,168 | 43,756,789 |
| (London) | | 944,756 | 28,886,176 |
| rights (b)(e) | | 848,488 | 280,850 |
| rights (b)(e) | | 1,328,319 | 434,226 |
| TotalEnergies SE | | 1,681,008 | 105,447,762 |
| TotalEnergies SE sponsored ADR | | 55,770 | 3,508,491 |
| Whitehaven Coal Ltd. | | 967,962 | 3,819,593 |
| Woodside Energy Group Ltd. | | 1,096,190 | 26,294,429 |
| | | | 454,247,051 |
TOTAL ENERGY | | | 456,790,438 |
| FINANCIALS - 8.0% | | | |
| Banks - 3.9% | | | |
| ABN AMRO Bank NV: | | | |
| rights 8/31/23 (b)(e) | | 44,151 | 29,683 |
| GDR (Bearer) (a) | | 44,151 | 650,862 |
| Agricultural Bank of China Ltd. (H Shares) | | 4,713,000 | 1,616,603 |
| AIB Group PLC | | 6,939,856 | 31,621,029 |
| ANZ Group Holdings Ltd. | | 656,864 | 10,724,693 |
| Banco Bilbao Vizcaya Argentaria SA | | 439,141 | 3,464,772 |
| Banco Bilbao Vizcaya Argentaria SA sponsored ADR | | 52,074 | 413,468 |
| Banco Comercial Portugues SA (Reg.) (b) | | 726,365 | 202,737 |
| Banco Santander SA (Spain) | | 1,326,511 | 5,178,181 |
| Banco Santander SA (Spain) sponsored ADR | | 146,996 | 568,875 |
| Bank Hapoalim BM (Reg.) | | 90,316 | 749,022 |
| Bank Leumi le-Israel BM | | 111,166 | 864,353 |
| Bank of China Ltd. (H Shares) | | 9,426,000 | 3,194,633 |
| Bank of Ireland Group PLC | | 1,511,608 | 15,076,553 |
| Barclays PLC | | 15,225,005 | 28,358,997 |
| Barclays PLC sponsored ADR | | 252,713 | 1,897,875 |
| BAWAG Group AG (a) | | 68,768 | 3,246,716 |
| BNP Paribas SA | | 646,791 | 41,826,455 |
| CaixaBank SA | | 3,400,953 | 13,774,670 |
| Chiba Bank Ltd. | | 907,600 | 6,496,893 |
| China Construction Bank Corp. (H Shares) | | 3,034,000 | 1,623,344 |
| China Merchants Bank Co. Ltd. (A Shares) | | 135,400 | 588,505 |
| Commerzbank AG | | 143,930 | 1,584,116 |
| Credicorp Ltd. (United States) | | 8,511 | 1,203,711 |
| DBS Group Holdings Ltd. | | 1,202,100 | 29,619,986 |
| DNB Bank ASA | | 1,105,952 | 21,860,862 |
| Erste Group Bank AG | | 3,409 | 123,638 |
| Erste Group Bank AG | | 137,450 | 4,913,978 |
| FinecoBank SpA | | 199,778 | 2,742,527 |
| First International Bank of Israel | | 2,775 | 112,297 |
| Haci Omer Sabanci Holding A/S | | 183,983 | 411,755 |
| HDFC Bank Ltd. (b) | | 1,048,586 | 19,874,405 |
| Hokuhoku Financial Group, Inc. | | 50,400 | 457,253 |
| HSBC Holdings PLC: | | | |
| (United Kingdom) | | 1,207,101 | 8,905,047 |
| sponsored ADR (c) | | 91,184 | 3,402,987 |
| Huaxia Bank Co. Ltd. (A Shares) | | 794,700 | 606,520 |
| Industrial & Commercial Bank of China Ltd. (H Shares) | | 6,707,000 | 3,075,008 |
| ING Groep NV: | | | |
| (Certificaten Van Aandelen) | | 3,297,801 | 46,845,214 |
| sponsored ADR (c) | | 67,886 | 960,587 |
| Intesa Sanpaolo SpA | | 6,222,403 | 16,616,311 |
| Jyske Bank A/S (Reg.) (b) | | 57,273 | 4,083,965 |
| KBC Group NV | | 214,823 | 14,107,048 |
| Kyushu Financial Group, Inc. | | 51,600 | 253,186 |
| Lloyds Banking Group PLC | | 30,748,562 | 16,427,831 |
| Mebuki Financial Group, Inc. | | 1,164,600 | 3,226,573 |
| Mediobanca SpA | | 39,868 | 521,797 |
| Mitsubishi UFJ Financial Group, Inc. | | 2,880,100 | 22,976,517 |
| Mizrahi Tefahot Bank Ltd. | | 47,928 | 1,577,835 |
| National Bank of Canada | | 130,985 | 9,128,817 |
| NatWest Group PLC | | 10,137,965 | 29,482,045 |
| Nordea Bank Abp | | 751,234 | 8,246,180 |
| Nordea Bank Abp | | 17,016 | 187,711 |
| Nordea Bank Abp (Helsinki Stock Exchange) | | 160,100 | 1,753,020 |
| North Pacific Bank Ltd. | | 676,200 | 1,426,808 |
| PT Bank Central Asia Tbk | | 13,456,600 | 8,106,652 |
| Resona Holdings, Inc. | | 2,781,800 | 14,766,034 |
| Sberbank of Russia (d) | | 1,813,540 | 10,822 |
| Shanghai Rural Commercial Bank Co. Ltd. (A Shares) | | 915,800 | 734,270 |
| Skandinaviska Enskilda Banken AB (A Shares) | | 635,000 | 7,374,549 |
| Societe Generale Series A | | 278,900 | 7,901,559 |
| Standard Chartered PLC (United Kingdom) | | 911,096 | 8,213,119 |
| Sumitomo Mitsui Financial Group, Inc. | | 478,900 | 21,893,618 |
| Sumitomo Mitsui Trust Holdings, Inc. | | 142,700 | 5,346,285 |
| Svenska Handelsbanken AB (A Shares) (c) | | 714,085 | 5,958,367 |
| Swedbank AB (A Shares) | | 249,953 | 4,432,422 |
| Sydbank A/S | | 75,943 | 3,575,556 |
| The Hachijuni Bank Ltd. | | 451,100 | 2,434,784 |
| The Toronto-Dominion Bank | | 75,338 | 4,595,440 |
| Turkiye Is Bankasi A/S Series C | | 1,657,373 | 1,306,286 |
| UniCredit SpA | | 1,857,435 | 45,252,906 |
| United Overseas Bank Ltd. | | 797,500 | 16,782,641 |
| Westpac Banking Corp. | | 354,000 | 5,034,766 |
| | | | 612,604,530 |
| Capital Markets - 1.4% | | | |
| 3i Group PLC | | 215,878 | 5,451,709 |
| Allfunds Group PLC | | 141,593 | 839,844 |
| Amundi SA (a) | | 104,900 | 6,261,845 |
| Azimut Holding SpA | | 37,992 | 880,784 |
| B3 SA - Brasil Bolsa Balcao | | 1,031,000 | 2,691,982 |
| Bridgepoint Group PLC (a) | | 992,616 | 2,196,758 |
| Brookfield Corp. (Canada) Class A (c) | | 139,141 | 4,749,247 |
| China Galaxy Securities Co. Ltd. (A Shares) | | 693,400 | 1,101,401 |
| Deutsche Borse AG | | 146,160 | 25,946,904 |
| Euronext NV (a) | | 290,844 | 21,019,857 |
| Hong Kong Exchanges and Clearing Ltd. | | 206,500 | 8,004,743 |
| Intermediate Capital Group PLC | | 122,397 | 2,097,085 |
| Julius Baer Group Ltd. | | 476,120 | 33,047,232 |
| London Stock Exchange Group PLC | | 254,434 | 26,322,268 |
| Macquarie Group Ltd. | | 201,511 | 23,179,924 |
| Nomura Holdings, Inc. | | 570,400 | 2,208,368 |
| Partners Group Holding AG | | 4,848 | 5,242,327 |
| SBI Holdings, Inc. Japan | | 534,300 | 10,926,902 |
| SDIC Capital Co. Ltd. | | 2,407,608 | 2,431,207 |
| UBS Group AG | | 1,386,408 | 36,882,989 |
| XP, Inc. Class A | | 114,394 | 2,898,744 |
| | | | 224,382,120 |
| Financial Services - 0.4% | | | |
| Adyen BV (a)(b) | | 5,048 | 4,215,188 |
| Challenger Ltd. | | 465,869 | 2,055,665 |
| Edenred SA | | 23,970 | 1,529,362 |
| Element Fleet Management Corp. | | 576,897 | 8,867,785 |
| EXOR NV | | 40,100 | 3,554,254 |
| GMO Payment Gateway, Inc. | | 13,400 | 849,893 |
| Groupe Bruxelles Lambert SA | | 73,300 | 5,910,345 |
| Helia Group Ltd. | | 274,965 | 691,275 |
| Investor AB (B Shares) | | 58,226 | 1,122,666 |
| Jio Financial Services Ltd. | | 160,536 | 453,214 |
| Mitsubishi UFJ Lease & Finance Co. Ltd. | | 514,100 | 3,345,828 |
| ORIX Corp. | | 987,200 | 18,455,507 |
| Paragon Banking Group PLC | | 170,220 | 1,135,317 |
| Visa, Inc. Class A | | 42,358 | 10,406,513 |
| Wise PLC (b) | | 144,460 | 1,171,578 |
| Worldline SA (a)(b) | | 10,779 | 351,581 |
| | | | 64,115,971 |
| Insurance - 2.3% | | | |
| Admiral Group PLC | | 102,364 | 3,228,900 |
| AIA Group Ltd. | | 3,970,200 | 35,923,402 |
| Allianz SE | | 148,703 | 36,146,596 |
| Aon PLC | | 42,517 | 14,174,743 |
| Assicurazioni Generali SpA | | 264,870 | 5,494,361 |
| Aviva PLC | | 541,975 | 2,576,025 |
| AXA SA | | 1,391,698 | 41,813,402 |
| Beazley PLC | | 1,825,227 | 12,624,599 |
| Dai-ichi Mutual Life Insurance Co. | | 361,900 | 6,744,506 |
| Definity Financial Corp. | | 85,692 | 2,357,925 |
| Gjensidige Forsikring ASA | | 60,952 | 948,819 |
| Hannover Reuck SE | | 15,069 | 3,206,739 |
| Hiscox Ltd. | | 698,804 | 8,830,318 |
| Intact Financial Corp. | | 34,754 | 4,899,820 |
| Japan Post Holdings Co. Ltd. | | 804,400 | 6,175,572 |
| Japan Post Insurance Co. Ltd. | | 40,900 | 659,904 |
| Legal & General Group PLC | | 6,312,270 | 17,488,091 |
| MAPFRE SA (Reg.) (c) | | 1,272,068 | 2,691,145 |
| MS&AD Insurance Group Holdings, Inc. | | 151,300 | 5,449,067 |
| Muenchener Rueckversicherungs-Gesellschaft AG in Muenchen | | 47,864 | 18,591,056 |
| NN Group NV | | 106,183 | 4,094,362 |
| NN Group NV rights (b)(e) | | 106,183 | 128,956 |
| Ping An Insurance Group Co. of China Ltd. (H Shares) | | 313,500 | 1,876,971 |
| Poste Italiane SpA (a) | | 36,071 | 401,110 |
| Prudential PLC | | 2,153,009 | 26,221,638 |
| Sampo Oyj (A Shares) | | 174,230 | 7,657,183 |
| Sompo Holdings, Inc. | | 98,000 | 4,275,102 |
| Steadfast Group Ltd. | | 467,511 | 1,708,490 |
| Storebrand ASA (A Shares) | | 672,514 | 5,402,024 |
| Sun Life Financial, Inc. (c) | | 156,571 | 7,637,355 |
| Swiss Re Ltd. | | 47,351 | 4,604,575 |
| T&D Holdings, Inc. | | 247,000 | 3,927,520 |
| Talanx AG | | 103,969 | 6,995,442 |
| Tokio Marine Holdings, Inc. | | 724,700 | 15,993,045 |
| UNIQA Insurance Group AG | | 110,504 | 890,300 |
| Willis Towers Watson PLC | | 50,925 | 10,529,253 |
| Zurich Insurance Group Ltd. | | 76,600 | 35,986,868 |
| | | | 368,355,184 |
TOTAL FINANCIALS | | | 1,269,457,805 |
| HEALTH CARE - 5.4% | | | |
| Biotechnology - 0.2% | | | |
| Abcam PLC ADR (b) | | 65,896 | 1,490,568 |
| Argenx SE (b) | | 5,575 | 2,801,907 |
| Ascendis Pharma A/S sponsored ADR (b) | | 21,024 | 2,060,772 |
| CSL Ltd. | | 64,084 | 11,317,165 |
| Genmab A/S (b) | | 30,882 | 11,831,989 |
| | | | 29,502,401 |
| Health Care Equipment & Supplies - 0.8% | | | |
| Alcon, Inc. (Switzerland) | | 99,041 | 8,287,894 |
| ASAHI INTECC Co. Ltd. | | 49,700 | 1,013,505 |
| Coloplast A/S Series B | | 22,811 | 2,605,985 |
| ConvaTec Group PLC (a) | | 3,497,297 | 10,296,193 |
| DiaSorin SpA | | 10,483 | 1,108,988 |
| Elekta AB (B Shares) (c) | | 470,260 | 3,366,578 |
| EssilorLuxottica SA | | 94,148 | 17,753,344 |
| Hoya Corp. | | 56,500 | 6,273,463 |
| InMode Ltd. (b)(c) | | 41,024 | 1,603,628 |
| Koninklijke Philips Electronics NV | | 1,380,155 | 31,014,271 |
| Olympus Corp. | | 496,900 | 6,729,726 |
| Siemens Healthineers AG (a) | | 175,519 | 8,802,486 |
| Smith & Nephew PLC | | 904,811 | 12,210,455 |
| Straumann Holding AG | | 29,070 | 4,409,781 |
| Terumo Corp. | | 231,200 | 7,012,513 |
| | | | 122,488,810 |
| Health Care Providers & Services - 0.2% | | | |
| Amplifon SpA | | 41,887 | 1,364,422 |
| Apollo Hospitals Enterprise Ltd. | | 20,677 | 1,203,502 |
| CVS Group PLC | | 48,584 | 1,304,780 |
| Fresenius SE & Co. KGaA | | 403,355 | 12,950,762 |
| Galenica AG (a) | | 20,585 | 1,635,894 |
| Max Healthcare Institute Ltd. | | 150,024 | 1,069,364 |
| Medipal Holdings Corp. | | 14,500 | 248,850 |
| Sonic Healthcare Ltd. | | 196,300 | 4,090,514 |
| Suzuken Co. Ltd. | | 104,600 | 3,104,318 |
| | | | 26,972,406 |
| Health Care Technology - 0.0% | | | |
| Pro Medicus Ltd. | | 32,677 | 1,552,409 |
| Life Sciences Tools & Services - 0.3% | | | |
| Agilent Technologies, Inc. | | 80,969 | 9,802,917 |
| Bruker Corp. | | 111,016 | 7,282,650 |
| Evotec OAI AG (b) | | 110,377 | 2,590,033 |
| ICON PLC (b) | | 26,473 | 6,881,392 |
| Lonza Group AG | | 12,783 | 7,050,991 |
| QIAGEN NV (Germany) (b) | | 280,309 | 12,823,780 |
| Sartorius Stedim Biotech | | 10,245 | 2,911,712 |
| Siegfried Holding AG | | 1,676 | 1,516,909 |
| Stevanato Group SpA (c) | | 68,887 | 2,207,139 |
| Tecan Group AG | | 8,935 | 3,570,561 |
| | | | 56,638,084 |
| Pharmaceuticals - 3.9% | | | |
| Astellas Pharma, Inc. | | 1,775,900 | 26,870,020 |
| AstraZeneca PLC: | | | |
| (United Kingdom) | | 319,725 | 42,946,335 |
| sponsored ADR | | 209,471 | 14,206,323 |
| Bayer AG | | 784,890 | 42,943,314 |
| Chugai Pharmaceutical Co. Ltd. | | 118,500 | 3,612,108 |
| Daiichi Sankyo Kabushiki Kaisha | | 176,700 | 5,204,462 |
| Eisai Co. Ltd. | | 34,400 | 2,188,908 |
| GSK PLC | | 2,071,478 | 36,283,898 |
| GSK PLC sponsored ADR | | 803,943 | 28,242,518 |
| Kyowa Hakko Kirin Co., Ltd. | | 433,200 | 7,951,205 |
| Merck KGaA | | 64,318 | 11,577,375 |
| Novartis AG | | 738,981 | 74,372,355 |
| Novo Nordisk A/S: | | | |
| Series B | | 417,780 | 77,061,083 |
| Series B sponsored ADR | | 29,198 | 5,419,733 |
| Ono Pharmaceutical Co. Ltd. | | 19,800 | 374,060 |
| Otsuka Holdings Co. Ltd. | | 210,800 | 8,035,306 |
| Roche Holding AG (participation certificate) | | 453,257 | 133,025,681 |
| Sanofi SA | | 698,669 | 74,411,022 |
| Santen Pharmaceutical Co. Ltd. | | 610,400 | 5,682,579 |
| Taisho Pharmaceutical Holdings Co. Ltd. | | 7,300 | 302,647 |
| Takeda Pharmaceutical Co. Ltd. | | 696,100 | 21,513,018 |
| UCB SA | | 34,019 | 3,054,368 |
| | | | 625,278,318 |
TOTAL HEALTH CARE | | | 862,432,428 |
| INDUSTRIALS - 7.5% | | | |
| Aerospace & Defense - 0.9% | | | |
| Airbus Group NV | | 96,416 | 14,106,343 |
| BAE Systems PLC | | 254,039 | 3,233,350 |
| Dassault Aviation SA | | 3,025 | 595,677 |
| Leonardo SpA | | 100,033 | 1,444,288 |
| Melrose Industries PLC | | 1,071,636 | 6,958,794 |
| MTU Aero Engines AG | | 67,616 | 15,822,329 |
| Rolls-Royce Holdings PLC (b) | | 24,573,722 | 68,937,259 |
| Safran SA | | 114,417 | 18,337,063 |
| Thales SA | | 79,971 | 11,689,392 |
| | | | 141,124,495 |
| Air Freight & Logistics - 0.2% | | | |
| DHL Group | | 432,879 | 20,223,769 |
| DSV A/S | | 46,854 | 8,913,242 |
| Konoike Transport Co. Ltd. | | 17,700 | 248,538 |
| Sankyu, Inc. | | 15,500 | 541,613 |
| | | | 29,927,162 |
| Building Products - 0.3% | | | |
| AGC, Inc. | | 73,300 | 2,575,916 |
| ASSA ABLOY AB (B Shares) | | 92,220 | 2,075,497 |
| Belimo Holding AG (Reg.) | | 3,106 | 1,637,827 |
| Compagnie de St.-Gobain | | 105,000 | 6,849,622 |
| Daikin Industries Ltd. | | 126,900 | 21,935,767 |
| Geberit AG (Reg.) | | 12,103 | 6,283,394 |
| Kingspan Group PLC (Ireland) | | 85,690 | 7,255,034 |
| Noritz Corp. | | 25,200 | 277,123 |
| Sekisui Jushi Corp. | | 61,400 | 1,062,615 |
| | | | 49,952,795 |
| Commercial Services & Supplies - 0.1% | | | |
| Boyd Group Services, Inc. | | 5,906 | 1,065,152 |
| Brambles Ltd. | | 103,570 | 1,004,609 |
| Japan Elevator Service Holdings Co. Ltd. | | 61,200 | 1,020,456 |
| RB Global, Inc. | | 86,150 | 5,327,630 |
| Rentokil Initial PLC | | 899,586 | 6,848,972 |
| Secom Co. Ltd. | | 40,100 | 2,809,853 |
| Toppan, Inc. | | 206,100 | 4,987,650 |
| | | | 23,064,322 |
| Construction & Engineering - 0.2% | | | |
| INFRONEER Holdings, Inc. | | 36,400 | 380,775 |
| Kajima Corp. | | 311,000 | 5,201,680 |
| Kinden Corp. | | 38,800 | 533,885 |
| Okumura Corp. | | 21,100 | 660,576 |
| Sanki Engineering Co. Ltd. | | 48,300 | 534,804 |
| Sweco AB (B Shares) | | 73,140 | 713,463 |
| Taisei Corp. | | 72,500 | 2,443,160 |
| VINCI SA | | 176,521 | 19,662,336 |
| Voltas Ltd. | | 105,624 | 1,110,903 |
| WorleyParsons Ltd. | | 542,055 | 6,135,893 |
| | | | 37,377,475 |
| Electrical Equipment - 1.2% | | | |
| ABB Ltd. (Reg.) | | 552,186 | 20,998,661 |
| Contemporary Amperex Technology Co. Ltd. | | 47,940 | 1,562,259 |
| Eurogroup Laminations SpA | | 99,836 | 548,323 |
| Fuji Electric Co. Ltd. | | 6,900 | 326,042 |
| Havells India Ltd. | | 97,895 | 1,638,752 |
| Hirakawa Hewtech Corp. | | 44,400 | 455,917 |
| Legrand SA | | 502,946 | 49,683,161 |
| Mitsubishi Electric Corp. | | 2,351,000 | 30,685,240 |
| Prysmian SpA | | 294,647 | 12,073,923 |
| Schneider Electric SA | | 364,954 | 62,556,164 |
| Shenzhen Megmeet Electrical Co. Ltd. | | 43,200 | 189,372 |
| Siemens Energy AG (b) | | 208,100 | 2,969,597 |
| Weg SA | | 188,700 | 1,367,223 |
| | | | 185,054,634 |
| Ground Transportation - 0.3% | | | |
| ALD SA (a) | | 143,635 | 1,391,632 |
| Aurizon Holdings Ltd. | | 203,070 | 480,264 |
| Canadian National Railway Co. | | 63,516 | 7,154,481 |
| Canadian Pacific Kansas City Ltd. | | 114,655 | 9,101,314 |
| Canadian Pacific Kansas City Ltd. | | 135,969 | 10,793,395 |
| Central Japan Railway Co. | | 29,100 | 3,738,128 |
| East Japan Railway Co. | | 35,500 | 2,008,564 |
| Mobico Group PLC | | 64,183 | 68,054 |
| Rumo SA | | 281,700 | 1,271,392 |
| TFI International, Inc. (Canada) | | 26,800 | 3,651,877 |
| Tokyu Corp. | | 9,100 | 115,114 |
| West Japan Railway Co. | | 4,200 | 181,977 |
| | | | 39,956,192 |
| Industrial Conglomerates - 0.7% | | | |
| CK Hutchison Holdings Ltd. | | 2,366,900 | 12,899,594 |
| DCC PLC (United Kingdom) | | 264,865 | 14,518,426 |
| Hitachi Ltd. | | 620,180 | 41,321,179 |
| Jardine Matheson Holdings Ltd. ADR (c) | | 999 | 47,443 |
| Lifco AB | | 96,397 | 1,767,961 |
| Siemens AG | | 295,564 | 44,402,824 |
| | | | 114,957,427 |
| Machinery - 1.6% | | | |
| Airtac International Group | | 43,158 | 1,246,127 |
| Alstom SA | | 801,837 | 22,111,801 |
| Alstom SA rights (b)(c)(e) | | 801,837 | 217,368 |
| Amada Co. Ltd. | | 51,000 | 541,214 |
| Atlas Copco AB (A Shares) | | 375,283 | 4,961,699 |
| AutoStore Holdings Ltd. (a)(b)(c) | | 634,784 | 1,088,454 |
| CNH Industrial NV | | 820,000 | 11,363,554 |
| Daimler Truck Holding AG | | 111,879 | 3,941,557 |
| Epiroc AB (A Shares) | | 384,179 | 7,370,624 |
| FANUC Corp. | | 1,022,400 | 29,078,444 |
| Furukawa Co. Ltd. | | 2,900 | 35,359 |
| GEA Group AG | | 401,591 | 15,850,933 |
| Harmonic Drive Systems, Inc. | | 24,400 | 643,142 |
| Hitachi Construction Machinery Co. Ltd. | | 8,100 | 252,807 |
| Husqvarna AB (B Shares) | | 266,700 | 2,301,973 |
| IMI PLC | | 788,303 | 14,999,306 |
| Indutrade AB | | 83,758 | 1,611,893 |
| Iveco Group NV (b) | | 168,182 | 1,673,775 |
| KION Group AG | | 85,391 | 3,416,709 |
| Kitz Corp. | | 61,200 | 443,768 |
| Knorr-Bremse AG | | 89,240 | 6,106,023 |
| Makita Corp. | | 75,600 | 2,077,383 |
| Metso Corp. | | 105,728 | 1,218,115 |
| Mitsubishi Heavy Industries Ltd. | | 24,000 | 1,364,171 |
| Mitsuboshi Belting Ltd. | | 29,200 | 967,346 |
| NGK Insulators Ltd. | | 80,500 | 1,070,051 |
| NTN Corp. | | 88,600 | 176,536 |
| OSG Corp. | | 54,700 | 691,387 |
| Rotork PLC | | 991,075 | 3,779,036 |
| Sandvik AB | | 269,586 | 5,098,361 |
| Schindler Holding AG (participation certificate) | | 45,459 | 10,145,743 |
| SMC Corp. | | 52,100 | 25,326,906 |
| Spirax-Sarco Engineering PLC | | 79,063 | 10,150,913 |
| Sumitomo Heavy Industries Ltd. | | 8,200 | 205,881 |
| Techtronic Industries Co. Ltd. | | 1,317,000 | 13,014,913 |
| The Weir Group PLC | | 289,293 | 6,723,009 |
| THK Co. Ltd. | | 118,900 | 2,178,274 |
| Toyota Industries Corp. | | 316,700 | 22,420,083 |
| Valmet Corp. | | 33,808 | 861,503 |
| VAT Group AG (a) | | 7,803 | 3,130,563 |
| Volvo AB (B Shares) | | 366,691 | 7,408,508 |
| Yangzijiang Shipbuilding Holdings Ltd. | | 1,936,400 | 2,421,485 |
| | | | 249,686,697 |
| Marine Transportation - 0.2% | | | |
| A.P. Moller - Maersk A/S: | | | |
| Series A | | 3,326 | 5,961,840 |
| Series B | | 1,683 | 3,055,258 |
| Kawasaki Kisen Kaisha Ltd. | | 39,100 | 1,313,053 |
| Mitsui OSK Lines Ltd. | | 200,000 | 5,547,957 |
| Nippon Yusen KK | | 319,000 | 8,520,114 |
| | | | 24,398,222 |
| Passenger Airlines - 0.2% | | | |
| Air France KLM (Reg.) (b) | | 145,983 | 2,220,902 |
| Deutsche Lufthansa AG (b) | | 50,137 | 448,357 |
| InterGlobe Aviation Ltd. (a)(b) | | 75,086 | 2,210,559 |
| International Consolidated Airlines Group SA CDI (b) | | 508,649 | 1,043,858 |
| Ryanair Holdings PLC sponsored ADR (b) | | 300,944 | 29,868,692 |
| | | | 35,792,368 |
| Professional Services - 0.7% | | | |
| BayCurrent Consulting, Inc. | | 37,000 | 1,274,827 |
| Benefit One, Inc. | | 93,100 | 808,494 |
| Bureau Veritas SA | | 145,677 | 3,908,051 |
| Experian PLC | | 561,340 | 19,640,734 |
| Intertek Group PLC | | 162,920 | 8,544,424 |
| Persol Holdings Co. Ltd. | | 164,100 | 2,814,045 |
| Recruit Holdings Co. Ltd. | | 267,446 | 9,527,095 |
| RELX PLC: | | | |
| (Euronext N.V.) | | 334,573 | 10,909,223 |
| (London Stock Exchange) | | 384,091 | 12,519,358 |
| rights (b)(e) | | 334,573 | 71,590 |
| SGS SA (Reg.) | | 119,752 | 10,896,775 |
| SMS Co., Ltd. | | 29,700 | 573,607 |
| TechnoPro Holdings, Inc. | | 268,000 | 6,572,842 |
| Teleperformance | | 25,013 | 3,467,656 |
| Wolters Kluwer NV | | 157,442 | 18,984,312 |
| Wolters Kluwer NV: | | | |
| ADR | | 1,564 | 188,446 |
| rights (b)(e) | | 155,408 | 121,332 |
| | | | 110,822,811 |
| Trading Companies & Distributors - 0.8% | | | |
| AerCap Holdings NV (b) | | 210,000 | 12,919,200 |
| Ashtead Group PLC | | 381,083 | 26,667,438 |
| Beijer Ref AB (B Shares) | | 167,366 | 1,923,062 |
| Brenntag SE | | 51,457 | 4,170,298 |
| Bunzl PLC | | 312,318 | 11,196,738 |
| Diploma PLC | | 61,680 | 2,448,789 |
| Hanwa Co. Ltd. | | 6,300 | 200,914 |
| IMCD NV | | 21,820 | 3,010,801 |
| Itochu Corp. | | 171,500 | 6,450,036 |
| Kanamoto Co. Ltd. | | 42,800 | 726,890 |
| Marubeni Corp. | | 153,900 | 2,522,249 |
| Mitsubishi Corp. | | 453,500 | 22,429,541 |
| Mitsui & Co. Ltd. | | 349,000 | 13,029,781 |
| MonotaRO Co. Ltd. | | 170,800 | 2,017,196 |
| Ochi Holdings Co. Ltd. (c) | | 95,700 | 919,541 |
| Rexel SA | | 190,400 | 4,480,187 |
| Seven Group Holdings Ltd. | | 14,596 | 264,431 |
| Sojitz Corp. | | 157,800 | 3,396,884 |
| Sumitomo Corp. | | 419,200 | 8,640,715 |
| Toromont Industries Ltd. | | 39,824 | 3,266,794 |
| Toyota Tsusho Corp. | | 18,400 | 1,099,612 |
| Wakita & Co. Ltd. | | 13,300 | 122,675 |
| Yamazen Co. Ltd. | | 192,500 | 1,512,268 |
| Yuasa Trading Co. Ltd. | | 31,500 | 926,630 |
| | | | 134,342,670 |
| Transportation Infrastructure - 0.1% | | | |
| Aena SME SA (a) | | 100,515 | 15,804,049 |
| Beijing Capital International Airport Co. Ltd. (H Shares) (b) | | 6,370,000 | 3,338,374 |
| Grupo Aeroportuario del Sureste S.A.B. de CV Series B sponsored ADR | | 4,738 | 1,290,063 |
| SATS Ltd. (b) | | 342,000 | 655,429 |
| The Sumitomo Warehouse Co. Ltd. | | 3,800 | 65,242 |
| | | | 21,153,157 |
TOTAL INDUSTRIALS | | | 1,197,610,427 |
| INFORMATION TECHNOLOGY - 5.9% | | | |
| Communications Equipment - 0.1% | | | |
| Ericsson (B Shares) | | 1,124,285 | 5,769,816 |
| Nokia Corp. | | 2,838,898 | 11,352,946 |
| Vtech Holdings Ltd. | | 56,700 | 346,316 |
| | | | 17,469,078 |
| Electronic Equipment, Instruments & Components - 0.8% | | | |
| Chongqing Chuanyi Automation Co. Ltd. (A Shares) | | 37,200 | 167,068 |
| Enplas Corp. | | 6,000 | 453,624 |
| Hagiwara Electric Holdings Co. Ltd. | | 95,900 | 2,596,969 |
| Halma PLC | | 163,914 | 4,451,936 |
| Hamamatsu Photonics K.K. | | 94,400 | 4,376,937 |
| Hexagon AB (B Shares) | | 496,933 | 4,436,697 |
| Hirose Electric Co. Ltd. | | 94,290 | 11,441,561 |
| Ibiden Co. Ltd. | | 42,800 | 2,586,327 |
| Keyence Corp. | | 28,100 | 11,688,457 |
| Kyocera Corp. | | 472,600 | 24,290,201 |
| Largan Precision Co. Ltd. | | 25,000 | 1,608,449 |
| Macnica Fuji Electronics Holdings, Inc. | | 11,600 | 544,541 |
| Murata Manufacturing Co. Ltd. | | 530,900 | 29,700,294 |
| OMRON Corp. | | 53,700 | 2,597,619 |
| Renishaw PLC | | 18,277 | 842,317 |
| Samsung SDI Co. Ltd. | | 3,125 | 1,448,206 |
| Sanshin Electronic Co. Ltd. | | 14,500 | 215,664 |
| SES-imagotag SA (b) | | 7,572 | 898,250 |
| Shimadzu Corp. | | 532,000 | 15,671,686 |
| Spectris PLC | | 39,714 | 1,672,797 |
| Sumida Corp. | | 8,900 | 101,421 |
| TDK Corp. | | 45,500 | 1,661,823 |
| Unimicron Technology Corp. | | 166,000 | 966,419 |
| Yokogawa Electric Corp. | | 357,800 | 7,103,373 |
| | | | 131,522,636 |
| IT Services - 0.7% | | | |
| Capgemini SA | | 158,309 | 29,543,828 |
| Fujitsu Ltd. | | 234,640 | 29,359,230 |
| Globant SA (b)(c) | | 9,300 | 1,901,571 |
| Infosys Ltd. | | 160,555 | 2,784,861 |
| Locaweb Servicos de Internet SA (a) | | 495,888 | 707,975 |
| Mitsubishi Research Institute, Inc. | | 4,400 | 151,813 |
| NEC Corp. | | 45,300 | 2,393,043 |
| Nomura Research Institute Ltd. | | 684,600 | 19,691,749 |
| NTT Data Corp. | | 647,700 | 8,729,782 |
| OBIC Co. Ltd. | | 1,100 | 191,505 |
| Otsuka Corp. | | 4,300 | 191,955 |
| SCSK Corp. | | 66,900 | 1,161,479 |
| SHIFT, Inc. (b) | | 6,600 | 1,360,872 |
| Shopify, Inc. Class A (b) | | 42,810 | 2,846,437 |
| Simplex Holdings, Inc. | | 55,500 | 1,097,069 |
| Softcat PLC | | 62,003 | 1,181,323 |
| TIS, Inc. | | 69,000 | 1,629,974 |
| Wix.com Ltd. (b) | | 17,096 | 1,688,572 |
| | | | 106,613,038 |
| Semiconductors & Semiconductor Equipment - 2.2% | | | |
| Advantest Corp. | | 14,726 | 1,853,212 |
| Analog Devices, Inc. | | 86,300 | 15,687,614 |
| ASML Holding NV: | | | |
| (depository receipt) | | 17,703 | 11,693,363 |
| (Netherlands) | | 143,293 | 94,219,183 |
| ASMPT Ltd. | | 95,900 | 960,547 |
| BE Semiconductor Industries NV | | 26,767 | 3,079,531 |
| Broadcom, Inc. | | 14,719 | 13,584,018 |
| Disco Corp. | | 110,700 | 21,879,236 |
| Global Unichip Corp. | | 30,000 | 1,374,635 |
| GlobalWafers Co. Ltd. | | 47,000 | 677,055 |
| Infineon Technologies AG | | 532,789 | 19,039,571 |
| MediaTek, Inc. | | 151,000 | 3,341,023 |
| NXP Semiconductors NV | | 139,536 | 28,705,346 |
| Renesas Electronics Corp. (b) | | 264,300 | 4,403,151 |
| ROHM Co. Ltd. | | 72,800 | 6,089,391 |
| Siltronic AG | | 9,983 | 798,349 |
| SK Hynix, Inc. | | 257,771 | 23,696,998 |
| Socionext, Inc. | | 5,500 | 682,326 |
| Sumco Corp. | | 723,200 | 9,677,792 |
| Taiwan Semiconductor Manufacturing Co. Ltd. | | 1,069,000 | 18,359,070 |
| Taiwan Semiconductor Manufacturing Co. Ltd. sponsored ADR | | 385,252 | 36,048,030 |
| Tokyo Electron Ltd. | | 215,517 | 32,009,807 |
| | | | 347,859,248 |
| Software - 1.3% | | | |
| Aisino Corp. (A Shares) | | 248,105 | 439,892 |
| ANSYS, Inc. (b) | | 22,598 | 7,205,824 |
| Cadence Design Systems, Inc. (b) | | 150,069 | 36,082,590 |
| Check Point Software Technologies Ltd. (b) | | 123,057 | 16,562,242 |
| Constellation Software, Inc. | | 6,340 | 13,022,807 |
| Constellation Software, Inc.: | | | |
| warrants 8/22/28 (b)(d) | | 6,340 | 0 |
| rights (b) | | 6,340 | 3,519 |
| Dassault Systemes SA | | 348,809 | 13,847,038 |
| Fortnox AB | | 185,255 | 963,120 |
| Kinaxis, Inc. (b) | | 10,565 | 1,302,407 |
| Lightspeed Commerce, Inc. (b) | | 88,994 | 1,453,272 |
| Nemetschek SE | | 16,400 | 1,133,510 |
| Newland Digital Technology Co. Ltd. (A Shares) (b) | | 406,600 | 1,116,927 |
| NICE Ltd. sponsored ADR (b)(c) | | 26,237 | 5,110,968 |
| Oracle Corp. Japan | | 12,800 | 894,711 |
| Rakus Co. Ltd. | | 64,600 | 1,052,728 |
| Sansan, Inc. (b) | | 81,000 | 808,358 |
| SAP SE | | 726,059 | 101,288,438 |
| SAP SE sponsored ADR (c) | | 54,394 | 7,598,298 |
| Shenzhen Fortune Trend Technology Co. Ltd. (A Shares) | | 2,385 | 50,510 |
| Technology One Ltd. | | 45,161 | 450,929 |
| Temenos Group AG | | 8,144 | 647,758 |
| Trend Micro, Inc. | | 18,400 | 782,691 |
| | | | 211,818,537 |
| Technology Hardware, Storage & Peripherals - 0.8% | | | |
| Brother Industries Ltd. | | 144,200 | 2,446,529 |
| Canon, Inc. | | 311,900 | 7,677,128 |
| FUJIFILM Holdings Corp. | | 155,100 | 9,182,662 |
| Lenovo Group Ltd. | | 844,000 | 954,597 |
| Ricoh Co. Ltd. | | 286,500 | 2,339,338 |
| Samsung Electronics Co. Ltd. | | 2,002,490 | 101,113,340 |
| Seiko Epson Corp. | | 215,000 | 3,372,882 |
| TPV Technology Co. Ltd. (A Shares) (b) | | 678,100 | 220,464 |
| | | | 127,306,940 |
TOTAL INFORMATION TECHNOLOGY | | | 942,589,477 |
| MATERIALS - 3.3% | | | |
| Chemicals - 1.7% | | | |
| Air Liquide SA | | 110,879 | 20,033,196 |
| Air Water, Inc. | | 26,400 | 332,597 |
| Akzo Nobel NV | | 456,359 | 37,133,760 |
| Arkema SA | | 17,427 | 1,826,203 |
| Asahi Kasei Corp. | | 502,000 | 3,240,356 |
| Asian Paints Ltd. | | 63,469 | 2,498,639 |
| BASF AG | | 222,506 | 11,262,666 |
| Covestro AG (a)(b) | | 105,407 | 5,608,607 |
| Croda International PLC | | 219,330 | 15,342,725 |
| Daicel Chemical Industries Ltd. | | 102,200 | 854,857 |
| Denka Co. Ltd. | | 163,460 | 3,086,748 |
| DSM-Firmenich AG | | 4,882 | 450,767 |
| EcoSynthetix, Inc. (b)(c) | | 111,015 | 347,538 |
| Givaudan SA | | 2,646 | 8,830,484 |
| Icl Group Ltd. | | 34,530 | 207,014 |
| Johnson Matthey PLC | | 185,068 | 3,821,440 |
| K+S AG | | 137,100 | 2,579,327 |
| Kansai Paint Co. Ltd. | | 331,800 | 5,448,092 |
| Kuraray Co. Ltd. | | 62,200 | 707,736 |
| Lanxess AG | | 199,757 | 6,320,578 |
| Linde PLC | | 52,330 | 20,253,803 |
| Linde PLC | | 80,522 | 31,114,355 |
| Methanex Corp. | | 34,516 | 1,468,820 |
| Nippon Sanso Holdings Corp. | | 229,900 | 5,557,293 |
| Nitto Denko Corp. | | 147,500 | 10,086,103 |
| Novozymes A/S Series B | | 123,233 | 5,352,032 |
| PhosAgro PJSC (d) | | 3,751 | 224 |
| Shin-Etsu Chemical Co. Ltd. | | 557,400 | 17,766,437 |
| Shin-Etsu Chemical Co. Ltd. ADR (c) | | 3,801 | 60,474 |
| Sika AG | | 81,842 | 23,199,453 |
| Sumitomo Chemical Co. Ltd. | | 271,700 | 753,316 |
| Symrise AG | | 154,058 | 16,059,763 |
| Toray Industries, Inc. | | 337,300 | 1,822,410 |
| Tosoh Corp. | | 172,600 | 2,237,352 |
| Umicore SA (c) | | 158,022 | 4,187,308 |
| Yara International ASA | | 96,151 | 3,517,135 |
| | | | 273,369,608 |
| Construction Materials - 0.2% | | | |
| CRH PLC | | 256,037 | 14,730,747 |
| CRH PLC sponsored ADR | | 10,124 | 582,839 |
| HeidelbergCement AG | | 177,000 | 14,256,557 |
| | | | 29,570,143 |
| Containers & Packaging - 0.2% | | | |
| Amcor PLC CDI | | 185,080 | 1,810,831 |
| CCL Industries, Inc. Class B | | 151,195 | 6,757,450 |
| Orora Ltd. (d) | | 245,296 | 559,467 |
| Sig Group AG | | 114,468 | 3,016,715 |
| Smurfit Kappa Group PLC | | 374,806 | 15,761,002 |
| Toyo Seikan Group Holdings Ltd. | | 56,800 | 1,029,462 |
| | | | 28,934,927 |
| Metals & Mining - 1.1% | | | |
| Agnico Eagle Mines Ltd. (Canada) | | 140,449 | 6,819,759 |
| Anglo American PLC (United Kingdom) | | 362,657 | 9,643,661 |
| Antofagasta PLC | | 306,927 | 5,630,043 |
| ArcelorMittal SA (Netherlands) | | 372,712 | 9,913,806 |
| Barrick Gold Corp. (Canada) | | 87,153 | 1,412,560 |
| BHP Group Ltd. | | 298,173 | 8,665,074 |
| BHP Group Ltd.: | | | |
| (London) | | 229,282 | 6,604,934 |
| sponsored ADR (c) | | 52,100 | 2,995,229 |
| Franco-Nevada Corp. | | 200,448 | 28,877,448 |
| Glencore PLC | | 6,571,967 | 35,087,263 |
| IGO Ltd. | | 1,253,145 | 11,302,696 |
| Ivanhoe Mines Ltd. (b) | | 55,493 | 493,654 |
| Nippon Steel & Sumitomo Metal Corp. | | 119,300 | 2,826,400 |
| Rio Tinto PLC | | 509,339 | 31,367,484 |
| South32 Ltd. | | 1,553,267 | 3,386,895 |
| Sumitomo Metal Mining Co. Ltd. | | 9,300 | 288,917 |
| Teck Resources Ltd. Class B (sub. vtg.) | | 21,098 | 872,525 |
| Wheaton Precious Metals Corp. | | 172,363 | 7,518,558 |
| | | | 173,706,906 |
| Paper & Forest Products - 0.1% | | | |
| Stora Enso Oyj (R Shares) | | 408,554 | 5,207,648 |
| Svenska Cellulosa AB SCA (B Shares) | | 338,257 | 4,510,711 |
| | | | 9,718,359 |
TOTAL MATERIALS | | | 515,299,943 |
| REAL ESTATE - 0.4% | | | |
| Equity Real Estate Investment Trusts (REITs) - 0.1% | | | |
| Big Yellow Group PLC | | 85,144 | 1,159,500 |
| Goodman Group unit | | 200,265 | 3,031,233 |
| Great Portland Estates PLC | | 480,980 | 2,560,302 |
| Klepierre SA | | 64,304 | 1,701,364 |
| Scentre Group unit | | 2,733,297 | 4,870,359 |
| Segro PLC | | 457,447 | 4,273,188 |
| Stockland Corp. Ltd. unit | | 436,617 | 1,199,521 |
| Warehouses de Pauw | | 34,194 | 978,866 |
| | | | 19,774,333 |
| Real Estate Management & Development - 0.3% | | | |
| CK Asset Holdings Ltd. | | 1,282,800 | 7,082,729 |
| Daito Trust Construction Co. Ltd. | | 15,967 | 1,763,015 |
| Grand City Properties SA (b) | | 78,311 | 700,137 |
| LEG Immobilien AG (b) | | 197,952 | 14,295,640 |
| Mitsui Fudosan Co. Ltd. | | 371,100 | 8,141,525 |
| Nomura Real Estate Holdings, Inc. | | 64,198 | 1,618,463 |
| TAG Immobilien AG (b) | | 218,386 | 2,481,736 |
| Vonovia SE | | 225,621 | 5,413,388 |
| | | | 41,496,633 |
TOTAL REAL ESTATE | | | 61,270,966 |
| UTILITIES - 1.3% | | | |
| Electric Utilities - 0.5% | | | |
| Chubu Electric Power Co., Inc. | | 66,200 | 884,972 |
| CLP Holdings Ltd. | | 542,500 | 4,254,305 |
| Enel SpA | | 5,294,252 | 35,549,975 |
| Energias de Portugal SA | | 497,177 | 2,267,513 |
| Iberdrola SA | | 1,817,042 | 21,555,085 |
| Kansai Electric Power Co., Inc. | | 163,400 | 2,329,232 |
| ORSTED A/S (a) | | 34,309 | 2,208,862 |
| SSE PLC | | 75,590 | 1,557,494 |
| Tokyo Electric Power Co., Inc. (b) | | 454,400 | 1,998,804 |
| | | | 72,606,242 |
| Gas Utilities - 0.1% | | | |
| APA Group unit | | 517,648 | 3,015,336 |
| Beijing Enterprises Holdings Ltd. | | 493,500 | 1,850,070 |
| China Resource Gas Group Ltd. | | 913,200 | 2,567,605 |
| Osaka Gas Co. Ltd. | | 130,400 | 2,088,264 |
| Tokyo Gas Co. Ltd. | | 324,900 | 7,541,065 |
| | | | 17,062,340 |
| Independent Power and Renewable Electricity Producers - 0.2% | | | |
| Electric Power Development Co. Ltd. | | 408,900 | 6,385,242 |
| RWE AG | | 452,534 | 18,676,242 |
| | | | 25,061,484 |
| Multi-Utilities - 0.5% | | | |
| E.ON SE | | 1,476,701 | 18,222,347 |
| Engie SA | | 2,468,962 | 39,760,750 |
| National Grid PLC | | 800,868 | 9,996,760 |
| Veolia Environnement SA | | 563,476 | 17,633,610 |
| | | | 85,613,467 |
TOTAL UTILITIES | | | 200,343,533 |
| TOTAL COMMON STOCKS (Cost $5,407,419,038) | | | 7,111,395,552 |
| | | | |
| Nonconvertible Preferred Stocks - 0.5% |
| | | Shares | Value ($) |
| CONSUMER DISCRETIONARY - 0.2% | | | |
| Automobiles - 0.2% | | | |
| Bayerische Motoren Werke AG (BMW) (non-vtg.) | | 100,992 | 9,719,072 |
| Dr. Ing. h.c. F. Porsche AG Series F (a) | | 55,323 | 6,109,930 |
| Volkswagen AG | | 106,115 | 12,986,607 |
| | | | 28,815,609 |
| CONSUMER STAPLES - 0.1% | | | |
| Household Products - 0.1% | | | |
| Henkel AG & Co. KGaA | | 118,164 | 9,061,434 |
| ENERGY - 0.2% | | | |
| Oil, Gas & Consumable Fuels - 0.2% | | | |
| Petroleo Brasileiro SA - Petrobras: | | | |
| (PN) (non-vtg.) | | 1,855,000 | 11,964,479 |
| (PN) sponsored ADR (non-vtg.) | | 643,292 | 8,324,198 |
| sponsored ADR | | 628,033 | 8,823,864 |
| | | | 29,112,541 |
| FINANCIALS - 0.0% | | | |
| Banks - 0.0% | | | |
| Banco Bradesco SA (PN) sponsored ADR | | 2,140,533 | 6,400,194 |
| Insurance - 0.0% | | | |
| Samsung Fire & Marine Insurance Co. Ltd. | | 34 | 4,655 |
TOTAL FINANCIALS | | | 6,404,849 |
| TOTAL NONCONVERTIBLE PREFERRED STOCKS (Cost $62,664,650) | | | 73,394,433 |
| | | | |
| Equity Funds - 50.9% |
| | | Shares | Value ($) |
| Diversified Emerging Markets Funds - 0.0% | | | |
| Matthews Pacific Tiger Fund Investor Class | | 19,976 | 391,726 |
| Europe Stock Funds - 0.1% | | | |
| WisdomTree Europe Hedged Equity ETF | | 419,228 | 16,991,311 |
| Foreign Large Blend Funds - 13.6% | | | |
| Artisan International Value Fund Investor Class | | 18,125,212 | 797,509,346 |
| Fidelity SAI International Index Fund (f) | | 19,829,603 | 258,181,437 |
| Fidelity SAI International Low Volatility Index Fund (f) | | 83,117,668 | 877,722,564 |
| Harbor International Fund Institutional Class | | 9,619 | 415,360 |
| Morgan Stanley Institutional Fund, Inc. International Equity Portfolio Class I | | 16,903,195 | 228,193,128 |
TOTAL FOREIGN LARGE BLEND FUNDS | | | 2,162,021,835 |
| Foreign Large Growth Funds - 16.6% | | | |
| American Funds EuroPacific Growth Fund Class F2 | | 151,393 | 8,170,700 |
| Fidelity Advisor International Discovery Fund Class Z (f) | | 18,169,411 | 775,107,087 |
| Fidelity Diversified International Fund (f) | | 11,604,088 | 472,054,282 |
| Fidelity Overseas Fund (f) | | 10,911,192 | 616,482,373 |
| Fidelity SAI International Momentum Index Fund (f) | | 9,951,385 | 124,193,282 |
| Fidelity SAI International Quality Index Fund (f) | | 236,975 | 2,751,280 |
| Invesco Oppenheimer International Growth Fund Class A (b) | | 665,519 | 24,704,055 |
| JOHCM International Select Fund Investor Shares | | 14,205,916 | 317,786,350 |
| WCM Focused International Growth Fund Investor Class | | 14,267,111 | 304,317,483 |
TOTAL FOREIGN LARGE GROWTH FUNDS | | | 2,645,566,892 |
| Foreign Large Value Funds - 10.3% | | | |
| Fidelity SAI International Value Index Fund (f) | | 48,077,485 | 450,486,038 |
| iShares MSCI EAFE Value ETF (c) | | 8,200,898 | 405,206,370 |
| Oakmark International Fund Investor Class | | 20,366,460 | 540,933,186 |
| Pear Tree Polaris Foreign Value Fund Institutional Shares | | 10,832,820 | 233,122,278 |
TOTAL FOREIGN LARGE VALUE FUNDS | | | 1,629,747,872 |
| Foreign Small Mid Blend Funds - 1.2% | | | |
| Fidelity Advisor International Small Cap Fund Class Z (f) | | 1,083,658 | 32,368,850 |
| Fidelity SAI International Small Cap Index Fund (f) | | 11,440,506 | 91,752,861 |
| Victory Trivalent International Small-Cap Fund Class I | | 4,365,042 | 61,678,047 |
TOTAL FOREIGN SMALL MID BLEND FUNDS | | | 185,799,758 |
| Foreign Small Mid Growth Funds - 0.6% | | | |
| Fidelity Advisor International Small Cap Opportunities Fund Class Z (f) | | 2,457,449 | 46,445,790 |
| Oberweis International Opportunities Institutional Fund (b) | | 1,390,140 | 11,732,784 |
| T. Rowe Price International Discovery Fund | | 593,490 | 36,102,025 |
| Wasatch International Growth Fund Investor Class (b) | | 110 | 2,480 |
TOTAL FOREIGN SMALL MID GROWTH FUNDS | | | 94,283,079 |
| Foreign Small Mid Value Funds - 0.6% | | | |
| Brandes International Small Cap Equity Fund Class A | | 1,575,547 | 22,719,389 |
| Oakmark International Small Cap Fund Investor Class | | 933,303 | 17,499,433 |
| Transamerica International Small Cap Value Fund Class I | | 4,189,103 | 57,893,399 |
TOTAL FOREIGN SMALL MID VALUE FUNDS | | | 98,112,221 |
| Other - 7.9% | | | |
| Fidelity Advisor Japan Fund Class Z (f) | | 8,342,789 | 132,984,050 |
| Fidelity Japan Smaller Companies Fund (f) | | 5,534,439 | 83,348,644 |
| Fidelity SAI Japan Stock Index Fund (f) | | 82,002,391 | 758,522,119 |
| iShares MSCI Australia ETF (c) | | 10,001,860 | 222,141,311 |
| Matthews Japan Fund Investor Class | | 237 | 4,008 |
| WisdomTree Japan Hedged Equity ETF (c) | | 465,136 | 40,024,953 |
| WisdomTree Japan SmallCap Dividend ETF (c) | | 274,241 | 19,189,877 |
TOTAL OTHER | | | 1,256,214,962 |
| TOTAL EQUITY FUNDS (Cost $6,581,468,890) | | | 8,089,129,656 |
| | | | |
| U.S. Treasury Obligations - 0.1% |
| | | Principal Amount (g) | Value ($) |
U.S. Treasury Bills, yield at date of purchase 5.12% to 5.21% 9/7/23 to 9/14/23 (h) (Cost $15,874,876) | | 15,890,000 | 15,874,472 |
| | | | |
| Money Market Funds - 4.1% |
| | | Shares | Value ($) |
| Fidelity Investments Money Market Government Portfolio Class I 5.21% (f)(i) | | 11,130,969 | 11,130,969 |
| Fidelity Securities Lending Cash Central Fund 5.44% (j)(k) | | 120,814,682 | 120,826,763 |
| State Street Institutional U.S. Government Money Market Fund Premier Class 5.28% (i) | | 525,426,951 | 525,426,951 |
| TOTAL MONEY MARKET FUNDS (Cost $657,384,683) | | | 657,384,683 |
| | | | |
| TOTAL INVESTMENT IN SECURITIES - 100.4% (Cost $12,724,812,137) | 15,947,178,796 |
NET OTHER ASSETS (LIABILITIES) - (0.4)% | (67,487,287) |
| NET ASSETS - 100.0% | 15,879,691,509 |
| | |
| Futures Contracts |
| | Number of contracts | Expiration Date | Notional Amount ($) | Value ($) | Unrealized Appreciation/ (Depreciation) ($) |
| Purchased | | | | | |
| | | | | | |
| Equity Index Contracts | | | | | |
| CME Nikkei 225 Index Contracts (United States) | 526 | Sep 2023 | 85,475,000 | 1,213,799 | 1,213,799 |
| ICE MSCI EAFE Index Contracts (United States) | 3,231 | Sep 2023 | 340,757,415 | (3,387,831) | (3,387,831) |
| | | | | | |
| TOTAL FUTURES CONTRACTS | | | | | (2,174,032) |
| The notional amount of futures purchased as a percentage of Net Assets is 2.6% |
Security Type Abbreviations
Legend
| (a) | Security exempt from registration under Rule 144A of the Securities Act of 1933. These securities may be resold in transactions exempt from registration, normally to qualified institutional buyers. At the end of the period, the value of these securities amounted to $120,762,610 or 0.8% of net assets. |
| (c) | Security or a portion of the security is on loan at period end. |
| (e) | Security or a portion of the security purchased on a delayed delivery or when-issued basis. |
| (g) | Amount is stated in United States dollars unless otherwise noted. |
| (h) | Security or a portion of the security was pledged to cover margin requirements for futures contracts. At period end, the value of securities pledged amounted to $14,139,997. |
| (i) | The rate quoted is the annualized seven-day yield of the fund at period end. |
| (j) | Affiliated fund that is generally available only to investment companies and other accounts managed by Fidelity Investments. The rate quoted is the annualized seven-day yield of the fund at period end. A complete unaudited listing of the fund's holdings as of its most recent quarter end is available upon request. In addition, each Fidelity Central Fund's financial statements are available on the SEC's website or upon request. |
| (k) | Investment made with cash collateral received from securities on loan. |
Affiliated Central Funds
Fiscal year to date information regarding the Fund's investments in Fidelity Central Funds, including the ownership percentage, is presented below.
| Affiliate | Value, beginning of period ($) | Purchases ($) | Sales Proceeds ($) | Dividend Income ($) | Realized Gain (loss) ($) | Change in Unrealized appreciation (depreciation) ($) | Value, end of period ($) | % ownership, end of period |
| Fidelity Securities Lending Cash Central Fund 5.44% | 189,895,696 | 1,524,803,538 | 1,593,872,471 | 1,297,948 | - | - | 120,826,763 | 0.4% |
| Total | 189,895,696 | 1,524,803,538 | 1,593,872,471 | 1,297,948 | - | - | 120,826,763 | |
| | | | | | | | | |
Amounts in the dividend income column in the above table include any capital gain distributions from underlying funds, which are presented in the corresponding line item in the Statement of Operations, if applicable.
Amounts in the dividend income column for Fidelity Securities Lending Cash Central Fund represents the income earned on investing cash collateral, less rebates paid to borrowers and any lending agent fees associated with the loan, plus any premium payments received for lending certain types of securities.
Amounts included in the purchases and sales proceeds columns may include in-kind transactions, if applicable.
Affiliated Underlying Funds
Fiscal year to date information regarding the Fund's investments in affiliated Underlying Funds is presented below. Exchanges between classes of the same affiliated Underlying Funds may occur. If an Underlying Funds changes its name, the name presented below is the name in effect at period end.
| Affiliate | Value, beginning of period ($) | Purchases ($) | Sales Proceeds ($) | Dividend Income ($) | Realized Gain (loss) ($) | Change in Unrealized appreciation (depreciation) ($) | Value, end of period ($) |
| Fidelity Advisor International Discovery Fund Class Z | 762,223,228 | - | 20,000,000 | - | 5,990,482 | 26,893,377 | 775,107,087 |
| Fidelity Advisor International Small Cap Fund Class Z | 36,356,224 | - | 5,311,314 | - | 621,127 | 702,813 | 32,368,850 |
| Fidelity Advisor International Small Cap Opportunities Fund - Class Z | 53,586,840 | - | 7,784,028 | - | (476,083) | 1,119,061 | 46,445,790 |
| Fidelity Advisor Japan Fund Class Z | 53,625,692 | 75,000,000 | - | - | - | 4,358,358 | 132,984,050 |
| Fidelity Diversified International Fund | 463,248,691 | - | 17,999,999 | - | 5,922,781 | 20,882,809 | 472,054,282 |
| Fidelity Investments Money Market Government Portfolio Class I 5.21% | - | 116,553,865 | 105,422,896 | 119,208 | - | - | 11,130,969 |
| Fidelity Japan Smaller Companies Fund | 95,282,551 | - | 21,000,001 | - | (310,217) | 9,376,311 | 83,348,644 |
| Fidelity Overseas Fund | 605,809,736 | - | 20,000,000 | - | (3,622,385) | 34,295,022 | 616,482,373 |
| Fidelity SAI International Index Fund | 3,779,269 | 285,000,000 | 34,500,000 | - | 133,514 | 3,768,654 | 258,181,437 |
| Fidelity SAI International Low Volatility Index Fund | 587,804,624 | 252,999,992 | - | - | - | 36,917,948 | 877,722,564 |
| Fidelity SAI International Momentum Index Fund | 115,734,605 | - | - | - | - | 8,458,677 | 124,193,282 |
| Fidelity SAI International Quality Index Fund | 2,597,246 | - | - | - | - | 154,034 | 2,751,280 |
| Fidelity SAI International Small Cap Index Fund | 105,356,169 | - | 15,238,711 | - | (4,429,164) | 6,064,567 | 91,752,861 |
| Fidelity SAI International Value Index Fund | 562,494,302 | - | 137,000,000 | - | (12,010,521) | 37,002,257 | 450,486,038 |
| Fidelity SAI Japan Stock Index Fund | 813,934,192 | - | 142,999,994 | - | (19,693,723) | 107,281,644 | 758,522,119 |
| | 4,261,833,369 | 729,553,857 | 527,256,943 | 119,208 | (27,874,189) | 297,275,532 | 4,733,531,626 |
Amounts in the dividend income column in the above table include any capital gain distributions from underlying funds, which are presented in the corresponding line item in the Statement of Operations, if applicable.
Amounts included in the purchases and sales proceeds columns may include in-kind transactions, if applicable.
Investment Valuation
The following is a summary of the inputs used, as of August 31, 2023, involving the Fund's assets and liabilities carried at fair value. The inputs or methodology used for valuing securities may not be an indication of the risk associated with investing in those securities. For more information on valuation inputs, and their aggregation into the levels used below, please refer to the Investment Valuation section in the accompanying Notes to Financial Statements.
| Valuation Inputs at Reporting Date: |
| Description | Total ($) | Level 1 ($) | Level 2 ($) | Level 3 ($) |
Investments in Securities: | | | | |
|
| Equities: | | | | |
Communication Services | 213,463,284 | 68,087,098 | 145,376,186 | - |
Consumer Discretionary | 696,941,385 | 414,350,404 | 282,590,981 | - |
Consumer Staples | 733,072,909 | 223,334,257 | 509,738,652 | - |
Energy | 485,902,979 | 208,014,298 | 277,429,226 | 459,455 |
Financials | 1,275,862,654 | 695,854,938 | 579,996,894 | 10,822 |
Health Care | 862,432,428 | 247,588,294 | 614,844,134 | - |
Industrials | 1,197,610,427 | 773,566,723 | 424,043,704 | - |
Information Technology | 942,589,477 | 560,125,451 | 382,464,026 | - |
Materials | 515,299,943 | 383,061,739 | 131,678,513 | 559,691 |
Real Estate | 61,270,966 | 55,857,578 | 5,413,388 | - |
Utilities | 200,343,533 | 93,480,963 | 106,862,570 | - |
|
| Equity Funds | 8,089,129,656 | 8,089,129,656 | - | - |
|
| Other Short-Term Investments | 15,874,472 | - | 15,874,472 | - |
|
| Money Market Funds | 657,384,683 | 657,384,683 | - | - |
| Total Investments in Securities: | 15,947,178,796 | 12,469,836,082 | 3,476,312,746 | 1,029,968 |
Derivative Instruments: | | | | |
|
| Assets | | | | |
Futures Contracts | 1,213,799 | 1,213,799 | - | - |
| Total Assets | 1,213,799 | 1,213,799 | - | - |
|
| Liabilities | | | | |
Futures Contracts | (3,387,831) | (3,387,831) | - | - |
| Total Liabilities | (3,387,831) | (3,387,831) | - | - |
| Total Derivative Instruments: | (2,174,032) | (2,174,032) | - | - |
Value of Derivative Instruments
The following table is a summary of the Fund's value of derivative instruments by primary risk exposure as of August 31, 2023. For additional information on derivative instruments, please refer to the Derivative Instruments section in the accompanying Notes to Financial Statements.
Primary Risk Exposure / Derivative Type | Value |
| Asset ($) | Liability ($) |
| Equity Risk | | |
Futures Contracts (a) | 1,213,799 | (3,387,831) |
| Total Equity Risk | 1,213,799 | (3,387,831) |
| Total Value of Derivatives | 1,213,799 | (3,387,831) |
(a)Reflects gross cumulative appreciation (depreciation) on futures contracts as presented in the Schedule of Investments. In the Statement of Assets and Liabilities, the period end daily variation margin is included in receivable or payable for daily variation margin on futures contracts, and the net cumulative appreciation (depreciation) is included in Total accumulated earnings (loss).
| Statement of Assets and Liabilities |
| | | | August 31, 2023 (Unaudited) |
| | | | | |
| Assets | | | | |
| Investment in securities, at value (including securities loaned of $116,446,586) - See accompanying schedule: | | | | |
Unaffiliated issuers (cost $8,452,354,359) | $ | 11,092,820,407 | | |
Fidelity Central Funds (cost $120,826,763) | | 120,826,763 | | |
Other affiliated issuers (cost $4,151,631,015) | | 4,733,531,626 | | |
| | | | | |
| | | | | |
| Total Investment in Securities (cost $12,724,812,137) | | | $ | 15,947,178,796 |
| Cash | | | | 2,135,007 |
| Foreign currency held at value (cost $4,590,497) | | | | 4,585,749 |
| Receivable for investments sold | | | | 13,021,786 |
| Receivable for fund shares sold | | | | 7,460,726 |
| Dividends receivable | | | | 18,447,874 |
| Reclaims receivable | | | | 26,455,210 |
| Interest receivable | | | | 2,215,378 |
| Distributions receivable from Fidelity Central Funds | | | | 78,704 |
| Prepaid expenses | | | | 26,701 |
| Other receivables | | | | 359,496 |
Total assets | | | | 16,021,965,427 |
| Liabilities | | | | |
| Payable for investments purchased | | | | |
Regular delivery | $ | 9,397,203 | | |
Delayed delivery | | 1,282,632 | | |
| Payable for fund shares redeemed | | 6,105,836 | | |
| Accrued management fee | | 1,937,137 | | |
| Payable for daily variation margin on futures contracts | | 1,414,981 | | |
| Other payables and accrued expenses | | 1,228,217 | | |
| Collateral on securities loaned | | 120,907,912 | | |
| Total Liabilities | | | | 142,273,918 |
| Net Assets | | | $ | 15,879,691,509 |
| Net Assets consist of: | | | | |
| Paid in capital | | | $ | 12,797,558,204 |
| Total accumulated earnings (loss) | | | | 3,082,133,305 |
| Net Assets | | | $ | 15,879,691,509 |
Net Asset Value, offering price and redemption price per share ($15,879,691,509 ÷ 1,432,931,782 shares) | | | $ | 11.08 |
| Statement of Operations |
| | | | Six months ended August 31, 2023 (Unaudited) |
| Investment Income | | | | |
| Dividends: | | | | |
| Unaffiliated issuers | | | $ | 193,210,053 |
| Affiliated issuers | | | | 119,208 |
| Interest | | | | 12,628,180 |
| Income from Fidelity Central Funds (including $1,297,948 from security lending) | | | | 1,297,948 |
| Income before foreign taxes withheld | | | $ | 207,255,389 |
| Less foreign taxes withheld | | | | (16,954,664) |
| Total Income | | | | 190,300,725 |
| Expenses | | | | |
| Management fee | $ | 31,941,541 | | |
| Custodian fees and expenses | | 319,266 | | |
| Independent trustees' fees and expenses | | 48,486 | | |
| Registration fees | | 63,298 | | |
| Audit | | 101,177 | | |
| Legal | | 19,497 | | |
| Miscellaneous | | 143,148 | | |
| Total expenses before reductions | | 32,636,413 | | |
| Expense reductions | | (19,760,926) | | |
| Total expenses after reductions | | | | 12,875,487 |
| Net Investment income (loss) | | | | 177,425,238 |
| Realized and Unrealized Gain (Loss) | | | | |
| Net realized gain (loss) on: | | | | |
| Investment Securities: | | | | |
| Unaffiliated issuers (net of foreign taxes of $144,410) | | 167,100,802 | | |
| Affiliated issuers | | (27,874,189) | | |
| Foreign currency transactions | | (1,398,784) | | |
| Futures contracts | | 40,488,918 | | |
| Total net realized gain (loss) | | | | 178,316,747 |
| Change in net unrealized appreciation (depreciation) on: | | | | |
| Investment Securities: | | | | |
| Unaffiliated issuers(net of increase in deferred foreign taxes of $255,376) | | 221,230,735 | | |
| Affiliated issuers | | 297,275,532 | | |
| Assets and liabilities in foreign currencies | | 510,393 | | |
| Futures contracts | | (4,408,839) | | |
| Total change in net unrealized appreciation (depreciation) | | | | 514,607,821 |
| Net gain (loss) | | | | 692,924,568 |
| Net increase (decrease) in net assets resulting from operations | | | $ | 870,349,806 |
| Statement of Changes in Net Assets |
| |
| | Six months ended August 31, 2023 (Unaudited) | | Year ended February 28, 2023 |
| Increase (Decrease) in Net Assets | | | | |
| Operations | | | | |
| Net investment income (loss) | $ | 177,425,238 | $ | 372,948,535 |
| Net realized gain (loss) | | 178,316,747 | | (429,459,615) |
| Change in net unrealized appreciation (depreciation) | | 514,607,821 | | (1,501,788,025) |
| Net increase (decrease) in net assets resulting from operations | | 870,349,806 | | (1,558,299,105) |
| Distributions to shareholders | | - | | (767,544,263) |
| | | | | |
| Share transactions | | | | |
| Proceeds from sales of shares | | 995,085,869 | | 2,127,444,820 |
| Reinvestment of distributions | | - | | 701,384,533 |
| Cost of shares redeemed | | (1,532,625,002) | | (7,614,587,352) |
| | | | | |
Net increase (decrease) in net assets resulting from share transactions | | (537,539,133) | | (4,785,757,999) |
| Total increase (decrease) in net assets | | 332,810,673 | | (7,111,601,367) |
| | | | | |
| Net Assets | | | | |
| Beginning of period | | 15,546,880,836 | | 22,658,482,203 |
| End of period | $ | 15,879,691,509 | $ | 15,546,880,836 |
| | | | | |
| Other Information | | | | |
| Shares | | | | |
| Sold | | 90,498,228 | | 206,337,946 |
| Issued in reinvestment of distributions | | - | | 66,242,351 |
| Redeemed | | (140,530,578) | | (750,797,416) |
| Net increase (decrease) | | (50,032,350) | | (478,217,119) |
| | | | | |
Financial Highlights
| Strategic Advisers® International Fund |
| |
| | Six months ended (Unaudited) August 31, 2023 | | Years ended February 28, 2023 | | 2022 | | 2021 | | 2020 A | | 2019 |
Selected Per-Share Data | | | | | | | | | | | | |
| Net asset value, beginning of period | $ | 10.48 | $ | 11.55 | $ | 12.55 | $ | 9.93 | $ | 10.03 | $ | 11.43 |
| Income from Investment Operations | | | | | | | | | | | | |
Net investment income (loss) B,C | | .12 | | .22 | | .24 | | .13 | | .20 | | .21 |
| Net realized and unrealized gain (loss) | | .48 | | (.83) | | (.12) | | 2.71 | | .06 | | (.98) |
| Total from investment operations | | .60 | | (.61) | | .12 | | 2.84 | | .26 | | (.77) |
| Distributions from net investment income | | - | | (.23) | | (.26) | | (.14) | | (.22) | | (.18) |
| Distributions from net realized gain | | - | | (.22) | | (.86) | | (.08) | | (.14) | | (.44) |
| Total distributions | | - | | (.46) D | | (1.12) | | (.22) | | (.36) | | (.63) D |
| Net asset value, end of period | $ | 11.08 | $ | 10.48 | $ | 11.55 | $ | 12.55 | $ | 9.93 | $ | 10.03 |
Total Return E,F | | 5.73% | | (5.30)% | | .30% | | 28.99% | | 2.35% | | (6.57)% |
Ratios to Average Net Assets C,G,H | | | | | | | | | | | | |
| Expenses before reductions | | .41% I,J | | .41% | | .41% | | .43% | | .44% | | .45% |
| Expenses net of fee waivers, if any | | .16% I,J | | .16% | | .16% | | .18% | | .19% | | .20% |
| Expenses net of all reductions | | .16% I,J | | .16% | | .16% | | .18% | | .19% | | .20% |
| Net investment income (loss) | | 2.25% I,J | | 2.16% | | 1.83% | | 1.25% | | 1.91% | | 1.95% |
| Supplemental Data | | | | | | | | | | | | |
| Net assets, end of period (000 omitted) | $ | 15,879,692 | $ | 15,546,881 | $ | 22,658,482 | $ | 19,800,311 | $ | 15,096,568 | $ | 15,904,961 |
Portfolio turnover rate K | | 31% I | | 25% | | 29% | | 41% | | 33% | | 39% |
AFor the year ended February 29.
BCalculated based on average shares outstanding during the period.
CNet investment income (loss) is affected by the timing of the declaration of dividends by any underlying mutual funds or exchange-traded funds (ETFs). Net investment income (loss) of any mutual funds or ETFs is not included in the Fund's net investment income (loss) ratio.
DTotal distributions per share do not sum due to rounding.
ETotal returns for periods of less than one year are not annualized.
FTotal returns would have been lower if certain expenses had not been reduced during the applicable periods shown.
GFees and expenses of any underlying mutual funds or exchange-traded funds (ETFs) are not included in the Fund's expense ratio. The Fund indirectly bears its proportionate share of these expenses. For additional expense information related to investments in Fidelity Central Funds, please refer to the "Investments in Fidelity Central Funds" note found in the Notes to Financial Statements section of the most recent Annual or Semi-Annual report.
HExpense ratios reflect operating expenses of the class. Expenses before reductions do not reflect amounts reimbursed, waived, or reduced through arrangements with the investment adviser, brokerage services, or other offset arrangements, if applicable, and do not represent the amount paid by the class during periods when reimbursements, waivers or reductions occur.
IAnnualized.
JProxy expenses are not annualized.
KAmount does not include the portfolio activity of any underlying mutual funds or exchange-traded funds (ETFs).
For the period ended August 31, 2023
1. Organization.
Strategic Advisers International Fund (the Fund) is a fund of Fidelity Rutland Square Trust II (the Trust), and is authorized to issue an unlimited number of shares. The Trust is registered under the Investment Company Act of 1940, as amended (the 1940 Act), as an open-end management investment company organized as a Delaware statutory trust. The Fund is offered exclusively to certain managed account clients of Strategic Advisers LLC (Strategic Advisers), an affiliate of Fidelity Management & Research Company LLC (FMR).
2. Significant Accounting Policies.
The Fund is an investment company and applies the accounting and reporting guidance of the Financial Accounting Standards Board (FASB) Accounting Standards Codification Topic 946 Financial Services - Investment Companies. The financial statements have been prepared in conformity with accounting principles generally accepted in the United States of America (GAAP), which require management to make certain estimates and assumptions at the date of the financial statements. Actual results could differ from those estimates. Subsequent events, if any, through the date that the financial statements were issued have been evaluated in the preparation of the financial statements. The Fund's Schedule of Investments lists any underlying mutual funds or exchange-traded funds (ETFs) but does not include the underlying holdings of these funds. The following summarizes the significant accounting policies of the Fund:
Investment Valuation. Investments are valued as of 4:00 p.m. Eastern time on the last calendar day of the period. The Board of Trustees (the Board) has designated the Fund's investment adviser as the valuation designee responsible for the fair valuation function and performing fair value determinations as needed. The investment adviser has established a Fair Value Committee (the Committee) to carry out the day-to-day fair valuation responsibilities and has adopted policies and procedures to govern the fair valuation process and the activities of the Committee. In accordance with these fair valuation policies and procedures, which have been approved by the Board, the Fund attempts to obtain prices from one or more third party pricing services or brokers to value its investments. When current market prices, quotations or currency exchange rates are not readily available or reliable, investments will be fair valued in good faith by the Committee, in accordance with the policies and procedures. Factors used in determining fair value vary by investment type and may include market or investment specific events, transaction data, estimated cash flows, and market observations of comparable investments. The frequency that the fair valuation procedures are used cannot be predicted and they may be utilized to a significant extent. The Committee manages the Fund's fair valuation practices and maintains the fair valuation policies and procedures. The Fund's investment adviser reports to the Board information regarding the fair valuation process and related material matters.
The Fund categorizes the inputs to valuation techniques used to value its investments into a disclosure hierarchy consisting of three levels as shown below:
Level 1 - unadjusted quoted prices in active markets for identical investments
Level 2 - other significant observable inputs (including quoted prices for similar investments, interest rates, prepayment speeds, etc.)
Level 3 - unobservable inputs (including the Fund's own assumptions based on the best information available)
Valuation techniques used to value the Fund's investments by major category are as follows:
Equity securities, including restricted securities, for which market quotations are readily available, are valued at the last reported sale price or official closing price as reported by a third party pricing service on the primary market or exchange on which they are traded and are categorized as Level 1 in the hierarchy. In the event there were no sales during the day or closing prices are not available, securities are valued at the last quoted bid price or may be valued using the last available price and are generally categorized as Level 2 in the hierarchy. For foreign equity securities, when market or security specific events arise, comparisons to the valuation of American Depositary Receipts (ADRs), futures contracts, ETFs and certain indexes as well as quoted prices for similar securities may be used and would be categorized as Level 2 in the hierarchy. For equity securities, including restricted securities, where observable inputs are limited, assumptions about market activity and risk are used and these securities may be categorized as Level 3 in the hierarchy.
Debt securities, including restricted securities, are valued based on evaluated prices received from third party pricing services or from brokers who make markets in such securities. U.S. government and government agency obligations are valued by pricing services who utilize matrix pricing which considers yield or price of bonds of comparable quality, coupon, maturity and type or by broker-supplied prices. When independent prices are unavailable or unreliable, debt securities may be valued utilizing pricing methodologies which consider similar factors that would be used by third party pricing services. Debt securities are generally categorized as Level 2 in the hierarchy but may be Level 3 depending on the circumstances. ETFs are valued at their last sale price or official closing price as reported by a third party pricing service on the primary market or exchange on which they are traded and are categorized as Level 1 in the hierarchy. In the event there were no sales during the day but the exchange reports a closing bid level, ETFs are valued at the closing bid and would be categorized as Level 1 in the hierarchy. In the event there was no closing bid, ETFs may be valued by another method that the Board believes reflects fair value in accordance with the Board's fair value pricing policies and may be categorized as Level 2 in the hierarchy.
Futures contracts are valued at the settlement price established each day by the board of trade or exchange on which they are traded and are categorized as Level 1 in the hierarchy. Investments in open-end mutual funds, including the Fidelity Central Funds, are valued at their closing net asset value (NAV) each business day and are categorized as Level 1 in the hierarchy. If an unaffiliated open-end mutual fund's NAV is unavailable, shares of that fund may be valued by another method that the Board believes reflects fair value in accordance with the Board's fair value pricing policies and is categorized as Level 2 in the hierarchy.
Changes in valuation techniques may result in transfers in or out of an assigned level within the disclosure hierarchy. The aggregate value of investments by input level as of August 31, 2023 is included at the end of the Fund's Schedule of Investments.
Foreign Currency. Certain Funds may use foreign currency contracts to facilitate transactions in foreign-denominated securities. Gains and losses from these transactions may arise from changes in the value of the foreign currency or if the counterparties do not perform under the contracts' terms.
Foreign-denominated assets, including investment securities, and liabilities are translated into U.S. dollars at the exchange rates at period end. Purchases and sales of investment securities, income and dividends received, and expenses denominated in foreign currencies are translated into U.S. dollars at the exchange rate in effect on the transaction date.
The effects of exchange rate fluctuations on investments are included with the net realized and unrealized gain (loss) on investment securities. Other foreign currency transactions resulting in realized and unrealized gain (loss) are disclosed separately.
Investment Transactions and Income. For financial reporting purposes, the Fund's investment holdings and NAV include trades executed through the end of the last business day of the period. The NAV per share for processing shareholder transactions is calculated as of the close of business of the New York Stock Exchange (NYSE), normally 4:00 p.m. Eastern time and includes trades executed through the end of the prior business day. Gains and losses on securities sold are determined on the basis of identified cost and include proceeds received from litigation. Commissions paid to certain brokers with whom the investment adviser, or its affiliates, places trades on behalf of a fund include an amount in addition to trade execution, which may be rebated back to a fund. Any such rebates are included in net realized gain (loss) on investments in the Statement of Operations. Dividend income is recorded on the ex-dividend date, except for certain dividends from foreign securities where the ex-dividend date may have passed, which are recorded as soon as the Fund is informed of the ex-dividend date. Non-cash dividends included in dividend income, if any, are recorded at the fair market value of the securities received. Income and capital gain distributions from Fidelity Central Funds, if any, are recorded on the ex-dividend date. Income and capital gain distributions from any underlying mutual funds or exchange-traded funds (ETFs) are recorded on the ex-dividend date. Interest income is accrued as earned and includes coupon interest and amortization of premium and accretion of discount on debt securities as applicable. Investment income is recorded net of foreign taxes withheld where recovery of such taxes is uncertain. Funds may file withholding tax reclaims in certain jurisdictions to recover a portion of amounts previously withheld. Any withholding tax reclaims income is included in the Statement of Operations in foreign taxes withheld. Any receivables for withholding tax reclaims are included in the Statement of Assets and Liabilities in reclaims receivable.
Expenses. Expenses directly attributable to a fund are charged to that fund. Expenses attributable to more than one fund are allocated among the respective funds on the basis of relative net assets or other appropriate methods. Expenses included in the accompanying financial statements reflect the expenses of that fund and do not include any expenses associated with any underlying mutual funds or exchange-traded funds. Although not included in a fund's expenses, a fund indirectly bears its proportionate share of these expenses through the net asset value of each underlying mutual fund or exchange-traded fund. Expense estimates are accrued in the period to which they relate and adjustments are made when actual amounts are known.
Deferred Trustee Compensation. Under a Deferred Compensation Plan (the Plan) for certain Funds, certain independent Trustees have elected to defer receipt of a portion of their annual compensation. Deferred amounts are invested in affiliated mutual funds, are marked-to-market and remain in a fund until distributed in accordance with the Plan. The investment of deferred amounts and the offsetting payable to the Trustees presented below are included in the accompanying Statement of Assets and Liabilities in other receivables and other payables and accrued expenses, as applicable.
| Strategic Advisers International Fund | $266,008 |
Income Tax Information and Distributions to Shareholders. Each year, the Fund intends to qualify as a regulated investment company under Subchapter M of the Internal Revenue Code, including distributing substantially all of its taxable income and realized gains. As a result, no provision for U.S. Federal income taxes is required. The Fund files a U.S. federal tax return, in addition to state and local tax returns as required. The Fund's federal income tax returns are subject to examination by the Internal Revenue Service (IRS) for a period of three fiscal years after they are filed. State and local tax returns may be subject to examination for an additional fiscal year depending on the jurisdiction. Foreign taxes are provided for based on the Fund's understanding of the tax rules and rates that exist in the foreign markets in which it invests. The Fund is subject to a tax imposed on capital gains by certain countries in which it invests. An estimated deferred tax liability for net unrealized appreciation on the applicable securities is included in Other payables and accrued expenses on the Statement of Assets & Liabilities.
Distributions are declared and recorded on the ex-dividend date. Income and capital gain distributions are determined in accordance with income tax regulations, which may differ from GAAP.
Capital accounts within the financial statements are adjusted for permanent book-tax differences. These adjustments have no impact on net assets or the results of operations. Capital accounts are not adjusted for temporary book-tax differences which will reverse in a subsequent period.
Book-tax differences are primarily due to the short-term gain distributions from the underlying mutual funds or exchange-traded funds (ETFs), futures contracts, foreign currency transactions, certain foreign taxes, passive foreign investment companies (PFIC) and deferred Trustee compensation, capital loss carryforwards and losses deferred due to wash sales.
As of period end, the cost and unrealized appreciation (depreciation) in securities, and derivatives if applicable, for federal income tax purposes were as follows:
| Gross unrealized appreciation | $3,650,458,860 |
| Gross unrealized depreciation | (472,228,053) |
| Net unrealized appreciation (depreciation) | $3,178,230,807 |
| Tax cost | $12,766,773,957 |
Capital loss carryforwards are only available to offset future capital gains of the Fund to the extent provided by regulations and may be limited. The capital loss carryforward information presented below, including any applicable limitation, is estimated as of prior fiscal period end and is subject to adjustment.
Delayed Delivery Transactions and When-Issued Securities. During the period, certain Funds transacted in securities on a delayed delivery or when-issued basis. Payment and delivery may take place after the customary settlement period for that security. The price of the underlying securities and the date when the securities will be delivered and paid for are fixed at the time the transaction is negotiated. Securities purchased on a delayed delivery or when-issued basis are identified as such in the Schedule of Investments. Compensation for interest forgone in the purchase of a delayed delivery or when-issued debt security may be received. With respect to purchase commitments, each applicable Fund identifies securities as segregated in its records with a value at least equal to the amount of the commitment. Payables and receivables associated with the purchases and sales of delayed delivery securities having the same coupon, settlement date and broker are offset. Delayed delivery or when-issued securities that have been purchased from and sold to different brokers are reflected as both payables and receivables in the Statement of Assets and Liabilities under the caption "Delayed delivery", as applicable. Losses may arise due to changes in the value of the underlying securities or if the counterparty does not perform under the contract's terms, or if the issuer does not issue the securities due to political, economic, or other factors.
Restricted Securities (including Private Placements). Funds may invest in securities that are subject to legal or contractual restrictions on resale. These securities generally may be resold in transactions exempt from registration or to the public if the securities are registered. Disposal of these securities may involve time-consuming negotiations and expense, and prompt sale at an acceptable price may be difficult. Information regarding restricted securities held at period end is included at the end of the Schedule of Investments, if applicable.
3. Derivative Instruments.
Risk Exposures and the Use of Derivative Instruments. The Fund's investment objectives allow for various types of derivative instruments, including futures contracts. Derivatives are investments whose value is primarily derived from underlying assets, indices or reference rates and may be transacted on an exchange or over-the-counter (OTC). Derivatives may involve a future commitment to buy or sell a specified asset based on specified terms, to exchange future cash flows at periodic intervals based on a notional principal amount, or for one party to make one or more payments upon the occurrence of specified events in exchange for periodic payments from the other party.
Derivatives were used to increase returns and to manage exposure to certain risks as defined below. The success of any strategy involving derivatives depends on analysis of numerous economic factors, and if the strategies for investment do not work as intended, the objectives may not be achieved.
Derivatives were used to increase or decrease exposure to the following risk(s):
| | |
| Equity Risk | Equity risk relates to the fluctuations in the value of financial instruments as a result of changes in market prices (other than those arising from interest rate risk or foreign exchange risk), whether caused by factors specific to an individual investment, its issuer, or all factors affecting all instruments traded in a market or market segment. |
Funds are also exposed to additional risks from investing in derivatives, such as liquidity risk and counterparty credit risk. Liquidity risk is the risk that a fund will be unable to close out the derivative in the open market in a timely manner. Counterparty credit risk is the risk that the counterparty will not be able to fulfill its obligation to a fund. Counterparty credit risk related to exchange-traded contracts may be mitigated by the protection provided by the exchange on which they trade.
Investing in derivatives may involve greater risks than investing in the underlying assets directly and, to varying degrees, may involve risk of loss in excess of any initial investment and collateral received and amounts recognized in the Statement of Assets and Liabilities. In addition, there may be the risk that the change in value of the derivative contract does not correspond to the change in value of the underlying instrument.
Futures Contracts. A futures contract is an agreement between two parties to buy or sell a specified underlying instrument for a fixed price at a specified future date. Futures contracts were used to manage exposure to the stock market.
Upon entering into a futures contract, a fund is required to deposit either cash or securities (initial margin) with a clearing broker in an amount equal to a certain percentage of the face value of the contract. Futures contracts are marked-to-market daily and subsequent daily payments are made or received by a fund depending on the daily fluctuations in the value of the futures contracts and are recorded as unrealized appreciation or (depreciation). This receivable and/or payable, if any, is included in daily variation margin on futures contracts in the Statement of Assets and Liabilities. Realized gain or (loss) is recorded upon the expiration or closing of a futures contract. The net realized gain (loss) and change in net unrealized appreciation (depreciation) on futures contracts during the period is presented in the Statement of Operations.
Any open futures contracts at period end are presented in the Schedule of Investments under the caption "Futures Contracts". The notional amount at value reflects each contract's exposure to the underlying instrument or index at period end, and is representative of volume of activity during the period unless an average notional amount is presented. Any securities deposited to meet initial margin requirements are identified in the Schedule of Investments. Any cash deposited to meet initial margin requirements is presented as segregated cash with brokers for derivative instruments in the Statement of Assets and Liabilities.
4. Purchases and Sales of Investments.
Purchases and sales of securities, other than short-term securities, U.S. government securities and in-kind transactions, as applicable, are noted in the table below.
| | Purchases ($) | Sales ($) |
| Strategic Advisers International Fund | 2,332,846,960 | 2,611,090,822 |
5. Fees and Other Transactions with Affiliates.
Management Fee. Strategic Advisers (the investment adviser) provides the Fund with investment management related services. For these services, the Fund pays a monthly management fee to the investment adviser. The management fee is calculated by adding the annual management fee rate of .25% of the Fund's average net assets throughout the month to the aggregate of the fee rates, payable monthly by the investment adviser, to the Fund's sub-advisers. The Fund's maximum aggregate management fee will not exceed 1.00% of the Fund's average net assets. For the reporting period, the total annualized management fee rate was .40% of the Fund's average net assets.
During the period, the investment adviser waived a portion of its management fee as described in the Expense Reductions note.
Sub-Advisers. Arrowstreet Capital, Limited Partnership, Causeway Capital Management, LLC, Massachusetts Financial Services Company (MFS), Thompson, Siegel & Walmsley LLC, T. Rowe Price Associates, Inc., Wellington Management Company LLP and William Blair Investment Management, LLC each served as a sub-adviser for the Fund during the period. Sub-advisers provide discretionary investment advisory services for their allocated portion of the Fund's assets and are paid as described in the Management Fee note.
FIAM LLC (an affiliate of the investment adviser), FIL Investment Advisors and Geode Capital Management, LLC, have been retained to serve as a sub-adviser for the Fund. As of the date of this report, these sub-advisers have not been allocated any portion of the Fund's assets. These sub-advisers in the future may provide discretionary investment advisory services for an allocated portion of the Fund's assets and will be paid by the investment adviser for providing these services.
Brokerage Commissions. A portion of portfolio transactions were placed with brokerage firms which are affiliates of the investment adviser. Brokerage commissions are included in net realized gain (loss) and change in net unrealized appreciation (depreciation) in the Statement of Operations. The commissions paid to these affiliated firms were as follows:
| | Amount |
| Strategic Advisers International Fund | $ 10 |
Interfund Trades. Funds may purchase from or sell securities to other funds affiliated with each sub-adviser under procedures adopted by the Board. The procedures have been designed to ensure these interfund trades are executed in accordance with Rule 17a-7 of the 1940 Act. Any interfund trades are included within the respective purchases and sales amounts shown in the Purchases and Sales of Investments note. During the period, there were no interfund trades.
Other. During the period, the investment adviser reimbursed the Fund for certain losses as follows:
| | Amount ($) |
| Strategic Advisers International Fund | 51,539 |
6. Investments in Fidelity Central Funds.
Funds may invest in Fidelity Central Funds, which are open-end investment companies generally available only to other investment companies and accounts managed by the investment adviser and its affiliates. The Schedule of Investments lists any Fidelity Central Funds held as an investment as of period end, but does not include the underlying holdings of each Fidelity Central Fund. An investing fund indirectly bears its proportionate share of the expenses of the underlying Fidelity Central Funds.
Based on its investment objective, each Fidelity Central Fund may invest or participate in various investment vehicles or strategies that are similar to those of the investing fund. These strategies are consistent with the investment objectives of the investing fund and may involve certain economic risks which may cause a decline in value of each of the Fidelity Central Funds and thus a decline in the value of the investing fund.
| Fidelity Central Fund | Investment Manager | Investment Objective | Investment Practices | Expense RatioA |
| Fidelity Money Market Central Funds | Fidelity Management & Research Company LLC (FMR) | Each fund seeks to obtain a high level of current income consistent with the preservation of capital and liquidity. | Short-term Investments | Less than .005% |
A Expenses expressed as a percentage of average net assets and are as of each underlying Central Fund's most recent annual or semi-annual shareholder report.
A complete unaudited list of holdings for each Fidelity Central Fund is available upon request or at the Securities and Exchange Commission website at www.sec.gov. In addition, the financial statements of the Fidelity Central Funds, which are not covered by the Report of Independent Registered Public Accounting Firm, are available on the Securities and Exchange Commission website or upon request.
7. Committed Line of Credit.
Certain Funds participate with other funds managed by the investment adviser or an affiliate in a $4.25 billion credit facility (the "line of credit") to be utilized for temporary or emergency purposes to fund shareholder redemptions or for other short-term liquidity purposes. The participating funds have agreed to pay commitment fees on their pro-rata portion of the line of credit, which are reflected in Miscellaneous expenses on the Statement of Operations, and are listed below. During the period, there were no borrowings on this line of credit.
| | Amount |
| Strategic Advisers International Fund | $15,083 |
8. Security Lending.
Funds lend portfolio securities from time to time in order to earn additional income. Lending agents are used, including National Financial Services (NFS), an affiliate of the investment adviser. Pursuant to a securities lending agreement, NFS will receive a fee, which is capped at 9.9% of a fund's daily lending revenue, for its services as lending agent. A fund may lend securities to certain qualified borrowers, including NFS. On the settlement date of the loan, a fund receives collateral (in the form of U.S. Treasury obligations, letters of credit and/or cash) against the loaned securities and maintains collateral in an amount not less than 100% of the market value of the loaned securities during the period of the loan. The market value of the loaned securities is determined at the close of business of a fund and any additional required collateral is delivered to a fund on the next business day. A fund or borrower may terminate the loan at any time, and if the borrower defaults on its obligation to return the securities loaned because of insolvency or other reasons, a fund may apply collateral received from the borrower against the obligation. A fund may experience delays and costs in recovering the securities loaned. Any cash collateral received is invested in the Fidelity Securities Lending Cash Central Fund. Any loaned securities are identified as such in the Schedule of Investments, and the value of loaned securities and cash collateral at period end, as applicable, are presented in the Statement of Assets and Liabilities. Security lending income represents the income earned on investing cash collateral, less rebates paid to borrowers and any lending agent fees associated with the loan, plus any premium payments received for lending certain types of securities. Security lending income is presented in the Statement of Operations as a component of income from Fidelity Central Funds. Affiliated security lending activity, if any, was as follows:
| | Total Security Lending Fees Paid to NFS | Security Lending Income From Securities Loaned to NFS | Value of Securities Loaned to NFS at Period End |
| Strategic Advisers International Fund | $139,871 | $ - | $- |
9. Expense Reductions.
The investment adviser has contractually agreed to waive the Fund's management fee in an amount equal to .25% of the Fund's average net assets until September 30, 2026. During the period, this waiver reduced the Fund's management fee by $19,750,880.
Through arrangements with the Fund's custodian, credits realized as a result of certain uninvested cash balances were used to reduce the Fund's expenses by $10,046.
10. Other.
A fund's organizational documents provide former and current trustees and officers with a limited indemnification against liabilities arising in connection with the performance of their duties to the fund. In the normal course of business, a fund may also enter into contracts that provide general indemnifications. A fund's maximum exposure under these arrangements is unknown as this would be dependent on future claims that may be made against a fund. The risk of material loss from such claims is considered remote.
Funds do not invest in underlying mutual funds for the purpose of exercising management or control; however, investments by funds within their principal investment strategies may represent a significant portion of the underlying mutual fund's net assets. At the end of the period, certain Funds were the owners of record of 10% or more of the total outstanding shares of the following underlying mutual funds as shown below.
| Fund | Strategic Advisers International Fund |
| Fidelity Japan Fund | 19% |
| Fidelity Japan Smaller Companies Fund | 17% |
| Fidelity SAI International Low Volatility Index Fund | 14% |
| Fidelity SAI International Momentum Index Fund | 19% |
| Fidelity SAI International Small Cap Index Fund | 13% |
| Fidelity SAI International Value Index Fund | 11% |
| Fidelity SAI Japan Stock Index Fund | 99% |
11. Risk and Uncertainties.
Many factors affect a fund's performance. Developments that disrupt global economies and financial markets, such as pandemics, epidemics, outbreaks of infectious diseases, war, terrorism, and environmental disasters, may significantly affect a fund's investment performance. The effects of these developments to a fund will be impacted by the types of securities in which a fund invests, the financial condition, industry, economic sector, and geographic location of an issuer, and a fund's level of investment in the securities of that issuer. Significant concentrations in security types, issuers, industries, sectors, and geographic locations may magnify the factors that affect a fund's performance.
As a shareholder, you incur two types of costs: (1) transaction costs, which may include sales charges (loads) on purchase payments or redemption proceeds, as applicable and (2) ongoing costs, which generally include management fees, distribution and/or service (12b-1) fees and other Fund expenses. This Example is intended to help you understand your ongoing costs (in dollars) of investing in a fund and to compare these costs with the ongoing costs of investing in other mutual funds.
| The Example is based on an investment of $1,000 invested at the beginning of the period and held for the entire period (March 1, 2023 to August 31, 2023). |
Actual Expenses
The first line of the accompanying table provides information about actual account values and actual expenses. You may use the information in this line, together with the amount you invested, to estimate the expenses that you paid over the period. Simply divide your account value by $1,000.00 (for example, an $8,600 account value divided by $1,000.00 = 8.6), then multiply the result by the number in the first line for a class/Fund under the heading entitled "Expenses Paid During Period" to estimate the expenses you paid on your account during this period. If any fund is a shareholder of any underlying mutual funds or exchange-traded funds (ETFs) (the Underlying Funds), such fund indirectly bears its proportional share of the expenses of the Underlying Funds in addition to the direct expenses incurred presented in the table. These fees and expenses are not included in the annualized expense ratio used to calculate the expense estimate in the table below.
Hypothetical Example for Comparison Purposes
The second line of the accompanying table provides information about hypothetical account values and hypothetical expenses based on the actual expense ratio and an assumed rate of return of 5% per year before expenses, which is not the actual return. The hypothetical account values and expenses may not be used to estimate the actual ending account balance or expenses you paid for the period. You may use this information to compare the ongoing costs of investing in the Fund and other funds. To do so, compare this 5% hypothetical example with the 5% hypothetical examples that appear in the shareholder reports of the other funds. If any fund is a shareholder of any Underlying Funds, such fund indirectly bears its proportional share of the expenses of the Underlying Funds in addition to the direct expenses as presented in the table. These fees and expenses are not included in the annualized expense ratio used to calculate the expense estimate in the table below.
Please note that the expenses shown in the table are meant to highlight your ongoing costs only and do not reflect any transaction costs. Therefore, the second line of the table is useful in comparing ongoing costs only, and will not help you determine the relative total costs of owning different funds. In addition, if these transactional costs were included, your costs would have been higher.
| | | | | Annualized Expense Ratio- A | | Beginning Account Value March 1, 2023 | | Ending Account Value August 31, 2023 | | Expenses Paid During Period- C March 1, 2023 to August 31, 2023 |
| | | | | | | | | | |
| Strategic Advisers® International Fund | | | | .16% | | | | | | |
| Actual | | | | | | $ 1,000 | | $ 1,057.30 | | $ .83 |
Hypothetical-B | | | | | | $ 1,000 | | $ 1,024.33 | | $ .81 |
| |
A Annualized expense ratio reflects expenses net of applicable fee waivers.
B 5% return per year before expenses
C Expenses are equal to the annualized expense ratio, multiplied by the average account value over the period, multiplied by 184/ 366 (to reflect the one-half year period). The fees and expenses of any Underlying Funds are not included in each annualized expense ratio.
Board Approval of Amended Sub-Advisory Agreement
Strategic Advisers International Fund
In March 2023, the Board of Trustees, including the Independent Trustees (together, the Board) voted to approve an amendment to the fee schedule for one investment mandate in the existing sub-advisory agreement among Strategic Advisers, FIAM LLC (the Sub-Adviser), and Fidelity Rutland Square Trust II (Trust) on behalf of the fund (Amended Sub-Advisory Agreement). The Board noted that the updated fee schedule in the Amended Sub-Advisory Agreement became effective as of February 1, 2023 and will result in a lower fee at all asset levels. The Board also noted that no other material contract terms are impacted by the Amended Sub-Advisory Agreement. The Board, assisted by the advice of fund counsel and Independent Trustees' counsel, considered a broad range of information.
In considering whether to approve the Amended Sub-Advisory Agreement, the Board reached a determination, with the assistance of fund counsel and Independent Trustees' counsel and through the exercise of its business judgment, that the approval of the Amended Sub-Advisory Agreement is in the best interests of the fund and its shareholders and that the approval of such agreements does not involve a conflict of interest from which Strategic Advisers or its affiliates derive an inappropriate advantage. The Board's decision to approve the Amended Sub-Advisory Agreements was not based on any single factor, but rather was based on a comprehensive consideration of all the information provided to the Board. In addition, individual Trustees did not necessarily attribute the same weight or importance to each factor.
Nature, Extent, and Quality of Services Provided. The Board considered the backgrounds of the investment personnel that provide services to the fund, the fund's investment objective, strategies and related investment philosophy, the current sub-adviser line-up, and the structure of the investment personnel compensation programs and whether such structure provides appropriate incentives to act in the best interests of the fund in connection with its annual renewal of the fund's management contract, sub-advisory agreements and sub-subadvisory agreements at its September 2022 meeting.
The Board noted that it had approved the existing sub-advisory agreement with the Sub-Adviser at its September 2022 meeting and the Amended Sub-Advisory Agreement will not result in any changes to: (i) the nature, extent and quality of the sub-advisory services provided; (ii) the investment process or strategies employed in the management of the fund's assets; or (iii) the day-to-day management of the fund or the persons primarily responsible for such management.
The Board did not consider performance to be a material factor in its decision to approve the Amended Sub-Advisory Agreement because the approval of the Amended Sub-Advisory Agreement will not result in any changes (i) to the fund's investment processes or strategies; or (ii) in the persons primarily responsible for the day-to-day management of the fund.
Based on its review, the Board concluded that the nature, extent, and quality of services that will be provided to the fund under the Amended Sub-Advisory Agreement should continue to benefit the fund's shareholders.
Competitiveness of Management Fee and Total Fund Expenses. The Board noted that the Amended Sub-Advisory Agreement will not result in changes to the maximum aggregate annual management fee payable by the fund or Strategic Advisers' portion of the management fee. The Board considered Strategic Advisers' contractual agreement to waive its portion of the fund's management fee.
The Board also considered that the Amended Sub-Advisory Agreement will not change the fund's total management fee rate because Strategic Advisers has not allocated assets of the fund to the Sub-Adviser for this investment mandate at this time.
Based on its review, the Board concluded that the fund's management fee structure and projected total expenses bear a reasonable relationship to the services that the fund and its shareholders will receive and the other factors considered.
Costs of the Services and Profitability. Because the Amended Sub-Advisory Agreement was negotiated at arm's length and will have no impact on the maximum management fees payable by the fund or Strategic Advisers' portion of the management fee, the Board did not consider the costs of services and profitability to be significant factors in its decision to approve the Amended Sub-Advisory Agreement.
Potential Fall-Out Benefits. The Board considered that it reviews information regarding the potential of direct and indirect benefits to Strategic Advisers and its affiliates from their relationships with the fund, including non-advisory fee compensation paid to affiliates of Strategic Advisers, if any, as well as information regarding potential fall-out benefits accruing to each sub-adviser, if any, as a result of its relationship with the fund, during its annual renewal of the fund's management contract, sub-advisory agreements, and sub-subadvisory agreements. The Board considered Strategic Advisers' representation that it does not anticipate that the approval of the Amended Sub-Advisory Agreement will have a significant impact on the profitability of, or potential fall-out benefits to, Strategic Advisers or its affiliates.
Possible Economies of Scale. The Board considered that it reviews whether there have been economies of scale in connection with the management of the fund during its annual renewal of the fund's management contract, sub-advisory agreements, and sub-subadvisory agreements. The Board also noted that it did not consider the possible realization of economies of scale to be a significant factor in its decision to approve the Amended Sub-Advisory Agreement because the fund is not expected to bear any additional expenses as a result of the Amended Sub-Advisory Agreement.
Conclusion. Based on its evaluation of all of the conclusions noted above, and after considering all factors it believed relevant, the Board concluded that the Amended Sub-Advisory Agreement's fee structure bears a reasonable relationship to the services to be rendered and that the Amended Sub-Advisory Agreement is in the best interests of the fund and its shareholders and should be approved. In addition, the Board concluded that the approval of the Amended Sub-Advisory Agreement does not involve a conflict of interest from which Strategic Advisers or its affiliates derive an inappropriate advantage.
Board Approval of New Sub-Advisory Agreement
Strategic Advisers International Fund
In June 2023, the Board of Trustees, including the Independent Trustees (together, the Board) voted to approve a new sub-advisory agreement among Strategic Advisers LLC (Strategic Advisers), Wellington Management Company LLP (New Sub-Adviser), and Fidelity Rutland Square Trust II (Trust) on behalf of the fund (New Sub-Advisory Agreement). The Board, assisted by the advice of fund counsel and Independent Trustees' counsel, considered a broad range of information.
In considering whether to approve the New Sub-Advisory Agreement, the Board reached a determination, with the assistance of fund counsel and Independent Trustees' counsel and through the exercise of its business judgment, that the approval of the New Sub-Advisory Agreement is in the best interests of the fund and its shareholders and that the approval of such agreement does not involve a conflict of interest from which Strategic Advisers or its affiliates derive an inappropriate advantage. The Board's decision to approve the New Sub-Advisory Agreement was not based on any single factor, but rather was based on a comprehensive consideration of all the information provided to the Board. In addition, individual Trustees did not necessarily attribute the same weight or importance to each factor.
Nature, Extent, and Quality of Services Provided. The Board considered the backgrounds of the investment personnel that will provide services to the fund, the fund's investment objective, strategies and related investment philosophy, the current sub-adviser line-up, and the structure of the investment personnel compensation programs and whether such structure provides appropriate incentives to act in the best interests of the fund. The Board noted its familiarity with the nature, extent and quality of services provided by the New Sub-Adviser to another Strategic Advisers fund with a different investment mandate which the Board approved at its December 2022 meeting, and that many of the same support staff, including compliance personnel, that currently provide services to the other Strategic Advisers fund will also provide services to the fund. The Board also took into consideration additional information regarding the new investment mandate provided by Strategic Advisers and the New Sub-Adviser.
Resources Dedicated to Investment Management and Support Services. The Board reviewed the general qualifications and capabilities of the New Sub-Adviser's investment staff, use of technology, and approach to managing and compensating investment personnel. The Board noted that the New Sub-Adviser's analysts have extensive resources, tools and capabilities which allow them to conduct sophisticated fundamental and/or quantitative analysis. Additionally, in its deliberations, the Board considered the New Sub-Adviser's trading capabilities and resources and compliance infrastructure, which are integral parts of the investment management process, and their respective investments in business continuity planning.
Shareholder and Administrative Services. The Board considered (i) the nature, extent, quality, and cost of advisory services to be performed by the New Sub-Adviser under the New Sub-Advisory Agreement; and (ii) the resources to be devoted to the fund's compliance policies and procedures.
Investment Performance. The Board considered the historical investment performance of the New Sub-Adviser and its portfolio managers in managing accounts under a similar investment mandate.
Based on its review, the Board concluded that the nature, extent, and quality of services that will be provided to the fund under the New Sub-Advisory Agreement should benefit the fund's shareholders.
Competitiveness of Management Fee and Total Fund Expenses. The Board considered the amount and nature of the fees to be paid by the fund to Strategic Advisers and by Strategic Advisers to the New Sub-Adviser. The Board also considered the projected change in the fund's management fee and total operating expenses, if any, as a result of hiring the New Sub-Adviser.
The Board noted that the New Sub-Advisory Agreement will not result in changes to the maximum aggregate annual management fee payable by the fund or Strategic Advisers' portion of the management fee. The Board considered Strategic Advisers' contractual agreement to waive its portion of the fund's management fee. The Board considered that after allocating assets to the New Sub-Adviser, the fund's management fee and total net expenses are each expected to increase slightly, but each is expected to continue to rank below the competitive peer group median reported in the June 2023 management contract renewal materials for the fund.
Based on its review, the Board concluded that the fund's management fee structure and projected total expenses bear a reasonable relationship to the services that the fund and its shareholders will receive and the other factors considered.
Costs of the Services and Profitability. Because the New Sub-Advisory Agreement was negotiated at arm's length and will have no impact on the maximum management fees payable by the fund or Strategic Advisers' portion of the management fee, the Board did not consider the costs of services and profitability to be significant factors in its decision to approve the New Sub-Advisory Agreement.
Potential Fall-Out Benefits. The Board considered that it reviews information regarding the potential of direct and indirect benefits to Strategic Advisers and its affiliates from their relationships with the fund, including non-advisory fee compensation paid to affiliates of Strategic Advisers, if any, as well as information regarding potential fall-out benefits accruing to each sub-adviser, if any, as a result of its relationship with the fund, during its annual renewal of the fund's management contract, sub-advisory agreements, and sub-subadvisory agreements. The Board considered Strategic Advisers' representation that it does not anticipate that the approval of the New Sub-Advisory Agreement will have a significant impact on the profitability of, or potential fall-out benefits to, Strategic Advisers or its affiliates.
Possible Economies of Scale. The Board considered that it reviews whether there have been economies of scale in connection with the management of the fund during its annual renewal of the fund's management contract, sub-advisory agreements, and sub-subadvisory agreements. The Board noted that the New Sub-Advisory Agreement provides for breakpoints that have the potential to reduce sub-advisory fees paid to the sub-adviser as assets allocated to the sub-adviser grow.
Conclusion. Based on its evaluation of all of the conclusions noted above, and after considering all factors it believed relevant, the Board concluded that the New Sub-Advisory Agreement's fee structure bears a reasonable relationship to the services to be rendered and that the New Sub-Advisory Agreement is in the best interests of the fund and its shareholders and should be approved. In addition, the Board concluded that the approval of the New Sub-Advisory Agreement does not involve a conflict of interest from which Strategic Advisers or its affiliates derive an inappropriate advantage.
1.912867.113
SIT-SANN-1023
Item 2.
Code of Ethics
Not applicable.
Item 3.
Audit Committee Financial Expert
Not applicable.
Item 4.
Principal Accountant Fees and Services
Not applicable.
Item 5.
Audit Committee of Listed Registrants
Not applicable.
Item 6.
Investments
(a)
Not applicable.
(b)
Not applicable
Item 7.
Disclosure of Proxy Voting Policies and Procedures for Closed-End Management Investment Companies
Not applicable.
Item 8.
Portfolio Managers of Closed-End Management Investment Companies
Not applicable.
Item 9.
Purchase of Equity Securities by Closed-End Management Investment Company and Affiliated Purchasers
Not applicable.
Item 10.
Submission of Matters to a Vote of Security Holders
There were no material changes to the procedures by which shareholders may recommend nominees to the Fidelity Rutland Square Trust II’s Board of Trustees.
Item 11.
Controls and Procedures
(a)(i) The President and Treasurer and the Chief Financial Officer have concluded that the Fidelity Rutland Square Trust II’s (the “Trust”) disclosure controls and procedures (as defined in Rule 30a-3(c) under the Investment Company Act) provide reasonable assurances that material information relating to the Trust is made known to them by the appropriate persons, based on their evaluation of these controls and procedures as of a date within 90 days of the filing date of this report.
(a)(ii) There was no change in the Trust’s internal control over financial reporting (as defined in Rule 30a-3(d) under the Investment Company Act) that occurred during the period covered by this report that has materially affected, or is reasonably likely to materially affect, the Trust’s internal control over financial reporting.
Item 12.
Disclosure of Securities Lending Activities for Closed-End Management
Investment Companies
Not applicable.
Item 13.
Exhibits
SIGNATURES
Pursuant to the requirements of the Securities Exchange Act of 1934 and the Investment Company Act of 1940, the registrant has duly caused this report to be signed on its behalf by the undersigned, thereunto duly authorized.
Fidelity Rutland Square Trust II
| |
By: | /s/Heather Bonner |
| Heather Bonner |
| President and Treasurer |
|
|
Date: | October 23, 2023 |
Pursuant to the requirements of the Securities Exchange Act of 1934 and the Investment Company Act of 1940, this report has been signed below by the following persons on behalf of the registrant and in the capacities and on the dates indicated.
| |
By: | /s/Heather Bonner |
| Heather Bonner |
| President and Treasurer |
|
|
Date: | October 23, 2023 |
| |
By: | /s/John J. Burke III |
| John J. Burke III |
| Chief Financial Officer |
|
|
Date: | October 23, 2023 |