UNITED STATES
SECURITIES AND EXCHANGE COMMISSION
Washington, D.C. 20549
FORM N-CSR
CERTIFIED SHAREHOLDER REPORT OF REGISTERED
MANAGEMENT INVESTMENT COMPANIES
Investment Company Act file number 811-21991
Fidelity Rutland Square Trust II
(Exact name of registrant as specified in charter)
245 Summer St., Boston, MA 02210
(Address of principal executive offices) (Zip code)
John Hitt, Secretary
245 Summer St.
Boston, Massachusetts 02210
(Name and address of agent for service)
Registrant's telephone number, including area code:
617-563-7000
Date of fiscal year end: | February 29 |
Date of reporting period: | August 31, 2019 |
Item 1.
Reports to Stockholders
Strategic Advisers® Core Income Fund Offered exclusively to certain clients of Strategic Advisers LLC - not available for sale to the general public Semi-Annual Report August 31, 2019 |
 |
Beginning on January 1, 2021, as permitted by regulations adopted by the Securities and Exchange Commission, paper copies of a fund’s shareholder reports will no longer be sent by mail, unless you specifically request paper copies of the reports from the fund or from your financial intermediary, such as a financial advisor, broker-dealer or bank. Instead, the reports will be made available on a website, and you will be notified by mail each time a report is posted and provided with a website link to access the report.
If you already elected to receive shareholder reports electronically, you will not be affected by this change and you need not take any action. You may elect to receive shareholder reports and other communications from a fund electronically, by contacting your financial intermediary. For Fidelity customers, visit Fidelity's web site or call Fidelity using the contact information listed below.
You may elect to receive all future reports in paper free of charge. If you wish to continue receiving paper copies of your shareholder reports, you may contact your financial intermediary or, if you are a Fidelity customer, visit Fidelity’s website, or call Fidelity at the applicable toll-free number listed below. Your election to receive reports in paper will apply to all funds held with the fund complex/your financial intermediary.
| Account Type | Website | Phone Number |
| Brokerage, Mutual Fund, or Annuity Contracts: | fidelity.com/mailpreferences | 1-800-343-3548 |
| Employer Provided Retirement Accounts: | netbenefits.fidelity.com/preferences (choose 'no' under Required Disclosures to continue to print) | 1-800-343-0860 |
| Advisor Sold Accounts Serviced Through Your Financial Intermediary: | Contact Your Financial Intermediary | Your Financial Intermediary's phone number |
| Advisor Sold Accounts Serviced by Fidelity: | institutional.fidelity.com | 1-877-208-0098 |
Contents
To view a fund's proxy voting record for the 12-month period ended June 30, visit http://www.fidelity.com/proxyvotingresults or visit the Securities and Exchange Commission's (SEC) web site at http://www.sec.gov.
You may also call 1-800-544-3455 to request a free copy of the proxy voting guidelines.
Standard & Poor's, S&P and S&P 500 are registered service marks of The McGraw-Hill Companies, Inc. and have been licensed for use by Fidelity Distributors Corporation.
Other third-party marks appearing herein are the property of their respective owners.
All other marks appearing herein are registered or unregistered trademarks or service marks of FMR LLC or an affiliated company. © 2019 FMR LLC. All rights reserved.
This report and the financial statements contained herein are submitted for the general information of the shareholders of the Fund. This report is not authorized for distribution to prospective investors in the Fund unless preceded or accompanied by an effective prospectus.
A fund files its complete schedule of portfolio holdings with the SEC for the first and third quarters of each fiscal year on Form N-PORT. Forms N-PORT are available on the SEC’s web site at http://www.sec.gov. A fund's Forms N-PORT may be reviewed and copied at the SEC’s Public Reference Room in Washington, DC. Information regarding the operation of the SEC's Public Reference Room may be obtained by calling 1-800-SEC-0330.
For a complete list of a fund's portfolio holdings, view the most recent holdings listing, semiannual report, or annual report on Fidelity's web site at http://www.fidelity.com, http://www.institutional.fidelity.com, or http://www.401k.com, as applicable.
NOT FDIC INSURED •MAY LOSE VALUE •NO BANK GUARANTEE
Neither the Fund nor Fidelity Distributors Corporation is a bank.
Investment Summary (Unaudited)
The information in the following tables is based on the direct investments of the Fund.Top Ten Holdings as of August 31, 2019
| (excluding cash equivalents) | % of fund's net assets |
| PIMCO Total Return Fund Institutional Class | 16.9 |
| Fidelity Total Bond Fund | 16.0 |
| Western Asset Core Plus Bond Fund | 7.6 |
| Fidelity SAI U.S. Treasury Bond Index Fund | 7.6 |
| U.S. Treasury Obligations | 6.9 |
| Metropolitan West Total Return Bond Fund Class M | 4.9 |
| Prudential Total Return Bond Fund Class A | 4.6 |
| Western Asset Core Bond Fund Class I | 4.6 |
| Ginnie Mae | 3.1 |
| PIMCO Income Fund Institutional Class | 3.0 |
Asset Allocation (% of fund's net assets)
| As of August 31, 2019 | ||
| Corporate Bonds | 7.6% | |
| U.S. Government and U.S. Government Agency Obligations | 15.1% | |
| Asset-Backed Securities | 0.6% | |
| CMOs and Other Mortgage Related Securities | 0.9% | |
| Municipal Securities | 0.2% | |
| Bank Loan Funds | 0.4% | |
| High Yield Fixed-Income Funds | 0.2% | |
| Intermediate-Term Bond Funds | 67.6% | |
| Long Government Bond Funds | 0.8% | |
| Other Investments | 0.2% | |
| Short-Term Investments and Net Other Assets (Liabilities)* | (1.3)% | |
| Intermediate Government Funds | 7.7% | |
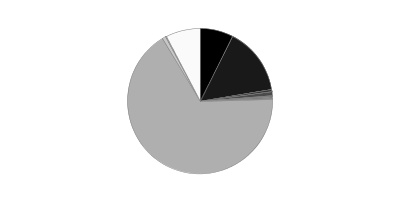
* Short-Term Investments and Net Other Assets (Liabilities) are not included in the pie chart
Asset allocations of funds in the pie chart reflect the categorizations of assets as defined by Morningstar as of the reporting date.
Percentages in the above tables are adjusted for the effect of TBA Sale Commitments.
Schedule of Investments August 31, 2019 (Unaudited)
Showing Percentage of Net Assets
| Nonconvertible Bonds - 7.6% | |||
| Principal Amount | Value | ||
| COMMUNICATION SERVICES - 0.7% | |||
| Diversified Telecommunication Services - 0.3% | |||
| AT&T, Inc.: | |||
| 3.4% 5/15/25 | $455,000 | $477,897 | |
| 3.55% 6/1/24 | 3,131,000 | 3,290,880 | |
| 3.6% 2/17/23 | 6,860,000 | 7,171,146 | |
| 3.6% 7/15/25 | 1,170,000 | 1,233,022 | |
| 3.8% 2/15/27 | 1,420,000 | 1,516,129 | |
| 3.95% 1/15/25 | 1,275,000 | 1,370,045 | |
| 4.3% 2/15/30 | 3,709,000 | 4,118,585 | |
| 4.45% 4/1/24 | 2,192,000 | 2,385,296 | |
| 4.5% 5/15/35 | 1,980,000 | 2,203,375 | |
| 4.5% 3/9/48 | 20,190,000 | 22,037,906 | |
| 4.55% 3/9/49 | 936,000 | 1,022,710 | |
| 4.75% 5/15/46 | 41,715,000 | 46,643,552 | |
| 4.8% 6/15/44 | 515,000 | 575,273 | |
| 4.9% 6/15/42 | 7,000,000 | 7,918,291 | |
| 5.15% 11/15/46 | 10,160,000 | 11,952,219 | |
| 5.35% 9/1/40 | 59,000 | 70,277 | |
| 6.2% 3/15/40 | 2,433,000 | 3,128,139 | |
| 6.3% 1/15/38 | 2,523,000 | 3,266,769 | |
| BellSouth Capital Funding Corp. 7.875% 2/15/30 | 56,000 | 74,427 | |
| British Telecommunications PLC 9.625% 12/15/30 (a) | 575,000 | 880,521 | |
| C&W Senior Financing Designated Activity Co. 7.5% 10/15/26 (b) | 1,100,000 | 1,193,280 | |
| CenturyLink, Inc. 6.15% 9/15/19 | 2,129,000 | 2,130,703 | |
| Level 3 Financing, Inc.: | |||
| 5.125% 5/1/23 | 900,000 | 914,661 | |
| 5.375% 1/15/24 | 900,000 | 915,750 | |
| SFR Group SA 7.375% 5/1/26 (b) | 400,000 | 427,000 | |
| Telecom Italia SpA 5.303% 5/30/24 (b) | 1,100,000 | 1,177,000 | |
| Telenet Finance Luxembourg Notes SARL 5.5% 3/1/28 (b) | 400,000 | 406,800 | |
| Verizon Communications, Inc.: | |||
| 4.016% 12/3/29 (b) | 971,000 | 1,096,741 | |
| 4.5% 8/10/33 | 1,310,000 | 1,548,676 | |
| 4.522% 9/15/48 | 911,000 | 1,097,080 | |
| 4.862% 8/21/46 | 4,163,000 | 5,183,848 | |
| 5.012% 4/15/49 | 3,858,000 | 4,931,825 | |
| 142,359,823 | |||
| Entertainment - 0.0% | |||
| NBCUniversal, Inc.: | |||
| 4.45% 1/15/43 | 2,406,000 | 2,832,141 | |
| 5.95% 4/1/41 | 1,495,000 | 2,080,327 | |
| The Walt Disney Co.: | |||
| 1.85% 7/30/26 | 2,030,000 | 2,001,430 | |
| 2.55% 2/15/22 | 335,000 | 341,016 | |
| 2.75% 8/16/21 | 200,000 | 202,901 | |
| 4.75% 9/15/44 (b) | 2,080,000 | 2,726,964 | |
| 4.95% 10/15/45 (b) | 50,000 | 67,873 | |
| 5.4% 10/1/43 (b) | 515,000 | 716,096 | |
| Viacom, Inc.: | |||
| 3.875% 4/1/24 | 1,380,000 | 1,457,808 | |
| 5.85% 9/1/43 | 220,000 | 275,266 | |
| 12,701,822 | |||
| Media - 0.4% | |||
| Altice Financing SA: | |||
| 6.625% 2/15/23 (b) | 400,000 | 412,500 | |
| 7.5% 5/15/26 (b) | 300,000 | 319,500 | |
| Cablevision Systems Corp. 5.875% 9/15/22 | 1,600,000 | 1,711,520 | |
| CBS Corp. 4.3% 2/15/21 | 270,000 | 275,992 | |
| CCO Holdings LLC/CCO Holdings Capital Corp.: | |||
| 4% 3/1/23 (b) | 1,200,000 | 1,212,000 | |
| 5.75% 2/15/26 (b) | 2,400,000 | 2,541,000 | |
| Charter Communications Operating LLC/Charter Communications Operating Capital Corp.: | |||
| 4.464% 7/23/22 | 11,002,000 | 11,624,889 | |
| 4.908% 7/23/25 | 7,565,000 | 8,360,714 | |
| 5.375% 4/1/38 | 450,000 | 507,563 | |
| 5.375% 5/1/47 | 29,049,000 | 32,261,450 | |
| 5.75% 4/1/48 | 14,203,000 | 16,570,651 | |
| 6.384% 10/23/35 | 2,985,000 | 3,643,669 | |
| 6.484% 10/23/45 | 995,000 | 1,230,358 | |
| Comcast Corp.: | |||
| 3.6% 3/1/24 | 1,495,000 | 1,593,258 | |
| 3.9% 3/1/38 | 1,317,000 | 1,476,717 | |
| 4.6% 8/15/45 | 5,366,000 | 6,488,458 | |
| 4.65% 7/15/42 | 3,521,000 | 4,296,503 | |
| 4.7% 10/15/48 | 930,000 | 1,163,596 | |
| CSC Holdings LLC 5.25% 6/1/24 | 1,600,000 | 1,712,000 | |
| Discovery Communications LLC: | |||
| 3.5% 6/15/22 | 1,105,000 | 1,137,336 | |
| 3.95% 6/15/25 | 710,000 | 746,153 | |
| 5% 9/20/37 | 255,000 | 281,322 | |
| 5.3% 5/15/49 | 150,000 | 171,603 | |
| DISH DBS Corp.: | |||
| 5.875% 11/15/24 | 200,000 | 190,260 | |
| 7.75% 7/1/26 | 200,000 | 196,500 | |
| Fox Corp.: | |||
| 3.666% 1/25/22 (b) | 986,000 | 1,022,057 | |
| 4.03% 1/25/24 (b) | 1,733,000 | 1,856,026 | |
| 4.709% 1/25/29 (b) | 2,509,000 | 2,906,362 | |
| 5.476% 1/25/39 (b) | 2,474,000 | 3,091,306 | |
| 5.576% 1/25/49 (b) | 1,641,000 | 2,135,124 | |
| Nielsen Finance LLC/Nielsen Finance Co. 5% 4/15/22 (b) | 1,200,000 | 1,206,000 | |
| Sirius XM Radio, Inc.: | |||
| 3.875% 8/1/22 (b) | 1,500,000 | 1,526,250 | |
| 4.625% 5/15/23 (b) | 1,500,000 | 1,526,250 | |
| Time Warner Cable, Inc.: | |||
| 4% 9/1/21 | 16,424,000 | 16,842,156 | |
| 5.5% 9/1/41 | 2,591,000 | 2,817,829 | |
| 5.875% 11/15/40 | 5,543,000 | 6,310,057 | |
| 6.55% 5/1/37 | 8,522,000 | 10,317,884 | |
| 7.3% 7/1/38 | 6,393,000 | 8,200,858 | |
| Virgin Media Secured Finance PLC 5.5% 8/15/26 (b) | 300,000 | 313,875 | |
| Ziggo Secured Finance BV 5.5% 1/15/27 (b) | 1,700,000 | 1,793,415 | |
| 161,990,961 | |||
| Wireless Telecommunication Services - 0.0% | |||
| Millicom International Cellular SA: | |||
| 5.125% 1/15/28 (b) | 500,000 | 519,219 | |
| 6.625% 10/15/26 (b) | 600,000 | 656,438 | |
| Rogers Communications, Inc. 3% 3/15/23 | 150,000 | 154,282 | |
| SoftBank Corp. 5.375% 7/30/22 (Reg. S) | 200,000 | 209,000 | |
| T-Mobile U.S.A., Inc. 5.125% 4/15/25 | 500,000 | 520,910 | |
| 2,059,849 | |||
| TOTAL COMMUNICATION SERVICES | 319,112,455 | ||
| CONSUMER DISCRETIONARY - 0.3% | |||
| Automobiles - 0.1% | |||
| Ford Motor Co. 6.375% 2/1/29 | 1,255,000 | 1,404,998 | |
| General Motors Co. 6.25% 10/2/43 | 1,780,000 | 2,001,601 | |
| General Motors Financial Co., Inc.: | |||
| 3.7% 5/9/23 | 11,800,000 | 12,104,758 | |
| 4% 1/15/25 | 1,675,000 | 1,724,103 | |
| 4.25% 5/15/23 | 1,875,000 | 1,963,230 | |
| 4.375% 9/25/21 | 7,321,000 | 7,582,185 | |
| 26,780,875 | |||
| Diversified Consumer Services - 0.0% | |||
| Ingersoll-Rand Global Holding Co. Ltd. 4.25% 6/15/23 | 425,000 | 454,619 | |
| President and Fellows of Harvard College: | |||
| 3.15% 7/15/46 | 190,000 | 209,904 | |
| 3.3% 7/15/56 | 190,000 | 214,223 | |
| Trustees of Boston University 4.061% 10/1/48 | 450,000 | 543,040 | |
| University of Pennsylvania Trustees 3.61% 2/15/2119 | 285,000 | 334,817 | |
| University of Southern California 3.841% 10/1/47 | 705,000 | 858,979 | |
| 2,615,582 | |||
| Hotels, Restaurants & Leisure - 0.0% | |||
| 1011778 BC Unlimited Liability Co./New Red Finance, Inc. 4.25% 5/15/24 (b) | 300,000 | 309,678 | |
| Aramark Services, Inc.: | |||
| 4.75% 6/1/26 | 100,000 | 102,500 | |
| 5% 4/1/25 (b) | 300,000 | 309,945 | |
| 5% 2/1/28 (b) | 960,000 | 997,200 | |
| GLP Capital LP/GLP Financing II, Inc. 5.25% 6/1/25 | 200,000 | 219,896 | |
| Hilton Worldwide Finance LLC/Hilton Worldwide Finance Corp. 4.625% 4/1/25 | 400,000 | 413,000 | |
| KFC Holding Co./Pizza Hut Holding LLC 5% 6/1/24 (b) | 300,000 | 310,125 | |
| Marriott International, Inc.: | |||
| 3.125% 6/15/26 | 1,090,000 | 1,112,216 | |
| 3.6% 4/15/24 | 660,000 | 696,955 | |
| McDonald's Corp. 4.7% 12/9/35 | 1,535,000 | 1,854,015 | |
| MCE Finance Ltd. 4.875% 6/6/25 (b) | 300,000 | 297,580 | |
| MGM Growth Properties Operating Partnership LP 5.625% 5/1/24 | 2,300,000 | 2,512,750 | |
| Wyndham Hotels & Resorts, Inc. 5.375% 4/15/26 (b) | 200,000 | 209,500 | |
| Wynn Las Vegas LLC/Wynn Las Vegas Capital Corp.: | |||
| 5.25% 5/15/27 (b) | 300,000 | 310,875 | |
| 5.5% 3/1/25 (b) | 300,000 | 316,500 | |
| Wynn Macau Ltd.: | |||
| 4.875% 10/1/24 (b) | 300,000 | 296,156 | |
| 5.5% 10/1/27 (b) | 300,000 | 295,875 | |
| 10,564,766 | |||
| Household Durables - 0.2% | |||
| Lennar Corp.: | |||
| 4.75% 11/29/27 | 9,350,000 | 10,168,125 | |
| 5% 6/15/27 | 12,100,000 | 12,977,250 | |
| 5.25% 6/1/26 | 2,920,000 | 3,179,150 | |
| Newell Brands, Inc. 4.2% 4/1/26 | 515,000 | 534,015 | |
| Toll Brothers Finance Corp.: | |||
| 4.35% 2/15/28 | 29,675,000 | 31,010,375 | |
| 4.375% 4/15/23 | 5,000,000 | 5,212,500 | |
| 4.875% 11/15/25 | 35,000 | 37,538 | |
| 4.875% 3/15/27 | 7,917,000 | 8,589,945 | |
| 5.625% 1/15/24 | 885,000 | 962,438 | |
| 5.875% 2/15/22 | 12,000,000 | 12,765,000 | |
| 85,436,336 | |||
| Internet & Direct Marketing Retail - 0.0% | |||
| Amazon.com, Inc. 2.8% 8/22/24 | 1,045,000 | 1,090,916 | |
| Zayo Group LLC/Zayo Capital, Inc. 6.375% 5/15/25 | 400,000 | 411,500 | |
| 1,502,416 | |||
| Leisure Products - 0.0% | |||
| Mattel, Inc. 6.75% 12/31/25 (b) | 300,000 | 308,250 | |
| Multiline Retail - 0.0% | |||
| Dollar Tree, Inc. 4.2% 5/15/28 | 1,395,000 | 1,486,603 | |
| Specialty Retail - 0.0% | |||
| AutoZone, Inc. 3.75% 4/18/29 | 1,200,000 | 1,296,504 | |
| Lowe's Companies, Inc. 4.25% 9/15/44 | 305,000 | 333,387 | |
| The Home Depot, Inc.: | |||
| 2.625% 6/1/22 | 260,000 | 266,233 | |
| 3.75% 2/15/24 | 4,226,000 | 4,567,522 | |
| 4.875% 2/15/44 | 625,000 | 815,325 | |
| 5.875% 12/16/36 | 300,000 | 423,459 | |
| 7,702,430 | |||
| TOTAL CONSUMER DISCRETIONARY | 136,397,258 | ||
| CONSUMER STAPLES - 0.4% | |||
| Beverages - 0.3% | |||
| Anheuser-Busch InBev Finance, Inc.: | |||
| 3.65% 2/1/26 | 12,330,000 | 13,239,227 | |
| 4.7% 2/1/36 | 9,871,000 | 11,490,193 | |
| 4.9% 2/1/46 | 12,306,000 | 14,636,937 | |
| Anheuser-Busch InBev Worldwide, Inc.: | |||
| 4.75% 4/15/58 | 6,987,000 | 8,179,684 | |
| 5.45% 1/23/39 | 5,390,000 | 6,878,175 | |
| 5.55% 1/23/49 | 14,627,000 | 19,268,265 | |
| 5.8% 1/23/59 (Reg. S) | 15,062,000 | 20,552,855 | |
| Constellation Brands, Inc.: | |||
| 4.4% 11/15/25 | 480,000 | 532,615 | |
| 4.75% 11/15/24 | 5,595,000 | 6,232,408 | |
| PepsiCo, Inc.: | |||
| 2.75% 3/5/22 | 900,000 | 924,840 | |
| 3.1% 7/17/22 | 260,000 | 269,156 | |
| 3.6% 3/1/24 | 1,952,000 | 2,097,102 | |
| 104,301,457 | |||
| Food & Staples Retailing - 0.0% | |||
| C&S Group Enterprises LLC 5.375% 7/15/22 (b) | 400,000 | 401,000 | |
| Kroger Co. 2.65% 10/15/26 | 345,000 | 343,622 | |
| Walgreens Boots Alliance, Inc. 3.3% 11/18/21 | 2,632,000 | 2,694,415 | |
| 3,439,037 | |||
| Food Products - 0.1% | |||
| CF Industries Holdings, Inc. 5.15% 3/15/34 | 300,000 | 307,500 | |
| Conagra Brands, Inc. 3.8% 10/22/21 | 1,514,000 | 1,557,662 | |
| H.J. Heinz Co.: | |||
| 3% 6/1/26 | 2,365,000 | 2,326,032 | |
| 4.375% 6/1/46 | 8,515,000 | 8,182,751 | |
| 5% 7/15/35 | 190,000 | 203,592 | |
| 5.2% 7/15/45 | 3,712,000 | 3,916,470 | |
| H.J. Heinz Finance Co. 7.125% 8/1/39 (b) | 4,607,000 | 5,777,385 | |
| JBS U.S.A. LLC/JBS U.S.A. Finance, Inc.: | |||
| 5.75% 6/15/25 (b) | 1,300,000 | 1,352,013 | |
| 5.875% 7/15/24 (b) | 1,300,000 | 1,334,125 | |
| JBS U.S.A. Lux SA / JBS Food Co. 5.5% 1/15/30 (b) | 270,000 | 286,200 | |
| Kraft Foods Group, Inc. 3.5% 6/6/22 | 7,550,000 | 7,728,631 | |
| Lamb Weston Holdings, Inc. 4.625% 11/1/24 (b) | 400,000 | 418,164 | |
| The J.M. Smucker Co. 3.5% 3/15/25 | 310,000 | 325,886 | |
| Tyson Foods, Inc.: | |||
| 3.95% 8/15/24 | 450,000 | 484,108 | |
| 4% 3/1/26 | 2,135,000 | 2,327,218 | |
| Unilever Capital Corp. 4.25% 2/10/21 | 375,000 | 387,095 | |
| 36,914,832 | |||
| Tobacco - 0.0% | |||
| Altria Group, Inc.: | |||
| 2.85% 8/9/22 | 1,570,000 | 1,602,377 | |
| 4% 1/31/24 | 1,380,000 | 1,473,913 | |
| BAT Capital Corp.: | |||
| 3.222% 8/15/24 | 3,195,000 | 3,286,560 | |
| 3.557% 8/15/27 | 770,000 | 789,098 | |
| Philip Morris International, Inc. 3.875% 8/21/42 | 530,000 | 544,342 | |
| Vector Group Ltd. 6.125% 2/1/25 (b) | 800,000 | 784,000 | |
| 8,480,290 | |||
| TOTAL CONSUMER STAPLES | 153,135,616 | ||
| ENERGY - 1.2% | |||
| Energy Equipment & Services - 0.0% | |||
| Baker Hughes A GE Co. LLC 4.08% 12/15/47 | 145,000 | 141,546 | |
| El Paso Pipeline Partners Operating Co. LLC 5% 10/1/21 | 1,212,000 | 1,268,329 | |
| Halliburton Co.: | |||
| 4.75% 8/1/43 | 445,000 | 477,192 | |
| 6.7% 9/15/38 | 170,000 | 228,718 | |
| Summit Midstream Holdings LLC 5.75% 4/15/25 | 1,100,000 | 943,470 | |
| 3,059,255 | |||
| Oil, Gas & Consumable Fuels - 1.2% | |||
| Alberta Energy Co. Ltd. 8.125% 9/15/30 | 6,179,000 | 8,388,768 | |
| Amerada Hess Corp.: | |||
| 7.125% 3/15/33 | 1,335,000 | 1,676,524 | |
| 7.3% 8/15/31 | 1,849,000 | 2,303,857 | |
| 7.875% 10/1/29 | 5,583,000 | 7,105,859 | |
| Anadarko Finance Co. 7.5% 5/1/31 | 8,126,000 | 10,824,730 | |
| Anadarko Petroleum Corp.: | |||
| 4.85% 3/15/21 | 1,762,000 | 1,821,533 | |
| 5.55% 3/15/26 | 6,913,000 | 7,830,287 | |
| 6.45% 9/15/36 | 4,200,000 | 5,261,244 | |
| 6.6% 3/15/46 | 6,475,000 | 8,633,683 | |
| 6.95% 7/1/24 | 975,000 | 1,153,376 | |
| Apache Corp. 3.25% 4/15/22 | 110,000 | 112,028 | |
| Canadian Natural Resources Ltd. 5.85% 2/1/35 | 2,743,000 | 3,314,909 | |
| Cenovus Energy, Inc.: | |||
| 4.25% 4/15/27 | 6,718,000 | 7,015,300 | |
| 5.25% 6/15/37 | 605,000 | 656,816 | |
| Cheniere Corpus Christi Holdings LLC: | |||
| 5.125% 6/30/27 | 1,200,000 | 1,324,500 | |
| 5.875% 3/31/25 | 1,200,000 | 1,338,000 | |
| 7% 6/30/24 | 1,200,000 | 1,384,500 | |
| Chevron Corp.: | |||
| 2.355% 12/5/22 | 840,000 | 854,724 | |
| 2.566% 5/16/23 | 4,322,000 | 4,439,890 | |
| Citgo Holding, Inc. 9.25% 8/1/24 (b) | 100,000 | 106,000 | |
| Columbia Pipeline Group, Inc.: | |||
| 3.3% 6/1/20 | 4,641,000 | 4,671,679 | |
| 4.5% 6/1/25 | 1,418,000 | 1,538,587 | |
| Concho Resources, Inc.: | |||
| 4.3% 8/15/28 | 415,000 | 451,267 | |
| 4.875% 10/1/47 | 185,000 | 214,918 | |
| Conoco, Inc. 6.95% 4/15/29 | 425,000 | 585,613 | |
| Consolidated Energy Finance SA 3 month U.S. LIBOR + 3.750% 6.1603% 6/15/22 (a)(b)(c) | 500,000 | 497,490 | |
| Crestwood Midstream Partners LP/Crestwood Midstream Finance Corp. 5.75% 4/1/25 | 1,500,000 | 1,533,750 | |
| CVR Refining LLC/Coffeyville Finance, Inc. 6.5% 11/1/22 | 399,000 | 404,486 | |
| DCP Midstream LLC: | |||
| 4.75% 9/30/21 (b) | 2,017,000 | 2,067,425 | |
| 5.35% 3/15/20 (b) | 2,258,000 | 2,285,096 | |
| 5.85% 5/21/43 (a)(b) | 7,892,000 | 7,004,150 | |
| DCP Midstream Operating LP: | |||
| 3.875% 3/15/23 | 17,626,000 | 17,846,325 | |
| 5.375% 7/15/25 | 800,000 | 846,000 | |
| 5.6% 4/1/44 | 3,773,000 | 3,556,053 | |
| Denbury Resources, Inc.: | |||
| 7.75% 2/15/24 (b) | 320,000 | 222,464 | |
| 9.25% 3/31/22 (b) | 30,000 | 25,200 | |
| Devon Energy Corp.: | |||
| 5% 6/15/45 | 915,000 | 1,075,995 | |
| 5.6% 7/15/41 | 175,000 | 214,769 | |
| Ecopetrol SA: | |||
| 4.125% 1/16/25 | 520,000 | 545,025 | |
| 5.875% 5/28/45 | 200,000 | 235,625 | |
| El Paso Corp. 6.5% 9/15/20 | 12,030,000 | 12,531,500 | |
| Enable Midstream Partners LP 3.9% 5/15/24 (a) | 1,210,000 | 1,244,205 | |
| Enbridge Energy Partners LP 4.2% 9/15/21 | 2,044,000 | 2,110,996 | |
| Enbridge, Inc.: | |||
| 4% 10/1/23 | 3,799,000 | 4,021,499 | |
| 4.25% 12/1/26 | 1,943,000 | 2,153,638 | |
| Encana Corp. 6.5% 8/15/34 | 1,165,000 | 1,423,218 | |
| Energy Transfer Partners LP: | |||
| 4.2% 9/15/23 | 1,452,000 | 1,535,224 | |
| 4.25% 3/15/23 | 1,373,000 | 1,442,045 | |
| 4.5% 4/15/24 | 1,723,000 | 1,847,255 | |
| 4.75% 1/15/26 | 1,935,000 | 2,116,131 | |
| 4.95% 6/15/28 | 4,954,000 | 5,541,803 | |
| 5.25% 4/15/29 | 2,803,000 | 3,210,844 | |
| 5.8% 6/15/38 | 2,762,000 | 3,216,895 | |
| 6% 6/15/48 | 1,799,000 | 2,145,649 | |
| 6.25% 4/15/49 | 2,230,000 | 2,759,371 | |
| 6.625% 10/15/36 | 900,000 | 1,104,105 | |
| Enterprise Products Operating LP: | |||
| 3.125% 7/31/29 | 515,000 | 533,422 | |
| 4.85% 3/15/44 | 2,500,000 | 2,912,358 | |
| EOG Resources, Inc.: | |||
| 3.9% 4/1/35 | 205,000 | 230,436 | |
| 4.1% 2/1/21 | 285,000 | 293,240 | |
| Exxon Mobil Corp.: | |||
| 2.397% 3/6/22 | 1,575,000 | 1,600,999 | |
| 4.114% 3/1/46 | 705,000 | 855,813 | |
| Global Partners LP/GLP Finance Corp. 7% 8/1/27 (b) | 500,000 | 506,250 | |
| Hess Infrastructure Partners LP 5.625% 2/15/26 (b) | 600,000 | 621,000 | |
| Hilcorp Energy I LP/Hilcorp Finance Co.: | |||
| 5% 12/1/24 (b) | 600,000 | 553,500 | |
| 5.75% 10/1/25 (b) | 295,000 | 275,088 | |
| Kinder Morgan Energy Partners LP: | |||
| 3.45% 2/15/23 | 1,900,000 | 1,969,014 | |
| 4.15% 3/1/22 | 885,000 | 924,523 | |
| 4.15% 2/1/24 | 300,000 | 319,260 | |
| Kinder Morgan, Inc. 5.55% 6/1/45 | 3,329,000 | 3,994,925 | |
| Magellan Midstream Partners LP: | |||
| 3.95% 3/1/50 | 935,000 | 977,238 | |
| 4.2% 10/3/47 | 570,000 | 610,591 | |
| 4.25% 9/15/46 | 65,000 | 70,210 | |
| Magnolia Oil & Gas Operating LLC 6% 8/1/26 (b) | 200,000 | 199,000 | |
| Marathon Petroleum Corp. 5.125% 3/1/21 | 2,870,000 | 2,986,210 | |
| MPLX LP: | |||
| 4.5% 7/15/23 | 1,235,000 | 1,317,847 | |
| 4.5% 4/15/38 | 900,000 | 933,831 | |
| 4.8% 2/15/29 | 2,380,000 | 2,647,411 | |
| 4.875% 12/1/24 | 2,489,000 | 2,730,051 | |
| 4.875% 6/1/25 | 625,000 | 690,049 | |
| 5.5% 2/15/49 | 4,516,000 | 5,176,381 | |
| Nakilat, Inc. 6.067% 12/31/33 (b) | 666,000 | 815,850 | |
| Noble Energy, Inc.: | |||
| 4.15% 12/15/21 | 1,185,000 | 1,223,746 | |
| 5.25% 11/15/43 | 295,000 | 334,444 | |
| 6% 3/1/41 | 360,000 | 426,786 | |
| Occidental Petroleum Corp.: | |||
| 2.6% 8/13/21 | 2,423,000 | 2,439,104 | |
| 2.6% 4/15/22 | 2,105,000 | 2,114,205 | |
| 2.7% 8/15/22 | 1,810,000 | 1,827,815 | |
| 2.9% 8/15/24 | 5,981,000 | 6,036,933 | |
| 3.125% 2/15/22 | 4,427,000 | 4,492,722 | |
| 3.2% 8/15/26 | 805,000 | 813,328 | |
| 3.5% 8/15/29 | 2,534,000 | 2,581,705 | |
| 4.1% 2/1/21 | 670,000 | 683,885 | |
| 4.3% 8/15/39 | 369,000 | 386,124 | |
| 4.4% 8/15/49 | 369,000 | 384,876 | |
| ONEOK Partners LP: | |||
| 3.375% 10/1/22 | 1,065,000 | 1,091,889 | |
| 6.65% 10/1/36 | 400,000 | 505,510 | |
| ONEOK, Inc.: | |||
| 4.45% 9/1/49 | 960,000 | 971,591 | |
| 4.95% 7/13/47 | 365,000 | 394,278 | |
| Parsley Energy LLC/Parsley 5.25% 8/15/25 (b) | 700,000 | 710,500 | |
| Petro-Canada 6.8% 5/15/38 | 350,000 | 500,044 | |
| Petrobras Global Finance BV 7.25% 3/17/44 | 34,097,000 | 40,330,358 | |
| Petroleos Mexicanos: | |||
| 4.25% 1/15/25 | 1,040,000 | 993,668 | |
| 4.625% 9/21/23 | 7,965,000 | 7,983,668 | |
| 4.875% 1/18/24 | 2,616,000 | 2,626,464 | |
| 5.375% 3/13/22 | 2,525,000 | 2,581,813 | |
| 6.375% 2/4/21 | 2,660,000 | 2,734,480 | |
| 6.375% 1/23/45 | 25,158,000 | 23,188,602 | |
| 6.5% 3/13/27 | 26,920,000 | 27,494,575 | |
| 6.5% 6/2/41 | 59,945,000 | 55,766,834 | |
| 6.75% 9/21/47 | 26,150,000 | 24,842,500 | |
| Phillips 66 Co. 4.875% 11/15/44 | 305,000 | 365,349 | |
| Phillips 66 Partners LP 3.75% 3/1/28 | 295,000 | 308,144 | |
| Plains All American Pipeline LP/PAA Finance Corp.: | |||
| 3.6% 11/1/24 | 1,877,000 | 1,928,430 | |
| 3.65% 6/1/22 | 10,550,000 | 10,843,030 | |
| QEP Resources, Inc. 5.25% 5/1/23 | 300,000 | 262,500 | |
| Regency Energy Partners LP/Regency Energy Finance Corp. 5.875% 3/1/22 | 2,310,000 | 2,479,939 | |
| Rose Rock Midstream LP/Rose Rock Finance Corp. 5.625% 11/15/23 | 300,000 | 283,500 | |
| Schlumberger Investment SA 3.65% 12/1/23 | 210,000 | 222,008 | |
| SemGroup Corp. 6.375% 3/15/25 | 800,000 | 756,000 | |
| Shell International Finance BV: | |||
| 3.25% 5/11/25 | 1,465,000 | 1,557,464 | |
| 4.3% 9/22/19 | 145,000 | 145,144 | |
| Spectra Energy Partners LP 4.75% 3/15/24 | 6,000,000 | 6,564,749 | |
| Sunoco Logistics Partner Operations LP: | |||
| 5.35% 5/15/45 | 625,000 | 681,057 | |
| 5.4% 10/1/47 | 1,861,000 | 2,075,710 | |
| Sunoco LP/Sunoco Finance Corp. 5.5% 2/15/26 | 500,000 | 518,750 | |
| Targa Resources Partners LP/Targa Resources Partners Finance Corp.: | |||
| 4.25% 11/15/23 | 600,000 | 599,250 | |
| 5.125% 2/1/25 | 900,000 | 922,500 | |
| 5.875% 4/15/26 | 400,000 | 419,000 | |
| The Williams Companies, Inc.: | |||
| 3.7% 1/15/23 | 2,512,000 | 2,605,981 | |
| 4.55% 6/24/24 | 12,246,000 | 13,263,335 | |
| Total Capital International SA: | |||
| 2.7% 1/25/23 | 1,375,000 | 1,408,219 | |
| 2.829% 1/10/30 | 800,000 | 827,715 | |
| Valero Energy Corp. 4% 4/1/29 | 820,000 | 875,017 | |
| Western Gas Partners LP: | |||
| 4.65% 7/1/26 | 1,249,000 | 1,272,007 | |
| 4.75% 8/15/28 | 1,465,000 | 1,483,864 | |
| 5.3% 3/1/48 | 645,000 | 589,343 | |
| 5.375% 6/1/21 | 4,846,000 | 5,010,792 | |
| Williams Partners LP: | |||
| 3.6% 3/15/22 | 660,000 | 679,528 | |
| 3.75% 6/15/27 | 1,385,000 | 1,445,539 | |
| 4% 11/15/21 | 1,643,000 | 1,692,100 | |
| 4.125% 11/15/20 | 394,000 | 400,593 | |
| 4.3% 3/4/24 | 2,607,000 | 2,782,646 | |
| 4.85% 3/1/48 | 100,000 | 109,403 | |
| 4.9% 1/15/45 | 470,000 | 513,471 | |
| 5.25% 3/15/20 | 150,000 | 152,228 | |
| 487,024,072 | |||
| TOTAL ENERGY | 490,083,327 | ||
| FINANCIALS - 3.1% | |||
| Banks - 1.6% | |||
| Banco Santander SA 3.848% 4/12/23 | 800,000 | 836,006 | |
| Bank of America Corp.: | |||
| 3.004% 12/20/23 (a) | 10,921,000 | 11,207,637 | |
| 3.3% 1/11/23 | 5,787,000 | 6,016,256 | |
| 3.419% 12/20/28 (a) | 12,988,000 | 13,706,574 | |
| 3.5% 4/19/26 | 5,358,000 | 5,740,885 | |
| 3.95% 4/21/25 | 14,568,000 | 15,554,332 | |
| 3.97% 3/5/29 (a) | 4,130,000 | 4,542,101 | |
| 4% 4/1/24 | 2,115,000 | 2,287,530 | |
| 4% 1/22/25 | 45,375,000 | 48,481,584 | |
| 4.1% 7/24/23 | 13,989,000 | 15,030,620 | |
| 4.2% 8/26/24 | 2,028,000 | 2,188,719 | |
| 4.25% 10/22/26 | 10,727,000 | 11,710,493 | |
| 4.45% 3/3/26 | 2,065,000 | 2,273,928 | |
| Banque Federative du Credit Mutuel SA 3 month U.S. LIBOR + 0.730% 3.0076% 7/20/22 (a)(b)(c) | 8,041,000 | 8,079,787 | |
| Barclays PLC: | |||
| 2.75% 11/8/19 | 3,229,000 | 3,230,592 | |
| 3.65% 3/16/25 | 925,000 | 942,261 | |
| 3.932% 5/7/25 (a) | 200,000 | 205,614 | |
| 4.337% 1/10/28 | 2,595,000 | 2,734,774 | |
| 4.375% 1/12/26 | 1,440,000 | 1,519,734 | |
| 4.836% 5/9/28 | 6,667,000 | 6,920,783 | |
| 4.972% 5/16/29 (a) | 15,000,000 | 16,485,366 | |
| 5.088% 6/20/30 (a) | 9,938,000 | 10,323,226 | |
| 5.2% 5/12/26 | 1,701,000 | 1,805,863 | |
| CIT Group, Inc.: | |||
| 4.75% 2/16/24 | 2,480,000 | 2,666,000 | |
| 5% 8/1/23 | 7,000,000 | 7,586,250 | |
| 6.125% 3/9/28 | 4,840,000 | 5,771,700 | |
| Citigroup, Inc.: | |||
| 2.7% 10/27/22 | 50,590,000 | 51,451,210 | |
| 3.2% 10/21/26 | 2,500,000 | 2,608,872 | |
| 3.352% 4/24/25 (a) | 6,698,000 | 6,998,003 | |
| 3.4% 5/1/26 | 1,045,000 | 1,105,404 | |
| 3.7% 1/12/26 | 3,940,000 | 4,245,750 | |
| 4.05% 7/30/22 | 1,159,000 | 1,215,495 | |
| 4.3% 11/20/26 | 2,129,000 | 2,323,452 | |
| 4.4% 6/10/25 | 17,376,000 | 18,855,582 | |
| 4.45% 9/29/27 | 3,875,000 | 4,264,413 | |
| 4.5% 1/14/22 | 2,773,000 | 2,925,764 | |
| 4.6% 3/9/26 | 2,235,000 | 2,459,749 | |
| 4.75% 5/18/46 | 10,000,000 | 12,115,478 | |
| 5.5% 9/13/25 | 8,267,000 | 9,474,978 | |
| Citizens Bank NA 2.55% 5/13/21 | 1,705,000 | 1,716,957 | |
| Citizens Financial Group, Inc.: | |||
| 4.15% 9/28/22 (b) | 3,115,000 | 3,251,523 | |
| 4.3% 12/3/25 | 9,918,000 | 10,716,897 | |
| Credit Suisse Group Funding Guernsey Ltd.: | |||
| 3.75% 3/26/25 | 16,672,000 | 17,622,447 | |
| 3.8% 9/15/22 | 10,230,000 | 10,676,174 | |
| 3.8% 6/9/23 | 9,457,000 | 9,928,461 | |
| 4.55% 4/17/26 | 5,384,000 | 5,965,761 | |
| Discover Bank 7% 4/15/20 | 3,143,000 | 3,230,833 | |
| Export-Import Bank of Korea 5.125% 6/29/20 | 800,000 | 819,808 | |
| Fifth Third Bancorp 8.25% 3/1/38 | 603,000 | 936,470 | |
| HSBC Holdings PLC: | |||
| 3.973% 5/22/30 (a) | 1,000,000 | 1,073,771 | |
| 4.041% 3/13/28 (a) | 1,780,000 | 1,898,746 | |
| 4.25% 3/14/24 | 1,872,000 | 1,975,400 | |
| 4.583% 6/19/29(a) | 1,300,000 | 1,456,578 | |
| 4.875% 1/14/22 | 4,645,000 | 4,925,859 | |
| Huntington Bancshares, Inc. 7% 12/15/20 | 404,000 | 428,104 | |
| Intesa Sanpaolo SpA: | |||
| 5.017% 6/26/24 (b) | 27,505,000 | 28,192,859 | |
| 5.71% 1/15/26 (b) | 7,646,000 | 8,067,188 | |
| Japan Bank International Cooperation 3.25% 7/20/23 | 400,000 | 422,378 | |
| JPMorgan Chase & Co.: | |||
| 2.95% 10/1/26 | 4,205,000 | 4,362,091 | |
| 3.3% 4/1/26 | 1,125,000 | 1,186,291 | |
| 3.509% 1/23/29 (a) | 2,405,000 | 2,575,309 | |
| 3.625% 5/13/24 | 2,860,000 | 3,058,815 | |
| 3.797% 7/23/24 (a) | 10,889,000 | 11,566,911 | |
| 3.875% 9/10/24 | 10,030,000 | 10,723,173 | |
| 3.882% 7/24/38 (a) | 6,115,000 | 6,855,303 | |
| 3.964% 11/15/48 (a) | 1,945,000 | 2,238,926 | |
| 4.125% 12/15/26 | 7,374,000 | 8,122,935 | |
| 4.35% 8/15/21 | 4,947,000 | 5,162,047 | |
| 4.625% 5/10/21 | 1,718,000 | 1,790,403 | |
| Lloyds Bank PLC 3.9% 3/12/24 | 300,000 | 314,283 | |
| Lloyds Banking Group PLC 4.375% 3/22/28 | 1,365,000 | 1,487,550 | |
| Peoples United Bank 4% 7/15/24 | 40,000 | 42,155 | |
| PNC Bank NA 3.25% 6/1/25 | 1,710,000 | 1,806,844 | |
| PNC Financial Services Group, Inc.: | |||
| 2.854% 11/9/22 | 275,000 | 281,396 | |
| 3.9% 4/29/24 | 375,000 | 404,117 | |
| Rabobank Nederland 4.375% 8/4/25 | 7,713,000 | 8,337,619 | |
| Regions Bank 6.45% 6/26/37 | 2,533,000 | 3,391,389 | |
| Regions Financial Corp. 3.2% 2/8/21 | 3,096,000 | 3,137,975 | |
| Royal Bank of Scotland Group PLC: | |||
| 4.269% 3/22/25 (a) | 1,735,000 | 1,812,433 | |
| 5.125% 5/28/24 | 21,274,000 | 22,514,270 | |
| 6% 12/19/23 | 27,105,000 | 29,519,690 | |
| 6.1% 6/10/23 | 29,526,000 | 32,021,853 | |
| 6.125% 12/15/22 | 5,889,000 | 6,370,665 | |
| Santander UK Group Holdings PLC 2.875% 10/16/20 | 550,000 | 552,021 | |
| Societe Generale 4.25% 4/14/25 (b) | 21,901,000 | 22,865,085 | |
| Sumitomo Mitsui Banking Corp. 3.95% 7/19/23 | 250,000 | 266,950 | |
| SunTrust Banks, Inc.: | |||
| 2.7% 1/27/22 | 540,000 | 546,944 | |
| 3.3% 5/15/26 | 965,000 | 1,008,689 | |
| Synchrony Bank 3% 6/15/22 | 5,477,000 | 5,576,418 | |
| U.S. Bancorp 2.625% 1/24/22 | 1,620,000 | 1,646,839 | |
| UniCredit SpA 6.572% 1/14/22 (b) | 7,600,000 | 8,172,181 | |
| Wells Fargo & Co.: | |||
| 2.1% 7/26/21 | 1,530,000 | 1,531,288 | |
| 3% 2/19/25 | 5,975,000 | 6,190,729 | |
| 4.125% 8/15/23 | 280,000 | 298,850 | |
| 4.65% 11/4/44 | 1,385,000 | 1,663,963 | |
| Westpac Banking Corp. 4.11% 7/24/34 (a) | 4,937,000 | 5,197,368 | |
| 665,800,747 | |||
| Capital Markets - 0.7% | |||
| Affiliated Managers Group, Inc. 4.25% 2/15/24 | 1,847,000 | 1,985,850 | |
| Ares Capital Corp. 4.2% 6/10/24 | 12,032,000 | 12,489,666 | |
| Deutsche Bank AG 4.5% 4/1/25 | 9,996,000 | 9,443,815 | |
| Deutsche Bank AG New York Branch: | |||
| 3.3% 11/16/22 | 10,180,000 | 10,118,334 | |
| 5% 2/14/22 | 14,609,000 | 15,142,337 | |
| Goldman Sachs Group, Inc.: | |||
| 2.876% 10/31/22 (a) | 12,744,000 | 12,919,576 | |
| 3.2% 2/23/23 | 5,700,000 | 5,889,159 | |
| 3.625% 2/20/24 | 2,205,000 | 2,325,568 | |
| 3.75% 5/22/25 | 3,095,000 | 3,300,280 | |
| 3.75% 2/25/26 | 1,650,000 | 1,757,893 | |
| 3.85% 7/8/24 | 1,900,000 | 2,028,116 | |
| 4.223% 5/1/29 (a) | 1,500,000 | 1,659,159 | |
| 6.75% 10/1/37 | 50,999,000 | 69,873,418 | |
| IntercontinentalExchange, Inc.: | |||
| 2.75% 12/1/20 | 1,768,000 | 1,783,015 | |
| 3.75% 12/1/25 | 3,162,000 | 3,422,675 | |
| Moody's Corp.: | |||
| 3.25% 1/15/28 | 2,897,000 | 3,054,871 | |
| 4.875% 2/15/24 | 2,720,000 | 3,013,563 | |
| Morgan Stanley: | |||
| 3 month U.S. LIBOR + 0.930% 3.2076% 7/22/22 (a)(c) | 3,691,000 | 3,716,536 | |
| 3.125% 1/23/23 | 7,600,000 | 7,836,283 | |
| 3.125% 7/27/26 | 37,616,000 | 39,076,681 | |
| 3.7% 10/23/24 | 21,259,000 | 22,708,984 | |
| 3.75% 2/25/23 | 3,725,000 | 3,918,210 | |
| 3.772% 1/24/29 (a) | 150,000 | 162,325 | |
| 3.875% 4/29/24 | 4,200,000 | 4,508,595 | |
| 3.875% 1/27/26 | 1,125,000 | 1,216,256 | |
| 4% 7/23/25 | 4,125,000 | 4,468,556 | |
| 4.1% 5/22/23 | 4,350,000 | 4,606,385 | |
| 4.35% 9/8/26 | 1,520,000 | 1,664,377 | |
| 4.431% 1/23/30 (a) | 6,039,000 | 6,891,934 | |
| 5% 11/24/25 | 41,781,000 | 47,141,618 | |
| 5.75% 1/25/21 | 4,996,000 | 5,241,597 | |
| MSCI, Inc. 5.25% 11/15/24 (b) | 1,000,000 | 1,038,200 | |
| The Bank of New York Mellon Corp. 3.4% 5/15/24 | 750,000 | 793,488 | |
| 315,197,320 | |||
| Consumer Finance - 0.3% | |||
| AerCap Ireland Capital Ltd./AerCap Global Aviation Trust: | |||
| 2.875% 8/14/24 | 7,954,000 | 7,980,085 | |
| 3.5% 5/26/22 | 1,949,000 | 2,002,194 | |
| 4.125% 7/3/23 | 5,132,000 | 5,444,096 | |
| 4.45% 12/16/21 | 4,011,000 | 4,167,858 | |
| 4.45% 4/3/26 | 4,282,000 | 4,597,717 | |
| 4.5% 5/15/21 | 1,455,000 | 1,500,967 | |
| 4.875% 1/16/24 | 6,861,000 | 7,441,881 | |
| 5% 10/1/21 | 2,185,000 | 2,291,185 | |
| Ally Financial, Inc.: | |||
| 4.125% 2/13/22 | 1,700,000 | 1,763,750 | |
| 5.125% 9/30/24 | 1,700,000 | 1,899,750 | |
| Capital One Bank U.S.A. NA 3.375% 2/15/23 | 1,035,000 | 1,067,998 | |
| Capital One Financial Corp. 3.8% 1/31/28 | 5,513,000 | 5,877,579 | |
| Caterpillar Financial Services Corp. 1.931% 10/1/21 | 1,605,000 | 1,601,625 | |
| Discover Financial Services: | |||
| 3.85% 11/21/22 | 2,293,000 | 2,405,159 | |
| 3.95% 11/6/24 | 2,567,000 | 2,736,491 | |
| 4.1% 2/9/27 | 645,000 | 694,459 | |
| 4.5% 1/30/26 | 6,463,000 | 7,137,892 | |
| 5.2% 4/27/22 | 1,093,000 | 1,175,362 | |
| Ford Motor Credit Co. LLC: | |||
| 3.35% 11/1/22 | 3,420,000 | 3,437,843 | |
| 3.664% 9/8/24 | 1,275,000 | 1,274,499 | |
| 5.085% 1/7/21 | 4,004,000 | 4,125,109 | |
| 5.584% 3/18/24 | 8,575,000 | 9,221,740 | |
| 5.596% 1/7/22 | 8,285,000 | 8,761,254 | |
| John Deere Capital Corp.: | |||
| 2.65% 6/24/24 | 615,000 | 633,740 | |
| 2.8% 1/27/23 | 585,000 | 601,742 | |
| 2.8% 3/6/23 | 1,435,000 | 1,476,748 | |
| Navient Corp.: | |||
| 6.625% 7/26/21 | 1,300,000 | 1,391,000 | |
| 6.75% 6/15/26 | 350,000 | 374,500 | |
| 7.25% 1/25/22 | 1,300,000 | 1,425,125 | |
| Springleaf Finance Corp. 6.875% 3/15/25 | 500,000 | 566,875 | |
| Synchrony Financial: | |||
| 2.85% 7/25/22 | 2,029,000 | 2,056,379 | |
| 3.75% 8/15/21 | 2,016,000 | 2,061,465 | |
| 3.95% 12/1/27 | 8,719,000 | 9,038,861 | |
| 4.25% 8/15/24 | 2,029,000 | 2,160,321 | |
| 4.375% 3/19/24 | 3,130,000 | 3,343,356 | |
| 5.15% 3/19/29 | 9,000,000 | 10,135,550 | |
| 123,872,155 | |||
| Diversified Financial Services - 0.3% | |||
| Anheuser-Busch Companies LLC / Anheuser-Busch InBev Worldwide, Inc.: | |||
| 3.65% 2/1/26 | 5,100,000 | 5,480,258 | |
| 4.7% 2/1/36 | 2,765,000 | 3,218,558 | |
| 4.9% 2/1/46 | 145,000 | 173,249 | |
| Arch Capital Finance LLC 4.011% 12/15/26 | 1,970,000 | 2,169,174 | |
| Avolon Holdings Funding Ltd.: | |||
| 3.625% 5/1/22 (b) | 3,055,000 | 3,098,687 | |
| 3.95% 7/1/24 (b) | 2,862,000 | 2,945,570 | |
| 4.375% 5/1/26 (b) | 3,477,000 | 3,610,169 | |
| 5.25% 5/15/24 (b) | 4,140,000 | 4,440,978 | |
| AXA Equitable Holdings, Inc. 3.9% 4/20/23 | 1,273,000 | 1,337,020 | |
| Berkshire Hathaway, Inc.: | |||
| 2.75% 3/15/23 | 2,695,000 | 2,781,190 | |
| 3.125% 3/15/26 | 1,615,000 | 1,712,075 | |
| BP Capital Markets America, Inc. 3.245% 5/6/22 | 2,610,000 | 2,694,632 | |
| Brixmor Operating Partnership LP: | |||
| 4.125% 6/15/26 | 5,706,000 | 6,082,391 | |
| 4.125% 5/15/29 | 6,724,000 | 7,274,201 | |
| Broadcom Corp./Broadcom Cayman LP 3.125% 1/15/25 | 1,260,000 | 1,244,462 | |
| Cigna Corp.: | |||
| 3.75% 7/15/23 | 6,229,000 | 6,548,287 | |
| 4.125% 11/15/25 | 5,691,000 | 6,191,620 | |
| 4.375% 10/15/28 | 7,774,000 | 8,692,895 | |
| 4.8% 8/15/38 | 4,840,000 | 5,595,739 | |
| 4.9% 12/15/48 | 4,836,000 | 5,722,877 | |
| CRC Escrow Issuer LLC/CRC Finance LLC 5.25% 10/15/25 (b) | 300,000 | 305,250 | |
| GE Capital International Funding Co. 4.418% 11/15/35 | 810,000 | 822,973 | |
| GEMS MENASA Cayman Ltd. 7.125% 7/31/26 (b) | 200,000 | 203,800 | |
| General Electric Capital Corp. 3.45% 5/15/24 | 920,000 | 933,898 | |
| Icahn Enterprises LP/Icahn Enterprises Finance Corp.: | |||
| 6.25% 5/15/26 (b) | 1,100,000 | 1,148,180 | |
| 6.375% 12/15/25 | 1,100,000 | 1,164,625 | |
| Park Aerospace Holdings Ltd.: | |||
| 4.5% 3/15/23 (b) | 900,000 | 931,140 | |
| 5.5% 2/15/24 (b) | 7,000,000 | 7,569,800 | |
| Pine Street Trust I: | |||
| 4.572% 2/15/29 (b) | 7,798,000 | 8,417,861 | |
| 5.568% 2/15/49 (b) | 7,800,000 | 8,923,668 | |
| Private Export Funding Corp. 3.55% 1/15/24 | 755,000 | 814,251 | |
| Radiate Holdco LLC/Radiate Financial Service Ltd. 6.625% 2/15/25 (b) | 115,000 | 114,138 | |
| Trivium Packaging Finance BV: | |||
| 5.5% 8/15/26 (b) | 60,000 | 63,450 | |
| 8.5% 8/15/27 (b) | 60,000 | 64,500 | |
| Voya Financial, Inc. 3.125% 7/15/24 | 3,436,000 | 3,550,386 | |
| 116,041,952 | |||
| Insurance - 0.2% | |||
| ACE INA Holdings, Inc.: | |||
| 2.7% 3/13/23 | 1,105,000 | 1,131,371 | |
| 3.15% 3/15/25 | 1,615,000 | 1,707,519 | |
| American International Group, Inc.: | |||
| 3.75% 7/10/25 | 2,360,000 | 2,513,638 | |
| 4.125% 2/15/24 | 360,000 | 387,973 | |
| 4.5% 7/16/44 | 1,930,000 | 2,206,342 | |
| 4.875% 6/1/22 | 3,898,000 | 4,175,041 | |
| Aon Corp. 5% 9/30/20 | 540,000 | 556,262 | |
| CNA Financial Corp. 3.95% 5/15/24 | 1,400,000 | 1,488,250 | |
| Liberty Mutual Group, Inc. 4.569% 2/1/29 (b) | 1,847,000 | 2,102,133 | |
| Lincoln National Corp.: | |||
| 3.05% 1/15/30 | 130,000 | 131,747 | |
| 4.35% 3/1/48 | 165,000 | 185,481 | |
| 6.3% 10/9/37 | 185,000 | 247,708 | |
| Markel Corp. 4.3% 11/1/47 | 525,000 | 571,567 | |
| Marsh & McLennan Companies, Inc.: | |||
| 3.5% 6/3/24 | 1,140,000 | 1,203,804 | |
| 4.375% 3/15/29 | 5,432,000 | 6,240,185 | |
| 4.75% 3/15/39 | 2,493,000 | 3,121,069 | |
| 4.8% 7/15/21 | 1,026,000 | 1,069,013 | |
| 4.9% 3/15/49 | 4,960,000 | 6,439,528 | |
| MetLife, Inc. 4.368% 9/15/23 (a) | 910,000 | 993,042 | |
| Metropolitan Life Global Funding I U.S. SOFR SEC OVRN FIN RATE INDX + 0.500% 2.62% 5/28/21 (a)(b)(c) | 31,400,000 | 31,423,603 | |
| Pricoa Global Funding I 5.375% 5/15/45 (a) | 5,278,000 | 5,631,415 | |
| Prudential Financial, Inc. 4.5% 11/16/21 | 1,118,000 | 1,179,566 | |
| Swiss Re Finance Luxembourg SA 5% 4/2/49 (a)(b) | 3,200,000 | 3,528,000 | |
| The Chubb Corp. 6% 5/11/37 | 300,000 | 424,798 | |
| Unum Group: | |||
| 4% 6/15/29 | 5,961,000 | 6,262,632 | |
| 5.625% 9/15/20 | 3,216,000 | 3,324,570 | |
| 5.75% 8/15/42 | 2,238,000 | 2,778,840 | |
| 91,025,097 | |||
| Thrifts & Mortgage Finance - 0.0% | |||
| Quicken Loans, Inc. 5.25% 1/15/28 (b) | 600,000 | 622,500 | |
| TOTAL FINANCIALS | 1,312,559,771 | ||
| HEALTH CARE - 0.6% | |||
| Biotechnology - 0.0% | |||
| AbbVie, Inc.: | |||
| 3.6% 5/14/25 | 2,980,000 | 3,107,409 | |
| 4.7% 5/14/45 | 1,785,000 | 1,928,895 | |
| 4.875% 11/14/48 | 585,000 | 651,681 | |
| Amgen, Inc.: | |||
| 2.6% 8/19/26 | 3,875,000 | 3,920,026 | |
| 4.5% 3/15/20 | 1,500,000 | 1,517,629 | |
| Baxalta, Inc. 4% 6/23/25 | 579,000 | 627,418 | |
| Celgene Corp.: | |||
| 3.625% 5/15/24 | 910,000 | 964,358 | |
| 5% 8/15/45 | 510,000 | 649,142 | |
| Gilead Sciences, Inc.: | |||
| 3.25% 9/1/22 | 195,000 | 202,069 | |
| 3.65% 3/1/26 | 685,000 | 736,257 | |
| 4.4% 12/1/21 | 1,120,000 | 1,174,699 | |
| 4.5% 2/1/45 | 665,000 | 775,802 | |
| 16,255,385 | |||
| Health Care Equipment & Supplies - 0.0% | |||
| Abbott Laboratories: | |||
| 2.55% 3/15/22 | 500,000 | 508,138 | |
| 2.9% 11/30/21 | 1,915,000 | 1,952,263 | |
| 3.75% 11/30/26 | 687,000 | 755,966 | |
| 4.9% 11/30/46 | 1,210,000 | 1,617,395 | |
| Becton, Dickinson & Co.: | |||
| 2.404% 6/5/20 | 4,246,000 | 4,250,921 | |
| 3.125% 11/8/21 | 1,050,000 | 1,069,388 | |
| 3.7% 6/6/27 | 118,000 | 126,412 | |
| 3.734% 12/15/24 | 855,000 | 909,826 | |
| Hologic, Inc. 4.375% 10/15/25 (b) | 200,000 | 204,500 | |
| Stryker Corp.: | |||
| 3.375% 5/15/24 | 335,000 | 353,079 | |
| 3.375% 11/1/25 | 305,000 | 325,008 | |
| 3.5% 3/15/26 | 675,000 | 725,116 | |
| Teleflex, Inc. 4.875% 6/1/26 | 1,000,000 | 1,053,460 | |
| 13,851,472 | |||
| Health Care Providers & Services - 0.4% | |||
| Ascension Health: | |||
| 3.945% 11/15/46 | 465,000 | 558,358 | |
| 4.847% 11/15/53 | 250,000 | 343,843 | |
| Cardinal Health, Inc.: | |||
| 3.2% 6/15/22 | 405,000 | 413,595 | |
| 4.625% 12/15/20 | 200,000 | 206,067 | |
| Childrens Hospital Corp. 4.115% 1/1/47 | 580,000 | 709,547 | |
| Cigna Holding Co.: | |||
| 3.25% 4/15/25 | 1,080,000 | 1,117,147 | |
| 4% 2/15/22 | 1,910,000 | 1,987,111 | |
| 4.375% 12/15/20 | 305,000 | 311,507 | |
| Commonspirit Health 2.76% 10/1/24 | 950,000 | 964,782 | |
| CVS Health Corp.: | |||
| 2.625% 8/15/24 | 1,021,000 | 1,026,851 | |
| 3% 8/15/26 | 828,000 | 838,128 | |
| 3.25% 8/15/29 | 2,198,000 | 2,227,738 | |
| 3.875% 7/20/25 | 628,000 | 665,383 | |
| 4.1% 3/25/25 | 29,063,000 | 31,092,540 | |
| 4.3% 3/25/28 | 18,219,000 | 19,886,788 | |
| 4.78% 3/25/38 | 7,828,000 | 8,778,024 | |
| 5.05% 3/25/48 | 12,398,000 | 14,445,667 | |
| 5.125% 7/20/45 | 125,000 | 145,296 | |
| 5.3% 12/5/43 | 265,000 | 312,920 | |
| Duke University Health System, Inc. 3.92% 6/1/47 | 635,000 | 766,969 | |
| Elanco Animal Health, Inc.: | |||
| 3.912% 8/27/21 | 1,274,000 | 1,298,567 | |
| 4.272% 8/28/23 | 4,020,000 | 4,210,566 | |
| 4.9% 8/28/28 | 1,693,000 | 1,846,425 | |
| Express Scripts Holding Co. 4.5% 2/25/26 | 3,085,000 | 3,407,052 | |
| Hackensack Meridian Health 4.5% 7/1/57 | 385,000 | 492,458 | |
| HCA Holdings, Inc.: | |||
| 4.75% 5/1/23 | 205,000 | 220,374 | |
| 5% 3/15/24 | 300,000 | 327,691 | |
| 5.25% 6/15/26 | 900,000 | 1,015,886 | |
| 5.375% 2/1/25 | 500,000 | 555,000 | |
| Kaiser Foundation Hospitals 4.15% 5/1/47 | 1,465,000 | 1,806,275 | |
| Laboratory Corp. of America Holdings: | |||
| 3.25% 9/1/24 | 395,000 | 411,055 | |
| 4.7% 2/1/45 | 830,000 | 943,424 | |
| Medco Health Solutions, Inc. 4.125% 9/15/20 | 1,049,000 | 1,066,883 | |
| Memorial Sloan-Kettring Cancer Center: | |||
| 4.2% 7/1/55 | 140,000 | 178,338 | |
| 5% 7/1/42 | 225,000 | 305,245 | |
| MPH Acquisition Holdings LLC 7.125% 6/1/24 (b) | 180,000 | 160,886 | |
| New York & Presbyterian Hospital: | |||
| 4.024% 8/1/45 | 550,000 | 662,712 | |
| 4.063% 8/1/56 | 540,000 | 652,001 | |
| NYU Hospitals Center 4.368% 7/1/47 | 810,000 | 975,345 | |
| Providence St. Joseph Health Obligated Group 2.746% 10/1/26 | 780,000 | 802,279 | |
| Quest Diagnostics, Inc.: | |||
| 4.7% 3/30/45 | 100,000 | 113,499 | |
| 5.75% 1/30/40 | 68,000 | 81,602 | |
| Sutter Health 4.091% 8/15/48 | 2,640,000 | 3,156,361 | |
| Tenet Healthcare Corp.: | |||
| 4.375% 10/1/21 | 900,000 | 938,700 | |
| 8.125% 4/1/22 | 900,000 | 969,660 | |
| The Johns Hopkins Health System Corp. 3.837% 5/15/46 | 400,000 | 477,288 | |
| Toledo Hospital: | |||
| 5.325% 11/15/28 | 2,792,000 | 3,154,555 | |
| 6.015% 11/15/48 | 9,884,000 | 12,466,989 | |
| UnitedHealth Group, Inc.: | |||
| 4.25% 4/15/47 | 470,000 | 551,532 | |
| 4.25% 6/15/48 | 1,050,000 | 1,230,594 | |
| 4.7% 2/15/21 | 240,000 | 247,550 | |
| 6.875% 2/15/38 | 700,000 | 1,056,171 | |
| Wellcare Health Plans, Inc. 5.25% 4/1/25 | 1,300,000 | 1,361,165 | |
| WellPoint, Inc.: | |||
| 3.125% 5/15/22 | 2,620,000 | 2,683,788 | |
| 3.3% 1/15/23 | 6,475,000 | 6,687,728 | |
| 143,313,905 | |||
| Health Care Technology - 0.0% | |||
| IMS Health, Inc. 5% 10/15/26 (b) | 900,000 | 949,500 | |
| Life Sciences Tools & Services - 0.0% | |||
| Charles River Laboratories International, Inc. 5.5% 4/1/26 (b) | 100,000 | 106,990 | |
| Thermo Fisher Scientific, Inc.: | |||
| 3.15% 1/15/23 | 365,000 | 376,067 | |
| 4.15% 2/1/24 | 570,000 | 613,328 | |
| 1,096,385 | |||
| Pharmaceuticals - 0.2% | |||
| Actavis Funding SCS: | |||
| 3.85% 6/15/24 | 560,000 | 591,377 | |
| 4.55% 3/15/35 | 400,000 | 430,295 | |
| Bayer U.S. Finance II LLC 4.25% 12/15/25 (b) | 26,954,000 | 29,051,019 | |
| Bristol-Myers Squibb Co. 4.25% 10/26/49 (b) | 1,295,000 | 1,557,693 | |
| GlaxoSmithKline Capital PLC 2.85% 5/8/22 | 710,000 | 726,049 | |
| GlaxoSmithKline Capital, Inc. 2.8% 3/18/23 | 1,425,000 | 1,470,032 | |
| Johnson & Johnson: | |||
| 2.45% 3/1/26 | 45,000 | 46,428 | |
| 3.625% 3/3/37 | 1,585,000 | 1,785,720 | |
| Merck & Co., Inc.: | |||
| 2.4% 9/15/22 | 2,875,000 | 2,920,003 | |
| 3.4% 3/7/29 | 1,525,000 | 1,679,080 | |
| Mylan NV: | |||
| 3.15% 6/15/21 | 5,494,000 | 5,558,881 | |
| 3.95% 6/15/26 | 2,804,000 | 2,917,735 | |
| 5.2% 4/15/48 | 1,345,000 | 1,466,581 | |
| Novartis Capital Corp.: | |||
| 2.4% 9/21/22 | 4,195,000 | 4,269,205 | |
| 4% 11/20/45 | 1,340,000 | 1,594,419 | |
| Perrigo Finance PLC 3.5% 12/15/21 | 400,000 | 401,804 | |
| Shire Acquisitions Investments Ireland DAC 3.2% 9/23/26 | 2,190,000 | 2,277,840 | |
| Teva Pharmaceutical Finance Netherlands III BV 2.2% 7/21/21 | 3,911,000 | 3,661,674 | |
| Valeant Pharmaceuticals International, Inc. 7% 3/15/24 (b) | 1,300,000 | 1,373,008 | |
| Wyeth LLC 6.45% 2/1/24 | 3,255,000 | 3,854,843 | |
| Zoetis, Inc.: | |||
| 3% 9/12/27 | 340,000 | 353,175 | |
| 3.25% 2/1/23 | 5,975,000 | 6,179,834 | |
| 74,166,695 | |||
| TOTAL HEALTH CARE | 249,633,342 | ||
| INDUSTRIALS - 0.2% | |||
| Aerospace & Defense - 0.1% | |||
| BBA U.S. Holdings, Inc. 5.375% 5/1/26 (b) | 700,000 | 731,500 | |
| BWX Technologies, Inc. 5.375% 7/15/26 (b) | 700,000 | 740,250 | |
| Embraer Netherlands Finance BV: | |||
| 5.05% 6/15/25 | 178,000 | 194,966 | |
| 5.4% 2/1/27 | 75,000 | 84,609 | |
| General Dynamics Corp.: | |||
| 2.25% 11/15/22 | 1,500,000 | 1,517,654 | |
| 3.5% 5/15/25 | 1,905,000 | 2,050,589 | |
| Lockheed Martin Corp.: | |||
| 2.9% 3/1/25 | 3,390,000 | 3,533,128 | |
| 3.8% 3/1/45 | 485,000 | 550,398 | |
| 4.25% 11/15/19 | 1,400,000 | 1,405,474 | |
| Northrop Grumman Corp. 4.75% 6/1/43 | 820,000 | 1,013,518 | |
| Rockwell Collins, Inc. 3.5% 3/15/27 | 1,525,000 | 1,642,403 | |
| The Boeing Co.: | |||
| 2.25% 6/15/26 | 1,335,000 | 1,337,902 | |
| 2.95% 2/1/30 | 2,080,000 | 2,159,418 | |
| 3.1% 5/1/26 | 360,000 | 380,638 | |
| TransDigm, Inc.: | |||
| 6.25% 3/15/26 (b) | 850,000 | 916,921 | |
| 6.5% 7/15/24 | 145,000 | 149,713 | |
| United Technologies Corp.: | |||
| 2.8% 5/4/24 | 2,742,000 | 2,822,987 | |
| 4.125% 11/16/28 | 490,000 | 560,708 | |
| 21,792,776 | |||
| Air Freight & Logistics - 0.0% | |||
| FedEx Corp. 3.3% 3/15/27 | 280,000 | 292,134 | |
| United Parcel Service, Inc.: | |||
| 2.05% 4/1/21 | 150,000 | 150,141 | |
| 3.125% 1/15/21 | 210,000 | 213,356 | |
| 655,631 | |||
| Airlines - 0.0% | |||
| American Airelines 2014-1 Class A Pass-Through Trust Equipment Trust Certificate 3.7% 10/1/26 | 248,134 | 261,756 | |
| American Airlines, Inc. equipment trust certificate 3.2% 6/15/28 | 473,580 | 492,050 | |
| Continental Airlines, Inc. 4.15% 4/11/24 | 775,156 | 821,356 | |
| Delta Air Lines, Inc.: | |||
| 3.4% 4/19/21 | 1,105,000 | 1,120,213 | |
| 3.625% 3/15/22 | 480,000 | 494,007 | |
| Delta Air Lines, Inc. pass-thru trust certificates 6.821% 8/10/22 | 115,372 | 127,197 | |
| United Airlines pass-thru Trust Series 2013-1A Class O, 4.3% 8/15/25 | 154,293 | 167,720 | |
| 3,484,299 | |||
| Building Products - 0.0% | |||
| Johnson Controls International PLC 4.95% 7/2/64 | 197,000 | 213,500 | |
| Masco Corp. 4.45% 4/1/25 | 1,610,000 | 1,753,804 | |
| 1,967,304 | |||
| Commercial Services & Supplies - 0.0% | |||
| Cintas Corp. No. 2 3.7% 4/1/27 | 1,135,000 | 1,246,923 | |
| LBC Tank Terminals Holding Netherlands BV 6.875% 5/15/23 (b) | 300,000 | 303,000 | |
| Prime Security One MS, Inc. 4.875% 7/15/32 (b) | 200,000 | 174,250 | |
| Waste Management, Inc.: | |||
| 2.9% 9/15/22 | 375,000 | 384,647 | |
| 3.45% 6/15/29 | 840,000 | 919,982 | |
| WMX Technologies, Inc. 4.6% 3/1/21 | 345,000 | 355,728 | |
| 3,384,530 | |||
| Construction & Engineering - 0.0% | |||
| AECOM: | |||
| 5.125% 3/15/27 | 600,000 | 626,712 | |
| 5.875% 10/15/24 | 1,100,000 | 1,188,000 | |
| 1,814,712 | |||
| Electrical Equipment - 0.0% | |||
| ABB Finance (U.S.A.), Inc. 2.875% 5/8/22 | 115,000 | 117,825 | |
| Fortive Corp. 3.15% 6/15/26 | 275,000 | 281,629 | |
| General Electric Capital Corp. 3.15% 9/7/22 | 1,386,000 | 1,393,741 | |
| Sensata Technologies BV 4.875% 10/15/23 (b) | 800,000 | 839,280 | |
| 2,632,475 | |||
| Industrial Conglomerates - 0.0% | |||
| Covidien International Finance SA 3.2% 6/15/22 | 865,000 | 894,820 | |
| General Electric Co. 2.7% 10/9/22 | 1,170,000 | 1,162,388 | |
| 2,057,208 | |||
| Machinery - 0.0% | |||
| Caterpillar, Inc. 2.6% 6/26/22 | 675,000 | 688,061 | |
| Pentair Finance SA 4.5% 7/1/29 | 670,000 | 706,666 | |
| Westinghouse Air Brake Co. 4.95% 9/15/28 | 430,000 | 480,036 | |
| Xylem, Inc.: | |||
| 3.25% 11/1/26 | 225,000 | 233,206 | |
| 4.875% 10/1/21 | 525,000 | 553,483 | |
| 2,661,452 | |||
| Professional Services - 0.0% | |||
| IHS Markit Ltd. 4.125% 8/1/23 | 365,000 | 384,783 | |
| Road & Rail - 0.0% | |||
| Burlington Northern Santa Fe LLC 4.1% 6/1/21 | 950,000 | 980,539 | |
| Canadian National Railway Co. 2.85% 12/15/21 | 600,000 | 609,546 | |
| CSX Corp.: | |||
| 3.4% 8/1/24 | 1,200,000 | 1,273,773 | |
| 6.15% 5/1/37 | 1,500,000 | 2,017,293 | |
| Union Pacific Corp.: | |||
| 3.6% 9/15/37 | 640,000 | 684,257 | |
| 4% 2/1/21 | 943,000 | 964,707 | |
| 4.3% 6/15/42 | 325,000 | 373,344 | |
| 6,903,459 | |||
| Trading Companies & Distributors - 0.1% | |||
| Air Lease Corp.: | |||
| 3% 9/15/23 | 800,000 | 814,239 | |
| 3.375% 6/1/21 | 2,750,000 | 2,795,446 | |
| 3.75% 2/1/22 | 4,752,000 | 4,895,679 | |
| 3.875% 4/1/21 | 2,900,000 | 2,967,060 | |
| 4.25% 2/1/24 | 7,846,000 | 8,375,323 | |
| 4.25% 9/15/24 | 3,212,000 | 3,453,001 | |
| 4.75% 3/1/20 | 3,227,000 | 3,263,219 | |
| FLY Leasing Ltd. 5.25% 10/15/24 | 160,000 | 164,400 | |
| 26,728,367 | |||
| Transportation Infrastructure - 0.0% | |||
| BNSF Funding Trust I 6.613% 12/15/55 (a) | 755,000 | 832,388 | |
| TOTAL INDUSTRIALS | 75,299,384 | ||
| INFORMATION TECHNOLOGY - 0.1% | |||
| Communications Equipment - 0.0% | |||
| Cisco Systems, Inc.: | |||
| 1.85% 9/20/21 | 725,000 | 724,462 | |
| 2.9% 3/4/21 | 150,000 | 152,347 | |
| 3% 6/15/22 | 310,000 | 320,493 | |
| 1,197,302 | |||
| Electronic Equipment & Components - 0.0% | |||
| Diamond 1 Finance Corp./Diamond 2 Finance Corp.: | |||
| 5.45% 6/15/23 (b) | 6,100,000 | 6,629,999 | |
| 6.02% 6/15/26 (b) | 2,112,000 | 2,383,599 | |
| TTM Technologies, Inc. 5.625% 10/1/25 (b) | 500,000 | 487,500 | |
| 9,501,098 | |||
| IT Services - 0.0% | |||
| Fiserv, Inc. 3.85% 6/1/25 | 1,695,000 | 1,826,324 | |
| Global Payments, Inc. 2.65% 2/15/25 | 495,000 | 497,657 | |
| IBM Corp. 3.625% 2/12/24 | 3,565,000 | 3,800,902 | |
| MasterCard, Inc. 3.375% 4/1/24 | 870,000 | 929,093 | |
| 7,053,976 | |||
| Semiconductors & Semiconductor Equipment - 0.0% | |||
| Entegris, Inc. 4.625% 2/10/26 (b) | 400,000 | 412,000 | |
| Qorvo, Inc. 5.5% 7/15/26 | 600,000 | 640,512 | |
| 1,052,512 | |||
| Software - 0.1% | |||
| CDK Global, Inc. 4.875% 6/1/27 | 500,000 | 516,620 | |
| Microsoft Corp.: | |||
| 2.875% 2/6/24 | 3,890,000 | 4,073,073 | |
| 3.7% 8/8/46 | 1,550,000 | 1,824,889 | |
| 4.1% 2/6/37 | 1,930,000 | 2,327,020 | |
| Nuance Communications, Inc. 5.625% 12/15/26 | 600,000 | 632,250 | |
| Open Text Corp. 5.875% 6/1/26 (b) | 500,000 | 534,350 | |
| Oracle Corp.: | |||
| 1.9% 9/15/21 | 570,000 | 569,742 | |
| 2.5% 10/15/22 | 1,855,000 | 1,888,329 | |
| 2.65% 7/15/26 | 2,595,000 | 2,658,516 | |
| 2.95% 5/15/25 | 2,085,000 | 2,182,620 | |
| 4.125% 5/15/45 | 1,595,000 | 1,842,937 | |
| Symantec Corp. 5% 4/15/25 (b) | 1,100,000 | 1,107,337 | |
| 20,157,683 | |||
| Technology Hardware, Storage & Peripherals - 0.0% | |||
| Apple, Inc.: | |||
| 2.4% 5/3/23 | 2,090,000 | 2,134,269 | |
| 2.85% 5/11/24 | 4,220,000 | 4,395,198 | |
| 3.25% 2/23/26 | 6,465,000 | 6,922,548 | |
| Hewlett Packard Enterprise Co. 4.4% 10/15/22 (a) | 5,700,000 | 6,040,192 | |
| 19,492,207 | |||
| TOTAL INFORMATION TECHNOLOGY | 58,454,778 | ||
| MATERIALS - 0.1% | |||
| Chemicals - 0.1% | |||
| DowDuPont, Inc. 4.493% 11/15/25 | 2,750,000 | 3,053,383 | |
| Eastman Chemical Co. 4.65% 10/15/44 | 485,000 | 529,451 | |
| Ecolab, Inc. 4.35% 12/8/21 | 245,000 | 257,591 | |
| LYB International Finance II BV 3.5% 3/2/27 | 130,000 | 134,231 | |
| LyondellBasell Industries NV: | |||
| 5.75% 4/15/24 | 1,730,000 | 1,962,689 | |
| 6% 11/15/21 | 1,919,000 | 2,054,956 | |
| Nufarm Australia Ltd. 5.75% 4/30/26 (b) | 400,000 | 377,000 | |
| Nutrien Ltd.: | |||
| 4.2% 4/1/29 | 839,000 | 937,704 | |
| 4.9% 6/1/43 | 825,000 | 941,912 | |
| 5% 4/1/49 | 1,461,000 | 1,744,071 | |
| 5.25% 1/15/45 | 180,000 | 216,337 | |
| OCI NV 6.625% 4/15/23 (b) | 400,000 | 422,000 | |
| Olin Corp. 5.125% 9/15/27 | 700,000 | 719,250 | |
| Sherwin-Williams Co. 4.5% 6/1/47 | 210,000 | 239,041 | |
| The Chemours Co. LLC 7% 5/15/25 | 600,000 | 592,500 | |
| The Dow Chemical Co.: | |||
| 3% 11/15/22 | 650,000 | 663,760 | |
| 3.625% 5/15/26 (b) | 2,815,000 | 2,960,852 | |
| 4.125% 11/15/21 | 1,350,000 | 1,400,813 | |
| Valvoline, Inc. 4.375% 8/15/25 | 400,000 | 404,000 | |
| W. R. Grace & Co.-Conn. 5.625% 10/1/24 (b) | 600,000 | 648,000 | |
| 20,259,541 | |||
| Construction Materials - 0.0% | |||
| Vulcan Materials Co. 4.5% 6/15/47 | 680,000 | 736,807 | |
| Containers & Packaging - 0.0% | |||
| Ardagh Packaging Finance PLC/Ardagh MP Holdings U.S.A., Inc.: | |||
| 4.625% 5/15/23 (b) | 600,000 | 614,076 | |
| 6% 2/15/25 (b) | 145,000 | 151,434 | |
| Crown Americas LLC/Crown Americas Capital Corp. V 4.25% 9/30/26 | 600,000 | 622,500 | |
| International Paper Co.: | |||
| 4.75% 2/15/22 | 882,000 | 932,305 | |
| 5% 9/15/35 | 405,000 | 476,710 | |
| 5.15% 5/15/46 | 116,000 | 134,188 | |
| OI European Group BV 4% 3/15/23 (b) | 500,000 | 503,750 | |
| Rock-Tenn Co. 4.9% 3/1/22 | 185,000 | 196,208 | |
| 3,631,171 | |||
| Metals & Mining - 0.0% | |||
| Anglo American Capital PLC: | |||
| 4.125% 4/15/21 (b) | 6,803,000 | 6,957,156 | |
| 4.125% 9/27/22 (b) | 1,333,000 | 1,390,673 | |
| Barrick North America Finance LLC 5.75% 5/1/43 | 330,000 | 443,852 | |
| BHP Billiton Financial (U.S.A.) Ltd. 6.25% 10/19/75 (a)(b) | 1,979,000 | 2,057,091 | |
| Corporacion Nacional del Cobre de Chile (Codelco): | |||
| 3.625% 8/1/27 (b) | 2,033,000 | 2,177,216 | |
| 4.5% 8/1/47 (b) | 1,715,000 | 2,014,589 | |
| Rio Tinto Finance (U.S.A.) Ltd. 3.75% 6/15/25 | 1,215,000 | 1,315,996 | |
| Southern Copper Corp. 5.875% 4/23/45 | 455,000 | 559,508 | |
| 16,916,081 | |||
| Paper & Forest Products - 0.0% | |||
| Berry Global Escrow Corp. 4.875% 7/15/26 (b) | 200,000 | 210,000 | |
| TOTAL MATERIALS | 41,753,600 | ||
| REAL ESTATE - 0.5% | |||
| Equity Real Estate Investment Trusts (REITs) - 0.3% | |||
| American Campus Communities Operating Partnership LP 3.75% 4/15/23 | 813,000 | 852,155 | |
| Boston Properties, Inc.: | |||
| 3.85% 2/1/23 | 1,175,000 | 1,240,305 | |
| 4.5% 12/1/28 | 5,210,000 | 6,019,876 | |
| Camden Property Trust: | |||
| 2.95% 12/15/22 | 954,000 | 978,235 | |
| 4.25% 1/15/24 | 2,838,000 | 3,071,780 | |
| Corporate Office Properties LP 5% 7/1/25 | 3,453,000 | 3,757,857 | |
| Corrections Corp. of America: | |||
| 4.125% 4/1/20 | 100,000 | 99,750 | |
| 4.625% 5/1/23 | 800,000 | 772,000 | |
| CTR Partnership LP/CareTrust Capital Corp. 5.25% 6/1/25 | 300,000 | 309,054 | |
| DDR Corp.: | |||
| 3.625% 2/1/25 | 2,396,000 | 2,472,257 | |
| 4.25% 2/1/26 | 5,582,000 | 5,951,829 | |
| 4.625% 7/15/22 | 1,600,000 | 1,677,589 | |
| Duke Realty LP: | |||
| 3.25% 6/30/26 | 805,000 | 841,120 | |
| 3.625% 4/15/23 | 1,382,000 | 1,447,032 | |
| 3.875% 10/15/22 | 2,108,000 | 2,209,647 | |
| 4.375% 6/15/22 | 1,237,000 | 1,306,608 | |
| Equinix, Inc. 5.75% 1/1/25 | 900,000 | 938,250 | |
| Equity One, Inc. 3.75% 11/15/22 | 3,200,000 | 3,335,145 | |
| HCP, Inc.: | |||
| 3.25% 7/15/26 | 776,000 | 802,486 | |
| 3.5% 7/15/29 | 887,000 | 936,670 | |
| Highwoods/Forsyth LP 3.2% 6/15/21 | 2,263,000 | 2,292,611 | |
| Hudson Pacific Properties LP 4.65% 4/1/29 | 10,503,000 | 11,805,205 | |
| Lexington Corporate Properties Trust 4.4% 6/15/24 | 1,319,000 | 1,380,030 | |
| MPT Operating Partnership LP/MPT Finance Corp. 6.375% 3/1/24 | 1,600,000 | 1,676,000 | |
| Omega Healthcare Investors, Inc.: | |||
| 4.375% 8/1/23 | 6,644,000 | 7,002,073 | |
| 4.5% 1/15/25 | 2,793,000 | 2,952,852 | |
| 4.5% 4/1/27 | 1,500,000 | 1,606,174 | |
| 4.75% 1/15/28 | 7,569,000 | 8,242,580 | |
| 4.95% 4/1/24 | 1,152,000 | 1,240,337 | |
| 5.25% 1/15/26 | 5,841,000 | 6,463,753 | |
| Realty Income Corp. 3% 1/15/27 | 585,000 | 608,938 | |
| Retail Opportunity Investments Partnership LP: | |||
| 4% 12/15/24 | 877,000 | 897,247 | |
| 5% 12/15/23 | 626,000 | 663,537 | |
| SBA Communications Corp. 4.875% 9/1/24 | 200,000 | 207,000 | |
| Simon Property Group LP: | |||
| 3.25% 11/30/26 | 1,070,000 | 1,131,917 | |
| 3.375% 10/1/24 | 1,870,000 | 1,986,480 | |
| 3.5% 9/1/25 | 55,000 | 58,585 | |
| 3.75% 2/1/24 | 275,000 | 294,471 | |
| Store Capital Corp. 4.625% 3/15/29 | 2,475,000 | 2,749,690 | |
| Ventas Realty LP: | |||
| 3% 1/15/30 | 5,819,000 | 5,857,915 | |
| 3.125% 6/15/23 | 1,414,000 | 1,459,350 | |
| 3.85% 4/1/27 | 1,050,000 | 1,126,056 | |
| 4% 3/1/28 | 2,712,000 | 2,946,464 | |
| 4.125% 1/15/26 | 1,628,000 | 1,764,487 | |
| Weingarten Realty Investors 3.375% 10/15/22 | 472,000 | 483,476 | |
| WP Carey, Inc.: | |||
| 3.85% 7/15/29 | 1,725,000 | 1,831,555 | |
| 4% 2/1/25 | 5,544,000 | 5,849,138 | |
| 4.6% 4/1/24 | 7,436,000 | 7,998,046 | |
| 121,595,612 | |||
| Real Estate Management & Development - 0.2% | |||
| Brandywine Operating Partnership LP: | |||
| 3.95% 2/15/23 | 4,006,000 | 4,190,513 | |
| 3.95% 11/15/27 | 5,608,000 | 5,912,520 | |
| 4.1% 10/1/24 | 3,830,000 | 4,057,918 | |
| CBRE Group, Inc. 4.875% 3/1/26 | 12,670,000 | 14,088,081 | |
| Digital Realty Trust LP 3.95% 7/1/22 | 3,488,000 | 3,653,033 | |
| Essex Portfolio LP 3.875% 5/1/24 | 2,685,000 | 2,865,345 | |
| Howard Hughes Corp. 5.375% 3/15/25 (b) | 400,000 | 412,000 | |
| Liberty Property LP: | |||
| 3.25% 10/1/26 | 2,158,000 | 2,232,702 | |
| 3.375% 6/15/23 | 4,307,000 | 4,470,304 | |
| 4.125% 6/15/22 | 1,061,000 | 1,111,521 | |
| 4.75% 10/1/20 | 2,674,000 | 2,731,284 | |
| Mack-Cali Realty LP: | |||
| 3.15% 5/15/23 | 3,436,000 | 3,267,063 | |
| 4.5% 4/18/22 | 644,000 | 646,878 | |
| Mid-America Apartments LP 4% 11/15/25 | 1,296,000 | 1,400,171 | |
| Post Apartment Homes LP 3.375% 12/1/22 | 1,800,000 | 1,859,475 | |
| Tanger Properties LP: | |||
| 3.125% 9/1/26 | 3,497,000 | 3,465,033 | |
| 3.75% 12/1/24 | 3,352,000 | 3,448,052 | |
| 3.875% 12/1/23 | 1,492,000 | 1,546,011 | |
| 3.875% 7/15/27 | 12,659,000 | 12,994,322 | |
| Twin River Worldwide Holdings, Inc. 6.75% 6/1/27 (b) | 300,000 | 316,125 | |
| 74,668,351 | |||
| TOTAL REAL ESTATE | 196,263,963 | ||
| UTILITIES - 0.4% | |||
| Electric Utilities - 0.2% | |||
| AEP Transmission Co. LLC 4% 12/1/46 | 225,000 | 262,691 | |
| Alabama Power Co.: | |||
| 3.75% 3/1/45 | 850,000 | 951,436 | |
| 3.85% 12/1/42 | 250,000 | 281,383 | |
| 4.1% 1/15/42 | 225,000 | 252,880 | |
| Appalachian Power Co. 3.3% 6/1/27 | 605,000 | 641,839 | |
| Arizona Public Service Co. 3.75% 5/15/46 | 390,000 | 426,437 | |
| Baltimore Gas & Electric Co. 3.35% 7/1/23 | 470,000 | 492,888 | |
| CenterPoint Energy Houston Electric LLC: | |||
| 2.25% 8/1/22 | 530,000 | 534,871 | |
| 3.95% 3/1/48 | 750,000 | 875,151 | |
| 4.25% 2/1/49 | 285,000 | 349,410 | |
| Commonwealth Edison Co.: | |||
| 3.65% 6/15/46 | 765,000 | 850,890 | |
| 3.7% 3/1/45 | 315,000 | 348,803 | |
| 3.75% 8/15/47 | 250,000 | 282,952 | |
| 4.6% 8/15/43 | 1,045,000 | 1,302,595 | |
| Dominion Energy South Carolina: | |||
| 5.1% 6/1/65 | 370,000 | 503,292 | |
| 5.45% 2/1/41 | 35,000 | 46,546 | |
| Duke Energy Carolinas LLC: | |||
| 2.95% 12/1/26 | 1,270,000 | 1,330,670 | |
| 3.2% 8/15/49 | 725,000 | 748,755 | |
| 4.25% 12/15/41 | 1,450,000 | 1,709,694 | |
| 6.1% 6/1/37 | 775,000 | 1,085,513 | |
| Duquesne Light Holdings, Inc.: | |||
| 5.9% 12/1/21 (b) | 8,875,000 | 9,471,051 | |
| 6.4% 9/15/20 (b) | 4,858,000 | 5,040,419 | |
| Entergy Corp. 5.125% 9/15/20 | 545,000 | 556,404 | |
| Entergy Louisiana LLC: | |||
| 2.4% 10/1/26 | 870,000 | 875,562 | |
| 4% 3/15/33 | 445,000 | 516,457 | |
| 4.05% 9/1/23 | 880,000 | 945,434 | |
| Exelon Corp. 3.497% 6/1/22 (a) | 835,000 | 859,724 | |
| FirstEnergy Corp.: | |||
| 4.25% 3/15/23 | 12,580,000 | 13,368,479 | |
| 7.375% 11/15/31 | 10,940,000 | 15,686,958 | |
| Florida Power & Light Co. 2.75% 6/1/23 | 1,200,000 | 1,235,316 | |
| Fortis, Inc. 3.055% 10/4/26 | 301,000 | 308,180 | |
| Hydro-Quebec 8.05% 7/7/24 | 1,455,000 | 1,867,376 | |
| IPALCO Enterprises, Inc.: | |||
| 3.45% 7/15/20 | 8,163,000 | 8,212,143 | |
| 3.7% 9/1/24 | 2,644,000 | 2,766,213 | |
| LG&E and KU Energy LLC 3.75% 11/15/20 | 211,000 | 214,174 | |
| Louisville Gas & Electric Co. 5.125% 11/15/40 | 245,000 | 313,759 | |
| MidAmerican Energy Co.: | |||
| 3.65% 8/1/48 | 620,000 | 694,906 | |
| 3.95% 8/1/47 | 1,125,000 | 1,318,761 | |
| NextEra Energy Capital Holdings, Inc. 3.15% 4/1/24 | 2,655,000 | 2,765,622 | |
| Northern States Power Co. 6.25% 6/1/36 | 370,000 | 532,726 | |
| NRG Yield Operating LLC 5% 9/15/26 | 300,000 | 303,750 | |
| NSG Holdings II LLC/NSG Holdings, Inc. 7.75% 12/15/25 (b) | 25,407 | 27,249 | |
| Ohio Power Co. 4% 6/1/49 | 555,000 | 646,908 | |
| PacifiCorp: | |||
| 5.25% 6/15/35 | 1,375,000 | 1,732,254 | |
| 5.75% 4/1/37 | 900,000 | 1,210,012 | |
| PPL Electric Utilities Corp.: | |||
| 4.15% 10/1/45 | 630,000 | 740,091 | |
| 6.25% 5/15/39 | 250,000 | 364,435 | |
| Public Service Co. of Colorado: | |||
| 2.5% 3/15/23 | 645,000 | 651,484 | |
| 3.2% 3/1/50 | 495,000 | 514,156 | |
| Public Service Electric & Gas Co.: | |||
| 2.25% 9/15/26 | 295,000 | 294,746 | |
| 3.2% 5/15/29 | 785,000 | 845,542 | |
| 3.6% 12/1/47 | 260,000 | 288,248 | |
| 3.65% 9/1/42 | 125,000 | 138,196 | |
| Puget Sound Energy, Inc. 5.764% 7/15/40 | 285,000 | 386,949 | |
| Southern California Edison Co.: | |||
| 3.6% 2/1/45 | 1,735,000 | 1,804,685 | |
| 4% 4/1/47 | 715,000 | 779,780 | |
| Southwestern Electric Power Co. 3.85% 2/1/48 | 660,000 | 719,907 | |
| Virginia Electric & Power Co.: | |||
| 3.15% 1/15/26 | 15,000 | 15,816 | |
| 6% 5/15/37 | 1,375,000 | 1,882,550 | |
| Vistra Operations Co. LLC 5.5% 9/1/26 (b) | 1,700,000 | 1,785,000 | |
| Westar Energy, Inc. 4.125% 3/1/42 | 655,000 | 767,020 | |
| Wisconsin Power & Light Co. 4.1% 10/15/44 | 240,000 | 274,748 | |
| 97,001,886 | |||
| Gas Utilities - 0.0% | |||
| AGL Capital Corp.: | |||
| 3.5% 9/15/21 | 1,030,000 | 1,052,769 | |
| 4.4% 6/1/43 | 440,000 | 499,749 | |
| Southern Natural Gas Co./Southern Natural Issuing Corp. 4.4% 6/15/21 | 527,000 | 542,201 | |
| 2,094,719 | |||
| Independent Power and Renewable Electricity Producers - 0.1% | |||
| Dolphin Subsidiary II, Inc. 7.25% 10/15/21 | 11,695,000 | 12,542,888 | |
| Emera U.S. Finance LP: | |||
| 2.7% 6/15/21 | 1,304,000 | 1,313,408 | |
| 3.55% 6/15/26 | 1,770,000 | 1,868,060 | |
| NextEra Energy Partners LP 4.25% 9/15/24 (b) | 300,000 | 311,100 | |
| NRG Energy, Inc. 6.625% 1/15/27 | 400,000 | 432,000 | |
| PSEG Power LLC 3% 6/15/21 | 1,075,000 | 1,088,120 | |
| TerraForm Power Operating LLC 5% 1/31/28 (b) | 400,000 | 416,508 | |
| The AES Corp. 4.875% 5/15/23 | 700,000 | 709,625 | |
| 18,681,709 | |||
| Multi-Utilities - 0.1% | |||
| Ameren Illinois Co. 4.5% 3/15/49 | 600,000 | 761,361 | |
| Consolidated Edison Co. of New York, Inc. 4.3% 12/1/56 | 300,000 | 355,455 | |
| Dominion Energy, Inc.: | |||
| 3 month U.S. LIBOR + 2.300% 4.6299% 9/30/66 (a)(c) | 6,307,000 | 5,897,045 | |
| 3 month U.S. LIBOR + 2.825% 5.1549% 6/30/66 (a)(c) | 924,000 | 873,180 | |
| DTE Energy Co. 3.8% 3/15/27 | 1,635,000 | 1,771,399 | |
| NiSource Finance Corp.: | |||
| 4.8% 2/15/44 | 305,000 | 365,849 | |
| 5.95% 6/15/41 | 640,000 | 855,197 | |
| NiSource, Inc. 2.95% 9/1/29 | 11,346,000 | 11,599,666 | |
| NorthWestern Energy Corp. 4.176% 11/15/44 | 260,000 | 299,750 | |
| Puget Energy, Inc.: | |||
| 3.65% 5/15/25 | 624,000 | 644,751 | |
| 5.625% 7/15/22 | 4,555,000 | 4,897,627 | |
| 6% 9/1/21 | 4,353,000 | 4,645,850 | |
| 6.5% 12/15/20 | 1,405,000 | 1,477,148 | |
| San Diego Gas & Electric Co.: | |||
| 3.6% 9/1/23 | 1,025,000 | 1,077,735 | |
| 3.75% 6/1/47 | 585,000 | 641,885 | |
| Sempra Energy 4% 2/1/48 | 390,000 | 423,557 | |
| Wisconsin Energy Corp. 3 month U.S. LIBOR + 2.113% 4.2706% 5/15/67 (a)(c) | 1,012,000 | 855,859 | |
| 37,443,314 | |||
| TOTAL UTILITIES | 155,221,628 | ||
| TOTAL NONCONVERTIBLE BONDS | |||
| (Cost $2,976,653,512) | 3,187,915,122 | ||
| U.S. Government and Government Agency Obligations - 6.9% | |||
| U.S. Government Agency Obligations - 0.0% | |||
| Fannie Mae: | |||
| 1.875% 9/24/26 | $495,000 | $507,335 | |
| 2% 10/5/22 | 1,130,000 | 1,148,555 | |
| 2.25% 4/12/22 | 1,350,000 | 1,376,771 | |
| 2.375% 1/19/23 | 455,000 | 468,290 | |
| 2.5% 2/5/24 | 665,000 | 695,776 | |
| 2.875% 10/30/20 | 765,000 | 775,692 | |
| 2.875% 9/12/23 | 670,000 | 707,336 | |
| 6.25% 5/15/29 | 520,000 | 734,004 | |
| 6.625% 11/15/30 | 670,000 | 998,641 | |
| Federal Home Loan Bank: | |||
| 1.5% 8/15/24 | 1,770,000 | 1,773,726 | |
| 2.625% 10/1/20 | 165,000 | 166,644 | |
| 3% 10/12/21 | 2,320,000 | 2,389,852 | |
| 3.25% 11/16/28 | 1,815,000 | 2,059,502 | |
| Freddie Mac: | |||
| 1.5% 1/17/20 | 1,965,000 | 1,961,717 | |
| 2.375% 2/16/21 | 2,785,000 | 2,816,025 | |
| 6.25% 7/15/32 | 40,000 | 60,218 | |
| Tennessee Valley Authority: | |||
| 2.25% 3/15/20 | 3,130,000 | 3,134,868 | |
| 2.875% 2/1/27 | 1,320,000 | 1,419,900 | |
| 5.25% 9/15/39 | 150,000 | 215,655 | |
| 7.125% 5/1/30 | 460,000 | 690,557 | |
| TOTAL U.S. GOVERNMENT AGENCY OBLIGATIONS | 24,101,064 | ||
| U.S. Treasury Obligations - 6.9% | |||
| U.S. Treasury Bonds: | |||
| 2.75% 8/15/47 | 14,430,000 | 16,864,499 | |
| 2.875% 8/15/45 | 17,715,000 | 21,037,254 | |
| 2.875% 11/15/46 | 7,015,000 | 8,371,690 | |
| 2.875% 5/15/49 | 2,095,000 | 2,526,327 | |
| 3% 11/15/44 | 2,555,000 | 3,090,652 | |
| 3% 5/15/45 | 49,521,000 | 60,048,081 | |
| 3.625% 8/15/43 | 36,230,000 | 48,076,927 | |
| 3.75% 11/15/43 | 2,285,000 | 3,092,694 | |
| 6.25% 8/15/23 | 11,080,000 | 13,130,233 | |
| 7.25% 8/15/22 | 7,335,000 | 8,555,876 | |
| U.S. Treasury Notes: | |||
| 1.125% 2/28/21 | 4,280,000 | 4,247,900 | |
| 1.25% 8/31/24 | 4,305,000 | 4,275,908 | |
| 1.375% 8/31/20 | 9,865,000 | 9,822,226 | |
| 1.375% 4/30/21 | 20,690,000 | 20,614,029 | |
| 1.375% 5/31/21 | 47,815,000 | 47,643,165 | |
| 1.5% 8/15/22 | 7,425,000 | 7,439,792 | |
| 1.625% 4/30/23 | 13,045,000 | 13,137,742 | |
| 1.625% 8/15/29 | 98,885,000 | 100,009,045 | |
| 1.75% 7/31/21 | 1,350,000 | 1,355,590 | |
| 1.75% 9/30/22 | 22,235,000 | 22,446,059 | |
| 1.75% 7/31/24 | 4,105,000 | 4,173,791 | |
| 1.875% 4/30/22 | 57,915,000 | 58,537,134 | |
| 1.875% 9/30/22 | 1,213,000 | 1,229,394 | |
| 1.875% 7/31/26 | 7,805,000 | 8,020,857 | |
| 2% 11/30/20 | 48,865,000 | 49,036,791 | |
| 2% 2/15/25 | 23,205,000 | 23,903,869 | |
| 2% 8/15/25 | 9,775,000 | 10,085,051 | |
| 2% 11/15/26 | 192,301,000 | 199,504,776 | |
| 2.125% 9/30/21 | 48,800,000 | 49,402,375 | |
| 2.125% 6/30/22 | 26,595,000 | 27,107,161 | |
| 2.125% 7/31/24 | 122,921,000 | 127,064,782 | |
| 2.125% 5/15/25 | 35,440,000 | 36,777,306 | |
| 2.25% 4/30/24 | 141,500,000 | 146,822,832 | |
| 2.25% 11/15/25 | 1,700,000 | 1,780,816 | |
| 2.25% 2/15/27 | 17,910,000 | 18,913,240 | |
| 2.25% 11/15/27 | 56,810,000 | 60,194,189 | |
| 2.375% 5/15/27 | 87,359,000 | 93,167,009 | |
| 2.625% 11/15/20 | 47,515,000 | 48,021,703 | |
| 2.625% 12/31/23 | 14,530,000 | 15,262,176 | |
| 2.625% 3/31/25 | 109,290,000 | 116,257,238 | |
| 2.625% 2/15/29 | 276,154,000 | 303,348,696 | |
| 2.75% 6/30/25 | 336,603,000 | 361,203,947 | |
| 2.875% 11/15/21 | 16,885,000 | 17,380,997 | |
| 2.875% 11/30/25 | 522,754,000 | 567,147,252 | |
| 2.875% 5/15/28 | 9,700,000 | 10,794,660 | |
| 3.125% 11/15/28 | 114,900,000 | 130,864,816 | |
| TOTAL U.S. TREASURY OBLIGATIONS | 2,901,788,547 | ||
| TOTAL U.S. GOVERNMENT AND GOVERNMENT AGENCY OBLIGATIONS | |||
| (Cost $2,751,250,013) | 2,925,889,611 | ||
| U.S. Government Agency - Mortgage Securities - 8.4% | |||
| Fannie Mae - 2.6% | |||
| 12 month U.S. LIBOR + 1.553% 4.337% 6/1/36 (a)(c) | 8,215 | 8,565 | |
| 12 month U.S. LIBOR + 1.825% 4.95% 2/1/35 (a)(c) | 183,373 | 192,121 | |
| 12 month U.S. LIBOR + 1.900% 4.776% 7/1/37 (a)(c) | 9,056 | 9,528 | |
| 2% 8/1/31 | 1,388,656 | 1,391,790 | |
| 2.5% 9/1/27 to 10/1/46 | 51,043,894 | 51,766,373 | |
| 3% 2/1/27 to 1/1/47 (d) | 281,441,487 | 290,307,863 | |
| 3.5% 9/1/26 to 5/1/49 (d)(e) | 246,137,893 | 257,868,539 | |
| 4% 5/1/29 to 10/1/48 | 277,757,738 | 293,150,687 | |
| 4.5% 6/1/24 to 2/1/49 | 89,591,026 | 95,974,341 | |
| 5% 10/1/21 to 5/1/48 | 49,456,927 | 53,893,159 | |
| 5.251% 8/1/41 (a) | 399,175 | 435,131 | |
| 5.5% 7/1/30 to 9/1/41 | 12,598,497 | 14,046,131 | |
| 6% 3/1/22 to 1/1/42 (d) | 16,864,586 | 19,098,474 | |
| 6.5% 2/1/36 | 1,838 | 2,115 | |
| 6.531% 2/1/39 (a) | 434,318 | 469,443 | |
| TOTAL FANNIE MAE | 1,078,614,260 | ||
| Freddie Mac - 1.8% | |||
| 6 month U.S. LIBOR + 2.276% 4.955% 10/1/35 (a)(c) | 6,952 | 7,216 | |
| 2% 1/1/32 | 2,306,893 | 2,313,186 | |
| 2.5% 3/1/28 to 2/1/43 | 33,497,821 | 34,024,455 | |
| 3% 10/1/28 to 1/1/47 | 151,526,002 | 156,386,269 | |
| 3.5% 8/1/26 to 5/1/49 (d)(e) | 291,010,522 | 305,001,065 | |
| 3.5% 8/1/47 | 12,330,627 | 12,921,648 | |
| 4% 6/1/33 to 7/1/48 | 144,934,470 | 153,518,494 | |
| 4.5% 7/1/25 to 4/1/49 | 61,305,347 | 65,454,695 | |
| 5% 10/1/33 to 12/1/47 | 8,632,190 | 9,470,554 | |
| 5.5% 3/1/34 to 6/1/41 | 5,018,104 | 5,560,472 | |
| 6% 7/1/37 to 9/1/38 | 206,160 | 235,096 | |
| 6.5% 9/1/39 | 608,642 | 703,500 | |
| TOTAL FREDDIE MAC | 745,596,650 | ||
| Ginnie Mae - 3.3% | |||
| 3.5% 9/20/40 to 8/20/48 | 286,129,495 | 299,817,428 | |
| 4.5% 5/15/39 to 6/20/48 | 92,903,931 | 98,687,632 | |
| 5.5% 6/15/36 to 3/20/41 | 238,322 | 265,221 | |
| 2.5% 12/20/46 | 1,164,983 | 1,186,361 | |
| 3% 8/20/42 to 6/20/48 | 163,624,344 | 169,326,659 | |
| 3% 9/1/49 (f) | 12,650,000 | 13,044,827 | |
| 3% 9/1/49 (f) | 8,700,000 | 8,971,541 | |
| 3% 9/1/49 (f) | 3,800,000 | 3,918,604 | |
| 3% 9/1/49 (f) | 12,750,000 | 13,147,948 | |
| 3% 9/1/49 (f) | 8,200,000 | 8,455,935 | |
| 3% 9/1/49 (f) | 9,850,000 | 10,157,434 | |
| 3% 9/1/49 (f) | 16,500,000 | 17,014,991 | |
| 3% 9/1/49 (f) | 19,800,000 | 20,417,990 | |
| 3% 9/1/49 (f) | 6,700,000 | 6,909,118 | |
| 3% 9/1/49 (f) | 10,300,000 | 10,621,479 | |
| 3% 9/1/49 (f) | 5,200,000 | 5,362,300 | |
| 3% 9/1/49 (f) | 4,900,000 | 5,052,937 | |
| 3% 9/1/49 (f) | 5,500,000 | 5,671,664 | |
| 3% 9/1/49 (f) | 7,100,000 | 7,321,602 | |
| 3% 9/1/49 (f) | 6,000,000 | 6,187,270 | |
| 3% 9/1/49 (f) | 4,600,000 | 4,743,573 | |
| 3% 9/1/49 (f) | 10,900,000 | 11,240,206 | |
| 3% 9/1/49 (f) | 18,500,000 | 19,077,415 | |
| 3% 9/1/49 (f) | 22,300,000 | 22,996,019 | |
| 3% 9/1/49 (f) | 38,000,000 | 39,186,041 | |
| 3% 9/1/49 (f) | 4,600,000 | 4,743,573 | |
| 3% 9/1/49 (f) | 2,100,000 | 2,165,544 | |
| 3% 9/1/49 (f) | 1,500,000 | 1,546,817 | |
| 3% 9/1/49 (f) | 3,900,000 | 4,021,725 | |
| 3% 9/1/49 (f) | 4,200,000 | 4,331,089 | |
| 3% 9/1/49 (f) | 1,800,000 | 1,856,181 | |
| 3% 9/1/49 (f) | 1,300,000 | 1,340,575 | |
| 3% 9/1/49 (f) | 1,300,000 | 1,340,575 | |
| 3% 9/1/49 (f) | 1,800,000 | 1,856,181 | |
| 3% 10/1/49 (f) | 21,000,000 | 21,627,551 | |
| 3% 10/1/49 (f) | 24,500,000 | 25,232,143 | |
| 3.5% 9/1/49 (f) | 36,500,000 | 37,920,080 | |
| 3.5% 9/1/49 (f) | 43,700,000 | 45,400,205 | |
| 3.5% 9/1/49 (f) | 29,800,000 | 30,959,408 | |
| 3.5% 9/1/49 (f) | 35,700,000 | 37,088,955 | |
| 3.5% 9/1/49 (f) | 28,500,000 | 29,608,830 | |
| 3.5% 9/1/49 (f) | 23,700,000 | 24,622,079 | |
| 3.5% 9/1/49 (f) | 19,625,000 | 20,388,536 | |
| 3.5% 9/1/49 (f) | 23,475,000 | 24,388,325 | |
| 3.5% 9/1/49 (f) | 9,700,000 | 10,077,391 | |
| 3.5% 9/1/49 (f) | 10,500,000 | 10,908,516 | |
| 3.5% 9/1/49 (f) | 3,000,000 | 3,116,719 | |
| 3.5% 9/1/49 (f) | 11,300,000 | 11,739,641 | |
| 3.5% 9/1/49 (f) | 3,500,000 | 3,636,172 | |
| 3.5% 9/1/49 (f) | 15,500,000 | 16,103,048 | |
| 3.5% 9/1/49 (f) | 17,800,000 | 18,492,532 | |
| 3.5% 9/1/49 (f) | 5,700,000 | 5,921,766 | |
| 3.5% 9/1/49 (f) | 5,700,000 | 5,921,766 | |
| 4% 5/20/40 to 5/20/49 | 177,684,811 | 188,665,365 | |
| 5% 6/20/34 to 9/20/46 | 9,061,645 | 9,894,963 | |
| TOTAL GINNIE MAE | 1,413,698,446 | ||
| Uniform Mortgage Backed Securities - 0.7% | |||
| 2.5% 9/1/34 (f) | 21,350,000 | 21,641,895 | |
| 3% 9/1/34 (f) | 47,350,000 | 48,552,245 | |
| 3% 9/1/34 (f) | 12,250,000 | 12,561,035 | |
| 3% 9/1/49 (f) | 6,700,000 | 6,829,289 | |
| 3% 9/1/49 (f) | 2,200,000 | 2,242,453 | |
| 3% 9/1/49 (f) | 29,450,000 | 30,018,294 | |
| 3% 9/1/49 (f) | 7,700,000 | 7,848,586 | |
| 3% 9/1/49 (f) | 9,200,000 | 9,377,531 | |
| 3% 9/1/49 (f) | 10,600,000 | 10,804,547 | |
| 3% 9/1/49 (f) | 4,200,000 | 4,281,047 | |
| 3% 9/1/49 (f) | 2,500,000 | 2,548,242 | |
| 3% 9/1/49 (f) | 2,700,000 | 2,752,102 | |
| 3% 9/1/49 (f) | 2,700,000 | 2,752,102 | |
| 3% 9/1/49 (f) | 2,500,000 | 2,548,242 | |
| 3.5% 9/1/49 (f) | 8,800,000 | 9,042,687 | |
| 3.5% 9/1/49 (f) | 8,350,000 | 8,580,277 | |
| 3.5% 9/1/49 (f) | 7,250,000 | 7,449,941 | |
| 3.5% 9/1/49 (f) | 26,800,000 | 27,539,093 | |
| 3.5% 9/1/49 (f) | 5,800,000 | 5,959,953 | |
| 3.5% 9/1/49 (f) | 3,100,000 | 3,185,492 | |
| 3.5% 9/1/49 (f) | 7,600,000 | 7,809,594 | |
| 3.5% 9/1/49 (f) | 7,000,000 | 7,193,047 | |
| 3.5% 9/1/49 (f) | 7,000,000 | 7,193,047 | |
| 3.5% 9/1/49 (f) | 7,600,000 | 7,809,594 | |
| 4% 9/1/49 (f) | 11,500,000 | 11,937,814 | |
| 4% 9/1/49 (f) | 15,100,000 | 15,674,869 | |
| 4% 9/1/49 (f) | 26,600,000 | 27,612,683 | |
| 4% 9/1/49 (f) | 3,500,000 | 3,633,248 | |
| 4% 9/1/49 (f) | 1,500,000 | 1,557,106 | |
| 4.5% 9/1/49 (f) | 2,300,000 | 2,420,933 | |
| TOTAL UNIFORM MORTGAGE BACKED SECURITIES | 319,356,988 | ||
| TOTAL U.S. GOVERNMENT AGENCY - MORTGAGE SECURITIES | |||
| (Cost $3,507,082,719) | 3,557,266,344 | ||
| Asset-Backed Securities - 0.6% | |||
| AASET Trust: | |||
| Series 2018-1A Class A, 3.844% 1/16/38 (b) | $4,646,653 | $4,697,264 | |
| Series 2019-1 Class A, 3.844% 5/15/39 (b) | 5,672,249 | 5,709,814 | |
| Aimco Series 2019-10A Class A, 3 month U.S. LIBOR + 1.320% 3.6184% 7/22/32 (a)(b)(c) | 8,486,000 | 8,486,000 | |
| Ares Xli Clo Ltd. / Ares Xli Cl Series 2016-41A Class AR, 3 month U.S. LIBOR + 1.200% 3.5034% 1/15/29 (a)(b)(c) | 9,133,000 | 9,129,977 | |
| Argent Securities, Inc. pass-thru certificates Series 2005-W2 Class A2C, 1 month U.S. LIBOR + 0.360% 2.5053% 10/25/35 (a)(c) | 2,120,705 | 2,113,244 | |
| Blackbird Capital Aircraft Series 2016-1A: | |||
| Class A, 4.213% 12/16/41 (b) | 9,167,776 | 9,513,479 | |
| Class AA, 2.487% 12/16/41 (b) | 1,870,781 | 1,869,033 | |
| CAM Mortgage Trust Series 2018-1 Class A1, 3.96% 12/1/65 (b) | 178,072 | 177,979 | |
| Castlelake Aircraft Securitization Trust Series 2019-1A: | |||
| Class A, 3.967% 4/15/39 (b) | 8,640,968 | 8,819,401 | |
| Class B, 5.095% 4/15/39 (b) | 2,963,754 | 3,027,583 | |
| Castlelake Aircraft Structured Trust Series 2018-1 Class A, 4.125% 6/15/43 (b) | 7,852,227 | 8,048,514 | |
| Cedar Funding Ltd.: | |||
| Series 2019-10A Class A, 3 month U.S. LIBOR + 1.340% 0% 10/20/32 (a)(b)(c)(f) | 5,957,000 | 5,957,000 | |
| Series 2019-11A Class A1A, 3 month U.S. LIBOR + 1.350% 3.8749% 5/29/32 (a)(b)(c) | 4,370,000 | 4,367,391 | |
| Chase Issuance Trust Series 2012-A7 Class A7, 2.16% 9/15/24 | 800,000 | 810,090 | |
| Citi Mortgage Loan Trust Series 2007-1 Class 1A, 1 month U.S. LIBOR + 1.350% 3.4953% 10/25/37 (a)(b)(c) | 2,896,483 | 2,927,032 | |
| Citibank Credit Card Issuance Trust: | |||
| Series 2018-A3 Class A3, 3.29% 5/23/25 | 700,000 | 737,368 | |
| Series 2018-A6 Class A6, 3.21% 12/7/24 | 2,400,000 | 2,518,017 | |
| Series 2018-A7 Class A7, 3.96% 10/13/30 | 2,200,000 | 2,543,601 | |
| Consumer Lending Receivables Trust Series 2019-A Class A, 3.52% 4/15/26 (b) | 1,558,409 | 1,566,941 | |
| Consumer Loan Underlying Bond Credit Trust: | |||
| Series 2018-P3 Class A, 3.82% 1/15/26 (b) | 10,339,590 | 10,437,019 | |
| Series 2019-P1 Class A, 2.94% 7/15/26 (b) | 4,331,901 | 4,346,435 | |
| Countrywide Home Loans, Inc. Series 2003-BC1 Class B1, 1 month U.S. LIBOR + 5.250% 7.3953% 3/25/32 (a)(c) | 4,144 | 4,383 | |
| DB Master Finance LLC Series 2017-1A: | |||
| Class A2I, 3.629% 11/20/47 (b) | 4,250,295 | 4,339,424 | |
| Class A2II, 4.03% 11/20/47 (b) | 7,184,040 | 7,493,959 | |
| Dryden Senior Loan Fund: | |||
| Series 2014-36A Class AR2, 3 month U.S. LIBOR + 1.280% 3.5834% 4/15/29 (a)(b)(c) | 10,300,000 | 10,326,574 | |
| Series 2019-72A Class A, 3 month U.S. LIBOR + 1.330% 3.7622% 5/15/32 (a)(b)(c) | 7,149,000 | 7,137,090 | |
| Finance of America Structured Securities Trust Series 2018-HB1 Class A, 3.3751% 9/25/28 (b) | 2,181,081 | 2,185,920 | |
| First Franklin Mortgage Loan Trust Series 2004-FF2 Class M3, 1 month U.S. LIBOR + 0.825% 2.9703% 3/25/34 (a)(c) | 318 | 299 | |
| Ford Credit Floorplan Master Owner Trust Series 2018-4 Class A, 4.06% 11/15/30 | 5,435,000 | 6,098,567 | |
| GCO Education Loan Funding Trust Series 2006-1 Class A9L, 3 month U.S. LIBOR + 0.160% 2.6806% 5/25/26 (a)(c) | 173,024 | 172,921 | |
| Grain Spectrum Funding II LLC Series 2014-1 3.29% 10/10/34 (b) | 2,995,079 | 2,940,129 | |
| Hertz Fleet Lease Funding LP Series 2017-1 Class A1, 1 month U.S. LIBOR + 0.650% 3.0294% 4/10/31 (a)(b)(c) | 1,858,417 | 1,860,612 | |
| Home Equity Asset Trust Series 2006-1 Class M1, 1 month U.S. LIBOR + 0.440% 2.5853% 4/25/36 (a)(c) | 919,530 | 919,000 | |
| Horizon Aircraft Finance I Ltd. Series 2018-1 Class A, 4.458% 12/15/38 (b) | 3,832,569 | 4,006,139 | |
| Horizon Aircraft Finance Ltd. Series 2019-1 Class A, 3.721% 7/15/39 (b) | 3,915,737 | 3,958,458 | |
| JPMorgan Mtg Acquisition Corp. Series 2005-FRE1 Class A2V3, 1 month U.S. LIBOR + 0.330% 2.4753% 10/25/35 (a)(c) | 4,001,383 | 3,963,473 | |
| Madison Park Funding Ltd.: | |||
| Series 2012-10A Class AR2, 3 month U.S. LIBOR + 1.220% 3.4976% 1/20/29 (a)(b)(c) | 3,469,000 | 3,467,200 | |
| Series 2019-37A Class A1, 3 month U.S. LIBOR + 1.300% 3.603% 7/15/32 (a)(b)(c) | 8,529,000 | 8,524,011 | |
| Magnetite CLO Ltd. Series 2019-21A Class A, 3 month U.S. LIBOR + 1.280% 3.9086% 4/20/30 (a)(b)(c) | 7,784,000 | 7,782,614 | |
| Metlife Securitization Trust Series 2019-1A Class A1A, 3.75% 4/25/58 (b) | 4,086,322 | 4,259,127 | |
| Nationstar HECM Loan Trust: | |||
| Series 2018-2A Class A, 3.1877% 7/25/28 (b) | 1,774,820 | 1,783,709 | |
| Series 2018-3A Class A 3.5545% 11/25/28 (b) | 6,312,672 | 6,297,717 | |
| Series 2019-1A Class A, 2.6513% 6/25/29 (b) | 4,544,582 | 4,555,980 | |
| Navient Student Loan Trust Series 2015-2 Class A2, 1 month U.S. LIBOR + 0.420% 2.5653% 8/27/29 (a)(c) | 580,557 | 580,586 | |
| Navistar Financial Dealer Note Master Trust Series 2018-1 Class A, 1 month U.S. LIBOR + 0.630% 2.896% 9/25/23 (a)(b)(c) | 11,000,000 | 11,014,398 | |
| New Century Home Equity Loan Trust Series 2005-4 Class M2, 1 month U.S. LIBOR + 0.510% 2.6553% 9/25/35 (a)(c) | 117,597 | 117,512 | |
| Niagara Park CLO, Ltd. Series 2019-1A Class A, 3 month U.S. LIBOR + 1.300% 3.6939% 7/17/32 (a)(b)(c) | 8,530,000 | 8,525,488 | |
| Prosper Marketplace Issuance Trust: | |||
| Series 2018-1A Class A, 3.11% 6/17/24 (b) | 73,524 | 73,542 | |
| Series 2018-2A Class A, 3.35% 10/15/24 (b) | 2,161,668 | 2,168,283 | |
| Terwin Mortgage Trust Series 2003-4HE Class A1, 1 month U.S. LIBOR + 0.860% 3.0053% 9/25/34 (a)(c) | 3,983 | 3,877 | |
| Thunderbolt Aircraft Lease Ltd. Series 2018-A Class A, 4.147% 9/15/38 (b) | 8,333,149 | 8,585,415 | |
| Towd Point Mortgage Trust: | |||
| Series 2018-3 Class A1, 3.75% 5/25/58 (b) | 7,075,287 | 7,384,455 | |
| Series 2018-6 Class A1A, 3.75% 3/25/58 (b) | 6,225,143 | 6,424,320 | |
| Series 2019-1 Class A1, 3.75% 3/25/58 (b) | 2,966,951 | 3,111,494 | |
| Upgrade Receivables Trust: | |||
| Series 2019-1A Class A, 3.48% 3/15/25 (b) | 2,419,811 | 2,428,295 | |
| Series 2019-2A Class A, 2.77% 10/15/25 (b) | 3,485,000 | 3,486,644 | |
| Verde CLO Ltd. Series 2019-1A Class A, 3 month U.S. LIBOR + 1.350% 3.9137% 4/15/32 (a)(b)(c) | 8,662,000 | 8,657,158 | |
| Voya CLO Ltd. Series 2019-2A Class A, 3 month U.S. LIBOR + 1.270% 3.5229% 7/20/32 (a)(b)(c) | 8,868,000 | 8,863,167 | |
| TOTAL ASSET-BACKED SECURITIES | |||
| (Cost $257,526,212) | 261,305,122 | ||
| Collateralized Mortgage Obligations - 0.3% | |||
| Private Sponsor - 0.1% | |||
| Banc of America Funding Corp. Series 2015-R3 Class 10A1, 1 month U.S. LIBOR + 0.140% 2.406% 6/27/36 (a)(b)(c) | 828,943 | 815,254 | |
| BCAP LLC Trust sequential payer: | |||
| Series 2010-RR2 Class 5A2, 5% 12/26/36 (b) | 707,118 | 711,390 | |
| Series 2012-RR5 Class 8A5, 2.4715% 7/26/36 (a)(b) | 145,757 | 143,533 | |
| Citigroup Mortgage Loan Trust, Inc. sequential payer Series 2009-5 Class 5A1, 4.8126% 1/25/37 (a)(b) | 184,462 | 187,492 | |
| Credit Suisse Mortgage Trust Series 2010-9R Class 2A5, 4% 2/27/38 (b) | 785,090 | 793,341 | |
| CSMC floater Series 2015-1R Class 6A1, 1 month U.S. LIBOR + 0.280% 2.4664% 5/27/37 (a)(b)(c) | 656,070 | 634,361 | |
| FirstKey Mortgage Trust sequential payer Series 2015-1 Class A9, 3% 3/25/45 (a)(b) | 2,047,991 | 2,047,828 | |
| Gosforth Funding PLC floater Series 2018-1A Class A1, 3 month U.S. LIBOR + 0.450% 2.5823% 8/25/60 (a)(b)(c) | 6,375,114 | 6,362,810 | |
| Holmes Master Issuer PLC floater Series 2018-2A Class A2, 3 month U.S. LIBOR + 0.420% 2.7234% 10/15/54 (a)(b)(c) | 8,170,465 | 8,162,033 | |
| JP Morgan Resecuritization Trust floater Series 2012-2 Class 6A1, 1 month U.S. LIBOR + 0.210% 2.4711% 6/21/36 (a)(b)(c) | 302,184 | 300,785 | |
| Lanark Master Issuer PLC: | |||
| floater Series 2019-1A Class 1A1, 3 month U.S. LIBOR + 0.770% 2.9023% 12/22/69 (a)(b)(c) | 4,749,733 | 4,763,071 | |
| Series 2019-2A Class 1A, 2.71% 12/22/69 (b) | 5,800,000 | 5,841,110 | |
| Merrill Lynch Alternative Note Asset Trust floater Series 2007-OAR1 Class A1, 1 month U.S. LIBOR + 0.170% 2.436% 2/25/37 (a)(c) | 12,274 | 12,334 | |
| Opteum Mortgage Acceptance Corp. floater Series 2005-3 Class APT, 1 month U.S. LIBOR + 0.290% 2.4353% 7/25/35 (a)(c) | 12,819 | 12,825 | |
| Permanent Master Issuer PLC floater Series 2018-1A Class 1A1, 3 month U.S. LIBOR + 0.380% 2.6834% 7/15/58 (a)(b)(c) | 10,927,000 | 10,924,771 | |
| Sequoia Mortgage Trust floater Series 2004-6 Class A3B, 6 month U.S. LIBOR + 0.880% 3.178% 7/20/34 (a)(c) | 1,725 | 1,678 | |
| Thornburg Mortgage Securities Trust floater Series 2003-4 Class A1, 1 month U.S. LIBOR + 0.640% 2.7853% 9/25/43 (a)(c) | 2,875,566 | 2,894,797 | |
| Winwater Mortgage Loan Trust sequential payer Series 2015-1 Class A9, 2.5% 1/20/45 (b) | 759,946 | 758,933 | |
| TOTAL PRIVATE SPONSOR | 45,368,346 | ||
| U.S. Government Agency - 0.2% | |||
| Fannie Mae: | |||
| planned amortization class Series 2012-149: | |||
| Class DA, 1.75% 1/25/43 | 1,436,305 | 1,428,930 | |
| Class GA, 1.75% 6/25/42 | 1,491,814 | 1,472,970 | |
| Series 2005-79 Class ZC, 5.9% 9/25/35 | 302,612 | 348,422 | |
| Series 2007-75 Class JI, 6.545% - 1 month U.S. LIBOR 4.3998% 8/25/37 (a)(g)(h) | 1,205,167 | 246,423 | |
| Series 2010-135 Class ZA, 4.5% 12/25/40 | 1,005,102 | 1,120,235 | |
| Series 2010-150 Class ZC, 4.75% 1/25/41 | 1,056,042 | 1,197,145 | |
| Series 2010-95 Class ZC, 5% 9/25/40 | 2,215,864 | 2,527,553 | |
| Series 2011-4 Class PZ, 5% 2/25/41 | 465,662 | 539,959 | |
| Series 2012-100 Class WI, 3% 9/25/27 (g) | 784,067 | 61,541 | |
| Series 2012-14 Class JS, 6.650% - 1 month U.S. LIBOR 4.5048% 12/25/30 (a)(g)(h) | 277,130 | 25,800 | |
| Series 2012-9 Class SH, 6.550% - 1 month U.S. LIBOR 4.4048% 6/25/41 (a)(g)(h) | 356,307 | 40,703 | |
| Series 2013-133 Class IB, 3% 4/25/32 (g) | 547,919 | 34,722 | |
| Series 2013-134 Class SA, 6.050% - 1 month U.S. LIBOR 3.9048% 1/25/44 (a)(g)(h) | 287,047 | 46,975 | |
| Series 2013-51 Class GI, 3% 10/25/32 (g) | 985,035 | 82,403 | |
| Series 2015-42 Class IL, 6% 6/25/45 (g) | 1,257,697 | 257,079 | |
| Series 2015-70 Class JC, 3% 10/25/45 | 997,858 | 1,036,897 | |
| Series 2017-30 Class AI, 5.5% 5/25/47 (g) | 668,010 | 134,448 | |
| Freddie Mac: | |||
| planned amortization class Series 4135 Class AB, 1.75% 6/15/42 | 1,120,167 | 1,113,924 | |
| sequential payer Series 3871 Class KB, 5.5% 6/15/41 | 818,615 | 953,831 | |
| Series 2017-4683 Class LM, 3% 5/15/47 | 1,365,949 | 1,387,433 | |
| Series 2933 Class ZM, 5.75% 2/15/35 | 601,929 | 707,208 | |
| Series 2996 Class ZD, 5.5% 6/15/35 | 410,587 | 477,956 | |
| Series 3237 Class C, 5.5% 11/15/36 | 599,165 | 683,740 | |
| Series 3955 Class YI, 3% 11/15/21 (g) | 109,408 | 2,550 | |
| Series 3980 Class EP, 5% 1/15/42 | 3,810,065 | 4,171,234 | |
| Series 4055 Class BI, 3.5% 5/15/31 (g) | 487,894 | 33,812 | |
| Series 4149 Class IO, 3% 1/15/33 (g) | 458,988 | 51,060 | |
| Series 4314 Class AI, 5% 3/15/34 (g) | 160,660 | 13,510 | |
| Series 4427 Class LI, 3.5% 2/15/34 (g) | 884,713 | 76,332 | |
| Series 4471 Class PA 4% 12/15/40 | 963,721 | 990,698 | |
| Freddie Mac Multi-family Structured pass-thru certificates Series 4386 Class AZ, 4.5% 11/15/40 | 1,022,065 | 1,101,297 | |
| Freddie Mac Seasoned Credit Risk Transfer Trust Series 2018-3 Class M55D, 4% 8/25/57 | 3,417,938 | 3,681,724 | |
| Ginnie Mae guaranteed REMIC pass-thru certificates: | |||
| floater: | |||
| Series 2010-H27 Series FA, 1 month U.S. LIBOR + 0.380% 2.7595% 12/20/60 (a)(c)(i) | 1,115,546 | 1,112,678 | |
| Series 2011-H20 Class FA, 1 month U.S. LIBOR + 0.550% 2.9295% 9/20/61 (a)(c)(i) | 5,291,957 | 5,302,289 | |
| Series 2012-H18 Class NA, 1 month U.S. LIBOR + 0.520% 2.8995% 8/20/62 (a)(c)(i) | 1,098,870 | 1,099,334 | |
| Series 2012-H21 Class DF, 1 month U.S. LIBOR + 0.650% 3.0295% 5/20/61 (a)(c)(i) | 29,596 | 29,680 | |
| Series 2013-H19 Class FC, 1 month U.S. LIBOR + 0.600% 2.9795% 8/20/63 (a)(c)(i) | 3,318,299 | 3,326,522 | |
| planned amortization class: | |||
| Series 2010-158 Class MS, 10.000% - 1 month U.S. LIBOR 5.6557% 12/20/40 (a)(h) | 1,187,000 | 1,431,688 | |
| Series 2016-69 Class WA, 3% 2/20/46 | 889,332 | 907,261 | |
| Series 2017-134 Class BA, 2.5% 11/20/46 | 1,506,738 | 1,529,669 | |
| sequential payer: | |||
| Series 2010-160 Class DY, 4% 12/20/40 | 2,766,684 | 3,040,418 | |
| Series 2010-170 Class B, 4% 12/20/40 | 623,064 | 684,740 | |
| Series 2017-139 Class BA, 3% 9/20/47 | 8,806,894 | 8,937,017 | |
| Series 2010-116 Class QB, 4% 9/16/40 | 4,359,997 | 4,541,602 | |
| Series 2010-14 Class SN, 5.950% - 1 month U.S. LIBOR 3.7526% 2/16/40 (a)(g)(h) | 640,212 | 106,112 | |
| Series 2011-94 Class SA, 6.100% - 1 month U.S. LIBOR 3.9279% 7/20/41 (a)(g)(h) | 204,091 | 37,164 | |
| Series 2013-149 Class MA, 2.5% 5/20/40 | 3,229,061 | 3,296,549 | |
| Series 2015-H13 Class HA, 2.5% 8/20/64 (i) | 1,470,748 | 1,469,595 | |
| Series 2015-H17 Class HA, 2.5% 5/20/65 (i) | 1,208,376 | 1,207,593 | |
| Series 2017-H06 Class FA, U.S. TREASURY 1 YEAR INDEX + 0.350% 2.28% 8/20/66 (a)(c)(i) | 3,867,381 | 3,857,422 | |
| TOTAL U.S. GOVERNMENT AGENCY | 67,965,847 | ||
| TOTAL COLLATERALIZED MORTGAGE OBLIGATIONS | |||
| (Cost $112,495,974) | 113,334,193 | ||
| Commercial Mortgage Securities - 0.8% | |||
| Barclays Commercial Mortgage Securities LLC: | |||
| Series 2015-STP Class A, 3.3228% 9/10/28 (b) | 3,445,145 | 3,475,702 | |
| Series 2018-C2 Class A5, 4.314% 12/15/51 | 1,800,000 | 2,089,595 | |
| Bayview Commercial Asset Trust floater: | |||
| Series 2005-3A Class A2, 1 month U.S. LIBOR + 0.400% 2.5453% 11/25/35 (a)(b)(c) | 26,739 | 25,865 | |
| Series 2005-4A: | |||
| Class A2, 1 month U.S. LIBOR + 0.390% 2.5353% 1/25/36 (a)(b)(c) | 64,917 | 62,879 | |
| Class M1, 1 month U.S. LIBOR + 0.450% 2.5953% 1/25/36 (a)(b)(c) | 20,954 | 20,196 | |
| Series 2006-4A Class A2, 1 month U.S. LIBOR + 0.270% 2.4153% 12/25/36 (a)(b)(c) | 167,859 | 160,841 | |
| Series 2007-1 Class A2, 1 month U.S. LIBOR + 0.270% 2.4153% 3/25/37 (a)(b)(c) | 40,536 | 38,222 | |
| Series 2007-2A: | |||
| Class A1, 1 month U.S. LIBOR + 0.270% 2.4153% 7/25/37 (a)(b)(c) | 117,679 | 111,949 | |
| Class A2, 1 month U.S. LIBOR + 0.320% 2.4653% 7/25/37 (a)(b)(c) | 110,179 | 103,402 | |
| Class M1, 1 month U.S. LIBOR + 0.370% 2.5153% 7/25/37 (a)(b)(c) | 37,502 | 34,691 | |
| Series 2007-3: | |||
| Class A2, 1 month U.S. LIBOR + 0.290% 2.4353% 7/25/37 (a)(b)(c) | 41,064 | 38,720 | |
| Class M1, 1 month U.S. LIBOR + 0.310% 2.4553% 7/25/37 (a)(b)(c) | 21,762 | 20,615 | |
| Class M2, 1 month U.S. LIBOR + 0.340% 2.4853% 7/25/37 (a)(b)(c) | 23,276 | 21,867 | |
| Class M3, 1 month U.S. LIBOR + 0.370% 2.5153% 7/25/37 (a)(b)(c) | 37,279 | 34,294 | |
| Class M4, 1 month U.S. LIBOR + 0.500% 2.6453% 7/25/37 (a)(b)(c) | 58,852 | 54,994 | |
| Class M5, 1 month U.S. LIBOR + 0.600% 2.7453% 7/25/37 (a)(b)(c) | 23,838 | 28,970 | |
| BBCMS Mortgage Trust sequential payer Series 2019-C4 Class A4, 2.661% 8/15/52 | 4,000,000 | 4,118,243 | |
| Benchmark Commercial Mortgage Trust Series 2018-B3 Class A3, 3.746% 4/10/51 | 1,700,000 | 1,831,666 | |
| Benchmark Mortgage Trust: | |||
| Series 2018-B8 Class A5, 4.2317% 1/15/52 | 6,339,000 | 7,345,369 | |
| Series 2019-B12 Class XA, 1.207% 8/15/52 (a)(g) | 40,200,000 | 3,135,254 | |
| BX Trust: | |||
| floater: | |||
| Series 2018-EXCL: | |||
| Class A, 1 month U.S. LIBOR + 1.088% 3.2828% 9/15/37 (a)(b)(c) | 1,724,036 | 1,715,386 | |
| Class B, 1 month U.S. LIBOR + 1.325% 3.5201% 9/15/37 (a)(b)(c) | 4,446,198 | 4,437,065 | |
| Class D, 1 month U.S. LIBOR + 2.625% 4.8201% 9/15/37 (a)(b)(c) | 2,530,703 | 2,530,932 | |
| Series 2018-IND Class F, 1 month U.S. LIBOR + 1.800% 3.9951% 11/15/35 (a)(b)(c) | 3,148,604 | 3,157,477 | |
| Series 2019-IMC: | |||
| Class B, 1 month U.S. LIBOR + 1.300% 3.4951% 4/15/34 (a)(b)(c) | 4,464,000 | 4,463,990 | |
| Class C, 1 month U.S. LIBOR + 1.600% 3.7951% 4/15/34 (a)(b)(c) | 2,952,000 | 2,952,005 | |
| Class D, 1 month U.S. LIBOR + 1.900% 4.0951% 4/15/34 (a)(b)(c) | 3,099,000 | 3,108,700 | |
| floater, sequential payer Series 2019-IMC Class A, 1 month U.S. LIBOR + 1.000% 3.1951% 4/15/34 (a)(b)(c) | 7,100,000 | 7,099,987 | |
| CD Commercial Mortgage Trust Series 2017-CD6 Class A3, 3.104% 11/13/50 | 2,500,000 | 2,618,938 | |
| CHC Commercial Mortgage Trust floater Series 2019-CHC: | |||
| Class A, 1 month U.S. LIBOR + 1.120% 3.3151% 6/15/34 (a)(b)(c) | 14,057,000 | 14,056,972 | |
| Class B, 1 month U.S. LIBOR + 1.500% 3.6951% 6/15/34 (a)(b)(c) | 2,119,000 | 2,119,004 | |
| Class C, 1 month U.S. LIBOR + 1.750% 3.9451% 6/15/34 (a)(b)(c) | 2,394,000 | 2,394,004 | |
| Citigroup Commercial Mortgage Trust: | |||
| sequential payer Series 2016-GC37 Class A3, 3.05% 4/10/49 | 4,000,000 | 4,209,796 | |
| Series 2015-GC29 Class XA, 1.2411% 4/10/48 (a)(g) | 37,210,084 | 1,624,350 | |
| Series 2015-GC33 Class XA, 1.0759% 9/10/58 (a)(g) | 19,349,752 | 844,911 | |
| Series 2016-C2 Class A3, 2.575% 8/10/49 | 2,800,000 | 2,876,665 | |
| Series 2016-GC36 Class A4, 3.349% 2/10/49 | 2,500,000 | 2,675,582 | |
| Series 2016-P6 Class XA, 0.9461% 12/10/49 (a)(g) | 17,508,217 | 641,557 | |
| Series 2018-C6 Class A4, 4.412% 11/10/51 | 1,419,000 | 1,661,962 | |
| COMM Mortgage Trust: | |||
| sequential payer: | |||
| Series 2013-CR7 Class AM, 3.314% 3/10/46 (b) | 1,700,000 | 1,761,887 | |
| Series 2015-DC1 Class A5, 3.35% 2/10/48 | 3,800,000 | 4,031,909 | |
| Series 2014-CR17 Class XA, 1.1456% 5/10/47 (a)(g) | 19,540,046 | 765,620 | |
| Series 2014-CR19 Class XA, 1.2328% 8/10/47 (a)(g) | 23,703,189 | 1,006,094 | |
| Series 2014-CR20 Class XA, 1.2084% 11/10/47 (a)(g) | 18,550,325 | 839,152 | |
| Series 2014-LC17 Class XA, 0.9977% 10/10/47 (a)(g) | 43,870,660 | 1,331,514 | |
| Series 2014-UBS4 Class XA, 1.2659% 8/10/47 (a)(g) | 20,884,317 | 938,817 | |
| Series 2014-UBS6: | |||
| Class A5, 3.644% 12/10/47 | 3,900,000 | 4,192,798 | |
| Class XA, 1.0841% 12/10/47 (a)(g) | 11,626,587 | 424,872 | |
| Series 2015-CR23 Class A3, 3.23% 5/10/48 | 2,500,000 | 2,649,092 | |
| Series 2015-CR24 Class A4, 3.432% 8/10/48 | 1,500,000 | 1,602,037 | |
| Series 2015-DC1 Class XA, 1.2533% 2/10/48 (a)(g) | 30,653,497 | 1,206,218 | |
| Series 2015-PC1 Class A4, 3.62% 7/10/50 | 1,900,000 | 2,040,921 | |
| Core Industrial Trust floater Series 2019-CORE Class A, 1 month U.S. LIBOR + 0.880% 3.0751% 12/15/31 (a)(b)(c) | 2,583,000 | 2,582,996 | |
| Credit Suisse Mortgage Trust: | |||
| floater Series 2019-ICE4 Class A, 1 month U.S. LIBOR + 0.980% 3.1751% 5/15/36 (a)(b)(c) | 6,600,000 | 6,604,142 | |
| Series 2018-SITE: | |||
| Class A, 4.284% 4/15/36 (b) | 5,008,000 | 5,370,513 | |
| Class B, 4.5349% 4/15/36 (b) | 1,543,000 | 1,651,399 | |
| Class C, 4.9414% 4/15/36 (a)(b) | 1,033,000 | 1,100,853 | |
| Class D, 4.9414% 4/15/36 (a)(b) | 2,066,000 | 2,166,739 | |
| CSAIL Commercial Mortgage Trust Series 2016-C7 Class A4, 3.21% 11/15/49 | 2,800,000 | 2,960,674 | |
| CSAIL Commercial Mtg Trust Series 2018-C14 Class A4 4.4216% 11/15/51 | 3,700,000 | 4,318,353 | |
| Fannie Mae Series 2017-M1 Class A2, 2.496% 10/25/26 (a) | 2,300,000 | 2,365,315 | |
| Freddie Mac: | |||
| sequential payer Series 2018-K083 Class AM, 4.03% 10/25/28 | 1,150,000 | 1,329,324 | |
| Series K076: | |||
| Class A2, 3.9% 4/25/28 | 4,800,000 | 5,483,234 | |
| Class AM, 3.9% 4/25/28 | 2,125,000 | 2,414,022 | |
| Series K077 Class AM, 3.85% 5/25/28 | 660,000 | 747,896 | |
| GS Mortgage Securities Trust: | |||
| floater: | |||
| Series 2018-3PCK Class A, 1 month U.S. LIBOR + 1.450% 3.6451% 9/15/31 (a)(b)(c) | 10,575,000 | 10,549,412 | |
| Series 2018-HART Class A, 1 month U.S. LIBOR + 1.090% 3.2851% 10/15/31 (a)(b)(c) | 4,013,000 | 4,010,200 | |
| sequential payer: | |||
| Series 2015-GC28 Class AAB, 3.206% 2/10/48 | 1,000,000 | 1,035,561 | |
| Series 2015-GC32 Class A4, 3.764% 7/10/48 | 9,400,000 | 10,246,937 | |
| Series 2013-GC12 Class XA, 1.5598% 6/10/46 (a)(g) | 5,492,314 | 238,746 | |
| Series 2015-GC30 Class A3, 3.119% 5/10/50 | 2,000,000 | 2,104,846 | |
| Series 2015-GC34 Class XA, 1.4773% 10/10/48 (a)(g) | 6,091,650 | 379,814 | |
| Series 2019-GC40 Class A3, 2.904% 7/10/52 | 2,000,000 | 2,101,910 | |
| JP Morgan Chase Commercial Mortgage Securities Trust Series 2019-COR4 Class A3, 3.7629% 3/10/52 | 5,400,000 | 5,967,901 | |
| JPMBB Commercial Mortgage Securities Trust: | |||
| sequential payer Series 2014-C21 Class A5, 3.7748% 8/15/47 | 9,000,000 | 9,704,133 | |
| Series 2014-C19 Class XA, 0.9299% 4/15/47 (a)(g) | 3,521,319 | 80,680 | |
| Series 2015-C30 Class A4, 3.5508% 7/15/48 | 1,900,000 | 2,050,797 | |
| JPMorgan Chase Commercial Mortgage Securities Trust: | |||
| Series 2007-CB19 Class B, 6.0038% 2/12/49 (a)(j) | 21,071 | 5,900 | |
| Series 2018-WPT: | |||
| Class AFX, 4.2475% 7/5/33 (b) | 2,700,000 | 2,907,910 | |
| Class CFX, 4.9498% 7/5/33 (b) | 919,000 | 992,515 | |
| Class DFX, 5.3503% 7/5/33 (b) | 1,414,000 | 1,529,097 | |
| Class EFX, 5.5422% 7/5/33 (b) | 1,934,000 | 2,071,685 | |
| Class XAFX, 1.2948% 7/5/33 (a)(b)(g) | 10,000,000 | 408,265 | |
| Morgan Stanley BAML Trust: | |||
| sequential payer: | |||
| Series 2014-C16 Class A3, 3.592% 6/15/47 | 1,637,170 | 1,659,932 | |
| Series 2015-C21 Class A3, 3.077% 3/15/48 | 3,900,000 | 4,080,627 | |
| Series 2015-C25: | |||
| Class A4, 3.372% 10/15/48 | 2,800,000 | 2,999,516 | |
| Class XA, 1.2557% 10/15/48 (a)(g) | 10,962,231 | 556,731 | |
| Series 2015-C26 Class A4, 3.252% 10/15/48 | 3,200,000 | 3,393,950 | |
| Series 2016-C32 Class A3, 3.459% 12/15/49 | 5,100,000 | 5,526,752 | |
| Morgan Stanley Capital I Trust: | |||
| floater: | |||
| Series 2018-BOP Class A, 1 month U.S. LIBOR + 0.850% 3.0451% 8/15/33 (a)(b)(c) | 7,150,000 | 7,114,162 | |
| Series 2019-AGLN Class A, 1 month U.S. LIBOR + 0.950% 3.1451% 3/15/34 (a)(b)(c) | 3,470,000 | 3,472,158 | |
| Series 2011-C3 Class AJ, 5.2925% 7/15/49 (a)(b) | 4,200,000 | 4,405,876 | |
| Series 2015-UBS8 Class A3, 3.54% 12/15/48 | 3,000,000 | 3,233,714 | |
| Series 2016-UB12 Class A3, 3.337% 12/15/49 | 2,000,000 | 2,150,491 | |
| Series 2018-H4 Class A4, 4.31% 12/15/51 | 12,588,000 | 14,661,123 | |
| MSCG Trust Series 2016-SNR: | |||
| Class A, 3.4596% 11/15/34 (a)(b) | 4,272,021 | 4,302,306 | |
| Class B, 4.181% 11/15/34 (b) | 1,796,900 | 1,826,200 | |
| Class C, 5.205% 11/15/34 (b) | 1,260,550 | 1,291,589 | |
| RETL floater Series 2019-RVP: | |||
| Class A, 1 month U.S. LIBOR + 1.150% 3.3451% 3/15/36 (a)(b)(c) | 4,236,772 | 4,243,384 | |
| Class B, 1 month U.S. LIBOR + 1.550% 3.7451% 3/15/36 (a)(b)(c) | 3,800,000 | 3,814,255 | |
| Class C, 1 month U.S. LIBOR + 2.100% 4.2951% 3/15/36 (a)(b)(c) | 8,731,000 | 8,766,479 | |
| UBS Commercial Mortgage Trust: | |||
| Series 2017-C1 Class A3, 3.283% 11/15/50 | 5,500,000 | 5,928,559 | |
| Series 2017-C7 Class XA, 1.2152% 12/15/50 (a)(g) | 17,648,029 | 1,180,343 | |
| Series 2018-C11 Class A3, 4.3124% 6/15/51 | 4,100,000 | 4,566,677 | |
| Series 2018-C13 Class A3, 4.0694% 10/15/51 | 6,000,000 | 6,813,940 | |
| Series 2018-C9 Class ASB, 4.09% 3/15/51 | 3,300,000 | 3,665,925 | |
| UBS-Barclays Commercial Mortgage Trust floater Series 2013-C6 Class A3, 1 month U.S. LIBOR + 0.790% 2.9909% 4/10/46 (a)(b)(c) | 5,423,000 | 5,487,679 | |
| Wells Fargo Commercial Mortgage Trust: | |||
| sequential payer Series 2015-C26 Class A4, 3.166% 2/15/48 | 6,200,000 | 6,533,811 | |
| Series 2015-C31 Class XA, 1.1774% 11/15/48 (a)(g) | 7,294,060 | 379,397 | |
| Series 2017-C42 Class XA, 1.039% 12/15/50 (a)(g) | 35,744,017 | 2,225,701 | |
| Series 2018-C46 Class XA, 1.1126% 8/15/51 (a)(g) | 13,129,415 | 791,479 | |
| Series 2018-C48 Class A5, 4.302% 1/15/52 | 7,543,000 | 8,739,972 | |
| WF-RBS Commercial Mortgage Trust: | |||
| floater Series 2013-C14 Class A3, 1 month U.S. LIBOR + 0.720% 2.9174% 6/15/46 (a)(b)(c) | 5,434,833 | 5,439,451 | |
| Series 2014-C24 Class XA, 1.0046% 11/15/47 (a)(g) | 6,829,795 | 224,909 | |
| Series 2014-C25 Class A5, 3.631% 11/15/47 | 6,087,000 | 6,543,454 | |
| Series 2014-LC14 Class XA, 1.397% 3/15/47 (a)(g) | 10,271,275 | 433,717 | |
| TOTAL COMMERCIAL MORTGAGE SECURITIES | |||
| (Cost $329,092,347) | 342,669,576 | ||
| Municipal Securities - 0.2% | |||
| Bay Area Toll Auth. San Francisco Bay Toll Bridge Rev. Series 2009 F2, 6.263% 4/1/49 | 3,470,000 | 5,691,737 | |
| California Gen. Oblig. Series 2009, 7.5% 4/1/34 | 630,000 | 992,515 | |
| Chicago O'Hare Int'l. Arpt. Rev. Series 2018 C, 4.472% 1/1/49 | 910,000 | 1,180,598 | |
| Colorado Reg'l. Trans. District Sales Tax Rev. (Fastracks Proj.) Series 2010 B, 5.844% 11/1/50 | 45,000 | 70,645 | |
| District of Columbia Income Tax Rev. Series 2010 F, 5.582% 12/1/35 | 75,000 | 100,493 | |
| Illinois Gen. Oblig.: | |||
| Series 2003: | $ | $ | |
| 4.95% 6/1/23 | 6,685,091 | 7,037,328 | |
| 5.1% 6/1/33 | 22,090,000 | 24,039,222 | |
| Series 2010-1, 6.63% 2/1/35 | 3,845,000 | 4,579,856 | |
| Series 2010-3: | |||
| 6.725% 4/1/35 | 2,510,000 | 2,979,822 | |
| 7.35% 7/1/35 | 4,655,000 | 5,667,044 | |
| Series 2010-5, 6.2% 7/1/21 | 958,000 | 1,004,415 | |
| Series 2013, 3.6% 12/1/19 | 2,105,000 | 2,108,661 | |
| Los Angeles Dept. of Wtr. & Pwr. Rev. Series 2010 A, 5.716% 7/1/39 | 190,000 | 272,413 | |
| Maryland Trans. Auth. Trans. Facility Projs. Rev. Series 2009 B, 5.888% 7/1/43 | 50,000 | 71,140 | |
| Massachusetts Commonwealth Trans. Fund Rev. (Accelerated Bridge Prog.) Series 2010 A, 5.731% 6/1/40 | 150,000 | 212,352 | |
| New Jersey Tpk. Auth. Tpk. Rev.: | |||
| Series 2009 E, 7.414% 1/1/40 | 1,540,000 | 2,541,647 | |
| Series 2010 A, 7.102% 1/1/41 | 1,675,000 | 2,691,055 | |
| New York City Muni. Wtr. Fin. Auth. Wtr. & Swr. Sys. Rev. Series 2010 DD, 5.952% 6/15/42 | 25,000 | 38,503 | |
| New York City Transitional Fin. Auth. Rev. Series 2010 C2, 5.767% 8/1/36 | 900,000 | 1,180,539 | |
| Ohio State Univ. Gen. Receipts: | |||
| Series 2010 C, 4.91% 6/1/40 | 365,000 | 487,144 | |
| Series 2011 A, 4.8% 6/1/11 | 1,528,000 | 2,151,592 | |
| Port Auth. of New York & New Jersey 174th Series, 4.458% 10/1/62 | 390,000 | 509,683 | |
| Salt River Proj. Agricultural Impt. & Pwr. District Elec. Sys. Rev. Series 2010 A, 4.839% 1/1/41 | 750,000 | 993,675 | |
| Univ. of California Revs. Series 2009 R, 5.77% 5/15/43 | 60,000 | 85,478 | |
| TOTAL MUNICIPAL SECURITIES | |||
| (Cost $59,950,041) | 66,687,557 | ||
| Foreign Government and Government Agency Obligations - 0.0% | |||
| Colombian Republic 5% 6/15/45 | $965,000 | $1,166,685 | |
| Indonesian Republic: | |||
| 3.4% 9/18/29 | 1,170,000 | 1,233,253 | |
| 3.5% 1/11/28 | 1,405,000 | 1,473,055 | |
| Israeli State: | |||
| (guaranteed by U.S. Government through Agency for International Development) 5.5% 12/4/23 | 180,000 | 208,625 | |
| 4% 6/30/22 | 1,700,000 | 1,799,433 | |
| Panamanian Republic 4.5% 4/16/50 | 400,000 | 497,500 | |
| Province of Quebec yankee 7.125% 2/9/24 | 1,110,000 | 1,355,088 | |
| United Mexican States 4.75% 3/8/44 | 2,700,000 | 2,986,875 | |
| Uruguay Republic: | |||
| 4.975% 4/20/55 | 455,000 | 560,361 | |
| 5.1% 6/18/50 | 1,250,000 | 1,555,078 | |
| TOTAL FOREIGN GOVERNMENT AND GOVERNMENT AGENCY OBLIGATIONS | |||
| (Cost $11,953,350) | 12,835,953 | ||
| Bank Notes - 0.1% | |||
| Capital One NA 2.95% 7/23/21 | 5,551,000 | 5,621,010 | |
| Discover Bank: | |||
| (Delaware) 3.2% 8/9/21 | $6,369,000 | $6,487,859 | |
| 3.1% 6/4/20 | 6,744,000 | 6,779,513 | |
| 3.45% 7/27/26 | 435,000 | 454,548 | |
| 4.682% 8/9/28 (a) | 3,503,000 | 3,674,997 | |
| 8.7% 11/18/19 | 357,000 | 361,292 | |
| KeyBank NA 3.9% 4/13/29 | 2,005,000 | 2,211,079 | |
| SunTrust Bank 4.05% 11/3/25 | 595,000 | 653,178 | |
| Synchrony Bank 3.65% 5/24/21 | 5,843,000 | 5,962,170 | |
| U.S. Bank NA 2.65% 5/23/22 | 1,500,000 | 1,528,944 | |
| TOTAL BANK NOTES | |||
| (Cost $32,886,646) | 33,734,590 | ||
| Shares | Value | ||
| Fixed-Income Funds - 76.8% | |||
| Bank Loan Funds - 0.4% | |||
| Eaton Vance Floating-Rate Fund - Advisers Class | 20,607,993 | $181,762,494 | |
| High Yield Fixed-Income Funds - 0.2% | |||
| Stone Harbor Emerging Markets Debt Fund | 8,212,098 | 81,710,374 | |
| Inflation-Protected Bond Funds - 0.1% | |||
| Fidelity Inflation-Protected Bond Index Fund (k) | 4,405,044 | 45,416,007 | |
| Intermediate Government Funds - 7.7% | |||
| Fidelity SAI U.S. Treasury Bond Index Fund (k) | 310,453,653 | 3,213,195,313 | |
| iShares 3-7 Year Treasury Bond ETF (l) | 5,100 | 651,525 | |
| TOTAL INTERMEDIATE GOVERNMENT FUNDS | 3,213,846,838 | ||
| Intermediate-Term Bond Funds - 67.6% | |||
| Baird Short-Term Bond Fund - Institutional Class | 49,979,301 | 583,258,443 | |
| DoubleLine Total Return Bond Fund Class N | 111,509,014 | 1,205,412,437 | |
| Fidelity SAI Total Bond Fund (k) | 627,649,527 | 6,753,508,912 | |
| Fidelity Sustainability Bond Index Fund (k) | 2,317,026 | 24,815,348 | |
| Fidelity U.S. Bond Index Fund (k) | 9,977,284 | 120,525,591 | |
| iShares Core U.S. Aggregate Bond ETF | 4,531 | 517,123 | |
| John Hancock Bond Fund Class A | 7,670,171 | 125,560,697 | |
| JPMorgan Core Plus Bond Fund Class A | 12,342,591 | 106,022,861 | |
| Metropolitan West Total Return Bond Fund Class M | 186,257,240 | 2,076,768,224 | |
| PIMCO Income Fund Institutional Class | 105,289,455 | 1,253,997,404 | |
| PIMCO Mortgage Opportunities Fund Institutional Class | 78,211,099 | 854,847,307 | |
| PIMCO Total Return Fund Institutional Class | 670,306,273 | 7,091,840,347 | |
| Prudential Total Return Bond Fund Class A | 129,183,228 | 1,955,834,078 | |
| Voya Intermediate Bond Fund Class I | 106,874,926 | 1,124,324,225 | |
| Western Asset Core Bond Fund Class I | 148,180,747 | 1,953,022,248 | |
| Western Asset Core Plus Bond Fund Class I | 265,273,269 | 3,217,764,758 | |
| TOTAL INTERMEDIATE-TERM BOND FUNDS | 28,448,020,003 | ||
| Long Government Bond Funds - 0.8% | |||
| iShares 20+ Year Treasury Bond ETF | 2,365,470 | 348,386,422 | |
| TOTAL FIXED-INCOME FUNDS | |||
| (Cost $31,013,831,683) | 32,319,142,138 | ||
| Principal Amount | Value | ||
| Preferred Securities - 0.1% | |||
| ENERGY - 0.0% | |||
| Oil, Gas & Consumable Fuels - 0.0% | |||
| MPLX LP 6.875% (a)(m) | 300,000 | 301,553 | |
| FINANCIALS - 0.1% | |||
| Banks - 0.1% | |||
| Bank of Nova Scotia 4.65% (a)(m) | 12,927,000 | 12,961,399 | |
| Barclays Bank PLC 7.625% 11/21/22 | 27,412,000 | 30,806,749 | |
| Barclays PLC 7.875% (Reg. S) (a)(m) | 290,000 | 306,400 | |
| Royal Bank of Scotland Group PLC 7.5% (a)(m) | 300,000 | 308,622 | |
| Wells Fargo & Co. 5.9% (a)(m) | 700,000 | 756,052 | |
| 45,139,222 | |||
| TOTAL PREFERRED SECURITIES | |||
| (Cost $46,141,557) | 45,440,775 | ||
| Shares | Value | ||
| Money Market Funds - 0.4% | |||
| Fidelity Cash Central Fund 2.13% (n) | 108,005,110 | 108,026,711 | |
| Fidelity Securities Lending Cash Central Fund 2.13% (n)(o) | 626,337 | 626,400 | |
| State Street Institutional U.S. Government Money Market Fund Premier Class 1.87%(p) | 40,648,261 | 40,648,261 | |
| TOTAL MONEY MARKET FUNDS | |||
| (Cost $149,297,121) | 149,301,372 |
| Purchased Swaptions - 0.0% | ||||
| Expiration Date | Notional Amount | Value | ||
| Put Options - 0.0% | ||||
| Option on an interest rate swap with Bank of America N.A. to pay semi-annually a fixed rate of 1.476% and receive quarterly a floating rate based on 3-month LIBOR, expiring August 2029 | 8/27/24 | 34,000,000 | $974,031 | |
| Option on an interest rate swap with Bank of America N.A. to pay semi-annually a fixed rate of 2.215% and receive quarterly a floating rate based on 3-month LIBOR, expiring July 2029 | 7/10/24 | 43,000,000 | 648,731 | |
| Option on an interest rate swap with Bank of America, N.A. to pay semi-annually a fixed rate of 2.605% and receive quarterly a floating rate based on 3-month LIBOR, expiring May 2029 | 4/29/22 | 5,300,000 | 35,787 | |
| Option on an interest rate swap with Citibank, N.A. to pay semi-annually a fixed rate of 2.54% and receive quarterly a floating rate based on 3-month LIBOR, expiring April 2029 | 4/5/22 | 4,500,000 | 31,702 | |
| Option on an interest rate swap with Goldman Sachs Bank U.S.A. to pay semi-annually a fixed rate of 2.2% and receive quarterly a floating rate based on 3-month LIBOR, expiring July 2029 | 7/18/24 | 79,000,000 | 1,215,797 | |
| Option on an interest rate swap with Goldman Sachs Bank U.S.A. to pay semi-annually a fixed rate of 2.5675% and receive quarterly a floating rate based on 3-month LIBOR, expiring April 2029 | 4/4/22 | 3,000,000 | 20,405 | |
| Option on an interest rate swap with Goldman Sachs Bank U.S.A. to pay semi-annually a fixed rate of 2.645% and receive quarterly a floating rate based on 3-month LIBOR, expiring April 2029 | 4/14/22 | 9,000,000 | 56,250 | |
| TOTAL PUT OPTIONS | 2,982,703 | |||
| Call Options - 0.0% | ||||
| Option on an interest rate swap with Bank of America N.A. to receive semi-annually a fixed rate of 1.476% and pay quarterly a floating rate based on 3-month LIBOR, expiring August 2029 | 8/27/24 | 34,000,000 | 1,013,335 | |
| Option on an interest rate swap with Bank of America N.A. to receive semi-annually a fixed rate of 2.215% and pay quarterly a floating rate based on 3-month LIBOR, expiring July 2029 | 7/10/24 | 43,000,000 | 2,175,760 | |
| Option on an interest rate swap with Bank of America, N.A. to receive semi-annually a fixed rate of 2.605% and pay quarterly a floating rate based on 3-month LIBOR, expiring May 2029 | 4/29/22 | 5,300,000 | 466,397 | |
| Option on an interest rate swap with Citibank, N.A. to receive semi-annually a fixed rate of 2.54% and pay quarterly a floating rate based on 3-month LIBOR, expiring April 2029 | 4/5/22 | 4,500,000 | 380,023 | |
| Option on an interest rate swap with Goldman Sachs Bank U.S.A. to receive semi-annually a fixed rate of 2.2% and pay quarterly a floating rate based on 3-month LIBOR, expiring July 2029 | 7/18/24 | 79,000,000 | 3,960,517 | |
| Option on an interest rate swap with Goldman Sachs Bank U.S.A. to receive semi-annually a fixed rate of 2.5675% and pay quarterly a floating rate based on 3-month LIBOR, expiring April 2029 | 4/4/22 | 3,000,000 | 257,898 | |
| Option on an interest rate swap with Goldman Sachs Bank U.S.A. to receive semi-annually a fixed rate of 2.645% and pay quarterly a floating rate based on 3-month LIBOR, expiring April 2029 | 4/14/22 | 9,000,000 | 812,667 | |
| TOTAL CALL OPTIONS | 9,066,597 | |||
| TOTAL PURCHASED SWAPTIONS | ||||
| (Cost $9,636,296) | 12,049,300 | |||
| TOTAL INVESTMENT IN SECURITIES - 102.2% | ||||
| (Cost $41,257,797,471) | 43,027,571,653 | |||
| NET OTHER ASSETS (LIABILITIES) - (2.2)% | (939,905,152) | |||
| NET ASSETS - 100% | $42,087,666,501 |
| TBA Sale Commitments | ||
| Principal Amount | Value | |
| Ginnie Mae | ||
| 3% 9/1/49 | $(6,300,000) | $(6,496,633) |
| 3% 9/1/49 | (24,500,000) | (25,264,683) |
| 3% 9/1/49 | (21,000,000) | (21,655,444) |
| 3.5% 9/1/49 | (1,000,000) | (1,038,906) |
| 3.5% 9/1/49 | (8,200,000) | (8,519,032) |
| 3.5% 9/1/49 | (7,450,000) | (7,739,852) |
| 3.5% 9/1/49 | (4,850,000) | (5,038,696) |
| 3.5% 9/1/49 | (8,000,000) | (8,311,250) |
| 3.5% 9/1/49 | (5,200,000) | (5,402,313) |
| 3.5% 9/1/49 | (4,650,000) | (4,830,914) |
| 3.5% 9/1/49 | (2,950,000) | (3,064,774) |
| 3.5% 9/1/49 | (2,550,000) | (2,649,211) |
| 3.5% 9/1/49 | (2,550,000) | (2,649,211) |
| TOTAL GINNIE MAE | (102,660,919) | |
| Uniform Mortgage Backed Securities | ||
| 2.5% 9/1/34 | (200,000) | (202,734) |
| 3.5% 9/1/49 | (51,300,000) | (52,714,757) |
| 3.5% 9/1/49 | (1,500,000) | (1,541,367) |
| 4% 9/1/49 | (6,000,000) | (6,228,425) |
| 4% 9/1/49 | (26,600,000) | (27,612,683) |
| 4% 9/1/49 | (26,600,000) | (27,612,683) |
| 4% 10/1/49 | (3,500,000) | (3,636,392) |
| 4% 10/1/49 | (1,500,000) | (1,558,454) |
| TOTAL UNIFORM MORTGAGE BACKED SECURITIES | (121,107,495) | |
| TOTAL TBA SALE COMMITMENTS | ||
| (Proceeds $223,472,287) | $(223,768,414) |
| Written Swaptions | |||
| Expiration Date | Notional Amount | Value | |
| Put Swaptions | |||
| Option on an interest rate swap with Bank of America N.A. to pay semi-annually a fixed rate of 1.507% and receive quarterly a floating rate based on 3-month LIBOR, expiring November 2029 | 11/8/19 | 2,000,000 | $(15,672) |
| Option on an interest rate swap with Bank of America N.A. to pay semi-annually a fixed rate of 1.97% and receive quarterly a floating rate based on 3-month LIBOR, expiring August 2029 | 8/1/24 | 17,000,000 | (321,502) |
| TOTAL PUT SWAPTIONS | (337,174) | ||
| Call Swaptions | |||
| Option on an interest rate swap with Bank of America N.A. to receive semi-annually a fixed rate of 1.507% and pay quarterly a floating rate based on 3-month LIBOR, expiring November 2029 | 11/8/19 | 2,000,000 | (41,078) |
| Option on an interest rate swap with Bank of America N.A. to receive semi-annually a fixed rate of 1.97% and pay quarterly a floating rate based on 3-month LIBOR, expiring August 2029 | 8/1/24 | 17,000,000 | (730,032) |
| TOTAL CALL SWAPTIONS | (771,110) | ||
| TOTAL WRITTEN SWAPTIONS | $(1,108,284) |
| Futures Contracts | |||||
| Number of contracts | Expiration Date | Notional Amount | Value | Unrealized Appreciation/(Depreciation) | |
| Sold | |||||
| Treasury Contracts | |||||
| CBOT 10-Year U.S. Treasury Note Contracts (United States) | 97 | Dec. 2019 | $12,776,719 | $6,621 | $6,621 |
| CBOT 2-Year U.S. Treasury Note Contracts (United States) | 462 | Dec. 2019 | 99,846,141 | (55,046) | (55,046) |
| CBOT 5-Year U.S. Treasury Note Contracts (United States) | 597 | Dec. 2019 | 71,626,008 | (54,162) | (54,162) |
| CBOT Long Term U.S. Treasury Bond Contracts (United States) | 99 | Dec. 2019 | 16,359,750 | (93,026) | (93,026) |
| CBOT Ultra 10-Year U.S. Treasury Note Contracts (United States) | 482 | Dec. 2019 | 69,618,875 | (192,976) | (192,976) |
| CBOT Ultra Long Term U.S. Treasury Bond Contracts (United States) | 69 | Dec. 2019 | 13,623,188 | 30,035 | 30,035 |
| TOTAL FUTURES CONTRACTS | $(358,554) |
The notional amount of futures sold as a percentage of Net Assets is 0.7%
Swaps
| Underlying Reference | Maturity Date | Clearinghouse / Counterparty | Fixed Payment Received/(Paid) | Payment Frequency | Notional Amount | Value | Upfront Premium Received/(Paid) | Unrealized Appreciation/(Depreciation) |
| Credit Default Swaps | ||||||||
| Buy Protection | ||||||||
| CMBX N.A. AAA Index Series 11 | Nov. 2054 | Citigroup Global Markets Ltd. | (0.5%) | Monthly | $4,369,000 | $(13,956) | $(31,130) | $(45,086) |
| CMBX N.A. AAA Index Series 11 | Nov. 2054 | Citigroup Global Markets Ltd. | (0.5%) | Monthly | 1,010,000 | (3,226) | (1,148) | (4,374) |
| CMBX N.A. AAA Index Series 11 | Nov. 2054 | Citigroup Global Markets Ltd. | (0.5%) | Monthly | 3,400,000 | (10,861) | 6,730 | (4,131) |
| CMBX N.A. AAA Index Series 11 | Nov. 2054 | Citigroup Global Markets Ltd. | (0.5%) | Monthly | 4,900,000 | (15,653) | 10,149 | (5,504) |
| CMBX N.A. AAA Index Series 11 | Nov. 2054 | Credit Suisse International | (0.5%) | Monthly | 5,441,000 | (17,381) | (38,769) | (56,150) |
| CMBX N.A. AAA Index Series 11 | Nov. 2054 | Credit Suisse International | (0.5%) | Monthly | 9,000,000 | (28,750) | (31,550) | (60,300) |
| CMBX N.A. AAA Index Series 11 | Nov. 2054 | Credit Suisse International | (0.5%) | Monthly | 6,000,000 | (19,166) | (943) | (20,109) |
| CMBX N.A. AAA Index Series 11 | Nov. 2054 | J.P. Morgan Securities LLC | (0.5%) | Monthly | 3,560,000 | (11,372) | (24,096) | (35,468) |
| TOTAL CREDIT DEFAULT SWAPS | $(120,365) | $(110,757) | $(231,122) | |||||
Swaps
| Payment Received | Payment Frequency | Payment Paid | Payment Frequency | Clearinghouse / Counterparty(1) | Maturity Date | Notional Amount | Value | Upfront Premium Received/(Paid)(2) | Unrealized Appreciation/(Depreciation) |
| Interest Rate Swaps | |||||||||
| 1.5% | Semi - annual | 3-month LIBOR(3) | Quarterly | LCH | Dec. 2021 | $21,345,000 | $(11,873) | $0 | $(11,873) |
| 1.5% | Semi - annual | 3-month LIBOR(3) | Quarterly | LCH | Dec. 2029 | 10,310,000 | (19,289) | 0 | (19,289) |
| 3-month LIBOR(3) | Quarterly | 1.5% | Semi - annual | LCH | Dec. 2029 | 9,760,000 | 16,248 | 0 | 16,248 |
| 3-month LIBOR(3) | Quarterly | 1.5% | Semi - annual | LCH | Dec. 2024 | 26,935,000 | 30,935 | 0 | 30,935 |
| TOTAL INTEREST RATE SWAPS | $16,021 | $0 | $16,021 | ||||||
(1) Swaps with LCH Clearnet Group (LCH) are centrally cleared over-the-counter (OTC) swaps.
(2) Any premiums for centrally cleared over-the-counter (OTC) swaps are recorded periodically throughout the term of the swap to variation margin and included in unrealized appreciation (depreciation).
(3) Represents floating rate.
Security Type Abbreviations
ETF – Exchange-Traded Fund
Legend
(a) Coupon rates for floating and adjustable rate securities reflect the rates in effect at period end.
(b) Security exempt from registration under Rule 144A of the Securities Act of 1933. These securities may be resold in transactions exempt from registration, normally to qualified institutional buyers. At the end of the period, the value of these securities amounted to $736,468,558 or 1.7% of net assets.
(c) Coupon is indexed to a floating interest rate which may be multiplied by a specified factor and/or subject to caps or floors.
(d) Security or a portion of the security was pledged to cover margin requirements for futures contracts. At period end, the value of securities pledged amounted to $2,716,539.
(e) Security or a portion of the security was pledged to cover margin requirements for centrally cleared OTC swaps. At period end, the value of securities pledged amounted to $750,695.
(f) Security or a portion of the security purchased on a delayed delivery or when-issued basis.
(g) Security represents right to receive monthly interest payments on an underlying pool of mortgages or assets. Principal shown is the outstanding par amount of the pool as of the end of the period.
(h) Coupon is inversely indexed to a floating interest rate multiplied by a specified factor. The price may be considerably more volatile than the price of a comparable fixed rate security.
(i) Represents an investment in an underlying pool of reverse mortgages which typically do not require regular principal and interest payments as repayment is deferred until a maturity event.
(j) Level 3 security
(k) Affiliated Fund
(l) Security or a portion of the security is on loan at period end.
(m) Security is perpetual in nature with no stated maturity date.
(n) Affiliated fund that is generally available only to investment companies and other accounts managed by Fidelity Investments. The rate quoted is the annualized seven-day yield of the fund at period end. A complete unaudited listing of the fund's holdings as of its most recent quarter end is available upon request. In addition, each Fidelity Central Fund's financial statements are available on the SEC's website or upon request.
(o) Investment made with cash collateral received from securities on loan.
(p) The rate quoted is the annualized seven-day yield of the fund at period end.
Affiliated Central Funds
Information regarding fiscal year to date income earned by the Fund from investments in Fidelity Central Funds is as follows:
| Fund | Income earned |
| Fidelity Cash Central Fund | $1,944,358 |
| Fidelity Securities Lending Cash Central Fund | 16,435 |
| Total | $1,960,793 |
Amounts in the income column in the above table include any capital gain distributions from underlying funds, which are presented in the corresponding line-item in the Statement of Operations, if applicable. Amount for Fidelity Securities Lending Cash Central Fund represents the income earned on investing cash collateral, less rebates paid to borrowers and any lending agent fees associated with the loan, plus any premium payments received for lending certain types of securities.
Affiliated Underlying Funds
Fiscal year to date information regarding the Fund's investments in affiliated Underlying Funds, excluding any Money Market Central Funds, is presented below. Exchanges between classes of the same affiliated Underlying Funds may occur.
| Affiliate | Value, beginning of period | Purchases | Sales Proceeds | Dividend Income | Realized Gain (loss) | Change in Unrealized appreciation (depreciation) | Value, end of period |
| Fidelity Inflation-Protected Bond Index Fund | $225,416,281 | $40,157,395 | $225,213,669 | $157,855 | $811,219 | $4,244,781 | $45,416,007 |
| Fidelity SAI Total Bond Fund | 6,465,621,313 | 109,674,635 | 188,302,114 | 109,673,614 | 4,135,877 | 362,379,201 | 6,753,508,912 |
| Fidelity SAI U.S. Treasury Bond Index Fund | 1,277,017,459 | 2,297,798,998 | 550,153,318 | 30,358,745 | 5,653,021 | 182,879,153 | 3,213,195,313 |
| Fidelity Sustainability Bond Index Fund | 23,027,435 | 338,947 | -- | 338,951 | -- | 1,448,966 | 24,815,348 |
| Fidelity U.S. Bond Index Fund | 193,744,006 | 187,569,072 | 276,141,596 | 3,625,719 | 8,067,328 | 7,286,781 | 120,525,591 |
| Total | $8,184,826,494 | $2,635,539,047 | $1,239,810,697 | $144,154,884 | $18,667,445 | $558,238,882 | $10,157,461,171 |
Amounts in the income column in the above table include any capital gain distributions from underlying funds, which are presented in the corresponding line-item in the Statement of Operations, if applicable.
Investment Valuation
The following is a summary of the inputs used, as of August 31, 2019, involving the Fund's assets and liabilities carried at fair value. The inputs or methodology used for valuing securities may not be an indication of the risk associated with investing in those securities. For more information on valuation inputs, and their aggregation into the levels used below, please refer to the Investment Valuation section in the accompanying Notes to Financial Statements.
| Valuation Inputs at Reporting Date: | ||||
| Description | Total | Level 1 | Level 2 | Level 3 |
| Investments in Securities: | ||||
| Corporate Bonds | $3,187,915,122 | $-- | $3,187,915,122 | $-- |
| U.S. Government and Government Agency Obligations | 2,925,889,611 | -- | 2,925,889,611 | -- |
| U.S. Government Agency - Mortgage Securities | 3,557,266,344 | -- | 3,557,266,344 | -- |
| Asset-Backed Securities | 261,305,122 | -- | 261,305,122 | -- |
| Collateralized Mortgage Obligations | 113,334,193 | -- | 113,334,193 | -- |
| Commercial Mortgage Securities | 342,669,576 | -- | 342,663,676 | 5,900 |
| Municipal Securities | 66,687,557 | -- | 66,687,557 | -- |
| Foreign Government and Government Agency Obligations | 12,835,953 | -- | 12,835,953 | -- |
| Bank Notes | 33,734,590 | -- | 33,734,590 | -- |
| Fixed-Income Funds | 32,319,142,138 | 32,319,142,138 | -- | -- |
| Preferred Securities | 45,440,775 | -- | 45,440,775 | -- |
| Money Market Funds | 149,301,372 | 149,301,372 | -- | -- |
| Purchased Swaptions | 12,049,300 | -- | 12,049,300 | -- |
| Total Investments in Securities: | $43,027,571,653 | $32,468,443,510 | $10,559,122,243 | $5,900 |
| Derivative Instruments: | ||||
| Assets | ||||
| Futures Contracts | $36,656 | $36,656 | $-- | $-- |
| Swaps | 47,183 | -- | 47,183 | -- |
| Total Assets | $83,839 | $36,656 | $47,183 | $-- |
| Liabilities | ||||
| Futures Contracts | $(395,210) | $(395,210) | $-- | $-- |
| Swaps | (151,527) | -- | (151,527) | -- |
| Written Swaptions | (1,108,284) | -- | (1,108,284) | -- |
| Total Liabilities | $(1,655,021) | $(395,210) | $(1,259,811) | $-- |
| Total Derivative Instruments: | $(1,571,182) | $(358,554) | $(1,212,628) | $-- |
| Other Financial Instruments: | ||||
| TBA Sale Commitments | $(223,768,414) | $-- | $(223,768,414) | $-- |
| Total Other Financial Instruments: | $(223,768,414) | $-- | $(223,768,414) | $-- |
Value of Derivative Instruments
The following table is a summary of the Fund's value of derivative instruments by primary risk exposure as of August 31, 2019. For additional information on derivative instruments, please refer to the Derivative Instruments section in the accompanying Notes to Financial Statements.
| Primary Risk Exposure / Derivative Type | Value | |
| Asset | Liability | |
| Credit Risk | ||
| Swaps(a) | $0 | $(120,365) |
| Total Credit Risk | 0 | (120,365) |
| Interest Rate Risk | ||
| Futures Contracts(b) | 36,656 | (395,210) |
| Purchased Swaptions(c) | 12,049,300 | 0 |
| Swaps(d) | 47,183 | (31,162) |
| Written Swaptions(e) | 0 | (1,108,284) |
| Total Interest Rate Risk | 12,133,139 | (1,534,656) |
| Total Value of Derivatives | $12,133,139 | $(1,655,021) |
(a) For bi-lateral over-the-counter (OTC) swaps, reflects gross value which is presented in the Statement of Assets and Liabilities in the bi-lateral OTC swaps, at value line-items.
(b) Reflects gross cumulative appreciation (depreciation) on futures contracts as presented in the Schedule of Investments. In the Statement of Assets and Liabilities, the period end daily variation margin is included in receivable or payable for daily variation margin on futures contracts, and the net cumulative appreciation (depreciation) is included in distributable earnings.
(c) Gross value is included in the Statement of Assets and Liabilities in the investments, at value line-item.
(d) For centrally cleared over-the-counter (OTC) swaps, reflects gross cumulative appreciation (depreciation) as presented in the Schedule of Investments. In the Statement of Assets and Liabilities, the period end daily variation margin for centrally cleared OTC swaps is included in receivable or payable for daily variation margin on centrally cleared OTC swaps, and the net cumulative appreciation (depreciation) for centrally cleared OTC swaps is included in distributable earnings.
(e) Gross value is presented in the Statement of Assets and Liabilities in the written options, at value line-item.
See accompanying notes which are an integral part of the financial statements.
Financial Statements
Statement of Assets and Liabilities
| August 31, 2019 (Unaudited) | ||
| Assets | ||
| Investment in securities, at value (including securities loaned of $613,200) — See accompanying schedule: Unaffiliated issuers (cost $31,667,585,952) | $32,761,457,371 | |
| Fidelity Central Funds (cost $108,648,860) | 108,653,111 | |
| Other affiliated issuers (cost $9,481,562,659) | 10,157,461,171 | |
| Total Investment in Securities (cost $41,257,797,471) | $43,027,571,653 | |
| Cash | 690,135 | |
| Receivable for investments sold | 38,788,716 | |
| Receivable for premium on written options | 1,003,601 | |
| Receivable for TBA sale commitments | 223,472,287 | |
| Receivable for fund shares sold | 12,997,833 | |
| Dividends receivable | 2,542,437 | |
| Interest receivable | 62,957,145 | |
| Distributions receivable from Fidelity Central Funds | 159,470 | |
| Prepaid expenses | 90,971 | |
| Other receivables | 396,396 | |
| Total assets | 43,370,670,644 | |
| Liabilities | ||
| Payable for investments purchased | ||
| Regular delivery | $62,097,691 | |
| Delayed delivery | 967,697,166 | |
| TBA sale commitments, at value | 223,768,414 | |
| Payable for fund shares redeemed | 23,271,149 | |
| Distributions payable | 2,494,810 | |
| Bi-lateral OTC swaps, at value | 120,365 | |
| Accrued management fee | 802,705 | |
| Payable for daily variation margin on futures contracts | 197,575 | |
| Payable for daily variation margin on centrally cleared OTC swaps | 28,312 | |
| Written options, at value (premium receivable $1,003,601) | 1,108,284 | |
| Other payables and accrued expenses | 791,272 | |
| Collateral on securities loaned | 626,400 | |
| Total liabilities | 1,283,004,143 | |
| Net Assets | $42,087,666,501 | |
| Net Assets consist of: | ||
| Paid in capital | $40,665,885,219 | |
| Total distributable earnings (loss) | 1,421,781,282 | |
| Net Assets, for 3,827,382,414 shares outstanding | $42,087,666,501 | |
| Net Asset Value, offering price and redemption price per share ($42,087,666,501 ÷ 3,827,382,414 shares) | $11.00 |
See accompanying notes which are an integral part of the financial statements.
Statement of Operations
| Six months ended August 31, 2019 (Unaudited) | ||
| Investment Income | ||
| Dividends: | ||
| Unaffiliated issuers | $381,342,853 | |
| Affiliated issuers | 144,154,883 | |
| Interest | 152,858,787 | |
| Income from Fidelity Central Funds (including $16,435 from security lending) | 1,960,793 | |
| Total income | 680,317,316 | |
| Expenses | ||
| Management fee | $56,376,259 | |
| Accounting and security lending fees | 762,473 | |
| Custodian fees and expenses | 88,289 | |
| Independent trustees' fees and expenses | 221,860 | |
| Registration fees | 352,504 | |
| Audit | 43,656 | |
| Legal | 81,525 | |
| Miscellaneous | 201,412 | |
| Total expenses before reductions | 58,127,978 | |
| Expense reductions | (51,128,323) | |
| Total expenses after reductions | 6,999,655 | |
| Net investment income (loss) | 673,317,661 | |
| Realized and Unrealized Gain (Loss) | ||
| Net realized gain (loss) on: | ||
| Investment securities: | ||
| Unaffiliated issuers | 101,508,907 | |
| Fidelity Central Funds | (8,263) | |
| Other affiliated issuers | 18,667,445 | |
| Futures contracts | (10,623,174) | |
| Swaps | (585,484) | |
| Written options | (379,112) | |
| Total net realized gain (loss) | 108,580,319 | |
| Change in net unrealized appreciation (depreciation) on: | ||
| Investment securities: | ||
| Unaffiliated issuers | 1,634,458,928 | |
| Affiliated issuers | 558,238,882 | |
| Futures contracts | (422,761) | |
| Swaps | 104,063 | |
| Written options | (104,683) | |
| Delayed delivery commitments | (1,138,623) | |
| Total change in net unrealized appreciation (depreciation) | 2,191,135,806 | |
| Net gain (loss) | 2,299,716,125 | |
| Net increase (decrease) in net assets resulting from operations | $2,973,033,786 |
See accompanying notes which are an integral part of the financial statements.
Statement of Changes in Net Assets
| Six months ended August 31, 2019 (Unaudited) | Year ended February 28, 2019 | |
| Increase (Decrease) in Net Assets | ||
| Operations | ||
| Net investment income (loss) | $673,317,661 | $1,179,353,603 |
| Net realized gain (loss) | 108,580,319 | (443,383,172) |
| Change in net unrealized appreciation (depreciation) | 2,191,135,806 | 395,454,319 |
| Net increase (decrease) in net assets resulting from operations | 2,973,033,786 | 1,131,424,750 |
| Distributions to shareholders | (623,295,970) | (1,143,156,839) |
| Share transactions | ||
| Proceeds from sales of shares | 4,972,841,205 | 9,961,531,357 |
| Reinvestment of distributions | 613,280,788 | 1,141,595,515 |
| Cost of shares redeemed | (3,880,846,853) | (8,764,885,562) |
| Net increase (decrease) in net assets resulting from share transactions | 1,705,275,140 | 2,338,241,310 |
| Total increase (decrease) in net assets | 4,055,012,956 | 2,326,509,221 |
| Net Assets | ||
| Beginning of period | 38,032,653,545 | 35,706,144,324 |
| End of period | $42,087,666,501 | $38,032,653,545 |
| Other Information | ||
| Shares | ||
| Sold | 471,210,829 | 965,172,695 |
| Issued in reinvestment of distributions | 57,260,055 | 110,799,972 |
| Redeemed | (364,243,182) | (852,168,708) |
| Net increase (decrease) | 164,227,702 | 223,803,959 |
See accompanying notes which are an integral part of the financial statements.
Financial Highlights
Strategic Advisers Core Income Fund
| Six months ended (Unaudited) August 31, | Years endedFebruary 28, | |||||
| 2019 | 2019 | 2018 | 2017 | 2016 A | 2015 | |
| Selected Per–Share Data | ||||||
| Net asset value, beginning of period | $10.38 | $10.38 | $10.50 | $10.40 | $10.78 | $10.61 |
| Income from Investment Operations | ||||||
| Net investment income (loss)B | .175 | .324 | .270 | .300 | .316 | .315 |
| Net realized and unrealized gain (loss) | .607 | (.009) | (.106) | .174 | (.366) | .177 |
| Total from investment operations | .782 | .315 | .164 | .474 | (.050) | .492 |
| Distributions from net investment income | (.162) | (.309) | (.270) | (.297) | (.322) | (.313) |
| Distributions from net realized gain | – | (.006) | (.014) | (.077) | (.008) | (.009) |
| Total distributions | (.162) | (.315) | (.284) | (.374) | (.330) | (.322) |
| Net asset value, end of period | $11.00 | $10.38 | $10.38 | $10.50 | $10.40 | $10.78 |
| Total ReturnC,D | 7.59% | 3.10% | 1.54% | 4.60% | (.45)% | 4.71% |
| Ratios to Average Net AssetsE,F | ||||||
| Expenses before reductions | .28%G | .30% | .31% | .31% | .31% | .32% |
| Expenses net of fee waivers, if any | .03%G | .05% | .06% | .06% | .06% | .07% |
| Expenses net of all reductions | .03%G | .05% | .06% | .06% | .06% | .07% |
| Net investment income (loss) | 3.27%G | 3.15% | 2.55% | 2.84% | 3.00% | 2.95% |
| Supplemental Data | ||||||
| Net assets, end of period (000 omitted) | $42,087,667 | $38,032,654 | $35,706,144 | $30,150,207 | $26,817,412 | $19,529,276 |
| Portfolio turnover rateH | 66%G | 78% | 45% | 52% | 69% | 120% |
A For the year ended February 29.
B Calculated based on average shares outstanding during the period.
C Total returns for periods of less than one year are not annualized.
D Total returns would have been lower if certain expenses had not been reduced during the applicable periods shown.
E Fees and expenses of any underlying Fidelity Central Funds are not included in the Fund's expense ratio. The Fund indirectly bears its proportionate share of the expenses of any underlying Fidelity Central Funds.
F Expense ratios reflect operating expenses of the Fund. Expenses before reductions do not reflect amounts reimbursed by the investment adviser or reductions from brokerage service arrangements or reductions from other expense offset arrangements and do not represent the amount paid by the Fund during periods when reimbursements or reductions occur. Expenses net of fee waivers reflect expenses after reimbursement by the investment adviser but prior to reductions from brokerage service arrangements or other expense offset arrangements. Expenses net of all reductions represent the net expenses paid by the Fund. Fees and expenses of the Underlying Funds are not included in the Fund's annualized ratios. The Fund indirectly bears its proportionate share of the expenses of the Underlying Funds.
G Annualized
H Amount does not include the portfolio activity of any Underlying Funds.
See accompanying notes which are an integral part of the financial statements.
Notes to Financial Statements (Unaudited)
For the period ended August 31, 2019
1. Organization.
Strategic Advisers Core Income Fund (the Fund) is a fund of Fidelity Rutland Square Trust II (the Trust), and is authorized to issue an unlimited number of shares. The Trust is registered under the Investment Company Act of 1940, as amended (the 1940 Act), as an open-end management investment company organized as a Delaware statutory trust. The Fund is offered exclusively to certain clients of Strategic Advisers LLC (Strategic Advisers), an affiliate of Fidelity Management & Research Company (FMR).
2. Significant Accounting Policies.
The Fund is an investment company and applies the accounting and reporting guidance of the Financial Accounting Standards Board (FASB) Accounting Standards Codification Topic 946 Financial Services – Investments Companies. The financial statements have been prepared in conformity with accounting principles generally accepted in the United States of America (GAAP), which require management to make certain estimates and assumptions at the date of the financial statements. Actual results could differ from those estimates. Subsequent events, if any, through the date that the financial statements were issued have been evaluated in the preparation of the financial statements. The following summarizes the significant accounting policies of the Fund:
Investment Valuation. Investments are valued as of 4:00 p.m. Eastern time on the last calendar day of the period. The Board of Trustees (the Board) has delegated the day to day responsibility for the valuation of the Fund's investments to the Fair Value Committee (the Committee) established by the Fund's investment adviser. In accordance with valuation policies and procedures approved by the Board, the Fund attempts to obtain prices from one or more third party pricing vendors or brokers to value its investments. When current market prices, quotations or currency exchange rates are not readily available or reliable, investments will be fair valued in good faith by the Committee, in accordance with procedures adopted by the Board. Factors used in determining fair value vary by investment type and may include market or investment specific events, changes in interest rates and credit quality. The frequency with which these procedures are used cannot be predicted and they may be utilized to a significant extent. The Committee oversees the Fund's valuation policies and procedures and reports to the Board on the Committee's activities and fair value determinations. The Board monitors the appropriateness of the procedures used in valuing the Fund's investments and ratifies the fair value determinations of the Committee.
The Fund categorizes the inputs to valuation techniques used to value its investments into a disclosure hierarchy consisting of three levels as shown below:
- Level 1 – quoted prices in active markets for identical investments
- Level 2 – other significant observable inputs (including quoted prices for similar investments, interest rates, prepayment speeds, etc.)
- Level 3 – unobservable inputs (including the Fund's own assumptions based on the best information available)
Valuation techniques used to value the Fund's investments by major category are as follows:
Debt securities, including restricted securities, are valued based on evaluated prices received from third party pricing vendors or from brokers who make markets in such securities. Corporate bonds, bank notes, foreign government and government agency obligations, municipal securities, preferred securities and U.S. government and government agency obligations are valued by pricing vendors who utilize matrix pricing which considers yield or price of bonds of comparable quality, coupon, maturity and type or by broker-supplied prices. Asset backed securities, collateralized mortgage obligations, commercial mortgage securities and U.S. government agency mortgage securities are valued by pricing vendors who utilize matrix pricing which considers prepayment speed assumptions, attributes of the collateral, yield or price of bonds of comparable quality, coupon, maturity and type or by broker-supplied prices. Swaps are marked-to-market daily based on valuations from third party pricing vendors, registered derivatives clearing organizations (clearinghouses) or broker-supplied valuations. These pricing sources may utilize inputs such as interest rate curves, credit spread curves, default possibilities and recovery rates. When independent prices are unavailable or unreliable, debt securities and swaps may be valued utilizing pricing methodologies which consider similar factors that would be used by third party pricing vendors. For foreign debt securities, when significant market or security specific events arise, valuations may be determined in good faith in accordance with procedures adopted by the Board. Debt securities and swaps are generally categorized as Level 2 in the hierarchy but may be Level 3 depending on the circumstances.
Exchange-Traded Funds (ETFs) are valued at their last sale price or official closing price as reported by a third party pricing vendor on the primary market or exchange on which they are traded and are categorized as Level 1 in the hierarchy. In the event there were no sales during the day but the exchange reports a closing bid level, ETFs are valued at the closing bid and would be categorized as Level 1 in the hierarchy. In the event there was no closing bid, ETFs may be valued by another method that the Board believes reflects fair value in accordance with the Board's fair value pricing policies and may be categorized as Level 2 in the hierarchy.
Futures contracts are valued at the settlement price established each day by the board of trade or exchange on which they are traded and are categorized as Level 1 in the hierarchy. Options traded over-the-counter are valued using vendor or broker-supplied valuations and are categorized as Level 2 in the hierarchy. Investments in open-end mutual funds, including the Fidelity Central Funds, are valued at their closing net asset value (NAV) each business day and are categorized as Level 1 in the hierarchy. If an unaffiliated open-end mutual fund's NAV is unavailable, shares of that fund may be valued by another method that the Board believes reflects fair value in accordance with the Board's fair value pricing policies and is categorized as Level 2 in the hierarchy.
Changes in valuation techniques may result in transfers in or out of an assigned level within the disclosure hierarchy. The aggregate value of investments by input level as of August 31, 2019 is included at the end of the Fund's Schedule of Investments.
Investment Transactions and Income. For financial reporting purposes, the Fund's investment holdings and NAV include trades executed through the end of the last business day of the period. The NAV per share for processing shareholder transactions is calculated as of the close of business of the New York Stock Exchange (NYSE), normally 4:00 p.m. Eastern time and includes trades executed through the end of the prior business day. Gains and losses on securities sold are determined on the basis of identified cost. Dividend income is recorded on the ex-dividend date, except for certain dividends from foreign securities where the ex-dividend date may have passed, which are recorded as soon as the Fund is informed of the ex-dividend date. Non-cash dividends included in dividend income, if any, are recorded at the fair market value of the securities received. Income and capital gain distributions from Fidelity Central Funds, if any, are recorded on the ex-dividend date. Income and capital gain distributions from Underlying Funds and distributions from ETFs, if any, are recorded on the ex-dividend date. Certain distributions received by the Fund represent a return of capital or capital gain. The Fund determines the components of these distributions subsequent to the ex-dividend date, based upon receipt of tax filings or other correspondence relating to the underlying investment. These distributions are recorded as a reduction of cost of investments and/or as a realized gain. Interest income is accrued as earned and includes coupon interest and amortization of premium and accretion of discount on debt securities as applicable. Debt obligations may be placed on non-accrual status and related interest income may be reduced by ceasing current accruals and writing off interest receivables when the collection of all or a portion of interest has become doubtful based on consistently applied procedures. A debt obligation is removed from non-accrual status when the issuer resumes interest payments or when collectability of interest is reasonably assured.
Expenses. Expenses directly attributable to a fund are charged to that fund. Expenses attributable to more than one fund are allocated among the respective funds on the basis of relative net assets or other appropriate methods. Expense estimates are accrued in the period to which they relate and adjustments are made when actual amounts are known.
Deferred Trustee Compensation. Under a Deferred Compensation Plan (the Plan), certain independent Trustees have elected to defer receipt of a portion of their annual compensation. Deferred amounts are invested in a cross-section of Strategic Advisers funds, are marked-to-market and remain in the Fund until distributed in accordance with the Plan. The investment of deferred amounts and the offsetting payable to the Trustees of $396,396 are included in the accompanying Statement of Assets and Liabilities in other receivables and other payables and accrued expenses, respectively.
Income Tax Information and Distributions to Shareholders. Each year, the Fund intends to qualify as a regulated investment company under Subchapter M of the Internal Revenue Code, including distributing substantially all of its taxable income and realized gains. As a result, no provision for U.S. Federal income taxes is required. The Fund files a U.S. federal tax return, in addition to state and local tax returns as required. The Fund's federal income tax returns are subject to examination by the Internal Revenue Service (IRS) for a period of three fiscal years after they are filed. State and local tax returns may be subject to examination for an additional fiscal year depending on the jurisdiction.
Distributions are declared and recorded daily and paid monthly from net investment income. Distributions from realized gains, if any, are declared and recorded on the ex-dividend date. Income and capital gain distributions are determined in accordance with income tax regulations, which may differ from GAAP.
Capital accounts within the financial statements are adjusted for permanent book-tax differences. These adjustments have no impact on net assets or the results of operations. Capital accounts are not adjusted for temporary book-tax differences which will reverse in a subsequent period.
Book-tax differences are primarily due to the short-term gain distributions from the Underlying Funds, futures contracts, swaps, market discount, deferred trustees compensation, capital loss carryforwards and losses deferred due to wash sales, futures contracts and excise tax regulations.
As of period end, the cost and unrealized appreciation (depreciation) in securities, and derivatives if applicable, for federal income tax purposes were as follows:
| Gross unrealized appreciation | $2,023,344,645 |
| Gross unrealized depreciation | (253,093,698) |
| Net unrealized appreciation (depreciation) | $1,770,250,947 |
| Tax cost | $41,256,346,241 |
Capital loss carryforwards are only available to offset future capital gains of the Fund to the extent provided by regulations and may be limited. Under the Regulated Investment Company Modernization Act of 2010 (the Act), the Fund is permitted to carry forward capital losses incurred in taxable years beginning after December 22, 2010 for an unlimited period and such capital losses are required to be used prior to any losses that expire. The capital loss carryforward information presented below, including any applicable limitation, is estimated as of prior fiscal period end and is subject to adjustment.
| No expiration | |
| Short-term | $(71,743,359) |
| Long-term | (427,336,866) |
| Total capital loss carryforward | $(499,080,225) |
At the prior fiscal period end, the Fund was required to defer approximately $893,261 of losses on futures contracts.
Delayed Delivery Transactions and When-Issued Securities. During the period, the Fund transacted in securities on a delayed delivery or when-issued basis. Payment and delivery may take place after the customary settlement period for that security. The price of the underlying securities and the date when the securities will be delivered and paid for are fixed at the time the transaction is negotiated. The securities purchased on a delayed delivery or when-issued basis are identified as such in the Fund's Schedule of Investments. The Fund may receive compensation for interest forgone in the purchase of a delayed delivery or when-issued security. With respect to purchase commitments, the Fund identifies securities as segregated in its records with a value at least equal to the amount of the commitment. Losses may arise due to changes in the value of the underlying securities or if the counterparty does not perform under the contract's terms, or if the issuer does not issue the securities due to political, economic, or other factors.
To-Be-Announced (TBA) Securities and Mortgage Dollar Rolls. During the period, the Fund transacted in TBA securities that involved buying or selling mortgage-backed securities (MBS) on a forward commitment basis. A TBA transaction typically does not designate the actual security to be delivered and only includes an approximate principal amount; however delivered securities must meet specified terms defined by industry guidelines, including issuer, rate and current principal amount outstanding on underlying mortgage pools. The Fund may enter into a TBA transaction with the intent to take possession of or deliver the underlying MBS, or the Fund may elect to extend the settlement by entering into either a mortgage or reverse mortgage dollar roll. Mortgage dollar rolls are transactions where a fund sells TBA securities and simultaneously agrees to repurchase MBS on a later date at a lower price and with the same counterparty. Reverse mortgage dollar rolls involve the purchase and simultaneous agreement to sell TBA securities on a later date at a lower price. Transactions in mortgage dollar rolls and reverse mortgage dollar rolls are accounted for as purchases and sales and may result in an increase to the Fund's portfolio turnover rate.
Purchases and sales of TBA securities involve risks similar to those discussed above for delayed delivery and when-issued securities. Also, if the counterparty in a mortgage dollar roll or a reverse mortgage dollar roll transaction files for bankruptcy or becomes insolvent, the Fund's right to repurchase or sell securities may be limited. Additionally, when a fund sells TBA securities without already owning or having the right to obtain the deliverable securities (an uncovered forward commitment to sell), it incurs a risk of loss because it could have to purchase the securities at a price that is higher than the price at which it sold them. A fund may be unable to purchase the deliverable securities if the corresponding market is illiquid.
TBA securities subject to a forward commitment to sell at period end are included at the end of the Fund's Schedule of Investments under the caption "TBA Sale Commitments." The proceeds and value of these commitments are reflected in the Fund's Statement of Assets and Liabilities as Receivable for TBA sale commitments and TBA sale commitments, at value, respectively.
Restricted Securities. The Fund may invest in securities that are subject to legal or contractual restrictions on resale. These securities generally may be resold in transactions exempt from registration or to the public if the securities are registered. Disposal of these securities may involve time-consuming negotiations and expense, and prompt sale at an acceptable price may be difficult. Information regarding restricted securities is included at the end of the Fund's Schedule of Investments.
3. Derivative Instruments.
Risk Exposures and the Use of Derivative Instruments. The Fund's investment objective allows the Fund to enter into various types of derivative contracts, including futures contracts, options and swaps. Derivatives are investments whose value is primarily derived from underlying assets, indices or reference rates and may be transacted on an exchange or over-the-counter (OTC). Derivatives may involve a future commitment to buy or sell a specified asset based on specified terms, to exchange future cash flows at periodic intervals based on a notional principal amount, or for one party to make one or more payments upon the occurrence of specified events in exchange for periodic payments from the other party.
The Fund used derivatives to increase returns, to gain exposure to certain types of assets and to manage exposure to certain risks as defined below. The success of any strategy involving derivatives depends on analysis of numerous economic factors, and if the strategies for investment do not work as intended, the Fund may not achieve its objectives.
The Fund's use of derivatives increased or decreased its exposure to the following risks:
| Credit Risk | Credit risk relates to the ability of the issuer of a financial instrument to make further principal or interest payments on an obligation or commitment that it has to the Fund. |
| Interest Rate Risk | Interest rate risk relates to the fluctuations in the value of interest-bearing securities due to changes in the prevailing levels of market interest rates. |
The Fund is also exposed to additional risks from investing in derivatives, such as liquidity risk and counterparty credit risk. Liquidity risk is the risk that the Fund will be unable to close out the derivative in the open market in a timely manner. Counterparty credit risk is the risk that the counterparty will not be able to fulfill its obligation to the Fund. Derivative counterparty credit risk is managed through formal evaluation of the creditworthiness of all potential counterparties. On certain OTC derivatives such as options and bi-lateral swaps, the Fund attempts to reduce its exposure to counterparty credit risk by entering into an International Swaps and Derivatives Association, Inc. (ISDA) Master Agreement with each of its counterparties. The ISDA Master Agreement gives the Fund the right to terminate all transactions traded under such agreement upon the deterioration in the credit quality of the counterparty beyond specified levels. The ISDA Master Agreement gives each party the right, upon an event of default by the other party or a termination of the agreement, to close out all transactions traded under such agreement and to net amounts owed under each transaction to one net payable by one party to the other. To mitigate counterparty credit risk on bi-lateral OTC derivatives, the Fund receives collateral in the form of cash or securities once the Fund's net unrealized appreciation on outstanding derivative contracts under an ISDA Master Agreement exceeds certain applicable thresholds, subject to certain minimum transfer provisions. The collateral received is held in segregated accounts with the Fund's custodian bank in accordance with the collateral agreements entered into between the Fund, the counterparty and the Fund's custodian bank. The Fund could experience delays and costs in gaining access to the collateral even though it is held by the Fund's custodian bank. The Fund's maximum risk of loss from counterparty credit risk related to bi-lateral OTC derivatives is generally the aggregate unrealized appreciation and unpaid counterparty payments in excess of any collateral pledged by the counterparty to the Fund. For OTC written options with upfront premiums received, the Fund is obligated to perform and therefore does not have counterparty risk. For OTC written options with premiums to be received at a future date, the maximum risk of loss from counterparty credit risk is the amount of the premium in excess of any collateral pledged by the counterparty. The Fund may be required to pledge collateral for the benefit of the counterparties on bi-lateral OTC derivatives in an amount not less than each counterparty's unrealized appreciation on outstanding derivative contracts, subject to certain minimum transfer provisions, and any such pledged collateral is identified in the Schedule of Investments. Exchange-traded futures contracts and exchange-traded options are not covered by the ISDA Master Agreement; however counterparty credit risk related to exchange-traded futures contracts and exchange-traded options may be mitigated by the protection provided by the exchange on which they trade. Counterparty credit risk related to centrally cleared OTC swaps may be mitigated by the protection provided by the clearinghouse.
Investing in derivatives may involve greater risks than investing in the underlying assets directly and, to varying degrees, may involve risk of loss in excess of any initial investment and collateral received and amounts recognized in the Statement of Assets and Liabilities. In addition, there may be the risk that the change in value of the derivative contract does not correspond to the change in value of the underlying instrument.
Net Realized Gain (Loss) and Change in Net Unrealized Appreciation (Depreciation) on Derivatives. The table below, which reflects the impacts of derivatives on the financial performance of the Fund, summarizes the net realized gain (loss) and change in net unrealized appreciation (depreciation) for derivatives during the period as presented in the Statement of Operations.
| Primary Risk Exposure / Derivative Type | Net Realized Gain (Loss) | Change in Net Unrealized Appreciation (Depreciation) |
| Credit Risk | ||
| Swaps | $(141,487) | $88,042 |
| Interest Rate Risk | ||
| Futures Contracts | (10,623,174) | (422,761) |
| Purchased Options | 1,580,006 | 2,413,004 |
| Written Options | (379,112) | (104,683) |
| Swaps | (443,997) | 16,021 |
| Total Interest Rate Risk | (9,866,277) | 1,901,581 |
| Totals | $(10,007,764) | $1,989,623 |
A summary of the value of derivatives by primary risk exposure as of period end is included at the end of the Schedule of Investments.
Futures Contracts. A futures contract is an agreement between two parties to buy or sell a specified underlying instrument for a fixed price at a specified future date. The Fund used futures contracts to manage its exposure to the bond market and fluctuations in interest rates.
Upon entering into a futures contract, a fund is required to deposit either cash or securities (initial margin) with a clearing broker in an amount equal to a certain percentage of the face value of the contract. Futures contracts are marked-to-market daily and subsequent daily payments (variation margin) are made or received by a fund depending on the daily fluctuations in the value of the futures contracts and are recorded as unrealized appreciation or (depreciation). This receivable and/or payable, if any, is included in daily variation margin on futures contracts in the Statement of Assets and Liabilities. Realized gain or (loss) is recorded upon the expiration or closing of a futures contract. The net realized gain (loss) and change in net unrealized appreciation (depreciation) on futures contracts during the period is presented in the Statement of Operations.
Any open futures contracts at period end are presented in the Schedule of Investments under the caption "Futures Contracts". The notional amount at value reflects each contract's exposure to the underlying instrument or index at period end and is representative of volume of activity during the period. Securities deposited to meet initial margin requirements are identified in the Schedule of Investments.
Options. Options give the purchaser the right, but not the obligation, to buy (call) or sell (put) an underlying security or financial instrument at an agreed exercise or strike price between or on certain dates. Options obligate the seller (writer) to buy (put) or sell (call) an underlying instrument at the exercise or strike price or cash settle an underlying derivative instrument if the holder exercises the option on or before the expiration date. The Fund uses OTC options, such as swaptions, which are options where the underlying instrument is a swap, to manage its exposure to fluctuations in interest rates.
Upon entering into an options contract, a fund will pay or receive a premium. Premiums paid on purchased options are reflected as cost of investments and premiums received on written options are reflected as a liability on the Statement of Assets and Liabilities. Certain options may be purchased or written with premiums to be paid or received on a future date. Options are valued daily and any unrealized appreciation (depreciation) is reflected on the Statement of Assets and Liabilities. When an option is exercised, the cost or proceeds of the underlying instrument purchased or sold is adjusted by the amount of the premium. When an option is closed the Fund will realize a gain or loss depending on whether the proceeds or amount paid for the closing sale transaction is greater or less than the premium received or paid. When an option expires, gains and losses are realized to the extent of premiums received and paid, respectively. The net realized and unrealized gains (losses) on purchased options are included in the Statement of Operations in net realized gain (loss) and change in net unrealized appreciation (depreciation) on investment securities. The net realized gain (loss) and change in net unrealized appreciation (depreciation) on written options are presented in the Statement of Operations.
Any open options at period end are presented in the Schedule of Investments under the captions "Purchased Options," "Purchased Swaptions," "Written Options" and "Written Swaptions," as applicable, and are representative of volume of activity during the period.
Writing puts and buying calls tend to increase exposure to the underlying instrument while buying puts and writing calls tend to decrease exposure to the underlying instrument. For purchased options, risk of loss is limited to the premium paid, and for written options, risk of loss is the change in value in excess of the premium received.
Swaps. A swap is a contract between two parties to exchange future cash flows at periodic intervals based on a notional principal amount. A bi-lateral OTC swap is a transaction between a fund and a dealer counterparty where cash flows are exchanged between the two parties for the life of the swap. A centrally cleared OTC swap is a transaction executed between a fund and a dealer counterparty, then cleared by a futures commission merchant (FCM) through a clearinghouse. Once cleared, the clearinghouse serves as a central counterparty, with whom a fund exchanges cash flows for the life of the transaction, similar to transactions in futures contracts.
Bi-lateral OTC swaps are marked-to-market daily and changes in value are reflected in the Statement of Assets and Liabilities in the bi-lateral OTC swaps at value line items. Any upfront premiums paid or received upon entering a bi-lateral OTC swap to compensate for differences between stated terms of the swap and prevailing market conditions (e.g. credit spreads, interest rates or other factors) are recorded in net unrealized appreciation (depreciation) in the Statement of Assets and Liabilities and amortized to realized gain or (loss) ratably over the term of the swap. Any unamortized upfront premiums are presented in the Schedule of Investments.
Centrally cleared OTC swaps require a fund to deposit either cash or securities (initial margin) with the FCM, at the instruction of and for the benefit of the clearinghouse. Securities deposited to meet initial margin requirements are identified in the Schedule of Investments. Centrally cleared OTC swaps are marked-to-market daily and subsequent payments (variation margin) are made or received depending on the daily fluctuations in the value of the swaps and are recorded as unrealized appreciation or (depreciation). These daily payments, if any, are included in receivable or payable for daily variation margin on centrally cleared OTC swaps in the Statement of Assets and Liabilities. Any premiums for centrally cleared OTC swaps are recorded periodically throughout the term of the swap to variation margin and included in unrealized appreciation (depreciation) in the Statement of Assets and Liabilities. Any premiums are recognized as realized gain (loss) upon termination or maturity of the swap.
For both bi-lateral and centrally cleared OTC swaps, payments are exchanged at specified intervals, accrued daily commencing with the effective date of the contract and recorded as realized gain or (loss). Some swaps may be terminated prior to the effective date and realize a gain or loss upon termination. The net realized gain (loss) and change in net unrealized appreciation (depreciation) on swaps during the period is presented in the Statement of Operations.
Any open swaps at period end are included in the Schedule of Investments under the caption "Swaps" and are representative of volume of activity during the period.
Credit Default Swaps. Credit default swaps enable the Fund to buy or sell protection against specified credit events on a single-name issuer or a traded credit index. Under the terms of a credit default swap the buyer of protection (buyer) receives credit protection in exchange for making periodic payments to the seller of protection (seller) based on a fixed percentage applied to a notional principal amount. In return for these payments, the seller will be required to make a payment upon the occurrence of one or more specified credit events. The Fund enters into credit default swaps as a seller to gain credit exposure to an issuer and/or as a buyer to obtain a measure of protection against defaults of an issuer. Periodic payments are made over the life of the contract by the buyer provided that no credit event occurs.
For credit default swaps on most corporate and sovereign issuers, credit events include bankruptcy, failure to pay or repudiation/moratorium. For credit default swaps on corporate or sovereign issuers, the obligation that may be put to the seller is not limited to the specific reference obligation described in the Schedule of Investments. For credit default swaps on asset-backed securities, a credit event may be triggered by events such as failure to pay principal, maturity extension, rating downgrade or write-down. For credit default swaps on asset-backed securities, the reference obligation described represents the security that may be put to the seller. For credit default swaps on a traded credit index, a specified credit event may affect all or individual underlying securities included in the index.
As a seller, if an underlying credit event occurs, the Fund will pay a net settlement amount of cash equal to the notional amount of the swap less the recovery value of the reference obligation or underlying securities comprising an index. Only in the event of the industry's inability to value the underlying asset will the Fund be required to take delivery of the reference obligation or underlying securities comprising an index and pay an amount equal to the notional amount of the swap.
As a buyer, if an underlying credit event occurs, the Fund will receive a net settlement amount of cash equal to the notional amount of the swap less the recovery value of the reference obligation or underlying securities comprising an index. Only in the event of the industry's inability to value the underlying asset will the Fund be required to deliver the reference obligation or underlying securities comprising an index in exchange for payment of an amount equal to the notional amount of the swap.
Typically, the value of each credit default swap and credit rating disclosed for each reference obligation in the Schedule of Investments, where the Fund is the seller, can be used as measures of the current payment/performance risk of the swap. As the value of the swap changes as a positive or negative percentage of the total notional amount, the payment/performance risk may decrease or increase, respectively. In addition to these measures, the investment adviser monitors a variety of factors including cash flow assumptions, market activity and market sentiment as part of its ongoing process of assessing payment/performance risk.
Interest Rate Swaps. Interest rate swaps are agreements between counterparties to exchange cash flows, one based on a fixed rate, and the other on a floating rate. The Fund entered into interest rate swaps to manage its exposure to interest rate changes. Changes in interest rates can have an effect on both the value of bond holdings as well as the amount of interest income earned. In general, the value of bonds can fall when interest rates rise and can rise when interest rates fall.
4. Purchases and Sales of Investments.
Purchases and sales of securities (including the Underlying Fund shares), other than short-term securities and U.S. government securities, aggregated $5,411,241,322 and $3,384,868,462, respectively.
5. Fees and Other Transactions with Affiliates.
Management Fee. Strategic Advisers (the investment adviser) provides the Fund with investment management related services. For these services, the Fund pays a monthly management fee to the investment adviser. The management fee is calculated by adding the annual management fee rate of .25% of the Fund's average net assets throughout the month payable to the investment adviser to the aggregate of the fee rates, payable monthly, to the Fund's sub-advisers. The Fund's maximum aggregate management fee will not exceed .60% of the Fund's average net assets. For the reporting period, the total annualized management fee rate was .27% of the Fund's average net assets.
During the period, the investment adviser waived a portion of its management fee as described in the Expense Reductions note.
Sub-Advisers. FIAM LLC (an affiliate of the investment adviser) and PGIM, Inc. each served as a sub-adviser for the Fund during the period. Sub-advisers provide discretionary investment advisory services for their allocated portion of the Fund's assets and are paid by the investment adviser and not the Fund for providing these services.
Accounting and Security Lending Fees. Fidelity Service Company, Inc. (FSC), an affiliate of the investment adviser, maintains the Fund's accounting records. The accounting fee is based on the level of average net assets for each month. Prior to April 1, 2019, FSC had a separate agreement with the Fund for administration of the security lending program, based on the number and duration of lending transactions. Effective July 1, 2019 accounting fees are not paid by the Fund and are instead paid by the investment adviser or an affiliate. For the period, the total fees paid for accounting and administration of securities lending were equivalent to an annualized rate of less than 0.005%.
Interfund Trades. The Fund may purchase from or sell securities to other funds affiliated with each sub-adviser under procedures adopted by the Board. The procedures have been designed to ensure these interfund trades are executed in accordance with Rule 17a-7 of the 1940 Act. Interfund trades are included within the respective purchases and sales amounts shown in the Purchases and Sales of Investments note.
Reallocation of Underlying Fund Investments. During the prior period, the investment adviser reallocated investments of the Fund. This involved taxable redemptions of the fund's interest in Fidelity Total Bond Fund in exchange for investments and cash, valued at $6,386,899,397, and non-taxable exchanges of those investments for shares of Fidelity SAI Total Bond Fund. The Fund had a net realized loss of $291,139,992 on the redemption of Fidelity Total Bond Fund shares.
6. Investments in Fidelity Central Funds.
The Fund invests in Fidelity Central Funds, which are open-end investment companies available only to other investment companies and accounts managed by the investment adviser and its affiliates. The Fund's Schedule of Investments lists each of the Fidelity Central Funds held as of period end, if any, as an investment of the Fund, but does not include the underlying holdings of each Fidelity Central Fund. As an Investing Fund, the Fund indirectly bears its proportionate share of the expenses of the underlying Fidelity Central Funds.
The Fidelity Money Market Central Funds are managed by Fidelity Investments Money Management, Inc. (FIMM), an affiliate of the investment adviser. Annualized expenses of the Money Market Central Funds as of their most recent shareholder report date ranged from less than .005% to .01%.
A complete unaudited list of holdings for each Fidelity Central Fund is available upon request or at the Securities and Exchange Commission (the SEC) website at www.sec.gov. In addition, the financial statements of the Fidelity Central Funds are available on the SEC website or upon request.
7. Committed Line of Credit.
The Fund participates with other funds managed by the investment adviser or an affiliate in a $4.25 billion credit facility (the "line of credit") to be utilized for temporary or emergency purposes to fund shareholder redemptions or for other short-term liquidity purposes. The Fund has agreed to pay commitment fees on its pro-rata portion of the line of credit, which amounted to $53,324 and is reflected in Miscellaneous expenses on the Statement of Operations. During the period, the Fund did not borrow on this line of credit.
8. Security Lending.
The Fund lends portfolio securities through a lending agent from time to time in order to earn additional income. On the settlement date of the loan, the Fund receives collateral (in the form of U.S. Treasury obligations, letters of credit and/or cash) against the loaned securities and maintains collateral in an amount not less than 100% of the market value of the loaned securities during the period of the loan. The market value of the loaned securities is determined at the close of business of the Fund and any additional required collateral is delivered to the Fund on the next business day. The Fund or borrower may terminate the loan at any time, and if the borrower defaults on its obligation to return the securities loaned because of insolvency or other reasons, the Fund may apply collateral received from the borrower against the obligation. The Fund may experience delays and costs in recovering the securities loaned. Any cash collateral received is invested in the Fidelity Securities Lending Cash Central Fund. The value of loaned securities and cash collateral at period end are disclosed on the Fund's Statement of Assets and Liabilities. Security lending income represents the income earned on investing cash collateral, less rebates paid to borrowers and any lending agent fees associated with the loan, plus any premium payments received for lending certain types of securities. Security lending income is presented in the Statement of Operations as a component of income from Fidelity Central Funds.
9. Expense Reductions.
The investment adviser has contractually agreed to waive the Fund's management fee in an amount equal to .25% of the Fund's average net assets until September 30, 2022. During the period, this waiver reduced the Fund's management fee by $51,122,198.
Commissions paid to certain brokers with whom the investment adviser, or its affiliates, places trades on behalf of the Fund include an amount in addition to trade execution, which may be rebated back to the Fund to offset certain expenses. This amount totaled $6,125 for the period.
10. Other.
The Fund's organizational documents provide former and current trustees and officers with a limited indemnification against liabilities arising in connection with the performance of their duties to the Fund. In the normal course of business, the Fund may also enter into contracts that provide general indemnifications. The Fund's maximum exposure under these arrangements is unknown as this would be dependent on future claims that may be made against the Fund. The risk of material loss from such claims is considered remote.
The Fund does not invest in the Underlying Funds for the purpose of exercising management or control; however, investments by the Fund within its principal investment strategies may represent a significant portion of an Underlying Fund's net assets.
At the end of the period, the Fund was the owner of record of 10% or more of the total outstanding shares of the following Underlying Funds:
| Fidelity SAI U.S. Treasury Bond Index Fund | 45% |
| Fidelity Sustainability Bond Index Fund | 32% |
| Fidelity SAI Total Bond Fund | 48% |
Shareholder Expense Example
As a shareholder of the Fund, you incur two types of costs: (1) transaction costs and (2) ongoing costs, including management fees and other Fund expenses. This Example is intended to help you understand your ongoing costs (in dollars) of investing in the Fund and to compare these costs with the ongoing costs of investing in other mutual funds.
The Example is based on an investment of $1,000 invested at the beginning of the period and held for the entire period (March 1, 2019 to August 31, 2019).
Actual Expenses
The first line of the accompanying table provides information about actual account values and actual expenses. You may use the information in this line, together with the amount you invested, to estimate the expenses that you paid over the period. Simply divide your account value by $1,000.00 (for example, an $8,600 account value divided by $1,000.00 = 8.6), then multiply the result by the number in the first line under the heading entitled "Expenses Paid During Period" to estimate the expenses you paid on your account during this period. In addition to the direct expenses incurred by the Fund presented in the table, as a shareholder of the underlying mutual funds and exchange-traded funds (ETFs) (the Underlying Funds), the Fund also indirectly bears its proportionate share of the expenses of the Underlying Funds. In addition, the Fund, as a shareholder in the underlying Fidelity Central Funds, will indirectly bear its pro-rata share of the fees and expenses incurred by the underlying Fidelity Central Funds. These fees and expenses are not included in the Fund's annualized expense ratio used to calculate the expense estimate in the table below.
Hypothetical Example for Comparison Purposes
The second line of the accompanying table provides information about hypothetical account values and hypothetical expenses based on the Fund's actual expense ratio and an assumed rate of return of 5% per year before expenses, which is not the Fund's actual return. The hypothetical account values and expenses may not be used to estimate the actual ending account balance or expenses you paid for the period. You may use this information to compare the ongoing costs of investing in the Fund and other funds. To do so, compare this 5% hypothetical example with the 5% hypothetical examples that appear in the shareholder reports of the other funds. In addition to the direct expenses incurred by the Fund presented in the table, as a shareholder of the Underlying Funds, the Fund also indirectly bears its proportionate share of the expenses of the Underlying Funds. In addition, the Fund, as a shareholder in the underlying Fidelity Central Funds, will indirectly bear its pro-rata share of the fees and expenses incurred by the underlying Fidelity Central Funds. These fees and expenses are not included in the Fund's annualized expense ratio used to calculate the expense estimate in the table below.
Please note that the expenses shown in the table are meant to highlight your ongoing costs only and do not reflect any transaction costs. Therefore, the second line of the table is useful in comparing ongoing costs only, and will not help you determine the relative total costs of owning different funds.
| Annualized Expense Ratio-A | Beginning Account Value March 1, 2019 | Ending Account Value August 31, 2019 | Expenses Paid During Period-B March 1, 2019 to August 31, 2019 | |
| Actual | .03% | $1,000.00 | $1,075.90 | $.16 |
| Hypothetical-C | $1,000.00 | $1,024.99 | $.15 |
A Annualized expense ratio reflects expenses net of applicable fee waivers.
B Expenses are equal to the Fund's annualized expense ratio, multiplied by the average account value over the period, multiplied by 184/366 (to reflect the one-half year period). The fees and expenses of the Underlying Funds in which the Fund invests are not included in the Fund's annualized expense ratio.
C 5% return per year before expenses
![]()
SSC-SANN-1019
1.912889.109
Strategic Advisers® Emerging Markets Fund Offered exclusively to certain clients of Strategic Advisers LLC - not available for sale to the general public Semi-Annual Report August 31, 2019 |
|
Beginning on January 1, 2021, as permitted by regulations adopted by the Securities and Exchange Commission, paper copies of a fund’s shareholder reports will no longer be sent by mail, unless you specifically request paper copies of the reports from the fund or from your financial intermediary, such as a financial advisor, broker-dealer or bank. Instead, the reports will be made available on a website, and you will be notified by mail each time a report is posted and provided with a website link to access the report.
If you already elected to receive shareholder reports electronically, you will not be affected by this change and you need not take any action. You may elect to receive shareholder reports and other communications from a fund electronically, by contacting your financial intermediary. For Fidelity customers, visit Fidelity's web site or call Fidelity using the contact information listed below.
You may elect to receive all future reports in paper free of charge. If you wish to continue receiving paper copies of your shareholder reports, you may contact your financial intermediary or, if you are a Fidelity customer, visit Fidelity’s website, or call Fidelity at the applicable toll-free number listed below. Your election to receive reports in paper will apply to all funds held with the fund complex/your financial intermediary.
| Account Type | Website | Phone Number |
| Brokerage, Mutual Fund, or Annuity Contracts: | fidelity.com/mailpreferences | 1-800-343-3548 |
| Employer Provided Retirement Accounts: | netbenefits.fidelity.com/preferences (choose 'no' under Required Disclosures to continue to print) | 1-800-343-0860 |
| Advisor Sold Accounts Serviced Through Your Financial Intermediary: | Contact Your Financial Intermediary | Your Financial Intermediary's phone number |
| Advisor Sold Accounts Serviced by Fidelity: | institutional.fidelity.com | 1-877-208-0098 |
Contents
Board Approval of Investment Advisory Contract and Management Fees |
To view a fund's proxy voting record for the 12-month period ended June 30, visit http://www.fidelity.com/proxyvotingresults or visit the Securities and Exchange Commission's (SEC) web site at http://www.sec.gov.
You may also call 1-800-544-3455 to request a free copy of the proxy voting guidelines.
Standard & Poor's, S&P and S&P 500 are registered service marks of The McGraw-Hill Companies, Inc. and have been licensed for use by Fidelity Distributors Corporation.
Other third-party marks appearing herein are the property of their respective owners.
All other marks appearing herein are registered or unregistered trademarks or service marks of FMR LLC or an affiliated company. © 2019 FMR LLC. All rights reserved.
This report and the financial statements contained herein are submitted for the general information of the shareholders of the Fund. This report is not authorized for distribution to prospective investors in the Fund unless preceded or accompanied by an effective prospectus.
A fund files its complete schedule of portfolio holdings with the SEC for the first and third quarters of each fiscal year on Form N-PORT. Forms N-PORT are available on the SEC’s web site at http://www.sec.gov. A fund's Forms N-PORT may be reviewed and copied at the SEC’s Public Reference Room in Washington, DC. Information regarding the operation of the SEC's Public Reference Room may be obtained by calling 1-800-SEC-0330.
For a complete list of a fund's portfolio holdings, view the most recent holdings listing, semiannual report, or annual report on Fidelity's web site at http://www.fidelity.com, http://www.institutional.fidelity.com, or http://www.401k.com, as applicable.
NOT FDIC INSURED •MAY LOSE VALUE •NO BANK GUARANTEE
Neither the Fund nor Fidelity Distributors Corporation is a bank.
Investment Summary (Unaudited)
The information in the following tables is based on the direct investments of the Fund.Top Ten Holdings as of August 31, 2019
| (excluding cash equivalents) | % of fund's net assets |
| Fidelity Emerging Markets Fund | 7.8 |
| Fidelity SAI Emerging Markets Low Volatility Index Fund | 5.1 |
| iShares MSCI China ETF | 3.3 |
| Goldman Sachs Emerging Markets Equity Fund Institutional Shares | 3.1 |
| Tencent Holdings Ltd. | 3.1 |
| Samsung Electronics Co. Ltd. | 2.9 |
| Alibaba Group Holding Ltd. sponsored ADR | 2.8 |
| Invesco Oppenheimer Developing Markets Fund Class R6 | 2.6 |
| Aberdeen Emerging Markets Fund Institutional Service Class | 2.2 |
| Taiwan Semiconductor Manufacturing Co. Ltd. | 2.0 |
| 34.9 |
Top Five Market Sectors as of August 31, 2019
| (stocks only) | % of fund's net assets |
| Financials | 17.1 |
| Information Technology | 11.0 |
| Communication Services | 9.9 |
| Consumer Discretionary | 9.8 |
| Consumer Staples | 5.5 |
Geographic Diversification (% of fund's net assets)
| As of August 31, 2019 | ||
| United States of America* | 39.1% | |
| Cayman Islands | 10.7% | |
| China | 7.1% | |
| Korea (South) | 7.5% | |
| Brazil | 5.5% | |
| Taiwan | 5.6% | |
| India | 5.3% | |
| Russia | 2.9% | |
| South Africa | 2.6% | |
| Other | 13.7% | |
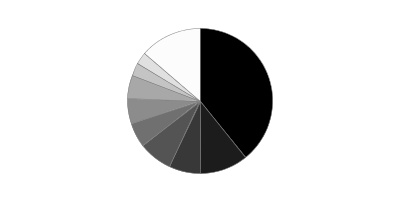
* Includes Short-Term investments and Net Other Assets (Liabilities).
Percentages are based on country or territory of incorporation and are adjusted for the effect of futures contracts, if applicable.
Asset Allocation (% of fund's net assets)
| As of August 31, 2019 | ||
| Common Stocks | 59.2% | |
| Preferred Stocks | 2.2% | |
| Diversifed Emerging Markets Funds | 27.3% | |
| Other | 3.6% | |
| Short-Term Investments and Net Other Assets (Liabilities) | 7.7% | |

Asset allocations of funds in the pie chart reflect the categorizations of assets as defined by Morningstar as of the reporting date.
Schedule of Investments August 31, 2019 (Unaudited)
Showing Percentage of Net Assets
| Common Stocks - 59.2% | |||
| Shares | Value | ||
| COMMUNICATION SERVICES - 6.2% | |||
| Diversified Telecommunication Services - 0.7% | |||
| China Telecom Corp. Ltd. (H Shares) | 13,872,000 | $6,198,701 | |
| China Unicom Ltd. | 1,634,000 | 1,623,346 | |
| Hellenic Telecommunications Organization SA | 94,354 | 1,258,915 | |
| HKBN Ltd. | 263,500 | 472,104 | |
| HKT Trust/HKT Ltd. unit | 219,000 | 342,108 | |
| KT Corp. | 54,291 | 1,212,172 | |
| LG Telecom Ltd. | 668,055 | 7,285,705 | |
| Magyar Telekom PLC | 28,408 | 39,870 | |
| PT Telekomunikasi Indonesia Tbk Series B | 24,847,183 | 7,812,245 | |
| Qatar Telecom (Qtel) Q.S.C. (a) | 62,110 | 119,385 | |
| Telecom Egypt SAE | 297,066 | 241,422 | |
| Telkom SA Ltd. | 1,192,970 | 6,261,053 | |
| Turk Telekomunikasyon A/S (a) | 717,003 | 652,212 | |
| 33,519,238 | |||
| Entertainment - 0.5% | |||
| CD Projekt RED SA | 131,834 | 8,378,613 | |
| Changyou.com Ltd. (A Shares) ADR | 15,523 | 89,102 | |
| Gamania Digital Entertainment Co. Ltd. | 59,000 | 115,070 | |
| Gravity Co. Ltd. ADR (a) | 498 | 14,930 | |
| IGG, Inc. | 103,376 | 69,887 | |
| International Games Systems Co. Ltd. | 52,000 | 627,426 | |
| NetEase, Inc. ADR | 51,043 | 13,015,965 | |
| NHN Entertainment Corp. (a) | 2,843 | 142,578 | |
| 22,453,571 | |||
| Interactive Media & Services - 4.0% | |||
| 58.com, Inc. ADR (a) | 38,125 | 2,050,744 | |
| AfreecaTV Co. Ltd. | 4,701 | 236,145 | |
| Autohome, Inc. ADR Class A (a)(b) | 64,708 | 5,639,949 | |
| Baidu.com, Inc. sponsored ADR (a) | 41,300 | 4,314,611 | |
| Mail.Ru Group Ltd. GDR (Reg. S) (a) | 308,293 | 6,868,768 | |
| NAVER Corp. | 37,022 | 4,481,082 | |
| Tencent Holdings Ltd. | 3,578,589 | 147,743,955 | |
| Yandex NV Series A (a) | 380,326 | 14,110,095 | |
| YY, Inc. ADR (a) | 50,455 | 2,883,503 | |
| 188,328,852 | |||
| Media - 0.0% | |||
| Cheil Worldwide, Inc. | 21,770 | 474,841 | |
| Cyfrowy Polsat SA | 28,793 | 210,477 | |
| Hyundai HCN | 146,658 | 452,566 | |
| INNOCEAN Worldwide, Inc. | 6,567 | 365,689 | |
| Smiles Fidelidade SA | 48,000 | 428,882 | |
| 1,932,455 | |||
| Wireless Telecommunication Services - 1.0% | |||
| Advanced Info Service PCL (For. Reg.) | 212,100 | 1,608,867 | |
| America Movil S.A.B. de CV Series L sponsored ADR | 478,005 | 6,988,433 | |
| China Mobile Ltd. | 2,653,000 | 21,952,482 | |
| China Mobile Ltd. sponsored ADR | 51,644 | 2,133,414 | |
| China United Network Communications Ltd. (A Shares) | 7,656,554 | 6,258,501 | |
| Globe Telecom, Inc. | 1,795 | 69,886 | |
| Mobile TeleSystems OJSC sponsored ADR | 321,287 | 2,579,935 | |
| MTN Group Ltd. | 258,907 | 1,751,052 | |
| SK Telecom Co. Ltd. | 12,259 | 2,425,168 | |
| SK Telecom Co. Ltd. sponsored ADR | 31,376 | 687,134 | |
| Taiwan Mobile Co. Ltd. | 36,000 | 128,703 | |
| Turkcell Iletisim Hizmet A/S | 765,822 | 1,699,490 | |
| VEON Ltd. sponsored ADR | 277,792 | 725,037 | |
| 49,008,102 | |||
| TOTAL COMMUNICATION SERVICES | 295,242,218 | ||
| CONSUMER DISCRETIONARY - 9.8% | |||
| Auto Components - 0.4% | |||
| Fuyao Glass Industries Group Co. Ltd. (A Shares) | 3,352,633 | 10,273,201 | |
| Huayu Automotive Systems Co. Ltd. (A Shares) | 537,049 | 1,870,757 | |
| Hyundai Mobis | 16,309 | 3,348,414 | |
| Sailun Group Co. Ltd. A Shares | 299,680 | 167,494 | |
| Tianneng Power International Ltd. | 1,275,826 | 1,005,302 | |
| Xinyi Glass Holdings Ltd. | 132,000 | 131,071 | |
| Yoo Sung Enterprise | 12,785 | 28,362 | |
| 16,824,601 | |||
| Automobiles - 1.0% | |||
| Bajaj Auto Ltd. | 219,453 | 8,563,682 | |
| Brilliance China Automotive Holdings Ltd. | 1,236,000 | 1,307,847 | |
| Dongfeng Motor Group Co. Ltd. (H Shares) | 1,514,000 | 1,402,880 | |
| DRB-Hicom Bhd | 93,300 | 55,907 | |
| Ford Otomotiv Sanayi A/S | 18,395 | 185,481 | |
| Guangzhou Automobile Group Co. Ltd. (H Shares) | 2,582,000 | 2,595,431 | |
| Hero Motocorp Ltd. | 241,697 | 8,700,219 | |
| Hyundai Motor Co. | 23,119 | 2,454,469 | |
| Kia Motors Corp. | 287,311 | 10,373,352 | |
| Mahindra & Mahindra Ltd. | 113,890 | 842,862 | |
| Maruti Suzuki India Ltd. | 22,078 | 1,892,155 | |
| PT Astra International Tbk | 18,701,500 | 8,800,318 | |
| Tofas Turk Otomobil Fabrikasi A/S | 506,214 | 1,535,193 | |
| 48,709,796 | |||
| Diversified Consumer Services - 0.5% | |||
| Estacio Participacoes SA | 920,400 | 6,992,462 | |
| New Oriental Education & Technology Group, Inc. sponsored ADR (a) | 105,644 | 11,980,030 | |
| TAL Education Group ADR (a) | 87,129 | 3,104,406 | |
| Visang Education, Inc. | 8,025 | 52,512 | |
| 22,129,410 | |||
| Hotels, Restaurants & Leisure - 0.5% | |||
| Galaxy Entertainment Group Ltd. | 21,000 | 131,428 | |
| Huazhu Group Ltd. ADR | 14,303 | 472,428 | |
| Jubilant Foodworks Ltd. | 103,634 | 1,724,792 | |
| Sands China Ltd. | 2,547,922 | 11,535,048 | |
| Shangri-La Asia Ltd. | 22,000 | 22,968 | |
| Yum China Holdings, Inc. | 172,769 | 7,848,896 | |
| 21,735,560 | |||
| Household Durables - 1.3% | |||
| Airmate Cayman International Co. Ltd. | 26,000 | 28,052 | |
| Arcelik A/S (a) | 125,764 | 368,885 | |
| Cyrela Brazil Realty SA | 290,413 | 1,766,603 | |
| Direcional Engenharia SA | 11,200 | 35,134 | |
| Haier Electronics Group Co. Ltd. | 2,888,349 | 7,520,518 | |
| Haier Smart Home Co. Ltd. (A Shares) | 1,357,922 | 3,018,743 | |
| LG Electronics, Inc. | 158,167 | 8,010,540 | |
| Midea Group Co. Ltd.: | |||
| (A Shares) | 212,808 | 1,569,417 | |
| (A Shares) | 4,149,382 | 30,600,881 | |
| MRV Engenharia e Participacoes SA | 334,681 | 1,592,180 | |
| Zhejiang Supor Cookware Co. Ltd. | 808,595 | 8,166,394 | |
| 62,677,347 | |||
| Internet & Direct Marketing Retail - 4.7% | |||
| Alibaba Group Holding Ltd. sponsored ADR (a) | 774,858 | 135,623,396 | |
| Ctrip.com International Ltd. ADR (a) | 280,223 | 9,073,621 | |
| JD.com, Inc. sponsored ADR (a) | 376,281 | 11,476,571 | |
| MakeMyTrip Ltd. (a) | 19,998 | 459,354 | |
| Meituan Dianping Class B | 1,204,300 | 11,396,403 | |
| MercadoLibre, Inc. (a) | 12,800 | 7,610,880 | |
| Naspers Ltd. Class N | 195,245 | 44,431,088 | |
| Pinduoduo, Inc. ADR (a) | 118,600 | 3,886,522 | |
| Vipshop Holdings Ltd. ADR (a) | 318,841 | 2,668,699 | |
| 226,626,534 | |||
| Multiline Retail - 0.3% | |||
| Lojas Renner SA | 1,303,858 | 15,916,451 | |
| Magazine Luiza SA | 87,187 | 764,071 | |
| 16,680,522 | |||
| Specialty Retail - 0.4% | |||
| Chow Tai Fook Jewellery Group Ltd. | 272,200 | 230,558 | |
| Lewis Group Ltd. | 11,913 | 24,653 | |
| Mr Price Group Ltd. | 355,151 | 4,019,835 | |
| Petrobras Distribuidora SA | 812,113 | 5,648,117 | |
| SSI Group, Inc. | 417,000 | 22,314 | |
| Suning.com Co. Ltd.: | |||
| (A Shares) | 31,000 | 46,521 | |
| (A Shares) | 61,900 | 92,892 | |
| Zhongsheng Group Holdings Ltd. Class H | 2,790,500 | 8,698,014 | |
| 18,782,904 | |||
| Textiles, Apparel & Luxury Goods - 0.7% | |||
| adidas AG | 3,622 | 1,073,611 | |
| Anta Sports Products Ltd. | 420,000 | 3,483,917 | |
| Bosideng International Holdings Ltd. | 854,000 | 292,559 | |
| CECEP COSTIN New Materials Group Ltd. (a)(c) | 741,000 | 28,353 | |
| China Tower Corp. Ltd. (H Shares) (d) | 18,650,000 | 4,245,658 | |
| Fila Korea Ltd. | 42,717 | 2,018,748 | |
| Jinli Group Holdings Ltd. | 46,000 | 20,410 | |
| LG Fashion Corp. | 7,144 | 113,916 | |
| Li Ning Co. Ltd. | 1,538,000 | 4,535,996 | |
| LPP SA | 54 | 100,788 | |
| Makalot Industrial Co. Ltd. | 152,250 | 899,076 | |
| Mavi Jeans Class B (a)(d) | 240,097 | 1,520,566 | |
| Pou Chen Corp. | 189,000 | 236,491 | |
| Regina Miracle International Holdings Ltd. (d) | 351,000 | 225,512 | |
| Samsonite International SA (d) | 267,901 | 509,826 | |
| Shenzhou International Group Holdings Ltd. | 770,100 | 10,448,190 | |
| Steinhoff Africa Retail Ltd. (d) | 372,304 | 408,415 | |
| Stella International Holdings Ltd. | 126,000 | 206,594 | |
| Titan Co. Ltd. | 136,413 | 2,109,779 | |
| Weiqiao Textile Co. Ltd. (H Shares) | 426,500 | 105,319 | |
| 32,583,724 | |||
| TOTAL CONSUMER DISCRETIONARY | 466,750,398 | ||
| CONSUMER STAPLES - 5.4% | |||
| Beverages - 1.3% | |||
| Anheuser-Busch InBev SA NV | 37,974 | 3,589,281 | |
| China Resources Beer Holdings Co. Ltd. | 1,722,000 | 9,747,332 | |
| Compania Cervecerias Unidas SA sponsored ADR | 27,971 | 632,145 | |
| Fomento Economico Mexicano S.A.B. de CV: | |||
| unit | 564,551 | 5,155,790 | |
| sponsored ADR | 158,222 | 14,455,162 | |
| Heineken NV (Bearer) | 33,196 | 3,530,198 | |
| Kweichow Moutai Co. Ltd.: | |||
| (A Shares) | 117,319 | 18,720,419 | |
| (A Shares) | 14,302 | 2,282,149 | |
| Thai Beverage PCL | 9,711,300 | 6,298,087 | |
| 64,410,563 | |||
| Food & Staples Retailing - 1.7% | |||
| Atacadao Distribuicao Comercio e Industria Ltda | 1,071,900 | 5,772,367 | |
| Bidcorp Ltd. | 16,987 | 363,957 | |
| Bim Birlesik Magazalar A/S JSC | 1,033,159 | 8,337,619 | |
| C.P. ALL PCL (For. Reg.) | 4,797,900 | 13,177,165 | |
| Clicks Group Ltd. | 158,210 | 2,075,569 | |
| Dino Polska SA (a)(d) | 65,118 | 2,515,832 | |
| Drogasil SA | 612,192 | 13,606,895 | |
| Grupo Comercial Chedraui S.A.B. de CV | 33,949 | 47,549 | |
| President Chain Store Corp. | 424,000 | 3,951,992 | |
| PUREGOLD Price Club, Inc. | 2,551,000 | 2,147,850 | |
| Shoprite Holdings Ltd. | 478,893 | 3,567,210 | |
| Sun Art Retail Group Ltd. | 597,000 | 579,864 | |
| Wal-Mart de Mexico SA de CV Series V | 4,579,579 | 12,963,077 | |
| X5 Retail Group NV GDR (Reg. S) | 358,386 | 12,335,646 | |
| 81,442,592 | |||
| Food Products - 1.7% | |||
| Angel Yeast Co. Ltd.: | |||
| (A Shares) | 79,000 | 314,927 | |
| (A Shares) | 20,400 | 81,323 | |
| AVI Ltd. | 503,258 | 2,752,388 | |
| Charoen Pokphand Foods PCL (For. Reg.) | 2,794,500 | 2,695,365 | |
| China Mengniu Dairy Co. Ltd. | 9,638,496 | 38,129,353 | |
| Fujian Sunner Development Co. Ltd. A Shares | 234,960 | 900,207 | |
| Gruma S.A.B. de CV Series B | 373,680 | 3,480,334 | |
| Inner Mongoli Yili Industries Co. Ltd.: | |||
| (A Shares) | 590,000 | 2,361,880 | |
| (A Shares) | 159,500 | 638,508 | |
| JBS SA | 1,754,878 | 12,560,875 | |
| Minerva SA (a) | 316,200 | 648,283 | |
| Shandong Yisheng Livestock & Poultry Breeding Co. Ltd. (A Shares) | 238,680 | 837,755 | |
| Tiger Brands Ltd. | 257,793 | 3,550,597 | |
| Unified-President Enterprises Corp. | 2,845,000 | 6,956,301 | |
| Universal Robina Corp. | 1,081,830 | 3,589,501 | |
| 79,497,597 | |||
| Household Products - 0.1% | |||
| Hindustan Unilever Ltd. | 169,092 | 4,453,476 | |
| Kimberly-Clark de Mexico SA de CV Series A | 366,600 | 749,608 | |
| 5,203,084 | |||
| Personal Products - 0.4% | |||
| AMOREPACIFIC Corp. | 11,185 | 1,201,337 | |
| Hengan International Group Co. Ltd. | 338,000 | 2,224,342 | |
| Kolmar Korea Co. Ltd. | 13,008 | 466,429 | |
| LG Household & Health Care Ltd. | 12,922 | 12,587,196 | |
| Natura Cosmeticos SA | 103,600 | 1,650,695 | |
| Organic Tea Cosmetics Holdings Co. Ltd. | 4,513 | 6,544 | |
| TCI Co. Ltd. | 61,477 | 604,409 | |
| 18,740,952 | |||
| Tobacco - 0.2% | |||
| ITC Ltd. | 2,239,173 | 7,698,107 | |
| PT Gudang Garam Tbk | 178,500 | 874,254 | |
| 8,572,361 | |||
| TOTAL CONSUMER STAPLES | 257,867,149 | ||
| ENERGY - 3.8% | |||
| Energy Equipment & Services - 0.1% | |||
| China Oilfield Services Ltd. (H Shares) | 608,000 | 750,435 | |
| Ezion Holdings Ltd. warrants 4/16/23 (a)(c) | 5,020,014 | 5,665 | |
| Tenaris SA sponsored ADR | 146,200 | 3,163,768 | |
| 3,919,868 | |||
| Oil, Gas & Consumable Fuels - 3.7% | |||
| China Petroleum & Chemical Corp. (H Shares) | 23,368,000 | 13,631,382 | |
| China Shenhua Energy Co. Ltd. (H Shares) | 464,000 | 910,526 | |
| CNOOC Ltd. | 14,395,000 | 21,324,986 | |
| CNOOC Ltd. sponsored ADR | 9,200 | 1,363,808 | |
| Cosan Ltd. Class A (a) | 27,087 | 379,760 | |
| Ecopetrol SA ADR | 270,066 | 4,264,342 | |
| Esso Thailand PCL unit | 140,900 | 39,619 | |
| Exxaro Resources Ltd. | 168,855 | 1,515,813 | |
| Gazprom OAO sponsored ADR (Reg. S) | 1,870,044 | 12,903,304 | |
| Grupa Lotos SA | 11,091 | 239,938 | |
| Hindustan Petroleum Corp. Ltd. | 653,255 | 2,378,407 | |
| Lukoil PJSC | 3,386 | 273,342 | |
| Lukoil PJSC sponsored ADR (b) | 316,505 | 25,428,012 | |
| MOL Hungarian Oil and Gas PLC Series A (For. Reg.) | 342,137 | 3,346,537 | |
| NOVATEK OAO GDR (Reg. S) | 98,652 | 19,128,623 | |
| Oil & Natural Gas Corp. Ltd. | 699,710 | 1,186,862 | |
| PetroChina Co. Ltd. (H Shares) | 6,262,000 | 3,082,238 | |
| Petroleo Brasileiro SA - Petrobras (ON) | 190,300 | 1,299,150 | |
| Polski Koncern Naftowy Orlen SA | 285,315 | 6,496,339 | |
| PT Adaro Energy Tbk | 20,554,500 | 1,630,160 | |
| PT Harum Energy Tbk | 14,706 | 1,462 | |
| PT Indo Tambangraya Megah Tbk | 28,027 | 25,686 | |
| PT United Tractors Tbk | 1,787,513 | 2,636,849 | |
| PTT Exploration and Production PCL: | |||
| (For. Reg.) | 237,300 | 965,959 | |
| NVDR | 1,305,273 | 5,313,274 | |
| PTT PCL: | |||
| (For. Reg.) | 2,120,300 | 3,067,624 | |
| NVDR | 5,193,000 | 7,513,168 | |
| QGEP Participacoes SA | 57,600 | 154,258 | |
| Reliance Industries Ltd. | 1,049,668 | 18,341,609 | |
| S-Oil Corp. | 27,902 | 2,229,191 | |
| Shanxi Lu'an Environmental Energy Development Co. Ltd. (A Shares) | 447,063 | 462,880 | |
| SK Energy Co. Ltd. | 72,276 | 9,852,887 | |
| Susco Public Co. Ltd. unit | 267,500 | 26,938 | |
| Tatneft PAO sponsored ADR | 34,126 | 2,268,696 | |
| Thai Oil PCL (For. Reg.) | 601,100 | 1,331,520 | |
| Tupras Turkiye Petrol Rafinerileri A/S | 131,237 | 2,838,044 | |
| YPF SA Class D sponsored ADR | 2,035 | 17,420 | |
| 177,870,613 | |||
| TOTAL ENERGY | 181,790,481 | ||
| FINANCIALS - 15.7% | |||
| Banks - 10.1% | |||
| Abu Dhabi Commercial Bank PJSC | 685,646 | 1,622,113 | |
| Abu Dhabi Islamic Bank (a) | 39,990 | 54,980 | |
| Agricultural Bank of China Ltd. (H Shares)�� | 1,597,000 | 613,969 | |
| Akbank TAS (a) | 2,800,132 | 3,335,264 | |
| Al Rajhi Bank | 253,548 | 4,089,811 | |
| Albaraka Turk Katilim Bankasi A/S (a) | 295,261 | 58,277 | |
| Alpha Bank AE (a) | 4,367,362 | 7,819,117 | |
| AMMB Holdings Bhd | 69,200 | 69,110 | |
| Axis Bank Ltd. | 771,817 | 7,171,278 | |
| Banco de Chile | 16,429,700 | 2,340,595 | |
| Banco do Brasil SA | 890,632 | 9,945,140 | |
| Banco Santander Chile sponsored ADR | 276,991 | 7,866,544 | |
| Bancolombia SA sponsored ADR | 45,389 | 2,260,372 | |
| Bangkok Bank PCL NVDR | 326,400 | 1,824,895 | |
| Bank of China Ltd. (H Shares) | 46,533,000 | 17,792,927 | |
| Bank Polska Kasa Opieki SA | 220,537 | 5,392,585 | |
| Barclays Africa Group Ltd. | 643,561 | 6,520,570 | |
| BOC Hong Kong (Holdings) Ltd. | 95,000 | 319,506 | |
| Bumiputra-Commerce Holdings Bhd | 162,000 | 194,916 | |
| Capitec Bank Holdings Ltd. | 46,645 | 3,366,896 | |
| China Construction Bank Corp. (H Shares) | 51,685,000 | 38,407,883 | |
| China Merchants Bank Co. Ltd. (H Shares) | 619,000 | 2,808,380 | |
| Chinatrust Financial Holding Co. Ltd. | 13,562,058 | 8,809,623 | |
| Chongqing Rural Commercial Bank Co. Ltd. (H Shares) | 34,000 | 16,406 | |
| Commercial International Bank SAE | 70,452 | 342,256 | |
| Commercial International Bank SAE sponsored GDR | 1,471,483 | 6,842,396 | |
| Credicorp Ltd. (United States) | 90,881 | 18,823,273 | |
| E.SUN Financial Holdings Co. Ltd. | 5,895,127 | 4,751,403 | |
| EFG Eurobank Ergasias SA (a) | 2,248,840 | 1,989,628 | |
| Emirates NBD Bank PJSC (a) | 32,838 | 103,257 | |
| Grupo Aval Acciones y Valores SA ADR | 199,868 | 1,465,032 | |
| Grupo Financiero Banorte S.A.B. de CV Series O | 3,718,253 | 20,003,594 | |
| Grupo Financiero Inbursa S.A.B. de CV Series O | 320,573 | 396,208 | |
| Guaranty Trust Bank PLC GDR (Reg. S) | 53,450 | 197,765 | |
| Habib Bank Ltd. | 309,900 | 217,108 | |
| Hana Financial Group, Inc. | 232,168 | 6,234,063 | |
| Hang Seng Bank Ltd. | 13,200 | 274,971 | |
| HDFC Bank Ltd. | 361,880 | 11,306,078 | |
| HDFC Bank Ltd. sponsored ADR | 128,796 | 13,884,209 | |
| ICICI Bank Ltd. | 1,061,566 | 6,067,417 | |
| ICICI Bank Ltd. sponsored ADR | 2,006,009 | 22,527,481 | |
| Industrial & Commercial Bank of China Ltd. (H Shares) | 39,885,000 | 25,153,751 | |
| Industrial Bank of Korea | 26,471 | 271,192 | |
| JB Financial Group Co. Ltd. | 5,224 | 23,695 | |
| JSC Halyk Bank of Kazakhstan GDR unit | 199,619 | 2,684,876 | |
| Kasikornbank PCL: | |||
| NVDR | 446,000 | 2,333,170 | |
| (For. Reg.) | 869,200 | 4,547,066 | |
| KB Financial Group, Inc. | 304,779 | 9,965,386 | |
| Kiatnakin Bank PCL (For. Reg.) | 679,500 | 1,610,716 | |
| King's Town Bank | 89,000 | 87,358 | |
| Komercni Banka A/S | 54,569 | 1,937,108 | |
| Krung Thai Bank PCL: | |||
| (For. Reg.) | 203,000 | 114,161 | |
| NVDR | 2,834,100 | 1,593,805 | |
| Malayan Banking Bhd | 691,025 | 1,427,894 | |
| Mega Financial Holding Co. Ltd. | 551,000 | 505,658 | |
| National Bank of Abu Dhabi PJSC | 3,974,402 | 16,511,543 | |
| National Bank of Greece SA (a) | 241,015 | 698,773 | |
| National Bank of Kuwait | 736,428 | 2,403,081 | |
| Nedbank Group Ltd. | 48,974 | 729,666 | |
| Nova Ljubljanska banka d.d. unit | 227,428 | 2,734,505 | |
| OTP Bank PLC | 644,756 | 25,692,506 | |
| Powszechna Kasa Oszczednosci Bank SA | 123,673 | 1,216,272 | |
| PT Bank Bukopin Tbk (a) | 4,000 | 78 | |
| PT Bank Central Asia Tbk | 6,398,100 | 13,756,930 | |
| PT Bank Mandiri (Persero) Tbk | 5,502,700 | 2,812,448 | |
| PT Bank Negara Indonesia (Persero) Tbk | 10,264,700 | 5,571,956 | |
| PT Bank Rakyat Indonesia Tbk | 20,419,800 | 6,146,813 | |
| Qatar National Bank SAQ (a) | 497,632 | 2,616,778 | |
| Sberbank of Russia | 2,805,080 | 9,429,188 | |
| Sberbank of Russia sponsored ADR (b) | 3,610,889 | 49,487,234 | |
| Shinhan Financial Group Co. Ltd. | 144,950 | 4,882,645 | |
| Sinopac Holdings Co. | 414,000 | 156,598 | |
| Standard Bank Group Ltd. | 569,458 | 6,654,611 | |
| State Bank of India (a) | 1,022,103 | 3,917,301 | |
| TCS Group Holding PLC unit | 92,248 | 1,715,813 | |
| Thanachart Capital PCL: | |||
| (For. Reg.) | 1,508,600 | 2,786,853 | |
| NVDR | 626,962 | 1,158,194 | |
| The Shanghai Commercial & Savings Bank Ltd. | 310,000 | 502,681 | |
| The Shanghai Commercial & Savings Bank Ltd. rights 10/7/19 (a) | 25,186 | 11,898 | |
| TISCO Financial Group PCL | 744,200 | 2,481,883 | |
| Turkiye Garanti Bankasi A/S (a) | 3,748,722 | 5,726,187 | |
| Turkiye Halk Bankasi A/S | 289,353 | 282,078 | |
| Turkiye Is Bankasi A/S Series C (a) | 5,487,232 | 5,189,161 | |
| Turkiye Vakiflar Bankasi TAO | 3,593,789 | 2,861,955 | |
| United Bank Ltd. | 1,705,406 | 1,411,431 | |
| Woori Financial Group, Inc. (a) | 294,220 | 2,892,708 | |
| Yapi ve Kredi Bankasi A/S (a) | 1,580,932 | 621,357 | |
| 483,444,257 | |||
| Capital Markets - 0.7% | |||
| BM&F BOVESPA SA | 1,606,666 | 17,381,946 | |
| BTG Pactual Participations Ltd. unit | 169,400 | 2,396,390 | |
| CITIC Securities Co. Ltd. (H Shares) | 284,000 | 506,559 | |
| Hong Kong Exchanges and Clearing Ltd. | 9,400 | 286,877 | |
| Huatai Securities Co. Ltd. (H Shares) (d) | 365,200 | 530,700 | |
| Korea Investment Holdings Co. Ltd. | 4,137 | 247,121 | |
| Meritz Securities Co. Ltd. | 312,059 | 1,225,950 | |
| Moscow Exchange MICEX-RTS OAO (a) | 795,893 | 1,128,877 | |
| Noah Holdings Ltd. sponsored ADR (a) | 10,037 | 301,110 | |
| Samsung Securities Co. Ltd. | 3,829 | 111,672 | |
| Yuanta Financial Holding Co. Ltd. | 14,145,000 | 8,149,810 | |
| 32,267,012 | |||
| Consumer Finance - 0.2% | |||
| Compartamos S.A.B. de CV | 284,714 | 213,093 | |
| Network International Holdings PLC (d) | 148,164 | 1,083,519 | |
| PPDAI Group, Inc. ADR | 12,096 | 45,239 | |
| Shriram Transport Finance Co. Ltd. | 484,386 | 6,549,614 | |
| 7,891,465 | |||
| Diversified Financial Services - 0.3% | |||
| Alexander Forbes Group Holdings Ltd. | 888 | 306 | |
| FirstRand Ltd. | 2,087,022 | 8,253,841 | |
| Haci Omer Sabanci Holding A/S | 788,246 | 1,186,461 | |
| Inversiones La Construccion SA | 139,104 | 2,012,536 | |
| Old Mutual Ltd. | 760,307 | 911,742 | |
| Power Finance Corp. Ltd. (a) | 281,909 | 413,475 | |
| Rec Ltd. | 844,074 | 1,704,025 | |
| 14,482,386 | |||
| Insurance - 3.8% | |||
| AIA Group Ltd. | 4,696,184 | 45,443,838 | |
| BB Seguridade Participacoes SA | 1,347,022 | 10,627,194 | |
| Cathay Financial Holding Co. Ltd. | 737,000 | 944,540 | |
| China Life Insurance Co. Ltd. (H Shares) | 4,028,000 | 9,415,111 | |
| China Pacific Insurance (Group) Co. Ltd. (H Shares) | 3,211,600 | 12,819,320 | |
| Discovery Ltd. | 5,699 | 43,270 | |
| FPC Par Corretora de Seguros | 17,800 | 51,453 | |
| Fubon Financial Holding Co. Ltd. | 2,156,000 | 3,004,003 | |
| Hapvida Participacoes e Investimentos SA (d) | 157,500 | 1,966,753 | |
| Hyundai Fire & Marine Insurance Co. Ltd. | 120,899 | 2,387,295 | |
| IRB Brasil Resseguros SA | 462,101 | 12,107,693 | |
| Liberty Holdings Ltd. | 494,964 | 3,577,282 | |
| MMI Holdings Ltd. | 1,737,544 | 1,883,163 | |
| PICC Property & Casualty Co. Ltd. (H Shares) | 5,014,000 | 5,733,467 | |
| Ping An Insurance (Group) Co. of China Ltd. (H Shares) | 3,701,500 | 42,467,355 | |
| Porto Seguro SA | 381,186 | 5,154,894 | |
| Powszechny Zaklad Ubezpieczen SA | 335,262 | 3,148,937 | |
| Qualitas Controladora S.A.B. de CV | 40,359 | 135,869 | |
| Samsung Life Insurance Co. Ltd. | 7,749 | 436,632 | |
| Sanlam Ltd. | 3,308,300 | 15,866,754 | |
| Sul America SA unit | 304,702 | 3,565,035 | |
| 180,779,858 | |||
| Thrifts & Mortgage Finance - 0.6% | |||
| Housing Development Finance Corp. Ltd. | 692,274 | 20,989,700 | |
| Indiabulls Housing Finance Ltd. | 174,484 | 1,111,938 | |
| LIC Housing Finance Ltd. | 1,195,796 | 7,119,248 | |
| 29,220,886 | |||
| TOTAL FINANCIALS | 748,085,864 | ||
| HEALTH CARE - 0.9% | |||
| Biotechnology - 0.0% | |||
| Medy-Tox, Inc. | 1,998 | 581,063 | |
| Wuxi Biologics (Cayman), Inc. (a)(d) | 59,000 | 619,232 | |
| 1,200,295 | |||
| Health Care Equipment & Supplies - 0.0% | |||
| Supermax Corp. Bhd | 63,500 | 22,498 | |
| Health Care Providers & Services - 0.2% | |||
| Aier Eye Hospital Group Co. Ltd.: | |||
| (A Shares) | 59,100 | 278,951 | |
| (A Shares) | 17,900 | 84,488 | |
| Mediclinic International PLC | 191,426 | 790,555 | |
| Notre Dame Intermedica Participacoes SA | 251,700 | 3,408,678 | |
| Qualicorp Consultoria E Corret | 45,400 | 313,447 | |
| Selcuk Ecza Deposu Tic A/S | 122,624 | 102,915 | |
| Shanghai Pharmaceuticals Holding Co. Ltd. (H Shares) | 813,000 | 1,532,422 | |
| Sinopharm Group Co. Ltd. (H Shares) | 889,300 | 3,209,498 | |
| 9,720,954 | |||
| Life Sciences Tools & Services - 0.3% | |||
| Hangzhou Tigermed Consulting Co. Ltd. (A Shares) | 816,525 | 6,959,538 | |
| WuXi AppTec Co. Ltd. | 42,337 | 512,885 | |
| WuXi AppTec Co. Ltd. (H Shares) (d) | 363,060 | 4,063,353 | |
| 11,535,776 | |||
| Pharmaceuticals - 0.4% | |||
| Aurobindo Pharma Ltd. | 196,954 | 1,655,777 | |
| CSPC Pharmaceutical Group Ltd. | 3,672,000 | 7,316,308 | |
| CStone Pharmaceuticals Co. Ltd. (a)(d) | 1,247,500 | 1,830,747 | |
| Dr. Reddy's Laboratories Ltd. | 32,576 | 1,168,701 | |
| Hansoh Pharmaceutical Group Co. Ltd. (d) | 66,000 | 222,379 | |
| Jiangsu Hengrui Medicine Co. Ltd.: | |||
| (A Shares) | 34,700 | 388,125 | |
| (A Shares) | 10,500 | 117,444 | |
| KPC Pharmaceuticals, Inc. (A Shares) | 68,400 | 106,660 | |
| Lijun International Pharmaceutical Holding Ltd. | 470,000 | 414,464 | |
| PT Kalbe Farma Tbk | 35,808,056 | 4,266,170 | |
| Richter Gedeon PLC | 114,851 | 1,914,868 | |
| Sino Biopharmaceutical Ltd. | 419,000 | 620,820 | |
| 20,022,463 | |||
| TOTAL HEALTH CARE | 42,501,986 | ||
| INDUSTRIALS - 2.1% | |||
| Aerospace & Defense - 0.1% | |||
| Elbit Systems Ltd. (Israel) | 16,800 | 2,592,075 | |
| Garden Reach Shipbuilders & Engineers Ltd. | 23,582 | 43,961 | |
| 2,636,036 | |||
| Air Freight & Logistics - 0.0% | |||
| Hyundai Glovis Co. Ltd. | 3,545 | 468,621 | |
| Airlines - 0.2% | |||
| Air Arabia PJSC (a) | 835,141 | 272,836 | |
| AirAsia Group BHD | 2,192,600 | 933,243 | |
| Azul SA sponsored ADR (a) | 78,633 | 2,761,591 | |
| China Southern Airlines Ltd. (H Shares) | 144,000 | 80,785 | |
| Copa Holdings SA Class A | 26,173 | 2,700,530 | |
| Pegasus Hava Tasimaciligi A/S (a) | 65,396 | 795,774 | |
| 7,544,759 | |||
| Commercial Services & Supplies - 0.0% | |||
| China Everbright International Ltd. | 76,000 | 59,544 | |
| Frontken Corp. BHD | 248,800 | 92,291 | |
| 151,835 | |||
| Construction & Engineering - 0.4% | |||
| China Communications Construction Co. Ltd. (H Shares) | 2,213,000 | 1,712,921 | |
| China Communications Services Corp. Ltd. (H Shares) | 1,926,000 | 1,075,759 | |
| China National Chemical Engineering Co. Ltd. (A Shares) | 1,436,292 | 1,109,811 | |
| China Railway Construction Corp. Ltd. (H Shares) | 1,635,000 | 1,762,078 | |
| China Railway Group Ltd. (H Shares) | 1,586,000 | 1,035,581 | |
| Daelim Industrial Co. | 23,895 | 1,928,799 | |
| Larsen & Toubro Ltd. | 316,696 | 5,887,107 | |
| Larsen & Toubro Ltd. unit | 88,216 | 1,610,824 | |
| Sinopec Engineering Group Co. Ltd. (H Shares) | 465,000 | 303,215 | |
| Tekfen Holding A/S | 964,184 | 3,428,798 | |
| 19,854,893 | |||
| Electrical Equipment - 0.1% | |||
| BizLink Holding, Inc. | 475,463 | 3,270,629 | |
| DONGYANG E&P, Inc. | 21,665 | 217,481 | |
| Weg SA | 306,712 | 1,666,511 | |
| Zhuzhou CRRC Times Electric Co. Ltd. (H Shares) | 486,700 | 1,932,104 | |
| 7,086,725 | |||
| Industrial Conglomerates - 0.3% | |||
| Alfa SA de CV Series A | 728,200 | 622,048 | |
| CK Hutchison Holdings Ltd. | 82,500 | 717,158 | |
| Fosun International Ltd. | 1,508,000 | 1,933,024 | |
| Hanwha Corp. | 57,986 | 1,173,747 | |
| Hong Leong Industries Bhd | 3,000 | 7,676 | |
| Hyosung Corp. | 1,214 | 86,660 | |
| Industries Qatar QSC (a) | 243,150 | 726,429 | |
| Koc Holding A/S | 512,646 | 1,538,862 | |
| LG Corp. | 35,682 | 2,099,011 | |
| Mannai Corp. | 86,440 | 81,414 | |
| San Miguel Corp. | 950 | 3,280 | |
| SK C&C Co. Ltd. | 5,174 | 854,952 | |
| SM Investments Corp. | 319,900 | 6,294,925 | |
| Turk Sise ve Cam Fabrikalari A/S | 141,791 | 105,373 | |
| 16,244,559 | |||
| Machinery - 0.4% | |||
| Airtac International Group | 343,000 | 3,541,895 | |
| Daewoo Shipbuilding & Marine Engineering Co. Ltd. (a) | 2,984 | 67,305 | |
| Estun Automation Co. Ltd.: | |||
| (A Shares) (c) | 25,200 | 32,254 | |
| (A Shares) (c) | 135,200 | 173,043 | |
| HIWIN Technologies Corp. | 524,270 | 4,259,024 | |
| Lonking Holdings Ltd. | 8,235,000 | 1,956,905 | |
| Sany Heavy Industry Co. Ltd. (A Shares) | 580,200 | 1,092,010 | |
| Shenzhen Inovance Technology Co. Ltd. (A Shares) | 460,700 | 1,481,851 | |
| Sinotruk Hong Kong Ltd. (b) | 1,614,983 | 2,484,889 | |
| Techtronic Industries Co. Ltd. | 136,000 | 938,091 | |
| Weichai Power Co. Ltd. (H Shares) | 1,951,000 | 2,977,244 | |
| XCMG Construction Machinery Co. Ltd. (A Shares) | 604,000 | 362,056 | |
| Zoomlion Heavy Industry Science and Technology Co. Ltd. (H Shares) | 384,600 | 231,904 | |
| 19,598,471 | |||
| Marine - 0.0% | |||
| MISC Bhd | 60,000 | 103,579 | |
| Qatar Navigation QPSC | 23,620 | 39,240 | |
| 142,819 | |||
| Professional Services - 0.2% | |||
| 51job, Inc. sponsored ADR (a) | 11,609 | 835,035 | |
| Centre Testing International Group Co. Ltd. (A Shares) | 2,997,400 | 5,126,338 | |
| Sporton International, Inc. | 169,000 | 1,178,706 | |
| 7,140,079 | |||
| Road & Rail - 0.1% | |||
| Globaltrans Investment PLC GDR (Reg. S) | 49,724 | 437,571 | |
| Localiza Rent A Car SA | 262,300 | 2,979,617 | |
| MTR Corp. Ltd. | 14,000 | 81,016 | |
| Rumo SA (a) | 641,529 | 3,423,760 | |
| 6,921,964 | |||
| Trading Companies & Distributors - 0.0% | |||
| Barloworld Ltd. | 60,268 | 440,307 | |
| CCS Supply Chain Management Co. Ltd. A Shares | 88,072 | 98,448 | |
| 538,755 | |||
| Transportation Infrastructure - 0.3% | |||
| Airports of Thailand PCL (For. Reg.) | 682,900 | 1,607,612 | |
| China Merchants Holdings International Co. Ltd. | 356,000 | 554,545 | |
| Cosco Shipping International Hk Co. Ltd. | 126,000 | 36,604 | |
| DP World Ltd. | 109,837 | 1,537,718 | |
| Grupo Aeroportuario del Sureste S.A.B. de CV Series B sponsored ADR | 11,643 | 1,716,062 | |
| Grupo Aeroportuario Norte S.A.B. de CV | 834,400 | 4,902,358 | |
| Malaysia Airports Holdings Bhd | 197,200 | 385,913 | |
| Shanghai International Airport Co. Ltd. (A Shares) | 266,711 | 3,132,274 | |
| Zhejiang Expressway Co. Ltd. (H Shares) | 1,226,000 | 1,024,062 | |
| 14,897,148 | |||
| TOTAL INDUSTRIALS | 103,226,664 | ||
| INFORMATION TECHNOLOGY - 10.7% | |||
| Communications Equipment - 0.1% | |||
| Accton Technology Corp. | 380,000 | 2,007,469 | |
| Hytera Communications Corp. Ltd.: | |||
| (A Shares) | 96,200 | 122,723 | |
| (A Shares) | 29,200 | 37,251 | |
| Lanner Electronics, Inc. | 97,200 | 228,666 | |
| Shenzhen Gongjin Electronics Co. Ltd. | 131,700 | 199,479 | |
| Shenzhen Sunway Communication Co. Ltd.: | |||
| (A Shares) | 9,600 | 42,656 | |
| (A Shares) | 31,800 | 141,298 | |
| Sunfun Information Co. Ltd. | 6,000 | 35,719 | |
| Tencent Music Entertainment Group ADR (a) | 130,100 | 1,730,330 | |
| Xiaomi Corp. Class B (a)(d) | 223,600 | 242,409 | |
| 4,788,000 | |||
| Electronic Equipment & Components - 1.6% | |||
| AAC Technology Holdings, Inc. | 207,000 | 889,040 | |
| AVIC Jonhon OptronicTechnology Co. Ltd. | 217,329 | 1,316,400 | |
| Chaozhou Three-Circle Group Co.: | |||
| (A Shares) | 41,600 | 114,567 | |
| (A Shares) | 6,900 | 19,003 | |
| China Railway Signal & Communications Corp. (H Shares) (d) | 270,000 | 161,527 | |
| Chroma ATE, Inc. | 439,000 | 2,129,980 | |
| Coretronic Corp. | 87,400 | 107,269 | |
| Delta Electronics, Inc. | 611,000 | 2,857,236 | |
| Enel Chile SA sponsored ADR | 176,677 | 750,877 | |
| FLEXium Interconnect, Inc. | 70,000 | 209,589 | |
| Hangzhou Hikvision Digital Technology Co. Ltd.: | |||
| (A Shares) | 117,100 | 505,915 | |
| (A Shares) | 591,403 | 2,555,078 | |
| Hollysys Automation Technologies Ltd. | 8,360 | 130,834 | |
| Hon Hai Precision Industry Co. Ltd. (Foxconn) | 4,237,626 | 10,036,767 | |
| INTOPS Co. Ltd. | 30,521 | 324,032 | |
| Largan Precision Co. Ltd. | 219,000 | 27,193,246 | |
| LG Display Co. Ltd. (a) | 256,540 | 2,967,332 | |
| LG Innotek Co. Ltd. | 9,439 | 768,153 | |
| Pinnacle Technology Holdings Ltd. | 11,198 | 11,553 | |
| Redington India Ltd. | 26,941 | 40,909 | |
| Samsung SDI Co. Ltd. | 54,970 | 11,331,352 | |
| Sunny Optical Technology Group Co. Ltd. | 532,700 | 7,333,460 | |
| Unimicron Technology Corp. | 3,455,000 | 4,306,619 | |
| Zhen Ding Technology Holding Ltd. | 524,000 | 1,940,245 | |
| 78,000,983 | |||
| Internet Software & Services - 0.0% | |||
| Danawa Co. Ltd. | 3,946 | 69,116 | |
| Qudian, Inc. ADR (a)(b) | 27,998 | 223,704 | |
| 292,820 | |||
| IT Services - 1.3% | |||
| Cognizant Technology Solutions Corp. Class A | 15,231 | 935,031 | |
| CSU Cardsystem SA | 20,432 | 30,937 | |
| HCL Technologies Ltd. | 620,377 | 9,553,578 | |
| Hexaware Technologies Ltd. | 544,539 | 2,949,685 | |
| Infosys Ltd. | 643,363 | 7,338,921 | |
| Infosys Ltd. sponsored ADR | 2,048,329 | 23,535,300 | |
| Mphasis BFL Ltd. | 77,236 | 1,054,776 | |
| PagSeguro Digital Ltd. (a) | 64,843 | 3,239,556 | |
| QIWI PLC Class B sponsored ADR | 16,212 | 393,952 | |
| Samsung SDS Co. Ltd. | 1,984 | 321,280 | |
| Sonata Software Ltd. | 6,875 | 29,625 | |
| Tata Consultancy Services Ltd. | 282,804 | 8,943,276 | |
| Wipro Ltd. | 429,905 | 1,532,125 | |
| WNS Holdings Ltd. sponsored ADR (a) | 24,362 | 1,480,722 | |
| 61,338,764 | |||
| Semiconductors & Semiconductor Equipment - 4.3% | |||
| ASE Technology Holding Co. Ltd. | 994,000 | 2,267,363 | |
| ASE Technology Holding Co. Ltd. ADR | 221,411 | 996,350 | |
| Dongbu HiTek Co. Ltd. | 29,703 | 360,747 | |
| Koh Young Technology, Inc. | 27,733 | 1,755,137 | |
| Malaysian Pacific Industries BHD | 12,286 | 26,001 | |
| MediaTek, Inc. | 867,000 | 10,170,534 | |
| Nanya Technology Corp. | 58,000 | 130,337 | |
| Novatek Microelectronics Corp. | 12,000 | 71,246 | |
| Phison Electronics Corp. | 313,000 | 2,882,421 | |
| Powertech Technology, Inc. | 575,000 | 1,378,400 | |
| Radiant Opto-Electronics Corp. | 250,000 | 905,739 | |
| Realtek Semiconductor Corp. | 943,000 | 6,471,687 | |
| Semiconductor Manufacturing International Corp. (a) | 348,000 | 381,618 | |
| Shenzhen Goodix Technology Co. Ltd. (A Shares) | 26,100 | 718,472 | |
| Sino-American Silicon Products, Inc. | 444,000 | 1,051,609 | |
| SK Hynix, Inc. | 648,613 | 41,477,450 | |
| Taiwan Semiconductor Manufacturing Co. Ltd. | 11,746,000 | 96,765,158 | |
| Taiwan Semiconductor Manufacturing Co. Ltd. sponsored ADR | 795,732 | 33,922,055 | |
| Unisem (M) Bhd | 103,259 | 47,142 | |
| United Microelectronics Corp. | 7,406,000 | 3,183,834 | |
| United Microelectronics Corp. sponsored ADR | 353,437 | 745,752 | |
| Winbond Electronics Corp. | 1,607,000 | 874,596 | |
| 206,583,648 | |||
| Software - 0.2% | |||
| Asseco Poland SA | 19,723 | 277,203 | |
| Bilibili, Inc. ADR (a) | 21,583 | 303,241 | |
| DuzonBizon Co. Ltd. | 1,297 | 61,509 | |
| Kingdee International Software Group Co. Ltd. | 1,671,000 | 1,507,453 | |
| Kingsoft Corp. Ltd. (a) | 263,000 | 483,415 | |
| Mix Telematics Ltd. sponsored ADR | 5,794 | 81,811 | |
| Nucleus Software Exports Ltd. (a) | 34,593 | 159,063 | |
| Shanghai 2345 Network Holding Group Co. Ltd. (A Shares) | 640,667 | 293,621 | |
| StoneCo Ltd. Class A (a) | 61,296 | 1,843,784 | |
| Totvs SA | 161,300 | 2,098,731 | |
| 7,109,831 | |||
| Technology Hardware, Storage & Peripherals - 3.2% | |||
| Catcher Technology Co. Ltd. | 579,000 | 4,075,252 | |
| Chicony Electronics Co. Ltd. | 92,000 | 259,014 | |
| Compal Electronics, Inc. | 952,000 | 545,467 | |
| Inventec Corp. | 1,236,000 | 848,251 | |
| Lenovo Group Ltd. | 8,172,000 | 5,360,645 | |
| Lite-On Technology Corp. | 1,393,000 | 2,223,251 | |
| Pegatron Corp. | 1,602,000 | 2,679,545 | |
| Samsung Electronics Co. Ltd. | 3,752,024 | 136,396,656 | |
| Samsung Electronics Co. Ltd. GDR | 2,265 | 2,070,210 | |
| TPV Technology Ltd. | 398,000 | 185,078 | |
| 154,643,369 | |||
| TOTAL INFORMATION TECHNOLOGY | 512,757,415 | ||
| MATERIALS - 2.4% | |||
| Chemicals - 0.4% | |||
| China Sanjiang Fine Chemicals Ltd. | 424,000 | 78,840 | |
| Dongyue Group Co. Ltd. | 40,724 | 19,164 | |
| LG Chemical Ltd. | 57,970 | 15,829,245 | |
| Sinofert Holdings Ltd. | 2,042,000 | 223,617 | |
| SKSHU Paint Co. Ltd. (A Shares) | 3,714 | 31,448 | |
| Solar Industries India Ltd. (a) | 88,400 | 1,374,009 | |
| Taekwang Industrial Co. Ltd. | 168 | 148,934 | |
| 17,705,257 | |||
| Construction Materials - 0.5% | |||
| Anhui Conch Cement Co. Ltd.: | |||
| (A Shares) | 72,500 | 399,435 | |
| (A Shares) | 19,800 | 109,087 | |
| (H Shares) | 2,058,500 | 11,555,009 | |
| Asia Cement (China) Holdings Corp. | 259,584 | 303,449 | |
| China Resources Cement Holdings Ltd. | 1,322,000 | 1,168,095 | |
| Gansu Qilianshan Cement Group Co. Ltd. (A Shares) | 264,100 | 324,368 | |
| JK Cement Ltd. | 135,600 | 1,953,165 | |
| Shree Cement Ltd. | 8,275 | 2,151,039 | |
| Siam Cement PCL (For. Reg.) | 204,200 | 2,777,414 | |
| Tangshan Jidong Cement Co. Ltd. A Shares | 215,800 | 458,328 | |
| West China Cement Ltd. | 346,000 | 58,543 | |
| 21,257,932 | |||
| Containers & Packaging - 0.0% | |||
| Anadolu Cam Sanayii A/S | 134,325 | 61,324 | |
| Bio Pappel S.A.B. de CV (a) | 24,738 | 29,316 | |
| Klabin SA unit | 267,675 | 973,481 | |
| 1,064,121 | |||
| Metals & Mining - 1.4% | |||
| Alrosa Co. Ltd. | 3,853,960 | 4,290,137 | |
| Aluminum Corp. of China Ltd. (H Shares) (a) | 594,000 | 173,655 | |
| Anglo American Platinum Ltd. | 30,984 | 1,901,149 | |
| AngloGold Ashanti Ltd. | 406,710 | 9,244,171 | |
| Ann Joo Resources Bhd | 500 | 143 | |
| Baoshan Iron & Steel Co. Ltd. (A Shares) | 205,794 | 167,067 | |
| CAP SA | 89,881 | 727,294 | |
| China Molybdenum Co. Ltd. (H Shares) | 894,000 | 242,020 | |
| Companhia Siderurgica Nacional SA (CSN) | 459,500 | 1,593,436 | |
| Compania de Minas Buenaventura SA sponsored ADR | 161,400 | 2,459,736 | |
| Daehan Steel Co. Ltd. | 2,905 | 15,841 | |
| Eregli Demir ve Celik Fabrikalari T.A.S. | 749,153 | 824,178 | |
| Evraz PLC | 27,577 | 166,537 | |
| Grupo Mexico SA de CV Series B | 619,202 | 1,426,159 | |
| Hindalco Industries Ltd. | 880,082 | 2,271,859 | |
| Hunan Valin Steel Co. Ltd. (A Shares) (a) | 394,340 | 220,951 | |
| Impala Platinum Holdings Ltd. (a) | 233,000 | 1,327,918 | |
| Jastrzebska Spolka Weglowa SA | 37,892 | 282,892 | |
| KISCO Corp. | 6,262 | 25,532 | |
| Korea Zinc Co. Ltd. | 11,447 | 4,114,020 | |
| Kumba Iron Ore Ltd. | 78,501 | 2,033,742 | |
| Lion Industries Corp. Bhd (a) | 110,565 | 10,385 | |
| Maanshan Iron & Steel Co. Ltd. (H Shares) | 1,556,000 | 582,318 | |
| Magnitogorsk Iron & Steel Works PJSC sponsored GDR (Reg. S) | 38,904 | 317,068 | |
| MMC Norilsk Nickel PJSC sponsored ADR | 155,090 | 3,760,933 | |
| MMG Ltd. (a) | 5,008,000 | 1,029,773 | |
| Nanjing Iron & Steel Co. Ltd. | 400,200 | 182,295 | |
| Novolipetsk Steel OJSC GDR (Reg. S) | 24,716 | 549,190 | |
| Polyus PJSC | 8,916 | 1,024,451 | |
| Polyus PJSC unit | 9,941 | 568,625 | |
| POSCO | 26,569 | 4,637,183 | |
| POSCO sponsored ADR | 36,270 | 1,582,097 | |
| Severstal PAO GDR (Reg. S) | 134,194 | 2,006,200 | |
| Shanxi Taigang Stainless Steel Co. Ltd. (A Shares) | 626,504 | 328,274 | |
| Sheng Yu Steel Co. Ltd. | 35,418 | 21,933 | |
| Southern Copper Corp. | 84,200 | 2,660,720 | |
| Tata Steel Ltd. | 192,275 | 928,102 | |
| Ternium SA sponsored ADR | 171,420 | 3,027,277 | |
| Vale SA sponsored ADR | 824,901 | 9,073,911 | |
| Vedanta Ltd. | 587,305 | 1,143,738 | |
| Zijin Mining Group Co. Ltd. (H Shares) | 1,014,000 | 378,918 | |
| 67,321,828 | |||
| Paper & Forest Products - 0.1% | |||
| Suzano Papel e Celulose SA | 874,900 | 6,143,949 | |
| West Coast Paper Mills Ltd. | 7,419 | 23,118 | |
| 6,167,067 | |||
| TOTAL MATERIALS | 113,516,205 | ||
| REAL ESTATE - 1.3% | |||
| Equity Real Estate Investment Trusts (REITs) - 0.0% | |||
| Link (REIT) | 103,500 | 1,160,269 | |
| Prologis Property Mexico SA | 60,798 | 118,766 | |
| 1,279,035 | |||
| Real Estate Management & Development - 1.3% | |||
| Agile Property Holdings Ltd. | 3,329,238 | 4,238,222 | |
| Aldar Properties PJSC (a) | 1,373,775 | 837,770 | |
| Ayala Land, Inc. | 11,964,500 | 10,853,871 | |
| BR Malls Participacoes SA | 472,066 | 1,536,694 | |
| Central China Real Estate Ltd. | 137,925 | 58,641 | |
| Cheung Kong Property Holdings Ltd. | 111,500 | 755,115 | |
| China Overseas Grand Oceans Group Ltd. | 656,000 | 310,153 | |
| China Overseas Land and Investment Ltd. | 800,000 | 2,523,621 | |
| China Resources Land Ltd. | 204,000 | 827,051 | |
| China Vanke Co. Ltd. (H Shares) | 135,300 | 466,288 | |
| Country Garden Holdings Co. Ltd. | 6,578,000 | 8,146,785 | |
| Country Garden Services Holdings Co. Ltd. | 319,502 | 921,594 | |
| Emaar Properties PJSC | 3,656,101 | 4,927,024 | |
| Gemdale Properties and Investment Corp. Ltd. | 628,000 | 69,514 | |
| Greenland Holdings Corp. Ltd. (A Shares) | 3,024,663 | 2,802,023 | |
| Greenland Hong Kong Holdings Ltd. | 133,366 | 46,122 | |
| Guangzhou R&F Properties Co. Ltd. (H Shares) | 680,400 | 1,092,153 | |
| Hang Lung Properties Ltd. | 360,000 | 812,007 | |
| IOI Properties Group Bhd | 77,800 | 22,015 | |
| K Wah International Holdings Ltd. | 409,123 | 212,505 | |
| Kaisa Group Holdings Ltd. | 327,000 | 112,627 | |
| KSL Holdings Bhd (a) | 105,100 | 19,868 | |
| KWG Property Holding Ltd. | 987,000 | 856,857 | |
| Logan Property Holdings Co. Ltd. | 466,000 | 654,721 | |
| Longfor Properties Co. Ltd. (d) | 1,743,048 | 6,198,226 | |
| Multiplan Empreendimentos Imobiliarios SA | 179,900 | 1,129,099 | |
| Poly Property Group Co. Ltd. | 1,135,686 | 397,334 | |
| Powerlong Real Estate Holding Ltd. | 378,417 | 221,340 | |
| Puradelta Lestari TBK PT | 1,429,600 | 31,243 | |
| Radium Life Tech Co. Ltd. | 422,280 | 159,730 | |
| Risesun Real Estate Development Co. Ltd. (A Shares) | 2,731,819 | 3,095,665 | |
| Road King Infrastructure Ltd. | 249,966 | 438,566 | |
| Sansiri PCL (For. Reg.) | 6,763,900 | 305,188 | |
| Shanghai Shimao Co. Ltd. (A Shares) | 1,163,615 | 651,981 | |
| Shimao Property Holdings Ltd. | 776,182 | 2,189,373 | |
| Shui On Land Ltd. | 360,500 | 74,832 | |
| Sunac China Holdings Ltd. | 503,000 | 2,005,487 | |
| United Development Co. (a) | 582,768 | 219,233 | |
| Yuexiu Property Co. Ltd. | 3,406,000 | 732,577 | |
| 60,953,115 | |||
| TOTAL REAL ESTATE | 62,232,150 | ||
| UTILITIES - 0.9% | |||
| Electric Utilities - 0.5% | |||
| Ceske Energeticke Zavody A/S | 48,974 | 1,078,780 | |
| Cheung Kong Infrastructure Holdings Ltd. | 102,000 | 686,665 | |
| EDP Energias do Brasil SA | 693,537 | 3,366,359 | |
| Energa SA (a) | 19,990 | 33,217 | |
| Enersis SA | 9,257,311 | 1,516,372 | |
| Enersis SA sponsored ADR | 113,466 | 928,152 | |
| Equatorial Energia SA | 175,145 | 4,050,625 | |
| Korea Electric Power Corp. (a) | 140,742 | 2,975,999 | |
| Polska Grupa Energetyczna SA (a) | 195,906 | 379,228 | |
| Power Grid Corp. of India Ltd. | 732,166 | 2,054,487 | |
| Tenaga Nasional Bhd | 1,459,430 | 4,844,523 | |
| 21,914,407 | |||
| Gas Utilities - 0.3% | |||
| Beijing Enterprises Holdings Ltd. | 236,500 | 1,124,715 | |
| China Gas Holdings Ltd. | 1,029,200 | 4,242,592 | |
| China Resource Gas Group Ltd. | 138,000 | 680,980 | |
| Daesung Energy Co. Ltd. | 20,047 | 87,783 | |
| GAIL India Ltd. (a) | 271,589 | 493,363 | |
| Gujarat State Petronet Ltd. | 7,065 | 21,738 | |
| Hong Kong & China Gas Co. Ltd. | 79,000 | 152,345 | |
| Indraprastha Gas Ltd. (a) | 1,130,824 | 5,312,038 | |
| Kunlun Energy Co. Ltd. | 190,000 | 165,170 | |
| PT Perusahaan Gas Negara Tbk Series B | 1,992,900 | 269,747 | |
| Samchully Co. Ltd. | 279 | 19,432 | |
| 12,569,903 | |||
| Independent Power and Renewable Electricity Producers - 0.1% | |||
| Benpres Holdings Corp. | 124,600 | 11,088 | |
| China Longyuan Power Grid Corp. Ltd. (H Shares) | 1,787,000 | 981,025 | |
| China Resources Power Holdings Co. Ltd. | 120,000 | 158,300 | |
| ENGIE Brasil Energia SA | 104,900 | 1,139,435 | |
| Huaneng Renewables Corp. Ltd. (H Shares) | 5,012,000 | 1,387,179 | |
| NTPC Ltd. | 1,373,547 | 2,338,488 | |
| 6,015,515 | |||
| Water Utilities - 0.0% | |||
| Companhia de Saneamento Basico do Estado de Sao Paulo (SABESP) | 121,900 | 1,521,910 | |
| SIIC Environment Holdings Ltd. | 187,000 | 31,198 | |
| 1,553,108 | |||
| TOTAL UTILITIES | 42,052,933 | ||
| TOTAL COMMON STOCKS | |||
| (Cost $2,502,666,681) | 2,826,023,463 | ||
| Nonconvertible Preferred Stocks - 2.2% | |||
| COMMUNICATION SERVICES - 0.1% | |||
| Diversified Telecommunication Services - 0.1% | |||
| Telefonica Brasil SA | 165,440 | 2,144,208 | |
| Telefonica Brasil SA sponsored ADR | 149,100 | 1,932,336 | |
| 4,076,544 | |||
| CONSUMER DISCRETIONARY - 0.0% | |||
| Automobiles - 0.0% | |||
| Hyundai Motor Co. Series 2 | 18,475 | 1,318,814 | |
| CONSUMER STAPLES - 0.1% | |||
| Beverages - 0.0% | |||
| Ambev SA sponsored ADR | 308,616 | 1,401,117 | |
| Food & Staples Retailing - 0.1% | |||
| Companhia Brasileira de Distribuicao Grupo Pao de Acucar (PN) | 151,500 | 3,203,415 | |
| TOTAL CONSUMER STAPLES | 4,604,532 | ||
| ENERGY - 0.3% | |||
| Oil, Gas & Consumable Fuels - 0.3% | |||
| Petroleo Brasileiro SA - Petrobras: | |||
| (PN) sponsored ADR (non-vtg.) | 143,846 | 1,759,237 | |
| sponsored ADR | 840,763 | 11,392,339 | |
| 13,151,576 | |||
| FINANCIALS - 1.4% | |||
| Banks - 1.4% | |||
| Banco Bradesco SA: | |||
| (PN) | 1,793,284 | 14,269,188 | |
| (PN) sponsored ADR | 201,867 | 1,612,917 | |
| Banco do Estado Rio Grande do Sul SA | 53,100 | 290,184 | |
| Itau Unibanco Holding SA | 3,937,736 | 32,274,030 | |
| Itau Unibanco Holding SA sponsored ADR | 794,035 | 6,542,848 | |
| Itausa-Investimentos Itau SA (PN) | 3,218,856 | 9,553,185 | |
| 64,542,352 | |||
| INFORMATION TECHNOLOGY - 0.3% | |||
| Technology Hardware, Storage & Peripherals - 0.3% | |||
| Samsung Electronics Co. Ltd. | 444,661 | 13,537,921 | |
| MATERIALS - 0.0% | |||
| Chemicals - 0.0% | |||
| Braskem SA (PN-A) (a) | 38,400 | 261,688 | |
| Metals & Mining - 0.0% | |||
| Gerdau SA sponsored ADR (b) | 240,700 | 734,135 | |
| TOTAL MATERIALS | 995,823 | ||
| UTILITIES - 0.0% | |||
| Electric Utilities - 0.0% | |||
| Companhia Paranaense de Energia-Copel (PN-B) | 105,100 | 1,322,316 | |
| Water Utilities - 0.0% | |||
| Cia de Saneamento do Parana | 109,070 | 460,933 | |
| Companhia de Saneamento Basico do Estado de Sao Paulo (SABESP) sponsored ADR | 30,784 | 381,106 | |
| 842,039 | |||
| TOTAL UTILITIES | 2,164,355 | ||
| TOTAL NONCONVERTIBLE PREFERRED STOCKS | |||
| (Cost $89,067,533) | 104,391,917 | ||
| Equity Funds - 30.9% | |||
| Diversified Emerging Markets Funds - 30.9% | |||
| Aberdeen Emerging Markets Fund Institutional Service Class | 7,281,258 | 107,107,304 | |
| Brandes Emerging Markets Value Fund Class A | 10,074,566 | 84,223,373 | |
| Fidelity Emerging Markets Fund (e) | 11,958,496 | 374,898,829 | |
| Fidelity SAI Emerging Markets Low Volatility Index Fund (e) | 24,780,038 | 242,596,574 | |
| GMO Emerging Markets Fund - Class III | 1,632,303 | 50,846,244 | |
| Goldman Sachs Emerging Markets Equity Fund Institutional Shares | 7,230,299 | 148,076,529 | |
| Invesco Oppenheimer Developing Markets Fund Class R6 | 2,947,882 | 122,396,043 | |
| Invesco Oppenheimer Emerging Markets Innovators Fund Class R6 (a) | 4,679,444 | 46,981,622 | |
| iShares MSCI China ETF (b) | 2,832,430 | 159,805,701 | |
| iShares MSCI Saudi Arabia ETF | 107,911 | 3,269,703 | |
| iShares MSCI South Korea Index ETF (b) | 373,835 | 19,910,452 | |
| iShares MSCI Taiwan Index ETF | 157,412 | 5,493,679 | |
| Lazard Emerging Markets Equity Portfolio Open Shares | 2,147,890 | 35,977,164 | |
| Matthews Korea Fund Investor Class | 6,983,487 | 28,841,803 | |
| Matthews Pacific Tiger Fund Investor Class | 123 | 3,393 | |
| Morgan Stanley Institutional Fund, Inc. Frontier Markets Portfolio Class I | 2,016,693 | 34,989,629 | |
| Xtrackers Harvest CSI 300 China ETF Class A (b) | 373,626 | 10,117,792 | |
| TOTAL EQUITY FUNDS | |||
| (Cost $1,337,921,176) | 1,475,535,834 | ||
| Principal Amount | |||
| U.S. Treasury Obligations - 0.3% | |||
| U.S. Treasury Bills, yield at date of purchase 1.94% to 2.29% 9/5/19 to 11/29/19 (f) | |||
| (Cost $14,594,106) | $14,640,000 | 14,596,029 | |
| Shares | |||
| Money Market Funds - 10.7% | |||
| Fidelity Cash Central Fund 2.13% (g) | 849,622 | 849,792 | |
| Fidelity Securities Lending Cash Central Fund 2.13% (g)(h) | 171,774,355 | 171,791,533 | |
| State Street Institutional U.S. Government Money Market Fund Premier Class 1.87% (i) | 339,801,598 | 339,801,598 | |
| TOTAL MONEY MARKET FUNDS | |||
| (Cost $512,442,923) | 512,442,923 | ||
| TOTAL INVESTMENT IN SECURITIES - 103.3% | |||
| (Cost $4,456,692,419) | 4,932,990,166 | ||
| NET OTHER ASSETS (LIABILITIES) - (3.3)% | (158,810,911) | ||
| NET ASSETS - 100% | $4,774,179,255 |
| Futures Contracts | |||||
| Number of contracts | Expiration Date | Notional Amount | Value | Unrealized Appreciation/(Depreciation) | |
| Purchased | |||||
| Equity Index Contracts | |||||
| ICE E-mini MSCI Emerging Markets Index Contracts (United States) | 5,406 | Sept. 2019 | $265,975,200 | $(5,022,411) | $(5,022,411) |
The notional amount of futures purchased as a percentage of Net Assets is 5.6%
For the period, the average monthly notional amount at value for futures contracts in the aggregate was $234,741,443.
Security Type Abbreviations
ETF – Exchange-Traded Fund
Legend
(a) Non-income producing
(b) Security or a portion of the security is on loan at period end.
(c) Level 3 security
(d) Security exempt from registration under Rule 144A of the Securities Act of 1933. These securities may be resold in transactions exempt from registration, normally to qualified institutional buyers. At the end of the period, the value of these securities amounted to $26,344,654 or 0.6% of net assets.
(e) Affiliated Fund
(f) Security or a portion of the security was pledged to cover margin requirements for futures contracts. At period end, the value of securities pledged amounted to $12,847,328.
(g) Affiliated fund that is generally available only to investment companies and other accounts managed by Fidelity Investments. The rate quoted is the annualized seven-day yield of the fund at period end. A complete unaudited listing of the fund's holdings as of its most recent quarter end is available upon request. In addition, each Fidelity Central Fund's financial statements are available on the SEC's website or upon request.
(h) Investment made with cash collateral received from securities on loan.
(i) The rate quoted is the annualized seven-day yield of the fund at period end.
Affiliated Central Funds
Information regarding fiscal year to date income earned by the Fund from investments in Fidelity Central Funds is as follows:
| Fund | Income earned |
| Fidelity Cash Central Fund | $21,766 |
| Fidelity Securities Lending Cash Central Fund | 199,769 |
| Total | $221,535 |
Amounts in the income column in the above table include any capital gain distributions from underlying funds, which are presented in the corresponding line-item in the Statement of Operations, if applicable. Amount for Fidelity Securities Lending Cash Central Fund represents the income earned on investing cash collateral, less rebates paid to borrowers and any lending agent fees associated with the loan, plus any premium payments received for lending certain types of securities.
Affiliated Underlying Funds
Fiscal year to date information regarding the Fund's investments in affiliated Underlying Funds, excluding any Money Market Central Funds, is presented below. Exchanges between classes of the same affiliated Underlying Funds may occur.
| Affiliate | Value, beginning of period | Purchases | Sales Proceeds | Dividend Income | Realized Gain (loss) | Change in Unrealized appreciation (depreciation) | Value, end of period |
| Fidelity Emerging Markets Fund | $355,884,838 | $-- | $-- | $-- | $-- | $19,013,991 | $374,898,829 |
| Fidelity SAI Emerging Markets Low Volatility Index Fund | -- | 252,000,000 | -- | -- | -- | (9,403,426) | 242,596,574 |
| Total | $355,884,838 | $252,000,000 | $-- | $-- | $-- | $9,610,565 | $617,495,403 |
Amounts in the income column in the above table include any capital gain distributions from underlying funds, which are presented in the corresponding line-item in the Statement of Operations, if applicable.
Investment Valuation
The following is a summary of the inputs used, as of August 31, 2019, involving the Fund's assets and liabilities carried at fair value. The inputs or methodology used for valuing securities may not be an indication of the risk associated with investing in those securities. For more information on valuation inputs, and their aggregation into the levels used below, please refer to the Investment Valuation section in the accompanying Notes to Financial Statements.
| Valuation Inputs at Reporting Date: | ||||
| Description | Total | Level 1 | Level 2 | Level 3 |
| Investments in Securities: | ||||
| Equities: | ||||
| Communication Services | $299,318,762 | $109,466,594 | $189,852,168 | $-- |
| Consumer Discretionary | 468,069,212 | 353,578,732 | 114,462,127 | 28,353 |
| Consumer Staples | 262,471,681 | 208,201,509 | 54,270,172 | -- |
| Energy | 194,942,057 | 154,963,483 | 39,972,909 | 5,665 |
| Financials | 812,628,216 | 568,374,584 | 244,253,632 | -- |
| Health Care | 42,501,986 | 21,504,062 | 20,997,924 | -- |
| Industrials | 103,226,664 | 82,123,938 | 20,897,429 | 205,297 |
| Information Technology | 526,295,336 | 395,695,958 | 130,599,378 | -- |
| Materials | 114,512,028 | 84,817,273 | 29,694,755 | -- |
| Real Estate | 62,232,150 | 26,710,170 | 35,521,980 | -- |
| Utilities | 44,217,288 | 31,631,120 | 12,586,168 | -- |
| Equity Funds | 1,475,535,834 | 1,475,535,834 | -- | -- |
| Other Short-Term Investments | 14,596,029 | -- | 14,596,029 | -- |
| Money Market Funds | 512,442,923 | 512,442,923 | -- | -- |
| Total Investments in Securities: | $4,932,990,166 | $4,025,046,180 | $907,704,671 | $239,315 |
| Derivative Instruments: | ||||
| Liabilities | ||||
| Futures Contracts | $(5,022,411) | $(5,022,411) | $-- | $-- |
| Total Liabilities | $(5,022,411) | $(5,022,411) | $-- | $-- |
| Total Derivative Instruments: | $(5,022,411) | $(5,022,411) | $-- | $-- |
Value of Derivative Instruments
The following table is a summary of the Fund's value of derivative instruments by primary risk exposure as of August 31, 2019. For additional information on derivative instruments, please refer to the Derivative Instruments section in the accompanying Notes to Financial Statements.
| Primary Risk Exposure / Derivative Type | Value | |
| Asset | Liability | |
| Equity Risk | ||
| Futures Contracts(a) | $0 | $(5,022,411) |
| Total Equity Risk | 0 | (5,022,411) |
| Total Value of Derivatives | $0 | $(5,022,411) |
(a) Reflects gross cumulative appreciation (depreciation) on futures contracts as presented in the Schedule of Investments. In the Statement of Assets and Liabilities, the period end daily variation margin is included in receivable or payable for daily variation margin on futures contracts, and the net cumulative appreciation (depreciation) is included in distributable earnings.
Other Information
Distribution of the direct investments by country of issue, as a percentage of Total Net Assets, is as follows (Unaudited):
| United States of America | 39.1% |
| Cayman Islands | 10.7% |
| Korea (South) | 7.5% |
| China | 7.1% |
| Taiwan | 5.6% |
| Brazil | 5.5% |
| India | 5.3% |
| Russia | 2.9% |
| Hong Kong | 2.9% |
| South Africa | 2.6% |
| Mexico | 1.6% |
| Thailand | 1.4% |
| Indonesia | 1.2% |
| Others (Individually Less Than 1%) | 6.6% |
| 100.0% |
See accompanying notes which are an integral part of the financial statements.
Financial Statements
Statement of Assets and Liabilities
| August 31, 2019 (Unaudited) | ||
| Assets | ||
| Investment in securities, at value (including securities loaned of $168,045,628) — See accompanying schedule: Unaffiliated issuers (cost $3,741,598,209) | $4,142,853,438 | |
| Fidelity Central Funds (cost $172,641,325) | 172,641,325 | |
| Other affiliated issuers (cost $542,452,885) | 617,495,403 | |
| Total Investment in Securities (cost $4,456,692,419) | $4,932,990,166 | |
| Cash | 6,642,214 | |
| Foreign currency held at value (cost $5,317,501) | 5,320,105 | |
| Receivable for investments sold | 10,579,803 | |
| Receivable for fund shares sold | 1,174,830 | |
| Dividends receivable | 3,384,436 | |
| Interest receivable | 542,047 | |
| Distributions receivable from Fidelity Central Funds | 55,291 | |
| Receivable for daily variation margin on futures contracts | 2,178,364 | |
| Prepaid expenses | 11,146 | |
| Other receivables | 61,777 | |
| Total assets | 4,962,940,179 | |
| Liabilities | ||
| Payable for investments purchased | $11,897,030 | |
| Payable for fund shares redeemed | 3,014,365 | |
| Accrued management fee | 1,393,107 | |
| Other payables and accrued expenses | 689,671 | |
| Collateral on securities loaned | 171,766,751 | |
| Total liabilities | 188,760,924 | |
| Net Assets | $4,774,179,255 | |
| Net Assets consist of: | ||
| Paid in capital | $4,512,656,737 | |
| Total distributable earnings (loss) | 261,522,518 | |
| Net Assets, for 476,859,880 shares outstanding | $4,774,179,255 | |
| Net Asset Value, offering price and redemption price per share ($4,774,179,255 ÷ 476,859,880 shares) | $10.01 |
See accompanying notes which are an integral part of the financial statements.
Statement of Operations
| Six months ended August 31, 2019 (Unaudited) | ||
| Investment Income | ||
| Dividends: | ||
| Unaffiliated issuers | $62,829,949 | |
| Interest | 3,359,230 | |
| Income from Fidelity Central Funds (including $199,769 from security lending) | 221,535 | |
| Income before foreign taxes withheld | 66,410,714 | |
| Less foreign taxes withheld | (6,547,578) | |
| Total income | 59,863,136 | |
| Expenses | ||
| Management fee | $14,298,689 | |
| Accounting and security lending fees | 521,164 | |
| Custodian fees and expenses | 432,003 | |
| Independent trustees' fees and expenses | 26,258 | |
| Registration fees | 28,401 | |
| Audit | 50,812 | |
| Legal | 10,301 | |
| Miscellaneous | 308,157 | |
| Total expenses before reductions | 15,675,785 | |
| Expense reductions | (5,981,867) | |
| Total expenses after reductions | 9,693,918 | |
| Net investment income (loss) | 50,169,218 | |
| Realized and Unrealized Gain (Loss) | ||
| Net realized gain (loss) on: | ||
| Investment securities: | ||
| Unaffiliated issuers | (24,234,351) | |
| Fidelity Central Funds | 3,056 | |
| Foreign currency transactions | (1,119,840) | |
| Futures contracts | 15,519,180 | |
| Total net realized gain (loss) | (9,831,955) | |
| Change in net unrealized appreciation (depreciation) on: | ||
| Investment securities: | ||
| Unaffiliated issuers | (120,641,017) | |
| Affiliated issuers | 9,610,565 | |
| Assets and liabilities in foreign currencies | 20,447 | |
| Futures contracts | (17,497,077) | |
| Total change in net unrealized appreciation (depreciation) | (128,507,082) | |
| Net gain (loss) | (138,339,037) | |
| Net increase (decrease) in net assets resulting from operations | $(88,169,819) |
See accompanying notes which are an integral part of the financial statements.
Statement of Changes in Net Assets
| Six months ended August 31, 2019 (Unaudited) | Year ended February 28, 2019 | |
| Increase (Decrease) in Net Assets | ||
| Operations | ||
| Net investment income (loss) | $50,169,218 | $77,358,567 |
| Net realized gain (loss) | (9,831,955) | (86,864,085) |
| Change in net unrealized appreciation (depreciation) | (128,507,082) | (640,462,210) |
| Net increase (decrease) in net assets resulting from operations | (88,169,819) | (649,967,728) |
| Distributions to shareholders | (2,282,939) | (69,748,423) |
| Share transactions | ||
| Proceeds from sales of shares | 540,800,639 | 1,059,692,349 |
| Reinvestment of distributions | 2,255,331 | 69,510,261 |
| Cost of shares redeemed | (339,189,308) | (819,100,492) |
| Net increase (decrease) in net assets resulting from share transactions | 203,866,662 | 310,102,118 |
| Total increase (decrease) in net assets | 113,413,904 | (409,614,033) |
| Net Assets | ||
| Beginning of period | 4,660,765,351 | 5,070,379,384 |
| End of period | $4,774,179,255 | $4,660,765,351 |
| Other Information | ||
| Shares | ||
| Sold | 53,870,162 | 96,882,174 |
| Issued in reinvestment of distributions | 211,569 | 7,458,183 |
| Redeemed | (32,942,330) | (80,109,848) |
| Net increase (decrease) | 21,139,401 | 24,230,509 |
See accompanying notes which are an integral part of the financial statements.
Financial Highlights
Strategic Advisers Emerging Markets Fund
| Six months ended (Unaudited) August 31, | Years endedFebruary 28, | |||||
| 2019 | 2019 | 2018 | 2017 | 2016 A | 2015 | |
| Selected Per–Share Data | ||||||
| Net asset value, beginning of period | $10.23 | $11.75 | $9.14 | $7.15 | $9.47 | $9.16 |
| Income from Investment Operations | ||||||
| Net investment income (loss)B | .11 | .17 | .14 | .10 | .10 | .14 |
| Net realized and unrealized gain (loss) | (.32) | (1.53) | 2.62 | 1.99 | (2.32) | .32 |
| Total from investment operations | (.21) | (1.36) | 2.76 | 2.09 | (2.22) | .46 |
| Distributions from net investment income | (.01) | (.16) | (.15) | (.10) | (.10) | (.15) |
| Distributions from net realized gain | – | – | –C | (.01) | – | – |
| Total distributions | (.01) | (.16) | (.15) | (.10)D | (.10) | (.15) |
| Net asset value, end of period | $10.01 | $10.23 | $11.75 | $9.14 | $7.15 | $9.47 |
| Total ReturnE,F | (2.10)% | (11.48)% | 30.23% | 29.40% | (23.49)% | 5.04% |
| Ratios to Average Net AssetsG,H | ||||||
| Expenses before reductions | .66%I | .66% | .70% | .60% | .50% | .46% |
| Expenses net of fee waivers, if any | .41%I | .41% | .45% | .35% | .25% | .21% |
| Expenses net of all reductions | .41%I | .40% | .45% | .35% | .24% | .21% |
| Net investment income (loss) | 2.10%I | 1.60% | 1.36% | 1.23% | 1.25% | 1.45% |
| Supplemental Data | ||||||
| Net assets, end of period (000 omitted) | $4,774,179 | $4,660,765 | $5,070,379 | $4,599,443 | $4,265,092 | $1,561,538 |
| Portfolio turnover rateJ | 49%I | 57% | 31% | 23% | 41% | 13% |
A For the year ended February 29.
B Calculated based on average shares outstanding during the period.
C Amount represents less than $.005 per share.
D Total distributions of $.10 per share is comprised of distributions from net investment income of $.097 and distributions from net realized gain of $.005 per share.
E Total returns for periods of less than one year are not annualized.
F Total returns would have been lower if certain expenses had not been reduced during the applicable periods shown.
G Fees and expenses of any underlying Fidelity Central Funds are not included in the Fund's expense ratio. The Fund indirectly bears its proportionate share of the expenses of any underlying Fidelity Central Funds.
H Expense ratios reflect operating expenses of the Fund. Expenses before reductions do not reflect amounts reimbursed by the investment adviser or reductions from brokerage service arrangements or reductions from other expense offset arrangements and do not represent the amount paid by the Fund during periods when reimbursements or reductions occur. Expenses net of fee waivers reflect expenses after reimbursement by the investment adviser but prior to reductions from brokerage service arrangements or other expense offset arrangements. Expenses net of all reductions represent the net expenses paid by the Fund. Fees and expenses of the Underlying Funds are not included in the Fund's annualized ratios. The Fund indirectly bears its proportionate share of the expenses of the Underlying Funds.
I Annualized
J Amount does not include the portfolio activity of any Underlying Funds.
See accompanying notes which are an integral part of the financial statements.
Notes to Financial Statements (Unaudited)
For the period ended August 31, 2019
1. Organization.
Strategic Advisers Emerging Markets Fund (the Fund) is a fund of Fidelity Rutland Square Trust II (the Trust), and is authorized to issue an unlimited number of shares. The Trust is registered under the Investment Company Act of 1940, as amended (the 1940 Act), as an open-end management investment company organized as a Delaware statutory trust. The Fund is offered exclusively to certain clients of Strategic Advisers LLC (Strategic Advisers), an affiliate of Fidelity Management & Research Company (FMR). The Fund's investments in emerging markets can be subject to social, economic, regulatory, and political uncertainties and can be extremely volatile.
2. Significant Accounting Policies.
The Fund is an investment company and applies the accounting and reporting guidance of the Financial Accounting Standards Board (FASB) Accounting Standards Codification Topic 946 Financial Services – Investments Companies. The financial statements have been prepared in conformity with accounting principles generally accepted in the United States of America (GAAP), which require management to make certain estimates and assumptions at the date of the financial statements. Actual results could differ from those estimates. Subsequent events, if any, through the date that the financial statements were issued have been evaluated in the preparation of the financial statements. The following summarizes the significant accounting policies of the Fund:
Investment Valuation. Investments are valued as of 4:00 p.m. Eastern time on the last calendar day of the period. The Board of Trustees (the Board) has delegated the day to day responsibility for the valuation of the Fund's investments to the Fair Value Committee (the Committee) established by the Fund's investment adviser. In accordance with valuation policies and procedures approved by the Board, the Fund attempts to obtain prices from one or more third party pricing vendors or brokers to value its investments. When current market prices, quotations or currency exchange rates are not readily available or reliable, investments will be fair valued in good faith by the Committee, in accordance with procedures adopted by the Board. Factors used in determining fair value vary by investment type and may include market or investment specific events, changes in interest rates and credit quality. The frequency with which these procedures are used cannot be predicted and they may be utilized to a significant extent. The Committee oversees the Fund's valuation policies and procedures and reports to the Board on the Committee's activities and fair value determinations. The Board monitors the appropriateness of the procedures used in valuing the Fund's investments and ratifies the fair value determinations of the Committee.
The Fund categorizes the inputs to valuation techniques used to value its investments into a disclosure hierarchy consisting of three levels as shown below:
- Level 1 – quoted prices in active markets for identical investments
- Level 2 – other significant observable inputs (including quoted prices for similar investments, interest rates, prepayment speeds, etc.)
- Level 3 – unobservable inputs (including the Fund's own assumptions based on the best information available)
Valuation techniques used to value the Fund's investments by major category are as follows:
Equity securities, including restricted securities, for which market quotations are readily available, are valued at the last reported sale price or official closing price as reported by a third party pricing vendor on the primary market or exchange on which they are traded and are categorized as Level 1 in the hierarchy. In the event there were no sales during the day or closing prices are not available, securities are valued at the last quoted bid price or may be valued using the last available price and are generally categorized as Level 2 in the hierarchy. For foreign equity securities, when market or security specific events arise, comparisons to the valuation of American Depositary Receipts (ADRs), futures contracts, Exchange-Traded Funds (ETFs) and certain indexes as well as quoted prices for similar securities may be used and would be categorized as Level 2 in the hierarchy. For equity securities, including restricted securities, where observable inputs are limited, assumptions about market activity and risk are used and these securities may be categorized as Level 3 in the hierarchy.
Debt securities, including restricted securities, are valued based on evaluated prices received from third party pricing vendors or from brokers who make markets in such securities. U.S. government and government agency obligations are valued by pricing vendors who utilize matrix pricing which considers yield or price of bonds of comparable quality, coupon, maturity and type or by broker-supplied prices. When independent prices are unavailable or unreliable, debt securities may be valued utilizing pricing methodologies which consider similar factors that would be used by third party pricing vendors. Debt securities are generally categorized as Level 2 in the hierarchy but may be Level 3 depending on the circumstances. ETFs are valued at their last sale price or official closing price as reported by a third party pricing vendor on the primary market or exchange on which they are traded and are categorized as Level 1 in the hierarchy. In the event there were no sales during the day but the exchange reports a closing bid level, ETFs are valued at the closing bid and would be categorized as Level 1 in the hierarchy. In the event there was no closing bid, ETFs may be valued by another method that the Board believes reflects fair value in accordance with the Board's fair value pricing policies and may be categorized as Level 2 in the hierarchy.
Futures contracts are valued at the settlement price established each day by the board of trade or exchange on which they are traded and are categorized as Level 1 in the hierarchy. Investments in open-end mutual funds, including the Fidelity Central Funds, are valued at their closing net asset value (NAV) each business day and are categorized as Level 1 in the hierarchy. If an unaffiliated open-end mutual fund's NAV is unavailable, shares of that fund may be valued by another method that the Board believes reflects fair value in accordance with the Board's fair value pricing policies and is categorized as Level 2 in the hierarchy.
Changes in valuation techniques may result in transfers in or out of an assigned level within the disclosure hierarchy. The aggregate value of investments by input level as of August 31, 2019 is included at the end of the Fund's Schedule of Investments.
Foreign Currency. The Fund may use foreign currency contracts to facilitate transactions in foreign-denominated securities. Gains and losses from these transactions may arise from changes in the value of the foreign currency or if the counterparties do not perform under the contracts' terms.
Foreign-denominated assets, including investment securities, and liabilities are translated into U.S. dollars at the exchange rates at period end. Purchases and sales of investment securities, income and dividends received and expenses denominated in foreign currencies are translated into U.S. dollars at the exchange rate in effect on the transaction date.
The effects of exchange rate fluctuations on investments are included with the net realized and unrealized gain (loss) on investment securities. Other foreign currency transactions resulting in realized and unrealized gain (loss) are disclosed separately.
Investment Transactions and Income. For financial reporting purposes, the Fund's investment holdings and NAV include trades executed through the end of the last business day of the period. The NAV per share for processing shareholder transactions is calculated as of the close of business of the New York Stock Exchange (NYSE), normally 4:00 p.m. Eastern time and includes trades executed through the end of the prior business day. Gains and losses on securities sold are determined on the basis of identified cost. Dividend income is recorded on the ex-dividend date, except for certain dividends from foreign securities where the ex-dividend date may have passed, which are recorded as soon as the Fund is informed of the ex-dividend date. Non-cash dividends included in dividend income, if any, are recorded at the fair market value of the securities received. Income and capital gain distributions from Fidelity Central Funds, if any, are recorded on the ex-dividend date. Income and capital gain distributions from Underlying Funds and distributions from ETFs, if any, are recorded on the ex-dividend date. Certain distributions received by the Fund represent a return of capital or capital gain. The Fund determines the components of these distributions subsequent to the ex-dividend date, based upon receipt of tax filings or other correspondence relating to the underlying investment. These distributions are recorded as a reduction of cost of investments and/or as a realized gain. Interest income is accrued as earned and includes coupon interest and amortization of premium and accretion of discount on debt securities as applicable. Investment income is recorded net of foreign taxes withheld where recovery of such taxes is uncertain.
Expenses. Expenses directly attributable to a fund are charged to that fund. Expenses attributable to more than one fund are allocated among the respective funds on the basis of relative net assets or other appropriate methods. Expense estimates are accrued in the period to which they relate and adjustments are made when actual amounts are known.
Deferred Trustee Compensation. Under a Deferred Compensation Plan (the Plan), certain independent Trustees have elected to defer receipt of a portion of their annual compensation. Deferred amounts are invested in a cross-section of Strategic Advisers funds, are marked-to-market and remain in the Fund until distributed in accordance with the Plan. The investment of deferred amounts and the offsetting payable to the Trustees of $56,507 are included in the accompanying Statement of Assets and Liabilities in other receivables and other payables and accrued expenses, respectively.
Income Tax Information and Distributions to Shareholders. Each year, the Fund intends to qualify as a regulated investment company under Subchapter M of the Internal Revenue Code, including distributing substantially all of its taxable income and realized gains. As a result, no provision for U.S. Federal income taxes is required. The Fund files a U.S. federal tax return, in addition to state and local tax returns as required. The Fund's federal income tax returns are subject to examination by the Internal Revenue Service (IRS) for a period of three fiscal years after they are filed. State and local tax returns may be subject to examination for an additional fiscal year depending on the jurisdiction. Foreign taxes are provided for based on the Fund's understanding of the tax rules and rates that exist in the foreign markets in which it invests.
Distributions are declared and recorded on the ex-dividend date. Income and capital gain distributions are determined in accordance with income tax regulations, which may differ from GAAP.
Capital accounts within the financial statements are adjusted for permanent book-tax differences. These adjustments have no impact on net assets or the results of operations. Capital accounts are not adjusted for temporary book-tax differences which will reverse in a subsequent period.
Book-tax differences are primarily due to the short-term gain distributions from the Underlying Funds, futures contracts, foreign currency transactions, passive foreign investment companies (PFIC), market discount, partnerships, deferred trustees compensation, capital loss carryforwards, and losses deferred due to wash sales.
As of period end, the cost and unrealized appreciation (depreciation) in securities, and derivatives if applicable, for federal income tax purposes were as follows:
| Gross unrealized appreciation | $680,520,705 |
| Gross unrealized depreciation | (224,073,539) |
| Net unrealized appreciation (depreciation) | $456,447,166 |
| Tax cost | $4,471,520,589 |
Capital loss carryforwards are only available to offset future capital gains of the Fund to the extent provided by regulations and may be limited. Under the Regulated Investment Company Modernization Act of 2010 (the Act), the Fund is permitted to carry forward capital losses incurred in taxable years beginning after December 22, 2010 for an unlimited period and such capital losses are required to be used prior to any losses that expire. The capital loss carryforward information presented below, including any applicable limitation, is estimated as of prior fiscal period end and is subject to adjustment.
| No expiration | |
| Short-term | $(221,212,468) |
Restricted Securities. The Fund may invest in securities that are subject to legal or contractual restrictions on resale. These securities generally may be resold in transactions exempt from registration or to the public if the securities are registered. Disposal of these securities may involve time-consuming negotiations and expense, and prompt sale at an acceptable price may be difficult. Information regarding restricted securities is included at the end of the Fund's Schedule of Investments.
3. Derivative Instruments.
Risk Exposures and the Use of Derivative Instruments. The Fund's investment objective allows the Fund to enter into various types of derivative contracts, including futures contracts. Derivatives are investments whose value is primarily derived from underlying assets, indices or reference rates and may be transacted on an exchange or over-the-counter (OTC). Derivatives may involve a future commitment to buy or sell a specified asset based on specified terms, to exchange future cash flows at periodic intervals based on a notional principal amount, or for one party to make one or more payments upon the occurrence of specified events in exchange for periodic payments from the other party.
The Fund used derivatives to increase returns and to manage exposure to certain risks as defined below. The success of any strategy involving derivatives depends on analysis of numerous economic factors, and if the strategies for investment do not work as intended, the Fund may not achieve its objectives.
The Fund's use of derivatives increased or decreased its exposure to the following risk:
| Equity Risk | Equity risk relates to the fluctuations in the value of financial instruments as a result of changes in market prices (other than those arising from interest rate risk or foreign exchange risk), whether caused by factors specific to an individual investment, its issuer, or all factors affecting all instruments traded in a market or market segment. |
The Fund is also exposed to additional risks from investing in derivatives, such as liquidity risk and counterparty credit risk. Liquidity risk is the risk that the Fund will be unable to close out the derivative in the open market in a timely manner. Counterparty credit risk is the risk that the counterparty will not be able to fulfill its obligation to the Fund. Counterparty credit risk related to exchange-traded futures contracts may be mitigated by the protection provided by the exchange on which they trade.
Investing in derivatives may involve greater risks than investing in the underlying assets directly and, to varying degrees, may involve risk of loss in excess of any initial investment and collateral received and amounts recognized in the Statement of Assets and Liabilities. In addition, there may be the risk that the change in value of the derivative contract does not correspond to the change in value of the underlying instrument.
Futures Contracts. A futures contract is an agreement between two parties to buy or sell a specified underlying instrument for a fixed price at a specified future date. The Fund used futures contracts to manage its exposure to the stock market.
Upon entering into a futures contract, a fund is required to deposit either cash or securities (initial margin) with a clearing broker in an amount equal to a certain percentage of the face value of the contract. Futures contracts are marked-to-market daily and subsequent daily payments (variation margin) are made or received by a fund depending on the daily fluctuations in the value of the futures contracts and are recorded as unrealized appreciation or (depreciation). This receivable and/or payable, if any, is included in daily variation margin on futures contracts in the Statement of Assets and Liabilities. Realized gain or (loss) is recorded upon the expiration or closing of a futures contract. The net realized gain (loss) and change in net unrealized appreciation (depreciation) on futures contracts during the period is presented in the Statement of Operations.
Any open futures contracts at period end are presented in the Schedule of Investments under the caption "Futures Contracts". The notional amount at value reflects each contract's exposure to the underlying instrument or index at period end. Securities deposited to meet initial margin requirements are identified in the Schedule of Investments.
4. Purchases and Sales of Investments.
Purchases and sales of securities (including the Underlying Fund shares), other than short-term securities, aggregated $1,237,704,135 and $1,086,795,997, respectively.
Prior Fiscal Year Unaffiliated Exchanges In-Kind. During the prior period, the Fund redeemed 30,747,979 shares of Causeway Emerging Markets Fund - Investor Class in exchange for investments and cash with a value of $409,716,815. The Fund had a net realized gain of $54,053,566 on the Fund's redemptions of Causeway Emerging Markets Fund - Investor Class shares. The Fund recognized gains on the exchanges for federal income tax purposes.
5. Fees and Other Transactions with Affiliates.
Management Fee. Strategic Advisers (the investment adviser) provides the Fund with investment management related services. For these services, the Fund pays a monthly management fee to the investment adviser. The management fee is calculated by adding the annual management fee rate of .25% of the Fund's average net assets throughout the month payable to the investment adviser to the aggregate of the fee rates, payable monthly, to the Fund's sub-advisers. The Fund's maximum aggregate management fee will not exceed 1.20% of the Fund's average net assets. For the reporting period, the total annualized management fee rate was .60% of the Fund's average net assets.
During the period, the investment adviser waived a portion of its management fee as described in the Expense Reductions note.
Sub-Advisers. Acadian Asset Management LLC, Causeway Capital Management, LLC, FIAM LLC (an affiliate of the investment adviser), FIL Investment Advisors (an affiliate of the investment adviser), Schroder Investment Management North America, Inc., Somerset Capital Management LLP and T. Rowe Price Associates, Inc. each served as a sub-adviser for the Fund during the period. Sub-advisers provide discretionary investment advisory services for their allocated portion of the Fund's assets and are paid by the investment adviser and not the Fund for providing these services.
Accounting and Security Lending Fees. Fidelity Service Company, Inc. (FSC), an affiliate of the investment adviser, maintains the Fund's accounting records. The accounting fee is based on the level of average net assets for each month. Prior to April 1, 2019, FSC had a separate agreement with the Fund for administration of the security lending program, based on the number and duration of lending transactions. Effective July 1, 2019 accounting fees are not paid by the Fund and are instead paid by the investment adviser or an affiliate. For the period, the total fees paid for accounting and administration of securities lending were equivalent to an annualized rate of .02%.
Brokerage Commissions. The Fund placed a portion of its portfolio transactions with brokerage firms which are affiliates of the investment adviser. Brokerage commissions are included in net realized gain (loss) and change in net unrealized appreciation (depreciation) in the Statement of Operations. The commissions paid to these affiliated firms were $446 for the period.
Interfund Trades. The Fund may purchase from or sell securities to other funds affiliated with each sub-adviser under procedures adopted by the Board. The procedures have been designed to ensure these interfund trades are executed in accordance with Rule 17a-7 of the 1940 Act. Interfund trades are included within the respective purchases and sales amounts shown in the Purchases and Sales of Investments note.
6. Investments in Fidelity Central Funds.
The Fund invests in Fidelity Central Funds, which are open-end investment companies available only to other investment companies and accounts managed by the investment adviser and its affiliates. The Fund's Schedule of Investments lists each of the Fidelity Central Funds held as of period end, if any, as an investment of the Fund, but does not include the underlying holdings of each Fidelity Central Fund. As an Investing Fund, the Fund indirectly bears its proportionate share of the expenses of the underlying Fidelity Central Funds.
The Fidelity Money Market Central Funds are managed by Fidelity Investments Money Management, Inc. (FIMM), an affiliate of the investment adviser. Annualized expenses of the Money Market Central Funds as of their most recent shareholder report date ranged from less than .005% to .01%.
A complete unaudited list of holdings for each Fidelity Central Fund is available upon request or at the Securities and Exchange Commission (the SEC) website at www.sec.gov. In addition, the financial statements of the Fidelity Central Funds are available on the SEC website or upon request.
7. Committed Line of Credit.
The Fund participates with other funds managed by the investment adviser or an affiliate in a $4.25 billion credit facility (the "line of credit") to be utilized for temporary or emergency purposes to fund shareholder redemptions or for other short-term liquidity purposes. The Fund has agreed to pay commitment fees on its pro-rata portion of the line of credit, which amounted to $6,340 and is reflected in Miscellaneous expenses on the Statement of Operations. During the period, the Fund did not borrow on this line of credit.
8. Security Lending.
The Fund lends portfolio securities through a lending agent from time to time in order to earn additional income. On the settlement date of the loan, the Fund receives collateral (in the form of U.S. Treasury obligations, letters of credit and/or cash) against the loaned securities and maintains collateral in an amount not less than 100% of the market value of the loaned securities during the period of the loan. The market value of the loaned securities is determined at the close of business of the Fund and any additional required collateral is delivered to the Fund on the next business day. The Fund or borrower may terminate the loan at any time, and if the borrower defaults on its obligation to return the securities loaned because of insolvency or other reasons, the Fund may apply collateral received from the borrower against the obligation. The Fund may experience delays and costs in recovering the securities loaned. Any cash collateral received is invested in the Fidelity Securities Lending Cash Central Fund. The value of loaned securities and cash collateral at period end are disclosed on the Fund's Statement of Assets and Liabilities. Security lending income represents the income earned on investing cash collateral, less rebates paid to borrowers and any lending agent fees associated with the loan, plus any premium payments received for lending certain types of securities. Security lending income is presented in the Statement of Operations as a component of income from Fidelity Central Funds.
9. Expense Reductions.
The investment adviser has contractually agreed to waive the Fund's management fee in an amount equal to .25% of the Fund's average net assets until September 30, 2022. During the period, this waiver reduced the Fund's management fee by $5,981,867.
10. Other.
The Fund's organizational documents provide former and current trustees and officers with a limited indemnification against liabilities arising in connection with the performance of their duties to the Fund. In the normal course of business, the Fund may also enter into contracts that provide general indemnifications. The Fund's maximum exposure under these arrangements is unknown as this would be dependent on future claims that may be made against the Fund. The risk of material loss from such claims is considered remote.
The Fund does not invest in the Underlying Funds for the purpose of exercising management or control; however, investments by the Fund within its principal investment strategies may represent a significant portion of an Underlying Fund's net assets.
At the end of the period, the Fund was the owner of record of 10% or more of the total outstanding shares of the following Underlying Funds:
| Fidelity SAI Emerging Markets Low Volatility Index Fund | 36% |
Shareholder Expense Example
As a shareholder of the Fund, you incur two types of costs: (1) transaction costs, and (2) ongoing costs, including management fees and other Fund expenses. This Example is intended to help you understand your ongoing costs (in dollars) of investing in the Fund and to compare these costs with the ongoing costs of investing in other mutual funds.
The Example is based on an investment of $1,000 invested at the beginning of the period and held for the entire period (March 1, 2019 to August 31, 2019).
Actual Expenses
The first line of the accompanying table provides information about actual account values and actual expenses. You may use the information in this line, together with the amount you invested, to estimate the expenses that you paid over the period. Simply divide your account value by $1,000.00 (for example, an $8,600 account value divided by $1,000.00 = 8.6), then multiply the result by the number in the first line under the heading entitled "Expenses Paid During Period" to estimate the expenses you paid on your account during this period. In addition to the direct expenses incurred by the Fund presented in the table, as a shareholder of the underlying mutual funds and exchange-traded funds (ETFs) (the Underlying Funds), the Fund also indirectly bears its proportionate share of the expenses of the Underlying Funds. In addition, the Fund, as a shareholder in the underlying Fidelity Central Funds, will indirectly bear its pro-rata share of the fees and expenses incurred by the underlying Fidelity Central Funds. These fees and expenses are not included in the Fund's annualized expense ratio used to calculate the expense estimate in the table below.
Hypothetical Example for Comparison Purposes
The second line of the accompanying table provides information about hypothetical account values and hypothetical expenses based on the Fund's actual expense ratio and an assumed rate of return of 5% per year before expenses, which is not the Fund's actual return. The hypothetical account values and expenses may not be used to estimate the actual ending account balance or expenses you paid for the period. You may use this information to compare the ongoing costs of investing in the Fund and other funds. To do so, compare this 5% hypothetical example with the 5% hypothetical examples that appear in the shareholder reports of the other funds. In addition to the direct expenses incurred by the Fund presented in the table, as a shareholder of the Underlying Funds, the Fund also indirectly bears its proportionate share of the expenses of the Underlying Funds. In addition, the Fund, as a shareholder in the underlying Fidelity Central Funds, will indirectly bear its pro-rata share of the fees and expenses incurred by the underlying Fidelity Central Funds. These fees and expenses are not included in the Fund's annualized expense ratio used to calculate the expense estimate in the table below.
Please note that the expenses shown in the table are meant to highlight your ongoing costs only and do not reflect any transaction costs. Therefore, the second line of the table is useful in comparing ongoing costs only, and will not help you determine the relative total costs of owning different funds.
| Annualized Expense Ratio-A | Beginning Account Value March 1, 2019 | Ending Account Value August 31, 2019 | Expenses Paid During Period-B March 1, 2019 to August 31, 2019 | |
| Actual | .41% | $1,000.00 | $979.00 | $2.04 |
| Hypothetical-C | $1,000.00 | $1,023.08 | $2.08 |
A Annualized expense ratio reflects expenses net of applicable fee waivers.
B Expenses are equal to the Fund's annualized expense ratio, multiplied by the average account value over the period, multiplied by 184/366 (to reflect the one-half year period). The fees and expenses of the Underlying Funds in which the Fund invests are not included in the Fund's annualized expense ratio.
C 5% return per year before expenses
Board Approval of Investment Advisory Contract and Management Fees
Strategic Advisers Emerging Markets Fund
On March 7, 2019, the Board of Trustees, including the Independent Trustees (together, the Board) voted at an in-person meeting to approve an investment advisory agreement (the Sub-Advisory Agreement) with Acadian Asset Management LLC (Acadian) for the fund, which would take effect upon the consummation of a potential change in control transaction of the parent company of Acadian, a sub-adviser to the fund. The Board noted that the terms of the Sub-Advisory Agreement are identical in all material respects to those of the existing sub-advisory agreement with Acadian, except with respect to the date of execution. The Board, assisted by the advice of fund counsel and Independent Trustees' counsel, considered a broad range of information it believed relevant to the approval of the Sub-Advisory Agreement.
In considering whether to approve the Sub-Advisory Agreement, the Board reached a determination, with the assistance of fund counsel and Independent Trustees' counsel and through the exercise of its business judgment, that the approval of the Sub-Advisory Agreement is in the best interests of the fund and its shareholders and that the approval of such agreement does not involve a conflict of interest from which the fund's investment adviser, Strategic Advisers LLC (Strategic Advisers), or its affiliates derive an inappropriate advantage. Also, the Board found that the fees to be charged under the Sub-Advisory Agreement bear a reasonable relationship to the services to be rendered and will be based upon services provided that will be in addition to, rather than duplicative of, services provided under the advisory contract of any underlying fund in which the fund may invest. The Board's decision to approve the Sub- Advisory Agreement was not based on any single factor, but rather was based on a comprehensive consideration of all the information provided to the Board.
Nature, Extent, and Quality of Services Provided. The Board considered that it reviewed information regarding Acadian, including the backgrounds of its investment personnel, and also took into consideration the fund's investment objective, strategies and related investment philosophy, in connection with the annual renewal of the fund's current sub-advisory agreement with Acadian at its September 2018 Board meeting.The Board considered that the Sub-Advisory Agreement will not result in any changes to the nature, extent and quality of the services provided to the fund. The Board also considered that the Sub-Advisory Agreement would not result in any changes to (i) the investment process or strategies employed in the management of the fund's assets or (ii) the day-to-day management of the fund or the persons primarily responsible for such management under the existing sub-advisory agreement.Investment Performance. The Board considered that it received information regarding Acadian's historical investment performance in managing fund assets in connection with the annual renewal of the fund's current sub-advisory agreement with Acadian and throughout the year. The Board did not consider performance to be a material factor in its decision to approve the Sub-Advisory Agreement because the Sub-Advisory Agreement would not result in any changes to the fund's investment processes or strategies or in the persons primarily responsible for the day-to-day management of the fund.Based on its review, the Board concluded that the nature, extent, and quality of services that will be provided to the fund under the Sub-Advisory Agreement should benefit the fund's shareholders.Competitiveness of Management Fee and Total Fund Expenses. In reviewing the Sub-Advisory Agreement, the Board considered the amount and nature of fees to be paid by the fund to Strategic Advisers and the amount and nature of fees to be paid by Strategic Advisers to Acadian and the absence of any change in the fund's total operating expenses as a result of approving the Sub- Advisory Agreement.The Board considered that there are no expected changes to the fund's management fee or total operating expenses as a result of approving the Sub-Advisory Agreement and that the fund's management fee and total net expenses are expected to maintain the same relationship to the competitive peer group medians reviewed by the Board in connection with the annual renewal of the fund's advisory contracts at the September 2018 meeting.Based on its review, the Board concluded that the fund's management fee structure and total expenses continue to bear a reasonable relationship to the services that the fund and its shareholders will receive and the other factors considered.Because the Sub-Advisory Agreement was negotiated at arm's length and will have no impact on the maximum management fees payable by the fund or Strategic Advisers portion of the management fee, the Board did not consider the costs of services and the profitability of the relationship with the fund to Strategic Advisers to be significant factors in its decision to approve the Sub-Advisory Agreement.Potential Fall-Out Benefits. The Board considered that it reviews information regarding the potential of direct and indirect benefits to Strategic Advisers and its affiliates from their relationships with the fund, including non-advisory fee compensation paid to affiliates of Strategic Advisers, if any, during its annual renewal of the fund's advisory agreement with Strategic Advisers. With respect to Acadian, the Board considered Strategic Advisers' representation that it does not anticipate that the approval of the Sub-Advisory Agreement will have a material impact on the potential for fall-out benefits to Strategic Advisers or its affiliates.Possible Economies of Scale. The Board considered that it reviews whether there have been economies of scale in connection with the management of the fund during its annual renewal of the fund's advisory agreement with Strategic Advisers and the fund's sub-advisory agreements. The Board noted that the Sub-Advisory Agreement provides for breakpoints that have the potential to reduce sub-advisory fees paid to Acadian as assets allocated to Acadian grow. The Board also considered that it reviewed whether there have been economies of scale in connection with the management of the fund during its annual renewal of the fund's advisory agreement with Strategic Advisers at its September 2018 Board meeting.Conclusion. Based on its evaluation of all of the conclusions noted above, and after considering all factors it believed relevant, the Board ultimately concluded that the Sub-Advisory Agreement's fee structure bears a reasonable relationship to the services to be rendered and that the Sub-Advisory Agreement should be approved because the Sub-Advisory Agreement is in the best interests of the fund and its shareholders. The Board also concluded that the sub-advisory fees to be charged thereunder will be based on services provided that will be in addition to, rather than duplicative of, services provided under the advisory contract of any underlying fund in which the fund may invest. In addition, the Board concluded that the approval of the Sub-Advisory Agreement does not involve a conflict of interest from which Strategic Advisers or its affiliates derive an inappropriate advantage.Board Approval of Investment Advisory Contract
Strategic Advisers Emerging Markets Fund
On June 5, 2019, the Board of Trustees, including the Independent Trustees (together, the Board), voted at an in-person meeting to approve an amendment to the fee schedule in each of the existing sub-advisory agreements with FIAM LLC (FIAM) and FIL Investment Advisors (FIA) (the Amended Sub-Advisory Agreements) for the fund, which has the potential to lower the amount of fees paid by Strategic Advisers LLC (Strategic Advisers) to each of FIAM and FIA, on behalf of the fund. The Board noted that the terms of each Amended Sub-Advisory Agreement are not materially different from those of the current sub-advisory agreement with the applicable sub-adviser.
The Board, assisted by the advice of fund counsel and Independent Trustees’ counsel, considered a broad range of information it believed relevant to the approval of each Amended Sub-Advisory Agreement.
In considering whether to approve each Amended Sub-Advisory Agreement, the Board reached a determination, with the assistance of fund counsel and Independent Trustees' counsel and through the exercise of its business judgment, that the approval of the Amended Sub-Advisory Agreement is in the best interests of the fund and its shareholders and that the approval of such agreement does not involve a conflict of interest from which Strategic Advisers or its affiliates derive an inappropriate advantage. Also, the Board found that the sub-advisory fees to be charged under each Amended Sub-Advisory Agreement bear a reasonable relationship to the services to be rendered and will be based upon services provided that will be in addition to, rather than duplicative of services provided under the advisory contract of any underlying fund in which the fund may invest. The Board’s decision to approve each Amended Sub-Advisory Agreement was not based on any single factor, but rather was based on a comprehensive consideration of all the information provided to the Board. In addition, individual Trustees did not necessarily attribute the same weight or importance to each factor.
Nature, Extent, and Quality of Services Provided. The Board considered that it reviewed information regarding FIAM and FIA, including the backgrounds of their investment personnel, and also took into consideration the fund’s investment objective, strategies and related investment philosophy, in connection with the approval of the sub-advisory agreement with FIA for the same mandates for a separate fund overseen by the Board, and the annual renewal of the fund’s current sub-advisory agreements at its September 2018 Board meeting. The Board also considered the information provided by FIAM and FIA in June 2019 in connection with the anticipated annual renewal of each sub-advisory agreement in September 2019.The Board considered that each Amended Sub-Advisory Agreement will not result in any changes to the nature, extent and quality of the services provided to the fund. The Board also considered each sub-adviser’s representation that the Amended Sub-Advisory Agreement would not result in any changes to (i) the investment process or strategies employed in the management of the fund’s assets or (ii) the day-to-day management of the fund or the persons primarily responsible for such management.Investment Performance. The Board considered that it received information regarding each sub-adviser’s historical investment performance in managing fund assets at its June 2019 Board meeting. The Board did not consider performance to be a material factor in its decision to approve the Amended Sub-Advisory Agreement because the Amended Sub-Advisory Agreement would not result in any changes to the fund’s investment processes or strategies or in the persons primarily responsible for the day-to-day management of the fund.Based on its review, the Board concluded that the nature, extent, and quality of services that will be provided to the fund under each Amended Sub-Advisory Agreement will continue to benefit the fund’s shareholders.Competitiveness of Management Fee and Total Fund Expenses. The Board considered that each new fee schedule is expected to lower the amount of fees paid by Strategic Advisers to FIAM and FIA under each respective Amended Sub-Advisory Agreement, on behalf of the fund. The Board also considered that each Amended Sub-Advisory Agreement would not result in any changes to the fund’s maximum aggregate annual management fee rate, Strategic Advisers’ portion of the fund’s management fee or Strategic Advisers’ contractual management fee waiver for the fund. The Board also considered that if the applicable investment mandates are funded, the new fee schedule under each Amended Sub-Advisory Agreement would result in lower fees to be paid by Strategic Advisers to each sub-adviser, on behalf of the fund, compared to the fees that would be paid to the sub-adviser under its current sub-advisory agreement. Based on its review, the Board concluded that the fund’s management fee structure and total expenses continue to bear a reasonable relationship to the services that the fund and its shareholders will receive under each Amended Sub-Advisory Agreement and the other factors considered.Because each Amended Sub-Advisory Agreement was negotiated at arm’s length and will have no impact on the maximum management fees payable by the fund, the Board did not consider the costs of services and profitability of the relationship with the fund to Strategic Advisers to be significant factors in its decision to approve each Amended Sub-Advisory Agreement.Potential Fall-Out Benefits. The Board considered that it reviews information regarding the potential of direct and indirect benefits to Strategic Advisers and its affiliates from their relationships with the fund, including non-advisory fee compensation paid to affiliates of Strategic Advisers, if any, as well as information regarding potential fall-out benefits accruing to each sub-adviser, if any, as a result of its relationship with the fund, during its annual renewal of the fund’s advisory agreements at its September Board meeting.Possible Economies of Scale. The Board considered that the Amended Sub-Advisory Agreement with FIA, like the current sub-advisory agreement with FIA, provides for breakpoints that, if the applicable investment mandate is funded, have the potential to reduce sub-advisory fees paid to FIA as assets allocated to FIA grow. The Board considered that it reviewed whether there have been economies of scale in connection with the management of the fund during its annual renewal of the fund’s advisory agreement with Strategic Advisers at its September 2018 Board meeting and that it will consider the potential for such benefits at its September 2019 meeting.Conclusion. Based on its evaluation of all of the conclusions noted above, and after considering all factors it believed relevant, the Board ultimately concluded that each Amended Sub-Advisory Agreement’s fee structure continues to bear a reasonable relationship to the services rendered to the fund and that each Amended Sub-Advisory Agreement should be approved because the Amended Sub-Advisory Agreement is in the best interests of the fund and its shareholders. The Board also concluded that the sub-advisory fees to be charged thereunder will be based on services provided that will be in addition to, rather than duplicative of services provided under the advisory contract of any underlying fund in which the fund may invest. In addition, the Board concluded that the approval of each Amended Sub-Advisory Agreement does not involve a conflict of interest from which Strategic Advisers or its affiliates derive an inappropriate advantage.![]()
SAE-SANN-1019
1.918361.109
Strategic Advisers® Income Opportunities Fund Offered exclusively to certain clients of Strategic Advisers LLC - not available for sale to the general public Semi-Annual Report August 31, 2019 |
|
Beginning on January 1, 2021, as permitted by regulations adopted by the Securities and Exchange Commission, paper copies of a fund’s shareholder reports will no longer be sent by mail, unless you specifically request paper copies of the reports from the fund or from your financial intermediary, such as a financial advisor, broker-dealer or bank. Instead, the reports will be made available on a website, and you will be notified by mail each time a report is posted and provided with a website link to access the report.
If you already elected to receive shareholder reports electronically, you will not be affected by this change and you need not take any action. You may elect to receive shareholder reports and other communications from a fund electronically, by contacting your financial intermediary. For Fidelity customers, visit Fidelity's web site or call Fidelity using the contact information listed below.
You may elect to receive all future reports in paper free of charge. If you wish to continue receiving paper copies of your shareholder reports, you may contact your financial intermediary or, if you are a Fidelity customer, visit Fidelity’s website, or call Fidelity at the applicable toll-free number listed below. Your election to receive reports in paper will apply to all funds held with the fund complex/your financial intermediary.
| Account Type | Website | Phone Number |
| Brokerage, Mutual Fund, or Annuity Contracts: | fidelity.com/mailpreferences | 1-800-343-3548 |
| Employer Provided Retirement Accounts: | netbenefits.fidelity.com/preferences (choose 'no' under Required Disclosures to continue to print) | 1-800-343-0860 |
| Advisor Sold Accounts Serviced Through Your Financial Intermediary: | Contact Your Financial Intermediary | Your Financial Intermediary's phone number |
| Advisor Sold Accounts Serviced by Fidelity: | institutional.fidelity.com | 1-877-208-0098 |
Contents
To view a fund's proxy voting record for the 12-month period ended June 30, visit http://www.fidelity.com/proxyvotingresults or visit the Securities and Exchange Commission's (SEC) web site at http://www.sec.gov.
You may also call 1-800-544-3455 to request a free copy of the proxy voting guidelines.
Standard & Poor's, S&P and S&P 500 are registered service marks of The McGraw-Hill Companies, Inc. and have been licensed for use by Fidelity Distributors Corporation.
Other third-party marks appearing herein are the property of their respective owners.
All other marks appearing herein are registered or unregistered trademarks or service marks of FMR LLC or an affiliated company. © 2019 FMR LLC. All rights reserved.
This report and the financial statements contained herein are submitted for the general information of the shareholders of the Fund. This report is not authorized for distribution to prospective investors in the Fund unless preceded or accompanied by an effective prospectus.
A fund files its complete schedule of portfolio holdings with the SEC for the first and third quarters of each fiscal year on Form N-PORT. Forms N-PORT are available on the SEC’s web site at http://www.sec.gov. A fund's Forms N-PORT may be reviewed and copied at the SEC’s Public Reference Room in Washington, DC. Information regarding the operation of the SEC's Public Reference Room may be obtained by calling 1-800-SEC-0330.
For a complete list of a fund's portfolio holdings, view the most recent holdings listing, semiannual report, or annual report on Fidelity's web site at http://www.fidelity.com, http://www.institutional.fidelity.com, or http://www.401k.com, as applicable.
NOT FDIC INSURED •MAY LOSE VALUE •NO BANK GUARANTEE
Neither the Fund nor Fidelity Distributors Corporation is a bank.
Investment Summary (Unaudited)
The information in the following tables is based on the direct investments of the Fund.Top Ten Holdings as of August 31, 2019
(excluding cash equivalents)
| % of fund's net assets | |
| Artisan High Income Fund Investor Shares | 13.0 |
| T. Rowe Price High Yield Fund Advisor Class | 11.2 |
| Mainstay High Yield Corporate Bond Fund Class A | 11.1 |
| Prudential High Yield Fund | 10.4 |
| Hotchkis & Wiley High Yield Fund Class A | 10.2 |
| Fidelity Capital & Income Fund | 7.3 |
| Eaton Vance Income Fund of Boston Class A | 4.8 |
| Fidelity Advisor High Income Advantage Fund Class I | 4.7 |
| Blackrock High Yield Bond Portfolio Institutional Class | 3.1 |
| Vanguard High-Yield Corporate Fund Admiral Shares | 1.9 |
| 77.7 |
Asset Allocation (% of fund's net assets)
| As of August 31, 2019 | ||
| Corporate Bonds | 20.4% | |
| High Yield Fixed-Income Funds | 77.7% | |
| Other Investments | 1.1% | |
| Short-Term Investments and Net Other Assets (Liabilities) | 0.8% | |
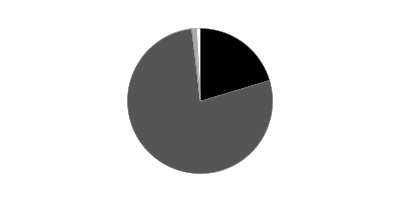
Asset allocations of funds in the pie chart reflect the categorizations of assets as defined by Morningstar as of the reporting date.
Schedule of Investments August 31, 2019 (Unaudited)
Showing Percentage of Net Assets
| Corporate Bonds - 20.4% | |||
| Principal Amount | Value | ||
| Convertible Bonds - 0.1% | |||
| COMMUNICATION SERVICES - 0.1% | |||
| Media - 0.1% | |||
| DISH Network Corp.: | |||
| 2.375% 3/15/24 | $1,500,000 | $1,308,438 | |
| 3.375% 8/15/26 | 800,000 | 736,202 | |
| 2,044,640 | |||
| Nonconvertible Bonds - 20.3% | |||
| COMMUNICATION SERVICES - 4.2% | |||
| Diversified Telecommunication Services - 1.0% | |||
| Altice Finco SA 7.625% 2/15/25 (a) | 1,595,000 | 1,642,850 | |
| C&W Senior Financing Designated Activity Co.: | |||
| 6.875% 9/15/27 (a) | 1,525,000 | 1,623,957 | |
| 7.5% 10/15/26 (a) | 1,725,000 | 1,871,280 | |
| Frontier Communications Corp. 8% 4/1/27 (a) | 835,000 | 870,488 | |
| Level 3 Communications, Inc. 5.75% 12/1/22 | 1,250,000 | 1,259,375 | |
| Level 3 Financing, Inc.: | |||
| 5.125% 5/1/23 | 1,600,000 | 1,626,064 | |
| 5.25% 3/15/26 | 590,000 | 615,075 | |
| 5.375% 1/15/24 | 675,000 | 686,813 | |
| 5.375% 5/1/25 | 715,000 | 743,600 | |
| Qwest Corp. 6.75% 12/1/21 | 670,000 | 722,763 | |
| SFR Group SA: | |||
| 6.25% 5/15/24 (a) | 800,000 | 824,736 | |
| 7.375% 5/1/26 (a) | 1,865,000 | 1,990,888 | |
| 8.125% 2/1/27 (a) | 1,510,000 | 1,664,775 | |
| Telecom Italia Capital SA: | |||
| 6% 9/30/34 | 560,000 | 574,000 | |
| 6.375% 11/15/33 | 315,000 | 333,113 | |
| Telecom Italia SpA 5.303% 5/30/24 (a) | 2,895,000 | 3,097,650 | |
| Telenet Finance Luxembourg Notes SARL 5.5% 3/1/28 (a) | 2,600,000 | 2,644,200 | |
| U.S. West Communications 7.25% 9/15/25 | 735,000 | 830,010 | |
| 23,621,637 | |||
| Media - 2.4% | |||
| Altice Financing SA 7.5% 5/15/26 (a) | 5,535,000 | 5,894,775 | |
| Altice SA 7.75% 5/15/22 (a) | 256,000 | 262,534 | |
| CCO Holdings LLC/CCO Holdings Capital Corp.: | |||
| 4% 3/1/23 (a) | 3,215,000 | 3,247,150 | |
| 5% 2/1/28 (a) | 1,325,000 | 1,391,250 | |
| 5.125% 5/1/23 (a) | 2,195,000 | 2,245,485 | |
| 5.125% 5/1/27 (a) | 2,805,000 | 2,966,259 | |
| 5.5% 5/1/26 (a) | 5,360,000 | 5,648,100 | |
| CSC Holdings LLC: | |||
| 5.25% 6/1/24 | 1,115,000 | 1,193,050 | |
| 5.375% 7/15/23 (a) | 3,000,000 | 3,083,280 | |
| 5.5% 5/15/26 (a) | 1,380,000 | 1,459,350 | |
| 5.5% 4/15/27 (a) | 2,650,000 | 2,835,500 | |
| 7.5% 4/1/28 (a) | 1,235,000 | 1,389,375 | |
| 7.75% 7/15/25 (a) | 1,555,000 | 1,669,681 | |
| DISH DBS Corp.: | |||
| 5.875% 11/15/24 | 2,840,000 | 2,701,692 | |
| 7.75% 7/1/26 | 1,060,000 | 1,041,450 | |
| E.W. Scripps Co. 5.125% 5/15/25 (a) | 830,000 | 836,225 | |
| MDC Partners, Inc. 6.5% 5/1/24 (a) | 1,605,000 | 1,460,550 | |
| Nielsen Co. SARL (Luxembourg): | |||
| 5% 2/1/25 (a) | 155,000 | 153,063 | |
| 5.5% 10/1/21 (a) | 225,000 | 225,653 | |
| Nielsen Finance LLC/Nielsen Finance Co. 5% 4/15/22 (a) | 2,135,000 | 2,145,675 | |
| Sirius XM Radio, Inc.: | |||
| 3.875% 8/1/22 (a) | 1,625,000 | 1,653,438 | |
| 4.625% 7/15/24 (a) | 750,000 | 782,813 | |
| 5% 8/1/27 (a) | 1,060,000 | 1,118,300 | |
| 5.375% 4/15/25 (a) | 2,165,000 | 2,246,188 | |
| Virgin Media Secured Finance PLC 5.5% 8/15/26 (a) | 2,970,000 | 3,107,363 | |
| Ziggo Bond Finance BV: | |||
| 5.875% 1/15/25 (a) | 2,425,000 | 2,506,844 | |
| 6% 1/15/27 (a) | 2,000,000 | 2,085,000 | |
| Ziggo Secured Finance BV 5.5% 1/15/27 (a) | 2,905,000 | 3,064,630 | |
| 58,414,673 | |||
| Wireless Telecommunication Services - 0.8% | |||
| Citizens Utilities Co. 7.05% 10/1/46 | 2,508,000 | 1,197,570 | |
| Intelsat Jackson Holdings SA 8.5% 10/15/24 (a) | 1,860,000 | 1,846,050 | |
| Millicom International Cellular SA: | |||
| 6% 3/15/25 (a) | 205,000 | 212,816 | |
| 6.625% 10/15/26 (a) | 2,740,000 | 2,997,731 | |
| Neptune Finco Corp. 6.625% 10/15/25 (a) | 750,000 | 802,935 | |
| Sprint Communications, Inc. 6% 11/15/22 | 4,800,000 | 5,108,976 | |
| Sprint Corp. 7.875% 9/15/23 | 3,795,000 | 4,269,375 | |
| T-Mobile U.S.A., Inc.: | |||
| 4.5% 2/1/26 | 1,060,000 | 1,099,750 | |
| 5.125% 4/15/25 | 995,000 | 1,036,611 | |
| 6.375% 3/1/25 | 700,000 | 724,850 | |
| 19,296,664 | |||
| TOTAL COMMUNICATION SERVICES | 101,332,974 | ||
| CONSUMER DISCRETIONARY - 1.9% | |||
| Diversified Consumer Services - 0.2% | |||
| Frontdoor, Inc. 6.75% 8/15/26 (a) | 860,000 | 933,100 | |
| Laureate Education, Inc. 8.25% 5/1/25 (a) | 2,265,000 | 2,466,019 | |
| Service Corp. International 5.125% 6/1/29 | 735,000 | 786,450 | |
| 4,185,569 | |||
| Hotels, Restaurants & Leisure - 1.4% | |||
| 1011778 BC Unlimited Liability Co./New Red Finance, Inc.: | |||
| 4.25% 5/15/24 (a) | 780,000 | 805,163 | |
| 5% 10/15/25 (a) | 1,410,000 | 1,455,825 | |
| Aramark Services, Inc. 4.75% 6/1/26 | 2,480,000 | 2,542,000 | |
| Eldorado Resorts, Inc.: | |||
| 6% 4/1/25 | 765,000 | 810,900 | |
| 6% 9/15/26 | 250,000 | 273,438 | |
| GLP Capital LP/GLP Financing II, Inc. 5.25% 6/1/25 | 1,325,000 | 1,456,811 | |
| Golden Entertainment, Inc. 7.625% 4/15/26 (a) | 2,185,000 | 2,272,619 | |
| Golden Nugget, Inc. 6.75% 10/15/24 (a) | 2,695,000 | 2,755,638 | |
| Hilton Escrow Issuer LLC 4.25% 9/1/24 | 670,000 | 683,400 | |
| Hilton Worldwide Finance LLC/Hilton Worldwide Finance Corp.: | |||
| 4.625% 4/1/25 | 655,000 | 676,288 | |
| 4.875% 4/1/27 | 390,000 | 410,475 | |
| MCE Finance Ltd. 4.875% 6/6/25 (a) | 215,000 | 213,265 | |
| MGM Growth Properties Operating Partnership LP: | |||
| 4.5% 9/1/26 | 3,050,000 | 3,194,875 | |
| 5.75% 2/1/27(a) | 505,000 | 557,495 | |
| Penn National Gaming, Inc. 5.625% 1/15/27 (a) | 1,300,000 | 1,334,255 | |
| Scientific Games Corp.: | |||
| 5% 10/15/25 (a) | 1,720,000 | 1,777,173 | |
| 10% 12/1/22 | 1,080,000 | 1,120,500 | |
| Stars Group Holdings BV 7% 7/15/26 (a) | 3,335,000 | 3,539,269 | |
| Station Casinos LLC 5% 10/1/25 (a) | 1,145,000 | 1,168,015 | |
| Wyndham Hotels & Resorts, Inc. 5.375% 4/15/26 (a) | 1,340,000 | 1,403,650 | |
| Wynn Las Vegas LLC/Wynn Las Vegas Capital Corp. 5.25% 5/15/27 (a) | 1,260,000 | 1,305,675 | |
| Wynn Macau Ltd.: | |||
| 4.875% 10/1/24 (a) | 1,950,000 | 1,925,016 | |
| 5.5% 10/1/27 (a) | 2,305,000 | 2,273,306 | |
| 33,955,051 | |||
| Household Durables - 0.1% | |||
| Reynolds Group Issuer, Inc./Reynolds Group Issuer LLC/Reynolds Group Issuer (Luxembourg) SA: | |||
| 5.125% 7/15/23 (a) | 1,000,000 | 1,028,050 | |
| 7% 7/15/24 (a) | 1,070,000 | 1,106,113 | |
| 2,134,163 | |||
| Internet & Direct Marketing Retail - 0.1% | |||
| Zayo Group LLC/Zayo Capital, Inc.: | |||
| 5.75% 1/15/27 (a) | 1,565,000 | 1,596,300 | |
| 6.375% 5/15/25 | 1,000,000 | 1,028,750 | |
| 2,625,050 | |||
| Leisure Products - 0.1% | |||
| Mattel, Inc. 6.75% 12/31/25 (a) | 1,520,000 | 1,561,800 | |
| Textiles, Apparel & Luxury Goods - 0.0% | |||
| The William Carter Co. 5.625% 3/15/27 (a) | 880,000 | 937,182 | |
| TOTAL CONSUMER DISCRETIONARY | 45,398,815 | ||
| CONSUMER STAPLES - 1.0% | |||
| Food & Staples Retailing - 0.1% | |||
| C&S Group Enterprises LLC 5.375% 7/15/22 (a) | 1,950,000 | 1,954,875 | |
| Food Products - 0.8% | |||
| CF Industries Holdings, Inc. 5.15% 3/15/34 | 75,000 | 76,875 | |
| JBS U.S.A. LLC/JBS U.S.A. Finance, Inc.: | |||
| 5.75% 6/15/25 (a) | 4,505,000 | 4,685,245 | |
| 5.875% 7/15/24 (a) | 5,915,000 | 6,070,269 | |
| 6.75% 2/15/28 (a) | 525,000 | 585,375 | |
| JBS U.S.A. Lux SA / JBS Food Co.: | |||
| 5.5% 1/15/30 (a) | 1,410,000 | 1,494,600 | |
| 6.5% 4/15/29 (a) | 1,390,000 | 1,539,425 | |
| Lamb Weston Holdings, Inc.: | |||
| 4.625% 11/1/24 (a) | 330,000 | 344,985 | |
| 4.875% 11/1/26 (a) | 2,000,000 | 2,087,500 | |
| Post Holdings, Inc.: | |||
| 5% 8/15/26 (a) | 865,000 | 901,763 | |
| 5.75% 3/1/27 (a) | 720,000 | 765,000 | |
| 18,551,037 | |||
| Personal Products - 0.0% | |||
| Prestige Brands, Inc. 6.375% 3/1/24 (a) | 500,000 | 523,750 | |
| Tobacco - 0.1% | |||
| Vector Group Ltd. 6.125% 2/1/25 (a) | 3,795,000 | 3,719,100 | |
| TOTAL CONSUMER STAPLES | 24,748,762 | ||
| ENERGY - 3.3% | |||
| Energy Equipment & Services - 0.3% | |||
| Archrock Partners LP / Archrock Partners Finance Corp. 6.875% 4/1/27 (a) | 775,000 | 811,813 | |
| Jonah Energy LLC 7.25% 10/15/25 (a) | 1,840,000 | 588,800 | |
| Nabors Industries, Inc. 5.5% 1/15/23 | 355,000 | 316,394 | |
| Noble Holding International Ltd.: | |||
| 6.2% 8/1/40 | 1,000,000 | 465,000 | |
| 7.875% 2/1/26 (a) | 515,000 | 415,863 | |
| Summit Midstream Holdings LLC 5.75% 4/15/25 | 1,650,000 | 1,415,205 | |
| Valaris PLC 5.2% 3/15/25 | 2,500,000 | 1,506,250 | |
| Weatherford International Ltd.: | |||
| 5.95% 4/15/42 (b) | 150,000 | 63,000 | |
| 6.5% 8/1/36 (b) | 440,000 | 184,800 | |
| 9.875% 2/15/24 (b) | 360,000 | 152,100 | |
| Weatherford International, Inc. 9.875% 3/1/25 (b) | 3,790,000 | 1,591,800 | |
| 7,511,025 | |||
| Oil, Gas & Consumable Fuels - 3.0% | |||
| California Resources Corp. 8% 12/15/22 (a) | 4,710,000 | 2,708,250 | |
| Cheniere Corpus Christi Holdings LLC: | |||
| 5.125% 6/30/27 | 1,080,000 | 1,192,050 | |
| 5.875% 3/31/25 | 2,230,000 | 2,486,450 | |
| 7% 6/30/24 | 3,345,000 | 3,859,294 | |
| Cheniere Energy Partners LP: | |||
| 5.25% 10/1/25 | 4,235,000 | 4,377,931 | |
| 5.625% 10/1/26 | 615,000 | 648,825 | |
| Chesapeake Energy Corp. 8% 1/15/25 | 2,760,000 | 2,090,700 | |
| Citgo Holding, Inc. 9.25% 8/1/24 (a) | 545,000 | 577,700 | |
| Citgo Petroleum Corp. 6.25% 8/15/22 (a) | 1,797,000 | 1,805,985 | |
| Comstock Escrow Corp. 9.75% 8/15/26 | 2,215,000 | 1,666,788 | |
| Consolidated Energy Finance SA: | |||
| 3 month U.S. LIBOR + 3.750% 6.1603% 6/15/22 (a)(c)(d) | 3,140,000 | 3,124,235 | |
| 6.5% 5/15/26 (a) | 1,100,000 | 1,097,250 | |
| 6.875% 6/15/25 (a) | 990,000 | 1,009,800 | |
| Crestwood Midstream Partners LP/Crestwood Midstream Finance Corp.: | |||
| 5.75% 4/1/25 | 900,000 | 920,250 | |
| 6.25% 4/1/23 | 1,580,000 | 1,607,650 | |
| CVR Refining LLC/Coffeyville Finance, Inc. 6.5% 11/1/22 | 2,605,000 | 2,640,819 | |
| DCP Midstream Operating LP: | |||
| 5.125% 5/15/29 | 1,700,000 | 1,742,585 | |
| 5.375% 7/15/25 | 1,785,000 | 1,887,638 | |
| Denbury Resources, Inc.: | |||
| 7.75% 2/15/24 (a) | 1,690,000 | 1,174,888 | |
| 9.25% 3/31/22 (a) | 4,230,000 | 3,553,200 | |
| Endeavor Energy Resources LP/EER Finance, Inc.: | |||
| 5.5% 1/30/26 (a) | 230,000 | 238,913 | |
| 5.75% 1/30/28 (a) | 230,000 | 240,925 | |
| EP Energy LLC/Everest Acquisition Finance, Inc.: | |||
| 7.75% 5/15/26 (a) | 935,000 | 780,725 | |
| 8% 11/29/24 (a) | 2,780,000 | 1,195,400 | |
| Global Partners LP/GLP Finance Corp. 7% 8/1/27 (a) | 1,200,000 | 1,215,000 | |
| Hess Infrastructure Partners LP 5.625% 2/15/26 (a) | 2,655,000 | 2,747,925 | |
| Hilcorp Energy I LP/Hilcorp Finance Co.: | |||
| 5% 12/1/24 (a) | 265,000 | 244,463 | |
| 5.75% 10/1/25 (a) | 990,000 | 923,175 | |
| Indigo Natural Resources LLC 6.875% 2/15/26 (a) | 1,250,000 | 1,031,250 | |
| Magnolia Oil & Gas Operating LLC 6% 8/1/26 (a) | 1,235,000 | 1,228,825 | |
| MEG Energy Corp.: | |||
| 6.375% 1/30/23 (a) | 925,000 | 874,125 | |
| 7% 3/31/24 (a) | 1,635,000 | 1,555,294 | |
| Parsley Energy LLC/Parsley: | |||
| 5.25% 8/15/25 (a) | 170,000 | 172,550 | |
| 5.375% 1/15/25 (a) | 1,760,000 | 1,795,200 | |
| PBF Logistics LP/PBF Logistics Finance, Inc. 6.875% 5/15/23 | 1,945,000 | 1,998,488 | |
| Rose Rock Midstream LP/Rose Rock Finance Corp. 5.625% 11/15/23 | 2,025,000 | 1,913,625 | |
| Sanchez Energy Corp. 7.25% 2/15/23 (a)(b) | 3,615,000 | 2,530,500 | |
| SemGroup Corp.: | |||
| 6.375% 3/15/25 | 1,750,000 | 1,653,750 | |
| 7.25% 3/15/26 | 1,730,000 | 1,652,150 | |
| Southwestern Energy Co. 7.75% 10/1/27 | 980,000 | 852,600 | |
| Sunoco LP/Sunoco Finance Corp.: | |||
| 4.875% 1/15/23 | 815,000 | 833,338 | |
| 5.5% 2/15/26 | 585,000 | 606,938 | |
| Targa Resources Partners LP/Targa Resources Partners Finance Corp.: | |||
| 5.25% 5/1/23 | 1,825,000 | 1,856,372 | |
| 5.375% 2/1/27 | 3,000,000 | 3,095,400 | |
| 71,409,219 | |||
| TOTAL ENERGY | 78,920,244 | ||
| FINANCIALS - 2.6% | |||
| Capital Markets - 0.1% | |||
| MSCI, Inc. 4.75% 8/1/26 (a) | 1,775,000 | 1,857,094 | |
| Consumer Finance - 1.0% | |||
| Ally Financial, Inc.: | |||
| 3.875% 5/21/24 | 840,000 | 885,150 | |
| 5.75% 11/20/25 | 7,320,000 | 8,381,400 | |
| 8% 11/1/31 | 1,850,000 | 2,585,375 | |
| Navient Corp.: | |||
| 5.5% 1/25/23 | 1,620,000 | 1,701,486 | |
| 5.875% 10/25/24 | 195,000 | 205,138 | |
| 6.125% 3/25/24 | 505,000 | 535,931 | |
| 6.5% 6/15/22 | 2,610,000 | 2,825,325 | |
| 6.75% 6/15/26 | 1,190,000 | 1,273,300 | |
| 7.25% 1/25/22 | 1,015,000 | 1,112,694 | |
| 7.25% 9/25/23 | 1,825,000 | 2,025,750 | |
| Springleaf Finance Corp.: | |||
| 6.875% 3/15/25 | 1,235,000 | 1,400,181 | |
| 7.125% 3/15/26 | 870,000 | 992,235 | |
| 23,923,965 | |||
| Diversified Financial Services - 1.3% | |||
| Avolon Holdings Funding Ltd.: | |||
| 5.125% 10/1/23 (a) | 3,745,000 | 3,976,067 | |
| 5.5% 1/15/23 (a) | 1,400,000 | 1,491,560 | |
| Chobani LLC/Finance Corp., Inc. 7.5% 4/15/25 (a) | 230,000 | 212,175 | |
| CRC Escrow Issuer LLC/CRC Finance LLC 5.25% 10/15/25 (a) | 3,200,000 | 3,256,000 | |
| Crown Americas LLC/Crown Americas Capital Corp. IV 4.75% 2/1/26 | 980,000 | 1,029,000 | |
| GEMS MENASA Cayman Ltd. 7.125% 7/31/26 (a) | 395,000 | 402,505 | |
| Icahn Enterprises LP/Icahn Enterprises Finance Corp.: | |||
| 6.25% 2/1/22 | 3,690,000 | 3,800,700 | |
| 6.25% 5/15/26 (a) | 1,210,000 | 1,262,998 | |
| 6.375% 12/15/25 | 1,080,000 | 1,143,450 | |
| 6.75% 2/1/24 | 1,975,000 | 2,066,344 | |
| Park Aerospace Holdings Ltd.: | |||
| 4.5% 3/15/23 (a) | 455,000 | 470,743 | |
| 5.25% 8/15/22 (a) | 1,285,000 | 1,357,281 | |
| 5.5% 2/15/24 (a) | 670,000 | 724,538 | |
| Radiate Holdco LLC/Radiate Financial Service Ltd.: | |||
| 6.625% 2/15/25 (a) | 2,255,000 | 2,238,088 | |
| 6.875% 2/15/23 (a) | 565,000 | 576,300 | |
| Solera LLC/Solera Finance, Inc. 10.5% 3/1/24 (a) | 4,910,000 | 5,204,600 | |
| Tempo Acquisition LLC 6.75% 6/1/25 (a) | 1,675,000 | 1,720,728 | |
| Trivium Packaging Finance BV: | |||
| 5.5% 8/15/26 (a) | 310,000 | 327,825 | |
| 8.5% 8/15/27 (a) | 315,000 | 338,625 | |
| 31,599,527 | |||
| Insurance - 0.1% | |||
| AmWINS Group, Inc. 7.75% 7/1/26 (a) | 1,595,000 | 1,674,750 | |
| USIS Merger Sub, Inc. 6.875% 5/1/25 (a) | 1,420,000 | 1,412,900 | |
| 3,087,650 | |||
| Mortgage Real Estate Investment Trusts - 0.0% | |||
| Starwood Property Trust, Inc. 4.75% 3/15/25 | 515,000 | 527,875 | |
| Thrifts & Mortgage Finance - 0.1% | |||
| Prime Securities Services Borrower LLC/Prime Finance, Inc. 9.25% 5/15/23 (a) | 675,000 | 709,830 | |
| Quicken Loans, Inc. 5.25% 1/15/28 (a) | 1,965,000 | 2,038,688 | |
| 2,748,518 | |||
| TOTAL FINANCIALS | 63,744,629 | ||
| HEALTH CARE - 2.0% | |||
| Health Care Equipment & Supplies - 0.1% | |||
| Hologic, Inc.: | |||
| 4.375% 10/15/25 (a) | 980,000 | 1,002,050 | |
| 4.625% 2/1/28 (a) | 185,000 | 191,244 | |
| Teleflex, Inc. 4.875% 6/1/26 | 1,750,000 | 1,843,555 | |
| 3,036,849 | |||
| Health Care Providers & Services - 1.5% | |||
| Community Health Systems, Inc.: | |||
| 6.25% 3/31/23 | 6,515,000 | 6,303,914 | |
| 8% 3/15/26 (a) | 960,000 | 921,600 | |
| 8.625% 1/15/24 (a) | 1,445,000 | 1,445,000 | |
| HCA Holdings, Inc.: | |||
| 4.5% 2/15/27 | 1,925,000 | 2,087,047 | |
| 5% 3/15/24 | 3,000,000 | 3,276,910 | |
| MPH Acquisition Holdings LLC 7.125% 6/1/24 (a) | 990,000 | 884,872 | |
| Sabra Health Care LP/Sabra Capital Corp. 5.375% 6/1/23 | 3,000,000 | 3,041,250 | |
| Tenet Healthcare Corp.: | |||
| 5.125% 5/1/25 | 915,000 | 917,288 | |
| 6.25% 2/1/27 (a) | 885,000 | 918,188 | |
| 6.75% 6/15/23 | 2,620,000 | 2,692,050 | |
| 8.125% 4/1/22 | 7,645,000 | 8,236,723 | |
| THC Escrow Corp. III 7% 8/1/25 | 1,815,000 | 1,833,150 | |
| Vizient, Inc. 6.25% 5/15/27 (a) | 125,000 | 134,375 | |
| Wellcare Health Plans, Inc.: | |||
| 5.25% 4/1/25 | 1,095,000 | 1,146,520 | |
| 5.375% 8/15/26 (a) | 1,810,000 | 1,929,913 | |
| 35,768,800 | |||
| Health Care Technology - 0.1% | |||
| IMS Health, Inc. 5% 5/15/27 (a) | 1,425,000 | 1,505,156 | |
| Life Sciences Tools & Services - 0.0% | |||
| Charles River Laboratories International, Inc. 5.5% 4/1/26 (a) | 735,000 | 786,377 | |
| Pharmaceuticals - 0.3% | |||
| Catalent Pharma Solutions 4.875% 1/15/26 (a) | 1,355,000 | 1,375,325 | |
| Valeant Pharmaceuticals International, Inc.: | |||
| 5.5% 11/1/25 (a) | 780,000 | 818,009 | |
| 5.875% 5/15/23 (a) | 155,000 | 156,938 | |
| 6.125% 4/15/25 (a) | 785,000 | 808,550 | |
| 7% 3/15/24 (a) | 2,500,000 | 2,640,400 | |
| 5,799,222 | |||
| TOTAL HEALTH CARE | 46,896,404 | ||
| INDUSTRIALS - 1.6% | |||
| Aerospace & Defense - 0.7% | |||
| BBA U.S. Holdings, Inc. 5.375% 5/1/26 (a) | 2,530,000 | 2,643,850 | |
| Bombardier, Inc.: | |||
| 7.5% 12/1/24 (a) | 2,040,000 | 2,032,554 | |
| 7.5% 3/15/25 (a) | 780,000 | 759,525 | |
| 7.875% 4/15/27 (a) | 1,630,000 | 1,579,063 | |
| BWX Technologies, Inc. 5.375% 7/15/26 (a) | 1,925,000 | 2,035,688 | |
| TransDigm, Inc.: | |||
| 6% 7/15/22 | 1,470,000 | 1,493,888 | |
| 6.25% 3/15/26 (a) | 2,455,000 | 2,648,282 | |
| 6.375% 6/15/26 | 1,470,000 | 1,542,750 | |
| 6.5% 7/15/24 | 780,000 | 805,350 | |
| 6.5% 5/15/25 | 1,805,000 | 1,881,713 | |
| 17,422,663 | |||
| Air Freight & Logistics - 0.1% | |||
| Aercap Global Aviation Trust 6.5% 6/15/45 (a)(c) | 2,815,000 | 3,001,494 | |
| Commercial Services & Supplies - 0.3% | |||
| APX Group, Inc.: | |||
| 7.625% 9/1/23 | 1,400,000 | 1,043,000 | |
| 7.875% 12/1/22 | 1,150,000 | 1,093,938 | |
| 8.75% 12/1/20 | 1,124,000 | 1,067,800 | |
| Brand Energy & Infrastructure Services, Inc. 8.5% 7/15/25 (a) | 1,030,000 | 907,688 | |
| LBC Tank Terminals Holding Netherlands BV 6.875% 5/15/23 (a) | 1,800,000 | 1,818,000 | |
| Prime Security One MS, Inc. 4.875% 7/15/32 (a) | 1,105,000 | 962,731 | |
| Tervita Escrow Corp. 7.625% 12/1/21 (a) | 240,000 | 243,600 | |
| 7,136,757 | |||
| Construction & Engineering - 0.2% | |||
| AECOM: | |||
| 5.125% 3/15/27 | 2,520,000 | 2,632,190 | |
| 5.875% 10/15/24 | 1,905,000 | 2,057,400 | |
| 4,689,590 | |||
| Electrical Equipment - 0.0% | |||
| Sensata Technologies BV 5% 10/1/25 (a) | 715,000 | 757,900 | |
| Machinery - 0.1% | |||
| U.S.A. Compression Partners LP: | |||
| 6.875% 4/1/26 | 1,500,000 | 1,537,500 | |
| 6.875% 9/1/27 (a) | 435,000 | 447,432 | |
| 1,984,932 | |||
| Trading Companies & Distributors - 0.2% | |||
| Avantor, Inc. 6% 10/1/24 (a) | 780,000 | 836,550 | |
| FLY Leasing Ltd.: | |||
| 5.25% 10/15/24 | 2,075,000 | 2,132,063 | |
| 6.375% 10/15/21 | 1,500,000 | 1,528,125 | |
| 4,496,738 | |||
| TOTAL INDUSTRIALS | 39,490,074 | ||
| INFORMATION TECHNOLOGY - 1.0% | |||
| Electronic Equipment & Components - 0.1% | |||
| TTM Technologies, Inc. 5.625% 10/1/25 (a) | 2,835,000 | 2,764,125 | |
| IT Services - 0.1% | |||
| Banff Merger Sub, Inc. 9.75% 9/1/26 (a) | 900,000 | 819,000 | |
| Gartner, Inc. 5.125% 4/1/25 (a) | 350,000 | 367,059 | |
| 1,186,059 | |||
| Semiconductors & Semiconductor Equipment - 0.1% | |||
| Qorvo, Inc. 5.5% 7/15/26 | 1,795,000 | 1,916,198 | |
| Sensata Technologies UK Financing Co. PLC 6.25% 2/15/26 (a) | 1,000,000 | 1,062,210 | |
| 2,978,408 | |||
| Software - 0.7% | |||
| Ascend Learning LLC: | |||
| 6.875% 8/1/25 (a) | 125,000 | 129,531 | |
| 6.875% 8/1/25 (a) | 1,160,000 | 1,202,050 | |
| CDK Global, Inc.: | |||
| 4.875% 6/1/27 | 485,000 | 501,121 | |
| 5.25% 5/15/29 (a) | 240,000 | 247,800 | |
| 5.875% 6/15/26 | 985,000 | 1,046,169 | |
| Ensemble S Merger Sub, Inc. 9% 9/30/23 (a) | 2,258,000 | 2,320,095 | |
| Fair Isaac Corp. 5.25% 5/15/26 (a) | 2,365,000 | 2,518,725 | |
| Nuance Communications, Inc. 5.625% 12/15/26 | 1,085,000 | 1,143,319 | |
| Open Text Corp. 5.875% 6/1/26 (a) | 3,330,000 | 3,558,771 | |
| SS&C Technologies, Inc. 5.5% 9/30/27 (a) | 1,150,000 | 1,207,500 | |
| Symantec Corp. 5% 4/15/25 (a) | 3,260,000 | 3,281,745 | |
| 17,156,826 | |||
| TOTAL INFORMATION TECHNOLOGY | 24,085,418 | ||
| MATERIALS - 1.3% | |||
| Chemicals - 0.5% | |||
| Element Solutions, Inc. 5.875% 12/1/25 (a) | 1,915,000 | 2,001,175 | |
| Nufarm Australia Ltd. 5.75% 4/30/26 (a) | 1,235,000 | 1,163,988 | |
| OCI NV 6.625% 4/15/23 (a) | 2,620,000 | 2,764,100 | |
| Olin Corp. 5.125% 9/15/27 | 1,495,000 | 1,536,113 | |
| The Chemours Co. LLC: | |||
| 5.375% 5/15/27 | 1,380,000 | 1,224,750 | |
| 7% 5/15/25 | 815,000 | 804,813 | |
| TPC Group, Inc. 10.5% 8/1/24 (a) | 330,000 | 346,500 | |
| Trinseo Materials Operating SCA/Trinseo Materials Finance, Inc. 5.375% 9/1/25 (a) | 1,240,000 | 1,165,600 | |
| Valvoline, Inc. 4.375% 8/15/25 | 1,025,000 | 1,035,250 | |
| 12,042,289 | |||
| Containers & Packaging - 0.5% | |||
| Ardagh Packaging Finance PLC/Ardagh MP Holdings U.S.A., Inc.: | |||
| 4.625% 5/15/23 (a) | 2,500,000 | 2,558,650 | |
| 6% 2/15/25 (a) | 2,260,000 | 2,360,288 | |
| Crown Americas LLC/Crown Americas Capital Corp. V 4.25% 9/30/26 | 2,120,000 | 2,199,500 | |
| Flex Acquisition Co., Inc.: | |||
| 6.875% 1/15/25 (a) | 1,440,000 | 1,296,000 | |
| 7.875% 7/15/26 (a) | 305,000 | 276,025 | |
| OI European Group BV 4% 3/15/23 (a) | 1,445,000 | 1,455,838 | |
| Owens-Brockway Glass Container, Inc. 5.375% 1/15/25 (a) | 2,000,000 | 2,070,000 | |
| Silgan Holdings, Inc. 4.75% 3/15/25 | 695,000 | 713,313 | |
| 12,929,614 | |||
| Metals & Mining - 0.2% | |||
| First Quantum Minerals Ltd.: | |||
| 7.25% 5/15/22 (a) | 565,000 | 548,403 | |
| 7.25% 4/1/23 (a) | 2,395,000 | 2,227,350 | |
| Freeport-McMoRan, Inc.: | |||
| 3.55% 3/1/22 | 475,000 | 476,188 | |
| 3.875% 3/15/23 | 1,645,000 | 1,662,108 | |
| 4,914,049 | |||
| Paper & Forest Products - 0.1% | |||
| Berry Global Escrow Corp. 4.875% 7/15/26 (a) | 1,105,000 | 1,160,250 | |
| TOTAL MATERIALS | 31,046,202 | ||
| REAL ESTATE - 0.4% | |||
| Equity Real Estate Investment Trusts (REITs) - 0.3% | |||
| Corrections Corp. of America: | |||
| 4.125% 4/1/20 | 530,000 | 528,675 | |
| 4.625% 5/1/23 | 275,000 | 265,375 | |
| 5% 10/15/22 | 802,000 | 793,980 | |
| CTR Partnership LP/CareTrust Capital Corp. 5.25% 6/1/25 | 1,170,000 | 1,205,311 | |
| MPT Operating Partnership LP/MPT Finance Corp.: | |||
| 5% 10/15/27 | 595,000 | 635,163 | |
| 5.25% 8/1/26 | 1,035,000 | 1,093,529 | |
| 5.5% 5/1/24 | 1,500,000 | 1,543,125 | |
| 6,065,158 | |||
| Real Estate Management & Development - 0.1% | |||
| Howard Hughes Corp. 5.375% 3/15/25 (a) | 2,345,000 | 2,415,350 | |
| Twin River Worldwide Holdings, Inc. 6.75% 6/1/27 (a) | 1,105,000 | 1,164,394 | |
| 3,579,744 | |||
| TOTAL REAL ESTATE | 9,644,902 | ||
| UTILITIES - 1.0% | |||
| Electric Utilities - 0.4% | |||
| Clearway Energy Operating LLC 5.75% 10/15/25 (a) | 900,000 | 938,268 | |
| InterGen NV 7% 6/30/23 (a) | 3,045,000 | 2,786,175 | |
| NRG Yield Operating LLC 5% 9/15/26 | 885,000 | 896,063 | |
| NSG Holdings II LLC/NSG Holdings, Inc. 7.75% 12/15/25 (a) | 1,611,557 | 1,728,395 | |
| Vistra Operations Co. LLC: | |||
| 5% 7/31/27 (a) | 1,025,000 | 1,058,313 | |
| 5.5% 9/1/26 (a) | 3,566,000 | 3,744,300 | |
| 11,151,514 | |||
| Independent Power and Renewable Electricity Producers - 0.6% | |||
| NextEra Energy Partners LP: | |||
| 4.25% 9/15/24 (a) | 1,365,000 | 1,415,505 | |
| 4.5% 9/15/27 (a) | 250,000 | 256,875 | |
| NRG Energy, Inc.: | |||
| 5.25% 6/15/29 (a) | 1,095,000 | 1,168,442 | |
| 6.625% 1/15/27 | 1,910,000 | 2,062,800 | |
| Talen Energy Supply LLC: | |||
| 6.5% 6/1/25 | 190,000 | 144,400 | |
| 10.5% 1/15/26 (a) | 2,235,000 | 2,031,615 | |
| TerraForm Power Operating LLC: | |||
| 4.25% 1/31/23 (a) | 500,000 | 512,325 | |
| 5% 1/31/28 (a) | 560,000 | 583,111 | |
| 6.625% 6/15/25 (a)(c) | 1,215,000 | 1,281,825 | |
| The AES Corp.: | |||
| 4.5% 3/15/23 | 755,000 | 776,065 | |
| 5.125% 9/1/27 | 1,150,000 | 1,232,835 | |
| 6% 5/15/26 | 2,000,000 | 2,144,480 | |
| 13,610,278 | |||
| TOTAL UTILITIES | 24,761,792 | ||
| TOTAL NONCONVERTIBLE BONDS | 490,070,216 | ||
| TOTAL CORPORATE BONDS | |||
| (Cost $483,581,102) | 492,114,856 | ||
| Bank Loan Obligations - 0.5% | |||
| COMMUNICATION SERVICES - 0.2% | |||
| Diversified Telecommunication Services - 0.1% | |||
| Frontier Communications Corp. Tranche B 1LN, term loan 3 month U.S. LIBOR + 3.750% 5.87% 6/15/24 (c)(d) | 2,744,000 | 2,710,468 | |
| Level 3 Financing, Inc. Tranche B, term loan 3 month U.S. LIBOR + 2.250% 4.362% 2/22/24 (c)(d) | 1,030,000 | 1,030,433 | |
| 3,740,901 | |||
| Media - 0.1% | |||
| WideOpenWest Finance LLC Tranche B, term loan 3 month U.S. LIBOR + 3.250% 5.3953% 8/19/23 (c)(d) | 1,463,925 | 1,404,153 | |
| TOTAL COMMUNICATION SERVICES | 5,145,054 | ||
| CONSUMER DISCRETIONARY - 0.1% | |||
| Hotels, Restaurants & Leisure - 0.1% | |||
| Golden Entertainment, Inc. Tranche B, term loan 3 month U.S. LIBOR + 3.000% 5.14% 10/20/24 (c)(d) | 1,312,400 | 1,310,484 | |
| ENERGY - 0.1% | |||
| Oil, Gas & Consumable Fuels - 0.1% | |||
| California Resources Corp. Tranche B, term loan 3 month U.S. LIBOR + 4.750% 6.8659% 12/31/22 (c)(d) | 475,000 | 431,856 | |
| Gavilan Resources LLC Tranche 2LN, term loan 3 month U.S. LIBOR + 6.000% 8.112% 3/1/24 (c)(d) | 850,000 | 361,250 | |
| Sanchez Energy Corp. 1LN, term loan 3 month U.S. LIBOR + 8.000% 2.8571% 5/11/20 (c)(d)(e)(f) | 1,590,296 | 1,510,781 | |
| 2,303,887 | |||
| INDUSTRIALS - 0.1% | |||
| Commercial Services & Supplies - 0.1% | |||
| Brand Energy & Infrastructure Services, Inc. Tranche B, term loan 3 month U.S. LIBOR + 4.250% 6.5149% 6/21/24 (c)(d) | 1,460,200 | 1,383,540 | |
| INFORMATION TECHNOLOGY - 0.0% | |||
| Communications Equipment - 0.0% | |||
| Radiate Holdco LLC Tranche B, term loan 3 month U.S. LIBOR + 3.000% 5.112% 2/1/24 (c)(d) | 405,663 | 401,606 | |
| Software - 0.0% | |||
| Almonde, Inc.: | |||
| Tranche 2LN, term loan 3 month U.S. LIBOR + 7.250% 9.4463% 6/13/25 (c)(d) | 55,000 | 53,648 | |
| Tranche B 1LN, term loan 3 month U.S. LIBOR + 3.500% 5.6963% 6/13/24 (c)(d) | 242,072 | 233,263 | |
| 286,911 | |||
| TOTAL INFORMATION TECHNOLOGY | 688,517 | ||
| TOTAL BANK LOAN OBLIGATIONS | |||
| (Cost $10,873,288) | 10,831,482 | ||
| Shares | Value | ||
| Fixed-Income Funds - 77.7% | |||
| High Yield Fixed-Income Funds - 77.7% | |||
| Artisan High Income Fund Investor Shares | 32,699,829 | 314,245,331 | |
| BlackRock High Yield Bond Portfolio Institutional Class | 9,856,038 | 75,694,371 | |
| Eaton Vance Income Fund of Boston Class A | 20,550,886 | 115,084,959 | |
| Fidelity Advisor High Income Advantage Fund Class I (g) | 10,932,206 | 113,804,267 | |
| Fidelity Capital & Income Fund (g) | 17,521,326 | 175,388,471 | |
| Hotchkis & Wiley High Yield Fund Class A | 21,476,441 | 245,046,193 | |
| MainStay High Yield Corporate Bond Fund Class A | 47,451,358 | 266,676,632 | |
| Prudential High Yield Fund | 45,880,116 | 251,881,836 | |
| T. Rowe Price High Yield Fund Advisor Class | 41,026,988 | 270,778,119 | |
| Vanguard High-Yield Corporate Fund Admiral Shares | 7,803,885 | 45,964,881 | |
| TOTAL FIXED-INCOME FUNDS | |||
| (Cost $1,811,638,970) | 1,874,565,060 | ||
| Principal Amount | Value | ||
| Preferred Securities - 0.6% | |||
| ENERGY - 0.1% | |||
| Oil, Gas & Consumable Fuels - 0.1% | |||
| MPLX LP 6.875% (c)(h) | 2,055,000 | 2,065,637 | |
| FINANCIALS - 0.5% | |||
| Banks - 0.5% | |||
| Bank of America Corp.: | |||
| 5.2% (c)(h) | 1,200,000 | 1,251,685 | |
| 6.25% (c)(h) | 4,000,000 | 4,482,283 | |
| Barclays PLC 7.875% (Reg. S) (c)(h) | 1,535,000 | 1,621,807 | |
| Royal Bank of Scotland Group PLC 7.5% (c)(h) | 1,840,000 | 1,892,881 | |
| Wells Fargo & Co. 5.9% (c)(h) | 2,250,000 | 2,430,166 | |
| 11,678,822 | |||
| TOTAL PREFERRED SECURITIES | |||
| (Cost $13,122,083) | 13,744,459 | ||
| Shares | Value | ||
| Money Market Funds - 0.5% | |||
| Fidelity Cash Central Fund 2.13% (i) | 12,365,279 | 12,367,752 | |
| State Street Institutional U.S. Government Money Market Fund Premier Class 1.87% (j) | 2,072 | 2,072 | |
| TOTAL MONEY MARKET FUNDS | |||
| (Cost $12,369,679) | 12,369,824 | ||
| TOTAL INVESTMENT IN SECURITIES - 99.7% | |||
| (Cost $2,331,585,122) | 2,403,625,681 | ||
| NET OTHER ASSETS (LIABILITIES) - 0.3% | 7,481,413 | ||
| NET ASSETS - 100% | $2,411,107,094 |
Legend
(a) Security exempt from registration under Rule 144A of the Securities Act of 1933. These securities may be resold in transactions exempt from registration, normally to qualified institutional buyers. At the end of the period, the value of these securities amounted to $295,701,026 or 12.3% of net assets.
(b) Non-income producing - Security is in default.
(c) Coupon rates for floating and adjustable rate securities reflect the rates in effect at period end.
(d) Coupon is indexed to a floating interest rate which may be multiplied by a specified factor and/or subject to caps or floors.
(e) Position or a portion of the position represents an unfunded loan commitment. At period end, the total principal amount and market value of unfunded commitments totaled $1,135,926 and $1,079,129, respectively.
(f) Level 3 security
(g) Affiliated Fund
(h) Security is perpetual in nature with no stated maturity date.
(i) Affiliated fund that is generally available only to investment companies and other accounts managed by Fidelity Investments. The rate quoted is the annualized seven-day yield of the fund at period end. A complete unaudited listing of the fund's holdings as of its most recent quarter end is available upon request. In addition, each Fidelity Central Fund's financial statements are available on the SEC's website or upon request.
(j) The rate quoted is the annualized seven-day yield of the fund at period end.
Affiliated Central Funds
Information regarding fiscal year to date income earned by the Fund from investments in Fidelity Central Funds is as follows:
| Fund | Income earned |
| Fidelity Cash Central Fund | $166,538 |
| Total | $166,538 |
Amounts in the income column in the above table include any capital gain distributions from underlying funds, which are presented in the corresponding line-item in the Statement of Operations, if applicable.
Affiliated Underlying Funds
Fiscal year to date information regarding the Fund's investments in affiliated Underlying Funds, excluding any Money Market Central Funds, is presented below. Exchanges between classes of the same affiliated Underlying Funds may occur.
| Affiliate | Value, beginning of period | Purchases | Sales Proceeds | Dividend Income | Realized Gain (loss) | Change in Unrealized appreciation (depreciation) | Value, end of period |
| Fidelity Advisor High Income Advantage Fund Class I | $160,296,900 | $3,426,629 | $50,249,535 | $3,426,380 | $1,423,717 | $(1,093,444) | $113,804,267 |
| Fidelity Capital & Income Fund | 360,272,960 | 4,967,725 | 193,034,748 | 4,967,274 | 20,266,037 | (17,083,503) | 175,388,471 |
| Total | $520,569,860 | $8,394,354 | $243,284,283 | $8,393,654 | $21,689,754 | $(18,176,947) | $289,192,738 |
Amounts in the income column in the above table include any capital gain distributions from underlying funds, which are presented in the corresponding line-item in the Statement of Operations, if applicable.
Investment Valuation
The following is a summary of the inputs used, as of August 31, 2019, involving the Fund's assets and liabilities carried at fair value. The inputs or methodology used for valuing securities may not be an indication of the risk associated with investing in those securities. For more information on valuation inputs, and their aggregation into the levels used below, please refer to the Investment Valuation section in the accompanying Notes to Financial Statements.
| Valuation Inputs at Reporting Date: | ||||
| Description | Total | Level 1 | Level 2 | Level 3 |
| Investments in Securities: | ||||
| Corporate Bonds | $492,114,856 | $-- | $492,114,856 | $-- |
| Bank Loan Obligations | 10,831,482 | -- | 9,320,701 | 1,510,781 |
| Fixed-Income Funds | 1,874,565,060 | 1,874,565,060 | -- | -- |
| Preferred Securities | 13,744,459 | -- | 13,744,459 | -- |
| Money Market Funds | 12,369,824 | 12,369,824 | -- | -- |
| Total Investments in Securities: | $2,403,625,681 | $1,886,934,884 | $515,180,016 | $1,510,781 |
See accompanying notes which are an integral part of the financial statements.
Financial Statements
Statement of Assets and Liabilities
| August 31, 2019 (Unaudited) | ||
| Assets | ||
| Investment in securities, at value — See accompanying schedule: Unaffiliated issuers (cost $2,088,752,696) | $2,102,065,191 | |
| Fidelity Central Funds (cost $12,367,607) | 12,367,752 | |
| Other affiliated issuers (cost $230,464,819) | 289,192,738 | |
| Total Investment in Securities (cost $2,331,585,122) | $2,403,625,681 | |
| Cash | 29,929 | |
| Receivable for investments sold | 5,202,201 | |
| Receivable for fund shares sold | 618,045 | |
| Dividends receivable | 188,747 | |
| Interest receivable | 8,617,928 | |
| Distributions receivable from Fidelity Central Funds | 25,070 | |
| Prepaid expenses | 6,282 | |
| Other receivables | 56,424 | |
| Total assets | 2,418,370,307 | |
| Liabilities | ||
| Payable for investments purchased | $1,224,053 | |
| Payable for fund shares redeemed | 1,466,015 | |
| Distributions payable | 4,353,299 | |
| Accrued management fee | 135,737 | |
| Other payables and accrued expenses | 84,109 | |
| Total liabilities | 7,263,213 | |
| Net Assets | $2,411,107,094 | |
| Net Assets consist of: | ||
| Paid in capital | $2,468,567,377 | |
| Total distributable earnings (loss) | (57,460,283) | |
| Net Assets, for 254,551,099 shares outstanding | $2,411,107,094 | |
| Net Asset Value, offering price and redemption price per share ($2,411,107,094 ÷ 254,551,099 shares) | $9.47 |
See accompanying notes which are an integral part of the financial statements.
Statement of Operations
| Six months ended August 31, 2019 (Unaudited) | ||
| Investment Income | ||
| Dividends: | ||
| Unaffiliated issuers | $46,776,797 | |
| Affiliated issuers | 7,758,990 | |
| Interest | 15,620,028 | |
| Income from Fidelity Central Funds | 166,538 | |
| Total income | 70,322,353 | |
| Expenses | ||
| Management fee | $3,881,344 | |
| Accounting fees and expenses | 266,939 | |
| Custodian fees and expenses | 7,912 | |
| Independent trustees' fees and expenses | 13,823 | |
| Registration fees | 22,736 | |
| Audit | 23,054 | |
| Legal | 5,336 | |
| Miscellaneous | 14,419 | |
| Total expenses before reductions | 4,235,563 | |
| Expense reductions | (3,066,848) | |
| Total expenses after reductions | 1,168,715 | |
| Net investment income (loss) | 69,153,638 | |
| Realized and Unrealized Gain (Loss) | ||
| Net realized gain (loss) on: | ||
| Investment securities: | ||
| Unaffiliated issuers | (10,778,175) | |
| Affiliated issuers | 21,689,754 | |
| Capital gain distributions from underlying funds: | ||
| Affiliated issuers | 634,664 | |
| Total net realized gain (loss) | 11,546,243 | |
| Change in net unrealized appreciation (depreciation) on: | ||
| Investment securities: | ||
| Unaffiliated issuers | 36,176,644 | |
| Fidelity Central Funds | 1 | |
| Other affiliated issuers | (18,176,947) | |
| Total change in net unrealized appreciation (depreciation) | 17,999,698 | |
| Net gain (loss) | 29,545,941 | |
| Net increase (decrease) in net assets resulting from operations | $98,699,579 |
See accompanying notes which are an integral part of the financial statements.
Statement of Changes in Net Assets
| Six months ended August 31, 2019 (Unaudited) | Year ended February 28, 2019 | |
| Increase (Decrease) in Net Assets | ||
| Operations | ||
| Net investment income (loss) | $69,153,638 | $163,409,710 |
| Net realized gain (loss) | 11,546,243 | (34,529,191) |
| Change in net unrealized appreciation (depreciation) | 17,999,698 | (47,729,454) |
| Net increase (decrease) in net assets resulting from operations | 98,699,579 | 81,151,065 |
| Distributions to shareholders | (65,661,029) | (152,578,108) |
| Share transactions | ||
| Proceeds from sales of shares | 139,099,480 | 518,968,318 |
| Reinvestment of distributions | 38,709,833 | 99,413,790 |
| Cost of shares redeemed | (442,225,672) | (951,905,541) |
| Net increase (decrease) in net assets resulting from share transactions | (264,416,359) | (333,523,433) |
| Total increase (decrease) in net assets | (231,377,809) | (404,950,476) |
| Net Assets | ||
| Beginning of period | 2,642,484,903 | 3,047,435,379 |
| End of period | $2,411,107,094 | $2,642,484,903 |
| Other Information | ||
| Shares | ||
| Sold | 14,767,188 | 55,268,271 |
| Issued in reinvestment of distributions | 4,104,148 | 10,691,042 |
| Redeemed | (47,092,690) | (102,827,858) |
| Net increase (decrease) | (28,221,354) | (36,868,545) |
See accompanying notes which are an integral part of the financial statements.
Financial Highlights
Strategic Advisers Income Opportunities Fund
| Six months ended (Unaudited) August 31, | Years endedFebruary 28, | |||||
| 2019 | 2019 | 2018 | 2017 | 2016 A | 2015 | |
| Selected Per–Share Data | ||||||
| Net asset value, beginning of period | $9.34 | $9.53 | $9.57 | $8.48 | $9.94 | $10.45 |
| Income from Investment Operations | ||||||
| Net investment income (loss)B | .266 | .513 | .489 | .493 | .518 | .551 |
| Net realized and unrealized gain (loss) | .116 | (.222) | (.050) | 1.091 | (1.300) | (.369) |
| Total from investment operations | .382 | .291 | .439 | 1.584 | (.782) | .182 |
| Distributions from net investment income | (.248) | (.469) | (.479) | (.494) | (.537)C | (.552) |
| Distributions from net realized gain | (.004) | (.012) | – | – | (.118)C | (.140) |
| Tax return of capital | – | – | – | – | (.023) | – |
| Total distributions | (.252) | (.481) | (.479) | (.494) | (.678) | (.692) |
| Net asset value, end of period | $9.47 | $9.34 | $9.53 | $9.57 | $8.48 | $9.94 |
| Total ReturnD,E | 4.13% | 3.21% | 4.66% | 19.08% | (8.26)% | 1.82% |
| Ratios to Average Net AssetsF,G | ||||||
| Expenses before reductions | .34%H | .36% | .38% | .29% | .26% | .26% |
| Expenses net of fee waivers, if any | .09%H | .11% | .13% | .04% | .01% | .01% |
| Expenses net of all reductions | .09%H | .11% | .13% | .04% | .01% | .01% |
| Net investment income (loss) | 5.61%H | 5.49% | 5.09% | 5.40% | 5.56% | 5.40% |
| Supplemental Data | ||||||
| Net assets, end of period (000 omitted) | $2,411,107 | $2,642,485 | $3,047,435 | $3,318,071 | $3,813,523 | $4,225,162 |
| Portfolio turnover rateI | 18%H | 22% | 33% | 38% | 10% | 16% |
A For the year ended February 29.
B Calculated based on average shares outstanding during the period.
C The amounts shown reflect certain reclassifications related to book to tax differences that were made in the year shown.
D Total returns for periods of less than one year are not annualized.
E Total returns would have been lower if certain expenses had not been reduced during the applicable periods shown.
F Fees and expenses of any underlying Fidelity Central Funds are not included in the Fund's expense ratio. The Fund indirectly bears its proportionate share of the expenses of any underlying Fidelity Central Funds.
G Expense ratios reflect operating expenses of the Fund. Expenses before reductions do not reflect amounts reimbursed by the investment adviser or reductions from expense offset arrangements and do not represent the amount paid by the Fund during periods when reimbursements or reductions occur. Expenses net of fee waivers reflect expenses after reimbursement by the investment adviser but prior to reductions from expense offset arrangements. Expenses net of all reductions represent the net expenses paid by the Fund. Fees and expenses of the Underlying Funds are not included in the Fund's annualized ratios. The Fund indirectly bears its proportionate share of the expenses of the Underlying Funds.
H Annualized
I Amount does not include the portfolio activity of any Underlying Funds.
See accompanying notes which are an integral part of the financial statements.
Notes to Financial Statements (Unaudited)
For the period ended August 31, 2019
1. Organization.
Strategic Advisers Income Opportunities Fund (the Fund) is a fund of Fidelity Rutland Square Trust II (the Trust), and is authorized to issue an unlimited number of shares. The Trust is registered under the Investment Company Act of 1940, as amended (the 1940 Act), as an open-end management investment company organized as a Delaware statutory trust. The Fund is offered exclusively to certain clients of Strategic Advisers LLC (Strategic Advisers), an affiliate of Fidelity Management & Research Company (FMR).
2. Significant Accounting Policies.
The Fund is an investment company and applies the accounting and reporting guidance of the Financial Accounting Standards Board (FASB) Accounting Standards Codification Topic 946 Financial Services – Investments Companies. The financial statements have been prepared in conformity with accounting principles generally accepted in the United States of America (GAAP), which require management to make certain estimates and assumptions at the date of the financial statements. Actual results could differ from those estimates. Subsequent events, if any, through the date that the financial statements were issued have been evaluated in the preparation of the financial statements. The Fund's Schedule of Investments lists each of the Underlying Funds as an investment of the Fund but does not include the underlying holdings of each Underlying Fund. The following summarizes the significant accounting policies of the Fund:
Investment Valuation. Investments are valued as of 4:00 p.m. Eastern time on the last calendar day of the period. The Board of Trustees (the Board) has delegated the day to day responsibility for the valuation of the Fund's investments to the Fair Value Committee (the Committee) established by the Fund's investment adviser. In accordance with valuation policies and procedures approved by the Board, the Fund attempts to obtain prices from one or more third party pricing vendors or brokers to value its investments. When current market prices, quotations or currency exchange rates are not readily available or reliable, investments will be fair valued in good faith by the Committee, in accordance with procedures adopted by the Board. Factors used in determining fair value vary by investment type and may include market or investment specific events, changes in interest rates and credit quality. The frequency with which these procedures are used cannot be predicted and they may be utilized to a significant extent. The Committee oversees the Fund's valuation policies and procedures and reports to the Board on the Committee's activities and fair value determinations. The Board monitors the appropriateness of the procedures used in valuing the Fund's investments and ratifies the fair value determinations of the Committee.
The Fund categorizes the inputs to valuation techniques used to value its investments into a disclosure hierarchy consisting of three levels as shown below:
- Level 1 – quoted prices in active markets for identical investments
- Level 2 – other significant observable inputs (including quoted prices for similar investments, interest rates, prepayment speeds, etc.)
- Level 3 – unobservable inputs (including the Fund's own assumptions based on the best information available)
Valuation techniques used to value the Fund's investments by major category are as follows:
Debt securities, including restricted securities, are valued based on evaluated prices received from third party pricing vendors or from brokers who make markets in such securities. Corporate bonds, bank loan obligations and preferred securities are valued by pricing vendors who utilize matrix pricing which considers yield or price of bonds of comparable quality, coupon, maturity and type or by broker-supplied prices. When independent prices are unavailable or unreliable, debt securities may be valued utilizing pricing methodologies which consider similar factors that would be used by third party pricing vendors. Debt securities are generally categorized as Level 2 in the hierarchy but may be Level 3 depending on the circumstances.
Investments in open-end mutual funds, including the Fidelity Central Funds, are valued at their closing net asset value (NAV) each business day and are categorized as Level 1 in the hierarchy. If an unaffiliated open-end mutual fund's NAV is unavailable, shares of that fund may be valued by another method that the Board believes reflects fair value in accordance with the Board's fair value pricing policies and is categorized as Level 2 in the hierarchy.
Changes in valuation techniques may result in transfers in or out of an assigned level within the disclosure hierarchy. The aggregate value of investments by input level as of August 31, 2019 is included at the end of the Fund's Schedule of Investments.
Investment Transactions and Income. For financial reporting purposes, the Fund's investment holdings and NAV include trades executed through the end of the last business day of the period. The NAV per share for processing shareholder transactions is calculated as of the close of business of the New York Stock Exchange (NYSE), normally 4:00 p.m. Eastern time and includes trades executed through the end of the prior business day. Gains and losses on securities sold are determined on the basis of identified cost and include proceeds received from litigation. Dividend income is recorded on the ex-dividend date. Income and capital gain distributions from Fidelity Central Funds, if any, are recorded on the ex-dividend date. Income and capital gain distributions from Underlying Funds, if any, are recorded on the ex-dividend date. Certain distributions received by the Fund represent a return of capital or capital gain. The Fund determines the components of these distributions subsequent to the ex-dividend date, based upon receipt of tax filings or other correspondence relating to the underlying investment. These distributions are recorded as a reduction of cost of investments and/or as a realized gain. Interest income is accrued as earned and includes coupon interest and amortization of premium and accretion of discount on debt securities as applicable. Paid in Kind (PIK) income is recorded at the fair market value of the securities received. Debt obligations may be placed on non-accrual status and related interest income may be reduced by ceasing current accruals and writing off interest receivables when the collection of all or a portion of interest has become doubtful based on consistently applied procedures. A debt obligation is removed from non-accrual status when the issuer resumes interest payments or when collectability of interest is reasonably assured.
Expenses. Expenses directly attributable to a fund are charged to that fund. Expenses attributable to more than one fund are allocated among the respective funds on the basis of relative net assets or other appropriate methods. Expenses included in the accompanying financial statements reflect the expenses of the Fund and do not include any expenses associated with the Underlying Funds. Although not included in the Fund's expenses, the Fund indirectly bears its proportionate share of the Underlying Funds' expenses through the impact of these expenses on each Underlying Fund's NAV. Expense estimates are accrued in the period to which they relate and adjustments are made when actual amounts are known.
Deferred Trustee Compensation. Under a Deferred Compensation Plan (the Plan), certain independent Trustees have elected to defer receipt of a portion of their annual compensation. Deferred amounts are invested in a cross-section of Strategic Advisers funds, are marked-to-market and remain in the Fund until distributed in accordance with the Plan. The investment of deferred amounts and the offsetting payable to the Trustees of $56,424 are included in the accompanying Statement of Assets and Liabilities in other receivables and other payables and accrued expenses, respectively.
Income Tax Information and Distributions to Shareholders. Each year, the Fund intends to qualify as a regulated investment company under Subchapter M of the Internal Revenue Code, including distributing substantially all of its taxable income and realized gains. As a result, no provision for U.S. Federal income taxes is required. The Fund files a U.S. federal tax return, in addition to state and local tax returns as required. The Fund's federal income tax returns are subject to examination by the Internal Revenue Service (IRS) for a period of three fiscal years after they are filed. State and local tax returns may be subject to examination for an additional fiscal year depending on the jurisdiction.
Distributions are declared and recorded daily and paid monthly from net investment income. Distributions from realized gains, if any, are declared and recorded on the ex-dividend date. Income and capital gain distributions are determined in accordance with income tax regulations, which may differ from GAAP.
Capital accounts within the financial statements are adjusted for permanent book-tax differences. These adjustments have no impact on net assets or the results of operations. Capital accounts are not adjusted for temporary book-tax differences which will reverse in a subsequent period.
Book-tax differences are primarily due to the short-term gain distributions from the Underlying Funds, partnerships, market discount, deferred trustees compensation, capital loss carryforwards and losses deferred due to wash sales.
As of period end, the cost and unrealized appreciation (depreciation) in securities, and derivatives if applicable, for federal income tax purposes were as follows:
| Gross unrealized appreciation | $117,211,710 |
| Gross unrealized depreciation | (46,116,339) |
| Net unrealized appreciation (depreciation) | $71,095,371 |
| Tax cost | $2,332,530,310 |
Capital loss carryforwards are only available to offset future capital gains of the Fund to the extent provided by regulations and may be limited. Under the Regulated Investment Company Modernization Act of 2010 (the Act), the Fund is permitted to carry forward capital losses incurred in taxable years beginning after December 22, 2010 for an unlimited period and such capital losses are required to be used prior to any losses that expire. The capital loss carryforward information presented below, including any applicable limitation, is estimated as of prior fiscal period end and is subject to adjustment.
| No expiration | |
| Short-term | $(14,878,146) |
| Long-term | (131,784,814) |
| Total capital loss carryforward | $(146,662,960) |
Restricted Securities. The Fund may invest in securities that are subject to legal or contractual restrictions on resale. These securities generally may be resold in transactions exempt from registration or to the public if the securities are registered. Disposal of these securities may involve time-consuming negotiations and expense, and prompt sale at an acceptable price may be difficult. Information regarding restricted securities is included at the end of the Fund's Schedule of Investments.
Loans and Other Direct Debt Instruments. The Fund invests in direct debt instruments which are interests in amounts owed to lenders by corporate or other borrowers. These instruments may be in the form of loans, trade claims or other receivables and may include standby financing commitments such as revolving credit facilities that obligate the Fund to supply additional cash to the borrower on demand. Loans may be acquired through assignment or participation. The Fund also invests in unfunded loan commitments, which are contractual obligations for future funding. Information regarding unfunded commitments is included at the end of the Fund's Schedule of Investments.
3. Purchases and Sales of Investments.
Purchases and sales of securities (including the Underlying Fund shares), other than short-term securities, aggregated $219,508,714 and $475,494,576, respectively.
4. Fees and Other Transactions with Affiliates.
Management Fee. Strategic Advisers (the investment adviser) provides the Fund with investment management related services. For these services, the Fund pays a monthly management fee to the investment adviser. The management fee is calculated by adding the annual management fee rate of .25% of the Fund's average net assets throughout the month payable to the investment adviser to the aggregate of the fee rates, payable monthly, to the Fund's sub-advisers. The Fund's maximum aggregate management fee will not exceed .75% of the Fund's average net assets. For the reporting period, the total annualized management fee rate was .31% of the Fund's average net assets.
During the period, the investment adviser waived a portion of its management fee as described in the Expense Reductions note.
Sub-Adviser. FIAM LLC (an affiliate of the investment adviser) served as a sub-adviser for the Fund during the period. Sub-advisers provide discretionary investment advisory services for their allocated portion of the Fund's assets and are paid by the investment adviser and not the Fund for providing these services.
Accounting Fees. Fidelity Service Company, Inc. (FSC), an affiliate of the investment adviser, maintains the Fund's accounting records. The fee is based on the level of average net assets for each month. Effective July 1, 2019 accounting fees are not paid by the Fund and are instead paid by the investment adviser or an affiliate. For the period, the fees were equivalent to an annualized rate of .02%.
Interfund Trades. The Fund may purchase from or sell securities to other Fidelity Funds under procedures adopted by the Board. The procedures have been designed to ensure these interfund trades are executed in accordance with Rule 17a-7 of the 1940 Act. Interfund trades are included within the respective purchases and sales amounts shown in the Purchases and Sales of Investments note.
5. Investments in Fidelity Central Funds.
The Fund invests in Fidelity Central Funds, which are open-end investment companies available only to other investment companies and accounts managed by the investment adviser and its affiliates. The Fund's Schedule of Investments lists each of the Fidelity Central Funds held as of period end, if any, as an investment of the Fund, but does not include the underlying holdings of each Fidelity Central Fund. As an Investing Fund, the Fund indirectly bears its proportionate share of the expenses of the underlying Fidelity Central Funds.
The Fidelity Money Market Central Funds are managed by Fidelity Investments Money Management, Inc. (FIMM), an affiliate of the investment adviser. Annualized expenses of the Money Market Central Funds as of their most recent shareholder report date ranged from less than .005% to .01%.
A complete unaudited list of holdings for each Fidelity Central Fund is available upon request or at the Securities and Exchange Commission (the SEC) website at www.sec.gov. In addition, the financial statements of the Fidelity Central Funds are available on the SEC website or upon request.
6. Committed Line of Credit.
The Fund participates with other funds managed by the investment adviser or an affiliate in a $4.25 billion credit facility (the "line of credit") to be utilized for temporary or emergency purposes to fund shareholder redemptions or for other short-term liquidity purposes. The Fund has agreed to pay commitment fees on its pro-rata portion of the line of credit, which amounted to $3,432 and is reflected in Miscellaneous expenses on the Statement of Operations. During the period, the Fund did not borrow on this line of credit.
7. Expense Reductions.
The investment adviser has contractually agreed to waive the Fund's management fee in an amount equal to .25% of the Fund's average net assets until September 30, 2022. During the period, this waiver reduced the Fund's management fee by $3,066,848.
8. Other.
The Fund's organizational documents provide former and current trustees and officers with a limited indemnification against liabilities arising in connection with the performance of their duties to the Fund. In the normal course of business, the Fund may also enter into contracts that provide general indemnifications. The Fund's maximum exposure under these arrangements is unknown as this would be dependent on future claims that may be made against the Fund. The risk of material loss from such claims is considered remote.
Shareholder Expense Example
As a shareholder of the Fund, you incur two types of costs: (1) transaction costs and (2) ongoing costs, including management fees and other Fund expenses. This Example is intended to help you understand your ongoing costs (in dollars) of investing in the Fund and to compare these costs with the ongoing costs of investing in other mutual funds.
The Example is based on an investment of $1,000 invested at the beginning of the period and held for the entire period (March 1, 2019 to August 31, 2019).
Actual Expenses
The first line of the accompanying table provides information about actual account values and actual expenses. You may use the information in this line, together with the amount you invested, to estimate the expenses that you paid over the period. Simply divide your account value by $1,000.00 (for example, an $8,600 account value divided by $1,000.00 = 8.6), then multiply the result by the number in the first line under the heading entitled "Expenses Paid During Period" to estimate the expenses you paid on your account during this period. In addition to the direct expenses incurred by the Fund presented in the table, as a shareholder of the underlying mutual funds (the Underlying Funds), the Fund also indirectly bears its proportionate share of the expenses of the Underlying Funds. In addition, the Fund, as a shareholder in the underlying Fidelity Central Funds, will indirectly bear its pro-rata share of the fees and expenses incurred by the underlying Fidelity Central Funds. These fees and expenses are not included in the Fund's annualized expense ratio used to calculate the expense estimate in the table below.
Hypothetical Example for Comparison Purposes
The second line of the accompanying table provides information about hypothetical account values and hypothetical expenses based on the Fund's actual expense ratio and an assumed rate of return of 5% per year before expenses, which is not the Fund's actual return. The hypothetical account values and expenses may not be used to estimate the actual ending account balance or expenses you paid for the period. You may use this information to compare the ongoing costs of investing in the Fund and other funds. To do so, compare this 5% hypothetical example with the 5% hypothetical examples that appear in the shareholder reports of the other funds. In addition to the direct expenses incurred by the Fund presented in the table, as a shareholder of the Underlying Funds, the Fund also indirectly bears its proportionate share of the expenses of the Underlying Funds. In addition, the Fund, as a shareholder in the underlying Fidelity Central Funds, will indirectly bear its pro-rata share of the fees and expenses incurred by the underlying Fidelity Central Funds. These fees and expenses are not included in the Fund's annualized expense ratio used to calculate the expense estimate in the table below.
Please note that the expenses shown in the table are meant to highlight your ongoing costs only and do not reflect any transaction costs. Therefore, the second line of the table is useful in comparing ongoing costs only, and will not help you determine the relative total costs of owning different funds.
| Annualized Expense Ratio-A | Beginning Account Value March 1, 2019 | Ending Account Value August 31, 2019 | Expenses Paid During Period-B March 1, 2019 to August 31, 2019 | |
| Actual | .09% | $1,000.00 | $1,041.30 | $.46 |
| Hypothetical-C | $1,000.00 | $1,024.68 | $.46 |
A Annualized expense ratio reflects expenses net of applicable fee waivers.
B Expenses are equal to the Fund's annualized expense ratio, multiplied by the average account value over the period, multiplied by 184/366 (to reflect the one-half year period). The fees and expenses of the Underlying Funds in which the Fund invests are not included in the Fund's annualized expense ratio.
C 5% return per year before expenses
![]()
SRQ-SANN-1019
1.912883.109
Strategic Advisers® International Fund Offered exclusively to certain clients of Strategic Advisers LLC - not available for sale to the general public Semi-Annual Report August 31, 2019 |
|
Beginning on January 1, 2021, as permitted by regulations adopted by the Securities and Exchange Commission, paper copies of a fund’s shareholder reports will no longer be sent by mail, unless you specifically request paper copies of the reports from the fund or from your financial intermediary, such as a financial advisor, broker-dealer or bank. Instead, the reports will be made available on a website, and you will be notified by mail each time a report is posted and provided with a website link to access the report.
If you already elected to receive shareholder reports electronically, you will not be affected by this change and you need not take any action. You may elect to receive shareholder reports and other communications from a fund electronically, by contacting your financial intermediary. For Fidelity customers, visit Fidelity's web site or call Fidelity using the contact information listed below.
You may elect to receive all future reports in paper free of charge. If you wish to continue receiving paper copies of your shareholder reports, you may contact your financial intermediary or, if you are a Fidelity customer, visit Fidelity’s website, or call Fidelity at the applicable toll-free number listed below. Your election to receive reports in paper will apply to all funds held with the fund complex/your financial intermediary.
| Account Type | Website | Phone Number |
| Brokerage, Mutual Fund, or Annuity Contracts: | fidelity.com/mailpreferences | 1-800-343-3548 |
| Employer Provided Retirement Accounts: | netbenefits.fidelity.com/preferences (choose 'no' under Required Disclosures to continue to print) | 1-800-343-0860 |
| Advisor Sold Accounts Serviced Through Your Financial Intermediary: | Contact Your Financial Intermediary | Your Financial Intermediary's phone number |
| Advisor Sold Accounts Serviced by Fidelity: | institutional.fidelity.com | 1-877-208-0098 |
Contents
Board Approval of Investment Advisory Contract and Management Fees |
To view a fund's proxy voting record for the 12-month period ended June 30, visit http://www.fidelity.com/proxyvotingresults or visit the Securities and Exchange Commission's (SEC) web site at http://www.sec.gov.
You may also call 1-800-544-3455 to request a free copy of the proxy voting guidelines.
Standard & Poor's, S&P and S&P 500 are registered service marks of The McGraw-Hill Companies, Inc. and have been licensed for use by Fidelity Distributors Corporation.
Other third-party marks appearing herein are the property of their respective owners.
All other marks appearing herein are registered or unregistered trademarks or service marks of FMR LLC or an affiliated company. © 2019 FMR LLC. All rights reserved.
This report and the financial statements contained herein are submitted for the general information of the shareholders of the Fund. This report is not authorized for distribution to prospective investors in the Fund unless preceded or accompanied by an effective prospectus.
A fund files its complete schedule of portfolio holdings with the SEC for the first and third quarters of each fiscal year on Form N-PORT. Forms N-PORT are available on the SEC’s web site at http://www.sec.gov. A fund's Forms N-PORT may be reviewed and copied at the SEC’s Public Reference Room in Washington, DC. Information regarding the operation of the SEC's Public Reference Room may be obtained by calling 1-800-SEC-0330.
For a complete list of a fund's portfolio holdings, view the most recent holdings listing, semiannual report, or annual report on Fidelity's web site at http://www.fidelity.com, http://www.institutional.fidelity.com, or http://www.401k.com, as applicable.
NOT FDIC INSURED •MAY LOSE VALUE •NO BANK GUARANTEE
Neither the Fund nor Fidelity Distributors Corporation is a bank.
Investment Summary (Unaudited)
The information in the following tables is based on the direct investments of the Fund.Top Ten Holdings as of August 31, 2019
(excluding cash equivalents)
| % of fund's net assets | |
| T. Rowe Price Overseas Stock Fund I Class | 7.8 |
| Fidelity International Discovery Fund | 6.5 |
| iShares MSCI Japan ETF | 5.4 |
| Fidelity Diversified International Fund | 4.1 |
| Artisan International Value Fund Investor Class | 3.7 |
| Fidelity Overseas Fund | 3.2 |
| Oakmark International Fund Investor Class | 3.1 |
| WCM Focused International Growth Fund Institutional Class | 3.1 |
| Morgan Stanley Institutional Fund, Inc. International Equity Portfolio Class I | 2.9 |
| JOHCM International Select Fund Class II Shares | 2.9 |
| 42.7 |
Asset Allocation (% of fund's net assets)
| As of August 31, 2019 | ||
| Common Stocks | 44.0% | |
| Preferred Stocks | 0.8% | |
| Europe Stock Funds | 0.8% | |
| Foreign Large Blend Funds | 18.7% | |
| Foreign Large Growth Funds | 20.6% | |
| Foreign Large Value Funds | 2.5% | |
| Foreign Small Mid Growth Funds | 0.6% | |
| Foreign Small Mid Blend Funds | 0.6% | |
| Foreign Small Mid Value Funds | 0.5% | |
| Other | 7.2% | |
| Sector Funds | 0.1% | |
| Short-Term Investments and Net Other Assets (Liabilities) | 3.6% | |
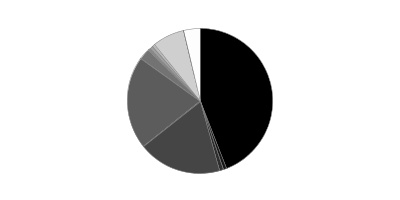
Asset allocations of funds in the pie chart reflect the categorizations of assets as defined by Morningstar as of the reporting date.
Schedule of Investments August 31, 2019 (Unaudited)
Showing Percentage of Net Assets
| Common Stocks - 44.0% | |||
| Shares | Value | ||
| COMMUNICATION SERVICES - 2.4% | |||
| Diversified Telecommunication Services - 0.3% | |||
| Bezeq The Israel Telecommunication Corp. Ltd. | 189,941 | $119,309 | |
| BT Group PLC sponsored ADR | 241,100 | 2,411,000 | |
| Deutsche Telekom AG | 608,341 | 10,156,037 | |
| Hellenic Telecommunications Organization SA | 457,168 | 6,099,749 | |
| Koninklijke KPN NV | 2,064,026 | 6,537,414 | |
| Nippon Telegraph & Telephone Corp. | 119,600 | 5,737,107 | |
| Nippon Telegraph & Telephone Corp. sponsored ADR | 24,984 | 1,197,483 | |
| Proximus | 53,487 | 1,580,726 | |
| Telecom Italia SpA (a) | 1,301,248 | 695,637 | |
| Telefonica SA | 648,291 | 4,503,975 | |
| Telefonica SA sponsored ADR (b) | 129,000 | 890,100 | |
| Telenor ASA | 133,934 | 2,750,055 | |
| Telstra Corp. Ltd. | 192,034 | 481,090 | |
| 43,159,682 | |||
| Entertainment - 0.2% | |||
| International Games Systems Co. Ltd. | 39,000 | 470,569 | |
| Konami Holdings Corp. | 28,800 | 1,305,333 | |
| NetEase, Inc. ADR | 29,823 | 7,604,865 | |
| Nintendo Co. Ltd. | 28,300 | 10,708,739 | |
| Square Enix Holdings Co. Ltd. | 177,300 | 7,076,312 | |
| Vivendi SA | 339,785 | 9,496,597 | |
| 36,662,415 | |||
| Interactive Media & Services - 0.4% | |||
| Baidu.com, Inc. sponsored ADR (a) | 260,957 | 27,262,178 | |
| Kakao Corp. | 19,594 | 2,177,363 | |
| NAVER Corp. | 48,195 | 5,833,444 | |
| realestate.com.au Ltd. | 29,352 | 2,065,860 | |
| Tencent Holdings Ltd. | 498,300 | 20,572,581 | |
| Yandex NV Series A (a) | 122,033 | 4,527,424 | |
| 62,438,850 | |||
| Media - 0.1% | |||
| Eutelsat Communications | 51,023 | 887,135 | |
| Informa PLC | 626,169 | 6,628,725 | |
| Telenet Group Holding NV | 3,676 | 183,178 | |
| Television Francaise 1 SA | 57,551 | 523,089 | |
| 8,222,127 | |||
| Wireless Telecommunication Services - 1.4% | |||
| Advanced Info Service PCL (For. Reg.) | 1,147,200 | 8,701,991 | |
| China Mobile Ltd. | 5,683,917 | 47,032,072 | |
| China Mobile Ltd. sponsored ADR | 21,354 | 882,134 | |
| KDDI Corp. | 2,558,300 | 68,142,424 | |
| NTT DOCOMO, Inc. | 203,000 | 5,124,921 | |
| Rogers Communications, Inc. Class B (non-vtg.) | 32,375 | 1,602,701 | |
| SK Telecom Co. Ltd. | 141,058 | 27,905,157 | |
| SoftBank Corp. | 391,000 | 17,754,827 | |
| Tele2 AB (B Shares) | 337,432 | 4,759,972 | |
| Vodafone Group PLC | 21,098,983 | 39,919,668 | |
| 221,825,867 | |||
| TOTAL COMMUNICATION SERVICES | 372,308,941 | ||
| CONSUMER DISCRETIONARY - 3.2% | |||
| Auto Components - 0.2% | |||
| Aisin Seiki Co. Ltd. | 6,900 | 204,594 | |
| Continental AG | 12,674 | 1,529,476 | |
| DENSO Corp. | 37,100 | 1,556,849 | |
| Koito Manufacturing Co. Ltd. | 220,400 | 10,352,483 | |
| Michelin CGDE Series B | 35,258 | 3,711,939 | |
| Schaeffler AG | 11,564 | 78,417 | |
| Toyota Industries Corp. | 208,200 | 11,445,268 | |
| TPR Co. Ltd. | 19,100 | 295,934 | |
| Unipres Corp. | 18,400 | 286,128 | |
| Yorozu Corp. | 17,400 | 205,062 | |
| 29,666,150 | |||
| Automobiles - 0.1% | |||
| Ferrari NV | 35,827 | 5,638,595 | |
| Fiat Chrysler Automobiles NV (Italy) | 253,289 | 3,295,430 | |
| Honda Motor Co. Ltd. sponsored ADR | 13,708 | 324,331 | |
| Maruti Suzuki India Ltd. | 33,903 | 2,905,595 | |
| Mazda Motor Corp. | 5,500 | 46,020 | |
| Nissan Motor Co. Ltd. | 321,800 | 1,988,230 | |
| Peugeot Citroen SA | 145,991 | 3,261,977 | |
| Yamaha Motor Co. Ltd. | 29,000 | 474,439 | |
| 17,934,617 | |||
| Distributors - 0.0% | |||
| Inchcape PLC | 832,263 | 5,853,392 | |
| Diversified Consumer Services - 0.0% | |||
| G8 Education Ltd. | 224,724 | 385,918 | |
| Ser Educacional SA (c) | 78,000 | 442,647 | |
| 828,565 | |||
| Hotels, Restaurants & Leisure - 0.8% | |||
| Aristocrat Leisure Ltd. | 213,777 | 4,283,052 | |
| Carnival PLC | 204,015 | 8,594,122 | |
| Carnival PLC sponsored ADR | 4,700 | 200,972 | |
| Collins Foods Ltd. | 95,921 | 557,481 | |
| Compass Group PLC | 2,371,968 | 60,158,708 | |
| Dominos Pizza Enterprises Ltd. | 4,607 | 132,698 | |
| Evolution Gaming Group AB (c) | 123,070 | 2,309,761 | |
| Galaxy Entertainment Group Ltd. | 841,000 | 5,263,383 | |
| Greggs PLC | 203,467 | 5,233,813 | |
| Herfy Food Services Co. | 34,940 | 475,095 | |
| Huazhu Group Ltd. ADR | 63,888 | 2,110,221 | |
| InterContinental Hotel Group PLC | 51,813 | 3,231,111 | |
| Jumbo Interactive Ltd. | 26,257 | 395,917 | |
| Leejam Sports Co. JSC | 5,657 | 117,493 | |
| Paddy Power Betfair PLC | 55,091 | 4,535,570 | |
| Sands China Ltd. | 264,400 | 1,197,002 | |
| SSP Group PLC | 254,556 | 2,189,888 | |
| The Star Entertainment Group Ltd. | 130,222 | 360,439 | |
| TUI AG (b) | 561,600 | 5,578,493 | |
| Whitbread PLC | 145,840 | 7,760,243 | |
| Yum China Holdings, Inc. | 184,660 | 8,389,104 | |
| 123,074,566 | |||
| Household Durables - 0.2% | |||
| Barratt Developments PLC | 640,770 | 4,930,753 | |
| Bovis Homes Group PLC | 7,528 | 94,166 | |
| Panasonic Corp. | 481,000 | 3,705,106 | |
| Persimmon PLC | 303,821 | 7,033,341 | |
| Redrow PLC | 28,544 | 191,723 | |
| Sony Corp. | 323,900 | 18,450,137 | |
| Starts Corp., Inc. | 1,700 | 38,005 | |
| Taylor Wimpey PLC | 1,088,460 | 1,933,017 | |
| 36,376,248 | |||
| Internet & Direct Marketing Retail - 0.2% | |||
| Alibaba Group Holding Ltd. sponsored ADR (a) | 121,149 | 21,204,709 | |
| Just Eat Holding Ltd. (a) | 757,432 | 7,242,273 | |
| Rakuten, Inc. | 731,300 | 6,890,679 | |
| Zozo, Inc. | 142,700 | 2,850,373 | |
| 38,188,034 | |||
| Leisure Products - 0.1% | |||
| Bandai Namco Holdings, Inc. | 34,400 | 2,023,815 | |
| Sega Sammy Holdings, Inc. | 568,900 | 7,797,039 | |
| Technogym SpA (c) | 138,088 | 1,397,003 | |
| 11,217,857 | |||
| Multiline Retail - 0.1% | |||
| Debenhams PLC (a)(d) | 913,233 | 11 | |
| Harvey Norman Holdings Ltd. | 69,494 | 204,987 | |
| Lojas Renner SA | 184,470 | 2,251,862 | |
| Magazine Luiza SA | 316,800 | 2,776,303 | |
| Wesfarmers Ltd. | 93,719 | 2,467,799 | |
| 7,700,962 | |||
| Specialty Retail - 0.3% | |||
| Arc Land Sakamoto Co. Ltd. | 8,200 | 92,856 | |
| Dufry AG | 39,752 | 3,222,734 | |
| Dunelm Group PLC | 81,503 | 868,754 | |
| Esprit Holdings Ltd. (a) | 3,313,500 | 498,237 | |
| Fast Retailing Co. Ltd. | 8,300 | 4,862,729 | |
| H&M Hennes & Mauritz AB (B Shares) | 127,955 | 2,450,722 | |
| Hikari Tsushin, Inc. | 3,200 | 750,035 | |
| John David Group PLC | 29,464 | 221,206 | |
| Kingfisher PLC | 457,685 | 1,083,647 | |
| Kingfisher PLC ADR | 67,268 | 316,832 | |
| Mr Price Group Ltd. | 108,665 | 1,229,943 | |
| Nitori Holdings Co. Ltd. | 21,900 | 3,159,199 | |
| Pets At Home Group PLC | 83,413 | 234,661 | |
| Super Retail Group Ltd. | 116,970 | 736,532 | |
| USS Co. Ltd. | 900,800 | 17,026,464 | |
| WH Smith PLC | 93,698 | 2,232,350 | |
| 38,986,901 | |||
| Textiles, Apparel & Luxury Goods - 1.2% | |||
| adidas AG | 86,170 | 25,541,976 | |
| adidas AG sponsored ADR | 500 | 74,223 | |
| Burberry Group PLC | 73,064 | 1,923,889 | |
| Compagnie Financiere Richemont SA: | |||
| ADR | 12,490 | 96,423 | |
| Series A | 369,285 | 28,694,042 | |
| ECLAT Textile Co. Ltd. | 135,000 | 1,654,750 | |
| Essilor International SA | 175,491 | 25,893,252 | |
| Gildan Activewear, Inc. | 416,707 | 15,276,753 | |
| Hermes International SCA | 6,007 | 4,099,838 | |
| Kering SA | 27,480 | 13,300,914 | |
| Li Ning Co. Ltd. | 1,946,000 | 5,739,303 | |
| lululemon athletica, Inc. (a) | 24,891 | 4,596,621 | |
| LVMH Moet Hennessy Louis Vuitton SE | 128,480 | 51,236,054 | |
| Moncler SpA | 50,177 | 1,879,962 | |
| Pandora A/S | 8,124 | 346,056 | |
| Puma AG | 59,440 | 4,510,866 | |
| Seiko Holdings Corp. | 35,900 | 753,246 | |
| Shenzhou International Group Holdings Ltd. | 304,000 | 4,124,464 | |
| Titan Co. Ltd. | 149,570 | 2,313,266 | |
| Youngone Holdings Co. Ltd. | 387 | 15,779 | |
| 192,071,677 | |||
| TOTAL CONSUMER DISCRETIONARY | 501,898,969 | ||
| CONSUMER STAPLES - 6.4% | |||
| Beverages - 1.5% | |||
| Anheuser-Busch InBev SA NV | 19,551 | 1,847,950 | |
| Carlsberg A/S Series B | 27,426 | 4,048,484 | |
| Coca-Cola HBC AG | 48,587 | 1,613,994 | |
| Coca-Cola West Co. Ltd. | 141,000 | 3,065,939 | |
| Davide Campari-Milano SpA | 155,584 | 1,457,729 | |
| Diageo PLC | 1,607,651 | 68,829,596 | |
| Diageo PLC sponsored ADR | 32,146 | 5,505,967 | |
| Fever-Tree Drinks PLC | 64,312 | 1,768,559 | |
| Heineken Holding NV | 126,096 | 12,465,794 | |
| Heineken NV (Bearer) | 295,741 | 31,450,304 | |
| ITO EN Ltd. | 465,500 | 21,273,615 | |
| Jiangsu Yanghe Brewery JSC Ltd. (A Shares) | 164,582 | 2,575,158 | |
| Kirin Holdings Co. Ltd. | 277,900 | 5,489,463 | |
| Kweichow Moutai Co. Ltd. (A Shares) | 75,822 | 12,098,804 | |
| Pernod Ricard SA | 279,072 | 53,276,236 | |
| Royal Unibrew A/S | 28,906 | 2,502,654 | |
| Wuliangye Yibin Co. Ltd. (A Shares) | 121,000 | 2,392,340 | |
| 231,662,586 | |||
| Food & Staples Retailing - 0.4% | |||
| Alimentation Couche-Tard, Inc. Class B (sub. vtg.) | 168,105 | 10,580,741 | |
| Bidcorp Ltd. | 80,872 | 1,732,733 | |
| Carrefour SA | 881,955 | 15,024,346 | |
| Coles Group Ltd. | 156,812 | 1,461,574 | |
| Colruyt NV | 3,887 | 198,947 | |
| Matsumotokiyoshi Holdings Co. Ltd. | 56,300 | 2,088,031 | |
| Metcash Ltd. | 416,638 | 813,696 | |
| Seven & i Holdings Co. Ltd. | 415,500 | 14,694,732 | |
| Seven & i Holdings Co. Ltd. ADR | 4,000 | 70,640 | |
| Sundrug Co. Ltd. | 173,300 | 5,391,411 | |
| Tesco PLC | 4,364,900 | 11,666,959 | |
| WM Morrison Supermarkets PLC | 137,100 | 304,619 | |
| Woolworths Group Ltd. | 285,264 | 7,256,034 | |
| 71,284,463 | |||
| Food Products - 2.2% | |||
| Aryzta AG (a) | 4,600,797 | 3,720,614 | |
| Associated British Foods PLC | 59,014 | 1,630,765 | |
| Ausnutria Dairy Hunan Co. Ltd. (H Shares) | 92,000 | 130,122 | |
| China Mengniu Dairy Co. Ltd. | 965,000 | 3,817,486 | |
| Danone SA | 696,015 | 62,355,531 | |
| Ezaki Glico Co. Ltd. | 95,200 | 4,131,143 | |
| Kerry Group PLC Class A | 250,661 | 29,835,456 | |
| La Doria SpA | 17,325 | 148,901 | |
| Lindt & Spruengli AG (participation certificate) | 219 | 1,620,788 | |
| Marine Harvest ASA (b) | 319,700 | 7,648,493 | |
| Nestle SA: | |||
| (Reg. S) | 1,620,858 | 182,143,006 | |
| sponsored ADR | 95,157 | 10,694,695 | |
| New Hampshire Foods Ltd. | 13,200 | 506,952 | |
| Nissin Food Holdings Co. Ltd. | 81,300 | 5,640,147 | |
| Tassal Group Ltd. | 56,664 | 164,853 | |
| Toyo Suisan Kaisha Ltd. | 514,400 | 20,942,062 | |
| Vitasoy International Holdings Ltd. | 404,000 | 1,877,618 | |
| WH Group Ltd. (c) | 2,001,000 | 1,603,528 | |
| WH Group Ltd. ADR | 4,700 | 74,965 | |
| Yakult Honsha Co. Ltd. | 83,000 | 4,781,475 | |
| 343,468,600 | |||
| Household Products - 0.6% | |||
| Colgate-Palmolive Co. | 412,726 | 30,603,633 | |
| Essity AB Class B | 133,358 | 4,159,179 | |
| Henkel AG & Co. KGaA | 4,707 | 434,810 | |
| Hindustan Unilever Ltd. | 140,542 | 3,701,538 | |
| Reckitt Benckiser Group PLC | 704,208 | 55,034,533 | |
| Reckitt Benckiser Group PLC ADR | 22,888 | 361,173 | |
| 94,294,866 | |||
| Personal Products - 1.2% | |||
| Kao Corp. | 687,100 | 49,633,411 | |
| Kobayashi Pharmaceutical Co. Ltd. | 280,300 | 21,002,382 | |
| Kose Corp. | 32,300 | 5,548,783 | |
| L'Oreal SA | 258,379 | 70,595,300 | |
| Shiseido Co. Ltd. | 148,900 | 12,179,988 | |
| Unilever NV | 197,642 | 12,263,351 | |
| Unilever NV (NY Reg.) | 10,400 | 645,736 | |
| Unilever PLC | 168,500 | 10,645,530 | |
| Unilever PLC sponsored ADR | 61,587 | 3,891,067 | |
| 186,405,548 | |||
| Tobacco - 0.5% | |||
| British American Tobacco PLC (United Kingdom) | 1,569,208 | 55,045,219 | |
| Imperial Tobacco Group PLC | 425,103 | 10,989,302 | |
| Imperial Tobacco Group PLC sponsored ADR | 18,500 | 480,815 | |
| Japan Tobacco, Inc. | 411,200 | 8,680,345 | |
| 75,195,681 | |||
| TOTAL CONSUMER STAPLES | 1,002,311,744 | ||
| ENERGY - 1.7% | |||
| Energy Equipment & Services - 0.1% | |||
| Core Laboratories NV (b) | 114,333 | 4,526,443 | |
| TechnipFMC PLC | 366,900 | 9,113,796 | |
| Tenaris SA | 222,599 | 2,420,676 | |
| 16,060,915 | |||
| Oil, Gas & Consumable Fuels - 1.6% | |||
| BP PLC | 8,191,558 | 49,888,695 | |
| Cairn Energy PLC (a) | 2,811,091 | 5,712,294 | |
| Caltex Australia Ltd. | 450,229 | 7,264,833 | |
| CNOOC Ltd. sponsored ADR | 768 | 113,848 | |
| Enbridge, Inc. | 178,216 | 5,960,612 | |
| Encana Corp. (Toronto) | 3,640,992 | 16,134,785 | |
| Eni SpA | 1,679,703 | 25,352,568 | |
| Eni SpA sponsored ADR (b) | 18,532 | 559,666 | |
| EnQuest PLC (a) | 567,627 | 127,363 | |
| Equinor ASA | 49,974 | 854,453 | |
| Galp Energia SGPS SA Class B | 767,575 | 11,031,367 | |
| Gazprom OAO | 875,100 | 3,044,288 | |
| Gazprom OAO sponsored ADR (Reg. S) | 733,802 | 5,063,234 | |
| Gaztransport et Technigaz SA | 2,119 | 198,188 | |
| Gulf Keystone Petroleum Ltd. | 8,842 | 25,499 | |
| INPEX Corp. | 15,900 | 137,545 | |
| JX Holdings, Inc. | 2,677,600 | 11,067,296 | |
| Lukoil PJSC | 63,949 | 5,162,419 | |
| Lundin Petroleum AB | 30,447 | 925,076 | |
| Neste Oyj | 262,524 | 8,263,413 | |
| Oil Search Ltd. ADR | 1,175,976 | 5,258,621 | |
| Premier Oil PLC (a) | 329,752 | 324,043 | |
| Repsol SA | 87,340 | 1,270,752 | |
| Royal Dutch Shell PLC: | |||
| Class A | 430,567 | 11,955,603 | |
| Class B (United Kingdom) | 1,072,678 | 29,702,291 | |
| Santos Ltd. | 980,900 | 4,762,833 | |
| SK Energy Co. Ltd. | 36,979 | 5,041,091 | |
| Total SA | 778,140 | 38,859,299 | |
| VERBIO Vereinigte BioEnergie AG | 8,253 | 74,106 | |
| 254,136,081 | |||
| TOTAL ENERGY | 270,196,996 | ||
| FINANCIALS - 6.6% | |||
| Banks - 2.6% | |||
| Agricultural Bank of China Ltd. (H Shares) | 6,073,000 | 2,334,775 | |
| AIB Group PLC | 4,749,417 | 12,016,087 | |
| Akbank TAS (a) | 3,094,138 | 3,685,457 | |
| Banco Santander SA (Spain) sponsored ADR (b) | 629,510 | 2,360,663 | |
| Bank Albilad | 27,238 | 190,267 | |
| Bank Leumi le-Israel BM | 244,240 | 1,664,087 | |
| Bank of China Ltd. (H Shares) | 6,762,000 | 2,585,601 | |
| Barclays PLC | 23,810,436 | 39,664,102 | |
| BNP Paribas SA | 1,081,529 | 48,750,906 | |
| CaixaBank SA | 5,531,493 | 12,551,908 | |
| Canadian Imperial Bank of Commerce | 123,107 | 9,535,846 | |
| Chiba Bank Ltd. | 735,600 | 3,669,864 | |
| China Merchants Bank Co. Ltd. (H Shares) | 2,448,000 | 11,106,484 | |
| Credicorp Ltd. (United States) | 31,317 | 6,486,377 | |
| DBS Group Holdings Ltd. | 615,700 | 10,883,171 | |
| Erste Group Bank AG | 19,934 | 641,261 | |
| First International Bank of Israel | 14,232 | 368,460 | |
| HDFC Bank Ltd. | 489,229 | 15,284,794 | |
| HSBC Holdings PLC (United Kingdom) | 1,323,600 | 9,529,486 | |
| ING Groep NV (Certificaten Van Aandelen) | 1,652,795 | 15,790,271 | |
| Intesa Sanpaolo SpA | 6,659,205 | 14,653,305 | |
| Jyske Bank A/S (Reg.) | 91,613 | 2,569,655 | |
| KB Financial Group, Inc. | 27,839 | 910,254 | |
| KBC Groep NV | 312,875 | 18,101,068 | |
| Lloyds Banking Group PLC | 27,871,176 | 16,957,305 | |
| Mebuki Financial Group, Inc. | 1,215,200 | 2,710,994 | |
| Mediobanca SpA | 887,700 | 8,790,396 | |
| Mitsubishi UFJ Financial Group, Inc. | 2,956,800 | 14,231,823 | |
| Mizrahi Tefahot Bank Ltd. | 13,398 | 308,200 | |
| National Bank of Abu Dhabi PJSC | 639,517 | 2,656,856 | |
| North Pacific Bank Ltd. | 1,081,700 | 2,168,797 | |
| PT Bank Central Asia Tbk | 5,789,200 | 12,447,698 | |
| Raiffeisen International Bank-Holding AG | 23,327 | 509,802 | |
| Riyad Bank | 22,357 | 152,595 | |
| Sberbank of Russia | 377,260 | 1,268,148 | |
| Sberbank of Russia sponsored ADR (United Kingdom) | 39,400 | 540,962 | |
| Societe Generale Series A | 135,803 | 3,437,805 | |
| Sumitomo Mitsui Financial Group, Inc. | 866,500 | 28,393,689 | |
| Svenska Handelsbanken AB (A Shares) | 858,303 | 7,562,501 | |
| Sydbank A/S | 121,475 | 1,698,256 | |
| The Hachijuni Bank Ltd. | 721,600 | 2,594,731 | |
| The Toronto-Dominion Bank | 179,329 | 9,724,766 | |
| TISCO Financial Group PCL | 730,900 | 2,437,528 | |
| Turkiye Is Bankasi A/S Series C (a) | 1,477,591 | 1,397,327 | |
| UniCredit SpA | 4,517,029 | 49,942,274 | |
| Yapi ve Kredi Bankasi A/S (a) | 272,103 | 106,945 | |
| 415,373,547 | |||
| Capital Markets - 1.2% | |||
| 3i Group PLC | 712,979 | 9,512,717 | |
| Ashmore Group PLC | 101,223 | 555,735 | |
| Azimut Holding SpA | 11,400 | 200,780 | |
| Banca Generali SpA | 83,626 | 2,483,385 | |
| BM&F BOVESPA SA | 574,000 | 6,209,901 | |
| Brewin Dolphin Holding PLC | 39,343 | 145,724 | |
| Brookfield Asset Management, Inc. Class A (b) | 279,022 | 14,389,102 | |
| BT Investment Management Ltd. | 223,809 | 1,002,316 | |
| Bure Equity AB | 30,199 | 464,617 | |
| Burford Capital Ltd. | 65,540 | 557,845 | |
| Close Brothers Group PLC | 70,193 | 1,100,946 | |
| Daiwa Securities Group, Inc. | 1,678,000 | 7,219,972 | |
| Deutsche Borse AG | 54,200 | 7,963,779 | |
| Euronext NV (c) | 268,442 | 21,050,475 | |
| Hargreaves Lansdown PLC | 22,415 | 512,216 | |
| HFA Holdings Ltd. | 102,672 | 206,742 | |
| Hong Kong Exchanges and Clearing Ltd. | 314,900 | 9,610,383 | |
| IG Group Holdings PLC | 403,608 | 2,651,013 | |
| Intermediate Capital Group PLC | 324,796 | 5,280,029 | |
| Investec Ltd. | 123,500 | 652,072 | |
| JAFCO Co. Ltd. | 27,500 | 962,959 | |
| Julius Baer Group Ltd. | 401,509 | 15,936,132 | |
| Jupiter Fund Management PLC | 142,203 | 591,252 | |
| London Stock Exchange Group PLC | 117,796 | 9,967,458 | |
| Macquarie Group Ltd. | 187,759 | 15,659,110 | |
| Magellan Financial Group Ltd. | 8,995 | 307,367 | |
| Partners Group Holding AG | 11,574 | 9,385,494 | |
| Pinnacle Investment Management Group Ltd. (b) | 67,087 | 199,243 | |
| President Securities Corp. | 619,000 | 251,923 | |
| St. James's Place Capital PLC | 365,620 | 4,083,168 | |
| TMX Group Ltd. | 141,943 | 12,293,411 | |
| Tullett Prebon PLC | 105,290 | 373,204 | |
| UBS Group AG | 3,553,757 | 37,521,355 | |
| 199,301,825 | |||
| Consumer Finance - 0.1% | |||
| AEON Financial Service Co. Ltd. | 721,400 | 10,566,183 | |
| Afterpay Touch Group Ltd. (a) | 32,989 | 688,265 | |
| Flexigroup Ltd. | 279,192 | 348,781 | |
| Hitachi Capital Corp. | 18,500 | 369,182 | |
| 11,972,411 | |||
| Diversified Financial Services - 0.3% | |||
| Cerved Information Solutions SpA | 168,198 | 1,354,085 | |
| Challenger Ltd. | 621,700 | 2,809,369 | |
| Dovalue SpA (c) | 28,285 | 310,866 | |
| EXOR NV | 47,522 | 3,212,087 | |
| Fuyo General Lease Co. Ltd. | 11,600 | 666,071 | |
| Grenkeleasing AG (b) | 20,199 | 1,636,119 | |
| Groupe Bruxelles Lambert SA | 80,200 | 7,488,698 | |
| Investor AB (B Shares) | 133,500 | 6,259,693 | |
| Nyfosa AB (a) | 5,462 | 36,674 | |
| ORIX Corp. | 1,027,500 | 15,175,295 | |
| Plus500 Ltd. | 16,664 | 138,206 | |
| RMB Holdings Ltd. | 506,199 | 2,384,370 | |
| Zenkoku Hosho Co. Ltd. | 47,900 | 1,823,839 | |
| 43,295,372 | |||
| Insurance - 2.4% | |||
| AEGON NV | 454,904 | 1,731,369 | |
| AEGON NV: | |||
| rights 9/20/19 (a)(b)(e) | 454,904 | 74,994 | |
| (NY Reg.) | 426,020 | 1,610,356 | |
| Ageas | 59,087 | 3,162,557 | |
| AIA Group Ltd. | 4,480,600 | 43,357,684 | |
| Allianz SE | 159,990 | 35,310,432 | |
| Allianz SE sponsored ADR | 38,870 | 855,140 | |
| Aon PLC | 106,919 | 20,833,167 | |
| ASR Nederland NV | 12,694 | 443,792 | |
| Assicurazioni Generali SpA | 472,735 | 8,557,143 | |
| Aviva PLC | 6,508,206 | 28,096,867 | |
| AXA SA | 435,974 | 9,997,133 | |
| AXA SA sponsored ADR | 3,619 | 82,839 | |
| Beazley PLC | 357,826 | 2,479,618 | |
| CNP Assurances | 97,156 | 1,763,994 | |
| Coface SA | 54,573 | 644,169 | |
| Dai-ichi Mutual Life Insurance Co. | 313,300 | 4,270,329 | |
| Direct Line Insurance Group PLC | 821,547 | 2,830,033 | |
| Fairfax Financial Holdings Ltd. (sub. vtg.) | 21,664 | 9,653,123 | |
| Hastings Group Holdings PLC (c) | 6,932 | 15,436 | |
| Hiscox Ltd. | 1,302,466 | 24,565,030 | |
| Insurance Australia Group Ltd. | 127,936 | 694,438 | |
| IRB Brasil Resseguros SA | 117,600 | 3,081,285 | |
| Japan Post Holdings Co. Ltd. | 152,900 | 1,390,327 | |
| Legal & General Group PLC | 662,178 | 1,769,401 | |
| Manulife Financial Corp. | 762,281 | 12,647,429 | |
| MAPFRE SA (Reg.) | 231,689 | 602,982 | |
| Medibank Private Ltd. | 476,482 | 1,168,028 | |
| Menora Mivtachim Holdings Ltd. | 9,590 | 140,204 | |
| MS&AD Insurance Group Holdings, Inc. | 360,500 | 11,459,580 | |
| MS&AD Insurance Group Holdings, Inc. ADR | 5,200 | 82,212 | |
| Muenchener Rueckversicherungs-Gesellschaft AG in Muenchen | 24,175 | 5,789,501 | |
| NKSJ Holdings, Inc. | 644,400 | 25,743,245 | |
| NN Group NV | 111,804 | 3,742,870 | |
| NN Group NV rights (a)(e) | 111,804 | 93,387 | |
| Ping An Insurance (Group) Co. of China Ltd. (H Shares) | 1,338,500 | 15,356,627 | |
| Poste Italiane SpA (c) | 57,081 | 613,045 | |
| Prudential PLC | 2,177,695 | 36,298,008 | |
| Prudential PLC ADR | 51,230 | 1,710,570 | |
| QBE Insurance Group Ltd. | 420,064 | 3,544,638 | |
| Saga PLC | 350,917 | 175,581 | |
| Societa Cattolica Di Assicurazioni SCRL | 75,279 | 612,656 | |
| Sony Financial Holdings, Inc. | 106,500 | 2,460,121 | |
| Steadfast Group Ltd. | 116,423 | 294,019 | |
| Storebrand ASA (A Shares) | 223,867 | 1,288,337 | |
| Suncorp Group Ltd. | 155,432 | 1,445,571 | |
| Swiss Re Ltd. | 83,002 | 7,980,268 | |
| T&D Holdings, Inc. | 275,000 | 2,677,907 | |
| Talanx AG | 126,500 | 5,238,644 | |
| The Phoenix Holdings Ltd. | 54,338 | 329,172 | |
| Tokio Marine Holdings, Inc. | 192,300 | 9,905,075 | |
| Tokio Marine Holdings, Inc. ADR | 4,200 | 216,468 | |
| Tryg A/S | 54,868 | 1,640,084 | |
| Unipol Gruppo SpA | 156,166 | 784,368 | |
| Vienna Insurance Group AG | 6,717 | 165,364 | |
| Zurich Insurance Group Ltd. | 39,408 | 14,023,236 | |
| 375,499,853 | |||
| Thrifts & Mortgage Finance - 0.0% | |||
| OneSavings Bank PLC | 7,895 | 30,914 | |
| TOTAL FINANCIALS | 1,045,473,922 | ||
| HEALTH CARE - 4.6% | |||
| Biotechnology - 0.2% | |||
| Abcam PLC | 90,244 | 1,270,489 | |
| CSL Ltd. | 69,974 | 11,350,756 | |
| Genmab A/S (a) | 31,239 | 6,385,865 | |
| Vitrolife AB | 74,046 | 1,282,554 | |
| 20,289,664 | |||
| Health Care Equipment & Supplies - 1.0% | |||
| Alcon, Inc. (a) | 84,486 | 5,147,265 | |
| ASAHI INTECC Co. Ltd. | 184,400 | 4,120,729 | |
| Carl Zeiss Meditec AG | 27,751 | 3,199,422 | |
| Cochlear Ltd. | 18,140 | 2,663,172 | |
| Coloplast A/S Series B | 63,002 | 7,503,168 | |
| Dentsply Sirona, Inc. | 106,135 | 5,534,940 | |
| Getinge AB (B Shares) | 109,280 | 1,508,151 | |
| Hoya Corp. | 268,600 | 21,867,759 | |
| Koninklijke Philips Electronics NV | 827,215 | 38,990,216 | |
| Koninklijke Philips Electronics NV (depositary receipt) (NY Reg.) (b) | 30,454 | 1,433,774 | |
| Nanosonics Ltd. (a) | 64,054 | 287,725 | |
| Nihon Kohden Corp. | 511,600 | 14,196,798 | |
| Olympus Corp. | 773,000 | 9,051,744 | |
| Smith & Nephew PLC | 233,472 | 5,594,668 | |
| Smith & Nephew PLC sponsored ADR | 13,035 | 625,159 | |
| Terumo Corp. | 1,326,700 | 38,551,540 | |
| 160,276,230 | |||
| Health Care Providers & Services - 0.2% | |||
| Amplifon SpA | 93,556 | 2,401,939 | |
| Estia Health Ltd. | 38,136 | 69,086 | |
| Fresenius SE & Co. KGaA | 235,700 | 11,439,475 | |
| Notre Dame Intermedica Participacoes SA | 242,100 | 3,278,669 | |
| Orpea | 26,000 | 3,280,444 | |
| Sinopharm Group Co. Ltd. (H Shares) | 1,010,862 | 3,648,218 | |
| Sonic Healthcare Ltd. | 396,412 | 7,862,080 | |
| Spire Healthcare Group PLC (c) | 91,336 | 117,028 | |
| Suzuken Co. Ltd. | 1,000 | 53,749 | |
| 32,150,688 | |||
| Life Sciences Tools & Services - 0.2% | |||
| Clinigen Group PLC | 7,657 | 82,456 | |
| ICON PLC (a) | 41,698 | 6,429,415 | |
| Lonza Group AG | 49,710 | 17,568,637 | |
| QIAGEN NV(a) | 153,372 | 5,320,475 | |
| Sartorius Stedim Biotech | 10,156 | 1,571,603 | |
| Tecan Group AG | 6,422 | 1,541,669 | |
| 32,514,255 | |||
| Pharmaceuticals - 3.0% | |||
| Allergan PLC | 20,700 | 3,306,204 | |
| Astellas Pharma, Inc. | 1,131,600 | 15,620,028 | |
| AstraZeneca PLC: | |||
| (United Kingdom) | 379,184 | 33,869,274 | |
| sponsored ADR | 188,952 | 8,508,509 | |
| Bayer AG | 585,556 | 43,520,756 | |
| Bayer AG sponsored ADR | 88,631 | 1,649,423 | |
| Dainippon Sumitomo Pharma Co. Ltd. | 10,400 | 181,695 | |
| Eisai Co. Ltd. | 35,600 | 1,819,626 | |
| GlaxoSmithKline PLC sponsored ADR | 162,855 | 6,771,511 | |
| Ipsen SA | 18,241 | 1,916,567 | |
| Kyowa Hakko Kirin Co., Ltd. | 310,700 | 5,688,441 | |
| Merck KGaA | 74,500 | 7,963,573 | |
| Novartis AG | 966,168 | 87,104,609 | |
| Novo Nordisk A/S: | |||
| Series B | 666,958 | 34,750,099 | |
| Series B sponsored ADR | 88,119 | 4,591,881 | |
| Roche Holding AG: | |||
| (Bearer) | 1,350 | 366,911 | |
| (participation certificate) | 294,289 | 80,417,489 | |
| sponsored ADR (a) | 133,321 | 4,556,912 | |
| Rohto Pharmaceutical Co. Ltd. | 398,600 | 9,890,428 | |
| Sanofi SA | 227,691 | 19,560,413 | |
| Sanofi SA sponsored ADR | 89,792 | 3,856,566 | |
| Santen Pharmaceutical Co. Ltd. | 2,381,000 | 41,709,804 | |
| Shionogi & Co. Ltd. | 87,800 | 4,706,744 | |
| Takeda Pharmaceutical Co. Ltd. | 1,471,200 | 49,602,858 | |
| UCB SA | 15,113 | 1,128,480 | |
| 473,058,801 | |||
| TOTAL HEALTH CARE | 718,289,638 | ||
| INDUSTRIALS - 7.8% | |||
| Aerospace & Defense - 0.8% | |||
| Airbus Group NV | 215,222 | 29,656,178 | |
| Airbus Group NV ADR | 4,300 | 148,006 | |
| BAE Systems PLC | 863,078 | 5,739,581 | |
| Chemring Group PLC | 41,521 | 90,234 | |
| Cobham PLC | 7,858,589 | 15,443,165 | |
| Dassault Aviation SA | 1,600 | 2,275,473 | |
| Leonardo SpA | 159,766 | 1,954,326 | |
| Meggitt PLC | 258,132 | 1,944,248 | |
| MTU Aero Engines Holdings AG | 47,518 | 12,967,383 | |
| QinetiQ Group PLC | 234,119 | 822,152 | |
| Rolls-Royce Holdings PLC | 3,462,260 | 32,539,291 | |
| Safran SA | 138,481 | 20,112,905 | |
| Senior Engineering Group PLC | 325,958 | 802,770 | |
| Thales SA | 70,841 | 8,186,748 | |
| 132,682,460 | |||
| Air Freight & Logistics - 0.3% | |||
| Deutsche Post AG | 1,068,142 | 35,100,850 | |
| Konoike Transport Co. Ltd. | 3,200 | 50,093 | |
| SBS Co. Ltd. | 12,800 | 180,972 | |
| Yamato Holdings Co. Ltd. | 270,800 | 4,687,732 | |
| 40,019,647 | |||
| Airlines - 0.3% | |||
| Air France KLM (Reg.) (a) | 25,047 | 282,023 | |
| Deutsche Lufthansa AG | 126,011 | 1,936,124 | |
| International Consolidated Airlines Group SA: | |||
| ADR | 16,000 | 162,400 | |
| CDI | 128,741 | 660,602 | |
| Japan Airlines Co. Ltd. | 288,700 | 9,019,582 | |
| Qantas Airways Ltd. | 2,752,109 | 11,324,322 | |
| Ryanair Holdings PLC sponsored ADR (a) | 526,876 | 30,189,995 | |
| 53,575,048 | |||
| Building Products - 0.4% | |||
| Agc, Inc. | 49,700 | 1,433,901 | |
| Agc, Inc. ADR | 9,900 | 56,232 | |
| Belimo Holding AG (Reg.) | 236 | 1,192,220 | |
| Central Glass Co. Ltd. | 10,400 | 215,763 | |
| Compagnie de St. Gobain | 146,589 | 5,287,586 | |
| Daikin Industries Ltd. | 216,600 | 26,821,415 | |
| Geberit AG (Reg.) | 16,850 | 7,662,728 | |
| GWA Group Ltd. | 212,008 | 471,163 | |
| Kingspan Group PLC (Ireland) | 112,305 | 5,127,233 | |
| Nibe Industrier AB (B Shares) | 148,318 | 1,855,741 | |
| Toto Ltd. | 314,100 | 11,368,330 | |
| 61,492,312 | |||
| Commercial Services & Supplies - 0.5% | |||
| Aggreko PLC | 90,090 | 839,920 | |
| AMA Group Ltd. | 137,227 | 127,533 | |
| BIC SA | 12,406 | 792,183 | |
| Brambles Ltd. | 2,633,404 | 20,040,165 | |
| Brambles Ltd. ADR | 1,383 | 20,897 | |
| Downer EDI Ltd. | 347,436 | 1,803,992 | |
| Duskin Co. Ltd. | 10,000 | 256,695 | |
| Edenred SA | 37,371 | 1,819,516 | |
| Intrum Justitia AB | 25,085 | 637,435 | |
| IWG PLC | 210,409 | 1,068,139 | |
| Rentokil Initial PLC | 2,004,631 | 10,981,436 | |
| Ritchie Bros. Auctioneers, Inc. | 192,156 | 7,601,665 | |
| Secom Co. Ltd. | 259,100 | 22,106,485 | |
| SG Fleet Group Ltd. | 74,291 | 125,078 | |
| Shanks Group PLC | 183,603 | 68,810 | |
| Sohgo Security Services Co., Ltd. | 150,600 | 7,598,400 | |
| Toppan Printing Co. Ltd. | 73,900 | 1,177,698 | |
| Transpacific Industries Group Ltd. | 31,867 | 44,424 | |
| 77,110,471 | |||
| Construction & Engineering - 0.1% | |||
| ACS Actividades de Construccion y Servicios SA | 156,766 | 5,932,278 | |
| Balfour Beatty PLC | 4,422,824 | 11,602,929 | |
| Cimic Group Ltd. | 12,848 | 268,227 | |
| Kajima Corp. | 29,300 | 356,614 | |
| Monadelphous Group Ltd. | 88,093 | 943,880 | |
| 19,103,928 | |||
| Electrical Equipment - 1.2% | |||
| ABB Ltd. (Reg.) | 2,753,522 | 52,361,405 | |
| Denyo Co. Ltd. | 12,000 | 173,615 | |
| Legrand SA | 617,122 | 43,557,082 | |
| Melrose Industries PLC | 4,279,820 | 9,423,306 | |
| Mitsubishi Electric Corp. | 317,700 | 3,838,358 | |
| Nexans SA | 14,913 | 478,592 | |
| Prysmian SpA | 235,824 | 5,159,025 | |
| Schneider Electric SA | 751,272 | 62,929,496 | |
| Siemens Gamesa Renewable Energy SA | 488,300 | 6,646,610 | |
| Tatsuta Electric Wire & Cable Co. Ltd. | 63,300 | 255,619 | |
| 184,823,108 | |||
| Industrial Conglomerates - 0.5% | |||
| Bidvest Group Ltd. | 80,872 | 952,737 | |
| CK Hutchison Holdings Ltd. | 1,391,900 | 12,099,548 | |
| DCC PLC (United Kingdom) | 88,700 | 7,537,842 | |
| Lifco AB | 41,099 | 1,997,445 | |
| Nolato AB Series B | 36,344 | 1,944,094 | |
| Siemens AG | 430,446 | 43,045,637 | |
| Toshiba Corp. | 415,690 | 12,912,665 | |
| 80,489,968 | |||
| Machinery - 1.4% | |||
| Amada Holdings Co. Ltd. | 17,700 | 184,439 | |
| Atlas Copco AB: | |||
| (A Shares) | 278,942 | 8,330,190 | |
| (B Shares) | 34,192 | 911,006 | |
| CNH Industrial NV | 181,133 | 1,861,344 | |
| Epiroc AB Class A | 191,537 | 1,984,718 | |
| Fanuc Corp. | 215,800 | 37,370,631 | |
| Fujitec Co. Ltd. | 20,700 | 244,148 | |
| GEA Group AG | 758,678 | 20,453,729 | |
| Harmonic Drive Systems, Inc. (b) | 54,200 | 2,153,000 | |
| Hino Motors Ltd. | 105,300 | 828,642 | |
| IMI PLC | 1,150,517 | 14,069,488 | |
| Interpump Group SpA | 57,668 | 1,644,078 | |
| JTEKT Corp. | 73,600 | 798,110 | |
| Kawasaki Heavy Industries Ltd. | 65,200 | 1,278,407 | |
| KION Group AG | 29,978 | 1,449,353 | |
| Kitz Corp. | 73,600 | 475,956 | |
| Kubota Corp. | 956,300 | 13,727,656 | |
| Max Co. Ltd. | 12,800 | 206,516 | |
| Meidensha Corp. | 5,300 | 87,257 | |
| Misumi Group, Inc. | 436,500 | 9,894,027 | |
| Mitsuboshi Belting Ltd. | 15,900 | 261,470 | |
| Morgan Advanced Materials PLC | 35,343 | 109,922 | |
| Nordson Corp. | 87,384 | 11,880,729 | |
| Noritake Co. Ltd. | 1,100 | 40,123 | |
| Organo Corp. | 9,900 | 378,816 | |
| Rotork PLC | 714,577 | 2,691,964 | |
| Ryobi Ltd. | 14,000 | 210,458 | |
| Schindler Holding AG (participation certificate) | 88,331 | 20,169,544 | |
| Sintokogio Ltd. | 39,800 | 338,301 | |
| SMC Corp. | 52,900 | 19,987,819 | |
| Sodick Co. Ltd. | 16,500 | 116,642 | |
| Spirax-Sarco Engineering PLC | 262,398 | 25,622,693 | |
| Sumitomo Heavy Industries Ltd. | 8,400 | 241,559 | |
| Techtronic Industries Co. Ltd. | 1,945,000 | 13,416,074 | |
| The Weir Group PLC | 129,473 | 2,307,214 | |
| VAT Group AG (c) | 17,481 | 2,101,782 | |
| Vesuvius PLC | 32,206 | 182,461 | |
| Wartsila Corp. | 194,179 | 2,380,616 | |
| 220,390,882 | |||
| Marine - 0.0% | |||
| A.P. Moller - Maersk A/S Series B | 6,100 | 6,496,621 | |
| Professional Services - 1.3% | |||
| 51job, Inc. sponsored ADR (a) | 86,672 | 6,234,317 | |
| Benefit One, Inc. | 127,800 | 2,065,540 | |
| Centre Testing International Group Co. Ltd. (A Shares) | 1,504,900 | 2,573,773 | |
| Experian PLC | 1,404,826 | 43,042,498 | |
| Experian PLC ADR | 11,200 | 344,848 | |
| Hays PLC | 86,830 | 147,917 | |
| Intertek Group PLC | 336,729 | 22,240,245 | |
| IPH Ltd. | 149,533 | 936,538 | |
| McMillan Shakespeare Ltd. | 17,175 | 184,370 | |
| Nihon M&A Center, Inc. | 104,300 | 3,043,536 | |
| Randstad NV | 16,012 | 747,035 | |
| Recruit Holdings Co. Ltd. | 173,800 | 5,266,270 | |
| RELX PLC: | |||
| (Euronext N.V.) | 1,160,152 | 27,745,416 | |
| (London Stock Exchange) | 912,999 | 21,846,580 | |
| SGS SA (Reg.) | 10,547 | 25,894,630 | |
| SR Teleperformance SA | 25,682 | 5,605,644 | |
| TechnoPro Holdings, Inc. | 47,600 | 2,764,550 | |
| Thomson Reuters Corp. | 175,095 | 12,032,028 | |
| Wolters Kluwer NV | 210,947 | 15,190,242 | |
| Wolters Kluwer NV ADR | 800 | 57,424 | |
| 197,963,401 | |||
| Road & Rail - 0.6% | |||
| Aurizon Holdings Ltd. | 482,334 | 1,919,732 | |
| Canadian National Railway Co. | 208,606 | 19,209,175 | |
| Canadian Pacific Railway Ltd. | 43,532 | 10,481,488 | |
| Central Japan Railway Co. | 10,800 | 2,136,415 | |
| DSV A/S | 103,666 | 10,274,081 | |
| East Japan Railway Co. | 375,200 | 35,724,083 | |
| Hankyu Hanshin Holdings, Inc. | 53,600 | 2,030,781 | |
| Keio Corp. | 2,700 | 168,758 | |
| Localiza Rent A Car SA | 224,400 | 2,549,089 | |
| Maruzen Showa Unyu Co. Ltd. | 3,800 | 110,886 | |
| Nikkon Holdings Co. Ltd. | 24,100 | 537,194 | |
| Nippon Express Co. Ltd. | 11,800 | 609,799 | |
| Sankyu, Inc. | 38,480 | 1,948,721 | |
| Seibu Holdings, Inc. | 61,100 | 1,036,977 | |
| The Go-Ahead Group PLC | 6,430 | 162,740 | |
| Tokyu Corp. | 80,700 | 1,442,550 | |
| West Japan Railway Co. | 39,200 | 3,302,490 | |
| 93,644,959 | |||
| Trading Companies & Distributors - 0.2% | |||
| AerCap Holdings NV (a) | 221 | 11,850 | |
| Ashtead Group PLC | 117,658 | 3,251,306 | |
| Brenntag AG | 209,914 | 10,111,843 | |
| Daiichi Jitsugyo Co. Ltd. | 3,200 | 83,317 | |
| Ferguson PLC | 20,046 | 1,474,251 | |
| Ferguson PLC ADR | 20,500 | 149,855 | |
| Indutrade AB | 69,324 | 1,980,555 | |
| Marubeni Corp. | 306,300 | 1,955,119 | |
| MonotaRO Co. Ltd. | 87,800 | 2,157,912 | |
| Rexel SA | 479,588 | 5,086,430 | |
| Sumitomo Corp. | 318,100 | 4,768,431 | |
| Toyota Tsusho Corp. | 49,300 | 1,529,096 | |
| 32,559,965 | |||
| Transportation Infrastructure - 0.2% | |||
| Aena Sme SA (c) | 22,109 | 3,985,019 | |
| Airports of Thailand PCL (For. Reg.) | 940,100 | 2,213,085 | |
| Astm SpA | 9,663 | 298,001 | |
| Atlantia SpA | 61,759 | 1,504,816 | |
| Auckland International Airport Ltd. | 260,928 | 1,581,631 | |
| China Merchants Holdings International Co. Ltd. | 3,778,582 | 5,885,939 | |
| Grupo Aeroportuario del Sureste S.A.B. de CV Series B sponsored ADR | 12,650 | 1,864,484 | |
| Kamigumi Co. Ltd. | 42,600 | 998,083 | |
| Malaysia Airports Holdings Bhd | 1,226,300 | 2,399,821 | |
| The Drilling Co. of 1972 A/S (a) | 24,800 | 1,363,451 | |
| The Sumitomo Warehouse Co. Ltd. | 60,500 | 800,136 | |
| 22,894,466 | |||
| TOTAL INDUSTRIALS | 1,223,247,236 | ||
| INFORMATION TECHNOLOGY - 6.1% | |||
| Communications Equipment - 0.1% | |||
| Nokia Corp. | 464,105 | 2,296,071 | |
| Telefonaktiebolaget LM Ericsson: | |||
| (B Shares) | 1,182,483 | 9,253,137 | |
| (B Shares) sponsored ADR | 91,702 | 718,944 | |
| Tencent Music Entertainment Group ADR (a)(b) | 108,724 | 1,446,029 | |
| 13,714,181 | |||
| Electronic Equipment & Components - 1.1% | |||
| Daiwabo Holdings Co. Ltd. | 14,000 | 544,924 | |
| Enplas Corp. | 6,600 | 184,329 | |
| ESPEC Corp. | 15,100 | 267,077 | |
| Halma PLC | 998,576 | 23,851,771 | |
| Hexagon AB (B Shares) | 150,974 | 6,706,777 | |
| Hirose Electric Co. Ltd. | 160,690 | 18,256,961 | |
| Hitachi High-Technologies Corp. | 28,000 | 1,512,872 | |
| Hitachi Ltd. | 1,032,380 | 35,266,221 | |
| Hitachi Ltd. sponsored ADR | 978 | 66,533 | |
| Hosiden Corp. | 13,800 | 129,901 | |
| Ingenico SA | 67,687 | 6,710,104 | |
| Keyence Corp. | 27,800 | 16,459,924 | |
| Kyocera Corp. | 324,700 | 19,301,365 | |
| Murata Manufacturing Co. Ltd. | 15,600 | 648,538 | |
| Mycronic AB | 16,873 | 205,956 | |
| Oki Electric Industry Co. Ltd. | 62,800 | 880,211 | |
| OMRON Corp. | 353,000 | 17,478,044 | |
| Philips Lighting NV (c) | 35,373 | 1,034,509 | |
| Renishaw PLC | 30,507 | 1,317,793 | |
| Samsung SDI Co. Ltd. | 19,869 | 4,095,736 | |
| Sanshin Electronic Co. Ltd. | 1,600 | 22,320 | |
| Shimadzu Corp. | 109,700 | 2,728,172 | |
| Spectris PLC | 340,105 | 9,563,837 | |
| TDK Corp. | 5,700 | 453,918 | |
| Yokogawa Electric Corp. | 369,300 | 6,709,173 | |
| 174,396,966 | |||
| Internet Software & Services - 0.0% | |||
| Scout24 AG (c) | 108,867 | 6,437,185 | |
| IT Services - 1.4% | |||
| Adyen BV (a)(c) | 7,851 | 5,684,549 | |
| ALTEN | 16,944 | 2,022,382 | |
| Amadeus IT Holding SA Class A | 955,337 | 71,145,502 | |
| Appen Ltd. | 32,933 | 574,651 | |
| Argo Graphics, Inc. | 5,100 | 127,938 | |
| Capgemini SA | 92,616 | 11,110,336 | |
| Cielo SA | 64,900 | 121,462 | |
| Cognizant Technology Solutions Corp. Class A | 130,624 | 8,019,007 | |
| Computershare Ltd. | 211,133 | 2,186,844 | |
| EPAM Systems, Inc. (a) | 37,346 | 7,145,410 | |
| Fujitsu Ltd. | 212,640 | 16,419,127 | |
| GMO Payment Gateway, Inc. | 32,700 | 2,533,261 | |
| Hexaware Technologies Ltd. | 275,588 | 1,492,818 | |
| Ines Corp. | 18,600 | 191,892 | |
| iomart Group PLC | 4,648 | 18,268 | |
| IT Holdings Corp. | 87,000 | 5,101,991 | |
| ITOCHU Techno-Solutions Corp. | 41,000 | 1,130,023 | |
| Kanematsu Electric Ltd. | 11,100 | 314,501 | |
| Link Administration Holdings Ltd. | 102,343 | 377,697 | |
| MasterCard, Inc. Class A | 36,551 | 10,284,355 | |
| NEC System Integration & Constuction Ltd. | 4,400 | 114,934 | |
| Net One Systems Co. Ltd. | 17,700 | 474,510 | |
| Nomura Research Institute Ltd. | 1,943,300 | 38,651,978 | |
| NSD Co. Ltd. | 14,500 | 431,308 | |
| NTT Data Corp. | 174,200 | 2,248,112 | |
| OBIC Co. Ltd. | 170,300 | 19,477,056 | |
| Otsuka Corp. | 8,700 | 323,071 | |
| SCSK Corp. | 28,000 | 1,381,089 | |
| Softcat PLC | 138,568 | 1,753,539 | |
| Wix.com Ltd. (a) | 51,637 | 7,242,089 | |
| Worldline SA (a)(c) | 27,537 | 1,900,613 | |
| 220,000,313 | |||
| Semiconductors & Semiconductor Equipment - 1.3% | |||
| Advantest Corp. | 14,700 | 603,996 | |
| Analog Devices, Inc. | 243,209 | 26,711,644 | |
| ASML Holding NV (Netherlands) | 114,893 | 25,552,983 | |
| Dialog Semiconductor PLC (a) | 4,029 | 190,230 | |
| Disco Corp. | 22,600 | 4,105,803 | |
| Infineon Technologies AG | 1,532,840 | 26,565,489 | |
| Melexis NV (b) | 20,195 | 1,280,670 | |
| Mellanox Technologies Ltd. (a) | 66,900 | 7,161,645 | |
| NuFlare Technology, Inc. | 300 | 21,603 | |
| NXP Semiconductors NV | 110,479 | 11,284,325 | |
| Phison Electronics Corp. | 57,000 | 524,914 | |
| Silicon Motion Technology Corp. sponsored ADR | 137,806 | 4,447,000 | |
| Siltronic AG | 7,689 | 494,867 | |
| STMicroelectronics NV: | |||
| (France) | 28,485 | 504,982 | |
| (NY Shares) unit (b) | 75,139 | 1,329,960 | |
| Taiwan Semiconductor Manufacturing Co. Ltd. sponsored ADR | 1,556,738 | 66,363,741 | |
| Texas Instruments, Inc. | 103,096 | 12,758,130 | |
| Tokyo Electron Ltd. | 40,200 | 7,191,613 | |
| 197,093,595 | |||
| Software - 1.7% | |||
| Altium Ltd. | 11,031 | 273,158 | |
| ANSYS, Inc. (a) | 116,613 | 24,087,581 | |
| Avast PLC (c) | 641,884 | 2,967,969 | |
| Aveva Group PLC | 105,640 | 4,756,082 | |
| Cadence Design Systems, Inc. (a) | 715,935 | 49,027,229 | |
| Check Point Software Technologies Ltd. (a) | 212,649 | 22,902,297 | |
| Constellation Software, Inc. | 7,328 | 7,137,067 | |
| CyberArk Software Ltd. (a) | 12,729 | 1,429,976 | |
| Dassault Systemes SA | 226,353 | 31,880,294 | |
| Descartes Systems Group, Inc. (Canada) (a) | 94,227 | 3,341,895 | |
| Digital Arts, Inc. | 25,400 | 1,821,885 | |
| Fukui Computer Holdings, Inc. | 15,100 | 293,799 | |
| Globant SA (a) | 20,745 | 1,969,323 | |
| Haansoft, Inc. | 4,416 | 36,850 | |
| Hansen Technologies Ltd. | 65,769 | 144,392 | |
| Iress Ltd. | 123,658 | 1,040,969 | |
| Micro Focus International PLC | 912,505 | 12,461,201 | |
| Micro Focus International PLC sponsored ADR | 23,617 | 325,915 | |
| NICE Systems Ltd. (a) | 2,026 | 309,840 | |
| NICE Systems Ltd. sponsored ADR (a) | 16,994 | 2,604,331 | |
| Sage Group PLC | 275,091 | 2,345,124 | |
| SAP SE | 706,641 | 84,356,962 | |
| SAP SE sponsored ADR | 7,697 | 917,098 | |
| Software AG (Bearer) | 32,444 | 873,611 | |
| SystemPro Co. Ltd. | 19,400 | 289,443 | |
| Temenos Group AG | 46,970 | 7,868,276 | |
| WiseTech Global Ltd. | 151,626 | 3,771,016 | |
| 269,233,583 | |||
| Technology Hardware, Storage & Peripherals - 0.5% | |||
| Asia Vital Components Co. Ltd. | 150,000 | 202,056 | |
| Brother Industries Ltd. | 38,300 | 663,360 | |
| Fujifilm Holdings Corp. | 148,600 | 6,363,076 | |
| Konica Minolta, Inc. | 112,800 | 802,719 | |
| Logitech International SA (Reg.) | 88,276 | 3,577,419 | |
| Ricoh Co. Ltd. | 208,800 | 1,932,041 | |
| Samsung Electronics Co. Ltd. | 1,754,070 | 63,765,392 | |
| Seiko Epson Corp. | 215,000 | 2,859,651 | |
| 80,165,714 | |||
| TOTAL INFORMATION TECHNOLOGY | 961,041,537 | ||
| MATERIALS - 3.1% | |||
| Chemicals - 2.5% | |||
| Akzo Nobel NV | 499,202 | 44,698,349 | |
| Arkema SA | 66,200 | 5,803,107 | |
| BASF AG | 734,544 | 48,602,559 | |
| Christian Hansen Holding A/S | 49,992 | 4,200,049 | |
| Chugoku Marine Paints Ltd. | 26,500 | 213,277 | |
| Covestro AG (c) | 57,707 | 2,612,388 | |
| Croda International PLC | 382,213 | 21,867,910 | |
| Denki Kagaku Kogyo KK | 176,360 | 4,600,118 | |
| Givaudan SA | 22,630 | 61,185,027 | |
| Ishihara Sangyo Kaisha Ltd. | 6,300 | 51,415 | |
| Israel Chemicals Ltd. | 48,979 | 220,903 | |
| Johnson Matthey PLC | 372,433 | 13,187,435 | |
| Kaneka Corp. | 4,100 | 122,921 | |
| Kansai Paint Co. Ltd. | 647,600 | 13,478,078 | |
| Kuraray Co. Ltd. | 590,800 | 6,740,242 | |
| Linde PLC | 367,999 | 69,039,496 | |
| Nitto Denko Corp. | 218,600 | 10,177,395 | |
| Novozymes A/S Series B | 290,168 | 12,373,054 | |
| Pidilite Industries Ltd. | 105,021 | 2,024,932 | |
| Shin-Etsu Chemical Co. Ltd. | 56,600 | 5,700,996 | |
| Shin-Etsu Polymer Co. Ltd. | 58,700 | 379,048 | |
| Sika AG | 191,241 | 27,456,778 | |
| Symrise AG | 447,470 | 41,762,969 | |
| Victrex PLC | 96,215 | 2,432,806 | |
| Wacker Chemie AG | 1,389 | 108,112 | |
| 399,039,364 | |||
| Construction Materials - 0.1% | |||
| HeidelbergCement Finance AG | 163,500 | 11,327,952 | |
| Taiheiyo Cement Corp. | 26,900 | 679,115 | |
| 12,007,067 | |||
| Containers & Packaging - 0.0% | |||
| Smurfit Kappa Group PLC | 292,708 | 9,026,922 | |
| Toyo Seikan Group Holdings Ltd. | 83,400 | 1,215,261 | |
| 10,242,183 | |||
| Metals & Mining - 0.5% | |||
| Acacia Mining PLC (a) | 52,380 | 169,538 | |
| Anglo American PLC (United Kingdom) | 64,041 | 1,382,547 | |
| ArcelorMittal SA (Netherlands) | 388,500 | 5,590,034 | |
| BHP Billiton Ltd. | 361,289 | 8,868,699 | |
| BHP Billiton Ltd. sponsored ADR (b) | 89,470 | 4,398,345 | |
| BHP Billiton PLC | 193,987 | 4,196,638 | |
| BHP Billiton PLC ADR | 249,326 | 10,768,390 | |
| Ferrexpo PLC | 108,337 | 266,417 | |
| Fortescue Metals Group Ltd. | 461,934 | 2,488,716 | |
| Glencore Xstrata PLC | 2,521,683 | 7,235,544 | |
| MMC Norilsk Nickel PJSC | 8,339 | 2,011,060 | |
| Newcrest Mining Ltd. | 144,386 | 3,597,760 | |
| Rio Tinto Ltd. | 68,699 | 4,051,919 | |
| Rio Tinto PLC | 136,644 | 6,925,912 | |
| Rio Tinto PLC sponsored ADR | 234,102 | 11,840,879 | |
| Salzgitter AG | 6,444 | 116,893 | |
| South32 Ltd. | 725,880 | 1,290,548 | |
| Westgold Resources Ltd. (a) | 189,980 | 299,384 | |
| 75,499,223 | |||
| TOTAL MATERIALS | 496,787,837 | ||
| REAL ESTATE - 1.1% | |||
| Equity Real Estate Investment Trusts (REITs) - 0.2% | |||
| Big Yellow Group PLC | 174,417 | 2,270,867 | |
| British Land Co. PLC | 1,246,000 | 7,729,245 | |
| Goodman Group unit | 492,723 | 4,818,089 | |
| Link (REIT) | 433,500 | 4,859,675 | |
| Scentre Group unit | 270,131 | 734,956 | |
| Segro PLC | 691,861 | 6,608,573 | |
| Vicinity Centres unit | 370,539 | 646,307 | |
| Warehouses de Pauw | 12,670 | 2,358,889 | |
| 30,026,601 | |||
| Real Estate Management & Development - 0.9% | |||
| Cheung Kong Property Holdings Ltd. | 1,230,100 | 8,330,650 | |
| Country Garden Services Holdings Co. Ltd. | 857,000 | 2,471,991 | |
| Daibiru Corp. | 13,300 | 128,199 | |
| Daito Trust Construction Co. Ltd. | 7,500 | 965,783 | |
| Daiwa House Industry Co. Ltd. | 84,900 | 2,662,840 | |
| Deutsche Wohnen AG (Bearer) | 723,368 | 25,647,268 | |
| Fabege AB | 150,255 | 2,513,015 | |
| Grand City Properties SA | 637,452 | 14,628,353 | |
| Hang Lung Group Ltd. | 205,000 | 508,761 | |
| Hongkong Land Holdings Ltd. | 44,600 | 243,516 | |
| LEG Immobilien AG | 237,085 | 27,828,691 | |
| New World Development Co. Ltd. | 251,000 | 312,357 | |
| Savills PLC | 188,954 | 1,901,432 | |
| Sun Hung Kai Properties Ltd. sponsored ADR | 4,800 | 67,440 | |
| Swire Pacific Ltd. (A Shares) | 113,000 | 1,105,422 | |
| TAG Immobilien AG | 370,562 | 8,650,333 | |
| Vonovia SE | 790,154 | 39,339,370 | |
| 137,305,421 | |||
| TOTAL REAL ESTATE | 167,332,022 | ||
| UTILITIES - 1.0% | |||
| Electric Utilities - 0.6% | |||
| Chubu Electric Power Co., Inc. | 135,200 | 1,993,607 | |
| CLP Holdings Ltd. | 951,000 | 9,786,927 | |
| Companhia Paranaense de Energia-Copel | 10,400 | 141,496 | |
| Contact Energy Ltd. | 47,849 | 252,654 | |
| EDF SA | 147,225 | 1,790,402 | |
| Endesa SA | 29,298 | 752,513 | |
| Enel SpA | 2,396,365 | 17,385,137 | |
| Enel SpA ADR (b) | 27,500 | 198,138 | |
| Enersis SA | 1,713,025 | 280,598 | |
| Iberdrola SA | 2,198,713 | 22,633,584 | |
| Kansai Electric Power Co., Inc. | 90,200 | 1,097,411 | |
| Mosenergo PJSC | 1,381,000 | 46,278 | |
| ORSTED A/S (c) | 168,439 | 16,082,833 | |
| Scottish & Southern Energy PLC | 1,739,505 | 24,404,141 | |
| Terna SpA | 325,280 | 2,041,319 | |
| Tohoku Electric Power Co., Inc. | 25,900 | 258,915 | |
| Tokyo Electric Power Co., Inc. (a) | 415,900 | 1,980,942 | |
| 101,126,895 | |||
| Gas Utilities - 0.1% | |||
| APA Group unit | 1,003,931 | 7,443,832 | |
| China Resource Gas Group Ltd. | 1,262,000 | 6,227,517 | |
| Gas Natural SDG SA | 133,282 | 3,486,309 | |
| Italgas SpA | 205,061 | 1,329,697 | |
| Rubis SCA | 35,841 | 2,071,969 | |
| Tokyo Gas Co. Ltd. | 2,900 | 73,309 | |
| 20,632,633 | |||
| Independent Power and Renewable Electricity Producers - 0.0% | |||
| Drax Group PLC | 70,014 | 230,021 | |
| Falck Renewables SpA | 54,897 | 234,339 | |
| Meridian Energy Ltd. | 188,178 | 590,483 | |
| 1,054,843 | |||
| Multi-Utilities - 0.3% | |||
| A2A SpA | 242,906 | 426,878 | |
| ACEA SpA | 11,832 | 229,650 | |
| AGL Energy Ltd. | 84,420 | 1,077,926 | |
| Centrica PLC | 248,346 | 210,894 | |
| E.ON AG | 151,190 | 1,406,625 | |
| ENGIE | 1,337,261 | 20,318,833 | |
| National Grid PLC sponsored ADR | 92,968 | 4,863,156 | |
| Veolia Environnement SA | 597,567 | 14,284,443 | |
| 42,818,405 | |||
| Water Utilities - 0.0% | |||
| Companhia de Saneamento de Minas Gerais | 1,600 | 26,799 | |
| TOTAL UTILITIES | 165,659,575 | ||
| TOTAL COMMON STOCKS | |||
| (Cost $5,785,560,047) | 6,924,548,417 | ||
| Nonconvertible Preferred Stocks - 0.8% | |||
| CONSUMER DISCRETIONARY - 0.4% | |||
| Automobiles - 0.4% | |||
| Porsche Automobil Holding SE (Germany) | 52,448 | 3,294,283 | |
| Volkswagen AG | 350,783 | 56,325,649 | |
| 59,619,932 | |||
| CONSUMER STAPLES - 0.3% | |||
| Beverages - 0.0% | |||
| Ambev SA sponsored ADR | 1,086,802 | 4,934,081 | |
| Household Products - 0.3% | |||
| Henkel AG & Co. KGaA | 427,362 | 42,788,960 | |
| TOTAL CONSUMER STAPLES | 47,723,041 | ||
| FINANCIALS - 0.0% | |||
| Banks - 0.0% | |||
| Sberbank of Russia | 297,550 | 869,278 | |
| INDUSTRIALS - 0.1% | |||
| Aerospace & Defense - 0.1% | |||
| Embraer SA sponsored ADR | 463,400 | 8,123,402 | |
| TOTAL NONCONVERTIBLE PREFERRED STOCKS | |||
| (Cost $105,237,492) | 116,335,653 | ||
| Equity Funds - 51.6% | |||
| Diversified Emerging Markets Funds - 0.0% | |||
| Matthews Pacific Tiger Fund Investor Class | 19,976 | 549,535 | |
| Europe Stock Funds - 0.8% | |||
| WisdomTree Europe Hedged Equity ETF | 1,838,675 | 119,734,516 | |
| Foreign Large Blend Funds - 18.7% | |||
| Artisan International Value Fund Investor Class | 17,075,625 | 577,326,876 | |
| Fidelity SAI International Low Volatility Index Fund (f) | 14,275,719 | 158,603,233 | |
| Harbor International Fund Institutional Class | 9,619 | 352,450 | |
| Janus Henderson International Opportunities Fund Class T | 1,209,926 | 28,784,128 | |
| Morgan Stanley Institutional Fund, Inc. International Equity Portfolio Class I | 30,885,905 | 458,964,547 | |
| Oakmark International Fund Investor Class | 22,513,876 | 492,153,335 | |
| T. Rowe Price Overseas Stock Fund I Class | 122,988,988 | 1,231,119,765 | |
| TOTAL FOREIGN LARGE BLEND FUNDS | 2,947,304,334 | ||
| Foreign Large Growth Funds - 20.6% | |||
| American Funds EuroPacific Growth Fund Class F-1 | 934,291 | 47,499,364 | |
| Fidelity Diversified International Fund (f) | 17,544,944 | 642,495,835 | |
| Fidelity International Discovery Fund (f) | 24,687,934 | 1,030,227,505 | |
| Fidelity Overseas Fund (f) | 10,729,668 | 508,157,055 | |
| Invesco Oppenheimer International Growth Fund Class R6 | 2,016,605 | 79,514,742 | |
| JOHCM International Select Fund Class II Shares | 20,055,620 | 454,660,898 | |
| WCM Focused International Growth Fund Institutional Class | 27,662,211 | 482,982,211 | |
| TOTAL FOREIGN LARGE GROWTH FUNDS | 3,245,537,610 | ||
| Foreign Large Value Funds - 2.5% | |||
| Dodge & Cox International Stock Fund | 67 | 2,635 | |
| iShares MSCI EAFE Value ETF (b) | 2,485,485 | 112,145,083 | |
| Pear Tree Polaris Foreign Value Fund Institutional Shares | 14,316,027 | 283,027,860 | |
| TOTAL FOREIGN LARGE VALUE FUNDS | 395,175,578 | ||
| Foreign Small Mid Blend Funds - 0.6% | |||
| Franklin International Small Cap Growth Fund | 543,980 | 8,371,857 | |
| iShares MSCI EAFE Small-Cap ETF | 568,615 | 31,609,308 | |
| Victory Trivalent International Small-Cap Fund Class I | 3,716,847 | 47,724,314 | |
| TOTAL FOREIGN SMALL MID BLEND FUNDS | 87,705,479 | ||
| Foreign Small Mid Growth Funds - 0.6% | |||
| Fidelity International Small Cap Opportunities Fund (f) | 2,860,136 | 51,825,673 | |
| Oberweis International Opportunities Fund | 573,914 | 10,330,444 | |
| T. Rowe Price International Discovery Fund | 550,704 | 34,072,049 | |
| Wasatch International Growth Fund Investor Class | 88 | 2,432 | |
| TOTAL FOREIGN SMALL MID GROWTH FUNDS | 96,230,598 | ||
| Foreign Small Mid Value Funds - 0.5% | |||
| Brandes International Small Cap Equity Fund Class A | 728,625 | 7,169,669 | |
| Segall Bryant & Hamill International Small Cap Fund Class I | 2,448,180 | 25,730,368 | |
| Transamerica International Small Cap Value Fund | 3,822,519 | 44,838,148 | |
| TOTAL FOREIGN SMALL MID VALUE FUNDS | 77,738,185 | ||
| Sector Funds - 0.1% | |||
| SPDR Dow Jones International Real Estate ETF (b) | 201,575 | 7,843,283 | |
| Victory Global Natural Resources Fund Class A (a) | 68 | 508 | |
| TOTAL SECTOR FUNDS | 7,843,791 | ||
| Other - 7.2% | |||
| Fidelity Advisor Japan Fund Class I (f) | 3,376,087 | 49,932,329 | |
| Fidelity Japan Smaller Companies Fund (f) | 6,397,352 | 104,660,684 | |
| iShares MSCI Australia ETF (b) | 5,784,157 | 125,400,524 | |
| iShares MSCI Japan ETF (b) | 15,785,258 | 851,141,111 | |
| Matthews Japan Fund Investor Class | 165 | 3,417 | |
| TOTAL OTHER | 1,131,138,065 | ||
| TOTAL EQUITY FUNDS | |||
| (Cost $6,854,941,306) | 8,108,957,691 | ||
| Principal Amount | Value | ||
| U.S. Treasury Obligations - 0.1% | |||
| U.S. Treasury Bills, yield at date of purchase 1.94% to 2.14% 9/12/19 to 11/29/19 (g) | |||
| (Cost $17,948,389) | 18,010,000 | 17,950,711 | |
| Shares | |||
| Money Market Funds - 4.2% | |||
| Fidelity Securities Lending Cash Central Fund 2.13% (h)(i) | 147,429,828 | 147,444,571 | |
| State Street Institutional U.S. Government Money Market Fund Premier Class 1.87% (j) | 515,431,642 | 515,431,642 | |
| TOTAL MONEY MARKET FUNDS | |||
| (Cost $662,876,213) | 662,876,213 | ||
| TOTAL INVESTMENT IN SECURITIES - 100.7% | |||
| (Cost $13,426,563,447) | 15,830,668,685 | ||
| NET OTHER ASSETS (LIABILITIES) - (0.7)% | (103,976,632) | ||
| NET ASSETS - 100% | $15,726,692,053 |
| Futures Contracts | |||||
| Number of contracts | Expiration Date | Notional Amount | Value | Unrealized Appreciation/(Depreciation) | |
| Purchased | |||||
| Equity Index Contracts | |||||
| CME Nikkei 225 Index Contracts (United States) | 1,086 | Sept. 2019 | $112,210,950 | $(1,036,109) | $(1,036,109) |
| ICE E-mini MSCI EAFE Index Contracts (United States) | 2,779 | Sept. 2019 | 256,209,905 | 371,970 | 371,970 |
| TOTAL FUTURES CONTRACTS | $(664,139) |
The notional amount of futures purchased as a percentage of Net Assets is 2.3%
For the period, the average monthly notional amount at value for futures contracts in the aggregate was $168,376,345.
Security Type Abbreviations
ETF – Exchange-Traded Fund
Legend
(a) Non-income producing
(b) Security or a portion of the security is on loan at period end.
(c) Security exempt from registration under Rule 144A of the Securities Act of 1933. These securities may be resold in transactions exempt from registration, normally to qualified institutional buyers. At the end of the period, the value of these securities amounted to $70,666,636 or 0.4% of net assets.
(d) Level 3 security
(e) Security or a portion of the security purchased on a delayed delivery or when-issued basis.
(f) Affiliated Fund
(g) Security or a portion of the security was pledged to cover margin requirements for futures contracts. At period end, the value of securities pledged amounted to $17,910,746.
(h) Affiliated fund that is generally available only to investment companies and other accounts managed by Fidelity Investments. The rate quoted is the annualized seven-day yield of the fund at period end. A complete unaudited listing of the fund's holdings as of its most recent quarter end is available upon request. In addition, each Fidelity Central Fund's financial statements are available on the SEC's website or upon request.
(i) Investment made with cash collateral received from securities on loan.
(j) The rate quoted is the annualized seven-day yield of the fund at period end.
Affiliated Central Funds
Information regarding fiscal year to date income earned by the Fund from investments in Fidelity Central Funds is as follows:
| Fund | Income earned |
| Fidelity Securities Lending Cash Central Fund | $997,307 |
| Total | $997,307 |
Amounts in the income column in the above table include any capital gain distributions from underlying funds, which are presented in the corresponding line-item in the Statement of Operations, if applicable. Amount for Fidelity Securities Lending Cash Central Fund represents the income earned on investing cash collateral, less rebates paid to borrowers and any lending agent fees associated with the loan, plus any premium payments received for lending certain types of securities.
Affiliated Underlying Funds
Fiscal year to date information regarding the Fund's investments in affiliated Underlying Funds, excluding any Money Market Central Funds, is presented below. Exchanges between classes of the same affiliated Underlying Funds may occur.
| Affiliate | Value, beginning of period | Purchases | Sales Proceeds | Dividend Income | Realized Gain (loss) | Change in Unrealized appreciation (depreciation) | Value, end of period |
| Fidelity Advisor Japan Fund Class I | $48,109,242 | $-- | $-- | $-- | $-- | $1,823,087 | $49,932,329 |
| Fidelity Diversified International Fund | 655,929,252 | 20,000,000 | 70,460,172 | -- | 8,647,060 | 28,379,695 | 642,495,835 |
| Fidelity International Discovery Fund | 1,037,139,792 | 15,000,000 | 70,460,173 | -- | 7,707,745 | 40,840,141 | 1,030,227,505 |
| Fidelity International Small Cap Opportunities Fund | 50,738,821 | -- | -- | -- | -- | 1,086,852 | 51,825,673 |
| Fidelity Japan Smaller Companies Fund | 104,404,790 | -- | -- | -- | -- | 255,894 | 104,660,684 |
| Fidelity Overseas Fund | 480,316,918 | 17,000,000 | 14,092,035 | -- | 18,862 | 24,913,310 | 508,157,055 |
| Fidelity SAI International Low Volatility Index Fund | -- | 155,000,000 | -- | -- | -- | 3,603,233 | 158,603,233 |
| Total | $2,376,638,815 | $207,000,000 | $155,012,380 | $-- | $16,373,667 | $100,902,212 | $2,545,902,314 |
Amounts in the income column in the above table include any capital gain distributions from underlying funds, which are presented in the corresponding line-item in the Statement of Operations, if applicable.
Investment Valuation
The following is a summary of the inputs used, as of August 31, 2019, involving the Fund's assets and liabilities carried at fair value. The inputs or methodology used for valuing securities may not be an indication of the risk associated with investing in those securities. For more information on valuation inputs, and their aggregation into the levels used below, please refer to the Investment Valuation section in the accompanying Notes to Financial Statements.
| Valuation Inputs at Reporting Date: | ||||
| Description | Total | Level 1 | Level 2 | Level 3 |
| Investments in Securities: | ||||
| Equities: | ||||
| Communication Services | $372,308,941 | $136,135,237 | $236,173,704 | $-- |
| Consumer Discretionary | 561,518,901 | 362,204,737 | 199,314,153 | 11 |
| Consumer Staples | 1,050,034,785 | 559,399,279 | 490,635,506 | -- |
| Energy | 270,196,996 | 91,509,038 | 178,687,958 | -- |
| Financials | 1,046,343,200 | 592,183,026 | 454,160,174 | -- |
| Health Care | 718,289,638 | 299,225,145 | 419,064,493 | -- |
| Industrials | 1,231,370,638 | 923,897,959 | 307,472,679 | -- |
| Information Technology | 961,041,537 | 799,402,174 | 161,639,363 | -- |
| Materials | 496,787,837 | 415,257,489 | 81,530,348 | -- |
| Real Estate | 167,332,022 | 149,743,166 | 17,588,856 | -- |
| Utilities | 165,659,575 | 83,604,750 | 82,054,825 | -- |
| Equity Funds | 8,108,957,691 | 8,108,957,691 | -- | -- |
| Other Short-Term Investments | 17,950,711 | -- | 17,950,711 | -- |
| Money Market Funds | 662,876,213 | 662,876,213 | -- | -- |
| Total Investments in Securities: | $15,830,668,685 | $13,184,395,904 | $2,646,272,770 | $11 |
| Derivative Instruments: | ||||
| Assets | ||||
| Futures Contracts | $371,970 | $371,970 | $-- | $-- |
| Total Assets | $371,970 | $371,970 | $-- | $-- |
| Liabilities | ||||
| Futures Contracts | $(1,036,109) | $(1,036,109) | $-- | $-- |
| Total Liabilities | $(1,036,109) | $(1,036,109) | $-- | $-- |
| Total Derivative Instruments: | $(664,139) | $(664,139) | $-- | $-- |
Value of Derivative Instruments
The following table is a summary of the Fund's value of derivative instruments by primary risk exposure as of August 31, 2019. For additional information on derivative instruments, please refer to the Derivative Instruments section in the accompanying Notes to Financial Statements.
| Primary Risk Exposure / Derivative Type | Value | |
| Asset | Liability | |
| Equity Risk | ||
| Futures Contracts(a) | $371,970 | $(1,036,109) |
| Total Equity Risk | 371,970 | (1,036,109) |
| Total Value of Derivatives | $371,970 | $(1,036,109) |
(a) Reflects gross cumulative appreciation (depreciation) on futures contracts as presented in the Schedule of Investments. In the Statement of Assets and Liabilities, the period end daily variation margin is included in receivable or payable for daily variation margin on futures contracts, and the net cumulative appreciation (depreciation) is included in distributable earnings.
See accompanying notes which are an integral part of the financial statements.
Financial Statements
Statement of Assets and Liabilities
| August 31, 2019 (Unaudited) | ||
| Assets | ||
| Investment in securities, at value (including securities loaned of $143,727,458) — See accompanying schedule: Unaffiliated issuers (cost $11,381,799,808) | $13,137,321,800 | |
| Fidelity Central Funds (cost $147,444,571) | 147,444,571 | |
| Other affiliated issuers (cost $1,897,319,068) | 2,545,902,314 | |
| Total Investment in Securities (cost $13,426,563,447) | $15,830,668,685 | |
| Cash | 2,068,329 | |
| Foreign currency held at value (cost $2,480,022) | 2,474,804 | |
| Receivable for investments sold | ||
| Regular delivery | 26,617,475 | |
| Delayed delivery | 356,915 | |
| Receivable for fund shares sold | 3,711,122 | |
| Dividends receivable | 34,884,934 | |
| Interest receivable | 666,592 | |
| Distributions receivable from Fidelity Central Funds | 45,558 | |
| Receivable for daily variation margin on futures contracts | 949,980 | |
| Prepaid expenses | 37,628 | |
| Other receivables | 528,501 | |
| Total assets | 15,903,010,523 | |
| Liabilities | ||
| Payable for investments purchased | ||
| Regular delivery | $15,313,730 | |
| Delayed delivery | 372,710 | |
| Payable for fund shares redeemed | 10,264,759 | |
| Accrued management fee | 2,094,685 | |
| Other payables and accrued expenses | 794,851 | |
| Collateral on securities loaned | 147,477,735 | |
| Total liabilities | 176,318,470 | |
| Net Assets | $15,726,692,053 | |
| Net Assets consist of: | ||
| Paid in capital | $13,201,716,351 | |
| Total distributable earnings (loss) | 2,524,975,702 | |
| Net Assets, for 1,572,294,020 shares outstanding | $15,726,692,053 | |
| Net Asset Value, offering price and redemption price per share ($15,726,692,053 ÷ 1,572,294,020 shares) | $10.00 |
See accompanying notes which are an integral part of the financial statements.
Statement of Operations
| Six months ended August 31, 2019 (Unaudited) | ||
| Investment Income | ||
| Dividends: | ||
| Unaffiliated issuers | $37,221,447 | |
| Interest | 3,751,520 | |
| Income from Fidelity Central Funds (including $997,307 from security lending) | 997,307 | |
| Income before foreign taxes withheld | 41,970,274 | |
| Less foreign taxes withheld | (14,077,087) | |
| Total income | 27,893,187 | |
| Expenses | ||
| Management fee | $32,510,508 | |
| Accounting and security lending fees | 680,342 | |
| Custodian fees and expenses | 256,242 | |
| Independent trustees' fees and expenses | 87,377 | |
| Registration fees | 58,103 | |
| Audit | 60,481 | |
| Legal | 47,205 | |
| Miscellaneous | 140,433 | |
| Total expenses before reductions | 33,840,691 | |
| Expense reductions | (19,753,769) | |
| Total expenses after reductions | 14,086,922 | |
| Net investment income (loss) | 13,806,265 | |
| Realized and Unrealized Gain (Loss) | ||
| Net realized gain (loss) on: | ||
| Investment securities: | ||
| Unaffiliated issuers | 13,364,237 | |
| Fidelity Central Funds | 6,296 | |
| Other affiliated issuers | 16,373,667 | |
| Foreign currency transactions | (539,393) | |
| Futures contracts | 8,246,197 | |
| Capital gain distributions from underlying funds: | ||
| Unaffiliated issuers | 146,763,757 | |
| Total net realized gain (loss) | 184,214,761 | |
| Change in net unrealized appreciation (depreciation) on: | ||
| Investment securities: | ||
| Unaffiliated issuers (net of increase in deferred foreign taxes of $98,208) | (134,239,758) | |
| Affiliated issuers | 100,902,212 | |
| Assets and liabilities in foreign currencies | (141,954) | |
| Futures contracts | (13,378,082) | |
| Total change in net unrealized appreciation (depreciation) | (46,857,582) | |
| Net gain (loss) | 137,357,179 | |
| Net increase (decrease) in net assets resulting from operations | $151,163,444 |
See accompanying notes which are an integral part of the financial statements.
Statement of Changes in Net Assets
| Six months ended August 31, 2019 (Unaudited) | Year ended February 28, 2019 | |
| Increase (Decrease) in Net Assets | ||
| Operations | ||
| Net investment income (loss) | $13,806,265 | $315,613,970 |
| Net realized gain (loss) | 184,214,761 | 460,628,213 |
| Change in net unrealized appreciation (depreciation) | (46,857,582) | (1,880,975,069) |
| Net increase (decrease) in net assets resulting from operations | 151,163,444 | (1,104,732,886) |
| Distributions to shareholders | (197,083,802) | (960,064,898) |
| Share transactions | ||
| Proceeds from sales of shares | 1,036,823,435 | 3,180,693,103 |
| Reinvestment of distributions | 194,768,067 | 956,581,738 |
| Cost of shares redeemed | (1,363,940,569) | (3,424,072,564) |
| Net increase (decrease) in net assets resulting from share transactions | (132,349,067) | 713,202,277 |
| Total increase (decrease) in net assets | (178,269,425) | (1,351,595,507) |
| Net Assets | ||
| Beginning of period | 15,904,961,478 | 17,256,556,985 |
| End of period | $15,726,692,053 | $15,904,961,478 |
| Other Information | ||
| Shares | ||
| Sold | 103,146,883 | 299,093,781 |
| Issued in reinvestment of distributions | 19,113,648 | 97,266,318 |
| Redeemed | (135,073,412) | (320,961,245) |
| Net increase (decrease) | (12,812,881) | 75,398,854 |
See accompanying notes which are an integral part of the financial statements.
Financial Highlights
Strategic Advisers International Fund
| Six months ended (Unaudited) August 31, | Years endedFebruary 28, | |||||
| 2019 | 2019 | 2018 | 2017 | 2016 A | 2015 | |
| Selected Per–Share Data | ||||||
| Net asset value, beginning of period | $10.03 | $11.43 | $9.78 | $8.74 | $10.45 | $10.77 |
| Income from Investment Operations | ||||||
| Net investment income (loss)B | .01 | .21 | .19 | .17 | .16 | .17 |
| Net realized and unrealized gain (loss) | .09 | (.98) | 1.82 | 1.07 | (1.54) | (.10) |
| Total from investment operations | .10 | (.77) | 2.01 | 1.24 | (1.38) | .07 |
| Distributions from net investment income | (.02) | (.18) | (.18) | (.18) | (.16) | (.18) |
| Distributions from net realized gain | (.11) | (.44) | (.18) | (.02) | (.17) | (.21) |
| Total distributions | (.13) | (.63)C | (.36) | (.20) | (.33) | (.39) |
| Net asset value, end of period | $10.00 | $10.03 | $11.43 | $9.78 | $8.74 | $10.45 |
| Total ReturnD,E | .94% | (6.57)% | 20.53% | 14.33% | (13.60)% | .85% |
| Ratios to Average Net AssetsF,G | ||||||
| Expenses before reductions | .43%H | .45% | .50% | .48% | .45% | .41% |
| Expenses net of fee waivers, if any | .18%H | .20% | .25% | .23% | .20% | .16% |
| Expenses net of all reductions | .18%H | .20% | .24% | .22% | .20% | .16% |
| Net investment income (loss) | .17%H | 1.95% | 1.68% | 1.81% | 1.57% | 1.63% |
| Supplemental Data | ||||||
| Net assets, end of period (000 omitted) | $15,726,692 | $15,904,961 | $17,256,557 | $16,141,374 | $18,533,655 | $24,528,266 |
| Portfolio turnover rateI | 31%H | 39% | 33% | 28% | 28% | 20% |
A For the year ended February 29.
B Calculated based on average shares outstanding during the period.
C Total distributions of $.63 per share is comprised of distributions from net investment income of $.184 and distributions from net realized gain of $.444 per share.
D Total returns for periods of less than one year are not annualized.
E Total returns would have been lower if certain expenses had not been reduced during the applicable periods shown.
F Fees and expenses of any underlying Fidelity Central Funds are not included in the Fund's expense ratio. The Fund indirectly bears its proportionate share of the expenses of any underlying Fidelity Central Funds.
G Expense ratios reflect operating expenses of the Fund. Expenses before reductions do not reflect amounts reimbursed by the investment adviser or reductions from brokerage service arrangements or reductions from other expense offset arrangements and do not represent the amount paid by the Fund during periods when reimbursements or reductions occur. Expenses net of fee waivers reflect expenses after reimbursement by the investment adviser but prior to reductions from brokerage service arrangements or other expense offset arrangements. Expenses net of all reductions represent the net expenses paid by the Fund. Fees and expenses of the Underlying Funds are not included in the Fund's annualized ratios. The Fund indirectly bears its proportionate share of the expenses of the Underlying Funds.
H Annualized
I Amount does not include the portfolio activity of any Underlying Funds.
See accompanying notes which are an integral part of the financial statements.
Notes to Financial Statements (Unaudited)
For the period ended August 31, 2019
1. Organization.
Strategic Advisers International Fund (the Fund) is a fund of Fidelity Rutland Square Trust II (the Trust), and is authorized to issue an unlimited number of shares. The Trust is registered under the Investment Company Act of 1940, as amended (the 1940 Act), as an open-end management investment company organized as a Delaware statutory trust. The Fund is offered exclusively to certain clients of Strategic Advisers LLC (Strategic Advisers), an affiliate of Fidelity Management & Research Company (FMR).
2. Significant Accounting Policies.
The Fund is an investment company and applies the accounting and reporting guidance of the Financial Accounting Standards Board (FASB) Accounting Standards Codification Topic 946 Financial Services – Investments Companies. The financial statements have been prepared in conformity with accounting principles generally accepted in the United States of America (GAAP), which require management to make certain estimates and assumptions at the date of the financial statements. Actual results could differ from those estimates. Subsequent events, if any, through the date that the financial statements were issued have been evaluated in the preparation of the financial statements. The following summarizes the significant accounting policies of the Fund:
Investment Valuation. Investments are valued as of 4:00 p.m. Eastern time on the last calendar day of the period. The Board of Trustees (the Board) has delegated the day to day responsibility for the valuation of the Fund's investments to the Fair Value Committee (the Committee) established by the Fund's investment adviser. In accordance with valuation policies and procedures approved by the Board, the Fund attempts to obtain prices from one or more third party pricing vendors or brokers to value its investments. When current market prices, quotations or currency exchange rates are not readily available or reliable, investments will be fair valued in good faith by the Committee, in accordance with procedures adopted by the Board. Factors used in determining fair value vary by investment type and may include market or investment specific events, changes in interest rates and credit quality. The frequency with which these procedures are used cannot be predicted and they may be utilized to a significant extent. The Committee oversees the Fund's valuation policies and procedures and reports to the Board on the Committee's activities and fair value determinations. The Board monitors the appropriateness of the procedures used in valuing the Fund's investments and ratifies the fair value determinations of the Committee.
The Fund categorizes the inputs to valuation techniques used to value its investments into a disclosure hierarchy consisting of three levels as shown below:
- Level 1 – quoted prices in active markets for identical investments
- Level 2 – other significant observable inputs (including quoted prices for similar investments, interest rates, prepayment speeds, etc.)
- Level 3 – unobservable inputs (including the Fund's own assumptions based on the best information available)
Valuation techniques used to value the Fund's investments by major category are as follows:
Equity securities, including restricted securities, for which market quotations are readily available, are valued at the last reported sale price or official closing price as reported by a third party pricing vendor on the primary market or exchange on which they are traded and are categorized as Level 1 in the hierarchy. In the event there were no sales during the day or closing prices are not available, securities are valued at the last quoted bid price or may be valued using the last available price and are generally categorized as Level 2 in the hierarchy. For foreign equity securities, when market or security specific events arise, comparisons to the valuation of American Depositary Receipts (ADRs), futures contracts, Exchange-Traded Funds (ETFs) and certain indexes as well as quoted prices for similar securities may be used and would be categorized as Level 2 in the hierarchy. For equity securities, including restricted securities, where observable inputs are limited, assumptions about market activity and risk are used and these securities may be categorized as Level 3 in the hierarchy.
Debt securities, including restricted securities, are valued based on evaluated prices received from third party pricing vendors or from brokers who make markets in such securities. U.S. government and government agency obligations are valued by pricing vendors who utilize matrix pricing which considers yield or price of bonds of comparable quality, coupon, maturity and type or by broker-supplied prices. When independent prices are unavailable or unreliable, debt securities may be valued utilizing pricing methodologies which consider similar factors that would be used by third party pricing vendors. Debt securities are generally categorized as Level 2 in the hierarchy but may be Level 3 depending on the circumstances. ETFs are valued at their last sale price or official closing price as reported by a third party pricing vendor on the primary market or exchange on which they are traded and are categorized as Level 1 in the hierarchy. In the event there were no sales during the day but the exchange reports a closing bid level, ETFs are valued at the closing bid and would be categorized as Level 1 in the hierarchy. In the event there was no closing bid, ETFs may be valued by another method that the Board believes reflects fair value in accordance with the Board's fair value pricing policies and may be categorized as Level 2 in the hierarchy.
Futures contracts are valued at the settlement price established each day by the board of trade or exchange on which they are traded and are categorized as Level 1 in the hierarchy. Investments in open-end mutual funds, including the Fidelity Central Funds, are valued at their closing net asset value (NAV) each business day and are categorized as Level 1 in the hierarchy. If an unaffiliated open-end mutual fund's NAV is unavailable, shares of that fund may be valued by another method that the Board believes reflects fair value in accordance with the Board's fair value pricing policies and is categorized as Level 2 in the hierarchy.
Changes in valuation techniques may result in transfers in or out of an assigned level within the disclosure hierarchy. The aggregate value of investments by input level as of August 31, 2019 is included at the end of the Fund's Schedule of Investments.
Foreign Currency. The Fund may use foreign currency contracts to facilitate transactions in foreign-denominated securities. Gains and losses from these transactions may arise from changes in the value of the foreign currency or if the counterparties do not perform under the contracts' terms.
Foreign-denominated assets, including investment securities, and liabilities are translated into U.S. dollars at the exchange rates at period end. Purchases and sales of investment securities, income and dividends received and expenses denominated in foreign currencies are translated into U.S. dollars at the exchange rate in effect on the transaction date.
The effects of exchange rate fluctuations on investments are included with the net realized and unrealized gain (loss) on investment securities. Other foreign currency transactions resulting in realized and unrealized gain (loss) are disclosed separately.
Investment Transactions and Income. For financial reporting purposes, the Fund's investment holdings and NAV include trades executed through the end of the last business day of the period. The NAV per share for processing shareholder transactions is calculated as of the close of business of the New York Stock Exchange (NYSE), normally 4:00 p.m. Eastern time and includes trades executed through the end of the prior business day. Gains and losses on securities sold are determined on the basis of identified cost. Dividend income is recorded on the ex-dividend date, except for certain dividends from foreign securities where the ex-dividend date may have passed, which are recorded as soon as the Fund is informed of the ex-dividend date. Non-cash dividends included in dividend income, if any, are recorded at the fair market value of the securities received. Income and capital gain distributions from Fidelity Central Funds, if any, are recorded on the ex-dividend date. Income and capital gain distributions from Underlying Funds and distributions from ETFs, if any, are recorded on the ex-dividend date. Certain distributions received by the Fund represent a return of capital or capital gain. The Fund determines the components of these distributions subsequent to the ex-dividend date, based upon receipt of tax filings or other correspondence relating to the underlying investment. These distributions are recorded as a reduction of cost of investments and/or as a realized gain. Interest income is accrued as earned and includes coupon interest and amortization of premium and accretion of discount on debt securities as applicable. Investment income is recorded net of foreign taxes withheld where recovery of such taxes is uncertain.
Expenses. Expenses directly attributable to a fund are charged to that fund. Expenses attributable to more than one fund are allocated among the respective funds on the basis of relative net assets or other appropriate methods. Expense estimates are accrued in the period to which they relate and adjustments are made when actual amounts are known.
Deferred Trustee Compensation. Under a Deferred Compensation Plan (the Plan), certain independent Trustees have elected to defer receipt of a portion of their annual compensation. Deferred amounts are invested in a cross-section of Strategic Advisers funds, are marked-to-market and remain in the Fund until distributed in accordance with the Plan. The investment of deferred amounts and the offsetting payable to the Trustees of $284,191 are included in the accompanying Statement of Assets and Liabilities in other receivables and other payables and accrued expenses, respectively.
Income Tax Information and Distributions to Shareholders. Each year, the Fund intends to qualify as a regulated investment company under Subchapter M of the Internal Revenue Code, including distributing substantially all of its taxable income and realized gains. As a result, no provision for U.S. Federal income taxes is required. The Fund files a U.S. federal tax return, in addition to state and local tax returns as required. The Fund's federal income tax returns are subject to examination by the Internal Revenue Service (IRS) for a period of three fiscal years after they are filed. State and local tax returns may be subject to examination for an additional fiscal year depending on the jurisdiction. Foreign taxes are provided for based on the Fund's understanding of the tax rules and rates that exist in the foreign markets in which it invests. The Fund is subject to a tax imposed on capital gains by certain countries in which it invests. An estimated deferred tax liability for net unrealized appreciation on the applicable securities is included in Other payables and accrued expenses on the Statement of Assets & Liabilities.
Distributions are declared and recorded on the ex-dividend date. Income and capital gain distributions are determined in accordance with income tax regulations, which may differ from GAAP.
Capital accounts within the financial statements are adjusted for permanent book-tax differences. These adjustments have no impact on net assets or the results of operations. Capital accounts are not adjusted for temporary book-tax differences which will reverse in a subsequent period.
Book-tax differences are primarily due to the short-term gain distributions from the Underlying Funds, futures contracts, foreign currency transactions, certain foreign taxes, passive foreign investment companies (PFIC), market discount, deferred trustees compensation and losses deferred due to wash sales.
As of period end, the cost and unrealized appreciation (depreciation) in securities, and derivatives if applicable, for federal income tax purposes were as follows:
| Gross unrealized appreciation | $3,031,145,950 |
| Gross unrealized depreciation | (670,823,782) |
| Net unrealized appreciation (depreciation) | $2,360,322,168 |
| Tax cost | $13,469,682,378 |
Delayed Delivery Transactions and When-Issued Securities. During the period, the Fund transacted in securities on a delayed delivery or when-issued basis. Payment and delivery may take place after the customary settlement period for that security. The price of the underlying securities and the date when the securities will be delivered and paid for are fixed at the time the transaction is negotiated. The securities purchased on a delayed delivery or when-issued basis are identified as such in the Fund's Schedule of Investments. Losses may arise due to changes in the value of the underlying securities or if the counterparty does not perform under the contract's terms, or if the issuer does not issue the securities due to political, economic, or other factors.
Restricted Securities. The Fund may invest in securities that are subject to legal or contractual restrictions on resale. These securities generally may be resold in transactions exempt from registration or to the public if the securities are registered. Disposal of these securities may involve time-consuming negotiations and expense, and prompt sale at an acceptable price may be difficult. Information regarding restricted securities is included at the end of the Fund's Schedule of Investments.
3. Derivative Instruments.
Risk Exposures and the Use of Derivative Instruments. The Fund's investment objective allows the Fund to enter into various types of derivative contracts, including futures contracts. Derivatives are investments whose value is primarily derived from underlying assets, indices or reference rates and may be transacted on an exchange or over-the-counter (OTC). Derivatives may involve a future commitment to buy or sell a specified asset based on specified terms, to exchange future cash flows at periodic intervals based on a notional principal amount, or for one party to make one or more payments upon the occurrence of specified events in exchange for periodic payments from the other party.
The Fund used derivatives to increase returns and to manage exposure to certain risks as defined below. The success of any strategy involving derivatives depends on analysis of numerous economic factors, and if the strategies for investment do not work as intended, the Fund may not achieve its objectives.
The Fund's use of derivatives increased or decreased its exposure to the following risk:
| Equity Risk | Equity risk relates to the fluctuations in the value of financial instruments as a result of changes in market prices (other than those arising from interest rate risk or foreign exchange risk), whether caused by factors specific to an individual investment, its issuer, or all factors affecting all instruments traded in a market or market segment. |
The Fund is also exposed to additional risks from investing in derivatives, such as liquidity risk and counterparty credit risk. Liquidity risk is the risk that the Fund will be unable to close out the derivative in the open market in a timely manner. Counterparty credit risk is the risk that the counterparty will not be able to fulfill its obligation to the Fund. Counterparty credit risk related to exchange-traded futures contracts may be mitigated by the protection provided by the exchange on which they trade.
Investing in derivatives may involve greater risks than investing in the underlying assets directly and, to varying degrees, may involve risk of loss in excess of any initial investment and collateral received and amounts recognized in the Statement of Assets and Liabilities. In addition, there may be the risk that the change in value of the derivative contract does not correspond to the change in value of the underlying instrument.
Futures Contracts. A futures contract is an agreement between two parties to buy or sell a specified underlying instrument for a fixed price at a specified future date. The Fund used futures contracts to manage its exposure to the stock market.
Upon entering into a futures contract, a fund is required to deposit either cash or securities (initial margin) with a clearing broker in an amount equal to a certain percentage of the face value of the contract. Futures contracts are marked-to-market daily and subsequent daily payments (variation margin) are made or received by a fund depending on the daily fluctuations in the value of the futures contracts and are recorded as unrealized appreciation or (depreciation). This receivable and/or payable, if any, is included in daily variation margin on futures contracts in the Statement of Assets and Liabilities. Realized gain or (loss) is recorded upon the expiration or closing of a futures contract. The net realized gain (loss) and change in net unrealized appreciation (depreciation) on futures contracts during the period is presented in the Statement of Operations.
Any open futures contracts at period end are presented in the Schedule of Investments under the caption "Futures Contracts". The notional amount at value reflects each contract's exposure to the underlying instrument or index at period end. Securities deposited to meet initial margin requirements are identified in the Schedule of Investments.
4. Purchases and Sales of Investments.
Purchases and sales of securities (including the Underlying Fund shares), other than short-term securities, aggregated $2,375,653,310 and $2,599,533,159, respectively.
5. Fees and Other Transactions with Affiliates.
Management Fee. Strategic Advisers (the investment adviser) provides the Fund with investment management related services. For these services, the Fund pays a monthly management fee to the investment adviser. The management fee is calculated by adding the annual management fee rate of .25% of the Fund's average net assets throughout the month payable to the investment adviser to the aggregate of the fee rates, payable monthly, to the Fund's sub-advisers. The Fund's maximum aggregate management fee will not exceed 1.00% of the Fund's average net assets. For the reporting period, the total annualized management fee rate was .41% of the Fund's average net assets.
During the period, the investment adviser waived a portion of its management fee as described in the Expense Reductions note.
Sub-Advisers. Arrowstreet Capital, Limited Partnership, Causeway Capital Management, LLC, Massachusetts Financial Services Company (MFS), Thompson, Siegel & Walmsley LLC and William Blair Investment Management, LLC each served as a sub-adviser for the Fund during the period. Sub-advisers provide discretionary investment advisory services for their allocated portion of the Fund's assets and are paid by the investment adviser and not the Fund for providing these services.
FIAM LLC (an affiliate of the investment adviser), FIL Investment Advisors and Geode Capital Management, LLC, have been retained to serve as a sub-adviser for the Fund. As of the date of this report, these sub-advisers have not been allocated any portion of the Fund's assets. These sub-advisers in the future may provide discretionary investment advisory services for an allocated portion of the Fund's assets and will be paid by the investment adviser for providing these services.
In September, 2019, the Board approved the appointment of T. Rowe Price Associates, Inc. as an additional sub-adviser for the Fund. Subsequent to period end, T. Rowe Price Associates, Inc. was allocated a portion of the Fund's assets.
Accounting and Security Lending Fees. Fidelity Service Company, Inc. (FSC), an affiliate of the investment adviser, maintains the Fund's accounting records. The accounting fee is based on the level of average net assets for each month. Prior to April 1, 2019, FSC had a separate agreement with the Fund for administration of the security lending program, based on the number and duration of lending transactions. Effective July 1, 2019 accounting fees are not paid by the Fund and are instead paid by the investment adviser or an affiliate. For the period, the total fees paid for accounting and administration of securities lending were equivalent to an annualized rate of .01%.
Brokerage Commissions. The Fund placed a portion of its portfolio transactions with brokerage firms which are affiliates of the investment adviser. Brokerage commissions are included in net realized gain (loss) and change in net unrealized appreciation (depreciation) in the Statement of Operations. The commissions paid to these affiliated firms were $1,106 for the period.
Interfund Trades. The Fund may purchase from or sell securities to other funds affiliated with each sub-adviser under procedures adopted by the Board. The procedures have been designed to ensure these interfund trades are executed in accordance with Rule 17a-7 of the 1940 Act. Interfund trades are included within the respective purchases and sales amounts shown in the Purchases and Sales of Investments note.
6. Investments in Fidelity Central Funds.
The Fund invests in Fidelity Central Funds, which are open-end investment companies available only to other investment companies and accounts managed by the investment adviser and its affiliates. The Fund's Schedule of Investments lists each of the Fidelity Central Funds held as of period end, if any, as an investment of the Fund, but does not include the underlying holdings of each Fidelity Central Fund. As an Investing Fund, the Fund indirectly bears its proportionate share of the expenses of the underlying Fidelity Central Funds.
The Fidelity Money Market Central Funds are managed by Fidelity Investments Money Management, Inc. (FIMM), an affiliate of the investment adviser. Annualized expenses of the Money Market Central Funds as of their most recent shareholder report date ranged from less than .005% to .01%.
A complete unaudited list of holdings for each Fidelity Central Fund is available upon request or at the Securities and Exchange Commission (the SEC) website at www.sec.gov. In addition, the financial statements of the Fidelity Central Funds are available on the SEC website or upon request.
7. Committed Line of Credit.
The Fund participates with other funds managed by the investment adviser or an affiliate in a $4.25 billion credit facility (the "line of credit") to be utilized for temporary or emergency purposes to fund shareholder redemptions or for other short-term liquidity purposes. The Fund has agreed to pay commitment fees on its pro-rata portion of the line of credit, which amounted to $21,328 and is reflected in Miscellaneous expenses on the Statement of Operations. During the period, the Fund did not borrow on this line of credit.
8. Security Lending.
The Fund lends portfolio securities through a lending agent from time to time in order to earn additional income. On the settlement date of the loan, the Fund receives collateral (in the form of U.S. Treasury obligations, letters of credit and/or cash) against the loaned securities and maintains collateral in an amount not less than 100% of the market value of the loaned securities during the period of the loan. The market value of the loaned securities is determined at the close of business of the Fund and any additional required collateral is delivered to the Fund on the next business day. The Fund or borrower may terminate the loan at any time, and if the borrower defaults on its obligation to return the securities loaned because of insolvency or other reasons, the Fund may apply collateral received from the borrower against the obligation. The Fund may experience delays and costs in recovering the securities loaned. Any cash collateral received is invested in the Fidelity Securities Lending Cash Central Fund. The value of loaned securities and cash collateral at period end are disclosed on the Fund's Statement of Assets and Liabilities. Security lending income represents the income earned on investing cash collateral, less rebates paid to borrowers and any lending agent fees associated with the loan, plus any premium payments received for lending certain types of securities. Security lending income is presented in the Statement of Operations as a component of income from Fidelity Central Funds.
9. Expense Reductions.
The investment adviser has contractually agreed to waive the Fund's management fee in an amount equal to .25% of the Fund's average net assets until September 30, 2022. During the period, this waiver reduced the Fund's management fee by $19,725,549.
In addition, during the period the investment adviser reimbursed and/or waived a portion of operating expenses in the amount of $28,220.
10. Other.
The Fund's organizational documents provide former and current trustees and officers with a limited indemnification against liabilities arising in connection with the performance of their duties to the Fund. In the normal course of business, the Fund may also enter into contracts that provide general indemnifications. The Fund's maximum exposure under these arrangements is unknown as this would be dependent on future claims that may be made against the Fund. The risk of material loss from such claims is considered remote.
The Fund does not invest in the Underlying Funds for the purpose of exercising management or control; however, investments by the Fund within its principal investment strategies may represent a significant portion of an Underlying Fund's net assets.
At the end of the period, the Fund was the owner of record of 10% or more of the total outstanding shares of the following Underlying Funds:
| Fidelity International Discovery Fund | 12% |
| Fidelity Japan Smaller Companies Fund | 16% |
Shareholder Expense Example
As a shareholder of the Fund, you incur two types of costs: (1) transaction costs and (2) ongoing costs, including management fees and other Fund expenses. This Example is intended to help you understand your ongoing costs (in dollars) of investing in the Fund and to compare these costs with the ongoing costs of investing in other mutual funds.
The Example is based on an investment of $1,000 invested at the beginning of the period and held for the entire period (March 1, 2019 to August 31, 2019).
Actual Expenses
The first line of the accompanying table provides information about actual account values and actual expenses. You may use the information in this line, together with the amount you invested, to estimate the expenses that you paid over the period. Simply divide your account value by $1,000.00 (for example, an $8,600 account value divided by $1,000.00 = 8.6), then multiply the result by the number in the first line under the heading entitled "Expenses Paid During Period" to estimate the expenses you paid on your account during this period. In addition to the direct expenses incurred by the Fund presented in the table, as a shareholder of the underlying mutual funds and exchange-traded funds (ETFs) (the Underlying Funds), the Fund also indirectly bears its proportionate share of the expenses of the Underlying Funds. In addition, the Fund, as a shareholder in the underlying Fidelity Central Funds, will indirectly bear its pro-rata share of the fees and expenses incurred by the underlying Fidelity Central Funds. These fees and expenses are not included in the Fund's annualized expense ratio used to calculate the expense estimate in the table below.
Hypothetical Example for Comparison Purposes
The second line of the accompanying table provides information about hypothetical account values and hypothetical expenses based on the Fund's actual expense ratio and an assumed rate of return of 5% per year before expenses, which is not the Fund's actual return. The hypothetical account values and expenses may not be used to estimate the actual ending account balance or expenses you paid for the period. You may use this information to compare the ongoing costs of investing in the Fund and other funds. To do so, compare this 5% hypothetical example with the 5% hypothetical examples that appear in the shareholder reports of the other funds. In addition to the direct expenses incurred by the Fund presented in the table, as a shareholder of the Underlying Funds, the Fund also indirectly bears its proportionate share of the expenses of the Underlying Funds. In addition, the Fund, as a shareholder in the underlying Fidelity Central Funds, will indirectly bear its pro-rata share of the fees and expenses incurred by the underlying Fidelity Central Funds. These fees and expenses are not included in the Fund's annualized expense ratio used to calculate the expense estimate in the table below.
Please note that the expenses shown in the table are meant to highlight your ongoing costs only and do not reflect any transaction costs. Therefore, the second line of the table is useful in comparing ongoing costs only, and will not help you determine the relative total costs of owning different funds.
| Annualized Expense Ratio-A | Beginning Account Value March 1, 2019 | Ending Account Value August 31, 2019 | Expenses Paid During Period-B March 1, 2019 to August 31, 2019 | |
| Actual | .18% | $1,000.00 | $1,009.40 | $.91 |
| Hypothetical-C | $1,000.00 | $1,024.23 | $.92 |
A Annualized expense ratio reflects expenses net of applicable fee waivers.
B Expenses are equal to the Fund's annualized expense ratio, multiplied by the average account value over the period, multiplied by 184/366 (to reflect the one-half year period). The fees and expenses of the Underlying Funds in which the Fund invests are not included in the Fund's annualized expense ratio.
C 5% return per year before expenses
Board Approval of Investment Advisory Contracts and Management Fees
Strategic Advisers International Fund
On March 7, 2019, the Board of Trustees, including the Independent Trustees (together, the Board) voted at an in-person meeting to approve an investment advisory agreement (the Sub-Advisory Agreement) with Thompson, Siegel & Walmsley, LLC (TSW) for the fund, which would take effect upon the consummation of a potential change in control transaction of the parent company of TSW, a sub-adviser to the fund. The Board noted that the terms of the Sub-Advisory Agreement are identical in all material respects to those of the existing sub-advisory agreement with TSW, except with respect to the date of execution. The Board, assisted by the advice of fund counsel and Independent Trustees' counsel, considered a broad range of information it believed relevant to the approval of the Sub-Advisory Agreement.
In considering whether to approve the Sub-Advisory Agreement, the Board reached a determination, with the assistance of fund counsel and Independent Trustees' counsel and through the exercise of its business judgment, that the approval of the Sub-Advisory Agreement is in the best interests of the fund and its shareholders and that the approval of such agreement does not involve a conflict of interest from which the fund's investment adviser, Strategic Advisers LLC (Strategic Advisers), or its affiliates derive an inappropriate advantage. Also, the Board found that the fees to be charged under the Sub-Advisory Agreement bear a reasonable relationship to the services to be rendered and will be based upon services provided that will be in addition to, rather than duplicative of, services provided under the advisory contract of any underlying fund in which the fund may invest. The Board's decision to approve the Sub- Advisory Agreement was not based on any single factor, but rather was based on a comprehensive consideration of all the information provided to the Board.
Nature, Extent, and Quality of Services Provided. The Board considered that it reviewed information regarding TSW, including the backgrounds of its investment personnel, and also took into consideration the fund's investment objective, strategies and related investment philosophy, in connection with the annual renewal of the fund's current sub-advisory agreement with TSW at its September 2018 Board meeting.The Board considered that the Sub-Advisory Agreement will not result in any changes to the nature, extent and quality of the services provided to the fund. The Board also considered that the Sub-Advisory Agreement would not result in any changes to (i) the investment process or strategies employed in the management of the fund's assets or (ii) the day-to-day management of the fund or the persons primarily responsible for such management under the existing sub-advisory agreement.Investment Performance. The Board considered that it received information regarding TSW's historical investment performance in managing fund assets in connection with the annual renewal of the fund's current sub-advisory agreement with TSW and throughout the year. The Board did not consider performance to be a material factor in its decision to approve the Sub-Advisory Agreement because the Sub-Advisory Agreement would not result in any changes to the fund's investment processes or strategies or in the persons primarily responsible for the day-to-day management of the fund.Based on its review, the Board concluded that the nature, extent, and quality of services that will be provided to the fund under the Sub-Advisory Agreement should benefit the fund's shareholders.Competitiveness of Management Fee and Total Fund Expenses. In reviewing the Sub-Advisory Agreement, the Board considered the amount and nature of fees to be paid by the fund to Strategic Advisers and the amount and nature of fees to be paid by Strategic Advisers to TSW and the absence of any change in the fund's total operating expenses as a result of approving the Sub-Advisory Agreement.The Board considered that there are no expected changes to the fund's management fee or total operating expenses as a result of approving the Sub-Advisory Agreement and that the fund's management fee and total net expenses are expected to maintain the same relationship to the competitive peer group medians reviewed by the Board in connection with the annual renewal of the fund's advisory contracts at the September 2018 meeting.Based on its review, the Board concluded that the fund's management fee structure and total expenses continue to bear a reasonable relationship to the services that the fund and its shareholders will receive and the other factors considered.Because the Sub-Advisory Agreement was negotiated at arm's length and will have no impact on the maximum management fees payable by the fund or Strategic Advisers portion of the management fee, the Board did not consider the costs of services and the profitability of the relationship with the fund to Strategic Advisers to be significant factors in its decision to approve the Sub-Advisory Agreement.Potential Fall-Out Benefits. The Board considered that it reviews information regarding the potential of direct and indirect benefits to Strategic Advisers and its affiliates from their relationships with the fund, including non-advisory fee compensation paid to affiliates of Strategic Advisers, if any, during its annual renewal of the fund's advisory agreement with Strategic Advisers. With respect to TSW, the Board considered Strategic Advisers' representation that it does not anticipate that the approval of the Sub-Advisory Agreement will have a material impact on the potential for fall-out benefits to Strategic Advisers or its affiliates.Possible Economies of Scale. The Board considered that it reviews whether there have been economies of scale in connection with the management of the fund during its annual renewal of the fund's advisory agreement with Strategic Advisers and the fund's sub-advisory agreements. The Board noted that the Sub-Advisory Agreement provides for breakpoints that have the potential to reduce sub-advisory fees paid to TSW as assets allocated to TSW grow. The Board also considered that it reviewed whether there have been economies of scale in connection with the management of the fund during its annual renewal of the fund's advisory agreement with Strategic Advisers at its September 2018 Board meeting.Conclusion. Based on its evaluation of all of the conclusions noted above, and after considering all factors it believed relevant, the Board ultimately concluded that the Sub-Advisory Agreement's fee structure bears a reasonable relationship to the services to be rendered and that the Sub-Advisory Agreement should be approved because the Sub-Advisory Agreement is in the best interests of the fund and its shareholders. The Board also concluded that the sub-advisory fees to be charged thereunder will be based on services provided that will be in addition to, rather than duplicative of, services provided under the advisory contract of any underlying fund in which the fund may invest. In addition, the Board concluded that the approval of the Sub-Advisory Agreement does not involve a conflict of interest from which Strategic Advisers or its affiliates derive an inappropriate advantage.Board Approval of Investment Advisory Contract
Strategic Advisers International Fund
On June 5, 2019, the Board of Trustees, including the Independent Trustees (together, the Board), voted at an in-person meeting to approve an amendment to the fee schedule in each of the existing sub-advisory agreements with FIAM LLC (FIAM) and FIL Investment Advisors (FIA) (the Amended Sub-Advisory Agreements) for the fund, which has the potential to lower the amount of fees paid by Strategic Advisers LLC (Strategic Advisers) to each of FIAM and FIA, on behalf of the fund for certain investment mandates. The Board noted that the terms of each Amended Sub-Advisory Agreement are not materially different from those of the current sub-advisory agreement with the applicable sub-adviser.
The Board, assisted by the advice of fund counsel and Independent Trustees’ counsel, considered a broad range of information it believed relevant to the approval of each Amended Sub-Advisory Agreement.
In considering whether to approve each Amended Sub-Advisory Agreement, the Board reached a determination, with the assistance of fund counsel and Independent Trustees' counsel and through the exercise of its business judgment, that the approval of the Amended Sub-Advisory Agreement is in the best interests of the fund and its shareholders and that the approval of such agreement does not involve a conflict of interest from which Strategic Advisers or its affiliates derive an inappropriate advantage. Also, the Board found that the sub-advisory fees to be charged under each Amended Sub-Advisory Agreement bear a reasonable relationship to the services to be rendered and will be based upon services provided that will be in addition to, rather than duplicative of services provided under the advisory contract of any underlying fund in which the fund may invest. The Board’s decision to approve each Amended Sub-Advisory Agreement was not based on any single factor, but rather was based on a comprehensive consideration of all the information provided to the Board. In addition, individual Trustees did not necessarily attribute the same weight or importance to each factor.
Nature, Extent, and Quality of Services Provided. The Board considered that it reviewed information regarding FIAM and FIA, including the backgrounds of their investment personnel, and also took into consideration the fund’s investment objective, strategies and related investment philosophy, in connection with the approval of the sub-advisory agreement with FIA for the same mandates for a separate fund overseen by the Board, and the annual renewal of the fund’s current sub-advisory agreements at its September 2018 Board meeting. The Board also considered the information provided by FIAM and FIA in June 2019 in connection with the anticipated annual renewal of each sub-advisory agreement in September 2019.The Board considered that each Amended Sub-Advisory Agreement will not result in any changes to the nature, extent and quality of the services provided to the fund. The Board also considered each sub-adviser’s representation that the Amended Sub-Advisory Agreement would not result in any changes to (i) the investment process or strategies employed in the management of the fund’s assets or (ii) the day-to-day management of the fund or the persons primarily responsible for such management.Investment Performance. The Board considered that it received information regarding each sub-adviser’s historical investment performance in managing fund assets at its June 2019 Board meeting. The Board did not consider performance to be a material factor in its decision to approve the Amended Sub-Advisory Agreement because the Amended Sub-Advisory Agreement would not result in any changes to the fund’s investment processes or strategies or in the persons primarily responsible for the day-to-day management of the fund.Based on its review, the Board concluded that the nature, extent, and quality of services that will be provided to the fund under each Amended Sub-Advisory Agreement will continue to benefit the fund’s shareholders.Competitiveness of Management Fee and Total Fund Expenses. The Board considered that if the applicable investment mandates are funded, each new fee schedule is expected to lower the amount of fees to be paid by Strategic Advisers to FIAM and FIA under each respective Amended Sub-Advisory Agreement, on behalf of the fund. The Board also considered that each Amended Sub-Advisory Agreement would not result in any changes to the fund’s maximum aggregate annual management fee rate, Strategic Advisers’ portion of the fund’s management fee or Strategic Advisers’ contractual management fee waiver for the fund. The Board also considered that if the applicable investment mandates are funded, each Amended Sub-Advisory Agreement has the potential to reduce total net fund expenses by the same amount as any resulting decrease in the fund’s management fee. Based on its review, the Board concluded that the fund’s management fee structure and total expenses continue to bear a reasonable relationship to the services that the fund and its shareholders will receive under each Amended Sub-Advisory Agreement and the other factors considered.Because each Amended Sub-Advisory Agreement was negotiated at arm’s length and will have no impact on the maximum management fees payable by the fund, the Board did not consider the costs of services and profitability of the relationship with the fund to Strategic Advisers to be significant factors in its decision to approve each Amended Sub-Advisory Agreement.Potential Fall-Out Benefits. The Board considered that it reviews information regarding the potential of direct and indirect benefits to Strategic Advisers and its affiliates from their relationships with the fund, including non-advisory fee compensation paid to affiliates of Strategic Advisers, if any, as well as information regarding potential fall-out benefits accruing to each sub-adviser, if any, as a result of its relationship with the fund, during its annual renewal of the fund’s advisory agreements at its September Board meeting.Possible Economies of Scale. The Board considered that the Amended Sub-Advisory Agreement with FIA, like the current sub-advisory agreement with FIA, provides for breakpoints that, if the applicable investment mandate is funded, have the potential to reduce sub-advisory fees paid to FIA as assets allocated to FIA grow. The Board considered that it reviewed whether there have been economies of scale in connection with the management of the fund during its annual renewal of the fund’s advisory agreement with Strategic Advisers at its September 2018 Board meeting and that it will consider the potential for such benefits at its September 2019 meeting.Conclusion. Based on its evaluation of all of the conclusions noted above, and after considering all factors it believed relevant, the Board ultimately concluded that each Amended Sub-Advisory Agreement’s fee structure continues to bear a reasonable relationship to the services rendered to the fund and that each Amended Sub-Advisory Agreement should be approved because the Amended Sub-Advisory Agreement is in the best interests of the fund and its shareholders. The Board also concluded that the sub-advisory fees to be charged thereunder will be based on services provided that will be in addition to, rather than duplicative of services provided under the advisory contract of any underlying fund in which the fund may invest. In addition, the Board concluded that the approval of each Amended Sub-Advisory Agreement does not involve a conflict of interest from which Strategic Advisers or its affiliates derive an inappropriate advantage.![]()
SIT-SANN-1019
1.912867.109
Strategic Advisers® Fidelity® International Fund Offered exclusively to certain clients of Strategic Advisers LLC - not available for sale to the general public Semi-Annual Report August 31, 2019 |
|
Beginning on January 1, 2021, as permitted by regulations adopted by the Securities and Exchange Commission, paper copies of a fund’s shareholder reports will no longer be sent by mail, unless you specifically request paper copies of the reports from the fund or from your financial intermediary, such as a financial advisor, broker-dealer or bank. Instead, the reports will be made available on a website, and you will be notified by mail each time a report is posted and provided with a website link to access the report.
If you already elected to receive shareholder reports electronically, you will not be affected by this change and you need not take any action. You may elect to receive shareholder reports and other communications from a fund electronically, by contacting your financial intermediary. For Fidelity customers, visit Fidelity's web site or call Fidelity using the contact information listed below.
You may elect to receive all future reports in paper free of charge. If you wish to continue receiving paper copies of your shareholder reports, you may contact your financial intermediary or, if you are a Fidelity customer, visit Fidelity’s website, or call Fidelity at the applicable toll-free number listed below. Your election to receive reports in paper will apply to all funds held with the fund complex/your financial intermediary.
| Account Type | Website | Phone Number |
| Brokerage, Mutual Fund, or Annuity Contracts: | fidelity.com/mailpreferences | 1-800-343-3548 |
| Employer Provided Retirement Accounts: | netbenefits.fidelity.com/preferences (choose 'no' under Required Disclosures to continue to print) | 1-800-343-0860 |
| Advisor Sold Accounts Serviced Through Your Financial Intermediary: | Contact Your Financial Intermediary | Your Financial Intermediary's phone number |
| Advisor Sold Accounts Serviced by Fidelity: | institutional.fidelity.com | 1-877-208-0098 |
Contents
To view a fund's proxy voting record for the 12-month period ended June 30, visit http://www.fidelity.com/proxyvotingresults or visit the Securities and Exchange Commission's (SEC) web site at http://www.sec.gov.
You may also call 1-800-544-3455 to request a free copy of the proxy voting guidelines.
Standard & Poor's, S&P and S&P 500 are registered service marks of The McGraw-Hill Companies, Inc. and have been licensed for use by Fidelity Distributors Corporation.
Other third-party marks appearing herein are the property of their respective owners.
All other marks appearing herein are registered or unregistered trademarks or service marks of FMR LLC or an affiliated company. © 2019 FMR LLC. All rights reserved.
This report and the financial statements contained herein are submitted for the general information of the shareholders of the Fund. This report is not authorized for distribution to prospective investors in the Fund unless preceded or accompanied by an effective prospectus.
A fund files its complete schedule of portfolio holdings with the SEC for the first and third quarters of each fiscal year on Form N-PORT. Forms N-PORT are available on the SEC’s web site at http://www.sec.gov. A fund's Forms N-PORT may be reviewed and copied at the SEC’s Public Reference Room in Washington, DC. Information regarding the operation of the SEC's Public Reference Room may be obtained by calling 1-800-SEC-0330.
For a complete list of a fund's portfolio holdings, view the most recent holdings listing, semiannual report, or annual report on Fidelity's web site at http://www.fidelity.com, http://www.institutional.fidelity.com, or http://www.401k.com, as applicable.
NOT FDIC INSURED •MAY LOSE VALUE •NO BANK GUARANTEE
Neither the Fund nor Fidelity Distributors Corporation is a bank.
Investment Summary (Unaudited)
The information in the following tables is based on the direct investments of the Fund.Top Ten Holdings as of August 31, 2019
(excluding cash equivalents)
| % of fund's net assets | |
| Fidelity Overseas Fund | 15.2 |
| Fidelity International Discovery Fund | 14.6 |
| Fidelity Diversified International Fund | 14.5 |
| Fidelity International Capital Appreciation Fund | 13.0 |
| Fidelity SAI International Value Index Fund | 9.1 |
| Fidelity SAI International Low Volatility Index Fund | 8.8 |
| Fidelity Advisor Japan Fund Class I | 3.0 |
| Fidelity International Value Fund | 2.5 |
| Fidelity Pacific Basin Fund | 1.9 |
| Fidelity International Small Cap Opportunities Fund | 0.9 |
| 83.5 |
Asset Allocation (% of fund's net assets)
| As of August 31, 2019 | ||
| Common Stocks | 8.1% | |
| Foreign Large Blend Funds | 10.7% | |
| Foreign Large Growth Funds | 58.2% | |
| Foreign Large Value Funds | 11.6% | |
| Foreign Small Mid Growth Funds | 0.9% | |
| Other | 3.5% | |
| Sector Funds | 0.9% | |
| Short-Term Investments and Net Other Assets (Liabilities) | 6.1% | |
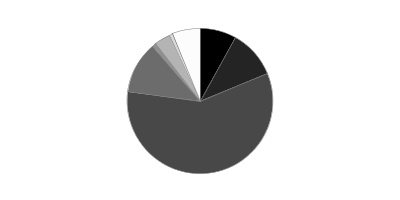
Asset allocations of funds in the pie chart reflect the categorizations of assets as defined by Morningstar as of the reporting date.
Schedule of Investments August 31, 2019 (Unaudited)
Showing Percentage of Net Assets
| Common Stocks - 8.1% | |||
| Shares | Value | ||
| COMMUNICATION SERVICES - 0.6% | |||
| Diversified Telecommunication Services - 0.2% | |||
| Cellnex Telecom SA (a) | 56,135 | $2,245,704 | |
| HKT Trust/HKT Ltd. unit | 4,218,000 | 6,589,089 | |
| Koninklijke KPN NV | 682,862 | 2,162,837 | |
| Nippon Telegraph & Telephone Corp. | 146,800 | 7,041,868 | |
| 18,039,498 | |||
| Entertainment - 0.1% | |||
| Nintendo Co. Ltd. | 7,800 | 2,951,525 | |
| Vivendi SA | 119,436 | 3,338,098 | |
| 6,289,623 | |||
| Interactive Media & Services - 0.0% | |||
| Adevinta ASA: | |||
| Class A (b) | 56,398 | 706,816 | |
| Class B | 94,700 | 1,180,606 | |
| Yahoo! Japan Corp. | 926,100 | 2,318,846 | |
| 4,206,268 | |||
| Media - 0.1% | |||
| CyberAgent, Inc. | 44,200 | 1,992,921 | |
| Informa PLC | 177,047 | 1,874,248 | |
| Schibsted ASA (A Shares) | 76,356 | 2,326,159 | |
| 6,193,328 | |||
| Wireless Telecommunication Services - 0.2% | |||
| SoftBank Corp. | 156,800 | 7,120,094 | |
| Vodafone Group PLC | 3,472,331 | 6,569,715 | |
| 13,689,809 | |||
| TOTAL COMMUNICATION SERVICES | 48,418,526 | ||
| CONSUMER DISCRETIONARY - 0.9% | |||
| Auto Components - 0.0% | |||
| Akasol AG (a)(b)(c) | 19,900 | 900,433 | |
| Pirelli & C. SpA (a) | 410,059 | 2,129,441 | |
| 3,029,874 | |||
| Automobiles - 0.4% | |||
| Bayerische Motoren Werke AG (BMW) | 34,271 | 2,290,442 | |
| Daimler AG (Germany) | 81,846 | 3,841,436 | |
| Ferrari NV | 23,439 | 3,688,923 | |
| Isuzu Motors Ltd. | 264,700 | 2,847,951 | |
| Subaru Corp. | 153,800 | 4,120,250 | |
| Suzuki Motor Corp. | 55,600 | 2,144,762 | |
| Toyota Motor Corp. | 156,100 | 10,222,361 | |
| 29,156,125 | |||
| Hotels, Restaurants & Leisure - 0.2% | |||
| Compass Group PLC | 166,337 | 4,218,699 | |
| Galaxy Entertainment Group Ltd. | 573,000 | 3,586,110 | |
| InterContinental Hotel Group PLC | 50,757 | 3,165,257 | |
| Oriental Land Co. Ltd. | 4,600 | 669,855 | |
| 11,639,921 | |||
| Household Durables - 0.1% | |||
| Sony Corp. | 78,000 | 4,443,071 | |
| Internet & Direct Marketing Retail - 0.0% | |||
| Delivery Hero AG (a)(b) | 47,635 | 2,406,155 | |
| Zozo, Inc. | 47,000 | 938,805 | |
| 3,344,960 | |||
| Leisure Products - 0.1% | |||
| Bandai Namco Holdings, Inc. | 74,900 | 4,406,504 | |
| Specialty Retail - 0.0% | |||
| Nitori Holdings Co. Ltd. | 10,600 | 1,529,110 | |
| Textiles, Apparel & Luxury Goods - 0.1% | |||
| adidas AG | 5,029 | 1,490,665 | |
| LVMH Moet Hennessy Louis Vuitton SE | 22,748 | 9,071,589 | |
| 10,562,254 | |||
| TOTAL CONSUMER DISCRETIONARY | 68,111,819 | ||
| CONSUMER STAPLES - 0.9% | |||
| Beverages - 0.3% | |||
| Asahi Group Holdings | 36,300 | 1,693,442 | |
| Coca-Cola European Partners PLC | 64,200 | 3,617,028 | |
| Davide Campari-Milano SpA | 200,458 | 1,878,171 | |
| Diageo PLC | 190,805 | 8,169,081 | |
| Heineken NV (Bearer) | 26,719 | 2,841,407 | |
| Pernod Ricard SA | 17,172 | 3,278,220 | |
| Treasury Wine Estates Ltd. | 217,208 | 2,741,263 | |
| 24,218,612 | |||
| Food & Staples Retailing - 0.0% | |||
| Tsuruha Holdings, Inc. | 12,100 | 1,318,944 | |
| Food Products - 0.2% | |||
| Danone SA | 65,432 | 5,862,010 | |
| Nestle SA (Reg. S) | 108,685 | 12,213,416 | |
| 18,075,426 | |||
| Personal Products - 0.3% | |||
| Kao Corp. | 55,200 | 3,987,432 | |
| Shiseido Co. Ltd. | 29,000 | 2,372,194 | |
| Unilever NV | 158,748 | 9,850,044 | |
| Unilever PLC | 119,118 | 7,525,663 | |
| 23,735,333 | |||
| Tobacco - 0.1% | |||
| British American Tobacco PLC (United Kingdom) | 103,863 | 3,643,342 | |
| Imperial Tobacco Group PLC | 40,830 | 1,055,493 | |
| 4,698,835 | |||
| TOTAL CONSUMER STAPLES | 72,047,150 | ||
| ENERGY - 0.4% | |||
| Oil, Gas & Consumable Fuels - 0.4% | |||
| BP PLC | 2,136,053 | 13,009,112 | |
| Lundin Petroleum AB | 184,836 | 5,615,900 | |
| Total SA | 230,393 | 11,505,527 | |
| Woodside Petroleum Ltd. | 113,009 | 2,445,283 | |
| 32,575,822 | |||
| FINANCIALS - 1.5% | |||
| Banks - 0.7% | |||
| Commonwealth Bank of Australia | 98,968 | 5,268,682 | |
| DBS Group Holdings Ltd. | 206,900 | 3,657,184 | |
| Erste Group Bank AG | 112,543 | 3,620,418 | |
| Intesa Sanpaolo SpA | 968,200 | 2,130,484 | |
| KBC Groep NV | 79,921 | 4,623,749 | |
| Lloyds Banking Group PLC | 5,626,900 | 3,423,503 | |
| Mediobanca SpA | 326,247 | 3,230,642 | |
| Mitsubishi UFJ Financial Group, Inc. | 1,264,000 | 6,083,950 | |
| Standard Chartered PLC (United Kingdom) | 830,294 | 6,284,077 | |
| Sumitomo Mitsui Financial Group, Inc. | 186,800 | 6,121,109 | |
| United Overseas Bank Ltd. | 231,803 | 4,169,197 | |
| Westpac Banking Corp. | 292,517 | 5,550,707 | |
| 54,163,702 | |||
| Capital Markets - 0.2% | |||
| Amundi SA (a) | 47,721 | 3,049,838 | |
| Deutsche Borse AG | 20,115 | 2,955,561 | |
| London Stock Exchange Group PLC | 21,162 | 1,790,650 | |
| Macquarie Group Ltd. | 49,976 | 4,168,001 | |
| Standard Life PLC | 1,291,999 | 3,919,256 | |
| 15,883,306 | |||
| Diversified Financial Services - 0.0% | |||
| ORIX Corp. | 164,000 | 2,422,140 | |
| Insurance - 0.6% | |||
| AIA Group Ltd. | 637,600 | 6,169,901 | |
| Allianz SE | 33,838 | 7,468,182 | |
| Hannover Reuck SE | 13,206 | 2,101,635 | |
| Insurance Australia Group Ltd. | 230,633 | 1,251,878 | |
| NN Group NV | 51,128 | 1,711,615 | |
| NN Group NV rights (b) | 51,128 | 42,706 | |
| Prudential PLC | 325,391 | 5,423,645 | |
| QBE Insurance Group Ltd. | 314,049 | 2,650,049 | |
| RSA Insurance Group PLC | 144,537 | 920,517 | |
| Swiss Re Ltd. | 53,207 | 5,115,613 | |
| Talanx AG | 39,158 | 1,621,619 | |
| Tokio Marine Holdings, Inc. | 80,700 | 4,156,732 | |
| Zurich Insurance Group Ltd. | 16,296 | 5,798,890 | |
| 44,432,982 | |||
| TOTAL FINANCIALS | 116,902,130 | ||
| HEALTH CARE - 1.0% | |||
| Biotechnology - 0.1% | |||
| CSL Ltd. | 21,589 | 3,502,036 | |
| Morphosys AG (b) | 25,914 | 3,061,684 | |
| Morphosys AG sponsored ADR (b) | 61,700 | 1,818,916 | |
| 8,382,636 | |||
| Health Care Equipment & Supplies - 0.2% | |||
| Hoya Corp. | 68,200 | 5,552,424 | |
| Koninklijke Philips Electronics NV | 100,170 | 4,721,445 | |
| Olympus Corp. | 69,500 | 813,837 | |
| Terumo Corp. | 68,900 | 2,002,111 | |
| 13,089,817 | |||
| Life Sciences Tools & Services - 0.0% | |||
| Lonza Group AG | 12,822 | 4,531,584 | |
| Pharmaceuticals - 0.7% | |||
| AstraZeneca PLC (United Kingdom) | 156,033 | 13,937,098 | |
| Bayer AG | 43,938 | 3,265,640 | |
| Daiichi Sankyo Kabushiki Kaisha | 38,300 | 2,530,140 | |
| Novartis AG | 101,003 | 9,105,898 | |
| Roche Holding AG (participation certificate) | 53,564 | 14,636,913 | |
| Sanofi SA | 88,461 | 7,599,482 | |
| Takeda Pharmaceutical Co. Ltd. | 69,000 | 2,326,398 | |
| Teva Pharmaceutical Industries Ltd. sponsored ADR (b)(c) | 213,500 | 1,473,150 | |
| 54,874,719 | |||
| TOTAL HEALTH CARE | 80,878,756 | ||
| INDUSTRIALS - 1.1% | |||
| Aerospace & Defense - 0.1% | |||
| Airbus Group NV | 30,307 | 4,176,105 | |
| MTU Aero Engines Holdings AG | 12,114 | 3,305,839 | |
| Rolls-Royce Holdings PLC | 79,793 | 749,917 | |
| 8,231,861 | |||
| Air Freight & Logistics - 0.1% | |||
| Deutsche Post AG | 135,167 | 4,441,803 | |
| Building Products - 0.1% | |||
| Agc, Inc. | 87,100 | 2,512,934 | |
| Compagnie de St. Gobain | 80,968 | 2,920,582 | |
| Daikin Industries Ltd. | 20,000 | 2,476,585 | |
| 7,910,101 | |||
| Construction & Engineering - 0.2% | |||
| Ferrovial SA | 116,848 | 3,322,272 | |
| Taisei Corp. | 36,600 | 1,295,392 | |
| VINCI SA | 75,304 | 8,227,515 | |
| 12,845,179 | |||
| Electrical Equipment - 0.0% | |||
| Nidec Corp. | 17,400 | 2,269,280 | |
| Industrial Conglomerates - 0.0% | |||
| Siemens AG | 35,621 | 3,562,186 | |
| Machinery - 0.2% | |||
| Fanuc Corp. | 20,100 | 3,480,768 | |
| Makita Corp. | 23,600 | 694,216 | |
| Minebea Mitsumi, Inc. | 162,500 | 2,510,119 | |
| SMC Corp. | 6,400 | 2,418,186 | |
| Techtronic Industries Co. Ltd. | 297,500 | 2,052,073 | |
| The Weir Group PLC | 98,012 | 1,746,577 | |
| THK Co. Ltd. | 60,500 | 1,405,507 | |
| 14,307,446 | |||
| Marine - 0.0% | |||
| A.P. Moller - Maersk A/S Series B | 1,644 | 1,750,893 | |
| Professional Services - 0.2% | |||
| Experian PLC | 94,462 | 2,894,224 | |
| Recruit Holdings Co. Ltd. | 106,400 | 3,224,000 | |
| RELX PLC (London Stock Exchange) | 96,943 | 2,319,688 | |
| SR Teleperformance SA | 17,425 | 3,803,378 | |
| Wolters Kluwer NV | 34,794 | 2,505,507 | |
| 14,746,797 | |||
| Road & Rail - 0.0% | |||
| DSV A/S | 16,445 | 1,629,823 | |
| Trading Companies & Distributors - 0.2% | |||
| Ashtead Group PLC | 58,155 | 1,607,028 | |
| Itochu Corp. | 323,300 | 6,447,132 | |
| MonotaRO Co. Ltd. | 84,400 | 2,074,348 | |
| Rexel SA | 230,656 | 2,446,299 | |
| 12,574,807 | |||
| TOTAL INDUSTRIALS | 84,270,176 | ||
| INFORMATION TECHNOLOGY - 0.5% | |||
| Communications Equipment - 0.0% | |||
| Telefonaktiebolaget LM Ericsson (B Shares) | 580,009 | 4,538,672 | |
| Electronic Equipment & Components - 0.2% | |||
| Hitachi High-Technologies Corp. | 64,300 | 3,474,203 | |
| Hitachi Ltd. | 86,500 | 2,954,850 | |
| Keyence Corp. | 7,000 | 4,144,585 | |
| Shimadzu Corp. | 93,000 | 2,312,854 | |
| TDK Corp. | 22,200 | 1,767,892 | |
| 14,654,384 | |||
| IT Services - 0.1% | |||
| Capgemini SA | 30,971 | 3,715,322 | |
| Netcompany Group A/S (a)(b) | 58,725 | 2,359,543 | |
| 6,074,865 | |||
| Semiconductors & Semiconductor Equipment - 0.1% | |||
| ASML Holding NV (Netherlands) | 10,694 | 2,378,418 | |
| Disco Corp. | 3,900 | 708,524 | |
| Renesas Electronics Corp. (b) | 167,900 | 1,049,424 | |
| ROHM Co. Ltd. | 13,500 | 963,242 | |
| 5,099,608 | |||
| Software - 0.1% | |||
| Oracle Corp. Japan | 16,900 | 1,455,594 | |
| SAP SE | 45,943 | 5,484,556 | |
| 6,940,150 | |||
| TOTAL INFORMATION TECHNOLOGY | 37,307,679 | ||
| MATERIALS - 0.5% | |||
| Chemicals - 0.1% | |||
| JSR Corp. | 213,400 | 3,491,215 | |
| Shin-Etsu Chemical Co. Ltd. | 32,900 | 3,313,830 | |
| Sika AG | 13,787 | 1,979,422 | |
| Yara International ASA | 52,207 | 2,264,813 | |
| 11,049,280 | |||
| Construction Materials - 0.1% | |||
| CRH PLC | 101,411 | 3,393,999 | |
| HeidelbergCement Finance AG | 32,992 | 2,285,821 | |
| James Hardie Industries PLC CDI | 130,891 | 1,987,750 | |
| 7,667,570 | |||
| Metals & Mining - 0.2% | |||
| Anglo American PLC (United Kingdom) | 261,030 | 5,635,237 | |
| Antofagasta PLC | 69,944 | 737,034 | |
| Newcrest Mining Ltd. | 238,279 | 5,937,353 | |
| 12,309,624 | |||
| Paper & Forest Products - 0.1% | |||
| Stora Enso Oyj (R Shares) | 184,925 | 2,066,969 | |
| Svenska Cellulosa AB (SCA) (B Shares) | 245,813 | 2,120,354 | |
| UPM-Kymmene Corp. | 52,742 | 1,421,329 | |
| 5,608,652 | |||
| TOTAL MATERIALS | 36,635,126 | ||
| REAL ESTATE - 0.3% | |||
| Real Estate Management & Development - 0.3% | |||
| Cheung Kong Property Holdings Ltd. | 164,500 | 1,114,049 | |
| LEG Immobilien AG | 25,324 | 2,972,494 | |
| Lendlease Group unit | 281,736 | 3,236,881 | |
| Mitsubishi Estate Co. Ltd. | 157,400 | 3,013,617 | |
| Mitsui Fudosan Co. Ltd. | 120,100 | 2,878,285 | |
| Sino Land Ltd. | 1,229,959 | 1,753,191 | |
| Vonovia SE | 86,669 | 4,314,986 | |
| 19,283,503 | |||
| UTILITIES - 0.4% | |||
| Electric Utilities - 0.3% | |||
| Enel SpA | 685,784 | 4,975,222 | |
| Fortum Corp. | 217,780 | 4,789,416 | |
| Iberdrola SA | 686,834 | 7,070,279 | |
| ORSTED A/S (a) | 58,482 | 5,583,958 | |
| SP AusNet | 3,147,777 | 3,815,767 | |
| 26,234,642 | |||
| Multi-Utilities - 0.1% | |||
| RWE AG | 164,218 | 4,681,353 | |
| TOTAL UTILITIES | 30,915,995 | ||
| TOTAL COMMON STOCKS | |||
| (Cost $579,941,375) | 627,346,682 | ||
| Equity Funds - 85.8% | |||
| Foreign Large Blend Funds - 10.7% | |||
| Fidelity Pacific Basin Fund (d) | 4,884,671 | 150,154,781 | |
| Fidelity SAI International Low Volatility Index Fund (d) | 61,763,263 | 686,189,856 | |
| TOTAL FOREIGN LARGE BLEND FUNDS | 836,344,637 | ||
| Foreign Large Growth Funds - 58.2% | |||
| Fidelity Advisor Overseas Fund Class I (d) | 3,075,382 | 72,825,056 | |
| Fidelity Diversified International Fund (d) | 30,790,319 | 1,127,541,497 | |
| Fidelity International Capital Appreciation Fund (d) | 46,056,729 | 1,009,102,935 | |
| Fidelity International Discovery Fund (d) | 27,205,762 | 1,135,296,434 | |
| Fidelity Overseas Fund (d) | 25,059,914 | 1,186,837,518 | |
| TOTAL FOREIGN LARGE GROWTH FUNDS | 4,531,603,440 | ||
| Foreign Large Value Funds - 11.6% | |||
| Fidelity International Value Fund (d) | 25,377,058 | 195,149,576 | |
| Fidelity SAI International Value Index Fund (d) | 83,129,221 | 705,767,084 | |
| TOTAL FOREIGN LARGE VALUE FUNDS | 900,916,660 | ||
| Foreign Small Mid Growth Funds - 0.9% | |||
| Fidelity International Small Cap Opportunities Fund (d) | 4,034,933 | 73,112,978 | |
| Sector Funds - 0.9% | |||
| Fidelity Advisor International Real Estate Fund Class I (d) | 5,436,531 | 67,467,355 | |
| Other - 3.5% | |||
| Fidelity Advisor Japan Fund Class I (d) | 15,525,623 | 229,623,965 | |
| Fidelity Japan Smaller Companies Fund (d) | 2,433,573 | 39,813,255 | |
| TOTAL OTHER | 269,437,220 | ||
| TOTAL EQUITY FUNDS | |||
| (Cost $6,278,433,203) | 6,678,882,290 | ||
| U.S. Treasury Obligations - 0.3% | |||
| Principal Amount | |||
| U.S. Treasury Bills, yield at date of purchase 1.95% to 2.29% 9/5/19 to 11/29/19 (e) | |||
| (Cost $21,638,996) | $21,690,000 | 21,642,754 | |
| Money Market Funds - 5.8% | |||
| Shares | |||
| Fidelity Securities Lending Cash Central Fund 2.13% (f)(g) | 3,517,452 | 3,517,804 | |
| State Street Institutional U.S. Government Money Market Fund Premier Class 1.87% (h) | 449,926,490 | 449,926,490 | |
| TOTAL MONEY MARKET FUNDS | |||
| (Cost $453,444,294) | 453,444,294 | ||
| TOTAL INVESTMENT IN SECURITIES - 100.0% | |||
| (Cost $7,333,457,868) | 7,781,316,020 | ||
| NET OTHER ASSETS (LIABILITIES) - 0.0% | 2,905,544 | ||
| NET ASSETS - 100% | $7,784,221,564 |
| Futures Contracts | |||||
| Number of contracts | Expiration Date | Notional Amount | Value | Unrealized Appreciation/(Depreciation) | |
| Purchased | |||||
| Equity Index Contracts | |||||
| CME Nikkei 225 Index Contracts (United States) | 250 | Sept. 2019 | $25,831,250 | $(238,515) | $(238,515) |
| ICE E-mini MSCI EAFE Index Contracts (United States) | 4,484 | Sept. 2019 | 413,402,380 | (6,400,820) | (6,400,820) |
| TOTAL FUTURES CONTRACTS | $(6,639,335) |
The notional amount of futures purchased as a percentage of Net Assets is 5.6%
For the period, the average monthly notional amount at value for futures contracts in the aggregate was $425,329,632.
Legend
(a) Security exempt from registration under Rule 144A of the Securities Act of 1933. These securities may be resold in transactions exempt from registration, normally to qualified institutional buyers. At the end of the period, the value of these securities amounted to $18,675,072 or 0.2% of net assets.
(b) Non-income producing
(c) Security or a portion of the security is on loan at period end.
(d) Affiliated Fund
(e) Security or a portion of the security was pledged to cover margin requirements for futures contracts. At period end, the value of securities pledged amounted to $21,608,757.
(f) Affiliated fund that is generally available only to investment companies and other accounts managed by Fidelity Investments. The rate quoted is the annualized seven-day yield of the fund at period end. A complete unaudited listing of the fund's holdings as of its most recent quarter end is available upon request. In addition, each Fidelity Central Fund's financial statements are available on the SEC's website or upon request.
(g) Investment made with cash collateral received from securities on loan.
(h) The rate quoted is the annualized seven-day yield of the fund at period end.
Affiliated Central Funds
Information regarding fiscal year to date income earned by the Fund from investments in Fidelity Central Funds is as follows:
| Fund | Income earned |
| Fidelity Securities Lending Cash Central Fund | $112,452 |
| Total | $112,452 |
Amounts in the income column in the above table include any capital gain distributions from underlying funds, which are presented in the corresponding line-item in the Statement of Operations, if applicable. Amount for Fidelity Securities Lending Cash Central Fund represents the income earned on investing cash collateral, less rebates paid to borrowers and any lending agent fees associated with the loan, plus any premium payments received for lending certain types of securities.
Affiliated Underlying Funds
Fiscal year to date information regarding the Fund's investments in affiliated Underlying Funds, excluding any Money Market Central Funds, is presented below. Exchanges between classes of the same affiliated Underlying Funds may occur.
| Affiliate | Value, beginning of period | Purchases | Sales Proceeds | Dividend Income | Realized Gain (loss) | Change in Unrealized appreciation (depreciation) | Value, end of period |
| Fidelity Advisor International Real Estate Fund Class I | $63,118,130 | $-- | $-- | $-- | $-- | $4,349,225 | $67,467,355 |
| Fidelity Advisor Japan Fund Class I | 163,992,431 | 58,403,134 | -- | -- | -- | 7,228,400 | 229,623,965 |
| Fidelity Advisor Overseas Fund Class I | 69,718,920 | -- | -- | -- | -- | 3,106,136 | 72,825,056 |
| Fidelity Diversified International Fund | 875,174,842 | 199,017,591 | -- | -- | -- | 53,349,064 | 1,127,541,497 |
| Fidelity International Capital Appreciation Fund | 719,283,460 | 210,698,226 | -- | -- | -- | 79,121,249 | 1,009,102,935 |
| Fidelity International Discovery Fund | 892,560,870 | 199,017,592 | -- | -- | -- | 43,717,972 | 1,135,296,434 |
| Fidelity International Small Cap Opportunities Fund | 71,579,704 | -- | -- | -- | -- | 1,533,274 | 73,112,978 |
| Fidelity International Value Fund | 200,478,758 | -- | -- | -- | -- | (5,329,182) | 195,149,576 |
| Fidelity Japan Smaller Companies Fund | 39,715,912 | -- | -- | -- | -- | 97,343 | 39,813,255 |
| Fidelity Overseas Fund | 866,297,158 | 272,668,282 | -- | -- | -- | 47,872,078 | 1,186,837,518 |
| Fidelity Pacific Basin Fund | 142,143,921 | -- | -- | -- | -- | 8,010,860 | 150,154,781 |
| Fidelity SAI International Low Volatility Index Fund | 522,200,627 | 148,728,155 | -- | -- | -- | 15,261,074 | 686,189,856 |
| Fidelity SAI International Value Index Fund | 597,997,103 | 150,868,312 | -- | -- | -- | (43,098,331) | 705,767,084 |
| Total | $5,224,261,836 | $1,239,401,292 | $-- | $-- | $-- | $215,219,162 | $6,678,882,290 |
Amounts in the income column in the above table include any capital gain distributions from underlying funds, which are presented in the corresponding line-item in the Statement of Operations, if applicable.
Investment Valuation
The following is a summary of the inputs used, as of August 31, 2019, involving the Fund's assets and liabilities carried at fair value. The inputs or methodology used for valuing securities may not be an indication of the risk associated with investing in those securities. For more information on valuation inputs, and their aggregation into the levels used below, please refer to the Investment Valuation section in the accompanying Notes to Financial Statements.
| Valuation Inputs at Reporting Date: | ||||
| Description | Total | Level 1 | Level 2 | Level 3 |
| Investments in Securities: | ||||
| Equities: | ||||
| Communication Services | $48,418,526 | $30,145,360 | $18,273,166 | $-- |
| Consumer Discretionary | 68,111,819 | 36,569,989 | 31,541,830 | -- |
| Consumer Staples | 72,047,150 | 24,783,594 | 47,263,556 | -- |
| Energy | 32,575,822 | 8,061,183 | 24,514,639 | -- |
| Financials | 116,902,130 | 71,575,088 | 45,327,042 | -- |
| Health Care | 80,878,756 | 25,285,882 | 55,592,874 | -- |
| Industrials | 84,270,176 | 60,270,719 | 23,999,457 | -- |
| Information Technology | 37,307,679 | 24,906,033 | 12,401,646 | -- |
| Materials | 36,635,126 | 29,927,297 | 6,707,829 | -- |
| Real Estate | 19,283,503 | 16,416,263 | 2,867,240 | -- |
| Utilities | 30,915,995 | 14,189,141 | 16,726,854 | -- |
| Equity Funds | 6,678,882,290 | 6,678,882,290 | -- | -- |
| Other Short-Term Investments | 21,642,754 | -- | 21,642,754 | -- |
| Money Market Funds | 453,444,294 | 453,444,294 | -- | -- |
| Total Investments in Securities: | $7,781,316,020 | $7,474,457,133 | $306,858,887 | $-- |
| Derivative Instruments: | ||||
| Liabilities | ||||
| Futures Contracts | $(6,639,335) | $(6,639,335) | $-- | $-- |
| Total Liabilities | $(6,639,335) | $(6,639,335) | $-- | $-- |
| Total Derivative Instruments: | $(6,639,335) | $(6,639,335) | $-- | $-- |
Value of Derivative Instruments
The following table is a summary of the Fund's value of derivative instruments by primary risk exposure as of August 31, 2019. For additional information on derivative instruments, please refer to the Derivative Instruments section in the accompanying Notes to Financial Statements.
| Primary Risk Exposure / Derivative Type | Value | |
| Asset | Liability | |
| Equity Risk | ||
| Futures Contracts(a) | $0 | $(6,639,335) |
| Total Equity Risk | 0 | (6,639,335) |
| Total Value of Derivatives | $0 | $(6,639,335) |
(a) Reflects gross cumulative appreciation (depreciation) on futures contracts as presented in the Schedule of Investments. In the Statement of Assets and Liabilities, the period end daily variation margin is included in receivable or payable for daily variation margin on futures contracts, and the net cumulative appreciation (depreciation) is included in distributable earnings.
See accompanying notes which are an integral part of the financial statements.
Financial Statements
Statement of Assets and Liabilities
| August 31, 2019 (Unaudited) | ||
| Assets | ||
| Investment in securities, at value (including securities loaned of $3,377,467) — See accompanying schedule: Unaffiliated issuers (cost $1,051,506,861) | $1,098,915,926 | |
| Fidelity Central Funds (cost $3,517,804) | 3,517,804 | |
| Other affiliated issuers (cost $6,278,433,203) | 6,678,882,290 | |
| Total Investment in Securities (cost $7,333,457,868) | $7,781,316,020 | |
| Cash | 950,700 | |
| Foreign currency held at value (cost $1,208,162) | 1,208,161 | |
| Receivable for investments sold | 2,377,597 | |
| Receivable for fund shares sold | 13,005,359 | |
| Dividends receivable | 3,418,840 | |
| Interest receivable | 711,706 | |
| Distributions receivable from Fidelity Central Funds | 6,093 | |
| Receivable for daily variation margin on futures contracts | 1,833,280 | |
| Prepaid expenses | 14,755 | |
| Other receivables | 41,618 | |
| Total assets | 7,804,884,129 | |
| Liabilities | ||
| Payable for investments purchased | $12,310,478 | |
| Payable for fund shares redeemed | 4,506,829 | |
| Accrued management fee | 126,628 | |
| Other payables and accrued expenses | 200,805 | |
| Collateral on securities loaned | 3,517,825 | |
| Total liabilities | 20,662,565 | |
| Net Assets | $7,784,221,564 | |
| Net Assets consist of: | ||
| Paid in capital | $7,340,839,149 | |
| Total distributable earnings (loss) | 443,382,415 | |
| Net Assets, for 786,945,746 shares outstanding | $7,784,221,564 | |
| Net Asset Value, offering price and redemption price per share ($7,784,221,564 ÷ 786,945,746 shares) | $9.89 |
See accompanying notes which are an integral part of the financial statements.
Statement of Operations
| Six months ended August 31, 2019 (Unaudited) | ||
| Investment Income | ||
| Dividends: | ||
| Unaffiliated issuers | $16,726,102 | |
| Interest | 5,371,177 | |
| Income from Fidelity Central Funds (including $112,452 from security lending) | 112,452 | |
| Income before foreign taxes withheld | 22,209,731 | |
| Less foreign taxes withheld | (1,253,718) | |
| Total income | 20,956,013 | |
| Expenses | ||
| Management fee | $9,665,217 | |
| Accounting and security lending fees | 547,705 | |
| Custodian fees and expenses | 32,617 | |
| Independent trustees' fees and expenses | 37,610 | |
| Registration fees | 286,491 | |
| Audit | 38,971 | |
| Legal | 12,240 | |
| Miscellaneous | 31,144 | |
| Total expenses before reductions | 10,651,995 | |
| Expense reductions | (8,903,102) | |
| Total expenses after reductions | 1,748,893 | |
| Net investment income (loss) | 19,207,120 | |
| Realized and Unrealized Gain (Loss) | ||
| Net realized gain (loss) on: | ||
| Investment securities: | ||
| Unaffiliated issuers | (9,611,884) | |
| Fidelity Central Funds | (14) | |
| Foreign currency transactions | (8,063) | |
| Futures contracts | 34,205,003 | |
| Total net realized gain (loss) | 24,585,042 | |
| Change in net unrealized appreciation (depreciation) on: | ||
| Investment securities: | ||
| Unaffiliated issuers | 9,508,989 | |
| Affiliated issuers | 215,219,162 | |
| Assets and liabilities in foreign currencies | (20,622) | |
| Futures contracts | (33,641,455) | |
| Total change in net unrealized appreciation (depreciation) | 191,066,074 | |
| Net gain (loss) | 215,651,116 | |
| Net increase (decrease) in net assets resulting from operations | $234,858,236 |
See accompanying notes which are an integral part of the financial statements.
Statement of Changes in Net Assets
| Six months ended August 31, 2019 (Unaudited) | Year ended February 28, 2019 | |
| Increase (Decrease) in Net Assets | ||
| Operations | ||
| Net investment income (loss) | $19,207,120 | $87,240,396 |
| Net realized gain (loss) | 24,585,042 | 43,857,518 |
| Change in net unrealized appreciation (depreciation) | 191,066,074 | (446,156,847) |
| Net increase (decrease) in net assets resulting from operations | 234,858,236 | (315,058,933) |
| Distributions to shareholders | (78,447,219) | (177,894,345) |
| Share transactions | ||
| Proceeds from sales of shares | 1,860,987,331 | 2,777,134,794 |
| Reinvestment of distributions | 72,930,731 | 177,319,906 |
| Cost of shares redeemed | (648,476,099) | (859,656,396) |
| Net increase (decrease) in net assets resulting from share transactions | 1,285,441,963 | 2,094,798,304 |
| Total increase (decrease) in net assets | 1,441,852,980 | 1,601,845,026 |
| Net Assets | ||
| Beginning of period | 6,342,368,584 | 4,740,523,558 |
| End of period | $7,784,221,564 | $6,342,368,584 |
| Other Information | ||
| Shares | ||
| Sold | 188,691,564 | 281,711,364 |
| Issued in reinvestment of distributions | 7,389,132 | 18,585,063 |
| Redeemed | (65,521,183) | (87,226,110) |
| Net increase (decrease) | 130,559,513 | 213,070,317 |
See accompanying notes which are an integral part of the financial statements.
Financial Highlights
Strategic Advisers Fidelity International Fund
| Six months ended (Unaudited) August 31, | Years endedFebruary 28, | |||||
| 2019 | 2019 | 2018 | 2017 | 2016 A | 2015 | |
| Selected Per–Share Data | ||||||
| Net asset value, beginning of period | $9.66 | $10.69 | $8.94 | $8.19 | $9.41 | $9.40 |
| Income from Investment Operations | ||||||
| Net investment income (loss)B | .03 | .16 | .12 | .14 | .10 | .11 |
| Net realized and unrealized gain (loss) | .32 | (.85) | 1.85 | .76 | (1.19) | .01 |
| Total from investment operations | .35 | (.69) | 1.97 | .90 | (1.09) | .12 |
| Distributions from net investment income | –C | (.15) | (.11) | (.13) | (.09) | (.10) |
| Distributions from net realized gain | (.11) | (.20) | (.11) | (.02) | (.05) | (.01) |
| Total distributions | (.12)D | (.34)E | (.22) | (.15) | (.13)F | (.11) |
| Net asset value, end of period | $9.89 | $9.66 | $10.69 | $8.94 | $8.19 | $9.41 |
| Total ReturnG,H | 3.58% | (6.41)% | 22.01% | 11.11% | (11.70)% | 1.36% |
| Ratios to Average Net AssetsI,J | ||||||
| Expenses before reductions | .30%K | .35% | .38% | .39% | .42% | .47% |
| Expenses net of fee waivers, if any | .05%K | .10% | .13% | .14% | .17% | .22% |
| Expenses net of all reductions | .05%K | .09% | .13% | .14% | .17% | .21% |
| Net investment income (loss) | .54%K | 1.65% | 1.16% | 1.58% | 1.09% | 1.19% |
| Supplemental Data | ||||||
| Net assets, end of period (000 omitted) | $7,784,222 | $6,342,369 | $4,740,524 | $3,593,237 | $2,736,052 | $1,754,709 |
| Portfolio turnover rateL | 5%K | 9% | 13% | 14% | 16% | 22% |
A For the year ended February 29.
B Calculated based on average shares outstanding during the period.
C Amount represents less than $.005 per share.
D Total distributions of $.12 per share is comprised of distributions from net investment income of $.004 and distributions from net realized gain of $.112 per share.
E Total distributions of $.34 per share is comprised of distributions from net investment income of $.145 and distributions from net realized gain of $.197 per share.
F Total distributions of $.13 per share is comprised of distributions from net investment income of $.088 and distributions from net realized gain of $.046 per share.
G Total returns for periods of less than one year are not annualized.
H Total returns would have been lower if certain expenses had not been reduced during the applicable periods shown.
I Fees and expenses of any underlying Fidelity Central Funds are not included in the Fund's expense ratio. The Fund indirectly bears its proportionate share of the expenses of any underlying Fidelity Central Funds.
J Expense ratios reflect operating expenses of the Fund. Expenses before reductions do not reflect amounts reimbursed by the investment adviser or reductions from brokerage service arrangements or reductions from other expense offset arrangements and do not represent the amount paid by the Fund during periods when reimbursements or reductions occur. Expenses net of fee waivers reflect expenses after reimbursement by the investment adviser but prior to reductions from brokerage service arrangements or other expense offset arrangements. Expenses net of all reductions represent the net expenses paid by the Fund. Fees and expenses of the Underlying Funds are not included in the Fund's annualized ratios. The Fund indirectly bears its proportionate share of the expenses of the Underlying Funds.
K Annualized
L Amount does not include the portfolio activity of any Underlying Funds.
See accompanying notes which are an integral part of the financial statements.
Notes to Financial Statements (Unaudited)
For the period ended August 31, 2019
1. Organization.
Strategic Advisers Fidelity International Fund (the Fund) is a fund of Fidelity Rutland Square Trust II (the Trust), and is authorized to issue an unlimited number of shares. The Trust is registered under the Investment Company Act of 1940, as amended (the 1940 Act), as an open-end management investment company organized as a Delaware statutory trust. The Fund is offered exclusively to certain clients of Strategic Advisers LLC (Strategic Advisers), an affiliate of Fidelity Management & Research Company (FMR).
2. Significant Accounting Policies.
The Fund is an investment company and applies the accounting and reporting guidance of the Financial Accounting Standards Board (FASB) Accounting Standards Codification Topic 946 Financial Services – Investments Companies. The financial statements have been prepared in conformity with accounting principles generally accepted in the United States of America (GAAP), which require management to make certain estimates and assumptions at the date of the financial statements. Actual results could differ from those estimates. Subsequent events, if any, through the date that the financial statements were issued have been evaluated in the preparation of the financial statements. The following summarizes the significant accounting policies of the Fund:
Investment Valuation. Investments are valued as of 4:00 p.m. Eastern time on the last calendar day of the period. The Board of Trustees (the Board) has delegated the day to day responsibility for the valuation of the Fund's investments to the Fair Value Committee (the Committee) established by the Fund's investment adviser. In accordance with valuation policies and procedures approved by the Board, the Fund attempts to obtain prices from one or more third party pricing vendors or brokers to value its investments. When current market prices, quotations or currency exchange rates are not readily available or reliable, investments will be fair valued in good faith by the Committee, in accordance with procedures adopted by the Board. Factors used in determining fair value vary by investment type and may include market or investment specific events, changes in interest rates and credit quality. The frequency with which these procedures are used cannot be predicted and they may be utilized to a significant extent. The Committee oversees the Fund's valuation policies and procedures and reports to the Board on the Committee's activities and fair value determinations. The Board monitors the appropriateness of the procedures used in valuing the Fund's investments and ratifies the fair value determinations of the Committee.
The Fund categorizes the inputs to valuation techniques used to value its investments into a disclosure hierarchy consisting of three levels as shown below:
- Level 1 – quoted prices in active markets for identical investments
- Level 2 – other significant observable inputs (including quoted prices for similar investments, interest rates, prepayment speeds, etc.)
- Level 3 – unobservable inputs (including the Fund's own assumptions based on the best information available)
Valuation techniques used to value the Fund's investments by major category are as follows:
Equity securities, including restricted securities, for which market quotations are readily available, are valued at the last reported sale price or official closing price as reported by a third party pricing vendor on the primary market or exchange on which they are traded and are categorized as Level 1 in the hierarchy. In the event there were no sales during the day or closing prices are not available, securities are valued at the last quoted bid price or may be valued using the last available price and are generally categorized as Level 2 in the hierarchy. For foreign equity securities, when market or security specific events arise, comparisons to the valuation of American Depositary Receipts (ADRs), futures contracts, Exchange-Traded Funds (ETFs) and certain indexes as well as quoted prices for similar securities may be used and would be categorized as Level 2 in the hierarchy. For equity securities, including restricted securities, where observable inputs are limited, assumptions about market activity and risk are used and these securities may be categorized as Level 3 in the hierarchy.
Debt securities, including restricted securities, are valued based on evaluated prices received from third party pricing vendors or from brokers who make markets in such securities. U.S. government and government agency obligations are valued by pricing vendors who utilize matrix pricing which considers yield or price of bonds of comparable quality, coupon, maturity and type or by broker-supplied prices. When independent prices are unavailable or unreliable, debt securities may be valued utilizing pricing methodologies which consider similar factors that would be used by third party pricing vendors. Debt securities are generally categorized as Level 2 in the hierarchy but may be Level 3 depending on the circumstances.
Futures contracts are valued at the settlement price established each day by the board of trade or exchange on which they are traded and are categorized as Level 1 in the hierarchy. Investments in open-end mutual funds, including the Fidelity Central Funds, are valued at their closing net asset value (NAV) each business day and are categorized as Level 1 in the hierarchy. If an unaffiliated open-end mutual fund's NAV is unavailable, shares of that fund may be valued by another method that the Board believes reflects fair value in accordance with the Board's fair value pricing policies and is categorized as Level 2 in the hierarchy.
Changes in valuation techniques may result in transfers in or out of an assigned level within the disclosure hierarchy. The aggregate value of investments by input level as of August 31, 2019 is included at the end of the Fund's Schedule of Investments.
Foreign Currency. The Fund may use foreign currency contracts to facilitate transactions in foreign-denominated securities. Gains and losses from these transactions may arise from changes in the value of the foreign currency or if the counterparties do not perform under the contracts' terms.
Foreign-denominated assets, including investment securities, and liabilities are translated into U.S. dollars at the exchange rates at period end. Purchases and sales of investment securities, income and dividends received and expenses denominated in foreign currencies are translated into U.S. dollars at the exchange rate in effect on the transaction date.
The effects of exchange rate fluctuations on investments are included with the net realized and unrealized gain (loss) on investment securities. Other foreign currency transactions resulting in realized and unrealized gain (loss) are disclosed separately.
Investment Transactions and Income. For financial reporting purposes, the Fund's investment holdings and NAV include trades executed through the end of the last business day of the period. The NAV per share for processing shareholder transactions is calculated as of the close of business of the New York Stock Exchange (NYSE), normally 4:00 p.m. Eastern time and includes trades executed through the end of the prior business day. Gains and losses on securities sold are determined on the basis of identified cost and include proceeds received from litigation. Dividend income is recorded on the ex-dividend date, except for certain dividends from foreign securities where the ex-dividend date may have passed, which are recorded as soon as the Fund is informed of the ex-dividend date. Non-cash dividends included in dividend income, if any, are recorded at the fair market value of the securities received. Income and capital gain distributions from Fidelity Central Funds, if any, are recorded on the ex-dividend date. Income and capital gain distributions from Underlying Funds, if any, are recorded on the ex-dividend date. Interest income is accrued as earned and includes coupon interest and amortization of premium and accretion of discount on debt securities as applicable. Investment income is recorded net of foreign taxes withheld where recovery of such taxes is uncertain.
Expenses. Expenses directly attributable to a fund are charged to that fund. Expenses attributable to more than one fund are allocated among the respective funds on the basis of relative net assets or other appropriate methods. Expense estimates are accrued in the period to which they relate and adjustments are made when actual amounts are known.
Deferred Trustee Compensation. Under a Deferred Compensation Plan (the Plan), certain independent Trustees have elected to defer receipt of a portion of their annual compensation. Deferred amounts are invested in a cross-section of Strategic Advisers funds, are marked-to-market and remain in the Fund until distributed in accordance with the Plan. The investment of deferred amounts and the offsetting payable to the Trustees of $41,618 are included in the accompanying Statement of Assets and Liabilities in other receivables and other payables and accrued expenses, respectively.
Income Tax Information and Distributions to Shareholders. Each year, the Fund intends to qualify as a regulated investment company under Subchapter M of the Internal Revenue Code, including distributing substantially all of its taxable income and realized gains. As a result, no provision for U.S. Federal income taxes is required. The Fund files a U.S. federal tax return, in addition to state and local tax returns as required. The Fund's federal income tax returns are subject to examination by the Internal Revenue Service (IRS) for a period of three fiscal years after they are filed. State and local tax returns may be subject to examination for an additional fiscal year depending on the jurisdiction. Foreign taxes are provided for based on the Fund's understanding of the tax rules and rates that exist in the foreign markets in which it invests.
Distributions are declared and recorded on the ex-dividend date. Income and capital gain distributions are determined in accordance with income tax regulations, which may differ from GAAP.
Capital accounts within the financial statements are adjusted for permanent book-tax differences. These adjustments have no impact on net assets or the results of operations. Capital accounts are not adjusted for temporary book-tax differences which will reverse in a subsequent period.
Book-tax differences are primarily due to the short-term gain distributions from the Underlying Funds, futures contracts, foreign currency transactions, passive foreign investment companies (PFIC), market discount, deferred trustees compensation and losses deferred due to wash sales.
As of period end, the cost and unrealized appreciation (depreciation) in securities, and derivatives if applicable, for federal income tax purposes were as follows:
| Gross unrealized appreciation | $615,392,367 |
| Gross unrealized depreciation | (186,906,729) |
| Net unrealized appreciation (depreciation) | $428,485,638 |
| Tax cost | $7,346,191,047 |
Restricted Securities. The Fund may invest in securities that are subject to legal or contractual restrictions on resale. These securities generally may be resold in transactions exempt from registration or to the public if the securities are registered. Disposal of these securities may involve time-consuming negotiations and expense, and prompt sale at an acceptable price may be difficult. Information regarding restricted securities is included at the end of the Fund's Schedule of Investments.
3. Derivative Instruments.
Risk Exposures and the Use of Derivative Instruments. The Fund's investment objective allows the Fund to enter into various types of derivative contracts, including futures contracts. Derivatives are investments whose value is primarily derived from underlying assets, indices or reference rates and may be transacted on an exchange or over-the-counter (OTC). Derivatives may involve a future commitment to buy or sell a specified asset based on specified terms, to exchange future cash flows at periodic intervals based on a notional principal amount, or for one party to make one or more payments upon the occurrence of specified events in exchange for periodic payments from the other party.
The Fund used derivatives to increase returns and to manage exposure to certain risks as defined below. The success of any strategy involving derivatives depends on analysis of numerous economic factors, and if the strategies for investment do not work as intended, the Fund may not achieve its objectives.
The Fund's use of derivatives increased or decreased its exposure to the following risk:
| Equity Risk | Equity risk relates to the fluctuations in the value of financial instruments as a result of changes in market prices (other than those arising from interest rate risk or foreign exchange risk), whether caused by factors specific to an individual investment, its issuer, or all factors affecting all instruments traded in a market or market segment. |
The Fund is also exposed to additional risks from investing in derivatives, such as liquidity risk and counterparty credit risk. Liquidity risk is the risk that the Fund will be unable to close out the derivative in the open market in a timely manner. Counterparty credit risk is the risk that the counterparty will not be able to fulfill its obligation to the Fund. Counterparty credit risk related to exchange-traded futures contracts may be mitigated by the protection provided by the exchange on which they trade.
Investing in derivatives may involve greater risks than investing in the underlying assets directly and, to varying degrees, may involve risk of loss in excess of any initial investment and collateral received and amounts recognized in the Statement of Assets and Liabilities. In addition, there may be the risk that the change in value of the derivative contract does not correspond to the change in value of the underlying instrument.
Futures Contracts. A futures contract is an agreement between two parties to buy or sell a specified underlying instrument for a fixed price at a specified future date. The Fund used futures contracts to manage its exposure to the stock market.
Upon entering into a futures contract, a fund is required to deposit either cash or securities (initial margin) with a clearing broker in an amount equal to a certain percentage of the face value of the contract. Futures contracts are marked-to-market daily and subsequent daily payments (variation margin) are made or received by a fund depending on the daily fluctuations in the value of the futures contracts and are recorded as unrealized appreciation or (depreciation). This receivable and/or payable, if any, is included in daily variation margin on futures contracts in the Statement of Assets and Liabilities. Realized gain or (loss) is recorded upon the expiration or closing of a futures contract. The net realized gain (loss) and change in net unrealized appreciation (depreciation) on futures contracts during the period is presented in the Statement of Operations.
Any open futures contracts at period end are presented in the Schedule of Investments under the caption "Futures Contracts". The notional amount at value reflects each contract's exposure to the underlying instrument or index at period end. Securities deposited to meet initial margin requirements are identified in the Schedule of Investments.
4. Purchases and Sales of Investments.
Purchases and sales of securities (including the Underlying Fund shares), other than short-term securities, aggregated $1,427,574,968 and $175,163,070, respectively.
5. Fees and Other Transactions with Affiliates.
Management Fee. Strategic Advisers (the investment adviser) provides the Fund with investment management related services. For these services, the Fund pays a monthly management fee to the investment adviser. The management fee is calculated by adding the annual management fee rate of .25% of the Fund's average net assets throughout the month payable to the investment adviser to the aggregate of the fee rates, payable monthly, to the Fund's sub-advisers. The Fund's maximum aggregate management fee will not exceed 1.00% of the Fund's average net assets. For the reporting period, the total annualized management fee rate was .27% of the Fund's average net assets.
During the period, the investment adviser waived a portion of its management fee as described in the Expense Reductions note.
Sub-Advisers. FIAM LLC (an affiliate of the investment adviser) served as a sub-adviser for the Fund during the period. Sub-advisers provide discretionary investment advisory services for their allocated portion of the Fund's assets and are paid by the investment adviser and not the Fund for providing these services.
FIL Investment Advisors and Geode Capital Management, LLC have been retained to serve as a sub-adviser for the Fund. As of the date of this report, however, these sub-advisers have not been allocated any portion of the Fund's assets. These sub-advisers in the future may provide discretionary investment advisory services for an allocated portion of the Fund's assets and will be paid by the investment adviser for providing these services.
Accounting and Security Lending Fees. Fidelity Service Company, Inc. (FSC), an affiliate of the investment adviser, maintains the Fund's accounting records. The accounting fee is based on the level of average net assets for each month. Prior to April 1, 2019, FSC had a separate agreement with the Fund for administration of the security lending program, based on the number and duration of lending transactions. Effective July 1, 2019 accounting fees are not paid by the Fund and are instead paid by the investment adviser or an affiliate. For the period, the total fees paid for accounting and administration of securities lending were equivalent to an annualized rate of .02%.
Interfund Trades. The Fund may purchase from or sell securities to other funds affiliated with each sub-adviser under procedures adopted by the Board. The procedures have been designed to ensure these interfund trades are executed in accordance with Rule 17a-7 of the 1940 Act. Interfund trades are included within the respective purchases and sales amounts shown in the Purchases and Sales of Investments note.
6. Investments in Fidelity Central Funds.
The Fund invests in Fidelity Central Funds, which are open-end investment companies available only to other investment companies and accounts managed by the investment adviser and its affiliates. The Fund's Schedule of Investments lists each of the Fidelity Central Funds held as of period end, if any, as an investment of the Fund, but does not include the underlying holdings of each Fidelity Central Fund. As an Investing Fund, the Fund indirectly bears its proportionate share of the expenses of the underlying Fidelity Central Funds.
The Fidelity Money Market Central Funds are managed by Fidelity Investments Money Management, Inc. (FIMM), an affiliate of the investment adviser. Annualized expenses of the Money Market Central Funds as of their most recent shareholder report date ranged from less than .005% to .01%.
A complete unaudited list of holdings for each Fidelity Central Fund is available upon request or at the Securities and Exchange Commission (the SEC) website at www.sec.gov. In addition, the financial statements of the Fidelity Central Funds are available on the SEC website or upon request.
7. Committed Line of Credit.
The Fund participates with other funds managed by the investment adviser or an affiliate in a $4.25 billion credit facility (the "line of credit") to be utilized for temporary or emergency purposes to fund shareholder redemptions or for other short-term liquidity purposes. The Fund has agreed to pay commitment fees on its pro-rata portion of the line of credit, which amounted to $8,867 and is reflected in Miscellaneous expenses on the Statement of Operations. During the period, the Fund did not borrow on this line of credit.
8. Security Lending.
The Fund lends portfolio securities through a lending agent from time to time in order to earn additional income. On the settlement date of the loan, the Fund receives collateral (in the form of U.S. Treasury obligations, letters of credit and/or cash) against the loaned securities and maintains collateral in an amount not less than 100% of the market value of the loaned securities during the period of the loan. The market value of the loaned securities is determined at the close of business of the Fund and any additional required collateral is delivered to the Fund on the next business day. The Fund or borrower may terminate the loan at any time, and if the borrower defaults on its obligation to return the securities loaned because of insolvency or other reasons, the Fund may apply collateral received from the borrower against the obligation. The Fund may experience delays and costs in recovering the securities loaned. Any cash collateral received is invested in the Fidelity Securities Lending Cash Central Fund. The value of loaned securities and cash collateral at period end are disclosed on the Fund's Statement of Assets and Liabilities. Security lending income represents the income earned on investing cash collateral, less rebates paid to borrowers and any lending agent fees associated with the loan, plus any premium payments received for lending certain types of securities. Security lending income is presented in the Statement of Operations as a component of income from Fidelity Central Funds.
9. Expense Reductions.
The investment adviser has contractually agreed to waive the Fund's management fee in an amount equal to .25% of the Fund's average net assets until September 30, 2022. During the period, this waiver reduced the Fund's management fee by $8,873,440.
Commissions paid to certain brokers with whom the investment adviser, or its affiliates, places trades on behalf of the Fund include an amount in addition to trade execution, which may be rebated back to the Fund to offset certain expenses. This amount totaled $29,662 for the period.
10. Other.
The Fund's organizational documents provide former and current trustees and officers with a limited indemnification against liabilities arising in connection with the performance of their duties to the Fund. In the normal course of business, the Fund may also enter into contracts that provide general indemnifications. The Fund's maximum exposure under these arrangements is unknown as this would be dependent on future claims that may be made against the Fund. The risk of material loss from such claims is considered remote.
The Fund does not invest in the Underlying Funds for the purpose of exercising management or control; however, investments by the Fund within its principal investment strategies may represent a significant portion of an Underlying Fund's net assets.
At the end of the period, the Fund was the owner of record of 10% or more of the total outstanding shares of the following Underlying Funds:
| Fidelity Advisor Overseas Fund | 12% |
| Fidelity International Capital Appreciation Fund | 33% |
| Fidelity International Discovery Fund | 13% |
| Fidelity International Real Estate Fund | 12% |
| Fidelity International Value Fund | 44% |
| Fidelity Japan Fund | 33% |
| Fidelity Overseas Fund | 16% |
| Fidelity Pacific Basin Fund | 18% |
| Fidelity SAI International Low Volatility Index Fund | 31% |
| Fidelity SAI International Value Index Fund | 99% |
Shareholder Expense Example
As a shareholder of the Fund, you incur two types of costs: (1) transaction costs and (2) ongoing costs, including management fees and other Fund expenses. This Example is intended to help you understand your ongoing costs (in dollars) of investing in the Fund and to compare these costs with the ongoing costs of investing in other mutual funds.
The Example is based on an investment of $1,000 invested at the beginning of the period and held for the entire period (March 1, 2019 to August 31, 2019).
Actual Expenses
The first line of the accompanying table provides information about actual account values and actual expenses. You may use the information in this line, together with the amount you invested, to estimate the expenses that you paid over the period. Simply divide your account value by $1,000.00 (for example, an $8,600 account value divided by $1,000.00 = 8.6), then multiply the result by the number in the first line under the heading entitled "Expenses Paid During Period" to estimate the expenses you paid on your account during this period. In addition to the direct expenses incurred by the Fund presented in the table, as a shareholder of the underlying mutual funds (the Underlying Funds), the Fund also indirectly bears its proportionate share of the expenses of the Underlying Funds. In addition, the Fund, as a shareholder in the underlying Fidelity Central Funds, will indirectly bear its pro-rata share of the fees and expenses incurred by the underlying Fidelity Central Funds. These fees and expenses are not included in the Fund's annualized expense ratio used to calculate the expense estimate in the table below.
Hypothetical Example for Comparison Purposes
The second line of the accompanying table provides information about hypothetical account values and hypothetical expenses based on the Fund's actual expense ratio and an assumed rate of return of 5% per year before expenses, which is not the Fund's actual return. The hypothetical account values and expenses may not be used to estimate the actual ending account balance or expenses you paid for the period. You may use this information to compare the ongoing costs of investing in the Fund and other funds. To do so, compare this 5% hypothetical example with the 5% hypothetical examples that appear in the shareholder reports of the other funds. In addition to the direct expenses incurred by the Fund presented in the table, as a shareholder of the Underlying Funds, the Fund also indirectly bears its proportionate share of the expenses of the Underlying Funds. In addition, the Fund, as a shareholder in the underlying Fidelity Central Funds, will indirectly bear its pro-rata share of the fees and expenses incurred by the underlying Fidelity Central Funds. These fees and expenses are not included in the Fund's annualized expense ratio used to calculate the expense estimate in the table below.
Please note that the expenses shown in the table are meant to highlight your ongoing costs only and do not reflect any transaction costs. Therefore, the second line of the table is useful in comparing ongoing costs only, and will not help you determine the relative total costs of owning different funds.
| Annualized Expense Ratio-A | Beginning Account Value March 1, 2019 | Ending Account Value August 31, 2019 | Expenses Paid During Period-B March 1, 2019 to August 31, 2019 | |
| Actual | .05% | $1,000.00 | $1,035.80 | $.26 |
| Hypothetical-C | $1,000.00 | $1,024.89 | $.25 |
A Annualized expense ratio reflects expenses net of applicable fee waivers.
B Expenses are equal to the Fund's annualized expense ratio, multiplied by the average account value over the period, multiplied by 184/366 (to reflect the one-half year period). The fees and expenses of the Underlying Funds in which the Fund invests are not included in the Fund's annualized expense ratio.
C 5% return per year before expenses
Board Approval of Investment Advisory Contract
Strategic Advisers Fidelity International Fund
On June 5, 2019, the Board of Trustees, including the Independent Trustees (together, the Board), voted at an in-person meeting to approve an amendment to the fee schedule in each of the existing sub-advisory agreements with FIAM LLC (FIAM) and FIL Investment Advisors (FIA) (the Amended Sub-Advisory Agreements) for the fund, which has the potential to lower the amount of fees paid by Strategic Advisers LLC (Strategic Advisers) to each of FIAM and FIA, on behalf of the fund for certain investment mandates. The Board noted that the terms of each Amended Sub-Advisory Agreement are not materially different from those of the current sub-advisory agreement with the applicable sub-adviser.
The Board, assisted by the advice of fund counsel and Independent Trustees' counsel, considered a broad range of information it believed relevant to the approval of each Amended Sub-Advisory Agreement.
In considering whether to approve each Amended Sub-Advisory Agreement, the Board reached a determination, with the assistance of fund counsel and Independent Trustees' counsel and through the exercise of its business judgment, that the approval of the Amended Sub-Advisory Agreement is in the best interests of the fund and its shareholders and that the approval of such agreement does not involve a conflict of interest from which Strategic Advisers or its affiliates derive an inappropriate advantage. Also, the Board found that the sub-advisory fees to be charged under each Amended Sub-Advisory Agreement bear a reasonable relationship to the services to be rendered and will be based upon services provided that will be in addition to, rather than duplicative of services provided under the advisory contract of any underlying fund in which the fund may invest. The Board's decision to approve each Amended Sub-Advisory Agreement was not based on any single factor, but rather was based on a comprehensive consideration of all the information provided to the Board. In addition, individual Trustees did not necessarily attribute the same weight or importance to each factor.
Nature, Extent, and Quality of Services Provided. The Board considered that it reviewed information regarding FIAM and FIA, including the backgrounds of their investment personnel, and also took into consideration the fund's investment objective, strategies and related investment philosophy, in connection with the approval of the sub-advisory agreement with FIA for the same mandates for a separate fund overseen by the Board, and the annual renewal of the fund's current sub-advisory agreements at its September 2018 Board meeting. The Board also considered the information provided by FIAM and FIA in June 2019 in connection with the anticipated annual renewal of each sub-advisory agreement in September 2019.The Board considered that each Amended Sub-Advisory Agreement will not result in any changes to the nature, extent and quality of the services provided to the fund. The Board also considered each sub-adviser's representation that the Amended Sub-Advisory Agreement would not result in any changes to (i) the investment process or strategies employed in the management of the fund's assets or (ii) the day-to-day management of the fund or the persons primarily responsible for such management.Investment Performance. The Board considered that it received information regarding each sub-adviser's historical investment performance in managing fund assets at its June 2019 Board meeting. The Board did not consider performance to be a material factor in its decision to approve the Amended Sub-Advisory Agreement because the Amended Sub-Advisory Agreement would not result in any changes to the fund's investment processes or strategies or in the persons primarily responsible for the day-to-day management of the fund.Based on its review, the Board concluded that the nature, extent, and quality of services that will be provided to the fund under each Amended Sub-Advisory Agreement will continue to benefit the fund's shareholders.Competitiveness of Management Fee and Total Fund Expenses. The Board considered that if the applicable investment mandates are funded, each new fee schedule is expected to lower the amount of fees to be paid by Strategic Advisers to FIAM and FIA under each respective Amended Sub-Advisory Agreement, on behalf of the fund. The Board also considered that each Amended Sub-Advisory Agreement would not result in any changes to the fund's maximum aggregate annual management fee rate, Strategic Advisers' portion of the fund's management fee or Strategic Advisers' contractual management fee waiver for the fund. The Board also considered that if the applicable investment mandates are funded, each Amended Sub-Advisory Agreement has the potential to reduce total net fund expenses by the same amount as any resulting decrease in the fund's management fee. Based on its review, the Board concluded that the fund's management fee structure and total expenses continue to bear a reasonable relationship to the services that the fund and its shareholders will receive under each Amended Sub-Advisory Agreement and the other factors considered.Because each Amended Sub-Advisory Agreement was negotiated at arm's length and will have no impact on the maximum management fees payable by the fund, the Board did not consider the costs of services and profitability of the relationship with the fund to Strategic Advisers to be significant factors in its decision to approve each Amended Sub-Advisory Agreement.Potential Fall-Out Benefits. The Board considered that it reviews information regarding the potential of direct and indirect benefits to Strategic Advisers and its affiliates from their relationships with the fund, including non-advisory fee compensation paid to affiliates of Strategic Advisers, if any, as well as information regarding potential fall-out benefits accruing to each sub-adviser, if any, as a result of its relationship with the fund, during its annual renewal of the fund's advisory agreements at its September Board meeting.Possible Economies of Scale. The Board considered that the Amended Sub-Advisory Agreement with FIA, like the current sub-advisory agreement with FIA, provides for breakpoints that, if the applicable investment mandate is funded, have the potential to reduce sub-advisory fees paid to FIA as assets allocated to FIA grow. The Board considered that it reviewed whether there have been economies of scale in connection with the management of the fund during its annual renewal of the fund's advisory agreement with Strategic Advisers at its September 2018 Board meeting and that it will consider the potential for such benefits at its September 2019 meeting.Conclusion. Based on its evaluation of all of the conclusions noted above, and after considering all factors it believed relevant, the Board ultimately concluded that each Amended Sub-Advisory Agreement's fee structure continues to bear a reasonable relationship to the services rendered to the fund and that each Amended Sub-Advisory Agreement should be approved because the Amended Sub-Advisory Agreement is in the best interests of the fund and its shareholders. The Board also concluded that the sub-advisory fees to be charged thereunder will be based on services provided that will be in addition to, rather than duplicative of services provided under the advisory contract of any underlying fund in which the fund may invest. In addition, the Board concluded that the approval of each Amended Sub-Advisory Agreement does not involve a conflict of interest from which Strategic Advisers or its affiliates derive an inappropriate advantage.![]()
SIL-SANN-1019
1.912841.109
Strategic Advisers® Small-Mid Cap Fund Offered exclusively to certain clients of Strategic Advisers LLC - not available for sale to the general public Semi-Annual Report August 31, 2019 |
|
Beginning on January 1, 2021, as permitted by regulations adopted by the Securities and Exchange Commission, paper copies of a fund’s shareholder reports will no longer be sent by mail, unless you specifically request paper copies of the reports from the fund or from your financial intermediary, such as a financial advisor, broker-dealer or bank. Instead, the reports will be made available on a website, and you will be notified by mail each time a report is posted and provided with a website link to access the report.
If you already elected to receive shareholder reports electronically, you will not be affected by this change and you need not take any action. You may elect to receive shareholder reports and other communications from a fund electronically, by contacting your financial intermediary. For Fidelity customers, visit Fidelity's web site or call Fidelity using the contact information listed below.
You may elect to receive all future reports in paper free of charge. If you wish to continue receiving paper copies of your shareholder reports, you may contact your financial intermediary or, if you are a Fidelity customer, visit Fidelity’s website, or call Fidelity at the applicable toll-free number listed below. Your election to receive reports in paper will apply to all funds held with the fund complex/your financial intermediary.
| Account Type | Website | Phone Number |
| Brokerage, Mutual Fund, or Annuity Contracts: | fidelity.com/mailpreferences | 1-800-343-3548 |
| Employer Provided Retirement Accounts: | netbenefits.fidelity.com/preferences (choose 'no' under Required Disclosures to continue to print) | 1-800-343-0860 |
| Advisor Sold Accounts Serviced Through Your Financial Intermediary: | Contact Your Financial Intermediary | Your Financial Intermediary's phone number |
| Advisor Sold Accounts Serviced by Fidelity: | institutional.fidelity.com | 1-877-208-0098 |
Contents
To view a fund's proxy voting record for the 12-month period ended June 30, visit http://www.fidelity.com/proxyvotingresults or visit the Securities and Exchange Commission's (SEC) web site at http://www.sec.gov.
You may also call 1-800-544-3455 to request a free copy of the proxy voting guidelines.
Standard & Poor's, S&P and S&P 500 are registered service marks of The McGraw-Hill Companies, Inc. and have been licensed for use by Fidelity Distributors Corporation.
Other third-party marks appearing herein are the property of their respective owners.
All other marks appearing herein are registered or unregistered trademarks or service marks of FMR LLC or an affiliated company. © 2019 FMR LLC. All rights reserved.
This report and the financial statements contained herein are submitted for the general information of the shareholders of the Fund. This report is not authorized for distribution to prospective investors in the Fund unless preceded or accompanied by an effective prospectus.
A fund files its complete schedule of portfolio holdings with the SEC for the first and third quarters of each fiscal year on Form N-PORT. Forms N-PORT are available on the SEC’s web site at http://www.sec.gov. A fund's Forms N-PORT may be reviewed and copied at the SEC’s Public Reference Room in Washington, DC. Information regarding the operation of the SEC's Public Reference Room may be obtained by calling 1-800-SEC-0330.
For a complete list of a fund's portfolio holdings, view the most recent holdings listing, semiannual report, or annual report on Fidelity's web site at http://www.fidelity.com, http://www.institutional.fidelity.com, or http://www.401k.com, as applicable.
NOT FDIC INSURED •MAY LOSE VALUE •NO BANK GUARANTEE
Neither the Fund nor Fidelity Distributors Corporation is a bank.
Investment Summary (Unaudited)
The information in the following tables is based on the direct investments of the Fund.Top Ten Holdings as of August 31, 2019
| (excluding cash equivalents) | % of fund's net assets |
| Fidelity SAI Small-Mid Cap 500 Index Fund | 2.1 |
| Fidelity Small Cap Index Fund | 2.0 |
| Fidelity SAI Real Estate Index Fund | 1.4 |
| Euronet Worldwide, Inc. | 0.7 |
| Aspen Technology, Inc. | 0.6 |
| Skechers U.S.A., Inc. Class A (sub. vtg.) | 0.5 |
| j2 Global, Inc. | 0.5 |
| Amdocs Ltd. | 0.5 |
| Pool Corp. | 0.5 |
| Bright Horizons Family Solutions, Inc. | 0.5 |
| 9.3 |
Top Five Market Sectors as of August 31, 2019
| (stocks only) | % of fund's net assets |
| Information Technology | 19.5 |
| Industrials | 16.6 |
| Financials | 13.8 |
| Consumer Discretionary | 12.1 |
| Health Care | 11.9 |
Asset Allocation (% of fund's net assets)
| As of August 31, 2019 | ||
| Common Stocks | 91.8% | |
| Mid-Cap Blend Funds | 2.1% | |
| Small Blend Funds | 2.0% | |
| Sector Funds | 1.4% | |
| Short-Term Investments and Net Other Assets (Liabilities) | 2.7% | |

Asset allocations of funds in the pie chart reflect the categorizations of assets as defined by Morningstar as of the reporting date.
Schedule of Investments August 31, 2019 (Unaudited)
Showing Percentage of Net Assets
| Common Stocks - 91.8% | |||
| Shares | Value | ||
| COMMUNICATION SERVICES - 2.8% | |||
| Diversified Telecommunication Services - 0.5% | |||
| Bandwidth, Inc. (a) | 259,468 | $22,623,015 | |
| CenturyLink, Inc. (b) | 273,210 | 3,109,130 | |
| Ooma, Inc. (a) | 245,133 | 3,064,163 | |
| Vonage Holdings Corp. (a) | 803,210 | 10,618,436 | |
| 39,414,744 | |||
| Entertainment - 1.0% | |||
| Cinemark Holdings, Inc. | 882,863 | 33,690,052 | |
| Glu Mobile, Inc. (a) | 234,922 | 1,043,054 | |
| Live Nation Entertainment, Inc. (a) | 256,360 | 17,819,584 | |
| Nintendo Co. Ltd. ADR (b) | 213,699 | 10,097,278 | |
| Take-Two Interactive Software, Inc. (a) | 54,700 | 7,218,759 | |
| World Wrestling Entertainment, Inc. Class A (b) | 66,265 | 4,733,309 | |
| 74,602,036 | |||
| Interactive Media & Services - 0.7% | |||
| Alphabet, Inc. Class C (a) | 7,148 | 8,492,539 | |
| ANGI Homeservices, Inc. Class A (a)(b) | 120,508 | 935,142 | |
| Care.com, Inc. (a) | 836,065 | 8,268,683 | |
| Facebook, Inc. Class A (a) | 44,389 | 8,241,706 | |
| IAC/InterActiveCorp (a) | 25,210 | 6,419,474 | |
| Match Group, Inc. (b) | 103,339 | 8,763,147 | |
| Pinterest, Inc. Class A (b) | 126,371 | 4,349,690 | |
| QuinStreet, Inc. (a) | 102,107 | 1,169,125 | |
| TripAdvisor, Inc. (a) | 86,825 | 3,298,482 | |
| 49,937,988 | |||
| Media - 0.5% | |||
| AMC Networks, Inc. Class A (a) | 135,361 | 6,565,009 | |
| Criteo SA sponsored ADR (a) | 468,219 | 9,092,813 | |
| Discovery Communications, Inc. Class A (a)(b) | 200,258 | 5,527,121 | |
| Entercom Communications Corp. Class A (b) | 1,144,683 | 4,075,071 | |
| National CineMedia, Inc. | 1,118,829 | 9,174,398 | |
| Sinclair Broadcast Group, Inc. Class A | 84,970 | 3,787,113 | |
| TechTarget, Inc. (a) | 126,711 | 3,008,119 | |
| 41,229,644 | |||
| Wireless Telecommunication Services - 0.1% | |||
| Boingo Wireless, Inc. (a) | 776,711 | 9,996,271 | |
| TOTAL COMMUNICATION SERVICES | 215,180,683 | ||
| CONSUMER DISCRETIONARY - 12.1% | |||
| Auto Components - 0.9% | |||
| Autoliv, Inc. (b) | 75,236 | 5,146,142 | |
| BorgWarner, Inc. | 133,700 | 4,362,631 | |
| Cooper Tire & Rubber Co. | 78,500 | 1,843,965 | |
| Cooper-Standard Holding, Inc. (a) | 165,707 | 6,204,070 | |
| Dana, Inc. | 597,051 | 7,600,459 | |
| Dorman Products, Inc. (a) | 18,368 | 1,305,597 | |
| Gentex Corp. | 342,879 | 9,120,581 | |
| LCI Industries (b) | 161,084 | 13,651,869 | |
| Lear Corp. | 101,538 | 11,398,656 | |
| Standard Motor Products, Inc. | 38,342 | 1,698,934 | |
| Stoneridge, Inc. (a) | 45,442 | 1,395,524 | |
| The Goodyear Tire & Rubber Co. | 208,800 | 2,394,936 | |
| Tower International, Inc. | 82,600 | 2,554,818 | |
| 68,678,182 | |||
| Automobiles - 0.2% | |||
| Harley-Davidson, Inc. | 131,000 | 4,178,900 | |
| Thor Industries, Inc. | 251,604 | 11,551,140 | |
| 15,730,040 | |||
| Distributors - 0.7% | |||
| LKQ Corp. (a) | 499,825 | 13,130,403 | |
| Pool Corp. | 201,314 | 39,534,043 | |
| 52,664,446 | |||
| Diversified Consumer Services - 1.8% | |||
| American Public Education, Inc. (a) | 14,151 | 342,879 | |
| Bright Horizons Family Solutions, Inc. (a) | 238,818 | 39,416,911 | |
| Chegg, Inc. (a) | 235,961 | 9,353,494 | |
| Frontdoor, Inc. (a) | 631,457 | 32,419,002 | |
| Grand Canyon Education, Inc. (a) | 202,202 | 25,396,571 | |
| Houghton Mifflin Harcourt Co. (a) | 529,053 | 3,147,865 | |
| ServiceMaster Global Holdings, Inc. (a) | 185,267 | 10,567,630 | |
| Sotheby's Class A (Ltd. vtg.) (a) | 40,896 | 2,361,744 | |
| Strategic Education, Inc. | 92,428 | 15,641,590 | |
| Weight Watchers International, Inc. (a) | 32,874 | 985,891 | |
| 139,633,577 | |||
| Hotels, Restaurants & Leisure - 1.7% | |||
| Bloomin' Brands, Inc. | 462,650 | 8,346,206 | |
| Boyd Gaming Corp. | 79,426 | 1,909,401 | |
| Brinker International, Inc. (b) | 33,348 | 1,267,224 | |
| Carrols Restaurant Group, Inc. (a) | 358,099 | 2,614,123 | |
| Cedar Fair LP (depositary unit) | 138,842 | 7,772,375 | |
| Chipotle Mexican Grill, Inc. (a) | 6,420 | 5,382,656 | |
| Cracker Barrel Old Country Store, Inc. (b) | 20,762 | 3,434,035 | |
| Dave & Buster's Entertainment, Inc. (b) | 142,272 | 6,124,810 | |
| Denny's Corp. (a) | 53,073 | 1,251,992 | |
| Domino's Pizza, Inc. | 16,751 | 3,799,797 | |
| Extended Stay America, Inc. unit | 354,120 | 4,975,386 | |
| Fiesta Restaurant Group, Inc. (a) | 72,664 | 627,817 | |
| Hyatt Hotels Corp. Class A | 31,278 | 2,256,708 | |
| Jack in the Box, Inc. | 45,964 | 3,921,648 | |
| Marriott International, Inc. Class A | 39,429 | 4,970,420 | |
| Papa John's International, Inc. (b) | 135,053 | 6,720,237 | |
| Planet Fitness, Inc. (a) | 289,984 | 20,475,770 | |
| Red Lion Hotels Corp. (a) | 209,760 | 1,099,142 | |
| Shake Shack, Inc. Class A (a) | 30,270 | 3,001,573 | |
| Six Flags Entertainment Corp. | 117,284 | 6,939,694 | |
| Vail Resorts, Inc. | 88,566 | 20,926,374 | |
| Wingstop, Inc. | 25,307 | 2,535,002 | |
| Wyndham Destinations, Inc. | 257,710 | 11,426,861 | |
| 131,779,251 | |||
| Household Durables - 1.2% | |||
| Cavco Industries, Inc. (a) | 7,388 | 1,355,476 | |
| D.R. Horton, Inc. | 213,745 | 10,573,965 | |
| Ethan Allen Interiors, Inc. | 21,290 | 366,188 | |
| Garmin Ltd. | 104,383 | 8,514,521 | |
| Helen of Troy Ltd. (a) | 22,806 | 3,500,949 | |
| La-Z-Boy, Inc. | 94,804 | 3,021,403 | |
| Lennar Corp. Class A | 143,928 | 7,340,328 | |
| LGI Homes, Inc. (a)(b) | 55,600 | 4,531,956 | |
| M.D.C. Holdings, Inc. | 213,386 | 8,251,637 | |
| NVR, Inc. (a) | 1,074 | 3,865,326 | |
| PulteGroup, Inc. | 155,000 | 5,239,000 | |
| Skyline Champion Corp. (a) | 140,074 | 3,922,072 | |
| Sonos, Inc. | 405,309 | 5,885,087 | |
| Taylor Morrison Home Corp. (a) | 368,979 | 8,803,839 | |
| Toll Brothers, Inc. | 158,280 | 5,728,153 | |
| TopBuild Corp. (a) | 19,783 | 1,832,301 | |
| Whirlpool Corp. | 39,900 | 5,549,691 | |
| William Lyon Homes, Inc. (a) | 100,530 | 1,776,365 | |
| 90,058,257 | |||
| Internet & Direct Marketing Retail - 0.7% | |||
| Chewy, Inc. (b) | 289,714 | 9,560,562 | |
| Etsy, Inc. (a) | 147,218 | 7,771,638 | |
| Expedia, Inc. | 7,818 | 1,017,122 | |
| GrubHub, Inc. (a)(b) | 233,458 | 13,853,398 | |
| PetMed Express, Inc. (b) | 17,813 | 281,445 | |
| Shutterfly, Inc. (a) | 115,263 | 5,864,581 | |
| Shutterstock, Inc. | 431,955 | 15,165,940 | |
| Wayfair LLC Class A (a) | 7,850 | 885,009 | |
| 54,399,695 | |||
| Leisure Products - 0.6% | |||
| Brunswick Corp. | 487,224 | 22,704,638 | |
| Callaway Golf Co. | 283,294 | 5,031,301 | |
| Polaris, Inc. | 186,294 | 15,279,834 | |
| Sturm, Ruger & Co., Inc. | 14,806 | 607,194 | |
| 43,622,967 | |||
| Multiline Retail - 0.2% | |||
| Dillard's, Inc. Class A | 46,400 | 2,715,328 | |
| Dollar Tree, Inc. (a) | 32,821 | 3,332,316 | |
| Kohl's Corp. | 96,200 | 4,546,412 | |
| Ollie's Bargain Outlet Holdings, Inc. (a) | 87,333 | 4,842,615 | |
| Tuesday Morning Corp. (a)(b) | 170,114 | 238,160 | |
| 15,674,831 | |||
| Specialty Retail - 2.6% | |||
| Aaron's, Inc. Class A | 357,113 | 22,894,514 | |
| Advance Auto Parts, Inc. | 40,520 | 5,589,734 | |
| America's Car Mart, Inc. (a) | 76,096 | 6,527,515 | |
| American Eagle Outfitters, Inc. | 316,563 | 5,324,590 | |
| Bed Bath & Beyond, Inc. (b) | 117,070 | 1,132,067 | |
| Burlington Stores, Inc. (a) | 108,262 | 21,921,972 | |
| Conn's, Inc. (a)(b) | 186,604 | 3,761,937 | |
| DSW, Inc. Class A | 57,846 | 953,881 | |
| Five Below, Inc. (a) | 89,731 | 11,025,248 | |
| Foot Locker, Inc. | 265,253 | 9,599,506 | |
| Group 1 Automotive, Inc. | 101,841 | 7,609,560 | |
| Haverty Furniture Companies, Inc. | 104,300 | 1,997,345 | |
| IAA Spinco, Inc. (a) | 690,505 | 33,731,169 | |
| Lithia Motors, Inc. Class A (sub. vtg.) | 79,118 | 10,369,996 | |
| Michaels Companies, Inc. (a) | 403,938 | 2,290,328 | |
| Monro, Inc. | 28,497 | 2,214,787 | |
| National Vision Holdings, Inc. (a) | 211,542 | 5,999,331 | |
| Office Depot, Inc. | 995,000 | 1,293,500 | |
| Party City Holdco, Inc. (a)(b) | 277,753 | 1,305,439 | |
| Penske Automotive Group, Inc. | 90,200 | 3,858,756 | |
| Ross Stores, Inc. | 28,006 | 2,968,916 | |
| Sally Beauty Holdings, Inc. (a) | 1,908,747 | 23,343,976 | |
| Shoe Carnival, Inc. | 8,648 | 265,840 | |
| Signet Jewelers Ltd. | 205,873 | 2,519,886 | |
| Sonic Automotive, Inc. Class A (sub. vtg.) | 111,800 | 3,008,538 | |
| The Buckle, Inc. (b) | 24,496 | 480,122 | |
| Ulta Beauty, Inc. (a) | 24,754 | 5,884,768 | |
| Urban Outfitters, Inc. (a)(b) | 65,100 | 1,523,991 | |
| Williams-Sonoma, Inc. (b) | 69,242 | 4,556,124 | |
| 203,953,336 | |||
| Textiles, Apparel & Luxury Goods - 1.5% | |||
| Capri Holdings Ltd. (a) | 241,242 | 6,363,964 | |
| Carter's, Inc. | 226,325 | 20,704,211 | |
| Crocs, Inc. (a) | 192,121 | 4,284,298 | |
| Hanesbrands, Inc. (b) | 1,632,542 | 22,300,524 | |
| Skechers U.S.A., Inc. Class A (sub. vtg.) (a) | 1,331,251 | 42,147,407 | |
| Steven Madden Ltd. | 209,566 | 6,961,783 | |
| Under Armour, Inc. Class C (non-vtg.) (a) | 386,051 | 6,531,983 | |
| Wolverine World Wide, Inc. | 289,253 | 7,506,115 | |
| 116,800,285 | |||
| TOTAL CONSUMER DISCRETIONARY | 932,994,867 | ||
| CONSUMER STAPLES - 3.0% | |||
| Beverages - 0.3% | |||
| Boston Beer Co., Inc. Class A (a) | 7,431 | 3,257,899 | |
| Brown-Forman Corp. Class B (non-vtg.) | 143,649 | 8,473,855 | |
| Cott Corp. | 189,261 | 2,385,308 | |
| Cott Corp. | 606,165 | 7,643,741 | |
| National Beverage Corp. (b) | 10,445 | 427,201 | |
| Primo Water Corp. (a) | 125,539 | 1,535,342 | |
| 23,723,346 | |||
| Food & Staples Retailing - 0.7% | |||
| BJ's Wholesale Club Holdings, Inc. (a) | 259,540 | 6,815,520 | |
| Casey's General Stores, Inc. | 6,970 | 1,169,915 | |
| Grocery Outlet Holding Corp. | 113,089 | 4,574,450 | |
| Performance Food Group Co. (a) | 646,251 | 30,238,084 | |
| SpartanNash Co. | 65,200 | 702,204 | |
| U.S. Foods Holding Corp. (a) | 279,557 | 11,308,081 | |
| Weis Markets, Inc. | 47,626 | 1,820,742 | |
| 56,628,996 | |||
| Food Products - 1.2% | |||
| Flowers Foods, Inc. | 148,928 | 3,395,558 | |
| Fresh Del Monte Produce, Inc. | 91,725 | 2,388,519 | |
| Hostess Brands, Inc. Class A (a) | 559,960 | 7,850,639 | |
| Ingredion, Inc. | 114,779 | 8,868,973 | |
| J&J Snack Foods Corp. | 12,973 | 2,504,567 | |
| John B. Sanfilippo & Son, Inc. | 7,559 | 699,963 | |
| Lamb Weston Holdings, Inc. | 256,946 | 18,086,429 | |
| Lancaster Colony Corp. | 16,860 | 2,459,874 | |
| Nomad Foods Ltd. (a) | 800,925 | 16,138,639 | |
| Pilgrim's Pride Corp. (a) | 199,300 | 6,210,188 | |
| Post Holdings, Inc. (a) | 103,072 | 10,275,248 | |
| The Hain Celestial Group, Inc. (a)(b) | 342,326 | 6,521,310 | |
| The J.M. Smucker Co. | 53,000 | 5,573,480 | |
| Tootsie Roll Industries, Inc. (b) | 16,499 | 605,183 | |
| 91,578,570 | |||
| Household Products - 0.3% | |||
| Central Garden & Pet Co. Class A (non-vtg.) (a) | 64,905 | 1,561,614 | |
| Church & Dwight Co., Inc. | 59,214 | 4,724,093 | |
| Energizer Holdings, Inc. (b) | 254,215 | 9,787,278 | |
| WD-40 Co. | 11,957 | 2,179,761 | |
| 18,252,746 | |||
| Personal Products - 0.4% | |||
| Edgewell Personal Care Co. (a) | 36,676 | 1,021,060 | |
| elf Beauty, Inc. (a) | 1,099,492 | 17,943,709 | |
| Herbalife Nutrition Ltd. (a) | 88,698 | 3,053,872 | |
| MediFast, Inc. (b) | 31,210 | 3,119,752 | |
| Nu Skin Enterprises, Inc. Class A | 147,898 | 6,007,617 | |
| USANA Health Sciences, Inc. (a) | 11,808 | 802,590 | |
| 31,948,600 | |||
| Tobacco - 0.1% | |||
| Turning Point Brands, Inc. (b) | 170,670 | 6,118,520 | |
| Universal Corp. | 56,074 | 2,807,064 | |
| 8,925,584 | |||
| TOTAL CONSUMER STAPLES | 231,057,842 | ||
| ENERGY - 2.6% | |||
| Energy Equipment & Services - 0.6% | |||
| Core Laboratories NV (b) | 129,022 | 5,107,981 | |
| Dril-Quip, Inc. (a) | 188,603 | 8,647,448 | |
| Helmerich & Payne, Inc. | 113,295 | 4,258,759 | |
| McDermott International, Inc. (a)(b) | 424,665 | 2,004,419 | |
| Oceaneering International, Inc. (a) | 137,661 | 1,784,087 | |
| Oil States International, Inc. (a) | 282,249 | 3,892,214 | |
| Patterson-UTI Energy, Inc. | 1,516,211 | 13,115,225 | |
| RigNet, Inc. (a) | 292,697 | 2,294,744 | |
| RPC, Inc. (b) | 842,974 | 4,476,192 | |
| TechnipFMC PLC | 200,375 | 4,977,315 | |
| 50,558,384 | |||
| Oil, Gas & Consumable Fuels - 2.0% | |||
| Abraxas Petroleum Corp. (a) | 3,228,401 | 1,684,902 | |
| Arch Coal, Inc. (b) | 21,000 | 1,607,760 | |
| Ardmore Shipping Corp. (a) | 225,346 | 1,406,159 | |
| Brigham Minerals, Inc. Class A | 167,043 | 3,339,190 | |
| Canacol Energy Ltd. (a) | 1,417,359 | 5,099,256 | |
| Carrizo Oil & Gas, Inc. (a) | 239,500 | 1,985,455 | |
| Cimarex Energy Co. | 261,620 | 11,192,104 | |
| CONSOL Energy, Inc. (a) | 23,493 | 393,743 | |
| Delek U.S. Holdings, Inc. | 105,693 | 3,461,446 | |
| Diamond S Shipping, Inc. (a) | 115,578 | 1,259,800 | |
| Diamondback Energy, Inc. | 198,427 | 19,461,720 | |
| Encana Corp. | 477,268 | 2,119,070 | |
| Enerplus Corp. (b) | 492,776 | 3,223,734 | |
| Equitrans Midstream Corp. | 55,304 | 746,051 | |
| Extraction Oil & Gas, Inc. (a)(b) | 216,549 | 872,692 | |
| Gulfport Energy Corp. (a) | 350,800 | 841,920 | |
| HollyFrontier Corp. | 143,500 | 6,365,660 | |
| Jagged Peak Energy, Inc. (a) | 135,885 | 937,607 | |
| Kosmos Energy Ltd. | 941,773 | 5,952,005 | |
| Laredo Petroleum, Inc. (a) | 135,500 | 336,040 | |
| Marathon Oil Corp. | 144,439 | 1,710,158 | |
| Marathon Petroleum Corp. | 258,799 | 12,735,499 | |
| Matador Resources Co. (a)(b) | 306,230 | 4,792,500 | |
| Northern Oil & Gas, Inc. (a)(b) | 3,100,628 | 5,705,156 | |
| Oasis Petroleum, Inc. (a) | 725,887 | 2,264,767 | |
| Parsley Energy, Inc. Class A | 655,047 | 11,731,892 | |
| PBF Energy, Inc. Class A | 307,753 | 7,293,746 | |
| PDC Energy, Inc. (a) | 157,725 | 5,023,541 | |
| QEP Resources, Inc. | 733,473 | 2,611,164 | |
| SM Energy Co. | 314,214 | 2,978,749 | |
| Southwestern Energy Co. (a)(b) | 800,000 | 1,264,000 | |
| SRC Energy, Inc. (a) | 707,100 | 3,549,642 | |
| Valero Energy Corp. | 45,765 | 3,445,189 | |
| W&T Offshore, Inc. (a) | 660,000 | 2,890,800 | |
| World Fuel Services Corp. | 339,215 | 13,025,856 | |
| 153,308,973 | |||
| TOTAL ENERGY | 203,867,357 | ||
| FINANCIALS - 13.8% | |||
| Banks - 4.6% | |||
| Associated Banc-Corp. | 329,444 | 6,338,503 | |
| Bank of Hawaii Corp. | 35,409 | 2,927,616 | |
| Bank OZK | 366,327 | 9,451,237 | |
| BankUnited, Inc. | 628,778 | 19,969,989 | |
| Berkshire Hills Bancorp, Inc. | 84,000 | 2,463,720 | |
| Boston Private Financial Holdings, Inc. | 140,267 | 1,489,636 | |
| Cadence Bancorp Class A | 718,877 | 11,049,139 | |
| Cathay General Bancorp | 102,900 | 3,415,251 | |
| Centerstate Banks of Florida, Inc. | 126,074 | 2,851,794 | |
| Central Pacific Financial Corp. | 51,486 | 1,432,341 | |
| CIT Group, Inc. | 136,200 | 5,800,758 | |
| Citizens Financial Group, Inc. | 387,700 | 13,080,998 | |
| Columbia Banking Systems, Inc. | 61,122 | 2,109,320 | |
| Comerica, Inc. | 108,661 | 6,698,951 | |
| Commerce Bancshares, Inc. | 254,770 | 14,539,724 | |
| Cullen/Frost Bankers, Inc. | 126,355 | 10,488,729 | |
| East West Bancorp, Inc. | 213,761 | 8,791,990 | |
| First Citizens Bancshares, Inc. | 7,038 | 3,129,095 | |
| First Financial Bankshares, Inc. | 108,194 | 3,312,900 | |
| First Hawaiian, Inc. | 696,129 | 17,890,515 | |
| First Merchants Corp. | 82,548 | 2,948,615 | |
| First Midwest Bancorp, Inc., Delaware | 141,362 | 2,714,150 | |
| First Republic Bank | 64,743 | 5,808,742 | |
| Fulton Financial Corp. | 239,600 | 3,821,620 | |
| Hancock Whitney Corp. | 156,697 | 5,501,632 | |
| Hanmi Financial Corp. | 207,839 | 3,722,396 | |
| Hope Bancorp, Inc. | 395,500 | 5,303,655 | |
| Huntington Bancshares, Inc. | 258,867 | 3,429,988 | |
| IBERIABANK Corp. | 187,987 | 12,969,223 | |
| KeyCorp | 420,100 | 6,973,660 | |
| PacWest Bancorp | 89,800 | 3,060,384 | |
| Peapack-Gladstone Financial Corp. | 59,832 | 1,683,074 | |
| Peoples Bancorp, Inc. | 40,051 | 1,229,966 | |
| Preferred Bank, Los Angeles | 61,341 | 3,064,596 | |
| Regions Financial Corp. | 365,500 | 5,343,610 | |
| ServisFirst Bancshares, Inc. | 39,607 | 1,204,053 | |
| Signature Bank | 112,184 | 13,086,264 | |
| Sterling Bancorp | 415,857 | 7,930,393 | |
| SVB Financial Group (a) | 108,364 | 21,089,802 | |
| Synovus Financial Corp. | 448,074 | 15,924,550 | |
| Tcf Financial Corp. | 202,274 | 7,799,685 | |
| Texas Capital Bancshares, Inc. (a) | 130,485 | 7,030,532 | |
| Umpqua Holdings Corp. | 672,323 | 10,562,194 | |
| United Community Bank, Inc. | 130,200 | 3,438,582 | |
| Webster Financial Corp. | 194,323 | 8,697,897 | |
| Western Alliance Bancorp. | 320,936 | 13,935,041 | |
| Wintrust Financial Corp. | 183,336 | 11,519,001 | |
| Zions Bancorp NA | 424,508 | 17,443,034 | |
| 354,468,545 | |||
| Capital Markets - 2.9% | |||
| Affiliated Managers Group, Inc. | 20,000 | 1,532,600 | |
| Ares Capital Corp. | 117,382 | 2,213,825 | |
| Ares Management Corp. | 196,624 | 5,721,758 | |
| Artisan Partners Asset Management, Inc. | 43,873 | 1,168,777 | |
| Cohen & Steers, Inc. | 18,585 | 1,002,289 | |
| Diamond Hill Investment Group, Inc. | 2,814 | 379,609 | |
| Donnelley Financial Solutions, Inc. (a) | 28,840 | 306,569 | |
| E*TRADE Financial Corp. | 629,897 | 26,291,901 | |
| Eaton Vance Corp. (non-vtg.) | 299,502 | 12,914,526 | |
| Evercore, Inc. Class A | 109,867 | 8,762,992 | |
| FactSet Research Systems, Inc. | 71,844 | 19,548,034 | |
| Federated Investors, Inc. Class B (non-vtg.) | 82,468 | 2,642,275 | |
| Houlihan Lokey | 29,448 | 1,301,013 | |
| Lazard Ltd. Class A | 774,946 | 26,611,646 | |
| Legg Mason, Inc. | 202,200 | 7,438,938 | |
| LPL Financial | 214,694 | 16,091,315 | |
| MarketAxess Holdings, Inc. | 32,474 | 12,912,312 | |
| Moelis & Co. Class A | 307,568 | 10,312,755 | |
| Morningstar, Inc. | 84,119 | 13,591,948 | |
| Newtek Business Services Corp. (b) | 142,900 | 3,259,549 | |
| Oaktree Specialty Lending Corp. | 547,600 | 2,842,044 | |
| Prospect Capital Corp. | 398,500 | 2,538,445 | |
| Raymond James Financial, Inc. | 123,882 | 9,725,976 | |
| SEI Investments Co. | 112,865 | 6,490,866 | |
| Stifel Financial Corp. | 218,581 | 11,676,597 | |
| T. Rowe Price Group, Inc. | 79,414 | 8,784,777 | |
| Waddell & Reed Financial, Inc. Class A (b) | 126,615 | 2,047,365 | |
| WisdomTree Investments, Inc. | 1,503,789 | 7,233,225 | |
| 225,343,926 | |||
| Consumer Finance - 1.0% | |||
| Ally Financial, Inc. | 351,087 | 11,006,577 | |
| Credit Acceptance Corp. (a) | 10,676 | 4,832,491 | |
| First Cash Financial Services, Inc. | 166,231 | 16,411,987 | |
| Navient Corp. | 857,905 | 10,929,710 | |
| Nelnet, Inc. Class A | 68,994 | 4,626,048 | |
| OneMain Holdings, Inc. | 148,418 | 5,320,785 | |
| PRA Group, Inc. (a) | 87,670 | 2,993,054 | |
| Regional Management Corp. (a) | 68,700 | 1,769,025 | |
| SLM Corp. | 1,740,590 | 14,690,580 | |
| 72,580,257 | |||
| Disc-Real Estate Inv Trusts - 0.1% | |||
| MGM Growth Properties LLC | 284,345 | 8,769,200 | |
| Diversified Financial Services - 0.4% | |||
| Banco Latinoamericano de Comercio Exterior SA Series E | 75,700 | 1,372,441 | |
| Focus Financial Partners, Inc. Class A (a) | 302,933 | 6,216,185 | |
| International Money Express, Inc. (a)(b) | 232,231 | 3,028,292 | |
| Jefferies Financial Group, Inc. | 355,177 | 6,620,499 | |
| On Deck Capital, Inc. (a) | 297,547 | 967,028 | |
| Voya Financial, Inc. | 263,412 | 12,991,480 | |
| 31,195,925 | |||
| Insurance - 3.4% | |||
| Alleghany Corp. (a) | 7,362 | 5,516,420 | |
| American Financial Group, Inc. | 85,508 | 8,633,743 | |
| Assurant, Inc. | 29,899 | 3,677,577 | |
| Assured Guaranty Ltd. | 289,626 | 12,323,586 | |
| Athene Holding Ltd. (a) | 45,331 | 1,761,563 | |
| Axis Capital Holdings Ltd. | 143,296 | 8,796,941 | |
| Brown & Brown, Inc. | 158,528 | 5,848,098 | |
| Cincinnati Financial Corp. | 95,694 | 10,764,618 | |
| CNA Financial Corp. | 293,792 | 13,846,417 | |
| CNO Financial Group, Inc. | 339,200 | 4,911,616 | |
| Crawford & Co. Class B | 166,972 | 1,445,978 | |
| Erie Indemnity Co. Class A | 17,156 | 3,762,482 | |
| Everest Re Group Ltd. | 96,510 | 22,764,779 | |
| First American Financial Corp. | 362,176 | 21,169,187 | |
| Genworth Financial, Inc. Class A | 149,800 | 663,614 | |
| Globe Life, Inc. | 56,757 | 5,066,130 | |
| Hanover Insurance Group, Inc. | 72,054 | 9,593,990 | |
| HCI Group, Inc. | 57,033 | 2,222,576 | |
| Heritage Insurance Holdings, Inc. | 151,238 | 1,982,730 | |
| Kemper Corp. | 89,061 | 6,232,489 | |
| Kinsale Capital Group, Inc. | 152,934 | 15,022,707 | |
| Lincoln National Corp. | 116,200 | 6,144,656 | |
| Maiden Holdings Ltd. | 333 | 160 | |
| National General Holdings Corp. | 298,631 | 7,041,719 | |
| Old Republic International Corp. | 640,664 | 14,965,911 | |
| Primerica, Inc. | 37,093 | 4,420,373 | |
| ProAssurance Corp. | 78,919 | 3,083,365 | |
| Reinsurance Group of America, Inc. | 157,943 | 24,318,484 | |
| RLI Corp. | 170,022 | 15,568,915 | |
| Selective Insurance Group, Inc. | 76,006 | 6,052,358 | |
| Universal Insurance Holdings, Inc. | 115,572 | 2,889,300 | |
| Unum Group | 241,300 | 6,131,433 | |
| White Mountains Insurance Group Ltd. | 4,570 | 4,847,399 | |
| 261,471,314 | |||
| Mortgage Real Estate Investment Trusts - 0.6% | |||
| AGNC Investment Corp. | 242,704 | 3,609,008 | |
| Annaly Capital Management, Inc. | 349,000 | 2,896,700 | |
| Ares Commercial Real Estate Corp. | 122,425 | 1,835,151 | |
| Blackstone Mortgage Trust, Inc. | 95,728 | 3,331,334 | |
| Chimera Investment Corp. | 176,100 | 3,358,227 | |
| MFA Financial, Inc. | 1,112,003 | 7,973,062 | |
| New York Mortgage Trust, Inc. | 403,200 | 2,479,680 | |
| Redwood Trust, Inc. | 337,844 | 5,608,210 | |
| Starwood Property Trust, Inc. | 224,999 | 5,271,727 | |
| Two Harbors Investment Corp. | 932,868 | 11,782,123 | |
| 48,145,222 | |||
| Real Estate Management & Development - 0.0% | |||
| The RMR Group, Inc. | 6,014 | 280,192 | |
| Thrifts & Mortgage Finance - 0.8% | |||
| Axos Financial, Inc. (a) | 164,843 | 4,271,082 | |
| Essent Group Ltd. | 464,697 | 22,537,805 | |
| Farmer Mac Class C (non-vtg.) | 25,700 | 2,116,395 | |
| LendingTree, Inc. (a)(b) | 15,570 | 4,828,101 | |
| MGIC Investment Corp. | 386,100 | 4,884,165 | |
| NMI Holdings, Inc. (a) | 9,567 | 271,129 | |
| Radian Group, Inc. | 395,049 | 8,908,355 | |
| Walker & Dunlop, Inc. | 207,632 | 11,598,324 | |
| 59,415,356 | |||
| TOTAL FINANCIALS | 1,061,669,937 | ||
| HEALTH CARE - 11.9% | |||
| Biotechnology - 2.3% | |||
| Agios Pharmaceuticals, Inc. (a)(b) | 114,208 | 4,334,194 | |
| Aimmune Therapeutics, Inc. (a)(b) | 175,513 | 3,578,710 | |
| Akebia Therapeutics, Inc. (a)(b) | 208,838 | 862,501 | |
| Allogene Therapeutics, Inc. (b) | 60,080 | 1,635,978 | |
| Alnylam Pharmaceuticals, Inc. (a) | 24,377 | 1,966,980 | |
| Amicus Therapeutics, Inc. (a) | 120,486 | 1,191,607 | |
| Anika Therapeutics, Inc. (a) | 12,053 | 684,128 | |
| Arena Pharmaceuticals, Inc. (a) | 53,791 | 2,845,006 | |
| Ascendis Pharma A/S sponsored ADR (a) | 22,061 | 2,471,494 | |
| BeiGene Ltd. ADR (a) | 17,130 | 2,462,438 | |
| Biohaven Pharmaceutical Holding Co. Ltd. (a) | 64,868 | 2,542,177 | |
| BioMarin Pharmaceutical, Inc. (a) | 48,461 | 3,637,483 | |
| Biospecifics Technologies Corp. (a) | 4,578 | 252,156 | |
| Blueprint Medicines Corp. (a) | 55,843 | 4,281,483 | |
| Clovis Oncology, Inc. (a)(b) | 40,036 | 224,602 | |
| DBV Technologies SA sponsored ADR (a)(b) | 353,141 | 3,213,583 | |
| Deciphera Pharmaceuticals, Inc. (a) | 176,835 | 6,415,574 | |
| Emergent BioSolutions, Inc. (a) | 128,600 | 5,632,680 | |
| Exact Sciences Corp. (a) | 158,382 | 18,882,302 | |
| Exelixis, Inc. (a) | 300,406 | 5,963,059 | |
| FibroGen, Inc. (a) | 28,257 | 1,261,958 | |
| Global Blood Therapeutics, Inc. (a) | 42,809 | 1,968,358 | |
| Gossamer Bio, Inc. | 74,667 | 1,565,020 | |
| Heron Therapeutics, Inc. (a)(b) | 376,917 | 6,980,503 | |
| Immunomedics, Inc. (a)(b) | 682,644 | 8,737,843 | |
| Incyte Corp. (a) | 47,490 | 3,885,632 | |
| Insmed, Inc. (a) | 73,736 | 1,212,220 | |
| Invitae Corp. (a) | 189,137 | 4,588,464 | |
| Ionis Pharmaceuticals, Inc. (a) | 29,621 | 1,872,343 | |
| Ligand Pharmaceuticals, Inc. Class B (a)(b) | 151,960 | 13,814,684 | |
| Madrigal Pharmaceuticals, Inc. (a)(b) | 12,310 | 1,141,137 | |
| Myriad Genetics, Inc. (a) | 146,888 | 3,456,275 | |
| Neurocrine Biosciences, Inc. (a) | 294,545 | 29,283,664 | |
| Precision BioSciences, Inc. (a)(b) | 114,053 | 971,732 | |
| Progenics Pharmaceuticals, Inc. (a) | 147,904 | 650,778 | |
| Puma Biotechnology, Inc. (a)(b) | 81,232 | 873,244 | |
| Rubius Therapeutics, Inc. (a)(b) | 106,386 | 987,262 | |
| Sage Therapeutics, Inc. (a) | 31,686 | 5,439,536 | |
| Sarepta Therapeutics, Inc. (a) | 47,253 | 4,259,858 | |
| Seattle Genetics, Inc. (a) | 27,241 | 1,978,786 | |
| Spectrum Pharmaceuticals, Inc. (a) | 599,525 | 4,400,514 | |
| Ultragenyx Pharmaceutical, Inc. (a) | 45,908 | 2,500,609 | |
| Viking Therapeutics, Inc. (a)(b) | 675,619 | 4,695,552 | |
| 179,604,107 | |||
| Health Care Equipment & Supplies - 3.4% | |||
| Abiomed, Inc. (a) | 25,846 | 4,990,087 | |
| Atrion Corp. | 1,233 | 958,226 | |
| AxoGen, Inc. (a) | 599,325 | 9,499,301 | |
| Cantel Medical Corp. | 29,233 | 2,687,390 | |
| CONMED Corp. | 39,886 | 4,019,312 | |
| DexCom, Inc. (a) | 48,840 | 8,381,432 | |
| Endologix, Inc. (a)(b) | 452,524 | 2,425,529 | |
| Haemonetics Corp. (a) | 19,620 | 2,619,859 | |
| Hill-Rom Holdings, Inc. | 36,754 | 3,957,671 | |
| ICU Medical, Inc. (a) | 42,090 | 6,808,058 | |
| IDEXX Laboratories, Inc. (a) | 73,837 | 21,393,532 | |
| Insulet Corp. (a)(b) | 55,790 | 8,601,144 | |
| Integra LifeSciences Holdings Corp. (a) | 113,557 | 6,815,691 | |
| LeMaitre Vascular, Inc. | 10,700 | 338,762 | |
| Masimo Corp. (a) | 82,883 | 12,701,820 | |
| Meridian Bioscience, Inc. | 36,535 | 337,218 | |
| Merit Medical Systems, Inc. (a) | 310,366 | 10,794,529 | |
| Neogen Corp. (a) | 44,918 | 3,167,617 | |
| Nevro Corp. (a) | 55,182 | 4,620,389 | |
| Penumbra, Inc. (a)(b) | 48,143 | 7,007,214 | |
| Quidel Corp. (a) | 148,096 | 9,337,453 | |
| STERIS PLC | 196,542 | 30,346,085 | |
| Teleflex, Inc. | 61,315 | 22,313,755 | |
| The Cooper Companies, Inc. | 85,364 | 26,441,499 | |
| West Pharmaceutical Services, Inc. | 266,519 | 38,767,854 | |
| Wright Medical Group NV (a) | 53,311 | 1,111,534 | |
| Zimmer Biomet Holdings, Inc. | 59,376 | 8,265,139 | |
| 258,708,100 | |||
| Health Care Providers & Services - 2.8% | |||
| Acadia Healthcare Co., Inc. (a)(b) | 113,903 | 3,013,873 | |
| Amedisys, Inc. (a) | 75,558 | 9,725,070 | |
| American Renal Associates Holdings, Inc. (a) | 14,793 | 91,717 | |
| BioTelemetry, Inc. (a) | 277,229 | 10,992,130 | |
| Castle Biosciences, Inc. | 27,037 | 754,873 | |
| Centene Corp. (a) | 346,372 | 16,147,863 | |
| Chemed Corp. | 29,117 | 12,503,713 | |
| Corvel Corp. (a) | 7,937 | 668,534 | |
| Covetrus, Inc. (a)(b) | 24,842 | 330,150 | |
| Encompass Health Corp. | 309,923 | 18,840,219 | |
| Guardant Health, Inc. | 53,263 | 4,662,110 | |
| HealthEquity, Inc. (a) | 134,389 | 7,977,331 | |
| Henry Schein, Inc. (a) | 164,602 | 10,142,775 | |
| Laboratory Corp. of America Holdings (a) | 40,440 | 6,776,126 | |
| LHC Group, Inc. (a) | 54,710 | 6,483,135 | |
| MEDNAX, Inc. (a) | 643,711 | 13,569,428 | |
| Molina Healthcare, Inc. (a) | 213,952 | 27,873,667 | |
| OptiNose, Inc. (a)(b) | 134,440 | 1,029,810 | |
| Owens & Minor, Inc. | 163,100 | 828,548 | |
| Patterson Companies, Inc. (b) | 85,411 | 1,428,072 | |
| PetIQ, Inc. Class A (a)(b) | 142,761 | 4,519,813 | |
| Premier, Inc. (a) | 460,830 | 16,248,866 | |
| Quest Diagnostics, Inc. | 80,100 | 8,199,837 | |
| Select Medical Holdings Corp. (a) | 318,986 | 5,173,953 | |
| U.S. Physical Therapy, Inc. | 10,759 | 1,436,542 | |
| Universal Health Services, Inc. Class B | 53,564 | 7,744,283 | |
| Wellcare Health Plans, Inc. (a) | 81,599 | 22,092,113 | |
| 219,254,551 | |||
| Health Care Technology - 0.6% | |||
| Change Healthcare, Inc. (b) | 220,207 | 3,089,504 | |
| Medidata Solutions, Inc. (a) | 271,837 | 24,894,832 | |
| Teladoc Health, Inc. (a)(b) | 138,540 | 8,018,695 | |
| Veeva Systems, Inc. Class A (a) | 57,090 | 9,156,094 | |
| 45,159,125 | |||
| Life Sciences Tools & Services - 1.5% | |||
| Avantor, Inc. | 248,757 | 4,353,248 | |
| Bio-Rad Laboratories, Inc. Class A (a) | 41,825 | 14,124,721 | |
| Bruker Corp. | 84,967 | 3,668,025 | |
| Charles River Laboratories International, Inc. (a) | 129,833 | 17,034,090 | |
| ICON PLC (a) | 131,374 | 20,256,557 | |
| IQVIA Holdings, Inc. (a) | 51,839 | 8,042,821 | |
| Medpace Holdings, Inc. (a) | 22,454 | 1,816,753 | |
| PerkinElmer, Inc. | 159,410 | 13,183,207 | |
| PRA Health Sciences, Inc. (a) | 41,902 | 4,141,594 | |
| Syneos Health, Inc. (a) | 561,909 | 29,517,080 | |
| 116,138,096 | |||
| Pharmaceuticals - 1.3% | |||
| Aerie Pharmaceuticals, Inc. (a)(b) | 129,451 | 2,803,909 | |
| Catalent, Inc. (a) | 457,741 | 24,141,260 | |
| Collegium Pharmaceutical, Inc. (a) | 105,291 | 1,219,270 | |
| GW Pharmaceuticals PLC ADR (a)(b) | 60,678 | 8,641,154 | |
| Horizon Pharma PLC (a) | 258,787 | 7,150,285 | |
| Innoviva, Inc. (a) | 216,035 | 2,503,846 | |
| Jazz Pharmaceuticals PLC (a) | 104,914 | 13,444,729 | |
| Lannett Co., Inc. (a)(b) | 177,600 | 1,829,280 | |
| Mallinckrodt PLC (a) | 152,186 | 394,162 | |
| Nektar Therapeutics (a)(b) | 121,546 | 2,135,563 | |
| Pacira Biosciences, Inc. (a) | 83,005 | 3,091,106 | |
| Prestige Brands Holdings, Inc. (a)(b) | 483,881 | 15,426,126 | |
| Reata Pharmaceuticals, Inc. (a) | 19,701 | 1,518,947 | |
| Revance Therapeutics, Inc. (a) | 713,691 | 7,565,125 | |
| Supernus Pharmaceuticals, Inc. (a) | 189,112 | 5,111,697 | |
| Zynerba Pharmaceuticals, Inc. (a)(b) | 310,566 | 3,319,951 | |
| 100,296,410 | |||
| TOTAL HEALTH CARE | 919,160,389 | ||
| INDUSTRIALS - 16.6% | |||
| Aerospace & Defense - 1.4% | |||
| AAR Corp. | 175,729 | 7,549,318 | |
| Axon Enterprise, Inc. (a) | 94,269 | 5,653,312 | |
| Curtiss-Wright Corp. | 45,136 | 5,535,479 | |
| HEICO Corp. | 35,481 | 5,133,036 | |
| HEICO Corp. Class A | 173,072 | 19,100,226 | |
| Hexcel Corp. | 178,350 | 15,008,153 | |
| Huntington Ingalls Industries, Inc. | 51,192 | 10,699,128 | |
| Mercury Systems, Inc. (a) | 57,660 | 4,937,426 | |
| National Presto Industries, Inc. | 4,250 | 364,268 | |
| Spirit AeroSystems Holdings, Inc. Class A | 195,700 | 15,773,420 | |
| Teledyne Technologies, Inc. (a) | 55,823 | 17,226,420 | |
| Textron, Inc. | 39,907 | 1,795,815 | |
| 108,776,001 | |||
| Air Freight & Logistics - 0.5% | |||
| Air Transport Services Group, Inc. (a) | 136,151 | 2,750,250 | |
| Atlas Air Worldwide Holdings, Inc. (a) | 147,623 | 3,816,055 | |
| Echo Global Logistics, Inc. (a) | 91,418 | 1,832,017 | |
| Expeditors International of Washington, Inc. | 48,287 | 3,433,206 | |
| Forward Air Corp. | 252,432 | 15,726,514 | |
| Hub Group, Inc. Class A (a) | 36,743 | 1,582,154 | |
| XPO Logistics, Inc. (a)(b) | 181,449 | 12,857,476 | |
| 41,997,672 | |||
| Airlines - 0.8% | |||
| Air Canada (a) | 113,604 | 3,818,371 | |
| Alaska Air Group, Inc. | 327,200 | 19,540,384 | |
| Azul SA sponsored ADR (a) | 170,110 | 5,974,263 | |
| Hawaiian Holdings, Inc. | 243,252 | 5,937,781 | |
| JetBlue Airways Corp. (a) | 520,555 | 9,016,013 | |
| SkyWest, Inc. | 273,880 | 15,682,369 | |
| Spirit Airlines, Inc. (a) | 62,989 | 2,364,607 | |
| 62,333,788 | |||
| Building Products - 1.5% | |||
| A.O. Smith Corp. | 124,300 | 5,782,436 | |
| AAON, Inc. | 35,102 | 1,683,843 | |
| Allegion PLC | 80,621 | 7,761,384 | |
| Apogee Enterprises, Inc. | 76,492 | 2,824,850 | |
| Armstrong World Industries, Inc. | 195,038 | 18,620,278 | |
| Continental Building Products, Inc. (a) | 31,834 | 800,307 | |
| CSW Industrials, Inc. | 13,192 | 899,826 | |
| Fortune Brands Home & Security, Inc. | 278,947 | 14,243,034 | |
| Lennox International, Inc. | 44,841 | 11,379,749 | |
| Masonite International Corp. (a) | 215,502 | 11,505,652 | |
| Owens Corning | 294,620 | 16,899,403 | |
| Patrick Industries, Inc. (a) | 208,777 | 7,545,201 | |
| Simpson Manufacturing Co. Ltd. | 35,740 | 2,294,508 | |
| Trex Co., Inc. (a) | 118,703 | 10,152,668 | |
| Universal Forest Products, Inc. | 161,594 | 6,318,325 | |
| 118,711,464 | |||
| Commercial Services & Supplies - 2.8% | |||
| ABM Industries, Inc. | 536,967 | 20,007,390 | |
| ACCO Brands Corp. | 483,748 | 4,484,344 | |
| Brady Corp. Class A | 316,201 | 14,927,849 | |
| Casella Waste Systems, Inc. Class A (a) | 68,288 | 3,107,104 | |
| Cimpress NV (a) | 165,430 | 18,973,167 | |
| Clean Harbors, Inc. (a) | 440,166 | 32,374,209 | |
| Copart, Inc. (a) | 68,281 | 5,147,705 | |
| Deluxe Corp. | 113,608 | 5,235,057 | |
| Evoqua Water Technologies Corp. (a) | 217,533 | 3,363,060 | |
| Herman Miller, Inc. | 182,300 | 7,707,644 | |
| KAR Auction Services, Inc. | 606,122 | 16,098,600 | |
| MSA Safety, Inc. | 144,450 | 15,258,254 | |
| Pitney Bowes, Inc. (b) | 367,000 | 1,306,520 | |
| Republic Services, Inc. | 36,500 | 3,257,625 | |
| Ritchie Bros. Auctioneers, Inc. | 388,714 | 15,373,639 | |
| Rollins, Inc. | 127,237 | 4,174,646 | |
| Steelcase, Inc. Class A | 373,818 | 5,805,394 | |
| Tetra Tech, Inc. | 43,090 | 3,495,461 | |
| The Brink's Co. | 32,646 | 2,456,612 | |
| U.S. Ecology, Inc. | 42,385 | 2,567,259 | |
| UniFirst Corp. | 13,332 | 2,611,872 | |
| Waste Connection, Inc. (United States) | 290,434 | 26,690,885 | |
| 214,424,296 | |||
| Construction & Engineering - 0.6% | |||
| AECOM (a) | 122,096 | 4,331,966 | |
| Aegion Corp. (a) | 233,397 | 4,607,257 | |
| Comfort Systems U.S.A., Inc. | 31,504 | 1,217,945 | |
| EMCOR Group, Inc. | 16,784 | 1,467,593 | |
| Granite Construction, Inc. | 45,039 | 1,280,909 | |
| Jacobs Engineering Group, Inc. | 69,360 | 6,163,330 | |
| Quanta Services, Inc. | 214,327 | 7,265,685 | |
| Tutor Perini Corp. (a) | 453,158 | 4,527,048 | |
| Williams Scotsman Corp. (a) | 804,535 | 11,223,263 | |
| 42,084,996 | |||
| Electrical Equipment - 1.3% | |||
| Acuity Brands, Inc. | 66,931 | 8,393,817 | |
| AMETEK, Inc. | 62,882 | 5,403,450 | |
| EnerSys | 216,700 | 12,135,200 | |
| Generac Holdings, Inc. (a) | 239,847 | 18,705,668 | |
| Hubbell, Inc. Class B | 19,850 | 2,603,129 | |
| Regal Beloit Corp. | 191,355 | 13,567,070 | |
| Rockwell Automation, Inc. | 47,618 | 7,275,554 | |
| Sensata Technologies, Inc. PLC (a) | 617,800 | 28,159,324 | |
| 96,243,212 | |||
| Industrial Conglomerates - 0.2% | |||
| Carlisle Companies, Inc. | 66,712 | 9,670,572 | |
| ITT, Inc. | 49,852 | 2,837,576 | |
| Raven Industries, Inc. | 30,494 | 889,510 | |
| 13,397,658 | |||
| Machinery - 4.1% | |||
| Allison Transmission Holdings, Inc. | 294,626 | 13,090,233 | |
| Altra Industrial Motion Corp. | 83,706 | 2,175,519 | |
| Apergy Corp. (a) | 86,846 | 2,256,259 | |
| Cactus, Inc. (a) | 85,788 | 2,185,020 | |
| Donaldson Co., Inc. | 110,475 | 5,342,571 | |
| Douglas Dynamics, Inc. | 192,107 | 8,022,388 | |
| EnPro Industries, Inc. | 25,542 | 1,590,756 | |
| Gardner Denver Holdings, Inc. (a)(b) | 122,132 | 3,502,746 | |
| Gates Industrial Corp. PLC (a) | 702,926 | 6,115,456 | |
| Graco, Inc. | 143,771 | 6,551,644 | |
| Hillenbrand, Inc. | 53,862 | 1,477,973 | |
| IDEX Corp. | 90,382 | 14,886,819 | |
| John Bean Technologies Corp. | 121,597 | 12,441,805 | |
| Kennametal, Inc. | 568,321 | 16,987,115 | |
| Lincoln Electric Holdings, Inc. | 360,462 | 29,759,743 | |
| Meritor, Inc. (a) | 219,680 | 3,695,018 | |
| Middleby Corp. (a) | 114,747 | 12,583,156 | |
| Nordson Corp. | 96,960 | 13,182,682 | |
| Oshkosh Corp. | 78,618 | 5,524,487 | |
| Proto Labs, Inc. (a) | 41,528 | 3,934,363 | |
| RBC Bearings, Inc. (a) | 100,498 | 16,032,446 | |
| Rexnord Corp. (a) | 90,415 | 2,367,065 | |
| Snap-On, Inc. | 117,880 | 17,526,398 | |
| Tennant Co. | 211,094 | 14,436,719 | |
| Terex Corp. | 303,546 | 7,537,047 | |
| Timken Co. | 182,589 | 7,336,426 | |
| Toro Co. | 537,606 | 38,713,008 | |
| Trinity Industries, Inc. | 168,100 | 2,936,707 | |
| Wabtec Corp. (b) | 99,304 | 6,872,830 | |
| Welbilt, Inc. (a) | 375,880 | 5,916,351 | |
| Woodward, Inc. | 289,736 | 31,248,028 | |
| Xylem, Inc. | 23,866 | 1,828,374 | |
| 318,057,152 | |||
| Marine - 0.3% | |||
| Kirby Corp. (a) | 193,591 | 14,246,362 | |
| Matson, Inc. | 194,691 | 6,917,371 | |
| 21,163,733 | |||
| Professional Services - 1.1% | |||
| Asgn, Inc. (a) | 137,556 | 8,593,123 | |
| Barrett Business Services, Inc. | 6,360 | 554,147 | |
| CoStar Group, Inc. (a) | 20,188 | 12,412,996 | |
| Exponent, Inc. | 88,142 | 6,248,386 | |
| FTI Consulting, Inc. (a) | 99,045 | 10,710,726 | |
| Huron Consulting Group, Inc. (a) | 39,675 | 2,428,507 | |
| Insperity, Inc. | 32,866 | 3,255,706 | |
| Kforce, Inc. | 20,273 | 659,683 | |
| Manpower, Inc. | 145,514 | 11,894,314 | |
| Navigant Consulting, Inc. | 167,506 | 4,668,392 | |
| Robert Half International, Inc. | 104,937 | 5,610,981 | |
| TriNet Group, Inc. (a) | 291,760 | 19,585,849 | |
| 86,622,810 | |||
| Road & Rail - 0.7% | |||
| Genesee & Wyoming, Inc. Class A (a) | 10,543 | 1,169,008 | |
| Heartland Express, Inc. | 608,357 | 12,513,903 | |
| Kansas City Southern | 51,424 | 6,469,139 | |
| Knight-Swift Transportation Holdings, Inc. Class A (b) | 467,765 | 15,969,497 | |
| Landstar System, Inc. | 130,134 | 14,512,544 | |
| Ryder System, Inc. | 66,500 | 3,203,305 | |
| Saia, Inc. (a) | 12,604 | 1,078,146 | |
| 54,915,542 | |||
| Trading Companies & Distributors - 1.3% | |||
| Air Lease Corp. Class A | 245,222 | 10,186,522 | |
| Applied Industrial Technologies, Inc. | 197,598 | 10,549,757 | |
| Beacon Roofing Supply, Inc. (a) | 60,946 | 1,942,958 | |
| BMC Stock Holdings, Inc. (a) | 151,671 | 3,856,994 | |
| HD Supply Holdings, Inc. (a) | 43,494 | 1,692,352 | |
| MRC Global, Inc. (a) | 295,008 | 3,708,251 | |
| MSC Industrial Direct Co., Inc. Class A | 362,608 | 24,519,553 | |
| SiteOne Landscape Supply, Inc. (a)(b) | 165,454 | 12,938,503 | |
| Triton International Ltd. | 186,565 | 5,998,065 | |
| United Rentals, Inc. (a) | 141,473 | 15,924,201 | |
| Watsco, Inc. | 21,218 | 3,470,204 | |
| WESCO International, Inc. (a) | 157,059 | 7,080,220 | |
| 101,867,580 | |||
| TOTAL INDUSTRIALS | 1,280,595,904 | ||
| INFORMATION TECHNOLOGY - 19.5% | |||
| Communications Equipment - 0.8% | |||
| Arista Networks, Inc. (a) | 15,560 | 3,526,207 | |
| CalAmp Corp. (a) | 95,258 | 914,477 | |
| Ciena Corp. (a) | 514,743 | 21,068,431 | |
| CommScope Holding Co., Inc. (a) | 181,395 | 1,948,182 | |
| F5 Networks, Inc. (a) | 26,700 | 3,437,091 | |
| Juniper Networks, Inc. | 304,600 | 7,054,536 | |
| KVH Industries, Inc. (a) | 286,286 | 2,662,460 | |
| Lumentum Holdings, Inc. (a) | 44,334 | 2,472,064 | |
| NetScout Systems, Inc. (a) | 422,835 | 9,365,795 | |
| Ubiquiti, Inc. (b) | 16,217 | 1,792,141 | |
| Viavi Solutions, Inc. (a) | 250,940 | 3,485,557 | |
| 57,726,941 | |||
| Electronic Equipment & Components - 2.5% | |||
| Arrow Electronics, Inc. (a) | 154,801 | 10,712,229 | |
| Avnet, Inc. | 275,696 | 11,548,905 | |
| Badger Meter, Inc. | 25,150 | 1,297,237 | |
| Belden, Inc. | 406,754 | 18,552,050 | |
| CDW Corp. | 137,207 | 15,847,409 | |
| Cognex Corp. | 373,625 | 16,843,015 | |
| Coherent, Inc. (a) | 22,672 | 3,286,533 | |
| Dolby Laboratories, Inc. Class A | 49,919 | 3,073,014 | |
| Fabrinet (a) | 71,060 | 3,587,819 | |
| Flextronics International Ltd. (a) | 248,787 | 2,395,819 | |
| FLIR Systems, Inc. | 180,956 | 8,915,702 | |
| Insight Enterprises, Inc. (a) | 99,871 | 4,799,800 | |
| IPG Photonics Corp. (a) | 56,067 | 6,937,170 | |
| Jabil, Inc. | 250,281 | 7,210,596 | |
| Littelfuse, Inc. | 62,660 | 9,779,346 | |
| National Instruments Corp. | 97,241 | 4,084,122 | |
| Novanta, Inc. (a) | 69,720 | 5,229,000 | |
| Rogers Corp. (a) | 36,890 | 4,884,974 | |
| Sanmina Corp. (a) | 129,900 | 3,754,110 | |
| ScanSource, Inc. (a) | 71,700 | 2,026,242 | |
| SYNNEX Corp. | 121,373 | 10,172,271 | |
| Tech Data Corp. (a) | 49,700 | 4,608,681 | |
| Trimble, Inc. (a) | 492,034 | 18,461,116 | |
| TTM Technologies, Inc. (a) | 694,956 | 7,408,231 | |
| Vishay Intertechnology, Inc. | 256,825 | 4,065,540 | |
| Zebra Technologies Corp. Class A (a) | 13,737 | 2,816,497 | |
| 192,297,428 | |||
| IT Services - 4.6% | |||
| Alliance Data Systems Corp. | 20,149 | 2,477,320 | |
| Amdocs Ltd. | 612,837 | 39,675,067 | |
| Booz Allen Hamilton Holding Corp. Class A | 238,910 | 18,040,094 | |
| Carbonite, Inc. (a) | 555,128 | 6,689,292 | |
| Cass Information Systems, Inc. | 10,419 | 527,201 | |
| CoreLogic, Inc. (a) | 346,925 | 16,791,170 | |
| CSG Systems International, Inc. | 48,511 | 2,613,773 | |
| Dynatrace, Inc. | 196,363 | 4,512,422 | |
| EPAM Systems, Inc. (a) | 58,247 | 11,144,399 | |
| Euronet Worldwide, Inc. (a) | 349,284 | 53,489,352 | |
| EVERTEC, Inc. | 127,424 | 4,442,001 | |
| ExlService Holdings, Inc. (a) | 35,543 | 2,406,261 | |
| Fidelity National Information Services, Inc. | 93,010 | 12,669,822 | |
| Gartner, Inc. (a) | 53,502 | 7,151,612 | |
| Genpact Ltd. | 428,991 | 17,571,471 | |
| GoDaddy, Inc. (a) | 315,046 | 19,955,014 | |
| Interxion Holding N.V. (a) | 122,260 | 9,895,724 | |
| Jack Henry & Associates, Inc. | 68,390 | 9,913,814 | |
| Maximus, Inc. | 164,448 | 12,652,629 | |
| NIC, Inc. | 57,513 | 1,197,421 | |
| Presidio, Inc. | 803,068 | 12,865,149 | |
| Science Applications International Corp. | 25,806 | 2,271,186 | |
| Switch, Inc. Class A (b) | 711,509 | 11,668,748 | |
| Sykes Enterprises, Inc. (a) | 67,353 | 1,953,237 | |
| Total System Services, Inc. | 167,044 | 22,420,646 | |
| Ttec Holdings, Inc. | 103,593 | 4,859,548 | |
| Twilio, Inc. Class A (a) | 28,820 | 3,760,145 | |
| Virtusa Corp. (a) | 24,096 | 870,829 | |
| WEX, Inc. (a) | 97,691 | 19,982,694 | |
| Wix.com Ltd. (a) | 87,304 | 12,244,386 | |
| WNS Holdings Ltd. sponsored ADR (a) | 105,483 | 6,411,257 | |
| 353,123,684 | |||
| Semiconductors & Semiconductor Equipment - 2.6% | |||
| Advanced Micro Devices, Inc. (a) | 188,715 | 5,935,087 | |
| Brooks Automation, Inc. | 44,810 | 1,493,517 | |
| Cabot Microelectronics Corp. | 97,439 | 12,145,771 | |
| Cirrus Logic, Inc. (a) | 97,800 | 5,245,992 | |
| Cree, Inc. (a) | 50,352 | 2,161,611 | |
| Cypress Semiconductor Corp. | 518,566 | 11,932,204 | |
| Diodes, Inc. (a) | 156,600 | 5,723,730 | |
| Entegris, Inc. | 85,515 | 3,662,607 | |
| Kulicke & Soffa Industries, Inc. | 447,465 | 9,320,696 | |
| Lam Research Corp. | 55,800 | 11,746,458 | |
| Lattice Semiconductor Corp. (a) | 183,908 | 3,621,149 | |
| Marvell Technology Group Ltd. | 80,623 | 1,932,533 | |
| Maxim Integrated Products, Inc. | 170,450 | 9,296,343 | |
| MaxLinear, Inc. Class A (a) | 301,394 | 5,973,629 | |
| MKS Instruments, Inc. | 127,337 | 9,969,214 | |
| Monolithic Power Systems, Inc. | 97,198 | 14,634,131 | |
| NVE Corp. | 4,174 | 267,971 | |
| ON Semiconductor Corp. (a) | 2,022,029 | 35,992,116 | |
| Power Integrations, Inc. | 24,871 | 2,214,016 | |
| Qorvo, Inc. (a) | 117,924 | 8,423,311 | |
| Semtech Corp. (a) | 205,902 | 8,641,707 | |
| Silicon Laboratories, Inc. (a) | 112,557 | 12,268,713 | |
| Teradyne, Inc. | 141,062 | 7,472,054 | |
| Universal Display Corp. | 27,375 | 5,624,741 | |
| Versum Materials, Inc. | 158,181 | 8,225,412 | |
| 203,924,713 | |||
| Software - 8.6% | |||
| 2U, Inc. (a) | 431,606 | 7,717,115 | |
| 8x8, Inc. (a) | 405,925 | 9,868,037 | |
| ACI Worldwide, Inc. (a) | 555,627 | 16,546,572 | |
| Anaplan, Inc. | 109,186 | 5,932,075 | |
| ANSYS, Inc. (a) | 50,167 | 10,362,496 | |
| Aspen Technology, Inc. (a) | 333,801 | 44,462,293 | |
| Autodesk, Inc. (a) | 111,269 | 15,891,439 | |
| Avalara, Inc. (a) | 79,650 | 6,717,681 | |
| Black Knight, Inc. (a) | 197,661 | 12,304,397 | |
| Carbon Black, Inc. (a) | 306,237 | 7,992,786 | |
| CDK Global, Inc. | 150,606 | 6,500,155 | |
| ChannelAdvisor Corp. (a) | 329,440 | 2,833,184 | |
| CommVault Systems, Inc. (a) | 137,489 | 5,962,898 | |
| Cornerstone OnDemand, Inc. (a) | 215,726 | 11,254,425 | |
| Coupa Software, Inc. (a) | 42,910 | 5,961,486 | |
| DocuSign, Inc. (a) | 117,770 | 5,498,681 | |
| Ebix, Inc. (b) | 34,372 | 1,217,456 | |
| Everbridge, Inc. (a) | 12,902 | 1,112,152 | |
| Fair Isaac Corp. (a) | 60,460 | 21,325,451 | |
| FireEye, Inc. (a) | 1,070,907 | 14,382,281 | |
| Guidewire Software, Inc. (a) | 113,188 | 10,886,422 | |
| HubSpot, Inc. (a) | 58,493 | 11,679,882 | |
| HyreCar, Inc. (a)(b) | 452,185 | 1,324,902 | |
| Instructure, Inc. (a) | 46,685 | 1,930,892 | |
| j2 Global, Inc. | 469,347 | 39,706,756 | |
| LivePerson, Inc. (a) | 540,431 | 21,476,728 | |
| LogMeIn, Inc. | 421,641 | 28,182,484 | |
| Manhattan Associates, Inc. (a) | 56,476 | 4,666,612 | |
| Mimecast Ltd. (a) | 303,167 | 12,408,625 | |
| Model N, Inc. (a) | 566,111 | 16,207,758 | |
| New Relic, Inc. (a) | 97,041 | 5,564,331 | |
| Nuance Communications, Inc. (a) | 1,571,575 | 26,418,176 | |
| Paycom Software, Inc. (a) | 84,337 | 21,094,370 | |
| Paylocity Holding Corp. (a) | 17,133 | 1,871,266 | |
| Progress Software Corp. | 64,500 | 2,436,810 | |
| Proofpoint, Inc. (a) | 32,396 | 3,680,510 | |
| Q2 Holdings, Inc. (a) | 182,732 | 16,436,743 | |
| QAD, Inc. Class A | 49,156 | 1,991,801 | |
| Rapid7, Inc. (a) | 105,019 | 5,638,470 | |
| RealPage, Inc. (a) | 219,197 | 13,956,273 | |
| RingCentral, Inc. (a) | 129,851 | 18,325,872 | |
| Salesforce.com, Inc. (a) | 21,167 | 3,303,534 | |
| Slack Technologies, Inc. Class A (a)(b) | 77,840 | 2,229,338 | |
| Smartsheet, Inc. (a) | 105,394 | 5,122,148 | |
| SolarWinds, Inc. (a)(b) | 919,106 | 15,643,184 | |
| Splunk, Inc. (a) | 115,838 | 12,953,005 | |
| SS&C Technologies Holdings, Inc. | 771,475 | 35,958,450 | |
| Synopsys, Inc. (a) | 124,275 | 17,623,438 | |
| The Trade Desk, Inc. (a) | 78,220 | 19,224,129 | |
| Tyler Technologies, Inc. (a) | 68,013 | 17,448,055 | |
| Upland Software, Inc. (a) | 504,102 | 19,155,876 | |
| Verint Systems, Inc. (a) | 232,111 | 12,369,195 | |
| Yext, Inc. (a) | 224,304 | 3,537,274 | |
| Zendesk, Inc. (a) | 141,297 | 11,332,019 | |
| Zix Corp. (a) | 297,147 | 2,184,030 | |
| Zoom Video Communications, Inc. Class A (b) | 21,054 | 1,930,020 | |
| 659,742,438 | |||
| Technology Hardware, Storage & Peripherals - 0.4% | |||
| 3D Systems Corp. (a)(b) | 661,156 | 4,628,092 | |
| NCR Corp. (a) | 541,220 | 17,053,842 | |
| Seagate Technology LLC | 127,000 | 6,376,670 | |
| Xerox Holdings Corp. | 164,200 | 4,760,158 | |
| 32,818,762 | |||
| TOTAL INFORMATION TECHNOLOGY | 1,499,633,966 | ||
| MATERIALS - 3.9% | |||
| Chemicals - 1.7% | |||
| Ashland Global Holdings, Inc. | 83,500 | 6,115,540 | |
| Axalta Coating Systems Ltd. (a) | 380,176 | 10,979,483 | |
| Cabot Corp. | 76,213 | 3,048,520 | |
| Celanese Corp. Class A | 57,600 | 6,530,112 | |
| Chase Corp. | 6,255 | 626,876 | |
| Eastman Chemical Co. | 114,700 | 7,497,939 | |
| FMC Corp. | 86,785 | 7,492,149 | |
| Huntsman Corp. | 495,140 | 9,863,189 | |
| Ingevity Corp. (a) | 92,186 | 7,021,808 | |
| International Flavors & Fragrances, Inc. (b) | 29,154 | 3,199,652 | |
| Minerals Technologies, Inc. | 82,670 | 3,984,694 | |
| Orion Engineered Carbons SA | 280,399 | 3,900,350 | |
| PolyOne Corp. | 90,277 | 2,889,767 | |
| PQ Group Holdings, Inc. (a) | 254,944 | 3,643,150 | |
| Quaker Chemical Corp. | 70,360 | 11,177,390 | |
| The Chemours Co. LLC | 127,000 | 1,799,590 | |
| The Mosaic Co. | 111,150 | 2,044,049 | |
| The Scotts Miracle-Gro Co. Class A | 97,879 | 10,406,495 | |
| Trinseo SA | 338,972 | 11,894,527 | |
| Valvoline, Inc. | 265,617 | 6,002,944 | |
| Venator Materials PLC (a) | 242,645 | 541,098 | |
| Westlake Chemical Corp. | 158,393 | 9,280,246 | |
| 129,939,568 | |||
| Construction Materials - 0.1% | |||
| Eagle Materials, Inc. | 40,505 | 3,410,116 | |
| nVent Electric PLC | 138,455 | 2,805,098 | |
| 6,215,214 | |||
| Containers & Packaging - 1.4% | |||
| Amcor PLC | 127,747 | 1,254,476 | |
| Aptargroup, Inc. | 243,392 | 29,747,370 | |
| Avery Dennison Corp. | 56,251 | 6,500,928 | |
| Crown Holdings, Inc. (a) | 223,019 | 14,683,571 | |
| Graphic Packaging Holding Co. | 2,153,872 | 29,744,972 | |
| Owens-Illinois, Inc. | 384,500 | 3,910,365 | |
| Packaging Corp. of America | 85,700 | 8,619,706 | |
| Sealed Air Corp. | 137,601 | 5,479,272 | |
| WestRock Co. | 155,117 | 5,301,899 | |
| 105,242,559 | |||
| Metals & Mining - 0.6% | |||
| Alcoa Corp. (a) | 295,831 | 5,304,250 | |
| Carpenter Technology Corp. | 137,758 | 6,700,549 | |
| Cleveland-Cliffs, Inc. (b) | 1,771,262 | 14,063,820 | |
| Compass Minerals International, Inc. | 36,257 | 1,803,061 | |
| Ferroglobe Representation & Warranty Insurance (a)(c) | 495,885 | 5 | |
| Nucor Corp. | 45,268 | 2,217,227 | |
| Reliance Steel & Aluminum Co. | 59,000 | 5,736,570 | |
| Steel Dynamics, Inc. | 342,223 | 9,240,021 | |
| SunCoke Energy, Inc. | 581,519 | 3,628,679 | |
| United States Steel Corp. (b) | 172,500 | 1,909,575 | |
| 50,603,757 | |||
| Paper & Forest Products - 0.1% | |||
| Domtar Corp. | 79,600 | 2,622,820 | |
| Schweitzer-Mauduit International, Inc. | 131,446 | 4,408,699 | |
| 7,031,519 | |||
| TOTAL MATERIALS | 299,032,617 | ||
| REAL ESTATE - 4.5% | |||
| Equity Real Estate Investment Trusts (REITs) - 4.3% | |||
| American Campus Communities, Inc. | 195,836 | 9,102,457 | |
| Americold Realty Trust | 307,200 | 11,188,224 | |
| Apartment Investment & Management Co. Class A | 130,384 | 6,649,584 | |
| Brixmor Property Group, Inc. | 313,300 | 5,774,119 | |
| Camden Property Trust (SBI) | 104,643 | 11,327,605 | |
| CBL & Associates Properties, Inc. | 226,300 | 205,933 | |
| Chatham Lodging Trust | 121,828 | 2,021,127 | |
| Colony Capital, Inc. | 533,407 | 2,400,332 | |
| CorEnergy Infrastructure Trust, Inc. | 84,100 | 3,793,751 | |
| Corrections Corp. of America | 159,700 | 2,706,915 | |
| Cousins Properties, Inc. | 225,464 | 7,823,601 | |
| CubeSmart | 370,107 | 13,283,140 | |
| DDR Corp. | 357,750 | 4,958,415 | |
| DiamondRock Hospitality Co. | 461,700 | 4,372,299 | |
| Easterly Government Properties, Inc. | 277,259 | 5,697,672 | |
| EastGroup Properties, Inc. | 125,981 | 15,687,154 | |
| Empire State Realty Trust, Inc. | 555,544 | 7,810,949 | |
| Essex Property Trust, Inc. | 11,435 | 3,673,608 | |
| Extra Space Storage, Inc. | 41,489 | 5,058,339 | |
| Franklin Street Properties Corp. | 275,093 | 2,082,454 | |
| Front Yard Residential Corp. Class B | 98,985 | 1,097,744 | |
| Gaming & Leisure Properties | 126,866 | 4,962,998 | |
| Government Properties Income Trust | 132,285 | 3,586,246 | |
| Hospitality Properties Trust (SBI) | 254,722 | 6,148,989 | |
| Hudson Pacific Properties, Inc. | 85,788 | 2,916,792 | |
| Industrial Logistics Properties Trust | 136,179 | 2,912,869 | |
| Lamar Advertising Co. Class A | 70,653 | 5,415,552 | |
| Liberty Property Trust (SBI) | 36,900 | 1,923,228 | |
| Medical Properties Trust, Inc. | 661,649 | 12,300,055 | |
| Mid-America Apartment Communities, Inc. | 113,657 | 14,398,069 | |
| National Retail Properties, Inc. | 342,779 | 19,247,041 | |
| Omega Healthcare Investors, Inc. | 208,228 | 8,470,715 | |
| One Liberty Properties, Inc. | 62,151 | 1,664,404 | |
| Outfront Media, Inc. | 640,703 | 17,606,518 | |
| Park Hotels & Resorts, Inc. | 279,576 | 6,584,015 | |
| Piedmont Office Realty Trust, Inc. Class A | 504,344 | 9,955,751 | |
| Preferred Apartment Communities, Inc. Class A | 234,200 | 3,152,332 | |
| Prologis, Inc. | 55,396 | 4,632,214 | |
| Retail Properties America, Inc. | 231,202 | 2,626,455 | |
| RLJ Lodging Trust | 556,959 | 9,028,305 | |
| Ryman Hospitality Properties, Inc. | 44,345 | 3,532,523 | |
| Sabra Health Care REIT, Inc. | 207,182 | 4,479,275 | |
| Senior Housing Properties Trust (SBI) | 399,400 | 3,390,906 | |
| SL Green Realty Corp. | 23,774 | 1,907,150 | |
| Spirit Realty Capital, Inc. | 46,912 | 2,248,961 | |
| Stag Industrial, Inc. | 325,829 | 9,475,107 | |
| Summit Hotel Properties, Inc. | 198,800 | 2,218,608 | |
| Sun Communities, Inc. | 82,483 | 12,190,987 | |
| Tanger Factory Outlet Centers, Inc. (b) | 101,800 | 1,439,452 | |
| The GEO Group, Inc. | 154,500 | 2,651,220 | |
| VEREIT, Inc. | 1,265,900 | 12,342,525 | |
| Washington Prime Group, Inc. | 365,000 | 1,178,950 | |
| Weyerhaeuser Co. | 155,342 | 4,087,048 | |
| Xenia Hotels & Resorts, Inc. | 257,700 | 5,208,117 | |
| 330,598,799 | |||
| Real Estate Management & Development - 0.2% | |||
| Cushman & Wakefield PLC | 648,946 | 10,928,251 | |
| Jones Lang LaSalle, Inc. | 22,289 | 2,987,840 | |
| Marcus & Millichap, Inc. (a) | 12,670 | 457,134 | |
| Retail Value, Inc. | 36,735 | 1,358,828 | |
| 15,732,053 | |||
| TOTAL REAL ESTATE | 346,330,852 | ||
| UTILITIES - 1.1% | |||
| Electric Utilities - 0.6% | |||
| Alliant Energy Corp. | 209,427 | 10,984,446 | |
| FirstEnergy Corp. | 136,900 | 6,297,400 | |
| PNM Resources, Inc. | 125,255 | 6,389,258 | |
| Portland General Electric Co. | 367,164 | 20,887,960 | |
| Vistra Energy Corp. | 253,776 | 6,331,711 | |
| 50,890,775 | |||
| Gas Utilities - 0.1% | |||
| Southwest Gas Holdings, Inc. | 68,658 | 6,263,669 | |
| Independent Power and Renewable Electricity Producers - 0.1% | |||
| The AES Corp. | 383,651 | 5,881,370 | |
| Multi-Utilities - 0.3% | |||
| Black Hills Corp. | 83,696 | 6,420,320 | |
| NorthWestern Energy Corp. | 192,317 | 13,931,443 | |
| 20,351,763 | |||
| TOTAL UTILITIES | 83,387,577 | ||
| TOTAL COMMON STOCKS | |||
| (Cost $6,141,303,484) | 7,072,911,991 | ||
| Convertible Preferred Stocks - 0.0% | |||
| CONSUMER DISCRETIONARY - 0.0% | |||
| Internet & Direct Marketing Retail - 0.0% | |||
| The Honest Co., Inc. Series D (a)(c)(d) | |||
| (Cost $257,662) | 6,381 | 291,995 | |
| Equity Funds - 5.5% | |||
| Mid-Cap Blend Funds - 2.1% | |||
| Fidelity SAI Small-Mid Cap 500 Index Fund (e) | 12,812,548 | 158,491,198 | |
| Mid-Cap Growth Funds - 0.0% | |||
| iShares Russell Midcap Growth Index ETF | 22,860 | 3,272,409 | |
| Sector Funds - 1.4% | |||
| Fidelity SAI Real Estate Index Fund (e) | 8,806,764 | 107,090,251 | |
| Small Blend Funds - 2.0% | |||
| Fidelity Small Cap Index Fund (e) | 7,908,651 | 152,083,349 | |
| Small Growth Funds - 0.0% | |||
| iShares Russell 2000 Growth Index ETF (b) | 15,120 | 2,943,864 | |
| TOTAL EQUITY FUNDS | |||
| (Cost $376,547,886) | 423,881,071 | ||
| Money Market Funds - 6.5% | |||
| Fidelity Cash Central Fund 2.13% (f) | 1,624,883 | 1,625,208 | |
| Fidelity Securities Lending Cash Central Fund 2.13% (f)(g) | 301,105,736 | 301,135,847 | |
| State Street Institutional U.S. Government Money Market Fund Premier Class 1.87% (h) | 197,652,609 | 197,652,609 | |
| TOTAL MONEY MARKET FUNDS | |||
| (Cost $500,413,664) | 500,413,664 | ||
| TOTAL INVESTMENT IN SECURITIES - 103.8% | |||
| (Cost $7,018,522,696) | 7,997,498,721 | ||
| NET OTHER ASSETS (LIABILITIES) - (3.8)% | (290,680,757) | ||
| NET ASSETS - 100% | $7,706,817,964 |
| Futures Contracts | |||||
| Number of contracts | Expiration Date | Notional Amount | Value | Unrealized Appreciation/(Depreciation) | |
| Purchased | |||||
| Equity Index Contracts | |||||
| CME E-mini Russell 2000 Index Contracts (United States) | 18 | Sept. 2019 | $1,344,780 | $(22,242) | $(22,242) |
| CME E-mini S&P MidCap 400 Index Contracts (United States) | 4 | Sept. 2019 | 752,560 | (25,777) | (25,777) |
| TOTAL FUTURES CONTRACTS | $(48,019) |
The notional amount of futures purchased as a percentage of Net Assets is 0.0%
Security Type Abbreviations
ETF – Exchange-Traded Fund
Legend
(a) Non-income producing
(b) Security or a portion of the security is on loan at period end.
(c) Level 3 security
(d) Restricted securities - Investment in securities not registered under the Securities Act of 1933 (excluding 144A issues). At the end of the period, the value of restricted securities (excluding 144A issues) amounted to $291,995 or 0.0% of net assets.
(e) Affiliated Fund
(f) Affiliated fund that is generally available only to investment companies and other accounts managed by Fidelity Investments. The rate quoted is the annualized seven-day yield of the fund at period end. A complete unaudited listing of the fund's holdings as of its most recent quarter end is available upon request. In addition, each Fidelity Central Fund's financial statements are available on the SEC's website or upon request.
(g) Investment made with cash collateral received from securities on loan.
(h) The rate quoted is the annualized seven-day yield of the fund at period end.
Additional information on each restricted holding is as follows:
| Security | Acquisition Date | Acquisition Cost |
| The Honest Co., Inc. Series D | 9/25/15 | $257,662 |
Affiliated Central Funds
Information regarding fiscal year to date income earned by the Fund from investments in Fidelity Central Funds is as follows:
| Fund | Income earned |
| Fidelity Cash Central Fund | $11,613 |
| Fidelity Securities Lending Cash Central Fund | 691,907 |
| Total | $703,520 |
Amounts in the income column in the above table include any capital gain distributions from underlying funds, which are presented in the corresponding line-item in the Statement of Operations, if applicable. Amount for Fidelity Securities Lending Cash Central Fund represents the income earned on investing cash collateral, less rebates paid to borrowers and any lending agent fees associated with the loan, plus any premium payments received for lending certain types of securities.
Affiliated Underlying Funds
Fiscal year to date information regarding the Fund's investments in affiliated Underlying Funds, excluding any Money Market Central Funds, is presented below. Exchanges between classes of the same affiliated Underlying Funds may occur.
| Affiliate | Value, beginning of period | Purchases | Sales Proceeds | Dividend Income | Realized Gain (loss) | Change in Unrealized appreciation (depreciation) | Value, end of period |
| Fidelity SAI Real Estate Index Fund | $99,325,713 | $925,713 | $-- | $925,712 | $-- | $6,838,825 | $107,090,251 |
| Fidelity SAI Small-Mid Cap 500 Index Fund | 166,666,203 | 174,120,946 | 184,321,731 | -- | 4,414,803 | (2,389,023) | 158,491,198 |
| Fidelity Small Cap Index Fund | 166,544,687 | 178,866,682 | 183,226,609 | 740,872 | (860,510 ) | (9,240,901) | 152,083,349 |
| Total | $432,536,603 | $353,913,341 | $367,548,340 | $1,666,584 | $3,554,293 | $(4,791,099) | $417,664,798 |
Amounts in the income column in the above table include any capital gain distributions from underlying funds, which are presented in the corresponding line-item in the Statement of Operations, if applicable.
Investment Valuation
The following is a summary of the inputs used, as of August 31, 2019, involving the Fund's assets and liabilities carried at fair value. The inputs or methodology used for valuing securities may not be an indication of the risk associated with investing in those securities. For more information on valuation inputs, and their aggregation into the levels used below, please refer to the Investment Valuation section in the accompanying Notes to Financial Statements.
| Valuation Inputs at Reporting Date: | ||||
| Description | Total | Level 1 | Level 2 | Level 3 |
| Investments in Securities: | ||||
| Equities: | ||||
| Communication Services | $215,180,683 | $215,180,683 | $-- | $-- |
| Consumer Discretionary | 933,286,862 | 932,994,867 | -- | 291,995 |
| Consumer Staples | 231,057,842 | 231,057,842 | -- | -- |
| Energy | 203,867,357 | 203,867,357 | -- | -- |
| Financials | 1,061,669,937 | 1,061,669,937 | -- | -- |
| Health Care | 919,160,389 | 919,160,389 | -- | -- |
| Industrials | 1,280,595,904 | 1,280,595,904 | -- | -- |
| Information Technology | 1,499,633,966 | 1,499,633,966 | -- | -- |
| Materials | 299,032,617 | 299,032,612 | -- | 5 |
| Real Estate | 346,330,852 | 346,330,852 | -- | -- |
| Utilities | 83,387,577 | 83,387,577 | -- | -- |
| Equity Funds | 423,881,071 | 423,881,071 | -- | -- |
| Money Market Funds | 500,413,664 | 500,413,664 | -- | -- |
| Total Investments in Securities: | $7,997,498,721 | $7,997,206,721 | $-- | $292,000 |
| Derivative Instruments: | ||||
| Liabilities | ||||
| Futures Contracts | $(48,019) | $(48,019) | $-- | $-- |
| Total Liabilities | $(48,019) | $(48,019) | $-- | $-- |
| Total Derivative Instruments: | $(48,019) | $(48,019) | $-- | $-- |
Value of Derivative Instruments
The following table is a summary of the Fund's value of derivative instruments by primary risk exposure as of August 31, 2019. For additional information on derivative instruments, please refer to the Derivative Instruments section in the accompanying Notes to Financial Statements.
| Primary Risk Exposure / Derivative Type | Value | |
| Asset | Liability | |
| Equity Risk | ||
| Futures Contracts(a) | $0 | $(48,019) |
| Total Equity Risk | 0 | (48,019) |
| Total Value of Derivatives | $0 | $(48,019) |
(a) Reflects gross cumulative appreciation (depreciation) on futures contracts as presented in the Schedule of Investments. In the Statement of Assets and Liabilities, the period end daily variation margin is included in receivable or payable for daily variation margin on futures contracts, and the net cumulative appreciation (depreciation) is included in distributable earnings.
See accompanying notes which are an integral part of the financial statements.
Financial Statements
Statement of Assets and Liabilities
| August 31, 2019 (Unaudited) | ||
| Assets | ||
| Investment in securities, at value (including securities loaned of $294,030,664) — See accompanying schedule: Unaffiliated issuers (cost $6,344,821,273) | $7,277,072,868 | |
| Fidelity Central Funds (cost $302,761,055) | 302,761,055 | |
| Other affiliated issuers (cost $370,940,368) | 417,664,798 | |
| Total Investment in Securities (cost $7,018,522,696) | $7,997,498,721 | |
| Segregated cash with brokers for derivative instruments | 89,300 | |
| Receivable for investments sold | 24,986,390 | |
| Receivable for fund shares sold | 1,816,689 | |
| Dividends receivable | 6,173,533 | |
| Interest receivable | 329,045 | |
| Distributions receivable from Fidelity Central Funds | 159,537 | |
| Prepaid expenses | 19,140 | |
| Other receivables | 161,026 | |
| Total assets | 8,031,233,381 | |
| Liabilities | ||
| Payable to custodian bank | $778,080 | |
| Payable for investments purchased | 14,547,545 | |
| Payable for fund shares redeemed | 5,078,728 | |
| Accrued management fee | 2,561,464 | |
| Payable for daily variation margin on futures contracts | 1,410 | |
| Other payables and accrued expenses | 307,546 | |
| Collateral on securities loaned | 301,140,644 | |
| Total liabilities | 324,415,417 | |
| Net Assets | $7,706,817,964 | |
| Net Assets consist of: | ||
| Paid in capital | $6,732,596,881 | |
| Total distributable earnings (loss) | 974,221,083 | |
| Net Assets, for 568,071,472 shares outstanding | $7,706,817,964 | |
| Net Asset Value, offering price and redemption price per share ($7,706,817,964 ÷ 568,071,472 shares) | $13.57 |
See accompanying notes which are an integral part of the financial statements.
Statement of Operations
| Six months ended August 31, 2019 (Unaudited) | ||
| Investment Income | ||
| Dividends: | ||
| Unaffiliated issuers | $48,733,858 | |
| Affiliated issuers | 1,666,584 | |
| Interest | 2,110,780 | |
| Income from Fidelity Central Funds (including $691,907 from security lending) | 703,520 | |
| Total income | 53,214,742 | |
| Expenses | ||
| Management fee | $25,623,604 | |
| Accounting and security lending fees | 410,860 | |
| Custodian fees and expenses | 140,469 | |
| Independent trustees' fees and expenses | 44,028 | |
| Registration fees | 58,081 | |
| Audit | 54,351 | |
| Legal | 21,555 | |
| Miscellaneous | 41,978 | |
| Total expenses before reductions | 26,394,926 | |
| Expense reductions | (9,890,142) | |
| Total expenses after reductions | 16,504,784 | |
| Net investment income (loss) | 36,709,958 | |
| Realized and Unrealized Gain (Loss) | ||
| Net realized gain (loss) on: | ||
| Investment securities: | ||
| Unaffiliated issuers | 78,851,769 | |
| Fidelity Central Funds | (5,360) | |
| Other affiliated issuers | 3,554,293 | |
| Foreign currency transactions | 127,089 | |
| Futures contracts | 133,294 | |
| Total net realized gain (loss) | 82,661,085 | |
| Change in net unrealized appreciation (depreciation) on: | ||
| Investment securities: | ||
| Unaffiliated issuers | (144,528,407) | |
| Affiliated issuers | (4,791,099) | |
| Assets and liabilities in foreign currencies | (989) | |
| Futures contracts | (167,073) | |
| Total change in net unrealized appreciation (depreciation) | (149,487,568) | |
| Net gain (loss) | (66,826,483) | |
| Net increase (decrease) in net assets resulting from operations | $(30,116,525) |
See accompanying notes which are an integral part of the financial statements.
Statement of Changes in Net Assets
| Six months ended August 31, 2019 (Unaudited) | Year ended February 28, 2019 | |
| Increase (Decrease) in Net Assets | ||
| Operations | ||
| Net investment income (loss) | $36,709,958 | $61,869,587 |
| Net realized gain (loss) | 82,661,085 | 378,717,385 |
| Change in net unrealized appreciation (depreciation) | (149,487,568) | (203,573,605) |
| Net increase (decrease) in net assets resulting from operations | (30,116,525) | 237,013,367 |
| Distributions to shareholders | – | (805,620,345) |
| Share transactions | ||
| Proceeds from sales of shares | 343,823,259 | 2,475,758,767 |
| Reinvestment of distributions | – | 803,532,856 |
| Cost of shares redeemed | (688,450,363) | (2,132,255,365) |
| Net increase (decrease) in net assets resulting from share transactions | (344,627,104) | 1,147,036,258 |
| Total increase (decrease) in net assets | (374,743,629) | 578,429,280 |
| Net Assets | ||
| Beginning of period | 8,081,561,593 | 7,503,132,313 |
| End of period | $7,706,817,964 | $8,081,561,593 |
| Other Information | ||
| Shares | ||
| Sold | 25,109,817 | 175,003,000 |
| Issued in reinvestment of distributions | – | 64,550,159 |
| Redeemed | (50,383,705) | (150,975,250) |
| Net increase (decrease) | (25,273,888) | 88,577,909 |
See accompanying notes which are an integral part of the financial statements.
Financial Highlights
Strategic Advisers Small-Mid Cap Fund
| Six months ended (Unaudited) August 31, | Years endedFebruary 28, | |||||
| 2019 | 2019 | 2018 | 2017 | 2016A | 2015 | |
| Selected Per–Share Data | ||||||
| Net asset value, beginning of period | $13.62 | $14.86 | $14.19 | $11.12 | $13.66 | $14.12 |
| Income from Investment Operations | ||||||
| Net investment income (loss)B | .06 | .11 | .08 | .05 | .04 | .03 |
| Net realized and unrealized gain (loss) | (.11) | .11 | 1.88 | 3.29 | (1.78) | .64 |
| Total from investment operations | (.05) | .22 | 1.96 | 3.34 | (1.74) | .67 |
| Distributions from net investment income | – | (.11) | (.07) | (.04) | (.03) | (.03) |
| Distributions from net realized gain | – | (1.35) | (1.22) | (.22) | (.77) | (1.11) |
| Total distributions | – | (1.46) | (1.29) | (.27)C | (.80) | (1.13)D |
| Net asset value, end of period | $13.57 | $13.62 | $14.86 | $14.19 | $11.12 | $13.66 |
| Total ReturnE,F | (.37)% | 2.64% | 14.04% | 30.11% | (13.45)% | 5.45% |
| Ratios to Average Net AssetsG,H | ||||||
| Expenses before reductions | .67%I | .73% | .85% | .87% | .72% | .62% |
| Expenses net of fee waivers, if any | .42%I | .48% | .60% | .62% | .46% | .37% |
| Expenses net of all reductions | .42%I | .48% | .60% | .62% | .46% | .37% |
| Net investment income (loss) | .93%I | .77% | .53% | .37% | .28% | .23% |
| Supplemental Data | ||||||
| Net assets, end of period (000 omitted) | $7,706,818 | $8,081,562 | $7,503,132 | $7,048,707 | $6,718,287 | $7,202,333 |
| Portfolio turnover rateJ | 55%I | 82% | 75% | 82% | 71% | 54% |
A For the year ended February 29.
B Calculated based on average shares outstanding during the period.
C Total distributions of $.27 per share is comprised of distributions from net investment income of $.044 and distributions from net realized gain of $.224 per share.
D Total distributions of $1.13 per share is comprised of distributions from net investment income of $.026 and distributions from net realized gain of $1.105 per share.
E Total returns for periods of less than one year are not annualized.
F Total returns would have been lower if certain expenses had not been reduced during the applicable periods shown.
G Fees and expenses of any underlying Fidelity Central Funds are not included in the Fund's expense ratio. The Fund indirectly bears its proportionate share of the expenses of any underlying Fidelity Central Funds.
H Expense ratios reflect operating expenses of the Fund. Expenses before reductions do not reflect amounts reimbursed by the investment adviser or reductions from brokerage service arrangements or reductions from other expense offset arrangements and do not represent the amount paid by the Fund during periods when reimbursements or reductions occur. Expenses net of fee waivers reflect expenses after reimbursement by the investment adviser but prior to reductions from brokerage service arrangements or other expense offset arrangements. Expenses net of all reductions represent the net expenses paid by the Fund. Fees and expenses of the Underlying Funds are not included in the Fund's annualized ratios. The Fund indirectly bears its proportionate share of the expenses of the Underlying Funds.
I Annualized
J Amount does not include the portfolio activity of any Underlying Funds.
See accompanying notes which are an integral part of the financial statements.
Notes to Financial Statements (Unaudited)
For the period ended August 31, 2019
1. Organization.
Strategic Advisers Small-Mid Cap Fund (the Fund) is a fund of Fidelity Rutland Square Trust II (the Trust), and is authorized to issue an unlimited number of shares. The Trust is registered under the Investment Company Act of 1940, as amended (the 1940 Act), as an open-end management investment company organized as a Delaware statutory trust. The Fund is offered exclusively to certain clients of Strategic Advisers LLC (Strategic Advisers), an affiliate of Fidelity Management & Research Company (FMR).
2. Significant Accounting Policies.
The Fund is an investment company and applies the accounting and reporting guidance of the Financial Accounting Standards Board (FASB) Accounting Standards Codification Topic 946 Financial Services – Investments Companies. The financial statements have been prepared in conformity with accounting principles generally accepted in the United States of America (GAAP), which require management to make certain estimates and assumptions at the date of the financial statements. Actual results could differ from those estimates. Subsequent events, if any, through the date that the financial statements were issued have been evaluated in the preparation of the financial statements. The following summarizes the significant accounting policies of the Fund:
Investment Valuation. Investments are valued as of 4:00 p.m. Eastern time on the last calendar day of the period. The Board of Trustees (the Board) has delegated the day to day responsibility for the valuation of the Fund's investments to the Fair Value Committee (the Committee) established by the Fund's investment adviser. In accordance with valuation policies and procedures approved by the Board, the Fund attempts to obtain prices from one or more third party pricing vendors or brokers to value its investments. When current market prices, quotations or currency exchange rates are not readily available or reliable, investments will be fair valued in good faith by the Committee, in accordance with procedures adopted by the Board. Factors used in determining fair value vary by investment type and may include market or investment specific events. The frequency with which these procedures are used cannot be predicted and they may be utilized to a significant extent. The Committee oversees the Fund's valuation policies and procedures and reports to the Board on the Committee's activities and fair value determinations. The Board monitors the appropriateness of the procedures used in valuing the Fund's investments and ratifies the fair value determinations of the Committee.
The Fund categorizes the inputs to valuation techniques used to value its investments into a disclosure hierarchy consisting of three levels as shown below:
- Level 1 – quoted prices in active markets for identical investments
- Level 2 – other significant observable inputs (including quoted prices for similar investments, interest rates, prepayment speeds, etc.)
- Level 3 – unobservable inputs (including the Fund's own assumptions based on the best information available)
Valuation techniques used to value the Fund's investments by major category are as follows:
Equity securities, including restricted securities, for which market quotations are readily available, are valued at the last reported sale price or official closing price as reported by a third party pricing vendor on the primary market or exchange on which they are traded and are categorized as Level 1 in the hierarchy. In the event there were no sales during the day or closing prices are not available, securities are valued at the last quoted bid price or may be valued using the last available price and are generally categorized as Level 2 in the hierarchy. For foreign equity securities, when market or security specific events arise, comparisons to the valuation of American Depositary Receipts (ADRs), futures contracts, Exchange-Traded Funds (ETFs) and certain indexes as well as quoted prices for similar securities may be used and would be categorized as Level 2 in the hierarchy. For equity securities, including restricted securities, where observable inputs are limited, assumptions about market activity and risk are used and these securities may be categorized as Level 3 in the hierarchy.
ETFs are valued at their last sale price or official closing price as reported by a third party pricing vendor on the primary market or exchange on which they are traded and are categorized as Level 1 in the hierarchy. In the event there were no sales during the day but the exchange reports a closing bid level, ETFs are valued at the closing bid and would be categorized as Level 1 in the hierarchy. In the event there was no closing bid, ETFs may be valued by another method that the Board believes reflects fair value in accordance with the Board's fair value pricing policies and may be categorized as Level 2 in the hierarchy.
Futures contracts are valued at the settlement price established each day by the board of trade or exchange on which they are traded and are categorized as Level 1 in the hierarchy. Investments in open-end mutual funds, including the Fidelity Central Funds, are valued at their closing net asset value (NAV) each business day and are categorized as Level 1 in the hierarchy. If an unaffiliated open-end mutual fund's NAV is unavailable, shares of that fund may be valued by another method that the Board believes reflects fair value in accordance with the Board's fair value pricing policies and is categorized as Level 2 in the hierarchy.
Changes in valuation techniques may result in transfers in or out of an assigned level within the disclosure hierarchy. The aggregate value of investments by input level as of August 31, 2019 is included at the end of the Fund's Schedule of Investments.
Foreign Currency. The Fund may use foreign currency contracts to facilitate transactions in foreign-denominated securities. Gains and losses from these transactions may arise from changes in the value of the foreign currency or if the counterparties do not perform under the contracts' terms.
Foreign-denominated assets, including investment securities, and liabilities are translated into U.S. dollars at the exchange rates at period end. Purchases and sales of investment securities, income and dividends received and expenses denominated in foreign currencies are translated into U.S. dollars at the exchange rate in effect on the transaction date.
The effects of exchange rate fluctuations on investments are included with the net realized and unrealized gain (loss) on investment securities. Other foreign currency transactions resulting in realized and unrealized gain (loss) are disclosed separately.
Investment Transactions and Income. For financial reporting purposes, the Fund's investment holdings and NAV include trades executed through the end of the last business day of the period. The NAV per share for processing shareholder transactions is calculated as of the close of business of the New York Stock Exchange (NYSE), normally 4:00 p.m. Eastern time and includes trades executed through the end of the prior business day. Gains and losses on securities sold are determined on the basis of identified cost and include proceeds received from litigation. Dividend income is recorded on the ex-dividend date, except for certain dividends from foreign securities where the ex-dividend date may have passed, which are recorded as soon as the Fund is informed of the ex-dividend date. Non-cash dividends included in dividend income, if any, are recorded at the fair market value of the securities received. Income and capital gain distributions from Fidelity Central Funds, if any, are recorded on the ex-dividend date. Income and capital gain distributions from Underlying Funds and distributions from ETFs, if any, are recorded on the ex-dividend date. Certain distributions received by the Fund represent a return of capital or capital gain. The Fund determines the components of these distributions subsequent to the ex-dividend date, based upon receipt of tax filings or other correspondence relating to the underlying investment. These distributions are recorded as a reduction of cost of investments and/or as a realized gain. Interest income is accrued as earned and includes coupon interest and amortization of premium and accretion of discount on debt securities as applicable. Investment income is recorded net of foreign taxes withheld where recovery of such taxes is uncertain.
Expenses. Expenses directly attributable to a fund are charged to that fund. Expenses attributable to more than one fund are allocated among the respective funds on the basis of relative net assets or other appropriate methods. Expense estimates are accrued in the period to which they relate and adjustments are made when actual amounts are known.
Deferred Trustee Compensation. Under a Deferred Compensation Plan (the Plan), certain independent Trustees have elected to defer receipt of a portion of their annual compensation. Deferred amounts are invested in a cross-section of Strategic Advisers funds, are marked-to-market and remain in the Fund until distributed in accordance with the Plan. The investment of deferred amounts and the offsetting payable to the Trustees of $99,747 are included in the accompanying Statement of Assets and Liabilities in other receivables and other payables and accrued expenses, respectively.
Income Tax Information and Distributions to Shareholders. Each year, the Fund intends to qualify as a regulated investment company under Subchapter M of the Internal Revenue Code, including distributing substantially all of its taxable income and realized gains. As a result, no provision for U.S. Federal income taxes is required. The Fund files a U.S. federal tax return, in addition to state and local tax returns as required. The Fund's federal income tax returns are subject to examination by the Internal Revenue Service (IRS) for a period of three fiscal years after they are filed. State and local tax returns may be subject to examination for an additional fiscal year depending on the jurisdiction. Foreign taxes are provided for based on the Fund's understanding of the tax rules and rates that exist in the foreign markets in which it invests.
Distributions are declared and recorded on the ex-dividend date. Income and capital gain distributions are determined in accordance with income tax regulations, which may differ from GAAP.
Capital accounts within the financial statements are adjusted for permanent book-tax differences. These adjustments have no impact on net assets or the results of operations. Capital accounts are not adjusted for temporary book-tax differences which will reverse in a subsequent period.
Book-tax differences are primarily due to the short-term gain distributions from the Underlying Funds, futures contracts, foreign currency transactions, passive foreign investment companies (PFIC), market discount, partnerships, deferred trustees compensation, and losses deferred due to wash sales and excise tax regulations.
As of period end, the cost and unrealized appreciation (depreciation) in securities, and derivatives if applicable, for federal income tax purposes were as follows:
| Gross unrealized appreciation | $1,658,626,123 |
| Gross unrealized depreciation | (722,059,365) |
| Net unrealized appreciation (depreciation) | $936,566,758 |
| Tax cost | $7,060,883,944 |
The Fund elected to defer to its next fiscal year approximately $61,715,443 of capital losses recognized during the period November 1, 2018 to February 28, 2019.
Restricted Securities. The Fund may invest in securities that are subject to legal or contractual restrictions on resale. These securities generally may be resold in transactions exempt from registration or to the public if the securities are registered. Disposal of these securities may involve time-consuming negotiations and expense, and prompt sale at an acceptable price may be difficult. Information regarding restricted securities is included at the end of the Fund's Schedule of Investments.
3. Derivative Instruments.
Risk Exposures and the Use of Derivative Instruments. The Fund's investment objective allows the Fund to enter into various types of derivative contracts, including futures contracts. Derivatives are investments whose value is primarily derived from underlying assets, indices or reference rates and may be transacted on an exchange or over-the-counter (OTC). Derivatives may involve a future commitment to buy or sell a specified asset based on specified terms, to exchange future cash flows at periodic intervals based on a notional principal amount, or for one party to make one or more payments upon the occurrence of specified events in exchange for periodic payments from the other party.
The Fund used derivatives to increase returns and to manage exposure to certain risks as defined below. The success of any strategy involving derivatives depends on analysis of numerous economic factors, and if the strategies for investment do not work as intended, the Fund may not achieve its objectives.
The Fund's use of derivatives increased or decreased its exposure to the following risk:
| Equity Risk | Equity risk relates to the fluctuations in the value of financial instruments as a result of changes in market prices (other than those arising from interest rate risk or foreign exchange risk), whether caused by factors specific to an individual investment, its issuer, or all factors affecting all instruments traded in a market or market segment. |
The Fund is also exposed to additional risks from investing in derivatives, such as liquidity risk and counterparty credit risk. Liquidity risk is the risk that the Fund will be unable to close out the derivative in the open market in a timely manner. Counterparty credit risk is the risk that the counterparty will not be able to fulfill its obligation to the Fund. Counterparty credit risk related to exchange-traded futures contracts may be mitigated by the protection provided by the exchange on which they trade.
Investing in derivatives may involve greater risks than investing in the underlying assets directly and, to varying degrees, may involve risk of loss in excess of any initial investment and collateral received and amounts recognized in the Statement of Assets and Liabilities. In addition, there may be the risk that the change in value of the derivative contract does not correspond to the change in value of the underlying instrument.
Futures Contracts. A futures contract is an agreement between two parties to buy or sell a specified underlying instrument for a fixed price at a specified future date. The Fund used futures contracts to manage its exposure to the stock market.
Upon entering into a futures contract, a fund is required to deposit either cash or securities (initial margin) with a clearing broker in an amount equal to a certain percentage of the face value of the contract. Futures contracts are marked-to-market daily and subsequent daily payments (variation margin) are made or received by a fund depending on the daily fluctuations in the value of the futures contracts and are recorded as unrealized appreciation or (depreciation). This receivable and/or payable, if any, is included in daily variation margin on futures contracts in the Statement of Assets and Liabilities. Realized gain or (loss) is recorded upon the expiration or closing of a futures contract. The net realized gain (loss) and change in net unrealized appreciation (depreciation) on futures contracts during the period is presented in the Statement of Operations.
Any open futures contracts at period end are presented in the Schedule of Investments under the caption "Futures Contracts". The notional amount at value reflects each contract's exposure to the underlying instrument or index at period end and is representative of volume of activity during the period. Cash deposited to meet initial margin requirements is presented as segregated cash with brokers for derivative instruments in the Statement of Assets and Liabilities.
4. Purchases and Sales of Investments.
Purchases and sales of securities (including the Underlying Fund shares), other than short-term securities, aggregated $2,108,261,397 and $2,420,778,542, respectively.
Prior Fiscal Year Unaffiliated Exchanges In-Kind. During the prior period, the Fund redeemed 13,396,695 shares of AB Discovery Value Fund Advisor Class in exchange for investments and cash with a value of $324,601,918. The Fund had a net realized gain of $5,799,071 on the Fund's redemptions of AB Discovery Value Fund Advisor Class shares. The Fund recognized gains on the exchanges for federal income tax purposes.
5. Fees and Other Transactions with Affiliates.
Management Fee. Strategic Advisers (the investment adviser) provides the Fund with investment management related services. For these services, the Fund pays a monthly management fee to the investment adviser. The management fee is calculated by adding the annual management fee rate of .25% of the Fund's average net assets throughout the month payable to the investment adviser to the aggregate of the fee rates, payable monthly, to the Fund's sub-advisers. The Fund's maximum aggregate management fee will not exceed 1.10% of the Fund's average net assets. For the reporting period, the total annualized management fee rate was .65% of the Fund's average net assets.
During the period, the investment adviser waived a portion of its management fee as described in the Expense Reductions note.
Sub-Advisers. AllianceBernstein, L.P. (AB), ArrowMark Colorado Holdings, LLC (d/b/a ArrowMark Partners), LLC, Boston Partners Global Investors, Inc., Fisher Investments, Geode Capital Management, LLC, J.P. Morgan Investment Management, Inc., LSV Asset Management, Portolan Capital Management, LLC, Rice Hall James & Associates, LLC, Victory Capital Management, Inc., Mellon Investments Corporation (through May 2, 2019) and Voya Investment Management Co., LLC each served as a sub-adviser for the Fund during the period. Sub-advisers provide discretionary investment advisory services for their allocated portion of the Fund's assets and are paid by the investment adviser and not the Fund for providing these services.
FIAM LLC (FIAM)(an affiliate of the investment adviser) has been retained to serve as a sub-adviser for the Fund. As of the date of this report, however, FIAM has not been allocated any portion of the Fund's assets. FIAM in the future may provide discretionary investment advisory services for an allocated portion of the Fund's assets and will be paid by the investment adviser for providing these services.
During September 2019, the agreement with Mellon Investments Corporation was not renewed.
Effective after the close of business on October 15, 2019, Fisher Investments did not provide investment advisory services for any portion of the Fund's assets.
Accounting and Security Lending Fees. Fidelity Service Company, Inc. (FSC), an affiliate of the investment adviser, maintains the Fund's accounting records. The accounting fee is based on the level of average net assets for each month. Prior to April 1, 2019, FSC had a separate agreement with the Fund for administration of the security lending program, based on the number and duration of lending transactions. Effective July 1, 2019 accounting fees are not paid by the Fund and are instead paid by the investment adviser or an affiliate. For the period, the total fees paid for accounting and administration of securities lending were equivalent to an annualized rate of .01%.
Brokerage Commissions. The Fund placed a portion of its portfolio transactions with brokerage firms which are affiliates of the investment adviser. Brokerage commissions are included in net realized gain (loss) and change in net unrealized appreciation (depreciation) in the Statement of Operations. The commissions paid to these affiliated firms were $2,364 for the period.
Interfund Trades. The Fund may purchase from or sell securities to other funds affiliated with each sub-adviser under procedures adopted by the Board. The procedures have been designed to ensure these interfund trades are executed in accordance with Rule 17a-7 of the 1940 Act. Interfund trades are included within the respective purchases and sales amounts shown in the Purchases and Sales of Investments note.
Other. During the period, the investment adviser reimbursed the Fund for certain losses in the amount of $116,019.
6. Investments in Fidelity Central Funds.
The Fund invests in Fidelity Central Funds, which are open-end investment companies available only to other investment companies and accounts managed by the investment adviser and its affiliates. The Fund's Schedule of Investments lists each of the Fidelity Central Funds held as of period end, if any, as an investment of the Fund, but does not include the underlying holdings of each Fidelity Central Fund. As an Investing Fund, the Fund indirectly bears its proportionate share of the expenses of the underlying Fidelity Central Funds.
The Fidelity Money Market Central Funds are managed by Fidelity Investments Money Management, Inc. (FIMM), an affiliate of the investment adviser. Annualized expenses of the Money Market Central Funds as of their most recent shareholder report date ranged from less than .005% to .01%.
A complete unaudited list of holdings for each Fidelity Central Fund is available upon request or at the Securities and Exchange Commission (the SEC) website at www.sec.gov. In addition, the financial statements of the Fidelity Central Funds are available on the SEC website or upon request.
7. Committed Line of Credit.
The Fund participates with other funds managed by the investment adviser or an affiliate in a $4.25 billion credit facility (the "line of credit") to be utilized for temporary or emergency purposes to fund shareholder redemptions or for other short-term liquidity purposes. The Fund has agreed to pay commitment fees on its pro-rata portion of the line of credit, which amounted to $10,775 and is reflected in Miscellaneous expenses on the Statement of Operations. During the period, the Fund did not borrow on this line of credit.
8. Security Lending.
The Fund lends portfolio securities through a lending agent from time to time in order to earn additional income. On the settlement date of the loan, the Fund receives collateral (in the form of U.S. Treasury obligations, letters of credit and/or cash) against the loaned securities and maintains collateral in an amount not less than 100% of the market value of the loaned securities during the period of the loan. The market value of the loaned securities is determined at the close of business of the Fund and any additional required collateral is delivered to the Fund on the next business day. The Fund or borrower may terminate the loan at any time, and if the borrower defaults on its obligation to return the securities loaned because of insolvency or other reasons, the Fund may apply collateral received from the borrower against the obligation. The Fund may experience delays and costs in recovering the securities loaned. Any cash collateral received is invested in the Fidelity Securities Lending Cash Central Fund. The value of loaned securities and cash collateral at period end are disclosed on the Fund's Statement of Assets and Liabilities. Security lending income represents the income earned on investing cash collateral, less rebates paid to borrowers and any lending agent fees associated with the loan, plus any premium payments received for lending certain types of securities. Security lending income is presented in the Statement of Operations as a component of income from Fidelity Central Funds.
9. Expense Reductions.
The investment adviser has contractually agreed to waive the Fund's management fee in an amount equal to .25% of the Fund's average net assets until September 30, 2022. During the period, this waiver reduced the Fund's management fee by $9,890,142.
10. Other.
The Fund's organizational documents provide former and current trustees and officers with a limited indemnification against liabilities arising in connection with the performance of their duties to the Fund. In the normal course of business, the Fund may also enter into contracts that provide general indemnifications. The Fund's maximum exposure under these arrangements is unknown as this would be dependent on future claims that may be made against the Fund. The risk of material loss from such claims is considered remote.
The Fund does not invest in the Underlying Funds for the purpose of exercising management or control; however, investments by the Fund within its principal investment strategies may represent a significant portion of an Underlying Fund's net assets.
At the end of the period, the Fund was the owner of record of 10% or more of the total outstanding shares of the following Underlying Funds:
| Fidelity SAI Real Estate Index Fund | 100% |
Shareholder Expense Example
As a shareholder of the Fund, you incur two types of costs: (1) transaction costs, and (2) ongoing costs, including management fees and other Fund expenses. This Example is intended to help you understand your ongoing costs (in dollars) of investing in the Fund and to compare these costs with the ongoing costs of investing in other mutual funds.
The Example is based on an investment of $1,000 invested at the beginning of the period and held for the entire period (March 1, 2019 to August 31, 2019).
Actual Expenses
The first line of the accompanying table provides information about actual account values and actual expenses. You may use the information in this line, together with the amount you invested, to estimate the expenses that you paid over the period. Simply divide your account value by $1,000.00 (for example, an $8,600 account value divided by $1,000.00 = 8.6), then multiply the result by the number in the first line under the heading entitled "Expenses Paid During Period" to estimate the expenses you paid on your account during this period. In addition to the direct expenses incurred by the Fund presented in the table, as a shareholder of the underlying mutual funds and exchange-traded funds (ETFs) (the Underlying Funds), the Fund also indirectly bears its proportionate share of the expenses of the Underlying Funds. In addition, the Fund, as a shareholder in the underlying Fidelity Central Funds, will indirectly bear its pro-rata share of the fees and expenses incurred by the underlying Fidelity Central Funds. These fees and expenses are not included in the Fund's annualized expense ratio used to calculate the expense estimate in the table below.
Hypothetical Example for Comparison Purposes
The second line of the accompanying table provides information about hypothetical account values and hypothetical expenses based on the Fund's actual expense ratio and an assumed rate of return of 5% per year before expenses, which is not the Fund's actual return. The hypothetical account values and expenses may not be used to estimate the actual ending account balance or expenses you paid for the period. You may use this information to compare the ongoing costs of investing in the Fund and other funds. To do so, compare this 5% hypothetical example with the 5% hypothetical examples that appear in the shareholder reports of the other funds. In addition to the direct expenses incurred by the Fund presented in the table, as a shareholder of the Underlying Funds, the Fund also indirectly bears its proportionate share of the expenses of the Underlying Funds. In addition, the Fund, as a shareholder in the underlying Fidelity Central Funds, will indirectly bear its pro-rata share of the fees and expenses incurred by the underlying Fidelity Central Funds. These fees and expenses are not included in the Fund's annualized expense ratio used to calculate the expense estimate in the table below.
Please note that the expenses shown in the table are meant to highlight your ongoing costs only and do not reflect any transaction costs. Therefore, the second line of the table is useful in comparing ongoing costs only, and will not help you determine the relative total costs of owning different funds.
| Annualized Expense Ratio-A | Beginning Account Value March 1, 2019 | Ending Account Value August 31, 2019 | Expenses Paid During Period-B March 1, 2019 to August 31, 2019 | |
| Actual | .42% | $1,000.00 | $996.30 | $2.11 |
| Hypothetical-C | $1,000.00 | $1,023.03 | $2.14 |
A Annualized expense ratio reflects expenses net of applicable fee waivers.
B Expenses are equal to the Fund's annualized expense ratio, multiplied by the average account value over the period, multiplied by 184/366 (to reflect the one-half year period). The fees and expenses of the Underlying Funds in which the Fund invests are not included in the Fund's annualized expense ratio.
C 5% return per year before expenses
![]()
SMC-SANN-1019
1.912859.109
Item 2.
Code of Ethics
Not applicable.
Item 3.
Audit Committee Financial Expert
Not applicable.
Item 4.
Principal Accountant Fees and Services
Not applicable.
Item 5.
Audit Committee of Listed Registrants
Not applicable.
Item 6.
Investments
(a)
Not applicable.
(b)
Not applicable
Item 7.
Disclosure of Proxy Voting Policies and Procedures for Closed-End Management Investment Companies
Not applicable.
Item 8.
Portfolio Managers of Closed-End Management Investment Companies
Not applicable.
Item 9.
Purchase of Equity Securities by Closed-End Management Investment Company and Affiliated Purchasers
Not applicable.
Item 10.
Submission of Matters to a Vote of Security Holders
There were no material changes to the procedures by which shareholders may recommend nominees to the Fidelity Rutland Square Trust II’s Board of Trustees.
Item 11.
Controls and Procedures
(a)(i) The President and Treasurer and the Chief Financial Officer have concluded that the Fidelity Rutland Square Trust II’s (the “Trust”) disclosure controls and procedures (as
defined in Rule 30a-3(c) under the Investment Company Act) provide reasonable assurances that material information relating to the Trust is made known to them by the appropriate persons, based on their evaluation of these controls and procedures as of a date within 90 days of the filing date of this report.
(a)(ii) There was no change in the Trust’s internal control over financial reporting (as defined in Rule 30a-3(d) under the Investment Company Act) that occurred during the period covered by this report that has materially affected, or is reasonably likely to materially affect, the Trust’s internal control over financial reporting.
Item 12.
Disclosure of Securities Lending Activities for Closed-End Management
Investment Companies
Not applicable.
Item 13.
Exhibits
(a) | (1) | Not applicable. |
(a) | (2) | Certification pursuant to Rule 30a-2(a) under the Investment Company Act of 1940 (17 CFR 270.30a-2(a)) is filed and attached hereto as Exhibit 99.CERT. |
(a) | (3) | Not applicable. |
(b) | Certification pursuant to Rule 30a-2(b) under the Investment Company Act of 1940 (17 CFR 270.30a-2(b)) is furnished and attached hereto as Exhibit 99.906CERT. |
SIGNATURES
Pursuant to the requirements of the Securities Exchange Act of 1934 and the Investment Company Act of 1940, the registrant has duly caused this report to be signed on its behalf by the undersigned, thereunto duly authorized.
Fidelity Rutland Square Trust II
By: | /s/Adrien E. Deberghes |
Adrien E. Deberghes | |
President and Treasurer | |
Date: | October 24, 2019 |
Pursuant to the requirements of the Securities Exchange Act of 1934 and the Investment Company Act of 1940, this report has been signed below by the following persons on behalf of the registrant and in the capacities and on the dates indicated.
By: | /s/Adrien E. Deberghes |
Adrien E. Deberghes | |
President and Treasurer | |
Date: | October 24, 2019 |
By: | /s/John J. Burke III |
John J. Burke III | |
Chief Financial Officer | |
Date: | October 24, 2019 |