UNITED STATES
SECURITIES AND EXCHANGE COMMISSION
Washington, D.C. 20549
FORM N-CSR
CERTIFIED SHAREHOLDER REPORT OF REGISTERED
MANAGEMENT INVESTMENT COMPANIES
Investment Company Act file number 811-21991
Fidelity Rutland Square Trust II
(Exact name of registrant as specified in charter)
245 Summer St., Boston, MA 02210
(Address of principal executive offices) (Zip code)
Christina H. Lee, Secretary
245 Summer St.
Boston, Massachusetts 02210
(Name and address of agent for service)
Registrant's telephone number, including area code:
617-563-7000
Date of fiscal year end: | May 31 |
Date of reporting period: | November 30, 2020 |
Item 1.
Reports to Stockholders
Strategic Advisers® Short Duration Fund
Offered exclusively to certain clients of Strategic Advisers LLC - not available for sale to the general public
Semi-Annual Report
November 30, 2020

Contents
Board Approval of Investment Advisory Contracts and Management Fees | |
To view a fund's proxy voting record for the 12-month period ended June 30, visit http://www.fidelity.com/proxyvotingresults or visit the Securities and Exchange Commission's (SEC) web site at http://www.sec.gov.
You may also call 1-800-544-3455 to request a free copy of the proxy voting guidelines.
Standard & Poor's, S&P and S&P 500 are registered service marks of The McGraw-Hill Companies, Inc. and have been licensed for use by Fidelity Distributors Corporation.
Other third-party marks appearing herein are the property of their respective owners.
All other marks appearing herein are registered or unregistered trademarks or service marks of FMR LLC or an affiliated company. © 2021 FMR LLC. All rights reserved.
This report and the financial statements contained herein are submitted for the general information of the shareholders of the Fund. This report is not authorized for distribution to prospective investors in the Fund unless preceded or accompanied by an effective prospectus.
A fund files its complete schedule of portfolio holdings with the SEC for the first and third quarters of each fiscal year on Form N-PORT. Forms N-PORT are available on the SEC’s web site at http://www.sec.gov. A fund's Forms N-PORT may be reviewed and copied at the SEC’s Public Reference Room in Washington, DC. Information regarding the operation of the SEC's Public Reference Room may be obtained by calling 1-800-SEC-0330.
For a complete list of a fund's portfolio holdings, view the most recent holdings listing, semiannual report, or annual report on Fidelity's web site at http://www.fidelity.com, http://www.institutional.fidelity.com, or http://www.401k.com, as applicable.
NOT FDIC INSURED •MAY LOSE VALUE •NO BANK GUARANTEE
Neither the Fund nor Fidelity Distributors Corporation is a bank.
Note to Shareholders:
Early in 2020, the outbreak and spread of a new coronavirus emerged as a public health emergency that had a major influence on financial markets, primarily based on its impact on the global economy and the outlook for corporate earnings. The virus causes a respiratory disease known as COVID-19. On March 11, the World Health Organization declared the COVID-19 outbreak a pandemic, citing sustained risk of further global spread.
In the weeks following, as the crisis worsened, we witnessed an escalating human tragedy with wide-scale social and economic consequences from coronavirus-containment measures. The outbreak of COVID-19 prompted a number of measures to limit the spread, including travel and border restrictions, quarantines, and restrictions on large gatherings. In turn, these resulted in lower consumer activity, diminished demand for a wide range of products and services, disruption in manufacturing and supply chains, and – given the wide variability in outcomes regarding the outbreak – significant market uncertainty and volatility. Amid the turmoil, global governments and central banks took unprecedented action to help support consumers, businesses, and the broader economies, and to limit disruption to financial systems.
The situation continues to unfold, and the extent and duration of its impact on financial markets and the economy remain highly uncertain. Extreme events such as the coronavirus crisis are “exogenous shocks” that can have significant adverse effects on mutual funds and their investments. Although multiple asset classes may be affected by market disruption, the duration and impact may not be the same for all types of assets.
Fidelity is committed to helping you stay informed amid news about COVID-19 and during increased market volatility, and we’re taking extra steps to be responsive to customer needs. We encourage you to visit our websites, where we offer ongoing updates, commentary, and analysis on the markets and our funds.
Investment Summary (Unaudited)
The information in the following tables is based on the direct investments of the Fund.Top Ten Holdings as of November 30, 2020
| (excluding cash equivalents) | % of fund's net assets |
| PIMCO Short-Term Fund Institutional Class | 12.8 |
| Baird Ultra Short Bond Fund Institutional Class | 6.1 |
| PIMCO Enhanced Short Maturity Active ETF | 5.4 |
| BlackRock Low Duration Bond Portfolio Investor A Shares | 4.5 |
| Fidelity SAI Short-Term Bond Fund | 4.2 |
| iShares Short Maturity Bond ETF | 3.8 |
| JPMorgan Ultra-Short Income ETF | 3.2 |
| Metropolitan West Low Duration Bond Fund - Class M | 2.9 |
| Baird Short-Term Bond Fund - Institutional Class | 2.7 |
| iShares Short Treasury Bond ETF | 2.2 |
| 47.8 |
Asset Allocation (% of fund's net assets)
| As of November 30, 2020 | ||
| Corporate Bonds | 24.4% | |
| U.S. Government and U.S. Government Agency Obligations | 3.1% | |
| Asset-Backed Securities | 7.9% | |
| CMOs and Other Mortgage Related Securities | 2.4% | |
| Municipal Securities | 0.1% | |
| Other Investments | 0.4% | |
| Short-Term Funds | 52.0% | |
| Short-Term Investments and Net Other Assets (Liabilities) | 9.7% | |
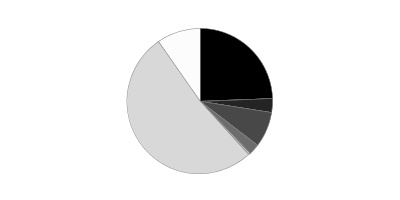
Asset allocations of funds in the pie chart reflect the categorizations of assets as defined by Morningstar as of the reporting date.
Schedule of Investments November 30, 2020 (Unaudited)
Showing Percentage of Net Assets
| Nonconvertible Bonds - 24.4% | |||
| �� | Principal Amount | Value | |
| COMMUNICATION SERVICES - 0.9% | |||
| Diversified Telecommunication Services - 0.3% | |||
| SBA Tower Trust 3.448% 3/15/48 (a) | $880,000 | $935,612 | |
| Verizon Communications, Inc.: | |||
| 3 month U.S. LIBOR + 1.000% 1.2373% 3/16/22 (b)(c) | 15,233,000 | 15,414,090 | |
| 0.85% 11/20/25 | 710,000 | 712,899 | |
| 17,062,601 | |||
| Interactive Media & Services - 0.0% | |||
| Baidu.com, Inc. 3.5% 11/28/22 | 780,000 | 816,563 | |
| Media - 0.4% | |||
| Charter Communications Operating LLC/Charter Communications Operating Capital Corp.: | |||
| 4.464% 7/23/22 | 3,590,000 | 3,794,486 | |
| 4.908% 7/23/25 | 2,145,000 | 2,482,902 | |
| Comcast Corp. 3.1% 4/1/25 | 355,000 | 390,394 | |
| COX Communications, Inc.: | |||
| 2.95% 6/30/23 (a) | 590,000 | 621,548 | |
| 3.15% 8/15/24 (a) | 1,600,000 | 1,730,151 | |
| Fox Corp.: | |||
| 3.05% 4/7/25 | 185,000 | 202,705 | |
| 3.666% 1/25/22 | 260,000 | 269,725 | |
| 4.03% 1/25/24 | 305,000 | 336,244 | |
| RELX Capital, Inc. 3.5% 3/16/23 | 575,000 | 612,891 | |
| Time Warner Cable, Inc. 4.125% 2/15/21 | 6,234,000 | 6,244,647 | |
| TWDC Enterprises 18 Corp. 3 month U.S. LIBOR + 0.390% 0.6413% 3/4/22 (b)(c) | 5,000,000 | 5,015,350 | |
| WPP Finance 2010 3.625% 9/7/22 | 310,000 | 324,479 | |
| 22,025,522 | |||
| Wireless Telecommunication Services - 0.2% | |||
| CC Holdings GS V LLC/Crown Castle GS III Corp. 3.849% 4/15/23 | 1,900,000 | 2,039,487 | |
| Rogers Communications, Inc. 3 month U.S. LIBOR + 0.600% 0.8254% 3/22/22 (b)(c) | 5,520,000 | 5,555,863 | |
| T-Mobile U.S.A., Inc. 3.5% 4/15/25 (a) | 1,005,000 | 1,111,409 | |
| Vodafone Group PLC 3.75% 1/16/24 | 770,000 | 842,067 | |
| 9,548,826 | |||
| TOTAL COMMUNICATION SERVICES | 49,453,512 | ||
| CONSUMER DISCRETIONARY - 2.0% | |||
| Automobiles - 1.3% | |||
| American Honda Finance Corp.: | |||
| 3 month U.S. LIBOR + 0.290% 0.5395% 12/10/21 (b)(c) | 5,000,000 | 5,008,406 | |
| 0.4% 10/21/22 | 2,775,000 | 2,778,182 | |
| BMW U.S. Capital LLC: | |||
| 3 month U.S. LIBOR + 0.410% 0.6305% 4/12/21 (a)(b)(c) | 11,110,000 | 11,120,953 | |
| 3 month U.S. LIBOR + 0.500% 0.7136% 8/13/21 (a)(b)(c) | 830,000 | 831,862 | |
| 2% 4/11/21 (a) | 1,500,000 | 1,507,188 | |
| Daimler Finance North America LLC: | |||
| 3 month U.S. LIBOR + 0.900% 1.121% 2/15/22 (a)(b)(c) | 5,000,000 | 5,033,028 | |
| 1.75% 3/10/23 (a) | 1,800,000 | 1,843,744 | |
| 2.3% 2/12/21 (a) | 1,745,000 | 1,751,266 | |
| General Motors Co.: | |||
| 4.875% 10/2/23 | 730,000 | 806,905 | |
| 5.4% 10/2/23 | 1,130,000 | 1,266,133 | |
| General Motors Financial Co., Inc.: | |||
| 3 month U.S. LIBOR + 0.850% 1.0795% 4/9/21 (b)(c) | 5,628,000 | 5,634,831 | |
| U.S. SECURED OVERNIGHT FINL RATE (SOFR) INDX + 1.200% 1.2656% 11/17/23 (b)(c) | 5,000,000 | 5,004,400 | |
| 2.9% 2/26/25 | 1,880,000 | 1,991,653 | |
| 3.2% 7/6/21 | 510,000 | 516,334 | |
| 4.2% 3/1/21 | 6,059,000 | 6,092,056 | |
| 4.2% 11/6/21 | 370,000 | 381,728 | |
| Harley-Davidson Financial Services, Inc.: | |||
| 3 month U.S. LIBOR + 0.940% 1.1809% 3/2/21 (a)(b)(c) | 995,000 | 995,779 | |
| 2.55% 6/9/22 (a) | 375,000 | 382,753 | |
| 4.05% 2/4/22 (a) | 1,210,000 | 1,252,486 | |
| Nissan Motor Acceptance Corp. 3.65% 9/21/21 (a) | 580,000 | 590,936 | |
| Nissan Motor Co. Ltd. 3.043% 9/15/23 (a) | 985,000 | 1,023,447 | |
| Volkswagen Group of America Finance LLC: | |||
| 0.75% 11/23/22 (a) | 10,620,000 | 10,634,745 | |
| 0.875% 11/22/23 (a) | 590,000 | 591,259 | |
| 2.5% 9/24/21 (a) | 1,805,000 | 1,834,122 | |
| 2.7% 9/26/22 (a) | 650,000 | 674,278 | |
| 2.9% 5/13/22 (a) | 2,663,000 | 2,749,873 | |
| 3.125% 5/12/23 (a) | 355,000 | 375,034 | |
| 72,673,381 | |||
| Hotels, Restaurants & Leisure - 0.0% | |||
| Marriott International, Inc. 3.6% 4/15/24 | 150,000 | 158,616 | |
| Starbucks Corp.: | |||
| 1.3% 5/7/22 | 1,195,000 | 1,210,459 | |
| 2.7% 6/15/22 | 435,000 | 448,823 | |
| 1,817,898 | |||
| Household Durables - 0.0% | |||
| D.R. Horton, Inc. 2.55% 12/1/20 | 495,000 | 495,000 | |
| Panasonic Corp. 2.536% 7/19/22 (a) | 785,000 | 807,742 | |
| 1,302,742 | |||
| Internet & Direct Marketing Retail - 0.1% | |||
| Expedia, Inc. 3.6% 12/15/23 (a) | 1,270,000 | 1,327,787 | |
| JD.com, Inc. 3.125% 4/29/21 | 2,645,000 | 2,662,358 | |
| QVC, Inc. 4.375% 3/15/23 | 660,000 | 691,350 | |
| The Booking Holdings, Inc. 4.1% 4/13/25 | 830,000 | 935,875 | |
| 5,617,370 | |||
| Leisure Products - 0.1% | |||
| Hasbro, Inc.: | |||
| 2.6% 11/19/22 | 885,000 | 916,164 | |
| 3% 11/19/24 | 1,190,000 | 1,281,567 | |
| 2,197,731 | |||
| Specialty Retail - 0.4% | |||
| AutoZone, Inc. 3.625% 4/15/25 | 485,000 | 540,220 | |
| O'Reilly Automotive, Inc. 3.8% 9/1/22 | 385,000 | 404,237 | |
| Ross Stores, Inc.: | |||
| 0.875% 4/15/26 | 450,000 | 445,708 | |
| 4.6% 4/15/25 | 2,310,000 | 2,671,367 | |
| The Home Depot, Inc. 3 month U.S. LIBOR + 0.310% 0.556% 3/1/22 (b)(c) | 14,500,000 | 14,542,749 | |
| TJX Companies, Inc. 3.5% 4/15/25 | 770,000 | 855,888 | |
| 19,460,169 | |||
| Textiles, Apparel & Luxury Goods - 0.1% | |||
| Ralph Lauren Corp. 1.7% 6/15/22 | 225,000 | 229,524 | |
| VF Corp. 2.05% 4/23/22 | 6,772,000 | 6,922,763 | |
| 7,152,287 | |||
| TOTAL CONSUMER DISCRETIONARY | 110,221,578 | ||
| CONSUMER STAPLES - 0.8% | |||
| Beverages - 0.1% | |||
| Diageo Capital PLC 1.375% 9/29/25 | 680,000 | 698,707 | |
| Molson Coors Beverage Co. 3.5% 5/1/22 | 3,209,000 | 3,340,028 | |
| 4,038,735 | |||
| Food & Staples Retailing - 0.0% | |||
| Prosperous Ray Ltd. 4.625% 11/12/23 (Reg. S) | 1,200,000 | 1,312,090 | |
| Walgreen Co. 3.1% 9/15/22 | 435,000 | 455,131 | |
| 1,767,221 | |||
| Food Products - 0.4% | |||
| Archer Daniels Midland Co. 2.75% 3/27/25 | 285,000 | 308,421 | |
| Bunge Ltd. Finance Corp.: | |||
| 3% 9/25/22 | 2,775,000 | 2,879,046 | |
| 4.35% 3/15/24 | 130,000 | 143,397 | |
| Cargill, Inc. 1.375% 7/23/23 (a) | 630,000 | 646,083 | |
| China Mengniu Dairy Co. Ltd. 1.875% 6/17/25 (Reg. S) | 2,004,000 | 2,015,517 | |
| General Mills, Inc. 3 month U.S. LIBOR + 0.540% 0.7701% 4/16/21 (b)(c) | 6,229,000 | 6,239,782 | |
| Mondelez International, Inc.: | |||
| 0.625% 7/1/22 | 6,350,000 | 6,380,607 | |
| 2.125% 4/13/23 | 2,351,000 | 2,439,066 | |
| 21,051,919 | |||
| Tobacco - 0.3% | |||
| Altria Group, Inc.: | |||
| 3.49% 2/14/22 | 1,657,000 | 1,721,293 | |
| 3.8% 2/14/24 | 1,300,000 | 1,419,719 | |
| BAT International Finance PLC 1.668% 3/25/26 | 885,000 | 900,799 | |
| Imperial Tobacco Finance PLC: | |||
| 3.5% 2/11/23 (a) | 1,125,000 | 1,179,194 | |
| 3.75% 7/21/22 (a) | 1,800,000 | 1,872,996 | |
| Philip Morris International, Inc. 1.125% 5/1/23 | 9,481,000 | 9,664,566 | |
| 16,758,567 | |||
| TOTAL CONSUMER STAPLES | 43,616,442 | ||
| ENERGY - 1.3% | |||
| Energy Equipment & Services - 0.0% | |||
| Schlumberger Finance Canada Ltd. 1.4% 9/17/25 | 290,000 | 295,985 | |
| Schlumberger Holdings Corp.: | |||
| 3.75% 5/1/24 (a) | 1,515,000 | 1,643,572 | |
| 4% 12/21/25 (a) | 375,000 | 420,807 | |
| 2,360,364 | |||
| Oil, Gas & Consumable Fuels - 1.3% | |||
| Aker BP ASA 3% 1/15/25 (a) | 995,000 | 1,011,700 | |
| Canadian Natural Resources Ltd. 2.05% 7/15/25 | 1,430,000 | 1,472,368 | |
| Cenovus Energy, Inc.: | |||
| 3% 8/15/22 | 1,515,000 | 1,519,076 | |
| 3.8% 9/15/23 | 165,000 | 170,176 | |
| Cheniere Corpus Christi Holdings LLC: | |||
| 5.875% 3/31/25 | 1,470,000 | 1,684,258 | |
| 7% 6/30/24 | 1,625,000 | 1,873,800 | |
| Chevron Corp.: | |||
| 3 month U.S. LIBOR + 0.480% 0.7311% 3/3/22 (b)(c) | 4,700,000 | 4,722,846 | |
| 1.141% 5/11/23 | 4,174,000 | 4,257,380 | |
| Diamondback Energy, Inc.: | |||
| 2.875% 12/1/24 | 2,720,000 | 2,834,092 | |
| 4.75% 5/31/25 | 1,080,000 | 1,204,024 | |
| Energy Transfer Partners LP: | |||
| 2.9% 5/15/25 | 255,000 | 264,565 | |
| 4.2% 9/15/23 | 280,000 | 298,114 | |
| 4.25% 3/15/23 | 855,000 | 899,900 | |
| 4.9% 2/1/24 | 245,000 | 265,995 | |
| 5.875% 1/15/24 | 2,375,000 | 2,636,136 | |
| Eni SpA 4% 9/12/23 (a) | 930,000 | 1,011,862 | |
| Enterprise Products Operating LP: | |||
| 2.85% 4/15/21 | 3,000,000 | 3,021,199 | |
| 3.5% 2/1/22 | 1,050,000 | 1,087,833 | |
| EOG Resources, Inc. 2.625% 3/15/23 | 291,000 | 303,641 | |
| EQT Corp.: | |||
| 3% 10/1/22 | 2,275,000 | 2,284,214 | |
| 4.875% 11/15/21 | 284,000 | 288,970 | |
| Gray Oak Pipeline LLC: | |||
| 2% 9/15/23 (a) | 120,000 | 120,935 | |
| 2.6% 10/15/25 (a) | 385,000 | 390,859 | |
| Kinder Morgan Energy Partners LP: | |||
| 3.5% 3/1/21 | 435,000 | 436,048 | |
| 3.95% 9/1/22 | 135,000 | 142,109 | |
| Kinder Morgan, Inc. 5% 2/15/21 (a) | 675,000 | 678,588 | |
| Marathon Oil Corp. 2.8% 11/1/22 | 653,000 | 667,222 | |
| MPLX LP 3 month U.S. LIBOR + 1.100% 1.3418% 9/9/22 (b)(c) | 1,683,000 | 1,683,245 | |
| Occidental Petroleum Corp. 2.6% 8/13/21 | 990,000 | 980,100 | |
| Phillips 66 Co.: | |||
| 3 month U.S. LIBOR + 0.600% 0.833% 2/26/21 (b)(c) | 5,033,000 | 5,033,458 | |
| 3 month U.S. LIBOR + 0.620% 0.8404% 2/15/24 (b)(c) | 10,000,000 | 10,007,850 | |
| Reliance Holding U.S.A., Inc. 5.4% 2/14/22 (Reg. S) | 1,700,000 | 1,784,469 | |
| Sabine Pass Liquefaction LLC: | |||
| 5.625% 4/15/23 (b) | 1,085,000 | 1,188,437 | |
| 6.25% 3/15/22 | 2,495,000 | 2,634,900 | |
| Saudi Arabian Oil Co. 2.75% 4/16/22 (a) | 1,815,000 | 1,859,241 | |
| Suncor Energy, Inc. 2.8% 5/15/23 | 505,000 | 530,883 | |
| Sunoco Logistics Partner Operations LP: | |||
| 3.45% 1/15/23 | 110,000 | 114,205 | |
| 4.25% 4/1/24 | 70,000 | 74,982 | |
| 4.4% 4/1/21 | 765,000 | 772,042 | |
| The Williams Companies, Inc. 3.7% 1/15/23 | 2,205,000 | 2,328,962 | |
| Valero Energy Corp.: | |||
| 1.2% 3/15/24 | 715,000 | 714,866 | |
| 2.7% 4/15/23 | 1,430,000 | 1,486,494 | |
| 3.65% 3/15/25 | 245,000 | 266,017 | |
| Western Gas Partners LP 4% 7/1/22 | 1,800,000 | 1,831,500 | |
| Williams Partners LP: | |||
| 3.35% 8/15/22 | 200,000 | 208,691 | |
| 4.3% 3/4/24 | 305,000 | 334,696 | |
| 69,382,948 | |||
| TOTAL ENERGY | 71,743,312 | ||
| FINANCIALS - 14.5% | |||
| Banks - 8.6% | |||
| Abbey National PLC 2.1% 1/13/23 | 1,255,000 | 1,296,436 | |
| ABN AMRO Bank NV: | |||
| 3 month U.S. LIBOR + 0.410% 0.6278% 1/19/21 (a)(b)(c) | 10,000,000 | 10,004,840 | |
| 3 month U.S. LIBOR + 0.570% 0.803% 8/27/21 (a)(b)(c) | 10,813,000 | 10,851,105 | |
| Banco Bilbao Vizcaya Argentaria SA 0.875% 9/18/23 | 1,800,000 | 1,809,119 | |
| Banco del Estado de Chile 2.704% 1/9/25 (a) | 665,000 | 700,328 | |
| Banco Santander Mexico SA 4.125% 11/9/22 (Reg. S) | 1,750,000 | 1,847,125 | |
| Bank of America Corp.: | |||
| 3 month U.S. LIBOR + 0.380% 0.5891% 1/23/22 (b)(c) | 15,000,000 | 15,005,908 | |
| 3 month U.S. LIBOR + 0.650% 0.875% 6/25/22 (b)(c) | 10,000,000 | 10,032,010 | |
| 0.81% 10/24/24 (b) | 755,000 | 757,947 | |
| 3.124% 1/20/23 (b) | 10,000,000 | 10,299,544 | |
| 3.3% 1/11/23 | 1,445,000 | 1,532,663 | |
| Bank of Montreal: | |||
| 3 month U.S. LIBOR + 0.400% 0.6495% 9/10/21 (b)(c) | 5,000,000 | 5,013,395 | |
| 3 month U.S. LIBOR + 0.460% 0.6841% 4/13/21 (b)(c) | 960,000 | 961,526 | |
| 3 month U.S. LIBOR + 0.570% 0.8033% 3/26/22 (b)(c) | 5,000,000 | 5,029,865 | |
| Bank of Nova Scotia 0.8% 6/15/23 | 7,000,000 | 7,079,539 | |
| Banque Federative du Credit Mutuel SA: | |||
| 0.65% 2/27/24 (a) | 860,000 | 860,869 | |
| 1.96% 7/21/21 (a) | 5,000,000 | 5,052,706 | |
| 2.125% 11/21/22 (a) | 1,415,000 | 1,461,962 | |
| 2.5% 4/13/21 (a) | 5,000,000 | 5,040,979 | |
| Barclays Bank PLC: | |||
| 1.7% 5/12/22 | 1,790,000 | 1,821,737 | |
| 2.65% 1/11/21 | 10,905,000 | 10,911,295 | |
| Barclays PLC 4.61% 2/15/23 (b) | 6,000,000 | 6,278,400 | |
| BB&T Corp. 2.15% 2/1/21 | 1,160,000 | 1,161,793 | |
| BBVA U.S.A. 3 month U.S. LIBOR + 0.730% 0.9803% 6/11/21 (b)(c) | 11,700,000 | 11,733,484 | |
| BNP Paribas SA: | |||
| 3 month U.S. LIBOR + 0.390% 0.603% 8/7/21 (a)(b)(c) | 5,000,000 | 5,010,786 | |
| 3.5% 3/1/23 (a) | 10,000,000 | 10,641,018 | |
| BPCE SA: | |||
| 3 month U.S. LIBOR + 0.300% 0.5289% 1/14/22 (a)(b)(c) | 5,000,000 | 5,006,337 | |
| 3 month U.S. LIBOR + 1.220% 1.4326% 5/22/22 (a)(b)(c) | 1,605,000 | 1,622,655 | |
| 5.7% 10/22/23 (a) | 530,000 | 597,688 | |
| Canadian Imperial Bank of Commerce 0.95% 6/23/23 | 7,200,000 | 7,290,065 | |
| Capital One Bank NA 2.014% 1/27/23 (b) | 7,000,000 | 7,120,567 | |
| Capital One NA 2.15% 9/6/22 | 1,370,000 | 1,410,289 | |
| Citibank NA 3 month U.S. LIBOR + 0.600% 0.8238% 5/20/22 (b)(c) | 8,000,000 | 8,014,539 | |
| Citigroup, Inc.: | |||
| 3 month U.S. LIBOR + 1.190% 1.4044% 8/2/21 (b)(c) | 9,500,000 | 9,568,922 | |
| 3 month U.S. LIBOR + 1.380% 1.6004% 3/30/21 (b)(c) | 10,000,000 | 10,043,926 | |
| 2.312% 11/4/22 (b) | 16,290,000 | 16,569,700 | |
| 2.9% 12/8/21 | 1,495,000 | 1,530,328 | |
| Credit Agricole SA 3 month U.S. LIBOR + 1.020% 1.2348% 4/24/23 (a)(b)(c) | 675,000 | 682,830 | |
| Credit Suisse Group Funding Guernsey Ltd.: | |||
| 3 month U.S. LIBOR + 2.290% 2.5078% 4/16/21 (b)(c) | 6,250,000 | 6,301,130 | |
| 3.125% 12/10/20 | 5,000,000 | 5,003,100 | |
| 3.45% 4/16/21 | 15,000,000 | 15,172,200 | |
| Danske Bank A/S: | |||
| 1.226% 6/22/24 (a) | 1,610,000 | 1,631,837 | |
| 3.001% 9/20/22 (a)(b) | 1,475,000 | 1,500,089 | |
| 5% 1/12/22 (a) | 1,050,000 | 1,099,127 | |
| Fifth Third Bancorp 1.625% 5/5/23 | 10,625,000 | 10,914,946 | |
| First Niagara Financial Group, Inc. 7.25% 12/15/21 | 515,000 | 550,594 | |
| HSBC Holdings PLC: | |||
| 1.645% 4/18/26 (b) | 1,735,000 | 1,759,492 | |
| 2.099% 6/4/26 (b) | 1,840,000 | 1,897,614 | |
| 3.262% 3/13/23 (b) | 3,300,000 | 3,414,829 | |
| 3.803% 3/11/25 (b) | 425,000 | 462,502 | |
| ING Groep NV 3 month U.S. LIBOR + 1.150% 1.3679% 3/29/22 (b)(c) | 735,000 | 742,981 | |
| JPMorgan Chase & Co.: | |||
| 3 month U.S. LIBOR + 1.100% 1.348% 6/7/21 (b)(c) | 11,083,000 | 11,133,055 | |
| 2.083% 4/22/26 (b) | 1,870,000 | 1,959,006 | |
| 2.776% 4/25/23 (b) | 5,200,000 | 5,370,576 | |
| 3.514% 6/18/22 (b) | 5,000,000 | 5,084,343 | |
| KeyBank NA 3 month U.S. LIBOR + 0.660% 0.8744% 2/1/22 (b)(c) | 8,128,000 | 8,179,526 | |
| Lloyds Bank PLC: | |||
| 3 month U.S. LIBOR + 0.490% 0.703% 5/7/21 (b)(c) | 9,000,000 | 9,016,569 | |
| 3.3% 5/7/21 | 2,649,000 | 2,683,331 | |
| 4.5% 11/4/24 | 480,000 | 533,778 | |
| Lloyds Banking Group PLC 1.326% 6/15/23 (b) | 1,803,000 | 1,821,770 | |
| Mitsubishi UFJ Financial Group, Inc.: | |||
| 3 month U.S. LIBOR + 0.650% 0.8648% 7/26/21 (b)(c) | 6,519,000 | 6,540,389 | |
| 3 month U.S. LIBOR + 0.700% 0.948% 3/7/22 (b)(c) | 10,000,000 | 10,058,431 | |
| 3 month U.S. LIBOR + 0.740% 0.9809% 3/2/23 (b)(c) | 1,623,000 | 1,633,549 | |
| 3 month U.S. LIBOR + 0.920% 1.1249% 2/22/22 (b)(c) | 840,000 | 847,498 | |
| 2.998% 2/22/22 | 5,000,000 | 5,160,194 | |
| 3.218% 3/7/22 | 1,090,000 | 1,129,178 | |
| Mizuho Financial Group, Inc.: | |||
| 3 month U.S. LIBOR + 0.940% 1.1644% 2/28/22 (b)(c) | 5,000,000 | 5,046,705 | |
| 3 month U.S. LIBOR + 1.140% 1.3891% 9/13/21 (b)(c) | 17,000,000 | 17,137,202 | |
| National Bank of Canada 0.9% 8/15/23 (b) | 7,000,000 | 7,048,864 | |
| NatWest Markets PLC 2.375% 5/21/23 (a) | 1,525,000 | 1,586,503 | |
| Nordea Bank ABP 4.875% 5/13/21 (a) | 710,000 | 724,073 | |
| PNC Bank NA: | |||
| 1.743% 2/24/23 (b) | 4,078,000 | 4,151,341 | |
| 2.028% 12/9/22 (b) | 7,000,000 | 7,120,054 | |
| QNB Finance Ltd. 3.5% 3/28/24 (Reg. S) | 1,000,000 | 1,069,375 | |
| Rabobank Nederland 3.95% 11/9/22 | 1,370,000 | 1,457,474 | |
| Rabobank Nederland New York Branch 3 month U.S. LIBOR + 0.830% 1.0541% 1/10/22 (b)(c) | 5,000,000 | 5,040,771 | |
| Royal Bank of Canada U.S. SECURED OVERNIGHT FINL RATE (SOFR) INDX + 0.450% 0.5346% 10/26/23 (b)(c) | 15,000,000 | 15,019,548 | |
| Royal Bank of Scotland Group PLC 3.875% 9/12/23 | 1,085,000 | 1,175,549 | |
| Santander Holdings U.S.A., Inc. 4.45% 12/3/21 | 7,000,000 | 7,250,885 | |
| Societe Generale 2.625% 10/16/24 (a) | 365,000 | 383,328 | |
| Standard Chartered PLC: | |||
| 3 month U.S. LIBOR + 1.150% 1.3684% 1/20/23 (a)(b)(c) | 910,000 | 914,521 | |
| 1.319% 10/14/23 (a)(b) | 200,000 | 201,906 | |
| 2.744% 9/10/22 (a)(b) | 1,495,000 | 1,517,084 | |
| 3.885% 3/15/24 (a)(b) | 365,000 | 388,052 | |
| 3.95% 1/11/23 (a) | 405,000 | 425,002 | |
| Sumitomo Mitsui Financial Group, Inc.: | |||
| 3 month U.S. LIBOR + 1.140% 1.3578% 10/19/21 (b)(c) | 6,500,000 | 6,558,360 | |
| 3 month U.S. LIBOR + 1.680% 1.9218% 3/9/21 (b)(c) | 3,000,000 | 3,012,961 | |
| 2.934% 3/9/21 | 10,000,000 | 10,071,600 | |
| Swedbank AB 1.3% 6/2/23 (a) | 1,150,000 | 1,172,025 | |
| Synchrony Bank 3% 6/15/22 | 10,395,000 | 10,742,468 | |
| Synovus Bank 2.289% 2/10/23 (b) | 1,237,000 | 1,252,433 | |
| The Toronto-Dominion Bank: | |||
| 3 month U.S. LIBOR + 0.530% 0.776% 12/1/22 (b)(c) | 5,000,000 | 5,038,464 | |
| U.S. SECURED OVERNIGHT FINL RATE (SOFR) INDX + 0.480% 0.565% 1/27/23 (b)(c) | 5,000,000 | 5,014,119 | |
| 0.75% 6/12/23 | 5,000,000 | 5,041,293 | |
| U.S. Bancorp 3% 3/15/22 | 1,530,000 | 1,579,750 | |
| Wells Fargo & Co.: | |||
| 1.654% 6/2/24 (b) | 5,935,000 | 6,073,387 | |
| 2.188% 4/30/26 (b) | 840,000 | 879,265 | |
| 3.5% 3/8/22 | 735,000 | 763,960 | |
| Wells Fargo Bank NA 2.082% 9/9/22 (b) | 1,105,000 | 1,119,342 | |
| Zions Bancorp NA 3.5% 8/27/21 | 5,000,000 | 5,104,937 | |
| 474,338,460 | |||
| Capital Markets - 2.9% | |||
| Credit Suisse AG: | |||
| U.S. SECURED OVERNIGHT FINL RATE (SOFR) INDX + 0.450% 0.5347% 2/4/22 (b)(c) | 5,310,000 | 5,317,381 | |
| 1% 5/5/23 | 6,590,000 | 6,678,578 | |
| 2.1% 11/12/21 | 8,156,000 | 8,292,470 | |
| 2.8% 4/8/22 | 2,340,000 | 2,417,618 | |
| Deutsche Bank AG New York Branch: | |||
| 3 month U.S. LIBOR + 0.810% 1.0308% 1/22/21 (b)(c) | 10,000,000 | 9,999,117 | |
| 3 month U.S. LIBOR + 1.290% 1.5101% 2/4/21 (b)(c) | 860,000 | 860,849 | |
| 3.15% 1/22/21 | 11,435,000 | 11,469,991 | |
| 3.375% 5/12/21 | 125,000 | 126,316 | |
| 4.25% 10/14/21 | 1,260,000 | 1,292,889 | |
| E*TRADE Financial Corp. 2.95% 8/24/22 | 2,362,000 | 2,461,940 | |
| Goldman Sachs Group, Inc.: | |||
| 3 month U.S. LIBOR + 1.360% 1.5748% 4/23/21 (b)(c) | 10,000,000 | 10,039,430 | |
| U.S. SECURED OVERNIGHT FINL RATE (SOFR) INDX + 0.540% 0.6114% 11/17/23 (b)(c) | 10,000,000 | 10,008,100 | |
| 2.876% 10/31/22 (b) | 520,000 | 531,407 | |
| 2.905% 7/24/23 (b) | 10,000,000 | 10,398,358 | |
| 3% 4/26/22 | 1,505,000 | 1,520,778 | |
| 3.5% 4/1/25 | 1,005,000 | 1,113,390 | |
| 5.75% 1/24/22 | 1,800,000 | 1,910,496 | |
| Morgan Stanley: | |||
| 3 month U.S. LIBOR + 0.930% 1.1458% 7/22/22 (b)(c) | 4,040,000 | 4,059,302 | |
| U.S. SECURED OVERNIGHT FINL RATE (SOFR) INDX + 0.700% 0.784% 1/20/23 (b)(c) | 5,000,000 | 5,013,823 | |
| U.S. SECURED OVERNIGHT FINL RATE (SOFR) INDX + 0.830% 0.9158% 6/10/22 (b)(c) | 5,000,000 | 5,011,735 | |
| 0.56% 11/10/23 (b) | 6,170,000 | 6,174,278 | |
| 2.625% 11/17/21 | 17,214,000 | 17,584,144 | |
| 2.75% 5/19/22 | 1,095,000 | 1,132,885 | |
| 5.5% 7/28/21 | 10,000,000 | 10,333,320 | |
| State Street Corp. 2.825% 3/30/23 (b) | 603,000 | 622,865 | |
| TD Ameritrade Holding Corp. 3 month U.S. LIBOR + 0.430% 0.6444% 11/1/21 (b)(c) | 7,500,000 | 7,523,580 | |
| UBS AG London Branch 1.75% 4/21/22 (a) | 7,525,000 | 7,663,339 | |
| UBS Group AG: | |||
| 3 month U.S. LIBOR + 1.220% 1.4326% 5/23/23 (a)(b)(c) | 880,000 | 890,618 | |
| 3 month U.S. LIBOR + 1.780% 2.0041% 4/14/21 (a)(b)(c) | 5,000,000 | 5,031,131 | |
| 1.008% 7/30/24 (a)(b) | 7,118,000 | 7,169,020 | |
| 162,649,148 | |||
| Consumer Finance - 1.4% | |||
| AerCap Ireland Capital Ltd./AerCap Global Aviation Trust: | |||
| 3.95% 2/1/22 | 1,070,000 | 1,098,080 | |
| 4.45% 12/16/21 | 1,395,000 | 1,436,660 | |
| 4.5% 9/15/23 | 1,095,000 | 1,172,326 | |
| American Express Co.: | |||
| 3 month U.S. LIBOR + 0.600% 0.8248% 11/5/21 (b)(c) | 6,750,000 | 6,779,093 | |
| 2.65% 12/2/22 | 9,500,000 | 9,937,128 | |
| 2.75% 5/20/22 | 5,000,000 | 5,165,006 | |
| 3.375% 5/17/21 | 1,500,000 | 1,517,430 | |
| Aviation Capital Group LLC: | |||
| 3 month U.S. LIBOR + 0.670% 0.8844% 7/30/21 (a)(b)(c) | 1,427,000 | 1,402,908 | |
| 3 month U.S. LIBOR + 0.950% 1.196% 6/1/21 (a)(b)(c) | 4,307,000 | 4,261,805 | |
| Capital One Financial Corp.: | |||
| 3.2% 1/30/23 | 8,016,000 | 8,475,370 | |
| 3.5% 6/15/23 | 555,000 | 595,159 | |
| 3.9% 1/29/24 | 505,000 | 553,626 | |
| Ford Motor Credit Co. LLC: | |||
| 3.47% 4/5/21 | 415,000 | 416,038 | |
| 3.813% 10/12/21 | 495,000 | 501,002 | |
| 5.875% 8/2/21 | 290,000 | 296,885 | |
| Hyundai Capital America: | |||
| 2.375% 2/10/23 (a) | 1,925,000 | 1,984,030 | |
| 2.45% 6/15/21 (a) | 755,000 | 760,771 | |
| 2.85% 11/1/22 (a) | 511,000 | 529,381 | |
| 3% 6/20/22 (a) | 1,060,000 | 1,093,768 | |
| 3.95% 2/1/22 (a) | 1,315,000 | 1,362,572 | |
| John Deere Capital Corp.: | |||
| 3 month U.S. LIBOR + 0.240% 0.4891% 3/12/21 (b)(c) | 5,000,000 | 5,002,815 | |
| 3 month U.S. LIBOR + 0.260% 0.5095% 9/10/21 (b)(c) | 5,000,000 | 5,012,105 | |
| PACCAR Financial Corp. 0.8% 6/8/23 | 445,000 | 450,187 | |
| Synchrony Financial 2.85% 7/25/22 | 3,473,000 | 3,587,396 | |
| Toyota Motor Credit Corp.: | |||
| 0.45% 7/22/22 | 7,207,000 | 7,237,069 | |
| 1.15% 5/26/22 | 5,000,000 | 5,063,992 | |
| 75,692,602 | |||
| Diversified Financial Services - 0.3% | |||
| AIG Global Funding: | |||
| 3 month U.S. LIBOR + 0.460% 0.685% 6/25/21 (a)(b)(c) | 4,293,000 | 4,303,003 | |
| 2.3% 7/1/22 (a) | 1,528,000 | 1,573,280 | |
| 3.35% 6/25/21 (a) | 770,000 | 783,522 | |
| BP Capital Markets America, Inc.: | |||
| 2.937% 4/6/23 | 700,000 | 740,637 | |
| 4.742% 3/11/21 | 5,000,000 | 5,060,900 | |
| Brixmor Operating Partnership LP: | |||
| 3.25% 9/15/23 | 1,355,000 | 1,419,643 | |
| 3.875% 8/15/22 | 170,000 | 176,801 | |
| CNH Industrial Capital LLC 3.875% 10/15/21 | 1,325,000 | 1,357,905 | |
| General Electric Capital Corp.: | |||
| 3.15% 9/7/22 | 555,000 | 580,145 | |
| 3.45% 5/15/24 | 530,000 | 574,510 | |
| Park Aerospace Holdings Ltd.: | |||
| 4.5% 3/15/23 (a) | 435,000 | 453,211 | |
| 5.25% 8/15/22 (a) | 880,000 | 920,193 | |
| 17,943,750 | |||
| Insurance - 1.3% | |||
| AIA Group Ltd. 3 month U.S. LIBOR + 0.520% 0.7474% 9/20/21 (a)(b)(c) | 6,046,000 | 6,039,947 | |
| American International Group, Inc.: | |||
| 4.875% 6/1/22 | 675,000 | 719,512 | |
| 6.4% 12/15/20 | 2,010,000 | 2,014,442 | |
| Aon Corp. 2.2% 11/15/22 | 1,592,000 | 1,647,269 | |
| Aon PLC 2.8% 3/15/21 | 1,320,000 | 1,326,874 | |
| Equitable Financial Life Global Funding 0.5% 11/17/23 (a) | 5,000,000 | 5,004,461 | |
| Lincoln National Corp. 4% 9/1/23 | 270,000 | 295,330 | |
| Marsh & McLennan Companies, Inc.: | |||
| 3 month U.S. LIBOR + 1.200% 1.4179% 12/29/21 (b)(c) | 4,546,000 | 4,547,925 | |
| 3.5% 12/29/20 | 1,135,000 | 1,137,713 | |
| MassMutual Global Funding II 0.85% 6/9/23 (a) | 10,000,000 | 10,116,692 | |
| Metropolitan Life Global Funding I: | |||
| U.S. SECURED OVERNIGHT FINL RATE (SOFR) INDX + 0.570% 0.6555% 1/13/23 (a)(b)(c) | 6,940,000 | 6,972,132 | |
| 0.9% 6/8/23 (a) | 4,918,000 | 4,982,556 | |
| Metropolitan Tower Global Funding: | |||
| U.S. SECURED OVERNIGHT FINL RATE (SOFR) INDX + 0.550% 0.635% 1/17/23 (a)(b)(c) | 5,000,000 | 5,021,293 | |
| 0.55% 7/13/22 (a) | 6,000,000 | 6,026,289 | |
| New York Life Global Funding: | |||
| 3 month U.S. LIBOR + 0.280% 0.5041% 1/10/23 (a)(b)(c) | 6,945,000 | 6,956,772 | |
| 3 month U.S. LIBOR + 0.320% 0.5523% 8/6/21 (a)(b)(c) | 4,942,000 | 4,952,173 | |
| 1.1% 5/5/23 (a) | 725,000 | 737,456 | |
| Protective Life Global Funding 3 month U.S. LIBOR + 0.520% 0.7533% 6/28/21 (a)(b)(c) | 2,000,000 | 2,005,858 | |
| Trinity Acquisition PLC 3.5% 9/15/21 | 650,000 | 663,895 | |
| 71,168,589 | |||
| Thrifts & Mortgage Finance - 0.0% | |||
| Crown Castle Towers LLC/Crown Atlantic Holdings Sub LLC/Crown Communication, Inc. 3.72% 7/15/43 (a) | 370,000 | 387,872 | |
| TOTAL FINANCIALS | 802,180,421 | ||
| HEALTH CARE - 1.8% | |||
| Biotechnology - 0.5% | |||
| AbbVie, Inc.: | |||
| 3 month U.S. LIBOR + 0.650% 0.8626% 11/21/22 (b)(c) | 7,100,000 | 7,144,908 | |
| 2.15% 11/19/21 | 11,244,000 | 11,434,415 | |
| 2.3% 5/14/21 | 850,000 | 856,891 | |
| 2.6% 11/21/24 | 3,500,000 | 3,740,761 | |
| 3.2% 11/6/22 | 170,000 | 178,066 | |
| 3.25% 10/1/22 | 185,000 | 193,141 | |
| 3.45% 3/15/22 | 615,000 | 635,762 | |
| Baxalta, Inc. 3.6% 6/23/22 | 265,000 | 276,163 | |
| Gilead Sciences, Inc. 0.75% 9/29/23 | 2,070,000 | 2,076,208 | |
| Nutrition & Biosciences, Inc. 0.697% 9/15/22 (a) | 582,000 | 584,091 | |
| 27,120,406 | |||
| Health Care Equipment & Supplies - 0.2% | |||
| Becton, Dickinson & Co.: | |||
| 2.894% 6/6/22 | 6,407,000 | 6,626,656 | |
| 3.363% 6/6/24 | 1,215,000 | 1,313,983 | |
| 3.734% 12/15/24 | 285,000 | 314,732 | |
| Stryker Corp. 0.6% 12/1/23 | 325,000 | 325,448 | |
| Zimmer Biomet Holdings, Inc. 3 month U.S. LIBOR + 0.750% 0.9774% 3/19/21 (b)(c) | 3,220,000 | 3,220,639 | |
| 11,801,458 | |||
| Health Care Providers & Services - 0.5% | |||
| Anthem, Inc. 2.375% 1/15/25 | 410,000 | 435,708 | |
| Cardinal Health, Inc.: | |||
| 2.616% 6/15/22 | 115,000 | 118,444 | |
| 3.079% 6/15/24 | 695,000 | 747,107 | |
| 3.2% 3/15/23 | 875,000 | 927,294 | |
| 3.5% 11/15/24 | 1,180,000 | 1,294,063 | |
| Cigna Corp.: | |||
| 3 month U.S. LIBOR + 0.650% 0.8961% 9/17/21 (b)(c) | 4,130,000 | 4,131,044 | |
| 3% 7/15/23 | 715,000 | 758,177 | |
| 3.75% 7/15/23 | 738,000 | 798,915 | |
| 3.9% 2/15/22 | 585,000 | 609,291 | |
| CommonSpirit Health 1.547% 10/1/25 | 670,000 | 679,967 | |
| CVS Health Corp.: | |||
| 2.625% 8/15/24 | 335,000 | 358,490 | |
| 3.35% 3/9/21 | 10,000,000 | 10,083,795 | |
| 3.7% 3/9/23 | 1,169,000 | 1,250,561 | |
| Humana, Inc.: | |||
| 2.9% 12/15/22 | 160,000 | 167,457 | |
| 3.15% 12/1/22 | 315,000 | 329,704 | |
| 3.85% 10/1/24 | 610,000 | 674,581 | |
| 4.5% 4/1/25 | 1,205,000 | 1,386,431 | |
| PeaceHealth Obligated Group 1.375% 11/15/25 | 190,000 | 193,872 | |
| 24,944,901 | |||
| Life Sciences Tools & Services - 0.0% | |||
| Thermo Fisher Scientific, Inc. 4.133% 3/25/25 | 385,000 | 437,677 | |
| Pharmaceuticals - 0.6% | |||
| Bayer U.S. Finance II LLC 3 month U.S. LIBOR + 0.630% 0.855% 6/25/21 (a)(b)(c) | 17,180,000 | 17,219,342 | |
| Bristol-Myers Squibb Co.: | |||
| 2.75% 2/15/23 | 605,000 | 634,600 | |
| 3.25% 2/20/23 | 185,000 | 196,363 | |
| 3.55% 8/15/22 | 600,000 | 632,584 | |
| 3.625% 5/15/24 | 160,000 | 175,533 | |
| EMD Finance LLC 2.95% 3/19/22 (a) | 430,000 | 441,829 | |
| Perrigo Finance PLC 3.9% 12/15/24 | 3,245,000 | 3,528,619 | |
| Royalty Pharma PLC 0.75% 9/2/23 (a) | 870,000 | 873,763 | |
| Shire Acquisitions Investments Ireland DAC 2.875% 9/23/23 | 115,000 | 122,053 | |
| Viatris, Inc. 1.125% 6/22/22 (a) | 1,153,000 | 1,163,308 | |
| Zoetis, Inc. 3 month U.S. LIBOR + 0.440% 0.6638% 8/20/21 (b)(c) | 10,000,000 | 10,022,720 | |
| 35,010,714 | |||
| TOTAL HEALTH CARE | 99,315,156 | ||
| INDUSTRIALS - 1.0% | |||
| Air Freight & Logistics - 0.0% | |||
| FedEx Corp. 3.8% 5/15/25 | 570,000 | 643,614 | |
| Airlines - 0.0% | |||
| American Airlines 2017-2 Class B Pass Through Trust equipment trust certificate 3.7% 4/15/27 | 582,843 | 402,163 | |
| Delta Air Lines, Inc. 2.6% 12/4/20 | 290,000 | 290,000 | |
| United Airlines 2019-2 Class B Pass Through Trust equipment trust certificate 3.5% 11/1/29 | 391,954 | 329,242 | |
| 1,021,405 | |||
| Building Products - 0.0% | |||
| Carrier Global Corp. 2.242% 2/15/25 (a) | 1,860,000 | 1,952,906 | |
| Commercial Services & Supplies - 0.0% | |||
| Republic Services, Inc. 2.5% 8/15/24 | 880,000 | 937,659 | |
| Construction & Engineering - 0.0% | |||
| Yongda Investment Ltd. 2.25% 6/16/25 (Reg. S) | 1,384,000 | 1,413,698 | |
| Electrical Equipment - 0.1% | |||
| Shanghai Electric Group Global Investment Ltd. 2.65% 11/21/24 | 2,220,000 | 2,296,023 | |
| Industrial Conglomerates - 0.2% | |||
| Honeywell International, Inc. 3 month U.S. LIBOR + 0.370% 0.583% 8/8/22 (b)(c) | 9,078,000 | 9,120,139 | |
| Roper Technologies, Inc.: | |||
| 0.45% 8/15/22 | 706,000 | 706,798 | |
| 1% 9/15/25 | 235,000 | 236,341 | |
| 2.35% 9/15/24 | 365,000 | 386,637 | |
| 3.125% 11/15/22 | 1,505,000 | 1,571,679 | |
| 3.65% 9/15/23 | 270,000 | 293,058 | |
| 12,314,652 | |||
| Machinery - 0.3% | |||
| Caterpillar Financial Services Corp.: | |||
| 3 month U.S. LIBOR + 0.200% 0.4136% 11/12/21 (b)(c) | 5,000,000 | 5,005,800 | |
| 3 month U.S. LIBOR + 0.220% 0.4535% 1/6/22 (b)(c) | 3,019,000 | 3,022,916 | |
| 3 month U.S. LIBOR + 0.280% 0.528% 9/7/21 (b)(c) | 6,190,000 | 6,201,697 | |
| Otis Worldwide Corp. 3 month U.S. LIBOR + 0.450% 0.684% 4/5/23 (b)(c) | 3,299,000 | 3,299,828 | |
| 17,530,241 | |||
| Professional Services - 0.1% | |||
| Equifax, Inc.: | |||
| 3 month U.S. LIBOR + 0.870% 1.091% 8/15/21 (b)(c) | 610,000 | 612,004 | |
| 2.3% 6/1/21 | 975,000 | 982,391 | |
| 3.95% 6/15/23 | 1,090,000 | 1,177,569 | |
| 2,771,964 | |||
| Road & Rail - 0.1% | |||
| Avolon Holdings Funding Ltd.: | |||
| 2.875% 2/15/25 (a) | 980,000 | 962,740 | |
| 3.625% 5/1/22 (a) | 1,560,000 | 1,583,142 | |
| 3.95% 7/1/24 (a) | 265,000 | 272,318 | |
| Eastern Creation II Investment Holdings Ltd. 1% 9/10/23 (Reg. S) | 1,670,000 | 1,661,082 | |
| SMBC Aviation Capital Finance: | |||
| 3.55% 4/15/24 (a) | 325,000 | 345,340 | |
| 4.125% 7/15/23 (a) | 200,000 | 212,748 | |
| 5,037,370 | |||
| Trading Companies & Distributors - 0.1% | |||
| Air Lease Corp.: | |||
| 2.25% 1/15/23 | 810,000 | 829,901 | |
| 2.5% 3/1/21 | 275,000 | 276,194 | |
| 3.5% 1/15/22 | 5,560,000 | 5,711,980 | |
| GATX Corp. 3.9% 3/30/23 | 545,000 | 581,462 | |
| 7,399,537 | |||
| Transportation Infrastructure - 0.1% | |||
| Heathrow Funding Ltd. 4.875% 7/15/23 (a) | 1,340,000 | 1,370,280 | |
| HPHT Finance 17 Ltd. 2.75% 9/11/22 (Reg. S) | 1,235,000 | 1,265,155 | |
| 2,635,435 | |||
| TOTAL INDUSTRIALS | 55,954,504 | ||
| INFORMATION TECHNOLOGY - 0.5% | |||
| Electronic Equipment & Components - 0.0% | |||
| Amphenol Corp. 2.05% 3/1/25 | 910,000 | 955,122 | |
| Avnet, Inc. 3.75% 12/1/21 | 905,000 | 925,801 | |
| 1,880,923 | |||
| IT Services - 0.3% | |||
| Global Payments, Inc. 2.65% 2/15/25 | 800,000 | 856,580 | |
| IBM Corp. 2.85% 5/13/22 | 10,000,000 | 10,374,787 | |
| PayPal Holdings, Inc. 1.35% 6/1/23 | 2,224,000 | 2,278,903 | |
| The Western Union Co.: | |||
| 2.85% 1/10/25 | 1,280,000 | 1,367,564 | |
| 3.6% 3/15/22 | 840,000 | 868,828 | |
| 15,746,662 | |||
| Semiconductors & Semiconductor Equipment - 0.2% | |||
| Analog Devices, Inc. 2.95% 4/1/25 | 295,000 | 321,827 | |
| Broadcom Corp./Broadcom Cayman LP 2.2% 1/15/21 | 225,000 | 225,430 | |
| Microchip Technology, Inc.: | |||
| 2.67% 9/1/23 (a) | 1,110,000 | 1,163,538 | |
| 3.922% 6/1/21 | 2,185,000 | 2,220,708 | |
| Micron Technology, Inc.: | |||
| 2.497% 4/24/23 | 2,585,000 | 2,699,414 | |
| 4.64% 2/6/24 | 340,000 | 378,702 | |
| NXP BV/NXP Funding LLC: | |||
| 3.875% 9/1/22 (a) | 1,355,000 | 1,430,809 | |
| 4.625% 6/1/23 (a) | 1,175,000 | 1,286,912 | |
| 4.875% 3/1/24 (a) | 195,000 | 219,889 | |
| NXP BV/NXP Funding LLC/NXP U.S.A., Inc. 2.7% 5/1/25 (a) | 205,000 | 220,205 | |
| 10,167,434 | |||
| TOTAL INFORMATION TECHNOLOGY | 27,795,019 | ||
| MATERIALS - 0.1% | |||
| Chemicals - 0.0% | |||
| LYB International Finance III LLC 1.25% 10/1/25 | 705,000 | 711,293 | |
| Syngenta Finance NV 3.933% 4/23/21 (a) | 735,000 | 742,480 | |
| 1,453,773 | |||
| Construction Materials - 0.0% | |||
| Boral Finance Pty Ltd. 3% 11/1/22 (a) | 135,000 | 138,174 | |
| Vulcan Materials Co. 3 month U.S. LIBOR + 0.650% 0.896% 3/1/21 (b)(c) | 1,620,000 | 1,620,099 | |
| 1,758,273 | |||
| Metals & Mining - 0.1% | |||
| Nucor Corp. 2% 6/1/25 | 350,000 | 367,627 | |
| POSCO 2.375% 1/17/23 (a) | 1,870,000 | 1,918,770 | |
| 2,286,397 | |||
| TOTAL MATERIALS | 5,498,443 | ||
| REAL ESTATE - 0.1% | |||
| Equity Real Estate Investment Trusts (REITs) - 0.1% | |||
| American Campus Communities Operating Partnership LP 3.75% 4/15/23 | 910,000 | 960,011 | |
| Highwoods/Forsyth LP 3.625% 1/15/23 | 1,620,000 | 1,688,765 | |
| Simon Property Group LP: | |||
| 2.625% 6/15/22 | 1,150,000 | 1,179,677 | |
| 3.375% 10/1/24 | 1,175,000 | 1,271,460 | |
| 3.5% 9/1/25 | 280,000 | 308,448 | |
| Ventas Realty LP 3.1% 1/15/23 | 180,000 | 189,013 | |
| 5,597,374 | |||
| UTILITIES - 1.4% | |||
| Electric Utilities - 0.8% | |||
| American Electric Power Co., Inc. 3.65% 12/1/21 | 180,000 | 185,888 | |
| Duke Energy Corp.: | |||
| 3 month U.S. LIBOR + 0.500% 0.721% 5/14/21 (a)(b)(c) | 7,000,000 | 7,013,624 | |
| 3.55% 9/15/21 | 330,000 | 335,694 | |
| Edison International: | |||
| 2.95% 3/15/23 | 455,000 | 469,754 | |
| 3.125% 11/15/22 | 650,000 | 672,239 | |
| ENEL Finance International NV: | |||
| 2.65% 9/10/24 (a) | 200,000 | 212,462 | |
| 2.875% 5/25/22 (a) | 1,660,000 | 1,715,007 | |
| 4.25% 9/14/23 (a) | 980,000 | 1,074,893 | |
| FirstEnergy Corp. 2.85% 7/15/22 | 885,000 | 905,708 | |
| Florida Power & Light Co. 3 month U.S. LIBOR + 0.380% 0.6023% 7/28/23 (b)(c) | 5,358,000 | 5,360,129 | |
| Israel Electric Corp. Ltd. 5% 11/12/24 (Reg. S) (a) | 1,365,000 | 1,546,900 | |
| NextEra Energy Capital Holdings, Inc. 2.403% 9/1/21 | 11,475,000 | 11,653,196 | |
| NRG Energy, Inc. 3.75% 6/15/24 (a) | 535,000 | 574,336 | |
| Pacific Gas & Electric Co.: | |||
| 3 month U.S. LIBOR + 1.370% 1.6% 11/15/21 (b)(c) | 1,755,000 | 1,756,905 | |
| 1.75% 6/16/22 | 3,430,000 | 3,436,630 | |
| PNM Resources, Inc. 3.25% 3/9/21 | 995,000 | 1,002,249 | |
| PPL Electric Utilities Corp. 0.000% x 3 month U.S. LIBOR 0.4751% 9/28/23 (b)(c) | 1,780,000 | 1,781,509 | |
| Sinosing Services Pte Ltd. 2.25% 2/20/25 (Reg. S) | 2,200,000 | 2,258,922 | |
| Vistra Operations Co. LLC 3.55% 7/15/24 (a) | 3,025,000 | 3,254,706 | |
| 45,210,751 | |||
| Gas Utilities - 0.0% | |||
| Southern California Gas Co. 3 month U.S. LIBOR + 0.350% 0.5774% 9/14/23 (b)(c) | 902,000 | 902,268 | |
| Independent Power and Renewable Electricity Producers - 0.0% | |||
| Hero Asia Investment Ltd. 1.5% 11/18/23 (Reg. S) | 1,650,000 | 1,647,251 | |
| The AES Corp. 3.3% 7/15/25 (a) | 820,000 | 894,423 | |
| 2,541,674 | |||
| Multi-Utilities - 0.6% | |||
| Consolidated Edison Co. of New York, Inc. 3 month U.S. LIBOR + 0.400% 0.625% 6/25/21 (b)(c) | 11,500,000 | 11,522,770 | |
| Dominion Energy, Inc.: | |||
| 3 month U.S. LIBOR + 0.400% 0.646% 12/1/20 (a)(b)(c) | 10,000,000 | 10,000,000 | |
| 3 month U.S. LIBOR + 0.530% 0.7761% 9/15/23 (b)(c) | 2,327,000 | 2,330,737 | |
| 2.715% 8/15/21 | 3,153,000 | 3,201,090 | |
| DTE Energy Co. 0.55% 11/1/22 | 5,000,000 | 5,010,665 | |
| San Diego Gas & Electric Co. 1.914% 2/1/22 | 102,860 | 103,426 | |
| Sempra Energy 2.875% 10/1/22 | 535,000 | 553,563 | |
| 32,722,251 | |||
| TOTAL UTILITIES | 81,376,944 | ||
| TOTAL NONCONVERTIBLE BONDS | |||
| (Cost $1,337,002,561) | 1,352,752,705 | ||
| U.S. Government and Government Agency Obligations - 2.5% | |||
| U.S. Government Agency Obligations - 0.4% | |||
| Fannie Mae U.S. SECURED OVERNIGHT FINL RATE (SOFR) INDX + 0.180% 0.2656% 7/8/22 (b)(c) | 20,000,000 | 20,036,268 | |
| U.S. Treasury Obligations - 2.1% | |||
| U.S. Treasury Notes: | |||
| 0.125% 4/30/22 | $7,520,000 | $7,520,294 | |
| 0.125% 9/30/22 | 12,080,000 | 12,076,697 | |
| 0.125% 10/31/22 | 13,245,000 | 13,239,826 | |
| 0.125% 11/30/22 | 4,860,000 | 4,858,102 | |
| 0.125% 5/15/23 | 3,315,000 | 3,311,763 | |
| 0.125% 7/15/23 | 5,180,000 | 5,172,918 | |
| 0.375% 3/31/22 | 35,500,000 | 35,610,938 | |
| 1.75% 6/15/22 | 810,000 | 829,997 | |
| 2.125% 5/15/22 | 14,690,000 | 15,112,911 | |
| 2.25% 4/15/22 (d) | 20,770,000 | 21,375,251 | |
| TOTAL U.S. TREASURY OBLIGATIONS | 119,108,697 | ||
| TOTAL U.S. GOVERNMENT AND GOVERNMENT AGENCY OBLIGATIONS | |||
| (Cost $138,094,825) | 139,144,965 | ||
| U.S. Government Agency - Mortgage Securities - 0.4% | |||
| Fannie Mae - 0.3% | |||
| 12 month U.S. LIBOR + 1.560% 3.23% 12/1/35 (b)(c) | 6,079 | 6,346 | |
| 12 month U.S. LIBOR + 1.620% 2.632% 7/1/35 (b)(c) | 5,513 | 5,769 | |
| 12 month U.S. LIBOR + 1.650% 2.62% 8/1/37 (b)(c) | 1,635 | 1,716 | |
| 12 month U.S. LIBOR + 1.690% 2.775% 5/1/38 (b)(c) | 22,516 | 23,608 | |
| 12 month U.S. LIBOR + 1.780% 3.788% 5/1/38 (b)(c) | 7,892 | 8,247 | |
| 12 month U.S. LIBOR + 1.830% 3.615% 4/1/38 (b)(c) | 14,749 | 15,494 | |
| 12 month U.S. LIBOR + 1.850% 2.692% 8/1/38 (b)(c) | 8,971 | 9,439 | |
| 12 month U.S. LIBOR + 1.860% 3.635% 5/1/38 (b)(c) | 14,286 | 14,992 | |
| 12 month U.S. LIBOR + 2.040% 3.612% 12/1/36 (b)(c) | 2,013 | 2,108 | |
| 6 month U.S. LIBOR + 1.360% 2.063% 10/1/33 (b)(c) | 32,413 | 33,438 | |
| 2% 9/1/35 to 12/1/50 (e) | 989,654 | 1,037,957 | |
| 2.5% 11/1/50 to 12/1/50 (e) | 994,473 | 1,043,736 | |
| 3% 9/1/28 to 12/1/34 | 1,913,064 | 2,042,993 | |
| 3.5% 11/1/26 to 7/1/50 | 1,151,735 | 1,218,013 | |
| 4% 1/1/47 to 12/1/49 | 770,826 | 830,721 | |
| 4.5% 8/1/24 to 1/1/50 | 3,651,436 | 3,977,449 | |
| 5% 12/1/20 to 7/1/45 | 1,447,133 | 1,645,895 | |
| 5.5% 3/1/21 to 5/1/40 | 1,857,393 | 2,158,523 | |
| 6% to 6% 1/1/22 to 2/1/49 | 1,751,716 | 2,072,562 | |
| 6.5% 7/1/32 to 12/1/32 | 82,296 | 95,719 | |
| TOTAL FANNIE MAE | 16,244,725 | ||
| Freddie Mac - 0.0% | |||
| 12 month U.S. LIBOR + 1.590% 2.216% 9/1/35 (b)(c) | 3,513 | 3,670 | |
| 12 month U.S. LIBOR + 1.620% 2.504% 7/1/38 (b)(c) | 23,158 | 24,062 | |
| 12 month U.S. LIBOR + 1.620% 2.888% 6/1/38 (b)(c) | 20,729 | 21,722 | |
| 12 month U.S. LIBOR + 1.720% 2.72% 7/1/35 (b)(c) | 8,050 | 8,408 | |
| 12 month U.S. LIBOR + 1.720% 3.193% 5/1/38 (b)(c) | 8,871 | 9,317 | |
| 12 month U.S. LIBOR + 1.730% 2.788% 10/1/36 (b)(c) | 22,107 | 23,235 | |
| 12 month U.S. LIBOR + 1.730% 3.733% 2/1/37 (b)(c) | 3,190 | 3,356 | |
| 12 month U.S. LIBOR + 1.730% 3.734% 2/1/37 (b)(c) | 4,409 | 4,639 | |
| 12 month U.S. LIBOR + 1.770% 3.377% 5/1/37 (b)(c) | 5,678 | 5,987 | |
| 12 month U.S. LIBOR + 2.020% 3.465% 11/1/36 (b)(c) | 2,926 | 3,057 | |
| 12 month U.S. LIBOR + 2.050% 4.073% 12/1/36 (b)(c) | 6,100 | 6,377 | |
| 12 month U.S. LIBOR + 2.080% 4.082% 2/1/38 (b)(c) | 17,713 | 18,613 | |
| 12 month U.S. LIBOR + 2.190% 4.191% 2/1/37 (b)(c) | 6,533 | 6,860 | |
| U.S. TREASURY 1 YEAR INDEX + 2.340% 3.759% 11/1/34 (b)(c) | 13,898 | 14,467 | |
| 3% 11/1/34 | 404,607 | 436,859 | |
| 4% 12/1/49 | 279,114 | 303,101 | |
| 4.5% 5/1/50 | 377,545 | 412,472 | |
| 5% 10/1/22 to 12/1/41 | 595,278 | 676,588 | |
| 5.5% 11/1/21 to 10/1/38 | 15,473 | 16,440 | |
| 6% 7/1/21 to 1/1/38 | 112,555 | 131,953 | |
| 7% 3/1/39 | 159,738 | 188,697 | |
| 7.5% 6/1/38 | 162,544 | 189,478 | |
| TOTAL FREDDIE MAC | 2,509,358 | ||
| Ginnie Mae - 0.1% | |||
| 6% 7/15/36 | 200,592 | 233,148 | |
| 4% 3/20/48 to 4/20/50 | 1,006,221 | 1,094,269 | |
| 4.5% 9/20/40 to 9/20/49 (e) | 1,067,063 | 1,160,527 | |
| 5% 12/20/34 to 5/20/48 | 1,241,501 | 1,391,082 | |
| 5.5% 9/15/45 to 2/20/49 | 909,979 | 1,035,435 | |
| TOTAL GINNIE MAE | 4,914,461 | ||
| TOTAL U.S. GOVERNMENT AGENCY - MORTGAGE SECURITIES | |||
| (Cost $22,927,843) | 23,668,544 | ||
| Asset-Backed Securities - 7.9% | |||
| Ally Auto Receivables Trust: | |||
| Series 2017-2: | |||
| Class C, 2.46% 9/15/22 | $745,000 | $745,649 | |
| Class D, 2.93% 11/15/23 | 200,000 | 200,186 | |
| Series 2019-3 Class A4, 1.96% 12/16/24 | 600,000 | 619,895 | |
| Series 2019-4 Class A2, 1.93% 10/17/22 | 1,464,760 | 1,469,382 | |
| Ally Master Owner Trust Series 2018-1 Class A1, 1 month U.S. LIBOR + 0.280% 0.4209% 1/17/23 (b)(c) | 8,383,000 | 8,385,463 | |
| American Credit Acceptance Receivables Trust Series 2019-3 Class A, 2.44% 12/12/22 (a) | 162,295 | 162,420 | |
| American Express Credit Account Master Trust Series 2019-3 Class B, 2.2% 4/15/25 | 740,000 | 761,835 | |
| AmeriCredit Automobile Receivables Trust: | |||
| Series 2016-3 Class D, 2.71% 9/8/22 | 810,000 | 818,436 | |
| Series 2017-1: | |||
| Class C, 2.71% 8/18/22 | 170,940 | 172,105 | |
| Class D, 3.13% 1/18/23 | 1,330,000 | 1,362,962 | |
| Series 2017-3: | |||
| Class B, 2.24% 6/19/23 | 178,800 | 179,248 | |
| Class C, 2.69% 6/19/23 | 420,000 | 426,594 | |
| Class D, 3.18% 7/18/23 | 1,355,000 | 1,397,807 | |
| Series 2018-1 Class D, 3.82% 3/18/24 | 1,645,000 | 1,730,027 | |
| Series 2019-3 Class B, 2.13% 7/18/25 | 985,000 | 1,012,684 | |
| Series 2020-1: | |||
| Class C, 1.59% 10/20/25 | 705,000 | 716,159 | |
| Class D, 1.8% 12/18/25 | 690,000 | 699,239 | |
| Series 2020-3 Class C, 1.06% 8/18/26 | 420,000 | 421,222 | |
| Applebee's/IHOP Funding LLC Series 2019-1A Class A2I, 4.194% 6/7/49 (a) | 1,440,000 | 1,407,125 | |
| Ares LVII CLO Ltd. / Ares LVII CLO LLC Series 2020-57A Class A, 3 month U.S. LIBOR + 1.320% 0% 10/25/31 (a)(b)(c)(e) | 895,000 | 895,000 | |
| ARI Fleet Lease Trust: | |||
| Series 2018-A Class A2, 2.55% 10/15/26 (a) | 29,504 | 29,537 | |
| Series 2020-A Class B, 2.06% 11/15/28 (a) | 770,000 | 789,531 | |
| Ascentium Equipment Receivables LLC Series 2017-1A Class A3, 2.29% 6/10/21 (a) | 21,945 | 21,973 | |
| Avis Budget Rental Car Funding (AESOP) LLC: | |||
| Series 2015-2A Class A, 2.63% 12/20/21 (a) | 148,333 | 148,474 | |
| Series 2016-1A Class A, 2.99% 6/20/22 (a) | 610,000 | 614,474 | |
| Series 2017-1A Class B, 3.41% 9/20/23 (a) | 540,000 | 548,255 | |
| Series 2017-2A Class A, 2.97% 3/20/24 (a) | 905,000 | 935,571 | |
| Series 2018-2A Class C, 4.95% 3/20/25 (a) | 430,000 | 450,832 | |
| Series 2019-1A Class B, 3.7% 3/20/23 (a) | 245,000 | 250,564 | |
| Series 2019-2A Class A, 3.35% 9/22/25 (a) | 650,000 | 688,592 | |
| Series 2020-1A Class A, 2.33% 8/20/26 (a) | 540,000 | 554,806 | |
| Babson CLO Ltd. Series 2013-IA Class AR, 3 month U.S. LIBOR + 0.800% 1.0184% 1/20/28 (a)(b)(c) | 971,087 | 966,072 | |
| Bank of The West Auto Trust Series 2019-1 Class A2, 2.4% 10/17/22 (a) | 331,296 | 332,659 | |
| Bayview Opportunity Master Fund Trust: | |||
| Series 2017-RT3 Class A, 3.5% 1/28/58 (a)(b) | 920,915 | 931,320 | |
| Series 2017-SPL4 Class A, 3.5% 1/28/55 (a) | 269,623 | 275,113 | |
| Bayview Opportunity Master Funding Trust Series 2017-SPL5 Class A, 3.5% 6/28/57 (a) | 791,813 | 818,454 | |
| BlueMountain CLO Ltd. Series 2015-2A Class A1R, 3 month U.S. LIBOR + 0.930% 1.1478% 7/18/27 (a)(b)(c) | 1,081,926 | 1,075,677 | |
| BMW Floorplan Master Owner Trust Series 2018-1 Class A2, 1 month U.S. LIBOR + 0.320% 0.4609% 5/15/23 (a)(b)(c) | 6,174,000 | 6,179,928 | |
| BMW Vehicle Owner Trust Series 2020-A Class A2, 0.39% 2/27/23 | 5,908,000 | 5,912,819 | |
| BRE Grand Islander Timeshare Issuer Series 2019-A Class A, 3.28% 9/26/33 (a) | 260,050 | 269,635 | |
| Canadian Pacer Auto Receivables Trust Series 2019-1A Class A2, 2.78% 3/21/22 (a) | 553,673 | 555,152 | |
| Capital Auto Receivables Asset Trust: | |||
| Series 2017-1: | |||
| Class B, 2.43% 5/20/22 (a) | 145,000 | 145,930 | |
| Class C, 2.7% 9/20/22 (a) | 235,000 | 238,141 | |
| Series 2018-1 Class B, 3.09% 8/22/22 (a) | 760,000 | 771,964 | |
| Series 2018-2: | |||
| Class B, 3.48% 10/20/23 (a) | 370,000 | 373,563 | |
| Class C, 3.69% 12/20/23 (a) | 460,000 | 468,086 | |
| Carlyle Global Market Strategies Series 2015-3A Class A1R, 3 month U.S. LIBOR + 1.000% 1.2223% 7/28/28 (a)(b)(c) | 506,433 | 503,905 | |
| CarMax Auto Owner Trust: | |||
| Series 2017-4 Class C, 2.7% 10/16/23 | 205,000 | 209,085 | |
| Series 2019-2 Class B, 3.01% 12/16/24 | 1,935,000 | 2,037,713 | |
| Series 2019-4 Class A2A, 2.01% 3/15/23 | 763,331 | 768,458 | |
| Series 2020-1 Class A2, 1.87% 4/17/23 | 2,701,764 | 2,721,772 | |
| Series 2020-3 Class A2A, 0.49% 6/15/23 | 8,502,000 | 8,512,444 | |
| Series 2020-4: | |||
| Class A2, 0.31% 1/16/24 | 7,423,000 | 7,422,087 | |
| Class D, 1.75% 4/15/27 | 540,000 | 541,429 | |
| Carvana Auto Receivables Trust Series 2019-4A Class A2, 2.2% 7/15/22 (a) | 126,877 | 127,173 | |
| Cayuga Park CLO, Ltd. Series 2020-1A, Class A, 3 month U.S. LIBOR + 1.600% 1.8318% 7/17/31 (a)(b)(c) | 1,020,000 | 1,022,568 | |
| Chesapeake Funding II LLC: | |||
| Series 2017-2A Class A2, 1 month U.S. LIBOR + 0.450% 0.5909% 5/15/29 (a)(b)(c) | 553,859 | 553,858 | |
| Series 2017-4A Class A2, 1 month U.S. LIBOR + 0.310% 0.4509% 11/15/29 (a)(b)(c) | 712,850 | 712,873 | |
| Series 2018-3A Class A2, 1 month U.S. LIBOR + 0.480% 0.6209% 1/15/31 (a)(b)(c) | 1,509,503 | 1,510,102 | |
| Series 2019-1A Class A1, 2.94% 4/15/31 (a) | 2,214,383 | 2,257,678 | |
| Series 2020-1A Class A1, 0.87% 8/16/32 (a) | 3,576,480 | 3,583,375 | |
| CIFC Funding Ltd./CIFC Funding LLC Series 2020-1A Class A1, 3 month U.S. LIBOR + 1.700% 1.9369% 7/15/32 (a)(b)(c) | 1,480,000 | 1,482,741 | |
| CIM Trust Series 2020-INV1 Class A2, 2.5% 4/25/50 (a) | 512,166 | 527,787 | |
| CNH Equipment Trust: | |||
| Series 2018-A Class B, 3.47% 10/15/25 | 380,000 | 393,205 | |
| Series 2019-B Class A2, 2.55% 9/15/22 | 1,116,359 | 1,119,356 | |
| Series 2019-C Class A2, 1.99% 3/15/23 | 668,740 | 672,904 | |
| Series 2020-A Class A4, 1.51% 4/15/27 | 590,000 | 609,345 | |
| Cole Park CLO Ltd. Series 2015-1A Class AR, 3 month U.S. LIBOR + 1.050% 1.2684% 10/20/28 (a)(b)(c) | 1,110,000 | 1,108,685 | |
| Daimler Trucks Retail Trust: | |||
| Series 2018-1 Class A4, 3.03% 11/15/24 (a) | 246,636 | 247,212 | |
| Series 2020-1 Class A4, 1.37% 6/15/27 | 1,820,000 | 1,831,558 | |
| Dell Equipment Finance Trust: | |||
| Series 2019-1 Class A2, 2.78% 8/23/21 (a) | 468,205 | 469,375 | |
| Series 2019-2: | |||
| Class A2, 1.95% 12/22/21 (a) | 2,725,735 | 2,743,182 | |
| Class A3, 1.91% 10/22/24 (a) | 1,714,000 | 1,744,176 | |
| Series 2020-2: | |||
| Class A2, 0.47% 10/24/22 (a) | 1,568,000 | 1,570,682 | |
| Class A3, 0.57% 10/23/23 (a) | 1,915,000 | 1,919,986 | |
| DLL Securitization Trust: | |||
| Series 2019-MA2 Class A2, 2.27% 5/20/22 (a) | 912,082 | 915,020 | |
| Series 2019-MT3: | |||
| Class A2, 2.13% 1/20/22 (a) | 2,262,719 | 2,272,115 | |
| Class A3, 2.08% 2/21/23 (a) | 1,639,000 | 1,662,855 | |
| Dryden CLO, Ltd. / Dryden CLO, LLC Series 2020-86A Class A, 3 month U.S. LIBOR + 1.650% 1.8838% 7/17/30 (a)(b)(c) | 1,220,000 | 1,222,166 | |
| DT Auto Owner Trust: | |||
| Series 2019-3A Class A, 2.55% 8/15/22 (a) | 499,905 | 501,179 | |
| Series 2019-4A Class A, 2.17% 5/15/23 (a) | 1,334,038 | 1,340,610 | |
| Elara HGV Timeshare Issuer LLC: | |||
| Series 2014-A Class A, 2.53% 2/25/27 (a) | 33,138 | 33,212 | |
| Series 2017-A Class A, 2.69% 3/25/30 (a) | 157,729 | 161,939 | |
| Ellington Financial Mortgage Trust Series 2019-2 Class A1, 2.739% 11/25/59 (a) | 509,235 | 517,007 | |
| Enterprise Fleet Financing LLC: | |||
| Series 2018-1 Class A2, 2.87% 10/20/23 (a) | 69,258 | 69,601 | |
| Series 2018-2 Class A2, 3.14% 2/20/24 (a) | 259,188 | 261,305 | |
| Series 2019-1 Class A2, 2.98% 10/20/24 (a) | 1,862,774 | 1,895,759 | |
| Series 2019-3 Class A2, 2.06% 5/20/25 (a) | 727,865 | 740,037 | |
| Series 2020-1 Class A2, 1.78% 12/22/25 (a) | 7,284,711 | 7,397,817 | |
| Series 2020-2 Class A2, 0.61% 7/20/26 (a) | 3,960,000 | 3,962,173 | |
| Fifth Third Auto Trust Series 2019-1 Class A2A, 2.66% 5/16/22 | 329,353 | 329,717 | |
| Ford Credit Auto Lease Trust: | |||
| Series 2019-B Class A2A, 2.28% 2/15/22 | 898,918 | 901,223 | |
| Series 2020-A Class A2, 1.8% 7/15/22 | 5,866,825 | 5,897,803 | |
| Series 2020-B Class A3, 0.62% 8/15/23 | 4,531,000 | 4,548,986 | |
| Ford Credit Auto Owner Trust Series 2020-2 Class C, 1.74% 4/15/33 (a) | 570,000 | 572,204 | |
| Ford Credit Floorplan Master Owner Trust Series 2020-1 Class A1, 0.7% 9/15/25 | 3,274,000 | 3,289,958 | |
| Freddie Mac STACR REMIC Trust Series 2020-DNA5 Class M1, UNITED STATES 30 DAY AVERAGE S + 1.300% 1.3877% 10/25/50 (a)(b)(c) | 250,000 | 250,477 | |
| GM Financial Automobile Leasing Trust: | |||
| Series 2019-1 Class C, 3.56% 12/20/22 | 835,000 | 850,422 | |
| Series 2020-1 Class A2A, 1.67% 4/20/22 | 9,214,767 | 9,260,696 | |
| Series 2020-2 Class C, 2.56% 7/22/24 | 445,000 | 461,564 | |
| Series 2020-3 Class A2A, 0.35% 11/21/22 | 10,000,000 | 10,003,740 | |
| GM Financial Consumer Automobile Receivables Trust: | |||
| Series 2020-1 Class A2, 1.83% 1/17/23 | 2,302,476 | 2,314,502 | |
| Series 2020-2 Class A3, 1.49% 12/16/24 | 335,000 | 340,761 | |
| Series 2020-3 Class A2, 0.35% 7/17/23 | 5,000,000 | 5,002,641 | |
| Series 2020-4: | |||
| Class A2, 0.26% 11/16/23 | 9,590,000 | 9,589,631 | |
| Class C, 1.05% 5/18/26 | 420,000 | 420,736 | |
| GM Financial Securitized Auto Receivables Trust Series 2017-3A Class C, 2.52% 3/16/23 (a) | 245,000 | 247,873 | |
| GMF Floorplan Owner Revolving Trust: | |||
| Series 2018-2 Class A2, 3.13% 3/15/23 (a) | 2,500,000 | 2,519,629 | |
| Series 2019-1 Class A, 2.7% 4/15/24 (a) | 710,000 | 732,074 | |
| Series 2020-1 Class A, 0.68% 8/15/25 (a) | 1,480,000 | 1,485,115 | |
| Series 2020-2 Class A, 0.69% 10/15/25 (a) | 3,238,000 | 3,241,173 | |
| Golub Capital Partners CLO 39B LLC Series 2018-39A Class A1, 3 month U.S. LIBOR + 1.150% 1.3684% 10/20/28 (a)(b)(c) | 680,000 | 678,390 | |
| GreatAmerica Leasing Receivables Funding LLC 2.6% 6/15/21 (a) | 12,950 | 12,960 | |
| Hardee's Funding LLC / Carl's Jr. Funding LLC Series 2018-1A Class AI, 4.25% 6/20/48 (a) | 924,278 | 925,276 | |
| Hilton Grand Vacations Trust: | |||
| Series 2017-AA: | |||
| Class A, 2.66% 12/26/28 (a) | 216,901 | 221,833 | |
| Class B, 2.96% 12/26/28 (a)(b) | 330,813 | 334,590 | |
| Series 2020-AA Class A, 2.74% 2/25/39 (a) | 567,829 | 591,109 | |
| HPEFS Equipment Trust: | |||
| Series 2020-1A Class A2, 1.73% 2/20/30 (a) | 3,564,225 | 3,588,611 | |
| Series 2020-2A Class A2, 0.65% 7/22/30 (a) | 5,990,000 | 6,001,368 | |
| Hyundai Auto Lease Securitization Trust Series 2020-A: | |||
| Class A2, 1.9% 5/16/22 (a) | 4,272,756 | 4,297,639 | |
| Class A3, 1.95% 7/17/23 (a) | 2,698,000 | 2,744,836 | |
| Hyundai Auto Receivables Trust: | |||
| Series 2017-A Class B, 2.38% 4/17/23 | 340,000 | 342,344 | |
| Series 2019-A Class B, 2.94% 5/15/25 | 635,000 | 665,241 | |
| Series 2020-A Class A3, 1.41% 11/15/24 | 735,000 | 749,422 | |
| Series 2020-C Class A2, 0.26% 9/15/23 | 8,398,000 | 8,398,421 | |
| John Deere Owner Trust: | |||
| Series 2019-B Class A2, 2.28% 5/16/22 | 1,160,239 | 1,163,795 | |
| Series 2020-A Class A2, 1.01% 1/17/23 | 2,476,653 | 2,485,086 | |
| Series 2020-B Class A2, 0.41% 3/15/23 | 9,670,000 | 9,677,423 | |
| KKR Finanical CLO Ltd. Series 13 Class A1R, 3 month U.S. LIBOR + 0.800% 1.0301% 1/16/28 (a)(b)(c) | 1,456,228 | 1,445,194 | |
| Kubota Credit Owner Trust Series 2020-1A Class A3, 1.96% 3/15/24 (a) | 380,000 | 391,031 | |
| Lanark Master Issuer PLC Series 2020-1A Class 1A, 2.277% 12/22/69 (a)(b) | 1,768,000 | 1,810,220 | |
| Madison Park Funding Ltd. Series 2015-18A Class A1R, 3 month U.S. LIBOR + 1.190% 1.3986% 10/21/30 (a)(b)(c) | 1,165,000 | 1,161,285 | |
| Magnetite XVI, Ltd. / Magnetite XVI, LLC Series 2015-16A Class AR, 3 month U.S. LIBOR + 0.800% 1.0178% 1/18/28 (a)(b)(c) | 2,017,652 | 2,005,078 | |
| Mercedes-Benz Auto Lease Trust: | |||
| Series 2019-A Class A3, 3.1% 11/15/21 | 1,341,529 | 1,348,399 | |
| Series 2019-B Class A3, 2% 10/17/22 | 8,016,000 | 8,123,172 | |
| Series 2020-A Class A2, 1.82% 3/15/22 | 4,455,889 | 4,472,576 | |
| Series 2020-B Class A2, 0.31% 2/15/23 | 5,200,000 | 5,202,068 | |
| Mercedes-Benz Auto Receivables Trust Series 2020-1 Class A2, 0.46% 3/15/23 | 5,892,000 | 5,899,356 | |
| MMAF Equipment Finance LLC Series 2019-B Class A2, 2.07% 10/12/22 (a) | 2,030,154 | 2,047,387 | |
| MVW Owner Trust: | |||
| Series 2014-1A Class A, 2.25% 9/22/31 (a) | 71,877 | 72,067 | |
| Series 2015-1A Class A, 2.52% 12/20/32 (a) | 176,596 | 177,642 | |
| Series 2017-1A: | |||
| Class A, 2.42% 12/20/34 (a) | 531,178 | 544,022 | |
| Class B, 2.75% 12/20/34 (a) | 31,246 | 31,846 | |
| Class C, 2.99% 12/20/34 (a) | 74,990 | 75,842 | |
| Navient Private Education Loan Trust: | |||
| Series 2020-A Class A2A, 2.46% 11/15/68 (a) | 840,000 | 874,901 | |
| Series 2020-CA Class A2A, 2.15% 11/15/68 (a) | 2,610,000 | 2,688,803 | |
| Navient Private Education Refi Loan Trust: | |||
| Series 2019-A Class A2A, 3.42% 1/15/43 (a) | 2,679,779 | 2,802,794 | |
| Series 2020-DA Class A, 1.69% 5/15/69 (a) | 1,061,514 | 1,079,469 | |
| Navient Student Loan Trust: | |||
| Series 2017-3A Class A2, 1 month U.S. LIBOR + 0.600% 0.7501% 7/26/66 (a)(b)(c) | 5,086,471 | 5,085,385 | |
| Series 2017-A Class A2A, 2.88% 12/16/58 (a) | 1,413,543 | 1,436,557 | |
| Series 2019-2A Class A1, 1 month U.S. LIBOR + 0.270% 0.4201% 2/27/68 (a)(b)(c) | 233,858 | 233,791 | |
| Series 2019-CA Class A1, 2.82% 2/15/68 (a) | 189,621 | 190,217 | |
| Series 2019-EA: | |||
| Class A1, 2.39% 5/15/68 (a) | 385,419 | 387,385 | |
| Class A2A, 2.64% 5/15/68 (a) | 1,560,000 | 1,601,358 | |
| Nelnet Student Loan Trust: | |||
| Series 2005-4 Class A4, 3 month U.S. LIBOR + 0.180% 0.4054% 3/22/32 (b)(c) | 691,489 | 652,177 | |
| Series 2020-1A Class A, 1 month U.S. LIBOR + 0.740% 0.8901% 3/26/68 (a)(b)(c) | 375,560 | 372,375 | |
| Neuberger Berman CLO Ltd. Series 2017-16SA Class A, 3 month U.S. LIBOR + 0.850% 1.0869% 1/15/28 (a)(b)(c) | 791,679 | 787,631 | |
| Neuberger Berman CLO XIX Ltd. Series 2015-19A Class A1R2, 3 month U.S. LIBOR + 0.800% 1.0369% 7/15/27 (a)(b)(c) | 296,604 | 295,052 | |
| New Residential Mortgage Loan Trust Series 2019-NQM3: | |||
| Class A1, 2.8018% 7/25/49 (a) | 857,718 | 868,037 | |
| Class A3, 3.0864% 7/25/49 (a) | 390,725 | 395,290 | |
| Nissan Auto Receivables Trust Series 2020-A Class A3, 1.38% 12/16/24 | 425,000 | 432,382 | |
| Nissan Master Owner Trust Receivables Series 2019-A Class A, 1 month U.S. LIBOR + 0.560% 0.7009% 2/15/24 (b)(c) | 1,350,000 | 1,355,739 | |
| OCP CLO Ltd. Series 2014-7A Class A1RR, 3 month U.S. LIBOR + 1.120% 1.3384% 7/20/29 (a)(b)(c) | 2,530,000 | 2,519,184 | |
| OZLM Ltd. Series 2014-8A Class RR, 3 month U.S. LIBOR + 1.170% 1.3878% 10/17/29 (a)(b)(c) | 610,198 | 606,674 | |
| Palmer Square CLO Ltd. / Palmer Square CLO LLC Series 2020-2A Class A1A, 3 month U.S. LIBOR + 1.700% 1.904% 7/15/31 (a)(b)(c) | 860,000 | 861,588 | |
| Reese Park CLO Ltd. / Reese Park CLO LLC Series 2020-1A Class A1, 3 month U.S. LIBOR + 1.320% 0% 10/15/32 (a)(b)(c) | 830,000 | 830,000 | |
| Santander Drive Auto Receivables Trust: | |||
| Series 2018-1 Class C, 2.96% 3/15/24 | 106,301 | 106,919 | |
| Series 2018-2 Class C, 3.35% 7/17/23 | 255,131 | 257,568 | |
| Series 2019-1 Class B, 3.21% 9/15/23 | 220,582 | 221,546 | |
| Series 2019-2 Class B, 2.79% 1/16/24 | 535,000 | 541,270 | |
| Series 2020-4 Class C, 1.01% 1/15/26 | 675,000 | 675,927 | |
| Santander Retail Auto Lease Trust: | |||
| Series 2019-A: | |||
| Class A2, 2.72% 1/20/22 (a) | 983,059 | 986,355 | |
| Class B, 3.01% 5/22/23 (a) | 700,000 | 718,010 | |
| Series 2019-B: | |||
| Class A2A, 2.29% 4/20/22 (a) | 2,788,710 | 2,808,479 | |
| Class C, 2.77% 8/21/23 (a) | 690,000 | 709,059 | |
| Series 2019-C: | |||
| Class A2A, 1.89% 9/20/22 (a) | 3,390,148 | 3,417,690 | |
| Class B, 2.17% 11/20/23 (a) | 495,000 | 506,068 | |
| Class C, 2.39% 11/20/23 (a) | 830,000 | 847,562 | |
| Class D, 2.88% 6/20/24 (a) | 870,000 | 888,174 | |
| Series 2020-A: | |||
| Class A2, 1.69% 1/20/23 (a) | 8,730,981 | 8,821,143 | |
| Class D, 2.52% 11/20/24 (a) | 720,000 | 735,724 | |
| Series 2020-B Class A2, 0.42% 11/20/23 (a) | 8,856,000 | 8,866,819 | |
| SBA Tower Trust: | |||
| Series 2019, 2.836% 1/15/50 (a) | 990,000 | 1,051,370 | |
| 1.884% 7/15/50 (a) | 365,000 | 375,794 | |
| 3.168% 4/9/47 (a) | 1,255,000 | 1,268,747 | |
| SG Residential Mortgage Trust Series 2019-3 Class A2, 2.877% 9/25/59 (a) | 824,192 | 824,148 | |
| Sierra Receivables Funding Co. LLC: | |||
| Series 2016-2A Class A, 2.33% 7/20/33 (a) | 57,806 | 57,976 | |
| Series 2019-1A Class A, 3.2% 1/20/36 (a) | 249,915 | 258,734 | |
| Series 2019-2A Class A, 2.59% 5/20/36 (a) | 1,572,583 | 1,625,001 | |
| Sierra Timeshare Receivables Funding Co. LLC Series 2017-1A Class A, 2.91% 3/20/34 (a) | 351,923 | 358,628 | |
| Sierra Timeshare Receivables Funding LLC: | |||
| Series 2019-3A Class A, 2.34% 8/20/36 (a) | 389,597 | 398,591 | |
| Series 2020-2A Class C, 3.51% 7/20/37 (a) | 534,700 | 551,070 | |
| SLM Student Loan Trust: | |||
| Series 2003-10A Class A3, 3 month U.S. LIBOR + 0.470% 0.7204% 12/15/27 (a)(b)(c) | 2,182,821 | 2,182,404 | |
| Series 2003-11 Class A6, 3 month U.S. LIBOR + 0.550% 0.8004% 12/15/25 (a)(b)(c) | 1,261,200 | 1,260,434 | |
| Series 2007-7 Class A4, 3 month U.S. LIBOR + 0.330% 0.5448% 1/25/22 (b)(c) | 564,958 | 541,773 | |
| Series 2008-1 Class A4, 3 month U.S. LIBOR + 0.650% 0.8648% 1/25/22 (b)(c) | 1,326,467 | 1,274,446 | |
| Series 2008-5 Class A4, 3 month U.S. LIBOR + 1.700% 1.9148% 7/25/23 (b)(c) | 165,608 | 165,353 | |
| Series 2008-9 Class A, 3 month U.S. LIBOR + 1.500% 1.7148% 4/25/23 (b)(c) | 120,058 | 119,743 | |
| Series 2010-1 Class A, 1 month U.S. LIBOR + 0.400% 0.5501% 3/25/25 (b)(c) | 802,496 | 778,244 | |
| SMB Private Education Loan Trust: | |||
| Series 2014-A Class A3, 1 month U.S. LIBOR + 1.500% 1.6409% 4/15/32 (a)(b)(c) | 1,400,000 | 1,414,711 | |
| Series 2015-A Class A2B, 1 month U.S. LIBOR + 1.000% 1.1409% 6/15/27 (a)(b)(c) | 152,465 | 152,825 | |
| Series 2016-C Class A2B, 1 month U.S. LIBOR + 1.100% 1.2409% 9/15/34 (a)(b)(c) | 881,611 | 882,301 | |
| Series 2018-B Class A2B, 1 month U.S. LIBOR + 0.720% 0.8609% 1/15/37 (a)(b)(c) | 1,600,907 | 1,599,496 | |
| Series 2020-BA Class A1A, 1.29% 7/15/53 (a) | 537,603 | 539,094 | |
| Series 2020-PTB Class A2A, 1.6% 9/15/54 (a) | 2,750,000 | 2,764,144 | |
| SoFi Consumer Loan Program Trust Series 2019-4 Class A, 2.45% 8/25/28 (a) | 1,695,385 | 1,713,861 | |
| Synchrony Credit Card Master Note Trust Series 2018-1 Class C, 3.36% 3/15/24 | 955,000 | 960,994 | |
| Tesla Series 2020-A: | |||
| Class A2, 0.55% 5/22/23 (a) | 2,221,000 | 2,224,888 | |
| Class A3, 0.68% 12/20/23 (a) | 2,527,000 | 2,540,623 | |
| Tesla Auto Lease Trust Series 2019-A Class A2, 2.13% 4/20/22 (a) | 5,017,583 | 5,063,283 | |
| Towd Point Mortgage Trust: | |||
| Series 2017-1 Class A1, 2.75% 10/25/56 (a)(b) | 453,949 | 465,196 | |
| Series 2017-4 Class A1, 2.75% 6/25/57 (a) | 245,581 | 254,269 | |
| Series 2019-1 Class A1, 3.7236% 3/25/58 (a)(b) | 914,514 | 981,203 | |
| Toyota Auto Receivables Owner Trust Series 2020-C Class A3, 0.44% 10/15/24 | 9,912,000 | 9,942,350 | |
| Verizon Owner Trust: | |||
| Series 2017-3A: | |||
| Class A1A, 2.06% 4/20/22 (a) | 28,097 | 28,126 | |
| Class C, 2.53% 4/20/22 (a) | 700,000 | 701,946 | |
| Series 2018-1A: | |||
| Class A1B, 1 month U.S. LIBOR + 0.260% 0.4114% 9/20/22 (a)(b)(c) | 1,872,313 | 1,872,904 | |
| Class C, 3.2% 9/20/22 (a) | 970,000 | 985,342 | |
| Series 2018-A: | |||
| Class A1A, 3.23% 4/20/23 | 4,551,672 | 4,610,177 | |
| Class A1B, 1 month U.S. LIBOR + 0.240% 0.3865% 4/20/23 (b)(c) | 3,547,679 | 3,550,551 | |
| Series 2020-A Class A1A, 1.85% 7/22/24 | 4,951,000 | 5,072,333 | |
| Volkswagen Auto Lease Trust: | |||
| Series 2019-A: | |||
| Class A2A, 2% 3/21/22 | 5,081,504 | 5,110,457 | |
| Class A3, 1.99% 11/21/22 | 2,795,000 | 2,838,736 | |
| Series 2020-A Class A2, 0.27% 4/20/23 | 10,000,000 | 9,999,334 | |
| Volkswagen Auto Loan Enhanced Trust Series 2020-1 Class A4, 1.26% 8/20/26 | 545,000 | 557,291 | |
| Volvo Financial Equipment LLC: | |||
| Series 2019-1A Class A2, 2.9% 11/15/21 (a) | 223,753 | 223,985 | |
| Series 2019-2A Class A3, 2.04% 11/15/23 (a) | 2,435,000 | 2,483,599 | |
| Volvo Financial Equipment Master Owner Trust Series 2018-A Class A, 1 month U.S. LIBOR + 0.520% 0.6609% 7/17/23 (a)(b)(c) | 5,080,000 | 5,087,978 | |
| World Omni Auto Receivables Trust: | |||
| Series 2019-C Class C, 2.4% 6/15/26 | 895,000 | 924,850 | |
| Series 2020-A: | |||
| Class A2A, 1.02% 6/15/23 | 3,321,785 | 3,333,877 | |
| Class C, 1.64% 8/17/26 | 480,000 | 489,480 | |
| Series 2020-C Class A2, 0.35% 12/15/23 | 5,000,000 | 5,003,707 | |
| World Omni Automobile Lease Securitization Trust: | |||
| Series 2019-A Class A3, 2.94% 5/16/22 | 2,284,000 | 2,310,344 | |
| Series 2019-B Class A3, 2.03% 11/15/22 | 2,480,000 | 2,524,652 | |
| Series 2020-A Class A2, 1.71% 11/15/22 | 9,267,561 | 9,355,312 | |
| Series 2020-B Class A2, 0.32% 9/15/23 | 4,533,000 | 4,533,462 | |
| World Omni Select Auto Trust: | |||
| Series 2019-A Class A2A, 2.06% 8/15/23 | 2,271,127 | 2,284,201 | |
| Series 2020-A: | |||
| Class B, 0.84% 6/15/26 | 510,000 | 511,197 | |
| Class C, 1.25% 10/15/26 | 585,000 | 587,209 | |
| TOTAL ASSET-BACKED SECURITIES | |||
| (Cost $434,192,559) | 436,792,369 | ||
| Collateralized Mortgage Obligations - 1.1% | |||
| Private Sponsor - 0.9% | |||
| Angel Oak Mortgage Trust: | |||
| sequential payer: | |||
| Series 2019-4 Class A3, 3.301% 7/26/49 (a) | 757,354 | 765,486 | |
| Series 2020-6 Class A1, 1.261% 5/25/65 (a) | 764,803 | 764,648 | |
| Series 2019-2 Class M1, 4.065% 3/25/49 (a) | 545,000 | 559,226 | |
| Angel Oak Mortgage Trust LLC sequential payer Series 2020-3 Class A1, 1.691% 4/25/65 (a) | 787,098 | 794,284 | |
| Citigroup Mortgage Loan Trust Series 2020-EXP2 Class A3, 2.5% 8/25/50 (a) | 603,057 | 621,031 | |
| COLT Funding LLC sequential payer Series 2019-2 Class A1, 3.337% 5/25/49 (a) | 279,891 | 282,797 | |
| COLT Mortgage Loan Trust sequential payer Series 2020-3 Class A1, 1.506% 4/27/65 (a) | 488,999 | 486,545 | |
| Deephaven Residential Mortgage Trust: | |||
| sequential payer Series 2020-2 Class A1, 1.692% 5/25/65 (a) | 957,768 | 963,160 | |
| Series 2017-1A Class A3, 3.485% 12/26/46 (a)(b) | 28,594 | 28,769 | |
| Series 2017-3A: | |||
| Class A1, 2.577% 10/25/47 (a)(b) | 132,982 | 133,890 | |
| Class A2, 2.711% 10/25/47 (a)(b) | 11,082 | 11,112 | |
| Class A3, 2.813% 10/25/47 (a)(b) | 10,554 | 10,530 | |
| Series 2018-1A Class A1, 2.976% 12/25/57 (a)(b) | 159,174 | 160,186 | |
| Series 2018-2A Class A1, 3.479% 4/25/58 (a) | 357,874 | 362,211 | |
| Series 2018-3A Class A3, 3.963% 8/25/58 (a) | 36,841 | 37,280 | |
| Series 2019-1A Class A1, 3.743% 1/25/59 (a) | 443,063 | 450,387 | |
| Series 2019-2A: | |||
| Class A3, 3.763% 4/25/59 (a) | 378,561 | 382,490 | |
| Class M1, 3.921% 4/25/59 (a) | 380,000 | 386,929 | |
| Ellington Financial Mortgage Trust Series 2020-1 Class A1, 2.006% 5/25/65 (a) | 340,815 | 342,956 | |
| Flagstar Mortgage Trust floater sequential payer Series 2020-1INV Class A11, 1 month U.S. LIBOR + 0.850% 0.9993% 3/25/50 (a)(b)(c) | 603,168 | 601,785 | |
| Freddie Mac STACR REMIC Trust floater: | |||
| Series 2020-DNA2 Class M1, 1 month U.S. LIBOR + 0.750% 0.8993% 2/25/50 (a)(b)(c) | 312,777 | 312,133 | |
| Series 2020-HQA1 Class M1, 1 month U.S. LIBOR + 0.750% 0.9001% 1/25/50 (a)(b)(c) | 190,940 | 190,807 | |
| Series 2020-HQA2 Class M1, 1 month U.S. LIBOR + 1.100% 1.2501% 3/25/50 (a)(b)(c) | 516,157 | 515,937 | |
| Series 2020-HQA3 Class M1, 1 month U.S. LIBOR + 1.550% 1.6993% 7/25/50 (a)(b)(c) | 470,000 | 470,181 | |
| Series 2020-HQA4 Class M1, 1 month U.S. LIBOR + 1.300% 1.4501% 9/25/50 (a)(b)(c) | 1,140,000 | 1,140,000 | |
| Series 2020-HQA5 Class M1, UNITED STATES 30 DAY AVERAGE S + 1.100% 1.191% 11/25/50 (a)(b)(c) | 530,000 | 530,005 | |
| Freddie Mac STACR Trust floater: | |||
| Series 2018-DNA2: | |||
| Class M1, 1 month U.S. LIBOR + 0.800% 0.9493% 12/25/30 (a)(b)(c) | 232,179 | 232,133 | |
| Class M2A/S, 1 month U.S. LIBOR + 0.950% 1.0993% 12/25/30 (a)(b)(c) | 450,000 | 448,118 | |
| Series 2018-HRP2 Class M2, 1 month U.S. LIBOR + 1.250% 1.4001% 2/25/47 (a)(b)(c) | 466,141 | 462,163 | |
| Series 2019-HRP1 Class M2, 1 month U.S. LIBOR + 1.400% 1.5493% 2/25/49 (a)(b)(c) | 628,406 | 606,572 | |
| Series 2020-DNA3 Class M1, 1 month U.S. LIBOR + 1.500% 1.6493% 6/25/50 (a)(b)(c) | 293,367 | 293,664 | |
| FWD Securitization Trust sequential payer Series 2020-INV1 Class A1, 2.24% 1/25/50 (a) | 1,465,409 | 1,495,804 | |
| Galton Funding Mortgage Trust: | |||
| sequential payer: | |||
| Series 2019-H1 Class M1, 3.339% 10/25/59 (a) | 600,000 | 598,862 | |
| Series 2020-H1 Class M1, 2.832% 1/25/60 (a) | 625,000 | 598,140 | |
| Series 2020-H1 Class A1, 2.31% 1/25/60 (a) | 525,098 | 535,138 | |
| GMRF Mortgage Acquisition Co., LLC: | |||
| Series 2018-1 Class A33, 3.5% 11/25/57 (a) | 337,911 | 345,450 | |
| Series 2019-1 Class A32, 4% 2/25/59 (a) | 251,916 | 253,577 | |
| Series 2019-2 Class A42, 3.5% 6/25/59 (a) | 542,290 | 539,789 | |
| Gosforth Funding PLC floater Series 2018-1A Class A1, 3 month U.S. LIBOR + 0.450% 0.6565% 8/25/60 (a)(b)(c) | 999,058 | 999,084 | |
| GS Mortgage-Backed Securites Trust Series 2014-EB1A Class 2A1, 2.3964% 7/25/44 (a)(b) | 25,934 | 25,893 | |
| Holmes Master Issuer PLC floater Series 2018-2A Class A2, 3 month U.S. LIBOR + 0.420% 0.6569% 10/15/54 (a)(b)(c) | 839,530 | 839,648 | |
| Homeward Opportunities Fund I Trust sequential payer: | |||
| Series 2019-1: | |||
| Class A1, 3.454% 1/25/59 (a) | 685,643 | 709,930 | |
| Class A3, 3.606% 1/25/59 (a) | 554,975 | 561,455 | |
| Series 2019-3 Class A1, 2.675% 11/25/59 (a) | 764,023 | 778,473 | |
| Homeward Opportunities Fund Trust sequential payer: | |||
| Series 2018-1: | |||
| Class A1, 3.766% 6/25/48 (a) | 379,048 | 395,023 | |
| Class A2, 3.897% 6/25/48 (a) | 365,337 | 377,709 | |
| Series 2020-2 Class A1, 1.657% 5/25/65 (a)(b) | 676,867 | 681,194 | |
| J.P. Morgan Mortgage Trust: | |||
| sequential payer Series 2020-LTV1 Class A4, 3.5% 6/25/50 (a) | 1,182,979 | 1,204,051 | |
| Series 2020-INV1 Class A15, 3.5% 8/25/50 (a) | 595,590 | 611,968 | |
| Lanark Master Issuer PLC floater Series 2019-1A Class 1A1, 3 month U.S. LIBOR + 0.770% 1.0261% 12/22/69 (a)(b)(c) | 945,567 | 948,467 | |
| Metlife Securitization Trust Series 2017-1A Class A, 3% 4/25/55 (a) | 349,553 | 364,653 | |
| Mill City Mortgage Loan Trust: | |||
| Series 2016-1 Class A1, 2.5% 4/25/57 (a) | 64,051 | 64,846 | |
| Series 2017-2 Class A1, 2.75% 7/25/59 (a) | 381,633 | 388,500 | |
| New Residential Mortgage Loan Trust sequential payer: | |||
| Series 2019-NQM5 Class A1, 2.7099% 11/25/59 (a) | 1,014,033 | 1,035,502 | |
| Series 2020-NQM1 Class A1, 2.4641% 1/26/60 (a) | 634,493 | 645,352 | |
| OBX Trust: | |||
| floater Series 2020-EXP1 Class 2A2, 1 month U.S. LIBOR + 0.950% 1.1001% 2/25/60 (a)(b)(c) | 795,859 | 797,104 | |
| Series 2020-EXP1 Class 1A8, 3.5% 2/25/60 (a)(b) | 868,530 | 885,554 | |
| Series 2020-EXP2: | |||
| Class A8, 3% 5/25/60 (a) | 1,329,805 | 1,364,688 | |
| Class A9, 3% 5/25/60 (a) | 327,141 | 333,711 | |
| Series 2020-INV1 Class A5, 3.5% 12/25/49 (a) | 370,453 | 384,529 | |
| Onslow Bay Financial LLC: | |||
| floater Series 2019-EXP2 Class 2A2, 1 month U.S. LIBOR + 1.200% 1.3501% 6/25/59 (a)(b)(c) | 825,397 | 830,145 | |
| floater sequential payer Series 2019-EXP2 Class 2A1A, 1 month U.S. LIBOR + 0.900% 1.0501% 6/25/59 (a)(b)(c) | 407,165 | 407,219 | |
| Permanent Master Issuer PLC floater Series-1A Class 1A1, 3 month U.S. LIBOR + 0.550% 0.7869% 7/15/58 (a)(b)(c) | 896,000 | 896,798 | |
| Sequoia Mortgage Trust: | |||
| sequential payer: | |||
| Series 2018-CH1 Class A11, 3.5% 2/25/48 (a) | 298,726 | 301,035 | |
| Series 2018-CH2 Class A3, 4% 6/25/48 (a) | 718,976 | 739,220 | |
| Series 2018-CH2 Class A21, 4% 6/25/48 (a) | 320,834 | 330,790 | |
| Series 2018-CH3 Class A19, 4.5% 8/25/48 (a) | 147,098 | 152,160 | |
| Series 2018-CH4 Class A2, 4% 10/25/48 (a) | 231,394 | 236,164 | |
| Silverstone Master Issuer PLC floater Series 2019-1A Class 1A, 3 month U.S. LIBOR + 0.570% 0.7786% 1/21/70 (a)(b)(c) | 3,610,800 | 3,618,433 | |
| Starvest Emerging Markets Cbo sequential payer Series 2019-IMC1 Class A1, 3.468% 2/25/49 (a) | 355,208 | 359,856 | |
| Starwood Mortgage Residential Trust: | |||
| sequential payer Series 2019-INV1: | |||
| Class A1, 2.61% 9/27/49 (a) | 132,000 | 134,072 | |
| Class A3, 2.916% 9/27/49 (a) | 388,376 | 396,295 | |
| Series 2019-1: | |||
| Class A1, 2.941% 6/25/49 (a) | 626,675 | 640,354 | |
| Class A3, 3.299% 6/25/49 (a) | 555,402 | 558,473 | |
| Series 2020-1 Class A2, 2.408% 2/25/50 (a) | 467,069 | 470,871 | |
| Towd Point Mortgage Trust: | |||
| Series 2015-4 Class A1B, 2.75% 4/25/55 (a) | 99,601 | 100,006 | |
| Series 2015-5 Class A1B, 2.75% 5/25/55 (a) | 123,101 | 123,628 | |
| Series 2016-1: | |||
| Class A1B, 2.75% 2/25/55 (a) | 82,697 | 83,832 | |
| Class A3B, 3% 2/25/55 (a) | 150,530 | 154,107 | |
| Series 2016-2 Class A1A, 2.75% 8/25/55 (a) | 139,843 | 142,685 | |
| Series 2016-3 Class A1, 2.25% 4/25/56 (a) | 30,750 | 31,016 | |
| Series 2017-2 Class A1, 2.75% 4/25/57 (a)(b) | 296,636 | 303,490 | |
| Series 2017-3 Class A1, 2.75% 7/25/57 (a)(b) | 669,424 | 687,629 | |
| Verus Securitization Trust: | |||
| sequential payer: | |||
| Series 2018-3 Class A1, 4.108% 10/25/58 (a) | 565,238 | 585,948 | |
| Series 2019-1 Class A1, 3.836% 2/25/59 (a) | 605,029 | 612,407 | |
| Series 2019-2 Class A1, 3.211% 5/25/59 (a) | 511,109 | 518,385 | |
| Series 2019-INV3 Class A3, 3.1% 11/25/59 (a) | 706,301 | 727,265 | |
| Series 2020-1 Class A3, 2.724% 1/25/60 (a) | 669,609 | 679,094 | |
| Series 2020-2 Class A1, 2.226% 5/25/60 (a) | 2,165,759 | 2,193,851 | |
| Series 2020-INV1 Class A1, 1.977% 3/25/60 (a) | 219,898 | 220,834 | |
| Series 2018-2: | |||
| Class A1, 3.677% 6/1/58 (a) | 453,396 | 457,755 | |
| Class A2, 3.779% 6/1/58 (a) | 167,301 | 168,081 | |
| Class A3, 3.83% 6/1/58 (a) | 105,423 | 105,827 | |
| Series 2019-3 Class A3, 3.04% 7/25/59 (a) | 1,132,737 | 1,141,724 | |
| Series 2019-INV1: | |||
| Class A1, 3.402% 12/25/59 (a)(b) | 413,977 | 432,971 | |
| Class M1, 4.034% 12/25/59 (a) | 195,000 | 201,312 | |
| Series 2019-INV2 Class A2, 3.117% 7/25/59 (a) | 854,285 | 876,959 | |
| Series 2020-5 Class A3, 1.733% 5/25/65 (a) | 438,405 | 438,540 | |
| Vista Point Securitization Trust sequential payer Series 2020-2 Class A3, 2.496% 4/25/65 (a) | 404,656 | 404,437 | |
| TOTAL PRIVATE SPONSOR | 53,575,177 | ||
| U.S. Government Agency - 0.2% | |||
| Fannie Mae: | |||
| Series 2017-90 Class KA, 3% 11/25/47 | 798,998 | 854,264 | |
| Series 2018-44 Class PC, 4% 6/25/44 | 643,151 | 654,000 | |
| Fannie Mae Connecticut Avenue Securities floater: | |||
| Series 2017-C02 Class 2ED3, 1 month U.S. LIBOR + 1.350% 1.5001% 9/25/29 (b)(c) | 941,886 | 919,340 | |
| Series 2017-C04 Class 2ED2, 1 month U.S. LIBOR + 1.100% 1.2501% 11/25/29 (b)(c) | 1,373,341 | 1,341,451 | |
| Series 2017-C05 Class 1ED3, 1 month U.S. LIBOR + 1.200% 1.3501% 1/25/30 (b)(c) | 583,910 | 574,606 | |
| Series 2018-C01 Class 1ED2, 1 month U.S. LIBOR + 0.850% 1.0001% 7/25/30 (b)(c) | 921,428 | 904,832 | |
| FHLMC Structured Agency Credit Risk Debt Notes floater: | |||
| Series 2014-DN3 Class M3, 1 month U.S. LIBOR + 4.000% 4.1501% 8/25/24 (b)(c) | 384,734 | 392,030 | |
| Series 2015-DNA3 Class M3, 1 month U.S. LIBOR + 4.700% 4.8493% 4/25/28 (b)(c) | 1,315,162 | 1,369,070 | |
| Series 2016-DNA2 Class M3, 1 month U.S. LIBOR + 4.650% 4.7993% 10/25/28 (b)(c) | 751,847 | 779,723 | |
| Series 2017-DNA2 Class M1, 1 month U.S. LIBOR + 1.200% 1.3493% 10/25/29 (b)(c) | 242,483 | 242,604 | |
| Series 2017-DNA3 Class M1, 1 month U.S. LIBOR + 0.750% 0.8993% 3/25/30 (b)(c) | 117,931 | 117,864 | |
| Freddie Mac: | |||
| planned amortization class Series 3713 Class PA, 2% 2/15/40 | 464,857 | 475,300 | |
| Series 4448 Class JA, 4% 11/15/36 | 26,487 | 26,642 | |
| Freddie Mac STACR Trust floater: | |||
| Series 18-HQA2 Class M1, 1 month U.S. LIBOR + 0.750% 0.9001% 10/25/48 (a)(b)(c) | 64,207 | 64,115 | |
| Series 2018-DNA3: | |||
| Class M1, 1 month U.S. LIBOR + 0.750% 0.9001% 9/25/48 (a)(b)(c) | 1,831 | 1,831 | |
| Class M2A/S, 1 month U.S. LIBOR + 0.900% 1.0501% 9/25/48 (a)(b)(c) | 600,000 | 595,277 | |
| Freddie Mac Whole Loan Securities Trust: | |||
| Series 2016-SC02 Class M1, 3.6052% 10/25/46 (b) | 713,221 | 706,452 | |
| Series 2017-SC02 Class M1, 3.8231% 5/25/47 (a)(b) | 73,251 | 72,850 | |
| TOTAL U.S. GOVERNMENT AGENCY | 10,092,251 | ||
| TOTAL COLLATERALIZED MORTGAGE OBLIGATIONS | |||
| (Cost $63,242,857) | 63,667,428 | ||
| Commercial Mortgage Securities - 1.5% | |||
| Americold Realty Trust floater Series 2020-ICE5 Class B, 1.4409% 11/15/37 (a)(b) | 1,735,000 | 1,734,999 | |
| Atrium Hotel Portfolio Trust floater Series 2017-ATRM Class A 1 month U.S. LIBOR + 0.930% 1.0709% 12/15/36 (a)(b)(c) | 1,395,000 | 1,332,090 | |
| Austin Fairmont Hotel Trust floater Series 2019-FAIR Class A, 1 month U.S. LIBOR + 1.050% 1.1909% 9/15/32 (a)(b)(c) | 615,000 | 599,593 | |
| Banc of America Merrill Lynch Large Loan, Inc. floater Series 2018-DSNY Class A, 1 month U.S. LIBOR + 0.850% 0.9909% 9/15/34 (a)(b)(c) | 970,000 | 949,253 | |
| BANK Series 2019-BN19 Class A1, 2.263% 8/15/61 | 437,028 | 447,326 | |
| BX Commercial Mortgage Trust: | |||
| floater Series 2020-BXLP: | |||
| Class C, 1 month U.S. LIBOR + 1.120% 1.2609% 12/15/36 (a)(b)(c) | 794,273 | 789,338 | |
| Class D, 1 month U.S. LIBOR + 1.250% 1.3909% 12/15/36 (a)(b)(c) | 759,305 | 749,337 | |
| floater sequential payer Series 2020-BXLP Class A, 1 month U.S. LIBOR + 0.800% 0.9409% 12/15/36 (a)(b)(c) | 2,330,867 | 2,328,067 | |
| BX Trust: | |||
| floater Series 2019-XL Class B, 1 month U.S. LIBOR + 1.080% 1.2209% 10/15/36 (a)(b)(c) | 427,184 | 426,381 | |
| floater, sequential payer: | |||
| Series 2019-IMC Class A, 1 month U.S. LIBOR + 1.000% 1.1409% 4/15/34 (a)(b)(c) | 2,135,000 | 2,068,231 | |
| Series 2019-XL Class A, 1 month U.S. LIBOR + 0.920% 1.0609% 10/15/36 (a)(b)(c) | 5,211,645 | 5,211,644 | |
| CGDB Commercial Mortgage Trust floater Series 2019-MOB: | |||
| Class A, 1 month U.S. LIBOR + 0.950% 1.0909% 11/15/36 (a)(b)(c) | 1,033,000 | 1,025,883 | |
| Class D, 1 month U.S. LIBOR + 1.650% 1.7909% 11/15/36 (a)(b)(c) | 1,545,000 | 1,487,915 | |
| CGDBB Commercial Mortgage Trust floater Series 2017-BIOC Class A, 1 month U.S. LIBOR + 0.790% 0.9309% 7/15/32 (a)(b)(c) | 3,713,554 | 3,712,434 | |
| CHC Commercial Mortgage Trust floater Series 2019-CHC Class A, 1 month U.S. LIBOR + 1.120% 1.2609% 6/15/34 (a)(b)(c) | 3,726,918 | 3,565,592 | |
| Citigroup Commercial Mortgage Trust: | |||
| sequential payer Series 2012-GC8 Class A/S, 3.683% 9/10/45 (a) | 2,157,000 | 2,230,030 | |
| Series 2013-375P Class C, 3.6348% 5/10/35 (a)(b) | 560,000 | 565,286 | |
| COMM Mortgage Trust: | |||
| sequential payer Series 2013-300P Class A1, 4.353% 8/10/30 (a) | 620,000 | 660,170 | |
| Series 2014-CR15 Class B, 4.8412% 2/10/47 (b) | 920,000 | 1,008,883 | |
| Series 2014-UBS2 Class B, 4.701% 3/10/47 | 520,000 | 556,889 | |
| Series 2020-CMB Class D, 3.7538% 2/10/37 (a)(b) | 560,000 | 532,347 | |
| Credit Suisse Mortgage Trust: | |||
| floater Series 2019-ICE4: | |||
| Class A, 1 month U.S. LIBOR + 0.980% 1.1209% 5/15/36 (a)(b)(c) | 5,485,000 | 5,486,710 | |
| Class C, 1 month U.S. LIBOR + 1.430% 1.5709% 5/15/36 (a)(b)(c) | 1,015,000 | 1,013,072 | |
| Class D, 1 month U.S. LIBOR + 1.600% 1.7409% 5/15/36 (a)(b)(c) | 780,000 | 774,137 | |
| sequential payer Series 2020-NET Class A, 2.2569% 8/15/37 (a) | 455,000 | 469,340 | |
| Series 2020-NET Class D, 3.8277% 8/15/37 (a)(b) | 985,000 | 983,490 | |
| CSAIL Commercial Mortgage Trust: | |||
| sequential payer Series 2015-C3 Class A4, 3.7182% 8/15/48 | 670,000 | 740,997 | |
| Series 2019-C16 Class A1, 2.3595% 6/15/52 | 527,163 | 539,843 | |
| CSMC Trust Series 2017-CHOP Class A, 1 month U.S. LIBOR + 0.750% 0.8909% 7/15/32 (a)(b)(c) | 4,189,000 | 4,083,699 | |
| Great Wolf Trust floater Series 2019-WOLF: | |||
| Class A, 1 month U.S. LIBOR + 1.030% 1.1749% 12/15/36 (a)(b)(c) | 1,906,000 | 1,846,409 | |
| Class C, 1 month U.S. LIBOR + 1.630% 1.7739% 12/15/36 (a)(b)(c) | 600,000 | 554,191 | |
| Intown Hotel Portfolio Trust Series 2018-STAY: | |||
| Class A, 1 month U.S. LIBOR + 0.700% 0.8409% 1/15/33 (a)(b)(c) | 245,000 | 242,842 | |
| Class C, 1 month U.S. LIBOR + 1.250% 1.3909% 1/15/33 (a)(b)(c) | 205,000 | 199,604 | |
| J.P. Morgan Chase Commercial Mortgage Securities Trust floater Series 2020-609M: | |||
| Class B, 1 month U.S. LIBOR + 1.770% 1.9109% 10/15/33 (a)(b)(c) | 995,000 | 993,797 | |
| Class C, 1 month U.S. LIBOR + 2.170% 2.3109% 10/15/33 (a)(b)(c) | 805,000 | 804,025 | |
| JPMorgan Chase Commercial Mortgage Securities Trust: | |||
| floater: | |||
| Series 2018-GW Class A, 1 month U.S. LIBOR + 0.800% 0.9409% 5/15/35 (a)(b)(c) | 2,440,000 | 2,369,701 | |
| Series 2019-BKWD: | |||
| Class A, 1 month U.S. LIBOR + 1.000% 1.1409% 9/15/29 (a)(b)(c) | 1,911,000 | 1,877,458 | |
| Class B, 1 month U.S. LIBOR + 1.350% 1.4909% 9/15/29 (a)(b)(c) | 1,830,000 | 1,774,961 | |
| Class C, 1 month U.S. LIBOR + 1.600% 1.7409% 9/15/29 (a)(b)(c) | 575,000 | 551,943 | |
| sequential payer Series 2014-C20 Class A3A1, 3.4718% 7/15/47 | 1,713,932 | 1,726,604 | |
| Series 2013-C13 Class A4, 3.9936% 1/15/46 (b) | 2,583,966 | 2,770,463 | |
| Merit floater Series 2020-HILL: | |||
| Class A, 1 month U.S. LIBOR + 1.150% 1.2909% 8/15/37 (a)(b)(c) | 576,000 | 576,722 | |
| Class B, 1 month U.S. LIBOR + 1.400% 1.5409% 8/15/37 (a)(b)(c) | 455,000 | 455,730 | |
| Class C, 1 month U.S. LIBOR + 1.700% 1.8409% 8/15/37 (a)(b)(c) | 410,000 | 410,780 | |
| Class D, 1 month U.S. LIBOR + 2.350% 2.4909% 8/15/37 (a)(b)(c) | 550,000 | 551,378 | |
| Morgan Stanley BAML Trust: | |||
| Series 2014-C18 Class A/S, 4.11% 10/15/47 | 370,000 | 400,480 | |
| Series 2016-C30 Class A1, 1.389% 9/15/49 | 56,820 | 56,866 | |
| Morgan Stanley Capital I Trust: | |||
| floater Series 2018-BOP Class A, 1 month U.S. LIBOR + 0.850% 0.9909% 8/15/33 (a)(b)(c) | 5,578,279 | 5,413,549 | |
| sequential payer Series 2014-150E Class A, 3.912% 9/9/32 (a) | 1,325,000 | 1,410,467 | |
| Series 2011-C3 Class AJ, 5.4191% 7/15/49 (a)(b) | 2,264,000 | 2,305,598 | |
| Series 2019-MEAD Class D, 3.283% 11/10/36 (a)(b) | 1,150,000 | 957,141 | |
| New Orleans Hotel Trust floater Series 2019-HNLA Class B, 1 month U.S. LIBOR + 1.289% 1.4296% 4/15/32 (a)(b)(c) | 1,585,000 | 1,473,632 | |
| Slide floater Series 2018-FUN Class D, 1 month U.S. LIBOR + 1.850% 1.9909% 6/15/31 (a)(b)(c) | 778,428 | 717,903 | |
| UBS-Barclays Commercial Mortgage Trust floater Series 2013-C6 Class A3, 1 month U.S. LIBOR + 0.790% 0.9314% 4/10/46 (a)(b)(c) | 3,020,457 | 3,018,518 | |
| Vista Point Securitization Trust sequential payer Series 2020-1 Class A1, 1.763% 3/25/65 (a) | 579,485 | 583,836 | |
| Wells Fargo Commercial Mortgage Trust Series 2015-NXS2 Class A2, 3.02% 7/15/58 | 332,927 | 338,327 | |
| WF-RBS Commercial Mortgage Trust: | |||
| floater Series 2013-C14 Class A3, 1 month U.S. LIBOR + 0.720% 0.8635% 6/15/46 (a)(b)(c) | 2,846,183 | 2,845,123 | |
| Series 2012-C6 Class B, 4.697% 4/15/45 | 760,000 | 782,526 | |
| TOTAL COMMERCIAL MORTGAGE SECURITIES | |||
| (Cost $85,287,002) | 84,083,550 | ||
| Municipal Securities - 0.1% | |||
| Chicago Transit Auth. Series 2020 B: | |||
| 1.708% 12/1/22 | $40,000 | $40,293 | |
| 1.838% 12/1/23 | 35,000 | 35,406 | |
| 2.064% 12/1/24 | 105,000 | 106,743 | |
| Connecticut Gen. Oblig. Series A: | |||
| 1.998% 7/1/24 | 285,000 | 298,059 | |
| 2% 7/1/23 | 115,000 | 119,119 | |
| 2.098% 7/1/25 | 190,000 | 200,999 | |
| Dallas Fort Worth Int'l. Arpt. Rev. Series 2020 C, 1.329% 11/1/25 | 245,000 | 246,566 | |
| Houston Arpt. Sys. Rev. Series 2020 C: | |||
| 0.883% 7/1/22 | 70,000 | 70,035 | |
| 1.054% 7/1/23 | 120,000 | 120,198 | |
| 1.272% 7/1/24 | 400,000 | 401,708 | |
| Illinois Gen. Oblig. Series 2020 A, 2.25% 10/1/22 | 1,640,000 | 1,605,363 | |
| Long Island Pwr. Auth. Elec. Sys. Rev. Series 2020 C, 0.764% 3/1/23 | 360,000 | 358,718 | |
| Port Auth. of New York & New Jersey Series AAA, 1.086% 7/1/23 | 1,405,000 | 1,421,045 | |
| TOTAL MUNICIPAL SECURITIES | |||
| (Cost $5,010,583) | 5,024,252 | ||
| Bank Notes - 0.4% | |||
| Citibank NA 2.844% 5/20/22 (b) | 1,485,000 | 1,502,663 | |
| Discover Bank 3.2% 8/9/21 | 1,050,000 | 1,068,151 | |
| First Republic Bank 1.912% 2/12/24 (b) | 2,031,000 | 2,091,714 | |
| KeyBank NA 2.3% 9/14/22 | 355,000 | 367,577 | |
| PNC Bank NA 2.95% 1/30/23 | 695,000 | 729,761 | |
| RBS Citizens NA: | |||
| 2.55% 5/13/21 | 1,320,000 | 1,330,784 | |
| 3.25% 2/14/22 | 1,015,000 | 1,047,662 | |
| Synchrony Bank 3.65% 5/24/21 | 3,082,000 | 3,120,287 | |
| Truist Bank 1.25% 3/9/23 | 9,650,000 | 9,835,699 | |
| TOTAL BANK NOTES | |||
| (Cost $20,715,230) | 21,094,298 | ||
| Certificates of Deposit - 0.1% | |||
| Sumitomo Mitsui Banking Corp. yankee 0.27% 5/10/21 | |||
| (Cost $6,000,000) | 6,000,000 | 6,000,347 | |
| Commercial Paper - 0.3% | |||
| Conagra Brands, Inc. 0% 4/3/21 | 3,355,000 | 3,347,270 | |
| Svenska Handelsbanken AB 3 month U.S. LIBOR + 0.090% 0.3084% 7/20/21 (b)(c) | 8,000,000 | 8,003,558 | |
| TransCanada PipeLines Ltd. 0.25% 12/15/20 | 4,300,000 | 4,299,696 | |
| TOTAL COMMERCIAL PAPER | |||
| (Cost $15,643,974) | 15,650,524 | ||
| Shares | Value | ||
| Short-Term Funds - 52.0% | |||
| Short-Term Funds - 52.0% | |||
| Baird Short-Term Bond Fund - Institutional Class | 14,943,440 | $149,135,528 | |
| Baird Ultra Short Bond Fund Institutional Class | 33,588,312 | 338,906,072 | |
| BlackRock Low Duration Bond Portfolio Investor A Shares | 25,493,332 | 248,559,985 | |
| Fidelity SAI Short-Term Bond Fund (f) | 23,419,908 | 234,433,279 | |
| iShares Short Maturity Bond ETF (g) | 4,226,791 | 212,100,372 | |
| iShares Short Treasury Bond ETF | 1,120,350 | 123,989,135 | |
| iShares Ultra Short-Term Bond ETF | 1,646,060 | 83,208,333 | |
| JPMorgan Ultra-Short Income ETF | 3,518,801 | 178,719,903 | |
| Metropolitan West Low Duration Bond Fund - Class M | 17,949,172 | 159,747,633 | |
| PIMCO Enhanced Low Duration Active ETF | 502,985 | 51,309,500 | |
| PIMCO Enhanced Short Maturity Active ETF (g) | 2,918,935 | 297,760,559 | |
| PIMCO Short-Term Fund Institutional Class | 71,610,278 | 706,077,326 | |
| Prudential Short-Term Corporate Bond Fund, Inc. Class A | 1,793,311 | 20,407,884 | |
| T. Rowe Price Ultra Short-Term Bond Fund | 14,767,487 | 75,166,511 | |
| TOTAL SHORT-TERM FUNDS | |||
| (Cost $2,840,899,008) | 2,879,522,020 | ||
| Money Market Funds - 13.6% | |||
| Fidelity Cash Central Fund 0.09%(h) | 87,445,934 | 87,463,423 | |
| Fidelity Investments Money Market Government Portfolio Institutional Class 0.01% (f)(i) | 430,453,231 | 430,453,231 | |
| Fidelity Securities Lending Cash Central Fund 0.09% (h)(j) | 228,723,916 | 228,746,789 | |
| State Street Institutional U.S. Government Money Market Fund Premier Class .02% (i) | 7,447,474 | 7,447,474 | |
| TOTAL MONEY MARKET FUNDS | |||
| (Cost $754,105,943) | 754,110,917 | ||
| TOTAL INVESTMENT IN SECURITIES - 104.3% | |||
| (Cost $5,723,122,385) | 5,781,511,919 | ||
| NET OTHER ASSETS (LIABILITIES) - (4.3)% | (240,539,198) | ||
| NET ASSETS - 100% | $5,540,972,721 |
| Futures Contracts | |||||
| Number of contracts | Expiration Date | Notional Amount | Value | Unrealized Appreciation/(Depreciation) | |
| Purchased | |||||
| Treasury Contracts | |||||
| CBOT 2-Year U.S. Treasury Note Contracts (United States) | 489 | March 2021 | $107,996,414 | $40,883 | $40,883 |
| Sold | |||||
| Treasury Contracts | |||||
| CBOT 10-Year U.S. Treasury Note Contracts (United States) | 162 | March 2021 | 22,383,844 | (11,620) | (11,620) |
| CBOT 5-Year U.S. Treasury Note Contracts (United States) | 211 | March 2021 | 26,592,594 | (26,036) | (26,036) |
| TOTAL FUTURES CONTRACTS | $3,227 |
The notional amount of futures purchased as a percentage of Net Assets is 1.9%
The notional amount of futures sold as a percentage of Net Assets is 0.9%
Security Type Abbreviations
ETF – Exchange-Traded Fund
Legend
(a) Security exempt from registration under Rule 144A of the Securities Act of 1933. These securities may be resold in transactions exempt from registration, normally to qualified institutional buyers. At the end of the period, the value of these securities amounted to $617,997,090 or 11.2% of net assets.
(b) Coupon rates for floating and adjustable rate securities reflect the rates in effect at period end.
(c) Coupon is indexed to a floating interest rate which may be multiplied by a specified factor and/or subject to caps or floors.
(d) Security or a portion of the security was pledged to cover margin requirements for futures contracts. At period end, the value of securities pledged amounted to $350,950.
(e) Security or a portion of the security purchased on a delayed delivery or when-issued basis.
(f) Affiliated Fund
(g) Security or a portion of the security is on loan at period end.
(h) Affiliated fund that is generally available only to investment companies and other accounts managed by Fidelity Investments. The rate quoted is the annualized seven-day yield of the fund at period end. A complete unaudited listing of the fund's holdings as of its most recent quarter end is available upon request. In addition, each Fidelity Central Fund's financial statements are available on the SEC's website or upon request.
(i) The rate quoted is the annualized seven-day yield of the fund at period end.
(j) Investment made with cash collateral received from securities on loan.
Affiliated Central Funds
Information regarding fiscal year to date income earned by the Fund from investments in Fidelity Central Funds is as follows:
| Fund | Income earned |
| Fidelity Cash Central Fund | $83,369 |
| Fidelity Securities Lending Cash Central Fund | 121,613 |
| Total | $204,982 |
Amounts in the income column in the above table include any capital gain distributions from underlying funds, which are presented in the corresponding line-item in the Statement of Operations, if applicable. Amount for Fidelity Securities Lending Cash Central Fund represents the income earned on investing cash collateral, less rebates paid to borrowers and any lending agent fees associated with the loan, plus any premium payments received for lending certain types of securities.
Affiliated Underlying Funds
Fiscal year to date information regarding the Fund's investments in affiliated Underlying Funds, excluding any Money Market Central Funds, is presented below. Exchanges between classes of the same affiliated Underlying Funds may occur.
| Affiliate | Value, beginning of period | Purchases(a) | Sales Proceeds(a) | Dividend Income | Realized Gain (loss) | Change in Unrealized appreciation (depreciation) | Value, end of period |
| Fidelity Conservative Income Bond Fund Institutional Class | $38,648,696 | $49,958 | $38,814,165 | $53,671 | $127,290 | $(11,779) | $-- |
| Fidelity Floating Rate High Income Fund | 58,035,797 | 283,180 | 58,957,982 | 283,495 | (3,777,578) | 4,416,583 | -- |
| Fidelity Investments Money Market Government Portfolio Institutional Class 0.01% | 82,618,947 | 2,955,977,647 | 2,608,143,363 | 73,768 | -- | -- | 430,453,231 |
| Fidelity SAI Short-Term Bond Fund | -- | 258,940,087 | 25,000,000 | 160,179 | 25,000 | 468,192 | 234,433,279 |
| Fidelity Short-Term Bond Fund | 419,380,785 | 2,691,803 | 424,000,435 | 2,968,008 | 15,690,781 | (13,762,934) | -- |
| Total | $598,684,225 | $3,217,942,675 | $3,154,915,945 | $3,539,121 | $12,065,493 | $(8,889,938) | $664,886,510 |
(a) Includes the value of shares purchased or redeemed through in-kind transactions, if applicable.
Amounts in the income column in the above table include any capital gain distributions from underlying funds, which are presented in the corresponding line-item in the Statement of Operations, if applicable.
Investment Valuation
The following is a summary of the inputs used, as of November 30, 2020, involving the Fund's assets and liabilities carried at fair value. The inputs or methodology used for valuing securities may not be an indication of the risk associated with investing in those securities. For more information on valuation inputs, and their aggregation into the levels used below, please refer to the Investment Valuation section in the accompanying Notes to Financial Statements.
| Valuation Inputs at Reporting Date: | ||||
| Description | Total | Level 1 | Level 2 | Level 3 |
| Investments in Securities: | ||||
| Corporate Bonds | $1,352,752,705 | $-- | $1,352,752,705 | $-- |
| U.S. Government and Government Agency Obligations | 139,144,965 | -- | 139,144,965 | -- |
| U.S. Government Agency - Mortgage Securities | 23,668,544 | -- | 23,668,544 | -- |
| Asset-Backed Securities | 436,792,369 | -- | 436,792,369 | -- |
| Collateralized Mortgage Obligations | 63,667,428 | -- | 63,667,428 | -- |
| Commercial Mortgage Securities | 84,083,550 | -- | 84,083,550 | -- |
| Municipal Securities | 5,024,252 | -- | 5,024,252 | -- |
| Bank Notes | 21,094,298 | -- | 21,094,298 | -- |
| Certificates of Deposit | 6,000,347 | -- | 6,000,347 | -- |
| Commercial Paper | 15,650,524 | -- | 15,650,524 | -- |
| Short-Term Funds | 2,879,522,020 | 2,879,522,020 | -- | -- |
| Money Market Funds | 754,110,917 | 754,110,917 | -- | -- |
| Total Investments in Securities: | $5,781,511,919 | $3,633,632,937 | $2,147,878,982 | $-- |
| Derivative Instruments: | ||||
| Assets | ||||
| Futures Contracts | $40,883 | $40,883 | $-- | $-- |
| Total Assets | $40,883 | $40,883 | $-- | $-- |
| Liabilities | ||||
| Futures Contracts | $(37,656) | $(37,656) | $-- | $-- |
| Total Liabilities | $(37,656) | $(37,656) | $-- | $-- |
| Total Derivative Instruments: | $3,227 | $3,227 | $-- | $-- |
Value of Derivative Instruments
The following table is a summary of the Fund's value of derivative instruments by primary risk exposure as of November 30, 2020. For additional information on derivative instruments, please refer to the Derivative Instruments section in the accompanying Notes to Financial Statements.
| Primary Risk Exposure / Derivative Type | Value | |
| Asset | Liability | |
| Interest Rate Risk | ||
| Futures Contracts(a) | $40,883 | $(37,656) |
| Total Interest Rate Risk | 40,883 | (37,656) |
| Total Value of Derivatives | $40,883 | $(37,656) |
(a) Reflects gross cumulative appreciation (depreciation) on futures contracts as presented in the Schedule of Investments. In the Statement of Assets and Liabilities, the period end daily variation margin is included in receivable or payable for daily variation margin on futures contracts, and the net cumulative appreciation (depreciation) is included in Total accumulated earnings (loss).
See accompanying notes which are an integral part of the financial statements.
Financial Statements
Statement of Assets and Liabilities
| November 30, 2020 (Unaudited) | ||
| Assets | ||
| Investment in securities, at value (including securities loaned of $223,934,972) — See accompanying schedule: Unaffiliated issuers (cost $4,742,498,829) | $4,800,415,197 | |
| Fidelity Central Funds (cost $316,205,238) | 316,210,212 | |
| Other affiliated issuers (cost $664,418,318) | 664,886,510 | |
| Total Investment in Securities (cost $5,723,122,385) | $5,781,511,919 | |
| Cash | 965,246 | |
| Receivable for securities sold on a delayed delivery basis | 465,727 | |
| Receivable for fund shares sold | 9,450,795 | |
| Interest receivable | 6,821,175 | |
| Distributions receivable from Fidelity Central Funds | 35,452 | |
| Receivable for daily variation margin on futures contracts | 11,228 | |
| Prepaid expenses | 8,521 | |
| Other receivables | 112,353 | |
| Total assets | 5,799,382,416 | |
| Liabilities | ||
| Payable for investments purchased | ||
| Regular delivery | $22,856,324 | |
| Delayed delivery | 2,522,998 | |
| Payable for fund shares redeemed | 3,155,552 | |
| Distributions payable | 717,464 | |
| Accrued management fee | 203,000 | |
| Other payables and accrued expenses | 230,107 | |
| Collateral on securities loaned | 228,724,250 | |
| Total liabilities | 258,409,695 | |
| Net Assets | $5,540,972,721 | |
| Net Assets consist of: | ||
| Paid in capital | $5,474,618,093 | |
| Total accumulated earnings (loss) | 66,354,628 | |
| Net Assets | $5,540,972,721 | |
| Net Asset Value, offering price and redemption price per share ($5,540,972,721 ÷ 545,280,879 shares) | $10.16 |
See accompanying notes which are an integral part of the financial statements.
Statement of Operations
| Six months ended November 30, 2020 (Unaudited) | ||
| Investment Income | ||
| Dividends: | ||
| Unaffiliated issuers | $18,751,493 | |
| Affiliated issuers | 3,539,121 | |
| Interest | 19,009,423 | |
| Income from Fidelity Central Funds (including $121,613 from security lending) | 204,982 | |
| Total income | 41,505,019 | |
| Expenses | ||
| Management fee | $9,616,136 | |
| Custodian fees and expenses | 26,827 | |
| Independent trustees' fees and expenses | 36,327 | |
| Registration fees | 64,366 | |
| Audit | 31,530 | |
| Legal | 13,946 | |
| Miscellaneous | 90,215 | |
| Total expenses before reductions | 9,879,347 | |
| Expense reductions | (8,198,488) | |
| Total expenses after reductions | 1,680,859 | |
| Net investment income (loss) | 39,824,160 | |
| Realized and Unrealized Gain (Loss) | ||
| Net realized gain (loss) on: | ||
| Investment securities: | ||
| Unaffiliated issuers | 22,636,706 | |
| Fidelity Central Funds | 17,457 | |
| Other affiliated issuers | 12,065,493 | |
| Futures contracts | (105,468) | |
| Total net realized gain (loss) | 34,614,188 | |
| Change in net unrealized appreciation (depreciation) on: | ||
| Investment securities: | ||
| Unaffiliated issuers | 40,546,518 | |
| Affiliated issuers | (8,889,938) | |
| Futures contracts | 26,736 | |
| Total change in net unrealized appreciation (depreciation) | 31,683,316 | |
| Net gain (loss) | 66,297,504 | |
| Net increase (decrease) in net assets resulting from operations | $106,121,664 |
See accompanying notes which are an integral part of the financial statements.
Statement of Changes in Net Assets
| Six months ended November 30, 2020 (Unaudited) | Year ended May 31, 2020 | |
| Increase (Decrease) in Net Assets | ||
| Operations | ||
| Net investment income (loss) | $39,824,160 | $169,307,872 |
| Net realized gain (loss) | 34,614,188 | 13,007,378 |
| Change in net unrealized appreciation (depreciation) | 31,683,316 | 9,847,421 |
| Net increase (decrease) in net assets resulting from operations | 106,121,664 | 192,162,671 |
| Distributions to shareholders | (30,703,911) | (168,201,353) |
| Share transactions | ||
| Proceeds from sales of shares | 1,551,604,305 | 2,771,783,132 |
| Reinvestment of distributions | 26,159,911 | 153,886,892 |
| Cost of shares redeemed | (4,161,249,424) | (2,045,344,183) |
| Net increase (decrease) in net assets resulting from share transactions | (2,583,485,208) | 880,325,841 |
| Total increase (decrease) in net assets | (2,508,067,455) | 904,287,159 |
| Net Assets | ||
| Beginning of period | 8,049,040,176 | 7,144,753,017 |
| End of period | $5,540,972,721 | $8,049,040,176 |
| Other Information | ||
| Shares | ||
| Sold | 153,235,977 | 277,408,378 |
| Issued in reinvestment of distributions | 2,579,685 | 15,320,138 |
| Redeemed | (410,425,113) | (204,536,004) |
| Net increase (decrease) | (254,609,451) | 88,192,512 |
See accompanying notes which are an integral part of the financial statements.
Financial Highlights
Strategic Advisers Short Duration Fund
| Six months ended (Unaudited) November 30, | Years endedMay 31, | |||||
| 2020 | 2020 | 2019 | 2018 | 2017 | 2016 | |
| Selected Per–Share Data | ||||||
| Net asset value, beginning of period | $10.06 | $10.04 | $10.03 | $10.05 | $10.01 | $10.07 |
| Income from Investment Operations | ||||||
| Net investment income (loss)A | .062 | .229 | .254 | .168 | .136 | .115 |
| Net realized and unrealized gain (loss) | .085 | .020 | .018 | (.028) | .033 | (.051) |
| Total from investment operations | .147 | .249 | .272 | .140 | .169 | .064 |
| Distributions from net investment income | (.047) | (.229) | (.259) | (.160) | (.129) | (.118) |
| Distributions from net realized gain | – | – | (.003) | – | – | (.006) |
| Total distributions | (.047) | (.229) | (.262) | (.160) | (.129) | (.124) |
| Net asset value, end of period | $10.16 | $10.06 | $10.04 | $10.03 | $10.05 | $10.01 |
| Total ReturnB,C | 1.46% | 2.51% | 2.75% | 1.40% | 1.69% | .64% |
| Ratios to Average Net AssetsD,E | ||||||
| Expenses before reductions | .30%F | .30% | .32% | .35% | .36% | .36% |
| Expenses net of fee waivers, if any | .05%F | .05% | .07% | .10% | .10% | .11% |
| Expenses net of all reductions | .05%F | .05% | .07% | .10% | .10% | .11% |
| Net investment income (loss) | 1.22%F | 2.28% | 2.54% | 1.67% | 1.36% | 1.15% |
| Supplemental Data | ||||||
| Net assets, end of period (000 omitted) | $5,540,973 | $8,049,040 | $7,144,753 | $8,841,193 | $9,920,937 | $6,593,754 |
| Portfolio turnover rateG | 148%F | 58% | 33% | 25% | 26% | 33% |
A Calculated based on average shares outstanding during the period.
B Total returns for periods of less than one year are not annualized.
C Total returns would have been lower if certain expenses had not been reduced during the applicable periods shown.
D Fees and expenses of any underlying mutual funds or exchange-traded funds (ETFs) are not included in the Fund's expense ratio. The Fund indirectly bears its proportionate share of these expenses. For additional expense information related to investments in Fidelity Central Funds, please refer to the "Investments in Fidelity Central Funds" note found in the Notes to Financial Statements section of the most recent Annual or Semi-Annual report.
E Expense ratios reflect operating expenses of the class. Expenses before reductions do not reflect amounts reimbursed, waived, or reduced through arrangements with the investment advisor, brokerage services, or other offset arrangements, if applicable, and do not represent the amount paid by the class during periods when reimbursements, waivers or reductions occur.
F Annualized
G Amount does not include the portfolio activity of any underlying mutual funds or exchange-traded funds (ETFs).
See accompanying notes which are an integral part of the financial statements.
Notes to Financial Statements (Unaudited)
For the period ended November 30, 2020
1. Organization.
Strategic Advisers Short Duration Fund (the Fund) is a fund of Fidelity Rutland Square Trust II (the Trust), and is authorized to issue an unlimited number of shares. The Trust is registered under the Investment Company Act of 1940, as amended (the 1940 Act), as an open-end management investment company organized as a Delaware statutory trust. The Fund is offered exclusively to certain clients of Strategic Advisers LLC (Strategic Advisers), an affiliate of Fidelity Management & Research Company LLC (FMR).
2. Significant Accounting Policies.
The Fund is an investment company and applies the accounting and reporting guidance of the Financial Accounting Standards Board (FASB) Accounting Standards Codification Topic 946 Financial Services – Investment Companies. The financial statements have been prepared in conformity with accounting principles generally accepted in the United States of America (GAAP), which require management to make certain estimates and assumptions at the date of the financial statements. Actual results could differ from those estimates. Subsequent events, if any, through the date that the financial statements were issued have been evaluated in the preparation of the financial statements. The following summarizes the significant accounting policies of the Fund:
Investment Valuation. Investments are valued as of 4:00 p.m. Eastern time on the last calendar day of the period. The Board of Trustees (the Board) has delegated the day to day responsibility for the valuation of the Fund's investments to the Fair Value Committee (the Committee) established by the Fund's investment adviser. In accordance with valuation policies and procedures approved by the Board, the Fund attempts to obtain prices from one or more third party pricing vendors or brokers to value its investments. When current market prices, quotations or currency exchange rates are not readily available or reliable, investments will be fair valued in good faith by the Committee, in accordance with procedures adopted by the Board. Factors used in determining fair value vary by investment type and may include market or investment specific events, changes in interest rates and credit quality. The frequency with which these procedures are used cannot be predicted and they may be utilized to a significant extent. The Committee oversees the Fund's valuation policies and procedures and reports to the Board on the Committee's activities and fair value determinations. The Board monitors the appropriateness of the procedures used in valuing the Fund's investments and ratifies the fair value determinations of the Committee.
The Fund categorizes the inputs to valuation techniques used to value its investments into a disclosure hierarchy consisting of three levels as shown below:
- Level 1 – quoted prices in active markets for identical investments
- Level 2 – other significant observable inputs (including quoted prices for similar investments, interest rates, prepayment speeds, etc.)
- Level 3 – unobservable inputs (including the Fund's own assumptions based on the best information available)
Valuation techniques used to value the Fund's investments by major category are as follows:
Debt securities, including restricted securities, are valued based on evaluated prices received from third party pricing vendors or from brokers who make markets in such securities. Corporate bonds, bank notes, municipal securities, U.S. government and government agency obligations, commercial paper and certificates of deposit are valued by pricing vendors who utilize matrix pricing which considers yield or price of bonds of comparable quality, coupon, maturity and type or by broker-supplied prices. Asset backed securities, collateralized mortgage obligations, commercial mortgage securities and U.S. government agency mortgage securities are valued by pricing vendors who utilize matrix pricing which considers prepayment speed assumptions, attributes of the collateral, yield or price of bonds of comparable quality, coupon, maturity and type or by broker-supplied prices. When independent prices are unavailable or unreliable, debt securities may be valued utilizing pricing methodologies which consider similar factors that would be used by third party pricing vendors. Debt securities are generally categorized as Level 2 in the hierarchy but may be Level 3 depending on the circumstances.
Exchange-Traded Funds (ETFs) are valued at their last sale price or official closing price as reported by a third party pricing vendor on the primary market or exchange on which they are traded and are categorized as Level 1 in the hierarchy. In the event there were no sales during the day but the exchange reports a closing bid level, ETFs are valued at the closing bid and would be categorized as Level 1 in the hierarchy. In the event there was no closing bid, ETFs may be valued by another method that the Board believes reflects fair value in accordance with the Board's fair value pricing policies and may be categorized as Level 2 in the hierarchy.
Futures contracts are valued at the settlement price established each day by the board of trade or exchange on which they are traded and are categorized as Level 1 in the hierarchy. Investments in open-end mutual funds, including the Fidelity Central Funds, are valued at their closing net asset value (NAV) each business day and are categorized as Level 1 in the hierarchy. If an unaffiliated open-end mutual fund's NAV is unavailable, shares of that fund may be valued by another method that the Board believes reflects fair value in accordance with the Board's fair value pricing policies and is categorized as Level 2 in the hierarchy.
Changes in valuation techniques may result in transfers in or out of an assigned level within the disclosure hierarchy. The aggregate value of investments by input level as of November 30, 2020 is included at the end of the Fund's Schedule of Investments.
Investment Transactions and Income. For financial reporting purposes, the Fund's investment holdings and NAV include trades executed through the end of the last business day of the period. The NAV per share for processing shareholder transactions is calculated as of the close of business of the New York Stock Exchange (NYSE), normally 4:00 p.m. Eastern time and includes trades executed through the end of the prior business day. Gains and losses on securities sold are determined on the basis of identified cost. Dividend income is recorded on the ex-dividend date, except for certain dividends from foreign securities where the ex-dividend date may have passed, which are recorded as soon as the Fund is informed of the ex-dividend date. Non-cash dividends included in dividend income, if any, are recorded at the fair market value of the securities received. Income and capital gain distributions from Fidelity Central Funds, if any, are recorded on the ex-dividend date. Income and capital gain distributions from any underlying mutual funds or exchange-traded funds ETFs are recorded on the ex-dividend date. Certain distributions received by the Fund represent a return of capital or capital gain. The Fund determines the components of these distributions subsequent to the ex-dividend date, based upon receipt of tax filings or other correspondence relating to the underlying investment. These distributions are recorded as a reduction of cost of investments and/or as a realized gain. Interest income is accrued as earned and includes coupon interest and amortization of premium and accretion of discount on debt securities as applicable. Debt obligations may be placed on non-accrual status and related interest income may be reduced by ceasing current accruals and writing off interest receivables when the collection of all or a portion of interest has become doubtful based on consistently applied procedures. A debt obligation is removed from non-accrual status when the issuer resumes interest payments or when collectability of interest is reasonably assured.
Expenses. Expenses directly attributable to a fund are charged to that fund. Expenses attributable to more than one fund are allocated among the respective funds on the basis of relative net assets or other appropriate methods. Expense estimates are accrued in the period to which they relate and adjustments are made when actual amounts are known.
Deferred Trustee Compensation. Under a Deferred Compensation Plan (the Plan) for certain Funds, certain independent Trustees have elected to defer receipt of a portion of their annual compensation. Deferred amounts are invested in affiliated mutual funds, are marked-to-market and remain in a fund until distributed in accordance with the Plan. The investment of deferred amounts and the offsetting payable to the Trustees presented below are included in the accompanying Statement of Assets and Liabilities in other receivables and other payables and accrued expenses, as applicable.
| Strategic Advisers Short Duration Fund | $112,346 |
Income Tax Information and Distributions to Shareholders. Each year, the Fund intends to qualify as a regulated investment company under Subchapter M of the Internal Revenue Code, including distributing substantially all of its taxable income and realized gains. As a result, no provision for U.S. Federal income taxes is required. The Fund files a U.S. federal tax return, in addition to state and local tax returns as required. The Fund's federal income tax returns are subject to examination by the Internal Revenue Service (IRS) for a period of three fiscal years after they are filed. State and local tax returns may be subject to examination for an additional fiscal year depending on the jurisdiction.
Distributions are declared and recorded daily and paid monthly from net investment income. Distributions from realized gains, if any, are declared and recorded on the ex-dividend date. Income and capital gain distributions are determined in accordance with income tax regulations, which may differ from GAAP.
Capital accounts within the financial statements are adjusted for permanent book-tax differences. These adjustments have no impact on net assets or the results of operations. Capital accounts are not adjusted for temporary book-tax differences which will reverse in a subsequent period.
Book-tax differences are primarily due to market discount, capital loss carryforwards, futures contracts, foreign currency transactions, deferred trustees compensation and losses deferred due to wash sales.
As of period end, the cost and unrealized appreciation (depreciation) in securities, and derivatives if applicable, for federal income tax purposes were as follows:
| Gross unrealized appreciation | $61,229,708 |
| Gross unrealized depreciation | (2,430,574) |
| Net unrealized appreciation (depreciation) | $58,799,134 |
| Tax cost | $5,722,716,012 |
Capital loss carryforwards are only available to offset future capital gains of the Fund to the extent provided by regulations and may be limited. The capital loss carryforward information presented below, including any applicable limitation, is estimated as of prior fiscal period end and is subject to adjustment.
| No expiration | |
| Long-term | $(44,113,019) |
Delayed Delivery Transactions and When-Issued Securities. During the period, certain Funds transacted in securities on a delayed delivery or when-issued basis. Payment and delivery may take place after the customary settlement period for that security. The price of the underlying securities and the date when the securities will be delivered and paid for are fixed at the time the transaction is negotiated. Securities purchased on a delayed delivery or when-issued basis are identified as such in the Schedule of Investments. Compensation for interest forgone in the purchase of a delayed delivery or when-issued debt security may be received. With respect to purchase commitments, each applicable Fund identifies securities as segregated in its records with a value at least equal to the amount of the commitment. Payables and receivables associated with the purchases and sales of delayed delivery securities having the same coupon, settlement date and broker are offset. Delayed delivery or when-issued securities that have been purchased from and sold to different brokers are reflected as both payables and receivables in the Statement of Assets and Liabilities under the caption "Delayed delivery", as applicable. Losses may arise due to changes in the value of the underlying securities or if the counterparty does not perform under the contract's terms, or if the issuer does not issue the securities due to political, economic, or other factors.
Restricted Securities (including Private Placements). The Fund may invest in securities that are subject to legal or contractual restrictions on resale. These securities generally may be resold in transactions exempt from registration or to the public if the securities are registered. Disposal of these securities may involve time-consuming negotiations and expense, and prompt sale at an acceptable price may be difficult. Information regarding restricted securities is included at the end of the Fund's Schedule of Investments.
3. Derivative Instruments.
Risk Exposures and the Use of Derivative Instruments. The Fund's investment objective allows the Fund to enter into various types of derivative contracts, including futures contracts. Derivatives are investments whose value is primarily derived from underlying assets, indices or reference rates and may be transacted on an exchange or over-the-counter (OTC). Derivatives may involve a future commitment to buy or sell a specified asset based on specified terms, to exchange future cash flows at periodic intervals based on a notional principal amount, or for one party to make one or more payments upon the occurrence of specified events in exchange for periodic payments from the other party.
The Fund used derivatives to increase returns and to manage exposure to certain risks as defined below. The success of any strategy involving derivatives depends on analysis of numerous economic factors, and if the strategies for investment do not work as intended, the Fund may not achieve its objectives.
The Fund's use of derivatives increased or decreased its exposure to the following risk:
| Interest Rate Risk | Interest rate risk relates to the fluctuations in the value of interest-bearing securities due to changes in the prevailing levels of market interest rates. |
The Fund is also exposed to additional risks from investing in derivatives, such as liquidity risk and counterparty credit risk. Liquidity risk is the risk that the Fund will be unable to close out the derivative in the open market in a timely manner. Counterparty credit risk is the risk that the counterparty will not be able to fulfill its obligation to the Fund. Counterparty credit risk related to exchange-traded futures contracts may be mitigated by the protection provided by the exchange on which they trade.
Investing in derivatives may involve greater risks than investing in the underlying assets directly and, to varying degrees, may involve risk of loss in excess of any initial investment and collateral received and amounts recognized in the Statement of Assets and Liabilities. In addition, there may be the risk that the change in value of the derivative contract does not correspond to the change in value of the underlying instrument.
Futures Contracts. A futures contract is an agreement between two parties to buy or sell a specified underlying instrument for a fixed price at a specified future date. The Fund used futures contracts to manage its exposure to the bond market and fluctuations in interest rates.
Upon entering into a futures contract, a fund is required to deposit either cash or securities (initial margin) with a clearing broker in an amount equal to a certain percentage of the face value of the contract. Futures contracts are marked-to-market daily and subsequent daily payments (variation margin) are made or received by a fund depending on the daily fluctuations in the value of the futures contracts and are recorded as unrealized appreciation or (depreciation). This receivable and/or payable, if any, is included in daily variation margin on futures contracts in the Statement of Assets and Liabilities. Realized gain or (loss) is recorded upon the expiration or closing of a futures contract. The net realized gain (loss) and change in net unrealized appreciation (depreciation) on futures contracts during the period is presented in the Statement of Operations.
Any open futures contracts at period end are presented in the Schedule of Investments under the caption "Futures Contracts". The notional amount at value reflects each contract's exposure to the underlying instrument or index at period end and is representative of volume of activity during the period. Securities deposited to meet initial margin requirements are identified in the Schedule of Investments.
4. Purchases and Sales of Investments.
Purchases and sales of securities, other than short-term securities are noted in the table below.
| Purchases ($) | Sales ($) | |
| Strategic Advisers Short Duration Fund | 4,047,250,743 | 6,231,030,850 |
5. Fees and Other Transactions with Affiliates.
Management Fee. Strategic Advisers (the investment adviser) provides the Fund with investment management related services. For these services, the Fund pays a monthly management fee to the investment adviser. The management fee is calculated by adding the annual management fee rate of .25% of the Fund's average net assets throughout the month payable to the investment adviser to the aggregate of the fee rates, payable monthly, to the Fund's sub-advisers. The Fund's maximum aggregate management fee will not exceed .55% of the Fund's average net assets. For the reporting period, the total annualized management fee rate was .29% of the Fund's average net assets.
During the period, the investment adviser waived a portion of its management fee as described in the Expense Reductions note.
Sub-Advisers. FIAM LLC (an affiliate of the investment adviser) and T. Rowe Price Associates, Inc. each served as a sub-adviser for the Fund during the period. Sub-advisers provide discretionary investment advisory services for their allocated portion of the Fund's assets and are paid by the investment adviser and not the Fund for providing these services.
Brokerage Commissions. A portion of portfolio transactions were placed with brokerage firms which are affiliates of the investment adviser. Brokerage commissions are included in net realized gain (loss) and change in net unrealized appreciation (depreciation) in the Statement of Operations. The commissions paid to these affiliated firms were as follows:
| Amount | |
| Strategic Advisers Short Duration Fund | $740 |
Interfund Trades. Funds may purchase from or sell securities to other funds affiliated with each sub-adviser under procedures adopted by the Board. The procedures have been designed to ensure these interfund trades are executed in accordance with Rule 17a-7 of the 1940 Act. Interfund trades are included within the respective purchases and sales amounts shown in the Purchases and Sales of Investments note.
Reallocation of Underlying Fund Investments. During the period, the investment adviser reallocated investments of the Fund. This involved a taxable redemption of the Fund's interest in Fidelity Short-Term Bond Fund in exchange for shares Fidelity SAI Short-Term Bond Fund. The Fund redeemed 29,295,214 shares of Fidelity Short-Term Bond Fund in exchange for 25,893,567 shares of Fidelity SAI Short-Term Bond Fund with a value of $258,676,739. The net realized gains of $9,260,000 on the Fund's redemptions of Fidelity Short Term Bond Fund shares is included in "Net realized gain (loss) on Other affiliated issuers." in the accompanying Statement of Operations. The Fund recognized net gains on the exchanges for federal income tax purposes.
6. Investments in Fidelity Central Funds.
The Fund invests in Fidelity Central Funds, which are open-end investment companies available only to other investment companies and accounts managed by the investment adviser and its affiliates. The Fund's Schedule of Investments lists each of the Fidelity Central Funds held as of period end, if any, as an investment of the Fund, but does not include the underlying holdings of each Fidelity Central Fund. As an Investing Fund, the Fund indirectly bears its proportionate share of the expenses of the underlying Fidelity Central Funds.
The Fidelity Money Market Central Funds are managed by FMR. Annualized expenses of the Money Market Central Funds as of their most recent shareholder report date ranged from less than .005% to .01%.
A complete unaudited list of holdings for each Fidelity Central Fund is available upon request or at the Securities and Exchange Commission (the SEC) website at www.sec.gov. In addition, the financial statements of the Fidelity Central Funds are available on the SEC website or upon request.
7. Committed Line of Credit.
Certain Funds participate with other funds managed by the investment adviser or an affiliate in a $4.25 billion credit facility (the "line of credit") to be utilized for temporary or emergency purposes to fund shareholder redemptions or for other short-term liquidity purposes. The participating funds have agreed to pay commitment fees on their pro-rata portion of the line of credit, which are reflected in Miscellaneous expenses on the Statement of Operations, and are as follows:
| Amount | |
| Strategic Advisers Short Duration Fund | $8,278 |
During the period, there were no borrowings on this line of credit.
8. Security Lending.
Funds lend portfolio securities through a lending agent from time to time in order to earn additional income. On the settlement date of the loan, a fund receives collateral (in the form of U.S. Treasury obligations, letters of credit and/or cash) against the loaned securities and maintains collateral in an amount not less than 100% of the market value of the loaned securities during the period of the loan. The market value of the loaned securities is determined at the close of business of a fund and any additional required collateral is delivered to a fund on the next business day. A fund or borrower may terminate the loan at any time, and if the borrower defaults on its obligation to return the securities loaned because of insolvency or other reasons, a fund may apply collateral received from the borrower against the obligation. A fund may experience delays and costs in recovering the securities loaned. Any cash collateral received is invested in the Fidelity Securities Lending Cash Central Fund. Any loaned securities are identified as such in the Schedule of Investments, and the value of loaned securities and cash collateral at period end, as applicable, are presented in the Statement of Assets and Liabilities. Security lending income represents the income earned on investing cash collateral, less rebates paid to borrowers and any lending agent fees associated with the loan, plus any premium payments received for lending certain types of securities. Security lending income is presented in the Statement of Operations as a component of income from Fidelity Central Funds.
9. Expense Reductions.
The investment adviser has contractually agreed to waive the Fund's management fee in an amount equal to .25% of the Fund's average net assets until September 30, 2023. During the period, this waiver reduced the Fund's management fee by $ 8,130,342.
In addition, the investment adviser has voluntarily agreed to waive a portion of the Fund's management fee. During the period, this waiver reduced the Fund's management fee by $49,560.
In addition, through arrangements with the Fund's custodian, credits realized as a result of certain uninvested cash balances were used to reduce the Fund's expenses by $18,586.
10. Other.
The Fund's organizational documents provide former and current trustees and officers with a limited indemnification against liabilities arising in connection with the performance of their duties to the Fund. In the normal course of business, the Fund may also enter into contracts that provide general indemnifications. The Fund's maximum exposure under these arrangements is unknown as this would be dependent on future claims that may be made against the Fund. The risk of material loss from such claims is considered remote.
The Fund does not invest in the Underlying Funds for the purpose of exercising management or control; however, investments by the Fund within its principal investment strategies may represent a significant portion of an Underlying Fund's net assets. At the end of the period, the Fund was the owner of record of approximately 14% of the total outstanding shares of Fidelity SAI Short-Term Bond Fund.
11. Coronavirus (COVID-19) Pandemic.
An outbreak of COVID-19 first detected in China during December 2019 has since spread globally and was declared a pandemic by the World Health Organization during March 2020. Developments that disrupt global economies and financial markets, such as the COVID-19 pandemic, may magnify factors that affect the Fund's performance.
Shareholder Expense Example
As a shareholder, you incur two types of costs: (1) transaction costs, which may include sales charges (loads) on purchase payments or redemption proceeds, as applicable and (2) ongoing costs, which generally include management fees, distribution and/or service (12b-1) fees and other Fund expenses. This Example is intended to help you understand your ongoing costs (in dollars) of investing in a fund and to compare these costs with the ongoing costs of investing in other mutual funds.
The Example is based on an investment of $1,000 invested at the beginning of the period and held for the entire period (June 1, 2020 to November 30, 2020).
Actual Expenses
The first line of the accompanying table provides information about actual account values and actual expenses. You may use the information in this line, together with the amount you invested, to estimate the expenses that you paid over the period. Simply divide your account value by $1,000.00 (for example, an $8,600 account value divided by $1,000.00 = 8.6), then multiply the result by the number in the first line for a class/Fund under the heading entitled "Expenses Paid During Period" to estimate the expenses you paid on your account during this period. If any fund is a shareholder of any underlying mutual funds or exchange-traded funds (ETFs) (the Underlying Funds), such fund indirectly bears its proportional share of the expenses of the Underlying Funds in addition to the direct expenses incurred presented in the table. These fees and expenses are not included in the annualized expense ratio used to calculate the expense estimate in the table below.
Hypothetical Example for Comparison Purposes
The second line of the accompanying table provides information about hypothetical account values and hypothetical expenses based on the actual expense ratio and an assumed rate of return of 5% per year before expenses, which is not the actual return. The hypothetical account values and expenses may not be used to estimate the actual ending account balance or expenses you paid for the period. You may use this information to compare the ongoing costs of investing in the Fund and other funds. To do so, compare this 5% hypothetical example with the 5% hypothetical examples that appear in the shareholder reports of the other funds. If any fund is a shareholder of any Underlying Funds, such fund indirectly bears its proportional share of the expenses of the Underlying Funds in addition to the direct expenses as presented in the table. These fees and expenses are not included in the annualized expense ratio used to calculate the expense estimate in the table below.
Please note that the expenses shown in the table are meant to highlight your ongoing costs only and do not reflect any transaction costs. Therefore, the second line of the table is useful in comparing ongoing costs only, and will not help you determine the relative total costs of owning different funds.
| Annualized Expense Ratio-A | Beginning Account Value June 1, 2020 | Ending Account Value November 30, 2020 | Expenses Paid During Period-B June 1, 2020 to November 30, 2020 | |
| Strategic Advisers Short Duration Fund | .05% | |||
| Actual | $1,000.00 | $1,014.60 | $.25 | |
| Hypothetical-C | $1,000.00 | $1,024.82 | $.25 |
A Annualized expense ratio reflects expenses net of applicable fee waivers.
B Expenses are equal to the annualized expense ratio, multiplied by the average account value over the period, multiplied by 183/ 365 (to reflect the one-half year period).
C 5% return per year before expenses
Board Approval of Investment Advisory Contracts and Management Fees
Strategic Advisers Short Duration Fund
Each year, the Board of Trustees, including the Independent Trustees (together, the Board), votes at a meeting on the renewal of the management contract with Strategic Advisers LLC (Strategic Advisers) and the sub-advisory agreements with FIAM LLC and T. Rowe Price Associates, Inc. (each a Sub-Adviser and collectively, the Sub-Advisers) (collectively, the Sub-Advisory Agreements and, together with the management contract, the Advisory Contracts) for the fund. Strategic Advisers and the Sub-Advisers are referred to herein as the Investment Advisers. The Board, assisted by the advice of fund counsel and Independent Trustees' counsel, requests and considers a broad range of information relevant to the renewal of the Advisory Contracts throughout the year.The Board meets at least four times per year and, at each of its meetings, covers an extensive agenda of topics and materials and considers factors that are relevant to its annual consideration of the renewal of the fund's Advisory Contracts, including the services and support provided to the fund and its shareholders. The full Board or the Independent Trustees, as appropriate, act on all major matters; however, a portion of the activities of the Board (including certain of those described herein) may be conducted through standing committees that have been established by the Board. The Board, acting directly and through its committees, requests and receives information concerning the annual consideration of the renewal of the fund's Advisory Contracts.At its September 2020 meeting, the Board, including the Independent Trustees, unanimously determined to renew the fund's Advisory Contracts. In reaching its determination to renew the fund's Advisory Contracts, the Board considered all factors it believed relevant, including (i) the nature, extent, and quality of the services provided to the fund and its shareholders (including the investment performance of the fund); (ii) the competitiveness of the fund's management fee and total expenses relative to peer funds; (iii) the total costs of the services provided by and the profits, if any, realized by Strategic Advisers from its relationships with the fund; and (iv) the extent to which, if any, economies of scale exist and are realized as the fund grows and whether any economies of scale are appropriately shared with fund shareholders.In considering whether to renew the Advisory Contracts for the fund, the Board reached a determination, with the assistance of fund counsel and Independent Trustees' counsel and through the exercise of its business judgment, that the renewal of the Advisory Contracts is in the best interests of the fund and its shareholders. In addition, with respect to the Sub-Advisory Agreements, the Board also concluded that the renewal of such agreements does not involve a conflict of interest from which Strategic Advisers or its affiliates derive an inappropriate advantage. Also, the Board found that the advisory fees charged under the Advisory Contracts bear a reasonable relationship to the services rendered and are based on services provided that are in addition to, rather than duplicative of, services provided under the advisory contract of any underlying fund in which the fund may invest. The Board's decision to renew the Advisory Contracts was not based on any single factor, but rather was based on a comprehensive consideration of all the information provided to the Board throughout the year.Nature, Extent, and Quality of Services Provided. The Board considered the staffing within the Investment Advisers, including the backgrounds of the fund's investment personnel and also considered the fund's investment objective, strategies, and related investment philosophy. The Independent Trustees also had discussions with senior management of Strategic Advisers' investment operations and investment groups. The Board considered the structure of each Investment Adviser's investment personnel compensation program and whether such structures provide appropriate incentives to act in the best interests of the fund.The Trustees also discussed with representatives of Strategic Advisers, at meetings throughout the year, Strategic Advisers' role in, among other things, (i) setting, implementing and monitoring the investment strategies for the funds; (ii) identifying and recommending sub-advisers for the funds; (iii) overseeing compliance with federal securities laws by each sub-adviser with respect to the portion of fund assets allocated to the sub-adviser; (iv) monitoring and overseeing the performance and investment capabilities of each sub-adviser; and (v) recommending the replacement of a sub-adviser as appropriate. The Trustees considered that the Board had received from Strategic Advisers substantial information and periodic reports about Strategic Advisers' sub-adviser oversight and due diligence processes, as well as periodic reports regarding the performance of each sub-adviser.The Board also considered the nature, extent and quality of services provided by each Sub-Adviser. The Trustees noted that under the Sub-Advisory Agreements subject to oversight by Strategic Advisers, each Sub-Adviser is responsible for, among other things, identifying investments for the portion of fund assets allocated to the Sub-Adviser, if any, and executing portfolio transactions to implement its investment strategy. In addition, the Trustees noted that each Sub-Adviser is responsible for providing such reporting as may be requested from Strategic Advisers to fulfill its oversight responsibilities discussed above.Resources Dedicated to Investment Management and Support Services. The Board reviewed the general qualifications and capabilities of the Investment Advisers' investment staffs, their use of technology, and the Investment Advisers' approach to managing and compensating investment personnel. The Board noted that the Investment Advisers' analysts have extensive resources, tools, and capabilities that allow them to conduct sophisticated quantitative and/or fundamental analysis. Additionally, in its deliberations, the Board considered the Investment Advisers' trading capabilities and resources and global compliance infrastructure, which are integral parts of the investment management process. The Board also considered the Investment Advisers' investments in business continuity planning, and their success in continuously providing services to the fund notwithstanding the severe disruptions caused by the COVID-19 pandemic.Shareholder and Administrative Services. The Board considered (i) the nature, extent, quality, and cost of administrative and shareholder services performed by Strategic Advisers and itsaffiliates under the management contract and under separate agreements covering transfer agency, pricing and bookkeeping, and securities lending services for the fund; (ii) the nature and extent of Strategic Advisers' supervision of third party service providers, including sub-advisers, custodians and subcustodians; and (iii) the resources devoted to, and the record of compliance with, the fund's compliance policies and procedures.Investment Performance. The Board considered whether the fund has operated in accordance with its investment objective, as well as its record of compliance with its investment restrictions and its performance history.In connection with the renewal of the Advisory Contracts, the Board considered annualized return information for the fund for different time periods, measured against an appropriate securities market index ("benchmark index") and a peer group of mutual funds with similar objectives ("peer group").The Board considered discussions that occur at Board meetings throughout the year with representatives of Strategic Advisers about fund investment performance and the performance of each Sub-Adviser as part of regularly scheduled fund reviews and other reports to the Board on fund performance, taking into account various factors including general market conditions. In its discussions with representatives of Strategic Advisers regarding fund performance, the Board gave particular attention to information indicating underperformance of certain funds for specific time periods and discussed with Strategic Advisers the reasons for any such underperformance.The following charts considered by the Board show, over the one-, three-, and five-year periods ended December 31, 2019, the cumulative total returns of the fund and the cumulative total returns of an appropriate benchmark index and peer group. The box within each chart shows the 25th percentile return (75% beaten, top of box) and the 75th percentile return (25% beaten, bottom of box) of the peer group. Returns shown above the box are in the first quartile and returns shown below the box are in the fourth quartile. The percentage beaten number noted below each chart corresponds to the percentile box and represents the percentage of funds in the peer group whose performance was equal to or lower than that of the fund.Strategic Advisers Short Duration Fund
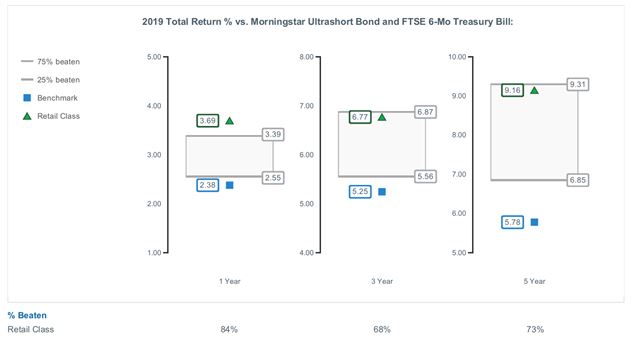
Strategic Advisers Short Duration Fund
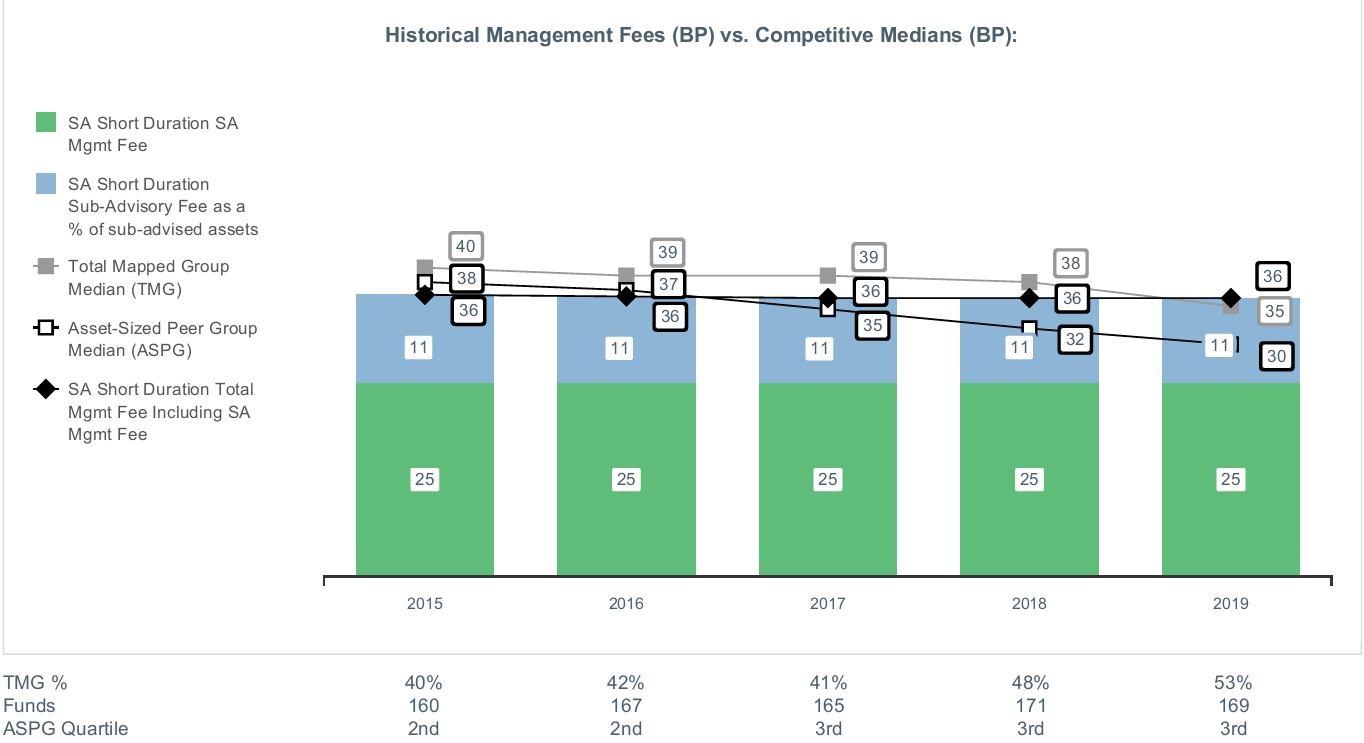
Board Approval of New Sub-Subadvisory Agreements
Strategic Advisers Short Duration Fund
In June 2020, the Board of Trustees, including the Independent Trustees (together, the Board) voted to approve sub-subadvisory agreements (New Sub-Subadvisory Agreements) among FIAM LLC (FIAM), each of FMR Investment Management (UK) Limited (FMR UK), Fidelity Management & Research (Japan) Limited (FMR Japan), and Fidelity Management & Research (Hong Kong) Limited (FMR H.K., and together with FMR UK and FMR Japan, New Sub-Subadvisers), and Fidelity Rutland Square Trust II on behalf of the fund. The Board, assisted by the advice of fund counsel and Independent Trustees' counsel, considered a broad range of information.The Board noted that it previously received and considered materials relating to the nature, extent and quality of services provided by Strategic Advisers LLC (Strategic Advisers) and FIAM, including the resources dedicated to investment management and support services, as well as shareholder and administrative services, in connection with its annual renewal of the fund's management contract and sub-advisory agreements at its September 2019 meeting. The Board noted its familiarity with the nature, extent and quality of services provided by the New Sub-Subadvisers to other Strategic Advisers funds. The Board also considered the detailed information provided by Strategic Advisers and FIAM in the June 2020 annual contract renewal materials.The Board considered that FIAM, and not the fund, will compensate the New Sub-Subadvisers under the terms of the New Sub-Subadvisory Agreements and that the fund and Strategic Advisers are not responsible for any such fees or expenses. The Board also considered that the New Sub-Subadvisory Agreements will not result in any changes to the fees paid under the sub-advisory agreement among Strategic Advisers, FIAM, and the Trust on behalf of the fund.Because the Board was approving New Sub-Subadvisory Agreements under which the fund will not bear any additional management fees or expenses, it did not consider the competitiveness of management fee and total expenses or the possible realization of economies of scale to be significant factors in its decision. In addition, because the New Sub-Subadvisory Agreements were negotiated at arm's length and will have no impact on the maximum management fees payable by the fund or Strategic Advisers' portion of the management fee, the Board did not consider the costs of services and profitability to be significant factors in its decision to approve the New Sub-Subadvisory Agreements. The Board considered Strategic Advisers' representation that it does not anticipate that the approval of the New Sub-Subadvisory Agreements will have a significant impact on the profitability of, or potential fall-out benefits to, Strategic Advisers or its affiliates.The Board noted that in connection with future annual contract renewals, it will consider: (i) the nature, extent, and quality of services provided to the fund, including administrative services and investment performance; (ii) the historical investment performance of the fund; (iii) the competitiveness of the fund's management fees and total expenses; (iv) the costs of services and profitability; (v) the potential fall-out benefits to Strategic Advisers and its affiliates from their relationships with the fund; and (vi) the possible realization of economies of scale.Based on its evaluation of all of the conclusions noted above, and after considering all factors it believed relevant, the Board concluded that the New Sub-Subadvisory Agreements are in the best interests of the fund and its shareholders and should be approved. In addition, the Board concluded that the approval of the New Sub-Subadvisory Agreements does not involve a conflict of interest from which Strategic Advisers or its affiliates derive an inappropriate advantage.Proxy Voting Results
A special meeting of shareholders was held on November 2, 2020. The results of votes taken among shareholders on the proposals before them are reported below. Each vote reported represents one dollar of net asset value held on the record date for the meeting.
PROPOSAL 1
To elect a Board of Trustees.
| # of Votes | % of Votes | |
| ROBERT A. LAWRENCE | ||
| Affirmative | 204,250,982,594.51 | 96.530 |
| Withheld | 7,343,512,146.85 | 3.470 |
| TOTAL | 211,594,494,741.36 | 100.000 |
| CHARLES S. MORRISON | ||
| Affirmative | 204,349,460,488.43 | 96.576 |
| Withheld | 7,245,034,252.93 | 3.424 |
| TOTAL | 211,594,494,741.36 | 100.000 |
| PETER C. ALDRICH | ||
| Affirmative | 203,499,803,652.67 | 96.175 |
| Withheld | 8,094,691,088.69 | 3.825 |
| TOTAL | 211,594,494,741.36 | 100.000 |
| MARY C. FARRELL | ||
| Affirmative | 204,011,925,737.22 | 96.417 |
| Withheld | 7,582,569,004.14 | 3.583 |
| TOTAL | 211,594,494,741.36 | 100.00 |
| KAREN KAPLAN | ||
| Affirmative | 204,297,547,550.53 | 96.552 |
| Withheld | 7,296,947,190.83 | 3.448 |
| TOTAL | 211,594,494,741.36 | 100.000 |
| CHRISTINE MARCKS | ||
| Affirmative | 204,700,871,317.72 | 96.743 |
| Withheld | 6,893,623,423.64 | 3.257 |
| TOTAL | 211,594,494,741.36 | 100.000 |
| HEIDI L. STEIGER | ||
| Affirmative | 204,406,589,957.28 | 96.603 |
| Withheld | 7,187,904,784.08 | 3.397 |
| TOTAL | 211,594,494,741.36 | 100.000 |
PROPOSAL 2
To approve the conversion of a fundamental investment policy to a non-fundamental investment policy.
| # of Votes | % of Votes | |
| Affirmative | 5,104,820,048.35 | 86.600 |
| Against | 329,800,777.16 | 5.594 |
| Abstain | 460,156,413.94 | 7.806 |
| Broker Non-Vote | 0.00 | 0.000 |
| TOTAL | 5,894,777,239.45 | 100.000 |
PROPOSAL 5
To approve a sub-subadvisory agreement between FIAM LLC (FIAM) and FMR Investment Management (UK) Limited (FMR UK).
| # of Votes | % of Votes | |
| Affirmative | 5,271,166,307.76 | 89.421 |
| Against | 225,238,983.44 | 3.821 |
| Abstain | 398,371,948.25 | 6.758 |
| Broker Non-Vote | 0.00 | 0.000 |
| TOTAL | 5,894,777,239.45 | 100.000 |
PROPOSAL 6
To approve a sub-subadvisory agreement between FIAM and Fidelity Management & Research (Hong Kong) Limited (FMR H.K.).
| # of Votes | % of Votes | |
| Affirmative | 5,195,633,592.20 | 88.140 |
| Against | 278,351,890.70 | 4.722 |
| Abstain | 420,791,756.55 | 7.138 |
| Broker Non-Vote | 0.00 | 0.000 |
| TOTAL | 5,894,777,239.45 | 100.000 |
PROPOSAL 7
To approve a sub-subadvisory agreement between FIAM and Fidelity Management & Research (Japan) Limited (FMR Japan).
| # of Votes | % of Votes | |
| Affirmative | 5,265,653,754.88 | 89.328 |
| Against | 229,669,288.91 | 3.896 |
| Abstain | 399,454,195.66 | 6.776 |
| Broker Non-Vote | 0.00 | 0.000 |
| TOTAL | 5,894,777,239.45 | 100.000 |
| Proposal 1 reflects trust wide proposal and voting results. |
![]()
ASD-SANN-0121
1.934461.108
Strategic Advisers® Tax-Sensitive Short Duration Fund
Offered exclusively to certain clients of Strategic Advisers LLC - not available for sale to the general public
Semi-Annual Report
November 30, 2020
Contents
Board Approval of Investment Advisory Contracts and Management Fees | |
To view a fund's proxy voting record for the 12-month period ended June 30, visit http://www.fidelity.com/proxyvotingresults or visit the Securities and Exchange Commission's (SEC) web site at http://www.sec.gov.
You may also call 1-800-544-3455 to request a free copy of the proxy voting guidelines.
Standard & Poor's, S&P and S&P 500 are registered service marks of The McGraw-Hill Companies, Inc. and have been licensed for use by Fidelity Distributors Corporation.
Other third-party marks appearing herein are the property of their respective owners.
All other marks appearing herein are registered or unregistered trademarks or service marks of FMR LLC or an affiliated company. © 2021 FMR LLC. All rights reserved.
This report and the financial statements contained herein are submitted for the general information of the shareholders of the Fund. This report is not authorized for distribution to prospective investors in the Fund unless preceded or accompanied by an effective prospectus.
A fund files its complete schedule of portfolio holdings with the SEC for the first and third quarters of each fiscal year on Form N-PORT. Forms N-PORT are available on the SEC’s web site at http://www.sec.gov. A fund's Forms N-PORT may be reviewed and copied at the SEC’s Public Reference Room in Washington, DC. Information regarding the operation of the SEC's Public Reference Room may be obtained by calling 1-800-SEC-0330.
For a complete list of a fund's portfolio holdings, view the most recent holdings listing, semiannual report, or annual report on Fidelity's web site at http://www.fidelity.com, http://www.institutional.fidelity.com, or http://www.401k.com, as applicable.
NOT FDIC INSURED •MAY LOSE VALUE •NO BANK GUARANTEE
Neither the Fund nor Fidelity Distributors Corporation is a bank.
Note to Shareholders:
Early in 2020, the outbreak and spread of a new coronavirus emerged as a public health emergency that had a major influence on financial markets, primarily based on its impact on the global economy and the outlook for corporate earnings. The virus causes a respiratory disease known as COVID-19. On March 11, the World Health Organization declared the COVID-19 outbreak a pandemic, citing sustained risk of further global spread.
In the weeks following, as the crisis worsened, we witnessed an escalating human tragedy with wide-scale social and economic consequences from coronavirus-containment measures. The outbreak of COVID-19 prompted a number of measures to limit the spread, including travel and border restrictions, quarantines, and restrictions on large gatherings. In turn, these resulted in lower consumer activity, diminished demand for a wide range of products and services, disruption in manufacturing and supply chains, and – given the wide variability in outcomes regarding the outbreak – significant market uncertainty and volatility. Amid the turmoil, global governments and central banks took unprecedented action to help support consumers, businesses, and the broader economies, and to limit disruption to financial systems.
The situation continues to unfold, and the extent and duration of its impact on financial markets and the economy remain highly uncertain. Extreme events such as the coronavirus crisis are “exogenous shocks” that can have significant adverse effects on mutual funds and their investments. Although multiple asset classes may be affected by market disruption, the duration and impact may not be the same for all types of assets.
Fidelity is committed to helping you stay informed amid news about COVID-19 and during increased market volatility, and we’re taking extra steps to be responsive to customer needs. We encourage you to visit our websites, where we offer ongoing updates, commentary, and analysis on the markets and our funds.
Investment Summary (Unaudited)
The information in the following tables is based on the direct investments of the Fund.Top Ten Holdings as of November 30, 2020
| (by issuer, excluding cash equivalents) | % of fund's net assets |
| JPMorgan Ultra-Short Municipal Fund Class I | 12.0 |
| New York Metropolitan Transportation Authority Rev. | 1.7 |
| Texas General Obligation | 1.5 |
| Denver City & County Airport Rev. | 1.2 |
| Illinois Gen. Oblig. | 0.8 |
| Harris County Cultural Education Facilities Finance Corp. Rev. | 0.8 |
| Port Arthur Navigation Dist. Environmental Facilities Rev. | 0.7 |
| Clark County Airport Rev. | 0.7 |
| Georgia Muni. Elec. Auth. Pwr. Rev. | 0.7 |
| New York City Gen. Oblig. | 0.7 |
Top Five Sectors as of November 30, 2020
| % of fund's net assets | |
| General Obligations | 16.7 |
| Transportation | 10.5 |
| Health Care | 8.2 |
| Other | 6.5 |
| Synthetics | 5.1 |
Quality Diversification (% of fund's net assets)
| As of November 30, 2020 | ||
| AAA,AA,A | 38.2% | |
| BBB | 4.3% | |
| Not Rated | 2.1% | |
| Equities | 12.6% | |
| Short-Term Investments and Net Other Assets | 42.8% | |

We have used ratings from Moody's Investors Service, Inc. Where Moody's® ratings are not available, we have used S&P® ratings. All ratings are as of the date indicated and do not reflect subsequent changes.
Asset Allocation (% of fund's net assets)
| As of November 30, 2020 | ||
| Municipal Bonds | 23.3% | |
| Short-Term Funds | 12.4% | |
| Investment Companies | 0.1% | |
| Short-Term Investments and Net Other Assets (Liabilities) | 64.2% | |

Schedule of Investments November 30, 2020 (Unaudited)
Showing Percentage of Net Assets
| Municipal Bonds - 45.2% | |||
| Principal Amount | Value | ||
| Alabama - 0.7% | |||
| Alabama Pub. School & College Auth. Rev. Series 2020 A: | |||
| 5% 11/1/22 | $1,500,000 | $1,636,860 | |
| 5% 11/1/24 | 1,500,000 | 1,777,335 | |
| Alabama Spl. Care Facilities Fing. Auth. Birmingham Rev. Bonds Series 2006 C1, 1.85%, tender 11/1/22 (a) | 1,025,000 | 1,054,500 | |
| Birmingham Arpt. Auth. Arpt. Series 2020: | |||
| 5% 7/1/24 (Build America Mutual Assurance Insured) | 325,000 | 373,857 | |
| 5% 7/1/25 (Build America Mutual Assurance Insured) | 325,000 | 386,731 | |
| Black Belt Energy Gas District: | |||
| (Proj. No. 4) Series 2019 A: | |||
| 4% 6/1/21 | 1,250,000 | 1,271,636 | |
| 4% 6/1/23 | 1,750,000 | 1,896,248 | |
| Bonds: | |||
| Series 2016 A, 4%, tender 6/1/21 (a) | 9,725,000 | 9,871,925 | |
| Series 2017 A, 4%, tender 7/1/22 (a) | 4,640,000 | 4,884,157 | |
| Chatom Indl. Dev. Board Gulf Opportunity Zone Series 2020, 5% 8/1/23 (FSA Insured) | 1,350,000 | 1,498,136 | |
| Health Care Auth. for Baptist Health Series 2006 B, 0.3%, tender 11/15/37 (a) | 1,150,000 | 1,150,000 | |
| Jefferson County Gen. Oblig. Series 2018 B, 5% 4/1/21 | 270,000 | 274,207 | |
| Lower Alabama Gas District (No. 2 Proj.) Series 2020, 4% 12/1/21 | 100,000 | 103,538 | |
| Mobile County Board of School Commissioners: | |||
| Series 2016 A: | |||
| 5% 3/1/22 | 15,000 | 15,875 | |
| 5% 3/1/23 | 20,000 | 21,939 | |
| 5% 3/1/24 | 25,000 | 28,431 | |
| 5% 3/1/25 | 25,000 | 29,427 | |
| Series 2016 B: | |||
| 5% 3/1/22 | 80,000 | 84,666 | |
| 5% 3/1/23 | 405,000 | 444,273 | |
| 5% 3/1/24 | 45,000 | 51,176 | |
| Mobile Indl. Dev. Board Poll. Cont. Rev. Bonds Series 2009 E, 1%, tender 6/26/25 (a) | 600,000 | 606,144 | |
| Montgomery Med. Clinic Facilities Series 2015: | |||
| 5% 3/1/21 | 10,000 | 10,085 | |
| 5% 3/1/22 | 70,000 | 73,006 | |
| Southeast Alabama Gas Supply District Bonds Series 2018 A, 4%, tender 4/1/24 (a) | 4,000,000 | 4,419,640 | |
| TOTAL ALABAMA | 31,963,792 | ||
| Alaska - 0.3% | |||
| Alaska Hsg. Fin. Corp. Mtg. Rev. Series 2020 A: | |||
| 0.3% 12/1/21 | 665,000 | 664,431 | |
| 0.35% 6/1/22 | 660,000 | 659,360 | |
| 0.4% 12/1/22 | 750,000 | 748,965 | |
| Alaska Int'l. Arpts. Revs. Series 2016 C: | |||
| 5% 10/1/22 (b) | 1,105,000 | 1,183,079 | |
| 5% 10/1/23 (b) | 425,000 | 472,315 | |
| Alaska Muni. Bond Bank Series 1, 5% 12/1/21 | 1,000,000 | 1,044,605 | |
| Anchorage Gen. Oblig.: | |||
| Series B, 5% 9/1/22 | 30,000 | 32,521 | |
| Series C, 5% 9/1/22 | 20,000 | 21,681 | |
| Valdez Marine Term. Rev. (BP Pipelines (Alaska), Inc. Proj.): | |||
| Series 2003 B, 5% 1/1/21 | 5,945,000 | 5,967,669 | |
| Series 2003 C, 5% 1/1/21 | 4,520,000 | 4,537,235 | |
| TOTAL ALASKA | 15,331,861 | ||
| Arizona - 1.8% | |||
| Arizona Board of Regents Ctfs. of Prtn. Series 2015 A, 5% 6/1/22 | 150,000 | 160,010 | |
| Arizona Ctfs. of Prtn. Series 2019 A, 5% 10/1/24 | 195,000 | 229,884 | |
| Arizona Health Facilities Auth. Hosp. Sys. Rev. Series 2012 A, 5% 2/1/21 | 500,000 | 503,753 | |
| Arizona Health Facilities Auth. Rev.: | |||
| (Scottsdale Lincoln Hospitals Proj.) Series 2014 A: | |||
| 5% 12/1/21 | 25,000 | 26,077 | |
| 5% 12/1/22 | 15,000 | 16,334 | |
| 5% 12/1/23 | 20,000 | 22,658 | |
| 5% 12/1/24 | 45,000 | 52,945 | |
| Bonds Series 2013 A3, SIFMA Municipal Swap Index + 1.850% 1.96%, tender 2/1/23 (a)(c) | 2,000,000 | 2,037,280 | |
| Arizona Indl. Dev. Auth. Hosp. Rev. Series 2020 A: | |||
| 5% 2/1/24 | 600,000 | 685,140 | |
| 5% 2/1/26 | 750,000 | 919,298 | |
| Chandler Indl. Dev. Auth. Indl. Dev. Rev. Bonds (Intel Corp. Proj.): | |||
| Series 2005, 2.4%, tender 8/14/23 (a) | 5,100,000 | 5,366,985 | |
| Series 2007, 2.7%, tender 8/14/23 (a)(b) | 6,500,000 | 6,863,675 | |
| Series 2019, 5%, tender 6/3/24 (a)(b) | 4,070,000 | 4,677,936 | |
| Coconino County Poll. Cont. Corp. Rev. Bonds: | |||
| Series 2017 A, 1.875%, tender 3/31/23 (a)(b) | 415,000 | 419,598 | |
| Series 2017 B, 1.65%, tender 3/31/23 (a) | 895,000 | 906,313 | |
| Glendale Gen. Oblig.: | |||
| Series 2015, 5% 7/1/22 (FSA Insured) | 20,000 | 21,521 | |
| Series 2017, 5% 7/1/22 | 75,000 | 80,159 | |
| Glendale Trans. Excise Tax Rev. Series 2015: | |||
| 5% 7/1/21 (FSA Insured) | 15,000 | 15,417 | |
| 5% 7/1/22 (FSA Insured) | 25,000 | 26,901 | |
| 5% 7/1/23 (FSA Insured) | 30,000 | 33,676 | |
| Maricopa County Rev.: | |||
| Bonds: | |||
| Series 2019 B, SIFMA Municipal Swap Index + 0.380% 0.49%, tender 10/18/22 (a)(c) | 4,185,000 | 4,176,630 | |
| Series B, 5%, tender 10/18/22 (a) | 2,980,000 | 3,227,906 | |
| Series 2016 A, 5% 1/1/25 | 105,000 | 124,285 | |
| Mesa Util. Sys. Rev. Series 2020, 5% 7/1/24 (d) | 635,000 | 740,112 | |
| Phoenix Civic Impt. Board Arpt. Rev.: | |||
| Series 2013, 5% 7/1/21 (b) | 2,750,000 | 2,814,145 | |
| Series 2017 A, 5% 7/1/22 (b) | 715,000 | 762,068 | |
| Series 2017 D: | |||
| 5% 7/1/22 | 500,000 | 534,555 | |
| 5% 7/1/24 | 250,000 | 288,830 | |
| Series 2018, 5% 7/1/23 (b) | 1,100,000 | 1,220,318 | |
| Series 2019 B, 5% 7/1/23 (b) | 1,000,000 | 1,106,670 | |
| Phoenix Indl. Solid Waste Disp. Rev. Bonds (Republic Svc., Inc. Proj.) Series 2013, 0.3%, tender 12/1/35 (a)(b) | 23,380,000 | 23,381,146 | |
| Pima County Ctfs. of Prtn. Series 2014: | |||
| 5% 12/1/21 | 50,000 | 52,333 | |
| 5% 12/1/22 | 130,000 | 142,048 | |
| 5% 12/1/23 | 75,000 | 85,403 | |
| Pima County Swr. Sys. Rev. Series 2020 A, 5% 7/1/23 | 260,000 | 291,931 | |
| Scottsdale Indl. Dev. Auth. Hosp. Rev. Series 2006 F, 0.23%, tender 9/1/45 (FSA Insured) (a) | 14,725,000 | 14,725,000 | |
| Tucson Ctfs. of Prtn.: | |||
| Series 2015, 5% 7/1/23 (FSA Insured) | 200,000 | 223,132 | |
| Series 2016, 4% 7/1/21 (FSA Insured) | 260,000 | 265,483 | |
| Western Maricopa Ed. Ctr. District Series 2019 B, 4% 7/1/21 | 1,365,000 | 1,394,998 | |
| Yavapai County Indl. Dev. Auth.: | |||
| Series 2016, 5% 8/1/23 | 275,000 | 306,257 | |
| Series 2019: | |||
| 5% 8/1/21 | 225,000 | 231,456 | |
| 5% 8/1/22 | 425,000 | 455,396 | |
| 5% 8/1/23 | 355,000 | 395,349 | |
| Yavapai County Indl. Dev. Auth. Solid Waste Disp. Rev. Bonds Series 2010, 0.25%, tender 12/1/20 (a) | 1,500,000 | 1,500,000 | |
| TOTAL ARIZONA | 81,511,011 | ||
| Arkansas - 0.4% | |||
| Arkansas Dev. Fin. Auth. Multi-family Hsg. Rev.: | |||
| (NLR Rad Family Homes Proj.) Series 2020, 1.2%, tender 9/1/22 (a) | 5,000,000 | 5,063,650 | |
| Bonds: | |||
| (Hsg. Alliance 2 Proj.) Series 2018 B, 2.1%, tender 12/1/20 (a) | 2,900,000 | 2,900,000 | |
| Series 2018 A, 2.1%, tender 12/1/20 (a) | 8,000,000 | 8,000,000 | |
| Batesville Pub. Facilities Board Series 2020: | |||
| 5% 6/1/22 | 590,000 | 615,889 | |
| 5% 6/1/23 | 790,000 | 842,227 | |
| Little Rock School District Series 2017, 3% 2/1/21 | 1,120,000 | 1,125,041 | |
| TOTAL ARKANSAS | 18,546,807 | ||
| California - 2.2% | |||
| Bay Area Toll Auth. San Francisco Bay Toll Bridge Rev. Bonds: | |||
| Series 2017 G, 2%, tender 4/1/24 (a) | 1,120,000 | 1,164,565 | |
| Series A, 2.95%, tender 4/1/26 (a) | 115,000 | 128,334 | |
| Series B, 2.85%, tender 4/1/25 (a) | 95,000 | 103,462 | |
| Burbank Glendale Pasadena Arpt. Auth. Rev. Series B, 5% 7/1/23 (b) | 1,290,000 | 1,417,504 | |
| California Gen. Oblig.: | |||
| Bonds Series 2013, SIFMA Municipal Swap Index + 0.380% 0.49%, tender 12/1/22 (a)(c) | 3,270,000 | 3,269,477 | |
| Series 2017, 5% 8/1/26 | 1,175,000 | 1,479,137 | |
| Series 2020: | |||
| 5% 3/1/22 | 3,180,000 | 3,370,037 | |
| 5% 11/1/24 | 500,000 | 592,015 | |
| 5.25% 9/1/22 | 35,000 | 38,075 | |
| California Health Facilities Fing. Auth. Rev.: | |||
| Bonds (Stanford Hosp. & Clinics Proj.) Series 2008 B2, 0.3%, tender 3/2/21 (a) | 4,050,000 | 4,050,000 | |
| Series 2014 A, 5% 10/1/21 | 325,000 | 337,521 | |
| California Infrastructure and Econ. Dev. Bank Rev. Bonds: | |||
| (Brightline West Passenger Rail Proj.) Series 2020 A, 0.45%, tender 7/1/21 (a)(b)(e) | 4,000,000 | 4,000,694 | |
| Series 2012 B, 1 month U.S. LIBOR + 0.200% 0.303%, tender 12/1/20 (a)(c) | 5,000,000 | 5,000,113 | |
| Series 2018 A, 1 month U.S. LIBOR + 0.380% 0.48%, tender 12/3/20 (a)(c) | 400,000 | 399,948 | |
| Series 2018 C, 1 month U.S. LIBOR + 0.380% 0.48%, tender 12/3/20 (a)(c) | 2,940,000 | 2,939,615 | |
| Series 2018 D, 1 month U.S. LIBOR + 0.380% 0.485%, tender 12/2/20 (a)(c) | 7,600,000 | 7,599,004 | |
| California Muni. Fin. Auth. Solid Waste Disp. Rev. Bonds (Waste Mgmt., Inc. Proj.) Series 2020, 0.23%, tender 12/1/20 (a)(b) | 2,000,000 | 2,000,000 | |
| California Poll. Cont. Fing. Auth. Solid Waste Disp. Rev. Bonds (Republic Svcs., Inc. Proj.) Series 2017 A2, 0.3%, tender 1/15/21 (a)(b)(e) | 1,850,000 | 1,850,000 | |
| California Statewide Cmntys. Dev. Auth. Rev. Series 2007: | |||
| 0.17%, tender 7/1/41 (FSA Insured) (a) | 4,475,000 | 4,475,000 | |
| 0.23%, tender 7/1/40 (FSA Insured) (a) | 4,275,000 | 4,275,000 | |
| Golden State Tobacco Securitization Corp. Tobacco Settlement Rev.: | |||
| Series 2017 A1: | |||
| 5% 6/1/21 | 25,000 | 25,602 | |
| 5% 6/1/22 | 40,000 | 42,838 | |
| 5% 6/1/23 | 45,000 | 50,246 | |
| 5% 6/1/24 | 25,000 | 28,953 | |
| Series A, 0% 6/1/24 (AMBAC Insured) | 75,000 | 72,916 | |
| Long Beach Hbr. Rev. Series 2020 C, 4% 7/15/21 | 2,500,000 | 2,557,986 | |
| Los Angeles Dept. Arpt. Rev.: | |||
| Series 2015 C, 5% 5/15/21 | 225,000 | 229,771 | |
| Series 2016 A, 5% 5/15/22 (b) | 250,000 | 266,378 | |
| Series 2017 B, 5% 5/15/23 (b) | 800,000 | 887,624 | |
| Series 2018 C, 5% 5/15/21 (b) | 360,000 | 367,383 | |
| Series 2019 F, 5% 5/15/24 (b) | 2,610,000 | 3,007,921 | |
| Series F, 5% 5/15/22 (b) | 1,400,000 | 1,491,714 | |
| Los Angeles Reg'l. Arpts. Impt. Rev. Series 2012, 4.5% 1/1/27 (b) | 375,000 | 387,705 | |
| Los Angeles Unified School District Series 2020 C, 5% 7/1/23 | 1,200,000 | 1,345,716 | |
| Oakland Unified School District Alameda County Series 2013, 5.5% 8/1/23 | 20,000 | 22,104 | |
| Palomar Pomerado Health Care Dis: | |||
| Series 2006 A, 0.66%, tender 11/1/36 (FSA Insured) (a) | 4,900,000 | 4,900,000 | |
| Series 2006 B, 0.66%, tender 11/1/36 (FSA Insured) (a) | 4,700,000 | 4,700,000 | |
| Series 2006 C, 0.69%, tender 11/1/36 (FSA Insured) (a) | 2,300,000 | 2,300,000 | |
| Port of Oakland Rev.: | |||
| Series 2012 P, 5% 5/1/21 (b) | 55,000 | 55,996 | |
| Series H: | |||
| 5% 5/1/22 (b)(d) | 2,750,000 | 2,897,620 | |
| 5% 5/1/23 (b)(d) | 5,515,000 | 6,038,870 | |
| 5% 5/1/24 (b)(d) | 930,000 | 1,055,039 | |
| Riverside County Teeter Plan Series A, 0.5% 10/21/21 | 590,000 | 591,676 | |
| San Diego County Reg'l. Arpt. Auth. Arpt. Rev.: | |||
| Series 2013 B: | |||
| 5% 7/1/21 (b) | 1,145,000 | 1,174,420 | |
| 5% 7/1/22 (b) | 1,800,000 | 1,925,280 | |
| Series 2020 C: | |||
| 5% 7/1/22 (b) | 1,475,000 | 1,577,660 | |
| 5% 7/1/23 (b) | 545,000 | 604,912 | |
| San Diego Pub. Facilities Fing. Auth. Lease Rev. Series 2016, 5% 10/15/22 | 1,940,000 | 2,104,900 | |
| San Diego Pub. Facilities Fing. Auth. Wtr. Rev. Series 2020 A: | |||
| 5% 8/1/21 | 250,000 | 258,042 | |
| 5% 8/1/22 | 250,000 | 270,230 | |
| San Francisco City & County Arpts. Commission Int'l. Arpt. Rev.: | |||
| Series 2016 A: | |||
| 5% 5/1/21 | 305,000 | 310,847 | |
| 5% 5/1/22 | 1,000,000 | 1,065,230 | |
| Series 2016 D, 5% 5/1/21 | 470,000 | 479,010 | |
| Series 2019 A, 5% 1/1/22 (b) | 2,900,000 | 3,041,752 | |
| Series 2019 H, 5% 5/1/23 (b) | 2,000,000 | 2,214,640 | |
| San Jose Int. Arpt. Rev. Series 2017 A, 5% 3/1/21 (b) | 2,550,000 | 2,574,368 | |
| San Pablo Redev. Agcy. Series 2014 A, 5% 6/15/24 (FSA Insured) | 30,000 | 34,717 | |
| TOTAL CALIFORNIA | 99,449,567 | ||
| Colorado - 1.0% | |||
| Colorado Bridge Enterprise Rev. Series 2017, 4% 6/30/24 (b) | 1,330,000 | 1,468,985 | |
| Colorado Ctfs. of Prtn. Series 2020 A, 5% 12/15/21 | 2,000,000 | 2,099,312 | |
| Colorado Health Facilities Auth.: | |||
| Bonds: | |||
| (Valley View Hosp. Assoc. Proj.) Series 2018, 2.8%, tender 5/15/23 (a) | 495,000 | 515,919 | |
| Series 2019 B: | |||
| 5%, tender 8/1/25 (a) | 300,000 | 349,614 | |
| 5%, tender 8/1/26 (a) | 240,000 | 287,522 | |
| 5%, tender 11/19/26 (a) | 1,590,000 | 1,996,961 | |
| Series 2019 A: | |||
| 5% 1/1/21 | 735,000 | 737,693 | |
| 5% 1/1/23 | 350,000 | 382,162 | |
| Series 2019, 4% 1/1/21 | 650,000 | 651,001 | |
| Colorado Health Facilities Auth. Retirement Hsg. Rev. (Liberty Heights Proj.) Series 1991 A, 0% 7/15/22 (Escrowed to Maturity) | 620,000 | 616,398 | |
| Colorado Health Facilities Auth. Rev. Bonds Series 2008 D3, 5%, tender 11/12/21 (a) | 115,000 | 119,424 | |
| Colorado Hsg. & Fin. Auth.: | |||
| Series 2019 F, 4.25% 11/1/49 | 190,000 | 213,830 | |
| Series 2019 H, 4.25% 11/1/49 | 110,000 | 124,001 | |
| Colorado Reg'l. Trans. District Ctfs. of Prtn.: | |||
| Series 2013 A, 5% 6/1/23 | 250,000 | 278,003 | |
| Series 2014 A, 5% 6/1/23 | 85,000 | 94,521 | |
| Colorado Univ. Co. Hosp. Auth. Rev. Bonds Series 2017C-2, 5%, tender 3/1/22 (a) | 1,120,000 | 1,157,285 | |
| Denver City & County Arpt. Rev.: | |||
| (Sub Lien Proj.) Series 2013 A, 5% 11/15/21 (b) | 900,000 | 938,269 | |
| Series 2011 A, 5.25% 11/15/22 (b) | 1,750,000 | 1,828,558 | |
| Series 2012 A: | |||
| 5% 11/15/22 (b) | 520,000 | 565,094 | |
| 5% 11/15/23 (b) | 250,000 | 270,563 | |
| Series 2012 B, 5% 11/15/22 | 250,000 | 272,603 | |
| Series 2013 A, 5% 11/15/22 (b) | 500,000 | 542,340 | |
| Series 2013 B, 5% 11/15/21 | 200,000 | 208,936 | |
| Series 2017 A: | |||
| 5% 11/15/21 (b) | 565,000 | 589,024 | |
| 5% 11/15/22 (b) | 3,455,000 | 3,754,618 | |
| Series 2018 A: | |||
| 5% 12/1/20 (b) | 8,375,000 | 8,375,000 | |
| 5% 12/1/21 (b) | 1,000,000 | 1,044,502 | |
| 5% 12/1/23 (b) | 250,000 | 282,110 | |
| Series 2020 A1, 5% 11/15/22 | 3,200,000 | 3,489,312 | |
| Series 2020 B1: | |||
| 5% 11/15/21 (b) | 3,855,000 | 4,018,918 | |
| 5% 11/15/22 (b) | 4,045,000 | 4,395,782 | |
| 5% 11/15/23 (b) | 935,000 | 1,054,830 | |
| Denver Health & Hosp. Auth. Healthcare Rev. Series 2017 A, 5% 12/1/20 (e) | 325,000 | 325,000 | |
| E-470 Pub. Hwy. Auth. Rev.: | |||
| Bonds Series 2019 A, 1 month U.S. LIBOR + 0.420% 0.517%, tender 12/3/20(a)(c) | 2,250,000 | 2,243,812 | |
| Series 2020 A: | |||
| 5% 9/1/23 | 275,000 | 309,620 | |
| 5% 9/1/24 | 450,000 | 526,014 | |
| 5% 9/1/25 | 300,000 | 363,021 | |
| Series B, 0% 9/1/21 (Nat'l. Pub. Fin. Guarantee Corp. Insured) | 525,000 | 523,045 | |
| Vauxmont Metropolitan District Series 2019: | |||
| 5% 12/15/22 (FSA Insured) | 100,000 | 108,363 | |
| 5% 12/15/23 (FSA Insured) | 120,000 | 134,884 | |
| TOTAL COLORADO | 47,256,849 | ||
| Connecticut - 1.4% | |||
| City of New Haven Series A, 5% 8/1/22 | 1,000,000 | 1,054,740 | |
| Connecticut Gen. Oblig.: | |||
| Series 2011 B, 5% 5/15/21 | 830,000 | 847,905 | |
| Series 2011 D, 5% 11/1/22 | 185,000 | 193,035 | |
| Series 2012 C, 5% 6/1/21 | 960,000 | 982,743 | |
| Series 2014 A: | |||
| 4% 3/1/21 | 800,000 | 807,447 | |
| 4% 3/1/22 | 450,000 | 471,114 | |
| Series 2014 H, 5% 11/15/21 | 925,000 | 966,968 | |
| Series 2015 A: | |||
| 4% 3/15/23 | 250,000 | 270,955 | |
| 5% 3/15/22 | 1,035,000 | 1,098,363 | |
| Series 2015 B, 5% 6/15/21 | 390,000 | 399,961 | |
| Series 2015 C: | |||
| SIFMA Municipal Swap Index + 0.900% 1.01% 6/15/21 (a)(c) | 2,500,000 | 2,508,055 | |
| 5% 6/15/22 | 400,000 | 429,176 | |
| Series 2015, 4% 11/15/21 | 290,000 | 300,399 | |
| Series 2016 A, 5% 3/15/26 | 60,000 | 73,844 | |
| Series 2016 B: | |||
| 5% 5/15/21 | 1,920,000 | 1,961,419 | |
| 5% 5/15/22 | 450,000 | 481,046 | |
| 5% 5/15/24 | 395,000 | 457,137 | |
| Series 2016 D, 5% 8/15/21 | 430,000 | 444,393 | |
| Series 2016 E, 5% 10/15/23 | 240,000 | 271,896 | |
| Series 2016 G, 5% 11/1/21 | 1,200,000 | 1,252,224 | |
| Series 2017 B, 3% 4/15/22 | 500,000 | 518,925 | |
| Series 2018 B, 5% 4/15/22 | 810,000 | 862,796 | |
| Series 2018 F: | |||
| 5% 9/15/21 | 665,000 | 689,897 | |
| 5% 9/15/22 | 225,000 | 244,076 | |
| Series 2019 A: | |||
| 5% 4/15/22 | 355,000 | 378,139 | |
| 5% 4/15/23 | 1,000,000 | 1,110,400 | |
| Series 2020 A, 5% 1/15/23 | 1,470,000 | 1,616,089 | |
| Series A: | |||
| 5% 10/15/21 | 1,050,000 | 1,093,475 | |
| 5% 3/15/23 | 690,000 | 763,540 | |
| Series B: | |||
| 4% 6/15/21 | 250,000 | 255,047 | |
| 4% 6/15/22 | 250,000 | 264,405 | |
| Series C: | |||
| 4% 6/1/24 | 1,050,000 | 1,180,851 | |
| 5% 6/15/21 | 1,000,000 | 1,025,541 | |
| 5% 6/1/24 | 300,000 | 320,967 | |
| Series H, 5% 11/15/22 | 390,000 | 425,744 | |
| Connecticut Health & Edl. Facilities Auth. Rev.: | |||
| (Quinnipiac Univ., Ct Proj.) Series 2016 M, 5% 7/1/21 | 400,000 | 410,753 | |
| Bonds: | |||
| Series 2014 A, 1.1%, tender 2/7/23 (a) | 5,000,000 | 5,082,000 | |
| Series 2014 B, 1.8%, tender 7/1/24 (a) | 345,000 | 358,638 | |
| Series 2015 A, 2.05%, tender 7/12/21 (a) | 5,000,000 | 5,054,302 | |
| Series 2017 B, 0.55%, tender 7/3/23 (a) | 10,000,000 | 10,121,000 | |
| Series U1, 2%, tender 2/8/22 (a) | 500,000 | 510,210 | |
| Series 2020 K: | |||
| 5% 7/1/22 | 250,000 | 267,688 | |
| 5% 7/1/23 | 250,000 | 278,505 | |
| Series A, 5% 7/1/21 (Escrowed to Maturity) | 800,000 | 821,792 | |
| Series N: | |||
| 5% 7/1/21 | 610,000 | 624,950 | |
| 5% 7/1/22 | 400,000 | 415,900 | |
| 5% 7/1/23 | 415,000 | 439,224 | |
| Connecticut Higher Ed. Supplemental Ln. Auth. Rev.: | |||
| (Chesla Ln. Prog.) Series 2017 A, 5% 11/15/22 (b) | 300,000 | 321,156 | |
| (Chesla Loan Prog.) Series B: | |||
| 5% 11/15/22 (b) | 115,000 | 122,650 | |
| 5% 11/15/23 (b) | 425,000 | 465,817 | |
| Series 2017 B: | |||
| 5% 11/15/21 (b) | 655,000 | 678,378 | |
| 5% 11/15/23 (b) | 125,000 | 137,766 | |
| Connecticut Hsg. Fin. Auth.: | |||
| Bonds Series 2019 E, 1.625%, tender 11/15/22 (a) | 3,000,000 | 3,002,460 | |
| Series 2013 B2, 4% 11/15/32 | 45,000 | 46,186 | |
| Series C: | |||
| 5% 5/15/23 (b) | 205,000 | 226,976 | |
| 5% 11/15/23 (b) | 710,000 | 799,432 | |
| Connecticut Muni. Elec. Energy Coop. Pwr. Supply Sys. Rev. Series 2012 A, 5% 1/1/23 | 395,000 | 415,275 | |
| Connecticut Spl. Tax Oblig. Trans. Infrastructure Rev.: | |||
| Series 2012 A, 5% 1/1/23 | 480,000 | 526,526 | |
| Series 2012 B, 5% 1/1/21 | 450,000 | 451,723 | |
| Series 2014 B, 5% 9/1/22 | 250,000 | 270,690 | |
| Series 2015 A, 5% 8/1/23 | 300,000 | 337,071 | |
| Series 2016 A, 5% 9/1/21 | 700,000 | 724,858 | |
| Series A: | |||
| 4% 5/1/21 | 250,000 | 253,886 | |
| 5% 1/1/22 | 290,000 | 304,889 | |
| 5% 5/1/22 | 1,080,000 | 1,152,360 | |
| Series B, 5% 10/1/21 | 1,070,000 | 1,112,231 | |
| Hartford Gen. Oblig. Series 2012 A, 5% 4/1/21 (FSA Insured) | 2,000,000 | 2,029,470 | |
| New Britain Gen. Oblig. Series 2017 A, 5% 3/1/21 (Escrowed to Maturity) | 90,000 | 91,076 | |
| New Haven Gen. Oblig.: | |||
| Series 2016 A, 5% 8/15/25 (FSA Insured) | 20,000 | 23,501 | |
| Series B, 5% 2/1/22 | 350,000 | 364,655 | |
| Univ. of Connecticut Gen. Oblig.: | |||
| Series 2016 A, 5% 3/15/22 | 190,000 | 201,149 | |
| Series 2019 A, 5% 11/1/25 | 225,000 | 273,377 | |
| TOTAL CONNECTICUT | 64,741,232 | ||
| Delaware - 0.1% | |||
| Delaware Econ. Dev. Auth. Rev. Bonds (Delmarva Pwr. & Lt. Co. Proj.) Series A, 1.05%, tender 7/1/25 (a) | 565,000 | 573,848 | |
| Delaware Trans. Auth. Grant Series 2020: | |||
| 5% 9/1/22 | 1,250,000 | 1,353,450 | |
| 5% 9/1/23 | 1,400,000 | 1,579,942 | |
| TOTAL DELAWARE | 3,507,240 | ||
| Delaware, New Jersey - 0.0% | |||
| Delaware River & Bay Auth. Rev. Series 2014 C, 5% 1/1/21 | 45,000 | 45,171 | |
| District Of Columbia - 0.6% | |||
| District of Columbia Hsg. Fin. Agcy. Multi-family Hsg. Rev. Bonds: | |||
| (Liberty Place Apts. Proj.) Series 2018, 2.13%, tender 12/1/20 (a) | 5,000,000 | 5,000,000 | |
| (Park Southern Apts. Proj.) Series 2020, 0.7%, tender 6/1/23 (a) | 9,000,000 | 9,015,030 | |
| Metropolitan Washington DC Arpts. Auth. Sys. Rev.: | |||
| Series 2011 C: | |||
| 5% 10/1/21 (b) | 365,000 | 378,812 | |
| 5% 10/1/22 (b) | 430,000 | 445,390 | |
| 5% 10/1/23 (b) | 140,000 | 145,298 | |
| 5% 10/1/24 (b) | 115,000 | 119,302 | |
| Series 2012 A: | |||
| 5% 10/1/22 (b) | 140,000 | 151,116 | |
| 5% 10/1/23 (b) | 500,000 | 541,250 | |
| Series 2014 A: | |||
| 5% 10/1/21 (b) | 400,000 | 415,137 | |
| 5% 10/1/23 (b) | 110,000 | 123,860 | |
| Series 2017 A, 5% 10/1/26 (b) | 145,000 | 180,129 | |
| Series 2019 A: | |||
| 5% 10/1/21 (b) | 130,000 | 134,919 | |
| 5% 10/1/22 (b) | 290,000 | 313,026 | |
| 5% 10/1/23 (b) | 50,000 | 56,300 | |
| 5% 10/1/25 (b) | 155,000 | 187,370 | |
| Series 2020 A: | |||
| 5% 10/1/21 (b) | 1,200,000 | 1,245,411 | |
| 5% 10/1/22 (b) | 1,750,000 | 1,888,950 | |
| 5% 10/1/23 (b) | 925,000 | 1,041,550 | |
| 5% 10/1/24 (b) | 2,575,000 | 3,008,810 | |
| 5% 10/1/25 (b) | 530,000 | 640,685 | |
| Washington D.C. Metropolitan Transit Auth. Rev. Series 2017 A1, 5% 7/1/24 | 870,000 | 1,011,523 | |
| TOTAL DISTRICT OF COLUMBIA | 26,043,868 | ||
| Florida - 1.6% | |||
| Alachua County Health Facilities Auth. Health Facilities Rev. Series 2019 B1, 5% 12/1/20 | 550,000 | 550,000 | |
| Brevard County School Board Ctfs. of Prtn.: | |||
| Series 2014, 5% 7/1/21 | 20,000 | 20,552 | |
| Series 2015 C: | |||
| 5% 7/1/21 | 15,000 | 15,414 | |
| 5% 7/1/22 | 80,000 | 85,990 | |
| 5% 7/1/23 | 65,000 | 72,500 | |
| Broward County Arpt. Sys. Rev.: | |||
| Series 2012 P1, 5% 10/1/25 (b) | 1,000,000 | 1,075,820 | |
| Series 2012 P2, 5% 10/1/22 | 230,000 | 248,262 | |
| Series 2012 Q, 5% 10/1/21 (b) | 320,000 | 331,891 | |
| Series 2012 Q2, 5% 10/1/30 (Pre-Refunded to 10/1/22 @ 100) (b) | 200,000 | 217,030 | |
| Series 2015 C, 5% 10/1/24 (b) | 145,000 | 168,587 | |
| Series 2019 A, 5% 10/1/21 (b) | 2,185,000 | 2,266,192 | |
| Series 2019 B: | |||
| 5% 10/1/21 (b) | 1,665,000 | 1,726,869 | |
| 5% 10/1/23 (b) | 700,000 | 785,666 | |
| Series A: | |||
| 5% 10/1/22 (b) | 65,000 | 69,975 | |
| 5% 10/1/23 (b) | 90,000 | 101,014 | |
| Broward County Fin. Auth. Multi-family Hsg. Rev. Bonds Series 2019 B, 1.2%, tender 8/1/21 (a) | 4,000,000 | 4,024,121 | |
| Broward County Port Facilities Rev.: | |||
| Series 2011 B: | |||
| 4.625% 9/1/27 (Pre-Refunded to 9/1/21 @ 100) (b) | 475,000 | 489,958 | |
| 5% 9/1/21 (b) | 215,000 | 221,514 | |
| 5% 9/1/21 (Escrowed to Maturity) (b) | 240,000 | 248,227 | |
| Series 2019 D, 5% 9/1/22 (b) | 850,000 | 909,959 | |
| Broward County School Board Ctfs. of Prtn.: | |||
| (Broward County School District Proj.) Series 2017 C, 5% 7/1/22 | 70,000 | 75,242 | |
| Series 2015 A: | |||
| 5% 7/1/21 | 100,000 | 102,760 | |
| 5% 7/1/22 | 345,000 | 370,834 | |
| 5% 7/1/23 | 60,000 | 67,022 | |
| 5% 7/1/24 | 30,000 | 34,845 | |
| Series 2015 B: | |||
| 5% 7/1/22 | 100,000 | 107,488 | |
| 5% 7/1/23 | 60,000 | 67,022 | |
| 5% 7/1/24 | 25,000 | 29,038 | |
| Central Florida Expressway Auth. Sr. Lien Rev.: | |||
| Series 2019 A, 5% 7/1/21 | 625,000 | 641,393 | |
| Series 2019 B, 5% 7/1/21 | 1,000,000 | 1,026,229 | |
| Citizens Property Ins. Corp. Series 2012 A1: | |||
| 5% 6/1/21 | 2,915,000 | 2,983,020 | |
| 5% 6/1/22 | 1,145,000 | 1,225,150 | |
| Escambia County Poll. Cont. Rev. (Gulf Pwr. Co. Proj.) Series 2003, 2.6% 6/1/23 | 2,500,000 | 2,633,175 | |
| Florida Dev. Fin. Corp. Edl. Facilities (Nova Southeastern Univ. Proj.) Series 2020 A: | |||
| 5% 4/1/23 | 350,000 | 382,438 | |
| 5% 4/1/24 | 360,000 | 407,221 | |
| 5% 4/1/25 | 200,000 | 233,572 | |
| Florida Governmental Util. Auth. Rev. Series 2019, 4% 10/1/21 | 400,000 | 412,164 | |
| Florida Higher Edl. Facilities Fing. Auth. Series 2019, 5% 10/1/21 | 450,000 | 458,951 | |
| Florida Hsg. Fin. Corp. Multi-family Mtg. Rev. Series 2019 A, 2% 8/1/21 | 2,500,000 | 2,529,335 | |
| Florida Hsg. Fin. Corp. Rev. Series 2017: | |||
| 1.95% 1/1/21 | 300,000 | 300,347 | |
| 2% 7/1/21 | 260,000 | 262,167 | |
| 2.05% 1/1/22 | 205,000 | 208,284 | |
| Florida Mid-Bay Bridge Auth. Rev. Series 2015 A: | |||
| 5% 10/1/21 | 20,000 | 20,682 | |
| 5% 10/1/22 | 45,000 | 48,359 | |
| 5% 10/1/23 | 55,000 | 60,862 | |
| 5% 10/1/24 | 45,000 | 51,438 | |
| 5% 10/1/25 | 40,000 | 47,079 | |
| 5% 10/1/26 | 45,000 | 52,688 | |
| Florida Muni. Pwr. Agcy. Rev. Series 2016 A, 5% 10/1/22 | 250,000 | 271,098 | |
| Greater Orlando Aviation Auth. Arpt. Facilities Rev.: | |||
| Series 2011 B, 4% 10/1/22 (b) | 500,000 | 513,595 | |
| Series 2015 A, 4% 10/1/22 (b) | 430,000 | 455,194 | |
| Series 2016, 5% 10/1/24 (b) | 285,000 | 331,598 | |
| Series 2017 A: | |||
| 5% 10/1/25 (b) | 65,000 | 78,162 | |
| 5% 10/1/26 (b) | 45,000 | 55,296 | |
| Series 2019 A: | |||
| 5% 10/1/22 (b) | 2,415,000 | 2,600,303 | |
| 5% 10/1/23 (b) | 700,000 | 785,876 | |
| Halifax Hosp. Med. Ctr. Rev. Series 2015, 5% 6/1/23 | 30,000 | 32,966 | |
| Hillsborough County Aviation Auth. Rev. Series A: | |||
| 5% 10/1/21 (b) | 990,000 | 1,025,942 | |
| 5% 10/1/25 (b) | 520,000 | 580,523 | |
| Hillsborough County School District Sales Tax Rev. Series 2015 B, 5% 10/1/22 (FSA Insured) | 45,000 | 48,815 | |
| Indian River County School Board Ctfs. of Prtn. Series 2014: | |||
| 5% 7/1/22 | 55,000 | 59,028 | |
| 5% 7/1/23 | 175,000 | 193,904 | |
| Jacksonville Elec. Auth. Elec. Sys. Rev.: | |||
| Series 2013 A, 5% 10/1/21 | 500,000 | 518,579 | |
| Series 2013 B, 5% 10/1/21 | 820,000 | 850,470 | |
| Series 2013 C, 5% 10/1/22 (Escrowed to Maturity) | 535,000 | 581,385 | |
| Series 2014 A, 5% 10/1/21 | 1,380,000 | 1,431,279 | |
| Lee Memorial Health Sys. Hosp. Rev. Series 2019 A1, 5% 4/1/21 | 400,000 | 405,989 | |
| Manatee County Rev. Series 2013, 5% 10/1/22 | 20,000 | 21,765 | |
| Manatee County School District Series 2017: | |||
| 5% 10/1/21 (FSA Insured) | 255,000 | 265,239 | |
| 5% 10/1/24 (FSA Insured) | 30,000 | 34,695 | |
| Miami Dade County Hsg. Multifamily Hsg. Rev. Bonds Series 2020, 1.4%, tender 4/1/22 (a) | 4,000,000 | 4,030,000 | |
| Miami-Dade County Aviation Rev.: | |||
| Series 2012 A: | |||
| 5% 10/1/21 (b) | 335,000 | 346,877 | |
| 5% 10/1/22 (b) | 250,000 | 269,183 | |
| 5% 10/1/24 (b) | 200,000 | 215,544 | |
| Series 2014, 5% 10/1/22 (b) | 235,000 | 253,032 | |
| Series 2015 A, 5% 10/1/21 (b) | 255,000 | 264,041 | |
| Miami-Dade County Expressway Auth.: | |||
| (Waste Mgmt., Inc. of Florida Proj.) Series 2013 A: | |||
| 5% 7/1/21 | 345,000 | 353,599 | |
| 5% 7/1/22 | 45,000 | 48,036 | |
| 5% 7/1/23 | 45,000 | 48,032 | |
| Series 2014 A, 5% 7/1/21 | 250,000 | 256,231 | |
| Series 2014 B: | |||
| 5% 7/1/22 | 35,000 | 37,361 | |
| 5% 7/1/23 | 70,000 | 77,714 | |
| Miami-Dade County Health Facilities Auth. Hosp. Rev. Series 2010, 5.25% 8/1/21 | 45,000 | 45,166 | |
| Miami-Dade County Indl. Dev. Auth. Solid Waste Disp. Rev. Bonds: | |||
| (Waste Mgmt. of Florida Proj.) Series 2018, 2.85%, tender 8/2/21 (a)(b) | 3,960,000 | 4,017,040 | |
| Series 2011, 0.55%, tender 11/1/41 (a)(b) | 2,900,000 | 2,901,583 | |
| Miami-Dade County School Board Ctfs. of Prtn.: | |||
| Series 2014 D: | |||
| 5% 11/1/21 | 135,000 | 140,862 | |
| 5% 11/1/22 | 65,000 | 70,721 | |
| 5% 11/1/23 | 200,000 | 226,608 | |
| Series 2015 A: | |||
| 5% 5/1/21 | 415,000 | 423,166 | |
| 5% 5/1/22 | 605,000 | 645,535 | |
| 5% 5/1/23 | 1,040,000 | 1,155,066 | |
| Series 2015 D, 5% 2/1/22 | 410,000 | 432,669 | |
| North Broward Hosp. District Rev. Series 2017 B, 5% 1/1/21 | 380,000 | 381,239 | |
| Orange County Health Facilities Auth. Series B: | |||
| 5% 10/1/21 | 1,330,000 | 1,378,853 | |
| 5% 10/1/22 | 1,295,000 | 1,399,312 | |
| Orlando & Orange County Expressway Auth. Rev. Series 2012, 5% 7/1/22 | 305,000 | 327,939 | |
| Palm Beach County Health Facilities Auth. Hosp. Rev.: | |||
| Series 2014: | |||
| 5% 12/1/20 (Escrowed to Maturity) | 30,000 | 30,000 | |
| 5% 12/1/21 (Escrowed to Maturity) | 35,000 | 36,640 | |
| 5% 12/1/23 (Escrowed to Maturity) | 5,000 | 5,694 | |
| 5% 12/1/24 (Escrowed to Maturity) | 10,000 | 11,840 | |
| Series 2019, 5% 8/15/21 | 425,000 | 438,213 | |
| Palm Beach County School Board Ctfs. of Prtn.: | |||
| (Palm Beach County School District Proj.): | |||
| Series 2018 A, 5% 8/1/21 | 2,000,000 | 2,063,107 | |
| Series 2018 B, 5% 8/1/21 | 1,100,000 | 1,134,709 | |
| Series 2014 B: | |||
| 4% 8/1/21 | 90,000 | 92,243 | |
| 5% 8/1/21 | 115,000 | 118,629 | |
| 5% 8/1/22 | 40,000 | 43,153 | |
| Pasco County School Board Ctfs. of Prtn. Bonds Series 2020 B, 0.86%, tender 8/2/23 (a) | 5,000,000 | 5,002,350 | |
| Pasco County School District Sales Tax Rev. Series 2013: | |||
| 5% 10/1/21 | 120,000 | 124,203 | |
| 5% 10/1/22 | 20,000 | 21,554 | |
| Pinellas County Hsg. Fin. Auth. Bonds (Lutheran Apts. Proj.) Series 2019 B, 1.25%, tender 8/1/21 (a) | 1,625,000 | 1,634,579 | |
| Seminole County School Board Ctfs. of Prtn. Series 2016 C: | |||
| 5% 7/1/25 | 20,000 | 24,150 | |
| 5% 7/1/26 | 25,000 | 31,204 | |
| Tallahassee Health Facilities Rev. (Tallahassee Memorial Healthcare, Inc. Proj.) Series 2016 A, 5% 12/1/21 | 65,000 | 67,402 | |
| Tampa Bay Wtr. Reg'l. Wtr. Supply Auth. Util. Sys. Rev. Series 2005, 5.5% 10/1/22 (FGIC Insured) | 30,000 | 32,892 | |
| Tampa Hosp. Rev. (H. Lee Moffitt Cancer Ctr. Proj.) Series 2020 B: | |||
| 5% 7/1/23 | 90,000 | 99,551 | |
| 5% 7/1/24 | 75,000 | 85,959 | |
| 5% 7/1/25 | 100,000 | 118,300 | |
| 5% 7/1/26 | 175,000 | 212,508 | |
| 5% 7/1/27 | 150,000 | 185,933 | |
| Volusia County Edl. Facilities Auth. Rev. (Embry-Riddle Aeronautical Univ., Inc. Proj.) Series 2020 A: | |||
| 4% 10/15/21 | 390,000 | 400,996 | |
| 4% 10/15/22 | 300,000 | 318,063 | |
| 5% 10/15/23 | 590,000 | 660,658 | |
| 5% 10/15/24 | 1,000,000 | 1,160,550 | |
| 5% 10/15/25 | 1,000,000 | 1,198,750 | |
| 5% 10/15/26 | 750,000 | 922,973 | |
| 5% 10/15/27 | 165,000 | 207,507 | |
| TOTAL FLORIDA | 75,839,766 | ||
| Georgia - 2.3% | |||
| Atlanta Arpt. Rev.: | |||
| Series 2011 B, 5% 1/1/26 (b) | 400,000 | 401,516 | |
| Series 2014 B, 5% 1/1/22 | 20,000 | 21,020 | |
| Series 2019 B, 5% 7/1/22 (b) | 845,000 | 905,620 | |
| Atlanta Urban Residential Fin. Auth. Bonds: | |||
| (Creekside at Adamsville Place Proj.) Series 2019, 1.95%, tender 5/1/21 (a) | 7,000,000 | 7,045,980 | |
| (Herndon Square Sr. Apts. Proj.) Series 2019, 1.36%, tender 12/1/21 (a) | 3,195,000 | 3,229,978 | |
| Atlanta Urban Residential Fin. Auth. Multi-family Hsg. Rev. Bonds (Parkside Proj.) Series 2019 B, 1.38%, tender 1/1/22 (a) | 4,685,000 | 4,731,382 | |
| Bartow County Dev. Auth. Poll. Cont. Rev. Bonds (Georgia Pwr. Co. Plant Bowen Proj.): | |||
| Series 2009 1st, 2.75%, tender 3/15/23 (a) | 1,500,000 | 1,566,570 | |
| Series 2013, 1.55%, tender 8/19/22 (a) | 2,370,000 | 2,404,247 | |
| Brookhaven Dev. Auth. Rev. Series 2019 A, 5% 7/1/22 | 1,000,000 | 1,074,550 | |
| Burke County Indl. Dev. Auth. Poll. Cont. Rev. Bonds: | |||
| (Georgia Pwr. Co. Plant Vogtle Proj.): | |||
| Series 1994, 2.25%, tender 5/25/23 (a) | 1,700,000 | 1,760,775 | |
| Series 1995 5, 2.05%, tender 11/19/21 (a) | 375,000 | 380,400 | |
| Series 2008, 1.65%, tender 6/18/21 (a) | 940,000 | 945,613 | |
| Series 2012 1st, 1.55%, tender 8/22/22 (a) | 2,000,000 | 2,028,900 | |
| Series 2013 1st, 2.925%, tender 3/12/24 (a) | 990,000 | 1,056,380 | |
| (Oglethorpe Pwr. Corp. Vogtle Proj.) Series 2017 E, 3.25%, tender 2/3/25 (a) | 100,000 | 108,551 | |
| Series 1996, 2.35%, tender 12/11/20 (a) | 1,840,000 | 1,840,834 | |
| Cobb County Kennestone Hosp. Auth. Rev.: | |||
| (Wellstar Health Sys., Inc. Proj.) Series 2017 A, 5% 4/1/21 | 100,000 | 101,494 | |
| (WellStar Health Sys., Inc. Proj.): | |||
| Series 2020 A: | |||
| 5% 4/1/22 | 150,000 | 159,002 | |
| 5% 4/1/23 | 150,000 | 165,479 | |
| Series 2020 B, 5% 4/1/22 (d) | 1,120,000 | 1,179,136 | |
| DeKalb County Hsg. Auth. Multi-family Hsg. Rev. Bonds Series 2019 A, 2%, tender 2/1/21 (a) | 9,000,000 | 9,024,140 | |
| Fayette County Hosp. Auth. Rev. Bonds (Piedmont Healthcare, Inc. Proj.) Series 2019 A, 5%, tender 7/1/24 (a) | 750,000 | 850,200 | |
| Fulton County Dev. Auth. Hosp. R (Wellstar Health Sys., Inc. Proj.) Series 2017 A, 5% 4/1/21 | 85,000 | 86,270 | |
| Fulton County Dev. Auth. Rev. Series 2019 C: | |||
| 5% 7/1/21 | 1,000,000 | 1,027,478 | |
| 5% 7/1/22 | 1,000,000 | 1,074,550 | |
| 5% 7/1/23 | 1,300,000 | 1,452,854 | |
| Georgia Muni. Elec. Auth. Pwr. Rev.: | |||
| Series 2008 A, 5.25% 1/1/21 | 140,000 | 140,563 | |
| Series 2011 A, 5% 1/1/21 | 5,775,000 | 5,797,069 | |
| Series 2011 B, 5% 1/1/21 | 750,000 | 752,866 | |
| Series 2012 A, 5% 11/1/21 | 435,000 | 453,685 | |
| Series 2015 A, 5% 1/1/21 | 255,000 | 255,974 | |
| Series 2016 A: | |||
| 4% 1/1/21 | 280,000 | 280,845 | |
| 5% 1/1/22 | 350,000 | 367,535 | |
| 5% 1/1/23 | 280,000 | 306,401 | |
| Series 2019 A: | |||
| 5% 1/1/21 | 600,000 | 602,293 | |
| 5% 1/1/22 | 1,495,000 | 1,569,900 | |
| Series 2020 A: | |||
| 3% 11/1/21 (d) | 1,300,000 | 1,330,860 | |
| 3% 11/1/22 (d) | 1,045,000 | 1,096,581 | |
| 4% 11/1/23 (d) | 2,780,000 | 3,065,840 | |
| 4% 11/1/24 (d) | 200,000 | 227,098 | |
| 4% 11/1/25 (d) | 800,000 | 931,896 | |
| 5% 1/1/22 | 1,905,000 | 2,000,441 | |
| 5% 1/1/23 | 5,625,000 | 6,155,381 | |
| 5% 1/1/24 | 2,105,000 | 2,391,070 | |
| 5% 1/1/24 | 1,250,000 | 1,419,875 | |
| 5% 11/1/26 (d) | 805,000 | 1,002,644 | |
| Series C, 5% 1/1/22 | 1,200,000 | 1,260,120 | |
| Series GG, 5% 1/1/21 | 255,000 | 255,974 | |
| Georgia Muni. Gas Auth. Rev. (Gas Portfolio III Proj.): | |||
| Series 2014 U: | |||
| 5% 10/1/22 | 20,000 | 21,722 | |
| 5% 10/1/23 | 55,000 | 62,046 | |
| Series R, 5% 10/1/21 | 110,000 | 114,313 | |
| Griffin-Spalding County Hosp. (Wellstar Health Sys., Inc. Proj.) Series 2017 A, 3% 4/1/21 | 35,000 | 35,292 | |
| Lagrange-Troup County Hosp. Rev. (Wellstar Health Sys., Inc. Proj.) Series 2017 A, 5% 4/1/21 | 85,000 | 86,270 | |
| Main Street Natural Gas, Inc.: | |||
| Bonds: | |||
| Series 2018 A, 4%, tender 9/1/23 (a) | 1,000,000 | 1,090,990 | |
| Series 2018 C, 4%, tender 12/1/23 (a) | 400,000 | 439,352 | |
| Series 2018 E, SIFMA Municipal Swap Index + 0.570% 0.68%, tender 12/1/23 (a)(c) | 12,500,000 | 12,530,000 | |
| Seroes 2018 B, 1 month U.S. LIBOR + 0.750% 0.849%, tender 9/1/23 (a)(c) | 11,500,000 | 11,517,365 | |
| Series 2019 A, 5% 5/15/22 | 1,000,000 | 1,062,430 | |
| Series 2019 C, 5% 9/1/21 | 285,000 | 294,333 | |
| Monroe County Dev. Auth. Poll. Cont. Rev.: | |||
| (Georgia Pwr. Co. Plant Scherer Proj.) Series 1995, 2.25% 7/1/25 | 435,000 | 448,276 | |
| Bonds: | |||
| (Georgia Pwr. Co. Plant Scherer Proj.): | |||
| Series 2009 1, 2.05%, tender 11/19/21 (a) | 705,000 | 715,152 | |
| Series 2009, 2.35%, tender 12/11/20 (a) | 2,275,000 | 2,276,049 | |
| (Oglethorpe Pwr. Corp. Scherer Proj.) Series 2013 A, 1.5%, tender 2/3/25 (a) | 1,500,000 | 1,521,690 | |
| Private Colleges & Univs. Auth. Rev. (The Savannah College of Arts and Design Projs.) Series 2014, 5% 4/1/21 | 75,000 | 76,022 | |
| TOTAL GEORGIA | 108,579,132 | ||
| Hawaii - 0.2% | |||
| Hawaii Dept. of Budget & Fin. Spl. Purp. Rev. (Queens Health Sys. Proj.) Series 2015 B, SIFMA Municipal Swap Index + 0.140% 0.56%, tender 7/1/39 (a)(c) | 545,000 | 545,000 | |
| Hawaii Gen. Oblig.: | |||
| Series 2020 A: | |||
| 5% 7/1/24 (b)(d) | 250,000 | 287,965 | |
| 5% 7/1/25 (b)(d) | 350,000 | 416,479 | |
| Series GA, 5% 10/1/21 | 5,000,000 | 5,199,055 | |
| State of Hawaii Dept. of Trans. Series 2013: | |||
| 5% 8/1/21 (b) | 10,000 | 10,260 | |
| 5% 8/1/21 (FSA Insured) (b) | 300,000 | 308,099 | |
| 5% 8/1/22 (b) | 45,000 | 47,870 | |
| 5% 8/1/23 (b) | 30,000 | 33,108 | |
| TOTAL HAWAII | 6,847,836 | ||
| Idaho - 0.0% | |||
| Idaho Health Facilities Auth. Rev.: | |||
| Series 2015 D, 5% 12/1/20 | 500,000 | 500,000 | |
| Series 2015 ID, 5% 12/1/21 | 250,000 | 261,408 | |
| Idaho Hsg. & Fin. Assoc. Single Family Mtg.: | |||
| (Idaho St Garvee Proj.) Series 2017 A, 5% 7/15/21 | 230,000 | 236,334 | |
| Series 2019 A, 4% 1/1/50 | 55,000 | 61,191 | |
| TOTAL IDAHO | 1,058,933 | ||
| Illinois - 3.3% | |||
| Champaign County Cmnty. Unit Series 2017, 5% 1/1/21 | 355,000 | 356,333 | |
| Chicago Board of Ed.: | |||
| Series 1999, 0% 12/1/22 (Berkshire Hathaway Assurance Corp. Insured) (FGIC Insured) | 560,000 | 546,890 | |
| Series 2019 A, 5% 12/1/23 | 1,000,000 | 1,072,790 | |
| Chicago Gen. Oblig.: | |||
| Series 2015 C, 5% 1/1/21 (Escrowed to Maturity) | 435,000 | 436,677 | |
| Series 2020 A: | |||
| 3% 1/1/21 | 500,000 | 500,123 | |
| 5% 1/1/21 | 400,000 | 400,734 | |
| 5% 1/1/25 | 1,500,000 | 1,613,625 | |
| Chicago Midway Arpt. Rev.: | |||
| Series 2013 B: | |||
| 5% 1/1/21 | 250,000 | 250,929 | |
| 5% 1/1/22 | 610,000 | 640,360 | |
| 5% 1/1/23 | 190,000 | 206,712 | |
| Series 2014 A: | |||
| 5% 1/1/22 (b) | 2,865,000 | 2,999,598 | |
| 5% 1/1/24 (b) | 1,000,000 | 1,120,220 | |
| Series 2014 B: | |||
| 5% 1/1/21 | 10,000 | 10,037 | |
| 5% 1/1/23 | 225,000 | 244,791 | |
| Series 2016 A, 5% 1/1/24 (b) | 1,000,000 | 1,120,220 | |
| Chicago Motor Fuel Tax Rev. Series 2013: | |||
| 5% 1/1/21 | 10,000 | 10,007 | |
| 5% 1/1/22 | 5,000 | 5,050 | |
| 5% 1/1/23 | 10,000 | 10,379 | |
| Chicago O'Hare Int'l. Arpt. Rev.: | |||
| Series 2012 A: | |||
| 5% 1/1/21 | 30,000 | 30,113 | |
| 5% 1/1/23 (Pre-Refunded to 1/1/22 @ 100) (b) | 1,000,000 | 1,049,880 | |
| 5% 1/1/25 (Pre-Refunded to 1/1/22 @ 100) (b) | 500,000 | 524,940 | |
| Series 2012 B: | |||
| 5% 1/1/21 (b) | 100,000 | 100,363 | |
| 5% 1/1/22 (b) | 1,875,000 | 1,964,138 | |
| 5% 1/1/22 (Escrowed to Maturity) (b) | 1,000,000 | 1,049,880 | |
| Series 2013 A: | |||
| 5% 1/1/21 (b) | 2,435,000 | 2,443,843 | |
| 5% 1/1/22 (Escrowed to Maturity) (b) | 1,400,000 | 1,469,832 | |
| 5% 1/1/23 (b) | 1,440,000 | 1,567,613 | |
| Series 2013 B: | |||
| 5% 1/1/21 | 725,000 | 727,723 | |
| 5% 1/1/22 (Escrowed to Maturity) | 135,000 | 141,931 | |
| Series 2013 C, 5% 1/1/22 (Escrowed to Maturity) (b) | 700,000 | 734,916 | |
| Series 2013 D, 5% 1/1/22 (Escrowed to Maturity) | 70,000 | 73,594 | |
| Series 2015 B, 5% 1/1/21 | 1,190,000 | 1,194,469 | |
| Series 2015 D, 5% 1/1/21 | 250,000 | 250,939 | |
| Series 2017 C, 5% 1/1/22 | 110,000 | 115,536 | |
| Series 2017 D, 5% 1/1/27 (b) | 35,000 | 42,903 | |
| Series 2018 A, 5% 1/1/21 (b) | 250,000 | 250,908 | |
| Chicago Park District Gen. Oblig.: | |||
| Series 2010 C, 5% 1/1/24 | 280,000 | 280,986 | |
| Series 2015 B, 5% 1/1/21 | 770,000 | 772,244 | |
| Chicago Transit Auth. Cap. Grant Receipts Rev. Series 2017: | |||
| 5% 6/1/21 | 635,000 | 648,336 | |
| 5% 6/1/25 | 25,000 | 29,556 | |
| Chicago Wastewtr. Transmission Rev. Series 2012, 5% 1/1/23 | 25,000 | 26,163 | |
| Cook County Cmnty. Consolidated School District No. 59 Series 2020, 4% 3/1/22 | 480,000 | 502,027 | |
| Cook County Gen. Oblig.: | |||
| Series 2010 A, 5.25% 11/15/22 | 545,000 | 546,891 | |
| Series 2011 A, 5.25% 11/15/22 | 20,000 | 20,820 | |
| Series 2012 C: | |||
| 5% 11/15/21 | 120,000 | 124,645 | |
| 5% 11/15/22 | 590,000 | 636,480 | |
| Series 2014 A: | |||
| 5% 11/15/21 | 35,000 | 36,355 | |
| 5% 11/15/22 | 275,000 | 296,665 | |
| Series 2016 A, 5% 11/15/21 | 2,250,000 | 2,337,092 | |
| DeKalb County Cmnty. Unit Scd Series 2001, 0% 1/1/21 (AMBAC Insured) | 1,175,000 | 1,174,253 | |
| Illinois Dev. Fin. Auth. Solid Waste Disp. Rev. Bonds (Waste Mgmt., Inc. Proj.) Series 2019, 0.55%, tender 11/1/21 (a)(b) | 6,000,000 | 6,003,276 | |
| Illinois Fin. Auth.: | |||
| Bonds Series 2020 B, 5%, tender 11/15/24 (a) | 1,450,000 | 1,659,801 | |
| Series 2013 A: | |||
| 5% 6/1/23 | 540,000 | 597,920 | |
| 5% 6/1/23 (Escrowed to Maturity) | 55,000 | 61,324 | |
| Series 2020 A: | |||
| 5% 8/15/21 | 1,000,000 | 1,030,730 | |
| 5% 8/15/22 | 750,000 | 804,218 | |
| Illinois Fin. Auth. Rev.: | |||
| (Bradley Univ. Proj.) Series 2017 C, 5% 8/1/26 | 35,000 | 40,339 | |
| (Edward-Elmhurst Healthcare) Series 2017 A, 5% 1/1/25 | 100,000 | 116,600 | |
| Bonds: | |||
| (Ascension Health Cr. Group Proj.) Series 2012 E2, 1.75%, tender 4/1/21 (a) | 3,030,000 | 3,044,399 | |
| Series 2016 B, 1 month U.S. LIBOR + 1.350% 1.453%, tender 12/1/20 (a)(c) | 1,090,000 | 1,090,151 | |
| Series 2017 B, 5%, tender 12/15/22 (a) | 265,000 | 289,200 | |
| Series E, 2.25%, tender 4/29/22 (a) | 770,000 | 790,867 | |
| Series 2011 IL: | |||
| 4% 12/1/20 | 350,000 | 350,000 | |
| 5% 12/1/22 (Pre-Refunded to 12/1/21 @ 100) | 25,000 | 26,185 | |
| Series 2012 A: | |||
| 5% 5/15/22 | 250,000 | 264,873 | |
| 5% 5/15/23 (Pre-Refunded to 5/15/22 @ 100) | 30,000 | 32,070 | |
| Series 2012: | |||
| 5% 9/1/21 | 45,000 | 46,588 | |
| 5% 9/1/22 | 75,000 | 80,987 | |
| Series 2014 A, 5.25% 7/1/44 (Pre-Refunded to 7/1/23 @ 100) | 3,000,000 | 3,379,770 | |
| Series 2014, 5% 8/1/22 | 1,000,000 | 1,075,860 | |
| Series 2015 A: | |||
| 5% 11/15/22 | 10,000 | 10,857 | |
| 5% 11/15/22 | 1,000,000 | 1,078,570 | |
| 5% 11/15/24 | 35,000 | 40,486 | |
| 5% 11/15/25 | 45,000 | 53,751 | |
| 5% 11/15/26 | 45,000 | 53,580 | |
| Series 2015 B, 5% 11/15/24 | 45,000 | 52,530 | |
| Series 2016 A: | |||
| 5% 2/15/21 | 15,000 | 15,128 | |
| 5% 8/15/21 (Escrowed to Maturity) | 15,000 | 15,504 | |
| 5% 2/15/23 | 20,000 | 21,819 | |
| 5% 8/15/23 (Escrowed to Maturity) | 35,000 | 39,344 | |
| 5% 8/15/24 (Escrowed to Maturity) | 50,000 | 58,445 | |
| 5% 7/1/25 | 250,000 | 296,368 | |
| Series 2016 C: | |||
| 5% 2/15/21 | 215,000 | 216,908 | |
| 5% 2/15/22 | 225,000 | 236,817 | |
| 5% 2/15/23 | 700,000 | 769,321 | |
| 5% 2/15/24 | 115,000 | 131,438 | |
| Series 2016: | |||
| 5% 5/15/21 | 740,000 | 754,152 | |
| 5% 12/1/21 | 5,000,000 | 5,210,213 | |
| 5% 7/1/22 | 65,000 | 69,900 | |
| 5% 5/15/25 | 10,000 | 11,757 | |
| 5% 5/15/26 | 20,000 | 24,185 | |
| 5% 5/15/27 | 25,000 | 30,032 | |
| Series 2017 A, 5% 7/15/21 | 600,000 | 616,827 | |
| Series 2017: | |||
| 5% 1/1/23 | 35,000 | 38,431 | |
| 5% 1/1/25 | 50,000 | 59,475 | |
| Series 2019: | |||
| 5% 9/1/22 | 225,000 | 235,141 | |
| 5% 4/1/26 | 1,000,000 | 1,220,590 | |
| Illinois Gen. Oblig.: | |||
| Series 2006, 5% 6/1/21 | 405,000 | 412,077 | |
| Series 2010: | |||
| 5% 1/1/21 (FSA Insured) | 35,000 | 35,115 | |
| 5% 1/1/23 (FSA Insured) | 250,000 | 254,118 | |
| Series 2012 A, 4% 1/1/23 | 30,000 | 30,593 | |
| Series 2012: | |||
| 5% 8/1/21 | 55,000 | 56,258 | |
| 5% 8/1/22 | 1,760,000 | 1,844,005 | |
| 5% 8/1/22 (FSA Insured) | 2,800,000 | 2,972,312 | |
| Series 2013: | |||
| 5% 7/1/21 | 3,070,000 | 3,132,021 | |
| 5% 7/1/22 | 375,000 | 392,333 | |
| Series 2014: | |||
| 5% 2/1/21 | 865,000 | 870,145 | |
| 5% 2/1/22 | 65,000 | 67,434 | |
| 5% 4/1/23 | 50,000 | 53,035 | |
| 5% 2/1/25 | 50,000 | 53,346 | |
| Series 2016: | |||
| 5% 1/1/21 | 3,325,000 | 3,334,827 | |
| 5% 2/1/21 | 4,000,000 | 4,023,794 | |
| 5% 11/1/21 | 1,505,000 | 1,551,079 | |
| 5% 1/1/22 | 1,650,000 | 1,708,328 | |
| 5% 1/1/26 | 300,000 | 329,547 | |
| 5% 2/1/26 | 1,235,000 | 1,357,858 | |
| Series 2017 A: | |||
| 5% 12/1/22 | 5,000,000 | 5,269,050 | |
| 5% 12/1/23 | 750,000 | 803,490 | |
| Series 2017 D: | |||
| 5% 11/1/21 | 2,180,000 | 2,223,718 | |
| 5% 11/1/23 | 420,000 | 443,327 | |
| Series 2018 A: | |||
| 5% 5/1/21 | 1,650,000 | 1,674,195 | |
| 5% 10/1/21 | 1,500,000 | 1,542,131 | |
| 5% 10/1/26 | 1,340,000 | 1,481,692 | |
| 5.25% 5/1/22 | 1,500,000 | 1,569,540 | |
| Series 2020 May, 5.125% 5/1/22 | 275,000 | 287,271 | |
| Series 2020, 4.875% 5/1/21 | 1,350,000 | 1,369,102 | |
| Illinois Health Facilities Auth. Rev. Series 2003, 1.6% 11/15/22 | 125,000 | 126,760 | |
| Illinois Hsg. Dev. Auth. Multi-family Hsg. Rev. Bonds Series 2020, 0.325%, tender 8/1/22 (a) | 12,250,000 | 12,241,548 | |
| Illinois Muni. Elec. Agcy. Pwr. Supply Series 2015 A: | |||
| 5% 2/1/21 | 470,000 | 473,512 | |
| 5% 2/1/22 | 905,000 | 952,956 | |
| 5% 2/1/23 | 25,000 | 27,462 | |
| Illinois Reg'l. Trans. Auth.: | |||
| Series 2002 A, 6% 7/1/21 | 460,000 | 474,207 | |
| Series 2017 A, 5% 7/1/21 | 210,000 | 215,271 | |
| Illinois Sales Tax Rev. Series 2016 D, 5% 6/15/23 | 1,500,000 | 1,625,220 | |
| Illinois State Univ. Revs. Series 2018 A, 5% 4/1/23 (FSA Insured) | 290,000 | 317,654 | |
| Illinois Toll Hwy. Auth. Toll Hwy. Rev. Series 2014 A: | |||
| 5% 12/1/20 | 3,200,000 | 3,200,000 | |
| 5% 12/1/21 | 990,000 | 1,035,889 | |
| 5% 12/1/22 | 1,090,000 | 1,188,732 | |
| Kane County School District #129, Aurora West Side Series 2014 A, 2.75% 2/1/22 | 1,000,000 | 1,023,600 | |
| Kane County School District No. 131: | |||
| Series 2020 A: | |||
| 3% 12/1/21 (FSA Insured) | 355,000 | 363,602 | |
| 4% 12/1/22 (FSA Insured) | 235,000 | 250,402 | |
| 5% 12/1/23 (FSA Insured) | 290,000 | 326,972 | |
| Series 2020 B: | |||
| 3% 12/1/21 (FSA Insured) | 510,000 | 522,358 | |
| 4% 12/1/22 (FSA Insured) | 435,000 | 463,510 | |
| Kendall, Kane & Will Counties Cmnty. Unit School District #308 Series 2011, 5.5% 2/1/23 | 550,000 | 605,418 | |
| Lake County Cmnty. Consolidated School District Series 2020, 4% 2/1/22 (FSA Insured) | 310,000 | 322,093 | |
| McHenry County Cmnty. School District #200 Series 2006 B: | |||
| 0% 1/15/24 | 105,000 | 101,988 | |
| 0% 1/15/25 | 110,000 | 105,603 | |
| 0% 1/15/26 | 80,000 | 75,731 | |
| McHenry County Conservation District Gen. Oblig. Series 2014, 5% 2/1/23 | 50,000 | 54,992 | |
| Metropolitan Pier & Exposition: | |||
| (McCormick Place Expansion Proj.) Series 1996 A, 0% 6/15/23 (Nat'l. Pub. Fin. Guarantee Corp. Insured) | 105,000 | 100,479 | |
| Series 1994, 0% 6/15/21 (Escrowed to Maturity) | 470,000 | 468,944 | |
| Series 2012 B, 5% 12/15/22 | 1,655,000 | 1,758,404 | |
| Northern Illinois Univ. Revs. Series 2020 B, 5% 4/1/22 (Build America Mutual Assurance Insured) | 250,000 | 262,975 | |
| Railsplitter Tobacco Settlement Auth. Rev.: | |||
| Series 2010: | |||
| 5.25% 6/1/21 | 500,000 | 512,034 | |
| 5.375% 6/1/21 | 310,000 | 317,653 | |
| Series 2017: | |||
| 5% 6/1/22 | 2,320,000 | 2,475,718 | |
| 5% 6/1/23 | 1,900,000 | 2,109,304 | |
| Rockford Park District Series 2019 B, 3% 12/15/20 | 1,165,000 | 1,165,933 | |
| Skokie Pk District Series 2003, 0% 12/1/22 | 1,830,000 | 1,801,068 | |
| Univ. of Illinois Board of Trustees Ctfs. of Prtn. Series 2014 C, 5% 3/15/23 | 265,000 | 290,117 | |
| Univ. of Illinois Rev.: | |||
| Series 2005 A, 5.5% 4/1/21 (Nat'l. Pub. Fin. Guarantee Corp. Insured) | 700,000 | 710,924 | |
| Series 2011 A, 5% 4/1/21 | 250,000 | 253,490 | |
| Series 2011, 5% 4/1/22 | 350,000 | 354,886 | |
| Series 2018 A, 5% 4/1/22 | 1,000,000 | 1,056,010 | |
| Series 2019 A, 5% 4/1/22 | 485,000 | 512,165 | |
| Waukegan Gen. Oblig.: | |||
| Series 2018 A: | |||
| 3% 12/30/20 (FSA Insured) | 1,000,000 | 1,001,860 | |
| 4% 12/30/21 (FSA Insured) | 410,000 | 424,908 | |
| 4% 12/30/22 (FSA Insured) | 425,000 | 453,968 | |
| Series 2018 B, 4% 12/30/22 (FSA Insured) | 400,000 | 427,868 | |
| Western Illinois Univ. Board Rev. Series 2020, 4% 4/1/22 | 1,200,000 | 1,249,728 | |
| Whiteside & Lee Counties Cmnty. Unit School District Series 2018 A, 4% 12/1/21 | 1,325,000 | 1,371,614 | |
| Will County Cmnty. Consolidated School District Series 2013, 2.3% 1/1/21 | 2,950,000 | 2,954,721 | |
| TOTAL ILLINOIS | 152,130,228 | ||
| Indiana - 1.0% | |||
| Indiana Bond Bank Series 2020 A, 3% 1/11/21 | 5,000,000 | 5,012,777 | |
| Indiana Dev. Fin. Auth. Solid Waste Disp. Rev. Bonds (Waste Mgmt., Inc. Proj.) Series 2001, 2.95%, tender 10/1/21 (a)(b) | 500,000 | 509,382 | |
| Indiana Fin. Auth. Econ. Dev. Rev. Bonds (Republic Svcs., Inc. Proj.) Series B, 0.25%, tender 12/1/20 (a) | 1,400,000 | 1,400,000 | |
| Indiana Fin. Auth. Health Sys. Rev. Bonds Series 2019 B, 2.25%, tender 7/1/25 (a) | 710,000 | 757,336 | |
| Indiana Fin. Auth. Hosp. Rev.: | |||
| (Cmnty. Health Network Proj.) Series 2012 A, 5% 5/1/42 (Pre-Refunded to 5/1/23 @ 100) | 2,000,000 | 2,224,880 | |
| Bonds: | |||
| Series 2011 H, 1.65%, tender 7/1/22 (a) | 3,300,000 | 3,345,507 | |
| Series 2011 L: | |||
| SIFMA Municipal Swap Index + 0.280% 0.39%, tender 12/3/20 (a)(c) | 3,300,000 | 3,299,844 | |
| SIFMA Municipal Swap Index + 0.280% 0.39%, tender 12/3/20 (a)(c) | 3,500,000 | 3,499,838 | |
| Series 2015 B, 1.65%, tender 7/2/22 (a) | 1,190,000 | 1,206,410 | |
| Series 2013: | |||
| 5% 8/15/22 | 15,000 | 16,138 | |
| 5% 8/15/23 | 20,000 | 22,363 | |
| Series 2016 A, 5% 12/1/20 | 450,000 | 450,000 | |
| Indiana Fin. Auth. Rev.: | |||
| (Butler Univ. Proj.) Series 2019: | |||
| 3% 2/1/22 | 210,000 | 215,439 | |
| 3% 2/1/23 | 225,000 | 232,283 | |
| 4% 2/1/24 | 200,000 | 215,418 | |
| 4% 2/1/25 | 275,000 | 302,253 | |
| (DePauw Univ. Proj.) Series 2019: | |||
| 5% 7/1/21 | 565,000 | 578,847 | |
| 5% 7/1/22 | 600,000 | 639,792 | |
| Series 2012, 5% 3/1/21 (Escrowed to Maturity) | 25,000 | 25,299 | |
| Series 2016, 5% 9/1/26 | 205,000 | 252,019 | |
| Indiana Fin. Auth. Wastewtr. Util. Rev. (CWA Auth. Proj.): | |||
| Series 2012 A, 5% 10/1/22 | 35,000 | 38,014 | |
| Series 2014 A: | |||
| 5% 10/1/21 | 10,000 | 10,396 | |
| 5% 10/1/22 | 15,000 | 16,292 | |
| Series 2015 A: | |||
| 5% 10/1/24 | 35,000 | 41,173 | |
| 5% 10/1/25 | 35,000 | 41,310 | |
| Indiana Health Facility Fing. Auth. Rev. Bonds Series 2001 A2, 2%, tender 2/1/23 (a) | 155,000 | 160,358 | |
| Indiana Univ. Student Fee Revs. Series Z1, 3% 8/1/21 | 1,895,000 | 1,930,693 | |
| Indianapolis Local Pub. Impt.: | |||
| (Indianapolis Arpt. Auth. Proj.): | |||
| Series 2016 A1: | |||
| 5% 1/1/21 (b) | 960,000 | 963,106 | |
| 5% 1/1/23 (b) | 45,000 | 48,812 | |
| 5% 1/1/24 (b) | 60,000 | 67,388 | |
| 5% 1/1/25 (b) | 65,000 | 75,477 | |
| Series 2019 D, 5% 1/1/24 (b) | 150,000 | 168,471 | |
| Series 2019, 1.45% 6/1/21 | 3,000,000 | 3,000,076 | |
| Indianapolis Multifamily Hsg. Rev. Bonds Series A, 1.4%, tender 9/1/21 (a) | 4,000,000 | 4,031,008 | |
| Lafayette School Corp. Series 2019, 4% 1/15/21 | 425,000 | 426,798 | |
| Lake Central Multi-District School Bldg. Corp. Series 2012 B: | |||
| 4% 1/15/21 | 25,000 | 25,108 | |
| 5% 7/15/21 | 20,000 | 20,571 | |
| Purdue Univ. Rev. Series 2012 AA, 5% 7/1/27 | 255,000 | 273,396 | |
| Warrick County Envir. Impt. Rev. Bonds (Southern Indiana Gas and Elec. Co.) Series 2015, 0.875%, tender 9/1/23 (a)(b) | 2,800,000 | 2,801,260 | |
| Whiting Envir. Facilities Rev.: | |||
| (BP Products North America, Inc. Proj.) Series 2009, 5.25% 1/1/21 | 1,825,000 | 1,832,326 | |
| Bonds (BP Products North America, Inc. Proj.): | |||
| Series 2015, 5%, tender 11/1/22 (a)(b) | 1,780,000 | 1,930,232 | |
| Series 2016 A, 5%, tender 3/1/23 (a)(b) | 3,400,000 | 3,727,794 | |
| Series 2019 A, 5%, tender 6/5/26 (a)(b) | 1,645,000 | 1,993,839 | |
| TOTAL INDIANA | 47,829,723 | ||
| Iowa - 0.2% | |||
| Iowa Fin. Auth. Rev. Series 2018 B, 5% 2/15/22 | 540,000 | 568,696 | |
| Iowa Fin. Auth. Single Family Mtg. Bonds Series 2018 B, SIFMA Municipal Swap Index + 0.300% 0.41%, tender 12/3/20 (a)(c) | 3,500,000 | 3,500,042 | |
| Iowa Student Ln. Liquidity Corp. Student Ln. Rev.: | |||
| Series 2015 A, 5% 12/1/21 (b) | 1,000,000 | 1,034,312 | |
| Series 2018 A: | |||
| 5% 12/1/20 (b) | 500,000 | 500,000 | |
| 5% 12/1/21 (b) | 500,000 | 517,156 | |
| 5% 12/1/22 (b) | 725,000 | 772,821 | |
| Series 2019 B, 5% 12/1/23 (b) | 600,000 | 661,236 | |
| TOTAL IOWA | 7,554,263 | ||
| Kansas - 0.1% | |||
| Desoto Unified School District # 232 Series 2015 A, 5% 9/1/22 | 35,000 | 37,935 | |
| Kansas Dept. of Trans. Hwy. Rev. Series 2004 C1, 1 month U.S. LIBOR + 0.300% 0.403% 9/1/21 (a)(c) | 5,000,000 | 4,997,593 | |
| Univ. of Kansas Hosp. Auth. Health Facilities Rev. Series 2019 B, 5% 3/1/21 | 500,000 | 505,674 | |
| Wichita Health Care Facilities Series III, 4% 5/15/21 | 455,000 | 455,940 | |
| Wyandotte County/Kansas City Unified Govt. Util. Sys. Rev. Series 2016 A: | |||
| 5% 9/1/22 | 10,000 | 10,800 | |
| 5% 9/1/23 | 15,000 | 16,871 | |
| 5% 9/1/25 | 15,000 | 18,159 | |
| TOTAL KANSAS | 6,042,972 | ||
| Kentucky - 1.6% | |||
| Ashland Med. Ctr. Rev.: | |||
| (Ashland Hosp. Corp. D/B/A King's Daughters Med. Ctr. Proj.) Series 2016 A: | |||
| 5% 2/1/24 | 30,000 | 33,021 | |
| 5% 2/1/25 | 20,000 | 22,587 | |
| Series 2019: | |||
| 5% 2/1/21 | 385,000 | 387,168 | |
| 5% 2/1/22 | 500,000 | 519,515 | |
| Carroll County Envir. Facilities Rev. Bonds (Kentucky Utils. Co. Proj.) Series 2008 A, 1.2%, tender 6/1/21 (a)(b) | 1,025,000 | 1,027,387 | |
| Kenton County Arpt. Board Arpt. Rev. Series 2016, 5% 1/1/22 | 285,000 | 298,452 | |
| Kentucky Asset/Liability Commission Agcy. Fund Rev. Series A, 5% 9/1/22 (d) | 2,000,000 | 2,159,680 | |
| Kentucky Bond Dev. Corp. (Lexington Ctr. Corp. Proj.) Series 2018 A, 5% 9/1/21 (Escrowed to Maturity) | 435,000 | 450,514 | |
| Kentucky Econ. Dev. Fin. Auth. Bonds Series 2009 B, 2.7%, tender 11/10/21 (a) | 345,000 | 350,792 | |
| Kentucky Econ. Dev. Fin. Auth. Hosp. Rev. Series 2017 A, 5% 6/1/21 | 230,000 | 233,270 | |
| Kentucky Econ. Dev. Fin. Auth. Solid Waste Disp. Rev. Bonds (Republic Svcs., Inc. Proj.): | |||
| Series A, 0.28%, tender 12/1/20 (a)(b) | 2,420,000 | 2,420,000 | |
| Series B, 0.25%, tender 12/1/20 (a) | 1,600,000 | 1,600,000 | |
| Kentucky Higher Ed. Student Ln. Corp. Rev.: | |||
| Series 2019 A1 5% 6/1/23 (b) | 250,000 | 271,483 | |
| Series 2019 A1, 5% 6/1/22 (b) | 200,000 | 210,586 | |
| Kentucky Hsg. Corp. Hsg. Rev. Bonds (Westminster Village Proj.) Series 2019, 2%, tender 4/1/21 (a) | 2,000,000 | 2,010,888 | |
| Kentucky Hsg. Corp. Multi-family Rev. Bonds (City View Park Proj.) Series 2020, 1.16%, tender 8/1/22 (a) | 4,000,000 | 4,045,480 | |
| Kentucky Rural Wtr. Fin. Corp. Series 2020 E, 0.425% 12/1/21 (d) | 3,000,000 | 3,000,372 | |
| Kentucky State Property & Buildings Commission Rev.: | |||
| (Kentucky St Proj.) Series D, 5% 5/1/21 | 1,130,000 | 1,151,662 | |
| (Kentucky St Proj.) Series 2005 5% 8/1/21 (Nat'l. Pub. Fin. Guarantee Corp. Insured) | 3,050,000 | 3,143,742 | |
| Series 2002, 5.5% 8/1/21 (AMBAC Insured) | 770,000 | 796,216 | |
| Series 2005, 5% 8/1/22 (Nat'l. Pub. Fin. Guarantee Corp. Insured) | 250,000 | 269,183 | |
| Series 2016 B, 5% 11/1/23 | 1,785,000 | 2,015,265 | |
| Series 2016, 5% 11/1/23 | 375,000 | 423,956 | |
| Series 2017: | |||
| 5% 4/1/21 | 600,000 | 609,186 | |
| 5% 4/1/22 | 400,000 | 424,612 | |
| 5% 4/1/23 | 500,000 | 552,580 | |
| 5% 4/1/24 | 900,000 | 1,030,815 | |
| Series 2018: | |||
| 5% 5/1/21 | 1,145,000 | 1,166,949 | |
| 5% 5/1/22 | 250,000 | 266,308 | |
| 5% 5/1/23 | 1,415,000 | 1,569,023 | |
| Series A: | |||
| 5% 10/1/21 | 765,000 | 794,407 | |
| 5% 11/1/21 | 350,000 | 364,803 | |
| 5% 2/1/22 | 350,000 | 368,844 | |
| 5% 8/1/22 | 905,000 | 932,756 | |
| 5% 11/1/22 | 610,000 | 663,814 | |
| 5% 11/1/25 | 350,000 | 422,986 | |
| Series B: | |||
| 3% 5/1/21 | 275,000 | 277,999 | |
| 5% 11/1/21 | 975,000 | 1,016,236 | |
| 5% 8/1/22 | 1,620,000 | 1,744,303 | |
| 5% 8/1/23 | 2,695,000 | 3,014,250 | |
| Series C, 5% 11/1/21 | 2,875,000 | 2,996,594 | |
| Kentucky, Inc. Pub. Energy: | |||
| Bonds Series 2019 A1, 4%, tender 6/1/25 (a) | 1,000,000 | 1,138,990 | |
| Series 2018 B, 4% 7/1/21 | 1,350,000 | 1,376,875 | |
| Series A: | |||
| 4% 6/1/21 | 270,000 | 274,646 | |
| 4% 12/1/22 | 350,000 | 373,594 | |
| Louisville & Jefferson County: | |||
| Bonds: | |||
| Series 2020 B, 5%, tender 10/1/23 (a) | 840,000 | 941,573 | |
| Series 2020 C, 5%, tender 10/1/26 (a) | 2,015,000 | 2,460,134 | |
| Series 2016 A, 5% 10/1/22 | 200,000 | 215,728 | |
| Louisville & Jefferson County Gen. Oblig. Series 2020 A, 5% 10/1/24 | 2,005,000 | 2,356,978 | |
| Louisville Reg'l. Arpt. Auth. Sys. Rev. Series 2014 A: | |||
| 5% 7/1/21 (b) | 1,250,000 | 1,280,192 | |
| 5% 7/1/23 (b) | 1,750,000 | 1,940,943 | |
| 5% 7/1/24 (b) | 155,000 | 177,886 | |
| Louisville/Jefferson County Metropolitan Gov. Series 2012 A: | |||
| 5% 12/1/28 (Pre-Refunded to 6/1/22 @ 100) | 55,000 | 58,868 | |
| 5% 12/1/29 (Pre-Refunded to 6/1/22 @ 100) | 230,000 | 246,174 | |
| Louisville/Jefferson County Metropolitan Govt. Poll. Cont. Rev. Bonds (Louisville Gas and Elec. Co. Proj.): | |||
| Series 2001 B, 2.55%, tender 5/3/21 (a) | 2,000,000 | 2,015,124 | |
| Series 2007 A, 1.65%, tender 6/1/21 (a) | 7,250,000 | 7,282,683 | |
| Series 2007 B, 1.65%, tender 6/1/21 (a) | 2,000,000 | 2,009,016 | |
| Paducah Elec. Plant Board Rev. Series 2019, 5% 10/1/22 | 2,005,000 | 2,166,503 | |
| Trimble County Poll. Cont. Rev. Bonds (Louisville Gas and Elec. Co. Proj.): | |||
| Series 2001 A, 2.3%, tender 9/1/21 (a) | 600,000 | 606,959 | |
| Series 2001 B, 2.55%, tender 5/3/21 (a) | 2,590,000 | 2,609,586 | |
| Univ. Louisville Revs. Series 2016 C, 3% 9/1/21 | 780,000 | 794,995 | |
| TOTAL KENTUCKY | 75,385,131 | ||
| Louisiana - 0.5% | |||
| Louisiana Citizens Property Ins. Corp. Assessment Rev. Series 2015: | |||
| 5% 6/1/21 (FSA Insured) | 1,770,000 | 1,811,302 | |
| 5% 6/1/22 (FSA Insured) | 900,000 | 963,000 | |
| Louisiana Gen. Oblig.: | |||
| Series 2012 C, 5% 7/15/21 | 240,000 | 247,082 | |
| Series 2016 D, 5% 9/1/24 | 155,000 | 181,942 | |
| Louisiana Hsg. Corp. Multifamily Hsg. Rev. Bonds Series 2018, 0.7%, tender 6/1/21 (a) | 7,000,000 | 7,001,400 | |
| Louisiana Local Govt. Envir. Facilities and Cmnty. Dev. Auth. Bonds (East Baton Rouge Sewerage Commission Proj.) Series 2020 B, 0.875%, tender 2/1/25 (a) | 4,000,000 | 4,004,240 | |
| Louisiana Offshore Term. Auth. Deepwater Port Rev. Bonds Series 2010 B-1A, 2%, tender 10/1/22 (a) | 815,000 | 823,069 | |
| Louisiana Stadium and Exposition District Series 2013 A: | |||
| 5% 7/1/21 | 35,000 | 35,802 | |
| 5% 7/1/22 | 20,000 | 21,238 | |
| New Orleans Aviation Board Rev.: | |||
| (North Term. Proj.) Series 2017 B: | |||
| 5% 1/1/22 (b) | 280,000 | 292,284 | |
| 5% 1/1/23 (b) | 1,070,000 | 1,162,491 | |
| 5% 1/1/24 (b) | 5,000 | 5,627 | |
| 5% 1/1/25 (b) | 5,000 | 5,817 | |
| 5% 1/1/26 (b) | 15,000 | 17,982 | |
| Series 2017 D2: | |||
| 5% 1/1/21 (b) | 290,000 | 290,950 | |
| 5% 1/1/22 (b) | 345,000 | 360,135 | |
| 5% 1/1/23 (b) | 10,000 | 10,864 | |
| 5% 1/1/24 (b) | 15,000 | 16,881 | |
| 5% 1/1/25 (b) | 115,000 | 133,789 | |
| St. John Baptist Parish Rev. Bonds (Marathon Oil Corp.) Series 2017, 2%, tender 4/1/23 (a) | 4,780,000 | 4,827,896 | |
| St. Tammany Parish Hosp. Svc. (St. Tammany Parish Hosp. Proj.) Series 2011, 4.5% 7/1/21 (Escrowed to Maturity) | 600,000 | 614,605 | |
| Tobacco Settlement Fing. Corp. Series 2013 A: | |||
| 5% 5/15/21 | 635,000 | 648,960 | |
| 5% 5/15/23 | 100,000 | 111,414 | |
| TOTAL LOUISIANA | 23,588,770 | ||
| Maine - 0.0% | |||
| Maine Fin. Auth. Student Ln. Rev. Series 2019 A, 5% 12/1/23 (FSA Insured) (b) | 500,000 | 555,075 | |
| Maine Health & Higher Edl. Facilities Auth. Rev.: | |||
| Series 2017 B, 4% 7/1/21 | 85,000 | 86,592 | |
| Series 2020 A, 4% 7/1/22 | 425,000 | 447,903 | |
| Maine Tpk. Auth. Tpk. Rev. Series 2015: | |||
| 5% 7/1/21 | 50,000 | 51,392 | |
| 5% 7/1/22 | 40,000 | 43,022 | |
| 5% 7/1/26 | 250,000 | 300,610 | |
| TOTAL MAINE | 1,484,594 | ||
| Maryland - 0.4% | |||
| Baltimore County Gen. Oblig. Series 2020: | |||
| 4% 1/1/21 | 650,000 | 651,502 | |
| 4% 1/1/22 | 830,000 | 855,049 | |
| Baltimore Proj. Rev.: | |||
| (Wtr. Proj.) Series 2020 A: | |||
| 5% 7/1/23 (d) | 400,000 | 448,904 | |
| 5% 7/1/24 (d) | 635,000 | 741,261 | |
| Series 2017 D: | |||
| 5% 7/1/24 | 70,000 | 81,714 | |
| 5% 7/1/25 | 75,000 | 90,904 | |
| Howard County Gen. Oblig. Series A: | |||
| 5% 8/15/21 | 100,000 | 103,398 | |
| 5% 8/15/22 | 1,000,000 | 1,082,090 | |
| Maryland Cmnty. Dev. Admin Dept. Hsg. & Cmnty. Dev.: | |||
| Series 2019 B: | |||
| 1.6% 3/1/21 | 1,390,000 | 1,394,010 | |
| 4% 9/1/49 | 270,000 | 300,483 | |
| Series 2020 C, 0.625% 7/1/22 | 500,000 | 500,425 | |
| Maryland Health & Higher Edl. Bonds Series 2020, 5%, tender 7/1/25 (a) | 1,000,000 | 1,171,710 | |
| Maryland Health & Higher Edl. Facilities Auth. Rev.: | |||
| Series 2015: | |||
| 5% 7/1/22 | 20,000 | 21,287 | |
| 5% 7/1/23 | 20,000 | 22,058 | |
| 5% 7/1/24 | 45,000 | 51,336 | |
| 5% 7/1/25 | 40,000 | 47,084 | |
| Series 2019 A, 5% 10/1/21 | 380,000 | 393,472 | |
| Series 2020 A: | |||
| 3% 7/1/21 | 210,000 | 212,719 | |
| 4% 7/1/22 | 100,000 | 105,064 | |
| Series 2020 B: | |||
| 5% 4/15/21 | 440,000 | 447,429 | |
| 5% 4/15/23 | 675,000 | 746,300 | |
| Maryland Trans. Auth. Series 2012 B, 5% 3/1/21 (b) | 3,565,000 | 3,600,865 | |
| Maryland Trans. Auth. Trans. Facility Projs. Rev. Series 2020, 5% 7/1/22 | 1,500,000 | 1,614,810 | |
| Montgomery County Gen. Oblig. Bonds Series 2013 MD, 0.18%, tender 12/1/20 (a) | 3,000,000 | 3,000,000 | |
| TOTAL MARYLAND | 17,683,874 | ||
| Massachusetts - 0.5% | |||
| Massachusetts Bay Trans. Auth. Sales Tax Rev. Series B: | |||
| 5% 7/1/21 | 780,000 | 801,758 | |
| 5% 7/1/22 | 900,000 | 968,139 | |
| Massachusetts Dept. of Trans. Metropolitan Hwy. Sys. Rev. Series 2019 C, 5% 1/1/21 | 2,500,000 | 2,509,636 | |
| Massachusetts Dev. Fin. Agcy. Rev.: | |||
| Bonds Series S3, SIFMA Municipal Swap Index + 0.500% 0.61%, tender 1/26/23 (a)(c) | 3,400,000 | 3,405,134 | |
| Series 2016 A, 5% 7/15/22 | 30,000 | 32,363 | |
| Series 2016 I: | |||
| 5% 7/1/21 | 10,000 | 10,229 | |
| 5% 7/1/22 | 15,000 | 15,934 | |
| 5% 7/1/23 | 15,000 | 16,511 | |
| 5% 7/1/24 | 25,000 | 28,463 | |
| 5% 7/1/25 | 20,000 | 23,424 | |
| 5% 7/1/26 | 20,000 | 24,046 | |
| Series 2019 A: | |||
| 5% 7/1/21 | 200,000 | 204,547 | |
| 5% 7/1/22 | 450,000 | 477,639 | |
| 5% 7/1/24 | 155,000 | 175,593 | |
| Series C: | |||
| 5% 10/1/21 (FSA Insured) | 250,000 | 258,970 | |
| 5% 10/1/22 (FSA Insured) | 275,000 | 296,362 | |
| 5% 10/1/23 (FSA Insured) | 350,000 | 390,635 | |
| 5% 10/1/24 (FSA Insured) | 325,000 | 375,733 | |
| Massachusetts Edl. Fing. Auth. Rev.: | |||
| Series 2011 J, 5.125% 7/1/22 (b) | 2,080,000 | 2,129,213 | |
| Series 2015 A, 5% 1/1/22 (b) | 600,000 | 627,984 | |
| Series 2016 J: | |||
| 5% 7/1/21 (b) | 1,465,000 | 1,503,512 | |
| 5% 7/1/22 (b) | 1,475,000 | 1,570,506 | |
| 5% 7/1/23 (b) | 725,000 | 799,197 | |
| Series 2016, 5% 7/1/24 (b) | 350,000 | 397,292 | |
| Series 2020 C, 5% 7/1/23 (b) | 200,000 | 220,468 | |
| Massachusetts Gen. Oblig. Bonds Series D2, 1.7%, tender 8/1/22 (a) | 250,000 | 255,510 | |
| Massachusetts Health & Edl. Facilities Auth. Rev. (Partners Healthcare Sys., Inc. Proj.) Series 2007 G2, 0.18%, tender 12/7/20 (FSA Insured) (a) | 3,930,000 | 3,930,000 | |
| Massachusetts Port Auth. Rev.: | |||
| Series 2017 A: | |||
| 5% 7/1/24 (b) | 65,000 | 75,046 | |
| 5% 7/1/25 (b) | 25,000 | 29,911 | |
| Series 2019 C, 5% 7/1/24 (b) | 345,000 | 398,320 | |
| TOTAL MASSACHUSETTS | 21,952,075 | ||
| Michigan - 1.5% | |||
| Armada Area Schools Series 2014, 4% 5/1/22 | 305,000 | 320,598 | |
| Brandon School District Series A, 5% 5/1/23 | 430,000 | 478,569 | |
| Chippewa Valley Schools: | |||
| Series 2013, 5% 5/1/21 | 310,000 | 316,139 | |
| Series A, 2% 5/1/21 | 250,000 | 251,850 | |
| Clarkston Cmnty. Schools Series 2015, 5% 5/1/22 | 35,000 | 37,309 | |
| Dearborn School District Series 2017, 5% 5/1/22 | 250,000 | 266,493 | |
| Detroit Downtown Dev. Auth. Tax: | |||
| Series 1, 5% 7/1/22 (FSA Insured) | 500,000 | 534,720 | |
| Series A, 5% 7/1/25 (FSA Insured) | 550,000 | 630,366 | |
| Detroit Swr. Disp. Rev. Series 2006 D, 3 month U.S. LIBOR + 0.600% 0.751% 7/1/32 (a)(c) | 90,000 | 86,279 | |
| Durand Area Schools Gen. Oblig. Series 2015, 5% 5/1/21 | 335,000 | 341,422 | |
| Grand Blanc Cmnty. Schools Series 2013: | |||
| 5% 5/1/21 | 45,000 | 45,872 | |
| 5% 5/1/22 | 40,000 | 42,639 | |
| Grand Rapids Pub. Schools Series 2017, 5% 5/1/23 (FSA Insured) | 30,000 | 33,358 | |
| Huron Valley School District Series 2011: | |||
| 5% 5/1/21 | 685,000 | 697,986 | |
| 5% 5/1/22 | 510,000 | 519,904 | |
| Kalamazoo Hosp. Fin. Auth. Hosp. Facilities Rev. Series 2016: | |||
| 5% 5/15/22 | 20,000 | 21,250 | |
| 5% 5/15/24 | 10,000 | 11,429 | |
| 5% 5/15/25 | 15,000 | 17,744 | |
| 5% 5/15/26 | 15,000 | 18,290 | |
| Michigan Bldg. Auth. Rev. (Facilities Prog.) Series 2016 I, 5% 4/15/24 | 60,000 | 69,344 | |
| Michigan Fin. Auth. Rev.: | |||
| (Detroit Wtr. and Sewage Dept. Wtr. Supply Sys. Rev. Rfdg. Local Proj.): | |||
| Series 2014 C3, 5% 7/1/22 (FSA Insured) | 1,155,000 | 1,241,290 | |
| Series 2014 D1, 5% 7/1/22 (FSA Insured) | 2,845,000 | 3,057,550 | |
| (Mclaren Health Care Corp. Proj.) Series 2015, 5% 5/15/21 | 145,000 | 147,907 | |
| (Trinity Health Proj.) Series 2017, 5% 12/1/23 | 250,000 | 283,790 | |
| Bonds: | |||
| Series 2013 M1, 0.18%, tender 12/1/20 (a) | 12,060,000 | 12,060,000 | |
| Series 2016 MI2, SIFMA Municipal Swap Index + 0.480% 0.59%, tender 2/1/22 (a)(c) | 5,000,000 | 5,006,050 | |
| Series 2019 B, 3.5%, tender 11/15/22 (a) | 5,750,000 | 6,070,908 | |
| Series 2019 MI2, 5%, tender 2/1/25 (a) | 1,605,000 | 1,889,631 | |
| Series 2012, 5% 11/1/22 | 350,000 | 380,100 | |
| Series 2015 A: | |||
| 5% 8/1/22 | 1,380,000 | 1,481,085 | |
| 5% 8/1/23 | 260,000 | 290,800 | |
| Series 2015 MI, 5% 12/1/22 | 475,000 | 518,125 | |
| Series 2015, 5% 11/15/21 | 435,000 | 452,900 | |
| Series 2016, 5% 11/15/22 | 100,000 | 108,549 | |
| Series 2020 A: | |||
| 4% 6/1/22 | 1,000,000 | 1,054,150 | |
| 5% 6/1/24 | 1,000,000 | 1,164,910 | |
| Michigan Gen. Oblig. Series 2016: | |||
| 5% 3/15/21 | 560,000 | 567,273 | |
| 5% 3/15/22 | 50,000 | 52,914 | |
| 5% 3/15/23 | 85,000 | 93,751 | |
| Michigan Hosp. Fin. Auth. Rev.: | |||
| Bonds: | |||
| (Ascension Health Cr. Group Proj.) Series F5, 2.4%, tender 3/15/23 (a) | 80,000 | 83,643 | |
| Series 2010 F1, 4%, tender 6/1/23 (a) | 200,000 | 217,862 | |
| Series 2005 A4, 5% 11/1/21 | 3,805,000 | 3,964,135 | |
| Series 2008 C: | |||
| 5% 12/1/20 | 500,000 | 500,000 | |
| 5% 12/1/21 | 500,000 | 522,354 | |
| Michigan State Univ. Revs. Series 2015 A, 5% 8/15/21 | 380,000 | 392,720 | |
| Michigan Strategic Fund Ltd. Oblig. Rev.: | |||
| Bonds: | |||
| Series 2008 ET2, 1.45%, tender 9/1/21 (a) | 2,700,000 | 2,709,815 | |
| Series CC, 1.45%, tender 9/1/21 (a) | 155,000 | 155,563 | |
| Series 2019, 4% 11/15/22 | 730,000 | 752,572 | |
| Michigan Trunk Line Fund Rev. Series 2020 A, 5% 11/15/21 | 1,500,000 | 1,568,795 | |
| Northern Michigan Univ. Revs. Series 2018 A, 5% 12/1/22 | 700,000 | 758,429 | |
| Novi Cmnty. School District Series I, 4% 5/1/23 | 550,000 | 599,324 | |
| Oakland Univ. Rev. Series 2016, 5% 3/1/22 | 385,000 | 407,607 | |
| Portage Pub. Schools Series 2016: | |||
| 5% 5/1/23 | 45,000 | 49,726 | |
| 5% 11/1/23 | 30,000 | 33,786 | |
| 5% 5/1/24 | 40,000 | 45,899 | |
| 5% 11/1/24 | 45,000 | 52,591 | |
| 5% 5/1/25 | 25,000 | 29,738 | |
| 5% 11/1/25 | 25,000 | 30,254 | |
| 5% 11/1/28 | 20,000 | 24,456 | |
| Royal Oak Hosp. Fin. Auth. Hosp. Rev. Series 2014 D: | |||
| 5% 9/1/21 | 35,000 | 36,157 | |
| 5% 9/1/23 | 10,000 | 11,221 | |
| Saginaw Hosp. Fin. Auth. Hosp. Rev. Series 2020 J: | |||
| 5% 7/1/21 | 285,000 | 292,323 | |
| 5% 7/1/22 | 455,000 | 486,668 | |
| 5% 7/1/23 | 250,000 | 278,233 | |
| Spring Lake Pub. Schools Series 2014, 5% 5/1/21 | 90,000 | 91,744 | |
| Wayne County Arpt. Auth. Rev.: | |||
| Series 2011 A: | |||
| 4.125% 12/1/22 (FSA Insured) (b) | 530,000 | 546,610 | |
| 5% 12/1/20 (b) | 1,385,000 | 1,385,000 | |
| 5% 12/1/21 (b) | 8,505,000 | 8,894,851 | |
| Series 2011 B, 5% 12/1/20 | 410,000 | 410,000 | |
| Series 2012 B: | |||
| 5% 12/1/20 (b) | 300,000 | 300,000 | |
| 5% 12/1/22 (b) | 485,000 | 524,775 | |
| Series 2017 A, 5% 12/1/20 | 155,000 | 155,000 | |
| Series 2017 B: | |||
| 5% 12/1/20 (b) | 355,000 | 355,000 | |
| 5% 12/1/21 (b) | 300,000 | 313,751 | |
| Zeeland Pub. Schools Series 2015, 5% 5/1/21 | 445,000 | 453,530 | |
| TOTAL MICHIGAN | 68,097,376 | ||
| Minnesota - 0.6% | |||
| Apple Valley Sr. Living Series 2016 B: | |||
| 4% 1/1/21 | 150,000 | 149,668 | |
| 4% 1/1/22 | 155,000 | 150,700 | |
| Maple Grove Health Care Sys. Rev. Series 2017: | |||
| 4% 5/1/21 | 110,000 | 111,253 | |
| 4% 5/1/22 | 110,000 | 114,194 | |
| 5% 5/1/23 | 110,000 | 120,800 | |
| Minneapolis & Saint Paul Metropolitan Arpts. Commission Arpt. Rev.: | |||
| Series 2014 A: | |||
| 5% 1/1/22 | 20,000 | 20,962 | |
| 5% 1/1/23 | 20,000 | 21,768 | |
| Series 2014 B: | |||
| 5% 1/1/21 (b) | 50,000 | 50,177 | |
| 5% 1/1/22 (b) | 45,000 | 47,089 | |
| 5% 1/1/23 (b) | 20,000 | 21,677 | |
| Series 2016 B, 5% 1/1/22 | 410,000 | 429,717 | |
| Series 2016 C, 5% 1/1/22 | 235,000 | 246,301 | |
| Series 2019 B: | |||
| 5% 1/1/21 (b) | 8,000,000 | 8,028,393 | |
| 5% 1/1/22 (b) | 3,000,000 | 3,139,260 | |
| Series 2019 C, 5% 1/1/21 | 675,000 | 677,479 | |
| Minneapolis Multi-family Rev. Bonds Series 2019, 1.55%, tender 11/1/21 (a) | 4,050,000 | 4,092,068 | |
| Minnesota Hsg. Fin. Agcy. Bonds Series 2018 D, SIFMA Municipal Swap Index + 0.430% 0.54%, tender 7/3/23 (a)(c) | 3,000,000 | 2,997,060 | |
| Minnesota Rural Wtr. Fin. Auth. Series 2020, 1% 8/1/21 | 2,000,000 | 2,002,125 | |
| Moorhead Edl. Facilities Rev. (The Concordia College Corp. Proj.) Series 2016, 5% 12/1/25 | 65,000 | 71,935 | |
| Northern Muni. Pwr. Agcy. Elec. Sys. Rev. Series 2017: | |||
| 5% 1/1/22 | 25,000 | 26,256 | |
| 5% 1/1/23 | 25,000 | 27,407 | |
| 5% 1/1/24 | 35,000 | 39,907 | |
| Rochester Health Care Facilities Rev. Bonds (Mayo Foundation Proj.) Series C, 4.5%, tender 11/15/21 (a) | 1,905,000 | 1,979,919 | |
| Roseville Independent School District #623 Series 2018A, 5% 2/1/21 | 1,715,000 | 1,728,305 | |
| Southern Minnesota Muni. Pwr. Agcy. Pwr. Supply Sys. Rev. (Cap. Appreciation) Series 1994 A, 0% 1/1/21 (Nat'l. Pub. Fin. Guarantee Corp. Insured) | 370,000 | 369,878 | |
| Western Minnesota Muni. Pwr. Agcy. Pwr. Supply Rev. Series 2014 A: | |||
| 5% 1/1/22 | 20,000 | 21,031 | |
| 5% 1/1/23 | 65,000 | 71,358 | |
| 5% 1/1/24 | 20,000 | 22,870 | |
| TOTAL MINNESOTA | 26,779,557 | ||
| Mississippi - 0.1% | |||
| Mississippi Bus. Fin. Corp. Solid Waste Disp. Rev. Bonds (Waste Mgmt., Inc. Proj.) Series 2004, 0.55%, tender 9/1/21 (a)(b) | 1,700,000 | 1,698,354 | |
| Mississippi Dev. Bank Spl. Obl (Jackson Mississippi Sales Tax Rev. Infrastructure Proj.) Series 2020, 5% 9/1/24 | 740,000 | 853,642 | |
| Mississippi Hosp. Equip. & Facilities Auth.: | |||
| (Forrest County Gen. Hosp. Rfdg. Proj.) Series 2019 B, 5% 1/1/22 | 350,000 | 366,328 | |
| Bonds Series 2020 A2, 0.65%, tender 9/1/21 (a) | 300,000 | 300,000 | |
| Series I, 5% 10/1/22 | 420,000 | 453,831 | |
| TOTAL MISSISSIPPI | 3,672,155 | ||
| Missouri - 0.3% | |||
| Cape Girardeau County Indl. Dev. Auth. (Southeast Hosp. Proj.) Series 2017 A: | |||
| 5% 3/1/21 | 10,000 | 10,074 | |
| 5% 3/1/22 | 15,000 | 15,549 | |
| 5% 3/1/23 | 20,000 | 21,254 | |
| 5% 3/1/24 | 15,000 | 16,360 | |
| 5% 3/1/25 | 15,000 | 16,723 | |
| 5% 3/1/26 | 20,000 | 22,709 | |
| Missouri Health & Edl. Facilities Rev.: | |||
| Series 2019 A, 5% 2/15/21 | 775,000 | 781,957 | |
| Series 2020: | |||
| 5% 11/15/21 | 520,000 | 543,183 | |
| 5% 11/15/22 | 660,000 | 719,129 | |
| 5% 11/15/23 | 815,000 | 924,585 | |
| Missouri Hsg. Dev. Commission Single Family Mtg. Rev. Series 2019, 4% 5/1/50 | 65,000 | 72,738 | |
| Missouri State Pub. Util. Commn Rev. Series 2020, 0.5% 3/1/22 | 5,000,000 | 5,003,000 | |
| Saint Louis Arpt. Rev.: | |||
| Series 2017 A, 5% 7/1/23 (FSA Insured) | 1,080,000 | 1,202,256 | |
| Series 2017 B: | |||
| 5% 7/1/21 (FSA Insured) (b) | 400,000 | 409,898 | |
| 5% 7/1/22 (FSA Insured) (b) | 500,000 | 533,160 | |
| Series 2019 B: | |||
| 5% 7/1/21 (b) | 350,000 | 358,247 | |
| 5% 7/1/22 (b) | 365,000 | 388,013 | |
| 5% 7/1/23 (b) | 385,000 | 423,569 | |
| 5% 7/1/24 (b) | 400,000 | 454,500 | |
| 5% 7/1/25(b) | 420,000 | 491,912 | |
| Series 2019 C, 5% 7/1/25 | 660,000 | 781,110 | |
| Saint Louis Muni. Fin. Corp. Leasehold Rev. Series 2017 B, 4% 6/1/21 (FSA Insured) | 320,000 | 325,781 | |
| TOTAL MISSOURI | 13,515,707 | ||
| Montana - 0.1% | |||
| Montana Board Hsg. Single Family: | |||
| Series 2019 B, 4% 6/1/50 | 30,000 | 34,295 | |
| Series A1, 3.5% 6/1/50 | 480,000 | 531,893 | |
| Montana Board of Invt.: | |||
| (Intercap Revolving Prog.) Series 2017, 1%, tender 3/1/21 (a) | 1,425,000 | 1,426,543 | |
| Series 2007, 1%, tender 3/1/21 (a) | 1,520,000 | 1,521,646 | |
| Montana Facility Fin. Auth. Rev.: | |||
| Series 2016, 5% 2/15/21 | 550,000 | 554,823 | |
| Series 2019 A: | |||
| 5% 1/1/21 | 500,000 | 501,832 | |
| 5% 1/1/22 | 430,000 | 451,113 | |
| TOTAL MONTANA | 5,022,145 | ||
| Nebraska - 0.3% | |||
| Central Plains Energy Proj. Gas Supply: | |||
| Bonds Series 2019, 4%, tender 8/1/25 (a) | 1,170,000 | 1,350,566 | |
| Series 2019: | |||
| 4% 2/1/21 | 1,150,000 | 1,157,078 | |
| 4% 8/1/21 | 1,500,000 | 1,537,184 | |
| 4% 2/1/22 | 1,465,000 | 1,527,892 | |
| 4% 8/1/23 | 580,000 | 635,489 | |
| Douglas County Hosp. Auth. #2 Health Facilities Rev. Series 2020: | |||
| 5% 11/15/21 | 100,000 | 104,213 | |
| 5% 11/15/22 | 130,000 | 141,141 | |
| Nebraska Invt. Fin. Auth. Single Family Hsg. Rev. Series 2019 B, 4% 9/1/49 (b) | 155,000 | 170,303 | |
| Nebraska Pub. Pwr. District Rev. Bonds Series 2020 A, 0.6%, tender 7/1/23 (a) | 5,000,000 | 5,016,050 | |
| TOTAL NEBRASKA | 11,639,916 | ||
| Nevada - 1.3% | |||
| Clark County Arpt. Rev.: | |||
| (Sub Lien Proj.) Series 2017 A-1: | |||
| 5% 7/1/21 (b) | 2,045,000 | 2,099,245 | |
| 5% 7/1/22 (b) | 160,000 | 171,506 | |
| Series 2017 C, 5% 7/1/21 (b) | 11,625,000 | 11,926,455 | |
| Series 2018 A, 5% 7/1/21 | 1,520,000 | 1,560,319 | |
| Series 2019 D: | |||
| 5% 7/1/21 | 5,800,000 | 5,957,298 | |
| 5% 7/1/22 | 10,000,000 | 10,735,600 | |
| Clark County McCarran Int'l. Arpt. Passenger Facility Charge Rev.: | |||
| (Clark County Arpt. Rev. Proj.) Series 2017 B, 5% 7/1/21 (b) | 800,000 | 821,221 | |
| Series 2019 E, 5% 7/1/22 | 480,000 | 515,309 | |
| Clark County School District: | |||
| Series 2012 A, 5% 6/15/21 | 560,000 | 573,443 | |
| Series 2016 A: | |||
| 5% 6/15/21 | 165,000 | 168,961 | |
| 5% 6/15/23 | 30,000 | 33,291 | |
| Series 2017 A, 5% 6/15/22 | 2,000,000 | 2,134,040 | |
| Series 2017 C, 5% 6/15/22 | 300,000 | 320,106 | |
| Series 2019 C, 5% 6/15/21 | 370,000 | 378,882 | |
| Series 2020 A: | |||
| 3% 6/15/22 | 500,000 | 518,240 | |
| 3% 6/15/23 (FSA Insured) | 450,000 | 477,338 | |
| Nevada Dept. of Bus. & Industry Bonds (Republic Svcs., Inc. Proj.) Series 2001, 0.875%, tender 12/1/20 (a)(b)(e) | 3,100,000 | 3,100,000 | |
| Nevada Gen. Oblig. Series 2013 D1, 5% 3/1/24 | 60,000 | 66,388 | |
| Nevada Hsg. Division Bonds Series 2020, 1.19%, tender 4/1/21 (a) | 5,000,000 | 5,013,690 | |
| Washoe County Gas & Wtr. Facilities Bonds (Sierra Pacific Pwr. Co. Proj.) Series 2016 B, 3%, tender 6/1/22 (a) | 940,000 | 975,870 | |
| Washoe County Gas Facilities Rev. Bonds: | |||
| (Sierra Pacific Pwr. Co. Proj.) Series 2016 C, 0.625%, tender 4/15/22 (a)(b) | 1,490,000 | 1,490,715 | |
| Series 2016 F, 2.05%, tender 4/15/22 (a)(b) | 7,900,000 | 8,057,052 | |
| Series 2016, 2.05%, tender 4/15/22 (a)(b) | 1,210,000 | 1,234,055 | |
| TOTAL NEVADA | 58,329,024 | ||
| New Hampshire - 0.0% | |||
| Nat'l. Fin. Auth. Solid Bonds (Waste Mgmt., Inc. Proj.) Series 2019 A2, 2.15%, tender 7/1/24 (a)(b) | 555,000 | 578,848 | |
| New Hampshire Bus. Fin. Auth. Wtr. Facility (Pennichuck Wtr. Works, Inc. Proj.) Series 2014 A, 5% 1/1/24 (Escrowed to Maturity) (b) | 260,000 | 295,550 | |
| New Hampshire Health & Ed. Facilities Auth. Rev.: | |||
| (Southern NH Med. Ctr. Proj.) Series 2016, 3% 10/1/21 | 225,000 | 228,975 | |
| Series 2012, 4% 7/1/21 | 35,000 | 35,569 | |
| Series 2016: | |||
| 5% 10/1/21 | 25,000 | 25,876 | |
| 5% 10/1/23 | 425,000 | 474,976 | |
| TOTAL NEW HAMPSHIRE | 1,639,794 | ||
| New Jersey - 2.8% | |||
| Camden County Impt. Auth. Health Care Redev. Rev. Series 2014 A: | |||
| 5% 2/15/21 | 55,000 | 55,431 | |
| 5% 2/15/22 | 55,000 | 57,548 | |
| 5% 2/15/23 | 70,000 | 75,884 | |
| Garden State Preservation Trust Open Space & Farmland Preservation: | |||
| Series 2005 C, 5.25% 11/1/21 (FSA Insured) | 1,000,000 | 1,042,970 | |
| Series B, 0% 11/1/22 (FSA Insured) | 680,000 | 668,426 | |
| Hudson County Impt. Auth. (Hudson County Courthouse Proj.) Series 2020, 4% 10/1/22 | 225,000 | 240,356 | |
| Hudson County Impt. Auth. Rev. Series 2020 C1A, 1.5% 9/2/21 | 1,750,000 | 1,765,644 | |
| Monmouth County Impt. Auth. Rev.: | |||
| Series 1, 2% 2/15/21 | 1,750,000 | 1,756,468 | |
| Series 2020 A, 2% 7/12/21 | 1,250,000 | 1,263,719 | |
| New Brunswick Parking Auth. Rev. Series 2020 B: | |||
| 5% 9/1/23 | 675,000 | 754,454 | |
| 5% 9/1/25 | 850,000 | 1,022,797 | |
| New Jersey Econ. Dev. Auth. Motor Vehicle Rev. Series A, 5% 7/1/23 (Build America Mutual Assurance Insured) | 250,000 | 277,578 | |
| New Jersey Econ. Dev. Auth. Rev.: | |||
| (New Jersey Gen. Oblig. Proj.) Series 2017 B, 5% 11/1/24 | 115,000 | 131,209 | |
| (New Jersey Transit Corp. Proj.) Series 2017 B, 5% 11/1/22 | 1,800,000 | 1,941,498 | |
| (Provident Montclair Proj.) Series 2017: | |||
| 4% 6/1/22 (FSA Insured) | 20,000 | 20,844 | |
| 5% 6/1/23 (FSA Insured) | 25,000 | 27,478 | |
| 5% 6/1/24 (FSA Insured) | 20,000 | 22,752 | |
| (The Goethals Bridge Replacement Proj.) Series 2013, 5% 1/1/24 (b) | 350,000 | 392,007 | |
| Series 2005 K, 5.25% 12/15/20 (AMBAC Insured) | 350,000 | 350,574 | |
| Series 2005, 5.25% 12/15/21 | 295,000 | 308,737 | |
| Series 2012 II: | |||
| 5% 3/1/22 | 135,000 | 141,951 | |
| 5% 3/1/23 | 835,000 | 879,155 | |
| Series 2013, 5% 3/1/23 | 4,920,000 | 5,365,162 | |
| Series 2015 XX: | |||
| 5% 6/15/21 | 500,000 | 511,483 | |
| 5% 6/15/23 | 75,000 | 82,638 | |
| Series 2016 BBB, 5% 6/15/21 | 1,090,000 | 1,115,034 | |
| Series 2017 DDD, 5% 6/15/22 | 220,000 | 233,904 | |
| New Jersey Econ. Dev. Auth. Wtr. Facilities Rev.: | |||
| (New Jersey-American Wtr. Co., Inc. Proj.) Series 2020 C, 1.15% 6/1/23 (b) | 2,500,000 | 2,533,275 | |
| Bonds (New Jersey-American Wtr. Co., Inc.) Series 2020, 1.2%, tender 6/1/23 (a)(b) | 2,000,000 | 2,028,600 | |
| New Jersey Edl. Facility: | |||
| Series 2014, 5% 6/15/21 | 240,000 | 245,512 | |
| Series 2015 B, 5% 7/1/21 (FSA Insured) | 300,000 | 307,619 | |
| Series 2016 A: | |||
| 5% 7/1/21 | 50,000 | 51,093 | |
| 5% 7/1/22 | 140,000 | 148,257 | |
| 5% 7/1/23 | 75,000 | 82,151 | |
| 5% 7/1/24 | 175,000 | 197,922 | |
| Series 2016 E, 5% 7/1/22 | 625,000 | 666,963 | |
| New Jersey Gen. Oblig.: | |||
| Series 2013, 5% 6/1/23 | 330,000 | 366,788 | |
| Series 2014, 5% 6/1/22 | 400,000 | 426,880 | |
| Series 2020 A: | |||
| 4% 6/1/23 | 21,665,000 | 23,543,139 | |
| 5% 6/1/24 | 1,530,000 | 1,759,913 | |
| 5% 6/1/25 | 2,330,000 | 2,768,250 | |
| New Jersey Health Care Facilities Fing. Auth. Rev.: | |||
| Series 2012 A, 5% 7/1/24 | 1,310,000 | 1,403,167 | |
| Series 2013, 5% 7/1/22 | 325,000 | 349,443 | |
| Series 2016 A: | |||
| 5% 7/1/21 | 5,000 | 5,116 | |
| 5% 7/1/22 | 5,000 | 5,310 | |
| 5% 7/1/23 | 15,000 | 16,531 | |
| 5% 7/1/24 | 10,000 | 11,404 | |
| 5% 7/1/24 | 25,000 | 29,047 | |
| 5% 7/1/24 | 20,000 | 22,808 | |
| 5% 7/1/25 | 10,000 | 11,781 | |
| 5% 7/1/26 | 5,000 | 6,057 | |
| 5% 7/1/27 | 5,000 | 6,013 | |
| Series 2016, 5% 7/1/21 | 220,000 | 224,393 | |
| New Jersey Higher Ed. Student Assistance Auth. Student Ln. Rev.: | |||
| Series 2011 1, 5% 12/1/20 (b) | 4,320,000 | 4,320,000 | |
| Series 2012 1, 5% 12/1/22 (b) | 400,000 | 433,056 | |
| Series 2012 1A, 5% 12/1/20 (b) | 2,000,000 | 2,000,000 | |
| Series 2013: | |||
| 4% 12/1/20 (b) | 1,055,000 | 1,055,000 | |
| 5% 12/1/21 (b) | 1,500,000 | 1,566,137 | |
| Series 2015 1A: | |||
| 5% 12/1/21 (b) | 4,650,000 | 4,855,025 | |
| 5% 12/1/22 (b) | 200,000 | 216,528 | |
| Series 2015 A, 5% 12/1/20 (b) | 1,700,000 | 1,700,000 | |
| Series 2017 1A: | |||
| 5% 12/1/22 (b) | 215,000 | 232,768 | |
| 5% 12/1/23 (b) | 45,000 | 50,310 | |
| Series 2017 1B: | |||
| 5% 12/1/20 (b) | 1,665,000 | 1,665,000 | |
| 5% 12/1/21 (b) | 190,000 | 198,377 | |
| Series 2018 B: | |||
| 5% 12/1/20 (b) | 4,475,000 | 4,475,000 | |
| 5% 12/1/21 (b) | 835,000 | 871,816 | |
| Series 2019 A: | |||
| 5% 12/1/20 | 1,150,000 | 1,150,000 | |
| 5% 12/1/22 | 245,000 | 266,268 | |
| 5% 12/1/23 | 80,000 | 89,818 | |
| 5% 12/1/24 | 45,000 | 52,035 | |
| Series 2020: | |||
| 5% 12/1/22(b) | 160,000 | 173,222 | |
| 5% 12/1/23 (b) | 545,000 | 609,305 | |
| New Jersey Hsg. & Mtg. Fin. Agcy. Bonds Series 2020 A, 0.75%, tender 6/1/22 (a) | 2,000,000 | 2,008,500 | |
| New Jersey Hsg. & Mtg. Fin. Agcy. Rev.: | |||
| Series 2018 B, 2.5% 4/1/21 (b) | 4,165,000 | 4,188,158 | |
| Series 2019 D: | |||
| 4% 10/1/22 (b) | 1,340,000 | 1,411,261 | |
| 4% 4/1/23 (b) | 115,000 | 122,602 | |
| 4% 10/1/23 (b) | 125,000 | 134,963 | |
| 4% 4/1/25 (b) | 150,000 | 168,029 | |
| New Jersey Tobacco Settlement Fing. Corp. Series 2018 A: | |||
| 5% 6/1/21 | 2,185,000 | 2,236,652 | |
| 5% 6/1/22 | 2,580,000 | 2,759,258 | |
| 5% 6/1/23 | 930,000 | 1,035,462 | |
| New Jersey Tpk. Auth. Tpk. Rev.: | |||
| Bonds Series 2017 C5, 1 month U.S. LIBOR + 0.460% 0.563%, tender 1/1/21 (a)(c) | 5,905,000 | 5,904,650 | |
| Series 2012 B, 5% 1/1/22 | 250,000 | 262,358 | |
| Series 2017 C1, 1 month U.S. LIBOR + 0.340% 0.443% 1/1/21 (Escrowed to Maturity) (a)(c) | 195,000 | 194,977 | |
| New Jersey Trans. Trust Fund Auth.: | |||
| Series 2005 B, 5.25% 12/15/23 | 260,000 | 293,491 | |
| Series 2006 A: | |||
| 5.25% 12/15/20 | 375,000 | 375,615 | |
| 5.25% 12/15/20 (FSA Insured) | 2,220,000 | 2,223,847 | |
| 5.25% 12/15/21 (FSA Insured) | 295,000 | 309,178 | |
| 5.25% 12/15/23 (FSA Insured) | 500,000 | 568,315 | |
| 5.5% 12/15/21 | 1,700,000 | 1,783,544 | |
| Series 2006, 5.25% 12/15/21 (Nat'l. Pub. Fin. Guarantee Corp. Insured) | 165,000 | 172,684 | |
| Series 2011 B, 5% 6/15/21 | 1,250,000 | 1,278,708 | |
| Series 2013 AA, 5% 6/15/23 | 580,000 | 639,067 | |
| Series 2016 A: | |||
| 5% 6/15/21 | 1,700,000 | 1,739,601 | |
| 5% 6/15/22 | 2,720,000 | 2,896,229 | |
| 5% 6/15/27 | 90,000 | 106,056 | |
| Series 2016 A-2, 5% 6/15/23 | 630,000 | 694,399 | |
| Series 2018 A: | |||
| 5% 6/15/21 | 3,995,000 | 4,088,062 | |
| 5% 6/15/22 | 4,175,000 | 4,445,498 | |
| 5% 6/15/24 | 405,000 | 459,667 | |
| Series A: | |||
| 5% 12/15/24 | 210,000 | 240,479 | |
| 5% 12/15/25 | 200,000 | 234,134 | |
| New Jersey Transit Corp. Ctfs. of Prtn. Series 2014 A, 5% 9/15/21 | 710,000 | 734,114 | |
| Newark Gen. Oblig. Series 2020: | |||
| 5% 10/1/21 | 250,000 | 258,778 | |
| 5% 10/1/21 | 100,000 | 103,443 | |
| 5% 10/1/22 | 900,000 | 968,715 | |
| 5% 10/1/22 | 650,000 | 699,010 | |
| Rutgers State Univ. Rev. Series Q: | |||
| 5% 5/1/21 | 125,000 | 127,327 | |
| 5% 5/1/22 | 80,000 | 85,066 | |
| 5% 5/1/23 | 65,000 | 71,993 | |
| Union County Gen. Oblig. Series 2020, 0.5% 3/1/22 | 1,700,000 | 1,707,191 | |
| TOTAL NEW JERSEY | 131,433,879 | ||
| New Mexico - 0.1% | |||
| New Mexico Mtg. Fin. Auth. Series 2019 C, 4% 1/1/50 | 510,000 | 567,742 | |
| New Mexico Muni. Energy Acquisition Auth. Gas Supply Rev.: | |||
| Bonds Series 2019 A, 5%, tender 5/1/25 (a) | 1,000,000 | 1,189,830 | |
| Series 2019 A: | |||
| 4% 5/1/22 | 140,000 | 147,294 | |
| 4% 5/1/23 | 580,000 | 630,402 | |
| 4% 11/1/23 | 245,000 | 270,580 | |
| 4% 11/1/24 | 250,000 | 284,395 | |
| 4% 5/1/25 | 960,000 | 1,101,974 | |
| New Mexico Severance Tax Rev. Series 2015 B, 5% 7/1/21 | 1,495,000 | 1,535,634 | |
| TOTAL NEW MEXICO | 5,727,851 | ||
| New York - 2.5% | |||
| Albany County Arpt. Auth. Arpt. Rev. Series 2020 B, 5% 12/15/21 (b) | 500,000 | 521,358 | |
| Dorm. Auth. New York Univ. Rev.: | |||
| Series 2016 A: | |||
| 5% 7/1/22 | 10,000 | 10,680 | |
| 5% 7/1/24 | 40,000 | 45,541 | |
| Series 2017, 4% 12/1/20 (e) | 200,000 | 200,000 | |
| Genessee Valley Central School District Series 2012, 5% 6/15/21 (FSA Insured) | 435,000 | 445,419 | |
| Hempstead Town Gen. Oblig. Series 2017, 4% 4/1/21 (FSA Insured) | 345,000 | 349,318 | |
| Hudson Yards Infrastructure Corp. New York Rev. Series 2017 A: | |||
| 5% 2/15/24 | 470,000 | 536,049 | |
| 5% 2/15/25 | 350,000 | 413,907 | |
| 5% 2/15/26 | 725,000 | 885,486 | |
| Long Island Pwr. Auth. Elec. Sys. Rev. Bonds: | |||
| Series 2019 B, 1.65%, tender 9/1/24 (a) | 1,055,000 | 1,087,600 | |
| Series 2020 B, 0.85%, tender 9/1/25 (a) | 11,000,000 | 11,080,410 | |
| Monroe County Indl. Dev. Corp. (The Rochester Gen. Hosp. Proj.) Series 2017, 5% 12/1/26 | 350,000 | 424,816 | |
| New York City Gen. Oblig.: | |||
| Bonds Series D, 5%, tender 2/1/24 (a) | 500,000 | 557,615 | |
| Series 2006, 0.24%, tender 6/1/36 (FSA Insured) (a) | 1,000,000 | 1,000,000 | |
| Series 2007 C-4, 0.18%, tender 1/1/32 (FSA Insured) (a) | 225,000 | 225,000 | |
| Series 2007, 0.1%, tender 12/4/20 (FSA Insured) (a) | 4,200,000 | 4,200,000 | |
| Series 2008 A-3, 0.33%, tender 8/1/26 (FSA Insured) (a) | 3,775,000 | 3,775,000 | |
| Series 2008 C-4, 0.24%, tender 10/1/27 (a) | 225,000 | 225,000 | |
| Series 2008 J3, 5% 8/1/22 | 450,000 | 484,371 | |
| Series 2013 D, 5% 8/1/23 | 1,535,000 | 1,687,195 | |
| Series 2014 B, 5% 8/1/21 | 400,000 | 412,512 | |
| Series 2016 B, 5% 8/1/22 | 300,000 | 322,914 | |
| Series 2016 E, 5% 8/1/24 | 700,000 | 817,040 | |
| Series 2016, 5% 8/1/22 | 555,000 | 597,391 | |
| Series 2017 A, 4% 8/1/21 | 460,000 | 471,341 | |
| Series 2017 C, 5% 8/1/21 | 500,000 | 515,640 | |
| Series 2017, 5% 8/1/23 | 375,000 | 421,020 | |
| Series 2019 B, 5% 8/1/21 | 200,000 | 206,256 | |
| Series A, 5% 8/1/22 | 440,000 | 473,607 | |
| Series C: | |||
| 5% 8/1/23 | 5,020,000 | 5,636,054 | |
| 5% 8/1/26 | 220,000 | 274,149 | |
| Series D1, 5% 10/1/21 | 250,000 | 259,696 | |
| Series J4, 5% 8/1/24 | 1,200,000 | 1,400,640 | |
| New York City Hsg. Dev. Corp.: | |||
| Bonds Series 2017 G-2, 2%, tender 12/31/21 (a) | 2,630,000 | 2,631,552 | |
| Series 2017 A2A, 1.9% 5/1/21 | 240,000 | 240,134 | |
| New York City Hsg. Dev. Corp. Multifamily Hsg. Bonds: | |||
| Series 2020 G, 0.2%, tender 2/22/21 (a) | 23,000,000 | 22,997,721 | |
| Series A3, 1.125%, tender 11/1/24 (a) | 2,000,000 | 2,015,320 | |
| New York City Transitional Fin. Auth. Rev.: | |||
| Series 1, 5% 11/1/22 | 400,000 | 436,092 | |
| Series 2015 C, 5% 11/1/22 | 220,000 | 239,851 | |
| Series C, 5% 11/1/21 | 230,000 | 240,053 | |
| Series C1, 3% 5/1/22 | 320,000 | 332,413 | |
| New York Dorm. Auth. Personal Income Tax Rev.: | |||
| Series 2012 A: | |||
| 4% 12/15/22 | 325,000 | 350,360 | |
| 5% 12/15/23 | 600,000 | 657,966 | |
| Series 2014 A, 5% 2/15/22 | 500,000 | 528,565 | |
| New York Dorm. Auth. Rev.: | |||
| Bonds Series 2019 B1, 5%, tender 5/1/22 (a) | 675,000 | 702,533 | |
| Series 2015, 5% 12/1/22 (e) | 700,000 | 754,509 | |
| New York Dorm. Auth. Sales Tax Rev.: | |||
| Series 2015 A, 5% 3/15/23 | 1,115,000 | 1,233,603 | |
| Series 2015 B, 5% 3/15/21 | 300,000 | 304,125 | |
| Series 2017 A, 5% 3/15/24 | 400,000 | 460,488 | |
| New York Metropolitan Trans. Auth. Dedicated Tax Fund Rev. Bonds Series 2008 A, SIFMA Municipal Swap Index + 0.450% 0.56%, tender 6/1/22 (a)(c) | 1,370,000 | 1,361,438 | |
| New York Metropolitan Trans. Auth. Rev.: | |||
| Bonds Series 2011 B, 1 month U.S. LIBOR + 0.550% 0.649%, tender 11/1/22 (a)(c) | 1,745,000 | 1,687,450 | |
| Series 2005 B, 5.25% 11/15/21 (Nat'l. Pub. Fin. Guarantee Corp. Insured) | 275,000 | 283,231 | |
| Series 2008 B2, 5% 11/15/21 | 110,000 | 112,613 | |
| Series 2012 B, 5% 11/15/22 | 45,000 | 47,122 | |
| Series 2012 E, 5% 11/15/21 | 55,000 | 56,307 | |
| Series 2012 F: | |||
| 5% 11/15/21 | 765,000 | 783,175 | |
| 5% 11/15/22 | 1,000,000 | 1,047,090 | |
| Series 2014 C, 5% 11/15/21 | 60,000 | 61,425 | |
| Series 2016 B, 5% 11/15/21 | 50,000 | 51,188 | |
| Series 2020 A: | |||
| 4% 2/1/22 | 4,800,000 | 4,874,736 | |
| 5% 2/1/23 | 4,200,000 | 4,416,846 | |
| New York St Mtg. Agcy. Homeowner: | |||
| Series 186, 3.4% 4/1/22 (b) | 1,160,000 | 1,198,048 | |
| Series 198, 1.65% 10/1/21 (b) | 2,245,000 | 2,264,120 | |
| Series 2014 189, 2.5% 10/1/21 (b) | 1,640,000 | 1,665,495 | |
| Series 212: | |||
| 2.4% 4/1/22 (b) | 1,130,000 | 1,156,555 | |
| 2.5% 10/1/22 (b) | 1,160,000 | 1,199,452 | |
| Series 214, 2.9% 10/1/22 (b) | 805,000 | 838,230 | |
| New York State Dorm. Auth.: | |||
| Series 2017 A: | |||
| 5% 2/15/22 | 355,000 | 375,281 | |
| 5% 2/15/23 | 1,795,000 | 1,978,664 | |
| Series 2017 B, 5% 2/15/23 | 245,000 | 270,068 | |
| New York State Energy Research & Dev. Auth. Poll. Cont. Rev. Series 1999, 1.35%, tender 12/4/20 (AMBAC Insured) (a) | 300,000 | 300,000 | |
| New York State Hsg. Fin. Agcy. Rev.: | |||
| Bonds Series 2019 F, 1.875%, tender 11/1/21 (a) | 2,365,000 | 2,366,698 | |
| Series J, 0.75% 5/1/25 | 360,000 | 360,234 | |
| New York State Mtg. Agcy. Homeowner Mtg. Series 221, 3.5% 10/1/32 (b) | 70,000 | 76,208 | |
| New York Trans. Dev. Corp.: | |||
| (Delta Air Lines, Inc. Laguardia Arpt. Terminals C&D Redev. Proj.) Series 2018, 5% 1/1/22 (b) | 1,500,000 | 1,549,785 | |
| (Term. 4 JFK Int'l. Arpt. Proj.) Series 2020 A: | |||
| 5% 12/1/22 (b) | 250,000 | 269,675 | |
| 5% 12/1/23 (b) | 175,000 | 194,660 | |
| 5% 12/1/25 (b) | 1,100,000 | 1,285,284 | |
| New York Urban Dev. Corp. Rev.: | |||
| Series 2015 A, 5% 3/15/24 | 300,000 | 345,579 | |
| Series 2016 A, 5% 3/15/22 | 210,000 | 222,827 | |
| Niagara Frontier Trans. Auth. Arpt. Rev.: | |||
| Series 2014 A, 5% 4/1/21 (b) | 300,000 | 304,097 | |
| Series 2019 A: | |||
| 5% 4/1/22 (b) | 700,000 | 738,346 | |
| 5% 4/1/23 (b) | 2,575,000 | 2,808,038 | |
| 5% 4/1/24 (b) | 1,720,000 | 1,938,354 | |
| Onondaga County Ind. Dev. Agcy. Swr. Facilities Rev. (Bristol-Meyers Squibb Co. Proj.) Series 1994, 5.75% 3/1/24 (b) | 770,000 | 890,413 | |
| Rockland County Gen. Oblig. Series 2014 A, 5% 3/1/22 (FSA Insured) | 340,000 | 360,142 | |
| Triborough Bridge & Tunnel Auth. Revs. Series 2016 A, 5% 11/15/23 | 300,000 | 340,434 | |
| Yonkers Gen. Oblig.: | |||
| Series 2016 C, 4% 11/15/21 (FSA Insured) | 225,000 | 233,112 | |
| Series 2017 C, 5% 10/1/22 (Build America Mutual Assurance Insured) | 55,000 | 59,262 | |
| TOTAL NEW YORK | 114,459,992 | ||
| New York And New Jersey - 0.5% | |||
| Port Auth. of New York & New Jersey: | |||
| Series 167, 5% 9/15/21 (b) | 465,000 | 471,189 | |
| Series 173, 4% 12/1/21 | 500,000 | 518,714 | |
| Series 188, 5% 5/1/21 (b) | 11,465,000 | 11,685,748 | |
| Series 197, 5% 11/15/21 (b) | 585,000 | 610,909 | |
| Series 2013: | |||
| 5% 12/1/22 | 250,000 | 272,855 | |
| 5% 12/1/23 | 705,000 | 801,874 | |
| Series 2018, 5% 9/15/22 (b) | 4,075,000 | 4,412,084 | |
| Series 202, 5% 10/15/22 (b) | 4,435,000 | 4,818,938 | |
| Series 207: | |||
| 5% 9/15/23 (b) | 505,000 | 566,903 | |
| 5% 9/15/24 (b) | 385,000 | 448,644 | |
| TOTAL NEW YORK AND NEW JERSEY | 24,607,858 | ||
| North Carolina - 0.6% | |||
| Charlotte Int'l. Arpt. Rev. Series 2017 B, 5% 7/1/25 (b) | 100,000 | 119,193 | |
| Charlotte-Mecklenburg Hosp. Auth. Health Care Sys. Rev. Series 2016 A, 5% 1/15/22 | 1,650,000 | 1,736,015 | |
| New Hanover County Hosp. Rev. Series 2017, 5% 10/1/26 | 290,000 | 358,020 | |
| North Carolina Cap. Facilities Fin. Agcy. Rev. Bonds: | |||
| (Republic Svcs., Inc. Proj.) Series 2010 B, 0.28%, tender 12/1/20 (a)(b) | 12,000,000 | 12,000,000 | |
| Series 2010, 0.25%, tender 12/1/20 (a) | 1,800,000 | 1,800,000 | |
| North Carolina Eastern Muni. Pwr. Agcy. Pwr. Sys. Rev. Series 1993 B, 6% 1/1/22 (Escrowed to Maturity) | 1,750,000 | 1,856,925 | |
| North Carolina Grant Anticipation Rev. Series 2017: | |||
| 5% 3/1/22 | 80,000 | 84,718 | |
| 5% 3/1/23 | 450,000 | 497,052 | |
| North Carolina Hsg. Fin. Agcy. Home Ownership Rev. Series 43, 4% 7/1/50 | 2,800,000 | 3,149,048 | |
| North Carolina Med. Care Commission Health Care Facilities Rev. Bonds Series 2019 B, 2.2%, tender 12/1/22 (a) | 1,420,000 | 1,455,997 | |
| North Carolina Muni. Pwr. Agcy. #1 Catawba Elec. Rev. Series 2015 E: | |||
| 5% 1/1/22 | 110,000 | 115,586 | |
| 5% 1/1/23 | 35,000 | 38,086 | |
| Raleigh Durham Arpt. Auth. Arpt. Rev.: | |||
| Series 2015 B, 5% 5/1/22 (b) | 550,000 | 584,018 | |
| Series 2017 A: | |||
| 4% 5/1/21 (b) | 300,000 | 304,221 | |
| 5% 5/1/22 (b) | 400,000 | 424,740 | |
| 5% 5/1/23 (b) | 235,000 | 258,845 | |
| Series 2020 B, 5% 5/1/21 | 425,000 | 433,003 | |
| TOTAL NORTH CAROLINA | 25,215,467 | ||
| North Dakota - 0.1% | |||
| North Dakota Hsg. Fin. Agcy. Bonds (Home Mtg. Fin. Prog.) Series 2019 B, SIFMA Municipal Swap Index + 0.400% 0.51%, tender 2/1/22 (a)(c) | 4,000,000 | 4,001,120 | |
| Ohio - 0.9% | |||
| Akron Bath Copley Hosp. District Rev. Series 2016, 5% 11/15/24 | 45,000 | 52,053 | |
| Akron Gen. Oblig. Series 2020, 2% 12/1/21 | 850,000 | 863,778 | |
| Allen County Hosp. Facilities Rev.: | |||
| Bonds (Mercy Health) Series 2017 B, 5%, tender 5/5/22 (a) | 350,000 | 372,439 | |
| Series 2017 A: | |||
| 5% 8/1/21 | 780,000 | 803,761 | |
| 5% 8/1/22 | 5,300,000 | 5,702,959 | |
| Series 2020 A: | |||
| 5% 12/1/20 | 1,405,000 | 1,405,000 | |
| 5% 12/1/21 | 1,000,000 | 1,045,735 | |
| 5% 12/1/22 | 1,550,000 | 1,686,819 | |
| 5% 12/1/23 | 1,000,000 | 1,131,960 | |
| American Muni. Pwr., Inc. Rev. Bonds: | |||
| (Combined Hydroelectric Proj.) Series 2018, 2.25%, tender 8/15/21 (a) | 3,570,000 | 3,581,755 | |
| Series 2019 A, 2.3%, tender 2/15/22 (a) | 1,800,000 | 1,818,090 | |
| Cleveland Arpt. Sys. Rev.: | |||
| Series 2016 A: | |||
| 5% 1/1/24 (FSA Insured) | 25,000 | 28,348 | |
| 5% 1/1/25 (FSA Insured) | 370,000 | 434,676 | |
| 5% 1/1/26 (FSA Insured) | 10,000 | 11,704 | |
| Series 2018 A, 5% 1/1/26 (b) | 290,000 | 346,695 | |
| Series 2019 B: | |||
| 5% 1/1/21 (b) | 1,700,000 | 1,705,347 | |
| 5% 1/1/22 (b) | 650,000 | 677,079 | |
| Cleveland Pub. Pwr. Sys. Rev. Series 2016, 5% 11/15/21 (FSA Insured) | 1,180,000 | 1,232,028 | |
| Cuyahoga Metropolitan Hsg. Auth. Bonds (Riverside Park Phase II Proj.) Series 2019, 2%, tender 4/1/21 (a) | 3,000,000 | 3,016,232 | |
| Fairfield County Hosp. Facilities Rev. (Fairfield Med. Ctr. Proj.) Series 2013: | |||
| 5% 6/15/22 | 45,000 | 47,439 | |
| 5% 6/15/23 | 40,000 | 43,384 | |
| Franklin County Hosp. Facilities Rev.: | |||
| Bonds: | |||
| (Ohio Health Corp.) Series 2018 B, SIFMA Municipal Swap Index + 0.430% 0.54%, tender 12/3/20 (a)(c) | 3,800,000 | 3,802,161 | |
| (U.S. Health Corp. of Columbus Proj.) Series 2011 B, 5%, tender 5/15/23 (a) | 390,000 | 432,416 | |
| Series 2016 C, 5% 11/1/23 | 60,000 | 67,870 | |
| Hamilton County Convention Facilities Auth. Rev. Series 2014, 5% 12/1/21 | 45,000 | 46,367 | |
| Hamilton County HealthCare Facilities Rev. Series 2012: | |||
| 5% 6/1/21 | 400,000 | 408,401 | |
| 5.25% 6/1/26 | 115,000 | 122,161 | |
| Miami County Hosp. Facilities Rev. (Kettering Health Network Obligated Group Proj.) Series 2019: | |||
| 5% 8/1/24 | 620,000 | 716,305 | |
| 5% 8/1/25 | 310,000 | 370,850 | |
| 5% 8/1/26 | 535,000 | 657,622 | |
| Miami Univ. Series 2020 A: | |||
| 5% 9/1/21 | 300,000 | 310,723 | |
| 5% 9/1/22 | 340,000 | 368,325 | |
| Ohio Higher Edl. Facility Commission Rev.: | |||
| (Case Western Reserve Univ. Proj.) Series 2016, 5% 12/1/22 | 585,000 | 635,170 | |
| (Xavier Univ. 2020 Proj.) Series 2020, 5% 5/1/24 | 490,000 | 560,830 | |
| Ohio Hosp. Facilities Rev.: | |||
| Series 2011 A, 5% 1/1/24 | 580,000 | 582,198 | |
| Series 2017 A: | |||
| 5% 1/1/21 | 60,000 | 60,229 | |
| 5% 1/1/22 | 35,000 | 36,789 | |
| 5% 1/1/23 | 45,000 | 49,342 | |
| 5% 1/1/24 | 40,000 | 45,648 | |
| 5% 1/1/25 | 45,000 | 53,346 | |
| Ohio Hsg. Fin. Agcy. Multi-family Hsg. Rev. Bonds (Brandt Meadows Apts. Proj.) Series 2019, 0.55%, tender 12/1/20 (a) | 3,700,000 | 3,700,000 | |
| Ohio Hsg. Fin. Agcy. Residential Mtg. Rev. (Mtg. Backed Securities Prog.) Series 2019 B, 4.5% 3/1/50 | 45,000 | 50,982 | |
| Ohio Spl. Oblig. Series 2020 A, 5% 2/1/22 | 185,000 | 195,184 | |
| Ross County Hosp. Facilities Rev. (Adena Health Sys. Obligated Group Proj.) Series 2019, 5% 12/1/20 | 375,000 | 375,000 | |
| Scioto County Hosp. Facilities Rev.: | |||
| Series 2016: | |||
| 5% 2/15/21 | 15,000 | 15,125 | |
| 5% 2/15/22 | 25,000 | 26,236 | |
| 5% 2/15/23 | 45,000 | 48,937 | |
| 5% 2/15/24 | 35,000 | 39,407 | |
| 5% 2/15/25 | 35,000 | 40,662 | |
| 5% 2/15/26 | 405,000 | 484,785 | |
| Series 2019, 5% 2/15/29 | 1,000,000 | 1,148,850 | |
| Toledo Gen. Oblig. Series 2020: | |||
| 3% 12/1/24 | 510,000 | 552,998 | |
| 3% 12/1/24 | 425,000 | 460,832 | |
| Univ. of Akron Gen. Receipts Series 2019 A: | |||
| 5% 1/1/24 | 300,000 | 338,310 | |
| 5% 1/1/25 | 400,000 | 467,276 | |
| TOTAL OHIO | 43,278,618 | ||
| Oklahoma - 0.2% | |||
| Beckham Independent School District#6 Elk City Series 2019, 2% 7/1/21 | 1,405,000 | 1,415,724 | |
| Canadian Cny Edl. Facilities Auth. (Yukon Pub. Schools Proj.) Series 2019, 5% 12/1/20 | 2,050,000 | 2,050,000 | |
| Oklahoma County Fin. Auth. Edl. Facilities: | |||
| (Jones Pub. Schools Proj.) Series 2020: | |||
| 4% 9/1/21 | 200,000 | 204,060 | |
| 4% 9/1/22 | 305,000 | 318,905 | |
| (Midwest City- Del City School Dis Proj.) Series 2018, 5% 10/1/21 | 240,000 | 249,226 | |
| Oklahoma County Independent School District No. 9 Series 2018, 2.5% 6/1/21 | 1,535,000 | 1,549,074 | |
| Oklahoma Dev. Fin. Auth. Health Sys. Rev. Series 2020 C, 0.34% 8/15/31 (a) | 1,000,000 | 1,000,000 | |
| Oklahoma Dev. Fin. Auth. Rev.: | |||
| (Oklahoma City Univ. Proj.) Series 2019, 5% 8/1/23 | 560,000 | 603,411 | |
| Series 2004 A, 2.375% 12/1/21 (a) | 30,000 | 30,450 | |
| Oklahoma Hsg. Fin. Agcy. Collateralized Bonds Series 2019, 1.6%, tender 1/1/22 | 185,000 | 186,231 | |
| Tulsa County Indl. Auth. Edl. Facilities Lease Rev. (Berryhill Pub. School Proj.) Series 2020: | |||
| 4% 9/1/24 | 445,000 | 495,036 | |
| 4% 9/1/25 | 690,000 | 785,220 | |
| TOTAL OKLAHOMA | 8,887,337 | ||
| Oregon - 0.2% | |||
| Oregon Bus. Dev. Commission Bonds Series 250, 5%, tender 3/1/22 (a)(b) | 2,970,000 | 3,130,974 | |
| Oregon Bus. Dev. Commission Recovery Zone Facility Bonds (Intel Corp. Proj.) Series 232, 2.4%, tender 8/14/23 (a) | 770,000 | 810,310 | |
| Oregon Facilities Auth. Rev. (Legacy Health Proj.) Series 2011 A, 5.25% 5/1/21 | 255,000 | 259,936 | |
| Port of Portland Arpt. Rev. Series 26 C: | |||
| 5% 7/1/21 (b) | 1,815,000 | 1,857,014 | |
| 5% 7/1/22 (b) | 1,300,000 | 1,382,173 | |
| 5% 7/1/23 (b) | 2,000,000 | 2,218,220 | |
| TOTAL OREGON | 9,658,627 | ||
| Pennsylvania - 2.5% | |||
| Albert Gallatin Area School District Series 2020 A, 4% 9/1/21 | 400,000 | 409,027 | |
| Allegheny County Sanitation Auth. Swr. Rev. Series 2020 A, 4% 6/1/24 | 300,000 | 337,833 | |
| Berks County Muni. Auth. Rev.: | |||
| (Tower Health Proj.) Series 2020 A: | |||
| 5% 2/1/21 | 400,000 | 401,831 | |
| 5% 2/1/22 | 500,000 | 515,400 | |
| Bonds (Tower Health Proj.) Series 2020 B1, 5%, tender 2/1/25 (a) | 255,000 | 274,566 | |
| Bethlehem Area School District Auth. Bonds (School District Rfdg. Proj.) Series 2018 A, 1 month U.S. LIBOR + 0.480% 0.585%, tender 12/3/20 (a)(c) | 3,990,000 | 3,980,505 | |
| Butler Area School District Series 2018, 5% 10/1/22 | 1,250,000 | 1,354,275 | |
| Chester County Health & Ed. Auth. Rev. Series 2017, 5% 11/1/21 | 160,000 | 159,233 | |
| Chester County Health & Ed. Facilities Auth. Health Sys. Rev. Series C, 3% 9/1/23 | 245,000 | 262,677 | |
| Coatesville Area School District Series 2017, 5% 8/1/23 (FSA Insured) | 350,000 | 389,585 | |
| Commonwealth Fing. Auth. Rev.: | |||
| Series 2019 B, 5% 6/1/24 | 265,000 | 305,317 | |
| Series 2020 A, 5% 6/1/23 | 350,000 | 388,280 | |
| Commonwealth Fing. Auth. Tobacco Series 2018, 5% 6/1/21 | 1,000,000 | 1,022,116 | |
| Cumberland County Muni. Auth. Rev. Bonds Series 2014 T1, 3.75%, tender 4/30/22 (a) | 1,000,000 | 1,006,580 | |
| Delaware County Auth. Univ. Rev. Series 2020: | |||
| 4% 10/1/22 | 190,000 | 196,272 | |
| 5% 10/1/23 | 240,000 | 258,406 | |
| Delaware Valley Reg'l. Fin. Auth. Local Govt. Rev. Bonds SIFMA Municipal Swap Index + 0.420% 0.53%, tender 9/1/22 (a)(c) | 5,000,000 | 4,971,600 | |
| Easton Area School District Series 2013 A, 5% 4/1/23 | 705,000 | 732,883 | |
| Geisinger Auth. Health Sys. Rev. Series 2020 A, 5% 4/1/22 | 6,075,000 | 6,443,753 | |
| Hollidaysburg Area School District Series 2020, 4% 7/15/22 | 500,000 | 529,275 | |
| Lehigh County Gen. Purp. Hosp. Rev. Series 2019 A, 5% 7/1/21 | 1,000,000 | 1,025,694 | |
| Lehigh County Indl. Dev. Auth. Poll. Cont. Rev. Bonds: | |||
| (PPL Elec. Utils. Corp. Proj.) Series 2016 A, 1.8%, tender 9/1/22 (a) | 1,260,000 | 1,273,545 | |
| Series B, 1.8%, tender 8/15/22 (a) | 985,000 | 996,229 | |
| Monroeville Fin. Auth. UPMC Rev. Series 2012, 5% 2/15/22 | 290,000 | 305,846 | |
| Montgomery County Higher Ed. & Health Auth. Rev.: | |||
| Bonds Series 2017, 3%, tender 5/1/21 (a) | 1,225,000 | 1,232,945 | |
| Series 2014 A, 5% 10/1/23 | 5,000 | 5,419 | |
| Series 2017: | |||
| 2% 12/1/20 | 145,000 | 145,000 | |
| 3% 12/1/21 | 155,000 | 156,308 | |
| Series 2019: | |||
| 5% 9/1/23 | 500,000 | 557,835 | |
| 5% 9/1/26 | 1,250,000 | 1,521,825 | |
| Montgomery County Indl. Dev. Auth. Rev. (Meadowood Sr. Living Proj.) Series 2018 A, 3% 12/1/20 | 250,000 | 250,000 | |
| New Kensington-Arnold School District Series 2019 A: | |||
| 4% 5/15/21 | 940,000 | 955,334 | |
| 4% 5/15/22 | 975,000 | 1,023,896 | |
| Northeastern Hosp. & Ed. Auth. Series 2016 A, 5% 3/1/21 | 110,000 | 110,554 | |
| Octorara Area School District Chester and Lancaster Counties Series 2020, 4% 4/1/23 | 700,000 | 757,575 | |
| Pennsylvania Econ. Dev. Fing. Auth.: | |||
| (Philadelphia Biosolids Facility Proj.) Series 2020: | |||
| 3% 1/1/21 | 150,000 | 150,233 | |
| 3% 1/1/22 | 360,000 | 367,286 | |
| Series 2020 A: | |||
| 5% 4/15/21 | 350,000 | 355,909 | |
| 5% 4/15/22 | 500,000 | 531,095 | |
| Pennsylvania Econ. Dev. Fing. Auth. Indl. Dev. Rev. (The Pennsylvania Rapid Bridge Replacement Proj.) Series 2015: | |||
| 5% 12/31/20 (b) | 980,000 | 983,228 | |
| 5% 6/30/22 (b) | 1,495,000 | 1,590,560 | |
| Pennsylvania Econ. Dev. Fing. Auth. Solid Waste Disp. Rev. Bonds: | |||
| (Waste Mgmt., Inc. Proj.): | |||
| Series 2009, 2.8%, tender 12/1/21 (a) | 600,000 | 614,682 | |
| Series 2017 A, 0.7%, tender 8/2/21 (a)(b) | 500,000 | 500,066 | |
| Series 2011, 2.15%, tender 7/1/24 (a)(b) | 445,000 | 467,130 | |
| 0.28%, tender 1/4/21 (a)(b) | 3,000,000 | 2,999,975 | |
| Pennsylvania Gen. Oblig.: | |||
| Series 2012 1, 5% 6/1/22 | 355,000 | 380,294 | |
| Series 2015 1, 5% 8/15/23 | 580,000 | 653,869 | |
| Series 2016: | |||
| 5% 9/15/21 | 400,000 | 415,008 | |
| 5% 1/15/22 | 290,000 | 305,489 | |
| Pennsylvania Higher Edl. Facilities Auth. Rev.: | |||
| Bonds: | |||
| Series 2014 T3 and T4, 2.875%, tender 4/30/21 (a) | 1,000,000 | 1,000,016 | |
| 3%, tender 4/30/22 (a) | 1,565,000 | 1,602,591 | |
| Series 2012 A, 5% 8/15/21 | 335,000 | 345,415 | |
| Series 2014: | |||
| 5% 12/1/21 | 5,000 | 5,238 | |
| 5% 12/1/22 | 20,000 | 21,803 | |
| Series 2015: | |||
| 5% 8/15/21 | 450,000 | 463,991 | |
| 5% 8/15/22 | 325,000 | 349,359 | |
| Pennsylvania Hsg. Fin. Agcy.: | |||
| Bonds: | |||
| Series 2018 127C, 0.675%, tender 10/1/23 (a)(c) | 4,000,000 | 4,000,360 | |
| Series 2019, 1.4%, tender 1/1/23 (a) | 4,500,000 | 4,576,950 | |
| Series 2018 127A, 2.25% 4/1/21 (b) | 1,900,000 | 1,909,000 | |
| Pennsylvania Hsg. Fin. Agcy. Multifamily Hsg. Dev. Rev. Bonds Series 2018, 2.45%, tender 7/1/21 (a) | 2,000,000 | 2,024,217 | |
| Pennsylvania Hsg. Fin. Agcy. Single Family Mtg. Rev. Series 114A, 2.9% 10/1/21 (b) | 585,000 | 595,097 | |
| Pennsylvania Indl. Dev. Auth. Rev. Series 2012, 5% 7/1/21 | 335,000 | 344,205 | |
| Pennsylvania Pub. School Bldg. Auth. School Rev. (The School District of The City of Harrisburg Proj.) Series 2016 A: | |||
| 5% 12/1/21 | 90,000 | 94,061 | |
| 5% 12/1/21 (Escrowed to Maturity) | 20,000 | 20,937 | |
| Pennsylvania Tpk. Commission Tpk. Rev.: | |||
| Series 2018 A1, SIFMA Municipal Swap Index + 0.430% 0.54% 12/1/21 (a)(c) | 3,500,000 | 3,501,764 | |
| Series 2018 B, SIFMA Municipal Swap Index + 0.500% 0.61% 12/1/21 (a)(c) | 3,460,000 | 3,460,473 | |
| Philadelphia Arpt. Rev.: | |||
| Series 2011 A: | |||
| 5% 6/15/21 (b) | 1,725,000 | 1,766,505 | |
| 5% 6/15/22 (b) | 1,400,000 | 1,433,614 | |
| Series 2015 A, 5% 6/15/24 (b) | 1,065,000 | 1,215,122 | |
| Series 2017 A, 5% 7/1/24 | 40,000 | 46,274 | |
| Series 2017 B: | |||
| 5% 7/1/21 (b) | 2,800,000 | 2,872,941 | |
| 5% 7/1/22 (b) | 620,000 | 663,766 | |
| 5% 7/1/24 (b) | 345,000 | 395,674 | |
| Series 2020 C: | |||
| 5% 7/1/21 (b) | 7,500,000 | 7,695,378 | |
| 5% 7/1/22 (b) | 2,750,000 | 2,944,123 | |
| 5% 7/1/23 (b) | 8,930,000 | 9,882,563 | |
| Philadelphia Auth. for Indl. Dev. Series 2020 C, 4% 11/1/24 | 535,000 | 599,082 | |
| Philadelphia Auth. Indl. Dev. Lease Rev. Series 2019, 5% 10/1/21 | 500,000 | 516,240 | |
| Philadelphia Gas Works Rev.: | |||
| Series 15, 5% 8/1/21 | 25,000 | 25,745 | |
| Series 2015 13, 5% 8/1/21 | 850,000 | 875,314 | |
| Series 2017 15, 5% 8/1/22 | 480,000 | 515,659 | |
| Philadelphia Gen. Oblig. Series 2019 B, 5% 2/1/21 | 1,500,000 | 1,510,983 | |
| Philadelphia School District Series 2019 A: | |||
| 5% 9/1/21 | 115,000 | 118,810 | |
| 5% 9/1/23 | 185,000 | 206,937 | |
| Philadelphia Wtr. & Wastewtr. Rev. Series 2013 A, 5% 1/1/21 | 250,000 | 250,953 | |
| Phoenixville Area School District Gen. Oblig. Series 2016 B, 4% 8/15/21 | 500,000 | 512,653 | |
| Pittsburgh & Allegheny County Sports & Exhibition Auth. Series 2020, 4% 2/1/23 (FSA Insured) | 1,775,000 | 1,914,373 | |
| Pittsburgh Wtr. & Swr. Auth. Wtr. & Swr. Sys. Rev.: | |||
| Bonds Series 2017 C, 1 month U.S. LIBOR + 0.640% 0.765%, tender 12/1/20 (FSA Insured) (a)(c)(d) | 7,270,000 | 7,279,015 | |
| Series 2019 A: | |||
| 5% 9/1/23 | 270,000 | 304,150 | |
| 5% 9/1/26 (FSA Insured) | 625,000 | 775,875 | |
| Quakertown Gen. Auth. Health Facilities Series 2017 A, 3.125% 7/1/21 | 705,000 | 696,720 | |
| Reading School District Series 2017: | |||
| 5% 3/1/21 (FSA Insured) | 50,000 | 50,557 | |
| 5% 3/1/25 (FSA Insured) | 5,000 | 5,902 | |
| 5% 3/1/26 (FSA Insured) | 5,000 | 6,069 | |
| 5% 3/1/27 (FSA Insured) | 5,000 | 6,159 | |
| 5% 3/1/28 (FSA Insured) | 5,000 | 6,254 | |
| Southeastern Pennsylvania Trans. Auth. Rev. Series 2020: | |||
| 5% 6/1/21 | 500,000 | 511,464 | |
| 5% 6/1/22 | 1,000,000 | 1,068,440 | |
| 5% 6/1/23 | 750,000 | 833,610 | |
| TOTAL PENNSYLVANIA | 116,394,644 | ||
| Rhode Island - 0.1% | |||
| Rhode Is Comm Corp. Spl. Facilities Rev. Series 2018, 5% 7/1/21 | 685,000 | 700,775 | |
| Rhode Island Comm Corp. Rev. Series 2016 A, 5% 6/15/24 | 1,010,000 | 1,170,348 | |
| Rhode Island Health & Edl. Bldg. Corp. Higher Ed. Facilities Rev. Series 2016: | |||
| 5% 5/15/22 | 45,000 | 47,402 | |
| 5% 5/15/23 | 25,000 | 27,174 | |
| 5% 5/15/24 | 160,000 | 179,248 | |
| 5% 5/15/25 | 120,000 | 138,310 | |
| Rhode Island Health & Edl. Bldg. Corp. Pub. Schools Rev. Series 2015, 5% 5/15/25 (FSA Insured) | 130,000 | 154,658 | |
| Rhode Island Hsg. & Mtg. Fin. Corp. Series 2019 70, 4% 10/1/49 | 105,000 | 116,691 | |
| Rhode Island Student Ln. Auth. Student Ln. Rev.: | |||
| Series 2019 A, 5% 12/1/28 (b) | 490,000 | 595,879 | |
| Series A, 5% 12/1/20 (b) | 250,000 | 250,000 | |
| Tobacco Settlement Fing. Corp. Series 2015 A: | |||
| 5% 6/1/21 | 555,000 | 567,838 | |
| 5% 6/1/26 | 75,000 | 87,325 | |
| 5% 6/1/27 | 20,000 | 23,158 | |
| TOTAL RHODE ISLAND | 4,058,806 | ||
| South Carolina - 0.5% | |||
| Charleston County Arpt. District Series 2013 A, 5.25% 7/1/22 (b) | 1,235,000 | 1,325,810 | |
| Lancaster County School District ( South Carolina Gen. Oblig. Proj.) Series 2017, 5% 3/1/22 | 45,000 | 47,707 | |
| Laurens County Wtr. & Swr. Cmnty. Wtrwks. Series 2020, 1.375% 2/1/22 (Pre-Refunded to 7/1/21 @ 100) | 3,000,000 | 3,017,640 | |
| Patriots Energy Group Fing. Agcy. Bonds Series 2018 A, 4%, tender 2/1/24 (a) | 1,100,000 | 1,213,916 | |
| Richland County School District #2 Gen. Oblig. (South Carolina Gen. Oblig. Proj.) Series 2015 A, 5% 2/1/23 | 55,000 | 60,667 | |
| Scago Edl. Facilities Corp. for Colleton School District (School District of Colleton County Proj.) Series 2015: | |||
| 5% 12/1/23 | 95,000 | 105,880 | |
| 5% 12/1/26 | 25,000 | 28,975 | |
| South Carolina Assoc. of Governmental Organizations Ctfs. of Prtn. Series 2020 C, 2% 3/1/21 | 10,000,000 | 10,045,451 | |
| South Carolina Hsg. Fin. & Dev. Auth. Mtg. Rev. Series 2019 A, 4% 1/1/50 | 135,000 | 152,495 | |
| South Carolina Ports Auth. Ports Rev. Series 2019 B, 5% 7/1/22 (b) | 310,000 | 331,830 | |
| South Carolina Pub. Svc. Auth. Rev.: | |||
| Series 2011 B, 5% 12/1/21 | 910,000 | 952,368 | |
| Series 2012 B, 5% 12/1/20 | 20,000 | 20,000 | |
| Series 2012 C, 5% 12/1/20 | 400,000 | 400,000 | |
| Series 2014 C: | |||
| 5% 12/1/22 | 25,000 | 27,270 | |
| 5% 12/1/23 | 110,000 | 124,797 | |
| Series 2015 A, 5% 12/1/21 | 225,000 | 235,476 | |
| Series 2015 C, 5% 12/1/21 | 295,000 | 308,735 | |
| Series A: | |||
| 5% 12/1/21 | 530,000 | 554,676 | |
| 5% 12/1/22 | 750,000 | 818,093 | |
| 5% 12/1/23 | 1,015,000 | 1,151,538 | |
| 5% 12/1/23 | 620,000 | 703,402 | |
| 5% 12/1/24 | 365,000 | 429,915 | |
| TOTAL SOUTH CAROLINA | 22,056,641 | ||
| South Dakota - 0.0% | |||
| South Dakota Health & Edl. Facilities Auth. Rev.: | |||
| Series 2014 B: | |||
| 4% 11/1/21 | 10,000 | 10,333 | |
| 5% 11/1/22 | 10,000 | 10,860 | |
| Series 2020 A: | |||
| 5% 9/1/21 | 190,000 | 196,659 | |
| 5% 9/1/22 | 140,000 | 151,304 | |
| 5% 9/1/23 | 335,000 | 376,976 | |
| South Dakota Hsg. Dev. Auth. Series 2017 D, 4% 11/1/47 | 1,000,000 | 1,087,540 | |
| TOTAL SOUTH DAKOTA | 1,833,672 | ||
| Tennessee - 0.4% | |||
| Greeneville Health & Edl. Facilities Board Series 2018 A, 5% 7/1/22 | 1,500,000 | 1,595,550 | |
| Metropolitan Nashville Arpt. Auth. Rev.: | |||
| Series 2015 B, 5% 7/1/21 (b) | 300,000 | 307,797 | |
| Series 2019 B, 5% 7/1/25 (b) | 770,000 | 910,533 | |
| Tennergy Corp. Gas Rev. Bonds Series 2019 A, 5%, tender 10/1/24 (a) | 2,050,000 | 2,386,262 | |
| Tennessee Energy Acquisition Corp.: | |||
| Bonds (Gas Rev. Proj.) Series A, 4%, tender 5/1/23 (a) | 10,000,000 | 10,777,400 | |
| Series 2006 A, 5.25% 9/1/21 | 1,235,000 | 1,279,542 | |
| Series 2018, 5% 11/1/22 | 1,500,000 | 1,626,930 | |
| TOTAL TENNESSEE | 18,884,014 | ||
| Texas - 5.0% | |||
| Alamito Pub. Facilities Corp. Bonds: | |||
| (Cramer Three Apts. Proj.) Series 2018, 2.5%, tender 5/1/21 (a) | 5,000,000 | 5,043,160 | |
| Series 2019, 1.51%, tender 5/1/22 (a) | 6,000,000 | 6,049,440 | |
| Aledo Independent School District Series 2015, 0% 2/15/24 | 25,000 | 24,583 | |
| Atascosa County Indl. Dev. Corp. Poll. Cont. Rev. Series 2020: | |||
| 5% 12/15/21 | 975,000 | 1,017,374 | |
| 5% 12/15/23 | 450,000 | 505,499 | |
| 5% 12/15/24 | 550,000 | 638,682 | |
| Austin Affordable Pfc, Inc. Multifamily Hsg. Rev. Bonds Series 2019, 1.46%, tender 6/1/22 (a) | 700,000 | 711,438 | |
| Austin Arpt. Sys. Rev.: | |||
| Series 2014, 5% 11/15/26 (b) | 715,000 | 828,578 | |
| Series 2019 B, 5% 11/15/22 (b) | 600,000 | 652,158 | |
| Series 2019: | |||
| 5% 11/15/21 (b) | 2,225,000 | 2,319,827 | |
| 5% 11/15/22 (b) | 385,000 | 418,468 | |
| 5% 11/15/23 (b) | 500,000 | 563,605 | |
| 5% 11/15/24 (b) | 500,000 | 583,885 | |
| Austin-Bergstrom Landhost Ente Series 2017, 5% 10/1/21 | 280,000 | 286,315 | |
| Burleson Independent School District Bonds Series 2018, 2.5%, tender 8/1/22 (a) | 5,000,000 | 5,180,750 | |
| Cap. Area Hsg. Fin. Corp. Multi-family Hsg. Rev. Bonds Series 2019, 2.1%, tender 9/1/22 (a) | 2,800,000 | 2,827,636 | |
| Central Reg'l. Mobility Auth.: | |||
| Series 2016: | |||
| 5% 1/1/21 | 10,000 | 10,036 | |
| 5% 1/1/22 | 35,000 | 36,687 | |
| 5% 1/1/23 | 55,000 | 60,066 | |
| 5% 1/1/24 | 75,000 | 84,995 | |
| 5% 1/1/26 | 65,000 | 78,531 | |
| Series 2020 B: | |||
| 5% 1/1/21 | 150,000 | 150,547 | |
| 5% 1/1/22 | 155,000 | 162,473 | |
| 5% 1/1/23 | 220,000 | 240,264 | |
| 5% 1/1/25 | 125,000 | 146,519 | |
| 5% 1/1/26 | 125,000 | 151,021 | |
| Series 2020 F, 5% 1/1/25 | 2,000,000 | 2,300,340 | |
| Coastal Bend Health Facilities Dev. Corp. Series 2005 B2, 0.24%, tender 7/1/31 (FSA Insured) (a) | 3,825,000 | 3,825,000 | |
| Corpus Christi Gen. Oblig. Series 2015, 5% 3/1/24 | 1,955,000 | 2,245,102 | |
| Cypress-Fairbanks Independent School District Bonds: | |||
| Series 2015 B2, 2.125%, tender 8/16/21 (a) | 4,000,000 | 4,051,690 | |
| Series 2017 A-2, 1.25%, tender 8/15/22 (a) | 3,000,000 | 3,047,340 | |
| Series 2017 A1, 2.125%, tender 8/16/21 (a) | 8,180,000 | 8,285,706 | |
| Dallas Fort Worth Int'l. Arpt. Rev.: | |||
| Series 2012 C, 5% 11/1/21 | 305,000 | 317,813 | |
| Series 2013 F: | |||
| 5% 11/1/21 | 75,000 | 78,151 | |
| 5% 11/1/22 | 240,000 | 261,026 | |
| Series 2014 A, 5.25% 11/1/26 (b) | 400,000 | 449,528 | |
| Series 2014 B, 5% 11/1/22 (b) | 100,000 | 108,420 | |
| Series 2014 C, 5% 11/1/22 | 400,000 | 435,044 | |
| Series 2014 D, 5% 11/1/21 (b) | 2,515,000 | 2,616,635 | |
| Series 2014 E, 5% 11/1/21 | 300,000 | 312,603 | |
| Series 2020 A, 5% 11/1/23 | 2,250,000 | 2,548,643 | |
| Series 2020 B: | |||
| 5% 11/1/21 | 3,580,000 | 3,730,399 | |
| 5% 11/1/22 | 3,000,000 | 3,262,830 | |
| Dallas Gen. Oblig. Series 2020 A: | |||
| 5% 2/15/23 | 2,000,000 | 2,203,660 | |
| 5% 2/15/24 | 1,000,000 | 1,145,350 | |
| Dallas Independent School District Bonds: | |||
| Series 2016 B5, 5%, tender 2/15/21 (a) | 175,000 | 176,669 | |
| Series 2016, 5%, tender 2/15/22 (a) | 5,000 | 5,286 | |
| Series B6: | |||
| 5%, tender 2/15/22 (a) | 100,000 | 105,713 | |
| 5%, tender 2/15/22 (a) | 100,000 | 105,613 | |
| Denton Independent School District Series 2016, 0% 8/15/25 | 35,000 | 34,358 | |
| El Paso Independent School District Bonds Series 2020, 2.5%, tender 8/1/21 (a) | 2,500,000 | 2,536,613 | |
| Fort Bend Independent School District Bonds: | |||
| Series 2019 A, 1.95%, tender 8/1/22 (a) | 5,585,000 | 5,735,963 | |
| Series 2020 B, 0.875%, tender 8/1/25 (a) | 2,700,000 | 2,733,696 | |
| Series D, 1.5%, tender 8/1/21 (a) | 70,000 | 70,561 | |
| Fort Worth Gen. Oblig.: | |||
| Series 2015 A, 5% 3/1/23 | 35,000 | 38,735 | |
| Series 2019, 5% 3/1/24 | 4,520,000 | 5,207,537 | |
| Fort Worth Independent School District Series 2015, 5% 2/15/22 | 35,000 | 37,035 | |
| Goose Creek Consolidated Independent School District Bonds Series 2019 B, 0.27%, tender 10/1/21 (a) | 3,000,000 | 2,999,502 | |
| Harris County Cultural Ed. Facilities Fin. Corp. Med. Facilities Rev. Series 2016, 5% 11/15/21 | 895,000 | 932,179 | |
| Harris County Cultural Ed. Facilities Fin. Corp. Rev.: | |||
| Bonds: | |||
| Series 2019 B, 5%, tender 12/1/22 (a) | 5,000,000 | 5,435,400 | |
| Series 2019 C, SIFMA Municipal Swap Index + 0.420% 0.53%, tender 12/1/22 (a)(c) | 3,250,000 | 3,237,585 | |
| Series 2020 C, 5%, tender 12/1/22 (a) | 6,180,000 | 6,735,026 | |
| Series 2013 A, 5% 12/1/21 | 450,000 | 469,841 | |
| Series 2013 B, SIFMA Municipal Swap Index + 0.900% 1.01% 6/1/22 (a)(c) | 600,000 | 602,874 | |
| Series 2014 A, 5% 12/1/26 | 120,000 | 140,434 | |
| Series 2019 A: | |||
| 5% 12/1/20 | 1,000,000 | 1,000,000 | |
| 5% 12/1/21 | 2,110,000 | 2,203,033 | |
| Series 2020, 5% 6/1/22 | 1,000,000 | 1,065,950 | |
| Harris County Gen. Oblig. Series 2012 B, 1.45% 8/15/21 (a) | 4,075,000 | 4,109,889 | |
| Harris County Health Facilities Dev. Corp. Rev.: | |||
| Series 2005 A4, 0.18%, tender 7/1/31 (FSA Insured) (a) | 925,000 | 925,000 | |
| Series A3, 0.24%, tender 7/1/31 (FSA Insured) (a) | 3,000,000 | 3,000,000 | |
| Houston Arpt. Sys. Rev.: | |||
| Series 2011 A, 5% 7/1/22 (Pre-Refunded to 7/1/21 @ 100) (b) | 410,000 | 420,853 | |
| Series 2012 A: | |||
| 5% 7/1/21 (b) | 300,000 | 307,708 | |
| 5% 7/1/23 (Pre-Refunded to 7/1/22 @ 100) (b) | 235,000 | 251,744 | |
| Series 2012 B: | |||
| 5% 7/1/21 | 655,000 | 672,608 | |
| 5% 7/1/27 (Pre-Refunded to 7/1/22 @ 100) | 4,000,000 | 4,300,200 | |
| Series 2018 A: | |||
| 5% 7/1/21 (b) | 275,000 | 282,066 | |
| 5% 7/1/22 (b) | 700,000 | 748,720 | |
| Series 2018 B, 5% 7/1/22 | 720,000 | 772,488 | |
| Series 2018 C, 5% 7/1/21 (b) | 635,000 | 651,316 | |
| Series 2020 A, 5% 7/1/23 (b) | 1,000,000 | 1,110,470 | |
| Series A: | |||
| 5% 7/1/21 (b) | 475,000 | 487,205 | |
| 5% 7/1/21 (Escrowed to Maturity) (b) | 200,000 | 205,293 | |
| Houston Independent School District Bonds: | |||
| Series 2012: | |||
| 2.4%, tender 6/1/21 (a) | 2,985,000 | 3,016,271 | |
| 4%, tender 6/1/29 | 1,000,000 | 1,090,620 | |
| Series 2013 B, 2.4%, tender 6/1/21 (a) | 3,100,000 | 3,132,476 | |
| Houston Util. Sys. Rev. Bonds Series 2018 C, 1 month U.S. LIBOR + 0.360% 0.465%, tender 12/3/20 (a)(c) | 8,245,000 | 8,243,010 | |
| Irving Hosp. Auth. Hosp. Rev. Series 2017 A, 5% 10/15/21 | 65,000 | 67,499 | |
| Jacksonville Independent School District Series 2020, 5% 2/15/24 | 1,915,000 | 2,201,273 | |
| Katy Independent School District Bonds Series 2015 C, 1 month U.S. LIBOR + 0.280% 0.374%, tender 12/15/20 (a)(c) | 4,800,000 | 4,792,978 | |
| Leander Independent School District Series 2013 A: | |||
| 0% 8/15/21 | 550,000 | 549,151 | |
| 0% 8/15/23 | 1,000,000 | 990,660 | |
| Love Field Arpt. Modernization Rev.: | |||
| Series 2015, 5% 11/1/23 (b) | 375,000 | 418,399 | |
| Series 2017, 5% 11/1/24 (b) | 750,000 | 864,863 | |
| Lower Colorado River Auth. Rev.: | |||
| (LCRA Transmission Corp. Proj.) Series 2011 B, 5% 5/15/23 | 465,000 | 475,030 | |
| (LCRA Transmission Svc. Corp. Proj.) Series 2019, 5% 5/15/21 | 500,000 | 510,879 | |
| (LCRA Transmission Svcs. Corp. Proj.): | |||
| Series 2019 A, 5% 5/15/21 | 1,335,000 | 1,364,047 | |
| Series 2019, 5% 5/15/23 | 1,070,000 | 1,191,937 | |
| Series 2020: | |||
| 5% 5/15/21 | 1,265,000 | 1,292,524 | |
| 5% 5/15/22 | 1,000,000 | 1,069,290 | |
| 5% 5/15/23 | 215,000 | 239,501 | |
| 5% 5/15/24 | 300,000 | 347,418 | |
| Mansfield Independent School District Series 2016, 5% 2/15/24 | 95,000 | 109,169 | |
| Mission Econ. Dev. Corp. Solid Waste Disp. Rev. Bonds: | |||
| (Republic Svcs., Inc. Proj.) Series 2008 A, 0.3%, tender 2/1/21 (a)(b) | 7,800,000 | 7,800,766 | |
| (Waste Mgmt., Inc. Proj.): | |||
| Series 2020 A, 0.4%, tender 12/1/20 (a)(b) | 5,200,000 | 5,200,000 | |
| Series 2020 B, 0.4%, tender 12/1/20 (a)(b) | 5,350,000 | 5,350,000 | |
| New Caney Independent School District Bonds Series 2018, 3%, tender 8/15/21 (a) | 1,090,000 | 1,110,720 | |
| Newark Higher Ed. Fin. Corp. (Abilene Christian Univ. Proj.) Series 2016 A, 5% 4/1/26 | 55,000 | 65,172 | |
| North East Texas Independent School District Bonds Series 2013 B, 1.42%, tender 8/1/21 (a) | 285,000 | 285,508 | |
| North Harris County Reg'l. Wtr. Auth. Series 2013, 4% 12/15/22 | 35,000 | 37,597 | |
| North Texas Tollway Auth. Rev.: | |||
| Series 2017 B, 5% 1/1/21 | 325,000 | 326,237 | |
| Series 2019 A, 5% 1/1/21 | 1,700,000 | 1,706,468 | |
| Series 2020 C, 5% 1/1/21 | 3,000,000 | 3,011,415 | |
| Northside Independent School District Bonds: | |||
| Series 2016, 2%, tender 6/1/21 (a) | 3,205,000 | 3,232,211 | |
| Series 2020, 0.7%, tender 6/1/25 (a) | 5,000,000 | 5,063,450 | |
| Odessa Hsg. Fin. Corp. Multifamily Hsg. Rev. Bonds Series 2020, 0.35%, tender 3/1/23 (a) | 2,500,000 | 2,498,000 | |
| Prosper Independent School District Bonds Series 2019 B, 2%, tender 8/15/23 (a) | 1,000,000 | 1,036,730 | |
| San Antonio Arpt. Sys. Rev. Series 2019 A: | |||
| 5% 7/1/21 (b) | 640,000 | 656,444 | |
| 5% 7/1/21 (b) | 1,330,000 | 1,364,173 | |
| 5% 7/1/22 (b) | 275,000 | 294,140 | |
| 5% 7/1/22 (b) | 265,000 | 283,444 | |
| 5% 7/1/23 (b) | 195,000 | 215,114 | |
| 5% 7/1/25 (b) | 400,000 | 469,468 | |
| 5% 7/1/26 (b) | 500,000 | 606,860 | |
| San Antonio Elec. & Gas Sys. Rev. Bonds: | |||
| Series 2015 B, 2%, tender 12/1/21 (a) | 3,550,000 | 3,577,653 | |
| Series 2015 D, 3%, tender 12/1/20 (a) | 4,000,000 | 4,000,000 | |
| San Antonio Hsg. Trust Fin. Corp. Bonds Series 2019, 1.4%, tender 1/1/22 (a) | 5,000,000 | 5,043,500 | |
| San Antonio Pub. Facilities Corp. and Rfdg. Lease (Convention Ctr. Proj.) Series 2012: | |||
| 5% 9/15/21 | 20,000 | 20,699 | |
| 5% 9/15/22 | 75,000 | 80,924 | |
| San Antonio Wtr. Sys. Rev. Bonds Series 2013 F, 2%, tender 11/1/21 (a) | 1,000,000 | 1,013,842 | |
| Tarrant County Cultural Ed. Facilities Fin. Corp. Hosp. Rev. (Scott & White Healthcare Proj.) Series 2013 A: | |||
| 5% 8/15/21 | 15,000 | 15,466 | |
| 5% 8/15/23 | 20,000 | 22,478 | |
| Tarrant County Cultural Ed. Facilities Fin. Corp. Rev.: | |||
| Series 2016 A: | |||
| 5% 2/15/25 | 345,000 | 407,835 | |
| 5% 2/15/26 | 35,000 | 42,687 | |
| Series 2017 A, 5% 2/15/24 | 195,000 | 222,203 | |
| Texas Dept. of Hsg. & Cmnty. Affairs Multi-family Hsg. Rev. Bonds: | |||
| Series 2018, 1.17%, tender 2/1/21 (a) | 3,800,000 | 3,802,012 | |
| Series 2019, 2.11%, tender 2/1/21 | 2,880,000 | 2,888,243 | |
| Texas Gen. Oblig. Bonds: | |||
| Series 2019 C2, 1.85%, tender 8/1/22 (a) | 115,000 | 115,104 | |
| Series 2019 E2, 2.25%, tender 8/1/22 (a) | 420,000 | 420,664 | |
| Texas State Univ. Sys. Fing. Rev. Series 2019 A, 4% 3/15/21 | 2,000,000 | 2,021,897 | |
| Texas Wtr. Dev. Board Rev. Series 2019 A, 5% 4/15/21 | 850,000 | 865,251 | |
| Tomball Independent School District Bonds Series 2014 B2, 2.125%, tender 8/15/21 (a) | 1,000,000 | 1,012,923 | |
| Trinity River Auth. Reg'l. Wastewtr. Sys. Rev. Series 2016, 5% 8/1/23 | 35,000 | 39,375 | |
| Univ. of Texas Board of Regents Sys. Rev. Series 2017 C, 5% 8/15/21 | 1,945,000 | 2,011,372 | |
| Weatherford Util. Sys. Rev. Series 2015, 5% 9/1/21 (FSA Insured) | 250,000 | 259,032 | |
| TOTAL TEXAS | 230,317,052 | ||
| Utah - 0.0% | |||
| Intermountain Pwr. Agcy. Pwr. Supply Rev. Series 2018 A, 5% 7/1/21 | 500,000 | 513,293 | |
| Salt Lake City Arpt. Rev. Series 2018 A, 5% 7/1/23 (b) | 250,000 | 277,210 | |
| Utah County Hosp. Rev. Bonds Series 2018 B2, 5%, tender 8/1/24 (a) | 135,000 | 154,111 | |
| TOTAL UTAH | 944,614 | ||
| Vermont - 0.0% | |||
| Vermont Student Assistant Corp. Ed. Ln. Rev.: | |||
| Series 2017 A, 5% 6/15/23 (b) | 700,000 | 761,964 | |
| Series 2020 A, 5% 6/15/27 (b) | 625,000 | 744,919 | |
| TOTAL VERMONT | 1,506,883 | ||
| Virginia - 1.2% | |||
| Arlington County IDA Hosp. Facilities Series 2020: | |||
| 5% 7/1/23 | 340,000 | 378,396 | |
| 5% 7/1/24 | 425,000 | 490,850 | |
| Charles City County Solid Wt Rev. Bonds Series 2002, 3%, tender 4/1/21 (a)(b) | 5,750,000 | 5,793,932 | |
| Charles City County Econ. Dev. Auth. Solid Waste Disp. Rev. Bonds (Waste Mgmt., Inc. Proj.) Series 2003 A, 2.4%, tender 5/2/22 (a)(b) | 1,750,000 | 1,793,610 | |
| Chesapeake Bay Bridge and Tunnel District Gen. Resolution Rev. Series 2019, 5% 11/1/23 | 2,000,000 | 2,235,760 | |
| Chesapeake Trans. Sys. Toll Road Rev. Series 2012 A, 5% 7/15/21 | 10,000 | 10,271 | |
| Fairfax County Indl. Dev. Auth. Bonds (Inova Health Sys. Proj.) Series 2018 B, 5%, tender 5/15/23 (a) | 1,200,000 | 1,333,932 | |
| Fredericksburg Econ. Dev. Auth. Rev. Series 2014, 5% 6/15/24 | 50,000 | 57,218 | |
| Halifax County Indl. Dev. Auth. Bonds (Virginia Elec. and Pwr. Co. Proj.) Series 2010 A, 0.45%, tender 4/1/22 (a) | 6,185,000 | 6,183,330 | |
| Hampton Roads Trans. Accountability Commission Series 2019 A, 5% 7/1/22 | 14,500,000 | 15,573,725 | |
| King George County Indl. Dev. Auth. Solid Waste Disp. Fac. Rev. (King George Landfill, Inc. Proj.) Series 2003 A, 2.5% 6/1/23 (a)(b) | 735,000 | 762,864 | |
| Louisa Indl. Dev. Auth. Poll. Cont. Rev. Bonds (Virginia Elec. and Pwr. Co. Proj.): | |||
| Series 2008 A, 1.9%, tender 6/1/23 (a) | 2,500,000 | 2,593,125 | |
| Series 2008 B, 0.75%, tender 9/2/25 (a) | 4,000,000 | 4,043,200 | |
| Series 2008 C, 1.8%, tender 4/1/22 (a) | 1,600,000 | 1,628,192 | |
| Russell County Poll. Cont. (Appalachian Pwr. Co. Proj.) Series K 4.625% 11/1/21 | 250,000 | 250,796 | |
| Spotsylvania County Econ. Dev. Bonds (Palmers Creek Apt. Proj.) Series 2019, 1.45%, tender 2/1/22 (a) | 5,000,000 | 5,057,300 | |
| Stafford County Econ. Dev. Auth. Hosp. Facilities Rev. Series 2016: | |||
| 5% 6/15/24 | 25,000 | 28,609 | |
| 5% 6/15/25 | 20,000 | 23,675 | |
| 5% 6/15/26 | 35,000 | 42,664 | |
| Sussex County Indl. Dev. Auth. Solid Waste Disp. Rev. Bonds Series 2003 A, 2.4%, tender 5/2/22 (a)(b) | 805,000 | 825,061 | |
| Virginia Pub. Bldg. Auth. Pub. Facilities Rev.: | |||
| Series 2020 A, 5% 8/1/22 | 1,940,000 | 2,095,627 | |
| Series 2020 B, 5% 8/1/21 | 2,625,000 | 2,709,263 | |
| Virginia Small Bus. Fing. Auth. Series 2020 A: | |||
| 5% 1/1/22 | 900,000 | 942,678 | |
| 5% 1/1/23 | 400,000 | 435,968 | |
| Wise County Indl. Dev. Auth. Waste & Sewage Rev. Bonds (Virginia Elec. and Pwr. Co. Proj.) Series 2010 A, 1.2%, tender 5/31/24 (a) | 1,890,000 | 1,932,468 | |
| York County Econ. Dev. Auth. Poll. Cont. Rev. Bonds (Virginia Elec. and Pwr. Co. Proj.) Series 2009 A, 1.9%, tender 6/1/23 (a) | 300,000 | 310,989 | |
| TOTAL VIRGINIA | 57,533,503 | ||
| Washington - 1.7% | |||
| Central Puget Sound Reg'l. Trans. Auth. Sales & Use Tax Rev. Bonds Series 2015 S2A, SIFMA Municipal Swap Index + 0.300% 0.41%, tender 12/3/20 (a)(c) | 20,000,000 | 20,000,256 | |
| Grant County Pub. Util. District #2 Series 2012 A, 5% 1/1/21 (Escrowed to Maturity) | 40,000 | 40,157 | |
| King County Hsg. Auth. Rev.: | |||
| Series 2018, 3.5% 5/1/21 | 500,000 | 506,276 | |
| Series 2019: | |||
| 3% 11/1/23 | 1,175,000 | 1,260,129 | |
| 4% 11/1/24 | 135,000 | 153,573 | |
| Series 2020: | |||
| 3% 6/1/21 | 400,000 | 404,839 | |
| 3% 6/1/22 | 250,000 | 258,873 | |
| 3% 6/1/23 | 400,000 | 422,916 | |
| 3% 6/1/25 | 275,000 | 300,908 | |
| King County Swr. Rev. Bonds: | |||
| Series 2012, 2.6%, tender 12/1/21 (a) | 3,600,000 | 3,619,987 | |
| Series 2020 B, 0.875%, tender 1/1/26 (a) | 2,000,000 | 2,020,320 | |
| Port of Seattle Gen. Oblig. Series 2011: | |||
| 5.25% 12/1/20 (b) | 375,000 | 375,000 | |
| 5.25% 12/1/21 (b) | 300,000 | 307,464 | |
| Port of Seattle Rev.: | |||
| Series 2012 A, 5% 8/1/22 | 325,000 | 349,372 | |
| Series 2012 B: | |||
| 5% 8/1/21 (b) | 500,000 | 514,687 | |
| 5% 8/1/23 (b) | 1,345,000 | 1,439,648 | |
| Series 2015 B, 5% 3/1/21 | 355,000 | 359,137 | |
| Series 2015 C, 5% 4/1/21 (b) | 540,000 | 548,231 | |
| Series 2016 B: | |||
| 5% 10/1/21 (b) | 60,000 | 62,230 | |
| 5% 10/1/22 (b) | 70,000 | 75,438 | |
| 5% 10/1/23 (b) | 65,000 | 72,740 | |
| Series 2017 C, 5% 5/1/22 (b) | 5,540,000 | 5,899,712 | |
| Series 2018 A, 5% 5/1/22 (b) | 11,475,000 | 12,220,072 | |
| Series 2019: | |||
| 5% 4/1/21 (b) | 1,000,000 | 1,015,242 | |
| 5% 4/1/22 (b) | 530,000 | 562,463 | |
| 5% 4/1/23 (b) | 615,000 | 675,596 | |
| Port of Seattle Spl. Facility Rev. Series 2013, 5% 6/1/22 (b) | 500,000 | 534,375 | |
| Seattle Muni. Lt. & Pwr. Rev. Bonds Series 2018 B2, SIFMA Municipal Swap Index + 0.290% 0.4%, tender 12/3/20 (a)(c) | 10,000,000 | 10,000,437 | |
| Tacoma Elec. Sys. Rev.: | |||
| Series 2013 A: | |||
| 4% 1/1/21 | 5,000 | 5,015 | |
| 5% 1/1/21 | 40,000 | 40,154 | |
| Series 2017: | |||
| 5% 1/1/22 | 15,000 | 15,783 | |
| 5% 1/1/25 | 25,000 | 29,760 | |
| 5% 1/1/26 | 10,000 | 12,351 | |
| Tobacco Settlement Auth. Rev. Series 2018, 5% 6/1/22 | 215,000 | 230,252 | |
| Washington Gen. Oblig. Series R 2020 C: | |||
| 5% 7/1/21 | 1,000,000 | 1,028,073 | |
| 5% 7/1/22 | 2,500,000 | 2,689,275 | |
| Washington Health Care Facilities Auth. Rev.: | |||
| (Providence Health Systems Proj.) Series 2012 A, 5% 10/1/24 | 250,000 | 270,715 | |
| (Virginia Mason Med. Ctr. Proj.) Series 2017: | |||
| 5% 8/15/25 | 205,000 | 230,857 | |
| 5% 8/15/26 | 115,000 | 131,825 | |
| 5% 8/15/27 | 50,000 | 58,114 | |
| Bonds: | |||
| Series 2012 B, 5%, tender 10/1/21 (a) | 450,000 | 466,760 | |
| Series 2019 B, 5%, tender 8/1/24 (a) | 1,095,000 | 1,236,540 | |
| Series 2011 B, 3.5% 10/1/21 | 250,000 | 256,081 | |
| Series 2012 A, 5% 10/1/22 | 445,000 | 479,995 | |
| Series 2015 B, 5% 8/15/23 | 600,000 | 673,296 | |
| Series 2018 B, 5% 10/1/25 | 1,195,000 | 1,445,197 | |
| Washington Hsg. Fin. Commission Multi-family Hsg. Rev. (Columbia Park Apts. Proj.) Series 2019, 1.39%, tender 7/1/21 (a) | 5,000,000 | 5,029,837 | |
| TOTAL WASHINGTON | 78,329,958 | ||
| West Virginia - 0.3% | |||
| Harrison County Commission Solid Waste Disp. Rev. Bonds (Monongahela Pwr. Co. Proj.) Series 2018 A, 3%, tender 10/15/21 (a)(b) | 6,900,000 | 7,009,326 | |
| Mason Co. Poll. Cont. Rev. (Appalachian Pwr. Co. Proj.) Series 2003 L, 2.75% 10/1/22 | 3,245,000 | 3,364,092 | |
| West Virginia Econ. Dev. Auth. Solid Waste Disp. Facilities Rev. Bonds (Appalachian Pwr. Co. - Amos Proj.) Series 2015 A, 2.55%, tender 4/1/24 (a) | 225,000 | 237,938 | |
| West Virginia Hosp. Fin. Auth. Hosp. Rev. Series 2016 A: | |||
| 5% 6/1/22 | 2,195,000 | 2,336,358 | |
| 5% 6/1/24 | 1,490,000 | 1,706,095 | |
| West Virginia Hsg. Dev. Fund Series 2017 A, 2.4% 11/1/22 (b) | 960,000 | 985,987 | |
| TOTAL WEST VIRGINIA | 15,639,796 | ||
| Wisconsin - 1.0% | |||
| Crosse Resources Recovery Rev. Series 1996, 6% 11/1/21 (b) | 1,500,000 | 1,572,852 | |
| Milwaukee County Arpt. Rev.: | |||
| Series 2013 A: | |||
| 5% 12/1/20 (b) | 30,000 | 30,000 | |
| 5% 12/1/22 (b) | 30,000 | 32,386 | |
| 5.25% 12/1/23 (b) | 35,000 | 39,443 | |
| Series 2016 A: | |||
| 5% 12/1/20 (b) | 375,000 | 375,000 | |
| 5% 12/1/22 (b) | 1,000,000 | 1,079,520 | |
| Milwaukee Gen. Oblig. Series 2020 N4, 5% 4/1/22 | 2,000,000 | 2,123,340 | |
| Pub. Fin. Auth. Series 2020 A: | |||
| 5% 1/1/21 | 225,000 | 225,786 | |
| 5% 1/1/25 | 300,000 | 349,536 | |
| Pub. Fin. Auth. Hosp. Rev. Series 2020 A: | |||
| 5% 6/1/23 | 345,000 | 383,371 | |
| 5% 6/1/24 | 675,000 | 778,208 | |
| 5% 6/1/25 | 375,000 | 447,551 | |
| 5% 6/1/26 | 300,000 | 367,860 | |
| Pub. Fin. Auth. Solid Waste Bonds (Waste Mgmt., Inc. Proj.): | |||
| Series 2017 A, 0.3%, tender 9/1/27 (a)(b) | 1,500,000 | 1,500,147 | |
| Series 2017 A-2, 0.3%, tender 10/1/25 (a)(b) | 16,000,000 | 16,001,571 | |
| Wisconsin Health & Edl. Facilities: | |||
| (Agnesian Healthcare Proj.) Series 2017, 5% 7/1/21 | 100,000 | 102,569 | |
| Bonds: | |||
| (Ascension Health Cr. Group Proj.) Series 2013 B, 5%, tender 6/1/21 (a) | 1,905,000 | 1,949,355 | |
| Series 2018 B, 5%, tender 1/26/22 (a) | 5,710,000 | 6,008,633 | |
| Series 2018 C, SIFMA Municipal Swap Index + 0.450% 0.56%, tender 7/27/22 (a)(c) | 3,885,000 | 3,889,312 | |
| Series 2018 C3, SIFMA Municipal Swap Index + 0.550% 0.66%, tender 7/26/23 (a)(c) | 4,000,000 | 4,008,600 | |
| Series 2014 A, 5% 11/15/21 | 325,000 | 338,692 | |
| Series 2014, 5% 5/1/21 | 15,000 | 15,251 | |
| Series 2016 A, 5% 11/15/21 | 480,000 | 500,928 | |
| Series 2018, 5% 4/1/26 | 195,000 | 238,473 | |
| Series 2019 A: | |||
| 5% 12/1/23 | 30,000 | 33,920 | |
| 5% 12/1/24 | 100,000 | 116,919 | |
| 5% 12/1/25 | 125,000 | 151,215 | |
| 5% 12/1/26 | 200,000 | 247,966 | |
| Series 2019, 5% 10/1/21 | 400,000 | 414,011 | |
| Series 2020, 4% 7/1/21 | 820,000 | 835,840 | |
| Wisconsin Health & Edl. Facilities Auth. Series 2014 A, 5% 12/1/24 | 695,000 | 813,101 | |
| Wisconsin Health & Edl. Facilities Auth. Rev.: | |||
| Series 2010, 5% 12/15/20 | 350,000 | 350,561 | |
| Series 2012, 5% 10/1/21 | 30,000 | 31,051 | |
| TOTAL WISCONSIN | 45,352,968 | ||
| Wyoming - 0.2% | |||
| Wyoming Cmnty. Dev. Auth. Hsg. Rev.: | |||
| Bonds Series 2018 4, SIFMA Municipal Swap Index + 0.320% 0.43%, tender 12/3/20 (a)(c) | 5,000,000 | 4,999,825 | |
| Series 2020 3: | |||
| 5% 12/1/21 (b) | 565,000 | 590,956 | |
| 5% 6/1/22 (b) | 280,000 | 298,880 | |
| 5% 6/1/23 (b) | 955,000 | 1,056,173 | |
| TOTAL WYOMING | 6,945,834 | ||
| TOTAL MUNICIPAL BONDS | |||
| (Cost $2,073,417,076) | 2,090,139,503 | ||
| Municipal Notes - 22.5% | |||
| Alabama - 0.2% | |||
| Health Care Auth. for Baptist Health Series 2013 B, 0.43% 12/7/20, VRDN (a) | 6,705,000 | $6,705,000 | |
| Mobile Indl. Dev. Board Rev. (Alabama Pwr. Co. Proj.) Series 2001 B, 0.15% 12/1/20, VRDN (a)(b) | 600,000 | 600,000 | |
| TOTAL ALABAMA | 7,305,000 | ||
| Alaska - 0.0% | |||
| Alaska Hsg. Fin. Corp. Series 2002 A, 0.13% 12/1/20 (Liquidity Facility JPMorgan Chase Bank), VRDN (a)(b) | 15,000 | 15,000 | |
| Arizona - 0.5% | |||
| Arizona St Indl. Dev. Auth. Multi Participating VRDN: | |||
| Series DBE 80 53, 0.71% 1/29/21 (Liquidity Facility Deutsche Bank AG New York Branch) (a)(f)(g)(h) | 10,200,000 | 10,200,000 | |
| Series XF 10 91, 0.51% 12/7/20 (Liquidity Facility Deutsche Bank AG New York Branch) (a)(b)(f)(h) | 950,000 | 950,000 | |
| Phoenix Civic Impt. Board Arpt. Rev. Participating VRDN Series XM 08 23, 0.36% 12/7/20 (Liquidity Facility Morgan Stanley Bank, West Valley City Utah) (a)(f)(h) | 1,900,000 | 1,900,000 | |
| Phoenix Indl. Dev. Auth. Health Care Facilities (Mayo Clinic Proj.) Series 2014 A, 0.08% 12/1/20 (Liquidity Facility Bank of America NA), VRDN (a) | 10,200,000 | 10,200,000 | |
| TOTAL ARIZONA | 23,250,000 | ||
| California - 1.3% | |||
| California Edl. Facilities Auth. Rev. Series 2020, 0.21% 3/3/21, CP | 1,500,000 | 1,500,267 | |
| Los Angeles County Gen. Oblig. TRAN Series A, 4% 6/30/21 | 15,000,000 | 15,329,028 | |
| Los Angeles Gen. Oblig. TRAN Series 2020, 4% 6/24/21 | 15,000,000 | 15,321,921 | |
| River Islands Pub. Fing. Auth. Participating VRDN Series MIZ 90 26, 0.46% 1/4/21 (Liquidity Facility Mizuho Cap. Markets Llc) (a)(f)(g)(h) | 4,300,000 | 4,300,000 | |
| Riverside County Gen. Oblig. TRAN Series 2020, 4% 6/30/21 | 5,000,000 | 5,110,773 | |
| San Diego Unified School District TRAN Series 2020, 5% 6/30/21 | 3,280,000 | 3,371,298 | |
| San Francisco City & County Series A1, 0.18% 1/13/21, LOC Bank of America NA, CP | 4,000,000 | 3,999,903 | |
| San Francisco City & County Arpts. Commission Int'l. Arpt. Rev.: | |||
| Participating VRDN: | |||
| Series Floaters XM 06 75, 0.36% 12/7/20 (Liquidity Facility Morgan Stanley Bank, West Valley City Utah) (a)(b)(f)(h) | 2,775,000 | 2,775,000 | |
| Series XM 09 16, 0.34% 12/7/20 (Liquidity Facility JPMorgan Chase Bank) (a)(b)(f)(h) | 2,200,000 | 2,200,000 | |
| Series 2010 A2, 0.12% 12/7/20, LOC Bank of America NA, VRDN (a)(b) | 4,000,000 | 4,000,000 | |
| Shafter Indl. Dev. Auth. Indl. Dev. Rev. 0.48% 12/7/20, LOC Deutsche Bank AG New York Branch, VRDN (a)(b) | 335,000 | 335,000 | |
| Transbay Joint Powers Auth. Participating VRDN Series YX 11 42, 0.21% 12/7/20 (Liquidity Facility Barclays Bank PLC) (a)(f)(h) | 500,000 | 500,000 | |
| TOTAL CALIFORNIA | 58,743,190 | ||
| Colorado - 1.4% | |||
| Colorado Ed. Ln. Prog. TRAN Series 2020 A: | |||
| 3% 6/29/21 | 8,000,000 | 8,129,744 | |
| 4% 6/29/21 | 12,000,000 | 12,263,875 | |
| Colorado Edl. & Cultural Facilities Auth. Rev. (Mesivta of Greater Los Angeles Proj.) Series 2005, 0.46% 12/7/20, LOC Deutsche Bank AG, VRDN (a) | 675,000 | 675,000 | |
| Colorado Gen. Fdg. Rev. TRAN Series 2020, 4% 6/25/21 | 20,000,000 | 20,432,498 | |
| Denver City & County Arpt. Rev. Participating VRDN: | |||
| Series Floaters XL 00 90, 0.36% 12/7/20 (Liquidity Facility Morgan Stanley Bank, West Valley City Utah) (a)(b)(f)(h) | 23,100,000 | 23,100,000 | |
| Series Floaters XM 07 15, 0.36% 12/7/20 (Liquidity Facility Morgan Stanley Bank, West Valley City Utah) (a)(b)(f)(h) | 1,240,000 | 1,240,000 | |
| TOTAL COLORADO | 65,841,117 | ||
| Connecticut - 0.6% | |||
| Connecticut Health & Edl. Facilities Auth. Rev. Series 2013 O, 0.11% 12/7/20, VRDN (a) | 23,125,000 | 23,125,000 | |
| Oxford Gen. Oblig. BAN Series 2020, 2.5% 1/15/21 | 2,000,000 | 2,004,380 | |
| Windsor Gen. Oblig. BAN Series 2020, 2% 6/24/21 | 3,000,000 | 3,028,540 | |
| TOTAL CONNECTICUT | 28,157,920 | ||
| Delaware - 0.1% | |||
| Delaware Econ. Dev. Auth. Rev. (Delmarva Pwr. & Lt. Co. Proj.) Series 1994, 0.18% 12/1/20, VRDN (a)(b) | 5,880,000 | 5,880,000 | |
| District Of Columbia - 0.0% | |||
| Washington D.C. Metropolitan Transit Auth. Rev. Participating VRDN Series ZM 06 10, 0.36% 12/7/20 (Liquidity Facility Morgan Stanley Bank, West Valley City Utah) (a)(f)(h) | 900,000 | 900,000 | |
| Florida - 1.4% | |||
| Broward County Arpt. Sys. Rev. Participating VRDN: | |||
| Series XL 01 36, 0.36% 12/7/20 (Liquidity Facility JPMorgan Chase Bank) (a)(b)(f)(h) | 3,000,000 | 3,000,000 | |
| Series XM 08 95, 0.36% 12/7/20 (Liquidity Facility JPMorgan Chase Bank) (a)(b)(f)(h) | 840,000 | 840,000 | |
| Broward County Indl. Dev. Rev. (Florida Pwr. & Lt. Co. Proj.) Series 2015, 0.16% 12/1/20, VRDN (a)(b) | 5,040,000 | 5,040,000 | |
| Broward County School District TAN Series 2020, 2% 6/30/21 | 15,000,000 | 15,159,207 | |
| Greater Orlando Aviation Auth. Arpt. Facilities Rev. Participating VRDN Series XM 08 91, 0.31% 12/7/20 (Liquidity Facility JPMorgan Chase Bank) (a)(b)(f)(h) | 1,100,000 | 1,100,000 | |
| Highlands County Health Facilities Auth. Rev. (Adventist Health Sys./Sunbelt, Inc. Prog.) Series 2007 A1, 0.1% 12/7/20, VRDN (a) | 1,250,000 | 1,250,000 | |
| Jacksonville Health Care Series 2020, 0.23% 2/4/21, CP | 2,200,000 | 2,199,960 | |
| Lee County Indl. Dev. Auth. Rev. (Florida Pwr. & Lt. Co. Proj.) Series 2016 A, 0.16% 12/1/20, VRDN (a)(b) | 700,000 | 700,000 | |
| Lee Memorial Health Sys. Hosp. Rev. Series 2019 B, 0.28% 12/7/23, VRDN (a) | 1,000,000 | 1,000,000 | |
| Miami-Dade County Aviation Rev. Participating VRDN Series XM 08 70, 0.38% 12/7/20 (Liquidity Facility JPMorgan Chase Bank) (a)(b)(f)(h) | 2,100,000 | 2,100,000 | |
| Miami-Dade County Expressway Auth. Participating VRDN Series XG 00 99, 0.21% 12/7/20 (Liquidity Facility Deutsche Bank AG New York Branch) (a)(f)(h) | 400,000 | 400,000 | |
| Saint Lucie County Solid Waste Disp. (Florida Pwr. & Lt. Co. Proj.) Series 2003, 0.15% 12/1/20, VRDN (a)(b) | 2,510,000 | 2,510,000 | |
| South Miami Health Facilities Auth. Hosp. Rev. Participating VRDN: | |||
| Series Floaters XF 25 30, 0.21% 12/7/20 (Liquidity Facility Citibank NA) (a)(f)(h) | 10,500,000 | 10,500,000 | |
| Series XF 25 23, 0.21% 12/7/20 (Liquidity Facility Barclays Bank PLC) (a)(f)(h) | 10,000,000 | 10,000,000 | |
| Series ZM 05 71, 0.21% 12/7/20 (Liquidity Facility Morgan Stanley Bank, West Valley City Utah) (a)(f)(h) | 5,230,000 | 5,230,000 | |
| Tampa Hosp. Rev. Participating VRDN Series XM 08 85, 0.26% 12/7/20 (Liquidity Facility JPMorgan Chase Bank) (a)(f)(h) | 3,300,000 | 3,300,000 | |
| TOTAL FLORIDA | 64,329,167 | ||
| Georgia - 0.3% | |||
| Burke County Indl. Dev. Auth. Poll. Cont. Rev. (Georgia Pwr. Co. Plant Vogtle Proj.): | |||
| First Series 2009, 0.15% 12/1/20, VRDN (a) | 940,000 | 940,000 | |
| Series 2012, 0.16% 12/1/20, VRDN (a)(b) | 6,125,000 | 6,125,000 | |
| Series 2018, 0.18% 12/1/20, VRDN (a) | 1,700,000 | 1,700,000 | |
| Griffin-Spalding County Hosp. Participating VRDN Series Floaters XL 00 76, 0.46% 12/7/20 (Liquidity Facility JPMorgan Chase Bank) (a)(f)(h) | 400,000 | 400,000 | |
| Monroe County Dev. Auth. Poll. Cont. Rev. (Georgia Pwr. Co. Plant Scherer Proj.): | |||
| Series 1997, 0.17% 12/1/20, VRDN (a) | 500,000 | 500,000 | |
| Series 2008, 0.17% 12/1/20, VRDN (a) | 1,800,000 | 1,800,000 | |
| Monroe County Dev. Auth. Rev. (Gulf Pwr. Co. Proj.) Series 2019, 0.16% 12/1/20, VRDN (a)(b) | 500,000 | 500,000 | |
| TOTAL GEORGIA | 11,965,000 | ||
| Hawaii - 0.1% | |||
| Hawaii Arpts. Sys. Rev. Participating VRDN Series XF 07 65, 0.23% 12/7/20 (Liquidity Facility JPMorgan Chase Bank) (a)(b)(f)(h) | 2,900,000 | 2,900,000 | |
| Idaho - 0.0% | |||
| Idaho Hsg. & Fin. Assoc. Single Family Mtg. Series A, 0.28% 12/7/20 (Liquidity Facility Fannie Mae) (Liquidity Facility Freddie Mac), VRDN (a) | 1,370,000 | 1,370,000 | |
| Illinois - 0.3% | |||
| Chicago O'Hare Int'l. Arpt. Rev. Participating VRDN: | |||
| Series Floaters XL 00 49, 0.31% 12/3/20 (Liquidity Facility Barclays Bank PLC) (a)(b)(f)(h) | 750,000 | 750,000 | |
| Series XM 08 79, 0.31% 12/7/20 (Liquidity Facility JPMorgan Chase Bank) (a)(f)(h) | 2,500,000 | 2,500,000 | |
| Series XM 08 84, 0.38% 12/7/20 (Liquidity Facility JPMorgan Chase Bank) (a)(b)(f)(h) | 2,500,000 | 2,500,000 | |
| Chicago Park District Gen. Oblig. Participating VRDN Series ROC II R 11935, 0.31% 12/7/20 (Liquidity Facility Citibank NA) (a)(f)(h) | 2,300,000 | 2,300,000 | |
| Chicago Transit Auth. Participating VRDN: | |||
| Series 20 XF 28 97, 0.29% 12/7/20 (Liquidity Facility Barclays Bank PLC) (a)(f)(h) | 900,000 | 900,000 | |
| Series XM 09 03, 0.31% 12/7/20 (Liquidity Facility JPMorgan Chase Bank) (a)(f)(h) | 300,000 | 300,000 | |
| Cook County Gen. Oblig. Participating VRDN Series 2015 XF0124, 0.34% 12/7/20 (Liquidity Facility JPMorgan Chase Bank) (a)(f)(h) | 1,280,000 | 1,280,000 | |
| Metropolitan Pier & Exposition Participating VRDN Series XF 09 65, 0.46% 12/7/20 (Liquidity Facility JPMorgan Chase Bank) (a)(f)(h) | 3,600,000 | 3,600,000 | |
| Reg'l. Transn Auth. Extend Series 2005 B, 0.75% 12/7/20, VRDN (a) | 1,690,000 | 1,690,000 | |
| TOTAL ILLINOIS | 15,820,000 | ||
| Kansas - 0.0% | |||
| Baldwin City BAN Series 2020 A, 4.4% 3/1/21 | 2,000,000 | 2,020,264 | |
| Kentucky - 0.9% | |||
| Kentucky Econ. Dev. Fin. Auth. Hosp. Rev. Participating VRDN Series XM 09 19, 0.26% 12/7/20 (Liquidity Facility JPMorgan Chase Bank) (a)(f)(h) | 1,100,000 | 1,100,000 | |
| Kentucky Hsg. Corp. Hsg. Rev. Participating VRDN Series XF 10 93, 0.46% 12/7/20 (Liquidity Facility Deutsche Bank AG New York Branch) (a)(f)(h) | 800,000 | 800,000 | |
| Kentucky Tpk. Auth. Econ. Dev. Road Rev. Participating VRDN Series XF 24 84, 0.36% 12/7/20 (Liquidity Facility Morgan Stanley Bank, West Valley City Utah) (a)(f)(h) | 1,780,000 | 1,780,000 | |
| Louisville & Jefferson County Metropolitan Swr. District Swr. & Drain Sys. Rev. BAN Series 2020, 5% 10/20/21 | 20,000,000 | 20,849,446 | |
| Louisville & Jefferson County Reg'l. Arpt. Auth. Spl. Facilities Rev. (UPS Worldwide Forwarding, Inc. Proj.): | |||
| Series 1999 B, 0.18% 12/1/20, VRDN (a)(b) | 400,000 | 400,000 | |
| Series 1999 C, 0.16% 12/1/20, VRDN (a)(b) | 13,700,000 | 13,700,000 | |
| Meade County Indl. Bldg. Rev. (Nucor Steel Brandenburg Proj.): | |||
| Series 2020 A1, 0.18% 12/1/20, VRDN (a)(b) | 1,400,000 | 1,400,000 | |
| Series 2020 B1, 0.18% 12/1/20, VRDN (a)(b) | 2,900,000 | 2,900,000 | |
| TOTAL KENTUCKY | 42,929,446 | ||
| Louisiana - 0.0% | |||
| Saint James Parish Gen. Oblig. (Nucor Steel Louisiana LLC Proj.) Series 2010 A1, 0.18% 12/7/20, VRDN (a) | 230,000 | 230,000 | |
| Maryland - 0.5% | |||
| Baltimore Proj. Rev. Bonds Series Floaters G 42, 0.31%, tender 7/1/21 (Liquidity Facility Royal Bank of Canada) (a)(f)(g)(h) | 4,500,000 | 4,500,000 | |
| Maryland Econ. Dev. Corp. Student Hsg. Rev. Participating VRDN Series XF 28 32, 0.33% 12/7/20 (a)(f)(h) | 14,985,000 | 14,985,000 | |
| Maryland Health & Higher Edl. Facilities Auth. Rev.: | |||
| (Anne Arundel Health Sys. Proj.) Series 2009 B, 0.12% 12/7/20, LOC Bank of America NA, VRDN (a) | 1,050,000 | 1,050,000 | |
| Participating VRDN Series 005, 0.41% 12/3/20 (Liquidity Facility Barclays Bank PLC) (a)(f)(h) | 2,720,000 | 2,720,000 | |
| TOTAL MARYLAND | 23,255,000 | ||
| Massachusetts - 0.5% | |||
| Ashland Gen. Oblig. BAN Series 2020, 1.75% 1/22/21 | 3,000,000 | 3,005,895 | |
| Massachusetts Edl. Fing. Auth. Rev. Participating VRDN Series Floaters XF 23 06, 0.41% 12/7/20 (Liquidity Facility Morgan Stanley Bank, West Valley City Utah) (a)(b)(f)(h) | 2,075,000 | 2,075,000 | |
| Massachusetts Health & Edl. Facilities Auth. Rev. Series 1997 P1, 0.1% 12/7/20 (Liquidity Facility JPMorgan Chase Bank), VRDN (a) | 5,000,000 | 5,000,000 | |
| Middleborough Gen. Oblig. BAN Series 2020, 2% 10/1/21 | 13,000,000 | 13,190,345 | |
| TOTAL MASSACHUSETTS | 23,271,240 | ||
| Michigan - 0.3% | |||
| Michigan Fin. Auth. Rev. RAN Series 2020 A2, 4% 8/20/21, LOC JPMorgan Chase Bank | 12,500,000 | 12,841,289 | |
| Minnesota - 0.0% | |||
| Minneapolis Health Care Sys. Rev. Participating VRDN Series XM 08 72, 0.34% 12/7/20 (Liquidity Facility JPMorgan Chase Bank) (a)(f)(h) | 1,000,000 | 1,000,000 | |
| Mississippi - 0.3% | |||
| Mississippi Bus. Fin. Corp. Solid Waste Disp. Rev. (Gulf Pwr. Co. Proj.) Series 2012, 0.13% 12/1/20, VRDN (a)(b) | 12,030,000 | 12,030,000 | |
| Missouri - 0.2% | |||
| Kansas City Indl. Dev. Auth. Participating VRDN Series XM 09 21, 0.27% 12/7/20 (Liquidity Facility Morgan Stanley Bank, West Valley City Utah) (a)(b)(f)(h) | 5,000,000 | 5,000,000 | |
| Mercy Health Participating VRDN Series Floaters XL 00 80, 0.26% 12/7/20 (Liquidity Facility JPMorgan Chase Bank) (a)(f)(h) | 1,200,000 | 1,200,000 | |
| Missouri Health & Edl. Facilities Auth. Edl. Facilities Rev. Participating VRDN Series XG 01 76, 0.36% 12/7/20 (Liquidity Facility Royal Bank of Canada) (a)(f)(h) | 2,400,000 | 2,400,000 | |
| TOTAL MISSOURI | 8,600,000 | ||
| New Jersey - 0.4% | |||
| Brick Township Gen. Oblig. BAN Series 2020, 2% 6/22/21 | 2,000,000 | 2,018,952 | |
| Jersey City Gen. Oblig. BAN Series 2020, 2% 6/17/21 | 2,000,000 | 2,019,579 | |
| Mercer County Gen. Oblig. BAN Series 2020, 2% 6/10/21 | 5,000,000 | 5,046,936 | |
| New Jersey Tpk. Auth. Tpk. Rev. Participating VRDN Series XM 09 11, 0.31% 12/7/20 (Liquidity Facility JPMorgan Chase Bank) (a)(f)(h) | 1,305,000 | 1,305,000 | |
| New Jersey Trans. Trust Fund Auth. Participating VRDN Series XF 09 75, 0.46% 12/7/20 (Liquidity Facility JPMorgan Chase Bank) (a)(f)(h) | 800,000 | 800,000 | |
| Newark Gen. Oblig. BAN Series 2020 C, 2% 10/5/21 | 2,000,000 | 2,022,015 | |
| Summit Gen. Oblig. BAN Series 2020, 2.5% 10/22/21 | 2,800,000 | 2,854,808 | |
| Union County Gen. Oblig. BAN Series 2020, 4% 6/18/21 | 2,000,000 | 2,041,544 | |
| TOTAL NEW JERSEY | 18,108,834 | ||
| New York - 4.3% | |||
| Connetquot Central School District TAN Series 2020, 1.75% 6/25/21 | 5,000,000 | 5,042,155 | |
| Cortland Enlarged City School District RAN Series 2020, 1.5% 7/30/21 | 1,000,000 | 1,005,885 | |
| Erie County Gen. Oblig. RAN Series 2020, 3% 6/24/21 | 2,000,000 | 2,029,142 | |
| Middletown BAN Series 2020, 1.5% 8/26/21 | 1,932,434 | 1,950,329 | |
| Nassau County Gen. Oblig. RAN Series A, 2% 12/9/20 | 10,000,000 | 10,003,861 | |
| New York City Gen. Oblig.: | |||
| Series 2006, 0.24% 12/4/20 (FSA Insured), VRDN (a) | 625,000 | 625,000 | |
| Series 2017 A, 0.12% 12/7/20 (Liquidity Facility Citibank NA), VRDN (a) | 6,650,000 | 6,650,000 | |
| New York City Muni. Wtr. Fin. Auth. Wtr. & Swr. Sys. Rev.: | |||
| Series 2010 CC, 0.11% 12/7/20 (Liquidity Facility Barclays Bank PLC), VRDN (a) | 15,000,000 | 15,000,000 | |
| Series 2014 BB1, 0.1% 12/1/20 (Liquidity Facility Bank of America NA), VRDN (a) | 12,885,000 | 12,885,000 | |
| New York Dorm. Auth. Rev. Participating VRDN Series XM 09 22, 0.17% 12/7/20 (Liquidity Facility Morgan Stanley Bank, West Valley City Utah) (a)(f)(h) | 1,600,000 | 1,600,000 | |
| New York Metropolitan Trans. Auth. Dedicated Tax Fund Rev. Participating VRDN Series ZM 06 00, 0.41% 12/7/20 (Liquidity Facility Wells Fargo Bank NA) (a)(f)(h) | 2,100,000 | 2,100,000 | |
| New York Metropolitan Trans. Auth. Rev.: | |||
| BAN: | |||
| Series 2018 B: | |||
| 5% 5/15/21 | 12,060,000 | 12,195,213 | |
| 5% 5/15/21 | 215,000 | 217,411 | |
| 5% 5/15/21 | 5,505,000 | 5,566,720 | |
| Series 2018 C, 5% 9/1/21 | 4,030,000 | 4,104,271 | |
| Series 2019 B, 5% 5/15/22 | 15,310,000 | 15,853,352 | |
| Series 2019 D1, 5% 9/1/22 | 19,500,000 | 20,327,580 | |
| Participating VRDN: | |||
| Series XF 05 20, 0.56% 12/7/20 (Liquidity Facility Royal Bank of Canada) (a)(f)(h) | 1,425,000 | 1,425,000 | |
| Series XG 02 90, 0.15% 12/7/20 (Liquidity Facility Barclays Bank PLC) (a)(f)(h) | 1,005,000 | 1,005,000 | |
| Series ZF 02 18, 0.48% 12/7/20 (Liquidity Facility JPMorgan Chase Bank) (a)(f)(h) | 4,200,000 | 4,200,000 | |
| New York Pwr. Auth. Series 1, 0.29% 7/13/21, CP | 8,000,000 | 7,999,505 | |
| New York State Dorm. Auth. RAN Series 2020 B, 5% 3/31/21 | 9,550,000 | 9,703,297 | |
| New York Thruway Auth. Gen. Rev. Participating VRDN: | |||
| Series XF 09 18, 0.34% 12/7/20 (Liquidity Facility JPMorgan Chase Bank) (a)(f)(h) | 1,600,000 | 1,600,000 | |
| Series XM 08 31, 0.36% 12/7/20 (Liquidity Facility Morgan Stanley Bank, West Valley City Utah) (a)(f)(h) | 2,000,000 | 2,000,000 | |
| Series XM 08 80, 0.31% 12/7/20 (Liquidity Facility JPMorgan Chase Bank) (a)(f)(h) | 1,500,000 | 1,500,000 | |
| Oyster Bay Gen. Oblig. BAN Series C, 4% 8/27/21 | 9,500,000 | 9,751,311 | |
| Port Washington Union Free School District BAN Series 2020, 1.5% 8/5/21 | 5,000,000 | 5,039,566 | |
| Putnam County Indl. Dev. Agcy. Rev. Series 2006 A, 0.37% 12/7/20, LOC RBS Citizens NA, VRDN (a) | 1,100,000 | 1,100,000 | |
| Riverhead Central School District TAN Series 2020 B, 1.5% 6/25/21 | 5,000,000 | 5,036,222 | |
| Rockland County Gen. Oblig. TAN Series 2020, 2% 4/1/21 | 3,000,000 | 3,017,276 | |
| Suffolk County Gen. Oblig.: | |||
| RAN Series 2020, 5% 3/19/21 | 2,000,000 | 2,025,704 | |
| TAN Series 2020 I, 3% 9/24/21 | 14,000,000 | 14,232,021 | |
| Syosset Central School District TAN Series 2020, 2% 6/25/21 | 5,000,000 | 5,048,657 | |
| Town of Colonie Albany County BAN Series 2020, 1.25% 3/12/21 | 5,987,000 | 5,993,831 | |
| TOTAL NEW YORK | 197,833,309 | ||
| Ohio - 0.6% | |||
| Coshocton City BAN Series 2020, 2.5% 2/18/21 | 1,245,000 | 1,250,849 | |
| Mahoning County BAN Series 2020, 1% 9/13/21 | 1,735,000 | 1,744,630 | |
| Mahoning County Sales Tax TAN Series 2020, 1% 9/13/21 | 1,025,000 | 1,030,287 | |
| Ohio Hsg. Fin. Agcy. Multi-family Hsg. Rev. Participating VRDN: | |||
| Series MIZ 90 50, 0.51% 1/4/21 (Liquidity Facility Mizuho Cap. Markets Llc) (a)(f)(h) | 1,100,000 | 1,100,000 | |
| Series XF 10 92, 0.46% 12/7/20 (Liquidity Facility Deutsche Bank AG New York Branch) (a)(f)(h) | 5,100,000 | 5,100,000 | |
| Ohio Parks & Recreation Cap. Facilities (Parks and Recreation Impt. Fund Projs.) Series 2020 B, 0.1% 12/7/20, VRDN (a) | 15,000,000 | 15,000,000 | |
| Sycamore Township BAN Series 2020, 1.55% 5/4/21 | 1,000,000 | 1,002,663 | |
| Tipp City BAN Series 2020 A, 2% 2/11/21 | 1,000,000 | 1,003,300 | |
| TOTAL OHIO | 27,231,729 | ||
| Oklahoma - 0.1% | |||
| Oklahoma Dev. Fin. Auth. Health Sys. Rev. Series 2020 B, 0.33% 12/7/20, VRDN (a) | 3,760,000 | 3,760,000 | |
| Pennsylvania - 1.4% | |||
| Pennsylvania Hsg. Fin. Agcy. Single Family Mtg. Rev. Series 2006 93B, 0.14% 12/7/20 (Liquidity Facility Wells Fargo Bank NA), VRDN (a)(b) | 6,000,000 | 6,000,000 | |
| Philadelphia Auth. Indl. Mrf Participating VRDN Series MIZ 90 51, 0.46% 1/4/21 (Liquidity Facility Mizuho Cap. Markets Llc) (a)(f)(h) | 1,000,000 | 1,000,000 | |
| Philadelphia Auth. for Indl. Dev. Series 2017 B, 0.29% 12/7/23, VRDN (a) | 10,210,000 | 10,210,000 | |
| Philadelphia Gen. Oblig. TRAN Series 2020 A, 4% 6/30/21 | 9,500,000 | 9,707,653 | |
| Philadelphia School District TRAN Series 2020 A, 4% 6/30/21 | 17,645,000 | 18,031,734 | |
| Southcentral Pennsylvania Gen. Auth. Rev. Series 2019 E, 0.09% 12/1/20 (Liquidity Facility U.S. Bank NA, Cincinnati), VRDN (a) | 20,000,000 | 20,000,000 | |
| TOTAL PENNSYLVANIA | 64,949,387 | ||
| South Carolina - 1.0% | |||
| Charleston County School District TAN (Sales Tax Proj. Phase IV) Series 2020 B, 5% 5/12/21 | 20,000,000 | 20,429,818 | |
| County Square Redev. Corp. BAN (Greenville County, SC Proj.) Series 2020, 2% 3/24/21 | 10,000,000 | 10,053,592 | |
| Greenville Hosp. Sys. Facilities Rev. Participating VRDN Series XF 01 45, 0.36% 12/7/20 (Liquidity Facility Toronto-Dominion Bank) (a)(f)(h) | 1,600,000 | 1,600,000 | |
| South Carolina Pub. Svc. Auth. Rev. Participating VRDN: | |||
| Series Floaters XM 03 84, 0.37% 12/7/20 (Liquidity Facility JPMorgan Chase Bank) (a)(f)(h) | 9,800,000 | 9,800,000 | |
| Series YX 11 57, 0.26% 12/7/20 (Liquidity Facility Barclays Bank PLC) (a)(f)(h) | 2,110,000 | 2,110,000 | |
| South Carolina St. Pub. Svc. Auth. Rev. Participating VRDN Series XG 0046, 0.16% 12/7/20 (Liquidity Facility Toronto-Dominion Bank) (a)(f)(h) | 265,000 | 265,000 | |
| TOTAL SOUTH CAROLINA | 44,258,410 | ||
| South Dakota - 0.0% | |||
| South Dakota Health & Edl. Facilities Auth. Rev. Participating VRDN Series XG 03 02, 0.26% 12/7/20 (Liquidity Facility Barclays Bank PLC) (a)(f)(h) | 600,000 | 600,000 | |
| Tennessee - 0.8% | |||
| Blount County Pub. Bldg. Auth. Series D3A, 0.09% 12/1/20 (Liquidity Facility Bank of America NA), VRDN (a) | 20,000,000 | 20,000,000 | |
| Greeneville Health & Edl. Facilities Board Series 2018 B, 0.1% 12/7/20, LOC U.S. Bank NA, Cincinnati, VRDN (a) | 800,000 | 800,000 | |
| Nashville and Davidson County Metropolitan Govt. Gen. Oblig. Series B1, 0.22% 1/6/21 (Liquidity Facility JPMorgan Chase Bank), CP | 8,000,000 | 8,000,162 | |
| Tennessee Gen. Oblig.: | |||
| Series 2020, 0.3% 12/29/20 (Liquidity Facility Tennessee Consldatd Retire Sys.), CP | 1,784,000 | 1,784,014 | |
| Series A: | |||
| 0.25% 3/10/21 (Liquidity Facility Tennessee Consldatd Retire Sys.), CP | 5,000,000 | 5,000,137 | |
| 0.28% 12/10/20 (Liquidity Facility Tennessee Consldatd Retire Sys.), CP | 2,000,000 | 1,999,995 | |
| TOTAL TENNESSEE | 37,584,308 | ||
| Texas - 3.4% | |||
| Dallas Fort Worth Int'l. Arpt. Rev. Participating VRDN Series Floaters XF 10 61, 0.36% 12/7/20 (Liquidity Facility Deutsche Bank AG New York Branch) (a)(b)(f)(h) | 8,000,000 | 8,000,000 | |
| Deutsche Spears/Lifers Trust Participating VRDN Series Floaters XG 00 58, 0.23% 12/7/20 (Liquidity Facility Deutsche Bank AG) (a)(f)(h) | 1,085,000 | 1,085,000 | |
| Harris County Cultural Ed. Facilities Fin. Corp. Rev.: | |||
| Series 2016 B3, 0.27% tender 1/6/21, CP mode | 8,000,000 | 8,000,566 | |
| Series 2016 D, 0.13% 12/7/20, VRDN (a) | 6,400,000 | 6,400,000 | |
| Houston Gen. Oblig. TRAN Series 2020: | |||
| 4% 6/30/21 | 5,000,000 | 5,111,069 | |
| 5% 6/30/21 | 11,000,000 | 11,306,840 | |
| Houston Util. Sys. Rev. Series 2004 B3, 0.1% 12/7/20, LOC Sumitomo Mitsui Banking Corp., VRDN (a) | 6,000,000 | 6,000,000 | |
| Hurst Participating VRDN Series XF 10 94, 0.46% 12/7/20 (Liquidity Facility Deutsche Bank AG New York Branch) (a)(f)(h) | 1,600,000 | 1,600,000 | |
| Port Arthur Navigation District Envir. Facilities Rev. (Motiva Enterprises LLC Proj.) Series 2004, 0.43% 12/7/20, VRDN (a)(b) | 33,015,000 | 33,015,000 | |
| San Antonio Elec. & Gas Sys. Rev. Series A: | |||
| 0.22% 1/28/21 (Liquidity Facility Bank of America NA), CP | 5,000,000 | 5,000,000 | |
| 0.25% 1/5/21 (Liquidity Facility Bank of America NA), CP | 4,000,000 | 4,000,512 | |
| Texas Gen. Oblig. TRAN Series 2020, 4% 8/26/21 | 65,000,000 | 66,820,689 | |
| Texas Private Activity Bond Surface Trans. Corp. Participating VRDN Series XM 07 56, 0.46% 12/7/20 (Liquidity Facility Deutsche Bank AG New York Branch) (a)(b)(f)(h) | 1,800,000 | 1,800,000 | |
| Trinity Riv Pub. Facilities Corp. Tex M Participating VRDN Series XF 10 83, 0.46% 12/7/20 (Liquidity Facility Deutsche Bank AG New York Branch) (a)(f)(h) | 1,600,000 | 1,600,000 | |
| TOTAL TEXAS | 159,739,676 | ||
| Utah - 0.3% | |||
| Salt Lake City Arpt. Rev. Participating VRDN: | |||
| Series 17 XM 0493, 0.36% 12/7/20 (Liquidity Facility Morgan Stanley Bank, West Valley City Utah) (a)(b)(f)(h) | 700,000 | 700,000 | |
| Series Floaters XM 06 99, 0.46% 12/7/20 (Liquidity Facility Cr. Suisse AG) (a)(b)(f)(h) | 11,030,000 | 11,030,000 | |
| Series XM 08 82, 0.38% 12/7/20 (Liquidity Facility JPMorgan Chase Bank) (a)(b)(f)(h) | 1,400,000 | 1,400,000 | |
| TOTAL UTAH | 13,130,000 | ||
| Virginia - 0.3% | |||
| Suffolk Econ. Dev. Auth. Hosp. Facilities Rev. Participating VRDN Series MIZ 90 25, 0.21% 12/7/20 (Liquidity Facility Mizuho Cap. Markets Llc) (a)(f)(h) | 14,490,000 | 14,490,000 | |
| Washington - 0.3% | |||
| Washington Convention Ctr. Pub. Facilities Participating VRDN Series XG 02 96, 0.15% 12/7/20 (Liquidity Facility Barclays Bank PLC) (a)(f)(h) | 7,985,000 | 7,985,000 | |
| Washington Econ. Dev. Fin. Auth. Rev. Participating VRDN Series Floaters 005, 0.46% 1/11/21 (Liquidity Facility Barclays Bank PLC) (a)(b)(f)(h) | 5,100,000 | 5,100,000 | |
| Washington Health Care Facilities Auth. Rev. Participating VRDN Series XM 08 83, 0.26% 12/7/20 (Liquidity Facility JPMorgan Chase Bank) (a)(f)(h) | 1,500,000 | 1,500,000 | |
| TOTAL WASHINGTON | 14,585,000 | ||
| West Virginia - 0.0% | |||
| Putnam County W Solid Waste Dis Series 1991, 0.31% 12/3/20, LOC Wells Fargo Bank NA, VRDN (a)(b) | 1,030,000 | 1,030,000 | |
| Wisconsin - 0.4% | |||
| JPMorgan Chase Participating VRDN Series Floaters XF 01 27, 0.29% 12/7/20 (a)(f)(h) | 1,060,000 | 1,060,000 | |
| Milwaukee School District RAN Series 2020 M8, 2% 7/1/21 | 10,000,000 | 10,104,291 | |
| Wisconsin Health & Edl. Facilities Series 2020 C, 0.31% 12/7/20, VRDN (a) | 6,750,000 | 6,750,000 | |
| TOTAL WISCONSIN | 17,914,291 | ||
| Wyoming - 0.3% | |||
| Lincoln County Poll. Cont. Rev. (ExxonMobile Proj.) Series 2014, 0.12% 12/1/20, VRDN (a) | 15,000,000 | 15,000,000 | |
| TOTAL MUNICIPAL NOTES | |||
| (Cost $1,043,093,211) | 1,042,868,577 | ||
| Shares | |||
| Short-Term Funds - 12.4% | |||
| Federated Hermes Municipal Ultrashort Fund Institutional Shares | 1,993,024 | $20,013,751 | |
| JPMorgan Ultra-Short Municipal Fund Class I | 55,221,047 | 556,075,852 | |
| TOTAL SHORT-TERM FUNDS | |||
| (Cost $575,547,181) | 576,089,603 | ||
| Shares | |||
| Municipal Bond Funds - 0.1% | |||
| Nuveen NY AMT-Free Quality Municipal Income Fund Preferred Shares 0.56%(a)(e)(i) | |||
| (Cost $6,800,000) | 6,800,000 | $6,800,000 | |
| Shares | Value | ||
| Money Market Funds - 20.4% | |||
| Fidelity Investments Money Market Government Portfolio Institutional Class 0.01% (j)(k) | 459,809,209 | 459,809,209 | |
| Fidelity Municipal Cash Central Fund .13% (l)(m) | 110,524,948 | 110,536,000 | |
| Fidelity SAI Municipal Money Market Fund 1.19% (j)(k) | 367,453,709 | 367,600,691 | |
| State Street Institutional U.S. Government Money Market Fund Premier Class .02% (j) | 5,350,358 | 5,350,358 | |
| TOTAL MONEY MARKET FUNDS | |||
| (Cost $943,238,723) | 943,296,258 | ||
| TOTAL INVESTMENT IN SECURITIES - 100.6% | |||
| (Cost $4,642,096,191) | 4,659,193,941 | ||
| NET OTHER ASSETS (LIABILITIES) - (0.6)% | (26,328,465) | ||
| NET ASSETS - 100% | $4,632,865,476 |
Security Type Abbreviations
BAN – BOND ANTICIPATION NOTE
CP – COMMERCIAL PAPER
RAN – REVENUE ANTICIPATION NOTE
TAN – TAX ANTICIPATION NOTE
TRAN – TAX AND REVENUE ANTICIPATION NOTE
VRDN – VARIABLE RATE DEMAND NOTE (A debt instrument that is payable upon demand, either daily, weekly or monthly)
Legend
(a) Coupon rates for floating and adjustable rate securities reflect the rates in effect at period end.
(b) Private activity obligations whose interest is subject to the federal alternative minimum tax for individuals.
(c) Coupon is indexed to a floating interest rate which may be multiplied by a specified factor and/or subject to caps or floors.
(d) Security or a portion of the security purchased on a delayed delivery or when-issued basis.
(e) Security exempt from registration under Rule 144A of the Securities Act of 1933. These securities may be resold in transactions exempt from registration, normally to qualified institutional buyers. At the end of the period, the value of these securities amounted to $17,030,203 or 0.4% of net assets.
(f) Provides evidence of ownership in one or more underlying municipal bonds.
(g) Restricted securities (including private placements) - Investment in securities not registered under the Securities Act of 1933 (excluding 144A issues). At the end of the period, the value of restricted securities (excluding 144A issues) amounted to $19,000,000 or 0.4% of net assets.
(h) Coupon rates are determined by re-marketing agents based on current market conditions.
(i) Non-income producing
(j) The rate quoted is the annualized seven-day yield of the fund at period end.
(k) Affiliated Fund
(l) Information in this report regarding holdings by state and security types does not reflect the holdings of the Fidelity Municipal Cash Central Fund.
(m) Affiliated fund that is available only to investment companies and other accounts managed by Fidelity Investments. The rate quoted is the annualized seven-day yield of the fund at period end. A complete unaudited listing of the fund's holdings as of its most recent quarter end is available upon request. In addition, each Fidelity Central Fund's financial statements are available on the SEC's website or upon request.
Additional information on each restricted holding is as follows:
| Security | Acquisition Date | Acquisition Cost |
| Arizona St Indl. Dev. Auth. Multi Participating VRDN Series DBE 80 53, 0.71% 1/29/21 (Liquidity Facility Deutsche Bank AG New York Branch) | 9/30/20 | $10,200,000 |
| Baltimore Proj. Rev. Bonds Series Floaters G 42, 0.31%, tender 7/1/21 (Liquidity Facility Royal Bank of Canada) | 7/1/20 | $4,500,000 |
| River Islands Pub. Fing. Auth. Participating VRDN Series MIZ 90 26, 0.46% 1/4/21 (Liquidity Facility Mizuho Cap. Markets Llc) | 8/14/20 | $4,300,000 |
Affiliated Central Funds
Information regarding fiscal year to date income earned by the Fund from investments in Fidelity Central Funds is as follows:
| Fund | Income earned |
| Fidelity Municipal Cash Central Fund | $25,813 |
| Total | $25,813 |
Amounts in the income column in the above table include any capital gain distributions from underlying funds, which are presented in the corresponding line-item in the Statement of Operations, if applicable.
Affiliated Underlying Funds
Fiscal year to date information regarding the Fund's investments in affiliated Underlying Funds, excluding any Money Market Central Funds, is presented below. Exchanges between classes of the same affiliated Underlying Funds may occur.
| Affiliate | Value, beginning of period | Purchases | Sales Proceeds | Dividend Income | Realized Gain (loss) | Change in Unrealized appreciation (depreciation) | Value, end of period |
| Fidelity Investments Money Market Government Portfolio Institutional Class 0.01% | $249,972,338 | $1,299,946,753 | $1,090,109,882 | $55,049 | $-- | $-- | $459,809,209 |
| Fidelity SAI Municipal Money Market Fund 1.19% | 190,501,215 | 200,997,984 | 23,878,416 | 120,940 | (133) | (19,959) | 367,600,691 |
| Total | $440,473,553 | $1,500,944,737 | $1,113,988,298 | $175,989 | $(133) | $(19,959) | $827,409,900 |
Amounts in the income column in the above table include any capital gain distributions from underlying funds, which are presented in the corresponding line-item in the Statement of Operations, if applicable.
Investment Valuation
The following is a summary of the inputs used, as of November 30, 2020, involving the Fund's assets and liabilities carried at fair value. The inputs or methodology used for valuing securities may not be an indication of the risk associated with investing in those securities. For more information on valuation inputs, and their aggregation into the levels used below, please refer to the Investment Valuation section in the accompanying Notes to Financial Statements.
| Valuation Inputs at Reporting Date: | ||||
| Description | Total | Level 1 | Level 2 | Level 3 |
| Investments in Securities: | ||||
| Municipal Securities | $3,133,008,080 | $-- | $3,133,008,080 | $-- |
| Money Market Funds | 943,296,258 | 943,296,258 | -- | -- |
| Investment Companies | 6,800,000 | -- | 6,800,000 | -- |
| Short-Term Funds | 576,089,603 | 576,089,603 | -- | -- |
| Total Investments in Securities: | $4,659,193,941 | $1,519,385,861 | $3,139,808,080 | $-- |
See accompanying notes which are an integral part of the financial statements.
Financial Statements
Statement of Assets and Liabilities
| November 30, 2020 (Unaudited) | ||
| Assets | ||
| Investment in securities, at value — See accompanying schedule: Unaffiliated issuers (cost $3,704,207,826) | $3,721,248,041 | |
| Fidelity Central Funds (cost $110,536,000) | 110,536,000 | |
| Other affiliated issuers (cost $827,352,365) | 827,409,900 | |
| Total Investment in Securities (cost $4,642,096,191) | $4,659,193,941 | |
| Receivable for fund shares sold | 38,007,103 | |
| Dividends receivable | 15,379 | |
| Interest receivable | 23,122,901 | |
| Distributions receivable from Fidelity Central Funds | 7,501 | |
| Prepaid expenses | 3,981 | |
| Other receivables | 4,237 | |
| Total assets | 4,720,355,043 | |
| Liabilities | ||
| Payable to custodian bank | $370,957 | |
| Payable for investments purchased | ||
| Regular delivery | 51,492,116 | |
| Delayed delivery | 30,620,214 | |
| Payable for fund shares redeemed | 2,397,844 | |
| Distributions payable | 2,238,469 | |
| Accrued management fee | 258,829 | |
| Other payables and accrued expenses | 111,138 | |
| Total liabilities | 87,489,567 | |
| Net Assets | $4,632,865,476 | |
| Net Assets consist of: | ||
| Paid in capital | $4,616,113,288 | |
| Total accumulated earnings (loss) | 16,752,188 | |
| Net Assets | $4,632,865,476 | |
| Net Asset Value, offering price and redemption price per share ($4,632,865,476 ÷ 461,114,520 shares) | $10.05 |
See accompanying notes which are an integral part of the financial statements.
Statement of Operations
| Six months ended November 30, 2020 (Unaudited) | ||
| Investment Income | ||
| Dividends: | ||
| Unaffiliated issuers | $516,725 | |
| Affiliated issuers | 175,119 | |
| Interest | 16,366,068 | |
| Income from Fidelity Central Funds | 25,813 | |
| Total income | 17,083,725 | |
| Expenses | ||
| Management fee | $5,936,105 | |
| Custodian fees and expenses | 17,339 | |
| Independent trustees' fees and expenses | 17,330 | |
| Registration fees | 66,842 | |
| Audit | 31,192 | |
| Legal | 6,203 | |
| Miscellaneous | 26,506 | |
| Total expenses before reductions | 6,101,517 | |
| Expense reductions | (4,468,078) | |
| Total expenses after reductions | 1,633,439 | |
| Net investment income (loss) | 15,450,286 | |
| Realized and Unrealized Gain (Loss) | ||
| Net realized gain (loss) on: | ||
| Investment securities: | ||
| Unaffiliated issuers | 403,478 | |
| Affiliated issuers | (133) | |
| Capital gain distributions from underlying funds: | ||
| Affiliated issuers | 870 | |
| Total net realized gain (loss) | 404,215 | |
| Change in net unrealized appreciation (depreciation) on: | ||
| Investment securities: | ||
| Unaffiliated issuers | 10,164,378 | |
| Affiliated issuers | (19,959) | |
| Total change in net unrealized appreciation (depreciation) | 10,144,419 | |
| Net gain (loss) | 10,548,634 | |
| Net increase (decrease) in net assets resulting from operations | $25,998,920 |
See accompanying notes which are an integral part of the financial statements.
Statement of Changes in Net Assets
| Six months ended November 30, 2020 (Unaudited) | Year ended May 31, 2020 | |
| Increase (Decrease) in Net Assets | ||
| Operations | ||
| Net investment income (loss) | $15,450,286 | $53,942,535 |
| Net realized gain (loss) | 404,215 | 413,520 |
| Change in net unrealized appreciation (depreciation) | 10,144,419 | (2,002,641) |
| Net increase (decrease) in net assets resulting from operations | 25,998,920 | 52,353,414 |
| Distributions to shareholders | (15,356,313) | (55,246,709) |
| Share transactions | ||
| Proceeds from sales of shares | 1,926,616,227 | 1,047,372,777 |
| Reinvestment of distributions | 7,817 | 3,699,668 |
| Cost of shares redeemed | (672,891,801) | (1,095,565,154) |
| Net increase (decrease) in net assets resulting from share transactions | 1,253,732,243 | (44,492,709) |
| Total increase (decrease) in net assets | 1,264,374,850 | (47,386,004) |
| Net Assets | ||
| Beginning of period | 3,368,490,626 | 3,415,876,630 |
| End of period | $4,632,865,476 | $3,368,490,626 |
| Other Information | ||
| Shares | ||
| Sold | 191,879,742 | 104,544,855 |
| Issued in reinvestment of distributions | 778 | 368,964 |
| Redeemed | (66,994,035) | (109,355,545) |
| Net increase (decrease) | 124,886,485 | (4,441,726) |
See accompanying notes which are an integral part of the financial statements.
Financial Highlights
Strategic Advisers Tax-Sensitive Short Duration Fund
| Six months ended (Unaudited) November 30, | Years endedMay 31, | |||
| 2020 | 2020 | 2019 | 2018 A | |
| Selected Per–Share Data | ||||
| Net asset value, beginning of period | $10.02 | $10.03 | $9.99 | $10.00 |
| Income from Investment Operations | ||||
| Net investment income (loss)B | .044 | .159 | .174 | .053 |
| Net realized and unrealized gain (loss) | .030 | (.006) | .042 | (.014) |
| Total from investment operations | .074 | .153 | .216 | .039 |
| Distributions from net investment income | (.044) | (.159) | (.173) | (.049) |
| Distributions from net realized gain | – | (.004) | (.003) | – |
| Total distributions | (.044) | (.163) | (.176) | (.049) |
| Net asset value, end of period | $10.05 | $10.02 | $10.03 | $9.99 |
| Total ReturnC,D | .74% | 1.53% | 2.19% | .39% |
| Ratios to Average Net AssetsE,F | ||||
| Expenses before reductions | .34%G | .34% | .37% | .52%G |
| Expenses net of fee waivers, if any | .09%G | .09% | .12% | .26%G,H |
| Expenses net of all reductions | .09%G | .09% | .12% | .26%G,H |
| Net investment income (loss) | .87%G | 1.59% | 1.74% | 1.28%G |
| Supplemental Data | ||||
| Net assets, end of period (000 omitted) | $4,632,865 | $3,368,491 | $3,415,877 | $3,219,118 |
| Portfolio turnover rateI | 131%G | 81% | 57% | 180%J |
A For the period December 28, 2017 (commencement of operations) to May 31, 2018.
B Calculated based on average shares outstanding during the period.
C Total returns for periods of less than one year are not annualized.
D Total returns would have been lower if certain expenses had not been reduced during the applicable periods shown.
E Fees and expenses of any underlying mutual funds or exchange-traded funds (ETFs) are not included in the Fund's expense ratio. The Fund indirectly bears its proportionate share of these expenses. For additional expense information related to investments in Fidelity Central Funds, please refer to the "Investments in Fidelity Central Funds" note found in the Notes to Financial Statements section of the most recent Annual or Semi-Annual report.
F Expense ratios reflect operating expenses of the class. Expenses before reductions do not reflect amounts reimbursed, waived, or reduced through arrangements with the investment advisor, brokerage services, or other offset arrangements, if applicable, and do not represent the amount paid by the class during periods when reimbursements, waivers or reductions occur.
G Annualized
H Audit fees are not annualized.
I Amount does not include the portfolio activity of any underlying mutual funds or exchange-traded funds (ETFs).
J Amount not annualized.
See accompanying notes which are an integral part of the financial statements.
Notes to Financial Statements (Unaudited)
For the period ended November 30, 2020
1. Organization.
Strategic Advisers Tax-Sensitive Short Duration Fund (the Fund) is a fund of Fidelity Rutland Square Trust II (the Trust), and is authorized to issue an unlimited number of shares. The Trust is registered under the Investment Company Act of 1940, as amended (the 1940 Act), as an open-end management investment company organized as a Delaware statutory trust. The Fund is offered exclusively to certain clients of Strategic Advisers LLC (Strategic Advisers), an affiliate of Fidelity Management & Research Company LLC (FMR).
2. Significant Accounting Policies.
The Fund is an investment company and applies the accounting and reporting guidance of the Financial Accounting Standards Board (FASB) Accounting Standards Codification Topic 946 Financial Services – Investment Companies. The financial statements have been prepared in conformity with accounting principles generally accepted in the United States of America (GAAP), which require management to make certain estimates and assumptions at the date of the financial statements. Actual results could differ from those estimates. Subsequent events, if any, through the date that the financial statements were issued have been evaluated in the preparation of the financial statements. The following summarizes the significant accounting policies of the Fund:
Investment Valuation. Investments are valued as of 4:00 p.m. Eastern time on the last calendar day of the period. The Board of Trustees (the Board) has delegated the day to day responsibility for the valuation of the Fund's investments to the Fair Value Committee (the Committee) established by the Fund's investment adviser. In accordance with valuation policies and procedures approved by the Board, the Fund attempts to obtain prices from one or more third party pricing vendors or brokers to value its investments. When current market prices, quotations or currency exchange rates are not readily available or reliable, investments will be fair valued in good faith by the Committee, in accordance with procedures adopted by the Board. Factors used in determining fair value vary by investment type and may include market or investment specific events, changes in interest rates and credit quality. The frequency with which these procedures are used cannot be predicted and they may be utilized to a significant extent. The Committee oversees the Fund's valuation policies and procedures and reports to the Board on the Committee's activities and fair value determinations. The Board monitors the appropriateness of the procedures used in valuing the Fund's investments and ratifies the fair value determinations of the Committee.
The Fund categorizes the inputs to valuation techniques used to value its investments into a disclosure hierarchy consisting of three levels as shown below:
- Level 1 – quoted prices in active markets for identical investments
- Level 2 – other significant observable inputs (including quoted prices for similar investments, interest rates, prepayment speeds, etc.)
- Level 3 – unobservable inputs (including the Fund's own assumptions based on the best information available)
Valuation techniques used to value the Fund's investments by major category are as follows:
Debt securities, including restricted securities, are valued based on evaluated prices received from third party pricing vendors or from brokers who make markets in such securities. Municipal securities are valued by pricing vendors who utilize matrix pricing which considers yield or price of bonds of comparable quality, coupon, maturity and type or by broker-supplied prices. When independent prices are unavailable or unreliable, debt securities may be valued utilizing pricing methodologies which consider similar factors that would be used by third party pricing vendors. Debt securities are generally categorized as Level 2 in the hierarchy but may be Level 3 depending on the circumstances.
Investments in open-end mutual funds, including the Fidelity Central Funds, are valued at their closing net asset value (NAV) each business day and are categorized as Level 1 in the hierarchy. If an unaffiliated open-end mutual fund's NAV is unavailable, shares of that fund may be valued by another method that the Board believes reflects fair value in accordance with the Board's fair value pricing policies and is categorized as Level 2 in the hierarchy.
Changes in valuation techniques may result in transfers in or out of an assigned level within the disclosure hierarchy. The aggregate value of investments by input level as of November 30, 2020 is included at the end of the Fund's Schedule of Investments.
Investment Transactions and Income. For financial reporting purposes, the Fund's investment holdings and NAV include trades executed through the end of the last business day of the period. The NAV per share for processing shareholder transactions is calculated as of the close of business of the New York Stock Exchange (NYSE), normally 4:00 p.m. Eastern time and includes trades executed through the end of the prior business day. Gains and losses on securities sold are determined on the basis of identified cost. Dividend income is recorded on the ex-dividend date, except for certain dividends from foreign securities where the ex-dividend date may have passed, which are recorded as soon as the Fund is informed of the ex-dividend date. Non-cash dividends included in dividend income, if any, are recorded at the fair market value of the securities received. Income and capital gain distributions from Fidelity Central Funds, if any, are recorded on the ex-dividend date. Income and capital gain distributions from any underlying mutual funds or exchange-traded funds (ETFs) are recorded on the ex-dividend date. Interest income is accrued as earned and includes coupon interest and amortization of premium and accretion of discount on debt securities as applicable. Debt obligations may be placed on non-accrual status and related interest income may be reduced by ceasing current accruals and writing off interest receivables when the collection of all or a portion of interest has become doubtful based on consistently applied procedures. A debt obligation is removed from non-accrual status when the issuer resumes interest payments or when collectability of interest is reasonably assured.
Expenses. Expenses directly attributable to a fund are charged to that fund. Expenses attributable to more than one fund are allocated among the respective funds on the basis of relative net assets or other appropriate methods. Expense estimates are accrued in the period to which they relate and adjustments are made when actual amounts are known.
Deferred Trustee Compensation. Under a Deferred Compensation Plan (the Plan) for certain Funds, certain independent Trustees have elected to defer receipt of a portion of their annual compensation. Deferred amounts are invested in affiliated mutual funds, are marked-to-market and remain in a fund until distributed in accordance with the Plan. The investment of deferred amounts and the offsetting payable to the Trustees presented below are included in the accompanying Statement of Assets and Liabilities in other receivables and other payables and accrued expenses, as applicable.
| Strategic Advisers Tax-Sensitive Short Duration Fund | $4,237 |
Income Tax Information and Distributions to Shareholders. Each year, the Fund intends to qualify as a regulated investment company under Subchapter M of the Internal Revenue Code, including distributing substantially all of its taxable income and realized gains. As a result, no provision for U.S. Federal income taxes is required. The Fund files a U.S. federal tax return, in addition to state and local tax returns as required. The Fund's federal income tax returns are subject to examination by the Internal Revenue Service (IRS) for a period of three fiscal years after they are filed. State and local tax returns may be subject to examination for an additional fiscal year depending on the jurisdiction.
Distributions are declared and recorded daily and paid monthly from net investment income. Distributions from realized gains, if any, are declared and recorded on the ex-dividend date. Income and capital gain distributions are determined in accordance with income tax regulations, which may differ from GAAP.
Capital accounts within the financial statements are adjusted for permanent book-tax differences. These adjustments have no impact on net assets or the results of operations. Capital accounts are not adjusted for temporary book-tax differences which will reverse in a subsequent period.
Book-tax differences are primarily due to the short-term gain distributions from the Underlying Funds, defaulted bonds, market discount, deferred trustees compensation and losses deferred due to wash sales and excise tax regulations.
As of period end, the cost and unrealized appreciation (depreciation) in securities, and derivatives if applicable, for federal income tax purposes were as follows:
| Gross unrealized appreciation | $18,196,561 |
| Gross unrealized depreciation | (1,596,547) |
| Net unrealized appreciation (depreciation) | $16,600,014 |
| Tax cost | $4,642,593,927 |
The Fund elected to defer to its next fiscal year approximately $209,233 of capital losses recognized during the period November 1, 2019 to May 31, 2020.
Delayed Delivery Transactions and When-Issued Securities. During the period, certain Funds transacted in securities on a delayed delivery or when-issued basis. Payment and delivery may take place after the customary settlement period for that security. The price of the underlying securities and the date when the securities will be delivered and paid for are fixed at the time the transaction is negotiated. Securities purchased on a delayed delivery or when-issued basis are identified as such in the Schedule of Investments. Compensation for interest forgone in the purchase of a delayed delivery or when-issued debt security may be received. With respect to purchase commitments, each applicable Fund identifies securities as segregated in its records with a value at least equal to the amount of the commitment. Payables and receivables associated with the purchases and sales of delayed delivery securities having the same coupon, settlement date and broker are offset. Delayed delivery or when-issued securities that have been purchased from and sold to different brokers are reflected as both payables and receivables in the Statement of Assets and Liabilities under the caption "Delayed delivery", as applicable. Losses may arise due to changes in the value of the underlying securities or if the counterparty does not perform under the contract's terms, or if the issuer does not issue the securities due to political, economic, or other factors.
Restricted Securities (including Private Placements). The Fund may invest in securities that are subject to legal or contractual restrictions on resale. These securities generally may be resold in transactions exempt from registration or to the public if the securities are registered. Disposal of these securities may involve time-consuming negotiations and expense, and prompt sale at an acceptable price may be difficult. Information regarding restricted securities is included at the end of the Fund's Schedule of Investments.
3. Purchases and Sales of Investments.
Purchases and sales of securities, other than short-term securities, are noted in the table below.
| Purchases ($) | Sales ($) | |
| Strategic Advisers Tax-Sensitive Short Duration Fund | 2,888,259,066 | 1,871,645,862 |
4. Fees and Other Transactions with Affiliates.
Management Fee. Strategic Advisers (the investment adviser) provides the Fund with investment management related services. For these services, the Fund pays a monthly management fee to the investment adviser. The management fee is calculated by adding the annual management fee rate of .25% of the Fund's average net assets throughout the month payable to the investment adviser to the aggregate of the fee rates, payable monthly, to the Fund's sub-advisers. The Fund's maximum aggregate management fee will not exceed .55% of the Fund's average net assets. For the reporting period, the total annualized management fee rate was .33% of the Fund's average net assets.
During the period, the investment adviser waived a portion of its management fee as described in the Expense Reductions note.
Sub-Advisers. FIAM LLC (an affiliate of the investment adviser), T. Rowe Price Associates, Inc. and Wells Capital Management, Inc. each served as a sub-adviser for the Fund during the period. Sub-advisers provide discretionary investment advisory services for their allocated portion of the Fund's assets and are paid by the investment adviser and not the Fund for providing these services.
Interfund Trades. Funds may purchase from or sell securities to other funds affiliated with each sub-adviser under procedures adopted by the Board. The procedures have been designed to ensure these interfund trades are executed in accordance with Rule 17a-7 of the 1940 Act. Interfund trades are included within the respective purchases and sales amounts shown in the Purchases and Sales of Investments note.
5. Investments in Fidelity Central Funds.
The Fund invests in Fidelity Central Funds, which are open-end investment companies available only to other investment companies and accounts managed by the investment adviser and its affiliates. The Fund's Schedule of Investments lists each of the Fidelity Central Funds held as of period end, if any, as an investment of the Fund, but does not include the underlying holdings of each Fidelity Central Fund. As an Investing Fund, the Fund indirectly bears its proportionate share of the expenses of the underlying Fidelity Central Funds.
The Fidelity Money Market Central Funds are managed by FMR. Annualized expenses of the Money Market Central Funds as of their most recent shareholder report date ranged from less than .005% to .01%.
A complete unaudited list of holdings for each Fidelity Central Fund is available upon request or at the Securities and Exchange Commission (the SEC) website at www.sec.gov. In addition, the financial statements of the Fidelity Central Funds are available on the SEC website or upon request.
6. Committed Line of Credit.
Certain Funds participate with other funds managed by the investment adviser or an affiliate in a $4.25 billion credit facility (the "line of credit") to be utilized for temporary or emergency purposes to fund shareholder redemptions or for other short-term liquidity purposes. The participating funds have agreed to pay commitment fees on their pro-rata portion of the line of credit, which are reflected in Miscellaneous expenses on the Statement of Operations, and are as follows:
| Amount | |
| Strategic Advisers Tax-Sensitive Short Duration Fund | $3,728 |
During the period, there were no borrowings on this line of credit.
7. Expense Reductions.
The investment adviser has contractually agreed to waive the Fund's management fee in an amount equal to .25% of the Fund's average net assets until September 30, 2023. During the period, this waiver reduced the Fund's management fee by $4,430,070.
In addition, the investment adviser has voluntarily agreed to waive a portion of the Fund's management fee. During the period, this waiver reduced the Fund's management fee by $38,008.
8. Other.
The Fund's organizational documents provide former and current trustees and officers with a limited indemnification against liabilities arising in connection with the performance of their duties to the Fund. In the normal course of business, the Fund may also enter into contracts that provide general indemnifications. The Fund's maximum exposure under these arrangements is unknown as this would be dependent on future claims that may be made against the Fund. The risk of material loss from such claims is considered remote.
The Fund does not invest in the Underlying Funds for the purpose of exercising management or control; however, investments by the Fund within its principal investment strategies may represent a significant portion of an Underlying Fund's net assets. At the end of the period, the Fund was the owner of record of approximately 100% of the total outstanding shares of Fidelity SAI Municipal Money Market Fund.
9. Coronavirus (COVID-19) Pandemic.
An outbreak of COVID-19 first detected in China during December 2019 has since spread globally and was declared a pandemic by the World Health Organization during March 2020. Developments that disrupt global economies and financial markets, such as the COVID-19 pandemic, may magnify factors that affect the Fund's performance.
Shareholder Expense Example
As a shareholder, you incur two types of costs: (1) transaction costs, which may include sales charges (loads) on purchase payments or redemption proceeds, as applicable and (2) ongoing costs, which generally include management fees, distribution and/or service (12b-1) fees and other Fund expenses. This Example is intended to help you understand your ongoing costs (in dollars) of investing in a fund and to compare these costs with the ongoing costs of investing in other mutual funds.
The Example is based on an investment of $1,000 invested at the beginning of the period and held for the entire period (June 1, 2020 to November 30, 2020).
Actual Expenses
The first line of the accompanying table provides information about actual account values and actual expenses. You may use the information in this line, together with the amount you invested, to estimate the expenses that you paid over the period. Simply divide your account value by $1,000.00 (for example, an $8,600 account value divided by $1,000.00 = 8.6), then multiply the result by the number in the first line for a class/Fund under the heading entitled "Expenses Paid During Period" to estimate the expenses you paid on your account during this period. If any fund is a shareholder of any underlying mutual funds or exchange-traded funds (ETFs) (the Underlying Funds), such fund indirectly bears its proportional share of the expenses of the Underlying Funds in addition to the direct expenses incurred presented in the table. These fees and expenses are not included in the annualized expense ratio used to calculate the expense estimate in the table below.
Hypothetical Example for Comparison Purposes
The second line of the accompanying table provides information about hypothetical account values and hypothetical expenses based on the actual expense ratio and an assumed rate of return of 5% per year before expenses, which is not the actual return. The hypothetical account values and expenses may not be used to estimate the actual ending account balance or expenses you paid for the period. You may use this information to compare the ongoing costs of investing in the Fund and other funds. To do so, compare this 5% hypothetical example with the 5% hypothetical examples that appear in the shareholder reports of the other funds. If any fund is a shareholder of any Underlying Funds, such fund indirectly bears its proportional share of the expenses of the Underlying Funds in addition to the direct expenses as presented in the table. These fees and expenses are not included in the annualized expense ratio used to calculate the expense estimate in the table below.
Please note that the expenses shown in the table are meant to highlight your ongoing costs only and do not reflect any transaction costs. Therefore, the second line of the table is useful in comparing ongoing costs only, and will not help you determine the relative total costs of owning different funds.
| Annualized Expense Ratio-A | Beginning Account Value June 1, 2020 | Ending Account Value November 30, 2020 | Expenses Paid During Period-B June 1, 2020 to November 30, 2020 | |
| Strategic Advisers Tax-Sensitive Short Duration Fund | .09% | |||
| Actual | $1,000.00 | $1,007.40 | $.45 | |
| Hypothetical-C | $1,000.00 | $1,024.62 | $.46 |
A Annualized expense ratio reflects expenses net of applicable fee waivers.
B Expenses are equal to the annualized expense ratio, multiplied by the average account value over the period, multiplied by 183/ 365 (to reflect the one-half year period).
C 5% return per year before expenses
Board Approval of Investment Advisory Contracts and Management Fees
Strategic Advisers Tax-Sensitive Short Duration Fund
Each year, the Board of Trustees, including the Independent Trustees (together, the Board), votes at a meeting on the renewal of the management contract with Strategic Advisers LLC (Strategic Advisers) and the sub-advisory agreements with FIAM LLC, T. Rowe Price Associates, Inc., and Wells Capital Management, Inc. (Wells Cap) (each a Sub-Adviser and collectively, the Sub-Advisers) (collectively, the Sub-Advisory Agreements), and the sub-sub-advisory agreements with FMR Investment Management (UK) Limited, Fidelity Management & Research (Japan) Limited, and Fidelity Management & Research (Hong Kong) Limited (collectively, the Sub-Sub-Advisory Agreements and, together with the management contract and the Sub-Advisory Agreements, the Advisory Contracts) for the fund. Strategic Advisers and the Sub-Advisers are referred to herein as the Investment Advisers. The Board, assisted by the advice of fund counsel and Independent Trustees' counsel, requests and considers a broad range of information relevant to the renewal of the Advisory Contracts throughout the year.The Board meets at least four times per year and, at each of its meetings, covers an extensive agenda of topics and materials and considers factors that are relevant to its annual consideration of the renewal of the fund's Advisory Contracts, including the services and support provided to the fund and its shareholders. The full Board or the Independent Trustees, as appropriate, act on all major matters; however, a portion of the activities of the Board (including certain of those described herein) may be conducted through standing committees that have been established by the Board. The Board, acting directly and through its committees, requests and receives information concerning the annual consideration of the renewal of the fund's Advisory Contracts.At its September 2020 meeting, the Board, including the Independent Trustees, unanimously determined to renew the fund's Advisory Contracts. In addition, the Board approved an amendment to the fund's sub-advisory agreement with Wells Cap (Amendment) to implement a new fee schedule, effective July 1, 2020, resulting in the same or lower fees at all asset levels. The Board noted that the other terms of the amended sub-advisory agreement are not materially different from those of the existing sub-advisory agreement with Wells Cap. The Board also noted that the amended sub-advisory agreement with Wells Cap would not result in changes to the nature, extent, and quality of the services that Wells Cap provides to the fund.In reaching its determination to renew the fund's Advisory Contracts and approve the Amendment, the Board considered all factors it believed relevant, including (i) the nature, extent, and quality of the services provided to the fund and its shareholders (including the investment performance of the fund); (ii) the competitiveness of the fund's management fee and total expenses relative to peer funds; (iii) the total costs of the services provided by and the profits, if any, realized by Strategic Advisers from its relationships with the fund; and (iv) the extent to which, if any, economies of scale exist and are realized as the fund grows and whether any economies of scale are appropriately shared with fund shareholders.In considering whether to renew the Advisory Contracts for the fund and approve the Amendment, the Board reached a determination, with the assistance of fund counsel and Independent Trustees' counsel and through the exercise of its business judgment, that the renewal of the Advisory Contracts and the approval of the Amendment is in the best interests of the fund and its shareholders. In addition, with respect to the Sub-Advisory Agreements, the Board also concluded that the renewal of such agreements and the approval of the Amendment do not involve a conflict of interest from which Strategic Advisers or its affiliates derive an inappropriate advantage. Also, the Board found that the advisory fees charged under the Advisory Contracts bear a reasonable relationship to the services rendered and are based on services provided that are in addition to, rather than duplicative of, services provided under the advisory contract of any underlying fund in which the fund may invest. The Board's decision to renew the Advisory Contracts and approve the Amendment was not based on any single factor, but rather was based on a comprehensive consideration of all the information provided to the Board throughout the year.Nature, Extent, and Quality of Services Provided. The Board considered the staffing within the Investment Advisers, including the backgrounds of the fund's investment personnel and also considered the fund's investment objective, strategies, and related investment philosophy. The Independent Trustees also had discussions with senior management of Strategic Advisers' investment operations and investment groups. The Board considered the structure of each Investment Adviser's investment personnel compensation program and whether such structures provide appropriate incentives to act in the best interests of the fund.The Trustees also discussed with representatives of Strategic Advisers, at meetings throughout the year, Strategic Advisers' role in, among other things, (i) setting, implementing and monitoring the investment strategies for the funds; (ii) identifying and recommending sub-advisers for the funds; (iii) overseeing compliance with federal securities laws by each sub-adviser with respect to the portion of fund assets allocated to the sub-adviser; (iv) monitoring and overseeing the performance and investment capabilities of each sub-adviser; and (v) recommending the replacement of a sub-adviser as appropriate. The Trustees considered that the Board had received from Strategic Advisers substantial information and periodic reports about Strategic Advisers' sub-adviser oversight and due diligence processes, as well as periodic reports regarding the performance of each sub-adviser.The Board also considered the nature, extent and quality of services provided by each Sub-Adviser. The Trustees noted that under the Sub-Advisory Agreements subject to oversight by Strategic Advisers, each Sub-Adviser is responsible for, among other things, identifying investments for the portion of fund assets allocated to the Sub-Adviser, if any, and executing portfolio transactions to implement its investment strategy. In addition, the Trustees noted that each Sub-Adviser is responsible for providing such reporting as may be requested from Strategic Advisers to fulfill its oversight responsibilities discussed above.Resources Dedicated to Investment Management and Support Services. The Board reviewed the general qualifications and capabilities of the Investment Advisers' investment staffs, their use of technology, and the Investment Advisers' approach to managing and compensating investment personnel. The Board noted that the Investment Advisers' analysts have extensive resources, tools, and capabilities that allow them to conduct sophisticated quantitative and/or fundamental analysis. Additionally, in its deliberations, the Board considered the Investment Advisers' trading capabilities and resources and global compliance infrastructure, which are integral parts of the investment management process. The Board also considered the Investment Advisers' investments in business continuity planning, and their success in continuously providing services to the fund notwithstanding the severe disruptions caused by the COVID-19 pandemic.Shareholder and Administrative Services. The Board considered (i) the nature, extent, quality, and cost of administrative and shareholder services performed by Strategic Advisers and its affiliates under the management contract and under separate agreements covering transfer agency, pricing and bookkeeping, and securities lending services for the fund; (ii) the nature and extent of Strategic Advisers' supervision of third party service providers, including sub-advisers, custodians and subcustodians; and (iii) the resources devoted to, and the record of compliance with, the fund's compliance policies and procedures.Investment Performance. The Board considered whether the fund has operated in accordance with its investment objective, as well as its record of compliance with its investment restrictions and its performance history.In connection with the renewal of the Advisory Contracts, the Board considered annualized return information for the fund for different time periods, measured against an appropriate securities market index ("benchmark index") and a peer group of mutual funds with similar objectives ("peer group").The Board considered discussions that occur at Board meetings throughout the year with representatives of Strategic Advisers about fund investment performance and the performance of each Sub-Adviser as part of regularly scheduled fund reviews and other reports to the Board on fund performance, taking into account various factors including general market conditions. In its discussions with representatives of Strategic Advisers regarding fund performance, the Board gave particular attention to information indicating underperformance of certain funds for specific time periods and discussed with Strategic Advisers the reasons for any such underperformance.The following chart considered by the Board shows, over the one-year period ended December 31, 2019, the cumulative total returns of the fund and the cumulative total returns of an appropriate benchmark index and peer group. The box within the chart shows the 25th percentile return (75% beaten, top of box) and the 75th percentile return (25% beaten, bottom of box) of the peer group. Returns shown above the box are in the first quartile and returns shown below the box are in the fourth quartile. The percentage beaten number noted below each chart corresponds to the percentile box and represents the percentage of funds in the peer group whose performance was equal to or lower than that of the fund.Strategic Advisers Tax-Sensitive Short Duration Fund
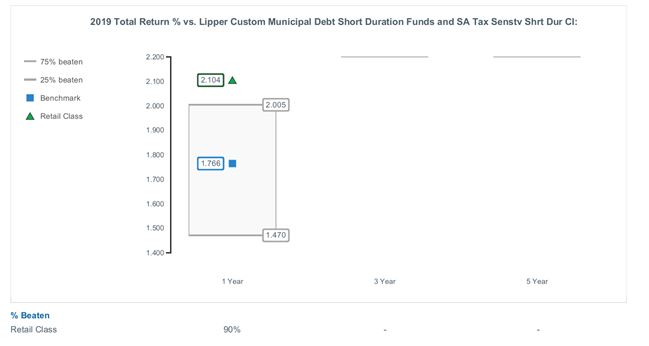
Strategic Advisers Tax-Sensitive Short Duration Fund
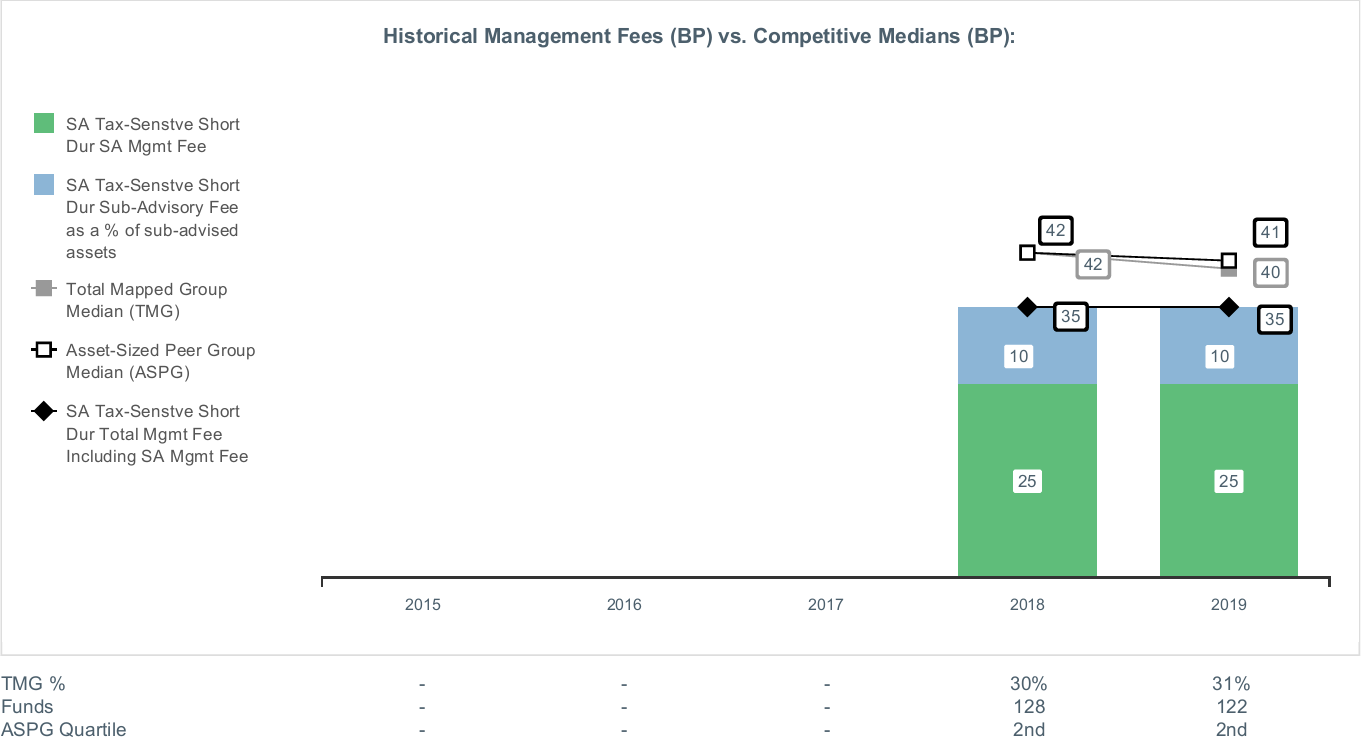
Board Approval of Amendments to Sub-Subadvisory Agreements
Strategic Advisers Tax-Sensitive Short Duration Fund
In June 2020, the Board of Trustees, including the Independent Trustees (together, the Board) voted to approve non-material amendments to the sub-subadvisory agreements (Sub-Subadvisory Agreements) among FIAM LLC (FIAM), each of FMR Investment Management (UK) Limited (FMR UK), Fidelity Management & Research (Japan) Limited (FMR Japan), and Fidelity Management & Research (Hong Kong) Limited (FMR H.K., and together with FMR UK and FMR Japan, Sub-Subadvisers), and Fidelity Rutland Square Trust II (Trust) on behalf of the fund (Amendments) to clarify the compensation that FIAM pays the Sub-Subadvisers for providing non-discretionary services. The Board, assisted by the advice of fund counsel and Independent Trustees' counsel, considered a broad range of information.The Board noted that it had approved the annual renewal of the Sub-Subadvisory Agreements at its September 2019 meeting and that no material contract terms are impacted by the Amendments. The Board considered that the Amendments will not change (i) the nature, extent and quality of the sub-advisory or sub-subadvisory services provided; (ii) the investment process or strategies employed in the management of the fund's assets; or (iii) the day-to-day management of the fund or the persons primarily responsible for such management.The Board also considered that FIAM, and not the fund, compensates the Sub-Subadvisers under the terms of the Sub-Subadvisory Agreements and that the fund and Strategic Advisers are not responsible for any such fees or expenses. The Board also considered that the Amendments will not result in any changes to the fees paid under the sub-advisory agreement among Strategic Advisers, FIAM, and the Trust on behalf of the fund.Because the Board was approving Amendments under which the fund will not bear any additional management fees or expenses, it did not consider the competitiveness of management fee and total expenses or the possible realization of economies of scale to be significant factors in its decision. In addition, because the Amendments were negotiated at arm's length and will have no impact on the maximum management fees payable by the fund or Strategic Advisers' portion of the management fee, the Board did not consider the costs of services and profitability to be significant factors in its decision to approve the Amendments. The Board considered Strategic Advisers' representation that it does not anticipate that the approval of the Amendments will have a significant impact on the profitability of, or potential fall-out benefits to, Strategic Advisers or its affiliates.The Board noted that in connection with future annual contract renewals, it will consider: (i) the nature, extent, and quality of services provided to the fund, including administrative services and investment performance; (ii) the historical investment performance of the fund; (iii) the competitiveness of the fund's management fees and total expenses; (iv) the costs of services and profitability; (v) the potential fall-out benefits to Strategic Advisers and its affiliates from their relationships with the fund; and (vi) the possible realization of economies of scale.Based on its evaluation of all of the conclusions noted above, and after considering all factors it believed relevant, the Board concluded that the Amendments are in the best interests of the fund and its shareholders and should be approved. In addition, the Board concluded that the approval of the Amendments does not involve a conflict of interest from which Strategic Advisers or its affiliates derive an inappropriate advantage.Proxy Voting Results
A special meeting of shareholders was held on November 2, 2020. The results of votes taken among shareholders on the proposals before them are reported below. Each vote reported represents one dollar of net asset value held on the record date for the meeting.
PROPOSAL 1
To elect a Board of Trustees.
| # of Votes | % of Votes | |
| ROBERT A. LAWRENCE | ||
| Affirmative | 204,250,982,594.51 | 96.530 |
| Withheld | 7,343,512,146.85 | 3.470 |
| TOTAL | 211,594,494,741.36 | 100.000 |
| CHARLES S. MORRISON | ||
| Affirmative | 204,349,460,488.43 | 96.576 |
| Withheld | 7,245,034,252.93 | 3.424 |
| TOTAL | 211,594,494,741.36 | 100.000 |
| PETER C. ALDRICH | ||
| Affirmative | 203,499,803,652.67 | 96.175 |
| Withheld | 8,094,691,088.69 | 3.825 |
| TOTAL | 211,594,494,741.36 | 100.000 |
| MARY C. FARRELL | ||
| Affirmative | 204,011,925,737.22 | 96.417 |
| Withheld | 7,582,569,004.14 | 3.583 |
| TOTAL | 211,594,494,741.36 | 100.00 |
| KAREN KAPLAN | ||
| Affirmative | 204,297,547,550.53 | 96.552 |
| Withheld | 7,296,947,190.83 | 3.448 |
| TOTAL | 211,594,494,741.36 | 100.000 |
| CHRISTINE MARCKS | ||
| Affirmative | 204,700,871,317.72 | 96.743 |
| Withheld | 6,893,623,423.64 | 3.257 |
| TOTAL | 211,594,494,741.36 | 100.000 |
| HEIDI L. STEIGER | ||
| Affirmative | 204,406,589,957.28 | 96.603 |
| Withheld | 7,187,904,784.08 | 3.397 |
| TOTAL | 211,594,494,741.36 | 100.000 |
PROPOSAL 2
To approve the conversion of a fundamental investment policy to a non-fundamental investment policy.
| # of Votes | % of Votes | |
| Affirmative | 2,144,720,745.71 | 79.830 |
| Against | 185,985,124.90 | 6.923 |
| Abstain | 355,906,306.35 | 13.247 |
| Broker Non-Vote | 0.00 | 0.000 |
| TOTAL | 2,686,612,176.96 | 100.000 |
| Proposal 1 reflects trust wide proposal and voting results. |
![]()
TSS-SANN-0121
1.9885905.102
Strategic Advisers® Fidelity® U.S. Total Stock Fund
Offered exclusively to certain clients of Strategic Advisers LLC - not available for sale to the general public
Semi-Annual Report
November 30, 2020
Contents
Board Approval of Investment Advisory Contracts and Management Fees | |
To view a fund's proxy voting record for the 12-month period ended June 30, visit http://www.fidelity.com/proxyvotingresults or visit the Securities and Exchange Commission's (SEC) web site at http://www.sec.gov.
You may also call 1-800-544-3455 to request a free copy of the proxy voting guidelines.
Standard & Poor's, S&P and S&P 500 are registered service marks of The McGraw-Hill Companies, Inc. and have been licensed for use by Fidelity Distributors Corporation.
Other third-party marks appearing herein are the property of their respective owners.
All other marks appearing herein are registered or unregistered trademarks or service marks of FMR LLC or an affiliated company. © 2021 FMR LLC. All rights reserved.
This report and the financial statements contained herein are submitted for the general information of the shareholders of the Fund. This report is not authorized for distribution to prospective investors in the Fund unless preceded or accompanied by an effective prospectus.
A fund files its complete schedule of portfolio holdings with the SEC for the first and third quarters of each fiscal year on Form N-PORT. Forms N-PORT are available on the SEC’s web site at http://www.sec.gov. A fund's Forms N-PORT may be reviewed and copied at the SEC’s Public Reference Room in Washington, DC. Information regarding the operation of the SEC's Public Reference Room may be obtained by calling 1-800-SEC-0330.
For a complete list of a fund's portfolio holdings, view the most recent holdings listing, semiannual report, or annual report on Fidelity's web site at http://www.fidelity.com, http://www.institutional.fidelity.com, or http://www.401k.com, as applicable.
NOT FDIC INSURED •MAY LOSE VALUE •NO BANK GUARANTEE
Neither the Fund nor Fidelity Distributors Corporation is a bank.
Note to Shareholders:
Early in 2020, the outbreak and spread of a new coronavirus emerged as a public health emergency that had a major influence on financial markets, primarily based on its impact on the global economy and the outlook for corporate earnings. The virus causes a respiratory disease known as COVID-19. On March 11, the World Health Organization declared the COVID-19 outbreak a pandemic, citing sustained risk of further global spread.
In the weeks following, as the crisis worsened, we witnessed an escalating human tragedy with wide-scale social and economic consequences from coronavirus-containment measures. The outbreak of COVID-19 prompted a number of measures to limit the spread, including travel and border restrictions, quarantines, and restrictions on large gatherings. In turn, these resulted in lower consumer activity, diminished demand for a wide range of products and services, disruption in manufacturing and supply chains, and – given the wide variability in outcomes regarding the outbreak – significant market uncertainty and volatility. Amid the turmoil, global governments and central banks took unprecedented action to help support consumers, businesses, and the broader economies, and to limit disruption to financial systems.
The situation continues to unfold, and the extent and duration of its impact on financial markets and the economy remain highly uncertain. Extreme events such as the coronavirus crisis are “exogenous shocks” that can have significant adverse effects on mutual funds and their investments. Although multiple asset classes may be affected by market disruption, the duration and impact may not be the same for all types of assets.
Fidelity is committed to helping you stay informed amid news about COVID-19 and during increased market volatility, and we’re taking extra steps to be responsive to customer needs. We encourage you to visit our websites, where we offer ongoing updates, commentary, and analysis on the markets and our funds.
Investment Summary (Unaudited)
The information in the following tables is based on the direct investments of the Fund.Top Ten Holdings as of November 30, 2020
| (excluding cash equivalents) | % of fund's net assets |
| Fidelity SAI U.S. Quality Index Fund | 10.4 |
| Fidelity Growth Company Fund | 9.9 |
| Fidelity SAI U.S. Large Cap Index Fund | 8.4 |
| Fidelity Contrafund | 5.7 |
| Fidelity Large Cap Value Enhanced Index Fund | 5.5 |
| Fidelity Magellan Fund | 4.4 |
| Fidelity SAI U.S. Value Index Fund | 3.4 |
| Fidelity Small Cap Index Fund | 3.4 |
| Fidelity SAI U.S. Low Volatility Index Fund | 2.2 |
| Fidelity SAI U.S. Momentum Index Fund | 2.1 |
| 55.4 |
Asset Allocation (% of fund's net assets)
| As of November 30, 2020 | ||
| Common Stocks | 42.6% | |
| Preferred Stocks | 0.2% | |
| Large Blend Funds | 10.6% | |
| Large Growth Funds | 32.5% | |
| Large Value Funds | 8.9% | |
| Small Blend Funds | 4.1% | |
| Small Growth Funds | 0.6% | |
| Short-Term Investments and Net Other Assets (Liabilities) | 0.5% | |

Asset allocations of funds in the pie chart reflect the categorizations of assets as defined by Morningstar as of the reporting date.
Schedule of Investments November 30, 2020 (Unaudited)
Showing Percentage of Net Assets
| Common Stocks - 42.6% | |||
| Shares | Value | ||
| COMMUNICATION SERVICES - 3.8% | |||
| Diversified Telecommunication Services - 0.4% | |||
| GCI Liberty, Inc. (a) | 213,600 | $19,463,232 | |
| Liberty Global PLC Class C (a) | 352,200 | 7,621,608 | |
| Verizon Communications, Inc. | 2,124,692 | 128,352,644 | |
| Vonage Holdings Corp.(a) | 479,697 | 6,168,903 | |
| 161,606,387 | |||
| Entertainment - 0.7% | |||
| Activision Blizzard, Inc. | 580,138 | 46,109,368 | |
| Cinemark Holdings, Inc. (b) | 487,000 | 7,524,150 | |
| Electronic Arts, Inc. | 196,900 | 25,153,975 | |
| Liberty Media Corp. Liberty Formula One Group Series C (a) | 366,800 | 15,324,904 | |
| Lions Gate Entertainment Corp. Class B (a) | 1,023,200 | 9,188,336 | |
| Netflix, Inc. (a) | 102,900 | 50,493,030 | |
| Nihon Falcom Corp. | 5,000 | 64,683 | |
| Nintendo Co. Ltd. ADR | 210,300 | 14,920,785 | |
| Sea Ltd. ADR (a) | 24,800 | 4,473,176 | |
| Spotify Technology SA (a) | 22,900 | 6,672,373 | |
| Take-Two Interactive Software, Inc. (a) | 37,798 | 6,822,917 | |
| The Walt Disney Co. | 772,494 | 114,336,837 | |
| Vivendi SA | 1,115,989 | 33,455,678 | |
| Warner Music Group Corp. Class A | 85,900 | 2,553,807 | |
| 337,094,019 | |||
| Interactive Media & Services - 1.3% | |||
| Alphabet, Inc.: | |||
| Class A (a) | 154,342 | 270,777,605 | |
| Class C (a) | 53,141 | 93,567,484 | |
| Dip Corp. | 60,000 | 1,393,682 | |
| Facebook, Inc. Class A (a) | 755,000 | 209,112,350 | |
| InterActiveCorp (a) | 79,300 | 11,259,807 | |
| Match Group, Inc. (a) | 106,076 | 14,766,840 | |
| Wise Talent Information Technology Co. Ltd. (a) | 1,100,103 | 2,770,385 | |
| ZIGExN Co. Ltd. | 695,603 | 2,165,786 | |
| Zoominfo Technologies, Inc. (b) | 116,000 | 5,945,000 | |
| 611,758,939 | |||
| Media - 1.2% | |||
| AMC Networks, Inc. Class A (a)(b) | 20,000 | 659,400 | |
| Comcast Corp. Class A | 6,182,078 | 310,587,599 | |
| Corus Entertainment, Inc. Class B (non-vtg.) | 95,400 | 315,135 | |
| Discovery Communications, Inc. Class A (a)(b) | 1,240,100 | 33,371,091 | |
| F@N Communications, Inc. | 26,900 | 107,361 | |
| Fox Corp. Class A | 382,633 | 11,035,136 | |
| Hyundai HCN | 486,513 | 1,437,349 | |
| Interpublic Group of Companies, Inc. | 3,746,503 | 83,472,087 | |
| Liberty Broadband Corp. Class C (a) | 194,800 | 30,651,780 | |
| News Corp. Class A | 1,007,700 | 17,785,905 | |
| Nippon Television Network Corp. | 70,700 | 769,033 | |
| Pico Far East Holdings Ltd. | 1,000,000 | 182,926 | |
| Trenders, Inc. | 10,000 | 68,276 | |
| ViacomCBS, Inc.: | |||
| Class A | 285,656 | 10,420,731 | |
| Class B | 327,600 | 11,557,728 | |
| WOWOW INC. | 100,000 | 2,714,189 | |
| WPP PLC | 2,130,900 | 20,532,829 | |
| 535,668,555 | |||
| Wireless Telecommunication Services - 0.2% | |||
| Okinawa Cellular Telephone Co. | 33,400 | 1,388,166 | |
| T-Mobile U.S., Inc. | 658,775 | 87,577,549 | |
| 88,965,715 | |||
| TOTAL COMMUNICATION SERVICES | 1,735,093,615 | ||
| CONSUMER DISCRETIONARY - 4.3% | |||
| Auto Components - 0.5% | |||
| Adient PLC (a) | 200,000 | 6,258,000 | |
| Aptiv PLC | 298,500 | 35,431,950 | |
| BorgWarner, Inc. | 1,639,564 | 63,697,061 | |
| Compagnie Plastic Omnium | 50,000 | 1,722,181 | |
| Cooper-Standard Holding, Inc. (a) | 30,000 | 1,017,600 | |
| DaikyoNishikawa Corp. | 150,000 | 983,651 | |
| Dana, Inc. | 934,400 | 15,735,296 | |
| DTR Automotive Corp. | 11,829 | 255,570 | |
| Eagle Industry Co. Ltd. | 71,400 | 614,958 | |
| G-Tekt Corp. | 599,800 | 7,966,972 | |
| Gentex Corp. | 64,000 | 2,086,400 | |
| Hi-Lex Corp. | 100,300 | 1,148,252 | |
| Hyundai Mobis | 97,500 | 21,461,047 | |
| IJT Technology Holdings Co. Ltd. | 350,000 | 1,624,779 | |
| Lear Corp. | 492,300 | 70,374,285 | |
| Linamar Corp. | 260,000 | 11,975,976 | |
| Strattec Security Corp. | 16,610 | 735,823 | |
| Topre Corp. | 47,750 | 594,318 | |
| TPR Co. Ltd. | 276,100 | 3,453,817 | |
| 247,137,936 | |||
| Automobiles - 0.1% | |||
| General Motors Co. | 860,589 | 37,728,222 | |
| Renault SA | 60,000 | 2,382,110 | |
| 40,110,332 | |||
| Distributors - 0.0% | |||
| Arata Corp. | 25,000 | 1,186,376 | |
| Harima-Kyowa Co. Ltd. (b) | 24,500 | 395,869 | |
| LKQ Corp. (a) | 133,700 | 4,708,914 | |
| Yagi & Co. Ltd. | 60,045 | 801,528 | |
| 7,092,687 | |||
| Diversified Consumer Services - 0.2% | |||
| Afya Ltd. (a) | 142,784 | 3,786,632 | |
| Heian Ceremony Service Co. Ltd. | 164,900 | 1,284,294 | |
| MegaStudy Co. Ltd. | 79,794 | 856,591 | |
| Multicampus Co. Ltd. | 33,128 | 1,017,581 | |
| Service Corp. International | 712,942 | 34,677,499 | |
| ServiceMaster Global Holdings, Inc. (a) | 668,900 | 32,796,167 | |
| 74,418,764 | |||
| Hotels, Restaurants & Leisure - 0.4% | |||
| Caesars Entertainment, Inc. (a) | 240,261 | 16,366,579 | |
| Darden Restaurants, Inc. | 224,700 | 24,263,106 | |
| Las Vegas Sands Corp. | 589,300 | 32,829,903 | |
| Marriott International, Inc. Class A | 289,200 | 36,690,804 | |
| McDonald's Corp. | 173,000 | 37,617,120 | |
| Starbucks Corp. | 91,802 | 8,998,432 | |
| The Restaurant Group PLC (a) | 1,119,900 | 960,808 | |
| Wendy's Co. | 978,650 | 21,520,514 | |
| 179,247,266 | |||
| Household Durables - 0.4% | |||
| Cuckoo Holdings Co. Ltd. | 22,347 | 1,931,262 | |
| FJ Next Co. Ltd. | 421,800 | 3,961,223 | |
| Gree Electric Appliances, Inc. of Zhuhai (A Shares) | 470,713 | 4,768,018 | |
| Iida Group Holdings Co. Ltd. | 68,900 | 1,380,739 | |
| Lennar Corp. Class A | 283,900 | 21,536,654 | |
| Mohawk Industries, Inc. (a) | 581,250 | 73,138,688 | |
| Newell Brands, Inc. | 506,100 | 10,759,686 | |
| Pressance Corp. (b) | 50,000 | 836,832 | |
| Sony Corp. | 43,700 | 4,072,205 | |
| Sony Corp. sponsored ADR | 76,700 | 7,155,343 | |
| Toll Brothers, Inc. | 547,685 | 25,932,885 | |
| Whirlpool Corp. | 237,916 | 46,300,833 | |
| 201,774,368 | |||
| Internet & Direct Marketing Retail - 0.9% | |||
| Alibaba Group Holding Ltd. sponsored ADR (a) | 59,900 | 15,775,264 | |
| Amazon.com, Inc. (a) | 89,400 | 283,222,776 | |
| Expedia, Inc. | 94,276 | 11,736,419 | |
| Hyundai Home Shopping Network Corp. | 4,861 | 319,237 | |
| NS Shopping Co. Ltd. | 21,105 | 248,458 | |
| Ocado Group PLC (a) | 30,400 | 893,797 | |
| Papyless Co. Ltd. | 1,000 | 22,849 | |
| The Booking Holdings, Inc. (a) | 38,982 | 79,073,038 | |
| 391,291,838 | |||
| Leisure Products - 0.1% | |||
| Brunswick Corp. | 365,092 | 27,250,467 | |
| Hasbro, Inc. | 347,900 | 32,365,137 | |
| 59,615,604 | |||
| Multiline Retail - 0.2% | |||
| Big Lots, Inc. | 2,000 | 103,340 | |
| Dollar General Corp. | 156,100 | 34,120,338 | |
| Dollar Tree, Inc. (a) | 302,500 | 33,045,100 | |
| Macy's, Inc. (b) | 50,000 | 510,500 | |
| Max Stock Ltd. | 250,000 | 1,064,875 | |
| Ryohin Keikaku Co. Ltd. | 1,000 | 20,522 | |
| 68,864,675 | |||
| Specialty Retail - 1.0% | |||
| Arc Land Sakamoto Co. Ltd. | 30,000 | 513,652 | |
| AT-Group Co. Ltd. | 152,100 | 2,120,823 | |
| Bed Bath & Beyond, Inc. (b) | 361,700 | 7,581,232 | |
| Best Buy Co., Inc. | 377,000 | 41,017,600 | |
| Burlington Stores, Inc. (a) | 237,745 | 51,956,792 | |
| Dick's Sporting Goods, Inc. | 256,600 | 14,577,446 | |
| Dunelm Group PLC | 200,000 | 3,216,649 | |
| Five Below, Inc. (a) | 148,900 | 23,287,960 | |
| Foot Locker, Inc. | 800,000 | 29,920,000 | |
| Gap, Inc. | 5,000 | 104,800 | |
| Genesco, Inc. (a) | 35,000 | 1,097,950 | |
| Hibbett Sports, Inc. (a) | 115,000 | 4,733,400 | |
| Hour Glass Ltd. | 1,871,200 | 1,067,344 | |
| JB Hi-Fi Ltd. | 5,000 | 167,767 | |
| John David Group PLC | 875,000 | 8,978,833 | |
| Ku Holdings Co. Ltd. | 47,500 | 362,961 | |
| Lookers PLC (c) | 828,728 | 232,012 | |
| Lowe's Companies, Inc. | 536,416 | 83,584,341 | |
| Mandarake, Inc. (b) | 30,000 | 141,565 | |
| Sally Beauty Holdings, Inc. (a) | 1,038,800 | 11,946,200 | |
| Samse SA | 2,200 | 394,680 | |
| The Buckle, Inc. | 25,000 | 670,500 | |
| The Home Depot, Inc. | 257,000 | 71,294,370 | |
| TJX Companies, Inc. | 663,200 | 42,119,832 | |
| Tokatsu Holdings Co. Ltd. | 18,700 | 72,984 | |
| Ulta Beauty, Inc. (a) | 126,000 | 34,700,400 | |
| Urban Outfitters, Inc. (a) | 350,000 | 9,583,000 | |
| Williams-Sonoma, Inc. | 238,300 | 26,086,701 | |
| 471,531,794 | |||
| Textiles, Apparel & Luxury Goods - 0.5% | |||
| Capri Holdings Ltd. (a) | 125,000 | 4,422,500 | |
| Columbia Sportswear Co. | 487,700 | 39,957,261 | |
| Embry Holdings Ltd. | 280,000 | 36,186 | |
| Fossil Group, Inc. (a) | 30,000 | 318,000 | |
| G-III Apparel Group Ltd. (a) | 100,000 | 2,037,000 | |
| Levi Strauss & Co. Class A | 1,426,600 | 26,235,174 | |
| NIKE, Inc. Class B | 420,900 | 56,695,230 | |
| PVH Corp. | 560,400 | 44,546,196 | |
| Sitoy Group Holdings Ltd. | 2,613,000 | 128,005 | |
| Tapestry, Inc. | 1,097,300 | 31,075,536 | |
| Ted Baker PLC | 418,192 | 759,627 | |
| VF Corp. | 425,800 | 35,511,720 | |
| Wolverine World Wide, Inc. | 3,000 | 86,580 | |
| 241,809,015 | |||
| TOTAL CONSUMER DISCRETIONARY | 1,982,894,279 | ||
| CONSUMER STAPLES - 2.6% | |||
| Beverages - 0.4% | |||
| Anheuser-Busch InBev SA NV ADR (b) | 76,200 | 5,081,016 | |
| Boston Beer Co., Inc. Class A (a) | 15,900 | 14,800,356 | |
| Britvic PLC | 588,000 | 6,406,327 | |
| C&C Group PLC (United Kingdom) | 4,373,700 | 12,792,558 | |
| Constellation Brands, Inc. Class A (sub. vtg.) | 268,800 | 55,329,792 | |
| Diageo PLC sponsored ADR | 85,863 | 13,304,472 | |
| Keurig Dr. Pepper, Inc. | 145,700 | 4,436,565 | |
| Monster Beverage Corp. (a) | 535,400 | 45,391,212 | |
| The Coca-Cola Co. | 754,292 | 38,921,467 | |
| Yantai Changyu Pioneer Wine Co. Ltd. (B Shares) | 690,621 | 1,291,955 | |
| 197,755,720 | |||
| Food & Staples Retailing - 0.8% | |||
| Amsterdam Commodities NV | 40,700 | 1,029,957 | |
| Halows Co. Ltd. | 11,868 | 392,794 | |
| Kroger Co. | 1,302,600 | 42,985,800 | |
| Nihon Chouzai Co. Ltd. | 13,400 | 194,347 | |
| OM2 Network Co. Ltd. | 70,900 | 899,046 | |
| Performance Food Group Co. (a) | 723,063 | 31,366,473 | |
| Qol Holdings Co. Ltd. | 100,000 | 993,183 | |
| Retail Partners Co. Ltd. | 154,400 | 2,190,301 | |
| Sapporo Clinical Laboratory | 8,900 | 119,316 | |
| Satoh & Co. Ltd. (b) | 12,300 | 172,901 | |
| Sysco Corp. | 1,083,191 | 77,220,686 | |
| U.S. Foods Holding Corp. (a) | 1,899,100 | 59,783,668 | |
| Walgreens Boots Alliance, Inc. | 1,100,000 | 41,811,000 | |
| Walmart, Inc. | 569,200 | 86,968,068 | |
| YAKUODO Holdings Co. Ltd. | 1,000 | 23,016 | |
| 346,150,556 | |||
| Food Products - 0.4% | |||
| Axyz Co. Ltd. | 17,100 | 529,077 | |
| Changshouhua Food Co. Ltd. (a) | 2,467,000 | 1,333,591 | |
| Freshpet, Inc. (a) | 99,900 | 13,674,312 | |
| Ingredion, Inc. | 175,000 | 13,501,250 | |
| JC Comsa Corp. | 39,900 | 175,882 | |
| Kaneko Seeds Co. Ltd. | 88,900 | 1,314,908 | |
| Lamb Weston Holdings, Inc. | 16,400 | 1,187,032 | |
| Lotte Samkang Co. Ltd. | 1,500 | 429,627 | |
| Mondelez International, Inc. | 1,674,200 | 96,182,790 | |
| Origin Enterprises PLC | 150,000 | 641,199 | |
| Pickles Corp. | 45,000 | 1,259,042 | |
| Post Holdings, Inc. (a) | 281,377 | 26,578,871 | |
| Prima Meat Packers Ltd. | 14,600 | 404,940 | |
| S Foods, Inc. | 27,400 | 823,330 | |
| Shinobu Food Products Co. Ltd. | 29,100 | 159,670 | |
| Toyo Sugar Refining Co. Ltd. | 39,400 | 458,054 | |
| Tyson Foods, Inc. Class A | 577,200 | 37,633,440 | |
| 196,287,015 | |||
| Household Products - 0.5% | |||
| Colgate-Palmolive Co. | 4,300 | 368,252 | |
| Procter & Gamble Co. | 1,417,000 | 196,778,790 | |
| Spectrum Brands Holdings, Inc. | 183,113 | 12,237,442 | |
| 209,384,484 | |||
| Personal Products - 0.1% | |||
| Estee Lauder Companies, Inc. Class A | 227,700 | 55,859,364 | |
| Hengan International Group Co. Ltd. | 280,000 | 1,925,830 | |
| Unilever PLC | 74,100 | 4,474,021 | |
| 62,259,215 | |||
| Tobacco - 0.4% | |||
| Altria Group, Inc. | 3,641,702 | 145,048,991 | |
| British American Tobacco PLC sponsored ADR | 710,607 | 25,091,533 | |
| KT&G Corp. | 23,699 | 1,763,764 | |
| Scandinavian Tobacco Group A/S (d) | 32,565 | 501,117 | |
| 172,405,405 | |||
| TOTAL CONSUMER STAPLES | 1,184,242,395 | ||
| ENERGY - 1.5% | |||
| Energy Equipment & Services - 0.1% | |||
| Baker Hughes Co. Class A | 161,000 | 3,013,920 | |
| Geospace Technologies Corp. (a) | 25,000 | 155,250 | |
| High Arctic Energy Services, Inc. | 362,600 | 307,123 | |
| Hoegh LNG Partners LP (b) | 368,400 | 4,907,088 | |
| Liberty Oilfield Services, Inc. Class A | 206,309 | 1,918,674 | |
| National Oilwell Varco, Inc. | 78,500 | 962,410 | |
| Oceaneering International, Inc. (a) | 555,508 | 3,371,934 | |
| SBM Offshore NV | 191,300 | 3,567,782 | |
| Subsea 7 SA (a) | 1,485,400 | 14,068,478 | |
| TechnipFMC PLC | 169,600 | 1,409,376 | |
| 33,682,035 | |||
| Oil, Gas & Consumable Fuels - 1.4% | |||
| Africa Oil Corp. (a)(b) | 2,222,500 | 1,865,346 | |
| Aker BP ASA | 84,400 | 1,895,086 | |
| Apache Corp. | 618,800 | 7,976,332 | |
| Baytex Energy Corp. (a)(b) | 2,463,500 | 1,251,952 | |
| Black Stone Minerals LP | 84,600 | 593,892 | |
| Bonterra Energy Corp. (b) | 218,300 | 267,265 | |
| Cabot Oil & Gas Corp. | 2,098,600 | 36,767,472 | |
| Canadian Natural Resources Ltd. | 546,500 | 12,468,465 | |
| Cenovus Energy, Inc. (Canada) | 4,678,214 | 23,198,351 | |
| Cheniere Energy, Inc. (a) | 40,700 | 2,307,283 | |
| Chevron Corp. | 114,900 | 10,016,982 | |
| China Petroleum & Chemical Corp.: | |||
| (H Shares) | 27,500,100 | 12,354,135 | |
| sponsored ADR (H Shares) | 9,600 | 432,768 | |
| CNOOC Ltd. sponsored ADR | 19,400 | 1,915,362 | |
| CNX Resources Corp. (a) | 175,000 | 1,646,750 | |
| ConocoPhillips Co. | 125,700 | 4,972,692 | |
| Delek U.S. Holdings, Inc. | 550,000 | 7,309,500 | |
| Enterprise Products Partners LP | 118,000 | 2,289,200 | |
| EQT Corp. | 1,250,000 | 18,600,000 | |
| Equinor ASA sponsored ADR | 1,578,160 | 24,208,974 | |
| Exxon Mobil Corp. | 4,388,145 | 167,319,969 | |
| Frontline Ltd. (NY Shares) (b) | 10,000 | 62,500 | |
| GasLog Partners LP (b) | 152,822 | 401,922 | |
| Golar LNG Partners LP | 778,067 | 2,155,246 | |
| Hess Corp. | 1,365,830 | 64,439,859 | |
| Husky Energy, Inc. | 1,800,000 | 7,304,227 | |
| Imperial Oil Ltd. (b) | 200,000 | 3,461,923 | |
| Kosmos Energy Ltd. | 7,013,100 | 12,343,056 | |
| Magellan Midstream Partners LP | 93,500 | 3,847,525 | |
| Magnolia Oil & Gas Corp. Class A (a) | 5,070,100 | 31,688,125 | |
| Marathon Oil Corp. | 422,000 | 2,498,240 | |
| Marathon Petroleum Corp. | 28,500 | 1,108,080 | |
| MEG Energy Corp. (a) | 1,947,925 | 5,474,649 | |
| Motor Oil (HELLAS) Corinth Refineries SA | 111,300 | 1,428,374 | |
| Murphy Oil Corp. | 300,000 | 3,018,000 | |
| NuVista Energy Ltd.(a)(b) | 5,000 | 3,773 | |
| Oil & Natural Gas Corp. Ltd. | 11,500,000 | 12,063,539 | |
| Parex Resources, Inc. (a) | 2,013,600 | 27,598,429 | |
| Phillips 66 Co. | 356,400 | 21,590,712 | |
| QEP Resources, Inc. | 1,000,000 | 1,610,000 | |
| Renewable Energy Group, Inc. (a) | 151,400 | 8,793,312 | |
| Royal Dutch Shell PLC Class B sponsored ADR | 604,995 | 19,632,088 | |
| Seven Generations Energy Ltd. (a) | 5,000 | 20,790 | |
| Sinopec Kantons Holdings Ltd. | 5,064,000 | 1,879,612 | |
| Southwestern Energy Co. (a) | 5,028,284 | 15,637,963 | |
| Star Petroleum Refining PCL | 2,366,800 | 594,831 | |
| Teekay LNG Partners LP | 1,342,300 | 15,906,255 | |
| Thai Oil PCL (For. Reg.) | 468,100 | 735,276 | |
| The Williams Companies, Inc. | 77,800 | 1,632,244 | |
| Total SA sponsored ADR | 961,946 | 40,536,404 | |
| Tsakos Energy Navigation Ltd. | 10,000 | 88,100 | |
| Unit Corp. (a)(b)(c) | 1,616,500 | 65,468 | |
| Valero Energy Corp. | 142,900 | 7,683,733 | |
| Whiting Petroleum Corp. (a) | 311 | 7,041 | |
| Whiting Petroleum Corp.: | |||
| warrants 9/1/24 (a) | 1,220 | 4,099 | |
| warrants 9/1/25 (a) | 610 | 2,031 | |
| World Fuel Services Corp. | 100,000 | 2,842,000 | |
| 657,817,202 | |||
| TOTAL ENERGY | 691,499,237 | ||
| FINANCIALS - 6.1% | |||
| Banks - 2.2% | |||
| Bank of America Corp. | 8,739,990 | 246,118,118 | |
| BankUnited, Inc. | 732,898 | 20,894,922 | |
| Citigroup, Inc. | 787,400 | 43,362,118 | |
| Comerica, Inc. | 202,100 | 9,943,320 | |
| Credit Agricole Atlantique Vendee | 7,800 | 1,121,309 | |
| Cullen/Frost Bankers, Inc. | 107,900 | 9,053,889 | |
| East West Bancorp, Inc. | 5,000 | 213,600 | |
| EFG Eurobank Ergasias SA (a) | 8,822,100 | 5,142,891 | |
| First Horizon National Corp. | 3,174,770 | 38,795,689 | |
| FNB Corp., Pennsylvania | 56,100 | 495,363 | |
| Gunma Bank Ltd. | 468,400 | 1,451,070 | |
| Hirogin Holdings, Inc. | 65,700 | 364,153 | |
| Huntington Bancshares, Inc. | 536,400 | 6,479,712 | |
| JPMorgan Chase & Co. | 1,274,409 | 150,227,333 | |
| KeyCorp | 512,595 | 7,924,719 | |
| M&T Bank Corp. | 426,898 | 49,729,348 | |
| NIBC Holding NV (a)(d) | 660,726 | 5,858,520 | |
| Northrim Bancorp, Inc. | 5,000 | 158,850 | |
| Ogaki Kyoritsu Bank Ltd. | 51,400 | 1,155,718 | |
| PacWest Bancorp | 1,183,259 | 27,522,604 | |
| PNC Financial Services Group, Inc. | 660,743 | 91,228,786 | |
| Shinsei Bank Ltd. | 82,500 | 975,026 | |
| Signature Bank | 31,700 | 3,556,423 | |
| Skandiabanken ASA (d) | 110,600 | 884,474 | |
| Societe Generale Series A | 113,700 | 2,254,415 | |
| Sumitomo Mitsui Financial Group, Inc. | 650,000 | 18,689,168 | |
| Synovus Financial Corp. | 92,800 | 2,929,696 | |
| TCF Financial Corp. | 925,600 | 31,100,160 | |
| The Keiyo Bank Ltd. | 148,400 | 647,961 | |
| The San-In Godo Bank Ltd. | 142,300 | 740,640 | |
| Truist Financial Corp. | 845,585 | 39,252,056 | |
| U.S. Bancorp | 680,875 | 29,420,609 | |
| Unicaja Banco SA (d) | 2,100,000 | 1,654,595 | |
| Van Lanschot NV (Bearer) | 5,800 | 137,693 | |
| Wells Fargo & Co. | 6,745,623 | 184,492,789 | |
| Yamaguchi Financial Group, Inc. | 127,800 | 792,547 | |
| 1,034,770,284 | |||
| Capital Markets - 1.0% | |||
| Affiliated Managers Group, Inc. | 206,400 | 17,981,568 | |
| Bank of New York Mellon Corp. | 1,449,300 | 56,696,616 | |
| BlackRock, Inc. Class A | 67,400 | 47,068,790 | |
| Cboe Global Markets, Inc. | 99,500 | 9,086,340 | |
| Daou Data Corp. | 1,000 | 11,321 | |
| Goldman Sachs Group, Inc. | 100,000 | 23,058,000 | |
| Intercontinental Exchange, Inc. | 217,400 | 22,937,874 | |
| Invesco Ltd. | 417,000 | 6,767,910 | |
| KKR & Co. LP | 425,799 | 16,150,556 | |
| Lazard Ltd. Class A | 821,963 | 30,675,659 | |
| Morgan Stanley | 1,245,974 | 77,038,572 | |
| Northern Trust Corp. | 514,212 | 47,883,421 | |
| Raymond James Financial, Inc. | 111,047 | 10,099,725 | |
| State Street Corp. | 886,190 | 62,458,671 | |
| StepStone Group, Inc. Class A | 272,400 | 7,387,488 | |
| Virtu Financial, Inc. Class A | 631,100 | 14,382,769 | |
| 449,685,280 | |||
| Consumer Finance - 1.0% | |||
| 360 Finance, Inc. ADR (a) | 177,800 | 2,204,720 | |
| Aeon Credit Service (Asia) Co. Ltd. | 3,946,000 | 2,673,238 | |
| Ally Financial, Inc. | 1,074,300 | 31,852,995 | |
| Capital One Financial Corp. | 1,377,400 | 117,960,536 | |
| Discover Financial Services | 2,108,734 | 160,622,269 | |
| Encore Capital Group, Inc. (a) | 16,726 | 571,026 | |
| First Cash Financial Services, Inc. | 479,410 | 30,797,298 | |
| Navient Corp. | 92,600 | 867,662 | |
| OneMain Holdings, Inc. | 1,233,859 | 48,108,162 | |
| Santander Consumer U.S.A. Holdings, Inc. | 185,300 | 4,095,130 | |
| Shriram Transport Finance Co. Ltd. | 369,861 | 5,309,267 | |
| SLM Corp. | 741,800 | 7,870,498 | |
| Synchrony Financial | 1,300,000 | 39,611,000 | |
| 452,543,801 | |||
| Diversified Financial Services - 0.6% | |||
| Berkshire Hathaway, Inc.: | |||
| Class A (a) | 2 | 687,376 | |
| Class B (a) | 1,032,000 | 236,235,120 | |
| Fuyo General Lease Co. Ltd. | 100,000 | 6,094,387 | |
| Jaws Acquisition Corp. (a) | 520,000 | 5,943,600 | |
| Ricoh Leasing Co. Ltd. | 114,000 | 3,159,021 | |
| Voya Financial, Inc. | 655,210 | 37,759,752 | |
| 289,879,256 | |||
| Insurance - 1.1% | |||
| AFLAC, Inc. | 950,000 | 41,733,500 | |
| Allstate Corp. | 99,900 | 10,224,765 | |
| American International Group, Inc. | 804,171 | 30,912,333 | |
| Arthur J. Gallagher & Co. | 101,800 | 11,748,738 | |
| ASR Nederland NV | 92,500 | 3,427,888 | |
| Assurant, Inc. | 233,930 | 30,205,042 | |
| Brown & Brown, Inc. | 583,782 | 26,287,703 | |
| BRP Group, Inc. (a) | 441,200 | 12,993,340 | |
| Chubb Ltd. | 408,072 | 60,325,284 | |
| Db Insurance Co. Ltd. | 280,000 | 11,113,918 | |
| Fairfax Financial Holdings Ltd. (sub. vtg.) | 15,400 | 5,281,558 | |
| First American Financial Corp. | 164,700 | 7,978,068 | |
| Genworth Financial, Inc. Class A (a) | 324,100 | 1,471,414 | |
| Hartford Financial Services Group, Inc. | 322,300 | 14,245,660 | |
| Hyundai Fire & Marine Insurance Co. Ltd. | 212,600 | 4,276,856 | |
| Lincoln National Corp. | 56,000 | 2,644,320 | |
| Marsh & McLennan Companies, Inc. | 160,100 | 18,353,864 | |
| MetLife, Inc. | 1,050,000 | 48,478,500 | |
| NN Group NV | 150,203 | 6,070,442 | |
| Prudential Financial, Inc. | 75,000 | 5,671,500 | |
| Reinsurance Group of America, Inc. | 131,700 | 15,182,376 | |
| Sul America SA unit | 10,188 | 81,429 | |
| The Travelers Companies, Inc. | 808,800 | 104,860,920 | |
| Willis Towers Watson PLC | 70,500 | 14,677,395 | |
| 488,246,813 | |||
| Thrifts & Mortgage Finance - 0.2% | |||
| ASAX Co. Ltd. | 188,500 | 1,272,989 | |
| Essent Group Ltd. | 807,230 | 35,405,108 | |
| Genworth Mortgage Insurance Ltd. | 400,000 | 778,093 | |
| MGIC Investment Corp. | 2,499,919 | 29,899,031 | |
| Radian Group, Inc. | 669,802 | 12,645,862 | |
| 80,001,083 | |||
| TOTAL FINANCIALS | 2,795,126,517 | ||
| HEALTH CARE - 6.7% | |||
| Biotechnology - 1.4% | |||
| AbbVie, Inc. | 81,507 | 8,524,002 | |
| ADC Therapeutics SA (a)(b) | 237,600 | 8,864,856 | |
| Alexion Pharmaceuticals, Inc. (a) | 647,560 | 79,073,552 | |
| Alnylam Pharmaceuticals, Inc. (a) | 107,600 | 13,978,316 | |
| Amgen, Inc. | 272,100 | 60,417,084 | |
| Arcutis Biotherapeutics, Inc. (a) | 100,000 | 2,712,000 | |
| Argenx SE ADR (a) | 66,000 | 18,930,120 | |
| Ascendis Pharma A/S sponsored ADR (a) | 112,000 | 18,897,760 | |
| Aurinia Pharmaceuticals, Inc. (a) | 973,200 | 14,792,640 | |
| Blueprint Medicines Corp. (a) | 412,498 | 44,582,784 | |
| Cell Biotech Co. Ltd. | 75,959 | 1,349,901 | |
| Crinetics Pharmaceuticals, Inc. (a) | 69,800 | 933,226 | |
| Deciphera Pharmaceuticals, Inc. (a) | 295,500 | 18,261,900 | |
| Essex Bio-Technology Ltd. | 500,000 | 267,948 | |
| Exelixis, Inc. (a) | 200,000 | 3,832,000 | |
| Fate Therapeutics, Inc. (a) | 60,000 | 3,507,900 | |
| Generation Bio Co. | 120,000 | 5,786,400 | |
| Gilead Sciences, Inc. | 325,000 | 19,717,750 | |
| Gritstone Oncology, Inc. (a)(b) | 310,600 | 947,330 | |
| Heron Therapeutics, Inc. (a) | 29,900 | 518,167 | |
| ImmunoGen, Inc. (a) | 3,117,000 | 16,987,650 | |
| Innovent Biologics, Inc. (a)(d) | 750,000 | 4,926,054 | |
| Insmed, Inc. (a) | 292,700 | 11,418,227 | |
| Intercept Pharmaceuticals, Inc. (a) | 177,782 | 6,313,039 | |
| Neurocrine Biosciences, Inc. (a) | 100,000 | 9,494,000 | |
| Prelude Therapeutics, Inc. (b) | 140,000 | 7,205,800 | |
| PTC Therapeutics, Inc. (a) | 582,500 | 36,447,025 | |
| Regeneron Pharmaceuticals, Inc. (a) | 143,500 | 74,050,305 | |
| Revolution Medicines, Inc. | 118,000 | 5,148,340 | |
| Sarepta Therapeutics, Inc. (a) | 276,992 | 39,017,093 | |
| Shattuck Labs, Inc. | 150,000 | 5,424,000 | |
| Stoke Therapeutics, Inc. (a) | 70,000 | 3,646,300 | |
| Turning Point Therapeutics, Inc. (a) | 332,400 | 35,400,600 | |
| uniQure B.V. (a) | 25,303 | 1,216,568 | |
| United Therapeutics Corp. (a) | 93,800 | 12,441,632 | |
| Vaxcyte, Inc. (b) | 192,600 | 6,182,460 | |
| Vertex Pharmaceuticals, Inc. (a) | 40,000 | 9,110,000 | |
| Xencor, Inc. (a) | 118,000 | 4,993,760 | |
| Zentalis Pharmaceuticals, Inc. | 120,000 | 6,115,200 | |
| Zymeworks, Inc. (a) | 112,620 | 5,929,443 | |
| 627,363,132 | |||
| Health Care Equipment & Supplies - 0.8% | |||
| A&T Corp. | 21,000 | 305,804 | |
| Atricure, Inc. (a) | 327,500 | 14,239,700 | |
| Axonics Modulation Technologies, Inc. (a)(b) | 422,000 | 18,521,580 | |
| Becton, Dickinson & Co. | 143,887 | 33,790,423 | |
| Boston Scientific Corp. (a) | 1,948,457 | 64,591,350 | |
| Danaher Corp. | 280,000 | 62,896,400 | |
| DexCom, Inc. (a) | 10,000 | 3,196,800 | |
| Fukuda Denshi Co. Ltd. | 85,000 | 6,090,003 | |
| Genmark Diagnostics, Inc. (a) | 600,000 | 8,022,000 | |
| Hologic, Inc. (a) | 330,000 | 22,812,900 | |
| InBody Co. Ltd. | 55,000 | 880,679 | |
| Insulet Corp. (a) | 105,000 | 27,059,550 | |
| Intuitive Surgical, Inc. (a) | 20,500 | 14,884,025 | |
| Masimo Corp. (a) | 40,000 | 10,179,600 | |
| Meridian Bioscience, Inc. (a) | 15,000 | 283,500 | |
| Penumbra, Inc. (a)(b) | 110,000 | 24,409,000 | |
| STERIS PLC | 125,649 | 24,352,033 | |
| Tandem Diabetes Care, Inc. (a) | 371,300 | 34,857,644 | |
| Value Added Technology Co. Ltd. | 15,000 | 300,401 | |
| Vieworks Co. Ltd. | 115,000 | 3,034,451 | |
| 374,707,843 | |||
| Health Care Providers & Services - 2.6% | |||
| 1Life Healthcare, Inc. (a) | 120,000 | 3,944,400 | |
| AmerisourceBergen Corp. | 48,800 | 5,031,768 | |
| Anthem, Inc. | 457,900 | 142,645,008 | |
| Cardinal Health, Inc. | 476,644 | 26,019,996 | |
| Centene Corp. (a) | 1,907,200 | 117,578,880 | |
| Cigna Corp. | 1,118,721 | 233,969,310 | |
| Covetrus, Inc. (a) | 165,800 | 4,479,087 | |
| CVS Health Corp. | 1,822,013 | 123,514,261 | |
| HCA Holdings, Inc. | 20,000 | 3,002,200 | |
| Humana, Inc. | 169,500 | 67,888,140 | |
| Laboratory Corp. of America Holdings (a) | 80,000 | 15,987,200 | |
| LHC Group, Inc. (a) | 182,800 | 35,887,296 | |
| McKesson Corp. | 293,853 | 52,867,093 | |
| MEDNAX, Inc. (a) | 125,000 | 2,526,250 | |
| Patterson Companies, Inc. | 101,000 | 2,803,760 | |
| Progyny, Inc. (a) | 386,255 | 13,708,190 | |
| Quest Diagnostics, Inc. | 3,700 | 458,726 | |
| Tokai Corp. | 150,000 | 2,919,980 | |
| UnitedHealth Group, Inc. | 804,528 | 270,594,948 | |
| Universal Health Services, Inc. Class B | 250,000 | 32,645,000 | |
| 1,158,471,493 | |||
| Health Care Technology - 0.1% | |||
| Inspire Medical Systems, Inc. (a) | 50,000 | 9,287,000 | |
| Phreesia, Inc. (a) | 1,051,100 | 46,416,576 | |
| 55,703,576 | |||
| Life Sciences Tools & Services - 0.3% | |||
| 10X Genomics, Inc. (a) | 40,000 | 6,124,400 | |
| Avantor, Inc. (a) | 764,500 | 20,855,560 | |
| Bio-Rad Laboratories, Inc. Class A (a) | 28,000 | 15,078,000 | |
| Bruker Corp. | 631,750 | 31,972,868 | |
| ICON PLC (a) | 5,200 | 1,013,376 | |
| Lonza Group AG | 20,000 | 12,583,456 | |
| Maravai LifeSciences Holdings, Inc. | 140,000 | 3,941,000 | |
| PRA Health Sciences, Inc. (a) | 195,500 | 21,935,100 | |
| Sotera Health Co. | 140,000 | 3,788,400 | |
| Thermo Fisher Scientific, Inc. | 47,500 | 22,086,550 | |
| 139,378,710 | |||
| Pharmaceuticals - 1.5% | |||
| AstraZeneca PLC (United Kingdom) | 365,000 | 38,191,729 | |
| Bayer AG | 792,925 | 45,683,374 | |
| Bristol-Myers Squibb Co. | 3,452,727 | 215,450,165 | |
| Bristol-Myers Squibb Co. rights (a) | 727,000 | 857,860 | |
| Daito Pharmaceutical Co. Ltd. | 17,200 | 595,385 | |
| Dawnrays Pharmaceutical Holdings Ltd. | 8,622,000 | 1,224,449 | |
| Eli Lilly & Co. | 320,000 | 46,608,000 | |
| Genomma Lab Internacional SA de CV (a) | 1,000,000 | 977,227 | |
| GlaxoSmithKline PLC sponsored ADR | 1,466,463 | 53,951,174 | |
| Intra-Cellular Therapies, Inc. (a) | 44,700 | 1,056,708 | |
| Jazz Pharmaceuticals PLC (a) | 64,800 | 9,118,008 | |
| Johnson & Johnson | 467,255 | 67,602,453 | |
| Korea United Pharm, Inc. | 77,800 | 3,670,606 | |
| Nektar Therapeutics (a)(b) | 194,000 | 3,179,660 | |
| Nippon Chemiphar Co. Ltd. | 10,400 | 246,207 | |
| Pliant Therapeutics, Inc. (b) | 176,500 | 4,857,280 | |
| Roche Holding AG (participation certificate) | 306,336 | 100,615,161 | |
| Royalty Pharma PLC | 178,000 | 7,582,800 | |
| Sanofi SA | 100,000 | 10,079,883 | |
| Sanofi SA sponsored ADR | 1,178,595 | 59,165,469 | |
| Taro Pharmaceutical Industries Ltd. (a) | 11,200 | 790,720 | |
| Theravance Biopharma, Inc. (a) | 180,000 | 2,986,200 | |
| UCB SA | 64,000 | 6,848,814 | |
| Viatris, Inc. (a) | 200,000 | 3,364,000 | |
| 684,703,332 | |||
| TOTAL HEALTH CARE | 3,040,328,086 | ||
| INDUSTRIALS - 5.1% | |||
| Aerospace & Defense - 0.4% | |||
| Airbus Group NV | 69,000 | 7,213,780 | |
| Axon Enterprise, Inc. (a) | 94,900 | 11,927,981 | |
| General Dynamics Corp. | 66,294 | 9,901,009 | |
| HEICO Corp. Class A | 257,546 | 28,523,220 | |
| Huntington Ingalls Industries, Inc. | 42,731 | 6,845,079 | |
| Lockheed Martin Corp. | 121,200 | 44,238,000 | |
| MTU Aero Engines Holdings AG | 1,700 | 400,339 | |
| Raytheon Technologies Corp. | 79,568 | 5,706,617 | |
| Safran SA (a) | 25,500 | 3,717,237 | |
| The Boeing Co. | 199,895 | 42,119,875 | |
| Vectrus, Inc. (a) | 5,000 | 238,350 | |
| 160,831,487 | |||
| Air Freight & Logistics - 0.4% | |||
| Air Transport Services Group, Inc. (a) | 816,000 | 25,083,840 | |
| Deutsche Post AG | 253,900 | 12,247,695 | |
| FedEx Corp. | 151,823 | 43,509,435 | |
| Onelogix Group Ltd. (a) | 574,686 | 92,403 | |
| United Parcel Service, Inc. Class B | 544,836 | 93,205,095 | |
| XPO Logistics, Inc. (a) | 92,600 | 9,878,568 | |
| 184,017,036 | |||
| Airlines - 0.1% | |||
| Delta Air Lines, Inc. | 471,500 | 18,977,875 | |
| Hawaiian Holdings, Inc. | 2,000 | 40,520 | |
| JetBlue Airways Corp. (a) | 958,200 | 14,459,238 | |
| Ryanair Holdings PLC sponsored ADR (a) | 46,700 | 4,846,059 | |
| 38,323,692 | |||
| Building Products - 0.6% | |||
| Apogee Enterprises, Inc. | 50,000 | 1,312,000 | |
| Carrier Global Corp. | 303,319 | 11,547,354 | |
| Fortune Brands Home & Security, Inc. | 1,144,329 | 95,551,472 | |
| Johnson Controls International PLC | 139,493 | 6,422,258 | |
| KVK Corp. | 5,500 | 93,344 | |
| Nihon Dengi Co. Ltd. | 113,700 | 4,234,367 | |
| Nihon Flush Co. Ltd. | 40,000 | 524,709 | |
| Owens Corning | 389,500 | 28,382,865 | |
| Trane Technologies PLC | 737,300 | 107,822,752 | |
| 255,891,121 | |||
| Commercial Services & Supplies - 0.0% | |||
| VSE Corp. | 1,000 | 34,200 | |
| Construction & Engineering - 0.0% | |||
| Arcadis NV | 44,800 | 1,368,332 | |
| Boustead Projs. Pte Ltd. | 2,180,500 | 1,268,158 | |
| Joban Kaihatsu Co. Ltd. | 1,400 | 114,101 | |
| Kawasaki Setsubi Kogyo Co. Ltd. | 35,000 | 166,553 | |
| Meisei Industrial Co. Ltd. | 425,200 | 3,157,514 | |
| Raiznext Corp. | 450,800 | 4,801,877 | |
| Seikitokyu Kogyo Co. Ltd. | 158,000 | 1,220,979 | |
| Watanabe Sato Co. Ltd. | 4,900 | 99,250 | |
| 12,196,764 | |||
| Electrical Equipment - 0.7% | |||
| Acuity Brands, Inc. | 101,352 | 12,032,509 | |
| Aichi Electric Co. Ltd. (b) | 231,450 | 4,991,659 | |
| AMETEK, Inc. | 705,400 | 83,611,062 | |
| Emerson Electric Co. | 506,400 | 38,901,648 | |
| Gerard Perrier Industrie SA (b) | 5,000 | 391,698 | |
| Hubbell, Inc. Class B | 65,950 | 10,656,861 | |
| Iwabuchi Corp. | 3,500 | 185,950 | |
| Regal Beloit Corp. | 287,600 | 34,235,904 | |
| Sensata Technologies, Inc. PLC (a) | 28,000 | 1,367,240 | |
| Siemens Energy AG (a) | 155,750 | 4,607,577 | |
| Soltec Power Holdings SA | 28,122 | 200,467 | |
| Sunrun, Inc. (a) | 1,365,010 | 87,469,841 | |
| Terasaki Electric Co. Ltd. | 33,600 | 334,284 | |
| Vertiv Holdings Co. | 670,853 | 12,551,660 | |
| Vertiv Holdings LLC (e) | 600,000 | 11,226,000 | |
| Vestas Wind Systems A/S | 186,500 | 38,011,218 | |
| 340,775,578 | |||
| Industrial Conglomerates - 0.9% | |||
| 3M Co. | 77,251 | 13,343,565 | |
| Carlisle Companies, Inc. | 249,120 | 36,080,050 | |
| General Electric Co. | 25,650,164 | 261,118,670 | |
| Mytilineos SA | 239,500 | 3,116,327 | |
| Reunert Ltd. | 56,900 | 136,240 | |
| Roper Technologies, Inc. | 135,000 | 57,645,000 | |
| Siemens AG | 311,400 | 41,563,980 | |
| 413,003,832 | |||
| Machinery - 0.9% | |||
| Caterpillar, Inc. | 21,700 | 3,766,903 | |
| Colfax Corp. (a) | 887,100 | 32,006,568 | |
| Conrad Industries, Inc. (a) | 5,400 | 59,400 | |
| Crane Co. | 5,000 | 347,650 | |
| Cummins, Inc. | 29,942 | 6,921,692 | |
| Epiroc AB Class A | 47,400 | 787,883 | |
| Flowserve Corp. | 665,658 | 22,685,625 | |
| Fortive Corp. | 1,152,005 | 80,790,111 | |
| Fukushima Industries Corp. | 10,000 | 420,687 | |
| Haitian International Holdings Ltd. | 1,290,000 | 3,494,821 | |
| Hy-Lok Corp. | 14,316 | 176,929 | |
| IDEX Corp. | 300,027 | 57,950,215 | |
| ITT, Inc. | 730,500 | 53,056,215 | |
| Koike Sanso Kogyo Co. Ltd. | 2,200 | 48,302 | |
| Nakanishi Manufacturing Co. Ltd. | 24,600 | 229,250 | |
| Nansin Co. Ltd. | 32,900 | 160,896 | |
| Oshkosh Corp. | 447,300 | 36,007,650 | |
| Otis Worldwide Corp. | 762,004 | 51,008,548 | |
| Pentair PLC | 359,200 | 18,613,744 | |
| Sakura Rubber Co. Ltd. | 20,800 | 860,593 | |
| Stanley Black & Decker, Inc. | 181,732 | 33,495,025 | |
| The Hanshin Diesel Works Ltd. | 4,500 | 78,763 | |
| Westinghouse Air Brake Co. | 170,895 | 12,526,604 | |
| Yamada Corp. | 22,300 | 516,345 | |
| 416,010,419 | |||
| Marine - 0.0% | |||
| Japan Transcity Corp. | 280,300 | 1,514,387 | |
| Professional Services - 0.0% | |||
| ABIST Co. Ltd. | 40,000 | 1,145,557 | |
| Altech Corp. | 10,000 | 199,620 | |
| Bertrandt AG | 50,000 | 2,276,620 | |
| Career Design Center Co. Ltd. | 50,000 | 471,050 | |
| Dun & Bradstreet Holdings, Inc. (a) | 147,100 | 3,943,751 | |
| Equifax, Inc. | 15,000 | 2,503,500 | |
| Gakujo Co. Ltd. | 10,000 | 103,832 | |
| McMillan Shakespeare Ltd. | 46,017 | 400,616 | |
| Outsourcing, Inc. | 105,000 | 1,433,270 | |
| Quick Co. Ltd. | 20,000 | 215,328 | |
| Robert Half International, Inc. | 5,000 | 320,900 | |
| SaraminHR Co. Ltd. | 29,600 | 683,578 | |
| SHL-JAPAN Ltd. | 34,800 | 824,243 | |
| 14,521,865 | |||
| Road & Rail - 0.6% | |||
| Autohellas SA | 51,600 | 328,519 | |
| CSX Corp. | 864,700 | 77,866,235 | |
| Daqin Railway Co. Ltd. (A Shares) | 2,952,141 | 3,042,380 | |
| J.B. Hunt Transport Services, Inc. | 51,690 | 6,992,623 | |
| Knight-Swift Transportation Holdings, Inc. Class A | 579,569 | 23,930,404 | |
| Landstar System, Inc. | 357,520 | 46,985,278 | |
| Lyft, Inc. (a) | 709,683 | 27,088,600 | |
| Meitetsu Transport Co. Ltd. | 15,000 | 321,855 | |
| NANSO Transport Co. Ltd. | 76,500 | 868,417 | |
| Nikkon Holdings Co. Ltd. | 150,000 | 2,910,808 | |
| Old Dominion Freight Lines, Inc. | 251,700 | 51,185,712 | |
| Ryder System, Inc. | 192,542 | 11,402,337 | |
| Schneider National, Inc. Class B | 1,260,600 | 26,346,540 | |
| STEF-TFE Group | 15,000 | 1,285,828 | |
| Tohbu Network Co. Ltd. | 42,500 | 375,691 | |
| Uber Technologies, Inc. (a) | 67,372 | 3,345,694 | |
| Utoc Corp. | 136,300 | 604,837 | |
| 284,881,758 | |||
| Trading Companies & Distributors - 0.5% | |||
| AerCap Holdings NV (a) | 50,000 | 1,838,000 | |
| Air Lease Corp. Class A | 895,000 | 32,730,150 | |
| Beacon Roofing Supply, Inc. (a) | 129,300 | 4,705,227 | |
| Beijer Ref AB (B Shares) | 28,900 | 988,929 | |
| Canox Corp. | 81,539 | 474,166 | |
| Daiichi Jitsugyo Co. Ltd. | 5,900 | 227,529 | |
| Green Cross Co. Ltd. | 81,100 | 726,528 | |
| HD Supply Holdings, Inc. (a) | 1,371,780 | 76,517,888 | |
| Howden Joinery Group PLC | 26,900 | 225,138 | |
| Itochu Corp. | 1,926,200 | 50,831,026 | |
| Kamei Corp. | 300,000 | 3,366,532 | |
| Mitani Shoji Co. Ltd. | 56,600 | 3,675,846 | |
| Mitsubishi Corp. | 447,900 | 10,406,154 | |
| MSC Industrial Direct Co., Inc. Class A | 5,000 | 416,600 | |
| Narasaki Sangyo Co. Ltd. | 25,000 | 502,492 | |
| Nishikawa Keisoku Co. Ltd. | 9,300 | 395,167 | |
| Pla Matels Corp. | 49,800 | 367,299 | |
| Sam Yung Trading Co. Ltd. | 2,000 | 24,808 | |
| Shinsho Corp. | 137,000 | 2,435,781 | |
| Totech Corp. | 1,000 | 24,075 | |
| United Rentals, Inc. (a) | 68,200 | 15,480,036 | |
| 206,359,371 | |||
| Transportation Infrastructure - 0.0% | |||
| Isewan Terminal Service Co. Ltd. | 200,400 | 1,520,651 | |
| Qingdao Port International Co. Ltd. (H Shares) (d) | 4,884,814 | 3,033,279 | |
| 4,553,930 | |||
| TOTAL INDUSTRIALS | 2,332,915,440 | ||
| INFORMATION TECHNOLOGY - 8.2% | |||
| Communications Equipment - 0.3% | |||
| Cisco Systems, Inc. | 1,828,300 | 78,653,466 | |
| CommScope Holding Co., Inc. (a) | 414,600 | 4,913,010 | |
| F5 Networks, Inc. (a) | 225,000 | 36,632,250 | |
| Juniper Networks, Inc. | 50,000 | 1,088,500 | |
| Lumentum Holdings, Inc. (a) | 2,400 | 207,312 | |
| 121,494,538 | |||
| Electronic Equipment & Components - 0.7% | |||
| Ai Holdings Corp. | 5,000 | 92,958 | |
| Avnet, Inc. | 847,600 | 25,724,660 | |
| CDW Corp. | 10,900 | 1,422,341 | |
| Cognex Corp. | 269,300 | 20,235,202 | |
| Corning, Inc. | 127,200 | 4,759,824 | |
| Daido Signal Co. Ltd. | 121,700 | 688,976 | |
| Elematec Corp. | 159,000 | 1,457,790 | |
| FLEXium Interconnect, Inc. | 101,316 | 425,548 | |
| Flextronics International Ltd. (a) | 3,268,893 | 53,054,133 | |
| HAGIAWARA ELECTRIC Co. Ltd. | 60,080 | 1,387,893 | |
| Hon Hai Precision Industry Co. Ltd. (Foxconn) | 600,000 | 1,728,386 | |
| II-VI, Inc. (a) | 104,523 | 7,070,981 | |
| Insight Enterprises, Inc. (a) | 96,948 | 6,929,843 | |
| Jabil, Inc. | 1,938,897 | 74,104,643 | |
| Kingboard Chemical Holdings Ltd. | 1,678,800 | 6,414,224 | |
| Makus, Inc. (f) | 1,300,684 | 5,585,155 | |
| Methode Electronics, Inc. Class A | 20,000 | 700,400 | |
| New Cosmos Electric Co. Ltd. | 11,000 | 172,807 | |
| PAX Global Technology Ltd. | 7,756,000 | 4,819,706 | |
| Redington India Ltd. | 517,144 | 911,700 | |
| Riken Kieki Co. Ltd. | 102,000 | 2,731,248 | |
| ScanSource, Inc. (a) | 119,631 | 3,002,738 | |
| Solid State PLC | 6,000 | 50,590 | |
| TE Connectivity Ltd. | 493,600 | 56,255,592 | |
| Thinking Electronic Industries Co. Ltd. | 400,000 | 2,044,102 | |
| Trimble, Inc. (a) | 457,800 | 27,408,486 | |
| Vontier Corp. (a) | 51,202 | 1,698,370 | |
| 310,878,296 | |||
| IT Services - 1.5% | |||
| Amadeus IT Holding SA Class A | 80,100 | 5,508,032 | |
| Amdocs Ltd. | 579,700 | 38,150,057 | |
| Avant Corp. | 300,000 | 3,173,684 | |
| CACI International, Inc. Class A (a) | 91,000 | 21,593,390 | |
| Capgemini SA | 291,400 | 40,541,279 | |
| Cielo SA | 600,000 | 397,581 | |
| Cognizant Technology Solutions Corp. Class A | 646,700 | 50,526,671 | |
| Data Applications Co. Ltd. | 11,000 | 164,187 | |
| DXC Technology Co. | 45,312 | 992,786 | |
| E-Credible Co. Ltd. | 125,000 | 2,751,416 | |
| Edenred SA | 118,700 | 6,783,126 | |
| Enea Data AB (a) | 67,600 | 1,365,622 | |
| FDM Group Holdings PLC | 5,000 | 68,253 | |
| Fidelity National Information Services, Inc. | 510,912 | 75,824,450 | |
| Fiserv, Inc. (a) | 35,400 | 4,077,372 | |
| FleetCor Technologies, Inc. (a) | 15,800 | 4,190,318 | |
| Future Corp. | 35,000 | 596,297 | |
| Gartner, Inc. (a) | 196,242 | 29,828,784 | |
| Genpact Ltd. | 817,101 | 33,215,156 | |
| Global Payments, Inc. | 74,832 | 14,606,458 | |
| GoDaddy, Inc. (a) | 534,104 | 42,482,632 | |
| Hexaware Technologies Ltd. | 100,000 | 641,892 | |
| IBM Corp. | 56,282 | 6,951,953 | |
| IFIS Japan Ltd. | 15,300 | 115,621 | |
| Korea Information & Communication Co. Ltd. (a) | 162,407 | 1,286,340 | |
| Liveramp Holdings, Inc. (a) | 48,300 | 2,826,033 | |
| MasterCard, Inc. Class A | 288,716 | 97,155,821 | |
| MongoDB, Inc. Class A (a) | 9,600 | 2,758,176 | |
| PayPal Holdings, Inc. (a) | 352,738 | 75,528,261 | |
| Sabre Corp. | 383,000 | 4,308,750 | |
| Snowflake Computing, Inc. (b) | 9,700 | 3,160,648 | |
| Tech Mahindra Ltd. | 50,000 | 588,185 | |
| Tessi SA (a) | 107 | 14,365 | |
| The Western Union Co. | 26,000 | 586,560 | |
| Twilio, Inc. Class A (a) | 10,100 | 3,232,909 | |
| Unisys Corp. (a) | 422,500 | 6,160,050 | |
| Visa, Inc. Class A | 498,851 | 104,933,308 | |
| WEX, Inc. (a) | 142,400 | 24,669,376 | |
| 711,755,799 | |||
| Semiconductors & Semiconductor Equipment - 1.4% | |||
| Advanced Micro Devices, Inc. (a) | 312,795 | 28,983,585 | |
| Analog Devices, Inc. | 87,326 | 12,145,300 | |
| Applied Materials, Inc. | 434,514 | 35,838,715 | |
| Array Technologies, Inc. (b) | 822,555 | 37,492,057 | |
| Broadcom, Inc. | 10,300 | 4,136,274 | |
| Cirrus Logic, Inc. (a) | 377,895 | 30,269,390 | |
| Intel Corp. | 69,800 | 3,374,830 | |
| Lam Research Corp. | 87,300 | 39,517,218 | |
| Marvell Technology Group Ltd. | 622,911 | 28,834,550 | |
| Micron Technology, Inc. (a) | 690,950 | 44,282,986 | |
| Miraial Co. Ltd. | 51,000 | 592,584 | |
| NVIDIA Corp. | 156,309 | 83,791,003 | |
| NXP Semiconductors NV | 474,042 | 75,097,734 | |
| ON Semiconductor Corp. (a) | 1,221,311 | 35,112,691 | |
| Phison Electronics Corp. | 300,000 | 3,391,670 | |
| Qualcomm, Inc. | 996,332 | 146,630,180 | |
| Sanken Electric Co. Ltd. | 64,089 | 2,330,843 | |
| Semtech Corp. (a) | 57,600 | 3,886,272 | |
| Sitronix Technology Corp. | 100,000 | 490,025 | |
| STMicroelectronics NV (France) | 54,000 | 2,127,293 | |
| Systems Technology, Inc. | 25,000 | 360,841 | |
| Topco Scientific Co. Ltd. | 100,000 | 425,271 | |
| Xilinx, Inc. | 79,071 | 11,508,784 | |
| 630,620,096 | |||
| Software - 3.1% | |||
| Adobe, Inc. (a) | 36,579 | 17,501,954 | |
| Asiainfo Technologies Ltd. (d) | 256,000 | 387,692 | |
| Autodesk, Inc. (a) | 130,487 | 36,566,372 | |
| Blackbaud, Inc. | 366,800 | 20,207,012 | |
| CENIT AG (a) | 20,000 | 309,851 | |
| Ceridian HCM Holding, Inc. (a) | 324,600 | 31,297,932 | |
| Cloudflare, Inc. (a) | 311,529 | 23,389,597 | |
| Cresco Ltd. | 92,900 | 1,137,592 | |
| Cyient Ltd. | 1,000,000 | 6,591,139 | |
| Digital Turbine, Inc. (a) | 66,400 | 2,986,672 | |
| Dynatrace, Inc. (a) | 133,502 | 5,075,746 | |
| Elastic NV (a) | 381,386 | 47,215,587 | |
| Encourage Technologies Co. Ltd. | 5,900 | 43,944 | |
| Envestnet, Inc. (a) | 100 | 8,026 | |
| FireEye, Inc. (a) | 891,300 | 13,396,239 | |
| HubSpot, Inc. (a) | 73,800 | 29,101,554 | |
| LivePerson, Inc. (a) | 292,506 | 17,088,201 | |
| Microsoft Corp. | 2,927,981 | 626,792,893 | |
| Nortonlifelock, Inc. | 3,036,683 | 55,358,731 | |
| Nuance Communications, Inc. (a) | 662,600 | 28,577,938 | |
| Nucleus Software Exports Ltd. (a) | 16,048 | 119,991 | |
| Oracle Corp. | 185,678 | 10,717,334 | |
| Parametric Technology Corp. (a) | 384,343 | 41,451,393 | |
| Pluralsight, Inc. (a) | 1,544,300 | 25,295,634 | |
| Proofpoint, Inc. (a) | 310,120 | 32,094,319 | |
| Rapid7, Inc. (a) | 189,800 | 14,223,612 | |
| RealPage, Inc. (a) | 721,200 | 49,755,588 | |
| RingCentral, Inc. (a) | 11,795 | 3,503,705 | |
| Salesforce.com, Inc. (a) | 249,670 | 61,368,886 | |
| SAP SE sponsored ADR (b) | 335,901 | 40,697,765 | |
| Sinosoft Tech Group Ltd. (a) | 12,500,000 | 2,120,147 | |
| SS&C Technologies Holdings, Inc. | 111,395 | 7,674,002 | |
| SurveyMonkey (a) | 1,378,053 | 29,324,968 | |
| System Research Co. Ltd. | 70,000 | 1,097,645 | |
| Telos Corp. | 62,000 | 1,244,340 | |
| Tenable Holdings, Inc. (a) | 427,500 | 15,394,275 | |
| Toho System Science Co. Ltd. (b) | 12,100 | 107,753 | |
| Verint Systems, Inc. (a) | 177,000 | 10,081,920 | |
| VMware, Inc. Class A (a)(b) | 35,200 | 4,924,128 | |
| Workday, Inc. Class A (a) | 95,623 | 21,495,094 | |
| Workiva, Inc. (a) | 257,393 | 19,301,901 | |
| Yext, Inc. (a) | 1,466,888 | 27,885,541 | |
| Zendesk, Inc. (a) | 190,467 | 25,427,345 | |
| Zensar Technologies Ltd. | 25,000 | 76,335 | |
| 1,408,418,293 | |||
| Technology Hardware, Storage & Peripherals - 1.2% | |||
| Apple, Inc. | 3,669,668 | 436,873,975 | |
| Dell Technologies, Inc. (a) | 10,000 | 690,300 | |
| Elecom Co. Ltd. | 50,000 | 2,289,891 | |
| HP, Inc. | 1,485,098 | 32,568,199 | |
| MCJ Co. Ltd. | 350,000 | 3,224,504 | |
| NetApp, Inc. | 140,000 | 7,463,400 | |
| Samsung Electronics Co. Ltd. | 355,980 | 21,419,430 | |
| Seagate Technology LLC | 150,000 | 8,821,500 | |
| TSC Auto ID Technology Corp. | 50,000 | 339,517 | |
| Western Digital Corp. | 395,021 | 17,728,542 | |
| Xerox Holdings Corp. | 31,556 | 690,761 | |
| 532,110,019 | |||
| TOTAL INFORMATION TECHNOLOGY | 3,715,277,041 | ||
| MATERIALS - 1.4% | |||
| Chemicals - 0.5% | |||
| Albemarle Corp. U.S. | 203,300 | 27,642,701 | |
| Amyris, Inc. (a)(b) | 919,943 | 2,686,234 | |
| Balchem Corp. | 179,100 | 18,570,879 | |
| C. Uyemura & Co. Ltd. | 74,000 | 5,138,571 | |
| Cabot Corp. | 10,000 | 414,100 | |
| CF Industries Holdings, Inc. | 30,000 | 1,119,000 | |
| DuPont de Nemours, Inc. | 1,035,751 | 65,708,043 | |
| Innospec, Inc. | 174,911 | 14,393,426 | |
| Isamu Paint Co. Ltd. | 3,800 | 109,024 | |
| KPC Holdings Corp. | 7,154 | 411,743 | |
| Linde PLC | 93,200 | 23,898,344 | |
| Livent Corp. (a) | 1,174,645 | 17,819,365 | |
| NOF Corp. | 21,600 | 955,860 | |
| Nutrien Ltd. | 178,751 | 8,822,622 | |
| Olin Corp. | 1,418,400 | 31,048,776 | |
| PPG Industries, Inc. | 55,748 | 8,182,134 | |
| Scientex Bhd | 590,400 | 1,724,536 | |
| Toho Acetylene Co. Ltd. | 103,800 | 1,225,696 | |
| Yara International ASA | 50,300 | 2,038,845 | |
| Yip's Chemical Holdings Ltd. | 450,000 | 175,990 | |
| 232,085,889 | |||
| Construction Materials - 0.2% | |||
| Kunimine Industries Co. Ltd. | 5,000 | 52,524 | |
| Mitani Sekisan Co. Ltd. | 16,400 | 653,901 | |
| Summit Materials, Inc. (a) | 3,163,900 | 60,114,100 | |
| Vulcan Materials Co. | 217,100 | 30,318,015 | |
| 91,138,540 | |||
| Containers & Packaging - 0.1% | |||
| Crown Holdings, Inc. (a) | 504,130 | 47,514,253 | |
| Mayr-Melnhof Karton AG | 11,200 | 1,967,628 | |
| Silgan Holdings, Inc. | 18,100 | 611,780 | |
| 50,093,661 | |||
| Metals & Mining - 0.6% | |||
| ArcelorMittal SA Class A unit (a) | 101,800 | 1,848,688 | |
| BHP Billiton Ltd. sponsored ADR (b) | 406,112 | 22,656,988 | |
| Chubu Steel Plate Co. Ltd. | 169,800 | 1,271,441 | |
| CI Resources Ltd. (a) | 136,202 | 96,980 | |
| CK-SAN-ETSU Co. Ltd. | 51,900 | 1,908,772 | |
| Commercial Metals Co. | 908,500 | 18,088,235 | |
| Compania de Minas Buenaventura SA sponsored ADR | 168,400 | 1,869,240 | |
| Freeport-McMoRan, Inc. | 3,006,285 | 70,317,006 | |
| Labrador Iron Ore Royalty Corp. | 4,700 | 95,144 | |
| Lundin Mining Corp. | 3,286,700 | 26,269,305 | |
| Mount Gibson Iron Ltd. | 5,500,000 | 3,027,956 | |
| Newmont Corp. | 1,534,500 | 90,259,290 | |
| Pacific Metals Co. Ltd. (b) | 58,300 | 1,029,667 | |
| Perenti Global Ltd. | 2,508,411 | 2,402,895 | |
| Rio Tinto PLC sponsored ADR | 15,000 | 974,550 | |
| Royal Gold, Inc. | 104,500 | 11,544,115 | |
| St Barbara Ltd. | 681,138 | 1,224,974 | |
| Teck Resources Ltd. Class B (sub. vtg.) | 150,000 | 2,370,062 | |
| 257,255,308 | |||
| TOTAL MATERIALS | 630,573,398 | ||
| REAL ESTATE - 1.2% | |||
| Equity Real Estate Investment Trusts (REITs) - 0.9% | |||
| Alexandria Real Estate Equities, Inc. | 40,000 | 6,549,200 | |
| American Tower Corp. | 178,486 | 41,265,963 | |
| Apartment Investment & Management Co. Class A | 776,477 | 23,566,077 | |
| CoreSite Realty Corp. | 199,142 | 24,970,415 | |
| Corporate Office Properties Trust (SBI) | 155,400 | 4,138,302 | |
| CubeSmart | 168,100 | 5,468,293 | |
| CyrusOne, Inc. | 354,400 | 24,776,104 | |
| Digital Realty Trust, Inc. | 85,500 | 11,521,125 | |
| Douglas Emmett, Inc. | 118,300 | 3,663,751 | |
| Empire State Realty Trust, Inc. | 2,234,326 | 20,220,650 | |
| Equinix, Inc. | 26,600 | 18,561,214 | |
| Healthcare Trust of America, Inc. | 219,477 | 5,712,986 | |
| Kilroy Realty Corp. | 79,900 | 4,886,684 | |
| Lexington Corporate Properties Trust | 1,973,500 | 20,149,435 | |
| Medical Properties Trust, Inc. | 1,139,130 | 22,099,122 | |
| Mid-America Apartment Communities, Inc. | 62,900 | 7,935,464 | |
| Outfront Media, Inc. | 1,846,540 | 34,973,468 | |
| Potlatch Corp. | 467,093 | 21,738,508 | |
| Prologis (REIT), Inc. | 216,600 | 21,670,830 | |
| SBA Communications Corp. Class A | 45,600 | 13,095,408 | |
| Simon Property Group, Inc. | 338,000 | 27,908,660 | |
| Uniti Group, Inc. | 1,018,800 | 10,473,264 | |
| Ventas, Inc. | 218,000 | 10,444,380 | |
| VICI Properties, Inc. | 124,700 | 3,153,663 | |
| Weyerhaeuser Co. | 599,900 | 17,421,096 | |
| 406,364,062 | |||
| Real Estate Management & Development - 0.3% | |||
| Arealink Co. Ltd. | 25,000 | 226,164 | |
| CBRE Group, Inc. (a) | 1,141,500 | 69,791,310 | |
| Cushman & Wakefield PLC (a) | 613,400 | 9,139,660 | |
| Howard Hughes Corp. (a) | 337,600 | 24,553,648 | |
| KE Holdings, Inc. ADR (a) | 247,500 | 16,169,175 | |
| Newmark Group, Inc. | 554,485 | 3,892,485 | |
| Nisshin Group Holdings Co. | 64,700 | 232,866 | |
| 124,005,308 | |||
| TOTAL REAL ESTATE | 530,369,370 | ||
| UTILITIES - 1.7% | |||
| Electric Utilities - 1.2% | |||
| American Electric Power Co., Inc. | 143,800 | 12,207,182 | |
| Duke Energy Corp. | 660,000 | 61,155,600 | |
| Edison International | 207,100 | 12,707,656 | |
| Entergy Corp. | 178,400 | 19,418,840 | |
| Evergy, Inc. | 850,964 | 47,151,915 | |
| Exelon Corp. | 1,538,766 | 63,197,120 | |
| FirstEnergy Corp. | 438,400 | 11,643,904 | |
| NextEra Energy, Inc. | 444,800 | 32,732,832 | |
| PG&E Corp. (a) | 4,484,046 | 56,947,384 | |
| PNM Resources, Inc. | 621,300 | 30,512,043 | |
| Portland General Electric Co. | 515,400 | 21,327,252 | |
| PPL Corp. | 2,237,700 | 63,595,434 | |
| Southern Co. | 1,563,266 | 93,561,470 | |
| 526,158,632 | |||
| Gas Utilities - 0.1% | |||
| Atmos Energy Corp. | 255,700 | 24,519,073 | |
| Busan City Gas Co. Ltd. | 60,816 | 2,759,576 | |
| China Resource Gas Group Ltd. | 764,000 | 3,682,236 | |
| Enagas SA | 56,000 | 1,368,122 | |
| Hokuriku Gas Co. | 6,200 | 184,717 | |
| Keiyo Gas Co. Ltd. | 3,000 | 104,399 | |
| Seoul City Gas Co. Ltd. | 13,199 | 1,133,534 | |
| South Jersey Industries, Inc. | 661,500 | 15,227,730 | |
| YESCO Co. Ltd. | 25,028 | 774,420 | |
| 49,753,807 | |||
| Independent Power and Renewable Electricity Producers - 0.1% | |||
| NextEra Energy Partners LP | 42,000 | 2,665,740 | |
| Sunnova Energy International, Inc. (a) | 372,700 | 15,098,077 | |
| The AES Corp. | 908,100 | 18,561,564 | |
| Vistra Corp. | 1,204,500 | 22,500,060 | |
| 58,825,441 | |||
| Multi-Utilities - 0.3% | |||
| CenterPoint Energy, Inc. | 582,044 | 13,497,600 | |
| Dominion Energy, Inc. | 708,717 | 55,627,197 | |
| MDU Resources Group, Inc. | 1,251,900 | 31,222,386 | |
| NiSource, Inc. | 771,500 | 18,670,300 | |
| Sempra Energy | 103,200 | 13,155,936 | |
| 132,173,419 | |||
| TOTAL UTILITIES | 766,911,299 | ||
| TOTAL COMMON STOCKS | |||
| (Cost $15,523,697,061) | 19,405,230,677 | ||
| Nonconvertible Preferred Stocks - 0.2% | |||
| CONSUMER DISCRETIONARY - 0.0% | |||
| Automobiles - 0.0% | |||
| Porsche Automobil Holding SE (Germany) | 100,000 | 6,351,217 | |
| INFORMATION TECHNOLOGY - 0.2% | |||
| Technology Hardware, Storage & Peripherals - 0.2% | |||
| Samsung Electronics Co. Ltd. | 1,437,090 | 79,210,298 | |
| UTILITIES - 0.0% | |||
| Electric Utilities - 0.0% | |||
| Companhia Paranaense de Energia-Copel (PN-B) | 40,600 | 517,371 | |
| TOTAL NONCONVERTIBLE PREFERRED STOCKS | |||
| (Cost $66,776,527) | 86,078,886 | ||
| Equity Funds - 56.7% | |||
| Large Blend Funds - 10.6% | |||
| Fidelity SAI U.S. Large Cap Index Fund (g) | 196,983,793 | 3,831,334,780 | |
| Fidelity SAI U.S. Low Volatility Index Fund(g) | 60,870,221 | 987,314,988 | |
| TOTAL LARGE BLEND FUNDS | 4,818,649,768 | ||
| Large Growth Funds - 32.5% | |||
| Fidelity Contrafund (g) | 149,235,022 | 2,611,612,889 | |
| Fidelity Growth Company Fund (g) | 131,113,457 | 4,519,480,855 | |
| Fidelity Magellan Fund (g) | 157,842,612 | 1,999,865,897 | |
| Fidelity SAI U.S. Momentum Index Fund (g) | 58,971,854 | 960,061,791 | |
| Fidelity SAI U.S. Quality Index Fund (g) | 292,210,745 | 4,745,502,484 | |
| TOTAL LARGE GROWTH FUNDS | 14,836,523,916 | ||
| Large Value Funds - 8.9% | |||
| Fidelity Large Cap Value Enhanced Index Fund (g) | 180,590,509 | 2,481,313,595 | |
| Fidelity SAI U.S. Value Index Fund (g) | 159,361,716 | 1,560,151,197 | |
| TOTAL LARGE VALUE FUNDS | 4,041,464,792 | ||
| Small Blend Funds - 4.1% | |||
| Fidelity Small Cap Discovery Fund (g) | 12,932,562 | 302,880,603 | |
| Fidelity Small Cap Index Fund (g) | 67,062,539 | 1,554,509,647 | |
| TOTAL SMALL BLEND FUNDS | 1,857,390,250 | ||
| Small Growth Funds - 0.6% | |||
| Fidelity Small Cap Growth Fund (g) | 9,244,346 | 299,331,931 | |
| TOTAL EQUITY FUNDS | |||
| (Cost $20,733,854,126) | 25,853,360,657 | ||
| Other - 0.0% | |||
| Commodity Funds - Broad Basket - 0.0% | |||
| Fidelity SAI Inflation-Focused Fund (g) | |||
| (Cost $6,694,501) | 851,569 | 8,464,593 | |
| Money Market Funds - 0.9% | |||
| Fidelity Cash Central Fund 0.09% (h) | 206,020,650 | 206,061,854 | |
| Fidelity Securities Lending Cash Central Fund 0.09% (h)(i) | 198,745,630 | 198,765,504 | |
| TOTAL MONEY MARKET FUNDS | |||
| (Cost $404,823,596) | 404,827,358 | ||
| TOTAL INVESTMENT IN SECURITIES - 100.4% | |||
| (Cost $36,735,845,811) | 45,757,962,171 | ||
| NET OTHER ASSETS (LIABILITIES) - (0.4)% | (193,810,596) | ||
| NET ASSETS - 100% | $45,564,151,575 |
Legend
(a) Non-income producing
(b) Security or a portion of the security is on loan at period end.
(c) Level 3 security
(d) Security exempt from registration under Rule 144A of the Securities Act of 1933. These securities may be resold in transactions exempt from registration, normally to qualified institutional buyers. At the end of the period, the value of these securities amounted to $17,245,731 or 0.0% of net assets.
(e) Restricted securities (including private placements) - Investment in securities not registered under the Securities Act of 1933 (excluding 144A issues). At the end of the period, the value of restricted securities (excluding 144A issues) amounted to $11,226,000 or 0.0% of net assets.
(f) Affiliated company
(g) Affiliated Fund
(h) Affiliated fund that is generally available only to investment companies and other accounts managed by Fidelity Investments. The rate quoted is the annualized seven-day yield of the fund at period end. A complete unaudited listing of the fund's holdings as of its most recent quarter end is available upon request. In addition, each Fidelity Central Fund's financial statements are available on the SEC's website or upon request.
(i) Investment made with cash collateral received from securities on loan.
Additional information on each restricted holding is as follows:
| Security | Acquisition Date | Acquisition Cost |
| Vertiv Holdings LLC | 2/6/20 | $6,000,000 |
Affiliated Central Funds
Information regarding fiscal year to date income earned by the Fund from investments in Fidelity Central Funds is as follows:
| Fund | Income earned |
| Fidelity Cash Central Fund | $163,210 |
| Fidelity Securities Lending Cash Central Fund | 1,397,275 |
| Total | $1,560,485 |
Amounts in the income column in the above table include any capital gain distributions from underlying funds, which are presented in the corresponding line-item in the Statement of Operations, if applicable. Amount for Fidelity Securities Lending Cash Central Fund represents the income earned on investing cash collateral, less rebates paid to borrowers and any lending agent fees associated with the loan, plus any premium payments received for lending certain types of securities.
Affiliated Underlying Funds
Fiscal year to date information regarding the Fund's investments in affiliated Underlying Funds, excluding any Money Market Central Funds, is presented below. Exchanges between classes of the same affiliated Underlying Funds may occur.
| Affili- ate | Value, beginning of period | Purchases | Sales Proceeds | Dividend Income | Realized Gain (loss) | Change in Unrealized appreciation (depreciation) | Value, end of period |
| Fidelity Contra- fund | $2,344,964,212 | $-- | $243,690,170 | $-- | $58,353,191 | $451,985,656 | $2,611,612,889 |
| Fidelity Gro- wth Co- mpa- ny Fund | 3,188,414,591 | 99,999,999 | 78,000,000 | -- | 11,514,890 | 1,297,551,375 | 4,519,480,855 |
| Fidelity Lar- ge Cap Value En- han- ced Index Fund | 1,962,505,180 | 150,000,001 | -- | -- | -- | 368,808,414 | 2,481,313,595 |
| Fidelity Ma- gellan Fund | 1,734,440,075 | -- | 61,999,999 | -- | 6,267,862 | 321,157,959 | 1,999,865,897 |
| Fidelity SAI Infla- tion-Foc- used Fund | 7,015,345 | 194,502 | -- | 194,501 | -- | 1,254,746 | 8,464,593 |
| Fidelity SAI U.S. Lar- ge Cap Index Fund | 2,085,384,411 | 4,360,394,341 | 3,090,863,772 | 14,104,623 | 309,851,010 | 166,568,790 | 3,831,334,780 |
| Fidelity SAI U.S. Low Volatil- ity Index Fund | 615,258,296 | 282,150,540 | -- | -- | -- | 89,906,152 | 987,314,988 |
| Fidelity SAI U.S. Momen- tum Index Fund | 654,081,230 | 326,737,347 | 120,000,000 | 76,737,347 | (5,963,340) | 105,206,554 | 960,061,791 |
| Fidelity SAI U.S. Qua- lity Index Fund | 3,701,607,976 | 664,979,599 | -- | 254,979,605 | -- | 378,914,909 | 4,745,502,484 |
| Fidelity SAI U.S. Value Index Fund | 1,201,926,152 | 195,258,986 | -- | 20,258,986 | -- | 162,966,059 | 1,560,151,197 |
| Fidelity Sm- all Cap Dis- cov- ery Fund | 183,429,936 | 59,999,999 | -- | -- | -- | 59,450,668 | 302,880,603 |
| Fidelity Sm- all Cap Gro- wth Fund | 173,905,565 | 74,044,088 | -- | 14,044,089 | -- | 51,382,278 | 299,331,931 |
| Makus, Inc. | 1,881,048 | 2,455,713 | -- | -- | -- | 1,248,394 | 5,585,155 |
| Fidelity Sm- all Cap Index Fund | 962,441,329 | 242,231,906 | -- | 2,231,906 | -- | 349,836,412 | 1,554,509,647 |
| 18,817,255,346 | 6,458,447,021 | 3,594,553,941 | 382,551,057 | 380,023,613 | 3,806,238,366 | 25,867,410,405 |
Amounts in the income column in the above table include any capital gain distributions from underlying funds, which are presented in the corresponding line-item in the Statement of Operations, if applicable.
Investment Valuation
The following is a summary of the inputs used, as of November 30, 2020, involving the Fund's assets and liabilities carried at fair value. The inputs or methodology used for valuing securities may not be an indication of the risk associated with investing in those securities. For more information on valuation inputs, and their aggregation into the levels used below, please refer to the Investment Valuation section in the accompanying Notes to Financial Statements.
| Valuation Inputs at Reporting Date: | ||||
| Description | Total | Level 1 | Level 2 | Level 3 |
| Investments in Securities: | ||||
| Equities: | ||||
| Communication Services | $1,735,093,615 | $1,669,480,621 | $65,612,994 | $-- |
| Consumer Discretionary | 1,989,245,496 | 1,929,628,222 | 59,385,262 | 232,012 |
| Consumer Staples | 1,184,242,395 | 1,146,361,579 | 37,880,816 | -- |
| Energy | 691,499,237 | 644,176,763 | 47,257,006 | 65,468 |
| Financials | 2,795,126,517 | 2,725,249,105 | 69,877,412 | -- |
| Health Care | 3,040,328,086 | 2,809,749,839 | 230,578,247 | -- |
| Industrials | 2,332,915,440 | 2,099,841,508 | 233,073,932 | -- |
| Information Technology | 3,794,487,339 | 3,694,283,592 | 100,203,747 | -- |
| Materials | 630,573,398 | 613,948,499 | 16,624,899 | -- |
| Real Estate | 530,369,370 | 529,910,340 | 459,030 | -- |
| Utilities | 767,428,670 | 762,089,196 | 5,339,474 | -- |
| Equity Funds | 25,853,360,657 | 25,853,360,657 | -- | -- |
| Other | 8,464,593 | 8,464,593 | -- | -- |
| Money Market Funds | 404,827,358 | 404,827,358 | -- | -- |
| Total Investments in Securities: | $45,757,962,171 | $44,891,371,872 | $866,292,819 | $297,480 |
See accompanying notes which are an integral part of the financial statements.
Financial Statements
Statement of Assets and Liabilities
| November 30, 2020 (Unaudited) | ||
| Assets | ||
| Investment in securities, at value (including securities loaned of $191,313,151) — See accompanying schedule: Unaffiliated issuers (cost $15,585,327,005) | $19,485,724,408 | |
| Fidelity Central Funds (cost $404,823,596) | 404,827,358 | |
| Other affiliated issuers (cost $20,745,695,210) | 25,867,410,405 | |
| Total Investment in Securities (cost $36,735,845,811) | $45,757,962,171 | |
| Cash | 757,779 | |
| Foreign currency held at value (cost $742,969) | 743,444 | |
| Receivable for investments sold | 85,143,403 | |
| Receivable for fund shares sold | 66,305,187 | |
| Dividends receivable | 29,553,032 | |
| Distributions receivable from Fidelity Central Funds | 80,192 | |
| Prepaid expenses | 35,324 | |
| Other receivables | 137,002 | |
| Total assets | 45,940,717,534 | |
| Liabilities | ||
| Payable for investments purchased | $158,994,758 | |
| Payable for fund shares redeemed | 13,356,889 | |
| Accrued management fee | 4,495,353 | |
| Other payables and accrued expenses | 957,083 | |
| Collateral on securities loaned | 198,761,876 | |
| Total liabilities | 376,565,959 | |
| Net Assets | $45,564,151,575 | |
| Net Assets consist of: | ||
| Paid in capital | $35,553,136,747 | |
| Total accumulated earnings (loss) | 10,011,014,828 | |
| Net Assets | $45,564,151,575 | |
| Net Asset Value, offering price and redemption price per share ($45,564,151,575 ÷ 3,517,313,275 shares) | $12.95 |
See accompanying notes which are an integral part of the financial statements.
Statement of Operations
| Six months ended November 30, 2020 (Unaudited) | ||
| Investment Income | ||
| Dividends: | ||
| Unaffiliated issuers | $149,074,210 | |
| Affiliated issuers | 94,372,340 | |
| Income from Fidelity Central Funds (including $1,397,275 from security lending) | 1,560,485 | |
| Total income | 245,007,035 | |
| Expenses | ||
| Management fee | $73,090,619 | |
| Custodian fees and expenses | 150,122 | |
| Independent trustees' fees and expenses | 189,004 | |
| Registration fees | 1,101,496 | |
| Audit | 43,396 | |
| Legal | 62,911 | |
| Miscellaneous | 153,707 | |
| Total expenses before reductions | 74,791,255 | |
| Expense reductions | (49,567,601) | |
| Total expenses after reductions | 25,223,654 | |
| Net investment income (loss) | 219,783,381 | |
| Realized and Unrealized Gain (Loss) | ||
| Net realized gain (loss) on: | ||
| Investment securities: | ||
| Unaffiliated issuers | 302,766,232 | |
| Fidelity Central Funds | (493) | |
| Other affiliated issuers | 380,023,613 | |
| Foreign currency transactions | (75,599) | |
| Written options | 243,257 | |
| Capital gain distributions from underlying funds: | ||
| Affiliated issuers | 288,178,717 | |
| Total net realized gain (loss) | 971,135,727 | |
| Change in net unrealized appreciation (depreciation) on: | ||
| Investment securities: | ||
| Unaffiliated issuers (net of increase in deferred foreign taxes of $374,352) | 3,049,645,234 | |
| Affiliated issuers | 3,806,238,366 | |
| Assets and liabilities in foreign currencies | 119,044 | |
| Written options | 178,456 | |
| Total change in net unrealized appreciation (depreciation) | 6,856,181,100 | |
| Net gain (loss) | 7,827,316,827 | |
| Net increase (decrease) in net assets resulting from operations | $8,047,100,208 |
See accompanying notes which are an integral part of the financial statements.
Statement of Changes in Net Assets
| Six months ended November 30, 2020 (Unaudited) | Year ended May 31, 2020 | |
| Increase (Decrease) in Net Assets | ||
| Operations | ||
| Net investment income (loss) | $219,783,381 | $592,082,136 |
| Net realized gain (loss) | 971,135,727 | 46,009,684 |
| Change in net unrealized appreciation (depreciation) | 6,856,181,100 | 2,317,613,529 |
| Net increase (decrease) in net assets resulting from operations | 8,047,100,208 | 2,955,705,349 |
| Distributions to shareholders | – | (835,651,420) |
| Share transactions | ||
| Proceeds from sales of shares | 8,703,929,356 | 15,476,810,855 |
| Reinvestment of distributions | – | 788,436,934 |
| Cost of shares redeemed | (4,616,871,737) | (7,367,011,490) |
| Net increase (decrease) in net assets resulting from share transactions | 4,087,057,619 | 8,898,236,299 |
| Total increase (decrease) in net assets | 12,134,157,827 | 11,018,290,228 |
| Net Assets | ||
| Beginning of period | 33,429,993,748 | 22,411,703,520 |
| End of period | $45,564,151,575 | $33,429,993,748 |
| Other Information | ||
| Shares | ||
| Sold | 745,841,823 | 1,518,664,437 |
| Issued in reinvestment of distributions | – | 71,866,316 |
| Redeemed | (394,524,056) | (730,138,079) |
| Net increase (decrease) | 351,317,767 | 860,392,674 |
See accompanying notes which are an integral part of the financial statements.
Financial Highlights
Strategic Advisers Fidelity U.S. Total Stock Fund
| Six months ended (Unaudited) November 30, | Years endedMay 31, | |||
| 2020 | 2020 | 2019 | 2018 A | |
| Selected Per–Share Data | ||||
| Net asset value, beginning of period | $10.56 | $9.72 | $9.96 | $10.00 |
| Income from Investment Operations | ||||
| Net investment income (loss)B | .07 | .22 | .18 | .01 |
| Net realized and unrealized gain (loss) | 2.32 | .94 | (.20) | (.05) |
| Total from investment operations | 2.39 | 1.16 | (.02) | (.04) |
| Distributions from net investment income | – | (.17) | (.09)C | – |
| Distributions from net realized gain | – | (.16) | (.13)C | – |
| Total distributions | – | (.32)D | (.22) | – |
| Net asset value, end of period | $12.95 | $10.56 | $9.72 | $9.96 |
| Total ReturnE,F | 22.63% | 11.84% | (.04)% | (.40)% |
| Ratios to Average Net AssetsG,H | ||||
| Expenses before reductions | .38%I | .39% | .42% | .54%I |
| Expenses net of fee waivers, if any | .13%I | .14% | .17% | .29%I,J |
| Expenses net of all reductions | .13%I | .14% | .17% | .29%I,J |
| Net investment income (loss) | 1.13%I | 2.14% | 1.81% | .55%I |
| Supplemental Data | ||||
| Net assets, end of period (000 omitted) | $45,564,152 | $33,429,994 | $22,411,704 | $16,637,411 |
| Portfolio turnover rateK | 43%I | 52% | 61% | 126%L,M |
A For the period March 20, 2018 (commencement of operations) to May 31, 2018.
B Calculated based on average shares outstanding during the period.
C The amounts shown reflect certain reclassifications related to book to tax differences that were made in the year shown.
D Total distributions per share do not sum due to rounding.
E Total returns for periods of less than one year are not annualized.
F Total returns would have been lower if certain expenses had not been reduced during the applicable periods shown.
G Fees and expenses of any underlying mutual funds or exchange-traded funds (ETFs) are not included in the Fund's expense ratio. The Fund indirectly bears its proportionate share of these expenses. For additional expense information related to investments in Fidelity Central Funds, please refer to the "Investments in Fidelity Central Funds" note found in the Notes to Financial Statements section of the most recent Annual or Semi-Annual report.
H Expense ratios reflect operating expenses of the class. Expenses before reductions do not reflect amounts reimbursed, waived, or reduced through arrangements with the investment advisor, brokerage services, or other offset arrangements, if applicable, and do not represent the amount paid by the class during periods when reimbursements, waivers or reductions occur.
I Annualized
J Audit fees are not annualized.
K Amount does not include the portfolio activity of any underlying mutual funds or exchange-traded funds (ETFs).
L Portfolio turnover rate excludes securities received or delivered in-kind.
M Amount not annualized.
See accompanying notes which are an integral part of the financial statements.
Notes to Financial Statements (Unaudited)
For the period ended November 30, 2020
1. Organization.
Strategic Advisers Fidelity U.S. Total Stock Fund (the Fund) is a fund of Fidelity Rutland Square Trust II (the Trust), and is authorized to issue an unlimited number of shares. The Trust is registered under the Investment Company Act of 1940, as amended (the 1940 Act), as an open-end management investment company organized as a Delaware statutory trust. The Fund is offered exclusively to certain clients of Strategic Advisers LLC (Strategic Advisers), an affiliate of Fidelity Management & Research Company LLC (FMR).
2. Significant Accounting Policies.
The Fund is an investment company and applies the accounting and reporting guidance of the Financial Accounting Standards Board (FASB) Accounting Standards Codification Topic 946 Financial Services – Investment Companies. The financial statements have been prepared in conformity with accounting principles generally accepted in the United States of America (GAAP), which require management to make certain estimates and assumptions at the date of the financial statements. Actual results could differ from those estimates. Subsequent events, if any, through the date that the financial statements were issued have been evaluated in the preparation of the financial statements. The following summarizes the significant accounting policies of the Fund:
Investment Valuation. Investments are valued as of 4:00 p.m. Eastern time on the last calendar day of the period. The Board of Trustees (the Board) has delegated the day to day responsibility for the valuation of the Fund's investments to the Fair Value Committee (the Committee) established by the Fund's investment adviser. In accordance with valuation policies and procedures approved by the Board, the Fund attempts to obtain prices from one or more third party pricing vendors or brokers to value its investments. When current market prices, quotations or currency exchange rates are not readily available or reliable, investments will be fair valued in good faith by the Committee, in accordance with procedures adopted by the Board. Factors used in determining fair value vary by investment type and may include market or investment specific events. The frequency with which these procedures are used cannot be predicted and they may be utilized to a significant extent. The Committee oversees the Fund's valuation policies and procedures and reports to the Board on the Committee's activities and fair value determinations. The Board monitors the appropriateness of the procedures used in valuing the Fund's investments and ratifies the fair value determinations of the Committee.
The Fund categorizes the inputs to valuation techniques used to value its investments into a disclosure hierarchy consisting of three levels as shown below:
- Level 1 – quoted prices in active markets for identical investments
- Level 2 – other significant observable inputs (including quoted prices for similar investments, interest rates, prepayment speeds, etc.)
- Level 3 – unobservable inputs (including the Fund's own assumptions based on the best information available)
Valuation techniques used to value the Fund's investments by major category are as follows:
Equity securities, including restricted securities, for which market quotations are readily available, are valued at the last reported sale price or official closing price as reported by a third party pricing vendor on the primary market or exchange on which they are traded and are categorized as Level 1 in the hierarchy. In the event there were no sales during the day or closing prices are not available, securities are valued at the last quoted bid price or may be valued using the last available price and are generally categorized as Level 2 in the hierarchy. For foreign equity securities, when market or security specific events arise, comparisons to the valuation of American Depositary Receipts (ADRs), futures contracts, Exchange-Traded Funds (ETFs) and certain indexes as well as quoted prices for similar securities may be used and would be categorized as Level 2 in the hierarchy. For equity securities, including restricted securities, where observable inputs are limited, assumptions about market activity and risk are used and these securities may be categorized as Level 3 in the hierarchy.
Investments in open-end mutual funds, including the Fidelity Central Funds, are valued at their closing net asset value (NAV) each business day and are categorized as Level 1 in the hierarchy.
Changes in valuation techniques may result in transfers in or out of an assigned level within the disclosure hierarchy. The aggregate value of investments by input level as of November 30, 2020 is included at the end of the Fund's Schedule of Investments.
Foreign Currency. Certain Funds may use foreign currency contracts to facilitate transactions in foreign-denominated securities. Gains and losses from these transactions may arise from changes in the value of the foreign currency or if the counterparties do not perform under the contracts' terms.
Foreign-denominated assets, including investment securities, and liabilities are translated into U.S. dollars at the exchange rates at period end. Purchases and sales of investment securities, income and dividends received, and expenses denominated in foreign currencies are translated into U.S. dollars at the exchange rate in effect on the transaction date.
The effects of exchange rate fluctuations on investments are included with the net realized and unrealized gain (loss) on investment securities. Other foreign currency transactions resulting in realized and unrealized gain (loss) are disclosed separately.
Investment Transactions and Income. For financial reporting purposes, the Fund's investment holdings and NAV include trades executed through the end of the last business day of the period. The NAV per share for processing shareholder transactions is calculated as of the close of business of the New York Stock Exchange (NYSE), normally 4:00 p.m. Eastern time and includes trades executed through the end of the prior business day. Gains and losses on securities sold are determined on the basis of identified cost. Dividend income is recorded on the ex-dividend date, except for certain dividends from foreign securities where the ex-dividend date may have passed, which are recorded as soon as the Fund is informed of the ex-dividend date. Non-cash dividends included in dividend income, if any, are recorded at the fair market value of the securities received. Income and capital gain distributions from Fidelity Central Funds, if any, are recorded on the ex-dividend date. Income and capital gain distributions from any underlying mutual funds or exchange-traded funds (ETFs) are recorded on the ex-dividend date. Certain distributions received by the Fund represent a return of capital or capital gain. The Fund determines the components of these distributions subsequent to the ex-dividend date, based upon receipt of tax filings or other correspondence relating to the underlying investment. These distributions are recorded as a reduction of cost of investments and/or as a realized gain. Interest income is accrued as earned and includes coupon interest and amortization of premium and accretion of discount on debt securities as applicable. Investment income is recorded net of foreign taxes withheld where recovery of such taxes is uncertain.
Expenses. Expenses directly attributable to a fund are charged to that fund. Expenses attributable to more than one fund are allocated among the respective funds on the basis of relative net assets or other appropriate methods. Expense estimates are accrued in the period to which they relate and adjustments are made when actual amounts are known.
Deferred Trustee Compensation. Under a Deferred Compensation Plan (the Plan) for certain Funds, certain independent Trustees have elected to defer receipt of a portion of their annual compensation. Deferred amounts are invested in affiliated mutual funds, are marked-to-market and remain in a fund until distributed in accordance with the Plan. The investment of deferred amounts and the offsetting payable to the Trustees presented below are included in the accompanying Statement of Assets and Liabilities in other receivables and other payables and accrued expenses, as applicable.
| Strategic Advisers Fidelity U.S. Total Stock Fund | $16,516 |
Income Tax Information and Distributions to Shareholders. Each year, the Fund intends to qualify as a regulated investment company under Subchapter M of the Internal Revenue Code, including distributing substantially all of its taxable income and realized gains. As a result, no provision for U.S. Federal income taxes is required. The Fund files a U.S. federal tax return, in addition to state and local tax returns as required. The Fund's federal income tax returns are subject to examination by the Internal Revenue Service (IRS) for a period of three fiscal years after they are filed. State and local tax returns may be subject to examination for an additional fiscal year depending on the jurisdiction. Foreign taxes are provided for based on the Fund's understanding of the tax rules and rates that exist in the foreign markets in which it invests. The Fund is subject to a tax imposed on capital gains by certain countries in which it invests. An estimated deferred tax liability for net unrealized appreciation on the applicable securities is included in Other payables and accrued expenses on the Statement of Assets & Liabilities.
Distributions are declared and recorded on the ex-dividend date. Income and capital gain distributions are determined in accordance with income tax regulations, which may differ from GAAP.
Capital accounts within the financial statements are adjusted for permanent book-tax differences. These adjustments have no impact on net assets or the results of operations. Capital accounts are not adjusted for temporary book-tax differences which will reverse in a subsequent period.
Book-tax differences are primarily due to the short-term gain distributions from the Underlying Funds, options, foreign currency transactions, passive foreign investment companies (PFIC), certain conversion ratio adjustments, partnerships, deferred trustees compensation and losses deferred due to wash sales and excise tax regulations.
As of period end, the cost and unrealized appreciation (depreciation) in securities, and derivatives if applicable, for federal income tax purposes were as follows:
| Gross unrealized appreciation | $9,660,712,409 |
| Gross unrealized depreciation | (820,078,919) |
| Net unrealized appreciation (depreciation) | $8,840,633,490 |
| Tax cost | $36,917,328,681 |
The Fund elected to defer to its next fiscal year approximately $102,700,382 of capital losses recognized during the period November 1, 2019 to May 31, 2020.
Restricted Securities (including Private Placements). The Fund may invest in securities that are subject to legal or contractual restrictions on resale. These securities generally may be resold in transactions exempt from registration or to the public if the securities are registered. Disposal of these securities may involve time-consuming negotiations and expense, and prompt sale at an acceptable price may be difficult. Information regarding restricted securities is included at the end of the Fund's Schedule of Investments.
3. Derivative Instruments.
Risk Exposures and the Use of Derivative Instruments. The Fund's investment objective allows the Fund to enter into various types of derivative contracts, including options. Derivatives are investments whose value is primarily derived from underlying assets, indices or reference rates and may be transacted on an exchange or over-the-counter (OTC). Derivatives may involve a future commitment to buy or sell a specified asset based on specified terms, to exchange future cash flows at periodic intervals based on a notional principal amount, or for one party to make one or more payments upon the occurrence of specified events in exchange for periodic payments from the other party.
The Fund used derivatives to increase returns and to manage exposure to certain risks as defined below. The success of any strategy involving derivatives depends on analysis of numerous economic factors, and if the strategies for investment do not work as intended, the Fund may not achieve its objectives.
The Fund's use of derivatives increased or decreased its exposure to the following risk:
| Equity Risk | Equity risk relates to the fluctuations in the value of financial instruments as a result of changes in market prices (other than those arising from interest rate risk or foreign exchange risk), whether caused by factors specific to an individual investment, its issuer, or all factors affecting all instruments traded in a market or market segment. |
The Fund is also exposed to additional risks from investing in derivatives, such as liquidity risk and counterparty credit risk. Liquidity risk is the risk that the Fund will be unable to close out the derivative in the open market in a timely manner. Counterparty credit risk is the risk that the counterparty will not be able to fulfill its obligation to the Fund.
Investing in derivatives may involve greater risks than investing in the underlying assets directly and, to varying degrees, may involve risk of loss in excess of any initial investment and collateral received and amounts recognized in the Statement of Assets and Liabilities. In addition, there may be the risk that the change in value of the derivative contract does not correspond to the change in value of the underlying instrument.
Options. Options give the purchaser the right, but not the obligation, to buy (call) or sell (put) an underlying security or financial instrument at an agreed exercise or strike price between or on certain dates. Options obligate the seller (writer) to buy (put) or sell (call) an underlying instrument at the exercise or strike price or cash settle an underlying derivative instrument if the holder exercises the option on or before the expiration date.
The Fund used exchange-traded written covered call options to manage its exposure to the market. When the Fund writes a covered call option, the Fund holds the underlying instrument which must be delivered to the holder upon the exercise of the option.
Upon entering into a written options contract, the Fund will receive a premium. Premiums received are reflected as a liability on the Statement of Assets and Liabilities. Options are valued daily and any unrealized appreciation (depreciation) is reflected on the Statement of Assets and Liabilities. When a written option is exercised, the premium is added to the proceeds from the sale of the underlying instrument in determining the gain or loss realized on that investment. When an option is closed the Fund will realize a gain or loss depending on whether the proceeds or amount paid for the closing sale transaction are greater or less than the premium received. When an option expires, gains and losses are realized to the extent of premiums received. The net realized gain (loss) on closed and expired written options and the change in net unrealized appreciation (depreciation) on written options are presented in the Statement of Operations.
Writing call options tends to decrease exposure to the underlying instrument and risk of loss is the change in value in excess of the premium received.
Any open options at period end are presented in the Schedule of Investments under the caption "Written Options" and are representative of volume of activity during the period.
4. Purchases and Sales of Investments.
Purchases and sales of securities, other than short-term securities are noted in the table below.
| Purchases ($) | Sales ($) | |
| Strategic Advisers Fidelity U.S. Total Stock Fund | 12,968,743,937 | 8,323,601,183 |
5. Fees and Other Transactions with Affiliates.
Management Fee. Strategic Advisers (the investment adviser) provides the Fund with investment management related services. For these services, the Fund pays a monthly management fee to the investment adviser. The management fee is calculated by adding the annual management fee rate of .25% of the Fund's average net assets throughout the month payable to the investment adviser to the aggregate of the fee rates, payable monthly, to the Fund's sub-advisers. The Fund's maximum aggregate management fee will not exceed 1.00% of the Fund's average net assets. For the reporting period, the total annualized management fee rate was .37% of the Fund's average net assets.
During the period, the investment adviser waived a portion of its management fee as described in the Expense Reductions note.
Sub-Advisers. FIAM LLC (an affiliate of the investment adviser) served as a sub-adviser for the Fund during the period. Sub-advisers provide discretionary investment advisory services for their allocated portion of the Fund's assets and are paid by the investment adviser and not the Fund for providing these services.
FIL Investment Advisors and Geode Capital Management, LLC (Geode) have been retained to serve as a sub-adviser for the Fund. As of the date of this report, however, these sub-advisers have not been allocated any portion of the Fund's assets. These sub-advisers in the future may provide discretionary investment advisory services for an allocated portion of the Fund's assets and will be paid by the investment adviser for providing these services.
Brokerage Commissions. A portion of portfolio transactions were placed with brokerage firms which are affiliates of the investment adviser. Brokerage commissions are included in net realized gain (loss) and change in net unrealized appreciation (depreciation) in the Statement of Operations. The commissions paid to these affiliated firms were as follows:
| Amount | |
| Strategic Advisers Fidelity U.S. Total Stock Fund | $138,142 |
Interfund Trades. Funds may purchase from or sell securities to other funds affiliated with each sub-adviser under procedures adopted by the Board. The procedures have been designed to ensure these interfund trades are executed in accordance with Rule 17a-7 of the 1940 Act. Interfund trades are included within the respective purchases and sales amounts shown in the Purchases and Sales of Investments note.
6. Investments in Fidelity Central Funds.
The Fund invests in Fidelity Central Funds, which are open-end investment companies available only to other investment companies and accounts managed by the investment adviser and its affiliates. The Fund's Schedule of Investments lists each of the Fidelity Central Funds held as of period end, if any, as an investment of the Fund, but does not include the underlying holdings of each Fidelity Central Fund. As an Investing Fund, the Fund indirectly bears its proportionate share of the expenses of the underlying Fidelity Central Funds.
The Fidelity Money Market Central Funds are managed by FMR. Annualized expenses of the Money Market Central Funds as of their most recent shareholder report date ranged from less than .005% to .01%.
A complete unaudited list of holdings for each Fidelity Central Fund is available upon request or at the Securities and Exchange Commission (the SEC) website at www.sec.gov. In addition, the financial statements of the Fidelity Central Funds are available on the SEC website or upon request.
7. Committed Line of Credit.
Certain Funds participate with other funds managed by the investment adviser or an affiliate in a $4.25 billion credit facility (the "line of credit") to be utilized for temporary or emergency purposes to fund shareholder redemptions or for other short-term liquidity purposes. The participating funds have agreed to pay commitment fees on their pro-rata portion of the line of credit, which are reflected in Miscellaneous expenses on the Statement of Operations, and are as follows:
| Amount | |
| Strategic Advisers Fidelity U.S. Total Stock Fund | $38,941 |
During the period, there were no borrowings on this line of credit.
8. Security Lending.
Funds lend portfolio securities through a lending agent from time to time in order to earn additional income. On the settlement date of the loan, a fund receives collateral (in the form of U.S. Treasury obligations, letters of credit and/or cash) against the loaned securities and maintains collateral in an amount not less than 100% of the market value of the loaned securities during the period of the loan. The market value of the loaned securities is determined at the close of business of a fund and any additional required collateral is delivered to a fund on the next business day. A fund or borrower may terminate the loan at any time, and if the borrower defaults on its obligation to return the securities loaned because of insolvency or other reasons, a fund may apply collateral received from the borrower against the obligation. A fund may experience delays and costs in recovering the securities loaned. Any cash collateral received is invested in the Fidelity Securities Lending Cash Central Fund. Any loaned securities are identified as such in the Schedule of Investments, and the value of loaned securities and cash collateral at period end, as applicable, are presented in the Statement of Assets and Liabilities. Security lending income represents the income earned on investing cash collateral, less rebates paid to borrowers and any lending agent fees associated with the loan, plus any premium payments received for lending certain types of securities. Security lending income is presented in the Statement of Operations as a component of income from Fidelity Central Funds.
9. Expense Reductions.
The investment adviser has contractually agreed to waive the Fund's management fee in an amount equal to .25% of the Fund's average net assets until September 30, 2023. During the period, this waiver reduced the Fund's management fee by $ 48,925,019.
Commissions paid to certain brokers with whom the investment adviser, or its affiliates, places trades on behalf of the Fund include an amount in addition to trade execution, which may be rebated back to the Fund to offset certain expenses. This amount totaled $639,993 for the period.
In addition, through arrangements with the Fund's custodian, credits realized as a result of certain uninvested cash balances were used to reduce the Fund's expenses by $2,589.
10. Other.
The Fund's organizational documents provide former and current trustees and officers with a limited indemnification against liabilities arising in connection with the performance of their duties to the Fund. In the normal course of business, the Fund may also enter into contracts that provide general indemnifications. The Fund's maximum exposure under these arrangements is unknown as this would be dependent on future claims that may be made against the Fund. The risk of material loss from such claims is considered remote.
The Fund does not invest in the Underlying Funds for the purpose of exercising management or control; however, investments by the Fund within its principal investment strategies may represent a significant portion of an Underlying Fund's net assets. At the end of the period, the Fund was the owner of record of 10% or more of the total outstanding shares of the following Underlying Funds.
| Fund | % of shares held |
| Fidelity Small Cap Index Fund | 11% |
| Fidelity SAI Inflation-Focused Fund | 24% |
| Fidelity SAI U.S. Large Cap Index Fund | 22% |
| Fidelity SAI U.S. Low Volatility Index Fund | 17% |
| Fidelity SAI U.S. Momentum Index Fund | 47% |
| Fidelity SAI U.S. Quality Index Fund | 61% |
| Fidelity SAI U.S. Value Index Fund | 67% |
11. Coronavirus (COVID-19) Pandemic.
An outbreak of COVID-19 first detected in China during December 2019 has since spread globally and was declared a pandemic by the World Health Organization during March 2020. Developments that disrupt global economies and financial markets, such as the COVID-19 pandemic, may magnify factors that affect the Fund's performance.
Shareholder Expense Example
As a shareholder, you incur two types of costs: (1) transaction costs, which may include sales charges (loads) on purchase payments or redemption proceeds, as applicable and (2) ongoing costs, which generally include management fees, distribution and/or service (12b-1) fees and other Fund expenses. This Example is intended to help you understand your ongoing costs (in dollars) of investing in a fund and to compare these costs with the ongoing costs of investing in other mutual funds.
The Example is based on an investment of $1,000 invested at the beginning of the period and held for the entire period (June 1, 2020 to November 30, 2020).
Actual Expenses
The first line of the accompanying table provides information about actual account values and actual expenses. You may use the information in this line, together with the amount you invested, to estimate the expenses that you paid over the period. Simply divide your account value by $1,000.00 (for example, an $8,600 account value divided by $1,000.00 = 8.6), then multiply the result by the number in the first line for a class/Fund under the heading entitled "Expenses Paid During Period" to estimate the expenses you paid on your account during this period. If any fund is a shareholder of any underlying mutual funds or exchange-traded funds (ETFs) (the Underlying Funds), such fund indirectly bears its proportional share of the expenses of the Underlying Funds in addition to the direct expenses incurred presented in the table.
Hypothetical Example for Comparison Purposes
The second line of the accompanying table provides information about hypothetical account values and hypothetical expenses based on the actual expense ratio and an assumed rate of return of 5% per year before expenses, which is not the actual return. The hypothetical account values and expenses may not be used to estimate the actual ending account balance or expenses you paid for the period. You may use this information to compare the ongoing costs of investing in the Fund and other funds. To do so, compare this 5% hypothetical example with the 5% hypothetical examples that appear in the shareholder reports of the other funds. If any fund is a shareholder of any Underlying Funds, such fund indirectly bears its proportional share of the expenses of the Underlying Funds in addition to the direct expenses as presented in the table.
Please note that the expenses shown in the table are meant to highlight your ongoing costs only and do not reflect any transaction costs. Therefore, the second line of the table is useful in comparing ongoing costs only, and will not help you determine the relative total costs of owning different funds.
| Annualized Expense Ratio-A | Beginning Account Value June 1, 2020 | Ending Account Value November 30, 2020 | Expenses Paid During Period-B June 1, 2020 to November 30, 2020 | |
| Strategic Advisers Fidelity U.S. Total Stock Fund | .13% | |||
| Actual | $1,000.00 | $1,226.30 | $.73 | |
| Hypothetical-C | $1,000.00 | $1,024.42 | $.66 |
A Annualized expense ratio reflects expenses net of applicable fee waivers.
B Expenses are equal to the annualized expense ratio, multiplied by the average account value over the period, multiplied by 183/ 365 (to reflect the one-half year period). The fees and expenses of any Underlying Funds are not included in each annualized expense ratio.
C 5% return per year before expenses
Board Approval of Investment Advisory Contracts and Management Fees
Strategic Advisers Fidelity U.S. Total Stock Fund
Each year, the Board of Trustees, including the Independent Trustees (together, the Board), votes at a meeting on the renewal of the management contract with Strategic Advisers LLC (Strategic Advisers) and the sub-advisory agreements with FIAM LLC and Geode Capital Management, LLC (each a Sub-Adviser and collectively, the Sub-Advisers) (collectively, the Sub-Advisory Agreements), and the sub-sub-advisory agreements with FMR Investment Management (UK) Limited, Fidelity Management & Research (Japan) Limited, and Fidelity Management & Research (Hong Kong) Limited (the Sub-Sub-Advisory Agreements and, together with the management contract and the Sub-Advisory Agreements, the Advisory Contracts) for the fund. Strategic Advisers and the Sub-Advisers are referred to herein as the Investment Advisers. The Board, assisted by the advice of fund counsel and Independent Trustees' counsel, requests and considers a broad range of information relevant to the renewal of the Advisory Contracts throughout the year.The Board meets at least four times per year and, at each of its meetings, covers an extensive agenda of topics and materials and considers factors that are relevant to its annual consideration of the renewal of the fund's Advisory Contracts, including the services and support provided to the fund and its shareholders. The full Board or the Independent Trustees, as appropriate, act on all major matters; however, a portion of the activities of the Board (including certain of those described herein) may be conducted through standing committees that have been established by the Board. The Board, acting directly and through its committees, requests and receives information concerning the annual consideration of the renewal of the fund's Advisory Contracts.At its September 2020 meeting, the Board, including the Independent Trustees, unanimously determined to renew the fund's Advisory Contracts. In reaching its determination to renew the fund's Advisory Contracts, the Board considered all factors it believed relevant, including (i) the nature, extent, and quality of the services provided to the fund and its shareholders (including the investment performance of the fund); (ii) the competitiveness of the fund's management fee and total expenses relative to peer funds; (iii) the total costs of the services provided by and the profits, if any, realized by Strategic Advisers from its relationships with the fund; and (iv) the extent to which, if any, economies of scale exist and are realized as the fund grows and whether any economies of scale are appropriately shared with fund shareholders.In considering whether to renew the Advisory Contracts for the fund, the Board reached a determination, with the assistance of fund counsel and Independent Trustees' counsel and through the exercise of its business judgment, that the renewal of the Advisory Contracts is in the best interests of the fund and its shareholders. In addition, with respect to the Sub-Advisory Agreements, the Board also concluded that the renewal of such agreements does not involve a conflict of interest from which Strategic Advisers or its affiliates derive an inappropriate advantage. Also, the Board found that the advisory fees charged under the Advisory Contracts bear a reasonable relationship to the services rendered and are based on services provided that are in addition to, rather than duplicative of, services provided under the advisory contract of any underlying fund in which the fund may invest. The Board's decision to renew the Advisory Contracts was not based on any single factor, but rather was based on a comprehensive consideration of all the information provided to the Board throughout the year.Nature, Extent, and Quality of Services Provided. The Board considered the staffing within the Investment Advisers, including the backgrounds of the fund's investment personnel and also considered the fund's investment objective, strategies, and related investment philosophy. The Independent Trustees also had discussions with senior management of Strategic Advisers' investment operations and investment groups. The Board considered the structure of each Investment Adviser's investment personnel compensation program and whether such structures provide appropriate incentives to act in the best interests of the fund.The Trustees also discussed with representatives of Strategic Advisers, at meetings throughout the year, Strategic Advisers' role in, among other things, (i) setting, implementing and monitoring the investment strategies for the funds; (ii) identifying and recommending sub-advisers for the funds; (iii) overseeing compliance with federal securities laws by each sub-adviser with respect to the portion of fund assets allocated to the sub-adviser; (iv) monitoring and overseeing the performance and investment capabilities of each sub-adviser; and (v) recommending the replacement of a sub-adviser as appropriate. The Trustees considered that the Board had received from Strategic Advisers substantial information and periodic reports about Strategic Advisers' sub-adviser oversight and due diligence processes, as well as periodic reports regarding the performance of each sub-adviser.The Board also considered the nature, extent and quality of services provided by each Sub-Adviser. The Trustees noted that under the Sub-Advisory Agreements subject to oversight by Strategic Advisers, each Sub-Adviser is responsible for, among other things, identifying investments for the portion of fund assets allocated to the Sub-Adviser, if any, and executing portfolio transactions to implement its investment strategy. In addition, the Trustees noted that each Sub-Adviser is responsible for providing such reporting as may be requested from Strategic Advisers to fulfill its oversight responsibilities discussed above.Resources Dedicated to Investment Management and Support Services. The Board reviewed the general qualifications and capabilities of the Investment Advisers' investment staffs, their use of technology, and the Investment Advisers' approach to managing and compensating investment personnel. The Board noted that the Investment Advisers' analysts have extensive resources, tools, and capabilities that allow them to conduct sophisticated quantitative and/or fundamental analysis. Additionally, in its deliberations, the Board considered the Investment Advisers' trading capabilities and resources and global compliance infrastructure, which are integral parts of the investment management process. The Board also considered the Investment Advisers' investments in business continuity planning, and their success in continuously providing services to the fund notwithstanding the severe disruptions caused by the COVID-19 pandemic.Shareholder and Administrative Services. The Board considered (i) the nature, extent, quality, and cost of administrative and shareholder services performed by Strategic Advisers and itsaffiliates under the management contract and under separate agreements covering transfer agency, pricing and bookkeeping, and securities lending services for the fund; (ii) the nature and extent of Strategic Advisers' supervision of third party service providers, including sub-advisers, custodians and subcustodians; and (iii) the resources devoted to, and the record of compliance with, the fund's compliance policies and procedures.Investment Performance. The Board considered whether the fund has operated in accordance with its investment objective, as well as its record of compliance with its investment restrictions and its performance history.In connection with the renewal of the Advisory Contracts, the Board considered annualized return information for the fund for different time periods, measured against an appropriate securities market index ("benchmark index") and a peer group of mutual funds with similar objectives ("peer group").The Board considered discussions that occur at Board meetings throughout the year with representatives of Strategic Advisers about fund investment performance and the performance of each Sub-Adviser as part of regularly scheduled fund reviews and other reports to the Board on fund performance, taking into account various factors including general market conditions. In its discussions with representatives of Strategic Advisers regarding fund performance, the Board gave particular attention to information indicating underperformance of certain funds for specific time periods and discussed with Strategic Advisers the reasons for any such underperformance.The following chart considered by the Board shows, over the one-year period ended December 31, 2019, the cumulative total returns of the fund and the cumulative total returns of an appropriate benchmark index and peer group. The box within the chart shows the 25th percentile return (75% beaten, top of box) and the 75th percentile return (25% beaten, bottom of box) of the peer group. Returns shown above the box are in the first quartile and returns shown below the box are in the fourth quartile. The percentage beaten number noted below each chart corresponds to the percentile box and represents the percentage of funds in the peer group whose performance was equal to or lower than that of the fund.Strategic Advisers Fidelity U.S. Total Stock Fund
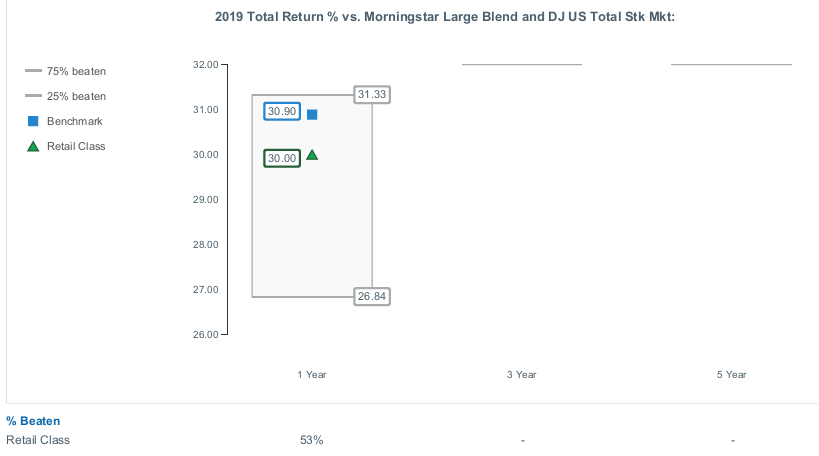
Strategic Advisers Fidelity U.S. Total Stock Fund

Board Approval of New Sub-Advisory Agreements and New and Amended Sub-Subadvisory Agreements
Strategic Advisers Fidelity U.S. Total Stock Fund
In June 2020, the Board of Trustees, including the Independent Trustees (together, the Board) voted to approve: (i) a new sub-advisory agreement among Strategic Advisers LLC (Strategic Advisers), FIL Investment Advisors (FIA), and Fidelity Rutland Square Trust II (Trust) on behalf of the fund (FIA Sub-Advisory Agreement); (ii) a new sub-subadvisory agreement among FIA, FIL Investment Advisors (UK) Limited (FIA UK), and the Trust on behalf of the fund (New Sub-Subadvisory Agreement and together with the FIA Sub-Advisory Agreement, New Agreements); and (iii) non-material amendments (Sub-Subadvisory Amendments) to the sub-subadvisory agreements (Existing Sub-Subadvisory Agreements) among FIAM LLC (FIAM), each of FMR Investment Management (UK) Limited (FMR UK), Fidelity Management & Research (Japan) Limited (FMR Japan), and Fidelity Management & Research (Hong Kong) Limited (FMR H.K., and together with FMR UK and FMR Japan, Existing Sub-Subadvisers), and the Trust on behalf of the fund to clarify the compensation that FIAM pays the Existing Sub-Subadvisers for providing non-discretionary services. The Board, assisted by the advice of fund counsel and Independent Trustees' counsel, considered a broad range of information.In considering whether to approve each New Agreement and the Sub-Subadvisory Amendments, the Board reached a determination, with the assistance of fund counsel and Independent Trustees' counsel and through the exercise of its business judgment, that the approval of each New Agreement and the Sub-Subadvisory Amendments is in the best interests of the fund and its shareholders and does not involve a conflict of interest from which Strategic Advisers or its affiliates derive an inappropriate advantage. Also, the Board found that the fees to be charged under the FIA Sub-Advisory Agreement bear a reasonable relationship to the services to be rendered and will be based on services provided that will be in addition to, rather than duplicative of services provided under the advisory contract of any underlying fund in which the fund may invest. The Board's decision to approve each New Agreement and the Sub-Subadvisory Amendments was not based on any single factor, but rather was based on a comprehensive consideration of all the information provided to the Board. In addition, individual Trustees did not necessarily attribute the same weight or importance to each factor.Nature, Extent, and Quality of Services Provided. The Board considered the backgrounds of the investment personnel that will provide services to the fund, and also considered the fund's investment objective, strategies and related investment philosophy and current sub-adviser line-up. The Board also considered the structures of the investment personnel compensation programs and whether such structures provide appropriate incentives to act in the best interests of the fund.With respect to the New Sub-Subadvisory Agreement, the Board noted that it previously received and considered materials relating to the nature, extent and quality of services provided by Strategic Advisers and FIA, including the resources dedicated to investment management and support services, as well as shareholder and administrative services, in connection with its annual renewal of the fund's management contract, sub-advisory agreements, and sub-subadvisory agreements at its September 2019 meeting. The Board noted its familiarity with the nature, extent and quality of services provided by FIA and FIA UK to other Strategic Advisers funds. The Board also considered the detailed information provided by Strategic Advisers and FIA in the June 2020 annual contract renewal materials.With respect to the Existing Sub-Subadvisory Agreements, the Board noted that it had approved the annual renewal of the Existing Sub-Subadvisory Agreements at its September 2019 meeting and that no material contract terms are impacted by the Sub-Subadvisory Amendments. The Board considered that the Sub-Subadvisory Amendments will not change (i) the nature, extent and quality of the sub-advisory or sub-subadvisory services provided; (ii) the investment process or strategies employed in the management of the fund's assets; or (iii) the day-to-day management of the fund or the persons primarily responsible for such management. The Board also considered that FIAM, and not the fund, compensates the Existing Sub-Subadvisers under the terms of the Existing Sub-Subadvisory Agreements and that the fund and Strategic Advisers are not responsible for any such fees or expenses.Resources Dedicated to Investment Management and Support Services. The Board reviewed the general qualifications and capabilities of FIA's investment staffs, their use of technology, and their approach to managing and compensating investment personnel. The Board noted that FIA's analysts have extensive resources, tools, and capabilities that allow them to conduct sophisticated quantitative and/or fundamental analysis. Additionally, in its deliberations, the Board considered FIA's trading capabilities and resources and global compliance infrastructure, which are integral parts of the investment management process.Shareholder and Administrative Services. The Board considered: (i) the nature, extent, quality, and cost of advisory services to be performed by FIA under the FIA Sub-Advisory Agreement; and (ii) the resources to be devoted to the fund's compliance policies and procedures.Investment Performance. The Board considered the composite performance of FIA and the portfolio managers in managing an open-end mutual fund trust established under the laws of Ontario under a similar mandate.Based on its review, the Board concluded that the nature, extent, and quality of services that will be provided to the fund under the New Agreements should benefit the fund's shareholders.Competitiveness of Management Fee and Total Fund Expenses. In reviewing the FIA Sub-Advisory Agreement, the Board considered the amount and nature of fees to be paid by the fund to Strategic Advisers and by Strategic Advisers to FIA. The Board also considered that the approval of the FIA Sub-Advisory Agreement will not initially result in any changes to the fund's management fee or total net expenses because Strategic Advisers does not expect to allocate assets to FIA at this time.With respect to the New Sub-Subadvisory Agreement, the Board considered that FIA, and not the fund, will compensate FIA UK under the terms of the New Sub-Subadvisory Agreement and that the fund and Strategic Advisers are not responsible for any such fees or expenses. The Board also considered that the New Sub-Subadvisory Agreement will not result in any changes to the fees paid under the sub-advisory agreement among Strategic Advisers, FIA, and the Trust on behalf of the fund.In reviewing the Sub-Subadvisory Amendments, the Board considered that FIAM, and not the fund, compensates the Existing Sub-Subadvisers under the terms of the Existing Sub-Subadvisory Agreements and that the fund and Strategic Advisers are not responsible for any such fees or expenses. The Board also considered that the Sub-Subadvisory Amendments will not result in changes to the fees paid under the sub-advisory agreement among Strategic Advisers, FIAM, and the Trust on behalf of the fund.The Board noted that the fund's maximum aggregate annual management fee rate may not exceed 1.00% of the fund's average daily net assets and that neither the New Agreements nor the Sub-Subadvisory Amendments will result in changes to the maximum aggregate annual management fee payable by the fund or in Strategic Advisers' contractual agreement to waive its 0.25% portion of the fund's management fee through September 30, 2022.Based on its review, the Board concluded that the fund's management fee structure and any changes to projected total expenses bear a reasonable relationship to the services that the fund and its shareholders will receive and the other factors considered.Because the New Agreements and Sub-Subadvisory Amendments were negotiated at arm's length and will have no impact on the maximum management fees payable by the fund or Strategic Advisers' portion of the management fee, the Board did not consider the costs of services and profitability to be significant factors in its decision to approve the New Agreements and the Sub-Subadvisory Amendments.Potential Fall-Out Benefits. The Board considered that it reviews information regarding the potential of direct and indirect benefits to Strategic Advisers and its affiliates from their relationships with the fund, including non-advisory fee compensation paid to affiliates of Strategic Advisers, if any, as well as information regarding potential fall-out benefits accruing to each sub-adviser, if any, as a result of its relationship with the fund, during its annual renewal of the fund's management contract, sub-advisory agreements, and sub-subadvisory agreements. The Board considered Strategic Advisers' representation that it does not anticipate that the approval of the New Agreements and/or the Sub-Subadvisory Amendments will have a significant impact on the profitability of, or potential fall-out benefits to, Strategic Advisers or its affiliates.Possible Economies of Scale. The Board considered that it reviews whether there have been economies of scale in connection with the management of the fund during its annual renewal of the fund's management contract, sub-advisory agreements, and sub-subadvisory agreements. The Board noted that the FIA Sub-Advisory Agreement provides for breakpoints that have the potential to reduce sub-advisory fees paid to FIA as assets allocated to FIA grow. The Board also noted that it did not consider the possible realization of economies of scale to be a significant factor in its decision to approve the New Sub-Subadvisory Agreement or the Sub-Subadvisory Amendments because the fund will not bear any additional management fees or expenses under the New Sub-Subadvisory Agreement or as a result of the Sub-Subadvisory Amendments.Conclusion. Based on its evaluation of all of the conclusions noted above, and after considering all factors it believed relevant, the Board concluded that the FIA Sub-Advisory Agreement's fee structure bears a reasonable relationship to the services to be rendered and that the New Agreements and the Sub-Subadvisory Amendments are in the best interests of the fund and its shareholders and should be approved. The Board also concluded that the sub-advisory fees to be charged under the FIA Sub-Advisory Agreement will be based on services provided that will be in addition to, rather than duplicative of, services provided under the advisory contract of any underlying fund in which the fund may invest. In addition, the Board concluded that the approval of the New Agreements and the Sub-Subadvisory Amendments does not involve a conflict of interest from which Strategic Advisers or its affiliates derive an inappropriate advantage.Proxy Voting Results
A special meeting of shareholders was held on November 2, 2020. The results of votes taken among shareholders on the proposals before them are reported below. Each vote reported represents one dollar of net asset value held on the record date for the meeting.
PROPOSAL 1
To elect a Board of Trustees.
| # of Votes | % of Votes | |
| ROBERT A. LAWRENCE | ||
| Affirmative | 204,250,982,594.51 | 96.530 |
| Withheld | 7,343,512,146.85 | 3.470 |
| TOTAL | 211,594,494,741.36 | 100.000 |
| CHARLES S. MORRISON | ||
| Affirmative | 204,349,460,488.43 | 96.576 |
| Withheld | 7,245,034,252.93 | 3.424 |
| TOTAL | 211,594,494,741.36 | 100.000 |
| PETER C. ALDRICH | ||
| Affirmative | 203,499,803,652.67 | 96.175 |
| Withheld | 8,094,691,088.69 | 3.825 |
| TOTAL | 211,594,494,741.36 | 100.000 |
| MARY C. FARRELL | ||
| Affirmative | 204,011,925,737.22 | 96.417 |
| Withheld | 7,582,569,004.14 | 3.583 |
| TOTAL | 211,594,494,741.36 | 100.00 |
| KAREN KAPLAN | ||
| Affirmative | 204,297,547,550.53 | 96.552 |
| Withheld | 7,296,947,190.83 | 3.448 |
| TOTAL | 211,594,494,741.36 | 100.000 |
| CHRISTINE MARCKS | ||
| Affirmative | 204,700,871,317.72 | 96.743 |
| Withheld | 6,893,623,423.64 | 3.257 |
| TOTAL | 211,594,494,741.36 | 100.000 |
| HEIDI L. STEIGER | ||
| Affirmative | 204,406,589,957.28 | 96.603 |
| Withheld | 7,187,904,784.08 | 3.397 |
| TOTAL | 211,594,494,741.36 | 100.000 |
PROPOSAL 3
To approve a sub-advisory agreement among Strategic Advisers LLC (Strategic Advisers), FIL Investment Advisors (FIA), and Fidelity Rutland Square Trust II (the trust) and a sub-subadvisory agreement between FIA and FIL Investment Advisors (UK) Limited (FIA (UK)).
| # of Votes | % of Votes | |
| Affirmative | 34,447,794,812.20 | 90.254 |
| Against | 1,646,630,202.93 | 4.314 |
| Abstain | 2,073,399,277.79 | 5.432 |
| Broker Non-Vote | 0.00 | 0.000 |
| TOTAL | 38,167,824,292.92 | 100.000 |
| Proposal 1 reflects trust wide proposal and voting results. |
![]()
TSF-SANN-0121
1.9887484.102
Strategic Advisers® Fidelity® Core Income Fund
Offered exclusively to certain clients of Strategic Advisers LLC - not available for sale to the general public
Semi-Annual Report
November 30, 2020
Contents
Board Approval of Investment Advisory Contracts and Management Fees | |
To view a fund's proxy voting record for the 12-month period ended June 30, visit http://www.fidelity.com/proxyvotingresults or visit the Securities and Exchange Commission's (SEC) web site at http://www.sec.gov.
You may also call 1-800-544-3455 to request a free copy of the proxy voting guidelines.
Standard & Poor's, S&P and S&P 500 are registered service marks of The McGraw-Hill Companies, Inc. and have been licensed for use by Fidelity Distributors Corporation.
Other third-party marks appearing herein are the property of their respective owners.
All other marks appearing herein are registered or unregistered trademarks or service marks of FMR LLC or an affiliated company. © 2021 FMR LLC. All rights reserved.
This report and the financial statements contained herein are submitted for the general information of the shareholders of the Fund. This report is not authorized for distribution to prospective investors in the Fund unless preceded or accompanied by an effective prospectus.
A fund files its complete schedule of portfolio holdings with the SEC for the first and third quarters of each fiscal year on Form N-PORT. Forms N-PORT are available on the SEC’s web site at http://www.sec.gov. A fund's Forms N-PORT may be reviewed and copied at the SEC’s Public Reference Room in Washington, DC. Information regarding the operation of the SEC's Public Reference Room may be obtained by calling 1-800-SEC-0330.
For a complete list of a fund's portfolio holdings, view the most recent holdings listing, semiannual report, or annual report on Fidelity's web site at http://www.fidelity.com, http://www.institutional.fidelity.com, or http://www.401k.com, as applicable.
NOT FDIC INSURED •MAY LOSE VALUE •NO BANK GUARANTEE
Neither the Fund nor Fidelity Distributors Corporation is a bank.
Note to Shareholders:
Early in 2020, the outbreak and spread of a new coronavirus emerged as a public health emergency that had a major influence on financial markets, primarily based on its impact on the global economy and the outlook for corporate earnings. The virus causes a respiratory disease known as COVID-19. On March 11, the World Health Organization declared the COVID-19 outbreak a pandemic, citing sustained risk of further global spread.
In the weeks following, as the crisis worsened, we witnessed an escalating human tragedy with wide-scale social and economic consequences from coronavirus-containment measures. The outbreak of COVID-19 prompted a number of measures to limit the spread, including travel and border restrictions, quarantines, and restrictions on large gatherings. In turn, these resulted in lower consumer activity, diminished demand for a wide range of products and services, disruption in manufacturing and supply chains, and – given the wide variability in outcomes regarding the outbreak – significant market uncertainty and volatility. Amid the turmoil, global governments and central banks took unprecedented action to help support consumers, businesses, and the broader economies, and to limit disruption to financial systems.
The situation continues to unfold, and the extent and duration of its impact on financial markets and the economy remain highly uncertain. Extreme events such as the coronavirus crisis are “exogenous shocks” that can have significant adverse effects on mutual funds and their investments. Although multiple asset classes may be affected by market disruption, the duration and impact may not be the same for all types of assets.
Fidelity is committed to helping you stay informed amid news about COVID-19 and during increased market volatility, and we’re taking extra steps to be responsive to customer needs. We encourage you to visit our websites, where we offer ongoing updates, commentary, and analysis on the markets and our funds.
Investment Summary (Unaudited)
The information in the following tables is based on the direct investments of the Fund.Top Ten Holdings as of November 30, 2020
| (by issuer, excluding cash equivalents) | % of fund's net assets |
| Fidelity SAI Total Bond Fund | 35.5 |
| U.S. Treasury Obligations | 6.8 |
| Fannie Mae | 5.9 |
| Ginnie Mae | 5.1 |
| Fidelity SAI Long-Term Treasury Bond Index Fund | 3.6 |
| Freddie Mac | 3.3 |
| Fidelity Corporate Bond Fund | 2.3 |
| Uniform Mortgage Backed Securities | 2.3 |
| Fidelity SAI U.S. Treasury Bond Index Fund | 2.1 |
| Fidelity U.S. Bond Index Fund | 2.0 |
Asset Allocation (% of fund's net assets)
| As of November 30, 2020 | ||
| Corporate Bonds | 14.9% | |
| U.S. Government and U.S. Government Agency Obligations | 25.0% | |
| Asset-Backed Securities | 2.6% | |
| CMOs and Other Mortgage Related Securities | 3.5% | |
| Municipal Securities | 0.2% | |
| Bank Loan Funds | 2.0% | |
| High Yield Fixed-Income Funds | 3.5% | |
| Intermediate-Term Bond Funds | 37.7% | |
| Investment Grade Fixed-Income Funds | 2.3% | |
| Long Government Bond Funds | 3.6% | |
| Sector Funds | 0.5% | |
| Other Investments | 0.2% | |
| Short-Term Investments and Net Other Assets (Liabilities) | 1.9% | |
| Intermediate Government Funds | 2.1% | |
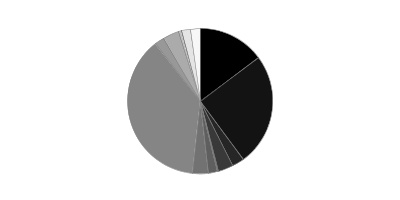
Asset allocations of funds in the pie chart reflect the categorizations of assets as defined by Morningstar as of the reporting date.
Percentages in the above tables are adjusted for the effect of TBA Sale Commitments.
Schedule of Investments November 30, 2020 (Unaudited)
Showing Percentage of Net Assets
| Nonconvertible Bonds - 14.9% | |||
| Principal Amount | Value | ||
| COMMUNICATION SERVICES - 1.8% | |||
| Diversified Telecommunication Services - 0.6% | |||
| AT&T, Inc.: | |||
| 4.1% 2/15/28 | $2,406,000 | $2,830,006 | |
| 4.3% 2/15/30 | 3,992,000 | 4,766,271 | |
| 4.5% 3/9/48 | 33,904,000 | 41,317,296 | |
| 4.75% 5/15/46 | 41,310,000 | 50,781,466 | |
| 4.9% 6/15/42 | 6,909,000 | 8,642,290 | |
| 5.55% 8/15/41 | 12,537,000 | 16,559,277 | |
| 6.2% 3/15/40 | 2,303,000 | 3,210,170 | |
| C&W Senior Financing Designated Activity Co.: | |||
| 6.875% 9/15/27 (a) | 1,246,000 | 1,343,661 | |
| 7.5% 10/15/26 (a) | 1,565,000 | 1,664,769 | |
| Century Telephone Enterprises, Inc. 6.875% 1/15/28 | 40,000 | 45,900 | |
| CenturyLink, Inc.: | |||
| 5.125% 12/15/26 (a) | 2,190,000 | 2,277,250 | |
| 5.625% 4/1/25 | 415,000 | 445,088 | |
| Frontier Communications Corp. 5.875% 10/15/27 (a) | 235,000 | 247,044 | |
| Level 3 Financing, Inc.: | |||
| 3.625% 1/15/29 (a) | 85,000 | 85,105 | |
| 4.25% 7/1/28 (a) | 2,240,000 | 2,312,800 | |
| 5.25% 3/15/26 | 1,028,000 | 1,062,757 | |
| Sable International Finance Ltd. 5.75% 9/7/27 (a) | 2,595,000 | 2,786,381 | |
| SFR Group SA: | |||
| 5.125% 1/15/29 (a) | 720,000 | 744,293 | |
| 7.375% 5/1/26 (a) | 1,245,000 | 1,307,250 | |
| 8.125% 2/1/27 (a) | 325,000 | 358,313 | |
| Sprint Capital Corp.: | |||
| 6.875% 11/15/28 | 1,850,000 | 2,402,595 | |
| 8.75% 3/15/32 | 935,000 | 1,435,814 | |
| Telecom Italia Capital SA 6% 9/30/34 | 286,000 | 338,329 | |
| Telenet Finance Luxembourg Notes SARL 5.5% 3/1/28 (a) | 800,000 | 856,400 | |
| Verizon Communications, Inc.: | |||
| 2.987% 10/30/56 (a) | 1,378,000 | 1,457,505 | |
| 3.15% 3/22/30 | 3,550,000 | 3,990,370 | |
| 4.329% 9/21/28 | 10,293,000 | 12,486,610 | |
| 5.012% 4/15/49 | 129,000 | 182,648 | |
| Virgin Media Finance PLC 5% 7/15/30 (a) | 636,000 | 667,800 | |
| 166,605,458 | |||
| Entertainment - 0.1% | |||
| NBCUniversal, Inc. 5.95% 4/1/41 | 1,429,000 | 2,192,641 | |
| Netflix, Inc.: | |||
| 4.375% 11/15/26 | 395,000 | 437,956 | |
| 4.875% 4/15/28 | 345,000 | 395,025 | |
| 4.875% 6/15/30 (a) | 175,000 | 202,344 | |
| 5.375% 11/15/29 (a) | 285,000 | 340,304 | |
| 5.875% 11/15/28 | 1,515,000 | 1,829,635 | |
| 6.375% 5/15/29 | 135,000 | 169,397 | |
| The Walt Disney Co.: | |||
| 2.2% 1/13/28 | 10,316,000 | 10,954,246 | |
| 2.65% 1/13/31 | 13,000,000 | 14,144,778 | |
| 30,666,326 | |||
| Media - 0.9% | |||
| Altice Financing SA: | |||
| 5% 1/15/28 (a) | 225,000 | 229,808 | |
| 7.5% 5/15/26 (a) | 819,000 | 864,045 | |
| Altice France Holding SA 6% 2/15/28 (a) | 250,000 | 253,738 | |
| CCO Holdings LLC/CCO Holdings Capital Corp.: | |||
| 4.25% 2/1/31 (a) | 2,265,000 | 2,349,711 | |
| 4.5% 8/15/30 (a) | 435,000 | 458,381 | |
| 4.5% 5/1/32 (a) | 875,000 | 924,788 | |
| 5% 2/1/28 (a) | 2,401,000 | 2,524,051 | |
| 5.5% 5/1/26 (a) | 528,000 | 549,912 | |
| 5.75% 2/15/26 (a) | 438,000 | 454,035 | |
| 5.875% 5/1/27 (a) | 697,000 | 727,842 | |
| Charter Communications Operating LLC/Charter Communications Operating Capital Corp.: | |||
| 2.8% 4/1/31 | 25,100,000 | 26,538,612 | |
| 3.7% 4/1/51 | 20,100,000 | 21,042,400 | |
| 4.464% 7/23/22 | 5,986,000 | 6,326,962 | |
| 4.8% 3/1/50 | 10,000,000 | 11,985,821 | |
| 4.908% 7/23/25 | 4,642,000 | 5,373,255 | |
| 5.375% 5/1/47 | 41,310,000 | 52,373,317 | |
| 5.75% 4/1/48 | 18,275,000 | 24,201,629 | |
| Comcast Corp.: | |||
| 3.4% 4/1/30 | 2,848,000 | 3,290,205 | |
| 3.75% 4/1/40 | 1,000,000 | 1,213,405 | |
| 3.9% 3/1/38 | 1,096,000 | 1,348,198 | |
| 4.65% 7/15/42 | 2,578,000 | 3,487,272 | |
| CSC Holdings LLC: | |||
| 4.125% 12/1/30 (a) | 510,000 | 527,748 | |
| 4.625% 12/1/30 (a) | 410,000 | 419,717 | |
| 5.5% 5/15/26 (a) | 503,000 | 523,120 | |
| 5.5% 4/15/27 (a) | 564,000 | 595,302 | |
| 5.75% 1/15/30 (a) | 875,000 | 944,116 | |
| Diamond Sports Group LLC/Diamond Sports Finance Co. 5.375% 8/15/26 (a) | 460,000 | 356,500 | |
| Discovery Communications LLC: | |||
| 3.625% 5/15/30 | 6,407,000 | 7,302,916 | |
| 4.65% 5/15/50 | 17,335,000 | 21,273,297 | |
| DISH DBS Corp. 5.875% 11/15/24 | 638,000 | 678,535 | |
| Fox Corp.: | |||
| 4.709% 1/25/29 | 2,296,000 | 2,776,019 | |
| 5.476% 1/25/39 | 2,264,000 | 3,148,296 | |
| 5.576% 1/25/49 | 1,502,000 | 2,194,659 | |
| Gray Television, Inc. 4.75% 10/15/30 (a) | 245,000 | 248,369 | |
| Radiate Holdco LLC/Radiate Financial Service Ltd. 4.5% 9/15/26 (a) | 650,000 | 676,000 | |
| Sirius XM Radio, Inc.: | |||
| 4.125% 7/1/30 (a) | 155,000 | 162,401 | |
| 4.625% 7/15/24 (a) | 337,000 | 349,028 | |
| 5% 8/1/27 (a) | 375,000 | 394,583 | |
| 5.375% 7/15/26 (a) | 2,275,000 | 2,366,000 | |
| 5.5% 7/1/29 (a) | 1,890,000 | 2,069,550 | |
| Tegna, Inc. 5% 9/15/29 | 55,000 | 57,853 | |
| Time Warner Cable, Inc.: | |||
| 4% 9/1/21 | 12,819,000 | 13,027,032 | |
| 4.5% 9/15/42 | 886,000 | 1,020,854 | |
| 5.5% 9/1/41 | 1,530,000 | 1,946,351 | |
| 5.875% 11/15/40 | 3,289,000 | 4,257,357 | |
| 6.55% 5/1/37 | 5,846,000 | 8,058,342 | |
| 6.75% 6/15/39 | 4,614,000 | 6,556,733 | |
| 7.3% 7/1/38 | 3,785,000 | 5,552,559 | |
| Virgin Media Secured Finance PLC: | |||
| 4.5% 8/15/30 (a) | 585,000 | 614,250 | |
| 5.5% 8/15/26 (a) | 709,000 | 741,706 | |
| 5.5% 5/15/29 (a) | 415,000 | 450,275 | |
| Ziggo Bond Co. BV 5.125% 2/28/30 (a) | 540,000 | 572,400 | |
| Ziggo BV: | |||
| 4.875% 1/15/30 (a) | 280,000 | 294,700 | |
| 5.5% 1/15/27 (a) | 3,220,000 | 3,368,764 | |
| 260,042,719 | |||
| Wireless Telecommunication Services - 0.2% | |||
| Intelsat Jackson Holdings SA 8% 2/15/24 (a) | 1,020,000 | 1,042,950 | |
| Millicom International Cellular SA: | |||
| 4.5% 4/27/31 (a) | 200,000 | 215,368 | |
| 5.125% 1/15/28 (a) | 1,200,000 | 1,282,560 | |
| 6.625% 10/15/26 (a) | 1,253,000 | 1,357,939 | |
| SoftBank Group Corp. 5.375% 7/30/22 (Reg. S) | 543,000 | 563,363 | |
| T-Mobile U.S.A., Inc.: | |||
| 3.75% 4/15/27 (a) | 10,840,000 | 12,271,964 | |
| 3.875% 4/15/30 (a) | 22,877,000 | 26,237,403 | |
| 4.375% 4/15/40 (a) | 2,340,000 | 2,857,819 | |
| 4.5% 4/15/50 (a) | 4,597,000 | 5,744,181 | |
| 51,573,547 | |||
| TOTAL COMMUNICATION SERVICES | 508,888,050 | ||
| CONSUMER DISCRETIONARY - 0.8% | |||
| Automobiles - 0.3% | |||
| General Motors Co. 5.4% 10/2/23 | 18,263,000 | 20,463,179 | |
| General Motors Financial Co., Inc.: | |||
| 3.7% 5/9/23 | 8,751,000 | 9,270,960 | |
| 4.25% 5/15/23 | 1,359,000 | 1,463,888 | |
| 4.375% 9/25/21 | 5,310,000 | 5,461,860 | |
| 5.2% 3/20/23 | 11,203,000 | 12,287,432 | |
| Volkswagen Group of America Finance LLC: | |||
| 2.9% 5/13/22 (a) | 10,524,000 | 10,867,316 | |
| 3.125% 5/12/23 (a) | 9,168,000 | 9,685,385 | |
| 3.35% 5/13/25 (a) | 14,765,000 | 16,191,531 | |
| 85,691,551 | |||
| Diversified Consumer Services - 0.0% | |||
| GEMS MENASA Cayman Ltd. 7.125% 7/31/26 (a) | 765,000 | 781,256 | |
| Service Corp. International 5.125% 6/1/29 | 970,000 | 1,077,913 | |
| 1,859,169 | |||
| Hotels, Restaurants & Leisure - 0.1% | |||
| 1011778 BC Unlimited Liability Co./New Red Finance, Inc.: | |||
| 4.25% 5/15/24 (a) | 384,000 | 391,803 | |
| 4.375% 1/15/28 (a) | 670,000 | 691,775 | |
| 5.75% 4/15/25 (a) | 210,000 | 224,209 | |
| Aramark Services, Inc.: | |||
| 4.75% 6/1/26 | 843,000 | 861,546 | |
| 5% 2/1/28 (a) | 3,530,000 | 3,707,383 | |
| 6.375% 5/1/25 (a) | 1,890,000 | 2,012,850 | |
| Caesars Entertainment, Inc. 6.25% 7/1/25 (a) | 905,000 | 965,173 | |
| Caesars Resort Collection LLC 5.25% 10/15/25 (a) | 836,000 | 836,000 | |
| Carnival Corp. 10.5% 2/1/26 (a) | 1,105,000 | 1,306,663 | |
| Hilton Domestic Operating Co., Inc. 4% 5/1/31 (a) | 510,000 | 536,138 | |
| Hilton Worldwide Finance LLC/Hilton Worldwide Finance Corp.: | |||
| 4.625% 4/1/25 | 836,000 | 855,328 | |
| 4.875% 4/1/27 | 164,000 | 170,952 | |
| MCE Finance Ltd.: | |||
| 4.875% 6/6/25 (a) | 750,000 | 766,087 | |
| 5.375% 12/4/29 (a) | 260,000 | 266,081 | |
| 5.75% 7/21/28 (a) | 390,000 | 409,695 | |
| MGM Mirage, Inc. 5.75% 6/15/25 | 820,000 | 886,625 | |
| Royal Caribbean Cruises Ltd.: | |||
| 9.125% 6/15/23 (a) | 130,000 | 140,725 | |
| 11.5% 6/1/25 (a) | 545,000 | 638,331 | |
| Starbucks Corp. 1.3% 5/7/22 | 5,502,000 | 5,573,176 | |
| Wyndham Hotels & Resorts, Inc. 5.375% 4/15/26 (a) | 478,000 | 493,535 | |
| Wynn Las Vegas LLC/Wynn Las Vegas Capital Corp.: | |||
| 5.25% 5/15/27 (a) | 522,000 | 527,220 | |
| 5.5% 3/1/25 (a) | 645,000 | 657,900 | |
| Wynn Macau Ltd.: | |||
| 4.875% 10/1/24 (a) | 497,000 | 498,708 | |
| 5.5% 10/1/27 (a) | 425,000 | 428,320 | |
| Yum! Brands, Inc. 7.75% 4/1/25 (a) | 805,000 | 891,538 | |
| 24,737,761 | |||
| Household Durables - 0.2% | |||
| Lennar Corp.: | |||
| 4.75% 11/29/27 | 9,429,000 | 11,185,151 | |
| 5% 6/15/27 | 12,243,000 | 14,494,488 | |
| 5.25% 6/1/26 | 2,965,000 | 3,506,113 | |
| Newell Brands, Inc. 5.875% 4/1/36 | 65,000 | 78,000 | |
| Toll Brothers Finance Corp.: | |||
| 4.35% 2/15/28 | 14,431,000 | 16,018,410 | |
| 4.875% 11/15/25 | 45,000 | 50,794 | |
| 4.875% 3/15/27 | 15,464,000 | 17,726,597 | |
| 5.625% 1/15/24 | 950,000 | 1,053,313 | |
| 64,112,866 | |||
| Internet & Direct Marketing Retail - 0.0% | |||
| Match Group Holdings II LLC 4.125% 8/1/30 (a) | 170,000 | 175,950 | |
| Leisure Products - 0.1% | |||
| Hasbro, Inc.: | |||
| 2.6% 11/19/22 | 2,845,000 | 2,945,182 | |
| 3% 11/19/24 | 6,474,000 | 6,972,154 | |
| Mattel, Inc.: | |||
| 5.45% 11/1/41 | 45,000 | 47,700 | |
| 6.2% 10/1/40 | 405,000 | 454,613 | |
| 6.75% 12/31/25 (a) | 355,000 | 373,354 | |
| 10,793,003 | |||
| Specialty Retail - 0.1% | |||
| AutoNation, Inc. 4.75% 6/1/30 | 1,430,000 | 1,719,122 | |
| AutoZone, Inc. 4% 4/15/30 | 19,121,000 | 22,502,877 | |
| O'Reilly Automotive, Inc. 4.2% 4/1/30 | 2,105,000 | 2,525,490 | |
| 26,747,489 | |||
| Textiles, Apparel & Luxury Goods - 0.0% | |||
| NIKE, Inc. 3.25% 3/27/40 | 4,305,000 | 5,052,707 | |
| The William Carter Co. 5.625% 3/15/27 (a) | 446,000 | 469,973 | |
| Wolverine World Wide, Inc. 6.375% 5/15/25 (a) | 645,000 | 683,700 | |
| 6,206,380 | |||
| TOTAL CONSUMER DISCRETIONARY | 220,324,169 | ||
| CONSUMER STAPLES - 1.4% | |||
| Beverages - 0.6% | |||
| Anheuser-Busch InBev Finance, Inc.: | |||
| 4.7% 2/1/36 | 6,600,000 | 8,202,103 | |
| 4.9% 2/1/46 | 14,391,000 | 18,706,489 | |
| Anheuser-Busch InBev Worldwide, Inc.: | |||
| 3.5% 6/1/30 | 10,375,000 | 11,984,849 | |
| 4.35% 6/1/40 | 6,274,000 | 7,774,532 | |
| 4.5% 6/1/50 | 11,500,000 | 14,401,727 | |
| 4.6% 6/1/60 | 18,803,000 | 24,020,307 | |
| 4.75% 1/23/29 | 11,220,000 | 13,767,111 | |
| 4.75% 4/15/58 | 5,641,000 | 7,440,311 | |
| 5.45% 1/23/39 | 5,480,000 | 7,464,759 | |
| 5.55% 1/23/49 | 13,389,000 | 19,219,227 | |
| 5.8% 1/23/59 (Reg. S) | 14,304,000 | 21,828,838 | |
| Constellation Brands, Inc. 4.75% 11/15/24 | 3,799,000 | 4,373,757 | |
| PepsiCo, Inc.: | |||
| 2.625% 3/19/27 | 1,114,000 | 1,226,907 | |
| 2.75% 3/19/30 | 5,700,000 | 6,389,460 | |
| 166,800,377 | |||
| Food & Staples Retailing - 0.4% | |||
| Sysco Corp.: | |||
| 6.6% 4/1/40 | 13,806,000 | 20,374,234 | |
| 6.6% 4/1/50 | 53,060,000 | 82,282,060 | |
| U.S. Foods, Inc. 6.25% 4/15/25 (a) | 445,000 | 473,278 | |
| Walgreens Boots Alliance, Inc. 3.3% 11/18/21 | 1,926,000 | 1,969,798 | |
| 105,099,370 | |||
| Food Products - 0.4% | |||
| Darling Ingredients, Inc. 5.25% 4/15/27 (a) | 615,000 | 654,975 | |
| General Mills, Inc. 2.875% 4/15/30 | 1,277,000 | 1,419,797 | |
| H.J. Heinz Finance Co. 7.125% 8/1/39 (a) | 9,489,000 | 13,308,603 | |
| JBS U.S.A. LLC/JBS U.S.A. Finance, Inc.: | |||
| 5.75% 6/15/25 (a) | 2,236,000 | 2,305,875 | |
| 6.75% 2/15/28 (a) | 269,000 | 299,263 | |
| JBS U.S.A. Lux SA / JBS Food Co.: | |||
| 5.5% 1/15/30 (a) | 23,280,000 | 26,169,048 | |
| 6.5% 4/15/29 (a) | 32,201,000 | 36,870,145 | |
| Kraft Heinz Foods Co.: | |||
| 3.875% 5/15/27 (a) | 560,000 | 605,879 | |
| 4.25% 3/1/31 (a) | 525,000 | 582,717 | |
| 4.375% 6/1/46 | 11,995,000 | 12,793,655 | |
| 4.625% 10/1/39 (a) | 820,000 | 904,479 | |
| 4.875% 10/1/49 (a) | 10,000,000 | 11,263,099 | |
| 5% 7/15/35 | 2,215,000 | 2,609,316 | |
| 5.2% 7/15/45 | 6,203,000 | 7,312,311 | |
| Lamb Weston Holdings, Inc. 4.875% 5/15/28 (a) | 825,000 | 915,750 | |
| Post Holdings, Inc. 4.625% 4/15/30 (a) | 905,000 | 944,820 | |
| TreeHouse Foods, Inc. 4% 9/1/28 | 390,000 | 395,928 | |
| 119,355,660 | |||
| Personal Products - 0.0% | |||
| Estee Lauder Companies, Inc.: | |||
| 2.6% 4/15/30 | 7,880,000 | 8,741,661 | |
| 3.125% 12/1/49 | 5,608,000 | 6,537,842 | |
| 15,279,503 | |||
| TOTAL CONSUMER STAPLES | 406,534,910 | ||
| ENERGY - 1.4% | |||
| Energy Equipment & Services - 0.0% | |||
| El Paso Pipeline Partners Operating Co. LLC 5% 10/1/21 | 1,456,000 | 1,493,778 | |
| Jonah Energy LLC 7.25% 10/15/25 (a)(b) | 301,000 | 6,020 | |
| 1,499,798 | |||
| Oil, Gas & Consumable Fuels - 1.4% | |||
| Alberta Energy Co. Ltd. 8.125% 9/15/30 | 5,649,000 | 6,508,776 | |
| Amerada Hess Corp.: | |||
| 7.125% 3/15/33 | 1,403,000 | 1,770,338 | |
| 7.3% 8/15/31 | 1,709,000 | 2,127,305 | |
| 7.875% 10/1/29 | 4,789,000 | 6,066,395 | |
| Apache Corp.: | |||
| 4.25% 1/15/30 | 90,000 | 89,550 | |
| 4.75% 4/15/43 | 805,000 | 800,975 | |
| 5.1% 9/1/40 | 150,000 | 153,938 | |
| 5.25% 2/1/42 | 495,000 | 508,217 | |
| 5.35% 7/1/49 | 80,000 | 77,600 | |
| Canadian Natural Resources Ltd. 3.45% 11/15/21 | 2,648,000 | 2,701,657 | |
| Cheniere Energy Partners LP: | |||
| 5.25% 10/1/25 | 4,295,000 | 4,407,744 | |
| 5.625% 10/1/26 | 1,835,000 | 1,915,281 | |
| Cheniere Energy, Inc. 4.625% 10/15/28 (a) | 550,000 | 569,938 | |
| Columbia Pipeline Group, Inc. 4.5% 6/1/25 | 852,000 | 980,272 | |
| Continental Resources, Inc. 5.75% 1/15/31 (a) | 895,000 | 959,888 | |
| Crestwood Midstream Partners LP/Crestwood Midstream Finance Corp.: | |||
| 5.625% 5/1/27 (a) | 1,558,000 | 1,498,463 | |
| 5.75% 4/1/25 | 2,038,000 | 2,022,715 | |
| 6.25% 4/1/23 | 918,000 | 922,159 | |
| CVR Energy, Inc.: | |||
| 5.25% 2/15/25 (a) | 790,000 | 695,200 | |
| 5.75% 2/15/28 (a) | 105,000 | 87,938 | |
| DCP Midstream LLC: | |||
| 4.75% 9/30/21 (a) | 2,233,000 | 2,263,704 | |
| 5.85% 5/21/43 (a)(c) | 4,466,000 | 3,572,800 | |
| DCP Midstream Operating LP: | |||
| 3.875% 3/15/23 | 3,116,000 | 3,193,900 | |
| 5.125% 5/15/29 | 1,740,000 | 1,843,304 | |
| 5.375% 7/15/25 | 1,605,000 | 1,731,394 | |
| 5.6% 4/1/44 | 2,708,000 | 2,531,980 | |
| 5.625% 7/15/27 | 620,000 | 671,150 | |
| Duke Energy Field Services 8.125% 8/16/30 | 15,000 | 18,150 | |
| EG Global Finance PLC: | |||
| 6.75% 2/7/25 (a) | 530,000 | 548,550 | |
| 8.5% 10/30/25 (a) | 910,000 | 980,480 | |
| Enable Midstream Partners LP 3.9% 5/15/24 (c) | 869,000 | 873,621 | |
| Enbridge Energy Partners LP 4.2% 9/15/21 | 2,622,000 | 2,674,373 | |
| Enbridge, Inc.: | |||
| 4% 10/1/23 | 3,854,000 | 4,175,012 | |
| 4.25% 12/1/26 | 1,461,000 | 1,690,953 | |
| Encana Corp. 5.15% 11/15/41 | 3,000,000 | 2,781,591 | |
| Endeavor Energy Resources LP/EER Finance, Inc.: | |||
| 5.5% 1/30/26 (a) | 45,000 | 46,294 | |
| 5.75% 1/30/28 (a) | 435,000 | 462,623 | |
| 6.625% 7/15/25 (a) | 110,000 | 117,247 | |
| Energy Transfer Partners LP: | |||
| 3.75% 5/15/30 | 3,643,000 | 3,777,934 | |
| 4.2% 9/15/23 | 1,203,000 | 1,280,824 | |
| 4.25% 3/15/23 | 1,393,000 | 1,466,153 | |
| 4.5% 4/15/24 | 1,576,000 | 1,698,692 | |
| 4.95% 6/15/28 | 4,103,000 | 4,587,828 | |
| 5% 5/15/50 | 7,800,000 | 8,273,426 | |
| 5.25% 4/15/29 | 2,564,000 | 2,901,821 | |
| 5.8% 6/15/38 | 2,288,000 | 2,527,883 | |
| 6% 6/15/48 | 1,490,000 | 1,675,066 | |
| 6.25% 4/15/49 | 1,761,000 | 2,057,898 | |
| EQM Midstream Partners LP 6.5% 7/1/27 (a) | 305,000 | 336,263 | |
| Global Partners LP/GLP Finance Corp. 7% 8/1/27 | 1,200,000 | 1,281,816 | |
| Hess Corp.: | |||
| 4.3% 4/1/27 | 1,341,000 | 1,448,017 | |
| 5.6% 2/15/41 | 2,100,000 | 2,471,861 | |
| 5.8% 4/1/47 | 5,019,000 | 6,211,211 | |
| Hess Midstream Partners LP: | |||
| 5.125% 6/15/28 (a) | 780,000 | 799,984 | |
| 5.625% 2/15/26 (a) | 1,503,000 | 1,551,848 | |
| Hilcorp Energy I LP/Hilcorp Finance Co. 5% 12/1/24 (a) | 542,000 | 528,450 | |
| Holly Energy Partners LP/Holly Energy Finance Corp. 5% 2/1/28 (a) | 910,000 | 895,986 | |
| Marathon Petroleum Corp. 5.125% 3/1/21 | 1,583,000 | 1,600,982 | |
| MPLX LP: | |||
| 3 month U.S. LIBOR + 1.100% 1.3418% 9/9/22 (c)(d) | 3,392,000 | 3,392,494 | |
| 4.8% 2/15/29 | 1,376,000 | 1,618,651 | |
| 4.875% 12/1/24 | 1,974,000 | 2,239,567 | |
| 5.5% 2/15/49 | 4,129,000 | 5,132,662 | |
| Occidental Petroleum Corp.: | |||
| 2.7% 8/15/22 | 1,780,000 | 1,753,834 | |
| 2.9% 8/15/24 | 6,978,000 | 6,506,985 | |
| 3.125% 2/15/22 | 4,013,000 | 4,002,767 | |
| 3.2% 8/15/26 | 865,000 | 761,806 | |
| 3.4% 4/15/26 | 310,000 | 277,450 | |
| 3.5% 8/15/29 | 3,191,000 | 2,792,125 | |
| 4.2% 3/15/48 | 310,000 | 249,550 | |
| 4.3% 8/15/39 | 562,000 | 463,650 | |
| 4.4% 4/15/46 | 480,000 | 404,107 | |
| 4.4% 8/15/49 | 3,942,000 | 3,202,875 | |
| 5.55% 3/15/26 | 5,734,000 | 5,724,883 | |
| 6.2% 3/15/40 | 160,000 | 152,800 | |
| 6.45% 9/15/36 | 5,135,000 | 5,018,436 | |
| 6.6% 3/15/46 | 4,886,000 | 4,776,065 | |
| 7.5% 5/1/31 | 7,400,000 | 7,779,250 | |
| 7.875% 9/15/31 | 100,000 | 106,971 | |
| 8.875% 7/15/30 | 345,000 | 389,419 | |
| PBF Holding Co. LLC/PBF Finance Corp. 9.25% 5/15/25 (a) | 1,125,000 | 1,119,375 | |
| Petrobras Global Finance BV 7.25% 3/17/44 | 27,432,000 | 34,007,108 | |
| Petroleos Mexicanos: | |||
| 6.35% 2/12/48 | 1,560,000 | 1,306,744 | |
| 6.49% 1/23/27 | 3,630,000 | 3,630,000 | |
| 6.5% 3/13/27 | 4,256,000 | 4,249,350 | |
| 6.75% 9/21/47 | 22,490,000 | 19,363,890 | |
| 6.84% 1/23/30 | 15,264,000 | 14,898,427 | |
| 6.95% 1/28/60 | 7,166,000 | 6,144,845 | |
| 7.69% 1/23/50 | 52,206,000 | 48,042,572 | |
| Plains All American Pipeline LP/PAA Finance Corp.: | |||
| 3.55% 12/15/29 | 1,968,000 | 2,017,220 | |
| 3.6% 11/1/24 | 1,903,000 | 1,986,753 | |
| 3.65% 6/1/22 | 3,779,000 | 3,881,492 | |
| Rattler Midstream LP 5.625% 7/15/25 (a) | 1,110,000 | 1,171,744 | |
| Regency Energy Partners LP/Regency Energy Finance Corp. 5.875% 3/1/22 | 2,000,000 | 2,095,020 | |
| Rockies Express Pipeline LLC 6.875% 4/15/40 (a) | 105,000 | 111,300 | |
| Sabine Pass Liquefaction LLC 4.5% 5/15/30 (a) | 14,626,000 | 17,064,536 | |
| Sunoco Logistics Partner Operations LP 5.4% 10/1/47 | 1,732,000 | 1,844,469 | |
| Sunoco LP/Sunoco Finance Corp.: | |||
| 4.5% 5/15/29 (a) | 635,000 | 656,431 | |
| 5.5% 2/15/26 | 1,315,000 | 1,351,491 | |
| 5.875% 3/15/28 | 135,000 | 144,450 | |
| 6% 4/15/27 | 15,000 | 16,065 | |
| Tallgrass Energy Partners LP / Tallgrass Energy Finance Corp. 5.5% 1/15/28 (a) | 30,000 | 28,575 | |
| Targa Resources Partners LP/Targa Resources Partners Finance Corp.: | |||
| 4.875% 2/1/31 (a) | 705,000 | 749,944 | |
| 5.125% 2/1/25 | 953,000 | 976,825 | |
| 5.375% 2/1/27 | 128,000 | 133,760 | |
| 5.5% 3/1/30 (a) | 135,000 | 146,424 | |
| 5.875% 4/15/26 | 881,000 | 927,253 | |
| The Williams Companies, Inc.: | |||
| 3.5% 11/15/30 | 15,742,000 | 17,428,769 | |
| 3.7% 1/15/23 | 808,000 | 853,425 | |
| Viper Energy Partners LP 5.375% 11/1/27 (a) | 600,000 | 633,570 | |
| Western Gas Partners LP: | |||
| 3.95% 6/1/25 | 1,395,000 | 1,388,025 | |
| 4.1% 2/1/25 | 475,000 | 473,950 | |
| 4.65% 7/1/26 | 2,820,000 | 2,884,522 | |
| 4.75% 8/15/28 | 1,236,000 | 1,279,260 | |
| 5.05% 2/1/30 | 805,000 | 859,776 | |
| 5.3% 3/1/48 | 240,000 | 214,800 | |
| 5.375% 6/1/21 | 4,807,000 | 4,843,053 | |
| 6.25% 2/1/50 | 90,000 | 89,550 | |
| Williams Partners LP 5.1% 9/15/45 | 9,765,000 | 11,732,078 | |
| 379,908,606 | |||
| TOTAL ENERGY | 381,408,404 | ||
| FINANCIALS - 6.4% | |||
| Banks - 2.8% | |||
| Bank of America Corp.: | |||
| 3.004% 12/20/23 (c) | 10,687,000 | 11,227,146 | |
| 3.3% 1/11/23 | 2,658,000 | 2,819,252 | |
| 3.419% 12/20/28 (c) | 5,193,000 | 5,843,534 | |
| 3.5% 4/19/26 | 6,078,000 | 6,892,778 | |
| 3.95% 4/21/25 | 37,660,000 | 42,233,648 | |
| 4% 1/22/25 | 26,856,000 | 30,047,410 | |
| 4.1% 7/24/23 | 1,426,000 | 1,561,075 | |
| 4.183% 11/25/27 | 6,909,000 | 7,972,478 | |
| 4.2% 8/26/24 | 8,311,000 | 9,298,421 | |
| 4.25% 10/22/26 | 38,178,000 | 44,556,141 | |
| 4.45% 3/3/26 | 6,522,000 | 7,611,525 | |
| Banque Federative du Credit Mutuel SA 3 month U.S. LIBOR + 0.730% 0.9484% 7/20/22 (a)(c)(d) | 8,158,000 | 8,222,395 | |
| Barclays Bank PLC: | |||
| 1.7% 5/12/22 | 5,246,000 | 5,339,012 | |
| 10.179% 6/12/21 (a) | 1,750,000 | 1,833,590 | |
| Barclays PLC: | |||
| 2.852% 5/7/26 (c) | 14,944,000 | 15,863,060 | |
| 4.375% 1/12/26 | 4,468,000 | 5,100,123 | |
| 4.836% 5/9/28 | 6,102,000 | 6,943,386 | |
| 5.088% 6/20/30 (c) | 29,218,000 | 34,432,756 | |
| 5.2% 5/12/26 | 1,556,000 | 1,798,378 | |
| BNP Paribas SA 2.219% 6/9/26 (a)(c) | 13,752,000 | 14,330,206 | |
| BPCE SA 4.875% 4/1/26 (a) | 7,383,000 | 8,604,756 | |
| CIT Group, Inc.: | |||
| 3.929% 6/19/24 (c) | 1,900,000 | 2,004,690 | |
| 4.75% 2/16/24 | 2,520,000 | 2,740,500 | |
| 6.125% 3/9/28 | 4,920,000 | 6,039,300 | |
| Citigroup, Inc.: | |||
| 4.075% 4/23/29 (c) | 4,606,000 | 5,365,391 | |
| 4.125% 7/25/28 | 6,909,000 | 8,068,065 | |
| 4.3% 11/20/26 | 1,766,000 | 2,043,361 | |
| 4.4% 6/10/25 | 19,341,000 | 22,149,838 | |
| 4.412% 3/31/31 (c) | 34,201,000 | 41,260,217 | |
| 4.45% 9/29/27 | 21,445,000 | 25,149,046 | |
| 4.6% 3/9/26 | 17,445,000 | 20,413,523 | |
| 5.3% 5/6/44 | 9,501,000 | 13,380,773 | |
| 5.5% 9/13/25 | 7,738,000 | 9,313,905 | |
| Citizens Financial Group, Inc. 2.638% 9/30/32 (a) | 7,305,000 | 7,615,884 | |
| Commonwealth Bank of Australia 3.61% 9/12/34 (a)(c) | 3,723,000 | 4,069,242 | |
| Fifth Third Bancorp 8.25% 3/1/38 | 1,098,000 | 1,854,517 | |
| HSBC Holdings PLC: | |||
| 4.25% 3/14/24 | 1,433,000 | 1,571,316 | |
| 4.95% 3/31/30 | 2,548,000 | 3,168,337 | |
| 5.25% 3/14/44 | 1,039,000 | 1,401,139 | |
| Huntington Bancshares, Inc. 7% 12/15/20 | 736,000 | 737,712 | |
| Intesa Sanpaolo SpA: | |||
| 5.017% 6/26/24 (a) | 10,324,000 | 11,274,507 | |
| 5.71% 1/15/26 (a) | 29,145,000 | 33,038,701 | |
| JPMorgan Chase & Co.: | |||
| 2.956% 5/13/31 (c) | 7,934,000 | 8,631,781 | |
| 4.125% 12/15/26 | 15,380,000 | 17,976,869 | |
| NatWest Markets PLC 2.375% 5/21/23 (a) | 15,700,000 | 16,333,181 | |
| Rabobank Nederland 4.375% 8/4/25 | 4,789,000 | 5,472,874 | |
| Royal Bank of Scotland Group PLC: | |||
| 3.073% 5/22/28 (c) | 8,707,000 | 9,400,742 | |
| 4.8% 4/5/26 | 19,815,000 | 23,245,032 | |
| 5.125% 5/28/24 | 35,958,000 | 40,126,219 | |
| 6% 12/19/23 | 43,478,000 | 49,384,342 | |
| 6.1% 6/10/23 | 19,857,000 | 22,197,591 | |
| 6.125% 12/15/22 | 21,905,000 | 24,072,066 | |
| Societe Generale 4.25% 4/14/25 (a) | 7,110,000 | 7,825,627 | |
| Synchrony Bank 3% 6/15/22 | 3,984,000 | 4,117,171 | |
| UniCredit SpA 6.572% 1/14/22 (a) | 6,953,000 | 7,351,755 | |
| Wells Fargo & Co.: | |||
| 2.406% 10/30/25 (c) | 7,739,000 | 8,149,246 | |
| 4.3% 7/22/27 | 25,328,000 | 29,523,330 | |
| 4.478% 4/4/31 (c) | 19,300,000 | 23,501,558 | |
| Westpac Banking Corp. 4.11% 7/24/34 (c) | 5,171,000 | 5,870,925 | |
| 798,371,343 | |||
| Capital Markets - 1.6% | |||
| Affiliated Managers Group, Inc. 4.25% 2/15/24 | 1,396,000 | 1,535,840 | |
| Ares Capital Corp.: | |||
| 3.875% 1/15/26 | 22,188,000 | 23,311,972 | |
| 4.2% 6/10/24 | 15,463,000 | 16,448,257 | |
| Credit Suisse Group AG: | |||
| 2.593% 9/11/25 (a)(c) | 14,306,000 | 15,093,226 | |
| 3.75% 3/26/25 | 9,717,000 | 10,784,611 | |
| 4.194% 4/1/31 (a)(c) | 37,158,000 | 43,788,754 | |
| 4.55% 4/17/26 | 3,126,000 | 3,663,123 | |
| Deutsche Bank AG 4.5% 4/1/25 | 15,769,000 | 16,859,179 | |
| Deutsche Bank AG New York Branch: | |||
| 3.3% 11/16/22 | 7,369,000 | 7,676,597 | |
| 4.1% 1/13/26 | 8,332,000 | 9,175,025 | |
| 5% 2/14/22 | 11,778,000 | 12,313,793 | |
| Goldman Sachs Group, Inc.: | |||
| 2.876% 10/31/22 (c) | 10,640,000 | 10,873,401 | |
| 3.272% 9/29/25 (c) | 35,921,000 | 39,157,793 | |
| 3.8% 3/15/30 | 20,550,000 | 24,025,358 | |
| 4.25% 10/21/25 | 12,215,000 | 14,024,728 | |
| 6.75% 10/1/37 | 59,592,000 | 91,200,379 | |
| Intercontinental Exchange, Inc. 3.75% 12/1/25 | 2,038,000 | 2,306,039 | |
| Morgan Stanley: | |||
| 3 month U.S. LIBOR + 0.930% 1.1458% 7/22/22 (c)(d) | 3,745,000 | 3,762,893 | |
| 3.125% 7/27/26 | 14,775,000 | 16,500,161 | |
| 3.622% 4/1/31 (c) | 17,370,000 | 20,207,212 | |
| 3.625% 1/20/27 | 16,594,000 | 18,962,218 | |
| 3.7% 10/23/24 | 4,754,000 | 5,284,362 | |
| 3.875% 4/29/24 | 4,377,000 | 4,837,553 | |
| 4.431% 1/23/30 (c) | 5,526,000 | 6,730,615 | |
| 4.875% 11/1/22 | 9,955,000 | 10,758,453 | |
| 5% 11/24/25 | 21,351,000 | 25,446,124 | |
| 5.75% 1/25/21 | 4,669,000 | 4,705,932 | |
| MSCI, Inc.: | |||
| 4.75% 8/1/26 (a) | 900,000 | 933,750 | |
| 5.375% 5/15/27 (a) | 1,242,000 | 1,330,493 | |
| State Street Corp.: | |||
| 2.825% 3/30/23 (c) | 1,216,000 | 1,256,059 | |
| 2.901% 3/30/26 (c) | 1,141,000 | 1,240,603 | |
| 464,194,503 | |||
| Consumer Finance - 1.0% | |||
| AerCap Ireland Capital Ltd./AerCap Global Aviation Trust: | |||
| 2.875% 8/14/24 | 8,576,000 | 8,775,525 | |
| 3.5% 5/26/22 | 1,452,000 | 1,493,367 | |
| 4.125% 7/3/23 | 4,250,000 | 4,505,498 | |
| 4.45% 4/3/26 | 4,254,000 | 4,578,262 | |
| 4.875% 1/16/24 | 6,629,000 | 7,139,669 | |
| 6.5% 7/15/25 | 6,613,000 | 7,643,551 | |
| Ally Financial, Inc.: | |||
| 1.45% 10/2/23 | 3,893,000 | 3,968,230 | |
| 3.05% 6/5/23 | 17,631,000 | 18,589,593 | |
| 3.875% 5/21/24 | 8,893,000 | 9,711,866 | |
| 4.625% 3/30/25 | 3,595,000 | 4,085,626 | |
| 5.125% 9/30/24 | 3,534,000 | 4,053,104 | |
| 5.75% 11/20/25 | 1,188,000 | 1,387,311 | |
| 5.8% 5/1/25 | 9,417,000 | 11,170,538 | |
| 8% 11/1/31 | 222,000 | 310,911 | |
| 8% 11/1/31 | 5,369,000 | 7,690,855 | |
| Capital One Financial Corp.: | |||
| 3.65% 5/11/27 | 21,700,000 | 24,644,826 | |
| 3.8% 1/31/28 | 6,880,000 | 7,901,979 | |
| Discover Financial Services: | |||
| 3.95% 11/6/24 | 1,874,000 | 2,076,814 | |
| 4.1% 2/9/27 | 17,218,000 | 19,617,450 | |
| 4.5% 1/30/26 | 5,913,000 | 6,793,028 | |
| Ford Motor Credit Co. LLC: | |||
| 4.063% 11/1/24 | 46,639,000 | 48,504,560 | |
| 4.687% 6/9/25 | 430,000 | 456,875 | |
| 5.085% 1/7/21 | 3,662,000 | 3,671,155 | |
| 5.113% 5/3/29 | 510,000 | 550,290 | |
| 5.125% 6/16/25 | 320,000 | 345,504 | |
| 5.584% 3/18/24 | 8,520,000 | 9,148,350 | |
| 5.596% 1/7/22 | 7,576,000 | 7,793,810 | |
| Navient Corp.: | |||
| 7.25% 1/25/22 | 241,000 | 253,653 | |
| 7.25% 9/25/23 | 1,246,000 | 1,358,140 | |
| Springleaf Finance Corp.: | |||
| 6.875% 3/15/25 | 935,000 | 1,070,575 | |
| 7.125% 3/15/26 | 241,000 | 277,413 | |
| Synchrony Financial: | |||
| 2.85% 7/25/22 | 2,154,000 | 2,224,950 | |
| 3.75% 8/15/21 | 1,457,000 | 1,480,938 | |
| 3.95% 12/1/27 | 8,239,000 | 9,137,353 | |
| 4.25% 8/15/24 | 1,467,000 | 1,610,628 | |
| 4.375% 3/19/24 | 8,694,000 | 9,553,742 | |
| 5.15% 3/19/29 | 18,424,000 | 22,053,588 | |
| 275,629,527 | |||
| Diversified Financial Services - 0.3% | |||
| Brixmor Operating Partnership LP: | |||
| 4.05% 7/1/30 | 9,134,000 | 10,305,458 | |
| 4.125% 6/15/26 | 5,362,000 | 5,951,101 | |
| 4.125% 5/15/29 | 19,691,000 | 22,437,738 | |
| Equitable Holdings, Inc. 3.9% 4/20/23 | 1,038,000 | 1,120,227 | |
| Icahn Enterprises LP/Icahn Enterprises Finance Corp.: | |||
| 4.75% 9/15/24 | 740,000 | 762,200 | |
| 5.25% 5/15/27 | 3,095,000 | 3,249,750 | |
| 6.25% 5/15/26 | 1,691,000 | 1,766,994 | |
| 6.375% 12/15/25 | 387,000 | 397,643 | |
| Park Aerospace Holdings Ltd. 5.5% 2/15/24 (a) | 7,300,000 | 7,793,383 | |
| Pine Street Trust I 4.572% 2/15/29 (a) | 7,749,000 | 9,162,759 | |
| Pine Street Trust II 5.568% 2/15/49 (a) | 7,700,000 | 9,829,243 | |
| VMED O2 UK Financing I PLC 4.25% 1/31/31 (a) | 1,190,000 | 1,221,535 | |
| Voya Financial, Inc. 3.125% 7/15/24 | 2,503,000 | 2,699,815 | |
| 76,697,846 | |||
| Insurance - 0.7% | |||
| AIA Group Ltd.: | |||
| 3.2% 9/16/40 (a) | 6,220,000 | 6,638,730 | |
| 3.375% 4/7/30 (a) | 13,088,000 | 14,652,735 | |
| American International Group, Inc. 3.4% 6/30/30 | 21,700,000 | 24,735,929 | |
| Five Corners Funding Trust II 2.85% 5/15/30 (a) | 15,870,000 | 17,471,397 | |
| Liberty Mutual Group, Inc.: | |||
| 3.95% 5/15/60 (a) | 12,820,000 | 15,251,109 | |
| 4.569% 2/1/29 (a) | 2,429,000 | 2,977,224 | |
| Lincoln National Corp. 3.4% 1/15/31 | 14,811,000 | 16,872,061 | |
| Marsh & McLennan Companies, Inc.: | |||
| 4.75% 3/15/39 | 2,280,000 | 3,082,285 | |
| 4.8% 7/15/21 | 1,355,000 | 1,378,370 | |
| Metropolitan Life Global Funding I U.S. SECURED OVERNIGHT FINL RATE (SOFR) INDX + 0.500% 0.58% 5/28/21 (a)(c)(d) | 33,100,000 | 33,155,277 | |
| New York Life Insurance Co. 3.75% 5/15/50 (a) | 3,182,000 | 3,761,293 | |
| Pacific LifeCorp 5.125% 1/30/43 (a) | 2,623,000 | 3,167,895 | |
| Pricoa Global Funding I 5.375% 5/15/45 (c) | 3,148,000 | 3,438,026 | |
| Progressive Corp. 3.2% 3/26/30 | 1,484,000 | 1,718,468 | |
| Prudential Financial, Inc. 4.5% 11/16/21 | 1,288,000 | 1,339,457 | |
| Swiss Re Finance Luxembourg SA 5% 4/2/49 (a)(c) | 3,000,000 | 3,487,500 | |
| Teachers Insurance & Annuity Association of America 3.3% 5/15/50 (a) | 7,316,000 | 7,892,430 | |
| Unum Group: | |||
| 4% 6/15/29 | 6,130,000 | 6,984,755 | |
| 4.5% 3/15/25 | 12,980,000 | 14,463,587 | |
| 5.75% 8/15/42 | 1,622,000 | 1,977,086 | |
| 184,445,614 | |||
| Mortgage Real Estate Investment Trusts - 0.0% | |||
| Starwood Property Trust, Inc. 4.75% 3/15/25 | 184,000 | 188,885 | |
| Thrifts & Mortgage Finance - 0.0% | |||
| Quicken Loans, Inc. 5.25% 1/15/28 (a) | 722,000 | 765,320 | |
| TOTAL FINANCIALS | 1,800,293,038 | ||
| HEALTH CARE - 0.7% | |||
| Biotechnology - 0.0% | |||
| AbbVie, Inc. 3.2% 11/21/29 | 4,900,000 | 5,555,718 | |
| Health Care Equipment & Supplies - 0.0% | |||
| Hologic, Inc.: | |||
| 3.25% 2/15/29 (a) | 545,000 | 553,856 | |
| 4.625% 2/1/28 (a) | 65,000 | 69,144 | |
| Teleflex, Inc.: | |||
| 4.25% 6/1/28 (a) | 145,000 | 153,352 | |
| 4.875% 6/1/26 | 562,000 | 584,480 | |
| 1,360,832 | |||
| Health Care Providers & Services - 0.3% | |||
| Anthem, Inc. 3.3% 1/15/23 | 4,322,000 | 4,577,321 | |
| Centene Corp.: | |||
| 3.375% 2/15/30 | 7,725,000 | 8,096,727 | |
| 4.25% 12/15/27 | 6,480,000 | 6,897,085 | |
| 4.625% 12/15/29 | 8,795,000 | 9,642,838 | |
| 4.75% 1/15/25 | 4,500,000 | 4,638,285 | |
| 5.375% 6/1/26 (a) | 805,000 | 846,256 | |
| 5.375% 8/15/26 (a) | 2,486,000 | 2,625,838 | |
| Cigna Corp.: | |||
| 4.375% 10/15/28 | 6,630,000 | 7,967,136 | |
| 4.8% 8/15/38 | 4,128,000 | 5,379,991 | |
| 4.9% 12/15/48 | 4,124,000 | 5,681,850 | |
| CVS Health Corp.: | |||
| 3.625% 4/1/27 | 3,208,000 | 3,643,094 | |
| 4.1% 3/25/25 | 6,710,000 | 7,599,036 | |
| DaVita HealthCare Partners, Inc. 4.625% 6/1/30 (a) | 315,000 | 331,144 | |
| HCA Holdings, Inc. 4.75% 5/1/23 | 138,000 | 150,776 | |
| Molina Healthcare, Inc. 3.875% 11/15/30 (a) | 235,000 | 249,037 | |
| Tenet Healthcare Corp.: | |||
| 4.625% 7/15/24 | 3,152,000 | 3,207,160 | |
| 4.875% 1/1/26 (a) | 385,000 | 396,550 | |
| 5.125% 5/1/25 | 669,000 | 675,657 | |
| 6.25% 2/1/27 (a) | 740,000 | 775,150 | |
| Toledo Hospital: | |||
| 5.325% 11/15/28 | 2,395,000 | 2,780,148 | |
| 6.015% 11/15/48 | 4,674,000 | 5,579,875 | |
| 81,740,954 | |||
| Health Care Technology - 0.0% | |||
| IMS Health, Inc.: | |||
| 5% 10/15/26 (a) | 1,449,000 | 1,516,016 | |
| 5% 5/15/27 (a) | 630,000 | 663,075 | |
| 2,179,091 | |||
| Life Sciences Tools & Services - 0.0% | |||
| Charles River Laboratories International, Inc.: | |||
| 4.25% 5/1/28 (a) | 70,000 | 73,763 | |
| 5.5% 4/1/26 (a) | 575,000 | 603,750 | |
| 677,513 | |||
| Pharmaceuticals - 0.4% | |||
| Bayer U.S. Finance II LLC 4.25% 12/15/25 (a) | 50,548,000 | 57,838,827 | |
| Elanco Animal Health, Inc.: | |||
| 4.912% 8/27/21 (c) | 1,077,000 | 1,104,033 | |
| 5.272% 8/28/23 (c) | 3,402,000 | 3,696,154 | |
| 5.9% 8/28/28 (c) | 1,432,000 | 1,680,882 | |
| Teva Pharmaceutical Finance Netherlands III BV 2.2% 7/21/21 | 748,000 | 748,262 | |
| Utah Acquisition Sub, Inc. 3.95% 6/15/26 | 2,065,000 | 2,356,072 | |
| Valeant Pharmaceuticals International, Inc. 7% 3/15/24 (a) | 874,000 | 901,313 | |
| Viatris, Inc.: | |||
| 1.65% 6/22/25 (a) | 1,773,000 | 1,826,030 | |
| 2.7% 6/22/30 (a) | 9,017,000 | 9,562,326 | |
| 3.85% 6/22/40 (a) | 3,928,000 | 4,424,609 | |
| 4% 6/22/50 (a) | 6,783,000 | 7,727,273 | |
| Zoetis, Inc. 3.25% 2/1/23 | 1,210,000 | 1,274,798 | |
| 93,140,579 | |||
| TOTAL HEALTH CARE | 184,654,687 | ||
| INDUSTRIALS - 0.6% | |||
| Aerospace & Defense - 0.2% | |||
| BAE Systems PLC 3.4% 4/15/30 (a) | 4,094,000 | 4,622,124 | |
| BBA U.S. Holdings, Inc. 5.375% 5/1/26 (a) | 1,556,000 | 1,598,790 | |
| BWX Technologies, Inc.: | |||
| 4.125% 6/30/28 (a) | 480,000 | 499,800 | |
| 5.375% 7/15/26 (a) | 1,748,000 | 1,815,735 | |
| Howmet Aerospace, Inc.: | |||
| 5.95% 2/1/37 | 25,000 | 29,435 | |
| 6.75% 1/15/28 | 365,000 | 430,700 | |
| Moog, Inc. 4.25% 12/15/27 (a) | 980,000 | 1,009,743 | |
| The Boeing Co.: | |||
| 5.04% 5/1/27 | 6,070,000 | 6,952,600 | |
| 5.15% 5/1/30 | 6,070,000 | 7,125,650 | |
| 5.705% 5/1/40 | 6,070,000 | 7,662,277 | |
| 5.805% 5/1/50 | 6,070,000 | 8,018,981 | |
| 5.93% 5/1/60 | 6,070,000 | 8,245,854 | |
| TransDigm, Inc.: | |||
| 6.25% 3/15/26 (a) | 2,552,000 | 2,705,120 | |
| 7.5% 3/15/27 | 95,000 | 101,650 | |
| 8% 12/15/25 (a) | 1,120,000 | 1,223,600 | |
| 52,042,059 | |||
| Air Freight & Logistics - 0.0% | |||
| XPO Logistics, Inc. 6.25% 5/1/25 (a) | 1,705,000 | 1,826,481 | |
| Building Products - 0.0% | |||
| Advanced Drain Systems, Inc. 5% 9/30/27 (a) | 965,000 | 1,013,250 | |
| Masco Corp. 4.45% 4/1/25 | 1,041,000 | 1,192,398 | |
| 2,205,648 | |||
| Commercial Services & Supplies - 0.0% | |||
| LBC Tank Terminals Holding Netherlands BV 6.875% 5/15/23 (a) | 915,000 | 915,000 | |
| Nielsen Co. SARL (Luxembourg) 5% 2/1/25 (a) | 595,000 | 612,106 | |
| Nielsen Finance LLC/Nielsen Finance Co.: | |||
| 5% 4/15/22 (a) | 394,000 | 394,000 | |
| 5.625% 10/1/28 (a) | 495,000 | 527,645 | |
| 5.875% 10/1/30 (a) | 490,000 | 538,388 | |
| Prime Securities Services Borrower LLC/Prime Finance, Inc. 3.375% 8/31/27 (a) | 1,230,000 | 1,214,625 | |
| Stericycle, Inc. 3.875% 1/15/29 (a) | 450,000 | 468,000 | |
| 4,669,764 | |||
| Construction & Engineering - 0.0% | |||
| AECOM: | |||
| 5.125% 3/15/27 | 2,077,000 | 2,321,048 | |
| 5.875% 10/15/24 | 360,000 | 399,600 | |
| 2,720,648 | |||
| Electrical Equipment - 0.0% | |||
| Sensata Technologies BV: | |||
| 4.875% 10/15/23 (a) | 791,000 | 850,325 | |
| 5% 10/1/25 (a) | 520,000 | 577,200 | |
| 1,427,525 | |||
| Industrial Conglomerates - 0.2% | |||
| General Electric Co.: | |||
| 3.45% 5/1/27 | 2,582,000 | 2,844,022 | |
| 3.625% 5/1/30 | 6,002,000 | 6,727,861 | |
| 4.25% 5/1/40 | 18,800,000 | 21,360,974 | |
| 4.35% 5/1/50 | 21,476,000 | 25,211,893 | |
| 56,144,750 | |||
| Machinery - 0.0% | |||
| Vertical U.S. Newco, Inc. 5.25% 7/15/27 (a) | 1,065,000 | 1,118,250 | |
| Professional Services - 0.0% | |||
| ASGN, Inc. 4.625% 5/15/28 (a) | 270,000 | 280,800 | |
| Booz Allen Hamilton, Inc. 3.875% 9/1/28 (a) | 765,000 | 789,863 | |
| 1,070,663 | |||
| Road & Rail - 0.1% | |||
| Avolon Holdings Funding Ltd.: | |||
| 3.625% 5/1/22 (a) | 2,141,000 | 2,172,760 | |
| 3.95% 7/1/24 (a) | 2,844,000 | 2,922,536 | |
| 4.375% 5/1/26 (a) | 3,481,000 | 3,594,023 | |
| 5.25% 5/15/24 (a) | 4,186,000 | 4,471,252 | |
| 13,160,571 | |||
| Trading Companies & Distributors - 0.1% | |||
| Air Lease Corp.: | |||
| 2.25% 1/15/23 | 1,863,000 | 1,908,772 | |
| 3% 9/15/23 | 583,000 | 604,401 | |
| 3.375% 6/1/21 | 1,957,000 | 1,979,832 | |
| 3.375% 7/1/25 | 11,630,000 | 12,265,691 | |
| 3.75% 2/1/22 | 2,924,000 | 3,004,823 | |
| 3.75% 6/1/26 | 5,000,000 | 5,387,421 | |
| 3.875% 4/1/21 | 2,112,000 | 2,128,304 | |
| 4.25% 2/1/24 | 7,180,000 | 7,724,041 | |
| 4.25% 9/15/24 | 2,331,000 | 2,515,793 | |
| 37,519,078 | |||
| Transportation Infrastructure - 0.0% | |||
| BNSF Funding Trust I 6.613% 12/15/55 (c) | 1,374,000 | 1,573,230 | |
| TOTAL INDUSTRIALS | 175,478,667 | ||
| INFORMATION TECHNOLOGY - 0.3% | |||
| Electronic Equipment & Components - 0.1% | |||
| Diamond 1 Finance Corp./Diamond 2 Finance Corp.: | |||
| 5.45% 6/15/23 (a) | 5,600,000 | 6,195,885 | |
| 6.02% 6/15/26 (a) | 1,948,000 | 2,364,735 | |
| Sensata Technologies, Inc. 3.75% 2/15/31 (a) | 1,410,000 | 1,431,150 | |
| TTM Technologies, Inc. 5.625% 10/1/25 (a) | 1,170,000 | 1,207,241 | |
| 11,199,011 | |||
| IT Services - 0.0% | |||
| Gartner, Inc.: | |||
| 3.75% 10/1/30 (a) | 255,000 | 265,282 | |
| 4.5% 7/1/28 (a) | 395,000 | 414,750 | |
| 680,032 | |||
| Semiconductors & Semiconductor Equipment - 0.0% | |||
| Entegris, Inc.: | |||
| 4.375% 4/15/28 (a) | 490,000 | 517,925 | |
| 4.625% 2/10/26 (a) | 836,000 | 861,080 | |
| NVIDIA Corp. 2.85% 4/1/30 | 3,561,000 | 3,991,108 | |
| ON Semiconductor Corp. 3.875% 9/1/28 (a) | 300,000 | 309,000 | |
| 5,679,113 | |||
| Software - 0.2% | |||
| CDK Global, Inc.: | |||
| 4.875% 6/1/27 | 1,199,000 | 1,262,337 | |
| 5.25% 5/15/29 (a) | 107,000 | 117,433 | |
| 5.875% 6/15/26 | 542,000 | 566,390 | |
| Fair Isaac Corp. 5.25% 5/15/26 (a) | 793,000 | 888,160 | |
| Nuance Communications, Inc. 5.625% 12/15/26 | 1,382,000 | 1,460,235 | |
| Open Text Corp. 3.875% 2/15/28 (a) | 420,000 | 433,650 | |
| Oracle Corp.: | |||
| 2.5% 4/1/25 | 8,253,000 | 8,849,884 | |
| 2.8% 4/1/27 | 8,253,000 | 9,081,409 | |
| 2.95% 4/1/30 | 8,300,000 | 9,312,506 | |
| 3.6% 4/1/40 | 8,250,000 | 9,626,945 | |
| 3.85% 4/1/60 | 8,300,000 | 10,204,455 | |
| SS&C Technologies, Inc. 5.5% 9/30/27 (a) | 1,000,000 | 1,069,890 | |
| 52,873,294 | |||
| Technology Hardware, Storage & Peripherals - 0.0% | |||
| Hewlett Packard Enterprise Co. 4.4% 10/15/22 (c) | 3,173,000 | 3,382,786 | |
| TOTAL INFORMATION TECHNOLOGY | 73,814,236 | ||
| MATERIALS - 0.1% | |||
| Chemicals - 0.1% | |||
| Axalta Coating Systems/Dutch Holding BV 4.75% 6/15/27 (a) | 585,000 | 617,175 | |
| CF Industries Holdings, Inc.: | |||
| 4.95% 6/1/43 | 5,000 | 6,231 | |
| 5.15% 3/15/34 | 867,000 | 1,047,583 | |
| 5.375% 3/15/44 | 255,000 | 324,169 | |
| Consolidated Energy Finance SA: | |||
| 3 month U.S. LIBOR + 3.750% 4.0004% 6/15/22 (a)(c)(d) | 1,306,000 | 1,266,820 | |
| 6.5% 5/15/26 (a) | 925,000 | 895,123 | |
| 6.875% 6/15/25 (a) | 80,000 | 78,517 | |
| Methanex Corp.: | |||
| 5.125% 10/15/27 | 765,000 | 805,163 | |
| 5.65% 12/1/44 | 276,000 | 286,088 | |
| Nufarm Australia Ltd. 5.75% 4/30/26 (a) | 1,087,000 | 1,116,838 | |
| Olin Corp.: | |||
| 5% 2/1/30 | 1,215,000 | 1,263,600 | |
| 5.125% 9/15/27 | 975,000 | 1,011,563 | |
| 5.625% 8/1/29 | 465,000 | 499,847 | |
| The Chemours Co. LLC: | |||
| 5.375% 5/15/27 | 1,115,000 | 1,159,600 | |
| 7% 5/15/25 | 849,000 | 878,715 | |
| Valvoline, Inc.: | |||
| 4.25% 2/15/30 (a) | 165,000 | 173,663 | |
| 4.375% 8/15/25 | 978,000 | 1,011,066 | |
| W. R. Grace & Co.-Conn.: | |||
| 4.875% 6/15/27 (a) | 305,000 | 319,488 | |
| 5.625% 10/1/24 (a) | 1,254,000 | 1,351,185 | |
| 14,112,434 | |||
| Containers & Packaging - 0.0% | |||
| Ardagh Packaging Finance PLC/Ardagh MP Holdings U.S.A., Inc. 4.125% 8/15/26 (a) | 25,000 | 25,938 | |
| Berry Global, Inc. 4.875% 7/15/26 (a) | 489,000 | 519,152 | |
| Crown Americas LLC/Crown Americas Capital Corp. IV 4.75% 2/1/26 | 238,000 | 247,074 | |
| Intelligent Packaging Ltd. Finco, Inc. 6% 9/15/28 (a) | 95,000 | 100,983 | |
| Silgan Holdings, Inc. 4.75% 3/15/25 | 165,000 | 168,609 | |
| Trivium Packaging Finance BV: | |||
| 5.5% 8/15/26 (a) | 485,000 | 508,038 | |
| 8.5% 8/15/27 (a) | 140,000 | 151,550 | |
| 1,721,344 | |||
| Metals & Mining - 0.0% | |||
| Anglo American Capital PLC 4.125% 4/15/21 (a) | 1,089,000 | 1,101,963 | |
| Corporacion Nacional del Cobre de Chile (Codelco): | |||
| 3.625% 8/1/27 (a) | 1,499,000 | 1,663,890 | |
| 4.5% 8/1/47 (a) | 1,522,000 | 1,866,353 | |
| FMG Resources (August 2006) Pty Ltd. 4.5% 9/15/27 (a) | 10,000 | 10,963 | |
| Freeport-McMoRan, Inc.: | |||
| 5.4% 11/14/34 | 310,000 | 384,013 | |
| 5.45% 3/15/43 | 330,000 | 412,500 | |
| Kaiser Aluminum Corp.: | |||
| 4.625% 3/1/28 (a) | 1,005,000 | 1,036,426 | |
| 6.5% 5/1/25 (a) | 260,000 | 278,200 | |
| 6,754,308 | |||
| TOTAL MATERIALS | 22,588,086 | ||
| REAL ESTATE - 0.9% | |||
| Equity Real Estate Investment Trusts (REITs) - 0.7% | |||
| Alexandria Real Estate Equities, Inc. 4.9% 12/15/30 | 7,224,000 | 9,118,860 | |
| Boston Properties, Inc. 4.5% 12/1/28 | 4,766,000 | 5,680,956 | |
| CoreCivic, Inc.: | |||
| 4.625% 5/1/23 | 1,421,000 | 1,335,740 | |
| 5% 10/15/22 | 443,000 | 435,779 | |
| Corporate Office Properties LP: | |||
| 2.25% 3/15/26 | 2,969,000 | 3,034,839 | |
| 5% 7/1/25 | 2,273,000 | 2,591,227 | |
| CTR Partnership LP/CareTrust Capital Corp. 5.25% 6/1/25 | 720,000 | 747,014 | |
| Duke Realty LP: | |||
| 3.25% 6/30/26 | 589,000 | 655,252 | |
| 3.625% 4/15/23 | 1,544,000 | 1,637,874 | |
| GLP Capital LP/GLP Financing II, Inc. 5.25% 6/1/25 | 486,000 | 539,484 | |
| Healthcare Trust of America Holdings LP: | |||
| 3.1% 2/15/30 | 1,868,000 | 2,029,501 | |
| 3.5% 8/1/26 | 1,945,000 | 2,193,449 | |
| Highwoods/Forsyth LP 3.2% 6/15/21 | 529,000 | 533,723 | |
| Hospitality Properties Trust: | |||
| 4.375% 2/15/30 | 125,000 | 117,250 | |
| 4.95% 2/15/27 | 65,000 | 61,994 | |
| 4.95% 10/1/29 | 25,000 | 23,438 | |
| 5.5% 12/15/27 | 125,000 | 130,549 | |
| Hudson Pacific Properties LP 4.65% 4/1/29 | 10,668,000 | 12,311,070 | |
| Lexington Corporate Properties Trust: | |||
| 2.7% 9/15/30 | 1,445,000 | 1,494,835 | |
| 4.4% 6/15/24 | 948,000 | 1,030,951 | |
| MGM Growth Properties Operating Partnership LP: | |||
| 4.5% 9/1/26 | 1,508,000 | 1,590,940 | |
| 4.5% 1/15/28 | 637,000 | 664,073 | |
| 4.625% 6/15/25 (a) | 150,000 | 158,250 | |
| 5.75% 2/1/27 | 256,000 | 285,332 | |
| MPT Operating Partnership LP/MPT Finance Corp.: | |||
| 5.25% 8/1/26 | 2,161,000 | 2,258,677 | |
| 6.375% 3/1/24 | 268,000 | 277,005 | |
| Omega Healthcare Investors, Inc.: | |||
| 3.375% 2/1/31 | 5,854,000 | 5,891,762 | |
| 3.625% 10/1/29 | 8,376,000 | 8,661,643 | |
| 4.375% 8/1/23 | 4,882,000 | 5,258,424 | |
| 4.5% 1/15/25 | 2,013,000 | 2,180,789 | |
| 4.5% 4/1/27 | 716,000 | 789,075 | |
| 4.75% 1/15/28 | 11,294,000 | 12,638,052 | |
| 4.95% 4/1/24 | 882,000 | 956,321 | |
| 5.25% 1/15/26 | 3,755,000 | 4,196,196 | |
| Realty Income Corp. 3.25% 1/15/31 | 1,828,000 | 2,068,723 | |
| Retail Opportunity Investments Partnership LP: | |||
| 4% 12/15/24 | 641,000 | 657,745 | |
| 5% 12/15/23 | 494,000 | 519,689 | |
| Retail Properties America, Inc.: | |||
| 4% 3/15/25 | 10,791,000 | 10,837,801 | |
| 4.75% 9/15/30 | 17,486,000 | 17,644,777 | |
| SBA Communications Corp. 4.875% 9/1/24 | 557,000 | 570,747 | |
| Simon Property Group LP: | |||
| 2.45% 9/13/29 | 3,008,000 | 3,075,461 | |
| 3.375% 12/1/27 | 8,103,000 | 8,893,115 | |
| SITE Centers Corp.: | |||
| 3.625% 2/1/25 | 1,532,000 | 1,582,828 | |
| 4.25% 2/1/26 | 2,753,000 | 2,937,571 | |
| Store Capital Corp.: | |||
| 2.75% 11/18/30 | 3,456,000 | 3,488,621 | |
| 4.625% 3/15/29 | 2,374,000 | 2,713,079 | |
| The GEO Group, Inc.: | |||
| 5.875% 10/15/24 | 170,000 | 134,109 | |
| 6% 4/15/26 | 610,000 | 451,400 | |
| Uniti Group, Inc. 7.875% 2/15/25 (a) | 1,050,000 | 1,115,972 | |
| Ventas Realty LP: | |||
| 3% 1/15/30 | 11,060,000 | 11,754,870 | |
| 3.125% 6/15/23 | 1,033,000 | 1,085,795 | |
| 4% 3/1/28 | 2,150,000 | 2,430,761 | |
| 4.125% 1/15/26 | 999,000 | 1,143,775 | |
| 4.75% 11/15/30 | 16,500,000 | 19,987,917 | |
| VEREIT Operating Partnership LP: | |||
| 2.2% 6/15/28 | 1,380,000 | 1,388,160 | |
| 2.85% 12/15/32 | 1,698,000 | 1,738,938 | |
| 3.4% 1/15/28 | 2,874,000 | 3,110,084 | |
| VICI Properties, Inc.: | |||
| 3.5% 2/15/25 (a) | 305,000 | 311,100 | |
| 4.25% 12/1/26 (a) | 1,640,000 | 1,701,500 | |
| 4.625% 12/1/29 (a) | 595,000 | 634,074 | |
| Weingarten Realty Investors 3.375% 10/15/22 | 456,000 | 468,410 | |
| WP Carey, Inc.: | |||
| 3.85% 7/15/29 | 1,773,000 | 1,992,576 | |
| 4% 2/1/25 | 3,423,000 | 3,771,669 | |
| 4.6% 4/1/24 | 5,327,000 | 5,903,831 | |
| 205,625,422 | |||
| Real Estate Management & Development - 0.2% | |||
| Brandywine Operating Partnership LP: | |||
| 3.95% 2/15/23 | 7,832,000 | 8,103,382 | |
| 3.95% 11/15/27 | 4,382,000 | 4,578,831 | |
| 4.1% 10/1/24 | 3,961,000 | 4,167,399 | |
| 4.55% 10/1/29 | 1,896,000 | 2,061,215 | |
| CBRE Group, Inc. 4.875% 3/1/26 | 7,844,000 | 9,190,039 | |
| Essex Portfolio LP 3.875% 5/1/24 | 1,923,000 | 2,103,564 | |
| Howard Hughes Corp. 5.375% 3/15/25 (a) | 927,000 | 953,651 | |
| Mack-Cali Realty LP: | |||
| 3.15% 5/15/23 | 3,573,000 | 3,547,082 | |
| 4.5% 4/18/22 | 678,000 | 668,712 | |
| Mid-America Apartments LP 4% 11/15/25 | 828,000 | 936,496 | |
| Post Apartment Homes LP 3.375% 12/1/22 | 502,000 | 523,243 | |
| Tanger Properties LP: | |||
| 3.125% 9/1/26 | 2,628,000 | 2,623,242 | |
| 3.75% 12/1/24 | 2,635,000 | 2,688,596 | |
| 3.875% 12/1/23 | 1,186,000 | 1,207,279 | |
| 3.875% 7/15/27 | 11,191,000 | 11,206,455 | |
| 54,559,186 | |||
| TOTAL REAL ESTATE | 260,184,608 | ||
| UTILITIES - 0.5% | |||
| Electric Utilities - 0.2% | |||
| Clearway Energy Operating LLC: | |||
| 4.75% 3/15/28 (a) | 140,000 | 150,139 | |
| 5% 9/15/26 | 925,000 | 952,750 | |
| 5.75% 10/15/25 | 333,000 | 350,483 | |
| Cleco Corporate Holdings LLC 3.375% 9/15/29 | 4,843,000 | 4,956,669 | |
| DPL, Inc. 4.35% 4/15/29 | 2,785,000 | 3,126,163 | |
| Duquesne Light Holdings, Inc.: | |||
| 2.532% 10/1/30 (a) | 2,328,000 | 2,377,596 | |
| 5.9% 12/1/21 (a) | 3,889,000 | 4,065,064 | |
| Exelon Corp.: | |||
| 4.05% 4/15/30 | 3,122,000 | 3,701,790 | |
| 4.7% 4/15/50 | 1,390,000 | 1,876,223 | |
| FirstEnergy Corp.: | |||
| 4.25% 3/15/23 | 4,502,000 | 4,750,442 | |
| 7.375% 11/15/31 | 5,738,000 | 7,827,804 | |
| InterGen NV 7% 6/30/23 (a) | 964,000 | 912,185 | |
| IPALCO Enterprises, Inc. 3.7% 9/1/24 | 1,963,000 | 2,134,174 | |
| NextEra Energy Partners LP 4.25% 9/15/24 (a) | 616,000 | 651,420 | |
| NRG Energy, Inc.: | |||
| 3.375% 2/15/29 (a)(e) | 110,000 | 112,338 | |
| 3.625% 2/15/31 (a)(e) | 225,000 | 233,438 | |
| 5.25% 6/15/29 (a) | 484,000 | 528,489 | |
| 5.75% 1/15/28 | 581,000 | 634,074 | |
| 6.625% 1/15/27 | 185,000 | 194,713 | |
| NSG Holdings II LLC/NSG Holdings, Inc. 7.75% 12/15/25 (a) | 1,507,774 | 1,598,240 | |
| Pattern Energy Operations LP 4.5% 8/15/28 (a) | 215,000 | 230,050 | |
| PG&E Corp. 5.25% 7/1/30 | 1,155,000 | 1,258,950 | |
| Vistra Operations Co. LLC: | |||
| 5% 7/31/27 (a) | 1,843,000 | 1,949,157 | |
| 5.5% 9/1/26 (a) | 3,498,000 | 3,660,132 | |
| 5.625% 2/15/27 (a) | 665,000 | 702,440 | |
| 48,934,923 | |||
| Gas Utilities - 0.0% | |||
| Nakilat, Inc. 6.067% 12/31/33 (a) | 1,213,000 | 1,558,326 | |
| Southern Natural Gas Co./Southern Natural Issuing Corp. 4.4% 6/15/21 | 701,000 | 708,738 | |
| 2,267,064 | |||
| Independent Power and Renewable Electricity Producers - 0.1% | |||
| TerraForm Power Operating LLC: | |||
| 4.25% 1/31/23 (a) | 68,000 | 70,210 | |
| 4.75% 1/15/30 (a) | 75,000 | 81,375 | |
| 5% 1/31/28 (a) | 656,000 | 733,080 | |
| The AES Corp.: | |||
| 3.3% 7/15/25 (a) | 15,965,000 | 17,413,983 | |
| 3.95% 7/15/30 (a) | 13,922,000 | 15,785,877 | |
| 34,084,525 | |||
| Multi-Utilities - 0.2% | |||
| Berkshire Hathaway Energy Co.: | |||
| 3.7% 7/15/30 (a) | 1,758,000 | 2,085,468 | |
| 4.05% 4/15/25 (a) | 21,459,000 | 24,362,822 | |
| Consolidated Edison Co. of New York, Inc.: | |||
| 3.35% 4/1/30 | 1,411,000 | 1,626,686 | |
| 3.95% 4/1/50 | 2,477,000 | 3,049,626 | |
| NiSource Finance Corp. 5.95% 6/15/41 | 1,737,000 | 2,480,402 | |
| NiSource, Inc. 2.95% 9/1/29 | 12,206,000 | 13,411,804 | |
| Puget Energy, Inc.: | |||
| 4.1% 6/15/30 (a) | 6,250,000 | 7,074,005 | |
| 5.625% 7/15/22 | 3,305,000 | 3,519,562 | |
| 6% 9/1/21 | 3,185,000 | 3,310,861 | |
| Sempra Energy 6% 10/15/39 | 2,744,000 | 3,933,903 | |
| WEC Energy Group, Inc. 3 month U.S. LIBOR + 2.110% 2.3335% 5/15/67 (c)(d) | 1,843,000 | 1,555,542 | |
| 66,410,681 | |||
| TOTAL UTILITIES | 151,697,193 | ||
| TOTAL NONCONVERTIBLE BONDS | |||
| (Cost $3,716,911,972) | 4,185,866,048 | ||
| U.S. Treasury Obligations - 6.8% | |||
| U.S. Treasury Bonds: | |||
| 1.25% 5/15/50 | $511,700,000 | $471,163,766 | |
| 1.375% 8/15/50 | 233,000,000 | 221,386,406 | |
| 1.625% 11/15/50 | 18,600,000 | 18,794,719 | |
| 2% 2/15/50 | 23,716,000 | 26,132,994 | |
| U.S. Treasury Notes: | |||
| 0.125% 6/30/22 | 455,500,000 | 455,428,828 | |
| 0.875% 11/15/30 | 266,938,000 | 267,563,636 | |
| 1.125% 2/28/22 | 399,000,000 | 404,049,844 | |
| 3.125% 11/15/28 | 51,642,000 | 61,336,979 | |
| TOTAL U.S. TREASURY OBLIGATIONS | |||
| (Cost $1,956,452,081) | 1,925,857,172 | ||
| U.S. Government Agency - Mortgage Securities - 21.9% | |||
| Fannie Mae - 5.8% | |||
| 12 month U.S. LIBOR + 1.440% 3.364% 4/1/37 (c)(d) | 11,369 | 11,854 | |
| 12 month U.S. LIBOR + 1.460% 2.991% 1/1/35 (c)(d) | 17,294 | 17,970 | |
| 12 month U.S. LIBOR + 1.480% 2.476% 7/1/34 (c)(d) | 2,981 | 3,105 | |
| 12 month U.S. LIBOR + 1.530% 3.535% 3/1/36 (c)(d) | 1,839 | 1,920 | |
| 12 month U.S. LIBOR + 1.550% 2.553% 6/1/36 (c)(d) | 10,754 | 11,270 | |
| 12 month U.S. LIBOR + 1.560% 3.565% 3/1/37 (c)(d) | 6,653 | 6,963 | |
| 12 month U.S. LIBOR + 1.620% 2.698% 5/1/36 (c)(d) | 28,073 | 29,495 | |
| 12 month U.S. LIBOR + 1.630% 2.156% 9/1/36 (c)(d) | 8,462 | 8,852 | |
| 12 month U.S. LIBOR + 1.630% 2.828% 3/1/33 (c)(d) | 10,013 | 10,409 | |
| 12 month U.S. LIBOR + 1.640% 3.722% 6/1/47 (c)(d) | 14,086 | 14,892 | |
| 12 month U.S. LIBOR + 1.660% 2.346% 5/1/35 (c)(d) | 20,793 | 21,720 | |
| 12 month U.S. LIBOR + 1.670% 2.967% 7/1/43 (c)(d) | 204,553 | 212,901 | |
| 12 month U.S. LIBOR + 1.680% 3.055% 11/1/36 (c)(d) | 6,045 | 6,334 | |
| 12 month U.S. LIBOR + 1.680% 3.435% 4/1/36 (c)(d) | 4,067 | 4,274 | |
| 12 month U.S. LIBOR + 1.700% 3.005% 6/1/42 (c)(d) | 15,767 | 16,465 | |
| 12 month U.S. LIBOR + 1.710% 2.672% 8/1/35 (c)(d) | 6,816 | 7,125 | |
| 12 month U.S. LIBOR + 1.730% 2.972% 5/1/36 (c)(d) | 10,843 | 11,401 | |
| 12 month U.S. LIBOR + 1.740% 3.488% 3/1/40 (c)(d) | 25,135 | 26,315 | |
| 12 month U.S. LIBOR + 1.750% 2.412% 8/1/41 (c)(d) | 19,540 | 20,337 | |
| 12 month U.S. LIBOR + 1.750% 3.382% 7/1/35 (c)(d) | 5,683 | 5,950 | |
| 12 month U.S. LIBOR + 1.800% 2.698% 12/1/40 (c)(d) | 592,629 | 620,232 | |
| 12 month U.S. LIBOR + 1.800% 2.706% 7/1/41 (c)(d) | 14,295 | 14,869 | |
| 12 month U.S. LIBOR + 1.800% 3.818% 1/1/42 (c)(d) | 32,715 | 34,105 | |
| 12 month U.S. LIBOR + 1.810% 2.321% 9/1/41 (c)(d) | 7,561 | 7,886 | |
| 12 month U.S. LIBOR + 1.810% 2.694% 7/1/41 (c)(d) | 13,080 | 13,713 | |
| 12 month U.S. LIBOR + 1.810% 3.81% 12/1/39 (c)(d) | 13,392 | 14,019 | |
| 12 month U.S. LIBOR + 1.810% 3.826% 2/1/42 (c)(d) | 41,855 | 43,799 | |
| 12 month U.S. LIBOR + 1.820% 3.825% 2/1/35 (c)(d) | 50,531 | 53,124 | |
| 12 month U.S. LIBOR + 1.830% 2.33% 10/1/41 (c)(d) | 6,340 | 6,590 | |
| 12 month U.S. LIBOR + 1.950% 2.806% 7/1/37 (c)(d) | 19,585 | 20,690 | |
| 6 month U.S. LIBOR + 1.500% 2.417% 1/1/35 (c)(d) | 21,289 | 22,057 | |
| 6 month U.S. LIBOR + 1.530% 2.41% 12/1/34 (c)(d) | 3,868 | 4,014 | |
| 6 month U.S. LIBOR + 1.530% 2.41% 3/1/35 (c)(d) | 3,869 | 4,017 | |
| 6 month U.S. LIBOR + 1.550% 1.874% 10/1/33 (c)(d) | 1,538 | 1,593 | |
| 6 month U.S. LIBOR + 1.560% 2.105% 7/1/35 (c)(d) | 2,486 | 2,583 | |
| 6 month U.S. LIBOR + 1.740% 2.865% 12/1/34 (c)(d) | 374 | 390 | |
| 6 month U.S. LIBOR + 1.960% 2.725% 9/1/35 (c)(d) | 4,517 | 4,741 | |
| U.S. TREASURY 1 YEAR INDEX + 2.200% 3.708% 3/1/35 (c)(d) | 4,268 | 4,482 | |
| U.S. TREASURY 1 YEAR INDEX + 2.270% 2.631% 6/1/36 (c)(d) | 23,712 | 24,628 | |
| U.S. TREASURY 1 YEAR INDEX + 2.280% 2.417% 10/1/33 (c)(d) | 10,902 | 11,314 | |
| U.S. TREASURY 1 YEAR INDEX + 2.460% 3.297% 7/1/34 (c)(d) | 29,335 | 30,670 | |
| 2.5% 11/1/26 to 10/1/50 | 188,211,286 | 199,052,203 | |
| 3% 7/1/27 to 9/1/50 | 583,760,137 | 619,312,103 | |
| 3.25% 12/1/41 | 6,817 | 7,404 | |
| 3.4% 7/1/42 to 9/1/42 | 135,707 | 147,220 | |
| 3.5% 7/1/32 to 6/1/50 | 514,192,408 | 548,900,107 | |
| 3.525% 5/1/42 | 3,948 | 4,376 | |
| 3.65% 5/1/42 to 8/1/42 | 46,458 | 51,185 | |
| 3.9% 4/1/42 | 10,475 | 11,706 | |
| 4% 11/1/31 to 11/1/49 | 128,089,114 | 140,121,694 | |
| 4.25% 11/1/41 | 32,846 | 36,998 | |
| 4.5% to 4.5% 12/1/23 to 9/1/49 | 85,635,143 | 94,622,546 | |
| 5% 5/1/21 to 2/1/49 | 14,280,009 | 16,281,926 | |
| 5.243% 8/1/41 (c) | 406,765 | 460,303 | |
| 5.5% 10/1/21 to 9/1/24 | 28,116 | 28,747 | |
| 6% to 6% 3/1/21 to 1/1/42 | 1,931,880 | 2,286,306 | |
| 6.5% 3/1/22 to 5/1/38 | 283,325 | 322,481 | |
| 6.572% 2/1/39 (c) | 334,666 | 369,255 | |
| 7% to 7% 9/1/21 to 7/1/37 | 200,376 | 230,182 | |
| 7.5% to 7.5% 9/1/22 to 9/1/32 | 98,981 | 113,240 | |
| 8% 3/1/37 | 3,158 | 3,834 | |
| 8.5% 2/1/22 to 9/1/22 | 653 | 685 | |
| 9% 10/1/30 | 7,484 | 8,852 | |
| TOTAL FANNIE MAE | 1,623,762,421 | ||
| Freddie Mac - 2.8% | |||
| 12 month U.S. LIBOR + 1.320% 3.212% 1/1/36 (c)(d) | 8,092 | 8,377 | |
| 12 month U.S. LIBOR + 1.370% 2.835% 3/1/36 (c)(d) | 27,153 | 28,209 | |
| 12 month U.S. LIBOR + 1.500% 3.076% 3/1/36 (c)(d) | 27,342 | 28,539 | |
| 12 month U.S. LIBOR + 1.510% 2.015% 11/1/35 (c)(d) | 6,428 | 6,703 | |
| 12 month U.S. LIBOR + 1.750% 2.328% 9/1/41 (c)(d) | 109,004 | 113,365 | |
| 12 month U.S. LIBOR + 1.750% 2.596% 7/1/41 (c)(d) | 56,697 | 58,942 | |
| 12 month U.S. LIBOR + 1.750% 3.088% 12/1/40 (c)(d) | 255,007 | 265,751 | |
| 12 month U.S. LIBOR + 1.790% 3.793% 4/1/37 (c)(d) | 2,616 | 2,745 | |
| 12 month U.S. LIBOR + 1.860% 3.614% 4/1/36 (c)(d) | 9,499 | 10,053 | |
| 12 month U.S. LIBOR + 1.870% 2.796% 10/1/42 (c)(d) | 38,813 | 40,600 | |
| 12 month U.S. LIBOR + 1.880% 2.463% 9/1/41 (c)(d) | 10,960 | 11,313 | |
| 12 month U.S. LIBOR + 1.880% 3.722% 4/1/41 (c)(d) | 5,069 | 5,325 | |
| 12 month U.S. LIBOR + 1.910% 2.91% 6/1/41 (c)(d) | 5,704 | 5,945 | |
| 12 month U.S. LIBOR + 1.910% 2.925% 6/1/41 (c)(d) | 20,590 | 21,611 | |
| 12 month U.S. LIBOR + 1.910% 3.069% 5/1/41 (c)(d) | 15,991 | 16,789 | |
| 12 month U.S. LIBOR + 1.910% 3.321% 5/1/41 (c)(d) | 19,138 | 20,101 | |
| 12 month U.S. LIBOR + 1.920% 2.92% 6/1/36 (c)(d) | 5,339 | 5,589 | |
| 12 month U.S. LIBOR + 1.960% 2.851% 6/1/33 (c)(d) | 13,308 | 14,000 | |
| 12 month U.S. LIBOR + 2.020% 3.869% 4/1/38 (c)(d) | 14,653 | 15,403 | |
| 12 month U.S. LIBOR + 2.040% 2.97% 7/1/36 (c)(d) | 17,024 | 17,832 | |
| 12 month U.S. LIBOR + 2.040% 3.236% 3/1/33 (c)(d) | 341 | 355 | |
| 12 month U.S. LIBOR + 2.200% 4.325% 12/1/36 (c)(d) | 24,039 | 25,104 | |
| 6 month U.S. LIBOR + 1.120% 2% 8/1/37 (c)(d) | 8,836 | 9,033 | |
| 6 month U.S. LIBOR + 1.580% 2.705% 12/1/35 (c)(d) | 1,144 | 1,190 | |
| 6 month U.S. LIBOR + 1.720% 2.274% 8/1/37 (c)(d) | 17,160 | 17,908 | |
| 6 month U.S. LIBOR + 1.830% 2.58% 5/1/37 (c)(d) | 4,437 | 4,649 | |
| 6 month U.S. LIBOR + 1.840% 2.596% 10/1/36 (c)(d) | 39,281 | 41,084 | |
| 6 month U.S. LIBOR + 1.840% 2.72% 2/1/37 (c)(d) | 4,528 | 4,754 | |
| 6 month U.S. LIBOR + 1.860% 2.642% 10/1/35 (c)(d) | 19,797 | 20,704 | |
| 6 month U.S. LIBOR + 2.020% 3.012% 6/1/37 (c)(d) | 22,783 | 23,805 | |
| 6 month U.S. LIBOR + 2.690% 2.993% 10/1/35 (c)(d) | 11,766 | 12,286 | |
| U.S. TREASURY 1 YEAR INDEX + 2.030% 3.106% 6/1/33 (c)(d) | 25,282 | 26,453 | |
| U.S. TREASURY 1 YEAR INDEX + 2.260% 3.043% 6/1/33 (c)(d) | 45,767 | 47,792 | |
| U.S. TREASURY 1 YEAR INDEX + 2.420% 3.174% 3/1/35 (c)(d) | 92,171 | 96,059 | |
| 2.5% 6/1/31 to 7/1/50 (f)(g)(h) | 60,527,947 | 63,708,239 | |
| 3% 6/1/31 to 8/1/50 | 236,869,539 | 252,007,447 | |
| 3.5% 6/1/27 to 3/1/50 | 245,529,259 | 262,916,415 | |
| 3.5% 8/1/47 | 4,604,230 | 4,948,764 | |
| 4% 6/1/33 to 1/1/49 (f)(i) | 160,444,415 | 174,476,763 | |
| 4% 4/1/48 | 30,458 | 32,644 | |
| 4.5% 6/1/25 to 12/1/48 | 20,545,797 | 22,737,579 | |
| 5% 2/1/21 to 7/1/41 | 4,085,080 | 4,700,526 | |
| 5.5% 6/1/22 | 12,972 | 13,268 | |
| 6% 12/1/21 to 6/1/39 | 411,335 | 479,496 | |
| 6.5% 5/1/21 to 9/1/39 | 676,856 | 793,470 | |
| 7% 8/1/21 to 9/1/36 | 194,541 | 226,644 | |
| 7.5% 1/1/27 to 7/1/34 | 56,628 | 65,881 | |
| 8% 7/1/24 to 4/1/32 | 4,300 | 4,937 | |
| 8.5% 12/1/22 to 1/1/28 | 2,854 | 3,185 | |
| TOTAL FREDDIE MAC | 788,143,626 | ||
| Ginnie Mae - 6.4% | |||
| 3.5% 9/20/40 to 4/20/50 | 132,786,526 | 144,039,519 | |
| 4% 7/20/33 to 6/20/49 | 261,332,458 | 282,717,705 | |
| 4.5% 6/20/33 to 11/20/47 | 39,896,342 | 44,057,770 | |
| 5.5% 8/15/33 to 9/15/39 | 350,913 | 412,456 | |
| 6% to 6% 10/15/30 to 5/15/40 | 506,997 | 595,723 | |
| 7% to 7% 11/15/22 to 11/15/32 | 197,652 | 227,546 | |
| 7.5% to 7.5% 2/15/22 to 9/15/31 | 53,138 | 58,955 | |
| 8% 11/15/21 to 11/15/29 | 15,341 | 16,689 | |
| 8.5% to 8.5% 10/15/21 to 1/15/31 | 6,437 | 7,378 | |
| 9% 1/15/23 | 27 | 28 | |
| 2.5% 11/20/47 | 79,407 | 84,119 | |
| 2.5% 12/1/50 (e) | 21,300,000 | 22,435,311 | |
| 2.5% 12/1/50 (e) | 16,000,000 | 16,852,816 | |
| 2.5% 12/1/50 (e) | 12,800,000 | 13,482,253 | |
| 2.5% 12/1/50 (e) | 17,050,000 | 17,958,782 | |
| 2.5% 12/1/50 (e) | 9,900,000 | 10,427,680 | |
| 2.5% 12/1/50 (e) | 13,200,000 | 13,903,573 | |
| 2.5% 12/1/50 (e) | 15,600,000 | 16,431,496 | |
| 2.5% 12/1/50 (e) | 42,450,000 | 44,712,627 | |
| 2.5% 12/1/50 (e) | 13,500,000 | 14,219,564 | |
| 2.5% 12/1/50 (e) | 36,700,000 | 38,656,147 | |
| 2.5% 12/1/50 (e) | 12,600,000 | 13,271,593 | |
| 2.5% 12/1/50 (e) | 12,600,000 | 13,271,593 | |
| 2.5% 12/1/50 (e) | 15,100,000 | 15,904,845 | |
| 2.5% 1/1/51 (e) | 9,550,000 | 10,037,015 | |
| 2.5% 1/1/51 (e) | 31,500,000 | 33,106,383 | |
| 2.5% 1/1/51 (e) | 9,700,000 | 10,194,664 | |
| 2.5% 1/1/51 (e) | 9,300,000 | 9,774,266 | |
| 2.5% 1/1/51 (e) | 32,150,000 | 33,789,531 | |
| 2.5% 1/1/51 (e) | 30,750,000 | 32,318,136 | |
| 3% 5/15/42 to 9/20/50 | 146,426,297 | 154,422,115 | |
| 3% 12/1/50 (e) | 5,950,000 | 6,209,814 | |
| 3% 12/1/50 (e) | 7,050,000 | 7,357,847 | |
| 3% 12/1/50 (e) | 7,100,000 | 7,410,031 | |
| 3% 12/1/50 (e) | 15,150,000 | 15,811,544 | |
| 3% 12/1/50 (e) | 7,750,000 | 8,088,414 | |
| 3% 12/1/50 (e) | 22,350,000 | 23,325,942 | |
| 3% 12/1/50 (e) | 17,900,000 | 18,681,627 | |
| 3% 12/1/50 (e) | 17,950,000 | 18,733,810 | |
| 3% 12/1/50 (e) | 23,900,000 | 24,943,625 | |
| 3% 1/1/51 (e) | 14,800,000 | 15,452,042 | |
| 3% 1/1/51 (e) | 1,100,000 | 1,148,463 | |
| 3% 1/1/51 (e) | 600,000 | 626,434 | |
| 3% 1/1/51 (e) | 8,150,000 | 8,509,064 | |
| 3.5% 12/1/50 (e) | 15,550,000 | 16,423,709 | |
| 3.5% 12/1/50 (e) | 38,600,000 | 40,768,822 | |
| 3.5% 12/1/50 (e) | 5,350,000 | 5,650,601 | |
| 3.5% 12/1/50 (e) | 3,000,000 | 3,168,561 | |
| 3.5% 12/1/50 (e) | 6,100,000 | 6,442,741 | |
| 3.5% 12/1/50 (e) | 3,400,000 | 3,591,036 | |
| 3.5% 12/1/50 (e) | 5,950,000 | 6,284,313 | |
| 3.5% 12/1/50 (e) | 14,850,000 | 15,684,378 | |
| 3.5% 12/1/50 (e) | 8,000,000 | 8,449,497 | |
| 3.5% 12/1/50 (e) | 19,850,000 | 20,965,314 | |
| 3.5% 12/1/50 (e) | 12,150,000 | 12,832,673 | |
| 3.5% 12/1/50 (e) | 10,750,000 | 11,354,011 | |
| 3.5% 12/1/50 (e) | 15,100,000 | 15,948,425 | |
| 3.5% 12/1/50 (e) | 45,550,000 | 48,109,322 | |
| 3.5% 12/1/50 (e) | 6,100,000 | 6,442,741 | |
| 3.5% 12/1/50 (e) | 9,000,000 | 9,505,684 | |
| 3.5% 12/1/50 (e) | 9,500,000 | 10,033,777 | |
| 3.5% 12/1/50 (e) | 4,000,000 | 4,224,748 | |
| 3.5% 12/1/50 (e) | 15,350,000 | 16,212,472 | |
| 3.5% 12/1/50 (e) | 21,550,000 | 22,760,832 | |
| 3.5% 12/1/50 (e) | 54,500,000 | 57,562,197 | |
| 3.5% 1/1/51 (e) | 19,600,000 | 20,693,611 | |
| 3.5% 1/1/51 (e) | 15,550,000 | 16,417,636 | |
| 3.5% 1/1/51 (e) | 49,600,000 | 52,367,506 | |
| 3.5% 1/1/51 (e) | 38,600,000 | 40,753,745 | |
| 3.5% 1/1/51 (e) | 39,800,000 | 42,020,701 | |
| 3.5% 1/1/51 (e) | 20,700,000 | 21,854,988 | |
| 3.5% 1/1/51 (e) | 19,400,000 | 20,482,452 | |
| 3.5% 1/1/51 (e) | 39,300,000 | 41,492,802 | |
| 3.5% 1/1/51 (e) | 4,900,000 | 5,173,403 | |
| 5% 4/15/33 to 6/20/48 | 24,825,406 | 27,583,564 | |
| 6.5% 3/20/31 to 6/15/37 | 70,739 | 83,139 | |
| TOTAL GINNIE MAE | 1,795,026,336 | ||
| Uniform Mortgage Backed Securities - 6.9% | |||
| 1.5% 12/1/35 (e) | 3,700,000 | 3,793,879 | |
| 1.5% 12/1/35 (e) | 4,050,000 | 4,152,759 | |
| 1.5% 12/1/35 (e) | 2,200,000 | 2,255,820 | |
| 1.5% 12/1/35 (e) | 2,200,000 | 2,255,820 | |
| 1.5% 12/1/35 (e) | 1,850,000 | 1,896,939 | |
| 1.5% 12/1/35 (e) | 19,250,000 | 19,738,423 | |
| 1.5% 12/1/35 (e) | 33,850,000 | 34,708,863 | |
| 1.5% 12/1/35 (e) | 13,450,000 | 13,791,261 | |
| 1.5% 12/1/35 (e) | 23,650,000 | 24,250,062 | |
| 1.5% 12/1/35 (e) | 19,250,000 | 19,738,423 | |
| 1.5% 12/1/35 (e) | 13,450,000 | 13,791,261 | |
| 1.5% 12/1/35 (e) | 33,850,000 | 34,708,863 | |
| 1.5% 12/1/35 (e) | 23,650,000 | 24,250,062 | |
| 1.5% 12/1/35 (e) | 4,400,000 | 4,511,639 | |
| 1.5% 12/1/35 (e) | 4,800,000 | 4,921,788 | |
| 1.5% 12/1/35 (e) | 2,600,000 | 2,665,969 | |
| 1.5% 1/1/36 (e) | 4,050,000 | 4,148,329 | |
| 1.5% 1/1/36 (e) | 14,250,000 | 14,595,973 | |
| 1.5% 1/1/36 (e) | 4,950,000 | 5,070,180 | |
| 1.5% 1/1/36 (e) | 29,950,000 | 30,677,150 | |
| 1.5% 1/1/36 (e) | 10,450,000 | 10,703,713 | |
| 1.5% 1/1/36 (e) | 4,800,000 | 4,916,538 | |
| 2% 12/1/35 (e) | 25,800,000 | 26,858,510 | |
| 2% 12/1/35 (e) | 13,200,000 | 13,741,563 | |
| 2% 12/1/35 (e) | 14,050,000 | 14,626,436 | |
| 2% 12/1/35 (e) | 27,500,000 | 28,628,256 | |
| 2% 12/1/35 (e) | 24,300,000 | 25,296,968 | |
| 2% 12/1/35 (e) | 12,450,000 | 12,960,792 | |
| 2% 12/1/35 (e) | 26,300,000 | 27,379,023 | |
| 2% 12/1/35 (e) | 13,450,000 | 14,001,820 | |
| 2% 1/1/36 (e) | 14,200,000 | 14,764,285 | |
| 2% 1/1/36 (e) | 27,800,000 | 28,904,728 | |
| 2% 1/1/36 (e) | 51,800,000 | 53,858,449 | |
| 2% 1/1/36 (e) | 26,500,000 | 27,553,068 | |
| 2% 12/1/50 (e) | 39,150,000 | 40,667,986 | |
| 2% 12/1/50 (e) | 11,850,000 | 12,309,467 | |
| 2% 12/1/50 (e) | 11,850,000 | 12,309,467 | |
| 2% 12/1/50 (e) | 23,900,000 | 24,826,689 | |
| 2% 12/1/50 (e) | 31,050,000 | 32,253,920 | |
| 2% 12/1/50 (e) | 18,950,000 | 19,684,760 | |
| 2% 12/1/50 (e) | 7,450,000 | 7,738,863 | |
| 2% 12/1/50 (e) | 37,800,000 | 39,265,642 | |
| 2% 12/1/50 (e) | 8,300,000 | 8,621,821 | |
| 2% 12/1/50 (e) | 1,100,000 | 1,142,651 | |
| 2% 12/1/50 (e) | 30,850,000 | 32,046,166 | |
| 2% 12/1/50 (e) | 9,200,000 | 9,556,717 | |
| 2% 12/1/50 (e) | 1,550,000 | 1,610,099 | |
| 2% 12/1/50 (e) | 14,500,000 | 15,062,217 | |
| 2% 12/1/50 (e) | 23,900,000 | 24,826,689 | |
| 2% 12/1/50 (e) | 19,450,000 | 20,204,147 | |
| 2% 12/1/50 (e) | 19,450,000 | 20,204,147 | |
| 2.5% 12/1/35 (e) | 11,400,000 | 11,850,648 | |
| 2.5% 12/1/35 (e) | 11,700,000 | 12,162,507 | |
| 2.5% 12/1/35 (e) | 8,450,000 | 8,784,033 | |
| 2.5% 12/1/35 (e) | 5,850,000 | 6,081,253 | |
| 2.5% 12/1/35 (e) | 800,000 | 831,624 | |
| 2.5% 12/1/35 (e) | 4,750,000 | 4,937,770 | |
| 2.5% 12/1/50 (e) | 33,500,000 | 35,099,089 | |
| 2.5% 12/1/50 (e) | 26,000,000 | 27,241,084 | |
| 3% 12/1/50 (e) | 8,300,000 | 8,670,914 | |
| 3% 12/1/50 (e) | 10,700,000 | 11,178,166 | |
| 3% 12/1/50 (e) | 9,400,000 | 9,820,071 | |
| 3% 12/1/50 (e) | 27,100,000 | 28,311,056 | |
| 3% 12/1/50 (e) | 27,450,000 | 28,676,697 | |
| 3% 12/1/50 (e) | 20,050,000 | 20,946,002 | |
| 3% 12/1/50 (e) | 20,350,000 | 21,259,409 | |
| 3% 12/1/50 (e) | 20,350,000 | 21,259,409 | |
| 3% 12/1/50 (e) | 27,900,000 | 29,146,806 | |
| 3% 12/1/50 (e) | 27,900,000 | 29,146,806 | |
| 3% 12/1/50 (e) | 22,000,000 | 22,983,145 | |
| 3% 12/1/50 (e) | 16,800,000 | 17,550,765 | |
| 3% 12/1/50 (e) | 36,800,000 | 38,444,533 | |
| 3% 12/1/50 (e) | 36,800,000 | 38,444,533 | |
| 3% 12/1/50 (e) | 9,700,000 | 10,133,477 | |
| 3% 12/1/50 (e) | 7,250,000 | 7,573,991 | |
| 3% 12/1/50 (e) | 7,250,000 | 7,573,991 | |
| 3% 12/1/50 (e) | 4,350,000 | 4,544,395 | |
| 3% 12/1/50 (e) | 5,650,000 | 5,902,489 | |
| 3% 1/1/51 (e) | 9,700,000 | 10,139,540 | |
| 3% 1/1/51 (e) | 9,500,000 | 9,930,477 | |
| 3% 1/1/51 (e) | 5,750,000 | 6,010,552 | |
| 3% 1/1/51 (e) | 8,050,000 | 8,414,773 | |
| 3% 1/1/51 (e) | 25,900,000 | 27,073,617 | |
| 3% 1/1/51 (e) | 26,400,000 | 27,596,274 | |
| 3.5% 12/1/50 (e) | 84,400,000 | 89,022,242 | |
| 3.5% 12/1/50 (e) | 7,900,000 | 8,332,651 | |
| 3.5% 12/1/50 (e) | 9,100,000 | 9,598,370 | |
| 3.5% 12/1/50 (e) | 8,100,000 | 8,543,604 | |
| 3.5% 12/1/50 (e) | 69,050,000 | 72,831,585 | |
| 3.5% 12/1/50 (e) | 68,500,000 | 72,251,464 | |
| 3.5% 12/1/50 (e) | 3,750,000 | 3,955,372 | |
| 3.5% 12/1/50 (e) | 4,350,000 | 4,588,232 | |
| 3.5% 12/1/50 (e) | 3,900,000 | 4,113,587 | |
| 3.5% 12/1/50 (e) | 7,300,000 | 7,699,791 | |
| 3.5% 12/1/50 (e) | 6,450,000 | 6,803,240 | |
| 3.5% 12/1/50 (e) | 14,350,000 | 15,135,891 | |
| 3.5% 12/1/50 (e) | 13,150,000 | 13,870,172 | |
| 3.5% 12/1/50 (e) | 4,750,000 | 5,010,138 | |
| 3.5% 12/1/50 (e) | 4,350,000 | 4,588,232 | |
| 3.5% 12/1/50 (e) | 54,500,000 | 57,484,742 | |
| 3.5% 12/1/50 (e) | 5,500,000 | 5,801,212 | |
| 3.5% 12/1/50 (e) | 3,700,000 | 3,902,634 | |
| 4% 12/1/50 (e) | 4,175,000 | 4,454,692 | |
| 4% 12/1/50 (e) | 150,000 | 160,049 | |
| 4% 12/1/50 (e) | 7,900,000 | 8,429,237 | |
| 4% 12/1/50 (e) | 5,150,000 | 5,495,009 | |
| 4% 12/1/50 (e) | 27,350,000 | 29,182,231 | |
| 4% 12/1/50 (e) | 3,800,000 | 4,054,570 | |
| 4% 12/1/50 (e) | 3,300,000 | 3,521,074 | |
| 4% 12/1/50 (e) | 6,350,000 | 6,775,399 | |
| 4% 12/1/50 (e) | 3,050,000 | 3,254,326 | |
| 4% 12/1/50 (e) | 4,925,000 | 5,254,936 | |
| 4% 12/1/50 (e) | 4,175,000 | 4,454,692 | |
| 4% 12/1/50 (e) | 150,000 | 160,049 | |
| 4% 12/1/50 (e) | 5,225,000 | 5,575,033 | |
| 4% 12/1/50 (e) | 14,450,000 | 15,418,034 | |
| 4% 12/1/50 (e) | 13,050,000 | 13,924,246 | |
| TOTAL UNIFORM MORTGAGE BACKED SECURITIES | 1,953,815,692 | ||
| TOTAL U.S. GOVERNMENT AGENCY - MORTGAGE SECURITIES | |||
| (Cost $6,076,700,116) | 6,160,748,075 | ||
| Asset-Backed Securities - 2.6% | |||
| AASET Trust: | |||
| Series 2018-1A Class A, 3.844% 1/16/38 (a) | $8,558,545 | $8,102,235 | |
| Series 2019-1 Class A, 3.844% 5/15/39 (a) | 5,259,112 | 4,941,181 | |
| Series 2019-2: | |||
| Class A, 3.376% 10/16/39 (a) | 8,813,579 | 8,325,496 | |
| Class B, 4.458% 10/16/39 (a) | 1,629,753 | 1,186,536 | |
| Aimco Series 2019-10A Class A, 3 month U.S. LIBOR + 1.320% 1.5358% 7/22/32 (a)(c)(d) | 11,898,000 | 11,886,887 | |
| AIMCO CLO Ltd. Series 2020-11A Class A1, 3 month U.S. LIBOR + 1.380% 1.6046% 10/15/31 (a)(c)(d) | 8,424,000 | 8,424,396 | |
| Allegany Park CLO, Ltd. / Allegany Series 2020-1A Class A, 3 month U.S. LIBOR + 1.330% 1.5484% 1/20/33 (a)(c)(d) | 4,684,000 | 4,681,325 | |
| Apollo Aviation Securitization Equity Trust Series 2020-1A: | |||
| Class A, 3.351% 1/16/40 (a) | 4,730,547 | 4,416,244 | |
| Class B, 4.335% 1/16/40 (a) | 766,953 | 557,569 | |
| Ares CLO Series 2019-54A Class A, 3 month U.S. LIBOR + 1.320% 1.5569% 10/15/32 (a)(c)(d) | 8,066,000 | 8,059,410 | |
| Ares CLO Ltd. Series 2020-58A Class A, 3 month U.S. LIBOR + 1.220% 0% 1/15/33 (a)(c)(d) | 11,060,000 | 11,060,000 | |
| Ares LV CLO Ltd. Series 2020-55A Class A1, 3 month U.S. LIBOR + 1.700% 1.9369% 4/15/31 (a)(c)(d) | 8,740,000 | 8,756,186 | |
| Ares XLI CLO Ltd. / Ares XLI CLO LLC Series 2016-41A Class AR, 3 month U.S. LIBOR + 1.200% 1.4369% 1/15/29 (a)(c)(d) | 9,695,000 | 9,656,336 | |
| Ares XXXIV CLO Ltd. Series 2020-2A Class AR2, 3 month U.S. LIBOR + 1.250% 1.4678% 4/17/33 (a)(c)(d) | 20,753,000 | 20,704,044 | |
| Argent Securities, Inc. pass-thru certificates Series 2005-W2 Class A2C, 1 month U.S. LIBOR + 0.360% 0.5101% 10/25/35 (c)(d) | 28,767 | 28,686 | |
| Babson CLO Ltd./Cayman Islands Series 2020-1A Class A1, 3 month U.S. LIBOR + 1.400% 1.6301% 10/15/32 (a)(c)(d) | 13,346,000 | 13,329,264 | |
| Beechwood Park CLO Ltd. Series 2019-1A Class A1, 3 month U.S. LIBOR + 1.330% 1.5478% 1/17/33 (a)(c)(d) | 3,961,000 | 3,958,726 | |
| Blackbird Capital Aircraft Series 2016-1A: | |||
| Class A, 4.213% 12/16/41 (a) | 6,217,167 | 5,909,627 | |
| Class AA, 2.487% 12/16/41 (a)(c) | 1,079,687 | 1,037,822 | |
| Brazos Higher Education Authority, Inc.: | |||
| Series 2010-1 Class A1, 3 month U.S. LIBOR + 0.900% 1.15% 5/25/29 (c)(d) | 413,701 | 414,110 | |
| Series 2011-2 Class A2, 3 month U.S. LIBOR + 0.850% 1.0648% 7/25/29 (c)(d) | 602,675 | 602,883 | |
| Bristol Park CLO, Ltd. Series 2020-1A Class AR, 3 month U.S. LIBOR + 0.990% 1.2269% 4/15/29 (a)(c)(d) | 10,597,000 | 10,508,727 | |
| Carvana Auto Receivables Trust Series 2019-4A Class A2, 2.2% 7/15/22 (a) | 549,328 | 550,609 | |
| Cascade Funding Mortgage Trust: | |||
| Series 2020-HB2 Class A, 3.4047% 4/25/30 (a) | 13,810,042 | 13,958,030 | |
| Series 2020-HB3 Class A, 2.8115% 5/25/30 (a)(c) | 1,645,666 | 1,659,820 | |
| Castlelake Aircraft Securitization Trust Series 2019-1A: | |||
| Class A, 3.967% 4/15/39 (a) | 8,902,123 | 8,329,629 | |
| Class B, 5.095% 4/15/39 (a) | 3,608,108 | 2,685,096 | |
| Castlelake Aircraft Structured Trust Series 2018-1 Class A, 4.125% 6/15/43 (a) | 5,614,441 | 5,305,649 | |
| Cedar Funding Ltd.: | |||
| Series 2019-10A Class A, 3 month U.S. LIBOR + 1.340% 1.5584% 10/20/32 (a)(c)(d) | 6,412,000 | 6,409,083 | |
| Series 2019-11A Class A1A, 3 month U.S. LIBOR + 1.350% 1.596% 5/29/32 (a)(c)(d) | 4,342,000 | 4,339,829 | |
| Cedar Funding XII CLO Ltd. / Cedar Funding XII CLO LLC Series 2020-12A Class A, 3 month U.S. LIBOR + 1.270% 1.5101% 10/25/32 (a)(c)(d) | 5,250,000 | 5,243,401 | |
| CEDF Series 2018-6A Class AR, 3 month U.S. LIBOR + 1.090% 1.3084% 10/20/28 (a)(c)(d) | 2,010,000 | 2,001,214 | |
| Cent CLO Ltd. / Cent CLO Series 2020-29A Class A1N, 3 month U.S. LIBOR + 1.700% 1.9194% 7/20/31 (a)(c)(d) | 10,867,000 | 10,907,751 | |
| Citi Mortgage Loan Trust Series 2007-1 Class 1A, 1 month U.S. LIBOR + 1.350% 1.5001% 10/25/37 (a)(c)(d) | 177,258 | 177,960 | |
| CNH Equipment Trust Series 2019-C Class A2, 1.99% 3/15/23 | 2,225,762 | 2,239,619 | |
| Collegiate Funding Services Education Loan Trust Series 2004-A Class A4, 3 month U.S. LIBOR + 0.340% 0.5733% 9/28/30 (c)(d) | 849,090 | 844,837 | |
| Consumer Lending Receivables Trust Series 2019-A Class A, 3.52% 4/15/26 (a) | 2,287,251 | 2,296,959 | |
| Consumer Loan Underlying Bond Credit Trust: | |||
| Series 2018-P3 Class A, 3.82% 1/15/26 (a) | 914,025 | 918,674 | |
| Series 2019-HP1 Class A, 2.59% 12/15/26 (a) | 9,648,836 | 9,760,861 | |
| Series 2019-P1 Class A, 2.94% 7/15/26 (a) | 2,641,744 | 2,660,127 | |
| CPS Auto Receivables Trust Series 2019-D Class A, 2.17% 12/15/22 (a) | 512,389 | 514,241 | |
| DB Master Finance LLC: | |||
| Series 2017-1A: | |||
| Class A2I, 3.629% 11/20/47 (a) | 3,145,065 | 3,228,787 | |
| Class A2II, 4.03% 11/20/47 (a) | 5,349,723 | 5,686,327 | |
| Series 2019-1A: | |||
| Class A23, 4.352% 5/20/49 (a) | 992,438 | 1,073,450 | |
| Class A2II, 4.021% 5/20/49 (a) | 746,550 | 787,200 | |
| Dominos Pizza Master Issuer LLC Series 2019-1A Class A2, 3.668% 10/25/49 (a) | 2,113,650 | 2,245,521 | |
| Dryden 68 CLO Ltd. 3 month U.S. LIBOR + 1.310% 1.5469% 7/15/32 (a)(c)(d) | 7,300,000 | 7,293,569 | |
| Dryden CLO, Ltd.: | |||
| Series 2019-75A Class AR, 3 month U.S. LIBOR + 1.200% 1.4369% 7/15/30 (a)(c)(d) | 4,690,000 | 4,672,305 | |
| Series 2019-76A Class A1, 3 month U.S. LIBOR + 1.330% 1.5484% 10/20/32 (a)(c)(d) | 10,321,000 | 10,322,713 | |
| Series 2021-83A Class A, 3 month U.S. LIBOR + 1.220% 1.22% 1/18/32 (a)(c)(d)(e) | 3,940,000 | 3,940,000 | |
| Dryden CLO, Ltd. / Dryden CLO, LLC Series 2020-85A Class A1, 3 month U.S. LIBOR + 1.350% 1.5633% 10/15/32 (a)(c)(d) | 9,656,000 | 9,643,843 | |
| Dryden Senior Loan Fund: | |||
| Series 2014-36A Class AR2, 3 month U.S. LIBOR + 1.280% 1.5169% 4/15/29 (a)(c)(d) | 10,233,000 | 10,223,678 | |
| Series 2018-70A Class A1, 3 month U.S. LIBOR + 1.170% 1.4001% 1/16/32 (a)(c)(d) | 2,909,000 | 2,905,355 | |
| Series 2019-72A Class A, 3 month U.S. LIBOR + 1.330% 1.6101% 5/15/32 (a)(c)(d) | 7,468,000 | 7,460,704 | |
| Series 2020-78A Class A, 3 month U.S. LIBOR + 1.180% 1.3978% 4/17/33 (a)(c)(d) | 7,000,000 | 6,956,726 | |
| Eaton Vance CLO, Ltd.: | |||
| Series 2020-1A Class A, 1.65% 10/15/30 (a) | 9,200,000 | 9,228,621 | |
| Series 2020-2A Class A1, 3 month U.S. LIBOR + 1.370% 1.5603% 10/15/32 (a)(c)(d) | 9,400,000 | 9,388,175 | |
| Exeter Automobile Receivables Trust Series 2019-4A Class A, 2.18% 1/17/23 (a) | 1,085,996 | 1,088,596 | |
| Flatiron CLO Ltd. Series 2019-1A Class A, 3 month U.S. LIBOR + 1.320% 1.541% 11/16/32 (a)(c)(d) | 8,949,000 | 8,942,091 | |
| Flatiron CLO Ltd. / Flatiron CLO LLC Series 2020-1A Class A, 3 month U.S. LIBOR + 1.300% 1.5483% 11/20/33 (a)(c)(d) | 8,920,000 | 8,919,946 | |
| Ford Credit Floorplan Master Owner Trust: | |||
| Series 2018-1 Class B, 3.1% 5/15/23 | 6,690,000 | 6,747,977 | |
| Series 2019-1 Class B, 3.04% 3/15/24 | 1,170,000 | 1,192,547 | |
| Series 2019-2 Class A, 3.06% 4/15/26 | 8,253,000 | 8,917,299 | |
| Series 2019-3 Class A1, 2.23% 9/15/24 | 4,320,000 | 4,458,497 | |
| Series 2019-4 Class A, 2.44% 9/15/26 | 1,300,000 | 1,383,696 | |
| GM Financial Automobile Leasing Trust Series 2020-1 Class A2A, 1.67% 4/20/22 | 5,768,240 | 5,796,991 | |
| GMF Floorplan Owner Revolving Trust: | |||
| Series 2018-2 Class A2, 3.13% 3/15/23 (a) | 6,010,000 | 6,057,187 | |
| Series 2018-4 Class A2, 1 month U.S. LIBOR + 0.410% 0.5509% 9/15/23 (a)(c)(d) | 4,186,000 | 4,192,428 | |
| Hertz Fleet Lease Funding LP Series 2017-1 Class A1, 1 month U.S. LIBOR + 0.650% 0.7778% 4/10/31 (a)(c)(d) | 25,928 | 25,926 | |
| Horizon Aircraft Finance I Ltd. Series 2018-1 Class A, 4.458% 12/15/38 (a) | 3,326,853 | 3,172,360 | |
| Horizon Aircraft Finance Ltd. Series 2019-1 Class A, 3.721% 7/15/39 (a) | 4,719,582 | 4,495,995 | |
| Lanark Master Issuer PLC Series 2020-1A Class 1A, 2.277% 12/22/69 (a)(c) | 7,887,000 | 8,075,342 | |
| Lucali CLO Ltd. Series 2021-1A Class A, 3 month U.S. LIBOR + 1.210% 1.21% 1/15/33 (a)(c)(d)(e) | 4,500,000 | 4,500,000 | |
| Madison Park Funding Series 2020-19A Class A1R2, 3 month U.S. LIBOR + 0.920% 1.1358% 1/22/28 (a)(c)(d) | 2,750,000 | 2,743,142 | |
| Madison Park Funding Ltd.: | |||
| Series 2012-10A Class AR2, 3 month U.S. LIBOR + 1.220% 1.4384% 1/20/29 (a)(c)(d) | 3,495,000 | 3,491,666 | |
| Series 2019-37A Class A1, 3 month U.S. LIBOR + 1.300% 1.5369% 7/15/32 (a)(c)(d) | 9,585,000 | 9,578,942 | |
| Madison Park Funding XLV Ltd./Madison Park Funding XLV LLC Series 2020-45A Class A, 3 month U.S. LIBOR + 1.650% 1.9184% 7/15/31 (a)(c)(d) | 9,770,000 | 9,786,795 | |
| Madison Park Funding XXXIII Ltd. Series 2019-33A Class A, 3 month U.S. LIBOR + 1.330% 1.5669% 10/15/32 (a)(c)(d) | 4,271,000 | 4,268,548 | |
| Magnetite CLO Ltd.: | |||
| Series 2019-21A Class A, 3 month U.S. LIBOR + 1.280% 1.4984% 4/20/30 (a)(c)(d) | 7,329,000 | 7,322,103 | |
| Series 2019-24A Class A, 3 month U.S. LIBOR + 1.330% 1.5669% 1/15/33 (a)(c)(d) | 23,148,000 | 23,134,713 | |
| Magnetite XVI, Ltd. / Magnetite XVI, LLC Series 2015-16A Class AR, 3 month U.S. LIBOR + 0.800% 1.0178% 1/18/28 (a)(c)(d) | 8,583,655 | 8,530,162 | |
| Marlette Funding Trust: | |||
| Series 2019-4A Class A, 2.39% 12/17/29 (a) | 2,641,718 | 2,663,510 | |
| Series 2020-1A Class A, 2.24% 3/15/30 (a) | 1,809,592 | 1,821,583 | |
| Mercedes-Benz Master Owner Trust Series 2019-BA Class A, 2.61% 5/15/24 (a) | 10,340,000 | 10,685,575 | |
| Metlife Securitization Trust Series 2019-1A Class A1A, 3.75% 4/25/58 (a) | 2,982,285 | 3,194,158 | |
| Milos CLO, Ltd. Series 2020-1A Class AR, 3 month U.S. LIBOR + 1.070% 1.2884% 10/20/30 (a)(c)(d) | 10,553,000 | 10,468,407 | |
| Mortgage Repurchase Agreement Financing Trust Series 2020-5 Class A1, 1 month U.S. LIBOR + 1.000% 1% 8/10/23 (a)(c)(d) | 21,867,000 | 21,867,284 | |
| Nationstar HECM Loan Trust: | |||
| Series 2019-1A Class A, 2.6513% 6/25/29 (a) | 1,510,163 | 1,512,462 | |
| Series 2020-1A Class A1, 1.2686% 9/25/30 (a) | 14,329,404 | 14,310,776 | |
| Navient Student Loan Trust Series 2017-3A Class A2, 1 month U.S. LIBOR + 0.600% 0.7501% 7/26/66 (a)(c)(d) | 551,905 | 551,787 | |
| New Century Home Equity Loan Trust Series 2005-4 Class M2, 1 month U.S. LIBOR + 0.510% 0.6601% 9/25/35 (c)(d) | 50,701 | 50,635 | |
| Niagara Park CLO, Ltd. Series 2019-1A Class A, 3 month U.S. LIBOR + 1.300% 1.5178% 7/17/32 (a)(c)(d) | 8,594,000 | 8,584,856 | |
| Planet Fitness Master Issuer LLC Series 2019-1A Class A2, 3.858% 12/5/49 (a) | 7,045,758 | 6,656,057 | |
| Prosper Marketplace Issuance Trust: | |||
| Series 2019-3A Class A, 3.19% 7/15/25 (a) | 2,568,484 | 2,579,575 | |
| Series 2019-4A Class A, 2.48% 2/17/26 (a) | 1,658,150 | 1,664,537 | |
| Provident Funding Mortgage Trust Series 2020-1 Class A3, 3% 2/25/50 (a) | 6,899,972 | 6,995,978 | |
| RMF Buyout Issuance Trust Series 2020-1 Class A, 2.1582% 2/25/30 (a) | 3,465,673 | 3,477,363 | |
| Santander Retail Auto Lease Trust Series 2019-C Class A2A, 1.89% 9/20/22 (a) | 2,935,868 | 2,959,719 | |
| Sapphire Aviation Finance Series 2020-1A: | |||
| Class A, 3.228% 3/15/40 (a) | 9,974,907 | 9,255,292 | |
| Class B, 4.335% 3/15/40 (a) | 853,777 | 582,942 | |
| SBA Tower Trust: | |||
| Series 2019, 2.836% 1/15/50 (a) | 8,715,000 | 9,255,243 | |
| 1.884% 7/15/50 (a) | 4,275,000 | 4,401,423 | |
| 2.328% 7/15/52 (a) | 3,269,000 | 3,302,109 | |
| SLM Student Loan Trust Series 2003-10A Class A3, 3 month U.S. LIBOR + 0.470% 0.7204% 12/15/27 (a)(c)(d) | 1,203,937 | 1,203,707 | |
| SoFi Consumer Loan Program Trust Series 2019-4 Class A, 2.45% 8/25/28 (a) | 4,444,051 | 4,492,482 | |
| Stratus CLO Ltd. Series 2020-1A Class A, 3 month U.S. LIBOR + 1.980% 2.1984% 5/1/28 (a)(c)(d) | 14,018,235 | 14,066,921 | |
| Symphony CLO XXIII Ltd. Series 2020-23A Class A, 3 month U.S. LIBOR + 0.000% 1.32% 1/15/34 (a)(c)(d) | 5,300,000 | 5,300,000 | |
| Taconic Park CLO, Ltd. Series 2020-1A Class A1R, 3 month U.S. LIBOR + 1.000% 1.2184% 1/20/29 (a)(c)(d) | 7,106,000 | 7,057,935 | |
| Terwin Mortgage Trust Series 2003-4HE Class A1, 1 month U.S. LIBOR + 0.860% 1.0101% 9/25/34 (c)(d) | 7,249 | 6,661 | |
| Thunderbolt Aircraft Lease Ltd. Series 2018-A Class A, 4.147% 9/15/38 (a)(c) | 9,675,593 | 9,242,247 | |
| Thunderbolt III Aircraft Lease Ltd. Series 2019-1 Class A, 3.671% 11/15/39 (a) | 20,541,060 | 19,501,715 | |
| Towd Point Mortgage Trust: | |||
| Series 2018-3 Class A1, 3.75% 5/25/58 (a) | 2,101,481 | 2,243,568 | |
| Series 2018-6 Class A1A, 3.75% 3/25/58 (a) | 309,466 | 325,724 | |
| Series 2019-1 Class A1, 3.7236% 3/25/58 (a)(c) | 1,139,996 | 1,223,127 | |
| Series 2019-MH1 Class A1, 3% 11/25/58 (a) | 1,820,109 | 1,865,121 | |
| Series 2020-4 Class A1, 1.75% 10/25/60 (a) | 6,728,956 | 6,872,618 | |
| Trapeza CDO XII Ltd./Trapeza CDO XII, Inc. Series 2007-12A Class B, 3 month U.S. LIBOR + 0.560% 0.7935% 4/6/42 (a)(c)(d) | 778,000 | 536,820 | |
| Upgrade Receivables Trust Series 2019-2A Class A, 2.77% 10/15/25 (a) | 1,499,318 | 1,502,369 | |
| Verde CLO Ltd. Series 2019-1A Class A, 3 month U.S. LIBOR + 1.350% 1.5869% 4/15/32 (a)(c)(d) | 8,606,000 | 8,597,764 | |
| Voya Series 2020-1A Class A, 3 month U.S. LIBOR + 1.700% 2.0027% 7/16/31 (a)(c)(d) | 12,409,000 | 12,451,377 | |
| Voya CLO Ltd. Series 2017-1A Class A1, 3 month U.S. LIBOR + 1.250% 1.4678% 4/17/30 (a)(c)(d) | 4,458,000 | 4,445,790 | |
| Voya CLO Ltd. / Voya CLO LLC Series 2020-3A Class A1, 3 month U.S. LIBOR + 1.300% 1.4965% 10/20/31 (a)(c)(d) | 11,800,000 | 11,785,179 | |
| Voya CLO Ltd./Voya CLO LLC Series 2020-2A Class A1, 3 month U.S. LIBOR + 1.600% 1.7848% 7/19/31 (a)(c)(d) | 9,150,000 | 9,161,611 | |
| TOTAL ASSET-BACKED SECURITIES | |||
| (Cost $718,430,496) | 717,955,009 | ||
| Collateralized Mortgage Obligations - 1.0% | |||
| Private Sponsor - 0.4% | |||
| Banc of America Funding Corp. Series 2015-R3 Class 10A1, 1 month U.S. LIBOR + 0.140% 0.2881% 6/27/36 (a)(c)(d) | 7,175 | 7,165 | |
| BCAP LLC Trust sequential payer Series 2010-RR2 Class 5A2, 5% 12/26/36 (a) | 4,151 | 4,141 | |
| Citigroup Mortgage Loan Trust sequential payer Series 2014-8 Class 2A1, 3.45% 6/27/37 (a)(c) | 111,700 | 111,416 | |
| CSMC: | |||
| floater Series 2015-1R Class 6A1, 1 month U.S. LIBOR + 0.280% 0.4143% 5/27/37 (a)(c)(d) | 103,947 | 98,261 | |
| Series 2014-3R: | |||
| Class 2A1, 1 month U.S. LIBOR + 0.700% 0% 5/27/37 (a)(c)(d)(j) | 543,242 | 54 | |
| Class AA1, 1 month U.S. LIBOR + 0.280% 0.4143% 5/27/37 (a)(c)(d) | 1,090,129 | 1,007,269 | |
| CSMC Trust sequential payer Series 2020-RPL4 Class A1, 2% 1/25/60 (a) | 5,778,197 | 5,952,267 | |
| Ginnie Mae guaranteed REMIC pass-thru certificates floater Series 2019-23 Class NF, 1 month U.S. LIBOR + 0.450% 0.5965% 2/20/49 (c)(d) | 4,903,009 | 4,953,557 | |
| Lanark Master Issuer PLC: | |||
| floater Series 2019-1A Class 1A1, 3 month U.S. LIBOR + 0.770% 1.0261% 12/22/69 (a)(c)(d) | 1,906,333 | 1,912,180 | |
| Series 2019-2A Class 1A, 2.71% 12/22/69 (a)(c) | 9,300,000 | 9,507,325 | |
| Mortgage Repurchase Agreement Financing Trust: | |||
| floater Series 2020-3 Class A1, 1 month U.S. LIBOR + 1.250% 1.3778% 1/23/23 (a)(c)(d) | 5,443,000 | 5,445,079 | |
| Series 2020-4 Class A1, 1 month U.S. LIBOR + 1.350% 1.4778% 4/23/23 (a)(c)(d) | 25,857,000 | 25,860,708 | |
| Nationstar HECM Loan Trust sequential payer Series 2019-2A Class A, 2.2722% 11/26/29 (a) | 2,802,183 | 2,809,421 | |
| New Residential Mortgage Loan Trust Series 2019-5A Class A1B, 3.5% 8/25/59 (a) | 5,006,803 | 5,217,767 | |
| New Residential Mtg Ln Trust 2020 3.5% 10/25/59 (a) | 6,826,409 | 7,228,057 | |
| Provident Funding Mortgage Trust sequential payer Series 2019-1 Class A3, 3% 12/25/49 (a) | 1,733,762 | 1,756,277 | |
| RMF Buyout Issuance Trust: | |||
| sequential payer Series 2020-2 Class A, 1.7063% 6/25/30 (a) | 22,177,538 | 22,215,812 | |
| Series 2020-HB1 Class A1, 1.7188% 10/25/50 (a) | 5,499,625 | 5,499,097 | |
| Sequoia Mortgage Trust floater Series 2004-6 Class A3B, 6 month U.S. LIBOR + 0.880% 1.3048% 7/20/34 (c)(d) | 2,425 | 2,334 | |
| Silverstone Master Issuer PLC floater Series 2019-1A Class 1A, 3 month U.S. LIBOR + 0.570% 0.7786% 1/21/70 (a)(c)(d) | 10,080,000 | 10,101,309 | |
| Thornburg Mortgage Securities Trust floater Series 2003-4 Class A1, 1 month U.S. LIBOR + 0.640% 0.7901% 9/25/43 (c)(d) | 97,439 | 94,712 | |
| Wells Fargo Mortgage Backed Securities Trust Series 2003-I Class A1, 2.8781% 9/25/33 (c) | 12,791 | 12,572 | |
| TOTAL PRIVATE SPONSOR | 109,796,780 | ||
| U.S. Government Agency - 0.6% | |||
| Fannie Mae: | |||
| floater: | |||
| Series 2002-18 Class FD, 1 month U.S. LIBOR + 0.800% 0.9501% 2/25/32 (c)(d) | 3,572 | 3,631 | |
| Series 2002-39 Class FD, 1 month U.S. LIBOR + 1.000% 1.1435% 3/18/32 (c)(d) | 6,403 | 6,545 | |
| Series 2002-60 Class FV, 1 month U.S. LIBOR + 1.000% 1.1501% 4/25/32 (c)(d) | 7,082 | 7,252 | |
| Series 2002-63 Class FN, 1 month U.S. LIBOR + 1.000% 1.1501% 10/25/32 (c)(d) | 9,422 | 9,640 | |
| Series 2002-7 Class FC, 1 month U.S. LIBOR + 0.750% 0.9001% 1/25/32 (c)(d) | 3,542 | 3,595 | |
| Series 2003-118 Class S, 8.100% - 1 month U.S. LIBOR 7.9499% 12/25/33 (c)(k)(l) | 131,247 | 36,360 | |
| Series 2006-104 Class GI, 6.680% - 1 month U.S. LIBOR 6.5299% 11/25/36 (c)(k)(l) | 88,724 | 19,705 | |
| Series 2012-154 Class F, 1 month U.S. LIBOR + 0.300% 0.4501% 1/25/43 (c)(d) | 921,749 | 922,720 | |
| Series 2017-36 Class FB, 1 month U.S. LIBOR + 0.350% 0.5001% 5/25/47 (c)(d) | 2,028,819 | 2,034,656 | |
| Series 2018-32 Class FB, 1 month U.S. LIBOR + 0.300% 0.4501% 5/25/48 (c)(d) | 1,235,667 | 1,237,084 | |
| Series 2018-38 Class FG, 1 month U.S. LIBOR + 0.300% 0.4501% 6/25/48 (c)(d) | 3,985,077 | 3,986,542 | |
| planned amortization class: | |||
| Series 1992-168 Class KB, 7% 10/25/22 | 1,260 | 1,323 | |
| Series 1993-207 Class H, 6.5% 11/25/23 | 29,666 | 31,679 | |
| Series 1996-28 Class PK, 6.5% 7/25/25 | 10,536 | 11,294 | |
| Series 1999-17 Class PG, 6% 4/25/29 | 63,381 | 70,545 | |
| Series 1999-32 Class PL, 6% 7/25/29 | 63,823 | 71,245 | |
| Series 1999-33 Class PK, 6% 7/25/29 | 47,415 | 53,003 | |
| Series 2001-52 Class YZ, 6.5% 10/25/31 | 6,382 | 7,519 | |
| Series 2003-28 Class KG, 5.5% 4/25/23 | 15,275 | 15,961 | |
| Series 2005-102 Class CO 11/25/35 (m) | 24,273 | 22,850 | |
| Series 2005-39 Class TE, 5% 5/25/35 | 24,617 | 27,639 | |
| Series 2005-73 Class SA, 17.500% - 1 month U.S. LIBOR 17.1597% 8/25/35 (c)(l) | 7,646 | 10,534 | |
| Series 2005-81 Class PC, 5.5% 9/25/35 | 67,970 | 77,312 | |
| Series 2006-12 Class BO 10/25/35 (m) | 110,647 | 103,862 | |
| Series 2006-15 Class OP 3/25/36 (m) | 125,358 | 117,998 | |
| Series 2006-37 Class OW 5/25/36 (m) | 11,858 | 11,082 | |
| Series 2006-45 Class OP 6/25/36 (m) | 39,049 | 36,637 | |
| Series 2006-62 Class KP 4/25/36 (m) | 65,156 | 61,472 | |
| Series 2012-149: | |||
| Class DA, 1.75% 1/25/43 | 185,370 | 191,244 | |
| Class GA, 1.75% 6/25/42 | 199,211 | 205,181 | |
| sequential payer: | |||
| Series 1997-41 Class J, 7.5% 6/18/27 | 10,275 | 11,777 | |
| Series 1999-25 Class Z, 6% 6/25/29 | 38,597 | 43,944 | |
| Series 2001-20 Class Z, 6% 5/25/31 | 65,905 | 74,010 | |
| Series 2001-31 Class ZC, 6.5% 7/25/31 | 33,675 | 38,898 | |
| Series 2002-16 Class ZD, 6.5% 4/25/32 | 19,684 | 23,255 | |
| Series 2002-74 Class SV, 7.550% - 1 month U.S. LIBOR 7.3999% 11/25/32 (c)(k)(l) | 66,531 | 9,861 | |
| Series 2012-67 Class AI, 4.5% 7/25/27 (k) | 128,431 | 8,035 | |
| Series 06-116 Class SG, 6.640% - 1 month U.S. LIBOR 6.4899% 12/25/36 (c)(k)(l) | 69,518 | 18,976 | |
| Series 07-40 Class SE, 6.440% - 1 month U.S. LIBOR 6.2899% 5/25/37 (c)(k)(l) | 38,150 | 8,688 | |
| Series 1993-165 Class SH, 19.800% - 1 month U.S. LIBOR 19.3752% 9/25/23 (c)(l) | 1,851 | 2,175 | |
| Series 2003-21 Class SK, 8.100% - 1 month U.S. LIBOR 7.9499% 3/25/33 (c)(k)(l) | 10,428 | 2,528 | |
| Series 2005-72 Class ZC, 5.5% 8/25/35 | 480,104 | 544,835 | |
| Series 2005-79 Class ZC, 5.9% 9/25/35 | 284,570 | 326,401 | |
| Series 2007-57 Class SA, 40.600% - 1 month U.S. LIBOR 39.7192% 6/25/37 (c)(l) | 41,644 | 89,137 | |
| Series 2007-66: | |||
| Class SA, 39.600% - 1 month U.S. LIBOR 38.6992% 7/25/37 (c)(l) | 43,503 | 93,172 | |
| Class SB, 39.600% - 1 month U.S. LIBOR 38.6992% 7/25/37 (c)(l) | 15,085 | 28,634 | |
| Series 2008-12 Class SG, 6.350% - 1 month U.S. LIBOR 6.1999% 3/25/38 (c)(k)(l) | 240,668 | 51,556 | |
| Series 2010-112 Class SG, 6.360% - 1 month U.S. LIBOR 6.2099% 6/25/21 (c)(k)(l) | 2 | 0 | |
| Series 2010-135: | |||
| Class LS, 6.050% - 1 month U.S. LIBOR 5.8999% 12/25/40 (c)(k)(l) | 229,482 | 47,370 | |
| Class ZA, 4.5% 12/25/40 | 139,300 | 153,939 | |
| Series 2010-139 Class NI, 4.5% 2/25/40 (k) | 134,301 | 8,211 | |
| Series 2010-150 Class ZC, 4.75% 1/25/41 | 1,023,704 | 1,152,459 | |
| Series 2010-95 Class ZC, 5% 9/25/40 | 2,166,866 | 2,452,905 | |
| Series 2011-39 Class ZA, 6% 11/25/32 | 150,029 | 174,736 | |
| Series 2011-4 Class PZ, 5% 2/25/41 | 375,843 | 438,102 | |
| Series 2011-67 Class AI, 4% 7/25/26 (k) | 39,267 | 2,162 | |
| Series 2011-83 Class DI, 6% 9/25/26 (k) | 23,426 | 796 | |
| Series 2012-100 Class WI, 3% 9/25/27 (k) | 660,922 | 43,842 | |
| Series 2012-14 Class JS, 6.650% - 1 month U.S. LIBOR 6.5008% 12/25/30 (c)(k)(l) | 197,046 | 12,732 | |
| Series 2012-9 Class SH, 6.550% - 1 month U.S. LIBOR 6.3999% 6/25/41 (c)(k)(l) | 249,143 | 20,645 | |
| Series 2013-133 Class IB, 3% 4/25/32 (k) | 413,616 | 14,111 | |
| Series 2013-134 Class SA, 6.050% - 1 month U.S. LIBOR 5.8999% 1/25/44 (c)(k)(l) | 202,112 | 33,212 | |
| Series 2013-44 Class DJ, 1.85% 5/25/33 | 13,406,559 | 13,714,499 | |
| Series 2013-51 Class GI, 3% 10/25/32 (k) | 155,615 | 11,303 | |
| Series 2013-N1 Class A, 6.720% - 1 month U.S. LIBOR 6.5699% 6/25/35 (c)(k)(l) | 186,359 | 38,464 | |
| Series 2015-42 Class IL, 6% 6/25/45 (k) | 1,034,197 | 201,135 | |
| Series 2015-70 Class JC, 3% 10/25/45 | 1,145,438 | 1,216,376 | |
| Series 2017-30 Class AI, 5.5% 5/25/47 (k) | 496,640 | 99,933 | |
| Fannie Mae Stripped Mortgage-Backed Securities: | |||
| Series 339 Class 5, 5.5% 7/25/33 (k) | 32,644 | 6,007 | |
| Series 343 Class 16, 5.5% 5/25/34 (k) | 28,817 | 4,782 | |
| Series 348 Class 14, 6.5% 8/25/34 (c)(k) | 25,806 | 5,865 | |
| Series 351: | |||
| Class 12, 5.5% 4/25/34 (c)(k) | 16,514 | 3,051 | |
| Class 13, 6% 3/25/34 (k) | 22,778 | 4,251 | |
| Series 359 Class 19, 6% 7/25/35 (c)(k) | 13,855 | 2,842 | |
| Series 384 Class 6, 5% 7/25/37 (k) | 147,432 | 25,490 | |
| Freddie Mac: | |||
| floater: | |||
| Series 2412 Class FK, 1 month U.S. LIBOR + 0.800% 0.9409% 1/15/32 (c)(d) | 3,037 | 3,087 | |
| Series 2423 Class FA, 1 month U.S. LIBOR + 0.900% 1.0409% 3/15/32 (c)(d) | 3,914 | 3,992 | |
| Series 2424 Class FM, 1 month U.S. LIBOR + 1.000% 1.1409% 3/15/32 (c)(d) | 4,247 | 4,344 | |
| Series 2432: | |||
| Class FE, 1 month U.S. LIBOR + 0.900% 1.0409% 6/15/31 (c)(d) | 7,305 | 7,443 | |
| Class FG, 1 month U.S. LIBOR + 0.900% 1.0409% 3/15/32 (c)(d) | 2,304 | 2,350 | |
| Series 4709 Class FE, 1 month U.S. LIBOR + 0.350% 0.4909% 8/15/47 (c)(d) | 1,085,058 | 1,088,654 | |
| floater target amortization class Series 3366 Class FD, 1 month U.S. LIBOR + 0.250% 0.3909% 5/15/37 (c)(d) | 165,229 | 165,697 | |
| planned amortization class: | |||
| Series 2095 Class PE, 6% 11/15/28 | 72,240 | 80,775 | |
| Series 2101 Class PD, 6% 11/15/28 | 4,695 | 5,235 | |
| Series 2104 Class PG, 6% 12/15/28 | 5,028 | 5,633 | |
| Series 2121 Class MG, 6% 2/15/29 | 28,442 | 31,781 | |
| Series 2131 Class BG, 6% 3/15/29 | 159,222 | 178,512 | |
| Series 2137 Class PG, 6% 3/15/29 | 23,698 | 26,599 | |
| Series 2154 Class PT, 6% 5/15/29 | 55,930 | 62,778 | |
| Series 2162 Class PH, 6% 6/15/29 | 10,039 | 11,184 | |
| Series 2520 Class BE, 6% 11/15/32 | 68,316 | 78,871 | |
| Series 2693 Class MD, 5.5% 10/15/33 | 314,132 | 362,790 | |
| Series 2802 Class OB, 6% 5/15/34 | 91,954 | 103,566 | |
| Series 3002 Class NE, 5% 7/15/35 | 177,472 | 198,994 | |
| Series 3110 Class OP 9/15/35 (m) | 65,945 | 64,281 | |
| Series 3119 Class PO 2/15/36 (m) | 146,505 | 137,820 | |
| Series 3121 Class KO 3/15/36 (m) | 24,626 | 23,465 | |
| Series 3123 Class LO 3/15/36 (m) | 83,574 | 78,670 | |
| Series 3145 Class GO 4/15/36 (m) | 82,560 | 78,091 | |
| Series 3189 Class PD, 6% 7/15/36 | 147,735 | 175,795 | |
| Series 3225 Class EO 10/15/36 (m) | 43,354 | 40,700 | |
| Series 3258 Class PM, 5.5% 12/15/36 | 64,330 | 74,208 | |
| Series 3415 Class PC, 5% 12/15/37 | 60,254 | 67,846 | |
| Series 3786 Class HI, 4% 3/15/38 (k) | 74,474 | 1,585 | |
| Series 3806 Class UP, 4.5% 2/15/41 | 440,924 | 487,820 | |
| Series 3832 Class PE, 5% 3/15/41 | 755,705 | 847,928 | |
| Series 4135 Class AB, 1.75% 6/15/42 | 150,137 | 154,652 | |
| Series 4765 Class PE, 3% 12/15/41 | 537,361 | 545,352 | |
| sequential payer: | |||
| Series 2114 Class ZM, 6% 1/15/29 | 2,373 | 2,657 | |
| Series 2135 Class JE, 6% 3/15/29 | 19,751 | 22,200 | |
| Series 2274 Class ZM, 6.5% 1/15/31 | 20,155 | 23,166 | |
| Series 2281 Class ZB, 6% 3/15/30 | 32,387 | 35,983 | |
| Series 2303 Class ZV, 6% 4/15/31 | 14,738 | 16,611 | |
| Series 2357 Class ZB, 6.5% 9/15/31 | 119,935 | 141,203 | |
| Series 2502 Class ZC, 6% 9/15/32 | 37,003 | 42,630 | |
| Series 2519 Class ZD, 5.5% 11/15/32 | 41,382 | 46,923 | |
| Series 2546 Class MJ, 5.5% 3/15/23 | 9,601 | 10,045 | |
| Series 2601 Class TB, 5.5% 4/15/23 | 4,501 | 4,713 | |
| Series 2998 Class LY, 5.5% 7/15/25 | 20,867 | 22,448 | |
| Series 3871 Class KB, 5.5% 6/15/41 | 803,233 | 955,734 | |
| Series 06-3115 Class SM, 6.600% - 1 month U.S. LIBOR 6.4591% 2/15/36 (c)(k)(l) | 46,055 | 9,639 | |
| Series 1658 Class GZ, 7% 1/15/24 | 6,199 | 6,727 | |
| Series 2013-4281 Class AI, 4% 12/15/28 (k) | 372,526 | 18,376 | |
| Series 2017-4683 Class LM, 3% 5/15/47 | 1,363,287 | 1,448,372 | |
| Series 2380 Class SY, 8.200% - 1 month U.S. LIBOR 8.0591% 11/15/31 (c)(k)(l) | 28,657 | 4,461 | |
| Series 2587 Class IM, 6.5% 3/15/33 (k) | 4,869 | 994 | |
| Series 2844: | |||
| Class SC, 46.800% - 1 month U.S. LIBOR 45.8843% 8/15/24 (c)(l) | 187 | 220 | |
| Class SD, 86.400% - 1 month U.S. LIBOR 84.6185% 8/15/24 (c)(l) | 343 | 450 | |
| Series 2933 Class ZM, 5.75% 2/15/35 | 596,965 | 706,772 | |
| Series 2935 Class ZK, 5.5% 2/15/35 | 556,289 | 637,777 | |
| Series 2947 Class XZ, 6% 3/15/35 | 255,723 | 298,100 | |
| Series 2996 Class ZD, 5.5% 6/15/35 | 444,624 | 525,397 | |
| Series 3237 Class C, 5.5% 11/15/36 | 629,943 | 729,400 | |
| Series 3244 Class SG, 6.660% - 1 month U.S. LIBOR 6.5191% 11/15/36 (c)(k)(l) | 192,138 | 48,823 | |
| Series 3287 Class SD, 6.750% - 1 month U.S. LIBOR 6.6091% 3/15/37 (c)(k)(l) | 296,571 | 79,442 | |
| Series 3297 Class BI, 6.760% - 1 month U.S. LIBOR 6.6191% 4/15/37 (c)(k)(l) | 421,924 | 113,432 | |
| Series 3336 Class LI, 6.580% - 1 month U.S. LIBOR 6.4391% 6/15/37 (c)(k)(l) | 147,337 | 34,353 | |
| Series 3949 Class MK, 4.5% 10/15/34 | 124,449 | 137,500 | |
| Series 3955 Class YI, 3% 11/15/21 (k) | 4,276 | 41 | |
| Series 4055 Class BI, 3.5% 5/15/31 (k) | 393,304 | 14,806 | |
| Series 4149 Class IO, 3% 1/15/33 (k) | 78,182 | 7,791 | |
| Series 4314 Class AI, 5% 3/15/34 (k) | 117,543 | 8,141 | |
| Series 4427 Class LI, 3.5% 2/15/34 (k) | 768,597 | 43,090 | |
| Series 4471 Class PA 4% 12/15/40 | 766,816 | 822,591 | |
| target amortization class Series 2156 Class TC, 6.25% 5/15/29 | 26,952 | 29,228 | |
| Freddie Mac Manufactured Housing participation certificates guaranteed: | |||
| floater Series 1686 Class FA, 1 month U.S. LIBOR + 0.900% 1.0484% 2/15/24 (c)(d) | 7,516 | 7,558 | |
| planned amortization class Series 2043 Class CJ, 6.5% 4/15/28 | 6,856 | 7,844 | |
| sequential payer: | |||
| Series 2043 Class ZH, 6% 4/15/28 | 18,709 | 20,850 | |
| Series 2056 Class Z, 6% 5/15/28 | 43,949 | 49,117 | |
| Freddie Mac Multi-family Structured pass-thru certificates: | |||
| floater Series 4795 Class FA, 1 month U.S. LIBOR + 0.300% 0.4409% 5/15/48 (c)(d) | 2,658,665 | 2,658,862 | |
| Series 4386 Class AZ, 4.5% 11/15/40 | 1,451,923 | 1,600,324 | |
| Freddie Mac Seasoned Credit Risk Transfer Trust: | |||
| sequential payer: | |||
| Series 2018-3 Class MA, 3.5% 8/25/57 | 11,958,991 | 12,811,616 | |
| Series 2018-4 Class MA, 3.5% 3/25/58 | 4,486,241 | 4,812,935 | |
| Series 2019-1 Class MA, 3.5% 7/25/58 | 7,741,248 | 8,309,449 | |
| Series 2018-3 Class M55D, 4% 8/25/57 | 564,757 | 615,996 | |
| Ginnie Mae guaranteed REMIC pass-thru certificates: | |||
| floater: | |||
| Series 2007-37 Class TS, 6.690% - 1 month U.S. LIBOR 6.5491% 6/16/37 (c)(k)(l) | 84,794 | 20,585 | |
| Series 2010-H03 Class FA, 1 month U.S. LIBOR + 0.550% 0.7063% 3/20/60 (c)(d)(n) | 1,024,494 | 1,027,588 | |
| Series 2010-H17 Class FA, 1 month U.S. LIBOR + 0.330% 0.4761% 7/20/60 (c)(d)(n) | 133,414 | 133,123 | |
| Series 2010-H18 Class AF, 1 month U.S. LIBOR + 0.300% 0.44% 9/20/60 (c)(d)(n) | 160,213 | 159,762 | |
| Series 2010-H19 Class FG, 1 month U.S. LIBOR + 0.300% 0.44% 8/20/60 (c)(d)(n) | 165,608 | 165,158 | |
| Series 2010-H27 Series FA, 1 month U.S. LIBOR + 0.380% 0.52% 12/20/60 (c)(d)(n) | 335,067 | 334,794 | |
| Series 2011-H05 Class FA, 1 month U.S. LIBOR + 0.500% 0.64% 12/20/60 (c)(d)(n) | 418,078 | 418,898 | |
| Series 2011-H07 Class FA, 1 month U.S. LIBOR + 0.500% 0.64% 2/20/61 (c)(d)(n) | 710,220 | 711,205 | |
| Series 2011-H12 Class FA, 1 month U.S. LIBOR + 0.490% 0.63% 2/20/61 (c)(d)(n) | 951,489 | 952,765 | |
| Series 2011-H13 Class FA, 1 month U.S. LIBOR + 0.500% 0.64% 4/20/61 (c)(d)(n) | 377,991 | 378,774 | |
| Series 2011-H14: | |||
| Class FB, 1 month U.S. LIBOR + 0.500% 0.64% 5/20/61 (c)(d)(n) | 543,002 | 544,127 | |
| Class FC, 1 month U.S. LIBOR + 0.500% 0.64% 5/20/61 (c)(d)(n) | 434,667 | 435,565 | |
| Series 2011-H17 Class FA, 1 month U.S. LIBOR + 0.530% 0.67% 6/20/61 (c)(d)(n) | 507,396 | 508,721 | |
| Series 2011-H20 Class FA, 1 month U.S. LIBOR + 0.550% 0.69% 9/20/61 (c)(d)(n) | 1,295,084 | 1,299,407 | |
| Series 2011-H21 Class FA, 1 month U.S. LIBOR + 0.600% 0.74% 10/20/61 (c)(d)(n) | 584,040 | 586,534 | |
| Series 2012-H01 Class FA, 1 month U.S. LIBOR + 0.700% 0.84% 11/20/61 (c)(d)(n) | 558,602 | 562,213 | |
| Series 2012-H03 Class FA, 1 month U.S. LIBOR + 0.700% 0.84% 1/20/62 (c)(d)(n) | 362,262 | 364,514 | |
| Series 2012-H06 Class FA, 1 month U.S. LIBOR + 0.630% 0.77% 1/20/62 (c)(d)(n) | 511,607 | 514,115 | |
| Series 2012-H07 Class FA, 1 month U.S. LIBOR + 0.630% 0.77% 3/20/62 (c)(d)(n) | 329,575 | 331,004 | |
| Series 2012-H21 Class DF, 1 month U.S. LIBOR + 0.650% 0.79% 5/20/61 (c)(d)(n) | 12,862 | 12,933 | |
| Series 2012-H26, Class CA, 1 month U.S. LIBOR + 0.530% 0.67% 7/20/60 (c)(d)(n) | 8,023 | 8,029 | |
| Series 2014-H03 Class FA, 1 month U.S. LIBOR + 0.600% 0.74% 1/20/64 (c)(d)(n) | 486,792 | 488,542 | |
| Series 2014-H05 Class FB, 1 month U.S. LIBOR + 0.600% 0.74% 12/20/63 (c)(d)(n) | 1,752,478 | 1,759,654 | |
| Series 2014-H11 Class BA, 1 month U.S. LIBOR + 0.500% 0.64% 6/20/64 (c)(d)(n) | 444,553 | 445,456 | |
| Series 2015-H07 Class FA, 1 month U.S. LIBOR + 0.300% 0.44% 3/20/65 (c)(d)(n) | 10,701 | 10,677 | |
| Series 2015-H13 Class FL, 1 month U.S. LIBOR + 0.280% 0.42% 5/20/63 (c)(d)(n) | 15,362 | 15,329 | |
| Series 2015-H19 Class FA, 1 month U.S. LIBOR + 0.200% 0.34% 4/20/63 (c)(d)(n) | 9,998 | 9,961 | |
| Series 2016-H20 Class FM, 1 month U.S. LIBOR + 0.400% 0.54% 12/20/62 (c)(d)(n) | 25,693 | 25,686 | |
| Series 2017-161 Class DF, 1 month U.S. LIBOR + 0.250% 0.3965% 10/20/47 (c)(d) | 1,213,048 | 1,213,012 | |
| Series 2018-159 Class F, 1 month U.S. LIBOR + 0.350% 0.4965% 11/20/48 (c)(d) | 2,863,681 | 2,876,153 | |
| Series 2018-65 Class DF, 1 month U.S. LIBOR + 0.300% 0.4465% 5/20/48 (c)(d) | 1,351,141 | 1,352,967 | |
| Series 2018-77 Class FA, 1 month U.S. LIBOR + 0.300% 0.4465% 6/20/48 (c)(d) | 1,629,279 | 1,632,017 | |
| Series 2018-78 Class AF, 1 month U.S. LIBOR + 0.300% 0.4465% 6/20/48 (c)(d) | 1,693,005 | 1,697,402 | |
| Series 2019-153 Class FB, 1 month U.S. LIBOR + 0.450% 0.5965% 12/20/49 (c)(d) | 17,730,787 | 17,853,426 | |
| Series 2020-32 Class GF, 1 month U.S. LIBOR + 0.400% 0.5465% 3/20/50 (c)(d) | 17,022,800 | 17,138,919 | |
| planned amortization class: | |||
| Series 2010-158 Class MS, 10.000% - 1 month U.S. LIBOR 9.707% 12/20/40 (c)(l) | 918,541 | 1,102,253 | |
| Series 2011-136 Class WI, 4.5% 5/20/40 (k) | 64,535 | 4,329 | |
| Series 2016-69 Class WA, 3% 2/20/46 | 612,159 | 633,937 | |
| Series 2017-134 Class BA, 2.5% 11/20/46 | 215,611 | 226,252 | |
| Series 2017-153 Class GA, 3% 9/20/47 | 2,104,915 | 2,223,318 | |
| Series 2017-182 Class KA, 3% 10/20/47 | 1,882,128 | 1,983,936 | |
| Series 2018-13 Class Q, 3% 4/20/47 | 2,645,687 | 2,771,339 | |
| sequential payer: | |||
| Series 2004-24 Class ZM, 5% 4/20/34 | 253,636 | 287,601 | |
| Series 2010-160 Class DY, 4% 12/20/40 | 2,024,151 | 2,227,377 | |
| Series 2010-170 Class B, 4% 12/20/40 | 450,484 | 495,798 | |
| Series 2016-H02 Class FM, 1 month U.S. LIBOR + 0.500% 0.64% 9/20/62 (c)(d)(n) | 31,489 | 31,490 | |
| Series 2016-H04 Class FE, 1 month U.S. LIBOR + 0.650% 0.79% 11/20/65 (c)(d)(n) | 9,630 | 9,632 | |
| Series 2017-139 Class BA, 3% 9/20/47 | 6,470,766 | 6,908,084 | |
| Series 2004-32 Class GS, 6.500% - 1 month U.S. LIBOR 6.3591% 5/16/34 (c)(k)(l) | 57,306 | 12,041 | |
| Series 2004-73 Class AL, 7.200% - 1 month U.S. LIBOR 7.0591% 8/17/34 (c)(k)(l) | 44,017 | 11,103 | |
| Series 2010-116 Class QB, 4% 9/16/40 | 140,573 | 152,703 | |
| Series 2010-14 Class SN, 5.950% - 1 month U.S. LIBOR 5.8091% 2/16/40 (c)(k)(l) | 308,839 | 57,418 | |
| Series 2010-H10 Class FA, 1 month U.S. LIBOR + 0.330% 0.4863% 5/20/60 (c)(d)(n) | 383,052 | 382,221 | |
| Series 2011-52 Class HI, 7% 4/16/41 (k) | 53,234 | 10,713 | |
| Series 2011-94 Class SA, 6.100% - 1 month U.S. LIBOR 5.9535% 7/20/41 (c)(k)(l) | 174,472 | 32,973 | |
| Series 2012-76 Class GS, 6.700% - 1 month U.S. LIBOR 6.5591% 6/16/42 (c)(k)(l) | 186,412 | 43,223 | |
| Series 2013-124: | |||
| Class ES, 8.667% - 1 month U.S. LIBOR 8.4713% 4/20/39 (c)(l) | 43,391 | 45,740 | |
| Class ST, 8.800% - 1 month U.S. LIBOR 8.6047% 8/20/39 (c)(l) | 143,465 | 148,375 | |
| Series 2013-149 Class MA, 2.5% 5/20/40 | 2,316,945 | 2,411,912 | |
| Series 2014-2 Class BA, 3% 1/20/44 | 3,339,579 | 3,590,618 | |
| Series 2014-21 Class HA, 3% 2/20/44 | 1,373,016 | 1,460,441 | |
| Series 2014-25 Class HC, 3% 2/20/44 | 2,173,860 | 2,354,429 | |
| Series 2014-5 Class A, 3% 1/20/44 | 1,989,866 | 2,128,504 | |
| Series 2015-H13 Class HA, 2.5% 8/20/64 (n) | 192,680 | 194,144 | |
| Series 2015-H17 Class HA, 2.5% 5/20/65 (n) | 61,790 | 61,804 | |
| Series 2016-H13 Class FB, U.S. TREASURY 1 YEAR INDEX + 0.500% 0.62% 5/20/66 (c)(d)(n) | 3,213,743 | 3,192,569 | |
| Series 2017-186 Class HK, 3% 11/16/45 | 1,840,980 | 1,976,581 | |
| Series 2017-H06 Class FA, U.S. TREASURY 1 YEAR INDEX + 0.350% 0.47% 8/20/66 (c)(d)(n) | 3,661,690 | 3,626,017 | |
| Ginnie Mae REMIC Trust Series 2015-H17 Class GZ, 4.0201% 5/20/65 (c)(n) | 146,247 | 152,210 | |
| TOTAL U.S. GOVERNMENT AGENCY | 170,746,597 | ||
| TOTAL COLLATERALIZED MORTGAGE OBLIGATIONS | |||
| (Cost $275,857,524) | 280,543,377 | ||
| Commercial Mortgage Securities - 3.1% | |||
| BAMLL Commercial Mortgage Securities Trust: | |||
| floater sequential payer Series 2020-JGDN Class A, 1 month U.S. LIBOR + 2.750% 3% 11/15/30 (a)(c)(d) | 10,322,000 | 10,322,189 | |
| sequential payer Series 2019-BPR: | |||
| Class AMP, 3.287% 11/5/32 (a) | 10,500,000 | 10,574,633 | |
| Class ANM, 3.112% 11/5/32 (a) | 5,768,000 | 5,755,049 | |
| Series 2019-BPR: | |||
| Class BNM, 3.465% 11/5/32 (a) | 1,295,000 | 1,149,496 | |
| Class CNM, 3.8425% 11/5/32 (a)(c) | 536,000 | 453,079 | |
| BANK sequential payer: | |||
| Series 2018-BN10 Class A5, 3.688% 2/15/61 | 2,901,000 | 3,330,325 | |
| Series 2019-BN21 Class A5, 2.851% 10/17/52 | 1,112,000 | 1,225,929 | |
| Bayview Commercial Asset Trust floater: | |||
| Series 2005-3A: | |||
| Class A2, 1 month U.S. LIBOR + 0.400% 0.5493% 11/25/35 (a)(c)(d) | 38,847 | 36,748 | |
| Class M1, 1 month U.S. LIBOR + 0.440% 0.5893% 11/25/35 (a)(c)(d) | 10,392 | 8,710 | |
| Series 2005-4A: | |||
| Class A2, 1 month U.S. LIBOR + 0.390% 0.5393% 1/25/36 (a)(c)(d) | 98,620 | 92,902 | |
| Class M1, 1 month U.S. LIBOR + 0.450% 0.5993% 1/25/36 (a)(c)(d) | 31,837 | 30,126 | |
| Class M2, 1 month U.S. LIBOR + 0.470% 0.6193% 1/25/36 (a)(c)(d) | 12,006 | 11,266 | |
| Class M3, 1 month U.S. LIBOR + 0.500% 0.6493% 1/25/36 (a)(c)(d) | 17,473 | 16,304 | |
| Series 2006-1: | |||
| Class A2, 1 month U.S. LIBOR + 0.360% 0.5093% 4/25/36 (a)(c)(d) | 16,730 | 15,606 | |
| Class M1, 1 month U.S. LIBOR + 0.380% 0.5293% 4/25/36 (a)(c)(d) | 10,116 | 9,140 | |
| Class M2, 1 month U.S. LIBOR + 0.400% 0.5493% 4/25/36 (a)(c)(d) | 10,699 | 8,109 | |
| Class M6, 1 month U.S. LIBOR + 0.640% 0.7893% 4/25/36 (a)(c)(d) | 10,116 | 7,490 | |
| Series 2006-2A: | |||
| Class M1, 1 month U.S. LIBOR + 0.310% 0.4593% 7/25/36 (a)(c)(d) | 15,873 | 14,317 | |
| Class M2, 1 month U.S. LIBOR + 0.330% 0.4793% 7/25/36 (a)(c)(d) | 11,278 | 9,913 | |
| Class M4, 1 month U.S. LIBOR + 0.420% 0.5693% 7/25/36 (a)(c)(d) | 10,652 | 8,536 | |
| Series 2006-4A: | |||
| Class A2, 1 month U.S. LIBOR + 0.270% 0.4193% 12/25/36 (a)(c)(d) | 239,353 | 219,826 | |
| Class M1, 1 month U.S. LIBOR + 0.290% 0.4393% 12/25/36 (a)(c)(d) | 19,236 | 14,544 | |
| Class M3, 1 month U.S. LIBOR + 0.340% 0.4893% 12/25/36 (a)(c)(d) | 13,039 | 9,167 | |
| Series 2007-1 Class A2, 1 month U.S. LIBOR + 0.270% 0.4193% 3/25/37 (a)(c)(d) | 59,843 | 55,385 | |
| Series 2007-2A: | |||
| Class A1, 1 month U.S. LIBOR + 0.270% 0.4193% 7/25/37 (a)(c)(d) | 175,895 | 162,970 | |
| Class A2, 1 month U.S. LIBOR + 0.320% 0.4693% 7/25/37 (a)(c)(d) | 164,636 | 148,314 | |
| Class M1, 1 month U.S. LIBOR + 0.370% 0.5193% 7/25/37 (a)(c)(d) | 56,083 | 42,112 | |
| Class M2, 1 month U.S. LIBOR + 0.410% 0.5593% 7/25/37 (a)(c)(d) | 36,539 | 26,961 | |
| Class M3, 1 month U.S. LIBOR + 0.490% 0.6393% 7/25/37 (a)(c)(d) | 32,528 | 32,706 | |
| Series 2007-3: | |||
| Class A2, 1 month U.S. LIBOR + 0.290% 0.4401% 7/25/37 (a)(c)(d) | 61,618 | 54,621 | |
| Class M1, 1 month U.S. LIBOR + 0.310% 0.4601% 7/25/37 (a)(c)(d) | 32,686 | 26,532 | |
| Class M2, 1 month U.S. LIBOR + 0.340% 0.4901% 7/25/37 (a)(c)(d) | 34,875 | 27,770 | |
| Class M3, 1 month U.S. LIBOR + 0.370% 0.5201% 7/25/37 (a)(c)(d) | 56,301 | 48,251 | |
| Class M4, 1 month U.S. LIBOR + 0.500% 0.6501% 7/25/37 (a)(c)(d) | 88,518 | 75,037 | |
| Class M5, 1 month U.S. LIBOR + 0.600% 0.7501% 7/25/37 (a)(c)(d) | 37,025 | 29,137 | |
| Benchmark Mortgage Trust: | |||
| sequential payer: | |||
| Series 2018-B4 Class A5, 4.121% 7/15/51 | 1,260,000 | 1,493,807 | |
| Series 2019-B10 Class A4, 3.717% 3/15/62 | 2,283,000 | 2,665,226 | |
| Series 2019-B11 Class A5, 3.5421% 5/15/52 | 8,500,000 | 9,821,977 | |
| Series 2019-B13 Class A4, 2.952% 8/15/57 | 30,611,000 | 34,026,930 | |
| Series 2019-B14 Class A5, 3.0486% 12/15/62 | 5,422,000 | 6,073,470 | |
| Series 2020-B17 Class A5, 2.289% 3/15/53 | 13,300,000 | 14,087,268 | |
| Series 2018-B8 Class A5, 4.2317% 1/15/52 | 15,369,000 | 18,467,941 | |
| Series 2019-B12 Class XA, 1.2035% 8/15/52 (c)(k) | 75,684,653 | 4,909,429 | |
| Series 2019-B14 Class XA, 0.914% 12/15/62 (c)(k) | 50,818,205 | 2,576,620 | |
| Series 2020-B17 Class XA, 1.5419% 3/15/53 (c)(k) | 11,995,449 | 1,116,089 | |
| Series 2020-B18 Class XA, 1.9193% 7/15/53 (c)(k) | 20,063,499 | 2,440,757 | |
| BFLD Trust floater sequential payer Series 2020-OBRK Class A, 1 month U.S. LIBOR + 2.050% 2.2% 11/15/22 (a)(c)(d) | 5,927,000 | 5,938,297 | |
| BX Commercial Mortgage Trust: | |||
| floater Series 2020-BXLP: | |||
| Class B, 1 month U.S. LIBOR + 1.000% 1.1409% 12/15/36 (a)(c)(d) | 6,567,989 | 6,549,566 | |
| Class C, 1 month U.S. LIBOR + 1.120% 1.2609% 12/15/36 (a)(c)(d) | 5,391,066 | 5,357,573 | |
| Class D, 1 month U.S. LIBOR + 1.250% 1.3909% 12/15/36 (a)(c)(d) | 6,052,460 | 5,973,008 | |
| floater sequential payer: | |||
| Series 2019-CALM Class A, 1 month U.S. LIBOR + 0.870% 1.0169% 11/15/32 (a)(c)(d) | 2,254,000 | 2,238,088 | |
| Series 2020-BXLP Class A, 1 month U.S. LIBOR + 0.800% 0.9409% 12/15/36 (a)(c)(d) | 10,781,132 | 10,768,181 | |
| Series 2020-FOX Class A, 1 month U.S. LIBOR + 1.000% 1.1409% 11/15/32 (a)(c)(d) | 8,932,000 | 8,946,296 | |
| BX Trust: | |||
| floater: | |||
| Series 2018-EXCL: | |||
| Class A, 1 month U.S. LIBOR + 1.088% 1.2285% 9/15/37 (a)(c)(d) | 11,493,874 | 10,631,121 | |
| Class B, 1 month U.S. LIBOR + 1.320% 1.4659% 9/15/37 (a)(c)(d) | 4,536,936 | 4,042,639 | |
| Class D, 1 month U.S. LIBOR + 2.620% 2.7659% 9/15/37 (a)(c)(d) | 2,186,803 | 1,656,004 | |
| Series 2018-IND: | |||
| Class B, 1 month U.S. LIBOR + 0.900% 1.0409% 11/15/35 (a)(c)(d) | 3,999,800 | 3,989,775 | |
| Class C, 1 month U.S. LIBOR + 1.100% 1.2409% 11/15/35 (a)(c)(d) | 893,200 | 890,425 | |
| Class F, 1 month U.S. LIBOR + 1.800% 1.9409% 11/15/35 (a)(c)(d) | 2,356,900 | 2,334,762 | |
| Series 2019-IMC: | |||
| Class B, 1 month U.S. LIBOR + 1.300% 1.4409% 4/15/34 (a)(c)(d) | 4,437,000 | 4,214,643 | |
| Class C, 1 month U.S. LIBOR + 1.600% 1.7409% 4/15/34 (a)(c)(d) | 2,933,000 | 2,749,274 | |
| Class D, 1 month U.S. LIBOR + 1.900% 2.0409% 4/15/34 (a)(c)(d) | 3,079,000 | 2,866,849 | |
| Series 2019-XL: | |||
| Class B, 1 month U.S. LIBOR + 1.080% 1.2209% 10/15/36 (a)(c)(d) | 4,253,804 | 4,245,808 | |
| Class C, 1 month U.S. LIBOR + 1.250% 1.3909% 10/15/36 (a)(c)(d) | 5,347,395 | 5,334,002 | |
| Class D, 1 month U.S. LIBOR + 1.450% 1.5909% 10/15/36 (a)(c)(d) | 7,574,447 | 7,541,228 | |
| Class E, 1 month U.S. LIBOR + 1.800% 1.9409% 10/15/36 (a)(c)(d) | 10,642,578 | 10,582,854 | |
| Series 2020-BXLP Class E, 1 month U.S. LIBOR + 1.600% 1.7409% 12/15/36 (a)(c)(d) | 5,741,745 | 5,644,661 | |
| floater, sequential payer: | |||
| Series 2019-IMC Class A, 1 month U.S. LIBOR + 1.000% 1.1409% 4/15/34 (a)(c)(d) | 11,557,000 | 11,195,571 | |
| Series 2019-XL Class A, 1 month U.S. LIBOR + 0.920% 1.0609% 10/15/36 (a)(c)(d) | 30,357,595 | 30,357,589 | |
| CF Hippolyta Issuer LLC sequential payer Series 2020-1: | |||
| Class A1, 1.69% 7/15/60 (a) | 25,157,512 | 25,468,067 | |
| Class A2, 1.99% 7/15/60 (a) | 11,168,449 | 11,318,191 | |
| CGDB Commercial Mortgage Trust floater Series 2019-MOB: | |||
| Class A, 1 month U.S. LIBOR + 0.950% 1.0909% 11/15/36 (a)(c)(d) | 4,222,000 | 4,192,913 | |
| Class B, 1 month U.S. LIBOR + 1.250% 1.3909% 11/15/36 (a)(c)(d) | 1,600,000 | 1,576,951 | |
| CHC Commercial Mortgage Trust floater Series 2019-CHC: | |||
| Class A, 1 month U.S. LIBOR + 1.120% 1.2609% 6/15/34 (a)(c)(d) | 21,133,804 | 20,218,992 | |
| Class B, 1 month U.S. LIBOR + 1.500% 1.6409% 6/15/34 (a)(c)(d) | 2,169,638 | 2,057,584 | |
| Class C, 1 month U.S. LIBOR + 1.750% 1.8909% 6/15/34 (a)(c)(d) | 2,451,422 | 2,304,267 | |
| Citigroup Commercial Mortgage Trust: | |||
| sequential payer: | |||
| Series 2017-P7 Class AAB, 3.509% 4/14/50 | 740,000 | 807,261 | |
| Series 2020-GC46 Class A5, 2.717% 2/15/53 | 20,180,000 | 22,065,395 | |
| Series 2015-GC33 Class XA, 1.0396% 9/10/58 (c)(k) | 1,607,568 | 56,537 | |
| Series 2016-P6 Class XA, 0.9188% 12/10/49 (c)(k) | 1,631,981 | 43,910 | |
| Series 2019-GC41 Class XA, 1.1872% 8/10/56 (c)(k) | 20,651,213 | 1,446,268 | |
| COMM Mortgage Trust: | |||
| sequential payer: | |||
| Series 2014-CR18 Class A5, 3.828% 7/15/47 | 2,137,000 | 2,344,508 | |
| Series 2017-CD4 Class ASB, 3.317% 5/10/50 | 2,000,000 | 2,181,132 | |
| Series 2014-CR20 Class XA, 1.1727% 11/10/47 (c)(k) | 386,297 | 12,721 | |
| Series 2014-LC17 Class XA, 0.8755% 10/10/47 (c)(k) | 1,308,100 | 29,045 | |
| Series 2014-UBS6 Class XA, 1.0361% 12/10/47 (c)(k) | 971,698 | 27,079 | |
| Core Industrial Trust floater Series 2019-CORE Class A, 1 month U.S. LIBOR + 0.880% 1.0209% 12/15/31 (a)(c)(d) | 1,667,000 | 1,659,240 | |
| Credit Suisse Mortgage Trust: | |||
| floater Series 2019-ICE4: | |||
| Class B, 1 month U.S. LIBOR + 1.230% 1.3709% 5/15/36 (a)(c)(d) | 6,081,000 | 6,073,678 | |
| Class C, 1 month U.S. LIBOR + 1.430% 1.5709% 5/15/36 (a)(c)(d) | 7,314,000 | 7,300,110 | |
| sequential payer Series 2020-NET Class A, 2.2569% 8/15/37 (a) | 3,554,000 | 3,666,012 | |
| Series 2018-SITE: | |||
| Class A, 4.284% 4/15/36 (a) | 4,971,000 | 4,932,598 | |
| Class B, 4.5349% 4/15/36 (a) | 1,471,000 | 1,427,538 | |
| Class C, 4.9414% 4/15/36 (a)(c) | 955,000 | 892,503 | |
| Class D, 4.9414% 4/15/36 (a)(c) | 1,909,000 | 1,601,473 | |
| DBUBS Mortgage Trust Series 2011-LC3A: | |||
| Class B, 5.5131% 8/10/44 (a)(c) | 500,000 | 505,098 | |
| Class C, 5.5131% 8/10/44 (a)(c) | 4,800,000 | 4,803,251 | |
| Freddie Mac: | |||
| sequential payer: | |||
| Series 2020-K118 Class A2, 1.493% 9/25/30 | 34,823,000 | 35,902,092 | |
| Series 2020-K120 Class A2, 1.5% 10/25/30 | 15,600,000 | 16,086,829 | |
| Series 2020-K739 Class A2, 1.336% 9/25/27 | 31,857,000 | 32,815,424 | |
| Series K069 Class A2, 3.187% 9/25/27 | 3,630,000 | 4,158,121 | |
| Series K073 Class A2, 3.35% 1/25/28 | 6,811,000 | 7,868,009 | |
| Series 2020-K119 Class A2, 1.566% 9/25/30 | 45,100,000 | 46,879,623 | |
| Series K734 Class A2, 3.208% 2/25/26 | 2,438,000 | 2,715,466 | |
| GB Trust floater Series 2020-FLIX: | |||
| Class A, 1 month U.S. LIBOR + 1.120% 1.2609% 8/15/37 (a)(c)(d) | 6,300,000 | 6,308,717 | |
| Class B, 1 month U.S. LIBOR + 1.350% 1.4909% 8/15/37 (a)(c)(d) | 1,300,000 | 1,304,179 | |
| Class C, 1 month U.S. LIBOR + 1.600% 1.7409% 8/15/37 (a)(c)(d) | 710,000 | 713,243 | |
| GS Mortgage Securities Trust: | |||
| floater: | |||
| Series 2018-3PCK Class A, 1 month U.S. LIBOR + 1.450% 1.5909% 9/15/31 (a)(c)(d) | 20,025,000 | 18,301,046 | |
| Series 2018-HART Class A, 1 month U.S. LIBOR + 1.090% 1.2309% 10/15/31 (a)(c)(d) | 3,300,000 | 3,259,734 | |
| sequential payer: | |||
| Series 2014-GC18 Class AAB, 3.648% 1/10/47 | 780,314 | 811,372 | |
| Series 2016-GC34 Class AAB, 3.278% 10/10/48 | 2,462,052 | 2,595,255 | |
| Series 2020-GC45 Class A5, 2.9106% 2/13/53 | 17,280,000 | 19,173,375 | |
| Series 2011-GC5 Class A/S, 5.209% 8/10/44 (a) | 13,806,000 | 14,033,512 | |
| JPMBB Commercial Mortgage Securities Trust Series 2013-C14 Class A/S, 4.4093% 8/15/46 | 4,614,000 | 4,948,364 | |
| JPMDB Commercial Mortgage Securities Trust sequential payer Series 2019-COR6 Class A4, 3.0565% 11/13/52 | 2,872,000 | 3,213,023 | |
| JPMorgan Chase Commercial Mortgage Securities Corp.: | |||
| sequential payer Series 2012-CBX Class A4, 3.4834% 6/15/45 | 4,491,819 | 4,571,923 | |
| Series 2012-C6 Class A/S, 4.1166% 5/15/45 | 500,000 | 516,687 | |
| Series 2012-CBX Class A/S, 4.2707% 6/15/45 | 2,528,000 | 2,629,068 | |
| JPMorgan Chase Commercial Mortgage Securities Trust: | |||
| floater Series 2019-BKWD Class A, 1 month U.S. LIBOR + 1.000% 1.1409% 9/15/29 (a)(c)(d) | 6,400,000 | 6,287,666 | |
| sequential payer Series 2013-LC11 Class A4, 2.6942% 4/15/46 | 2,558,201 | 2,653,270 | |
| Series 2018-WPT: | |||
| Class AFX, 4.2475% 7/5/33 (a) | 84,000 | 88,539 | |
| Class CFX, 4.9498% 7/5/33 (a) | 767,000 | 791,996 | |
| Class DFX, 5.3503% 7/5/33 (a) | 1,180,000 | 1,177,954 | |
| Class EFX, 5.5422% 7/5/33 (a) | 1,614,000 | 1,571,222 | |
| Ladder Capital Commercial Mortgage Securities Trust: | |||
| sequential payer Series 2014-909 Class A, 3.388% 5/15/31 (a) | 12,000,000 | 12,021,376 | |
| Series 2014-909 Class B, 3.59% 5/15/31 (a) | 7,769,000 | 7,781,668 | |
| Merit floater Series 2020-HILL Class A, 1 month U.S. LIBOR + 1.150% 1.2909% 8/15/37 (a)(c)(d) | 3,354,000 | 3,358,205 | |
| Morgan Stanley BAML Trust: | |||
| sequential payer: | |||
| Series 2013-C10 Class A4, 4.2178% 7/15/46 (c) | 3,100,000 | 3,313,581 | |
| Series 2016-C28 Class A3, 3.272% 1/15/49 | 6,454,095 | 6,998,107 | |
| Series 2017-C33 Class A4, 3.337% 5/15/50 | 13,400,000 | 14,822,100 | |
| Series 2015-C25 Class XA, 1.2041% 10/15/48 (c)(k) | 953,128 | 37,479 | |
| Morgan Stanley Capital Barclays Bank Trust sequential payer Series 2016-MART Class A, 2.2004% 9/13/31 (a) | 3,061,000 | 3,053,889 | |
| Morgan Stanley Capital I Trust: | |||
| floater Series 2018-BOP Class A, 1 month U.S. LIBOR + 0.850% 0.9909% 8/15/33 (a)(c)(d) | 205,211 | 199,151 | |
| floater sequential payer Series 2019-NUGS Class A, 1 month U.S. LIBOR + 0.950% 2.45% 12/15/36 (a)(c)(d) | 9,700,000 | 9,891,587 | |
| sequential payer Series 2019-MEAD Class A, 3.17% 11/10/36 (a) | 16,247,000 | 16,785,637 | |
| Series 2011-C3 Class AJ, 5.4191% 7/15/49 (a)(c) | 24,300,000 | 24,746,481 | |
| Series 2018-H4 Class A4, 4.31% 12/15/51 | 2,991,000 | 3,584,042 | |
| Series 2019-MEAD: | |||
| Class B, 3.283% 11/10/36 (a)(c) | 1,783,000 | 1,725,704 | |
| Class C, 3.283% 11/10/36 (a)(c) | 1,712,000 | 1,549,338 | |
| NYT Mortgage Trust floater Series 2019-NYT Class A, 1 month U.S. LIBOR + 1.200% 1.3409% 12/15/35 (a)(c)(d) | 20,822,000 | 20,777,639 | |
| RETL floater Series 2019-RVP: | |||
| Class B, 1 month U.S. LIBOR + 1.550% 1.6909% 3/15/36 (a)(c)(d) | 1,812,322 | 1,811,789 | |
| Class C, 1 month U.S. LIBOR + 2.100% 2.2409% 3/15/36 (a)(c)(d) | 11,487,000 | 10,381,969 | |
| UBS Commercial Mortgage Trust: | |||
| sequential payer: | |||
| Series 2017-C1 Class ASB, 3.462% 11/15/50 | 1,400,000 | 1,548,706 | |
| Series 2017-C7 Class ASB, 3.586% 12/15/50 | 1,000,000 | 1,112,787 | |
| Series 2012-C1 Class A/S, 4.171% 5/10/45 | 9,200,000 | 9,502,178 | |
| Series 2017-C7 Class XA, 1.1877% 12/15/50 (c)(k) | 1,224,871 | 65,157 | |
| UBS-Barclays Commercial Mortgage Trust: | |||
| floater Series 2013-C6 Class A3, 1 month U.S. LIBOR + 0.790% 0.9314% 4/10/46 (a)(c)(d) | 110,576 | 110,505 | |
| sequential payer Series 2012-C4 Class A/S, 3.3165% 12/10/45 (a) | 4,200,000 | 4,353,153 | |
| Series 2012-C3 Class A/S, 3.814% 8/10/49 (a) | 12,000,000 | 12,514,148 | |
| VLS Commercial Mortgage Trust: | |||
| sequential payer Series 2020-LAB Class A, 2.13% 10/10/42 (a) | 5,920,000 | 6,131,100 | |
| Series 2020-LAB: | |||
| Class B, 2.453% 10/10/42 (a) | 470,000 | 485,425 | |
| Class X, 0.4294% 10/10/42 (a)(k) | 27,100,000 | 1,027,472 | |
| Wells Fargo Commercial Mortgage Trust: | |||
| sequential payer: | |||
| Series 2015-C26 Class A4, 3.166% 2/15/48 | 11,250,000 | 12,217,854 | |
| Series 2015-C29 Class ASB, 3.4% 6/15/48 | 5,570,834 | 5,862,591 | |
| Series 2016-LC24 Class A3, 2.684% 10/15/49 | 4,700,000 | 5,063,306 | |
| Series 2017-C40 Class ASB, 3.395% 10/15/50 | 1,000,000 | 1,101,684 | |
| Series 2018-C44 Class ASB, 4.167% 5/15/51 | 1,000,000 | 1,149,995 | |
| Series 2019-C52 Class A5, 2.892% 8/15/52 | 3,829,000 | 4,225,149 | |
| Series 2019-C54 Class ASB, 3.063% 12/15/52 | 1,000,000 | 1,117,526 | |
| Series 2015-SG1 Class ASB, 3.556% 9/15/48 | 4,930,675 | 5,216,294 | |
| Series 2017-C42 Class XA, 1.0298% 12/15/50 (c)(k) | 1,452,662 | 74,514 | |
| Series 2018-C46 Class XA, 1.106% 8/15/51 (c)(k) | 25,009,466 | 1,233,872 | |
| Series 2018-C48 Class A5, 4.302% 1/15/52 | 3,836,000 | 4,552,906 | |
| WF-RBS Commercial Mortgage Trust: | |||
| floater Series 2013-C14 Class A3, 1 month U.S. LIBOR + 0.720% 0.8635% 6/15/46 (a)(c)(d) | 104,171 | 104,132 | |
| Series 2012-C8 Class A/S, 3.66% 8/15/45 | 4,873,000 | 5,043,090 | |
| Series 2012-C9 Class A/S, 3.388% 11/15/45 | 1,300,000 | 1,346,310 | |
| TOTAL COMMERCIAL MORTGAGE SECURITIES | |||
| (Cost $876,364,808) | 884,168,555 | ||
| Municipal Securities - 0.2% | |||
| Illinois Gen. Oblig.: | |||
| Series 2003: | $ | $ | |
| 4.95% 6/1/23 | 3,343,364 | 3,407,857 | |
| 5.1% 6/1/33 | 22,095,000 | 22,166,588 | |
| Series 2010-1, 6.63% 2/1/35 | 2,035,000 | 2,230,909 | |
| Series 2010-3: | |||
| 6.725% 4/1/35 | 2,710,000 | 2,973,439 | |
| 7.35% 7/1/35 | 1,385,000 | 1,553,097 | |
| Series 2010-5, 6.2% 7/1/21 | 295,000 | 300,696 | |
| New Jersey Econ. Dev. Auth. State Pension Fdg. Rev. Series 1997, 7.425% 2/15/29 (Nat'l. Pub. Fin. Guarantee Corp. Insured) | 11,609,000 | 14,525,181 | |
| TOTAL MUNICIPAL SECURITIES | |||
| (Cost $45,897,996) | 47,157,767 | ||
| Foreign Government and Government Agency Obligations - 0.0% | |||
| State of Qatar 3.4% 4/16/25 (Cost $4,098,738)(a) | $4,110,000 | $4,522,284 | |
| Shares | Value | ||
| Common Stocks - 0.0% | |||
| ENERGY - 0.0% | |||
| Oil, Gas & Consumable Fuels - 0.0% | |||
| Denbury, Inc. (o) | |||
| (Cost $614,873) | 25,192 | 565,812 | |
| Principal Amount | Value | ||
| Bank Notes - 0.1% | |||
| Discover Bank 4.682% 8/9/28 (c) | 2,954,000 | 3,133,160 | |
| KeyBank NA 6.95% 2/1/28 | 619,000 | 806,866 | |
| RBS Citizens NA 2.55% 5/13/21 | 1,236,000 | 1,246,098 | |
| Regions Bank 6.45% 6/26/37 | 4,251,000 | 5,992,288 | |
| Synchrony Bank 3.65% 5/24/21 | 4,817,000 | 4,876,840 | |
| TOTAL BANK NOTES | |||
| (Cost $14,557,851) | 16,055,252 | ||
| Shares | Value | ||
| Fixed-Income Funds - 53.3% | |||
| Bank Loan Funds - 2.0% | |||
| Fidelity Floating Rate High Income Fund (p) | 61,289,884 | $562,641,135 | |
| High Yield Fixed-Income Funds - 3.5% | |||
| Fidelity Capital & Income Fund (p) | 4,849,737 | 51,164,722 | |
| Fidelity High Income Fund (p) | 50,222,719 | 434,426,516 | |
| Fidelity New Markets Income Fund (p) | 33,968,155 | 503,068,372 | |
| TOTAL HIGH YIELD FIXED-INCOME FUNDS | 988,659,610 | ||
| Inflation-Protected Bond Funds - 1.6% | |||
| Fidelity Inflation-Protected Bond Index Fund (p) | 41,869,844 | 461,824,380 | |
| Intermediate Government Funds - 2.1% | |||
| Fidelity SAI U.S. Treasury Bond Index Fund (p) | 55,904,924 | 600,977,936 | |
| Intermediate-Term Bond Funds - 37.7% | |||
| Fidelity Global Credit Fund (p) | 3,059,509 | 31,054,020 | |
| Fidelity SAI Total Bond Fund (p) | 932,075,430 | 9,991,848,564 | |
| Fidelity Sustainability Bond Index Fund (p) | 2,345,322 | 25,962,717 | |
| Fidelity U.S. Bond Index Fund (p) | 45,438,497 | 567,072,449 | |
| TOTAL INTERMEDIATE-TERM BOND FUNDS | 10,615,937,750 | ||
| Investment Grade Fixed-Income Funds - 2.3% | |||
| Fidelity Corporate Bond Fund (p) | 49,665,291 | 643,165,515 | |
| Long Government Bond Funds - 3.6% | |||
| Fidelity SAI Long-Term Treasury Bond Index Fund (p) | 76,932,303 | 997,042,649 | |
| Sector Funds - 0.5% | |||
| Fidelity Advisor Real Estate Income Fund Class I | 12,854,118 | 151,292,972 | |
| TOTAL FIXED-INCOME FUNDS | |||
| (Cost $14,313,955,439) | 15,021,541,947 | ||
| Principal Amount | Value | ||
| Preferred Securities - 0.1% | |||
| FINANCIALS - 0.1% | |||
| Banks - 0.1% | |||
| Bank of Nova Scotia 4.65% (c)(q) | 13,095,000 | 13,272,177 | |
| Barclays Bank PLC 7.625% 11/21/22 | 12,633,000 | 13,999,975 | |
| TOTAL PREFERRED SECURITIES | |||
| (Cost $26,529,144) | 27,272,152 | ||
| Shares | Value | ||
| Money Market Funds - 6.7% | |||
| Fidelity Cash Central Fund 0.09% (r) | 1,083,113,535 | 1,083,330,158 | |
| Fidelity Investments Money Market Government Portfolio Institutional Class 0.01% (p)(s) | 813,481,331 | 813,481,331 | |
| TOTAL MONEY MARKET FUNDS | |||
| (Cost $1,896,811,450) | 1,896,811,489 |
| Purchased Swaptions - 0.0% | ||||
| Expiration Date | Notional Amount | Value | ||
| Put Options - 0.0% | ||||
| Option on an interest rate swap with Bank of America N.A. to pay semi-annually a fixed rate of 0.865% and receive quarterly a floating rate based on 3-month LIBOR, expiring October 2031 | 10/14/21 | 47,500,000 | $1,235,009 | |
| Option on an interest rate swap with Bank of America N.A. to pay semi-annually a fixed rate of 1.78% and receive quarterly a floating rate based on 3-month LIBOR, expiring October 2029 | 10/15/24 | 4,600,000 | 45,889 | |
| Option on an interest rate swap with Bank of America N.A. to pay semi-annually a fixed rate of 1.785% and receive quarterly a floating rate based on 3-month LIBOR, expiring October 2029 | 10/24/24 | 27,200,000 | 273,470 | |
| Option on an interest rate swap with Bank of America N.A. to pay semi-annually a fixed rate of 1.82% and receive quarterly a floating rate based on 3-month LIBOR, expiring October 2029 | 10/18/24 | 33,500,000 | 320,339 | |
| Option on an interest rate swap with Goldman Sachs Bank U.S.A. to pay semi-annually a fixed rate of 1.4% and receive quarterly a floating rate based on 3-month LIBOR, expiring February 2030 | 2/26/25 | 2,800,000 | 50,490 | |
| Option on an interest rate swap with Goldman Sachs Bank U.S.A. to pay semi-annually a fixed rate of 2.2% and receive quarterly a floating rate based on 3-month LIBOR, expiring July 2029 | 7/18/24 | 43,600,000 | 227,958 | |
| Option on an interest rate swap with JPMorgan Chase Bank N.A. to pay semi-annually a fixed rate of 1.741% and receive quarterly a floating rate based on 3-month LIBOR, expiring September 2029 | 9/12/24 | 16,000,000 | 159,741 | |
| Option on an interest rate swap with JPMorgan Chase Bank, N.A. to pay semi-annually a fixed rate of 2.313% and receive quarterly a floating rate based on 3-month LIBOR, expiring June 2029 | 6/6/24 | 12,300,000 | 52,035 | |
| TOTAL PUT OPTIONS | 2,364,931 | |||
| Call Options - 0.0% | ||||
| Option on an interest rate swap with Bank of America N.A. to receive semi-annually a fixed rate of 0.865% and pay quarterly a floating rate based on 3-month LIBOR, expiring October 2031 | 10/14/21 | 47,500,000 | 761,540 | |
| Option on an interest rate swap with Bank of America N.A. to receive semi-annually a fixed rate of 1.78% and pay quarterly a floating rate based on 3-month LIBOR, expiring October 2029 | 10/15/24 | 4,600,000 | 190,624 | |
| Option on an interest rate swap with Bank of America N.A. to receive semi-annually a fixed rate of 1.785% and pay quarterly a floating rate based on 3-month LIBOR, expiring October 2029 | 10/24/24 | 27,200,000 | 1,129,554 | |
| Option on an interest rate swap with Bank of America N.A. to receive semi-annually a fixed rate of 1.82% and pay quarterly a floating rate based on 3-month LIBOR, expiring October 2029 | 10/18/24 | 33,500,000 | 1,435,868 | |
| Option on an interest rate swap with Goldman Sachs Bank U.S.A. to receive semi-annually a fixed rate of 1.4% and pay quarterly a floating rate based on 3-month LIBOR, expiring February 2030 | 2/26/25 | 2,800,000 | 79,043 | |
| Option on an interest rate swap with Goldman Sachs Bank U.S.A. to receive semi-annually a fixed rate of 2.2% and pay quarterly a floating rate based on 3-month LIBOR, expiring July 2029 | 7/18/24 | 43,600,000 | 2,580,499 | |
| Option on an interest rate swap with JPMorgan Chase Bank N.A. to receive semi-annually a fixed rate of 1.741% and pay quarterly a floating rate based on 3-month LIBOR, expiring September 2029 | 9/12/24 | 16,000,000 | 644,151 | |
| Option on an interest rate swap with JPMorgan Chase Bank, N.A. to receive semi-annually a fixed rate of 2.313% and pay quarterly a floating rate based on 3-month LIBOR, expiring June 2029 | 6/6/24 | 12,300,000 | 796,193 | |
| TOTAL CALL OPTIONS | 7,617,472 | |||
| TOTAL PURCHASED SWAPTIONS | ||||
| (Cost $10,006,084) | 9,982,403 | |||
| TOTAL INVESTMENT IN SECURITIES - 110.7% | ||||
| (Cost $29,933,188,572) | 31,179,047,342 | |||
| NET OTHER ASSETS (LIABILITIES) - (10.7)% | (3,019,411,804) | |||
| NET ASSETS - 100% | $28,159,635,538 |
| TBA Sale Commitments | ||
| Principal Amount | Value | |
| Ginnie Mae | ||
| 2.5% 12/1/50 | $(3,950,000) | $(4,160,539) |
| 2.5% 12/1/50 | (4,650,000) | (4,897,850) |
| 2.5% 12/1/50 | (4,600,000) | (4,845,185) |
| 2.5% 12/1/50 | (9,550,000) | (10,059,025) |
| 2.5% 12/1/50 | (10,075,000) | (10,612,008) |
| 2.5% 12/1/50 | (11,750,000) | (12,376,287) |
| 2.5% 12/1/50 | (11,675,000) | (12,297,289) |
| 2.5% 12/1/50 | (31,500,000) | (33,178,982) |
| 2.5% 12/1/50 | (15,700,000) | (16,536,826) |
| 2.5% 12/1/50 | (12,600,000) | (13,271,593) |
| 2.5% 12/1/50 | (9,700,000) | (10,217,020) |
| 2.5% 12/1/50 | (9,300,000) | (9,795,699) |
| 2.5% 12/1/50 | (32,150,000) | (33,863,627) |
| 2.5% 12/1/50 | (30,750,000) | (32,389,006) |
| 2.5% 12/1/50 | (12,600,000) | (13,271,593) |
| 2.5% 12/1/50 | (12,600,000) | (13,271,593) |
| 2.5% 12/1/50 | (15,100,000) | (15,904,845) |
| 3% 12/1/50 | (20,000,000) | (20,873,326) |
| 3% 12/1/50 | (14,800,000) | (15,446,261) |
| 3% 12/1/50 | (1,100,000) | (1,148,033) |
| 3% 12/1/50 | (600,000) | (626,200) |
| 3% 12/1/50 | (8,150,000) | (8,505,880) |
| 3.5% 12/1/50 | (15,550,000) | (16,423,709) |
| 3.5% 12/1/50 | (38,600,000) | (40,768,822) |
| 3.5% 12/1/50 | (7,300,000) | (7,710,166) |
| 3.5% 12/1/50 | (6,450,000) | (6,812,407) |
| 3.5% 12/1/50 | (39,800,000) | (42,036,247) |
| 3.5% 12/1/50 | (20,700,000) | (21,863,073) |
| 3.5% 12/1/50 | (19,400,000) | (20,490,030) |
| 3.5% 12/1/50 | (39,300,000) | (41,508,153) |
| TOTAL GINNIE MAE | (495,161,274) | |
| Uniform Mortgage Backed Securities | ||
| 1.5% 12/1/35 | (4,050,000) | (4,152,759) |
| 1.5% 12/1/35 | (13,500,000) | (13,842,530) |
| 1.5% 12/1/35 | (17,100,000) | (17,533,871) |
| 1.5% 12/1/35 | (14,250,000) | (14,611,560) |
| 1.5% 12/1/35 | (4,950,000) | (5,075,594) |
| 1.5% 12/1/35 | (19,250,000) | (19,738,423) |
| 1.5% 12/1/35 | (13,450,000) | (13,791,261) |
| 1.5% 12/1/35 | (29,950,000) | (30,709,909) |
| 1.5% 12/1/35 | (10,450,000) | (10,715,144) |
| 1.5% 12/1/35 | (33,850,000) | (34,708,863) |
| 1.5% 12/1/35 | (23,650,000) | (24,250,062) |
| 1.5% 12/1/35 | (4,800,000) | (4,921,788) |
| 2% 12/1/35 | (14,200,000) | (14,782,591) |
| 2% 12/1/35 | (27,800,000) | (28,940,565) |
| 2% 12/1/35 | (51,800,000) | (53,925,225) |
| 2% 12/1/35 | (24,300,000) | (25,296,968) |
| 2% 12/1/35 | (26,500,000) | (27,587,229) |
| 2% 12/1/35 | (12,450,000) | (12,960,792) |
| 2% 12/1/50 | (350,000) | (363,571) |
| 2% 12/1/50 | (14,400,000) | (14,958,340) |
| 2% 12/1/50 | (9,400,000) | (9,764,472) |
| 2% 12/1/50 | (14,500,000) | (15,062,217) |
| 2% 12/1/50 | (37,800,000) | (39,265,642) |
| 2% 12/1/50 | (7,900,000) | (8,206,311) |
| 2% 12/1/50 | (14,700,000) | (15,269,972) |
| 2% 12/1/50 | (18,900,000) | (19,632,821) |
| 2% 12/1/50 | (11,500,000) | (11,945,896) |
| 2% 12/1/50 | (23,900,000) | (24,826,689) |
| 2% 12/1/50 | (11,700,000) | (12,153,651) |
| 2% 12/1/50 | (5,900,000) | (6,128,764) |
| 2% 12/1/50 | (4,700,000) | (4,882,236) |
| 2% 12/1/50 | (7,450,000) | (7,738,863) |
| 2% 12/1/50 | (37,800,000) | (39,265,642) |
| 2% 12/1/50 | (8,300,000) | (8,621,821) |
| 2% 12/1/50 | (1,100,000) | (1,142,651) |
| 2% 12/1/50 | (30,850,000) | (32,046,166) |
| 2% 12/1/50 | (9,200,000) | (9,556,717) |
| 2% 12/1/50 | (1,550,000) | (1,610,099) |
| 2% 12/1/50 | (14,500,000) | (15,062,217) |
| 2% 12/1/50 | (23,900,000) | (24,826,689) |
| 2.5% 12/1/50 | (26,000,000) | (27,241,084) |
| 2.5% 12/1/50 | (26,000,000) | (27,241,084) |
| 3% 12/1/50 | (15,100,000) | (15,774,795) |
| 3% 12/1/50 | (41,200,000) | (43,041,162) |
| 3% 12/1/50 | (13,950,000) | (14,573,403) |
| 3% 12/1/50 | (5,700,000) | (5,954,724) |
| 3% 12/1/50 | (4,250,000) | (4,439,926) |
| 3% 12/1/50 | (1,750,000) | (1,828,205) |
| 3% 12/1/50 | (9,700,000) | (10,133,477) |
| 3% 12/1/50 | (9,500,000) | (9,924,540) |
| 3% 12/1/50 | (5,750,000) | (6,006,958) |
| 3% 12/1/50 | (8,050,000) | (8,409,742) |
| 3% 12/1/50 | (25,900,000) | (27,057,430) |
| 3% 12/1/50 | (26,400,000) | (27,579,774) |
| 3% 12/1/50 | (49,400,000) | (51,607,607) |
| 3.5% 12/1/50 | (5,850,000) | (6,170,381) |
| 3.5% 12/1/50 | (3,000,000) | (3,164,298) |
| 3.5% 12/1/50 | (6,600,000) | (6,961,455) |
| 3.5% 12/1/50 | (3,450,000) | (3,638,942) |
| 3.5% 12/1/50 | (13,200,000) | (13,922,910) |
| 3.5% 12/1/50 | (11,600,000) | (12,235,284) |
| 3.5% 12/1/50 | (15,100,000) | (15,926,965) |
| 3.5% 12/1/50 | (6,100,000) | (6,434,072) |
| 3.5% 12/1/50 | (9,000,000) | (9,492,893) |
| 3.5% 12/1/50 | (4,000,000) | (4,219,064) |
| 3.5% 12/1/50 | (15,350,000) | (16,190,657) |
| 3.5% 12/1/50 | (21,550,000) | (22,730,205) |
| 3.5% 12/1/50 | (54,500,000) | (57,484,742) |
| 3.5% 12/1/50 | (54,500,000) | (57,484,742) |
| 3.5% 12/1/50 | (5,500,000) | (5,801,212) |
| 3.5% 12/1/50 | (3,700,000) | (3,902,634) |
| 3.5% 12/1/50 | (14,700,000) | (15,505,059) |
| 3.5% 12/1/50 | (43,850,000) | (46,251,485) |
| 3.5% 12/1/50 | (43,850,000) | (46,251,485) |
| 3.5% 12/1/50 | (8,650,000) | (9,123,725) |
| 3.5% 12/1/50 | (8,650,000) | (9,123,725) |
| 4% 12/1/50 | (14,350,000) | (15,311,335) |
| 4% 12/1/50 | (13,150,000) | (14,030,945) |
| 4% 12/1/50 | (4,750,000) | (5,068,212) |
| 4% 12/1/50 | (4,350,000) | (4,641,415) |
| 4% 12/1/50 | (11,725,000) | (12,510,481) |
| 4% 12/1/50 | (12,900,000) | (13,764,197) |
| 4% 12/1/50 | (4,925,000) | (5,254,936) |
| 4% 12/1/50 | (4,175,000) | (4,454,692) |
| 4% 12/1/50 | (150,000) | (160,049) |
| 4% 12/1/50 | (5,225,000) | (5,575,033) |
| 4% 12/1/50 | (14,450,000) | (15,418,034) |
| 4% 12/1/50 | (13,050,000) | (13,924,246) |
| TOTAL UNIFORM MORTGAGE BACKED SECURITIES | (1,442,820,002) | |
| TOTAL TBA SALE COMMITMENTS | ||
| Proceeds $(1,934,866,940) | $(1,937,981,276) |
| Written Swaptions | |||
| Expiration Date | Notional Amount | Value | |
| Put Swaptions | |||
| Option on an interest rate swap with Goldman Sachs Bank U.S.A. to pay semi-annually a fixed rate of 1.27% and receive quarterly a floating rate based on 3-month LIBOR, expiring November 2030 | 11/25/25 | 96,100,000 | $(2,467,346) |
| Call Swaptions | |||
| Option on an interest rate swap with Goldman Sachs Bank U.S.A. to receive semi-annually a fixed rate of 1.27% and pay quarterly a floating rate based on 3-month LIBOR, expiring November 2030 | 11/25/25 | 96,100,000 | (2,375,412) |
| TOTAL WRITTEN SWAPTIONS | $(4,842,758) |
| Futures Contracts | |||||
| Number of contracts | Expiration Date | Notional Amount | Value | Unrealized Appreciation/(Depreciation) | |
| Purchased | |||||
| Treasury Contracts | |||||
| CBOT 5-Year U.S. Treasury Note Contracts (United States) | 257 | March 2021 | $32,390,031 | $41,105 | $41,105 |
| CBOT Long Term U.S. Treasury Bond Contracts (United States) | 621 | March 2021 | 108,616,781 | 622,150 | 622,150 |
| TOTAL PURCHASED | 663,255 | ||||
| Sold | |||||
| Treasury Contracts | |||||
| CBOT 10-Year U.S. Treasury Note Contracts (United States) | 2,291 | March 2021 | 316,551,766 | (604,246) | (604,246) |
| CBOT 2-Year U.S. Treasury Note Contracts (United States) | 1,264 | March 2021 | 279,156,375 | (170,175) | (170,175) |
| TOTAL SOLD | (774,421) | ||||
| TOTAL FUTURES CONTRACTS | $(111,166) |
The notional amount of futures purchased as a percentage of Net Assets is 0.5%
The notional amount of futures sold as a percentage of Net Assets is 2.1%
Swaps
| Underlying Reference | Maturity Date | Clearinghouse / Counterparty | Fixed Payment Received/(Paid) | Payment Frequency | Notional Amount | Value | Upfront Premium Received/(Paid) | Unrealized Appreciation/(Depreciation) |
| Credit Default Swaps | ||||||||
| Buy Protection | ||||||||
| CMBX N.A. AAA Index Series 12 | Aug. 2061 | Citigroup Global Markets Ltd. | (0.5%) | Monthly | $ 5,000,000 | $(31,962) | $(69,143) | $(101,105) |
| CMBX N.A. AAA Index Series 12 | Aug. 2061 | JPMorgan Securities LLC | (0.5%) | Monthly | 2,510,000 | (16,045) | (30,706) | (46,751) |
| CMBX N.A. AAA Index Series 12 | Aug. 2061 | Morgan Stanley Capital Services LLC | (0.5%) | Monthly | 20,000,000 | (127,848) | (140,121) | (267,969) |
| CMBX N.A. AAA Index Series 12 | Aug. 2061 | Morgan Stanley Capital Services LLC | (0.5%) | Monthly | 6,100,000 | (38,994) | 24,035 | (14,959) |
| CMBX N.A. AAA Index Series 12 | Aug. 2061 | Morgan Stanley Capital Services LLC | (0.5%) | Monthly | 1,930,000 | (12,337) | (14,933) | (27,270) |
| CMBX N.A. AAA Index Series 12 | Aug. 2061 | Morgan Stanley Capital Services LLC | (0.5%) | Monthly | 5,440,000 | (34,775) | (191,522) | (226,297) |
| CMBX N.A. AAA Index Series 12 | Aug. 2061 | Morgan Stanley Capital Services LLC | (0.5%) | Monthly | 6,800,000 | (43,468) | (187,639) | (231,107) |
| CMBX N.A. AAA Index Series 12 | Aug. 2061 | Morgan Stanley Capital Services LLC | (0.5%) | Monthly | 3,180,000 | (20,328) | (15,125) | (35,453) |
| CMBX N.A. AAA Index Series 12 | Aug. 2061 | Morgan Stanley Capital Services LLC | (0.5%) | Monthly | 8,460,000 | (54,080) | (70,233) | (124,313) |
| CMBX N.A. AAA Index Series 12 | Aug. 2061 | Morgan Stanley Capital Services LLC | (0.5%) | Monthly | 9,300,000 | (59,449) | (102,935) | (162,384) |
| TOTAL CREDIT DEFAULT SWAPS | $(439,286) | $(798,322) | $(1,237,608) | |||||
Swaps
| Payment Received | Payment Frequency | Payment Paid | Payment Frequency | Clearinghouse / Counterparty(1) | Maturity Date | Notional Amount | Value | Upfront Premium Received/(Paid)(2) | Unrealized Appreciation/(Depreciation) |
| Interest Rate Swaps | |||||||||
| 0.25% | Semi - annual | 3-month LIBOR(3) | Quarterly | LCH | Mar. 2023 | $98,050,000 | $(12,454) | $0 | $(12,454) |
| 0.5% | Semi - annual | 3-month LIBOR(3) | Quarterly | LCH | Mar. 2026 | 42,988,000 | (210,298) | 0 | (210,298) |
| 3-month LIBOR(3) | Quarterly | 0.75% | Semi - annual | LCH | Mar. 2031 | 34,010,000 | 236,442 | 0 | 236,442 |
| TOTAL INTEREST RATE SWAPS | $13,690 | $0 | $13,690 | ||||||
(1) Swaps with LCH Clearnet Group (LCH) are centrally cleared over-the-counter (OTC) swaps.
(2) Any premiums for centrally cleared over-the-counter (OTC) swaps are recorded periodically throughout the term of the swap to variation margin and included in unrealized appreciation (depreciation).
(3) Represents floating rate.
Legend
(a) Security exempt from registration under Rule 144A of the Securities Act of 1933. These securities may be resold in transactions exempt from registration, normally to qualified institutional buyers. At the end of the period, the value of these securities amounted to $2,120,052,059 or 7.5% of net assets.
(b) Non-income producing - Security is in default.
(c) Coupon rates for floating and adjustable rate securities reflect the rates in effect at period end.
(d) Coupon is indexed to a floating interest rate which may be multiplied by a specified factor and/or subject to caps or floors.
(e) Security or a portion of the security purchased on a delayed delivery or when-issued basis.
(f) Security or a portion of the security was pledged to cover margin requirements for futures contracts. At period end, the value of securities pledged amounted to $2,428,659.
(g) Security or a portion of the security has been segregated as collateral for open options. At period end, the value of securities pledged amounted to $556,072.
(h) Security or a portion of the security was pledged to cover margin requirements for centrally cleared OTC swaps. At period end, the value of securities pledged amounted to $1,337,658.
(i) Security or a portion of the security has been segregated as collateral for mortgage-backed or asset-backed securities purchased on a delayed delivery or when-issued basis. At period end, the value of securities pledged amounted to $205,682.
(j) Level 3 security
(k) Security represents right to receive monthly interest payments on an underlying pool of mortgages or assets. Principal shown is the outstanding par amount of the pool as of the end of the period.
(l) Coupon is inversely indexed to a floating interest rate multiplied by a specified factor. The price may be considerably more volatile than the price of a comparable fixed rate security.
(m) Principal Only Strips represent the right to receive the monthly principal payments on an underlying pool of mortgage loans.
(n) Represents an investment in an underlying pool of reverse mortgages which typically do not require regular principal and interest payments as repayment is deferred until a maturity event.
(o) Non-income producing
(p) Affiliated Fund
(q) Security is perpetual in nature with no stated maturity date.
(r) Affiliated fund that is generally available only to investment companies and other accounts managed by Fidelity Investments. The rate quoted is the annualized seven-day yield of the fund at period end. A complete unaudited listing of the fund's holdings as of its most recent quarter end is available upon request. In addition, each Fidelity Central Fund's financial statements are available on the SEC's website or upon request.
(s) The rate quoted is the annualized seven-day yield of the fund at period end.
Affiliated Central Funds
Information regarding fiscal year to date income earned by the Fund from investments in Fidelity Central Funds is as follows:
| Fund | Income earned |
| Fidelity Cash Central Fund | $555,215 |
| Total | $555,215 |
Amounts in the income column in the above table include any capital gain distributions from underlying funds, which are presented in the corresponding line-item in the Statement of Operations, if applicable.
Affiliated Underlying Funds
Fiscal year to date information regarding the Fund's investments in affiliated Underlying Funds, excluding any Money Market Central Funds, is presented below. Exchanges between classes of the same affiliated Underlying Funds may occur.
| Affiliate | Value, beginning of period | Purchases | Sales Proceeds | Dividend Income | Realized Gain (loss) | Change in Unrealized appreciation (depreciation) | Value, end of period |
| Fidelity Advisor Real Estate Income Fund Class Z | $130,711,979 | $1,148,146 | $126,148,146 | $1,148,146 | $-- | $(5,711,979) | $-- |
| Fidelity Capital & Income Fund | -- | 50,099,862 | -- | 99,862 | -- | 1,064,860 | 51,164,722 |
| Fidelity Corporate Bond Fund | 502,825,401 | 118,718,183 | -- | 11,674,418 | -- | 21,621,931 | 643,165,515 |
| Fidelity Floating Rate High Income Fund | 554,823,681 | 9,941,095 | 30,000,000 | 9,888,719 | (2,125,984) | 30,002,343 | 562,641,135 |
| Fidelity Global Credit Fund | 26,242,053 | 3,300,903 | -- | 300,903 | -- | 1,511,064 | 31,054,020 |
| Fidelity High Income Fund | 189,708,266 | 254,611,438 | 20,000,000 | 4,582,669 | 1,182,757 | 8,924,055 | 434,426,516 |
| Fidelity Inflation-Protected Bond Index Fund | 417,876,035 | 25,413,071 | -- | 411,324 | -- | 18,535,274 | 461,824,380 |
| Fidelity Investments Money Market Government Portfolio Institutional Class 0.01% | 502,472,950 | 3,160,918,992 | 2,849,910,611 | 157,715 | -- | -- | 813,481,331 |
| Fidelity New Markets Income Fund | 437,744,286 | 34,244,480 | -- | 9,244,179 | -- | 31,079,606 | 503,068,372 |
| Fidelity SAI Long-Term Treasury Bond Index Fund | 1,107,985,358 | 9,029,630 | 100,000,000 | 9,029,359 | 2,024,246 | (21,996,585) | 997,042,649 |
| Fidelity SAI Total Bond Fund | 9,212,423,374 | 774,811,693 | -- | 449,130,539 | -- | 4,613,497 | 9,991,848,564 |
| Fidelity SAI U.S. Treasury Bond Index Fund | -- | 602,158,480 | -- | 2,160,194 | -- | (1,180,544) | 600,977,936 |
| Fidelity Sustainability Bond Index Fund | 25,576,136 | 293,906 | -- | 292,929 | -- | 92,675 | 25,962,717 |
| Fidelity U.S. Bond Index Fund | 101,109,716 | 471,011,199 | -- | 7,664,063 | -- | (5,048,466) | 567,072,449 |
| Total | $13,209,499,235 | $5,515,701,078 | $3,126,058,757 | $505,785,019 | $1,081,019 | $83,507,731 | $15,683,730,306 |
Amounts in the income column in the above table include any capital gain distributions from underlying funds, which are presented in the corresponding line-item in the Statement of Operations, if applicable.
Investment Valuation
The following is a summary of the inputs used, as of November 30, 2020, involving the Fund's assets and liabilities carried at fair value. The inputs or methodology used for valuing securities may not be an indication of the risk associated with investing in those securities. For more information on valuation inputs, and their aggregation into the levels used below, please refer to the Investment Valuation section in the accompanying Notes to Financial Statements.
| Valuation Inputs at Reporting Date: | ||||
| Description | Total | Level 1 | Level 2 | Level 3 |
| Investments in Securities: | ||||
| Equities: | ||||
| Energy | $565,812 | $565,812 | $-- | $-- |
| Corporate Bonds | 4,185,866,048 | -- | 4,185,866,048 | -- |
| U.S. Government and Government Agency Obligations | 1,925,857,172 | -- | 1,925,857,172 | -- |
| U.S. Government Agency - Mortgage Securities | 6,160,748,075 | -- | 6,160,748,075 | -- |
| Asset-Backed Securities | 717,955,009 | -- | 717,955,009 | -- |
| Collateralized Mortgage Obligations | 280,543,377 | -- | 280,543,323 | 54 |
| Commercial Mortgage Securities | 884,168,555 | -- | 884,168,555 | -- |
| Municipal Securities | 47,157,767 | -- | 47,157,767 | -- |
| Foreign Government and Government Agency Obligations | 4,522,284 | -- | 4,522,284 | -- |
| Bank Notes | 16,055,252 | -- | 16,055,252 | -- |
| Fixed-Income Funds | 15,021,541,947 | 15,021,541,947 | -- | -- |
| Preferred Securities | 27,272,152 | -- | 27,272,152 | -- |
| Money Market Funds | 1,896,811,489 | 1,896,811,489 | -- | -- |
| Purchased Swaptions | 9,982,403 | -- | 9,982,403 | -- |
| Total Investments in Securities: | $31,179,047,342 | $16,918,919,248 | $14,260,128,040 | $54 |
| Derivative Instruments: | ||||
| Assets | ||||
| Futures Contracts | $663,255 | $663,255 | $-- | $-- |
| Swaps | 236,442 | -- | 236,442 | -- |
| Total Assets | $899,697 | $663,255 | $236,442 | $-- |
| Liabilities | ||||
| Futures Contracts | $(774,421) | $(774,421) | $-- | $-- |
| Swaps | (662,038) | -- | (662,038) | -- |
| Written Swaptions | (4,842,758) | -- | (4,842,758) | -- |
| Total Liabilities | $(6,279,217) | $(774,421) | $(5,504,796) | $-- |
| Total Derivative Instruments: | $(5,379,520) | $(111,166) | $(5,268,354) | $-- |
| Other Financial Instruments: | ||||
| TBA Sale Commitments | $(1,937,981,276) | $-- | $(1,937,981,276) | $-- |
| Total Other Financial Instruments: | $(1,937,981,276) | $-- | $(1,937,981,276) | $-- |
Value of Derivative Instruments
The following table is a summary of the Fund's value of derivative instruments by primary risk exposure as of November 30, 2020. For additional information on derivative instruments, please refer to the Derivative Instruments section in the accompanying Notes to Financial Statements.
| Primary Risk Exposure / Derivative Type | Value | |
| Asset | Liability | |
| Credit Risk | ||
| Swaps(a) | $0 | $(439,286) |
| Total Credit Risk | 0 | (439,286) |
| Interest Rate Risk | ||
| Futures Contracts(b) | 663,255 | (774,421) |
| Purchased Swaptions(c) | 9,982,403 | 0 |
| Swaps(d) | 236,442 | (222,752) |
| Written Swaptions(e) | 0 | (4,842,758) |
| Total Interest Rate Risk | 10,882,100 | (5,839,931) |
| Total Value of Derivatives | $10,882,100 | $(6,279,217) |
(a) For bi-lateral over-the-counter (OTC) swaps, reflects gross value which is presented in the Statement of Assets and Liabilities in the bi-lateral OTC swaps, at value line-items.
(b) Reflects gross cumulative appreciation (depreciation) on futures contracts as presented in the Schedule of Investments. In the Statement of Assets and Liabilities, the period end daily variation margin is included in receivable or payable for daily variation margin on futures contracts, and the net cumulative appreciation (depreciation) is included in Total accumulated earnings (loss).
(c) Gross value is included in the Statement of Assets and Liabilities in the investments, at value line-item.
(d) For centrally cleared over-the-counter (OTC) swaps, reflects gross cumulative appreciation (depreciation) as presented in the Schedule of Investments. In the Statement of Assets and Liabilities, the period end daily variation margin for centrally cleared OTC swaps is included in receivable or payable for daily variation margin on centrally cleared OTC swaps, and the net cumulative appreciation (depreciation) for centrally cleared OTC swaps is included in Total accumulated earnings (loss).
(e) Gross value is presented in the Statement of Assets and Liabilities in the written options, at value line-item.
See accompanying notes which are an integral part of the financial statements.
Financial Statements
Statement of Assets and Liabilities
| November 30, 2020 (Unaudited) | ||
| Assets | ||
| Investment in securities, at value — See accompanying schedule: Unaffiliated issuers (cost $13,254,586,692) | $13,768,821,363 | |
| Fidelity Central Funds (cost $1,678,788,953) | 1,726,495,673 | |
| Other affiliated issuers (cost $14,999,812,927) | 15,683,730,306 | |
| Total Investment in Securities (cost $29,933,188,572) | $31,179,047,342 | |
| Cash | 6,310,062 | |
| Receivable for investments sold | 125,172,979 | |
| Receivable for premium on written options | 4,800,194 | |
| Receivable for TBA sale commitments | 1,934,866,935 | |
| Receivable for fund shares sold | 39,651,143 | |
| Dividends receivable | 28,063,345 | |
| Interest receivable | 57,197,414 | |
| Distributions receivable from Fidelity Central Funds | 71,061 | |
| Receivable for daily variation margin on centrally cleared OTC swaps | 147,148 | |
| Prepaid expenses | 26,826 | |
| Other receivables | 2,017 | |
| Total assets | 33,375,356,466 | |
| Liabilities | ||
| Payable for investments purchased | ||
| Regular delivery | $153,094,542 | |
| Delayed delivery | 3,108,191,376 | |
| TBA sale commitments, at value | 1,937,981,276 | |
| Payable for fund shares redeemed | 8,659,798 | |
| Distributions payable | 610,022 | |
| Bi-lateral OTC swaps, at value | 439,286 | |
| Accrued management fee | 1,274,772 | |
| Payable for daily variation margin on futures contracts | 116,425 | |
| Written options, at value (premium receivable $4,800,194) | 4,842,758 | |
| Other payables and accrued expenses | 510,673 | |
| Total liabilities | 5,215,720,928 | |
| Net Assets | $28,159,635,538 | |
| Net Assets consist of: | ||
| Paid in capital | $25,732,161,005 | |
| Total accumulated earnings (loss) | 2,427,474,533 | |
| Net Assets | $28,159,635,538 | |
| Net Asset Value, offering price and redemption price per share ($28,159,635,538 ÷ 2,496,507,902 shares) | $11.28 |
See accompanying notes which are an integral part of the financial statements.
Statement of Operations
| Six months ended November 30, 2020 (Unaudited) | ||
| Investment Income | ||
| Dividends: | ||
| Unaffiliated issuers | $2,315,744 | |
| Affiliated issuers | 505,785,019 | |
| Interest | 134,473,923 | |
| Income from Fidelity Central Funds | 555,215 | |
| Total income | 643,129,901 | |
| Expenses | ||
| Management fee | $40,488,293 | |
| Custodian fees and expenses | 125,363 | |
| Independent trustees' fees and expenses | 132,300 | |
| Registration fees | 830,623 | |
| Audit | 41,336 | |
| Legal | 47,124 | |
| Miscellaneous | 138,778 | |
| Total expenses before reductions | 41,803,817 | |
| Expense reductions | (32,962,013) | |
| Total expenses after reductions | 8,841,804 | |
| Net investment income (loss) | 634,288,097 | |
| Realized and Unrealized Gain (Loss) | ||
| Net realized gain (loss) on: | ||
| Investment securities: | ||
| Unaffiliated issuers | 153,891,977 | |
| Fidelity Central Funds | (33,415) | |
| Other affiliated issuers | 1,081,019 | |
| Futures contracts | (268,926) | |
| Swaps | 145,651 | |
| Written options | (124,920) | |
| Total net realized gain (loss) | 154,691,386 | |
| Change in net unrealized appreciation (depreciation) on: | ||
| Investment securities: | ||
| Unaffiliated issuers | 149,402,909 | |
| Fidelity Central Funds | 47,706,681 | |
| Other affiliated issuers | 83,507,731 | |
| Futures contracts | 609,171 | |
| Swaps | (705,284) | |
| Written options | 264,890 | |
| Delayed delivery commitments | (2,951,864) | |
| Total change in net unrealized appreciation (depreciation) | 277,834,234 | |
| Net gain (loss) | 432,525,620 | |
| Net increase (decrease) in net assets resulting from operations | $1,066,813,717 |
See accompanying notes which are an integral part of the financial statements.
Statement of Changes in Net Assets
| Six months ended November 30, 2020 (Unaudited) | Year ended May 31, 2020 | |
| Increase (Decrease) in Net Assets | ||
| Operations | ||
| Net investment income (loss) | $634,288,097 | $612,486,361 |
| Net realized gain (loss) | 154,691,386 | 904,314,719 |
| Change in net unrealized appreciation (depreciation) | 277,834,234 | 369,303,590 |
| Net increase (decrease) in net assets resulting from operations | 1,066,813,717 | 1,886,104,670 |
| Distributions to shareholders | (292,219,094) | (870,231,562) |
| Share transactions | ||
| Proceeds from sales of shares | 5,669,116,386 | 13,153,308,317 |
| Reinvestment of distributions | 287,794,210 | 789,311,102 |
| Cost of shares redeemed | (3,346,184,383) | (7,137,434,535) |
| Net increase (decrease) in net assets resulting from share transactions | 2,610,726,213 | 6,805,184,884 |
| Total increase (decrease) in net assets | 3,385,320,836 | 7,821,057,992 |
| Net Assets | ||
| Beginning of period | 24,774,314,702 | 16,953,256,710 |
| End of period | $28,159,635,538 | $24,774,314,702 |
| Other Information | ||
| Shares | ||
| Sold | 507,285,832 | 1,238,104,414 |
| Issued in reinvestment of distributions | 25,729,052 | 74,193,651 |
| Redeemed | (299,829,981) | (668,720,512) |
| Net increase (decrease) | 233,184,903 | 643,577,553 |
See accompanying notes which are an integral part of the financial statements.
Financial Highlights
Strategic Advisers Fidelity Core Income Fund
| Six months ended (Unaudited) November 30, | Years endedMay 31, | ||
| 2020 | 2020 | 2019 A | |
| Selected Per–Share Data | |||
| Net asset value, beginning of period | $10.95 | $10.47 | $10.00 |
| Income from Investment Operations | |||
| Net investment income (loss)B | .269 | .302 | .209 |
| Net realized and unrealized gain (loss) | .185 | .613 | .445 |
| Total from investment operations | .454 | .915 | .654 |
| Distributions from net investment income | (.124) | (.299) | (.182) |
| Distributions from net realized gain | – | (.136) | (.002) |
| Total distributions | (.124) | (.435) | (.184) |
| Net asset value, end of period | $11.28 | $10.95 | $10.47 |
| Total ReturnC,D | 4.16% | 8.94% | 6.60% |
| Ratios to Average Net AssetsE,F | |||
| Expenses before reductions | .32%G | .32% | .37%G |
| Expenses net of fee waivers, if any | .07%G | .07% | .12%G |
| Expenses net of all reductions | .07%G | .07% | .12%G |
| Net investment income (loss) | 4.80%G | 2.83% | 3.30%G |
| Supplemental Data | |||
| Net assets, end of period (000 omitted) | $28,159,636 | $24,774,315 | $16,953,257 |
| Portfolio turnover rateH | 186%G | 247% | 124%G,I |
A For the period October 16, 2018 (commencement of operations) to May 31, 2019.
B Calculated based on average shares outstanding during the period.
C Total returns for periods of less than one year are not annualized.
D Total returns would have been lower if certain expenses had not been reduced during the applicable periods shown.
E Fees and expenses of any underlying mutual funds or exchange-traded funds (ETFs) are not included in the Fund's expense ratio. The Fund indirectly bears its proportionate share of these expenses. For additional expense information related to investments in Fidelity Central Funds, please refer to the "Investments in Fidelity Central Funds" note found in the Notes to Financial Statements section of the most recent Annual or Semi-Annual report.
F Expense ratios reflect operating expenses of the class. Expenses before reductions do not reflect amounts reimbursed, waived, or reduced through arrangements with the investment advisor, brokerage services, or other offset arrangements, if applicable, and do not represent the amount paid by the class during periods when reimbursements, waivers or reductions occur.
G Annualized
H Amount does not include the portfolio activity of any underlying mutual funds or exchange-traded funds (ETFs).
I Portfolio turnover rate excludes securities received or delivered in-kind.
See accompanying notes which are an integral part of the financial statements.
Notes to Financial Statements (Unaudited)
For the period ended November 30, 2020
1. Organization.
Strategic Advisers Fidelity Core Income Fund (the Fund) is a fund of Fidelity Rutland Square Trust II (the Trust), and is authorized to issue an unlimited number of shares. The Trust is registered under the Investment Company Act of 1940, as amended (the 1940 Act), as an open-end management investment company organized as a Delaware statutory trust. The Fund is offered exclusively to certain clients of Strategic Advisers LLC (Strategic Advisers), an affiliate of Fidelity Management & Research Company LLC (FMR).
2. Significant Accounting Policies.
The Fund is an investment company and applies the accounting and reporting guidance of the Financial Accounting Standards Board (FASB) Accounting Standards Codification Topic 946 Financial Services – Investment Companies. The financial statements have been prepared in conformity with accounting principles generally accepted in the United States of America (GAAP), which require management to make certain estimates and assumptions at the date of the financial statements. Actual results could differ from those estimates. Subsequent events, if any, through the date that the financial statements were issued have been evaluated in the preparation of the financial statements. The following summarizes the significant accounting policies of the Fund:
Investment Valuation. Investments are valued as of 4:00 p.m. Eastern time on the last calendar day of the period. The Board of Trustees (the Board) has delegated the day to day responsibility for the valuation of the Fund's investments to the Fair Value Committee (the Committee) established by the Fund's investment adviser. In accordance with valuation policies and procedures approved by the Board, the Fund attempts to obtain prices from one or more third party pricing vendors or brokers to value its investments. When current market prices, quotations or currency exchange rates are not readily available or reliable, investments will be fair valued in good faith by the Committee, in accordance with procedures adopted by the Board. Factors used in determining fair value vary by investment type and may include market or investment specific events, changes in interest rates and credit quality. The frequency with which these procedures are used cannot be predicted and they may be utilized to a significant extent. The Committee oversees the Fund's valuation policies and procedures and reports to the Board on the Committee's activities and fair value determinations. The Board monitors the appropriateness of the procedures used in valuing the Fund's investments and ratifies the fair value determinations of the Committee.
The Fund categorizes the inputs to valuation techniques used to value its investments into a disclosure hierarchy consisting of three levels as shown below:
- Level 1 – quoted prices in active markets for identical investments
- Level 2 – other significant observable inputs (including quoted prices for similar investments, interest rates, prepayment speeds, etc.)
- Level 3 – unobservable inputs (including the Fund's own assumptions based on the best information available)
Valuation techniques used to value the Fund's investments by major category are as follows:
Debt securities, including restricted securities, are valued based on evaluated prices received from third party pricing vendors or from brokers who make markets in such securities. Corporate bonds, bank notes, foreign government and government agency obligations, municipal securities, preferred securities and U.S. government and government agency obligations are valued by pricing vendors who utilize matrix pricing which considers yield or price of bonds of comparable quality, coupon, maturity and type or by broker-supplied prices. Asset backed securities, collateralized mortgage obligations, commercial mortgage securities and U.S. government agency mortgage securities are valued by pricing vendors who utilize matrix pricing which considers prepayment speed assumptions, attributes of the collateral, yield or price of bonds of comparable quality, coupon, maturity and type or by broker-supplied prices. Swaps are marked-to-market daily based on valuations from third party pricing vendors, registered derivatives clearing organizations (clearinghouses) or broker-supplied valuations. These pricing sources may utilize inputs such as interest rate curves, credit spread curves, default possibilities and recovery rates. When independent prices are unavailable or unreliable, debt securities and swaps may be valued utilizing pricing methodologies which consider similar factors that would be used by third party pricing vendors. Debt securities and swaps are generally categorized as Level 2 in the hierarchy but may be Level 3 depending on the circumstances.
Futures contracts are valued at the settlement price established each day by the board of trade or exchange on which they are traded and are categorized as Level 1 in the hierarchy. Options traded over-the-counter are valued using vendor or broker-supplied valuations and are categorized as Level 2 in the hierarchy. Investments in open-end mutual funds, including the Fidelity Central Funds, are valued at their closing net asset value (NAV) each business day and are categorized as Level 1 in the hierarchy.
Changes in valuation techniques may result in transfers in or out of an assigned level within the disclosure hierarchy. The aggregate value of investments by input level as of November 30, 2020 is included at the end of the Fund's Schedule of Investments.
Investment Transactions and Income. For financial reporting purposes, the Fund's investment holdings and NAV include trades executed through the end of the last business day of the period. The NAV per share for processing shareholder transactions is calculated as of the close of business of the New York Stock Exchange (NYSE), normally 4:00 p.m. Eastern time and includes trades executed through the end of the prior business day. Gains and losses on securities sold are determined on the basis of identified cost. Dividend income is recorded on the ex-dividend date, except for certain dividends from foreign securities where the ex-dividend date may have passed, which are recorded as soon as the Fund is informed of the ex-dividend date. Non-cash dividends included in dividend income, if any, are recorded at the fair market value of the securities received. Income and capital gain distributions from Fidelity Central Funds, if any, are recorded on the ex-dividend date. Income and capital gain distributions from any underlying mutual funds or exchange-traded funds (ETFs) are recorded on the ex-dividend date. Certain distributions received by the Fund represent a return of capital or capital gain. The Fund determines the components of these distributions subsequent to the ex-dividend date, based upon receipt of tax filings or other correspondence relating to the underlying investment. These distributions are recorded as a reduction of cost of investments and/or as a realized gain. Interest income is accrued as earned and includes coupon interest and amortization of premium and accretion of discount on debt securities as applicable. Debt obligations may be placed on non-accrual status and related interest income may be reduced by ceasing current accruals and writing off interest receivables when the collection of all or a portion of interest has become doubtful based on consistently applied procedures. A debt obligation is removed from non-accrual status when the issuer resumes interest payments or when collectability of interest is reasonably assured.
Expenses. Expenses directly attributable to a fund are charged to that fund. Expenses attributable to more than one fund are allocated among the respective funds on the basis of relative net assets or other appropriate methods. Expense estimates are accrued in the period to which they relate and adjustments are made when actual amounts are known.
Deferred Trustee Compensation. Under a Deferred Compensation Plan (the Plan) for certain Funds, certain independent Trustees have elected to defer receipt of a portion of their annual compensation. Deferred amounts are invested in affiliated mutual funds, are marked-to-market and remain in a fund until distributed in accordance with the Plan. The investment of deferred amounts and the offsetting payable to the Trustees presented below are included in the accompanying Statement of Assets and Liabilities in other receivables and other payables and accrued expenses, as applicable.
| Strategic Advisers Fidelity Core Income Fund | $2,017 |
Income Tax Information and Distributions to Shareholders. Each year, the Fund intends to qualify as a regulated investment company under Subchapter M of the Internal Revenue Code, including distributing substantially all of its taxable income and realized gains. As a result, no provision for U.S. Federal income taxes is required. The Fund files a U.S. federal tax return, in addition to state and local tax returns as required. The Fund's federal income tax returns are subject to examination by the Internal Revenue Service (IRS) for a period of three fiscal years after they are filed. State and local tax returns may be subject to examination for an additional fiscal year depending on the jurisdiction.
Distributions are declared and recorded daily and paid monthly from net investment income. Distributions from realized gains, if any, are declared and recorded on the ex-dividend date. Income and capital gain distributions are determined in accordance with income tax regulations, which may differ from GAAP.
Capital accounts within the financial statements are adjusted for permanent book-tax differences. These adjustments have no impact on net assets or the results of operations. Capital accounts are not adjusted for temporary book-tax differences which will reverse in a subsequent period.
Book-tax differences are primarily due to short-term gain distributions from the Underlying funds, swaps, futures and options transactions, market discount, partnerships, deferred trustees compensation and losses deferred due to wash sales and futures transactions.
As of period end, the cost and unrealized appreciation (depreciation) in securities, and derivatives if applicable, for federal income tax purposes were as follows:
| Gross unrealized appreciation | $1,369,774,515 |
| Gross unrealized depreciation | (120,762,282) |
| Net unrealized appreciation (depreciation) | $1,249,012,233 |
| Tax cost | $29,928,657,461 |
Delayed Delivery Transactions and When-Issued Securities. During the period, certain Funds transacted in securities on a delayed delivery or when-issued basis. Payment and delivery may take place after the customary settlement period for that security. The price of the underlying securities and the date when the securities will be delivered and paid for are fixed at the time the transaction is negotiated. Securities purchased on a delayed delivery or when-issued basis are identified as such in the Schedule of Investments. Compensation for interest forgone in the purchase of a delayed delivery or when-issued debt security may be received. With respect to purchase commitments, each applicable Fund identifies securities as segregated in its records with a value at least equal to the amount of the commitment. Payables and receivables associated with the purchases and sales of delayed delivery securities having the same coupon, settlement date and broker are offset. Delayed delivery or when-issued securities that have been purchased from and sold to different brokers are reflected as both payables and receivables in the Statement of Assets and Liabilities under the caption "Delayed delivery", as applicable. Losses may arise due to changes in the value of the underlying securities or if the counterparty does not perform under the contract's terms, or if the issuer does not issue the securities due to political, economic, or other factors.
To-Be-Announced (TBA) Securities and Mortgage Dollar Rolls. During the period, the Fund transacted in TBA securities that involved buying or selling mortgage-backed securities (MBS) on a forward commitment basis. A TBA transaction typically does not designate the actual security to be delivered and only includes an approximate principal amount; however delivered securities must meet specified terms defined by industry guidelines, including issuer, rate and current principal amount outstanding on underlying mortgage pools. The Fund may enter into a TBA transaction with the intent to take possession of or deliver the underlying MBS, or the Fund may elect to extend the settlement by entering into either a mortgage or reverse mortgage dollar roll. Mortgage dollar rolls are transactions where a fund sells TBA securities and simultaneously agrees to repurchase MBS on a later date at a lower price and with the same counterparty. Reverse mortgage dollar rolls involve the purchase and simultaneous agreement to sell TBA securities on a later date at a lower price. Transactions in mortgage dollar rolls and reverse mortgage dollar rolls are accounted for as purchases and sales and may result in an increase to the Fund's portfolio turnover rate.
Purchases and sales of TBA securities involve risks similar to those discussed above for delayed delivery and when-issued securities. Also, if the counterparty in a mortgage dollar roll or a reverse mortgage dollar roll transaction files for bankruptcy or becomes insolvent, the Fund's right to repurchase or sell securities may be limited. Additionally, when a fund sells TBA securities without already owning or having the right to obtain the deliverable securities (an uncovered forward commitment to sell), it incurs a risk of loss because it could have to purchase the securities at a price that is higher than the price at which it sold them. A fund may be unable to purchase the deliverable securities if the corresponding market is illiquid.
TBA securities subject to a forward commitment to sell at period end are included at the end of the Fund's Schedule of Investments under the caption "TBA Sale Commitments." The proceeds and value of these commitments are reflected in the Fund's Statement of Assets and Liabilities as Receivable for TBA sale commitments and TBA sale commitments, at value, respectively.
Restricted Securities (including Private Placements). The Fund may invest in securities that are subject to legal or contractual restrictions on resale. These securities generally may be resold in transactions exempt from registration or to the public if the securities are registered. Disposal of these securities may involve time-consuming negotiations and expense, and prompt sale at an acceptable price may be difficult. Information regarding restricted securities is included at the end of the Fund's Schedule of Investments.
3. Derivative Instruments.
Risk Exposures and the Use of Derivative Instruments. The Fund's investment objective allows the Fund to enter into various types of derivative contracts, including futures contracts, options and swaps. Derivatives are investments whose value is primarily derived from underlying assets, indices or reference rates and may be transacted on an exchange or over-the-counter (OTC). Derivatives may involve a future commitment to buy or sell a specified asset based on specified terms, to exchange future cash flows at periodic intervals based on a notional principal amount, or for one party to make one or more payments upon the occurrence of specified events in exchange for periodic payments from the other party.
The Fund used derivatives to increase returns, to gain exposure to certain types of assets and to manage exposure to certain risks as defined below. The success of any strategy involving derivatives depends on analysis of numerous economic factors, and if the strategies for investment do not work as intended, the Fund may not achieve its objectives.
The Fund's use of derivatives increased or decreased its exposure to the following risks:
| Credit Risk | Credit risk relates to the ability of the issuer of a financial instrument to make further principal or interest payments on an obligation or commitment that it has to the Fund. |
| Interest Rate Risk | Interest rate risk relates to the fluctuations in the value of interest-bearing securities due to changes in the prevailing levels of market interest rates. |
The Fund is also exposed to additional risks from investing in derivatives, such as liquidity risk and counterparty credit risk. Liquidity risk is the risk that the Fund will be unable to close out the derivative in the open market in a timely manner. Counterparty credit risk is the risk that the counterparty will not be able to fulfill its obligation to the Fund. Derivative counterparty credit risk is managed through formal evaluation of the creditworthiness of all potential counterparties. On certain OTC derivatives such as options and bi-lateral swaps, the Fund attempts to reduce its exposure to counterparty credit risk by entering into an International Swaps and Derivatives Association, Inc. (ISDA) Master Agreement with each of its counterparties. The ISDA Master Agreement gives the Fund the right to terminate all transactions traded under such agreement upon the deterioration in the credit quality of the counterparty beyond specified levels. The ISDA Master Agreement gives each party the right, upon an event of default by the other party or a termination of the agreement, to close out all transactions traded under such agreement and to net amounts owed under each transaction to one net payable by one party to the other. To mitigate counterparty credit risk on bi-lateral OTC derivatives, the Fund receives collateral in the form of cash or securities once the Fund's net unrealized appreciation on outstanding derivative contracts under an ISDA Master Agreement exceeds certain applicable thresholds, subject to certain minimum transfer provisions. The collateral received is held in segregated accounts with the Fund's custodian bank in accordance with the collateral agreements entered into between the Fund, the counterparty and the Fund's custodian bank. The Fund could experience delays and costs in gaining access to the collateral even though it is held by the Fund's custodian bank. The Fund's maximum risk of loss from counterparty credit risk related to bi-lateral OTC derivatives is generally the aggregate unrealized appreciation and unpaid counterparty payments in excess of any collateral pledged by the counterparty to the Fund. For OTC written options with upfront premiums received, the Fund is obligated to perform and therefore does not have counterparty risk. For OTC written options with premiums to be received at a future date, the maximum risk of loss from counterparty credit risk is the amount of the premium in excess of any collateral pledged by the counterparty. The Fund may be required to pledge collateral for the benefit of the counterparties on bi-lateral OTC derivatives in an amount not less than each counterparty's unrealized appreciation on outstanding derivative contracts, subject to certain minimum transfer provisions, and any such pledged collateral is identified in the Schedule of Investments. Exchange-traded futures contracts are not covered by the ISDA Master Agreement; however counterparty credit risk related to exchange-traded futures contracts may be mitigated by the protection provided by the exchange on which they trade. Counterparty credit risk related to centrally cleared OTC swaps may be mitigated by the protection provided by the clearinghouse.
Investing in derivatives may involve greater risks than investing in the underlying assets directly and, to varying degrees, may involve risk of loss in excess of any initial investment and collateral received and amounts recognized in the Statement of Assets and Liabilities. In addition, there may be the risk that the change in value of the derivative contract does not correspond to the change in value of the underlying instrument.
Net Realized Gain (Loss) and Change in Net Unrealized Appreciation (Depreciation) on Derivatives. The table below, which reflects the impacts of derivatives on the financial performance of the Fund, summarizes the net realized gain (loss) and change in net unrealized appreciation (depreciation) for derivatives during the period as presented in the Statement of Operations.
| Primary Risk Exposure / Derivative Type | Net Realized Gain (Loss) | Change in Net Unrealized Appreciation (Depreciation) |
| Credit Risk | ||
| Swaps | $145,651 | $(629,559) |
| Total Credit Risk | $145,651 | $(629,559) |
| Interest Rate Risk | ||
| Futures Contracts | (268,926) | 609,171 |
| Purchased Options | (740,246) | (1,858,091) |
| Swaps | – | (75,725) |
| Written Options | (124,920) | 264,890 |
| Total Interest Rate Risk | $(1,134,092) | $(1,059,755) |
| Totals | $(988,441) | $(1,689,314) |
A summary of the value of derivatives by primary risk exposure as of period end is included at the end of the Schedule of Investments.
Futures Contracts. A futures contract is an agreement between two parties to buy or sell a specified underlying instrument for a fixed price at a specified future date. The Fund used futures contracts to manage its exposure to the bond market and fluctuations in interest rates.
Upon entering into a futures contract, a fund is required to deposit either cash or securities (initial margin) with a clearing broker in an amount equal to a certain percentage of the face value of the contract. Futures contracts are marked-to-market daily and subsequent daily payments (variation margin) are made or received by a fund depending on the daily fluctuations in the value of the futures contracts and are recorded as unrealized appreciation or (depreciation). This receivable and/or payable, if any, is included in daily variation margin on futures contracts in the Statement of Assets and Liabilities. Realized gain or (loss) is recorded upon the expiration or closing of a futures contract. The net realized gain (loss) and change in net unrealized appreciation (depreciation) on futures contracts during the period is presented in the Statement of Operations.
Any open futures contracts at period end are presented in the Schedule of Investments under the caption "Futures Contracts". The notional amount at value reflects each contract's exposure to the underlying instrument or index at period end and is representative of volume of activity during the period. Securities deposited to meet initial margin requirements are identified in the Schedule of Investments.
Options. Options give the purchaser the right, but not the obligation, to buy (call) or sell (put) an underlying security or financial instrument at an agreed exercise or strike price between or on certain dates. Options obligate the seller (writer) to buy (put) or sell (call) an underlying instrument at the exercise or strike price or cash settle an underlying derivative instrument if the holder exercises the option on or before the expiration date. The Fund uses OTC options, such as swaptions, which are options where the underlying instrument is a swap, to manage its exposure to fluctuations in interest rates.
Upon entering into an options contract, a fund will pay or receive a premium. Premiums paid on purchased options are reflected as cost of investments and premiums received on written options are reflected as a liability on the Statement of Assets and Liabilities. Certain options may be purchased or written with premiums to be paid or received on a future date. Options are valued daily and any unrealized appreciation (depreciation) is reflected on the Statement of Assets and Liabilities. When an option is exercised, the cost or proceeds of the underlying instrument purchased or sold is adjusted by the amount of the premium. When an option is closed the Fund will realize a gain or loss depending on whether the proceeds or amount paid for the closing sale transaction is greater or less than the premium received or paid. When an option expires, gains and losses are realized to the extent of premiums received and paid, respectively. The net realized and unrealized gains (losses) on purchased options are included in the Statement of Operations in net realized gain (loss) and change in net unrealized appreciation (depreciation) on investment securities. The net realized gain (loss) and change in net unrealized appreciation (depreciation) on written options are presented in the Statement of Operations.
Any open options at period end are presented in the Schedule of Investments under the captions "Purchased Options," "Purchased Swaptions," "Written Options" and "Written Swaptions," as applicable, and are representative of volume of activity during the period.
Writing puts and buying calls tend to increase exposure to the underlying instrument while buying puts and writing calls tend to decrease exposure to the underlying instrument. For purchased options, risk of loss is limited to the premium paid, and for written options, risk of loss is the change in value in excess of the premium received.
Swaps. A swap is a contract between two parties to exchange future cash flows at periodic intervals based on a notional principal amount. A bi-lateral OTC swap is a transaction between a fund and a dealer counterparty where cash flows are exchanged between the two parties for the life of the swap. A centrally cleared OTC swap is a transaction executed between a fund and a dealer counterparty, then cleared by a futures commission merchant (FCM) through a clearinghouse. Once cleared, the clearinghouse serves as a central counterparty, with whom a fund exchanges cash flows for the life of the transaction, similar to transactions in futures contracts.
Bi-lateral OTC swaps are marked-to-market daily and changes in value are reflected in the Statement of Assets and Liabilities in the bi-lateral OTC swaps at value line items. Any upfront premiums paid or received upon entering a bi-lateral OTC swap to compensate for differences between stated terms of the swap and prevailing market conditions (e.g. credit spreads, interest rates or other factors) are recorded in net unrealized appreciation (depreciation) in the Statement of Assets and Liabilities and amortized to realized gain or (loss) ratably over the term of the swap. Any unamortized upfront premiums are presented in the Schedule of Investments.
Centrally cleared OTC swaps require a fund to deposit either cash or securities (initial margin) with the FCM, at the instruction of and for the benefit of the clearinghouse. Securities deposited to meet initial margin requirements are identified in the Schedule of Investments. Centrally cleared OTC swaps are marked-to-market daily and subsequent payments (variation margin) are made or received depending on the daily fluctuations in the value of the swaps and are recorded as unrealized appreciation or (depreciation). These daily payments, if any, are included in receivable or payable for daily variation margin on centrally cleared OTC swaps in the Statement of Assets and Liabilities. Any premiums for centrally cleared OTC swaps are recorded periodically throughout the term of the swap to variation margin and included in unrealized appreciation (depreciation) in the Statement of Assets and Liabilities. Any premiums are recognized as realized gain (loss) upon termination or maturity of the swap.
For both bi-lateral and centrally cleared OTC swaps, payments are exchanged at specified intervals, accrued daily commencing with the effective date of the contract and recorded as realized gain or (loss). Some swaps may be terminated prior to the effective date and realize a gain or loss upon termination. The net realized gain (loss) and change in net unrealized appreciation (depreciation) on swaps during the period is presented in the Statement of Operations.
Any open swaps at period end are included in the Schedule of Investments under the caption "Swaps" and are representative of volume of activity during the period.
Credit Default Swaps. Credit default swaps enable the Fund to buy or sell protection against specified credit events on a single-name issuer or a traded credit index. Under the terms of a credit default swap the buyer of protection (buyer) receives credit protection in exchange for making periodic payments to the seller of protection (seller) based on a fixed percentage applied to a notional principal amount. In return for these payments, the seller will be required to make a payment upon the occurrence of one or more specified credit events. The Fund enters into credit default swaps as a seller to gain credit exposure to an issuer and/or as a buyer to obtain a measure of protection against defaults of an issuer. Periodic payments are made over the life of the contract by the buyer provided that no credit event occurs.
For credit default swaps on most corporate and sovereign issuers, credit events include bankruptcy, failure to pay or repudiation/moratorium. For credit default swaps on corporate or sovereign issuers, the obligation that may be put to the seller is not limited to the specific reference obligation described in the Schedule of Investments. For credit default swaps on asset-backed securities, a credit event may be triggered by events such as failure to pay principal, maturity extension, rating downgrade or write-down. For credit default swaps on asset-backed securities, the reference obligation described represents the security that may be put to the seller. For credit default swaps on a traded credit index, a specified credit event may affect all or individual underlying securities included in the index.
As a seller, if an underlying credit event occurs, the Fund will pay a net settlement amount of cash equal to the notional amount of the swap less the recovery value of the reference obligation or underlying securities comprising an index. Only in the event of the industry's inability to value the underlying asset will the Fund be required to take delivery of the reference obligation or underlying securities comprising an index and pay an amount equal to the notional amount of the swap.
As a buyer, if an underlying credit event occurs, the Fund will receive a net settlement amount of cash equal to the notional amount of the swap less the recovery value of the reference obligation or underlying securities comprising an index. Only in the event of the industry's inability to value the underlying asset will the Fund be required to deliver the reference obligation or underlying securities comprising an index in exchange for payment of an amount equal to the notional amount of the swap.
Typically, the value of each credit default swap and credit rating disclosed for each reference obligation in the Schedule of Investments, where the Fund is the seller[[s]], can be used as measures of the current payment/performance risk of the swap. As the value of the swap changes as a positive or negative percentage of the total notional amount, the payment/performance risk may decrease or increase, respectively. In addition to these measures, the investment adviser monitors a variety of factors including cash flow assumptions, market activity and market sentiment as part of its ongoing process of assessing payment/performance risk.
Interest Rate Swaps. Interest rate swaps are agreements between counterparties to exchange cash flows, one based on a fixed rate, and the other on a floating rate. The Fund entered into interest rate swaps to manage its exposure to interest rate changes. Changes in interest rates can have an effect on both the value of bond holdings as well as the amount of interest income earned. In general, the value of bonds can fall when interest rates rise and can rise when interest rates fall.
4. Purchases and Sales of Investments.
Purchases and sales of securities, other than short-term securities and U.S. government securities are noted in the table below.
| Purchases ($) | Sales ($) | |
| Strategic Advisers Fidelity Core Income Fund | 19,081,811,183 | 18,302,777,646 |
5. Fees and Other Transactions with Affiliates.
Management Fee. Strategic Advisers (the investment adviser) provides the Fund with investment management related services. For these services, the Fund pays a monthly management fee to the investment adviser. The management fee is calculated by adding the annual management fee rate of .25% of the Fund's average net assets throughout the month payable to the investment adviser to the aggregate of the fee rates, payable monthly, to the Fund's sub-advisers. The Fund's maximum aggregate management fee will not exceed .60% of the Fund's average net assets. For the reporting period, the total annualized management fee rate was .31% of the Fund's average net assets.
During the period, the investment adviser waived a portion of its management fee as described in the Expense Reductions note.
Sub-Adviser. FIAM LLC (an affiliate of the investment adviser) served as a sub-adviser for the Fund during the period. Sub-advisers provide discretionary investment advisory services for their allocated portion of the Fund's assets and are paid by the investment adviser and not the Fund for providing these services.
Interfund Trades. Funds may purchase from or sell securities to other funds affiliated with each sub-adviser under procedures adopted by the Board. The procedures have been designed to ensure these interfund trades are executed in accordance with Rule 17a-7 of the 1940 Act. Interfund trades are included within the respective purchases and sales amounts shown in the Purchases and Sales of Investments note.
Prior Fiscal Year Reallocation of Underlying Fund Investments. During the prior period, the investment adviser reallocated investments of the Fund. This involved a taxable redemption of the Fund's interest in Fidelity Specialized High Income Central Fund. The Fund redeemed 2,350,309 shares of Fidelity Specialized High Income Central Fund in exchange for investments, including accrued interest, and cash with a value of $238,156,796. The Fund realized gains of $9,525,452 on the Fund's redemptions of Fidelity Specialized High Income Central Fund shares. The Fund recognized net gains on the exchanges for federal income tax purposes.
6. Investments in Fidelity Central Funds.
The Fund invests in Fidelity Central Funds, which are open-end investment companies available only to other investment companies and accounts managed by the investment adviser and its affiliates. The Fund's Schedule of Investments lists each of the Fidelity Central Funds held as of period end, if any, as an investment of the Fund, but does not include the underlying holdings of each Fidelity Central Fund. As an Investing Fund, the Fund indirectly bears its proportionate share of the expenses of the underlying Fidelity Central Funds.
The Fidelity Money Market Central Funds are managed by FMR. Annualized expenses of the Money Market Central Funds as of their most recent shareholder report date ranged from less than .005% to .01%.
A complete unaudited list of holdings for each Fidelity Central Fund is available upon request or at the Securities and Exchange Commission (the SEC) website at www.sec.gov. In addition, the financial statements of the Fidelity Central Funds are available on the SEC website or upon request.
7. Committed Line of Credit.
Certain Funds participate with other funds managed by the investment adviser or an affiliate in a $4.25 billion credit facility (the "line of credit") to be utilized for temporary or emergency purposes to fund shareholder redemptions or for other short-term liquidity purposes. The participating funds have agreed to pay commitment fees on their pro-rata portion of the line of credit, which are reflected in Miscellaneous expenses on the Statement of Operations, and are as follows:
| Amount | |
| Strategic Advisers Fidelity Core Income Fund | $28,283 |
During the period, there were no borrowings on this line of credit.
8. Expense Reductions.
The investment adviser has contractually agreed to waive the Fund's management fee in an amount equal to .25% of the Fund's average net assets until September 30, 2023. During the period, this waiver reduced the Fund's management fee by $ 32,962,013.
9. Other.
The Fund's organizational documents provide former and current trustees and officers with a limited indemnification against liabilities arising in connection with the performance of their duties to the Fund. In the normal course of business, the Fund may also enter into contracts that provide general indemnifications. The Fund's maximum exposure under these arrangements is unknown as this would be dependent on future claims that may be made against the Fund. The risk of material loss from such claims is considered remote.
The Fund does not invest in the Underlying Funds for the purpose of exercising management or control; however, investments by the Fund within its principal investment strategies may represent a significant portion of an Underlying Fund's net assets. At the end of the period, the Fund was the owner of record of 10% or more of the total outstanding shares of the following Underlying Funds.
| Fund | % of shares held |
| Fidelity Corporate Bond Fund | 18% |
| Fidelity Global Credit Fund | 28% |
| Fidelity SAI Long-Term Treasury Bond Index Fund | 100% |
| Fidelity SAI Total Bond Fund | 61% |
| Fidelity Sustainability Bond Index Fund | 13% |
10. Coronavirus (COVID-19) Pandemic.
An outbreak of COVID-19 first detected in China during December 2019 has since spread globally and was declared a pandemic by the World Health Organization during March 2020. Developments that disrupt global economies and financial markets, such as the COVID-19 pandemic, may magnify factors that affect the Fund's performance.
Shareholder Expense Example
As a shareholder, you incur two types of costs: (1) transaction costs, which may include sales charges (loads) on purchase payments or redemption proceeds, as applicable and (2) ongoing costs, which generally include management fees, distribution and/or service (12b-1) fees and other Fund expenses. This Example is intended to help you understand your ongoing costs (in dollars) of investing in a fund and to compare these costs with the ongoing costs of investing in other mutual funds.
The Example is based on an investment of $1,000 invested at the beginning of the period and held for the entire period (June 1, 2020 to November 30, 2020).
Actual Expenses
The first line of the accompanying table provides information about actual account values and actual expenses. You may use the information in this line, together with the amount you invested, to estimate the expenses that you paid over the period. Simply divide your account value by $1,000.00 (for example, an $8,600 account value divided by $1,000.00 = 8.6), then multiply the result by the number in the first line for a class/Fund under the heading entitled "Expenses Paid During Period" to estimate the expenses you paid on your account during this period. If any fund is a shareholder of any underlying mutual funds or exchange-traded funds (ETFs) (the Underlying Funds), such fund indirectly bears its proportional share of the expenses of the Underlying Funds in addition to the direct expenses incurred presented in the table. These fees and expenses are not included in the annualized expense ratio used to calculate the expense estimate in the table below.
Hypothetical Example for Comparison Purposes
The second line of the accompanying table provides information about hypothetical account values and hypothetical expenses based on the actual expense ratio and an assumed rate of return of 5% per year before expenses, which is not the actual return. The hypothetical account values and expenses may not be used to estimate the actual ending account balance or expenses you paid for the period. You may use this information to compare the ongoing costs of investing in the Fund and other funds. To do so, compare this 5% hypothetical example with the 5% hypothetical examples that appear in the shareholder reports of the other funds. If any fund is a shareholder of any Underlying Funds, such fund indirectly bears its proportional share of the expenses of the Underlying Funds in addition to the direct expenses as presented in the table. These fees and expenses are not included in the annualized expense ratio used to calculate the expense estimate in the table below.
Please note that the expenses shown in the table are meant to highlight your ongoing costs only and do not reflect any transaction costs. Therefore, the second line of the table is useful in comparing ongoing costs only, and will not help you determine the relative total costs of owning different funds.
| Annualized Expense Ratio-A | Beginning Account Value June 1, 2020 | Ending Account Value November 30, 2020 | Expenses Paid During Period-B June 1, 2020 to November 30, 2020 | |
| Strategic Advisers Fidelity Core Income Fund | .07% | |||
| Actual | $1,000.00 | $1,041.60 | $.36 | |
| Hypothetical-C | $1,000.00 | $1,024.72 | $.36 |
A Annualized expense ratio reflects expenses net of applicable fee waivers.
B Expenses are equal to the annualized expense ratio, multiplied by the average account value over the period, multiplied by 183/ 365 (to reflect the one-half year period). The fees and expenses of any Underlying Funds are not included in each annualized expense ratio.
C 5% return per year before expenses
Board Approval of Investment Advisory Contracts and Management Fees
Strategic Advisers Fidelity Core Income Fund
Each year, the Board of Trustees, including the Independent Trustees (together, the Board), votes at a meeting on the renewal of the management contract with Strategic Advisers LLC (Strategic Advisers) and the sub-advisory agreement with FIAM LLC (the Sub-Adviser) (the Sub-Advisory Agreement), and the sub-sub-advisory agreements with FMR Investment Management (UK) Limited, Fidelity Management & Research (Japan) Limited, and Fidelity Management & Research (Hong Kong) Limited (together, the Sub-Sub-Advisory Agreements and, together with the management contract and the Sub-Advisory Agreement, the Advisory Contracts) for the fund. Strategic Advisers and the Sub-Adviser are referred to herein as the Investment Advisers. The Board, assisted by the advice of fund counsel and Independent Trustees' counsel, requests and considers a broad range of information relevant to the renewal of the Advisory Contracts throughout the year.The Board meets at least four times per year and, at each of its meetings, covers an extensive agenda of topics and materials and considers factors that are relevant to its annual consideration of the renewal of the fund's Advisory Contracts, including the services and support provided to the fund and its shareholders. The full Board or the Independent Trustees, as appropriate, act on all major matters; however, a portion of the activities of the Board (including certain of those described herein) may be conducted through standing committees that have been established by the Board. The Board, acting directly and through its committees, requests and receives information concerning the annual consideration of the renewal of the fund's Advisory Contracts.At its September 2020 meeting, the Board, including the Independent Trustees, unanimously determined to renew the fund's Advisory Contracts. In reaching its determination to renew the fund's Advisory Contracts, the Board considered all factors it believed relevant, including (i) the nature, extent, and quality of the services provided to the fund and its shareholders (including the investment performance of the fund); (ii) the competitiveness of the fund's management fee and total expenses relative to peer funds; (iii) the total costs of the services provided by and the profits, if any, realized by Strategic Advisers from its relationships with the fund; and (iv) the extent to which, if any, economies of scale exist and are realized as the fund grows and whether any economies of scale are appropriately shared with fund shareholders.In considering whether to renew the Advisory Contracts for the fund, the Board reached a determination, with the assistance of fund counsel and Independent Trustees' counsel and through the exercise of its business judgment, that the renewal of the Advisory Contracts is in the best interests of the fund and its shareholders. In addition, with respect to the Sub-Advisory Agreement, the Board also concluded that the renewal of the agreement does not involve a conflict of interest from which Strategic Advisers or its affiliates derive an inappropriate advantage. Also, the Board found that the advisory fees charged under the Advisory Contracts bear a reasonable relationship to the services rendered and are based on services provided that are in addition to, rather than duplicative of, services provided under the advisory contract of any underlying fund in which the fund may invest. The Board's decision to renew the Advisory Contracts was not based on any single factor, but rather was based on a comprehensive consideration of all the information provided to the Board throughout the year.Nature, Extent, and Quality of Services Provided. The Board considered the staffing within the Investment Advisers, including the backgrounds of the fund's investment personnel and also considered the fund's investment objective, strategies, and related investment philosophy. The Independent Trustees also had discussions with senior management of Strategic Advisers' investment operations and investment groups. The Board considered the structure of each Investment Adviser's investment personnel compensation program and whether such structures provide appropriate incentives to act in the best interests of the fund.The Trustees also discussed with representatives of Strategic Advisers, at meetings throughout the year, Strategic Advisers' role in, among other things, (i) setting, implementing and monitoring the investment strategies for the funds; (ii) identifying and recommending sub-advisers for the funds; (iii) overseeing compliance with federal securities laws by each sub-adviser with respect to the portion of fund assets allocated to the sub-adviser; (iv) monitoring and overseeing the performance and investment capabilities of each sub-adviser; and (v) recommending the replacement of a sub-adviser as appropriate. The Trustees considered that the Board had received from Strategic Advisers substantial information and periodic reports about Strategic Advisers' sub-adviser oversight and due diligence processes, as well as periodic reports regarding the performance of each sub-adviser.The Board also considered the nature, extent and quality of services provided by the Sub-Adviser. The Trustees noted that under the Sub-Advisory Agreement subject to oversight by Strategic Advisers, the Sub-Adviser is responsible for, among other things, identifying investments for the portion of fund assets allocated to the Sub-Adviser, if any, and executing portfolio transactions to implement its investment strategy. In addition, the Trustees noted that the Sub-Adviser is responsible for providing such reporting as may be requested from Strategic Advisers to fulfill its oversight responsibilities discussed above.Resources Dedicated to Investment Management and Support Services. The Board reviewed the general qualifications and capabilities of the Investment Advisers' investment staffs, their use of technology, and the Investment Advisers' approach to managing and compensating investment personnel. The Board noted that the Investment Advisers' analysts have extensive resources, tools, and capabilities that allow them to conduct sophisticated quantitative and/or fundamental analysis. Additionally, in its deliberations, the Board considered the Investment Advisers' trading capabilities and resources and global compliance infrastructure, which are integral parts of the investment management process. The Board also considered the Investment Advisers' investments in business continuity planning, and their success in continuously providing services to the fund notwithstanding the severe disruptions caused by the COVID-19 pandemic.Shareholder and Administrative Services. The Board considered (i) the nature, extent, quality, and cost of administrative and shareholder services performed by Strategic Advisers and itsaffiliates under the management contract and under separate agreements covering transfer agency, pricing and bookkeeping, and securities lending services for the fund; (ii) the nature and extent of Strategic Advisers' supervision of third party service providers, including sub-advisers, custodians and subcustodians; and (iii) the resources devoted to, and the record of compliance with, the fund's compliance policies and procedures.Investment Performance. The Board considered whether the fund has operated in accordance with its investment objective, as well as its record of compliance with its investment restrictions and its performance history.In connection with the renewal of the Advisory Contracts, the Board considered annualized return information for the fund for different time periods, measured against an appropriate securities market index ("benchmark index") and a peer group of mutual funds with similar objectives ("peer group").The Board considered discussions that occur at Board meetings throughout the year with representatives of Strategic Advisers about fund investment performance and the performance of each Sub-Adviser as part of regularly scheduled fund reviews and other reports to the Board on fund performance, taking into account various factors including general market conditions. In its discussions with representatives of Strategic Advisers regarding fund performance, the Board gave particular attention to information indicating underperformance of certain funds for specific time periods and discussed with Strategic Advisers the reasons for any such underperformance.The following chart considered by the Board shows, over the one-year period ended December 31, 2019, the cumulative total returns of the fund and the cumulative total returns of an appropriate benchmark index and peer group. The box within the chart shows the 25th percentile return (75% beaten, top of box) and the 75th percentile return (25% beaten, bottom of box) of the peer group. Returns shown above the box are in the first quartile and returns shown below the box are in the fourth quartile. The percentage beaten number noted below each chart corresponds to the percentile box and represents the percentage of funds in the peer group whose performance was equal to or lower than that of the fund.Strategic Advisers Fidelity Core Income Fund
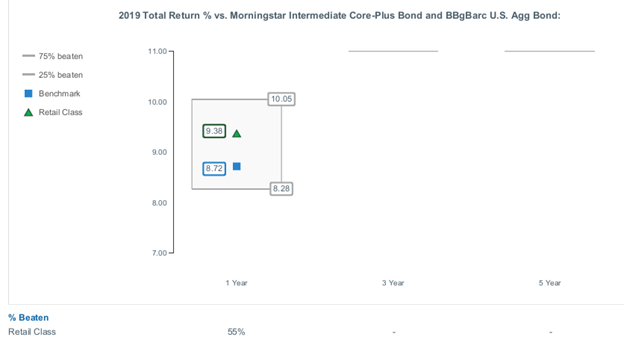
Strategic Advisers Fidelity Core Income Fund
Proxy Voting Results
A special meeting of shareholders was held on November 2, 2020. The results of votes taken among shareholders on the proposal before them are reported below. Each vote reported represents one dollar of net asset value held on the record date for the meeting.
PROPOSAL 1
To elect a Board of Trustees.
| # of Votes | % of Votes | |
| ROBERT A. LAWRENCE | ||
| Affirmative | 204,250,982,594.51 | 96.530 |
| Withheld | 7,343,512,146.85 | 3.470 |
| TOTAL | 211,594,494,741.36 | 100.000 |
| CHARLES S. MORRISON | ||
| Affirmative | 204,349,460,488.43 | 96.576 |
| Withheld | 7,245,034,252.93 | 3.424 |
| TOTAL | 211,594,494,741.36 | 100.000 |
| PETER C. ALDRICH | ||
| Affirmative | 203,499,803,652.67 | 96.175 |
| Withheld | 8,094,691,088.69 | 3.825 |
| TOTAL | 211,594,494,741.36 | 100.000 |
| MARY C. FARRELL | ||
| Affirmative | 204,011,925,737.22 | 96.417 |
| Withheld | 7,582,569,004.14 | 3.583 |
| TOTAL | 211,594,494,741.36 | 100.00 |
| KAREN KAPLAN | ||
| Affirmative | 204,297,547,550.53 | 96.552 |
| Withheld | 7,296,947,190.83 | 3.448 |
| TOTAL | 211,594,494,741.36 | 100.000 |
| CHRISTINE MARCKS | ||
| Affirmative | 204,700,871,317.72 | 96.743 |
| Withheld | 6,893,623,423.64 | 3.257 |
| TOTAL | 211,594,494,741.36 | 100.000 |
| HEIDI L. STEIGER | ||
| Affirmative | 204,406,589,957.28 | 96.603 |
| Withheld | 7,187,904,784.08 | 3.397 |
| TOTAL | 211,594,494,741.36 | 100.000 |
| Proposal 1 reflects trust wide proposal and voting results. |
![]()
COI-SANN-0121
1.9887940.102
Strategic Advisers® Fidelity® Emerging Markets Fund
Offered exclusively to certain clients of Strategic Advisers LLC - not available for sale to the general public
Semi-Annual Report
November 30, 2020
Contents
Board Approval of Investment Advisory Contracts and Management Fees | |
To view a fund's proxy voting record for the 12-month period ended June 30, visit http://www.fidelity.com/proxyvotingresults or visit the Securities and Exchange Commission's (SEC) web site at http://www.sec.gov.
You may also call 1-800-544-3455 to request a free copy of the proxy voting guidelines.
Standard & Poor's, S&P and S&P 500 are registered service marks of The McGraw-Hill Companies, Inc. and have been licensed for use by Fidelity Distributors Corporation.
Other third-party marks appearing herein are the property of their respective owners.
All other marks appearing herein are registered or unregistered trademarks or service marks of FMR LLC or an affiliated company. © 2021 FMR LLC. All rights reserved.
This report and the financial statements contained herein are submitted for the general information of the shareholders of the Fund. This report is not authorized for distribution to prospective investors in the Fund unless preceded or accompanied by an effective prospectus.
A fund files its complete schedule of portfolio holdings with the SEC for the first and third quarters of each fiscal year on Form N-PORT. Forms N-PORT are available on the SEC’s web site at http://www.sec.gov. A fund's Forms N-PORT may be reviewed and copied at the SEC’s Public Reference Room in Washington, DC. Information regarding the operation of the SEC's Public Reference Room may be obtained by calling 1-800-SEC-0330.
For a complete list of a fund's portfolio holdings, view the most recent holdings listing, semiannual report, or annual report on Fidelity's web site at http://www.fidelity.com, http://www.institutional.fidelity.com, or http://www.401k.com, as applicable.
NOT FDIC INSURED •MAY LOSE VALUE •NO BANK GUARANTEE
Neither the Fund nor Fidelity Distributors Corporation is a bank.
Note to Shareholders:
Early in 2020, the outbreak and spread of a new coronavirus emerged as a public health emergency that had a major influence on financial markets, primarily based on its impact on the global economy and the outlook for corporate earnings. The virus causes a respiratory disease known as COVID-19. On March 11, the World Health Organization declared the COVID-19 outbreak a pandemic, citing sustained risk of further global spread.
In the weeks following, as the crisis worsened, we witnessed an escalating human tragedy with wide-scale social and economic consequences from coronavirus-containment measures. The outbreak of COVID-19 prompted a number of measures to limit the spread, including travel and border restrictions, quarantines, and restrictions on large gatherings. In turn, these resulted in lower consumer activity, diminished demand for a wide range of products and services, disruption in manufacturing and supply chains, and – given the wide variability in outcomes regarding the outbreak – significant market uncertainty and volatility. Amid the turmoil, global governments and central banks took unprecedented action to help support consumers, businesses, and the broader economies, and to limit disruption to financial systems.
The situation continues to unfold, and the extent and duration of its impact on financial markets and the economy remain highly uncertain. Extreme events such as the coronavirus crisis are “exogenous shocks” that can have significant adverse effects on mutual funds and their investments. Although multiple asset classes may be affected by market disruption, the duration and impact may not be the same for all types of assets.
Fidelity is committed to helping you stay informed amid news about COVID-19 and during increased market volatility, and we’re taking extra steps to be responsive to customer needs. We encourage you to visit our websites, where we offer ongoing updates, commentary, and analysis on the markets and our funds.
Investment Summary (Unaudited)
The information in the following tables is based on the direct investments of the Fund.Top Ten Holdings as of November 30, 2020
| (excluding cash equivalents) | % of fund's net assets |
| Fidelity SAI Emerging Markets Value Index Fund | 11.8 |
| Fidelity Emerging Markets Fund | 11.3 |
| Fidelity SAI Emerging Markets Index Fund | 11.0 |
| Fidelity SAI Emerging Markets Low Volatility Index Fund | 6.2 |
| Alibaba Group Holding Ltd. sponsored ADR | 3.6 |
| Tencent Holdings Ltd. | 3.3 |
| Samsung Electronics Co. Ltd. | 3.0 |
| Taiwan Semiconductor Manufacturing Co. Ltd. | 3.0 |
| JD.com, Inc. sponsored ADR | 0.9 |
| Naspers Ltd. Class N | 0.8 |
| 54.9 |
Asset Allocation (% of fund's net assets)
| As of November 30, 2020 | ||
| Common Stocks | 49.7% | |
| Preferred Stocks | 1.1% | |
| Diversifed Emerging Markets Funds | 40.3% | |
| Short-Term Investments and Net Other Assets (Liabilities) | 8.9% | |

Asset allocations of funds in the pie chart reflect the categorizations of assets as defined by Morningstar as of the reporting date.
Schedule of Investments November 30, 2020 (Unaudited)
Showing Percentage of Net Assets
| Common Stocks - 49.7% | |||
| Shares | Value | ||
| COMMUNICATION SERVICES - 5.3% | |||
| Diversified Telecommunication Services - 0.0% | |||
| HKBN Ltd. | 735,000 | $1,269,423 | |
| Entertainment - 0.7% | |||
| Bilibili, Inc. ADR (a)(b) | 204,319 | 12,843,492 | |
| CD Projekt RED SA (a) | 71,367 | 7,411,068 | |
| DouYu International Holdings Ltd. ADR (a)(b) | 362,896 | 4,812,001 | |
| HUYA, Inc. ADR (a)(b) | 125,569 | 2,598,023 | |
| International Games Systems Co. Ltd. | 125,000 | 2,966,398 | |
| NetEase, Inc. ADR | 80,975 | 7,317,711 | |
| Wuhu Sanqi Interactive Entertainment Network Technology Group Co. Ltd. (A Shares) | 354,000 | 1,406,013 | |
| 39,354,706 | |||
| Interactive Media & Services - 4.2% | |||
| Autohome, Inc. ADR Class A | 8,772 | 828,252 | |
| Baidu.com, Inc. sponsored ADR (a) | 19,000 | 2,640,810 | |
| Kakao Corp. | 17,014 | 5,648,208 | |
| NAVER Corp. | 16,611 | 4,158,294 | |
| Tencent Holdings Ltd. | 2,434,900 | 177,498,718 | |
| Yandex NV Series A (a) | 363,850 | 25,091,096 | |
| YY, Inc. ADR | 59,500 | 5,299,665 | |
| 221,165,043 | |||
| Media - 0.1% | |||
| Focus Media Information Technology Co. Ltd. (A Shares) | 1,513,800 | 2,231,963 | |
| Wireless Telecommunication Services - 0.3% | |||
| Bharti Airtel Ltd. | 1,546,002 | 9,653,373 | |
| China Mobile Ltd. | 1,219,000 | 7,271,586 | |
| 16,924,959 | |||
| TOTAL COMMUNICATION SERVICES | 280,946,094 | ||
| CONSUMER DISCRETIONARY - 11.2% | |||
| Automobiles - 0.7% | |||
| Great Wall Motor Co. Ltd. (H Shares) | 972,500 | 1,966,541 | |
| Guangzhou Automobile Group Co. Ltd. (H Shares) | 4,372,000 | 4,701,593 | |
| Hyundai Motor Co. | 92,058 | 15,072,824 | |
| Kia Motors Corp. | 45,711 | 2,383,444 | |
| XPeng, Inc. ADR (a)(b) | 234,100 | 13,755,716 | |
| 37,880,118 | |||
| Diversified Consumer Services - 0.5% | |||
| New Oriental Education & Technology Group, Inc. (a) | 16,000 | 2,615,528 | |
| New Oriental Education & Technology Group, Inc. sponsored ADR (a) | 122,368 | 20,172,365 | |
| TAL Education Group ADR (a) | 81,326 | 5,697,700 | |
| 28,485,593 | |||
| Hotels, Restaurants & Leisure - 0.3% | |||
| Galaxy Entertainment Group Ltd. | 108,000 | 819,481 | |
| Haidilao International Holding Ltd. (c) | 91,000 | 596,978 | |
| Sands China Ltd. | 372,000 | 1,520,412 | |
| Shangri-La Asia Ltd. (a) | 7,972,000 | 7,290,626 | |
| Wynn Macau Ltd. (a) | 223,600 | 381,042 | |
| Yum China Holdings, Inc. | 21,006 | 1,184,318 | |
| Yum China Holdings, Inc. | 11,800 | 672,714 | |
| 12,465,571 | |||
| Household Durables - 1.2% | |||
| Gree Electric Appliances, Inc. of Zhuhai (A Shares) | 37,500 | 379,851 | |
| Haier Smart Home Co. Ltd. (A Shares) | 9,031,929 | 37,026,118 | |
| Midea Group Co. Ltd. (A Shares) | 2,135,989 | 28,197,821 | |
| 65,603,790 | |||
| Internet & Direct Marketing Retail - 6.5% | |||
| Alibaba Group Holding Ltd. (a) | 205,900 | 6,764,168 | |
| Alibaba Group Holding Ltd. sponsored ADR (a) | 724,520 | 190,809,587 | |
| Baozun, Inc.: | |||
| Class A (a) | 216,800 | 2,720,523 | |
| sponsored ADR (a)(b) | 116,122 | 4,315,094 | |
| Ctrip.com International Ltd. ADR (a) | 219,382 | 7,369,041 | |
| JD.com, Inc.: | |||
| Class A | 59,200 | 2,540,490 | |
| sponsored ADR (a) | 530,432 | 45,272,371 | |
| MakeMyTrip Ltd. (a) | 132,098 | 3,277,351 | |
| Meituan Class B (a) | 610,500 | 22,830,512 | |
| Naspers Ltd. Class N | 217,985 | 43,823,047 | |
| Pinduoduo, Inc. ADR (a) | 127,850 | 17,746,859 | |
| 347,469,043 | |||
| Leisure Products - 0.0% | |||
| Goodbaby International Holdings Ltd. (a) | 794,000 | 102,943 | |
| Multiline Retail - 0.0% | |||
| MINISO Group Holding Ltd. ADR | 9,230 | 184,046 | |
| Specialty Retail - 0.6% | |||
| China Yongda Automobiles Services Holdings Ltd. | 3,581,000 | 6,117,288 | |
| Zhongsheng Group Holdings Ltd. Class H | 3,074,500 | 23,116,271 | |
| 29,233,559 | |||
| Textiles, Apparel & Luxury Goods - 1.4% | |||
| adidas AG | 32,971 | 10,522,485 | |
| Anta Sports Products Ltd. | 1,773,000 | 24,059,564 | |
| ECLAT Textile Co. Ltd. | 566,000 | 7,924,396 | |
| Li Ning Co. Ltd. | 5,179,500 | 27,984,642 | |
| Regina Miracle International Holdings Ltd. (c) | 227,000 | 90,152 | |
| Shenzhou International Group Holdings Ltd. | 298,900 | 5,023,755 | |
| 75,604,994 | |||
| TOTAL CONSUMER DISCRETIONARY | 597,029,657 | ||
| CONSUMER STAPLES - 3.9% | |||
| Beverages - 1.6% | |||
| China Resources Beer Holdings Co. Ltd. | 3,656,000 | 26,880,445 | |
| Kweichow Moutai Co. Ltd. (A Shares) | 140,062 | 36,488,419 | |
| Nongfu Spring Co. Ltd. (H Shares) (a) | 432,800 | 2,356,486 | |
| Shanghai Bairun Investment Holding Group Co. Ltd. (A Shares) | 595,200 | 6,925,559 | |
| Thai Beverage PCL | 15,987,300 | 8,821,237 | |
| Tsingtao Brewery Co. Ltd. (H Shares) | 301,054 | 2,921,362 | |
| 84,393,508 | |||
| Food & Staples Retailing - 0.7% | |||
| Atacadao SA | 385,900 | 1,448,548 | |
| Bidcorp Ltd. | 147,109 | 2,653,733 | |
| CP ALL PCL (For. Reg.) | 4,808,300 | 9,619,780 | |
| President Chain Store Corp. | 147,000 | 1,332,622 | |
| Wal-Mart de Mexico SA de CV Series V | 7,689,400 | 20,260,044 | |
| X5 Retail Group NV GDR (Reg. S) | 124,778 | 4,465,314 | |
| 39,780,041 | |||
| Food Products - 1.3% | |||
| Angel Yeast Co. Ltd. (A Shares) | 566,300 | 3,959,598 | |
| China Mengniu Dairy Co. Ltd. | 7,001,000 | 35,210,400 | |
| Gruma S.A.B. de CV Series B | 478,015 | 5,259,519 | |
| Inner Mongoli Yili Industries Co. Ltd. (A Shares) | 987,367 | 5,671,556 | |
| Tingyi (Cayman Islands) Holding Corp. | 432,000 | 729,741 | |
| Unified-President Enterprises Corp. | 7,936,201 | 18,055,760 | |
| WH Group Ltd. (c) | 1,212,500 | 987,790 | |
| 69,874,364 | |||
| Personal Products - 0.3% | |||
| Hengan International Group Co. Ltd. | 169,500 | 1,165,815 | |
| LG Household & Health Care Ltd. | 1,561 | 2,131,990 | |
| Natura & Co. Holding SA | 1,275,724 | 12,003,817 | |
| 15,301,622 | |||
| TOTAL CONSUMER STAPLES | 209,349,535 | ||
| ENERGY - 1.7% | |||
| Energy Equipment & Services - 0.2% | |||
| China Oilfield Services Ltd. (H Shares) | 7,316,000 | 5,526,648 | |
| Yantai Jereh Oilfield Services (A Shares) | 790,415 | 4,444,125 | |
| 9,970,773 | |||
| Oil, Gas & Consumable Fuels - 1.5% | |||
| China Petroleum & Chemical Corp. (H Shares) | 14,268,000 | 6,409,751 | |
| CNOOC Ltd. | 9,580,000 | 9,532,747 | |
| CNOOC Ltd. sponsored ADR | 58,082 | 5,734,436 | |
| Lukoil PJSC | 96,272 | 6,373,513 | |
| Lukoil PJSC sponsored ADR | 216,713 | 13,950,940 | |
| Petroleo Brasileiro SA - Petrobras (ON) | 3,162,600 | 15,082,770 | |
| Pilipinas Shell Petroleum Corp. (a) | 768,700 | 316,389 | |
| Reliance Industries Ltd. | 711,471 | 18,411,805 | |
| Reliance Industries Ltd. | 50,414 | 710,906 | |
| Reliance Industries Ltd. sponsored GDR (c) | 102,000 | 5,260,769 | |
| 81,784,026 | |||
| TOTAL ENERGY | 91,754,799 | ||
| FINANCIALS - 8.6% | |||
| Banks - 5.7% | |||
| Absa Group Ltd. | 695,977 | 4,952,565 | |
| Axis Bank Ltd. (a) | 2,318,321 | 18,752,348 | |
| Banco do Brasil SA | 693,200 | 4,381,183 | |
| Capitec Bank Holdings Ltd. | 61,716 | 5,162,923 | |
| China Construction Bank Corp. (H Shares) | 17,257,000 | 13,490,361 | |
| China Merchants Bank Co. Ltd. (H Shares) | 4,308,500 | 27,308,448 | |
| Credicorp Ltd. (United States) | 59,200 | 9,111,472 | |
| E.SUN Financial Holdings Co. Ltd. | 7,636,267 | 6,722,160 | |
| Grupo Financiero Banorte S.A.B. de CV Series O (a) | 3,718,745 | 18,619,255 | |
| Hana Financial Group, Inc. | 289,149 | 8,829,515 | |
| HDFC Bank Ltd. (a) | 475,743 | 9,195,050 | |
| HDFC Bank Ltd. sponsored ADR (a) | 590,077 | 40,715,313 | |
| ICICI Bank Ltd. (a) | 1,775,422 | 11,325,945 | |
| Industrial & Commercial Bank of China Ltd. (H Shares) | 43,850,000 | 27,701,144 | |
| KB Financial Group, Inc. | 169,755 | 7,005,227 | |
| Kotak Mahindra Bank Ltd. (a) | 258,914 | 6,634,932 | |
| National Bank of Abu Dhabi PJSC | 650,014 | 2,233,281 | |
| PT Bank Central Asia Tbk | 7,887,586 | 17,330,903 | |
| PT Bank Mandiri (Persero) Tbk | 51,260,000 | 22,991,197 | |
| Qatar National Bank SAQ | 555,268 | 2,701,819 | |
| Sberbank of Russia | 3,666,386 | 11,933,175 | |
| Sberbank of Russia sponsored ADR | 1,022,434 | 13,487,524 | |
| Shinhan Financial Group Co. Ltd. | 366,950 | 10,785,988 | |
| TCS Group Holding PLC GDR | 65,745 | 2,016,833 | |
| 303,388,561 | |||
| Capital Markets - 0.4% | |||
| BM&F BOVESPA SA | 1,666,500 | 17,460,082 | |
| CITIC Securities Co. Ltd. (H Shares) | 629,500 | 1,415,858 | |
| Hong Kong Exchanges and Clearing Ltd. | 34,100 | 1,693,643 | |
| Huatai Securities Co. Ltd. (H Shares) (c) | 935,200 | 1,461,081 | |
| Noah Holdings Ltd. sponsored ADR (a) | 69,530 | 2,058,088 | |
| 24,088,752 | |||
| Consumer Finance - 0.3% | |||
| Bajaj Finance Ltd. | 75,083 | 4,952,262 | |
| Kaspi.KZ JSC unit | 122,209 | 6,207,728 | |
| Shriram Transport Finance Co. Ltd. | 431,392 | 6,192,529 | |
| 17,352,519 | |||
| Diversified Financial Services - 0.2% | |||
| Chailease Holding Co. Ltd. | 1,556,146 | 8,496,982 | |
| Insurance - 1.5% | |||
| AIA Group Ltd. | 2,877,400 | 31,577,706 | |
| China Life Insurance Co. Ltd. (H Shares) | 8,283,000 | 18,692,388 | |
| China Pacific Insurance (Group) Co. Ltd. (H Shares) | 460,400 | 1,749,645 | |
| HDFC Standard Life Insurance Co. Ltd. (a)(c) | 405,426 | 3,516,479 | |
| Hyundai Fire & Marine Insurance Co. Ltd. | 168,319 | 3,386,059 | |
| ICICI Lombard General Insurance Co. Ltd. (c) | 225,283 | 4,386,928 | |
| Ping An Insurance Group Co. of China Ltd. (H Shares) | 1,406,500 | 16,542,617 | |
| 79,851,822 | |||
| Thrifts & Mortgage Finance - 0.5% | |||
| Housing Development Finance Corp. Ltd. | 840,769 | 25,521,916 | |
| TOTAL FINANCIALS | 458,700,552 | ||
| HEALTH CARE - 1.3% | |||
| Biotechnology - 0.1% | |||
| Akeso, Inc. (c) | 116,000 | 374,134 | |
| Innovent Biologics, Inc. (a)(c) | 314,500 | 2,065,659 | |
| Remegen Co. Ltd. (H Shares) (a)(c) | 187,000 | 1,676,982 | |
| Zai Lab Ltd. (a) | 40,000 | 4,263,557 | |
| 8,380,332 | |||
| Health Care Equipment & Supplies - 0.3% | |||
| Peijia Medical Ltd. (a)(b)(c) | 267,000 | 709,820 | |
| Shenzhen Mindray Bio-Medical Electronics Co. Ltd. (A Shares) | 325,603 | 16,696,130 | |
| Venus MedTech Hangzhou, Inc. (H Shares) (a)(c) | 39,000 | 356,540 | |
| 17,762,490 | |||
| Health Care Providers & Services - 0.0% | |||
| Aier Eye Hospital Group Co. Ltd. (A Shares) | 66,409 | 617,768 | |
| Aster DM Healthcare Ltd. (a)(c) | 1,192 | 2,680 | |
| 620,448 | |||
| Life Sciences Tools & Services - 0.4% | |||
| Hangzhou Tigermed Consulting Co. Ltd. (H Shares) (a)(c) | 407,600 | 6,895,400 | |
| Pharmaron Beijing Co. Ltd. (H Shares) (c) | 116,400 | 1,410,454 | |
| WuXi AppTec Co. Ltd. (H Shares) (c) | 615,180 | 9,211,356 | |
| Wuxi Biologics (Cayman), Inc. (a)(c) | 289,500 | 2,866,000 | |
| 20,383,210 | |||
| Pharmaceuticals - 0.5% | |||
| Hansoh Pharmaceutical Group Co. Ltd. (a)(c) | 1,007,610 | 4,834,898 | |
| Jiangsu Hengrui Medicine Co. Ltd. (A Shares) | 113,616 | 1,485,026 | |
| Richter Gedeon PLC | 709,300 | 16,805,251 | |
| Sino Biopharmaceutical Ltd. | 1,496,000 | 1,501,382 | |
| 24,626,557 | |||
| TOTAL HEALTH CARE | 71,773,037 | ||
| INDUSTRIALS - 2.6% | |||
| Air Freight & Logistics - 0.0% | |||
| ZTO Express, Inc. (a) | 74,000 | 2,110,307 | |
| Airlines - 0.2% | |||
| Azul SA sponsored ADR (a) | 208,067 | 4,425,585 | |
| Copa Holdings SA Class A | 51,960 | 4,141,212 | |
| 8,566,797 | |||
| Construction & Engineering - 0.2% | |||
| Larsen & Toubro Ltd. | 812,100 | 12,236,591 | |
| Electrical Equipment - 0.0% | |||
| Voltronic Power Technology Corp. | 81,966 | 2,507,465 | |
| Machinery - 1.7% | |||
| Airtac International Group | 465,000 | 13,508,925 | |
| Estun Automation Co. Ltd. (A Shares) (a) | 616,670 | 2,244,942 | |
| HIWIN Technologies Corp. | 1,363,000 | 14,574,606 | |
| HIWIN Technologies Corp. rights 11/14/20 (a) | 41,938 | 162,203 | |
| Sany Heavy Industry Co. Ltd. (A Shares) | 4,369,838 | 20,398,201 | |
| Shenzhen Inovance Technology Co. Ltd. (A Shares) | 1,118,253 | 13,088,127 | |
| Techtronic Industries Co. Ltd. | 641,500 | 8,189,360 | |
| Weichai Power Co. Ltd.: | |||
| (A Shares) | 5,718,902 | 14,508,273 | |
| (H Shares) | 700,000 | 1,429,598 | |
| Zoomlion Heavy Industry Science and Technology Co. Ltd. (H Shares) | 434,200 | 453,302 | |
| 88,557,537 | |||
| Professional Services - 0.2% | |||
| Sporton International, Inc. | 1,031,000 | 8,660,833 | |
| Road & Rail - 0.3% | |||
| Localiza Rent A Car SA | 927,855 | 11,641,918 | |
| Rumo SA (a) | 834,800 | 2,954,382 | |
| 14,596,300 | |||
| Trading Companies & Distributors - 0.0% | |||
| BOC Aviation Ltd. Class A (c) | 72,200 | 643,118 | |
| Transportation Infrastructure - 0.0% | |||
| Grupo Aeroportuario Norte S.A.B. de CV (a) | 481,900 | 2,798,610 | |
| TOTAL INDUSTRIALS | 140,677,558 | ||
| INFORMATION TECHNOLOGY - 11.2% | |||
| Electronic Equipment & Components - 1.4% | |||
| Chaozhou Three-Circle Group Co. (A Shares) | 199,600 | 969,344 | |
| Hangzhou Hikvision Digital Technology Co. Ltd. (A Shares) | 88,800 | 616,440 | |
| Hon Hai Precision Industry Co. Ltd. (Foxconn) | 1,655,000 | 4,767,466 | |
| Largan Precision Co. Ltd. | 75,000 | 8,466,048 | |
| LG Innotek Co. Ltd. | 31,045 | 4,340,900 | |
| Samsung SDI Co. Ltd. | 31,946 | 15,360,316 | |
| Sunny Optical Technology Group Co. Ltd. | 1,555,000 | 30,374,730 | |
| Yageo Corp. | 571,000 | 8,833,812 | |
| Zhejiang Dahua Technology Co. Ltd.: | |||
| (A Shares) | 49,100 | 155,907 | |
| (A Shares) | 64,100 | 203,537 | |
| 74,088,500 | |||
| IT Services - 0.5% | |||
| Infosys Ltd. | 431,226 | 6,445,414 | |
| Infosys Ltd. sponsored ADR | 1,069,852 | 16,283,147 | |
| Tech Mahindra Ltd. | 145,654 | 1,713,430 | |
| 24,441,991 | |||
| Semiconductors & Semiconductor Equipment - 5.7% | |||
| ASE Technology Holding Co. Ltd. | 4,047,000 | 10,766,344 | |
| ASM Pacific Technology Ltd. | 36,200 | 452,025 | |
| eMemory Technology, Inc. | 163,000 | 3,269,128 | |
| MediaTek, Inc. | 1,577,000 | 38,859,223 | |
| Realtek Semiconductor Corp. | 293,000 | 3,804,795 | |
| Semiconductor Manufacturing International Corp. (a) | 189,500 | 523,396 | |
| Silergy Corp. | 19,000 | 1,476,374 | |
| SK Hynix, Inc. | 429,288 | 37,758,074 | |
| Taiwan Semiconductor Manufacturing Co. Ltd. | 9,408,000 | 159,763,034 | |
| Taiwan Semiconductor Manufacturing Co. Ltd. sponsored ADR | 429,719 | 41,691,337 | |
| Xinyi Solar Holdings Ltd. | 3,772,000 | 6,908,429 | |
| 305,272,159 | |||
| Software - 0.0% | |||
| Kingsoft Corp. Ltd. | 160,000 | 803,055 | |
| Ming Yuan Cloud Group Holdings Ltd. | 198,575 | 992,151 | |
| 1,795,206 | |||
| Technology Hardware, Storage & Peripherals - 3.6% | |||
| Samsung Electronics Co. Ltd. | 2,680,067 | 161,260,481 | |
| Samsung Electronics Co. Ltd. unit | 17,014 | 25,774,342 | |
| Xiaomi Corp. Class B (a)(c) | 1,329,400 | 4,538,752 | |
| 191,573,575 | |||
| TOTAL INFORMATION TECHNOLOGY | 597,171,431 | ||
| MATERIALS - 3.3% | |||
| Chemicals - 0.8% | |||
| LG Chemical Ltd. | 29,594 | 21,357,486 | |
| PhosAgro OJSC GDR (Reg. S) | 182,254 | 2,327,898 | |
| Sociedad Quimica y Minera de Chile SA (PN-B) sponsored ADR | 230,078 | 10,829,771 | |
| Solar Industries India Ltd. | 555,100 | 7,790,021 | |
| 42,305,176 | |||
| Construction Materials - 0.4% | |||
| Anhui Conch Cement Co. Ltd.: | |||
| (A Shares) | 125,700 | 1,079,519 | |
| (H Shares) | 143,000 | 914,037 | |
| CEMEX S.A.B. de CV sponsored ADR | 1,580,546 | 7,270,512 | |
| JK Cement Ltd. | 433,600 | 11,849,612 | |
| 21,113,680 | |||
| Metals & Mining - 1.6% | |||
| Alrosa Co. Ltd. | 2,159,090 | 2,487,695 | |
| AngloGold Ashanti Ltd. | 193,119 | 4,141,474 | |
| Barrick Gold Corp. | 504,100 | 11,664,874 | |
| Grupo Mexico SA de CV Series B | 3,474,922 | 12,609,977 | |
| Harmony Gold Mining Co. Ltd. (a) | 632,190 | 2,610,960 | |
| Impala Platinum Holdings Ltd. | 2,177,462 | 22,879,433 | |
| MMC Norilsk Nickel PJSC | 1,365 | 383,787 | |
| MMC Norilsk Nickel PJSC sponsored ADR | 88,063 | 2,442,308 | |
| Novolipetsk Steel OJSC GDR (Reg. S) | 52,936 | 1,309,620 | |
| POSCO | 46,317 | 9,801,554 | |
| Sibanye Stillwater Ltd. | 3,205,236 | 10,679,716 | |
| Vale SA | 241,200 | 3,511,703 | |
| Vale SA sponsored ADR | 74,600 | 1,086,176 | |
| 85,609,277 | |||
| Paper & Forest Products - 0.5% | |||
| Suzano Papel e Celulose SA (a) | 2,410,600 | 25,422,574 | |
| TOTAL MATERIALS | 174,450,707 | ||
| REAL ESTATE - 0.4% | |||
| Equity Real Estate Investment Trusts (REITs) - 0.0% | |||
| Link (REIT) | 127,200 | 1,112,121 | |
| Real Estate Management & Development - 0.4% | |||
| Ayala Land, Inc. | 8,584,300 | 6,782,672 | |
| China Overseas Land and Investment Ltd. | 1,156,500 | 2,815,833 | |
| China Resources Land Ltd. | 404,000 | 1,748,386 | |
| Hemisphere Properties India Ltd. (a) | 11,700 | 9,889 | |
| Longfor Properties Co. Ltd. (c) | 878,500 | 5,740,850 | |
| Shimao Services Holdings Ltd. (a)(c) | 485,000 | 859,937 | |
| Sun Hung Kai Properties Ltd. | 105,000 | 1,395,703 | |
| 19,353,270 | |||
| TOTAL REAL ESTATE | 20,465,391 | ||
| UTILITIES - 0.2% | |||
| Electric Utilities - 0.0% | |||
| Cheung Kong Infrastructure Holdings Ltd. | 104,500 | 533,262 | |
| Gas Utilities - 0.2% | |||
| China Gas Holdings Ltd. | 1,976,800 | 7,261,956 | |
| China Resource Gas Group Ltd. | 302,000 | 1,455,543 | |
| Indraprastha Gas Ltd. | 596,275 | 4,005,785 | |
| 12,723,284 | |||
| Independent Power and Renewable Electricity Producers - 0.0% | |||
| Huadian Power International Corp. Ltd. (H Shares) | 812,000 | 214,753 | |
| TOTAL UTILITIES | 13,471,299 | ||
| TOTAL COMMON STOCKS | |||
| (Cost $2,036,520,753) | 2,655,790,060 | ||
| Nonconvertible Preferred Stocks - 1.1% | |||
| ENERGY - 0.3% | |||
| Oil, Gas & Consumable Fuels - 0.3% | |||
| Petroleo Brasileiro SA - Petrobras sponsored ADR | 1,385,966 | 13,263,695 | |
| FINANCIALS - 0.7% | |||
| Banks - 0.7% | |||
| Banco Bradesco SA (PN) | 977,572 | 4,434,054 | |
| Itau Unibanco Holding SA | 4,300,709 | 22,926,839 | |
| Sberbank of Russia | 385,881 | 1,159,425 | |
| Sberbank of Russia | 3,791,522 | 11,392,075 | |
| 39,912,393 | |||
| INDUSTRIALS - 0.1% | |||
| Airlines - 0.1% | |||
| Azul SA (a) | 868,400 | 6,162,797 | |
| TOTAL NONCONVERTIBLE PREFERRED STOCKS | |||
| (Cost $53,135,000) | 59,338,885 | ||
| Equity Funds - 40.3% | |||
| Diversified Emerging Markets Funds - 40.3% | |||
| Fidelity Emerging Markets Fund (d) | 14,017,451 | 603,311,103 | |
| Fidelity SAI Emerging Markets Index Fund (d) | 37,256,148 | 586,784,328 | |
| Fidelity SAI Emerging Markets Low Volatility Index Fund (d) | 32,620,248 | 331,095,519 | |
| Fidelity SAI Emerging Markets Value Index Fund (d) | 48,706,138 | 628,309,191 | |
| TOTAL EQUITY FUNDS | |||
| (Cost $1,784,790,685) | 2,149,500,141 | ||
| U.S. Treasury Obligations - 0.6% | |||
| U.S. Treasury Bills, yield at date of purchase 0.06% to 0.11% 12/3/20 to 2/25/21 (e) | |||
| (Cost $33,955,411) | 33,960,000 | 33,955,797 | |
| Money Market Funds - 9.2% | |||
| Fidelity Cash Central Fund 0.09% (f) | 38,052,259 | 38,059,870 | |
| Fidelity Securities Lending Cash Central Fund 0.09% (f)(g) | 41,826,324 | 41,830,507 | |
| Invesco Government & Agency Portfolio Institutional Class .01% (h) | 410,702,328 | 410,702,328 | |
| TOTAL MONEY MARKET FUNDS | |||
| (Cost $490,572,562) | 490,592,705 | ||
| TOTAL INVESTMENT IN SECURITIES - 100.9% | |||
| (Cost $4,398,974,411) | 5,389,177,588 | ||
| NET OTHER ASSETS (LIABILITIES) - (0.9)% | (48,296,296) | ||
| NET ASSETS - 100% | $5,340,881,292 |
| Futures Contracts | |||||
| Number of contracts | Expiration Date | Notional Amount | Value | Unrealized Appreciation/(Depreciation) | |
| Purchased | |||||
| Equity Index Contracts | |||||
| ICE E-mini MSCI Emerging Markets Index Contracts (United States) | 6,953 | Dec. 2020 | $417,979,595 | $27,035,817 | $27,035,817 |
The notional amount of futures purchased as a percentage of Net Assets is 7.8%
For the period, the average monthly notional amount at value for futures contracts in the aggregate was $280,066,293.
Legend
(a) Non-income producing
(b) Security or a portion of the security is on loan at period end.
(c) Security exempt from registration under Rule 144A of the Securities Act of 1933. These securities may be resold in transactions exempt from registration, normally to qualified institutional buyers. At the end of the period, the value of these securities amounted to $58,486,757 or 1.1% of net assets.
(d) Affiliated Fund
(e) Security or a portion of the security was pledged to cover margin requirements for futures contracts. At period end, the value of securities pledged amounted to $33,040,894.
(f) Affiliated fund that is generally available only to investment companies and other accounts managed by Fidelity Investments. The rate quoted is the annualized seven-day yield of the fund at period end. A complete unaudited listing of the fund's holdings as of its most recent quarter end is available upon request. In addition, each Fidelity Central Fund's financial statements are available on the SEC's website or upon request.
(g) Investment made with cash collateral received from securities on loan.
(h) The rate quoted is the annualized seven-day yield of the fund at period end.
Affiliated Central Funds
Information regarding fiscal year to date income earned by the Fund from investments in Fidelity Central Funds is as follows:
| Fund | Income earned |
| Fidelity Cash Central Fund | $21,214 |
| Fidelity Securities Lending Cash Central Fund | 47,531 |
| Total | $68,745 |
Amounts in the income column in the above table include any capital gain distributions from underlying funds, which are presented in the corresponding line-item in the Statement of Operations, if applicable. Amount for Fidelity Securities Lending Cash Central Fund represents the income earned on investing cash collateral, less rebates paid to borrowers and any lending agent fees associated with the loan, plus any premium payments received for lending certain types of securities.
Affiliated Underlying Funds
Fiscal year to date information regarding the Fund's investments in affiliated Underlying Funds, excluding any Money Market Central Funds, is presented below. Exchanges between classes of the same affiliated Underlying Funds may occur.
| Affiliate | Value, beginning of period | Purchases | Sales Proceeds | Dividend Income | Realized Gain (loss) | Change in Unrealized appreciation (depreciation) | Value, end of period |
| Fidelity Emerging Markets Fund | $335,597,285 | $144,000,000 | $-- | $-- | $-- | $123,713,818 | $603,311,103 |
| Fidelity SAI Emerging Markets Index Fund | 842,100,133 | 134,835,393 | 566,000,000 | -- | 1,933,367 | 173,915,435 | 586,784,328 |
| Fidelity SAI Emerging Markets Low Volatility Index Fund | 166,174,301 | 126,000,000 | -- | -- | -- | 38,921,218 | 331,095,519 |
| Fidelity SAI Emerging Markets Value Index Fund | 21,609,000 | 524,999,996 | -- | -- | -- | 81,700,195 | 628,309,191 |
| Total | $1,365,480,719 | $929,835,389 | $566,000,000 | $-- | $1,933,367 | $418,250,666 | $2,149,500,141 |
Amounts in the income column in the above table include any capital gain distributions from underlying funds, which are presented in the corresponding line-item in the Statement of Operations, if applicable.
Investment Valuation
The following is a summary of the inputs used, as of November 30, 2020, involving the Fund's assets and liabilities carried at fair value. The inputs or methodology used for valuing securities may not be an indication of the risk associated with investing in those securities. For more information on valuation inputs, and their aggregation into the levels used below, please refer to the Investment Valuation section in the accompanying Notes to Financial Statements.
| Valuation Inputs at Reporting Date: | ||||
| Description | Total | Level 1 | Level 2 | Level 3 |
| Investments in Securities: | ||||
| Equities: | ||||
| Communication Services | $280,946,094 | $77,841,926 | $203,104,168 | $-- |
| Consumer Discretionary | 597,029,657 | 400,768,902 | 196,260,755 | -- |
| Consumer Staples | 209,349,535 | 134,632,182 | 74,717,353 | -- |
| Energy | 105,018,494 | 38,525,026 | 66,493,468 | -- |
| Financials | 498,612,945 | 192,073,993 | 306,538,952 | -- |
| Health Care | 71,773,037 | 35,604,175 | 36,168,862 | -- |
| Industrials | 146,840,355 | 121,615,876 | 25,224,479 | -- |
| Information Technology | 597,171,431 | 348,116,329 | 249,055,102 | -- |
| Materials | 174,450,707 | 120,199,720 | 54,250,987 | -- |
| Real Estate | 20,465,391 | -- | 20,465,391 | -- |
| Utilities | 13,471,299 | -- | 13,471,299 | -- |
| Equity Funds | 2,149,500,141 | 2,149,500,141 | -- | -- |
| Other Short-Term Investments | 33,955,797 | -- | 33,955,797 | -- |
| Money Market Funds | 490,592,705 | 490,592,705 | -- | -- |
| Total Investments in Securities: | $5,389,177,588 | $4,109,470,975 | $1,279,706,613 | $-- |
| Derivative Instruments: | ||||
| Assets | ||||
| Futures Contracts | $27,035,817 | $27,035,817 | $-- | $-- |
| Total Assets | $27,035,817 | $27,035,817 | $-- | $-- |
| Total Derivative Instruments: | $27,035,817 | $27,035,817 | $-- | $-- |
Value of Derivative Instruments
The following table is a summary of the Fund's value of derivative instruments by primary risk exposure as of November 30, 2020. For additional information on derivative instruments, please refer to the Derivative Instruments section in the accompanying Notes to Financial Statements.
| Primary Risk Exposure / Derivative Type | Value | |
| Asset | Liability | |
| Equity Risk | ||
| Futures Contracts(a) | $27,035,817 | $0 |
| Total Equity Risk | 27,035,817 | 0 |
| Total Value of Derivatives | $27,035,817 | $0 |
(a) Reflects gross cumulative appreciation (depreciation) on futures contracts as presented in the Schedule of Investments. In the Statement of Assets and Liabilities, the period end daily variation margin is included in receivable or payable for daily variation margin on futures contracts, and the net cumulative appreciation (depreciation) is included in Total accumulated earnings (loss).
Other Information
Distribution of the direct investments by country of issue, as a percentage of Total Net Assets, is as follows (Unaudited):
| United States of America | 49.3% |
| Cayman Islands | 14.8% |
| Taiwan | 6.4% |
| Korea (South) | 6.4% |
| China | 6.2% |
| India | 4.4% |
| Brazil | 2.8% |
| Hong Kong | 1.8% |
| South Africa | 1.8% |
| Russia | 1.2% |
| Mexico | 1.2% |
| Others (Individually Less Than 1%) | 3.7% |
| 100.0% |
See accompanying notes which are an integral part of the financial statements.
Financial Statements
Statement of Assets and Liabilities
| November 30, 2020 (Unaudited) | ||
| Assets | ||
| Investment in securities, at value (including securities loaned of $38,391,776) — See accompanying schedule: Unaffiliated issuers (cost $2,534,313,492) | $3,159,787,070 | |
| Fidelity Central Funds (cost $79,870,234) | 79,890,377 | |
| Other affiliated issuers (cost $1,784,790,685) | 2,149,500,141 | |
| Total Investment in Securities (cost $4,398,974,411) | $5,389,177,588 | |
| Foreign currency held at value (cost $1,855,967) | 1,858,592 | |
| Receivable for investments sold | 8,990,673 | |
| Receivable for fund shares sold | 8,053,795 | |
| Dividends receivable | 642,825 | |
| Interest receivable | 2,893 | |
| Distributions receivable from Fidelity Central Funds | 17,576 | |
| Prepaid expenses | 3,335 | |
| Other receivables | 336,870 | |
| Total assets | 5,409,084,147 | |
| Liabilities | ||
| Payable to custodian bank | $3,428,422 | |
| Payable for investments purchased | 3,950,838 | |
| Payable for fund shares redeemed | 1,535,317 | |
| Accrued management fee | 1,016,063 | |
| Payable for daily variation margin on futures contracts | 11,203,255 | |
| Other payables and accrued expenses | 5,239,510 | |
| Collateral on securities loaned | 41,829,450 | |
| Total liabilities | 68,202,855 | |
| Net Assets | $5,340,881,292 | |
| Net Assets consist of: | ||
| Paid in capital | $4,385,161,941 | |
| Total accumulated earnings (loss) | 955,719,351 | |
| Net Assets | $5,340,881,292 | |
| Net Asset Value, offering price and redemption price per share ($5,340,881,292 ÷ 392,193,504 shares) | $13.62 |
See accompanying notes which are an integral part of the financial statements.
Statement of Operations
| Six months ended November 30, 2020 (Unaudited) | ||
| Investment Income | ||
| Dividends: | ||
| Unaffiliated issuers | $21,059,915 | |
| Interest | 81,383 | |
| Income from Fidelity Central Funds (including $47,531 from security lending) | 68,745 | |
| Income before foreign taxes withheld | 21,210,043 | |
| Less foreign taxes withheld | (2,658,580) | |
| Total income | 18,551,463 | |
| Expenses | ||
| Management fee | $9,712,954 | |
| Custodian fees and expenses | 190,878 | |
| Independent trustees' fees and expenses | 18,812 | |
| Registration fees | 205,530 | |
| Audit | 36,417 | |
| Legal | 6,017 | |
| Miscellaneous | 49,682 | |
| Total expenses before reductions | 10,220,290 | |
| Expense reductions | (5,241,748) | |
| Total expenses after reductions | 4,978,542 | |
| Net investment income (loss) | 13,572,921 | |
| Realized and Unrealized Gain (Loss) | ||
| Net realized gain (loss) on: | ||
| Investment securities: | ||
| Unaffiliated issuers | (11,005,306) | |
| Fidelity Central Funds | (2,201) | |
| Other affiliated issuers | 1,933,367 | |
| Foreign currency transactions | (1,568,705) | |
| Futures contracts | 73,387,236 | |
| Total net realized gain (loss) | 62,744,391 | |
| Change in net unrealized appreciation (depreciation) on: | ||
| Investment securities: | ||
| Unaffiliated issuers (net of increase in deferred foreign taxes of $4,955,367) | 588,947,731 | |
| Affiliated issuers | 418,250,666 | |
| Assets and liabilities in foreign currencies | 95,934 | |
| Futures contracts | (6,106,246) | |
| Total change in net unrealized appreciation (depreciation) | 1,001,188,085 | |
| Net gain (loss) | 1,063,932,476 | |
| Net increase (decrease) in net assets resulting from operations | $1,077,505,397 |
See accompanying notes which are an integral part of the financial statements.
Statement of Changes in Net Assets
| Six months ended November 30, 2020 (Unaudited) | Year ended May 31, 2020 | |
| Increase (Decrease) in Net Assets | ||
| Operations | ||
| Net investment income (loss) | $13,572,921 | $59,865,849 |
| Net realized gain (loss) | 62,744,391 | (118,494,533) |
| Change in net unrealized appreciation (depreciation) | 1,001,188,085 | (21,079,610) |
| Net increase (decrease) in net assets resulting from operations | 1,077,505,397 | (79,708,294) |
| Distributions to shareholders | – | (58,777,125) |
| Share transactions | ||
| Proceeds from sales of shares | 1,604,192,094 | 1,609,511,839 |
| Reinvestment of distributions | – | 56,678,011 |
| Cost of shares redeemed | (317,203,699) | (495,169,459) |
| Net increase (decrease) in net assets resulting from share transactions | 1,286,988,395 | 1,171,020,391 |
| Total increase (decrease) in net assets | 2,364,493,792 | 1,032,534,972 |
| Net Assets | ||
| Beginning of period | 2,976,387,500 | 1,943,852,528 |
| End of period | $5,340,881,292 | $2,976,387,500 |
| Other Information | ||
| Shares | ||
| Sold | 130,075,632 | 149,103,119 |
| Issued in reinvestment of distributions | – | 4,725,743 |
| Redeemed | (26,320,052) | (46,868,850) |
| Net increase (decrease) | 103,755,580 | 106,960,012 |
See accompanying notes which are an integral part of the financial statements.
Financial Highlights
Strategic Advisers Fidelity Emerging Markets Fund
| Six months ended (Unaudited) November 30, | Years endedMay 31, | ||
| 2020 | 2020 | 2019 A | |
| Selected Per–Share Data | |||
| Net asset value, beginning of period | $10.32 | $10.71 | $10.00 |
| Income from Investment Operations | |||
| Net investment income (loss)B | .04 | .26C | .18 |
| Net realized and unrealized gain (loss) | 3.26 | (.39) | .67 |
| Total from investment operations | 3.30 | (.13) | .85 |
| Distributions from net investment income | – | (.26) | (.14) |
| Total distributions | – | (.26) | (.14) |
| Net asset value, end of period | $13.62 | $10.32 | $10.71 |
| Total ReturnD,E | 31.98% | (1.58)% | 8.63% |
| Ratios to Average Net AssetsF,G,H | |||
| Expenses before reductions | .50%I | .49% | .57%I |
| Expenses net of fee waivers, if any | .25%I | .24% | .32%I |
| Expenses net of all reductions | .24%I | .23% | .31%I |
| Net investment income (loss) | .66%I | 2.35%C | 2.82%I |
| Supplemental Data | |||
| Net assets, end of period (000 omitted) | $5,340,881 | $2,976,388 | $1,943,853 |
| Portfolio turnover rateH | 67%I | 49% | 125%I |
A For the period October 30, 2018 (commencement of operations) to May 31, 2019.
B Calculated based on average shares outstanding during the period.
C Net investment income per share reflects one or more large, non-recurring dividend(s) which amounted to $.06 per share. Excluding such non-recurring dividend(s), the ratio of net investment income (loss) to average net assets would have been 1.80%.
D Total returns for periods of less than one year are not annualized.
E Total returns would have been lower if certain expenses had not been reduced during the applicable periods shown.
F Fees and expenses of any underlying mutual funds or exchange-traded funds (ETFs) are not included in the Fund's expense ratio. The Fund indirectly bears its proportionate share of these expenses. For additional expense information related to investments in Fidelity Central Funds, please refer to the "Investments in Fidelity Central Funds" note found in the Notes to Financial Statements section of the most recent Annual or Semi-Annual report.
G Expense ratios reflect operating expenses of the class. Expenses before reductions do not reflect amounts reimbursed, waived, or reduced through arrangements with the investment advisor, brokerage services, or other offset arrangements, if applicable, and do not represent the amount paid by the class during periods when reimbursements, waivers or reductions occur.
H Amount does not include the portfolio activity of any underlying mutual funds or exchange-traded funds (ETFs).
I Annualized
See accompanying notes which are an integral part of the financial statements.
Notes to Financial Statements (Unaudited)
For the period ended November 30, 2020
1. Organization.
Strategic Advisers Fidelity Emerging Markets Fund (the Fund) is a fund of Fidelity Rutland Square Trust II (the Trust), and is authorized to issue an unlimited number of shares. The Trust is registered under the Investment Company Act of 1940, as amended (the 1940 Act), as an open-end management investment company organized as a Delaware statutory trust. The Fund is offered exclusively to certain clients of Strategic Advisers LLC (Strategic Advisers), an affiliate of Fidelity Management & Research Company LLC (FMR).
2. Significant Accounting Policies.
The Fund is an investment company and applies the accounting and reporting guidance of the Financial Accounting Standards Board (FASB) Accounting Standards Codification Topic 946 Financial Services – Investment Companies. The financial statements have been prepared in conformity with accounting principles generally accepted in the United States of America (GAAP), which require management to make certain estimates and assumptions at the date of the financial statements. Actual results could differ from those estimates. Subsequent events, if any, through the date that the financial statements were issued have been evaluated in the preparation of the financial statements. The following summarizes the significant accounting policies of the Fund:
Investment Valuation. Investments are valued as of 4:00 p.m. Eastern time on the last calendar day of the period. The Board of Trustees (the Board) has delegated the day to day responsibility for the valuation of the Fund's investments to the Fair Value Committee (the Committee) established by the Fund's investment adviser. In accordance with valuation policies and procedures approved by the Board, the Fund attempts to obtain prices from one or more third party pricing vendors or brokers to value its investments. When current market prices, quotations or currency exchange rates are not readily available or reliable, investments will be fair valued in good faith by the Committee, in accordance with procedures adopted by the Board. Factors used in determining fair value vary by investment type and may include market or investment specific events, changes in interest rates and credit quality. The frequency with which these procedures are used cannot be predicted and they may be utilized to a significant extent. The Committee oversees the Fund's valuation policies and procedures and reports to the Board on the Committee's activities and fair value determinations. The Board monitors the appropriateness of the procedures used in valuing the Fund's investments and ratifies the fair value determinations of the Committee.
The Fund categorizes the inputs to valuation techniques used to value its investments into a disclosure hierarchy consisting of three levels as shown below:
- Level 1 – quoted prices in active markets for identical investments
- Level 2 – other significant observable inputs (including quoted prices for similar investments, interest rates, prepayment speeds, etc.)
- Level 3 – unobservable inputs (including the Fund's own assumptions based on the best information available)
Valuation techniques used to value the Fund's investments by major category are as follows:
Equity securities, including restricted securities, for which market quotations are readily available, are valued at the last reported sale price or official closing price as reported by a third party pricing vendor on the primary market or exchange on which they are traded and are categorized as Level 1 in the hierarchy. In the event there were no sales during the day or closing prices are not available, securities are valued at the last quoted bid price or may be valued using the last available price and are generally categorized as Level 2 in the hierarchy. For foreign equity securities, when market or security specific events arise, comparisons to the valuation of American Depositary Receipts (ADRs), futures contracts, Exchange-Traded Funds (ETFs) and certain indexes as well as quoted prices for similar securities may be used and would be categorized as Level 2 in the hierarchy. For equity securities, including restricted securities, where observable inputs are limited, assumptions about market activity and risk are used and these securities may be categorized as Level 3 in the hierarchy.
Debt securities, including restricted securities, are valued based on evaluated prices received from third party pricing vendors or from brokers who make markets in such securities. U.S. government and government agency obligations are valued by pricing vendors who utilize matrix pricing which considers yield or price of bonds of comparable quality, coupon, maturity and type or by broker-supplied prices. When independent prices are unavailable or unreliable, debt securities may be valued utilizing pricing methodologies which consider similar factors that would be used by third party pricing vendors. Debt securities are generally categorized as Level 2 in the hierarchy but may be Level 3 depending on the circumstances.
Futures contracts are valued at the settlement price established each day by the board of trade or exchange on which they are traded and are categorized as Level 1 in the hierarchy. Investments in open-end mutual funds, including the Fidelity Central Funds, are valued at their closing net asset value (NAV) each business day and are categorized as Level 1 in the hierarchy. If an unaffiliated open-end mutual fund's NAV is unavailable, shares of that fund may be valued by another method that the Board believes reflects fair value in accordance with the Board's fair value pricing policies and is categorized as Level 2 in the hierarchy.
Changes in valuation techniques may result in transfers in or out of an assigned level within the disclosure hierarchy. The aggregate value of investments by input level as of November 30, 2020 is included at the end of the Fund's Schedule of Investments.
Foreign Currency. Certain Funds may use foreign currency contracts to facilitate transactions in foreign-denominated securities. Gains and losses from these transactions may arise from changes in the value of the foreign currency or if the counterparties do not perform under the contracts' terms.
Foreign-denominated assets, including investment securities, and liabilities are translated into U.S. dollars at the exchange rates at period end. Purchases and sales of investment securities, income and dividends received, and expenses denominated in foreign currencies are translated into U.S. dollars at the exchange rate in effect on the transaction date.
The effects of exchange rate fluctuations on investments are included with the net realized and unrealized gain (loss) on investment securities. Other foreign currency transactions resulting in realized and unrealized gain (loss) are disclosed separately.
Investment Transactions and Income. For financial reporting purposes, the Fund's investment holdings and NAV include trades executed through the end of the last business day of the period. The NAV per share for processing shareholder transactions is calculated as of the close of business of the New York Stock Exchange (NYSE), normally 4:00 p.m. Eastern time and includes trades executed through the end of the prior business day. Gains and losses on securities sold are determined on the basis of identified cost. Dividend income is recorded on the ex-dividend date, except for certain dividends from foreign securities where the ex-dividend date may have passed, which are recorded as soon as the Fund is informed of the ex-dividend date. Non-cash dividends included in dividend income, if any, are recorded at the fair market value of the securities received. Income and capital gain distributions from Fidelity Central Funds, if any, are recorded on the ex-dividend date. Income and capital gain distributions from any underlying mutual funds or exchange-traded funds (ETFs) are recorded on the ex-dividend date. Certain distributions received by the Fund represent a return of capital or capital gain. The Fund determines the components of these distributions subsequent to the ex-dividend date, based upon receipt of tax filings or other correspondence relating to the underlying investment. These distributions are recorded as a reduction of cost of investments and/or as a realized gain. Interest income is accrued as earned and includes coupon interest and amortization of premium and accretion of discount on debt securities as applicable. Investment income is recorded net of foreign taxes withheld where recovery of such taxes is uncertain.
Expenses. Expenses directly attributable to a fund are charged to that fund. Expenses attributable to more than one fund are allocated among the respective funds on the basis of relative net assets or other appropriate methods. Expense estimates are accrued in the period to which they relate and adjustments are made when actual amounts are known.
Deferred Trustee Compensation. Under a Deferred Compensation Plan (the Plan) for certain Funds, certain independent Trustees have elected to defer receipt of a portion of their annual compensation. Deferred amounts are invested in affiliated mutual funds, are marked-to-market and remain in a fund until distributed in accordance with the Plan. The investment of deferred amounts and the offsetting payable to the Trustees presented below are included in the accompanying Statement of Assets and Liabilities in other receivables and other payables and accrued expenses, as applicable.
| Strategic Advisers Fidelity Emerging Markets Fund | $9 |
Income Tax Information and Distributions to Shareholders. Each year, the Fund intends to qualify as a regulated investment company under Subchapter M of the Internal Revenue Code, including distributing substantially all of its taxable income and realized gains. As a result, no provision for U.S. Federal income taxes is required. The Fund files a U.S. federal tax return, in addition to state and local tax returns as required. The Fund's federal income tax returns are subject to examination by the Internal Revenue Service (IRS) for a period of three fiscal years after they are filed. State and local tax returns may be subject to examination for an additional fiscal year depending on the jurisdiction. Foreign taxes are provided for based on the Fund's understanding of the tax rules and rates that exist in the foreign markets in which it invests. The Fund is subject to a tax imposed on capital gains by certain countries in which it invests. An estimated deferred tax liability for net unrealized appreciation on the applicable securities is included in Other payables and accrued expenses on the Statement of Assets & Liabilities.
Distributions are declared and recorded on the ex-dividend date. Income and capital gain distributions are determined in accordance with income tax regulations, which may differ from GAAP.
Capital accounts within the financial statements are adjusted for permanent book-tax differences. These adjustments have no impact on net assets or the results of operations. Capital accounts are not adjusted for temporary book-tax differences which will reverse in a subsequent period.
Book-tax differences are primarily due to futures contracts, foreign currency transactions, certain foreign taxes, passive foreign investment companies (PFIC), market discount, deferred trustees compensation, capital loss carryforwards and losses deferred due to wash sales.
As of period end, the cost and unrealized appreciation (depreciation) in securities, and derivatives if applicable, for federal income tax purposes were as follows:
| Gross unrealized appreciation | $1,046,446,501 |
| Gross unrealized depreciation | (62,882,555) |
| Net unrealized appreciation (depreciation) | $983,563,946 |
| Tax cost | $4,432,649,459 |
Capital loss carryforwards are only available to offset future capital gains of the Fund to the extent provided by regulations and may be limited. The capital loss carryforward information presented below, including any applicable limitation, is estimated as of prior fiscal period end and is subject to adjustment.
| No expiration | |
| Short-term | $(75,892,074) |
| Long-term | (6,235,505) |
| Total capital loss carryforward | $(82,127,579) |
Restricted Securities (including Private Placements). The Fund may invest in securities that are subject to legal or contractual restrictions on resale. These securities generally may be resold in transactions exempt from registration or to the public if the securities are registered. Disposal of these securities may involve time-consuming negotiations and expense, and prompt sale at an acceptable price may be difficult. Information regarding restricted securities is included at the end of the Fund's Schedule of Investments.
3. Derivative Instruments.
Risk Exposures and the Use of Derivative Instruments. The Fund's investment objective allows the Fund to enter into various types of derivative contracts, including futures contracts. Derivatives are investments whose value is primarily derived from underlying assets, indices or reference rates and may be transacted on an exchange or over-the-counter (OTC). Derivatives may involve a future commitment to buy or sell a specified asset based on specified terms, to exchange future cash flows at periodic intervals based on a notional principal amount, or for one party to make one or more payments upon the occurrence of specified events in exchange for periodic payments from the other party.
The Fund used derivatives to increase returns and to manage exposure to certain risks as defined below. The success of any strategy involving derivatives depends on analysis of numerous economic factors, and if the strategies for investment do not work as intended, the Fund may not achieve its objectives.
The Fund's use of derivatives increased or decreased its exposure to the following risk:
| Equity Risk | Equity risk relates to the fluctuations in the value of financial instruments as a result of changes in market prices (other than those arising from interest rate risk or foreign exchange risk), whether caused by factors specific to an individual investment, its issuer, or all factors affecting all instruments traded in a market or market segment. |
The Fund is also exposed to additional risks from investing in derivatives, such as liquidity risk and counterparty credit risk. Liquidity risk is the risk that the Fund will be unable to close out the derivative in the open market in a timely manner. Counterparty credit risk is the risk that the counterparty will not be able to fulfill its obligation to the Fund. Counterparty credit risk related to exchange-traded futures contracts may be mitigated by the protection provided by the exchange on which they trade.
Investing in derivatives may involve greater risks than investing in the underlying assets directly and, to varying degrees, may involve risk of loss in excess of any initial investment and collateral received and amounts recognized in the Statement of Assets and Liabilities. In addition, there may be the risk that the change in value of the derivative contract does not correspond to the change in value of the underlying instrument.
Futures Contracts. A futures contract is an agreement between two parties to buy or sell a specified underlying instrument for a fixed price at a specified future date. The Fund used futures contracts to manage its exposure to the stock market.
Upon entering into a futures contract, a fund is required to deposit either cash or securities (initial margin) with a clearing broker in an amount equal to a certain percentage of the face value of the contract. Futures contracts are marked-to-market daily and subsequent daily payments (variation margin) are made or received by a fund depending on the daily fluctuations in the value of the futures contracts and are recorded as unrealized appreciation or (depreciation). This receivable and/or payable, if any, is included in daily variation margin on futures contracts in the Statement of Assets and Liabilities. Realized gain or (loss) is recorded upon the expiration or closing of a futures contract. The net realized gain (loss) and change in net unrealized appreciation (depreciation) on futures contracts during the period is presented in the Statement of Operations.
Any open futures contracts at period end are presented in the Schedule of Investments under the caption "Futures Contracts". The notional amount at value reflects each contract's exposure to the underlying instrument or index at period end. Securities deposited to meet initial margin requirements are identified in the Schedule of Investments.
4. Purchases and Sales of Investments.
Purchases and sales of securities, other than short-term securities are noted in the table below.
| Purchases ($) | Sales ($) | |
| Strategic Advisers Fidelity Emerging Markets Fund | 2,442,806,009 | 1,254,131,182 |
5. Fees and Other Transactions with Affiliates.
Management Fee. Strategic Advisers (the investment adviser) provides the Fund with investment management related services. For these services, the Fund pays a monthly management fee to the investment adviser. The management fee is calculated by adding the annual management fee rate of .25% of the Fund's average net assets throughout the month payable to the investment adviser to the aggregate of the fee rates, payable monthly, to the Fund's sub-advisers. The Fund's maximum aggregate management fee will not exceed 1.20% of the Fund's average net assets. For the reporting period, the total annualized management fee rate was .47% of the Fund's average net assets.
During the period, the investment adviser waived a portion of its management fee as described in the Expense Reductions note.
Sub-Advisers. FIAM LLC (an affiliate of the investment adviser) and FIL Investment Advisors each served as a sub-adviser for the Fund during the period. Sub-advisers provide discretionary investment advisory services for their allocated portion of the Fund's assets and are paid by the investment adviser and not the Fund for providing these services.
Geode Capital Management, LLC (Geode) has been retained to serve as a sub-adviser for the Fund. As of the date of this report, however, Geode has not been allocated any portion of the Fund's assets. Geode in the future may provide discretionary investment advisory services for an allocated portion of the Fund's assets and will be paid by the investment adviser for providing these services.
Brokerage Commissions. A portion of portfolio transactions were placed with brokerage firms which are affiliates of the investment adviser. Brokerage commissions are included in net realized gain (loss) and change in net unrealized appreciation (depreciation) in the Statement of Operations. The commissions paid to these affiliated firms were as follows:
| Amount | |
| Strategic Advisers Fidelity Emerging Markets Fund | $1,932 |
Interfund Trades. Funds may purchase from or sell securities to other funds affiliated with each sub-adviser under procedures adopted by the Board. The procedures have been designed to ensure these interfund trades are executed in accordance with Rule 17a-7 of the 1940 Act. Interfund trades are included within the respective purchases and sales amounts shown in the Purchases and Sales of Investments note.
6. Investments in Fidelity Central Funds.
The Fund invests in Fidelity Central Funds, which are open-end investment companies available only to other investment companies and accounts managed by the investment adviser and its affiliates. The Fund's Schedule of Investments lists each of the Fidelity Central Funds held as of period end, if any, as an investment of the Fund, but does not include the underlying holdings of each Fidelity Central Fund. As an Investing Fund, the Fund indirectly bears its proportionate share of the expenses of the underlying Fidelity Central Funds.
The Fidelity Money Market Central Funds are managed by FMR. Annualized expenses of the Money Market Central Funds as of their most recent shareholder report date ranged from less than .005% to .01%.
A complete unaudited list of holdings for each Fidelity Central Fund is available upon request or at the Securities and Exchange Commission (the SEC) website at www.sec.gov. In addition, the financial statements of the Fidelity Central Funds are available on the SEC website or upon request.
7. Committed Line of Credit.
Certain Funds participate with other funds managed by the investment adviser or an affiliate in a $4.25 billion credit facility (the "line of credit") to be utilized for temporary or emergency purposes to fund shareholder redemptions or for other short-term liquidity purposes. The participating funds have agreed to pay commitment fees on their pro-rata portion of the line of credit, which are reflected in Miscellaneous expenses on the Statement of Operations, and are as follows:
| Amount | |
| Strategic Advisers Fidelity Emerging Markets Fund | $3,795 |
During the period, there were no borrowings on this line of credit.
8. Security Lending.
Funds lend portfolio securities through a lending agent from time to time in order to earn additional income. On the settlement date of the loan, a fund receives collateral (in the form of U.S. Treasury obligations, letters of credit and/or cash) against the loaned securities and maintains collateral in an amount not less than 100% of the market value of the loaned securities during the period of the loan. The market value of the loaned securities is determined at the close of business of a fund and any additional required collateral is delivered to a fund on the next business day. A fund or borrower may terminate the loan at any time, and if the borrower defaults on its obligation to return the securities loaned because of insolvency or other reasons, a fund may apply collateral received from the borrower against the obligation. A fund may experience delays and costs in recovering the securities loaned. Any cash collateral received is invested in the Fidelity Securities Lending Cash Central Fund. Any loaned securities are identified as such in the Schedule of Investments, and the value of loaned securities and cash collateral at period end, as applicable, are presented in the Statement of Assets and Liabilities. Security lending income represents the income earned on investing cash collateral, less rebates paid to borrowers and any lending agent fees associated with the loan, plus any premium payments received for lending certain types of securities. Security lending income is presented in the Statement of Operations as a component of income from Fidelity Central Funds.
9. Expense Reductions.
The investment adviser has contractually agreed to waive the Fund's management fee in an amount equal to .25% of the Fund's average net assets until September 30, 2023. During the period, this waiver reduced the Fund's management fee by $ 5,137,944.
Commissions paid to certain brokers with whom the investment adviser, or its affiliates, places trades on behalf of the Fund include an amount in addition to trade execution, which may be rebated back to the Fund to offset certain expenses. This amount totaled $101,897 for the period.
In addition, through arrangements with the Fund's custodian, credits realized as a result of certain uninvested cash balances were used to reduce the Fund's expenses by $1,907.
10. Other.
The Fund's organizational documents provide former and current trustees and officers with a limited indemnification against liabilities arising in connection with the performance of their duties to the Fund. In the normal course of business, the Fund may also enter into contracts that provide general indemnifications. The Fund's maximum exposure under these arrangements is unknown as this would be dependent on future claims that may be made against the Fund. The risk of material loss from such claims is considered remote.
The Fund does not invest in the Underlying Funds for the purpose of exercising management or control; however, investments by the Fund within its principal investment strategies may represent a significant portion of an Underlying Fund's net assets. At the end of the period, the Fund was the owner of record of 10% or more of the total outstanding shares of the following Underlying Funds.
| Fund | % of shares held |
| Fidelity SAI Emerging Markets Index Fund | 15% |
| Fidelity SAI Emerging Markets Low Volatility Index Fund | 25% |
| Fidelity SAI Emerging Markets Value Index Fund | 68% |
11. Coronavirus (COVID-19) Pandemic.
An outbreak of COVID-19 first detected in China during December 2019 has since spread globally and was declared a pandemic by the World Health Organization during March 2020. Developments that disrupt global economies and financial markets, such as the COVID-19 pandemic, may magnify factors that affect the Fund's performance.
Shareholder Expense Example
As a shareholder, you incur two types of costs: (1) transaction costs, which may include sales charges (loads) on purchase payments or redemption proceeds, as applicable and (2) ongoing costs, which generally include management fees, distribution and/or service (12b-1) fees and other Fund expenses. This Example is intended to help you understand your ongoing costs (in dollars) of investing in a fund and to compare these costs with the ongoing costs of investing in other mutual funds.
The Example is based on an investment of $1,000 invested at the beginning of the period and held for the entire period (June 1, 2020 to November 30, 2020).
Actual Expenses
The first line of the accompanying table provides information about actual account values and actual expenses. You may use the information in this line, together with the amount you invested, to estimate the expenses that you paid over the period. Simply divide your account value by $1,000.00 (for example, an $8,600 account value divided by $1,000.00 = 8.6), then multiply the result by the number in the first line for a class/Fund under the heading entitled "Expenses Paid During Period" to estimate the expenses you paid on your account during this period. If any fund is a shareholder of any underlying mutual funds or exchange-traded funds (ETFs) (the Underlying Funds), such fund indirectly bears its proportional share of the expenses of the Underlying Funds in addition to the direct expenses incurred presented in the table.
Hypothetical Example for Comparison Purposes
The second line of the accompanying table provides information about hypothetical account values and hypothetical expenses based on the actual expense ratio and an assumed rate of return of 5% per year before expenses, which is not the actual return. The hypothetical account values and expenses may not be used to estimate the actual ending account balance or expenses you paid for the period. You may use this information to compare the ongoing costs of investing in the Fund and other funds. To do so, compare this 5% hypothetical example with the 5% hypothetical examples that appear in the shareholder reports of the other funds. If any fund is a shareholder of any Underlying Funds, such fund indirectly bears its proportional share of the expenses of the Underlying Funds in addition to the direct expenses as presented in the table.
Please note that the expenses shown in the table are meant to highlight your ongoing costs only and do not reflect any transaction costs. Therefore, the second line of the table is useful in comparing ongoing costs only, and will not help you determine the relative total costs of owning different funds.
| Annualized Expense Ratio-A | Beginning Account Value June 1, 2020 | Ending Account Value November 30, 2020 | Expenses Paid During Period-B June 1, 2020 to November 30, 2020 | |
| Strategic Advisers Fidelity Emerging Markets Fund | .25% | |||
| Actual | $1,000.00 | $1,319.80 | $1.45 | |
| Hypothetical-C | $1,000.00 | $1,023.82 | $1.27 |
A Annualized expense ratio reflects expenses net of applicable fee waivers.
B Expenses are equal to the annualized expense ratio, multiplied by the average account value over the period, multiplied by 183/ 365 (to reflect the one-half year period). The fees and expenses of any Underlying Funds are not included in each annualized expense ratio.
C 5% return per year before expenses
Board Approval of Investment Advisory Contracts and Management Fees
Strategic Advisers Fidelity Emerging Markets Fund
Each year, the Board of Trustees, including the Independent Trustees (together, the Board), votes at a meeting on the renewal of the management contract with Strategic Advisers LLC (Strategic Advisers) and the sub-advisory agreements with FIAM LLC (FIAM), FIL Investment Advisors, and Geode Capital Management, LLC (each a Sub-Adviser and collectively, the Sub-Advisers) (collectively, the Sub-Advisory Agreements), and the sub-sub-advisory agreements with FMR Investment Management (UK) Limited, Fidelity Management & Research (Japan) Limited, Fidelity Management & Research (Hong Kong) Limited, and FIL Investment Advisors (UK) Limited (collectively, the Sub-Sub-Advisory Agreements and, together with the management contract and the Sub-Advisory Agreements, the Advisory Contracts) for the fund. Strategic Advisers and the Sub-Advisers are referred to herein as the Investment Advisers. The Board, assisted by the advice of fund counsel and Independent Trustees' counsel, requests and considers a broad range of information relevant to the renewal of the Advisory Contracts throughout the year.The Board meets at least four times per year and, at each of its meetings, covers an extensive agenda of topics and materials and considers factors that are relevant to its annual consideration of the renewal of the fund's Advisory Contracts, including the services and support provided to the fund and its shareholders. The full Board or the Independent Trustees, as appropriate, act on all major matters; however, a portion of the activities of the Board (including certain of those described herein) may be conducted through standing committees that have been established by the Board. The Board, acting directly and through its committees, requests and receives information concerning the annual consideration of the renewal of the fund's Advisory Contracts.At its September 2020 meeting, the Board, including the Independent Trustees, unanimously determined to renew the fund's Advisory Contracts. In addition, the Board approved an amendment to the fund's sub-advisory agreement with FIAM (Amendment) to remove a mandate that was previously defunded due to a portfolio manager departure. The Board noted that no other contact terms are impacted by the Amendment.In reaching its determination to renew the fund's Advisory Contracts and approve the Amendment, the Board considered all factors it believed relevant, including (i) the nature, extent, and quality of the services provided to the fund and its shareholders (including the investment performance of the fund); (ii) the competitiveness of the fund's management fee and total expenses relative to peer funds; (iii) the total costs of the services provided by and the profits, if any, realized by Strategic Advisers from its relationships with the fund; and (iv) the extent to which, if any, economies of scale exist and are realized as the fund grows and whether any economies of scale are appropriately shared with fund shareholders.In considering whether to renew the Advisory Contracts for the fund and approve the Amendment, the Board reached a determination, with the assistance of fund counsel and Independent Trustees' counsel and through the exercise of its business judgment, that the renewal of the Advisory Contracts and the approval of the Amendment is in the best interests of the fund and its shareholders. In addition, with respect to the Sub-Advisory Agreements, the Board also concluded that the renewal of such agreements and the approval of the Amendment do not involve a conflict of interest from which Strategic Advisers or its affiliates derive an inappropriate advantage. Also, the Board found that the advisory fees charged under the Advisory Contracts bear a reasonable relationship to the services rendered and are based on services provided that are in addition to, rather than duplicative of, services provided under the advisory contract of any underlying fund in which the fund may invest. The Board's decision to renew the Advisory Contracts and approve the Amendment was not based on any single factor, but rather was based on a comprehensive consideration of all the information provided to the Board throughout the year.Nature, Extent, and Quality of Services Provided. The Board considered the staffing within the Investment Advisers, including the backgrounds of the fund's investment personnel and also considered the fund's investment objective, strategies, and related investment philosophy. The Independent Trustees also had discussions with senior management of Strategic Advisers' investment operations and investment groups. The Board considered the structure of each Investment Adviser's investment personnel compensation program and whether such structures provide appropriate incentives to act in the best interests of the fund.The Trustees also discussed with representatives of Strategic Advisers, at meetings throughout the year, Strategic Advisers' role in, among other things, (i) setting, implementing and monitoring the investment strategies for the funds; (ii) identifying and recommending sub-advisers for the funds; (iii) overseeing compliance with federal securities laws by each sub-adviser with respect to the portion of fund assets allocated to the sub-adviser; (iv) monitoring and overseeing the performance and investment capabilities of each sub-adviser; and (v) recommending the replacement of a sub-adviser as appropriate. The Trustees considered that the Board had received from Strategic Advisers substantial information and periodic reports about Strategic Advisers' sub-adviser oversight and due diligence processes, as well as periodic reports regarding the performance of each sub-adviser.The Board also considered the nature, extent and quality of services provided by each Sub-Adviser. The Trustees noted that under the Sub-Advisory Agreements subject to oversight by Strategic Advisers, each Sub-Adviser is responsible for, among other things, identifying investments for the portion of fund assets allocated to the Sub-Adviser, if any, and executing portfolio transactions to implement its investment strategy. In addition, the Trustees noted that each Sub-Adviser is responsible for providing such reporting as may be requested from Strategic Advisers to fulfill its oversight responsibilities discussed above.Resources Dedicated to Investment Management and Support Services. The Board reviewed the general qualifications and capabilities of the Investment Advisers' investment staffs, their use of technology, and the Investment Advisers' approach to managing and compensating investment personnel. The Board noted that the Investment Advisers' analysts have extensive resources, tools, and capabilities that allow them to conduct sophisticated quantitative and/or fundamental analysis. Additionally, in its deliberations, the Board considered the Investment Advisers' trading capabilities and resources and global compliance infrastructure, which are integral parts of the investment management process. The Board also considered the Investment Advisers' investments in business continuity planning, and their success in continuously providing services to the fund notwithstanding the severe disruptions caused by the COVID-19 pandemic.Shareholder and Administrative Services. The Board considered (i) the nature, extent, quality, and cost of administrative and shareholder services performed by Strategic Advisers and itsaffiliates under the management contract and under separate agreements covering transfer agency, pricing and bookkeeping, and securities lending services for the fund; (ii) the nature and extent of Strategic Advisers' supervision of third party service providers, including sub-advisers, custodians and subcustodians; and (iii) the resources devoted to, and the record of compliance with, the fund's compliance policies and procedures.Investment Performance. The Board considered whether the fund has operated in accordance with its investment objective, as well as its record of compliance with its investment restrictions and its performance history.In connection with the renewal of the Advisory Contracts, the Board considered annualized return information for the fund for different time periods, measured against an appropriate securities market index ("benchmark index") and a peer group of mutual funds with similar objectives ("peer group").The Board considered discussions that occur at Board meetings throughout the year with representatives of Strategic Advisers about fund investment performance and the performance of each Sub-Adviser as part of regularly scheduled fund reviews and other reports to the Board on fund performance, taking into account various factors including general market conditions. In its discussions with representatives of Strategic Advisers regarding fund performance, the Board gave particular attention to information indicating underperformance of certain funds for specific time periods and discussed with Strategic Advisers the reasons for any such underperformance.The following chart considered by the Board shows, over the one-year period ended December 31, 2019, the cumulative total returns of the fund and the cumulative total returns of an appropriate benchmark index and peer group. The box within the chart shows the 25th percentile return (75% beaten, top of box) and the 75th percentile return (25% beaten, bottom of box) of the peer group. Returns shown above the box are in the first quartile and returns shown below the box are in the fourth quartile. The percentage beaten number noted below each chart corresponds to the percentile box and represents the percentage of funds in the peer group whose performance was equal to or lower than that of the fund.Strategic Advisers Fidelity Emerging Markets Fund
Strategic Advisers Fidelity Emerging Markets Fund
Proxy Voting Results
A special meeting of shareholders was held on November 2, 2020. The results of votes taken among shareholders on the proposal before them are reported below. Each vote reported represents one dollar of net asset value held on the record date for the meeting.
PROPOSAL 1
To elect a Board of Trustees.
| # of Votes | % of Votes | |
| ROBERT A. LAWRENCE | ||
| Affirmative | 204,250,982,594.51 | 96.530 |
| Withheld | 7,343,512,146.85 | 3.470 |
| TOTAL | 211,594,494,741.36 | 100.000 |
| CHARLES S. MORRISON | ||
| Affirmative | 204,349,460,488.43 | 96.576 |
| Withheld | 7,245,034,252.93 | 3.424 |
| TOTAL | 211,594,494,741.36 | 100.000 |
| PETER C. ALDRICH | ||
| Affirmative | 203,499,803,652.67 | 96.175 |
| Withheld | 8,094,691,088.69 | 3.825 |
| TOTAL | 211,594,494,741.36 | 100.000 |
| MARY C. FARRELL | ||
| Affirmative | 204,011,925,737.22 | 96.417 |
| Withheld | 7,582,569,004.14 | 3.583 |
| TOTAL | 211,594,494,741.36 | 100.00 |
| KAREN KAPLAN | ||
| Affirmative | 204,297,547,550.53 | 96.552 |
| Withheld | 7,296,947,190.83 | 3.448 |
| TOTAL | 211,594,494,741.36 | 100.000 |
| CHRISTINE MARCKS | ||
| Affirmative | 204,700,871,317.72 | 96.743 |
| Withheld | 6,893,623,423.64 | 3.257 |
| TOTAL | 211,594,494,741.36 | 100.000 |
| HEIDI L. STEIGER | ||
| Affirmative | 204,406,589,957.28 | 96.603 |
| Withheld | 7,187,904,784.08 | 3.397 |
| TOTAL | 211,594,494,741.36 | 100.000 |
| Proposal 1 reflects trust wide proposal and voting results. |
![]()
STE-SANN-0121
1.9890708.102
Strategic Advisers® Large Cap Fund
Offered exclusively to certain clients of Strategic Advisers LLC - not available for sale to the general public
Semi-Annual Report
November 30, 2020
Contents
Board Approval of Investment Advisory Contracts and Management Fees |
To view a fund's proxy voting record for the 12-month period ended June 30, visit http://www.fidelity.com/proxyvotingresults or visit the Securities and Exchange Commission's (SEC) web site at http://www.sec.gov.
You may also call 1-800-544-3455 to request a free copy of the proxy voting guidelines.
Standard & Poor's, S&P and S&P 500 are registered service marks of The McGraw-Hill Companies, Inc. and have been licensed for use by Fidelity Distributors Corporation.
Other third-party marks appearing herein are the property of their respective owners.
All other marks appearing herein are registered or unregistered trademarks or service marks of FMR LLC or an affiliated company. © 2021 FMR LLC. All rights reserved.
This report and the financial statements contained herein are submitted for the general information of the shareholders of the Fund. This report is not authorized for distribution to prospective investors in the Fund unless preceded or accompanied by an effective prospectus.
A fund files its complete schedule of portfolio holdings with the SEC for the first and third quarters of each fiscal year on Form N-PORT. Forms N-PORT are available on the SEC’s web site at http://www.sec.gov. A fund's Forms N-PORT may be reviewed and copied at the SEC’s Public Reference Room in Washington, DC. Information regarding the operation of the SEC's Public Reference Room may be obtained by calling 1-800-SEC-0330.
For a complete list of a fund's portfolio holdings, view the most recent holdings listing, semiannual report, or annual report on Fidelity's web site at http://www.fidelity.com, http://www.institutional.fidelity.com, or http://www.401k.com, as applicable.
NOT FDIC INSURED •MAY LOSE VALUE •NO BANK GUARANTEE
Neither the Fund nor Fidelity Distributors Corporation is a bank.
Note to Shareholders:
Early in 2020, the outbreak and spread of a new coronavirus emerged as a public health emergency that had a major influence on financial markets, primarily based on its impact on the global economy and the outlook for corporate earnings. The virus causes a respiratory disease known as COVID-19. On March 11, the World Health Organization declared the COVID-19 outbreak a pandemic, citing sustained risk of further global spread.
In the weeks following, as the crisis worsened, we witnessed an escalating human tragedy with wide-scale social and economic consequences from coronavirus-containment measures. The outbreak of COVID-19 prompted a number of measures to limit the spread, including travel and border restrictions, quarantines, and restrictions on large gatherings. In turn, these resulted in lower consumer activity, diminished demand for a wide range of products and services, disruption in manufacturing and supply chains, and – given the wide variability in outcomes regarding the outbreak – significant market uncertainty and volatility. Amid the turmoil, global governments and central banks took unprecedented action to help support consumers, businesses, and the broader economies, and to limit disruption to financial systems.
The situation continues to unfold, and the extent and duration of its impact on financial markets and the economy remain highly uncertain. Extreme events such as the coronavirus crisis are “exogenous shocks” that can have significant adverse effects on mutual funds and their investments. Although multiple asset classes may be affected by market disruption, the duration and impact may not be the same for all types of assets.
Fidelity is committed to helping you stay informed amid news about COVID-19 and during increased market volatility, and we’re taking extra steps to be responsive to customer needs. We encourage you to visit our websites, where we offer ongoing updates, commentary, and analysis on the markets and our funds.
Investment Summary (Unaudited)
The information in the following tables is based on the direct investments of the Fund.Top Ten Holdings as of November 30, 2020
| % of fund's net assets | |
| Fidelity Growth Company Fund | 7.6 |
| Microsoft Corp. | 3.7 |
| Apple, Inc. | 3.2 |
| Amazon.com, Inc. | 3.1 |
| Fidelity SAI U.S. Quality Index Fund | 2.8 |
| Fidelity SAI U.S. Large Cap Index Fund | 2.8 |
| Facebook, Inc. Class A | 1.7 |
| Alphabet, Inc. Class C | 1.7 |
| Janus Henderson Enterprise Fund | 1.5 |
| Fidelity SAI U.S. Low Volatility Index Fund | 1.3 |
| 29.4 |
Top Five Market Sectors as of November 30, 2020
(stocks only)
| % of fund's net assets | |
| Information Technology | 20.2 |
| Health Care | 11.6 |
| Financials | 10.4 |
| Consumer Discretionary | 9.3 |
| Communication Services | 8.4 |
Asset Allocation (% of fund's net assets)
| As of November 30, 2020 * | ||
| Common Stocks | 79.7% | |
| Large Blend Funds | 6.5% | |
| Large Growth Funds | 10.4% | |
| Large Value Funds | 0.2% | |
| Mid-Cap Blend Funds | 0.8% | |
| Mid-Cap Growth Funds | 1.5% | |
| Short-Term Investments and Net Other Assets (Liabilities) | 0.9% | |

Asset allocations of funds in the pie chart reflect the categorizations of assets as defined by Morningstar as of the reporting date.
Schedule of Investments November 30, 2020 (Unaudited)
Showing Percentage of Net Assets
| Common Stocks - 79.7% | |||
| Shares | Value | ||
| COMMUNICATION SERVICES - 8.4% | |||
| Diversified Telecommunication Services - 1.1% | |||
| AT&T, Inc. | 6,262,786 | $180,055,098 | |
| Cellnex Telecom SA (a) | 188,107 | 11,915,919 | |
| CenturyLink, Inc. | 79,691 | 832,771 | |
| Liberty Global PLC Class C (b) | 145,800 | 3,155,112 | |
| Verizon Communications, Inc. | 5,950,134 | 359,447,595 | |
| Vonage Holdings Corp. (b) | 190,500 | 2,449,830 | |
| 557,856,325 | |||
| Entertainment - 1.3% | |||
| Activision Blizzard, Inc. | 1,549,491 | 123,153,545 | |
| Cinemark Holdings, Inc. | 202,200 | 3,123,990 | |
| Electronic Arts, Inc. | 295,074 | 37,695,704 | |
| Liberty Media Corp. Liberty SiriusXM Series C (b) | 179,056 | 7,343,087 | |
| Live Nation Entertainment, Inc. (b) | 47,447 | 3,114,896 | |
| Netflix, Inc. (b) | 484,375 | 237,682,813 | |
| Nintendo Co. Ltd. ADR | 59,600 | 4,228,620 | |
| Sea Ltd. ADR (b) | 10,300 | 1,857,811 | |
| Spotify Technology SA (b) | 27,276 | 7,947,408 | |
| Take-Two Interactive Software, Inc. (b) | 51,117 | 9,227,130 | |
| The Walt Disney Co. | 1,424,376 | 210,821,892 | |
| Vivendi SA | 945,411 | 28,342,005 | |
| Warner Music Group Corp. Class A | 153,862 | 4,574,317 | |
| Zynga, Inc. (b) | 640,802 | 5,286,617 | |
| 684,399,835 | |||
| Interactive Media & Services - 4.1% | |||
| Alphabet, Inc.: | |||
| Class A (b) | 205,161 | 359,934,458 | |
| Class C (b) | 481,885 | 848,474,195 | |
| Facebook, Inc. Class A (b) | 3,104,605 | 859,882,447 | |
| Match Group, Inc. (b) | 30,020 | 4,179,084 | |
| Pinterest, Inc. Class A (b) | 131,115 | 9,180,672 | |
| Snap, Inc. Class A (b) | 233,581 | 10,375,668 | |
| Tencent Holdings Ltd. sponsored ADR | 85,969 | 6,275,737 | |
| Twitter, Inc. (b) | 432,256 | 20,104,227 | |
| Wise Talent Information Technology Co. Ltd. (b) | 446,200 | 1,123,664 | |
| Zoominfo Technologies, Inc. | 49,500 | 2,536,875 | |
| 2,122,067,027 | |||
| Media - 1.6% | |||
| Charter Communications, Inc. Class A (b) | 266,001 | 173,429,992 | |
| Comcast Corp. Class A | 9,637,517 | 484,188,854 | |
| Discovery Communications, Inc.: | |||
| Class A (b) | 127,788 | 3,438,775 | |
| Class C (non-vtg.) (b) | 1,156,353 | 27,775,599 | |
| DISH Network Corp. Class A (b) | 402,425 | 14,434,985 | |
| Fox Corp. Class A | 231,515 | 6,676,893 | |
| Interpublic Group of Companies, Inc. | 337,074 | 7,510,009 | |
| Liberty Broadband Corp. Class C (b) | 335,680 | 52,819,248 | |
| Nexstar Broadcasting Group, Inc. Class A | 122,282 | 12,870,181 | |
| Omnicom Group, Inc. | 34,951 | 2,201,913 | |
| Tegna, Inc. | 536,100 | 7,725,201 | |
| ViacomCBS, Inc. Class B | 705,570 | 24,892,510 | |
| 817,964,160 | |||
| Wireless Telecommunication Services - 0.3% | |||
| T-Mobile U.S., Inc. | 1,148,310 | 152,656,331 | |
| TOTAL COMMUNICATION SERVICES | 4,334,943,678 | ||
| CONSUMER DISCRETIONARY - 9.3% | |||
| Auto Components - 0.3% | |||
| Aptiv PLC | 432,074 | 51,287,184 | |
| BorgWarner, Inc. | 642,447 | 24,959,066 | |
| Compagnie Generale des Etablissements Michelin SCA ADR | 61,921 | 1,542,452 | |
| Cooper Tire & Rubber Co. | 320,927 | 12,750,430 | |
| Gentex Corp. | 118,367 | 3,858,764 | |
| Lear Corp. | 205,000 | 29,304,750 | |
| Magna International, Inc. Class A (sub. vtg.) | 329,020 | 20,176,448 | |
| The Goodyear Tire & Rubber Co. | 871,600 | 9,082,072 | |
| 152,961,166 | |||
| Automobiles - 0.4% | |||
| Ferrari NV | 115,750 | 24,435,983 | |
| Ford Motor Co. | 5,051,900 | 45,871,252 | |
| General Motors Co. | 2,057,889 | 90,217,854 | |
| Harley-Davidson, Inc. | 502,772 | 20,256,684 | |
| Tesla, Inc. (b) | 28,280 | 16,051,728 | |
| 196,833,501 | |||
| Distributors - 0.0% | |||
| Genuine Parts Co. | 72,353 | 7,117,365 | |
| LKQ Corp. (b) | 237,672 | 8,370,808 | |
| Pool Corp. | 14,262 | 4,936,221 | |
| 20,424,394 | |||
| Diversified Consumer Services - 0.0% | |||
| Afya Ltd. (b) | 66,334 | 1,759,178 | |
| Service Corp. International | 85,700 | 4,168,448 | |
| 5,927,626 | |||
| Hotels, Restaurants & Leisure - 1.1% | |||
| Brinker International, Inc. | 182,200 | 9,130,042 | |
| Carnival Corp. | 85,250 | 1,703,295 | |
| Chipotle Mexican Grill, Inc. (b) | 5,319 | 6,858,478 | |
| Domino's Pizza, Inc. | 38,423 | 15,083,717 | |
| Hilton Worldwide Holdings, Inc. | 392,555 | 40,680,475 | |
| Las Vegas Sands Corp. | 366,629 | 20,424,902 | |
| Marriott International, Inc. Class A | 339,918 | 43,125,397 | |
| McDonald's Corp. | 717,967 | 156,114,744 | |
| Royal Caribbean Cruises Ltd. | 119,000 | 9,378,390 | |
| Starbucks Corp. | 913,826 | 89,573,225 | |
| Wyndham Destinations, Inc. | 289,680 | 12,183,941 | |
| Wynn Resorts Ltd. | 216,115 | 21,719,558 | |
| Yum China Holdings, Inc. | 270,077 | 15,226,941 | |
| Yum! Brands, Inc. | 886,758 | 93,818,996 | |
| 535,022,101 | |||
| Household Durables - 0.6% | |||
| D.R. Horton, Inc. | 492,106 | 36,661,897 | |
| Garmin Ltd. | 49,832 | 5,818,384 | |
| Lennar Corp.: | |||
| Class A | 911,831 | 69,171,500 | |
| Class B | 6,000 | 364,200 | |
| Mohawk Industries, Inc. (b) | 189,076 | 23,791,433 | |
| Newell Brands, Inc. | 841,996 | 17,900,835 | |
| NVR, Inc. (b) | 3,600 | 14,389,848 | |
| PulteGroup, Inc. | 1,126,042 | 49,129,212 | |
| Sony Corp. | 18,200 | 1,695,976 | |
| Sony Corp. sponsored ADR | 278,220 | 25,955,144 | |
| Toll Brothers, Inc. | 62,100 | 2,940,435 | |
| Whirlpool Corp. | 256,675 | 49,951,522 | |
| 297,770,386 | |||
| Internet & Direct Marketing Retail - 3.9% | |||
| Alibaba Group Holding Ltd. sponsored ADR (b) | 505,636 | 133,164,297 | |
| Amazon.com, Inc. (b) | 497,095 | 1,574,816,844 | |
| eBay, Inc. | 1,562,532 | 78,798,489 | |
| Etsy, Inc. (b) | 83,302 | 13,386,631 | |
| Expedia, Inc. | 26,799 | 3,336,208 | |
| Ocado Group PLC (b) | 8,667 | 254,820 | |
| The Booking Holdings, Inc. (b) | 86,926 | 176,325,045 | |
| 1,980,082,334 | |||
| Leisure Products - 0.0% | |||
| Brunswick Corp. | 38,500 | 2,873,640 | |
| Hasbro, Inc. | 49,800 | 4,632,894 | |
| Polaris, Inc. | 20,800 | 1,996,800 | |
| 9,503,334 | |||
| Multiline Retail - 0.5% | |||
| Big Lots, Inc. | 174,300 | 9,006,081 | |
| Dillard's, Inc. Class A | 129,000 | 6,032,040 | |
| Dollar General Corp. | 161,873 | 35,382,200 | |
| Dollar Tree, Inc. (b) | 394,812 | 43,129,263 | |
| Kohl's Corp. | 566,681 | 18,247,128 | |
| Macy's, Inc. | 451,300 | 4,607,773 | |
| Nordstrom, Inc. | 229,330 | 5,944,234 | |
| Target Corp. | 802,147 | 144,009,451 | |
| 266,358,170 | |||
| Specialty Retail - 2.2% | |||
| Advance Auto Parts, Inc. | 179,525 | 26,515,843 | |
| AutoZone, Inc. (b) | 69,119 | 78,633,230 | |
| Best Buy Co., Inc. | 692,024 | 75,292,211 | |
| Burlington Stores, Inc. (b) | 103,607 | 22,642,274 | |
| CarMax, Inc. (b) | 268,327 | 25,083,208 | |
| Dick's Sporting Goods, Inc. | 385,230 | 21,884,916 | |
| Lowe's Companies, Inc. | 1,463,310 | 228,012,964 | |
| Murphy U.S.A., Inc. | 69,096 | 8,858,107 | |
| O'Reilly Automotive, Inc. (b) | 243,537 | 107,750,510 | |
| Penske Automotive Group, Inc. | 237,800 | 13,095,646 | |
| Ross Stores, Inc. | 309,607 | 33,288,945 | |
| Sally Beauty Holdings, Inc. (b) | 463,900 | 5,334,850 | |
| Sleep Number Corp. (b) | 202,500 | 14,051,475 | |
| The Home Depot, Inc. | 1,166,116 | 323,492,240 | |
| The ODP Corp. | 62,070 | 1,779,547 | |
| TJX Companies, Inc. | 1,236,676 | 78,541,293 | |
| Tractor Supply Co. | 71,570 | 10,077,772 | |
| Ulta Beauty, Inc. (b) | 174,636 | 48,094,754 | |
| Williams-Sonoma, Inc. | 38,400 | 4,203,648 | |
| 1,126,633,433 | |||
| Textiles, Apparel & Luxury Goods - 0.3% | |||
| Columbia Sportswear Co. | 167,599 | 13,731,386 | |
| Deckers Outdoor Corp. (b) | 5,300 | 1,349,327 | |
| Hanesbrands, Inc. | 220,265 | 3,127,763 | |
| NIKE, Inc. Class B | 831,728 | 112,033,762 | |
| Ralph Lauren Corp. | 122,981 | 10,545,621 | |
| Skechers U.S.A., Inc. Class A (sub. vtg.) (b) | 68,300 | 2,286,001 | |
| Tapestry, Inc. | 29,200 | 826,944 | |
| VF Corp. | 369,730 | 30,835,482 | |
| 174,736,286 | |||
| TOTAL CONSUMER DISCRETIONARY | 4,766,252,731 | ||
| CONSUMER STAPLES - 4.8% | |||
| Beverages - 1.1% | |||
| Anheuser-Busch InBev SA NV ADR | 197,774 | 13,187,570 | |
| Constellation Brands, Inc. Class A (sub. vtg.) | 356,913 | 73,466,972 | |
| Diageo PLC sponsored ADR | 24,025 | 3,722,674 | |
| Keurig Dr. Pepper, Inc. | 1,221,965 | 37,208,834 | |
| Molson Coors Beverage Co. Class B | 467,900 | 21,523,400 | |
| Monster Beverage Corp. (b) | 1,304,162 | 110,566,854 | |
| PepsiCo, Inc. | 591,503 | 85,312,478 | |
| The Coca-Cola Co. | 4,079,354 | 210,494,666 | |
| 555,483,448 | |||
| Food & Staples Retailing - 0.9% | |||
| Costco Wholesale Corp. | 328,703 | 128,775,974 | |
| Kroger Co. | 2,209,072 | 72,899,376 | |
| Performance Food Group Co. (b) | 51,442 | 2,231,554 | |
| Sysco Corp. | 651,626 | 46,454,418 | |
| Walgreens Boots Alliance, Inc. | 1,126,693 | 42,825,601 | |
| Walmart, Inc. | 1,020,028 | 155,850,078 | |
| 449,037,001 | |||
| Food Products - 0.8% | |||
| Archer Daniels Midland Co. | 276,200 | 13,746,474 | |
| Bunge Ltd. | 68,700 | 4,045,743 | |
| Campbell Soup Co. | 232,618 | 11,635,552 | |
| Conagra Brands, Inc. | 1,896,519 | 69,336,735 | |
| Darling Ingredients, Inc. (b) | 44,300 | 2,138,804 | |
| General Mills, Inc. | 320,444 | 19,489,404 | |
| Ingredion, Inc. | 242,400 | 18,701,160 | |
| Kellogg Co. | 244,642 | 15,635,070 | |
| Lamb Weston Holdings, Inc. | 4,600 | 332,948 | |
| Mondelez International, Inc. | 1,355,606 | 77,879,565 | |
| Pilgrim's Pride Corp. (b) | 262,000 | 4,949,180 | |
| Post Holdings, Inc. (b) | 205,913 | 19,450,542 | |
| The a2 Milk Co. Ltd. (b) | 187,816 | 1,905,313 | |
| The Hershey Co. | 39,224 | 5,800,837 | |
| The J.M. Smucker Co. | 374,156 | 43,851,083 | |
| The Kraft Heinz Co. | 1,478,785 | 48,711,178 | |
| Tyson Foods, Inc. Class A | 1,160,660 | 75,675,032 | |
| 433,284,620 | |||
| Household Products - 1.3% | |||
| Clorox Co. | 59,349 | 12,045,473 | |
| Colgate-Palmolive Co. | 544,940 | 46,668,662 | |
| Energizer Holdings, Inc. | 277,005 | 11,603,739 | |
| Kimberly-Clark Corp. | 258,845 | 36,059,697 | |
| Procter & Gamble Co. | 4,031,419 | 559,843,157 | |
| Reckitt Benckiser Group PLC | 45,619 | 3,981,972 | |
| Spectrum Brands Holdings, Inc. | 13,800 | 922,254 | |
| 671,124,954 | |||
| Personal Products - 0.2% | |||
| Coty, Inc. Class A | 773,522 | 5,561,623 | |
| Estee Lauder Companies, Inc. Class A | 397,459 | 97,504,642 | |
| Unilever PLC | 21,600 | 1,304,168 | |
| 104,370,433 | |||
| Tobacco - 0.5% | |||
| Altria Group, Inc. | 2,825,861 | 112,554,044 | |
| British American Tobacco PLC sponsored ADR | 200,434 | 7,077,325 | |
| Philip Morris International, Inc. | 1,563,775 | 118,455,956 | |
| 238,087,325 | |||
| TOTAL CONSUMER STAPLES | 2,451,387,781 | ||
| ENERGY - 1.7% | |||
| Energy Equipment & Services - 0.1% | |||
| Baker Hughes Co. Class A | 148,884 | 2,787,108 | |
| Halliburton Co. | 1,678,179 | 27,840,990 | |
| National Oilwell Varco, Inc. | 252,509 | 3,095,760 | |
| Oceaneering International, Inc. (b) | 245,567 | 1,490,592 | |
| SBM Offshore NV | 78,800 | 1,469,635 | |
| Schlumberger Ltd. | 900,158 | 18,714,285 | |
| Subsea 7 SA (b) | 528,800 | 5,008,356 | |
| TechnipFMC PLC | 458,757 | 3,812,271 | |
| 64,218,997 | |||
| Oil, Gas & Consumable Fuels - 1.6% | |||
| Africa Oil Corp. (b) | 1,010,500 | 848,114 | |
| Aker BP ASA | 36,700 | 824,048 | |
| Apache Corp. | 274,579 | 3,539,323 | |
| Black Stone Minerals LP | 37,300 | 261,846 | |
| Cabot Oil & Gas Corp. | 1,765,117 | 30,924,850 | |
| Canadian Natural Resources Ltd. | 240,300 | 5,482,474 | |
| Cenovus Energy, Inc. (Canada) | 1,646,400 | 8,164,176 | |
| Cheniere Energy, Inc. (b) | 142,200 | 8,061,318 | |
| Chevron Corp. | 1,999,791 | 174,341,779 | |
| Concho Resources, Inc. | 271,504 | 15,606,050 | |
| ConocoPhillips Co. | 2,005,530 | 79,338,767 | |
| Diamondback Energy, Inc. | 655,740 | 26,203,370 | |
| EOG Resources, Inc. | 1,014,634 | 47,566,042 | |
| EQT Corp. | 418,776 | 6,231,387 | |
| Equinor ASA sponsored ADR | 499,731 | 7,665,874 | |
| Equitrans Midstream Corp. | 836,918 | 6,829,251 | |
| Exxon Mobil Corp. | 2,227,012 | 84,915,968 | |
| Hess Corp. | 748,581 | 35,318,052 | |
| HollyFrontier Corp. | 128,937 | 3,015,836 | |
| Kinder Morgan, Inc. | 951,540 | 13,683,145 | |
| Kosmos Energy Ltd. | 2,268,500 | 3,992,560 | |
| Magellan Midstream Partners LP | 403,025 | 16,584,479 | |
| Marathon Oil Corp. | 504,394 | 2,986,012 | |
| Marathon Petroleum Corp. | 1,048,916 | 40,781,854 | |
| MEG Energy Corp. (b) | 799,200 | 2,246,154 | |
| Occidental Petroleum Corp. | 96,931 | 1,527,633 | |
| PBF Energy, Inc. Class A | 512,500 | 3,720,750 | |
| Phillips 66 Co. | 1,015,126 | 61,496,333 | |
| Pioneer Natural Resources Co. | 345,912 | 34,791,829 | |
| Royal Dutch Shell PLC Class B sponsored ADR | 204,539 | 6,637,291 | |
| Targa Resources Corp. | 205,750 | 4,835,125 | |
| The Williams Companies, Inc. | 1,121,188 | 23,522,524 | |
| Total SA sponsored ADR | 492,272 | 20,744,342 | |
| Valero Energy Corp. | 793,724 | 42,678,539 | |
| 825,367,095 | |||
| TOTAL ENERGY | 889,586,092 | ||
| FINANCIALS - 10.4% | |||
| Banks - 4.1% | |||
| Bank of America Corp. | 17,794,160 | 501,083,546 | |
| BOK Financial Corp. | 28,654 | 1,918,385 | |
| CIT Group, Inc. | 325,700 | 10,907,693 | |
| Citigroup, Inc. | 1,958,823 | 107,872,383 | |
| Citizens Financial Group, Inc. | 1,418,583 | 46,330,921 | |
| Comerica, Inc. | 80,700 | 3,970,440 | |
| Commerce Bancshares, Inc. | 221,879 | 14,635,139 | |
| Cullen/Frost Bankers, Inc. | 121,526 | 10,197,247 | |
| East West Bancorp, Inc. | 293,304 | 12,529,947 | |
| EFG Eurobank Ergasias SA (b) | 3,514,900 | 2,049,030 | |
| Fifth Third Bancorp | 4,644,466 | 117,690,768 | |
| First Horizon National Corp. | 175,900 | 2,149,498 | |
| First Republic Bank | 24,028 | 3,113,068 | |
| Huntington Bancshares, Inc. | 3,514,467 | 42,454,761 | |
| JPMorgan Chase & Co. | 4,297,801 | 506,624,782 | |
| KeyCorp | 1,344,800 | 20,790,608 | |
| M&T Bank Corp. | 192,675 | 22,444,711 | |
| Mitsubishi UFJ Financial Group, Inc. sponsored ADR | 2,031,403 | 8,714,719 | |
| Peoples United Financial, Inc. | 284,595 | 3,528,978 | |
| PNC Financial Services Group, Inc. | 1,828,710 | 252,489,990 | |
| Regions Financial Corp. | 3,295,300 | 50,319,231 | |
| Signature Bank | 12,600 | 1,413,594 | |
| Societe Generale Series A | 46,300 | 918,025 | |
| SVB Financial Group (b) | 82,861 | 28,575,444 | |
| Synovus Financial Corp. | 37,800 | 1,193,346 | |
| Truist Financial Corp. | 1,523,394 | 70,715,949 | |
| U.S. Bancorp | 773,990 | 33,444,108 | |
| Wells Fargo & Co. | 8,655,457 | 236,726,749 | |
| Zions Bancorp NA | 80,700 | 3,114,213 | |
| 2,117,917,273 | |||
| Capital Markets - 2.5% | |||
| Ameriprise Financial, Inc. | 491,336 | 91,015,081 | |
| Bank of New York Mellon Corp. | 1,184,925 | 46,354,266 | |
| BlackRock, Inc. Class A | 125,376 | 87,556,330 | |
| Brookfield Asset Management, Inc. Class A | 1,316,660 | 53,311,563 | |
| Cboe Global Markets, Inc. | 126,691 | 11,569,422 | |
| Charles Schwab Corp. | 2,813,997 | 137,266,774 | |
| CME Group, Inc. | 181,170 | 31,710,185 | |
| FactSet Research Systems, Inc. | 76,081 | 25,392,795 | |
| Goldman Sachs Group, Inc. | 901,545 | 207,878,246 | |
| Intercontinental Exchange, Inc. | 580,824 | 61,282,740 | |
| Invesco Ltd. | 388,212 | 6,300,681 | |
| KKR & Co. LP | 617,501 | 23,421,813 | |
| LPL Financial | 39,935 | 3,624,900 | |
| Moody's Corp. | 62,843 | 17,743,093 | |
| Morgan Stanley | 3,224,150 | 199,349,195 | |
| Northern Trust Corp. | 554,427 | 51,628,242 | |
| Raymond James Financial, Inc. | 229,541 | 20,876,754 | |
| S&P Global, Inc. | 79,402 | 27,932,036 | |
| SEI Investments Co. | 510,337 | 26,920,277 | |
| State Street Corp. | 1,087,376 | 76,638,260 | |
| StepStone Group, Inc. Class A | 62,200 | 1,686,864 | |
| T. Rowe Price Group, Inc. | 259,815 | 37,260,069 | |
| The NASDAQ OMX Group, Inc. | 80,700 | 10,328,793 | |
| Tradeweb Markets, Inc. Class A | 197,239 | 11,765,306 | |
| Virtu Financial, Inc. Class A | 251,270 | 5,726,443 | |
| 1,274,540,128 | |||
| Consumer Finance - 0.7% | |||
| 360 Finance, Inc. ADR (b) | 69,700 | 864,280 | |
| Ally Financial, Inc. | 1,063,090 | 31,520,619 | |
| American Express Co. | 425,317 | 50,438,343 | |
| Capital One Financial Corp. | 2,617,962 | 224,202,266 | |
| Discover Financial Services | 689,243 | 52,499,639 | |
| Encore Capital Group, Inc. (b) | 2,500 | 85,350 | |
| Navient Corp. | 734,600 | 6,883,202 | |
| OneMain Holdings, Inc. | 199,000 | 7,759,010 | |
| SLM Corp. | 295,392 | 3,134,109 | |
| Synchrony Financial | 340,185 | 10,365,437 | |
| 387,752,255 | |||
| Diversified Financial Services - 0.9% | |||
| Berkshire Hathaway, Inc.: | |||
| Class A (b) | 1 | 343,688 | |
| Class B (b) | 1,656,208 | 379,122,573 | |
| Equitable Holdings, Inc. | 2,395,084 | 60,787,232 | |
| Jaws Acquisition Corp. (b) | 210,000 | 2,400,300 | |
| Jefferies Financial Group, Inc. | 149,218 | 3,391,725 | |
| Voya Financial, Inc. | 290,706 | 16,753,387 | |
| 462,798,905 | |||
| Insurance - 2.1% | |||
| AFLAC, Inc. | 1,023,020 | 44,941,269 | |
| Alleghany Corp. | 15,725 | 9,045,020 | |
| Allstate Corp. | 697,289 | 71,367,529 | |
| American Financial Group, Inc. | 247,600 | 22,137,916 | |
| American International Group, Inc. | 2,353,055 | 90,451,434 | |
| Aon PLC | 106,584 | 21,837,996 | |
| Arthur J. Gallagher & Co. | 73,511 | 8,483,905 | |
| Assurant, Inc. | 29,800 | 3,847,776 | |
| Assured Guaranty Ltd. | 257,800 | 7,767,514 | |
| Axis Capital Holdings Ltd. | 200,700 | 10,057,077 | |
| Chubb Ltd. | 1,187,075 | 175,485,297 | |
| Cincinnati Financial Corp. | 185,377 | 14,153,534 | |
| CNA Financial Corp. | 112,024 | 3,865,948 | |
| Everest Re Group Ltd. | 104,675 | 23,795,768 | |
| Fairfax Financial Holdings Ltd. | 26,814 | 9,193,448 | |
| Fairfax Financial Holdings Ltd. (sub. vtg.) | 6,100 | 2,092,046 | |
| First American Financial Corp. | 51,600 | 2,499,504 | |
| Globe Life, Inc. | 117,382 | 10,928,264 | |
| Hartford Financial Services Group, Inc. | 921,432 | 40,727,294 | |
| Lincoln National Corp. | 665,800 | 31,439,076 | |
| Loews Corp. | 878,414 | 36,814,331 | |
| Markel Corp. (b) | 6,932 | 6,750,590 | |
| Marsh & McLennan Companies, Inc. | 171,613 | 19,673,714 | |
| MetLife, Inc. | 1,996,325 | 92,170,325 | |
| Old Republic International Corp. | 110,200 | 1,974,784 | |
| Primerica, Inc. | 18,700 | 2,436,049 | |
| Principal Financial Group, Inc. | 174,396 | 8,683,177 | |
| Progressive Corp. | 1,287,704 | 112,171,895 | |
| Prudential Financial, Inc. | 530,308 | 40,101,891 | |
| Reinsurance Group of America, Inc. | 18,700 | 2,155,736 | |
| The Travelers Companies, Inc. | 710,310 | 92,091,692 | |
| Unum Group | 479,100 | 10,650,393 | |
| W.R. Berkley Corp. | 87,715 | 5,712,878 | |
| Willis Towers Watson PLC | 114,023 | 23,738,448 | |
| 1,059,243,518 | |||
| Mortgage Real Estate Investment Trusts - 0.0% | |||
| Annaly Capital Management, Inc. | 1,720,500 | 13,764,000 | |
| Thrifts & Mortgage Finance - 0.1% | |||
| MGIC Investment Corp. | 805,500 | 9,633,780 | |
| Radian Group, Inc. | 789,100 | 14,898,208 | |
| Rocket Cos., Inc. (b) | 661,517 | 13,706,632 | |
| 38,238,620 | |||
| TOTAL FINANCIALS | 5,354,254,699 | ||
| HEALTH CARE - 11.6% | |||
| Biotechnology - 2.0% | |||
| AbbVie, Inc. | 2,501,474 | 261,604,151 | |
| ADC Therapeutics SA (b) | 90,500 | 3,376,555 | |
| Alexion Pharmaceuticals, Inc. (b) | 890,861 | 108,783,037 | |
| Alnylam Pharmaceuticals, Inc. (b) | 41,123 | 5,342,289 | |
| Amgen, Inc. | 1,122,837 | 249,314,727 | |
| Arcutis Biotherapeutics, Inc. (b) | 50,000 | 1,356,000 | |
| Argenx SE ADR (b) | 28,000 | 8,030,960 | |
| Ascendis Pharma A/S sponsored ADR (b) | 47,000 | 7,930,310 | |
| Biogen, Inc. (b) | 231,605 | 55,624,573 | |
| BioMarin Pharmaceutical, Inc. (b) | 129,890 | 10,222,343 | |
| Crinetics Pharmaceuticals, Inc. (b) | 31,000 | 414,470 | |
| Exelixis, Inc. (b) | 86,000 | 1,647,760 | |
| Fate Therapeutics, Inc. (b) | 20,000 | 1,169,300 | |
| Generation Bio Co. | 54,000 | 2,603,880 | |
| Gilead Sciences, Inc. | 1,128,737 | 68,480,474 | |
| Gritstone Oncology, Inc. (b) | 93,400 | 284,870 | |
| Heron Therapeutics, Inc. (b) | 13,800 | 239,154 | |
| Incyte Corp. (b) | 151,881 | 12,840,020 | |
| Innovent Biologics, Inc. (a)(b) | 340,000 | 2,233,145 | |
| Insmed, Inc. (b) | 126,800 | 4,946,468 | |
| Intercept Pharmaceuticals, Inc. (b) | 77,900 | 2,766,229 | |
| Neurocrine Biosciences, Inc. (b) | 90,600 | 8,601,564 | |
| Prelude Therapeutics, Inc. | 58,000 | 2,985,260 | |
| PTC Therapeutics, Inc. (b) | 54,000 | 3,378,780 | |
| Regeneron Pharmaceuticals, Inc. (b) | 195,718 | 100,996,360 | |
| Revolution Medicines, Inc. | 50,000 | 2,181,500 | |
| Sarepta Therapeutics, Inc. (b) | 35,000 | 4,930,100 | |
| Seagen, Inc. (b) | 48,600 | 8,277,066 | |
| Shattuck Labs, Inc. | 58,500 | 2,115,360 | |
| Stoke Therapeutics, Inc. (b) | 20,600 | 1,073,054 | |
| Turning Point Therapeutics, Inc. (b) | 23,400 | 2,492,100 | |
| uniQure B.V. (b) | 6,500 | 312,520 | |
| United Therapeutics Corp. (b) | 4,700 | 623,408 | |
| Vaxcyte, Inc. | 70,452 | 2,261,509 | |
| Vertex Pharmaceuticals, Inc. (b) | 400,353 | 91,180,396 | |
| Xencor, Inc. (b) | 50,000 | 2,116,000 | |
| Zentalis Pharmaceuticals, Inc. | 50,000 | 2,548,000 | |
| Zymeworks, Inc. (b) | 55,000 | 2,895,750 | |
| 1,048,179,442 | |||
| Health Care Equipment & Supplies - 1.9% | |||
| Abbott Laboratories | 1,032,011 | 111,684,230 | |
| Alcon, Inc. (b) | 496,475 | 31,883,625 | |
| Alcon, Inc. (Switzerland) (b) | 91,382 | 5,835,222 | |
| Align Technology, Inc. (b) | 1,215 | 584,767 | |
| Baxter International, Inc. | 806,317 | 61,336,534 | |
| Becton, Dickinson & Co. | 342,221 | 80,367,180 | |
| Boston Scientific Corp. (b) | 2,470,624 | 81,901,186 | |
| Danaher Corp. | 634,032 | 142,422,608 | |
| Dentsply Sirona, Inc. | 15,532 | 790,423 | |
| DexCom, Inc. (b) | 8,998 | 2,876,481 | |
| Edwards Lifesciences Corp. (b) | 53,264 | 4,468,317 | |
| Genmark Diagnostics, Inc. (b) | 280,000 | 3,743,600 | |
| Hill-Rom Holdings, Inc. | 125,700 | 11,923,902 | |
| Hologic, Inc. (b) | 590,161 | 40,797,830 | |
| IDEXX Laboratories, Inc. (b) | 18,179 | 8,380,155 | |
| Insulet Corp. (b) | 44,000 | 11,339,240 | |
| Intuitive Surgical, Inc. (b) | 146,059 | 106,046,137 | |
| Masimo Corp. (b) | 16,900 | 4,300,881 | |
| Medtronic PLC | 578,752 | 65,804,102 | |
| Penumbra, Inc. (b) | 46,000 | 10,207,400 | |
| Quidel Corp. (b) | 12,831 | 2,502,687 | |
| ResMed, Inc. | 18,120 | 3,797,952 | |
| STERIS PLC | 7,437 | 1,441,365 | |
| Stryker Corp. | 176,875 | 41,282,625 | |
| Tandem Diabetes Care, Inc. (b) | 28,000 | 2,628,640 | |
| The Cooper Companies, Inc. | 14,969 | 5,017,908 | |
| West Pharmaceutical Services, Inc. | 7,370 | 2,027,929 | |
| Zimmer Biomet Holdings, Inc. | 673,774 | 100,473,179 | |
| 945,866,105 | |||
| Health Care Providers & Services - 3.1% | |||
| 1Life Healthcare, Inc. (b) | 50,000 | 1,643,500 | |
| AmerisourceBergen Corp. | 222,042 | 22,894,751 | |
| Anthem, Inc. | 286,334 | 89,198,768 | |
| Cardinal Health, Inc. | 657,624 | 35,899,694 | |
| Centene Corp. (b) | 837,760 | 51,647,904 | |
| Cigna Corp. | 915,929 | 191,557,391 | |
| Covetrus, Inc. (b) | 48,040 | 1,297,801 | |
| CVS Health Corp. | 1,569,466 | 106,394,100 | |
| DaVita HealthCare Partners, Inc. (b) | 293,045 | 32,190,993 | |
| HCA Holdings, Inc. | 864,440 | 129,761,088 | |
| Henry Schein, Inc. (b) | 72,864 | 4,685,884 | |
| Humana, Inc. | 291,317 | 116,678,285 | |
| Laboratory Corp. of America Holdings (b) | 106,734 | 21,329,723 | |
| McKesson Corp. | 582,010 | 104,709,419 | |
| Molina Healthcare, Inc. (b) | 28,300 | 5,776,879 | |
| Quest Diagnostics, Inc. | 521,428 | 64,646,643 | |
| UnitedHealth Group, Inc. | 1,780,763 | 598,941,827 | |
| Universal Health Services, Inc. Class B | 218,719 | 28,560,327 | |
| 1,607,814,977 | |||
| Health Care Technology - 0.1% | |||
| Cerner Corp. | 350,493 | 26,230,896 | |
| Inspire Medical Systems, Inc. (b) | 20,800 | 3,863,392 | |
| Phreesia, Inc. (b) | 54,000 | 2,384,640 | |
| Veeva Systems, Inc. Class A (b) | 46,263 | 12,808,837 | |
| 45,287,765 | |||
| Life Sciences Tools & Services - 0.7% | |||
| 10X Genomics, Inc. (b) | 17,000 | 2,602,870 | |
| Agilent Technologies, Inc. | 292,260 | 34,165,194 | |
| Avantor, Inc. (b) | 196,716 | 5,366,412 | |
| Bio-Rad Laboratories, Inc. Class A (b) | 23,400 | 12,600,900 | |
| Bruker Corp. | 100,000 | 5,061,000 | |
| Illumina, Inc. (b) | 119,753 | 38,571,244 | |
| Lonza Group AG | 8,400 | 5,285,051 | |
| Maravai LifeSciences Holdings, Inc. | 184,614 | 5,196,884 | |
| Mettler-Toledo International, Inc. (b) | 2,735 | 3,145,359 | |
| PerkinElmer, Inc. | 37,010 | 4,922,330 | |
| Sotera Health Co. | 60,000 | 1,623,600 | |
| Thermo Fisher Scientific, Inc. | 508,582 | 236,480,458 | |
| 355,021,302 | |||
| Pharmaceuticals - 3.8% | |||
| AstraZeneca PLC: | |||
| (United Kingdom) | 154,000 | 16,113,771 | |
| sponsored ADR | 1,117,618 | 59,166,697 | |
| Bayer AG | 224,801 | 12,951,626 | |
| Bristol-Myers Squibb Co. | 3,159,487 | 197,151,989 | |
| Elanco Animal Health, Inc. (b) | 2,168,151 | 66,323,739 | |
| Eli Lilly & Co. | 1,957,128 | 285,055,693 | |
| GlaxoSmithKline PLC sponsored ADR | 416,248 | 15,313,764 | |
| Intra-Cellular Therapies, Inc. (b) | 15,600 | 368,784 | |
| Jazz Pharmaceuticals PLC (b) | 207,300 | 29,169,183 | |
| Johnson & Johnson | 2,984,655 | 431,819,885 | |
| Merck & Co., Inc. | 4,058,972 | 326,300,759 | |
| Nektar Therapeutics (b) | 84,000 | 1,376,760 | |
| Novartis AG sponsored ADR | 814,351 | 73,967,501 | |
| Novo Nordisk A/S Series B sponsored ADR | 204,916 | 13,756,011 | |
| Perrigo Co. PLC | 67,300 | 3,245,206 | |
| Pfizer, Inc. | 6,179,864 | 236,750,590 | |
| Pliant Therapeutics, Inc. | 72,500 | 1,995,200 | |
| Roche Holding AG: | |||
| (participation certificate) | 65,000 | 21,349,059 | |
| sponsored ADR | 1,048,553 | 42,801,933 | |
| Royalty Pharma PLC | 78,000 | 3,322,800 | |
| Sanofi SA | 44,000 | 4,435,149 | |
| Sanofi SA sponsored ADR | 572,143 | 28,721,579 | |
| Theravance Biopharma, Inc. (b) | 80,000 | 1,327,200 | |
| UCB SA | 26,000 | 2,782,331 | |
| Viatris, Inc. (b) | 550,649 | 9,261,916 | |
| Zoetis, Inc. Class A | 536,329 | 86,016,445 | |
| 1,970,845,570 | |||
| TOTAL HEALTH CARE | 5,973,015,161 | ||
| INDUSTRIALS - 7.8% | |||
| Aerospace & Defense - 1.4% | |||
| Airbus Group NV | 19,517 | 2,040,454 | |
| Axon Enterprise, Inc. (b) | 41,300 | 5,190,997 | |
| BWX Technologies, Inc. | 32,400 | 1,842,912 | |
| Curtiss-Wright Corp. | 5,460 | 629,320 | |
| General Dynamics Corp. | 330,912 | 49,421,707 | |
| Harris Corp. | 136,326 | 26,173,229 | |
| Howmet Aerospace, Inc. | 61,600 | 1,445,136 | |
| Huntington Ingalls Industries, Inc. | 144,984 | 23,224,987 | |
| Lockheed Martin Corp. | 292,863 | 106,894,995 | |
| Moog, Inc. Class A | 127,400 | 9,855,664 | |
| MTU Aero Engines Holdings AG | 500 | 117,747 | |
| Northrop Grumman Corp. | 412,410 | 124,655,047 | |
| Raytheon Technologies Corp. | 1,525,655 | 109,419,977 | |
| Safran SA (b) | 6,376 | 929,455 | |
| Spirit AeroSystems Holdings, Inc. Class A | 224,300 | 7,626,200 | |
| Teledyne Technologies, Inc. (b) | 59,855 | 22,621,599 | |
| Textron, Inc. | 1,099,829 | 49,602,288 | |
| The Boeing Co. | 650,185 | 137,000,481 | |
| TransDigm Group, Inc. | 88,965 | 51,527,638 | |
| Vectrus, Inc. (b) | 37,733 | 1,798,732 | |
| 732,018,565 | |||
| Air Freight & Logistics - 0.7% | |||
| C.H. Robinson Worldwide, Inc. | 66,970 | 6,293,171 | |
| Expeditors International of Washington, Inc. | 503,253 | 44,975,721 | |
| FedEx Corp. | 427,326 | 122,463,085 | |
| United Parcel Service, Inc. Class B | 1,213,660 | 207,620,816 | |
| 381,352,793 | |||
| Airlines - 0.1% | |||
| Alaska Air Group, Inc. | 201,648 | 10,277,999 | |
| American Airlines Group, Inc. | 66,000 | 932,580 | |
| Delta Air Lines, Inc. | 726,600 | 29,245,650 | |
| JetBlue Airways Corp. (b) | 149,800 | 2,260,482 | |
| Ryanair Holdings PLC sponsored ADR (b) | 13,200 | 1,369,764 | |
| Southwest Airlines Co. | 21,421 | 992,649 | |
| United Airlines Holdings, Inc. (b) | 679,199 | 30,597,915 | |
| 75,677,039 | |||
| Building Products - 0.4% | |||
| A.O. Smith Corp. | 74,334 | 4,185,748 | |
| Allegion PLC | 190,729 | 21,750,735 | |
| Carrier Global Corp. | 327,755 | 12,477,633 | |
| Fortune Brands Home & Security, Inc. | 300,708 | 25,109,118 | |
| Johnson Controls International PLC | 1,287,574 | 59,279,907 | |
| Masco Corp. | 179,036 | 9,608,862 | |
| Owens Corning | 173,205 | 12,621,448 | |
| Trane Technologies PLC | 533,512 | 78,020,795 | |
| 223,054,246 | |||
| Commercial Services & Supplies - 0.1% | |||
| Deluxe Corp. | 215,300 | 5,541,822 | |
| Herman Miller, Inc. | 68,300 | 2,434,212 | |
| Republic Services, Inc. | 22,578 | 2,183,744 | |
| Waste Connection, Inc. (United States) | 353,013 | 36,706,292 | |
| Waste Management, Inc. | 10,662 | 1,270,164 | |
| 48,136,234 | |||
| Construction & Engineering - 0.1% | |||
| Jacobs Engineering Group, Inc. | 565,611 | 60,995,490 | |
| MasTec, Inc. (b) | 170,900 | 9,691,739 | |
| Quanta Services, Inc. | 70,802 | 4,838,609 | |
| 75,525,838 | |||
| Electrical Equipment - 0.4% | |||
| Acuity Brands, Inc. | 52,826 | 6,271,503 | |
| AMETEK, Inc. | 273,000 | 32,358,690 | |
| Eaton Corp. PLC | 423,427 | 51,281,244 | |
| Emerson Electric Co. | 559,736 | 42,998,920 | |
| Generac Holdings, Inc. (b) | 43,175 | 9,308,530 | |
| Hubbell, Inc. Class B | 64,838 | 10,477,172 | |
| Sensata Technologies, Inc. PLC (b) | 79,093 | 3,862,111 | |
| Soltec Power Holdings SA | 7,862 | 56,044 | |
| Sunrun, Inc. (b) | 581,515 | 37,263,481 | |
| Vertiv Holdings Co. | 80,266 | 1,501,777 | |
| Vertiv Holdings LLC (c) | 450,000 | 8,419,500 | |
| 203,798,972 | |||
| Industrial Conglomerates - 1.2% | |||
| 3M Co. | 371,573 | 64,181,804 | |
| Carlisle Companies, Inc. | 92,615 | 13,413,430 | |
| General Electric Co. | 16,181,939 | 164,732,139 | |
| Honeywell International, Inc. | 1,357,798 | 276,882,168 | |
| Roper Technologies, Inc. | 185,748 | 79,314,396 | |
| 598,523,937 | |||
| Machinery - 1.8% | |||
| AGCO Corp. | 316,138 | 29,245,926 | |
| Allison Transmission Holdings, Inc. | 309,700 | 12,713,185 | |
| Caterpillar, Inc. | 375,555 | 65,192,592 | |
| Crane Co. | 183,100 | 12,730,943 | |
| Cummins, Inc. | 664,187 | 153,540,109 | |
| Deere & Co. | 362,343 | 94,796,176 | |
| Dover Corp. | 235,743 | 28,767,718 | |
| Epiroc AB Class A | 13,400 | 222,735 | |
| Flowserve Corp. | 498,879 | 17,001,796 | |
| Fortive Corp. | 813,869 | 57,076,633 | |
| Illinois Tool Works, Inc. | 104,468 | 22,052,150 | |
| Ingersoll Rand, Inc. (b) | 550,816 | 24,384,624 | |
| ITT, Inc. | 182,014 | 13,219,677 | |
| Meritor, Inc. (b) | 117,300 | 3,096,720 | |
| Middleby Corp. (b) | 53,820 | 7,318,982 | |
| Oshkosh Corp. | 446,710 | 35,960,155 | |
| Otis Worldwide Corp. | 580,486 | 38,857,733 | |
| PACCAR, Inc. | 657,498 | 57,241,776 | |
| Parker Hannifin Corp. | 218,371 | 58,361,833 | |
| Pentair PLC | 81,819 | 4,239,861 | |
| Snap-On, Inc. | 122,400 | 21,524,040 | |
| Stanley Black & Decker, Inc. | 411,335 | 75,813,154 | |
| Timken Co. | 260,200 | 19,109,088 | |
| Trinity Industries, Inc. | 468,600 | 10,707,510 | |
| Westinghouse Air Brake Co. | 360,668 | 26,436,964 | |
| Xylem, Inc. | 203,567 | 19,536,325 | |
| 909,148,405 | |||
| Professional Services - 0.2% | |||
| CoStar Group, Inc. (b) | 24,537 | 22,342,656 | |
| Dun & Bradstreet Holdings, Inc. (b) | 58,700 | 1,573,747 | |
| Equifax, Inc. | 190,882 | 31,858,206 | |
| IHS Markit Ltd. | 248,231 | 24,689,055 | |
| Manpower, Inc. | 48,100 | 4,167,865 | |
| Robert Half International, Inc. | 113,672 | 7,295,469 | |
| 91,926,998 | |||
| Road & Rail - 1.2% | |||
| AMERCO | 9,639 | 3,992,763 | |
| CSX Corp. | 802,183 | 72,236,579 | |
| J.B. Hunt Transport Services, Inc. | 145,634 | 19,701,368 | |
| Kansas City Southern | 89,426 | 16,648,438 | |
| Knight-Swift Transportation Holdings, Inc. Class A | 247,900 | 10,235,791 | |
| Lyft, Inc. (b) | 908,723 | 34,685,957 | |
| Norfolk Southern Corp. | 808,242 | 191,569,519 | |
| Old Dominion Freight Lines, Inc. | 121,335 | 24,674,686 | |
| Ryder System, Inc. | 54,665 | 3,237,261 | |
| Uber Technologies, Inc. (b) | 499,177 | 24,789,130 | |
| Union Pacific Corp. | 955,979 | 195,096,194 | |
| 596,867,686 | |||
| Trading Companies & Distributors - 0.2% | |||
| Beijer Ref AB (B Shares) | 8,800 | 301,127 | |
| Fastenal Co. | 37,470 | 1,852,892 | |
| HD Supply Holdings, Inc. (b) | 374,116 | 20,868,190 | |
| United Rentals, Inc. (b) | 99,167 | 22,508,926 | |
| W.W. Grainger, Inc. | 88,577 | 37,051,759 | |
| 82,582,894 | |||
| TOTAL INDUSTRIALS | 4,018,613,607 | ||
| INFORMATION TECHNOLOGY - 20.2% | |||
| Communications Equipment - 0.6% | |||
| Arista Networks, Inc. (b) | 4,584 | 1,240,889 | |
| Ciena Corp. (b) | 75,900 | 3,400,320 | |
| Cisco Systems, Inc. | 5,616,650 | 241,628,283 | |
| CommScope Holding Co., Inc. (b) | 870,035 | 10,309,915 | |
| F5 Networks, Inc. (b) | 121,596 | 19,797,045 | |
| Juniper Networks, Inc. | 246,319 | 5,362,365 | |
| Lumentum Holdings, Inc. (b) | 2,400 | 207,312 | |
| Motorola Solutions, Inc. | 235,773 | 40,442,143 | |
| 322,388,272 | |||
| Electronic Equipment & Components - 0.4% | |||
| Amphenol Corp. Class A | 281,262 | 36,791,882 | |
| Arrow Electronics, Inc. (b) | 386,143 | 35,390,006 | |
| CDW Corp. | 175,410 | 22,889,251 | |
| Corning, Inc. | 408,200 | 15,274,844 | |
| Flextronics International Ltd. (b) | 1,210,500 | 19,646,415 | |
| II-VI, Inc. (b) | 47,082 | 3,185,097 | |
| Insight Enterprises, Inc. (b) | 37,700 | 2,694,796 | |
| Jabil, Inc. | 881,281 | 33,682,560 | |
| Keysight Technologies, Inc. (b) | 117,201 | 14,068,808 | |
| Vishay Intertechnology, Inc. | 618,200 | 11,968,352 | |
| Vontier Corp. (b) | 14,829 | 491,878 | |
| 196,083,889 | |||
| IT Services - 4.0% | |||
| Accenture PLC Class A | 386,681 | 96,318,370 | |
| Akamai Technologies, Inc. (b) | 236,431 | 24,472,973 | |
| Amadeus IT Holding SA Class A | 22,700 | 1,560,953 | |
| Amdocs Ltd. | 281,703 | 18,538,874 | |
| Automatic Data Processing, Inc. | 79,410 | 13,807,811 | |
| Booz Allen Hamilton Holding Corp. Class A | 235,267 | 20,418,823 | |
| Broadridge Financial Solutions, Inc. | 12,204 | 1,792,524 | |
| Capgemini SA | 74,100 | 10,309,227 | |
| Cognizant Technology Solutions Corp. Class A | 851,214 | 66,505,350 | |
| CSG Systems International, Inc. | 185,800 | 8,060,004 | |
| DXC Technology Co. | 219,760 | 4,814,942 | |
| Edenred SA | 33,700 | 1,925,791 | |
| Fidelity National Information Services, Inc. | 890,270 | 132,125,001 | |
| Fiserv, Inc. (b) | 841,077 | 96,875,249 | |
| FleetCor Technologies, Inc. (b) | 307,938 | 81,668,237 | |
| Gartner, Inc. (b) | 31,354 | 4,765,808 | |
| Genpact Ltd. | 417,400 | 16,967,310 | |
| Global Payments, Inc. | 386,502 | 75,441,325 | |
| GoDaddy, Inc. (b) | 54,300 | 4,319,022 | |
| IBM Corp. | 821,253 | 101,441,171 | |
| Jack Henry & Associates, Inc. | 16,444 | 2,645,182 | |
| Leidos Holdings, Inc. | 480,797 | 48,416,258 | |
| Liveramp Holdings, Inc. (b) | 18,100 | 1,059,031 | |
| MasterCard, Inc. Class A | 1,097,909 | 369,457,358 | |
| MongoDB, Inc. Class A (b) | 4,100 | 1,177,971 | |
| PayPal Holdings, Inc. (b) | 1,312,383 | 281,007,448 | |
| Sabre Corp. | 179,800 | 2,022,750 | |
| Snowflake Computing, Inc. | 42,856 | 13,964,199 | |
| The Western Union Co. | 496,622 | 11,203,792 | |
| Twilio, Inc. Class A (b) | 2,697 | 863,283 | |
| Unisys Corp. (b) | 184,600 | 2,691,468 | |
| VeriSign, Inc. (b) | 153,073 | 30,724,813 | |
| Visa, Inc. Class A | 2,467,263 | 518,988,772 | |
| 2,066,351,090 | |||
| Semiconductors & Semiconductor Equipment - 5.0% | |||
| Advanced Micro Devices, Inc. (b) | 1,911,488 | 177,118,478 | |
| Analog Devices, Inc. | 686,108 | 95,423,901 | |
| Applied Materials, Inc. | 2,949,559 | 243,279,626 | |
| Array Technologies, Inc. | 244,324 | 11,136,288 | |
| ASML Holding NV | 26,790 | 11,726,787 | |
| Broadcom, Inc. | 473,279 | 190,059,381 | |
| Cirrus Logic, Inc. (b) | 192,000 | 15,379,200 | |
| Intel Corp. | 3,110,539 | 150,394,561 | |
| KLA-Tencor Corp. | 179,636 | 45,262,883 | |
| Lam Research Corp. | 461,088 | 208,716,094 | |
| Marvell Technology Group Ltd. | 317,103 | 14,678,698 | |
| Microchip Technology, Inc. | 199,230 | 26,774,520 | |
| Micron Technology, Inc. (b) | 2,142,466 | 137,310,646 | |
| Monolithic Power Systems, Inc. | 68,285 | 21,848,469 | |
| NVIDIA Corp. | 822,043 | 440,664,371 | |
| NXP Semiconductors NV | 607,138 | 96,182,802 | |
| ON Semiconductor Corp. (b) | 512,200 | 14,725,750 | |
| Qorvo, Inc. (b) | 138,920 | 21,765,986 | |
| Qualcomm, Inc. | 2,453,500 | 361,081,595 | |
| Sanken Electric Co. Ltd. | 20,693 | 752,581 | |
| Semtech Corp. (b) | 24,400 | 1,646,268 | |
| STMicroelectronics NV (France) | 18,600 | 732,734 | |
| Taiwan Semiconductor Manufacturing Co. Ltd. sponsored ADR | 313,090 | 30,375,992 | |
| Teradyne, Inc. | 338,726 | 37,375,027 | |
| Texas Instruments, Inc. | 1,080,714 | 174,265,133 | |
| Xilinx, Inc. | 203,262 | 29,584,784 | |
| 2,558,262,555 | |||
| Software - 6.8% | |||
| Adobe, Inc. (b) | 455,190 | 217,794,759 | |
| ANSYS, Inc. (b) | 93,791 | 31,706,985 | |
| Atlassian Corp. PLC (b) | 32,210 | 7,248,861 | |
| Autodesk, Inc. (b) | 413,188 | 115,787,673 | |
| CDK Global, Inc. | 59,911 | 2,869,737 | |
| Ceridian HCM Holding, Inc. (b) | 247,005 | 23,816,222 | |
| Citrix Systems, Inc. | 162,107 | 20,088,299 | |
| Cloudflare, Inc. (b) | 113,736 | 8,539,299 | |
| Coupa Software, Inc. (b) | 61,731 | 20,303,943 | |
| Digital Turbine, Inc. (b) | 28,100 | 1,263,938 | |
| Dynatrace, Inc. (b) | 35,592 | 1,353,208 | |
| Elastic NV (b) | 101,000 | 12,503,800 | |
| Envestnet, Inc. (b) | 100 | 8,026 | |
| FireEye, Inc. (b) | 384,900 | 5,785,047 | |
| Fortinet, Inc. (b) | 52,205 | 6,433,222 | |
| Intuit, Inc. | 259,306 | 91,280,898 | |
| j2 Global, Inc. (b) | 164,500 | 14,740,845 | |
| LivePerson, Inc. (b) | 120,818 | 7,058,188 | |
| Microsoft Corp. | 8,932,953 | 1,912,277,249 | |
| Nortonlifelock, Inc. | 2,891,941 | 52,720,084 | |
| Nuance Communications, Inc. (b) | 280,900 | 12,115,217 | |
| Nutanix, Inc. Class A (b) | 308,290 | 8,444,063 | |
| Oracle Corp. | 3,461,126 | 199,776,193 | |
| Palo Alto Networks, Inc. (b) | 65,693 | 19,308,487 | |
| Parametric Technology Corp. (b) | 18,929 | 2,041,493 | |
| Paylocity Holding Corp. (b) | 78,340 | 15,401,644 | |
| Pluralsight, Inc. (b) | 159,300 | 2,609,334 | |
| Rapid7, Inc. (b) | 80,600 | 6,040,164 | |
| RealPage, Inc. (b) | 71,900 | 4,960,381 | |
| RingCentral, Inc. (b) | 5,100 | 1,514,955 | |
| Salesforce.com, Inc. (b) | 1,670,653 | 410,646,507 | |
| SAP SE sponsored ADR | 94,736 | 11,478,214 | |
| ServiceNow, Inc. (b) | 14,467 | 7,733,335 | |
| Splunk, Inc. (b) | 110,230 | 22,506,761 | |
| SS&C Technologies Holdings, Inc. | 154,843 | 10,667,134 | |
| SurveyMonkey (b) | 584,700 | 12,442,416 | |
| Synopsys, Inc. (b) | 205,558 | 46,764,445 | |
| Telos Corp. | 20,300 | 407,421 | |
| Tyler Technologies, Inc. (b) | 8,043 | 3,439,187 | |
| Verint Systems, Inc. (b) | 74,800 | 4,260,608 | |
| VMware, Inc. Class A (b) | 127,359 | 17,816,251 | |
| Workday, Inc. Class A (b) | 386,690 | 86,924,045 | |
| Workiva, Inc. (b) | 18,800 | 1,409,812 | |
| Yext, Inc. (b) | 605,100 | 11,502,951 | |
| Zendesk, Inc. (b) | 74,400 | 9,932,400 | |
| Zoom Video Communications, Inc. Class A (b) | 14,555 | 6,962,530 | |
| 3,490,686,231 | |||
| Technology Hardware, Storage & Peripherals - 3.4% | |||
| Apple, Inc. | 13,550,277 | 1,613,160,477 | |
| Hewlett Packard Enterprise Co. | 1,497,500 | 16,532,400 | |
| HP, Inc. | 2,538,705 | 55,673,801 | |
| NCR Corp. (b) | 312,300 | 8,641,341 | |
| NetApp, Inc. | 109,200 | 5,821,452 | |
| Seagate Technology LLC | 432,700 | 25,447,087 | |
| Western Digital Corp. | 43,500 | 1,952,280 | |
| Xerox Holdings Corp. | 403,350 | 8,829,332 | |
| 1,736,058,170 | |||
| TOTAL INFORMATION TECHNOLOGY | 10,369,830,207 | ||
| MATERIALS - 2.1% | |||
| Chemicals - 1.3% | |||
| Albemarle Corp. U.S. | 95,100 | 12,930,747 | |
| Amyris, Inc. (b) | 563,600 | 1,645,712 | |
| Cabot Corp. | 215,400 | 8,919,714 | |
| Celanese Corp. Class A | 439,017 | 56,778,069 | |
| CF Industries Holdings, Inc. | 215,370 | 8,033,301 | |
| Corteva, Inc. | 892,389 | 34,196,346 | |
| Dow, Inc. | 128,343 | 6,803,462 | |
| DuPont de Nemours, Inc. | 492,067 | 31,216,730 | |
| Eastman Chemical Co. | 897,820 | 87,447,668 | |
| Ecolab, Inc. | 95,440 | 21,201,996 | |
| FMC Corp. | 95,249 | 11,049,836 | |
| Huntsman Corp. | 1,028,400 | 25,473,468 | |
| Ingevity Corp. (b) | 136,575 | 9,093,164 | |
| Linde PLC | 509,517 | 130,650,349 | |
| Livent Corp. (b) | 494,800 | 7,506,116 | |
| LyondellBasell Industries NV Class A | 696,690 | 59,288,319 | |
| Nutrien Ltd. | 49,725 | 2,454,279 | |
| PPG Industries, Inc. | 207,623 | 30,472,828 | |
| RPM International, Inc. | 283,834 | 24,980,230 | |
| Sherwin-Williams Co. | 49,368 | 36,908,998 | |
| The Chemours Co. LLC | 353,000 | 8,588,490 | |
| The Mosaic Co. | 253,008 | 5,556,056 | |
| Trinseo SA | 47,700 | 1,812,123 | |
| Valvoline, Inc. | 281,832 | 6,422,951 | |
| Westlake Chemical Corp. | 198,098 | 14,887,065 | |
| 644,318,017 | |||
| Construction Materials - 0.1% | |||
| Martin Marietta Materials, Inc. | 140,522 | 37,326,859 | |
| Summit Materials, Inc. (b) | 495,100 | 9,406,900 | |
| Vulcan Materials Co. | 126,931 | 17,725,914 | |
| 64,459,673 | |||
| Containers & Packaging - 0.5% | |||
| Amcor PLC | 771,700 | 8,743,361 | |
| Avery Dennison Corp. | 38,956 | 5,817,689 | |
| Ball Corp. | 100,977 | 9,694,802 | |
| Berry Global Group, Inc. (b) | 835,686 | 44,291,358 | |
| Crown Holdings, Inc. (b) | 480,305 | 45,268,746 | |
| Graphic Packaging Holding Co. | 727,720 | 11,148,670 | |
| International Paper Co. | 828,947 | 41,016,298 | |
| O-I Glass, Inc. | 154,700 | 1,751,204 | |
| Packaging Corp. of America | 233,252 | 30,322,760 | |
| Sealed Air Corp. | 478,052 | 21,541,023 | |
| Sonoco Products Co. | 49,356 | 2,865,609 | |
| WestRock Co. | 841,581 | 35,523,134 | |
| 257,984,654 | |||
| Metals & Mining - 0.2% | |||
| BHP Billiton Ltd. sponsored ADR | 92,379 | 5,153,824 | |
| Freeport-McMoRan, Inc. | 2,128,155 | 49,777,545 | |
| Newmont Corp. | 378,263 | 22,249,430 | |
| Nucor Corp. | 279,317 | 14,999,323 | |
| Reliance Steel & Aluminum Co. | 123,964 | 14,602,959 | |
| Steel Dynamics, Inc. | 106,700 | 3,863,607 | |
| 110,646,688 | |||
| Paper & Forest Products - 0.0% | |||
| Schweitzer-Mauduit International, Inc. | 240,600 | 8,368,068 | |
| TOTAL MATERIALS | 1,085,777,100 | ||
| REAL ESTATE - 1.5% | |||
| Equity Real Estate Investment Trusts (REITs) - 1.4% | |||
| Alexandria Real Estate Equities, Inc. | 114,228 | 18,702,550 | |
| American Homes 4 Rent Class A | 367,606 | 10,557,644 | |
| American Tower Corp. | 387,955 | 89,695,196 | |
| Apartment Investment & Management Co. Class A | 210,580 | 6,391,103 | |
| AvalonBay Communities, Inc. | 123,024 | 20,494,568 | |
| Boston Properties, Inc. | 55,688 | 5,466,334 | |
| Brandywine Realty Trust (SBI) | 767,000 | 8,536,710 | |
| Brixmor Property Group, Inc. | 601,505 | 9,184,981 | |
| Corporate Office Properties Trust (SBI) | 69,200 | 1,842,796 | |
| Crown Castle International Corp. | 65,848 | 11,034,149 | |
| CubeSmart | 74,500 | 2,423,485 | |
| Digital Realty Trust, Inc. | 37,900 | 5,107,025 | |
| Douglas Emmett, Inc. | 52,300 | 1,619,731 | |
| Duke Realty Corp. | 125,450 | 4,774,627 | |
| EastGroup Properties, Inc. | 47,210 | 6,436,139 | |
| Equinix, Inc. | 78,099 | 54,496,701 | |
| Equity Lifestyle Properties, Inc. | 162,577 | 9,525,386 | |
| Equity Residential (SBI) | 194,252 | 11,251,076 | |
| Essex Property Trust, Inc. | 30,411 | 7,477,457 | |
| Federal Realty Investment Trust (SBI) | 87,021 | 7,589,972 | |
| Hospitality Properties Trust (SBI) | 584,000 | 6,926,240 | |
| Host Hotels & Resorts, Inc. | 133,600 | 1,874,408 | |
| Kilroy Realty Corp. | 35,300 | 2,158,948 | |
| Kimco Realty Corp. | 851,646 | 12,297,768 | |
| Lexington Corporate Properties Trust | 173,100 | 1,767,351 | |
| Mid-America Apartment Communities, Inc. | 170,415 | 21,499,556 | |
| Omega Healthcare Investors, Inc. | 439,500 | 15,479,190 | |
| Outfront Media, Inc. | 454,307 | 8,604,575 | |
| Paramount Group, Inc. | 715,000 | 6,613,750 | |
| Park Hotels & Resorts, Inc. | 418,700 | 6,833,184 | |
| Piedmont Office Realty Trust, Inc. Class A | 784,400 | 12,260,172 | |
| Potlatch Corp. | 49,095 | 2,284,881 | |
| Prologis (REIT), Inc. | 1,240,718 | 124,133,836 | |
| Public Storage | 132,510 | 29,743,195 | |
| Rayonier, Inc. | 392,123 | 11,046,105 | |
| SBA Communications Corp. Class A | 127,475 | 36,608,271 | |
| Simon Property Group, Inc. | 213,405 | 17,620,851 | |
| SITE Centers Corp. | 166,350 | 1,678,472 | |
| Sun Communities, Inc. | 70,575 | 9,809,925 | |
| Ventas, Inc. | 754,983 | 36,171,236 | |
| VEREIT, Inc. | 2,488,300 | 17,642,047 | |
| VICI Properties, Inc. | 55,200 | 1,396,008 | |
| Welltower, Inc. | 243,146 | 15,313,335 | |
| Weyerhaeuser Co. | 1,112,650 | 32,311,356 | |
| 724,682,290 | |||
| Real Estate Management & Development - 0.1% | |||
| CBRE Group, Inc. (b) | 413,246 | 25,265,860 | |
| Cushman & Wakefield PLC (b) | 252,100 | 3,756,290 | |
| KE Holdings, Inc. ADR (b) | 86,000 | 5,618,380 | |
| 34,640,530 | |||
| TOTAL REAL ESTATE | 759,322,820 | ||
| UTILITIES - 1.9% | |||
| Electric Utilities - 1.3% | |||
| American Electric Power Co., Inc. | 772,173 | 65,549,766 | |
| Duke Energy Corp. | 506,219 | 46,906,253 | |
| Edison International | 237,207 | 14,555,022 | |
| Entergy Corp. | 336,004 | 36,574,035 | |
| Evergy, Inc. | 412,895 | 22,878,512 | |
| Exelon Corp. | 1,644,058 | 67,521,462 | |
| FirstEnergy Corp. | 126,600 | 3,362,496 | |
| NextEra Energy, Inc. | 3,168,516 | 233,171,092 | |
| NRG Energy, Inc. | 874,306 | 28,633,522 | |
| OGE Energy Corp. | 96,136 | 3,113,845 | |
| PG&E Corp. (b) | 372,718 | 4,733,519 | |
| Pinnacle West Capital Corp. | 196,047 | 16,046,447 | |
| PPL Corp. | 69,800 | 1,983,716 | |
| Southern Co. | 1,057,522 | 63,292,692 | |
| Xcel Energy, Inc. | 759,352 | 51,149,951 | |
| 659,472,330 | |||
| Gas Utilities - 0.0% | |||
| Atmos Energy Corp. | 66,697 | 6,395,575 | |
| UGI Corp. | 102,500 | 3,636,700 | |
| 10,032,275 | |||
| Independent Power and Renewable Electricity Producers - 0.1% | |||
| NextEra Energy Partners LP | 19,400 | 1,231,318 | |
| The AES Corp. | 618,263 | 12,637,296 | |
| Vistra Corp. | 1,049,400 | 19,602,792 | |
| 33,471,406 | |||
| Multi-Utilities - 0.5% | |||
| Ameren Corp. | 726,183 | 56,482,514 | |
| CenterPoint Energy, Inc. | 202,046 | 4,685,447 | |
| Dominion Energy, Inc. | 627,214 | 49,230,027 | |
| DTE Energy Co. | 20,451 | 2,572,940 | |
| MDU Resources Group, Inc. | 383,500 | 9,564,490 | |
| NiSource, Inc. | 436,093 | 10,553,451 | |
| Public Service Enterprise Group, Inc. | 1,005,368 | 58,592,847 | |
| Sempra Energy | 495,927 | 63,220,774 | |
| 254,902,490 | |||
| TOTAL UTILITIES | 957,878,501 | ||
| TOTAL COMMON STOCKS | |||
| (Cost $24,402,522,016) | 40,960,862,377 | ||
| Convertible Preferred Stocks - 0.0% | |||
| CONSUMER DISCRETIONARY - 0.0% | |||
| Diversified Consumer Services - 0.0% | |||
| Airbnb, Inc. Series D (b)(c) | 197,718 | 12,100,342 | |
| Internet & Direct Marketing Retail - 0.0% | |||
| The Honest Co., Inc. Series D (b)(c)(d) | 32,084 | 1,468,164 | |
| TOTAL CONVERTIBLE PREFERRED STOCKS | |||
| (Cost $5,492,853) | 13,568,506 | ||
| Equity Funds - 19.4% | |||
| Large Blend Funds - 6.5% | |||
| Fidelity SAI U.S. Large Cap Index Fund (e) | 74,298,311 | 1,445,102,156 | |
| Fidelity SAI U.S. Low Volatility Index Fund (e) | 42,335,514 | 686,682,043 | |
| JPMorgan U.S. Large Cap Core Plus Fund Select Class (f) | 22,226,205 | 663,452,228 | |
| PIMCO StocksPLUS Absolute Return Fund Institutional Class | 45,074,756 | 549,010,524 | |
| TOTAL LARGE BLEND FUNDS | 3,344,246,951 | ||
| Large Growth Funds - 10.4% | |||
| Fidelity Growth Company Fund (e) | 113,079,612 | 3,897,854,206 | |
| Fidelity SAI U.S. Momentum Index Fund (e) | 1,743,757 | 28,388,360 | |
| Fidelity SAI U.S. Quality Index Fund (e) | 89,205,982 | 1,448,705,144 | |
| TOTAL LARGE GROWTH FUNDS | 5,374,947,710 | ||
| Large Value Funds - 0.2% | |||
| Fidelity SAI U.S. Value Index Fund (e) | 9,029,500 | 88,398,804 | |
| Mid-Cap Blend Funds - 0.8% | |||
| Fidelity Mid Cap Index Fund (e) | 16,464,304 | 432,681,915 | |
| Mid-Cap Growth Funds - 1.5% | |||
| Janus Henderson Enterprise Fund | 4,663,817 | 749,335,471 | |
| TOTAL EQUITY FUNDS | |||
| (Cost $5,743,995,660) | 9,989,610,851 | ||
| Other - 0.0% | |||
| Commodity Funds - Broad Basket - 0.0% | |||
| Fidelity SAI Inflation-Focused Fund (e) | |||
| (Cost $6,694,501) | 851,569 | 8,464,593 | |
| U.S. Treasury Obligations - 0.0% | |||
| U.S. Treasury Bills, yield at date of purchase 0.1% to 0.11% 2/25/21 to 3/25/21 (g) | |||
| (Cost $4,948,388) | 4,950,000 | 4,948,644 | |
| Money Market Funds - 0.7% | |||
| Fidelity Cash Central Fund 0.09% (h) | 31,384,561 | 31,390,838 | |
| Invesco Government & Agency Portfolio Institutional Class .01% (i) | 314,092,185 | 314,092,185 | |
| TOTAL MONEY MARKET FUNDS | |||
| (Cost $345,479,573) | 345,483,023 | ||
| TOTAL INVESTMENT IN SECURITIES - 99.8% | |||
| (Cost $30,509,132,991) | 51,322,937,994 | ||
| NET OTHER ASSETS (LIABILITIES) - 0.2% | 85,156,968 | ||
| NET ASSETS - 100% | $51,408,094,962 |
| Futures Contracts | |||||
| Number of contracts | Expiration Date | Notional Amount | Value | Unrealized Appreciation/(Depreciation) | |
| Purchased | |||||
| Equity Index Contracts | |||||
| CME E-mini S&P 500 Index Contracts (United States) | 230 | Dec. 2020 | $41,666,800 | $3,216,210 | $3,216,210 |
The notional amount of futures purchased as a percentage of Net Assets is 0.0%
Legend
(a) Security exempt from registration under Rule 144A of the Securities Act of 1933. These securities may be resold in transactions exempt from registration, normally to qualified institutional buyers. At the end of the period, the value of these securities amounted to $14,149,064 or 0.0% of net assets.
(b) Non-income producing
(c) Restricted securities (including private placements) - Investment in securities not registered under the Securities Act of 1933 (excluding 144A issues). At the end of the period, the value of restricted securities (excluding 144A issues) amounted to $21,988,005 or 0.0% of net assets.
(d) Level 3 security
(e) Affiliated Fund
(f) The JPMorgan U.S. Large Cap Core Plus Fund seeks to provide a high total return from a portfolio of selected equity securities which includes both long and short positions.
(g) Security or a portion of the security was pledged to cover margin requirements for futures contracts. At period end, the value of securities pledged amounted to $3,049,123.
(h) Affiliated fund that is generally available only to investment companies and other accounts managed by Fidelity Investments. The rate quoted is the annualized seven-day yield of the fund at period end. A complete unaudited listing of the fund's holdings as of its most recent quarter end is available upon request. In addition, each Fidelity Central Fund's financial statements are available on the SEC's website or upon request.
(i) The rate quoted is the annualized seven-day yield of the fund at period end.
Additional information on each restricted holding is as follows:
| Security | Acquisition Date | Acquisition Cost |
| Airbnb, Inc. Series D | 4/16/14 | $4,024,850 |
| The Honest Co., Inc. Series D | 8/12/15 | $1,468,003 |
| Vertiv Holdings LLC | 2/6/20 | $4,500,000 |
Affiliated Central Funds
Information regarding fiscal year to date income earned by the Fund from investments in Fidelity Central Funds is as follows:
| Fund | Income earned |
| Fidelity Cash Central Fund | $608 |
| Total | $608 |
Amounts in the income column in the above table include any capital gain distributions from underlying funds, which are presented in the corresponding line-item in the Statement of Operations, if applicable.
Affiliated Underlying Funds
Fiscal year to date information regarding the Fund's investments in affiliated Underlying Funds, excluding any Money Market Central Funds, is presented below. Exchanges between classes of the same affiliated Underlying Funds may occur.
| Affiliate | Value, beginning of period | Purchases(a) | Sales Proceeds(a) | Dividend Income | Realized Gain (loss) | Change in Unrealized appreciation (depreciation) | Value, end of period |
| Fidelity Growth Company Fund | $-- | $-- | $-- | $-- | $-- | $2,676,977,731 | $3,897,854,206 |
| Fidelity Mid Cap Index Fund | -- | -- | -- | -- | -- | 94,260,811 | 432,681,915 |
| Fidelity SAI Inflation-Focused Fund | -- | -- | -- | -- | -- | 1,770,091 | 8,464,593 |
| Fidelity SAI U.S. Large Cap Index Fund | -- | 307,083,477 | 12,713,349 | -- | 15,790 | 201,265,807 | 1,445,102,156 |
| Fidelity SAI U.S. Low Volatility Index Fund | -- | -- | -- | -- | -- | 119,048,152 | 686,682,043 |
| Fidelity SAI U.S. Momentum Index Fund | -- | -- | -- | -- | -- | 1,381,612 | 28,388,360 |
| Fidelity SAI U.S. Quality Index Fund | -- | -- | -- | -- | -- | 557,231,223 | 1,448,705,144 |
| Fidelity SAI U.S. Value Index Fund | -- | -- | -- | -- | -- | 10,541,073 | 88,398,804 |
| Total | $-- | $307,083,477 | $12,713,349 | $-- | $15,790 | $3,662,476,500 | $8,036,277,221 |
(a) Excludes the value of securities received and delivered through merger transactions, if applicable.
Amounts in the income column in the above table include any capital gain distributions from underlying funds, which are presented in the corresponding line-item in the Statement of Operations, if applicable.
Investment Valuation
The following is a summary of the inputs used, as of November 30, 2020, involving the Fund's assets and liabilities carried at fair value. The inputs or methodology used for valuing securities may not be an indication of the risk associated with investing in those securities. For more information on valuation inputs, and their aggregation into the levels used below, please refer to the Investment Valuation section in the accompanying Notes to Financial Statements.
| Valuation Inputs at Reporting Date: | ||||
| Description | Total | Level 1 | Level 2 | Level 3 |
| Investments in Securities: | ||||
| Equities: | ||||
| Communication Services | $4,334,943,678 | $4,293,562,090 | $41,381,588 | $-- |
| Consumer Discretionary | 4,779,821,237 | 4,764,301,935 | 14,051,138 | 1,468,164 |
| Consumer Staples | 2,451,387,781 | 2,446,101,641 | 5,286,140 | -- |
| Energy | 889,586,092 | 882,284,053 | 7,302,039 | -- |
| Financials | 5,354,254,699 | 5,351,287,644 | 2,967,055 | -- |
| Health Care | 5,973,015,161 | 5,902,029,807 | 70,985,354 | -- |
| Industrials | 4,018,613,607 | 4,014,946,045 | 3,667,562 | -- |
| Information Technology | 10,369,830,207 | 10,354,548,921 | 15,281,286 | -- |
| Materials | 1,085,777,100 | 1,085,777,100 | -- | -- |
| Real Estate | 759,322,820 | 759,322,820 | -- | -- |
| Utilities | 957,878,501 | 957,878,501 | -- | -- |
| Equity Funds | 9,989,610,851 | 9,989,610,851 | -- | -- |
| Other | 8,464,593 | 8,464,593 | -- | -- |
| Other Short-Term Investments | 4,948,644 | -- | 4,948,644 | -- |
| Money Market Funds | 345,483,023 | 345,483,023 | -- | -- |
| Total Investments in Securities: | $51,322,937,994 | $51,155,599,024 | $165,870,806 | $1,468,164 |
| Derivative Instruments: | ||||
| Assets | ||||
| Futures Contracts | $3,216,210 | $3,216,210 | $-- | $-- |
| Total Assets | $3,216,210 | $3,216,210 | $-- | $-- |
| Total Derivative Instruments: | $3,216,210 | $3,216,210 | $-- | $-- |
Value of Derivative Instruments
The following table is a summary of the Fund's value of derivative instruments by primary risk exposure as of November 30, 2020. For additional information on derivative instruments, please refer to the Derivative Instruments section in the accompanying Notes to Financial Statements.
| Primary Risk Exposure / Derivative Type | Value | |
| Asset | Liability | |
| Equity Risk | ||
| Futures Contracts(a) | $3,216,210 | $0 |
| Total Equity Risk | 3,216,210 | 0 |
| Total Value of Derivatives | $3,216,210 | $0 |
(a) Reflects gross cumulative appreciation (depreciation) on futures contracts as presented in the Schedule of Investments. In the Statement of Assets and Liabilities, the period end daily variation margin is included in receivable or payable for daily variation margin on futures contracts, and the net cumulative appreciation (depreciation) is included in Total accumulated earnings (loss).
See accompanying notes which are an integral part of the financial statements.
Financial Statements
Statement of Assets and Liabilities
| November 30, 2020 (Unaudited) | ||
| Assets | ||
| Investment in securities, at value — See accompanying schedule: Unaffiliated issuers (cost $26,103,944,882) | $43,255,269,935 | |
| Fidelity Central Funds (cost $31,387,388) | 31,390,838 | |
| Other affiliated issuers (cost $4,373,800,721) | 8,036,277,221 | |
| Total Investment in Securities (cost $30,509,132,991) | $51,322,937,994 | |
| Cash | 765,904 | |
| Foreign currency held at value (cost $4,564,069) | 4,564,700 | |
| Receivable for investments sold | 130,645,915 | |
| Receivable for fund shares sold | 12,704,002 | |
| Dividends receivable | 62,957,772 | |
| Interest receivable | 2,932 | |
| Distributions receivable from Fidelity Central Funds | 17,642 | |
| Other receivables | 929,350 | |
| Total assets | 51,535,526,211 | |
| Liabilities | ||
| Payable for investments purchased | $100,125,847 | |
| Payable for fund shares redeemed | 18,741,432 | |
| Accrued management fee | 7,414,034 | |
| Payable for daily variation margin on futures contracts | 152,950 | |
| Other affiliated payables | 34,712 | |
| Other payables and accrued expenses | 962,274 | |
| Total liabilities | 127,431,249 | |
| Net Assets | $51,408,094,962 | |
| Net Assets consist of: | ||
| Paid in capital | $30,458,481,467 | |
| Total accumulated earnings (loss) | 20,949,613,495 | |
| Net Assets | $51,408,094,962 | |
| Net Asset Value, offering price and redemption price per share ($51,408,094,962 ÷ 5,020,495,901 shares) | $10.24 |
See accompanying notes which are an integral part of the financial statements.
Statement of Operations
| For the period November 12, 2020 (commencement of operations) to November 30, 2020 (Unaudited) | ||
| Investment Income | ||
| Dividends: | ||
| Unaffiliated issuers | $17,598,253 | |
| Interest | 985 | |
| Income from Fidelity Central Funds | 608 | |
| Total income | 17,599,846 | |
| Expenses | ||
| Management fee | $4,626,605 | |
| Custodian fees and expenses | 1 | |
| Independent trustees' fees and expenses | 34,712 | |
| Registration fees | 1,312 | |
| Audit | 3,036 | |
| Total expenses before reductions | 4,665,666 | |
| Expense reductions | (2,714,004) | |
| Total expenses after reductions | 1,951,662 | |
| Net investment income (loss) | 15,648,184 | |
| Realized and Unrealized Gain (Loss) | ||
| Net realized gain (loss) on: | ||
| Investment securities: | ||
| Unaffiliated issuers (net of foreign taxes of $307) | 116,776,020 | |
| Affiliated issuers | 15,790 | |
| Foreign currency transactions | (686,468) | |
| Futures contracts | 54,509 | |
| Total net realized gain (loss) | 116,159,851 | |
| Change in net unrealized appreciation (depreciation) on: | ||
| Investment securities: | ||
| Unaffiliated issuers | (2,765,488,226) | |
| Fidelity Central Funds | 3,450 | |
| Other affiliated issuers | 3,662,476,500 | |
| Assets and liabilities in foreign currencies | 784,247 | |
| Futures contracts | 858,789 | |
| Total change in net unrealized appreciation (depreciation) | 898,634,760 | |
| Net gain (loss) | 1,014,794,611 | |
| Net increase (decrease) in net assets resulting from operations | $1,030,442,795 |
See accompanying notes which are an integral part of the financial statements.
Statement of Changes in Net Assets
| For the period November 12, 2020 (commencement of operations) to November 30, 2020 (Unaudited) | Strategic Advisers Core Fund(a) Year ended May 31, 2020 | |
| Increase (Decrease) in Net Assets | ||
| Operations | ||
| Net investment income (loss) | $15,648,184 | $453,924,654 |
| Net realized gain (loss) | 116,159,851 | 755,139,994 |
| Change in net unrealized appreciation (depreciation) | 898,634,760 | 1,822,878,765 |
| Net increase (decrease) in net assets resulting from operations | 1,030,442,795 | 3,031,943,413 |
| Distributions to shareholders | – | (1,621,230,881) |
| Share transactions | ||
| Proceeds from sales of shares | 383,146,519 | 5,134,133,462 |
| Net asset value of shares issued in exchange for the net assets of Target Funds (note 9) | 50,151,841,835 | – |
| Reinvestment of distributions | – | 1,597,215,641 |
| Cost of shares redeemed | (157,336,187) | (5,836,940,101) |
| Net increase (decrease) in net assets resulting from share transactions | 50,377,652,167 | 894,409,002 |
| Total increase (decrease) in net assets | 51,408,094,962 | 2,305,121,534 |
| Net Assets | ||
| Beginning of period | – | 24,720,959,735 |
| End of period | $51,408,094,962 | $27,026,081,269 |
| Other Information | ||
| Shares | ||
| Sold | 40,690,964 | 291,290,156 |
| Issued in exchange for the shares of Target Funds (note 9) | 4,995,203,101 | – |
| Issued in reinvestment of distributions | – | 84,035,568 |
| Redeemed | (15,398,164) | (325,208,146) |
| Net increase (decrease) | 5,020,495,901 | 50,117,578 |
(a) See Note 1 and Note 9.
See accompanying notes which are an integral part of the financial statements.
Financial Highlights
Strategic Advisers Large Cap Fund
| Six months ended (Unaudited) November 30, | Years endedMay 31, | |||||
| 2020 A | 2020 B | 2019 B | 2018 B | 2017 B | 2016 B | |
| Selected Per–Share Data | ||||||
| Net asset value, beginning of period | $10.00 | $17.31 | $18.40 | $17.32 | $15.07 | $16.12 |
| Income from Investment Operations | ||||||
| Net investment income (loss)C | .01 | .32 | .29 | .25 | .22 | .19 |
| Net realized and unrealized gain (loss) | .23 | 1.81 | .08 | 2.18 | 2.48 | (.37) |
| Total from investment operations | .24 | 2.13 | .37 | 2.43 | 2.70 | (.18) |
| Distributions from net investment income | – | (.29) | (.29) | (.24) | (.19) | (.19) |
| Distributions from net realized gain | – | (.87) | (1.17) | (1.11) | (.26) | (.68) |
| Total distributions | – | (1.15)D | (1.46) | (1.35) | (.45) | (.87) |
| Net asset value, end of period | $10.24 | $18.29 | $17.31 | $18.40 | $17.32 | $15.07 |
| Total ReturnE,F | 1.99%G | 12.17% | 2.41% | 14.59% | 18.22% | (1.10)% |
| Ratios to Average Net AssetsH,I | ||||||
| Expenses before reductions | .44%J | .45% | .45% | .47% | .46% | .43% |
| Expenses net of fee waivers, if any | .18%J | .20% | .20% | .21% | .21% | .18% |
| Expenses net of all reductions | .18%J | .20% | .20% | .21% | .21% | .18% |
| Net investment income (loss) | 1.46%J | 1.74% | 1.65% | 1.41% | 1.40% | 1.32% |
| Supplemental Data | ||||||
| Net assets, end of period (000 omitted) | $51,408,095 | $27,026,081 | $24,720,960 | $24,984,597 | $23,157,908 | $23,636,860 |
| Portfolio turnover rateK | 4%L,M | 90% | 84% | 98% | 100% | 85% |
A For the period November 12, 2020 (commencement of operations) to November 30, 2020.
B Effective November 20, 2020, Strategic Advisers Core Fund ("Predecessor Fund") and two other funds were reorganized into the Fund. The Fund has adopted the Financial Statements of the Predecessor Fund. Therefore, the financial highlights shown above are those of the Predecessor Fund for all periods prior to the Fund's commencement of operations.
C Calculated based on average shares outstanding during the period.
D Total distributions per share do not sum due to rounding.
E Total returns for periods of less than one year are not annualized.
F Total returns would have been lower if certain expenses had not been reduced during the applicable periods shown.
G The Fund commenced operations on November 12, 2020. Returns prior to November 20, 2020 are those of the Predecessor Fund.
H Fees and expenses of any underlying mutual funds or exchange-traded funds (ETFs) are not included in the Fund's expense ratio. The Fund indirectly bears its proportionate share of these expenses. For additional expense information related to investments in Fidelity Central Funds, please refer to the "Investments in Fidelity Central Funds" note found in the Notes to Financial Statements section of the most recent Annual or Semi-Annual report.
I Expense ratios reflect operating expenses of the class. Expenses before reductions do not reflect amounts reimbursed, waived, or reduced through arrangements with the investment advisor, brokerage services, or other offset arrangements, if applicable, and do not represent the amount paid by the class during periods when reimbursements, waivers or reductions occur.
J Annualized
K Amount does not include the portfolio activity of any underlying mutual funds or exchange-traded funds (ETFs).
L The portfolio turnover rate does not include the assets acquired in the merger.
M Amount not annualized.
See accompanying notes which are an integral part of the financial statements.
Notes to Financial Statements (Unaudited)
For the period ended November 30, 2020
1. Organization.
Strategic Advisers Large Cap Fund (the Fund) is a fund of Fidelity Rutland Square Trust II (the Trust), and is authorized to issue an unlimited number of shares. The Trust is registered under the Investment Company Act of 1940, as amended (the 1940 Act), as an open-end management investment company organized as a Delaware statutory trust. The Fund is offered exclusively to certain clients of Strategic Advisers LLC (Strategic Advisers), an affiliate of Fidelity Management & Research Company LLC (FMR). Effective November 20, 2020, Strategic Advisers Core Fund ("Predecessor Fund") and two other funds were reorganized into the Fund. The Fund has adopted the Financial Statements of the Predecessor Fund. Therefore, the Statement of Changes in Net Assets and Financial Highlights are those of the Predecessor Fund for all periods prior to the Fund's commencement of operations on November 12, 2020.
2. Significant Accounting Policies.
The Fund is an investment company and applies the accounting and reporting guidance of the Financial Accounting Standards Board (FASB) Accounting Standards Codification Topic 946 Financial Services – Investment Companies. The financial statements have been prepared in conformity with accounting principles generally accepted in the United States of America (GAAP), which require management to make certain estimates and assumptions at the date of the financial statements. Actual results could differ from those estimates. Subsequent events, if any, through the date that the financial statements were issued have been evaluated in the preparation of the financial statements. The following summarizes the significant accounting policies of the Fund:
Investment Valuation. Investments are valued as of 4:00 p.m. Eastern time on the last calendar day of the period. The Board of Trustees (the Board) has delegated the day to day responsibility for the valuation of the Fund's investments to the Fair Value Committee (the Committee) established by the Fund's investment adviser. In accordance with valuation policies and procedures approved by the Board, the Fund attempts to obtain prices from one or more third party pricing vendors or brokers to value its investments. When current market prices, quotations or currency exchange rates are not readily available or reliable, investments will be fair valued in good faith by the Committee, in accordance with procedures adopted by the Board. Factors used in determining fair value vary by investment type and may include market or investment specific events, changes in interest rates and credit quality. The frequency with which these procedures are used cannot be predicted and they may be utilized to a significant extent. The Committee oversees the Fund's valuation policies and procedures and reports to the Board on the Committee's activities and fair value determinations. The Board monitors the appropriateness of the procedures used in valuing the Fund's investments and ratifies the fair value determinations of the Committee.
The Fund categorizes the inputs to valuation techniques used to value its investments into a disclosure hierarchy consisting of three levels as shown below:
- Level 1 – quoted prices in active markets for identical investments
- Level 2 – other significant observable inputs (including quoted prices for similar investments, interest rates, prepayment speeds, etc.)
- Level 3 – unobservable inputs (including the Fund's own assumptions based on the best information available)
Valuation techniques used to value the Fund's investments by major category are as follows:
Equity securities, including restricted securities, for which market quotations are readily available, are valued at the last reported sale price or official closing price as reported by a third party pricing vendor on the primary market or exchange on which they are traded and are categorized as Level 1 in the hierarchy. In the event there were no sales during the day or closing prices are not available, securities are valued at the last quoted bid price or may be valued using the last available price and are generally categorized as Level 2 in the hierarchy. For foreign equity securities, when market or security specific events arise, comparisons to the valuation of American Depositary Receipts (ADRs), futures contracts, Exchange-Traded Funds (ETFs) and certain indexes as well as quoted prices for similar securities may be used and would be categorized as Level 2 in the hierarchy. For equity securities, including restricted securities, where observable inputs are limited, assumptions about market activity and risk are used and these securities may be categorized as Level 3 in the hierarchy.
Debt securities, including restricted securities, are valued based on evaluated prices received from third party pricing vendors or from brokers who make markets in such securities. U.S. government and government agency obligations are valued by pricing vendors who utilize matrix pricing which considers yield or price of bonds of comparable quality, coupon, maturity and type or by broker-supplied prices. When independent prices are unavailable or unreliable, debt securities may be valued utilizing pricing methodologies which consider similar factors that would be used by third party pricing vendors. Debt securities are generally categorized as Level 2 in the hierarchy but may be Level 3 depending on the circumstances.
Futures contracts are valued at the settlement price established each day by the board of trade or exchange on which they are traded and are categorized as Level 1 in the hierarchy. Investments in open-end mutual funds, including the Fidelity Central Funds, are valued at their closing net asset value (NAV) each business day and are categorized as Level 1 in the hierarchy. If an unaffiliated open-end mutual fund's NAV is unavailable, shares of that fund may be valued by another method that the Board believes reflects fair value in accordance with the Board's fair value pricing policies and is categorized as Level 2 in the hierarchy.
Changes in valuation techniques may result in transfers in or out of an assigned level within the disclosure hierarchy. The aggregate value of investments by input level as of November 30, 2020 is included at the end of the Fund's Schedule of Investments.
Foreign Currency. Certain Funds may use foreign currency contracts to facilitate transactions in foreign-denominated securities. Gains and losses from these transactions may arise from changes in the value of the foreign currency or if the counterparties do not perform under the contracts' terms.
Foreign-denominated assets, including investment securities, and liabilities are translated into U.S. dollars at the exchange rates at period end. Purchases and sales of investment securities, income and dividends received and expenses denominated in foreign currencies are translated into U.S. dollars at the exchange rate in effect on the transaction date.
The effects of exchange rate fluctuations on investments are included with the net realized and unrealized gain (loss) on investment securities. Other foreign currency transactions resulting in realized and unrealized gain (loss) are disclosed separately.
Investment Transactions and Income. For financial reporting purposes, the Fund's investment holdings and NAV include trades executed through the end of the last business day of the period. The NAV per share for processing shareholder transactions is calculated as of the close of business of the New York Stock Exchange (NYSE), normally 4:00 p.m. Eastern time and includes trades executed through the end of the prior business day. Gains and losses on securities sold are determined on the basis of identified cost. Dividend income is recorded on the ex-dividend date, except for certain dividends from foreign securities where the ex-dividend date may have passed, which are recorded as soon as the Fund is informed of the ex-dividend date. Non-cash dividends included in dividend income, if any, are recorded at the fair market value of the securities received. Income and capital gain distributions from Fidelity Central Funds, if any, are recorded on the ex-dividend date. Income and capital gain distributions from any underlying mutual funds or exchange-traded funds (ETFs) are recorded on the ex-dividend date. Certain distributions received by the Fund represent a return of capital or capital gain. The Fund determines the components of these distributions subsequent to the ex-dividend date, based upon receipt of tax filings or other correspondence relating to the underlying investment. These distributions are recorded as a reduction of cost of investments and/or as a realized gain. Interest income is accrued as earned and includes coupon interest and amortization of premium and accretion of discount on debt securities as applicable. Investment income is recorded net of foreign taxes withheld where recovery of such taxes is uncertain.
Expenses. Expenses directly attributable to a fund are charged to that fund. Expenses attributable to more than one fund are allocated among the respective funds on the basis of relative net assets or other appropriate methods. Expense estimates are accrued in the period to which they relate and adjustments are made when actual amounts are known.
Deferred Trustee Compensation. Under a Deferred Compensation Plan (the Plan) for certain Funds, certain independent Trustees have elected to defer receipt of a portion of their annual compensation. Deferred amounts are invested in affiliated mutual funds, are marked-to-market and remain in a fund until distributed in accordance with the Plan. The investment of deferred amounts and the offsetting payable to the Trustees presented below are included in the accompanying Statement of Assets and Liabilities in other receivables and other payables and accrued expenses, as applicable.
| Strategic Advisers Large Cap Fund | $680,176 |
Income Tax Information and Distributions to Shareholders. Each year, the Fund intends to qualify as a regulated investment company under Subchapter M of the Internal Revenue Code, including distributing substantially all of its taxable income and realized gains. As a result, no provision for U.S. Federal income taxes is required. The Fund files a U.S. federal tax return, in addition to state and local tax returns as required. The Fund's federal income tax returns are subject to examination by the Internal Revenue Service (IRS) for a period of three fiscal years after they are filed. State and local tax returns may be subject to examination for an additional fiscal year depending on the jurisdiction. Foreign taxes are provided for based on the Fund's understanding of the tax rules and rates that exist in the foreign markets in which it invests. The Fund is subject to a tax imposed on capital gains by certain countries in which it invests.
Distributions are declared and recorded on the ex-dividend date. Income and capital gain distributions are determined in accordance with income tax regulations, which may differ from GAAP.
Capital accounts within the financial statements are adjusted for permanent book-tax differences. These adjustments have no impact on net assets or the results of operations. Capital accounts are not adjusted for temporary book-tax differences which will reverse in a subsequent period.
As of period end, the cost and unrealized appreciation (depreciation) in securities, and derivatives if applicable, for federal income tax purposes were as follows:
| Gross unrealized appreciation | $21,310,043,897 |
| Gross unrealized depreciation | (757,505,712) |
| Net unrealized appreciation (depreciation) | $20,552,538,185 |
| Tax cost | $30,773,616,019 |
Restricted Securities (including Private Placements). The Fund may invest in securities that are subject to legal or contractual restrictions on resale. These securities generally may be resold in transactions exempt from registration or to the public if the securities are registered. Disposal of these securities may involve time-consuming negotiations and expense, and prompt sale at an acceptable price may be difficult. Information regarding restricted securities is included at the end of the Fund's Schedule of Investments.
3. Derivative Instruments.
Risk Exposures and the Use of Derivative Instruments. The Fund's investment objective allows the Fund to enter into various types of derivative contracts, including futures contracts. Derivatives are investments whose value is primarily derived from underlying assets, indices or reference rates and may be transacted on an exchange or over-the-counter (OTC). Derivatives may involve a future commitment to buy or sell a specified asset based on specified terms, to exchange future cash flows at periodic intervals based on a notional principal amount, or for one party to make one or more payments upon the occurrence of specified events in exchange for periodic payments from the other party.
The Fund used derivatives to increase returns and to manage exposure to certain risks as defined below. The success of any strategy involving derivatives depends on analysis of numerous economic factors, and if the strategies for investment do not work as intended, the Fund may not achieve its objectives.
The Fund's use of derivatives increased or decreased its exposure to the following risk:
| Equity Risk | Equity risk relates to the fluctuations in the value of financial instruments as a result of changes in market prices (other than those arising from interest rate risk or foreign exchange risk), whether caused by factors specific to an individual investment, its issuer, or all factors affecting all instruments traded in a market or market segment. |
The Fund is also exposed to additional risks from investing in derivatives, such as liquidity risk and counterparty credit risk. Liquidity risk is the risk that the Fund will be unable to close out the derivative in the open market in a timely manner. Counterparty credit risk is the risk that the counterparty will not be able to fulfill its obligation to the Fund. Counterparty credit risk related to exchange-traded futures contracts may be mitigated by the protection provided by the exchange on which they trade.
Investing in derivatives may involve greater risks than investing in the underlying assets directly and, to varying degrees, may involve risk of loss in excess of any initial investment and collateral received and amounts recognized in the Statement of Assets and Liabilities. In addition, there may be the risk that the change in value of the derivative contract does not correspond to the change in value of the underlying instrument.
Futures Contracts. A futures contract is an agreement between two parties to buy or sell a specified underlying instrument for a fixed price at a specified future date. The Fund used futures contracts to manage its exposure to the stock market.
Upon entering into a futures contract, a fund is required to deposit either cash or securities (initial margin) with a clearing broker in an amount equal to a certain percentage of the face value of the contract. Futures contracts are marked-to-market daily and subsequent daily payments (variation margin) are made or received by a fund depending on the daily fluctuations in the value of the futures contracts and are recorded as unrealized appreciation or (depreciation). This receivable and/or payable, if any, is included in daily variation margin on futures contracts in the Statement of Assets and Liabilities. Realized gain or (loss) is recorded upon the expiration or closing of a futures contract. The net realized gain (loss) and change in net unrealized appreciation (depreciation) on futures contracts during the period is presented in the Statement of Operations.
Any open futures contracts at period end are presented in the Schedule of Investments under the caption "Futures Contracts". The notional amount at value reflects each contract's exposure to the underlying instrument or index at period end and is representative of volume of activity during the period. Securities deposited to meet initial margin requirements are identified in the Schedule of Investments.
4. Purchases and Sales of Investments.
Purchases and sales of securities, other than short-term securities and securities acquired in the merger, are noted in the table below.
| Purchases ($) | Sales ($) | |
| Strategic Advisers Large Cap Fund | 1,062,596,281 | 797,345,589 |
5. Fees and Other Transactions with Affiliates.
Management Fee. Strategic Advisers (the investment adviser) provides the Fund with investment management related services. For these services, the Fund pays a monthly management fee to the investment adviser. The management fee is calculated by adding the annual management fee rate of .25% of the Fund's average net assets throughout the month payable to the investment adviser to the aggregate of the fee rates, payable monthly, to the Fund's sub-advisers. The Fund's maximum aggregate management fee will not exceed .65% of the Fund's average net assets. For the reporting period, the total annualized management fee rate was .43% of the Fund's average net assets.
During the period, the investment adviser waived a portion of its management fee as described in the Expense Reductions note.
Sub-Advisers. AllianceBernstein, L.P. (AB), Aristotle Capital Management, LLC, Brandywine Global Investment Management, LLC, ClariVest Asset Management LLC, ClearBridge Investments, LLC, FIAM LLC (an affiliate of the investment adviser), Geode Capital Management, LLC, Invesco Advisers, Inc., J.P. Morgan Investment Management, Inc., Loomis Sayles & Company, L.P., LSV Asset Management, PineBridge Investments, LLC, Principal Global Investors, LLC and T. Rowe Price Associates, Inc. each served as a sub-adviser for the Fund during the period. Sub-advisers provide discretionary investment advisory services for their allocated portion of the Fund's assets and are paid by the investment adviser and not the Fund for providing these services.
Brokerage Commissions. A portion of portfolio transactions were placed with brokerage firms which are affiliates of the investment adviser. Brokerage commissions are included in net realized gain (loss) and change in net unrealized appreciation (depreciation) in the Statement of Operations. The commissions paid to these affiliated firms were as follows:
| Amount | |
| Strategic Advisers Large Cap Fund | $19,828 |
Interfund Trades. Funds may purchase from or sell securities to other funds affiliated with each sub-adviser under procedures adopted by the Board. The procedures have been designed to ensure these interfund trades are executed in accordance with Rule 17a-7 of the 1940 Act. Interfund trades are included within the respective purchases and sales amounts shown in the Purchases and Sales of Investments note.
6. Investments in Fidelity Central Funds.
The Fund invests in Fidelity Central Funds, which are open-end investment companies available only to other investment companies and accounts managed by the investment adviser and its affiliates. The Fund's Schedule of Investments lists each of the Fidelity Central Funds held as of period end, if any, as an investment of the Fund, but does not include the underlying holdings of each Fidelity Central Fund. As an Investing Fund, the Fund indirectly bears its proportionate share of the expenses of the underlying Fidelity Central Funds.
The Fidelity Money Market Central Funds are managed by FMR. Annualized expenses of the Money Market Central Funds as of their most recent shareholder report date ranged from less than .005% to .01%.
A complete unaudited list of holdings for each Fidelity Central Fund is available upon request or at the Securities and Exchange Commission (the SEC) website at www.sec.gov. In addition, the financial statements of the Fidelity Central Funds are available on the SEC website or upon request.
7. Expense Reductions.
The investment adviser has contractually agreed to waive the Fund's management fee in an amount equal to .25% of the Fund's average net assets until September 30, 2023. During the period, this waiver reduced the Fund's management fee by $2,676,443.
In addition, the investment adviser has voluntarily agreed to waive a portion of the Fund's management fee. During the period, this waiver reduced the Fund's management fee by $37,561.
8. Other.
The Fund's organizational documents provide former and current trustees and officers with a limited indemnification against liabilities arising in connection with the performance of their duties to the Fund. In the normal course of business, the Fund may also enter into contracts that provide general indemnifications. The Fund's maximum exposure under these arrangements is unknown as this would be dependent on future claims that may be made against the Fund. The risk of material loss from such claims is considered remote.
9. Merger Information.
On November 20, 2020, the Fund acquired all of the assets and assumed all of the liabilities of Strategic Advisers Core Fund, Strategic Advisers Growth Fund and Strategic Advisers Value Fund (Target Funds) pursuant to an Agreement and Plan of Reorganization approved by the Board of Trustees ("The Board"). Each acquisition was accomplished by an exchange of shares of the Fund for shares then outstanding of each Target Fund at their respective net asset value on the acquisition date. The reorganization provides shareholders of each Target Fund access to a larger portfolio with a similar investment objective and lower expenses. The reorganization qualified as a tax-free reorganization for federal income tax purposes with no gain or loss recognized to the funds or their shareholders.
| Target Funds | Securities $ | Unrealized appreciation (depreciation) $ | Net Assets $ | Shares Exchanged |
| Strategic Advisers Core Fund | 31,619,450,950 | 12,056,868,793 | 31,632,208,284 | 3,150,617,669 |
| Strategic Advisers Growth Fund | 9,684,515,165 | 5,505,004,332 | 9,686,104,070 | 964,750,799 |
| Strategic Advisers Value Fund | 8,821,520,451 | 2,357,297,576 | 8,833,529,481 | 879,834,633 |
| Acquiring Fund | Net Assets $ | Total net assets after the acquisition $ |
| Strategic Advisers Large Cap Fund | 1,004,000 | 50,152,845,835 |
Pro forma results of operations of the combined entity for the entire period ended November 30, 2020 as though the acquisition had occurred as of the beginning of the year (rather than on the actual acquisition date), are as follows:
| Net investment income (loss) | $391,730,122 |
| Total net realized gain (loss) | 1,996,572,313 |
| Total change in net unrealized appreciation (depreciation) | 7,065,040,379 |
| Net increase (decrease) in net assets resulting from operations | $9,453,342,814 |
Because the combined investment portfolios have been managed as a single portfolio since each acquisition was completed, it is not practicable to separate the amounts of revenue and earnings of each Target Fund that has been included in the Fund's accompanying Statement of Operations since November 20, 2020.
10. Coronavirus (COVID-19) Pandemic.
An outbreak of COVID-19 first detected in China during December 2019 has since spread globally and was declared a pandemic by the World Health Organization during March 2020. Developments that disrupt global economies and financial markets, such as the COVID-19 pandemic, may magnify factors that affect the Fund's performance.
Shareholder Expense Example
As a shareholder, you incur two types of costs: (1) transaction costs, which may include sales charges (loads) on purchase payments or redemption proceeds, as applicable and (2) ongoing costs, which generally include management fees, distribution and/or service (12b-1) fees and other Fund expenses. This Example is intended to help you understand your ongoing costs (in dollars) of investing in a fund and to compare these costs with the ongoing costs of investing in other mutual funds.
The actual expense Example is based on an investment of $1,000 invested at the beginning of the period and held for the entire period (November 12, 2020 to November 30, 2020). The hypothetical expense Example is based on an investment of $1,000 invested for the one-half year period (June 1, 2020 to November 30, 2020).
Actual Expenses
The first line of the accompanying table provides information about actual account values and actual expenses. You may use the information in this line, together with the amount you invested, to estimate the expenses that you paid over the period. Simply divide your account value by $1,000.00 (for example, an $8,600 account value divided by $1,000.00 = 8.6), then multiply the result by the number in the first line for a class/Fund under the heading entitled "Expenses Paid During Period" to estimate the expenses you paid on your account during this period. If any fund is a shareholder of any underlying mutual funds or exchange-traded funds (ETFs) (the Underlying Funds), such fund indirectly bears its proportional share of the expenses of the Underlying Funds in addition to the direct expenses incurred presented in the table. These fees and expenses are not included in the annualized expense ratio used to calculate the expense estimate in the table below.
Hypothetical Example for Comparison Purposes
The second line of the accompanying table provides information about hypothetical account values and hypothetical expenses based on the actual expense ratio and an assumed rate of return of 5% per year before expenses, which is not the actual return. The hypothetical account values and expenses may not be used to estimate the actual ending account balance or expenses you paid for the period. You may use this information to compare the ongoing costs of investing in the Fund and other funds. To do so, compare this 5% hypothetical example with the 5% hypothetical examples that appear in the shareholder reports of the other funds. If any fund is a shareholder of any Underlying Funds, such fund indirectly bears its proportional share of the expenses of the Underlying Funds in addition to the direct expenses as presented in the table. These fees and expenses are not included in the annualized expense ratio used to calculate the expense estimate in the table below.
Please note that the expenses shown in the table are meant to highlight your ongoing costs only and do not reflect any transaction costs. Therefore, the second line of the table is useful in comparing ongoing costs only, and will not help you determine the relative total costs of owning different funds.
| Annualized Expense Ratio-A | Beginning Account Value November 12, 2020 | Ending Account Value November 30, 2020 | Expenses Paid During Period November 12, 2020 to November 30, 2020 | |
| Strategic Advisers Large Cap Fund | .18% | |||
| Actual | $1,000.00 | $1,019.90 | $.09-B | |
| Hypothetical-C | $1,000.00 | $1,024.17 | $.91-D |
A Annualized expense ratio reflects expenses net of applicable fee waivers.
B Actual expenses are equal to the annualized expense ratio, multiplied by the average account value over the period, multiplied by 19/365 (to reflect the period November 12, 2020 to November 30, 2020.
C 5% return per year before expenses
D Hypothetical expenses are equal to the annualized expense ratio, multiplied by the average account value over the period, multiplied by 183/365 (to reflect the one-half year period).
Board Approval of Investment Advisory Contracts and Management Fees
Strategic Advisers Large Cap Fund
In June 2020, the Board of Trustees, including the Independent Trustees (together, the Board) voted to approve (i) the management contract between Strategic Advisers LLC (Strategic Advisers) and Fidelity Rutland Square Trust II (Trust) on behalf of the fund (Management Contract); (ii) the sub-advisory agreements among Strategic Advisers, each of AllianceBernstein L.P., Aristotle Capital Management, LLC, Brandywine Global Investment Management, LLC (Brandywine), ClariVest Asset Management LLC, ClearBridge Investments, LLC (ClearBridge), FIAM LLC (FIAM), Geode Capital Management, LLC, Invesco Advisers, Inc., J.P. Morgan Investment Management Inc., Loomis, Sayles & Company, L.P., LSV Asset Management, PineBridge Investments LLC, Principal Global Investors, LLC (Principal), and T. Rowe Price Associates, Inc., and the Trust on behalf of the fund (each respective agreement, a Sub-Advisory Agreement and collectively, the Sub-Advisory Agreements); and (iii) the sub-subadvisory agreements among FIAM, each of FMR Investment Management (UK) Limited, Fidelity Management & Research (Japan) Limited and Fidelity Management & Research (Hong Kong) Limited, and the Trust on behalf of the fund (Sub-Subadvisory Agreements and together with the Management Contract and Sub-Advisory Agreements, the Advisory Contracts). Strategic Advisers and the sub-advisers are referred to herein as the Investment Advisers. The Board, assisted by the advice of fund counsel and Independent Trustees' counsel, considered a broad range of information it believed relevant to the approval of the Advisory Contracts.In considering whether to approve each Advisory Contract, the Board reached a determination, with the assistance of fund counsel and Independent Trustees' counsel and through the exercise of its business judgment, that the approval of each Advisory Contract is in the best interests of the fund and its shareholders and that the approval of such agreement does not involve a conflict of interest from which Strategic Advisers or its affiliates derive an inappropriate advantage. Also, the Board found that the advisory fees to be charged under each Advisory Contract bear a reasonable relationship to the services to be rendered and will be based upon services provided that will be in addition to, rather than duplicative of services provided under the advisory contract of any underlying fund in which the fund may invest. The Board's decision to approve each Advisory Contract was not based on any single factor, but rather was based on a comprehensive consideration of all the information provided to the Board. In addition, individual Trustees did not necessarily attribute the same weight or importance to each factor.Additional Sub-Advisory Agreements with Brandywine and ClearBridge. The Board also approved additional sub-advisory agreements with Brandywine and ClearBridge, which will take effect upon consummation of a transaction pursuant to which Franklin Resources, Inc. will acquire the parent company of Brandywine and ClearBridge (Transaction). The Board noted that the additional sub-advisory agreements were not materially different from the initial sub-advisory agreements with Brandywine and ClearBridge and that the Transaction would not result in changes to the nature, extent, and quality of the services provided to the fund. As used herein, the term Advisory Contracts includes the additional sub-advisory agreements with Brandywine and ClearBridge.Nature, Extent, and Quality of Services Provided. The Board considered the backgrounds of the investment personnel that will provide services to the fund, and also took into consideration the fund's investment objective, strategies and related investment philosophy and the proposed sub-adviser line-up. The Board considered the structure of each Investment Adviser's investment personnel compensation program and whether such structures provide appropriate incentives to act in the best interests of the fund. The Board noted that it is familiar with the nature, extent and quality of services provided by the Investment Advisers, with the exception of Principal, from its oversight of the Investment Advisers, on behalf of other funds overseen by the Board and that the same support staff, including compliance personnel, that currently provides services to other Strategic Advisers funds will also provide services to the fund.The Board noted Strategic Advisers' role in, among other things, (i) setting, implementing and monitoring the investment strategy for the fund; (ii) identifying and recommending to the Board the sub-advisers for the fund; (iii) overseeing compliance with federal securities laws by each sub-adviser with respect to fund assets; (iv) monitoring and overseeing the performance and investment capabilities of each sub-adviser; and (v) recommending the replacement of a sub-adviser as appropriate. The Board also noted that it receives from Strategic Advisers substantial information and periodic reports about Strategic Advisers' sub-adviser oversight and due diligence processes, as well as periodic reports regarding the performance of each sub-adviser.The Board noted that under the Sub-Advisory Agreements, and subject to oversight by Strategic Advisers, each sub-adviser will be responsible for, among other things, identifying investments for the portion of fund assets allocated to the sub-adviser, if any, and executing portfolio transactions to implement its investment strategy. In addition, the Board noted that each sub-adviser will be responsible for providing such reporting as may be requested from Strategic Advisers to fulfill its oversight responsibilities discussed above.Resources Dedicated to Investment Management and Support Services. The Board reviewed the general qualifications and capabilities of the Investment Advisers' investment staff that will provide services to the fund, their use of technology, and the Investment Advisers' approach to managing and compensating its investment personnel. The Board noted that the Investment Advisers' analysts have extensive resources, tools and capabilities which allow them to conduct sophisticated fundamental and/or quantitative analysis. Additionally, in their deliberations, the Board considered the Investment Advisers' trading capabilities and resources which are integral parts of the investment management process.Shareholder and Administrative Services. The Board considered (i) the nature, extent, quality, and cost of administrative, and shareholder services to be performed by Strategic Advisers and its affiliates under the Management Contract and under separate agreements covering transfer agency and pricing and bookkeeping services for the fund; (ii) the nature and extent of Strategic Advisers' supervision of third party service providers, including the sub-advisers; and (iii) the resources to be devoted to the fund's compliance policies and procedures.The Board noted that the growth of fund assets over time across the complex allows Strategic Advisers to reinvest in the development of services designed to enhance the value or convenience of the Strategic Advisers funds as investment vehicles. These services include 24-hour access to account information and market information through telephone representatives and over the Internet, investor education materials and asset allocation tools, and the expanded availability of Fidelity Investor Centers.Investment Performance. The fund is a new fund and therefore had no historical performance for the Board to review at the time it approved the fund's Advisory Contracts. Once the fund has been in operation for at least one calendar year, the Board will review the fund's absolute investment performance, as well as the fund's relative investment performance measured against a broad-based securities market index.Based on its review, the Board concluded that the nature, extent, and quality of services that will be provided to the fund under the Advisory Contracts should benefit the fund's shareholders.Competitiveness of Management Fee and Total Fund Expenses. In reviewing the Advisory Contracts, the Board considered the amount and nature of fees to be paid by the fund to the fund's investment adviser, Strategic Advisers, the amount and nature of fees to be paid by Strategic Advisers to the sub-advisers, and the projected total management fee rate and operating expenses of the fund.The Board noted that the fund's maximum aggregate annual management fee rate may not exceed 0.65% of the fund's average daily net assets and that Strategic Advisers has contractually agreed to waive its 0.25% portion of the fund's management fee through September 30, 2023. The Board considered that the proposed maximum aggregate annual management fee rate and estimated effective and total management fee rates rank below the median of the fund's total mapped group. The Board noted that FIAM, and not the fund, will compensate the sub-subadvisers under the terms of each Sub-Subadvisory Agreement and that the fund and Strategic Advisers are not responsible for any such fees or expenses. The Board also considered that the fund's projected total net expenses, including acquired fund fees and expenses, if any, rank below the competitive median.Based on its review, the Board concluded that the fund's management fee structure and projected total expenses bear a reasonable relationship to the services that the fund and its shareholders will receive and the other factors considered.Costs of the Services and Profitability. The fund is a new fund and therefore no revenue, cost, or profitability data was available for the Board to review in respect of the fund at the time it approved the Advisory Contracts. The Board noted that it will consider costs of services and the profitability of Strategic Advisers and each sub-adviser as a result of their relationship with the fund in connection with future renewals of the Advisory Contracts.Potential Fall-Out Benefits. The fund is a new fund and therefore the Board was unable to consider any direct and indirect benefits to Strategic Advisers and its affiliates from their relationships with the fund. The Board noted that it will review information regarding the potential of direct and indirect benefits accruing to Strategic Advisers and its affiliates from their relationships with the fund, including non-advisory fee compensation paid to affiliates of Strategic Advisers, if any, as well as information regarding potential fall-out benefits accruing to each sub-adviser, if any, as a result of its relationship with the fund, in connection with future renewals of the Advisory Contracts.Possible Economies of Scale. The Board noted that because the fund is a new fund a determination of economies of scale was premature until the fund has assets.Conclusion. Based on its evaluation of all of the conclusions noted above, and after considering all factors it believed relevant, the Board ultimately concluded that the advisory fee structures proposed on behalf of the fund bear a reasonable relationship to the services to be rendered and that each Advisory Contract should be approved because each agreement is in the best interests of the fund and its shareholders. The Board also concluded that the advisory fees to be charged thereunder will be based on services provided that will be in addition to, rather than duplicative of, services provided under the advisory contract of any underlying fund in which the fund may invest. In addition, the Board concluded that the approval of each Sub-Advisory Agreement and Sub-Subadvisory Agreement does not involve a conflict of interest from which Strategic Advisers or its affiliates derive an inappropriate advantage.![]()
LGC-SANN-0121
1.9899747.100
Item 2.
Code of Ethics
Not applicable.
Item 3.
Audit Committee Financial Expert
Not applicable.
Item 4.
Principal Accountant Fees and Services
Not applicable.
Item 5.
Audit Committee of Listed Registrants
Not applicable.
Item 6.
Investments
(a)
Not applicable.
(b)
Not applicable
Item 7.
Disclosure of Proxy Voting Policies and Procedures for Closed-End Management Investment Companies
Not applicable.
Item 8.
Portfolio Managers of Closed-End Management Investment Companies
Not applicable.
Item 9.
Purchase of Equity Securities by Closed-End Management Investment Company and Affiliated Purchasers
Not applicable.
Item 10.
Submission of Matters to a Vote of Security Holders
There were no material changes to the procedures by which shareholders may recommend nominees to the Fidelity Rutland Square Trust II’s Board of Trustees.
Item 11.
Controls and Procedures
(a)(i) The President and Treasurer and the Chief Financial Officer have concluded that the Fidelity Rutland Square Trust II’s (the “Trust”) disclosure controls and procedures (as
defined in Rule 30a-3(c) under the Investment Company Act) provide reasonable assurances that material information relating to the Trust is made known to them by the appropriate persons, based on their evaluation of these controls and procedures as of a date within 90 days of the filing date of this report.
(a)(ii) There was no change in the Trust’s internal control over financial reporting (as defined in Rule 30a-3(d) under the Investment Company Act) that occurred during the period covered by this report that has materially affected, or is reasonably likely to materially affect, the Trust’s internal control over financial reporting.
Item 12.
Disclosure of Securities Lending Activities for Closed-End Management
Investment Companies
Not applicable.
Item 13.
Exhibits
(a) | (1) | Not applicable. |
(a) | (2) | |
(a) | (3) | Not applicable. |
(b) |
SIGNATURES
Pursuant to the requirements of the Securities Exchange Act of 1934 and the Investment Company Act of 1940, the registrant has duly caused this report to be signed on its behalf by the undersigned, thereunto duly authorized.
Fidelity Rutland Square Trust II
By: | /s/Stacie M. Smith |
Stacie M. Smith | |
President and Treasurer | |
Date: | January 22, 2021 |
Pursuant to the requirements of the Securities Exchange Act of 1934 and the Investment Company Act of 1940, this report has been signed below by the following persons on behalf of the registrant and in the capacities and on the dates indicated.
By: | /s/Stacie M. Smith |
Stacie M. Smith | |
President and Treasurer | |
Date: | January 22, 2021 |
By: | /s/John J. Burke III |
John J. Burke III | |
Chief Financial Officer | |
Date: | January 22, 2021 |