UNITED STATES
SECURITIES AND EXCHANGE COMMISSION
Washington, D.C. 20549
FORM N-CSR
CERTIFIED SHAREHOLDER REPORT OF REGISTERED
MANAGEMENT INVESTMENT COMPANIES
Investment Company Act file number 811-21991
Fidelity Rutland Square Trust II
(Exact name of registrant as specified in charter)
245 Summer St., Boston, MA 02210
(Address of principal executive offices) (Zip code)
Christina H. Lee, Secretary
245 Summer St.
Boston, Massachusetts 02210
(Name and address of agent for service)
Registrant's telephone number, including area code:
617-563-7000
Date of fiscal year end: | May 31 |
Date of reporting period: | November 30, 2021 |
Item 1.
Reports to Stockholders
Strategic Advisers® Short Duration Fund
Offered exclusively to certain managed account clients of Strategic Advisers LLC or its affiliates - not available for sale to the general public
Semi-Annual Report
November 30, 2021

Contents
Board Approval of Investment Advisory Contracts and Management Fees |
To view a fund's proxy voting record for the 12-month period ended June 30, visit http://www.fidelity.com/proxyvotingresults or visit the Securities and Exchange Commission's (SEC) web site at http://www.sec.gov.
You may also call 1-800-544-3455 to request a free copy of the proxy voting guidelines.
Standard & Poor's, S&P and S&P 500 are registered service marks of The McGraw-Hill Companies, Inc. and have been licensed for use by Fidelity Distributors Corporation.
Other third-party marks appearing herein are the property of their respective owners.
All other marks appearing herein are registered or unregistered trademarks or service marks of FMR LLC or an affiliated company. © 2022 FMR LLC. All rights reserved.
This report and the financial statements contained herein are submitted for the general information of the shareholders of the Fund. This report is not authorized for distribution to prospective investors in the Fund unless preceded or accompanied by an effective prospectus.
A fund files its complete schedule of portfolio holdings with the SEC for the first and third quarters of each fiscal year on Form N-PORT. Forms N-PORT are available on the SEC’s web site at http://www.sec.gov. A fund's Forms N-PORT may be reviewed and copied at the SEC’s Public Reference Room in Washington, DC. Information regarding the operation of the SEC's Public Reference Room may be obtained by calling 1-800-SEC-0330.
For a complete list of a fund's portfolio holdings, view the most recent holdings listing, semiannual report, or annual report on Fidelity's web site at http://www.fidelity.com, http://www.institutional.fidelity.com, or http://www.401k.com, as applicable.
NOT FDIC INSURED •MAY LOSE VALUE •NO BANK GUARANTEE
Neither the Fund nor Fidelity Distributors Corporation is a bank.
Note to Shareholders:
Early in 2020, the outbreak and spread of COVID-19 emerged as a public health emergency that had a major influence on financial markets, primarily based on its impact on the global economy and corporate earnings. On March 11, 2020, the World Health Organization declared the COVID-19 outbreak a pandemic, citing sustained risk of further global spread. The pandemic prompted a number of measures to limit the spread of COVID-19, including travel and border restrictions, quarantines, and restrictions on large gatherings. In turn, these resulted in lower consumer activity, diminished demand for a wide range of products and services, disruption in manufacturing and supply chains, and – given the wide variability in outcomes regarding the outbreak – significant market uncertainty and volatility. To help stem the turmoil, the U.S. government took unprecedented action – in concert with the U.S. Federal Reserve and central banks around the world – to help support consumers, businesses, and the broader economy, and to limit disruption to the financial system.
In general, the overall impact of the pandemic lessened in 2021, amid a resilient economy and widespread distribution of three COVID-19 vaccines granted emergency use authorization from the U.S. Food and Drug Administration (FDA) early in the year. Still, the situation remains dynamic, and the extent and duration of its influence on financial markets and the economy is highly uncertain, due in part to a recent spike in cases based on highly contagious variants of the coronavirus.
Extreme events such as the COVID-19 crisis are exogenous shocks that can have significant adverse effects on mutual funds and their investments. Although multiple asset classes may be affected by market disruption, the duration and impact may not be the same for all types of assets. Fidelity is committed to helping you stay informed amid news about COVID-19 and during increased market volatility, and we continue to take extra steps to be responsive to customer needs. We encourage you to visit us online, where we offer ongoing updates, commentary, and analysis on the markets and our funds.
Investment Summary (Unaudited)
The information in the following tables is based on the direct investments of the Fund.Top Ten Holdings as of November 30, 2021
| (excluding cash equivalents) | % of fund's net assets |
| PIMCO Short-Term Fund Institutional Class | 13.6 |
| Baird Ultra Short Bond Fund Institutional Class | 6.3 |
| PIMCO Enhanced Short Maturity Active ETF | 4.9 |
| T. Rowe Price Ultra Short-Term Bond Fund | 4.4 |
| Fidelity SAI Short-Term Bond Fund | 4.4 |
| BlackRock Low Duration Bond Portfolio Investor A Shares | 4.2 |
| Metropolitan West Low Duration Bond Fund - Class M | 3.9 |
| iShares Short Treasury Bond ETF | 3.7 |
| JPMorgan Ultra-Short Income ETF | 3.7 |
| iShares Short Maturity Bond ETF | 3.5 |
Asset Allocation (% of fund's net assets)
| As of November 30, 2021 | ||
| Corporate Bonds | 22.7% | |
| U.S. Government and U.S. Government Agency Obligations | 3.7% | |
| Asset-Backed Securities | 6.6% | |
| CMOs and Other Mortgage Related Securities | 2.6% | |
| Municipal Securities | 0.1% | |
| Other Investments | 0.4% | |
| Short-Term Funds | 59.9% | |
| Short-Term Investments and Net Other Assets (Liabilities) | 4.0% | |

Asset allocations of funds in the pie chart reflect the categorizations of assets as defined by Morningstar as of the reporting date.
Schedule of Investments November 30, 2021 (Unaudited)
Showing Percentage of Net Assets
| Nonconvertible Bonds - 22.7% | |||
| Principal Amount | Value | ||
| COMMUNICATION SERVICES - 1.0% | |||
| Diversified Telecommunication Services - 0.5% | |||
| AT&T, Inc. 0.9% 3/25/24 | $2,145,000 | $2,131,172 | |
| NBN Co. Ltd. 1.45% 5/5/26 (a) | 1,765,000 | 1,738,961 | |
| NTT Finance Corp.: | |||
| 0.373% 3/3/23 (a) | 5,265,000 | 5,249,663 | |
| 0.583% 3/1/24 (a) | 2,184,000 | 2,163,327 | |
| SBA Tower Trust 3.448% 3/15/48 (a) | 880,000 | 886,855 | |
| Verizon Communications, Inc.: | |||
| 3 month U.S. LIBOR + 1.000% 1.118% 3/16/22 (b)(c) | 15,233,000 | 15,275,043 | |
| U.S. Secured Overnight Fin. Rate (SOFR) Indx + 0.500% 0.549% 3/22/24 (b)(c) | 2,563,000 | 2,574,277 | |
| 0.85% 11/20/25 | 710,000 | 689,625 | |
| 1.45% 3/20/26 | 1,155,000 | 1,146,945 | |
| 31,855,868 | |||
| Entertainment - 0.1% | |||
| The Walt Disney Co. 3% 9/15/22 | 4,273,000 | 4,356,509 | |
| Interactive Media & Services - 0.0% | |||
| Baidu, Inc. 3.5% 11/28/22 | 780,000 | 798,233 | |
| Media - 0.2% | |||
| Charter Communications Operating LLC/Charter Communications Operating Capital Corp.: | |||
| 4.464% 7/23/22 | 3,670,000 | 3,734,834 | |
| 4.908% 7/23/25 | 2,295,000 | 2,531,963 | |
| Comcast Corp. 3.1% 4/1/25 | 355,000 | 374,305 | |
| COX Communications, Inc.: | |||
| 2.95% 6/30/23 (a) | 1,950,000 | 2,002,046 | |
| 3.15% 8/15/24 (a) | 796,000 | 834,290 | |
| Fox Corp. 3.666% 1/25/22 | 260,000 | 261,239 | |
| RELX Capital, Inc. 3.5% 3/16/23 | 575,000 | 593,595 | |
| SES SA 3.6% 4/4/23 (a) | 155,000 | 159,890 | |
| TWDC Enterprises 18 Corp. 3 month U.S. LIBOR + 0.390% 0.5055% 3/4/22 (b)(c) | 5,000,000 | 5,004,527 | |
| 15,496,689 | |||
| Wireless Telecommunication Services - 0.2% | |||
| CC Holdings GS V LLC/Crown Castle GS III Corp. 3.849% 4/15/23 | 2,615,000 | 2,713,381 | |
| Rogers Communications, Inc. 3 month U.S. LIBOR + 0.600% 0.7254% 3/22/22 (b)(c) | 5,520,000 | 5,527,288 | |
| T-Mobile U.S.A., Inc. 3.5% 4/15/25 | 1,005,000 | 1,063,127 | |
| 9,303,796 | |||
| TOTAL COMMUNICATION SERVICES | 61,811,095 | ||
| CONSUMER DISCRETIONARY - 1.5% | |||
| Automobiles - 1.1% | |||
| American Honda Finance Corp.: | |||
| 3 month U.S. LIBOR + 0.150% 0.3096% 2/22/23 (b)(c) | 3,342,000 | 3,341,985 | |
| 3 month U.S. LIBOR + 0.290% 0.4058% 12/10/21 (b)(c) | 5,000,000 | 5,000,186 | |
| 0.4% 10/21/22 | 2,775,000 | 2,772,257 | |
| BMW U.S. Capital LLC U.S. Secured Overnight Fin. Rate (SOFR) Indx + 0.530% 0.5789% 4/1/24 (a)(b)(c) | 5,925,000 | 5,966,319 | |
| Daimler Finance North America LLC: | |||
| 3 month U.S. LIBOR + 0.840% 0.985% 5/4/23 (a)(b)(c) | 3,240,000 | 3,268,827 | |
| 3 month U.S. LIBOR + 0.900% 1.056% 2/15/22 (a)(b)(c) | 5,000,000 | 5,007,689 | |
| 1.75% 3/10/23 (a) | 1,800,000 | 1,821,204 | |
| General Motors Co.: | |||
| 4.875% 10/2/23 | 730,000 | 776,205 | |
| 5.4% 10/2/23 | 1,130,000 | 1,217,262 | |
| General Motors Financial Co., Inc.: | |||
| U.S. Secured Overnight Fin. Rate (SOFR) Indx + 0.000% 0.6685% 10/15/24 (b)(c) | 4,200,000 | 4,197,578 | |
| U.S. Secured Overnight Fin. Rate (SOFR) Indx + 0.760% 0.8092% 3/8/24 (b)(c) | 4,061,000 | 4,076,488 | |
| U.S. Secured Overnight Fin. Rate (SOFR) Indx + 1.200% 1.25% 11/17/23 (b)(c) | 5,000,000 | 5,068,950 | |
| 2.9% 2/26/25 | 1,880,000 | 1,947,548 | |
| 3.25% 1/5/23 | 5,000,000 | 5,120,538 | |
| Harley-Davidson Financial Services, Inc.: | |||
| 2.55% 6/9/22 (a) | 375,000 | 378,260 | |
| 4.05% 2/4/22 (a) | 1,210,000 | 1,217,132 | |
| Nissan Motor Acceptance Corp.: | |||
| 2.6% 9/28/22 (a) | 1,610,000 | 1,629,217 | |
| 2.65% 7/13/22 (a) | 560,000 | 565,880 | |
| Nissan Motor Co. Ltd. 3.043% 9/15/23 (a) | 1,550,000 | 1,596,107 | |
| Stellantis Finance U.S., Inc. 1.711% 1/29/27 (a) | 675,000 | 662,223 | |
| Volkswagen Group of America Finance LLC: | |||
| 0.75% 11/23/22 (a) | 10,620,000 | 10,628,190 | |
| 0.875% 11/22/23 (a) | 590,000 | 587,366 | |
| 2.7% 9/26/22 (a) | 650,000 | 660,537 | |
| 2.9% 5/13/22 (a) | 5,663,000 | 5,720,975 | |
| 3.125% 5/12/23 (a) | 355,000 | 366,105 | |
| 73,595,028 | |||
| Hotels, Restaurants & Leisure - 0.1% | |||
| Expedia, Inc. 3.6% 12/15/23 | 1,270,000 | 1,324,143 | |
| Hyatt Hotels Corp. 1.3% 10/1/23 | 565,000 | 565,235 | |
| Marriott International, Inc.: | |||
| 2.3% 1/15/22 | 90,000 | 90,057 | |
| 3.125% 2/15/23 | 290,000 | 295,674 | |
| 3.6% 4/15/24 | 1,750,000 | 1,838,437 | |
| 4.15% 12/1/23 | 175,000 | 184,703 | |
| Starbucks Corp. 2.7% 6/15/22 | 435,000 | 438,559 | |
| 4,736,808 | |||
| Household Durables - 0.0% | |||
| Panasonic Corp. 2.536% 7/19/22 (a) | 785,000 | 793,208 | |
| Internet & Direct Marketing Retail - 0.1% | |||
| QVC, Inc. 4.375% 3/15/23 | 3,565,000 | 3,694,231 | |
| Leisure Products - 0.0% | |||
| Brunswick Corp. 0.85% 8/18/24 | 1,190,000 | 1,174,451 | |
| Hasbro, Inc. 3% 11/19/24 | 1,485,000 | 1,551,710 | |
| 2,726,161 | |||
| Multiline Retail - 0.0% | |||
| Nordstrom, Inc. 2.3% 4/8/24 | 150,000 | 147,750 | |
| Specialty Retail - 0.1% | |||
| AutoZone, Inc. 3.625% 4/15/25 | 485,000 | 517,314 | |
| O'Reilly Automotive, Inc. 3.8% 9/1/22 | 385,000 | 391,054 | |
| Ross Stores, Inc.: | |||
| 0.875% 4/15/26 | 450,000 | 436,361 | |
| 4.6% 4/15/25 | 2,310,000 | 2,538,139 | |
| Triton Container International Ltd. 0.8% 8/1/23 (a) | 1,350,000 | 1,344,094 | |
| 5,226,962 | |||
| Textiles, Apparel & Luxury Goods - 0.1% | |||
| Ralph Lauren Corp. 1.7% 6/15/22 | 225,000 | 226,578 | |
| VF Corp. 2.05% 4/23/22 | 6,772,000 | 6,813,165 | |
| 7,039,743 | |||
| TOTAL CONSUMER DISCRETIONARY | 97,959,891 | ||
| CONSUMER STAPLES - 0.7% | |||
| Beverages - 0.0% | |||
| Coca-Cola European Partners PLC 0.8% 5/3/24 (a) | 2,005,000 | 1,975,275 | |
| Diageo Capital PLC 1.375% 9/29/25 | 680,000 | 679,996 | |
| 2,655,271 | |||
| Food & Staples Retailing - 0.1% | |||
| 7-Eleven, Inc.: | |||
| 0.625% 2/10/23 (a) | 1,072,000 | 1,068,709 | |
| 0.8% 2/10/24 (a) | 1,448,000 | 1,432,454 | |
| Prosperous Ray Ltd. 4.625% 11/12/23 (Reg. S) | 1,200,000 | 1,269,225 | |
| 3,770,388 | |||
| Food Products - 0.2% | |||
| Bunge Ltd. Finance Corp.: | |||
| 3% 9/25/22 | 3,375,000 | 3,434,409 | |
| 4.35% 3/15/24 | 130,000 | 139,053 | |
| China Mengniu Dairy Co. Ltd. 1.875% 6/17/25 (Reg. S) | 2,004,000 | 1,995,683 | |
| JDE Peet's BV 0.8% 9/24/24 (a) | 515,000 | 504,745 | |
| Mondelez International, Inc. 0.625% 7/1/22 | 6,350,000 | 6,356,073 | |
| 12,429,963 | |||
| Tobacco - 0.4% | |||
| BAT International Finance PLC 1.668% 3/25/26 | 885,000 | 871,801 | |
| Imperial Tobacco Finance PLC: | |||
| 3.125% 7/26/24 (a) | 1,565,000 | 1,622,507 | |
| 3.5% 2/11/23 (a) | 14,124,000 | 14,441,198 | |
| 3.75% 7/21/22 (a) | 3,390,000 | 3,436,808 | |
| Philip Morris International, Inc. 1.125% 5/1/23 | 8,991,000 | 9,044,925 | |
| 29,417,239 | |||
| TOTAL CONSUMER STAPLES | 48,272,861 | ||
| ENERGY - 1.1% | |||
| Energy Equipment & Services - 0.0% | |||
| Schlumberger Finance Canada Ltd. 1.4% 9/17/25 | 290,000 | 291,509 | |
| Schlumberger Holdings Corp.: | |||
| 3.75% 5/1/24 (a) | 1,515,000 | 1,594,326 | |
| 4% 12/21/25 (a) | 375,000 | 408,177 | |
| 2,294,012 | |||
| Oil, Gas & Consumable Fuels - 1.1% | |||
| Aker BP ASA 3% 1/15/25 (a) | 995,000 | 1,035,454 | |
| Canadian Natural Resources Ltd. 2.05% 7/15/25 | 1,430,000 | 1,445,076 | |
| Cheniere Corpus Christi Holdings LLC: | |||
| 5.875% 3/31/25 | 1,470,000 | 1,637,605 | |
| 7% 6/30/24 | 1,625,000 | 1,805,849 | |
| Chevron Corp.: | |||
| 3 month U.S. LIBOR + 0.480% 0.5989% 3/3/22 (b)(c) | 4,700,000 | 4,703,732 | |
| 1.141% 5/11/23 | 4,174,000 | 4,203,450 | |
| Devon Energy Corp. 8.25% 8/1/23 (a) | 525,000 | 577,689 | |
| Diamondback Energy, Inc.: | |||
| 2.875% 12/1/24 | 2,720,000 | 2,822,299 | |
| 4.75% 5/31/25 | 1,080,000 | 1,183,358 | |
| Enbridge, Inc.: | |||
| U.S. Secured Overnight Fin. Rate (SOFR) Indx + 0.400% 0.45% 2/17/23 (b)(c) | 1,892,000 | 1,891,489 | |
| 0.55% 10/4/23 | 5,000,000 | 4,963,731 | |
| 2.5% 1/15/25 | 1,115,000 | 1,148,135 | |
| 4% 10/1/23 | 1,605,000 | 1,680,641 | |
| Energy Transfer LP: | |||
| 2.9% 5/15/25 | 255,000 | 263,180 | |
| 3.45% 1/15/23 | 110,000 | 112,242 | |
| 4.2% 9/15/23 | 280,000 | 293,412 | |
| 4.25% 3/15/23 | 1,795,000 | 1,853,389 | |
| 4.25% 4/1/24 | 70,000 | 73,725 | |
| 4.9% 2/1/24 | 245,000 | 260,151 | |
| 5.875% 1/15/24 | 2,375,000 | 2,559,614 | |
| Eni SpA 4% 9/12/23 (a) | 1,610,000 | 1,688,812 | |
| Enterprise Products Operating LP 3.5% 2/1/22 | 1,050,000 | 1,055,030 | |
| EOG Resources, Inc. 2.625% 3/15/23 | 291,000 | 296,455 | |
| EQT Corp. 3% 10/1/22 | 2,275,000 | 2,280,688 | |
| Gray Oak Pipeline LLC: | |||
| 2% 9/15/23 (a) | 205,000 | 207,331 | |
| 2.6% 10/15/25 (a) | 385,000 | 391,548 | |
| Kinder Morgan Energy Partners LP 3.95% 9/1/22 | 135,000 | 137,243 | |
| Phillips 66 Co. 3 month U.S. LIBOR + 0.620% 0.776% 2/15/24 (b)(c) | 10,000,000 | 10,000,227 | |
| Pioneer Natural Resources Co.: | |||
| 0.55% 5/15/23 | 3,792,000 | 3,774,041 | |
| 0.75% 1/15/24 | 610,000 | 605,457 | |
| Plains All American Pipeline LP/PAA Finance Corp. 2.85% 1/31/23 | 1,275,000 | 1,299,046 | |
| Reliance Industries Ltd. 5.4% 2/14/22 (Reg. S) | 1,700,000 | 1,711,475 | |
| Sabine Pass Liquefaction LLC: | |||
| 5.625% 4/15/23 (b) | 1,810,000 | 1,902,672 | |
| 6.25% 3/15/22 | 1,698,000 | 1,701,385 | |
| Saudi Arabian Oil Co. 2.75% 4/16/22 (a) | 1,815,000 | 1,829,520 | |
| Suncor Energy, Inc. 2.8% 5/15/23 | 975,000 | 998,959 | |
| The Williams Companies, Inc.: | |||
| 3.35% 8/15/22 | 200,000 | 202,341 | |
| 3.7% 1/15/23 | 2,205,000 | 2,260,239 | |
| 4.3% 3/4/24 | 305,000 | 323,794 | |
| Valero Energy Corp.: | |||
| 1.2% 3/15/24 | 715,000 | 711,692 | |
| 3.65% 3/15/25 | 245,000 | 261,793 | |
| Western Gas Partners LP 4% 7/1/22 | 1,800,000 | 1,804,500 | |
| 69,958,469 | |||
| TOTAL ENERGY | 72,252,481 | ||
| FINANCIALS - 13.1% | |||
| Banks - 7.6% | |||
| Banco Bilbao Vizcaya Argentaria SA 0.875% 9/18/23 | 1,800,000 | 1,797,537 | |
| Banco del Estado de Chile 2.704% 1/9/25 (a) | 665,000 | 679,256 | |
| Banco Santander Mexico SA 4.125% 11/9/22 (Reg. S) | 1,750,000 | 1,790,338 | |
| Banco Santander SA 0.701% 6/30/24 (b) | 200,000 | 198,878 | |
| Bank Ireland Group PLC 4.5% 11/25/23 (a) | 2,655,000 | 2,822,383 | |
| Bank of America Corp.: | |||
| U.S. Secured Overnight Fin. Rate (SOFR) Indx + 0.690% 0.7398% 4/22/25 (b)(c) | 10,000,000 | 10,055,779 | |
| 0.523% 6/14/24 (b) | 1,210,000 | 1,200,920 | |
| 0.81% 10/24/24 (b) | 755,000 | 750,263 | |
| 0.976% 4/22/25 (b) | 1,050,000 | 1,041,067 | |
| 1.734% 7/22/27 (b) | 765,000 | 758,089 | |
| 3.124% 1/20/23 (b) | 20,000,000 | 20,067,090 | |
| Bank of Montreal: | |||
| 3 month U.S. LIBOR + 0.570% 0.7023% 3/26/22 (b)(c) | 5,000,000 | 5,008,661 | |
| U.S. Secured Overnight Fin. Rate (SOFR) Indx + 0.260% 0.3141% 9/15/23 (b)(c) | 10,000,000 | 9,996,961 | |
| U.S. Secured Overnight Fin. Rate (SOFR) Indx + 0.270% 0.3186% 4/14/23 (b)(c) | 8,000,000 | 8,007,760 | |
| Bank of Nova Scotia: | |||
| U.S. Secured Overnight Fin. Rate (SOFR) Indx + 0.000% 0.3091% 9/15/23 (b)(c) | 5,000,000 | 4,989,757 | |
| U.S. Secured Overnight Fin. Rate (SOFR) Indx + 0.380% 0.43% 7/31/24 (b)(c) | 5,000,000 | 4,997,614 | |
| U.S. Secured Overnight Fin. Rate (SOFR) Indx + 0.440% 0.4935% 4/15/24 (b)(c) | 10,000,000 | 10,017,000 | |
| Banque Federative du Credit Mutuel SA: | |||
| 0.65% 2/27/24 (a) | 860,000 | 851,933 | |
| 0.998% 2/4/25 (a) | 1,145,000 | 1,133,536 | |
| 2.125% 11/21/22 (a) | 4,457,000 | 4,523,858 | |
| Barclays Bank PLC 1.7% 5/12/22 | 650,000 | 652,809 | |
| Barclays PLC: | |||
| 4.338% 5/16/24 (b) | 660,000 | 691,049 | |
| 4.61% 2/15/23 (b) | 15,000,000 | 15,116,009 | |
| BNP Paribas SA 3.5% 3/1/23 (a) | 10,000,000 | 10,334,637 | |
| BPCE SA: | |||
| 3 month U.S. LIBOR + 0.300% 0.4268% 1/14/22 (a)(b)(c) | 5,000,000 | 5,001,412 | |
| 3 month U.S. LIBOR + 1.220% 1.3796% 5/22/22 (a)(b)(c) | 1,605,000 | 1,613,291 | |
| 3% 5/22/22 (a) | 5,508,000 | 5,572,851 | |
| 5.7% 10/22/23 (a) | 2,710,000 | 2,930,078 | |
| Canadian Imperial Bank of Commerce: | |||
| U.S. Secured Overnight Fin. Rate (SOFR) Indx + 0.340% 0.389% 6/22/23 (b)(c) | 5,885,000 | 5,891,186 | |
| 0.95% 6/23/23 | 7,200,000 | 7,219,051 | |
| Capital One Bank NA 2.014% 1/27/23 (b) | 7,000,000 | 7,013,010 | |
| Citigroup, Inc.: | |||
| 0.981% 5/1/25 (b) | 880,000 | 874,148 | |
| 2.7% 10/27/22 | 15,130,000 | 15,403,002 | |
| Credit Agricole SA 3 month U.S. LIBOR + 1.020% 1.1439% 4/24/23 (a)(b)(c) | 675,000 | 681,990 | |
| Credit Suisse Group Funding Guernsey Ltd. 3.8% 9/15/22 | 10,000,000 | 10,245,935 | |
| Danske Bank A/S: | |||
| 1.226% 6/22/24 (a) | 1,610,000 | 1,613,724 | |
| 5% 1/12/22 (a) | 1,050,000 | 1,055,196 | |
| 5.375% 1/12/24 (a) | 775,000 | 838,129 | |
| Federation des caisses Desjardin U.S. Secured Overnight Fin. Rate (SOFR) Indx + 0.430% 0.48% 5/21/24 (a)(b)(c) | 5,316,000 | 5,312,013 | |
| Fifth Third Bancorp 1.625% 5/5/23 | 10,625,000 | 10,748,807 | |
| First Niagara Financial Group, Inc. 7.25% 12/15/21 | 515,000 | 516,226 | |
| First Republic Bank 2.5% 6/6/22 | 6,050,000 | 6,104,394 | |
| HSBC Holdings PLC: | |||
| U.S. Secured Overnight Fin. Rate (SOFR) Indx + 0.580% 0.63% 11/22/24 (b)(c) | 10,000,000 | 10,000,000 | |
| 0.976% 5/24/25 (b) | 245,000 | 242,242 | |
| 1.162% 11/22/24 (b) | 750,000 | 748,815 | |
| 1.645% 4/18/26 (b) | 850,000 | 846,085 | |
| 2.099% 6/4/26 (b) | 645,000 | 649,039 | |
| 3.262% 3/13/23 (b) | 15,300,000 | 15,407,618 | |
| 3.803% 3/11/25 (b) | 425,000 | 447,473 | |
| ING Groep NV 3 month U.S. LIBOR + 1.150% 1.2818% 3/29/22 (b)(c) | 735,000 | 737,404 | |
| Intesa Sanpaolo SpA 3.125% 7/14/22 (a) | 7,500,000 | 7,607,065 | |
| JPMorgan Chase & Co.: | |||
| U.S. Secured Overnight Fin. Rate (SOFR) Indx + 0.530% 0.585% 6/1/25 (b)(c) | 10,000,000 | 10,018,855 | |
| U.S. Secured Overnight Fin. Rate (SOFR) Indx + 0.580% 0.6291% 3/16/24 (b)(c) | 5,000,000 | 5,018,289 | |
| U.S. Secured Overnight Fin. Rate (SOFR) Indx + 0.880% 0.9338% 4/22/27 (b)(c) | 380,000 | 384,588 | |
| 0.824% 6/1/25 (b) | 965,000 | 953,475 | |
| 2.083% 4/22/26 (b) | 1,870,000 | 1,901,908 | |
| 2.776% 4/25/23 (b) | 5,200,000 | 5,242,138 | |
| KeyBank NA: | |||
| 3 month U.S. LIBOR + 0.660% 0.7916% 2/1/22 (b)(c) | 8,128,000 | 8,135,787 | |
| U.S. Secured Overnight Fin. Rate (SOFR) Indx + 0.320% 0.37% 6/14/24 (b)(c) | 10,000,000 | 9,986,724 | |
| U.S. Secured Overnight Fin. Rate (SOFR) Indx + 0.340% 0.39% 1/3/24 (b)(c) | 6,000,000 | 6,001,320 | |
| Lloyds Banking Group PLC: | |||
| 0.695% 5/11/24 (b) | 2,698,000 | 2,688,355 | |
| 1.326% 6/15/23 (b) | 1,803,000 | 1,807,723 | |
| 3% 1/11/22 | 5,000,000 | 5,013,850 | |
| 4.5% 11/4/24 | 480,000 | 517,751 | |
| Mitsubishi UFJ Financial Group, Inc.: | |||
| 3 month U.S. LIBOR + 0.700% 0.8155% 3/7/22 (b)(c) | 10,000,000 | 10,016,626 | |
| 3 month U.S. LIBOR + 0.740% 0.8596% 3/2/23 (b)(c) | 1,623,000 | 1,632,850 | |
| 3 month U.S. LIBOR + 0.920% 1.0796% 2/22/22 (b)(c) | 840,000 | 841,091 | |
| 0.953% 7/19/25 (b) | 1,660,000 | 1,643,412 | |
| 2.623% 7/18/22 | 7,441,000 | 7,541,052 | |
| 3.218% 3/7/22 | 1,090,000 | 1,098,234 | |
| Mizuho Financial Group Cayman 2 Ltd. 4.2% 7/18/22 (Reg. S) | 1,625,000 | 1,663,838 | |
| Mizuho Financial Group, Inc.: | |||
| 3 month U.S. LIBOR + 0.850% 0.9641% 9/13/23 (b)(c) | 10,000,000 | 10,042,529 | |
| 3 month U.S. LIBOR + 0.940% 1.1156% 2/28/22 (b)(c) | 5,000,000 | 5,009,950 | |
| National Bank of Canada 0.9% 8/15/23 (b) | 7,000,000 | 7,010,226 | |
| NatWest Group PLC 3.875% 9/12/23 | 1,085,000 | 1,134,199 | |
| NatWest Markets PLC: | |||
| U.S. Secured Overnight Fin. Rate (SOFR) Indx + 0.530% 0.58% 8/12/24 (a)(b)(c) | 5,905,000 | 5,913,031 | |
| 0.8% 8/12/24 (a) | 370,000 | 364,993 | |
| 2.375% 5/21/23 (a) | 1,525,000 | 1,558,885 | |
| 3.625% 9/29/22 (a) | 5,000,000 | 5,129,571 | |
| PNC Bank NA: | |||
| 1.743% 2/24/23 (b) | 4,078,000 | 4,088,220 | |
| 2.028% 12/9/22 (b) | 7,000,000 | 7,002,023 | |
| QNB Finance Ltd.: | |||
| 2.625% 5/12/25 (Reg. S) | 500,000 | 513,750 | |
| 3.5% 3/28/24 (Reg. S) | 1,000,000 | 1,048,750 | |
| Rabobank Nederland 3.95% 11/9/22 | 11,630,000 | 11,964,220 | |
| Rabobank Nederland New York Branch 3 month U.S. LIBOR + 0.830% 0.9511% 1/10/22 (b)(c) | 5,000,000 | 5,004,140 | |
| Royal Bank of Canada U.S. Secured Overnight Fin. Rate (SOFR) Indx + 0.450% 0.4997% 10/26/23 (b)(c) | 15,000,000 | 15,062,925 | |
| Santander Holdings U.S.A., Inc. 4.45% 12/3/21 | 7,000,000 | 7,000,770 | |
| Societe Generale 2.625% 10/16/24 (a) | 365,000 | 375,955 | |
| Standard Chartered PLC: | |||
| 3 month U.S. LIBOR + 1.150% 1.2815% 1/20/23 (a)(b)(c) | 910,000 | 910,955 | |
| 0.991% 1/12/25 (a)(b) | 375,000 | 371,086 | |
| 1.214% 3/23/25 (a)(b) | 200,000 | 198,860 | |
| 1.319% 10/14/23 (a)(b) | 200,000 | 200,453 | |
| 1.822% 11/23/25 (a)(b) | 475,000 | 475,035 | |
| 3.885% 3/15/24 (a)(b) | 365,000 | 377,270 | |
| 3.95% 1/11/23 (a) | 1,245,000 | 1,279,845 | |
| Svenska Handelsbanken AB: | |||
| 0.55% 6/11/24 (a) | 720,000 | 711,427 | |
| 1.418% 6/11/27 (a)(b) | 695,000 | 683,845 | |
| Swedbank AB: | |||
| 0.6% 9/25/23 (a) | 500,000 | 498,039 | |
| 1.3% 6/2/23 (a) | 1,150,000 | 1,160,129 | |
| Synchrony Bank 3% 6/15/22 | 10,395,000 | 10,511,625 | |
| Synovus Bank 2.289% 2/10/23 (b) | 1,237,000 | 1,239,386 | |
| Synovus Financial Corp. 3.125% 11/1/22 | 5,000,000 | 5,080,803 | |
| The Toronto-Dominion Bank: | |||
| 3 month U.S. LIBOR + 0.530% 0.6499% 12/1/22 (b)(c) | 5,000,000 | 5,025,524 | |
| U.S. Secured Overnight Fin. Rate (SOFR) Indx + 0.220% 0.2692% 6/2/23 (b)(c) | 10,000,000 | 10,001,650 | |
| U.S. Secured Overnight Fin. Rate (SOFR) Indx + 0.480% 0.5297% 1/27/23 (b)(c) | 5,000,000 | 5,017,055 | |
| 0.25% 1/6/23 | 4,000,000 | 3,985,625 | |
| 0.55% 3/4/24 | 1,790,000 | 1,775,267 | |
| 0.7% 9/10/24 | 1,430,000 | 1,415,404 | |
| Truist Bank U.S. Secured Overnight Fin. Rate (SOFR) Indx + 0.200% 0.2491% 1/17/24 (b)(c) | 10,000,000 | 9,995,100 | |
| Truist Financial Corp. U.S. Secured Overnight Fin. Rate (SOFR) Indx + 0.400% 0.4492% 6/9/25 (b)(c) | 10,710,000 | 10,679,701 | |
| U.S. Bancorp 3% 3/15/22 | 1,530,000 | 1,538,441 | |
| UniCredit SpA 3.75% 4/12/22 (a) | 1,740,000 | 1,759,053 | |
| Wells Fargo & Co.: | |||
| 1.654% 6/2/24 (b) | 5,935,000 | 5,997,252 | |
| 2.188% 4/30/26 (b) | 840,000 | 857,724 | |
| 3.5% 3/8/22 | 123,000 | 124,031 | |
| 495,005,956 | |||
| Capital Markets - 2.6% | |||
| Credit Suisse AG: | |||
| U.S. Secured Overnight Fin. Rate (SOFR) Indx + 0.380% 0.43% 8/9/23 (b)(c) | 5,000,000 | 4,996,606 | |
| 0.495% 2/2/24 | 810,000 | 801,771 | |
| 1% 5/5/23 | 6,590,000 | 6,610,201 | |
| 2.8% 4/8/22 | 2,340,000 | 2,359,538 | |
| Credit Suisse Group AG: | |||
| 2.997% 12/14/23 (a)(b) | 250,000 | 254,786 | |
| 3.574% 1/9/23 (a) | 650,000 | 651,803 | |
| Deutsche Bank AG New York Branch: | |||
| U.S. Secured Overnight Fin. Rate (SOFR) Indx + 0.500% 0.55% 11/8/23 (b)(c) | 10,000,000 | 9,987,900 | |
| 2.222% 9/18/24 (b) | 10,000,000 | 10,142,131 | |
| 3.3% 11/16/22 | 7,072,000 | 7,241,169 | |
| E*TRADE Financial Corp. 2.95% 8/24/22 | 8,277,000 | 8,408,839 | |
| Goldman Sachs Group, Inc.: | |||
| 3 month U.S. LIBOR + 0.750% 0.914% 2/23/23 (b)(c) | 5,000,000 | 5,024,930 | |
| U.S. Secured Overnight Fin. Rate (SOFR) Indx + 0.540% 0.59% 11/17/23 (b)(c) | 10,000,000 | 9,991,580 | |
| 0.523% 3/8/23 | 3,300,000 | 3,289,294 | |
| 0.657% 9/10/24 (b) | 725,000 | 719,391 | |
| 0.673% 3/8/24 (b) | 1,180,000 | 1,175,633 | |
| 0.925% 10/21/24 (b) | 555,000 | 552,952 | |
| 2.905% 7/24/23 (b) | 10,000,000 | 10,129,816 | |
| 2.908% 6/5/23 (b) | 11,000,000 | 11,116,709 | |
| 3.5% 4/1/25 | 1,005,000 | 1,065,682 | |
| 5.75% 1/24/22 | 1,800,000 | 1,813,861 | |
| Moody's Corp. 4.5% 9/1/22 | 5,000,000 | 5,098,305 | |
| Morgan Stanley: | |||
| U.S. Secured Overnight Fin. Rate (SOFR) Indx + 0.700% 0.7488% 1/20/23 (b)(c) | 5,000,000 | 5,003,250 | |
| 0.529% 1/25/24 (b) | 3,994,000 | 3,978,300 | |
| 0.56% 11/10/23 (b) | 6,170,000 | 6,151,165 | |
| 0.731% 4/5/24 (b) | 985,000 | 982,486 | |
| 1.164% 10/21/25 (b) | 785,000 | 778,753 | |
| 2.75% 5/19/22 | 1,095,000 | 1,106,422 | |
| 3.737% 4/24/24 (b) | 5,000,000 | 5,187,756 | |
| 4.1% 5/22/23 | 275,000 | 287,448 | |
| 4.875% 11/1/22 | 8,160,000 | 8,468,184 | |
| NASDAQ, Inc. 0.445% 12/21/22 | 2,417,000 | 2,411,460 | |
| State Street Corp. 2.825% 3/30/23 (b) | 330,000 | 332,406 | |
| UBS AG London Branch: | |||
| U.S. Secured Overnight Fin. Rate (SOFR) Indx + 0.360% 0.41% 2/9/24 (a)(b)(c) | 10,000,000 | 10,024,170 | |
| 1.75% 4/21/22 (a) | 7,000,000 | 7,029,897 | |
| UBS Group AG: | |||
| 1.008% 7/30/24 (a)(b) | 7,118,000 | 7,113,636 | |
| 1.494% 8/10/27 (a)(b) | 375,000 | 366,788 | |
| 3.491% 5/23/23 (a) | 5,000,000 | 5,065,518 | |
| 165,720,536 | |||
| Consumer Finance - 1.1% | |||
| AerCap Ireland Capital Ltd./AerCap Global Aviation Trust: | |||
| U.S. Secured Overnight Fin. Rate (SOFR) Indx + 0.680% 0.73% 9/29/23 (b)(c) | 9,823,000 | 9,814,847 | |
| 1.65% 10/29/24 | 1,365,000 | 1,362,538 | |
| 3.95% 2/1/22 | 1,070,000 | 1,072,805 | |
| 4.125% 7/3/23 | 1,025,000 | 1,068,861 | |
| 4.5% 9/15/23 | 1,095,000 | 1,153,442 | |
| 4.875% 1/16/24 | 490,000 | 523,579 | |
| American Express Co.: | |||
| 2.65% 12/2/22 | 9,500,000 | 9,705,670 | |
| 2.75% 5/20/22 | 5,000,000 | 5,045,447 | |
| Capital One Financial Corp.: | |||
| 3.2% 1/30/23 | 8,016,000 | 8,233,664 | |
| 3.5% 6/15/23 | 555,000 | 576,674 | |
| 3.9% 1/29/24 | 505,000 | 532,958 | |
| Discover Financial Services 3.85% 11/21/22 | 3,500,000 | 3,605,359 | |
| Hyundai Capital America: | |||
| 0.8% 1/8/24 (a) | 660,000 | 654,544 | |
| 0.875% 6/14/24 (a) | 535,000 | 528,541 | |
| 1% 9/17/24 (a) | 445,000 | 439,123 | |
| 2.375% 2/10/23 (a) | 1,925,000 | 1,956,808 | |
| 2.85% 11/1/22 (a) | 511,000 | 520,610 | |
| 3% 6/20/22 (a) | 1,060,000 | 1,071,775 | |
| 3.95% 2/1/22 (a) | 1,315,000 | 1,321,947 | |
| LeasePlan Corp. NV 2.875% 10/24/24 (a) | 750,000 | 777,618 | |
| Synchrony Financial: | |||
| 2.85% 7/25/22 | 3,758,000 | 3,808,225 | |
| 4.25% 8/15/24 | 1,960,000 | 2,086,607 | |
| Toyota Motor Credit Corp.: | |||
| U.S. Secured Overnight Fin. Rate (SOFR) Indx + 0.300% 0.35% 6/13/22 (b)(c) | 5,450,000 | 5,454,988 | |
| 0.45% 7/22/22 | 7,207,000 | 7,202,806 | |
| 68,519,436 | |||
| Diversified Financial Services - 0.3% | |||
| Athene Global Funding: | |||
| U.S. Secured Overnight Fin. Rate (SOFR) Indx + 0.700% 0.75% 5/24/24 (a)(b)(c) | 8,000,000 | 8,010,776 | |
| 0.95% 1/8/24 (a) | 3,469,000 | 3,457,590 | |
| BP Capital Markets America, Inc. 2.937% 4/6/23 | 1,035,000 | 1,064,749 | |
| Jackson Financial, Inc. 1.125% 11/22/23 (a) | 5,631,000 | 5,627,849 | |
| LSEGA Financing PLC 0.65% 4/6/24 (a) | 1,355,000 | 1,341,155 | |
| Park Aerospace Holdings Ltd.: | |||
| 4.5% 3/15/23 (a) | 660,000 | 684,110 | |
| 5.25% 8/15/22 (a) | 880,000 | 902,716 | |
| 21,088,945 | |||
| Insurance - 1.5% | |||
| ACE INA Holdings, Inc. 2.875% 11/3/22 | 2,500,000 | 2,542,007 | |
| American International Group, Inc. 2.5% 6/30/25 | 1,000,000 | 1,034,713 | |
| Aon Corp. 2.2% 11/15/22 | 1,592,000 | 1,616,101 | |
| Brighthouse Financial Global Funding: | |||
| 0.6% 6/28/23 (a) | 845,000 | 842,155 | |
| 1% 4/12/24 (a) | 855,000 | 850,761 | |
| CNO Global Funding 1.75% 10/7/26 (a) | 850,000 | 842,444 | |
| Equitable Financial Life Global Funding: | |||
| U.S. Secured Overnight Fin. Rate (SOFR) Indx + 0.390% 0.438% 4/6/23 (a)(b)(c) | 10,000,000 | 10,014,980 | |
| 0.5% 4/6/23 (a) | 2,010,000 | 2,005,234 | |
| 0.5% 11/17/23 (a) | 5,000,000 | 4,960,551 | |
| 1.1% 11/12/24 (a) | 780,000 | 773,759 | |
| Health Care Service Corp. 1.5% 6/1/25 (a) | 1,375,000 | 1,381,928 | |
| Lincoln National Corp. 4% 9/1/23 | 270,000 | 284,250 | |
| MassMutual Global Funding II 0.85% 6/9/23 (a) | 10,000,000 | 10,025,872 | |
| Metropolitan Life Global Funding I: | |||
| U.S. Secured Overnight Fin. Rate (SOFR) Indx + 0.570% 0.6187% 1/13/23 (a)(b)(c) | 6,940,000 | 6,970,536 | |
| 0.9% 6/8/23 (a) | 4,918,000 | 4,935,513 | |
| Metropolitan Tower Global Funding: | |||
| U.S. Secured Overnight Fin. Rate (SOFR) Indx + 0.550% 0.5985% 1/17/23 (a)(b)(c) | 5,000,000 | 5,016,016 | |
| 0.55% 7/13/22 (a) | 6,000,000 | 6,002,514 | |
| New York Life Global Funding: | |||
| 3 month U.S. LIBOR + 0.280% 0.4011% 1/10/23 (a)(b)(c) | 6,945,000 | 6,960,307 | |
| U.S. Secured Overnight Fin. Rate (SOFR) Indx + 0.220% 0.27% 2/2/23 (a)(b)(c) | 10,000,000 | 10,004,740 | |
| 1.1% 5/5/23 (a) | 725,000 | 730,304 | |
| Northwestern Mutual Global Funding U.S. Secured Overnight Fin. Rate (SOFR) Indx + 0.330% 0.3788% 3/25/24 (a)(b)(c) | 4,063,000 | 4,073,486 | |
| Pacific Life Global Funding II U.S. Secured Overnight Fin. Rate (SOFR) Indx + 0.380% 0.4278% 4/12/24 (a)(b)(c) | 10,000,000 | 10,014,367 | |
| Principal Life Global Funding II: | |||
| U.S. Secured Overnight Fin. Rate (SOFR) Indx + 0.450% 0.4987% 4/12/24 (a)(b)(c) | 1,763,000 | 1,770,572 | |
| 0.75% 4/12/24 (a) | 930,000 | 922,173 | |
| Trinity Acquisition PLC 4.625% 8/15/23 | 1,054,000 | 1,111,202 | |
| 95,686,485 | |||
| Thrifts & Mortgage Finance - 0.0% | |||
| Crown Castle Towers LLC/Crown Atlantic Holdings Sub LLC/Crown Communication, Inc. 3.72% 7/15/43 (a) | 370,000 | 375,437 | |
| Nationwide Building Society: | |||
| 3.622% 4/26/23 (a)(b) | 1,035,000 | 1,046,532 | |
| 3.766% 3/8/24 (a)(b) | 500,000 | 517,189 | |
| 1,939,158 | |||
| TOTAL FINANCIALS | 847,960,516 | ||
| HEALTH CARE - 1.5% | |||
| Biotechnology - 0.4% | |||
| AbbVie, Inc.: | |||
| 3 month U.S. LIBOR + 0.650% 0.8096% 11/21/22 (b)(c) | 7,100,000 | 7,135,420 | |
| 2.6% 11/21/24 | 3,500,000 | 3,628,104 | |
| 2.9% 11/6/22 | 5,000,000 | 5,100,453 | |
| 2.95% 11/21/26 | 90,000 | 94,718 | |
| 3.2% 11/6/22 | 170,000 | 173,208 | |
| 3.2% 5/14/26 | 175,000 | 185,090 | |
| 3.25% 10/1/22 | 5,850,000 | 5,939,920 | |
| 3.45% 3/15/22 | 615,000 | 617,138 | |
| Baxalta, Inc. 3.6% 6/23/22 | 265,000 | 268,056 | |
| Gilead Sciences, Inc. 0.75% 9/29/23 | 1,553,000 | 1,547,826 | |
| 24,689,933 | |||
| Health Care Equipment & Supplies - 0.0% | |||
| Baxter International, Inc. 0.868% 12/1/23 (a)(d) | 1,460,000 | 1,453,164 | |
| Becton, Dickinson & Co.: | |||
| 3.363% 6/6/24 | 551,000 | 578,044 | |
| 3.734% 12/15/24 | 128,000 | 136,559 | |
| Stryker Corp. 0.6% 12/1/23 | 325,000 | 322,221 | |
| 2,489,988 | |||
| Health Care Providers & Services - 0.4% | |||
| Aetna, Inc. 2.8% 6/15/23 | 885,000 | 907,962 | |
| AmerisourceBergen Corp. 0.737% 3/15/23 | 1,855,000 | 1,853,159 | |
| Anthem, Inc.: | |||
| 0.45% 3/15/23 | 4,094,000 | 4,076,574 | |
| 2.375% 1/15/25 | 410,000 | 421,953 | |
| Cardinal Health, Inc.: | |||
| 3.079% 6/15/24 | 695,000 | 724,071 | |
| 3.2% 3/15/23 | 875,000 | 899,727 | |
| 3.5% 11/15/24 | 1,180,000 | 1,250,353 | |
| Cigna Corp.: | |||
| 0.613% 3/15/24 | 6,302,000 | 6,226,137 | |
| 3% 7/15/23 | 715,000 | 737,299 | |
| 3.05% 11/30/22 | 1,729,000 | 1,768,255 | |
| 3.75% 7/15/23 | 401,000 | 418,402 | |
| CommonSpirit Health 1.547% 10/1/25 | 670,000 | 666,462 | |
| CVS Health Corp.: | |||
| 2.625% 8/15/24 | 335,000 | 346,446 | |
| 3.7% 3/9/23 | 369,000 | 381,612 | |
| Humana, Inc.: | |||
| 0.65% 8/3/23 | 4,706,000 | 4,680,675 | |
| 1.35% 2/3/27 | 120,000 | 116,326 | |
| 2.9% 12/15/22 | 160,000 | 163,474 | |
| 3.15% 12/1/22 | 315,000 | 321,124 | |
| 3.85% 10/1/24 | 745,000 | 794,445 | |
| 4.5% 4/1/25 | 1,205,000 | 1,317,735 | |
| PeaceHealth Obligated Group 1.375% 11/15/25 | 190,000 | 189,264 | |
| 28,261,455 | |||
| Life Sciences Tools & Services - 0.3% | |||
| PerkinElmer, Inc.: | |||
| 0.55% 9/15/23 | 10,675,000 | 10,601,250 | |
| 0.85% 9/15/24 | 1,290,000 | 1,269,326 | |
| Thermo Fisher Scientific, Inc.: | |||
| 0.5788% 10/18/24 (b) | 2,411,000 | 2,414,292 | |
| 0.797% 10/18/23 | 1,865,000 | 1,859,246 | |
| 4.133% 3/25/25 | 385,000 | 416,773 | |
| 16,560,887 | |||
| Pharmaceuticals - 0.4% | |||
| AstraZeneca Finance LLC: | |||
| 0.7% 5/28/24 | 995,000 | 984,935 | |
| 1.2% 5/28/26 | 1,390,000 | 1,372,062 | |
| AstraZeneca PLC: | |||
| 0.3% 5/26/23 | 1,425,000 | 1,417,534 | |
| 3.5% 8/17/23 | 365,000 | 381,428 | |
| Bristol-Myers Squibb Co. 3.25% 2/20/23 | 178,000 | 183,274 | |
| EMD Finance LLC 2.95% 3/19/22 (a) | 430,000 | 431,380 | |
| Perrigo Finance PLC 3.9% 12/15/24 | 3,240,000 | 3,412,780 | |
| Royalty Pharma PLC 0.75% 9/2/23 | 870,000 | 865,162 | |
| Shire Acquisitions Investments Ireland DAC 2.875% 9/23/23 | 1,845,000 | 1,903,844 | |
| Viatris, Inc. 1.125% 6/22/22 | 13,114,000 | 13,133,637 | |
| 24,086,036 | |||
| TOTAL HEALTH CARE | 96,088,299 | ||
| INDUSTRIALS - 1.3% | |||
| Aerospace & Defense - 0.1% | |||
| DAE Funding LLC 1.55% 8/1/24 (a) | 465,000 | 456,863 | |
| The Boeing Co. 1.167% 2/4/23 | 2,790,000 | 2,791,043 | |
| 3,247,906 | |||
| Airlines - 0.0% | |||
| American Airlines 2017-2 Class B Pass Through Trust equipment trust certificate 3.7% 4/15/27 | 503,980 | 486,730 | |
| United Airlines 2019-2 Class B Pass Through Trust equipment trust certificate 3.5% 11/1/29 | 342,590 | 337,452 | |
| 824,182 | |||
| Building Products - 0.0% | |||
| Carrier Global Corp. 2.242% 2/15/25 | 1,860,000 | 1,901,679 | |
| Commercial Services & Supplies - 0.0% | |||
| HPHT Finance 19 Ltd. 2.875% 11/5/24 (Reg. S) | 400,000 | 416,112 | |
| Republic Services, Inc. 2.5% 8/15/24 | 880,000 | 908,400 | |
| 1,324,512 | |||
| Construction & Engineering - 0.0% | |||
| Yongda Investment Ltd. 2.25% 6/16/25 (Reg. S) | 944,000 | 940,913 | |
| Industrial Conglomerates - 0.4% | |||
| Honeywell International, Inc. 3 month U.S. LIBOR + 0.370% 0.5144% 8/8/22 (b)(c) | 9,078,000 | 9,089,874 | |
| Roper Technologies, Inc.: | |||
| 0.45% 8/15/22 | 205,000 | 204,815 | |
| 1% 9/15/25 | 235,000 | 229,503 | |
| 2.35% 9/15/24 | 365,000 | 375,602 | |
| 3.125% 11/15/22 | 1,505,000 | 1,531,149 | |
| 3.65% 9/15/23 | 270,000 | 282,083 | |
| Siemens Financieringsmaatschappij NV: | |||
| U.S. Secured Overnight Fin. Rate (SOFR) Indx + 0.430% 0.4792% 3/11/24 (a)(b)(c) | 10,290,000 | 10,322,475 | |
| 0.65% 3/11/24 (a) | 690,000 | 685,814 | |
| 22,721,315 | |||
| Machinery - 0.3% | |||
| Caterpillar Financial Services Corp.: | |||
| U.S. Secured Overnight Fin. Rate (SOFR) Indx + 0.150% 0.2% 11/17/22 (b)(c) | 5,000,000 | 4,997,123 | |
| 0.25% 3/1/23 | 10,000,000 | 9,958,012 | |
| Otis Worldwide Corp. 3 month U.S. LIBOR + 0.450% 0.5831% 4/5/23 (b)(c) | 3,299,000 | 3,299,168 | |
| 18,254,303 | |||
| Professional Services - 0.0% | |||
| Equifax, Inc. 3.95% 6/15/23 | 1,090,000 | 1,138,210 | |
| IHS Markit Ltd. 3.625% 5/1/24 | 985,000 | 1,031,689 | |
| 2,169,899 | |||
| Road & Rail - 0.2% | |||
| Canadian Pacific Railway Co.: | |||
| 1.35% 12/2/24 (d) | 7,739,000 | 7,731,903 | |
| 1.75% 12/2/26 (d) | 580,000 | 580,326 | |
| Eastern Creation II Investment Holdings Ltd. 1% 9/10/23 (Reg. S) | 1,670,000 | 1,662,485 | |
| Guangzhou Metro Investment Finance (BVI) Ltd. 1.507% 9/17/25 (Reg. S) | 1,300,000 | 1,274,299 | |
| Penske Truck Leasing Co. LP: | |||
| 2.7% 3/14/23 (a) | 1,556,000 | 1,589,289 | |
| 4.25% 1/17/23 (a) | 285,000 | 295,594 | |
| SMBC Aviation Capital Finance: | |||
| 3.55% 4/15/24 (a) | 815,000 | 854,842 | |
| 4.125% 7/15/23 (a) | 900,000 | 942,279 | |
| 14,931,017 | |||
| Trading Companies & Distributors - 0.2% | |||
| Air Lease Corp.: | |||
| 2.25% 1/15/23 | 3,810,000 | 3,869,120 | |
| 3.5% 1/15/22 | 5,560,000 | 5,579,935 | |
| GATX Corp.: | |||
| 3.9% 3/30/23 | 820,000 | 851,220 | |
| 4.35% 2/15/24 | 965,000 | 1,028,201 | |
| 11,328,476 | |||
| Transportation Infrastructure - 0.1% | |||
| Avolon Holdings Funding Ltd.: | |||
| 2.125% 2/21/26 (a) | 1,035,000 | 1,013,346 | |
| 2.875% 2/15/25 (a) | 980,000 | 1,000,985 | |
| 3.625% 5/1/22 (a) | 1,560,000 | 1,575,233 | |
| 3.95% 7/1/24 (a) | 265,000 | 277,746 | |
| HPHT Finance 17 Ltd. 2.75% 9/11/22 (Reg. S) | 1,650,000 | 1,669,554 | |
| Sydney Airport Finance Co. Property Ltd. 3.9% 3/22/23 (a) | 1,133,000 | 1,174,932 | |
| 6,711,796 | |||
| TOTAL INDUSTRIALS | 84,355,998 | ||
| INFORMATION TECHNOLOGY - 0.6% | |||
| Electronic Equipment & Components - 0.0% | |||
| Amphenol Corp. 2.05% 3/1/25 | 910,000 | 933,550 | |
| Avnet, Inc. 4.875% 12/1/22 | 325,000 | 337,755 | |
| 1,271,305 | |||
| IT Services - 0.3% | |||
| CDW LLC/CDW Finance Corp. 5.5% 12/1/24 | 320,000 | 348,414 | |
| Fidelity National Information Services, Inc.: | |||
| 0.375% 3/1/23 | 1,160,000 | 1,154,761 | |
| 0.6% 3/1/24 | 555,000 | 548,231 | |
| Global Payments, Inc. 2.65% 2/15/25 | 800,000 | 824,196 | |
| HCL America, Inc. 1.375% 3/10/26 (a) | 1,800,000 | 1,763,213 | |
| IBM Corp. 2.85% 5/13/22 | 10,000,000 | 10,111,539 | |
| PayPal Holdings, Inc. 1.35% 6/1/23 | 2,224,000 | 2,247,177 | |
| The Western Union Co. 2.85% 1/10/25 | 1,280,000 | 1,331,012 | |
| 18,328,543 | |||
| Semiconductors & Semiconductor Equipment - 0.2% | |||
| Analog Devices, Inc.: | |||
| U.S. Secured Overnight Fin. Rate (SOFR) Indx + 0.000% 0.2988% 10/1/24 (b)(c) | 2,353,000 | 2,356,977 | |
| 2.95% 4/1/25 | 295,000 | 311,573 | |
| Marvell Technology, Inc. 4.2% 6/22/23 (a) | 1,050,000 | 1,097,358 | |
| Microchip Technology, Inc.: | |||
| 0.972% 2/15/24 (a) | 1,165,000 | 1,154,283 | |
| 0.983% 9/1/24 (a) | 970,000 | 955,987 | |
| 2.67% 9/1/23 | 1,110,000 | 1,138,872 | |
| NXP BV/NXP Funding LLC: | |||
| 3.875% 9/1/22 (a) | 1,355,000 | 1,384,117 | |
| 4.625% 6/1/23 (a) | 2,745,000 | 2,886,875 | |
| 4.875% 3/1/24 (a) | 560,000 | 602,207 | |
| NXP BV/NXP Funding LLC/NXP U.S.A., Inc. 2.7% 5/1/25 (a) | 205,000 | 212,272 | |
| Skyworks Solutions, Inc. 0.9% 6/1/23 | 305,000 | 304,001 | |
| 12,404,522 | |||
| Software - 0.1% | |||
| Fortinet, Inc. 1% 3/15/26 | 675,000 | 656,789 | |
| Oracle Corp. 2.4% 9/15/23 | 1,280,000 | 1,308,485 | |
| VMware, Inc. 0.6% 8/15/23 | 4,644,000 | 4,616,544 | |
| 6,581,818 | |||
| Technology Hardware, Storage & Peripherals - 0.0% | |||
| Hewlett Packard Enterprise Co. 4.4% 10/15/22 (b) | 3,269,000 | 3,355,059 | |
| TOTAL INFORMATION TECHNOLOGY | 41,941,247 | ||
| MATERIALS - 0.1% | |||
| Chemicals - 0.0% | |||
| Cytec Industries, Inc. 3.5% 4/1/23 | 919,000 | 942,073 | |
| International Flavors & Fragrances, Inc. 0.697% 9/15/22 (a) | 582,000 | 582,333 | |
| LYB International Finance III LLC 1.25% 10/1/25 | 705,000 | 696,044 | |
| Westlake Chemical Corp. 0.875% 8/15/24 | 180,000 | 178,191 | |
| 2,398,641 | |||
| Construction Materials - 0.0% | |||
| Boral Finance Pty Ltd. 3% 11/1/22 (a) | 135,000 | 136,871 | |
| Martin Marietta Materials, Inc. 0.65% 7/15/23 | 405,000 | 403,841 | |
| 540,712 | |||
| Metals & Mining - 0.1% | |||
| ArcelorMittal SA 3.6% 7/16/24 | 390,000 | 408,608 | |
| Nucor Corp. 2% 6/1/25 | 350,000 | 355,652 | |
| POSCO 2.375% 1/17/23 (a) | 1,870,000 | 1,898,106 | |
| 2,662,366 | |||
| Paper & Forest Products - 0.0% | |||
| Celulosa Arauco y Constitucion SA 4.5% 8/1/24 | 635,000 | 674,386 | |
| TOTAL MATERIALS | 6,276,105 | ||
| REAL ESTATE - 0.1% | |||
| Equity Real Estate Investment Trusts (REITs) - 0.1% | |||
| American Campus Communities Operating Partnership LP 3.75% 4/15/23 | 1,449,000 | 1,494,322 | |
| Crown Castle International Corp. 1.05% 7/15/26 | 1,005,000 | 970,193 | |
| Highwoods/Forsyth LP 3.625% 1/15/23 | 1,620,000 | 1,654,313 | |
| Public Storage U.S. Secured Overnight Fin. Rate (SOFR) Indx + 0.470% 0.5193% 4/23/24 (b)(c) | 495,000 | 495,337 | |
| Simon Property Group LP: | |||
| 2% 9/13/24 | 380,000 | 387,858 | |
| 3.375% 10/1/24 | 985,000 | 1,041,732 | |
| 6,043,755 | |||
| UTILITIES - 1.7% | |||
| Electric Utilities - 1.2% | |||
| American Electric Power Co., Inc. 3.65% 12/1/21 | 180,000 | 180,000 | |
| Cleco Power LLC 3 month U.S. LIBOR + 0.500% 0.6158% 6/15/23 (a)(b)(c) | 3,377,000 | 3,376,013 | |
| Duke Energy Corp. U.S. Secured Overnight Fin. Rate (SOFR) Indx + 0.250% 0.2992% 6/10/23 (b)(c) | 3,003,000 | 3,001,474 | |
| Edison International: | |||
| 2.95% 3/15/23 | 455,000 | 463,042 | |
| 3.125% 11/15/22 | 650,000 | 660,857 | |
| ENEL Finance International NV: | |||
| 1.375% 7/12/26 (a) | 1,105,000 | 1,082,190 | |
| 2.65% 9/10/24 (a) | 1,375,000 | 1,421,592 | |
| Eversource Energy U.S. Secured Overnight Fin. Rate (SOFR) Indx + 0.250% 0.3% 8/15/23 (b)(c) | 5,000,000 | 4,993,300 | |
| FirstEnergy Corp. 3.35% 7/15/22 | 885,000 | 888,761 | |
| Florida Power & Light Co. U.S. Secured Overnight Fin. Rate (SOFR) Indx + 0.250% 0.3% 5/10/23 (b)(c) | 3,574,000 | 3,571,716 | |
| Israel Electric Corp. Ltd. 5% 11/12/24 (Reg. S) (a) | 1,365,000 | 1,486,294 | |
| Korea Hydro & Nuclear Power Co. Ltd. 1.25% 4/27/26 (a) | 1,421,000 | 1,403,785 | |
| Mississippi Power Co. U.S. Secured Overnight Fin. Rate (SOFR) Indx + 0.300% 0.349% 6/28/24 (b)(c) | 5,297,000 | 5,265,072 | |
| NextEra Energy Capital Holdings, Inc.: | |||
| 3 month U.S. LIBOR + 0.270% 0.4296% 2/22/23 (b)(c) | 10,000,000 | 9,983,800 | |
| U.S. Secured Overnight Fin. Rate (SOFR) Indx + 0.000% 0.45% 11/3/23 (b)(c) | 6,000,000 | 5,989,290 | |
| U.S. Secured Overnight Fin. Rate (SOFR) Indx + 0.540% 0.59% 3/1/23 (b)(c) | 3,472,000 | 3,481,961 | |
| NRG Energy, Inc. 3.75% 6/15/24 (a) | 535,000 | 558,770 | |
| Pacific Gas & Electric Co.: | |||
| U.S. Secured Overnight Fin. Rate (SOFR) Indx + 1.150% 1.2% 11/14/22 (b)(c) | 180,000 | 180,172 | |
| 1.75% 6/16/22 | 6,280,000 | 6,276,094 | |
| 3.5% 6/15/25 | 955,000 | 989,544 | |
| PPL Electric Utilities Corp.: | |||
| 3 month U.S. LIBOR + 0.250% 0.3823% 9/28/23 (b)(c) | 1,780,000 | 1,780,005 | |
| U.S. Secured Overnight Fin. Rate (SOFR) Indx + 0.330% 0.379% 6/24/24 (b)(c) | 4,059,000 | 4,058,476 | |
| Sinosing Services Pte Ltd. 2.25% 2/20/25 (Reg. S) | 2,200,000 | 2,213,464 | |
| Southern California Edison Co.: | |||
| 3 month U.S. LIBOR + 0.270% 0.3889% 12/3/21 (b)(c) | 2,687,000 | 2,687,004 | |
| U.S. Secured Overnight Fin. Rate (SOFR) Indx + 0.640% 0.6889% 4/3/23 (b)(c) | 5,000,000 | 5,006,076 | |
| Southern Co.: | |||
| U.S. Secured Overnight Fin. Rate (SOFR) Indx + 0.370% 0.42% 5/10/23 (b)(c) | 3,257,000 | 3,251,691 | |
| 0.6% 2/26/24 | 2,230,000 | 2,201,003 | |
| Vistra Operations Co. LLC 3.55% 7/15/24 (a) | 3,435,000 | 3,561,077 | |
| 80,012,523 | |||
| Gas Utilities - 0.2% | |||
| APT Pipelines Ltd. 4.2% 3/23/25 (a) | 1,645,000 | 1,770,090 | |
| Atmos Energy Corp. 3 month U.S. LIBOR + 0.380% 0.496% 3/9/23 (b)(c) | 2,617,000 | 2,617,179 | |
| CenterPoint Energy Resources Corp. 3 month U.S. LIBOR + 0.500% 0.6196% 3/2/23 (b)(c) | 3,494,000 | 3,488,469 | |
| ONE Gas, Inc. 3 month U.S. LIBOR + 0.610% 0.7241% 3/11/23 (b)(c) | 2,500,000 | 2,500,046 | |
| 10,375,784 | |||
| Independent Power and Renewable Electricity Producers - 0.1% | |||
| Alexander Funding Trust 1.841% 11/15/23 (a) | 920,000 | 929,118 | |
| Hero Asia Investment Ltd. 1.5% 11/18/23 (Reg. S) | 1,650,000 | 1,643,836 | |
| The AES Corp. 3.3% 7/15/25 (a) | 820,000 | 857,786 | |
| 3,430,740 | |||
| Multi-Utilities - 0.2% | |||
| CenterPoint Energy, Inc. U.S. Secured Overnight Fin. Rate (SOFR) Indx + 0.650% 0.7% 5/13/24 (b)(c) | 2,893,000 | 2,892,855 | |
| Dominion Energy, Inc. 3 month U.S. LIBOR + 0.530% 0.646% 9/15/23 (b)(c) | 2,327,000 | 2,327,538 | |
| DTE Energy Co. 0.55% 11/1/22 | 5,000,000 | 4,991,647 | |
| Puget Energy, Inc. 5.625% 7/15/22 | 5,000,000 | 5,092,697 | |
| San Diego Gas & Electric Co. 1.914% 2/1/22 | 34,289 | 34,354 | |
| Sempra Energy 2.875% 10/1/22 | 535,000 | 542,701 | |
| 15,881,792 | |||
| TOTAL UTILITIES | 109,700,839 | ||
| TOTAL NONCONVERTIBLE BONDS | |||
| (Cost $1,469,579,761) | 1,472,663,087 | ||
| U.S. Government and Government Agency Obligations - 3.1% | |||
| U.S. Government Agency Obligations - 0.3% | |||
| Fannie Mae U.S. Secured Overnight Fin. Rate (SOFR) Indx + 0.180% 0.23% 7/8/22 (b)(c) | 20,000,000 | 20,020,301 | |
| U.S. Treasury Inflation-Protected Obligations - 0.1% | |||
| U.S. Treasury Inflation-Indexed Notes 0.625% 4/15/23 | 3,989,666 | 4,207,041 | |
| U.S. Treasury Obligations - 2.7% | |||
| U.S. Treasury Notes: | |||
| 0.125% 1/31/23 | $18,625,000 | $18,582,803 | |
| 0.125% 4/30/23 (e) | 28,965,000 | 28,856,381 | |
| 0.125% 5/31/23 | 3,860,000 | 3,843,113 | |
| 0.125% 6/30/23 | 31,945,000 | 31,794,010 | |
| 0.125% 7/31/23 | 7,205,000 | 7,164,753 | |
| 0.125% 8/31/23 | 1,820,000 | 1,808,767 | |
| 0.25% 9/30/23 | 20,000,000 | 19,908,594 | |
| 0.375% 3/31/22 | 30,000,000 | 30,029,757 | |
| 0.375% 10/31/23 | 32,000,000 | 31,912,500 | |
| 0.5% 11/30/23 | 3,425,000 | 3,421,388 | |
| TOTAL U.S. TREASURY OBLIGATIONS | 177,322,066 | ||
| TOTAL U.S. GOVERNMENT AND GOVERNMENT AGENCY OBLIGATIONS | |||
| (Cost $201,500,217) | 201,549,408 | ||
| U.S. Government Agency - Mortgage Securities - 0.4% | |||
| Fannie Mae - 0.2% | |||
| 12 month U.S. LIBOR + 1.560% 1.841% 7/1/35 (b)(c) | 3,518 | 3,693 | |
| 12 month U.S. LIBOR + 1.590% 1.926% 12/1/35 (b)(c) | 5,228 | 5,494 | |
| 12 month U.S. LIBOR + 1.650% 1.905% 8/1/37 (b)(c) | 1,517 | 1,596 | |
| 12 month U.S. LIBOR + 1.690% 1.94% 5/1/38 (b)(c) | 21,422 | 22,563 | |
| 12 month U.S. LIBOR + 1.780% 2.163% 5/1/38 (b)(c) | 2,518 | 2,645 | |
| 12 month U.S. LIBOR + 1.830% 2.098% 4/1/38 (b)(c) | 14,014 | 14,763 | |
| 12 month U.S. LIBOR + 1.850% 2.103% 8/1/38 (b)(c) | 7,526 | 7,964 | |
| 12 month U.S. LIBOR + 1.880% 2.191% 5/1/38 (b)(c) | 8,325 | 8,771 | |
| 12 month U.S. LIBOR + 2.040% 2.415% 12/1/36 (b)(c) | 1,239 | 1,310 | |
| 6 month U.S. LIBOR + 1.360% 1.492% 10/1/33 (b)(c) | 25,540 | 26,427 | |
| 2% 11/1/51 | 284,244 | 284,692 | |
| 2.5% 10/1/51 | 276,878 | 283,996 | |
| 3% 9/1/28 to 11/1/51 (d) | 4,160,519 | 4,349,698 | |
| 3.5% 11/1/26 to 7/1/50 | 1,000,036 | 1,055,880 | |
| 4% 1/1/47 to 12/1/49 | 415,343 | 446,261 | |
| 4.5% 8/1/24 to 1/1/50 | 2,114,340 | 2,280,661 | |
| 5% 3/1/23 to 7/1/45 | 1,025,835 | 1,140,446 | |
| 5.5% 5/1/22 to 5/1/40 | 1,350,534 | 1,545,988 | |
| 6% to 6% 1/1/22 to 2/1/49 | 1,329,137 | 1,540,623 | |
| 6.5% 7/1/32 to 12/1/32 | 63,954 | 73,761 | |
| TOTAL FANNIE MAE | 13,097,232 | ||
| Freddie Mac - 0.1% | |||
| 12 month U.S. LIBOR + 1.620% 1.875% 6/1/38 (b)(c) | 14,200 | 14,931 | |
| 12 month U.S. LIBOR + 1.620% 1.875% 7/1/38 (b)(c) | 22,186 | 23,276 | |
| 12 month U.S. LIBOR + 1.720% 1.976% 7/1/35 (b)(c) | 6,449 | 6,785 | |
| 12 month U.S. LIBOR + 1.730% 2.006% 10/1/36 (b)(c) | 12,394 | 13,041 | |
| 12 month U.S. LIBOR + 1.730% 2.046% 5/1/38 (b)(c) | 5,484 | 5,786 | |
| 12 month U.S. LIBOR + 1.730% 2.108% 2/1/37 (b)(c) | 3,021 | 3,188 | |
| 12 month U.S. LIBOR + 1.770% 2.025% 5/1/37 (b)(c) | 2,642 | 2,789 | |
| 12 month U.S. LIBOR + 1.830% 2.204% 2/1/37 (b)(c) | 2,724 | 2,883 | |
| 12 month U.S. LIBOR + 1.920% 2.307% 12/1/36 (b)(c) | 4,932 | 5,200 | |
| 12 month U.S. LIBOR + 2.020% 2.351% 11/1/36 (b)(c) | 2,771 | 2,918 | |
| 12 month U.S. LIBOR + 2.080% 2.457% 2/1/38 (b)(c) | 11,068 | 11,760 | |
| 12 month U.S. LIBOR + 2.160% 2.537% 2/1/37 (b)(c) | 5,301 | 5,614 | |
| U.S. TREASURY 1 YEAR INDEX + 2.340% 2.472% 11/1/34 (b)(c) | 9,869 | 10,413 | |
| 2% 1/1/36 to 9/1/36 | 1,953,893 | 2,006,148 | |
| 3% 11/1/34 | 290,427 | 307,088 | |
| 3.5% 12/1/47 | 843,057 | 890,457 | |
| 4% 12/1/49 | 175,378 | 188,637 | |
| 4.5% 5/1/50 | 195,636 | 211,488 | |
| 5% 10/1/22 to 12/1/41 | 384,860 | 430,022 | |
| 5.5% 4/1/23 to 10/1/38 | 6,479 | 6,940 | |
| 6% 8/1/22 to 9/1/35 | 84,116 | 96,833 | |
| 7% 3/1/39 | 129,308 | 152,039 | |
| 7.5% 6/1/38 | 127,008 | 147,218 | |
| TOTAL FREDDIE MAC | 4,545,454 | ||
| Ginnie Mae - 0.1% | |||
| 6% 7/15/36 | 155,042 | 176,439 | |
| 3.5% 8/20/44 to 11/20/50 | 3,757,490 | 3,931,830 | |
| 4% 3/20/48 to 8/20/50 | 812,582 | 870,343 | |
| 4.5% 9/20/40 to 8/20/47 | 630,826 | 689,696 | |
| 5% 12/20/34 to 5/20/48 | 745,392 | 815,823 | |
| 5.5% 9/15/45 to 2/20/49 | 576,328 | 641,655 | |
| TOTAL GINNIE MAE | 7,125,786 | ||
| TOTAL U.S. GOVERNMENT AGENCY - MORTGAGE SECURITIES | |||
| (Cost $24,550,520) | 24,768,472 | ||
| Asset-Backed Securities - 6.6% | |||
| Aimco: | |||
| Series 2021-10A Class AR, 3 month U.S. LIBOR + 1.060% 1.1883% 7/22/32 (a)(b)(c) | $4,100,000 | $4,099,988 | |
| Series 2021-BA Class AR, 3 month U.S. LIBOR + 1.100% 1.2238% 1/15/32 (a)(b)(c) | 4,342,000 | 4,342,282 | |
| Ally Auto Receivables Trust Series 2019-3 Class A4, 1.96% 12/16/24 | 600,000 | 609,952 | |
| American Express Credit Account Master Trust Series 2019-3 Class B, 2.2% 4/15/25 | 740,000 | 749,317 | |
| AmeriCredit Automobile Receivables Trust: | |||
| Series 2017-3: | |||
| Class C, 2.69% 6/19/23 | 55,346 | 55,443 | |
| Class D, 3.18% 7/18/23 | 1,355,000 | 1,365,187 | |
| Series 2018-1 Class D, 3.82% 3/18/24 | 1,645,000 | 1,688,043 | |
| Series 2019-3 Class B, 2.13% 7/18/25 | 985,000 | 995,351 | |
| Series 2020-1: | |||
| Class C, 1.59% 10/20/25 | 705,000 | 711,657 | |
| Class D, 1.8% 12/18/25 | 690,000 | 697,682 | |
| Series 2020-3 Class C, 1.06% 8/18/26 | 420,000 | 419,820 | |
| Series 2021-1: | |||
| Class C, 0.89% 10/19/26 | 755,000 | 749,572 | |
| Class D, 1.21% 12/18/26 | 470,000 | 463,171 | |
| Series 2021-2: | |||
| Class A2, 0.26% 11/18/24 | 4,028,961 | 4,026,579 | |
| Class D, 1.29% 6/18/27 | 995,000 | 981,506 | |
| Series 2021-3 Class A2, 0.41% 2/18/25 | 7,839,000 | 7,833,223 | |
| Applebee's/IHOP Funding LLC Series 2019-1A Class A2I, 4.194% 6/5/49 (a) | 1,613,700 | 1,634,188 | |
| Arbor Realty Collateralized Loan Obligation Series 2021-FL3 Class A, 1 month U.S. LIBOR + 1.070% 1.1595% 8/15/34 (a)(b)(c) | 1,100,000 | 1,097,592 | |
| Arbor Realty Commercial Real Estate Notes, Ltd. Series 2021-FL4 Class A, 1 month U.S. LIBOR + 1.350% 1.44% 11/15/36 (a)(b)(c) | 845,000 | 845,000 | |
| Ares LII CLO Ltd. Series 2021-52A Class A1R, 3 month U.S. LIBOR + 1.050% 1.1783% 4/22/31 (a)(b)(c) | 3,577,000 | 3,581,156 | |
| Ares LVII CLO Ltd. / Ares LVII CLO LLC Series 2020-57A Class A, 3 month U.S. LIBOR + 1.320% 1.4453% 10/25/31 (a)(b)(c) | 895,000 | 895,261 | |
| ARI Fleet Lease Trust Series 2020-A Class B, 2.06% 11/15/28 (a) | 770,000 | 776,366 | |
| Avis Budget Rental Car Funding (AESOP) LLC: | |||
| Series 2017-1A Class B, 3.41% 9/20/23 (a) | 540,000 | 547,431 | |
| Series 2017-2A Class A, 2.97% 3/20/24 (a) | 905,000 | 927,702 | |
| Series 2018-2A Class C, 4.95% 3/20/25 (a) | 430,000 | 457,061 | |
| Series 2019-1A Class B, 3.7% 3/20/23 (a) | 163,333 | 164,196 | |
| Series 2019-2A Class A, 3.35% 9/22/25 (a) | 650,000 | 684,785 | |
| Series 2020-1A Class A, 2.33% 8/20/26 (a) | 540,000 | 556,593 | |
| Babson CLO Ltd. Series 2013-IA Class AR, 3 month U.S. LIBOR + 0.800% 0.9315% 1/20/28 (a)(b)(c) | 838,097 | 837,470 | |
| Bank of America Credit Card Master Trust Series 2020-A1 Class A1, 0.34% 5/15/26 | 4,768,000 | 4,721,930 | |
| Bayview Opportunity Master Fund Trust: | |||
| Series 2017-RT3 Class A, 3.5% 1/28/58 (a)(b) | 620,230 | 623,786 | |
| Series 2017-SPL4 Class A, 3.5% 1/28/55 (a) | 187,897 | 190,568 | |
| Series 2017-SPL5 Class A, 3.5% 6/28/57 (a) | 539,567 | 548,741 | |
| BDS Ltd. / BDS LLC Series 2021-FL10 Class A, 1 month U.S. LIBOR + 1.350% 1.45% 12/18/36 (a)(b)(c) | 770,000 | 769,997 | |
| Blackbird Capital Aircraft Series 2016-1A Class AA, 2.487% 12/16/41 (a)(b) | 601,667 | 603,731 | |
| BlueMountain CLO Ltd. Series 2015-2A Class A1R, 3 month U.S. LIBOR + 0.930% 1.0523% 7/18/27 (a)(b)(c) | 533,029 | 533,173 | |
| BRE Grand Islander Timeshare Issuer Series 2019-A Class A, 3.28% 9/26/33 (a) | 198,259 | 204,693 | |
| Carlyle Global Market Strategies Series 2015-3A Class A1R, 3 month U.S. LIBOR + 1.000% 1.1359% 7/28/28 (a)(b)(c) | 424,735 | 424,783 | |
| CarMax Auto Owner Trust: | |||
| Series 2017-4 Class C, 2.7% 10/16/23 | 205,000 | 205,183 | |
| Series 2019-2 Class B, 3.01% 12/16/24 | 1,935,000 | 1,990,913 | |
| Series 2020-3 Class A2A, 0.49% 6/15/23 | 1,055,583 | 1,055,766 | |
| Series 2020-4: | |||
| Class A2, 0.31% 1/16/24 | 3,273,929 | 3,273,774 | |
| Class D, 1.75% 4/15/27 | 540,000 | 540,072 | |
| Series 2021-1 Class A3, 0.34% 12/15/25 | 2,373,000 | 2,362,039 | |
| Series 2021-2 Class C, 1.34% 2/16/27 | 545,000 | 537,684 | |
| Carvana Auto Receivables Trust: | |||
| Series 2021-P2 Class A2, 0.3% 7/10/24 | 6,185,622 | 6,185,230 | |
| Series 2021-P3 Class A2, 0.38% 1/10/25 | 3,044,000 | 3,038,364 | |
| Cedar Funding Ltd.: | |||
| Series 2021-10A Class AR, 3 month U.S. LIBOR + 1.100% 1.1% 10/20/32 (a)(b)(c) | 1,089,000 | 1,088,546 | |
| Series 2021-14A Class A, 3 month U.S. LIBOR + 1.100% 1.2238% 7/15/33 (a)(b)(c) | 5,722,000 | 5,723,419 | |
| Cent CLO LP Series 2021-21A Class A1R3, 3 month U.S. LIBOR + 0.970% 1.1045% 7/27/30 (a)(b)(c) | 4,090,000 | 4,090,515 | |
| Chesapeake Funding II LLC: | |||
| Series 2018-3A Class A2, 1 month U.S. LIBOR + 0.480% 0.5695% 1/15/31 (a)(b)(c) | 783,687 | 784,809 | |
| Series 2019-1A Class A1, 2.94% 4/15/31 (a) | 1,149,654 | 1,160,089 | |
| Series 2020-1A Class A1, 0.87% 8/16/32 (a) | 2,534,823 | 2,540,207 | |
| Series 2021-1A Class A2, 1 month U.S. LIBOR + 0.230% 0.3195% 4/15/33 (a)(b)(c) | 3,153,163 | 3,155,225 | |
| CIFC Funding Ltd. / CIFC Funding LLC Series 2021-4A Class A, 3 month U.S. LIBOR + 1.050% 1.1738% 7/15/33 (a)(b)(c) | 1,360,000 | 1,360,593 | |
| CIM Trust Series 2020-INV1 Class A2, 2.5% 4/25/50 (a) | 248,164 | 249,869 | |
| CNH Equipment Trust: | |||
| Series 2018-A Class B, 3.47% 10/15/25 | 380,000 | 383,413 | |
| Series 2020-A Class A4, 1.51% 4/15/27 | 590,000 | 597,458 | |
| Series 2021-C Class A2, 0.33% 1/15/25 | 4,124,000 | 4,116,744 | |
| Daimler Trucks Retail Trust Series 2020-1 Class A4, 1.37% 6/15/27 | 1,820,000 | 1,827,069 | |
| Dell Equipment Finance Trust: | |||
| Series 2019-2 Class A3, 1.91% 10/22/24 (a) | 1,102,454 | 1,107,799 | |
| Series 2020-2: | |||
| Class A2, 0.47% 10/24/22 (a) | 842,402 | 842,918 | |
| Class A3, 0.57% 10/23/23 (a) | 1,915,000 | 1,914,927 | |
| Series 2021-1 Class A3, 0.43% 5/22/26 (a) | 1,601,000 | 1,594,155 | |
| Series 2021-2 Class A2, 0.33% 12/22/26 (a) | 4,976,000 | 4,959,726 | |
| DLL Securitization Trust Series 2019-MT3 Class A3, 2.08% 2/21/23 (a) | 635,854 | 637,906 | |
| DLLAD LLC Series 2021-1A Class A2, 0.35% 9/20/24 (a) | 2,882,000 | 2,874,584 | |
| DLLMT LLC Series 2021-1A Class A2, 0.6% 3/20/24 (a) | 7,674,000 | 7,666,411 | |
| Donlen Fleet Lease Funding Series 2021-2 Class A1, 1 month U.S. LIBOR + 0.330% 0.4211% 12/11/34 (a)(b)(c) | 4,058,000 | 4,060,505 | |
| Drive Auto Receivables Trust: | |||
| Series 2021-1 Class D, 1.45% 1/16/29 | 630,000 | 628,574 | |
| Series 2021-2: | |||
| Class A2, 0.36% 5/15/24 | 4,100,000 | 4,098,107 | |
| Class D, 1.39% 3/15/29 | 785,000 | 771,601 | |
| Series 2021-3 Class A2, 0.52% 1/15/25 | 5,000,000 | 4,998,409 | |
| Dryden CLO, Ltd. / Dryden CLO, LLC Series 2021-86A Class A1R, 3 month U.S. LIBOR + 1.100% 1.2223% 7/17/34 (a)(b)(c) | 1,055,000 | 1,055,169 | |
| Eagle Re Ltd. Series 2021-2 Class M1A, U.S. 30-Day Avg. Secured Overnight Fin. Rate (SOFR) Indx + 1.550% 1.5993% 4/25/34 (a)(b)(c) | 460,000 | 460,364 | |
| Eaton Vance CLO, Ltd. Series 2021-1A Class AR, 3 month U.S. LIBOR + 1.100% 1.2238% 4/15/31 (a)(b)(c) | 3,935,000 | 3,937,703 | |
| Elara HGV Timeshare Issuer LLC Series 2017-A Class A, 2.69% 3/25/30 (a) | 485,848 | 492,675 | |
| Ellington Financial Mortgage Trust Series 2019-2 Class A1, 2.739% 11/25/59 (a) | 248,903 | 251,190 | |
| Enterprise Fleet Financing LLC: | |||
| Series 2019-1 Class A2, 2.98% 10/20/24 (a) | 77,434 | 77,702 | |
| Series 2019-3 Class A2, 2.06% 5/20/25 (a) | 372,726 | 376,138 | |
| Series 2020-1 Class A2, 1.78% 12/22/25 (a) | 4,135,620 | 4,172,145 | |
| Series 2020-2 Class A2, 0.61% 7/20/26 (a) | 3,221,523 | 3,218,995 | |
| Series 2021-1 Class A2, 0.44% 12/21/26 (a) | 1,372,807 | 1,367,093 | |
| Series 2021-2 Class A2, 0.48% 5/20/27 (a) | 3,480,000 | 3,453,393 | |
| Exeter Automobile Receivables Trust: | |||
| Series 2021-2A Class A2, 0.27% 1/16/24 | 3,523,312 | 3,522,636 | |
| Series 2021-3A Class A2, 0.34% 1/16/24 | 2,071,843 | 2,070,901 | |
| Ford Credit Auto Lease Trust Series 2020-B Class A3, 0.62% 8/15/23 | 4,531,000 | 4,536,437 | |
| Ford Credit Auto Owner Trust: | |||
| Series 2020-2 Class C, 1.74% 4/15/33 (a) | 570,000 | 564,908 | |
| Series 2020-B Class C, 2.04% 12/15/26 | 1,270,000 | 1,296,867 | |
| Ford Credit Floorplan Master Owner Trust Series 2020-1 Class A1, 0.7% 9/15/25 | 5,274,000 | 5,261,231 | |
| GM Financial Automobile Leasing Trust: | |||
| Series 2020-2 Class C, 2.56% 7/22/24 | 445,000 | 454,513 | |
| Series 2020-3 Class A2A, 0.35% 11/21/22 | 2,019,399 | 2,019,517 | |
| Series 2021-2 Class A2, 0.22% 7/20/23 | 3,974,424 | 3,971,992 | |
| Series 2021-3 Class A2, 0.24% 12/20/23 | 5,000,000 | 4,991,866 | |
| GM Financial Consumer Automobile Receivables Trust: | |||
| Series 2020-2 Class A3, 1.49% 12/16/24 | 300,228 | 302,313 | |
| Series 2020-3 Class A2, 0.35% 7/17/23 | 778,804 | 778,825 | |
| Series 2020-4: | |||
| Class A2, 0.26% 11/16/23 | 3,420,773 | 3,420,683 | |
| Class C, 1.05% 5/18/26 | 420,000 | 417,691 | |
| GMF Floorplan Owner Revolving Trust: | |||
| Series 2020-1 Class A, 0.68% 8/15/25 (a) | 1,480,000 | 1,476,386 | |
| Series 2020-2 Class A, 0.69% 10/15/25 (a) | 3,238,000 | 3,223,097 | |
| Hardee's Funding LLC / Carl's Jr. Funding LLC Series 2018-1A Class A2II, 4.959% 6/20/48 (a) | 213,400 | 224,693 | |
| Hilton Grand Vacations Trust: | |||
| Series 2017-AA: | |||
| Class A, 2.66% 12/26/28 (a) | 144,728 | 147,030 | |
| Class B, 2.96% 12/26/28 (a) | 220,737 | 223,867 | |
| Series 2020-AA: | |||
| Class A, 2.74% 2/25/39 (a) | 564,166 | 581,380 | |
| Class B, 4.22% 2/25/39 (a) | 869,210 | 917,479 | |
| HPEFS Equipment Trust: | |||
| Series 2020-2A Class A2, 0.65% 7/22/30 (a) | 1,010,993 | 1,011,432 | |
| Series 2021-2A Class A2, 0.3% 9/20/28 (a) | 2,780,000 | 2,774,418 | |
| Hyundai Auto Lease Securitization Trust: | |||
| Series 2020-A Class A3, 1.95% 7/17/23 (a) | 1,411,860 | 1,415,614 | |
| Series 2021-A Class A2, 0.25% 4/17/23 (a) | 5,305,022 | 5,303,470 | |
| Series 2021-B Class A2, 0.19% 10/16/23 (a) | 5,140,000 | 5,132,022 | |
| Hyundai Auto Receivables Trust: | |||
| Series 2019-A Class B, 2.94% 5/15/25 | 635,000 | 650,234 | |
| Series 2020-A Class A3, 1.41% 11/15/24 | 735,000 | 740,491 | |
| Series 2020-C Class A2, 0.26% 9/15/23 | 4,103,164 | 4,103,035 | |
| John Deere Owner Trust Series 2020-B Class A2, 0.41% 3/15/23 | 1,152,766 | 1,152,912 | |
| KKR CLO Ltd. / KKR CLO LLC Series 2021-29A Class A, 3 month U.S. LIBOR + 1.200% 1.3238% 1/15/32 (a)(b)(c) | 1,250,000 | 1,248,696 | |
| KKR Finanical CLO Ltd. Series 13 Class A1R, 3 month U.S. LIBOR + 0.800% 0.9223% 1/16/28 (a)(b)(c) | 852,677 | 852,757 | |
| KKR Industrial Portfolio Trust Series 2021-KDIP Class C, 1 month U.S. LIBOR + 1.000% 1.0895% 12/15/37 (a)(b)(c) | 1,061,250 | 1,047,003 | |
| Kubota Credit Owner Trust Series 2020-1A Class A3, 1.96% 3/15/24 (a) | 380,000 | 383,951 | |
| Lanark Master Issuer PLC Series 2020-1A Class 1A, 2.277% 12/22/69 (a)(b) | 1,768,000 | 1,792,955 | |
| Madison Park Funding Ltd. Series 2015-18A Class A1R, 3 month U.S. LIBOR + 1.190% 1.3195% 10/21/30 (a)(b)(c) | 1,165,000 | 1,165,871 | |
| Madison Park Funding XXIII, Ltd. Series 2021-23A: | |||
| Class AR, 3 month U.S. LIBOR + 0.970% 1.1045% 7/27/31 (a)(b)(c) | 4,376,000 | 4,376,271 | |
| Class BR, 3 month U.S. LIBOR + 1.550% 1.6845% 7/27/31 (a)(b)(c) | 800,000 | 800,074 | |
| Madison Park Funding XXXII, Ltd. / Madison Park Funding XXXII LLC Series 2021-32A Class A1R, 3 month U.S. LIBOR + 1.000% 1.1283% 1/22/31 (a)(b)(c) | 3,229,000 | 3,229,139 | |
| Madison Park Funding XXXV Ltd. / Madison Park Funding XXXV LLC Series 2021-35A Class A1R, 3 month U.S. LIBOR + 0.990% 1.1215% 4/20/32 (a)(b)(c) | 1,650,000 | 1,648,799 | |
| Magnetite XVI, Ltd. / Magnetite XVI, LLC Series 2015-16A Class AR, 3 month U.S. LIBOR + 0.800% 0.9223% 1/18/28 (a)(b)(c) | 1,956,769 | 1,956,196 | |
| Mercedes-Benz Auto Lease Trust: | |||
| Series 2019-B Class A3, 2% 10/17/22 | 2,813,790 | 2,820,441 | |
| Series 2020-B Class A2, 0.31% 2/15/23 | 1,465,037 | 1,465,154 | |
| Series 2021-B Class A2, 0.22% 1/16/24 | 10,000,000 | 9,993,630 | |
| Mercedes-Benz Auto Receivables Trust Series 2020-1 Class A2, 0.46% 3/15/23 | 455,477 | 455,537 | |
| MF1 Multifamily Housing Mortgage Loan Trust Series 2021-FL7 Class A, 1 month U.S. LIBOR + 1.080% 1.1691% 10/16/36 (a)(b)(c) | 800,000 | 798,056 | |
| MFRA Trust Series 2021-INV1 Class A1, 0.852% 1/25/56 (a)(b) | 435,212 | 432,733 | |
| MMAF Equipment Finance LLC Series 2019-B Class A2, 2.07% 10/12/22 (a) | 102,095 | 102,156 | |
| MVW LLC Series 2020-1A Class B, 2.73% 10/20/37 (a) | 463,658 | 470,801 | |
| MVW Owner Trust: | |||
| Series 2017-1A: | |||
| Class A, 2.42% 12/20/34 (a) | 342,831 | 347,215 | |
| Class B, 2.75% 12/20/34 (a) | 20,167 | 20,392 | |
| Class C, 2.99% 12/20/34 (a) | 48,400 | 48,755 | |
| Series 2021-1WA Class C, 1.94% 1/22/41 (a) | 292,019 | 288,996 | |
| Navient Private Education Loan Trust: | |||
| Series 2019-D Class A2A, 3.01% 12/15/59 (a) | 437,313 | 451,530 | |
| Series 2020-A Class A2A, 2.46% 11/15/68 (a) | 840,000 | 859,167 | |
| Series 2020-CA Class A2A, 2.15% 11/15/68 (a) | 2,610,000 | 2,641,708 | |
| Series 2020-IA Class A1A, 1.33% 4/15/69 (a) | 594,010 | 587,304 | |
| Navient Private Education Refi Loan Trust: | |||
| Series 2019-A Class A2A, 3.42% 1/15/43 (a) | 1,470,917 | 1,500,716 | |
| Series 2019-GA Class A, 2.4% 10/15/68 (a) | 392,578 | 398,963 | |
| Series 2020-DA Class A, 1.69% 5/15/69 (a) | 603,816 | 606,682 | |
| Navient Student Loan Trust: | |||
| Series 2017-3A Class A2, 1 month U.S. LIBOR + 0.600% 0.692% 7/26/66 (a)(b)(c) | 3,183,893 | 3,190,366 | |
| Series 2017-A Class A2A, 2.88% 12/16/58 (a) | 774,002 | 782,934 | |
| Series 2019-EA Class A2A, 2.64% 5/15/68 (a) | 1,096,348 | 1,108,941 | |
| Nelnet Student Loan Trust: | |||
| Series 2005-4 Class A4, 3 month U.S. LIBOR + 0.180% 0.3054% 3/22/32 (b)(c) | 608,595 | 591,214 | |
| Series 2020-1A Class A, 1 month U.S. LIBOR + 0.740% 0.832% 3/26/68 (a)(b)(c) | 335,616 | 337,007 | |
| Series 2021-CA Class AFX, 1.32% 4/20/62 (a) | 1,734,867 | 1,716,384 | |
| Series 2021-DA Class AFX, 1.63% 4/20/62 (a) | 605,000 | 603,046 | |
| Neuberger Berman Loan Advisers CLO 32 Ltd. Series 2021-32A Class AR, 3 month U.S. LIBOR + 0.990% 1.1136% 1/20/32 (a)(b)(c) | 1,570,000 | 1,570,738 | |
| Neuberger Berman Loan Advisers CLO 40, Ltd. / Neuberger Berman Loan Advisers CLO 40 LLC Series 2021-40A Class A, 3 month U.S. LIBOR + 1.060% 1.1823% 4/16/33 (a)(b)(c) | 455,000 | 455,647 | |
| Neuberger Berman Loan Advisers CLO, Ltd. Series 2021-26A Class BR, 3 month U.S. LIBOR + 1.400% 1.545% 10/18/30 (a)(b)(c) | 890,000 | 889,244 | |
| Niagara Park CLO, Ltd. Series 2021-1A Class AR, 3 month U.S. LIBOR + 1.000% 1.1223% 7/17/32 (a)(b)(c) | 4,100,000 | 4,104,945 | |
| Nissan Auto Receivables Trust Series 2020-A Class A3, 1.38% 12/16/24 | 407,629 | 410,526 | |
| Nissan Master Owner Trust Receivables Series 2019-A Class A, 1 month U.S. LIBOR + 0.560% 0.6495% 2/15/24 (b)(c) | 1,350,000 | 1,350,964 | |
| OCP CLO Ltd. Series 2014-7A Class A1RR, 3 month U.S. LIBOR + 1.120% 1.2515% 7/20/29 (a)(b)(c) | 2,530,000 | 2,531,139 | |
| OCP CLO Ltd. / OCP CLO LLC Series 2021-13A Class A2R, 1.6738% 7/15/30 (a)(b) | 1,320,000 | 1,316,590 | |
| Octane Receivables Trust Series 2021-2A Class A, 1.21% 9/20/28 (a) | 745,000 | 742,042 | |
| OZLM Ltd. Series 2014-8A Class RR, 3 month U.S. LIBOR + 1.170% 1.2923% 10/17/29 (a)(b)(c) | 610,198 | 610,295 | |
| Palmer Square Loan Funding, Ltd. Series 2021-2A Class A1, 3 month U.S. LIBOR + 0.800% 0.9596% 5/20/29 (a)(b)(c) | 3,617,073 | 3,617,558 | |
| Planet Fitness Master Issuer LLC Series 2018-1A Class A2II, 4.666% 9/5/48 (a) | 1,508,350 | 1,545,633 | |
| Santander Consumer Auto Receivables Trust: | |||
| Series 2021-AA Class A2, 0.23% 11/15/23 (a) | 4,014,167 | 4,013,439 | |
| 1.57% 1/15/27 (a) | 801,000 | 795,000 | |
| Santander Drive Auto Receivables Trust: | |||
| Series 2020-4 Class C, 1.01% 1/15/26 | 675,000 | 676,774 | |
| Series 2021-2 Class A2, 0.28% 4/15/24 | 4,638,070 | 4,636,717 | |
| Series 2021-3 Class A2, 0.29% 5/15/24 | 5,096,684 | 5,095,456 | |
| Series 2021-4: | |||
| Class A2, 0.37% 8/15/24 | 4,907,000 | 4,904,938 | |
| Class D, 1.67% 10/15/27 | 1,310,000 | 1,306,492 | |
| Santander Retail Auto Lease Trust: | |||
| Series 2019-B Class C, 2.77% 8/21/23 (a) | 690,000 | 697,581 | |
| Series 2019-C: | |||
| Class B, 2.17% 11/20/23 (a) | 495,000 | 500,524 | |
| Class C, 2.39% 11/20/23 (a) | 830,000 | 839,970 | |
| Class D, 2.88% 6/20/24 (a) | 870,000 | 884,945 | |
| Series 2020-A: | |||
| Class A2, 1.69% 1/20/23 (a) | 1,503,829 | 1,505,698 | |
| Class D, 2.52% 11/20/24 (a) | 720,000 | 732,939 | |
| Series 2020-B Class A2, 0.42% 11/20/23 (a) | 5,447,638 | 5,445,785 | |
| Series 2021-A: | |||
| Class A2, 0.32% 2/20/24 (a) | 4,296,354 | 4,292,700 | |
| Class C, 1.14% 3/20/26 (a) | 1,815,000 | 1,796,568 | |
| Series 2021-B Class A2, 0.31% 1/22/24 (a) | 3,585,729 | 3,580,890 | |
| Series 2021-C: | |||
| Class A2, 0.29% 4/22/24 (a) | 4,069,000 | 4,063,751 | |
| Class C, 1.11% 3/20/26 (a) | 630,000 | 623,291 | |
| SBA Tower Trust: | |||
| Series 2019, 2.836% 1/15/50 (a) | 990,000 | 1,021,250 | |
| 1.631% 5/15/51 (a) | 495,000 | 489,859 | |
| 1.884% 7/15/50 (a) | 365,000 | 366,518 | |
| SG Residential Mortgage Trust Series 2019-3 Class A2, 2.877% 9/25/59 (a) | 738,995 | 739,436 | |
| Sierra Receivables Funding Co. LLC: | |||
| Series 2019-1A Class A, 3.2% 1/20/36 (a) | 159,341 | 163,467 | |
| Series 2019-2A Class A, 2.59% 5/20/36 (a) | 974,992 | 989,115 | |
| Sierra Timeshare Receivables Funding Co. LLC Series 2017-1A Class A, 2.91% 3/20/34 (a) | 229,574 | 230,004 | |
| Sierra Timeshare Receivables Funding LLC: | |||
| Series 2019-3A Class A, 2.34% 8/20/36 (a) | 237,231 | 239,407 | |
| Series 2020-2A Class C, 3.51% 7/20/37 (a) | 320,377 | 326,784 | |
| Series 2021-1A Class B, 1.34% 11/20/37 (a) | 338,305 | 334,223 | |
| SLM Student Loan Trust: | |||
| Series 2003-10A Class A3, 3 month U.S. LIBOR + 0.470% 0.586% 12/15/27 (a)(b)(c) | 877,440 | 877,466 | |
| Series 2003-11 Class A6, 3 month U.S. LIBOR + 0.550% 0.666% 12/15/25 (a)(b)(c) | 736,243 | 736,062 | |
| Series 2010-1 Class A, 1 month U.S. LIBOR + 0.400% 0.492% 3/25/25 (b)(c) | 718,278 | 706,577 | |
| SMB Private Education Loan Trust: | |||
| Series 2014-A Class A3, 1 month U.S. LIBOR + 1.500% 1.5895% 4/15/32 (a)(b)(c) | 1,221,726 | 1,233,435 | |
| Series 2015-A Class A2B, 1 month U.S. LIBOR + 1.000% 1.0895% 6/15/27 (a)(b)(c) | 18,443 | 18,452 | |
| Series 2016-C Class A2B, 1 month U.S. LIBOR + 1.100% 1.1893% 9/15/34 (a)(b)(c) | 659,613 | 662,707 | |
| Series 2018-B Class A2B, 1 month U.S. LIBOR + 0.720% 0.8093% 1/15/37 (a)(b)(c) | 1,242,751 | 1,246,517 | |
| Series 2020-BA Class A1A, 1.29% 7/15/53 (a) | 395,571 | 392,421 | |
| Series 2020-PTB Class A2A, 1.6% 9/15/54 (a) | 2,512,739 | 2,485,442 | |
| Series 2021-B Class A, 1.31% 7/17/51 (a) | 1,544,649 | 1,539,893 | |
| SoFi Consumer Loan Program Trust Series 2019-4 Class A, 2.45% 8/25/28 (a) | 138,077 | 138,322 | |
| Symphony CLO XXI, Ltd. Series 2021-21A Class AR, 3 month U.S. LIBOR + 1.060% 1.1836% 7/15/32 (a)(b)(c) | 3,117,000 | 3,117,383 | |
| Symphony CLO XXIII Ltd. Series 2021-23A Class AR, 3 month U.S. LIBOR + 1.020% 0% 1/15/34 (a)(b)(c) | 6,116,000 | 6,116,000 | |
| Symphony CLO XXVI Ltd. / Symphony CLO XXVI LLC Series 2021-26A Class AR, 3 month U.S. LIBOR + 1.080% 1.2115% 4/20/33 (a)(b)(c) | 465,000 | 464,132 | |
| Symphony Static CLO Ltd. Series 2021-1A Class B, 3 month U.S. LIBOR + 1.450% 1.5791% 10/25/29 (a)(b)(c) | 1,385,000 | 1,381,100 | |
| TCI-Flatiron CLO Ltd. / LLC Series 2021-1A Class AR, 3 month U.S. LIBOR + 0.960% 1.1179% 11/18/30 (a)(b)(c) | 4,292,000 | 4,291,996 | |
| TCI-Symphony CLO Series 2021-1A Class AR, 3 month U.S. LIBOR + 0.920% 1.0423% 7/15/30 (a)(b)(c) | 4,588,000 | 4,589,546 | |
| Tesla Series 2020-A: | |||
| Class A2, 0.55% 5/22/23 (a) | 1,004,202 | 1,004,531 | |
| Class A3, 0.68% 12/20/23 (a) | 2,527,000 | 2,531,025 | |
| Tesla Auto Lease Trust: | |||
| Series 2021-A Class A2, 0.36% 3/20/25 (a) | 4,593,884 | 4,588,200 | |
| Series 2021-B Class A2, 0.36% 9/22/25 (a) | 4,737,000 | 4,714,467 | |
| Towd Point Mortgage Trust: | |||
| Series 2017-1 Class A1, 2.75% 10/25/56 (a)(b) | 220,974 | 223,147 | |
| Series 2017-4 Class A1, 2.75% 6/25/57 (a) | 158,037 | 160,994 | |
| Series 2019-1 Class A1, 3.6777% 3/25/58 (a)(b) | 676,734 | 702,212 | |
| Toyota Auto Receivables Owner Trust Series 2020-C Class A3, 0.44% 10/15/24 | 9,912,000 | 9,910,190 | |
| Verizon Owner Trust: | |||
| Series 2018-A: | |||
| Class A1A, 3.23% 4/20/23 | 221,251 | 221,719 | |
| Class A1B, 1 month U.S. LIBOR + 0.240% 0.3311% 4/20/23 (b)(c) | 172,448 | 172,465 | |
| Series 2020-A Class A1A, 1.85% 7/22/24 | 4,951,000 | 4,997,196 | |
| Volkswagen Auto Lease Trust: | |||
| Series 2019-A Class A3, 1.99% 11/21/22 | 1,169,021 | 1,172,102 | |
| Series 2020-A Class A2, 0.27% 4/20/23 | 6,681,056 | 6,680,384 | |
| Volkswagen Auto Loan Enhanced Trust Series 2020-1 Class A4, 1.26% 8/20/26 | 545,000 | 549,676 | |
| Volvo Financial Equipment LLC Series 2019-2A Class A3, 2.04% 11/15/23 (a) | 1,862,869 | 1,876,649 | |
| Voya CLO Ltd. Series 2021-1A Class A1R, 3 month U.S. LIBOR + 0.950% 1.0723% 4/17/30 (a)(b)(c) | 4,486,000 | 4,486,354 | |
| Wheels SPV LLC Series 2021-1A Class A, 1 month U.S. LIBOR + 0.280% 0.3711% 8/20/29 (a)(b)(c) | 3,226,261 | 3,228,058 | |
| World Omni Auto Receivables Trust: | |||
| Series 2019-C Class C, 2.4% 6/15/26 | 895,000 | 912,246 | |
| Series 2020-A Class C, 1.64% 8/17/26 | 480,000 | 483,448 | |
| Series 2020-C Class A2, 0.35% 12/15/23 | 1,725,927 | 1,726,340 | |
| Series 2021-D Class A2, 0.35% 12/16/24 | 4,626,000 | 4,621,703 | |
| World Omni Automobile Lease Securitization Trust: | |||
| Series 2019-B Class A3, 2.03% 11/15/22 | 1,138,516 | 1,140,980 | |
| Series 2020-A Class A2, 1.71% 11/15/22 | 897,668 | 898,624 | |
| Series 2020-B Class A2, 0.32% 9/15/23 | 2,091,938 | 2,091,681 | |
| World Omni Select Auto Trust Series 2020-A: | |||
| Class B, 0.84% 6/15/26 | 510,000 | 510,544 | |
| Class C, 1.25% 10/15/26 | 585,000 | 586,542 | |
| TOTAL ASSET-BACKED SECURITIES | |||
| (Cost $427,009,086) | 427,137,396 | ||
| Collateralized Mortgage Obligations - 1.1% | |||
| Private Sponsor - 0.9% | |||
| Angel Oak Mortgage Trust: | |||
| sequential payer: | |||
| Series 2019-4 Class A3, 3.301% 7/26/49 (a) | 274,211 | 274,468 | |
| Series 2020-6 Class A1, 1.261% 5/25/65 (a) | 385,026 | 385,442 | |
| Series 2021-1: | |||
| Class A1, 0.909% 1/25/66 (a) | 981,623 | 981,196 | |
| Class A2, 1.115% 1/25/66 (a) | 287,073 | 286,793 | |
| Series 2021-2 Class A1, 0.985% 4/25/66 (a) | 786,807 | 785,943 | |
| Series 2019-2 Class M1, 4.065% 3/25/49 (a) | 545,000 | 547,575 | |
| Series 2021-3 Class A1, 1.068% 5/25/66 (a) | 571,150 | 568,867 | |
| Series 2021-6 Class A3, 1.714% 9/25/66 (a) | 528,240 | 524,344 | |
| Angel Oak Mortgage Trust LLC: | |||
| sequential payer Series 2020-3 Class A1, 1.691% 4/25/65 (a) | 579,687 | 581,706 | |
| Series 2020-3 Class A3, 2.872% 4/25/65 (a)(b) | 940,091 | 950,225 | |
| Barclays Mortgage Loan Trust sequential payer Series 2021-NQM1 Class A1, 1.747% 9/25/51 (a) | 1,570,000 | 1,569,620 | |
| Bayview MSR Opportunity Master Fund Trust sequential payer Series 2021-5 Class A5, 2.5% 11/25/51 (a) | 1,920,485 | 1,951,542 | |
| Brass PLC Series 2021-10A Class A1, 0.669% 4/16/69 (a)(b) | 883,579 | 883,638 | |
| BRAVO Residential Funding Trust sequential payer Series 2021-NQM3 Class A1, 1.699% 4/26/60 (a) | 967,633 | 972,610 | |
| CIM Trust Series 2021-INV1 Class A8, 2.5% 7/1/51 (a) | 470,811 | 479,896 | |
| Citigroup Mortgage Loan Trust Series 2020-EXP2 Class A3, 2.5% 8/25/50 (a) | 294,607 | 297,736 | |
| Colt Funding LLC Series 2021-1 Class A2, 1.167% 6/25/66 (a) | 663,267 | 659,670 | |
| COLT Funding LLC Series 2021-3 Class A3, 1.419% 9/27/66 (a)(b) | 440,420 | 438,752 | |
| COLT Mortgage Loan Trust sequential payer Series 2020-3 Class A1, 1.506% 4/27/65 (a) | 181,985 | 182,504 | |
| Deephaven Residential Mortgage Trust: | |||
| sequential payer Series 2020-2 Class A1, 1.692% 5/25/65 (a) | 279,326 | 280,070 | |
| Series 2021-1 Class A2, 0.973% 5/25/65 (a) | 225,521 | 223,895 | |
| Series 2021-2: | |||
| Class A1, 0.899% 4/25/66 (a) | 296,100 | 295,404 | |
| Class A3, 1.26% 4/25/66 (a) | 329,940 | 328,541 | |
| Ellington Financial Mortgage Trust: | |||
| Series 2019-2 Class A3, 3.046% 11/25/59 (a) | 159,879 | 161,111 | |
| Series 2020-1 Class A1, 2.006% 5/25/65 (a) | 463,532 | 465,975 | |
| Series 2020-2 Class A1, 1.178% 10/25/65 (a) | 529,513 | 529,360 | |
| Series 2021-1: | |||
| Class A1, 0.797% 2/25/66 (a) | 212,478 | 211,972 | |
| Class A3, 1.106% 2/25/66 (a) | 177,065 | 176,246 | |
| Series 2021-2: | |||
| Class A1, 0.931% 6/25/66 (a)(b) | 380,730 | 378,019 | |
| Class A3, 1.291% 6/25/66 (a) | 368,179 | 364,621 | |
| Series 2021-3: | |||
| Class A1, 1.241% 9/25/66 (a) | 481,459 | 479,521 | |
| Class A3, 1.55% 9/25/66 (a) | 342,481 | 340,484 | |
| Flagstar Mortgage Trust floater sequential payer Series 2020-1INV Class A11, 1 month U.S. LIBOR + 0.850% 0.942% 3/25/50 (a)(b)(c) | 333,190 | 333,384 | |
| FWD Securitization Trust sequential payer Series 2020-INV1 Class A1, 2.24% 1/25/50 (a) | 851,650 | 862,098 | |
| Galton Funding Mortgage Trust: | |||
| sequential payer: | |||
| Series 2019-H1 Class M1, 3.339% 10/25/59 (a) | 600,000 | 611,255 | |
| Series 2020-H1 Class M1, 2.832% 1/25/60 (a) | 625,000 | 630,530 | |
| Series 2019-1: | |||
| Class A21, 4.5% 2/25/59 (a) | 163,877 | 166,505 | |
| Class A32, 4% 2/25/59 (a) | 82,839 | 83,858 | |
| Series 2020-H1 Class A1, 2.31% 1/25/60 (a) | 450,627 | 455,444 | |
| GMRF Mortgage Acquisition Co., LLC Series 2018-1 Class A33, 3.5% 11/25/57 (a) | 125,429 | 126,819 | |
| Gosforth Funding PLC floater Series 2018-1A Class A1, 3 month U.S. LIBOR + 0.450% 0.628% 8/25/60 (a)(b)(c) | 399,284 | 399,598 | |
| GS Mortgage Securities Trust sequential payer Series 2021-NQM1 Class A1, 1.017% 7/25/61 (a) | 437,877 | 437,707 | |
| GS Mortgage-Backed Securites Trust: | |||
| sequential payer Series 2021-HP1 Class A6, 2.5% 1/25/52 (a)(b) | 590,804 | 598,106 | |
| Series 2014-EB1A Class 2A1, 1.636% 7/25/44 (a)(b) | 12,523 | 12,483 | |
| Series 2021-GR2 Class A6, 2.5% 2/25/52 (a)(b) | 1,052,887 | 1,071,413 | |
| GS Mortgage-Backed Securities Trust Series 2021-PJ5 Class A8, 2.5% 10/25/51 (a)(b) | 1,393,455 | 1,411,636 | |
| Homeward Opportunities Fund I Trust sequential payer Series 2019-3 Class A1, 2.675% 11/25/59 (a) | 134,981 | 135,267 | |
| Homeward Opportunities Fund Trust sequential payer Series 2020-2 Class A1, 1.657% 5/25/65 (a)(b) | 293,207 | 294,037 | |
| Hundred Acre Wood Trust Series 2021-INV1 Class A9, 2.5% 7/25/51 (a)(b) | 941,114 | 958,498 | |
| Imperial Fund Mortgage Trust Series 2021-NQM2 Class A3, 1.516% 9/25/56 (a) | 599,002 | 595,115 | |
| J.P. Morgan Mortgage Trust Series 2020-INV1 Class A15, 3.5% 8/25/50 (a) | 278,583 | 282,720 | |
| Mello Mortgage Capital Acceptance sequential payer Series 2021-INV3 Class A4, 2.5% 10/25/51 (a) | 791,480 | 807,248 | |
| Metlife Securitization Trust Series 2017-1A Class A, 3% 4/25/55 (a) | 223,911 | 228,857 | |
| MFRA Trust Series 2021-NQM2 Class A2, 1.317% 11/25/64 (a) | 361,472 | 359,599 | |
| Mill City Mortgage Loan Trust: | |||
| Series 2016-1 Class A1, 2.5% 4/25/57 (a) | 7,035 | 7,035 | |
| Series 2017-2 Class A1, 2.75% 7/25/59 (a) | 186,972 | 189,050 | |
| New Residential Mortgage Loan Trust: | |||
| sequential payer: | |||
| Series 2019-NQM5 Class A1, 2.7099% 11/25/59 (a) | 561,600 | 567,809 | |
| Series 2020-NQM1 Class A1, 2.4641% 1/26/60 (a) | 298,853 | 300,706 | |
| Series 2021-NQ1R Class A1, 0.9426% 7/25/55 (a) | 723,596 | 725,193 | |
| Series 2021-INV1 Class A6, 2.5% 6/25/51 (a) | 629,453 | 641,207 | |
| NMLT Trust sequential payer Series 2021-INV2: | |||
| Class A1, 1.162% 8/25/56 (a) | 1,900,444 | 1,890,714 | |
| Class A3, 1.52% 8/25/56 (a) | 489,805 | 486,837 | |
| OBX Trust: | |||
| floater Series 2020-EXP1 Class 2A2, 1 month U.S. LIBOR + 0.950% 1.0416% 2/25/60 (a)(b)(c) | 358,059 | 358,374 | |
| sequential payer Series 2021-NQM3 Class A1, 1.054% 7/25/61 (a) | 471,957 | 469,092 | |
| Series 2020-EXP1 Class 1A8, 3.5% 2/25/60 (a)(b) | 511,395 | 521,117 | |
| Series 2020-EXP2: | |||
| Class A8, 3% 5/25/60 (a) | 686,042 | 694,590 | |
| Class A9, 3% 5/25/60 (a) | 168,771 | 170,590 | |
| Series 2020-INV1 Class A5, 3.5% 12/25/49 (a) | 148,765 | 151,928 | |
| Oceanview Mortgage Trust sequential payer Series 2021-2 Class A5, 2.5% 6/25/51 (a) | 945,155 | 962,757 | |
| Onslow Bay Financial LLC: | |||
| floater Series 2019-EXP2 Class 2A2, 1 month U.S. LIBOR + 1.200% 1.2916% 6/25/59 (a)(b)(c) | 420,329 | 420,329 | |
| floater sequential payer Series 2019-EXP2 Class 2A1A, 1 month U.S. LIBOR + 0.900% 0.9916% 6/25/59 (a)(b)(c) | 84,659 | 84,659 | |
| sequential payer: | |||
| Series 2021-J1 Class A4, 2.5% 5/25/51 (a) | 1,059,161 | 1,072,979 | |
| Series 2021-NQM1: | |||
| Class A1, 1.072% 2/25/66 (a) | 941,352 | 938,626 | |
| Class A2, 1.175% 2/25/66 (a) | 501,100 | 498,840 | |
| PSMC Trust sequential payer: | |||
| Series 2021-1 Class A11, 2.5% 3/25/51 (a)(b) | 1,518,029 | 1,538,916 | |
| Series 2021-2 Class A3, 2.5% 5/25/51 (a) | 1,171,594 | 1,186,919 | |
| Sequoia Mortgage Trust: | |||
| sequential payer Series 2018-CH2 Class A3, 4% 6/25/48 (a) | 232,657 | 236,571 | |
| Series 2018-CH2 Class A21, 4% 6/25/48 (a) | 103,820 | 105,452 | |
| Series 2018-CH3 Class A19, 4.5% 8/25/48 (a) | 38,536 | 38,915 | |
| Series 2018-CH4 Class A2, 4% 10/25/48 (a) | 58,434 | 58,895 | |
| SG Residential Mortgage Trust Series 2020-2 Class A1, 1.381% 5/25/65 (a) | 299,426 | 300,211 | |
| Starwood Mortgage Residential Trust: | |||
| sequential payer Series 2019-INV1: | |||
| Class A1, 2.61% 9/27/49 (a) | 42,355 | 42,767 | |
| Class A3, 2.916% 9/27/49 (a) | 388,376 | 391,502 | |
| Series 2020-1 Class A2, 2.408% 2/25/50 (a) | 467,069 | 469,434 | |
| Series 2021-2 Class A1, 0.943% 5/25/65 (a) | 520,903 | 520,015 | |
| Series 2021-4 Class A1, 1.162% 8/25/56 (a) | 1,674,542 | 1,663,204 | |
| Toorak Mortgage Corp. Series 2021-INV1 Class A2, 1.409% 7/25/56 (a) | 295,727 | 293,682 | |
| Towd Point Mortgage Trust: | |||
| Series 2016-1 Class A3B, 3% 2/25/55 (a) | 53,181 | 53,464 | |
| Series 2016-2 Class A1A, 2.75% 8/25/55 (a) | 37,811 | 37,944 | |
| Series 2016-3 Class A1, 2.25% 4/25/56 (a) | 4,621 | 4,628 | |
| Series 2017-2 Class A1, 2.75% 4/25/57 (a)(b) | 141,173 | 142,510 | |
| Series 2017-3 Class A1, 2.75% 7/25/57 (a)(b) | 363,425 | 368,121 | |
| United Wholesale Mortgage LLC sequential payer Series 2021-INV2 Class A4, 2.5% 9/25/51 (a) | 310,949 | 317,144 | |
| Verus Securitization Trust: | |||
| sequential payer: | |||
| Series 2019-INV3 Class A3, 3.1% 11/25/59 (a) | 625,253 | 631,605 | |
| Series 2020-1 Class A3, 2.724% 1/25/60 (a) | 669,609 | 673,850 | |
| Series 2020-2 Class A1, 2.226% 5/25/60 (a) | 728,348 | 733,014 | |
| Series 2020-INV1 Class A1, 1.977% 3/25/60 (a) | 109,589 | 110,421 | |
| Series 2019-3 Class A3, 3.04% 7/25/59 (a) | 945,637 | 950,694 | |
| Series 2019-4 Class A3, 3% 11/25/59 (a) | 323,667 | 326,477 | |
| Series 2019-INV2 Class A2, 3.117% 7/25/59 (a) | 714,160 | 720,330 | |
| Series 2020-5 Class A3, 1.733% 5/25/65 (a) | 256,215 | 255,607 | |
| Series 2021-1: | |||
| Class A2, 1.052% 1/25/66 (a) | 370,121 | 369,509 | |
| Class A3, 1.155% 1/25/66 (a) | 218,708 | 218,226 | |
| Series 2021-2 Class A1, 1.031% 2/25/66 (a) | 523,041 | 523,784 | |
| Series 2021-5 Class A3, 1.373% 9/25/66 (a) | 501,942 | 498,685 | |
| Series 2021-7 Class A1, 1.829% 10/25/66 (a) | 1,850,000 | 1,849,335 | |
| Series 2021-R1 Class A2, 1.057% 10/25/63 (a) | 206,857 | 206,311 | |
| Series 2021-R2 Class A1, 0.918% 2/25/64 (a) | 561,517 | 560,397 | |
| Vista Point Securitization Trust sequential payer Series 2020-2 Class A3, 2.496% 4/25/65 (a) | 231,891 | 233,412 | |
| Wells Fargo Mortgage Backed Securities Trust: | |||
| Series 2021-INV2 Class A4, 2.5% 9/25/51 (a) | 1,110,000 | 1,125,870 | |
| Series 2021-RR1 Class A3, 2.5% 12/25/50 (a)(b) | 1,306,007 | 1,329,576 | |
| ZH Trust sequential payer Series 2021-1 Class A, 2.2525% 2/18/27 (a) | 595,000 | 592,359 | |
| TOTAL PRIVATE SPONSOR | 59,252,111 | ||
| U.S. Government Agency - 0.2% | |||
| Fannie Mae: | |||
| Series 2017-90 Class KA, 3% 11/25/47 | 606,468 | 637,322 | |
| Series 2018-44 Class PC, 4% 6/25/44 | 24,201 | 24,254 | |
| Fannie Mae Connecticut Avenue Securities floater: | |||
| Series 2017-C02 Class 2ED3, 1 month U.S. LIBOR + 1.350% 1.442% 9/25/29 (b)(c) | 73,253 | 73,920 | |
| Series 2017-C04 Class 2ED2, 1 month U.S. LIBOR + 1.100% 1.192% 11/25/29 (b)(c) | 1,297,886 | 1,299,594 | |
| Series 2017-C05 Class 1ED3, 1 month U.S. LIBOR + 1.200% 1.292% 1/25/30 (b)(c) | 537,296 | 536,520 | |
| Series 2018-C01 Class 1ED2, 1 month U.S. LIBOR + 0.850% 0.942% 7/25/30 (b)(c) | 862,714 | 862,714 | |
| FHLMC Structured Agency Credit Risk Debt Notes floater: | |||
| Series 2014-DN3 Class M3, 1 month U.S. LIBOR + 4.000% 4.092% 8/25/24 (b)(c) | 184,794 | 188,269 | |
| Series 2015-DNA3 Class M3, 1 month U.S. LIBOR + 4.700% 4.792% 4/25/28 (b)(c) | 876,525 | 904,671 | |
| Series 2016-DNA2 Class M3, 1 month U.S. LIBOR + 4.650% 4.742% 10/25/28 (b)(c) | 610,636 | 631,623 | |
| Series 2017-DNA2 Class M1, 1 month U.S. LIBOR + 1.200% 1.292% 10/25/29 (b)(c) | 166,667 | 166,855 | |
| Series 2017-DNA3 Class M1, 1 month U.S. LIBOR + 0.750% 0.842% 3/25/30 (b)(c) | 63,486 | 63,492 | |
| Freddie Mac planned amortization class Series 3713 Class PA, 2% 2/15/40 | 279,307 | 283,057 | |
| Freddie Mac STACR REMIC Trust: | |||
| floater: | |||
| Series 2020-DNA6 Class M1, U.S. 30-Day Avg. Secured Overnight Fin. Rate (SOFR) Indx + 0.900% 0.9497% 12/25/50 (a)(b)(c) | 89,850 | 89,850 | |
| Series 2021-DNA2 Class M1, U.S. 30-Day Avg. Secured Overnight Fin. Rate (SOFR) Indx + 0.800% 0.8497% 8/25/33 (a)(b)(c) | 564,178 | 564,525 | |
| Series 2021-DNA3 Class M2, U.S. 30-Day Avg. Secured Overnight Fin. Rate (SOFR) Indx + 2.100% 2.1497% 10/25/33 (a)(b)(c) | 690,000 | 695,286 | |
| Series 2021-DNA5 Class M2, U.S. 30-Day Avg. Secured Overnight Fin. Rate (SOFR) Indx + 1.650% 1.6997% 1/25/34 (a)(b)(c) | 440,000 | 442,258 | |
| Series 2021-DNA6 Class M2, U.S. 30-Day Avg. Secured Overnight Fin. Rate (SOFR) Indx + 1.500% 1.5497% 10/25/41 (a)(b)(c) | 575,000 | 575,810 | |
| Series 2021-DNA7 Class M2, U.S. 30-Day Avg. Secured Overnight Fin. Rate (SOFR) Indx + 1.800% 1.8477% 11/25/41 (a)(b)(c) | 555,000 | 556,042 | |
| Series 2021-HQA1 Class M1, U.S. 30-Day Avg. Secured Overnight Fin. Rate (SOFR) Indx + 0.700% 0.7497% 8/25/33 (a)(b)(c) | 741,520 | 741,665 | |
| Series 2021-HQA3 Class M1, U.S. 30-Day Avg. Secured Overnight Fin. Rate (SOFR) Indx + 0.850% 0.8997% 9/25/41 (a)(b)(c) | 510,000 | 510,000 | |
| U.S. 30-Day Avg. Secured Overnight Fin. Rate (SOFR) Indx + 0.650% 0.6997% 1/25/51 (a)(b)(c) | 131,173 | 131,159 | |
| Freddie Mac STACR Trust floater: | |||
| Series 18-HQA2 Class M1, 1 month U.S. LIBOR + 0.750% 0.842% 10/25/48 (a)(b)(c) | 64,207 | 64,207 | |
| Series 2018-DNA2: | |||
| Class M1, 1 month U.S. LIBOR + 0.800% 0.892% 12/25/30 (a)(b)(c) | 232,179 | 232,221 | |
| Class M2A/S, 1 month U.S. LIBOR + 0.950% 1.042% 12/25/30 (a)(b)(c) | 450,000 | 448,870 | |
| Series 2018-DNA3: | |||
| Class M1, 1 month U.S. LIBOR + 0.750% 0.842% 9/25/48 (a)(b)(c) | 1,831 | 1,831 | |
| Class M2A/S, 1 month U.S. LIBOR + 0.900% 0.992% 9/25/48 (a)(b)(c) | 600,000 | 599,038 | |
| Series 2018-HRP2 Class M2, 1 month U.S. LIBOR + 1.250% 1.342% 2/25/47 (a)(b)(c) | 466,141 | 466,915 | |
| Series 2019-HRP1 Class M2, 1 month U.S. LIBOR + 1.400% 1.492% 2/25/49 (a)(b)(c) | 628,406 | 630,400 | |
| Freddie Mac Whole Loan Securities Trust: | |||
| Series 2016-SC02 Class M1, 3.6515% 10/25/46 (b) | 122,127 | 121,688 | |
| Series 2017-SC02 Class M1, 3.8427% 5/25/47 (a)(b) | 67,851 | 69,572 | |
| TOTAL U.S. GOVERNMENT AGENCY | 12,613,628 | ||
| TOTAL COLLATERALIZED MORTGAGE OBLIGATIONS | |||
| (Cost $71,969,004) | 71,865,739 | ||
| Commercial Mortgage Securities - 1.7% | |||
| ALEN Mortgage Trust floater Series 2021-ACEN Class A, 1 month U.S. LIBOR + 1.150% 1.24% 4/15/34 (a)(b)(c) | 595,000 | 594,256 | |
| Americold Realty Trust floater Series 2020-ICE5 Class B, 1 month U.S. LIBOR + 1.300% 1.3895% 11/15/37 (a)(b)(c) | 1,705,489 | 1,702,282 | |
| Atrium Hotel Portfolio Trust floater Series 2017-ATRM Class A 1 month U.S. LIBOR + 0.930% 1.02% 12/15/36 (a)(b)(c) | 1,395,000 | 1,392,360 | |
| Austin Fairmont Hotel Trust floater Series 2019-FAIR Class A, 1 month U.S. LIBOR + 1.050% 1.14% 9/15/32 (a)(b)(c) | 615,000 | 614,228 | |
| BAMLL Commercial Mortgage Securities Trust floater Series 2021-JACX Class C, 1 month U.S. LIBOR + 2.000% 2.09% 9/15/38 (a)(b)(c) | 805,000 | 804,999 | |
| Banc of America Merrill Lynch Large Loan, Inc. floater Series 2018-DSNY Class A, 1 month U.S. LIBOR + 0.850% 0.939% 9/15/34 (a)(b)(c) | 970,000 | 966,951 | |
| BANK Series 2019-BN19 Class A1, 2.263% 8/15/61 | 354,917 | 361,018 | |
| BCP Trust floater Series 2021-330N Class A, 1 month U.S. LIBOR + 0.790% 0.889% 6/15/38 (a)(b)(c) | 500,000 | 494,912 | |
| BLOX Trust floater sequential payer Series 2021-BLOX Class A, 1 month U.S. LIBOR + 0.750% 0.84% 9/15/26 (a)(b)(c) | 2,040,000 | 2,036,634 | |
| BPR Trust floater Series 2021-TY Class B, 1 month U.S. LIBOR + 1.150% 1.24% 9/15/38 (a)(b)(c) | 780,000 | 779,766 | |
| BSREP Commercial Mortgage Trust floater Series 2021-DC Class D, 1 month U.S. LIBOR + 1.900% 1.99% 8/15/38 (a)(b)(c) | 340,000 | 337,889 | |
| BX Commercial Mortgage Trust: | |||
| floater: | |||
| Series 2020-BXLP: | |||
| Class C, 1 month U.S. LIBOR + 1.120% 1.21% 12/15/36 (a)(b)(c) | 663,857 | 661,793 | |
| Class D, 1 month U.S. LIBOR + 1.250% 1.34% 12/15/36 (a)(b)(c) | 634,631 | 631,848 | |
| Series 2021-PAC Class A, 1 month U.S. LIBOR + 0.680% 0.7791% 10/15/36 (a)(b)(c) | 1,872,000 | 1,866,735 | |
| Series 2021-VINO Class A, 1 month U.S. LIBOR + 0.650% 0.7423% 5/15/38 (a)(b)(c) | 1,600,000 | 1,595,129 | |
| floater sequential payer Series 2020-BXLP Class A, 1 month U.S. LIBOR + 0.800% 0.89% 12/15/36 (a)(b)(c) | 1,948,150 | 1,946,318 | |
| BX Trust: | |||
| floater: | |||
| Series 2019-XL Class B, 1 month U.S. LIBOR + 1.080% 1.17% 10/15/36 (a)(b)(c) | 382,500 | 381,661 | |
| Series 2021-ACNT Class A, 1 month U.S. LIBOR + 0.850% 0.95% 11/15/26 (a)(b)(c) | 1,838,000 | 1,833,419 | |
| Series 2021-ARIA Class C, 1 month U.S. LIBOR + 1.640% 1.736% 10/15/36 (a)(b)(c) | 590,000 | 587,784 | |
| Series 2021-BXMF Class A, 1 month U.S. LIBOR + 0.630% 0.7259% 10/15/26 (a)(b)(c) | 1,715,000 | 1,701,672 | |
| Series 2021-SOAR Class D, 1 month U.S. LIBOR + 1.400% 1.49% 6/15/38 (a)(b)(c) | 665,000 | 660,872 | |
| floater sequential payer Series 2021-SOAR Class A, 0.76% 6/15/38 (a)(b) | 1,777,000 | 1,767,029 | |
| floater, sequential payer: | |||
| Series 2019-IMC Class A, 1 month U.S. LIBOR + 1.000% 1.089% 4/15/34 (a)(b)(c) | 2,135,000 | 2,130,319 | |
| Series 2019-XL Class A, 1 month U.S. LIBOR + 0.920% 1.01% 10/15/36 (a)(b)(c) | 5,095,725 | 5,095,724 | |
| CGDB Commercial Mortgage Trust floater Series 2019-MOB: | |||
| Class A, 1 month U.S. LIBOR + 0.950% 1.0395% 11/15/36 (a)(b)(c) | 1,033,000 | 1,030,412 | |
| Class D, 1 month U.S. LIBOR + 1.650% 1.7395% 11/15/36 (a)(b)(c) | 1,545,000 | 1,527,653 | |
| CHC Commercial Mortgage Trust floater Series 2019-CHC Class A, 1 month U.S. LIBOR + 1.120% 1.21% 6/15/34 (a)(b)(c) | 3,715,877 | 3,708,887 | |
| CIM Retail Portfolio Trust floater Series 2021-RETL Class A, 1 month U.S. LIBOR + 1.400% 1.49% 8/15/36 (a)(b)(c) | 1,166,000 | 1,163,802 | |
| Citigroup Commercial Mortgage Trust: | |||
| sequential payer: | |||
| Series 2012-GC8 Class A/S, 3.683% 9/10/45 (a) | 2,157,000 | 2,182,871 | |
| Series 2015-GC27 Class AAB, 2.944% 2/10/48 | 3,303,415 | 3,392,373 | |
| Series 2013-375P Class C, 3.6348% 5/10/35 (a)(b) | 560,000 | 565,579 | |
| COMM Mortgage Trust: | |||
| sequential payer Series 2013-300P Class A1, 4.353% 8/10/30 (a) | 620,000 | 644,641 | |
| Series 2014-CR15 Class B, 4.8116% 2/10/47 (b) | 920,000 | 977,199 | |
| Series 2014-CR19 Class AM, 4.08% 8/10/47 | 860,000 | 911,649 | |
| Series 2014-UBS2 Class B, 4.701% 3/10/47 | 915,000 | 965,708 | |
| Series 2015-CR22 Class B, 3.926% 3/10/48 (b) | 405,000 | 427,153 | |
| Series 2020-CMB Class D, 3.7538% 2/10/37 (a)(b) | 560,000 | 556,095 | |
| Credit Suisse Mortgage Trust: | |||
| floater Series 2019-ICE4: | |||
| Class A, 1 month U.S. LIBOR + 0.980% 1.07% 5/15/36 (a)(b)(c) | 5,485,000 | 5,484,999 | |
| Class C, 1 month U.S. LIBOR + 1.430% 1.52% 5/15/36 (a)(b)(c) | 1,015,000 | 1,011,184 | |
| Class D, 1 month U.S. LIBOR + 1.600% 1.69% 5/15/36 (a)(b)(c) | 780,000 | 778,951 | |
| sequential payer Series 2020-NET Class A, 2.2569% 8/15/37 (a) | 455,000 | 460,133 | |
| Series 2020-NET Class D, 3.8277% 8/15/37 (a)(b) | 985,000 | 1,008,127 | |
| CSAIL Commercial Mortgage Trust: | |||
| sequential payer Series 2015-C3 Class A4, 3.7182% 8/15/48 | 670,000 | 715,518 | |
| Series 2019-C16 Class A1, 2.3595% 6/15/52 | 402,571 | 408,104 | |
| CSMC Trust Series 2017-CHOP Class A, 1 month U.S. LIBOR + 1.000% 1.09% 7/15/32 (a)(b)(c) | 4,189,000 | 4,179,548 | |
| ELP Commercial Mortgage Trust floater Series 2021-ELP Class A, 1 month U.S. LIBOR + 0.700% 0.801% 11/15/38 (a)(b)(c) | 2,555,000 | 2,543,006 | |
| Extended Stay America Trust floater Series 2021-ESH: | |||
| Class A, 1 month U.S. LIBOR + 1.080% 1.17% 7/15/38 (a)(b)(c) | 858,534 | 858,019 | |
| Class C, 1 month U.S. LIBOR + 1.700% 1.79% 7/15/38 (a)(b)(c) | 810,782 | 810,538 | |
| Fontainebleau Miami Beach Trust Series 2019-FBLU Class B, 3.447% 12/10/36 (a) | 1,075,000 | 1,102,578 | |
| GCT Commercial Mortgage Trust floater Series 2021-GCT Class A, 1 month U.S. LIBOR + 0.800% 0.89% 2/15/38 (a)(b)(c) | 555,000 | 555,491 | |
| Great Wolf Trust floater Series 2019-WOLF: | |||
| Class A, 1 month U.S. LIBOR + 1.030% 1.124% 12/15/36 (a)(b)(c) | 1,906,000 | 1,902,407 | |
| Class C, 1 month U.S. LIBOR + 1.630% 1.723% 12/15/36 (a)(b)(c) | 600,000 | 595,485 | |
| GS Mortgage Securities Corp. Trust floater Series 2021-ROSS Class B, 1 month U.S. LIBOR + 1.600% 1.69% 5/15/26 (a)(b)(c) | 685,000 | 685,379 | |
| GS Mortgage Securities Trust floater Series 2021-IP Class A, 1 month U.S. LIBOR + 0.950% 1.04% 10/15/36 (a)(b)(c) | 1,087,000 | 1,087,323 | |
| Intown Hotel Portfolio Trust Series 2018-STAY: | |||
| Class A, 1 month U.S. LIBOR + 0.950% 1.04% 1/15/33 (a)(b)(c) | 245,000 | 245,001 | |
| Class C, 1 month U.S. LIBOR + 1.500% 1.59% 1/15/33 (a)(b)(c) | 205,000 | 204,939 | |
| J.P. Morgan Chase Commercial Mortgage Securities Trust floater Series 2020-609M: | |||
| Class B, 1 month U.S. LIBOR + 1.770% 1.86% 10/15/33 (a)(b)(c) | 995,000 | 993,119 | |
| Class C, 1 month U.S. LIBOR + 2.170% 2.26% 10/15/33 (a)(b)(c) | 805,000 | 803,478 | |
| JPMorgan Chase Commercial Mortgage Securities Trust floater: | |||
| Series 2018-GW Class A, 1 month U.S. LIBOR + 0.800% 0.89% 5/15/35 (a)(b)(c) | 2,440,000 | 2,435,383 | |
| Series 2019-BKWD: | |||
| Class A, 1 month U.S. LIBOR + 1.000% 1.09% 9/15/29 (a)(b)(c) | 1,911,000 | 1,907,362 | |
| Class B, 1 month U.S. LIBOR + 1.350% 1.44% 9/15/29 (a)(b)(c) | 1,830,000 | 1,811,606 | |
| Class C, 1 month U.S. LIBOR + 1.600% 1.69% 9/15/29 (a)(b)(c) | 575,000 | 566,338 | |
| KKR Industrial Portfolio Trust floater Series 2021-KDIP Class D, 1 month U.S. LIBOR + 1.250% 1.3395% 12/15/37 (a)(b)(c) | 198,750 | 195,390 | |
| KNDR Trust floater Series 2021-KIND Class C, 1 month U.S. LIBOR + 1.750% 1.84% 8/15/38 (a)(b)(c) | 980,000 | 976,318 | |
| LIFE Mortgage Trust floater Series 2021-BMR Class A, 1 month U.S. LIBOR + 0.700% 0.79% 3/15/38 (a)(b)(c) | 1,660,000 | 1,656,633 | |
| Merit floater: | |||
| Series 2020-HILL: | |||
| Class A, 1 month U.S. LIBOR + 1.150% 1.24% 8/15/37 (a)(b)(c) | 543,187 | 542,337 | |
| Class B, 1 month U.S. LIBOR + 1.400% 1.49% 8/15/37 (a)(b)(c) | 778,003 | 776,785 | |
| Class C, 1 month U.S. LIBOR + 1.700% 1.79% 8/15/37 (a)(b)(c) | 386,644 | 386,038 | |
| Class D, 1 month U.S. LIBOR + 2.350% 2.44% 8/15/37 (a)(b)(c) | 518,669 | 517,856 | |
| Series 2021-STOR Class A, 1 month U.S. LIBOR + 0.700% 0.79% 7/15/38 (a)(b)(c) | 907,000 | 903,310 | |
| MHC Commercial Mortgage Trust floater Series 2021-MHC Class B, 1 month U.S. LIBOR + 1.100% 1.1905% 4/15/38 (a)(b)(c) | 710,000 | 708,224 | |
| MHC Trust floater Series 2021-MHC2 Class B, 1 month U.S. LIBOR + 1.100% 1.19% 5/15/23 (a)(b)(c) | 660,000 | 655,899 | |
| Morgan Stanley BAML Trust Series 2014-C18 Class A/S, 4.11% 10/15/47 | 370,000 | 390,469 | |
| Morgan Stanley Capital I Trust: | |||
| floater: | |||
| Series 2018-BOP Class A, 1 month U.S. LIBOR + 0.850% 0.94% 8/15/33 (a)(b)(c) | 5,578,279 | 5,574,876 | |
| Series 2019-NUGS Class D, 1 month U.S. LIBOR + 1.800% 3.3% 12/15/36 (a)(b)(c) | 510,000 | 511,388 | |
| sequential payer Series 2014-150E Class A, 3.912% 9/9/32 (a) | 1,325,000 | 1,391,555 | |
| Series 2019-MEAD Class D, 3.283% 11/10/36 (a)(b) | 1,150,000 | 1,130,038 | |
| New Orleans Hotel Trust floater Series 2019-HNLA Class B, 1 month U.S. LIBOR + 1.289% 1.3777% 4/15/32 (a)(b)(c) | 1,585,000 | 1,571,477 | |
| OPG Trust floater Series 2021-PORT Class A, 1 month U.S. LIBOR + 0.480% 0.574% 10/15/36 (a)(b)(c) | 4,110,000 | 4,077,564 | |
| RLGH Trust floater Series 2021-TROT Class A, 1 month U.S. LIBOR + 0.800% 0.89% 4/15/36 (a)(b)(c) | 650,000 | 650,172 | |
| Shelter Growth CRE Issuer Ltd. floater Series 2021-FL3 Class A, 1 month U.S. LIBOR + 1.080% 1.1695% 9/15/36 (a)(c) | 580,000 | 578,584 | |
| Slide floater Series 2018-FUN Class D, 1 month U.S. LIBOR + 2.100% 2.19% 6/15/31 (a)(b)(c) | 764,775 | 749,399 | |
| SREIT Trust floater Series 2021-MFP Class A, 1 month U.S. LIBOR + 0.730% 0.8308% 11/15/38 (a)(b)(c) | 1,753,000 | 1,742,952 | |
| UBS-Barclays Commercial Mortgage Trust floater Series 2013-C6 Class A3, 1 month U.S. LIBOR + 0.790% 0.8795% 4/10/46 (a)(b)(c) | 2,917,076 | 2,911,080 | |
| Vista Point Securitization Trust sequential payer Series 2020-1 Class A1, 1.763% 3/25/65 (a) | 194,159 | 194,784 | |
| Wells Fargo Commercial Mortgage Trust Series 2015-NXS2 Class A2, 3.02% 7/15/58 | 275,793 | 280,308 | |
| WF-RBS Commercial Mortgage Trust Series 2012-C6 Class B, 4.697% 4/15/45 | 760,000 | 763,226 | |
| TOTAL COMMERCIAL MORTGAGE SECURITIES | |||
| (Cost $112,143,143) | 111,990,298 | ||
| Municipal Securities - 0.1% | |||
| Chicago Transit Auth. Series 2020 B: | |||
| 1.708% 12/1/22 | $40,000 | $40,420 | |
| 1.838% 12/1/23 | 35,000 | 35,534 | |
| 2.064% 12/1/24 | 105,000 | 107,090 | |
| Connecticut Gen. Oblig. Series A: | |||
| 1.998% 7/1/24 | 285,000 | 292,801 | |
| 2% 7/1/23 | 115,000 | 117,507 | |
| 2.098% 7/1/25 | 190,000 | 196,271 | |
| Dallas Fort Worth Int'l. Arpt. Rev. Series 2020 C, 1.329% 11/1/25 | 245,000 | 245,835 | |
| Houston Arpt. Sys. Rev. Series 2020 C: | |||
| 0.883% 7/1/22 | 70,000 | 70,257 | |
| 1.054% 7/1/23 | 120,000 | 120,928 | |
| 1.272% 7/1/24 | 400,000 | 403,152 | |
| Illinois Gen. Oblig. Series 2020 A, 2.25% 10/1/22 | 1,640,000 | 1,656,902 | |
| Long Island Pwr. Auth. Elec. Sys. Rev. Series 2020 C, 0.764% 3/1/23 | 360,000 | 360,298 | |
| TOTAL MUNICIPAL SECURITIES | |||
| (Cost $3,605,361) | 3,646,995 | ||
| Bank Notes - 0.4% | |||
| BBVA U.S.A. 2.875% 6/29/22 | 12,000,000 | 12,144,190 | |
| Capital One NA 2.15% 9/6/22 | 1,370,000 | 1,385,046 | |
| Citizens Bank NA 3.25% 2/14/22 | 1,015,000 | 1,018,481 | |
| First Republic Bank 1.912% 2/12/24 (b) | 2,031,000 | 2,056,265 | |
| PNC Bank NA 2.95% 1/30/23 | 695,000 | 712,018 | |
| Truist Bank 1.25% 3/9/23 | 7,000,000 | 7,045,219 | |
| TOTAL BANK NOTES | |||
| (Cost $24,272,597) | 24,361,219 | ||
| Commercial Paper - 1.0% | |||
| AT&T, Inc. 0% 12/14/21 | 2,185,000 | 2,184,882 | |
| Enel Finance America LLC: | |||
| yankee 0.37% 7/11/22 | 7,000,000 | 6,982,699 | |
| 0.4% 8/11/22 | 5,000,000 | 4,985,219 | |
| General Motors Financial Co., Inc.: | |||
| 0.34% 1/20/22 | 5,000,000 | 4,997,585 | |
| 0.38% 3/21/22 | 5,000,000 | 4,993,849 | |
| 0.4% 3/28/22 | 5,000,000 | 4,993,363 | |
| HSBC U.S.A., Inc.: | |||
| yankee 0.4% 2/9/22 | 10,000,000 | 9,994,853 | |
| 0.33% 10/4/22 | 5,000,000 | 4,979,467 | |
| NatWest Markets PLC yankee 0.35% 4/19/22 | 10,000,000 | 9,991,172 | |
| Viatris, Inc.: | |||
| 0.45% 12/20/21 | 8,000,000 | 7,998,414 | |
| 0.68% 4/26/22 | 5,000,000 | 4,990,200 | |
| TOTAL COMMERCIAL PAPER | |||
| (Cost $67,088,937) | 67,091,703 | ||
| Shares | Value | ||
| Short-Term Funds - 59.9% | |||
| Short-Term Funds - 59.9% | |||
| Baird Short-Term Bond Fund - Institutional Class | 17,765,488 | $173,924,131 | |
| Baird Ultra Short Bond Fund Institutional Class | 40,760,623 | 409,644,260 | |
| BlackRock Low Duration Bond Portfolio Investor A Shares | 28,327,287 | 272,791,772 | |
| Fidelity SAI Short-Term Bond Fund (f) | 28,535,247 | 283,640,353 | |
| iShares Floating Rate Bond ETF (g) | 1,477,153 | 74,935,972 | |
| iShares Short Maturity Bond ETF (g) | 4,526,102 | 226,305,100 | |
| iShares Short Treasury Bond ETF (g) | 2,161,608 | 238,619,907 | |
| iShares Ultra Short-Term Bond ETF | 2,537,045 | 127,968,550 | |
| JPMorgan Ultra-Short Income ETF (g) | 4,701,077 | 237,827,485 | |
| Metropolitan West Low Duration Bond Fund - Class M | 28,834,868 | 255,188,581 | |
| PIMCO Enhanced Low Duration Active ETF | 747,550 | 75,569,830 | |
| PIMCO Enhanced Short Maturity Active ETF (g) | 3,163,695 | 321,716,145 | |
| PIMCO Short-Term Fund Institutional Class | 90,333,584 | 882,559,099 | |
| Prudential Short-Term Corporate Bond Fund, Inc. Class A | 1,827,943 | 20,363,281 | |
| T. Rowe Price Ultra Short-Term Bond Fund | 56,332,039 | 285,603,436 | |
| TOTAL SHORT-TERM FUNDS | |||
| (Cost $3,872,788,190) | 3,886,657,902 | ||
| Money Market Funds - 3.9% | |||
| Fidelity Cash Central Fund 0.06% (h) | 77,384,668 | 77,400,145 | |
| Fidelity Investments Money Market Government Portfolio Institutional Class 0.01% (f)(i) | 145,829,551 | 145,829,551 | |
| Fidelity Securities Lending Cash Central Fund 0.07% (h)(j) | 23,291,409 | 23,293,739 | |
| State Street Institutional U.S. Government Money Market Fund Premier Class 0.03% (i) | 7,076,789 | 7,076,789 | |
| TOTAL MONEY MARKET FUNDS | |||
| (Cost $253,595,250) | 253,600,224 | ||
| TOTAL INVESTMENT IN SECURITIES - 100.9% | |||
| (Cost $6,528,102,066) | 6,545,332,443 | ||
| NET OTHER ASSETS (LIABILITIES) - (0.9)% | (60,139,690) | ||
| NET ASSETS - 100% | $6,485,192,753 |
| Futures Contracts | |||||
| Number of contracts | Expiration Date | Notional Amount | Value | Unrealized Appreciation/(Depreciation) | |
| Purchased | |||||
| Treasury Contracts | |||||
| CBOT 2-Year U.S. Treasury Note Contracts (United States) | 583 | March 2022 | $127,522,141 | $84,309 | $84,309 |
| Sold | |||||
| Treasury Contracts | |||||
| CBOT 10-Year U.S. Treasury Note Contracts (United States) | 52 | March 2022 | 6,802,250 | (38,668) | (38,668) |
| CBOT 5-Year U.S. Treasury Note Contracts (United States) | 152 | March 2022 | 18,452,563 | (63,153) | (63,153) |
| CBOT Ultra 10-Year U.S. Treasury Note Contracts (United States) | 35 | March 2022 | 5,141,172 | (89,190) | (89,190) |
| Total Sold | $(191,011) | ||||
| TOTAL FUTURES CONTRACTS | $(106,702) |
The notional amount of futures purchased as a percentage of Net Assets is 2.0%
The notional amount of futures sold as a percentage of Net Assets is 0.5%
Security Type Abbreviations
ETF – Exchange-Traded Fund
Legend
(a) Security exempt from registration under Rule 144A of the Securities Act of 1933. These securities may be resold in transactions exempt from registration, normally to qualified institutional buyers. At the end of the period, the value of these securities amounted to $784,181,603 or 12.1% of net assets.
(b) Coupon rates for floating and adjustable rate securities reflect the rates in effect at period end.
(c) Coupon is indexed to a floating interest rate which may be multiplied by a specified factor and/or subject to caps or floors.
(d) Security or a portion of the security purchased on a delayed delivery or when-issued basis.
(e) Security or a portion of the security was pledged to cover margin requirements for futures contracts. At period end, the value of securities pledged amounted to $387,733.
(f) Affiliated Fund
(g) Security or a portion of the security is on loan at period end.
(h) Affiliated fund that is generally available only to investment companies and other accounts managed by Fidelity Investments. The rate quoted is the annualized seven-day yield of the fund at period end. A complete unaudited listing of the fund's holdings as of its most recent quarter end is available upon request. In addition, each Fidelity Central Fund's financial statements are available on the SEC's website or upon request.
(i) The rate quoted is the annualized seven-day yield of the fund at period end.
(j) Investment made with cash collateral received from securities on loan.
Affiliated Central Funds
Fiscal year to date information regarding the Fund's investments in Fidelity Central Funds, including the ownership percentage, is presented below.
| Fund | Value, beginning of period | Purchases | Sales Proceeds | Dividend Income | Realized Gain/Loss | Change in Unrealized appreciation (depreciation) | Value, end of period | % ownership, end of period |
| Fidelity Cash Central Fund 0.06% | $140,618,356 | $335,775,897 | $398,994,108 | $27,571 | $-- | $- | $77,400,145 | 0.1% |
| Fidelity Securities Lending Cash Central Fund 0.07% | 83,337,814 | 796,049,753 | 856,093,828 | 51,064 | -- | -- | 23,293,739 | 0.1% |
| Total | $223,956,170 | $1,131,825,650 | $1,255,087,936 | $78,635 | $-- | $- | $100,693,884 |
Amounts in the income column in the above table include any capital gain distributions from underlying funds, which are presented in the corresponding line-item in the Statement of Operations, if applicable. Amount for Fidelity Securities Lending Cash Central Fund represents the income earned on investing cash collateral, less rebates paid to borrowers and any lending agent fees associated with the loan, plus any premium payments received for lending certain types of securities.
Affiliated Underlying Funds
Fiscal year to date information regarding the Fund's investments in affiliated Underlying Funds is presented below. Exchanges between classes of the same affiliated Underlying Funds may occur. If an underlying Fund changes its name, the name presented below is the name in effect at period end.
| Affiliate | Value, beginning of period | Purchases | Sales Proceeds | Dividend Income | Realized Gain (loss) | Change in Unrealized appreciation (depreciation) | Value, end of period |
| Fidelity Investments Money Market Government Portfolio Institutional Class 0.01% | $367,658,318 | $161,616,089 | $383,444,856 | $12,542 | $-- | $-- | $145,829,551 |
| Fidelity SAI Short-Term Bond Fund | 285,020,885 | 615,423 | -- | 615,430 | -- | (1,995,955) | 283,640,353 |
| Total | $652,679,203 | $162,231,512 | $383,444,856 | $627,972 | $-- | $(1,995,955) | $429,469,904 |
Amounts in the income column in the above table include any capital gain distributions from underlying funds, which are presented in the corresponding line-item in the Statement of Operations, if applicable.
Investment Valuation
The following is a summary of the inputs used, as of November 30, 2021, involving the Fund's assets and liabilities carried at fair value. The inputs or methodology used for valuing securities may not be an indication of the risk associated with investing in those securities. For more information on valuation inputs, and their aggregation into the levels used below, please refer to the Investment Valuation section in the accompanying Notes to Financial Statements.
| Valuation Inputs at Reporting Date: | ||||
| Description | Total | Level 1 | Level 2 | Level 3 |
| Investments in Securities: | ||||
| Corporate Bonds | $1,472,663,087 | $-- | $1,472,663,087 | $-- |
| U.S. Government and Government Agency Obligations | 201,549,408 | -- | 201,549,408 | -- |
| U.S. Government Agency - Mortgage Securities | 24,768,472 | -- | 24,768,472 | -- |
| Asset-Backed Securities | 427,137,396 | -- | 427,137,396 | -- |
| Collateralized Mortgage Obligations | 71,865,739 | -- | 71,865,739 | -- |
| Commercial Mortgage Securities | 111,990,298 | -- | 111,990,298 | -- |
| Municipal Securities | 3,646,995 | -- | 3,646,995 | -- |
| Bank Notes | 24,361,219 | -- | 24,361,219 | -- |
| Commercial Paper | 67,091,703 | -- | 67,091,703 | -- |
| Short-Term Funds | 3,886,657,902 | 3,886,657,902 | -- | -- |
| Money Market Funds | 253,600,224 | 253,600,224 | -- | -- |
| Total Investments in Securities: | $6,545,332,443 | $4,140,258,126 | $2,405,074,317 | $-- |
| Derivative Instruments: | ||||
| Assets | ||||
| Futures Contracts | $84,309 | $84,309 | $-- | $-- |
| Total Assets | $84,309 | $84,309 | $-- | $-- |
| Liabilities | ||||
| Futures Contracts | $(191,011) | $(191,011) | $-- | $-- |
| Total Liabilities | $(191,011) | $(191,011) | $-- | $-- |
| Total Derivative Instruments: | $(106,702) | $(106,702) | $-- | $-- |
Value of Derivative Instruments
The following table is a summary of the Fund's value of derivative instruments by primary risk exposure as of November 30, 2021. For additional information on derivative instruments, please refer to the Derivative Instruments section in the accompanying Notes to Financial Statements.
| Primary Risk Exposure / Derivative Type | Value | |
| Asset | Liability | |
| Interest Rate Risk | ||
| Futures Contracts(a) | $84,309 | $(191,011) |
| Total Interest Rate Risk | 84,309 | (191,011) |
| Total Value of Derivatives | $84,309 | $(191,011) |
(a) Reflects gross cumulative appreciation (depreciation) on futures contracts as presented in the Schedule of Investments. In the Statement of Assets and Liabilities, the period end daily variation margin is included in receivable or payable for daily variation margin on futures contracts, and the net cumulative appreciation (depreciation) is included in Total accumulated earnings (loss).
See accompanying notes which are an integral part of the financial statements.
Financial Statements
Statement of Assets and Liabilities
| November 30, 2021 (Unaudited) | ||
| Assets | ||
| Investment in securities, at value (including securities loaned of $22,781,331) — See accompanying schedule: Unaffiliated issuers (cost $5,996,365,522) | $6,015,168,655 | |
| Fidelity Central Funds (cost $100,688,909) | 100,693,884 | |
| Other affiliated issuers (cost $431,047,635) | 429,469,904 | |
| Total Investment in Securities (cost $6,528,102,066) | $6,545,332,443 | |
| Cash | 3,646,709 | |
| Receivable for investments sold | 3,339,532 | |
| Receivable for fund shares sold | 4,295,816 | |
| Interest receivable | 6,857,537 | |
| Distributions receivable from Fidelity Central Funds | 13,562 | |
| Prepaid expenses | 5,209 | |
| Other receivables | 135,782 | |
| Total assets | 6,563,626,590 | |
| Liabilities | ||
| Payable for investments purchased | ||
| Regular delivery | $35,463,175 | |
| Delayed delivery | 12,217,278 | |
| Payable for fund shares redeemed | 6,493,255 | |
| Distributions payable | 479,989 | |
| Accrued management fee | 216,421 | |
| Payable for daily variation margin on futures contracts | 110,409 | |
| Other payables and accrued expenses | 182,110 | |
| Collateral on securities loaned | 23,271,200 | |
| Total liabilities | 78,433,837 | |
| Net Assets | $6,485,192,753 | |
| Net Assets consist of: | ||
| Paid in capital | $6,460,320,842 | |
| Total accumulated earnings (loss) | 24,871,911 | |
| Net Assets | $6,485,192,753 | |
| Net Asset Value, offering price and redemption price per share ($6,485,192,753 ÷ 642,545,948 shares) | $10.09 |
See accompanying notes which are an integral part of the financial statements.
Statement of Operations
| Six months ended November 30, 2021 (Unaudited) | ||
| Investment Income | ||
| Dividends: | ||
| Unaffiliated issuers | $10,130,097 | |
| Affiliated issuers | 513,944 | |
| Interest | 11,369,709 | |
| Income from Fidelity Central Funds (including $51,064 from security lending) | 78,635 | |
| Total income | 22,092,385 | |
| Expenses | ||
| Management fee | $9,086,628 | |
| Custodian fees and expenses | 23,406 | |
| Independent trustees' fees and expenses | 22,469 | |
| Registration fees | 63,203 | |
| Audit | 39,304 | |
| Legal | 5,721 | |
| Miscellaneous | 20,016 | |
| Total expenses before reductions | 9,260,747 | |
| Expense reductions | (7,794,283) | |
| Total expenses after reductions | 1,466,464 | |
| Net investment income (loss) | 20,625,921 | |
| Realized and Unrealized Gain (Loss) | ||
| Net realized gain (loss) on: | ||
| Investment securities: | ||
| Unaffiliated issuers | 766,492 | |
| Futures contracts | (408,999) | |
| Capital gain distributions from underlying funds: | ||
| Affiliated issuers | 114,028 | |
| Total net realized gain (loss) | 471,521 | |
| Change in net unrealized appreciation (depreciation) on: | ||
| Investment securities: | ||
| Unaffiliated issuers | (31,564,322) | |
| Affiliated issuers | (1,995,955) | |
| Futures contracts | (73,466) | |
| Total change in net unrealized appreciation (depreciation) | (33,633,743) | |
| Net gain (loss) | (33,162,222) | |
| Net increase (decrease) in net assets resulting from operations | $(12,536,301) |
See accompanying notes which are an integral part of the financial statements.
Statement of Changes in Net Assets
| Six months ended November 30, 2021 (Unaudited) | Year ended May 31, 2021 | |
| Increase (Decrease) in Net Assets | ||
| Operations | ||
| Net investment income (loss) | $20,625,921 | $65,632,999 |
| Net realized gain (loss) | 471,521 | 40,280,476 |
| Change in net unrealized appreciation (depreciation) | (33,633,743) | 24,047,973 |
| Net increase (decrease) in net assets resulting from operations | (12,536,301) | 129,961,448 |
| Distributions to shareholders | (13,136,078) | (70,450,374) |
| Share transactions | ||
| Proceeds from sales of shares | 1,149,865,689 | 3,198,769,089 |
| Reinvestment of distributions | 10,074,085 | 56,384,302 |
| Cost of shares redeemed | (829,862,876) | (5,182,916,407) |
| Net increase (decrease) in net assets resulting from share transactions | 330,076,898 | (1,927,763,016) |
| Total increase (decrease) in net assets | 304,404,519 | (1,868,251,942) |
| Net Assets | ||
| Beginning of period | 6,180,788,234 | 8,049,040,176 |
| End of period | $6,485,192,753 | $6,180,788,234 |
| Other Information | ||
| Shares | ||
| Sold | 113,642,602 | 315,709,701 |
| Issued in reinvestment of distributions | 995,813 | 5,562,128 |
| Redeemed | (81,996,823) | (511,257,803) |
| Net increase (decrease) | 32,641,592 | (189,985,974) |
See accompanying notes which are an integral part of the financial statements.
Financial Highlights
Strategic Advisers Short Duration Fund
| Six months ended (Unaudited) November 30, | Years endedMay 31, | |||||
| 2021 | 2021 | 2020 | 2019 | 2018 | 2017 | |
| Selected Per–Share Data | ||||||
| Net asset value, beginning of period | $10.13 | $10.06 | $10.04 | $10.03 | $10.05 | $10.01 |
| Income from Investment Operations | ||||||
| Net investment income (loss)A | .033 | .106 | .229 | .254 | .168 | .136 |
| Net realized and unrealized gain (loss) | (.052) | .081 | .020 | .018 | (.028) | .033 |
| Total from investment operations | (.019) | .187 | .249 | .272 | .140 | .169 |
| Distributions from net investment income | (.021) | (.112) | (.229) | (.259) | (.160) | (.129) |
| Distributions from net realized gain | – | (.005) | – | (.003) | – | – |
| Total distributions | (.021) | (.117) | (.229) | (.262) | (.160) | (.129) |
| Net asset value, end of period | $10.09 | $10.13 | $10.06 | $10.04 | $10.03 | $10.05 |
| Total ReturnB,C | (.18)% | 1.86% | 2.51% | 2.75% | 1.40% | 1.69% |
| Ratios to Average Net AssetsD,E | ||||||
| Expenses before reductions | .30%F | .30% | .30% | .32% | .35% | .36% |
| Expenses net of fee waivers, if any | .05%F | .05% | .05% | .07% | .10% | .10% |
| Expenses net of all reductions | .05%F | .05% | .05% | .07% | .10% | .10% |
| Net investment income (loss) | .66%F | 1.05% | 2.28% | 2.54% | 1.67% | 1.36% |
| Supplemental Data | ||||||
| Net assets, end of period (000 omitted) | $6,485,193 | $6,180,788 | $8,049,040 | $7,144,753 | $8,841,193 | $9,920,937 |
| Portfolio turnover rateG | 34%F | 102% | 58% | 33% | 25% | 26% |
A Calculated based on average shares outstanding during the period.
B Total returns for periods of less than one year are not annualized.
C Total returns would have been lower if certain expenses had not been reduced during the applicable periods shown.
D Fees and expenses of any underlying mutual funds or exchange-traded funds (ETFs) are not included in the Fund's expense ratio. The Fund indirectly bears its proportionate share of these expenses. For additional expense information related to investments in Fidelity Central Funds, please refer to the "Investments in Fidelity Central Funds" note found in the Notes to Financial Statements section of the most recent Annual or Semi-Annual report.
E Expense ratios reflect operating expenses of the class. Expenses before reductions do not reflect amounts reimbursed, waived, or reduced through arrangements with the investment adviser, brokerage services, or other offset arrangements, if applicable, and do not represent the amount paid by the class during periods when reimbursements, waivers or reductions occur.
F Annualized
G Amount does not include the portfolio activity of any underlying mutual funds or exchange-traded funds (ETFs).
See accompanying notes which are an integral part of the financial statements.
Notes to Financial Statements (Unaudited)
For the period ended November 30, 2021
1. Organization.
Strategic Advisers Short Duration Fund (the Fund) is a fund of Fidelity Rutland Square Trust II (the Trust), and is authorized to issue an unlimited number of shares. The Trust is registered under the Investment Company Act of 1940, as amended (the 1940 Act), as an open-end management investment company organized as a Delaware statutory trust. The Fund is offered exclusively to certain managed account clients of Strategic Advisers LLC (Strategic Advisers), an affiliate of Fidelity Management & Research Company LLC (FMR).
2. Significant Accounting Policies.
The Fund is an investment company and applies the accounting and reporting guidance of the Financial Accounting Standards Board (FASB) Accounting Standards Codification Topic 946 Financial Services - Investment Companies. The financial statements have been prepared in conformity with accounting principles generally accepted in the United States of America (GAAP), which require management to make certain estimates and assumptions at the date of the financial statements. Actual results could differ from those estimates. Subsequent events, if any, through the date that the financial statements were issued have been evaluated in the preparation of the financial statements. The Fund's Schedule of Investments lists any underlying mutual funds or exchange-traded funds (ETFs) but does not include the underlying holdings of these funds. The following summarizes the significant accounting policies of the Fund:
Investment Valuation. Investments are valued as of 4:00 p.m. Eastern time on the last calendar day of the period. The Board of Trustees (the Board) has delegated the day to day responsibility for the valuation of the Fund's investments to the Fair Value Committee (the Committee) established by the Fund's investment adviser. In accordance with valuation policies and procedures approved by the Board, the Fund attempts to obtain prices from one or more third party pricing vendors or brokers to value its investments. When current market prices, quotations or currency exchange rates are not readily available or reliable, investments will be fair valued in good faith by the Committee, in accordance with procedures adopted by the Board. Factors used in determining fair value vary by investment type and may include market or investment specific events, changes in interest rates and credit quality. The frequency with which these procedures are used cannot be predicted and they may be utilized to a significant extent. The Committee oversees the Fund's valuation policies and procedures and reports to the Board on the Committee's activities and fair value determinations. The Board monitors the appropriateness of the procedures used in valuing the Fund's investments and ratifies the fair value determinations of the Committee.
The Fund categorizes the inputs to valuation techniques used to value its investments into a disclosure hierarchy consisting of three levels as shown below:
- Level 1 – quoted prices in active markets for identical investments
- Level 2 – other significant observable inputs (including quoted prices for similar investments, interest rates, prepayment speeds, etc.)
- Level 3 – unobservable inputs (including the Fund's own assumptions based on the best information available)
Valuation techniques used to value the Fund's investments by major category are as follows:
Debt securities, including restricted securities, are valued based on evaluated prices received from third party pricing vendors or from brokers who make markets in such securities. Corporate bonds, bank notes, municipal securities, U.S. government and government agency obligations and commercial paper are valued by pricing vendors who utilize matrix pricing which considers yield or price of bonds of comparable quality, coupon, maturity and type or by broker-supplied prices. Asset backed securities, collateralized mortgage obligations, commercial mortgage securities and U.S. government agency mortgage securities are valued by pricing vendors who utilize matrix pricing which considers prepayment speed assumptions, attributes of the collateral, yield or price of bonds of comparable quality, coupon, maturity and type or by broker-supplied prices. When independent prices are unavailable or unreliable, debt securities may be valued utilizing pricing methodologies which consider similar factors that would be used by third party pricing vendors. Debt securities are generally categorized as Level 2 in the hierarchy but may be Level 3 depending on the circumstances.
Exchange-Traded Funds (ETFs) are valued at their last sale price or official closing price as reported by a third party pricing vendor on the primary market or exchange on which they are traded and are categorized as Level 1 in the hierarchy. In the event there were no sales during the day but the exchange reports a closing bid level, ETFs are valued at the closing bid and would be categorized as Level 1 in the hierarchy. In the event there was no closing bid, ETFs may be valued by another method that the Board believes reflects fair value in accordance with the Board's fair value pricing policies and may be categorized as Level 2 in the hierarchy.
Futures contracts are valued at the settlement price established each day by the board of trade or exchange on which they are traded and are categorized as Level 1 in the hierarchy. Investments in open-end mutual funds, including the Fidelity Central Funds, are valued at their closing net asset value (NAV) each business day and are categorized as Level 1 in the hierarchy. If an unaffiliated open-end mutual fund's NAV is unavailable, shares of that fund may be valued by another method that the Board believes reflects fair value in accordance with the Board's fair value pricing policies and is categorized as Level 2 in the hierarchy.
Changes in valuation techniques may result in transfers in or out of an assigned level within the disclosure hierarchy. The aggregate value of investments by input level as of November 30, 2021 is included at the end of the Fund's Schedule of Investments.
Investment Transactions and Income. For financial reporting purposes, the Fund's investment holdings and NAV include trades executed through the end of the last business day of the period. The NAV per share for processing shareholder transactions is calculated as of the close of business of the New York Stock Exchange (NYSE), normally 4:00 p.m. Eastern time and includes trades executed through the end of the prior business day. Gains and losses on securities sold are determined on the basis of identified cost. Commissions paid to certain brokers with whom the investment adviser, or its affiliates, places trades on behalf of a fund include an amount in addition to trade execution, which may be rebated back to a fund. Any such rebates are included in net realized gain (loss) on investments in the Statement of Operations. Dividend income is recorded on the ex-dividend date, except for certain dividends from foreign securities where the ex-dividend date may have passed, which are recorded as soon as the Fund is informed of the ex-dividend date. Non-cash dividends included in dividend income, if any, are recorded at the fair market value of the securities received. Income and capital gain distributions from Fidelity Central Funds, if any, are recorded on the ex-dividend date. Income and capital gain distributions from any underlying mutual funds or exchange-traded funds (ETFs) are recorded on the ex-dividend date. Interest income is accrued as earned and includes coupon interest and amortization of premium and accretion of discount on debt securities as applicable. The principal amount on inflation-indexed securities is periodically adjusted to the rate of inflation and interest is accrued based on the principal amount. The adjustments to principal due to inflation are reflected as increases or decreases to Interest in the accompanying Statement of Operations. Debt obligations may be placed on non-accrual status and related interest income may be reduced by ceasing current accruals and writing off interest receivables when the collection of all or a portion of interest has become doubtful based on consistently applied procedures. A debt obligation is removed from non-accrual status when the issuer resumes interest payments or when collectability of interest is reasonably assured.
Expenses. Expenses directly attributable to a fund are charged to that fund. Expenses attributable to more than one fund are allocated among the respective funds on the basis of relative net assets or other appropriate methods. Expenses included in the accompanying financial statements reflect the expenses of that fund and do not include any expenses associated with any underlying mutual funds or exchange-traded funds. Although not included in a fund's expenses, a fund indirectly bears its proportionate share of these expenses through the net asset value of each underlying mutual fund or exchange-traded fund. Expense estimates are accrued in the period to which they relate and adjustments are made when actual amounts are known.
Deferred Trustee Compensation. Under a Deferred Compensation Plan (the Plan) for certain Funds, certain independent Trustees have elected to defer receipt of a portion of their annual compensation. Deferred amounts are invested in affiliated mutual funds, are marked-to-market and remain in a fund until distributed in accordance with the Plan. The investment of deferred amounts and the offsetting payable to the Trustees presented below are included in the accompanying Statement of Assets and Liabilities in other receivables and other payables and accrued expenses, as applicable.
| Strategic Advisers Short Duration Fund | $135,470 |
Income Tax Information and Distributions to Shareholders. Each year, the Fund intends to qualify as a regulated investment company under Subchapter M of the Internal Revenue Code, including distributing substantially all of its taxable income and realized gains. As a result, no provision for U.S. Federal income taxes is required. The Fund files a U.S. federal tax return, in addition to state and local tax returns as required. The Fund's federal income tax returns are subject to examination by the Internal Revenue Service (IRS) for a period of three fiscal years after they are filed. State and local tax returns may be subject to examination for an additional fiscal year depending on the jurisdiction.
Distributions are declared and recorded daily and paid monthly from net investment income. Distributions from realized gains, if any, are declared and recorded on the ex-dividend date. Income and capital gain distributions are determined in accordance with income tax regulations, which may differ from GAAP.
Capital accounts within the financial statements are adjusted for permanent book-tax differences. These adjustments have no impact on net assets or the results of operations. Capital accounts are not adjusted for temporary book-tax differences which will reverse in a subsequent period.
Book-tax differences are primarily due to market discount, capital loss carryforwards, futures contracts, short-term gain distributions from the Underlying Funds, deferred trustees compensation and losses deferred due to wash sales.
As of period end, the cost and unrealized appreciation (depreciation) in securities, and derivatives if applicable, for federal income tax purposes were as follows:
| Gross unrealized appreciation | $28,698,788 |
| Gross unrealized depreciation | (11,251,516) |
| Net unrealized appreciation (depreciation) | $17,447,272 |
| Tax cost | $6,527,778,469 |
Capital loss carryforwards are only available to offset future capital gains of the Fund to the extent provided by regulations and may be limited. The capital loss carryforward information presented below, including any applicable limitation, is estimated as of prior fiscal period end and is subject to adjustment.
| No expiration | |
| Long-term | $(6,304,429) |
Delayed Delivery Transactions and When-Issued Securities. During the period, certain Funds transacted in securities on a delayed delivery or when-issued basis. Payment and delivery may take place after the customary settlement period for that security. The price of the underlying securities and the date when the securities will be delivered and paid for are fixed at the time the transaction is negotiated. Securities purchased on a delayed delivery or when-issued basis are identified as such in the Schedule of Investments. Compensation for interest forgone in the purchase of a delayed delivery or when-issued debt security may be received. With respect to purchase commitments, each applicable Fund identifies securities as segregated in its records with a value at least equal to the amount of the commitment. Payables and receivables associated with the purchases and sales of delayed delivery securities having the same coupon, settlement date and broker are offset. Delayed delivery or when-issued securities that have been purchased from and sold to different brokers are reflected as both payables and receivables in the Statement of Assets and Liabilities under the caption "Delayed delivery", as applicable. Losses may arise due to changes in the value of the underlying securities or if the counterparty does not perform under the contract's terms, or if the issuer does not issue the securities due to political, economic, or other factors.
Restricted Securities (including Private Placements). Funds may invest in securities that are subject to legal or contractual restrictions on resale. These securities generally may be resold in transactions exempt from registration or to the public if the securities are registered. Disposal of these securities may involve time-consuming negotiations and expense, and prompt sale at an acceptable price may be difficult. Information regarding restricted securities held at period end is included at the end of the Schedule of Investments, if applicable.
3. Derivative Instruments.
Risk Exposures and the Use of Derivative Instruments. The Fund's investment objective allows the Fund to enter into various types of derivative contracts, including futures contracts. Derivatives are investments whose value is primarily derived from underlying assets, indices or reference rates and may be transacted on an exchange or over-the-counter (OTC). Derivatives may involve a future commitment to buy or sell a specified asset based on specified terms, to exchange future cash flows at periodic intervals based on a notional principal amount, or for one party to make one or more payments upon the occurrence of specified events in exchange for periodic payments from the other party.
The Fund used derivatives to increase returns and to manage exposure to certain risks as defined below. The success of any strategy involving derivatives depends on analysis of numerous economic factors, and if the strategies for investment do not work as intended, the Fund may not achieve its objectives.
The Fund's use of derivatives increased or decreased its exposure to the following risk:
| Interest Rate Risk | Interest rate risk relates to the fluctuations in the value of interest-bearing securities due to changes in the prevailing levels of market interest rates. |
The Fund is also exposed to additional risks from investing in derivatives, such as liquidity risk and counterparty credit risk. Liquidity risk is the risk that the Fund will be unable to close out the derivative in the open market in a timely manner. Counterparty credit risk is the risk that the counterparty will not be able to fulfill its obligation to the Fund. Counterparty credit risk related to exchange-traded futures contracts may be mitigated by the protection provided by the exchange on which they trade.
Investing in derivatives may involve greater risks than investing in the underlying assets directly and, to varying degrees, may involve risk of loss in excess of any initial investment and collateral received and amounts recognized in the Statement of Assets and Liabilities. In addition, there may be the risk that the change in value of the derivative contract does not correspond to the change in value of the underlying instrument.
Futures Contracts. A futures contract is an agreement between two parties to buy or sell a specified underlying instrument for a fixed price at a specified future date. The Fund used futures contracts to manage its exposure to the bond market and fluctuations in interest rates.
Upon entering into a futures contract, a fund is required to deposit either cash or securities (initial margin) with a clearing broker in an amount equal to a certain percentage of the face value of the contract. Futures contracts are marked-to-market daily and subsequent daily payments (variation margin) are made or received by a fund depending on the daily fluctuations in the value of the futures contracts and are recorded as unrealized appreciation or (depreciation). This receivable and/or payable, if any, is included in daily variation margin on futures contracts in the Statement of Assets and Liabilities. Realized gain or (loss) is recorded upon the expiration or closing of a futures contract. The net realized gain (loss) and change in net unrealized appreciation (depreciation) on futures contracts during the period is presented in the Statement of Operations.
Any open futures contracts at period end are presented in the Schedule of Investments under the caption "Futures Contracts". The notional amount at value reflects each contract's exposure to the underlying instrument or index at period end and is representative of volume of activity during the period. Securities deposited to meet initial margin requirements are identified in the Schedule of Investments.
4. Purchases and Sales of Investments.
Purchases and sales of securities, other than short-term securities, U.S. government securities and in-kind transactions, as applicable, are noted in the table below.
| Purchases ($) | Sales ($) | |
| Strategic Advisers Short Duration Fund | 1,210,111,051 | 952,889,949 |
5. Fees and Other Transactions with Affiliates.
Management Fee. Strategic Advisers (the investment adviser) provides the Fund with investment management related services. For these services, the Fund pays a monthly management fee to the investment adviser. The management fee is calculated by adding the annual management fee rate of .25% of the Fund's average net assets throughout the month to the aggregate of the fee rates, payable monthly by the investment adviser, to the Fund's sub-advisers. The Fund's maximum aggregate management fee will not exceed .55% of the Fund's average net assets. For the reporting period, the total annualized management fee rate was .29% of the Fund's average net assets.
During the period, the investment adviser waived a portion of its management fee as described in the Expense Reductions note.
Sub-Advisers. FIAM LLC (an affiliate of the investment adviser) and T. Rowe Price Associates, Inc. each served as a sub-adviser for the Fund during the period. Sub-advisers provide discretionary investment advisory services for their allocated portion of the Fund's assets and are paid as described in the Management Fee note.
Brokerage Commissions. A portion of portfolio transactions were placed with brokerage firms which are affiliates of the investment adviser. Brokerage commissions are included in net realized gain (loss) and change in net unrealized appreciation (depreciation) in the Statement of Operations. The commissions paid to these affiliated firms were as follows:
| Amount | |
| Strategic Advisers Short Duration Fund | $1,397 |
Interfund Trades. Funds may purchase from or sell securities to other funds affiliated with each sub-adviser under procedures adopted by the Board. The procedures have been designed to ensure these interfund trades are executed in accordance with Rule 17a-7 of the 1940 Act. During the period there were no interfund trades.
Prior Fiscal Year Reallocation of Underlying Fund Investments. During the prior period, the investment adviser reallocated investments of the Fund. This involved taxable redemptions of the Fund's interest in Fidelity Short-Term Bond Fund in exchange for shares of Fidelity SAI Short Term Bond Fund. The Fund redeemed 29,295,214 shares of Fidelity Short-Term Bond Fund in exchange for 25,893,567 shares of Fidelity SAI Short Term Bond Fund with a value of $258,676,739. The Fund had a net realized gain (loss) of $9,260,000 on the Fund's redemptions of Fidelity Short-Term Bond Fund shares which is included in the accompanying Statements of Changes in Net Assets. The Fund recognized net gains on the exchanges for federal income tax purposes.
6. Investments in Fidelity Central Funds.
Funds may invest in Fidelity Central Funds, which are open-end investment companies generally available only to other investment companies and accounts managed by the investment adviser and its affiliates. The Schedule of Investments lists any Fidelity Central Funds held as an investment as of period end, but does not include the underlying holdings of each Fidelity Central Fund. An investing fund indirectly bears its proportionate share of the expenses of the underlying Fidelity Central Funds.
Based on its investment objective, each Fidelity Central Fund may invest or participate in various investment vehicles or strategies that are similar to those of the investing fund. These strategies are consistent with the investment objectives of the investing fund and may involve certain economic risks which may cause a decline in value of each of the Fidelity Central Funds and thus a decline in the value of the investing fund.
| Fidelity Central Fund | Investment Manager | Investment Objective | Investment Practices | Expense Ratio(a) |
| Fidelity Money Market Central Funds | Fidelity Management & Research Company LLC (FMR) | Each fund seeks to obtain a high level of current income consistent with the preservation of capital and liquidity. | Short-term Investments | Less than .005% |
(a) Expenses expressed as a percentage of average net assets and are as of each underlying Central Fund's most recent annual or semi-annual shareholder report.
A complete unaudited list of holdings for each Fidelity Central Fund is available upon request or at the Securities and Exchange Commission website at www.sec.gov. In addition, the financial statements of the Fidelity Central Funds, which are not covered by the Report of Independent Registered Public Accounting Firm, are available on the Securities and Exchange Commission website or upon request.
7. Committed Line of Credit.
Certain Funds participate with other funds managed by the investment adviser or an affiliate in a $4.25 billion credit facility (the "line of credit") to be utilized for temporary or emergency purposes to fund shareholder redemptions or for other short-term liquidity purposes. The participating funds have agreed to pay commitment fees on their pro-rata portion of the line of credit, which are reflected in Miscellaneous expenses on the Statement of Operations, and are listed below. During the period, there were no borrowings on this line of credit.
| Amount | |
| Strategic Advisers Short Duration Fund | $5,094 |
8. Security Lending.
Funds lend portfolio securities from time to time in order to earn additional income. Lending agents are used, including National Financial Services (NFS), an affiliate of the investment adviser. Pursuant to a securities lending agreement, NFS will receive a fee, which is capped at 9.9% of a fund's daily lending revenue, for its services as lending agent. A fund may lend securities to certain qualified borrowers, including NFS. On the settlement date of the loan, a fund receives collateral (in the form of U.S. Treasury obligations, letters of credit and/or cash) against the loaned securities and maintains collateral in an amount not less than 100% of the market value of the loaned securities during the period of the loan. The market value of the loaned securities is determined at the close of business of a fund and any additional required collateral is delivered to a fund on the next business day. A fund or borrower may terminate the loan at any time, and if the borrower defaults on its obligation to return the securities loaned because of insolvency or other reasons, a fund may apply collateral received from the borrower against the obligation. A fund may experience delays and costs in recovering the securities loaned. Any cash collateral received is invested in the Fidelity Securities Lending Cash Central Fund. Any loaned securities are identified as such in the Schedule of Investments, and the value of loaned securities and cash collateral at period end, as applicable, are presented in the Statement of Assets and Liabilities. Security lending income represents the income earned on investing cash collateral, less rebates paid to borrowers and any lending agent fees associated with the loan, plus any premium payments received for lending certain types of securities. Security lending income is presented in the Statement of Operations as a component of income from Fidelity Central Funds. Affiliated security lending activity, if any, was as follows:
| Total Security Lending Fees Paid to NFS | Security Lending Income From Securities Loaned to NFS | Value of Securities Loaned to NFS at Period End | |
| Strategic Advisers Short Duration Fund | $2,314 | $– | $– |
9. Expense Reductions.
The investment adviser has contractually agreed to waive the Fund's management fee in an amount equal to .25% of the Fund's average net assets until September 30, 2024. During the period, this waiver reduced the Fund's management fee by $ 7,794,272.
Through arrangements with the Fund's custodian, credits realized as a result of certain uninvested cash balances were used to reduce the Fund's expenses by $11.
10. Other.
A fund's organizational documents provide former and current trustees and officers with a limited indemnification against liabilities arising in connection with the performance of their duties to the fund. In the normal course of business, a fund may also enter into contracts that provide general indemnifications. A fund's maximum exposure under these arrangements is unknown as this would be dependent on future claims that may be made against a fund. The risk of material loss from such claims is considered remote.
Funds do not invest in underlying mutual funds for the purpose of exercising management or control; however, investments by funds within their principal investment strategies may represent a significant portion of the underlying mutual fund's net assets. At the end of the period, certain Funds were the owners of record of 10% or more of the total outstanding shares of the following underlying mutual funds as shown below.
| Fund | Strategic Advisers Short Duration Fund |
| Fidelity SAI Short-Term Bond Fund | 15% |
11. Coronavirus (COVID-19) Pandemic.
An outbreak of COVID-19 first detected in China during December 2019 has since spread globally and was declared a pandemic by the World Health Organization during March 2020. Developments that disrupt global economies and financial markets, such as the COVID-19 pandemic, may magnify factors that affect the Fund's performance.
Shareholder Expense Example
As a shareholder, you incur two types of costs: (1) transaction costs, which may include sales charges (loads) on purchase payments or redemption proceeds, as applicable and (2) ongoing costs, which generally include management fees, distribution and/or service (12b-1) fees and other Fund expenses. This Example is intended to help you understand your ongoing costs (in dollars) of investing in a fund and to compare these costs with the ongoing costs of investing in other mutual funds.
The Example is based on an investment of $1,000 invested at the beginning of the period and held for the entire period (June 1, 2021 to November 30, 2021).
Actual Expenses
The first line of the accompanying table provides information about actual account values and actual expenses. You may use the information in this line, together with the amount you invested, to estimate the expenses that you paid over the period. Simply divide your account value by $1,000.00 (for example, an $8,600 account value divided by $1,000.00 = 8.6), then multiply the result by the number in the first line for a class/Fund under the heading entitled "Expenses Paid During Period" to estimate the expenses you paid on your account during this period. If any fund is a shareholder of any underlying mutual funds or exchange-traded funds (ETFs) (the Underlying Funds), such fund indirectly bears its proportional share of the expenses of the Underlying Funds in addition to the direct expenses incurred presented in the table. These fees and expenses are not included in the annualized expense ratio used to calculate the expense estimate in the table below.
Hypothetical Example for Comparison Purposes
The second line of the accompanying table provides information about hypothetical account values and hypothetical expenses based on the actual expense ratio and an assumed rate of return of 5% per year before expenses, which is not the actual return. The hypothetical account values and expenses may not be used to estimate the actual ending account balance or expenses you paid for the period. You may use this information to compare the ongoing costs of investing in the Fund and other funds. To do so, compare this 5% hypothetical example with the 5% hypothetical examples that appear in the shareholder reports of the other funds. If any fund is a shareholder of any Underlying Funds, such fund indirectly bears its proportional share of the expenses of the Underlying Funds in addition to the direct expenses as presented in the table. These fees and expenses are not included in the annualized expense ratio used to calculate the expense estimate in the table below.
Please note that the expenses shown in the table are meant to highlight your ongoing costs only and do not reflect any transaction costs. Therefore, the second line of the table is useful in comparing ongoing costs only, and will not help you determine the relative total costs of owning different funds. In addition, if these transactional costs were included, your costs would have been higher.
| Annualized Expense Ratio-A | Beginning Account Value June 1, 2021 | Ending Account Value November 30, 2021 | Expenses Paid During Period-B June 1, 2021 to November 30, 2021 | |
| Strategic Advisers Short Duration Fund | .05% | |||
| Actual | $1,000.00 | $998.20 | $.25 | |
| Hypothetical-C | $1,000.00 | $1,024.82 | $.25 |
A Annualized expense ratio reflects expenses net of applicable fee waivers.
B Expenses are equal to the annualized expense ratio, multiplied by the average account value over the period, multiplied by 183/ 365 (to reflect the one-half year period). The fees and expenses of any Underlying Funds are not included in each annualized expense ratio.
C 5% return per year before expenses
Board Approval of Investment Advisory Contracts and Management Fees
Strategic Advisers Short Duration Fund
Each year, the Board of Trustees, including the Independent Trustees (together, the Board), votes at a meeting on the renewal of the management contract with Strategic Advisers LLC (Strategic Advisers), the sub-advisory agreements with FIAM LLC and T. Rowe Price Associates, Inc. (each a Sub-Adviser and collectively, the Sub-Advisers) (collectively, the Sub-Advisory Agreements), and the sub-sub-advisory agreements with FMR Investment Management (UK) Limited, Fidelity Management & Research (Japan) Limited, and Fidelity Management & Research (Hong Kong) Limited (collectively, the Sub-Sub-Advisory Agreements and, together with the management contract and the Sub-Advisory Agreements, the Advisory Contracts) for the fund. Strategic Advisers and the Sub-Advisers are referred to herein as the Investment Advisers. The Board, assisted by the advice of fund counsel and Independent Trustees' counsel, requests and considers a broad range of information relevant to the renewal of the Advisory Contracts throughout the year.The Board meets at least four times per year and, at each of its meetings, covers an extensive agenda of topics and materials and considers factors that are relevant to its annual consideration of the renewal of the fund's Advisory Contracts, including the services and support provided to the fund and its shareholders. The full Board or the Independent Trustees, as appropriate, act on all major matters; however, a portion of the activities of the Board (including certain of those described herein) may be conducted through standing committees that have been established by the Board. The Board, acting directly and through its committees, requests and receives information concerning the annual consideration of the renewal of the fund's Advisory Contracts.At its September 2021 meeting, the Board, including the Independent Trustees, unanimously determined to renew the fund's Advisory Contracts. In reaching its determination to renew the fund's Advisory Contracts, the Board considered all factors it believed relevant, including (i) the nature, extent, and quality of the services provided to the fund and its shareholders (including the investment performance of the fund); (ii) the competitiveness relative to peer funds of the fund's management fee and total expenses; (iii) the total costs of the services provided by and the profits, if any, realized by Strategic Advisers from its relationships with the fund; and (iv) the extent to which, if any, economies of scale exist and are realized as the fund grows and whether any economies of scale are appropriately shared with fund shareholders.In considering whether to renew the Advisory Contracts for the fund, the Board reached a determination, with the assistance of fund counsel and Independent Trustees' counsel and through the exercise of its business judgment, that the renewal of the Advisory Contracts is in the best interests of the fund and its shareholders. In addition, the Board concluded that the renewal of each Sub-Advisory Agreement does not involve a conflict of interest from which Strategic Advisers or its affiliates derive an inappropriate advantage. Also, the Board found that the advisory fees charged under the Advisory Contracts bear a reasonable relationship to the services rendered and are based on services provided that are in addition to, rather than duplicative of, services provided under the advisory contract of any underlying fund in which the fund may invest. The Board's decision to renew the Advisory Contracts was not based on any single factor, but rather was based on a comprehensive consideration of all the information provided to the Board throughout the year.Nature, Extent, and Quality of Services Provided. The Board considered the staffing within the Investment Advisers, including the backgrounds of the fund's investment personnel and also considered the fund's investment objective, strategies, and related investment philosophy. The Independent Trustees also had discussions with senior management of Strategic Advisers' investment operations and investment groups. The Board considered the structure of each Investment Adviser's investment personnel compensation program and whether such structures provide appropriate incentives to act in the best interests of the fund. The Board also considered steps taken by the Investment Advisers to continue to provide the same nature, extent, and quality of services to the funds during the COVID-19 pandemic.The Trustees also discussed with representatives of Strategic Advisers, at meetings throughout the year, Strategic Advisers' role in, among other things, (i) setting, implementing and monitoring the investment strategies for the funds; (ii) identifying and recommending sub-advisers for the funds; (iii) overseeing compliance with federal securities laws by each sub-adviser with respect to the portion of fund assets allocated to the sub-adviser; (iv) monitoring and overseeing the performance and investment capabilities of each sub-adviser; and (v) recommending the replacement of a sub-adviser as appropriate. The Trustees considered that the Board had received from Strategic Advisers substantial information and periodic reports about Strategic Advisers' sub-adviser oversight and due diligence processes, as well as periodic reports regarding the performance of each sub-adviser.The Board also considered the nature, extent and quality of services provided by each Sub-Adviser. The Trustees noted that under the Sub-Advisory Agreements subject to oversight by Strategic Advisers, each Sub-Adviser is responsible for, among other things, identifying investments for the portion of fund assets allocated to the Sub-Adviser, if any, and executing portfolio transactions to implement its investment strategy. In addition, the Trustees noted that each Sub-Adviser is responsible for providing such reporting as may be requested from Strategic Advisers to fulfill its oversight responsibilities discussed above.Resources Dedicated to Investment Management and Support Services. The Board reviewed the general qualifications and capabilities of the Investment Advisers' investment staffs, their use of technology, and the Investment Advisers' approach to managing and compensating investment personnel. The Board noted that the Investment Advisers' analysts have extensive resources, tools, and capabilities that allow them to conduct sophisticated quantitative and/or fundamental analysis. Additionally, in its deliberations, the Board considered the Investment Advisers' trading capabilities and resources and global compliance infrastructure, which are integral parts of the investment management process.Shareholder and Administrative Services. The Board considered (i) the nature, extent, quality, and cost of administrative and shareholder services performed by Strategic Advisers and its affiliates under the management contract and under separate agreements covering transfer agency, pricing and bookkeeping, and securities lending services for the fund; (ii) the nature and extent of Strategic Advisers' supervision of third party service providers, including sub-advisers, custodians and subcustodians; and (iii) the resources devoted to, and the record of compliance with, the fund's compliance policies and procedures.Investment Performance. The Board considered whether the fund has operated in accordance with its investment objective, as well as its record of compliance with its investment restrictions and its performance history.In connection with the renewal of the Advisory Contracts, the Board considered annualized return information for the fund for different time periods, measured against an appropriate securities market index (benchmark index) and a peer group of mutual funds with similar objectives (peer group).The Board considered discussions that occur at Board meetings throughout the year with representatives of Strategic Advisers about fund investment performance and the performance of each Sub-Adviser as part of regularly scheduled fund reviews and other reports to the Board on fund performance, taking into account various factors including general market conditions. In its discussions with representatives of Strategic Advisers regarding fund performance, the Board gave particular attention to information indicating underperformance of certain funds for specific time periods and discussed with Strategic Advisers the reasons for any such underperformance.The following charts considered by the Board show, over the one-, three-, and five-year periods ended December 31, 2020, the cumulative total returns of the fund and the cumulative total returns of an appropriate benchmark index and peer group. The box within each chart shows the 25th percentile return (75% beaten, top of box) and the 75th percentile return (25% beaten, bottom of box) of the peer group. Returns shown above the box are in the first quartile and returns shown below the box are in the fourth quartile. The percentage beaten number noted below each chart corresponds to the percentile box and represents the percentage of funds in the peer group whose performance was equal to or lower than that of the fund.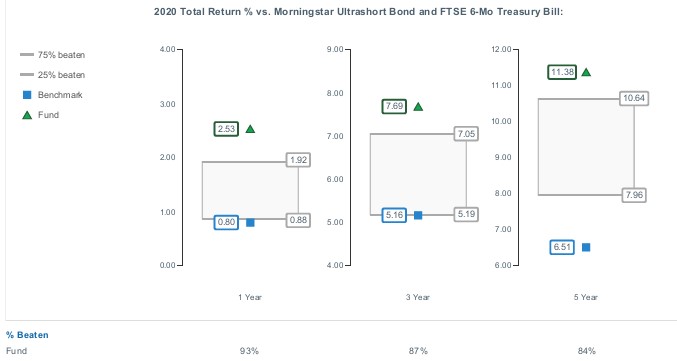
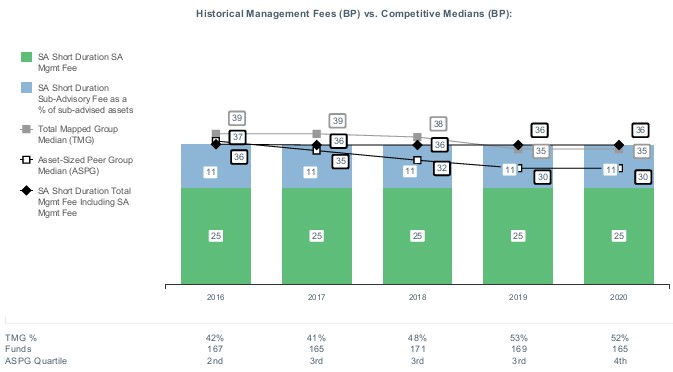
![]()
ASD-SANN-0122
1.934461.109
Strategic Advisers® Tax-Sensitive Short Duration Fund
Offered exclusively to certain managed account clients of Strategic Advisers LLC or its affiliates - not available for sale to the general public
Semi-Annual Report
November 30, 2021
Contents
Board Approval of Investment Advisory Contracts and Management Fees |
To view a fund's proxy voting record for the 12-month period ended June 30, visit http://www.fidelity.com/proxyvotingresults or visit the Securities and Exchange Commission's (SEC) web site at http://www.sec.gov.
You may also call 1-800-544-3455 to request a free copy of the proxy voting guidelines.
Standard & Poor's, S&P and S&P 500 are registered service marks of The McGraw-Hill Companies, Inc. and have been licensed for use by Fidelity Distributors Corporation.
Other third-party marks appearing herein are the property of their respective owners.
All other marks appearing herein are registered or unregistered trademarks or service marks of FMR LLC or an affiliated company. © 2022 FMR LLC. All rights reserved.
This report and the financial statements contained herein are submitted for the general information of the shareholders of the Fund. This report is not authorized for distribution to prospective investors in the Fund unless preceded or accompanied by an effective prospectus.
A fund files its complete schedule of portfolio holdings with the SEC for the first and third quarters of each fiscal year on Form N-PORT. Forms N-PORT are available on the SEC’s web site at http://www.sec.gov. A fund's Forms N-PORT may be reviewed and copied at the SEC’s Public Reference Room in Washington, DC. Information regarding the operation of the SEC's Public Reference Room may be obtained by calling 1-800-SEC-0330.
For a complete list of a fund's portfolio holdings, view the most recent holdings listing, semiannual report, or annual report on Fidelity's web site at http://www.fidelity.com, http://www.institutional.fidelity.com, or http://www.401k.com, as applicable.
NOT FDIC INSURED •MAY LOSE VALUE •NO BANK GUARANTEE
Neither the Fund nor Fidelity Distributors Corporation is a bank.
Note to Shareholders:
Early in 2020, the outbreak and spread of COVID-19 emerged as a public health emergency that had a major influence on financial markets, primarily based on its impact on the global economy and corporate earnings. On March 11, 2020, the World Health Organization declared the COVID-19 outbreak a pandemic, citing sustained risk of further global spread. The pandemic prompted a number of measures to limit the spread of COVID-19, including travel and border restrictions, quarantines, and restrictions on large gatherings. In turn, these resulted in lower consumer activity, diminished demand for a wide range of products and services, disruption in manufacturing and supply chains, and – given the wide variability in outcomes regarding the outbreak – significant market uncertainty and volatility. To help stem the turmoil, the U.S. government took unprecedented action – in concert with the U.S. Federal Reserve and central banks around the world – to help support consumers, businesses, and the broader economy, and to limit disruption to the financial system.
In general, the overall impact of the pandemic lessened in 2021, amid a resilient economy and widespread distribution of three COVID-19 vaccines granted emergency use authorization from the U.S. Food and Drug Administration (FDA) early in the year. Still, the situation remains dynamic, and the extent and duration of its influence on financial markets and the economy is highly uncertain, due in part to a recent spike in cases based on highly contagious variants of the coronavirus.
Extreme events such as the COVID-19 crisis are exogenous shocks that can have significant adverse effects on mutual funds and their investments. Although multiple asset classes may be affected by market disruption, the duration and impact may not be the same for all types of assets. Fidelity is committed to helping you stay informed amid news about COVID-19 and during increased market volatility, and we continue to take extra steps to be responsive to customer needs. We encourage you to visit us online, where we offer ongoing updates, commentary, and analysis on the markets and our funds.
Investment Summary (Unaudited)
The information in the following tables is based on the direct investments of the Fund.Top Ten Holdings as of November 30, 2021
| (by issuer, excluding cash equivalents) | % of fund's net assets |
| JPMorgan Ultra-Short Municipal Fund Class I | 8.4 |
| Vanguard Short-Term Tax-Exempt Fund Admiral Shares | 4.7 |
| New York Metropolitan Transportation Authority Rev. | 2.1 |
| Federated Hermes Municipal Ultrashort Fund Institutional Shares | 1.1 |
| Saint James Parish Gen. Oblig. | 1.0 |
| New York City Gen. Oblig. | 0.9 |
| Illinois Gen. Oblig. | 0.9 |
| Denver City & County Airport Rev. | 0.9 |
| Main Street Natural Gas, Inc. | 0.7 |
| Harris County Cultural Education Facilities Finance Corp. Rev. | 0.7 |
Top Five Sectors as of November 30, 2021
| % of fund's net assets | |
| General Obligations | 12.8 |
| Transportation | 10.7 |
| Synthetics | 8.2 |
| Health Care | 6.9 |
| Other | 4.9 |
Quality Diversification (% of fund's net assets)
| As of November 30, 2021 | ||
| AAA,AA,A | 34.8% | |
| BBB | 6.1% | |
| Not Rated | 2.1% | |
| Equities | 14.3% | |
| Short-Term Investments and Net Other Assets | 42.7% | |

We have used ratings from Moody’s Investors Service, Inc. Where Moody’s® ratings are not available, we have used S&P® ratings. All ratings are as of the date indicated and do not reflect subsequent changes.
Asset Allocation (% of fund's net assets)
| As of November 30, 2021 | ||
| Municipal Bond Funds | 0.1% | |
| Short-Term Funds | 14.2% | |
| Municipal Bonds | 24.7% | |
| Short-Term Investments and Net Other Assets (Liabilities) | 61.0% | |

Schedule of Investments November 30, 2021 (Unaudited)
Showing Percentage of Net Assets
| Municipal Bonds - 42.7% | |||
| Principal Amount | Value | ||
| Alabama - 0.6% | |||
| Alabama Pub. School & College Auth. Rev. Series 2020 A: | |||
| 5% 11/1/22 | $1,500,000 | $1,566,397 | |
| 5% 11/1/24 | 1,500,000 | 1,701,509 | |
| Alabama Spl. Care Facilities Fing. Auth. Birmingham Rev. Bonds Series 2006 C1, 1.85%, tender 11/1/22 (a) | 1,025,000 | 1,040,234 | |
| Birmingham Arpt. Auth. Arpt. Series 2020: | |||
| 5% 7/1/24 (Build America Mutual Assurance Insured) | 325,000 | 362,867 | |
| 5% 7/1/25 (Build America Mutual Assurance Insured) | 325,000 | 376,061 | |
| Black Belt Energy Gas District: | |||
| (Proj. No. 4) Series 2019 A, 4% 6/1/23 | 1,750,000 | 1,841,376 | |
| (Proj. No. 6) Series 2021 B: | |||
| 4% 12/1/22 | 500,000 | 517,712 | |
| 4% 12/1/23 | 1,250,000 | 1,335,430 | |
| 4% 12/1/24 | 1,250,000 | 1,372,206 | |
| Bonds: | |||
| Series 2017 A, 4%, tender 7/1/22 (a) | 4,750,000 | 4,832,467 | |
| Series 2021 B, 4%, tender 10/1/52 | 2,850,000 | 3,253,343 | |
| Series 2021 A: | |||
| 4% 12/1/21 | 435,000 | 435,000 | |
| 4% 6/1/22 | 340,000 | 346,181 | |
| 4% 12/1/22 | 470,000 | 486,985 | |
| 4% 6/1/23 | 400,000 | 421,318 | |
| 4% 12/1/23 | 435,000 | 465,540 | |
| Chatom Indl. Dev. Board Gulf Opportunity Zone Series 2020, 5% 8/1/23 (FSA Insured) | 1,350,000 | 1,449,552 | |
| Health Care Auth. for Baptist Health Series 2006 B, 0.25%, tender 11/15/37 (a) | 1,325,000 | 1,325,000 | |
| Lower Alabama Gas District (No. 2 Proj.) Series 2020, 4% 12/1/21 | 100,000 | 100,000 | |
| Mobile County Board of School Commissioners: | |||
| Series 2016 A: | |||
| 5% 3/1/22 | 15,000 | 15,175 | |
| 5% 3/1/23 | 20,000 | 21,117 | |
| 5% 3/1/24 | 25,000 | 27,543 | |
| 5% 3/1/25 | 25,000 | 28,541 | |
| Series 2016 B: | |||
| 5% 3/1/22 | 80,000 | 80,935 | |
| 5% 3/1/23 | 405,000 | 427,625 | |
| 5% 3/1/24 | 45,000 | 49,578 | |
| Mobile Indl. Dev. Board Poll. Cont. Rev. Bonds Series 2009 E, 1%, tender 6/26/25 (a) | 600,000 | 605,477 | |
| Montgomery Med. Clinic Facilities Series 2015, 5% 3/1/22 | 70,000 | 70,691 | |
| Southeast Alabama Gas Supply District Bonds: | |||
| (Proj. No. 2) Series 2018 A, 4%, tender 6/1/24 (a) | 1,695,000 | 1,826,345 | |
| Series 2018 A, 4%, tender 4/1/24 (a) | 4,000,000 | 4,293,768 | |
| Southeast Energy Auth. Rev. Bonds: | |||
| (Proj. No. 1) Series 2021 A: | |||
| 4% 10/1/22 | 355,000 | 365,295 | |
| 4% 10/1/23 | 425,000 | 450,960 | |
| (Proj. No. 2) Series 2021 B1: | |||
| 4% 6/1/22 | 770,000 | 783,921 | |
| 4% 6/1/23 | 1,500,000 | 1,579,016 | |
| 4% 6/1/24 | 1,090,000 | 1,181,544 | |
| 4% 6/1/25 | 300,000 | 333,470 | |
| Univ. of South Alabama Univ. Rev. Series 2021, 4% 4/1/26 | 500,000 | 568,384 | |
| TOTAL ALABAMA | 35,938,563 | ||
| Alaska - 0.3% | |||
| Alaska Hsg. Fin. Corp. Series 2021 A: | |||
| 3% 12/1/23 | 450,000 | 473,951 | |
| 3% 6/1/24 | 400,000 | 425,855 | |
| Alaska Hsg. Fin. Corp. Mtg. Rev. Series 2020 A: | |||
| 0.3% 12/1/21 | 665,000 | 665,000 | |
| 0.35% 6/1/22 | 660,000 | 660,336 | |
| 0.4% 12/1/22 | 750,000 | 750,551 | |
| Alaska Int'l. Arpts. Revs.: | |||
| Series 2016 C: | |||
| 5% 10/1/22 (b) | 1,605,000 | 1,668,535 | |
| 5% 10/1/23 (b) | 425,000 | 461,043 | |
| Series 2021 C, 5% 10/1/23 (b) | 1,525,000 | 1,654,333 | |
| Alaska Muni. Bond Bank: | |||
| Series 1, 5% 12/1/21 | 1,000,000 | 1,000,000 | |
| Series 2021 1, 5% 12/1/22 | 2,190,000 | 2,293,627 | |
| Anchorage Gen. Oblig.: | |||
| Series B, 5% 9/1/22 | 30,000 | 31,079 | |
| Series C, 5% 9/1/22 | 20,000 | 20,722 | |
| Northern Tobacco Securitization Corp. Tobacco Settlement Rev. Series 2021 A: | |||
| 3% 6/1/22 | 600,000 | 607,793 | |
| 4% 6/1/23 | 1,000,000 | 1,053,430 | |
| 5% 6/1/24 | 1,000,000 | 1,111,734 | |
| 5% 6/1/25 | 715,000 | 822,366 | |
| 5% 6/1/26 | 1,000,000 | 1,185,963 | |
| TOTAL ALASKA | 14,886,318 | ||
| Arizona - 1.5% | |||
| Arizona Board of Regents Arizona State Univ. Rev.: | |||
| Series 2015 B, 5% 7/1/26 | 790,000 | 913,812 | |
| Series 2021: | |||
| 5% 8/1/24 | 1,000,000 | 1,123,178 | |
| 5% 8/1/25 | 700,000 | 814,436 | |
| Arizona Board of Regents Ctfs. of Prtn. Series 2015 A, 5% 6/1/22 | 150,000 | 153,548 | |
| Arizona Ctfs. of Prtn. Series 2019 A: | |||
| 5% 10/1/24 (Escrowed to Maturity) | 195,000 | 220,303 | |
| 5% 10/1/25 (Escrowed to Maturity) | 570,000 | 667,574 | |
| Arizona Health Facilities Auth. Rev.: | |||
| (Scottsdale Lincoln Hospitals Proj.) Series 2014 A: | |||
| 5% 12/1/21 | 25,000 | 25,000 | |
| 5% 12/1/22 | 15,000 | 15,714 | |
| 5% 12/1/23 | 20,000 | 21,852 | |
| 5% 12/1/24 | 45,000 | 51,091 | |
| Bonds Series 2013 A3, SIFMA Municipal Swap Index + 1.850% 1.9%, tender 2/1/23 (a)(c) | 2,000,000 | 2,017,988 | |
| Series 2015 A: | |||
| 5% 1/1/22 | 370,000 | 371,436 | |
| 5% 1/1/23 | 160,000 | 168,224 | |
| Arizona Indl. Dev. Auth. Hosp. Rev.: | |||
| Series 2020 A: | |||
| 5% 2/1/24 | 600,000 | 659,290 | |
| 5% 2/1/26 | 750,000 | 883,370 | |
| Series 2021 A, 5% 2/1/23 | 1,000,000 | 1,054,411 | |
| Arizona State Univ. Ctfs. of Partnership (Arizona State Univ. Projs.) Series 2013 A, 5% 9/1/25 | 1,085,000 | 1,170,421 | |
| Bullhead City Excise Taxes Series 2021 2, 0.75% 7/1/25 | 325,000 | 323,040 | |
| Chandler Indl. Dev. Auth. Indl. Dev. Rev. Bonds (Intel Corp. Proj.): | |||
| Series 2005, 2.4%, tender 8/14/23 (a) | 5,100,000 | 5,265,101 | |
| Series 2007, 2.7%, tender 8/14/23 (a)(b) | 6,820,000 | 7,065,930 | |
| Series 2019, 5%, tender 6/3/24 (a)(b) | 7,610,000 | 8,411,042 | |
| Coconino County Poll. Cont. Corp. Rev. Bonds: | |||
| Series 2017 A, 1.875%, tender 3/31/23 (a)(b) | 1,145,000 | 1,164,791 | |
| Series 2017 B, 1.65%, tender 3/31/23 (a) | 1,020,000 | 1,036,368 | |
| Glendale Union School District 205 Series A: | |||
| 5% 7/1/24 (FSA Insured) | 225,000 | 251,092 | |
| 5% 7/1/25 (FSA Insured) | 225,000 | 260,176 | |
| Glendale Gen. Oblig.: | |||
| Series 2015, 5% 7/1/22 (FSA Insured) | 20,000 | 20,560 | |
| Series 2017, 5% 7/1/22 | 75,000 | 77,100 | |
| Glendale Trans. Excise Tax Rev. Series 2015: | |||
| 5% 7/1/22 (FSA Insured) | 25,000 | 25,700 | |
| 5% 7/1/23 (FSA Insured) | 30,000 | 32,230 | |
| Maricopa County Indl. Dev. Auth. Series 2019 A, 5% 9/1/23 | 365,000 | 394,939 | |
| Maricopa County Rev.: | |||
| Bonds: | |||
| Series 2019 B, SIFMA Municipal Swap Index + 0.380% 0.43%, tender 12/2/21 (a)(c) | 4,065,000 | 4,066,535 | |
| Series B, 5%, tender 10/18/22 (a) | 2,980,000 | 3,103,782 | |
| Series 2016 A: | |||
| 4% 1/1/24 | 115,000 | 123,640 | |
| 5% 1/1/25 | 105,000 | 119,534 | |
| Maricopa County Spl. Health Care District Gen. Oblig. Series 2021 D, 5% 7/1/25 | 1,000,000 | 1,154,412 | |
| Maricopa County Unified School District #48 Scottsdale Series D, 4% 7/1/23 | 500,000 | 529,611 | |
| Mesa Util. Sys. Rev.: | |||
| Series 2016, 5% 7/1/25 | 1,015,000 | 1,177,213 | |
| Series 2020, 5% 7/1/24 | 635,000 | 710,731 | |
| Phoenix Civic Impt. Board Arpt. Rev.: | |||
| Series 2017 A: | |||
| 5% 7/1/22 (b) | 715,000 | 734,891 | |
| 5% 7/1/24 (b) | 1,020,000 | 1,134,102 | |
| Series 2017 D: | |||
| 5% 7/1/22 | 940,000 | 966,038 | |
| 5% 7/1/24 | 250,000 | 279,334 | |
| Series 2018, 5% 7/1/23 (b) | 1,100,000 | 1,181,395 | |
| Series 2019 B: | |||
| 5% 7/1/22 (b) | 725,000 | 744,780 | |
| 5% 7/1/23 (b) | 1,000,000 | 1,072,839 | |
| Phoenix Civic Impt. Corp. Wtr. Sys. Rev. Series 2014 B, 5% 7/1/27 | 400,000 | 446,606 | |
| Phoenix Indl. Solid Waste Disp. Rev. Bonds (Republic Svc., Inc. Proj.) Series 2013, 0.2%, tender 2/1/22 (a)(b) | 23,880,000 | 23,879,988 | |
| Pima County Ctfs. of Prtn.: | |||
| Series 2014: | |||
| 5% 12/1/21 | 50,000 | 50,000 | |
| 5% 12/1/22 | 130,000 | 136,259 | |
| 5% 12/1/23 | 75,000 | 81,976 | |
| Series 2019, 5% 12/1/26 | 1,120,000 | 1,347,107 | |
| Pima County Swr. Sys. Rev. Series 2020 A, 5% 7/1/23 | 270,000 | 290,202 | |
| Salt River Proj. Agricultural Impt. & Pwr. District Elec. Sys. Rev. Series 2011 A, 5% 12/1/22 | 1,000,000 | 1,000,000 | |
| Tucson Ctfs. of Prtn. Series 2015: | |||
| 5% 7/1/22 (FSA Insured) | 290,000 | 298,154 | |
| 5% 7/1/23 (FSA Insured) | 200,000 | 215,031 | |
| Yavapai County Indl. Dev. Auth.: | |||
| Series 2016, 5% 8/1/23 | 275,000 | 295,996 | |
| Series 2019: | |||
| 5% 8/1/22 | 425,000 | 438,364 | |
| 5% 8/1/23 | 355,000 | 382,104 | |
| Yuma Pledged Rev. Series 2021: | |||
| 4% 7/1/24 | 300,000 | 326,781 | |
| 4% 7/1/25 | 505,000 | 564,175 | |
| TOTAL ARIZONA | 81,511,297 | ||
| Arkansas - 0.1% | |||
| Arkansas Dev. Fin. Auth. Multi-family Hsg. Rev. (NLR Rad Family Homes Proj.) Series 2020, 1.2%, tender 9/1/22 (a) | 5,000,000 | 5,031,621 | |
| Arkansas Dev. Fin. Auth. Pub. Safety Charges (Arkansas Division of Emergency Mgmt. Proj.) Series 2020, 5% 6/1/24 | 565,000 | 627,926 | |
| Batesville Pub. Facilities Board Series 2020: | |||
| 5% 6/1/22 | 590,000 | 601,832 | |
| 5% 6/1/23 | 790,000 | 836,536 | |
| TOTAL ARKANSAS | 7,097,915 | ||
| California - 2.8% | |||
| ABC Unified School District Series 2001 C, 0% 8/1/25 (FGIC Insured) (Nat'l. Pub. Fin. Guarantee Corp. Insured) | 2,035,000 | 1,984,136 | |
| Bay Area Toll Auth. San Francisco Bay Toll Bridge Rev. Bonds: | |||
| Series 2017 G, 2%, tender 4/1/24 (a) | 1,120,000 | 1,150,613 | |
| Series 2021 B, 0.280% x SIFMA Municipal Swap Index 0.33%, tender 4/1/24 (a)(c) | 2,500,000 | 2,504,233 | |
| Series A, 2.95%, tender 4/1/26 (a) | 115,000 | 124,068 | |
| Series B, 2.85%, tender 4/1/25 (a) | 95,000 | 101,422 | |
| Burbank Glendale Pasadena Arpt. Auth. Rev. Series B, 5% 7/1/23 (b) | 1,290,000 | 1,383,749 | |
| California Gen. Oblig.: | |||
| Bonds Series 2013, SIFMA Municipal Swap Index + 0.380% 0.43%, tender 12/1/21 (a)(c) | 3,270,000 | 3,270,000 | |
| Series 2011, 5.25% 9/1/22 | 35,000 | 36,335 | |
| Series 2015, 5% 3/1/23 | 310,000 | 328,522 | |
| Series 2020: | |||
| 5% 3/1/22 | 3,180,000 | 3,218,390 | |
| 5% 11/1/24 | 500,000 | 567,013 | |
| Series 2021: | |||
| 4% 12/1/22 | 4,150,000 | 4,308,463 | |
| 5% 12/1/22 | 4,000,000 | 4,192,574 | |
| 5% 9/1/23 | 1,000,000 | 1,082,209 | |
| 5% 12/1/23 | 2,000,000 | 2,187,277 | |
| 5% 12/1/24 | 565,000 | 642,752 | |
| California Health Facilities Fing. Auth. Rev.: | |||
| Bonds: | |||
| (Stanford Hosp. & Clinics Proj.) Series 2008 B2, 0.12%, tender 3/2/22 (a) | 1,700,000 | 1,700,000 | |
| Series 2009 C, 5%, tender 10/18/22 (a) | 970,000 | 1,010,819 | |
| Series 2017 A, 5%, tender 11/1/22 (a) | 210,000 | 219,236 | |
| Series 2017 C, 5%, tender 11/1/22 (a) | 1,185,000 | 1,237,118 | |
| Series 2021 A, 3%, tender 8/15/25 (a) | 2,000,000 | 2,181,109 | |
| Series 2013 A, 5% 3/1/22 | 375,000 | 379,461 | |
| Series 2015, 5% 11/15/23 | 200,000 | 218,535 | |
| Series 2018 A, 5% 11/15/22 | 195,000 | 203,879 | |
| California Infrastructure and Econ. Dev. Bank Rev. Bonds: | |||
| (Brightline West Passenger Rail Proj.) Series 2020 A, 0.2%, tender 1/1/22 (a)(b)(d) | 10,430,000 | 10,429,302 | |
| Series 2021 B1, 0.39%, tender 1/1/24 (a) | 1,000,000 | 999,145 | |
| California Muni. Fin. Auth. Solid Waste Disp. Rev. Bonds: | |||
| (Republic Svcs., Inc. Proj.): | |||
| Series 2021 A, 0.3%, tender 4/1/22 (a)(b) | 4,200,000 | 4,201,416 | |
| Series 2021 B, 0.3%, tender 1/18/22 (a)(b) | 4,100,000 | 4,100,633 | |
| (Waste Mgmt., Inc. Proj.): | |||
| Series 2017 A, 0.7%, tender 12/1/23 (a)(b) | 1,600,000 | 1,605,397 | |
| Series 2020, 0.15%, tender 12/1/21 (a)(b) | 3,000,000 | 3,000,000 | |
| California Muni. Fin. Auth. Student Hsg. (CHF Davis II, L.L.C. Orchard Park Student Hsg. Proj.) Series 2021, 5% 5/15/24 (Build America Mutual Assurance Insured) | 500,000 | 553,451 | |
| California Poll. Cont. Fing. Auth. Solid Waste Disp. Rev. Bonds (Republic Svcs., Inc. Proj.): | |||
| Series 2017 A1, 0.18%, tender 1/18/22 (a)(b)(d) | 1,150,000 | 1,150,002 | |
| Series 2017 A2, 0.18%, tender 1/15/22 (a)(b)(d) | 7,750,000 | 7,750,012 | |
| California Pub. Fin. Auth. Rev. Series 2021 A: | |||
| 4% 10/15/23 | 285,000 | 302,589 | |
| 4% 10/15/24 | 380,000 | 414,793 | |
| California Pub. Works Board Lease Rev.: | |||
| (Various Cap. Projs.): | |||
| Series 2021 B, 5% 5/1/24 | 1,095,000 | 1,216,742 | |
| Series 2022 C, 5% 8/1/23 (e) | 1,030,000 | 1,067,045 | |
| Series 2014 B, 5% 10/1/25 | 350,000 | 394,589 | |
| California School Cash Reserve Prog. Auth. Series 2021 L, 2% 1/31/22 | 7,000,000 | 7,020,857 | |
| California Statewide Cmntys. Dev. Auth. Series 2021, 4% 5/15/23 | 1,300,000 | 1,367,528 | |
| California Statewide Cmntys. Dev. Auth. Rev. Series 2007: | |||
| 0.18%, tender 7/1/41 (FSA Insured) (a) | 4,475,000 | 4,475,000 | |
| 0.22%, tender 7/1/40 (FSA Insured) (a) | 4,275,000 | 4,275,000 | |
| Cathedral City Redev. Agcy. (Merged Redev. Proj.) Series 2021 C: | |||
| 4% 8/1/22 | 200,000 | 204,273 | |
| 4% 8/1/23 | 225,000 | 237,099 | |
| Golden State Tobacco Securitization Corp. Tobacco Settlement Rev.: | |||
| Series 2017 A1: | |||
| 5% 6/1/22 | 40,000 | 40,927 | |
| 5% 6/1/23 | 45,000 | 48,093 | |
| 5% 6/1/24 | 25,000 | 27,815 | |
| Series A, 0% 6/1/24 (Escrowed to Maturity) | 75,000 | 74,151 | |
| Long Beach Hbr. Rev. Series 2020 B, 5% 5/15/24 (b) | 1,225,000 | 1,355,004 | |
| Los Angeles Dept. Arpt. Rev.: | |||
| Series 2016 A, 5% 5/15/22 (b) | 250,000 | 255,353 | |
| Series 2016 B, 5% 5/15/26 (b) | 135,000 | 159,847 | |
| Series 2017 A, 5% 5/15/24 (b) | 430,000 | 476,413 | |
| Series 2017 B, 5% 5/15/23 (b) | 800,000 | 853,966 | |
| Series 2018 D, 5% 5/15/22 (b) | 200,000 | 204,282 | |
| Series 2019 A, 5% 5/15/24 (b) | 375,000 | 415,477 | |
| Series 2019 D, 5% 5/15/24 (b) | 415,000 | 459,794 | |
| Series 2019 E, 4% 5/15/24 | 200,000 | 217,799 | |
| Series 2019 F, 5% 5/15/24 (b) | 2,610,000 | 2,891,718 | |
| Series 2020 C, 5% 5/15/24 (b) | 250,000 | 277,309 | |
| Series F, 5% 5/15/22 (b) | 1,700,000 | 1,736,398 | |
| Los Angeles Dept. of Wtr. & Pwr. Rev. Series 2018 B, 4% 1/1/22 | 200,000 | 200,000 | |
| Los Angeles Hbr. Dept. Rev. Series 2019 A, 5% 8/1/22 (b) | 1,175,000 | 1,212,187 | |
| Los Angeles Reg'l. Arpts. Impt. Rev. Series 2012, 4.5% 1/1/27 (b) | 375,000 | 376,181 | |
| Los Angeles Unified School District Series 2020 C, 5% 7/1/23 | 1,200,000 | 1,290,184 | |
| Metropolitan Wtr. District of Southern California Wtr. Rev. Bonds Series 2017 C, SIFMA Municipal Swap Index + 0.140% 0.19%, tender 5/21/24 (a)(c) | 1,000,000 | 1,000,136 | |
| Mount Diablo Unified School District Series 2022 B, 4% 8/1/26 (e) | 510,000 | 576,072 | |
| Oakland Unified School District Alameda County Series 2013, 5.5% 8/1/23 | 20,000 | 21,237 | |
| Palomar Pomerado Health Care Dis: | |||
| Series 2006 A, 0.75%, tender 11/1/36 (FSA Insured) (a) | 4,650,000 | 4,650,000 | |
| Series 2006 B, 0.69%, tender 11/1/36 (FSA Insured) (a) | 4,475,000 | 4,475,000 | |
| Series 2006 C, 0.69%, tender 11/1/36 (FSA Insured) (a) | 2,200,000 | 2,200,000 | |
| Port of Oakland Rev.: | |||
| Series 2012 P, 5% 5/1/23 (Pre-Refunded to 5/1/22 @ 100) (b) | 335,000 | 341,603 | |
| Series 2017 D: | |||
| 5% 11/1/23 (b) | 500,000 | 544,448 | |
| 5% 11/1/24 (b) | 100,000 | 112,780 | |
| Series H: | |||
| 5% 5/1/22 (b) | 2,750,000 | 2,804,433 | |
| 5% 5/1/23 (b) | 5,515,000 | 5,881,471 | |
| 5% 5/1/24 (b) | 930,000 | 1,029,591 | |
| Riverside County Teeter Plan Series 2021 A, 0.5% 10/20/22 | 8,000,000 | 8,021,046 | |
| San Diego County Reg'l. Arpt. Auth. Arpt. Rev.: | |||
| Series 2013 A, 5% 7/1/22 (Escrowed to Maturity) | 200,000 | 205,576 | |
| Series 2013 B, 5% 7/1/22 (Escrowed to Maturity) (b) | 1,800,000 | 1,849,109 | |
| Series 2019 B, 5% 7/1/22 (b) | 250,000 | 256,806 | |
| Series 2020 C: | |||
| 5% 7/1/22 (b) | 1,475,000 | 1,515,155 | |
| 5% 7/1/23 (b) | 545,000 | 584,607 | |
| San Diego County Reg'l. Trans. Commission Sales Tax Rev. Series A, 5% 10/1/22 | 4,050,000 | 4,213,100 | |
| San Diego Pub. Facilities Fing. Auth. Wtr. Rev. Series 2020 A, 5% 8/1/22 | 250,000 | 258,049 | |
| San Francisco City & County Arpts. Commission Int'l. Arpt. Rev.: | |||
| Series 2013 A: | |||
| 5% 5/1/22 (Escrowed to Maturity) (b) | 500,000 | 509,895 | |
| 5% 5/1/23 (b) | 705,000 | 751,120 | |
| Series 2016 A, 5% 5/1/23 | 225,000 | 240,084 | |
| Series 2018 A, 5% 5/1/23 (b) | 400,000 | 426,167 | |
| Series 2019 A: | |||
| 5% 1/1/22 (b) | 3,025,000 | 3,036,568 | |
| 5% 1/1/24 (b) | 655,000 | 715,480 | |
| 5% 1/1/25 (b) | 575,000 | 651,751 | |
| Series 2019 H, 5% 5/1/23 (b) | 2,000,000 | 2,130,837 | |
| San Jose Int. Arpt. Rev.: | |||
| Series 2014 A, 5% 3/1/23 (Escrowed to Maturity) (b) | 1,400,000 | 1,481,197 | |
| Series 2017 B, 5% 3/1/23 (Escrowed to Maturity) | 200,000 | 211,859 | |
| Series 2021 A, 5% 3/1/24 (b) | 1,000,000 | 1,099,354 | |
| Series 2021 B, 5% 3/1/24 | 500,000 | 552,170 | |
| San Pablo Redev. Agcy. Series 2014 A, 5% 6/15/24 (FSA Insured) | 30,000 | 33,398 | |
| Southern California Pub. Pwr. Auth. Rev. Bonds Series 2020 C, 0.65%, tender 7/1/25 (a) | 250,000 | 249,104 | |
| Washington Township Health Care District Rev. Series A: | |||
| 5% 7/1/22 | 200,000 | 205,266 | |
| 5% 7/1/23 | 200,000 | 214,040 | |
| West Contra Costa Unified School District Series 2004 C, 0% 8/1/25 (Nat'l. Pub. Fin. Guarantee Corp. Insured) | 260,000 | 251,383 | |
| TOTAL CALIFORNIA | 154,869,576 | ||
| Colorado - 0.7% | |||
| Colorado Bridge Enterprise Rev. Series 2017, 4% 6/30/24 (b) | 1,330,000 | 1,444,664 | |
| Colorado Ctfs. of Prtn. Series 2020 A, 5% 12/15/21 | 2,000,000 | 2,003,532 | |
| Colorado Health Facilities Auth.: | |||
| Bonds: | |||
| (Valley View Hosp. Assoc. Proj.) Series 2018, 2.8%, tender 5/15/23 (a) | 480,000 | 490,556 | |
| Series 2018 B, 5%, tender 11/20/25 (a) | 250,000 | 293,802 | |
| Series 2019 B: | |||
| 5%, tender 8/1/25 (a) | 300,000 | 342,151 | |
| 5%, tender 8/1/26 (a) | 340,000 | 400,400 | |
| 5%, tender 11/19/26 (a) | 1,590,000 | 1,923,520 | |
| Series 2019 A, 5% 1/1/23 | 870,000 | 914,716 | |
| Colorado Health Facilities Auth. Retirement Hsg. Rev. (Liberty Heights Proj.) Series 1991 A, 0% 7/15/22 (Escrowed to Maturity) | 620,000 | 619,169 | |
| Colorado Health Facilities Auth. Rev. Bonds Series 2016 C, 5%, tender 11/15/23 (a) | 355,000 | 388,984 | |
| Colorado Hsg. & Fin. Auth.: | |||
| Series 2019 F, 4.25% 11/1/49 | 165,000 | 182,210 | |
| Series 2019 H, 4.25% 11/1/49 | 85,000 | 94,008 | |
| Colorado Reg'l. Trans. District (Denver Transit Partners Eagle P3 Proj.) Series 2020: | |||
| 5% 1/15/24 | 750,000 | 817,979 | |
| 5% 1/15/25 | 650,000 | 733,210 | |
| Colorado Reg'l. Trans. District Ctfs. of Prtn.: | |||
| Series 2013 A, 5% 6/1/23 | 250,000 | 266,856 | |
| Series 2014 A, 5% 6/1/23 | 85,000 | 90,731 | |
| Denver City & County Arpt. Rev.: | |||
| Series 2011 A, 5.25% 11/15/22 (b) | 1,750,000 | 1,757,078 | |
| Series 2012 A: | |||
| 5% 11/15/22 (b) | 520,000 | 543,625 | |
| 5% 11/15/23 (b) | 250,000 | 260,949 | |
| Series 2012 B, 5% 11/15/22 | 250,000 | 261,481 | |
| Series 2013 A, 5% 11/15/22 (b) | 500,000 | 522,716 | |
| Series 2013 B, 5% 11/15/24 | 250,000 | 272,551 | |
| Series 2016 A, 5% 11/15/23 | 300,000 | 327,184 | |
| Series 2017 A: | |||
| 5% 11/15/22 (b) | 3,455,000 | 3,611,970 | |
| 5% 11/15/23 (b) | 2,300,000 | 2,506,050 | |
| Series 2018 A: | |||
| 5% 12/1/21 (b) | 1,000,000 | 1,000,000 | |
| 5% 12/1/23 (b) | 250,000 | 272,202 | |
| 5% 12/1/29 (b) | 185,000 | 229,829 | |
| Series 2020 A1, 5% 11/15/22 | 3,200,000 | 3,346,961 | |
| Series 2020 B1: | |||
| 5% 11/15/22 (b) | 4,045,000 | 4,228,776 | |
| 5% 11/15/23 (b) | 935,000 | 1,018,764 | |
| E-470 Pub. Hwy. Auth. Rev.: | |||
| Bonds Series 2021 B, U.S. Secured Overnight Fin. Rate (SOFR) Indx + 0.350% 0.384%, tender 9/1/24 (a)(c) | 3,250,000 | 3,256,711 | |
| Series 2020 A: | |||
| 5% 9/1/23 | 275,000 | 297,003 | |
| 5% 9/1/24 | 450,000 | 505,348 | |
| 5% 9/1/25 | 300,000 | 348,806 | |
| Univ. of Colorado Enterprise Sys. Rev. Bonds Series 2021 C3A, 2%, tender 10/15/25 (a) | 645,000 | 678,013 | |
| Vauxmont Metropolitan District Series 2019: | |||
| 5% 12/15/22 (FSA Insured) | 100,000 | 104,584 | |
| 5% 12/15/23 (FSA Insured) | 120,000 | 130,581 | |
| TOTAL COLORADO | 36,487,670 | ||
| Connecticut - 1.4% | |||
| Bridgeport Gen. Oblig. Series 2020, 1.5% 12/9/21 | 1,500,000 | 1,500,296 | |
| City of New Haven Series A, 5% 8/1/22 | 1,000,000 | 1,030,898 | |
| Connecticut Gen. Oblig.: | |||
| Series 2013 A, 1.04% 3/1/25 (a) | 510,000 | 519,895 | |
| Series 2014 A, 4% 3/1/22 | 450,000 | 454,309 | |
| Series 2015 A: | |||
| 4% 3/15/23 | 250,000 | 262,047 | |
| 5% 3/15/23 | 280,000 | 297,086 | |
| Series 2015 C, 5% 6/15/22 | 400,000 | 410,414 | |
| Series 2016 A: | |||
| 5% 3/15/24 | 380,000 | 420,026 | |
| 5% 3/15/26 | 70,000 | 83,023 | |
| Series 2016 B: | |||
| 5% 5/15/22 | 575,000 | 587,658 | |
| 5% 5/15/24 | 575,000 | 639,604 | |
| Series 2016 E, 5% 10/15/23 | 240,000 | 260,908 | |
| Series 2017 B, 3% 4/15/22 | 625,000 | 631,623 | |
| Series 2018 B, 5% 4/15/22 | 810,000 | 824,564 | |
| Series 2018 F, 5% 9/15/22 | 225,000 | 233,562 | |
| Series 2019 A: | |||
| 5% 4/15/22 | 670,000 | 682,047 | |
| 5% 4/15/23 | 1,000,000 | 1,064,851 | |
| Series 2020 A, 5% 1/15/23 | 1,740,000 | 1,832,768 | |
| Series 2021 D: | |||
| 5% 7/15/24 | 300,000 | 335,868 | |
| 5% 7/15/25 | 495,000 | 574,474 | |
| Series A: | |||
| 3% 1/15/22 | 1,725,000 | 1,730,933 | |
| 4% 1/15/25 | 3,500,000 | 3,884,005 | |
| 5% 3/15/23 | 690,000 | 732,105 | |
| Series B, 4% 6/15/22 | 250,000 | 255,169 | |
| Series C: | |||
| 4% 6/1/24 | 1,050,000 | 1,143,936 | |
| 5% 6/1/24 | 300,000 | 306,991 | |
| Series H, 5% 11/15/22 | 390,000 | 407,911 | |
| Connecticut Health & Edl. Facilities Auth. Rev.: | |||
| Bonds: | |||
| Series 2014 A, 1.1%, tender 2/7/23 (a) | 5,450,000 | 5,502,978 | |
| Series 2014 B, 1.8%, tender 7/1/24 (a) | 545,000 | 560,203 | |
| Series 2015 A, 0.375%, tender 7/12/24 (a) | 1,525,000 | 1,522,591 | |
| Series 2017 B, 0.55%, tender 7/3/23 (a) | 11,050,000 | 11,087,676 | |
| Series U1, 2%, tender 2/8/22 (a) | 975,000 | 978,284 | |
| Series U2, 2%, tender 2/8/22 (a) | 200,000 | 200,674 | |
| Series X2, 0.25%, tender 2/9/24 (a) | 11,565,000 | 11,517,129 | |
| Series 2013 N, 5% 7/1/24 | 100,000 | 107,449 | |
| Series 2014 A, 5% 7/1/27 | 390,000 | 435,227 | |
| Series 2017 I1, 5% 7/1/22 | 275,000 | 282,503 | |
| Series 2019 A, 5% 7/1/26 | 260,000 | 308,501 | |
| Series 2020 K: | |||
| 5% 7/1/22 | 250,000 | 256,821 | |
| 5% 7/1/23 | 250,000 | 267,592 | |
| Series 2022 M, 5% 7/1/26 (e) | 200,000 | 231,764 | |
| Series L1: | |||
| 4% 7/1/22 | 800,000 | 816,906 | |
| 4% 7/1/23 | 225,000 | 237,626 | |
| 4% 7/1/25 | 600,000 | 670,307 | |
| Series N: | |||
| 5% 7/1/22 | 780,000 | 799,150 | |
| 5% 7/1/23 | 830,000 | 884,183 | |
| 5% 7/1/24 | 375,000 | 412,477 | |
| Connecticut Higher Ed. Supplemental Ln. Auth. Rev.: | |||
| (Chesla Ln. Prog.) Series 2017 A, 5% 11/15/22 (b) | 300,000 | 313,040 | |
| (Chesla Loan Prog.) Series B: | |||
| 5% 11/15/22 (b) | 115,000 | 120,055 | |
| 5% 11/15/23 (b) | 425,000 | 461,942 | |
| Series 2017 B, 5% 11/15/23 (b) | 125,000 | 135,763 | |
| Connecticut Hsg. Fin. Auth.: | |||
| Bonds Series 2019 E, 1.625%, tender 11/15/22 (a) | 1,620,000 | 1,621,629 | |
| Series 2013 B2, 4% 11/15/32 | 5,000 | 5,076 | |
| Series 2016 E2: | |||
| 1.85% 11/15/22 (b) | 1,000,000 | 1,013,547 | |
| 2.1% 11/15/23 (b) | 1,000,000 | 1,029,071 | |
| Series 2021, 0.45% 11/15/25 | 700,000 | 692,412 | |
| Series A2: | |||
| 0.2% 5/15/22 (b) | 700,000 | 699,953 | |
| 0.25% 11/15/22 (b) | 1,175,000 | 1,174,475 | |
| 0.35% 5/15/23 (b) | 825,000 | 824,152 | |
| 0.4% 11/15/23 (b) | 300,000 | 299,358 | |
| Series C: | |||
| 5% 5/15/23 (b) | 205,000 | 217,808 | |
| 5% 11/15/23 (b) | 710,000 | 768,092 | |
| Connecticut Muni. Elec. Energy Coop. Pwr. Supply Sys. Rev. Series 2012 A, 5% 1/1/23 | 395,000 | 396,530 | |
| Connecticut Spl. Tax Oblig. Trans. Infrastructure Rev.: | |||
| Series 2012 A: | |||
| 5% 1/1/23 | 665,000 | 699,254 | |
| 5% 1/1/24 | 200,000 | 210,280 | |
| Series 2014 B, 5% 9/1/22 | 600,000 | 621,715 | |
| Series 2015 A, 5% 8/1/23 | 1,370,000 | 1,477,224 | |
| Series 2021 C: | |||
| 5% 1/1/23 | 795,000 | 835,950 | |
| 5% 1/1/24 | 215,000 | 235,558 | |
| 5% 1/1/25 | 535,000 | 608,349 | |
| Series A: | |||
| 4% 1/1/23 | 315,000 | 327,828 | |
| 5% 1/1/22 | 355,000 | 356,396 | |
| 5% 5/1/22 | 280,000 | 285,637 | |
| 5% 12/1/23 | 700,000 | 700,000 | |
| New Haven Gen. Oblig.: | |||
| Series 2016 A, 5% 8/15/25 (FSA Insured) | 20,000 | 23,220 | |
| Series B, 5% 2/1/22 | 350,000 | 352,686 | |
| Univ. of Connecticut Gen. Oblig.: | |||
| Series 2016 A, 5% 3/15/22 | 190,000 | 192,642 | |
| Series 2019 A, 5% 11/1/25 | 225,000 | 263,491 | |
| West Haven Gen. Oblig. Series 2021: | |||
| 4% 9/15/22 | 180,000 | 185,103 | |
| 4% 9/15/23 | 290,000 | 307,842 | |
| 4% 9/15/24 | 260,000 | 283,927 | |
| 4% 9/15/25 | 255,000 | 285,290 | |
| 4% 9/15/26 | 255,000 | 290,744 | |
| TOTAL CONNECTICUT | 76,503,051 | ||
| Delaware - 0.1% | |||
| Delaware Econ. Dev. Auth. Rev. Bonds (Delmarva Pwr. & Lt. Co. Proj.) Series A, 1.05%, tender 7/1/25 (a) | 565,000 | 573,261 | |
| Delaware Trans. Auth. Grant Series 2020: | |||
| 5% 9/1/22 | 1,250,000 | 1,295,143 | |
| 5% 9/1/23 | 1,400,000 | 1,512,782 | |
| TOTAL DELAWARE | 3,381,186 | ||
| District Of Columbia - 1.1% | |||
| District of Columbia Gen. Oblig. Series 2021 E, 5% 2/1/24 | 3,730,000 | 4,104,554 | |
| District of Columbia Hsg. Fin. Agcy. Multi-family Hsg. Rev. Bonds: | |||
| (218 Vine St. Apts. Proj.) Series 2020, 0.3%, tender 7/1/23 (a) | 5,000,000 | 5,003,667 | |
| (Liberty Place Apts. Proj.) Series 2018, 0.5%, tender 12/1/21 (a) | 5,000,000 | 5,001,386 | |
| (Park Southern Apts. Proj.) Series 2020, 0.7%, tender 6/1/23 (a) | 9,000,000 | 9,015,079 | |
| District of Columbia Income Tax Rev. Series 2012 C, 5% 12/1/21 (Escrowed to Maturity) | 275,000 | 275,000 | |
| Metropolitan Washington DC Arpts. Auth. Sys. Rev.: | |||
| Series 2012 A: | |||
| 5% 10/1/22 (b) | 140,000 | 145,518 | |
| 5% 10/1/23 (b) | 500,000 | 519,229 | |
| Series 2014 A: | |||
| 5% 10/1/23 (b) | 110,000 | 119,329 | |
| 5% 10/1/27 (b) | 500,000 | 560,537 | |
| Series 2017 A: | |||
| 5% 10/1/24 (b) | 115,000 | 129,027 | |
| 5% 10/1/26 (b) | 145,000 | 172,976 | |
| Series 2018 A, 5% 10/1/26 (b) | 325,000 | 387,705 | |
| Series 2019 A: | |||
| 5% 10/1/22 (b) | 290,000 | 301,430 | |
| 5% 10/1/23 (b) | 50,000 | 54,240 | |
| 5% 10/1/25 (b) | 155,000 | 179,744 | |
| Series 2020 A: | |||
| 5% 10/1/22 (b) | 1,750,000 | 1,818,975 | |
| 5% 10/1/23 (b) | 925,000 | 1,003,448 | |
| 5% 10/1/24 (b) | 2,575,000 | 2,889,084 | |
| 5% 10/1/25 (b) | 530,000 | 614,610 | |
| Series 2021 A: | |||
| 5% 10/1/22 (b) | 2,000,000 | 2,078,828 | |
| 5% 10/1/23 (b) | 9,750,000 | 10,576,880 | |
| 5% 10/1/24 (b) | 8,000,000 | 8,975,794 | |
| 5% 10/1/25 (b) | 3,000,000 | 3,478,922 | |
| 5% 10/1/26 (b) | 335,000 | 399,635 | |
| Washington D.C. Metropolitan Transit Auth. Rev. Series 2017 A1, 5% 7/1/24 | 1,120,000 | 1,251,418 | |
| TOTAL DISTRICT OF COLUMBIA | 59,057,015 | ||
| Florida - 1.5% | |||
| Brevard County Hsg. Fin. Auth. Bonds Series 2021, 0.25%, tender 12/1/22 (a) | 2,000,000 | 1,997,201 | |
| Brevard County School Board Ctfs. of Prtn.: | |||
| Series 2014, 5% 7/1/27 | 115,000 | 128,179 | |
| Series 2015 C: | |||
| 5% 7/1/22 | 80,000 | 82,230 | |
| 5% 7/1/23 | 65,000 | 69,745 | |
| Broward County Arpt. Sys. Rev.: | |||
| Series 2012 P-1: | |||
| 5% 10/1/22 (b) | 300,000 | 311,696 | |
| 5% 10/1/25 (b) | 1,000,000 | 1,038,387 | |
| Series 2012 P1: | |||
| 5% 10/1/23 (b) | 235,000 | 243,977 | |
| 5% 10/1/26 (Pre-Refunded to 10/1/22 @ 100) (b) | 350,000 | 363,786 | |
| Series 2012 P2, 5% 10/1/22 | 415,000 | 431,357 | |
| series 2012 Q1, 5% 10/1/22 | 200,000 | 207,883 | |
| Series 2012 Q2, 5% 10/1/30 (Pre-Refunded to 10/1/22 @ 100) (b) | 200,000 | 207,878 | |
| Series 2013 A: | |||
| 5% 10/1/23 (b) | 600,000 | 650,424 | |
| 5.125% 10/1/38 (Pre-Refunded to 10/1/23 @ 100) (b) | 310,000 | 336,711 | |
| 5.25% 10/1/25 (b) | 1,500,000 | 1,630,582 | |
| Series 2013 C, 5.25% 10/1/25 | 575,000 | 626,385 | |
| Series 2015 A, 5% 10/1/22 (b) | 75,000 | 77,924 | |
| Series 2015 C, 5% 10/1/24 (b) | 245,000 | 274,884 | |
| Series 2017, 5% 10/1/25 (b) | 500,000 | 579,820 | |
| Series 2019 B, 5% 10/1/23 (b) | 700,000 | 758,828 | |
| Series C, 5% 10/1/23 (b) | 90,000 | 97,564 | |
| Broward County Port Facilities Rev. Series 2019 D, 5% 9/1/22 (b) | 850,000 | 880,108 | |
| Broward County School Board Ctfs. of Prtn.: | |||
| (Broward County School District Proj.) Series 2017 C, 5% 7/1/22 | 70,000 | 71,939 | |
| (Broward County School District) Series 2012 A, 5% 7/1/25 | 525,000 | 539,199 | |
| Series 2015 A: | |||
| 5% 7/1/22 | 345,000 | 354,556 | |
| 5% 7/1/23 | 180,000 | 193,319 | |
| 5% 7/1/24 | 30,000 | 33,495 | |
| Series 2015 B: | |||
| 5% 7/1/22 | 100,000 | 102,770 | |
| 5% 7/1/23 | 85,000 | 91,290 | |
| 5% 7/1/24 | 25,000 | 27,913 | |
| Cap. Trust Agcy. Hsg. Rev. Bonds (College Park Towers Apts. Proj.) Series 2021, 1.25%, tender 5/1/23 (a) | 3,000,000 | 3,033,482 | |
| Central Florida Expressway Auth. Sr. Lien Rev.: | |||
| Series 2016 B, 4% 7/1/22 | 215,000 | 219,683 | |
| Series 2021, 5% 7/1/24 (FSA Insured) | 885,000 | 990,789 | |
| Citizens Property Ins. Corp.: | |||
| Series 2012 A1, 5% 6/1/22 | 1,325,000 | 1,356,541 | |
| Series 2015 A1, 5% 6/1/22 | 345,000 | 345,000 | |
| Escambia County Poll. Cont. Rev. (Gulf Pwr. Co. Proj.) Series 2003, 2.6% 6/1/23 | 2,500,000 | 2,578,392 | |
| Florida Board of Ed. Lottery Rev. Series 2014 A, 5% 7/1/24 | 200,000 | 214,998 | |
| Florida Dev. Fin. Corp. Edl. Facilities (Nova Southeastern Univ. Proj.) Series 2020 A: | |||
| 5% 4/1/23 | 350,000 | 371,105 | |
| 5% 4/1/24 | 360,000 | 396,493 | |
| 5% 4/1/25 | 200,000 | 228,189 | |
| Florida Hsg. Fin. Corp. Rev. Series 2017, 2.05% 1/1/22 | 125,000 | 125,153 | |
| Florida Keys Aqueduct Auth. Wtr. Rev. Series 2021 B, 5% 9/1/25 | 350,000 | 407,790 | |
| Florida Mid-Bay Bridge Auth. Rev. Series 2015 A: | |||
| 5% 10/1/22 | 45,000 | 46,555 | |
| 5% 10/1/23 | 55,000 | 59,338 | |
| 5% 10/1/24 | 45,000 | 50,340 | |
| 5% 10/1/25 | 40,000 | 46,172 | |
| 5% 10/1/26 | 45,000 | 51,824 | |
| Florida Muni. Pwr. Agcy. Rev.: | |||
| Series 2016 A: | |||
| 5% 10/1/22 | 790,000 | 821,205 | |
| 5% 10/1/24 | 475,000 | 535,514 | |
| Series 2021 A: | |||
| 5% 10/1/22 | 500,000 | 519,750 | |
| 5% 10/1/23 | 400,000 | 433,846 | |
| 5% 10/1/24 | 450,000 | 507,329 | |
| 5% 10/1/25 | 500,000 | 582,294 | |
| 5% 10/1/26 | 300,000 | 359,611 | |
| Greater Orlando Aviation Auth. Arpt. Facilities Rev.: | |||
| Series 2011 B, 4% 10/1/22 (b) | 115,000 | 115,351 | |
| Series 2015 A: | |||
| 4% 10/1/22 (b) | 350,000 | 361,012 | |
| 4% 10/1/22 (Escrowed to Maturity) (b) | 80,000 | 82,435 | |
| 5% 10/1/23 (b) | 160,000 | 173,631 | |
| 5% 10/1/23 (Escrowed to Maturity) (b) | 40,000 | 43,339 | |
| Series 2016: | |||
| 5% 10/1/23 (b) | 2,400,000 | 2,601,694 | |
| 5% 10/1/24 (b) | 285,000 | 319,763 | |
| Series 2017 A: | |||
| 5% 10/1/25 (b) | 30,000 | 34,789 | |
| 5% 10/1/25 (Escrowed to Maturity) (b) | 55,000 | 64,075 | |
| 5% 10/1/26 (b) | 10,000 | 11,929 | |
| 5% 10/1/26 (Escrowed to Maturity) (b) | 35,000 | 42,047 | |
| Series 2019 A: | |||
| 5% 10/1/22 (b) | 2,415,000 | 2,511,013 | |
| 5% 10/1/23 (b) | 3,700,000 | 4,015,214 | |
| Halifax Hosp. Med. Ctr. Rev. Series 2015, 5% 6/1/23 | 30,000 | 32,046 | |
| Hillsborough County Aviation Auth. Rev.: | |||
| Series 2013 A, 5.5% 10/1/24 (b) | 685,000 | 747,882 | |
| Series A, 5% 10/1/25 (b) | 705,000 | 762,489 | |
| Hillsborough County School Board Ctfs. of Prtn. Series 2015 A, 5% 7/1/26 | 230,000 | 264,191 | |
| Hillsborough County School District Sales Tax Rev. Series 2015 B, 5% 10/1/22 (FSA Insured) | 145,000 | 150,628 | |
| Indian River County School Board Ctfs. of Prtn. Series 2014: | |||
| 5% 7/1/22 | 85,000 | 87,339 | |
| 5% 7/1/23 | 175,000 | 187,776 | |
| Jacksonville Elec. Auth. Elec. Sys. Rev. Series 2013 C, 5% 10/1/22 (Escrowed to Maturity) | 535,000 | 556,302 | |
| Lee County Arpt. Rev.: | |||
| Series 2021 A: | |||
| 5% 10/1/23 (b) | 2,820,000 | 3,053,201 | |
| 5% 10/1/24 (b) | 745,000 | 835,871 | |
| 5% 10/1/25 (b) | 1,375,000 | 1,594,506 | |
| Series 2021 B: | |||
| 5% 10/1/22 (b) | 845,000 | 877,437 | |
| 5% 10/1/23 (b) | 800,000 | 866,156 | |
| 5% 10/1/24 (b) | 1,250,000 | 1,402,468 | |
| 5% 10/1/25 (b) | 925,000 | 1,072,668 | |
| Manatee County Rev. Series 2013, 5% 10/1/22 | 20,000 | 20,802 | |
| Manatee County School District Series 2017, 5% 10/1/24 (FSA Insured) | 30,000 | 33,740 | |
| Miami Beach Health Facilities Auth. Hosp. Rev. (Mount Sinai Med. Ctr. of Florida Proj.) Series 2012, 5% 11/15/22 | 1,250,000 | 1,305,315 | |
| Miami Dade County Hsg. Multifamily Hsg. Rev. Bonds: | |||
| Series 2020, 1.4%, tender 4/1/22 (a) | 4,000,000 | 4,002,769 | |
| Series 2021, 0.25%, tender 12/1/22 (a) | 3,000,000 | 2,998,477 | |
| Miami-Dade County Aviation Rev.: | |||
| Series 2012 A: | |||
| 5% 10/1/22 (b) | 250,000 | 259,939 | |
| 5% 10/1/24 (b) | 200,000 | 207,677 | |
| 5% 10/1/29 (Pre-Refunded to 10/1/22 @ 100) (b) | 210,000 | 218,223 | |
| Series 2012 B, 5% 10/1/22 | 400,000 | 416,040 | |
| Series 2014, 5% 10/1/22 (b) | 485,000 | 504,282 | |
| Series 2016 A, 5% 10/1/23 | 335,000 | 363,604 | |
| Series 2020 A: | |||
| 5% 10/1/23 | 2,435,000 | 2,642,913 | |
| 5% 10/1/25 | 1,255,000 | 1,463,115 | |
| Miami-Dade County Expressway Auth.: | |||
| (Waste Mgmt., Inc. of Florida Proj.) Series 2013 A: | |||
| 5% 7/1/22 | 45,000 | 46,220 | |
| 5% 7/1/23 | 45,000 | 46,198 | |
| Series 2014 B: | |||
| 5% 7/1/22 | 35,000 | 35,949 | |
| 5% 7/1/23 | 70,000 | 75,064 | |
| Miami-Dade County Health Facilities Auth. Hosp. Rev. (Nicklaus Children's Hosp. Proj.) Series 2021 A: | |||
| 5% 8/1/22 | 480,000 | 495,421 | |
| 5% 8/1/23 | 325,000 | 350,153 | |
| 5% 8/1/24 | 600,000 | 672,032 | |
| 5% 8/1/25 | 700,000 | 811,389 | |
| Miami-Dade County Indl. Dev. Auth. Solid Waste Disp. Rev. Bonds: | |||
| (Waste Mgmt., Inc. of Florida Proj.) Series 2007, 0.32%, tender 11/1/22 (a) | 600,000 | 600,103 | |
| (Waste Mgmt. of Florida Proj.) Series 2018, 0.4%, tender 8/1/23 (a)(b) | 1,250,000 | 1,248,724 | |
| Miami-Dade County School Board Ctfs. of Prtn.: | |||
| Bonds Series 2014 A, 5%, tender 5/1/24 (a) | 260,000 | 287,644 | |
| Series 2014 D: | |||
| 5% 11/1/22 | 120,000 | 125,300 | |
| 5% 11/1/23 | 300,000 | 325,824 | |
| Series 2015 A: | |||
| 5% 5/1/22 | 1,210,000 | 1,234,309 | |
| 5% 5/1/23 | 1,075,000 | 1,145,483 | |
| 5% 5/1/27 (FSA Insured) | 265,000 | 303,753 | |
| Series 2015 D: | |||
| 5% 2/1/22 | 410,000 | 413,277 | |
| 5% 2/1/23 | 830,000 | 876,264 | |
| North Sumter County Util. Dependent District Series 2021: | |||
| 3% 10/1/22 (FSA Insured) | 295,000 | 301,511 | |
| 4% 10/1/24 (FSA Insured) | 795,000 | 870,648 | |
| Okeechobee County Solid Waste Rev. Bonds (Waste Mgmt., Inc.-Okeechobee Landfill Proj.) Series 2004 A, 0.55%, tender 7/1/24 (a) | 750,000 | 747,127 | |
| Orange County Health Facilities Auth. Series B, 5% 10/1/22 | 1,295,000 | 1,345,598 | |
| Orange County Hsg. Fin. Auth. Multi-family Rev. Bonds Series 2021 B, 0.55%, tender 7/1/24 (a) | 1,450,000 | 1,448,768 | |
| Orlando & Orange County Expressway Auth. Rev.: | |||
| Series 2012, 5% 7/1/22 | 530,000 | 544,744 | |
| Series 2013 B, 5% 7/1/22 | 250,000 | 256,955 | |
| Orlando Utils. Commission Util. Sys. Rev.: | |||
| Series 2013 A, 5% 10/1/24 | 250,000 | 282,530 | |
| Series 2016 A, 5% 10/1/22 | 200,000 | 208,003 | |
| Palm Beach County Edl. Facilities Auth. Series 2021: | |||
| 4% 10/1/22 | 205,000 | 210,390 | |
| 4% 10/1/23 | 220,000 | 232,319 | |
| Palm Beach County Health Facilities Auth. Hosp. Rev. Series 2014: | |||
| 5% 12/1/21 (Escrowed to Maturity) | 35,000 | 35,000 | |
| 5% 12/1/23 (Escrowed to Maturity) | 5,000 | 5,466 | |
| 5% 12/1/24 (Escrowed to Maturity) | 10,000 | 11,374 | |
| Palm Beach County School Board Ctfs. of Prtn.: | |||
| Series 2014 B, 5% 8/1/22 | 40,000 | 41,277 | |
| Series 2018 A, 5% 8/1/23 | 100,000 | 107,739 | |
| Pasco County School District Sales Tax Rev. Series 2013, 5% 10/1/22 | 20,000 | 20,787 | |
| Seminole County School Board Ctfs. of Prtn.: | |||
| Series 2012 A, 5% 7/1/23 | 120,000 | 128,760 | |
| Series 2016 C: | |||
| 5% 7/1/25 | 20,000 | 23,081 | |
| 5% 7/1/26 | 25,000 | 29,775 | |
| Tallahassee Health Facilities Rev. (Tallahassee Memorial Healthcare, Inc. Proj.) Series 2016 A, 5% 12/1/21 | 65,000 | 65,000 | |
| Tampa Bay Wtr. Reg'l. Wtr. Supply Auth. Util. Sys. Rev. Series 2005, 5.5% 10/1/22 (FGIC Insured) | 30,000 | 31,330 | |
| Tampa Hosp. Rev. (H. Lee Moffitt Cancer Ctr. Proj.) Series 2020 B: | |||
| 5% 7/1/23 | 90,000 | 96,585 | |
| 5% 7/1/24 | 75,000 | 83,636 | |
| 5% 7/1/25 | 100,000 | 115,403 | |
| 5% 7/1/26 | 175,000 | 208,166 | |
| 5% 7/1/27 | 150,000 | 183,199 | |
| Volusia County Edl. Facilities Auth. Rev. (Embry-Riddle Aeronautical Univ., Inc. Proj.) Series 2020 A: | |||
| 4% 10/15/22 | 300,000 | 309,580 | |
| 5% 10/15/23 | 590,000 | 640,356 | |
| 5% 10/15/24 | 1,000,000 | 1,123,229 | |
| 5% 10/15/25 | 1,000,000 | 1,160,613 | |
| 5% 10/15/26 | 750,000 | 894,086 | |
| 5% 10/15/27 | 165,000 | 201,698 | |
| TOTAL FLORIDA | 85,053,411 | ||
| Georgia - 1.8% | |||
| Atlanta Arpt. Rev.: | |||
| Series 2012 B, 5% 1/1/23 | 615,000 | 617,382 | |
| Series 2014 B, 5% 1/1/22 | 30,000 | 30,118 | |
| Series 2019 B, 5% 7/1/22 (b) | 845,000 | 868,507 | |
| Series 2020 B, 5% 7/1/24 (b) | 1,400,000 | 1,556,610 | |
| Atlanta Urban Residential Fin. Auth. Bonds (Herndon Square Sr. Apts. Proj.) Series 2019, 1.36%, tender 12/1/21 (a) | 3,195,000 | 3,195,000 | |
| Atlanta Urban Residential Fin. Auth. Multi-family Hsg. Rev. Bonds (Parkside Proj.) Series 2019 B, 1.38%, tender 1/1/22 (a) | 4,685,000 | 4,689,005 | |
| Bartow County Dev. Auth. Poll. Cont. Rev. Bonds (Georgia Pwr. Co. Plant Bowen Proj.): | |||
| Series 2009 1st, 2.75%, tender 3/15/23 (a) | 3,360,000 | 3,457,894 | |
| Series 2013, 1.55%, tender 8/19/22 (a) | 2,370,000 | 2,390,946 | |
| Brookhaven Dev. Auth. Rev. Series 2019 A, 5% 7/1/25 | 100,000 | 115,904 | |
| Burke County Indl. Dev. Auth. Poll. Cont. Rev. Bonds: | |||
| (Georgia Pwr. Co. Plant Vogtle Proj.): | |||
| Series 1994, 2.25%, tender 5/25/23 (a) | 2,375,000 | 2,437,523 | |
| Series 2008, 2.925%, tender 3/12/24 (a) | 250,000 | 263,286 | |
| Series 2012 1st, 1.55%, tender 8/19/22 (a) | 2,000,000 | 2,017,676 | |
| Series 2013 1st, 2.925%, tender 3/12/24 (a) | 990,000 | 1,042,614 | |
| (Oglethorpe Pwr. Corp. Vogtle Proj.) Series 2017 E, 3.25%, tender 2/3/25 (a) | 100,000 | 108,048 | |
| Cobb County Kennestone Hosp. Auth. Rev. (WellStar Health Sys., Inc. Proj.): | |||
| Series 2020 A: | |||
| 5% 4/1/22 | 150,000 | 152,333 | |
| 5% 4/1/23 | 150,000 | 159,232 | |
| Series 2020 B, 5% 4/1/22 | 1,120,000 | 1,137,421 | |
| Fayette County Hosp. Auth. Rev. Bonds (Piedmont Healthcare, Inc. Proj.) Series 2019 A, 5%, tender 7/1/24 (a) | 750,000 | 819,251 | |
| Fulton County Dev. Auth. Rev. Series 2019 C: | |||
| 5% 7/1/22 | 1,000,000 | 1,027,879 | |
| 5% 7/1/23 | 1,300,000 | 1,396,838 | |
| Gainesville & Hall County Hosp. Auth. Rev. Series 2021 A, 5% 2/15/25 | 675,000 | 771,274 | |
| Georgia Gen. Oblig. Series 2014 A, 5% 2/1/22 | 200,000 | 201,605 | |
| Georgia Muni. Elec. Auth. Pwr. Rev.: | |||
| Series 2016 A: | |||
| 5% 1/1/22 | 780,000 | 782,963 | |
| 5% 1/1/23 | 410,000 | 430,614 | |
| Series 2019 A, 5% 1/1/22 | 1,620,000 | 1,626,155 | |
| Series 2020 A: | |||
| 3% 11/1/22 | 1,045,000 | 1,070,524 | |
| 4% 11/1/23 | 2,780,000 | 2,968,614 | |
| 4% 11/1/24 | 200,000 | 220,033 | |
| 4% 11/1/25 | 800,000 | 903,284 | |
| 5% 1/1/22 | 1,905,000 | 1,912,238 | |
| 5% 1/1/23 | 5,625,000 | 5,907,818 | |
| 5% 1/1/24 | 2,105,000 | 2,302,129 | |
| 5% 1/1/24 | 1,250,000 | 1,367,060 | |
| 5% 11/1/26 | 870,000 | 1,045,361 | |
| Series 2021 A: | |||
| 5% 1/1/23 | 140,000 | 146,992 | |
| 5% 1/1/24 | 170,000 | 185,586 | |
| 5% 1/1/24 | 190,000 | 207,793 | |
| Series C, 5% 1/1/22 | 1,900,000 | 1,907,219 | |
| Georgia Muni. Gas Auth. Rev. (Gas Portfolio III Proj.) Series 2014 U: | |||
| 5% 10/1/22 | 20,000 | 20,785 | |
| 5% 10/1/23 | 55,000 | 59,664 | |
| Georgia Road & Thruway Auth. Rev. Series 2020, 5% 6/1/24 | 2,000,000 | 2,231,229 | |
| Main Street Natural Gas, Inc.: | |||
| Bonds: | |||
| Series 2018 A, 4%, tender 9/1/23 (a) | 4,750,000 | 5,024,959 | |
| Series 2018 B, 1 month U.S. LIBOR + 0.750% 0.808%, tender 9/1/23 (a)(c) | 12,200,000 | 12,257,329 | |
| Series 2018 C, 4%, tender 12/1/23 (a) | 3,055,000 | 3,255,876 | |
| Series 2018 E, SIFMA Municipal Swap Index + 0.570% 0.62%, tender 12/1/23 (a)(c) | 12,500,000 | 12,614,124 | |
| Series 2019 B, 4%, tender 12/2/24 (a) | 1,210,000 | 1,330,280 | |
| Series 2018 A, 4% 3/1/23 | 200,000 | 209,254 | |
| Series 2019 A: | |||
| 5% 5/15/22 | 1,000,000 | 1,020,809 | |
| 5% 5/15/23 | 1,750,000 | 1,862,761 | |
| Series 2021 A: | |||
| 4% 9/1/24 | 500,000 | 546,576 | |
| 4% 3/1/25 | 430,000 | 475,188 | |
| 4% 9/1/25 | 400,000 | 447,116 | |
| Series 2021 C: | |||
| 4% 12/1/22 | 800,000 | 828,747 | |
| 4% 12/1/23 | 1,470,000 | 1,570,770 | |
| Monroe County Dev. Auth. Poll. Cont. Rev.: | |||
| (Georgia Pwr. Co. Plant Scherer Proj.) Series 1995, 2.25% 7/1/25 | 435,000 | 452,758 | |
| Bonds (Oglethorpe Pwr. Corp. Scherer Proj.) Series 2013 A, 1.5%, tender 2/3/25 (a) | 1,500,000 | 1,538,312 | |
| Private Colleges & Univs. Auth. Rev. (The Savannah College of Art & Design Projs.) Series 2021: | |||
| 5% 4/1/22 | 175,000 | 177,787 | |
| 5% 4/1/25 | 600,000 | 686,275 | |
| TOTAL GEORGIA | 98,051,328 | ||
| Hawaii - 0.1% | |||
| Hawaii Dept. of Budget & Fin. Spl. Purp. Rev. (Queens Health Sys. Proj.) Series 2015 B, SIFMA Municipal Swap Index + 0.140% 0.5%, tender 7/1/39 (a)(c) | 515,000 | 515,000 | |
| Hawaii Gen. Oblig. Series 2020 A: | |||
| 5% 7/1/24 (b) | 655,000 | 728,271 | |
| 5% 7/1/25 (b) | 350,000 | 402,700 | |
| Honolulu City & County Gen. Oblig. Series 2022 A, 5% 11/1/26 (e) | 815,000 | 946,810 | |
| State of Hawaii Dept. of Trans. Series 2013: | |||
| 5% 8/1/22 (b) | 45,000 | 46,403 | |
| 5% 8/1/23 (b) | 30,000 | 32,301 | |
| 5.25% 8/1/24 (b) | 890,000 | 958,846 | |
| TOTAL HAWAII | 3,630,331 | ||
| Idaho - 0.0% | |||
| Idaho Health Facilities Auth. Rev. Series 2015 ID, 5% 12/1/21 | 350,000 | 350,000 | |
| Idaho Hsg. & Fin. Assoc. Single Family Mtg. Series 2019 A, 4% 1/1/50 | 45,000 | 49,156 | |
| TOTAL IDAHO | 399,156 | ||
| Illinois - 3.3% | |||
| Champaign County Cmnty. Unit Series 2020 A, 0% 1/1/26 | 800,000 | 768,610 | |
| Chicago Board of Ed.: | |||
| Series 1999, 0% 12/1/22 (Berkshire Hathaway Assurance Corp. Insured) (FGIC Insured) | 560,000 | 557,350 | |
| Series 2019 A, 5% 12/1/23 | 1,000,000 | 1,087,078 | |
| Series 2021 B, 5% 12/1/21 | 400,000 | 400,000 | |
| Chicago Gen. Oblig. Series 2020 A, 5% 1/1/25 | 1,500,000 | 1,692,880 | |
| Chicago Metropolitan Wtr. Reclamation District of Greater Chicago Series 2021 C, 5% 12/1/23 (e) | 990,000 | 1,081,645 | |
| Chicago Midway Arpt. Rev.: | |||
| Series 2013 B: | |||
| 5% 1/1/22 | 1,235,000 | 1,239,825 | |
| 5% 1/1/23 | 205,000 | 215,514 | |
| 5% 1/1/25 | 150,000 | 157,458 | |
| 5% 1/1/26 | 275,000 | 288,612 | |
| Series 2014 A: | |||
| 5% 1/1/22 (b) | 2,865,000 | 2,875,885 | |
| 5% 1/1/24 (b) | 1,000,000 | 1,091,243 | |
| 5% 1/1/26 (b) | 525,000 | 572,673 | |
| 5% 1/1/27 (b) | 370,000 | 403,598 | |
| 5% 1/1/28 (b) | 100,000 | 109,081 | |
| 5% 1/1/29 (b) | 675,000 | 735,853 | |
| Series 2014 B: | |||
| 5% 1/1/23 | 225,000 | 236,539 | |
| 5% 1/1/26 | 140,000 | 153,049 | |
| Series 2016 A, 5% 1/1/24 (b) | 1,000,000 | 1,091,243 | |
| Series 2016 B, 5% 1/1/22 | 200,000 | 200,781 | |
| Chicago Motor Fuel Tax Rev. Series 2013: | |||
| 5% 1/1/22 | 5,000 | 5,015 | |
| 5% 1/1/23 | 10,000 | 10,410 | |
| Chicago O'Hare Int'l. Arpt. Rev.: | |||
| Series 2012 A: | |||
| 5% 1/1/23 (Pre-Refunded to 1/1/22 @ 100) (b) | 1,000,000 | 1,003,853 | |
| 5% 1/1/25 (Pre-Refunded to 1/1/22 @ 100) (b) | 500,000 | 501,926 | |
| Series 2012 B: | |||
| 5% 1/1/22 (b) | 1,875,000 | 1,882,124 | |
| 5% 1/1/22 (Escrowed to Maturity) (b) | 1,000,000 | 1,003,853 | |
| Series 2013 A: | |||
| 5% 1/1/22 (Escrowed to Maturity) (b) | 1,400,000 | 1,405,394 | |
| 5% 1/1/23 (b) | 1,740,000 | 1,827,485 | |
| Series 2013 B: | |||
| 5% 1/1/22 (Escrowed to Maturity) | 135,000 | 135,531 | |
| 5% 1/1/23 | 1,020,000 | 1,071,855 | |
| Series 2013 C, 5% 1/1/22 (Escrowed to Maturity) (b) | 700,000 | 702,697 | |
| Series 2013 D, 5% 1/1/22 (Escrowed to Maturity) | 70,000 | 70,275 | |
| Series 2015 B, 5% 1/1/23 | 475,000 | 499,148 | |
| Series 2015 D: | |||
| 5% 1/1/22 (Escrowed to Maturity) | 510,000 | 512,007 | |
| 5% 1/1/23 | 200,000 | 210,168 | |
| Series 2016 A: | |||
| 5% 1/1/23 (b) | 250,000 | 262,570 | |
| 5% 1/1/24 (b) | 305,000 | 332,829 | |
| Series 2016 D, 5% 1/1/22 | 300,000 | 301,165 | |
| Series 2017 C, 5% 1/1/22 | 110,000 | 110,427 | |
| Series 2017 D: | |||
| 5% 1/1/24 (b) | 1,000,000 | 1,091,243 | |
| 5% 1/1/27 (b) | 85,000 | 101,998 | |
| Chicago Park District Gen. Oblig. Series 2021 D, 4% 1/1/23 | 975,000 | 1,012,758 | |
| Chicago Transit Auth. Cap. Grant Receipts Rev.: | |||
| Series 2017: | |||
| 5% 6/1/24 | 445,000 | 493,856 | |
| 5% 6/1/25 | 25,000 | 28,772 | |
| Series 2021: | |||
| 5% 6/1/22 | 875,000 | 894,984 | |
| 5% 6/1/23 | 1,075,000 | 1,147,481 | |
| Chicago Wastewtr. Transmission Rev. Series 2012, 5% 1/1/23 | 25,000 | 25,094 | |
| Cook County Cmnty. Consolidated School District No. 59 Series 2020, 4% 3/1/22 | 480,000 | 484,572 | |
| Cook County Gen. Oblig.: | |||
| Series 2011 A, 5.25% 11/15/22 | 20,000 | 20,051 | |
| Series 2012 C: | |||
| 5% 11/15/22 | 740,000 | 773,839 | |
| 5% 11/15/23 | 385,000 | 402,012 | |
| Series 2014 A, 5% 11/15/22 | 475,000 | 496,721 | |
| Series 2021 A: | |||
| 5% 11/15/22 | 10,200,000 | 10,666,429 | |
| 5% 11/15/23 | 4,550,000 | 4,961,359 | |
| 5% 11/15/24 | 50,000 | 56,595 | |
| 5% 11/15/25 | 50,000 | 58,520 | |
| Series 2021 B: | |||
| 4% 11/15/22 | 1,250,000 | 1,295,268 | |
| 4% 11/15/23 | 865,000 | 926,385 | |
| 4% 11/15/24 | 625,000 | 689,140 | |
| 4% 11/15/25 | 465,000 | 525,328 | |
| 4% 11/15/26 | 235,000 | 271,043 | |
| Geneva Gen. Oblig. Series 2021, 4% 2/1/23 (e) | 275,000 | 286,247 | |
| Illinois Dev. Fin. Auth. Retirement Hsg. Regency Park Rev. Series 1991 A, 0% 7/15/23 (Escrowed to Maturity) | 300,000 | 297,856 | |
| Illinois Dev. Fin. Auth. Solid Waste Disp. Rev. Bonds (Waste Mgmt., Inc. Proj.) Series 2019, 0.4%, tender 11/1/22 (a)(b) | 1,900,000 | 1,899,807 | |
| Illinois Fin. Auth.: | |||
| Bonds Series 2020 B, 5%, tender 11/15/24 (a) | 1,450,000 | 1,607,638 | |
| Series 2013 A: | |||
| 5% 6/1/23 | 540,000 | 578,263 | |
| 5% 6/1/23 (Escrowed to Maturity) | 55,000 | 58,828 | |
| Series 2020 A, 5% 8/15/22 | 750,000 | 775,274 | |
| Series 2021 A: | |||
| 5% 7/15/22 | 300,000 | 308,882 | |
| 5% 10/1/25 | 2,000,000 | 2,334,971 | |
| Illinois Fin. Auth. Rev.: | |||
| (Bradley Univ. Proj.) Series 2017 C, 5% 8/1/26 | 35,000 | 41,190 | |
| (Edward-Elmhurst Healthcare) Series 2017 A, 5% 1/1/25 | 100,000 | 113,578 | |
| Bonds: | |||
| Series 2017 B, 5%, tender 12/15/22 (a) | 265,000 | 277,931 | |
| Series E, 2.25%, tender 4/29/22 (a) | 770,000 | 776,432 | |
| Series 2011 IL, 5% 12/1/22 (Pre-Refunded to 12/1/21 @ 100) | 25,000 | 25,000 | |
| Series 2012 A: | |||
| 5% 5/15/22 | 250,000 | 255,330 | |
| 5% 5/15/23 (Pre-Refunded to 5/15/22 @ 100) | 30,000 | 30,658 | |
| Series 2012, 5% 9/1/22 (Escrowed to Maturity) | 75,000 | 77,703 | |
| Series 2014 A: | |||
| 5% 10/1/26 | 500,000 | 562,793 | |
| 5.25% 7/1/44 (Pre-Refunded to 7/1/23 @ 100) | 3,000,000 | 3,231,813 | |
| Series 2014, 5% 8/1/22 | 1,000,000 | 1,031,922 | |
| Series 2015 A: | |||
| 5% 11/15/22 | 1,000,000 | 1,044,547 | |
| 5% 11/15/22 | 10,000 | 10,449 | |
| 5% 11/15/24 | 35,000 | 39,583 | |
| 5% 11/15/25 | 45,000 | 52,591 | |
| 5% 11/15/26 | 45,000 | 52,208 | |
| Series 2015 B, 5% 11/15/24 | 45,000 | 50,850 | |
| Series 2016 A: | |||
| 5% 2/15/23 | 20,000 | 21,141 | |
| 5% 8/15/23 (Escrowed to Maturity) | 35,000 | 37,768 | |
| 5% 8/15/24 (Escrowed to Maturity) | 50,000 | 56,119 | |
| 5% 7/1/25 | 250,000 | 289,567 | |
| Series 2016 B, 5% 8/15/24 | 775,000 | 868,424 | |
| Series 2016 C: | |||
| 5% 2/15/22 | 225,000 | 227,219 | |
| 5% 2/15/23 | 700,000 | 740,369 | |
| 5% 2/15/24 | 230,000 | 253,436 | |
| Series 2016: | |||
| 5% 12/1/21 | 5,000,000 | 5,000,000 | |
| 5% 7/1/22 | 65,000 | 66,831 | |
| 5% 11/15/23 | 235,000 | 256,053 | |
| 5% 11/15/24 | 245,000 | 276,313 | |
| 5% 5/15/25 | 10,000 | 11,499 | |
| 5% 12/1/25 | 325,000 | 379,097 | |
| 5% 5/15/26 | 20,000 | 23,720 | |
| 5% 5/15/27 | 25,000 | 29,541 | |
| Series 2017: | |||
| 5% 1/1/23 | 35,000 | 36,822 | |
| 5% 1/1/25 | 50,000 | 56,921 | |
| Series 2018 A, 5% 5/15/24 | 250,000 | 277,503 | |
| Series 2019: | |||
| 5% 9/1/22 | 225,000 | 232,679 | |
| 5% 4/1/26 | 1,000,000 | 1,182,077 | |
| Illinois Gen. Oblig.: | |||
| Series 2012 A, 4% 1/1/23 | 30,000 | 30,089 | |
| Series 2012: | |||
| 4% 9/1/22 | 200,000 | 205,511 | |
| 5% 3/1/22 | 1,105,000 | 1,118,160 | |
| 5% 8/1/22 | 1,760,000 | 1,814,937 | |
| 5% 8/1/22 (FSA Insured) | 2,800,000 | 2,889,120 | |
| Series 2013 A, 5% 4/1/24 | 795,000 | 845,128 | |
| Series 2013: | |||
| 5% 7/1/22 | 375,000 | 385,271 | |
| 5% 7/1/23 | 1,700,000 | 1,821,399 | |
| 5.5% 7/1/24 | 835,000 | 901,749 | |
| Series 2014: | |||
| 5% 2/1/22 | 2,335,000 | 2,353,522 | |
| 5% 4/1/23 | 50,000 | 53,032 | |
| 5% 2/1/25 | 50,000 | 54,654 | |
| Series 2016: | |||
| 5% 1/1/22 | 1,650,000 | 1,656,441 | |
| 5% 2/1/22 | 3,100,000 | 3,124,591 | |
| 5% 2/1/24 | 450,000 | 493,028 | |
| 5% 1/1/26 | 300,000 | 349,087 | |
| 5% 2/1/26 | 1,235,000 | 1,439,979 | |
| Series 2017 A: | |||
| 5% 12/1/22 | 5,000,000 | 5,231,154 | |
| 5% 12/1/23 | 750,000 | 816,673 | |
| Series 2017 D: | |||
| 5% 11/1/22 | 2,400,000 | 2,502,044 | |
| 5% 11/1/23 | 2,400,000 | 2,604,966 | |
| Series 2018 A: | |||
| 5% 10/1/26 | 1,340,000 | 1,587,083 | |
| 5.25% 5/1/22 | 1,660,000 | 1,694,799 | |
| Series 2018 B, 5% 5/1/22 | 900,000 | 917,745 | |
| Series 2020 D, 5% 10/1/22 | 7,500,000 | 7,790,817 | |
| Series 2020 May, 5.125% 5/1/22 | 275,000 | 280,564 | |
| Series 2021 A: | |||
| 5% 3/1/22 | 2,555,000 | 2,585,428 | |
| 5% 3/1/23 | 380,000 | 401,694 | |
| 5% 3/1/24 | 2,000,000 | 2,197,703 | |
| Series 2021 B: | |||
| 5% 3/1/22 | 2,110,000 | 2,135,128 | |
| 5% 3/1/23 | 670,000 | 708,250 | |
| Illinois Health Facilities Auth. Rev. Series 2003, 1.6% 11/15/22 | 155,000 | 156,724 | |
| Illinois Hsg. Dev. Auth. Multi-family Hsg. Rev. Bonds Series 2020, 0.325%, tender 8/1/22 (a) | 12,250,000 | 12,256,404 | |
| Illinois Muni. Elec. Agcy. Pwr. Supply Series 2015 A: | |||
| 5% 2/1/22 | 1,270,000 | 1,279,980 | |
| 5% 2/1/23 | 25,000 | 26,381 | |
| 5% 2/1/24 | 420,000 | 460,257 | |
| Illinois Reg'l. Trans. Auth.: | |||
| Series 2004 A, 5.5% 6/1/22 (FSA Insured) | 350,000 | 359,219 | |
| Series 2017 A, 5% 7/1/24 | 285,000 | 318,050 | |
| Illinois Sales Tax Rev.: | |||
| Series 2013, 5% 6/15/24 | 400,000 | 427,429 | |
| Series 2016 C, 5% 6/15/22 | 285,000 | 292,222 | |
| Series 2016 D, 5% 6/15/23 | 1,500,000 | 1,603,156 | |
| Series 2021 A: | |||
| 3% 6/15/22 | 1,670,000 | 1,694,439 | |
| 4% 6/15/23 | 3,175,000 | 3,344,824 | |
| 4% 6/15/24 | 1,670,000 | 1,812,086 | |
| Series 2021 C: | |||
| 5% 6/15/23 | 75,000 | 80,158 | |
| 5% 6/15/24 | 85,000 | 94,368 | |
| 5% 6/15/25 | 50,000 | 57,413 | |
| Illinois State Univ. Revs. Series 2018 A, 5% 4/1/23 (FSA Insured) | 290,000 | 307,407 | |
| Illinois Toll Hwy. Auth. Toll Hwy. Rev.: | |||
| Series 2014 A: | |||
| 5% 12/1/21 | 1,360,000 | 1,360,000 | |
| 5% 12/1/22 | 1,090,000 | 1,141,689 | |
| Series 2018 A, 5% 1/1/25 | 485,000 | 551,494 | |
| Kane County School District #129, Aurora West Side Series 2014 A, 2.75% 2/1/22 | 1,000,000 | 1,004,174 | |
| Kane County School District No. 131: | |||
| Series 2020 A: | |||
| 3% 12/1/21 (FSA Insured) | 355,000 | 355,000 | |
| 4% 12/1/22 (FSA Insured) | 235,000 | 243,468 | |
| 5% 12/1/23 (FSA Insured) | 290,000 | 314,240 | |
| Series 2020 B: | |||
| 3% 12/1/21 (FSA Insured) | 510,000 | 510,000 | |
| 4% 12/1/22 (FSA Insured) | 435,000 | 450,675 | |
| Kane, Cook, DuPage, McHenry & DeKalb Counties Cmnty. College District #509 Elgin Series 2021 B: | |||
| 4% 12/15/23 | 155,000 | 166,509 | |
| 4% 12/15/24 | 450,000 | 498,070 | |
| Kendall, Kane & Will Counties Cmnty. Unit School District #308: | |||
| Series 2008, 0% 2/1/22 (FSA Insured) | 265,000 | 264,835 | |
| Series 2011, 5.5% 2/1/23 | 550,000 | 582,252 | |
| Lake County Cmnty. Consolidated School District Series 2020, 4% 2/1/22 (FSA Insured) | 310,000 | 311,861 | |
| Matteson Gen. Oblig.: | |||
| Series 2021 A, 4% 12/1/23 | 705,000 | 752,454 | |
| Series 2021 B, 4% 12/1/23 | 525,000 | 560,338 | |
| McHenry County Cmnty. School District #200 Series 2006 B: | |||
| 0% 1/15/24 (Pre-Refunded to 1/15/24 @ 100) | 105,000 | 102,967 | |
| 0% 1/15/25 | 110,000 | 106,254 | |
| 0% 1/15/26 | 80,000 | 75,879 | |
| McHenry County Conservation District Gen. Oblig. Series 2014, 5% 2/1/23 | 65,000 | 68,537 | |
| Metropolitan Pier & Exposition: | |||
| (McCormick Place Expansion Proj.) Series 1996 A, 0% 6/15/23 (Nat'l. Pub. Fin. Guarantee Corp. Insured) | 150,000 | 148,128 | |
| Series 2012 B, 5% 12/15/22 | 1,655,000 | 1,732,839 | |
| Series 2022 A, 3% 6/15/24 (e) | 630,000 | 655,191 | |
| Northern Illinois Univ. Revs. Series 2020 B, 5% 4/1/22 (Build America Mutual Assurance Insured) | 250,000 | 253,855 | |
| Peoria County Gen. Oblig. Series 2021 A: | |||
| 4% 1/1/22 | 150,000 | 150,437 | |
| 4% 1/1/24 | 1,000,000 | 1,070,378 | |
| Railsplitter Tobacco Settlement Auth. Rev. Series 2017: | |||
| 5% 6/1/22 | 3,520,000 | 3,602,181 | |
| 5% 6/1/23 | 2,990,000 | 3,193,928 | |
| 5% 6/1/24 | 635,000 | 704,715 | |
| Skokie Pk District Series 2003, 0% 12/1/22 | 1,830,000 | 1,816,277 | |
| Southern Illinois Univ. Rev. Series 2021 A, 4% 4/1/22 | 650,000 | 658,118 | |
| Univ. of Illinois Board of Trustees Ctfs. of Prtn. Series 2014 C, 5% 3/15/23 | 265,000 | 281,135 | |
| Univ. of Illinois Rev.: | |||
| Series 2015 A, 3% 4/1/22 | 455,000 | 459,226 | |
| Series 2016 A, 5% 4/1/22 | 245,000 | 248,894 | |
| Series 2018 A, 5% 4/1/22 | 1,000,000 | 1,015,893 | |
| Series 2018 B, 5% 4/1/23 (FSA Insured) | 270,000 | 286,991 | |
| Series 2019 A, 5% 4/1/22 | 485,000 | 492,708 | |
| Upper Illinois River Valley Dev. Auth. Rev. Series 2018, 5% 12/1/24 | 300,000 | 330,399 | |
| Village of Westchester Gen. Oblig. Series 2021, 4% 12/1/22 | 500,000 | 518,171 | |
| Waukegan Gen. Oblig.: | |||
| Series 2018 A: | |||
| 4% 12/30/21 (FSA Insured) | 410,000 | 411,169 | |
| 4% 12/30/22 (FSA Insured) | 425,000 | 440,854 | |
| Series 2018 B, 4% 12/30/22 (FSA Insured) | 400,000 | 414,922 | |
| Western Illinois Univ. Board Rev. Series 2020, 4% 4/1/22 | 1,200,000 | 1,214,543 | |
| Whiteside & Lee Counties Cmnty. Unit School District Series 2018 A, 4% 12/1/21 | 1,325,000 | 1,325,000 | |
| TOTAL ILLINOIS | 185,783,451 | ||
| Indiana - 0.8% | |||
| Ctr. Grove Cmnty. School Corp. Series 2021 B: | |||
| 3% 1/1/23 (e) | 600,000 | 615,308 | |
| 4% 1/1/24 (e) | 2,065,000 | 2,203,700 | |
| Fort Wayne Cmnty. Schools Bldg. Corp. Series 2021: | |||
| 4% 7/15/22 | 575,000 | 588,503 | |
| 4% 1/15/23 | 625,000 | 651,050 | |
| Hammond Loc Pub. Impt. Bd Bank Series 2021 A, 2% 12/31/21 | 1,170,000 | 1,171,185 | |
| Indiana Dev. Fin. Auth. Solid Waste Disp. Rev. Bonds (Waste Mgmt., Inc. Proj.) Series 2001, 0.4%, tender 10/3/22 (a)(b) | 3,500,000 | 3,500,385 | |
| Indiana Fin. Auth. Econ. Dev. Rev. Bonds (Republic Svcs., Inc. Proj.): | |||
| Series 2012, 0.15%, tender 12/1/21 (a)(b) | 2,000,000 | 2,000,000 | |
| Series A, 0.15%, tender 12/1/21 (a)(b) | 5,100,000 | 5,100,000 | |
| Indiana Fin. Auth. Health Sys. Rev. Bonds Series 2019 B, 2.25%, tender 7/1/25 (a) | 710,000 | 748,987 | |
| Indiana Fin. Auth. Hosp. Rev.: | |||
| (Cmnty. Health Network Proj.) Series 2012 A, 5% 5/1/42 (Pre-Refunded to 5/1/23 @ 100) | 2,000,000 | 2,133,195 | |
| Bonds: | |||
| Series 2011 H, 1.65%, tender 1/1/22 (a) | 3,300,000 | 3,303,832 | |
| Series 2011 M, 0.7%, tender 1/1/26 (a) | 3,680,000 | 3,670,645 | |
| Series 2015 B, 1.65%, tender 1/1/22 (a) | 1,290,000 | 1,291,550 | |
| Series 2013: | |||
| 5% 8/15/22 | 15,000 | 15,504 | |
| 5% 8/15/23 | 20,000 | 21,597 | |
| Series 2016 A, 5% 12/1/21 | 200,000 | 200,000 | |
| Indiana Fin. Auth. Rev.: | |||
| (Butler Univ. Proj.): | |||
| Series 2012 A, 5% 2/1/25 | 515,000 | 518,910 | |
| Series 2019: | |||
| 3% 2/1/22 | 210,000 | 210,952 | |
| 3% 2/1/23 | 225,000 | 232,072 | |
| 4% 2/1/24 | 200,000 | 214,829 | |
| 4% 2/1/25 | 275,000 | 303,900 | |
| (DePauw Univ. Proj.) Series 2019, 5% 7/1/22 | 600,000 | 615,621 | |
| Series 2016, 5% 9/1/26 | 205,000 | 246,205 | |
| Indiana Fin. Auth. Wastewtr. Util. Rev. (CWA Auth. Proj.): | |||
| Series 2012 A, 5% 10/1/22 | 35,000 | 36,392 | |
| Series 2014 A, 5% 10/1/22 | 15,000 | 15,596 | |
| Series 2015 A: | |||
| 5% 10/1/24 | 35,000 | 39,565 | |
| 5% 10/1/25 | 35,000 | 39,524 | |
| Indiana Health Facility Fing. Auth. Rev. Bonds Series 2001 A2, 2%, tender 2/1/23 (a) | 155,000 | 157,854 | |
| Indiana Hsg. & Cmnty. Dev. Auth. Series 2021 C1, 3% 1/1/52 | 1,000,000 | 1,086,906 | |
| Indiana Muni. Pwr. Agcy. Pwr. Supply Sys. Rev. Series 2017 A, 5% 1/1/25 | 705,000 | 800,727 | |
| Indianapolis Local Pub. Impt.: | |||
| (Indianapolis Arpt. Auth. Proj.): | |||
| Series 2016 A1: | |||
| 5% 1/1/23 (b) | 45,000 | 47,263 | |
| 5% 1/1/24 (b) | 60,000 | 65,475 | |
| 5% 1/1/25 (b) | 65,000 | 73,463 | |
| Series 2019 D, 5% 1/1/24 (b) | 270,000 | 294,636 | |
| Series 2021 A: | |||
| 5% 6/1/22 | 1,265,000 | 1,294,598 | |
| 5% 6/1/23 | 255,000 | 272,631 | |
| Marion High School Bldg. Corp.: | |||
| Series 2021 A: | |||
| 4% 1/15/24 | 240,000 | 257,503 | |
| 4% 1/15/25 | 250,000 | 275,870 | |
| 4% 7/15/25 | 255,000 | 284,957 | |
| Series 2021 B, 4% 1/15/23 | 205,000 | 213,262 | |
| Purdue Univ. Rev. Series 2012 AA, 5% 7/1/27 | 255,000 | 261,790 | |
| Upland Econ. Dev. Rfdg. Rev. (Taylor Univ. Proj.) Series 2021: | |||
| 4% 9/1/22 | 200,000 | 205,424 | |
| 4% 9/1/23 | 275,000 | 291,971 | |
| Vinton Tecumseh School Bldg. Corp. Series 2021: | |||
| 3% 1/15/24 | 490,000 | 515,210 | |
| 3% 7/15/25 | 515,000 | 557,323 | |
| Warrick County Envir. Impt. Rev. Bonds (Southern Indiana Gas and Elec. Co.) Series 2015, 0.875%, tender 9/1/23 (a)(b) | 2,800,000 | 2,797,822 | |
| Whiting Envir. Facilities Rev. Bonds (BP Products North America, Inc. Proj.): | |||
| Series 2015, 5%, tender 11/1/22 (a)(b) | 1,780,000 | 1,855,954 | |
| Series 2016 A, 5%, tender 3/1/23 (a)(b) | 3,400,000 | 3,596,566 | |
| Series 2019 A, 5%, tender 6/5/26 (a)(b) | 1,645,000 | 1,959,991 | |
| TOTAL INDIANA | 46,856,203 | ||
| Iowa - 0.1% | |||
| Iowa Fin. Auth. Rev. Series 2018 B: | |||
| 5% 2/15/22 | 540,000 | 545,248 | |
| 5% 2/15/24 | 200,000 | 220,007 | |
| Iowa Fin. Auth. Solid Waste Facilities Bonds (Gevo NW Iowa RNG, LLC Renewable Natural Gas Proj.) Series 2021, 1.5%, tender 4/1/24, LOC Citibank NA (a)(b) | 1,500,000 | 1,510,774 | |
| Iowa Higher Ed. Ln. Auth. Rev. (Grinnell College Proj.) Series 2017, 4% 12/1/24 | 250,000 | 276,327 | |
| Iowa Student Ln. Liquidity Corp. Student Ln. Rev.: | |||
| Series 2015 A, 5% 12/1/21 (b) | 1,000,000 | 1,000,000 | |
| Series 2018 A: | |||
| 5% 12/1/21 (b) | 500,000 | 500,000 | |
| 5% 12/1/22 (b) | 725,000 | 757,218 | |
| Series 2019 B, 5% 12/1/23 (b) | 600,000 | 652,656 | |
| TOTAL IOWA | 5,462,230 | ||
| Kansas - 0.2% | |||
| Desoto Unified School District # 232 Series 2015 A, 5% 9/1/22 | 35,000 | 36,261 | |
| Wichita Gen. Oblig. Series 2021 306, 4% 10/15/22 | 10,000,000 | 10,333,416 | |
| Wyandotte County/Kansas City Unified Govt. Util. Sys. Rev. Series 2016 A: | |||
| 5% 9/1/22 | 10,000 | 10,344 | |
| 5% 9/1/23 | 15,000 | 16,175 | |
| 5% 9/1/25 | 15,000 | 17,380 | |
| TOTAL KANSAS | 10,413,576 | ||
| Kentucky - 0.9% | |||
| Ashland Med. Ctr. Rev.: | |||
| (Ashland Hosp. Corp. D/B/A King's Daughters Med. Ctr. Proj.) Series 2016 A: | |||
| 5% 2/1/24 | 30,000 | 32,800 | |
| 5% 2/1/25 | 20,000 | 22,660 | |
| Series 2019, 5% 2/1/22 | 500,000 | 503,711 | |
| Hazard Healthcare Rev. Series 2021: | |||
| 5% 7/1/23 | 350,000 | 375,725 | |
| 5% 7/1/24 | 230,000 | 256,988 | |
| Kenton County Arpt. Board Arpt. Rev. Series 2016: | |||
| 5% 1/1/22 | 285,000 | 286,104 | |
| 5% 1/1/24 | 200,000 | 219,124 | |
| Kentucky Asset/Liability Commission Agcy. Fund Rev. Series A, 5% 9/1/22 | 2,000,000 | 2,071,305 | |
| Kentucky Asset/Liability Commission Gen. Fund Rev. Series 2021 A, 5% 11/1/24 | 435,000 | 491,539 | |
| Kentucky Bond Dev. Corp. Edl. Facilities: | |||
| (Transylvania Univ. Proj.) Series 2021 A, 2% 3/1/23 | 320,000 | 325,957 | |
| (Transylvania Univ. Proj.) Series 2021 A, 4% 3/1/25 | 340,000 | 374,807 | |
| Kentucky Econ. Dev. Fin. Auth. Solid Waste Disp. Rev. Bonds (Republic Svcs., Inc. Proj.) Series B, 0.15%, tender 12/1/21 (a) | 1,400,000 | 1,400,000 | |
| Kentucky Higher Ed. Student Ln. Corp. Rev.: | |||
| Series 2019 A1 5% 6/1/23 (b) | 250,000 | 266,273 | |
| Series 2019 A1, 5% 6/1/22 (b) | 200,000 | 204,568 | |
| Kentucky Hsg. Corp. Multi-family Rev. Bonds: | |||
| (Cambridge Square Proj.) Series 2021, 0.3%, tender 2/1/24 (a) | 3,500,000 | 3,491,842 | |
| (City View Park Proj.) Series 2020, 1.16%, tender 2/7/22 (a) | 4,000,000 | 4,006,548 | |
| Kentucky Rural Wtr. Fin. Corp. Series 2020 E, 0.425% 12/1/21 | 3,000,000 | 3,000,000 | |
| Kentucky State Property & Buildings Commission Rev.: | |||
| Series 2005, 5% 8/1/22 (Nat'l. Pub. Fin. Guarantee Corp. Insured) | 250,000 | 257,861 | |
| Series 2013 A, 5% 10/1/23 | 365,000 | 395,885 | |
| Series 2015, 4% 8/1/25 | 200,000 | 224,125 | |
| Series 2016 B: | |||
| 5% 11/1/23 | 2,730,000 | 2,971,038 | |
| 5% 11/1/24 | 285,000 | 322,753 | |
| Series 2016: | |||
| 3% 2/1/24 | 350,000 | 368,121 | |
| 5% 11/1/23 | 1,435,000 | 1,561,699 | |
| 5% 2/1/24 | 275,000 | 302,489 | |
| 5% 10/1/24 | 425,000 | 478,246 | |
| Series 2017: | |||
| 5% 4/1/22 | 400,000 | 406,330 | |
| 5% 4/1/23 | 600,000 | 637,342 | |
| 5% 4/1/24 | 900,000 | 996,553 | |
| Series 2018: | |||
| 5% 5/1/22 | 385,000 | 392,621 | |
| 5% 5/1/23 | 1,415,000 | 1,508,401 | |
| Series A: | |||
| 5% 2/1/22 | 550,000 | 554,322 | |
| 5% 11/1/22 | 610,000 | 636,310 | |
| 5% 11/1/25 | 350,000 | 408,098 | |
| Series B: | |||
| 5% 8/1/22 | 4,660,000 | 4,806,528 | |
| 5% 8/1/23 | 3,265,000 | 3,517,121 | |
| 5% 8/1/25 | 300,000 | 346,910 | |
| Kentucky State Univ. Ctfs. of Prtn. (Kentucky State Univ. Proj.) Series 2021, 5% 11/1/25 | 280,000 | 324,830 | |
| Kentucky, Inc. Pub. Energy: | |||
| Bonds Series 2019 A1, 4%, tender 6/1/25 (a) | 1,000,000 | 1,104,227 | |
| Series A, 4% 12/1/22 | 350,000 | 362,827 | |
| Louisville & Jefferson County: | |||
| Bonds: | |||
| Series 2020 B, 5%, tender 10/1/23 (a) | 840,000 | 910,855 | |
| Series 2020 C, 5%, tender 10/1/26 (a) | 2,015,000 | 2,418,502 | |
| Series 2016 A, 5% 10/1/22 | 200,000 | 207,797 | |
| Louisville & Jefferson County Gen. Oblig. Series 2020 A, 5% 10/1/24 | 2,005,000 | 2,265,284 | |
| Louisville Reg'l. Arpt. Auth. Sys. Rev. Series 2014 A: | |||
| 5% 7/1/23 (b) | 1,750,000 | 1,874,581 | |
| 5% 7/1/24 (b) | 155,000 | 172,339 | |
| Louisville/Jefferson County Metropolitan Gov. Series 2012 A: | |||
| 5% 12/1/28 (Pre-Refunded to 6/1/22 @ 100) | 55,000 | 56,301 | |
| 5% 12/1/29 (Pre-Refunded to 6/1/22 @ 100) | 230,000 | 235,442 | |
| Paducah Elec. Plant Board Rev. Series 2019, 5% 10/1/22 | 2,005,000 | 2,078,711 | |
| TOTAL KENTUCKY | 50,434,400 | ||
| Louisiana - 0.4% | |||
| Louisiana Citizens Property Ins. Corp. Assessment Rev. Series 2015, 5% 6/1/22 (FSA Insured) | 900,000 | 921,424 | |
| Louisiana Gen. Oblig.: | |||
| Series 2015 A, 5% 5/1/24 | 350,000 | 389,272 | |
| Series 2016 D, 5% 9/1/24 | 155,000 | 174,610 | |
| Series 2020 A, 5% 3/1/23 | 500,000 | 529,420 | |
| Louisiana Local Govt. Envir. Facilities and Cmnty. Dev. Auth. Bonds (East Baton Rouge Sewerage Commission Proj.) Series 2020 B, 0.875%, tender 2/1/25 (a) | 4,000,000 | 4,009,304 | |
| Louisiana Offshore Term. Auth. Deepwater Port Rev. Bonds Series 2010 B-1A, 2%, tender 10/1/22 (a) | 815,000 | 822,219 | |
| Louisiana Stadium and Exposition District: | |||
| Series 2013 A, 5% 7/1/22 | 20,000 | 20,544 | |
| Series 2021, 4% 7/3/23 | 1,685,000 | 1,759,322 | |
| New Orleans Aviation Board Rev.: | |||
| (North Term. Proj.): | |||
| Series 2015 B, 5% 1/1/25 (b) | 150,000 | 169,530 | |
| Series 2017 B: | |||
| 5% 1/1/22 (b) | 280,000 | 281,064 | |
| 5% 1/1/23 (b) | 1,070,000 | 1,123,798 | |
| 5% 1/1/24 (b) | 20,000 | 21,825 | |
| 5% 1/1/25 (b) | 5,000 | 5,651 | |
| 5% 1/1/26 (b) | 15,000 | 17,496 | |
| Series 2017 D2: | |||
| 5% 1/1/22 (b) | 345,000 | 346,311 | |
| 5% 1/1/23 (b) | 10,000 | 10,503 | |
| 5% 1/1/24 (b) | 15,000 | 16,369 | |
| 5% 1/1/25 (b) | 115,000 | 129,973 | |
| St. John Baptist Parish Rev. Bonds (Marathon Oil Corp.) Series 2017, 2%, tender 4/1/23 (a) | 9,280,000 | 9,446,915 | |
| State of Louisiana Grant Anticipation Rev. Series 2021: | |||
| 5% 9/1/22 | 2,400,000 | 2,486,490 | |
| 5% 9/1/23 | 865,000 | 936,428 | |
| 5% 9/1/24 | 785,000 | 880,404 | |
| Tobacco Settlement Fing. Corp. Series 2013 A, 5% 5/15/23 | 110,000 | 117,448 | |
| TOTAL LOUISIANA | 24,616,320 | ||
| Maine - 0.0% | |||
| Maine Fin. Auth. Student Ln. Rev. Series 2019 A, 5% 12/1/23 (FSA Insured) (b) | 500,000 | 542,314 | |
| Maine Health & Higher Edl. Facilities Auth. Rev. Series 2020 A: | |||
| 4% 7/1/22 | 235,000 | 240,161 | |
| 4% 7/1/22 | 190,000 | 194,128 | |
| Maine Tpk. Auth. Tpk. Rev. Series 2015: | |||
| 5% 7/1/22 | 40,000 | 41,118 | |
| 5% 7/1/24 | 630,000 | 703,923 | |
| 5% 7/1/26 | 250,000 | 289,664 | |
| TOTAL MAINE | 2,011,308 | ||
| Maryland - 0.3% | |||
| Baltimore County Gen. Oblig. Series 2020, 4% 1/1/22 | 830,000 | 832,561 | |
| Baltimore Proj. Rev.: | |||
| (Wtr. Projs.) Series 2020 A: | |||
| 5% 7/1/23 | 400,000 | 429,796 | |
| 5% 7/1/24 | 635,000 | 710,381 | |
| Series 2017 D: | |||
| 5% 7/1/24 | 70,000 | 78,310 | |
| 5% 7/1/25 | 75,000 | 87,015 | |
| Howard County Gen. Oblig. Series A, 5% 8/15/22 | 1,000,000 | 1,034,133 | |
| Hsg. Opportunities Commission of Montgomery County Series 2021 C, 0.8% 7/1/25 (e) | 105,000 | 105,061 | |
| Maryland Cmnty. Dev. Admin Dept. Hsg. & Cmnty. Dev.: | |||
| Series 2019 B, 4% 9/1/49 | 215,000 | 234,698 | |
| Series 2020 C, 0.625% 7/1/22 | 500,000 | 500,109 | |
| Series 2021 A, 0.83% 5/1/23 (d) | 4,000,000 | 3,995,111 | |
| Series 2021 C: | |||
| 0.375% 7/1/23 | 260,000 | 259,965 | |
| 0.6% 7/1/24 | 560,000 | 559,811 | |
| Series A: | |||
| 0.2% 3/1/23 | 1,015,000 | 1,012,467 | |
| 0.25% 9/1/23 | 775,000 | 771,636 | |
| Maryland Dept. of Trans. Consolidated Trans. Rev.: | |||
| Series 2022 A: | |||
| 5% 12/1/22 (e) | 205,000 | 212,117 | |
| 5% 12/1/23 (e) | 95,000 | 102,494 | |
| Series 2022 B: | |||
| 5% 12/1/23 (e) | 120,000 | 125,378 | |
| 5% 12/1/24 (e) | 220,000 | 238,581 | |
| Maryland Health & Higher Edl.: | |||
| Bonds Series 2020, 5%, tender 7/1/25 (a) | 1,000,000 | 1,132,168 | |
| Series 2020, 4% 1/1/22 | 200,000 | 200,591 | |
| Maryland Health & Higher Edl. Facilities Auth. Rev.: | |||
| Series 2015: | |||
| 5% 7/1/22 | 20,000 | 20,550 | |
| 5% 7/1/23 | 20,000 | 21,470 | |
| 5% 7/1/24 | 45,000 | 50,255 | |
| 5% 7/1/25 | 40,000 | 46,300 | |
| 5% 7/1/25 (Pre-Refunded to 7/1/24 @ 100) | 1,145,000 | 1,280,609 | |
| Series 2020 A, 4% 7/1/22 | 100,000 | 102,113 | |
| Series 2020 B, 5% 4/15/23 | 675,000 | 718,196 | |
| Maryland Stadium Auth. Built to Learn Rev. Series 2021, 5% 6/1/23 | 1,250,000 | 1,337,205 | |
| Maryland Trans. Auth. Trans. Facility Projs. Rev.: | |||
| Series 2020, 5% 7/1/22 | 1,500,000 | 1,542,354 | |
| Series 2021 A, 5% 7/1/24 | 1,250,000 | 1,398,389 | |
| TOTAL MARYLAND | 19,139,824 | ||
| Massachusetts - 1.3% | |||
| Boston Hsg. Auth. Cap. Prog. Series 2020 B: | |||
| 5% 4/1/23 | 450,000 | 478,381 | |
| 5% 4/1/24 | 475,000 | 525,489 | |
| Massachusetts Bay Trans. Auth. Sales Tax Rev.: | |||
| Series 2016 A, 0% 7/1/23 | 355,000 | 353,080 | |
| Series 2021, 4% 5/1/25 | 2,500,000 | 2,799,364 | |
| Series B, 5% 7/1/22 | 900,000 | 925,359 | |
| Massachusetts Dept. of Trans. Metropolitan Hwy. Sys. Rev. Bonds Series 2019 A, 5%, tender 1/1/23 (a) | 4,880,000 | 5,124,269 | |
| Massachusetts Dev. Fin. Agcy. Multi-family Hsg. Rev. Bonds Series 2021, 0.25%, tender 7/1/23 (a) | 1,750,000 | 1,742,414 | |
| Massachusetts Dev. Fin. Agcy. Rev.: | |||
| Bonds: | |||
| Series 2011 N, 0.45%, tender 7/1/25 (a) | 1,000,000 | 994,638 | |
| Series S3, SIFMA Municipal Swap Index + 0.500% 0.55%, tender 1/26/23 (a)(c) | 3,400,000 | 3,404,803 | |
| Series 2015 C, 5% 10/1/22 | 200,000 | 207,763 | |
| Series 2015 H1, 5% 7/1/22 | 575,000 | 590,756 | |
| Series 2016 A, 5% 7/15/22 | 30,000 | 30,903 | |
| Series 2016 I: | |||
| 5% 7/1/22 | 410,000 | 420,967 | |
| 5% 7/1/23 | 15,000 | 16,046 | |
| 5% 7/1/24 | 25,000 | 27,742 | |
| 5% 7/1/25 | 20,000 | 22,950 | |
| 5% 7/1/26 | 20,000 | 23,642 | |
| Series 2019 A: | |||
| 5% 7/1/22 | 450,000 | 462,036 | |
| 5% 7/1/24 | 155,000 | 172,170 | |
| Series 2019 O: | |||
| 5% 12/1/23 | 130,000 | 141,599 | |
| 5% 12/1/24 | 100,000 | 113,056 | |
| Series 2020 A2, 5% 7/1/22 | 310,000 | 318,661 | |
| Series C: | |||
| 5% 10/1/22 (FSA Insured) | 275,000 | 285,580 | |
| 5% 10/1/23 (FSA Insured) | 350,000 | 378,273 | |
| 5% 10/1/24 (FSA Insured) | 325,000 | 364,642 | |
| Series Q, 5% 7/1/22 | 250,000 | 256,985 | |
| Massachusetts Edl. Fing. Auth. Rev.: | |||
| Series 2011 J, 5.125% 7/1/22 (b) | 2,080,000 | 2,082,635 | |
| Series 2013, 5% 7/1/22 (b) | 400,000 | 411,104 | |
| Series 2014: | |||
| 5% 1/1/23 (b) | 3,000,000 | 3,147,484 | |
| 5% 1/1/24 (b) | 5,000,000 | 5,418,180 | |
| Series 2015 A: | |||
| 5% 1/1/22 (b) | 600,000 | 602,314 | |
| 5% 1/1/23 (b) | 9,000,000 | 9,447,478 | |
| 5% 1/1/24 (b) | 8,250,000 | 8,939,997 | |
| Series 2016 J: | |||
| 5% 7/1/22 (b) | 1,475,000 | 1,515,330 | |
| 5% 7/1/23 (b) | 725,000 | 776,493 | |
| Series 2016, 5% 7/1/24 (b) | 535,000 | 588,900 | |
| Series 2020 C, 5% 7/1/23 (b) | 375,000 | 401,634 | |
| Series 2021 B: | |||
| 5% 7/1/24 (b) | 750,000 | 828,802 | |
| 5% 7/1/25 (b) | 750,000 | 854,354 | |
| Massachusetts Gen. Oblig.: | |||
| Bonds Series D2, 1.7%, tender 8/1/22 (a) | 980,000 | 989,641 | |
| Series 2021 B, 5% 11/1/23 | 8,880,000 | 9,683,720 | |
| Massachusetts Health & Edl. Facilities Auth. Rev.: | |||
| (Partners Healthcare Sys., Inc. Proj.) Series 2007 G2, 0.2%, tender 12/7/21 (FSA Insured) (a) | 6,790,000 | 6,790,000 | |
| Bonds Series I, 0.7%, tender 7/1/25 (a) | 395,000 | 395,858 | |
| Massachusetts Port Auth. Rev.: | |||
| Series 2017 A: | |||
| 5% 7/1/24 (b) | 65,000 | 72,484 | |
| 5% 7/1/25 (b) | 25,000 | 28,841 | |
| Series 2019 C, 5% 7/1/24 (b) | 345,000 | 384,725 | |
| Series 2021 E, 5% 7/1/23 (b) | 500,000 | 536,502 | |
| TOTAL MASSACHUSETTS | 74,078,044 | ||
| Michigan - 0.9% | |||
| Armada Area Schools Series 2014, 4% 5/1/22 | 305,000 | 309,725 | |
| Brandon School District Series A, 5% 5/1/23 | 430,000 | 458,320 | |
| Carman-Ainsworth Cmnty. School District Series 2021, 4% 5/1/24 | 1,335,000 | 1,442,295 | |
| Chippewa Valley Schools Series 2016 B, 5% 5/1/24 | 200,000 | 222,287 | |
| Clarkston Cmnty. Schools Series 2015, 5% 5/1/22 | 35,000 | 35,688 | |
| Dearborn School District Series 2017, 5% 5/1/22 | 250,000 | 255,023 | |
| Detroit Downtown Dev. Auth. Tax: | |||
| Series 1, 5% 7/1/22 (FSA Insured) | 500,000 | 513,642 | |
| Series A, 5% 7/1/25 (FSA Insured) | 550,000 | 610,326 | |
| Grand Blanc Cmnty. Schools Series 2013, 5% 5/1/22 | 40,000 | 40,799 | |
| Grand Rapids Pub. Schools Series 2017, 5% 5/1/23 (FSA Insured) | 30,000 | 32,002 | |
| Grand Traverse County Hosp. Fin. Auth.: | |||
| Series 2019 B, 5% 7/1/23 | 255,000 | 273,827 | |
| Series 2021: | |||
| 5% 7/1/24 | 650,000 | 726,091 | |
| 5% 7/1/25 | 480,000 | 555,228 | |
| Grosse Ile Township School District Unltd. Tax Gen. Oblig. Series 2016, 2% 5/1/24 | 125,000 | 129,251 | |
| Huron School District Series 2019, 5% 5/1/24 | 205,000 | 227,424 | |
| Kalamazoo Hosp. Fin. Auth. Hosp. Facilities Rev. Series 2016: | |||
| 5% 5/15/22 | 20,000 | 20,428 | |
| 5% 5/15/24 | 10,000 | 11,113 | |
| 5% 5/15/25 | 15,000 | 17,271 | |
| 5% 5/15/26 | 15,000 | 17,819 | |
| Kent City Cmnty. Schools Series 2020, 4% 5/1/23 | 205,000 | 215,492 | |
| Kent Hosp. Fin. Auth. Hosp. Facilities Rev. (Spectrum Health Sys. Proj.) Series 2015 A, SIFMA Municipal Swap Index + 0.250% 0.3%, tender 6/28/22 (a)(c) | 1,000,000 | 1,000,000 | |
| Lake Superior State Univ. Series 2021, 4% 11/15/22 (FSA Insured) | 305,000 | 315,569 | |
| Michigan Bldg. Auth. Rev. (Facilities Prog.) Series 2016 I, 5% 4/15/24 | 60,000 | 66,433 | |
| Michigan Fin. Auth. Rev.: | |||
| (Detroit Wtr. and Sewage Dept. Wtr. Supply Sys. Rev. Rfdg. Local Proj.): | |||
| Series 2014 C3, 5% 7/1/22 (FSA Insured) | 1,155,000 | 1,186,443 | |
| Series 2014 D1, 5% 7/1/22 (FSA Insured) | 2,845,000 | 2,922,451 | |
| (Trinity Health Proj.) Series 2017, 5% 12/1/23 | 250,000 | 273,146 | |
| Bonds: | |||
| Series 2016 E1, 4%, tender 8/15/24 (a) | 275,000 | 300,700 | |
| Series 2016 MI2, SIFMA Municipal Swap Index + 0.480% 0.53%, tender 12/2/21 (a)(c) | 5,000,000 | 5,000,702 | |
| Series 2019 B, 3.5%, tender 11/15/22 (a) | 5,750,000 | 5,920,803 | |
| Series 2019 MI2, 5%, tender 2/1/25 (a) | 1,605,000 | 1,828,202 | |
| Series 2012, 5% 11/1/22 | 350,000 | 365,427 | |
| Series 2015 A: | |||
| 5% 8/1/22 | 1,380,000 | 1,424,335 | |
| 5% 8/1/23 | 630,000 | 679,747 | |
| Series 2015 D1: | |||
| 0.25% 10/15/22 | 500,000 | 499,898 | |
| 0.4% 10/15/23 | 650,000 | 650,460 | |
| 0.55% 10/15/24 | 300,000 | 299,936 | |
| 0.75% 10/15/25 | 250,000 | 250,590 | |
| Series 2015 MI: | |||
| 5% 12/1/22 | 600,000 | 628,886 | |
| 5% 12/1/24 | 100,000 | 113,568 | |
| Series 2016: | |||
| 5% 11/15/22 | 715,000 | 747,133 | |
| 5% 11/15/23 | 225,000 | 245,249 | |
| Series 2020 A: | |||
| 4% 6/1/22 | 1,000,000 | 1,018,180 | |
| 5% 6/1/24 | 1,000,000 | 1,113,397 | |
| Michigan Gen. Oblig. Series 2016: | |||
| 5% 3/15/22 | 50,000 | 50,678 | |
| 5% 3/15/23 | 85,000 | 90,062 | |
| Michigan Hosp. Fin. Auth. Rev.: | |||
| Bonds: | |||
| (Ascension Health Cr. Group Proj.) Series F5, 2.4%, tender 3/15/23 (a) | 330,000 | 338,868 | |
| Series 2010 F1, 4%, tender 6/1/23 (a) | 200,000 | 211,154 | |
| Series 2008 C, 5% 12/1/21 | 500,000 | 500,000 | |
| Series 2012 A, 5% 6/1/23 | 200,000 | 204,641 | |
| Michigan Strategic Fund Exempt Facilities Rev. Bonds (Waste Mgmt., Inc. Proj.) Series 2001, 0.58%, tender 8/1/24 (a)(b) | 150,000 | 149,526 | |
| Michigan Strategic Fund Ltd. Oblig. Rev. Series 2019, 4% 11/15/22 | 730,000 | 749,655 | |
| Northern Michigan Univ. Revs. Series 2018 A, 5% 12/1/22 | 700,000 | 732,907 | |
| Novi Cmnty. School District Series I, 4% 5/1/23 | 550,000 | 579,195 | |
| Oakland Univ. Rev. Series 2016, 5% 3/1/22 | 385,000 | 389,531 | |
| Portage Pub. Schools Series 2016: | |||
| 5% 5/1/23 | 45,000 | 47,997 | |
| 5% 11/1/23 | 30,000 | 32,673 | |
| 5% 5/1/24 | 40,000 | 44,355 | |
| 5% 11/1/24 | 45,000 | 50,849 | |
| 5% 5/1/25 | 25,000 | 28,748 | |
| 5% 11/1/25 | 25,000 | 29,224 | |
| 5% 11/1/28 | 20,000 | 23,769 | |
| Rockford Pub. Schools Gen. Oblig. Series 2019 I, 4% 5/1/22 | 285,000 | 289,439 | |
| Roseville Cmnty. Schools Series 2014, 5% 5/1/23 | 300,000 | 320,023 | |
| Royal Oak Hosp. Fin. Auth. Hosp. Rev. Series 2014 D, 5% 9/1/23 | 345,000 | 372,919 | |
| Saginaw Hosp. Fin. Auth. Hosp. Rev. Series 2020 J: | |||
| 5% 7/1/22 | 455,000 | 467,522 | |
| 5% 7/1/23 | 250,000 | 268,375 | |
| Warren Consolidated School District Series 2019, 4% 5/1/23 | 230,000 | 241,873 | |
| Wayne County Arpt. Auth. Rev.: | |||
| Series 2011 A: | |||
| 4.125% 12/1/22 (FSA Insured) (b) | 530,000 | 531,606 | |
| 5% 12/1/21 (b) | 8,505,000 | 8,505,000 | |
| 5% 12/1/22 (b) | 250,000 | 252,392 | |
| Series 2012 B, 5% 12/1/22 (b) | 485,000 | 507,999 | |
| Series 2017 B, 5% 12/1/21 (b) | 300,000 | 300,000 | |
| Wayne State Univ. Revs. Series 2013 A, 4% 11/15/23 | 350,000 | 374,269 | |
| Wayne-Westland Cmnty. Schools Series 2019, 5% 11/1/24 | 335,000 | 379,063 | |
| TOTAL MICHIGAN | 50,029,618 | ||
| Minnesota - 0.2% | |||
| Central Muni. Pwr. Agcy. Rev. Series 2021: | |||
| 5% 1/1/23 (FSA Insured) | 330,000 | 346,703 | |
| 5% 1/1/25 (FSA Insured) | 265,000 | 301,157 | |
| Maple Grove Health Care Sys. Rev. Series 2017: | |||
| 4% 5/1/22 | 110,000 | 111,639 | |
| 5% 5/1/23 | 110,000 | 117,018 | |
| Minneapolis & Saint Paul Hsg. & Redev. Auth. Health Care Sys. Rev. (Allina Health Sys. Proj.) Series 2017 A, 5% 11/15/23 | 355,000 | 387,095 | |
| Minneapolis & Saint Paul Metropolitan Arpts. Commission Arpt. Rev.: | |||
| Series 2014 A: | |||
| 5% 1/1/22 | 20,000 | 20,078 | |
| 5% 1/1/23 | 20,000 | 21,039 | |
| Series 2014 B: | |||
| 5% 1/1/22 (b) | 45,000 | 45,172 | |
| 5% 1/1/23 (b) | 20,000 | 21,015 | |
| Series 2016 B: | |||
| 4% 1/1/23 | 300,000 | 312,351 | |
| 5% 1/1/22 | 1,085,000 | 1,089,257 | |
| Series 2016 C, 5% 1/1/22 | 485,000 | 486,903 | |
| Series 2016, 5% 1/1/25 | 620,000 | 705,207 | |
| Series 2019 B, 5% 1/1/22 (b) | 3,000,000 | 3,011,497 | |
| Series 2019 C, 5% 1/1/26 | 380,000 | 445,896 | |
| Minnesota Hsg. Fin. Agcy.: | |||
| Bonds Series 2018 D, SIFMA Municipal Swap Index + 0.430% 0.48%, tender 7/3/23 (a)(c) | 2,955,000 | 2,960,410 | |
| Series 2021 A: | |||
| 0.25% 1/1/22 (b) | 200,000 | 199,997 | |
| 0.3% 7/1/22 (b) | 200,000 | 199,974 | |
| 0.4% 1/1/23 (b) | 200,000 | 199,969 | |
| 0.5% 7/1/23 (b) | 200,000 | 199,958 | |
| 0.625% 1/1/24 (b) | 395,000 | 394,948 | |
| Series H: | |||
| 0.55% 1/1/23 (b) | 185,000 | 185,210 | |
| 0.65% 1/1/24 (b) | 190,000 | 190,152 | |
| Moorhead Edl. Facilities Rev. (The Concordia College Corp. Proj.) Series 2016, 5% 12/1/25 | 65,000 | 71,419 | |
| Northern Muni. Pwr. Agcy. Elec. Sys. Rev. Series 2017: | |||
| 5% 1/1/22 | 25,000 | 25,095 | |
| 5% 1/1/23 | 250,000 | 262,458 | |
| 5% 1/1/24 | 35,000 | 38,255 | |
| Southern Minnesota Muni. Pwr. Agcy. Pwr. Supply Sys. Rev.: | |||
| Series 1994 A, 0% 1/1/24 (Nat'l. Pub. Fin. Guarantee Corp. Insured) | 290,000 | 286,103 | |
| Series 2015 A, 3% 1/1/23 | 250,000 | 256,879 | |
| Western Minnesota Muni. Pwr. Agcy. Pwr. Supply Rev. Series 2014 A: | |||
| 5% 1/1/22 | 20,000 | 20,078 | |
| 5% 1/1/23 | 65,000 | 68,297 | |
| 5% 1/1/24 | 20,000 | 21,912 | |
| TOTAL MINNESOTA | 13,003,141 | ||
| Mississippi - 0.1% | |||
| Jackson Gen. Oblig. Series 2021: | |||
| 5% 3/1/22 | 325,000 | 328,693 | |
| 5% 3/1/23 | 325,000 | 343,030 | |
| 5% 3/1/24 | 500,000 | 550,863 | |
| Mississippi Dev. Bank Spl. Oblig. (Jackson Mississippi Sales Tax Rev. Infrastructure Proj.) Series 2020, 5% 9/1/24 | 740,000 | 827,777 | |
| Mississippi Hosp. Equip. & Facilities Auth.: | |||
| (Forrest County Gen. Hosp. Rfdg. Proj.) Series 2019 B, 5% 1/1/22 | 350,000 | 351,330 | |
| Bonds Series 2020 A2, 0.2%, tender 9/1/22 (a) | 4,500,000 | 4,497,260 | |
| Series I, 5% 10/1/22 | 420,000 | 436,590 | |
| TOTAL MISSISSIPPI | 7,335,543 | ||
| Missouri - 0.5% | |||
| Cape Girardeau County Indl. Dev. Auth. (Southeast Hosp. Proj.) Series 2017 A: | |||
| 5% 3/1/22 | 15,000 | 15,159 | |
| 5% 3/1/23 | 20,000 | 21,053 | |
| 5% 3/1/24 | 15,000 | 16,374 | |
| 5% 3/1/25 | 15,000 | 16,928 | |
| 5% 3/1/26 | 20,000 | 23,235 | |
| Missouri Health & Edl. Facilities Rev.: | |||
| Bonds Series 2021 B, 4%, tender 5/1/26 (a) | 9,000,000 | 10,347,423 | |
| Series 2014 A, 5% 6/1/24 | 1,710,000 | 1,907,701 | |
| Series 2020: | |||
| 5% 11/15/22 | 660,000 | 689,661 | |
| 5% 11/15/23 | 815,000 | 887,344 | |
| Missouri Hsg. Dev. Commission Single Family Mtg. Rev. Series 2019, 4% 5/1/50 | 65,000 | 71,345 | |
| Missouri State Pub. Util. Commn Rev. Series 2020, 0.5% 3/1/22 | 5,000,000 | 5,000,912 | |
| Ozarks Technical Cmnty. College Series 2021: | |||
| 5% 3/1/23 | 225,000 | 237,918 | |
| 5% 3/1/25 | 225,000 | 256,399 | |
| Saint Louis Arpt. Rev.: | |||
| Series 2017 A: | |||
| 5% 7/1/22 (FSA Insured) | 1,175,000 | 1,207,617 | |
| 5% 7/1/23 (FSA Insured) | 1,160,000 | 1,246,026 | |
| Series 2017 B: | |||
| 5% 7/1/22 (FSA Insured) (b) | 500,000 | 513,612 | |
| 5% 7/1/24 (FSA Insured) (b) | 250,000 | 277,966 | |
| Series 2019 B: | |||
| 5% 7/1/22 (b) | 365,000 | 374,937 | |
| 5% 7/1/23 (b) | 385,000 | 412,979 | |
| 5% 7/1/24 (b) | 400,000 | 444,746 | |
| 5% 7/1/25 (b) | 420,000 | 482,436 | |
| Series 2019 C, 5% 7/1/25 | 660,000 | 763,184 | |
| TOTAL MISSOURI | 25,214,955 | ||
| Montana - 0.0% | |||
| Montana Board Hsg. Single Family: | |||
| Series 2019 B, 4% 6/1/50 | 30,000 | 33,453 | |
| Series A1, 3.5% 6/1/50 | 445,000 | 483,440 | |
| Montana Facility Fin. Auth. Rev. Series 2019 A, 5% 1/1/22 | 430,000 | 431,669 | |
| TOTAL MONTANA | 948,562 | ||
| Nebraska - 0.3% | |||
| Central Plains Energy Proj. Gas Supply: | |||
| Bonds Series 2019, 4%, tender 8/1/25 (a) | 1,170,000 | 1,307,938 | |
| Series 2019: | |||
| 4% 2/1/22 | 1,465,000 | 1,474,089 | |
| 4% 8/1/23 | 580,000 | 615,173 | |
| Douglas County Hosp. Auth. #2 Health Facilities Rev. Series 2020, 5% 11/15/22 | 130,000 | 135,842 | |
| Gretna Ctfs. Prtn. Series 2021, 4% 12/15/25 | 2,620,000 | 2,884,396 | |
| Lincoln Arpt. Auth. Series 2021, 5% 7/1/23 (b) | 725,000 | 778,646 | |
| Nebraska Invt. Fin. Auth. Single Family Hsg. Rev. Series 2019 B, 4% 9/1/49 (b) | 135,000 | 146,721 | |
| Nebraska Pub. Pwr. District Rev.: | |||
| Bonds Series 2020 A, 0.6%, tender 7/1/23 (a) | 5,800,000 | 5,815,347 | |
| Series 2012 A, 4% 1/1/22 | 200,000 | 200,624 | |
| Series 2016 C, 5% 1/1/25 | 200,000 | 227,420 | |
| Series B, 5% 1/1/23 | 250,000 | 262,877 | |
| Omaha Pub. Pwr. District Elec. Rev. Series A, 5% 2/1/25 | 200,000 | 228,492 | |
| TOTAL NEBRASKA | 14,077,565 | ||
| Nevada - 1.0% | |||
| Clark County Arpt. Rev.: | |||
| (Sub Lien Proj.) Series 2017 A-1, 5% 7/1/22 (b) | 360,000 | 369,758 | |
| Series 2019 A, 5% 7/1/23 | 200,000 | 214,799 | |
| Series 2019 D, 5% 7/1/22 | 10,000,000 | 10,276,998 | |
| Series 2021 B: | |||
| 5% 7/1/22 (b) | 1,510,000 | 1,551,647 | |
| 5% 7/1/23 (b) | 2,500,000 | 2,679,622 | |
| 5% 7/1/24 (b) | 2,145,000 | 2,384,949 | |
| Clark County McCarran Int'l. Arpt. Passenger Facility Charge Rev.: | |||
| (Clark County Arpt. Rev. Proj.) Series 2017 B, 5% 7/1/22 (b) | 2,665,000 | 2,737,233 | |
| Series 2019 E: | |||
| 5% 7/1/22 | 480,000 | 493,296 | |
| 5% 7/1/24 | 575,000 | 642,943 | |
| 5% 7/1/25 | 100,000 | 115,904 | |
| Clark County School District: | |||
| Series 2015 C, 5% 6/15/22 | 500,000 | 512,880 | |
| Series 2016 A: | |||
| 5% 6/15/23 | 255,000 | 273,275 | |
| 5% 6/15/24 | 685,000 | 762,221 | |
| Series 2017 A, 5% 6/15/22 | 710,000 | 728,212 | |
| Series 2017 C: | |||
| 5% 6/15/22 | 3,300,000 | 3,385,009 | |
| 5% 6/15/24 | 200,000 | 222,546 | |
| Series 2017 D: | |||
| 5% 6/15/24 | 400,000 | 419,005 | |
| 5% 6/15/25 | 350,000 | 366,330 | |
| Series 2018 A: | |||
| 5% 6/15/23 | 435,000 | 466,174 | |
| 5% 6/15/24 | 630,000 | 701,021 | |
| 5% 6/15/25 | 315,000 | 363,106 | |
| Series 2020 A: | |||
| 3% 6/15/22 | 500,000 | 507,524 | |
| 3% 6/15/23 (FSA Insured) | 450,000 | 468,469 | |
| Las Vegas Convention & Visitors Auth. Series 2021: | |||
| 5% 7/1/23 | 1,000,000 | 1,072,179 | |
| 5% 7/1/24 | 1,000,000 | 1,114,050 | |
| Las Vegas Valley Wtr. District Wtr. Impt. Gen. Oblig. Series 2015 B, 5% 12/1/21 | 600,000 | 600,000 | |
| Nevada Dept. of Bus. & Industry Bonds: | |||
| (Brightline West Passenger Rail Proj.) Series 2020 A, 0.25%, tender 2/1/22 (a)(b)(d) | 2,500,000 | 2,500,040 | |
| (Republic Svcs., Inc. Proj.) Series 2001, 0.25%, tender 12/1/21 (a)(b)(d) | 3,600,000 | 3,600,000 | |
| Nevada Gen. Oblig.: | |||
| Series 2013 D1, 5% 3/1/24 | 60,000 | 63,515 | |
| Series 2013 F1, 5% 3/1/25 | 250,000 | 264,483 | |
| Nevada Hsg. Division Bonds Series 2020, 0.3%, tender 10/1/22 (a) | 4,220,000 | 4,221,026 | |
| Washoe County Gas & Wtr. Facilities Bonds (Sierra Pacific Pwr. Co. Proj.) Series 2016 B, 3%, tender 6/1/22 (a) | 1,460,000 | 1,478,782 | |
| Washoe County Gas Facilities Rev. Bonds: | |||
| (Sierra Pacific Pwr. Co. Proj.) Series 2016 C, 0.625%, tender 4/15/22 (a)(b) | 1,590,000 | 1,590,672 | |
| Series 2016 F, 2.05%, tender 4/15/22 (a)(b) | 8,400,000 | 8,447,658 | |
| Series 2016, 2.05%, tender 4/15/22 (a)(b) | 1,210,000 | 1,216,865 | |
| TOTAL NEVADA | 56,812,191 | ||
| New Hampshire - 0.1% | |||
| Nat'l. Fin. Auth. Hosp. Rev. (St. Luke's Univ. Health Network Proj.) Series 2021 B, 5% 8/15/25 | 1,140,000 | 1,318,988 | |
| Nat'l. Fin. Auth. Solid Bonds (Waste Mgmt., Inc. Proj.): | |||
| Series 2018 A, 0.425%, tender 7/1/24 (a)(b) | 5,000,000 | 4,998,602 | |
| Series 2019 A2, 2.15%, tender 7/1/24 (a)(b) | 555,000 | 573,590 | |
| New Hampshire Bus. Fin. Auth. Wtr. Facility (Pennichuck Wtr. Works, Inc. Proj.) Series 2014 A, 5% 1/1/24 (Escrowed to Maturity) (b) | 260,000 | 283,797 | |
| New Hampshire Health & Ed. Facilities Auth. Rev.: | |||
| Series 2012, 5% 7/1/27 | 120,000 | 122,762 | |
| Series 2016, 5% 10/1/23 | 425,000 | 460,146 | |
| TOTAL NEW HAMPSHIRE | 7,757,885 | ||
| New Jersey - 2.8% | |||
| Burlington County Bridge Commission Lease Rev. (Governmental Leasing Prog.) Series 2021: | |||
| 4% 4/1/23 | 715,000 | 750,504 | |
| 4% 4/1/24 | 425,000 | 460,846 | |
| Camden County Impt. Auth. Health Care Redev. Rev. Series 2014 A: | |||
| 5% 2/15/22 | 55,000 | 55,508 | |
| 5% 2/15/23 | 70,000 | 73,775 | |
| Garden State Preservation Trust Open Space & Farmland Preservation Series B, 0% 11/1/22 (FSA Insured) | 680,000 | 676,219 | |
| Gloucester County Impt. Auth. Rev. Series 2021, 0.6% 3/1/24 | 2,400,000 | 2,400,319 | |
| Hudson County Impt. Auth. (Hudson County Courthouse Proj.) Series 2020, 4% 10/1/22 | 225,000 | 231,984 | |
| New Brunswick Parking Auth. Rev. Series 2020 B: | |||
| 5% 9/1/23 | 675,000 | 726,540 | |
| 5% 9/1/25 | 850,000 | 986,908 | |
| New Jersey Econ. Dev. Auth. Series QQQ: | |||
| 5% 6/15/22 | 400,000 | 410,063 | |
| 5% 6/15/23 | 420,000 | 449,292 | |
| 5% 6/15/24 | 300,000 | 332,929 | |
| 5% 6/15/25 | 385,000 | 442,151 | |
| 5% 6/15/26 | 555,000 | 657,263 | |
| New Jersey Econ. Dev. Auth. Motor Vehicle Rev. Series 2017 A, 4% 7/1/22 | 1,400,000 | 1,429,336 | |
| New Jersey Econ. Dev. Auth. Rev.: | |||
| (New Jersey Gen. Oblig. Proj.) Series 2017 B, 5% 11/1/24 | 515,000 | 579,361 | |
| (New Jersey Transit Corp. Projs.) Series 2017 B, 5% 11/1/22 | 1,900,000 | 1,981,233 | |
| (Provident Montclair Proj.) Series 2017: | |||
| 4% 6/1/22 (FSA Insured) | 20,000 | 20,285 | |
| 5% 6/1/23 (FSA Insured) | 25,000 | 26,705 | |
| 5% 6/1/24 (FSA Insured) | 20,000 | 22,222 | |
| (The Goethals Bridge Replacement Proj.) Series 2013, 5% 1/1/24 (b) | 350,000 | 383,545 | |
| Series 2005 N1, 5.5% 9/1/23 (Nat'l. Pub. Fin. Guarantee Corp. Insured) | 300,000 | 326,281 | |
| Series 2005, 5.25% 12/15/21 | 1,720,000 | 1,723,116 | |
| Series 2012 II: | |||
| 5% 3/1/22 | 135,000 | 136,575 | |
| 5% 3/1/23 | 835,000 | 844,453 | |
| 5% 3/1/27 (Pre-Refunded to 3/1/22 @ 100) | 240,000 | 242,879 | |
| Series 2012: | |||
| 5% 6/15/22 | 315,000 | 322,907 | |
| 5% 6/15/22 (Assured Guaranty Corp. Insured) | 900,000 | 923,085 | |
| Series 2013: | |||
| 5% 3/1/23 | 5,045,000 | 5,332,701 | |
| 5% 3/1/24 | 480,000 | 507,005 | |
| 5% 3/1/25 | 355,000 | 374,927 | |
| Series 2014 UU, 5% 6/15/24 | 400,000 | 443,905 | |
| Series 2015 XX: | |||
| 4% 6/15/24 | 545,000 | 591,131 | |
| 5% 6/15/23 | 75,000 | 80,231 | |
| Series 2017 DDD, 5% 6/15/22 | 220,000 | 225,546 | |
| Series 2019: | |||
| 5.25% 9/1/22 (d) | 5,550,000 | 5,746,687 | |
| 5.25% 9/1/23 (d) | 5,000,000 | 5,416,284 | |
| 5.25% 9/1/24 (d) | 2,100,000 | 2,362,695 | |
| Series UU, 3.1% 6/15/23 | 575,000 | 598,395 | |
| New Jersey Econ. Dev. Auth. Wtr. Facilities Rev.: | |||
| (New Jersey-American Wtr. Co., Inc. Proj.): | |||
| Series 2020 C, 1.15% 6/1/23 (b) | 2,500,000 | 2,524,760 | |
| Series 2020 E, 0.85% 12/1/25 (b) | 1,600,000 | 1,599,126 | |
| Bonds (New Jersey-American Wtr. Co., Inc.) Series 2020, 1.2%, tender 6/1/23 (a)(b) | 2,000,000 | 2,015,607 | |
| New Jersey Edl. Facility: | |||
| Series 2015 C, 5% 7/1/22 | 240,000 | 246,320 | |
| Series 2016 A: | |||
| 5% 7/1/22 | 140,000 | 143,603 | |
| 5% 7/1/23 | 75,000 | 80,142 | |
| 5% 7/1/24 | 175,000 | 193,814 | |
| Series 2016 E, 5% 7/1/22 | 625,000 | 641,643 | |
| New Jersey Gen. Oblig.: | |||
| Series 2013, 5% 6/1/23 | 580,000 | 619,558 | |
| Series 2014: | |||
| 5% 6/1/22 | 400,000 | 409,237 | |
| 5% 6/1/24 | 385,000 | 428,184 | |
| Series 2020 A: | |||
| 4% 6/1/23 | 24,320,000 | 25,616,127 | |
| 5% 6/1/24 | 1,530,000 | 1,701,616 | |
| 5% 6/1/25 | 2,330,000 | 2,684,178 | |
| Series 2021, 2% 6/1/25 | 840,000 | 880,606 | |
| New Jersey Health Care Facilities Fing. Auth. Rev.: | |||
| Series 2011, 5% 7/1/22 | 400,000 | 411,318 | |
| Series 2012 A, 5% 7/1/24 (Pre-Refunded to 7/1/22 @ 100) | 1,310,000 | 1,346,365 | |
| Series 2013, 5% 7/1/22 | 325,000 | 334,196 | |
| Series 2016 A: | |||
| 2% 7/1/22 | 250,000 | 252,459 | |
| 5% 7/1/22 | 5,000 | 5,130 | |
| 5% 7/1/22 | 300,000 | 308,489 | |
| 5% 7/1/23 | 15,000 | 16,041 | |
| 5% 7/1/24 | 25,000 | 27,940 | |
| 5% 7/1/24 | 20,000 | 22,205 | |
| 5% 7/1/24 | 10,000 | 11,102 | |
| 5% 7/1/25 | 10,000 | 11,483 | |
| 5% 7/1/26 | 5,000 | 5,915 | |
| 5% 7/1/27 | 5,000 | 5,905 | |
| Series 2016, 5% 7/1/22 | 460,000 | 473,016 | |
| New Jersey Higher Ed. Student Assistance Auth. Student Ln. Rev.: | |||
| Series 2012 1, 5% 12/1/22 (b) | 500,000 | 522,733 | |
| Series 2013, 5% 12/1/21 (b) | 1,500,000 | 1,500,000 | |
| Series 2015 1A: | |||
| 5% 12/1/21 (b) | 4,650,000 | 4,650,000 | |
| 5% 12/1/22 (b) | 200,000 | 209,196 | |
| Series 2016 1A: | |||
| 5% 12/1/22 (b) | 1,400,000 | 1,465,092 | |
| 5% 12/1/23 (b) | 1,400,000 | 1,526,678 | |
| 5% 12/1/24 (b) | 1,430,000 | 1,619,904 | |
| Series 2017 1A: | |||
| 5% 12/1/22 (b) | 215,000 | 224,775 | |
| 5% 12/1/23 (b) | 4,195,000 | 4,567,545 | |
| Series 2017 1B, 5% 12/1/21 (b) | 190,000 | 190,000 | |
| Series 2018 B, 5% 12/1/21 (b) | 835,000 | 835,000 | |
| Series 2019 A: | |||
| 5% 12/1/22 | 245,000 | 256,391 | |
| 5% 12/1/23 | 4,260,000 | 4,645,463 | |
| 5% 12/1/24 | 260,000 | 293,863 | |
| Series 2020 A, 5% 12/1/23 (b) | 1,500,000 | 1,632,268 | |
| Series 2020: | |||
| 5% 12/1/22 (b) | 1,600,000 | 1,672,745 | |
| 5% 12/1/22 (b) | 1,360,000 | 1,421,833 | |
| 5% 12/1/23 (b) | 945,000 | 1,028,329 | |
| 5% 12/1/24 (b) | 675,000 | 761,837 | |
| Series 2021 A: | |||
| 5% 12/1/23 (b) | 200,000 | 217,552 | |
| 5% 12/1/24 (b) | 330,000 | 371,928 | |
| 5% 12/1/25 (b) | 700,000 | 811,418 | |
| Series 2021 B, 5% 12/1/24 (b) | 570,000 | 642,422 | |
| New Jersey Hsg. & Mtg. Fin. Agcy. Bonds Series 2020 A, 0.75%, tender 6/1/22 (a) | 2,000,000 | 2,004,095 | |
| New Jersey Hsg. & Mtg. Fin. Agcy. Rev.: | |||
| Series 2019 D: | |||
| 4% 10/1/22 (b) | 1,340,000 | 1,377,496 | |
| 4% 4/1/23 (b) | 115,000 | 119,971 | |
| 4% 10/1/23 (b) | 125,000 | 132,235 | |
| 4% 4/1/25 (b) | 150,000 | 164,185 | |
| Series 2021 H: | |||
| 0.2% 4/1/23 | 235,000 | 234,505 | |
| 0.35% 4/1/24 | 775,000 | 771,554 | |
| New Jersey Tobacco Settlement Fing. Corp. Series 2018 A: | |||
| 5% 6/1/22 | 2,580,000 | 2,639,395 | |
| 5% 6/1/23 | 1,080,000 | 1,153,534 | |
| 5% 6/1/25 | 825,000 | 947,998 | |
| New Jersey Tpk. Auth. Tpk. Rev.: | |||
| Series 2004 C2, 5.5% 1/1/25 | 350,000 | 404,377 | |
| Series 2012 B, 5% 1/1/22 (Escrowed to Maturity) | 520,000 | 522,046 | |
| New Jersey Trans. Trust Fund Auth.: | |||
| Series 2005 B: | |||
| 5.25% 12/15/22 (AMBAC Insured) | 5,365,000 | 5,638,356 | |
| 5.25% 12/15/23 | 470,000 | 515,898 | |
| Series 2006 A: | |||
| 5.25% 12/15/21 | 2,000,000 | 2,003,624 | |
| 5.25% 12/15/21 (FSA Insured) | 645,000 | 646,176 | |
| 5.25% 12/15/22 | 1,160,000 | 1,219,104 | |
| 5.25% 12/15/23 (FSA Insured) | 500,000 | 549,365 | |
| 5.5% 12/15/21 | 1,900,000 | 1,903,614 | |
| Series 2006, 5.25% 12/15/21 (Nat'l. Pub. Fin. Guarantee Corp. Insured) | 465,000 | 465,842 | |
| Series 2010 D, 5.25% 12/15/23 | 555,000 | 609,199 | |
| Series 2013 AA: | |||
| 5% 6/15/22 | 215,000 | 220,420 | |
| 5% 6/15/23 | 785,000 | 839,748 | |
| Series 2016 A: | |||
| 5% 6/15/22 | 2,720,000 | 2,788,724 | |
| 5% 6/15/27 | 90,000 | 106,512 | |
| Series 2016 A-2, 5% 6/15/23 | 1,205,000 | 1,289,618 | |
| Series 2018 A: | |||
| 5% 6/15/22 | 4,475,000 | 4,588,065 | |
| 5% 6/15/23 | 445,000 | 476,249 | |
| 5% 6/15/24 | 755,000 | 839,707 | |
| Series 2022 AA: | |||
| 5% 6/15/23 (e) | 150,000 | 157,391 | |
| 5% 6/15/24 (e) | 330,000 | 360,506 | |
| 5% 6/15/25 (e) | 2,000,000 | 2,255,834 | |
| Series A: | |||
| 5% 12/15/23 | 365,000 | 398,796 | |
| 5% 12/15/24 | 210,000 | 237,250 | |
| 5% 12/15/25 | 200,000 | 233,274 | |
| Series D, 5% 12/15/23 | 480,000 | 524,444 | |
| Newark Gen. Oblig. Series 2020: | |||
| 5% 10/1/22 | 900,000 | 933,010 | |
| 5% 10/1/22 | 650,000 | 672,733 | |
| Rutgers State Univ. Rev.: | |||
| Series 2013 J, 5% 5/1/23 | 275,000 | 293,031 | |
| Series 2018 N, 4% 5/1/23 | 370,000 | 389,153 | |
| Series Q: | |||
| 5% 5/1/22 | 80,000 | 81,577 | |
| 5% 5/1/23 | 65,000 | 69,281 | |
| The Board of Ed. of Newark Series 2021: | |||
| 5% 7/15/22 | 125,000 | 128,693 | |
| 5% 7/15/25 (Build America Mutual Assurance Insured) | 250,000 | 288,288 | |
| 5% 7/15/26 (Build America Mutual Assurance Insured) | 300,000 | 355,910 | |
| Union County Gen. Oblig. Series 2020, 0.5% 3/1/22 | 1,700,000 | 1,700,905 | |
| TOTAL NEW JERSEY | 157,630,536 | ||
| New Mexico - 0.1% | |||
| New Mexico Mtg. Fin. Auth. Series 2019 C, 4% 1/1/50 | 450,000 | 491,923 | |
| New Mexico Muni. Energy Acquisition Auth. Gas Supply Rev.: | |||
| Bonds Series 2019 A, 5%, tender 5/1/25 (a) | 1,000,000 | 1,144,074 | |
| Series 2019 A: | |||
| 4% 5/1/22 | 140,000 | 142,163 | |
| 4% 5/1/23 | 980,000 | 1,030,445 | |
| 4% 11/1/23 | 645,000 | 689,274 | |
| 4% 11/1/24 | 250,000 | 275,347 | |
| 4% 5/1/25 | 960,000 | 1,068,318 | |
| Santa Fe Pub. School District Gen. Oblig. Series 2021: | |||
| 4% 8/1/22 | 500,000 | 512,611 | |
| 4% 8/1/23 | 450,000 | 477,677 | |
| TOTAL NEW MEXICO | 5,831,832 | ||
| New York - 3.7% | |||
| Albany County Arpt. Auth. Arpt. Rev. Series 2020 B, 5% 12/15/21 (b) | 500,000 | 500,861 | |
| Dorm. Auth. New York Univ. Rev. Series 2016 A: | |||
| 5% 7/1/22 | 10,000 | 10,272 | |
| 5% 7/1/24 | 40,000 | 44,573 | |
| East Ramapo Central School District Series 2021, 1.25% 5/5/22 | 1,250,000 | 1,254,253 | |
| Hempstead Local Dev. Corp. Rev. (Adelphi Univ. Proj.) Series 2021: | |||
| 5% 6/1/22 | 200,000 | 204,619 | |
| 5% 6/1/23 | 400,000 | 427,281 | |
| 5% 6/1/24 | 940,000 | 1,038,252 | |
| Hudson Yards Infrastructure Corp. New York Rev. Series 2017 A: | |||
| 5% 2/15/24 | 1,280,000 | 1,411,921 | |
| 5% 2/15/25 | 805,000 | 923,143 | |
| 5% 2/15/26 | 1,545,000 | 1,834,643 | |
| Long Island Pwr. Auth. Elec. Sys. Rev. Bonds: | |||
| Series 2019 B, 1.65%, tender 9/1/24 (a) | 1,055,000 | 1,081,710 | |
| Series 2020 B, 0.85%, tender 9/1/25 (a) | 11,560,000 | 11,560,101 | |
| Series 2021 B, 1.5%, tender 9/1/26 (a) | 470,000 | 481,877 | |
| Monroe County Indl. Dev. Corp.: | |||
| (The Rochester Gen. Hosp. Proj.) Series 2017, 5% 12/1/26 | 350,000 | 419,832 | |
| Series 2020 A, 5% 7/1/23 | 300,000 | 322,596 | |
| Nassau County Local Econ. Assistance Corp. Multifamily Hsg. Rev. Bonds (Park Lake Hempstead, L.P. Proj.) Series 2021, 0.3%, tender 11/1/23 (a) | 5,190,000 | 5,177,529 | |
| New York Bridge Auth. Gen. Rev. Series 2021 B: | |||
| 5% 1/1/23 | 1,025,000 | 1,076,650 | |
| 5% 1/1/24 | 1,100,000 | 1,205,907 | |
| 5% 1/1/25 | 1,315,000 | 1,497,024 | |
| New York City Edl. Construction Fund Series 2021 A, 5% 4/1/22 | 1,080,000 | 1,097,054 | |
| New York City Gen. Oblig.: | |||
| Bonds Series D, 5%, tender 2/1/24 (a) | 900,000 | 966,911 | |
| Series 1, 5% 8/1/23 | 405,000 | 436,980 | |
| Series 2006, 0.23%, tender 6/1/36 (FSA Insured) (a) | 1,000,000 | 1,000,000 | |
| Series 2007 A, 0.2%, tender 8/1/26 (FSA Insured) (a) | 800,000 | 800,000 | |
| Series 2007 C-4, 0.2%, tender 1/1/32 (FSA Insured) (a) | 225,000 | 225,000 | |
| Series 2007, 0.15%, tender 12/7/21 (FSA Insured) (a) | 3,550,000 | 3,550,000 | |
| Series 2008 A-3, 0.3%, tender 8/1/26 (FSA Insured) (a) | 3,175,000 | 3,175,000 | |
| Series 2008 C-4, 0.2%, tender 10/1/27 (a) | 2,550,000 | 2,550,000 | |
| Series 2008 J3, 5% 8/1/22 | 550,000 | 567,707 | |
| Series 2012 D1, 5% 10/1/26 | 440,000 | 441,748 | |
| Series 2012 E, 5% 8/1/24 | 365,000 | 367,948 | |
| Series 2013 D, 5% 8/1/23 | 1,605,000 | 1,693,704 | |
| Series 2013 I, 5% 8/1/23 | 200,000 | 215,793 | |
| Series 2014 J, 5% 8/1/25 | 410,000 | 460,037 | |
| Series 2015 A, 5% 8/1/23 | 570,000 | 615,009 | |
| Series 2016 B, 5% 8/1/22 | 300,000 | 309,659 | |
| Series 2016 E, 5% 8/1/24 | 840,000 | 942,992 | |
| Series 2016: | |||
| 5% 8/1/22 | 1,405,000 | 1,450,234 | |
| 5% 8/1/26 | 5,885,000 | 6,958,134 | |
| Series 2017 C, 5% 8/1/23 | 120,000 | 129,476 | |
| Series 2017, 5% 8/1/23 | 1,105,000 | 1,192,255 | |
| Series 2018 A: | |||
| 5% 8/1/23 | 200,000 | 215,793 | |
| 5% 8/1/24 | 150,000 | 168,391 | |
| Series 2018, 5% 8/1/22 | 540,000 | 557,385 | |
| Series 2021 F1, 5% 3/1/23 | 85,000 | 90,079 | |
| Series A: | |||
| 4% 8/1/23 | 995,000 | 1,057,057 | |
| 5% 8/1/22 | 440,000 | 454,166 | |
| 5% 8/1/23 | 100,000 | 107,896 | |
| 5% 8/1/25 | 570,000 | 639,563 | |
| Series A1, 5% 10/1/22 | 350,000 | 364,065 | |
| Series C: | |||
| 5% 8/1/23 | 300,000 | 323,689 | |
| 5% 8/1/23 | 5,040,000 | 5,437,978 | |
| 5% 8/1/26 | 220,000 | 264,123 | |
| Series D, 5% 8/1/25 | 710,000 | 748,717 | |
| Series E, 5% 8/1/22 | 590,000 | 608,995 | |
| Series F1: | |||
| 5% 3/1/27 | 325,000 | 343,913 | |
| 5% 3/1/37 (Pre-Refunded to 3/1/23 @ 100) | 405,000 | 429,198 | |
| Series H3, 5% 8/1/23 | 475,000 | 512,508 | |
| Series I1, 5% 3/1/27 | 200,000 | 220,203 | |
| Series J4, 5% 8/1/24 | 2,100,000 | 2,357,480 | |
| New York City Health & Hosp. Corp. Rev. Series A, 4% 2/15/25 | 1,440,000 | 1,600,181 | |
| New York City Hsg. Dev. Corp. Series G1, 2.35% 11/1/23 | 450,000 | 465,258 | |
| New York City Hsg. Dev. Corp. Multifamily Hsg.: | |||
| Bonds: | |||
| Series 2021 C2, 0.7%, tender 7/1/25 (a) | 2,710,000 | 2,715,893 | |
| Series 2021 H, 0.12%, tender 3/15/22 (a) | 950,000 | 948,736 | |
| Series 2021, 0.6%, tender 7/1/25 (a) | 430,000 | 426,946 | |
| Series A3, 1.125%, tender 11/1/24 (a) | 2,000,000 | 2,005,150 | |
| Series 2017 C3A, 0.2% 5/1/22 | 2,390,000 | 2,389,679 | |
| New York City Indl. Dev. Agcy. Rev. Series 2021 A, 5% 1/1/25 (FSA Insured) | 1,000,000 | 1,136,772 | |
| New York City Muni. Wtr. Fin. Auth. Wtr. & Swr. Sys. Rev. Series AA, 4% 6/15/24 | 845,000 | 922,812 | |
| New York City Transitional Fin. Auth. Bldg. Aid Rev.: | |||
| Series 2016 S 1: | |||
| 5% 7/15/24 | 70,000 | 78,395 | |
| 5% 7/15/24 (Escrowed to Maturity) | 305,000 | 341,383 | |
| Series 2018 S1, 5% 7/15/25 (Escrowed to Maturity) | 370,000 | 430,493 | |
| Series S1, 5% 7/15/23 (Escrowed to Maturity) | 600,000 | 646,199 | |
| New York City Transitional Fin. Auth. Rev.: | |||
| Series 1: | |||
| 5% 11/1/22 | 400,000 | 417,555 | |
| 5% 11/1/22 | 215,000 | 224,436 | |
| Series 2013 E, 2% 11/1/23 | 230,000 | 233,595 | |
| Series 2014 D1, 5% 2/1/27 | 350,000 | 383,787 | |
| Series 2014, 5% 11/1/26 | 750,000 | 831,273 | |
| Series 2015 C, 5% 11/1/22 | 370,000 | 386,238 | |
| Series 2015 D, 5% 11/1/26 | 525,000 | 615,481 | |
| Series A1: | |||
| 5% 5/1/23 | 300,000 | 320,156 | |
| 5% 8/1/24 | 250,000 | 280,297 | |
| Series A3, 5% 8/1/23 | 1,045,000 | 1,127,152 | |
| Series B1: | |||
| 5% 8/1/22 | 350,000 | 361,244 | |
| 5% 8/1/24 | 545,000 | 611,048 | |
| Series C1, 3% 5/1/22 | 320,000 | 323,809 | |
| New York Convention Ctr. Dev. Corp. Rev. Series 2015, 5% 11/15/22 | 755,000 | 788,559 | |
| New York Dorm. Auth. Personal Income Tax Rev.: | |||
| Series 2012 A, 4% 12/15/22 (Escrowed to Maturity) | 325,000 | 337,858 | |
| Series 2014 A: | |||
| 5% 2/15/22 | 695,000 | 701,899 | |
| 5% 2/15/26 | 865,000 | 951,328 | |
| Series 2014 E, 5% 2/15/26 | 300,000 | 342,995 | |
| Series 2015 E, 5% 3/15/23 (Escrowed to Maturity) | 300,000 | 318,483 | |
| Series 2016 D: | |||
| 5% 2/15/23 (Escrowed to Maturity) | 665,000 | 703,387 | |
| 5% 2/15/25 (Escrowed to Maturity) | 855,000 | 980,352 | |
| New York Dorm. Auth. Rev.: | |||
| Series 1, 5% 7/1/22 (Pre-Refunded to 1/1/22 @ 100) | 400,000 | 401,569 | |
| Series 2015 A: | |||
| 5% 5/1/23 | 510,000 | 543,363 | |
| 5% 7/1/24 | 275,000 | 307,645 | |
| Series 2015, 5% 12/1/22 (d) | 700,000 | 732,042 | |
| Series 2021 A: | |||
| 4% 10/1/22 | 2,875,000 | 2,966,437 | |
| 5% 7/1/24 | 1,410,000 | 1,574,285 | |
| New York Dorm. Auth. Sales Tax Rev.: | |||
| Series 2015 A, 5% 3/15/24 | 250,000 | 276,717 | |
| Series 2017 A, 5% 3/15/24 | 445,000 | 492,556 | |
| Series 2018 C, 5% 3/15/24 | 600,000 | 664,120 | |
| New York Metropolitan Trans. Auth. Dedicated Tax Fund Rev.: | |||
| Bonds Series 2008 A, SIFMA Municipal Swap Index + 0.450% 0.5%, tender 12/2/21 (a)(c) | 1,160,000 | 1,161,340 | |
| Series 2012 A, 5% 11/15/22 | 225,000 | 235,314 | |
| Series 2016 A: | |||
| 4% 11/15/25 | 350,000 | 397,478 | |
| 5% 11/15/22 | 400,000 | 418,336 | |
| Series 2016 B1, 5% 11/15/25 | 255,000 | 299,553 | |
| Series 2017 B2, 5% 11/15/24 | 365,000 | 414,373 | |
| Series 2021 B1, 3% 11/1/22 | 3,000,000 | 3,077,220 | |
| New York Metropolitan Trans. Auth. Rev.: | |||
| Bonds: | |||
| Series 2005 D1, U.S. Secured Overnight Fin. Rate (SOFR) Indx + 0.330% 0.364%, tender 4/1/24 (a)(c) | 5,700,000 | 5,670,233 | |
| Series 2011 B, 1 month U.S. LIBOR + 0.550% 0.608%, tender 12/4/21 (a)(c) | 1,745,000 | 1,749,376 | |
| Series 2012 B, 5% 11/15/22 | 45,000 | 46,996 | |
| Series 2012 F: | |||
| 5% 11/15/22 | 1,000,000 | 1,044,348 | |
| 5% 11/15/23 | 985,000 | 1,029,234 | |
| Series 2014 C, 5% 11/15/22 | 255,000 | 266,309 | |
| Series 2015 A1, 5% 11/15/22 | 700,000 | 731,043 | |
| Series 2015 F, 5% 11/15/22 | 855,000 | 892,917 | |
| Series 2016 B, 5% 11/15/23 | 765,000 | 832,662 | |
| Series 2017 B: | |||
| 5% 11/15/22 | 1,605,000 | 1,676,178 | |
| 5% 11/15/23 | 780,000 | 848,989 | |
| Series 2017 D, 5% 11/15/23 | 420,000 | 457,148 | |
| Series 2019 F, 5% 11/15/22 | 250,000 | 261,052 | |
| Series 2020 A: | |||
| 4% 2/1/22 | 6,700,000 | 6,740,749 | |
| 5% 2/1/23 | 7,880,000 | 8,300,443 | |
| New York St Mtg. Agcy. Homeowner: | |||
| Series 186, 3.4% 4/1/22 (b) | 1,160,000 | 1,170,750 | |
| Series 2014 189, 2.85% 10/1/22 (b) | 500,000 | 509,362 | |
| Series 212: | |||
| 2.4% 4/1/22 (b) | 1,130,000 | 1,136,936 | |
| 2.5% 10/1/22 (b) | 1,160,000 | 1,178,361 | |
| Series 214, 2.9% 10/1/22 (b) | 805,000 | 819,864 | |
| New York State Dorm. Auth.: | |||
| Series 2012 A: | |||
| 5% 12/15/21 | 540,000 | 540,956 | |
| 5% 12/15/23 | 415,000 | 435,662 | |
| 5% 12/15/23 (Pre-Refunded to 12/15/22 @ 100) | 345,000 | 362,034 | |
| Series 2017 A: | |||
| 5% 2/15/22 | 935,000 | 944,281 | |
| 5% 2/15/23 | 555,000 | 587,076 | |
| 5% 2/15/23 (Escrowed to Maturity) | 1,925,000 | 2,034,917 | |
| 5% 2/15/25 | 195,000 | 223,522 | |
| 5% 2/15/25 (Escrowed to Maturity) | 440,000 | 503,750 | |
| Series 2017 B: | |||
| 5% 2/15/23 | 210,000 | 222,137 | |
| 5% 2/15/23 (Escrowed to Maturity) | 455,000 | 480,980 | |
| Series 2018 A, 5% 3/15/25 (Escrowed to Maturity) | 200,000 | 230,006 | |
| Series 2019 D, 5% 2/15/23 | 390,000 | 412,540 | |
| Series 2020 A, 5% 3/15/23 (Escrowed to Maturity) | 250,000 | 265,403 | |
| New York State Energy Research & Dev. Auth. Poll. Cont. Rev. Series 1999, 0.5%, tender 12/3/21 (AMBAC Insured) (a) | 300,000 | 300,000 | |
| New York State Hsg. Fin. Agcy. Rev.: | |||
| Bonds Series 2021 D2, 0.65%, tender 11/1/25 (a) | 405,000 | 403,075 | |
| Series J, 0.75% 5/1/25 | 360,000 | 360,561 | |
| New York State Mtg. Agcy. Homeowner Mtg.: | |||
| Series 2021 232, 5% 4/1/24 (b) | 1,110,000 | 1,223,884 | |
| Series 221, 3.5% 10/1/32 (b) | 60,000 | 64,673 | |
| New York Trans. Dev. Corp.: | |||
| (Delta Air Lines, Inc. Laguardia Arpt. Terminals C&D Redev. Proj.) Series 2018, 5% 1/1/22 (b) | 1,500,000 | 1,505,509 | |
| (Term. 4 JFK Int'l. Arpt. Proj.): | |||
| Series 2020 A: | |||
| 5% 12/1/22 (b) | 475,000 | 495,767 | |
| 5% 12/1/23 (b) | 675,000 | 731,561 | |
| 5% 12/1/25 (b) | 1,100,000 | 1,268,531 | |
| Series 2020 C: | |||
| 5% 12/1/22 | 2,355,000 | 2,459,410 | |
| 5% 12/1/23 | 1,000,000 | 1,085,671 | |
| New York Urban Dev. Corp. Rev.: | |||
| Series 2013 A1, 4% 3/15/23 | 250,000 | 262,213 | |
| Series 2013 D, 5% 3/15/24 | 355,000 | 376,805 | |
| Series 2014 A, 5% 3/15/26 | 340,000 | 375,236 | |
| Series 2015 A, 5% 3/15/24 | 590,000 | 651,765 | |
| Series 2016 A: | |||
| 5% 3/15/23 | 640,000 | 679,482 | |
| 5% 3/15/27 | 350,000 | 412,999 | |
| 5% 3/15/29 | 420,000 | 494,431 | |
| Series 2017 A, 5% 3/15/23 | 200,000 | 212,338 | |
| Niagara Frontier Trans. Auth. Arpt. Rev. Series 2019 A: | |||
| 5% 4/1/22 (b) | 700,000 | 711,006 | |
| 5% 4/1/23 (b) | 4,225,000 | 4,485,026 | |
| 5% 4/1/24 (b) | 2,885,000 | 3,174,622 | |
| Onondaga County Ind. Dev. Agcy. Swr. Facilities Rev. (Bristol-Meyers Squibb Co. Proj.) Series 1994, 5.75% 3/1/24 (b) | 945,000 | 1,052,440 | |
| Poughkeepsie Gen. Oblig. Series 2021, 4% 4/15/23 | 270,000 | 281,315 | |
| Rockland County Gen. Oblig. Series 2014 A: | |||
| 5% 3/1/22 (FSA Insured) | 925,000 | 936,096 | |
| 5% 3/1/23 (FSA Insured) | 275,000 | 291,395 | |
| Schenectady County Cap. Resources Corp. Rev. (Union College Proj.) Series 2017, 5% 1/1/22 | 420,000 | 421,648 | |
| Suffolk County Gen. Oblig. Series 2014, 5% 2/1/22 (FSA Insured) | 300,000 | 302,347 | |
| Syracuse Reg'l. Arpt. Auth. Series 2021, 5% 7/1/23 (b) | 750,000 | 803,639 | |
| Triborough Bridge & Tunnel Auth. Bonds: | |||
| Series 2021 A2: | |||
| 2%, tender 5/15/24 (a) | 6,000,000 | 6,218,734 | |
| 2%, tender 5/15/26 (a) | 1,285,000 | 1,360,684 | |
| Series 2021 B, 5%, tender 5/15/26 (a) | 5,000,000 | 5,941,992 | |
| Series 2021 C, 5%, tender 5/15/26 (a) | 4,200,000 | 4,989,240 | |
| Triborough Bridge & Tunnel Auth. Revs.: | |||
| Bonds Series 2005 B 4A, U.S. Secured Overnight Fin. Rate (SOFR) Indx + 0.380% 0.414%, tender 2/1/24 (a)(c) | 2,000,000 | 2,001,810 | |
| Series 2013 A, 5% 11/15/26 | 400,000 | 426,680 | |
| Series 2016 A, 5% 11/15/23 | 400,000 | 436,575 | |
| Yonkers Gen. Oblig.: | |||
| Series 2017 C, 5% 10/1/22 (Build America Mutual Assurance Insured) | 55,000 | 57,163 | |
| Series 2021 A: | |||
| 4% 2/15/24 | 250,000 | 268,617 | |
| 5% 2/15/26 (FSA Insured) | 400,000 | 470,238 | |
| Series 2021 B: | |||
| 4% 2/15/24 | 290,000 | 311,662 | |
| 5% 2/15/26 | 320,000 | 376,336 | |
| TOTAL NEW YORK | 205,120,451 | ||
| New York And New Jersey - 0.4% | |||
| Port Auth. of New York & New Jersey: | |||
| Series 173, 4% 12/1/21 | 675,000 | 675,000 | |
| Series 188, 5% 5/1/23 (b) | 200,000 | 213,025 | |
| Series 189, 5% 5/1/23 | 200,000 | 213,290 | |
| Series 2013 178, 5% 12/1/25 (b) | 975,000 | 1,060,158 | |
| Series 2013: | |||
| 5% 12/1/22 | 275,000 | 288,098 | |
| 5% 12/1/23 | 725,000 | 792,735 | |
| 5% 12/1/24 (b) | 250,000 | 272,411 | |
| Series 2015 188, 5% 5/1/22 (b) | 370,000 | 377,245 | |
| Series 2018, 5% 9/15/22 (b) | 4,105,000 | 4,256,891 | |
| Series 202, 5% 10/15/22 (b) | 4,435,000 | 4,616,296 | |
| Series 2020 221, 5% 7/15/24 (b) | 605,000 | 675,311 | |
| Series 2022 209, 5% 7/15/22 | 300,000 | 309,035 | |
| Series 207: | |||
| 5% 9/15/23 (b) | 2,095,000 | 2,265,785 | |
| 5% 9/15/24 (b) | 430,000 | 482,949 | |
| Series 223: | |||
| 5% 7/15/22 (b) | 2,500,000 | 2,573,062 | |
| 5% 7/15/23 (b) | 3,275,000 | 3,518,067 | |
| 5% 7/15/24 (b) | 1,250,000 | 1,395,271 | |
| TOTAL NEW YORK AND NEW JERSEY | 23,984,629 | ||
| North Carolina - 0.5% | |||
| Charlotte Int'l. Arpt. Rev.: | |||
| Series 2014 A, 5% 7/1/25 | 560,000 | 625,863 | |
| Series 2017 B, 5% 7/1/25 (b) | 100,000 | 115,057 | |
| Series 2019 B, 5% 7/1/22 (b) | 400,000 | 411,128 | |
| Series 2021 B: | |||
| 5% 7/1/22 (b) | 270,000 | 277,511 | |
| 5% 7/1/24 (b) | 2,000,000 | 2,223,729 | |
| 5% 7/1/25 (b) | 1,345,000 | 1,547,518 | |
| Charlotte-Mecklenburg Hosp. Auth. Health Care Sys. Rev.: | |||
| Bonds: | |||
| Series 2018 E, 0.8%, tender 10/31/25 (a) | 1,500,000 | 1,500,375 | |
| Series 2021 B, 5%, tender 12/2/24 (a) | 2,360,000 | 2,677,429 | |
| Series 2016 A, 5% 1/15/22 | 1,650,000 | 1,659,534 | |
| Columbus County Indl. Facilities And Poll. Cont. Fing. Auth. Rev. Bonds Series 2019 C, 2.1%, tender 10/1/24 (a)(b) | 2,000,000 | 2,082,966 | |
| New Hanover County Hosp. Rev. Series 2017, 5% 10/1/26 (Escrowed to Maturity) | 290,000 | 348,234 | |
| North Carolina Cap. Facilities Fin. Agcy. Edl. Facilities Rev. Series 2021, 3% 5/1/22 | 225,000 | 227,480 | |
| North Carolina Grant Anticipation Rev.: | |||
| Series 2017: | |||
| 5% 3/1/22 | 425,000 | 430,109 | |
| 5% 3/1/23 | 450,000 | 476,712 | |
| Series 2019, 5% 3/1/25 | 335,000 | 384,083 | |
| Series 2021, 5% 3/1/25 | 1,250,000 | 1,433,145 | |
| North Carolina Hsg. Fin. Agcy. Home Ownership Rev. Series 43, 4% 7/1/50 | 2,490,000 | 2,731,892 | |
| North Carolina Med. Care Commission Health Care Facilities Rev.: | |||
| Bonds Series 2019 B, 2.2%, tender 12/1/22 (a) | 1,420,000 | 1,432,914 | |
| Series 2012 B, 4% 12/1/21 | 200,000 | 200,000 | |
| North Carolina Muni. Pwr. Agcy. #1 Catawba Elec. Rev.: | |||
| Series 2015 A: | |||
| 5% 1/1/23 | 385,000 | 404,659 | |
| 5% 1/1/25 | 200,000 | 227,091 | |
| Series 2015 B, 5% 1/1/23 | 425,000 | 446,701 | |
| Series 2015 E: | |||
| 5% 1/1/22 | 680,000 | 682,617 | |
| 5% 1/1/23 | 35,000 | 36,787 | |
| North Carolina Tpk. Auth. Triangle Expressway Sys. Series 2017, 5% 1/1/22 | 1,100,000 | 1,104,179 | |
| Raleigh Durham Arpt. Auth. Arpt. Rev.: | |||
| Series 2015 B, 5% 5/1/22 (b) | 750,000 | 764,909 | |
| Series 2017 A: | |||
| 5% 5/1/22 (b) | 400,000 | 407,951 | |
| 5% 5/1/23 (b) | 235,000 | 250,616 | |
| Series 2020 A, 5% 5/1/23 (b) | 340,000 | 362,593 | |
| TOTAL NORTH CAROLINA | 25,473,782 | ||
| North Dakota - 0.1% | |||
| Cass County Joint Wtr. Resource District Series 2021 A, 0.48% 5/1/24 | 3,000,000 | 3,001,934 | |
| Ohio - 0.6% | |||
| Akron Bath Copley Hosp. District Rev.: | |||
| Series 2012, 5% 11/15/24 | 830,000 | 847,617 | |
| Series 2016, 5% 11/15/24 | 45,000 | 50,512 | |
| Akron Gen. Oblig. Series 2020, 2% 12/1/21 | 850,000 | 850,000 | |
| Allen County Hosp. Facilities Rev.: | |||
| Bonds (Mercy Health) Series 2017 B, 5%, tender 5/5/22 (a) | 985,000 | 1,004,204 | |
| Series 2017 A, 5% 8/1/22 | 5,300,000 | 5,466,652 | |
| Series 2020 A: | |||
| 5% 12/1/21 | 1,410,000 | 1,410,000 | |
| 5% 12/1/22 | 1,550,000 | 1,622,864 | |
| 5% 12/1/23 | 1,000,000 | 1,091,534 | |
| American Muni. Pwr., Inc. Rev.: | |||
| Bonds Series 2021 A2, 1%, tender 8/15/24 (a) | 565,000 | 572,140 | |
| Series 2021 A, 5% 2/15/24 | 555,000 | 611,294 | |
| Cleveland Arpt. Sys. Rev.: | |||
| Series 2016 A: | |||
| 5% 1/1/22 (FSA Insured) | 200,000 | 200,776 | |
| 5% 1/1/24 (FSA Insured) | 25,000 | 27,385 | |
| 5% 1/1/25 (FSA Insured) | 395,000 | 449,285 | |
| 5% 1/1/26 (FSA Insured) | 10,000 | 11,351 | |
| Series 2018 A, 5% 1/1/26 (b) | 290,000 | 338,122 | |
| Series 2019 B: | |||
| 5% 1/1/22 (b) | 650,000 | 652,443 | |
| 5% 1/1/27 (b) | 350,000 | 419,029 | |
| Dayton City School District Ctfs. Prtn. Series 2021: | |||
| 3% 12/1/22 | 270,000 | 277,099 | |
| 3% 12/1/24 | 165,000 | 176,449 | |
| Fairfield County Hosp. Facilities Rev. (Fairfield Med. Ctr. Proj.) Series 2013: | |||
| 5% 6/15/22 | 45,000 | 45,889 | |
| 5% 6/15/23 | 40,000 | 42,194 | |
| Franklin County Hosp. Facilities Rev.: | |||
| Bonds (U.S. Health Corp. of Columbus Proj.) Series 2011 B, 5%, tender 5/15/23 (a) | 1,385,000 | 1,476,124 | |
| Series 2013, 5% 5/15/22 (Escrowed to Maturity) | 415,000 | 423,909 | |
| Series 2016 C, 5% 11/1/23 | 60,000 | 65,358 | |
| Franklin County Rev. Bonds Series 2013 OH, 0.1%, tender 2/1/22 (a) | 1,000,000 | 1,000,000 | |
| Gahanna-Jefferson City School District (School Facilities Proj.) Series 2021: | |||
| 2% 12/1/22 | 425,000 | 432,591 | |
| 2% 12/1/23 | 355,000 | 366,833 | |
| Gahanna-Jefferson School District Series 2021, 2% 12/1/21 (FSA Insured) | 800,000 | 800,000 | |
| Hamilton County Convention Facilities Auth. Rev. Series 2014, 5% 12/1/21 | 45,000 | 45,000 | |
| Hamilton County Healthcare Facilities Rev. Series 2012, 5.25% 6/1/26 | 115,000 | 117,588 | |
| Miami County Hosp. Facilities Rev. (Kettering Health Network Obligated Group Proj.) Series 2019: | |||
| 5% 8/1/24 | 770,000 | 862,878 | |
| 5% 8/1/25 | 310,000 | 359,697 | |
| 5% 8/1/26 | 535,000 | 640,118 | |
| Miami Univ. Series 2020 A, 5% 9/1/22 | 340,000 | 352,305 | |
| Montgomery County Hosp. Rev. (Kettering Health Network Obligated Group Proj.) Series 2021, 5% 8/1/23 | 485,000 | 522,536 | |
| Ohio Gen. Oblig. Series 2021 A, 5% 3/1/23 | 800,000 | 847,592 | |
| Ohio Higher Edl. Facility Commission Rev.: | |||
| (Case Western Reserve Univ. Proj.) Series 2016, 5% 12/1/22 | 585,000 | 612,862 | |
| (Xavier Univ. 2020 Proj.) Series 2020, 5% 5/1/24 | 490,000 | 540,975 | |
| Ohio Hosp. Facilities Rev. Series 2017 A: | |||
| 5% 1/1/22 | 35,000 | 35,136 | |
| 5% 1/1/23 | 650,000 | 683,263 | |
| 5% 1/1/24 | 40,000 | 43,851 | |
| 5% 1/1/25 | 45,000 | 51,244 | |
| Ohio Hsg. Fin. Agcy. Residential Mtg. Rev.: | |||
| (Mtg. Backed Securities Prog.) Series 2019 B, 4.5% 3/1/50 | 45,000 | 49,786 | |
| Series 2021 C, 3.25% 3/1/51 | 2,100,000 | 2,295,175 | |
| Ohio Spl. Oblig. Series 2020 A, 5% 2/1/22 | 185,000 | 186,472 | |
| Scioto County Hosp. Facilities Rev.: | |||
| Series 2016: | |||
| 5% 2/15/22 | 25,000 | 25,236 | |
| 5% 2/15/23 | 45,000 | 47,483 | |
| 5% 2/15/24 | 35,000 | 38,412 | |
| 5% 2/15/25 | 35,000 | 39,836 | |
| 5% 2/15/26 | 405,000 | 475,932 | |
| Series 2019, 5% 2/15/29 | 900,000 | 1,046,182 | |
| Toledo Gen. Oblig. Series 2020: | |||
| 3% 12/1/24 | 510,000 | 545,388 | |
| 3% 12/1/24 | 425,000 | 455,146 | |
| Univ. of Akron Gen. Receipts Series 2019 A: | |||
| 5% 1/1/24 | 300,000 | 328,160 | |
| 5% 1/1/25 | 400,000 | 454,050 | |
| Univ. of Toledo Gen. Receipts Series 2013 C, 5% 6/1/22 | 260,000 | 265,885 | |
| Wright State Univ. Gen. Receipts Series 2021 A, 4% 5/1/22 (Build America Mutual Assurance Insured) | 700,000 | 710,785 | |
| TOTAL OHIO | 33,410,627 | ||
| Oklahoma - 0.2% | |||
| Canadian Cny Edl. Facilities Auth. Series 2021, 3% 9/1/23 | 2,000,000 | 2,094,392 | |
| Cleveland County Edl. Facilities Auth. (Moore Pub. Schools Proj.) Series 2021: | |||
| 4% 6/1/24 | 900,000 | 980,046 | |
| 4% 6/1/25 | 295,000 | 330,084 | |
| Oklahoma County Fin. Auth. Edl. Facilities (Jones Pub. Schools Proj.) Series 2020, 4% 9/1/22 | 305,000 | 312,366 | |
| Oklahoma Dev. Fin. Auth. Health Sys. Rev. Series 2020 C, 0.13% 8/15/31 (a) | 925,000 | 925,000 | |
| Oklahoma Dev. Fin. Auth. Rev.: | |||
| (Oklahoma City Univ. Proj.) Series 2019, 5% 8/1/23 | 560,000 | 599,163 | |
| Series 2004 A, 2.375% 12/1/21 (a) | 30,000 | 30,000 | |
| Oklahoma Hsg. Fin. Agcy. Collateralized Bonds Series 2019, 1.6%, tender 1/1/22 | 185,000 | 185,212 | |
| Oklahoma Tpk. Auth. Tpk. Rev. Series 2017 D, 5% 1/1/25 | 205,000 | 233,919 | |
| Tulsa County Independent School District #1 Series 2021 B, 0.25% 9/1/24 | 4,000,000 | 3,962,751 | |
| Tulsa County Indl. Auth. Edl. Facilities Lease Rev. (Berryhill Pub. School Proj.) Series 2020: | |||
| 4% 9/1/24 | 445,000 | 483,522 | |
| 4% 9/1/25 | 690,000 | 768,026 | |
| Univ. of Oklahoma Gen. Rev.: | |||
| Series 2020 B, 4% 7/1/24 | 490,000 | 533,609 | |
| Series 2021 A, 5% 7/1/23 (FSA Insured) (e) | 1,125,000 | 1,206,673 | |
| TOTAL OKLAHOMA | 12,644,763 | ||
| Oregon - 0.2% | |||
| Oregon Bus. Dev. Commission Bonds Series 250, 5%, tender 3/1/22 (a)(b) | 2,970,000 | 3,003,374 | |
| Oregon Bus. Dev. Commission Recovery Zone Facility Bonds (Intel Corp. Proj.) Series 232, 2.4%, tender 8/14/23(a) | 770,000 | 794,528 | |
| Oregon Gen. Oblig. Series 2021 A, 5% 5/1/24 | 1,500,000 | 1,667,154 | |
| Port of Morrow Full Faith and Cr. Obligations Series 2021 D: | |||
| 4% 12/1/22 | 135,000 | 139,686 | |
| 4% 12/1/23 | 110,000 | 117,245 | |
| 4% 12/1/24 | 150,000 | 164,149 | |
| 4% 12/1/25 | 150,000 | 167,690 | |
| Port of Portland Arpt. Rev.: | |||
| Series 2015 23, 5% 7/1/23 | 275,000 | 295,394 | |
| Series 26 C: | |||
| 5% 7/1/22 (b) | 1,300,000 | 1,334,463 | |
| 5% 7/1/23 (b) | 2,000,000 | 2,141,391 | |
| 5% 7/1/24 (b) | 1,000,000 | 1,111,865 | |
| TOTAL OREGON | 10,936,939 | ||
| Pennsylvania - 2.4% | |||
| Allegheny County Hosp. Dev. Auth. Rev. Series 2021 B: | |||
| 5% 10/15/23 | 950,000 | 1,032,014 | |
| 5% 10/15/24 | 705,000 | 795,321 | |
| 5% 10/15/25 | 740,000 | 863,788 | |
| Allegheny County Sanitation Auth. Swr. Rev. Series 2020 A, 4% 6/1/24 | 300,000 | 326,133 | |
| Bucks Co. Indl. Dev. Auth. Solid Waste Rev. Bonds (Waste Mgmt., Inc. Proj.) Series 2002, 2.75%, tender 12/1/22 (a)(b) | 1,700,000 | 1,737,143 | |
| Butler Area School District Series 2018, 5% 10/1/22 | 1,250,000 | 1,299,375 | |
| Chester County Health & Ed. Facilities Auth. Health Sys. Rev. Series C, 3% 9/1/23 | 245,000 | 256,783 | |
| Coatesville Area School District Series 2017, 5% 8/1/23 (FSA Insured) | 710,000 | 763,343 | |
| Commonwealth Fing. Auth. Rev.: | |||
| Series 2019 B, 5% 6/1/24 | 275,000 | 305,846 | |
| Series 2020 A, 5% 6/1/23 | 350,000 | 374,691 | |
| Cumberland County Muni. Auth. Rev. Bonds Series 2014 T1, 3.75%, tender 4/30/22 (a) | 1,000,000 | 1,001,948 | |
| Delaware County Auth. Rev. Series 2015, 5% 8/1/22 | 475,000 | 489,936 | |
| Delaware County Auth. Univ. Rev. Series 2020: | |||
| 4% 10/1/22 | 190,000 | 195,075 | |
| 5% 10/1/23 | 240,000 | 257,331 | |
| Delaware Valley Reg'l. Fin. Auth. Local Govt. Rev. Bonds Series 2018 B, SIFMA Municipal Swap Index + 0.420% 0.47%, tender 12/2/21 (a)(c) | 5,000,000 | 5,000,266 | |
| Geisinger Auth. Health Sys. Rev. Series 2020 A, 5% 4/1/22 | 6,075,000 | 6,171,753 | |
| Hollidaysburg Area School District Series 2020, 4% 7/15/22 | 500,000 | 511,584 | |
| Lancaster County Hosp. Auth. Health Ctr. Rev. Series 2016 A, 4% 8/15/22 | 470,000 | 482,675 | |
| Laurel Highlands School District Series 2021: | |||
| 4% 2/1/24 | 635,000 | 678,666 | |
| 4% 2/1/25 | 345,000 | 378,520 | |
| Lehigh County Indl. Dev. Auth. Poll. Cont. Rev. Bonds: | |||
| (PPL Elec. Utils. Corp. Proj.) Series 2016 A, 1.8%, tender 9/1/22 (a) | 2,405,000 | 2,428,434 | |
| Series B, 1.8%, tender 8/15/22 (a) | 1,595,000 | 1,609,651 | |
| Monroeville Fin. Auth. UPMC Rev. Series 2012: | |||
| 3% 2/15/23 | 340,000 | 346,446 | |
| 5% 2/15/22 | 440,000 | 444,249 | |
| Montgomery County Higher Ed. & Health Auth. Rev.: | |||
| Series 2014 A, 5% 10/1/23 | 5,000 | 5,366 | |
| Series 2017, 3% 12/1/21 | 155,000 | 155,000 | |
| Series 2019: | |||
| 5% 9/1/23 | 500,000 | 539,090 | |
| 5% 9/1/26 | 1,250,000 | 1,485,782 | |
| Neshannock Township School District Gen. Oblig. Series 2021 B: | |||
| 2% 9/1/22 | 115,000 | 116,491 | |
| 2% 9/1/23 | 325,000 | 333,872 | |
| New Kensington-Arnold School District Series 2019 A, 4% 5/15/22 | 975,000 | 990,435 | |
| Northampton County Gen. Purp. College Rev. Series 2017, 5% 11/1/23 | 365,000 | 396,566 | |
| Octorara Area School District Chester and Lancaster Counties Series 2020, 4% 4/1/23 | 700,000 | 733,319 | |
| Parkland School District Series 2021 A, 3% 2/1/24 | 225,000 | 237,249 | |
| Pennsylvania Econ. Dev. Fing. Auth.: | |||
| (Philadelphia Biosolids Facility Proj.) Series 2020, 3% 1/1/22 | 360,000 | 360,686 | |
| Series 2017 A, 5% 11/15/23 | 225,000 | 245,018 | |
| Series 2020 A, 5% 4/15/22 | 500,000 | 508,782 | |
| Series 2021 A, 4% 10/15/23 | 425,000 | 453,780 | |
| Pennsylvania Econ. Dev. Fing. Auth. Indl. Dev. Rev. (The Pennsylvania Rapid Bridge Replacement Proj.) Series 2015, 5% 6/30/22 (b) | 1,495,000 | 1,534,266 | |
| Pennsylvania Econ. Dev. Fing. Auth. Solid Waste Disp. Rev. Bonds: | |||
| (Republic Svcs., Inc. Proj.): | |||
| Series 2019 A, 0.18%, tender 1/18/22 (a)(b) | 7,550,000 | 7,550,011 | |
| Series 2019 B1, 0.18%, tender 1/15/22 (a)(b) | 5,000,000 | 5,000,008 | |
| (Republic Svcs., Inc. Proj.) Series 2014, 0.23%, tender 1/3/22 (a)(b) | 4,000,000 | 4,000,173 | |
| (Waste Mgmt., Inc. Proj.) Series 2013, 0.18%, tender 2/1/22 (a)(b) | 12,000,000 | 11,999,995 | |
| (Waste Mgmt., Inc. Proj.): | |||
| Series 2009, 2.8%, tender 12/1/21 (a) | 600,000 | 600,000 | |
| Series 2010 B, 0.2%, tender 1/3/22 (a) | 300,000 | 300,019 | |
| Series 2017 A, 0.58%, tender 8/1/24 (a)(b) | 500,000 | 498,419 | |
| Series 2021 A, SIFMA Municipal Swap Index + 0.400% 0.45%, tender 6/3/24 (a)(b)(c) | 1,365,000 | 1,365,128 | |
| Series 2011, 2.15%, tender 7/1/24 (a)(b) | 775,000 | 803,687 | |
| Pennsylvania Gen. Oblig.: | |||
| Series 2012 1, 5% 6/1/22 (Escrowed to Maturity) | 355,000 | 363,541 | |
| Series 2015 1: | |||
| 5% 8/15/23 | 780,000 | 842,973 | |
| 5% 3/15/25 | 425,000 | 487,482 | |
| Series 2016, 5% 1/15/22 | 290,000 | 291,686 | |
| Pennsylvania Higher Edl. Facilities Auth. Rev.: | |||
| Bonds (AICUP Fing. Prog.-York College of Pennsylvania Proj.) Series 2014 T3, 3%, tender 4/30/22 (a) | 1,470,000 | 1,480,436 | |
| Series 2014: | |||
| 5% 12/1/21 | 5,000 | 5,000 | |
| 5% 12/1/22 | 20,000 | 20,961 | |
| Series 2015, 5% 8/15/22 | 565,000 | 584,203 | |
| Series 2017, 5% 5/1/22 | 1,000,000 | 1,019,624 | |
| Pennsylvania Hsg. Fin. Agcy.: | |||
| Bonds: | |||
| Series 2018 127C, 0.634%, tender 10/1/23 (a)(c) | 4,000,000 | 4,013,461 | |
| Series 2019, 1.4%, tender 1/1/23 (a) | 4,500,000 | 4,544,834 | |
| Series 2021 134 B, 5% 10/1/23 (b) | 1,000,000 | 1,080,779 | |
| Series 2021 135 B: | |||
| 5% 4/1/22 (b) | 390,000 | 396,132 | |
| 5% 10/1/22 (b) | 660,000 | 685,618 | |
| 5% 4/1/23 (b) | 660,000 | 700,163 | |
| 5% 10/1/23 (b) | 1,025,000 | 1,108,780 | |
| 5% 4/1/24 (b) | 600,000 | 660,233 | |
| 5% 10/1/24 (b) | 805,000 | 900,775 | |
| 5% 4/1/25 (b) | 180,000 | 204,731 | |
| Series 2021 137: | |||
| 0.45% 10/1/23 (e) | 325,000 | 324,781 | |
| 5% 4/1/24 (e) | 200,000 | 220,226 | |
| 5% 4/1/25 (e) | 200,000 | 228,120 | |
| 5% 10/1/26 (e) | 280,000 | 333,186 | |
| Pennsylvania Pub. School Bldg. Auth. School Rev. (The School District of The City of Harrisburg Proj.) Series 2016 A: | |||
| 5% 12/1/21 | 90,000 | 90,000 | |
| 5% 12/1/21 (Escrowed to Maturity) | 20,000 | 20,000 | |
| Pennsylvania Tpk. Commission Tpk. Rev.: | |||
| Series 2016, 5% 6/1/22 | 200,000 | 204,741 | |
| Series 2021 B: | |||
| 5% 12/1/22 | 800,000 | 837,855 | |
| 5% 12/1/23 | 1,410,000 | 1,541,436 | |
| Philadelphia Arpt. Rev.: | |||
| Series 2015 A, 5% 6/15/24 (b) | 1,315,000 | 1,459,715 | |
| Series 2017 A, 5% 7/1/24 | 40,000 | 44,694 | |
| Series 2017 B: | |||
| 5% 7/1/22 (b) | 2,840,000 | 2,917,315 | |
| 5% 7/1/23 (b) | 3,280,000 | 3,518,369 | |
| 5% 7/1/24 (b) | 660,000 | 733,831 | |
| 5% 7/1/25 (b) | 440,000 | 506,251 | |
| Series 2020 C: | |||
| 5% 7/1/22 (b) | 2,750,000 | 2,824,865 | |
| 5% 7/1/23 (b) | 8,930,000 | 9,578,974 | |
| Series 2021: | |||
| 5% 7/1/24 (b) | 1,970,000 | 2,190,373 | |
| 5% 7/1/25 (b) | 3,925,000 | 4,515,992 | |
| Philadelphia Auth. for Indl. Dev. Series 2020 C, 4% 11/1/24 | 535,000 | 585,652 | |
| Philadelphia Gas Works Rev.: | |||
| Series 14, 5% 10/1/22 | 390,000 | 405,305 | |
| Series 2017 15, 5% 8/1/22 | 480,000 | 495,093 | |
| Philadelphia School District: | |||
| Series 2019 A, 5% 9/1/23 | 185,000 | 200,039 | |
| Series 2021 A, 5% 9/1/22 | 850,000 | 880,370 | |
| Series 2021 B: | |||
| 5% 9/1/22 | 1,000,000 | 1,035,730 | |
| 5% 9/1/23 | 660,000 | 713,652 | |
| Pittsburgh & Allegheny County Sports & Exhibition Auth. Series 2020, 4% 2/1/23 (FSA Insured) | 1,775,000 | 1,849,488 | |
| Pittsburgh Wtr. & Swr. Auth. Wtr. & Swr. Sys. Rev.: | |||
| Bonds Series 2017 C, 1 month U.S. LIBOR + 0.640% 0.7%, tender 12/1/23 (FSA Insured) (a)(c) | 4,000,000 | 4,028,686 | |
| Series 2019 A: | |||
| 5% 9/1/23 | 270,000 | 291,751 | |
| 5% 9/1/26 (FSA Insured) | 625,000 | 748,036 | |
| Reading School District Series 2017: | |||
| 5% 3/1/25 (FSA Insured) | 5,000 | 5,682 | |
| 5% 3/1/26 (FSA Insured) | 5,000 | 5,861 | |
| 5% 3/1/27 (FSA Insured) | 5,000 | 6,029 | |
| 5% 3/1/28 (FSA Insured) | 5,000 | 6,048 | |
| Southcentral Pennsylvania Gen. Auth. Rev. Series 2021 TT2: | |||
| 5% 5/1/24 | 210,000 | 232,007 | |
| 5% 5/1/25 | 340,000 | 388,976 | |
| 5% 5/1/26 | 320,000 | 377,392 | |
| Southeastern Pennsylvania Trans. Auth. Rev. Series 2020: | |||
| 5% 6/1/22 | 1,000,000 | 1,024,110 | |
| 5% 6/1/23 | 750,000 | 802,674 | |
| Township of East Vincent Gen. Oblig. Series 2021: | |||
| 3% 12/1/23 | 200,000 | 210,234 | |
| 3% 12/1/24 | 250,000 | 268,894 | |
| Westmoreland County Indl. Dev. Auth. (Excela Health Proj.) Series 2020 A: | |||
| 4% 7/1/23 | 350,000 | 369,355 | |
| 4% 7/1/24 | 450,000 | 488,959 | |
| TOTAL PENNSYLVANIA | 134,866,272 | ||
| Rhode Island - 0.1% | |||
| Rhode Island Comm Corp. Rev. Series 2016 A, 5% 6/15/24 | 1,010,000 | 1,127,122 | |
| Rhode Island Health & Edl. Bldg. Corp. Higher Ed. Facilities Rev. Series 2016: | |||
| 5% 5/15/22 | 295,000 | 301,084 | |
| 5% 5/15/23 | 25,000 | 26,622 | |
| 5% 5/15/24 | 160,000 | 177,104 | |
| 5% 5/15/25 | 120,000 | 137,547 | |
| Rhode Island Health & Edl. Bldg. Corp. Pub. Schools Rev. Series 2015, 5% 5/15/25 (FSA Insured) | 130,000 | 149,635 | |
| Rhode Island Hsg. & Mtg. Fin. Corp. Series 2019 70, 4% 10/1/49 | 95,000 | 103,665 | |
| Rhode Island Student Ln. Auth. Student Ln. Rev.: | |||
| Series 2019 A, 5% 12/1/28 (b) | 490,000 | 602,501 | |
| Series A, 4% 12/1/26 (b) | 540,000 | 585,243 | |
| Tobacco Settlement Fing. Corp. Series 2015 A: | |||
| 5% 6/1/26 | 75,000 | 86,187 | |
| 5% 6/1/27 | 20,000 | 22,897 | |
| TOTAL RHODE ISLAND | 3,319,607 | ||
| South Carolina - 0.6% | |||
| Charleston County Arpt. District Series 2013 A: | |||
| 5.25% 7/1/22 (b) | 1,235,000 | 1,270,778 | |
| 5.5% 7/1/27 (b) | 850,000 | 916,914 | |
| Lancaster County School District ( South Carolina Gen. Oblig. Proj.) Series 2017, 5% 3/1/22 | 45,000 | 45,541 | |
| Patriots Energy Group Fing. Agcy. Bonds Series 2018 A, 4%, tender 2/1/24 (a) | 9,000,000 | 9,636,007 | |
| Richland County School District #2 Gen. Oblig. (South Carolina Gen. Oblig. Proj.) Series 2015 A, 5% 2/1/23 | 85,000 | 89,697 | |
| Scago Edl. Facilities Corp. for Colleton School District (School District of Colleton County Proj.) Series 2015: | |||
| 5% 12/1/23 | 95,000 | 103,536 | |
| 5% 12/1/26 | 25,000 | 28,570 | |
| South Carolina Assoc. of Governmental Organizations Ctfs. of Prtn. Series 2021 B, 3% 3/1/22 | 10,000,000 | 10,071,888 | |
| South Carolina Hsg. Fin. & Dev. Auth. Mtg. Rev. Series 2019 A, 4% 1/1/50 | 115,000 | 127,020 | |
| South Carolina Ports Auth. Ports Rev.: | |||
| Series 2015, 5.25% 7/1/55 (Pre-Refunded to 7/1/25 @ 100) (b) | 175,000 | 204,192 | |
| Series 2019 B: | |||
| 5% 7/1/22 (b) | 310,000 | 318,089 | |
| 5% 7/1/26 (b) | 185,000 | 219,419 | |
| South Carolina Pub. Svc. Auth. Rev.: | |||
| Series 2011 B, 5% 12/1/21 (Escrowed to Maturity) | 1,110,000 | 1,110,000 | |
| Series 2014 C: | |||
| 5% 12/1/22 | 25,000 | 26,183 | |
| 5% 12/1/23 | 110,000 | 120,115 | |
| Series 2015 A: | |||
| 5% 12/1/21 (Escrowed to Maturity) | 400,000 | 400,000 | |
| 5% 12/1/25 | 115,000 | 132,469 | |
| Series 2015 C: | |||
| 5% 12/1/21 | 890,000 | 890,000 | |
| 5% 12/1/22 | 560,000 | 586,498 | |
| Series 2021 A: | |||
| 5% 12/1/24 | 375,000 | 425,521 | |
| 5% 12/1/25 | 850,000 | 997,354 | |
| Series A: | |||
| 5% 12/1/21 | 350,000 | 350,000 | |
| 5% 12/1/21 | 530,000 | 530,000 | |
| 5% 12/1/22 | 750,000 | 785,489 | |
| 5% 12/1/23 | 620,000 | 677,012 | |
| 5% 12/1/23 | 1,015,000 | 1,108,334 | |
| 5% 12/1/24 | 365,000 | 414,174 | |
| Spartanburg County Reg'l. Health Series 2022, 5% 4/15/23 (e) | 690,000 | 728,712 | |
| TOTAL SOUTH CAROLINA | 32,313,512 | ||
| South Dakota - 0.1% | |||
| South Dakota Board of Regents Hsg. and Auxiliary Facilities Series 2021: | |||
| 3% 4/1/22 | 250,000 | 252,297 | |
| 3% 4/1/23 | 275,000 | 284,669 | |
| 3% 4/1/24 | 425,000 | 449,156 | |
| 3% 4/1/25 | 500,000 | 538,646 | |
| South Dakota Health & Edl. Facilities Auth. Rev.: | |||
| Series 2014 B, 5% 11/1/22 | 10,000 | 10,432 | |
| Series 2020 A: | |||
| 5% 9/1/22 | 140,000 | 144,991 | |
| 5% 9/1/23 | 335,000 | 362,356 | |
| South Dakota Hsg. Dev. Auth. Series 2017 D, 4% 11/1/47 | 795,000 | 853,962 | |
| TOTAL SOUTH DAKOTA | 2,896,509 | ||
| Tennessee - 0.8% | |||
| Greeneville Health & Edl. Facilities Board Series 2018 A, 5% 7/1/22 | 1,500,000 | 1,541,103 | |
| Lewisburg Indl. Dev. Board Bonds (Waste Mgmt. Tennessee Proj.) Series 2012, 0.18%, tender 2/1/22 (a)(b) | 4,000,000 | 3,999,998 | |
| Memphis Health, Edl. & Hsg. Facilities Board Bonds Series 2020, 0.25%, tender 12/1/22 (a) | 1,250,000 | 1,250,919 | |
| Memphis-Shelby County Arpt. Auth. Arpt. Rev.: | |||
| Series 2020 B: | |||
| 5% 7/1/22 (b) | 300,000 | 308,238 | |
| 5% 7/1/23 (b) | 250,000 | 268,333 | |
| Series 2021 B, 5% 7/1/22 (b) | 400,000 | 410,985 | |
| Series 2021 C: | |||
| 5% 7/1/22 (b) | 400,000 | 410,985 | |
| 5% 7/1/23 (b) | 1,750,000 | 1,878,334 | |
| 5% 7/1/24 (b) | 1,850,000 | 2,056,949 | |
| Metropolitan Gov Nashvle&David Ind. Bonds (Waste Mgmt., Inc. Proj.) Series 2001, 0.58%, tender 8/1/24 (a)(b) | 400,000 | 398,735 | |
| Metropolitan Nashville Arpt. Auth. Rev. Series 2019 B, 5% 7/1/25 (b) | 1,910,000 | 2,197,591 | |
| Tennergy Corp. Gas Rev.: | |||
| Bonds Series 2019 A, 5%, tender 10/1/24 (a) | 10,650,000 | 11,932,027 | |
| Series 2021 A: | |||
| 4% 9/1/22 | 335,000 | 344,265 | |
| 4% 3/1/23 | 350,000 | 365,610 | |
| 4% 9/1/23 | 275,000 | 291,921 | |
| 4% 3/1/24 | 300,000 | 323,185 | |
| Tennessee Energy Acquisition Corp.: | |||
| Bonds (Gas Rev. Proj.) Series A, 4%, tender 5/1/23 (a) | 10,140,000 | 10,605,639 | |
| Series 2018, 5% 11/1/22 | 1,500,000 | 1,562,577 | |
| Series 2021 A: | |||
| 5% 11/1/22 | 150,000 | 156,258 | |
| 5% 11/1/23 | 250,000 | 270,819 | |
| Tennessee Hsg. Dev. Agcy. Residential: | |||
| Series 2021 3A, 3% 1/1/52 (e) | 260,000 | 281,952 | |
| Series 2021 3B, 0.25% 7/1/22 (e) | 3,350,000 | 3,349,951 | |
| TOTAL TENNESSEE | 44,206,374 | ||
| Texas - 4.4% | |||
| Alamito Pub. Facilities Corp. Bonds Series 2019, 1.51%, tender 5/1/22 (a) | 6,000,000 | 6,003,275 | |
| Aledo Independent School District Series 2015, 0% 2/15/24 | 25,000 | 24,774 | |
| Andrews County Hosp. District Series 2021, 5% 3/15/26 (e) | 1,430,000 | 1,663,468 | |
| Atascosa County Indl. Dev. Corp. Poll. Cont. Rev. Series 2020: | |||
| 5% 12/15/21 | 975,000 | 976,495 | |
| 5% 12/15/23 | 450,000 | 484,503 | |
| 5% 12/15/24 | 550,000 | 609,288 | |
| Austin Affordable Pfc, Inc. Multifamily Hsg. Rev. Bonds Series 2019, 1.46%, tender 6/1/22 (a) | 700,000 | 704,250 | |
| Austin Arpt. Sys. Rev.: | |||
| Series 2014, 5% 11/15/26 (b) | 715,000 | 804,365 | |
| Series 2019 B, 5% 11/15/22 (b) | 600,000 | 627,142 | |
| Series 2019: | |||
| 5% 11/15/22 (b) | 885,000 | 925,034 | |
| 5% 11/15/23 (b) | 845,000 | 921,569 | |
| 5% 11/15/24 (b) | 515,000 | 580,336 | |
| Austin Gen. Oblig. Series 2019, 5% 5/1/25 | 780,000 | 900,653 | |
| Burleson Independent School District Bonds Series 2018, 2.5%, tender 8/1/22 (a) | 5,000,000 | 5,073,357 | |
| Cap. Area Hsg. Fin. Corp. Multi-family Hsg. Rev. Bonds Series 2019, 2.1%, tender 9/1/22 (a) | 2,800,000 | 2,803,474 | |
| Central Reg'l. Mobility Auth.: | |||
| Series 2016: | |||
| 5% 1/1/22 | 35,000 | 35,133 | |
| 5% 1/1/23 | 55,000 | 57,759 | |
| 5% 1/1/24 | 75,000 | 82,007 | |
| 5% 1/1/26 | 75,000 | 87,841 | |
| Series 2020 B: | |||
| 5% 1/1/22 | 155,000 | 155,588 | |
| 5% 1/1/23 | 220,000 | 231,037 | |
| 5% 1/1/25 | 125,000 | 141,808 | |
| 5% 1/1/26 | 125,000 | 146,401 | |
| Series 2020 F, 5% 1/1/25 | 2,000,000 | 2,219,070 | |
| City of Beaumont Series 2021, 5% 3/1/23 | 665,000 | 703,526 | |
| Clear Creek Independent School District: | |||
| Bonds Series 2021 B, 0.28%, tender 8/15/24 (a) | 630,000 | 626,897 | |
| Series 2019, 5% 2/15/25 | 500,000 | 572,174 | |
| Coastal Bend Health Facilities Dev. Corp. Series 2005 B2, 0.2%, tender 7/1/31 (FSA Insured) (a) | 5,450,000 | 5,450,000 | |
| Corpus Christi Gen. Oblig. Series 2015, 5% 3/1/24 | 1,955,000 | 2,155,265 | |
| Corpus Christi Util. Sys. Rev. Series 2012, 5% 7/15/23 | 200,000 | 205,841 | |
| Cypress-Fairbanks Independent School District: | |||
| Bonds: | |||
| Series 2015 B1, 0.28%, tender 8/15/24 (a) | 4,700,000 | 4,658,039 | |
| Series 2017 A-2, 1.25%, tender 8/15/22 (a) | 3,000,000 | 3,020,863 | |
| Series 2020 A, 5% 2/15/25 | 200,000 | 228,594 | |
| Dallas Fort Worth Int'l. Arpt. Rev.: | |||
| Series 2013 A, 5% 11/1/28 (Pre-Refunded to 11/1/22 @ 100) (b) | 1,000,000 | 1,042,566 | |
| Series 2013 E, 5% 11/1/23 (b) | 1,455,000 | 1,584,344 | |
| Series 2013 F, 5% 11/1/22 | 580,000 | 605,564 | |
| Series 2014 A: | |||
| 4% 11/1/23 (b) | 200,000 | 213,967 | |
| 5.25% 11/1/26 (b) | 900,000 | 981,211 | |
| 5.25% 11/1/30 (b) | 1,000,000 | 1,087,223 | |
| Series 2014 B: | |||
| 5% 11/1/22 (b) | 100,000 | 104,341 | |
| 5% 11/1/29 (Pre-Refunded to 11/1/22 @ 100) (b) | 515,000 | 536,921 | |
| Series 2014 C, 5% 11/1/22 | 550,000 | 574,242 | |
| Series 2020 A: | |||
| 5% 11/1/23 | 2,250,000 | 2,450,923 | |
| 5% 11/1/24 | 225,000 | 254,594 | |
| Series 2020 B, 5% 11/1/22 | 3,000,000 | 3,132,227 | |
| Series 2021 B, 5% 11/1/24 | 3,500,000 | 3,955,998 | |
| Dallas Gen. Oblig. Series 2020 A: | |||
| 5% 2/15/23 | 2,020,000 | 2,136,241 | |
| 5% 2/15/24 | 1,000,000 | 1,102,597 | |
| Dallas Independent School District Bonds: | |||
| Series 2016, 5%, tender 2/15/22 (a) | 5,000 | 5,049 | |
| Series B6: | |||
| 5%, tender 2/15/22 (a) | 100,000 | 100,986 | |
| 5%, tender 2/15/22 (a) | 100,000 | 100,988 | |
| Denton Independent School District Series 2016, 0% 8/15/25 | 35,000 | 34,211 | |
| East Downtown Redev. Auth. Series 2021: | |||
| 5% 9/1/24 (e) | 405,000 | 450,165 | |
| 5% 9/1/26 (e) | 300,000 | 352,198 | |
| El Paso Gen. Oblig. Series 2021 B, 5% 8/15/22 (e) | 565,000 | 583,624 | |
| Fort Bend County Muni. Util. District Series 2021, 2% 4/1/24 | 750,000 | 775,461 | |
| Fort Bend Independent School District Bonds: | |||
| Series 2019 A, 1.95%, tender 8/1/22 (a) | 5,490,000 | 5,548,697 | |
| Series 2020 B, 0.875%, tender 8/1/25 (a) | 3,245,000 | 3,293,624 | |
| Series 2021 B, 0.72%, tender 8/1/26 (a) | 2,525,000 | 2,520,446 | |
| Fort Worth Gen. Oblig.: | |||
| Series 2015 A, 5% 3/1/23 | 35,000 | 37,087 | |
| Series 2016, 5% 3/1/25 | 120,000 | 137,289 | |
| Series 2019, 5% 3/1/24 | 4,520,000 | 4,986,241 | |
| Fort Worth Independent School District Series 2015, 5% 2/15/22 | 35,000 | 35,345 | |
| Galveston Pub. Facility Corp. Multifamily Hsg. Rev. Bonds Series 2021, 0.47%, tender 8/1/24 (a) | 3,000,000 | 2,990,483 | |
| Goose Creek Consolidated Independent School District Bonds Series 2021 B, 0.6%, tender 8/17/26 (a) | 500,000 | 496,431 | |
| Grand Parkway Trans. Corp. Bonds Series 2018 B, 5%, tender 10/1/23 (a) | 1,865,000 | 2,017,797 | |
| Harris County Cultural Ed. Facilities Fin. Corp. Med. Facilities Rev.: | |||
| (Baylor College of Medicine Proj.) Series 2012 A, 5% 11/15/37 (Pre-Refunded to 11/15/22 @ 100) | 435,000 | 455,078 | |
| Series 2012 A, 5% 11/15/22 (Escrowed to Maturity) | 245,000 | 256,309 | |
| Harris County Cultural Ed. Facilities Fin. Corp. Rev.: | |||
| Bonds: | |||
| Series 2019 B, 5%, tender 12/1/22 (a) | 5,000,000 | 5,220,837 | |
| Series 2019 C, SIFMA Municipal Swap Index + 0.420% 0.47%, tender 12/2/21 (a)(c) | 3,250,000 | 3,249,364 | |
| Series 2020 A, 0.9%, tender 5/15/25 (a) | 1,770,000 | 1,771,145 | |
| Series 2020 C, 5%, tender 12/1/22 (a) | 6,710,000 | 7,024,847 | |
| Series 2020 C2, 5%, tender 12/1/24 (a) | 200,000 | 226,654 | |
| Series 2013 A, 5% 12/1/21 | 450,000 | 450,000 | |
| Series 2013 B, SIFMA Municipal Swap Index + 0.900% 0.95% 6/1/22 (a)(c) | 600,000 | 601,383 | |
| Series 2014 A, 5% 12/1/26 | 120,000 | 135,782 | |
| Series 2019 A, 5% 12/1/21 | 2,310,000 | 2,310,000 | |
| Series 2020 A, 4% 7/1/25 | 250,000 | 280,239 | |
| Series 2020, 5% 6/1/22 | 1,000,000 | 1,024,008 | |
| Harris County Health Facilities Dev. Corp. Rev.: | |||
| Series 2005 A4, 0.19%, tender 7/1/31 (FSA Insured) (a) | 1,750,000 | 1,750,000 | |
| Series A3, 0.2%, tender 7/1/31 (FSA Insured) (a) | 4,050,000 | 4,050,000 | |
| Houston Arpt. Sys. Rev.: | |||
| Series 2012 A: | |||
| 5% 7/1/23 (Pre-Refunded to 7/1/22 @ 100) (b) | 235,000 | 241,453 | |
| 5% 7/1/31 (Pre-Refunded to 7/1/22 @ 100) (b) | 630,000 | 647,301 | |
| Series 2018 A, 5% 7/1/22 (b) | 860,000 | 883,822 | |
| Series 2018 B, 5% 7/1/22 | 720,000 | 740,244 | |
| Series 2018 C, 5% 7/1/25 (b) | 400,000 | 460,229 | |
| Series 2020 A, 5% 7/1/23 (b) | 1,000,000 | 1,073,995 | |
| Series 2021 A: | |||
| 5% 7/1/24 (b) | 500,000 | 555,932 | |
| 5% 7/1/26 (b) | 1,250,000 | 1,480,703 | |
| Houston Convention and Entertainment Facilities Dept. Hotel Occupancy Tax and Spl. Rev. Series 2021: | |||
| 4% 9/1/24 | 250,000 | 273,575 | |
| 4% 9/1/25 | 215,000 | 241,342 | |
| 4% 9/1/26 | 275,000 | 315,372 | |
| Houston Independent School District Bonds Series 2012, 4%, tender 6/1/23 (a) | 1,000,000 | 1,054,067 | |
| Jacksonville Independent School District Series 2020, 5% 2/15/24 | 1,915,000 | 2,108,794 | |
| Katy Independent School District Bonds Series 2021 C, 1.5%, tender 8/15/24 (a) | 2,500,000 | 2,570,874 | |
| Klein Independent School District Series 2015 A, 5% 8/1/24 | 225,000 | 252,267 | |
| Leander Independent School District Series 2013 A, 0% 8/15/23 (Escrowed to Maturity) | 1,000,000 | 994,103 | |
| Love Field Arpt. Modernization Rev.: | |||
| Series 2015, 5% 11/1/23 (b) | 375,000 | 408,110 | |
| Series 2017: | |||
| 5% 11/1/22 (b) | 620,000 | 646,742 | |
| 5% 11/1/23 (b) | 1,250,000 | 1,360,365 | |
| 5% 11/1/24 (b) | 750,000 | 843,989 | |
| Series 2021: | |||
| 5% 11/1/22 (b) | 2,880,000 | 3,004,219 | |
| 5% 11/1/23 (b) | 3,860,000 | 4,200,808 | |
| 5% 11/1/24 (b) | 3,560,000 | 4,006,136 | |
| 5% 11/1/25 (b) | 605,000 | 702,118 | |
| 5% 11/1/26 (b) | 405,000 | 483,827 | |
| 5% 11/1/27 (b) | 415,000 | 506,502 | |
| Lower Colorado River Auth. Rev.: | |||
| (LCRA Transmission Svcs. Corp. Proj.): | |||
| Series 2018, 5% 5/15/23 | 265,000 | 283,157 | |
| Series 2019: | |||
| 5% 5/15/23 | 1,070,000 | 1,143,314 | |
| 5% 5/15/24 | 550,000 | 610,508 | |
| Series 2020: | |||
| 5% 5/15/22 | 1,000,000 | 1,021,874 | |
| 5% 5/15/23 | 215,000 | 229,731 | |
| 5% 5/15/24 | 550,000 | 610,508 | |
| Series 2015 B, 5% 5/15/24 | 325,000 | 360,754 | |
| Series 2022: | |||
| 5% 5/15/24 (FSA Insured) (e) | 3,365,000 | 3,691,179 | |
| 5% 5/15/25 (FSA Insured) (e) | 1,000,000 | 1,135,420 | |
| Lubbock Elec. Lt. & Pwr. Sys. Rev. Series 2021: | |||
| 5% 4/15/24 | 875,000 | 970,354 | |
| 5% 4/15/25 | 725,000 | 833,727 | |
| 5% 4/15/26 | 675,000 | 800,760 | |
| Mansfield Independent School District Series 2016, 5% 2/15/24 | 110,000 | 121,004 | |
| McKinney Independent School District Series 2021, 5% 2/15/25 | 600,000 | 687,850 | |
| Midland County Pub. Facilities Corp. Bonds Series 2020, 0.35%, tender 6/1/23 (a) | 2,000,000 | 1,996,266 | |
| Mission Econ. Dev. Corp. Solid Waste Disp. Rev. Bonds: | |||
| (Republic Svcs., Inc. Proj.): | |||
| Series 2008 A, 0.2%, tender 2/1/22 (a)(b) | 10,000,000 | 10,000,327 | |
| Series 2020 A, 0.2%, tender 2/1/22 (a)(b) | 10,300,000 | 10,300,337 | |
| (Waste Mgmt., Inc. Proj.): | |||
| Series 2018, 0.425%, tender 7/1/24 (a)(b) | 3,425,000 | 3,424,042 | |
| Series 2020 B, 0.15%, tender 12/1/21 (a)(b) | 4,500,000 | 4,500,000 | |
| New Caney Independent School District Bonds Series 2018, 1.25%, tender 8/15/24 (a) | 600,000 | 611,681 | |
| Newark Higher Ed. Fin. Corp. (Abilene Christian Univ. Proj.) Series 2016 A, 5% 4/1/26 | 55,000 | 64,526 | |
| North Harris County Reg'l. Wtr. Auth. Series 2013, 4% 12/15/22 | 35,000 | 36,335 | |
| North Texas Tollway Auth. Rev.: | |||
| Series 2014 A, 5% 1/1/22 (Escrowed to Maturity) | 1,015,000 | 1,018,953 | |
| Series 2015 A, 5% 1/1/22 | 200,000 | 200,785 | |
| Series 2015 B, 5% 1/1/23 | 325,000 | 341,704 | |
| Series 2016 A: | |||
| 5% 1/1/22 | 200,000 | 200,785 | |
| 5% 1/1/23 | 780,000 | 820,090 | |
| Series 2017 A: | |||
| 5% 1/1/22 | 830,000 | 833,256 | |
| 5% 1/1/24 | 605,000 | 635,419 | |
| 5% 1/1/26 | 580,000 | 609,032 | |
| Series 2019 A: | |||
| 5% 1/1/22 | 285,000 | 286,118 | |
| 5% 1/1/23 | 325,000 | 341,704 | |
| Series 2019 B, 5% 1/1/25 | 325,000 | 369,772 | |
| Series 2020 A, 5% 1/1/25 | 265,000 | 301,507 | |
| Northside Independent School District Bonds Series 2020, 0.7%, tender 6/1/25 (a) | 6,300,000 | 6,308,460 | |
| Odessa College District Rev. Series 2021, 4% 7/1/22 (FSA Insured) | 740,000 | 756,119 | |
| Odessa Hsg. Fin. Corp. Multifamily Hsg. Rev. Bonds Series 2020, 0.35%, tender 3/1/23 (a) | 2,500,000 | 2,500,918 | |
| Pearland Gen. Oblig. Series 2020, 5% 3/1/24 | 295,000 | 324,869 | |
| Pflugerville Independent School District Bonds Series 2019 B, 2.5%, tender 8/15/23 (a) | 610,000 | 631,233 | |
| Port Arthur Series 2021: | |||
| 5% 2/15/22 | 185,000 | 186,790 | |
| 5% 2/15/24 | 240,000 | 263,729 | |
| 5% 2/15/24 | 195,000 | 214,280 | |
| Port of Houston Auth. Series 2021, 5% 10/1/23 (e) | 805,000 | 873,314 | |
| Prosper Independent School District: | |||
| Bonds Series 2019 B, 2%, tender 8/15/23 (a) | 1,000,000 | 1,028,407 | |
| Series 2015, 5% 2/15/24 | 250,000 | 275,533 | |
| San Antonio Arpt. Sys. Rev. Series 2019 A: | |||
| 5% 7/1/22 (b) | 275,000 | 282,617 | |
| 5% 7/1/22 (b) | 265,000 | 272,340 | |
| 5% 7/1/23 (b) | 195,000 | 209,429 | |
| 5% 7/1/25 (b) | 400,000 | 459,463 | |
| 5% 7/1/26 (b) | 500,000 | 592,281 | |
| San Antonio Elec. & Gas Sys. Rev.: | |||
| Bonds Series 2015 B, 2%, tender 12/1/21 (a) | 3,700,000 | 3,700,000 | |
| Series 2016, 5% 2/1/25 (Escrowed to Maturity) | 330,000 | 377,124 | |
| San Antonio Hsg. Trust Fin. Corp. Bonds Series 2019, 1.4%, tender 1/1/22 (a) | 5,000,000 | 5,003,828 | |
| San Antonio Independent School District Series 2015, 5% 2/15/24 | 315,000 | 347,244 | |
| San Antonio Pub. Facilities Corp. and Rfdg. Lease (Convention Ctr. Proj.) Series 2012, 5% 9/15/22 | 75,000 | 77,702 | |
| San Antonio Wtr. Sys. Rev. Bonds: | |||
| Series 2013 F, 1%, tender 11/1/26 (a) | 3,000,000 | 3,026,284 | |
| Series 2014 B, 2%, tender 11/1/22 (a) | 520,000 | 527,960 | |
| Splendora Independent School District Series 2016 A, 5% 2/15/25 | 200,000 | 228,045 | |
| Tarrant County Cultural Ed. Facilities Fin. Corp. Hosp. Rev. (Scott & White Healthcare Proj.) Series 2013 A: | |||
| 5% 8/15/23 (Escrowed to Maturity) | 20,000 | 21,595 | |
| 5% 8/15/28 (Pre-Refunded to 8/15/23 @ 100) | 50,000 | 53,987 | |
| Tarrant County Cultural Ed. Facilities Fin. Corp. Rev.: | |||
| Series 2016 A: | |||
| 5% 2/15/25 | 1,240,000 | 1,416,432 | |
| 5% 2/15/26 | 35,000 | 41,289 | |
| Series 2017 A, 5% 2/15/24 | 500,000 | 550,483 | |
| Texas A&M Univ. Rev. Series 2021 A: | |||
| 5% 5/15/24 | 1,350,000 | 1,503,791 | |
| 5% 5/15/26 | 725,000 | 864,402 | |
| Texas Muni. Gas Acquisition And Supply Corp. Series 2021: | |||
| 5% 12/15/21 | 1,520,000 | 1,522,555 | |
| 5% 12/15/22 | 1,250,000 | 1,308,454 | |
| 5% 12/15/23 | 3,450,000 | 3,754,697 | |
| Texas Muni. Pwr. Agcy. Rev. Series 2021: | |||
| 3% 9/1/22 (FSA Insured) | 1,450,000 | 1,480,059 | |
| 3% 9/1/23 (FSA Insured) | 900,000 | 941,831 | |
| 3% 9/1/24 (FSA Insured) | 850,000 | 908,213 | |
| Texas State Univ. Sys. Fing. Rev. Series 2019 A, 5% 3/15/24 | 250,000 | 276,393 | |
| Texas Trans. Commission Hwy. Impt. Gen. Oblig. Bonds Series 2014 B, 0.65%, tender 4/1/26 (a) | 3,500,000 | 3,477,446 | |
| Trinity River Auth. Reg'l. Wastewtr. Sys. Rev. Series 2016, 5% 8/1/23 | 35,000 | 37,752 | |
| Tyler Independent School District Series 2017, 5% 2/15/25 | 215,000 | 245,813 | |
| Waco Edl. Fin. Corp. Rev. Series 2021: | |||
| 3% 3/1/23 | 325,000 | 336,036 | |
| 4% 3/1/24 | 580,000 | 627,135 | |
| 4% 3/1/25 | 400,000 | 445,178 | |
| 4% 3/1/26 | 575,000 | 654,723 | |
| Wichita Falls Independent School District Series 2021, 3% 2/1/23 | 1,400,000 | 1,444,671 | |
| TOTAL TEXAS | 246,745,125 | ||
| Utah - 0.1% | |||
| Salt Lake City Arpt. Rev.: | |||
| Series 2018 A, 5% 7/1/23 (b) | 250,000 | 268,333 | |
| Series 2021 A: | |||
| 5% 7/1/22 (b) | 650,000 | 667,850 | |
| 5% 7/1/23 (b) | 550,000 | 590,334 | |
| 5% 7/1/24 (b) | 1,000,000 | 1,111,865 | |
| Utah County Hosp. Rev.: | |||
| Bonds Series 2018 B2, 5%, tender 8/1/24 (a) | 135,000 | 148,371 | |
| Series 2016 B, 5% 5/15/22 | 250,000 | 255,457 | |
| Utah Infrastructure Agcy. Series 2021, 3% 10/15/24 | 500,000 | 532,500 | |
| Vineyard Redev. Agcy. Series 2021, 5% 5/1/24 (FSA Insured) | 675,000 | 747,801 | |
| TOTAL UTAH | 4,322,511 | ||
| Vermont - 0.0% | |||
| Vermont Student Assistant Corp. Ed. Ln. Rev.: | |||
| Series 2017 A, 5% 6/15/23 (b) | 700,000 | 745,580 | |
| Series 2020 A, 5% 6/15/27 (b) | 665,000 | 790,282 | |
| TOTAL VERMONT | 1,535,862 | ||
| Virginia - 1.1% | |||
| Arlington County IDA Hosp. Facilities Series 2020: | |||
| 5% 7/1/23 | 340,000 | 364,877 | |
| 5% 7/1/24 | 425,000 | 474,635 | |
| Charles City County Econ. Dev. Auth. Solid Waste Disp. Rev. Bonds (Waste Mgmt., Inc. Proj.) Series 2003 A, 2.4%, tender 5/2/22 (a)(b) | 1,750,000 | 1,763,451 | |
| Chesapeake Bay Bridge and Tunnel District Gen. Resolution Rev. Series 2019, 5% 11/1/23 | 2,400,000 | 2,606,595 | |
| Fairfax County Indl. Dev. Auth. Bonds (Inova Health Sys. Proj.) Series 2018 B, 5%, tender 5/15/23 (a) | 1,625,000 | 1,734,618 | |
| Fredericksburg Econ. Dev. Auth. Rev. Series 2014, 5% 6/15/24 | 50,000 | 55,677 | |
| Gloucester County Indl. Dev. Auth. Bonds Series 2003 A, 2.4%, tender 5/2/22 (a)(b) | 475,000 | 478,651 | |
| Halifax County Indl. Dev. Auth. Bonds (Virginia Elec. and Pwr. Co. Proj.) Series 2010 A, 0.45%, tender 4/1/22 (a) | 6,685,000 | 6,688,580 | |
| Hampton Roads Trans. Accountability Commission Series 2019 A, 5% 7/1/22 | 14,500,000 | 14,906,831 | |
| King George County Indl. Dev. Auth. Solid Waste Disp. Fac. Rev. (King George Landfill, Inc. Proj.) Series 2003 A, 2.5% 6/1/23 (a)(b) | 735,000 | 755,561 | |
| Louisa Indl. Dev. Auth. Poll. Cont. Rev. Bonds (Virginia Elec. and Pwr. Co. Proj.): | |||
| Series 2008 A, 1.9%, tender 6/1/23 (a) | 2,500,000 | 2,557,236 | |
| Series 2008 B, 0.75%, tender 9/2/25 (a) | 4,000,000 | 4,011,723 | |
| Series 2008 C, 1.8%, tender 4/1/22 (a) | 2,600,000 | 2,612,978 | |
| Norfolk Arpt. Auth.: | |||
| Series 2021 A: | |||
| 4% 7/1/24 | 1,170,000 | 1,276,973 | |
| 4% 7/1/25 | 1,000,000 | 1,120,955 | |
| Series 2021 B: | |||
| 4% 7/1/23 (b) | 500,000 | 528,057 | |
| 5% 7/1/24 (b) | 400,000 | 444,746 | |
| Peninsula Port Auth. Coal Term. Rev. Bonds (Dominion Term. Associates Proj. - Detc Issue) Series 2003, 1.7%, tender 10/1/22 (a) | 2,000,000 | 2,022,502 | |
| Spotsylvania County Econ. Dev. Bonds (Palmers Creek Apt. Proj.) Series 2019, 1.45%, tender 2/1/22 (a) | 5,000,000 | 5,009,240 | |
| Stafford County Econ. Dev. Auth. Hosp. Facilities Rev. Series 2016: | |||
| 5% 6/15/24 | 25,000 | 27,832 | |
| 5% 6/15/25 | 20,000 | 23,032 | |
| 5% 6/15/26 | 35,000 | 41,544 | |
| Sussex County Indl. Dev. Auth. Solid Waste Disp. Rev. Bonds Series 2003 A, 2.4%, tender 5/2/22 (a)(b) | 1,205,000 | 1,214,262 | |
| Virginia Pub. Bldg. Auth. Pub. Facilities Rev.: | |||
| Series 2019 B, 5% 8/1/23 (b) | 410,000 | 441,874 | |
| Series 2020 A, 5% 8/1/22 | 1,940,000 | 2,002,458 | |
| Virginia Small Bus. Fing. Auth. Series 2020 A: | |||
| 5% 1/1/22 | 900,000 | 903,427 | |
| 5% 1/1/23 | 400,000 | 420,111 | |
| Wise County Indl. Dev. Auth. Waste & Sewage Rev. Bonds (Virginia Elec. and Pwr. Co. Proj.): | |||
| Series 2009 A, 0.75%, tender 9/2/25 (a) | 7,000,000 | 7,060,520 | |
| Series 2010 A, 1.2%, tender 5/31/24 (a) | 2,075,000 | 2,109,606 | |
| York County Econ. Dev. Auth. Poll. Cont. Rev. Bonds (Virginia Elec. and Pwr. Co. Proj.) Series 2009 A, 1.9%, tender 6/1/23 (a) | 300,000 | 306,868 | |
| TOTAL VIRGINIA | 63,965,420 | ||
| Washington - 1.1% | |||
| Energy Northwest Elec. Rev. Series 2021 A, 5% 7/1/22 | 1,395,000 | 1,434,223 | |
| King County Hsg. Auth. Rev.: | |||
| Series 2019: | |||
| 3% 11/1/23 | 1,175,000 | 1,231,659 | |
| 4% 11/1/24 | 135,000 | 148,688 | |
| Series 2020: | |||
| 3% 6/1/22 | 250,000 | 253,291 | |
| 3% 6/1/23 | 400,000 | 414,743 | |
| 3% 6/1/25 | 275,000 | 295,616 | |
| King County Hsg. Auth. Workforce Hsg. Preservation Series 2021: | |||
| 2% 10/1/22 | 100,000 | 101,228 | |
| 2% 10/1/23 | 100,000 | 102,456 | |
| King County Swr. Rev.: | |||
| Bonds Series 2020 B, 0.875%, tender 1/1/26 (a) | 2,105,000 | 2,116,399 | |
| Series B, 5% 7/1/25 | 1,885,000 | 2,106,698 | |
| Port of Seattle Rev.: | |||
| Series 2012 A: | |||
| 5% 8/1/22 | 400,000 | 412,796 | |
| 5% 8/1/27 | 400,000 | 412,468 | |
| Series 2012 B, 5% 8/1/23 (b) | 1,345,000 | 1,385,957 | |
| Series 2015 A, 3% 4/1/22 | 250,000 | 252,347 | |
| Series 2016 B: | |||
| 5% 10/1/22 (b) | 70,000 | 72,777 | |
| 5% 10/1/23 (b) | 65,000 | 70,500 | |
| Series 2016, 5% 2/1/25 | 290,000 | 330,919 | |
| Series 2017 C, 5% 5/1/22 (b) | 5,540,000 | 5,648,954 | |
| Series 2018 A, 5% 5/1/22 (b) | 11,475,000 | 11,700,677 | |
| Series 2019: | |||
| 5% 4/1/22 (b) | 790,000 | 802,421 | |
| 5% 4/1/23 (b) | 615,000 | 652,765 | |
| 5% 4/1/24 (b) | 400,000 | 441,334 | |
| 5% 4/1/25 (b) | 280,000 | 319,763 | |
| Series 2021 C: | |||
| 5% 8/1/22 (b) | 3,510,000 | 3,620,367 | |
| 5% 8/1/23 (b) | 3,665,000 | 3,944,180 | |
| 5% 8/1/24 (b) | 1,360,000 | 1,519,424 | |
| 5% 8/1/25 (b) | 390,000 | 450,216 | |
| Series 2021: | |||
| 5% 9/1/23 (b) | 2,100,000 | 2,269,943 | |
| 5% 9/1/24 (b) | 1,080,000 | 1,211,256 | |
| Port of Seattle Spl. Facility Rev. Series 2013, 5% 6/1/22 (b) | 500,000 | 511,801 | |
| Seattle Hsg. Auth. Rev. (Northgate Plaza Proj.) Series 2021, 1% 6/1/26 | 1,740,000 | 1,742,051 | |
| Seattle Muni. Lt. & Pwr. Rev. Series 2012 A, 5% 6/1/24 | 500,000 | 511,979 | |
| Tacoma Elec. Sys. Rev. Series 2017: | |||
| 5% 1/1/22 | 15,000 | 15,059 | |
| 5% 1/1/25 | 25,000 | 28,477 | |
| 5% 1/1/26 | 35,000 | 41,240 | |
| Tobacco Settlement Auth. Rev. Series 2018, 5% 6/1/22 | 915,000 | 936,723 | |
| Washington Fed. Hwy. Grant Anticipation Rev. Series 2012 F, 5% 9/1/22 | 300,000 | 310,673 | |
| Washington Gen. Oblig.: | |||
| Series 2020 R, 5% 1/1/22 | 200,000 | 200,785 | |
| Series R 2020 A, 5% 1/1/25 | 250,000 | 284,936 | |
| Series R 2020 C, 5% 7/1/22 | 2,500,000 | 2,570,292 | |
| Washington Health Care Facilities Auth. Rev.: | |||
| (Providence Health Systems Proj.) Series 2012 A, 5% 10/1/24 | 250,000 | 259,918 | |
| (Virginia Mason Med. Ctr. Proj.) Series 2017: | |||
| 5% 8/15/25 | 205,000 | 234,192 | |
| 5% 8/15/26 | 115,000 | 135,014 | |
| 5% 8/15/27 | 50,000 | 60,112 | |
| Bonds Series 2019 B, 5%, tender 8/1/24 (a) | 1,095,000 | 1,205,746 | |
| Series 2012 A, 5% 10/1/22 | 445,000 | 462,806 | |
| Series 2012 B, 5% 10/1/24 (Pre-Refunded to 10/1/22 @ 100) | 405,000 | 421,032 | |
| Series 2014, 5% 3/1/22 | 200,000 | 202,349 | |
| Series 2015 B, 5% 8/15/23 | 600,000 | 647,904 | |
| Series 2015, 5% 7/1/24 | 1,250,000 | 1,391,537 | |
| Series 2018 B, 5% 10/1/25 | 1,220,000 | 1,422,311 | |
| Washington Hsg. Fin. Commission Series 2021 2N, 5% 6/1/25 | 945,000 | 1,087,937 | |
| TOTAL WASHINGTON | 58,408,939 | ||
| West Virginia - 0.2% | |||
| Hsg. Auth. of Everett Bonds Series 2021, 0.3%, tender 9/1/23 (a) | 1,500,000 | 1,496,353 | |
| Mason Co. Poll. Cont. Rev. (Appalachian Pwr. Co. Proj.) Series 2003 L, 2.75% 10/1/22 | 3,245,000 | 3,307,440 | |
| West Virginia Econ. Dev. Auth. Solid Waste Disp. Facilities Rev. Bonds (Appalachian Pwr. Co. Amos Proj.): | |||
| Series 2010 A, 0.625%, tender 12/15/25 (a) | 2,000,000 | 1,981,638 | |
| Series 2011 A, 1%, tender 9/1/25 (a)(b) | 1,500,000 | 1,510,623 | |
| Series 2015 A, 2.55%, tender 4/1/24 (a) | 225,000 | 235,262 | |
| West Virginia Hosp. Fin. Auth. Hosp. Rev. Series 2016 A: | |||
| 5% 6/1/22 | 2,195,000 | 2,246,247 | |
| 5% 6/1/24 | 1,490,000 | 1,657,129 | |
| West Virginia Hsg. Dev. Fund Series 2017 A, 2.4% 11/1/22 (b) | 960,000 | 973,769 | |
| TOTAL WEST VIRGINIA | 13,408,461 | ||
| Wisconsin - 0.7% | |||
| Blue Ridge Healthcare Pub. Fin. Auth. Series 2020 A, 5% 1/1/25 | 300,000 | 339,847 | |
| Clayton Town Series 2021 B, 2% 6/1/26 | 2,000,000 | 2,034,263 | |
| Dunn County Gen. Oblig. Series 2021 A, 0.25% 10/1/24 | 1,155,000 | 1,142,111 | |
| Milwaukee County Arpt. Rev.: | |||
| Series 2013 A: | |||
| 5% 12/1/22 (b) | 30,000 | 31,398 | |
| 5.25% 12/1/23 (b) | 35,000 | 38,282 | |
| Series 2016 A, 5% 12/1/22 (b) | 1,000,000 | 1,046,597 | |
| Series 2021, 5% 12/1/21 | 300,000 | 300,000 | |
| Milwaukee Gen. Oblig.: | |||
| Series 2018 N4, 5% 4/1/25 | 1,130,000 | 1,293,290 | |
| Series 2020 N4, 5% 4/1/22 | 2,125,000 | 2,158,556 | |
| Pub. Fin. Auth. Hosp. Rev. Series 2020 A: | |||
| 5% 6/1/23 | 345,000 | 369,069 | |
| 5% 6/1/24 | 675,000 | 750,713 | |
| 5% 6/1/25 | 375,000 | 432,003 | |
| 5% 6/1/26 | 300,000 | 356,418 | |
| Pub. Fin. Auth. Solid Waste Bonds (Waste Mgmt., Inc. Proj.) Series 2017 A-2, 0.18%, tender 2/1/22 (a)(b) | 2,500,000 | 2,499,999 | |
| Racine County Gen. Oblig. Series 2021, 2% 4/1/22 | 1,150,000 | 1,150,853 | |
| Racine Unified School District Series 2021: | |||
| 2% 4/1/22 | 175,000 | 176,053 | |
| 2% 4/1/23 | 225,000 | 230,230 | |
| 2% 4/1/24 | 475,000 | 492,473 | |
| 2% 4/1/25 | 600,000 | 628,465 | |
| Waukesha Gen. Oblig. Series 2021 A, 2% 7/1/22 | 1,500,000 | 1,512,131 | |
| Wisconsin Gen. Oblig. Series 2014 4, 5% 5/1/25 | 90,000 | 102,034 | |
| Wisconsin Health & Edl. Facilities: | |||
| Bonds: | |||
| Series 2018 B: | |||
| 5%, tender 1/26/22 (a) | 5,710,000 | 5,749,231 | |
| 5%, tender 1/29/25 (a) | 355,000 | 404,291 | |
| Series 2018 C, SIFMA Municipal Swap Index + 0.450% 0.5%, tender 12/2/21 (a)(c) | 3,885,000 | 3,886,420 | |
| Series 2018 C3, SIFMA Municipal Swap Index + 0.550% 0.6%, tender 7/26/23 (a)(c) | 4,000,000 | 4,009,010 | |
| Series 2018, 5% 4/1/26 | 195,000 | 231,239 | |
| Series 2019 A: | |||
| 5% 11/15/22 | 325,000 | 339,830 | |
| 5% 12/1/23 | 35,000 | 38,160 | |
| 5% 12/1/24 | 100,000 | 113,152 | |
| 5% 12/1/25 | 125,000 | 146,076 | |
| 5% 12/1/26 | 200,000 | 240,555 | |
| Wisconsin Health & Edl. Facilities Auth. Series 2014 A, 5% 12/1/24 | 775,000 | 876,936 | |
| Wisconsin Health & Edl. Facilities Auth. Rev. Series 2021 B: | |||
| 4% 9/15/24 | 200,000 | 215,926 | |
| 4% 9/15/26 | 220,000 | 245,845 | |
| Wisconsin Hsg. & Econ. Dev. Auth. Hsg. Rev. Bonds Series 2019 A, 0.2%, tender 10/14/22 (a) | 3,250,000 | 3,246,951 | |
| TOTAL WISCONSIN | 36,828,407 | ||
| Wyoming - 0.1% | |||
| Laramie County Hosp. Rev. (Cheyenne Reg'l. Med. Ctr. Proj.) Series 2021: | |||
| 4% 5/1/22 | 775,000 | 787,201 | |
| 4% 5/1/23 | 250,000 | 262,869 | |
| 4% 5/1/25 | 260,000 | 289,447 | |
| Wyoming Cmnty. Dev. Auth. Hsg. Rev.: | |||
| Series 2020 3: | |||
| 5% 12/1/21 (b) | 565,000 | 565,000 | |
| 5% 6/1/22 (b) | 280,000 | 286,310 | |
| 5% 6/1/23 (b) | 955,000 | 1,015,238 | |
| Series 2021 4: | |||
| 0.2% 6/1/22 (b) | 575,000 | 574,807 | |
| 0.3% 6/1/23 (b) | 1,170,000 | 1,167,989 | |
| TOTAL WYOMING | 4,948,861 | ||
| TOTAL MUNICIPAL BONDS | |||
| (Cost $2,367,781,952) | 2,376,642,986 | ||
| Municipal Notes - 24.3% | |||
| Alabama - 0.8% | |||
| East Alabama Health Care Auth. Series 2012 B, 0.09% 12/7/21, VRDN (a) | 4,897,000 | $4,897,000 | |
| Health Care Auth. for Baptist Health Series 2013 B, 0.18% 12/7/21, VRDN (a) | 6,705,000 | 6,705,000 | |
| Huntsville Health Care Auth. Participating VRDN Series XG 03 01, 0.09% 12/7/21 (Liquidity Facility Bank of America NA) (a)(f)(g) | 5,000,000 | 5,000,000 | |
| Walker County Econ. & Indl. Dev. Auth. Solid Waste Disp. Rev. (Alabama Pwr. Co. Plant Gorgas Proj.) Series 2007, 0.07% 12/1/21, VRDN (a)(b) | 6,500,000 | 6,500,000 | |
| West Jefferson Indl. Dev. Board Solid Waste Disp. Rev. (Alabama Pwr. Co. Miller Plant Proj.) Series 2008, 0.07% 12/1/21, VRDN (a)(b) | 11,200,000 | 11,200,000 | |
| Wilsonville Indl. Dev. Board Poll. Cont. Rev. (Alabama Pwr. Co. Gaston Plant Proj.) Series 2008, 0.07% 12/1/21, VRDN (a)(b) | 11,690,000 | 11,690,000 | |
| TOTAL ALABAMA | 45,992,000 | ||
| Alaska - 0.1% | |||
| Anchorage Gen. Oblig. TAN Series 2021, 1.5% 12/15/21 | 6,000,000 | 6,003,272 | |
| Arizona - 0.3% | |||
| Arizona Health Facilities Auth. Rev. Series 2015 B, 0.3% 12/1/21, LOC MUFG Bank Ltd., VRDN (a) | 2,500,000 | 2,500,000 | |
| Arizona St Indl. Dev. Auth. Multi Participating VRDN Series XF 10 91, 0.3% 12/7/21 (Liquidity Facility Deutsche Bank AG New York Branch) (a)(b)(f)(g) | 950,000 | 950,000 | |
| Maricopa County Indl. Dev. Auth. Participating VRDN Series 2021 XG 03 09, 0.12% 12/7/21 (Liquidity Facility JPMorgan Chase Bank) (a)(f)(g) | 6,145,000 | 6,145,000 | |
| Maricopa County Rev. Participating VRDN Series Floaters YX 10 32, 0.08% 12/7/21 (Liquidity Facility Barclays Bank PLC) (a)(f)(g) | 4,835,000 | 4,835,000 | |
| Phoenix Civic Impt. Board Arpt. Rev. Participating VRDN Series XM 08 23, 0.17% 12/7/21 (Liquidity Facility Morgan Stanley Bank, West Valley City Utah) (a)(f)(g) | 1,300,000 | 1,300,000 | |
| Pima County Indl. Dev. Auth. Multi-family Hsg. Rev. Participating VRDN Series XF 10 96, 0.3% 12/7/21 (Liquidity Facility Deutsche Bank AG New York Branch) (a)(f)(g) | 400,000 | 400,000 | |
| TOTAL ARIZONA | 16,130,000 | ||
| California - 2.3% | |||
| Bay Area Toll Auth. San Francisco Bay Toll Bridge Rev. Participating VRDN Series XF 05 68, 0.07% 12/7/21 (Liquidity Facility Bank of America NA) (a)(f)(g) | 10,400,000 | 10,400,000 | |
| California Health Facilities Fing. Auth. Rev. Participating VRDN Series Floaters XG 01 75, 0.18% 12/7/21 (Liquidity Facility Bank of America NA) (a)(f)(g) | 4,825,000 | 4,825,000 | |
| California Muni. Fin. Auth. Participating VRDN Series DBE 80 61, 0.45% 12/7/21 (Liquidity Facility Deutsche Bank AG) (a)(f)(g) | 1,278,846 | 1,278,846 | |
| California School Fin. Auth. Rev. TRAN Series 2021 A1, 3% 12/30/21 | 2,500,000 | 2,505,823 | |
| California Statewide Cmntys. Dev. Auth. Multi-family Hsg. Rev. Series 2005 F, 0.08% 12/7/21, LOC Citibank NA, VRDN (a)(b) | 700,000 | 700,000 | |
| California Statewide Cmntys. Dev. Auth. Rev.: | |||
| Series 2004 E, 0.17% tender 12/9/21, CP mode | 6,000,000 | 6,000,089 | |
| Series 2008 A, 0.02% 12/1/21, LOC U.S. Bank NA, Cincinnati, VRDN (a) | 1,450,000 | 1,450,000 | |
| Series 2021 E, 0.14% tender 5/3/22, CP mode (a) | 10,000,000 | 10,000,000 | |
| Contra Costa County Schools TRAN Series A, 2% 12/1/21 | 2,000,000 | 2,000,000 | |
| Fresno Calif Unified School District Participating VRDN Series 2021 XF 11 04, 0.11% 12/7/21 (Liquidity Facility Deutsche Bank AG New York Branch) (a)(f)(g) | 485,000 | 485,000 | |
| Lodi Unified School District Participating VRDN Series 2021 XG 03 22, 0.08% 12/7/21 (Liquidity Facility Royal Bank of Canada) (a)(f)(g) | 7,400,000 | 7,400,000 | |
| Los Angeles County Schools Pooled Fing. Prog. Ctfs. of Prtn. TRAN Series B: | |||
| 2% 12/30/21 | 2,500,000 | 2,503,831 | |
| 2% 12/30/21 | 2,915,000 | 2,919,467 | |
| Los Angeles Dept. Arpt. Rev. Series 2021, 0.09% 1/4/22, LOC Sumitomo Mitsui Banking Corp., CP (b) | 3,569,000 | 3,569,034 | |
| Los Angeles Gen. Oblig. TRAN Series 2021, 4% 6/23/22 | 15,000,000 | 15,327,081 | |
| River Islands Pub. Fing. Auth. Participating VRDN Series MIZ 90 26, 0.3% 1/4/22 (Liquidity Facility Mizuho Cap. Markets Llc) (a)(f)(g)(h) | 4,300,000 | 4,300,000 | |
| Riverside County Ind. Dev. Auth. Ind. Dev. Rev. Series 1999, 0.11% 12/7/21, LOC JPMorgan Chase Bank, VRDN (a)(b) | 1,000,000 | 1,000,000 | |
| Riverside County Office of Ed. TRAN Series 2021, 2% 12/31/21 | 10,000,000 | 10,015,683 | |
| Sacramento Gen. Oblig. Participating VRDN Series XG 00 67, 0.11% 12/7/21 (Liquidity Facility Deutsche Bank AG New York Branch) (a)(f)(g) | 1,500,000 | 1,500,000 | |
| San Francisco City & County Series 2021 A1, 0.08% 12/7/21, LOC Bank of America NA, CP | 4,600,000 | 4,600,027 | |
| San Francisco City & County Arpts. Commission Int'l. Arpt. Rev.: | |||
| Participating VRDN: | |||
| Series Floaters XM 06 75, 0.17% 12/7/21 (Liquidity Facility Morgan Stanley Bank, West Valley City Utah) (a)(b)(f)(g) | 1,850,000 | 1,850,000 | |
| Series XM 09 16, 0.11% 12/7/21 (Liquidity Facility JPMorgan Chase Bank) (a)(b)(f)(g) | 2,200,000 | 2,200,000 | |
| Series 2021 A4, 0.1% 1/5/22, LOC U.S. Bank NA, Cincinnati, CP (b) | 5,000,000 | 4,999,951 | |
| San Francisco City & County Multi-family Hsg. Rev. Participating VRDN Series MIZ 90 63, 0.3% 1/4/22 (Liquidity Facility Mizuho Cap. Markets Llc) (a)(f)(g) | 16,325,000 | 16,325,000 | |
| San Francisco City & County Pub. Util. Commission Wastewtr. Rev. Series 2021 A2, 0.08% 12/1/21, LOC Bank of America NA, CP | 5,400,000 | 5,400,006 | |
| Transbay Joint Powers Auth. Participating VRDN Series YX 11 42, 0.1% 12/7/21 (Liquidity Facility Barclays Bank PLC) (a)(f)(g) | 500,000 | 500,000 | |
| Univ. of California Revs. Participating VRDN Series Floaters XM 04 34, 0.07% 12/7/21 (Liquidity Facility Barclays Bank PLC) (a)(f)(g) | 5,800,000 | 5,800,000 | |
| TOTAL CALIFORNIA | 129,854,838 | ||
| Colorado - 0.5% | |||
| Colorado Edl. & Cultural Facilities Auth. Rev. (Mesivta of Greater Los Angeles Proj.) Series 2005, 0.4% 12/7/21, LOC Deutsche Bank AG, VRDN (a) | 665,000 | 665,000 | |
| Colorado Hsg. & Fin. Auth. Multi-family Hsg. Rev. Participating VRDN Series Floater 2021 MIZ 90 68, 0.3% 1/4/22 (Liquidity Facility Mizuho Cap. Markets Llc) (a)(f)(g) | 99,832 | 99,832 | |
| Denver City & County Arpt. Rev. Participating VRDN: | |||
| Series Floaters XL 00 90, 0.17% 12/7/21 (Liquidity Facility Morgan Stanley Bank, West Valley City Utah) (a)(b)(f)(g) | 23,100,000 | 23,100,000 | |
| Series Floaters XM 07 15, 0.15% 12/7/21 (Liquidity Facility Morgan Stanley Bank, West Valley City Utah) (a)(b)(f)(g) | 1,240,000 | 1,240,000 | |
| TOTAL COLORADO | 25,104,832 | ||
| Connecticut - 0.3% | |||
| Connecticut Health & Edl. Facilities Auth. Rev.: | |||
| Participating VRDN Series Floaters XG 02 04, 0.08% 12/7/21 (Liquidity Facility Barclays Bank PLC) (a)(f)(g) | 1,200,000 | 1,200,000 | |
| Series 2013 O, 0.05% 12/7/21, VRDN (a) | 18,000,000 | 18,000,000 | |
| TOTAL CONNECTICUT | 19,200,000 | ||
| Delaware - 0.1% | |||
| Delaware Econ. Dev. Auth. Rev. (Delmarva Pwr. & Lt. Co. Proj.) Series 1994, 0.09% 12/1/21, VRDN (a)(b) | 5,880,000 | 5,880,000 | |
| District Of Columbia - 0.2% | |||
| District of Columbia Gen. Oblig. Series 2021, 0.09% 12/1/21, LOC Barclays Bank PLC, CP | 6,500,000 | 6,500,007 | |
| Metropolitan Washington DC Arpts. Auth. Sys. Rev. Participating VRDN Series 2021 XF 12 62, 0.1% 12/7/21 (Liquidity Facility JPMorgan Chase Bank) (a)(b)(f)(g) | 1,710,000 | 1,710,000 | |
| Washington D.C. Metropolitan Transit Auth. Rev. Participating VRDN Series ZM 06 10, 0.13% 12/7/21 (Liquidity Facility Morgan Stanley Bank, West Valley City Utah) (a)(f)(g) | 900,000 | 900,000 | |
| TOTAL DISTRICT OF COLUMBIA | 9,110,007 | ||
| Florida - 1.6% | |||
| Broward County Arpt. Sys. Rev. Participating VRDN: | |||
| Series XL 01 36, 0.15% 12/7/21 (Liquidity Facility JPMorgan Chase Bank) (a)(b)(f)(g) | 3,000,000 | 3,000,000 | |
| Series XM 08 95, 0.15% 12/7/21 (Liquidity Facility JPMorgan Chase Bank) (a)(b)(f)(g) | 840,000 | 840,000 | |
| Greater Orlando Aviation Auth. Arpt. Facilities Rev. Participating VRDN Series XM 08 91, 0.15% 12/7/21 (Liquidity Facility JPMorgan Chase Bank) (a)(b)(f)(g) | 1,100,000 | 1,100,000 | |
| Jacksonville Health Care Series 2021, 0.17% 1/28/22, CP | 2,000,000 | 1,999,967 | |
| Lee Memorial Health Sys. Hosp. Rev. Series 2019 B, 0.12% 12/7/21, VRDN (a) | 14,500,000 | 14,500,000 | |
| Miami Dade County Hsg. Multifamily Hsg. Rev. Participating VRDN Series MIZ 90 72, 0.3% 1/4/22 (Liquidity Facility Mizuho Cap. Markets Llc) (a)(f)(g) | 400,000 | 400,000 | |
| Miami-Dade County Participating VRDN: | |||
| Series XF 29 47, 0.11% 12/7/21 (Liquidity Facility Barclays Bank PLC) (a)(b)(f)(g) | 3,400,000 | 3,400,000 | |
| Series XF 29 48, 0.1% 12/7/21 (Liquidity Facility Citibank NA) (a)(f)(g) | 3,400,000 | 3,400,000 | |
| Miami-Dade County Aviation Rev.: | |||
| Participating VRDN Series XM 08 70, 0.15% 12/7/21 (Liquidity Facility JPMorgan Chase Bank) (a)(b)(f)(g) | 2,100,000 | 2,100,000 | |
| Series 2021, 0.12% 12/9/21, LOC Bank of America NA, CP (b) | 2,000,000 | 2,000,020 | |
| Miami-Dade County Edl. Facilities Rev. Participating VRDN Series 2018 XM 06 76, 0.15% 12/7/21 (a)(f)(g) | 5,000,000 | 5,000,000 | |
| Miami-Dade County Expressway Auth. Participating VRDN Series XG 00 99, 0.11% 12/7/21 (Liquidity Facility Deutsche Bank AG New York Branch) (a)(f)(g) | 400,000 | 400,000 | |
| Miami-Dade County Health Facilities Auth. Hosp. Rev. Participating VRDN Series 2021 XF 12 61, 0.12% 12/7/21 (Liquidity Facility JPMorgan Chase Bank) (a)(f)(g) | 1,755,000 | 1,755,000 | |
| Miami-Dade County Indl. Dev. Auth. Rev. (Florida Pwr. & Lt. Co. Proj.) Series 2021, 0.05% 12/1/21, VRDN (a)(b) | 5,000,000 | 5,000,000 | |
| Miami-Dade County School District TAN Series 2021, 2.5% 2/23/22 | 10,000,000 | 10,053,424 | |
| Miami-Dade County Wtr. & Swr. Rev. Participating VRDN: | |||
| Series 2021 XF 11 01, 0.11% 12/7/21 (Liquidity Facility Deutsche Bank AG New York Branch) (a)(f)(g) | 2,000,000 | 2,000,000 | |
| Series 2021 XM 09 42, 0.09% 12/7/21 (Liquidity Facility Bank of America NA) (a)(f)(g) | 3,475,000 | 3,475,000 | |
| South Miami Health Facilities Auth. Hosp. Rev. Participating VRDN: | |||
| Series Floaters XF 25 30, 0.11% 12/7/21 (Liquidity Facility Citibank NA) (a)(f)(g) | 10,500,000 | 10,500,000 | |
| Series XF 25 23, 0.11% 12/7/21 (Liquidity Facility Barclays Bank PLC) (a)(f)(g) | 10,000,000 | 10,000,000 | |
| Series ZM 05 71, 0.15% 12/7/21 (Liquidity Facility Morgan Stanley Bank, West Valley City Utah) (a)(f)(g) | 5,230,000 | 5,230,000 | |
| Tampa Hosp. Rev. Participating VRDN Series XM 08 85, 0.15% 12/7/21 (Liquidity Facility JPMorgan Chase Bank) (a)(f)(g) | 3,300,000 | 3,300,000 | |
| TOTAL FLORIDA | 89,453,411 | ||
| Georgia - 0.4% | |||
| Atlanta Arpt. Rev. Series 2021 J2, 0.12% 2/4/22, LOC Bank of America NA, CP (b) | 7,163,000 | 7,162,870 | |
| Brookhaven Dev. Auth. Rev. Participating VRDN Series XX 11 22, 0.08% 12/7/21 (Liquidity Facility Barclays Bank PLC) (a)(f)(g) | 1,050,000 | 1,050,000 | |
| Burke County Indl. Dev. Auth. Poll. Cont. Rev.: | |||
| (Georgia Pwr. Co. Plant Vogtle Proj.) Series 2012, 0.09% 12/1/21, VRDN (a)(b) | 3,600,000 | 3,600,000 | |
| Participating VRDN Series 2021 XG 03 08, 0.11% 12/7/21 (Liquidity Facility Bank of America NA) (a)(f)(g) | 7,000,000 | 7,000,000 | |
| Georgia Road & Thruway Auth. Rev. Participating VRDN Series 2021 XF 11 17, 0.11% 12/7/21 (Liquidity Facility Deutsche Bank AG) (a)(f)(g) | 1,440,000 | 1,440,000 | |
| Griffin-Spalding County Hosp. Participating VRDN Series Floaters XL 00 76, 0.21% 12/7/21 (Liquidity Facility JPMorgan Chase Bank) (a)(f)(g) | 400,000 | 400,000 | |
| TOTAL GEORGIA | 20,652,870 | ||
| Hawaii - 0.1% | |||
| Hawaii Arpts. Sys. Rev. Participating VRDN Series XF 07 65, 0.15% 12/7/21 (Liquidity Facility JPMorgan Chase Bank) (a)(b)(f)(g) | 2,900,000 | 2,900,000 | |
| Idaho - 0.1% | |||
| Idaho Gen. Oblig. TAN Series 2021, 3% 6/30/22 | 7,000,000 | 7,116,850 | |
| Idaho Hsg. & Fin. Assoc. Single Family Mtg. Series A, 0.1% 12/7/21 (Liquidity Facility Fannie Mae) (Liquidity Facility Freddie Mac), VRDN (a) | 920,000 | 920,000 | |
| TOTAL IDAHO | 8,036,850 | ||
| Illinois - 0.9% | |||
| Chicago Midway Arpt. Rev. Series 2021 A, 0.1% 12/15/21, LOC JPMorgan Chase Bank, CP (b) | 6,000,000 | 6,000,074 | |
| Chicago O'Hare Int'l. Arpt. Rev. Participating VRDN: | |||
| Series Floaters XL 00 49, 0.13% 12/7/21 (Liquidity Facility Barclays Bank PLC) (a)(b)(f)(g) | 750,000 | 750,000 | |
| Series XM 08 79, 0.12% 12/7/21 (Liquidity Facility JPMorgan Chase Bank) (a)(f)(g) | 2,500,000 | 2,500,000 | |
| Series XM 08 84, 0.15% 12/7/21 (Liquidity Facility JPMorgan Chase Bank) (a)(b)(f)(g) | 2,500,000 | 2,500,000 | |
| Series XM 09 18, 0.12% 12/7/21 (Liquidity Facility JPMorgan Chase Bank) (a)(f)(g) | 700,000 | 700,000 | |
| Chicago Park District Gen. Oblig. Participating VRDN Series 2021 XX 11 68, 0.12% 12/7/21 (Liquidity Facility Barclays Bank PLC) (a)(f)(g) | 1,200,000 | 1,200,000 | |
| Chicago Transit Auth. Participating VRDN: | |||
| Series 20 XF 28 97, 0.13% 12/7/21 (Liquidity Facility Barclays Bank PLC) (a)(f)(g) | 900,000 | 900,000 | |
| Series XM 09 03, 0.15% 12/7/21 (Liquidity Facility JPMorgan Chase Bank) (a)(f)(g) | 300,000 | 300,000 | |
| Series XM 09 05, 0.15% 12/7/21 (Liquidity Facility JPMorgan Chase Bank) (a)(f)(g) | 1,100,000 | 1,100,000 | |
| Cook County Gen. Oblig. Participating VRDN Series 2015 XF0124, 0.15% 12/7/21 (Liquidity Facility JPMorgan Chase Bank) (a)(f)(g) | 1,280,000 | 1,280,000 | |
| Illinois Fin. Auth. Participating VRDN Series 2021 XL 01 72, 0.11% 12/7/21 (Liquidity Facility Deutsche Bank AG New York Branch) (a)(f)(g) | 1,300,000 | 1,300,000 | |
| Illinois Fin. Auth. Rev.: | |||
| Participating VRDN Series Floaters XF 25 35, 0.08% 12/7/21 (Liquidity Facility Barclays Bank PLC) (a)(f)(g) | 700,000 | 700,000 | |
| Series 2009 D1, 0.03% 12/1/21, LOC PNC Bank NA, VRDN (a) | 3,325,000 | 3,325,000 | |
| Illinois Sales Tax Rev. Participating VRDN Series XF 24 06, 0.09% 12/7/21 (Liquidity Facility Barclays Bank PLC) (a)(f)(g) | 7,055,000 | 7,055,000 | |
| Metropolitan Pier & Exposition Participating VRDN Series XF 09 65, 0.13% 12/7/21 (Liquidity Facility JPMorgan Chase Bank) (a)(f)(g) | 4,000,000 | 4,000,000 | |
| Reg'l. Transn Auth. Extend Series 2005 B, 0.4% 12/7/21, VRDN (a) | 1,360,000 | 1,360,000 | |
| Sales Tax Securitization Corp. Participating VRDN Series XF 06 03, 0.19% 12/7/21 (Liquidity Facility Royal Bank of Canada) (a)(f)(g) | 13,615,000 | 13,615,000 | |
| TOTAL ILLINOIS | 48,585,074 | ||
| Indiana - 0.1% | |||
| Indiana Univ. Student Fee Revs. Series 2021, 0.13% 3/7/22, CP | 2,500,000 | 2,499,934 | |
| Indianapolis Local Pub. Impt. Participating VRDN Series XM 09 27, 0.11% 12/7/21 (Liquidity Facility JPMorgan Chase Bank) (a)(f)(g) | 800,000 | 800,000 | |
| TOTAL INDIANA | 3,299,934 | ||
| Iowa - 0.5% | |||
| Iowa Fin. Auth. Midwestern Disaster Area Econ. Dev. Series 2012 IA, 0.09% 12/2/21, VRDN (a) | 14,000,000 | 14,000,000 | |
| Iowa Fin. Auth. Sewage And Solid Waste Disp. Facilities Rev. Series 2021, 0.11% 12/7/21, VRDN (a)(b) | 2,000,000 | 2,000,000 | |
| Iowa Fin. Auth. Single Family Mtg. (Mtg. Backed Securities Prog.) Series 2019 B, 0.06% 12/7/21 (Liquidity Facility U.S. Bank NA, Cincinnati), VRDN (a) | 14,000,000 | 14,000,000 | |
| TOTAL IOWA | 30,000,000 | ||
| Kentucky - 1.1% | |||
| Kentucky Econ. Dev. Fin. Auth. Hosp. Rev. Participating VRDN Series XM 09 19, 0.12% 12/7/21 (Liquidity Facility JPMorgan Chase Bank) (a)(f)(g) | 1,100,000 | 1,100,000 | |
| Kentucky Hsg. Corp. Hsg. Rev. Participating VRDN Series XF 10 93, 0.3% 12/7/21 (Liquidity Facility Deutsche Bank AG New York Branch) (a)(f)(g) | 1,200,000 | 1,200,000 | |
| Kentucky Tpk. Auth. Econ. Dev. Road Rev. Participating VRDN Series XF 24 84, 0.13% 12/7/21 (Liquidity Facility Morgan Stanley Bank, West Valley City Utah) (a)(f)(g) | 1,780,000 | 1,780,000 | |
| Louisville & Jefferson County Metropolitan Swr. District Swr. & Drain Sys. Rev. BAN Series 2021, 3% 10/14/22 | 20,000,000 | 20,491,034 | |
| Louisville & Jefferson County Reg'l. Arpt. Auth. Spl. Facilities Rev. (UPS Worldwide Forwarding, Inc. Proj.) Series 1999 A, 0.06% 12/1/21, VRDN (a)(b) | 6,100,000 | 6,100,000 | |
| Louisville Reg'l. Arpt. Auth. Series 2006 A, 0.06% 12/1/21, VRDN (a)(b) | 3,800,000 | 3,800,000 | |
| Louisville/Jefferson County Metropolitan Govt. Poll. Cont. Rev. (Louisville Gas And Elec. Co. Proj.) Series 2007 B, 0.06% 12/7/21, VRDN (a) | 13,000,000 | 13,000,000 | |
| Maysville Indl. Bldg. Rev. Series 1996, 0.09% 12/2/21, LOC MUFG Union Bank NA, VRDN (a)(b) | 5,340,000 | 5,340,000 | |
| Meade County Indl. Bldg. Rev. (Nucor Steel Brandenburg Proj.) Series 2020 A1, 0.07% 12/1/21, VRDN (a)(b) | 5,700,000 | 5,700,000 | |
| TOTAL KENTUCKY | 58,511,034 | ||
| Louisiana - 1.0% | |||
| Louisiana Hsg. Corp. Multifamily Hsg. Rev. Participating VRDN Series MIZ 90 53, 0.3% 1/4/22 (Liquidity Facility Mizuho Cap. Markets Llc) (a)(f)(g) | 585,000 | 585,000 | |
| Saint James Parish Gen. Oblig. (Nucor Steel Louisiana LLC Proj.): | |||
| Series 2010 A1, 0.09% 12/7/21, VRDN (a) | 29,730,000 | 29,730,000 | |
| Series 2010 B1, 0.09% 12/7/21, VRDN (a) | 27,100,000 | 27,100,000 | |
| TOTAL LOUISIANA | 57,415,000 | ||
| Maryland - 0.6% | |||
| Baltimore County Gen. Oblig. BAN Series 2021, 4% 3/23/22 | 10,000,000 | 10,121,060 | |
| Baltimore Proj. Rev. Bonds Series Floaters G 42, 0.25%, tender 7/1/22 (Liquidity Facility Royal Bank of Canada) (a)(f)(g)(h) | 4,500,000 | 4,500,000 | |
| Maryland Econ. Dev. Corp. Student Hsg. Rev. Participating VRDN Series XF 28 32, 0.18% 12/7/21 (a)(f)(g) | 14,985,000 | 14,985,000 | |
| Maryland Gen. Oblig. Participating VRDN: | |||
| Series DB 80 76, 0.11% 12/2/21 (Liquidity Facility Deutsche Bank AG New York Branch) (a)(f)(g) | 1,565,000 | 1,565,000 | |
| Series DB 807, 0.11% 12/7/21 (Liquidity Facility Deutsche Bank AG New York Branch) (a)(f)(g) | 1,660,000 | 1,660,000 | |
| Maryland Health & Higher Edl. Facilities Auth. Rev. Series 2021 B, 0.09% 12/8/21, CP | 2,500,000 | 2,500,022 | |
| TOTAL MARYLAND | 35,331,082 | ||
| Massachusetts - 0.2% | |||
| Boston Wtr. & Swr. Commission Rev. Series 2021 A, 0.1% 1/5/22, LOC State Street Bank & Trust Co., Boston, CP | 4,400,000 | 4,400,043 | |
| Massachusetts Edl. Fing. Auth. Rev. Participating VRDN Series Floaters XF 23 06, 0.3% 12/7/21 (Liquidity Facility Morgan Stanley Bank, West Valley City Utah) (a)(b)(f)(g) | 1,445,000 | 1,445,000 | |
| Massachusetts Port Auth. Rev. Participating VRDN Series XM 08 51, 0.12% 12/7/21 (Liquidity Facility JPMorgan Chase Bank) (a)(b)(f)(g) | 3,200,000 | 3,200,000 | |
| TOTAL MASSACHUSETTS | 9,045,043 | ||
| Michigan - 0.6% | |||
| Michigan Bldg. Auth. Rev. Participating VRDN Series 2021 XF 11 15, 0.11% 12/7/21 (Liquidity Facility Deutsche Bank AG New York Branch) (a)(f)(g) | 2,800,000 | 2,800,000 | |
| Michigan Fin. Auth. Rev. RAN Series 2021 A, 3% 8/22/22, LOC PNC Bank NA | 16,500,000 | 16,835,400 | |
| Michigan Hsg. Dev. Auth. Rental Hsg. Rev. Series 2002 A, 0.08% 12/7/21, LOC Bank of America NA, VRDN (a)(b) | 6,200,000 | 6,200,000 | |
| Michigan Strategic Fund Ltd. Oblig. Rev. Series 2002, 0.15% 12/2/21, LOC JPMorgan Chase Bank, VRDN (a)(b) | 250,000 | 250,000 | |
| Univ. of Michigan Rev. Series 2021 B, 0.09% tender 12/3/21, CP mode | 5,000,000 | 5,000,017 | |
| TOTAL MICHIGAN | 31,085,417 | ||
| Minnesota - 0.1% | |||
| Minneapolis Health Care Sys. Rev. Participating VRDN Series XM 08 72, 0.15% 12/7/21 (Liquidity Facility JPMorgan Chase Bank) (a)(f)(g) | 1,000,000 | 1,000,000 | |
| Minnesota Rural Wtr. Fin. Auth. BAN Series 2021 B, 0.3% 8/1/22 | 2,700,000 | 2,700,123 | |
| Univ. of Minnesota Gen. Oblig. Series 2021 G, 0.1% 12/8/21, CP | 4,000,000 | 4,000,040 | |
| TOTAL MINNESOTA | 7,700,163 | ||
| Mississippi - 0.2% | |||
| Jackson County Poll. Cont. Rev. (Chevron U.S.A., Inc. Proj.) Series 1993 0.02% 12/1/21, VRDN (a) | 7,650,000 | 7,650,000 | |
| Mississippi Bus. Fin. Corp. Solid Waste Disp. Rev. (Mississippi Pwr. Co. Proj.): | |||
| Series 1995, 0.07% 12/1/21, VRDN (a)(b) | 3,900,000 | 3,900,000 | |
| Series 1998, 0.07% 12/1/21, VRDN (a)(b) | 1,600,000 | 1,600,000 | |
| TOTAL MISSISSIPPI | 13,150,000 | ||
| Missouri - 0.2% | |||
| Kansas City Indl. Dev. Auth. Participating VRDN Series XM 09 21, 0.17% 12/7/21 (Liquidity Facility Morgan Stanley Bank, West Valley City Utah) (a)(b)(f)(g) | 6,150,000 | 6,150,000 | |
| Lees Summit Indl. Dev. Auth. Multi-family Hsg. Rev. Participating VRDN Series MIZ 90 55, 0.3% 1/4/22 (Liquidity Facility Mizuho Cap. Markets Llc) (a)(f)(g) | 200,000 | 200,000 | |
| Mercy Health Participating VRDN Series Floaters XL 00 80, 0.12% 12/7/21 (Liquidity Facility JPMorgan Chase Bank) (a)(f)(g) | 1,200,000 | 1,200,000 | |
| Missouri Health & Edl. Facilities Auth. Edl. Facilities Rev. Participating VRDN Series XG 01 76, 0.17% 12/7/21 (Liquidity Facility Royal Bank of Canada) (a)(f)(g) | 3,200,000 | 3,200,000 | |
| TOTAL MISSOURI | 10,750,000 | ||
| Montana - 0.0% | |||
| Montana Board of Hsg. Participating VRDN Series Floater MIZ 90 61, 0.3% 1/4/22 (Liquidity Facility Mizuho Cap. Markets Llc) (a)(f)(g) | 500,000 | 500,000 | |
| Montana Facility Fin. Auth. Participating VRDN Series 2021 XF 11 14, 0.11% 12/7/21 (Liquidity Facility Deutsche Bank AG New York Branch) (a)(f)(g) | 700,000 | 700,000 | |
| TOTAL MONTANA | 1,200,000 | ||
| Nebraska - 0.0% | |||
| Univ. of Nebraska Facilities Corp. Participating VRDN Series 2021 XF 11 03, 0.11% 12/7/21 (Liquidity Facility Deutsche Bank AG New York Branch) (a)(f)(g) | 1,100,000 | 1,100,000 | |
| New Jersey - 0.8% | |||
| Borough of Mountainside Gen. Oblig. BAN Series 2021, 2% 4/29/22 | 1,100,000 | 1,107,664 | |
| Borough of Oceanport BAN Series 2021, 2% 2/24/22 | 1,100,000 | 1,104,502 | |
| Burlington County Bridge Commission Lease Rev. BAN (Governmental Leasing Prog.) Series 2021 A, 1% 4/14/22 | 13,000,000 | 13,040,180 | |
| Hudson County Impt. Auth. Rev. BAN: | |||
| (Local Unit Ln. Prog.) Series 2021 A1, 1.5% 2/8/22 | 2,774,000 | 2,781,002 | |
| Series 2021 C1, 1% 8/16/22 | 4,400,000 | 4,425,130 | |
| Jersey City Gen. Oblig. BAN Series 2021 A, 1.5% 1/12/22 | 295,000 | 295,454 | |
| New Jersey Tpk. Auth. Tpk. Rev. Participating VRDN Series XM 09 11, 0.15% 12/7/21 (Liquidity Facility JPMorgan Chase Bank) (a)(f)(g) | 1,305,000 | 1,305,000 | |
| New Jersey Trans. Trust Fund Auth. Participating VRDN: | |||
| Series Floaters XG 02 05, 0.08% 12/7/21 (Liquidity Facility Barclays Bank PLC) (a)(f)(g) | 6,140,000 | 6,140,000 | |
| Series XF 09 75, 0.21% 12/7/21 (Liquidity Facility JPMorgan Chase Bank) (a)(f)(g) | 1,066,000 | 1,066,000 | |
| Series XM 09 29, 0.17% 12/7/21 (Liquidity Facility JPMorgan Chase Bank) (a)(f)(g) | 400,000 | 400,000 | |
| Newark Gen. Oblig. BAN Series 2021 C, 1.25% 7/25/22 | 600,000 | 603,766 | |
| Ramsey Borough Gen. Oblig. BAN Series 2021, 1.25% 1/7/22 | 2,000,000 | 2,001,951 | |
| Roselle County of Union BAN Series 2021 A, 1.5% 7/20/22 | 1,000,000 | 1,007,730 | |
| Springfield Township Gen. Oblig. BAN Series 2021, 2% 7/29/22 | 3,228,000 | 3,263,292 | |
| West Orange Gen. Oblig. BAN Series 2021, 2% 11/11/22 | 4,500,000 | 4,568,971 | |
| TOTAL NEW JERSEY | 43,110,642 | ||
| New York - 4.1% | |||
| Broome County Gen. Oblig. BAN Series 2021 A, 1.5% 4/29/22 | 20,000,000 | 20,105,730 | |
| Connetquot Central School District: | |||
| BAN Series 2021, 1.25% 7/27/22 | 5,000,000 | 5,031,980 | |
| TAN Series 2021, 1.5% 6/24/22 | 10,000,000 | 10,069,101 | |
| East Rochester Hsg. Auth. Rev. (Home Good Sheperd Proj.) Series A, 0.18% 12/7/21, LOC Citizens Bank NA, VRDN (a) | 400,000 | 400,000 | |
| Hempstead Indl. Dev. Auth. Participating VRDN Series DBE 80 63, 0.45% 12/7/21, LOC Deutsche Bank AG, (Liquidity Facility Deutsche Bank AG) (a)(b)(f)(g) | 8,341,186 | 8,341,186 | |
| Hempstead Union Free School District BAN Series 2021 A, 1.5% 11/30/22 | 6,427,819 | 6,503,103 | |
| New York City Gen. Oblig.: | |||
| Series 2006, 0.2% 12/3/21 (FSA Insured), VRDN (a) | 4,275,000 | 4,275,000 | |
| Series 2021 3, 0.1% 12/8/21, VRDN (a) | 5,000,000 | 5,000,000 | |
| New York Metropolitan Trans. Auth. Dedicated Tax Fund Rev.: | |||
| BAN Series 2019 A, 5% 3/1/22 | 4,055,000 | 4,102,331 | |
| Participating VRDN Series ZM 06 00, 0.1% 12/7/21 (Liquidity Facility Wells Fargo Bank NA) (a)(f)(g) | 2,100,000 | 2,100,000 | |
| New York Metropolitan Trans. Auth. Rev.: | |||
| BAN: | |||
| Series 2019 B, 5% 5/15/22 | 27,265,000 | 27,843,078 | |
| Series 2019 D1, 5% 9/1/22 | 23,990,000 | 24,823,432 | |
| Participating VRDN: | |||
| Series XF 05 20, 0.09% 12/7/21 (Liquidity Facility Royal Bank of Canada) (a)(f)(g) | 1,425,000 | 1,425,000 | |
| Series XF 28 68, 0.09% 12/7/21 (Liquidity Facility Barclays Bank PLC) (a)(f)(g) | 10,000,000 | 10,000,000 | |
| Series XG 02 90, 0.09% 12/7/21 (Liquidity Facility Barclays Bank PLC) (a)(f)(g) | 15,000,000 | 15,000,000 | |
| Series XM 09 35, 0.21% 12/7/21 (Liquidity Facility JPMorgan Chase Bank) (a)(f)(g) | 300,000 | 300,000 | |
| Series ZF 02 18, 0.21% 12/7/21 (Liquidity Facility JPMorgan Chase Bank) (a)(f)(g) | 4,200,000 | 4,200,000 | |
| New York Pwr. Auth. Series 2021, 0.1% 1/6/22 (Liquidity Facility TD Banknorth, NA) (Liquidity Facility Wells Fargo Bank NA), CP | 8,000,000 | 7,999,918 | |
| New York Thruway Auth. Gen. Rev. Participating VRDN: | |||
| Series XF 09 18, 0.1% 12/7/21 (Liquidity Facility JPMorgan Chase Bank) (a)(f)(g) | 1,600,000 | 1,600,000 | |
| Series XM 08 30, 0.15% 12/7/21 (Liquidity Facility JPMorgan Chase Bank) (a)(f)(g) | 1,700,000 | 1,700,000 | |
| Series XM 08 31, 0.2% 12/7/21 (Liquidity Facility Morgan Stanley Bank, West Valley City Utah) (a)(f)(g) | 2,000,000 | 2,000,000 | |
| Series XM 08 80, 0.15% 12/7/21 (Liquidity Facility JPMorgan Chase Bank) (a)(f)(g) | 1,500,000 | 1,500,000 | |
| New York Trans. Dev. Corp.: | |||
| Participating VRDN Series XL 01 68, 0.16% 12/7/21 (Liquidity Facility Barclays Bank PLC) (a)(b)(f)(g) | 200,000 | 200,000 | |
| RAN (Term. 4 JFK Int'l. Arpt. Proj.) Series 2020 C, 5% 12/1/21 | 2,100,000 | 2,100,000 | |
| Oneida County Indl. Dev. Agcy. Rev. (Mohawk Valley Cmnty. College Dorm. Corp. Proj.) Series 2004 A, 0.15% 12/7/21, LOC Manufacturers & Traders Trust Co., VRDN (a) | 500,000 | 500,000 | |
| Port Washington Union Free School District TAN Series 2021, 2% 6/23/22 | 3,000,000 | 3,030,051 | |
| Putnam County Indl. Dev. Agcy. Rev. Series 2006 A, 0.23% 12/7/21, LOC Citizens Bank NA, VRDN (a) | 1,100,000 | 1,100,000 | |
| Riverhead Central School District TAN: | |||
| Series 2021 A, 1.5% 2/25/22 | 7,500,000 | 7,523,559 | |
| Series 2021 B, 2% 6/24/22 | 15,500,000 | 15,660,441 | |
| South Huntington Union Free School District TAN Series 2021, 1.5% 6/24/22 | 10,000,000 | 10,073,639 | |
| Syosset Central School District TAN Series 2021, 1.5% 6/24/22 | 9,500,000 | 9,571,035 | |
| Triborough Bridge & Tunnel Auth. Participating VRDN Series 2021 XF 11 25, 0.11% 12/7/21 (Liquidity Facility Deutsche Bank AG New York Branch) (a)(f)(g) | 2,265,000 | 2,265,000 | |
| Village of Garden City BAN Series 2021, 1% 2/18/22 | 2,000,000 | 2,003,407 | |
| Westchester County BAN: | |||
| Series 2021 A, 1% 12/17/21 | 9,000,000 | 9,003,530 | |
| Series 2021 B, 1.5% 12/17/21 | 3,316,861 | 3,318,825 | |
| TOTAL NEW YORK | 230,669,346 | ||
| New York And New Jersey - 0.2% | |||
| Port Auth. of New York & New Jersey Series 2021 A: | |||
| 0.12% 12/9/21, CP (b) | 2,000,000 | 2,000,020 | |
| 0.13% 1/12/22, CP (b) | 525,000 | 525,000 | |
| 0.13% 2/2/22, CP (b) | 4,000,000 | 4,000,000 | |
| 0.13% 3/3/22, CP (b) | 5,015,000 | 5,014,872 | |
| TOTAL NEW YORK AND NEW JERSEY | 11,539,892 | ||
| North Carolina - 0.1% | |||
| Charlotte Ctfs. of Prtn. Participating VRDN Series 2021 XG 03 31, 0.11% 12/7/21 (Liquidity Facility Deutsche Bank AG New York Branch) (a)(f)(g) | 342,000 | 342,000 | |
| Charlotte Int'l. Arpt. Rev. Participating VRDN Series Floaters ZF 24 90, 0.08% 12/7/21 (Liquidity Facility Barclays Bank PLC) (a)(f)(g) | 7,500,000 | 7,500,000 | |
| TOTAL NORTH CAROLINA | 7,842,000 | ||
| North Dakota - 0.1% | |||
| Basin Elec. Pwr. Coop. Series 2021, 0.18% 1/19/22 (Liquidity Facility Nat'l. Rural Utils. Coop. Fin. Corp.), CP | 8,200,000 | 8,199,888 | |
| Ohio - 0.6% | |||
| American Muni. Pwr. BAN: | |||
| (City of Wapakoneta Proj.) Series 2021, 1% 6/23/22 | 1,210,000 | 1,215,203 | |
| (Village of Carey Proj.) Series 2021, 1.25% 11/30/22 | 500,000 | 504,813 | |
| (Village of Grafton Proj.) Series 2021, 1% 4/14/22 | 1,235,000 | 1,238,497 | |
| (Village of Pioneer Proj.) Series 2021, 1.25% 12/1/22 | 400,000 | 403,770 | |
| Lorain County Gen. Oblig. BAN: | |||
| (North Ridge Road Proj.) Series 2020 D, 1% 12/17/21 | 2,190,000 | 2,190,742 | |
| Series 2021 A, 1.5% 5/4/22 | 2,900,000 | 2,915,229 | |
| Oakwood Village BAN Series 2021, 1.375% 9/15/22 | 1,675,000 | 1,687,281 | |
| Ohio Hosp. Rev.: | |||
| Series 2021 B, 0.1% 12/1/21, VRDN (a) | 3,000,000 | 3,000,000 | |
| Series 2021 D, 0.04% 12/7/21, LOC U.S. Bank NA, Cincinnati, VRDN (a) | 10,000,000 | 10,000,000 | |
| Ohio Hsg. Fin. Agcy. Multi-family Hsg. Rev. Participating VRDN Series XF 10 92, 0.3% 12/7/21 (Liquidity Facility Deutsche Bank AG New York Branch) (a)(f)(g) | 5,100,000 | 5,100,000 | |
| Ohio Tpk. Commission Tpk. Rev. Participating VRDN Series Floaters XL 00 57, 0.12% 12/7/21 (Liquidity Facility Cr. Suisse AG) (a)(f)(g) | 800,000 | 800,000 | |
| Whitehall Spl. Oblig. Nontax Rev. BAN Series 2021 A, 1.5% 12/7/22 (e) | 1,700,000 | 1,720,479 | |
| TOTAL OHIO | 30,776,014 | ||
| Oklahoma - 0.3% | |||
| Oklahoma Dev. Fin. Auth. Health Sys. Rev. Series 2020 B, 0.14% 12/7/21, VRDN (a) | 16,680,000 | 16,680,000 | |
| Oregon - 0.0% | |||
| Oregon St Hsg. & Cmnty. Svcs. Dep Participating VRDN Series 2021 XF 11 23, 0.3% 12/7/21 (Liquidity Facility Deutsche Bank AG New York Branch) (a)(f)(g) | 600,000 | 600,000 | |
| Pennsylvania - 0.5% | |||
| Allentown School District TRAN Series 2021, 1% 3/31/22 | 750,000 | 749,964 | |
| Central Bradford Progress Auth. Rev. Series 2021 D, 0.16% 12/7/21, VRDN (a) | 2,000,000 | 2,000,000 | |
| Pennsylvania Econ. Dev. Fing. Auth. Exempt Facilities Rev. Series 2009 B, 0.17% 12/7/21, LOC MUFG Bank Ltd., VRDN (a) | 5,000,000 | 5,000,000 | |
| Pennsylvania Hsg. Fin. Agcy. Multifamily Hsg. Dev. Rev. Participating VRDN Series XF 10 95, 0.3% 12/7/21 (Liquidity Facility Deutsche Bank AG New York Branch) (a)(f)(g) | 2,615,000 | 2,615,000 | |
| Pennsylvania Tpk. Commission Tpk. Rev. Participating VRDN Series 2021 XL 01 80, 0.11% 12/7/21 (Liquidity Facility Deutsche Bank AG New York Branch) (a)(f)(g) | 4,000,000 | 4,000,000 | |
| Philadelphia Auth. Indl. Mrf Participating VRDN Series MIZ 90 51, 0.3% 1/4/22 (Liquidity Facility Mizuho Cap. Markets Llc) (a)(f)(g) | 1,000,000 | 1,000,000 | |
| Philadelphia Auth. for Indl. Dev. Series 2017 B, 0.13% 12/6/24, VRDN (a) | 12,565,000 | 12,565,000 | |
| TOTAL PENNSYLVANIA | 27,929,964 | ||
| South Carolina - 0.8% | |||
| Charleston County School District TAN Series 2021, 1.25% 4/1/22 | 10,000,000 | 10,037,889 | |
| County Square Redev. Corp. BAN (Greenville County, South Carolina Proj.) Series 2021, 2% 3/3/22 | 6,945,000 | 6,978,299 | |
| Greenville Hosp. Sys. Facilities Rev. Participating VRDN Series XF 01 45, 0.2% 12/7/21 (Liquidity Facility Toronto-Dominion Bank) (a)(f)(g) | 1,600,000 | 1,600,000 | |
| South Carolina Jobs-Econ. Dev. Auth. Series 2018 C, 0.14% 12/6/24, VRDN (a) | 10,000,000 | 10,000,000 | |
| South Carolina Pub. Svc. Auth. Rev.: | |||
| Participating VRDN: | |||
| Series 2021 XL 01 85, 0.13% 12/7/21 (Liquidity Facility Barclays Bank PLC) (a)(f)(g) | 600,000 | 600,000 | |
| Series Floaters XM 03 84, 0.15% 12/7/21 (Liquidity Facility JPMorgan Chase Bank) (a)(f)(g) | 9,800,000 | 9,800,000 | |
| Series YX 11 57, 0.13% 12/7/21 (Liquidity Facility Barclays Bank PLC) (a)(f)(g) | 2,110,000 | 2,110,000 | |
| Series 2021 B, 0.1% 12/15/21, LOC Barclays Bank PLC, CP | 2,000,000 | 2,000,033 | |
| TOTAL SOUTH CAROLINA | 43,126,221 | ||
| South Dakota - 0.0% | |||
| South Dakota Health & Edl. Facilities Auth. Rev. Participating VRDN Series XG 03 02, 0.12% 12/7/21 (Liquidity Facility Barclays Bank PLC) (a)(f)(g) | 600,000 | 600,000 | |
| Tennessee - 0.2% | |||
| Greeneville Health & Edl. Facilities Board: | |||
| Participating VRDN Series Floaters XF 25 76, 0.09% 12/7/21 (Liquidity Facility Barclays Bank PLC) (a)(f)(g) | 6,000,000 | 6,000,000 | |
| Series 2018 B, 0.05% 12/7/21, LOC U.S. Bank NA, Cincinnati, VRDN (a) | 800,000 | 800,000 | |
| Metropolitan Govt. Nashville & Davidson County Health & Edl. Facilities Board Participating VRDN Series XF 10 97, 0.3% 12/7/21 (Liquidity Facility Deutsche Bank AG New York Branch) (a)(f)(g) | 1,590,000 | 1,590,000 | |
| Tennessee Gen. Oblig. Series 2021 A, 0.1% 1/11/22 (Liquidity Facility Tennessee Consldatd Retire Sys.), CP | 5,000,000 | 5,000,000 | |
| TOTAL TENNESSEE | 13,390,000 | ||
| Texas - 2.8% | |||
| Arlington Higher Ed. Fin. Corp. Participating VRDN Series 2021 MS 00 02, 0.25% 12/7/21 (a)(f)(g) | 10,000,000 | 10,000,000 | |
| Austin Affordable Pfc, Inc. Multifamily Hsg. Rev. Participating VRDN: | |||
| Series XF 11 02, 0.3% 12/7/21 (Liquidity Facility Deutsche Bank AG New York Branch) (a)(f)(g) | 2,000,000 | 2,000,000 | |
| Series XF 11 19, 0.3% 12/7/21 (Liquidity Facility Deutsche Bank AG New York Branch) (a)(f)(g) | 800,000 | 800,000 | |
| Calhoun County Navigation Indl. Dev. Auth. Port Rev. (B P Chemicals, Inc. Proj.) Series 1998, 0.1% 12/7/21, VRDN (a)(b) | 11,300,000 | 11,300,000 | |
| Dallas Area Rapid Transit Sales Tax Rev. Series 2021 IIA, 0.1% 12/3/21 (Liquidity Facility JPMorgan Chase Bank), CP | 8,000,000 | 8,000,026 | |
| Dallas/Fort Worth Int'l. Arpt. Facility Impt. Corp. Rev. (United Parcel Svc., Inc. Proj.) Series 2002, 0.07% 12/1/21, VRDN (a)(b) | 1,180,000 | 1,180,000 | |
| Deutsche Spears/Lifers Trust Participating VRDN Series Floaters XG 00 58, 0.11% 12/7/21 (Liquidity Facility Deutsche Bank AG) (a)(f)(g) | 1,085,000 | 1,085,000 | |
| Harris County Cultural Ed. Facilities Fin. Corp. Rev.: | |||
| Participating VRDN Series 2021 XG 03 28, 0.11% 12/7/21 (Liquidity Facility Deutsche Bank AG New York Branch) (a)(f)(g) | 4,120,000 | 4,120,000 | |
| Series 2021 C2, 0.1% tender 2/2/22, CP mode | 9,000,000 | 8,999,842 | |
| Series 2021, 0.1% tender 2/2/22, CP mode | 4,000,000 | 3,999,930 | |
| Houston Arpt. Sys. Rev. Series 2021 A, 0.11% 12/14/21, LOC Sumitomo Mitsui Banking Corp., CP (b) | 4,500,000 | 4,500,069 | |
| Houston Gen. Oblig. TRAN Series 2021: | |||
| 2% 6/30/22 | 5,000,000 | 5,053,870 | |
| 3% 6/30/22 | 8,500,000 | 8,641,889 | |
| Hurst Participating VRDN Series XF 10 94, 0.3% 12/7/21 (Liquidity Facility Deutsche Bank AG New York Branch) (a)(f)(g) | 1,600,000 | 1,600,000 | |
| Lamar Consolidated Independent School District Participating VRDN Series XF 11 18, 0.11% 12/7/21 (Liquidity Facility Deutsche Bank AG New York Branch) (a)(f)(g) | 700,000 | 700,000 | |
| Love Field Arpt. Modernization Corp. Series 2021, 0.11% 1/11/22, CP | 2,280,000 | 2,279,974 | |
| Lower Colorado River Auth. Rev.: | |||
| Series 2021, 0.09% 1/5/22, LOC JPMorgan Chase Bank, LOC State Street Bank & Trust Co., Boston, CP | 1,546,000 | 1,546,015 | |
| TRAN (LCRA Transmission Svcs. Corp. Proj.) Series 2012 A, 5% 5/15/22 | 2,365,000 | 2,416,732 | |
| North Central Texas Hsg. Fin. Corp. Mu Participating VRDN Series XF 10 99, 0.3% 12/7/21 (Liquidity Facility Deutsche Bank AG New York Branch) (a)(f)(g) | 400,000 | 400,000 | |
| North Texas Tollway Auth. Rev. Participating VRDN: | |||
| Series 2021 XF 12 25, 0.13% 12/7/21 (Liquidity Facility JPMorgan Chase Bank) (a)(f)(g) | 1,160,000 | 1,160,000 | |
| Series XF 12 21, 0.13% 12/7/21 (Liquidity Facility JPMorgan Chase Bank) (a)(f)(g) | 6,760,000 | 6,760,000 | |
| Series XM0085, 0.13% 12/7/21 (Liquidity Facility Barclays Bank PLC) (a)(f)(g) | 400,000 | 400,000 | |
| Port Arthur Navigation District Envir. Facilities Rev. (Motiva Enterprises LLC Proj.) Series 2004, 0.18% 12/7/21, VRDN (a)(b) | 33,015,000 | 33,015,000 | |
| San Antonio Elec. & Gas Sys. Rev. Series 2021, 0.09% 12/16/21 (Liquidity Facility Bank of America NA), CP | 10,000,000 | 10,000,044 | |
| Temple Tex College District Participating VRDN Series XL 01 82, 0.11% 12/7/21, LOC Deutsche Bank AG, (Liquidity Facility Deutsche Bank AG) (a)(f)(g) | 2,495,000 | 2,495,000 | |
| Tender Option Bond Trust Receipts Participating VRDN Series 2021 XF 11 09, 0.3% 12/7/21 (Liquidity Facility Deutsche Bank AG) (a)(f)(g) | 2,000,000 | 2,000,000 | |
| Texas A&M Univ. Rev. Series 2021 B, 0.09% 12/2/21, CP | 15,000,000 | 15,000,041 | |
| Texas Dept. of Hsg. & Cmnty. Affairs Residential Mtg. Rev. Participating VRDN Series XF 10 98, 0.3% 12/7/21 (Liquidity Facility Deutsche Bank AG New York Branch) (a)(f)(g) | 1,100,000 | 1,100,000 | |
| Texas Private Activity Bond Surface Trans. Corp. Participating VRDN Series XM 07 56, 0.24% 12/7/21 (Liquidity Facility Deutsche Bank AG New York Branch) (a)(b)(f)(g) | 1,800,000 | 1,800,000 | |
| Trinity Riv Pub. Facilities Corp. Tex M Participating VRDN Series XF 10 83, 0.3% 12/7/21 (Liquidity Facility Deutsche Bank AG New York Branch) (a)(f)(g) | 1,600,000 | 1,600,000 | |
| Waco Edl. Fin. Corp. Rev. Participating VRDN Series 2021 XF 11 13, 0.11% 12/7/21 (Liquidity Facility Deutsche Bank AG New York Branch) (a)(f)(g) | 300,000 | 300,000 | |
| TOTAL TEXAS | 154,253,432 | ||
| Utah - 0.4% | |||
| Salt Lake City Arpt. Rev. Participating VRDN: | |||
| Series 17 XM 0493, 0.17% 12/7/21 (Liquidity Facility Morgan Stanley Bank, West Valley City Utah) (a)(b)(f)(g) | 500,000 | 500,000 | |
| Series 2021 XG 03 43, 0.15% 12/7/21 (Liquidity Facility Morgan Stanley Bank, West Valley City Utah) (a)(b)(f)(g) | 2,800,000 | 2,800,000 | |
| Series Floaters XM 06 99, 0.19% 12/7/21 (Liquidity Facility Cr. Suisse AG) (a)(b)(f)(g) | 11,030,000 | 11,030,000 | |
| Series XM 08 82, 0.15% 12/7/21 (Liquidity Facility JPMorgan Chase Bank) (a)(b)(f)(g) | 1,400,000 | 1,400,000 | |
| Utah Hsg. Corp. Multi-family Hsg. Rev. Participating VRDN Series 2021 XF 11 00, 0.3% 12/7/21 (Liquidity Facility Deutsche Bank AG New York Branch) (a)(f)(g) | 4,000,000 | 4,000,000 | |
| TOTAL UTAH | 19,730,000 | ||
| Virginia - 0.4% | |||
| Loudoun County Indl. Dev. Auth. (Howard Hughes Med. Institute Proj.) Series 2003 B, 0.06% 12/7/21, VRDN (a) | 4,000,000 | 4,000,000 | |
| Lynchburg Econ. Dev. Series 2017 B, 0.05% 12/1/21, LOC Truist Bank, VRDN (a) | 650,000 | 650,000 | |
| Suffolk Econ. Dev. Auth. Hosp. Facilities Rev. Participating VRDN Series MIZ 90 25, 0.12% 12/7/21 (Liquidity Facility Mizuho Cap. Markets Llc) (a)(f)(g) | 13,965,000 | 13,965,000 | |
| Virginia Commonwealth Trans. Board Rev. Participating VRDN Series DB 80 80, 0.11% 12/7/21 (Liquidity Facility Deutsche Bank AG New York Branch) (a)(f)(g) | 2,270,000 | 2,270,000 | |
| TOTAL VIRGINIA | 20,885,000 | ||
| Washington - 0.5% | |||
| Port of Seattle Gen. Oblig. Series 2021 B1, 0.1% 12/2/21, LOC Bayerische Landesbank Girozentrale, CP (b) | 2,000,000 | 2,000,004 | |
| Univ. of Washington Univ. Revs. Series 2021, 0.11% 2/17/22, CP | 1,500,000 | 1,499,935 | |
| Washington Convention Ctr. Pub. Facilities Participating VRDN Series XG 02 96, 0.09% 12/7/21 (Liquidity Facility Barclays Bank PLC) (a)(f)(g) | 7,985,000 | 7,985,000 | |
| Washington Econ. Dev. Fin. Auth. Rev. Participating VRDN Series Floaters 005, 0.23% 1/11/22 (Liquidity Facility Barclays Bank PLC) (a)(b)(f)(g) | 5,000,000 | 5,000,000 | |
| Washington Health Care Facilities Auth. Rev. Participating VRDN Series XM 08 83, 0.12% 12/7/21 (Liquidity Facility JPMorgan Chase Bank) (a)(f)(g) | 1,500,000 | 1,500,000 | |
| Washington Hsg. Fin. Commission Multi-family Hsg. Rev. (Merrill Gardens at Queen Anne Proj.) Series A, 0.06% 12/7/21, LOC Bank of America NA, VRDN (a)(b) | 10,000,000 | 10,000,000 | |
| TOTAL WASHINGTON | 27,984,939 | ||
| Wisconsin - 0.2% | |||
| JPMorgan Chase Participating VRDN Series Floaters XF 01 27, 0.08% 12/2/21 (a)(f)(g) | 1,060,000 | 1,060,000 | |
| Wisconsin Ctr. District Tax Rev. Participating VRDN Series 2021 XF 12 22, 0.15% 12/7/21 (Liquidity Facility JPMorgan Chase Bank) (a)(f)(g) | 212,000 | 212,000 | |
| Wisconsin Health & Edl. Facilities: | |||
| Participating VRDN Series Floaters XG 00 72, 0.11% 12/7/21 (Liquidity Facility Deutsche Bank AG New York Branch) (a)(f)(g) | 600,000 | 600,000 | |
| Series 2020 C, 0.14% 12/7/21, VRDN (a) | 6,750,000 | 6,750,000 | |
| Wood County BAN Series 2021, 0.75% 3/7/22 | 1,550,000 | 1,550,115 | |
| TOTAL WISCONSIN | 10,172,115 | ||
| TOTAL MUNICIPAL NOTES | |||
| (Cost $1,352,783,136) | 1,352,980,280 | ||
| Shares | Value | ||
| Municipal Bond Funds - 0.1% | |||
| Nuveen NY AMT-Free Quality Municipal Income Fund Preferred Shares 0.25% (a)(d)(i) | |||
| (Cost $6,800,000) | 6,800,000 | 6,800,000 | |
| Short-Term Funds - 14.2% | |||
| Federated Hermes Municipal Ultrashort Fund Institutional Shares | 5,990,726 | 60,086,980 | |
| JPMorgan Ultra-Short Municipal Fund Class I | 46,903,464 | 471,379,777 | |
| Vanguard Short-Term Tax-Exempt Fund Admiral Shares | 16,387,855 | 260,403,010 | |
| TOTAL SHORT-TERM FUNDS | |||
| (Cost $793,132,856) | 791,869,767 | ||
| Money Market Funds - 19.2% | |||
| Fidelity Investments Money Market Government Portfolio Institutional Class 0.01% (j)(k) | 532,154,256 | 532,154,256 | |
| Fidelity Municipal Cash Central Fund 0.06% (l)(m) | 50,029,994 | 50,040,000 | |
| Fidelity SAI Municipal Money Market Fund 0.01% (j)(k) | 477,991,818 | 478,183,015 | |
| State Street Institutional U.S. Government Money Market Fund Premier Class 0.03% (j) | 9,858,408 | 9,858,408 | |
| TOTAL MONEY MARKET FUNDS | |||
| (Cost $1,070,178,858) | 1,070,235,679 | ||
| TOTAL INVESTMENT IN SECURITIES - 100.5% | |||
| (Cost $5,590,676,802) | 5,598,528,712 | ||
| NET OTHER ASSETS (LIABILITIES) - (0.5)% | (29,439,526) | ||
| NET ASSETS - 100% | $5,569,089,186 |
Security Type Abbreviations
BAN – BOND ANTICIPATION NOTE
CP – COMMERCIAL PAPER
RAN – REVENUE ANTICIPATION NOTE
TAN – TAX ANTICIPATION NOTE
TRAN – TAX AND REVENUE ANTICIPATION NOTE
VRDN – VARIABLE RATE DEMAND NOTE (A debt instrument that is payable upon demand, either daily, weekly or monthly)
Legend
(a) Coupon rates for floating and adjustable rate securities reflect the rates in effect at period end.
(b) Private activity obligations whose interest is subject to the federal alternative minimum tax for individuals.
(c) Coupon is indexed to a floating interest rate which may be multiplied by a specified factor and/or subject to caps or floors.
(d) Security exempt from registration under Rule 144A of the Securities Act of 1933. These securities may be resold in transactions exempt from registration, normally to qualified institutional buyers. At the end of the period, the value of these securities amounted to $50,482,175 or 0.9% of net assets.
(e) Security or a portion of the security purchased on a delayed delivery or when-issued basis.
(f) Provides evidence of ownership in one or more underlying municipal bonds.
(g) Coupon rates are determined by re-marketing agents based on current market conditions.
(h) Restricted securities (including private placements) - Investment in securities not registered under the Securities Act of 1933 (excluding 144A issues). At the end of the period, the value of restricted securities (excluding 144A issues) amounted to $8,800,000 or 0.2% of net assets.
(i) Non-income producing
(j) The rate quoted is the annualized seven-day yield of the fund at period end.
(k) Affiliated Fund
(l) Information in this report regarding holdings by state and security types does not reflect the holdings of the Fidelity Municipal Cash Central Fund.
(m) Affiliated fund that is generally available only to investment companies and other accounts managed by Fidelity Investments. The rate quoted is the annualized seven-day yield of the fund at period end. A complete unaudited listing of the fund's holdings as of its most recent quarter end is available upon request. In addition, each Fidelity Central Fund's financial statements are available on the SEC's website or upon request.
Additional information on each restricted holding is as follows:
| Security | Acquisition Date | Acquisition Cost |
| Baltimore Proj. Rev. Bonds Series Floaters G 42, 0.25%, tender 7/1/22 (Liquidity Facility Royal Bank of Canada) | 7/1/21 | $4,500,000 |
| River Islands Pub. Fing. Auth. Participating VRDN Series MIZ 90 26, 0.3% 1/4/22 (Liquidity Facility Mizuho Cap. Markets Llc) | 8/14/20 | $4,300,000 |
Affiliated Central Funds
Fiscal year to date information regarding the Fund's investments in Fidelity Central Funds, including the ownership percentage, is presented below.
| Fund | Value, beginning of period | Purchases | Sales Proceeds | Dividend Income | Realized Gain/Loss | Change in Unrealized appreciation (depreciation) | Value, end of period | % ownership, end of period |
| Fidelity Municipal Cash Central Fund 0.06% | $10,608,583 | $240,139,000 | $200,707,583 | $10,791 | $715 | $(715) | $50,040,000 | 3.2% |
| Total | $10,608,583 | $240,139,000 | $200,707,583 | $10,791 | $715 | $(715) | $50,040,000 |
Amounts in the income column in the above table include any capital gain distributions from underlying funds, which are presented in the corresponding line-item in the Statement of Operations, if applicable.
Affiliated Underlying Funds
Fiscal year to date information regarding the Fund's investments in affiliated Underlying Funds is presented below. Exchanges between classes of the same affiliated Underlying Funds may occur. If an underlying Fund changes its name, the name presented below is the name in effect at period end.
| Affiliate | Value, beginning of period | Purchases | Sales Proceeds | Dividend Income | Realized Gain (loss) | Change in Unrealized appreciation (depreciation) | Value, end of period |
| Fidelity Investments Money Market Government Portfolio Institutional Class 0.01% | $483,241,223 | $201,403,797 | $152,490,764 | $21,288 | $-- | $-- | $532,154,256 |
| Fidelity SAI Municipal Money Market Fund 0.01% | 455,032,513 | 23,150,502 | -- | 19,553 | -- | -- | 478,183,015 |
| Total | $938,273,736 | $224,554,299 | $152,490,764 | $40,841 | $-- | $-- | $1,010,337,271 |
Amounts in the income column in the above table include any capital gain distributions from underlying funds, which are presented in the corresponding line-item in the Statement of Operations, if applicable.
Investment Valuation
The following is a summary of the inputs used, as of November 30, 2021, involving the Fund's assets and liabilities carried at fair value. The inputs or methodology used for valuing securities may not be an indication of the risk associated with investing in those securities. For more information on valuation inputs, and their aggregation into the levels used below, please refer to the Investment Valuation section in the accompanying Notes to Financial Statements.
| Valuation Inputs at Reporting Date: | ||||
| Description | Total | Level 1 | Level 2 | Level 3 |
| Investments in Securities: | ||||
| Municipal Securities | $3,729,623,266 | $-- | $3,729,623,266 | $-- |
| Municipal Bond Funds | 6,800,000 | -- | 6,800,000 | -- |
| Short-Term Funds | 791,869,767 | 791,869,767 | -- | -- |
| Money Market Funds | 1,070,235,679 | 1,070,235,679 | -- | -- |
| Total Investments in Securities: | $5,598,528,712 | $1,862,105,446 | $3,736,423,266 | $-- |
See accompanying notes which are an integral part of the financial statements.
Financial Statements
Statement of Assets and Liabilities
| November 30, 2021 (Unaudited) | ||
| Assets | ||
| Investment in securities, at value — See accompanying schedule: Unaffiliated issuers (cost $4,530,356,352) | $4,538,151,441 | |
| Fidelity Central Funds (cost $50,039,654) | 50,040,000 | |
| Other affiliated issuers (cost $1,010,280,796) | 1,010,337,271 | |
| Total Investment in Securities (cost $5,590,676,802) | $5,598,528,712 | |
| Cash | 3,256,826 | |
| Receivable for investments sold | 2,868,650 | |
| Receivable for fund shares sold | 1,946,359 | |
| Dividends receivable | 138,991 | |
| Interest receivable | 25,381,793 | |
| Distributions receivable from Fidelity Central Funds | 2,824 | |
| Prepaid expenses | 4,563 | |
| Other receivables | 5,797 | |
| Total assets | 5,632,134,515 | |
| Liabilities | ||
| Payable for investments purchased | ||
| Regular delivery | $29,491,268 | |
| Delayed delivery | 28,350,777 | |
| Payable for fund shares redeemed | 3,184,416 | |
| Distributions payable | 1,627,062 | |
| Accrued management fee | 285,527 | |
| Other payables and accrued expenses | 106,279 | |
| Total liabilities | 63,045,329 | |
| Net Assets | $5,569,089,186 | |
| Net Assets consist of: | ||
| Paid in capital | $5,562,205,763 | |
| Total accumulated earnings (loss) | 6,883,423 | |
| Net Assets | $5,569,089,186 | |
| Net Asset Value, offering price and redemption price per share ($5,569,089,186 ÷ 555,253,107 shares) | $10.03 |
See accompanying notes which are an integral part of the financial statements.
Statement of Operations
| Six months ended November 30, 2021 (Unaudited) | ||
| Investment Income | ||
| Dividends: | ||
| Unaffiliated issuers | $1,408,959 | |
| Affiliated issuers | 39,627 | |
| Interest | 11,227,548 | |
| Income from Fidelity Central Funds | 10,791 | |
| Total income | 12,686,925 | |
| Expenses | ||
| Management fee | $8,542,396 | |
| Custodian fees and expenses | 22,572 | |
| Independent trustees' fees and expenses | 19,806 | |
| Registration fees | 23,686 | |
| Audit | 32,990 | |
| Legal | 4,664 | |
| Miscellaneous | 16,061 | |
| Total expenses before reductions | 8,662,175 | |
| Expense reductions | (6,872,849) | |
| Total expenses after reductions | 1,789,326 | |
| Net investment income (loss) | 10,897,599 | |
| Realized and Unrealized Gain (Loss) | ||
| Net realized gain (loss) on: | ||
| Investment securities: | ||
| Unaffiliated issuers | (242,534) | |
| Fidelity Central Funds | 715 | |
| Capital gain distributions from underlying funds: | ||
| Affiliated issuers | 1,214 | |
| Total net realized gain (loss) | (240,605) | |
| Change in net unrealized appreciation (depreciation) on: | ||
| Investment securities: | ||
| Unaffiliated issuers | (10,042,374) | |
| Fidelity Central Funds | (715) | |
| Other affiliated issuers | 1 | |
| Total change in net unrealized appreciation (depreciation) | (10,043,088) | |
| Net gain (loss) | (10,283,693) | |
| Net increase (decrease) in net assets resulting from operations | $613,906 |
See accompanying notes which are an integral part of the financial statements.
Statement of Changes in Net Assets
| Six months ended November 30, 2021 (Unaudited) | Year ended May 31, 2021 | |
| Increase (Decrease) in Net Assets | ||
| Operations | ||
| Net investment income (loss) | $10,897,599 | $28,802,287 |
| Net realized gain (loss) | (240,605) | 455,658 |
| Change in net unrealized appreciation (depreciation) | (10,043,088) | 10,941,667 |
| Net increase (decrease) in net assets resulting from operations | 613,906 | 40,199,612 |
| Distributions to shareholders | (10,888,499) | (29,155,326) |
| Share transactions | ||
| Proceeds from sales of shares | 677,694,919 | 3,198,122,199 |
| Reinvestment of distributions | 2,539 | 11,827 |
| Cost of shares redeemed | (487,891,574) | (1,188,111,043) |
| Net increase (decrease) in net assets resulting from share transactions | 189,805,884 | 2,010,022,983 |
| Total increase (decrease) in net assets | 179,531,291 | 2,021,067,269 |
| Net Assets | ||
| Beginning of period | 5,389,557,895 | 3,368,490,626 |
| End of period | $5,569,089,186 | $5,389,557,895 |
| Other Information | ||
| Shares | ||
| Sold | 67,475,958 | 318,386,661 |
| Issued in reinvestment of distributions | 253 | 1,177 |
| Redeemed | (48,578,392) | (118,260,585) |
| Net increase (decrease) | 18,897,819 | 200,127,253 |
See accompanying notes which are an integral part of the financial statements.
Financial Highlights
Strategic Advisers Tax-Sensitive Short Duration Fund
| Six months ended (Unaudited) November 30, | Years endedMay 31, | ||||
| 2021 | 2021 | 2020 | 2019 | 2018 A | |
| Selected Per–Share Data | |||||
| Net asset value, beginning of period | $10.05 | $10.02 | $10.03 | $9.99 | $10.00 |
| Income from Investment Operations | |||||
| Net investment income (loss)B | .020 | .067 | .159 | .174 | .053 |
| Net realized and unrealized gain (loss) | (.020) | .034 | (.006) | .042 | (.014) |
| Total from investment operations | – | .101 | .153 | .216 | .039 |
| Distributions from net investment income | (.020) | (.070) | (.159) | (.173) | (.049) |
| Distributions from net realized gain | – | (.001) | (.004) | (.003) | – |
| Total distributions | (.020) | (.071) | (.163) | (.176) | (.049) |
| Net asset value, end of period | $10.03 | $10.05 | $10.02 | $10.03 | $9.99 |
| Total ReturnC,D | -% | 1.01% | 1.53% | 2.19% | .39% |
| Ratios to Average Net AssetsE,F | |||||
| Expenses before reductions | .31%G | .33% | .34% | .37% | .52%G |
| Expenses net of fee waivers, if any | .06%G | .08% | .09% | .12% | .26%G,H |
| Expenses net of all reductions | .06%G | .08% | .09% | .12% | .26%G,H |
| Net investment income (loss) | .40%G | .66% | 1.59% | 1.74% | 1.28%G |
| Supplemental Data | |||||
| Net assets, end of period (000 omitted) | $5,569,089 | $5,389,558 | $3,368,491 | $3,415,877 | $3,219,118 |
| Portfolio turnover rateI | 52%G | 86% | 81% | 57% | 180%J |
A For the period December 28, 2017 (commencement of operations) through May 31, 2018.
B Calculated based on average shares outstanding during the period.
C Total returns for periods of less than one year are not annualized.
D Total returns would have been lower if certain expenses had not been reduced during the applicable periods shown.
E Fees and expenses of any underlying mutual funds or exchange-traded funds (ETFs) are not included in the Fund's expense ratio. The Fund indirectly bears its proportionate share of these expenses. For additional expense information related to investments in Fidelity Central Funds, please refer to the "Investments in Fidelity Central Funds" note found in the Notes to Financial Statements section of the most recent Annual or Semi-Annual report.
F Expense ratios reflect operating expenses of the class. Expenses before reductions do not reflect amounts reimbursed, waived, or reduced through arrangements with the investment adviser, brokerage services, or other offset arrangements, if applicable, and do not represent the amount paid by the class during periods when reimbursements, waivers or reductions occur.
G Annualized
H Audit fees are not annualized.
I Amount does not include the portfolio activity of any underlying mutual funds or exchange-traded funds (ETFs).
J Amount not annualized.
See accompanying notes which are an integral part of the financial statements.
Notes to Financial Statements (Unaudited)
For the period ended November 30, 2021
1. Organization.
Strategic Advisers Tax-Sensitive Short Duration Fund (the Fund) is a fund of Fidelity Rutland Square Trust II (the Trust), and is authorized to issue an unlimited number of shares. The Trust is registered under the Investment Company Act of 1940, as amended (the 1940 Act), as an open-end management investment company organized as a Delaware statutory trust. The Fund is offered exclusively to certain managed account clients of Strategic Advisers LLC (Strategic Advisers), an affiliate of Fidelity Management & Research Company LLC (FMR).
2. Significant Accounting Policies.
The Fund is an investment company and applies the accounting and reporting guidance of the Financial Accounting Standards Board (FASB) Accounting Standards Codification Topic 946 Financial Services - Investment Companies. The financial statements have been prepared in conformity with accounting principles generally accepted in the United States of America (GAAP), which require management to make certain estimates and assumptions at the date of the financial statements. Actual results could differ from those estimates. Subsequent events, if any, through the date that the financial statements were issued have been evaluated in the preparation of the financial statements. The Fund's Schedule of Investments lists any underlying mutual funds or exchange-traded funds (ETFs) but does not include the underlying holdings of these funds. The following summarizes the significant accounting policies of the Fund:
Investment Valuation. Investments are valued as of 4:00 p.m. Eastern time on the last calendar day of the period. The Board of Trustees (the Board) has delegated the day to day responsibility for the valuation of the Fund's investments to the Fair Value Committee (the Committee) established by the Fund's investment adviser. In accordance with valuation policies and procedures approved by the Board, the Fund attempts to obtain prices from one or more third party pricing vendors or brokers to value its investments. When current market prices, quotations or currency exchange rates are not readily available or reliable, investments will be fair valued in good faith by the Committee, in accordance with procedures adopted by the Board. Factors used in determining fair value vary by investment type and may include market or investment specific events, changes in interest rates and credit quality. The frequency with which these procedures are used cannot be predicted and they may be utilized to a significant extent. The Committee oversees the Fund's valuation policies and procedures and reports to the Board on the Committee's activities and fair value determinations. The Board monitors the appropriateness of the procedures used in valuing the Fund's investments and ratifies the fair value determinations of the Committee.
The Fund categorizes the inputs to valuation techniques used to value its investments into a disclosure hierarchy consisting of three levels as shown below:
- Level 1 – quoted prices in active markets for identical investments
- Level 2 – other significant observable inputs (including quoted prices for similar investments, interest rates, prepayment speeds, etc.)
- Level 3 – unobservable inputs (including the Fund's own assumptions based on the best information available)
Valuation techniques used to value the Fund's investments by major category are as follows:
Debt securities, including restricted securities, are valued based on evaluated prices received from third party pricing vendors or from brokers who make markets in such securities. Municipal securities are valued by pricing vendors who utilize matrix pricing which considers yield or price of bonds of comparable quality, coupon, maturity and type or by broker-supplied prices. When independent prices are unavailable or unreliable, debt securities may be valued utilizing pricing methodologies which consider similar factors that would be used by third party pricing vendors. Debt securities are generally categorized as Level 2 in the hierarchy but may be Level 3 depending on the circumstances.
Investments in open-end mutual funds, including the Fidelity Central Funds, are valued at their closing net asset value (NAV) each business day and are categorized as Level 1 in the hierarchy. If an unaffiliated open-end mutual fund's NAV is unavailable, shares of that fund may be valued by another method that the Board believes reflects fair value in accordance with the Board's fair value pricing policies and is categorized as Level 2 in the hierarchy.
Changes in valuation techniques may result in transfers in or out of an assigned level within the disclosure hierarchy. The aggregate value of investments by input level as of November 30, 2021 is included at the end of the Fund's Schedule of Investments.
Investment Transactions and Income. For financial reporting purposes, the Fund's investment holdings and NAV include trades executed through the end of the last business day of the period. The NAV per share for processing shareholder transactions is calculated as of the close of business of the New York Stock Exchange (NYSE), normally 4:00 p.m. Eastern time and includes trades executed through the end of the prior business day. Gains and losses on securities sold are determined on the basis of identified cost. Dividend income is recorded on the ex-dividend date, except for certain dividends from foreign securities where the ex-dividend date may have passed, which are recorded as soon as the Fund is informed of the ex-dividend date. Non-cash dividends included in dividend income, if any, are recorded at the fair market value of the securities received. Income and capital gain distributions from Fidelity Central Funds, if any, are recorded on the ex-dividend date. Income and capital gain distributions from any underlying mutual funds or exchange-traded funds (ETFs) are recorded on the ex-dividend date. Interest income is accrued as earned and includes coupon interest and amortization of premium and accretion of discount on debt securities as applicable. Debt obligations may be placed on non-accrual status and related interest income may be reduced by ceasing current accruals and writing off interest receivables when the collection of all or a portion of interest has become doubtful based on consistently applied procedures. A debt obligation is removed from non-accrual status when the issuer resumes interest payments or when collectability of interest is reasonably assured.
Expenses. Expenses directly attributable to a fund are charged to that fund. Expenses attributable to more than one fund are allocated among the respective funds on the basis of relative net assets or other appropriate methods. Expenses included in the accompanying financial statements reflect the expenses of that fund and do not include any expenses associated with any underlying mutual funds or exchange-traded funds. Although not included in a fund's expenses, a fund indirectly bears its proportionate share of these expenses through the net asset value of each underlying mutual fund or exchange-traded fund. Expense estimates are accrued in the period to which they relate and adjustments are made when actual amounts are known.
Deferred Trustee Compensation. Under a Deferred Compensation Plan (the Plan) for certain Funds, certain independent Trustees have elected to defer receipt of a portion of their annual compensation. Deferred amounts are invested in affiliated mutual funds, are marked-to-market and remain in a fund until distributed in accordance with the Plan. The investment of deferred amounts and the offsetting payable to the Trustees presented below are included in the accompanying Statement of Assets and Liabilities in other receivables and other payables and accrued expenses, as applicable.
| Strategic Advisers Tax-Sensitive Short Duration Fund | $5,797 |
Income Tax Information and Distributions to Shareholders. Each year, the Fund intends to qualify as a regulated investment company under Subchapter M of the Internal Revenue Code, including distributing substantially all of its taxable income and realized gains. As a result, no provision for U.S. Federal income taxes is required. The Fund files a U.S. federal tax return, in addition to state and local tax returns as required. The Fund's federal income tax returns are subject to examination by the Internal Revenue Service (IRS) for a period of three fiscal years after they are filed. State and local tax returns may be subject to examination for an additional fiscal year depending on the jurisdiction.
Distributions are declared and recorded daily and paid monthly from net investment income. Distributions from realized gains, if any, are declared and recorded on the ex-dividend date. Income and capital gain distributions are determined in accordance with income tax regulations, which may differ from GAAP.
Capital accounts within the financial statements are adjusted for permanent book-tax differences. These adjustments have no impact on net assets or the results of operations. Capital accounts are not adjusted for temporary book-tax differences which will reverse in a subsequent period.
Book-tax differences are primarily due to market discount, deferred trustees compensation and losses deferred due to wash sales and excise tax regulations.
As of period end, the cost and unrealized appreciation (depreciation) in securities, and derivatives if applicable, for federal income tax purposes were as follows:
| Gross unrealized appreciation | $11,038,500 |
| Gross unrealized depreciation | (3,224,089) |
| Net unrealized appreciation (depreciation) | $7,814,411 |
| Tax cost | $5,590,714,301 |
Delayed Delivery Transactions and When-Issued Securities. During the period, certain Funds transacted in securities on a delayed delivery or when-issued basis. Payment and delivery may take place after the customary settlement period for that security. The price of the underlying securities and the date when the securities will be delivered and paid for are fixed at the time the transaction is negotiated. Securities purchased on a delayed delivery or when-issued basis are identified as such in the Schedule of Investments. Compensation for interest forgone in the purchase of a delayed delivery or when-issued debt security may be received. With respect to purchase commitments, each applicable Fund identifies securities as segregated in its records with a value at least equal to the amount of the commitment. Payables and receivables associated with the purchases and sales of delayed delivery securities having the same coupon, settlement date and broker are offset. Delayed delivery or when-issued securities that have been purchased from and sold to different brokers are reflected as both payables and receivables in the Statement of Assets and Liabilities under the caption "Delayed delivery", as applicable. Losses may arise due to changes in the value of the underlying securities or if the counterparty does not perform under the contract's terms, or if the issuer does not issue the securities due to political, economic, or other factors.
Restricted Securities (including Private Placements). Funds may invest in securities that are subject to legal or contractual restrictions on resale. These securities generally may be resold in transactions exempt from registration or to the public if the securities are registered. Disposal of these securities may involve time-consuming negotiations and expense, and prompt sale at an acceptable price may be difficult. Information regarding restricted securities held at period end is included at the end of the Schedule of Investments, if applicable.
3. Purchases and Sales of Investments.
Purchases and sales of securities, other than short-term securities and in-kind transactions, as applicable, are noted in the table below.
| Purchases ($) | Sales ($) | |
| Strategic Advisers Tax-Sensitive Short Duration Fund | 1,117,789,298 | 1,120,176,795 |
4. Fees and Other Transactions with Affiliates.
Management Fee. Strategic Advisers (the investment adviser) provides the Fund with investment management related services. For these services, the Fund pays a monthly management fee to the investment adviser. The management fee is calculated by adding the annual management fee rate of .25% of the Fund's average net assets throughout the month to the aggregate of the fee rates, payable monthly by the investment adviser, to the Fund's sub-advisers. The Fund's maximum aggregate management fee will not exceed .55% of the Fund's average net assets. For the reporting period, the total annualized management fee rate was .31% of the Fund's average net assets.
During the period, the investment adviser waived a portion of its management fee as described in the Expense Reductions note.
Sub-Advisers. FIAM LLC (an affiliate of the investment adviser), T. Rowe Price Associates, Inc. and Allspring Global Investments, LLC (formerly known as Wells Capital Management, Inc.) each served as a sub-adviser for the Fund during the period. Sub-advisers provide discretionary investment advisory services for their allocated portion of the Fund's assets and are paid as described in the Management Fee note.
Interfund Trades. Funds may purchase from or sell securities to other funds affiliated with each sub-adviser under procedures adopted by the Board. The procedures have been designed to ensure these interfund trades are executed in accordance with Rule 17a-7 of the 1940 Act. Any interfund trades are included within the respective purchases and sales amounts shown in the Purchases and Sales of Investments note. Interfund trades during the period are noted in the table below.
| Purchases ($) | Sales ($) | Realized Gain (Loss) ($) | |
| Strategic Advisers Tax-Sensitive Short Duration Fund | 29,030,000 | 19,655,000 | – |
Other. During the period, the investment adviser reimbursed the Fund for certain losses as follows:
| Amount ($) | |
| Strategic Advisers Tax-Sensitive Short Duration Fund | 1,830 |
5. Investments in Fidelity Central Funds.
Funds may invest in Fidelity Central Funds, which are open-end investment companies generally available only to other investment companies and accounts managed by the investment adviser and its affiliates. The Schedule of Investments lists any Fidelity Central Funds held as an investment as of period end, but does not include the underlying holdings of each Fidelity Central Fund. An investing fund indirectly bears its proportionate share of the expenses of the underlying Fidelity Central Funds.
Based on its investment objective, each Fidelity Central Fund may invest or participate in various investment vehicles or strategies that are similar to those of the investing fund. These strategies are consistent with the investment objectives of the investing fund and may involve certain economic risks which may cause a decline in value of each of the Fidelity Central Funds and thus a decline in the value of the investing fund.
| Fidelity Central Fund | Investment Manager | Investment Objective | Investment Practices | Expense Ratio(a) |
| Fidelity Money Market Central Funds | Fidelity Management & Research Company LLC (FMR) | Each fund seeks to obtain a high level of current income consistent with the preservation of capital and liquidity. | Short-term Investments | Less than .005% |
(a) Expenses expressed as a percentage of average net assets and are as of each underlying Central Fund's most recent annual or semi-annual shareholder report.
A complete unaudited list of holdings for each Fidelity Central Fund is available upon request or at the Securities and Exchange Commission website at www.sec.gov. In addition, the financial statements of the Fidelity Central Funds, which are not covered by the Report of Independent Registered Public Accounting Firm, are available on the Securities and Exchange Commission website or upon request.
6. Committed Line of Credit.
Certain Funds participate with other funds managed by the investment adviser or an affiliate in a $4.25 billion credit facility (the "line of credit") to be utilized for temporary or emergency purposes to fund shareholder redemptions or for other short-term liquidity purposes. The participating funds have agreed to pay commitment fees on their pro-rata portion of the line of credit, which are reflected in Miscellaneous expenses on the Statement of Operations, and are listed below. During the period, there were no borrowings on this line of credit.
| Amount | |
| Strategic Advisers Tax-Sensitive Short Duration Fund | $4,433 |
7. Expense Reductions.
The investment adviser has contractually agreed to waive the Fund's management fee in an amount equal to .25% of the Fund's average net assets until September 30, 2024. During the period, this waiver reduced the Fund's management fee by $ 6,872,849.
8. Other.
A fund's organizational documents provide former and current trustees and officers with a limited indemnification against liabilities arising in connection with the performance of their duties to the fund. In the normal course of business, a fund may also enter into contracts that provide general indemnifications. A fund's maximum exposure under these arrangements is unknown as this would be dependent on future claims that may be made against a fund. The risk of material loss from such claims is considered remote.
Funds do not invest in underlying mutual funds for the purpose of exercising management or control; however, investments by funds within their principal investment strategies may represent a significant portion of the underlying mutual fund's net assets. At the end of the period, certain Funds were the owners of record of 10% or more of the total outstanding shares of the following underlying mutual funds as shown below.
| Fund | Strategic Advisers Tax-Sensitive Short Duration Fund |
| Fidelity SAI Municipal Money Market Fund | 100% |
9. Coronavirus (COVID-19) Pandemic.
An outbreak of COVID-19 first detected in China during December 2019 has since spread globally and was declared a pandemic by the World Health Organization during March 2020. Developments that disrupt global economies and financial markets, such as the COVID-19 pandemic, may magnify factors that affect the Fund's performance.
Shareholder Expense Example
As a shareholder, you incur two types of costs: (1) transaction costs, which may include sales charges (loads) on purchase payments or redemption proceeds, as applicable and (2) ongoing costs, which generally include management fees, distribution and/or service (12b-1) fees and other Fund expenses. This Example is intended to help you understand your ongoing costs (in dollars) of investing in a fund and to compare these costs with the ongoing costs of investing in other mutual funds.
The Example is based on an investment of $1,000 invested at the beginning of the period and held for the entire period (June 1, 2021 to November 30, 2021).
Actual Expenses
The first line of the accompanying table provides information about actual account values and actual expenses. You may use the information in this line, together with the amount you invested, to estimate the expenses that you paid over the period. Simply divide your account value by $1,000.00 (for example, an $8,600 account value divided by $1,000.00 = 8.6), then multiply the result by the number in the first line for a class/Fund under the heading entitled "Expenses Paid During Period" to estimate the expenses you paid on your account during this period. If any fund is a shareholder of any underlying mutual funds or exchange-traded funds (ETFs) (the Underlying Funds), such fund indirectly bears its proportional share of the expenses of the Underlying Funds in addition to the direct expenses incurred presented in the table. These fees and expenses are not included in the annualized expense ratio used to calculate the expense estimate in the table below.
Hypothetical Example for Comparison Purposes
The second line of the accompanying table provides information about hypothetical account values and hypothetical expenses based on the actual expense ratio and an assumed rate of return of 5% per year before expenses, which is not the actual return. The hypothetical account values and expenses may not be used to estimate the actual ending account balance or expenses you paid for the period. You may use this information to compare the ongoing costs of investing in the Fund and other funds. To do so, compare this 5% hypothetical example with the 5% hypothetical examples that appear in the shareholder reports of the other funds. If any fund is a shareholder of any Underlying Funds, such fund indirectly bears its proportional share of the expenses of the Underlying Funds in addition to the direct expenses as presented in the table. These fees and expenses are not included in the annualized expense ratio used to calculate the expense estimate in the table below.
Please note that the expenses shown in the table are meant to highlight your ongoing costs only and do not reflect any transaction costs. Therefore, the second line of the table is useful in comparing ongoing costs only, and will not help you determine the relative total costs of owning different funds. In addition, if these transactional costs were included, your costs would have been higher.
| Annualized Expense Ratio-A | Beginning Account Value June 1, 2021 | Ending Account Value November 30, 2021 | Expenses Paid During Period-B June 1, 2021 to November 30, 2021 | |
| Strategic Advisers Tax-Sensitive Short Duration Fund | .06% | |||
| Actual | $1,000.00 | $1,000.00 | $.30 | |
| Hypothetical-C | $1,000.00 | $1,024.77 | $.30 |
A Annualized expense ratio reflects expenses net of applicable fee waivers.
B Expenses are equal to the annualized expense ratio, multiplied by the average account value over the period, multiplied by 183/ 365 (to reflect the one-half year period). The fees and expenses of any Underlying Funds are not included in each annualized expense ratio.
C 5% return per year before expenses
Board Approval of Investment Advisory Contracts and Management Fees
Strategic Advisers Tax-Sensitive Short Duration Fund
Each year, the Board of Trustees, including the Independent Trustees (together, the Board), votes at a meeting on the renewal of the management contract with Strategic Advisers LLC (Strategic Advisers), the sub-advisory agreements with FIAM LLC, T. Rowe Price Associates, Inc., and Wells Capital Management, Inc. (Wells Cap) (each a Sub-Adviser and collectively, the Sub-Advisers) (collectively, the Sub-Advisory Agreements), and the sub-sub-advisory agreements with FMR Investment Management (UK) Limited, Fidelity Management & Research (Japan) Limited, and Fidelity Management & Research (Hong Kong) Limited (collectively, the Sub-Sub-Advisory Agreements and, together with the management contract and the Sub-Advisory Agreements, the Advisory Contracts) for the fund. Strategic Advisers and the Sub-Advisers are referred to herein as the Investment Advisers. The Board, assisted by the advice of fund counsel and Independent Trustees' counsel, requests and considers a broad range of information relevant to the renewal of the Advisory Contracts throughout the year.The Board meets at least four times per year and, at each of its meetings, covers an extensive agenda of topics and materials and considers factors that are relevant to its annual consideration of the renewal of the fund's Advisory Contracts, including the services and support provided to the fund and its shareholders. The full Board or the Independent Trustees, as appropriate, act on all major matters; however, a portion of the activities of the Board (including certain of those described herein) may be conducted through standing committees that have been established by the Board. The Board, acting directly and through its committees, requests and receives information concerning the annual consideration of the renewal of the fund's Advisory Contracts.At its September 2021 meeting, the Board, including the Independent Trustees, unanimously determined to renew the fund's Advisory Contracts. In addition, the Board approved a prospective new sub-advisory agreement with Wells Cap (New Wells Cap Agreement) to take effect upon consummation of a transaction that is expected to result in a change of control of Wells Cap (Transaction). The Board noted that it had previously approved a separate prospective new sub-advisory agreement with Wells Cap in connection with the Transaction, which never became effective and expired on September 30, 2021. The Board further noted that the New Wells Cap Agreement has the same terms as the previously approved prospective sub-advisory agreement with Wells Cap except that the New Wells Cap Agreement has been updated to include Wells Cap's new name, Allspring Global Investments, LLC, and is for an initial one-year term.In reaching its determination to renew the fund's Advisory Contracts and approve the New Wells Cap Agreement, the Board considered all factors it believed relevant, including (i) the nature, extent, and quality of the services provided to the fund and its shareholders (including the investment performance of the fund); (ii) the competitiveness relative to peer funds of the fund's management fee and total expenses; (iii) the total costs of the services provided by and the profits, if any, realized by Strategic Advisers from its relationships with the fund; and (iv) the extent to which, if any, economies of scale exist and are realized as the fund grows and whether any economies of scale are appropriately shared with fund shareholders.In considering whether to renew the Advisory Contracts for the fund and approve the New Wells Cap Agreement, the Board reached a determination, with the assistance of fund counsel and Independent Trustees' counsel and through the exercise of its business judgment, that the renewal of the Advisory Contracts and the approval of the New Wells Cap Agreement is in the best interests of the fund and its shareholders. In addition, with respect to the Sub-Advisory Agreements, the Board also concluded that the renewal of such agreements and the approval of the New Wells Cap Agreement do not involve a conflict of interest from which Strategic Advisers or its affiliates derive an inappropriate advantage. Also, the Board found that the advisory fees charged under the Advisory Contracts bear a reasonable relationship to the services rendered and are based on services provided that are in addition to, rather than duplicative of, services provided under the advisory contract of any underlying fund in which the fund may invest. The Board's decision to renew the Advisory Contracts and approve the New Wells Cap Agreement was not based on any single factor, but rather was based on a comprehensive consideration of all the information provided to the Board throughout the year.Nature, Extent, and Quality of Services Provided. The Board considered the staffing within the Investment Advisers, including the backgrounds of the fund's investment personnel and also considered the fund's investment objective, strategies, and related investment philosophy. The Independent Trustees also had discussions with senior management of Strategic Advisers' investment operations and investment groups. The Board considered the structure of each Investment Adviser's investment personnel compensation program and whether such structures provide appropriate incentives to act in the best interests of the fund. The Board also considered steps taken by the Investment Advisers to continue to provide the same nature, extent, and quality of services to the funds during the COVID-19 pandemic.The Trustees also discussed with representatives of Strategic Advisers, at meetings throughout the year, Strategic Advisers' role in, among other things, (i) setting, implementing and monitoring the investment strategies for the funds; (ii) identifying and recommending sub-advisers for the funds; (iii) overseeing compliance with federal securities laws by each sub-adviser with respect to the portion of fund assets allocated to the sub-adviser; (iv) monitoring and overseeing the performance and investment capabilities of each sub-adviser; and (v) recommending the replacement of a sub-adviser as appropriate. The Trustees considered that the Board had received from Strategic Advisers substantial information and periodic reports about Strategic Advisers' sub-adviser oversight and due diligence processes, as well as periodic reports regarding the performance of each sub-adviser.The Board also considered the nature, extent and quality of services provided by each Sub-Adviser. The Trustees noted that under the Sub-Advisory Agreements subject to oversight by Strategic Advisers, each Sub-Adviser is responsible for, among other things, identifying investments for the portion of fund assets allocated to the Sub-Adviser, if any, and executing portfolio transactions to implement its investment strategy. In addition, the Trustees noted that each Sub-Adviser is responsible for providing such reporting as may be requested from Strategic Advisers to fulfill its oversight responsibilities discussed above.Resources Dedicated to Investment Management and Support Services. The Board reviewed the general qualifications and capabilities of the Investment Advisers' investment staffs, their use of technology, and the Investment Advisers' approach to managing and compensating investment personnel. The Board noted that the Investment Advisers' analysts have extensive resources, tools, and capabilities that allow them to conduct sophisticated quantitative and/or fundamental analysis. Additionally, in its deliberations, the Board considered the Investment Advisers' trading capabilities and resources and global compliance infrastructure, which are integral parts of the investment management process.Shareholder and Administrative Services. The Board considered (i) the nature, extent, quality, and cost of administrative and shareholder services performed by Strategic Advisers and itsaffiliates under the management contract and under separate agreements covering transfer agency, pricing and bookkeeping, and securities lending services for the fund; (ii) the nature and extent of Strategic Advisers' supervision of third party service providers, including sub-advisers, custodians and subcustodians; and (iii) the resources devoted to, and the record of compliance with, the fund's compliance policies and procedures.Investment Performance. The Board considered whether the fund has operated in accordance with its investment objective, as well as its record of compliance with its investment restrictions and its performance history.In connection with the renewal of the Advisory Contracts, the Board considered annualized return information for the fund for different time periods, measured against an appropriate securities market index (benchmark index) and a peer group of mutual funds with similar objectives (peer group).The Board considered discussions that occur at Board meetings throughout the year with representatives of Strategic Advisers about fund investment performance and the performance of each Sub-Adviser as part of regularly scheduled fund reviews and other reports to the Board on fund performance, taking into account various factors including general market conditions. In its discussions with representatives of Strategic Advisers regarding fund performance, the Board gave particular attention to information indicating underperformance of certain funds for specific time periods and discussed with Strategic Advisers the reasons for any such underperformance.The following charts considered by the Board show, over the one- and three-year periods ended December 31, 2020, the cumulative total returns of the fund and the cumulative total returns of an appropriate benchmark index and peer group. The box within each chart shows the 25th percentile return (75% beaten, top of box) and the 75th percentile return (25% beaten, bottom of box) of the peer group. Returns shown above the box are in the first quartile and returns shown below the box are in the fourth quartile. The percentage beaten number noted below each chart corresponds to the percentile box and represents the percentage of funds in the peer group whose performance was equal to or lower than that of the fund.

![]()
TSS-SANN-0122
1.9885905.103
Strategic Advisers® Fidelity® U.S. Total Stock Fund
Offered exclusively to certain managed account clients of Strategic Advisers LLC or its affiliates - not available for sale to the general public
Semi-Annual Report
November 30, 2021
Contents
Board Approval of Investment Advisory Contracts and Management Fees |
To view a fund's proxy voting record for the 12-month period ended June 30, visit http://www.fidelity.com/proxyvotingresults or visit the Securities and Exchange Commission's (SEC) web site at http://www.sec.gov.
You may also call 1-800-544-3455 to request a free copy of the proxy voting guidelines.
Standard & Poor's, S&P and S&P 500 are registered service marks of The McGraw-Hill Companies, Inc. and have been licensed for use by Fidelity Distributors Corporation.
Other third-party marks appearing herein are the property of their respective owners.
All other marks appearing herein are registered or unregistered trademarks or service marks of FMR LLC or an affiliated company. © 2022 FMR LLC. All rights reserved.
This report and the financial statements contained herein are submitted for the general information of the shareholders of the Fund. This report is not authorized for distribution to prospective investors in the Fund unless preceded or accompanied by an effective prospectus.
A fund files its complete schedule of portfolio holdings with the SEC for the first and third quarters of each fiscal year on Form N-PORT. Forms N-PORT are available on the SEC’s web site at http://www.sec.gov. A fund's Forms N-PORT may be reviewed and copied at the SEC’s Public Reference Room in Washington, DC. Information regarding the operation of the SEC's Public Reference Room may be obtained by calling 1-800-SEC-0330.
For a complete list of a fund's portfolio holdings, view the most recent holdings listing, semiannual report, or annual report on Fidelity's web site at http://www.fidelity.com, http://www.institutional.fidelity.com, or http://www.401k.com, as applicable.
NOT FDIC INSURED •MAY LOSE VALUE •NO BANK GUARANTEE
Neither the Fund nor Fidelity Distributors Corporation is a bank.
Note to Shareholders:
Early in 2020, the outbreak and spread of COVID-19 emerged as a public health emergency that had a major influence on financial markets, primarily based on its impact on the global economy and corporate earnings. On March 11, 2020, the World Health Organization declared the COVID-19 outbreak a pandemic, citing sustained risk of further global spread. The pandemic prompted a number of measures to limit the spread of COVID-19, including travel and border restrictions, quarantines, and restrictions on large gatherings. In turn, these resulted in lower consumer activity, diminished demand for a wide range of products and services, disruption in manufacturing and supply chains, and – given the wide variability in outcomes regarding the outbreak – significant market uncertainty and volatility. To help stem the turmoil, the U.S. government took unprecedented action – in concert with the U.S. Federal Reserve and central banks around the world – to help support consumers, businesses, and the broader economy, and to limit disruption to the financial system.
In general, the overall impact of the pandemic lessened in 2021, amid a resilient economy and widespread distribution of three COVID-19 vaccines granted emergency use authorization from the U.S. Food and Drug Administration (FDA) early in the year. Still, the situation remains dynamic, and the extent and duration of its influence on financial markets and the economy is highly uncertain, due in part to a recent spike in cases based on highly contagious variants of the coronavirus.
Extreme events such as the COVID-19 crisis are exogenous shocks that can have significant adverse effects on mutual funds and their investments. Although multiple asset classes may be affected by market disruption, the duration and impact may not be the same for all types of assets. Fidelity is committed to helping you stay informed amid news about COVID-19 and during increased market volatility, and we continue to take extra steps to be responsive to customer needs. We encourage you to visit us online, where we offer ongoing updates, commentary, and analysis on the markets and our funds.
Investment Summary (Unaudited)
The information in the following tables is based on the direct investments of the Fund.Top Ten Holdings as of November 30, 2021
| (excluding cash equivalents) | % of fund's net assets |
| Fidelity SAI U.S. Quality Index Fund | 12.0 |
| Fidelity Growth Company Fund | 11.5 |
| Fidelity Contrafund | 7.1 |
| Fidelity Magellan Fund | 5.9 |
| Fidelity Large Cap Value Enhanced Index Fund | 4.5 |
| Fidelity SAI U.S. Value Index Fund | 3.6 |
| Fidelity SAI U.S. Low Volatility Index Fund | 3.5 |
| Fidelity SAI U.S. Momentum Index Fund | 2.6 |
| Microsoft Corp. | 1.9 |
| Fidelity Extended Market Index Fund | 1.4 |
| 54.0 |
Asset Allocation (% of fund's net assets)
| As of November 30, 2021 | ||
| Common Stocks | 43.3% | |
| Preferred Stocks | 0.2% | |
| Large Blend Funds | 4.8% | |
| Large Growth Funds | 39.6% | |
| Large Value Funds | 8.1% | |
| Mid-Cap Growth Funds | 1.4% | |
| Small Blend Funds | 1.3% | |
| Small Growth Funds | 0.8% | |
| Short-Term Investments and Net Other Assets (Liabilities) | 0.5% | |
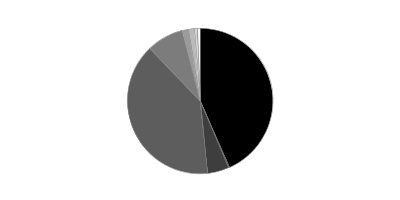
Asset allocations of funds in the pie chart reflect the categorizations of assets as defined by Morningstar as of the reporting date.
Schedule of Investments November 30, 2021 (Unaudited)
Showing Percentage of Net Assets
| Common Stocks - 43.3% | |||
| Shares | Value | ||
| COMMUNICATION SERVICES - 3.6% | |||
| Diversified Telecommunication Services - 0.3% | |||
| AT&T, Inc. | 1,332,700 | $30,425,541 | |
| Cellnex Telecom SA (a) | 74,800 | 4,414,589 | |
| Cogent Communications Group, Inc. | 4,400 | 329,692 | |
| Deutsche Telekom AG | 978,800 | 17,239,299 | |
| Liberty Global PLC Class C (b) | 1,164,600 | 31,024,944 | |
| Verizon Communications, Inc. | 2,211,209 | 111,157,476 | |
| 194,591,541 | |||
| Entertainment - 0.4% | |||
| Activision Blizzard, Inc. | 594,644 | 34,846,138 | |
| Cinemark Holdings, Inc. (b)(c) | 362,100 | 5,619,792 | |
| IMAX Corp. (b) | 14,690 | 242,238 | |
| Netflix, Inc. (b) | 91,800 | 58,926,420 | |
| Nihon Falcom Corp. | 5,000 | 59,141 | |
| Nintendo Co. Ltd. ADR | 334,483 | 18,423,324 | |
| Sea Ltd. ADR (b) | 100,900 | 29,066,263 | |
| Take-Two Interactive Software, Inc. (b) | 48,598 | 8,061,436 | |
| The Walt Disney Co. (b) | 824,622 | 119,487,728 | |
| Universal Music Group NV | 1,276,883 | 36,651,740 | |
| Zynga, Inc. (b) | 744,700 | 4,490,541 | |
| 315,874,761 | |||
| Interactive Media & Services - 1.7% | |||
| Alphabet, Inc.: | |||
| Class A (b) | 227,092 | 644,475,741 | |
| Class C (b) | 54,730 | 155,927,959 | |
| Dip Corp. | 320,000 | 11,267,307 | |
| Meta Platforms, Inc. Class A (b) | 1,032,000 | 334,842,720 | |
| QuinStreet, Inc. (b) | 22,080 | 338,045 | |
| Snap, Inc. Class A (b) | 337,100 | 16,049,331 | |
| Tongdao Liepin Group (b) | 1,265,703 | 2,480,116 | |
| Ziff Davis, Inc. (b) | 6,030 | 686,636 | |
| ZIGExN Co. Ltd. | 1,550,000 | 4,237,183 | |
| Zoominfo Technologies, Inc. (b) | 146,500 | 9,039,050 | |
| 1,179,344,088 | |||
| Media - 1.1% | |||
| Altice U.S.A., Inc. Class A (b) | 187,300 | 2,966,832 | |
| AMC Networks, Inc. Class A (b)(c) | 20,000 | 772,200 | |
| Cogeco Communications, Inc. | 20,000 | 1,528,514 | |
| Comcast Corp. Class A | 8,021,401 | 400,909,622 | |
| Corus Entertainment, Inc. Class B (non-vtg.) | 95,400 | 368,173 | |
| Discovery Communications, Inc.: | |||
| Class A (b) | 550,000 | 12,798,500 | |
| Class C (non-vtg.) (b) | 1,350,000 | 30,658,500 | |
| F@N Communications, Inc. | 26,900 | 96,144 | |
| Fox Corp. Class A | 474,333 | 16,938,431 | |
| Hyundai HCN | 486,513 | 1,706,443 | |
| iHeartMedia, Inc. (b)(c) | 1,010,450 | 19,814,925 | |
| Intage Holdings, Inc. | 5,000 | 77,454 | |
| Interpublic Group of Companies, Inc. | 4,340,725 | 144,068,663 | |
| Magnite, Inc. (b) | 393,400 | 6,935,642 | |
| Meredith Corp. (b) | 1,400 | 82,600 | |
| News Corp. Class A | 1,097,800 | 23,734,436 | |
| Nexstar Broadcasting Group, Inc. Class A | 730 | 109,135 | |
| Nippon Television Network Corp. | 70,700 | 719,290 | |
| Pico Far East Holdings Ltd. | 1,000,000 | 161,580 | |
| Sinclair Broadcast Group, Inc. Class A (c) | 50,000 | 1,166,500 | |
| TechTarget, Inc. (b) | 227,550 | 21,988,157 | |
| Thryv Holdings, Inc. (b) | 5,750 | 224,768 | |
| Trenders, Inc. | 150,000 | 1,089,486 | |
| ViacomCBS, Inc. Class B | 550,000 | 17,022,500 | |
| WOWOW INC. | 100,000 | 1,799,443 | |
| WPP PLC | 2,663,100 | 36,964,137 | |
| 744,702,075 | |||
| Wireless Telecommunication Services - 0.1% | |||
| KDDI Corp. | 100,000 | 2,901,518 | |
| Okinawa Cellular Telephone Co. | 43,400 | 1,885,204 | |
| T-Mobile U.S., Inc. (b) | 379,875 | 41,334,199 | |
| 46,120,921 | |||
| TOTAL COMMUNICATION SERVICES | 2,480,633,386 | ||
| CONSUMER DISCRETIONARY - 4.3% | |||
| Auto Components - 0.3% | |||
| Adient PLC (b) | 881,700 | 37,428,165 | |
| Akwel | 25,000 | 567,050 | |
| Aptiv PLC (b) | 299,200 | 47,976,720 | |
| BorgWarner, Inc. | 814,903 | 35,269,002 | |
| Cie Automotive SA | 125,000 | 3,470,346 | |
| Cooper-Standard Holding, Inc. (b) | 35,000 | 808,150 | |
| DaikyoNishikawa Corp. | 604,000 | 2,869,448 | |
| DTR Automotive Corp. | 15,029 | 758,322 | |
| Eagle Industry Co. Ltd. | 71,400 | 647,454 | |
| G-Tekt Corp. | 650,000 | 7,665,325 | |
| Gentex Corp. | 64,000 | 2,203,520 | |
| Hi-Lex Corp. | 200,300 | 2,888,389 | |
| IJTT Co. Ltd. | 450,000 | 2,105,985 | |
| Lear Corp. | 275,000 | 46,142,250 | |
| Linamar Corp. | 300,000 | 17,223,375 | |
| Murakami Corp. | 70,000 | 1,701,155 | |
| Patrick Industries, Inc. | 22,450 | 1,790,837 | |
| Plastic Omnium SA | 125,000 | 3,135,787 | |
| Topre Corp. | 350,000 | 3,378,157 | |
| TPR Co. Ltd. | 500,000 | 6,051,223 | |
| 224,080,660 | |||
| Automobiles - 0.4% | |||
| Daimler AG (Germany) | 572,800 | 53,917,836 | |
| General Motors Co. (b) | 285,246 | 16,507,186 | |
| Renault SA (b) | 60,000 | 1,936,589 | |
| Rivian Automotive, Inc. | 157,400 | 18,850,224 | |
| Tesla, Inc. (b) | 143,800 | 164,616,488 | |
| 255,828,323 | |||
| Distributors - 0.0% | |||
| Arata Corp. | 25,000 | 851,506 | |
| Harima-Kyowa Co. Ltd. | 39,600 | 600,823 | |
| LKQ Corp. | 12,600 | 704,340 | |
| Yagi & Co. Ltd. | 60,045 | 738,378 | |
| 2,895,047 | |||
| Diversified Consumer Services - 0.0% | |||
| Adtalem Global Education, Inc. (b) | 51,320 | 1,522,664 | |
| Heian Ceremony Service Co. Ltd. | 175,000 | 1,334,542 | |
| Laureate Education, Inc. Class A | 20,900 | 209,000 | |
| MegaStudy Co. Ltd. | 79,794 | 856,492 | |
| Multicampus Co. Ltd. | 33,128 | 1,016,368 | |
| Service Corp. International | 489,442 | 32,381,483 | |
| 37,320,549 | |||
| Hotels, Restaurants & Leisure - 0.6% | |||
| Bally's Corp. (b) | 4,720 | 180,965 | |
| Betsson AB (B Shares) | 200,000 | 1,112,528 | |
| Booking Holdings, Inc. (b) | 56,467 | 118,685,164 | |
| Caesars Entertainment, Inc. (b) | 168,661 | 15,191,296 | |
| Churchill Downs, Inc. | 208,000 | 46,637,760 | |
| El Pollo Loco Holdings, Inc. (b) | 13,970 | 176,301 | |
| Elior SA (a)(b) | 557,345 | 3,583,922 | |
| Everi Holdings, Inc. (b) | 43,310 | 898,249 | |
| Expedia, Inc. (b) | 117,466 | 18,922,598 | |
| Golden Entertainment, Inc. (b) | 4,970 | 228,173 | |
| Jack in the Box, Inc. | 6,180 | 510,468 | |
| Las Vegas Sands Corp. (b) | 1,083,100 | 38,580,022 | |
| Marriott International, Inc. Class A (b) | 541,400 | 79,888,984 | |
| Marriott Vacations Worldwide Corp. | 324,920 | 49,599,038 | |
| NeoGames SA | 5,380 | 179,262 | |
| Noodles & Co. (b) | 23,010 | 236,773 | |
| Penn National Gaming, Inc. (b) | 289,400 | 14,825,962 | |
| Red Rock Resorts, Inc. | 5,370 | 255,290 | |
| Starbucks Corp. | 64,102 | 7,028,143 | |
| The Restaurant Group PLC (b) | 1,271,237 | 1,347,473 | |
| Tosho Co. Ltd. | 5,000 | 74,048 | |
| 398,142,419 | |||
| Household Durables - 0.5% | |||
| Cuckoo Holdings Co. Ltd. | 111,735 | 1,714,017 | |
| ES-Con Japan Ltd. | 25,000 | 165,878 | |
| FJ Next Co. Ltd. | 600,000 | 5,164,772 | |
| GoPro, Inc. Class A (b)(c) | 1,146,400 | 11,464,000 | |
| Gree Electric Appliances, Inc. of Zhuhai (A Shares) | 750,013 | 4,072,789 | |
| Haseko Corp. | 25,000 | 296,930 | |
| Helen of Troy Ltd. (b)(c) | 160,900 | 38,696,450 | |
| Hinokiya Holdings Co. Ltd. | 25,000 | 468,439 | |
| Installed Building Products, Inc. | 1,430 | 184,599 | |
| Lennar Corp. Class A | 525,300 | 55,182,765 | |
| Mohawk Industries, Inc. (b) | 207,261 | 34,792,904 | |
| Open House Co. Ltd. | 5,000 | 284,868 | |
| Portmeirion Group PLC (b) | 23,413 | 211,739 | |
| Pressance Corp. | 1,225,100 | 18,576,736 | |
| PulteGroup, Inc. | 1,015,500 | 50,805,465 | |
| Sony Group Corp. sponsored ADR | 103,900 | 12,660,215 | |
| Taylor Morrison Home Corp. (b) | 14,340 | 445,400 | |
| Tempur Sealy International, Inc. | 39,390 | 1,687,468 | |
| Token Corp. | 5,000 | 395,895 | |
| TopBuild Corp. (b) | 1,810 | 488,320 | |
| TRI Pointe Homes, Inc. (b) | 12,860 | 321,114 | |
| Tupperware Brands Corp. (b) | 1,800 | 28,152 | |
| Whirlpool Corp. | 379,752 | 82,687,200 | |
| 320,796,115 | |||
| Internet & Direct Marketing Retail - 0.9% | |||
| Alibaba Group Holding Ltd. sponsored ADR (b) | 246,800 | 31,474,404 | |
| Amazon.com, Inc. (b) | 138,000 | 483,975,660 | |
| Aucfan Co. Ltd. (b) | 25,000 | 124,961 | |
| Chewy, Inc. (b)(c) | 34,700 | 2,368,622 | |
| eBay, Inc. | 605,100 | 40,820,046 | |
| Global-e Online Ltd. (c) | 84,700 | 5,627,468 | |
| Hyundai Home Shopping Network Corp. | 4,861 | 251,435 | |
| Locondo, Inc. | 10,000 | 100,677 | |
| Moneysupermarket.com Group PLC | 400,000 | 1,070,344 | |
| Oisix Ra Daichi, Inc. (b) | 5,000 | 147,742 | |
| Papyless Co. Ltd. | 100,000 | 983,766 | |
| Porch Group, Inc. Class A (b)(c) | 617,932 | 13,001,289 | |
| Syuppin Co. Ltd. | 5,000 | 43,040 | |
| The RealReal, Inc. (b)(c) | 762,400 | 11,870,568 | |
| Vipshop Holdings Ltd. ADR (b) | 25,000 | 244,250 | |
| 592,104,272 | |||
| Leisure Products - 0.0% | |||
| Brunswick Corp. | 341,182 | 32,040,402 | |
| Clarus Corp. | 4,580 | 120,866 | |
| 32,161,268 | |||
| Multiline Retail - 0.1% | |||
| Big Lots, Inc. (c) | 250,000 | 10,845,000 | |
| Dollar General Corp. | 276,900 | 61,277,970 | |
| Europris ASA (a) | 5,000 | 34,662 | |
| Macy's, Inc. | 50,000 | 1,425,000 | |
| Max Stock Ltd. | 250,000 | 924,031 | |
| Ollie's Bargain Outlet Holdings, Inc. (b)(c) | 9,950 | 615,806 | |
| Ryohin Keikaku Co. Ltd. | 10,000 | 162,339 | |
| 75,284,808 | |||
| Specialty Retail - 1.0% | |||
| Academy Sports & Outdoors, Inc. (b) | 17,890 | 798,252 | |
| America's Car Mart, Inc. (b) | 1,310 | 128,563 | |
| American Eagle Outfitters, Inc. (c) | 10,390 | 268,997 | |
| Arcland Sakamoto Co. Ltd. | 100,000 | 1,467,687 | |
| AT-Group Co. Ltd. | 225,000 | 2,641,438 | |
| Auto1 Group SE (a) | 173,200 | 4,871,368 | |
| Bed Bath & Beyond, Inc. (b)(c) | 350,000 | 6,415,500 | |
| Best Buy Co., Inc. | 784,000 | 83,778,240 | |
| Burlington Stores, Inc. (b) | 146,600 | 42,972,858 | |
| Dick's Sporting Goods, Inc. | 8,230 | 967,519 | |
| Dunelm Group PLC | 200,000 | 3,574,906 | |
| Floor & Decor Holdings, Inc. Class A (b) | 203,600 | 26,246,076 | |
| Foot Locker, Inc. | 1,100,000 | 50,204,000 | |
| Genesco, Inc. (b) | 25,000 | 1,580,000 | |
| Hour Glass Ltd. | 1,871,200 | 2,961,996 | |
| JB Hi-Fi Ltd. | 5,000 | 171,761 | |
| JD Sports Fashion PLC | 4,375,000 | 12,969,506 | |
| Kid ASA (a) | 25,000 | 307,920 | |
| Ku Holdings Co. Ltd. | 100,000 | 826,293 | |
| Lithia Motors, Inc. Class A (sub. vtg.) | 1,800 | 524,394 | |
| Lookers PLC (b) | 828,728 | 643,665 | |
| Lowe's Companies, Inc. | 383,208 | 93,728,845 | |
| Mandarake, Inc. | 43,600 | 223,333 | |
| Sally Beauty Holdings, Inc. (b) | 1,038,800 | 20,350,092 | |
| Samse SA | 4,000 | 900,475 | |
| The Children's Place, Inc. (b) | 2,930 | 253,533 | |
| The Container Store Group, Inc. (b) | 14,440 | 167,937 | |
| The Home Depot, Inc. | 380,600 | 152,472,166 | |
| TJX Companies, Inc. | 960,400 | 66,651,760 | |
| Tokatsu Holdings Co. Ltd. | 18,700 | 67,663 | |
| Ulta Beauty, Inc. (b) | 168,500 | 64,695,575 | |
| Urban Outfitters, Inc. (b) | 350,000 | 11,084,500 | |
| 654,916,818 | |||
| Textiles, Apparel & Luxury Goods - 0.5% | |||
| Capri Holdings Ltd. (b) | 125,000 | 7,402,500 | |
| Carter's, Inc. | 110,000 | 11,113,300 | |
| Columbia Sportswear Co. | 351,500 | 34,281,795 | |
| Crocs, Inc. (b) | 8,360 | 1,371,207 | |
| Deckers Outdoor Corp. (b) | 109,455 | 44,373,057 | |
| Embry Holdings Ltd. | 280,000 | 36,625 | |
| Fossil Group, Inc. (b) | 30,000 | 358,500 | |
| G-III Apparel Group Ltd. (b) | 258,190 | 7,652,752 | |
| Hagihara Industries, Inc. | 25,000 | 293,272 | |
| Levi Strauss & Co. Class A | 1,633,400 | 41,766,038 | |
| NIKE, Inc. Class B | 705,500 | 119,398,820 | |
| PVH Corp. | 207,100 | 22,114,138 | |
| Rocky Brands, Inc. | 12,010 | 426,715 | |
| Seiren Co. Ltd. | 10,000 | 201,088 | |
| Sitoy Group Holdings Ltd. | 2,613,000 | 177,596 | |
| Skechers U.S.A., Inc. Class A (sub. vtg.) (b) | 12,370 | 555,660 | |
| Steven Madden Ltd. | 7,070 | 335,472 | |
| Tapestry, Inc. | 997,200 | 40,007,664 | |
| Ted Baker PLC (b) | 418,192 | 617,354 | |
| Wolverine World Wide, Inc. | 14,070 | 437,999 | |
| 332,921,552 | |||
| TOTAL CONSUMER DISCRETIONARY | 2,926,451,831 | ||
| CONSUMER STAPLES - 2.5% | |||
| Beverages - 0.4% | |||
| Anheuser-Busch InBev SA NV ADR (c) | 20,600 | 1,147,832 | |
| Britvic PLC | 500,000 | 5,918,277 | |
| Diageo PLC sponsored ADR | 174,805 | 35,515,132 | |
| Keurig Dr. Pepper, Inc. | 548,500 | 18,643,515 | |
| Monster Beverage Corp. (b) | 551,600 | 46,213,048 | |
| Primo Water Corp. | 14,400 | 239,328 | |
| The Coca-Cola Co. | 3,633,486 | 190,576,341 | |
| Yantai Changyu Pioneer Wine Co. Ltd. (B Shares) | 690,621 | 1,223,953 | |
| 299,477,426 | |||
| Food & Staples Retailing - 0.7% | |||
| Alimentation Couche-Tard, Inc. Class A (multi-vtg.) | 380,000 | 13,975,028 | |
| Amsterdam Commodities NV (b) | 40,700 | 1,100,865 | |
| Belc Co. Ltd. | 15,000 | 698,014 | |
| BJ's Wholesale Club Holdings, Inc. (b) | 14,070 | 930,731 | |
| Costco Wholesale Corp. | 19,600 | 10,571,848 | |
| Daiichi Co. Ltd. | 10,000 | 76,702 | |
| G-7 Holdings, Inc. | 443,600 | 6,491,037 | |
| Grocery Outlet Holding Corp. (b) | 6,900 | 199,824 | |
| Halows Co. Ltd. | 77,768 | 1,821,134 | |
| Natural Grocers by Vitamin Cottage, Inc. | 50,000 | 643,000 | |
| Nihon Chouzai Co. Ltd. | 13,400 | 150,200 | |
| Ocado Group PLC (b) | 30,400 | 725,929 | |
| OM2 Network Co. Ltd. | 70,900 | 733,870 | |
| Performance Food Group Co. (b) | 828,869 | 33,411,709 | |
| Qol Holdings Co. Ltd. | 425,000 | 5,192,418 | |
| Retail Partners Co. Ltd. | 154,400 | 1,655,530 | |
| Sapporo Clinical Laboratory | 15,000 | 169,992 | |
| Satoh & Co. Ltd. | 12,300 | 162,027 | |
| Sprouts Farmers Market LLC (b)(c) | 1,500,000 | 39,690,000 | |
| Sundrug Co. Ltd. | 1,000 | 26,443 | |
| Sysco Corp. | 1,452,955 | 101,764,968 | |
| U.S. Foods Holding Corp. (b) | 2,277,870 | 71,570,675 | |
| Walgreens Boots Alliance, Inc. | 1,325,000 | 59,360,000 | |
| Walmart, Inc. | 959,200 | 134,892,296 | |
| YAKUODO Holdings Co. Ltd. | 85,000 | 1,607,732 | |
| Yaoko Co. Ltd. | 2,000 | 118,370 | |
| 487,740,342 | |||
| Food Products - 0.3% | |||
| Armanino Foods of Distinction | 10,000 | 33,400 | |
| Axyz Co. Ltd. | 30,000 | 832,043 | |
| Bunge Ltd. | 273,400 | 23,668,238 | |
| Darling Ingredients, Inc. (b) | 4,140 | 279,533 | |
| Delsole Corp. | 65,000 | 309,948 | |
| Freshpet, Inc. (b) | 175,100 | 18,914,302 | |
| Ingredion, Inc. | 175,000 | 16,297,750 | |
| Kaneko Seeds Co. Ltd. | 88,900 | 1,060,178 | |
| Lamb Weston Holdings, Inc. | 138,450 | 7,188,324 | |
| LDC SA | 10,059 | 1,079,188 | |
| Lotte Samkang Co. Ltd. | 1,500 | 403,785 | |
| Mondelez International, Inc. | 1,355,000 | 79,863,700 | |
| Origin Enterprises PLC | 179,000 | 705,439 | |
| Pickles Corp. | 100,000 | 1,561,463 | |
| Prima Meat Packers Ltd. | 20,000 | 419,516 | |
| S Foods, Inc. | 200,000 | 5,812,359 | |
| Shinobu Food Products Co. Ltd. | 50,000 | 289,291 | |
| Sunjuice Holdings Co. Ltd. | 50,000 | 643,511 | |
| SunOpta, Inc. (b) | 15,510 | 92,595 | |
| Toyo Sugar Refining Co. Ltd. | 39,400 | 392,832 | |
| Tyson Foods, Inc. Class A | 559,700 | 44,193,912 | |
| Whole Earth Brands, Inc. Class A (b)(c) | 54,290 | 573,302 | |
| 204,614,609 | |||
| Household Products - 0.7% | |||
| Central Garden & Pet Co. Class A (non-vtg.) (b) | 1,400 | 60,690 | |
| Colgate-Palmolive Co. | 11,200 | 840,224 | |
| Energizer Holdings, Inc. | 5,440 | 202,314 | |
| Procter & Gamble Co. | 2,156,600 | 311,801,228 | |
| Reckitt Benckiser Group PLC | 551,800 | 44,697,487 | |
| Reynolds Consumer Products, Inc. (c) | 5,000 | 145,900 | |
| Spectrum Brands Holdings, Inc. | 556,473 | 55,702,947 | |
| The Clorox Co. | 187,800 | 30,583,230 | |
| Transaction Co. Ltd. | 75,000 | 641,615 | |
| 444,675,635 | |||
| Personal Products - 0.2% | |||
| Estee Lauder Companies, Inc. Class A | 249,100 | 82,718,637 | |
| Hengan International Group Co. Ltd. | 1,100,000 | 5,310,977 | |
| Herbalife Nutrition Ltd. (b) | 150,000 | 5,604,000 | |
| The Beauty Health Co. (c) | 500,000 | 12,980,000 | |
| USANA Health Sciences, Inc. (b) | 1,000 | 99,720 | |
| 106,713,334 | |||
| Tobacco - 0.2% | |||
| Altria Group, Inc. | 3,425,381 | 146,058,246 | |
| KT&G Corp. | 40,099 | 2,775,662 | |
| Scandinavian Tobacco Group A/S (a) | 32,565 | 598,384 | |
| Swedish Match Co. AB | 981,600 | 7,170,781 | |
| 156,603,073 | |||
| TOTAL CONSUMER STAPLES | 1,699,824,419 | ||
| ENERGY - 2.1% | |||
| Energy Equipment & Services - 0.1% | |||
| Aspen Aerogels, Inc. (b) | 6,740 | 385,258 | |
| Baker Hughes Co. Class A | 130,900 | 3,055,206 | |
| Cactus, Inc. | 5,820 | 212,430 | |
| Championx Corp. (b) | 34,800 | 710,268 | |
| Halliburton Co. | 780,100 | 16,842,359 | |
| Helix Energy Solutions Group, Inc. (b) | 14,230 | 43,259 | |
| High Arctic Energy Services, Inc. | 362,600 | 425,770 | |
| Liberty Oilfield Services, Inc. Class A (b) | 520,709 | 4,790,523 | |
| Natural Gas Services Group, Inc. (b) | 27,390 | 291,977 | |
| Oceaneering International, Inc. (b) | 287,508 | 3,073,461 | |
| Schlumberger Ltd. | 173,000 | 4,961,640 | |
| Subsea 7 SA | 1,121,800 | 7,875,936 | |
| Weatherford International PLC (b) | 102,400 | 2,944,000 | |
| 45,612,087 | |||
| Oil, Gas & Consumable Fuels - 2.0% | |||
| Africa Oil Corp. (b)(c) | 3,743,500 | 5,333,414 | |
| Antero Resources Corp. (b) | 356,680 | 6,263,301 | |
| APA Corp. | 710,500 | 18,309,585 | |
| ARC Resources Ltd. | 5,540 | 48,615 | |
| Baytex Energy Corp. (b)(c) | 2,463,500 | 7,096,700 | |
| Bonterra Energy Corp. (b) | 218,300 | 963,804 | |
| Canadian Natural Resources Ltd. (c) | 918,100 | 37,544,752 | |
| Cenovus Energy, Inc.: | |||
| warrants 1/1/26 (b) | 117,180 | 845,747 | |
| (Canada) | 7,410,754 | 87,946,323 | |
| China Petroleum & Chemical Corp.: | |||
| (H Shares) | 31,000,100 | 13,513,242 | |
| sponsored ADR (H Shares) | 9,600 | 420,000 | |
| Civitas Resources, Inc. (c) | 95,065 | 4,858,772 | |
| Clean Energy Fuels Corp. (b)(c) | 18,170 | 130,279 | |
| CNX Resources Corp. (b)(c) | 259,630 | 3,541,353 | |
| ConocoPhillips Co. | 118,400 | 8,303,392 | |
| Delek U.S. Holdings, Inc. (b) | 550,000 | 8,624,000 | |
| Diamondback Energy, Inc. | 382,900 | 40,866,917 | |
| Enterprise Products Partners LP | 400,000 | 8,556,000 | |
| EQT Corp. (b) | 1,400,000 | 27,202,000 | |
| Exxon Mobil Corp. | 8,829,845 | 528,377,925 | |
| Frontline Ltd. (NY Shares) (b)(c) | 10,000 | 68,500 | |
| Genesis Energy LP | 1,011,900 | 10,210,071 | |
| Harbour Energy PLC (b) | 2,730,370 | 14,278,097 | |
| Headwater Exploration, Inc. (b) | 254,000 | 906,681 | |
| Hess Corp. | 1,689,763 | 125,921,139 | |
| Imperial Oil Ltd. | 478,900 | 15,831,498 | |
| Iwatani Corp. | 30,000 | 1,520,768 | |
| Kosmos Energy Ltd. (b) | 6,769,727 | 24,777,201 | |
| Magnolia Oil & Gas Corp. Class A | 2,339,360 | 44,377,659 | |
| Marathon Oil Corp. | 450,000 | 6,970,500 | |
| MEG Energy Corp. (b) | 2,211,425 | 18,003,695 | |
| Motor Oil (HELLAS) Corinth Refineries SA | 111,300 | 1,691,419 | |
| Murphy Oil Corp. | 572,037 | 15,204,743 | |
| National Energy Services Reunited Corp. (b) | 55,430 | 549,311 | |
| Oil & Natural Gas Corp. Ltd. | 17,750,000 | 33,585,553 | |
| Oil India Ltd. | 2,300,000 | 6,481,957 | |
| Ovintiv, Inc. | 12,410 | 431,372 | |
| Parex Resources, Inc. | 1,848,500 | 29,635,039 | |
| PDC Energy, Inc. | 1,340 | 67,576 | |
| Petronet LNG Ltd. | 1,500,000 | 4,391,145 | |
| Phillips 66 Co. | 536,368 | 37,100,575 | |
| Range Resources Corp. (b) | 1,964,330 | 38,422,295 | |
| Renewable Energy Group, Inc. (b)(c) | 5,000 | 238,900 | |
| Sinopec Kantons Holdings Ltd. | 5,064,000 | 1,844,288 | |
| Southwestern Energy Co. (b) | 6,250,084 | 28,000,376 | |
| Star Petroleum Refining PCL (b) | 2,366,800 | 632,740 | |
| Thai Oil PCL (For. Reg.) | 468,100 | 646,566 | |
| Total SA sponsored ADR | 750,000 | 34,492,500 | |
| Tourmaline Oil Corp. | 1,065,000 | 35,440,252 | |
| Tsakos Energy Navigation Ltd. (c) | 10,000 | 72,700 | |
| Unit Corp. warrants 9/3/27 (b)(c)(d) | 55,938 | 65,468 | |
| Valero Energy Corp. | 177,000 | 11,848,380 | |
| Whiting Petroleum Corp. (b) | 220,311 | 14,251,919 | |
| Whiting Petroleum Corp.: | |||
| warrants 9/1/24 (b) | 1,220 | 12,786 | |
| warrants 9/1/25 (b) | 610 | 6,283 | |
| 1,366,726,073 | |||
| TOTAL ENERGY | 1,412,338,160 | ||
| FINANCIALS - 6.7% | |||
| Banks - 3.1% | |||
| Arrow Financial Corp. | 70,000 | 2,415,000 | |
| Associated Banc-Corp. | 2,278,100 | 49,890,390 | |
| Bancorp, Inc., Delaware (b) | 19,530 | 552,113 | |
| Bank of America Corp. (e) | 12,142,473 | 539,975,774 | |
| Bank OZK | 19,510 | 872,292 | |
| Bank7 Corp. | 10,000 | 229,900 | |
| BankUnited, Inc. | 870,848 | 34,520,415 | |
| Byline Bancorp, Inc. | 7,100 | 184,387 | |
| Camden National Corp. | 4,490 | 205,732 | |
| Chesapeake Financial Shares, Inc. | 5,000 | 147,800 | |
| Citizens Financial Group, Inc. | 466,012 | 22,028,387 | |
| Citizens Financial Services, Inc. | 5,010 | 303,305 | |
| CNB Financial Corp., Pennsylvania (c) | 125,000 | 3,293,750 | |
| Comerica, Inc. | 131,500 | 10,852,695 | |
| Credit Agricole Atlantique Vendee | 7,800 | 796,846 | |
| Cullen/Frost Bankers, Inc. | 134,600 | 16,944,794 | |
| Eagle Bancorp, Inc. (c) | 65,000 | 3,662,750 | |
| East West Bancorp, Inc. | 5,000 | 385,000 | |
| EFG Eurobank Ergasias SA (b) | 8,216,400 | 8,190,715 | |
| Embassy Bancorp, Inc. | 5,000 | 99,000 | |
| Enterprise Bancorp, Inc. | 5,000 | 197,100 | |
| First Foundation, Inc. | 47,840 | 1,216,093 | |
| First Horizon National Corp. | 3,066,670 | 49,465,387 | |
| First Northwest Bancorp | 21,710 | 396,208 | |
| First of Long Island Corp. | 49,800 | 1,043,310 | |
| FNB Corp., Pennsylvania | 127,720 | 1,489,215 | |
| Great Southern Bancorp, Inc. | 70,000 | 3,894,100 | |
| Gunma Bank Ltd. | 468,400 | 1,371,614 | |
| Hanmi Financial Corp. | 26,030 | 584,894 | |
| Hirogin Holdings, Inc. | 65,700 | 361,529 | |
| Independent Bank Corp. | 4,820 | 108,691 | |
| JPMorgan Chase & Co. | 1,914,173 | 304,028,098 | |
| M&T Bank Corp. | 627,698 | 92,026,804 | |
| NIBC Holding NV (a)(c) | 15,000 | 119,081 | |
| Nicolet Bankshares, Inc. (b)(c) | 30,000 | 2,139,300 | |
| Northrim Bancorp, Inc. | 10,000 | 405,500 | |
| Ogaki Kyoritsu Bank Ltd. | 51,400 | 805,320 | |
| Old Second Bancorp, Inc. | 3,400 | 41,990 | |
| Orrstown Financial Services, Inc. | 8,200 | 191,880 | |
| PacWest Bancorp | 1,407,539 | 62,973,295 | |
| Parke Bancorp, Inc. | 10,000 | 205,000 | |
| Piraeus Financial Holdings SA (b) | 3,013,900 | 4,361,450 | |
| Plumas Bancorp | 145,000 | 4,957,550 | |
| PNC Financial Services Group, Inc. | 1,129,203 | 222,452,991 | |
| Professional Holdings Corp. (A Shares) (b)(c) | 11,590 | 220,674 | |
| Sbanken ASA (a) | 149,998 | 1,567,221 | |
| Seven Bank Ltd. | 500,000 | 1,008,537 | |
| Shinsei Bank Ltd. (c) | 82,500 | 1,391,952 | |
| Signature Bank | 31,400 | 9,492,220 | |
| Silvergate Capital Corp. (b) | 82,200 | 16,808,256 | |
| Societe Generale Series A | 370,461 | 11,527,747 | |
| Standard Chartered PLC (United Kingdom) | 843,500 | 4,668,985 | |
| Sterling Bancorp | 53,110 | 1,317,659 | |
| SVB Financial Group (b) | 30,700 | 21,254,531 | |
| Texas Capital Bancshares, Inc. (b) | 160,000 | 9,011,200 | |
| The Bank of NT Butterfield & Son Ltd. | 23,770 | 875,449 | |
| The Bank of Princeton | 5,000 | 149,050 | |
| The Keiyo Bank Ltd. | 148,400 | 554,030 | |
| The San-In Godo Bank Ltd. | 142,300 | 710,021 | |
| Truist Financial Corp. | 1,001,842 | 59,419,249 | |
| U.S. Bancorp | 857,740 | 47,467,332 | |
| UniCredit SpA | 606,800 | 7,326,388 | |
| Union Bankshares, Inc. (c) | 30,000 | 939,000 | |
| United Community Bank, Inc. | 18,440 | 631,939 | |
| Univest Corp. of Pennsylvania | 32,230 | 888,581 | |
| Washington Trust Bancorp, Inc. | 190,000 | 10,222,000 | |
| Wells Fargo & Co. | 10,368,117 | 495,388,630 | |
| West Bancorp., Inc. (c) | 25,000 | 775,750 | |
| Western Alliance Bancorp. | 3,770 | 413,871 | |
| Yamaguchi Financial Group, Inc. | 127,800 | 702,117 | |
| 2,155,119,834 | |||
| Capital Markets - 1.2% | |||
| Affiliated Managers Group, Inc. | 292,100 | 49,694,973 | |
| Bank of New York Mellon Corp. | 1,652,950 | 90,565,131 | |
| BlackRock, Inc. Class A | 81,975 | 74,155,405 | |
| BrightSphere Investment Group, Inc. | 26,840 | 806,005 | |
| Cboe Global Markets, Inc. | 97,600 | 12,584,544 | |
| CI Financial Corp. | 2,250,000 | 49,598,810 | |
| CME Group, Inc. | 88,500 | 19,516,020 | |
| Cowen Group, Inc. Class A | 11,320 | 400,502 | |
| Daou Data Corp. | 1,000 | 10,987 | |
| Federated Hermes, Inc. (c) | 250,000 | 8,427,500 | |
| Focus Financial Partners, Inc. Class A (b) | 9,100 | 560,014 | |
| Goldman Sachs Group, Inc. | 51,824 | 19,744,426 | |
| Hennessy Advisors, Inc. (c) | 10,000 | 106,700 | |
| Intercontinental Exchange, Inc. | 348,700 | 45,582,064 | |
| Invesco Ltd. | 764,300 | 17,066,819 | |
| KKR & Co. LP | 528,607 | 39,354,791 | |
| Lazard Ltd. Class A | 991,063 | 42,239,105 | |
| Morgan Stanley | 915,443 | 86,802,305 | |
| Northern Trust Corp. | 1,052,266 | 121,747,176 | |
| Patria Investments Ltd. | 27,310 | 466,455 | |
| Perella Weinberg Partners Class A (c) | 18,160 | 216,467 | |
| Raymond James Financial, Inc. | 204,859 | 20,135,591 | |
| State Street Corp. (e) | 1,168,476 | 103,959,310 | |
| StepStone Group, Inc. Class A | 238,299 | 9,858,430 | |
| Van Lanschot NV (Bearer) | 5,800 | 137,476 | |
| Virtu Financial, Inc. Class A | 140,789 | 3,967,434 | |
| Virtus Investment Partners, Inc. | 2,050 | 609,629 | |
| 818,314,069 | |||
| Consumer Finance - 0.6% | |||
| Aeon Credit Service (Asia) Co. Ltd. | 5,000,000 | 3,135,419 | |
| Ally Financial, Inc. | 363,900 | 16,677,537 | |
| American Express Co. | 245,217 | 37,346,549 | |
| Capital One Financial Corp. | 420,635 | 59,111,837 | |
| Discover Financial Services | 1,098,948 | 118,521,542 | |
| First Cash Financial Services, Inc. | 442,096 | 28,223,409 | |
| Navient Corp. | 150,000 | 2,959,500 | |
| OneMain Holdings, Inc. | 1,375,359 | 68,479,125 | |
| Santander Consumer U.S.A. Holdings, Inc. | 175,000 | 7,306,250 | |
| Shriram Transport Finance Co. Ltd. | 188,146 | 3,524,167 | |
| Synchrony Financial | 1,250,000 | 55,987,500 | |
| 401,272,835 | |||
| Diversified Financial Services - 0.5% | |||
| Berkshire Hathaway, Inc.: | |||
| Class A (b) | 2 | 833,752 | |
| Class B (b) | 1,035,559 | 286,528,820 | |
| BFF Bank SpA (a) | 693,800 | 5,224,608 | |
| Cannae Holdings, Inc. (b) | 8,120 | 240,108 | |
| Fuyo General Lease Co. Ltd. | 100,000 | 6,352,015 | |
| Jackson Financial, Inc. (c) | 1,300,000 | 41,158,000 | |
| Local Bounti Corp. (f) | 364,047 | 2,152,610 | |
| WeWork, Inc. (b) | 209,650 | 1,821,859 | |
| Zenkoku Hosho Co. Ltd. | 100,000 | 4,388,021 | |
| 348,699,793 | |||
| Insurance - 1.0% | |||
| AFLAC, Inc. | 1,300,000 | 70,382,000 | |
| AIA Group Ltd. | 272,600 | 2,869,783 | |
| American International Group, Inc. | 479,100 | 25,200,660 | |
| Arthur J. Gallagher & Co. | 165,209 | 26,912,546 | |
| ASR Nederland NV | 150,000 | 6,418,439 | |
| Assurant, Inc. | 234,930 | 35,732,853 | |
| Axis Capital Holdings Ltd. | 14,330 | 711,914 | |
| BRP Group, Inc. (b)(c) | 745,030 | 27,595,911 | |
| Chubb Ltd. | 555,966 | 99,779,218 | |
| Db Insurance Co. Ltd. | 600,000 | 27,282,408 | |
| Enstar Group Ltd. (b) | 1,280 | 285,568 | |
| Hartford Financial Services Group, Inc. | 516,159 | 34,118,110 | |
| Hyundai Fire & Marine Insurance Co. Ltd. | 435,000 | 8,456,025 | |
| Investors Title Co. | 6,000 | 1,296,000 | |
| Legal & General Group PLC | 100,000 | 374,913 | |
| Marsh & McLennan Companies, Inc. | 226,100 | 37,084,922 | |
| NN Group NV | 150,203 | 7,484,969 | |
| Primerica, Inc. | 268,700 | 39,539,205 | |
| Prudential Financial, Inc. | 100,000 | 10,226,000 | |
| Prudential PLC (b) | 155,200 | 2,621,524 | |
| Qualitas Controladora S.A.B. de CV | 49,200 | 214,835 | |
| Reinsurance Group of America, Inc. | 147,750 | 14,022,953 | |
| Selectquote, Inc. (b)(c) | 50,000 | 450,000 | |
| Sul America SA unit | 10,803 | 47,963 | |
| The Travelers Companies, Inc. | 1,160,745 | 170,571,478 | |
| Willis Towers Watson PLC | 242,600 | 54,788,784 | |
| 704,468,981 | |||
| Mortgage Real Estate Investment Trusts - 0.1% | |||
| Hannon Armstrong Sustainable Infrastructure Capital, Inc. | 2,670 | 151,870 | |
| New Residential Investment Corp. | 4,340,700 | 46,141,641 | |
| Redwood Trust, Inc. | 26,250 | 336,525 | |
| 46,630,036 | |||
| Thrifts & Mortgage Finance - 0.2% | |||
| ASAX Co. Ltd. | 188,500 | 1,140,656 | |
| Axos Financial, Inc. (b) | 55,000 | 3,113,550 | |
| Bridgewater Bancshares, Inc. (b) | 17,010 | 290,701 | |
| Enact Holdings, Inc. | 300,000 | 6,228,000 | |
| Equitable Group, Inc. | 50,000 | 2,919,097 | |
| Essent Group Ltd. | 1,105,750 | 45,977,085 | |
| Federal Agricultural Mortgage Corp. Class C (non-vtg.) | 35,000 | 4,260,200 | |
| Genworth Mortgage Insurance Ltd. | 600,000 | 958,070 | |
| Greene County Bancorp, Inc. | 205,000 | 6,929,000 | |
| MGIC Investment Corp. | 3,196,775 | 45,074,528 | |
| NMI Holdings, Inc. (b) | 44,470 | 871,612 | |
| Radian Group, Inc. | 736,342 | 14,999,287 | |
| Sangsangin Co. Ltd. (b) | 35,000 | 227,480 | |
| Southern Missouri Bancorp, Inc. | 35,000 | 1,869,350 | |
| 134,858,616 | |||
| TOTAL FINANCIALS | 4,609,364,164 | ||
| HEALTH CARE - 6.2% | |||
| Biotechnology - 0.9% | |||
| 89Bio, Inc. (b)(c) | 8,550 | 112,946 | |
| ADC Therapeutics SA (b)(c) | 235,800 | 5,248,908 | |
| Agios Pharmaceuticals, Inc. (b)(c) | 134,700 | 4,798,014 | |
| Akouos, Inc. (b)(c) | 420 | 3,230 | |
| Allakos, Inc. (b) | 1,600 | 125,360 | |
| Alnylam Pharmaceuticals, Inc. (b) | 176,100 | 32,367,180 | |
| Ambrx Biopharma, Inc. ADR | 132,050 | 1,234,668 | |
| Arcutis Biotherapeutics, Inc. (b) | 174,120 | 2,885,168 | |
| Argenx SE ADR (b) | 90,910 | 25,382,981 | |
| Ascendis Pharma A/S sponsored ADR (b) | 132,513 | 18,156,931 | |
| Atara Biotherapeutics, Inc. (b) | 280,000 | 5,009,200 | |
| Aurinia Pharmaceuticals, Inc. (b) | 14,750 | 277,890 | |
| Avid Bioservices, Inc. (b)(c) | 321,520 | 9,825,651 | |
| BioAtla, Inc. | 100,230 | 2,530,808 | |
| BioCryst Pharmaceuticals, Inc. (b)(c) | 1,383,500 | 16,685,010 | |
| Blueprint Medicines Corp. (b) | 399,848 | 38,465,378 | |
| Bolt Biotherapeutics, Inc. | 3,600 | 33,372 | |
| Cell Biotech Co. Ltd. | 75,959 | 1,226,201 | |
| Celldex Therapeutics, Inc. (b) | 492,319 | 18,757,354 | |
| Century Therapeutics, Inc. (c) | 166,390 | 3,179,713 | |
| Cerevel Therapeutics Holdings (b) | 6,530 | 203,671 | |
| Connect Biopharma Holdings Ltd. ADR (c) | 400 | 1,740 | |
| Crinetics Pharmaceuticals, Inc. (b) | 153,900 | 4,204,548 | |
| Cytokinetics, Inc. (b) | 244,890 | 9,633,973 | |
| Erasca, Inc. (c) | 336,260 | 4,764,804 | |
| Essex Bio-Technology Ltd. | 700,000 | 494,614 | |
| Exelixis, Inc. (b) | 228,000 | 3,828,120 | |
| Forma Therapeutics Holdings, Inc. (b)(c) | 1,680 | 24,343 | |
| Fusion Pharmaceuticals, Inc. (b)(c) | 450 | 2,610 | |
| Generation Bio Co. (b)(c) | 130,660 | 2,243,432 | |
| Gilead Sciences, Inc. | 325,000 | 22,402,250 | |
| Global Blood Therapeutics, Inc. (b) | 15,370 | 434,356 | |
| Graphite Bio, Inc. (c) | 930 | 8,389 | |
| Gritstone Bio, Inc. (b) | 138,500 | 1,828,200 | |
| Heron Therapeutics, Inc. (b)(c) | 29,900 | 282,555 | |
| Imago BioSciences, Inc. (c) | 115,000 | 2,572,550 | |
| ImmunoGen, Inc. (b) | 3,860,750 | 23,820,828 | |
| Innovent Biologics, Inc. (a)(b) | 1,280,000 | 11,383,432 | |
| Insmed, Inc. (b)(c) | 221,600 | 6,098,432 | |
| Instil Bio, Inc. (c) | 220,190 | 4,839,776 | |
| Intercept Pharmaceuticals, Inc. (b)(c) | 367,582 | 6,326,086 | |
| Iovance Biotherapeutics, Inc. (b) | 7,180 | 134,410 | |
| Kalvista Pharmaceuticals, Inc. (b) | 10,170 | 147,465 | |
| Kinnate Biopharma, Inc. (c) | 230 | 4,595 | |
| Krystal Biotech, Inc. (b)(c) | 234,270 | 18,870,449 | |
| Kura Oncology, Inc. (b) | 8,330 | 116,287 | |
| Macrogenics, Inc. (b) | 9,960 | 175,296 | |
| Mirati Therapeutics, Inc. (b) | 80,850 | 11,057,855 | |
| Natera, Inc. (b) | 376,700 | 34,452,982 | |
| Nuvalent, Inc. Class A (c) | 128,000 | 2,730,240 | |
| ORIC Pharmaceuticals, Inc. (b) | 1,320 | 18,269 | |
| Poseida Therapeutics, Inc. (b)(c) | 2,900 | 20,155 | |
| Prelude Therapeutics, Inc. (b)(c) | 16,180 | 231,212 | |
| PTC Therapeutics, Inc. (b) | 220,920 | 8,209,387 | |
| RAPT Therapeutics, Inc. (b) | 490,790 | 16,024,294 | |
| Regeneron Pharmaceuticals, Inc. (b) | 218,900 | 139,336,417 | |
| Relay Therapeutics, Inc. (b)(c) | 225,380 | 6,630,680 | |
| Repare Therapeutics, Inc. (b) | 100 | 2,347 | |
| Revolution Medicines, Inc. (b) | 10,180 | 281,579 | |
| Sarepta Therapeutics, Inc. (b) | 91,500 | 7,394,115 | |
| Scholar Rock Holding Corp. (b)(c) | 190 | 5,045 | |
| Shattuck Labs, Inc. (b)(c) | 152,300 | 1,291,504 | |
| Stoke Therapeutics, Inc. (b)(c) | 17,010 | 423,549 | |
| TG Therapeutics, Inc. (b)(c) | 317,550 | 4,826,760 | |
| United Therapeutics Corp. (b) | 75,000 | 14,212,500 | |
| Vaxcyte, Inc. (b) | 102,400 | 2,086,912 | |
| Vertex Pharmaceuticals, Inc. (b) | 62,600 | 11,702,444 | |
| Verve Therapeutics, Inc. | 106,600 | 3,632,928 | |
| Xencor, Inc. (b) | 180,000 | 6,519,600 | |
| Zentalis Pharmaceuticals, Inc. (b)(c) | 162,580 | 13,339,689 | |
| Zymeworks, Inc. (b) | 160,000 | 3,217,600 | |
| 598,801,237 | |||
| Health Care Equipment & Supplies - 0.7% | |||
| Abbott Laboratories | 50,100 | 6,301,077 | |
| Axonics Modulation Technologies, Inc. (b)(c) | 629,200 | 34,234,772 | |
| Becton, Dickinson & Co. | 69,725 | 16,534,587 | |
| Boston Scientific Corp. (b) | 4,263,709 | 162,319,402 | |
| Butterfly Network, Inc. Class A (b)(c) | 1,244,160 | 8,771,328 | |
| DexCom, Inc. (b) | 10,800 | 6,075,972 | |
| Envista Holdings Corp. (b) | 425,984 | 16,528,179 | |
| Fukuda Denshi Co. Ltd. | 125,000 | 9,112,222 | |
| Heska Corp. (b) | 1,920 | 309,043 | |
| Hologic, Inc. (b) | 210,000 | 15,693,300 | |
| InBody Co. Ltd. | 215,000 | 4,015,872 | |
| Inogen, Inc. (b) | 4,690 | 143,280 | |
| Insulet Corp. (b) | 145,428 | 41,947,252 | |
| Intuitive Surgical, Inc. (b) | 25,800 | 8,367,972 | |
| iRhythm Technologies, Inc. (b)(c) | 1,909 | 201,590 | |
| Koninklijke Philips Electronics NV (depositary receipt) (NY Reg.) | 239,100 | 8,411,538 | |
| Masimo Corp. (b) | 30,000 | 8,343,600 | |
| Meridian Bioscience, Inc. (b) | 30,000 | 597,300 | |
| Penumbra, Inc. (b) | 162,000 | 39,795,300 | |
| Pulmonx Corp. (b) | 60 | 1,938 | |
| Tandem Diabetes Care, Inc. (b)(c) | 384,260 | 49,385,095 | |
| Value Added Technology Co. Ltd. | 150,000 | 4,158,285 | |
| Vieworks Co. Ltd. | 375,000 | 11,251,458 | |
| ViewRay, Inc. (b) | 5,953,910 | 30,603,097 | |
| 483,103,459 | |||
| Health Care Providers & Services - 2.5% | |||
| Acadia Healthcare Co., Inc. (b) | 5,690 | 319,607 | |
| Addus HomeCare Corp. (b)(c) | 3,870 | 337,541 | |
| agilon health, Inc. | 360,000 | 7,920,000 | |
| Alignment Healthcare, Inc. (c) | 500,000 | 8,105,000 | |
| AMN Healthcare Services, Inc. (b) | 6,720 | 766,147 | |
| Anthem, Inc. | 385,000 | 156,398,550 | |
| Cano Health, Inc. (b) | 1,000,000 | 9,340,000 | |
| Cardinal Health, Inc. | 569,727 | 26,338,479 | |
| Centene Corp. (b) | 2,771,900 | 197,941,379 | |
| Cigna Corp. | 1,446,055 | 277,497,955 | |
| Covetrus, Inc. (b) | 139,200 | 2,502,816 | |
| CVS Health Corp. | 1,484,038 | 132,168,424 | |
| Guardant Health, Inc. (b) | 49,100 | 5,161,392 | |
| Hanger, Inc. (b) | 11,660 | 196,704 | |
| HCA Holdings, Inc. | 95,000 | 21,431,050 | |
| Humana, Inc. | 405,600 | 170,234,376 | |
| Laboratory Corp. of America Holdings (b) | 50,000 | 14,266,500 | |
| LHC Group, Inc. (b) | 3,740 | 429,053 | |
| LifeStance Health Group, Inc. (c) | 500,000 | 3,970,000 | |
| McKesson Corp. | 340,774 | 73,866,172 | |
| MEDNAX, Inc. (b) | 1,211,850 | 29,763,036 | |
| Modivcare, Inc. (b) | 1,640 | 224,729 | |
| Oak Street Health, Inc. (b) | 185,000 | 5,725,750 | |
| Option Care Health, Inc. (b) | 37,370 | 945,835 | |
| Owens & Minor, Inc. | 40,140 | 1,605,600 | |
| Progyny, Inc. (b) | 651,010 | 33,051,778 | |
| Quest Diagnostics, Inc. | 3,700 | 550,116 | |
| R1 RCM, Inc. (b) | 56,670 | 1,349,879 | |
| RadNet, Inc. (b) | 12,020 | 324,059 | |
| Rede D'Oregon Sao Luiz SA (a) | 800,000 | 7,139,287 | |
| Sinopharm Group Co. Ltd. (H Shares) | 4,000,000 | 8,689,408 | |
| Surgery Partners, Inc. (b) | 190,530 | 8,451,911 | |
| Tenet Healthcare Corp. (b) | 6,670 | 486,043 | |
| The Ensign Group, Inc. | 700 | 53,431 | |
| Tokai Corp. | 150,000 | 2,586,367 | |
| UnitedHealth Group, Inc. | 1,074,030 | 477,105,607 | |
| Universal Health Services, Inc. Class B | 500,000 | 59,365,000 | |
| 1,746,608,981 | |||
| Health Care Technology - 0.1% | |||
| Definitive Healthcare Corp. (c) | 60,000 | 1,758,600 | |
| Doximity, Inc. | 65,000 | 4,397,250 | |
| Evolent Health, Inc. (b) | 197,030 | 5,122,780 | |
| GPI SpA (c) | 10,000 | 154,805 | |
| Health Catalyst, Inc. (b)(c) | 2,200 | 95,458 | |
| Inspire Medical Systems, Inc. (b) | 460 | 102,704 | |
| Omnicell, Inc. (b)(c) | 5,330 | 943,410 | |
| Phreesia, Inc. (b)(c) | 676,630 | 39,028,018 | |
| 51,603,025 | |||
| Life Sciences Tools & Services - 0.6% | |||
| Avantor, Inc. (b) | 1,642,500 | 64,845,900 | |
| Bio-Rad Laboratories, Inc. Class A (b) | 40,800 | 30,730,560 | |
| Bruker Corp. (c) | 737,530 | 59,732,555 | |
| Charles River Laboratories International, Inc. (b) | 47,000 | 17,195,890 | |
| Danaher Corp. | 359,800 | 115,726,072 | |
| ICON PLC (b) | 5,200 | 1,406,444 | |
| Lonza Group AG | 24,000 | 19,423,779 | |
| Quanterix Corp. (b) | 4,650 | 185,861 | |
| Sartorius Stedim Biotech | 28,000 | 16,556,953 | |
| Seer, Inc. | 80 | 1,785 | |
| Syneos Health, Inc. (b) | 9,970 | 968,685 | |
| Thermo Fisher Scientific, Inc. | 108,500 | 68,662,055 | |
| 395,436,539 | |||
| Pharmaceuticals - 1.4% | |||
| Antares Pharma, Inc. (b) | 45,470 | 146,868 | |
| Arvinas Holding Co. LLC (b) | 634,990 | 48,011,594 | |
| AstraZeneca PLC: | |||
| (United Kingdom) | 228,000 | 24,996,745 | |
| sponsored ADR | 1,305,920 | 71,603,594 | |
| Bayer AG | 1,013,308 | 51,162,055 | |
| Bristol-Myers Squibb Co. | 4,237,561 | 227,260,396 | |
| Dai Han Pharmaceutical Co. Ltd. | 25,000 | 552,536 | |
| Daito Pharmaceutical Co. Ltd. | 90,600 | 2,277,123 | |
| Dawnrays Pharmaceutical Holdings Ltd. | 8,622,000 | 1,879,636 | |
| Eli Lilly & Co. | 434,800 | 107,847,792 | |
| Faes Farma SA | 100,000 | 374,707 | |
| Fuji Pharma Co. Ltd. | 5,000 | 47,773 | |
| Genomma Lab Internacional SA de CV | 1,000,000 | 837,123 | |
| GlaxoSmithKline PLC sponsored ADR (c) | 1,801,859 | 74,092,442 | |
| Humedix Co. Ltd. | 10,000 | 196,927 | |
| Huons Co. Ltd. | 10,000 | 384,557 | |
| Jazz Pharmaceuticals PLC (b) | 125,000 | 14,983,750 | |
| Johnson & Johnson | 484,389 | 75,530,777 | |
| Kaken Pharmaceutical Co. Ltd. | 2,000 | 71,571 | |
| Nektar Therapeutics (b) | 252,430 | 2,842,362 | |
| Nippon Chemiphar Co. Ltd. | 40,100 | 724,060 | |
| Pliant Therapeutics, Inc. (b)(c) | 180,200 | 2,555,236 | |
| Reata Pharmaceuticals, Inc. (b)(c) | 241,840 | 20,701,504 | |
| Roche Holding AG (participation certificate) | 312,146 | 121,865,029 | |
| Royalty Pharma PLC | 560,000 | 22,271,200 | |
| Sanofi SA sponsored ADR | 1,628,250 | 77,455,853 | |
| UCB SA | 71,000 | 7,741,299 | |
| Viatris, Inc. | 63,300 | 779,223 | |
| 959,193,732 | |||
| TOTAL HEALTH CARE | 4,234,746,973 | ||
| INDUSTRIALS - 5.2% | |||
| Aerospace & Defense - 0.7% | |||
| AerSale Corp. (c) | 3,390 | 61,325 | |
| Airbus Group NV (b) | 456,498 | 50,954,313 | |
| General Dynamics Corp. | 78,927 | 14,914,835 | |
| HEICO Corp. Class A | 374,646 | 46,531,033 | |
| Huntington Ingalls Industries, Inc. | 60,931 | 10,815,862 | |
| Kratos Defense & Security Solutions, Inc. (b) | 15,000 | 295,650 | |
| L3Harris Technologies, Inc. | 242,200 | 50,639,176 | |
| Lockheed Martin Corp. | 122,000 | 40,665,040 | |
| Magellan Aerospace Corp. | 50,000 | 369,095 | |
| Maxar Technologies, Inc. (c) | 29,500 | 812,135 | |
| Mercury Systems, Inc. (b) | 5,370 | 262,862 | |
| MTU Aero Engines AG | 27,400 | 5,125,712 | |
| Northrop Grumman Corp. | 240,100 | 83,746,880 | |
| Raytheon Technologies Corp. | 79,568 | 6,438,643 | |
| Rolls-Royce Holdings PLC (b) | 6,547,000 | 10,680,422 | |
| Safran SA | 31,700 | 3,540,692 | |
| The Boeing Co. (b) | 730,597 | 144,548,616 | |
| Triumph Group, Inc. (b) | 32,150 | 538,834 | |
| Vectrus, Inc. (b) | 85,800 | 3,589,872 | |
| 474,530,997 | |||
| Air Freight & Logistics - 0.3% | |||
| Air Transport Services Group, Inc. (b) | 899,100 | 22,198,779 | |
| Deutsche Post AG | 502,100 | 29,707,247 | |
| FedEx Corp. | 134,383 | 30,957,812 | |
| Onelogix Group Ltd. (b) | 574,686 | 91,585 | |
| Sinotrans Ltd. (H Shares) | 1,000,000 | 320,595 | |
| United Parcel Service, Inc. Class B | 617,660 | 122,525,214 | |
| 205,801,232 | |||
| Airlines - 0.1% | |||
| Copa Holdings SA Class A (b)(c) | 17,300 | 1,209,616 | |
| Delta Air Lines, Inc. (b) | 635,400 | 23,001,480 | |
| Hawaiian Holdings, Inc. (b)(c) | 50,000 | 914,000 | |
| JetBlue Airways Corp. (b) | 1,956,400 | 26,254,888 | |
| Ryanair Holdings PLC sponsored ADR (b) | 49,500 | 4,729,725 | |
| SkyWest, Inc. (b) | 5,300 | 207,601 | |
| Spirit Airlines, Inc. (b) | 4,490 | 93,886 | |
| 56,411,196 | |||
| Building Products - 0.5% | |||
| Builders FirstSource, Inc. (b) | 598,080 | 41,530,675 | |
| Carlisle Companies, Inc. | 242,740 | 54,665,048 | |
| Fortune Brands Home & Security, Inc. | 1,207,429 | 121,382,837 | |
| Johnson Controls International PLC | 139,493 | 10,428,497 | |
| KVK Corp. | 10,000 | 171,717 | |
| Nihon Dengi Co. Ltd. | 171,800 | 5,851,550 | |
| Nihon Flush Co. Ltd. | 350,078 | 3,298,386 | |
| Trane Technologies PLC | 690,500 | 128,881,825 | |
| UFP Industries, Inc. | 2,090 | 174,055 | |
| 366,384,590 | |||
| Commercial Services & Supplies - 0.0% | |||
| ACV Auctions, Inc. Class A (b)(c) | 545,700 | 11,557,926 | |
| Casella Waste Systems, Inc. Class A (b) | 4,040 | 342,511 | |
| CoreCivic, Inc. (b) | 200,000 | 2,154,000 | |
| CTS Co. Ltd. | 5,000 | 34,458 | |
| Millerknoll, Inc. | 4,340 | 164,660 | |
| Tetra Tech, Inc. | 2,070 | 382,288 | |
| The Brink's Co. | 19,250 | 1,177,330 | |
| VSE Corp. | 20,054 | 1,097,756 | |
| 16,910,929 | |||
| Construction & Engineering - 0.1% | |||
| API Group Corp. (b) | 4,090 | 95,338 | |
| Boustead Projs. Pte Ltd. | 2,180,500 | 1,589,973 | |
| Br Holding Corp. | 50,000 | 156,146 | |
| Dai-Ichi Cutter Kogyo KK | 25,000 | 280,665 | |
| Dycom Industries, Inc. (b) | 7,170 | 670,252 | |
| IES Holdings, Inc. (b) | 340 | 16,317 | |
| Kawasaki Setsubi Kogyo Co. Ltd. | 35,000 | 124,165 | |
| Meisei Industrial Co. Ltd. | 700,000 | 4,037,687 | |
| Primoris Services Corp. | 325,000 | 7,286,500 | |
| Raiznext Corp. | 550,800 | 5,462,439 | |
| Seikitokyu Kogyo Co. Ltd. | 200,000 | 1,457,956 | |
| Shinnihon Corp. | 25,000 | 164,772 | |
| Totetsu Kogyo Co. Ltd. | 350,000 | 7,038,086 | |
| Watanabe Sato Co. Ltd. | 20,000 | 552,926 | |
| Willscot Mobile Mini Holdings (b) | 1,248,000 | 47,536,320 | |
| 76,469,542 | |||
| Electrical Equipment - 0.6% | |||
| Acuity Brands, Inc. | 147,752 | 29,749,865 | |
| Aichi Electric Co. Ltd. | 231,450 | 5,649,317 | |
| AMETEK, Inc. | 806,900 | 110,141,850 | |
| AQ Group AB (b) | 1,000 | 31,723 | |
| Array Technologies, Inc. (b) | 1,088,162 | 19,603,238 | |
| Atkore, Inc. (b) | 11,650 | 1,240,725 | |
| BizLink Holding, Inc. | 50,000 | 465,623 | |
| Emerson Electric Co. | 682,500 | 59,950,800 | |
| FTC Solar, Inc. | 290,900 | 2,490,104 | |
| Hubbell, Inc. Class B | 78,060 | 15,276,342 | |
| Iwabuchi Corp. | 8,700 | 422,551 | |
| Plug Power, Inc. (b)(c) | 219,600 | 8,751,060 | |
| Regal Rexnord Corp. | 264,200 | 41,770,020 | |
| Shoals Technologies Group, Inc. (c) | 227,450 | 6,391,345 | |
| Sunrun, Inc. (b) | 1,533,910 | 70,621,216 | |
| Terasaki Electric Co. Ltd. | 33,600 | 328,762 | |
| Vertiv Holdings Co. | 1,098,234 | 28,158,720 | |
| Vertiv Holdings LLC (b)(f) | 600,000 | 15,384,000 | |
| 416,427,261 | |||
| Industrial Conglomerates - 0.9% | |||
| 3M Co. | 99,403 | 16,902,486 | |
| General Electric Co. | 4,367,845 | 414,901,597 | |
| Hitachi Ltd. | 507,800 | 29,745,995 | |
| Reunert Ltd. | 56,900 | 172,467 | |
| Roper Technologies, Inc. | 217,700 | 101,045,455 | |
| Siemens AG | 432,200 | 68,899,448 | |
| 631,667,448 | |||
| Machinery - 1.1% | |||
| AGCO Corp. | 364,100 | 40,127,461 | |
| Caterpillar, Inc. | 364,500 | 70,476,075 | |
| Chart Industries, Inc. (b) | 244,720 | 42,715,876 | |
| Clean & Science Co. Ltd. | 5,000 | 78,602 | |
| Colfax Corp. (b) | 987,700 | 45,868,788 | |
| Columbus McKinnon Corp. (NY Shares) | 19,670 | 873,741 | |
| Crane Co. | 12,870 | 1,242,470 | |
| Cummins, Inc. | 28,942 | 6,070,585 | |
| Danieli & C. Officine Meccaniche SpA (c) | 25,000 | 710,230 | |
| Ebara Jitsugyo Co. Ltd. | 50,000 | 1,110,276 | |
| Epiroc AB (A Shares) | 27,600 | 671,670 | |
| Estic Corp. | 14,900 | 715,769 | |
| Flowserve Corp. | 1,710,431 | 51,278,721 | |
| Fortive Corp. | 1,352,924 | 99,940,496 | |
| Fukushima Industries Corp. | 10,000 | 369,797 | |
| Haitian International Holdings Ltd. | 900,000 | 2,469,864 | |
| Hy-Lok Corp. | 14,316 | 185,729 | |
| IDEX Corp. | 181,727 | 40,814,067 | |
| ITT, Inc. | 1,014,780 | 95,977,892 | |
| John Bean Technologies Corp. (c) | 1,080 | 170,392 | |
| Kito Corp. | 10,000 | 155,173 | |
| Koike Sanso Kogyo Co. Ltd. | 2,200 | 42,235 | |
| Mitsui Engineering & Shipbuilding Co. (b) | 2,105,800 | 6,994,729 | |
| Nakanishi Manufacturing Co. Ltd. | 30,000 | 303,623 | |
| Nansin Co. Ltd. | 32,900 | 163,576 | |
| Oshkosh Corp. | 644,000 | 69,294,400 | |
| Otis Worldwide Corp. | 612,254 | 49,225,222 | |
| PACCAR, Inc. | 39,000 | 3,253,380 | |
| Park-Ohio Holdings Corp. | 50,000 | 1,055,500 | |
| Pentair PLC | 642,700 | 47,360,563 | |
| Sakura Rubber Co. Ltd. | 20,800 | 654,169 | |
| Semperit AG Holding | 25,000 | 738,583 | |
| Shinwa Co. Ltd. | 50,000 | 858,141 | |
| Stanley Black & Decker, Inc. | 235,132 | 41,091,668 | |
| Takamatsu Machinery Co. Ltd. | 25,000 | 156,589 | |
| The Hanshin Diesel Works Ltd. | 4,500 | 68,395 | |
| Trinity Industrial Corp. | 10,000 | 72,632 | |
| Westinghouse Air Brake Tech Co. | 177,614 | 15,766,795 | |
| Yamada Corp. | 25,000 | 519,972 | |
| 739,643,846 | |||
| Marine - 0.0% | |||
| Genco Shipping & Trading Ltd. | 295,300 | 4,550,573 | |
| Japan Transcity Corp. | 280,300 | 1,373,789 | |
| 5,924,362 | |||
| Professional Services - 0.2% | |||
| ABIST Co. Ltd. | 57,385 | 1,397,628 | |
| Altech Corp. | 125,000 | 2,067,944 | |
| Artner Co. Ltd. | 10,000 | 72,986 | |
| ASGN, Inc. (b) | 21,110 | 2,568,665 | |
| Bertrandt AG | 55,000 | 3,661,442 | |
| Career Design Center Co. Ltd. | 152,800 | 1,304,481 | |
| CBIZ, Inc. (b) | 2,250 | 81,068 | |
| Clarivate Analytics PLC (b) | 2,339,900 | 54,613,266 | |
| CRA International, Inc. | 17,240 | 1,587,287 | |
| Creek & River Co. Ltd. | 45,000 | 795,815 | |
| Dun & Bradstreet Holdings, Inc. (b) | 531,300 | 10,094,700 | |
| Equifax, Inc. | 32,000 | 8,916,800 | |
| Gakujo Co. Ltd. | 268,800 | 2,565,888 | |
| ICF International, Inc. | 7,990 | 772,953 | |
| Insperity, Inc. | 7,150 | 827,541 | |
| KBR, Inc. | 9,360 | 411,840 | |
| Kforce, Inc. | 17,040 | 1,305,775 | |
| Mastech Digital, Inc. (b) | 30,000 | 529,500 | |
| McMillan Shakespeare Ltd. | 46,017 | 410,696 | |
| Outsourcing, Inc. | 125,000 | 1,663,202 | |
| Quick Co. Ltd. | 325,900 | 4,045,098 | |
| SaraminHR Co. Ltd. | 112,438 | 3,658,668 | |
| SHL-JAPAN Ltd. | 51,600 | 1,081,895 | |
| TriNet Group, Inc. (b) | 5,390 | 540,617 | |
| Upwork, Inc. (b) | 2,390 | 89,051 | |
| WDB Holdings Co. Ltd. | 60,000 | 1,658,778 | |
| Will Group, Inc. | 250,000 | 3,007,918 | |
| Willdan Group, Inc. (b)(c) | 880 | 35,209 | |
| World Holdings Co. Ltd. | 150,000 | 3,356,040 | |
| 113,122,751 | |||
| Road & Rail - 0.5% | |||
| Autohellas SA | 51,600 | 505,609 | |
| CSX Corp. | 3,217,500 | 111,518,550 | |
| Daqin Railway Co. Ltd. (A Shares) | 2,952,141 | 2,824,904 | |
| Hertz Global Holdings, Inc. (c) | 4,300 | 103,888 | |
| Knight-Swift Transportation Holdings, Inc. Class A | 691,985 | 39,616,141 | |
| Landstar System, Inc. | 161,420 | 27,207,341 | |
| Lyft, Inc. (b) | 247,183 | 10,038,102 | |
| Meitetsu Transport Co. Ltd. | 32,200 | 664,311 | |
| NANSO Transport Co. Ltd. | 90,000 | 863,892 | |
| Nikkon Holdings Co. Ltd. | 150,000 | 2,631,486 | |
| Old Dominion Freight Lines, Inc. | 339,300 | 120,509,181 | |
| Patriot Transportation Holding, Inc. | 10,000 | 97,200 | |
| Ryder System, Inc. | 27,864 | 2,314,941 | |
| Sakai Moving Service Co. Ltd. | 10,000 | 371,124 | |
| SENKO Co. Ltd. | 5,000 | 40,961 | |
| Stef SA | 118,234 | 13,945,275 | |
| Tohbu Network Co. Ltd. | 42,500 | 341,399 | |
| Uber Technologies, Inc. (b) | 855,100 | 32,493,800 | |
| 366,088,105 | |||
| Trading Companies & Distributors - 0.2% | |||
| AerCap Holdings NV (b) | 50,000 | 2,802,000 | |
| Air Lease Corp. Class A | 653,500 | 26,525,565 | |
| Alconix Corp. | 2,500 | 25,988 | |
| Applied Industrial Technologies, Inc. | 9,260 | 880,070 | |
| Beacon Roofing Supply, Inc. (b) | 12,720 | 634,855 | |
| Beijer Ref AB (B Shares) | 86,700 | 1,721,402 | |
| Canox Corp. | 81,539 | 908,914 | |
| Daiichi Jitsugyo Co. Ltd. | 5,900 | 255,240 | |
| Green Cross Co. Ltd. | 81,100 | 672,993 | |
| Itochu Corp. | 1,850,200 | 52,912,238 | |
| Kamei Corp. | 300,000 | 2,632,813 | |
| Mitani Shoji Co. Ltd. | 226,400 | 3,487,083 | |
| Mitsubishi Corp. | 400,000 | 11,893,783 | |
| Narasaki Sangyo Co. Ltd. | 25,000 | 468,881 | |
| Nishikawa Keisoku Co. Ltd. | 15,000 | 627,682 | |
| Rasa Corp. (b) | 25,000 | 189,543 | |
| Sam Yung Trading Co. Ltd. | 7,856 | 92,956 | |
| Shinsho Corp. | 274,300 | 7,631,915 | |
| Totech Corp. | 50,000 | 1,028,443 | |
| Triton International Ltd. | 5,000 | 279,850 | |
| Univar, Inc. (b) | 5,060 | 131,105 | |
| 115,803,319 | |||
| Transportation Infrastructure - 0.0% | |||
| Isewan Terminal Service Co. Ltd. | 200,400 | 1,230,394 | |
| Meiko Transportation Co. Ltd. | 25,000 | 235,104 | |
| Qingdao Port International Co. Ltd. (H Shares) (a) | 4,884,814 | 2,443,033 | |
| 3,908,531 | |||
| TOTAL INDUSTRIALS | 3,589,094,109 | ||
| INFORMATION TECHNOLOGY - 8.5% | |||
| Communications Equipment - 0.2% | |||
| AudioCodes Ltd. | 6,110 | 211,773 | |
| Cisco Systems, Inc. | 2,271,000 | 124,541,640 | |
| Lumentum Holdings, Inc. (b) | 4,590 | 398,274 | |
| 125,151,687 | |||
| Electronic Equipment & Components - 0.6% | |||
| Advanced Energy Industries, Inc. | 1,850 | 162,227 | |
| Ai Holdings Corp. | 5,000 | 85,726 | |
| Avnet, Inc. | 795,500 | 28,852,785 | |
| CDW Corp. | 42,800 | 8,104,608 | |
| Cognex Corp. | 344,700 | 26,628,075 | |
| Daido Signal Co. Ltd. | 155,000 | 821,383 | |
| Daiwabo Holdings Co. Ltd. | 250,000 | 4,000,973 | |
| Elematec Corp. | 177,000 | 1,579,980 | |
| Flex Ltd. (b) | 3,124,613 | 53,430,882 | |
| FLEXium Interconnect, Inc. | 101,316 | 375,900 | |
| Hagiwara Electric Holdings Co. Ltd. | 60,080 | 1,058,781 | |
| Hon Hai Precision Industry Co. Ltd. (Foxconn) | 600,000 | 2,236,235 | |
| II-VI, Inc. (b)(c) | 16,760 | 1,048,003 | |
| Insight Enterprises, Inc. (b) | 91,848 | 9,058,050 | |
| Jabil, Inc. | 1,866,597 | 109,121,261 | |
| Kingboard Chemical Holdings Ltd. | 1,550,000 | 7,771,865 | |
| Kitron ASA | 250,000 | 531,259 | |
| Makus, Inc. (g) | 1,300,684 | 7,970,012 | |
| Methode Electronics, Inc. Class A | 210,000 | 9,338,700 | |
| Mirion Technologies, Inc. (f) | 1,430,613 | 15,250,335 | |
| New Cosmos Electric Co. Ltd. | 20,000 | 362,720 | |
| PAX Global Technology Ltd. | 11,000,000 | 8,562,452 | |
| Redington (India) Ltd. | 1,034,288 | 2,025,194 | |
| Riken Kieki Co. Ltd. | 110,000 | 5,225,815 | |
| ScanSource, Inc. (b) | 119,631 | 3,738,469 | |
| TD SYNNEX Corp. | 5,000 | 517,300 | |
| TE Connectivity Ltd. | 561,800 | 86,477,874 | |
| Thinking Electronic Industries Co. Ltd. | 700,000 | 3,792,240 | |
| TTM Technologies, Inc. (b) | 56,920 | 784,358 | |
| Vontier Corp. | 497,829 | 15,686,592 | |
| 414,600,054 | |||
| IT Services - 1.3% | |||
| Amadeus IT Holding SA Class A (b) | 234,000 | 14,981,992 | |
| Amdocs Ltd. | 673,500 | 47,023,770 | |
| Asahi Intelligence Service Co. | 35,000 | 377,140 | |
| Avant Corp. | 300,000 | 3,559,075 | |
| Capgemini SA | 159,100 | 36,826,847 | |
| CDS Co. Ltd. | 10,000 | 144,911 | |
| Cielo SA | 625,000 | 230,129 | |
| Cognizant Technology Solutions Corp. Class A | 1,045,600 | 81,535,888 | |
| CSE Global Ltd. | 1,349,925 | 479,802 | |
| Cyxtera Technologies, Inc. Class A (b) | 50,160 | 497,086 | |
| Data Applications Co. Ltd. | 20,000 | 297,253 | |
| DTS Corp. | 275,000 | 5,758,615 | |
| DXC Technology Co. (b) | 200,000 | 5,998,000 | |
| E-Credible Co. Ltd. | 127,100 | 2,073,252 | |
| E-Guardian, Inc. | 10,000 | 308,312 | |
| Edenred SA | 401,159 | 17,979,799 | |
| Enea Data AB (b) | 67,600 | 1,927,037 | |
| Euronet Worldwide, Inc. (b) | 1,730 | 175,370 | |
| ExlService Holdings, Inc. (b) | 5,290 | 687,012 | |
| FDM Group Holdings PLC | 5,000 | 74,610 | |
| Fidelity National Information Services, Inc. | 379,947 | 39,704,462 | |
| Fiserv, Inc. (b) | 656,500 | 63,365,380 | |
| Future Corp. | 35,000 | 1,255,585 | |
| Gartner, Inc. (b) | 63,100 | 19,702,975 | |
| Genpact Ltd. | 250,508 | 12,092,021 | |
| Global Payments, Inc. | 131,632 | 15,669,473 | |
| GoDaddy, Inc. (b) | 526,200 | 36,923,454 | |
| IBM Corp. | 58,082 | 6,801,402 | |
| IFIS Japan Ltd. | 30,000 | 171,451 | |
| Information Planning Co. | 5,000 | 128,323 | |
| Kgmobilians Co. Ltd. | 5,000 | 35,878 | |
| Korea Information & Communication Co. Ltd. (b) | 250,407 | 1,801,048 | |
| MasterCard, Inc. Class A | 374,786 | 118,027,607 | |
| Maximus, Inc. | 6,670 | 503,252 | |
| MongoDB, Inc. Class A (b) | 90,300 | 44,978,430 | |
| Nice Information & Telecom, Inc. | 6,500 | 149,703 | |
| Payoneer Global, Inc. | 219,400 | 1,700,350 | |
| PayPal Holdings, Inc. (b) | 347,538 | 64,256,301 | |
| Sabre Corp. (b)(c) | 1,533,800 | 11,549,514 | |
| Shift4 Payments, Inc. (b) | 31,900 | 1,659,438 | |
| Snowflake Computing, Inc. (b) | 6,000 | 2,040,900 | |
| Softcreate Co. Ltd. | 5,000 | 193,966 | |
| Sysage Technology Co. Ltd. | 50,000 | 68,475 | |
| TaskUs, Inc. (c) | 70,950 | 3,160,823 | |
| TDC Soft, Inc. | 250,000 | 2,638,563 | |
| Techmatrix Corp. | 1,000 | 17,296 | |
| The Western Union Co. | 50,000 | 791,000 | |
| Twilio, Inc. Class A (b) | 49,100 | 14,049,965 | |
| Unisys Corp. (b) | 561,603 | 10,198,710 | |
| Verra Mobility Corp. (b) | 62,870 | 904,699 | |
| Visa, Inc. Class A (c) | 951,874 | 184,444,625 | |
| WEX, Inc. (b) | 214,800 | 27,155,016 | |
| Wix.com Ltd. (b) | 14,900 | 2,276,720 | |
| WNS Holdings Ltd. sponsored ADR (b) | 19,620 | 1,649,453 | |
| 911,002,158 | |||
| Semiconductors & Semiconductor Equipment - 1.4% | |||
| Advanced Micro Devices, Inc. (b) | 48,995 | 7,759,338 | |
| Analog Devices, Inc. | 60,726 | 10,945,862 | |
| Applied Materials, Inc. | 414,818 | 61,057,061 | |
| Cirrus Logic, Inc. (b) | 219,780 | 17,621,960 | |
| indie Semiconductor, Inc. (c) | 182,200 | 2,501,606 | |
| Intel Corp. | 583,322 | 28,699,442 | |
| Lam Research Corp. | 51,100 | 34,740,335 | |
| MACOM Technology Solutions Holdings, Inc. (b) | 4,950 | 355,955 | |
| Marvell Technology, Inc. | 538,011 | 38,290,243 | |
| Microchip Technology, Inc. | 555,300 | 46,328,679 | |
| Micron Technology, Inc. | 331,050 | 27,808,200 | |
| Nova Ltd. (b)(c) | 2,130 | 273,812 | |
| NVIDIA Corp. | 777,236 | 253,969,635 | |
| NXP Semiconductors NV | 445,942 | 99,605,605 | |
| ON Semiconductor Corp. (b) | 972,511 | 59,741,351 | |
| Qualcomm, Inc. | 777,775 | 140,435,054 | |
| Renesas Electronics Corp. (b) | 776,700 | 9,759,492 | |
| Semtech Corp. (b) | 80,490 | 6,895,578 | |
| Sitronix Technology Corp. | 100,000 | 1,013,962 | |
| SMART Global Holdings, Inc. (b)(c) | 6,160 | 351,243 | |
| SolarEdge Technologies, Inc. (b) | 99,300 | 32,546,568 | |
| Synaptics, Inc. (b) | 1,050 | 296,352 | |
| Systems Technology, Inc. | 100,000 | 1,512,872 | |
| Teradyne, Inc. | 45,500 | 6,955,585 | |
| Topco Scientific Co. Ltd. | 953,000 | 5,021,195 | |
| Universal Display Corp. | 13,000 | 1,859,650 | |
| Xilinx, Inc. | 83,471 | 19,068,950 | |
| 915,415,585 | |||
| Software - 3.5% | |||
| 8x8, Inc. (b) | 10,500 | 226,275 | |
| Adobe, Inc. (b) | 156,300 | 104,697,555 | |
| Altair Engineering, Inc. Class A (b) | 1,530 | 113,909 | |
| Anaplan, Inc. (b) | 1,109,700 | 47,506,257 | |
| Asiainfo Technologies Ltd. (a) | 400,000 | 663,760 | |
| Autodesk, Inc. (b) | 118,728 | 30,179,470 | |
| Avalara, Inc. (b) | 23,000 | 3,212,640 | |
| AvidXchange Holdings, Inc. | 153,700 | 3,283,032 | |
| Blackbaud, Inc. (b)(c) | 479,033 | 36,147,830 | |
| Braze, Inc. | 28,300 | 2,156,460 | |
| CCC Intelligent Solutions Holdings, Inc. (f) | 134,385 | 1,726,847 | |
| Cerence, Inc. (b)(c) | 4,130 | 310,493 | |
| Ceridian HCM Holding, Inc. (b) | 458,600 | 50,170,840 | |
| Check Point Software Technologies Ltd. (b) | 10,000 | 1,113,100 | |
| Cognyte Software Ltd. | 617,319 | 12,574,788 | |
| Confluent, Inc. | 23,700 | 1,849,074 | |
| Coupa Software, Inc. (b) | 56,000 | 11,012,960 | |
| Cresco Ltd. | 450,800 | 7,657,239 | |
| DoubleVerify Holdings, Inc. | 101,700 | 3,140,496 | |
| Dynatrace, Inc. (b) | 162,602 | 10,219,536 | |
| Ebix, Inc. (c) | 41,900 | 1,280,464 | |
| Elastic NV (b) | 401,186 | 62,368,376 | |
| Encourage Technologies Co. Ltd. | 25,000 | 135,135 | |
| Envestnet, Inc. (b) | 100 | 7,667 | |
| Everbridge, Inc. (b) | 71,100 | 8,064,162 | |
| GitLab, Inc. | 55,600 | 5,367,624 | |
| HubSpot, Inc. (b) | 2,100 | 1,694,511 | |
| Intuit, Inc. | 79,900 | 52,118,770 | |
| Lightspeed Commerce, Inc. (b)(c) | 95,400 | 4,816,746 | |
| LivePerson, Inc. (b)(c) | 267,030 | 10,323,380 | |
| Mandiant, Inc. (b) | 190,200 | 3,227,694 | |
| Microsoft Corp. | 3,978,502 | 1,315,252,976 | |
| Model N, Inc. (b) | 1,200 | 33,720 | |
| Momentive Global, Inc. (b) | 1,751,861 | 35,790,520 | |
| NCR Corp. (b) | 5,460 | 212,394 | |
| New Relic, Inc. (b) | 11,620 | 1,287,845 | |
| NortonLifeLock, Inc. | 3,552,200 | 88,272,170 | |
| Ping Identity Holding Corp. (b) | 2,810 | 66,906 | |
| PTC, Inc. (b) | 445,643 | 48,833,560 | |
| Qualtrics International, Inc. | 220,500 | 7,135,380 | |
| Qualys, Inc. (b) | 2,380 | 310,090 | |
| Rapid7, Inc. (b) | 9,530 | 1,182,292 | |
| Rimini Street, Inc. (b) | 1,130,425 | 7,472,109 | |
| SailPoint Technologies Holding, Inc. (b) | 19,920 | 1,047,593 | |
| Salesforce.com, Inc. (b) | 447,070 | 127,397,067 | |
| SAP SE sponsored ADR (c) | 426,255 | 54,748,192 | |
| Scala, Inc. | 25,000 | 134,472 | |
| ServiceNow, Inc. (b) | 39,200 | 25,389,840 | |
| Sinosoft Tech Group Ltd. | 23,000,000 | 2,625,032 | |
| System Information Co. Ltd. | 75,000 | 583,890 | |
| System Research Co. Ltd. | 186,400 | 3,011,159 | |
| Telos Corp. | 183,360 | 2,887,920 | |
| Tenable Holdings, Inc. (b) | 919,008 | 45,398,995 | |
| Toho System Science Co. Ltd. | 12,100 | 106,083 | |
| UiPath, Inc. Class A (b) | 91,200 | 4,400,400 | |
| Varonis Systems, Inc. (b) | 11,820 | 612,394 | |
| Verint Systems, Inc. (b)(c) | 47,997 | 2,284,177 | |
| VMware, Inc. Class A (b) | 220,313 | 25,719,340 | |
| Vonage Holdings Corp. (b) | 15,370 | 316,929 | |
| Workday, Inc. Class A (b) | 138,723 | 38,042,008 | |
| Workiva, Inc. (b) | 161,300 | 22,496,511 | |
| Yext, Inc. (b) | 1,348,462 | 13,026,143 | |
| Zendesk, Inc. (b) | 387,600 | 39,577,836 | |
| Zuora, Inc. (b) | 39,100 | 774,571 | |
| 2,393,797,604 | |||
| Technology Hardware, Storage & Peripherals - 1.5% | |||
| ABKO Co. Ltd. | 1,000 | 10,692 | |
| Apple, Inc. | 5,717,357 | 945,079,112 | |
| Avid Technology, Inc. (b) | 6,040 | 193,642 | |
| Dell Technologies, Inc. (b) | 500,000 | 28,235,000 | |
| Elecom Co. Ltd. | 115,000 | 1,348,034 | |
| HP, Inc. | 496,098 | 17,502,337 | |
| MCJ Co. Ltd. | 2,200,000 | 19,190,516 | |
| Pure Storage, Inc. Class A (b) | 17,700 | 548,169 | |
| Samsung Electronics Co. Ltd. | 101,720 | 6,129,782 | |
| TSC Auto ID Technology Corp. | 193,000 | 1,402,266 | |
| Western Digital Corp. (b) | 429,621 | 24,849,279 | |
| 1,044,488,829 | |||
| TOTAL INFORMATION TECHNOLOGY | 5,804,455,917 | ||
| MATERIALS - 1.4% | |||
| Chemicals - 0.6% | |||
| Ashland Global Holdings, Inc. | 5,820 | 588,227 | |
| C. Uyemura & Co. Ltd. | 150,000 | 6,568,762 | |
| CF Industries Holdings, Inc. | 818,728 | 49,606,730 | |
| Ciner Resources LP | 25,000 | 442,750 | |
| DuPont de Nemours, Inc. | 1,301,175 | 96,234,903 | |
| EcoGreen International Group Ltd. | 300,000 | 63,093 | |
| Element Solutions, Inc. | 1,280,820 | 29,292,353 | |
| International Flavors & Fragrances, Inc. | 242,021 | 34,408,126 | |
| Isamu Paint Co. Ltd. | 5,000 | 158,800 | |
| K+S AG | 200,000 | 3,407,971 | |
| KPX Holdings Corp. | 7,154 | 377,901 | |
| Linde PLC | 266,000 | 84,625,240 | |
| Livent Corp. (b) | 64,700 | 1,959,763 | |
| LyondellBasell Industries NV Class A | 275,000 | 23,960,750 | |
| Olin Corp. | 913,460 | 49,646,551 | |
| PPG Industries, Inc. | 55,748 | 8,594,669 | |
| Quaker Houghton (c) | 1,380 | 314,433 | |
| Scientex Bhd | 1,771,200 | 1,896,585 | |
| Scientex Bhd warrants 1/14/26 (b) | 118,080 | 33,155 | |
| SK Kaken Co. Ltd. | 5,000 | 1,643,296 | |
| Toho Acetylene Co. Ltd. | 125,000 | 1,320,387 | |
| Tokuyama Corp. | 14,280 | 223,416 | |
| Tronox Holdings PLC | 21,810 | 479,602 | |
| Yara International ASA | 50,300 | 2,478,142 | |
| Yip's Chemical Holdings Ltd. | 450,000 | 229,097 | |
| 398,554,702 | |||
| Construction Materials - 0.2% | |||
| Eagle Materials, Inc. | 4,210 | 649,266 | |
| Kunimine Industries Co. Ltd. | 5,000 | 44,853 | |
| Summit Materials, Inc. (b) | 2,052,470 | 76,557,131 | |
| Vertex Corp. | 20,000 | 530,455 | |
| Vicat SA | 2,000 | 77,459 | |
| Vulcan Materials Co. | 224,000 | 42,927,360 | |
| 120,786,524 | |||
| Containers & Packaging - 0.0% | |||
| Crown Holdings, Inc. | 214,630 | 22,707,854 | |
| Mayr-Melnhof Karton AG | 11,200 | 2,179,649 | |
| O-I Glass, Inc. (b) | 38,260 | 423,538 | |
| Silgan Holdings, Inc. | 30,000 | 1,244,100 | |
| Vidrala SA | 250 | 23,674 | |
| Vidrala SA | 5,000 | 473,487 | |
| 27,052,302 | |||
| Metals & Mining - 0.5% | |||
| Anglo American PLC (United Kingdom) | 329,948 | 12,145,335 | |
| Arconic Corp. (b) | 16,220 | 433,398 | |
| Chubu Steel Plate Co. Ltd. | 169,800 | 1,273,857 | |
| CI Resources Ltd. | 136,202 | 124,277 | |
| CK-SAN-ETSU Co. Ltd. | 55,000 | 1,632,459 | |
| Commercial Metals Co. | 1,010,550 | 31,225,995 | |
| Compania de Minas Buenaventura SA sponsored ADR (b) | 168,400 | 1,231,004 | |
| Daiki Aluminum Industry Co. Ltd. | 10,000 | 129,340 | |
| First Quantum Minerals Ltd. | 1,004,200 | 21,405,430 | |
| Freeport-McMoRan, Inc. | 4,009,912 | 148,687,537 | |
| Fresnillo PLC | 10,000 | 120,759 | |
| Glencore Xstrata PLC | 2,097,100 | 9,956,604 | |
| Labrador Iron Ore Royalty Corp. | 4,700 | 133,445 | |
| Lundin Mining Corp. | 6,307,100 | 49,520,696 | |
| Mount Gibson Iron Ltd. | 23,500,000 | 6,114,471 | |
| Newmont Corp. | 954,600 | 52,426,632 | |
| Pacific Metals Co. Ltd. | 58,300 | 1,036,698 | |
| Perenti Global Ltd. | 3,500,411 | 2,046,120 | |
| Rio Tinto PLC sponsored ADR (c) | 100,000 | 6,269,000 | |
| Sandfire Resources NL | 900,000 | 3,855,806 | |
| St Barbara Ltd. | 681,138 | 655,491 | |
| Teck Resources Ltd. Class B (sub. vtg.) | 300,000 | 7,956,476 | |
| 358,380,830 | |||
| Paper & Forest Products - 0.1% | |||
| Louisiana-Pacific Corp. | 375,300 | 24,525,855 | |
| Stella-Jones, Inc. | 99,000 | 3,101,476 | |
| 27,627,331 | |||
| TOTAL MATERIALS | 932,401,689 | ||
| REAL ESTATE - 1.3% | |||
| Equity Real Estate Investment Trusts (REITs) - 0.9% | |||
| Alexandria Real Estate Equities, Inc. | 78,700 | 15,745,509 | |
| American Tower Corp. | 509,599 | 133,759,546 | |
| Americold Realty Trust | 7,660 | 250,022 | |
| Armada Hoffler Properties, Inc. | 21,810 | 304,250 | |
| CoreSite Realty Corp. | 195,350 | 33,414,618 | |
| Corporate Office Properties Trust (SBI) | 118,310 | 3,035,835 | |
| CubeSmart | 390,400 | 21,050,368 | |
| CyrusOne, Inc. | 514,600 | 45,809,692 | |
| Digital Realty Trust, Inc. | 48,100 | 8,068,294 | |
| Douglas Emmett, Inc. | 264,700 | 8,674,219 | |
| Equinix, Inc. | 11,895 | 9,661,119 | |
| Equity Lifestyle Properties, Inc. | 261,200 | 21,235,560 | |
| Invitation Homes, Inc. | 525,900 | 21,267,396 | |
| Kilroy Realty Corp. | 95,100 | 6,136,803 | |
| Lexington Corporate Properties Trust | 3,518,621 | 52,955,246 | |
| Mid-America Apartment Communities, Inc. | 139,300 | 28,730,625 | |
| Outfront Media, Inc. | 1,232,640 | 30,803,674 | |
| Plymouth Industrial REIT, Inc. | 1,384,670 | 41,193,933 | |
| Prologis (REIT), Inc. | 277,500 | 41,833,125 | |
| RLJ Lodging Trust | 24,970 | 314,372 | |
| Sabra Health Care REIT, Inc. | 13,840 | 178,951 | |
| Simon Property Group, Inc. | 670,035 | 102,408,149 | |
| Spirit Realty Capital, Inc. | 5,750 | 256,220 | |
| Terreno Realty Corp. | 4,140 | 315,261 | |
| The GEO Group, Inc. | 30,530 | 256,452 | |
| Uniti Group, Inc. | 1,943,080 | 25,784,672 | |
| Ventas, Inc. | 159,400 | 7,479,048 | |
| VICI Properties, Inc. | 121,300 | 3,299,360 | |
| Weyerhaeuser Co. | 99,400 | 3,738,434 | |
| 667,960,753 | |||
| Real Estate Management & Development - 0.4% | |||
| Anabuki Kosan, Inc. | 25,000 | 412,483 | |
| Arealink Co. Ltd. | 100,000 | 1,342,062 | |
| CBRE Group, Inc. (b) | 1,234,900 | 118,019,393 | |
| Cushman & Wakefield PLC (b) | 1,978,870 | 34,986,422 | |
| Daito Trust Construction Co. Ltd. | 85,000 | 9,241,828 | |
| Howard Hughes Corp. (b) | 343,250 | 28,143,068 | |
| Jones Lang LaSalle, Inc. (b) | 50,010 | 11,747,849 | |
| Newmark Group, Inc. | 2,549,900 | 40,951,394 | |
| Nihon Housing Co. Ltd. | 46,000 | 436,661 | |
| Nisshin Group Holdings Co. | 64,700 | 266,161 | |
| Opendoor Technologies, Inc. (b) | 755,000 | 11,959,200 | |
| Realogy Holdings Corp. (b) | 32,330 | 491,093 | |
| Sun Frontier Fudousan Co. Ltd. | 50,000 | 423,763 | |
| Will Co. Ltd. | 10,000 | 32,556 | |
| 258,453,933 | |||
| TOTAL REAL ESTATE | 926,414,686 | ||
| UTILITIES - 1.5% | |||
| Electric Utilities - 1.1% | |||
| Allete, Inc. | 5,810 | 340,640 | |
| Duke Energy Corp. | 722,400 | 70,080,024 | |
| Edison International | 230,300 | 15,033,984 | |
| Entergy Corp. | 361,400 | 36,262,876 | |
| Evergy, Inc. | 1,172,564 | 74,223,301 | |
| Exelon Corp. | 2,382,966 | 125,653,797 | |
| FirstEnergy Corp. | 425,500 | 16,024,330 | |
| Fjordkraft Holding ASA (a) | 1,000 | 4,768 | |
| NextEra Energy, Inc. | 609,700 | 52,909,766 | |
| NRG Energy, Inc. | 101,200 | 3,645,224 | |
| PG&E Corp. (b) | 9,623,246 | 114,324,162 | |
| Portland General Electric Co. | 703,120 | 34,220,850 | |
| PPL Corp. | 2,766,900 | 77,002,827 | |
| Southern Co. | 2,105,466 | 128,643,973 | |
| 748,370,522 | |||
| Gas Utilities - 0.0% | |||
| Brookfield Infrastructure Corp. A Shares | 7,420 | 439,190 | |
| Busan City Gas Co. Ltd. | 44,516 | 3,167,943 | |
| China Resource Gas Group Ltd. | 764,000 | 3,953,244 | |
| Enagas SA | 56,000 | 1,275,908 | |
| Hokuriku Gas Co. | 6,200 | 171,407 | |
| Keiyo Gas Co. Ltd. | 3,000 | 85,460 | |
| New Jersey Resources Corp. | 7,880 | 289,826 | |
| Seoul City Gas Co. Ltd. | 13,199 | 1,756,996 | |
| South Jersey Industries, Inc. | 794,970 | 18,681,795 | |
| YESCO Co. Ltd. | 25,028 | 761,514 | |
| 30,583,283 | |||
| Independent Power and Renewable Electricity Producers - 0.1% | |||
| Brookfield Renewable Corp. | 430,870 | 15,955,116 | |
| Clearway Energy, Inc. Class C | 10,710 | 399,697 | |
| Sunnova Energy International, Inc. (b)(c) | 567,140 | 20,967,166 | |
| The AES Corp. | 596,300 | 13,941,494 | |
| 51,263,473 | |||
| Multi-Utilities - 0.3% | |||
| CenterPoint Energy, Inc. | 599,944 | 15,544,549 | |
| Dominion Energy, Inc. | 1,453,017 | 103,454,810 | |
| MDU Resources Group, Inc. | 1,105,850 | 30,112,296 | |
| NiSource, Inc. | 337,500 | 8,272,125 | |
| Public Service Enterprise Group, Inc. | 136,083 | 8,503,827 | |
| Sempra Energy | 163,900 | 19,646,693 | |
| 185,534,300 | |||
| TOTAL UTILITIES | 1,015,751,578 | ||
| TOTAL COMMON STOCKS | |||
| (Cost $22,509,819,073) | 29,631,476,912 | ||
| Nonconvertible Preferred Stocks - 0.2% | |||
| CONSUMER DISCRETIONARY - 0.0% | |||
| Automobiles - 0.0% | |||
| Porsche Automobil Holding SE (Germany) | 180,000 | 15,101,191 | |
| INDUSTRIALS - 0.0% | |||
| Aerospace & Defense - 0.0% | |||
| Embraer SA sponsored ADR (b) | 534,300 | 7,335,939 | |
| INFORMATION TECHNOLOGY - 0.2% | |||
| Technology Hardware, Storage & Peripherals - 0.2% | |||
| Samsung Electronics Co. Ltd. | 1,570,630 | 84,825,011 | |
| TOTAL NONCONVERTIBLE PREFERRED STOCKS | |||
| (Cost $89,920,350) | 107,262,141 | ||
| Equity Funds - 56.0% | |||
| Large Blend Funds - 4.8% | |||
| Fidelity SAI U.S. Large Cap Index Fund (h) | 41,252,739 | 903,434,990 | |
| Fidelity SAI U.S. Low Volatility Index Fund (h) | 126,416,756 | 2,382,955,843 | |
| TOTAL LARGE BLEND FUNDS | 3,286,390,833 | ||
| Large Growth Funds - 39.6% | |||
| Fidelity Blue Chip Growth Fund (h) | 1,629,172 | 306,773,089 | |
| Fidelity Contrafund (h) | 241,441,022 | 4,857,793,355 | |
| Fidelity Growth Company Fund (h) | 188,836,190 | 7,874,469,129 | |
| Fidelity Magellan Fund (h) | 261,799,669 | 4,065,748,863 | |
| Fidelity SAI U.S. Momentum Index Fund (h) | 103,948,895 | 1,794,157,925 | |
| Fidelity SAI U.S. Quality Index Fund (h) | 453,224,733 | 8,207,899,885 | |
| TOTAL LARGE GROWTH FUNDS | 27,106,842,246 | ||
| Large Value Funds - 8.1% | |||
| Fidelity Large Cap Value Enhanced Index Fund (h) | 183,630,797 | 3,108,869,398 | |
| Fidelity SAI U.S. Value Index Fund (h) | 203,149,425 | 2,437,793,104 | |
| TOTAL LARGE VALUE FUNDS | 5,546,662,502 | ||
| Mid-Cap Growth Funds - 1.4% | |||
| Fidelity Extended Market Index Fund (h) | 10,838,363 | 952,583,749 | |
| Small Blend Funds - 1.3% | |||
| Fidelity Small Cap Discovery Fund (h) | 17,033,309 | 507,422,286 | |
| Fidelity Small Cap Index Fund (h) | 14,917,806 | 417,251,036 | |
| TOTAL SMALL BLEND FUNDS | 924,673,322 | ||
| Small Growth Funds - 0.8% | |||
| Fidelity Advisor Small Cap Growth Fund - Class Z (h) | 17,280,586 | 568,185,681 | |
| TOTAL EQUITY FUNDS | |||
| (Cost $29,198,425,278) | 38,385,338,333 | ||
| Other - 0.0% | |||
| Commodity Funds - Broad Basket - 0.0% | |||
| Fidelity SAI Inflation-Focused Fund (h) | |||
| (Cost $9,232,556) | 1,094,386 | 11,370,671 | |
| Money Market Funds - 1.0% | |||
| Fidelity Cash Central Fund 0.06% (i) | 274,125,530 | 274,180,355 | |
| Fidelity Securities Lending Cash Central Fund 0.07% (i)(j) | 412,440,376 | 412,481,620 | |
| TOTAL MONEY MARKET FUNDS | |||
| (Cost $686,658,213) | 686,661,975 | ||
| TOTAL INVESTMENT IN SECURITIES - 100.5% | |||
| (Cost $52,494,055,470) | 68,822,110,032 | ||
| NET OTHER ASSETS (LIABILITIES) - (0.5)% | (326,653,462) | ||
| NET ASSETS - 100% | $68,495,456,570 |
| Written Options | ||||||
| Counterparty | Number of Contracts | Notional Amount | Exercise Price | Expiration Date | Value | |
| Call Options | ||||||
| Bank of America Corp. | Chicago Board Options Exchange | 2,751 | $12,233,697 | $50.00 | 1/21/22 | $(118,293) |
| State Street Corp. | Chicago Board Options Exchange | 624 | 5,551,728 | 105.00 | 1/21/22 | (29,640) |
| TOTAL WRITTEN OPTIONS | $(147,933) |
Legend
(a) Security exempt from registration under Rule 144A of the Securities Act of 1933. These securities may be resold in transactions exempt from registration, normally to qualified institutional buyers. At the end of the period, the value of these securities amounted to $42,356,035 or 0.1% of net assets.
(b) Non-income producing
(c) Security or a portion of the security is on loan at period end.
(d) Level 3 security
(e) Security or a portion of the security is pledged as collateral for call options written. At period end, the value of securities pledged amounted to $17,785,425.
(f) Restricted securities (including private placements) - Investment in securities not registered under the Securities Act of 1933 (excluding 144A issues). At the end of the period, the value of restricted securities (excluding 144A issues) amounted to $34,513,792 or 0.1% of net assets.
(g) Affiliated company
(h) Affiliated Fund
(i) Affiliated fund that is generally available only to investment companies and other accounts managed by Fidelity Investments. The rate quoted is the annualized seven-day yield of the fund at period end. A complete unaudited listing of the fund's holdings as of its most recent quarter end is available upon request. In addition, each Fidelity Central Fund's financial statements are available on the SEC's website or upon request.
(j) Investment made with cash collateral received from securities on loan.
Additional information on each restricted holding is as follows:
| Security | Acquisition Date | Acquisition Cost |
| CCC Intelligent Solutions Holdings, Inc. | 2/2/21 | $1,343,850 |
| Local Bounti Corp. | 6/17/21 - 11/4/21 | $3,640,470 |
| Mirion Technologies, Inc. | 6/16/21 | $14,306,130 |
| Vertiv Holdings LLC | 2/6/20 | $6,000,000 |
Affiliated Central Funds
Fiscal year to date information regarding the Fund's investments in Fidelity Central Funds, including the ownership percentage, is presented below.
| Fund | Value, beginning of period | Purchases | Sales Proceeds | Dividend Income | Realized Gain/Loss | Change in Unrealized appreciation (depreciation) | Value, end of period | % ownership, end of period |
| Fidelity Cash Central Fund 0.06% | $469,648,079 | $2,813,790,319 | $3,009,258,043 | $134,235 | $-- | $-- | $274,180,355 | 0.5% |
| Fidelity Securities Lending Cash Central Fund 0.07% | 173,683,379 | 1,071,535,484 | 832,737,243 | 3,997,319 | -- | -- | 412,481,620 | 1.3% |
| Total | $643,331,458 | $3,885,325,803 | $3,841,995,286 | $4,131,554 | $-- | $-- | $686,661,975 |
Amounts in the income column in the above table include any capital gain distributions from underlying funds, which are presented in the corresponding line-item in the Statement of Operations, if applicable. Amount for Fidelity Securities Lending Cash Central Fund represents the income earned on investing cash collateral, less rebates paid to borrowers and any lending agent fees associated with the loan, plus any premium payments received for lending certain types of securities.
Affiliated Underlying Funds
Fiscal year to date information regarding the Fund's investments in affiliated Underlying Funds is presented below. Exchanges between classes of the same affiliated Underlying Funds may occur. If an underlying Fund changes its name, the name presented below is the name in effect at period end.
| Affiliate | Value, beginning of period | Purchases | Sales Proceeds | Dividend Income | Realized Gain (loss) | Change in Unrealized appreciation (depreciation) | Value, end of period |
| Fidelity Advisor Small Cap Growth Fund - Class Z | $-- | $76,208,679 | $-- | $76,208,678 | $-- | $50,226,436 | $568,185,681 |
| Fidelity Blue Chip Growth Fund | -- | 306,225,389 | -- | -- | -- | 547,700 | 306,773,089 |
| Fidelity Contrafund | 3,354,370,561 | 1,062,445,304 | -- | -- | -- | 440,977,490 | 4,857,793,355 |
| Fidelity Extended Market Index Fund | -- | 1,000,000,001 | -- | -- | -- | (47,416,252) | 952,583,749 |
| Fidelity Growth Company Fund | 5,718,686,749 | 1,050,462,347 | -- | -- | -- | 1,105,320,033 | 7,874,469,129 |
| Fidelity Large Cap Value Enhanced Index Fund | 3,116,214,629 | 1 | -- | -- | -- | (7,345,232) | 3,108,869,398 |
| Fidelity Magellan Fund | 2,787,054,916 | 764,246,547 | -- | -- | -- | 514,447,400 | 4,065,748,863 |
| Fidelity SAI Inflation-Focused Fund | 10,795,429 | 2,463,970 | -- | 2,463,969 | -- | (1,888,728) | 11,370,671 |
| Fidelity SAI U.S. Large Cap Index Fund | 1,279,013,129 | 4,014,555,843 | 4,355,139,475 | 176,944,744 | 248,037,076 | (283,031,583) | 903,434,990 |
| Fidelity SAI U.S. Low Volatility Index Fund | 2,108,242,671 | 145,000,000 | -- | -- | -- | 129,713,172 | 2,382,955,843 |
| Fidelity SAI U.S. Momentum Index Fund | 1,526,869,335 | 308,368,938 | -- | 258,368,838 | -- | (41,080,348) | 1,794,157,925 |
| Fidelity SAI U.S. Quality Index Fund | 6,488,426,308 | 1,512,959,883 | -- | 542,319,030 | -- | 206,513,694 | 8,207,899,885 |
| Fidelity SAI U.S. Value Index Fund | 2,410,798,537 | 100,716,325 | -- | 50,716,325 | -- | (73,721,758) | 2,437,793,104 |
| Fidelity Small Cap Discovery Fund | 466,394,048 | 48,257,391 | -- | 13,757,391 | -- | (7,229,153) | 507,422,286 |
| Fidelity Small Cap Growth Fund | 546,324,788 | -- | -- | -- | -- | (104,574,222) | -- |
| Fidelity Small Cap Index Fund | 2,007,379,429 | 29,796,743 | 1,641,234,742 | 4,796,743 | 496,678,582 | (475,368,976) | 417,251,036 |
| Total | $31,820,570,529 | $10,421,707,361 | $5,996,374,217 | $1,125,575,718 | $744,715,658 | $1,406,089,673 | $38,396,709,004 |
Amounts in the income column in the above table include any capital gain distributions from underlying funds, which are presented in the corresponding line-item in the Statement of Operations, if applicable.
Other Affiliated Issuers
An affiliated company is a company in which the Fund has ownership of at least 5% of the voting securities. Fiscal year to date transactions with companies which are or were affiliates are as follows:
| Affiliate | Value, beginning of period | Purchases | Sales Proceeds | Dividend Income | Realized Gain (loss) | Change in Unrealized appreciation (depreciation) | Value, end of period |
| Makus, Inc. | $8,085,051 | $-- | $-- | $-- | $-- | $(115,039) | $7,970,012 |
| Total | $8,085,051 | $-- | $-- | $-- | $-- | $(115,039) | $7,970,012 |
Investment Valuation
The following is a summary of the inputs used, as of November 30, 2021, involving the Fund's assets and liabilities carried at fair value. The inputs or methodology used for valuing securities may not be an indication of the risk associated with investing in those securities. For more information on valuation inputs, and their aggregation into the levels used below, please refer to the Investment Valuation section in the accompanying Notes to Financial Statements.
| Valuation Inputs at Reporting Date: | ||||
| Description | Total | Level 1 | Level 2 | Level 3 |
| Investments in Securities: | ||||
| Equities: | ||||
| Communication Services | $2,480,633,386 | $2,423,528,432 | $57,104,954 | $-- |
| Consumer Discretionary | 2,941,553,022 | 2,926,154,901 | 15,398,121 | -- |
| Consumer Staples | 1,699,824,419 | 1,654,483,421 | 45,340,998 | -- |
| Energy | 1,412,338,160 | 1,398,759,450 | 13,513,242 | 65,468 |
| Financials | 4,609,364,164 | 4,581,474,160 | 27,890,004 | -- |
| Health Care | 4,234,746,973 | 4,087,885,199 | 146,861,774 | -- |
| Industrials | 3,596,430,048 | 3,360,078,753 | 236,351,295 | -- |
| Information Technology | 5,889,280,928 | 5,850,629,171 | 38,651,757 | -- |
| Materials | 932,401,689 | 909,039,636 | 23,362,053 | -- |
| Real Estate | 926,414,686 | 926,414,686 | -- | -- |
| Utilities | 1,015,751,578 | 1,015,751,578 | -- | -- |
| Equity Funds | 38,385,338,333 | 38,385,338,333 | -- | -- |
| Other | 11,370,671 | 11,370,671 | -- | -- |
| Money Market Funds | 686,661,975 | 686,661,975 | -- | -- |
| Total Investments in Securities: | $68,822,110,032 | $68,217,570,366 | $604,474,198 | $65,468 |
| Net unrealized depreciation on unfunded commitments | $(274,973) | $-- | $(274,973) | $-- |
| Derivative Instruments: | ||||
| Liabilities | ||||
| Written Options | $(147,933) | $(147,933) | $-- | $-- |
| Total Liabilities | $(147,933) | $(147,933) | $-- | $-- |
| Total Derivative Instruments: | $(147,933) | $(147,933) | $-- | $-- |
Value of Derivative Instruments
The following table is a summary of the Fund's value of derivative instruments by primary risk exposure as of November 30, 2021. For additional information on derivative instruments, please refer to the Derivative Instruments section in the accompanying Notes to Financial Statements.
| Primary Risk Exposure / Derivative Type | Value | |
| Asset | Liability | |
| Equity Risk | ||
| Written Options(a) | $0 | $(147,933) |
| Total Equity Risk | 0 | (147,933) |
| Total Value of Derivatives | $0 | $(147,933) |
(a) Gross value is presented in the Statement of Assets and Liabilities in the written options, at value line-item.
See accompanying notes which are an integral part of the financial statements.
Financial Statements
Statement of Assets and Liabilities
| November 30, 2021 (Unaudited) | ||
| Assets | ||
| Investment in securities, at value (including securities loaned of $392,265,485) — See accompanying schedule: Unaffiliated issuers (cost $22,594,592,846) | $29,730,769,041 | |
| Fidelity Central Funds (cost $686,658,213) | 686,661,975 | |
| Other affiliated issuers (cost $29,212,804,411) | 38,404,679,016 | |
| Total Investment in Securities (cost $52,494,055,470) | $68,822,110,032 | |
| Cash | 1,051,681 | |
| Foreign currency held at value (cost $399,856) | 715,696 | |
| Receivable for investments sold | 329,737,401 | |
| Receivable for fund shares sold | 66,713,167 | |
| Dividends receivable | 44,761,727 | |
| Distributions receivable from Fidelity Central Funds | 96,672 | |
| Prepaid expenses | 45,105 | |
| Other receivables | 310,781 | |
| Total assets | 69,265,542,262 | |
| Liabilities | ||
| Payable for investments purchased | $323,315,103 | |
| Unrealized depreciation on unfunded commitments | 274,973 | |
| Payable for fund shares redeemed | 23,299,250 | |
| Accrued management fee | 7,094,535 | |
| Written options, at value (premium received $467,913) | 147,933 | |
| Other payables and accrued expenses | 3,475,906 | |
| Collateral on securities loaned | 412,477,992 | |
| Total liabilities | 770,085,692 | |
| Net Assets | $68,495,456,570 | |
| Net Assets consist of: | ||
| Paid in capital | $49,438,233,573 | |
| Total accumulated earnings (loss) | 19,057,222,997 | |
| Net Assets | $68,495,456,570 | |
| Net Asset Value, offering price and redemption price per share ($68,495,456,570 ÷ 4,465,204,145 shares) | $15.34 |
See accompanying notes which are an integral part of the financial statements.
Statement of Operations
| Six months ended November 30, 2021 (Unaudited) | ||
| Investment Income | ||
| Dividends: | ||
| Unaffiliated issuers | $211,939,649 | |
| Affiliated issuers | 105,021,036 | |
| Non-Cash dividends | 35,306,158 | |
| Income from Fidelity Central Funds (including $3,997,319 from security lending) | 4,131,554 | |
| Total income | 356,398,397 | |
| Expenses | ||
| Management fee | $122,053,376 | |
| Custodian fees and expenses | 234,496 | |
| Independent trustees' fees and expenses | 228,298 | |
| Registration fees | 1,533,583 | |
| Audit | 52,302 | |
| Legal | 55,826 | |
| Miscellaneous | 164,434 | |
| Total expenses before reductions | 124,322,315 | |
| Expense reductions | (82,218,453) | |
| Total expenses after reductions | 42,103,862 | |
| Net investment income (loss) | 314,294,535 | |
| Realized and Unrealized Gain (Loss) | ||
| Net realized gain (loss) on: | ||
| Investment securities: | ||
| Unaffiliated issuers (net of foreign taxes of $1,910,640) | 816,045,854 | |
| Affiliated issuers | 744,715,658 | |
| Foreign currency transactions | (542,089) | |
| Capital gain distributions from underlying funds: | ||
| Affiliated issuers | 1,020,554,682 | |
| Total net realized gain (loss) | 2,580,774,105 | |
| Change in net unrealized appreciation (depreciation) on: | ||
| Investment securities: | ||
| Unaffiliated issuers (net of decrease in deferred foreign taxes of $22,775) | (610,078,550) | |
| Affiliated issuers | 1,405,974,634 | |
| Unfunded commitments | (2,076,652) | |
| Assets and liabilities in foreign currencies | 128,890 | |
| Written options | 319,980 | |
| Total change in net unrealized appreciation (depreciation) | 794,268,302 | |
| Net gain (loss) | 3,375,042,407 | |
| Net increase (decrease) in net assets resulting from operations | $3,689,336,942 |
See accompanying notes which are an integral part of the financial statements.
Statement of Changes in Net Assets
| Six months ended November 30, 2021 (Unaudited) | Year ended May 31, 2021 | |
| Increase (Decrease) in Net Assets | ||
| Operations | ||
| Net investment income (loss) | $314,294,535 | $512,715,492 |
| Net realized gain (loss) | 2,580,774,105 | 3,451,371,630 |
| Change in net unrealized appreciation (depreciation) | 794,268,302 | 13,365,930,289 |
| Net increase (decrease) in net assets resulting from operations | 3,689,336,942 | 17,330,017,411 |
| Distributions to shareholders | (2,425,942,274) | (1,284,354,099) |
| Share transactions | ||
| Proceeds from sales of shares | 12,806,723,333 | 20,227,797,679 |
| Reinvestment of distributions | 2,375,547,375 | 1,253,181,860 |
| Cost of shares redeemed | (8,063,955,379) | (10,842,890,026) |
| Net increase (decrease) in net assets resulting from share transactions | 7,118,315,329 | 10,638,089,513 |
| Total increase (decrease) in net assets | 8,381,709,997 | 26,683,752,825 |
| Net Assets | ||
| Beginning of period | 60,113,746,573 | 33,429,993,748 |
| End of period | $68,495,456,570 | $60,113,746,573 |
| Other Information | ||
| Shares | ||
| Sold | 839,345,789 | 1,563,776,896 |
| Issued in reinvestment of distributions | 159,005,848 | 95,299,001 |
| Redeemed | (522,406,118) | (835,812,779) |
| Net increase (decrease) | 475,945,519 | 823,263,118 |
See accompanying notes which are an integral part of the financial statements.
Financial Highlights
Strategic Advisers Fidelity U.S. Total Stock Fund
| Six months ended (Unaudited) November 30, | Years endedMay 31, | ||||
| 2021 | 2021 | 2020 | 2019 | 2018 A | |
| Selected Per–Share Data | |||||
| Net asset value, beginning of period | $15.07 | $10.56 | $9.72 | $9.96 | $10.00 |
| Income from Investment Operations | |||||
| Net investment income (loss)B | .07 | .14 | .16 | .18 | .01 |
| Net realized and unrealized gain (loss) | .80 | 4.73 | 1.00 | (.20) | (.05) |
| Total from investment operations | .87 | 4.87 | 1.16 | (.02) | (.04) |
| Distributions from net investment income | (.01) | (.18) | (.17) | (.09)C | – |
| Distributions from net realized gain | (.60) | (.19) | (.16) | (.13)C | – |
| Total distributions | (.60)D | (.36)D | (.32)D | (.22) | – |
| Net asset value, end of period | $15.34 | $15.07 | $10.56 | $9.72 | $9.96 |
| Total ReturnE,F | 5.88% | 46.63% | 11.84% | (.04)% | (.40)% |
| Ratios to Average Net AssetsG,H | |||||
| Expenses before reductions | .38%I | .38% | .39% | .42% | .54%I |
| Expenses net of fee waivers, if any | .13%I | .13% | .14% | .17% | .29%I,J |
| Expenses net of all reductions | .13%I | .13% | .14% | .17% | .29%I,J |
| Net investment income (loss) | .96%I | 1.11% | 1.55% | 1.81% | .55%I |
| Supplemental Data | |||||
| Net assets, end of period (000 omitted) | $68,495,457 | $60,113,747 | $33,429,994 | $22,411,704 | $16,637,411 |
| Portfolio turnover rateK | 34%I | 46% | 52% | 61% | 126%L,M |
A For the period March 20, 2018 (commencement of operations) through May 31, 2018.
B Calculated based on average shares outstanding during the period.
C The amounts shown reflect certain reclassifications related to book to tax differences that were made in the year shown.
D Total distributions per share do not sum due to rounding.
E Total returns for periods of less than one year are not annualized.
F Total returns would have been lower if certain expenses had not been reduced during the applicable periods shown.
G Fees and expenses of any underlying mutual funds or exchange-traded funds (ETFs) are not included in the Fund's expense ratio. The Fund indirectly bears its proportionate share of these expenses. For additional expense information related to investments in Fidelity Central Funds, please refer to the "Investments in Fidelity Central Funds" note found in the Notes to Financial Statements section of the most recent Annual or Semi-Annual report.
H Expense ratios reflect operating expenses of the class. Expenses before reductions do not reflect amounts reimbursed, waived, or reduced through arrangements with the investment adviser, brokerage services, or other offset arrangements, if applicable, and do not represent the amount paid by the class during periods when reimbursements, waivers or reductions occur.
I Annualized
J Audit fees are not annualized.
K Amount does not include the portfolio activity of any underlying mutual funds or exchange-traded funds (ETFs).
L Portfolio turnover rate excludes securities received or delivered in-kind.
M Amount not annualized.
See accompanying notes which are an integral part of the financial statements.
Notes to Financial Statements (Unaudited)
For the period ended November 30, 2021
1. Organization.
Strategic Advisers Fidelity U.S. Total Stock Fund (the Fund) is a fund of Fidelity Rutland Square Trust II (the Trust), and is authorized to issue an unlimited number of shares. The Trust is registered under the Investment Company Act of 1940, as amended (the 1940 Act), as an open-end management investment company organized as a Delaware statutory trust. The Fund is offered exclusively to certain managed account clients of Strategic Advisers LLC (Strategic Advisers), an affiliate of Fidelity Management & Research Company LLC (FMR).
2. Significant Accounting Policies.
The Fund is an investment company and applies the accounting and reporting guidance of the Financial Accounting Standards Board (FASB) Accounting Standards Codification Topic 946 Financial Services - Investment Companies. The financial statements have been prepared in conformity with accounting principles generally accepted in the United States of America (GAAP), which require management to make certain estimates and assumptions at the date of the financial statements. Actual results could differ from those estimates. Subsequent events, if any, through the date that the financial statements were issued have been evaluated in the preparation of the financial statements. The Fund's Schedule of Investments lists any underlying mutual funds or exchange-traded funds (ETFs) but does not include the underlying holdings of these funds. The following summarizes the significant accounting policies of the Fund:
Investment Valuation. Investments are valued as of 4:00 p.m. Eastern time on the last calendar day of the period. The Board of Trustees (the Board) has delegated the day to day responsibility for the valuation of the Fund's investments to the Fair Value Committee (the Committee) established by the Fund's investment adviser. In accordance with valuation policies and procedures approved by the Board, the Fund attempts to obtain prices from one or more third party pricing vendors or brokers to value its investments. When current market prices, quotations or currency exchange rates are not readily available or reliable, investments will be fair valued in good faith by the Committee, in accordance with procedures adopted by the Board. Factors used in determining fair value vary by investment type and may include market or investment specific events. The frequency with which these procedures are used cannot be predicted and they may be utilized to a significant extent. The Committee oversees the Fund's valuation policies and procedures and reports to the Board on the Committee's activities and fair value determinations. The Board monitors the appropriateness of the procedures used in valuing the Fund's investments and ratifies the fair value determinations of the Committee.
The Fund categorizes the inputs to valuation techniques used to value its investments into a disclosure hierarchy consisting of three levels as shown below:
- Level 1 – quoted prices in active markets for identical investments
- Level 2 – other significant observable inputs (including quoted prices for similar investments, interest rates, prepayment speeds, etc.)
- Level 3 – unobservable inputs (including the Fund's own assumptions based on the best information available)
Valuation techniques used to value the Fund's investments by major category are as follows:
Equity securities, including restricted securities, for which market quotations are readily available, are valued at the last reported sale price or official closing price as reported by a third party pricing vendor on the primary market or exchange on which they are traded and are categorized as Level 1 in the hierarchy. In the event there were no sales during the day or closing prices are not available, securities are valued at the last quoted bid price or may be valued using the last available price and are generally categorized as Level 2 in the hierarchy. For foreign equity securities, when market or security specific events arise, comparisons to the valuation of American Depositary Receipts (ADRs), futures contracts, Exchange-Traded Funds (ETFs) and certain indexes as well as quoted prices for similar securities may be used and would be categorized as Level 2 in the hierarchy. For equity securities, including restricted securities, where observable inputs are limited, assumptions about market activity and risk are used and these securities may be categorized as Level 3 in the hierarchy.
Exchange-traded options are valued using the last sale price or, in the absence of a sale, the last offering price and are categorized as Level 1 in the hierarchy. Investments in open-end mutual funds, including the Fidelity Central Funds, are valued at their closing net asset value (NAV) each business day and are categorized as Level 1 in the hierarchy.
Changes in valuation techniques may result in transfers in or out of an assigned level within the disclosure hierarchy. The aggregate value of investments by input level as of November 30, 2021 is included at the end of the Fund's Schedule of Investments.
Foreign Currency. Certain Funds may use foreign currency contracts to facilitate transactions in foreign-denominated securities. Gains and losses from these transactions may arise from changes in the value of the foreign currency or if the counterparties do not perform under the contracts' terms.
Foreign-denominated assets, including investment securities, and liabilities are translated into U.S. dollars at the exchange rates at period end. Purchases and sales of investment securities, income and dividends received, and expenses denominated in foreign currencies are translated into U.S. dollars at the exchange rate in effect on the transaction date.
The effects of exchange rate fluctuations on investments are included with the net realized and unrealized gain (loss) on investment securities. Other foreign currency transactions resulting in realized and unrealized gain (loss) are disclosed separately.
Investment Transactions and Income. For financial reporting purposes, the Fund's investment holdings and NAV include trades executed through the end of the last business day of the period. The NAV per share for processing shareholder transactions is calculated as of the close of business of the New York Stock Exchange (NYSE), normally 4:00 p.m. Eastern time and includes trades executed through the end of the prior business day. Gains and losses on securities sold are determined on the basis of identified cost and include proceeds received from litigation. Commissions paid to certain brokers with whom the investment adviser, or its affiliates, places trades on behalf of a fund include an amount in addition to trade execution, which may be rebated back to a fund. Any such rebates are included in net realized gain (loss) on investments in the Statement of Operations. Dividend income is recorded on the ex-dividend date, except for certain dividends from foreign securities where the ex-dividend date may have passed, which are recorded as soon as the Fund is informed of the ex-dividend date. Non-cash dividends included in dividend income, if any, are recorded at the fair market value of the securities received. Income and capital gain distributions from Fidelity Central Funds, if any, are recorded on the ex-dividend date. Income and capital gain distributions from any underlying mutual funds or exchange-traded funds (ETFs) are recorded on the ex-dividend date. Certain distributions received by the Fund represent a return of capital or capital gain. The Fund determines the components of these distributions subsequent to the ex-dividend date, based upon receipt of tax filings or other correspondence relating to the underlying investment. These distributions are recorded as a reduction of cost of investments and/or as a realized gain. Investment income is recorded net of foreign taxes withheld where recovery of such taxes is uncertain. Funds may file withholding tax reclaims in certain jurisdictions to recover a portion of amounts previously withheld. Any withholding tax reclaims income is included in the Statement of Operations in dividends. Any receivables for withholding tax reclaims are included in the Statement of Assets and Liabilities in dividends receivable.
Expenses. Expenses directly attributable to a fund are charged to that fund. Expenses attributable to more than one fund are allocated among the respective funds on the basis of relative net assets or other appropriate methods. Expenses included in the accompanying financial statements reflect the expenses of that fund and do not include any expenses associated with any underlying mutual funds or exchange-traded funds. Although not included in a fund's expenses, a fund indirectly bears its proportionate share of these expenses through the net asset value of each underlying mutual fund or exchange-traded fund. Expense estimates are accrued in the period to which they relate and adjustments are made when actual amounts are known.
Deferred Trustee Compensation. Under a Deferred Compensation Plan (the Plan) for certain Funds, certain independent Trustees have elected to defer receipt of a portion of their annual compensation. Deferred amounts are invested in affiliated mutual funds, are marked-to-market and remain in a fund until distributed in accordance with the Plan. The investment of deferred amounts and the offsetting payable to the Trustees presented below are included in the accompanying Statement of Assets and Liabilities in other receivables and other payables and accrued expenses, as applicable.
| Strategic Advisers Fidelity U.S. Total Stock Fund | $23,267 |
Income Tax Information and Distributions to Shareholders. Each year, the Fund intends to qualify as a regulated investment company under Subchapter M of the Internal Revenue Code, including distributing substantially all of its taxable income and realized gains. As a result, no provision for U.S. Federal income taxes is required. The Fund files a U.S. federal tax return, in addition to state and local tax returns as required. The Fund's federal income tax returns are subject to examination by the Internal Revenue Service (IRS) for a period of three fiscal years after they are filed. State and local tax returns may be subject to examination for an additional fiscal year depending on the jurisdiction. Foreign taxes are provided for based on the Fund's understanding of the tax rules and rates that exist in the foreign markets in which it invests. The Fund is subject to a tax imposed on capital gains by certain countries in which it invests. An estimated deferred tax liability for net unrealized appreciation on the applicable securities is included in Other payables and accrued expenses on the Statement of Assets & Liabilities.
Distributions are declared and recorded on the ex-dividend date. Income and capital gain distributions are determined in accordance with income tax regulations, which may differ from GAAP.
Capital accounts within the financial statements are adjusted for permanent book-tax differences. These adjustments have no impact on net assets or the results of operations. Capital accounts are not adjusted for temporary book-tax differences which will reverse in a subsequent period.
Book-tax differences are primarily due the short-term gain distributions from the Underlying Funds, foreign currency transactions, passive foreign investment companies (PFIC), certain foreign taxes, partnerships, deferred trustees compensation and losses deferred due to wash sales and excise tax regulations.
As of period end, the cost and unrealized appreciation (depreciation) in securities, and derivatives if applicable, for federal income tax purposes were as follows:
| Gross unrealized appreciation | $17,273,549,261 |
| Gross unrealized depreciation | (1,074,999,639) |
| Net unrealized appreciation (depreciation) | $16,198,549,622 |
| Tax cost | $52,624,155,363 |
Restricted Securities (including Private Placements). Funds may invest in securities that are subject to legal or contractual restrictions on resale. These securities generally may be resold in transactions exempt from registration or to the public if the securities are registered. Disposal of these securities may involve time-consuming negotiations and expense, and prompt sale at an acceptable price may be difficult. Information regarding restricted securities held at period end is included at the end of the Schedule of Investments, if applicable.
Special Purpose Acquisition Companies. Funds may invest in stock, warrants, and other securities of special purpose acquisition companies (SPACs) or similar special purpose entities. A SPAC is a publicly traded company that raises investment capital via an initial public offering (IPO) for the purpose of acquiring the equity securities of one or more existing companies via merger, business combination, acquisition or other similar transactions within a designated time frame.
Private Investment in Public Equity. Funds may acquire equity securities of an issuer through a private investment in a public equity (PIPE) transaction, including through commitments to purchase securities on a when-issued basis. A PIPE typically involves the purchase of securities directly from a publicly traded company in a private placement transaction. Securities purchased through PIPE transactions will be restricted from trading and considered illiquid until a resale registration statement for the shares is filed and declared effective.
At period end, the Fund had commitments to purchase when-issued securities through PIPE transactions with SPACs. The commitments are contingent upon the SPACs acquiring the securities of target companies. Unrealized appreciation (depreciation) on these commitments is separately presented in the Statements of Assets and Liabilities as Unrealized appreciation (depreciation) on unfunded commitments, and in the Statement of Operations as Change in unrealized appreciation (depreciation) on unfunded commitments.
3. Derivative Instruments.
Risk Exposures and the Use of Derivative Instruments. The Fund's investment objective allows the Fund to enter into various types of derivative contracts, including options. Derivatives are investments whose value is primarily derived from underlying assets, indices or reference rates and may be transacted on an exchange or over-the-counter (OTC). Derivatives may involve a future commitment to buy or sell a specified asset based on specified terms, to exchange future cash flows at periodic intervals based on a notional principal amount, or for one party to make one or more payments upon the occurrence of specified events in exchange for periodic payments from the other party.
The Fund used derivatives to increase returns and to manage exposure to certain risks as defined below. The success of any strategy involving derivatives depends on analysis of numerous economic factors, and if the strategies for investment do not work as intended, the Fund may not achieve its objectives.
The Fund's use of derivatives increased or decreased its exposure to the following risk:
| Equity Risk | Equity risk relates to the fluctuations in the value of financial instruments as a result of changes in market prices (other than those arising from interest rate risk or foreign exchange risk), whether caused by factors specific to an individual investment, its issuer, or all factors affecting all instruments traded in a market or market segment. |
The Fund is also exposed to additional risks from investing in derivatives, such as liquidity risk and counterparty credit risk. Liquidity risk is the risk that the Fund will be unable to close out the derivative in the open market in a timely manner. Counterparty credit risk is the risk that the counterparty will not be able to fulfill its obligation to the Fund. Counterparty credit risk related to exchange-traded options may be mitigated by the protection provided by the exchange on which they trade.
Investing in derivatives may involve greater risks than investing in the underlying assets directly and, to varying degrees, may involve risk of loss in excess of any initial investment and collateral received and amounts recognized in the Statement of Assets and Liabilities. In addition, there may be the risk that the change in value of the derivative contract does not correspond to the change in value of the underlying instrument.
Options. Options give the purchaser the right, but not the obligation, to buy (call) or sell (put) an underlying security or financial instrument at an agreed exercise or strike price between or on certain dates. Options obligate the seller (writer) to buy (put) or sell (call) an underlying instrument at the exercise or strike price or cash settle an underlying derivative instrument if the holder exercises the option on or before the expiration date.
The Fund used exchange-traded written covered call options to manage its exposure to the market. When the Fund writes a covered call option, the Fund holds the underlying instrument which must be delivered to the holder upon the exercise of the option.
Upon entering into a written options contract, the Fund will receive a premium. Premiums received are reflected as a liability on the Statement of Assets and Liabilities. Options are valued daily and any unrealized appreciation (depreciation) is reflected on the Statement of Assets and Liabilities. When a written option is exercised, the premium is added to the proceeds from the sale of the underlying instrument in determining the gain or loss realized on that investment. When an option is closed the Fund will realize a gain or loss depending on whether the proceeds or amount paid for the closing sale transaction are greater or less than the premium received. When an option expires, gains and losses are realized to the extent of premiums received. The net realized gain (loss) on closed and expired written options and the change in net unrealized appreciation (depreciation) on written options are presented in the Statement of Operations.
Writing call options tends to decrease exposure to the underlying instrument and risk of loss is the change in value in excess of the premium received.
Any open options at period end are presented in the Schedule of Investments under the caption "Written Options" and are representative of volume of activity during the period.
4. Purchases and Sales of Investments.
Purchases and sales of securities, other than short-term securities and in-kind transactions, as applicable, are noted in the table below.
| Purchases ($) | Sales ($) | |
| Strategic Advisers Fidelity U.S. Total Stock Fund | 17,132,690,292 | 10,882,717,353 |
5. Fees and Other Transactions with Affiliates.
Management Fee. Strategic Advisers (the investment adviser) provides the Fund with investment management related services. For these services, the Fund pays a monthly management fee to the investment adviser. The management fee is calculated by adding the annual management fee rate of .25% of the Fund's average net assets throughout the month to the aggregate of the fee rates, payable monthly by the investment adviser, to the Fund's sub-advisers. The Fund's maximum aggregate management fee will not exceed 1.00% of the Fund's average net assets. For the reporting period, the total annualized management fee rate was .37% of the Fund's average net assets.
During the period, the investment adviser waived a portion of its management fee as described in the Expense Reductions note.
Sub-Advisers. FIAM LLC (an affiliate of the investment adviser) served as a sub-adviser for the Fund during the period. Sub-advisers provide discretionary investment advisory services for their allocated portion of the Fund's assets and are paid as described in the Management Fee note.
FIL Investment Advisors and Geode Capital Management, LLC (Geode) have been retained to serve as a sub-adviser for the Fund. As of the date of this report, however, these sub-advisers have not been allocated any portion of the Fund's assets. These sub-advisers in the future may provide discretionary investment advisory services for an allocated portion of the Fund's assets and will be paid by the investment adviser for providing these services.
Brokerage Commissions. A portion of portfolio transactions were placed with brokerage firms which are affiliates of the investment adviser. Brokerage commissions are included in net realized gain (loss) and change in net unrealized appreciation (depreciation) in the Statement of Operations. The commissions paid to these affiliated firms were as follows:
| Amount | |
| Strategic Advisers Fidelity U.S. Total Stock Fund | $98,143 |
Interfund Trades. Funds may purchase from or sell securities to other funds affiliated with each sub-adviser under procedures adopted by the Board. The procedures have been designed to ensure these interfund trades are executed in accordance with Rule 17a-7 of the 1940 Act. Any interfund trades are included within the respective purchases and sales amounts shown in the Purchases and Sales of Investments note. Interfund trades during the period are noted in the table below.
| Purchases ($) | Sales ($) | Realized Gain (Loss) ($) | |
| Strategic Advisers Fidelity U.S. Total Stock Fund | 480,102,669 | 275,546,402 | 31,679,047 |
Other. During the period, the investment adviser reimbursed the Fund for certain losses as follows:
| Amount ($) | |
| Strategic Advisers Fidelity U.S. Total Stock Fund | 7,405 |
6. Investments in Fidelity Central Funds.
Funds may invest in Fidelity Central Funds, which are open-end investment companies generally available only to other investment companies and accounts managed by the investment adviser and its affiliates. The Schedule of Investments lists any Fidelity Central Funds held as an investment as of period end, but does not include the underlying holdings of each Fidelity Central Fund. An investing fund indirectly bears its proportionate share of the expenses of the underlying Fidelity Central Funds.
Based on its investment objective, each Fidelity Central Fund may invest or participate in various investment vehicles or strategies that are similar to those of the investing fund. These strategies are consistent with the investment objectives of the investing fund and may involve certain economic risks which may cause a decline in value of each of the Fidelity Central Funds and thus a decline in the value of the investing fund.
| Fidelity Central Fund | Investment Manager | Investment Objective | Investment Practices | Expense Ratio(a) |
| Fidelity Money Market Central Funds | Fidelity Management & Research Company LLC (FMR) | Each fund seeks to obtain a high level of current income consistent with the preservation of capital and liquidity. | Short-term Investments | Less than .005% |
(a) Expenses expressed as a percentage of average net assets and are as of each underlying Central Fund's most recent annual or semi-annual shareholder report.
A complete unaudited list of holdings for each Fidelity Central Fund is available upon request or at the Securities and Exchange Commission website at www.sec.gov. In addition, the financial statements of the Fidelity Central Funds, which are not covered by the Report of Independent Registered Public Accounting Firm, are available on the Securities and Exchange Commission website or upon request.
7. Committed Line of Credit.
Certain Funds participate with other funds managed by the investment adviser or an affiliate in a $4.25 billion credit facility (the "line of credit") to be utilized for temporary or emergency purposes to fund shareholder redemptions or for other short-term liquidity purposes. The participating funds have agreed to pay commitment fees on their pro-rata portion of the line of credit, which are reflected in Miscellaneous expenses on the Statement of Operations, and are listed below. During the period, there were no borrowings on this line of credit.
| Amount | |
| Strategic Advisers Fidelity U.S. Total Stock Fund | $50,303 |
8. Security Lending.
Funds lend portfolio securities from time to time in order to earn additional income. Lending agents are used, including National Financial Services (NFS), an affiliate of the investment adviser. Pursuant to a securities lending agreement, NFS will receive a fee, which is capped at 9.9% of a fund's daily lending revenue, for its services as lending agent. A fund may lend securities to certain qualified borrowers, including NFS. On the settlement date of the loan, a fund receives collateral (in the form of U.S. Treasury obligations, letters of credit and/or cash) against the loaned securities and maintains collateral in an amount not less than 100% of the market value of the loaned securities during the period of the loan. The market value of the loaned securities is determined at the close of business of a fund and any additional required collateral is delivered to a fund on the next business day. A fund or borrower may terminate the loan at any time, and if the borrower defaults on its obligation to return the securities loaned because of insolvency or other reasons, a fund may apply collateral received from the borrower against the obligation. A fund may experience delays and costs in recovering the securities loaned. Any cash collateral received is invested in the Fidelity Securities Lending Cash Central Fund. Any loaned securities are identified as such in the Schedule of Investments, and the value of loaned securities and cash collateral at period end, as applicable, are presented in the Statement of Assets and Liabilities. Security lending income represents the income earned on investing cash collateral, less rebates paid to borrowers and any lending agent fees associated with the loan, plus any premium payments received for lending certain types of securities. Security lending income is presented in the Statement of Operations as a component of income from Fidelity Central Funds. Affiliated security lending activity, if any, was as follows:
| Total Security Lending Fees Paid to NFS | Security Lending Income From Securities Loaned to NFS | Value of Securities Loaned to NFS at Period End | |
| Strategic Advisers Fidelity U.S. Total Stock Fund | $14,395 | $– | $– |
9. Expense Reductions.
The investment adviser has contractually agreed to waive the Fund's management fee in an amount equal to .25% of the Fund's average net assets until September 30, 2024. During the period, this waiver reduced the Fund's management fee by $ 81,857,909.
In addition, during the period the investment adviser or an affiliate reimbursed and/or waived a portion of operating expenses in the amount of $360,544.
10. Other.
A fund's organizational documents provide former and current trustees and officers with a limited indemnification against liabilities arising in connection with the performance of their duties to the fund. In the normal course of business, a fund may also enter into contracts that provide general indemnifications. A fund's maximum exposure under these arrangements is unknown as this would be dependent on future claims that may be made against a fund. The risk of material loss from such claims is considered remote.
Funds do not invest in underlying mutual funds for the purpose of exercising management or control; however, investments by funds within their principal investment strategies may represent a significant portion of the underlying mutual fund's net assets. At the end of the period, certain Funds were the owners of record of 10% or more of the total outstanding shares of the following underlying mutual funds as shown below.
| Fund | Strategic Advisers Fidelity U.S. Total Stock Fund |
| Fidelity Growth Company Fund | 11% |
| Fidelity Large Cap Value Enhanced Index Fund | 52% |
| Fidelity Magellan Fund | 13% |
| Fidelity SAI Inflation-Focused Fund | 24% |
| Fidelity SAI U.S. Low Volatility Index Fund | 32% |
| Fidelity SAI U.S. Momentum Index Fund | 57% |
| Fidelity SAI U.S. Quality Index Fund | 78% |
| Fidelity SAI U.S. Value Index Fund | 68% |
| Fidelity Small Cap Discovery Fund | 16% |
11. Coronavirus (COVID-19) Pandemic.
An outbreak of COVID-19 first detected in China during December 2019 has since spread globally and was declared a pandemic by the World Health Organization during March 2020. Developments that disrupt global economies and financial markets, such as the COVID-19 pandemic, may magnify factors that affect the Fund's performance.
Shareholder Expense Example
As a shareholder, you incur two types of costs: (1) transaction costs, which may include sales charges (loads) on purchase payments or redemption proceeds, as applicable and (2) ongoing costs, which generally include management fees, distribution and/or service (12b-1) fees and other Fund expenses. This Example is intended to help you understand your ongoing costs (in dollars) of investing in a fund and to compare these costs with the ongoing costs of investing in other mutual funds.
The Example is based on an investment of $1,000 invested at the beginning of the period and held for the entire period (June 1, 2021 to November 30, 2021).
Actual Expenses
The first line of the accompanying table provides information about actual account values and actual expenses. You may use the information in this line, together with the amount you invested, to estimate the expenses that you paid over the period. Simply divide your account value by $1,000.00 (for example, an $8,600 account value divided by $1,000.00 = 8.6), then multiply the result by the number in the first line for a class/Fund under the heading entitled "Expenses Paid During Period" to estimate the expenses you paid on your account during this period. If any fund is a shareholder of any underlying mutual funds or exchange-traded funds (ETFs) (the Underlying Funds), such fund indirectly bears its proportional share of the expenses of the Underlying Funds in addition to the direct expenses incurred presented in the table. These fees and expenses are not included in the annualized expense ratio used to calculate the expense estimate in the table below.
Hypothetical Example for Comparison Purposes
The second line of the accompanying table provides information about hypothetical account values and hypothetical expenses based on the actual expense ratio and an assumed rate of return of 5% per year before expenses, which is not the actual return. The hypothetical account values and expenses may not be used to estimate the actual ending account balance or expenses you paid for the period. You may use this information to compare the ongoing costs of investing in the Fund and other funds. To do so, compare this 5% hypothetical example with the 5% hypothetical examples that appear in the shareholder reports of the other funds. If any fund is a shareholder of any Underlying Funds, such fund indirectly bears its proportional share of the expenses of the Underlying Funds in addition to the direct expenses as presented in the table. These fees and expenses are not included in the annualized expense ratio used to calculate the expense estimate in the table below.
Please note that the expenses shown in the table are meant to highlight your ongoing costs only and do not reflect any transaction costs. Therefore, the second line of the table is useful in comparing ongoing costs only, and will not help you determine the relative total costs of owning different funds. In addition, if these transactional costs were included, your costs would have been higher.
| Annualized Expense Ratio-A | Beginning Account Value June 1, 2021 | Ending Account Value November 30, 2021 | Expenses Paid During Period-B June 1, 2021 to November 30, 2021 | |
| Strategic Advisers Fidelity U.S. Total Stock Fund | .13% | |||
| Actual | $1,000.00 | $1,058.80 | $.67 | |
| Hypothetical-C | $1,000.00 | $1,024.42 | $.66 |
A Annualized expense ratio reflects expenses net of applicable fee waivers.
B Expenses are equal to the annualized expense ratio, multiplied by the average account value over the period, multiplied by 183/ 365 (to reflect the one-half year period). The fees and expenses of any Underlying Funds are not included in each annualized expense ratio.
C 5% return per year before expenses
Board Approval of Investment Advisory Contracts and Management Fees
Strategic Advisers Fidelity U.S. Total Stock Fund
Each year, the Board of Trustees, including the Independent Trustees (together, the Board), votes at a meeting on the renewal of the management contract with Strategic Advisers LLC (Strategic Advisers), the sub-advisory agreements with FIAM LLC (FIAM), FIL Investment Advisors, and Geode Capital Management, LLC (each a Sub-Adviser and collectively, the Sub-Advisers) (collectively, the Sub-Advisory Agreements), and the sub-sub-advisory agreements with FMR Investment Management (UK) Limited, Fidelity Management & Research (Japan) Limited, Fidelity Management & Research (Hong Kong) Limited, and FIL Investment Advisors (UK) Limited (collectively, the Sub-Sub-Advisory Agreements and, together with the management contract and the Sub-Advisory Agreements, the Advisory Contracts) for the fund. Strategic Advisers and the Sub-Advisers are referred to herein as the Investment Advisers. The Board, assisted by the advice of fund counsel and Independent Trustees' counsel, requests and considers a broad range of information relevant to the renewal of the Advisory Contracts throughout the year.The Board meets at least four times per year and, at each of its meetings, covers an extensive agenda of topics and materials and considers factors that are relevant to its annual consideration of the renewal of the fund's Advisory Contracts, including the services and support provided to the fund and its shareholders. The full Board or the Independent Trustees, as appropriate, act on all major matters; however, a portion of the activities of the Board (including certain of those described herein) may be conducted through standing committees that have been established by the Board. The Board, acting directly and through its committees, requests and receives information concerning the annual consideration of the renewal of the fund's Advisory Contracts.At its September 2021 meeting, the Board, including the Independent Trustees, unanimously determined to renew the fund's Advisory Contracts. In addition, the Board approved amendments to the Sub-Advisory Agreement with FIAM to add two new mandates (Amendments). The Board noted that, combined, the two new mandates (once funded) are expected to increase each of the fund's total management fee rate and total net expenses by less than 0.5 basis points. The Board noted that no other contract terms are impacted by the Amendments.In reaching its determination to renew the fund's Advisory Contracts and approve the Amendments, the Board considered all factors it believed relevant, including (i) the nature, extent, and quality of the services provided to the fund and its shareholders (including the investment performance of the fund); (ii) the competitiveness relative to peer funds of the fund's management fee and total expenses; (iii) the total costs of the services provided by and the profits, if any, realized by Strategic Advisers from its relationships with the fund; and (iv) the extent to which, if any, economies of scale exist and are realized as the fund grows and whether any economies of scale are appropriately shared with fund shareholders.In considering whether to renew the Advisory Contracts for the fund and approve the Amendments, the Board reached a determination, with the assistance of fund counsel and Independent Trustees' counsel and through the exercise of its business judgment, that the renewal of the Advisory Contracts and the approval of the Amendments is in the best interests of the fund and its shareholders. In addition, the Board concluded that the renewal of each Sub-Advisory Agreement and the approval of each Amendment do not involve a conflict of interest from which Strategic Advisers or its affiliates derive an inappropriate advantage. Also, the Board found that the advisory fees charged under the Advisory Contracts bear a reasonable relationship to the services rendered and are based on services provided that are in addition to, rather than duplicative of, services provided under the advisory contract of any underlying fund in which the fund may invest. The Board's decision to renew the Advisory Contracts and approve the Amendments was not based on any single factor, but rather was based on a comprehensive consideration of all the information provided to the Board throughout the year.Nature, Extent, and Quality of Services Provided. The Board considered the staffing within the Investment Advisers, including the backgrounds of the fund's investment personnel and also considered the fund's investment objective, strategies, and related investment philosophy. The Independent Trustees also had discussions with senior management of Strategic Advisers' investment operations and investment groups. The Board considered the structure of each Investment Adviser's investment personnel compensation program and whether such structures provide appropriate incentives to act in the best interests of the fund. The Board also considered steps taken by the Investment Advisers to continue to provide the same nature, extent, and quality of services to the funds during the COVID-19 pandemic.The Trustees also discussed with representatives of Strategic Advisers, at meetings throughout the year, Strategic Advisers' role in, among other things, (i) setting, implementing and monitoring the investment strategies for the funds; (ii) identifying and recommending sub-advisers for the funds; (iii) overseeing compliance with federal securities laws by each sub-adviser with respect to the portion of fund assets allocated to the sub-adviser; (iv) monitoring and overseeing the performance and investment capabilities of each sub-adviser; and (v) recommending the replacement of a sub-adviser as appropriate. The Trustees considered that the Board had received from Strategic Advisers substantial information and periodic reports about Strategic Advisers' sub-adviser oversight and due diligence processes, as well as periodic reports regarding the performance of each sub-adviser.The Board also considered the nature, extent and quality of services provided by each Sub-Adviser. The Trustees noted that under the Sub-Advisory Agreements subject to oversight by Strategic Advisers, each Sub-Adviser is responsible for, among other things, identifying investments for the portion of fund assets allocated to the Sub-Adviser, if any, and executing portfolio transactions to implement its investment strategy. In addition, the Trustees noted that each Sub-Adviser is responsible for providing such reporting as may be requested from Strategic Advisers to fulfill its oversight responsibilities discussed above.Resources Dedicated to Investment Management and Support Services. The Board reviewed the general qualifications and capabilities of the Investment Advisers' investment staffs, their use of technology, and the Investment Advisers' approach to managing and compensating investment personnel. The Board noted that the Investment Advisers' analysts have extensive resources, tools, and capabilities that allow them to conduct sophisticated quantitative and/or fundamental analysis. Additionally, in its deliberations, the Board considered the Investment Advisers' trading capabilities and resources and global compliance infrastructure, which are integral parts of the investment management process.Shareholder and Administrative Services. The Board considered (i) the nature, extent, quality, and cost of administrative and shareholder services performed by Strategic Advisers and its affiliates under the management contract and under separate agreements covering transfer agency, pricing and bookkeeping, and securities lending services for the fund; (ii) the nature and extent of Strategic Advisers' supervision of third party service providers, including sub-advisers, custodians and subcustodians; and (iii) the resources devoted to, and the record of compliance with, the fund's compliance policies and procedures.Investment Performance. The Board considered whether the fund has operated in accordance with its investment objective, as well as its record of compliance with its investment restrictions and its performance history.In connection with the renewal of the Advisory Contracts, the Board considered annualized return information for the fund for different time periods, measured against an appropriate securities market index (benchmark index) and a peer group of mutual funds with similar objectives (peer group).The Board considered discussions that occur at Board meetings throughout the year with representatives of Strategic Advisers about fund investment performance and the performance of each Sub-Adviser as part of regularly scheduled fund reviews and other reports to the Board on fund performance, taking into account various factors including general market conditions. In its discussions with representatives of Strategic Advisers regarding fund performance, the Board gave particular attention to information indicating underperformance of certain funds for specific time periods and discussed with Strategic Advisers the reasons for any such underperformance.The following chart considered by the Board shows, over the one-year period ended December 31, 2020, the cumulative total returns of the fund and the cumulative total returns of an appropriate benchmark index and peer group. The box within the chart shows the 25th percentile return (75% beaten, top of box) and the 75th percentile return (25% beaten, bottom of box) of the peer group. Returns shown above the box are in the first quartile and returns shown below the box are in the fourth quartile. The percentage beaten number noted below each chart corresponds to the percentile box and represents the percentage of funds in the peer group whose performance was equal to or lower than that of the fund.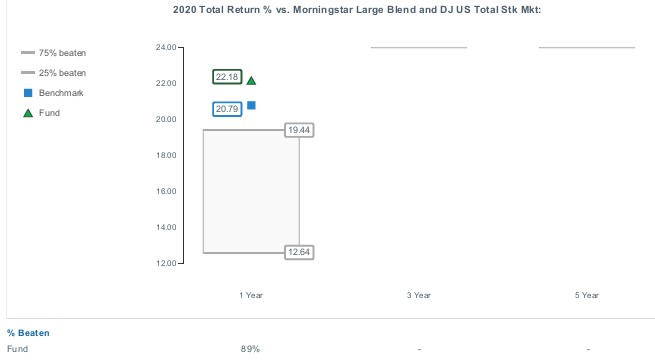

![]()
TSF-SANN-0122
1.9887484.103
Strategic Advisers® Fidelity® Core Income Fund
Offered exclusively to certain managed account clients of Strategic Advisers LLC or its affiliates - not available for sale to the general public
Semi-Annual Report
November 30, 2021
Contents
Board Approval of Investment Advisory Contracts and Management Fees |
To view a fund's proxy voting record for the 12-month period ended June 30, visit http://www.fidelity.com/proxyvotingresults or visit the Securities and Exchange Commission's (SEC) web site at http://www.sec.gov.
You may also call 1-800-544-3455 to request a free copy of the proxy voting guidelines.
Standard & Poor's, S&P and S&P 500 are registered service marks of The McGraw-Hill Companies, Inc. and have been licensed for use by Fidelity Distributors Corporation.
Other third-party marks appearing herein are the property of their respective owners.
All other marks appearing herein are registered or unregistered trademarks or service marks of FMR LLC or an affiliated company. © 2022 FMR LLC. All rights reserved.
This report and the financial statements contained herein are submitted for the general information of the shareholders of the Fund. This report is not authorized for distribution to prospective investors in the Fund unless preceded or accompanied by an effective prospectus.
A fund files its complete schedule of portfolio holdings with the SEC for the first and third quarters of each fiscal year on Form N-PORT. Forms N-PORT are available on the SEC’s web site at http://www.sec.gov. A fund's Forms N-PORT may be reviewed and copied at the SEC’s Public Reference Room in Washington, DC. Information regarding the operation of the SEC's Public Reference Room may be obtained by calling 1-800-SEC-0330.
For a complete list of a fund's portfolio holdings, view the most recent holdings listing, semiannual report, or annual report on Fidelity's web site at http://www.fidelity.com, http://www.institutional.fidelity.com, or http://www.401k.com, as applicable.
NOT FDIC INSURED •MAY LOSE VALUE •NO BANK GUARANTEE
Neither the Fund nor Fidelity Distributors Corporation is a bank.
Note to Shareholders:
Early in 2020, the outbreak and spread of COVID-19 emerged as a public health emergency that had a major influence on financial markets, primarily based on its impact on the global economy and corporate earnings. On March 11, 2020, the World Health Organization declared the COVID-19 outbreak a pandemic, citing sustained risk of further global spread. The pandemic prompted a number of measures to limit the spread of COVID-19, including travel and border restrictions, quarantines, and restrictions on large gatherings. In turn, these resulted in lower consumer activity, diminished demand for a wide range of products and services, disruption in manufacturing and supply chains, and – given the wide variability in outcomes regarding the outbreak – significant market uncertainty and volatility. To help stem the turmoil, the U.S. government took unprecedented action – in concert with the U.S. Federal Reserve and central banks around the world – to help support consumers, businesses, and the broader economy, and to limit disruption to the financial system.
In general, the overall impact of the pandemic lessened in 2021, amid a resilient economy and widespread distribution of three COVID-19 vaccines granted emergency use authorization from the U.S. Food and Drug Administration (FDA) early in the year. Still, the situation remains dynamic, and the extent and duration of its influence on financial markets and the economy is highly uncertain, due in part to a recent spike in cases based on highly contagious variants of the coronavirus.
Extreme events such as the COVID-19 crisis are exogenous shocks that can have significant adverse effects on mutual funds and their investments. Although multiple asset classes may be affected by market disruption, the duration and impact may not be the same for all types of assets. Fidelity is committed to helping you stay informed amid news about COVID-19 and during increased market volatility, and we continue to take extra steps to be responsive to customer needs. We encourage you to visit us online, where we offer ongoing updates, commentary, and analysis on the markets and our funds.
Investment Summary (Unaudited)
The information in the following tables is based on the direct investments of the Fund.Top Ten Holdings as of November 30, 2021
| (by issuer, excluding cash equivalents) | % of fund's net assets |
| Fidelity SAI Total Bond Fund | 26.4 |
| Fidelity SAI U.S. Treasury Bond Index Fund | 9.1 |
| U.S. Treasury Obligations | 7.9 |
| Fidelity SAI Long-Term Treasury Bond Index Fund | 5.0 |
| Fannie Mae | 4.8 |
| Fidelity U.S. Bond Index Fund | 4.4 |
| Freddie Mac | 4.4 |
| Ginnie Mae | 3.9 |
| Uniform Mortgage Backed Securities | 3.2 |
| Fidelity Advisor Corporate Bond Fund Class Z | 2.8 |
Asset Allocation (% of fund's net assets)
| As of November 30, 2021 | ||
| Corporate Bonds | 10.5% | |
| U.S. Government and U.S. Government Agency Obligations | 26.2% | |
| Asset-Backed Securities | 2.1% | |
| CMOs and Other Mortgage Related Securities | 2.8% | |
| Municipal Securities | 0.1% | |
| Bank Loan Funds | 2.4% | |
| High Yield Fixed-Income Funds | 3.2% | |
| Intermediate-Term Bond Funds | 35.7% | |
| Long Government Bond Funds | 5.0% | |
| Sector Funds | 1.7% | |
| Other Investments | 0.4% | |
| Intermediate Government Funds | 10.2% | |
| Short-Term Investments and Net Other Assets (Liabilities)* | (0.3)% | |
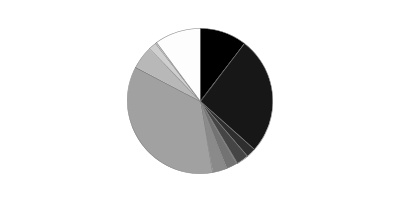
* Short-Term Investments and Net Other Assets (Liabilities) are not included in the pie chart
Asset allocations of funds in the pie chart reflect the categorizations of assets as defined by Morningstar as of the reporting date.
Percentages in the above tables are adjusted for the effect of TBA Sale Commitments.
Percentages are adjusted for the effect of futures contracts and swaps, if applicable.
Schedule of Investments November 30, 2021 (Unaudited)
Showing Percentage of Net Assets
| Nonconvertible Bonds - 10.5% | |||
| Principal Amount(a) | Value | ||
| COMMUNICATION SERVICES - 1.1% | |||
| Diversified Telecommunication Services - 0.4% | |||
| Altice France SA: | |||
| 5.125% 1/15/29 (b) | $720,000 | $681,790 | |
| 8.125% 2/1/27 (b) | 325,000 | 346,661 | |
| AT&T, Inc.: | |||
| 2.55% 12/1/33 | 2,825,000 | 2,730,714 | |
| 3.8% 12/1/57 | 39,772,000 | 41,534,707 | |
| 4.3% 2/15/30 | 3,992,000 | 4,505,508 | |
| 4.75% 5/15/46 | 41,310,000 | 50,287,154 | |
| 4.9% 6/15/42 | 6,909,000 | 8,376,508 | |
| 5.55% 8/15/41 | 12,537,000 | 16,262,500 | |
| 6.2% 3/15/40 | 2,303,000 | 3,083,260 | |
| C&W Senior Financing Designated Activity Co. 6.875% 9/15/27 (b) | 1,246,000 | 1,302,070 | |
| Frontier Communications Holdings LLC 5.875% 10/15/27 (b) | 235,000 | 242,679 | |
| Iliad SA 1.5% 10/14/24 (Reg. S) | EUR | 5,600,000 | 6,311,952 |
| Level 3 Financing, Inc.: | |||
| 3.625% 1/15/29 (b) | 85,000 | 78,625 | |
| 4.25% 7/1/28 (b) | 2,240,000 | 2,184,000 | |
| Lumen Technologies, Inc.: | |||
| 4.5% 1/15/29 (b) | 280,000 | 263,281 | |
| 5.125% 12/15/26 (b) | 2,190,000 | 2,193,833 | |
| 5.625% 4/1/25 | 415,000 | 432,297 | |
| 6.875% 1/15/28 | 40,000 | 43,891 | |
| Sable International Finance Ltd. 5.75% 9/7/27 (b) | 2,332,000 | 2,401,960 | |
| Sprint Capital Corp.: | |||
| 6.875% 11/15/28 | 5,880,000 | 7,259,272 | |
| 8.75% 3/15/32 | 1,315,000 | 1,944,096 | |
| Telecom Italia Capital SA: | |||
| 6% 9/30/34 | 286,000 | 287,727 | |
| 7.2% 7/18/36 | 1,635,000 | 1,780,858 | |
| Telenet Finance Luxembourg Notes SARL 5.5% 3/1/28 (b) | 800,000 | 824,400 | |
| Verizon Communications, Inc.: | |||
| 2.987% 10/30/56 | 1,378,000 | 1,325,749 | |
| 4.329% 9/21/28 | 10,293,000 | 11,723,408 | |
| 5.012% 4/15/49 | 129,000 | 175,347 | |
| Virgin Media Finance PLC 5% 7/15/30 (b) | 636,000 | 616,920 | |
| 169,201,167 | |||
| Entertainment - 0.1% | |||
| Roblox Corp. 3.875% 5/1/30 (b) | 670,000 | 671,675 | |
| The Walt Disney Co.: | |||
| 2.2% 1/13/28 | 10,316,000 | 10,465,367 | |
| 2.65% 1/13/31 | 13,000,000 | 13,495,005 | |
| 24,632,047 | |||
| Interactive Media & Services - 0.0% | |||
| Twitter, Inc. 3.875% 12/15/27 (b) | 510,000 | 528,202 | |
| Media - 0.5% | |||
| Altice Financing SA: | |||
| 5% 1/15/28 (b) | 225,000 | 210,340 | |
| 5.75% 8/15/29 (b) | 1,500,000 | 1,428,623 | |
| CCO Holdings LLC/CCO Holdings Capital Corp.: | |||
| 4.25% 2/1/31 (b) | 940,000 | 925,985 | |
| 4.5% 8/15/30 (b) | 435,000 | 438,456 | |
| 4.5% 5/1/32 | 2,380,000 | 2,370,194 | |
| 4.5% 6/1/33 (b) | 500,000 | 492,500 | |
| 5% 2/1/28 (b) | 2,401,000 | 2,473,030 | |
| Charter Communications Operating LLC/Charter Communications Operating Capital Corp.: | |||
| 2.8% 4/1/31 | 25,100,000 | 24,877,599 | |
| 3.7% 4/1/51 | 20,100,000 | 19,485,369 | |
| 4.464% 7/23/22 | 5,986,000 | 6,091,748 | |
| 4.8% 3/1/50 | 10,000,000 | 11,263,950 | |
| 4.908% 7/23/25 | 4,642,000 | 5,121,294 | |
| 5.375% 5/1/47 | 41,310,000 | 49,575,440 | |
| 5.75% 4/1/48 | 18,275,000 | 23,011,406 | |
| Comcast Corp.: | |||
| 3.75% 4/1/40 | 1,000,000 | 1,126,656 | |
| 4.65% 7/15/42 | 2,578,000 | 3,215,354 | |
| CSC Holdings LLC: | |||
| 4.125% 12/1/30 (b) | 510,000 | 488,055 | |
| 4.625% 12/1/30 (b) | 410,000 | 381,300 | |
| 5.5% 4/15/27 (b) | 564,000 | 579,067 | |
| 5.75% 1/15/30 (b) | 875,000 | 856,958 | |
| Diamond Sports Group LLC/Diamond Sports Finance Co. 5.375% 8/15/26 (b) | 925,000 | 409,313 | |
| Discovery Communications LLC: | |||
| 3.625% 5/15/30 | 6,407,000 | 6,854,263 | |
| 4.65% 5/15/50 | 17,335,000 | 20,552,562 | |
| Fox Corp.: | |||
| 5.476% 1/25/39 | 2,264,000 | 2,925,853 | |
| 5.576% 1/25/49 | 1,502,000 | 2,053,881 | |
| Gray Television, Inc. 4.75% 10/15/30 (b) | 245,000 | 236,119 | |
| Lagardere S.C.A. 2.125% 10/16/26 (Reg. S) | EUR | 1,400,000 | 1,628,132 |
| Lamar Media Corp. 3.625% 1/15/31 | 515,000 | 492,610 | |
| Meredith Corp. 6.5% 7/1/25 | 615,000 | 654,206 | |
| Scripps Escrow II, Inc. 3.875% 1/15/29 (b) | 225,000 | 223,594 | |
| Sirius XM Radio, Inc.: | |||
| 3.875% 9/1/31 (b) | 275,000 | 260,563 | |
| 4.125% 7/1/30 (b) | 10,155,000 | 9,920,623 | |
| 5% 8/1/27 (b) | 375,000 | 386,138 | |
| 5.5% 7/1/29 (b) | 2,890,000 | 3,065,539 | |
| Tegna, Inc.: | |||
| 4.625% 3/15/28 | 915,000 | 911,386 | |
| 5% 9/15/29 | 115,000 | 115,288 | |
| Time Warner Cable LLC: | |||
| 4.5% 9/15/42 | 886,000 | 973,925 | |
| 5.5% 9/1/41 | 1,530,000 | 1,874,434 | |
| 5.875% 11/15/40 | 8,089,000 | 10,249,593 | |
| 6.55% 5/1/37 | 5,846,000 | 7,829,237 | |
| 6.75% 6/15/39 | 4,614,000 | 6,326,076 | |
| 7.3% 7/1/38 | 3,785,000 | 5,430,223 | |
| Virgin Media Secured Finance PLC: | |||
| 4.5% 8/15/30 (b) | 585,000 | 571,738 | |
| 5.5% 5/15/29 (b) | 415,000 | 431,189 | |
| Ziggo Bond Co. BV 5.125% 2/28/30 (b) | 540,000 | 539,611 | |
| Ziggo BV: | |||
| 4.875% 1/15/30 (b) | 550,000 | 556,531 | |
| 5.5% 1/15/27 (b) | 1,083,000 | 1,114,710 | |
| 241,000,661 | |||
| Wireless Telecommunication Services - 0.1% | |||
| Millicom International Cellular SA: | |||
| 4.5% 4/27/31 (b) | 7,026,000 | 6,994,383 | |
| 5.125% 1/15/28 (b) | 540,000 | 556,470 | |
| T-Mobile U.S.A., Inc.: | |||
| 2.875% 2/15/31 | 695,000 | 672,419 | |
| 3.75% 4/15/27 | 10,840,000 | 11,654,168 | |
| 3.875% 4/15/30 | 22,877,000 | 24,863,731 | |
| 4.5% 4/15/50 | 4,597,000 | 5,376,424 | |
| Vodafone Group PLC: | �� | ||
| 4.875% 10/3/78 (Reg. S) (c) | GBP | 1,100,000 | 1,547,064 |
| 6.25% 10/3/78 (Reg. S) (c) | 1,445,000 | 1,549,242 | |
| 53,213,901 | |||
| TOTAL COMMUNICATION SERVICES | 488,575,978 | ||
| CONSUMER DISCRETIONARY - 0.6% | |||
| Auto Components - 0.0% | |||
| Allison Transmission, Inc. 3.75% 1/30/31 (b) | 615,000 | 587,931 | |
| Dana, Inc. 4.5% 2/15/32 | 275,000 | 268,155 | |
| Valeo SA 1% 8/3/28 (Reg. S) | EUR | 1,100,000 | 1,202,650 |
| ZF Finance GmbH 2% 5/6/27 (Reg. S) | EUR | 1,400,000 | 1,577,420 |
| 3,636,156 | |||
| Automobiles - 0.1% | |||
| General Motors Co. 5.4% 10/2/23 | 18,263,000 | 19,673,318 | |
| General Motors Financial Co., Inc.: | |||
| 3.7% 5/9/23 | 8,751,000 | 9,053,037 | |
| 4.25% 5/15/23 | 1,359,000 | 1,422,145 | |
| Thor Industries, Inc. 4% 10/15/29 (b) | 355,000 | 347,723 | |
| Volkswagen Group of America Finance LLC: | |||
| 2.9% 5/13/22 (b) | 10,524,000 | 10,631,739 | |
| 3.125% 5/12/23 (b) | 9,168,000 | 9,454,788 | |
| 3.35% 5/13/25 (b) | 14,765,000 | 15,572,559 | |
| 66,155,309 | |||
| Diversified Consumer Services - 0.0% | |||
| Adtalem Global Education, Inc. 5.5% 3/1/28 (b) | 825,000 | 794,648 | |
| GEMS MENASA Cayman Ltd. 7.125% 7/31/26 (b) | 765,000 | 782,834 | |
| Service Corp. International 5.125% 6/1/29 | 970,000 | 1,033,050 | |
| 2,610,532 | |||
| Hotels, Restaurants & Leisure - 0.1% | |||
| Accor SA 2.375% 11/29/28 (Reg. S) | EUR | 1,300,000 | 1,463,479 |
| Aramark Services, Inc.: | |||
| 5% 2/1/28 (b) | 3,530,000 | 3,547,650 | |
| 6.375% 5/1/25 (b) | 1,890,000 | 1,971,270 | |
| Carnival Corp. 10.5% 2/1/26 (b) | 1,105,000 | 1,259,700 | |
| Hilton Domestic Operating Co., Inc.: | |||
| 3.625% 2/15/32 (b) | 660,000 | 640,642 | |
| 3.75% 5/1/29 (b) | 700,000 | 693,511 | |
| 4% 5/1/31 (b) | 1,535,000 | 1,538,082 | |
| Hilton Worldwide Finance LLC/Hilton Worldwide Finance Corp. 4.875% 4/1/27 | 164,000 | 168,305 | |
| InterContinental Hotel Group PLC 3.375% 10/8/28 (Reg. S) | GBP | 4,895,000 | 6,889,634 |
| Melco Resorts Finance Ltd.: | |||
| 4.875% 6/6/25 (b) | 750,000 | 742,485 | |
| 5.375% 12/4/29 (b) | 260,000 | 253,612 | |
| 5.75% 7/21/28 (b) | 390,000 | 383,175 | |
| MGM Resorts International 5.75% 6/15/25 | 820,000 | 865,215 | |
| Royal Caribbean Cruises Ltd.: | |||
| 5.5% 4/1/28 (b) | 755,000 | 734,238 | |
| 9.125% 6/15/23 (b) | 130,000 | 137,885 | |
| 11.5% 6/1/25 (b) | 325,000 | 361,969 | |
| Starbucks Corp. 1.3% 5/7/22 | 5,502,000 | 5,521,590 | |
| Whitbread PLC: | |||
| 2.375% 5/31/27 (Reg. S) | GBP | 2,360,000 | 3,143,503 |
| 3.375% 10/16/25 (Reg. S) | GBP | 3,355,000 | 4,651,311 |
| Wyndham Hotels & Resorts, Inc. 4.375% 8/15/28 (b) | 290,000 | 293,003 | |
| Wynn Las Vegas LLC/Wynn Las Vegas Capital Corp. 5.5% 3/1/25 (b) | 645,000 | 645,922 | |
| Yum! Brands, Inc. 3.625% 3/15/31 | 358,000 | 347,142 | |
| 36,253,323 | |||
| Household Durables - 0.2% | |||
| Century Communities, Inc. 3.875% 8/15/29 (b) | 325,000 | 320,169 | |
| D.R. Horton, Inc. 1.3% 10/15/26 | 15,859,000 | 15,476,073 | |
| Lennar Corp.: | |||
| 4.75% 11/29/27 | 9,429,000 | 10,715,964 | |
| 5% 6/15/27 | 12,243,000 | 13,962,162 | |
| 5.25% 6/1/26 | 2,965,000 | 3,363,348 | |
| Newell Brands, Inc.: | |||
| 5.875% 4/1/36 | 270,000 | 329,586 | |
| 6% 4/1/46 | 1,185,000 | 1,472,363 | |
| Tempur Sealy International, Inc. 3.875% 10/15/31 (b) | 280,000 | 270,511 | |
| The Berkeley Group PLC 2.5% 8/11/31 (Reg. S) | GBP | 1,820,000 | 2,357,208 |
| Toll Brothers Finance Corp.: | |||
| 4.35% 2/15/28 | 14,431,000 | 15,594,572 | |
| 4.875% 11/15/25 | 45,000 | 49,275 | |
| 4.875% 3/15/27 | 15,464,000 | 17,049,060 | |
| TopBuild Corp. 4.125% 2/15/32 (b) | 580,000 | 581,093 | |
| 81,541,384 | |||
| Internet & Direct Marketing Retail - 0.0% | |||
| Alibaba Group Holding Ltd.: | |||
| 2.125% 2/9/31 | 2,350,000 | 2,280,675 | |
| 2.7% 2/9/41 | 12,255,000 | 11,353,890 | |
| Match Group Holdings II LLC: | |||
| 3.625% 10/1/31 (b) | 410,000 | 386,507 | |
| 4.125% 8/1/30 (b) | 170,000 | 168,513 | |
| 14,189,585 | |||
| Leisure Products - 0.0% | |||
| Hasbro, Inc. 3% 11/19/24 | 6,474,000 | 6,764,827 | |
| Mattel, Inc.: | |||
| 3.75% 4/1/29 (b) | 430,000 | 439,940 | |
| 5.45% 11/1/41 | 70,000 | 82,503 | |
| 6.2% 10/1/40 | 531,000 | 678,459 | |
| 7,965,729 | |||
| Multiline Retail - 0.0% | |||
| John Lewis PLC 6.125% 1/21/25 | GBP | 1,157,000 | 1,704,122 |
| Marks & Spencer PLC 4.5% 7/10/27 (Reg. S) | GBP | 2,700,000 | 3,752,921 |
| Nordstrom, Inc.: | |||
| 4.25% 8/1/31 | 10,000,000 | 9,574,549 | |
| 4.375% 4/1/30 | 510,000 | 500,489 | |
| 15,532,081 | |||
| Specialty Retail - 0.1% | |||
| Asbury Automotive Group, Inc.: | |||
| 4.625% 11/15/29 (b) | 175,000 | 176,105 | |
| 5% 2/15/32 (b) | 190,000 | 191,209 | |
| AutoNation, Inc. 4.75% 6/1/30 | 1,430,000 | 1,654,172 | |
| AutoZone, Inc. 4% 4/15/30 | 19,121,000 | 21,379,020 | |
| Bath & Body Works, Inc. 6.625% 10/1/30 (b) | 825,000 | 915,222 | |
| Foot Locker, Inc. 4% 10/1/29 (b) | 145,000 | 143,550 | |
| Gap, Inc. 3.875% 10/1/31 (b) | 275,000 | 263,181 | |
| LCM Investments Holdings 4.875% 5/1/29 (b) | 120,000 | 119,536 | |
| VIA Outlets 1.75% 11/15/28 (Reg. S) | EUR | 1,300,000 | 1,472,089 |
| 26,314,084 | |||
| Textiles, Apparel & Luxury Goods - 0.1% | |||
| Crocs, Inc. 4.125% 8/15/31 (b) | 285,000 | 283,575 | |
| Hanesbrands, Inc. 4.875% 5/15/26 (b) | 615,000 | 656,636 | |
| Kontoor Brands, Inc. 4.125% 11/15/29 (b) | 95,000 | 94,764 | |
| Levi Strauss & Co. 3.5% 3/1/31 (b) | 355,000 | 360,769 | |
| Tapestry, Inc. 3.05% 3/15/32 (d) | 33,118,000 | 33,474,994 | |
| The William Carter Co. 5.625% 3/15/27 (b) | 446,000 | 459,175 | |
| Wolverine World Wide, Inc. 4% 8/15/29 (b) | 380,000 | 368,600 | |
| 35,698,513 | |||
| TOTAL CONSUMER DISCRETIONARY | 289,896,696 | ||
| CONSUMER STAPLES - 0.9% | |||
| Beverages - 0.3% | |||
| Anheuser-Busch InBev Finance, Inc.: | |||
| 4.7% 2/1/36 | 6,600,000 | 7,913,930 | |
| 4.9% 2/1/46 | 14,391,000 | 18,108,887 | |
| Anheuser-Busch InBev Worldwide, Inc.: | |||
| 3.5% 6/1/30 | 10,375,000 | 11,346,138 | |
| 4.35% 6/1/40 | 6,274,000 | 7,369,805 | |
| 4.5% 6/1/50 | 11,500,000 | 14,231,647 | |
| 4.6% 6/1/60 | 18,803,000 | 23,368,438 | |
| 4.75% 1/23/29 | 11,220,000 | 13,080,607 | |
| 4.75% 4/15/58 | 5,641,000 | 7,154,652 | |
| 5.45% 1/23/39 | 5,480,000 | 7,182,196 | |
| 5.55% 1/23/49 | 13,389,000 | 18,467,646 | |
| 5.8% 1/23/59 (Reg. S) | 14,304,000 | 20,975,242 | |
| Constellation Brands, Inc. 4.75% 11/15/24 | 3,799,000 | 4,170,843 | |
| PepsiCo, Inc.: | |||
| 2.625% 3/19/27 | 1,114,000 | 1,173,225 | |
| 2.75% 3/19/30 | 5,700,000 | 6,004,342 | |
| 160,547,598 | |||
| Food & Staples Retailing - 0.2% | |||
| Albertsons Companies LLC/Safeway, Inc./New Albertson's, Inc./Albertson's LLC: | |||
| 3.5% 3/15/29 (b) | 2,290,000 | 2,269,505 | |
| 4.625% 1/15/27 (b) | 125,000 | 129,581 | |
| 4.875% 2/15/30 (b) | 1,090,000 | 1,158,485 | |
| Sysco Corp. 6.6% 4/1/50 | 53,060,000 | 83,349,444 | |
| U.S. Foods, Inc.: | |||
| 4.625% 6/1/30 (b) | 130,000 | 130,650 | |
| 6.25% 4/15/25 (b) | 445,000 | 463,112 | |
| 87,500,777 | |||
| Food Products - 0.4% | |||
| Darling Ingredients, Inc. 5.25% 4/15/27 (b) | 615,000 | 635,716 | |
| General Mills, Inc. 2.875% 4/15/30 | 1,277,000 | 1,340,452 | |
| JBS Finance Luxembourg SARL 2.5% 1/15/27 (b) | 12,010,000 | 11,909,116 | |
| JBS U.S.A. LLC/JBS U.S.A. Finance, Inc. 6.75% 2/15/28 (b) | 269,000 | 290,117 | |
| JBS U.S.A. Lux SA / JBS Food Co.: | |||
| 3% 5/15/32 (b)(d) | 9,870,000 | 9,762,516 | |
| 5.5% 1/15/30 (b) | 23,280,000 | 24,972,223 | |
| 6.5% 4/15/29 (b) | 42,201,000 | 46,210,095 | |
| JDE Peet's BV 2.25% 9/24/31 (b) | 2,500,000 | 2,439,742 | |
| Kraft Heinz Foods Co.: | |||
| 3.875% 5/15/27 | 560,000 | 605,441 | |
| 4.25% 3/1/31 | 525,000 | 600,591 | |
| 4.375% 6/1/46 | 11,995,000 | 13,882,266 | |
| 4.625% 1/30/29 | 10,000,000 | 11,559,238 | |
| 4.875% 10/1/49 | 10,000,000 | 12,467,569 | |
| 5% 7/15/35 | 2,215,000 | 2,744,798 | |
| 5.2% 7/15/45 | 6,203,000 | 7,894,843 | |
| 7.125% 8/1/39 (b) | 9,489,000 | 14,241,110 | |
| Lamb Weston Holdings, Inc. 4.875% 5/15/28 (b) | 825,000 | 875,531 | |
| Post Holdings, Inc. 4.625% 4/15/30 (b) | 905,000 | 893,688 | |
| TreeHouse Foods, Inc. 4% 9/1/28 | 390,000 | 369,763 | |
| 163,694,815 | |||
| Personal Products - 0.0% | |||
| Prestige Brands, Inc. 3.75% 4/1/31 (b) | 340,000 | 325,763 | |
| Tobacco - 0.0% | |||
| BAT International Finance PLC 2.25% 6/26/28 (Reg. S) | GBP | 7,165,000 | 9,377,779 |
| TOTAL CONSUMER STAPLES | 421,446,732 | ||
| ENERGY - 0.9% | |||
| Energy Equipment & Services - 0.0% | |||
| Technip Energies NV 1.125% 5/28/28 | EUR | 1,465,000 | 1,676,345 |
| Oil, Gas & Consumable Fuels - 0.9% | |||
| Apache Corp.: | |||
| 5.1% 9/1/40 | 330,000 | 357,806 | |
| 5.25% 2/1/42 | 495,000 | 546,975 | |
| 5.35% 7/1/49 | 80,000 | 91,212 | |
| Cheniere Energy Partners LP: | |||
| 3.25% 1/31/32 (b) | 275,000 | 267,094 | |
| 4% 3/1/31 (b) | 925,000 | 943,500 | |
| Cheniere Energy, Inc. 4.625% 10/15/28 | 595,000 | 612,850 | |
| Citgo Petroleum Corp. 6.375% 6/15/26 (b) | 660,000 | 660,000 | |
| CNX Midstream Partners LP 4.75% 4/15/30 (b) | 115,000 | 113,275 | |
| Colgate Energy Partners III LLC 5.875% 7/1/29 (b) | 145,000 | 143,913 | |
| Columbia Pipeline Group, Inc. 4.5% 6/1/25 | 852,000 | 933,022 | |
| Continental Resources, Inc. 5.75% 1/15/31 (b) | 895,000 | 1,042,478 | |
| Crestwood Midstream Partners LP/Crestwood Midstream Finance Corp.: | |||
| 5.625% 5/1/27 (b) | 1,653,000 | 1,653,000 | |
| 5.75% 4/1/25 | 2,038,000 | 2,044,022 | |
| 6% 2/1/29 (b) | 1,420,000 | 1,435,975 | |
| CVR Energy, Inc.: | |||
| 5.25% 2/15/25 (b) | 790,000 | 752,554 | |
| 5.75% 2/15/28 (b) | 105,000 | 99,171 | |
| DCP Midstream Operating LP: | |||
| 3.875% 3/15/23 | 3,116,000 | 3,170,530 | |
| 5.125% 5/15/29 | 1,740,000 | 1,929,486 | |
| 5.375% 7/15/25 | 540,000 | 576,126 | |
| 5.6% 4/1/44 | 2,748,000 | 3,269,296 | |
| 5.625% 7/15/27 | 620,000 | 692,472 | |
| 5.85% 5/21/43 (b)(c) | 29,466,000 | 28,165,371 | |
| 6.45% 11/3/36 (b) | 210,000 | 273,000 | |
| 8.125% 8/16/30 | 15,000 | 20,063 | |
| EG Global Finance PLC 6.75% 2/7/25 (b) | 530,000 | 533,975 | |
| Enable Midstream Partners LP 3.9% 5/15/24 (c) | 869,000 | 911,986 | |
| Enbridge, Inc.: | |||
| 4% 10/1/23 | 3,854,000 | 4,035,633 | |
| 4.25% 12/1/26 | 1,461,000 | 1,602,813 | |
| Endeavor Energy Resources LP/EER Finance, Inc.: | |||
| 5.75% 1/30/28 (b) | 435,000 | 452,400 | |
| 6.625% 7/15/25 (b) | 110,000 | 115,638 | |
| Energy Transfer LP: | |||
| 3.75% 5/15/30 | 3,643,000 | 3,835,053 | |
| 4.2% 9/15/23 | 1,203,000 | 1,260,622 | |
| 4.25% 3/15/23 | 1,393,000 | 1,438,313 | |
| 4.5% 4/15/24 | 1,576,000 | 1,678,333 | |
| 4.95% 6/15/28 | 4,103,000 | 4,638,561 | |
| 5% 5/15/50 | 7,800,000 | 8,962,838 | |
| 5.25% 4/15/29 | 2,564,000 | 2,932,480 | |
| 5.4% 10/1/47 | 1,732,000 | 2,061,748 | |
| 5.8% 6/15/38 | 2,288,000 | 2,776,757 | |
| 6% 6/15/48 | 1,490,000 | 1,870,286 | |
| 6.25% 4/15/49 | 1,761,000 | 2,286,261 | |
| EnLink Midstream LLC 5.625% 1/15/28 (b) | 105,000 | 107,625 | |
| EnLink Midstream Partners LP: | |||
| 5.05% 4/1/45 | 140,000 | 129,501 | |
| 5.45% 6/1/47 | 290,000 | 281,201 | |
| 5.6% 4/1/44 | 490,000 | 463,050 | |
| EQM Midstream Partners LP: | |||
| 4.75% 1/15/31 (b) | 550,000 | 555,500 | |
| 5.5% 7/15/28 | 440,000 | 466,400 | |
| 6.5% 7/1/27 (b) | 465,000 | 502,200 | |
| 6.5% 7/15/48 | 265,000 | 307,586 | |
| EQT Corp. 3.9% 10/1/27 | 405,000 | 422,229 | |
| Global Partners LP/GLP Finance Corp. 7% 8/1/27 | 1,200,000 | 1,236,000 | |
| Hess Corp.: | |||
| 4.3% 4/1/27 | 7,041,000 | 7,646,606 | |
| 5.6% 2/15/41 | 50,505,000 | 62,248,736 | |
| 5.8% 4/1/47 | 5,019,000 | 6,592,231 | |
| 7.125% 3/15/33 | 1,403,000 | 1,875,151 | |
| 7.3% 8/15/31 | 1,709,000 | 2,280,063 | |
| 7.875% 10/1/29 | 4,789,000 | 6,450,190 | |
| Hess Midstream Partners LP: | |||
| 5.125% 6/15/28 (b) | 780,000 | 797,550 | |
| 5.625% 2/15/26 (b) | 1,503,000 | 1,536,818 | |
| Hilcorp Energy I LP/Hilcorp Finance Co. 6.25% 11/1/28 (b) | 185,000 | 187,775 | |
| Holly Energy Partners LP/Holly Energy Finance Corp. 5% 2/1/28 (b) | 910,000 | 905,450 | |
| MPLX LP: | |||
| 4.8% 2/15/29 | 1,376,000 | 1,560,782 | |
| 4.875% 12/1/24 | 1,974,000 | 2,146,002 | |
| 5.5% 2/15/49 | 4,129,000 | 5,214,921 | |
| Murphy Oil U.S.A., Inc. 3.75% 2/15/31 (b) | 110,000 | 105,947 | |
| New Fortress Energy, Inc. 6.5% 9/30/26 (b) | 650,000 | 614,465 | |
| Occidental Petroleum Corp.: | |||
| 3.5% 8/15/29 | 3,191,000 | 3,124,978 | |
| 4.2% 3/15/48 | 310,000 | 297,800 | |
| 4.3% 8/15/39 | 562,000 | 547,950 | |
| 4.4% 4/15/46 | 480,000 | 471,677 | |
| 4.4% 8/15/49 | 3,942,000 | 3,873,015 | |
| 5.55% 3/15/26 | 5,734,000 | 6,129,847 | |
| 6.125% 1/1/31 | 365,000 | 425,335 | |
| 6.2% 3/15/40 | 160,000 | 189,600 | |
| 6.45% 9/15/36 | 5,135,000 | 6,376,335 | |
| 6.6% 3/15/46 | 4,886,000 | 6,219,145 | |
| 7.5% 5/1/31 | 7,400,000 | 9,327,219 | |
| 7.875% 9/15/31 | 100,000 | 130,250 | |
| 8.875% 7/15/30 | 345,000 | 453,045 | |
| Ovintiv, Inc.: | |||
| 5.15% 11/15/41 | 3,000,000 | 3,310,668 | |
| 8.125% 9/15/30 | 5,649,000 | 7,430,113 | |
| PBF Holding Co. LLC/PBF Finance Corp. 9.25% 5/15/25 (b) | 1,500,000 | 1,387,500 | |
| Petroleos Mexicanos: | |||
| 6.35% 2/12/48 | 1,560,000 | 1,224,990 | |
| 6.49% 1/23/27 | 3,630,000 | 3,711,494 | |
| 6.5% 3/13/27 | 9,576,000 | 9,784,278 | |
| 6.75% 9/21/47 | 22,490,000 | 18,388,949 | |
| 6.84% 1/23/30 | 15,264,000 | 15,241,104 | |
| 6.95% 1/28/60 | 7,166,000 | 5,858,205 | |
| 7.69% 1/23/50 | 73,606,000 | 66,047,400 | |
| Plains All American Pipeline LP/PAA Finance Corp.: | |||
| 3.55% 12/15/29 | 1,968,000 | 2,039,318 | |
| 3.6% 11/1/24 | 1,903,000 | 1,992,144 | |
| 3.65% 6/1/22 | 3,779,000 | 3,805,342 | |
| Rattler Midstream LP 5.625% 7/15/25 (b) | 1,110,000 | 1,143,300 | |
| Regency Energy Partners LP/Regency Energy Finance Corp. 5.875% 3/1/22 | 2,000,000 | 2,000,000 | |
| Rockies Express Pipeline LLC: | |||
| 4.8% 5/15/30 (b) | 735,000 | 760,725 | |
| 4.95% 7/15/29 (b) | 276,000 | 289,455 | |
| 6.875% 4/15/40 (b) | 105,000 | 117,075 | |
| Sabine Pass Liquefaction LLC 4.5% 5/15/30 | 14,626,000 | 16,545,491 | |
| Sunoco LP/Sunoco Finance Corp.: | |||
| 4.5% 5/15/29 | 635,000 | 626,428 | |
| 5.875% 3/15/28 | 135,000 | 141,075 | |
| 6% 4/15/27 | 15,000 | 15,544 | |
| Tallgrass Energy Partners LP / Tallgrass Energy Finance Corp.: | |||
| 5.5% 1/15/28 (b) | 125,000 | 122,031 | |
| 6% 3/1/27 (b) | 545,000 | 558,625 | |
| 6% 12/31/30 (b) | 655,000 | 647,230 | |
| 6% 9/1/31 (b) | 270,000 | 261,225 | |
| Targa Resources Partners LP/Targa Resources Partners Finance Corp.: | |||
| 4% 1/15/32 (b) | 1,200,000 | 1,239,624 | |
| 4.875% 2/1/31 | 1,705,000 | 1,828,613 | |
| 5.375% 2/1/27 | 128,000 | 130,880 | |
| 5.5% 3/1/30 | 135,000 | 146,813 | |
| 5.875% 4/15/26 | 881,000 | 912,936 | |
| The Williams Companies, Inc.: | |||
| 3.5% 11/15/30 | 15,742,000 | 16,699,869 | |
| 3.7% 1/15/23 | 808,000 | 828,242 | |
| 5.1% 9/15/45 | 9,765,000 | 12,041,804 | |
| Venture Global Calcasieu Pass LLC: | |||
| 3.875% 8/15/29 (b) | 340,000 | 341,411 | |
| 3.875% 11/1/33 (b) | 275,000 | 275,688 | |
| 4.125% 8/15/31 (b) | 325,000 | 332,365 | |
| Viper Energy Partners LP 5.375% 11/1/27 (b) | 600,000 | 618,000 | |
| Western Gas Partners LP: | |||
| 3.95% 6/1/25 | 1,280,000 | 1,323,475 | |
| 4.65% 7/1/26 | 2,046,000 | 2,184,105 | |
| 4.75% 8/15/28 | 1,236,000 | 1,345,695 | |
| 5.3% 2/1/30 | 1,420,000 | 1,528,346 | |
| 438,614,638 | |||
| TOTAL ENERGY | 440,290,983 | ||
| FINANCIALS - 4.8% | |||
| Banks - 2.5% | |||
| AIB Group PLC 1.875% 11/19/29 (Reg. S) (c) | EUR | 2,710,000 | 3,113,599 |
| Alpha Bank SA 4.25% 2/13/30 (Reg. S) (c) | EUR | 795,000 | 863,291 |
| Bank Ireland Group PLC: | |||
| 1.375% 8/11/31 (Reg. S) (c) | EUR | 4,235,000 | 4,717,345 |
| 2.029% 9/30/27 (b)(c) | 2,500,000 | 2,468,343 | |
| Bank of America Corp.: | |||
| 1.734% 7/22/27 (c) | 25,000,000 | 24,774,156 | |
| 2.299% 7/21/32 (c) | 50,000,000 | 49,065,730 | |
| 3.3% 1/11/23 | 2,658,000 | 2,736,397 | |
| 3.419% 12/20/28 (c) | 5,193,000 | 5,532,553 | |
| 3.5% 4/19/26 | 6,078,000 | 6,545,245 | |
| 3.95% 4/21/25 | 37,660,000 | 40,408,619 | |
| 4% 1/22/25 | 26,856,000 | 28,726,982 | |
| 4.1% 7/24/23 | 1,426,000 | 1,505,887 | |
| 4.183% 11/25/27 | 6,909,000 | 7,556,492 | |
| 4.2% 8/26/24 | 8,311,000 | 8,930,940 | |
| 4.25% 10/22/26 | 38,178,000 | 42,083,312 | |
| 4.45% 3/3/26 | 6,522,000 | 7,176,840 | |
| Banque Federative du Credit Mutuel SA 3 month U.S. LIBOR + 0.730% 0.8615% 7/20/22 (b)(c)(e) | 8,158,000 | 8,191,770 | |
| Barclays Bank PLC 1.7% 5/12/22 | 5,246,000 | 5,268,672 | |
| Barclays PLC: | |||
| 2.279% 11/24/27 (c) | 25,000,000 | 25,030,048 | |
| 2.852% 5/7/26 (c) | 14,944,000 | 15,423,220 | |
| 4.375% 1/12/26 | 4,468,000 | 4,886,613 | |
| 4.836% 5/9/28 | 6,102,000 | 6,727,068 | |
| 5.088% 6/20/30 (c) | 29,218,000 | 33,206,745 | |
| 5.2% 5/12/26 | 1,556,000 | 1,747,186 | |
| BNP Paribas SA: | |||
| 2.159% 9/15/29 (b)(c) | 3,350,000 | 3,290,775 | |
| 2.219% 6/9/26 (b)(c) | 13,752,000 | 13,961,224 | |
| BPCE SA: | |||
| 1.5% 1/13/42 (Reg. S) (c) | EUR | 2,200,000 | 2,472,315 |
| 4.875% 4/1/26 (b) | 7,383,000 | 8,200,629 | |
| CIT Group, Inc.: | |||
| 3.929% 6/19/24 (c) | 1,900,000 | 1,956,836 | |
| 4.75% 2/16/24 | 2,520,000 | 2,658,600 | |
| 6.125% 3/9/28 | 40,155,000 | 47,382,900 | |
| Citigroup, Inc.: | |||
| 4.075% 4/23/29 (c) | 4,606,000 | 5,083,082 | |
| 4.125% 7/25/28 | 6,909,000 | 7,587,778 | |
| 4.3% 11/20/26 | 1,766,000 | 1,947,649 | |
| 4.4% 6/10/25 | 19,341,000 | 21,005,266 | |
| 4.412% 3/31/31 (c) | 34,201,000 | 39,012,861 | |
| 4.45% 9/29/27 | 21,445,000 | 23,848,868 | |
| 4.6% 3/9/26 | 17,445,000 | 19,275,787 | |
| 5.3% 5/6/44 | 9,501,000 | 12,452,999 | |
| 5.5% 9/13/25 | 7,738,000 | 8,757,199 | |
| Citizens Financial Group, Inc. 2.638% 9/30/32 | 7,305,000 | 7,309,259 | |
| Commonwealth Bank of Australia 3.61% 9/12/34 (b)(c) | 3,723,000 | 3,905,099 | |
| Danske Bank A/S 2.25% 1/14/28 (Reg. S) (c) | GBP | 1,760,000 | 2,357,869 |
| DNB Bank ASA 1.535% 5/25/27 (b)(c) | 48,309,000 | 47,683,653 | |
| HAT Holdings I LLC/HAT Holdings II LLC 3.375% 6/15/26 (b) | 350,000 | 344,313 | |
| HSBC Holdings PLC: | |||
| 2.251% 11/22/27 (c) | 25,000,000 | 25,057,682 | |
| 4.25% 3/14/24 | 1,433,000 | 1,519,767 | |
| 4.95% 3/31/30 | 2,548,000 | 2,995,970 | |
| 5.25% 3/14/44 | 1,039,000 | 1,347,238 | |
| Intesa Sanpaolo SpA: | |||
| 4.198% 6/1/32 (b)(c) | 17,320,000 | 17,364,932 | |
| 5.017% 6/26/24 (b) | 10,324,000 | 11,036,742 | |
| 5.71% 1/15/26 (b) | 77,369,000 | 85,760,169 | |
| JPMorgan Chase & Co.: | |||
| 2.956% 5/13/31 (c) | 7,934,000 | 8,194,769 | |
| 4.125% 12/15/26 | 15,380,000 | 16,999,373 | |
| Lloyds Banking Group PLC 1.985% 12/15/31 (c) | GBP | 1,195,000 | 1,560,327 |
| NatWest Group PLC: | |||
| 3.073% 5/22/28 (c) | 8,707,000 | 9,069,696 | |
| 3.622% 8/14/30 (Reg. S) (c) | GBP | 3,400,000 | 4,715,862 |
| 4.8% 4/5/26 | 19,815,000 | 22,084,674 | |
| 5.125% 5/28/24 | 35,958,000 | 38,919,593 | |
| 6% 12/19/23 | 43,478,000 | 47,409,929 | |
| 6.1% 6/10/23 | 19,857,000 | 21,273,952 | |
| 6.125% 12/15/22 | 21,905,000 | 23,046,639 | |
| NatWest Markets PLC 2.375% 5/21/23 (b) | 15,700,000 | 16,048,844 | |
| Rabobank Nederland 4.375% 8/4/25 | 4,789,000 | 5,206,274 | |
| Societe Generale: | |||
| 1.038% 6/18/25 (b)(c) | 75,000,000 | 73,975,228 | |
| 1.488% 12/14/26 (b)(c) | 16,638,000 | 16,260,032 | |
| 4.25% 4/14/25 (b) | 7,110,000 | 7,573,310 | |
| 4.75% 11/24/25 (b) | 1,485,000 | 1,616,431 | |
| Synchrony Bank 3% 6/15/22 | 3,984,000 | 4,028,698 | |
| UniCredit SpA: | |||
| 2.731% 1/15/32 (Reg. S) (c) | EUR | 3,365,000 | 3,848,830 |
| 6.572% 1/14/22 (b) | 6,953,000 | 6,997,916 | |
| Virgin Money UK PLC 5.125% 12/11/30 (Reg. S) (c) | GBP | 1,075,000 | 1,548,175 |
| Wells Fargo & Co.: | |||
| 2.406% 10/30/25 (c) | 7,739,000 | 7,945,971 | |
| 4.3% 7/22/27 | 25,328,000 | 28,161,481 | |
| 4.478% 4/4/31 (c) | 19,300,000 | 22,302,566 | |
| Westpac Banking Corp. 4.11% 7/24/34 (c) | 5,171,000 | 5,607,575 | |
| 1,156,660,659 | |||
| Capital Markets - 1.1% | |||
| Affiliated Managers Group, Inc. 4.25% 2/15/24 | 1,396,000 | 1,490,143 | |
| Ares Capital Corp.: | |||
| 3.25% 7/15/25 | 42,000,000 | 43,243,137 | |
| 3.875% 1/15/26 | 22,188,000 | 23,355,749 | |
| 4.2% 6/10/24 | 15,463,000 | 16,291,324 | |
| Coinbase Global, Inc.: | |||
| 3.375% 10/1/28 (b) | 685,000 | 643,900 | |
| 3.625% 10/1/31 (b) | 685,000 | 635,338 | |
| Credit Suisse Group AG: | |||
| 2.125% 11/15/29 (Reg. S) (c) | GBP | 1,300,000 | 1,712,441 |
| 2.593% 9/11/25 (b)(c) | 14,306,000 | 14,628,125 | |
| 3.75% 3/26/25 | 9,717,000 | 10,357,217 | |
| 4.194% 4/1/31 (b)(c) | 38,618,000 | 42,477,013 | |
| 4.282% 1/9/28 (b) | 2,250,000 | 2,453,538 | |
| 4.55% 4/17/26 | 3,126,000 | 3,452,350 | |
| Deutsche Bank AG 4.5% 4/1/25 | 33,327,000 | 35,560,350 | |
| Deutsche Bank AG New York Branch: | |||
| 2.311% 11/16/27 (c) | 25,000,000 | 24,957,658 | |
| 3.3% 11/16/22 | 7,369,000 | 7,545,274 | |
| 3.729% 1/14/32 (c) | 10,000,000 | 10,187,976 | |
| 4.1% 1/13/26 | 8,332,000 | 8,959,509 | |
| 5% 2/14/22 | 11,778,000 | 11,881,536 | |
| Goldman Sachs Group, Inc.: | |||
| 2.383% 7/21/32 (c) | 18,425,000 | 18,078,449 | |
| 3.272% 9/29/25 (c) | 35,921,000 | 37,679,378 | |
| 4.25% 10/21/25 | 12,215,000 | 13,283,017 | |
| 6.75% 10/1/37 | 59,592,000 | 84,160,572 | |
| Intercontinental Exchange, Inc. 3.75% 12/1/25 | 2,038,000 | 2,207,384 | |
| Jane Street Group LLC/JSG Finance, Inc. 4.5% 11/15/29 (b) | 155,000 | 154,768 | |
| LPL Holdings, Inc. 4% 3/15/29 (b) | 1,070,000 | 1,074,483 | |
| Morgan Stanley: | |||
| 3.125% 7/27/26 | 14,775,000 | 15,654,645 | |
| 3.622% 4/1/31 (c) | 17,370,000 | 18,964,305 | |
| 3.625% 1/20/27 | 16,594,000 | 17,959,204 | |
| 3.7% 10/23/24 | 4,754,000 | 5,067,479 | |
| 3.875% 4/29/24 | 4,377,000 | 4,648,481 | |
| 4.875% 11/1/22 | 9,955,000 | 10,330,976 | |
| 5% 11/24/25 | 21,351,000 | 23,868,974 | |
| MSCI, Inc. 3.25% 8/15/33 (b) | 215,000 | 214,389 | |
| State Street Corp.: | |||
| 2.825% 3/30/23 (c) | 1,216,000 | 1,224,865 | |
| 2.901% 3/30/26 (c) | 1,141,000 | 1,200,062 | |
| UBS Group AG 1.494% 8/10/27 (b)(c) | 11,792,000 | 11,533,772 | |
| 527,137,781 | |||
| Consumer Finance - 0.8% | |||
| AerCap Ireland Capital Ltd./AerCap Global Aviation Trust: | |||
| 1.65% 10/29/24 | 22,700,000 | 22,659,059 | |
| 1.75% 1/30/26 | 14,780,000 | 14,489,064 | |
| 2.45% 10/29/26 | 8,602,000 | 8,623,641 | |
| 2.875% 8/14/24 | 8,576,000 | 8,851,954 | |
| 3% 10/29/28 | 9,010,000 | 9,073,096 | |
| 3.3% 1/30/32 | 9,639,000 | 9,712,546 | |
| 3.5% 5/26/22 | 293,000 | 296,400 | |
| 4.125% 7/3/23 | 4,250,000 | 4,431,862 | |
| 4.45% 4/3/26 | 4,254,000 | 4,614,957 | |
| 4.875% 1/16/24 | 6,629,000 | 7,083,273 | |
| 6.5% 7/15/25 | 6,613,000 | 7,564,789 | |
| Ally Financial, Inc.: | |||
| 1.45% 10/2/23 | 3,893,000 | 3,910,216 | |
| 3.05% 6/5/23 | 17,631,000 | 18,101,999 | |
| 3.875% 5/21/24 | 8,893,000 | 9,378,102 | |
| 4.625% 3/30/25 | 3,595,000 | 3,925,081 | |
| 5.125% 9/30/24 | 3,534,000 | 3,872,168 | |
| 5.75% 11/20/25 | 1,188,000 | 1,345,388 | |
| 5.8% 5/1/25 | 9,417,000 | 10,642,578 | |
| 8% 11/1/31 | 5,827,000 | 8,243,060 | |
| 8% 11/1/31 | 222,000 | 308,358 | |
| Capital One Financial Corp.: | |||
| 3.65% 5/11/27 | 21,700,000 | 23,465,583 | |
| 3.8% 1/31/28 | 10,723,000 | 11,738,347 | |
| Discover Financial Services: | |||
| 3.95% 11/6/24 | 1,874,000 | 2,001,869 | |
| 4.1% 2/9/27 | 13,375,000 | 14,571,044 | |
| 4.5% 1/30/26 | 5,913,000 | 6,486,428 | |
| Ford Motor Credit Co. LLC: | |||
| 2.7% 8/10/26 | 5,665,000 | 5,615,431 | |
| 3.625% 6/17/31 | 5,000,000 | 5,100,000 | |
| 4% 11/13/30 | 17,230,000 | 18,069,963 | |
| 4.063% 11/1/24 | 46,639,000 | 48,644,477 | |
| 4.125% 8/17/27 | 19,335,000 | 20,396,878 | |
| 4.687% 6/9/25 | 430,000 | 455,905 | |
| 5.113% 5/3/29 | 1,320,000 | 1,461,372 | |
| 5.125% 6/16/25 | 320,000 | 345,882 | |
| 5.584% 3/18/24 | 8,520,000 | 9,089,136 | |
| 5.596% 1/7/22 | 7,576,000 | 7,603,274 | |
| OneMain Finance Corp.: | |||
| 3.5% 1/15/27 | 805,000 | 776,825 | |
| 3.875% 9/15/28 | 1,350,000 | 1,302,750 | |
| Synchrony Financial: | |||
| 2.85% 7/25/22 | 2,154,000 | 2,182,788 | |
| 3.95% 12/1/27 | 8,239,000 | 8,894,986 | |
| 4.25% 8/15/24 | 8,335,000 | 8,873,401 | |
| 4.375% 3/19/24 | 8,694,000 | 9,217,512 | |
| 5.15% 3/19/29 | 18,424,000 | 21,417,341 | |
| 384,838,783 | |||
| Diversified Financial Services - 0.2% | |||
| Brixmor Operating Partnership LP: | |||
| 4.05% 7/1/30 | 9,134,000 | 10,035,408 | |
| 4.125% 6/15/26 | 5,362,000 | 5,844,886 | |
| 4.125% 5/15/29 | 19,691,000 | 21,919,695 | |
| Equitable Holdings, Inc. 3.9% 4/20/23 | 674,000 | 700,917 | |
| Icahn Enterprises LP/Icahn Enterprises Finance Corp.: | |||
| 4.75% 9/15/24 | 740,000 | 749,250 | |
| 5.25% 5/15/27 | 3,430,000 | 3,490,025 | |
| 6.25% 5/15/26 | 1,691,000 | 1,737,503 | |
| Leighton Finance U.S.A. Pty Ltd. 1.5% 5/28/29 (Reg. S) | EUR | 2,050,000 | 2,351,851 |
| M&G PLC 5.625% 10/20/51 (Reg. S) (c) | GBP | 1,485,000 | 2,288,404 |
| Park Aerospace Holdings Ltd. 5.5% 2/15/24 (b) | 7,300,000 | 7,864,498 | |
| Pine Street Trust I 4.572% 2/15/29 (b) | 7,749,000 | 8,839,344 | |
| Pine Street Trust II 5.568% 2/15/49 (b) | 7,700,000 | 10,377,183 | |
| VMED O2 UK Financing I PLC 4.25% 1/31/31 (b) | 1,805,000 | 1,726,898 | |
| 77,925,862 | |||
| Insurance - 0.2% | |||
| AIA Group Ltd. 0.88% 9/9/33 (Reg. S) (c) | EUR | 705,000 | 789,794 |
| Credit Agricole Assurances SA 4.75% 9/27/48 (c) | EUR | 2,200,000 | 2,958,575 |
| Demeter Investments BV 5.625% 8/15/52 (Reg. S) (c) | 5,775,000 | 6,483,131 | |
| Fidelidade-Companhia de Seguros SA 4.25% 9/4/31 (Reg. S) (c) | EUR | 800,000 | 922,132 |
| Five Corners Funding Trust II 2.85% 5/15/30 (b) | 15,870,000 | 16,435,968 | |
| Liberty Mutual Group, Inc. 3.95% 5/15/60 (b) | 12,820,000 | 14,658,640 | |
| Lincoln National Corp. 3.4% 1/15/31 | 14,811,000 | 16,006,261 | |
| Pacific LifeCorp 5.125% 1/30/43 (b) | 2,623,000 | 3,380,806 | |
| Pricoa Global Funding I 5.375% 5/15/45 (c) | 3,148,000 | 3,369,556 | |
| Prudential PLC 2.95% 11/3/33 (Reg. S) (c) | 3,700,000 | 3,637,285 | |
| QBE Insurance Group Ltd.: | |||
| 2.5% 9/13/38 (Reg. S) (c) | GBP | 1,705,000 | 2,185,801 |
| 6.75% 12/2/44 (Reg. S) (c) | 3,605,000 | 3,989,775 | |
| Swiss Re Finance Luxembourg SA 5% 4/2/49 (b)(c) | 3,000,000 | 3,345,000 | |
| Unum Group: | |||
| 4% 6/15/29 | 6,130,000 | 6,787,705 | |
| 5.75% 8/15/42 | 1,622,000 | 2,046,836 | |
| Zurich Finance (Ireland) DAC 3.5% 5/2/52 (Reg. S) (c) | 1,650,000 | 1,614,938 | |
| 88,612,203 | |||
| Thrifts & Mortgage Finance - 0.0% | |||
| Quicken Loans LLC/Quicken Loans Co-Issuer, Inc. 3.625% 3/1/29 (b) | 655,000 | 640,263 | |
| TOTAL FINANCIALS | 2,235,815,551 | ||
| HEALTH CARE - 0.4% | |||
| Biotechnology - 0.0% | |||
| AbbVie, Inc. 3.2% 11/21/29 | 4,900,000 | 5,198,731 | |
| Emergent BioSolutions, Inc. 3.875% 8/15/28 (b) | 212,000 | 201,336 | |
| Grifols Escrow Issuer SA 4.75% 10/15/28 (b) | 200,000 | 198,000 | |
| 5,598,067 | |||
| Health Care Equipment & Supplies - 0.0% | |||
| Hologic, Inc.: | |||
| 3.25% 2/15/29 (b) | 545,000 | 534,781 | |
| 4.625% 2/1/28 (b) | 65,000 | 67,438 | |
| Mozart Debt Merger Sub, Inc. 3.875% 4/1/29 (b) | 820,000 | 809,750 | |
| Teleflex, Inc. 4.25% 6/1/28(b) | 145,000 | 146,450 | |
| 1,558,419 | |||
| Health Care Providers & Services - 0.2% | |||
| 180 Medical, Inc. 3.875% 10/15/29 (b) | 200,000 | 196,392 | |
| Anthem, Inc. 3.3% 1/15/23 | 4,322,000 | 4,444,370 | |
| Centene Corp.: | |||
| 2.45% 7/15/28 | 11,370,000 | 11,156,813 | |
| 2.5% 3/1/31 | 945,000 | 905,475 | |
| 2.625% 8/1/31 | 5,485,000 | 5,306,738 | |
| 3.375% 2/15/30 | 7,725,000 | 7,780,172 | |
| 4.25% 12/15/27 | 6,215,000 | 6,448,063 | |
| 4.625% 12/15/29 | 8,795,000 | 9,410,650 | |
| Cigna Corp. 4.375% 10/15/28 | 6,630,000 | 7,511,892 | |
| CVS Health Corp. 3.625% 4/1/27 | 3,208,000 | 3,468,246 | |
| DaVita HealthCare Partners, Inc. 4.625% 6/1/30 (b) | 1,405,000 | 1,387,438 | |
| HCA Holdings, Inc. 4.75% 5/1/23 | 138,000 | 144,950 | |
| HealthEquity, Inc. 4.5% 10/1/29 (b) | 110,000 | 108,625 | |
| Molina Healthcare, Inc. 3.875% 11/15/30 (b) | 850,000 | 854,250 | |
| Owens & Minor, Inc. 4.5% 3/31/29 (b) | 160,000 | 162,172 | |
| Sabra Health Care LP 3.2% 12/1/31 | 18,596,000 | 18,246,204 | |
| Tenet Healthcare Corp.: | |||
| 4.625% 6/15/28 (b) | 2,765,000 | 2,821,434 | |
| 4.875% 1/1/26 (b) | 385,000 | 393,663 | |
| 5.125% 11/1/27 (b) | 1,000,000 | 1,026,830 | |
| Toledo Hospital 5.325% 11/15/28 | 2,395,000 | 2,672,475 | |
| 84,446,852 | |||
| Health Care Technology - 0.0% | |||
| IQVIA, Inc. 5% 5/15/27 (b) | 630,000 | 648,900 | |
| Life Sciences Tools & Services - 0.0% | |||
| Charles River Laboratories International, Inc.: | |||
| 3.75% 3/15/29 (b) | 180,000 | 177,975 | |
| 4.25% 5/1/28 (b) | 70,000 | 70,960 | |
| 248,935 | |||
| Pharmaceuticals - 0.2% | |||
| Bayer AG 2.375% 4/2/75 (Reg. S) (c) | EUR | 4,095,000 | 4,675,069 |
| Bayer U.S. Finance II LLC 4.25% 12/15/25 (b) | 50,548,000 | 55,024,570 | |
| Catalent Pharma Solutions 3.5% 4/1/30 (b) | 1,205,000 | 1,170,537 | |
| Elanco Animal Health, Inc.: | |||
| 5.272% 8/28/23 (c) | 3,402,000 | 3,593,975 | |
| 5.9% 8/28/28 (c) | 1,432,000 | 1,638,022 | |
| Jazz Securities DAC 4.375% 1/15/29 (b) | 225,000 | 229,235 | |
| Organon & Co. / Organon Foreign Debt Co-Issuer BV 4.125% 4/30/28 (b) | 530,000 | 528,784 | |
| Utah Acquisition Sub, Inc. 3.95% 6/15/26 | 2,065,000 | 2,220,359 | |
| Viatris, Inc.: | |||
| 1.65% 6/22/25 | 1,773,000 | 1,769,461 | |
| 2.7% 6/22/30 | 9,017,000 | 9,003,487 | |
| 3.85% 6/22/40 | 3,928,000 | 4,183,670 | |
| 4% 6/22/50 | 6,783,000 | 7,308,874 | |
| Zoetis, Inc. 3.25% 2/1/23 | 1,210,000 | 1,235,957 | |
| 92,582,000 | |||
| TOTAL HEALTH CARE | 185,083,173 | ||
| INDUSTRIALS - 0.3% | |||
| Aerospace & Defense - 0.1% | |||
| BAE Systems PLC 3.4% 4/15/30 (b) | 4,094,000 | 4,381,412 | |
| BWX Technologies, Inc. 4.125% 6/30/28 (b) | 480,000 | 480,000 | |
| Howmet Aerospace, Inc.: | |||
| 5.95% 2/1/37 | 25,000 | 29,313 | |
| 6.75% 1/15/28 | 365,000 | 426,138 | |
| Moog, Inc. 4.25% 12/15/27 (b) | 980,000 | 995,362 | |
| Rolls-Royce PLC: | |||
| 3.375% 6/18/26 | GBP | 1,940,000 | 2,581,393 |
| 5.75% 10/15/27 (b) | 615,000 | 677,269 | |
| The Boeing Co.: | |||
| 5.04% 5/1/27 | 6,070,000 | 6,834,469 | |
| 5.15% 5/1/30 | 6,070,000 | 7,041,154 | |
| 5.805% 5/1/50 | 6,070,000 | 8,187,277 | |
| 5.93% 5/1/60 | 6,070,000 | 8,390,227 | |
| TransDigm, Inc.: | |||
| 6.25% 3/15/26 (b) | 2,552,000 | 2,647,700 | |
| 7.5% 3/15/27 | 95,000 | 99,038 | |
| 8% 12/15/25 (b) | 1,120,000 | 1,180,200 | |
| 43,950,952 | |||
| Airlines - 0.0% | |||
| United Airlines, Inc. 4.375% 4/15/26 (b) | 530,000 | 532,109 | |
| Building Products - 0.0% | |||
| Advanced Drain Systems, Inc. 5% 9/30/27 (b) | 965,000 | 997,733 | |
| Standard Industries, Inc./New Jersey 4.375% 7/15/30 (b) | 715,000 | 703,381 | |
| 1,701,114 | |||
| Commercial Services & Supplies - 0.0% | |||
| ADT Corp.: | |||
| 4.125% 8/1/29 (b) | 270,000 | 262,744 | |
| 4.875% 7/15/32 (b) | 670,000 | 663,173 | |
| Nielsen Finance LLC/Nielsen Finance Co.: | |||
| 5.625% 10/1/28 (b) | 495,000 | 505,286 | |
| 5.875% 10/1/30 (b) | 490,000 | 509,786 | |
| Prime Securities Services Borrower LLC/Prime Finance, Inc. 3.375% 8/31/27 (b) | 1,230,000 | 1,163,888 | |
| Stericycle, Inc. 3.875% 1/15/29 (b) | 450,000 | 438,750 | |
| 3,543,627 | |||
| Construction & Engineering - 0.0% | |||
| AECOM 5.125% 3/15/27 | 1,077,000 | 1,154,339 | |
| Electrical Equipment - 0.0% | |||
| Sensata Technologies BV 4% 4/15/29 (b) | 275,000 | 278,850 | |
| Vertiv Group Corp. 4.125% 11/15/28 (b) | 675,000 | 673,313 | |
| 952,163 | |||
| Industrial Conglomerates - 0.0% | |||
| Ladder Capital Finance Holdings LLLP/Ladder Capital Finance Corp. 4.25% 2/1/27 (b) | 500,000 | 497,050 | |
| Machinery - 0.0% | |||
| Vertical U.S. Newco, Inc. 5.25% 7/15/27 (b) | 1,065,000 | 1,083,030 | |
| Marine - 0.0% | |||
| Seaspan Corp. 5.5% 8/1/29 (b) | 270,000 | 267,894 | |
| Professional Services - 0.0% | |||
| ASGN, Inc. 4.625% 5/15/28 (b) | 1,470,000 | 1,507,779 | |
| Booz Allen Hamilton, Inc.: | |||
| 3.875% 9/1/28 (b) | 765,000 | 768,833 | |
| 4% 7/1/29 (b) | 105,000 | 105,525 | |
| TriNet Group, Inc. 3.5% 3/1/29 (b) | 405,000 | 400,140 | |
| 2,782,277 | |||
| Road & Rail - 0.0% | |||
| Alpha Trains Finance SA 2.064% 6/30/30 | EUR | 1,740,000 | 2,057,039 |
| XPO Logistics, Inc. 6.25% 5/1/25 (b) | 1,705,000 | 1,772,757 | |
| 3,829,796 | |||
| Trading Companies & Distributors - 0.1% | |||
| Air Lease Corp.: | |||
| 0.7% 2/15/24 | 10,742,000 | 10,590,430 | |
| 2.25% 1/15/23 | 1,863,000 | 1,891,908 | |
| 3% 9/15/23 | 583,000 | 599,485 | |
| 3.375% 7/1/25 | 11,630,000 | 12,191,223 | |
| 3.75% 2/1/22 | 2,924,000 | 2,924,000 | |
| 3.75% 6/1/26 | 5,000,000 | 5,316,646 | |
| 4.25% 2/1/24 | 7,180,000 | 7,600,522 | |
| 4.25% 9/15/24 | 2,331,000 | 2,493,592 | |
| Travis Perkins PLC 3.75% 2/17/26 (Reg. S) | GBP | 1,100,000 | 1,510,491 |
| 45,118,297 | |||
| Transportation Infrastructure - 0.1% | |||
| Aeroporti di Roma SPA 1.75% 7/30/31 (Reg. S) | EUR | 1,340,000 | 1,554,437 |
| Avolon Holdings Funding Ltd.: | |||
| 3.25% 2/15/27 (b) | 10,726,000 | 10,901,386 | |
| 3.625% 5/1/22 (b) | 2,141,000 | 2,161,906 | |
| 3.95% 7/1/24 (b) | 2,844,000 | 2,980,790 | |
| 4.375% 5/1/26 (b) | 7,394,000 | 7,923,098 | |
| 5.25% 5/15/24 (b) | 4,186,000 | 4,504,632 | |
| Heathrow Funding Ltd. 2.625% 3/16/28 (Reg. S) | GBP | 3,560,000 | 4,732,444 |
| Holding d'Infrastructures et des Metiers de l'Environnement 0.625% 9/16/28 (Reg. S) | EUR | 700,000 | 783,645 |
| 35,542,338 | |||
| TOTAL INDUSTRIALS | 140,954,986 | ||
| INFORMATION TECHNOLOGY - 0.3% | |||
| Communications Equipment - 0.0% | |||
| Cellnex Finance Co. SA 1% 9/15/27 (Reg. S) | EUR | 2,900,000 | 3,191,934 |
| Viavi Solutions, Inc. 3.75% 10/1/29 (b) | 545,000 | 532,738 | |
| 3,724,672 | |||
| Electronic Equipment & Components - 0.0% | |||
| Dell International LLC/EMC Corp.: | |||
| 5.45% 6/15/23 | 3,360,000 | 3,563,826 | |
| 6.02% 6/15/26 | 1,948,000 | 2,267,454 | |
| Sensata Technologies, Inc. 3.75% 2/15/31 (b) | 1,410,000 | 1,385,325 | |
| TTM Technologies, Inc. 4% 3/1/29 (b) | 315,000 | 305,607 | |
| 7,522,212 | |||
| IT Services - 0.0% | |||
| Gartner, Inc.: | |||
| 3.625% 6/15/29 (b) | 155,000 | 154,031 | |
| 3.75% 10/1/30 (b) | 255,000 | 254,363 | |
| 4.5% 7/1/28 (b) | 395,000 | 410,524 | |
| Square, Inc. 2.75% 6/1/26 (b) | 265,000 | 263,712 | |
| Twilio, Inc. 3.875% 3/15/31 | 200,000 | 198,500 | |
| 1,281,130 | |||
| Semiconductors & Semiconductor Equipment - 0.2% | |||
| Broadcom, Inc.: | |||
| 1.95% 2/15/28 (b) | 2,879,000 | 2,808,966 | |
| 2.45% 2/15/31 (b) | 19,432,000 | 18,701,634 | |
| 2.6% 2/15/33 (b) | 19,432,000 | 18,590,083 | |
| 3.5% 2/15/41 (b) | 19,430,000 | 19,379,847 | |
| 3.75% 2/15/51 (b) | 9,284,000 | 9,657,171 | |
| Entegris, Inc. 4.375% 4/15/28 (b) | 755,000 | 769,156 | |
| ON Semiconductor Corp. 3.875% 9/1/28 (b) | 300,000 | 305,217 | |
| Qorvo, Inc. 3.375% 4/1/31 (b) | 615,000 | 619,859 | |
| 70,831,933 | |||
| Software - 0.1% | |||
| CDK Global, Inc. 5.25% 5/15/29 (b) | 1,132,000 | 1,197,090 | |
| Crowdstrike Holdings, Inc. 3% 2/15/29 | 295,000 | 284,480 | |
| Fair Isaac Corp. 5.25% 5/15/26 (b) | 793,000 | 871,309 | |
| Nuance Communications, Inc. 5.625% 12/15/26 | 1,382,000 | 1,423,729 | |
| Open Text Corp.: | |||
| 3.875% 2/15/28 (b) | 420,000 | 415,800 | |
| 3.875% 12/1/29 (b) | 960,000 | 954,317 | |
| Oracle Corp.: | |||
| 2.5% 4/1/25 | 8,253,000 | 8,494,880 | |
| 2.8% 4/1/27 | 8,253,000 | 8,550,683 | |
| 2.95% 4/1/30 | 8,300,000 | 8,570,470 | |
| 3.85% 4/1/60 | 8,300,000 | 8,616,279 | |
| 39,379,037 | |||
| Technology Hardware, Storage & Peripherals - 0.0% | |||
| Hewlett Packard Enterprise Co. 4.4% 10/15/22 (c) | 3,173,000 | 3,256,532 | |
| TOTAL INFORMATION TECHNOLOGY | 125,995,516 | ||
| MATERIALS - 0.0% | |||
| Chemicals - 0.0% | |||
| Axalta Coating Systems/Dutch Holding BV 4.75% 6/15/27 (b) | 585,000 | 604,568 | |
| CF Industries Holdings, Inc.: | |||
| 4.95% 6/1/43 | 5,000 | 6,015 | |
| 5.15% 3/15/34 | 1,617,000 | 1,938,039 | |
| 5.375% 3/15/44 | 255,000 | 322,583 | |
| LSB Industries, Inc. 6.25% 10/15/28 (b) | 165,000 | 170,372 | |
| Methanex Corp.: | |||
| 5.125% 10/15/27 | 765,000 | 799,425 | |
| 5.25% 12/15/29 | 90,000 | 94,050 | |
| 5.65% 12/1/44 | 581,000 | 586,188 | |
| NOVA Chemicals Corp. 5.25% 6/1/27 (b) | 949,000 | 996,450 | |
| Olin Corp.: | |||
| 5% 2/1/30 | 1,715,000 | 1,792,175 | |
| 5.125% 9/15/27 | 975,000 | 1,004,250 | |
| 5.625% 8/1/29 | 465,000 | 501,516 | |
| SPCM SA 3.125% 3/15/27 (b) | 285,000 | 278,588 | |
| The Chemours Co. LLC: | |||
| 5.375% 5/15/27 | 1,115,000 | 1,165,404 | |
| 5.75% 11/15/28 (b) | 275,000 | 281,875 | |
| Valvoline, Inc. 4.25% 2/15/30 (b) | 165,000 | 163,581 | |
| W.R. Grace Holding LLC: | |||
| 4.875% 6/15/27 (b) | 305,000 | 302,617 | |
| 5.625% 10/1/24 (b) | 1,254,000 | 1,334,388 | |
| 12,342,084 | |||
| Containers & Packaging - 0.0% | |||
| Ardagh Packaging Finance PLC/Ardagh MP Holdings U.S.A., Inc. 4.125% 8/15/26 (b) | 25,000 | 25,283 | |
| Ball Corp. 3.125% 9/15/31 | 955,000 | 919,001 | |
| Graphic Packaging International, Inc. 3.75% 2/1/30 (b) | 135,000 | 134,172 | |
| OI European Group BV 4.75% 2/15/30 (b) | 280,000 | 279,714 | |
| Trivium Packaging Finance BV 5.5% 8/15/26 (b) | 485,000 | 500,675 | |
| 1,858,845 | |||
| Metals & Mining - 0.0% | |||
| FMG Resources (August 2006) Pty Ltd. 4.5% 9/15/27 (b) | 10,000 | 10,362 | |
| HudBay Minerals, Inc. 4.5% 4/1/26 (b) | 135,000 | 132,638 | |
| Kaiser Aluminum Corp. 4.625% 3/1/28 (b) | 1,005,000 | 984,327 | |
| Novelis Corp. 3.875% 8/15/31 (b) | 270,000 | 260,550 | |
| Roller Bearing Co. of America, Inc. 4.375% 10/15/29 (b) | 75,000 | 74,831 | |
| 1,462,708 | |||
| Paper & Forest Products - 0.0% | |||
| Glatfelter Corp. 4.75% 11/15/29 (b) | 220,000 | 222,750 | |
| TOTAL MATERIALS | 15,886,387 | ||
| REAL ESTATE - 0.8% | |||
| Equity Real Estate Investment Trusts (REITs) - 0.6% | |||
| Alexandria Real Estate Equities, Inc.: | |||
| 2% 5/18/32 | 8,258,000 | 7,966,268 | |
| 4.9% 12/15/30 | 7,224,000 | 8,710,328 | |
| American Homes 4 Rent LP: | |||
| 2.375% 7/15/31 | 1,482,000 | 1,465,941 | |
| 3.375% 7/15/51 | 2,291,000 | 2,365,829 | |
| ARGAN SA 1.011% 11/17/26 (Reg. S) | EUR | 1,000,000 | 1,136,402 |
| Boston Properties, Inc. 4.5% 12/1/28 | 4,766,000 | 5,420,872 | |
| Corporate Office Properties LP: | |||
| 2.25% 3/15/26 | 2,969,000 | 3,004,512 | |
| 2.75% 4/15/31 | 2,188,000 | 2,193,901 | |
| Duke Realty LP 3.25% 6/30/26 | 589,000 | 629,690 | |
| Healthcare Trust of America Holdings LP: | |||
| 3.1% 2/15/30 | 1,868,000 | 1,938,933 | |
| 3.5% 8/1/26 | 1,945,000 | 2,088,399 | |
| Hudson Pacific Properties LP 4.65% 4/1/29 | 10,668,000 | 12,157,066 | |
| Iron Mountain, Inc. 4.875% 9/15/29 (b) | 615,000 | 623,610 | |
| Kimco Realty Corp.: | |||
| 2.25% 12/1/31 | 15,265,000 | 14,844,700 | |
| 3.375% 10/15/22 | 456,000 | 463,564 | |
| Kite Realty Group Trust: | |||
| 4% 3/15/25 | 10,791,000 | 11,339,594 | |
| 4.75% 9/15/30 | 17,486,000 | 19,373,264 | |
| Lexington Corporate Properties Trust: | |||
| 2.7% 9/15/30 | 1,445,000 | 1,453,634 | |
| 4.4% 6/15/24 | 948,000 | 1,005,505 | |
| MGM Growth Properties Operating Partnership LP: | |||
| 4.5% 9/1/26 | 1,508,000 | 1,617,330 | |
| 4.5% 1/15/28 | 637,000 | 684,775 | |
| 4.625% 6/15/25 (b) | 150,000 | 159,750 | |
| 5.75% 2/1/27 | 256,000 | 289,920 | |
| Omega Healthcare Investors, Inc.: | |||
| 3.25% 4/15/33 | 9,457,000 | 9,201,090 | |
| 3.375% 2/1/31 | 5,854,000 | 5,894,775 | |
| 3.625% 10/1/29 | 8,376,000 | 8,762,796 | |
| 4.375% 8/1/23 | 1,006,000 | 1,053,786 | |
| 4.5% 1/15/25 | 2,013,000 | 2,161,925 | |
| 4.5% 4/1/27 | 716,000 | 787,226 | |
| 4.75% 1/15/28 | 11,294,000 | 12,520,185 | |
| 4.95% 4/1/24 | 882,000 | 946,785 | |
| 5.25% 1/15/26 | 3,755,000 | 4,194,185 | |
| Piedmont Operating Partnership LP 2.75% 4/1/32 | 3,072,000 | 3,030,699 | |
| Realty Income Corp.: | |||
| 2.2% 6/15/28 | 1,380,000 | 1,392,669 | |
| 2.85% 12/15/32 | 1,698,000 | 1,771,272 | |
| 3.25% 1/15/31 | 1,828,000 | 1,964,332 | |
| 3.4% 1/15/28 | 2,874,000 | 3,089,603 | |
| Retail Opportunity Investments Partnership LP: | |||
| 4% 12/15/24 | 641,000 | 676,694 | |
| 5% 12/15/23 | 494,000 | 525,168 | |
| SBA Communications Corp. 3.875% 2/15/27 | 515,000 | 527,142 | |
| Service Properties Trust: | |||
| 3.95% 1/15/28 | 40,000 | 35,998 | |
| 4.375% 2/15/30 | 415,000 | 373,500 | |
| 4.95% 2/15/27 | 600,000 | 572,394 | |
| 4.95% 10/1/29 | 245,000 | 228,855 | |
| 5.5% 12/15/27 | 230,000 | 232,190 | |
| Simon Property Group LP: | |||
| 2.45% 9/13/29 | 3,008,000 | 3,051,650 | |
| 3.375% 12/1/27 | 6,125,000 | 6,582,581 | |
| SITE Centers Corp.: | |||
| 3.625% 2/1/25 | 1,532,000 | 1,611,011 | |
| 4.25% 2/1/26 | 2,753,000 | 2,945,562 | |
| Store Capital Corp.: | |||
| 2.75% 11/18/30 | 3,456,000 | 3,474,483 | |
| 4.625% 3/15/29 | 2,374,000 | 2,682,767 | |
| The GEO Group, Inc. 6% 4/15/26 | 305,000 | 262,300 | |
| Uniti Group, Inc. 7.875% 2/15/25 (b) | 1,050,000 | 1,097,901 | |
| Ventas Realty LP: | |||
| 2.5% 9/1/31 | 22,080,000 | 21,813,595 | |
| 3% 1/15/30 | 11,060,000 | 11,434,101 | |
| 4% 3/1/28 | 2,150,000 | 2,372,956 | |
| 4.125% 1/15/26 | 999,000 | 1,093,535 | |
| 4.75% 11/15/30 | 16,500,000 | 19,330,184 | |
| VICI Properties, Inc.: | |||
| 4.25% 12/1/26 (b) | 1,640,000 | 1,693,300 | |
| 4.625% 12/1/29 (b) | 595,000 | 632,045 | |
| Vornado Realty LP: | |||
| 2.15% 6/1/26 | 3,558,000 | 3,571,720 | |
| 3.4% 6/1/31 | 12,870,000 | 13,267,364 | |
| WP Carey, Inc.: | |||
| 3.85% 7/15/29 | 1,773,000 | 1,966,720 | |
| 4% 2/1/25 | 3,423,000 | 3,666,450 | |
| 4.6% 4/1/24 | 5,327,000 | 5,685,347 | |
| 269,112,628 | |||
| Real Estate Management & Development - 0.2% | |||
| ACCENTRO Real Estate AG 3.625% 2/13/23 (Reg. S) | EUR | 1,460,000 | 1,364,368 |
| ADLER Group SA: | |||
| 1.875% 1/14/26 (Reg. S) | EUR | 500,000 | 462,146 |
| 2.25% 4/27/27 (Reg. S) | EUR | 5,500,000 | 5,021,228 |
| Akelius Residential Property AB 3.875% 10/5/78 (Reg. S) (c) | EUR | 1,295,000 | 1,527,744 |
| Blackstone Property Partners Europe LP: | |||
| 1% 5/4/28 (Reg. S) | EUR | 4,220,000 | 4,671,161 |
| 2.625% 10/20/28 (Reg. S) | GBP | 650,000 | 876,635 |
| Brandywine Operating Partnership LP: | |||
| 3.95% 2/15/23 | 7,832,000 | 8,050,674 | |
| 3.95% 11/15/27 | 4,382,000 | 4,727,213 | |
| 4.1% 10/1/24 | 3,961,000 | 4,217,810 | |
| 4.55% 10/1/29 | 1,896,000 | 2,108,579 | |
| CBRE Group, Inc.: | |||
| 2.5% 4/1/31 | 10,225,000 | 10,255,711 | |
| 4.875% 3/1/26 | 7,844,000 | 8,817,402 | |
| Essex Portfolio LP 3.875% 5/1/24 | 1,923,000 | 2,033,706 | |
| GTC Aurora Luxembourg SA 2.25% 6/23/26 (Reg. S) | EUR | 1,390,000 | 1,554,219 |
| Heimstaden AB 4.375% 3/6/27 (Reg. S) | EUR | 1,400,000 | 1,577,721 |
| Howard Hughes Corp. 4.375% 2/1/31 (b) | 395,000 | 390,588 | |
| Kennedy-Wilson, Inc. 4.75% 2/1/30 | 540,000 | 542,700 | |
| Mid-America Apartments LP 4% 11/15/25 | 828,000 | 902,762 | |
| Post Apartment Homes LP 3.375% 12/1/22 | 251,000 | 256,000 | |
| Sirius Real Estate Ltd. 1.125% 6/22/26 (Reg. S) | EUR | 700,000 | 788,376 |
| Sun Communities Operating LP: | |||
| 2.3% 11/1/28 | 3,510,000 | 3,502,951 | |
| 2.7% 7/15/31 | 8,479,000 | 8,492,206 | |
| Tanger Properties LP: | |||
| 2.75% 9/1/31 | 8,876,000 | 8,512,608 | |
| 3.125% 9/1/26 | 2,628,000 | 2,730,624 | |
| 3.875% 7/15/27 | 11,191,000 | 12,025,923 | |
| Tritax EuroBox PLC 0.95% 6/2/26 (Reg. S) | EUR | 1,300,000 | 1,481,585 |
| 96,892,640 | |||
| TOTAL REAL ESTATE | 366,005,268 | ||
| UTILITIES - 0.4% | |||
| Electric Utilities - 0.1% | |||
| AusNet Services Holdings Pty Ltd. 1.625% 3/11/81 (Reg. S) (c) | EUR | 1,360,000 | 1,540,448 |
| Clearway Energy Operating LLC: | |||
| 3.75% 2/15/31 (b) | 925,000 | 914,289 | |
| 4.75% 3/15/28 (b) | 140,000 | 147,000 | |
| Cleco Corporate Holdings LLC 3.375% 9/15/29 | 4,843,000 | 4,919,427 | |
| DPL, Inc. 4.35% 4/15/29 | 7,785,000 | 8,252,100 | |
| Duquesne Light Holdings, Inc.: | |||
| 2.532% 10/1/30 (b) | 2,328,000 | 2,292,563 | |
| 2.775% 1/7/32 (b) | 8,828,000 | 8,823,308 | |
| Enel SpA 3.375% (Reg. S) (c)(f) | EUR | 1,855,000 | 2,285,204 |
| FirstEnergy Corp.: | |||
| 4.75% 3/15/23 | 4,502,000 | 4,628,191 | |
| 7.375% 11/15/31 | 5,738,000 | 7,674,059 | |
| InterGen NV 7% 6/30/23 (b) | 964,000 | 944,720 | |
| IPALCO Enterprises, Inc. 3.7% 9/1/24 | 1,963,000 | 2,063,955 | |
| NextEra Energy Partners LP 4.25% 9/15/24 (b) | 56,000 | 58,479 | |
| NGG Finance PLC 2.125% 9/5/82 (Reg. S) (c) | EUR | 2,060,000 | 2,329,938 |
| NRG Energy, Inc.: | |||
| 3.625% 2/15/31 (b) | 1,785,000 | 1,695,750 | |
| 5.25% 6/15/29 (b) | 484,000 | 501,714 | |
| 5.75% 1/15/28 | 581,000 | 607,145 | |
| 6.625% 1/15/27 | 57,000 | 58,924 | |
| NSG Holdings II LLC/NSG Holdings, Inc. 7.75% 12/15/25 (b) | 1,206,034 | 1,284,426 | |
| PG&E Corp.: | |||
| 5% 7/1/28 | 4,480,000 | 4,614,400 | |
| 5.25% 7/1/30 | 1,155,000 | 1,183,875 | |
| Southern Co. 1.875% 9/15/81 (c) | EUR | 2,800,000 | 3,073,865 |
| SSE PLC 4.75% 9/16/77 (Reg. S) (c) | 6,395,000 | 6,506,913 | |
| Vistra Operations Co. LLC: | |||
| 5.5% 9/1/26 (b) | 3,498,000 | 3,583,771 | |
| 5.625% 2/15/27 (b) | 665,000 | 682,885 | |
| 70,667,349 | |||
| Gas Utilities - 0.0% | |||
| Nakilat, Inc. 6.067% 12/31/33 (b) | 1,181,644 | 1,443,304 | |
| Superior Plus LP / Superior General Partner, Inc. 4.5% 3/15/29 (b) | 185,000 | 188,534 | |
| 1,631,838 | |||
| Independent Power and Renewable Electricity Producers - 0.1% | |||
| TerraForm Power Operating LLC: | |||
| 4.75% 1/15/30 (b) | 75,000 | 76,106 | |
| 5% 1/31/28 (b) | 656,000 | 682,240 | |
| The AES Corp.: | |||
| 2.45% 1/15/31 | 4,011,000 | 3,926,263 | |
| 3.3% 7/15/25 (b) | 15,965,000 | 16,700,667 | |
| 3.95% 7/15/30 (b) | 13,922,000 | 15,009,169 | |
| 36,394,445 | |||
| Multi-Utilities - 0.2% | |||
| Berkshire Hathaway Energy Co.: | |||
| 3.7% 7/15/30 | 1,758,000 | 1,956,966 | |
| 4.05% 4/15/25 | 21,459,000 | 23,349,707 | |
| Consolidated Edison Co. of New York, Inc. 3.95% 4/1/50 | 2,477,000 | 2,888,572 | |
| NiSource, Inc.: | |||
| 2.95% 9/1/29 | 12,206,000 | 12,648,907 | |
| 3.49% 5/15/27 | 13,900,000 | 14,908,831 | |
| 5.95% 6/15/41 | 1,737,000 | 2,394,268 | |
| Puget Energy, Inc.: | |||
| 4.1% 6/15/30 | 6,250,000 | 6,787,630 | |
| 5.625% 7/15/22 | 3,305,000 | 3,366,273 | |
| Sempra Energy 6% 10/15/39 | 2,744,000 | 3,807,636 | |
| WEC Energy Group, Inc. 3 month U.S. LIBOR + 2.110% 2.2685% 5/15/67 (c)(e) | 1,843,000 | 1,713,990 | |
| 73,822,780 | |||
| TOTAL UTILITIES | 182,516,412 | ||
| TOTAL NONCONVERTIBLE BONDS | |||
| (Cost $4,601,745,339) | 4,892,467,682 | ||
| U.S. Treasury Obligations - 7.9% | |||
| U.S. Treasury Bonds 2.375% 5/15/51 | 674,726,000 | 765,286,880 | |
| U.S. Treasury Notes: | |||
| 0.125% 6/30/22 | $455,500,000 | $455,393,240 | |
| 0.5% 5/31/27 | 520,000,000 | 500,114,061 | |
| 0.875% 11/15/30 | 428,909,000 | 410,060,461 | |
| 1.125% 2/28/22 | 199,000,000 | 199,518,928 | |
| 1.125% 10/31/26 | 250,000,000 | 249,648,438 | |
| 1.125% 2/15/31 | 160,064,000 | 156,256,228 | |
| 1.25% 4/30/28 | 250,000,000 | 248,925,780 | |
| 1.25% 5/31/28 | 74,500,000 | 74,142,051 | |
| 1.25% 6/30/28 | 75,000,000 | 74,566,406 | |
| 1.25% 8/15/31 | 314,600,000 | 309,536,906 | |
| 1.375% 11/15/31 (g) | 193,097,000 | 191,920,315 | |
| 3.125% 11/15/28 | 51,642,000 | 57,728,090 | |
| TOTAL U.S. TREASURY OBLIGATIONS | |||
| (Cost $3,605,867,800) | 3,693,097,784 | ||
| U.S. Government Agency - Mortgage Securities - 17.2% | |||
| Fannie Mae - 4.7% | |||
| 12 month U.S. LIBOR + 1.440% 1.779% 4/1/37 (c)(e) | 10,777 | 11,285 | |
| 12 month U.S. LIBOR + 1.460% 1.859% 1/1/35 (c)(e) | 7,962 | 8,322 | |
| 12 month U.S. LIBOR + 1.480% 1.855% 7/1/34 (c)(e) | 1,986 | 2,074 | |
| 12 month U.S. LIBOR + 1.530% 1.91% 3/1/36 (c)(e) | 1,721 | 1,808 | |
| 12 month U.S. LIBOR + 1.550% 1.803% 6/1/36 (c)(e) | 7,396 | 7,761 | |
| 12 month U.S. LIBOR + 1.560% 1.94% 3/1/37 (c)(e) | 6,331 | 6,656 | |
| 12 month U.S. LIBOR + 1.620% 1.875% 5/1/35 (c)(e) | 15,535 | 16,259 | |
| 12 month U.S. LIBOR + 1.620% 1.927% 3/1/33 (c)(e) | 8,948 | 9,332 | |
| 12 month U.S. LIBOR + 1.630% 1.815% 9/1/36 (c)(e) | 5,564 | 5,841 | |
| 12 month U.S. LIBOR + 1.630% 1.947% 11/1/36 (c)(e) | 4,342 | 4,557 | |
| 12 month U.S. LIBOR + 1.640% 1.896% 5/1/36 (c)(e) | 23,819 | 25,040 | |
| 12 month U.S. LIBOR + 1.640% 2.096% 6/1/47 (c)(e) | 13,718 | 14,545 | |
| 12 month U.S. LIBOR + 1.680% 1.994% 7/1/43 (c)(e) | 141,985 | 149,022 | |
| 12 month U.S. LIBOR + 1.700% 1.968% 6/1/42 (c)(e) | 12,569 | 13,186 | |
| 12 month U.S. LIBOR + 1.710% 1.95% 8/1/35 (c)(e) | 4,748 | 4,993 | |
| 12 month U.S. LIBOR + 1.730% 1.988% 5/1/36 (c)(e) | 10,263 | 10,826 | |
| 12 month U.S. LIBOR + 1.730% 2.085% 3/1/40 (c)(e) | 14,526 | 15,287 | |
| 12 month U.S. LIBOR + 1.750% 2% 8/1/41 (c)(e) | 18,594 | 19,620 | |
| 12 month U.S. LIBOR + 1.750% 2.08% 7/1/35 (c)(e) | 4,458 | 4,685 | |
| 12 month U.S. LIBOR + 1.800% 2.05% 7/1/41 (c)(e) | 10,488 | 11,051 | |
| 12 month U.S. LIBOR + 1.800% 2.074% 12/1/40 (c)(e) | 434,150 | 458,195 | |
| 12 month U.S. LIBOR + 1.800% 2.175% 1/1/42 (c)(e) | 31,063 | 32,725 | |
| 12 month U.S. LIBOR + 1.810% 2.068% 7/1/41 (c)(e) | 10,855 | 11,486 | |
| 12 month U.S. LIBOR + 1.810% 2.068% 9/1/41 (c)(e) | 4,380 | 4,635 | |
| 12 month U.S. LIBOR + 1.810% 2.185% 12/1/39 (c)(e) | 9,634 | 10,151 | |
| 12 month U.S. LIBOR + 1.810% 2.193% 2/1/42 (c)(e) | 16,795 | 17,735 | |
| 12 month U.S. LIBOR + 1.820% 2.2% 2/1/35 (c)(e) | 16,488 | 17,422 | |
| 12 month U.S. LIBOR + 1.830% 2.08% 10/1/41 (c)(e) | 3,893 | 4,003 | |
| 12 month U.S. LIBOR + 1.950% 2.202% 7/1/37 (c)(e) | 18,072 | 19,189 | |
| 6 month U.S. LIBOR + 1.500% 1.723% 1/1/35 (c)(e) | 19,518 | 20,319 | |
| 6 month U.S. LIBOR + 1.530% 1.7% 12/1/34 (c)(e) | 3,626 | 3,777 | |
| 6 month U.S. LIBOR + 1.530% 1.737% 3/1/35 (c)(e) | 3,600 | 3,753 | |
| 6 month U.S. LIBOR + 1.550% 1.675% 10/1/33 (c)(e) | 1,247 | 1,298 | |
| 6 month U.S. LIBOR + 1.560% 1.71% 7/1/35 (c)(e) | 2,332 | 2,436 | |
| 6 month U.S. LIBOR + 1.740% 1.99% 12/1/34 (c)(e) | 353 | 369 | |
| 6 month U.S. LIBOR + 1.960% 2.085% 9/1/35 (c)(e) | 4,231 | 4,466 | |
| U.S. TREASURY 1 YEAR INDEX + 2.200% 2.333% 3/1/35 (c)(e) | 3,977 | 4,204 | |
| U.S. TREASURY 1 YEAR INDEX + 2.270% 2.395% 6/1/36 (c)(e) | 18,444 | 19,407 | |
| U.S. TREASURY 1 YEAR INDEX + 2.280% 2.41% 10/1/33 (c)(e) | 9,155 | 9,622 | |
| U.S. TREASURY 1 YEAR INDEX + 2.460% 2.53% 7/1/34 (c)(e) | 21,469 | 22,570 | |
| 1.5% 2/1/51 to 6/1/51 | 39,853,732 | 38,575,154 | |
| 2% 7/1/50 to 11/1/51 | 371,818,690 | 373,511,283 | |
| 2.5% 5/1/31 to 12/1/51 | 490,294,726 | 506,456,922 | |
| 3% 12/1/28 to 11/1/51 (d)(g)(h)(i) | 401,968,301 | 422,644,679 | |
| 3.25% 12/1/41 | 6,491 | 6,917 | |
| 3.4% 7/1/42 to 9/1/42 | 114,960 | 122,836 | |
| 3.5% 10/1/33 to 1/1/51 | 631,861,968 | 670,976,294 | |
| 3.65% 5/1/42 to 8/1/42 | 36,250 | 39,199 | |
| 3.9% 4/1/42 | 10,088 | 11,082 | |
| 4% 3/1/36 to 11/1/49 | 57,244,665 | 62,106,929 | |
| 4.25% 11/1/41 | 28,604 | 31,257 | |
| 4.5% to 4.5% 12/1/23 to 9/1/49 (h) | 108,738,465 | 118,172,051 | |
| 5% 1/1/22 to 2/1/49 | 9,942,569 | 11,102,100 | |
| 5.237% 8/1/41 (c) | 308,197 | 343,234 | |
| 5.5% 3/1/22 to 9/1/24 | 2,767 | 2,794 | |
| 6% to 6% 1/1/22 to 1/1/42 | 1,516,388 | 1,754,769 | |
| 6.5% 3/1/22 to 5/1/38 | 216,565 | 244,761 | |
| 6.623% 2/1/39 (c) | 226,584 | 249,450 | |
| 7% to 7% 4/1/23 to 7/1/37 | 150,230 | 171,525 | |
| 7.5% to 7.5% 9/1/22 to 9/1/32 | 79,328 | 90,099 | |
| 8% 3/1/37 | 3,063 | 3,684 | |
| 8.5% 9/1/22 | 79 | 81 | |
| 9% 10/1/30 | 3,699 | 4,331 | |
| TOTAL FANNIE MAE | 2,207,631,343 | ||
| Freddie Mac - 3.0% | |||
| 12 month U.S. LIBOR + 1.320% 1.7% 1/1/36 (c)(e) | 6,722 | 6,996 | |
| 12 month U.S. LIBOR + 1.370% 1.7% 3/1/36 (c)(e) | 25,546 | 26,660 | |
| 12 month U.S. LIBOR + 1.500% 1.839% 3/1/36 (c)(e) | 25,594 | 26,832 | |
| 12 month U.S. LIBOR + 1.750% 2% 7/1/41 (c)(e) | 41,236 | 43,488 | |
| 12 month U.S. LIBOR + 1.750% 2% 9/1/41 (c)(e) | 82,317 | 86,807 | |
| 12 month U.S. LIBOR + 1.750% 2.068% 12/1/40 (c)(e) | 193,894 | 204,182 | |
| 12 month U.S. LIBOR + 1.790% 2.168% 4/1/37 (c)(e) | 2,487 | 2,625 | |
| 12 month U.S. LIBOR + 1.860% 2.114% 4/1/36 (c)(e) | 8,875 | 9,408 | |
| 12 month U.S. LIBOR + 1.880% 2.13% 4/1/41 (c)(e) | 1,732 | 1,834 | |
| 12 month U.S. LIBOR + 1.880% 2.13% 9/1/41 (c)(e) | 6,239 | 6,579 | |
| 12 month U.S. LIBOR + 1.900% 2.174% 10/1/42 (c)(e) | 28,958 | 30,607 | |
| 12 month U.S. LIBOR + 1.910% 2.16% 5/1/41 (c)(e) | 12,662 | 13,419 | |
| 12 month U.S. LIBOR + 1.910% 2.16% 6/1/41 (c)(e) | 16,552 | 17,540 | |
| 12 month U.S. LIBOR + 1.910% 2.16% 6/1/41 (c)(e) | 4,353 | 4,613 | |
| 12 month U.S. LIBOR + 1.910% 2.197% 5/1/41 (c)(e) | 12,027 | 12,754 | |
| 12 month U.S. LIBOR + 1.960% 2.211% 6/1/33 (c)(e) | 10,615 | 11,195 | |
| 12 month U.S. LIBOR + 2.020% 2.32% 4/1/38 (c)(e) | 13,931 | 14,698 | |
| 12 month U.S. LIBOR + 2.030% 2.296% 3/1/33 (c)(e) | 255 | 267 | |
| 12 month U.S. LIBOR + 2.040% 2.295% 7/1/36 (c)(e) | 14,521 | 15,350 | |
| 12 month U.S. LIBOR + 2.200% 2.575% 12/1/36 (c)(e) | 22,871 | 24,211 | |
| 6 month U.S. LIBOR + 1.120% 1.325% 8/1/37 (c)(e) | 8,398 | 8,637 | |
| 6 month U.S. LIBOR + 1.580% 1.83% 12/1/35 (c)(e) | 825 | 863 | |
| 6 month U.S. LIBOR + 1.720% 1.97% 8/1/37 (c)(e) | 3,537 | 3,715 | |
| 6 month U.S. LIBOR + 1.840% 1.97% 2/1/37 (c)(e) | 4,313 | 4,540 | |
| 6 month U.S. LIBOR + 1.880% 2.021% 10/1/36 (c)(e) | 29,373 | 30,831 | |
| 6 month U.S. LIBOR + 1.990% 2.152% 10/1/35 (c)(e) | 10,786 | 11,344 | |
| 6 month U.S. LIBOR + 2.020% 2.245% 6/1/37 (c)(e) | 21,392 | 22,530 | |
| 6 month U.S. LIBOR + 2.680% 2.812% 10/1/35 (c)(e) | 10,411 | 11,010 | |
| U.S. TREASURY 1 YEAR INDEX + 2.030% 2.158% 6/1/33 (c)(e) | 20,046 | 21,065 | |
| U.S. TREASURY 1 YEAR INDEX + 2.260% 2.387% 6/1/33 (c)(e) | 37,676 | 39,525 | |
| U.S. TREASURY 1 YEAR INDEX + 2.430% 2.515% 3/1/35 (c)(e) | 72,306 | 76,221 | |
| 1.5% 11/1/50 to 6/1/51 | 3,177,621 | 3,081,922 | |
| 2% 6/1/50 to 11/1/51 | 353,264,536 | 355,025,327 | |
| 2.5% 6/1/31 to 12/1/51 | 403,347,819 | 416,077,578 | |
| 3% 6/1/31 to 8/1/50 | 256,223,001 | 269,268,724 | |
| 3.5% 3/1/32 to 4/1/50 (i) | 163,379,763 | 174,099,952 | |
| 3.5% 8/1/47 | 2,961,544 | 3,161,258 | |
| 4% 5/1/33 to 3/1/49 (h) | 117,784,643 | 127,031,211 | |
| 4% 4/1/48 | 8,922 | 9,578 | |
| 4.5% 6/1/25 to 7/1/49 | 30,480,814 | 33,219,875 | |
| 5% 7/1/33 to 7/1/41 | 3,055,505 | 3,433,438 | |
| 5.5% 6/1/22 | 1,460 | 1,471 | |
| 6% 12/1/21 to 12/1/37 | 320,303 | 366,687 | |
| 6.5% 12/1/21 to 9/1/39 | 512,150 | 598,361 | |
| 7% 3/1/26 to 9/1/36 | 157,505 | 182,415 | |
| 7.5% 1/1/27 to 7/1/34 | 43,263 | 50,230 | |
| 8% 7/1/24 to 4/1/32 | 3,649 | 4,149 | |
| 8.5% 12/1/22 to 1/1/28 | 2,044 | 2,264 | |
| TOTAL FREDDIE MAC | 1,386,404,786 | ||
| Ginnie Mae - 4.3% | |||
| 3.5% 9/20/40 to 11/20/50 | 265,666,290 | 278,960,288 | |
| 4% 7/20/33 to 6/20/49 | 134,621,064 | 144,284,207 | |
| 4.5% 6/20/33 to 9/20/46 | 9,323,833 | 10,296,526 | |
| 5.5% 8/15/33 to 9/15/39 | 261,966 | 298,137 | |
| 6% to 6% 10/15/30 to 5/15/40 | 376,185 | 432,190 | |
| 7% to 7% 11/15/22 to 11/15/32 | 157,502 | 178,949 | |
| 7.5% to 7.5% 2/15/22 to 9/15/31 | 36,398 | 40,025 | |
| 8% 1/15/22 to 11/15/29 | 9,045 | 9,798 | |
| 8.5% to 8.5% 11/15/27 to 1/15/31 | 4,909 | 5,582 | |
| 9% 1/15/23 | 13 | 13 | |
| 2% 12/1/51 (d) | 46,900,000 | 47,499,377 | |
| 2% 12/1/51 (d) | 14,650,000 | 14,837,226 | |
| 2% 12/1/51 (d) | 15,500,000 | 15,698,088 | |
| 2% 12/1/51 (d) | 49,650,000 | 50,284,522 | |
| 2% 12/1/51 (d) | 50,300,000 | 50,942,829 | |
| 2% 12/1/51 (d) | 15,700,000 | 15,900,644 | |
| 2% 12/1/51 (d) | 35,250,000 | 35,700,491 | |
| 2% 12/1/51 (d) | 10,950,000 | 11,089,940 | |
| 2% 12/1/51 (d) | 25,200,000 | 25,522,053 | |
| 2% 12/1/51 (d) | 7,850,000 | 7,950,322 | |
| 2% 12/1/51 (d) | 16,950,000 | 17,166,619 | |
| 2% 12/1/51 (d) | 5,250,000 | 5,317,094 | |
| 2% 12/1/51 (d) | 4,725,000 | 4,785,385 | |
| 2% 12/1/51 (d) | 15,150,000 | 15,343,615 | |
| 2% 12/1/51 (d) | 11,500,000 | 11,646,969 | |
| 2% 12/1/51 (d) | 13,300,000 | 13,469,973 | |
| 2.5% 11/20/47 to 7/20/51 | 35,168,522 | 36,158,566 | |
| 2.5% 12/1/51 (d) | 6,800,000 | 6,986,055 | |
| 2.5% 12/1/51 (d) | 82,150,000 | 84,397,706 | |
| 2.5% 12/1/51 (d) | 22,550,000 | 23,166,991 | |
| 2.5% 12/1/51 (d) | 32,700,000 | 33,594,705 | |
| 2.5% 12/1/51 (d) | 10,200,000 | 10,479,082 | |
| 2.5% 12/1/51 (d) | 28,350,000 | 29,125,684 | |
| 2.5% 12/1/51 (d) | 8,850,000 | 9,092,145 | |
| 2.5% 12/1/51 (d) | 6,675,000 | 6,857,635 | |
| 2.5% 12/1/51 (d) | 21,475,000 | 22,062,577 | |
| 2.5% 12/1/51 (d) | 17,275,000 | 17,747,661 | |
| 2.5% 12/1/51 (d) | 5,375,000 | 5,522,065 | |
| 2.5% 12/1/51 (d) | 25,200,000 | 25,889,497 | |
| 2.5% 12/1/51 (d) | 13,300,000 | 13,663,901 | |
| 3% 5/15/42 to 7/20/51 | 217,810,447 | 226,057,121 | |
| 3% 12/1/51 (d) | 9,200,000 | 9,534,132 | |
| 3% 12/1/51 (d) | 7,900,000 | 8,186,918 | |
| 3% 12/1/51 (d) | 5,150,000 | 5,337,041 | |
| 3% 12/1/51 (d) | 4,450,000 | 4,611,618 | |
| 3% 12/1/51 (d) | 2,900,000 | 3,005,324 | |
| 3% 12/1/51 (d) | 4,075,000 | 4,222,999 | |
| 3% 12/1/51 (d) | 2,625,000 | 2,720,337 | |
| 3% 12/1/51 (d) | 11,000,000 | 11,399,506 | |
| 3% 12/1/51 (d) | 16,600,000 | 17,202,890 | |
| 3.5% 12/1/51 (d) | 6,500,000 | 6,788,160 | |
| 3.5% 12/1/51 (d) | 2,000,000 | 2,088,665 | |
| 3.5% 12/1/51 (d) | 35,700,000 | 37,282,663 | |
| 3.5% 12/1/51 (d) | 11,550,000 | 12,062,038 | |
| 3.5% 12/1/51 (d) | 45,950,000 | 47,987,069 | |
| 3.5% 12/1/51 (d) | 27,650,000 | 28,875,788 | |
| 3.5% 12/1/51 (d) | 6,950,000 | 7,258,109 | |
| 3.5% 12/1/51 (d) | 11,500,000 | 12,009,821 | |
| 3.5% 12/1/51 (d) | 45,950,000 | 47,987,069 | |
| 3.5% 12/1/51 (d) | 9,200,000 | 9,607,857 | |
| 3.5% 12/1/51 (d) | 2,300,000 | 2,401,964 | |
| 3.5% 12/1/51 (d) | 2,300,000 | 2,401,964 | |
| 3.5% 12/1/51 (d) | 9,200,000 | 9,607,857 | |
| 3.5% 12/1/51 (d) | 27,650,000 | 28,875,788 | |
| 3.5% 12/1/51 (d) | 6,950,000 | 7,258,109 | |
| 3.5% 12/1/51 (d) | 18,350,000 | 19,163,498 | |
| 3.5% 12/1/51 (d) | 4,600,000 | 4,803,929 | |
| 3.5% 12/1/51 (d) | 18,400,000 | 19,215,714 | |
| 3.5% 12/1/51 (d) | 4,600,000 | 4,803,929 | |
| 3.5% 12/1/51 (d) | 9,250,000 | 9,660,074 | |
| 3.5% 12/1/51 (d) | 2,300,000 | 2,401,964 | |
| 3.5% 12/1/51 (d) | 4,600,000 | 4,803,929 | |
| 3.5% 12/1/51 (d) | 18,350,000 | 19,163,498 | |
| 3.5% 12/1/51 (d) | 13,700,000 | 14,307,353 | |
| 3.5% 12/1/51 (d) | 3,450,000 | 3,602,946 | |
| 3.5% 12/1/51 (d) | 16,125,000 | 16,839,858 | |
| 3.5% 12/1/51 (d) | 4,075,000 | 4,255,654 | |
| 3.5% 12/1/51 (d) | 34,500,000 | 36,029,464 | |
| 3.5% 1/1/52 (d) | 8,750,000 | 9,128,337 | |
| 3.5% 1/1/52 (d) | 41,800,000 | 43,607,369 | |
| 3.5% 1/1/52 (d) | 28,150,000 | 29,367,164 | |
| 3.5% 1/1/52 (d) | 7,050,000 | 7,354,831 | |
| 3.5% 1/1/52 (d) | 27,500,000 | 28,689,059 | |
| 3.5% 1/1/52 (d) | 6,900,000 | 7,198,346 | |
| 3.5% 1/1/52 (d) | 27,600,000 | 28,793,383 | |
| 3.5% 1/1/52 (d) | 6,900,000 | 7,198,346 | |
| 5% 4/15/33 to 6/20/48 | 13,911,808 | 15,217,600 | |
| 6.5% 3/20/31 to 6/15/37 | 62,636 | 72,239 | |
| TOTAL GINNIE MAE | 1,992,854,423 | ||
| Uniform Mortgage Backed Securities - 5.2% | |||
| 1.5% 12/1/51 (d) | 18,200,000 | 17,599,282 | |
| 1.5% 12/1/51 (d) | 65,650,000 | 63,483,123 | |
| 1.5% 12/1/51 (d) | 25,650,000 | 24,803,383 | |
| 1.5% 12/1/51 (d) | 45,550,000 | 44,046,554 | |
| 1.5% 12/1/51 (d) | 17,800,000 | 17,212,484 | |
| 1.5% 12/1/51 (d) | 32,550,000 | 31,475,638 | |
| 1.5% 12/1/51 (d) | 12,700,000 | 12,280,817 | |
| 2% 12/1/51 (d) | 5,650,000 | 5,655,109 | |
| 2% 12/1/51 (d) | 17,200,000 | 17,215,554 | |
| 2% 12/1/51 (d) | 35,600,000 | 35,632,193 | |
| 2% 12/1/51 (d) | 51,400,000 | 51,446,481 | |
| 2% 12/1/51 (d) | 15,050,000 | 15,063,610 | |
| 2% 12/1/51 (d) | 71,550,000 | 71,614,703 | |
| 2% 12/1/51 (d) | 26,050,000 | 26,073,557 | |
| 2% 12/1/51 (d) | 1,300,000 | 1,301,176 | |
| 2% 12/1/51 (d) | 4,250,000 | 4,253,843 | |
| 2% 12/1/51 (d) | 18,500,000 | 18,516,730 | |
| 2% 12/1/51 (d) | 28,000,000 | 28,025,320 | |
| 2% 12/1/51 (d) | 1,700,000 | 1,701,537 | |
| 2% 12/1/51 (d) | 7,600,000 | 7,606,873 | |
| 2% 12/1/51 (d) | 9,100,000 | 9,108,229 | |
| 2% 12/1/51 (d) | 2,500,000 | 2,502,261 | |
| 2% 12/1/51 (d) | 40,900,000 | 40,936,986 | |
| 2% 12/1/51 (d) | 2,800,000 | 2,802,532 | |
| 2% 12/1/51 (d) | 63,700,000 | 63,757,604 | |
| 2% 12/1/51 (d) | 20,950,000 | 20,968,945 | |
| 2% 12/1/51 (d) | 21,100,000 | 21,119,081 | |
| 2% 12/1/51 (d) | 64,200,000 | 64,258,056 | |
| 2% 12/1/51 (d) | 64,650,000 | 64,708,463 | |
| 2% 12/1/51 (d) | 20,850,000 | 20,868,855 | |
| 2% 12/1/51 (d) | 97,950,000 | 98,038,576 | |
| 2% 12/1/51 (d) | 31,550,000 | 31,578,531 | |
| 2% 12/1/51 (d) | 27,550,000 | 27,574,913 | |
| 2% 12/1/51 (d) | 85,650,000 | 85,727,453 | |
| 2% 12/1/51 (d) | 54,250,000 | 54,299,058 | |
| 2% 12/1/51 (d) | 17,450,000 | 17,465,780 | |
| 2% 12/1/51 (d) | 22,500,000 | 22,520,347 | |
| 2% 12/1/51 (d) | 7,350,000 | 7,356,647 | |
| 2% 12/1/51 (d) | 33,900,000 | 33,930,656 | |
| 2% 12/1/51 (d) | 2,500,000 | 2,502,261 | |
| 2% 12/1/51 (d) | 25,400,000 | 25,422,969 | |
| 2% 12/1/51 (d) | 25,400,000 | 25,422,969 | |
| 2% 1/1/52 (d) | 68,650,000 | 68,578,000 | |
| 2% 1/1/52 (d) | 20,700,000 | 20,678,290 | |
| 2% 1/1/52 (d) | 73,050,000 | 72,973,385 | |
| 2% 1/1/52 (d) | 21,150,000 | 21,127,818 | |
| 2.5% 12/1/51 (d) | 5,500,000 | 5,637,500 | |
| 2.5% 12/1/51 (d) | 4,800,000 | 4,920,000 | |
| 2.5% 12/1/51 (d) | 42,000,000 | 43,050,000 | |
| 2.5% 12/1/51 (d) | 4,250,000 | 4,356,250 | |
| 2.5% 12/1/51 (d) | 5,200,000 | 5,330,000 | |
| 2.5% 12/1/51 (d) | 10,300,000 | 10,557,500 | |
| 2.5% 12/1/51 (d) | 5,700,000 | 5,842,500 | |
| 2.5% 12/1/51 (d) | 15,700,000 | 16,092,500 | |
| 2.5% 12/1/51 (d) | 4,300,000 | 4,407,500 | |
| 2.5% 12/1/51 (d) | 7,500,000 | 7,687,500 | |
| 2.5% 12/1/51 (d) | 84,700,000 | 86,817,500 | |
| 2.5% 12/1/51 (d) | 20,550,000 | 21,063,750 | |
| 2.5% 12/1/51 (d) | 82,950,000 | 85,023,750 | |
| 2.5% 12/1/51 (d) | 22,300,000 | 22,857,500 | |
| 2.5% 12/1/51 (d) | 55,800,000 | 57,195,000 | |
| 2.5% 12/1/51 (d) | 15,000,000 | 15,375,000 | |
| 2.5% 12/1/51 (d) | 64,775,000 | 66,394,375 | |
| 2.5% 12/1/51 (d) | 17,450,000 | 17,886,250 | |
| 2.5% 12/1/51 (d) | 38,100,000 | 39,052,500 | |
| 2.5% 12/1/51 (d) | 2,925,000 | 2,998,125 | |
| 2.5% 12/1/51 (d) | 31,850,000 | 32,646,250 | |
| 2.5% 12/1/51 (d) | 9,800,000 | 10,045,000 | |
| 2.5% 12/1/51 (d) | 26,350,000 | 27,008,750 | |
| 2.5% 12/1/51 (d) | 6,600,000 | 6,765,000 | |
| 2.5% 1/1/52 (d) | 9,450,000 | 9,662,625 | |
| 2.5% 1/1/52 (d) | 42,000,000 | 42,945,000 | |
| 3% 12/1/51 (d) | 13,700,000 | 14,223,382 | |
| 3% 12/1/51 (d) | 31,600,000 | 32,807,218 | |
| 3% 12/1/51 (d) | 8,000,000 | 8,305,625 | |
| 3% 12/1/51 (d) | 1,900,000 | 1,972,586 | |
| 3% 12/1/51 (d) | 26,100,000 | 27,097,101 | |
| 3% 12/1/51 (d) | 4,000,000 | 4,152,812 | |
| 3% 12/1/51 (d) | 19,200,000 | 19,933,500 | |
| 3% 12/1/51 (d) | 5,900,000 | 6,125,398 | |
| 3% 12/1/51 (d) | 1,900,000 | 1,972,586 | |
| 3% 12/1/51 (d) | 24,500,000 | 25,435,976 | |
| 3.5% 12/1/51 (d) | 3,400,000 | 3,574,383 | |
| 3.5% 12/1/51 (d) | 15,200,000 | 15,979,594 | |
| 3.5% 12/1/51 (d) | 30,700,000 | 32,274,575 | |
| 3.5% 12/1/51 (d) | 4,200,000 | 4,415,414 | |
| 3.5% 12/1/51 (d) | 68,600,000 | 72,118,432 | |
| 3.5% 12/1/51 (d) | 6,900,000 | 7,253,895 | |
| 3.5% 12/1/51 (d) | 8,000,000 | 8,410,313 | |
| 3.5% 12/1/51 (d) | 44,400,000 | 46,677,236 | |
| TOTAL UNIFORM MORTGAGE BACKED SECURITIES | 2,405,584,283 | ||
| TOTAL U.S. GOVERNMENT AGENCY - MORTGAGE SECURITIES | |||
| (Cost $7,979,536,873) | 7,992,474,835 | ||
| Asset-Backed Securities - 2.1% | |||
| AASET Trust: | |||
| Series 2018-1A Class A, 3.844% 1/16/38 (b) | $7,986,087 | $7,036,153 | |
| Series 2019-1 Class A, 3.844% 5/15/39 (b) | 4,486,323 | 4,260,656 | |
| Series 2019-2: | |||
| Class A, 3.376% 10/16/39 (b) | 8,065,531 | 7,766,757 | |
| Class B, 4.458% 10/16/39 (b) | 1,488,945 | 1,240,390 | |
| Series 2021-1A Class A, 2.95% 11/16/41 (b) | 11,336,884 | 11,181,433 | |
| Series 2021-2A Class A, 2.798% 1/15/47 (b) | 21,050,000 | 21,014,299 | |
| Affirm, Inc. Series 2021-A Class A, 0.88% 8/15/25 (b) | 4,062,000 | 4,064,410 | |
| Aimco Series 2021-BA Class AR, 3 month U.S. LIBOR + 1.100% 1.2238% 1/15/32 (b)(c)(e) | 3,420,000 | 3,420,222 | |
| AIMCO CLO Ltd.: | |||
| Series 2021-11A Class AR, 3 month U.S. LIBOR + 1.130% 1.14% 10/17/34 (b)(c)(e) | 7,980,000 | 7,980,000 | |
| Series 2021-12A Class A, 3 month U.S. LIBOR + 1.210% 1.3323% 1/17/32 (b)(c)(e) | 9,320,000 | 9,313,308 | |
| Ajax Mortgage Loan Trust Series 2021-C Class A, 2.115% 1/25/61 (b) | 4,015,954 | 4,003,848 | |
| Allegany Park CLO, Ltd. / Allegany Series 2020-1A Class A, 3 month U.S. LIBOR + 1.330% 1.4615% 1/20/33 (b)(c)(e) | 4,684,000 | 4,685,906 | |
| Allegro CLO, Ltd. Series 2021-1A Class A, 3 month U.S. LIBOR + 1.140% 1.2715% 7/20/34 (b)(c)(e) | 8,250,000 | 8,252,673 | |
| Apollo Aviation Securitization Equity Trust Series 2020-1A: | |||
| Class A, 3.351% 1/16/40 (b) | 4,403,273 | 4,173,756 | |
| Class B, 4.335% 1/16/40 (b) | 766,953 | 550,762 | |
| Ares CLO Series 2019-54A Class A, 3 month U.S. LIBOR + 1.320% 1.4438% 10/15/32 (b)(c)(e) | 8,066,000 | 8,069,372 | |
| Ares CLO Ltd. Series 2020-58A Class A, 3 month U.S. LIBOR + 1.220% 1.3438% 1/15/33 (b)(c)(e) | 13,570,000 | 13,574,573 | |
| Ares LV CLO Ltd. Series 2021-55A Class A1R, 3 month U.S. LIBOR + 1.130% 1.2538% 7/15/34 (b)(c)(e) | 10,540,000 | 10,546,819 | |
| Ares XLI CLO Ltd. / Ares XLI CLO LLC Series 2021-41A Class AR2, 3 month U.S. LIBOR + 1.070% 1.1938% 4/15/34 (b)(c)(e) | 11,760,000 | 11,761,588 | |
| Ares XXXIV CLO Ltd. Series 2020-2A Class AR2, 3 month U.S. LIBOR + 1.250% 1.3723% 4/17/33 (b)(c)(e) | 20,753,000 | 20,759,309 | |
| Babson CLO Ltd. Series 2021-1A Class AR, 3 month U.S. LIBOR + 1.150% 1.2738% 10/15/36 (b)(c)(e) | 7,970,000 | 7,965,250 | |
| Barings CLO Ltd. Series 2021-4A Class A, 3 month U.S. LIBOR + 1.220% 1.3515% 1/20/32 (b)(c)(e) | 9,220,000 | 9,220,231 | |
| Beechwood Park CLO Ltd. Series 2019-1A Class A1, 3 month U.S. LIBOR + 1.330% 1.4523% 1/17/33 (b)(c)(e) | 7,381,000 | 7,384,691 | |
| BETHP Series 2021-1A Class A, 3 month U.S. LIBOR + 1.130% 1.2698% 1/15/35 (b)(c)(e) | 11,380,000 | 11,379,943 | |
| Blackbird Capital Aircraft: | |||
| Series 2016-1A: | |||
| Class A, 4.213% 12/16/41 (b) | 5,740,452 | 5,749,788 | |
| Class AA, 2.487% 12/16/41 (b)(c) | 820,562 | 823,378 | |
| Series 2021-1A Class A, 2.443% 7/15/46 (b) | 22,271,147 | 22,112,088 | |
| Brazos Higher Education Authority, Inc.: | |||
| Series 2010-1 Class A1, 3 month U.S. LIBOR + 0.900% 1.078% 5/25/29 (c)(e) | 203,762 | 203,900 | |
| Series 2011-2 Class A2, 3 month U.S. LIBOR + 0.850% 0.9739% 7/25/29 (c)(e) | 279,630 | 280,150 | |
| Bristol Park CLO, Ltd. Series 2020-1A Class AR, 3 month U.S. LIBOR + 0.990% 1.1138% 4/15/29 (b)(c)(e) | 10,597,000 | 10,574,725 | |
| Cascade Funding Mortgage Trust Series 2021-HB6 Class A, 0.8983% 6/25/36 (b) | 9,768,942 | 9,762,576 | |
| Castlelake Aircraft Securitization Trust: | |||
| Series 2019-1A: | |||
| Class A, 3.967% 4/15/39 (b) | 7,965,815 | 7,941,275 | |
| Class B, 5.095% 4/15/39 (b) | 3,098,041 | 2,943,707 | |
| Series 2021-1R Class A, 2.741% 8/15/41 (b) | 32,113,292 | 31,953,741 | |
| Castlelake Aircraft Structured Trust: | |||
| Series 2018-1 Class A, 4.125% 6/15/43 (b) | 4,472,967 | 4,421,830 | |
| Series 2021-1A: | |||
| Class A, 3.474% 1/15/46 (b) | 3,530,513 | 3,603,406 | |
| Class B, 6.656% 1/15/46 (b) | 2,884,224 | 3,091,683 | |
| Cedar Funding Ltd. Series 2021-10A Class AR, 3 month U.S. LIBOR + 1.100% 1.1% 10/20/32 (b)(c)(e) | 7,910,000 | 7,906,702 | |
| Cedar Funding XII CLO Ltd. / Cedar Funding XII CLO LLC Series 2021-12A Class A1R, 3 month U.S. LIBOR + 1.130% 1.13% 10/25/34 (b)(c)(e) | 6,880,000 | 6,875,927 | |
| Cent CLO Ltd. / Cent CLO Series 2021-29A Class AR, 3 month U.S. LIBOR + 1.170% 1.3244% 10/20/34 (b)(c)(e) | 11,410,000 | 11,382,799 | |
| Citi Mortgage Loan Trust Series 2007-1 Class 1A, 1 month U.S. LIBOR + 1.350% 1.442% 10/25/37 (b)(c)(e) | 110,710 | 111,489 | |
| Collegiate Funding Services Education Loan Trust Series 2004-A Class A4, 3 month U.S. LIBOR + 0.340% 0.4723% 9/28/30 (c)(e) | 269,638 | 269,354 | |
| Columbia Cent CLO 31 Ltd. Series 2021-31A Class A1, 3 month U.S. LIBOR + 1.200% 1.3315% 4/20/34 (b)(c)(e) | 9,300,000 | 9,280,005 | |
| Columbia Cent CLO Ltd. / Columbia Cent CLO Corp. Series 2021-30A Class A1, 3 month U.S. LIBOR + 1.310% 1.4415% 1/20/34 (b)(c)(e) | 12,220,000 | 12,230,130 | |
| Consumer Loan Underlying Bond Credit Trust Series 2019-HP1 Class A, 2.59% 12/15/26 (b) | 2,258,906 | 2,268,921 | |
| DB Master Finance LLC: | |||
| Series 2017-1A Class A2II, 4.03% 11/20/47 (b) | 5,294,713 | 5,521,914 | |
| Series 2019-1A: | |||
| Class A23, 4.352% 5/20/49 (b) | 982,388 | 1,055,950 | |
| Class A2II, 4.021% 5/20/49 (b) | 738,990 | 764,379 | |
| Dominos Pizza Master Issuer LLC Series 2019-1A Class A2, 3.668% 10/25/49 (b) | 2,097,638 | 2,221,417 | |
| Dryden CLO, Ltd.: | |||
| Series 2021-76A Class A1R, 3 month U.S. LIBOR + 1.150% 1.15% 10/20/34 (b)(c)(e) | 7,990,000 | 7,990,000 | |
| Series 2021-83A Class A, 3 month U.S. LIBOR + 1.220% 1.3423% 1/18/32 (b)(c)(e) | 7,360,000 | 7,361,575 | |
| Dryden Senior Loan Fund: | |||
| Series 2018-70A Class A1, 3 month U.S. LIBOR + 1.170% 1.2923% 1/16/32 (b)(c)(e) | 2,909,000 | 2,909,428 | |
| Series 2020-78A Class A, 3 month U.S. LIBOR + 1.180% 1.3023% 4/17/33 (b)(c)(e) | 7,000,000 | 7,003,479 | |
| Series 2021-85A Class AR, 3 month U.S. LIBOR + 1.150% 1.2738% 10/15/35 (b)(c)(e) | 9,590,000 | 9,584,227 | |
| Series 2021-90A Class A1A, 3 month U.S. LIBOR + 1.130% 1.13% 2/20/35 (b)(c)(d)(e) | 6,930,000 | 6,930,000 | |
| Eaton Vance CLO, Ltd.: | |||
| Series 2020-2A Class A1, 3 month U.S. LIBOR + 1.370% 1.4938% 10/15/32 (b)(c)(e) | 9,400,000 | 9,403,158 | |
| Series 2021-1A Class AR, 3 month U.S. LIBOR + 1.100% 1.2238% 4/15/31 (b)(c)(e) | 4,560,000 | 4,563,133 | |
| Eaton Vance CLO, Ltd. / Eaton Vance CLO LLC Series 2021-1A Class A13R, 3 month U.S. LIBOR + 1.250% 1.3738% 1/15/34 (b)(c)(e) | 2,000,000 | 2,001,128 | |
| Enterprise Fleet Financing LLC Series 2021-1 Class A2, 0.44% 12/21/26 (b) | 11,063,267 | 11,017,220 | |
| Finance of America HECM Buyout Series 2021-HB1 Class A, 0.8754% 2/25/31 (b)(c) | 6,691,559 | 6,688,050 | |
| Flatiron CLO Ltd. Series 2021-1A: | |||
| Class A1, 3 month U.S. LIBOR + 1.110% 1.2613% 7/19/34 (b)(c)(e) | 7,180,000 | 7,189,133 | |
| Class AR, 3 month U.S. LIBOR + 1.080% 0% 11/16/34 (b)(c)(e) | 11,500,000 | 11,500,000 | |
| Flatiron CLO Ltd. / Flatiron CLO LLC Series 2020-1A Class A, 3 month U.S. LIBOR + 1.300% 1.4596% 11/20/33 (b)(c)(e) | 8,920,000 | 8,929,598 | |
| Ford Credit Floorplan Master Owner Trust: | |||
| Series 2019-1 Class B, 3.04% 3/15/24 | 1,170,000 | 1,178,565 | |
| Series 2019-2 Class A, 3.06% 4/15/26 | 8,253,000 | 8,632,940 | |
| Series 2019-3 Class A1, 2.23% 9/15/24 | 4,320,000 | 4,383,977 | |
| Series 2019-4 Class A, 2.44% 9/15/26 | 1,300,000 | 1,338,233 | |
| Horizon Aircraft Finance I Ltd. Series 2018-1 Class A, 4.458% 12/15/38 (b) | 3,007,862 | 2,975,842 | |
| Horizon Aircraft Finance Ltd. Series 2019-1 Class A, 3.721% 7/15/39 (b) | 4,416,268 | 4,378,137 | |
| Invesco CLO Ltd. Series 2021-3A Class A, 3 month U.S. LIBOR + 1.130% 1.13% 10/22/34 (b)(c)(d)(e) | 9,130,000 | 9,130,000 | |
| Lanark Master Issuer PLC Series 2020-1A Class 1A, 2.277% 12/22/69 (b)(c) | 7,887,000 | 7,998,325 | |
| Lucali CLO Ltd. Series 2021-1A Class A, 3 month U.S. LIBOR + 1.210% 1.3338% 1/15/33 (b)(c)(e) | 4,500,000 | 4,501,395 | |
| Madison Park Funding Series 2020-19A Class A1R2, 3 month U.S. LIBOR + 0.920% 1.0483% 1/22/28 (b)(c)(e) | 2,599,040 | 2,602,918 | |
| Madison Park Funding L Ltd. / Madison Park Funding L LLC Series 2021-50A Class A, 3 month U.S. LIBOR + 1.140% 1.2636% 4/19/34 (b)(c)(e) | 9,810,000 | 9,829,022 | |
| Madison Park Funding LII Ltd. / Madison Park Funding LII LLC Series 2021-52A Class A, 3 month U.S. LIBOR + 1.120% 1.13% 1/22/35 (b)(c)(d)(e) | 11,690,000 | 11,689,380 | |
| Madison Park Funding XLV Ltd./Madison Park Funding XLV LLC Series 2021-45A Class AR, 3 month U.S. LIBOR + 1.120% 1.2438% 7/15/34 (b)(c)(e) | 7,360,000 | 7,355,834 | |
| Madison Park Funding XXXIII Ltd. Series 2019-33A Class A, 3 month U.S. LIBOR + 1.330% 1.4538% 10/15/32 (b)(c)(e) | 4,271,000 | 4,273,891 | |
| Magnetite CLO Ltd. Series 2021-27A Class AR, 3 month U.S. LIBOR + 1.140% 1.2715% 10/20/34 (b)(c)(e) | 3,092,000 | 3,090,157 | |
| Magnetite XVI, Ltd. / Magnetite XVI, LLC Series 2015-16A Class AR, 3 month U.S. LIBOR + 0.800% 0.9223% 1/18/28 (b)(c)(e) | 8,324,642 | 8,322,202 | |
| Magnetite XXI Ltd. Series 2019-24A Class A, 3 month U.S. LIBOR + 1.330% 1.4538% 1/15/33 (b)(c)(e) | 23,148,000 | 23,152,630 | |
| Magnetite XXIII, Ltd. Series 2021-23A Class AR, 3 month U.S. LIBOR + 1.130% 0% 1/25/35 (b)(c)(e) | 9,420,000 | 9,420,000 | |
| Magnetite XXIX, Ltd. / Magnetite XXIX LLC Series 2021-29A Class A, 3 month U.S. LIBOR + 0.990% 1.1138% 1/15/34 (b)(c)(e) | 8,400,000 | 8,407,762 | |
| MAPS Trust Series 2021-1A Class A, 2.521% 6/15/46 (b) | 36,209,139 | 35,981,228 | |
| Marlette Funding Trust: | |||
| Series 2019-4A Class A, 2.39% 12/17/29 (b) | 287,191 | 287,603 | |
| Series 2021-3A Class A, 0.65% 12/15/31 (b) | 19,400,000 | 19,351,003 | |
| Metlife Securitization Trust Series 2019-1A Class A1A, 3.75% 4/25/58 (b) | 1,844,820 | 1,894,847 | |
| Milos CLO, Ltd. Series 2020-1A Class AR, 3 month U.S. LIBOR + 1.070% 1.2015% 10/20/30 (b)(c)(e) | 10,553,000 | 10,553,274 | |
| Mortgage Repurchase Agreement Financing Trust Series 2020-5 Class A1, 1 month U.S. LIBOR + 1.000% 1.0911% 8/10/23 (b)(c)(e) | 21,867,000 | 21,917,119 | |
| Nationstar HECM Loan Trust Series 2020-1A Class A1, 1.2686% 9/25/30 (b) | 11,433,691 | 11,408,892 | |
| Navient Student Loan Trust Series 2017-3A Class A2, 1 month U.S. LIBOR + 0.600% 0.692% 7/26/66 (b)(c)(e) | 345,466 | 346,169 | |
| Peace Park CLO, Ltd. Series 2021-1A Class A, 3 month U.S. LIBOR + 1.130% 1.2682% 10/20/34 (b)(c)(e) | 5,068,000 | 5,065,015 | |
| Planet Fitness Master Issuer LLC: | |||
| Series 2018-1A Class A2I, 4.262% 9/5/48 (b) | 291,000 | 290,822 | |
| Series 2019-1A Class A2, 3.858% 12/5/49 (b) | 7,085,790 | 7,348,815 | |
| Preston Ridge Partners Mortgage Trust Series 2021-RPL2 Class A1, 1.455% 10/25/51 (b)(c) | 7,163,937 | 7,147,949 | |
| Project Silver Series 2019-1 Class A, 3.967% 7/15/44 (b) | 6,653,705 | 6,530,070 | |
| Provident Funding Mortgage Trust Series 2020-1 Class A3, 3% 2/25/50 (b) | 100,987 | 100,798 | |
| Rockland Park CLO Ltd. Series 2021-1A Class A, 3 month U.S. LIBOR + 1.120% 1.2515% 4/20/34 (b)(c)(e) | 12,190,000 | 12,198,435 | |
| Sapphire Aviation Finance Series 2020-1A: | |||
| Class A, 3.228% 3/15/40 (b) | 19,740,481 | 19,366,575 | |
| Class B, 4.335% 3/15/40 (b) | 853,777 | 746,745 | |
| SBA Tower Trust: | |||
| Series 2019, 2.836% 1/15/50 (b) | 8,715,000 | 8,990,096 | |
| 1.884% 7/15/50 (b) | 4,275,000 | 4,292,776 | |
| 2.328% 7/15/52 (b) | 3,269,000 | 3,343,143 | |
| SLM Student Loan Trust Series 2003-10A Class A3, 3 month U.S. LIBOR + 0.470% 0.586% 12/15/27 (b)(c)(e) | 483,953 | 483,967 | |
| SoFi Consumer Loan Program Trust Series 2019-4 Class A, 2.45% 8/25/28 (b) | 361,936 | 362,578 | |
| Store Master Funding Series 2021-1A Class A1, 2.12% 6/20/51 (b) | 10,977,083 | 10,858,198 | |
| Symphony CLO XXI, Ltd. Series 2021-21A Class AR, 3 month U.S. LIBOR + 1.060% 1.1836% 7/15/32 (b)(c)(e) | 1,769,000 | 1,769,218 | |
| Symphony CLO XXIII Ltd. Series 2020-23A Class A, 3 month U.S. LIBOR + 1.320% 1.4438% 1/15/34 (b)(c)(e) | 5,300,000 | 5,300,000 | |
| Symphony CLO XXVI Ltd. / Symphony CLO XXVI LLC Series 2021-26A Class AR, 3 month U.S. LIBOR + 1.080% 1.2115% 4/20/33 (b)(c)(e) | 7,300,000 | 7,286,371 | |
| Taconic Park CLO, Ltd. Series 2020-1A Class A1R, 3 month U.S. LIBOR + 1.000% 1.1315% 1/20/29 (b)(c)(e) | 7,106,000 | 7,131,020 | |
| Terwin Mortgage Trust Series 2003-4HE Class A1, 1 month U.S. LIBOR + 0.860% 0.9516% 9/25/34 (c)(e) | 7,249 | 6,790 | |
| Thunderbolt Aircraft Lease Ltd. Series 2018-A Class A, 4.147% 9/15/38 (b)(c) | 9,411,899 | 9,394,892 | |
| Thunderbolt III Aircraft Lease Ltd. Series 2019-1 Class A, 3.671% 11/15/39 (b) | 19,974,463 | 19,924,563 | |
| Towd Point Mortgage Trust Series 2019-1 Class A1, 3.6777% 3/25/58 (b)(c) | 862,768 | 895,250 | |
| Trapeza CDO XII Ltd./Trapeza CDO XII, Inc. Series 2007-12A Class B, 3 month U.S. LIBOR + 0.560% 0.6866% 4/6/42 (b)(c)(e) | 778,000 | 566,497 | |
| Upstart Securitization Trust: | |||
| Series 2021-1 Class A, 0.87% 3/20/31 (b) | 923,828 | 921,119 | |
| Series 2021-2 Class A, 0.91% 6/20/31 (b) | 14,927,386 | 14,913,892 | |
| Series 2021-3 Class A, 0.83% 7/20/31 (b) | 25,316,063 | 25,258,342 | |
| Series 2021-4 Class A, 0.84% 9/20/31 (b) | 32,253,852 | 31,985,964 | |
| Series 2021-5 Class A, 1.31% 11/20/31 (b) | 22,400,000 | 22,347,992 | |
| Voya CLO Ltd./Voya CLO LLC: | |||
| Series 2021-2A Class A1R, 3 month U.S. LIBOR + 1.160% 1.2836% 7/19/34 (b)(c)(e) | 7,780,000 | 7,775,558 | |
| Series 2021-3A Class AR, 3 month U.S. LIBOR + 1.150% 1.2815% 10/20/34 (b)(c)(e) | 13,570,000 | 13,561,926 | |
| Voya CLO, Ltd. Series 2021-1A Class AR, 3 month U.S. LIBOR + 1.150% 1.2723% 7/16/34 (b)(c)(e) | 7,590,000 | 7,589,977 | |
| TOTAL ASSET-BACKED SECURITIES | |||
| (Cost $963,872,456) | 964,184,410 | ||
| Collateralized Mortgage Obligations - 0.8% | |||
| Private Sponsor - 0.5% | |||
| Ajax Mortgage Loan Trust sequential payer Series 2021-E Class A1, 1.74% 12/25/60 (b) | 17,439,820 | 17,492,145 | |
| Brass PLC Series 2021-10A Class A1, 0.669% 4/16/69 (b)(c) | 7,122,981 | 7,123,458 | |
| Cascade Funding Mortgage Trust: | |||
| Series 2021-EBO1 Class A, 0.9849% 11/25/50 (b)(c) | 14,472,658 | 14,454,599 | |
| Series 2021-HB5 Class A, 0.8006% 2/25/31 (b) | 8,115,254 | 8,109,610 | |
| Series 2021-HB7 Class A, 1.1512% 10/27/31 (b) | 12,537,000 | 12,518,415 | |
| CFMT LLC Series 2020-HB4 Class A, 0.9461% 12/26/30 (b) | 5,561,415 | 5,567,394 | |
| Citigroup Mortgage Loan Trust sequential payer Series 2014-8 Class 2A1, 3.45% 6/27/37 (b)(c) | 58,350 | 58,253 | |
| COLT Trust sequential payer Series 2021-RPL1 Class A1, 1.6654% 9/25/61 (b) | 10,872,641 | 10,881,480 | |
| CSMC: | |||
| floater Series 2015-1R Class 6A1, 1 month U.S. LIBOR + 0.280% 0.3921% 5/27/37 (b)(c)(e) | 64,525 | 63,454 | |
| Series 2014-3R: | |||
| Class 2A1, 1 month U.S. LIBOR + 0.700% 0% 5/27/37 (b)(c)(e)(j) | 552,731 | 55 | |
| Class AA1, 1 month U.S. LIBOR + 0.280% 0.3921% 5/27/37 (b)(c)(e) | 767,463 | 730,849 | |
| CSMC Trust sequential payer Series 2020-RPL4 Class A1, 2% 1/25/60 (b) | 4,228,511 | 4,253,469 | |
| Lanark Master Issuer PLC Series 2019-2A Class 1A, 2.71% 12/22/69 (b)(c) | 9,300,000 | 9,388,443 | |
| New Residential Mortgage Loan Trust: | |||
| Series 2019-5A Class A1B, 3.5% 8/25/59 (b) | 3,493,330 | 3,615,961 | |
| Series 2020-1A Class A1B, 3.5% 10/25/59 (b) | 5,155,936 | 5,424,637 | |
| New York Mortgage Trust sequential payer Series 2021-SP1 Class A1, 1.6696% 8/25/61 (b) | 11,452,151 | 11,362,689 | |
| Oceanview Trust sequential payer Series 2021-1 Class A, 1.2187% 12/25/51 (b)(c) | 35,900,000 | 35,900,000 | |
| Preston Ridge Partners Mortgage Trust Series 2021-RPL1 Class A1, 1.319% 7/25/51 (b) | 5,375,727 | 5,328,174 | |
| RMF Buyout Issuance Trust: | |||
| sequential payer Series 2021-HB1 Class A, 1.2586% 11/25/31 (b) | 25,826,000 | 25,859,703 | |
| Series 2020-HB1 Class A1, 1.7188% 10/25/50 (b) | 5,498,794 | 5,496,195 | |
| Sequoia Mortgage Trust floater Series 2004-6 Class A3B, 6 month U.S. LIBOR + 0.880% 1.0386% 7/20/34 (c)(e) | 1,656 | 1,620 | |
| Thornburg Mortgage Securities Trust floater Series 2003-4 Class A1, 1 month U.S. LIBOR + 0.640% 0.732% 9/25/43 (c)(e) | 76,548 | 75,589 | |
| Towd Point Mortgage Trust sequential payer Series 2021-1 Class A1, 2.25% 11/25/61 (b)(c) | 46,585,000 | 47,292,533 | |
| Wells Fargo Mortgage Backed Securities Trust Series 2003-I Class A1, 2.3785% 9/25/33 (c) | 9,966 | 9,904 | |
| TOTAL PRIVATE SPONSOR | 231,008,629 | ||
| U.S. Government Agency - 0.3% | |||
| Fannie Mae: | |||
| floater: | |||
| Series 2002-18 Class FD, 1 month U.S. LIBOR + 0.800% 0.892% 2/25/32 (c)(e) | 2,793 | 2,843 | |
| Series 2002-39 Class FD, 1 month U.S. LIBOR + 1.000% 1.0889% 3/18/32 (c)(e) | 5,125 | 5,233 | |
| Series 2002-60 Class FV, 1 month U.S. LIBOR + 1.000% 1.092% 4/25/32 (c)(e) | 5,882 | 6,026 | |
| Series 2002-63 Class FN, 1 month U.S. LIBOR + 1.000% 1.092% 10/25/32 (c)(e) | 7,650 | 7,819 | |
| Series 2002-7 Class FC, 1 month U.S. LIBOR + 0.750% 0.842% 1/25/32 (c)(e) | 2,710 | 2,753 | |
| Series 2003-118 Class S, 8.100% - 1 month U.S. LIBOR 8.008% 12/25/33 (c)(k)(l) | 106,380 | 25,859 | |
| Series 2006-104 Class GI, 6.680% - 1 month U.S. LIBOR 6.588% 11/25/36 (c)(k)(l) | 70,716 | 13,414 | |
| Series 2012-154 Class F, 1 month U.S. LIBOR + 0.300% 0.392% 1/25/43 (c)(e) | 669,537 | 671,338 | |
| Series 2017-36 Class FB, 1 month U.S. LIBOR + 0.350% 0.442% 5/25/47 (c)(e) | 1,357,570 | 1,362,978 | |
| Series 2018-32 Class FB, 1 month U.S. LIBOR + 0.300% 0.392% 5/25/48 (c)(e) | 772,541 | 774,095 | |
| Series 2018-38 Class FG, 1 month U.S. LIBOR + 0.300% 0.392% 6/25/48 (c)(e) | 1,945,683 | 1,949,817 | |
| Series 2019-23 Class FC, 1 month U.S. LIBOR + 0.450% 0.542% 5/25/49 (c)(e) | 11,359,063 | 11,454,954 | |
| planned amortization class: | |||
| Series 1992-168 Class KB, 7% 10/25/22 | 432 | 442 | |
| Series 1993-207 Class H, 6.5% 11/25/23 | 13,759 | 14,200 | |
| Series 1996-28 Class PK, 6.5% 7/25/25 | 5,527 | 5,722 | |
| Series 1999-17 Class PG, 6% 4/25/29 | 43,863 | 48,157 | |
| Series 1999-32 Class PL, 6% 7/25/29 | 50,006 | 55,086 | |
| Series 1999-33 Class PK, 6% 7/25/29 | 35,064 | 38,660 | |
| Series 2001-52 Class YZ, 6.5% 10/25/31 | 5,362 | 5,939 | |
| Series 2003-28 Class KG, 5.5% 4/25/23 | 6,028 | 6,179 | |
| Series 2005-102 Class CO 11/25/35 (m) | 18,684 | 17,208 | |
| Series 2005-39 Class TE, 5% 5/25/35 | 18,608 | 20,639 | |
| Series 2005-73 Class SA, 17.500% - 1 month U.S. LIBOR 17.3108% 8/25/35 (c)(l) | 5,436 | 7,076 | |
| Series 2005-81 Class PC, 5.5% 9/25/35 | 51,949 | 58,005 | |
| Series 2006-12 Class BO 10/25/35 (m) | 85,327 | 78,735 | |
| Series 2006-15 Class OP 3/25/36 (m) | 97,665 | 89,123 | |
| Series 2006-37 Class OW 5/25/36 (m) | 9,662 | 8,649 | |
| Series 2006-45 Class OP 6/25/36 (m) | 30,479 | 27,279 | |
| Series 2006-62 Class KP 4/25/36 (m) | 49,898 | 45,700 | |
| Series 2012-149: | |||
| Class DA, 1.75% 1/25/43 | 141,902 | 143,233 | |
| Class GA, 1.75% 6/25/42 | 153,778 | 155,489 | |
| sequential payer: | |||
| Series 1997-41 Class J, 7.5% 6/18/27 | 7,163 | 7,849 | |
| Series 1999-25 Class Z, 6% 6/25/29 | 30,610 | 33,119 | |
| Series 2001-20 Class Z, 6% 5/25/31 | 47,734 | 52,915 | |
| Series 2001-31 Class ZC, 6.5% 7/25/31 | 23,851 | 26,086 | |
| Series 2002-16 Class ZD, 6.5% 4/25/32 | 14,428 | 16,017 | |
| Series 2002-74 Class SV, 7.550% - 1 month U.S. LIBOR 7.458% 11/25/32 (c)(k)(l) | 45,818 | 5,276 | |
| Series 2012-67 Class AI, 4.5% 7/25/27 (k) | 73,213 | 3,827 | |
| Series 06-116 Class SG, 6.640% - 1 month U.S. LIBOR 6.548% 12/25/36 (c)(k)(l) | 52,752 | 12,391 | |
| Series 07-40 Class SE, 6.440% - 1 month U.S. LIBOR 6.348% 5/25/37 (c)(k)(l) | 28,740 | 6,208 | |
| Series 1993-165 Class SH, 19.800% - 1 month U.S. LIBOR 19.5396% 9/25/23 (c)(l) | 946 | 1,048 | |
| Series 2003-21 Class SK, 8.100% - 1 month U.S. LIBOR 8.008% 3/25/33 (c)(k)(l) | 7,995 | 1,765 | |
| Series 2005-72 Class ZC, 5.5% 8/25/35 | 404,951 | 450,250 | |
| Series 2005-79 Class ZC, 5.9% 9/25/35 | 231,990 | 262,555 | |
| Series 2007-57 Class SA, 40.600% - 1 month U.S. LIBOR 40.068% 6/25/37 (c)(l) | 32,435 | 64,665 | |
| Series 2007-66: | |||
| Class SA, 39.600% - 1 month U.S. LIBOR 39.048% 7/25/37 (c)(l) | 33,914 | 67,677 | |
| Class SB, 39.600% - 1 month U.S. LIBOR 39.048% 7/25/37 (c)(l) | 10,998 | 19,122 | |
| Series 2008-12 Class SG, 6.350% - 1 month U.S. LIBOR 6.258% 3/25/38 (c)(k)(l) | 182,372 | 35,590 | |
| Series 2010-135: | |||
| Class LS, 6.050% - 1 month U.S. LIBOR 5.958% 12/25/40 (c)(k)(l) | 183,706 | 32,191 | |
| Class ZA, 4.5% 12/25/40 | 71,379 | 79,973 | |
| Series 2010-139 Class NI, 4.5% 2/25/40 (k) | 81,976 | 3,556 | |
| Series 2010-150 Class ZC, 4.75% 1/25/41 | 778,256 | 876,720 | |
| Series 2010-95 Class ZC, 5% 9/25/40 | 1,687,902 | 1,894,509 | |
| Series 2011-39 Class ZA, 6% 11/25/32 | 118,222 | 133,409 | |
| Series 2011-4 Class PZ, 5% 2/25/41 | 260,371 | 283,001 | |
| Series 2011-67 Class AI, 4% 7/25/26 (k) | 22,460 | 952 | |
| Series 2011-83 Class DI, 6% 9/25/26 (k) | 4,710 | 79 | |
| Series 2012-100 Class WI, 3% 9/25/27 (k) | 457,727 | 31,190 | |
| Series 2012-14 Class JS, 6.650% - 1 month U.S. LIBOR 6.558% 12/25/30 (c)(k)(l) | 88,229 | 4,290 | |
| Series 2012-9 Class SH, 6.550% - 1 month U.S. LIBOR 6.458% 6/25/41 (c)(k)(l) | 75,891 | 2,843 | |
| Series 2013-133 Class IB, 3% 4/25/32 (k) | 197,761 | 6,835 | |
| Series 2013-134 Class SA, 6.050% - 1 month U.S. LIBOR 5.958% 1/25/44 (c)(k)(l) | 118,743 | 22,299 | |
| Series 2013-44 Class DJ, 1.85% 5/25/33 | 9,464,771 | 9,582,523 | |
| Series 2013-51 Class GI, 3% 10/25/32 (k) | 120,109 | 8,450 | |
| Series 2013-N1 Class A, 6.720% - 1 month U.S. LIBOR 6.628% 6/25/35 (c)(k)(l) | 152,206 | 26,411 | |
| Series 2015-42 Class IL, 6% 6/25/45 (k) | 784,810 | 148,718 | |
| Series 2015-70 Class JC, 3% 10/25/45 | 885,984 | 928,897 | |
| Series 2017-30 Class AI, 5.5% 5/25/47 (k) | 388,207 | 74,779 | |
| Fannie Mae Stripped Mortgage-Backed Securities: | |||
| Series 339 Class 5, 5.5% 7/25/33 (k) | 25,976 | 4,618 | |
| Series 343 Class 16, 5.5% 5/25/34 (k) | 22,460 | 3,630 | |
| Series 348 Class 14, 6.5% 8/25/34 (c)(k) | 20,921 | 4,526 | |
| Series 351: | |||
| Class 12, 5.5% 4/25/34 (c)(k) | 12,669 | 2,279 | |
| Class 13, 6% 3/25/34 (k) | 18,444 | 3,325 | |
| Series 359 Class 19, 6% 7/25/35 (c)(k) | 10,907 | 2,164 | |
| Series 384 Class 6, 5% 7/25/37 (k) | 109,798 | 19,063 | |
| Freddie Mac: | |||
| floater: | |||
| Series 2412 Class FK, 1 month U.S. LIBOR + 0.800% 0.8893% 1/15/32 (c)(e) | 2,324 | 2,366 | |
| Series 2423 Class FA, 1 month U.S. LIBOR + 0.900% 0.9893% 3/15/32 (c)(e) | 3,150 | 3,217 | |
| Series 2424 Class FM, 1 month U.S. LIBOR + 1.000% 1.0893% 3/15/32 (c)(e) | 3,136 | 3,204 | |
| Series 2432: | |||
| Class FE, 1 month U.S. LIBOR + 0.900% 0.9893% 6/15/31 (c)(e) | 5,569 | 5,670 | |
| Class FG, 1 month U.S. LIBOR + 0.900% 0.9893% 3/15/32 (c)(e) | 1,721 | 1,754 | |
| Series 4709 Class FE, 1 month U.S. LIBOR + 0.350% 0.4393% 8/15/47 (c)(e) | 728,979 | 732,149 | |
| floater target amortization class Series 3366 Class FD, 1 month U.S. LIBOR + 0.250% 0.3393% 5/15/37 (c)(e) | 130,434 | 130,840 | |
| planned amortization class: | |||
| Series 2095 Class PE, 6% 11/15/28 | 52,125 | 57,568 | |
| Series 2101 Class PD, 6% 11/15/28 | 3,236 | 3,573 | |
| Series 2104 Class PG, 6% 12/15/28 | 3,882 | 4,292 | |
| Series 2121 Class MG, 6% 2/15/29 | 20,612 | 22,732 | |
| Series 2131 Class BG, 6% 3/15/29 | 118,089 | 130,538 | |
| Series 2137 Class PG, 6% 3/15/29 | 19,029 | 21,059 | |
| Series 2154 Class PT, 6% 5/15/29 | 40,945 | 45,306 | |
| Series 2162 Class PH, 6% 6/15/29 | 7,684 | 8,450 | |
| Series 2520 Class BE, 6% 11/15/32 | 54,972 | 62,388 | |
| Series 2693 Class MD, 5.5% 10/15/33 | 239,418 | 260,202 | |
| Series 2802 Class OB, 6% 5/15/34 | 65,827 | 72,941 | |
| Series 3002 Class NE, 5% 7/15/35 | 134,518 | 148,540 | |
| Series 3110 Class OP 9/15/35 (m) | 45,256 | 43,493 | |
| Series 3119 Class PO 2/15/36 (m) | 117,013 | 106,384 | |
| Series 3121 Class KO 3/15/36 (m) | 18,618 | 17,083 | |
| Series 3123 Class LO 3/15/36 (m) | 66,564 | 60,652 | |
| Series 3145 Class GO 4/15/36 (m) | 68,720 | 62,879 | |
| Series 3189 Class PD, 6% 7/15/36 | 116,152 | 133,402 | |
| Series 3225 Class EO 10/15/36 (m) | 35,346 | 31,873 | |
| Series 3258 Class PM, 5.5% 12/15/36 | 45,337 | 51,271 | |
| Series 3415 Class PC, 5% 12/15/37 | 49,672 | 54,629 | |
| Series 3786 Class HI, 4% 3/15/38 (k) | 7,206 | 8 | |
| Series 3806 Class UP, 4.5% 2/15/41 | 231,888 | 243,406 | |
| Series 3832 Class PE, 5% 3/15/41 | 547,917 | 605,776 | |
| Series 4135 Class AB, 1.75% 6/15/42 | 115,785 | 117,179 | |
| Series 4765 Class PE, 3% 12/15/41 | 119,287 | 119,944 | |
| sequential payer: | |||
| Series 2114 Class ZM, 6% 1/15/29 | 1,779 | 1,966 | |
| Series 2135 Class JE, 6% 3/15/29 | 14,194 | 15,569 | |
| Series 2274 Class ZM, 6.5% 1/15/31 | 15,376 | 16,764 | |
| Series 2281 Class ZB, 6% 3/15/30 | 25,174 | 27,672 | |
| Series 2303 Class ZV, 6% 4/15/31 | 11,524 | 12,806 | |
| Series 2357 Class ZB, 6.5% 9/15/31 | 93,704 | 106,471 | |
| Series 2502 Class ZC, 6% 9/15/32 | 28,761 | 32,591 | |
| Series 2519 Class ZD, 5.5% 11/15/32 | 30,798 | 34,476 | |
| Series 2546 Class MJ, 5.5% 3/15/23 | 4,038 | 4,144 | |
| Series 2601 Class TB, 5.5% 4/15/23 | 1,842 | 1,893 | |
| Series 2998 Class LY, 5.5% 7/15/25 | 14,780 | 15,827 | |
| Series 3871 Class KB, 5.5% 6/15/41 | 634,152 | 726,181 | |
| Series 06-3115 Class SM, 6.600% - 1 month U.S. LIBOR 6.5108% 2/15/36 (c)(k)(l) | 36,144 | 6,372 | |
| Series 1658 Class GZ, 7% 1/15/24 | 3,623 | 3,836 | |
| Series 2013-4281 Class AI, 4% 12/15/28 (k) | 205,529 | 7,641 | |
| Series 2017-4683 Class LM, 3% 5/15/47 | 1,091,992 | 1,140,990 | |
| Series 2380 Class SY, 8.200% - 1 month U.S. LIBOR 8.1108% 11/15/31 (c)(k)(l) | 20,823 | 2,254 | |
| Series 2587 Class IM, 6.5% 3/15/33 (k) | 3,711 | 742 | |
| Series 2844: | |||
| Class SC, 46.800% - 1 month U.S. LIBOR 46.2199% 8/15/24 (c)(l) | 10 | 10 | |
| Class SD, 86.400% - 1 month U.S. LIBOR 85.2897% 8/15/24 (c)(l) | 18 | 20 | |
| Series 2933 Class ZM, 5.75% 2/15/35 | 521,213 | 587,460 | |
| Series 2935 Class ZK, 5.5% 2/15/35 | 456,382 | 516,147 | |
| Series 2947 Class XZ, 6% 3/15/35 | 215,197 | 246,347 | |
| Series 2996 Class ZD, 5.5% 6/15/35 | 348,346 | 395,240 | |
| Series 3237 Class C, 5.5% 11/15/36 | 514,551 | 575,314 | |
| Series 3244 Class SG, 6.660% - 1 month U.S. LIBOR 6.5708% 11/15/36 (c)(k)(l) | 158,470 | 34,166 | |
| Series 3287 Class SD, 6.750% - 1 month U.S. LIBOR 6.6608% 3/15/37 (c)(k)(l) | 238,641 | 56,064 | |
| Series 3297 Class BI, 6.760% - 1 month U.S. LIBOR 6.6708% 4/15/37 (c)(k)(l) | 334,184 | 72,969 | |
| Series 3336 Class LI, 6.580% - 1 month U.S. LIBOR 6.4908% 6/15/37 (c)(k)(l) | 125,329 | 23,064 | |
| Series 3949 Class MK, 4.5% 10/15/34 | 97,091 | 105,630 | |
| Series 4055 Class BI, 3.5% 5/15/31 (k) | 226,572 | 9,532 | |
| Series 4149 Class IO, 3% 1/15/33 (k) | 61,541 | 5,518 | |
| Series 4314 Class AI, 5% 3/15/34 (k) | 70,908 | 3,788 | |
| Series 4427 Class LI, 3.5% 2/15/34 (k) | 485,181 | 37,026 | |
| Series 4471 Class PA 4% 12/15/40 | 520,163 | 551,383 | |
| target amortization class Series 2156 Class TC, 6.25% 5/15/29 | 18,547 | 19,774 | |
| Freddie Mac Manufactured Housing participation certificates guaranteed: | |||
| floater Series 1686 Class FA, 1 month U.S. LIBOR + 0.900% 0.9903% 2/15/24 (c)(e) | 4,063 | 4,080 | |
| planned amortization class Series 2043 Class CJ, 6.5% 4/15/28 | 4,882 | 5,309 | |
| sequential payer: | |||
| Series 2043 Class ZH, 6% 4/15/28 | 12,891 | 14,166 | |
| Series 2056 Class Z, 6% 5/15/28 | 34,493 | 38,025 | |
| Freddie Mac Multi-family Structured pass-thru certificates: | |||
| floater Series 4795 Class FA, 1 month U.S. LIBOR + 0.300% 0.3893% 5/15/48 (c)(e) | 1,252,024 | 1,253,536 | |
| Series 4386 Class AZ, 4.5% 11/15/40 | 1,089,441 | 1,199,121 | |
| Freddie Mac Seasoned Credit Risk Transfer Trust: | |||
| sequential payer: | |||
| Series 2018-3 Class MA, 3.5% 8/25/57 | 8,433,093 | 8,848,282 | |
| Series 2018-4 Class MA, 3.5% 3/25/58 | 3,207,612 | 3,354,500 | |
| Series 2019-1 Class MA, 3.5% 7/25/58 | 5,619,890 | 5,895,651 | |
| Series 2018-3 Class M55D, 4% 8/25/57 | 448,256 | 479,615 | |
| Ginnie Mae guaranteed REMIC pass-thru certificates: | |||
| floater: | |||
| Series 2007-37 Class TS, 6.690% - 1 month U.S. LIBOR 6.6009% 6/16/37 (c)(k)(l) | 67,743 | 13,933 | |
| Series 2010-H03 Class FA, 1 month U.S. LIBOR + 0.550% 0.6378% 3/20/60 (c)(e)(n) | 809,926 | 812,689 | |
| Series 2010-H17 Class FA, 1 month U.S. LIBOR + 0.330% 0.4178% 7/20/60 (c)(e)(n) | 120,799 | 120,703 | |
| Series 2010-H18 Class AF, 1 month U.S. LIBOR + 0.300% 0.3753% 9/20/60 (c)(e)(n) | 136,577 | 136,373 | |
| Series 2010-H19 Class FG, 1 month U.S. LIBOR + 0.300% 0.3753% 8/20/60 (c)(e)(n) | 129,468 | 129,285 | |
| Series 2010-H27 Class FA, 1 month U.S. LIBOR + 0.380% 0.4553% 12/20/60 (c)(e)(n) | 291,361 | 291,464 | |
| Series 2011-H05 Class FA, 1 month U.S. LIBOR + 0.500% 0.5753% 12/20/60 (c)(e)(n) | 313,329 | 314,172 | |
| Series 2011-H07 Class FA, 1 month U.S. LIBOR + 0.500% 0.5753% 2/20/61 (c)(e)(n) | 356,981 | 357,819 | |
| Series 2011-H12 Class FA, 1 month U.S. LIBOR + 0.490% 0.5653% 2/20/61 (c)(e)(n) | 556,041 | 557,215 | |
| Series 2011-H13 Class FA, 1 month U.S. LIBOR + 0.500% 0.5753% 4/20/61 (c)(e)(n) | 279,116 | 279,915 | |
| Series 2011-H14: | |||
| Class FB, 1 month U.S. LIBOR + 0.500% 0.5753% 5/20/61 (c)(e)(n) | 458,658 | 459,889 | |
| Class FC, 1 month U.S. LIBOR + 0.500% 0.5753% 5/20/61 (c)(e)(n) | 334,231 | 335,180 | |
| Series 2011-H17 Class FA, 1 month U.S. LIBOR + 0.530% 0.6053% 6/20/61 (c)(e)(n) | 399,640 | 400,914 | |
| Series 2011-H20 Class FA, 1 month U.S. LIBOR + 0.550% 0.6253% 9/20/61 (c)(e)(n) | 1,050,806 | 1,054,772 | |
| Series 2011-H21 Class FA, 1 month U.S. LIBOR + 0.600% 0.6753% 10/20/61 (c)(e)(n) | 454,196 | 456,300 | |
| Series 2012-H01 Class FA, 1 month U.S. LIBOR + 0.700% 0.7753% 11/20/61 (c)(e)(n) | 439,151 | 442,067 | |
| Series 2012-H03 Class FA, 1 month U.S. LIBOR + 0.700% 0.7753% 1/20/62 (c)(e)(n) | 277,251 | 278,966 | |
| Series 2012-H06 Class FA, 1 month U.S. LIBOR + 0.630% 0.7053% 1/20/62 (c)(e)(n) | 390,588 | 392,631 | |
| Series 2012-H07 Class FA, 1 month U.S. LIBOR + 0.630% 0.7053% 3/20/62 (c)(e)(n) | 248,214 | 249,446 | |
| Series 2012-H21 Class DF, 1 month U.S. LIBOR + 0.650% 0.7253% 5/20/61 (c)(e)(n) | 7,074 | 7,123 | |
| Series 2014-H03 Class FA, 1 month U.S. LIBOR + 0.600% 0.6753% 1/20/64 (c)(e)(n) | 331,985 | 333,292 | |
| Series 2014-H05 Class FB, 1 month U.S. LIBOR + 0.600% 0.6753% 12/20/63 (c)(e)(n) | 1,389,069 | 1,394,304 | |
| Series 2014-H11 Class BA, 1 month U.S. LIBOR + 0.500% 0.5753% 6/20/64 (c)(e)(n) | 343,663 | 344,562 | |
| Series 2015-H07 Class FA, 1 month U.S. LIBOR + 0.300% 0.3753% 3/20/65 (c)(e)(n) | 4,001 | 3,996 | |
| Series 2015-H13 Class FL, 1 month U.S. LIBOR + 0.280% 0.3553% 5/20/63 (c)(e)(n) | 8,093 | 8,076 | |
| Series 2015-H19 Class FA, 1 month U.S. LIBOR + 0.200% 0.2753% 4/20/63 (c)(e)(n) | 7,136 | 7,113 | |
| Series 2016-H20 Class FM, 1 month U.S. LIBOR + 0.400% 0.4753% 12/20/62 (c)(e)(n) | 19,089 | 19,109 | |
| Series 2017-161 Class DF, 1 month U.S. LIBOR + 0.250% 0.3411% 10/20/47 (c)(e) | 868,170 | 869,223 | |
| Series 2018-159 Class F, 1 month U.S. LIBOR + 0.350% 0.4411% 11/20/48 (c)(e) | 1,687,308 | 1,698,913 | |
| Series 2018-65 Class DF, 1 month U.S. LIBOR + 0.300% 0.3911% 5/20/48 (c)(e) | 834,105 | 836,544 | |
| Series 2018-77 Class FA, 1 month U.S. LIBOR + 0.300% 0.3911% 6/20/48 (c)(e) | 1,081,939 | 1,082,967 | |
| Series 2018-78 Class AF, 1 month U.S. LIBOR + 0.300% 0.3911% 6/20/48 (c)(e) | 975,964 | 980,446 | |
| Series 2019-153 Class FB, 1 month U.S. LIBOR + 0.450% 0.5411% 12/20/49 (c)(e) | 11,593,262 | 11,709,892 | |
| Series 2019-23 Class NF, 1 month U.S. LIBOR + 0.450% 0.5411% 2/20/49 (c)(e) | 3,197,264 | 3,222,776 | |
| Series 2020-32 Class GF, 1 month U.S. LIBOR + 0.400% 0.4911% 3/20/50 (c)(e) | 10,725,968 | 10,792,062 | |
| planned amortization class: | |||
| Series 2010-158 Class MS, 10.000% - 1 month U.S. LIBOR 9.8177% 12/20/40 (c)(l) | 614,211 | 700,229 | |
| Series 2011-136 Class WI, 4.5% 5/20/40 (k) | 29,709 | 1,890 | |
| Series 2016-69 Class WA, 3% 2/20/46 | 417,305 | 436,075 | |
| Series 2017-134 Class BA, 2.5% 11/20/46 | 163,492 | 169,139 | |
| Series 2017-153 Class GA, 3% 9/20/47 | 1,392,115 | 1,454,178 | |
| Series 2017-182 Class KA, 3% 10/20/47 | 1,144,422 | 1,195,510 | |
| Series 2018-13 Class Q, 3% 4/20/47 | 1,518,026 | 1,571,107 | |
| sequential payer: | |||
| Series 2004-24 Class ZM, 5% 4/20/34 | 194,711 | 207,418 | |
| Series 2010-160 Class DY, 4% 12/20/40 | 1,353,512 | 1,444,549 | |
| Series 2010-170 Class B, 4% 12/20/40 | 303,948 | 324,458 | |
| Series 2017-139 Class BA, 3% 9/20/47 | 4,290,495 | 4,506,221 | |
| Series 2004-32 Class GS, 6.500% - 1 month U.S. LIBOR 6.4109% 5/16/34 (c)(k)(l) | 46,942 | 8,257 | |
| Series 2004-73 Class AL, 7.200% - 1 month U.S. LIBOR 7.1109% 8/17/34 (c)(k)(l) | 35,402 | 7,538 | |
| Series 2010-116 Class QB, 4% 9/16/40 | 99,962 | 106,966 | |
| Series 2010-14 Class SN, 5.950% - 1 month U.S. LIBOR 5.8609% 2/16/40 (c)(k)(l) | 242,932 | 37,290 | |
| Series 2010-H10 Class FA, 1 month U.S. LIBOR + 0.330% 0.4178% 5/20/60 (c)(e)(n) | 347,324 | 347,045 | |
| Series 2011-52 Class HI, 7% 4/16/41 (k) | 43,900 | 8,142 | |
| Series 2011-94 Class SA, 6.100% - 1 month U.S. LIBOR 6.0089% 7/20/41(c)(k)(l) | 117,866 | 21,582 | |
| Series 2012-76 Class GS, 6.700% - 1 month U.S. LIBOR 6.6109% 6/16/42 (c)(k)(l) | 152,822 | 29,812 | |
| Series 2013-124 Class ES, 8.667% - 1 month U.S. LIBOR 8.5452% 4/20/39 (c)(l) | 16,652 | 16,922 | |
| Series 2013-149 Class MA, 2.5% 5/20/40 | 1,333,638 | 1,359,837 | |
| Series 2014-2 Class BA, 3% 1/20/44 | 2,510,918 | 2,628,936 | |
| Series 2014-21 Class HA, 3% 2/20/44 | 934,482 | 978,059 | |
| Series 2014-25 Class HC, 3% 2/20/44 | 1,601,071 | 1,663,506 | |
| Series 2014-5 Class A, 3% 1/20/44 | 1,416,053 | 1,469,045 | |
| Series 2015-H13 Class HA, 2.5% 8/20/64 (n) | 14,656 | 15,035 | |
| Series 2016-H13 Class FB, U.S. TREASURY 1 YEAR INDEX + 0.500% 0.59% 5/20/66 (c)(e)(n) | 2,495,477 | 2,480,261 | |
| Series 2017-186 Class HK, 3% 11/16/45 | 1,340,624 | 1,399,278 | |
| Series 2017-H06 Class FA, U.S. TREASURY 1 YEAR INDEX + 0.350% 0.44% 8/20/66 (c)(e)(n) | 2,999,245 | 2,972,494 | |
| Ginnie Mae REMIC Trust Series 2015-H17 Class GZ, 4.108% 5/20/65 (c)(n) | 59,950 | 62,853 | |
| TOTAL U.S. GOVERNMENT AGENCY | 130,222,703 | ||
| TOTAL COLLATERALIZED MORTGAGE OBLIGATIONS | |||
| (Cost $359,882,347) | 361,231,332 | ||
| Commercial Mortgage Securities - 3.5% | |||
| BAMLL Commercial Mortgage Securities Trust: | |||
| floater sequential payer Series 2020-JGDN Class A, 1 month U.S. LIBOR + 2.750% 2.84% 11/15/30 (b)(c)(e) | 10,322,000 | 10,458,342 | |
| sequential payer Series 2019-BPR: | |||
| Class AMP, 3.287% 11/5/32 (b) | 10,500,000 | 10,784,767 | |
| Class ANM, 3.112% 11/5/32 (b) | 5,768,000 | 5,910,720 | |
| Series 2019-BPR: | |||
| Class BNM, 3.465% 11/5/32 (b) | 1,295,000 | 1,310,351 | |
| Class CNM, 3.8425% 11/5/32 (b)(c) | 536,000 | 537,348 | |
| BANK: | |||
| sequential payer: | |||
| Series 2018-BN10 Class A5, 3.688% 2/15/61 | 2,901,000 | 3,180,200 | |
| Series 2019-BN21 Class A5, 2.851% 10/17/52 | 1,112,000 | 1,170,142 | |
| Series 2020-BN25 Class XB, 0.5326% 1/15/63 (c)(k) | 30,600,000 | 1,042,273 | |
| Series 2021-BN33 Class XA, 1.1754% 5/15/64 (c)(k) | 72,535,271 | 5,633,822 | |
| Bayview Commercial Asset Trust floater: | |||
| Series 2005-3A: | |||
| Class A2, 1 month U.S. LIBOR + 0.600% 0.6916% 11/25/35 (b)(c)(e) | 33,672 | 32,263 | |
| Class M1, 1 month U.S. LIBOR + 0.660% 0.7516% 11/25/35 (b)(c)(e) | 9,007 | 8,345 | |
| Series 2005-4A: | |||
| Class A2, 1 month U.S. LIBOR + 0.580% 0.6766% 1/25/36 (b)(c)(e) | 83,544 | 80,747 | |
| Class M1, 1 month U.S. LIBOR + 0.670% 0.7666% 1/25/36 (b)(c)(e) | 26,970 | 26,060 | |
| Class M2, 1 month U.S. LIBOR + 0.700% 0.7966% 1/25/36 (b)(c)(e) | 10,171 | 9,801 | |
| Class M3, 1 month U.S. LIBOR + 0.750% 0.8416% 1/25/36 (b)(c)(e) | 14,802 | 14,273 | |
| Series 2006-1: | |||
| Class A2, 1 month U.S. LIBOR + 0.540% 0.6316% 4/25/36 (b)(c)(e) | 14,044 | 13,383 | |
| Class M1, 1 month U.S. LIBOR + 0.570% 0.6616% 4/25/36 (b)(c)(e) | 8,492 | 8,001 | |
| Class M2, 1 month U.S. LIBOR + 0.600% 0.6916% 4/25/36 (b)(c)(e) | 8,981 | 8,164 | |
| Class M6, 1 month U.S. LIBOR + 0.960% 1.0516% 4/25/36 (b)(c)(e) | 8,492 | 7,525 | |
| Series 2006-2A: | |||
| Class M1, 1 month U.S. LIBOR + 0.460% 0.5566% 7/25/36 (b)(c)(e) | 12,959 | 11,887 | |
| Class M2, 1 month U.S. LIBOR + 0.490% 0.5866% 7/25/36 (b)(c)(e) | 9,207 | 8,355 | |
| Class M4, 1 month U.S. LIBOR + 0.630% 0.7216% 7/25/36 (b)(c)(e) | 8,696 | 7,899 | |
| Series 2006-4A: | |||
| Class A2, 1 month U.S. LIBOR + 0.400% 0.4966% 12/25/36 (b)(c)(e) | 187,737 | 179,676 | |
| Class M1, 1 month U.S. LIBOR + 0.430% 0.5266% 12/25/36 (b)(c)(e) | 15,088 | 13,928 | |
| Class M3, 1 month U.S. LIBOR + 0.510% 0.6016% 12/25/36 (b)(c)(e) | 10,227 | 9,216 | |
| Series 2007-1 Class A2, 1 month U.S. LIBOR + 0.270% 0.3616% 3/25/37 (b)(c)(e) | 46,769 | 44,863 | |
| Series 2007-2A: | |||
| Class A1, 1 month U.S. LIBOR + 0.270% 0.3616% 7/25/37 (b)(c)(e) | 138,030 | 132,698 | |
| Class A2, 1 month U.S. LIBOR + 0.320% 0.4116% 7/25/37 (b)(c)(e) | 129,195 | 120,327 | |
| Class M1, 1 month U.S. LIBOR + 0.370% 0.4616% 7/25/37 (b)(c)(e) | 44,010 | 42,650 | |
| Class M2, 1 month U.S. LIBOR + 0.410% 0.5016% 7/25/37 (b)(c)(e) | 28,673 | 27,471 | |
| Class M3, 1 month U.S. LIBOR + 0.490% 0.5816% 7/25/37 (b)(c)(e) | 31,355 | 35,656 | |
| Series 2007-3: | |||
| Class A2, 1 month U.S. LIBOR + 0.290% 0.3816% 7/25/37 (b)(c)(e) | 49,117 | 46,629 | |
| Class M1, 1 month U.S. LIBOR + 0.310% 0.4016% 7/25/37 (b)(c)(e) | 26,055 | 24,597 | |
| Class M2, 1 month U.S. LIBOR + 0.340% 0.4316% 7/25/37 (b)(c)(e) | 27,800 | 25,966 | |
| Class M3, 1 month U.S. LIBOR + 0.370% 0.4616% 7/25/37 (b)(c)(e) | 44,879 | 41,016 | |
| Class M4, 1 month U.S. LIBOR + 0.500% 0.5916% 7/25/37 (b)(c)(e) | 70,559 | 64,073 | |
| Class M5, 1 month U.S. LIBOR + 0.600% 0.6916% 7/25/37 (b)(c)(e) | 29,631 | 34,100 | |
| Benchmark Mortgage Trust: | |||
| sequential payer: | |||
| Series 2018-B1 Class ASB, 3.602% 1/15/51 | 3,507,000 | 3,759,440 | |
| Series 2018-B2 Class ASB, 3.7802% 2/15/51 | 1,800,000 | 1,930,006 | |
| Series 2018-B4 Class A5, 4.121% 7/15/51 | 1,260,000 | 1,417,676 | |
| Series 2019-B10 Class A4, 3.717% 3/15/62 | 2,283,000 | 2,536,307 | |
| Series 2019-B13 Class A4, 2.952% 8/15/57 | 12,263,000 | 12,965,983 | |
| Series 2018-B8 Class A5, 4.2317% 1/15/52 | 15,369,000 | 17,490,162 | |
| Series 2019-B12 Class XA, 1.2% 8/15/52 (c)(k) | 75,438,147 | 4,413,177 | |
| Series 2019-B14 Class XA, 0.9093% 12/15/62 (c)(k) | 121,673,771 | 5,423,499 | |
| Series 2020-B17 Class XA, 1.5406% 3/15/53 (c)(k) | 11,983,468 | 998,419 | |
| Series 2020-B18 Class XA, 1.9178% 7/15/53 (c)(k) | 20,036,146 | 2,143,553 | |
| BFLD Trust floater sequential payer Series 2020-OBRK Class A, 1 month U.S. LIBOR + 2.050% 2.14% 11/15/28 (b)(c)(e) | 6,075,000 | 6,082,314 | |
| BLOX Trust floater sequential payer Series 2021-BLOX Class A, 1 month U.S. LIBOR + 0.750% 0.84% 9/15/26 (b)(c)(e) | 19,346,000 | 19,314,079 | |
| BX Commercial Mortgage Trust: | |||
| floater: | |||
| Series 2018-BIOA: | |||
| Class E, 1 month U.S. LIBOR + 1.950% 2.0411% 3/15/37 (b)(c)(e) | 9,800,000 | 9,756,913 | |
| Class F, 1 month U.S. LIBOR + 2.470% 2.5611% 3/15/37 (b)(c)(e) | 2,450,000 | 2,431,550 | |
| Series 2020-BXLP: | |||
| Class B, 1 month U.S. LIBOR + 1.000% 1.09% 12/15/36 (b)(c)(e) | 5,489,560 | 5,475,799 | |
| Class C, 1 month U.S. LIBOR + 1.120% 1.21% 12/15/36 (b)(c)(e) | 4,505,881 | 4,491,872 | |
| Class D, 1 month U.S. LIBOR + 1.250% 1.34% 12/15/36 (b)(c)(e) | 5,058,678 | 5,036,495 | |
| Series 2021-PAC: | |||
| Class A, 1 month U.S. LIBOR + 0.680% 0.7791% 10/15/36 (b)(c)(e) | 18,411,000 | 18,359,219 | |
| Class B, 1 month U.S. LIBOR + 0.890% 0.9888% 10/15/36 (b)(c)(e) | 2,754,000 | 2,747,345 | |
| Class C, 1 month U.S. LIBOR + 1.090% 1.1886% 10/15/36 (b)(c)(e) | 3,686,000 | 3,677,102 | |
| Class D, 1 month U.S. LIBOR + 1.290% 1.3883% 10/15/36 (b)(c)(e) | 3,579,000 | 3,570,352 | |
| Class E, 1 month U.S. LIBOR + 1.940% 2.0375% 10/15/36 (b)(c)(e) | 11,390,000 | 11,362,490 | |
| Series 2021-VINO Class A, 1 month U.S. LIBOR + 0.650% 0.7423% 5/15/38 (b)(c)(e) | 14,550,000 | 14,505,704 | |
| floater sequential payer: | |||
| Series 2019-CALM Class A, 1 month U.S. LIBOR + 0.870% 0.966% 11/15/32 (b)(c)(e) | 2,254,000 | 2,254,000 | |
| Series 2020-BXLP Class A, 1 month U.S. LIBOR + 0.800% 0.89% 12/15/36 (b)(c)(e) | 13,253,771 | 13,241,307 | |
| Series 2020-FOX Class A, 1 month U.S. LIBOR + 1.000% 1.09% 11/15/32 (b)(c)(e) | 7,527,922 | 7,518,864 | |
| BX Trust: | |||
| floater: | |||
| Series 2018-EXCL: | |||
| Class A, 1 month U.S. LIBOR + 1.088% 1.1776% 9/15/37 (b)(c)(e) | 10,436,160 | 10,391,400 | |
| Class B, 1 month U.S. LIBOR + 1.320% 1.415% 9/15/37 (b)(c)(e) | 4,119,428 | 4,018,798 | |
| Class D, 1 month U.S. LIBOR + 2.620% 2.715% 9/15/37 (b)(c)(e) | 1,985,564 | 1,690,075 | |
| Series 2018-IND Class F, 1 month U.S. LIBOR + 1.800% 1.89% 11/15/35 (b)(c)(e) | 2,356,900 | 2,348,040 | |
| Series 2019-IMC: | |||
| Class B, 1 month U.S. LIBOR + 1.300% 1.389% 4/15/34 (b)(c)(e) | 4,437,000 | 4,406,418 | |
| Class C, 1 month U.S. LIBOR + 1.600% 1.689% 4/15/34 (b)(c)(e) | 2,933,000 | 2,900,076 | |
| Class D, 1 month U.S. LIBOR + 1.900% 1.989% 4/15/34(b)(c)(e) | 3,079,000 | 3,036,567 | |
| Series 2019-XL: | |||
| Class B, 1 month U.S. LIBOR + 1.080% 1.17% 10/15/36 (b)(c)(e) | 3,808,850 | 3,800,500 | |
| Class C, 1 month U.S. LIBOR + 1.250% 1.34% 10/15/36 (b)(c)(e) | 4,788,050 | 4,774,601 | |
| Class D, 1 month U.S. LIBOR + 1.450% 1.54% 10/15/36 (b)(c)(e) | 6,782,150 | 6,759,028 | |
| Class E, 1 month U.S. LIBOR + 1.800% 1.89% 10/15/36 (b)(c)(e) | 9,529,350 | 9,490,540 | |
| Series 2020-BXLP Class E, 1 month U.S. LIBOR + 1.600% 1.69% 12/15/36 (b)(c)(e) | 4,798,981 | 4,774,922 | |
| Series 2021-ACNT Class A, 1 month U.S. LIBOR + 0.850% 0.95% 11/15/26 (b)(c)(e) | 18,162,000 | 18,116,731 | |
| Series 2021-BXMF Class A, 1 month U.S. LIBOR + 0.630% 0.7259% 10/15/26 (b)(c)(e) | 16,987,000 | 16,854,986 | |
| floater sequential payer: | |||
| Series 2021-MFM1 Class A, 1 month U.S. LIBOR + 0.700% 0.7895% 1/15/34 (b)(c)(e) | 6,330,000 | 6,304,227 | |
| Series 2021-SOAR Class A, 0.76% 6/15/38 (b)(c) | 18,360,000 | 18,256,980 | |
| floater, sequential payer: | |||
| Series 2019-IMC Class A, 1 month U.S. LIBOR + 1.000% 1.089% 4/15/34 (b)(c)(e) | 6,400,000 | 6,385,968 | |
| Series 2019-XL Class A, 1 month U.S. LIBOR + 0.920% 1.01% 10/15/36 (b)(c)(e) | 21,556,638 | 21,556,634 | |
| CD Commercial Mortgage Trust sequential payer Series 2017-CD6 Class ASB, 3.332% 11/13/50 | 17,655,000 | 18,692,035 | |
| CF Hippolyta Issuer LLC sequential payer: | |||
| Series 2020-1: | |||
| Class A1, 1.69% 7/15/60 (b) | 27,063,695 | 26,951,173 | |
| Class A2, 1.99% 7/15/60 (b) | 10,613,912 | 10,485,986 | |
| Series 2021-1A Class A1, 1.53% 3/15/61 (b) | 14,295,383 | 14,058,911 | |
| CGDB Commercial Mortgage Trust floater Series 2019-MOB: | |||
| Class A, 1 month U.S. LIBOR + 0.950% 1.0395% 11/15/36 (b)(c)(e) | 4,222,000 | 4,211,421 | |
| Class B, 1 month U.S. LIBOR + 1.250% 1.3395% 11/15/36 (b)(c)(e) | 1,600,000 | 1,590,054 | |
| CHC Commercial Mortgage Trust floater Series 2019-CHC: | |||
| Class A, 1 month U.S. LIBOR + 1.120% 1.21% 6/15/34 (b)(c)(e) | 28,328,229 | 28,274,938 | |
| Class B, 1 month U.S. LIBOR + 1.500% 1.59% 6/15/34 (b)(c)(e) | 2,163,210 | 2,146,934 | |
| Class C, 1 month U.S. LIBOR + 1.750% 1.84% 6/15/34 (b)(c)(e) | 2,444,160 | 2,413,515 | |
| CIM Retail Portfolio Trust floater Series 2021-RETL: | |||
| Class A, 1 month U.S. LIBOR + 1.400% 1.49% 8/15/36 (b)(c)(e) | 10,885,000 | 10,864,482 | |
| Class B, 1 month U.S. LIBOR + 1.900% 1.99% 8/15/36 (b)(c)(e) | 3,280,000 | 3,267,656 | |
| Class C, 1 month U.S. LIBOR + 2.300% 2.39% 8/15/36 (b)(c)(e) | 2,493,000 | 2,482,051 | |
| Class D, 1 month U.S. LIBOR + 3.050% 3.14% 8/15/36 (b)(c)(e) | 3,078,000 | 3,062,564 | |
| Citigroup Commercial Mortgage Trust: | |||
| sequential payer Series 2017-P7 Class AAB, 3.509% 4/14/50 | 740,000 | 779,450 | |
| Series 2015-GC33 Class XA, 1.0347% 9/10/58 (c)(k) | 1,554,936 | 45,202 | |
| Series 2016-P6 Class XA, 0.7802% 12/10/49 (c)(k) | 1,319,452 | 30,627 | |
| Series 2019-GC41 Class XA, 1.1846% 8/10/56 (c)(k) | 20,608,385 | 1,309,195 | |
| COMM Mortgage Trust: | |||
| sequential payer: | |||
| Series 2014-CR18 Class A5, 3.828% 7/15/47 | 2,137,000 | 2,259,471 | |
| Series 2017-CD4 Class ASB, 3.317% 5/10/50 | 10,467,000 | 11,030,446 | |
| Series 2014-CR20 Class XA, 1.1497% 11/10/47 (c)(k) | 360,678 | 8,785 | |
| Series 2014-LC17 Class XA, 0.8567% 10/10/47 (c)(k) | 1,137,420 | 19,048 | |
| Series 2014-UBS6 Class XA, 1.0107% 12/10/47 (c)(k) | 921,144 | 19,832 | |
| Core Industrial Trust floater Series 2019-CORE Class A, 1 month U.S. LIBOR + 0.880% 0.97% 12/15/31 (b)(c)(e) | 273,770 | 272,740 | |
| Credit Suisse Mortgage Trust: | |||
| floater Series 2019-ICE4: | |||
| Class B, 1 month U.S. LIBOR + 1.230% 1.32% 5/15/36 (b)(c)(e) | 6,081,000 | 6,065,768 | |
| Class C, 1 month U.S. LIBOR + 1.430% 1.52% 5/15/36 (b)(c)(e) | 1,603,000 | 1,596,973 | |
| sequential payer Series 2020-NET Class A, 2.2569% 8/15/37(b) | 3,554,000 | 3,594,095 | |
| Series 2018-SITE: | |||
| Class A, 4.284% 4/15/36 (b) | 4,971,000 | 5,124,925 | |
| Class B, 4.5349% 4/15/36 (b) | 1,471,000 | 1,502,625 | |
| Class C, 4.9414% 4/15/36 (b)(c) | 955,000 | 966,962 | |
| Class D, 4.9414% 4/15/36 (b)(c) | 1,909,000 | 1,882,565 | |
| DBJPM Mortgage Trust sequential payer Series 2017-C6 Class ASB, 3.121% 6/10/50 | 4,803,000 | 5,040,451 | |
| DBUBS Mortgage Trust Series 2011-LC3A Class C, 5.5442% 8/10/44 (b)(c) | 1,099,140 | 1,100,854 | |
| ELP Commercial Mortgage Trust floater Series 2021-ELP: | |||
| Class A, 1 month U.S. LIBOR + 0.700% 0.801% 11/15/38 (b)(c)(e) | 25,278,000 | 25,159,332 | |
| Class B, 1 month U.S. LIBOR + 1.120% 1.2202% 11/15/38 (b)(c)(e) | 6,150,000 | 6,121,137 | |
| Extended Stay America Trust floater Series 2021-ESH: | |||
| Class A, 1 month U.S. LIBOR + 1.080% 1.17% 7/15/38 (b)(c)(e) | 15,315,323 | 15,306,139 | |
| Class B, 1 month U.S. LIBOR + 1.380% 1.47% 7/15/38 (b)(c)(e) | 4,198,159 | 4,195,528 | |
| Class C, 1 month U.S. LIBOR + 1.700% 1.79% 7/15/38 (b)(c)(e) | 3,143,645 | 3,142,701 | |
| Class D, 1 month U.S. LIBOR + 2.250% 2.34% 7/15/38 (b)(c)(e) | 7,942,679 | 7,942,671 | |
| Freddie Mac: | |||
| floater: | |||
| Series 2021-F104 Class A/S, U.S. 30-Day Avg. Secured Overnight Fin. Rate (SOFR) Indx + 0.250% 0.2977% 1/25/31 (c)(e) | 26,400,000 | 26,376,050 | |
| Series 2021-F108 Class A/S, U.S. 30-Day Avg. Secured Overnight Fin. Rate (SOFR) Indx + 0.250% 0.2977% 2/25/31 (c)(e) | 29,600,000 | 29,614,670 | |
| Series 2021-F109 Class A/S, U.S. 30-Day Avg. Secured Overnight Fin. Rate (SOFR) Indx + 0.240% 0.2877% 3/25/31 (c)(e) | 51,500,000 | 51,525,415 | |
| Series 2021-F110 Class A/S, U.S. 30-Day Avg. Secured Overnight Fin. Rate (SOFR) Indx + 0.240% 0.2877% 3/25/31 (c)(e) | 24,100,000 | 24,078,344 | |
| Series 2021-F111 Class A/S, U.S. 30-Day Avg. Secured Overnight Fin. Rate (SOFR) Indx + 0.240% 0.2877% 3/25/31 (c)(e) | 28,097,562 | 28,072,005 | |
| Series 2021-F112 Class A/S, U.S. 30-Day Avg. Secured Overnight Fin. Rate (SOFR) Indx + 0.230% 0.2777% 4/25/31 (c)(e) | 23,200,000 | 23,200,000 | |
| Series 2021-F113 Class A/S, U.S. 30-Day Avg. Secured Overnight Fin. Rate (SOFR) Indx + 0.230% 0.2777% 5/25/28 (c)(e) | 14,205,407 | 14,205,407 | |
| Series 2021-F114 Class A/S, 0.2677% 5/25/31 (c) | 65,899,000 | 65,839,994 | |
| Series 2021-F115 Class A/S, U.S. 30-Day Avg. Secured Overnight Fin. Rate (SOFR) Indx + 0.210% 0.2577% 6/25/31 (c)(e) | 77,180,000 | 77,032,532 | |
| Series 2021-F120 Class A/S, U.S. 30-Day Avg. Secured Overnight Fin. Rate (SOFR) Indx + 0.210% 0.2477% 8/25/31 (c)(e) | 21,177,000 | 21,147,617 | |
| Series 2021-F121 Class A/S, U.S. 30-Day Avg. Secured Overnight Fin. Rate (SOFR) Indx + 0.180% 0.2277% 8/25/28 (c)(e) | 24,572,000 | 24,523,357 | |
| floater sequential payer Series 2021-KF124 Class A/S, U.S. 30-Day Avg. Secured Overnight Fin. Rate (SOFR) Indx + 0.220% 0.2677% 10/25/31 (c)(e) | 121,900,000 | 121,676,850 | |
| GS Mortgage Securities Trust: | |||
| floater: | |||
| Series 2018-3PCK Class A, 1 month U.S. LIBOR + 1.700% 1.789% 9/15/31 (b)(c)(e) | 14,140,814 | 14,092,268 | |
| Series 2018-HART Class A, 1 month U.S. LIBOR + 1.090% 1.18% 10/15/31 (b)(c)(e) | 3,300,000 | 3,292,620 | |
| Series 2021-IP: | |||
| Class A, 1 month U.S. LIBOR + 0.950% 1.04% 10/15/36 (b)(c)(e) | 10,697,000 | 10,700,176 | |
| Class B, 1 month U.S. LIBOR + 1.150% 1.24% 10/15/36 (b)(c)(e) | 1,654,000 | 1,654,496 | |
| Class C, 1 month U.S. LIBOR + 1.550% 1.64% 10/15/36 (b)(c)(e) | 1,363,000 | 1,363,405 | |
| sequential payer: | |||
| Series 2014-GC18 Class AAB, 3.648% 1/10/47 | 884,119 | 908,019 | |
| Series 2016-GC34 Class AAB, 3.278% 10/10/48 | 2,135,633 | 2,218,314 | |
| Series 2019-GC39 Class A4, 3.567% 5/10/52 | 130,000 | 143,023 | |
| Series 2011-GC5 Class A/S, 5.209% 8/10/44 (b)(c) | 10,701,380 | 10,745,481 | |
| Series 2013-GC16 Class A/S, 4.649% 11/10/46 | 2,932,000 | 3,090,798 | |
| Series 2015-GC30 Class A/S, 3.777% 5/10/50 | 2,577,000 | 2,717,294 | |
| JP Morgan Chase Commercial Mortgage Securities Trust sequential payer Series 2021-2NU Class A, 1.9739% 1/5/40 (b) | 24,200,000 | 23,894,823 | |
| JPMBB Commercial Mortgage Securities Trust Series 2013-C14 Class A/S, 4.4093% 8/15/46 | 4,614,000 | 4,766,292 | |
| JPMDB Commercial Mortgage Securities Trust sequential payer: | |||
| Series 2017-C5 Class ASB, 3.4919% 3/15/50 | 3,236,000 | 3,396,305 | |
| Series 2018-C8 Class ASB, 4.145% 6/15/51 | 8,779,000 | 9,647,130 | |
| Series 2019-COR6 Class A4, 3.0565% 11/13/52 | 2,872,000 | 3,058,952 | |
| JPMorgan Chase Commercial Mortgage Securities Corp. Series 2012-C6 Class A/S, 4.1166% 5/15/45 | 600,000 | 605,655 | |
| JPMorgan Chase Commercial Mortgage Securities Trust: | |||
| floater Series 2019-BKWD Class A, 1 month U.S. LIBOR + 1.000% 1.09% 9/15/29 (b)(c)(e) | 6,400,000 | 6,387,817 | |
| sequential payer Series 2013-LC11 Class A5, 2.9599% 4/15/46 | 7,200,000 | 7,343,461 | |
| Series 2012-C8 Class A/S, 3.4239% 10/15/45 (b) | 6,783,000 | 6,866,692 | |
| Series 2012-CBX Class A/S, 4.2707% 6/15/45 | 31,528,000 | 31,924,701 | |
| Series 2013-C16 Class A/S, 4.5169% 12/15/46 | 7,001,000 | 7,372,979 | |
| Series 2013-LC11 Class A/S, 3.216% 4/15/46 | 5,691,000 | 5,822,723 | |
| Series 2018-WPT: | |||
| Class AFX, 4.2475% 7/5/33 (b) | 84,000 | 87,579 | |
| Class CFX, 4.9498% 7/5/33 (b) | 767,000 | 795,874 | |
| Class DFX, 5.3503% 7/5/33 (b) | 1,370,000 | 1,417,149 | |
| Class EFX, 5.5422% 7/5/33 (b) | 1,614,000 | 1,648,971 | |
| LIFE Mortgage Trust floater Series 2021-BMR: | |||
| Class A, 1 month U.S. LIBOR + 0.700% 0.79% 3/15/38 (b)(c)(e) | 13,421,000 | 13,393,781 | |
| Class B, 1 month U.S. LIBOR + 0.880% 0.97% 3/15/38 (b)(c)(e) | 2,940,000 | 2,918,822 | |
| Class C, 1 month U.S. LIBOR + 1.100% 1.19% 3/15/38 (b)(c)(e) | 2,038,000 | 2,020,846 | |
| Class D, 1 month U.S. LIBOR + 1.400% 1.49% 3/15/38 (b)(c)(e) | 2,834,000 | 2,808,266 | |
| Class E, 1 month U.S. LIBOR + 1.750% 1.84% 3/15/38 (b)(c)(e) | 2,476,000 | 2,455,903 | |
| Merit floater: | |||
| Series 2020-HILL Class A, 1 month U.S. LIBOR + 1.150% 1.24% 8/15/37 (b)(c)(e) | 5,445,077 | 5,436,556 | |
| Series 2021-STOR Class A, 1 month U.S. LIBOR + 0.700% 0.79% 7/15/38 (b)(c)(e) | 8,363,000 | 8,328,976 | |
| MHC Commercial Mortgage Trust floater sequential payer Series 2021-MHC Class A, 1 month U.S. LIBOR + 0.800% 0.8905% 4/15/38 (b)(c)(e) | 34,600,000 | 34,513,455 | |
| Morgan Stanley BAML Trust: | |||
| sequential payer: | |||
| Series 2016-C28 Class A3, 3.272% 1/15/49 | 5,961,171 | 6,199,029 | |
| Series 2017-C33 Class A4, 3.337% 5/15/50 | 13,400,000 | 14,206,495 | |
| Series 2012-C5 Class A/S, 3.792% 8/15/45 | 6,800,000 | 6,905,864 | |
| Series 2012-C6 Class A/S, 3.476% 11/15/45 | 8,330,000 | 8,459,240 | |
| Series 2015-C25 Class XA, 1.1981% 10/15/48 (c)(k) | 910,660 | 28,486 | |
| Morgan Stanley Capital I Trust: | |||
| floater Series 2018-BOP Class A, 1 month U.S. LIBOR + 0.850% 0.94% 8/15/33 (b)(c)(e) | 205,211 | 205,086 | |
| floater sequential payer Series 2019-NUGS Class A, 1 month U.S. LIBOR + 0.950% 2.45% 12/15/36 (b)(c)(e) | 9,700,000 | 9,705,109 | |
| sequential payer: | |||
| Series 2019-L2 Class A3, 3.806% 3/15/52 | 100,000 | 109,417 | |
| Series 2019-MEAD Class A, 3.17% 11/10/36 (b) | 16,247,000 | 16,696,629 | |
| Series 2018-H4 Class A4, 4.31% 12/15/51 | 2,991,000 | 3,411,305 | |
| Series 2019-MEAD: | |||
| Class B, 3.283% 11/10/36 (b)(c) | 1,783,000 | 1,804,243 | |
| Class C, 3.283% 11/10/36 (b)(c) | 1,712,000 | 1,710,431 | |
| Series 2021-L6 Class XA, 1.3542% 6/15/54 (c)(k) | 26,695,016 | 2,264,098 | |
| NYT Mortgage Trust floater Series 2019-NYT Class A, 1 month U.S. LIBOR + 1.200% 1.29% 12/15/35 (b)(c)(e) | 20,822,000 | 20,800,368 | |
| Prima Capital Ltd.: | |||
| floater Series 2021-9A Class B, 1 month U.S. LIBOR + 1.800% 1.8911% 12/15/37 (b)(c)(e) | 4,403,000 | 4,402,995 | |
| floater sequential payer Series 2021-9A Class A, 1 month U.S. LIBOR + 1.450% 1.5411% 12/15/37 (b)(c)(e) | 4,740,641 | 4,740,584 | |
| RLGH Trust floater Series 2021-TROT Class A, 1 month U.S. LIBOR + 0.800% 0.89% 4/15/36 (b)(c)(e) | 23,000,000 | 23,006,090 | |
| SLG Office Trust Series 2021-OVA Class X, 0.258% 7/15/41 (b)(c)(k) | 213,942,750 | 4,408,718 | |
| SREIT Trust floater: | |||
| Series 2021-IND Class A, 1 month U.S. LIBOR + 0.700% 0.79% 10/15/38 (b)(c)(e) | 3,400,000 | 3,367,899 | |
| Series 2021-MFP: | |||
| Class A, 1 month U.S. LIBOR + 0.730% 0.8308% 11/15/38 (b)(c)(e) | 17,028,000 | 16,930,399 | |
| Class B, 1 month U.S. LIBOR + 1.070% 1.1798% 11/15/38 (b)(c)(e) | 9,752,000 | 9,696,127 | |
| Class C, 1 month U.S. LIBOR + 1.320% 1.429% 11/15/38 (b)(c)(e) | 5,710,000 | 5,677,273 | |
| Class D, 1 month U.S. LIBOR + 1.570% 1.6782% 11/15/38 (b)(c)(e) | 3,430,000 | 3,410,333 | |
| UBS Commercial Mortgage Trust: | |||
| sequential payer: | |||
| Series 2017-C1 Class ASB, 3.462% 11/15/50 | 1,400,000 | 1,487,541 | |
| Series 2017-C7 Class ASB, 3.586% 12/15/50 | 1,000,000 | 1,066,795 | |
| Series 2012-C1 Class A/S, 4.171% 5/10/45 | 9,200,000 | 9,221,514 | |
| Series 2017-C7 Class XA, 1.1691% 12/15/50 (c)(k) | 1,207,929 | 56,233 | |
| UBS-Barclays Commercial Mortgage Trust: | |||
| floater Series 2013-C6 Class A3, 1 month U.S. LIBOR + 0.790% 0.8795% 4/10/46 (b)(c)(e) | 106,791 | 106,571 | |
| sequential payer Series 2012-C4 Class A/S, 3.3165% 12/10/45 (b) | 4,200,000 | 4,272,694 | |
| Series 2012-C3 Class A/S, 3.814% 8/10/49 (b) | 12,000,000 | 12,247,249 | |
| VLS Commercial Mortgage Trust: | |||
| sequential payer Series 2020-LAB Class A, 2.13% 10/10/42 (b) | 8,020,000 | 7,962,130 | |
| Series 2020-LAB: | |||
| Class B, 2.453% 10/10/42 (b) | 470,000 | 469,054 | |
| Class X, 0.5162% 10/10/42 (b)(c)(k) | 27,100,000 | 906,251 | |
| Wells Fargo Commercial Mortgage Trust: | |||
| floater Series 2021-FCMT Class A, 1 month U.S. LIBOR + 1.200% 1.29% 5/15/31 (b)(c)(e) | 16,435,000 | 16,430,088 | |
| sequential payer: | |||
| Series 2015-C26 Class A4, 3.166% 2/15/48 | 11,250,000 | 11,779,886 | |
| Series 2015-C29 Class ASB, 3.4% 6/15/48 | 4,312,734 | 4,469,956 | |
| Series 2016-LC24 Class A3, 2.684% 10/15/49 | 4,700,000 | 4,848,886 | |
| Series 2017-C40 Class ASB, 3.395% 10/15/50 | 1,000,000 | 1,058,237 | |
| Series 2018-C44 Class ASB, 4.167% 5/15/51 | 1,000,000 | 1,094,163 | |
| Series 2019-C52 Class A5, 2.892% 8/15/52 | 3,829,000 | 4,027,230 | |
| Series 2019-C54 Class ASB, 3.063% 12/15/52 | 1,000,000 | 1,068,174 | |
| Series 2015-SG1 Class ASB, 3.556% 9/15/48 | 3,777,939 | 3,923,048 | |
| Series 2017-C42 Class XA, 1.0213% 12/15/50 (c)(k) | 1,443,634 | 66,981 | |
| Series 2018-C46 Class XA, 1.1013% 8/15/51 (c)(k) | 37,785,054 | 1,577,654 | |
| Series 2018-C48 Class A5, 4.302% 1/15/52 | 3,836,000 | 4,361,651 | |
| Series 2019-C54 Class XA, 0.9657% 12/15/52 (c)(k) | 63,663,501 | 3,637,452 | |
| WF-RBS Commercial Mortgage Trust: | |||
| Series 2012-C8 Class A/S, 3.66% 8/15/45 | 5,036,000 | 5,096,378 | |
| Series 2012-C9 Class A/S, 3.388% 11/15/45 | 1,300,000 | 1,321,454 | |
| Series 2013-C12 Class A/S, 3.56% 3/15/48 | 17,361,000 | 17,840,858 | |
| Series 2013-C16 Class A/S, 4.668% 9/15/46 (c) | 8,828,629 | 9,309,388 | |
| TOTAL COMMERCIAL MORTGAGE SECURITIES | |||
| (Cost $1,649,575,525) | 1,645,882,471 | ||
| Municipal Securities - 0.1% | |||
| Chicago Board of Ed. Series 2009 G, 1.75% 12/15/25 | 4,720,000 | 4,524,897 | |
| Illinois Gen. Oblig.: | |||
| Series 2003: | $ | $ | |
| 4.95% 6/1/23 | 2,400,364 | 2,510,670 | |
| 5.1% 6/1/33 | 22,095,000 | 25,832,955 | |
| Series 2010-1, 6.63% 2/1/35 | 2,035,000 | 2,527,885 | |
| Series 2010-3: | |||
| 6.725% 4/1/35 | 2,710,000 | 3,393,753 | |
| 7.35% 7/1/35 | 1,385,000 | 1,773,570 | |
| New Jersey Econ. Dev. Auth. State Pension Fdg. Rev. Series 1997, 7.425% 2/15/29 (Nat'l. Pub. Fin. Guarantee Corp. Insured) | 11,609,000 | 14,754,454 | |
| TOTAL MUNICIPAL SECURITIES | |||
| (Cost $48,911,312) | 55,318,184 | ||
| Foreign Government and Government Agency Obligations - 0.1% | |||
| Kingdom of Saudi Arabia 3.25% 11/17/51 (b) | $15,410,000 | $14,966,963 | |
| State of Qatar 3.4% 4/16/25 (b) | 4,110,000 | 4,368,930 | |
| United Kingdom, Great Britain and Northern Ireland 1.25% 10/22/41 (Reg. S) (h) | GBP | 3,760,000 | 5,216,888 |
| TOTAL FOREIGN GOVERNMENT AND GOVERNMENT AGENCY OBLIGATIONS | |||
| (Cost $24,545,776) | 24,552,781 | ||
| Shares | Value | ||
| Common Stocks - 0.0% | |||
| ENERGY - 0.0% | |||
| Energy Equipment & Services - 0.0% | |||
| Jonah Energy Parent LLC (j) | |||
| (Cost $65,550) | 4,766 | 246,736 | |
| Principal Amount(a) | Value | ||
| Bank Notes - 0.0% | |||
| Discover Bank 4.682% 8/9/28 (c) | 2,954,000 | 3,099,855 | |
| KeyBank NA 6.95% 2/1/28 | 619,000 | 787,026 | |
| Regions Bank 6.45% 6/26/37 | 4,251,000 | 6,033,517 | |
| TOTAL BANK NOTES | |||
| (Cost $8,485,692) | 9,920,398 | ||
| Shares | Value | ||
| Fixed-Income Funds - 60.2% | |||
| Bank Loan Funds - 2.4% | |||
| Fidelity Advisor Floating Rate High Income Fund Class Z (o) | 119,898,806 | $1,133,043,712 | |
| High Yield Fixed-Income Funds - 3.2% | |||
| Fidelity Advisor High Income Fund Class Z (o) | 43,087,404 | 369,689,922 | |
| Fidelity Advisor New Markets Income Fund Class Z (o) | 78,593,974 | 1,112,104,734 | |
| TOTAL HIGH YIELD FIXED-INCOME FUNDS | 1,481,794,656 | ||
| Inflation-Protected Bond Funds - 2.0% | |||
| Fidelity Inflation-Protected Bond Index Fund (o) | 78,301,363 | 913,776,908 | |
| Intermediate Government Funds - 10.2% | |||
| Fidelity Advisor Government Income Fund Class Z (o) | 46,858,319 | 501,852,593 | |
| Fidelity SAI U.S. Treasury Bond Index Fund (o) | 421,504,419 | 4,269,839,763 | |
| TOTAL INTERMEDIATE GOVERNMENT FUNDS | 4,771,692,356 | ||
| Intermediate-Term Bond Funds - 35.7% | |||
| Fidelity Advisor Corporate Bond Fund Class Z (o) | 105,563,458 | 1,317,431,950 | |
| Fidelity Advisor Global Credit Fund Class Z (o) | 3,168,781 | 31,149,122 | |
| Fidelity Intermediate Bond Fund (o) | 78,745,769 | 870,928,208 | |
| Fidelity SAI Total Bond Fund (o) | 1,171,942,256 | 12,317,113,079 | |
| Fidelity Sustainability Bond Index Fund (o) | 2,380,881 | 25,546,852 | |
| Fidelity U.S. Bond Index Fund (o) | 171,658,509 | 2,066,768,447 | |
| TOTAL INTERMEDIATE-TERM BOND FUNDS | 16,628,937,658 | ||
| Long Government Bond Funds - 5.0% | |||
| Fidelity SAI Long-Term Treasury Bond Index Fund (o) | 201,005,111 | 2,335,679,393 | |
| Sector Funds - 1.7% | |||
| Fidelity Advisor Real Estate Income Fund Class Z (o) | 57,430,610 | 777,036,151 | |
| TOTAL FIXED-INCOME FUNDS | |||
| (Cost $27,570,344,977) | 28,041,960,834 | ||
| Principal Amount(a) | Value | ||
| Preferred Securities - 0.3% | |||
| COMMUNICATION SERVICES - 0.0% | |||
| Diversified Telecommunication Services - 0.0% | |||
| Telefonica Europe BV 3.875% (Reg. S) (c)(f) | 1,100,000 | 1,323,835 | |
| CONSUMER DISCRETIONARY - 0.0% | |||
| Automobiles - 0.0% | |||
| Volkswagen International Finance NV 3.5% (Reg. S) (c)(f) | 9,200,000 | 11,265,952 | |
| CONSUMER STAPLES - 0.0% | |||
| Tobacco - 0.0% | |||
| British American Tobacco PLC 3% (Reg. S) (c)(f) | 5,200,000 | 5,810,880 | |
| FINANCIALS - 0.1% | |||
| Banks - 0.1% | |||
| AIB Group PLC 6.25% (Reg. S) (c)(f) | 1,235,000 | 1,563,601 | |
| Banco Bilbao Vizcaya Argentaria SA 5.875% (Reg. S) (c)(f) | 1,200,000 | 1,450,666 | |
| Bank of Nova Scotia: | |||
| 4.65% (c)(f) | 13,095,000 | 12,844,720 | |
| 4.9% (c)(f) | 9,500,000 | 10,172,989 | |
| Barclays Bank PLC 7.625% 11/21/22 | 12,633,000 | 13,383,296 | |
| Barclays PLC 5.875% (Reg. S) (c)(f) | 600,000 | 836,786 | |
| BNP Paribas SA 6.625% (Reg. S) (c)(f) | 1,485,000 | 1,621,464 | |
| HSBC Holdings PLC 6.375% (c)(f) | 1,470,000 | 1,596,153 | |
| Lloyds Banking Group PLC 5.125% (c)(f) | 200,000 | 275,770 | |
| Societe Generale 7.875% (Reg. S) (c)(f) | 740,000 | 833,179 | |
| 44,578,624 | |||
| Capital Markets - 0.0% | |||
| Credit Suisse Group AG 7.5% (Reg. S) (c)(f) | 4,925,000 | 5,478,340 | |
| Consumer Finance - 0.0% | |||
| Ally Financial, Inc. 4.7% (c)(f) | 2,600,000 | 2,686,563 | |
| Insurance - 0.0% | |||
| QBE Insurance Group Ltd. 5.25% (Reg. S) (c)(f) | 4,750,000 | 4,996,696 | |
| TOTAL FINANCIALS | 57,740,223 | ||
| HEALTH CARE - 0.0% | |||
| Pharmaceuticals - 0.0% | |||
| Bayer AG 2.375% 11/12/79 (Reg. S) (c) | 8,300,000 | 9,463,285 | |
| INDUSTRIALS - 0.0% | |||
| Road & Rail - 0.0% | |||
| National Express Group PLC 4.25% (Reg. S) (c)(f) | 570,000 | 793,799 | |
| REAL ESTATE - 0.1% | |||
| Real Estate Management & Development - 0.1% | |||
| Aroundtown SA 3.375% (Reg. S) (c)(f) | 3,900,000 | 4,692,936 | |
| AT Securities BV 5.25% (Reg. S) (c)(f) | 4,750,000 | 4,998,758 | |
| CPI Property Group SA 3.75% (Reg. S) (c)(f) | 2,370,000 | 2,613,644 | |
| Grand City Properties SA 1.5% (Reg. S) (c)(f) | 4,300,000 | 4,742,014 | |
| Heimstaden Bostad AB: | |||
| 3.248% (Reg. S) (c)(f) | 3,735,000 | 4,327,460 | |
| 3.625% (Reg. S) (c)(f) | 195,000 | 219,461 | |
| Samhallsbyggnadsbolaget I Norden AB 2.624% (Reg. S) (c)(f) | 1,385,000 | 1,561,277 | |
| 23,155,550 | |||
| UTILITIES - 0.1% | |||
| Electric Utilities - 0.1% | |||
| EDF SA 5.625% (Reg. S) (c)(f) | 6,300,000 | 6,749,988 | |
| SSE PLC 3.74% (Reg. S) (c)(f) | 1,135,000 | 1,579,186 | |
| 8,329,174 | |||
| Multi-Utilities - 0.0% | |||
| ELM BV for Firmenich International SA 3.75% (Reg. S) (c)(f) | 520,000 | 626,085 | |
| Veolia Environnement SA 2% (Reg. S) (c)(f) | 2,300,000 | 2,584,372 | |
| 3,210,457 | |||
| TOTAL UTILITIES | 11,539,631 | ||
| TOTAL PREFERRED SECURITIES | |||
| (Cost $125,164,460) | 121,093,155 | ||
| Shares | Value | ||
| Money Market Funds - 6.1% | |||
| Fidelity Cash Central Fund 0.06% (p) | 2,110,182,205 | 2,110,604,241 | |
| Fidelity Investments Money Market Government Portfolio Institutional Class 0.01% (o)(q) | 751,155,219 | 751,155,219 | |
| TOTAL MONEY MARKET FUNDS | |||
| (Cost $2,861,759,421) | 2,861,759,460 |
| Purchased Swaptions - 0.0% | ||||
| Expiration Date | Notional Amount | Value | ||
| Put Options - 0.0% | ||||
| Option with an exercise rate of 3.125% on a credit default swap with BNP Paribas SA to buy protection on the 5-Year iTraxx Europe Crossover Series 36 Index expiring December 2026, paying 5% quarterly. | 2/16/22 | EUR 29,300,000 | $463,903 | |
| TOTAL PURCHASED SWAPTIONS | ||||
| (Cost $424,716) | 463,903 | |||
| TOTAL INVESTMENT IN SECURITIES - 108.8% | ||||
| (Cost $49,800,182,244) | 50,664,653,965 | |||
| NET OTHER ASSETS (LIABILITIES) - (8.8)% | (4,087,724,203) | |||
| NET ASSETS - 100% | $46,576,929,762 |
| TBA Sale Commitments | ||
| Principal Amount | Value | |
| Ginnie Mae | ||
| 3.5% 12/1/51 | $(41,800,000) | $(43,653,090) |
| 3.5% 12/1/51 | (8,750,000) | (9,137,908) |
| 3.5% 12/1/51 | (7,050,000) | (7,362,543) |
| 3.5% 12/1/51 | (28,150,000) | (29,397,954) |
| 3.5% 12/1/51 | (27,500,000) | (28,719,138) |
| 3.5% 12/1/51 | (6,900,000) | (7,205,893) |
| 3.5% 12/1/51 | (27,600,000) | (28,823,571) |
| 3.5% 12/1/51 | (6,900,000) | (7,205,893) |
| TOTAL GINNIE MAE | (161,505,990) | |
| Uniform Mortgage Backed Securities | ||
| 2% 12/1/51 | (25,400,000) | (25,422,969) |
| 2% 12/1/51 | (17,200,000) | (17,215,554) |
| 2% 12/1/51 | (5,650,000) | (5,655,109) |
| 2% 12/1/51 | (35,600,000) | (35,632,193) |
| 2% 12/1/51 | (51,400,000) | (51,446,481) |
| 2% 12/1/51 | (71,550,000) | (71,614,703) |
| 2% 12/1/51 | (15,050,000) | (15,063,610) |
| 2% 12/1/51 | (26,050,000) | (26,073,557) |
| 2% 12/1/51 | (14,400,000) | (14,413,022) |
| 2% 12/1/51 | (4,250,000) | (4,253,843) |
| 2% 12/1/51 | (1,300,000) | (1,301,176) |
| 2% 12/1/51 | (5,300,000) | (5,304,793) |
| 2% 12/1/51 | (1,700,000) | (1,701,537) |
| 2% 12/1/51 | (68,650,000) | (68,712,080) |
| 2% 12/1/51 | (20,700,000) | (20,718,719) |
| 2% 12/1/51 | (73,050,000) | (73,116,059) |
| 2% 12/1/51 | (21,150,000) | (21,169,126) |
| 2% 12/1/51 | (49,900,000) | (49,945,125) |
| 2% 12/1/51 | (14,450,000) | (14,463,067) |
| 2.5% 12/1/51 | (4,800,000) | (4,920,000) |
| 2.5% 12/1/51 | (5,500,000) | (5,637,500) |
| 2.5% 12/1/51 | (42,000,000) | (43,050,000) |
| 2.5% 12/1/51 | (4,250,000) | (4,356,250) |
| 2.5% 12/1/51 | (5,200,000) | (5,330,000) |
| 2.5% 12/1/51 | (26,100,000) | (26,752,500) |
| 2.5% 12/1/51 | (4,000,000) | (4,100,000) |
| 2.5% 12/1/51 | (27,850,000) | (28,546,250) |
| 2.5% 12/1/51 | (2,925,000) | (2,998,125) |
| 2.5% 12/1/51 | (19,200,000) | (19,680,000) |
| 2.5% 12/1/51 | (5,900,000) | (6,047,500) |
| 2.5% 12/1/51 | (31,850,000) | (32,646,250) |
| 2.5% 12/1/51 | (9,800,000) | (10,045,000) |
| 2.5% 12/1/51 | (5,100,000) | (5,227,500) |
| 2.5% 12/1/51 | (16,600,000) | (17,015,000) |
| 2.5% 12/1/51 | (26,350,000) | (27,008,750) |
| 2.5% 12/1/51 | (6,600,000) | (6,765,000) |
| 2.5% 12/1/51 | (2,925,000) | (2,998,125) |
| 2.5% 12/1/51 | (31,850,000) | (32,646,250) |
| 2.5% 12/1/51 | (9,800,000) | (10,045,000) |
| 2.5% 12/1/51 | (4,800,000) | (4,920,000) |
| 2.5% 12/1/51 | (5,500,000) | (5,637,500) |
| 2.5% 12/1/51 | (6,600,000) | (6,765,000) |
| 2.5% 12/1/51 | (26,350,000) | (27,008,750) |
| 2.5% 12/1/51 | (42,000,000) | (43,050,000) |
| 2.5% 12/1/51 | (9,450,000) | (9,686,250) |
| 3% 12/1/51 | (31,600,000) | (32,807,218) |
| 3% 12/1/51 | (8,000,000) | (8,305,625) |
| 3% 12/1/51 | (1,900,000) | (1,972,586) |
| 3% 12/1/51 | (4,000,000) | (4,152,812) |
| 3% 12/1/51 | (26,100,000) | (27,097,101) |
| 3% 12/1/51 | (19,200,000) | (19,933,500) |
| 3% 12/1/51 | (5,900,000) | (6,125,398) |
| TOTAL UNIFORM MORTGAGE BACKED SECURITIES | (1,016,499,463) | |
| TOTAL TBA SALE COMMITMENTS | ||
| (Proceeds $1,173,274,347) | $(1,178,005,453) |
| Futures Contracts | |||||
| Number of contracts | Expiration Date | Notional Amount | Value | Unrealized Appreciation/(Depreciation) | |
| Purchased | |||||
| Bond Index Contracts | |||||
| ASX 10 Year Treasury Bond Index Contracts (Australia) | 19 | Dec. 2021 | $1,887,922 | $(62,283) | $(62,283) |
| Eurex Euro-Bund Contracts (Germany) | 139 | Dec. 2021 | 27,172,390 | 157,452 | 157,452 |
| Eurex Euro-Buxl 30 Year Bond Contracts (Germany) | 41 | Dec. 2021 | 10,142,166 | 469,232 | 469,232 |
| TME 10 Year Canadian Note Contracts (Canada) | 101 | March 2022 | 11,160,640 | 165,979 | 165,979 |
| TOTAL BOND INDEX CONTRACTS | 730,380 | ||||
| Treasury Contracts | |||||
| CBOT 10-Year U.S. Treasury Note Contracts (United States) | 2,392 | March 2022 | 312,903,500 | 2,679,650 | 2,679,650 |
| CBOT 5-Year U.S. Treasury Note Contracts (United States) | 570 | March 2022 | 69,197,109 | 229,622 | 229,622 |
| CBOT Ultra 10-Year U.S. Treasury Note Contracts (United States) | 117 | March 2022 | 17,186,203 | 221,681 | 221,681 |
| CBOT Ultra Long Term U.S. Treasury Bond Contracts (United States) | 106 | March 2022 | 21,259,625 | 645,079 | 645,079 |
| TOTAL TREASURY CONTRACTS | 3,776,032 | ||||
| TOTAL PURCHASED | 4,506,412 | ||||
| Sold | |||||
| Bond Index Contracts | |||||
| Eurex Euro-Bobl Contracts (Germany) | 167 | Dec. 2021 | 25,662,982 | (21,087) | (21,087) |
| ICE Long Gilt Contracts (United Kingdom) | 134 | March 2022 | 22,504,775 | (206,998) | (206,998) |
| TOTAL BOND INDEX CONTRACTS | (228,085) | ||||
| Treasury Contracts | |||||
| CBOT 2-Year U.S. Treasury Note Contracts (United States) | 2,391 | March 2022 | 522,993,891 | (299,513) | (299,513) |
| CBOT Long Term U.S. Treasury Bond Contracts (United States) | 1,308 | March 2022 | 212,059,500 | (3,543,321) | (3,543,321) |
| TOTAL TREASURY CONTRACTS | (3,842,834) | ||||
| TOTAL SOLD | (4,070,919) | ||||
| TOTAL FUTURES CONTRACTS | $435,493 |
The notional amount of futures purchased as a percentage of Net Assets is 1.0%
The notional amount of futures sold as a percentage of Net Assets is 1.7%
| Forward Foreign Currency Contracts | ||||||
| Currency Purchased | Currency Sold | Counterparty | Settlement Date | Unrealized Appreciation/(Depreciation) | ||
| USD | 117,314 | CAD | 150,000 | JPMorgan Chase Bank, N.A. | 12/1/21 | $(107) |
| USD | 264,725 | EUR | 235,000 | State Street Bank And Trust Co | 12/1/21 | (1,788) |
| GBP | 70,000 | USD | 92,705 | Brown Brothers Harriman & Co. | 12/2/21 | 392 |
| USD | 225,470 | EUR | 200,000 | JPMorgan Chase Bank, N.A. | 12/2/21 | (1,350) |
| CAD | 46,000 | USD | 36,974 | State Street Bank And Trust Co | 1/13/22 | (947) |
| EUR | 331,000 | USD | 382,895 | Goldman Sachs Bank USA | 1/13/22 | (6,864) |
| EUR | 214,000 | USD | 250,610 | JPMorgan Chase Bank, N.A. | 1/13/22 | (7,497) |
| EUR | 116,000 | USD | 134,540 | JPMorgan Chase Bank, N.A. | 1/13/22 | (2,759) |
| EUR | 715,000 | USD | 810,923 | JPMorgan Chase Bank, N.A. | 1/13/22 | 1,348 |
| EUR | 236,000 | USD | 273,498 | State Street Bank And Trust Co | 1/13/22 | (5,392) |
| EUR | 282,000 | USD | 327,502 | State Street Bank And Trust Co | 1/13/22 | (7,137) |
| EUR | 553,000 | USD | 641,993 | State Street Bank And Trust Co | 1/13/22 | (13,760) |
| EUR | 957,000 | USD | 1,079,672 | State Street Bank And Trust Co | 1/13/22 | 7,522 |
| EUR | 282,000 | USD | 318,197 | State Street Bank And Trust Co | 1/13/22 | 2,168 |
| GBP | 133,000 | USD | 181,023 | State Street Bank And Trust Co | 1/13/22 | (3,988) |
| GBP | 297,000 | USD | 397,802 | State Street Bank And Trust Co | 1/13/22 | (2,468) |
| GBP | 118,000 | USD | 157,476 | State Street Bank And Trust Co | 1/13/22 | (407) |
| USD | 149,218 | AUD | 199,000 | BNP Paribas | 1/13/22 | 7,281 |
| USD | 66,362 | CAD | 84,000 | Citibank NA | 1/13/22 | 574 |
| USD | 27,077 | CAD | 34,000 | Goldman Sachs Bank USA | 1/13/22 | 449 |
| USD | 27,521 | CAD | 34,000 | JPMorgan Chase Bank, N.A. | 1/13/22 | 892 |
| USD | 161,395 | CAD | 200,000 | Royal Bank Of Canada | 1/13/22 | 4,758 |
| USD | 206,433 | EUR | 180,000 | BNP Paribas | 1/13/22 | 1,945 |
| USD | 61,216 | EUR | 54,000 | BNP Paribas | 1/13/22 | (130) |
| USD | 132,984,321 | EUR | 114,522,000 | Citibank NA | 1/13/22 | 2,882,335 |
| USD | 586,568 | EUR | 505,000 | Citibank NA | 1/13/22 | 12,866 |
| USD | 169,477 | EUR | 146,000 | Goldman Sachs Bank USA | 1/13/22 | 3,614 |
| USD | 382,429 | EUR | 337,000 | JPMorgan Chase Bank, N.A. | 1/13/22 | (418) |
| USD | 42,910 | EUR | 38,000 | JPMorgan Chase Bank, N.A. | 1/13/22 | (259) |
| USD | 1,513,068 | EUR | 1,349,000 | Royal Bank Of Canada | 1/13/22 | (19,456) |
| USD | 2,840,880 | EUR | 2,462,000 | State Street Bank And Trust Co | 1/13/22 | 43,940 |
| USD | 65,810,369 | GBP | 47,795,000 | BNP Paribas | 1/13/22 | 2,190,933 |
| USD | 917,717 | GBP | 677,000 | BNP Paribas | 1/13/22 | 16,569 |
| USD | 372,195 | GBP | 277,000 | BNP Paribas | 1/13/22 | 3,483 |
| USD | 883,771 | GBP | 655,000 | BNP Paribas | 1/13/22 | 11,907 |
| USD | 820,480 | GBP | 615,000 | BNP Paribas | 1/13/22 | 1,860 |
| USD | 231,955 | GBP | 175,000 | Brown Brothers Harriman & Co. | 1/13/22 | (986) |
| USD | 236,139 | GBP | 171,000 | Goldman Sachs Bank USA | 1/13/22 | 8,523 |
| USD | 376,977 | GBP | 275,000 | JPMorgan Chase Bank, N.A. | 1/13/22 | 10,927 |
| USD | 123,744 | GBP | 93,000 | Royal Bank Of Canada | 1/13/22 | (47) |
| USD | 194,515 | GBP | 144,000 | State Street Bank And Trust Co | 1/13/22 | 2,838 |
| USD | 198,033 | GBP | 146,000 | State Street Bank And Trust Co | 1/13/22 | 3,694 |
| USD | 1,736,480 | GBP | 1,288,000 | State Street Bank And Trust Co | 1/13/22 | 22,037 |
| TOTAL FORWARD FOREIGN CURRENCY CONTRACTS | $5,167,095 | |||||
| Unrealized Appreciation | 5,242,855 | |||||
| Unrealized Depreciation | (75,760) | |||||
Swaps
| Underlying Reference | Maturity Date | Clearinghouse / Counterparty | Fixed Payment Received/(Paid) | Payment Frequency | Notional Amount | Value | Upfront Premium Received/(Paid) | Unrealized Appreciation/(Depreciation) |
| Credit Default Swaps | ||||||||
| Buy Protection | ||||||||
| BMW Finance NV | Dec. 2026 | Citibank, N.A. | (1%) | Quarterly | EUR 2,700,000 | $(89,363) | $88,102 | $(1,261) |
| CMBX N.A. AAA Index Series 12 | Dec. 2072 | Citigroup Global Markets Ltd. | (0.5%) | Monthly | 13,700,000 | 9,752 | 42,898 | 52,650 |
| CMBX N.A. AAA Index Series 13 | Dec. 2072 | Citigroup Global Markets Ltd. | (0.5%) | Monthly | 14,200,000 | 10,108 | 47,432 | 57,540 |
| CMBX N.A. AAA Index Series 13 | Dec. 2072 | Goldman Sachs & Co. LLC | (0.5%) | Monthly | 1,110,000 | 790 | 3,005 | 3,795 |
| Daimler AG | Dec. 2026 | Citibank, N.A. | (1%) | Quarterly | EUR 2,700,000 | (80,395) | 71,767 | (8,628) |
| Deutsche Bank AG | Dec. 2026 | Citibank, N.A. | (1%) | Quarterly | EUR 2,750,000 | (29,695) | 41,883 | 12,188 |
| Intesa Sanpaolo SpA | Dec. 2026 | JPMorgan Chase Bank, N.A. | (1%) | Quarterly | EUR 2,700,000 | (57,297) | 70,142 | 12,845 |
| Shell International Finance BV | Dec. 2026 | Citibank, N.A. | (1%) | Quarterly | EUR 2,700,000 | (99,717) | 99,621 | (96) |
| TOTAL CREDIT DEFAULT SWAPS | $(335,817) | $464,850 | $129,033 | |||||
Swaps
| Payment Received | Payment Frequency | Payment Paid | Payment Frequency | Clearinghouse / Counterparty(1) | Maturity Date | Notional Amount | Value | Upfront Premium Received/(Paid)(2) | Unrealized Appreciation/(Depreciation) |
| Interest Rate Swaps | |||||||||
| 0.5% | Semi - annual | 3-month LIBOR(3) | Quarterly | LCH | Dec. 2023 | $54,704,000 | $(437,738) | $0 | $(437,738) |
| 1.25% | Semi - annual | 3-month LIBOR(3) | Quarterly | LCH | Dec. 2026 | 33,414,000 | (580,921) | 0 | (580,921) |
| 1.5% | Semi - annual | 3-month LIBOR(3) | Quarterly | LCH | Dec. 2028 | 14,181,000 | (252,245) | 0 | (252,245) |
| 2% | Semi - annual | 3-month LIBOR(3) | Quarterly | LCH | Dec. 2051 | 2,983,000 | 17,018 | 0 | 17,018 |
| TOTAL INTEREST RATE SWAPS | $(1,253,886) | $0 | $(1,253,886) | ||||||
(1) Swaps with LCH Clearnet Group (LCH) are centrally cleared over-the-counter (OTC) swaps.
(2) Any premiums for centrally cleared over-the-counter (OTC) swaps are recorded periodically throughout the term of the swap to variation margin and included in unrealized appreciation (depreciation).
(3) Represents floating rate.
Currency Abbreviations
AUD – Australian dollar
CAD – Canadian dollar
EUR – European Monetary Unit
GBP – British pound
USD – U.S. dollar
Legend
(a) Amount is stated in United States dollars unless otherwise noted.
(b) Security exempt from registration under Rule 144A of the Securities Act of 1933. These securities may be resold in transactions exempt from registration, normally to qualified institutional buyers. At the end of the period, the value of these securities amounted to $3,020,152,351 or 6.5% of net assets.
(c) Coupon rates for floating and adjustable rate securities reflect the rates in effect at period end.
(d) Security or a portion of the security purchased on a delayed delivery or when-issued basis.
(e) Coupon is indexed to a floating interest rate which may be multiplied by a specified factor and/or subject to caps or floors.
(f) Security is perpetual in nature with no stated maturity date.
(g) Security or a portion of the security has been segregated as collateral for mortgage-backed or asset-backed securities purchased on a delayed delivery or when-issued basis. At period end, the value of securities pledged amounted to $1,862,483.
(h) Security or a portion of the security was pledged to cover margin requirements for futures contracts. At period end, the value of securities pledged amounted to $6,229,277.
(i) Security or a portion of the security was pledged to cover margin requirements for centrally cleared OTC swaps. At period end, the value of securities pledged amounted to $2,167,601.
(j) Level 3 security
(k) Security represents right to receive monthly interest payments on an underlying pool of mortgages or assets. Principal shown is the outstanding par amount of the pool as of the end of the period.
(l) Coupon is inversely indexed to a floating interest rate multiplied by a specified factor. The price may be considerably more volatile than the price of a comparable fixed rate security.
(m) Principal Only Strips represent the right to receive the monthly principal payments on an underlying pool of mortgage loans.
(n) Represents an investment in an underlying pool of reverse mortgages which typically do not require regular principal and interest payments as repayment is deferred until a maturity event.
(o) Affiliated Fund
(p) Affiliated fund that is generally available only to investment companies and other accounts managed by Fidelity Investments. The rate quoted is the annualized seven-day yield of the fund at period end. A complete unaudited listing of the fund's holdings as of its most recent quarter end is available upon request. In addition, each Fidelity Central Fund's financial statements are available on the SEC's website or upon request.
(q) The rate quoted is the annualized seven-day yield of the fund at period end.
Affiliated Central Funds
Fiscal year to date information regarding the Fund's investments in Fidelity Central Funds, including the ownership percentage, is presented below.
| Fund | Value, beginning of period | Purchases | Sales Proceeds | Dividend Income | Realized Gain/Loss | Change in Unrealized appreciation (depreciation) | Value, end of period | % ownership, end of period |
| Fidelity Cash Central Fund 0.06% | $2,065,023,730 | $3,864,291,319 | $3,818,710,808 | $650,673 | $-- | $-- | $2,110,604,241 | 3.5% |
| Total | $2,065,023,730 | $3,864,291,319 | $3,818,710,808 | $650,673 | $-- | $-- | $2,110,604,241 |
Amounts in the income column in the above table include any capital gain distributions from underlying funds, which are presented in the corresponding line-item in the Statement of Operations, if applicable.
Affiliated Underlying Funds
Fiscal year to date information regarding the Fund's investments in affiliated Underlying Funds is presented below. Exchanges between classes of the same affiliated Underlying Funds may occur. If an underlying Fund changes its name, the name presented below is the name in effect at period end.
| Affiliate | Value, beginning of period | Purchases | Sales Proceeds | Dividend Income | Realized Gain (loss) | Change in Unrealized appreciation (depreciation) | Value, end of period |
| Fidelity Advisor Corporate Bond Fund Class Z | $-- | $338,930,304 | $-- | $13,930,304 | $-- | $18,895,627 | $1,317,431,950 |
| Fidelity Advisor Floating Rate High Income Fund Class Z | -- | 235,353,677 | -- | 10,353,677 | -- | 10,539,630 | 1,133,043,712 |
| Fidelity Advisor Global Credit Fund Class Z | -- | 154,502 | -- | 154,502 | -- | 1,125,780 | 31,149,122 |
| Fidelity Advisor Government Income Fund Class Z | -- | 500,450,630 | -- | 196,676 | -- | 1,401,963 | 501,852,593 |
| Fidelity Advisor High Income Fund Class Z | -- | 4,910,509 | -- | 4,910,510 | -- | 12,672,374 | 369,689,922 |
| Fidelity Advisor New Markets Income Fund Class Z | -- | 261,880,791 | -- | 11,880,791 | -- | (40,395,399) | 1,112,104,734 |
| Fidelity Advisor Real Estate Income Fund Class I | 646,246,691 | 49,903 | -- | 49,903 | -- | (71,882,750) | -- |
| Fidelity Advisor Real Estate Income Fund Class Z | -- | 102,090,819 | -- | 2,090,819 | -- | 100,531,488 | 777,036,151 |
| Fidelity Corporate Bond Fund | 828,101,099 | 154,935,371 | -- | 3,935,371 | -- | (23,430,451) | -- |
| Fidelity Floating Rate High Income Fund | 792,379,385 | 104,706,150 | -- | 4,706,150 | -- | (9,935,130) | -- |
| Fidelity Global Credit Fund | 30,723,536 | 113,325 | -- | 113,325 | -- | (968,021) | -- |
| Fidelity High Income Fund | 292,575,915 | 77,332,952 | -- | 2,332,952 | -- | (17,801,828) | -- |
| Fidelity Inflation-Protected Bond Index Fund | 749,815,600 | 125,000,107 | -- | 107 | -- | 38,961,201 | 913,776,908 |
| Fidelity Intermediate Bond Fund | 548,937,405 | 331,103,621 | -- | 6,103,622 | -- | (9,112,818) | 870,928,208 |
| Fidelity Investments Money Market Government Portfolio Institutional Class 0.01% | 1,590,674,573 | 5,836,699,149 | 6,676,218,503 | 44,781 | -- | -- | 751,155,219 |
| Fidelity New Markets Income Fund | 711,717,114 | 180,052,864 | -- | 5,052,864 | -- | (1,150,636) | -- |
| Fidelity SAI Long-Term Treasury Bond Index Fund | 1,166,946,960 | 1,792,320,802 | 750,000,000 | 17,331,219 | (68,847,692) | 195,259,323 | 2,335,679,393 |
| Fidelity SAI Total Bond Fund | 10,738,130,397 | 1,598,867,931 | -- | 173,867,932 | -- | (19,885,249) | 12,317,113,079 |
| Fidelity SAI U.S. Treasury Bond Index Fund | 2,358,068,459 | 1,978,217,193 | 100,002,514 | 14,431,626 | (6,167,212) | 39,723,837 | 4,269,839,763 |
| Fidelity Sustainability Bond Index Fund | 25,317,551 | 182,788 | -- | 182,792 | -- | 46,513 | 25,546,852 |
| Fidelity U.S. Bond Index Fund | 1,030,314,170 | 1,293,117,170 | 250,622,924 | 17,494,246 | (9,330,713) | 3,290,744 | 2,066,768,447 |
| Total | $21,509,948,855 | $14,916,470,558 | $7,776,843,941 | $289,164,169 | $(84,345,617) | $227,886,198 | $28,793,116,053 |
Amounts in the income column in the above table include any capital gain distributions from underlying funds, which are presented in the corresponding line-item in the Statement of Operations, if applicable.
Investment Valuation
The following is a summary of the inputs used, as of November 30, 2021, involving the Fund's assets and liabilities carried at fair value. The inputs or methodology used for valuing securities may not be an indication of the risk associated with investing in those securities. For more information on valuation inputs, and their aggregation into the levels used below, please refer to the Investment Valuation section in the accompanying Notes to Financial Statements.
| Valuation Inputs at Reporting Date: | ||||
| Description | Total | Level 1 | Level 2 | Level 3 |
| Investments in Securities: | ||||
| Equities: | ||||
| Energy | $246,736 | $-- | $-- | $246,736 |
| Corporate Bonds | 4,892,467,682 | -- | 4,892,467,682 | -- |
| U.S. Government and Government Agency Obligations | 3,693,097,784 | -- | 3,693,097,784 | -- |
| U.S. Government Agency - Mortgage Securities | 7,992,474,835 | -- | 7,992,474,835 | -- |
| Asset-Backed Securities | 964,184,410 | -- | 964,184,410 | -- |
| Collateralized Mortgage Obligations | 361,231,332 | -- | 361,231,277 | 55 |
| Commercial Mortgage Securities | 1,645,882,471 | -- | 1,645,882,471 | -- |
| Municipal Securities | 55,318,184 | -- | 55,318,184 | -- |
| Foreign Government and Government Agency Obligations | 24,552,781 | -- | 24,552,781 | -- |
| Bank Notes | 9,920,398 | -- | 9,920,398 | -- |
| Fixed-Income Funds | 28,041,960,834 | 28,041,960,834 | -- | -- |
| Preferred Securities | 121,093,155 | -- | 121,093,155 | -- |
| Money Market Funds | 2,861,759,460 | 2,861,759,460 | -- | -- |
| Purchased Swaptions | 463,903 | -- | 463,903 | -- |
| Total Investments in Securities: | $50,664,653,965 | $30,903,720,294 | $19,760,686,880 | $246,791 |
| Derivative Instruments: | ||||
| Assets | ||||
| Futures Contracts | $4,568,695 | $4,568,695 | $-- | $-- |
| Forward Foreign Currency Contracts | 5,242,855 | 5,242,855 | ||
| Swaps | 37,668 | -- | 37,668 | -- |
| Total Assets | $9,849,218 | $4,568,695 | $5,280,523 | $-- |
| Liabilities | ||||
| Futures Contracts | $(4,133,202) | $(4,133,202) | $-- | $-- |
| Forward Foreign Currency Contracts | (75,760) | (75,760) | ||
| Swaps | (1,627,371) | -- | (1,627,371) | -- |
| Total Liabilities | $(5,836,333) | $(4,133,202) | $(1,703,131) | $-- |
| Total Derivative Instruments: | $4,012,885 | $435,493 | $3,577,392 | $-- |
| Other Financial Instruments: | ||||
| TBA Sale Commitments | $(1,178,005,453) | $-- | $(1,178,005,453) | $-- |
| Total Other Financial Instruments: | $(1,178,005,453) | $-- | $(1,178,005,453) | $-- |
Value of Derivative Instruments
The following table is a summary of the Fund's value of derivative instruments by primary risk exposure as of November 30, 2021. For additional information on derivative instruments, please refer to the Derivative Instruments section in the accompanying Notes to Financial Statements.
| Primary Risk Exposure / Derivative Type | Value | |
| Asset | Liability | |
| Credit Risk | ||
| Purchased Swaptions(a) | $463,903 | $0 |
| Swaps(b) | 20,650 | (356,467) |
| Total Credit Risk | 484,553 | (356,467) |
| Foreign Exchange Risk | ||
| Forward Foreign Currency Contracts(c) | 5,242,855 | (75,760) |
| Total Foreign Exchange Risk | 5,242,855 | (75,760) |
| Interest Rate Risk | ||
| Futures Contracts(d) | 4,568,695 | (4,133,202) |
| Purchased Swaptions(a) | 0 | 0 |
| Swaps(e) | 17,018 | (1,270,904) |
| Written Swaptions(f) | 0 | 0 |
| Total Interest Rate Risk | 4,585,713 | (5,404,106) |
| Total Value of Derivatives | $10,313,121 | $(5,836,333) |
(a) Gross value is included in the Statement of Assets and Liabilities in the investments in securities, at value line-item.
(b) For bi-lateral over-the-counter (OTC) swaps, reflects gross value which is presented in the Statement of Assets and Liabilities in the bi-lateral OTC swaps, at value line-items.
(c) Gross value is presented in the Statement of Assets and Liabilities in the unrealized appreciation/depreciation on forward foreign currency contracts line-items.
(d) Reflects gross cumulative appreciation (depreciation) on futures contracts as presented in the Schedule of Investments. In the Statement of Assets and Liabilities, the period end daily variation margin is included in receivable or payable for daily variation margin on futures contracts, and the net cumulative appreciation (depreciation) is included in Total accumulated earnings (loss).
(e) For centrally cleared over-the-counter (OTC) swaps, reflects gross cumulative appreciation (depreciation) as presented in the Schedule of Investments. In the Statement of Assets and Liabilities, the period end daily variation margin for centrally cleared OTC swaps is included in receivable or payable for daily variation margin on centrally cleared OTC swaps, and the net cumulative appreciation (depreciation) for centrally cleared OTC swaps is included in Total accumulated earnings (loss).
(f) Gross value is presented in the Statement of Assets and Liabilities in the written options, at value line-item.
See accompanying notes which are an integral part of the financial statements.
Financial Statements
Statement of Assets and Liabilities
| November 30, 2021 (Unaudited) | ||
| Assets | ||
| Investment in securities, at value — See accompanying schedule: Unaffiliated issuers (cost $19,368,077,846) | $19,760,933,671 | |
| Fidelity Central Funds (cost $2,110,604,202) | 2,110,604,241 | |
| Other affiliated issuers (cost $28,321,500,196) | 28,793,116,053 | |
| Total Investment in Securities (cost $49,800,182,244) | $50,664,653,965 | |
| Cash | 216,876 | |
| Foreign currency held at value (cost $1,378,750) | 1,371,923 | |
| Receivable for investments sold | 51,040,798 | |
| Receivable for TBA sale commitments | 1,173,274,347 | |
| Unrealized appreciation on forward foreign currency contracts | 5,242,855 | |
| Receivable for fund shares sold | 44,444,490 | |
| Dividends receivable | 42,224,643 | |
| Interest receivable | 65,653,251 | |
| Distributions receivable from Fidelity Central Funds | 103,198 | |
| Receivable for daily variation margin on centrally cleared OTC swaps | 100,242 | |
| Bi-lateral OTC swaps, at value | 20,650 | |
| Prepaid expenses | 27,769 | |
| Other receivables | 4,868 | |
| Total assets | 52,048,379,875 | |
| Liabilities | ||
| Payable for investments purchased | ||
| Regular delivery | $491,458,401 | |
| Delayed delivery | 3,781,940,333 | |
| TBA sale commitments, at value | 1,178,005,453 | |
| Unrealized depreciation on forward foreign currency contracts | 75,760 | |
| Payable for fund shares redeemed | 16,384,246 | |
| Distributions payable | 728,446 | |
| Bi-lateral OTC swaps, at value | 356,467 | |
| Accrued management fee | 1,423,193 | |
| Payable for daily variation margin on futures contracts | 46,489 | |
| Other payables and accrued expenses | 1,031,325 | |
| Total liabilities | 5,471,450,113 | |
| Net Assets | $46,576,929,762 | |
| Net Assets consist of: | ||
| Paid in capital | $45,770,798,036 | |
| Total accumulated earnings (loss) | 806,131,726 | |
| Net Assets | $46,576,929,762 | |
| Net Asset Value, offering price and redemption price per share ($46,576,929,762 ÷ 4,361,199,516 shares) | $10.68 |
See accompanying notes which are an integral part of the financial statements.
Statement of Operations
| Six months ended November 30, 2021 (Unaudited) | ||
| Investment Income | ||
| Dividends: | ||
| Unaffiliated issuers | $1,096,382 | |
| Affiliated issuers | 233,191,919 | |
| Interest | 146,046,852 | |
| Income from Fidelity Central Funds | 650,673 | |
| Total income | 380,985,826 | |
| Expenses | ||
| Management fee | $59,110,704 | |
| Custodian fees and expenses | 141,524 | |
| Independent trustees' fees and expenses | 140,556 | |
| Registration fees | 1,133,351 | |
| Audit | 38,379 | |
| Legal | 31,892 | |
| Miscellaneous | 119,187 | |
| Total expenses before reductions | 60,715,593 | |
| Expense reductions | (51,034,944) | |
| Total expenses after reductions | 9,680,649 | |
| Net investment income (loss) | 371,305,177 | |
| Realized and Unrealized Gain (Loss) | ||
| Net realized gain (loss) on: | ||
| Investment securities: | ||
| Unaffiliated issuers | 10,945,572 | |
| Affiliated issuers | (84,345,617) | |
| Forward foreign currency contracts | 2,844,387 | |
| Foreign currency transactions | (278,175) | |
| Futures contracts | 10,118,925 | |
| Swaps | 1,267,278 | |
| Written options | (1,117,915) | |
| Capital gain distributions from underlying funds: | ||
| Affiliated issuers | 55,972,250 | |
| Total net realized gain (loss) | (4,593,295) | |
| Change in net unrealized appreciation (depreciation) on: | ||
| Investment securities: | ||
| Unaffiliated issuers | (8,565,215) | |
| Affiliated issuers | 227,886,198 | |
| Forward foreign currency contracts | 5,167,095 | |
| Assets and liabilities in foreign currencies | (67,502) | |
| Futures contracts | (542,403) | |
| Swaps | (1,883,750) | |
| Written options | 1,915,061 | |
| Delayed delivery commitments | (4,218,212) | |
| Total change in net unrealized appreciation (depreciation) | 219,691,272 | |
| Net gain (loss) | 215,097,977 | |
| Net increase (decrease) in net assets resulting from operations | $586,403,154 |
See accompanying notes which are an integral part of the financial statements.
Statement of Changes in Net Assets
| Six months ended November 30, 2021 (Unaudited) | Year ended May 31, 2021 | |
| Increase (Decrease) in Net Assets | ||
| Operations | ||
| Net investment income (loss) | $371,305,177 | $636,999,362 |
| Net realized gain (loss) | (4,593,295) | 445,887,103 |
| Change in net unrealized appreciation (depreciation) | 219,691,272 | (319,072,971) |
| Net increase (decrease) in net assets resulting from operations | 586,403,154 | 763,813,494 |
| Distributions to shareholders | (344,336,321) | (1,837,657,639) |
| Share transactions | ||
| Proceeds from sales of shares | 12,209,879,004 | 15,795,273,550 |
| Reinvestment of distributions | 340,694,332 | 1,814,939,433 |
| Cost of shares redeemed | (2,171,247,195) | (5,355,146,752) |
| Net increase (decrease) in net assets resulting from share transactions | 10,379,326,141 | 12,255,066,231 |
| Total increase (decrease) in net assets | 10,621,392,974 | 11,181,222,086 |
| Net Assets | ||
| Beginning of period | 35,955,536,788 | 24,774,314,702 |
| End of period | $46,576,929,762 | $35,955,536,788 |
| Other Information | ||
| Shares | ||
| Sold | 1,141,004,310 | 1,448,161,531 |
| Issued in reinvestment of distributions | 31,804,490 | 166,996,807 |
| Redeemed | (202,911,591) | (487,179,030) |
| Net increase (decrease) | 969,897,209 | 1,127,979,308 |
See accompanying notes which are an integral part of the financial statements.
Financial Highlights
Strategic Advisers Fidelity Core Income Fund
| Six months ended (Unaudited) November 30, | Years endedMay 31, | |||
| 2021 | 2021 | 2020 | 2019 A | |
| Selected Per–Share Data | ||||
| Net asset value, beginning of period | $10.60 | $10.95 | $10.47 | $10.00 |
| Income from Investment Operations | ||||
| Net investment income (loss)B | .097 | .239 | .302 | .209 |
| Net realized and unrealized gain (loss) | .073 | .106 | .613 | .445 |
| Total from investment operations | .170 | .345 | .915 | .654 |
| Distributions from net investment income | (.090) | (.245) | (.299) | (.182) |
| Distributions from net realized gain | – | (.450) | (.136) | (.002) |
| Total distributions | (.090) | (.695) | (.435) | (.184) |
| Net asset value, end of period | $10.68 | $10.60 | $10.95 | $10.47 |
| Total ReturnC,D | 1.61% | 3.10% | 8.94% | 6.60% |
| Ratios to Average Net AssetsE,F | ||||
| Expenses before reductions | .30%G | .31% | .32% | .37%G |
| Expenses net of fee waivers, if any | .05%G | .06% | .07% | .12%G |
| Expenses net of all reductions | .05%G | .06% | .07% | .12%G |
| Net investment income (loss) | 1.81%G | 2.18% | 2.83% | 3.30%G |
| Supplemental Data | ||||
| Net assets, end of period (000 omitted) | $46,576,930 | $35,955,537 | $24,774,315 | $16,953,257 |
| Portfolio turnover rateH | 197%G | 191% | 247% | 124%G,I |
A For the period October 16, 2018 (commencement of operations) through May 31, 2019.
B Calculated based on average shares outstanding during the period.
C Total returns for periods of less than one year are not annualized.
D Total returns would have been lower if certain expenses had not been reduced during the applicable periods shown.
E Fees and expenses of any underlying mutual funds or exchange-traded funds (ETFs) are not included in the Fund's expense ratio. The Fund indirectly bears its proportionate share of these expenses. For additional expense information related to investments in Fidelity Central Funds, please refer to the "Investments in Fidelity Central Funds" note found in the Notes to Financial Statements section of the most recent Annual or Semi-Annual report.
F Expense ratios reflect operating expenses of the class. Expenses before reductions do not reflect amounts reimbursed, waived, or reduced through arrangements with the investment adviser, brokerage services, or other offset arrangements, if applicable, and do not represent the amount paid by the class during periods when reimbursements, waivers or reductions occur.
G Annualized
H Amount does not include the portfolio activity of any underlying mutual funds or exchange-traded funds (ETFs).
I Portfolio turnover rate excludes securities received or delivered in-kind.
See accompanying notes which are an integral part of the financial statements.
Notes to Financial Statements (Unaudited)
For the period ended November 30, 2021
1. Organization.
Strategic Advisers Fidelity Core Income Fund (the Fund) is a fund of Fidelity Rutland Square Trust II (the Trust), and is authorized to issue an unlimited number of shares. The Trust is registered under the Investment Company Act of 1940, as amended (the 1940 Act), as an open-end management investment company organized as a Delaware statutory trust. The Fund is offered exclusively to certain managed account clients of Strategic Advisers LLC (Strategic Advisers), an affiliate of Fidelity Management & Research Company LLC (FMR).
2. Significant Accounting Policies.
The Fund is an investment company and applies the accounting and reporting guidance of the Financial Accounting Standards Board (FASB) Accounting Standards Codification Topic 946 Financial Services - Investment Companies. The financial statements have been prepared in conformity with accounting principles generally accepted in the United States of America (GAAP), which require management to make certain estimates and assumptions at the date of the financial statements. Actual results could differ from those estimates. Subsequent events, if any, through the date that the financial statements were issued have been evaluated in the preparation of the financial statements. The Fund's Schedule of Investments lists any underlying mutual funds or exchange-traded funds (ETFs) but does not include the underlying holdings of these funds. The following summarizes the significant accounting policies of the Fund:
Investment Valuation. Investments are valued as of 4:00 p.m. Eastern time on the last calendar day of the period. The Board of Trustees (the Board) has delegated the day to day responsibility for the valuation of the Fund's investments to the Fair Value Committee (the Committee) established by the Fund's investment adviser. In accordance with valuation policies and procedures approved by the Board, the Fund attempts to obtain prices from one or more third party pricing vendors or brokers to value its investments. When current market prices, quotations or currency exchange rates are not readily available or reliable, investments will be fair valued in good faith by the Committee, in accordance with procedures adopted by the Board. Factors used in determining fair value vary by investment type and may include market or investment specific events, changes in interest rates and credit quality. The frequency with which these procedures are used cannot be predicted and they may be utilized to a significant extent. The Committee oversees the Fund's valuation policies and procedures and reports to the Board on the Committee's activities and fair value determinations. The Board monitors the appropriateness of the procedures used in valuing the Fund's investments and ratifies the fair value determinations of the Committee.
The Fund categorizes the inputs to valuation techniques used to value its investments into a disclosure hierarchy consisting of three levels as shown below:
- Level 1 – quoted prices in active markets for identical investments
- Level 2 – other significant observable inputs (including quoted prices for similar investments, interest rates, prepayment speeds, etc.)
- Level 3 – unobservable inputs (including the Fund's own assumptions based on the best information available)
Valuation techniques used to value the Fund's investments by major category are as follows:
Debt securities, including restricted securities, are valued based on evaluated prices received from third party pricing vendors or from brokers who make markets in such securities. Corporate bonds, bank notes, foreign government and government agency obligations, municipal securities, preferred securities and U.S. government and government agency obligations are valued by pricing vendors who utilize matrix pricing which considers yield or price of bonds of comparable quality, coupon, maturity and type or by broker-supplied prices. Asset backed securities, collateralized mortgage obligations, commercial mortgage securities and U.S. government agency mortgage securities are valued by pricing vendors who utilize matrix pricing which considers prepayment speed assumptions, attributes of the collateral, yield or price of bonds of comparable quality, coupon, maturity and type or by broker-supplied prices. Swaps are marked-to-market daily based on valuations from third party pricing vendors, registered derivatives clearing organizations (clearinghouses) or broker-supplied valuations. These pricing sources may utilize inputs such as interest rate curves, credit spread curves, default possibilities and recovery rates. When independent prices are unavailable or unreliable, debt securities and swaps may be valued utilizing pricing methodologies which consider similar factors that would be used by third party pricing vendors. For foreign debt securities, when significant market or security specific events arise, valuations may be determined in good faith in accordance with procedures adopted by the Board. Debt securities and swaps are generally categorized as Level 2 in the hierarchy but may be Level 3 depending on the circumstances.
Equity securities, including restricted securities, for which market quotations are readily available, are valued at the last reported sale price or official closing price as reported by a third party pricing vendor on the primary market or exchange on which they are traded and are categorized as Level 1 in the hierarchy. In the event there were no sales during the day or closing prices are not available, securities are valued at the last quoted bid price or may be valued using the last available price and are generally categorized as Level 2 in the hierarchy. For equity securities, including restricted securities, where observable inputs are limited, assumptions about market activity and risk are used and these securities may be categorized as Level 3 in the hierarchy.
The U.S. dollar value of foreign currency contracts is determined using currency exchange rates supplied by a pricing service and are categorized as Level 2 in the hierarchy. Futures contracts are valued at the settlement price established each day by the board of trade or exchange on which they are traded and are categorized as Level 1 in the hierarchy. Options traded over-the-counter are valued using vendor or broker-supplied valuations and are categorized as Level 2 in the hierarchy. Investments in open-end mutual funds, including the Fidelity Central Funds, are valued at their closing net asset value (NAV) each business day and are categorized as Level 1 in the hierarchy.
Changes in valuation techniques may result in transfers in or out of an assigned level within the disclosure hierarchy. The aggregate value of investments by input level as of November 30, 2021 is included at the end of the Fund's Schedule of Investments.
Foreign Currency. Foreign-denominated assets, including investment securities, and liabilities are translated into U.S. dollars at the exchange rates at period end. Purchases and sales of investment securities, income and dividends received, and expenses denominated in foreign currencies are translated into U.S. dollars at the exchange rate in effect on the transaction date.
The effects of exchange rate fluctuations on investments are included with the net realized and unrealized gain (loss) on investment securities. Other foreign currency transactions resulting in realized and unrealized gain (loss) are disclosed separately.
Realized gains and losses on foreign currency transactions arise from the disposition of foreign currency, realized changes in the value of foreign currency between the trade and settlement dates on security transactions, and the difference between the amounts of dividends, interest and foreign withholding taxes recorded on transaction date and the U.S. dollar equivalent of the amounts actually received or paid. Unrealized gains and losses on assets and liabilities in foreign currencies arise from changes in the value of foreign currency, and from assets and liabilities denominated in foreign currencies, other than investments, which are held at period end.
Investment Transactions and Income. For financial reporting purposes, the Fund's investment holdings and NAV include trades executed through the end of the last business day of the period. The NAV per share for processing shareholder transactions is calculated as of the close of business of the New York Stock Exchange (NYSE), normally 4:00 p.m. Eastern time and includes trades executed through the end of the prior business day. Gains and losses on securities sold are determined on the basis of identified cost. Commissions paid to certain brokers with whom the investment adviser, or its affiliates, places trades on behalf of a fund include an amount in addition to trade execution, which may be rebated back to a fund. Any such rebates are included in net realized gain (loss) on investments in the Statement of Operations. Dividend income is recorded on the ex-dividend date. Income and capital gain distributions from any underlying mutual funds or exchange-traded funds (ETFs) are recorded on the ex-dividend date. Certain distributions received by the Fund represent a return of capital or capital gain. The Fund determines the components of these distributions subsequent to the ex-dividend date, based upon receipt of tax filings or other correspondence relating to the underlying investment. These distributions are recorded as a reduction of cost of investments and/or as a realized gain. Interest income is accrued as earned and includes coupon interest and amortization of premium and accretion of discount on debt securities as applicable. Investment income is recorded net of foreign taxes withheld where recovery of such taxes is uncertain. Debt obligations may be placed on non-accrual status and related interest income may be reduced by ceasing current accruals and writing off interest receivables when the collection of all or a portion of interest has become doubtful based on consistently applied procedures. A debt obligation is removed from non-accrual status when the issuer resumes interest payments or when collectability of interest is reasonably assured.
Expenses. Expenses directly attributable to a fund are charged to that fund. Expenses attributable to more than one fund are allocated among the respective funds on the basis of relative net assets or other appropriate methods. Expenses included in the accompanying financial statements reflect the expenses of that fund and do not include any expenses associated with any underlying mutual funds or exchange-traded funds. Although not included in a fund's expenses, a fund indirectly bears its proportionate share of these expenses through the net asset value of each underlying mutual fund or exchange-traded fund. Expense estimates are accrued in the period to which they relate and adjustments are made when actual amounts are known.
Deferred Trustee Compensation. Under a Deferred Compensation Plan (the Plan) for certain Funds, certain independent Trustees have elected to defer receipt of a portion of their annual compensation. Deferred amounts are invested in affiliated mutual funds, are marked-to-market and remain in a fund until distributed in accordance with the Plan. The investment of deferred amounts and the offsetting payable to the Trustees presented below are included in the accompanying Statement of Assets and Liabilities in other receivables and other payables and accrued expenses, as applicable.
| Strategic Advisers Fidelity Core Income Fund | $2,728 |
Income Tax Information and Distributions to Shareholders. Each year, the Fund intends to qualify as a regulated investment company under Subchapter M of the Internal Revenue Code, including distributing substantially all of its taxable income and realized gains. As a result, no provision for U.S. Federal income taxes is required. The Fund files a U.S. federal tax return, in addition to state and local tax returns as required. The Fund's federal income tax returns are subject to examination by the Internal Revenue Service (IRS) for a period of three fiscal years after they are filed. State and local tax returns may be subject to examination for an additional fiscal year depending on the jurisdiction. Foreign taxes are provided for based on the Fund's understanding of the tax rules and rates that exist in the foreign markets in which it invests.
Distributions are declared and recorded daily and paid monthly from net investment income. Distributions from realized gains, if any, are declared and recorded on the ex-dividend date. Income and capital gain distributions are determined in accordance with income tax regulations, which may differ from GAAP.
Capital accounts within the financial statements are adjusted for permanent book-tax differences. These adjustments have no impact on net assets or the results of operations. Capital accounts are not adjusted for temporary book-tax differences which will reverse in a subsequent period.
Book-tax differences are primarily due to the short-term gain distributions from the underlying mutual funds or exchange-traded funds (ETFs), futures contracts, swaps, market discount, partnerships, deferred Trustees compensation and losses deferred due to wash sales, futures contracts and excise tax regulations.
As of period end, the cost and unrealized appreciation (depreciation) in securities, and derivatives if applicable, for federal income tax purposes were as follows:
| Gross unrealized appreciation | $1,161,803,615 |
| Gross unrealized depreciation | (376,869,467) |
| Net unrealized appreciation (depreciation) | $784,934,148 |
| Tax cost | $49,879,467,110 |
The Fund elected to defer to its next fiscal year approximately $83,070,110 of capital losses recognized during the period November 1, 2020 to May 31, 2021.
Delayed Delivery Transactions and When-Issued Securities. During the period, certain Funds transacted in securities on a delayed delivery or when-issued basis. Payment and delivery may take place after the customary settlement period for that security. The price of the underlying securities and the date when the securities will be delivered and paid for are fixed at the time the transaction is negotiated. Securities purchased on a delayed delivery or when-issued basis are identified as such in the Schedule of Investments. Compensation for interest forgone in the purchase of a delayed delivery or when-issued debt security may be received. With respect to purchase commitments, each applicable Fund identifies securities as segregated in its records with a value at least equal to the amount of the commitment. Payables and receivables associated with the purchases and sales of delayed delivery securities having the same coupon, settlement date and broker are offset. Delayed delivery or when-issued securities that have been purchased from and sold to different brokers are reflected as both payables and receivables in the Statement of Assets and Liabilities under the caption "Delayed delivery", as applicable. Losses may arise due to changes in the value of the underlying securities or if the counterparty does not perform under the contract's terms, or if the issuer does not issue the securities due to political, economic, or other factors.
To-Be-Announced (TBA) Securities and Mortgage Dollar Rolls. TBA securities involve buying or selling mortgage-backed securities (MBS) on a forward commitment basis. A TBA transaction typically does not designate the actual security to be delivered and only includes an approximate principal amount; however delivered securities must meet specified terms defined by industry guidelines, including issuer, rate and current principal amount outstanding on underlying mortgage pools. Funds may enter into a TBA transaction with the intent to take possession of or deliver the underlying MBS, or a fund may elect to extend the settlement by entering into either a mortgage or reverse mortgage dollar roll. Mortgage dollar rolls are transactions where a fund sells TBA securities and simultaneously agrees to repurchase MBS on a later date at a lower price and with the same counterparty. Reverse mortgage dollar rolls involve the purchase and simultaneous agreement to sell TBA securities on a later date at a lower price. Transactions in mortgage dollar rolls and reverse mortgage dollar rolls are accounted for as purchases and sales and may result in an increase to a fund's portfolio turnover rate.
Purchases and sales of TBA securities involve risks similar to those discussed above for delayed delivery and when-issued securities. Also, if the counterparty in a mortgage dollar roll or a reverse mortgage dollar roll transaction files for bankruptcy or becomes insolvent, a fund's right to repurchase or sell securities may be limited. Additionally, when a fund sells TBA securities without already owning or having the right to obtain the deliverable securities (an uncovered forward commitment to sell), it incurs a risk of loss because it could have to purchase the securities at a price that is higher than the price at which it sold them. A fund may be unable to purchase the deliverable securities if the corresponding market is illiquid.
TBA securities subject to a forward commitment to sell at period end are included at the end of the Schedule of Investments under the caption "TBA Sale Commitments." The proceeds and value of these commitments are reflected in the Statement of Assets and Liabilities as "Receivable for TBA sale commitments" and "TBA sale commitments, at value," respectively.
Restricted Securities (including Private Placements). Funds may invest in securities that are subject to legal or contractual restrictions on resale. These securities generally may be resold in transactions exempt from registration or to the public if the securities are registered. Disposal of these securities may involve time-consuming negotiations and expense, and prompt sale at an acceptable price may be difficult. Information regarding restricted securities held at period end is included at the end of the Schedule of Investments, if applicable.
3. Derivative Instruments.
Risk Exposures and the Use of Derivative Instruments. The Fund's investment objective allows the Fund to enter into various types of derivative contracts, including futures contracts, forward foreign currency contracts, options and swaps. Derivatives are investments whose value is primarily derived from underlying assets, indices or reference rates and may be transacted on an exchange or over-the-counter (OTC). Derivatives may involve a future commitment to buy or sell a specified asset based on specified terms, to exchange future cash flows at periodic intervals based on a notional principal amount, or for one party to make one or more payments upon the occurrence of specified events in exchange for periodic payments from the other party.
The Fund used derivatives to increase returns, to gain exposure to certain types of assets, to facilitate transactions in foreign-denominated securities and to manage exposure to certain risks as defined below. The success of any strategy involving derivatives depends on analysis of numerous economic factors, and if the strategies for investment do not work as intended, the Fund may not achieve its objectives.
The Fund's use of derivatives increased or decreased its exposure to the following risks:
| Credit Risk | Credit risk relates to the ability of the issuer of a financial instrument to make further principal or interest payments on an obligation or commitment that it has to the Fund. |
| Foreign Exchange Risk | Foreign exchange rate risk relates to fluctuations in the value of an asset or liability due to changes in currency exchange rates. |
| Interest Rate Risk | Interest rate risk relates to the fluctuations in the value of interest-bearing securities due to changes in the prevailing levels of market interest rates. |
The Fund is also exposed to additional risks from investing in derivatives, such as liquidity risk and counterparty credit risk. Liquidity risk is the risk that the Fund will be unable to close out the derivative in the open market in a timely manner. Counterparty credit risk is the risk that the counterparty will not be able to fulfill its obligation to the Fund. Derivative counterparty credit risk is managed through formal evaluation of the creditworthiness of all potential counterparties. On certain OTC derivatives such as forward foreign currency contracts, options and bi-lateral swaps, the Fund attempts to reduce its exposure to counterparty credit risk by entering into an International Swaps and Derivatives Association, Inc. (ISDA) Master Agreement with each of its counterparties. The ISDA Master Agreement gives the Fund the right to terminate all transactions traded under such agreement upon the deterioration in the credit quality of the counterparty beyond specified levels. The ISDA Master Agreement gives each party the right, upon an event of default by the other party or a termination of the agreement, to close out all transactions traded under such agreement and to net amounts owed under each transaction to one net payable by one party to the other. To mitigate counterparty credit risk on bi-lateral OTC derivatives, the Fund receives collateral in the form of cash or securities once the Fund's net unrealized appreciation on outstanding derivative contracts under an ISDA Master Agreement exceeds certain applicable thresholds, subject to certain minimum transfer provisions. The collateral received is held in segregated accounts with the Fund's custodian bank in accordance with the collateral agreements entered into between the Fund, the counterparty and the Fund's custodian bank. The Fund could experience delays and costs in gaining access to the collateral even though it is held by the Fund's custodian bank. The Fund's maximum risk of loss from counterparty credit risk related to bi-lateral OTC derivatives is generally the aggregate unrealized appreciation and unpaid counterparty payments in excess of any collateral pledged by the counterparty to the Fund. For OTC written options with upfront premiums received, the Fund is obligated to perform and therefore does not have counterparty risk. For OTC written options with premiums to be received at a future date, the maximum risk of loss from counterparty credit risk is the amount of the premium in excess of any collateral pledged by the counterparty. The Fund may be required to pledge collateral for the benefit of the counterparties on bi-lateral OTC derivatives in an amount not less than each counterparty's unrealized appreciation on outstanding derivative contracts, subject to certain minimum transfer provisions, and any such pledged collateral is identified in the Schedule of Investments. Exchange-traded futures contracts are not covered by the ISDA Master Agreement; however counterparty credit risk related to exchange-traded futures contracts may be mitigated by the protection provided by the exchange on which they trade. Counterparty credit risk related to centrally cleared OTC swaps may be mitigated by the protection provided by the clearinghouse.
Investing in derivatives may involve greater risks than investing in the underlying assets directly and, to varying degrees, may involve risk of loss in excess of any initial investment and collateral received and amounts recognized in the Statement of Assets and Liabilities. In addition, there may be the risk that the change in value of the derivative contract does not correspond to the change in value of the underlying instrument.
Net Realized Gain (Loss) and Change in Net Unrealized Appreciation (Depreciation) on Derivatives. The table below, which reflects the impacts of derivatives on the financial performance of the Fund, summarizes the net realized gain (loss) and change in net unrealized appreciation (depreciation) for derivatives during the period as presented in the Statement of Operations.
| Primary Risk Exposure / Derivative Type | Net Realized Gain (Loss) | Change in Net Unrealized Appreciation (Depreciation) |
| Credit Risk | ||
| Purchased Options | $132,674 | $39,187 |
| Swaps | 154,368 | 24,100 |
| Total Credit Risk | $287,042 | $63,287 |
| Foreign Exchange Risk | ||
| Forward Foreign Currency Contracts | $2,844,387 | $5,167,095 |
| Total Foreign Exchange Risk | $2,844,387 | $5,167,095 |
| Interest Rate Risk | ||
| Futures Contracts | $10,118,925 | $(542,403) |
| Purchased Options | (84,094) | (598,456) |
| Swaps | 1,112,910 | (1,907,850) |
| Written Options | (1,117,915) | 1,915,061 |
| Total Interest Rate Risk | $10,029,826 | $(1,133,648) |
| Totals | $13,161,255 | $4,096,734 |
A summary of the value of derivatives by primary risk exposure as of period end is included at the end of the Schedule of Investments.
Forward Foreign Currency Contracts. Forward foreign currency contracts represent obligations to purchase or sell foreign currency on a specified future date at a price fixed at the time the contracts are entered into. The Fund used forward foreign currency contracts to facilitate transactions in foreign-denominated securities and to manage exposure to certain foreign currencies.
Forward foreign currency contracts are valued daily and fluctuations in exchange rates on open contracts are recorded as unrealized appreciation or (depreciation) and reflected in the Statement of Assets and Liabilities. When the contract is closed, the Fund realizes a gain or loss equal to the difference between the closing value and the value at the time it was opened. Non-deliverable forward foreign currency exchange contracts are settled with the counterparty in cash without the delivery of foreign currency. The net realized gain (loss) and change in net unrealized appreciation (depreciation) on forward foreign currency contracts during the period is presented in the Statement of Operations.
Any open forward foreign currency contracts at period end are presented in the Schedule of Investments under the caption "Forward Foreign Currency Contracts." The contract amount and unrealized appreciation (depreciation) reflects each contract's exposure to the underlying currency at period end and is representative of volume of activity during the period.
Futures Contracts. A futures contract is an agreement between two parties to buy or sell a specified underlying instrument for a fixed price at a specified future date. The Fund used futures contracts to manage its exposure to the bond market and fluctuations in interest rates.
Upon entering into a futures contract, a fund is required to deposit either cash or securities (initial margin) with a clearing broker in an amount equal to a certain percentage of the face value of the contract. Futures contracts are marked-to-market daily and subsequent daily payments (variation margin) are made or received by a fund depending on the daily fluctuations in the value of the futures contracts and are recorded as unrealized appreciation or (depreciation). This receivable and/or payable, if any, is included in daily variation margin on futures contracts in the Statement of Assets and Liabilities. Realized gain or (loss) is recorded upon the expiration or closing of a futures contract. The net realized gain (loss) and change in net unrealized appreciation (depreciation) on futures contracts during the period is presented in the Statement of Operations.
Any open futures contracts at period end are presented in the Schedule of Investments under the caption "Futures Contracts". The notional amount at value reflects each contract's exposure to the underlying instrument or index at period end and is representative of volume of activity during the period. Securities deposited to meet initial margin requirements are identified in the Schedule of Investments.
Options. Options give the purchaser the right, but not the obligation, to buy (call) or sell (put) an underlying security or financial instrument at an agreed exercise or strike price between or on certain dates. Options obligate the seller (writer) to buy (put) or sell (call) an underlying instrument at the exercise or strike price or cash settle an underlying derivative instrument if the holder exercises the option on or before the expiration date. The Fund uses OTC options, such as swaptions, which are options where the underlying instrument is a swap, to manage its exposure to fluctuations in interest rates.
Upon entering into an options contract, a fund will pay or receive a premium. Premiums paid on purchased options are reflected as cost of investments and premiums received on written options are reflected as a liability on the Statement of Assets and Liabilities. Certain options may be purchased or written with premiums to be paid or received on a future date. Options are valued daily and any unrealized appreciation (depreciation) is reflected on the Statement of Assets and Liabilities. When an option is exercised, the cost or proceeds of the underlying instrument purchased or sold is adjusted by the amount of the premium. When an option is closed the Fund will realize a gain or loss depending on whether the proceeds or amount paid for the closing sale transaction is greater or less than the premium received or paid. When an option expires, gains and losses are realized to the extent of premiums received and paid, respectively. The net realized and unrealized gains (losses) on purchased options are included in the Statement of Operations in net realized gain (loss) and change in net unrealized appreciation (depreciation) on investment securities. The net realized gain (loss) and change in net unrealized appreciation (depreciation) on written options are presented in the Statement of Operations.
Any open options at period end are presented in the Schedule of Investments under the captions "Purchased Options," "Purchased Swaptions," "Written Options" and "Written Swaptions," as applicable, and are representative of volume of activity during the period.
Writing puts and buying calls tend to increase exposure to the underlying instrument while buying puts and writing calls tend to decrease exposure to the underlying instrument. For purchased options, risk of loss is limited to the premium paid, and for written options, risk of loss is the change in value in excess of the premium received.
Swaps. A swap is a contract between two parties to exchange future cash flows at periodic intervals based on a notional principal amount. A bi-lateral OTC swap is a transaction between a fund and a dealer counterparty where cash flows are exchanged between the two parties for the life of the swap. A centrally cleared OTC swap is a transaction executed between a fund and a dealer counterparty, then cleared by a futures commission merchant (FCM) through a clearinghouse. Once cleared, the clearinghouse serves as a central counterparty, with whom a fund exchanges cash flows for the life of the transaction, similar to transactions in futures contracts.
Bi-lateral OTC swaps are marked-to-market daily and changes in value are reflected in the Statement of Assets and Liabilities in the bi-lateral OTC swaps at value line items. Any upfront premiums paid or received upon entering a bi-lateral OTC swap to compensate for differences between stated terms of the swap and prevailing market conditions (e.g. credit spreads, interest rates or other factors) are recorded in net unrealized appreciation (depreciation) in the Statement of Assets and Liabilities and amortized to realized gain or (loss) ratably over the term of the swap. Any unamortized upfront premiums are presented in the Schedule of Investments.
Centrally cleared OTC swaps require a fund to deposit either cash or securities (initial margin) with the FCM, at the instruction of and for the benefit of the clearinghouse. Securities deposited to meet initial margin requirements are identified in the Schedule of Investments. Centrally cleared OTC swaps are marked-to-market daily and subsequent payments (variation margin) are made or received depending on the daily fluctuations in the value of the swaps and are recorded as unrealized appreciation or (depreciation). These daily payments, if any, are included in receivable or payable for daily variation margin on centrally cleared OTC swaps in the Statement of Assets and Liabilities. Any premiums for centrally cleared OTC swaps are recorded periodically throughout the term of the swap to variation margin and included in unrealized appreciation (depreciation) in the Statement of Assets and Liabilities. Any premiums are recognized as realized gain (loss) upon termination or maturity of the swap.
For both bi-lateral and centrally cleared OTC swaps, payments are exchanged at specified intervals, accrued daily commencing with the effective date of the contract and recorded as realized gain or (loss). Some swaps may be terminated prior to the effective date and realize a gain or loss upon termination. The net realized gain (loss) and change in net unrealized appreciation (depreciation) on swaps during the period is presented in the Statement of Operations.
Any open swaps at period end are included in the Schedule of Investments under the caption "Swaps" and are representative of volume of activity during the period.
Credit Default Swaps. Credit default swaps enable the Fund to buy or sell protection against specified credit events on a single-name issuer or a traded credit index. Under the terms of a credit default swap the buyer of protection (buyer) receives credit protection in exchange for making periodic payments to the seller of protection (seller) based on a fixed percentage applied to a notional principal amount. In return for these payments, the seller will be required to make a payment upon the occurrence of one or more specified credit events. The Fund enters into credit default swaps as a seller to gain credit exposure to an issuer and/or as a buyer to obtain a measure of protection against defaults of an issuer. Periodic payments are made over the life of the contract by the buyer provided that no credit event occurs.
For credit default swaps on most corporate and sovereign issuers, credit events include bankruptcy, failure to pay or repudiation/moratorium. For credit default swaps on corporate or sovereign issuers, the obligation that may be put to the seller is not limited to the specific reference obligation described in the Schedule of Investments. For credit default swaps on asset-backed securities, a credit event may be triggered by events such as failure to pay principal, maturity extension, rating downgrade or write-down. For credit default swaps on asset-backed securities, the reference obligation described represents the security that may be put to the seller. For credit default swaps on a traded credit index, a specified credit event may affect all or individual underlying securities included in the index.
As a seller, if an underlying credit event occurs, the Fund will pay a net settlement amount of cash equal to the notional amount of the swap less the recovery value of the reference obligation or underlying securities comprising an index. Only in the event of the industry's inability to value the underlying asset will the Fund be required to take delivery of the reference obligation or underlying securities comprising an index and pay an amount equal to the notional amount of the swap.
As a buyer, if an underlying credit event occurs, the Fund will receive a net settlement amount of cash equal to the notional amount of the swap less the recovery value of the reference obligation or underlying securities comprising an index. Only in the event of the industry's inability to value the underlying asset will the Fund be required to deliver the reference obligation or underlying securities comprising an index in exchange for payment of an amount equal to the notional amount of the swap.
Typically, the value of each credit default swap and credit rating disclosed for each reference obligation in the Schedule of Investments, where the Fund is the seller, can be used as measures of the current payment/performance risk of the swap. As the value of the swap changes as a positive or negative percentage of the total notional amount, the payment/performance risk may decrease or increase, respectively. In addition to these measures, the investment adviser monitors a variety of factors including cash flow assumptions, market activity and market sentiment as part of its ongoing process of assessing payment/performance risk.
Interest Rate Swaps. Interest rate swaps are agreements between counterparties to exchange cash flows, one based on a fixed rate, and the other on a floating rate. The Fund entered into interest rate swaps to manage its exposure to interest rate changes. Changes in interest rates can have an effect on both the value of bond holdings as well as the amount of interest income earned. In general, the value of bonds can fall when interest rates rise and can rise when interest rates fall.
4. Purchases and Sales of Investments.
Purchases and sales of securities, other than short-term securities, U.S. government securities and in-kind transactions, as applicable, are noted in the table below.
| Purchases ($) | Sales ($) | |
| Strategic Advisers Fidelity Core Income Fund | 37,342,376,534 | 28,371,810,432 |
5. Fees and Other Transactions with Affiliates.
Management Fee. Strategic Advisers (the investment adviser) provides the Fund with investment management related services. For these services, the Fund pays a monthly management fee to the investment adviser. The management fee is calculated by adding the annual management fee rate of .25% of the Fund's average net assets throughout the month to the aggregate of the fee rates, payable monthly by the investment adviser, to the Fund's sub-advisers. The Fund's maximum aggregate management fee will not exceed .60% of the Fund's average net assets. For the reporting period, the total annualized management fee rate was .29% of the Fund's average net assets.
During the period, the investment adviser waived a portion of its management fee as described in the Expense Reductions note.
Sub-Adviser. FIAM LLC (an affiliate of the investment adviser) served as a sub-adviser for the Fund during the period. Sub-advisers provide discretionary investment advisory services for their allocated portion of the Fund's assets and are paid as described in the Management Fee note.
Interfund Trades. Funds may purchase from or sell securities to other funds affiliated with each sub-adviser under procedures adopted by the Board. The procedures have been designed to ensure these interfund trades are executed in accordance with Rule 17a-7 of the 1940 Act. Any interfund trades are included within the respective purchases and sales amounts shown in the Purchases and Sales of Investments note. During the period there were no interfund trades.
6. Investments in Fidelity Central Funds.
Funds may invest in Fidelity Central Funds, which are open-end investment companies generally available only to other investment companies and accounts managed by the investment adviser and its affiliates. The Schedule of Investments lists any Fidelity Central Funds held as an investment as of period end, but does not include the underlying holdings of each Fidelity Central Fund. An investing fund indirectly bears its proportionate share of the expenses of the underlying Fidelity Central Funds.
Based on its investment objective, each Fidelity Central Fund may invest or participate in various investment vehicles or strategies that are similar to those of the investing fund. These strategies are consistent with the investment objectives of the investing fund and may involve certain economic risks which may cause a decline in value of each of the Fidelity Central Funds and thus a decline in the value of the investing fund.
| Fidelity Central Fund | Investment Manager | Investment Objective | Investment Practices | Expense Ratio(a) |
| Fidelity Money Market Central Funds | Fidelity Management & Research Company LLC (FMR) | Each fund seeks to obtain a high level of current income consistent with the preservation of capital and liquidity. | Short-term Investments | Less than .005% |
(a) Expenses expressed as a percentage of average net assets and are as of each underlying Central Fund's most recent annual or semi-annual shareholder report.
A complete unaudited list of holdings for each Fidelity Central Fund is available upon request or at the Securities and Exchange Commission website at www.sec.gov. In addition, the financial statements of the Fidelity Central Funds, which are not covered by the Report of Independent Registered Public Accounting Firm, are available on the Securities and Exchange Commission website or upon request.
7. Committed Line of Credit.
Certain Funds participate with other funds managed by the investment adviser or an affiliate in a $4.25 billion credit facility (the "line of credit") to be utilized for temporary or emergency purposes to fund shareholder redemptions or for other short-term liquidity purposes. The participating funds have agreed to pay commitment fees on their pro-rata portion of the line of credit, which are reflected in Miscellaneous expenses on the Statement of Operations, and are listed below. During the period, there were no borrowings on this line of credit.
| Amount | |
| Strategic Advisers Fidelity Core Income Fund | $30,643 |
8. Expense Reductions.
The investment adviser has contractually agreed to waive the Fund's management fee in an amount equal to .25% of the Fund's average net assets until September 30, 2024. During the period, this waiver reduced the Fund's management fee by $ 51,034,944.
9. Other.
A fund's organizational documents provide former and current trustees and officers with a limited indemnification against liabilities arising in connection with the performance of their duties to the fund. In the normal course of business, a fund may also enter into contracts that provide general indemnifications. A fund's maximum exposure under these arrangements is unknown as this would be dependent on future claims that may be made against a fund. The risk of material loss from such claims is considered remote.
Funds do not invest in underlying mutual funds for the purpose of exercising management or control; however, investments by funds within their principal investment strategies may represent a significant portion of the underlying mutual fund's net assets. At the end of the period, certain Funds were the owners of record of 10% or more of the total outstanding shares of the following underlying mutual funds as shown below.
| Fund | Strategic Advisers Fidelity Core Income Fund |
| Fidelity Advisor Floating Rate High Income Fund | 10% |
| Fidelity Corporate Bond Fund | 35% |
| Fidelity Global Credit Fund | 23% |
| Fidelity Government Income Fund | 13% |
| Fidelity Intermediate Bond Fund | 21% |
| Fidelity New Markets Income Fund | 19% |
| Fidelity Real Estate Income Fund | 10% |
| Fidelity SAI Long-Term Treasury Bond Index Fund | 30% |
| Fidelity SAI Total Bond Fund | 66% |
| Fidelity SAI U.S. Treasury Bond Index Fund | 34% |
10. Coronavirus (COVID-19) Pandemic.
An outbreak of COVID-19 first detected in China during December 2019 has since spread globally and was declared a pandemic by the World Health Organization during March 2020. Developments that disrupt global economies and financial markets, such as the COVID-19 pandemic, may magnify factors that affect the Fund's performance.
Shareholder Expense Example
As a shareholder, you incur two types of costs: (1) transaction costs, which may include sales charges (loads) on purchase payments or redemption proceeds, as applicable and (2) ongoing costs, which generally include management fees, distribution and/or service (12b-1) fees and other Fund expenses. This Example is intended to help you understand your ongoing costs (in dollars) of investing in a fund and to compare these costs with the ongoing costs of investing in other mutual funds.
The Example is based on an investment of $1,000 invested at the beginning of the period and held for the entire period (June 1, 2021 to November 30, 2021).
Actual Expenses
The first line of the accompanying table provides information about actual account values and actual expenses. You may use the information in this line, together with the amount you invested, to estimate the expenses that you paid over the period. Simply divide your account value by $1,000.00 (for example, an $8,600 account value divided by $1,000.00 = 8.6), then multiply the result by the number in the first line for a class/Fund under the heading entitled "Expenses Paid During Period" to estimate the expenses you paid on your account during this period. If any fund is a shareholder of any underlying mutual funds or exchange-traded funds (ETFs) (the Underlying Funds), such fund indirectly bears its proportional share of the expenses of the Underlying Funds in addition to the direct expenses incurred presented in the table. These fees and expenses are not included in the annualized expense ratio used to calculate the expense estimate in the table below.
Hypothetical Example for Comparison Purposes
The second line of the accompanying table provides information about hypothetical account values and hypothetical expenses based on the actual expense ratio and an assumed rate of return of 5% per year before expenses, which is not the actual return. The hypothetical account values and expenses may not be used to estimate the actual ending account balance or expenses you paid for the period. You may use this information to compare the ongoing costs of investing in the Fund and other funds. To do so, compare this 5% hypothetical example with the 5% hypothetical examples that appear in the shareholder reports of the other funds. If any fund is a shareholder of any Underlying Funds, such fund indirectly bears its proportional share of the expenses of the Underlying Funds in addition to the direct expenses as presented in the table. These fees and expenses are not included in the annualized expense ratio used to calculate the expense estimate in the table below.
Please note that the expenses shown in the table are meant to highlight your ongoing costs only and do not reflect any transaction costs. Therefore, the second line of the table is useful in comparing ongoing costs only, and will not help you determine the relative total costs of owning different funds. In addition, if these transactional costs were included, your costs would have been higher.
| Annualized Expense Ratio-A | Beginning Account Value June 1, 2021 | Ending Account Value November 30, 2021 | Expenses Paid During Period-B June 1, 2021 to November 30, 2021 | |
| Strategic Advisers Fidelity Core Income Fund | .05% | |||
| Actual | $1,000.00 | $1,016.10 | $.25 | |
| Hypothetical-C | $1,000.00 | $1,024.82 | $.25 |
A Annualized expense ratio reflects expenses net of applicable fee waivers.
B Expenses are equal to the annualized expense ratio, multiplied by the average account value over the period, multiplied by 183/ 365 (to reflect the one-half year period). The fees and expenses of any Underlying Funds are not included in each annualized expense ratio.
C 5% return per year before expenses
Board Approval of Investment Advisory Contracts and Management Fees
Strategic Advisers Fidelity Core Income Fund
Each year, the Board of Trustees, including the Independent Trustees (together, the Board), votes at a meeting on the renewal of the management contract with Strategic Advisers LLC (Strategic Advisers), the sub-advisory agreement with FIAM LLC (the Sub-Adviser) (the Sub-Advisory Agreement), and the sub-sub-advisory agreements with FMR Investment Management (UK) Limited, Fidelity Management & Research (Japan) Limited, and Fidelity Management & Research (Hong Kong) Limited (collectively, the Sub-Sub-Advisory Agreements and, together with the management contract and the Sub-Advisory Agreement, the Advisory Contracts) for the fund. Strategic Advisers and the Sub-Adviser are referred to herein as the Investment Advisers. The Board, assisted by the advice of fund counsel and Independent Trustees' counsel, requests and considers a broad range of information relevant to the renewal of the Advisory Contracts throughout the year.The Board meets at least four times per year and, at each of its meetings, covers an extensive agenda of topics and materials and considers factors that are relevant to its annual consideration of the renewal of the fund's Advisory Contracts, including the services and support provided to the fund and its shareholders. The full Board or the Independent Trustees, as appropriate, act on all major matters; however, a portion of the activities of the Board (including certain of those described herein) may be conducted through standing committees that have been established by the Board. The Board, acting directly and through its committees, requests and receives information concerning the annual consideration of the renewal of the fund's Advisory Contracts.At its September 2021 meeting, the Board, including the Independent Trustees, unanimously determined to renew the fund's Advisory Contracts. In reaching its determination to renew the fund's Advisory Contracts, the Board considered all factors it believed relevant, including (i) the nature, extent, and quality of the services provided to the fund and its shareholders (including the investment performance of the fund); (ii) the competitiveness relative to peer funds of the fund's management fee and total expenses; (iii) the total costs of the services provided by and the profits, if any, realized by Strategic Advisers from its relationships with the fund; and (iv) the extent to which, if any, economies of scale exist and are realized as the fund grows and whether any economies of scale are appropriately shared with fund shareholders.In considering whether to renew the Advisory Contracts for the fund, the Board reached a determination, with the assistance of fund counsel and Independent Trustees' counsel and through the exercise of its business judgment, that the renewal of the Advisory Contracts is in the best interests of the fund and its shareholders. In addition, the Board concluded that the renewal of the Sub-Advisory Agreement does not involve a conflict of interest from which Strategic Advisers or its affiliates derive an inappropriate advantage. Also, the Board found that the advisory fees charged under the Advisory Contracts bear a reasonable relationship to the services rendered and are based on services provided that are in addition to, rather than duplicative of, services provided under the advisory contract of any underlying fund in which the fund may invest. The Board's decision to renew the Advisory Contracts was not based on any single factor, but rather was based on a comprehensive consideration of all the information provided to the Board throughout the year.Nature, Extent, and Quality of Services Provided. The Board considered the staffing within the Investment Advisers, including the backgrounds of the fund's investment personnel and also considered the fund's investment objective, strategies, and related investment philosophy. The Independent Trustees also had discussions with senior management of Strategic Advisers' investment operations and investment groups. The Board considered the structure of each Investment Adviser's investment personnel compensation program and whether such structures provide appropriate incentives to act in the best interests of the fund. The Board also considered steps taken by the Investment Advisers to continue to provide the same nature, extent, and quality of services to the funds during the COVID-19 pandemic.The Trustees also discussed with representatives of Strategic Advisers, at meetings throughout the year, Strategic Advisers' role in, among other things, (i) setting, implementing and monitoring the investment strategies for the funds; (ii) identifying and recommending sub-advisers for the funds; (iii) overseeing compliance with federal securities laws by each sub-adviser with respect to the portion of fund assets allocated to the sub-adviser; (iv) monitoring and overseeing the performance and investment capabilities of each sub-adviser; and (v) recommending the replacement of a sub-adviser as appropriate. The Trustees considered that the Board had received from Strategic Advisers substantial information and periodic reports about Strategic Advisers' sub-adviser oversight and due diligence processes, as well as periodic reports regarding the performance of each sub-adviser.The Board also considered the nature, extent and quality of services provided by the Sub-Adviser. The Trustees noted that under the Sub-Advisory Agreement subject to oversight by Strategic Advisers, the Sub-Adviser is responsible for, among other things, identifying investments for the portion of fund assets allocated to the Sub-Adviser, if any, and executing portfolio transactions to implement its investment strategy. In addition, the Trustees noted that the Sub-Adviser is responsible for providing such reporting as may be requested from Strategic Advisers to fulfill its oversight responsibilities discussed above.Resources Dedicated to Investment Management and Support Services. The Board reviewed the general qualifications and capabilities of the Investment Advisers' investment staffs, their use of technology, and the Investment Advisers' approach to managing and compensating investment personnel. The Board noted that the Investment Advisers' analysts have extensive resources, tools, and capabilities that allow them to conduct sophisticated quantitative and/or fundamental analysis. Additionally, in its deliberations, the Board considered the Investment Advisers' trading capabilities and resources and global compliance infrastructure, which are integral parts of the investment management process.Shareholder and Administrative Services. The Board considered (i) the nature, extent, quality, and cost of administrative and shareholder services performed by Strategic Advisers and its affiliates under the management contract and under separate agreements covering transfer agency, pricing and bookkeeping, and securities lending services for the fund; (ii) the nature and extent of Strategic Advisers' supervision of third party service providers, including sub-advisers, custodians and subcustodians; and (iii) the resources devoted to, and the record of compliance with, the fund's compliance policies and procedures.Investment Performance. The Board considered whether the fund has operated in accordance with its investment objective, as well as its record of compliance with its investment restrictions and its performance history.In connection with the renewal of the Advisory Contracts, the Board considered annualized return information for the fund for different time periods, measured against an appropriate securities market index (benchmark index) and a peer group of mutual funds with similar objectives (peer group).The Board considered discussions that occur at Board meetings throughout the year with representatives of Strategic Advisers about fund investment performance and the performance of each Sub-Adviser as part of regularly scheduled fund reviews and other reports to the Board on fund performance, taking into account various factors including general market conditions. In its discussions with representatives of Strategic Advisers regarding fund performance, the Board gave particular attention to information indicating underperformance of certain funds for specific time periods and discussed with Strategic Advisers the reasons for any such underperformance.The following chart considered by the Board shows, over the one-year period ended December 31, 2020, the cumulative total returns of the fund and the cumulative total returns of an appropriate benchmark index and peer group. The box within the chart shows the 25th percentile return (75% beaten, top of box) and the 75th percentile return (25% beaten, bottom of box) of the peer group. Returns shown above the box are in the first quartile and returns shown below the box are in the fourth quartile. The percentage beaten number noted below each chart corresponds to the percentile box and represents the percentage of funds in the peer group whose performance was equal to or lower than that of the fund.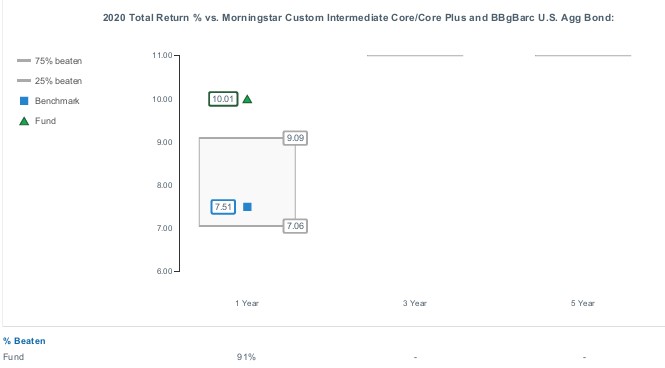

![]()
COI-SANN-0122
1.9887940.103
Strategic Advisers® Fidelity® Emerging Markets Fund
Offered exclusively to certain managed account clients of Strategic Advisers LLC or its affiliates - not available for sale to the general public
Semi-Annual Report
November 30, 2021
Contents
Board Approval of Investment Advisory Contracts and Management Fees |
To view a fund's proxy voting record for the 12-month period ended June 30, visit http://www.fidelity.com/proxyvotingresults or visit the Securities and Exchange Commission's (SEC) web site at http://www.sec.gov.
You may also call 1-800-544-3455 to request a free copy of the proxy voting guidelines.
Standard & Poor's, S&P and S&P 500 are registered service marks of The McGraw-Hill Companies, Inc. and have been licensed for use by Fidelity Distributors Corporation.
Other third-party marks appearing herein are the property of their respective owners.
All other marks appearing herein are registered or unregistered trademarks or service marks of FMR LLC or an affiliated company. © 2022 FMR LLC. All rights reserved.
This report and the financial statements contained herein are submitted for the general information of the shareholders of the Fund. This report is not authorized for distribution to prospective investors in the Fund unless preceded or accompanied by an effective prospectus.
A fund files its complete schedule of portfolio holdings with the SEC for the first and third quarters of each fiscal year on Form N-PORT. Forms N-PORT are available on the SEC’s web site at http://www.sec.gov. A fund's Forms N-PORT may be reviewed and copied at the SEC’s Public Reference Room in Washington, DC. Information regarding the operation of the SEC's Public Reference Room may be obtained by calling 1-800-SEC-0330.
For a complete list of a fund's portfolio holdings, view the most recent holdings listing, semiannual report, or annual report on Fidelity's web site at http://www.fidelity.com, http://www.institutional.fidelity.com, or http://www.401k.com, as applicable.
NOT FDIC INSURED •MAY LOSE VALUE •NO BANK GUARANTEE
Neither the Fund nor Fidelity Distributors Corporation is a bank.
Note to Shareholders:
Early in 2020, the outbreak and spread of COVID-19 emerged as a public health emergency that had a major influence on financial markets, primarily based on its impact on the global economy and corporate earnings. On March 11, 2020, the World Health Organization declared the COVID-19 outbreak a pandemic, citing sustained risk of further global spread. The pandemic prompted a number of measures to limit the spread of COVID-19, including travel and border restrictions, quarantines, and restrictions on large gatherings. In turn, these resulted in lower consumer activity, diminished demand for a wide range of products and services, disruption in manufacturing and supply chains, and – given the wide variability in outcomes regarding the outbreak – significant market uncertainty and volatility. To help stem the turmoil, the U.S. government took unprecedented action – in concert with the U.S. Federal Reserve and central banks around the world – to help support consumers, businesses, and the broader economy, and to limit disruption to the financial system.
In general, the overall impact of the pandemic lessened in 2021, amid a resilient economy and widespread distribution of three COVID-19 vaccines granted emergency use authorization from the U.S. Food and Drug Administration (FDA) early in the year. Still, the situation remains dynamic, and the extent and duration of its influence on financial markets and the economy is highly uncertain, due in part to a recent spike in cases based on highly contagious variants of the coronavirus.
Extreme events such as the COVID-19 crisis are exogenous shocks that can have significant adverse effects on mutual funds and their investments. Although multiple asset classes may be affected by market disruption, the duration and impact may not be the same for all types of assets. Fidelity is committed to helping you stay informed amid news about COVID-19 and during increased market volatility, and we continue to take extra steps to be responsive to customer needs. We encourage you to visit us online, where we offer ongoing updates, commentary, and analysis on the markets and our funds.
Investment Summary (Unaudited)
The information in the following tables is based on the direct investments of the Fund.Top Ten Holdings as of November 30, 2021
| (excluding cash equivalents) | % of fund's net assets |
| Fidelity SAI Emerging Markets Value Index Fund | 16.9 |
| Fidelity Advisor Emerging Markets Fund - Class Z | 12.2 |
| Fidelity SAI Emerging Markets Low Volatility Index Fund | 6.8 |
| Fidelity SAI Emerging Markets Index Fund | 6.0 |
| Taiwan Semiconductor Manufacturing Co. Ltd. | 3.8 |
| Samsung Electronics Co. Ltd. | 3.0 |
| Tencent Holdings Ltd. | 3.0 |
| Alibaba Group Holding Ltd. sponsored ADR | 1.4 |
| JD.com, Inc. sponsored ADR | 1.0 |
| MediaTek, Inc. | 0.9 |
| 55.0 |
Top Five Market Sectors as of November 30, 2021
| (stocks only) | % of fund's net assets |
| Consumer Discretionary | 12.3 |
| Financials | 11.3 |
| Consumer Discretionary | 8.4 |
| Communication Services | 4.8 |
| Materials | 3.7 |
Geographic Diversification (% of fund's net assets)
| As of November 30, 2021 | ||
| United States of America | 49.2% | |
| Cayman Islands | 11.7% | |
| Taiwan | 7.5% | |
| Korea (South) | 6.4% | |
| India | 6.2% | |
| China | 4.9% | |
| Russia | 2.3% | |
| Brazil | 1.9% | |
| Hong Kong | 1.3% | |
| Other | 8.6% | |

Asset Allocation (% of fund's net assets)
| As of November 30, 2021 | ||
| Common Stocks | 49.9% | |
| Preferred Stocks | 1.2% | |
| Diversifed Emerging Markets Funds | 41.9% | |
| Short-Term Investments and Net Other Assets (Liabilities) | 7.0% | |

Asset allocations of funds in the pie chart reflect the categorizations of assets as defined by Morningstar as of the reporting date.
Schedule of Investments November 30, 2021 (Unaudited)
Showing Percentage of Net Assets
| Common Stocks - 49.9% | |||
| Shares | Value | ||
| COMMUNICATION SERVICES - 4.8% | |||
| Diversified Telecommunication Services - 0.1% | |||
| PT Telkom Indonesia Persero Tbk | 18,793,700 | $5,232,648 | |
| Entertainment - 0.7% | |||
| Bilibili, Inc.: | |||
| ADR (a)(b) | 330,732 | 21,831,619 | |
| Class Z (a) | 143,960 | 9,470,480 | |
| NetEase, Inc. | 321,100 | 6,942,480 | |
| NetEase, Inc. ADR | 263,212 | 28,355,829 | |
| 66,600,408 | |||
| Interactive Media & Services - 3.6% | |||
| Kuaishou Technology Class B (c) | 277,232 | 3,020,115 | |
| NAVER Corp. | 42,590 | 13,714,557 | |
| Tencent Holdings Ltd. | 4,532,375 | 264,323,942 | |
| Yandex NV Series A (a)(b) | 494,125 | 35,547,353 | |
| 316,605,967 | |||
| Wireless Telecommunication Services - 0.4% | |||
| Bharti Airtel Ltd. (a) | 1,886,919 | 18,297,587 | |
| MTN Group Ltd. (a) | 1,616,274 | 16,303,665 | |
| 34,601,252 | |||
| TOTAL COMMUNICATION SERVICES | 423,040,275 | ||
| CONSUMER DISCRETIONARY - 8.4% | |||
| Automobiles - 1.3% | |||
| Eicher Motors Ltd. | 655,163 | 20,679,509 | |
| Great Wall Motor Co. Ltd. (H Shares) | 795,000 | 3,323,545 | |
| Guangzhou Automobile Group Co. Ltd. (H Shares) | 12,682,000 | 12,977,989 | |
| Hyundai Motor Co. | 134,733 | 22,262,294 | |
| Kia Corp. | 198,368 | 13,043,688 | |
| Li Auto, Inc. ADR (a) | 426,237 | 15,105,839 | |
| XPeng, Inc.: | |||
| ADR (a) | 530,923 | 29,200,765 | |
| Class A | 107,100 | 2,950,150 | |
| 119,543,779 | |||
| Hotels, Restaurants & Leisure - 0.4% | |||
| Jiumaojiu International Holdings Ltd. (c) | 972,000 | 2,016,794 | |
| MakeMyTrip Ltd. (a) | 217,097 | 5,286,312 | |
| Shangri-La Asia Ltd. (a) | 12,476,000 | 9,871,367 | |
| Trip.com Group Ltd. ADR (a) | 472,301 | 12,988,278 | |
| Yum China Holdings, Inc. | 25,526 | 1,278,853 | |
| Yum China Holdings, Inc. | 32,200 | 1,611,239 | |
| 33,052,843 | |||
| Household Durables - 0.6% | |||
| Haier Smart Home Co. Ltd. (A Shares) | 9,787,666 | 41,861,677 | |
| Midea Group Co. Ltd. (A Shares) | 1,325,100 | 14,112,358 | |
| 55,974,035 | |||
| Internet & Direct Marketing Retail - 4.4% | |||
| Alibaba Group Holding Ltd. (a) | 971,800 | 15,517,413 | |
| Alibaba Group Holding Ltd. sponsored ADR (a) | 954,813 | 121,767,302 | |
| Coupang, Inc. Class A (b) | 170,346 | 4,514,169 | |
| JD.com, Inc.: | |||
| Class A (a) | 271,150 | 11,450,097 | |
| sponsored ADR (a) | 1,102,537 | 92,734,387 | |
| Meituan Class B (a)(c) | 2,661,345 | 80,889,759 | |
| MercadoLibre, Inc. (a) | 2,275 | 2,703,633 | |
| momo.com, Inc. | 161,200 | 10,357,579 | |
| Naspers Ltd. Class N | 127,336 | 19,503,601 | |
| Pinduoduo, Inc. ADR (a) | 112,916 | 7,508,914 | |
| Prosus NV | 283,770 | 22,823,727 | |
| 389,770,581 | |||
| Leisure Products - 0.0% | |||
| Bafang Electric Suzhou Co. Ltd. (A Shares) | 87,091 | 3,389,465 | |
| Specialty Retail - 0.4% | |||
| China International Travel Service Corp. Ltd. (A Shares) | 156,700 | 5,058,532 | |
| Pop Mart International Group Ltd. (c) | 331,400 | 2,290,646 | |
| Zhongsheng Group Holdings Ltd. Class H | 3,463,000 | 28,488,260 | |
| 35,837,438 | |||
| Textiles, Apparel & Luxury Goods - 1.3% | |||
| Anta Sports Products Ltd. | 1,175,000 | 18,714,414 | |
| ECLAT Textile Co. Ltd. | 788,000 | 16,500,528 | |
| Li Ning Co. Ltd. | 5,556,564 | 63,133,056 | |
| Shenzhou International Group Holdings Ltd. | 885,434 | 16,626,551 | |
| 114,974,549 | |||
| TOTAL CONSUMER DISCRETIONARY | 752,542,690 | ||
| CONSUMER STAPLES - 2.8% | |||
| Beverages - 1.1% | |||
| China Resources Beer Holdings Co. Ltd. | 4,132,000 | 33,806,309 | |
| Fomento Economico Mexicano S.A.B. de CV sponsored ADR | 74,330 | 5,258,104 | |
| Kweichow Moutai Co. Ltd. (A Shares) | 102,911 | 31,220,633 | |
| Thai Beverage PCL | 25,894,700 | 12,714,411 | |
| Wuliangye Yibin Co. Ltd. (A Shares) | 420,800 | 14,413,903 | |
| 97,413,360 | |||
| Food & Staples Retailing - 0.5% | |||
| Atacadao SA | 1,515,459 | 4,132,445 | |
| Bid Corp. Ltd. | 470,722 | 9,026,548 | |
| CP ALL PCL: | |||
| (For. Reg.) | 6,804,831 | 11,824,821 | |
| rights (a) | 453,655 | 6,738 | |
| Wal-Mart de Mexico SA de CV Series V | 5,761,607 | 18,105,029 | |
| 43,095,581 | |||
| Food Products - 1.0% | |||
| Angel Yeast Co. Ltd. (A Shares) | 1,515,700 | 13,341,532 | |
| China Mengniu Dairy Co. Ltd. | 11,472,000 | 63,994,870 | |
| Inner Mongoli Yili Industries Co. Ltd. (A Shares) | 574,767 | 3,537,486 | |
| Uni-President Enterprises Corp. | 4,989,201 | 11,767,479 | |
| 92,641,367 | |||
| Personal Products - 0.2% | |||
| LG Household & Health Care Ltd. | 2,397 | 2,135,295 | |
| Natura & Co. Holding SA (a) | 2,445,040 | 11,607,944 | |
| Proya Cosmetics Co. Ltd. (A Shares) | 67,700 | 2,113,132 | |
| 15,856,371 | |||
| TOTAL CONSUMER STAPLES | 249,006,679 | ||
| ENERGY - 2.4% | |||
| Energy Equipment & Services - 0.0% | |||
| Yantai Jereh Oilfield Services (A Shares) | 791,535 | 4,854,204 | |
| Oil, Gas & Consumable Fuels - 2.4% | |||
| China Merchants Energy Shipping Co. Ltd. (A Shares) | 4,333,780 | 2,975,758 | |
| China Petroleum & Chemical Corp. (H Shares) | 11,312,471 | 4,931,215 | |
| Gazprom OAO | 4,360,151 | 19,813,532 | |
| Gazprom OAO sponsored ADR (Reg. S) | 1,218,916 | 10,872,731 | |
| Lukoil PJSC | 328,025 | 28,900,599 | |
| Lukoil PJSC sponsored ADR | 368,813 | 32,175,246 | |
| Novatek PJSC GDR (Reg. S) | 53,767 | 11,780,350 | |
| Oil & Natural Gas Corp. Ltd. | 10,099,867 | 19,110,401 | |
| Petroleo Brasileiro SA - Petrobras (ON) | 1,785,038 | 9,569,989 | |
| Petronet LNG Ltd. | 2,056,479 | 6,020,199 | |
| PT United Tractors Tbk | 9,319,300 | 13,891,922 | |
| Reliance Industries Ltd. | 1,287,271 | 41,230,382 | |
| Reliance Industries Ltd. sponsored GDR (c) | 175,356 | 11,205,248 | |
| 212,477,572 | |||
| TOTAL ENERGY | 217,331,776 | ||
| FINANCIALS - 10.7% | |||
| Banks - 7.5% | |||
| Absa Group Ltd. | 569,496 | 4,781,728 | |
| Al Rajhi Bank | 786,623 | 27,719,256 | |
| Axis Bank Ltd. (a) | 1,368,510 | 11,947,584 | |
| Capitec Bank Holdings Ltd. | 61,806 | 7,041,578 | |
| China Construction Bank Corp. (H Shares) | 34,773,431 | 22,658,595 | |
| China Merchants Bank Co. Ltd. (H Shares) | 5,574,401 | 43,105,460 | |
| Credicorp Ltd. (United States) | 203,000 | 23,954,000 | |
| E.SUN Financial Holdings Co. Ltd. | 10,534,187 | 10,240,618 | |
| Grupo Financiero Banorte S.A.B. de CV Series O | 4,534,759 | 27,097,525 | |
| Hana Financial Group, Inc. | 229,760 | 7,670,447 | |
| HDFC Bank Ltd. | 1,329,220 | 26,351,367 | |
| HDFC Bank Ltd. sponsored ADR | 909,319 | 59,533,115 | |
| ICICI Bank Ltd. | 2,901,733 | 27,447,701 | |
| Industrial & Commercial Bank of China Ltd. (H Shares) | 91,899,208 | 48,562,589 | |
| KB Financial Group, Inc. | 290,403 | 12,957,840 | |
| Kotak Mahindra Bank Ltd. (a) | 284,160 | 7,423,349 | |
| National Bank of Greece SA (a) | 6,138,000 | 18,356,436 | |
| OTP Bank PLC (a) | 166,751 | 9,233,851 | |
| PT Bank Central Asia Tbk | 66,987,303 | 34,025,668 | |
| PT Bank Mandiri (Persero) Tbk | 79,639,185 | 38,922,974 | |
| PT Bank Rakyat Indonesia Tbk | 35,913,945 | 10,233,214 | |
| Sberbank of Russia | 2,323,310 | 9,947,528 | |
| Sberbank of Russia | 5,810,767 | 24,794,438 | |
| Sberbank of Russia sponsored ADR | 2,068,544 | 34,979,079 | |
| Shinhan Financial Group Co. Ltd. | 1,160,431 | 33,881,504 | |
| Siam Commercial Bank PCL (For. Reg.) | 3,200,514 | 11,598,476 | |
| State Bank of India | 4,566,342 | 28,003,047 | |
| TCS Group Holding PLC GDR | 495,763 | 47,464,350 | |
| 669,933,317 | |||
| Capital Markets - 0.5% | |||
| East Money Information Co. Ltd. (A Shares) | 1,764,560 | 9,604,255 | |
| Hong Kong Exchanges and Clearing Ltd. | 108,200 | 5,966,402 | |
| Noah Holdings Ltd. sponsored ADR (a) | 83,689 | 3,048,790 | |
| XP, Inc. Class A (a) | 881,889 | 25,292,577 | |
| 43,912,024 | |||
| Consumer Finance - 0.8% | |||
| Bajaj Finance Ltd. | 184,154 | 17,158,077 | |
| Kaspi.KZ JSC unit | 334,042 | 43,091,418 | |
| Shriram Transport Finance Co. Ltd. | 643,135 | 12,046,578 | |
| 72,296,073 | |||
| Diversified Financial Services - 0.4% | |||
| Chailease Holding Co. Ltd. | 3,508,503 | 31,221,093 | |
| Insurance - 1.0% | |||
| AIA Group Ltd. | 4,758,400 | 50,093,821 | |
| China Life Insurance Co. Ltd. (H Shares) | 14,608,000 | 24,025,214 | |
| HDFC Standard Life Insurance Co. Ltd. (c) | 908,669 | 8,237,308 | |
| ICICI Lombard General Insurance Co. Ltd. (c) | 327,901 | 6,275,746 | |
| Ping An Insurance Group Co. of China Ltd. (H Shares) | 675,249 | 4,680,990 | |
| 93,313,079 | |||
| Thrifts & Mortgage Finance - 0.5% | |||
| Housing Development Finance Corp. Ltd. | 1,184,371 | 42,156,353 | |
| TOTAL FINANCIALS | 952,831,939 | ||
| HEALTH CARE - 1.9% | |||
| Biotechnology - 0.2% | |||
| InnoCare Pharma Ltd. (a)(c) | 691,000 | 1,761,616 | |
| Innovent Biologics, Inc. (a)(c) | 271,000 | 2,410,086 | |
| Remegen Co. Ltd. (H Shares) (a)(c) | 231,500 | 3,140,895 | |
| Zai Lab Ltd. (a) | 141,032 | 9,957,439 | |
| Zai Lab Ltd. ADR (a) | 3,100 | 214,675 | |
| 17,484,711 | |||
| Health Care Equipment & Supplies - 0.4% | |||
| Peijia Medical Ltd. (a)(c) | 1,047,000 | 2,252,970 | |
| Shenzhen Mindray Bio-Medical Electronics Co. Ltd. (A Shares) | 666,186 | 37,518,823 | |
| 39,771,793 | |||
| Health Care Providers & Services - 0.1% | |||
| Apollo Hospitals Enterprise Ltd. | 79,240 | 6,001,296 | |
| Aster DM Healthcare Ltd. (a)(c) | 1,192 | 3,047 | |
| 6,004,343 | |||
| Health Care Technology - 0.0% | |||
| Medlive Technology Co. Ltd. (c) | 620,000 | 3,156,450 | |
| Life Sciences Tools & Services - 0.7% | |||
| Hangzhou Tigermed Consulting Co. Ltd. (H Shares) (c) | 132,600 | 2,113,642 | |
| Pharmaron Beijing Co. Ltd. (H Shares) (c) | 514,027 | 10,592,990 | |
| WuXi AppTec Co. Ltd. (H Shares) (c) | 913,629 | 20,351,033 | |
| Wuxi Biologics (Cayman), Inc. (a)(c) | 1,885,600 | 25,436,351 | |
| 58,494,016 | |||
| Pharmaceuticals - 0.5% | |||
| Hansoh Pharmaceutical Group Co. Ltd. (c) | 3,017,757 | 6,160,899 | |
| Richter Gedeon PLC | 1,526,758 | 40,632,617 | |
| 46,793,516 | |||
| TOTAL HEALTH CARE | 171,704,829 | ||
| INDUSTRIALS - 2.6% | |||
| Airlines - 0.1% | |||
| Copa Holdings SA Class A (a) | 59,963 | 4,192,613 | |
| Wizz Air Holdings PLC (a)(c) | 57,692 | 3,027,666 | |
| 7,220,279 | |||
| Building Products - 0.0% | |||
| Zhejiang Weixing New Building Materials Co. Ltd. (A Shares) | 647,248 | 1,885,514 | |
| Construction & Engineering - 0.8% | |||
| Larsen & Toubro Ltd. | 2,111,011 | 49,605,948 | |
| Voltas Ltd. | 1,141,000 | 18,246,884 | |
| 67,852,832 | |||
| Electrical Equipment - 0.3% | |||
| Graphite India Ltd. | 557,168 | 3,032,893 | |
| Sungrow Power Supply Co. Ltd. (A Shares) | 935,130 | 23,726,850 | |
| Zhejiang HangKe Technology, Inc. Co. (A Shares) | 157,440 | 3,042,031 | |
| 29,801,774 | |||
| Machinery - 0.9% | |||
| Estun Automation Co. Ltd. (A Shares) | 628,210 | 2,715,469 | |
| HIWIN Technologies Corp. | 2,123,716 | 21,849,671 | |
| Shandong Himile Mechanical Science & Technology Co. Ltd. (A Shares) | 647,360 | 2,797,228 | |
| Techtronic Industries Co. Ltd. | 1,442,500 | 29,763,818 | |
| Zhejiang Sanhua Intelligent Controls Co. Ltd. (A Shares) | 7,568,499 | 27,625,384 | |
| 84,751,570 | |||
| Professional Services - 0.1% | |||
| Sporton International, Inc. | 902,500 | 6,851,376 | |
| Road & Rail - 0.3% | |||
| Localiza Rent A Car SA | 2,345,905 | 21,327,357 | |
| TuSimple Holdings, Inc. | 24,381 | 974,996 | |
| 22,302,353 | |||
| Trading Companies & Distributors - 0.0% | |||
| BOC Aviation Ltd. Class A (c) | 296,800 | 2,095,260 | |
| Transportation Infrastructure - 0.1% | |||
| Grupo Aeroportuario del Sureste S.A.B. de CV Series B | 558,326 | 10,228,621 | |
| TOTAL INDUSTRIALS | 232,989,579 | ||
| INFORMATION TECHNOLOGY - 12.3% | |||
| Communications Equipment - 0.0% | |||
| Accton Technology Corp. | 334,000 | 3,489,473 | |
| Electronic Equipment & Components - 0.8% | |||
| Hon Hai Precision Industry Co. Ltd. (Foxconn) | 2,813,162 | 10,484,817 | |
| Samsung SDI Co. Ltd. | 20,668 | 12,018,107 | |
| SINBON Electronics Co. Ltd. | 285,000 | 2,626,987 | |
| Sunny Optical Technology Group Co. Ltd. | 120,400 | 3,640,718 | |
| Unimicron Technology Corp. | 2,806,972 | 23,055,659 | |
| Wuxi Lead Intelligent Equipment Co. Ltd. (A Shares) | 396,967 | 4,944,389 | |
| Yageo Corp. | 821,000 | 13,489,253 | |
| 70,259,930 | |||
| IT Services - 0.7% | |||
| Globant SA (a) | 26,100 | 6,916,761 | |
| Infosys Ltd. | 345,249 | 7,858,527 | |
| Infosys Ltd. sponsored ADR | 1,772,169 | 40,015,576 | |
| Tata Consultancy Services Ltd. | 178,948 | 8,409,245 | |
| 63,200,109 | |||
| Semiconductors & Semiconductor Equipment - 7.3% | |||
| ASML Holding NV (Netherlands) | 6,807 | 5,342,679 | |
| eMemory Technology, Inc. | 214,265 | 16,675,312 | |
| Global Unichip Corp. | 276,000 | 5,844,028 | |
| LONGi Green Energy Technology Co. Ltd. | 285,705 | 3,924,443 | |
| MediaTek, Inc. | 2,277,720 | 83,051,236 | |
| Parade Technologies Ltd. | 174,982 | 13,407,715 | |
| Silergy Corp. | 191,593 | 32,571,997 | |
| SK Hynix, Inc. | 764,187 | 73,629,810 | |
| Taiwan Semiconductor Manufacturing Co. Ltd. | 15,769,913 | 337,364,965 | |
| Taiwan Semiconductor Manufacturing Co. Ltd. sponsored ADR | 612,059 | 71,702,712 | |
| United Microelectronics Corp. | 1,108,000 | 2,551,348 | |
| Vanguard International Semiconductor Corp. | 870,000 | 4,875,292 | |
| 650,941,537 | |||
| Technology Hardware, Storage & Peripherals - 3.5% | |||
| Samsung Electronics Co. Ltd. | 4,415,359 | 266,075,404 | |
| Samsung Electronics Co. Ltd. unit | 25,472 | 38,157,056 | |
| Wiwynn Corp. | 98,000 | 3,700,408 | |
| 307,932,868 | |||
| TOTAL INFORMATION TECHNOLOGY | 1,095,823,917 | ||
| MATERIALS - 3.7% | |||
| Chemicals - 0.8% | |||
| Hansol Chemical Co. Ltd. | 90,734 | 22,852,594 | |
| LG Chemical Ltd. | 11,717 | 6,872,664 | |
| PhosAgro OJSC GDR (Reg. S) | 243,709 | 5,376,221 | |
| PT Avia Avian (d) | 76,285,000 | 4,953,399 | |
| Shandong Sinocera Functional Material Co. Ltd. (A Shares) | 453,600 | 3,200,138 | |
| SKSHU Paint Co. Ltd. (A Shares) | 258,864 | 4,841,066 | |
| Sociedad Quimica y Minera de Chile SA (PN-B) sponsored ADR | 74,904 | 4,663,523 | |
| Solar Industries India Ltd. | 525,100 | 19,350,040 | |
| 72,109,645 | |||
| Construction Materials - 0.5% | |||
| Anhui Conch Cement Co. Ltd. (H Shares) | 614,500 | 2,793,540 | |
| Beijing Oriental Yuhong Waterproof Technology Co. Ltd. (A Shares) | 372,300 | 2,312,433 | |
| CEMEX S.A.B. de CV: | |||
| unit (a) | 12,165,542 | 7,545,842 | |
| sponsored ADR (a) | 2,045,146 | 12,577,648 | |
| JK Cement Ltd. | 489,500 | 21,085,327 | |
| 46,314,790 | |||
| Metals & Mining - 2.3% | |||
| AngloGold Ashanti Ltd. | 264,459 | 5,653,157 | |
| Barrick Gold Corp. | 1,892,800 | 35,944,272 | |
| China Molybdenum Co. Ltd. (A Shares) | 3,732,616 | 3,454,442 | |
| First Quantum Minerals Ltd. | 1,363,570 | 29,065,726 | |
| Grupo Mexico SA de CV Series B | 7,108,620 | 29,743,984 | |
| Impala Platinum Holdings Ltd. | 2,122,863 | 26,587,551 | |
| Novolipetsk Steel OJSC GDR (Reg. S) | 103,536 | 2,996,332 | |
| POSCO | 154,725 | 34,106,231 | |
| Sibanye Stillwater Ltd. | 4,392,792 | 13,697,979 | |
| Tata Steel Ltd. | 522,316 | 7,450,132 | |
| Vale SA | 435,373 | 5,417,139 | |
| Vale SA sponsored ADR | 472,800 | 5,848,536 | |
| 199,965,481 | |||
| Paper & Forest Products - 0.1% | |||
| Suzano Papel e Celulose SA (a) | 821,521 | 8,206,661 | |
| TOTAL MATERIALS | 326,596,577 | ||
| REAL ESTATE - 0.2% | |||
| Equity Real Estate Investment Trusts (REITs) - 0.0% | |||
| Link (REIT) | 62,800 | 544,406 | |
| Real Estate Management & Development - 0.2% | |||
| Ayala Land, Inc. | 22,586,204 | 15,422,327 | |
| TOTAL REAL ESTATE | 15,966,733 | ||
| UTILITIES - 0.1% | |||
| Gas Utilities - 0.1% | |||
| ENN Energy Holdings Ltd. | 233,100 | 4,376,230 | |
| Indraprastha Gas Ltd. | 970,834 | 6,260,005 | |
| 10,636,235 | |||
| TOTAL COMMON STOCKS | |||
| (Cost $3,900,821,619) | 4,448,471,229 | ||
| Nonconvertible Preferred Stocks - 1.2% | |||
| CONSUMER STAPLES - 0.2% | |||
| Beverages - 0.2% | |||
| Ambev SA sponsored ADR | 5,659,300 | 15,959,226 | |
| ENERGY - 0.3% | |||
| Oil, Gas & Consumable Fuels - 0.3% | |||
| Petroleo Brasileiro SA - Petrobras sponsored ADR (b) | 2,613,726 | 27,888,456 | |
| FINANCIALS - 0.6% | |||
| Banks - 0.6% | |||
| Banco Bradesco SA (PN) | 1,225,652 | 4,340,694 | |
| Itau Unibanco Holding SA | 5,687,881 | 22,642,863 | |
| Sberbank of Russia | 2,462,434 | 9,710,550 | |
| Sberbank of Russia (Russia) | 3,791,522 | 14,979,790 | |
| 51,673,897 | |||
| INDUSTRIALS - 0.1% | |||
| Airlines - 0.1% | |||
| Azul SA (a) | 1,053,179 | 4,379,933 | |
| MATERIALS - 0.0% | |||
| Metals & Mining - 0.0% | |||
| Gerdau SA | 909,305 | 4,173,016 | |
| TOTAL NONCONVERTIBLE PREFERRED STOCKS | |||
| (Cost $103,487,023) | 104,074,528 | ||
| Equity Funds - 41.9% | |||
| Diversified Emerging Markets Funds - 41.9% | |||
| Fidelity Advisor Emerging Markets Fund - Class Z (e) | 23,530,352 | 1,086,396,339 | |
| Fidelity SAI Emerging Markets Index Fund (e) | 33,734,203 | 535,024,457 | |
| Fidelity SAI Emerging Markets Low Volatility Index Fund (e) | 54,066,028 | 612,568,102 | |
| Fidelity SAI Emerging Markets Value Index Fund (e) | 109,049,898 | 1,508,160,093 | |
| TOTAL EQUITY FUNDS | |||
| (Cost $3,302,493,694) | 3,742,148,991 | ||
| U.S. Treasury Obligations - 0.4% | |||
| U.S. Treasury Bills, yield at date of purchase 0.03% to 0.06% 12/2/21 to 2/17/22 (f) | |||
| (Cost $35,178,277) | 35,180,000 | 35,177,490 | |
| Money Market Funds - 7.0% | |||
| Fidelity Cash Central Fund 0.06% (g) | 100,004,662 | 100,024,663 | |
| Fidelity Securities Lending Cash Central Fund 0.07% (g)(h) | 52,356,171 | 52,361,407 | |
| Invesco Government & Agency Portfolio Institutional Class .03% (i) | 474,941,510 | 474,941,510 | |
| TOTAL MONEY MARKET FUNDS | |||
| (Cost $627,307,437) | 627,327,580 | ||
| TOTAL INVESTMENT IN SECURITIES - 100.4% | |||
| (Cost $7,969,288,050) | 8,957,199,818 | ||
| NET OTHER ASSETS (LIABILITIES) - (0.4)% | (32,629,376) | ||
| NET ASSETS - 100% | $8,924,570,442 |
| Futures Contracts | |||||
| Number of contracts | Expiration Date | Notional Amount | Value | Unrealized Appreciation/(Depreciation) | |
| Purchased | |||||
| Equity Index Contracts | |||||
| ICE MSCI Emerging Markets Index Contracts (United States) | 7,856 | Dec. 2021 | $476,191,440 | $(19,943,826) | $(19,943,826) |
The notional amount of futures purchased as a percentage of Net Assets is 5.3%
Legend
(a) Non-income producing
(b) Security or a portion of the security is on loan at period end.
(c) Security exempt from registration under Rule 144A of the Securities Act of 1933. These securities may be resold in transactions exempt from registration, normally to qualified institutional buyers. At the end of the period, the value of these securities amounted to $196,438,521 or 2.2% of net assets.
(d) Security or a portion of the security purchased on a delayed delivery or when-issued basis. Interest rate to be determined at settlement date.
(e) Affiliated Fund
(f) Security or a portion of the security was pledged to cover margin requirements for futures contracts. At period end, the value of securities pledged amounted to $28,630,045.
(g) Affiliated fund that is generally available only to investment companies and other accounts managed by Fidelity Investments. The rate quoted is the annualized seven-day yield of the fund at period end. A complete unaudited listing of the fund's holdings as of its most recent quarter end is available upon request. In addition, each Fidelity Central Fund's financial statements are available on the SEC's website or upon request.
(h) Investment made with cash collateral received from securities on loan.
(i) The rate quoted is the annualized seven-day yield of the fund at period end.
Affiliated Central Funds
Fiscal year to date information regarding the Fund's investments in Fidelity Central Funds, including the ownership percentage, is presented below.
| Fund | Value, beginning of period | Purchases | Sales Proceeds | Dividend Income | Realized Gain/Loss | Change in Unrealized appreciation (depreciation) | Value, end of period | % ownership, end of period |
| Fidelity Cash Central Fund 0.06% | $78,422,634 | $955,680,046 | $934,078,017 | $30,236 | $-- | $-- | $100,024,663 | 0.2% |
| Fidelity Securities Lending Cash Central Fund 0.07% | 24,237,307 | 265,971,494 | 237,847,394 | 128,633 | -- | -- | 52,361,407 | 0.2% |
| Total | $102,659,941 | $1,221,651,540 | $1,171,925,411 | $158,869 | $-- | $-- | $152,386,070 |
Amounts in the income column in the above table include any capital gain distributions from underlying funds, which are presented in the corresponding line-item in the Statement of Operations, if applicable. Amount for Fidelity Securities Lending Cash Central Fund represents the income earned on investing cash collateral, less rebates paid to borrowers and any lending agent fees associated with the loan, plus any premium payments received for lending certain types of securities.
Affiliated Underlying Funds
Fiscal year to date information regarding the Fund's investments in affiliated Underlying Funds is presented below. Exchanges between classes of the same affiliated Underlying Funds may occur. If an underlying Fund changes its name, the name presented below is the name in effect at period end.
| Affiliate | Value, beginning of period | Purchases | Sales Proceeds | Dividend Income | Realized Gain (loss) | Change in Unrealized appreciation (depreciation) | Value, end of period |
| Fidelity Emerging Markets Fund | $886,916,276 | $243,000,000 | $-- | $-- | $-- | $(43,519,937) | $1,086,396,339 |
| Fidelity SAI Emerging Markets Index Fund | 595,071,338 | -- | -- | -- | -- | (60,046,881) | 535,024,457 |
| Fidelity SAI Emerging Markets Low Volatility Index Fund | 491,205,946 | 131,000,000 | -- | -- | -- | (9,637,844) | 612,568,102 |
| Fidelity SAI Emerging Markets Value Index Fund | 1,092,630,032 | 526,000,005 | -- | -- | -- | (110,469,944) | 1,508,160,093 |
| Total | $3,065,823,592 | $900,000,005 | $-- | $-- | $-- | $(223,674,606) | $3,742,148,991 |
Amounts in the income column in the above table include any capital gain distributions from underlying funds, which are presented in the corresponding line-item in the Statement of Operations, if applicable.
Investment Valuation
The following is a summary of the inputs used, as of November 30, 2021, involving the Fund's assets and liabilities carried at fair value. The inputs or methodology used for valuing securities may not be an indication of the risk associated with investing in those securities. For more information on valuation inputs, and their aggregation into the levels used below, please refer to the Investment Valuation section in the accompanying Notes to Financial Statements.
| Valuation Inputs at Reporting Date: | ||||
| Description | Total | Level 1 | Level 2 | Level 3 |
| Investments in Securities: | ||||
| Equities: | ||||
| Communication Services | $423,040,275 | $127,709,540 | $295,330,735 | $-- |
| Consumer Discretionary | 752,542,690 | 578,747,012 | 173,795,678 | -- |
| Consumer Staples | 264,965,905 | 244,165,140 | 20,800,765 | -- |
| Energy | 245,220,232 | 191,574,886 | 53,645,346 | -- |
| Financials | 1,004,505,836 | 630,895,678 | 373,610,158 | -- |
| Health Care | 171,704,829 | 136,311,039 | 35,393,790 | -- |
| Industrials | 237,369,512 | 208,668,465 | 28,701,047 | -- |
| Information Technology | 1,095,823,917 | 529,434,221 | 566,389,696 | -- |
| Materials | 330,769,593 | 245,771,276 | 84,998,317 | -- |
| Real Estate | 15,966,733 | 544,406 | 15,422,327 | -- |
| Utilities | 10,636,235 | 10,636,235 | -- | -- |
| Equity Funds | 3,742,148,991 | 3,742,148,991 | -- | -- |
| Other Short-Term Investments | 35,177,490 | -- | 35,177,490 | -- |
| Money Market Funds | 627,327,580 | 627,327,580 | -- | -- |
| Total Investments in Securities: | $8,957,199,818 | $7,273,934,469 | $1,683,265,349 | $-- |
| Derivative Instruments: | ||||
| Liabilities | ||||
| Futures Contracts | $(19,943,826) | $(19,943,826) | $-- | $-- |
| Total Liabilities | $(19,943,826) | $(19,943,826) | $-- | $-- |
| Total Derivative Instruments: | $(19,943,826) | $(19,943,826) | $-- | $-- |
Value of Derivative Instruments
The following table is a summary of the Fund's value of derivative instruments by primary risk exposure as of November 30, 2021. For additional information on derivative instruments, please refer to the Derivative Instruments section in the accompanying Notes to Financial Statements.
| Primary Risk Exposure / Derivative Type | Value | |
| Asset | Liability | |
| Equity Risk | ||
| Futures Contracts(a) | $0 | $(19,943,826) |
| Total Equity Risk | 0 | (19,943,826) |
| Total Value of Derivatives | $0 | $(19,943,826) |
(a) Reflects gross cumulative appreciation (depreciation) on futures contracts as presented in the Schedule of Investments. In the Statement of Assets and Liabilities, the period end daily variation margin is included in receivable or payable for daily variation margin on futures contracts, and the net cumulative appreciation (depreciation) is included in Total accumulated earnings (loss).
Other Information
Distribution of the direct investments by country of issue, as a percentage of Total Net Assets, is as follows (Unaudited):
| United States of America | 49.2% |
| Cayman Islands | 11.7% |
| Taiwan | 7.5% |
| Korea (South) | 6.4% |
| India | 6.2% |
| China | 4.9% |
| Russia | 2.3% |
| Brazil | 1.9% |
| Hong Kong | 1.3% |
| Mexico | 1.3% |
| Indonesia | 1.3% |
| South Africa | 1.3% |
| Others (Individually Less Than 1%) | 4.7% |
| 100.0% |
See accompanying notes which are an integral part of the financial statements.
Financial Statements
Statement of Assets and Liabilities
| November 30, 2021 (Unaudited) | ||
| Assets | ||
| Investment in securities, at value (including securities loaned of $50,334,889) — See accompanying schedule: Unaffiliated issuers (cost $4,514,428,429) | $5,062,664,757 | |
| Fidelity Central Funds (cost $152,365,927) | 152,386,070 | |
| Other affiliated issuers (cost $3,302,493,694) | 3,742,148,991 | |
| Total Investment in Securities (cost $7,969,288,050) | $8,957,199,818 | |
| Cash | 31,028 | |
| Foreign currency held at value (cost $2,867,961) | 2,793,451 | |
| Receivable for investments sold | 32,212,193 | |
| Receivable for fund shares sold | 8,513,881 | |
| Dividends receivable | 2,852,145 | |
| Interest receivable | 10,382 | |
| Distributions receivable from Fidelity Central Funds | 10,763 | |
| Receivable for daily variation margin on futures contracts | 312,304 | |
| Prepaid expenses | 5,650 | |
| Other receivables | 731,671 | |
| Total assets | 9,004,673,286 | |
| Liabilities | ||
| Payable for investments purchased | ||
| Regular delivery | $7,056,154 | |
| Delayed delivery | 5,002,932 | |
| Payable for fund shares redeemed | 2,935,152 | |
| Accrued management fee | 1,755,311 | |
| Other payables and accrued expenses | 10,992,945 | |
| Collateral on securities loaned | 52,360,350 | |
| Total liabilities | 80,102,844 | |
| Net Assets | $8,924,570,442 | |
| Net Assets consist of: | ||
| Paid in capital | $8,081,126,888 | |
| Total accumulated earnings (loss) | 843,443,554 | |
| Net Assets | $8,924,570,442 | |
| Net Asset Value, offering price and redemption price per share ($8,924,570,442÷ 640,446,699 shares) | $13.93 |
See accompanying notes which are an integral part of the financial statements.
Statement of Operations
| Six months ended November 30, 2021 (Unaudited) | ||
| Investment Income | ||
| Dividends: | ||
| Unaffiliated issuers | $45,566,074 | |
| Non-Cash dividends | 5,933,219 | |
| Interest | 77,959 | |
| Income from Fidelity Central Funds (including $128,633 from security lending) | 158,869 | |
| Income before foreign taxes withheld | 51,736,121 | |
| Less foreign taxes withheld | (5,549,381) | |
| Total income | 46,186,740 | |
| Expenses | ||
| Management fee | $20,288,191 | |
| Custodian fees and expenses | 349,040 | |
| Independent trustees' fees and expenses | 28,995 | |
| Registration fees | 385,585 | |
| Audit | 54,130 | |
| Legal | 7,690 | |
| Miscellaneous | 20,189 | |
| Total expenses before reductions | 21,133,820 | |
| Expense reductions | (10,488,972) | |
| Total expenses after reductions | 10,644,848 | |
| Net investment income (loss) | 35,541,892 | |
| Realized and Unrealized Gain (Loss) | ||
| Net realized gain (loss) on: | ||
| Investment securities: | ||
| Unaffiliated issuers (net of foreign taxes of $3,352,090) | (82,729,216) | |
| Foreign currency transactions | (2,172,337) | |
| Futures contracts | (20,396,515) | |
| Total net realized gain (loss) | (105,298,068) | |
| Change in net unrealized appreciation (depreciation) on: | ||
| Investment securities: | ||
| Unaffiliated issuers (net of decrease in deferred foreign taxes of $666,600) | (455,117,101) | |
| Affiliated issuers | (223,674,606) | |
| Assets and liabilities in foreign currencies | (14,192) | |
| Futures contracts | (27,199,053) | |
| Total change in net unrealized appreciation (depreciation) | (706,004,952) | |
| Net gain (loss) | (811,303,020) | |
| Net increase (decrease) in net assets resulting from operations | $(775,761,128) |
See accompanying notes which are an integral part of the financial statements.
Statement of Changes in Net Assets
| Six months ended November 30, 2021 (Unaudited) | Year ended May 31, 2021 | |
| Increase (Decrease) in Net Assets | ||
| Operations | ||
| Net investment income (loss) | $35,541,892 | $55,084,427 |
| Net realized gain (loss) | (105,298,068) | 272,233,390 |
| Change in net unrealized appreciation (depreciation) | (706,004,952) | 1,652,625,526 |
| Net increase (decrease) in net assets resulting from operations | (775,761,128) | 1,979,943,343 |
| Distributions to shareholders | (187,248,947) | (42,636,300) |
| Share transactions | ||
| Proceeds from sales of shares | 2,906,039,689 | 3,477,545,708 |
| Reinvestment of distributions | 185,516,382 | 42,188,485 |
| Cost of shares redeemed | (707,917,611) | (929,486,679) |
| Net increase (decrease) in net assets resulting from share transactions | 2,383,638,460 | 2,590,247,514 |
| Total increase (decrease) in net assets | 1,420,628,385 | 4,527,554,557 |
| Net Assets | ||
| Beginning of period | 7,503,942,057 | 2,976,387,500 |
| End of period | $8,924,570,442 | $7,503,942,057 |
| Other Information | ||
| Shares | ||
| Sold | 198,434,547 | 252,627,825 |
| Issued in reinvestment of distributions | 12,400,820 | 2,895,572 |
| Redeemed | (48,326,846) | (66,023,143) |
| Net increase (decrease) | 162,508,521 | 189,500,254 |
See accompanying notes which are an integral part of the financial statements.
Financial Highlights
Strategic Advisers Fidelity Emerging Markets Fund
| Six months ended (Unaudited) November 30, | Years endedMay 31, | |||
| 2021 | 2021 | 2020 | 2019 A | |
| Selected Per–Share Data | ||||
| Net asset value, beginning of period | $15.70 | $10.32 | $10.71 | $10.00 |
| Income from Investment Operations | ||||
| Net investment income (loss)B | .06 | .15 | .26C | .18 |
| Net realized and unrealized gain (loss) | (1.45) | 5.34 | (.39) | .67 |
| Total from investment operations | (1.39) | 5.49 | (.13) | .85 |
| Distributions from net investment income | (.02) | (.11) | (.26) | (.14) |
| Distributions from net realized gain | (.36) | – | – | – |
| Total distributions | (.38) | (.11) | (.26) | (.14) |
| Net asset value, end of period | $13.93 | $15.70 | $10.32 | $10.71 |
| Total ReturnD,E | (9.03)% | 53.25% | (1.58)% | 8.63% |
| Ratios to Average Net AssetsF,G | ||||
| Expenses before reductions | .50%H | .51% | .49% | .57%H |
| Expenses net of fee waivers, if any | .25%H | .25% | .24% | .32%H |
| Expenses net of all reductions | .25%H | .24% | .23% | .31%H |
| Net investment income (loss) | .85%H | 1.05% | 2.35%C | 2.82%H |
| Supplemental Data | ||||
| Net assets, end of period (000 omitted) | $8,924,570 | $7,503,942 | $2,976,388 | $1,943,853 |
| Portfolio turnover rateI | 29%H | 47% | 49% | 125%H |
A For the period October 30, 2018 (commencement of operations) through May 31, 2019.
B Calculated based on average shares outstanding during the period.
C Net investment income per share reflects one or more large, non-recurring dividend(s) which amounted to $.06 per share. Excluding such non-recurring dividend(s), the ratio of net investment income (loss) to average net assets would have been 1.80%.
D Total returns for periods of less than one year are not annualized.
E Total returns would have been lower if certain expenses had not been reduced during the applicable periods shown.
F Fees and expenses of any underlying mutual funds or exchange-traded funds (ETFs) are not included in the Fund's expense ratio. The Fund indirectly bears its proportionate share of these expenses. For additional expense information related to investments in Fidelity Central Funds, please refer to the "Investments in Fidelity Central Funds" note found in the Notes to Financial Statements section of the most recent Annual or Semi-Annual report.
G Expense ratios reflect operating expenses of the class. Expenses before reductions do not reflect amounts reimbursed, waived, or reduced through arrangements with the investment adviser, brokerage services, or other offset arrangements, if applicable, and do not represent the amount paid by the class during periods when reimbursements, waivers or reductions occur.
H Annualized
I Amount does not include the portfolio activity of any underlying mutual funds or exchange-traded funds (ETFs).
See accompanying notes which are an integral part of the financial statements.
Notes to Financial Statements (Unaudited)
For the period ended November 30, 2021
1. Organization.
Strategic Advisers Fidelity Emerging Markets Fund (the Fund) is a fund of Fidelity Rutland Square Trust II (the Trust), and is authorized to issue an unlimited number of shares. The Trust is registered under the Investment Company Act of 1940, as amended (the 1940 Act), as an open-end management investment company organized as a Delaware statutory trust. The Fund is offered exclusively to certain managed account clients of Strategic Advisers LLC (Strategic Advisers), an affiliate of Fidelity Management & Research Company LLC (FMR). The Fund's investments in emerging markets can be subject to social, economic, regulatory, and political uncertainties and can be extremely volatile.
2. Significant Accounting Policies.
The Fund is an investment company and applies the accounting and reporting guidance of the Financial Accounting Standards Board (FASB) Accounting Standards Codification Topic 946 Financial Services - Investment Companies. The financial statements have been prepared in conformity with accounting principles generally accepted in the United States of America (GAAP), which require management to make certain estimates and assumptions at the date of the financial statements. Actual results could differ from those estimates. Subsequent events, if any, through the date that the financial statements were issued have been evaluated in the preparation of the financial statements. The Fund's Schedule of Investments lists any underlying mutual funds or exchange-traded funds (ETFs) but does not include the underlying holdings of these funds. The following summarizes the significant accounting policies of the Fund:
Investment Valuation. Investments are valued as of 4:00 p.m. Eastern time on the last calendar day of the period. The Board of Trustees (the Board) has delegated the day to day responsibility for the valuation of the Fund's investments to the Fair Value Committee (the Committee) established by the Fund's investment adviser. In accordance with valuation policies and procedures approved by the Board, the Fund attempts to obtain prices from one or more third party pricing vendors or brokers to value its investments. When current market prices, quotations or currency exchange rates are not readily available or reliable, investments will be fair valued in good faith by the Committee, in accordance with procedures adopted by the Board. Factors used in determining fair value vary by investment type and may include market or investment specific events, changes in interest rates and credit quality. The frequency with which these procedures are used cannot be predicted and they may be utilized to a significant extent. The Committee oversees the Fund's valuation policies and procedures and reports to the Board on the Committee's activities and fair value determinations. The Board monitors the appropriateness of the procedures used in valuing the Fund's investments and ratifies the fair value determinations of the Committee.
The Fund categorizes the inputs to valuation techniques used to value its investments into a disclosure hierarchy consisting of three levels as shown below:
- Level 1 – quoted prices in active markets for identical investments
- Level 2 – other significant observable inputs (including quoted prices for similar investments, interest rates, prepayment speeds, etc.)
- Level 3 – unobservable inputs (including the Fund's own assumptions based on the best information available)
Valuation techniques used to value the Fund's investments by major category are as follows:
Equity securities, including restricted securities, for which market quotations are readily available, are valued at the last reported sale price or official closing price as reported by a third party pricing vendor on the primary market or exchange on which they are traded and are categorized as Level 1 in the hierarchy. In the event there were no sales during the day or closing prices are not available, securities are valued at the last quoted bid price or may be valued using the last available price and are generally categorized as Level 2 in the hierarchy. For foreign equity securities, when market or security specific events arise, comparisons to the valuation of American Depositary Receipts (ADRs), futures contracts, Exchange-Traded Funds (ETFs) and certain indexes as well as quoted prices for similar securities may be used and would be categorized as Level 2 in the hierarchy. For equity securities, including restricted securities, where observable inputs are limited, assumptions about market activity and risk are used and these securities may be categorized as Level 3 in the hierarchy.
Debt securities, including restricted securities, are valued based on evaluated prices received from third party pricing vendors or from brokers who make markets in such securities. U.S. government and government agency obligations are valued by pricing vendors who utilize matrix pricing which considers yield or price of bonds of comparable quality, coupon, maturity and type or by broker-supplied prices. When independent prices are unavailable or unreliable, debt securities may be valued utilizing pricing methodologies which consider similar factors that would be used by third party pricing vendors. Debt securities are generally categorized as Level 2 in the hierarchy but may be Level 3 depending on the circumstances.
Futures contracts are valued at the settlement price established each day by the board of trade or exchange on which they are traded and are categorized as Level 1 in the hierarchy. Investments in open-end mutual funds, including the Fidelity Central Funds, are valued at their closing net asset value (NAV) each business day and are categorized as Level 1 in the hierarchy. If an unaffiliated open-end mutual fund's NAV is unavailable, shares of that fund may be valued by another method that the Board believes reflects fair value in accordance with the Board's fair value pricing policies and is categorized as Level 2 in the hierarchy.
Changes in valuation techniques may result in transfers in or out of an assigned level within the disclosure hierarchy. The aggregate value of investments by input level as of November 30, 2021 is included at the end of the Fund's Schedule of Investments.
Foreign Currency. Certain Funds may use foreign currency contracts to facilitate transactions in foreign-denominated securities. Gains and losses from these transactions may arise from changes in the value of the foreign currency or if the counterparties do not perform under the contracts' terms.
Foreign-denominated assets, including investment securities, and liabilities are translated into U.S. dollars at the exchange rates at period end. Purchases and sales of investment securities, income and dividends received, and expenses denominated in foreign currencies are translated into U.S. dollars at the exchange rate in effect on the transaction date.
The effects of exchange rate fluctuations on investments are included with the net realized and unrealized gain (loss) on investment securities. Other foreign currency transactions resulting in realized and unrealized gain (loss) are disclosed separately.
Investment Transactions and Income. For financial reporting purposes, the Fund's investment holdings and NAV include trades executed through the end of the last business day of the period. The NAV per share for processing shareholder transactions is calculated as of the close of business of the New York Stock Exchange (NYSE), normally 4:00 p.m. Eastern time and includes trades executed through the end of the prior business day. Gains and losses on securities sold are determined on the basis of identified cost and include proceeds received from litigation. Commissions paid to certain brokers with whom the investment adviser, or its affiliates, places trades on behalf of a fund include an amount in addition to trade execution, which may be rebated back to a fund. Any such rebates are included in net realized gain (loss) on investments in the Statement of Operations. Dividend income is recorded on the ex-dividend date, except for certain dividends from foreign securities where the ex-dividend date may have passed, which are recorded as soon as the Fund is informed of the ex-dividend date. Non-cash dividends included in dividend income, if any, are recorded at the fair market value of the securities received. Income and capital gain distributions from Fidelity Central Funds, if any, are recorded on the ex-dividend date. Income and capital gain distributions from any underlying mutual funds or exchange-traded funds (ETFs) are recorded on the ex-dividend date. Interest income is accrued as earned and includes coupon interest and amortization of premium and accretion of discount on debt securities as applicable. Investment income is recorded net of foreign taxes withheld where recovery of such taxes is uncertain. Funds may file withholding tax reclaims in certain jurisdictions to recover a portion of amounts previously withheld. Any withholding tax reclaims income is included in the Statement of Operations in dividends. Any receivables for withholding tax reclaims are included in the Statement of Assets and Liabilities in dividends receivable.
Expenses. Expenses directly attributable to a fund are charged to that fund. Expenses attributable to more than one fund are allocated among the respective funds on the basis of relative net assets or other appropriate methods. Expenses included in the accompanying financial statements reflect the expenses of that fund and do not include any expenses associated with any underlying mutual funds or exchange-traded funds. Although not included in a fund's expenses, a fund indirectly bears its proportionate share of these expenses through the net asset value of each underlying mutual fund or exchange-traded fund. Expense estimates are accrued in the period to which they relate and adjustments are made when actual amounts are known.
Deferred Trustee Compensation. Under a Deferred Compensation Plan (the Plan) for certain Funds, certain independent Trustees have elected to defer receipt of a portion of their annual compensation. Deferred amounts are invested in affiliated mutual funds, are marked-to-market and remain in a fund until distributed in accordance with the Plan. The investment of deferred amounts and the offsetting payable to the Trustees presented below are included in the accompanying Statement of Assets and Liabilities in other receivables and other payables and accrued expenses, as applicable.
| Strategic Advisers Fidelity Emerging Markets Fund | $12 |
Income Tax Information and Distributions to Shareholders. Each year, the Fund intends to qualify as a regulated investment company under Subchapter M of the Internal Revenue Code, including distributing substantially all of its taxable income and realized gains. As a result, no provision for U.S. Federal income taxes is required. The Fund files a U.S. federal tax return, in addition to state and local tax returns as required. The Fund's federal income tax returns are subject to examination by the Internal Revenue Service (IRS) for a period of three fiscal years after they are filed. State and local tax returns may be subject to examination for an additional fiscal year depending on the jurisdiction. Foreign taxes are provided for based on the Fund's understanding of the tax rules and rates that exist in the foreign markets in which it invests. The Fund is subject to a tax imposed on capital gains by certain countries in which it invests. An estimated deferred tax liability for net unrealized appreciation on the applicable securities is included in Other payables and accrued expenses on the Statement of Assets & Liabilities.
Distributions are declared and recorded on the ex-dividend date. Income and capital gain distributions are determined in accordance with income tax regulations, which may differ from GAAP.
Capital accounts within the financial statements are adjusted for permanent book-tax differences. These adjustments have no impact on net assets or the results of operations. Capital accounts are not adjusted for temporary book-tax differences which will reverse in a subsequent period.
Book-tax differences are primarily due to the short-term gain distributions from the underlying mutual funds or exchange-traded funds (ETFs), futures contracts, foreign currency transactions, certain foreign taxes, passive foreign investment companies (PFIC), deferred Trustees compensation, capital loss carryforwards and losses deferred due to wash sales.
As of period end, the cost and unrealized appreciation (depreciation) in securities, and derivatives if applicable, for federal income tax purposes were as follows:
| Gross unrealized appreciation | $1,346,318,734 |
| Gross unrealized depreciation | (431,227,389) |
| Net unrealized appreciation (depreciation) | $915,091,345 |
| Tax cost | $8,022,164,647 |
Delayed Delivery Transactions and When-Issued Securities. During the period, certain Funds transacted in securities on a delayed delivery or when-issued basis. Payment and delivery may take place after the customary settlement period for that security. The price of the underlying securities and the date when the securities will be delivered and paid for are fixed at the time the transaction is negotiated. Securities purchased on a delayed delivery or when-issued basis are identified as such in the Schedule of Investments. Compensation for interest forgone in the purchase of a delayed delivery or when-issued debt security may be received. With respect to purchase commitments, each applicable Fund identifies securities as segregated in its records with a value at least equal to the amount of the commitment. Payables and receivables associated with the purchases and sales of delayed delivery securities having the same coupon, settlement date and broker are offset. Delayed delivery or when-issued securities that have been purchased from and sold to different brokers are reflected as both payables and receivables in the Statement of Assets and Liabilities under the caption "Delayed delivery", as applicable. Losses may arise due to changes in the value of the underlying securities or if the counterparty does not perform under the contract's terms, or if the issuer does not issue the securities due to political, economic, or other factors.
Restricted Securities (including Private Placements). Funds may invest in securities that are subject to legal or contractual restrictions on resale. These securities generally may be resold in transactions exempt from registration or to the public if the securities are registered. Disposal of these securities may involve time-consuming negotiations and expense, and prompt sale at an acceptable price may be difficult. Information regarding restricted securities held at period end is included at the end of the Schedule of Investments, if applicable.
3. Derivative Instruments.
Risk Exposures and the Use of Derivative Instruments. The Fund's investment objective allows the Fund to enter into various types of derivative contracts, including futures contracts. Derivatives are investments whose value is primarily derived from underlying assets, indices or reference rates and may be transacted on an exchange or over-the-counter (OTC). Derivatives may involve a future commitment to buy or sell a specified asset based on specified terms, to exchange future cash flows at periodic intervals based on a notional principal amount, or for one party to make one or more payments upon the occurrence of specified events in exchange for periodic payments from the other party.
The Fund used derivatives to increase returns and to manage exposure to certain risks as defined below. The success of any strategy involving derivatives depends on analysis of numerous economic factors, and if the strategies for investment do not work as intended, the Fund may not achieve its objectives.
The Fund's use of derivatives increased or decreased its exposure to the following risk:
| Equity Risk | Equity risk relates to the fluctuations in the value of financial instruments as a result of changes in market prices (other than those arising from interest rate risk or foreign exchange risk), whether caused by factors specific to an individual investment, its issuer, or all factors affecting all instruments traded in a market or market segment. |
The Fund is also exposed to additional risks from investing in derivatives, such as liquidity risk and counterparty credit risk. Liquidity risk is the risk that the Fund will be unable to close out the derivative in the open market in a timely manner. Counterparty credit risk is the risk that the counterparty will not be able to fulfill its obligation to the Fund. Counterparty credit risk related to exchange-traded futures contracts may be mitigated by the protection provided by the exchange on which they trade.
Investing in derivatives may involve greater risks than investing in the underlying assets directly and, to varying degrees, may involve risk of loss in excess of any initial investment and collateral received and amounts recognized in the Statement of Assets and Liabilities. In addition, there may be the risk that the change in value of the derivative contract does not correspond to the change in value of the underlying instrument.
Futures Contracts. A futures contract is an agreement between two parties to buy or sell a specified underlying instrument for a fixed price at a specified future date. The Fund used futures contracts to manage its exposure to the stock market.
Upon entering into a futures contract, a fund is required to deposit either cash or securities (initial margin) with a clearing broker in an amount equal to a certain percentage of the face value of the contract. Futures contracts are marked-to-market daily and subsequent daily payments (variation margin) are made or received by a fund depending on the daily fluctuations in the value of the futures contracts and are recorded as unrealized appreciation or (depreciation). This receivable and/or payable, if any, is included in daily variation margin on futures contracts in the Statement of Assets and Liabilities. Realized gain or (loss) is recorded upon the expiration or closing of a futures contract. The net realized gain (loss) and change in net unrealized appreciation (depreciation) on futures contracts during the period is presented in the Statement of Operations.
Any open futures contracts at period end are presented in the Schedule of Investments under the caption "Futures Contracts". The notional amount at value reflects each contract's exposure to the underlying instrument or index at period end and is representative of volume of activity during the period. Securities deposited to meet initial margin requirements are identified in the Schedule of Investments.
4. Purchases and Sales of Investments.
Purchases and sales of securities, other than short-term securities and in-kind transactions, as applicable, are noted in the table below.
| Purchases ($) | Sales ($) | |
| Strategic Advisers Fidelity Emerging Markets Fund | 3,049,878,564 | 1,130,867,739 |
5. Fees and Other Transactions with Affiliates.
Management Fee. Strategic Advisers (the investment adviser) provides the Fund with investment management related services. For these services, the Fund pays a monthly management fee to the investment adviser. The management fee is calculated by adding the annual management fee rate of .25% of the Fund's average net assets throughout the month to the aggregate of the fee rates, payable monthly by the investment adviser, to the Fund's sub-advisers. The Fund's maximum aggregate management fee will not exceed 1.20% of the Fund's average net assets. For the reporting period, the total annualized management fee rate was .48% of the Fund's average net assets.
During the period, the investment adviser waived a portion of its management fee as described in the Expense Reductions note.
Sub-Advisers. FIAM LLC (an affiliate of the investment adviser) and FIL Investment Advisors each served as a sub-adviser for the Fund during the period. Sub-advisers provide discretionary investment advisory services for their allocated portion of the Fund's assets and are paid as described in the Management Fee note.
Geode Capital Management, LLC (Geode) has been retained to serve as a sub-adviser for the Fund. As of the date of this report, however, Geode has not been allocated any portion of the Fund's assets. Geode in the future may provide discretionary investment advisory services for an allocated portion of the Fund's assets and will be paid by the investment adviser for providing these services.
Brokerage Commissions. A portion of portfolio transactions were placed with brokerage firms which are affiliates of the investment adviser. Brokerage commissions are included in net realized gain (loss) and change in net unrealized appreciation (depreciation) in the Statement of Operations. The commissions paid to these affiliated firms were as follows:
| Amount | |
| Strategic Advisers Fidelity Emerging Markets Fund | $4,619 |
Interfund Trades. Funds may purchase from or sell securities to other funds affiliated with each sub-adviser under procedures adopted by the Board. The procedures have been designed to ensure these interfund trades are executed in accordance with Rule 17a-7 of the 1940 Act. Any interfund trades are included within the respective purchases and sales amounts shown in the Purchases and Sales of Investments note. Interfund trades during the period are noted in the table below.
| Purchases ($) | Sales ($) | Realized Gain (Loss) ($) | |
| Strategic Advisers Fidelity Emerging Markets Fund | 17,627,331 | 5,218,712 | (112,036) |
Other. During the period, the investment adviser reimbursed the Fund for certain losses as follows:
| Amount ($) | |
| Strategic Advisers Fidelity Emerging Markets Fund | 40,709 |
6. Investments in Fidelity Central Funds.
Funds may invest in Fidelity Central Funds, which are open-end investment companies generally available only to other investment companies and accounts managed by the investment adviser and its affiliates. The Schedule of Investments lists any Fidelity Central Funds held as an investment as of period end, but does not include the underlying holdings of each Fidelity Central Fund. An investing fund indirectly bears its proportionate share of the expenses of the underlying Fidelity Central Funds.
Based on its investment objective, each Fidelity Central Fund may invest or participate in various investment vehicles or strategies that are similar to those of the investing fund. These strategies are consistent with the investment objectives of the investing fund and may involve certain economic risks which may cause a decline in value of each of the Fidelity Central Funds and thus a decline in the value of the investing fund.
| Fidelity Central Fund | Investment Manager | Investment Objective | Investment Practices | Expense Ratio(a) |
| Fidelity Money Market Central Funds | Fidelity Management & Research Company LLC (FMR) | Each fund seeks to obtain a high level of current income consistent with the preservation of capital and liquidity. | Short-term Investments | Less than .005% |
(a) Expenses expressed as a percentage of average net assets and are as of each underlying Central Fund's most recent annual or semi-annual shareholder report.
A complete unaudited list of holdings for each Fidelity Central Fund is available upon request or at the Securities and Exchange Commission website at www.sec.gov. In addition, the financial statements of the Fidelity Central Funds, which are not covered by the Report of Independent Registered Public Accounting Firm, are available on the Securities and Exchange Commission website or upon request.
7. Committed Line of Credit.
Certain Funds participate with other funds managed by the investment adviser or an affiliate in a $4.25 billion credit facility (the "line of credit") to be utilized for temporary or emergency purposes to fund shareholder redemptions or for other short-term liquidity purposes. The participating funds have agreed to pay commitment fees on their pro-rata portion of the line of credit, which are reflected in Miscellaneous expenses on the Statement of Operations, and are listed below. During the period, there were no borrowings on this line of credit.
| Amount | |
| Strategic Advisers Fidelity Emerging Markets Fund | $6,282 |
8. Security Lending.
Funds lend portfolio securities from time to time in order to earn additional income. Lending agents are used, including National Financial Services (NFS), an affiliate of the investment adviser. Pursuant to a securities lending agreement, NFS will receive a fee, which is capped at 9.9% of a fund's daily lending revenue, for its services as lending agent. A fund may lend securities to certain qualified borrowers, including NFS. On the settlement date of the loan, a fund receives collateral (in the form of U.S. Treasury obligations, letters of credit and/or cash) against the loaned securities and maintains collateral in an amount not less than 100% of the market value of the loaned securities during the period of the loan. The market value of the loaned securities is determined at the close of business of a fund and any additional required collateral is delivered to a fund on the next business day. A fund or borrower may terminate the loan at any time, and if the borrower defaults on its obligation to return the securities loaned because of insolvency or other reasons, a fund may apply collateral received from the borrower against the obligation. A fund may experience delays and costs in recovering the securities loaned. Any cash collateral received is invested in the Fidelity Securities Lending Cash Central Fund. Any loaned securities are identified as such in the Schedule of Investments, and the value of loaned securities and cash collateral at period end, as applicable, are presented in the Statement of Assets and Liabilities. Security lending income represents the income earned on investing cash collateral, less rebates paid to borrowers and any lending agent fees associated with the loan, plus any premium payments received for lending certain types of securities. Security lending income is presented in the Statement of Operations as a component of income from Fidelity Central Funds. Affiliated security lending activity, if any, was as follows:
| Total Security Lending Fees Paid to NFS | Security Lending Income From Securities Loaned to NFS | Value of Securities Loaned to NFS at Period End | |
| Strategic Advisers Fidelity Emerging Markets Fund | $1,642 | $– | $– |
9. Expense Reductions.
The investment adviser has contractually agreed to waive the Fund's management fee in an amount equal to .25% of the Fund's average net assets until September 30, 2024. During the period, this waiver reduced the Fund's management fee by $10,488,831.
Through arrangements with the Fund's custodian, credits realized as a result of certain uninvested cash balances were used to reduce the Fund's expenses by $141.
10. Other.
A fund's organizational documents provide former and current trustees and officers with a limited indemnification against liabilities arising in connection with the performance of their duties to the fund. In the normal course of business, a fund may also enter into contracts that provide general indemnifications. A fund's maximum exposure under these arrangements is unknown as this would be dependent on future claims that may be made against a fund. The risk of material loss from such claims is considered remote.
Funds do not invest in underlying mutual funds for the purpose of exercising management or control; however, investments by funds within their principal investment strategies may represent a significant portion of the underlying mutual fund's net assets. At the end of the period, certain Funds were the owners of record of 10% or more of the total outstanding shares of the following underlying mutual funds as shown below.
| Fund | Strategic Advisers Fidelity Emerging Markets Fund |
| Fidelity Emerging Markets Fund | 13% |
| Fidelity SAI Emerging Markets Index Fund | 14% |
| Fidelity SAI Emerging Markets Low Volatility Index Fund | 35% |
| Fidelity SAI Emerging Markets Value Index Fund | 74% |
11. Coronavirus (COVID-19) Pandemic.
An outbreak of COVID-19 first detected in China during December 2019 has since spread globally and was declared a pandemic by the World Health Organization during March 2020. Developments that disrupt global economies and financial markets, such as the COVID-19 pandemic, may magnify factors that affect the Fund's performance.
Shareholder Expense Example
As a shareholder, you incur two types of costs: (1) transaction costs, which may include sales charges (loads) on purchase payments or redemption proceeds, as applicable and (2) ongoing costs, which generally include management fees, distribution and/or service (12b-1) fees and other Fund expenses. This Example is intended to help you understand your ongoing costs (in dollars) of investing in a fund and to compare these costs with the ongoing costs of investing in other mutual funds.
The Example is based on an investment of $1,000 invested at the beginning of the period and held for the entire period (June 1, 2021 to November 30, 2021).
Actual Expenses
The first line of the accompanying table provides information about actual account values and actual expenses. You may use the information in this line, together with the amount you invested, to estimate the expenses that you paid over the period. Simply divide your account value by $1,000.00 (for example, an $8,600 account value divided by $1,000.00 = 8.6), then multiply the result by the number in the first line for a class/Fund under the heading entitled "Expenses Paid During Period" to estimate the expenses you paid on your account during this period. If any fund is a shareholder of any underlying mutual funds or exchange-traded funds (ETFs) (the Underlying Funds), such fund indirectly bears its proportional share of the expenses of the Underlying Funds in addition to the direct expenses incurred presented in the table. These fees and expenses are not included in the annualized expense ratio used to calculate the expense estimate in the table below.
Hypothetical Example for Comparison Purposes
The second line of the accompanying table provides information about hypothetical account values and hypothetical expenses based on the actual expense ratio and an assumed rate of return of 5% per year before expenses, which is not the actual return. The hypothetical account values and expenses may not be used to estimate the actual ending account balance or expenses you paid for the period. You may use this information to compare the ongoing costs of investing in the Fund and other funds. To do so, compare this 5% hypothetical example with the 5% hypothetical examples that appear in the shareholder reports of the other funds. If any fund is a shareholder of any Underlying Funds, such fund indirectly bears its proportional share of the expenses of the Underlying Funds in addition to the direct expenses as presented in the table. These fees and expenses are not included in the annualized expense ratio used to calculate the expense estimate in the table below.
Please note that the expenses shown in the table are meant to highlight your ongoing costs only and do not reflect any transaction costs. Therefore, the second line of the table is useful in comparing ongoing costs only, and will not help you determine the relative total costs of owning different funds. In addition, if these transactional costs were included, your costs would have been higher.
| Annualized Expense Ratio-A | Beginning Account Value June 1, 2021 | Ending Account Value November 30, 2021 | Expenses Paid During Period-B June 1, 2021 to November 30, 2021 | |
| Strategic Advisers Fidelity Emerging Markets Fund | .25% | |||
| Actual | $1,000.00 | $909.70 | $1.20 | |
| Hypothetical-C | $1,000.00 | $1,023.82 | $1.27 |
A Annualized expense ratio reflects expenses net of applicable fee waivers.
B Expenses are equal to the annualized expense ratio, multiplied by the average account value over the period, multiplied by 183/ 365 (to reflect the one-half year period). The fees and expenses of any Underlying Funds are not included in each annualized expense ratio.
C 5% return per year before expenses
Board Approval of Investment Advisory Contracts and Management Fees
Strategic Advisers Fidelity Emerging Markets Fund
Each year, the Board of Trustees, including the Independent Trustees (together, the Board), votes at a meeting on the renewal of the management contract with Strategic Advisers LLC (Strategic Advisers), the sub-advisory agreements with FIAM LLC, FIL Investment Advisors, and Geode Capital Management, LLC (each a Sub-Adviser and collectively, the Sub-Advisers) (collectively, the Sub-Advisory Agreements), and the sub-sub-advisory agreements with FMR Investment Management (UK) Limited, Fidelity Management & Research (Japan) Limited, Fidelity Management & Research (Hong Kong) Limited, and FIL Investment Advisors (UK) Limited (collectively, the Sub-Sub-Advisory Agreements and, together with the management contract and the Sub-Advisory Agreements, the Advisory Contracts) for the fund. Strategic Advisers and the Sub-Advisers are referred to herein as the Investment Advisers. The Board, assisted by the advice of fund counsel and Independent Trustees' counsel, requests and considers a broad range of information relevant to the renewal of the Advisory Contracts throughout the year.The Board meets at least four times per year and, at each of its meetings, covers an extensive agenda of topics and materials and considers factors that are relevant to its annual consideration of the renewal of the fund's Advisory Contracts, including the services and support provided to the fund and its shareholders. The full Board or the Independent Trustees, as appropriate, act on all major matters; however, a portion of the activities of the Board (including certain of those described herein) may be conducted through standing committees that have been established by the Board. The Board, acting directly and through its committees, requests and receives information concerning the annual consideration of the renewal of the fund's Advisory Contracts.At its September 2021 meeting, the Board, including the Independent Trustees, unanimously determined to renew the fund's Advisory Contracts. In reaching its determination to renew the fund's Advisory Contracts, the Board considered all factors it believed relevant, including (i) the nature, extent, and quality of the services provided to the fund and its shareholders (including the investment performance of the fund); (ii) the competitiveness relative to peer funds of the fund's management fee and total expenses; (iii) the total costs of the services provided by and the profits, if any, realized by Strategic Advisers from its relationships with the fund; and (iv) the extent to which, if any, economies of scale exist and are realized as the fund grows and whether any economies of scale are appropriately shared with fund shareholders.In considering whether to renew the Advisory Contracts for the fund, the Board reached a determination, with the assistance of fund counsel and Independent Trustees' counsel and through the exercise of its business judgment, that the renewal of the Advisory Contracts is in the best interests of the fund and its shareholders. In addition, the Board concluded that the renewal of each Sub-Advisory Agreement does not involve a conflict of interest from which Strategic Advisers or its affiliates derive an inappropriate advantage. Also, the Board found that the advisory fees charged under the Advisory Contracts bear a reasonable relationship to the services rendered and are based on services provided that are in addition to, rather than duplicative of, services provided under the advisory contract of any underlying fund in which the fund may invest. The Board's decision to renew the Advisory Contracts was not based on any single factor, but rather was based on a comprehensive consideration of all the information provided to the Board throughout the year.Nature, Extent, and Quality of Services Provided. The Board considered the staffing within the Investment Advisers, including the backgrounds of the fund's investment personnel and also considered the fund's investment objective, strategies, and related investment philosophy. The Independent Trustees also had discussions with senior management of Strategic Advisers' investment operations and investment groups. The Board considered the structure of each Investment Adviser's investment personnel compensation program and whether such structures provide appropriate incentives to act in the best interests of the fund. The Board also considered steps taken by the Investment Advisers to continue to provide the same nature, extent, and quality of services to the funds during the COVID-19 pandemic.The Trustees also discussed with representatives of Strategic Advisers, at meetings throughout the year, Strategic Advisers' role in, among other things, (i) setting, implementing and monitoring the investment strategies for the funds; (ii) identifying and recommending sub-advisers for the funds; (iii) overseeing compliance with federal securities laws by each sub-adviser with respect to the portion of fund assets allocated to the sub-adviser; (iv) monitoring and overseeing the performance and investment capabilities of each sub-adviser; and (v) recommending the replacement of a sub-adviser as appropriate. The Trustees considered that the Board had received from Strategic Advisers substantial information and periodic reports about Strategic Advisers' sub-adviser oversight and due diligence processes, as well as periodic reports regarding the performance of each sub-adviser.The Board also considered the nature, extent and quality of services provided by each Sub-Adviser. The Trustees noted that under the Sub-Advisory Agreements subject to oversight by Strategic Advisers, each Sub-Adviser is responsible for, among other things, identifying investments for the portion of fund assets allocated to the Sub-Adviser, if any, and executing portfolio transactions to implement its investment strategy. In addition, the Trustees noted that each Sub-Adviser is responsible for providing such reporting as may be requested from Strategic Advisers to fulfill its oversight responsibilities discussed above.Resources Dedicated to Investment Management and Support Services. The Board reviewed the general qualifications and capabilities of the Investment Advisers' investment staffs, their use of technology, and the Investment Advisers' approach to managing and compensating investment personnel. The Board noted that the Investment Advisers' analysts have extensive resources, tools, and capabilities that allow them to conduct sophisticated quantitative and/or fundamental analysis. Additionally, in its deliberations, the Board considered the Investment Advisers' trading capabilities and resources and global compliance infrastructure, which are integral parts of the investment management process.Shareholder and Administrative Services. The Board considered (i) the nature, extent, quality, and cost of administrative and shareholder services performed by Strategic Advisers and its affiliates under the management contract and under separate agreements covering transfer agency, pricing and bookkeeping, and securities lending services for the fund; (ii) the nature and extent of Strategic Advisers’ supervision of third party service providers, including sub-advisers, custodians and subcustodians; and (iii) the resources devoted to, and the record of compliance with, the fund’s compliance policies and procedures.Investment Performance. The Board considered whether the fund has operated in accordance with its investment objective, as well as its record of compliance with its investment restrictions and its performance history.In connection with the renewal of the Advisory Contracts, the Board considered annualized return information for the fund for different time periods, measured against an appropriate securities market index (benchmark index) and a peer group of mutual funds with similar objectives (peer group).The Board considered discussions that occur at Board meetings throughout the year with representatives of Strategic Advisers about fund investment performance and the performance of each Sub-Adviser as part of regularly scheduled fund reviews and other reports to the Board on fund performance, taking into account various factors including general market conditions. In its discussions with representatives of Strategic Advisers regarding fund performance, the Board gave particular attention to information indicating underperformance of certain funds for specific time periods and discussed with Strategic Advisers the reasons for any such underperformance.The following chart considered by the Board shows, over the one-year period ended December 31, 2020, the cumulative total returns of the fund and the cumulative total returns of an appropriate benchmark index and peer group. The box within the chart shows the 25th percentile return (75% beaten, top of box) and the 75th percentile return (25% beaten, bottom of box) of the peer group. Returns shown above the box are in the first quartile and returns shown below the box are in the fourth quartile. The percentage beaten number noted below each chart corresponds to the percentile box and represents the percentage of funds in the peer group whose performance was equal to or lower than that of the fund.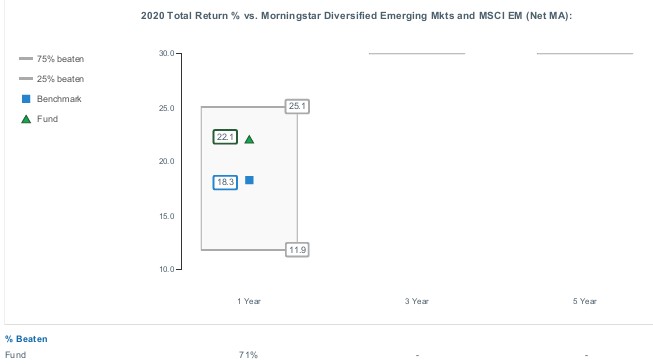

![]()
STE-SANN-0122
1.9890708.103
Strategic Advisers® Large Cap Fund
Offered exclusively to certain managed account clients of Strategic Advisers LLC or its affiliates - not available for sale to the general public
Semi-Annual Report
November 30, 2021
Contents
Board Approval of Investment Advisory Contracts and Management Fees |
To view a fund's proxy voting record for the 12-month period ended June 30, visit http://www.fidelity.com/proxyvotingresults or visit the Securities and Exchange Commission's (SEC) web site at http://www.sec.gov.
You may also call 1-800-544-3455 to request a free copy of the proxy voting guidelines.
Standard & Poor's, S&P and S&P 500 are registered service marks of The McGraw-Hill Companies, Inc. and have been licensed for use by Fidelity Distributors Corporation.
Other third-party marks appearing herein are the property of their respective owners.
All other marks appearing herein are registered or unregistered trademarks or service marks of FMR LLC or an affiliated company. © 2022 FMR LLC. All rights reserved.
This report and the financial statements contained herein are submitted for the general information of the shareholders of the Fund. This report is not authorized for distribution to prospective investors in the Fund unless preceded or accompanied by an effective prospectus.
A fund files its complete schedule of portfolio holdings with the SEC for the first and third quarters of each fiscal year on Form N-PORT. Forms N-PORT are available on the SEC’s web site at http://www.sec.gov. A fund's Forms N-PORT may be reviewed and copied at the SEC’s Public Reference Room in Washington, DC. Information regarding the operation of the SEC's Public Reference Room may be obtained by calling 1-800-SEC-0330.
For a complete list of a fund's portfolio holdings, view the most recent holdings listing, semiannual report, or annual report on Fidelity's web site at http://www.fidelity.com, http://www.institutional.fidelity.com, or http://www.401k.com, as applicable.
NOT FDIC INSURED •MAY LOSE VALUE •NO BANK GUARANTEE
Neither the Fund nor Fidelity Distributors Corporation is a bank.
Note to Shareholders:
Early in 2020, the outbreak and spread of COVID-19 emerged as a public health emergency that had a major influence on financial markets, primarily based on its impact on the global economy and corporate earnings. On March 11, 2020, the World Health Organization declared the COVID-19 outbreak a pandemic, citing sustained risk of further global spread. The pandemic prompted a number of measures to limit the spread of COVID-19, including travel and border restrictions, quarantines, and restrictions on large gatherings. In turn, these resulted in lower consumer activity, diminished demand for a wide range of products and services, disruption in manufacturing and supply chains, and – given the wide variability in outcomes regarding the outbreak – significant market uncertainty and volatility. To help stem the turmoil, the U.S. government took unprecedented action – in concert with the U.S. Federal Reserve and central banks around the world – to help support consumers, businesses, and the broader economy, and to limit disruption to the financial system.
In general, the overall impact of the pandemic lessened in 2021, amid a resilient economy and widespread distribution of three COVID-19 vaccines granted emergency use authorization from the U.S. Food and Drug Administration (FDA) early in the year. Still, the situation remains dynamic, and the extent and duration of its influence on financial markets and the economy is highly uncertain, due in part to a recent spike in cases based on highly contagious variants of the coronavirus.
Extreme events such as the COVID-19 crisis are exogenous shocks that can have significant adverse effects on mutual funds and their investments. Although multiple asset classes may be affected by market disruption, the duration and impact may not be the same for all types of assets. Fidelity is committed to helping you stay informed amid news about COVID-19 and during increased market volatility, and we continue to take extra steps to be responsive to customer needs. We encourage you to visit us online, where we offer ongoing updates, commentary, and analysis on the markets and our funds.
Investment Summary (Unaudited)
The information in the following tables is based on the direct investments of the Fund.Top Ten Holdings as of November 30, 2021
| % of fund's net assets | |
| Fidelity Growth Company Fund | 6.6 |
| Microsoft Corp. | 4.9 |
| Apple, Inc. | 4.0 |
| Amazon.com, Inc. | 3.2 |
| Fidelity SAI U.S. Large Cap Index Fund | 2.9 |
| Fidelity SAI U.S. Quality Index Fund | 2.3 |
| Alphabet, Inc. Class C | 2.0 |
| Meta Platforms, Inc. Class A | 1.7 |
| NVIDIA Corp. | 1.7 |
| Fidelity SAI U.S. Low Volatility Index Fund | 1.4 |
| 30.7 |
Top Five Market Sectors as of November 30, 2021
| (stocks only) | % of fund's net assets |
| Financials | 26.6 |
| Information Technology | 22.4 |
| Consumer Discretionary | 11.0 |
| Health Care | 10.9 |
| Communication Services | 8.4 |
Asset Allocation (% of fund's net assets)
| As of November 30, 2021 | ||
| Common Stocks | 84.2% | |
| Large Blend Funds | 4.8% | |
| Large Growth Funds | 9.2% | |
| Mid-Cap Growth Funds | 1.0% | |
| Short-Term Investments and Net Other Assets (Liabilities) | 0.8% | |

Asset allocations of funds in the pie chart reflect the categorizations of assets as defined by Morningstar as of the reporting date.
Schedule of Investments November 30, 2021 (Unaudited)
Showing Percentage of Net Assets
| Common Stocks - 84.2% | |||
| Shares | Value | ||
| COMMUNICATION SERVICES - 8.4% | |||
| Diversified Telecommunication Services - 0.5% | |||
| AT&T, Inc. | 6,135,599 | $140,075,725 | |
| Cellnex Telecom SA (a) | 7,900 | 466,247 | |
| Deutsche Telekom AG | 309,400 | 5,449,366 | |
| Liberty Global PLC Class C (b) | 367,400 | 9,787,536 | |
| Lumen Technologies, Inc. | 158,162 | 1,951,719 | |
| Verizon Communications, Inc. | 3,467,374 | 174,304,891 | |
| 332,035,484 | |||
| Entertainment - 1.0% | |||
| Activision Blizzard, Inc. | 955,484 | 55,991,362 | |
| Cinemark Holdings, Inc. (b)(c) | 113,700 | 1,764,624 | |
| Electronic Arts, Inc. | 160,519 | 19,939,670 | |
| Netflix, Inc. (b) | 482,814 | 309,918,307 | |
| Nintendo Co. Ltd. ADR | 36,686 | 2,020,665 | |
| Playtika Holding Corp. | 608,765 | 10,470,758 | |
| Sea Ltd. ADR (b) | 96,380 | 27,764,187 | |
| Spotify Technology SA (b) | 21,466 | 5,119,641 | |
| Take-Two Interactive Software, Inc. (b) | 15,500 | 2,571,140 | |
| The Walt Disney Co. (b) | 1,360,679 | 197,162,387 | |
| Universal Music Group NV | 142,449 | 4,088,866 | |
| Zynga, Inc. (b) | 236,700 | 1,427,301 | |
| 638,238,908 | |||
| Interactive Media & Services - 5.3% | |||
| Alphabet, Inc.: | |||
| Class A (b) | 298,054 | 845,862,349 | |
| Class C (b) | 432,184 | 1,231,309,503 | |
| IAC (b) | 66,518 | 8,890,131 | |
| Meta Platforms, Inc. Class A (b) | 3,300,815 | 1,070,982,435 | |
| Snap, Inc. Class A (b) | 851,862 | 40,557,150 | |
| Tongdao Liepin Group (b) | 446,200 | 874,319 | |
| Twitter, Inc. (b) | 528,844 | 23,237,405 | |
| Ziff Davis, Inc. (b)(c) | 156,600 | 17,832,042 | |
| Zoominfo Technologies, Inc. (b) | 464,451 | 28,656,627 | |
| 3,268,201,961 | |||
| Media - 1.4% | |||
| Altice U.S.A., Inc. Class A (b) | 61,900 | 980,496 | |
| Charter Communications, Inc. Class A (b) | 290,963 | 188,043,568 | |
| Comcast Corp. Class A | 9,153,608 | 457,497,328 | |
| DISH Network Corp. Class A (b) | 389,060 | 12,158,125 | |
| Fox Corp.: | |||
| Class A | 898,100 | 32,071,151 | |
| Class B | 16,584 | 557,222 | |
| Interpublic Group of Companies, Inc. | 469,500 | 15,582,705 | |
| Liberty Broadband Corp. Class C (b) | 406,339 | 62,921,594 | |
| Liberty Media Corp. Liberty SiriusXM Series C (b) | 308,804 | 15,109,780 | |
| News Corp. Class B | 27,801 | 599,112 | |
| Nexstar Broadcasting Group, Inc. Class A | 73,514 | 10,990,343 | |
| Omnicom Group, Inc. | 236,836 | 15,941,431 | |
| Tegna, Inc. | 536,100 | 10,587,975 | |
| ViacomCBS, Inc. Class B | 426,450 | 13,198,628 | |
| 836,239,458 | |||
| Wireless Telecommunication Services - 0.2% | |||
| T-Mobile U.S., Inc. (b) | 922,859 | 100,416,288 | |
| TOTAL COMMUNICATION SERVICES | 5,175,132,099 | ||
| CONSUMER DISCRETIONARY - 11.0% | |||
| Auto Components - 0.3% | |||
| Aptiv PLC (b) | 402,819 | 64,592,027 | |
| BorgWarner, Inc. | 523,554 | 22,659,417 | |
| Compagnie Generale des Etablissements Michelin SCA ADR (c) | 900,000 | 26,568,000 | |
| Lear Corp. | 136,800 | 22,953,672 | |
| Magna International, Inc. Class A (sub. vtg.) | 243,678 | 18,264,643 | |
| The Goodyear Tire & Rubber Co. (b) | 857,300 | 17,240,303 | |
| 172,278,062 | |||
| Automobiles - 1.4% | |||
| Daimler AG (Germany) | 172,700 | 16,256,303 | |
| Ferrari NV | 80,837 | 21,054,805 | |
| Ford Motor Co. | 4,528,245 | 86,897,022 | |
| General Motors Co. (b) | 1,753,301 | 101,463,529 | |
| Harley-Davidson, Inc. | 418,400 | 15,325,992 | |
| Rivian Automotive, Inc. | 797,226 | 95,475,786 | |
| Tesla, Inc. (b) | 454,947 | 520,805,128 | |
| 857,278,565 | |||
| Distributors - 0.0% | |||
| Genuine Parts Co. | 87,200 | 11,138,928 | |
| LKQ Corp. | 336,270 | 18,797,493 | |
| 29,936,421 | |||
| Diversified Consumer Services - 0.0% | |||
| Service Corp. International | 105,900 | 7,006,344 | |
| Udemy, Inc. | 12,704 | 349,233 | |
| 7,355,577 | |||
| Hotels, Restaurants & Leisure - 1.3% | |||
| Airbnb, Inc. Class A | 25,086 | 4,328,338 | |
| Booking Holdings, Inc. (b) | 81,437 | 171,168,358 | |
| Caesars Entertainment, Inc. (b) | 36,469 | 3,284,763 | |
| Chipotle Mexican Grill, Inc. (b) | 22,700 | 37,305,407 | |
| Cracker Barrel Old Country Store, Inc. | 28,638 | 3,494,409 | |
| Darden Restaurants, Inc. | 105,782 | 14,592,627 | |
| Domino's Pizza, Inc. | 10,581 | 5,545,925 | |
| Elior SA (a)(b) | 87,837 | 564,822 | |
| Expedia, Inc. (b) | 31,822 | 5,126,206 | |
| Hilton Worldwide Holdings, Inc. (b) | 374,547 | 50,590,063 | |
| Las Vegas Sands Corp. (b) | 807,983 | 28,780,354 | |
| Marriott International, Inc. Class A (b) | 392,538 | 57,922,907 | |
| McDonald's Corp. | 775,378 | 189,657,459 | |
| MGM Resorts International | 474,692 | 18,788,309 | |
| Penn National Gaming, Inc. (b) | 17,948 | 919,476 | |
| Royal Caribbean Cruises Ltd. (b) | 71,700 | 5,006,094 | |
| Starbucks Corp. | 1,263,474 | 138,527,289 | |
| Sweetgreen, Inc. Class A | 6,363 | 242,939 | |
| Wynn Resorts Ltd. (b) | 101,915 | 8,256,134 | |
| Yum China Holdings, Inc. | 234,114 | 11,729,111 | |
| Yum! Brands, Inc. | 270,730 | 33,256,473 | |
| 789,087,463 | |||
| Household Durables - 0.6% | |||
| D.R. Horton, Inc. | 221,200 | 21,611,240 | |
| Garmin Ltd. | 34,468 | 4,602,857 | |
| GoPro, Inc. Class A (b) | 364,800 | 3,648,000 | |
| Lennar Corp.: | |||
| Class A | 1,100,565 | 115,614,353 | |
| Class B | 6,000 | 514,680 | |
| Mohawk Industries, Inc. (b) | 195,444 | 32,809,184 | |
| Newell Brands, Inc. | 725,415 | 15,574,660 | |
| NVR, Inc. (b) | 5,751 | 30,050,930 | |
| PulteGroup, Inc. | 782,799 | 39,163,434 | |
| Sony Group Corp. sponsored ADR | 320,287 | 39,026,971 | |
| Tempur Sealy International, Inc. | 92,700 | 3,971,268 | |
| Toll Brothers, Inc. | 50,800 | 3,224,276 | |
| Whirlpool Corp. | 224,656 | 48,916,597 | |
| 358,728,450 | |||
| Internet & Direct Marketing Retail - 3.4% | |||
| Alibaba Group Holding Ltd. sponsored ADR (b) | 610,597 | 77,869,435 | |
| Amazon.com, Inc. (b) | 554,016 | 1,942,972,893 | |
| Chewy, Inc. (b)(c) | 4,200 | 286,692 | |
| Doordash, Inc. | 42,311 | 7,563,937 | |
| eBay, Inc. | 998,952 | 67,389,302 | |
| Etsy, Inc. (b) | 47,625 | 13,076,873 | |
| Global-e Online Ltd. | 27,600 | 1,833,744 | |
| Porch Group, Inc. Class A (b)(c) | 225,670 | 4,748,097 | |
| 2,115,740,973 | |||
| Leisure Products - 0.0% | |||
| Brunswick Corp. | 47,500 | 4,460,725 | |
| Hasbro, Inc. | 124,470 | 12,062,388 | |
| Polaris, Inc. | 28,900 | 3,230,731 | |
| 19,753,844 | |||
| Multiline Retail - 0.6% | |||
| Big Lots, Inc. (c) | 174,300 | 7,561,134 | |
| Dollar General Corp. | 354,931 | 78,546,230 | |
| Dollar Tree, Inc. (b) | 144,651 | 19,358,643 | |
| Kohl's Corp. | 537,575 | 27,539,967 | |
| Macy's, Inc. | 451,300 | 12,862,050 | |
| Target Corp. | 875,179 | 213,403,647 | |
| 359,271,671 | |||
| Specialty Retail - 2.9% | |||
| Advance Auto Parts, Inc. | 198,275 | 43,763,258 | |
| Auto1 Group SE (a) | 49,496 | 1,392,109 | |
| AutoNation, Inc. (b) | 104,200 | 12,905,170 | |
| AutoZone, Inc. (b) | 54,341 | 98,741,401 | |
| Bath & Body Works, Inc. | 92,192 | 6,926,385 | |
| Best Buy Co., Inc. | 876,868 | 93,702,114 | |
| Burlington Stores, Inc. (b) | 146,567 | 42,963,185 | |
| CarMax, Inc. (b) | 205,902 | 29,083,658 | |
| Dick's Sporting Goods, Inc. (c) | 394,638 | 46,393,643 | |
| Foot Locker, Inc. | 94,900 | 4,331,236 | |
| Gap, Inc. | 878,553 | 14,522,481 | |
| Lowe's Companies, Inc. | 1,852,237 | 453,038,648 | |
| Murphy U.S.A., Inc. | 110,486 | 19,150,538 | |
| O'Reilly Automotive, Inc. (b) | 324,883 | 207,327,335 | |
| Penske Automotive Group, Inc. | 230,100 | 22,922,562 | |
| Ross Stores, Inc. | 618,786 | 67,503,365 | |
| Sally Beauty Holdings, Inc. (b) | 463,900 | 9,087,801 | |
| Sleep Number Corp. (b)(c) | 111,000 | 8,855,580 | |
| The Home Depot, Inc. | 929,565 | 372,393,035 | |
| The ODP Corp. (b) | 62,070 | 2,343,763 | |
| TJX Companies, Inc. | 1,572,870 | 109,157,178 | |
| Tractor Supply Co. | 94,680 | 21,334,244 | |
| Ulta Beauty, Inc. (b) | 190,405 | 73,106,000 | |
| Williams-Sonoma, Inc. | 36,100 | 7,033,724 | |
| 1,767,978,413 | |||
| Textiles, Apparel & Luxury Goods - 0.5% | |||
| Allbirds, Inc. Class A (c) | 12,825 | 246,753 | |
| Capri Holdings Ltd. (b) | 32,100 | 1,900,962 | |
| Columbia Sportswear Co. | 92,017 | 8,974,418 | |
| Hanesbrands, Inc. | 1,102,046 | 17,798,043 | |
| lululemon athletica, Inc. (b) | 49,400 | 22,447,854 | |
| NIKE, Inc. Class B | 1,394,880 | 236,069,491 | |
| PVH Corp. | 29,500 | 3,150,010 | |
| Ralph Lauren Corp. | 146,037 | 16,946,133 | |
| Skechers U.S.A., Inc. Class A (sub. vtg.) (b) | 57,100 | 2,564,932 | |
| Tapestry, Inc. | 210,198 | 8,433,144 | |
| Under Armour, Inc.: | |||
| Class A (sub. vtg.) (b) | 157,707 | 3,720,308 | |
| Class C (non-vtg.) (b) | 158,901 | 3,189,143 | |
| VF Corp. | 117,091 | 8,398,937 | |
| 333,840,128 | |||
| TOTAL CONSUMER DISCRETIONARY | 6,811,249,567 | ||
| CONSUMER STAPLES - 4.3% | |||
| Beverages - 1.2% | |||
| Anheuser-Busch InBev SA NV ADR (c) | 2,359 | 131,443 | |
| Constellation Brands, Inc. Class A (sub. vtg.) | 435,831 | 98,205,799 | |
| Diageo PLC sponsored ADR | 16,968 | 3,447,389 | |
| Keurig Dr. Pepper, Inc. | 1,382,218 | 46,981,590 | |
| Molson Coors Beverage Co. Class B | 720,700 | 32,027,908 | |
| Monster Beverage Corp. (b) | 1,403,583 | 117,592,184 | |
| PepsiCo, Inc. | 1,013,983 | 162,014,204 | |
| The Coca-Cola Co. | 5,052,661 | 265,012,069 | |
| 725,412,586 | |||
| Food & Staples Retailing - 0.8% | |||
| BJ's Wholesale Club Holdings, Inc. (b) | 64,400 | 4,260,060 | |
| Costco Wholesale Corp. | 278,461 | 150,196,294 | |
| Kroger Co. | 1,475,057 | 61,259,117 | |
| Ocado Group PLC (b) | 3,831 | 91,481 | |
| Performance Food Group Co. (b) | 24,524 | 988,562 | |
| Sysco Corp. | 492,174 | 34,471,867 | |
| U.S. Foods Holding Corp. (b) | 29,900 | 939,458 | |
| Walgreens Boots Alliance, Inc. | 1,344,500 | 60,233,600 | |
| Walmart, Inc. | 1,409,923 | 198,277,471 | |
| 510,717,910 | |||
| Food Products - 0.7% | |||
| Archer Daniels Midland Co. | 337,400 | 20,989,654 | |
| Bunge Ltd. | 84,900 | 7,349,793 | |
| Conagra Brands, Inc. | 1,030,583 | 31,484,311 | |
| Darling Ingredients, Inc. (b) | 105,400 | 7,116,608 | |
| General Mills, Inc. | 622,400 | 38,445,648 | |
| Ingredion, Inc. | 209,500 | 19,510,735 | |
| Kellogg Co. | 150,184 | 9,188,257 | |
| Lamb Weston Holdings, Inc. | 16,754 | 869,868 | |
| Mondelez International, Inc. | 1,523,389 | 89,788,548 | |
| Mowi ASA ADR | 103,300 | 2,340,778 | |
| Pilgrim's Pride Corp. (b) | 148,461 | 4,168,785 | |
| Post Holdings, Inc. (b)(c) | 169,551 | 16,378,627 | |
| The Hershey Co. | 39,812 | 7,066,232 | |
| The J.M. Smucker Co. | 309,900 | 39,193,053 | |
| The Kraft Heinz Co. | 1,894,616 | 63,678,044 | |
| Tyson Foods, Inc. Class A | 1,186,610 | 93,694,726 | |
| 451,263,667 | |||
| Household Products - 1.0% | |||
| Colgate-Palmolive Co. | 584,550 | 43,852,941 | |
| Energizer Holdings, Inc. (c) | 525,316 | 19,536,502 | |
| Kimberly-Clark Corp. | 291,200 | 37,946,272 | |
| Procter & Gamble Co. | 3,384,255 | 489,295,588 | |
| Spectrum Brands Holdings, Inc. | 6,612 | 661,861 | |
| 591,293,164 | |||
| Personal Products - 0.1% | |||
| Estee Lauder Companies, Inc. Class A | 263,008 | 87,337,067 | |
| The Beauty Health Co. (c) | 160,000 | 4,153,600 | |
| 91,490,667 | |||
| Tobacco - 0.5% | |||
| Altria Group, Inc. | 2,777,283 | 118,423,347 | |
| Philip Morris International, Inc. | 1,855,182 | 159,434,341 | |
| Swedish Match Co. AB | 121,900 | 890,503 | |
| 278,748,191 | |||
| TOTAL CONSUMER STAPLES | 2,648,926,185 | ||
| ENERGY - 2.5% | |||
| Energy Equipment & Services - 0.1% | |||
| Baker Hughes Co. Class A | 38,800 | 905,592 | |
| Championx Corp. (b) | 11,100 | 226,551 | |
| Halliburton Co. | 2,031,437 | 43,858,725 | |
| Liberty Oilfield Services, Inc. Class A (b) | 97,800 | 899,760 | |
| Oceaneering International, Inc. (b) | 96,667 | 1,033,370 | |
| Schlumberger Ltd. | 1,404,464 | 40,280,028 | |
| Subsea 7 SA | 137,500 | 965,360 | |
| Weatherford International PLC (b) | 33,600 | 966,000 | |
| 89,135,386 | |||
| Oil, Gas & Consumable Fuels - 2.4% | |||
| Africa Oil Corp. (b)(c) | 1,201,200 | 1,711,366 | |
| Antero Resources Corp. (b) | 73,600 | 1,292,416 | |
| APA Corp. | 77,500 | 1,997,175 | |
| Canadian Natural Resources Ltd. | 243,029 | 9,938,420 | |
| Cenovus Energy, Inc. (Canada) | 678,343 | 8,050,162 | |
| Chevron Corp. | 1,732,867 | 195,588,698 | |
| ConocoPhillips Co. | 3,067,720 | 215,139,204 | |
| Coterra Energy, Inc. | 1,950,579 | 39,167,626 | |
| Diamondback Energy, Inc. | 65,802 | 7,023,047 | |
| EOG Resources, Inc. | 1,718,642 | 149,521,854 | |
| Exxon Mobil Corp. | 5,320,081 | 318,353,647 | |
| Genesis Energy LP | 318,296 | 3,211,607 | |
| Harbour Energy PLC (b) | 499,495 | 2,612,041 | |
| Headwater Exploration, Inc. (b) | 82,700 | 295,207 | |
| Hess Corp. | 264,047 | 19,676,782 | |
| HollyFrontier Corp. | 72,800 | 2,352,896 | |
| Imperial Oil Ltd. | 92,217 | 3,048,514 | |
| Kinder Morgan, Inc. | 1,967,748 | 30,421,384 | |
| Kosmos Energy Ltd. (b) | 1,076,097 | 3,938,515 | |
| Marathon Oil Corp. | 923,976 | 14,312,388 | |
| Marathon Petroleum Corp. | 1,066,800 | 64,914,780 | |
| MEG Energy Corp. (b) | 857,700 | 6,982,723 | |
| Murphy Oil Corp. | 95,800 | 2,546,364 | |
| Occidental Petroleum Corp. | 516,428 | 15,312,090 | |
| ONEOK, Inc. | 375,040 | 22,442,394 | |
| Ovintiv, Inc. | 55,700 | 1,936,132 | |
| Phillips 66 Co. | 822,817 | 56,914,252 | |
| Pioneer Natural Resources Co. | 676,408 | 120,617,075 | |
| Reliance Industries Ltd. | 88,400 | 2,831,390 | |
| TC Energy Corp. (c) | 637,750 | 29,916,853 | |
| The Williams Companies, Inc. | 1,252,284 | 33,548,688 | |
| Total SA sponsored ADR | 795,137 | 36,568,351 | |
| Tourmaline Oil Corp. | 198,400 | 6,602,203 | |
| Valero Energy Corp. | 501,300 | 33,557,022 | |
| 1,462,343,266 | |||
| TOTAL ENERGY | 1,551,478,652 | ||
| FINANCIALS - 11.6% | |||
| Banks - 4.9% | |||
| Bank of America Corp. | 15,037,958 | 668,737,992 | |
| Citigroup, Inc. | 2,030,702 | 129,355,717 | |
| Citizens Financial Group, Inc. | 2,429,861 | 114,859,529 | |
| Comerica, Inc. | 110,961 | 9,157,611 | |
| Commerce Bancshares, Inc. | 278,100 | 19,411,380 | |
| Cullen/Frost Bankers, Inc. | 195,700 | 24,636,673 | |
| East West Bancorp, Inc. | 135,458 | 10,430,266 | |
| EFG Eurobank Ergasias SA (b) | 2,805,257 | 2,796,487 | |
| Fifth Third Bancorp | 6,425,961 | 270,854,256 | |
| First Horizon National Corp. | 1,365,936 | 22,032,548 | |
| First Republic Bank | 37,759 | 7,916,552 | |
| Huntington Bancshares, Inc. | 4,329,362 | 64,247,732 | |
| JPMorgan Chase & Co. | 2,507,489 | 398,264,478 | |
| KeyCorp | 2,394,064 | 53,722,796 | |
| M&T Bank Corp. | 330,515 | 48,456,804 | |
| Mitsubishi UFJ Financial Group, Inc. sponsored ADR (c) | 2,250,000 | 11,880,000 | |
| Piraeus Financial Holdings SA (b) | 639,038 | 924,759 | |
| PNC Financial Services Group, Inc. | 1,262,709 | 248,753,673 | |
| Regions Financial Corp. | 2,674,000 | 60,833,500 | |
| Signature Bank | 126,422 | 38,217,371 | |
| Societe Generale Series A | 128,682 | 4,004,237 | |
| Standard Chartered PLC (United Kingdom) | 293,599 | 1,625,144 | |
| SVB Financial Group (b) | 95,479 | 66,102,976 | |
| Truist Financial Corp. | 2,559,206 | 151,786,508 | |
| U.S. Bancorp | 1,642,559 | 90,899,215 | |
| UniCredit SpA | 213,408 | 2,576,648 | |
| Wells Fargo & Co. | 10,778,165 | 514,980,724 | |
| Western Alliance Bancorp. | 45,800 | 5,027,924 | |
| Zions Bancorp NA | 77,400 | 4,882,392 | |
| 3,047,375,892 | |||
| Capital Markets - 2.8% | |||
| Ameriprise Financial, Inc. | 393,400 | 113,928,640 | |
| Apollo Global Management LLC Class A | 148,973 | 10,544,309 | |
| Bank of New York Mellon Corp. | 1,868,045 | 102,350,186 | |
| BlackRock, Inc. Class A | 19,710 | 17,829,863 | |
| Blackstone, Inc. | 80,600 | 11,400,870 | |
| Brookfield Asset Management, Inc. Class A | 1,292,287 | 72,587,761 | |
| Cboe Global Markets, Inc. | 281,067 | 36,240,779 | |
| Charles Schwab Corp. | 1,962,533 | 151,880,429 | |
| CME Group, Inc. | 320,255 | 70,622,633 | |
| FactSet Research Systems, Inc. | 65,771 | 30,818,317 | |
| Goldman Sachs Group, Inc. | 961,924 | 366,483,425 | |
| Intercontinental Exchange, Inc. | 532,138 | 69,561,079 | |
| Invesco Ltd. | 858,935 | 19,180,019 | |
| Jefferies Financial Group, Inc. | 1,659,016 | 62,345,821 | |
| KKR & Co. LP | 653,237 | 48,633,495 | |
| MarketAxess Holdings, Inc. | 27,400 | 9,663,706 | |
| Moody's Corp. | 54,717 | 21,374,649 | |
| Morgan Stanley | 1,530,519 | 145,123,812 | |
| Northern Trust Corp. | 304,377 | 35,216,419 | |
| Raymond James Financial, Inc. | 560,116 | 55,053,802 | |
| S&P Global, Inc. | 140,192 | 63,889,700 | |
| SEI Investments Co. | 439,747 | 26,222,114 | |
| State Street Corp. (d) | 1,681,775 | 149,627,522 | |
| StepStone Group, Inc. Class A | 77,623 | 3,211,264 | |
| T. Rowe Price Group, Inc. | 251,424 | 50,272,229 | |
| Tradeweb Markets, Inc. Class A | 66,291 | 6,363,936 | |
| Virtu Financial, Inc. Class A | 55,366 | 1,560,214 | |
| 1,751,986,993 | |||
| Consumer Finance - 0.7% | |||
| Ally Financial, Inc. | 176,400 | 8,084,412 | |
| American Express Co. | 673,225 | 102,532,168 | |
| Capital One Financial Corp. | 1,582,617 | 222,405,167 | |
| Credit Acceptance Corp. (b)(c) | 7,400 | 4,624,260 | |
| Discover Financial Services | 518,839 | 55,956,786 | |
| Navient Corp. | 734,600 | 14,493,658 | |
| OneMain Holdings, Inc. | 263,500 | 13,119,665 | |
| Synchrony Financial | 275,600 | 12,344,124 | |
| 433,560,240 | |||
| Diversified Financial Services - 0.9% | |||
| Berkshire Hathaway, Inc.: | |||
| Class A (b) | 1 | 416,876 | |
| Class B (b) | 1,798,537 | 497,637,203 | |
| Equitable Holdings, Inc. | 1,299,675 | 40,887,776 | |
| Local Bounti Corp. (e) | 125,589 | 742,608 | |
| Voya Financial, Inc. (c) | 433,700 | 26,950,118 | |
| WeWork, Inc. (b) | 46,800 | 406,692 | |
| 567,041,273 | |||
| Insurance - 2.2% | |||
| AFLAC, Inc. | 1,245,447 | 67,428,501 | |
| AIA Group Ltd. | 94,600 | 995,897 | |
| Alleghany Corp. (b) | 23,569 | 15,246,315 | |
| Allstate Corp. | 608,081 | 66,110,566 | |
| American Financial Group, Inc. | 258,900 | 34,591,629 | |
| American International Group, Inc. | 1,499,633 | 78,880,696 | |
| Aon PLC | 24,483 | 7,241,337 | |
| Arch Capital Group Ltd. (b) | 189,900 | 7,668,162 | |
| Arthur J. Gallagher & Co. | 56,030 | 9,127,287 | |
| Assurant, Inc. | 191,632 | 29,147,227 | |
| Axis Capital Holdings Ltd. | 200,700 | 9,970,776 | |
| Brookfield Asset Management Reinsurance Partners Ltd. (c) | 9,003 | 516,232 | |
| Chubb Ltd. | 1,038,178 | 186,321,806 | |
| Cincinnati Financial Corp. | 439,937 | 50,108,824 | |
| CNA Financial Corp. | 145,843 | 6,072,903 | |
| Everest Re Group Ltd. | 83,600 | 21,433,368 | |
| Fairfax Financial Holdings Ltd. | 27,858 | 12,371,738 | |
| Fidelity National Financial, Inc. | 134,600 | 6,583,286 | |
| First American Financial Corp. | 51,800 | 3,842,524 | |
| Globe Life, Inc. | 43,900 | 3,799,106 | |
| Hartford Financial Services Group, Inc. | 1,750,112 | 115,682,403 | |
| Lincoln National Corp. | 494,800 | 32,820,084 | |
| Loews Corp. | 860,649 | 46,010,296 | |
| Markel Corp. (b) | 6,020 | 7,192,816 | |
| Marsh & McLennan Companies, Inc. | 343,554 | 56,349,727 | |
| MetLife, Inc. | 1,909,419 | 112,006,519 | |
| Old Republic International Corp. | 94,800 | 2,271,408 | |
| Principal Financial Group, Inc. | 129,800 | 8,901,684 | |
| Progressive Corp. | 1,535,266 | 142,687,622 | |
| Prudential Financial, Inc. | 479,800 | 49,064,348 | |
| Prudential PLC (b) | 51,100 | 863,144 | |
| Reinsurance Group of America, Inc. | 18,700 | 1,774,817 | |
| RenaissanceRe Holdings Ltd. | 226,335 | 34,880,487 | |
| The Travelers Companies, Inc. | 647,634 | 95,169,816 | |
| Unum Group | 479,100 | 11,067,210 | |
| W.R. Berkley Corp. | 155,147 | 11,890,466 | |
| Willis Towers Watson PLC | 60,900 | 13,753,656 | |
| 1,359,844,683 | |||
| Mortgage Real Estate Investment Trusts - 0.0% | |||
| Annaly Capital Management, Inc. | 1,720,500 | 13,936,050 | |
| Thrifts & Mortgage Finance - 0.1% | |||
| MGIC Investment Corp. | 640,031 | 9,024,437 | |
| Radian Group, Inc. | 783,700 | 15,963,969 | |
| 24,988,406 | |||
| TOTAL FINANCIALS | 7,198,733,537 | ||
| HEALTH CARE - 10.9% | |||
| Biotechnology - 1.8% | |||
| AbbVie, Inc. | 3,664,076 | 422,394,681 | |
| ADC Therapeutics SA (b)(c) | 89,400 | 1,990,044 | |
| Agios Pharmaceuticals, Inc. (b)(c) | 40,000 | 1,424,800 | |
| Alnylam Pharmaceuticals, Inc. (b) | 52,066 | 9,569,731 | |
| Ambrx Biopharma, Inc. ADR | 30,800 | 287,980 | |
| Amgen, Inc. | 691,575 | 137,540,436 | |
| Arcutis Biotherapeutics, Inc. (b) | 62,000 | 1,027,340 | |
| Argenx SE ADR (b) | 28,000 | 7,817,880 | |
| Ascendis Pharma A/S sponsored ADR (b) | 48,400 | 6,631,768 | |
| Atara Biotherapeutics, Inc. (b) | 85,000 | 1,520,650 | |
| Avid Bioservices, Inc. (b) | 100,000 | 3,056,000 | |
| BioAtla, Inc. (c) | 36,000 | 909,000 | |
| Biogen, Inc. (b) | 286,307 | 67,494,012 | |
| BioMarin Pharmaceutical, Inc. (b) | 131,620 | 11,357,490 | |
| Celldex Therapeutics, Inc. (b) | 36,954 | 1,407,947 | |
| Century Therapeutics, Inc. (c) | 50,000 | 955,500 | |
| Crinetics Pharmaceuticals, Inc. (b) | 27,292 | 745,617 | |
| Cytokinetics, Inc. (b)(c) | 75,000 | 2,950,500 | |
| Erasca, Inc. (c) | 100,000 | 1,417,000 | |
| Exelixis, Inc. (b) | 75,000 | 1,259,250 | |
| Generation Bio Co. (b)(c) | 54,000 | 927,180 | |
| Gilead Sciences, Inc. | 1,020,772 | 70,361,814 | |
| Gritstone Bio, Inc. (b) | 15,967 | 210,764 | |
| Heron Therapeutics, Inc. (b)(c) | 6,100 | 57,645 | |
| Imago BioSciences, Inc. (c) | 17,500 | 391,475 | |
| Innovent Biologics, Inc. (a)(b) | 400,000 | 3,557,322 | |
| Insmed, Inc. (b) | 43,647 | 1,201,165 | |
| Instil Bio, Inc.(c) | 60,000 | 1,318,800 | |
| Intercept Pharmaceuticals, Inc. (b)(c) | 55,404 | 953,503 | |
| Mirati Therapeutics, Inc. (b) | 25,000 | 3,419,250 | |
| Moderna, Inc. (b) | 123,173 | 43,409,860 | |
| Neurocrine Biosciences, Inc. (b) | 260,680 | 21,701,610 | |
| Nuvalent, Inc. Class A (c) | 35,310 | 753,162 | |
| PTC Therapeutics, Inc. (b) | 64,000 | 2,378,240 | |
| Regeneron Pharmaceuticals, Inc. (b) | 264,686 | 168,480,580 | |
| Relay Therapeutics, Inc. (b)(c) | 65,000 | 1,912,300 | |
| Sarepta Therapeutics, Inc. (b) | 30,000 | 2,424,300 | |
| Seagen, Inc. (b) | 12,482 | 1,997,120 | |
| Shattuck Labs, Inc. (b) | 59,250 | 502,440 | |
| TG Therapeutics, Inc. (b) | 100,000 | 1,520,000 | |
| Vaxcyte, Inc. (b) | 25,452 | 518,712 | |
| Vertex Pharmaceuticals, Inc. (b) | 580,466 | 108,512,314 | |
| Xencor, Inc. (b)(c) | 56,000 | 2,028,320 | |
| Zentalis Pharmaceuticals, Inc. (b)(c) | 50,000 | 4,102,500 | |
| Zymeworks, Inc. (b)(c) | 50,000 | 1,005,500 | |
| 1,125,403,502 | |||
| Health Care Equipment & Supplies - 1.6% | |||
| Abbott Laboratories | 1,104,152 | 138,869,197 | |
| Alcon, Inc. (c) | 617,316 | 48,397,574 | |
| Align Technology, Inc. (b) | 26,037 | 15,922,407 | |
| Becton, Dickinson & Co. | 521,021 | 123,554,920 | |
| Boston Scientific Corp. (b) | 2,691,667 | 102,471,763 | |
| DexCom, Inc. (b) | 3,400 | 1,912,806 | |
| Envista Holdings Corp. (b) | 125,000 | 4,850,000 | |
| Hologic, Inc. (b) | 556,153 | 41,561,314 | |
| IDEXX Laboratories, Inc. (b) | 35,663 | 21,685,600 | |
| Insulet Corp. (b) | 46,000 | 13,268,240 | |
| Intuitive Surgical, Inc. (b) | 566,520 | 183,745,097 | |
| iRhythm Technologies, Inc. (b) | 500 | 52,800 | |
| Koninklijke Philips Electronics NV (depositary receipt) (NY Reg.) | 26,800 | 942,824 | |
| Masimo Corp. (b) | 10,000 | 2,781,200 | |
| Medtronic PLC | 1,223,526 | 130,550,224 | |
| Penumbra, Inc. (b) | 50,000 | 12,282,500 | |
| Stryker Corp. | 198,038 | 46,861,732 | |
| Tandem Diabetes Care, Inc. (b) | 21,000 | 2,698,920 | |
| Teleflex, Inc. | 5,301 | 1,576,623 | |
| The Cooper Companies, Inc. | 21,386 | 8,051,187 | |
| Zimmer Biomet Holdings, Inc. | 437,825 | 52,363,870 | |
| 954,400,798 | |||
| Health Care Providers & Services - 2.8% | |||
| agilon health, Inc. | 115,000 | 2,530,000 | |
| Alignment Healthcare, Inc. | 160,000 | 2,593,600 | |
| AmerisourceBergen Corp. | 293,796 | 34,006,887 | |
| Anthem, Inc. | 327,684 | 133,115,071 | |
| Cano Health, Inc. (b)(c) | 330,000 | 3,082,200 | |
| Cardinal Health, Inc. | 380,343 | 17,583,257 | |
| Centene Corp. (b) | 2,012,124 | 143,685,775 | |
| Cigna Corp. | 529,193 | 101,552,137 | |
| Covetrus, Inc. (b) | 18,645 | 335,237 | |
| CVS Health Corp. | 2,057,096 | 183,204,970 | |
| DaVita HealthCare Partners, Inc. (b) | 319,783 | 30,219,494 | |
| Guardant Health, Inc. (b) | 5,150 | 541,368 | |
| HCA Holdings, Inc. | 542,655 | 122,417,541 | |
| Henry Schein, Inc. (b) | 65,900 | 4,682,854 | |
| Humana, Inc. | 250,866 | 105,290,969 | |
| Laboratory Corp. of America Holdings (b) | 185,644 | 52,969,803 | |
| LifeStance Health Group, Inc. (c) | 160,000 | 1,270,400 | |
| McKesson Corp. | 426,202 | 92,383,546 | |
| Oak Street Health, Inc. (b) | 34,600 | 1,070,870 | |
| Quest Diagnostics, Inc. | 229,311 | 34,093,959 | |
| Rede D'Oregon Sao Luiz SA (a) | 260,000 | 2,320,268 | |
| Surgery Partners, Inc. (b) | 56,000 | 2,484,160 | |
| UnitedHealth Group, Inc. | 1,453,271 | 645,572,044 | |
| Universal Health Services, Inc. Class B | 179,100 | 21,264,543 | |
| 1,738,270,953 | |||
| Health Care Technology - 0.1% | |||
| Cerner Corp. | 497,294 | 35,034,362 | |
| Definitive Healthcare Corp. | 18,000 | 527,580 | |
| Doximity, Inc. | 20,000 | 1,353,000 | |
| Evolent Health, Inc. (b) | 60,000 | 1,560,000 | |
| Phreesia, Inc. (b) | 50,000 | 2,884,000 | |
| Veeva Systems, Inc. Class A (b) | 35,163 | 9,936,361 | |
| 51,295,303 | |||
| Life Sciences Tools & Services - 1.5% | |||
| Agilent Technologies, Inc. | 360,640 | 54,420,576 | |
| Avantor, Inc. (b) | 80,000 | 3,158,400 | |
| Bio-Rad Laboratories, Inc. Class A (b) | 27,500 | 20,713,000 | |
| Bruker Corp. | 60,000 | 4,859,400 | |
| Charles River Laboratories International, Inc. (b) | 15,000 | 5,488,050 | |
| Danaher Corp. | 900,920 | 289,771,909 | |
| Illumina, Inc. (b) | 85,573 | 31,262,384 | |
| IQVIA Holdings, Inc. (b) | 310,956 | 80,578,028 | |
| Lonza Group AG | 7,600 | 6,150,863 | |
| Mettler-Toledo International, Inc. (b) | 11,134 | 16,858,323 | |
| PerkinElmer, Inc. | 18,358 | 3,344,093 | |
| Sartorius Stedim Biotech | 8,800 | 5,203,614 | |
| Thermo Fisher Scientific, Inc. | 649,423 | 410,974,357 | |
| Waters Corp. (b) | 26,229 | 8,604,948 | |
| West Pharmaceutical Services, Inc. | 5,301 | 2,346,541 | |
| 943,734,486 | |||
| Pharmaceuticals - 3.1% | |||
| Arvinas Holding Co. LLC (b) | 32,000 | 2,419,520 | |
| AstraZeneca PLC: | |||
| (United Kingdom) | 72,000 | 7,893,709 | |
| sponsored ADR | 1,180,712 | 64,738,439 | |
| Bayer AG | 110,957 | 5,602,234 | |
| Bristol-Myers Squibb Co. | 3,365,509 | 180,492,248 | |
| Elanco Animal Health, Inc. (b) | 2,024,471 | 58,183,297 | |
| Eli Lilly & Co. | 1,187,922 | 294,652,173 | |
| GlaxoSmithKline PLC sponsored ADR | 196,419 | 8,076,749 | |
| Jazz Pharmaceuticals PLC (b)(c) | 179,500 | 21,516,665 | |
| Johnson & Johnson | 3,223,169 | 502,588,742 | |
| Merck & Co., Inc. | 2,844,517 | 213,082,768 | |
| Nektar Therapeutics (b) | 80,000 | 900,800 | |
| Novartis AG sponsored ADR | 535,055 | 42,643,884 | |
| Novo Nordisk A/S Series B sponsored ADR | 186,511 | 19,924,970 | |
| Organon & Co. | 281,337 | 8,223,481 | |
| Pfizer, Inc. | 4,632,721 | 248,916,099 | |
| Pliant Therapeutics, Inc. (b)(c) | 72,500 | 1,028,050 | |
| Roche Holding AG: | |||
| (participation certificate) | 21,000 | 8,198,617 | |
| sponsored ADR | 1,129,365 | 55,090,425 | |
| Royalty Pharma PLC | 175,000 | 6,959,750 | |
| Sanofi SA sponsored ADR | 817,914 | 38,908,169 | |
| UCB SA | 22,800 | 2,485,938 | |
| Viatris, Inc. | 880,348 | 10,837,084 | |
| Zoetis, Inc. Class A | 483,371 | 107,327,697 | |
| 1,910,691,508 | |||
| TOTAL HEALTH CARE | 6,723,796,550 | ||
| INDUSTRIALS - 7.2% | |||
| Aerospace & Defense - 1.3% | |||
| Airbus Group NV (b) | 24,732 | 2,760,586 | |
| Curtiss-Wright Corp. | 5,460 | 686,977 | |
| General Dynamics Corp. | 390,411 | 73,775,967 | |
| Huntington Ingalls Industries, Inc. | 134,831 | 23,933,851 | |
| L3Harris Technologies, Inc. | 363,747 | 76,052,223 | |
| Lockheed Martin Corp. | 121,449 | 40,481,381 | |
| Maxar Technologies, Inc. | 5,000 | 137,650 | |
| Moog, Inc. Class A | 127,400 | 8,812,258 | |
| MTU Aero Engines AG | 1,917 | 358,613 | |
| Northrop Grumman Corp. | 371,613 | 129,618,614 | |
| Raytheon Technologies Corp. | 2,391,723 | 193,538,225 | |
| Rolls-Royce Holdings PLC (b) | 709,995 | 1,158,247 | |
| Safran SA | 2,251 | 251,423 | |
| Textron, Inc. | 811,128 | 57,427,862 | |
| The Boeing Co. (b) | 755,073 | 149,391,193 | |
| TransDigm Group, Inc. (b) | 108,169 | 62,527,090 | |
| Vectrus, Inc. (b) | 37,733 | 1,578,749 | |
| 822,490,909 | |||
| Air Freight & Logistics - 0.7% | |||
| C.H. Robinson Worldwide, Inc. | 51,991 | 4,943,824 | |
| Expeditors International of Washington, Inc. | 333,004 | 40,499,946 | |
| FedEx Corp. | 627,967 | 144,664,758 | |
| GXO Logistics, Inc. | 47,700 | 4,581,585 | |
| United Parcel Service, Inc. Class B | 1,138,482 | 225,840,674 | |
| 420,530,787 | |||
| Airlines - 0.1% | |||
| Copa Holdings SA Class A (b) | 3,000 | 209,760 | |
| Delta Air Lines, Inc. (b) | 616,600 | 22,320,920 | |
| Ryanair Holdings PLC sponsored ADR (b) | 7,253 | 693,024 | |
| Southwest Airlines Co. (b) | 406,400 | 18,044,160 | |
| United Airlines Holdings, Inc. (b) | 542,157 | 22,911,555 | |
| 64,179,419 | |||
| Building Products - 0.4% | |||
| A.O. Smith Corp. | 193,376 | 15,286,373 | |
| Carlisle Companies, Inc. | 60,973 | 13,731,120 | |
| Carrier Global Corp. | 333,970 | 18,074,456 | |
| Fortune Brands Home & Security, Inc. | 405,802 | 40,795,275 | |
| Johnson Controls International PLC | 625,591 | 46,769,183 | |
| Masco Corp. | 158,700 | 10,458,330 | |
| Owens Corning | 184,805 | 15,678,856 | |
| Trane Technologies PLC | 537,493 | 100,323,068 | |
| 261,116,661 | |||
| Commercial Services & Supplies - 0.2% | |||
| ACV Auctions, Inc. Class A (b) | 66,600 | 1,410,588 | |
| Copart, Inc. (b) | 21,241 | 3,083,344 | |
| Deluxe Corp. (c) | 215,300 | 7,285,752 | |
| Republic Services, Inc. | 294,868 | 38,999,242 | |
| Rollins, Inc. | 195,148 | 6,494,525 | |
| Waste Connections, Inc. (United States) | 298,268 | 39,687,540 | |
| 96,960,991 | |||
| Construction & Engineering - 0.0% | |||
| MasTec, Inc. (b) | 119,200 | 10,986,664 | |
| Quanta Services, Inc. | 65,700 | 7,475,346 | |
| 18,462,010 | |||
| Electrical Equipment - 0.4% | |||
| Acuity Brands, Inc. | 101,799 | 20,497,229 | |
| AMETEK, Inc. | 230,900 | 31,517,850 | |
| Array Technologies, Inc. (b)(c) | 267,424 | 4,817,643 | |
| Eaton Corp. PLC | 726,027 | 117,659,936 | |
| Emerson Electric Co. | 195,300 | 17,155,152 | |
| FTC Solar, Inc. | 104,700 | 896,232 | |
| Generac Holdings, Inc. (b) | 32,775 | 13,806,141 | |
| Hubbell, Inc. Class B | 8,716 | 1,705,721 | |
| Regal Rexnord Corp. | 1,100 | 173,910 | |
| Sensata Technologies, Inc. PLC (b) | 65,300 | 3,637,210 | |
| Shoals Technologies Group, Inc. | 82,400 | 2,315,440 | |
| Sunrun, Inc. (b)(c) | 579,015 | 26,657,851 | |
| Vertiv Holdings Co. | 213,543 | 5,475,243 | |
| 246,315,558 | |||
| Industrial Conglomerates - 0.9% | |||
| 3M Co. | 528,739 | 89,906,780 | |
| General Electric Co. | 1,775,641 | 168,668,139 | |
| Hitachi Ltd. | 160,400 | 9,395,939 | |
| Honeywell International, Inc. | 765,104 | 154,734,633 | |
| Roper Technologies, Inc. | 222,525 | 103,284,979 | |
| 525,990,470 | |||
| Machinery - 1.7% | |||
| AGCO Corp. | 324,100 | 35,719,061 | |
| Allison Transmission Holdings, Inc. | 309,700 | 10,712,523 | |
| Caterpillar, Inc. | 195,448 | 37,789,871 | |
| Crane Co. | 183,100 | 17,676,474 | |
| Cummins, Inc. | 629,595 | 132,057,551 | |
| Deere & Co. | 524,139 | 181,110,990 | |
| Dover Corp. | 232,492 | 38,093,814 | |
| Epiroc AB (A Shares) | 3,100 | 75,441 | |
| Flowserve Corp. | 330,462 | 9,907,251 | |
| Fortive Corp. | 760,666 | 56,190,397 | |
| Illinois Tool Works, Inc. | 110,268 | 25,598,716 | |
| Ingersoll Rand, Inc. | 1,659,972 | 96,842,766 | |
| ITT, Inc. | 139,824 | 13,224,554 | |
| Meritor, Inc. (b) | 117,300 | 2,966,517 | |
| Middleby Corp. (b) | 33,500 | 5,851,780 | |
| Oshkosh Corp. | 282,235 | 30,368,486 | |
| Otis Worldwide Corp. | 511,528 | 41,126,851 | |
| PACCAR, Inc. | 630,247 | 52,575,205 | |
| Parker Hannifin Corp. | 326,368 | 98,582,718 | |
| Snap-On, Inc. | 69,935 | 14,400,316 | |
| Stanley Black & Decker, Inc. | 426,771 | 74,582,500 | |
| Timken Co. | 253,729 | 16,702,980 | |
| Westinghouse Air Brake Tech Co. | 135,496 | 12,027,980 | |
| Xylem, Inc. | 252,000 | 30,519,720 | |
| 1,034,704,462 | |||
| Professional Services - 0.4% | |||
| Booz Allen Hamilton Holding Corp. Class A | 28,600 | 2,400,684 | |
| Clarivate Analytics PLC (b) | 1,055,888 | 24,644,426 | |
| CoStar Group, Inc. (b) | 310,242 | 24,124,418 | |
| Dun & Bradstreet Holdings, Inc. (b) | 178,553 | 3,392,507 | |
| Equifax, Inc. | 30,696 | 8,553,440 | |
| IHS Markit Ltd. | 369,362 | 47,211,851 | |
| Jacobs Engineering Group, Inc. | 317,102 | 45,206,061 | |
| Leidos Holdings, Inc. | 791,524 | 69,582,875 | |
| Manpower, Inc. | 134,300 | 12,037,309 | |
| Robert Half International, Inc. | 110,238 | 12,255,158 | |
| 249,408,729 | |||
| Road & Rail - 1.0% | |||
| AMERCO | 12,400 | 8,736,544 | |
| Canadian Pacific Railway Ltd. (c) | 240,800 | 16,863,224 | |
| CSX Corp. | 2,120,886 | 73,509,909 | |
| Knight-Swift Transportation Holdings, Inc. Class A | 154,818 | 8,863,331 | |
| Lyft, Inc. (b) | 1,249,053 | 50,724,042 | |
| Norfolk Southern Corp. | 1,004,188 | 266,380,951 | |
| Old Dominion Freight Lines, Inc. | 124,200 | 44,112,114 | |
| Ryder System, Inc. | 2,750 | 228,470 | |
| Uber Technologies, Inc. (b) | 814,051 | 30,933,938 | |
| Union Pacific Corp. | 515,428 | 121,455,454 | |
| XPO Logistics, Inc. (b) | 47,700 | 3,455,388 | |
| 625,263,365 | |||
| Trading Companies & Distributors - 0.1% | |||
| Beijer Ref AB (B Shares) | 11,700 | 232,300 | |
| United Rentals, Inc. (b) | 124,315 | 42,110,463 | |
| W.W. Grainger, Inc. | 67,776 | 32,628,044 | |
| 74,970,807 | |||
| TOTAL INDUSTRIALS | 4,440,394,168 | ||
| INFORMATION TECHNOLOGY - 22.4% | |||
| Communications Equipment - 0.6% | |||
| Arista Networks, Inc. (b) | 15,882 | 1,970,321 | |
| Cisco Systems, Inc. | 5,159,762 | 282,961,348 | |
| CommScope Holding Co., Inc. (b) | 455,689 | 4,538,662 | |
| F5, Inc. (b) | 160,205 | 36,459,454 | |
| Juniper Networks, Inc. | 220,200 | 6,854,826 | |
| Motorola Solutions, Inc. | 143,492 | 36,329,305 | |
| 369,113,916 | |||
| Electronic Equipment & Components - 0.5% | |||
| Amphenol Corp. Class A | 563,159 | 45,379,352 | |
| Arrow Electronics, Inc. (b) | 251,500 | 30,594,975 | |
| CDW Corp. | 168,030 | 31,818,161 | |
| Corning, Inc. | 217,555 | 8,069,115 | |
| Flex Ltd. (b) | 1,012,800 | 17,318,880 | |
| Insight Enterprises, Inc. (b) | 22,400 | 2,209,088 | |
| Jabil, Inc. | 871,881 | 50,970,163 | |
| Keysight Technologies, Inc. (b) | 102,401 | 19,914,946 | |
| Mirion Technologies, Inc. (e) | 200,814 | 2,140,677 | |
| TD SYNNEX Corp. | 139,827 | 14,466,501 | |
| TE Connectivity Ltd. | 58,523 | 9,008,445 | |
| Teledyne Technologies, Inc. (b) | 83,654 | 34,740,670 | |
| Trimble, Inc. (b) | 194,564 | 16,707,211 | |
| Vishay Intertechnology, Inc. | 618,200 | 12,592,734 | |
| Vontier Corp. | 43,891 | 1,383,005 | |
| Zebra Technologies Corp. Class A (b) | 1,128 | 664,144 | |
| 297,978,067 | |||
| IT Services - 3.2% | |||
| Accenture PLC Class A | 465,499 | 166,369,343 | |
| Amadeus IT Holding SA Class A (b) | 19,200 | 1,229,292 | |
| Amdocs Ltd. | 226,500 | 15,814,230 | |
| Automatic Data Processing, Inc. | 59,084 | 13,641,905 | |
| Cognizant Technology Solutions Corp. Class A | 601,110 | 46,874,558 | |
| CSG Systems International, Inc. | 185,800 | 9,793,518 | |
| DXC Technology Co. (b) | 248,014 | 7,437,940 | |
| Edenred SA | 47,023 | 2,107,554 | |
| EPAM Systems, Inc. (b) | 19,600 | 11,927,580 | |
| Fidelity National Information Services, Inc. | 724,669 | 75,727,932 | |
| Fiserv, Inc. (b) | 1,207,757 | 116,572,706 | |
| FleetCor Technologies, Inc. (b) | 496,425 | 102,824,510 | |
| Gartner, Inc. (b) | 43,062 | 13,446,110 | |
| Genpact Ltd. | 140,444 | 6,779,232 | |
| Global Payments, Inc. | 510,875 | 60,814,560 | |
| IBM Corp. | 792,237 | 92,770,953 | |
| Kyndryl Holdings, Inc. (c) | 246,947 | 3,901,763 | |
| MasterCard, Inc. Class A | 1,330,278 | 418,931,148 | |
| MongoDB, Inc. Class A (b) | 4,900 | 2,440,690 | |
| Payoneer Global, Inc. | 71,700 | 555,675 | |
| PayPal Holdings, Inc. (b) | 781,084 | 144,414,621 | |
| Sabre Corp. (b)(c) | 185,508 | 1,396,875 | |
| Shift4 Payments, Inc. (b) | 10,300 | 535,806 | |
| Shopify, Inc. Class A (b) | 30,846 | 46,941,134 | |
| Snowflake Computing, Inc. (b) | 8,979 | 3,054,207 | |
| TaskUs, Inc. (c) | 23,000 | 1,024,650 | |
| The Western Union Co. | 687,415 | 10,874,905 | |
| Twilio, Inc. Class A (b) | 91,542 | 26,194,743 | |
| Unisys Corp. (b) | 115,684 | 2,100,821 | |
| VeriSign, Inc. (b) | 139,327 | 33,425,941 | |
| Visa, Inc. Class A | 2,685,529 | 520,374,954 | |
| Wix.com Ltd. (b) | 4,700 | 718,160 | |
| 1,961,018,016 | |||
| Semiconductors & Semiconductor Equipment - 5.2% | |||
| Advanced Micro Devices, Inc. (b) | 1,964,274 | 311,082,073 | |
| Analog Devices, Inc. | 522,575 | 94,194,144 | |
| Applied Materials, Inc. | 493,841 | 72,688,457 | |
| ASML Holding NV | 25,830 | 20,444,703 | |
| Broadcom, Inc. | 621,349 | 344,028,514 | |
| First Solar, Inc. (b) | 50,200 | 5,200,720 | |
| indie Semiconductor, Inc. (c) | 55,600 | 763,388 | |
| Intel Corp. | 1,971,994 | 97,022,105 | |
| KLA Corp. | 312,004 | 127,338,193 | |
| Lam Research Corp. | 114,451 | 77,809,512 | |
| Marvell Technology, Inc. | 214,854 | 15,291,159 | |
| Microchip Technology, Inc. | 714,940 | 59,647,444 | |
| Micron Technology, Inc. | 58,900 | 4,947,600 | |
| Monolithic Power Systems, Inc. | 44,998 | 24,904,593 | |
| NVIDIA Corp. | 3,174,238 | 1,037,214,009 | |
| NXP Semiconductors NV | 1,245,080 | 278,101,069 | |
| ON Semiconductor Corp. (b) | 373,800 | 22,962,534 | |
| Qorvo, Inc. (b) | 213,987 | 31,291,319 | |
| Qualcomm, Inc. | 1,921,100 | 346,873,816 | |
| Renesas Electronics Corp. (b) | 263,600 | 3,312,221 | |
| Semtech Corp. (b) | 22,200 | 1,901,874 | |
| Teradyne, Inc. | 155,957 | 23,841,147 | |
| Texas Instruments, Inc. | 697,739 | 134,224,051 | |
| Universal Display Corp. | 4,400 | 629,420 | |
| Xilinx, Inc. | 351,157 | 80,221,817 | |
| 3,215,935,882 | |||
| Software - 8.6% | |||
| Adobe, Inc. (b) | 500,020 | 334,938,397 | |
| Anaplan, Inc. (b) | 43,400 | 1,857,954 | |
| ANSYS, Inc. (b) | 110,000 | 43,062,800 | |
| Atlassian Corp. PLC (b) | 83,320 | 31,354,982 | |
| Autodesk, Inc. (b) | 351,111 | 89,248,905 | |
| Avalara, Inc. (b) | 8,100 | 1,131,408 | |
| AvidXchange Holdings, Inc. | 35,400 | 756,144 | |
| Braze, Inc. | 26,106 | 1,989,277 | |
| Cadence Design Systems, Inc. (b) | 205,171 | 36,409,646 | |
| CCC Intelligent Solutions Holdings, Inc. (e) | 35,655 | 458,167 | |
| Ceridian HCM Holding, Inc. (b) | 463,837 | 50,743,768 | |
| Citrix Systems, Inc. | 364,569 | 29,322,285 | |
| Cognyte Software Ltd. | 233,979 | 4,766,152 | |
| Confluent, Inc. | 7,800 | 608,556 | |
| Consensus Cloud Solutions, Inc. | 54,833 | 3,434,739 | |
| DoubleVerify Holdings, Inc. | 11,500 | 355,120 | |
| Dropbox, Inc. Class A (b) | 292,900 | 7,208,269 | |
| Dynatrace, Inc. (b) | 17,838 | 1,121,118 | |
| Ebix, Inc. (c) | 13,500 | 412,560 | |
| Elastic NV (b) | 28,439 | 4,421,127 | |
| Envestnet, Inc. (b) | 100 | 7,667 | |
| Everbridge, Inc. (b) | 21,200 | 2,404,504 | |
| Fortinet, Inc. (b) | 105,668 | 35,093,399 | |
| GitLab, Inc. | 13,600 | 1,312,944 | |
| HubSpot, Inc. (b) | 500 | 403,455 | |
| Intuit, Inc. | 392,329 | 255,916,207 | |
| Lightspeed Commerce, Inc. (b) | 31,800 | 1,605,582 | |
| LivePerson, Inc. (b)(c) | 80,244 | 3,102,233 | |
| Mandiant, Inc. (b) | 62,500 | 1,060,625 | |
| Microsoft Corp. | 9,181,367 | 3,035,268,117 | |
| Momentive Global, Inc. (b) | 562,032 | 11,482,314 | |
| NCR Corp. (b) | 312,300 | 12,148,470 | |
| NortonLifeLock, Inc. | 1,737,433 | 43,175,210 | |
| Oracle Corp. | 3,773,863 | 342,440,329 | |
| Palo Alto Networks, Inc. (b) | 79,623 | 43,549,004 | |
| PTC, Inc. (b) | 8,419 | 922,554 | |
| Qualtrics International, Inc. | 72,500 | 2,346,100 | |
| Rimini Street, Inc. (b) | 327,876 | 2,167,260 | |
| Salesforce.com, Inc. (b) | 1,830,262 | 521,551,460 | |
| SAP SE sponsored ADR (c) | 46,451 | 5,966,166 | |
| ServiceNow, Inc. (b) | 37,449 | 24,255,717 | |
| Splunk, Inc. (b) | 146,300 | 17,702,300 | |
| SS&C Technologies Holdings, Inc. | 180,243 | 13,757,948 | |
| Synopsys, Inc. (b) | 215,473 | 73,476,293 | |
| Telos Corp. | 35,400 | 557,550 | |
| UiPath, Inc. Class A (b)(c) | 206,655 | 9,971,104 | |
| VMware, Inc. Class A (b)(c) | 105,309 | 12,293,773 | |
| Workday, Inc. Class A (b) | 480,691 | 131,819,893 | |
| Yext, Inc. (b) | 368,000 | 3,554,880 | |
| Zoom Video Communications, Inc. Class A (b) | 262,945 | 55,589,202 | |
| 5,308,503,634 | |||
| Technology Hardware, Storage & Peripherals - 4.3% | |||
| Apple, Inc. | 14,867,019 | 2,457,518,241 | |
| Dell Technologies, Inc. (b) | 267,600 | 15,111,372 | |
| Hewlett Packard Enterprise Co. | 2,281,500 | 32,739,525 | |
| HP, Inc. | 2,719,305 | 95,937,080 | |
| NetApp, Inc. | 23,631 | 2,100,323 | |
| Seagate Technology Holdings PLC | 789,254 | 81,032,708 | |
| Western Digital Corp. (b) | 146,500 | 8,473,560 | |
| Xerox Holdings Corp. | 386,650 | 7,122,093 | |
| 2,700,034,902 | |||
| TOTAL INFORMATION TECHNOLOGY | 13,852,584,417 | ||
| MATERIALS - 2.3% | |||
| Chemicals - 1.5% | |||
| Air Products & Chemicals, Inc. | 181,100 | 52,055,384 | |
| Albemarle Corp. U.S. | 49,084 | 13,080,395 | |
| Axalta Coating Systems Ltd. (b) | 231,615 | 7,022,567 | |
| Cabot Corp. (c) | 215,400 | 11,304,192 | |
| Celanese Corp. Class A | 244,100 | 36,946,976 | |
| CF Industries Holdings, Inc. | 461,693 | 27,973,979 | |
| Corteva, Inc. | 1,147,020 | 51,615,900 | |
| Dow, Inc. | 439,828 | 24,159,752 | |
| DuPont de Nemours, Inc. | 176,288 | 13,038,260 | |
| Eastman Chemical Co. | 978,040 | 101,999,792 | |
| Ecolab, Inc. | 165,237 | 36,595,038 | |
| Huntsman Corp. | 701,000 | 22,214,690 | |
| Ingevity Corp. (b)(c) | 136,575 | 9,821,108 | |
| International Flavors & Fragrances, Inc. | 103,440 | 14,706,065 | |
| Linde PLC | 687,664 | 218,773,425 | |
| Livent Corp. (b) | 8,693 | 263,311 | |
| LyondellBasell Industries NV Class A | 355,498 | 30,974,541 | |
| Olin Corp. | 259,100 | 14,082,085 | |
| PPG Industries, Inc. | 334,862 | 51,625,675 | |
| RPM International, Inc. | 461,865 | 42,048,190 | |
| Sherwin-Williams Co. | 240,049 | 79,513,831 | |
| The Chemours Co. LLC | 353,000 | 10,484,100 | |
| The Mosaic Co. | 366,460 | 12,540,261 | |
| Valvoline, Inc. | 544,800 | 18,561,336 | |
| 901,400,853 | |||
| Construction Materials - 0.2% | |||
| Martin Marietta Materials, Inc. | 132,758 | 53,569,181 | |
| Summit Materials, Inc. (b) | 325,200 | 12,129,960 | |
| Vulcan Materials Co. | 193,800 | 37,139,832 | |
| 102,838,973 | |||
| Containers & Packaging - 0.4% | |||
| Amcor PLC | 950,000 | 10,754,000 | |
| Ball Corp. | 419,900 | 39,239,655 | |
| Berry Global Group, Inc. (b) | 480,400 | 33,171,620 | |
| Crown Holdings, Inc. | 81,800 | 8,654,440 | |
| Graphic Packaging Holding Co. | 79,000 | 1,559,460 | |
| International Paper Co. | 1,181,214 | 53,768,861 | |
| O-I Glass, Inc. (b) | 154,700 | 1,712,529 | |
| Packaging Corp. of America | 401,933 | 52,488,430 | |
| Sealed Air Corp. | 696,747 | 43,281,924 | |
| WestRock Co. | 835,554 | 36,254,688 | |
| 280,885,607 | |||
| Metals & Mining - 0.2% | |||
| Anglo American PLC (United Kingdom) | 37,082 | 1,364,983 | |
| First Quantum Minerals Ltd. | 128,700 | 2,743,357 | |
| Freeport-McMoRan, Inc. | 1,093,256 | 40,537,932 | |
| Glencore Xstrata PLC | 234,700 | 1,114,308 | |
| Nucor Corp. | 286,940 | 30,490,244 | |
| Reliance Steel & Aluminum Co. | 129,600 | 19,262,448 | |
| Steel Dynamics, Inc. | 127,900 | 7,648,420 | |
| United States Steel Corp. | 175,900 | 3,977,099 | |
| 107,138,791 | |||
| Paper & Forest Products - 0.0% | |||
| Schweitzer-Mauduit International, Inc. | 240,600 | 6,905,220 | |
| Sylvamo Corp. | 28,090 | 850,565 | |
| West Fraser Timber Co. Ltd. (c) | 51,700 | 4,236,815 | |
| 11,992,600 | |||
| TOTAL MATERIALS | 1,404,256,824 | ||
| REAL ESTATE - 1.8% | |||
| Equity Real Estate Investment Trusts (REITs) - 1.7% | |||
| Alexandria Real Estate Equities, Inc. | 89,027 | 17,811,632 | |
| American Homes 4 Rent Class A | 316,106 | 12,672,690 | |
| American Tower Corp. | 481,459 | 126,373,358 | |
| Apple Hospitality (REIT), Inc. | 429,479 | 6,450,775 | |
| AvalonBay Communities, Inc. | 107,379 | 25,649,622 | |
| Brandywine Realty Trust (SBI) | 767,000 | 9,855,950 | |
| Brixmor Property Group, Inc. | 701,452 | 15,951,018 | |
| Camden Property Trust (SBI) | 117,173 | 19,358,151 | |
| Corporate Office Properties Trust (SBI) | 39,900 | 1,023,834 | |
| Crown Castle International Corp. | 173,000 | 31,425,450 | |
| CubeSmart | 137,600 | 7,419,392 | |
| Digital Realty Trust, Inc. | 17,400 | 2,918,676 | |
| Douglas Emmett, Inc. | 50,300 | 1,648,331 | |
| EastGroup Properties, Inc. | 19,679 | 4,008,612 | |
| Equinix, Inc. | 76,850 | 62,417,570 | |
| Equity Lifestyle Properties, Inc. | 322,200 | 26,194,860 | |
| Equity Residential (SBI) | 186,519 | 15,911,936 | |
| Essex Property Trust, Inc. | 46,495 | 15,782,263 | |
| Extra Space Storage, Inc. | 51,735 | 10,347,000 | |
| Federal Realty Investment Trust (SBI) | 81,082 | 9,946,329 | |
| Healthpeak Properties, Inc. | 363,525 | 11,945,432 | |
| Host Hotels & Resorts, Inc. (b) | 2,770,924 | 43,503,507 | |
| Invitation Homes, Inc. | 155,100 | 6,272,244 | |
| Iron Mountain, Inc. | 52,579 | 2,389,190 | |
| JBG SMITH Properties | 125,483 | 3,487,173 | |
| Kilroy Realty Corp. | 34,000 | 2,194,020 | |
| Kimco Realty Corp. | 796,556 | 17,858,786 | |
| Lamar Advertising Co. Class A | 33,654 | 3,677,036 | |
| Lexington Corporate Properties Trust | 248,100 | 3,733,905 | |
| Mid-America Apartment Communities, Inc. | 121,135 | 24,984,094 | |
| Omega Healthcare Investors, Inc. | 439,500 | 12,279,630 | |
| Paramount Group, Inc. | 715,000 | 5,691,400 | |
| Piedmont Office Realty Trust, Inc. Class A | 784,400 | 13,632,872 | |
| Prologis (REIT), Inc. | 1,133,045 | 170,806,534 | |
| Public Storage | 107,502 | 35,194,005 | |
| Rayonier, Inc. | 453,496 | 17,128,544 | |
| SBA Communications Corp. Class A | 89,138 | 30,645,644 | |
| Service Properties Trust | 340,500 | 2,897,655 | |
| Simon Property Group, Inc. | 232,295 | 35,503,968 | |
| SITE Centers Corp. | 166,350 | 2,505,231 | |
| Sun Communities, Inc. | 371,795 | 70,113,101 | |
| Ventas, Inc. | 504,459 | 23,669,216 | |
| VICI Properties, Inc. | 42,800 | 1,164,160 | |
| Vornado Realty Trust | 189,479 | 7,605,687 | |
| Welltower, Inc. | 471,592 | 37,548,155 | |
| Weyerhaeuser Co. | 1,304,835 | 49,074,844 | |
| 1,058,673,482 | |||
| Real Estate Management & Development - 0.1% | |||
| CBRE Group, Inc. (b) | 315,446 | 30,147,174 | |
| Cushman & Wakefield PLC (b) | 252,100 | 4,457,128 | |
| Jones Lang LaSalle, Inc. (b) | 41,400 | 9,725,274 | |
| Opendoor Technologies, Inc. (b) | 437,121 | 6,923,997 | |
| 51,253,573 | |||
| TOTAL REAL ESTATE | 1,109,927,055 | ||
| UTILITIES - 1.8% | |||
| Electric Utilities - 1.2% | |||
| Alliant Energy Corp. | 118,100 | 6,470,699 | |
| American Electric Power Co., Inc. | 151,263 | 12,259,866 | |
| Duke Energy Corp. | 35,800 | 3,472,958 | |
| Edison International | 696,751 | 45,483,905 | |
| Entergy Corp. | 228,304 | 22,908,023 | |
| Evergy, Inc. | 179,465 | 11,360,135 | |
| Eversource Energy | 430,900 | 35,450,143 | |
| Exelon Corp. | 837,664 | 44,170,023 | |
| FirstEnergy Corp. | 394,200 | 14,845,572 | |
| NextEra Energy, Inc. | 3,494,928 | 303,289,852 | |
| NRG Energy, Inc. | 906,870 | 32,665,457 | |
| PG&E Corp. (b) | 787,496 | 9,355,452 | |
| PPL Corp. | 1,139,906 | 31,723,584 | |
| Southern Co. | 1,581,668 | 96,639,915 | |
| Xcel Energy, Inc. | 855,547 | 54,524,010 | |
| 724,619,594 | |||
| Gas Utilities - 0.0% | |||
| Atmos Energy Corp. | 60,400 | 5,455,328 | |
| UGI Corp. | 126,500 | 5,218,125 | |
| 10,673,453 | |||
| Independent Power and Renewable Electricity Producers - 0.0% | |||
| Sunnova Energy International, Inc. (b) | 29,300 | 1,083,221 | |
| The AES Corp. | 194,600 | 4,549,748 | |
| Vistra Corp. | 1,037,600 | 20,627,488 | |
| 26,260,457 | |||
| Multi-Utilities - 0.6% | |||
| Ameren Corp. | 500,044 | 40,798,590 | |
| CenterPoint Energy, Inc. | 1,017,807 | 26,371,379 | |
| CMS Energy Corp. | 330,100 | 19,426,385 | |
| Dominion Energy, Inc. | 1,468,783 | 104,577,350 | |
| DTE Energy Co. | 201,700 | 21,852,178 | |
| MDU Resources Group, Inc. | 780,700 | 21,258,461 | |
| NiSource, Inc. | 110,100 | 2,698,551 | |
| Public Service Enterprise Group, Inc. | 473,853 | 29,611,074 | |
| Sempra Energy | 393,618 | 47,182,990 | |
| WEC Energy Group, Inc. | 340,369 | 29,588,277 | |
| 343,365,235 | |||
| Water Utilities - 0.0% | |||
| Essential Utilities, Inc. | 102,000 | 4,821,540 | |
| TOTAL UTILITIES | 1,109,740,279 | ||
| TOTAL COMMON STOCKS | |||
| (Cost $27,742,894,623) | 52,026,219,333 | ||
| Nonconvertible Preferred Stocks - 0.0% | |||
| INDUSTRIALS - 0.0% | |||
| Aerospace & Defense - 0.0% | |||
| Embraer SA sponsored ADR (b) | |||
| (Cost $608,498) | 58,446 | 802,464 | |
| Equity Funds - 15.0% | |||
| Large Blend Funds - 4.8% | |||
| Fidelity SAI U.S. Large Cap Index Fund (f) | 81,644,301 | 1,788,010,184 | |
| Fidelity SAI U.S. Low Volatility Index Fund (f) | 46,062,847 | 868,284,665 | |
| PIMCO StocksPLUS Absolute Return Fund Institutional Class | 23,140,982 | 325,130,790 | |
| TOTAL LARGE BLEND FUNDS | 2,981,425,639 | ||
| Large Growth Funds - 9.2% | |||
| Fidelity Growth Company Fund (f) | 98,276,989 | 4,098,150,431 | |
| Fidelity SAI U.S. Momentum Index Fund (f) | 10,436,475 | 180,133,564 | |
| Fidelity SAI U.S. Quality Index Fund (f) | 77,342,417 | 1,400,671,172 | |
| TOTAL LARGE GROWTH FUNDS | 5,678,955,167 | ||
| Mid-Cap Growth Funds - 1.0% | |||
| Janus Henderson Enterprise Fund | 3,572,773 | 619,983,224 | |
| TOTAL EQUITY FUNDS | |||
| (Cost $4,792,021,859) | 9,280,364,030 | ||
| Other - 0.0% | |||
| Commodity Funds - Broad Basket - 0.0% | |||
| Fidelity SAI Inflation-Focused Fund (f) | |||
| (Cost $9,232,556) | 1,094,386 | 11,370,671 | |
| U.S. Treasury Obligations - 0.0% | |||
| U.S. Treasury Bills, yield at date of purchase 0.05% to 0.05% 12/30/21 (g) | |||
| (Cost $5,359,790) | 5,360,000 | 5,359,601 | |
| Money Market Funds - 1.0% | |||
| Fidelity Cash Central Fund 0.06% (h) | 28,871,997 | 28,877,772 | |
| Fidelity Securities Lending Cash Central Fund 0.07% (h)(i) | 134,363,293 | 134,376,729 | |
| Invesco Government & Agency Portfolio Institutional Class .03% (j) | 446,217,503 | 446,217,503 | |
| TOTAL MONEY MARKET FUNDS | |||
| (Cost $609,470,414) | 609,472,004 | ||
| TOTAL INVESTMENT IN SECURITIES - 100.2% | |||
| (Cost $33,159,587,740) | 61,933,588,103 | ||
| NET OTHER ASSETS (LIABILITIES) - (0.2)% | (117,571,950) | ||
| NET ASSETS - 100% | $61,816,016,153 |
| Written Options | ||||||
| Counterparty | Number of Contracts | Notional Amount | Exercise Price | Expiration Date | Value | |
| Call Options | ||||||
| State Street Corp. | Chicago Board Options Exchange | 76 | $676,172 | $105.00 | 1/21/22 | $(3,610) |
| Futures Contracts | |||||
| Number of contracts | Expiration Date | Notional Amount | Value | Unrealized Appreciation/(Depreciation) | |
| Purchased | |||||
| Equity Index Contracts | |||||
| CME E-mini S&P 500 Index Contracts (United States) | 98 | Dec. 2021 | $22,374,625 | $123,582 | $123,582 |
The notional amount of futures purchased as a percentage of Net Assets is 0.0%
Legend
(a) Security exempt from registration under Rule 144A of the Securities Act of 1933. These securities may be resold in transactions exempt from registration, normally to qualified institutional buyers. At the end of the period, the value of these securities amounted to $8,300,768 or 0.0% of net assets.
(b) Non-income producing
(c) Security or a portion of the security is on loan at period end.
(d) Security or a portion of the security is pledged as collateral for call options written. At period end, the value of securities pledged amounted to $676,172.
(e) Restricted securities (including private placements) - Investment in securities not registered under the Securities Act of 1933 (excluding 144A issues). At the end of the period, the value of restricted securities (excluding 144A issues) amounted to $3,341,452 or 0.0% of net assets.
(f) Affiliated Fund
(g) Security or a portion of the security was pledged to cover margin requirements for futures contracts. At period end, the value of securities pledged amounted to $1,192,911.
(h) Affiliated fund that is generally available only to investment companies and other accounts managed by Fidelity Investments. The rate quoted is the annualized seven-day yield of the fund at period end. A complete unaudited listing of the fund's holdings as of its most recent quarter end is available upon request. In addition, each Fidelity Central Fund's financial statements are available on the SEC's website or upon request.
(i) Investment made with cash collateral received from securities on loan.
(j) The rate quoted is the annualized seven-day yield of the fund at period end.
Additional information on each restricted holding is as follows:
| Security | Acquisition Date | Acquisition Cost |
| CCC Intelligent Solutions Holdings, Inc. | 2/2/21 | $356,550 |
| Local Bounti Corp. | 6/17/21 - 11/4/21 | $1,255,890 |
| Mirion Technologies, Inc. | 6/16/21 | $2,008,140 |
Affiliated Central Funds
Fiscal year to date information regarding the Fund's investments in Fidelity Central Funds, including the ownership percentage, is presented below.
| Fund | Value, beginning of period | Purchases | Sales Proceeds | Dividend Income | Realized Gain/Loss | Change in Unrealized appreciation (depreciation) | Value, end of period | % ownership, end of period |
| Fidelity Cash Central Fund 0.06% | $42,716,602 | $178,937,613 | $192,776,443 | $10,369 | $-- | $-- | $28,877,772 | 0.0% |
| Fidelity Securities Lending Cash Central Fund 0.07% | 292,027,572 | 615,483,587 | 773,134,430 | 1,050,985 | -- | -- | 134,376,729 | 0.4% |
| Total | $334,744,174 | $794,421,200 | $965,910,873 | $1,061,354 | $-- | $-- | $163,254,501 |
Amounts in the income column in the above table include any capital gain distributions from underlying funds, which are presented in the corresponding line-item in the Statement of Operations, if applicable. Amount for Fidelity Securities Lending Cash Central Fund represents the income earned on investing cash collateral, less rebates paid to borrowers and any lending agent fees associated with the loan, plus any premium payments received for lending certain types of securities.
Affiliated Underlying Funds
Fiscal year to date information regarding the Fund's investments in affiliated Underlying Funds is presented below. Exchanges between classes of the same affiliated Underlying Funds may occur. If an underlying Fund changes its name, the name presented below is the name in effect at period end.
| Affiliate | Value, beginning of period | Purchases | Sales Proceeds | Dividend Income | Realized Gain (loss) | Change in Unrealized appreciation (depreciation) | Value, end of period |
| Fidelity Growth Company Fund | $3,660,707,600 | $50,000,012 | $240,000,000 | $-- | $150,514,455 | $476,928,364 | $4,098,150,431 |
| Fidelity SAI Inflation-Focused Fund | 10,795,429 | 2,463,970 | -- | 2,463,969 | -- | (1,888,728) | 11,370,671 |
| Fidelity SAI U.S. Large Cap Index Fund | 2,057,113,253 | 2,628,175,527 | 2,926,420,646 | 185,381,409 | 90,712,637 | (61,570,587) | 1,788,010,184 |
| Fidelity SAI U.S. Low Volatility Index Fund | 1,442,168,893 | -- | 660,966,341 | -- | 95,969,810 | (8,887,697) | 868,284,665 |
| Fidelity SAI U.S. Momentum Index Fund | 31,475,001 | 143,299,133 | 75 | 5,158,158 | 4 | 5,359,501 | 180,133,564 |
| Fidelity SAI U.S. Quality Index Fund | 1,001,129,553 | 368,952,513 | -- | 83,952,438 | -- | 30,589,106 | 1,400,671,172 |
| Total | $8,203,389,729 | $3,192,891,155 | $3,827,387,062 | $276,955,974 | $337,196,906 | $440,529,959 | $8,346,620,687 |
Amounts in the income column in the above table include any capital gain distributions from underlying funds, which are presented in the corresponding line-item in the Statement of Operations, if applicable.
Investment Valuation
The following is a summary of the inputs used, as of November 30, 2021, involving the Fund's assets and liabilities carried at fair value. The inputs or methodology used for valuing securities may not be an indication of the risk associated with investing in those securities. For more information on valuation inputs, and their aggregation into the levels used below, please refer to the Investment Valuation section in the accompanying Notes to Financial Statements.
| Valuation Inputs at Reporting Date: | ||||
| Description | Total | Level 1 | Level 2 | Level 3 |
| Investments in Securities: | ||||
| Equities: | ||||
| Communication Services | $5,175,132,099 | $5,169,682,733 | $5,449,366 | $-- |
| Consumer Discretionary | 6,811,249,567 | 6,811,249,567 | -- | -- |
| Consumer Staples | 2,648,926,185 | 2,648,926,185 | -- | -- |
| Energy | 1,551,478,652 | 1,551,478,652 | -- | -- |
| Financials | 7,198,733,537 | 7,189,551,003 | 9,182,534 | -- |
| Health Care | 6,723,796,550 | 6,707,704,224 | 16,092,326 | -- |
| Industrials | 4,441,196,632 | 4,427,630,437 | 13,566,195 | -- |
| Information Technology | 13,852,584,417 | 13,848,042,904 | 4,541,513 | -- |
| Materials | 1,404,256,824 | 1,401,777,533 | 2,479,291 | -- |
| Real Estate | 1,109,927,055 | 1,109,927,055 | -- | -- |
| Utilities | 1,109,740,279 | 1,109,740,279 | -- | -- |
| Equity Funds | 9,280,364,030 | 9,280,364,030 | -- | -- |
| Other | 11,370,671 | 11,370,671 | -- | -- |
| Other Short-Term Investments and Net Other Assets | 5,359,601 | -- | 5,359,601 | -- |
| Money Market Funds | 609,472,004 | 609,472,004 | -- | -- |
| Total Investments in Securities: | $61,933,588,103 | $61,876,917,277 | $56,670,826 | $-- |
| Net unrealized depreciation on unfunded commitments | $(90,457) | $-- | $(90,457) | $-- |
| Derivative Instruments: | ||||
| Assets | ||||
| Futures Contracts | $123,582 | $123,582 | $-- | $-- |
| Total Assets | $123,582 | $123,582 | $-- | $-- |
| Liabilities | ||||
| Written Options | $(3,610) | $(3,610) | $-- | $-- |
| Total Liabilities | $(3,610) | $(3,610) | $-- | $-- |
| Total Derivative Instruments: | $119,972 | $119,972 | $-- | $-- |
Value of Derivative Instruments
The following table is a summary of the Fund's value of derivative instruments by primary risk exposure as of November 30, 2021. For additional information on derivative instruments, please refer to the Derivative Instruments section in the accompanying Notes to Financial Statements.
| Primary Risk Exposure / Derivative Type | Value | |
| Asset | Liability | |
| Equity Risk | ||
| Futures Contracts(a) | $123,582 | $0 |
| Written Options(b) | 0 | (3,610) |
| Total Equity Risk | 123,582 | (3,610) |
| Total Value of Derivatives | $123,582 | $(3,610) |
(a) Reflects gross cumulative appreciation (depreciation) on futures contracts as presented in the Schedule of Investments. In the Statement of Assets and Liabilities, the period end daily variation margin is included in receivable or payable for daily variation margin on futures contracts, and the net cumulative appreciation (depreciation) is included in Total accumulated earnings (loss).
(b) Gross value is presented in the Statement of Assets and Liabilities in the written options, at value line-item.
See accompanying notes which are an integral part of the financial statements.
Financial Statements
Statement of Assets and Liabilities
| November 30, 2021 (Unaudited) | ||
| Assets | ||
| Investment in securities, at value (including securities loaned of $129,034,707) — See accompanying schedule: Unaffiliated issuers (cost $28,806,272,392) | $53,423,712,915 | |
| Fidelity Central Funds (cost $163,252,911) | 163,254,501 | |
| Other affiliated issuers (cost $4,190,062,437) | 8,346,620,687 | |
| Total Investment in Securities (cost $33,159,587,740) | $61,933,588,103 | |
| Cash | 549,569 | |
| Foreign currency held at value (cost $5,158,217) | 5,123,487 | |
| Receivable for investments sold | 378,702,796 | |
| Receivable for fund shares sold | 22,076,789 | |
| Dividends receivable | 68,921,073 | |
| Interest receivable | 10,726 | |
| Distributions receivable from Fidelity Central Funds | 23,190 | |
| Prepaid expenses | 48,624 | |
| Other receivables | 842,473 | |
| Total assets | 62,409,886,830 | |
| Liabilities | ||
| Payable for investments purchased | $419,965,749 | |
| Unrealized depreciation on unfunded commitments | 90,457 | |
| Payable for fund shares redeemed | 27,884,963 | |
| Accrued management fee | 9,460,096 | |
| Payable for daily variation margin on futures contracts | 415,275 | |
| Written options, at value (premium received $20,784) | 3,610 | |
| Other payables and accrued expenses | 1,673,798 | |
| Collateral on securities loaned | 134,376,729 | |
| Total liabilities | 593,870,677 | |
| Net Assets | $61,816,016,153 | |
| Net Assets consist of: | ||
| Paid in capital | $30,543,291,552 | |
| Total accumulated earnings (loss) | 31,272,724,601 | |
| Net Assets | $61,816,016,153 | |
| Net Asset Value, offering price and redemption price per share ($61,816,016,153 ÷ 5,004,538,532 shares) | $12.35 |
See accompanying notes which are an integral part of the financial statements.
Statement of Operations
| Six months ended November 30, 2021 (Unaudited) | ||
| Investment Income | ||
| Dividends: | ||
| Unaffiliated issuers | $394,588,846 | |
| Affiliated issuers | 26,351,771 | |
| Interest | 62,287 | |
| Income from Fidelity Central Funds (including $1,050,985 from security lending) | 1,061,354 | |
| Total income | 422,064,258 | |
| Expenses | ||
| Management fee | $132,290,705 | |
| Custodian fees and expenses | 292,004 | |
| Independent trustees' fees and expenses | 221,184 | |
| Registration fees | 1,522,245 | |
| Audit | 52,812 | |
| Legal | 70,319 | |
| Interest | 8,437 | |
| Miscellaneous | 168,116 | |
| Total expenses before reductions | 134,625,822 | |
| Expense reductions | (77,311,820) | |
| Total expenses after reductions | 57,314,002 | |
| Net investment income (loss) | 364,750,256 | |
| Realized and Unrealized Gain (Loss) | ||
| Net realized gain (loss) on: | ||
| Investment securities: | ||
| Unaffiliated issuers (net of foreign taxes of $92,267) | 1,773,743,698 | |
| Affiliated issuers | 337,196,906 | |
| Foreign currency transactions | (186,954) | |
| Futures contracts | 7,401,665 | |
| Capital gain distributions from underlying funds: | ||
| Affiliated issuers | 250,604,203 | |
| Total net realized gain (loss) | 2,368,759,518 | |
| Change in net unrealized appreciation (depreciation) on: | ||
| Investment securities: | ||
| Unaffiliated issuers (net of increase in deferred foreign taxes of $46,757) | 1,236,746,163 | |
| Affiliated issuers | 440,529,959 | |
| Unfunded commitments | (549,056) | |
| Assets and liabilities in foreign currencies | (98,861) | |
| Futures contracts | (3,031,800) | |
| Written options | 17,174 | |
| Total change in net unrealized appreciation (depreciation) | 1,673,613,579 | |
| Net gain (loss) | 4,042,373,097 | |
| Net increase (decrease) in net assets resulting from operations | $4,407,123,353 |
See accompanying notes which are an integral part of the financial statements.
Statement of Changes in Net Assets
| Six months ended November 30, 2021 (Unaudited) | Year ended May 31, 2021(a) | |
| Increase (Decrease) in Net Assets | ||
| Operations | ||
| Net investment income (loss) | $364,750,256 | $558,140,028 |
| Net realized gain (loss) | 2,368,759,518 | 4,435,084,434 |
| Change in net unrealized appreciation (depreciation) | 1,673,613,579 | 11,147,436,258 |
| Net increase (decrease) in net assets resulting from operations | 4,407,123,353 | 16,140,660,720 |
| Distributions to shareholders | (3,314,328,717) | (1,568,168,745) |
| Share transactions | ||
| Proceeds from sales of shares | 5,077,269,556 | 7,520,866,873 |
| Net asset value of shares issued in merger transaction (note 12) | – | 18,520,637,551 |
| Reinvestment of distributions | 3,140,671,354 | 232,385,307 |
| Cost of shares redeemed | (7,686,562,638) | (7,680,619,730) |
| Net increase (decrease) in net assets resulting from share transactions | 531,378,272 | 18,593,270,001 |
| Total increase (decrease) in net assets | 1,624,172,908 | 33,165,761,976 |
| Net Assets | ||
| Beginning of period | 60,191,843,245 | 27,026,081,269 |
| End of period | $61,816,016,153 | $60,191,843,245 |
| Other Information | ||
| Shares(b) | ||
| Sold | 412,230,394 | 905,089,646 |
| Issued in exchange for shares in merger transaction (note 12) | – | 1,844,685,437 |
| Issued in reinvestment of distributions | 263,921,962 | 143,286,389 |
| Redeemed | (624,558,911) | (1,009,622,141) |
| Net increase (decrease) | 51,593,445 | 1,883,439,331 |
(a) See Note 1 and Note 12.
(b) For the year ended May 31, 2021, as further described in Notes 1 and 12, amounts have been adjusted to reflect the impact of the change in capital structure associated with the merger that occurred on November 20, 2020. All financial information prior to the merger is that of the Predecessor Fund.
See accompanying notes which are an integral part of the financial statements.
Financial Highlights
Strategic Advisers Large Cap Fund
| Six months ended (Unaudited) November 30, | Years endedMay 31, | |||||
| 2021 | 2021 A | 2020 A | 2019 A | 2018 A | 2017 A | |
| Selected Per–Share Data | ||||||
| Net asset value, beginning of period | $12.15 | $8.81 | $8.33 | $8.86 | $8.34 | $7.26 |
| Income from Investment Operations | ||||||
| Net investment income (loss)B | .07 | .14 | .15 | .14 | .12 | .11 |
| Net realized and unrealized gain (loss) | .80 | 3.69 | .88 | .03 | 1.05 | 1.19 |
| Total from investment operations | .87 | 3.83 | 1.03 | .17 | 1.17 | 1.30 |
| Distributions from net investment income | (.05) | (.15) | (.14) | (.14) | (.12) | (.09) |
| Distributions from net realized gain | (.62) | (.34) | (.42) | (.56) | (.53) | (.13) |
| Total distributions | (.67) | (.49) | (.55)C | (.70) | (.65) | (.22) |
| Net asset value, end of period | $12.35 | $12.15 | $8.81 | $8.33 | $8.86 | $8.34 |
| Total ReturnD,E | 7.40% | 44.55% | 12.17% | 2.41% | 14.59% | 18.22% |
| Ratios to Average Net AssetsF,G | ||||||
| Expenses before reductions | .44%H | .44% | .45% | .45% | .47% | .46% |
| Expenses net of fee waivers, if any | .19%H | .19% | .20% | .20% | .21% | .21% |
| Expenses net of all reductions | .19%H | .19% | .20% | .20% | .21% | .21% |
| Net investment income (loss) | 1.18%H | 1.29% | 1.74% | 1.65% | 1.41% | 1.40% |
| Supplemental Data | ||||||
| Net assets, end of period (000 omitted) | $61,816,016 | $60,191,843 | $27,026,081 | $24,720,960 | $24,984,597 | $23,157,908 |
| Portfolio turnover rateI | 48%H | 74%J | 90% | 84% | 98% | 100% |
A As further described in Notes 1 and 12, per share amounts have been adjusted to reflect the impact of the change in capital structure associated with the merger that occurred on November 20, 2020. All financial information prior to the merger is that of the Predecessor Fund.
B Calculated based on average shares outstanding during the period.
C Total distributions per share do not sum due to rounding.
D Total returns for periods of less than one year are not annualized.
E Total returns would have been lower if certain expenses had not been reduced during the applicable periods shown.
F Fees and expenses of any underlying mutual funds or exchange-traded funds (ETFs) are not included in the Fund's expense ratio. The Fund indirectly bears its proportionate share of these expenses. For additional expense information related to investments in Fidelity Central Funds, please refer to the "Investments in Fidelity Central Funds" note found in the Notes to Financial Statements section of the most recent Annual or Semi-Annual report.
G Expense ratios reflect operating expenses of the class. Expenses before reductions do not reflect amounts reimbursed, waived, or reduced through arrangements with the investment adviser, brokerage services, or other offset arrangements, if applicable, and do not represent the amount paid by the class during periods when reimbursements, waivers or reductions occur.
H Annualized
I Amount does not include the portfolio activity of any underlying mutual funds or exchange-traded funds (ETFs).
J The portfolio turnover rate does not include the assets acquired in the merger.
See accompanying notes which are an integral part of the financial statements.
Notes to Financial Statements (Unaudited)
For the period ended November 30, 2021
1. Organization.
Strategic Advisers Large Cap Fund (the Fund) is a fund of Fidelity Rutland Square Trust II (the Trust), and is authorized to issue an unlimited number of shares. The Trust is registered under the Investment Company Act of 1940, as amended (the 1940 Act), as an open-end management investment company organized as a Delaware statutory trust. The Fund is offered exclusively to certain managed account clients of Strategic Advisers LLC (Strategic Advisers), an affiliate of Fidelity Management & Research Company LLC (FMR). Effective November 20, 2020, Strategic Advisers Core Fund ("Predecessor Fund") and two other funds were reorganized into the Fund. The Predecessor Fund was the accounting survivor in the reorganization, and, as such, the financial statements and financial highlights for the fiscal year ended May 31, 2021 and prior reflect the financial information of the Predecessor Fund through November 20, 2020 (see Note 12).
2. Significant Accounting Policies.
The Fund is an investment company and applies the accounting and reporting guidance of the Financial Accounting Standards Board (FASB) Accounting Standards Codification Topic 946 Financial Services - Investment Companies. The financial statements have been prepared in conformity with accounting principles generally accepted in the United States of America (GAAP), which require management to make certain estimates and assumptions at the date of the financial statements. Actual results could differ from those estimates. Subsequent events, if any, through the date that the financial statements were issued have been evaluated in the preparation of the financial statements. The Fund's Schedule of Investments lists any underlying mutual funds or exchange-traded funds (ETFs) but does not include the underlying holdings of these funds. The following summarizes the significant accounting policies of the Fund:
Investment Valuation. Investments are valued as of 4:00 p.m. Eastern time on the last calendar day of the period. The Board of Trustees (the Board) has delegated the day to day responsibility for the valuation of the Fund's investments to the Fair Value Committee (the Committee) established by the Fund's investment adviser. In accordance with valuation policies and procedures approved by the Board, the Fund attempts to obtain prices from one or more third party pricing vendors or brokers to value its investments. When current market prices, quotations or currency exchange rates are not readily available or reliable, investments will be fair valued in good faith by the Committee, in accordance with procedures adopted by the Board. Factors used in determining fair value vary by investment type and may include market or investment specific events, changes in interest rates and credit quality. The frequency with which these procedures are used cannot be predicted and they may be utilized to a significant extent. The Committee oversees the Fund's valuation policies and procedures and reports to the Board on the Committee's activities and fair value determinations. The Board monitors the appropriateness of the procedures used in valuing the Fund's investments and ratifies the fair value determinations of the Committee.
The Fund categorizes the inputs to valuation techniques used to value its investments into a disclosure hierarchy consisting of three levels as shown below:
- Level 1 – quoted prices in active markets for identical investments
- Level 2 – other significant observable inputs (including quoted prices for similar investments, interest rates, prepayment speeds, etc.)
- Level 3 – unobservable inputs (including the Fund's own assumptions based on the best information available)
Valuation techniques used to value the Fund's investments by major category are as follows:
Equity securities, including restricted securities, for which market quotations are readily available, are valued at the last reported sale price or official closing price as reported by a third party pricing vendor on the primary market or exchange on which they are traded and are categorized as Level 1 in the hierarchy. In the event there were no sales during the day or closing prices are not available, securities are valued at the last quoted bid price or may be valued using the last available price and are generally categorized as Level 2 in the hierarchy. For foreign equity securities, when market or security specific events arise, comparisons to the valuation of American Depositary Receipts (ADRs), futures contracts, ETFs and certain indexes as well as quoted prices for similar securities may be used and would be categorized as Level 2 in the hierarchy. For equity securities, including restricted securities, where observable inputs are limited, assumptions about market activity and risk are used and these securities may be categorized as Level 3 in the hierarchy.
Debt securities, including restricted securities, are valued based on evaluated prices received from third party pricing vendors or from brokers who make markets in such securities. U.S. government and government agency obligations are valued by pricing vendors who utilize matrix pricing which considers yield or price of bonds of comparable quality, coupon, maturity and type or by broker-supplied prices. When independent prices are unavailable or unreliable, debt securities may be valued utilizing pricing methodologies which consider similar factors that would be used by third party pricing vendors. Debt securities are generally categorized as Level 2 in the hierarchy but may be Level 3 depending on the circumstances.
Futures contracts are valued at the settlement price established each day by the board of trade or exchange on which they are traded and are categorized as Level 1 in the hierarchy. Exchange-traded options are valued using the last sale price or, in the absence of a sale, the last offering price and are categorized as Level 1 in the hierarchy. Investments in open-end mutual funds, including the are valued at their closing net asset value (NAV) each business day and are categorized as Level 1 in the hierarchy. If an unaffiliated open-end mutual fund's NAV is unavailable, shares of that fund may be valued by another method that the Board believes reflects fair value in accordance with the Board's fair value pricing policies and is categorized as Level 2 in the hierarchy.
Changes in valuation techniques may result in transfers in or out of an assigned level within the disclosure hierarchy. The aggregate value of investments by input level as of November 30, 2021 is included at the end of the Fund's Schedule of Investments.
Foreign Currency. Certain Funds may use foreign currency contracts to facilitate transactions in foreign-denominated securities. Gains and losses from these transactions may arise from changes in the value of the foreign currency or if the counterparties do not perform under the contracts' terms.
Foreign-denominated assets, including investment securities, and liabilities are translated into U.S. dollars at the exchange rates at period end. Purchases and sales of investment securities, income and dividends received, and expenses denominated in foreign currencies are translated into U.S. dollars at the exchange rate in effect on the transaction date.
The effects of exchange rate fluctuations on investments are included with the net realized and unrealized gain (loss) on investment securities. Other foreign currency transactions resulting in realized and unrealized gain (loss) are disclosed separately.
Investment Transactions and Income. For financial reporting purposes, the Fund's investment holdings and NAV include trades executed through the end of the last business day of the period. The NAV per share for processing shareholder transactions is calculated as of the close of business of the New York Stock Exchange (NYSE), normally 4:00 p.m. Eastern time and includes trades executed through the end of the prior business day. Gains and losses on securities sold are determined on the basis of identified cost and include proceeds received from litigation. Commissions paid to certain brokers with whom the investment adviser, or its affiliates, places trades on behalf of a fund include an amount in addition to trade execution, which may be rebated back to a fund. Any such rebates are included in net realized gain (loss) on investments in the Statement of Operations. Dividend income is recorded on the ex-dividend date, except for certain dividends from foreign securities where the ex-dividend date may have passed, which are recorded as soon as the Fund is informed of the ex-dividend date. Non-cash dividends included in dividend income, if any, are recorded at the fair market value of the securities received. Income and capital gain distributions from Fidelity Central Funds, if any, are recorded on the ex-dividend date. Income and capital gain distributions from any underlying mutual funds or exchange-traded funds (ETFs) are recorded on the ex-dividend date. Certain distributions received by the Fund represent a return of capital or capital gain. The Fund determines the components of these distributions subsequent to the ex-dividend date, based upon receipt of tax filings or other correspondence relating to the underlying investment. These distributions are recorded as a reduction of cost of investments and/or as a realized gain. Interest income is accrued as earned and includes coupon interest and amortization of premium and accretion of discount on debt securities as applicable. Investment income is recorded net of foreign taxes withheld where recovery of such taxes is uncertain. Funds may file withholding tax reclaims in certain jurisdictions to recover a portion of amounts previously withheld. Any withholding tax reclaims income is included in the Statement of Operations in dividends. Any receivables for withholding tax reclaims are included in the Statement of Assets and Liabilities in reclaims receivable.
Expenses. Expenses directly attributable to a fund are charged to that fund. Expenses attributable to more than one fund are allocated among the respective funds on the basis of relative net assets or other appropriate methods. Expenses included in the accompanying financial statements reflect the expenses of that fund and do not include any expenses associated with any underlying mutual funds or exchange-traded funds. Although not included in a fund's expenses, a fund indirectly bears its proportionate share of these expenses through the net asset value of each underlying mutual fund or exchange-traded fund. Expense estimates are accrued in the period to which they relate and adjustments are made when actual amounts are known.
Deferred Trustee Compensation. Under a Deferred Compensation Plan (the Plan) for certain Funds, certain independent Trustees have elected to defer receipt of a portion of their annual compensation. Deferred amounts are invested in affiliated mutual funds, are marked-to-market and remain in a fund until distributed in accordance with the Plan. The investment of deferred amounts and the offsetting payable to the Trustees presented below are included in the accompanying Statement of Assets and Liabilities in other receivables and other payables and accrued expenses, as applicable.
| Strategic Advisers Large Cap Fund | $823,948 |
Income Tax Information and Distributions to Shareholders. Each year, the Fund intends to qualify as a regulated investment company under Subchapter M of the Internal Revenue Code, including distributing substantially all of its taxable income and realized gains. As a result, no provision for U.S. Federal income taxes is required. The Fund files a U.S. federal tax return, in addition to state and local tax returns as required. The Fund's federal income tax returns are subject to examination by the Internal Revenue Service (IRS) for a period of three fiscal years after they are filed. State and local tax returns may be subject to examination for an additional fiscal year depending on the jurisdiction. Foreign taxes are provided for based on the Fund's understanding of the tax rules and rates that exist in the foreign markets in which it invests. The Fund is subject to a tax imposed on capital gains by certain countries in which it invests. An estimated deferred tax liability for net unrealized appreciation on the applicable securities is included in Other payables and accrued expenses on the Statement of Assets & Liabilities.
Distributions are declared and recorded on the ex-dividend date. Income and capital gain distributions are determined in accordance with income tax regulations, which may differ from GAAP.
Capital accounts within the financial statements are adjusted for permanent book-tax differences. These adjustments have no impact on net assets or the results of operations. Capital accounts are not adjusted for temporary book-tax differences which will reverse in a subsequent period.
Book-tax differences are primarily due to the short-term gain distributions from the underlying mutual funds, futures contracts, foreign currency transactions, certain foreign taxes, passive foreign investment companies (PFIC), partnerships, deferred Trustees compensation and losses deferred due to wash sales.
As of period end, the cost and unrealized appreciation (depreciation) in securities, and derivatives if applicable, for federal income tax purposes were as follows:
| Gross unrealized appreciation | $29,238,714,058 |
| Gross unrealized depreciation | (647,100,651) |
| Net unrealized appreciation (depreciation) | $28,591,613,407 |
| Tax cost | $33,342,024,995 |
Restricted Securities (including Private Placements). Funds may invest in securities that are subject to legal or contractual restrictions on resale. These securities generally may be resold in transactions exempt from registration or to the public if the securities are registered. Disposal of these securities may involve time-consuming negotiations and expense, and prompt sale at an acceptable price may be difficult. Information regarding restricted securities held at period end is included at the end of the Schedule of Investments, if applicable.
Special Purpose Acquisition Companies. Funds may invest in stock, warrants, and other securities of special purpose acquisition companies (SPACs) or similar special purpose entities. A SPAC is a publicly traded company that raises investment capital via an initial public offering (IPO) for the purpose of acquiring the equity securities of one or more existing companies via merger, business combination, acquisition or other similar transactions within a designated time frame.
Private Investment in Public Equity. Funds may acquire equity securities of an issuer through a private investment in a public equity (PIPE) transaction, including through commitments to purchase securities on a when-issued basis. A PIPE typically involves the purchase of securities directly from a publicly traded company in a private placement transaction. Securities purchased through PIPE transactions will be restricted from trading and considered illiquid until a resale registration statement for the shares is filed and declared effective.
At period end, the Fund had commitments to purchase when-issued securities through PIPE transactions with SPACs. The commitments are contingent upon the SPACs acquiring the securities of target companies. Unrealized appreciation (depreciation) on these commitments is separately presented in the Statements of Assets and Liabilities as Unrealized appreciation (depreciation) on unfunded commitments, and in the Statement of Operations as Change in unrealized appreciation (depreciation) on unfunded commitments.
3. Derivative Instruments.
Risk Exposures and the Use of Derivative Instruments. The Fund's investment objective allows the Fund to enter into various types of derivative contracts, including futures contracts and options. Derivatives are investments whose value is primarily derived from underlying assets, indices or reference rates and may be transacted on an exchange or over-the-counter (OTC). Derivatives may involve a future commitment to buy or sell a specified asset based on specified terms, to exchange future cash flows at periodic intervals based on a notional principal amount, or for one party to make one or more payments upon the occurrence of specified events in exchange for periodic payments from the other party.
The Fund used derivatives to increase returns and to manage exposure to certain risks as defined below. The success of any strategy involving derivatives depends on analysis of numerous economic factors, and if the strategies for investment do not work as intended, the Fund may not achieve its objectives.
The Fund's use of derivatives increased or decreased its exposure to the following risk:
| Equity Risk | Equity risk relates to the fluctuations in the value of financial instruments as a result of changes in market prices (other than those arising from interest rate risk or foreign exchange risk), whether caused by factors specific to an individual investment, its issuer, or all factors affecting all instruments traded in a market or market segment. |
The Fund is also exposed to additional risks from investing in derivatives, such as liquidity risk and counterparty credit risk. Liquidity risk is the risk that the Fund will be unable to close out the derivative in the open market in a timely manner. Counterparty credit risk is the risk that the counterparty will not be able to fulfill its obligation to the Fund. Counterparty credit risk related to exchange-traded futures contracts and exchange-traded options may be mitigated by the protection provided by the exchange on which they trade.
Investing in derivatives may involve greater risks than investing in the underlying assets directly and, to varying degrees, may involve risk of loss in excess of any initial investment and collateral received and amounts recognized in the Statement of Assets and Liabilities. In addition, there may be the risk that the change in value of the derivative contract does not correspond to the change in value of the underlying instrument.
Net Realized Gain (Loss) and Change in Net Unrealized Appreciation (Depreciation) on Derivatives. The table below, which reflects the impacts of derivatives on the financial performance of the Fund, summarizes the net realized gain (loss) and change in net unrealized appreciation (depreciation) for derivatives during the period as presented in the Statement of Operations.
| Primary Risk Exposure / Derivative Type | Net Realized Gain (Loss) | Change in Net Unrealized Appreciation (Depreciation) |
| Equity Risk | ||
| Futures Contracts | $7,401,665 | $(3,031,800) |
| Written Options | – | 17,174 |
| Total Equity Risk | $7,401,665 | $(3,014,626) |
A summary of the value of derivatives by primary risk exposure as of period end, if any, is included at the end of the Schedule of Investments.
Futures Contracts. A futures contract is an agreement between two parties to buy or sell a specified underlying instrument for a fixed price at a specified future date. The Fund used futures contracts to manage its exposure to the stock market.
Upon entering into a futures contract, a fund is required to deposit either cash or securities (initial margin) with a clearing broker in an amount equal to a certain percentage of the face value of the contract. Futures contracts are marked-to-market daily and subsequent daily payments (variation margin) are made or received by a fund depending on the daily fluctuations in the value of the futures contracts and are recorded as unrealized appreciation or (depreciation). This receivable and/or payable, if any, is included in daily variation margin on futures contracts in the Statement of Assets and Liabilities. Realized gain or (loss) is recorded upon the expiration or closing of a futures contract. The net realized gain (loss) and change in net unrealized appreciation (depreciation) on futures contracts during the period is presented in the Statement of Operations.
Any open futures contracts at period end are presented in the Schedule of Investments under the caption "Futures Contracts". The notional amount at value reflects each contract's exposure to the underlying instrument or index at period end and is representative of volume of activity during the period. Securities deposited to meet initial margin requirements are identified in the Schedule of Investments.
Options. Options give the purchaser the right, but not the obligation, to buy (call) or sell (put) an underlying security or financial instrument at an agreed exercise or strike price between or on certain dates. Options obligate the seller (writer) to buy (put) or sell (call) an underlying instrument at the exercise or strike price or cash settle an underlying derivative instrument if the holder exercises the option on or before the expiration date.
The Fund used exchange-traded written covered call options to manage its exposure to the market. When the Fund writes a covered call option, the Fund holds the underlying instrument which must be delivered to the holder upon the exercise of the option.
Upon entering into a written options contract, the Fund will receive a premium. Premiums received are reflected as a liability on the Statement of Assets and Liabilities. Options are valued daily and any unrealized appreciation (depreciation) is reflected on the Statement of Assets and Liabilities. When a written option is exercised, the premium is added to the proceeds from the sale of the underlying instrument in determining the gain or loss realized on that investment. When an option is closed the Fund will realize a gain or loss depending on whether the proceeds or amount paid for the closing sale transaction are greater or less than the premium received. When an option expires, gains and losses are realized to the extent of premiums received. The net realized gain (loss) on closed and expired written options and the change in net unrealized appreciation (depreciation) on written options are presented in the Statement of Operations.
Writing call options tends to decrease exposure to the underlying instrument and risk of loss is the change in value in excess of the premium received.
Any open options at period end are presented in the Schedule of Investments under the caption "Written Options" and are representative of volume of activity during the period.
4. Purchases and Sales of Investments.
Purchases and sales of securities, other than short-term securities and in-kind transactions, as applicable, are noted in the table below.
| Purchases ($) | Sales ($) | |
| Strategic Advisers Large Cap Fund | 14,591,096,191 | 16,626,949,404 |
Prior Fiscal Year Unaffiliated Exchanges In-Kind. During the prior period, the Fund redeemed 19,946,276 shares of JPMorgan U.S. Large Cap Core Plus Fund Select Class in exchange for investments and cash with a value of $487,287,521. The Fund had a net realized gain of $132,702,495 on the Fund's redemptions of JPMorgan U.S. Large Cap Core Plus Fund Select Class which is included in the accompanying Statement of Changes in Net Assets. The Fund recognized a net gain for federal income tax purposes.
5. Fees and Other Transactions with Affiliates.
Management Fee. Strategic Advisers (the investment adviser) provides the Fund with investment management related services. For these services, the Fund pays a monthly management fee to the investment adviser. The management fee is calculated by adding the annual management fee rate of .25% of the Fund's average net assets throughout the month to the aggregate of the fee rates, payable monthly by the investment adviser, to the Fund's sub-advisers. The Fund's maximum aggregate management fee will not exceed .65% of the Fund's average net assets. For the reporting period, the total annualized management fee rate was .43% of the Fund's average net assets.
During the period, the investment adviser waived a portion of its management fee as described in the Expense Reductions note.
Sub-Advisers. AllianceBernstein, L.P. (AB), Aristotle Capital Management, LLC, Brandywine Global Investment Management, LLC, ClariVest Asset Management LLC, ClearBridge Investments, LLC, FIAM LLC (an affiliate of the investment adviser), Invesco Advisers, Inc. (through October 7, 2021), J.P. Morgan Investment Management, Inc., Loomis Sayles & Company, L.P., LSV Asset Management, PineBridge Investments LLC, Principal Global Investors, LLC and T. Rowe Price Associates, Inc. each served as a sub-adviser for the Fund during the period. Sub-advisers provide discretionary investment advisory services for their allocated portion of the Fund's assets and are paid as described in the Management Fee note.
Geode Capital Management, LLC (Geode) has been retained to serve as a sub-adviser for the Fund. As of the date of this report, however, Geode has not been allocated any portion of the Fund's assets. Geode in the future may provide discretionary investment advisory services for an allocated portion of the Fund's assets and will be paid by the investment adviser for providing these services.
Brokerage Commissions. A portion of portfolio transactions were placed with brokerage firms which are affiliates of the investment adviser. Brokerage commissions are included in net realized gain (loss) and change in net unrealized appreciation (depreciation) in the Statement of Operations. The commissions paid to these affiliated firms were as follows:
| Amount | |
| Strategic Advisers Large Cap Fund | $26,978 |
Interfund Trades. Funds may purchase from or sell securities to other funds affiliated with each sub-adviser under procedures adopted by the Board. The procedures have been designed to ensure these interfund trades are executed in accordance with Rule 17a-7 of the 1940 Act. Any interfund trades are included within the respective purchases and sales amounts shown in the Purchases and Sales of Investments note. Interfund trades during the period are noted in the table below.
| Purchases ($) | Sales ($) | Realized Gain (Loss) ($) | |
| Strategic Advisers Large Cap Fund | 38,084,368 | 67,510,628 | 13,110,889 |
Other. During the period, the investment adviser reimbursed the Fund for certain losses as follows:
| Amount ($) | |
| Strategic Advisers Large Cap Fund | 1,475 |
6. Investments in Fidelity Central Funds.
Funds may invest in Fidelity Central Funds, which are open-end investment companies generally available only to other investment companies and accounts managed by the investment adviser and its affiliates. The Schedule of Investments lists any Fidelity Central Funds held as an investment as of period end, but does not include the underlying holdings of each Fidelity Central Fund. An investing fund indirectly bears its proportionate share of the expenses of the underlying Fidelity Central Funds.
Based on its investment objective, each Fidelity Central Fund may invest or participate in various investment vehicles or strategies that are similar to those of the investing fund. These strategies are consistent with the investment objectives of the investing fund and may involve certain economic risks which may cause a decline in value of each of the Fidelity Central Funds and thus a decline in the value of the investing fund.
| Fidelity Central Fund | Investment Manager | Investment Objective | Investment Practices | Expense Ratio(a) |
| Fidelity Money Market Central Funds | Fidelity Management & Research Company LLC (FMR) | Each fund seeks to obtain a high level of current income consistent with the preservation of capital and liquidity. | Short-term Investments | Less than .005% |
(a) Expenses expressed as a percentage of average net assets and are as of each underlying Central Fund's most recent annual or semi-annual shareholder report.
A complete unaudited list of holdings for each Fidelity Central Fund is available upon request or at the Securities and Exchange Commission website at www.sec.gov. In addition, the financial statements of the Fidelity Central Funds, which are not covered by the Report of Independent Registered Public Accounting Firm, are available on the Securities and Exchange Commission website or upon request.
7. Committed Line of Credit.
Certain Funds participate with other funds managed by the investment adviser or an affiliate in a $4.25 billion credit facility (the "line of credit") to be utilized for temporary or emergency purposes to fund shareholder redemptions or for other short-term liquidity purposes. The participating funds have agreed to pay commitment fees on their pro-rata portion of the line of credit, which are reflected in Miscellaneous expenses on the Statement of Operations, and are listed below. During the period, there were no borrowings on this line of credit.
| Amount | |
| Strategic Advisers Large Cap Fund | $49,775 |
8. Security Lending.
Funds lend portfolio securities from time to time in order to earn additional income. Lending agents are used, including National Financial Services (NFS), an affiliate of the investment adviser. Pursuant to a securities lending agreement, NFS will receive a fee, which is capped at 9.9% of a fund's daily lending revenue, for its services as lending agent. A fund may lend securities to certain qualified borrowers, including NFS. On the settlement date of the loan, a fund receives collateral (in the form of U.S. Treasury obligations, letters of credit and/or cash) against the loaned securities and maintains collateral in an amount not less than 100% of the market value of the loaned securities during the period of the loan. The market value of the loaned securities is determined at the close of business of a fund and any additional required collateral is delivered to a fund on the next business day. A fund or borrower may terminate the loan at any time, and if the borrower defaults on its obligation to return the securities loaned because of insolvency or other reasons, a fund may apply collateral received from the borrower against the obligation. A fund may experience delays and costs in recovering the securities loaned. Any cash collateral received is invested in the Fidelity Securities Lending Cash Central Fund. Any loaned securities are identified as such in the Schedule of Investments, and the value of loaned securities and cash collateral at period end, as applicable, are presented in the Statement of Assets and Liabilities. Security lending income represents the income earned on investing cash collateral, less rebates paid to borrowers and any lending agent fees associated with the loan, plus any premium payments received for lending certain types of securities. Security lending income is presented in the Statement of Operations as a component of income from Fidelity Central Funds. Affiliated security lending activity, if any, was as follows:
| Total Security Lending Fees Paid to NFS | Security Lending Income From Securities Loaned to NFS | Value of Securities Loaned to NFS at Period End | |
| Strategic Advisers Large Cap Fund | $28,715 | $– | $– |
9. Bank Borrowings.
The Fund is permitted to have bank borrowings for temporary or emergency purposes to fund shareholder redemptions or for other short-term liquidity requirements. The Fund has established borrowing arrangements with certain banks. The interest rate on the borrowings is the bank's base rate, as revised from time to time. Any open loans, including accrued interest, at period end are presented under the caption "Notes payable" in the Statement of Assets and Liabilities, if applicable. Activity in this program during the period for which loans were outstanding was as follows:
| Average Loan Balance | Weighted Average Interest Rate | Interest Expense | |
| Strategic Advisers Large Cap Fund | $75,332,143 | .58% | $8,437 |
10. Expense Reductions.
The investment adviser has contractually agreed to waive the Fund's management fee in an amount equal to .25% of the Fund's average net assets until September 30, 2024. During the period, this waiver reduced the Fund's management fee by $ 77,158,562.
In addition, during the period the investment adviser or an affiliate reimbursed and/or waived a portion of operating expenses in the amount of $153,258.
11. Other.
A fund's organizational documents provide former and current trustees and officers with a limited indemnification against liabilities arising in connection with the performance of their duties to the fund. In the normal course of business, a fund may also enter into contracts that provide general indemnifications. A fund's maximum exposure under these arrangements is unknown as this would be dependent on future claims that may be made against a fund. The risk of material loss from such claims is considered remote.
Funds do not invest in underlying mutual funds for the purpose of exercising management or control; however, investments by funds within their principal investment strategies may represent a significant portion of the underlying mutual fund's net assets. At the end of the period, certain Funds were the owners of record of 10% or more of the total outstanding shares of the following underlying mutual funds as shown below.
| Fund | Strategic Advisers Large Cap Fund |
| Fidelity SAI Inflation-Focused Fund | 24% |
| Fidelity SAI U.S. Large Cap Index Fund | 13% |
| Fidelity SAI U.S. Low Volatility Index Fund | 12% |
| Fidelity SAI U.S. Quality Index Fund | 13% |
12. Prior Fiscal Year Merger Information.
On November 20, 2020, the Fund acquired all of the assets and assumed all of the liabilities of Strategic Advisers Growth Fund, Strategic Advisers Value Fund (Target Funds) and Strategic Advisers Core Fund (Predecessor Fund) pursuant to an Agreement and Plan of Reorganization approved by the Board of Trustees ("The Board"). The securities held by the Target Funds and Predecessor Fund were the primary assets acquired by the Fund. Each acquisition was accomplished by an exchange of shares of the Fund for shares then outstanding of each Target Fund and the Predecessor Fund at their respective net asset value on the acquisition date. The reorganization provides shareholders of each Target Fund and the Predecessor Fund access to a larger portfolio with a similar investment objective and lower projected expenses. As a result of this transaction the Predecessor Fund was determined to be the accounting survivor. As such, performance and financial history prior to the merger is that of Predecessor Fund. Historical share transactions and per share information for the Predecessor Fund has been retroactively adjusted to reflect the change in capital structure due to the merger. The reorganization qualified as a tax-free reorganization for federal income tax purposes with no gain or loss recognized to the funds or their shareholders. For financial reporting purposes, the assets and liabilities of the Predecessor Fund and Target Funds and shares issued by the Fund were recorded at fair value; however, the cost basis of the investments received from the Predecessor Fund and Target Funds were carried forward to align ongoing reporting of realized and unrealized gains and losses with amounts distributable to shareholders for tax purposes. Costs incurred in connection with the reorganization were paid by the respective fund.
| Predecessor and Target Funds | Securities $ | Unrealized appreciation (depreciation) $ | Net Assets $ | Shares Exchanged | Shares Exchanged Ratio |
| Strategic Advisers Core Fund * | 31,619,450,950 | 12,056,868,793 | 31,632,208,284 | 3,150,617,669 | 2.0769521912 |
| Strategic Advisers Growth Fund | 9,684,515,165 | 5,505,004,332 | 9,686,104,070 | 964,750,799 | 2.1295816733 |
| Strategic Advisers Value Fund | 8,821,520,451 | 2,357,297,576 | 8,833,529,481 | 879,834,633 | 1.7264342629 |
*Predecessor Fund/Accounting survivor
| Legal Acquiring Fund | Net Assets $ | Total Net Assets after the acquisition $ |
| Strategic Advisers Large Cap Fund | 1,004,000 | 50,152,845,835 |
Pro forma results of operations of the combined entity for the entire period ended May 31, 2021 as though the acquisition had occurred as of the beginning of the year (rather than on the actual acquisition date) are as follows:
| Net investment income (loss) | $568,896,394 |
| Total net realized gain (loss) | 5,389,603,115 |
| Total change in net unrealized appreciation (depreciation) | 13,348,109,861 |
| Net increase (decrease) in net assets resulting from operations | $19,306,609,370 |
Because the combined investment portfolios have been managed as a single portfolio since each acquisition was completed, it is not practicable to separate the amounts of revenue and earnings of each Target Fund that has been included in the Fund's Statement of Operations since November 20, 2020.
13. Coronavirus (COVID-19) Pandemic.
An outbreak of COVID-19 first detected in China during December 2019 has since spread globally and was declared a pandemic by the World Health Organization during March 2020. Developments that disrupt global economies and financial markets, such as the COVID-19 pandemic, may magnify factors that affect the Fund's performance.
Shareholder Expense Example
As a shareholder, you incur two types of costs: (1) transaction costs, which may include sales charges (loads) on purchase payments or redemption proceeds, as applicable and (2) ongoing costs, which generally include management fees, distribution and/or service (12b-1) fees and other Fund expenses. This Example is intended to help you understand your ongoing costs (in dollars) of investing in a fund and to compare these costs with the ongoing costs of investing in other mutual funds.
The Example is based on an investment of $1,000 invested at the beginning of the period and held for the entire period (June 1, 2021 to November 30, 2021).
Actual Expenses
The first line of the accompanying table provides information about actual account values and actual expenses. You may use the information in this line, together with the amount you invested, to estimate the expenses that you paid over the period. Simply divide your account value by $1,000.00 (for example, an $8,600 account value divided by $1,000.00 = 8.6), then multiply the result by the number in the first line for a class/Fund under the heading entitled "Expenses Paid During Period" to estimate the expenses you paid on your account during this period. If any fund is a shareholder of any underlying mutual funds or exchange-traded funds (ETFs) (the Underlying Funds), such fund indirectly bears its proportional share of the expenses of the Underlying Funds in addition to the direct expenses incurred presented in the table. These fees and expenses are not included in the annualized expense ratio used to calculate the expense estimate in the table below.
Hypothetical Example for Comparison Purposes
The second line of the accompanying table provides information about hypothetical account values and hypothetical expenses based on the actual expense ratio and an assumed rate of return of 5% per year before expenses, which is not the actual return. The hypothetical account values and expenses may not be used to estimate the actual ending account balance or expenses you paid for the period. You may use this information to compare the ongoing costs of investing in the Fund and other funds. To do so, compare this 5% hypothetical example with the 5% hypothetical examples that appear in the shareholder reports of the other funds. If any fund is a shareholder of any Underlying Funds, such fund indirectly bears its proportional share of the expenses of the Underlying Funds in addition to the direct expenses as presented in the table. These fees and expenses are not included in the annualized expense ratio used to calculate the expense estimate in the table below.
Please note that the expenses shown in the table are meant to highlight your ongoing costs only and do not reflect any transaction costs. Therefore, the second line of the table is useful in comparing ongoing costs only, and will not help you determine the relative total costs of owning different funds. In addition, if these transactional costs were included, your costs would have been higher.
| Annualized Expense Ratio-A | Beginning Account Value June 1, 2021 | Ending Account Value November 30, 2021 | Expenses Paid During Period-B June 1, 2021 to November 30, 2021 | |
| Strategic Advisers Large Cap Fund | .19% | |||
| Actual | $1,000.00 | $1,074.00 | $.99 | |
| Hypothetical-C | $1,000.00 | $1,024.12 | $.96 |
A Annualized expense ratio reflects expenses net of applicable fee waivers.
B Expenses are equal to the annualized expense ratio, multiplied by the average account value over the period, multiplied by 183/ 365 (to reflect the one-half year period). The fees and expenses of any Underlying Funds are not included in each annualized expense ratio.
C 5% return per year before expenses
Board Approval of Investment Advisory Contracts and Management Fees
Strategic Advisers Large Cap Fund
Each year, the Board of Trustees, including the Independent Trustees (together, the Board), votes at a meeting on the renewal of the management contract with Strategic Advisers LLC (Strategic Advisers), the sub-advisory agreements with AllianceBernstein L.P., Aristotle Capital Management LLC, Brandywine Global Investment Management, LLC, ClariVest Asset Management LLC, ClearBridge Investments, LLC, FIAM LLC (FIAM), Geode Capital Management, LLC, Invesco Advisers, Inc., J.P. Morgan Investment Management Inc., Loomis Sayles & Company, L.P., LSV Asset Management, PineBridge Investments LLC, Principal Global Investors LLC and T. Rowe Price Associates, Inc. (each a Sub-Adviser and collectively, the Sub-Advisers) (collectively, the Sub-Advisory Agreements) and the sub-sub-advisory agreements with FMR Investment Management (UK) Limited, Fidelity Management & Research (Japan) Limited, and Fidelity Management & Research (Hong Kong) Limited (collectively, the Sub-Sub-Advisory Agreements and, together with the management contract and the Sub-Advisory Agreements, the Advisory Contracts) for the fund. Strategic Advisers and the Sub-Advisers are referred to herein as the Investment Advisers. The Board, assisted by the advice of fund counsel and Independent Trustees' counsel, requests and considers a broad range of information relevant to the renewal of the Advisory Contracts throughout the year.The Board meets at least four times per year and, at each of its meetings, covers an extensive agenda of topics and materials and considers factors that are relevant to its annual consideration of the renewal of the fund's Advisory Contracts, including the services and support provided to the fund and its shareholders. The full Board or the Independent Trustees, as appropriate, act on all major matters; however, a portion of the activities of the Board (including certain of those described herein) may be conducted through standing committees that have been established by the Board. The Board, acting directly and through its committees, requests and receives information concerning the annual consideration of the renewal of the fund's Advisory Contracts.At its September 2021 meeting, the Board, including the Independent Trustees, unanimously determined to renew the fund's Advisory Contracts. In addition, the Board approved an amendment to the fund's sub-advisory agreement with FIAM that was previously defunded (Amendment). The Board noted that no other contact terms are impacted by the Amendment.In reaching its determination to renew the fund's Advisory Contracts and approve the Amendment, the Board considered all factors it believed relevant, including (i) the nature, extent, and quality of the services provided to the fund and its shareholders (including the investment performance of the fund); (ii) the competitiveness relative to peer funds of the fund's management fee and total expenses; (iii) the total costs of the services provided by and the profits, if any, realized by Strategic Advisers from its relationships with the fund; and (iv) the extent to which, if any, economies of scale exist and are realized as the fund grows and whether any economies of scale are appropriately shared with fund shareholders.In considering whether to renew the Advisory Contracts for the fund and approve the Amendment, the Board reached a determination, with the assistance of fund counsel and Independent Trustees' counsel and through the exercise of its business judgment, that the renewal of the Advisory Contracts and the approval of the Amendment is in the best interests of the fund and its shareholders. In addition, the Board concluded that the renewal of each Sub-Advisory Agreement and the approval of the Amendment do not involve a conflict of interest from which Strategic Advisers or its affiliates derive an inappropriate advantage. Also, the Board found that the advisory fees charged under the Advisory Contracts bear a reasonable relationship to the services rendered and are based on services provided that are in addition to, rather than duplicative of, services provided under the advisory contract of any underlying fund in which the fund may invest. The Board's decision to renew the Advisory Contracts and approve the Amendment was not based on any single factor, but rather was based on a comprehensive consideration of all the information provided to the Board throughout the year.Nature, Extent, and Quality of Services Provided. The Board considered the staffing within the Investment Advisers, including the backgrounds of the fund's investment personnel and also considered the fund's investment objective, strategies, and related investment philosophy. The Independent Trustees also had discussions with senior management of Strategic Advisers' investment operations and investment groups. The Board considered the structure of each Investment Adviser's investment personnel compensation program and whether such structures provide appropriate incentives to act in the best interests of the fund. The Board also considered steps taken by the Investment Advisers to continue to provide the same nature, extent, and quality of services to the funds during the COVID-19 pandemic.The Trustees also discussed with representatives of Strategic Advisers, at meetings throughout the year, Strategic Advisers' role in, among other things, (i) setting, implementing and monitoring the investment strategies for the funds; (ii) identifying and recommending sub-advisers for the funds; (iii) overseeing compliance with federal securities laws by each sub-adviser with respect to the portion of fund assets allocated to the sub-adviser; (iv) monitoring and overseeing the performance and investment capabilities of each sub-adviser; and (v) recommending the replacement of a sub-adviser as appropriate. The Trustees considered that the Board had received from Strategic Advisers substantial information and periodic reports about Strategic Advisers' sub-adviser oversight and due diligence processes, as well as periodic reports regarding the performance of each sub-adviser.The Board also considered the nature, extent and quality of services provided by each Sub-Adviser. The Trustees noted that under the Sub-Advisory Agreements subject to oversight by Strategic Advisers, each Sub-Adviser is responsible for, among other things, identifying investments for the portion of fund assets allocated to the Sub-Adviser, if any, and executing portfolio transactions to implement its investment strategy. In addition, the Trustees noted that each Sub-Adviser is responsible for providing such reporting as may be requested from Strategic Advisers to fulfill its oversight responsibilities discussed above.Resources Dedicated to Investment Management and Support Services. The Board reviewed the general qualifications and capabilities of the Investment Advisers' investment staffs, their use of technology, and the Investment Advisers' approach to managing and compensating investment personnel. The Board noted that the Investment Advisers' analysts have extensive resources, tools, and capabilities that allow them to conduct sophisticated quantitative and/or fundamental analysis. Additionally, in its deliberations, the Board considered the Investment Advisers' trading capabilities and resources and global compliance infrastructure, which are integral parts of the investment management process.Shareholder and Administrative Services. The Board considered (i) the nature, extent, quality, and cost of administrative and shareholder services performed by Strategic Advisers and its affiliates under the management contract and under separate agreements covering transfer agency, pricing and bookkeeping, and securities lending services for the fund; (ii) the nature and extent of Strategic Advisers' supervision of third party service providers, including sub-advisers, custodians and subcustodians; and (iii) the resources devoted to, and the record of compliance with, the fund's compliance policies and procedures.Investment Performance. The Board noted that effective November 20, 2020, three predecessor funds reorganized into the fund and the fund assumed the historical performance of Strategic Advisers Core Fund, the predecessor fund designated as the accounting survivor in the reorganization.The Board considered whether the fund has operated in accordance with its investment objective, as well as its record of compliance with its investment restrictions and its performance history.In connection with the renewal of the Advisory Contracts, the Board considered annualized return information for the fund for different time periods, measured against an appropriate securities market index (benchmark index) and a peer group of mutual funds with similar objectives (peer group).The Board considered discussions that occur at Board meetings throughout the year with representatives of Strategic Advisers about fund investment performance and the performance of each Sub-Adviser as part of regularly scheduled fund reviews and other reports to the Board on fund performance, taking into account various factors including general market conditions. In its discussions with representatives of Strategic Advisers regarding fund performance, the Board gave particular attention to information indicating underperformance of certain funds for specific time periods and discussed with Strategic Advisers the reasons for any such underperformance.The following charts considered by the Board show, over the one-, three-, and five-year periods ended December 31, 2020, the cumulative total returns of the fund and the cumulative total returns of an appropriate benchmark index and peer group. The box within each chart shows the 25th percentile return (75% beaten, top of box) and the 75th percentile return (25% beaten, bottom of box) of the peer group. Returns shown above the box are in the first quartile and returns shown below the box are in the fourth quartile. The percentage beaten number noted below each chart corresponds to the percentile box and represents the percentage of funds in the peer group whose performance was equal to or lower than that of the fund.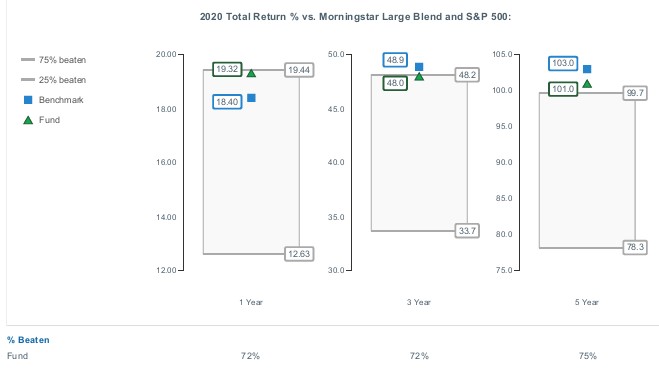
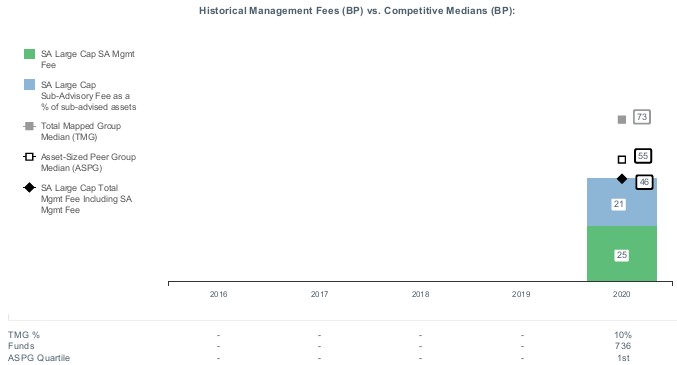
Board Approval of Amended Sub-Advisory Agreement
Strategic Advisers Large Cap Fund
In June 2021, the Board of Trustees, including the Independent Trustees (together, the Board) voted to approve amendments to the fee schedules for the investment mandates in the existing sub-advisory agreements among Strategic Advisers LLC (Strategic Advisers), each of AllianceBernstein L.P. (AllianceBernstein) and Aristotle Capital Management, LLC (Aristotle) (each, a Sub-Adviser), and Fidelity Rutland Square Trust II (Trust) on behalf of the fund. The Board noted that the updated fee schedule in the Amended Sub-Advisory Agreement with AllianceBernstein will result in the same or lower fees at all asset levels. With respect to the Amended Sub-Advisory Agreement with Aristotle, the Board noted that the updated fee schedule will result in lower fees at current and anticipated asset levels, and that Strategic Advisers does not currently expect asset levels to decrease such that the updated fee schedule would result in higher fees than the existing fee schedule. The Board also noted that no other material contract terms are impacted by the Amended Sub-Advisory Agreements. The Board, assisted by the advice of fund counsel and Independent Trustees' counsel, considered a broad range of information.In considering whether to approve each Amended Sub-Advisory Agreement, the Board reached a determination, with the assistance of fund counsel and Independent Trustees' counsel and through the exercise of its business judgment, that the approval of each Amended Sub-Advisory Agreement is in the best interests of the fund and its shareholders and that the approval of such agreement does not involve a conflict of interest from which Strategic Advisers or its affiliates derive an inappropriate advantage. Also, the Board found that the fees to be charged under each Amended Sub-Advisory Agreement bear a reasonable relationship to the services to be rendered and will be based on services provided that will be in addition to, rather than duplicative of services provided under the advisory contract of any underlying fund in which the fund may invest. The Board's decision to approve each Amended Sub-Advisory Agreement was not based on any single factor, but rather was based on a comprehensive consideration of all the information provided to the Board. In addition, individual Trustees did not necessarily attribute the same weight or importance to each factor.Nature, Extent, and Quality of Services Provided. The Board considered the backgrounds of the investment personnel that will provide services to the fund, and also considered the fund's investment objective, strategies and related investment philosophy and current sub-adviser line-up, as well as the structures of the investment personnel compensation programs and whether such structures provide appropriate incentives to act in the best interests of the fund, at its June 2020 meeting. The Board considered the detailed information provided by Strategic Advisers and each Sub-Adviser in the June 2021 annual contract renewal materials.The Board noted that it had approved the existing sub-advisory agreement with each Sub-Adviser at its June 2020 meeting and that each Amended Sub-Advisory Agreement will not result in any changes to: (i) the nature, extent and quality of the sub-advisory services provided; (ii) the investment process or strategies employed in the management of the fund's assets; or (iii) the day-to-day management of the fund or the persons primarily responsible for such management.Investment Performance. The Board did not consider performance to be a material factor in its decision to approve each Amended Sub-Advisory Agreement because the approval of each Amended Sub-Advisory Agreement will not result in any changes (i) to the fund's investment processes or strategies; or (ii) in the persons primarily responsible for the day-to-day management of the fund.Based on its review, the Board concluded that the nature, extent, and quality of services that will be provided to the fund under each Amended Sub-Advisory Agreement will continue to benefit the fund's shareholders.Competitiveness of Management Fee and Total Fund Expenses.
The Board noted that each Amended Sub-Advisory Agreement will not result in changes to the maximum aggregate annual management fee payable by the fund or Strategic Advisers' portion of the management fee. The Board considered Strategic Advisers' contractual agreement to waive its portion of the fund's management fee. The Board considered that the Amended Sub-Advisory Agreement with AllianceBernstein, and the Amended Sub-Advisory Agreement with Aristotle at current and anticipated asset levels, are each expected to result in a decrease in the total management fees of the fund. The Board also considered that at certain lower asset levels the updated fee schedule for Aristotle would result in an increase in the total management fees of the fund, but that Strategic Advisers does not currently expect Aristotle's assets to decrease to these levels. Based on its review, the Board concluded that the fund's management fee structure and any changes to projected total expenses bear a reasonable relationship to the services that the fund and its shareholders will receive and the other factors considered.Because each Amended Sub-Advisory Agreement was negotiated at arm's length and will have no impact on the maximum management fees payable by the fund, the Board did not consider the costs of services and profitability of the relationship with the fund to Strategic Advisers to be significant factors in its decision to approve each Amended Sub-Advisory Agreement.Potential Fall-Out Benefits. The Board considered that it reviews information regarding the potential of direct and indirect benefits to Strategic Advisers and its affiliates from their relationships with the fund, including non-advisory fee compensation paid to affiliates of Strategic Advisers, if any, as well as information regarding potential fall-out benefits accruing to each Sub-Adviser, if any, as a result of its relationship with the fund, during its annual renewal of the fund's management contract, sub-advisory agreements, and sub-subadvisory agreements. The Board considered Strategic Advisers' representation that it does not anticipate that the approval of each Amended Sub-Advisory Agreement will have a significant impact on the profitability of, or potential fall-out benefits to, Strategic Advisers or its affiliates.Possible Economies of Scale. The Board considered that it reviews whether there have been economies of scale in connection with the management of the fund during its annual renewal of the fund's management contract, sub-advisory agreements, and sub-subadvisory agreements. The Board noted that each Amended Sub-Advisory Agreement will continue to provide for breakpoints that have the potential to reduce sub-advisory fees paid to the Sub-Adviser as assets allocated to the Sub-Adviser grow. The Board also noted that it did not consider the possible realization of economies of scale to be a significant factor in its decision to approve each Amended Sub-Advisory Agreement because the fund will not bear any additional management fees or expenses under each Amended Sub-Advisory Agreement.Conclusion. Based on its evaluation of all of the conclusions noted above, and after considering all factors it believed relevant, the Board concluded that each Amended Sub-Advisory Agreement's fee structure bears a reasonable relationship to the services to be rendered and that each Amended Sub-Advisory Agreement is in the best interests of the fund and its shareholders and should be approved. The Board also concluded that the sub-advisory fees to be charged under each Amended Sub-Advisory Agreement will be based on services provided that will be in addition to, rather than duplicative of, services provided under the advisory contract of any underlying fund in which the fund may invest. In addition, the Board concluded that the approval of each Amended Sub-Advisory Agreement does not involve a conflict of interest from which Strategic Advisers or its affiliates derive an inappropriate advantage.![]()
LGC-SANN-0122
1.9899747.101
Strategic Advisers® Municipal Bond Fund
Offered exclusively to certain managed account clients of Strategic Advisers LLC or its affiliates - not available for sale to the general public
Semi-Annual Report
November 30, 2021
Contents
Board Approval of Investment Advisory Contracts and Management Fees |
To view a fund's proxy voting record for the 12-month period ended June 30, visit http://www.fidelity.com/proxyvotingresults or visit the Securities and Exchange Commission's (SEC) web site at http://www.sec.gov.
You may also call 1-800-544-3455 to request a free copy of the proxy voting guidelines.
Standard & Poor's, S&P and S&P 500 are registered service marks of The McGraw-Hill Companies, Inc. and have been licensed for use by Fidelity Distributors Corporation.
Other third-party marks appearing herein are the property of their respective owners.
All other marks appearing herein are registered or unregistered trademarks or service marks of FMR LLC or an affiliated company. © 2022 FMR LLC. All rights reserved.
This report and the financial statements contained herein are submitted for the general information of the shareholders of the Fund. This report is not authorized for distribution to prospective investors in the Fund unless preceded or accompanied by an effective prospectus.
A fund files its complete schedule of portfolio holdings with the SEC for the first and third quarters of each fiscal year on Form N-PORT. Forms N-PORT are available on the SEC’s web site at http://www.sec.gov. A fund's Forms N-PORT may be reviewed and copied at the SEC’s Public Reference Room in Washington, DC. Information regarding the operation of the SEC's Public Reference Room may be obtained by calling 1-800-SEC-0330.
For a complete list of a fund's portfolio holdings, view the most recent holdings listing, semiannual report, or annual report on Fidelity's web site at http://www.fidelity.com, http://www.institutional.fidelity.com, or http://www.401k.com, as applicable.
NOT FDIC INSURED •MAY LOSE VALUE •NO BANK GUARANTEE
Neither the Fund nor Fidelity Distributors Corporation is a bank.
Note to Shareholders:
Early in 2020, the outbreak and spread of COVID-19 emerged as a public health emergency that had a major influence on financial markets, primarily based on its impact on the global economy and corporate earnings. On March 11, 2020, the World Health Organization declared the COVID-19 outbreak a pandemic, citing sustained risk of further global spread. The pandemic prompted a number of measures to limit the spread of COVID-19, including travel and border restrictions, quarantines, and restrictions on large gatherings. In turn, these resulted in lower consumer activity, diminished demand for a wide range of products and services, disruption in manufacturing and supply chains, and – given the wide variability in outcomes regarding the outbreak – significant market uncertainty and volatility. To help stem the turmoil, the U.S. government took unprecedented action – in concert with the U.S. Federal Reserve and central banks around the world – to help support consumers, businesses, and the broader economy, and to limit disruption to the financial system.
In general, the overall impact of the pandemic lessened in 2021, amid a resilient economy and widespread distribution of three COVID-19 vaccines granted emergency use authorization from the U.S. Food and Drug Administration (FDA) early in the year. Still, the situation remains dynamic, and the extent and duration of its influence on financial markets and the economy is highly uncertain, due in part to a recent spike in cases based on highly contagious variants of the coronavirus.
Extreme events such as the COVID-19 crisis are exogenous shocks that can have significant adverse effects on mutual funds and their investments. Although multiple asset classes may be affected by market disruption, the duration and impact may not be the same for all types of assets. Fidelity is committed to helping you stay informed amid news about COVID-19 and during increased market volatility, and we continue to take extra steps to be responsive to customer needs. We encourage you to visit us online, where we offer ongoing updates, commentary, and analysis on the markets and our funds.
Investment Summary (Unaudited)
The information in the following tables is based on the direct investments of the Fund.Top Ten Holdings as of November 30, 2021
| (excluding cash equivalents) | % of fund's net assets |
| Fidelity SAI Municipal Income Fund | 12.1 |
| Vanguard Long-Term Tax-Exempt Fund Admiral Shares | 11.9 |
| MFS Municipal Income Fund Class A | 9.9 |
| MainStay MacKay Tax Free Bond Fund Class A | 7.6 |
| Western Asset Managed Municipals Fund Class A | 7.2 |
| Fidelity SAI Tax-Free Bond Fund | 5.6 |
| Wells Fargo Municipal Bond Fund - Class Admin | 4.0 |
| BlackRock National Municipal Fund Investor A Shares | 3.5 |
| MainStay MacKay High Yield Municipal Bond Fund Class A | 2.3 |
| iShares S&P National Municipal Bond ETF | 2.1 |
Top Five Sectors as of November 30, 2021
| % of fund's net assets | |
| Transportation | 6.4 |
| Health Care | 4.4 |
| Special Tax | 4.0 |
| General Obligations | 3.3 |
| Education | 1.8 |
Asset Allocation (% of fund's net assets)
| As of November 30, 2021 | ||
| Municipal Bond Funds | 69.6% | |
| Municipal Bonds | 26.1% | |
| Investment Companies | 2.1% | |
| Short-Term Investments and Net Other Assets (Liabilities) | 2.2% | |

Asset allocations of funds in the pie chart reflect the categorizations of assets as defined by Morningstar as of the reporting date.
Schedule of Investments November 30, 2021 (Unaudited)
Showing Percentage of Net Assets
| Municipal Bonds - 27.1% | |||
| Principal Amount | Value | ||
| Alabama - 0.3% | |||
| Auburn Univ. Gen. Fee Rev. Series 2018 A, 5% 6/1/33 | 195,000 | 244,441 | |
| Birmingham Wtrwks. Board Series 2016 B, 5% 1/1/32 (Pre-Refunded to 1/1/27 @ 100) | 250,000 | 303,872 | |
| Decatur Wtr. & Swr. Rev. Series 2021 A, 4% 8/15/50 | 610,000 | 719,368 | |
| Hoover Indl. Dev. Board Envir. Impt. Rev. (United States Steel Corp. Proj.) Series 2019, 5.75% 10/1/49 (a) | 570,000 | 677,331 | |
| Huntsville Health Care Auth. Series 2020 B, 4% 6/1/45 | 450,000 | 523,490 | |
| Huntsville Redstone Village Spl. Care Facilities Finanacing Auth.: | |||
| Series 2007: | $ | $ | |
| 5.5% 1/1/28 | 225,000 | 152,407 | |
| 5.5% 1/1/43 | 175,000 | 116,000 | |
| Series 2008 A, 6.875% 1/1/43 | 120,000 | 79,644 | |
| Series 2011 A, 7.5% 1/1/47 | 215,000 | 142,615 | |
| Jefferson County Swr. Rev.: | |||
| Series 2013 A: | |||
| 5.25% 10/1/48 (FSA Insured) | 880,000 | 970,533 | |
| 5.5% 10/1/53 (FSA Insured) | 1,395,000 | 1,544,030 | |
| Series 2013 D, 6% 10/1/42 | 250,000 | 285,584 | |
| Lower Alabama Gas District: | |||
| (Gas Proj.) Series 2016 A, 5% 9/1/34 | 515,000 | 689,607 | |
| Series 2016 A, 5% 9/1/46 | 595,000 | 877,191 | |
| Southeast Energy Auth. Rev. Bonds Bonds: | |||
| (Proj. No. 1) Series 2021 A, 4%, tender 10/1/28 (b) | 800,000 | 937,707 | |
| (Proj. No. 2) Series 2021 B1, 4%, tender 12/1/31 (b) | 630,000 | 758,019 | |
| Tuscaloosa County Indl. Dev. Gulf Opportunity (Hunt Refining Proj.) Series 2019 A: | |||
| 4.5% 5/1/32 (c) | 199,735 | 215,274 | |
| 5.25% 5/1/44 (c) | 1,875,000 | 2,165,593 | |
| TOTAL ALABAMA | 11,402,706 | ||
| Arizona - 0.4% | |||
| Arizona Health Facilities Auth. Rev. (Banner Health Sys. Proj.) Series 2007 B, 3 month U.S. LIBOR + 0.810% 0.898%, tender 1/1/37 (b)(d) | 255,000 | 253,687 | |
| Arizona Indl. Dev. Auth. Econ. Dev. Rev. (Legacy Cares, Inc. Proj.) Series 2020 A, 7.75% 7/1/50 (c) | 960,000 | 1,150,767 | |
| Arizona Indl. Dev. Auth. Ed. Rev.: | |||
| (Cadence Campus Proj.) Series 2020 A: | |||
| 4% 7/15/40 (c) | 55,000 | 59,480 | |
| 4% 7/15/50 (c) | 95,000 | 101,487 | |
| (Doral Academy of Nevada, Fire Mesa and Red Rock Campus Projs.) Series 2019 A: | |||
| 5% 7/15/39 (c) | 80,000 | 92,741 | |
| 5% 7/15/49 (c) | 70,000 | 80,186 | |
| (Odyssey Preparatory Academy Proj.): | |||
| Series 2017 A: | |||
| 5.25% 7/1/37 (c) | 180,000 | 194,840 | |
| 5.5% 7/1/52 (c) | 205,000 | 221,442 | |
| Series 2019, 5% 7/1/49 (c) | 265,000 | 295,791 | |
| Arizona Indl. Dev. Auth. Hosp. Rev. Series 2020 A, 4% 2/1/50 | 955,000 | 1,102,077 | |
| Arizona Indl. Dev. Auth. Rev. (Lincoln South Beltway Proj.) Series 2020, 5% 2/1/30 | 20,000 | 25,901 | |
| Arizona Indl. Dev. Auth. Sr. Living: | |||
| (Great Lakes Sr. Living Cmntys. LLC Proj.) Series 2021, 7.75% 1/1/54 (c) | 100,000 | 79,406 | |
| Series 2019 A, 5% 1/1/54 | 125,000 | 130,031 | |
| Series 2019 B: | |||
| 5% 1/1/49 | 50,000 | 46,607 | |
| 5.125% 1/1/54 | 55,000 | 51,842 | |
| Arizona State Univ. Revs. Series 2020 A, 5% 7/1/43 | 250,000 | 320,281 | |
| Glendale Indl. dev auth Sr Living Facilities Rev. (Royal Oaks Inspirata Pointe Proj.) Series 2020 A, 5% 5/15/56 | 290,000 | 325,918 | |
| Maricopa County Indl. Dev. Auth. Sr. Living Facilities Series 2016, 6% 1/1/48 (c) | 135,000 | 133,588 | |
| Maricopa County Poll. Cont. Rev. Series 2012 A, 4.5% 8/1/42 | 195,000 | 198,649 | |
| Maricopa County Rev.: | |||
| Series 2017 A, 4% 1/1/41 | 300,000 | 342,534 | |
| Series 2019 E, 4% 1/1/45 | 250,000 | 292,920 | |
| Peoria Indl. Dev. Auth. Rev. (Sierra Winds Life Care Cmnty. Proj.) Series 2014 A: | |||
| 5.5% 11/15/34 | 225,000 | 229,406 | |
| 5.75% 11/15/40 | 365,000 | 372,318 | |
| Phoenix Civic Impt. Board Arpt. Rev.: | |||
| Series 2017 A, 5% 7/1/47 (a) | 365,000 | 436,346 | |
| Series 2018: | |||
| 5% 7/1/37 (a) | 305,000 | 371,808 | |
| 5% 7/1/38 (a) | 305,000 | 371,290 | |
| Series 2019 B, 5% 7/1/49 (a) | 570,000 | 694,785 | |
| Phoenix Civic Impt. Corp. District Rev. Series 2005 B: | |||
| 5.5% 7/1/29 | 485,000 | 631,913 | |
| 5.5% 7/1/30 | 445,000 | 590,687 | |
| 5.5% 7/1/33 | 75,000 | 105,357 | |
| Phoenix Civic Impt. Corp. Wtr. Sys. Rev. Series 2021 A: | |||
| 4% 7/1/40 | 165,000 | 201,240 | |
| 4% 7/1/41 | 320,000 | 389,303 | |
| 4% 7/1/42 | 185,000 | 224,450 | |
| 5% 7/1/45 | 1,025,000 | 1,343,080 | |
| Phoenix IDA Student Hsg. Rev.: | |||
| (Downtown Phoenix Student Hsg. II LLC Arizona State Univ. Proj.) Series 2019 A: | |||
| 5% 7/1/44 | 60,000 | 71,393 | |
| 5% 7/1/49 | 35,000 | 41,459 | |
| 5% 7/1/54 | 160,000 | 188,916 | |
| 5% 7/1/59 | 130,000 | 153,001 | |
| Series 2018 A, (Downtown Phoenix Student Hsg., LLC AZ State Univ. Proj.) 5% 7/1/42 | 395,000 | 465,054 | |
| Pima County Indl. Dev. Auth. Ed. Rev.: | |||
| (American Leadership Academy Proj.) Series 2022, 4% 6/15/57 (e) | 600,000 | 612,663 | |
| Series 2017, 4.75% 6/15/37 (c) | 320,000 | 327,609 | |
| Saddle Mountain Unified School District No. 90 Series 2020, 4% 7/1/35 (FSA Insured) | 250,000 | 297,683 | |
| Salt River Proj. Agricultural Impt. & Pwr. District Elec. Sys. Rev. Series 2017 A, 5% 1/1/30 | 685,000 | 851,079 | |
| Salt Verde Finl. Corp. Sr. Gas Rev.: | |||
| Series 2007 1, 5% 12/1/32 | 215,000 | 284,029 | |
| Series 2007, 5% 12/1/37 | 200,000 | 280,369 | |
| Tempe Indl. Dev. Auth. Rev.: | |||
| (Friendship Village of Tempe Proj.): | |||
| Series 2019: | |||
| 5% 12/1/50 | 135,000 | 151,135 | |
| 5% 12/1/54 | 150,000 | 167,629 | |
| Series 2021 A, 4% 12/1/46 | 150,000 | 163,144 | |
| (Friendship Village of Temple Proj.) Series 2021 A, 4% 12/1/38 | 90,000 | 99,818 | |
| (Mirabella At ASU, Inc. Proj.) Series 2017 A, 6.125% 10/1/52 (c) | 210,000 | 230,018 | |
| Series 2012 A, 6.25% 12/1/46 | 120,000 | 120,000 | |
| Town of Carefree Utils. Cmnty. Facilities District Wtr. Sys. Rev. Series 2021: | |||
| 4% 7/1/41 | 155,000 | 185,521 | |
| 4% 7/1/46 | 155,000 | 183,438 | |
| TOTAL ARIZONA | 16,336,116 | ||
| Arkansas - 0.1% | |||
| Arkansas Dev. Auth. Indl. Dev. Rev. (Big River Steel Proj.): | |||
| Series 2019, 4.5% 9/1/49 (a)(c) | 885,000 | 976,773 | |
| Series 2020 A, 4.75% 9/1/49 (a)(c) | 305,000 | 345,032 | |
| Arkansas Dev. Fin. Auth. Health Care Rev. Series 2019, 5% 12/1/47 | 610,000 | 747,073 | |
| Arkansas Dev. Fin. Auth. Hosp. Rev.: | |||
| Series 2015 A, 5% 2/1/35 | 55,000 | 60,948 | |
| Series 2015 B: | |||
| 5% 2/1/22 | 50,000 | 50,369 | |
| 5% 2/1/23 | 75,000 | 78,873 | |
| 5% 2/1/24 | 95,000 | 103,825 | |
| Series 2015 C, 5% 2/1/35 | 75,000 | 83,110 | |
| Pulaski County Spl. School District Series 2017, 4% 2/1/48 (Pre-Refunded to 8/1/22 @ 100) | 325,000 | 333,219 | |
| Springdale School District No. 050 Series 2017, 4% 6/1/40 | 300,000 | 304,865 | |
| TOTAL ARKANSAS | 3,084,087 | ||
| California - 3.0% | |||
| ABAG Fin. Auth. for Nonprofit Corps. Rev. Series 2014 A, 5% 8/1/43 | 790,000 | 848,256 | |
| Antelope Valley Cmnty. College District: | |||
| Series 2017 A, 4.5% 8/1/38 (Pre-Refunded to 2/15/27 @ 100) | 275,000 | 329,878 | |
| Series 2020 B, 4% 8/1/45 | 700,000 | 831,733 | |
| Series B, 3% 8/1/50 | 250,000 | 266,305 | |
| Bay Area Toll Auth. San Francisco Bay Toll Bridge Rev. Bonds Series 2021 B, 0.280% x SIFMA Municipal Swap Index 0.33%, tender 4/1/24 (b)(d) | 365,000 | 365,618 | |
| California Cmnty. Choice Fing. Auth. Clean Energy Proj. Rev. Bonds Series 2021 B1, 4%, tender 8/1/31 (b) | 4,275,000 | 5,176,642 | |
| California Cmnty. Hsg. Agcy. Essential Hsg. Rev.: | |||
| Series 2020 A, 5% 2/1/50 (c) | 605,000 | 671,199 | |
| Series 2021 A: | |||
| 4% 2/1/56 (c) | 120,000 | 125,047 | |
| 4% 2/1/56 (c) | 1,820,000 | 1,884,926 | |
| Series 2021 A2: | |||
| 4% 8/1/46 (c) | 315,000 | 318,262 | |
| 4% 2/1/50 (c) | 1,125,000 | 1,137,632 | |
| California Edl. Facilities Auth. Rev.: | |||
| Series 2017 A, 5% 4/1/47 | 120,000 | 140,220 | |
| Series T1, 5% 3/15/39 | 915,000 | 1,340,765 | |
| Series V1, 5% 5/1/49 | 950,000 | 1,504,138 | |
| California Gen. Oblig.: | |||
| Series 2013: | |||
| 5% 9/1/31 | 610,000 | 658,694 | |
| 5% 4/1/37 | 570,000 | 604,214 | |
| Series 2014, 5% 10/1/39 | 430,000 | 481,933 | |
| Series 2015, 5% 3/1/30 | 570,000 | 650,732 | |
| Series 2016, 5% 8/1/27 | 290,000 | 348,014 | |
| Series 2018: | |||
| 5% 8/1/30 | 535,000 | 673,490 | |
| 5% 10/1/47 | 245,000 | 285,956 | |
| 5.25% 10/1/39 | 250,000 | 297,472 | |
| Series 2019: | |||
| 4% 10/1/34 | 425,000 | 512,270 | |
| 4% 10/1/36 | 345,000 | 414,639 | |
| 5% 4/1/32 | 165,000 | 225,832 | |
| 5% 10/1/39 | 250,000 | 320,067 | |
| Series 2020: | |||
| 4% 3/1/36 | 870,000 | 1,049,936 | |
| 4% 3/1/37 | 425,000 | 511,048 | |
| 4% 11/1/37 | 1,395,000 | 1,698,903 | |
| 4% 3/1/38 | 250,000 | 299,663 | |
| 4% 3/1/40 | 250,000 | 298,591 | |
| 4% 3/1/46 | 425,000 | 501,473 | |
| Series 2021: | |||
| 4% 10/1/37 | 250,000 | 306,601 | |
| 4% 10/1/41 | 1,715,000 | 2,082,382 | |
| 5% 9/1/32 | 275,000 | 371,849 | |
| 5% 12/1/35 | 365,000 | 484,341 | |
| 5% 12/1/36 | 545,000 | 722,095 | |
| 5% 9/1/41 | 1,550,000 | 2,060,438 | |
| 5% 10/1/41 | 385,000 | 506,707 | |
| California Health Facilities Fing. Auth. Rev.: | |||
| Bonds Series 2017 A, 5%, tender 11/1/22 (b) | 230,000 | 240,116 | |
| Series 2012 A, 5% 10/1/33 | 335,000 | 347,860 | |
| Series 2015: | |||
| 5% 11/15/28 | 105,000 | 123,116 | |
| 5% 11/15/32 | 20,000 | 23,365 | |
| 5% 11/15/33 | 200,000 | 233,651 | |
| Series 2016 A, 5% 11/15/41 (Pre-Refunded to 11/15/25 @ 100) | 840,000 | 989,806 | |
| Series 2017 A2, 5% 11/1/47 | 900,000 | 1,376,646 | |
| Series 2018 A: | |||
| 5% 11/15/35 | 180,000 | 221,960 | |
| 5% 11/15/38 | 120,000 | 147,540 | |
| Series 2019, 5% 11/15/49 | 940,000 | 1,112,625 | |
| Series 2020 A: | |||
| 4% 4/1/37 | 365,000 | 436,120 | |
| 4% 4/1/38 | 145,000 | 172,949 | |
| 4% 4/1/40 | 255,000 | 301,962 | |
| 4% 4/1/45 | 250,000 | 290,083 | |
| Series 2021 A, 4% 8/15/48 (e) | 2,625,000 | 3,113,101 | |
| Series 2022 A, 4% 5/15/46 | 1,215,000 | 1,407,124 | |
| California Hsg. Fin. Agcy. Series 2019 A, 4.25% 1/15/35 | 309,507 | 372,095 | |
| California Infrastructure & Econ. Dev. Series 2019: | |||
| 5% 8/1/44 | 840,000 | 1,046,901 | |
| 5% 8/1/49 | 695,000 | 860,440 | |
| California Muni. Fin. Auth. Mobile Home Park Sr. Rev.: | |||
| (Caritas Affordable Hsg., Inc. Proj.) Series 2014 A, 5.25% 8/15/39 | 85,000 | 92,128 | |
| (Caritas Affordable Hsg., Inc. Projs.) Series 2014 A, 5.25% 8/15/49 | 235,000 | 253,463 | |
| California Muni. Fin. Auth. Rev.: | |||
| (LINXS APM Proj.) Series 2018 A: | |||
| 5% 12/31/36 (a) | 395,000 | 472,201 | |
| 5% 12/31/43 (a) | 2,510,000 | 2,994,689 | |
| 5% 12/31/47 (a) | 1,185,000 | 1,410,996 | |
| Series 2017 A, 5% 2/1/42 | 300,000 | 358,885 | |
| California Muni. Fin. Auth. Solid Waste Disp. Rev. Bonds: | |||
| (Republic Svcs., Inc. Proj.) Series 2021 B, 0.3%, tender 1/18/22 (a)(b) | 970,000 | 970,150 | |
| (Waste Mgmt., Inc. Proj.) Series 2020, 0.15%, tender 12/1/21 (a)(b) | 245,000 | 245,000 | |
| California Muni. Fin. Auth. Student Hsg.: | |||
| (CHF-Riverside II, LLC-UCR North District Phase I Student Hsg. Proj.) Series 2019: | |||
| 5% 5/15/49 | 180,000 | 215,859 | |
| 5% 5/15/52 | 150,000 | 179,521 | |
| Series 2018: | |||
| 5% 5/15/36 | 250,000 | 311,258 | |
| 5% 5/15/39 | 300,000 | 371,897 | |
| 5% 5/15/43 | 300,000 | 369,156 | |
| California Pub. Fin. Auth.: | |||
| (Enso Village Proj.) Series 2021 B1, 3.125% 5/15/29 (c) | 100,000 | 101,336 | |
| (Enso Villiage Proj.) Series 2021 B2, 2.375% 11/15/28 (c) | 90,000 | 90,958 | |
| Series 2021 A, 5% 11/15/46 (c) | 45,000 | 51,655 | |
| Series 2021 B3, 2.125% 11/15/27 (c) | 160,000 | 161,408 | |
| California Pub. Works Board Lease Rev.: | |||
| (Various Cap. Projs.) Series 2021 B: | |||
| 4% 5/1/38 | 120,000 | 145,461 | |
| 4% 5/1/46 | 310,000 | 368,914 | |
| (Various Univ. of California Projs.) Series 2011 G, 5% 12/1/28 (Pre-Refunded to 12/1/21 @ 100) | 485,000 | 485,000 | |
| Series 2013 A, 5% 3/1/38 | 275,000 | 289,936 | |
| Series 2014 B, 5% 10/1/34 | 620,000 | 695,624 | |
| California School Fin. Auth. Charter School Rev.: | |||
| Series 2016: | |||
| 5% 8/1/41 (c) | 195,000 | 219,628 | |
| 5% 8/1/41 (Pre-Refunded to 8/1/25 @ 100) (c) | 25,000 | 29,091 | |
| Series 2021 A, 4% 6/1/61(e) | 250,000 | 260,643 | |
| California State Univ. Rev. Series 2019 A, 5% 11/1/44 | 600,000 | 768,236 | |
| California Statewide Cmntys. Dev. Auth. Series 2017, 5% 5/15/47 | 485,000 | 571,606 | |
| California Statewide Cmntys. Dev. Auth. Rev.: | |||
| (899 Charleston Proj.) Series 2014 A, 5.375% 11/1/49 (c) | 210,000 | 223,448 | |
| (The Terraces at San Joaquin Gardens Proj.) Series 2012 A: | |||
| 6% 10/1/42 (Pre-Refunded to 10/1/22 @ 100) | 320,000 | 335,230 | |
| 6% 10/1/47 (Pre-Refunded to 10/1/22 @ 100) | 50,000 | 52,380 | |
| Series 2014 A, 5.5% 12/1/54 | 1,240,000 | 1,405,818 | |
| Series 2014 B, 5% 7/1/28 (Pre-Refunded to 7/1/24 @ 100) | 355,000 | 397,924 | |
| Series 2016 A: | |||
| 5% 12/1/27 (c) | 180,000 | 211,628 | |
| 5% 12/1/46 (c) | 245,000 | 280,588 | |
| 5.25% 12/1/56 (c) | 740,000 | 851,441 | |
| Series 2018 A: | |||
| 5.25% 12/1/48 (c) | 105,000 | 127,528 | |
| 5.5% 12/1/58 (c) | 1,410,000 | 1,728,253 | |
| Series 2019 B: | |||
| 4% 9/2/29 | 190,000 | 212,676 | |
| 5% 9/2/34 | 65,000 | 78,737 | |
| 5% 9/2/39 | 60,000 | 72,127 | |
| 5% 9/2/44 | 60,000 | 71,554 | |
| 5% 9/2/49 | 30,000 | 35,562 | |
| Series 2021 A: | |||
| 3% 4/1/37 | 350,000 | 375,557 | |
| 4% 9/2/28 | 15,000 | 17,055 | |
| 4% 9/2/29 | 15,000 | 17,189 | |
| 4% 9/2/30 | 20,000 | 23,136 | |
| 4% 9/2/31 | 15,000 | 17,464 | |
| 4% 9/2/41 | 100,000 | 115,263 | |
| 4% 9/2/51 | 60,000 | 68,004 | |
| Series 2021 B: | |||
| 4% 9/2/41 | 265,000 | 302,209 | |
| 4% 9/2/51 | 320,000 | 358,560 | |
| California Statewide Fing. Auth. Series 2002 A, 6% 5/1/43 | 90,000 | 90,890 | |
| Chino Valley Unified School District Series 2020 B: | |||
| 3.375% 8/1/50 | 300,000 | 326,181 | |
| 4% 8/1/45 | 500,000 | 592,323 | |
| CMFA Spl. Fin. Agcy. Essential Hsg. Rev. Series 2021, 4% 8/1/45 (c) | 1,075,000 | 1,058,768 | |
| Coachella Valley Unified School District Series 2016 F, 5% 8/1/46 | 300,000 | 350,670 | |
| Coast Cmnty. College District Series 2017 D, 4.5% 8/1/39 | 500,000 | 593,882 | |
| Corona-Norco Unified School District Series 2019 C, 4% 8/1/49 | 250,000 | 288,003 | |
| CSCDA Cmnty. Impt. Auth. Essential Hsg. Rev.: | |||
| Series 2021 A, 4% 8/1/56 (c) | 285,000 | 294,931 | |
| Series 2021 A2: | |||
| 4% 7/1/56 (c) | 525,000 | 547,068 | |
| 4% 9/1/56 (c) | 195,000 | 204,630 | |
| 4% 10/1/56 (c) | 1,715,000 | 1,782,842 | |
| Series 2021 B, 4% 3/1/57 (c) | 585,000 | 591,756 | |
| El Monte Union High School District Series 2019, 5% 6/1/49 | 500,000 | 603,540 | |
| Escondido Gen. Oblig. Series 2015, 5% 9/1/36 | 250,000 | 289,562 | |
| Fontana Unified School District Gen. Oblig. Series 2012 C: | |||
| 0% 8/1/35 (Pre-Refunded to 8/1/22 @ 50.022) | 250,000 | 124,895 | |
| 0% 8/1/36 (Pre-Refunded to 8/1/22 @ 46.467) | 250,000 | 116,018 | |
| Glendale Cmnty. College District Series 2020 B, 4% 8/1/50 | 250,000 | 291,540 | |
| Golden State Tobacco Securitization Corp. Tobacco Settlement Rev.: | |||
| Series 2007 A2, 5.3% 6/1/37 | 2,005,000 | 2,049,267 | |
| Series 2015 A: | |||
| 5% 6/1/34 (Pre-Refunded to 6/1/25 @ 100) | 610,000 | 706,404 | |
| 5% 6/1/35 (Pre-Refunded to 6/1/25 @ 100) | 360,000 | 416,894 | |
| 5% 6/1/40 (Pre-Refunded to 6/1/25 @ 100) | 250,000 | 289,510 | |
| Series 2018 A1: | |||
| 5% 6/1/33 | 250,000 | 304,735 | |
| 5% 6/1/47 | 375,000 | 383,115 | |
| Inland Empire Tobacco Securitization Auth. Series 2007: | |||
| 0% 6/1/57 (c) | 17,305,000 | 1,214,868 | |
| 0% 6/1/57 (c) | 11,325,000 | 657,645 | |
| Irvine Reassessment District 12-1 Ltd. Oblig.: | |||
| Series 2012, 4% 9/2/27 | 20,000 | 20,486 | |
| Series 2012, 4% 9/2/28 | 25,000 | 25,579 | |
| Irvine Unified School District Cmnty. Facilities District Series 2017 D, 5% 3/1/57 | 320,000 | 375,034 | |
| Jurupa Unified School District Series 2019 C, 5.25% 8/1/43 | 250,000 | 316,427 | |
| Los Angeles Cmnty. College District Series 2015 C, 5% 8/1/25 | 290,000 | 338,793 | |
| Los Angeles County Pub. Works Fing. Auth. Lease Rev.: | |||
| (Lacma Bldg. for the Permanent Collection Proj.) Series 2020 A: | |||
| 4% 12/1/37 | 695,000 | 841,858 | |
| 4% 12/1/38 | 255,000 | 308,303 | |
| 4% 12/1/39 | 415,000 | 500,702 | |
| 4% 12/1/40 | 450,000 | 540,713 | |
| 4% 12/1/43 | 275,000 | 328,157 | |
| (Multiple Cap. Projs. II) Series 2012: | |||
| 5% 8/1/29 | 245,000 | 252,888 | |
| 5% 8/1/37 | 245,000 | 252,888 | |
| (Multiple Cap. Projs.) Series 2015 A, 5% 12/1/33 | 340,000 | 384,717 | |
| Series 2019 E1, 5% 12/1/49 | 275,000 | 348,778 | |
| Los Angeles Dept. Arpt. Rev.: | |||
| Series 2019 E, 5% 5/15/44 | 300,000 | 374,798 | |
| Series 2020 A, 5% 5/15/40 | 250,000 | 321,920 | |
| Series 2020 C: | |||
| 4% 5/15/50 (a) | 450,000 | 520,049 | |
| 5% 5/15/34 (a) | 300,000 | 383,089 | |
| Series A, 5% 5/15/51 (a) | 300,000 | 377,371 | |
| Series F, 5% 5/15/44 (a) | 790,000 | 972,053 | |
| Los Angeles Muni. Impt. Corp. Lease Rev. Series 2012 C: | |||
| 5% 3/1/30 (Pre-Refunded to 3/1/22 @ 100) | 180,000 | 182,168 | |
| 5% 3/1/31 (Pre-Refunded to 3/1/22 @ 100) | 190,000 | 192,289 | |
| 5% 3/1/32 (Pre-Refunded to 3/1/22 @ 100) | 85,000 | 86,024 | |
| Los Angeles Unified School District: | |||
| Series 2018 B1, 5.25% 7/1/42 | 1,400,000 | 1,730,475 | |
| Series 2020 C: | |||
| 4% 7/1/36 | 250,000 | 302,329 | |
| 4% 7/1/37 | 250,000 | 300,753 | |
| Los Angeles Wastewtr. Sys. Rev. Series 2018 A, 5% 6/1/43 | 250,000 | 308,566 | |
| Metropolitan Wtr. District of Southern California Wtr. Rev. Bonds: | |||
| Series 2017 C, SIFMA Municipal Swap Index + 0.140% 0.19%, tender 5/21/24 (b)(d) | 370,000 | 370,050 | |
| Series 2017 D, SIFMA Municipal Swap Index + 0.140% 0.19%, tender 5/21/24 (b)(d) | 610,000 | 610,083 | |
| Series 2017 E, SIFMA Municipal Swap Index + 0.140% 0.19%, tender 7/1/37 (b)(d) | 415,000 | 415,058 | |
| MSR Energy Auth. Gas Rev.: | |||
| Series 2009 A, 6.125% 11/1/29 | 215,000 | 267,905 | |
| Series 2009 B, 6.5% 11/1/39 | 595,000 | 952,692 | |
| Series 2009 C, 6.5% 11/1/39 | 290,000 | 464,337 | |
| Napa Valley Unified School District Series 2019 C, 4% 8/1/44 (FSA Insured) | 300,000 | 340,391 | |
| Northern California Gas Auth. #1 Gas Proj. Rev. Series 2007 B, 3 month U.S. LIBOR + 0.720% 0.808% 7/1/27 (b)(d) | 400,000 | 402,977 | |
| Paramount Unified School District Series 2013, 0% 8/1/43 (Pre-Refunded to 8/1/23 @ 26) | 250,000 | 64,669 | |
| Rancho Cucamonga Redev. Agcy. Series 2014: | |||
| 5% 9/1/30 (FSA Insured) | 120,000 | 133,896 | |
| 5% 9/1/31 (FSA Insured) | 340,000 | 379,259 | |
| 5% 9/1/32 (FSA Insured) | 320,000 | 356,937 | |
| Riverside County Redev. Agcy. Tax Allocation Series 2011 E: | |||
| 7% 12/1/31 (Pre-Refunded to 12/1/21 @ 100) | 95,000 | 95,000 | |
| 7% 12/1/31 (Pre-Refunded to 12/1/21 @ 100) | 20,000 | 20,000 | |
| 7.25% 12/1/40 (Pre-Refunded to 12/1/21 @ 100) | 175,000 | 175,000 | |
| Riverside County Trans. Commission Sales Tax Rev. Series 2017 B, 4% 6/1/36 | 450,000 | 520,661 | |
| Riverside County Trans. Commission Toll Rev. Series 2021 B1: | |||
| 3% 6/1/49 | 275,000 | 290,693 | |
| 4% 6/1/37 | 230,000 | 276,826 | |
| 4% 6/1/39 | 225,000 | 269,034 | |
| 4% 6/1/40 | 835,000 | 996,567 | |
| 4% 6/1/41 | 215,000 | 255,964 | |
| 4% 6/1/46 | 480,000 | 565,091 | |
| Riverside Unified School District Gen. Oblig. Series 2019 B, 4% 8/1/42 | 250,000 | 287,310 | |
| Sacramento County Arpt. Sys. Rev. Series 2018 C, 5% 7/1/37 (a) | 245,000 | 299,697 | |
| Sacramento Spl. Tax Greenbriar Cmnty. Facilities District No. 2018-03 Area No. 1 Series 2021: | |||
| 4% 9/1/41 | 120,000 | 136,335 | |
| 4% 9/1/46 | 145,000 | 163,387 | |
| Sacramento TOT Rev. Series 2018 A, 5% 6/1/30 | 250,000 | 304,574 | |
| San Bernardino Cmnty. College District Series 2019 A, 3% 8/1/41 (Pre-Refunded to 8/16/27 @ 100) | 250,000 | 284,221 | |
| San Diego County Reg'l. Arpt. Auth. Arpt. Rev.: | |||
| Series 2013 B, 5% 7/1/43 (Pre-Refunded to 7/1/23 @ 100) (a) | 850,000 | 912,053 | |
| Series 2021 B, 4% 7/1/56 (a)(e) | 1,000,000 | 1,149,544 | |
| San Francisco Bay Area Rapid Transit Fing. Auth. Series 2020, 3% 8/1/50 | 1,000,000 | 1,069,244 | |
| San Francisco City & County Arpts. Commission Int'l. Arpt. Rev.: | |||
| Second Series 2019 A, 5% 5/1/44 (a) | 1,785,000 | 2,194,322 | |
| Series 2017 A, 5% 5/1/47 (a) | 250,000 | 298,614 | |
| Series 2018 D, 5% 5/1/48 (a) | 250,000 | 302,243 | |
| Series 2019 A: | |||
| 5% 5/1/38 (a) | 250,000 | 309,653 | |
| 5% 5/1/49 (a) | 300,000 | 367,352 | |
| Series 2019 E: | |||
| 5% 5/1/35 (a) | 250,000 | 311,332 | |
| 5% 5/1/37 (a) | 250,000 | 310,133 | |
| 5% 5/1/50 (a) | 450,000 | 550,918 | |
| Series 2019 F, 5% 5/1/50 | 800,000 | 986,288 | |
| Series 2020 A, 5% 5/1/38 (a) | 760,000 | 960,811 | |
| San Marcos Redev. Agcy. Successor Series 2015 A: | |||
| 5% 10/1/30 | 190,000 | 220,041 | |
| 5% 10/1/33 | 135,000 | 156,224 | |
| San Mateo Cmnty. Facilities District No. 2008 1 Spl. Tax Series 2012: | |||
| 5.875% 9/1/32 | 165,000 | 170,230 | |
| 6% 9/1/42 | 90,000 | 92,714 | |
| Santa Margarita Wtr. District Spl. Tax Series 2013, 5.625% 9/1/43 | 145,000 | 154,944 | |
| Santa Monica Cmnty. College District Gen. Oblig. Series 2018 A, 4% 8/1/47 | 300,000 | 348,183 | |
| Solano Cmnty. College District Series 2017, 5.25% 8/1/42 (Pre-Refunded to 8/15/27 @ 100) | 350,000 | 439,707 | |
| Successor Agcy. to the Inland Valley Dev. Agcy. Tax Allocation Series 2014 A: | |||
| 5% 9/1/44 (FSA Insured) | 235,000 | 256,906 | |
| 5.25% 9/1/37 | 500,000 | 546,128 | |
| Tobacco Securitization Auth. Northern California Tobacco Settlement Rev. Series 2021 B2, 0% 6/1/60 | 1,275,000 | 313,785 | |
| Tobacco Securitization Auth. Southern California Tobacco Settlement: | |||
| Series 2006 2C, 0% 6/1/46 | 1,945,000 | 378,080 | |
| Series 2006 3D, 0% 6/1/46 | 320,000 | 57,925 | |
| Tulare County Trans. Auth. Sales Tax Rev. Series 2020, 4% 2/1/37 | 250,000 | 297,585 | |
| Univ. of California Revs.: | |||
| Series 2017 M, 5% 5/15/47 | 610,000 | 736,443 | |
| Series 2018 AZ: | |||
| 5% 5/15/43 | 250,000 | 309,053 | |
| 5.25% 5/15/58 | 250,000 | 312,106 | |
| Series 2018 O, 5.5% 5/15/58 | 1,825,000 | 2,307,886 | |
| Series 2020 BE, 4% 5/15/47 | 210,000 | 246,586 | |
| West Sacramento Fing. Auth. Spl. Tax Rev. Series 2006 A, 5% 9/1/34 | 120,000 | 160,846 | |
| TOTAL CALIFORNIA | 115,973,088 | ||
| Colorado - 0.7% | |||
| Aerotropolis Reg'l. Trans. Auth. Spl. Rev. Series 2021, 4.375% 12/1/52 | 1,105,000 | 1,123,896 | |
| Arista Metropolitan District Broomfield Gen. Oblig. and Spl. Rev. Series 2018 A, 5.125% 12/1/48 | 500,000 | 534,600 | |
| Berthoud-Heritage Metropolitan District No. 1 Ltd. Tax Supported Rev. Series 2019, 5.625% 12/1/48 | 525,000 | 569,606 | |
| Colorado Ctfs. of Prtn. Series 2021 A: | |||
| 4% 12/15/35 | 280,000 | 344,907 | |
| 4% 12/15/36 | 280,000 | 344,342 | |
| 4% 12/15/38 | 280,000 | 342,747 | |
| Colorado Health Facilities Auth.: | |||
| (Adventist Health Sys. / Sunbelt Obligated Group) Series 2016 A, 5% 11/15/41 | 610,000 | 714,965 | |
| (Christian Living Neighborhoods Proj.) Series 2016: | |||
| 5% 1/1/31 | 80,000 | 86,093 | |
| 5% 1/1/37 | 100,000 | 107,020 | |
| (Frasier Meadows Retirement Cmnty. Proj.) Series 2017 B: | |||
| 5% 5/15/33 | 100,000 | 106,540 | |
| 5% 5/15/39 | 135,000 | 143,829 | |
| Series 2019 A: | |||
| 4% 11/15/43 | 345,000 | 404,728 | |
| 5% 11/1/44 | 1,215,000 | 1,509,147 | |
| Series 2019 A2: | |||
| 4% 8/1/49 | 720,000 | 820,360 | |
| 5% 8/1/44 | 345,000 | 423,826 | |
| Series 2021 A, 4% 11/15/46 | 400,000 | 477,985 | |
| Colorado Health Facilities Auth. Rev.: | |||
| (Mental Health Ctr. of Denver Proj.) Series 2014, 5.75% 2/1/44 | 215,000 | 231,178 | |
| (Sunny Vista Living Ctr. Proj.) Series 2015 A: | |||
| 5.75% 12/1/35 (c) | 100,000 | 96,229 | |
| 6.125% 12/1/45 (c) | 400,000 | 387,297 | |
| 6.25% 12/1/50 (c) | 350,000 | 340,781 | |
| Series 2013 A, 5.25% 1/1/40 (Pre-Refunded to 1/1/23 @ 100) | 875,000 | 921,822 | |
| Series 2013, 8% 8/1/43 | 245,000 | 259,254 | |
| Colorado High Performance Trans. Enterprise C-470 Express Lanes Sr. Rev. Series 2017: | |||
| 5% 12/31/47 | 425,000 | 479,998 | |
| 5% 12/31/51 | 945,000 | 1,065,745 | |
| 5% 12/31/56 | 1,385,000 | 1,559,705 | |
| Colorado Int'l. Ctr. Metropolitan District No. 14 Ltd. Tax Gen. Oblig. Series 2018, 5.875% 12/1/46 | 500,000 | 537,975 | |
| Colorado Reg'l. Trans. District (Denver Transit Partners Eagle P3 Proj.) Series 2020, 4% 7/15/40 | 300,000 | 393,057 | |
| Colorado Reg'l. Trans. District Ctfs. of Prtn. Series 2014 A, 4.5% 6/1/44 | 275,000 | 288,026 | |
| Colorado Reg'l. Trans. District Sales Tax Rev. (Fastracks Proj.) Series 2016 A, 5% 11/1/46 | 610,000 | 712,731 | |
| Denver City & County Arpt. Rev.: | |||
| Series 2013 B, 5% 11/15/43 | 150,000 | 162,670 | |
| Series 2018 A: | |||
| 5% 12/1/25 (a) | 250,000 | 291,398 | |
| 5% 12/1/35 (a) | 350,000 | 428,423 | |
| 5% 12/1/43 (a) | 685,000 | 832,701 | |
| 5% 12/1/48 (a) | 305,000 | 368,386 | |
| 5.25% 12/1/48 (a) | 1,950,000 | 2,387,146 | |
| Denver City & County Spl. Facilities Arpt. Rev. (United Airlines, Inc. Proj.) Series 2017, 5% 10/1/32 (a) | 1,955,000 | 2,066,556 | |
| E-470 Pub. Hwy. Auth. Rev. Bonds Series 2021 B, U.S. Secured Overnight Fin. Rate (SOFR) Indx + 0.350% 0.384%, tender 9/1/24 (b)(d) | 250,000 | 250,516 | |
| Park Creek Metropolitan District Sr. Ltd. Property Tax Supported Rev. Series 2015 A, 5% 12/1/45 | 1,185,000 | 1,334,819 | |
| Pub. Auth. For Colorado Energy Rev. Series 2008: | |||
| 6.25% 11/15/28 | 365,000 | 456,627 | |
| 6.5% 11/15/38 | 1,725,000 | 2,677,791 | |
| Pueblo Urban Renewal Auth. Tax Increment Rev. (Evraz Proj.) Series 2021 A, 4.75% 12/1/45 (c) | 245,000 | 277,350 | |
| Rampart Range Metropolitan District No. 5 Ltd. Tax Supported & Spl. Rev. Series 2021, 4% 12/1/51 | 540,000 | 552,298 | |
| Vauxmont Metropolitan District Series 2020: | |||
| 5% 12/1/32 (FSA Insured) | 45,000 | 57,476 | |
| 5% 12/1/35 (FSA Insured) | 20,000 | 25,426 | |
| 5% 12/1/50 (FSA Insured) | 90,000 | 111,740 | |
| TOTAL COLORADO | 27,609,712 | ||
| Connecticut - 0.3% | |||
| Connecticut Gen. Oblig.: | |||
| Series 2015 B, 5% 6/15/35 | 285,000 | 327,252 | |
| Series 2017 A, 5% 4/15/35 | 250,000 | 301,548 | |
| Series 2018 E: | |||
| 5% 9/15/35 | 290,000 | 363,788 | |
| 5% 9/15/37 | 250,000 | 312,607 | |
| Series 2018 F, 5% 9/15/28 | 300,000 | 380,195 | |
| Series 2021 A: | |||
| 3% 1/15/32 | 275,000 | 308,543 | |
| 3% 1/15/35 | 250,000 | 278,530 | |
| Connecticut Health & Edl. Facilities Auth. Rev.: | |||
| (Church Home of Hartford, Inc. Proj.) Series 2016 A: | |||
| 5% 9/1/46 (c) | 100,000 | 110,461 | |
| 5% 9/1/53 (c) | 100,000 | 110,132 | |
| Series 2012 J, 5% 7/1/42 | 935,000 | 960,543 | |
| Series 2016 F: | |||
| 5% 7/1/31 | 240,000 | 273,619 | |
| 5% 7/1/32 | 250,000 | 284,312 | |
| 5% 7/1/33 | 160,000 | 181,733 | |
| 5% 7/1/34 | 110,000 | 124,787 | |
| 5% 7/1/43 | 620,000 | 695,526 | |
| Series 2019, 4% 7/1/44 | 405,000 | 448,322 | |
| Series L1: | |||
| 4% 7/1/22 | 25,000 | 25,528 | |
| 4% 7/1/23 | 40,000 | 42,245 | |
| Series N: | |||
| 4% 7/1/39 | 300,000 | 336,088 | |
| 4% 7/1/49 | 440,000 | 484,775 | |
| Connecticut Hsg. Fin. Auth. Series 2018 C1, 4% 11/15/45 | 250,000 | 272,732 | |
| Connecticut Spl. Tax Oblig. Trans. Infrastructure Rev.: | |||
| Series 2014 A, 5% 9/1/30 | 250,000 | 280,456 | |
| Series 2016 A: | |||
| 5% 9/1/31 | 400,000 | 478,330 | |
| 5% 9/1/33 | 300,000 | 357,666 | |
| Series 2018 A: | |||
| 5% 1/1/31 | 250,000 | 310,578 | |
| 5% 1/1/33 | 765,000 | 944,801 | |
| Series 2020 A: | |||
| 4% 5/1/39 | 250,000 | 297,620 | |
| 5% 5/1/32 | 275,000 | 357,682 | |
| Hamden Gen. Oblig. (Whitney Ctr. Proj.) Series 2019: | |||
| 5% 1/1/40 | 545,000 | 589,793 | |
| 5% 1/1/50 | 565,000 | 606,488 | |
| Hartford Gen. Oblig. Series 2015 C, 5% 7/15/32 (FSA Insured) | 250,000 | 286,675 | |
| Steelpointe Hbr. Infrastructure Impt. District (Steelpointe Hbr. Proj.) Series 2021, 4% 4/1/51 (c) | 100,000 | 104,096 | |
| Waterbury Gen. Oblig. Series 2013, 5% 12/1/32 (Pre-Refunded to 12/1/23 @ 100) | 120,000 | 131,262 | |
| TOTAL CONNECTICUT | 11,368,713 | ||
| Delaware - 0.3% | |||
| Delaware Econ. Dev. Auth. Retirement Communitites Rev. Series 2018 B, 5% 11/15/48 | 730,000 | 836,402 | |
| Delaware Health Facilities Auth. Rev.: | |||
| (Beebe Med. Ctr. Proj.) Series 2018: | |||
| 5% 6/1/37 | 60,000 | 72,910 | |
| 5% 6/1/43 | 775,000 | 932,477 | |
| 5% 6/1/48 | 740,000 | 884,663 | |
| 5% 6/1/50 | 205,000 | 244,677 | |
| (Nanticoke Memorial Hosp. Proj.) Series 2013: | |||
| 5% 7/1/28 (Pre-Refunded to 7/1/23 @ 100) | 245,000 | 262,603 | |
| 5% 7/1/32 (Pre-Refunded to 7/1/23 @ 100) | 195,000 | 209,010 | |
| Series 2020 A: | |||
| 4% 10/1/49 | 1,010,000 | 1,176,660 | |
| 5% 10/1/34 | 250,000 | 320,150 | |
| 5% 10/1/35 | 250,000 | 319,738 | |
| 5% 10/1/37 | 300,000 | 382,315 | |
| 5% 10/1/38 | 250,000 | 318,078 | |
| 5% 10/1/45 | 1,220,000 | 1,531,383 | |
| Delaware Trans. Auth. Grant Series 2020: | |||
| 5% 9/1/33 | 150,000 | 195,454 | |
| 5% 9/1/34 | 245,000 | 318,598 | |
| 5% 9/1/35 | 120,000 | 155,701 | |
| Kent County Student Hsg. & Dining Facility Rev. (CHF Dover, L.L.C. Delaware State Univ. Proj.) Series 2018 A: | |||
| 5% 7/1/32 | 15,000 | 17,176 | |
| 5% 7/1/40 | 70,000 | 79,055 | |
| 5% 7/1/48 | 180,000 | 201,142 | |
| 5% 7/1/53 | 265,000 | 295,343 | |
| 5% 7/1/58 | 225,000 | 250,101 | |
| Sussex County Rev. (Cadbury at Lewes Proj.) Series 2016, 5% 1/1/36 | 645,000 | 699,453 | |
| The Delaware Econ. Dev. Auth. Charter School Rev. (Newark Charter School, Inc. Proj.) Series 2020: | |||
| 4% 9/1/30 | 15,000 | 17,221 | |
| 5% 9/1/40 | 80,000 | 99,265 | |
| 5% 9/1/50 | 105,000 | 128,275 | |
| TOTAL DELAWARE | 9,947,850 | ||
| District Of Columbia - 0.5% | |||
| District of Columbia Rev.: | |||
| (Ingleside at Rock Creek Proj.) Series 2017 A: | |||
| 5% 7/1/32 | 220,000 | 237,587 | |
| 5% 7/1/37 | 235,000 | 252,681 | |
| 5% 7/1/42 | 395,000 | 422,667 | |
| 5% 7/1/52 | 905,000 | 964,648 | |
| Series 2009 A: | |||
| 5.125% 1/1/35 | 95,000 | 99,271 | |
| 5.25% 1/1/39 | 60,000 | 62,718 | |
| Series 2009, 5% 7/1/42 (Pre-Refunded to 7/1/22 @ 100) | 535,000 | 549,934 | |
| Series 2012 A: | |||
| 5% 6/1/32 (Pre-Refunded to 12/1/22 @ 100) | 130,000 | 136,130 | |
| 5% 6/1/42 (Pre-Refunded to 12/1/22 @ 100) | 250,000 | 261,788 | |
| Series 2016 A: | |||
| 5% 6/1/36 | 180,000 | 204,174 | |
| 5% 6/1/41 | 120,000 | 135,257 | |
| 5% 6/1/46 | 175,000 | 196,299 | |
| Series 2019: | |||
| 4% 7/1/39 | 420,000 | 478,683 | |
| 4% 7/1/44 | 60,000 | 67,612 | |
| 4% 7/1/49 | 670,000 | 749,462 | |
| Series 2020, 5% 6/1/50 | 120,000 | 141,330 | |
| District of Columbia Tax Increment Rev. (Union Market Infastructure Proj.) Series 2021 A, 0% 6/1/46 (c)(f) | 215,000 | 179,208 | |
| District of Columbia Tobacco Settlement Fing. Corp.: | |||
| Series 2006 A, 0% 6/15/46 | 3,895,000 | 860,533 | |
| Series 2006 B, 0% 6/15/46 | 1,395,000 | 254,951 | |
| District of Columbia Wtr. & Swr. Auth. Pub. Util. Rev.: | |||
| Series 2013 A, 5% 10/1/48 (Pre-Refunded to 10/1/23 @ 100) | 690,000 | 749,873 | |
| Series 2015 B, 5% 10/1/37 | 410,000 | 475,790 | |
| Metropolitan Washington Arpts. Auth. Dulles Toll Road Rev.: | |||
| (Dulles Metrorail And Cap. Impt. Proj.) Series 2019 B, 4% 10/1/53 (FSA Insured) | 130,000 | 148,119 | |
| (Dulles Metrorail and Cap. Impt. Projs.) Series 2019 A, 5% 10/1/44 | 1,250,000 | 1,545,326 | |
| (Dulles Metrorail And Cap. Impt. Projs.) Series 2019 B, 4% 10/1/49 | 490,000 | 553,987 | |
| (Dulles Metrorail and Cap. Impt. Projs.) Series 2019 B, 5% 10/1/34 | 85,000 | 106,259 | |
| Series 2009 B: | |||
| 0% 10/1/37 | 775,000 | 543,623 | |
| 0% 10/1/38 | 605,000 | 409,196 | |
| 0% 10/1/39 | 120,000 | 78,783 | |
| 0% 10/1/40 | 305,000 | 194,737 | |
| Series 2009 C, 6.5% 10/1/41 (Assured Guaranty Corp. Insured) | 310,000 | 393,589 | |
| Series 2010 B, 6.5% 10/1/44 | 1,360,000 | 1,805,564 | |
| Metropolitan Washington DC Arpts. Auth. Sys. Rev.: | |||
| Series 2018 A: | |||
| 5% 10/1/43 (a) | 1,645,000 | 2,003,536 | |
| 5% 10/1/48 (a) | 1,180,000 | 1,428,148 | |
| Series 2021 A: | |||
| 5% 10/1/29 (a) | 300,000 | 382,133 | |
| 5% 10/1/46 (a) | 485,000 | 615,914 | |
| Washington D.C. Metropolitan Transit Auth. Rev. Series 2018, 5% 7/1/43 | 610,000 | 732,326 | |
| TOTAL DISTRICT OF COLUMBIA | 18,421,836 | ||
| Florida - 1.5% | |||
| Alachua County Health Facilities Auth. Continuing Care Retirement Cmnty. Rev. (Oak Hammock at the Univ. of Florida, Inc. Proj.) Series 2012 A, 8% 10/1/42 | 120,000 | 129,854 | |
| Alachua County Health Facilities Auth. Health Facilities Rev.: | |||
| (East Ridge Retirement Villiage, Inc. Proj.) Series 2014: | |||
| 6% 11/15/34 | 330,000 | 317,520 | |
| 6.375% 11/15/49 | 575,000 | 555,723 | |
| Series 2014 A, 5% 12/1/44 | 1,625,000 | 1,816,036 | |
| Series 2019 A, 4% 12/1/49 | 610,000 | 696,998 | |
| Boggy Creek Impt. District Spl. Assessment Rev. Series 2013, 5.125% 5/1/43 | 580,000 | 606,212 | |
| Brevard County Health Facilities Auth. Health Care Facilities Rev. (Health First, Inc. Proj.) Series 2014, 5% 4/1/39 | 365,000 | 400,927 | |
| Broward County Arpt. Sys. Rev.: | |||
| Series 2013 C, 5.25% 10/1/30 (Pre-Refunded to 10/1/23 @ 100) | 570,000 | 621,511 | |
| Series 2019 A: | |||
| 4% 10/1/49 (a) | 935,000 | 1,070,130 | |
| 5% 10/1/33 (a) | 15,000 | 18,887 | |
| Cap. Projs. Fin. Auth. Student Hsg. Rev. (Cap. Projs. Ln. Prog. - Florida Univs.) Series 2020 A: | |||
| 5% 10/1/30 | 100,000 | 124,537 | |
| 5% 10/1/34 | 100,000 | 122,624 | |
| Cap. Trust Agcy. Student Hsg. Rev. Series 2018 A, 5.25% 12/1/58 (c) | 555,000 | 633,289 | |
| Celebration Pointe Cmnty. Dev. District No. 1 Spl. Assessment Rev.: | |||
| Series 2014: | |||
| 4.75% 5/1/24 | 35,000 | 37,513 | |
| 5.125% 5/1/45 | 60,000 | 63,564 | |
| Series 2017: | |||
| 5% 5/1/32 (c) | 70,000 | 78,294 | |
| 5% 5/1/48 (c) | 190,000 | 209,050 | |
| Series 2021: | |||
| 3.375% 5/1/41 | 100,000 | 101,615 | |
| 4% 5/1/53 | 250,000 | 260,854 | |
| Central Florida Expressway Auth. Sr. Lien Rev.: | |||
| Series 2016 B, 5% 7/1/34 | 220,000 | 259,952 | |
| Series 2017, 5% 7/1/42 | 635,000 | 767,106 | |
| Series 2019 A, 5% 7/1/33 | 15,000 | 19,148 | |
| Series 2021, 4% 7/1/34 (FSA Insured) | 475,000 | 585,710 | |
| County Wtr.-Swr. District Collier County Wtr. Rev. Series 2021: | |||
| 4% 7/1/40 | 1,015,000 | 1,238,941 | |
| 4% 7/1/44 | 610,000 | 735,629 | |
| Davie Edl. Facilities Rev. (Nova Southeastern Univ. Proj.): | |||
| Series 2013 A, 6% 4/1/42 (Pre-Refunded to 4/1/23 @ 100) | 1,190,000 | 1,280,016 | |
| Series 2018, 5% 4/1/38 | 345,000 | 418,426 | |
| Double Branch Cmnty. Dev. District Spl. Assessment Series 2013 A1, 4% 5/1/25 | 15,000 | 15,702 | |
| Fishhawk Cmnty. Dev. District IV Spl. Assessment Rev. Series 2013 A, 7.25% 5/1/43 | 130,000 | 139,351 | |
| Florida Dept. of Trans. Tpk. Rev. Series 2021 C, 3% 7/1/35 | 250,000 | 281,092 | |
| Florida Dev. Fin. Corp. Solid Waste Disp. Rev. Series 2021, 3% 6/1/32 (a) | 245,000 | 256,512 | |
| Florida Dev. Fin. Corp. Surface T: | |||
| Bonds (Virgin Trains U.S.A. Passenger Rail Proj.) Series 2019 A, 6.5%, tender 1/1/29 (a)(b)(c) | 385,000 | 392,911 | |
| Series 2019 B, 7.375% 1/1/49 (a)(c) | 1,065,000 | 1,161,031 | |
| Florida Gen. Oblig. Series 2019 A: | |||
| 4% 7/1/33 | 290,000 | 345,343 | |
| 4% 7/1/34 | 420,000 | 499,379 | |
| Florida Higher Edl. Facilities Fing. Auth.: | |||
| (Jacksonville Univ. Proj.) Series 2018 A1: | |||
| 4.5% 6/1/33 (c) | 245,000 | 283,648 | |
| 4.75% 6/1/38 (c) | 450,000 | 521,481 | |
| 5% 6/1/48 (c) | 1,270,000 | 1,465,902 | |
| (Nova Southeastern Univ. Proj.) Series 2016: | |||
| 5% 4/1/30 | 70,000 | 81,827 | |
| 5% 4/1/31 | 160,000 | 187,002 | |
| 5% 4/1/32 | 105,000 | 122,534 | |
| 5% 4/1/36 | 60,000 | 69,752 | |
| Florida Keys Aqueduct Auth. Wtr. Rev. Series 2019 A, 5% 9/1/49 | 250,000 | 283,596 | |
| Florida State Dept. Trans. Fing. Corp. Series 2020: | |||
| 3% 7/1/32 | 250,000 | 280,893 | |
| 3% 7/1/33 | 250,000 | 279,945 | |
| Gainesville Utils. Sys. Rev. Series 2019 A, 5% 10/1/44 | 275,000 | 345,734 | |
| Greater Orlando Aviation Auth. Arpt. Facilities Rev.: | |||
| Series 2017 A: | |||
| 5% 10/1/32 (a) | 120,000 | 145,383 | |
| 5% 10/1/47 (a) | 1,825,000 | 2,192,544 | |
| 5% 10/1/52 (a) | 180,000 | 215,788 | |
| Series 2019 A: | |||
| 5% 10/1/32 (a) | 250,000 | 315,275 | |
| 5% 10/1/44 (a) | 670,000 | 827,286 | |
| Hillsborough County Port District (Tampa Port Auth. Proj.) Series 2018 B: | |||
| 5% 6/1/30 (a) | 100,000 | 121,622 | |
| 5% 6/1/31 (a) | 105,000 | 127,275 | |
| 5% 6/1/46 (a) | 610,000 | 722,345 | |
| Jacksonville Edl. Facilities Rev. (Jacksonville Univ. Proj.) Series 2018 B, 5% 6/1/53 (c) | 1,030,000 | 1,185,539 | |
| Jacksonville Elec. Auth. Elec. Sys. Rev.: | |||
| Series 2017 B, 4% 10/1/36 | 250,000 | 289,420 | |
| Series 2020 A, 4% 10/1/37 | 610,000 | 726,228 | |
| Jacksonville Sales Tax Rev. Series 2012 A, 5% 10/1/30 | 365,000 | 379,292 | |
| Jacksonville Trans. Rev. Series 2012 A: | |||
| 5% 10/1/30 (Pre-Refunded to 10/1/22 @ 100) | 300,000 | 311,945 | |
| 5% 10/1/31 (Pre-Refunded to 10/1/22 @ 100) | 230,000 | 239,158 | |
| Lake County Retirement Facilities Rev. (Lakeside At Waterman Village Proj.) Series 2020 A, 5.75% 8/15/50 | 100,000 | 113,158 | |
| Lakewood Ranch Stewardship District Spl. Assessment Rev.: | |||
| (Lakewood Centre & NW Sector Projs.) Series 2018: | |||
| 5.5% 5/1/39 (c) | 75,000 | 87,108 | |
| 5.65% 5/1/48 (c) | 90,000 | 104,584 | |
| (Lakewood Nat'l. and Polo Run Projs.) Series 2017: | |||
| 4% 5/1/22 | 5,000 | 5,048 | |
| 5.25% 5/1/37 | 220,000 | 246,897 | |
| 5.375% 5/1/47 | 450,000 | 503,076 | |
| (Northeast Sector Proj. - Phase 1B) Series 2018: | |||
| 5.3% 5/1/39 | 60,000 | 69,370 | |
| 5.45% 5/1/48 | 105,000 | 120,411 | |
| (Villages of Lakewood Ranch South Proj.) Series 2016: | |||
| 5% 5/1/36 | 110,000 | 120,231 | |
| 5.125% 5/1/46 | 215,000 | 234,566 | |
| Lee County Arpt. Rev. Series 2021 B: | |||
| 5% 10/1/34 (a) | 250,000 | 325,443 | |
| 5% 10/1/35 (a) | 250,000 | 324,937 | |
| 5% 10/1/39 (a) | 250,000 | 322,197 | |
| Lee County Indl. Dev. Auth. Health Care Facilities Rev. (The Preserve Proj.) Series 2017 A: | |||
| 5.625% 12/1/37 (c) | 100,000 | 104,573 | |
| 5.75% 12/1/52 (c) | 500,000 | 516,622 | |
| Lee Memorial Health Sys. Hosp. Rev. Series 2019 A1: | |||
| 5% 4/1/39 | 165,000 | 204,506 | |
| 5% 4/1/44 | 885,000 | 1,087,160 | |
| Martin County Health Facilities Series 2015, 5% 11/15/45 (Pre-Refunded to 11/15/24 @ 100) | 455,000 | 516,216 | |
| Miami-Dade County Series 2021 A1, 4% 10/1/45 (FSA Insured) (a) | 1,240,000 | 1,461,656 | |
| Miami-Dade County Aviation Rev.: | |||
| Series 2012 A: | |||
| 5% 10/1/28 (Pre-Refunded to 10/1/22 @ 100) (a) | 435,000 | 452,033 | |
| 5% 10/1/31 (Pre-Refunded to 10/1/22 @ 100) (a) | 730,000 | 758,585 | |
| Series 2016 A, 5% 10/1/41 | 700,000 | 832,158 | |
| Miami-Dade County Edl. Facilities Rev.: | |||
| Series 2015 A: | |||
| 5% 4/1/40 | 1,380,000 | 1,559,538 | |
| 5% 4/1/45 | 610,000 | 686,112 | |
| Series 2018 A, 5% 4/1/53 | 1,215,000 | 1,453,606 | |
| Miami-Dade County Health Facilities Auth. Hosp. Rev. (Nicklaus Children's Hosp. Proj.): | |||
| Series 2017, 5% 8/1/42 | 170,000 | 203,299 | |
| Series 2021 A, 4% 8/1/51 | 500,000 | 583,499 | |
| Miami-Dade County Transit Sales Surtax Rev. Series 2020 A, 4% 7/1/48 | 500,000 | 582,640 | |
| Miami-Dade County Wtr. & Swr. Rev.: | |||
| Series 2017 B, 5% 10/1/31 | 250,000 | 290,631 | |
| Series 2017 C, 4% 10/1/44 | 250,000 | 284,087 | |
| Series 2019 B, 5% 10/1/44 | 325,000 | 408,321 | |
| Series 2021, 4% 10/1/48 | 835,000 | 990,308 | |
| North Sumter County Util. Dependent District (Sumter Wtr. Conservation Auth. Proj.) Series 2021: | |||
| 5% 10/1/46 (FSA Insured) | 250,000 | 322,389 | |
| 5% 10/1/52 (FSA Insured) | 300,000 | 384,485 | |
| Orange County Health Facilities Auth.: | |||
| Series 2016 A, 5% 10/1/39 | 770,000 | 908,171 | |
| Series 2019 A, 5% 10/1/47 | 425,000 | 522,205 | |
| Orlando & Orange County Expressway Auth. Rev. Series 2013 A, 5% 7/1/32 (Pre-Refunded to 7/1/23 @ 100) | 185,000 | 198,567 | |
| OTC Cmnty. Dev. District Jacksonville Spl. Assessment Series 2007 A, 5.3% 5/1/38 | 160,000 | 160,219 | |
| Palm Beach County Health Facilities Series 2018 A, 5% 11/15/45 | 315,000 | 361,569 | |
| Palm Beach County Health Facilities Auth. Hosp. Rev. Series 2019, 4% 8/15/49 | 900,000 | 1,032,259 | |
| Palm Beach County Health Facilities Auth. Rev.: | |||
| (Sinai Residences of Boca Raton Proj.) Series 2014 A: | |||
| 7.25% 6/1/34 | 85,000 | 88,893 | |
| 7.5% 6/1/49 | 390,000 | 407,761 | |
| Series 2022, 4.25% 6/1/56 (e) | 830,000 | 862,742 | |
| Putnam County Dev. Auth. Poll. Cont. Rev. (Seminole Elec. Coop., Inc. Proj.) Series 2018 A, 5% 3/15/42 | 250,000 | 299,402 | |
| Reedy Creek Impt. District Series 2013 A, 5% 6/1/26 (Pre-Refunded to 6/1/23 @ 100) | 365,000 | 390,977 | |
| Sarasota County Health Facilities Auth. Retirement Facility Rev. (Village On The Isle Proj.) Series 2017 A: | |||
| 5% 1/1/37 | 85,000 | 91,666 | |
| 5% 1/1/42 | 95,000 | 102,146 | |
| 5% 1/1/47 | 195,000 | 209,212 | |
| 5% 1/1/52 | 410,000 | 439,446 | |
| Sarasota County Pub. Hosp. District Hosp. Rev. (Sarasota Memorial Hosp. Proj.) Series 2018, 5% 7/1/41 | 1,215,000 | 1,487,530 | |
| Sarasota County Util. Sys. Rev. Series 2019 A, 5% 10/1/40 | 250,000 | 312,750 | |
| Sawyers Landing Cmnty. Dev. District Spl. Assessment Rev. Series 2021: | |||
| 4.125% 5/1/41 | 185,000 | 200,376 | |
| 4.25% 5/1/53 | 245,000 | 263,691 | |
| Seminole County Indl. Dev. Auth. Retirement Facility Rev. (Legacy Pointe At UCF Proj.) Series 2019 A, 5.5% 11/15/49 | 460,000 | 509,990 | |
| South Miami Health Facilities Auth. Hosp. Rev. (Baptist Med. Ctr., FL. Proj.) Series 2017: | |||
| 5% 8/15/42 | 450,000 | 546,154 | |
| 5% 8/15/47 | 1,000,000 | 1,209,968 | |
| Sumter County Indl. Dev. Auth. Hosp. Rev. (Central Florida Health Alliance Projs.) Series 2014 A, 5.25% 7/1/44 | 375,000 | 407,072 | |
| Tampa Rev. (The Univ. of Tampa Proj.) Series 2015: | |||
| 5% 4/1/40 | 150,000 | 169,094 | |
| 5% 4/1/45 | 370,000 | 415,133 | |
| Tampa-Hillsborough County Expressway Auth. Rev. Series 2017, 5% 7/1/47 | 1,825,000 | 2,187,162 | |
| The Crossings at Fleming Island Cmnty. Dev. District Spl. Assessment Series 2014 A1, 4.5% 5/1/30 | 25,000 | 25,985 | |
| Viera Stewardship District Spl. Assessment Rev. (Village 2 - Series 2021 Proj.) Series 2021, 4% 5/1/53 | 160,000 | 168,731 | |
| Village Cmnty. Dev. District Series 2020, 3.5% 5/1/40 (FSA Insured) | 250,000 | 278,354 | |
| Village Cmnty. Dev. District # 10. Spl. Assessment Rev.: | |||
| Series 2012: | |||
| 5% 5/1/32 | 130,000 | 132,037 | |
| 5.125% 5/1/43 | 250,000 | 254,109 | |
| Series 2014: | |||
| 5.125% 5/1/24 | 100,000 | 105,543 | |
| 5.75% 5/1/31 | 195,000 | 207,059 | |
| 6% 5/1/44 | 255,000 | 271,733 | |
| Village Cmnty. Dev. District # 9 Series 2012: | |||
| 5.25% 5/1/31 | 70,000 | 70,930 | |
| 5.5% 5/1/42 | 90,000 | 91,218 | |
| West Palm Beach Cmnty. Redev. Agcy. Tax Increment Rev. Series 2019: | |||
| 5% 3/1/34 | 350,000 | 437,277 | |
| 5% 3/1/35 | 300,000 | 373,963 | |
| TOTAL FLORIDA | 60,443,345 | ||
| Georgia - 1.0% | |||
| Atlanta Arpt. Rev.: | |||
| Series 2014 B, 5% 1/1/33 | 305,000 | 333,096 | |
| Series 2019 B, 4% 7/1/49 (a) | 305,000 | 347,779 | |
| Atlanta Dev. Auth. Rev. (New Downtown Atlanta Stadium Proj.) Series 2015 A1: | |||
| 5.25% 7/1/40 | 275,000 | 315,723 | |
| 5.25% 7/1/44 | 1,335,000 | 1,531,757 | |
| Atlanta Dev. Auth. Sr. Health Care Facilities Current Interest Rev. (Georgia Proton Treatment Ctr. Proj.) Series 2017 A1: | |||
| 6.5% 1/1/29 | 180,000 | 136,573 | |
| 6.75% 1/1/35 | 1,110,000 | 832,373 | |
| 7% 1/1/40 | 1,210,000 | 893,495 | |
| Bibb County Dev. Auth. Rev. Series 2011 A, 5.75% 7/1/40 (FSA Insured) | 290,000 | 291,262 | |
| Brookhaven Dev. Auth. Rev. Series 2019 A, 4% 7/1/44 | 250,000 | 291,403 | |
| Burke County Indl. Dev. Auth. Poll. Cont. Rev. Bonds (Oglethorpe Pwr. Corp. Vogtle Proj.) Series 2013 A, 1.5%, tender 2/3/25 (b) | 250,000 | 256,441 | |
| Coweta County Dev. Auth. Rev. (Piedmont Healthcare, Inc. Proj.) Series 2019 A, 5% 7/1/44 | 250,000 | 311,151 | |
| Dalton Gen. Oblig. Series 2018, 5% 2/1/42 | 1,035,000 | 1,281,779 | |
| Fulton County Dev. Auth. (Robert W. Woodruff Arts Ctr., Inc. Proj.) Series 2015 A, 5% 3/15/36 | 320,000 | 366,717 | |
| Fulton County Dev. Auth. Hosp. Rev. (Wellstar Health Sys., Inc. Proj.) Series 2017 A: | |||
| 5% 4/1/37 | 160,000 | 191,369 | |
| 5% 4/1/42 | 600,000 | 716,995 | |
| 5% 4/1/47 | 250,000 | 297,321 | |
| Fulton County Dev. Auth. Rev.: | |||
| (Piedmont Healthcare, Inc. Proj.) Series 2019 A, 4% 7/1/49 | 1,335,000 | 1,536,432 | |
| (Robert W. Woodruff Arts Ctr., Inc. Proj.) Series 2019 A, 5% 3/15/44 | 445,000 | 532,574 | |
| Fulton County Residential Care Facilities (Canterbury Court Proj.): | |||
| Series 2019 A: | |||
| 5% 4/1/47 (c) | 210,000 | 233,288 | |
| 5% 4/1/54 (c) | 165,000 | 182,796 | |
| Series 2021 A: | |||
| 4% 4/1/41 (c) | 180,000 | 193,335 | |
| 4% 4/1/51 (c) | 515,000 | 545,855 | |
| Gainesville & Hall County Dev. Auth. Retirement Cmnty. Rev. Series 2016, 5% 11/15/33 | 245,000 | 288,473 | |
| Gainesville & Hall County Hosp. Auth. Rev. (Northeast Georgia Health Sys., Inc. Proj.): | |||
| Series 2014 A, 5.25% 8/15/49 (Pre-Refunded to 2/15/25 @ 100) | 1,585,000 | 1,823,945 | |
| Series 2017 A: | |||
| 5% 2/15/42 | 330,000 | 393,403 | |
| 5% 2/15/45 | 335,000 | 398,291 | |
| Series 2017 B, 5.5% 2/15/42 | 605,000 | 728,655 | |
| Georgia Gen. Oblig.: | |||
| Series 2020 A, 5% 8/1/32 | 250,000 | 330,975 | |
| Series 2021 A, 5% 7/1/33 | 1,115,000 | 1,508,585 | |
| Georgia Muni. Elec. Auth. Pwr. Rev.: | |||
| Series 2015 A, 5% 1/1/35 | 250,000 | 281,020 | |
| Series 2018 A: | |||
| 5% 1/1/26 | 85,000 | 99,628 | |
| 5% 1/1/27 | 155,000 | 186,594 | |
| 5% 1/1/28 | 45,000 | 55,492 | |
| Series 2018 HH: | |||
| 5% 1/1/26 | 440,000 | 515,719 | |
| 5% 1/1/27 | 250,000 | 300,957 | |
| 5% 1/1/28 | 260,000 | 320,622 | |
| Series 2019 A: | |||
| 5% 1/1/49 | 2,470,000 | 3,001,676 | |
| 5% 1/1/56 | 250,000 | 303,009 | |
| 5% 1/1/59 | 300,000 | 363,820 | |
| Series 2019 B, 5% 1/1/59 | 250,000 | 303,183 | |
| Series 2021 A: | |||
| 4% 1/1/51 | 275,000 | 311,611 | |
| 5% 1/1/62 (FSA Insured) | 300,000 | 367,518 | |
| Georgia Road & Thruway Auth. Rev. Series 2021 A, 4% 7/15/46 | 570,000 | 693,407 | |
| Glynn-Brunswick Memorial Hosp. Auth. Rev. (Southeast Georgia Health Sys. Proj.) Series 2017, 5% 8/1/47 | 300,000 | 354,097 | |
| Griffin-Spalding County Hosp. (Wellstar Health Sys., Inc. Proj.) Series 2017 A, 5% 4/1/37 | 180,000 | 215,290 | |
| Hosp. Auth. of Savannah Auth. Rev. Series 2013 A, 5.5% 7/1/31 | 225,000 | 242,936 | |
| Macon-Bibb County Urban Dev. Auh. Series 2017 A: | |||
| 5% 6/15/27 (c) | 20,000 | 21,780 | |
| 5.75% 6/15/37 (c) | 95,000 | 109,965 | |
| 5.875% 6/15/47 (c) | 150,000 | 172,257 | |
| 6% 6/15/52 (c) | 95,000 | 109,437 | |
| Main Street Natural Gas, Inc.: | |||
| Bonds: | |||
| Series 2018 C, 4%, tender 12/1/23 (b) | 780,000 | 831,288 | |
| Series 2019 B, 4%, tender 12/2/24 (b) | 340,000 | 373,798 | |
| Series 2019 C, 4%, tender 9/1/26 (b) | 860,000 | 978,084 | |
| Series 2021 A, 4%, tender 9/1/27 (b) | 1,000,000 | 1,155,586 | |
| Series 2021 C, 4%, tender 12/1/28 (b) | 805,000 | 949,748 | |
| Series 2019 A: | |||
| 5% 5/15/31 | 485,000 | 603,393 | |
| 5% 5/15/32 | 305,000 | 377,849 | |
| 5% 5/15/49 | 180,000 | 268,855 | |
| Marietta Dev. Auth. Rev.: | |||
| (Life Univ., Inc. Proj.) Series 2017 A: | |||
| 5% 11/1/27 (c) | 210,000 | 233,373 | |
| 5% 11/1/37 (c) | 170,000 | 190,053 | |
| (Life Univ., Inc. Proj.) Series 2017 A, 5% 11/1/47 (c) | 670,000 | 737,526 | |
| Private Colleges & Univs. Auth. Rev.: | |||
| (The Savannah College of Art & Design Projs.) Series 2021, 4% 4/1/44 | 250,000 | 292,703 | |
| Series 2016 A, 4% 10/1/46 | 1,145,000 | 1,291,765 | |
| Series 2016 B, 5% 10/1/38 | 355,000 | 421,643 | |
| Series 2020 B, 4% 9/1/40 | 925,000 | 1,104,116 | |
| Savannah Econ. Dev. Auth. Rev. (The Marshes of Skidaway Island Proj.) Series 2013, 7.25% 1/1/44 (Pre-Refunded to 1/1/24 @ 100) | 580,000 | 660,558 | |
| World Congress Ctr. Auth. Convention Ctr. Hotel Second Tier Rev.: | |||
| Series 2021 A: | |||
| 2.375% 1/1/31 | 170,000 | 177,191 | |
| 4% 1/1/36 | 285,000 | 329,239 | |
| 4% 1/1/54 | 1,845,000 | 2,090,508 | |
| Series 2021 B: | |||
| 3.625% 1/1/31 (c) | 100,000 | 108,779 | |
| 5% 1/1/36 (c) | 200,000 | 238,557 | |
| 5% 1/1/54 (c) | 1,465,000 | 1,703,570 | |
| TOTAL GEORGIA | 40,540,041 | ||
| Guam - 0.0% | |||
| Guam Govt. Bus. Privilege Tax Rev.: | |||
| Series 2021 F: | |||
| 4% 1/1/42 | 295,000 | 333,012 | |
| 5% 1/1/30 | 60,000 | 74,919 | |
| 5% 1/1/31 | 60,000 | 76,558 | |
| Series 2021, 4% 1/1/36 | 275,000 | 317,441 | |
| Guam Pwr. Auth. Rev. Series 2012 A, 5% 10/1/30 (FSA Insured) | 250,000 | 258,735 | |
| Guam Wtrwks. Auth. Wtr. and Wastewtr. Sys. Rev. Series 2020 A, 5% 1/1/50 | 225,000 | 275,195 | |
| TOTAL GUAM | 1,335,860 | ||
| Hawaii - 0.0% | |||
| Hawaii Arpts. Sys. Rev. Series 2018 A, 5% 7/1/43 (a) | 730,000 | 881,567 | |
| Hawaii Dept. Budget & Fin. Spl. Purp. Sr. Living Rev. Series 2012: | |||
| 5.125% 11/15/32 | 80,000 | 82,878 | |
| 5.25% 11/15/37 | 125,000 | 129,462 | |
| Hawaii Dept. of Budget & Fin. Spl. Purp. Rev. Series 2019, 3.5% 10/1/49 (a) | 250,000 | 260,287 | |
| TOTAL HAWAII | 1,354,194 | ||
| Idaho - 0.1% | |||
| Idaho Health Facilities Auth. Rev.: | |||
| (St. Luke's Health Sys. Proj.) Series 2014 A, 5% 3/1/39 | 1,075,000 | 1,174,200 | |
| Series 2021 A, 4% 3/1/51 (e) | 345,000 | 402,272 | |
| Idaho Hsg. & Fin. Assoc. Single Family Mtg. Series 2019 A: | |||
| 5% 7/15/36 | 400,000 | 504,636 | |
| 5% 7/15/37 | 350,000 | 440,680 | |
| Idaho Hsg. and Fin. Assoc. (Sage Int'l. School of Boise Proj.) Series 2020 A, 4% 5/1/50 | 60,000 | 68,551 | |
| Pwr. County Idaho Indl. Dev. Corp. Solid Waste Disp. Rev. Series 1999, 6.45% 8/1/32 (a) | 275,000 | 276,423 | |
| Spring Valley Cmnty. Infrastructure District No. 1 Eagle Spl. Assessment Series 2021, 3.75% 9/1/51 (c) | 1,287,000 | 1,294,079 | |
| TOTAL IDAHO | 4,160,841 | ||
| Illinois - 1.6% | |||
| Chicago Board of Ed.: | |||
| Series 1998 B1: | |||
| 0% 12/1/27 (FGIC Insured) | 940,000 | 851,018 | |
| 0% 12/1/29 (FSA Insured) | 860,000 | 742,938 | |
| Series 1999 A: | |||
| 0% 12/1/23 (FGIC Insured) | 120,000 | 117,740 | |
| 0% 12/1/26 (Nat'l. Pub. Fin. Guarantee Corp. Insured) | 500,000 | 464,316 | |
| Series 2011 A, 5.5% 12/1/39 | 300,000 | 300,832 | |
| Series 2016, 6% 4/1/46 | 425,000 | 514,329 | |
| Series 2017: | |||
| 5% 4/1/42 | 135,000 | 157,064 | |
| 5% 4/1/46 | 135,000 | 156,330 | |
| Series 2018 A: | |||
| 5% 12/1/24 (FSA Insured) | 120,000 | 135,323 | |
| 5% 12/1/27 (FSA Insured) | 300,000 | 367,038 | |
| Chicago Gen. Oblig.: | |||
| (Cap. Impt. Proj.) Series 1999, 0% 1/1/27 (Nat'l. Pub. Fin. Guarantee Corp. Insured) | 605,000 | 562,811 | |
| Series 2005 D, 5.5% 1/1/40 | 730,000 | 836,003 | |
| Series 2007 E, 5.5% 1/1/35 | 90,000 | 103,428 | |
| Series 2014 A, 5.25% 1/1/29 | 225,000 | 249,729 | |
| Series 2017 A: | |||
| 6% 1/1/38 | 1,260,000 | 1,561,409 | |
| 6% 1/1/38 | 250,000 | 305,758 | |
| Series 2019 A: | |||
| 5% 1/1/39 | 80,000 | 98,264 | |
| 5% 1/1/40 | 180,000 | 220,018 | |
| 5.5% 1/1/35 | 245,000 | 311,180 | |
| 5.5% 1/1/49 | 740,000 | 920,440 | |
| Chicago Midway Arpt. Rev.: | |||
| Series 2014 A: | |||
| 5% 1/1/28 (a) | 225,000 | 245,431 | |
| 5% 1/1/33 (a) | 435,000 | 472,796 | |
| 5% 1/1/34 (a) | 290,000 | 314,883 | |
| Series 2016 B, 5% 1/1/46 | 285,000 | 332,128 | |
| Chicago Motor Fuel Tax Rev. Series 2013, 5% 1/1/33 (FSA Insured) | 250,000 | 276,539 | |
| Chicago O'Hare Int'l. Arpt. Rev.: | |||
| Series 2013, 5.75% 1/1/38 | 730,000 | 768,107 | |
| Series 2015 A: | |||
| 5% 1/1/27 (a) | 610,000 | 689,423 | |
| 5% 1/1/32 (a) | 250,000 | 280,027 | |
| Series 2015 B: | |||
| 5% 1/1/28 | 260,000 | 294,364 | |
| 5% 1/1/33 | 270,000 | 305,331 | |
| Series 2016 C, 5% 1/1/35 | 250,000 | 291,781 | |
| Series 2016 D: | |||
| 5% 1/1/47 | 455,000 | 539,682 | |
| 5.25% 1/1/42 | 225,000 | 270,381 | |
| Series 2018 A: | |||
| 5% 1/1/37 (a) | 195,000 | 238,444 | |
| 5% 1/1/38 (a) | 70,000 | 85,468 | |
| 5% 1/1/48 (a) | 365,000 | 437,940 | |
| Series 2018 B, 4% 1/1/53 (FSA Insured) | 300,000 | 341,273 | |
| Series 2020 A: | |||
| 4% 1/1/37 | 300,000 | 354,554 | |
| 4% 1/1/37 (FSA Insured) | 300,000 | 354,554 | |
| Chicago Park District Gen. Oblig. Series 2020 D, 4% 1/1/34 | 250,000 | 293,070 | |
| Chicago Transit Auth. Series 2020 A: | |||
| 4% 12/1/50 | 1,275,000 | 1,467,679 | |
| 5% 12/1/45 | 225,000 | 278,804 | |
| Chicago Wastewtr. Transmission Rev.: | |||
| Series 2008 C: | |||
| 5% 1/1/31 | 170,000 | 192,301 | |
| 5% 1/1/33 | 60,000 | 67,773 | |
| 5% 1/1/34 | 60,000 | 67,694 | |
| 5% 1/1/35 | 60,000 | 67,655 | |
| 5% 1/1/39 | 90,000 | 101,102 | |
| Series 2014: | |||
| 5% 1/1/39 | 250,000 | 271,451 | |
| 5% 1/1/44 | 250,000 | 271,342 | |
| Series 2017 B, 5% 1/1/30 | 250,000 | 300,180 | |
| Chicago Wtr. Rev.: | |||
| Series 2004, 5% 11/1/25 | 120,000 | 139,616 | |
| Series 2014, 5% 11/1/44 | 160,000 | 178,112 | |
| Series 2016 A1, 5% 11/1/27 | 80,000 | 96,353 | |
| Series 2017 2: | |||
| 5% 11/1/32 (FSA Insured) | 250,000 | 305,974 | |
| 5% 11/1/33 (FSA Insured) | 250,000 | 306,093 | |
| Series 2017, 5.25% 11/1/33 (FSA Insured) | 250,000 | 310,475 | |
| Cook County Cmnty. College District Series 2016, 5.5% 12/1/38 | 250,000 | 272,989 | |
| Cook County Gen. Oblig. Series 2012 C: | |||
| 5% 11/15/29 | 215,000 | 224,472 | |
| 5% 11/15/33 | 335,000 | 349,722 | |
| Illinois Dev. Fin. Auth. Envir. Facilities Rev. Series 2002, 8% 6/1/32 (a) | 105,000 | 105,144 | |
| Illinois Fin. Auth.: | |||
| Series 2020 A, 4% 4/1/50 | 300,000 | 346,572 | |
| Series 2021 A: | |||
| 5% 8/15/35 | 250,000 | 330,662 | |
| 5% 8/15/36 | 300,000 | 395,993 | |
| Illinois Fin. Auth. Rev.: | |||
| (Franciscan Cmntys. Proj.) Series 2017 A, 5% 5/15/37 | 235,000 | 267,727 | |
| (Franciscan Communitites Proj.) Series 2017 A, 5% 5/15/47 | 95,000 | 106,880 | |
| (Presence Health Proj.) Series 2016 C, 5% 2/15/36 | 80,000 | 95,903 | |
| (The Admiral at the Lake Proj.) Series 2017: | |||
| 5% 5/15/33 | 825,000 | 867,105 | |
| 5.125% 5/15/38 | 670,000 | 703,238 | |
| 5.25% 5/15/42 | 120,000 | 125,962 | |
| 5.25% 5/15/54 | 730,000 | 759,775 | |
| 5.5% 5/15/54 | 45,000 | 47,351 | |
| Series 2013 A: | |||
| 5.125% 5/15/43 | 80,000 | 83,035 | |
| 5.125% 5/15/43 (Pre-Refunded to 5/15/23 @ 100) | 10,000 | 10,687 | |
| 5.25% 5/15/47 | 370,000 | 384,262 | |
| Series 2013 A, 5.25% 5/15/47 (Pre-Refunded to 5/15/23 @ 100) | 55,000 | 58,879 | |
| Series 2013 A, 6% 7/1/43 | 250,000 | 266,583 | |
| Series 2015 C: | |||
| 5% 8/15/35 | 305,000 | 349,149 | |
| 5% 8/15/44 | 305,000 | 348,073 | |
| Series 2015: | |||
| 5.25% 5/15/45 (Pre-Refunded to 5/15/25 @ 100) | 75,000 | 86,814 | |
| 5.25% 5/15/50 (Pre-Refunded to 5/15/25 @ 100) | 195,000 | 225,717 | |
| 6.125% 11/15/35 | 205,000 | 231,482 | |
| 6.375% 11/15/43 | 245,000 | 276,282 | |
| Series 2016 C: | |||
| 5% 2/15/34 | 55,000 | 66,120 | |
| 5% 2/15/41 | 225,000 | 268,902 | |
| Series 2016: | |||
| 5% 5/15/36 | 85,000 | 95,889 | |
| 5% 5/15/40 | 75,000 | 84,063 | |
| Series 2017: | |||
| 5% 2/15/32 | 70,000 | 75,920 | |
| 5.25% 2/15/37 | 50,000 | 54,325 | |
| 5.25% 2/15/47 | 250,000 | 270,152 | |
| Illinois Fin. Auth. Student Hsg. and Academic Facility Rev. (CHF - Chicago, LLC - Univ. of Illinois At Chicago Proj.) Series 2017 A: | |||
| 5% 2/15/47 | 215,000 | 244,989 | |
| 5% 2/15/50 | 60,000 | 68,266 | |
| Illinois Gen. Oblig.: | |||
| Series 2013 A, 5% 4/1/38 | 100,000 | 105,492 | |
| Series 2013, 5.5% 7/1/38 | 1,060,000 | 1,140,004 | |
| Series 2014 February: | |||
| 5.25% 2/1/33 | 335,000 | 367,218 | |
| 5.25% 2/1/34 | 190,000 | 208,186 | |
| Series 2014 May, 5% 5/1/34 | 120,000 | 131,903 | |
| Series 2014: | |||
| 5% 5/1/36 | 55,000 | 60,372 | |
| 5% 2/1/39 | 235,000 | 255,281 | |
| 5.25% 2/1/30 | 395,000 | 433,347 | |
| 5.25% 2/1/32 | 385,000 | 421,939 | |
| Series 2016: | |||
| 4% 6/1/41 | 250,000 | 278,572 | |
| 5% 1/1/28 | 250,000 | 290,508 | |
| 5% 2/1/28 | 535,000 | 638,132 | |
| 5% 11/1/36 | 200,000 | 233,814 | |
| Series 2017 A, 4% 12/1/33 | 120,000 | 134,734 | |
| Series 2017 B, 5% 12/1/23 | 575,000 | 626,116 | |
| Series 2017 C, 5% 11/1/29 | 1,805,000 | 2,168,023 | |
| Series 2017 D: | |||
| 5% 11/1/24 | 340,000 | 382,063 | |
| 5% 11/1/25 | 60,000 | 69,515 | |
| 5% 11/1/26 | 250,000 | 296,644 | |
| 5% 11/1/27 | 405,000 | 489,849 | |
| 5% 11/1/28 | 685,000 | 827,722 | |
| Series 2018 A: | |||
| 5% 10/1/25 | 95,000 | 109,827 | |
| 5% 10/1/31 | 270,000 | 328,855 | |
| 6% 5/1/27 | 275,000 | 344,126 | |
| Series 2018 B: | |||
| 5% 10/1/31 | 320,000 | 389,754 | |
| 5% 10/1/32 | 335,000 | 407,234 | |
| Series 2019 B: | |||
| 4% 11/1/33 | 610,000 | 705,816 | |
| 4% 11/1/39 | 1,225,000 | 1,401,489 | |
| Series 2020 May, 5.125% 5/1/22 | 30,000 | 30,607 | |
| Series 2020: | |||
| 5.375% 5/1/23 | 65,000 | 69,516 | |
| 5.5% 5/1/24 | 60,000 | 67,031 | |
| 5.5% 5/1/25 | 275,000 | 318,749 | |
| 5.5% 5/1/26 | 195,000 | 232,990 | |
| 5.5% 5/1/39 | 895,000 | 1,142,812 | |
| Series 2021 A: | |||
| 5% 3/1/24 | 55,000 | 60,437 | |
| 5% 3/1/25 | 150,000 | 170,463 | |
| 5% 3/1/35 | 330,000 | 419,704 | |
| Series 2021 B, 5% 3/1/24 | 75,000 | 82,414 | |
| Illinois Reg'l. Trans. Auth.: | |||
| Series 2003 A, 6% 7/1/33 (FGIC Insured) | 700,000 | 980,504 | |
| Series 2003 B, 5.5% 6/1/27 | 560,000 | 656,414 | |
| Illinois Sales Tax Rev. Series 2002, 6% 6/15/26 (Nat'l. Pub. Fin. Guarantee Corp. Insured) | 120,000 | 147,017 | |
| Illinois Sports Facilities Auth. Series 2014, 5.25% 6/15/31 (FSA Insured) | 250,000 | 273,244 | |
| Illinois Toll Hwy. Auth. Toll Hwy. Rev.: | |||
| Series 2014 C, 5% 1/1/37 | 610,000 | 686,634 | |
| Series 2016 B, 5% 1/1/41 | 250,000 | 292,947 | |
| Metropolitan Pier & Exposition: | |||
| (McCormick Place Expansion Proj.): | |||
| Series 2002 A: | |||
| 0% 12/15/30 (Nat'l. Pub. Fin. Guarantee Corp. Insured) | 235,000 | 196,421 | |
| 0% 6/15/36 (Nat'l. Pub. Fin. Guarantee Corp. Insured) | 1,200,000 | 857,875 | |
| Series 2010 B1, 0% 6/15/44 (FSA Insured) | 250,000 | 137,966 | |
| Series 2002 A, 0% 12/15/33 (Nat'l. Pub. Fin. Guarantee Corp. Insured) | 3,675,000 | 2,831,905 | |
| Series 2017 A, 5% 6/15/57 | 865,000 | 1,008,703 | |
| Series 2020 A: | |||
| 4% 6/15/50 | 225,000 | 254,031 | |
| 5% 12/15/45 | 45,000 | 54,341 | |
| 5% 6/15/50 | 1,920,000 | 2,307,985 | |
| 5% 6/15/50 | 325,000 | 395,434 | |
| Series 2022 A: | |||
| 0% 12/15/35 (e) | 65,000 | 46,207 | |
| 0% 6/15/36 | 260,000 | 181,482 | |
| 0% 6/15/37 | 85,000 | 57,248 | |
| 0% 12/15/38 | 180,000 | 115,436 | |
| 0% 6/15/39 | 195,000 | 122,685 | |
| 0% 6/15/40 (e) | 200,000 | 121,462 | |
| 0% 6/15/41 | 70,000 | 41,042 | |
| 4% 12/15/42 | 330,000 | 377,436 | |
| 4% 12/15/47 | 975,000 | 1,104,227 | |
| 4% 6/15/52 | 475,000 | 536,137 | |
| Rosemont Gen. Oblig. Series 2016 A, 5% 12/1/40 (FSA Insured) | 250,000 | 295,982 | |
| Sales Tax Securitization Corp.: | |||
| Series 2018 A: | |||
| 4% 1/1/48 | 500,000 | 562,377 | |
| 5% 1/1/40 | 20,000 | 24,213 | |
| Series 2018 C: | |||
| 5% 1/1/43 | 250,000 | 307,690 | |
| 5.25% 1/1/35 | 250,000 | 316,275 | |
| 5.25% 1/1/43 | 500,000 | 623,732 | |
| Schaumburg Village Gen. Oblig. Series 2013 A, 4% 12/1/41 | 850,000 | 889,390 | |
| Southwestern Dev. Auth. Heath Facility Rev. Series 2013, 7.125% 11/1/43 (Pre-Refunded to 11/1/23 @ 100) | 225,000 | 253,651 | |
| Upper Illinois River Valley Dev. Auth. Edl. Facility Rev. (Cambridge Lakes Learning Ctr. Proj.) Series 2017 A: | |||
| 5% 12/1/32 (c) | 255,000 | 274,975 | |
| 5.25% 12/1/47 (c) | 490,000 | 524,095 | |
| Village of Oswego Gen. Oblig. Series 2016, 5% 12/15/33 | 275,000 | 322,355 | |
| Will County Illinois Series 2016, 5% 11/15/45 (Pre-Refunded to 11/15/25 @ 100) | 500,000 | 587,020 | |
| TOTAL ILLINOIS | 63,741,628 | ||
| Indiana - 0.3% | |||
| East Chicago Solid Waste Disp. Rev. Series 1998, 5.5% 9/1/28 (a) | 105,000 | 112,877 | |
| Indiana Dev. Fin. Auth. Envir. Rev. (United States Steel Corp. Proj.) Series 2021 A, 4.125% 12/1/26 | 840,000 | 924,066 | |
| Indiana Fin. Auth. Econ. Dev. Rev. Bonds (Republic Svcs., Inc. Proj.) Series 2012, 0.15%, tender 12/1/21 (a)(b) | 1,215,000 | 1,215,000 | |
| Indiana Fin. Auth. Exempt Facilities Rev. (Resources Polyflow Indiana Proj.) Series 2019, 7% 3/1/39 (a)(c) | 350,000 | 331,227 | |
| Indiana Fin. Auth. Midwestern Disaster Relief Rev. (Ohio Valley Elec. Corp. Proj.) Series 2012 A: | |||
| 5% 6/1/32 | 180,000 | 183,100 | |
| 5% 6/1/39 | 755,000 | 767,193 | |
| Indiana Fin. Auth. Poll. Cont. Rev. Series 2010 B, 2.5% 11/1/30 | 165,000 | 168,360 | |
| Indiana Fin. Auth. Rev.: | |||
| (Butler Univ. Proj.) Series 2012 B, 5% 2/1/26 | 250,000 | 251,901 | |
| (Greencroft Obligated Group) Series 2013 A, 7% 11/15/43 | 485,000 | 545,309 | |
| (Ohio River Bridges East End Crossing Proj.) Series 2013 A: | |||
| 5% 7/1/48 (Pre-Refunded to 7/1/23 @ 100) (a) | 1,425,000 | 1,525,975 | |
| 5.25% 1/1/51 (Pre-Refunded to 7/1/23 @ 100) (a) | 1,570,000 | 1,687,422 | |
| Series 2012, 5% 3/1/41 (Pre-Refunded to 3/1/22 @ 100) | 260,000 | 263,086 | |
| Series 2015, 5% 3/1/36 | 545,000 | 619,357 | |
| Series 2021 A, 4% 11/15/43 | 235,000 | 268,558 | |
| Indianapolis Local Pub. Impt. Series 2021 A: | |||
| 4% 6/1/37 (FSA Insured) | 500,000 | 599,368 | |
| 4% 6/1/38 (FSA Insured) | 250,000 | 298,373 | |
| Shoals Exempt Facilities Rev. (Nat'l. Gypsum Co. Proj.) Series 2013, 7.25% 11/1/43 (a) | 235,000 | 251,482 | |
| Valparaiso Exempt Facilities Rev. (Pratt Paper (IN), LLC Proj.) Series 2013: | |||
| 6.75% 1/1/34 (a) | 695,000 | 770,365 | |
| 7% 1/1/44 (a) | 805,000 | 899,051 | |
| Whiting Envir. Facilities Rev. Bonds (BP Products North America, Inc. Proj.) Series 2019 A, 5%, tender 6/5/26 (a)(b) | 660,000 | 786,379 | |
| TOTAL INDIANA | 12,468,449 | ||
| Iowa - 0.1% | |||
| Iowa Fin. Auth. Midwestern Disaster Area Rev.: | |||
| (Iowa Fertilizer Co. Proj.): | |||
| Series 2013, 5.25% 12/1/25 | 260,000 | 280,022 | |
| Series 2019, 3.125% 12/1/22 | 135,000 | 136,867 | |
| Bonds Series 2018 B, 5.25%, tender 12/1/37 (b) | 285,000 | 309,639 | |
| Pefa, Inc. Iowa Gas Proj. Rev. Bonds Series 2019, 5%, tender 9/1/26 (b) | 3,025,000 | 3,569,729 | |
| TOTAL IOWA | 4,296,257 | ||
| Kansas - 0.0% | |||
| Lenexa Health Care Facilities Rev. Series 2018 A: | |||
| 5% 5/15/30 | 75,000 | 84,706 | |
| 5% 5/15/32 | 70,000 | 78,705 | |
| 5% 5/15/39 | 70,000 | 77,929 | |
| Univ. of Kansas Hosp. Auth. Health Facilities Rev. Series 2019 A, 5% 9/1/48 | 730,000 | 893,981 | |
| Wyandotte County-Kansas City Unified Govt. Sales Tax Spl. Oblig. Rev. Series 2015 A, 5.75% 9/1/32 | 375,000 | 380,403 | |
| TOTAL KANSAS | 1,515,724 | ||
| Kentucky - 0.3% | |||
| Ashland Med. Ctr. Rev. Series 2019: | |||
| 4% 2/1/33 | 70,000 | 80,739 | |
| 4% 2/1/35 | 55,000 | 63,212 | |
| 4% 2/1/38 | 80,000 | 91,367 | |
| 5% 2/1/32 | 40,000 | 49,742 | |
| Econ. Dev. Fin. Auth. Lousiville Arena Proj. Rev.: | |||
| Louisville Arena Auth., Inc. Series 2017 A, 5% 12/1/47 (FSA Insured) | 265,000 | 276,517 | |
| Series 2017 A, 5% 12/1/45 (FSA Insured) | 195,000 | 238,781 | |
| Kentucky Econ. Dev. Fin. Auth. (Masonic Home Independent Living II, Inc. - The Meadow Proj. and Grove Pointe Proj.) Series 2016 A: | |||
| 5% 5/15/46 | 430,000 | 452,206 | |
| 5% 5/15/51 | 225,000 | 236,149 | |
| Kentucky Econ. Dev. Fin. Auth. Healthcare Facilities Rev.: | |||
| (Baptist Life Cmntys. Proj.) Series 2016 A: | |||
| 6.25% 11/15/46 | 310,000 | 323,219 | |
| 6.375% 11/15/51 | 355,000 | 372,051 | |
| Series 2012: | |||
| 5.375% 11/15/42 | 275,000 | 277,494 | |
| 5.5% 11/15/45 | 145,000 | 146,361 | |
| Kentucky Econ. Dev. Fin. Auth. Hosp. Rev.: | |||
| Series 2015 A, 5.25% 6/1/50 | 1,440,000 | 1,611,294 | |
| Series 2017 A: | |||
| 5% 6/1/37 | 380,000 | 446,362 | |
| 5% 6/1/41 | 410,000 | 480,541 | |
| 5% 6/1/45 | 900,000 | 1,051,183 | |
| 5.25% 6/1/41 | 735,000 | 868,520 | |
| Kentucky Pub. Trans. Infrastructure Auth. First Tier Toll Rev. (Downtown Crossing Proj.) Series 2013 A: | |||
| 5.75% 7/1/49 (Pre-Refunded to 7/1/23 @ 100) | 175,000 | 190,192 | |
| 6% 7/1/53 (Pre-Refunded to 7/1/23 @ 100) | 605,000 | 659,602 | |
| Kentucky, Inc. Pub. Energy Bonds: | |||
| Series 2018 A, 4%, tender 4/1/24 (b) | 300,000 | 321,914 | |
| Series 2018 B, 4%, tender 1/1/25 (b) | 1,520,000 | 1,669,049 | |
| Series 2019 C, 4%, tender 2/1/28 (b) | 885,000 | 1,025,003 | |
| TOTAL KENTUCKY | 10,931,498 | ||
| Louisiana - 0.3% | |||
| Jefferson Parish Econ. Dev. & Port District Rev. Series 2018 A: | |||
| 5.5% 6/15/38 (c) | 145,000 | 166,091 | |
| 5.625% 6/15/48 (c) | 170,000 | 192,745 | |
| Louisiana Gen. Oblig. Series 2014 A, 4% 2/1/34 | 250,000 | 268,916 | |
| Louisiana Local Govt. Envir. Facilities and Cmnty. Dev. Auth. (Westlake Chemical Corp. Projs.) Series 2017, 3.5% 11/1/32 | 1,395,000 | 1,529,088 | |
| Louisiana Local Govt. Envir. Facilities And Cmnty. Dev. Auth. Facilities Rev. (The Glen Retirement Sys. Proj.) Series 2019 A, 5% 1/1/49 | 290,000 | 282,433 | |
| Louisiana Stadium and Exposition District Series 2020, 5% 7/3/23 | 275,000 | 288,274 | |
| New Orleans Aviation Board Rev.: | |||
| (North Term. Proj.): | |||
| Series 2015 A, 5% 1/1/40 | 295,000 | 332,445 | |
| Series 2015 B: | |||
| 5% 1/1/34 (a) | 485,000 | 543,095 | |
| 5% 1/1/40 (a) | 60,000 | 67,129 | |
| Series 2017 A: | |||
| 5% 1/1/43 | 225,000 | 267,304 | |
| 5% 1/1/48 | 515,000 | 610,530 | |
| Series 2017 B: | |||
| 5% 1/1/43 (a) | 120,000 | 141,912 | |
| 5% 1/1/48 (a) | 745,000 | 878,764 | |
| Series 2017 D2: | |||
| 5% 1/1/28 (a) | 35,000 | 41,758 | |
| 5% 1/1/29 (a) | 30,000 | 35,705 | |
| 5% 1/1/30 (a) | 20,000 | 23,687 | |
| 5% 1/1/31 (a) | 40,000 | 47,326 | |
| 5% 1/1/32 (a) | 45,000 | 53,382 | |
| 5% 1/1/34 (a) | 50,000 | 59,315 | |
| 5% 1/1/35 (a) | 40,000 | 47,391 | |
| 5% 1/1/38 (a) | 150,000 | 177,467 | |
| New Orleans Swr. Svc. Rev. Series 2015: | |||
| 5% 6/1/33 (Pre-Refunded to 6/1/25 @ 100) | 90,000 | 103,914 | |
| 5% 6/1/40 (Pre-Refunded to 6/1/25 @ 100) | 345,000 | 398,338 | |
| 5% 6/1/45 (Pre-Refunded to 6/1/25 @ 100) | 270,000 | 311,743 | |
| New Orleans Wtr. Series 2015: | |||
| 5% 12/1/40 (Pre-Refunded to 12/1/25 @ 100) | 410,000 | 481,841 | |
| 5% 12/1/45 (Pre-Refunded to 12/1/25 @ 100) | 1,005,000 | 1,181,098 | |
| Port of New Orleans Port Facility Rev. Series 2020 D, 5% 4/1/50 | 250,000 | 308,362 | |
| Saint James Parish Gen. Oblig.: | |||
| (Nustar Logistics, L.P. Proj.) Series 2010, 6.35% 7/1/40 (c) | 325,000 | 429,012 | |
| Bonds (Nustar Logistics, L.P. Proj.): | |||
| Series 2008, 6.1%, tender 6/1/30 (b)(c) | 320,000 | 422,057 | |
| Series 2010 B, 6.1%, tender 6/1/30 (b)(c) | 420,000 | 553,950 | |
| Series 2011, 5.85%, tender 6/1/25 (b)(c) | 585,000 | 667,091 | |
| Shreveport Gen. Oblig. Series 2017, 5% 8/1/30 | 250,000 | 304,346 | |
| St. Charles Parish Gulf Opportunity Zone Rev. Bonds (Valero Proj.) Series 2010, 4%, tender 6/1/22 (b) | 60,000 | 61,070 | |
| St. John Baptist Parish Rev.: | |||
| (Marathon Oil Corp.) Series 2017, 2.2% 6/1/37 (b) | 180,000 | 188,327 | |
| Bonds: | |||
| (Marathon Oil Corp. Proj.) Series 2017 B1, 2.125%, tender 7/1/24 (b) | 120,000 | 123,990 | |
| (Marathon Oil Corp.) Series 2017, 2.1%, tender 7/1/24 (b) | 75,000 | 77,446 | |
| Series 2017 B2, 2.375%, tender 7/1/26 (b) | 120,000 | 126,485 | |
| TOTAL LOUISIANA | 11,793,827 | ||
| Maryland - 1.0% | |||
| Baltimore Convention Ctr. Hotel Rev. Series 2017: | |||
| 5% 9/1/36 | 360,000 | 384,544 | |
| 5% 9/1/42 | 175,000 | 186,101 | |
| 5% 9/1/46 | 1,575,000 | 1,669,453 | |
| Baltimore County Gen. Oblig. Series 2019, 4% 3/1/37 | 250,000 | 299,738 | |
| Baltimore Proj. Rev.: | |||
| (Wastewtr. Projs.) Series 2014 C, 5% 7/1/33 | 390,000 | 441,573 | |
| (Wtr. Projs.): | |||
| Series 2013 B: | |||
| 5% 7/1/28 (Pre-Refunded to 1/1/24 @ 100) | 180,000 | 197,370 | |
| 5% 7/1/30 (Pre-Refunded to 1/1/24 @ 100) | 275,000 | 301,537 | |
| Series 2014 C, 5% 7/1/31 | 260,000 | 294,368 | |
| Frederick County Spl. Oblig. Series 2020 C, 4% 7/1/50 | 100,000 | 112,587 | |
| Gaithersburg Eco Dev. Rev. Bd Series 2018 A: | |||
| 5% 1/1/27 | 90,000 | 100,758 | |
| 5% 1/1/28 | 120,000 | 133,970 | |
| 5% 1/1/33 | 755,000 | 836,361 | |
| 5% 1/1/36 | 150,000 | 165,867 | |
| Maryland Cmnty. Dev. Admin Dept. Hsg. & Cmnty. Dev. Series 2018 A, 4.5% 9/1/48 | 425,000 | 472,413 | |
| Maryland Dept. of Trans. Series 2021 B: | |||
| 4% 8/1/37 (a) | 140,000 | 167,169 | |
| 4% 8/1/38 (a) | 170,000 | 202,588 | |
| 5% 8/1/36 (a) | 120,000 | 155,868 | |
| 5% 8/1/46 (a) | 420,000 | 531,623 | |
| Maryland Dept. of Trans. Consolidated Trans. Rev. Series 2021 A: | |||
| 3% 10/1/32 | 400,000 | 446,076 | |
| 3% 10/1/33 | 300,000 | 331,675 | |
| Maryland Econ. Dev. Auth. Rev.: | |||
| (Ports America Chesapeake LLC. Proj.) Series 2017 A: | |||
| 5% 6/1/23 | 60,000 | 63,766 | |
| 5% 6/1/24 | 35,000 | 38,769 | |
| 5% 6/1/25 | 65,000 | 74,442 | |
| 5% 6/1/27 | 60,000 | 72,552 | |
| 5% 6/1/30 | 60,000 | 73,223 | |
| 5% 6/1/32 | 65,000 | 78,765 | |
| 5% 6/1/35 | 155,000 | 187,042 | |
| (Trans. Facilities Proj.) Series 2017 A, 5% 6/1/28 | 90,000 | 111,274 | |
| Maryland Econ. Dev. Corp. (Port Covington Proj.) Series 2020: | |||
| 4% 9/1/40 | 135,000 | 154,121 | |
| 4% 9/1/50 | 140,000 | 158,165 | |
| Maryland Econ. Dev. Corp. Sr. Parking Facilities Rev. (Baltimore City Proj.) Series 2018 A, 5% 6/1/58 | 310,000�� | 333,086 | |
| Maryland Econ. Dev. Corp. Student Hsg. Rev. (Bowie State Univ. Proj.) Series 2015: | |||
| 5% 6/1/25 (c) | 105,000 | 113,714 | |
| 5% 6/1/29 (c) | 145,000 | 163,922 | |
| 5% 6/1/33 (c) | 155,000 | 173,810 | |
| Maryland Gen. Oblig. Series 2018 A: | |||
| 5% 3/15/26 | 570,000 | 677,648 | |
| 5% 3/15/28 | 345,000 | 434,261 | |
| Maryland Health & Higher Edl. Series 2021 A: | |||
| 4% 6/1/46 | 445,000 | 509,762 | |
| 4% 6/1/51 | 690,000 | 786,218 | |
| 4% 6/1/55 | 430,000 | 488,394 | |
| Maryland Health & Higher Edl. Facilities Auth. Rev.: | |||
| (Medstar Health, Inc. Proj.) Series 2017 A, 5% 5/15/45 | 795,000 | 960,579 | |
| Series 2011 A, 6.25% 1/1/31 | 60,000 | 60,303 | |
| Series 2013 A: | |||
| 5% 7/1/43 (Pre-Refunded to 7/1/22 @ 100) | 1,035,000 | 1,064,200 | |
| 6.75% 7/1/44 | 165,000 | 174,871 | |
| Series 2014: | |||
| 5% 7/1/39 | 915,000 | 1,010,643 | |
| 5.25% 7/1/34 (Pre-Refunded to 7/1/24 @ 100) | 1,030,000 | 1,157,176 | |
| Series 2015: | |||
| 5% 7/1/27 | 370,000 | 424,999 | |
| 5% 7/1/29 | 160,000 | 182,441 | |
| 5% 8/15/33 | 545,000 | 617,513 | |
| 5% 8/15/38 | 485,000 | 548,706 | |
| 5% 7/1/45 | 815,000 | 912,893 | |
| Series 2016 A: | |||
| 5% 7/1/32 | 35,000 | 41,077 | |
| 5% 7/1/33 | 95,000 | 111,382 | |
| 5% 7/1/34 | 110,000 | 128,774 | |
| 5% 7/1/35 | 95,000 | 111,019 | |
| 5% 7/1/36 | 90,000 | 105,013 | |
| 5% 1/1/45 | 60,000 | 68,978 | |
| 5.5% 1/1/36 | 590,000 | 714,926 | |
| 5.5% 1/1/46 | 2,090,000 | 2,520,583 | |
| Maryland Stadium Auth. Built to Learn Rev. Series 2021, 4% 6/1/46 | 1,150,000 | 1,348,423 | |
| Maryland Stadium Auth. Rev.: | |||
| Series 2018 A, 5% 5/1/42 | 1,230,000 | 1,503,982 | |
| Series 2018 B, 5% 5/1/35 | 485,000 | 596,354 | |
| Series 2020 A, 5% 5/1/50 | 610,000 | 910,786 | |
| Series 2020 B, 5% 5/1/47 | 305,000 | 449,142 | |
| Maryland Trans. Auth. Series 2012 B, 5% 3/1/27 (Pre-Refunded to 3/1/22 @ 100) (a) | 970,000 | 981,145 | |
| Maryland Trans. Auth. Passenger Facility Charge Rev. Series 2019, 4% 6/1/33 (a) | 395,000 | 461,583 | |
| Maryland Trans. Auth. Trans. Facility Projs. Rev. Series 2021 A: | |||
| 4% 7/1/38 | 120,000 | 146,476 | |
| 4% 7/1/40 | 150,000 | 182,349 | |
| Montgomery County Econ. Dev. Rev. Series 2018 A, 5.375% 7/1/48 | 395,000 | 418,192 | |
| Prince Georges County Rev. Auth. Spl. Oblig. (Suitland-Naylor Road Proj.) Series 2016: | |||
| 4.75% 7/1/36 (c) | 105,000 | 116,042 | |
| 5% 7/1/46 (c) | 150,000 | 166,427 | |
| Prince Georges County Spl. Oblig. Series 2004, 5.2% 7/1/34 | 155,000 | 156,337 | |
| Rockville Mayor & Council Econ. Dev.: | |||
| (Ingleside at King Farm Proj.): | |||
| Series 2017 A1, 5% 11/1/31 | 90,000 | 98,258 | |
| Series 2017 A2: | |||
| 5% 11/1/29 | 30,000 | 32,923 | |
| 5% 11/1/31 | 35,000 | 38,212 | |
| 5% 11/1/32 | 30,000 | 32,708 | |
| Series 2017 B: | |||
| 4.25% 11/1/37 | 25,000 | 26,362 | |
| 4.5% 11/1/43 | 120,000 | 127,656 | |
| 5% 11/1/47 | 405,000 | 436,075 | |
| (Rfdg.-Ingleside King Farm Proj.) Series 2017: | |||
| 5% 11/1/35 | 60,000 | 65,203 | |
| 5% 11/1/37 | 120,000 | 130,194 | |
| 5% 11/1/42 | 510,000 | 550,774 | |
| Washington County Econ. Dev. Rev. (Homewood Maryland Obligated Group Proj.) Series 2021: | |||
| 4% 5/1/26 | 105,000 | 112,770 | |
| 4% 5/1/27 | 110,000 | 118,942 | |
| 4% 5/1/30 | 125,000 | 136,467 | |
| 4% 5/1/31 | 65,000 | 71,019 | |
| 4% 5/1/36 | 415,000 | 447,395 | |
| 4% 5/1/42 | 850,000 | 902,035 | |
| Washington Metropolitan Area Transit Auth.: | |||
| Series 2020 A: | |||
| 4% 7/15/40 | 180,000 | 215,020 | |
| 4% 7/15/45 | 245,000 | 288,948 | |
| 5% 7/15/38 | 305,000 | 394,232 | |
| 5% 7/15/39 | 670,000 | 864,319 | |
| Series 2021 A: | |||
| 3% 7/15/36 | 275,000 | 305,766 | |
| 3% 7/15/43 | 400,000 | 434,602 | |
| 4% 7/15/38 | 425,000 | 516,998 | |
| 4% 7/15/46 | 1,485,000 | 1,772,860 | |
| 5% 7/15/41 | 305,000 | 400,041 | |
| Westminster Proj. Rev.: | |||
| Series 2014 A: | |||
| 5% 7/1/24 | 80,000 | 84,724 | |
| 6.25% 7/1/44 | 220,000 | 240,372 | |
| Series 2014: | |||
| 5.125% 7/1/34 | 275,000 | 292,926 | |
| 5.5% 7/1/44 | 275,000 | 293,850 | |
| TOTAL MARYLAND | 39,909,538 | ||
| Massachusetts - 0.3% | |||
| Massachusetts Bay Trans. Auth. Sales Tax Rev.: | |||
| Series 2021 A1, 4% 7/1/51 | 1,635,000 | 1,954,512 | |
| Series 2021, 4% 5/1/25 | 1,830,000 | 2,049,134 | |
| Massachusetts Dept. of Trans. Metropolitan Hwy. Sys. Rev. Series 2019 A, 5% 1/1/32 | 955,000 | 1,195,570 | |
| Massachusetts Dev. Fin. Agcy. Rev.: | |||
| (Newbridge On The Charles Proj.) Series 2017: | |||
| 5% 10/1/37 (c) | 275,000 | 297,513 | |
| 5% 10/1/47 (c) | 400,000 | 432,001 | |
| 5% 10/1/57 (c) | 985,000 | 1,062,930 | |
| Series 1999 P, 5.45% 5/15/59 (Assured Guaranty Corp. Insured) | 155,000 | 204,000 | |
| Series 2014 F: | |||
| 5.625% 7/15/36 | 35,000 | 37,062 | |
| 5.75% 7/15/43 | 200,000 | 211,537 | |
| Series 2018: | |||
| 5% 11/15/38 (c) | 165,000 | 182,926 | |
| 5.125% 11/15/46 (c) | 225,000 | 248,515 | |
| Massachusetts Gen. Oblig.: | |||
| Series 2004 A, 5.5% 8/1/30 | 120,000 | 160,844 | |
| Series 2021 B, 3% 4/1/49 | 300,000 | 321,008 | |
| Massachusetts Hsg. Fin. Agcy. Series 2010 A, 5.25% 12/1/35 | 80,000 | 80,669 | |
| Massachusetts Port Auth. Rev. Series 2019 A: | |||
| 5% 7/1/37 (a) | 460,000 | 570,760 | |
| 5% 7/1/39 (a) | 340,000 | 420,464 | |
| 5% 7/1/40 (a) | 210,000 | 259,312 | |
| Massachusetts School Bldg. Auth. Dedicated Sales Tax Rev. Series 2015 C: | |||
| 5% 8/15/31 | 120,000 | 139,384 | |
| 5% 8/15/31 (Pre-Refunded to 8/15/25 @ 100) | 165,000 | 192,126 | |
| Univ. of Massachusetts Bldg. Auth. Facilities Rev. Series 2013, 5% 11/1/39 (Pre-Refunded to 11/1/22 @ 100) | 120,000 | 125,289 | |
| TOTAL MASSACHUSETTS | 10,145,556 | ||
| Michigan - 0.6% | |||
| Calhoun County Hosp. Fin. Auth. Rev. Series 2016: | |||
| 5% 2/15/37 | 60,000 | 69,099 | |
| 5% 2/15/41 | 345,000 | 395,382 | |
| 5% 2/15/47 | 965,000 | 1,098,056 | |
| Detroit Downtown Dev. Auth. Tax Series 2018 A: | |||
| 5% 7/1/43 | 255,000 | 281,172 | |
| 5% 7/1/48 (FSA Insured) | 280,000 | 307,757 | |
| Detroit Gen. Oblig.: | |||
| Series 2018: | |||
| 5% 4/1/27 | 95,000 | 111,652 | |
| 5% 4/1/29 | 45,000 | 53,565 | |
| 5% 4/1/30 | 40,000 | 47,355 | |
| 5% 4/1/31 | 45,000 | 53,085 | |
| 5% 4/1/32 | 50,000 | 58,858 | |
| 5% 4/1/33 | 75,000 | 88,261 | |
| 5% 4/1/37 | 125,000 | 146,197 | |
| 5% 4/1/38 | 85,000 | 99,281 | |
| Series 2020: | |||
| 5.5% 4/1/32 | 70,000 | 88,679 | |
| 5.5% 4/1/34 | 40,000 | 50,498 | |
| 5.5% 4/1/36 | 55,000 | 69,163 | |
| 5.5% 4/1/38 | 120,000 | 150,332 | |
| 5.5% 4/1/40 | 85,000 | 106,118 | |
| 5.5% 4/1/45 | 60,000 | 74,587 | |
| 5.5% 4/1/50 | 120,000 | 148,444 | |
| Detroit School District School Bldg. and Site Impt. Series 2005 A, 5.25% 5/1/30 (FSA Insured) | 250,000 | 331,523 | |
| Detroit Swr. Disp. Rev. Series 2012 A, 5.25% 7/1/39 (Pre-Refunded to 7/1/22 @ 100) | 275,000 | 283,157 | |
| Gerald R. Ford Int'l. Arpt. Auth. Rev. Series 2021, 5% 1/1/51 (a) | 630,000 | 811,531 | |
| Grand Rapids Econ. Dev. Corp. Econ. Dev. Rev. (Beacon Hill at Eastgate Proj.) Series 2017 A: | |||
| 5% 11/1/32 | 130,000 | 143,054 | |
| 5% 11/1/37 | 70,000 | 76,715 | |
| 5% 11/1/47 | 170,000 | 184,793 | |
| 5% 11/1/52 | 70,000 | 75,988 | |
| Great Lakes Wtr. Auth. Sew Disp. Sys. Series 2016 C: | |||
| 5% 7/1/30 | 60,000 | 71,371 | |
| 5% 7/1/36 | 1,855,000 | 2,191,868 | |
| Great Lakes Wtr. Auth. Wtr. Supply Sys. Rev.: | |||
| Series 2016 B, 5% 7/1/46 | 1,320,000 | 1,537,129 | |
| Series 2016 C, 5.25% 7/1/35 | 300,000 | 360,374 | |
| Karegnondi Wtr. Auth. Genesee, Lapeer and Sanilac Wtr. Supply Sys. Series 2014 A, 5.25% 11/1/40 | 1,215,000 | 1,322,926 | |
| Kentwood Econ. Dev. Corp. Series 2022: | |||
| 4% 11/15/31 | 110,000 | 120,940 | |
| 4% 11/15/43 | 150,000 | 160,234 | |
| Michigan Fin. Auth. Rev.: | |||
| Series 2014 C1, 5% 7/1/44 (Pre-Refunded to 7/1/22 @ 100) | 120,000 | 123,367 | |
| Series 2014 C2, 5% 7/1/44 (Pre-Refunded to 7/1/22 @ 100) (a) | 75,000 | 77,060 | |
| Series 2014 D6, 5% 7/1/36 | 250,000 | 276,945 | |
| Series 2015 B, 5% 5/15/35 | 610,000 | 694,485 | |
| Series 2015 C: | |||
| 5% 7/1/34 | 250,000 | 286,305 | |
| 5% 7/1/35 | 1,155,000 | 1,322,288 | |
| Series 2015 D2, 5% 7/1/34 | 275,000 | 314,935 | |
| Series 2015: | |||
| 5% 12/1/31 (Pre-Refunded to 6/1/22 @ 100) | 330,000 | 337,939 | |
| 5% 12/1/35 (Pre-Refunded to 6/1/22 @ 100) | 610,000 | 624,676 | |
| Series 2016: | |||
| 5% 11/15/34 | 390,000 | 464,313 | |
| 5% 11/15/37 | 425,000 | 504,174 | |
| Series 2017 A, 5% 12/1/47 (Pre-Refunded to 12/1/22 @ 100) | 365,000 | 382,309 | |
| Series 2019 A: | |||
| 5% 2/15/37 | 170,000 | 215,067 | |
| 5% 2/15/38 | 245,000 | 309,453 | |
| 5% 2/15/39 | 720,000 | 907,794 | |
| Series 2020 B1, 5% 6/1/49 | 670,000 | 808,105 | |
| Michigan Tobacco Settlement Fin. Auth. Tobacco Settlement Asset Rev. Series 2007 B, 0% 6/1/52 | 1,545,000 | 176,121 | |
| Monroe County Econ. Dev. Corp. Ltd. Oblig. Series 1992 AA, 6.95% 9/1/22 (Nat'l. Pub. Fin. Guarantee Corp. Insured) | 60,000 | 62,956 | |
| South Huron Valley Util. Auth. Series 2020, 4% 5/1/34 | 250,000 | 298,620 | |
| Wayne County Arpt. Auth. Rev.: | |||
| Series 2012 A, 5% 12/1/42 | 605,000 | 632,196 | |
| Series 2014 B, 5% 12/1/44 | 135,000 | 151,938 | |
| Series 2015 D, 5% 12/1/45 (FSA Insured) | 90,000 | 104,325 | |
| Wayne County Arpt. Rev. Series 2017 C, 5% 12/1/37 (FSA Insured) (a)(c) | 1,215,000 | 1,461,689 | |
| TOTAL MICHIGAN | 21,706,204 | ||
| Minnesota - 0.0% | |||
| Apple Valley Sr. Living (Minnesota Sr. Living LLC Proj.): | |||
| Series 2016 B, 5% 1/1/47 | 275,000 | 212,268 | |
| Series 2016 D, 7.25% 1/1/52 | 295,000 | 227,054 | |
| Deephaven Charter School Lease Rev. Series 2017 A: | |||
| 5% 10/1/37 | 30,000 | 31,209 | |
| 5% 10/1/49 | 60,000 | 62,010 | |
| Minneapolis Dev. Rev. Series 2010, 6.25% 12/1/30 | 30,000 | 30,000 | |
| Minnesota Hsg. Fin. Agcy. Series 2011, 5% 8/1/31 | 25,000 | 25,096 | |
| Minnesota Office of Higher Ed. Series 2020, 2.65% 11/1/38 (a) | 250,000 | 255,443 | |
| Rochester Health Cr.&Hsg. Rev. Series 2013 A, 6.875% 12/1/48 | 270,000 | 286,947 | |
| White Bear Lake Independent School District #624 Gen. Oblig. Series 2020 A, 3% 2/1/44 | 300,000 | 320,634 | |
| Woodbury Charter School Lease Rev. (Woodbury Leadership Academy Proj.) Series 2021 A: | |||
| 4% 7/1/41 | 50,000 | 54,927 | |
| 4% 7/1/51 | 40,000 | 43,510 | |
| 4% 7/1/56 | 35,000 | 37,925 | |
| TOTAL MINNESOTA | 1,587,023 | ||
| Mississippi - 0.0% | |||
| Mississippi Dev. Bank Spl. Oblig. (City of Jackson, Mississippi Wtr. And Swr. Sys. Rev. Bond Proj.) Series 2013, 6.75% 12/1/30 (FSA Insured) | 120,000 | 133,422 | |
| Missouri - 0.4% | |||
| Conley Road Trans. Dev. District Series 2017, 5.375% 5/1/47 | 245,000 | 253,585 | |
| Kansas City Indl. Dev. Auth.: | |||
| (Kansas City Int'l. Arpt. Term. Modernization Proj.): | |||
| Series 2019 B: | |||
| 5% 3/1/46 (a) | 250,000 | 303,051 | |
| 5% 3/1/54 (a) | 305,000 | 366,368 | |
| 5% 3/1/55 (FSA Insured) (a) | 2,005,000 | 2,415,924 | |
| Series 2020 A, 4% 3/1/50 (a) | 685,000 | 784,186 | |
| (Kansas City Int'l. Arpt. Term. modernization Proj.) Series 2020 A, 4% 3/1/50 (FSA Insured) (a) | 650,000 | 744,118 | |
| (Kansas City Int'l. Arpt. Term. Modernization Proj.) Series 2020 A: | |||
| 4% 3/1/57 (FSA Insured) (a) | 1,140,000 | 1,297,380 | |
| 5% 3/1/57 (FSA Insured) (a) | 1,015,000 | 1,239,124 | |
| Kansas City Spl. Oblig.: | |||
| (Downtown Arena Proj.) Series 2016 E, 5% 4/1/40 | 300,000 | 339,980 | |
| (Downtown Streetcar Proj.) Series 2014 A, 5% 9/1/34 | 460,000 | 461,774 | |
| Kirkwood Indl. Dev. Retirement Commission Series 2017 A: | |||
| 5.25% 5/15/37 | 120,000 | 134,319 | |
| 5.25% 5/15/42 | 105,000 | 116,578 | |
| 5.25% 5/15/50 | 245,000 | 269,944 | |
| Missouri Health & Edl. Facilities Auth. Rev.: | |||
| (Lutheran Sr. Svcs. Proj.) Series 2016 B, 5% 2/1/46 | 395,000 | 439,598 | |
| (Lutheran Sr. Svcs. Projs.) Series 2016 B: | |||
| 5% 2/1/34 | 85,000 | 96,411 | |
| 5% 2/1/35 | 65,000 | 73,502 | |
| Missouri Hsg. Dev. Commission Single Family Mtg. Rev. (First Place Homeownership Ln. Prog.) Series 2019 A, 4.25% 5/1/47 | 250,000 | 275,648 | |
| Missouri Joint Muni. Elec. Util. Commission Pwr. Proj. Rev.: | |||
| (Iatan 2 Proj.) Series 2014 A, 5% 1/1/33 | 245,000 | 267,868 | |
| (Plum Point Proj.) Series 2014 A, 5% 1/1/33 | 610,000 | 687,693 | |
| Saint Louis County Indl. Dev. Auth. Sr. Living Facilities Rev.: | |||
| Series 2015 A: | |||
| 5% 12/1/35 | 120,000 | 131,536 | |
| 5.125% 12/1/45 | 230,000 | 250,453 | |
| Series 2017, 5% 9/1/48 | 810,000 | 908,071 | |
| Series 2018 A: | |||
| 5% 9/1/38 | 380,000 | 426,791 | |
| 5.125% 9/1/48 | 1,175,000 | 1,314,035 | |
| Saint Louis Muni. Fin. Corp. Leasehold Rev. (Convention Ctr. Expansion And Impt. Projs.) Series 2020, 5% 10/1/49 (FSA Insured) | 250,000 | 308,450 | |
| St Louis Indl. Dev. Auth. Dev. Fing. Rev. (Ballpark Village Dev. Proj.) Series 2017 A: | |||
| 3.875% 11/15/29 | 65,000 | 64,494 | |
| 4.375% 11/15/35 | 235,000 | 235,466 | |
| 4.75% 11/15/47 | 240,000 | 242,167 | |
| St Louis Land Clearance Redev. Auth. Annual Appropriation Redev. Rev. (Nat'l. Geospatial-Intelligence Agcy. Site Impt. Proj.) Series 2017 A: | |||
| 5.125% 6/1/46 | 320,000 | 361,211 | |
| 5.375% 6/1/43 | 890,000 | 1,020,921 | |
| St. Louis County Indl. Dev. Auth. Health Facilities Rev. Series 2015 A: | |||
| 5% 8/15/30 | 60,000 | 64,785 | |
| 5% 8/15/35 | 40,000 | 42,840 | |
| 5.125% 8/15/45 | 105,000 | 111,022 | |
| TOTAL MISSOURI | 16,049,293 | ||
| Montana - 0.0% | |||
| Kalispell Hsg. and Healthcare Facilities Rev. (Immanuel Lutheran Corp. Proj.) Series 2017 A: | |||
| 5.25% 5/15/37 | 40,000 | 43,694 | |
| 5.25% 5/15/47 | 440,000 | 475,936 | |
| 5.25% 5/15/52 | 460,000 | 495,998 | |
| TOTAL MONTANA | 1,015,628 | ||
| Nebraska - 0.2% | |||
| Central Plains Energy Proj. Rev.: | |||
| (Proj. No. 3): | |||
| Series 2012, 5% 9/1/42 (Pre-Refunded to 9/1/22 @ 100) | 275,000 | 284,551 | |
| Series 2017 A: | |||
| 5% 9/1/30 | 210,000 | 267,391 | |
| 5% 9/1/35 | 885,000 | 1,214,517 | |
| Series 2012, 5.25% 9/1/37 (Pre-Refunded to 9/1/22 @ 100) | 120,000 | 124,391 | |
| Series 2017 A: | |||
| 5% 9/1/31 | 320,000 | 413,961 | |
| 5% 9/1/42 | 300,000 | 442,409 | |
| Omaha Pub. Pwr. District Elec. Rev. Series 2021 A: | |||
| 4% 2/1/51 | 1,800,000 | 2,114,282 | |
| 5% 2/1/46 | 600,000 | 762,939 | |
| TOTAL NEBRASKA | 5,624,441 | ||
| Nevada - 0.2% | |||
| Clark County Fuel Tax: | |||
| Series 2018: | |||
| 4% 12/1/35 | 300,000 | 352,864 | |
| 4% 12/1/36 | 250,000 | 293,687 | |
| Series 2021, 3% 11/1/33 | 250,000 | 283,342 | |
| Clark County School District: | |||
| Series 2015 C, 4% 6/15/32 | 250,000 | 280,955 | |
| Series 2017 C, 4% 6/15/37 | 250,000 | 287,455 | |
| Series 2018 B, 5% 6/15/34 | 250,000 | 313,384 | |
| Series 2019 B, 4% 6/15/35 (FSA Insured) | 250,000 | 296,448 | |
| Series 2020 B: | |||
| 3% 6/15/37 | 250,000 | 272,550 | |
| 3% 6/15/39 | 250,000 | 270,468 | |
| Series 2021 B: | |||
| 3% 6/15/35 | 300,000 | 331,575 | |
| 3% 6/15/36 | 300,000 | 330,799 | |
| Henderson Pub. Impt. Trust Touro College & Univ. Sys. Obligated Group Rev. Series 2014 A: | |||
| 5.5% 1/1/34 | 105,000 | 114,975 | |
| 5.5% 1/1/39 | 160,000 | 174,351 | |
| 5.5% 1/1/44 | 225,000 | 244,114 | |
| Las Vegas Convention & Visitors Auth.: | |||
| Series 2018 B: | |||
| 4% 7/1/49 | 250,000 | 280,899 | |
| 5% 7/1/43 | 1,760,000 | 2,124,204 | |
| Series 2019 B, 5% 7/1/33 | 255,000 | 318,795 | |
| Las Vegas Redev. Agcy., Tax Increment Rev. Series 2016: | |||
| 5% 6/15/30 | 25,000 | 28,920 | |
| 5% 6/15/40 | 665,000 | 759,257 | |
| 5% 6/15/45 | 795,000 | 902,033 | |
| Reno Sales Tax Rev. (Retrac-Reno Trans. Rail Access Corridor Proj.): | |||
| Series 2018 A: | |||
| 5% 6/1/36 | 15,000 | 17,740 | |
| 5% 6/1/37 | 30,000 | 35,415 | |
| 5% 6/1/48 | 30,000 | 34,844 | |
| Series 2018 B: | |||
| 5% 6/1/33 (FSA Insured) | 10,000 | 12,062 | |
| 5% 6/1/38 (FSA Insured) | 5,000 | 5,983 | |
| Series 2018 C, 0% 7/1/58 (c) | 1,000,000 | 175,876 | |
| Sparks Tourism Impt. District No. 1 Sr. Sales Tax Anticipation Rev. Series 2019 A, 2.5% 6/15/24 (c) | 70,000 | 71,094 | |
| Washoe County School District Series 2020 A, 4% 10/1/49 | 500,000 | 583,184 | |
| TOTAL NEVADA | 9,197,273 | ||
| New Hampshire - 0.1% | |||
| Nat'l. Fin. Auth. Rev.: | |||
| (The Lawrenceville School Proj.) Series 2021 A, 4% 7/1/51 | 575,000 | 675,738 | |
| (The Vista Proj.) Series 2019 A: | |||
| 5.25% 7/1/39 (c) | 95,000 | 101,065 | |
| 5.625% 7/1/46 (c) | 55,000 | 58,866 | |
| 5.75% 7/1/54 (c) | 135,000 | 144,670 | |
| Bonds Series 2020 B, 3.75%, tender 7/2/40 (a)(b)(c) | 250,000 | 263,357 | |
| Nat'l. Finnance Auth. Series 2020 1, 4.125% 1/20/34 | 272,949 | 325,222 | |
| New Hampshire Bus. Fin. Auth. Wtr. Facility (Pennichuck Wtr. Works, Inc. Proj.) Series 2020 A, 4% 4/1/50 (a) | 250,000 | 279,833 | |
| New Hampshire Health & Ed. Facilities Auth. Series 2017 A: | |||
| 6.125% 7/1/37 (c) | 105,000 | 55,650 | |
| 6.125% 7/1/52 (c) | 255,000 | 135,150 | |
| 6.25% 7/1/42 (c) | 155,000 | 82,150 | |
| New Hampshire Health & Ed. Facilities Auth. Rev. Series 2016: | |||
| 5% 10/1/36 | 50,000 | 57,519 | |
| 5% 10/1/40 | 45,000 | 51,498 | |
| 5% 10/1/46 | 370,000 | 420,493 | |
| TOTAL NEW HAMPSHIRE | 2,651,211 | ||
| New Jersey - 1.4% | |||
| Atlantic County Impt. Auth. (Atlantic City Campus Phase II Proj.) Series 2021 A, 4% 7/1/53 (FSA Insured) | 320,000 | 375,758 | |
| Essex County Impt. Auth. (CHF-Newark, L.L.C. - NJIT Student Hsg. Proj.) Series 2021 A, 4% 8/1/46 | 145,000 | 172,518 | |
| Essex County Impt. Auth. Charter School Rev.: | |||
| (The Friends o Team Charter Schools, Inc. - 2021 Proj.) Series 2021, 4% 6/15/46 | 120,000 | 136,097 | |
| (The Friends of Team Charter Schools, Inc. - 2021 Proj.) Series 2021, 4% 6/15/56 | 185,000 | 207,863 | |
| Hudson County Impt. Auth. (Hudson County Courthouse Proj.) Series 2020, 4% 10/1/33 | 245,000 | 299,509 | |
| New Brunswick Parking Auth. Rev. Series 2016 A: | |||
| 5% 9/1/30 | 250,000 | 297,156 | |
| 5% 9/1/31 | 250,000 | 296,900 | |
| New Jersey Econ. Dev. Auth. Series 2020 A: | |||
| 4% 11/1/38 | 120,000 | 137,455 | |
| 4% 11/1/44 | 580,000 | 655,430 | |
| New Jersey Econ. Dev. Auth. Energy Facility Rev. (Umm Energy Partners, LLC Proj.) Series 2012 A: | |||
| 5% 6/15/37 (a) | 75,000 | 76,403 | |
| 5.125% 6/15/43 (a) | 105,000 | 106,992 | |
| New Jersey Econ. Dev. Auth. Rev.: | |||
| (Goethals Bridge Replacement Proj.) Series 2013: | |||
| 5.125% 1/1/34 (a) | 680,000 | 745,458 | |
| 5.375% 1/1/43 (a) | 455,000 | 500,448 | |
| (Lions Gate Proj.) Series 2014: | |||
| 4.375% 1/1/24 | 45,000 | 45,681 | |
| 4.875% 1/1/29 | 65,000 | 66,714 | |
| 5% 1/1/34 | 120,000 | 122,658 | |
| 5.25% 1/1/44 | 295,000 | 300,962 | |
| (Provident Group - Rowan Properties L.L.C. - Rowan Univ. Student Hsg. Proejct) Series 2015 A, 5% 1/1/48 | 475,000 | 490,711 | |
| (Provident Group - Rowan Properties L.L.C. - Rowan Univ. Student Hsg. Proj.) Series 2015 A, 5% 1/1/30 | 120,000 | 126,214 | |
| (Provident Group-Montclair Properties L.L.C. - Montclair State Univ. Student Hsg. Proj.) Series 2017, 5% 6/1/42 (FSA Insured) | 145,000 | 172,347 | |
| (The Goethals Bridge Replacement Proj.) Series 2013: | |||
| 5% 1/1/31 (FSA Insured) (a) | 300,000 | 329,882 | |
| 5.125% 7/1/42 (FSA Insured) (a) | 135,000 | 148,143 | |
| 5.625% 1/1/52 (a) | 1,280,000 | 1,412,503 | |
| Series 1997 A, 0% 7/1/26 (Escrowed to Maturity) | 150,000 | 143,726 | |
| Series 2012: | |||
| 5% 6/15/24 | 120,000 | 122,920 | |
| 5% 6/15/25 | 610,000 | 624,689 | |
| 5% 6/15/28 | 370,000 | 378,678 | |
| Series 2018, 5% 1/1/39 | 205,000 | 232,819 | |
| New Jersey Econ. Dev. Auth. Spl. Facilities Rev.: | |||
| (Continental Airlines, Inc. Proj.) Series 2000 B, 5.625% 11/15/30 (a) | 850,000 | 935,062 | |
| (Port Newark Container Term. LLC. Proj.) Series 2017: | |||
| 5% 10/1/37 (a) | 1,520,000 | 1,772,452 | |
| 5% 10/1/47 (a) | 1,640,000 | 1,887,035 | |
| Series 1999: | |||
| 5.125% 9/15/23 (a) | 30,000 | 31,153 | |
| 5.25% 9/15/29 (a) | 305,000 | 316,380 | |
| New Jersey Econ. Dev. Auth. Wtr. Facilities Rev. (Middlesex Wtr. Co. Proj.): | |||
| Series 2012 A, 5% 10/1/23 | 300,000 | 324,521 | |
| Series 2019, 5% 8/1/59 (a) | 245,000 | 292,884 | |
| New Jersey Edl. Facility Series 2016 A: | |||
| 5% 7/1/29 | 250,000 | 295,990 | |
| 5% 7/1/30 | 250,000 | 295,257 | |
| New Jersey Gen. Oblig.: | |||
| Series 2020 A: | |||
| 4% 6/1/30 | 750,000 | 911,372 | |
| 4% 6/1/31 | 1,030,000 | 1,266,907 | |
| 4% 6/1/32 | 170,000 | 211,322 | |
| 5% 6/1/25 | 1,030,000 | 1,186,568 | |
| 5% 6/1/26 | 845,000 | 1,001,851 | |
| 5% 6/1/28 | 275,000 | 341,558 | |
| 5% 6/1/29 | 300,000 | 380,692 | |
| Series 2020: | |||
| 5% 6/1/41 | 300,000 | 362,730 | |
| 5% 6/1/42 | 250,000 | 301,738 | |
| New Jersey Health Care Facilities Fing. Auth. Rev.: | |||
| Series 2011: | |||
| 5% 7/1/25 | 485,000 | 498,521 | |
| 5% 7/1/26 | 120,000 | 123,324 | |
| Series 2012 A: | |||
| 5% 7/1/23 (Pre-Refunded to 7/1/22 @ 100) | 150,000 | 154,164 | |
| 5% 7/1/24 (Pre-Refunded to 7/1/22 @ 100) | 545,000 | 560,129 | |
| 5% 7/1/25 (Pre-Refunded to 7/1/22 @ 100) | 120,000 | 123,331 | |
| Series 2013 A, 5.5% 7/1/43 | 245,000 | 263,841 | |
| Series 2014 A, 5% 7/1/44 | 405,000 | 449,532 | |
| Series 2015 A, 5% 7/1/46 (FSA Insured) | 430,000 | 489,045 | |
| Series 2016 A, 5% 7/1/43 | 715,000 | 842,381 | |
| Series 2017 A: | |||
| 5% 7/1/38 | 300,000 | 362,852 | |
| 5.25% 7/1/57 | 245,000 | 297,326 | |
| Series 2019: | |||
| 4% 7/1/35 | 60,000 | 70,734 | |
| 5% 7/1/31 | 60,000 | 76,582 | |
| Series 2021 A: | |||
| 4% 7/1/45 | 610,000 | 725,310 | |
| 4% 7/1/51 | 1,075,000 | 1,269,503 | |
| Series 2021, 3% 7/1/46 | 250,000 | 266,598 | |
| New Jersey Higher Ed. Student Assistance Auth. Student Ln. Rev. Series 2014 A1 1, 5% 12/1/22 (a) | 245,000 | 256,164 | |
| New Jersey Hsg. & Mtg. Fin. Agcy. Rev.: | |||
| Series 2019 C, 4.75% 10/1/50 | 250,000 | 279,052 | |
| Series 2020 E, 3.5% 4/1/51 | 500,000 | 546,246 | |
| New Jersey Institute of Technology: | |||
| Series 2012 A, 5% 7/1/42 (Pre-Refunded to 7/1/22 @ 100) | 340,000 | 349,491 | |
| Series 2015 A, 5% 7/1/40 | 425,000 | 484,210 | |
| New Jersey Tobacco Settlement Fing. Corp. Series 2018 A: | |||
| 5% 6/1/33 | 250,000 | 303,952 | |
| 5% 6/1/36 | 250,000 | 301,875 | |
| 5.25% 6/1/46 | 970,000 | 1,161,181 | |
| New Jersey Tpk. Auth. Tpk. Rev.: | |||
| Series 2012 B, 5% 1/1/30 (Pre-Refunded to 1/1/23 @ 100) | 485,000 | 510,145 | |
| Series 2014 A, 5% 1/1/28 | 570,000 | 633,763 | |
| Series 2015 E, 5% 1/1/45 | 685,000 | 772,620 | |
| Series 2017 D1, 1 month U.S. LIBOR + 0.700% 0.76% 1/1/24 (b)(d) | 550,000 | 553,446 | |
| Series 2021 A: | |||
| 4% 1/1/42 | 235,000 | 280,054 | |
| 4% 1/1/51 | 2,850,000 | 3,351,403 | |
| New Jersey Trans. Trust Fund Auth.: | |||
| (Trans. Prog.) Series 2019 AA: | |||
| 5% 6/15/46 | 275,000 | 330,875 | |
| 5.25% 6/15/43 | 2,145,000 | 2,626,814 | |
| Series 2006 C: | |||
| 0% 12/15/30 (FGIC Insured) | 700,000 | 594,586 | |
| 0% 12/15/31 (FGIC Insured) | 585,000 | 483,514 | |
| 0% 12/15/34 | 500,000 | 385,968 | |
| Series 2008 A, 0% 12/15/28 | 910,000 | 811,081 | |
| Series 2012 AA, 5% 6/15/24 | 570,000 | 584,385 | |
| Series 2018 A: | |||
| 5% 6/15/29 | 250,000 | 293,904 | |
| 5% 6/15/31 | 1,070,000 | 1,252,265 | |
| Series 2019 BB, 5% 6/15/44 | 300,000 | 361,833 | |
| Series 2020 AA, 4% 6/15/50 | 1,380,000 | 1,596,234 | |
| Series 2021 A: | |||
| 4% 6/15/34 | 295,000 | 348,217 | |
| 4% 6/15/35 | 150,000 | 176,537 | |
| 4% 6/15/36 | 810,000 | 950,752 | |
| 4% 6/15/38 | 325,000 | 377,414 | |
| Series 2022 A: | |||
| 4% 6/15/39 | 410,000 | 474,719 | |
| 4% 6/15/40 | 415,000 | 479,299 | |
| 4% 6/15/41 | 300,000 | 345,409 | |
| 4% 6/15/42 | 205,000 | 235,266 | |
| Series 2022 AA: | |||
| 5% 6/15/35 | 190,000 | 243,164 | |
| 5% 6/15/36 | 275,000 | 350,086 | |
| 5% 6/15/37 | 220,000 | 278,794 | |
| 5% 6/15/38 | 110,000 | 138,715 | |
| Series A: | |||
| 5% 12/15/25 | 350,000 | 408,230 | |
| 5% 12/15/26 | 250,000 | 300,234 | |
| Series AA: | |||
| 4% 6/15/45 | 285,000 | 325,035 | |
| 4% 6/15/50 | 1,500,000 | 1,701,824 | |
| 5% 6/15/44 | 300,000 | 318,246 | |
| Series BB, 4% 6/15/44 | 710,000 | 795,822 | |
| South Jersey Port Corp. Rev.: | |||
| (New Jersey Gen. Oblig. Proj.) Series 2017 B: | |||
| 5% 1/1/42 (a) | 165,000 | 192,304 | |
| 5% 1/1/48 (a) | 690,000 | 800,943 | |
| Series 2017 A, 5% 1/1/49 | 55,000 | 64,604 | |
| The Poll. Cont. Fin. Auth. of Gloucester County Poll. Cont. Rev. (Logan Proj.) Series 2014 A, 5% 12/1/24 (a) | 205,000 | 217,779 | |
| Union County Impt. Auth. Solid Waste Disp. Rev. (Aries Linden, LLC Proj.) Series 2019, 6.75% 12/1/41 (a)(c) | 220,000 | 230,338 | |
| TOTAL NEW JERSEY | 56,274,071 | ||
| New Mexico - 0.0% | |||
| Farmington Poll. Cont. Rev. Bonds (Pub. Svc. Co. of New Mexico San Juan Proj.) Series 2010 C, 1.15%, tender 6/1/24 (b) | 245,000 | 248,476 | |
| New Mexico Hosp. Equip. Ln. Council Rev. Series 2019 A, 4% 8/1/48 | 545,000 | 627,392 | |
| TOTAL NEW MEXICO | 875,868 | ||
| New York - 2.7% | |||
| Brookhaven Loc Dev. Corp. (Active Retirement Cmnty., Inc. D/B/A Jeffersons Ferry Proj.) Series 2016, 5.25% 11/1/36 | 90,000 | 106,692 | |
| Brooklyn Arena Local Dev. Corp. Series 2016 A, 5% 7/15/42 | 585,000 | 675,530 | |
| Build NYC Resource Corp. Rev.: | |||
| (Richmond Preparatory Charter School Proj.) Series 2021 A, 5% 6/1/51 (c) | 150,000 | 168,551 | |
| (Shefa School Proj.) Series 2021 A, 5% 6/15/51 (c) | 585,000 | 700,163 | |
| Build NYC Resource Corp. Solid Waste Disp. Rev. (Pratt Paper NY, Inc. Proj.) Series 2014, 5% 1/1/35 (a)(c) | 940,000 | 1,043,175 | |
| Dorm. Auth. New York Univ. Rev.: | |||
| Series 2011 A, 5% 10/1/25 | 5,000 | 5,020 | |
| Series 2016 A, 5% 7/1/37 | 315,000 | 377,044 | |
| Series 2017: | |||
| 5% 12/1/30 (c) | 100,000 | 119,847 | |
| 5% 12/1/31 (c) | 100,000 | 119,590 | |
| 5% 12/1/34 (c) | 100,000 | 119,072 | |
| 5% 12/1/35 (c) | 105,000 | 124,797 | |
| 5% 12/1/36 (c) | 100,000 | 118,738 | |
| 5% 12/1/37 (c) | 105,000 | 124,489 | |
| Erie County Tobacco Asset Securitization Corp. Series 2006 A, 0% 6/1/60 (c) | 9,465,000 | 525,829 | |
| Glen Cove Local Econ. Assistance Corp. Rev. (Garvies Point Pub. Impt. Proj.): | |||
| Series 2016 A, 5% 1/1/56 | 480,000 | 528,014 | |
| Series 2016 B, 0% 1/1/45 | 2,955,000 | 1,187,263 | |
| Series 2016 C, 0% 1/1/55 (f) | 705,000 | 754,552 | |
| Hudson Yards Infrastructure Corp. New York Rev. Series 2017 A, 4% 2/15/47 | 300,000 | 338,014 | |
| Liberty Dev. Corp. Rev. Series 2005, 5.25% 10/1/35 | 2,200,000 | 3,109,281 | |
| Long Island Pwr. Auth. Elec. Sys. Rev.: | |||
| Series 2012 A: | |||
| 5% 9/1/37 | 260,000 | 268,930 | |
| 5% 9/1/37 (Pre-Refunded to 9/1/22 @ 100) | 160,000 | 165,754 | |
| Series 2012, 5% 9/1/37 (Pre-Refunded to 9/1/22 @ 100) | 210,000 | 217,603 | |
| Series 2014 A: | |||
| 5% 9/1/34 | 160,000 | 179,119 | |
| 5% 9/1/39 | 250,000 | 278,782 | |
| 5% 9/1/44 | 250,000 | 277,697 | |
| Series 2015 B, 5% 9/1/45 | 250,000 | 286,163 | |
| Series 2016 B, 5% 9/1/41 | 345,000 | 406,733 | |
| Series 2017, 5% 9/1/47 | 175,000 | 212,890 | |
| Series 2019 A, 4% 9/1/34 | 300,000 | 352,632 | |
| Series 2021 A, 4% 9/1/32 | 250,000 | 310,137 | |
| Monroe County Indl. Dev. Corp. (Univ. of Rochester Proj.) Series 2020 A, 4% 7/1/50 | 1,060,000 | 1,229,100 | |
| Nassau County Gen. Oblig. Series 2019 B, 5% 4/1/44 (FSA Insured) | 250,000 | 314,150 | |
| Nassau County Indl. Dev. Agcy.: | |||
| Series 2021 A, 9% 1/1/41 (c) | 675,000 | 675,267 | |
| Series 2021 B, 5% 1/1/58 (g) | 1,390,000 | 1,351,637 | |
| New York City Gen. Oblig.: | |||
| Series 2014 J: | |||
| 5% 8/1/30 | 525,000 | 586,542 | |
| 5% 8/1/33 | 180,000 | 200,846 | |
| Series 2017 B: | |||
| 5% 12/1/37 | 515,000 | 615,247 | |
| 5% 12/1/41 | 570,000 | 679,725 | |
| Series 2018 B1: | |||
| 5% 10/1/38 | 310,000 | 377,175 | |
| 5.25% 10/1/32 | 500,000 | 621,690 | |
| Series 2018 E1: | |||
| 5% 3/1/41 | 15,000 | 18,342 | |
| 5% 3/1/44 | 570,000 | 695,175 | |
| Series 2018 F, 5% 4/1/45 | 610,000 | 744,282 | |
| Series 2018 F1, 5% 4/1/43 | 300,000 | 367,312 | |
| Series 2019 D1: | |||
| 4% 12/1/42 | 195,000 | 226,547 | |
| 5% 12/1/42 | 610,000 | 760,894 | |
| Series 2019: | |||
| 3% 8/1/36 | 300,000 | 328,536 | |
| 4% 8/1/38 | 300,000 | 352,751 | |
| Series 2020 C, 5% 8/1/43 | 170,000 | 216,797 | |
| Series 2020 D: | |||
| 4% 3/1/41 | 300,000 | 352,940 | |
| 4% 3/1/50 | 500,000 | 578,965 | |
| Series 2021 F1, 4% 3/1/40 | 245,000 | 292,404 | |
| Series 2021, 4% 8/1/40 | 655,000 | 786,985 | |
| Series B, 5% 10/1/42 | 850,000 | 1,063,217 | |
| New York City Hsg. Dev. Corp. Series 2013 E1C, 4.95% 11/1/46 | 250,000 | 289,479 | |
| New York City Hsg. Dev. Corp. Multifamily Hsg.: | |||
| Series 2019 G1B, 3.05% 5/1/50 | 500,000 | 513,582 | |
| Series 2019 J: | |||
| 3.05% 11/1/49 | 300,000 | 311,438 | |
| 3.15% 11/1/54 | 500,000 | 519,654 | |
| New York City Muni. Wtr. Fin. Auth. Wtr. & Swr. Sys. Rev.: | |||
| Series 2013 EE, 5% 6/15/47 | 250,000 | 266,517 | |
| Series 2014 CC, 5% 6/15/47 | 250,000 | 276,443 | |
| Series 2018 EE, 5% 6/15/40 | 300,000 | 368,799 | |
| Series 2020: | |||
| 4% 6/15/42 | 250,000 | 296,133 | |
| 4% 6/15/43 | 250,000 | 298,055 | |
| Series 2021 AA1, 4% 6/15/50 | 1,885,000 | 2,222,523 | |
| Series 2021, 3.5% 6/15/48 | 600,000 | 671,534 | |
| New York City Transitional Fin. Auth. Bldg. Aid Rev.: | |||
| Series 2013 S1, 5% 7/15/37 | 570,000 | 586,441 | |
| Series 2015 S1: | |||
| 5% 7/15/33 | 250,000 | 284,578 | |
| 5% 7/15/36 | 300,000 | 340,893 | |
| Series 2016 S1, 5% 7/15/43 | 275,000 | 319,307 | |
| Series 2018 S3, 5% 7/15/43 | 610,000 | 752,417 | |
| Series 2019 S1, 5% 7/15/45 | 610,000 | 750,576 | |
| Series 2019 S3, 5% 7/15/37 | 290,000 | 360,909 | |
| New York City Transitional Fin. Auth. Rev.: | |||
| Series 2014 A1, 5% 11/1/42 | 1,145,000 | 1,239,893 | |
| Series 2017 A, 5% 8/1/34 | 250,000 | 306,238 | |
| Series 2017 A1, 5% 5/1/33 | 275,000 | 325,108 | |
| Series 2017 F1, 5% 5/1/42 | 300,000 | 362,182 | |
| Series 2019 B1: | |||
| 5% 8/1/36 | 845,000 | 1,058,510 | |
| 5% 8/1/38 | 610,000 | 760,367 | |
| Series 2019 C1, 4% 11/1/38 | 275,000 | 324,187 | |
| Series 2020 B1: | |||
| 4% 11/1/37 | 800,000 | 954,463 | |
| 4% 11/1/38 | 250,000 | 297,563 | |
| 4% 11/1/39 | 610,000 | 724,197 | |
| 4% 11/1/41 | 275,000 | 324,822 | |
| 4% 11/1/42 | 300,000 | 353,530 | |
| Series 2021 A, 3% 11/1/37 | 250,000 | 272,394 | |
| Series 2021 C, 4% 5/1/40 | 250,000 | 298,354 | |
| Series 2021 C1, 4% 5/1/38 | 300,000 | 359,674 | |
| Series 2021 E1, 4% 2/1/42 | 250,000 | 296,703 | |
| Series 2021 F1: | |||
| 4% 11/1/36 | 60,000 | 72,699 | |
| 4% 11/1/37 | 180,000 | 217,217 | |
| Series 2021, 4% 11/1/38 | 250,000 | 303,348 | |
| Series 2022 B1, 5% 8/1/45 | 1,330,000 | 1,722,492 | |
| Series C1, 4% 5/1/42 | 250,000 | 296,888 | |
| New York Dorm. Auth. Personal Income Tax Rev. Series 2012 B: | |||
| 5% 3/15/32 | 760,000 | 770,392 | |
| 5% 3/15/34 | 570,000 | 577,760 | |
| New York Dorm. Auth. Rev.: | |||
| Series 2013 A, 5% 7/1/44 | 170,000 | 179,600 | |
| Series 2020 A, 4% 7/1/50 | 570,000 | 662,885 | |
| Series 2021 A, 4% 7/1/46 | 330,000 | 393,733 | |
| New York Dorm. Auth. Sales Tax Rev.: | |||
| Series 2016 A, 5% 3/15/35 | 735,000 | 874,572 | |
| Series 2017 A: | |||
| 5% 3/15/39 | 460,000 | 554,662 | |
| 5% 3/15/40 | 250,000 | 301,261 | |
| 5% 3/15/42 | 225,000 | 270,564 | |
| Series 2018 A: | |||
| 5% 3/15/40 | 600,000 | 743,101 | |
| 5% 3/15/43 | 250,000 | 307,581 | |
| Series 2018 C, 4% 3/15/44 | 275,000 | 315,997 | |
| Series 2018 E, 5% 3/15/40 | 250,000 | 314,199 | |
| New York Liberty Dev. Corp.: | |||
| (3 World Trade Ctr. Proj.) Series 2014: | |||
| 5.15% 11/15/34 (c) | 335,000 | 372,344 | |
| 5.375% 11/15/40 (c) | 2,305,000 | 2,559,195 | |
| (Bank of America Tower at One Bryant Park Proj.) Series 2019 1, 2.45% 9/15/69 | 400,000 | 419,312 | |
| (Bank of America Tower At One Bryant Park Proj.) Series 2019 3, 2.8% 9/15/69 | 345,000 | 357,152 | |
| (World Trade Ctr. Proj.) Series 2021 A, 3% 11/15/51 | 275,000 | 285,742 | |
| New York Metropolitan Trans. Auth. Dedicated Tax Fund Rev.: | |||
| Series 2016 A: | |||
| 5% 11/15/22 | 300,000 | 313,752 | |
| 5.25% 11/15/31 | 610,000 | 737,525 | |
| 5.25% 11/15/33 | 250,000 | 301,937 | |
| 5.25% 11/15/34 | 275,000 | 332,971 | |
| 5.25% 11/15/36 | 275,000 | 332,404 | |
| Series 2016 B1, 5% 11/15/36 | 300,000 | 358,002 | |
| Series 2016 B2, 5% 11/15/36 | 225,000 | 268,528 | |
| New York Metropolitan Trans. Auth. Rev.: | |||
| Bonds Series 2002 D2: | |||
| 0.550% x U.S. Secured Overnight Fin. Rate (SOFR) Indx 0.584%, tender 4/1/24 (FSA Insured) (b)(d) | 1,245,000 | 1,246,035 | |
| 0.550% x U.S. Secured Overnight Fin. Rate (SOFR) Indx 0.584%, tender 4/1/24 (FSA Insured) (b)(d) | 205,000 | 205,170 | |
| Series 2006 B, 5.25% 11/15/26 (FSA Insured) | 485,000 | 588,923 | |
| Series 2013 C: | |||
| 5% 11/15/38 | 250,000 | 263,779 | |
| 5% 11/15/42 | 275,000 | 289,675 | |
| Series 2017 D, 5% 11/15/33 | 165,000 | 198,943 | |
| Series 2019 C: | |||
| 4% 11/15/48 (FSA Insured) | 275,000 | 319,166 | |
| 5% 11/15/40 | 250,000 | 311,786 | |
| 5% 11/15/44 | 400,000 | 495,135 | |
| Series 2019 F, 5% 11/15/22 | 510,000 | 532,547 | |
| Series 2020 A: | |||
| 4% 2/1/22 | 350,000 | 352,129 | |
| 5% 2/1/23 | 270,000 | 284,406 | |
| 5% 11/15/47 | 670,000 | 812,779 | |
| Series 2020 A1: | |||
| 4% 11/15/42 (FSA Insured) | 250,000 | 293,164 | |
| 5% 11/15/49 | 1,275,000 | 1,544,605 | |
| Series 2020 C1, 5.25% 11/15/55 | 670,000 | 824,508 | |
| Series 2020 D, 5% 11/15/45 | 350,000 | 429,591 | |
| New York State Dorm. Auth.: | |||
| Series 2017 A, 5% 2/15/31 | 15,000 | 18,092 | |
| Series 2017 B, 5% 2/15/38 | 300,000 | 366,597 | |
| Series 2019 A, 5% 3/15/46 | 610,000 | 756,990 | |
| Series 2019 D: | |||
| 4% 2/15/39 | 275,000 | 324,294 | |
| 4% 2/15/47 | 700,000 | 812,216 | |
| 5% 2/15/48 | 275,000 | 342,702 | |
| Series 2020 A, 3% 3/15/38 | 300,000 | 324,890 | |
| Series 2021 A: | |||
| 4% 3/15/39 | 1,215,000 | 1,458,260 | |
| 4% 3/15/40 | 800,000 | 957,664 | |
| New York State Hsg. Fin. Agcy. Rev.: | |||
| Series 2020 L2, 0.75% 11/1/25 | 545,000 | 545,107 | |
| Series 2020 M2, 0.75% 11/1/25 | 305,000 | 305,065 | |
| New York State Urban Dev. Corp.: | |||
| Series 2020 C: | |||
| 3% 3/15/40 | 400,000 | 430,174 | |
| 5% 3/15/47 | 250,000 | 317,259 | |
| Series 2020 E: | |||
| 4% 3/15/34 | 300,000 | 359,411 | |
| 4% 3/15/37 | 2,655,000 | 3,149,269 | |
| 4% 3/15/38 | 315,000 | 372,990 | |
| 4% 3/15/39 | 1,215,000 | 1,435,885 | |
| 4% 3/15/43 | 340,000 | 397,718 | |
| New York State Urban Eev Corp.: | |||
| Series 2019 A, 5% 3/15/41 | 300,000 | 379,964 | |
| Series 2021 A: | |||
| 3% 3/15/40 | 550,000 | 594,236 | |
| 4% 3/15/43 | 425,000 | 511,225 | |
| New York Thruway Auth. Gen. Rev.: | |||
| Series 2019 B: | |||
| 4% 1/1/39 | 375,000 | 438,504 | |
| 4% 1/1/45 | 250,000 | 288,568 | |
| 4% 1/1/50 | 300,000 | 344,319 | |
| 4% 1/1/50 (FSA Insured) | 300,000 | 346,740 | |
| Series 2020 N: | |||
| 4% 1/1/45 | 250,000 | 290,395 | |
| 5% 1/1/34 | 275,000 | 353,580 | |
| 5% 1/1/35 | 250,000 | 320,153 | |
| 5% 1/1/36 | 350,000 | 446,799 | |
| 5% 1/1/38 | 250,000 | 317,507 | |
| Series 2021 O, 4% 1/1/39 | 250,000 | 301,766 | |
| New York Thruway Auth. Personal Income Tax Rev. Series 2021 A1, 4% 3/15/52 | 225,000 | 263,521 | |
| New York Trans. Dev. Corp.: | |||
| (American Airlines, Inc. John F. Kennedy Int'l. Arpt. Proj.): | |||
| Series 2016: | |||
| 5% 8/1/26 (a) | 900,000 | 902,094 | |
| 5% 8/1/31 (a) | 1,130,000 | 1,132,586 | |
| Series 2020: | |||
| 5.25% 8/1/31 (a) | 165,000 | 197,023 | |
| 5.375% 8/1/36 (a) | 195,000 | 245,518 | |
| (Delta Air Lines, Inc. - Laguardia Arpt. Terminals C&D Redev. Proj.) Series 2020: | |||
| 4.375% 10/1/45 (a) | 1,465,000 | 1,692,349 | |
| 5% 10/1/40 (a) | 230,000 | 282,573 | |
| (Delta Air Lines, Inc. Laguardia Arpt. Terminals C&D Redev. Proj.) Series 2018, 5% 1/1/34 (a) | 710,000 | 850,329 | |
| (Delta Airlines, Inc. LaGuardia Arpt. Terminals C&D Redev. Proj.) Series 2020, 5% 10/1/35 (a) | 685,000 | 849,320 | |
| Series 2016 A: | |||
| 4% 7/1/31 (a) | 300,000 | 325,046 | |
| 4% 7/1/36 (FSA Insured) (a) | 500,000 | 539,951 | |
| Series 2021: | |||
| 2.25% 8/1/26 (a) | 80,000 | 82,841 | |
| 3% 8/1/31 (a) | 180,000 | 195,578 | |
| New York Urban Dev. Corp. Rev.: | |||
| Series 2016 A, 5% 3/15/30 | 300,000 | 352,333 | |
| Series 2019 A: | |||
| 5% 3/15/37 | 345,000 | 430,122 | |
| 5% 3/15/43 | 275,000 | 339,543 | |
| Onondaga Civic Dev. Corp.: | |||
| (St. Joseph's Hosp. Health Ctr. Proj.) Series 2012, 5% 7/1/42 (Pre-Refunded to 7/1/22 @ 100) | 955,000 | 981,567 | |
| Series 2011: | |||
| 5.25% 12/1/41 (Pre-Refunded to 12/1/21 @ 100) | 245,000 | 245,000 | |
| 5.5% 12/1/31 (Pre-Refunded to 12/1/21 @ 100) | 245,000 | 245,000 | |
| Onondaga County Trust for Cultural Resources Rev. Series 2019, 5% 12/1/43 | 500,000 | 638,494 | |
| Orange County N Y Fdg Corp. Assistance (The Hamlet at Wallkill Assisted Living Proj.) Series 2012, 6.5% 1/1/46 | 325,000 | 327,262 | |
| Port Auth. of New York & New Jersey Series 2020 222, 4% 7/15/39 | 250,000 | 298,483 | |
| Suffolk County Econ. Dev. Corp. Rev. Series 2021: | |||
| 5.125% 11/1/41 (c) | 125,000 | 129,195 | |
| 5.375% 11/1/54 (c) | 105,000 | 108,486 | |
| Tobacco Settlement Asset Securitization Corp. Series 2017 A, 5% 6/1/34 | 250,000 | 297,711 | |
| Tompkins County Dev. Corp. Continuing Care Retirement Cmnty. Rev.: | |||
| (Kendal at Itchaca, Inc. Proj.) Series 2014 A, 5% 7/1/29 | 55,000 | 60,620 | |
| (Kendal at Ithaca, Inc. Proj.) Series 2014 A, 5% 7/1/34 | 100,000 | 109,466 | |
| (Kendal at Ithaca, Inc. Proj.) Series 2014 A, 5% 7/1/44 | 110,000 | 119,504 | |
| Triborough Bridge & Tunnel Auth.: | |||
| Series 2021 A1, 5% 5/15/51 | 910,000 | 1,166,357 | |
| Series 2021 C2, 3% 5/15/32 | 250,000 | 283,835 | |
| Triborough Bridge & Tunnel Auth. Revs.: | |||
| Series 2011 A, 5% 1/1/28 (Pre-Refunded to 1/1/22 @ 100) | 365,000 | 366,432 | |
| Series 2012 B, 5% 11/15/25 | 245,000 | 255,986 | |
| Series 2017 B, 5% 11/15/35 | 250,000 | 304,103 | |
| Series 2018 A: | |||
| 5% 11/15/45 | 300,000 | 366,435 | |
| 5% 11/15/46 | 250,000 | 305,057 | |
| Series 2019 A: | |||
| 5% 11/15/43 | 250,000 | 312,749 | |
| 5% 11/15/49 | 350,000 | 434,487 | |
| Series 2020 A, 5% 11/15/49 | 755,000 | 962,045 | |
| Westchester County Indl. Dev. Agcy. Spl. Facility Rev. (Million Air Two LLC Gen. Aviation Facilities Proj.) Series 2017 A, 7% 6/1/46 (a)(c) | 100,000 | 106,796 | |
| Westchester County Local Dev. Co. Series 2014 A, 5.5% 5/1/42 | 1,370,000 | 1,508,655 | |
| TOTAL NEW YORK | 105,059,037 | ||
| New York And New Jersey - 0.1% | |||
| New York Liberty Dev. Corp. Series 2011 1WTC, 5% 12/15/41 | 300,000 | 300,698 | |
| Port Auth. of New York & New Jersey: | |||
| Series 2012 172: | |||
| 4.25% 10/1/32 (a) | 250,000 | 253,083 | |
| 5% 10/1/34 (a) | 245,000 | 248,761 | |
| Series 2016 197: | |||
| 5% 11/15/34 (a) | 300,000 | 356,206 | |
| 5% 11/15/35 (a) | 250,000 | 296,441 | |
| Series 2019 218, 4% 11/1/41 (a) | 250,000 | 291,848 | |
| Series 214, 4% 9/1/43 (a) | 535,000 | 620,312 | |
| TOTAL NEW YORK AND NEW JERSEY | 2,367,349 | ||
| North Carolina - 0.5% | |||
| Mecklenburg County Gen. Oblig.: | |||
| Series 2016 A, 5% 9/1/25 | 915,000 | 1,069,798 | |
| Series 2017 A, 5% 4/1/25 | 290,000 | 334,192 | |
| Nash Health Care Sys. Health Care Facilities Rev. Series 2003, 5.5% 11/1/26 (FSA Insured) | 120,000 | 120,535 | |
| North Carolina Med. Care Commission Health Care Facilities Rev.: | |||
| (Lutheran Svcs. for the Aging) Series 2012 A: | |||
| 4.75% 3/1/32 (Pre-Refunded to 3/1/22 @ 100) | 60,000 | 60,660 | |
| 5% 3/1/37 (Pre-Refunded to 3/1/22 @ 100) | 120,000 | 121,394 | |
| 5% 3/1/42 (Pre-Refunded to 3/1/22 @ 100) | 120,000 | 121,394 | |
| Series 2015: | |||
| 5% 10/1/25 | 215,000 | 230,645 | |
| 5% 10/1/30 | 115,000 | 122,741 | |
| 5% 10/1/35 | 350,000 | 371,586 | |
| 5% 6/1/40 | 1,575,000 | 1,793,839 | |
| 5% 6/1/45 | 1,600,000 | 1,816,393 | |
| Series 2021 A, 4% 3/1/51 | 150,000 | 162,408 | |
| Series 2021 C: | |||
| 4% 3/1/36 | 140,000 | 151,580 | |
| 4% 3/1/42 | 295,000 | 313,500 | |
| North Carolina Med. Care Commission Retirement Facilities Rev.: | |||
| (Salemtowne Proj.) Series 2015: | |||
| 5.25% 10/1/35 | 120,000 | 120,250 | |
| 5.25% 10/1/37 | 55,000 | 60,048 | |
| 5.375% 10/1/45 | 715,000 | 777,878 | |
| Series 2013, 6.25% 7/1/35 (Pre-Refunded to 7/1/23 @ 100) | 275,000 | 300,213 | |
| Series 2015 A, 5% 9/1/37 (Pre-Refunded to 9/1/24 @ 100) | 125,000 | 140,338 | |
| Series 2015: | |||
| 4.7% 7/1/37 | 165,000 | 175,955 | |
| 4.875% 7/1/40 | 325,000 | 347,244 | |
| 5% 7/1/45 | 270,000 | 288,671 | |
| Series 2016: | |||
| 5% 10/1/31 | 105,000 | 114,145 | |
| 5% 10/1/37 | 95,000 | 102,483 | |
| Series 2017 A, 5% 7/1/47 | 70,000 | 76,879 | |
| Series 2017 C, 5% 9/1/41 (Pre-Refunded to 9/1/23 @ 103) | 100,000 | 110,867 | |
| Series 2019 A: | |||
| 5% 7/1/39 | 105,000 | 118,123 | |
| 5% 7/1/44 | 135,000 | 150,936 | |
| 5% 7/1/49 | 120,000 | 133,668 | |
| Series 2021 A: | |||
| 4% 9/1/41 | 65,000 | 73,320 | |
| 4% 9/1/47 | 60,000 | 66,797 | |
| 4% 9/1/51 | 60,000 | 66,361 | |
| North Carolina Muni. Pwr. Agcy. #1 Catawba Elec. Rev. Series 2015 A, 5% 1/1/28 | 930,000 | 1,081,059 | |
| North Carolina Tpk. Auth. Monroe Expressway Toll Rev. Series 2016 A: | |||
| 5% 7/1/42 | 70,000 | 79,669 | |
| 5% 7/1/47 | 325,000 | 368,054 | |
| 5% 7/1/51 | 315,000 | 355,970 | |
| 5% 7/1/54 | 1,230,000 | 1,388,253 | |
| North Carolina Tpk. Auth. Triangle Expressway Sys.: | |||
| Series 2017: | |||
| 5% 1/1/30 | 90,000 | 106,250 | |
| 5% 1/1/32 | 135,000 | 158,400 | |
| Series 2018: | |||
| 5% 1/1/36 (FSA Insured) | 345,000 | 431,813 | |
| 5% 1/1/40 | 1,025,000 | 1,240,842 | |
| Raleigh Durham Arpt. Auth. Arpt. Rev. Series 2020 A: | |||
| 5% 5/1/34 (a) | 260,000 | 329,610 | |
| 5% 5/1/35 (a) | 120,000 | 151,867 | |
| 5% 5/1/36 (a) | 60,000 | 75,771 | |
| Univ. of North Carolina at Chapel Hill Rev. Series 2021 B: | |||
| 5% 12/1/36 | 495,000 | 671,028 | |
| 5% 12/1/37 | 775,000 | 1,047,965 | |
| 5% 12/1/38 | 875,000 | 1,180,813 | |
| Univ. of North Carolina Hosp. at Chapel Hill Rev. Series 2016, 5% 2/1/46 | 60,000 | 70,380 | |
| TOTAL NORTH CAROLINA | 18,752,585 | ||
| North Dakota - 0.0% | |||
| Univ. of North Dakota Series 2021 A, 3% 6/1/61 (FSA Insured) | 300,000 | 310,186 | |
| Univ. of North Dakota Hsg. and Auxiliary Facilities Rev. Series 2019 A, 4% 4/1/44 (FSA Insured) | 250,000 | 289,370 | |
| TOTAL NORTH DAKOTA | 599,556 | ||
| Ohio - 1.0% | |||
| Akron Bath Copley Hosp. District Rev. Series 2012, 5% 11/15/42 | 250,000 | 255,017 | |
| American Muni. Pwr., Inc. Rev. Series 2021 A: | |||
| 4% 2/15/34 | 475,000 | 561,822 | |
| 5% 2/15/33 | 300,000 | 383,724 | |
| Buckeye Tobacco Settlement Fing. Auth.: | |||
| Series 2020 A2: | |||
| 3% 6/1/48 | 915,000 | 942,743 | |
| 4% 6/1/37 | 315,000 | 368,807 | |
| 4% 6/1/38 | 215,000 | 250,934 | |
| 4% 6/1/39 | 425,000 | 494,365 | |
| 4% 6/1/48 | 1,345,000 | 1,520,536 | |
| Series 2020 B2, 5% 6/1/55 | 12,385,000 | 14,210,657 | |
| Cleveland-Cuyahoga County Port Auth.: | |||
| (Playhouse Square Foundation Proj.) Series 2018: | |||
| 5.5% 12/1/43 | 105,000 | 123,047 | |
| 5.5% 12/1/53 | 590,000 | 685,301 | |
| (The Cleveland Museum of Natural History Proj.) Series 2021: | |||
| 4% 7/1/40 | 35,000 | 41,555 | |
| 4% 7/1/41 | 45,000 | 53,294 | |
| 4% 7/1/46 | 90,000 | 105,395 | |
| 4% 7/1/51 | 120,000 | 139,771 | |
| Cuyahoga County Hosp. Rev. Series 2017: | |||
| 5% 2/15/42 | 275,000 | 322,674 | |
| 5% 2/15/57 | 180,000 | 209,717 | |
| 5.25% 2/15/47 | 250,000 | 296,726 | |
| 5.5% 2/15/52 | 1,795,000 | 2,148,749 | |
| 5.5% 2/15/57 | 1,535,000 | 1,829,038 | |
| Franklin County Convention Facilities Auth. (Greater Columbus Convention Ctr. Hotel Expansion Proj.) Series 2019: | |||
| 5% 12/1/44 | 845,000 | 975,066 | |
| 5% 12/1/51 | 1,135,000 | 1,298,553 | |
| Franklin County Health Care Facilities Rev. Series 2013 A: | |||
| 6.125% 7/1/40 (Pre-Refunded to 7/1/22 @ 100) | 25,000 | 25,838 | |
| 6.125% 7/1/40 (Pre-Refunded to 7/1/22 @ 100) | 415,000 | 428,904 | |
| Hamilton County Healthcare Rev.: | |||
| (Life Enriching Cmntys. Proj.): | |||
| Series 2016, 5% 1/1/36 | 180,000 | 198,527 | |
| Series 2017 A, 5% 1/1/52 | 120,000 | 132,538 | |
| (Life Enriching Communitites Proj.) Series 2016, 5% 1/1/46 | 510,000 | 555,642 | |
| Marion County Health Care Rev. Series 2019: | |||
| 5% 12/1/39 | 100,000 | 109,490 | |
| 5.125% 12/1/49 | 110,000 | 119,734 | |
| Muskingum County Hosp. Facilities (Genesis Healthcare Sys. Obligated Group Proj.) Series 2013, 5% 2/15/44 | 305,000 | 316,682 | |
| Ohio Air Quality Dev. Auth. Exempt Facilities Rev.: | |||
| (AMG Vanadium Proj.) Series 2019, 5% 7/1/49 (a)(c) | 1,045,000 | 1,222,796 | |
| (Pratt Paper (OH), LLC Proj.) Series 2017, 4.5% 1/15/48 (a)(c) | 310,000 | 358,483 | |
| Ohio Air Quality Dev. Auth. Rev.: | |||
| (Ohio Valley Elec. Corp. Proj.) Series 2019 A, 3.25% 9/1/29 | 765,000 | 828,692 | |
| Series 2012 A, 6.75% 6/1/24 (a) | 365,000 | 367,867 | |
| Ohio Hosp. Facilities Rev. Series 2019 B, 4% 1/1/46 | 300,000 | 345,702 | |
| Ohio Hosp. Rev. Series 2020 A: | |||
| 4% 1/15/38 | 65,000 | 75,506 | |
| 4% 1/15/39 | 120,000 | 139,131 | |
| 4% 1/15/50 | 610,000 | 693,655 | |
| 5% 1/15/50 | 515,000 | 629,817 | |
| Ohio Hsg. Fin. Agcy. Residential Mtg. Rev. (Mtg.-Backed Securities Prog.) Series 2018 A, 4.5% 9/1/48 | 250,000 | 275,102 | |
| Ohio State Univ. Gen. Receipts Series 2021 A, 4% 12/1/48 | 1,190,000 | 1,426,992 | |
| Ohio Tpk. Commission Tpk. Rev. (Infrastructure Projs.) Series 2013 A1, 5% 2/15/28 | 30,000 | 31,674 | |
| Southeastern Ohio Port Auth. Hosp. Facilities Rev. (Memorial Health Sys. Obligated Group Proj.) Series 2012, 6% 12/1/42 | 865,000 | 894,971 | |
| Southern Ohio Port Auth. Exempt Facility Rev. (Purecycle Proj.) Series 2020 A, 7% 12/1/42 (a)(c) | 120,000 | 137,891 | |
| Toledo Wtrwks. Rev. Series 2013, 5% 11/15/38 | 120,000 | 127,371 | |
| Univ. of Cincinnati Gen. Receipts Series 2017 A, 5% 6/1/45 | 350,000 | 424,935 | |
| TOTAL OHIO | 37,085,431 | ||
| Oklahoma - 0.2% | |||
| Garfield County Edl. Facilities Auth. (Enid Pub. Schools Proj.) Series 2016 A: | |||
| 5% 9/1/28 | 250,000 | 296,603 | |
| 5% 9/1/29 | 250,000 | 295,857 | |
| Norman Reg'l. Hosp. Auth. Hosp. Rev. Series 2019, 4% 9/1/45 | 505,000 | 577,966 | |
| Oklahoma County Fin. Auth. Rev.: | |||
| (Epworth Villa Proj.): | |||
| Series 2004 B, 5.75% 4/1/27 (b) | 40,000 | 34,000 | |
| Series 2005 B, 6% 4/1/30 (b) | 50,000 | 42,500 | |
| Series 2012 A: | |||
| 5% 4/1/33 | 180,000 | 153,000 | |
| 5.125% 4/1/42 | 180,000 | 153,000 | |
| Series 2005 A, 5.875% 4/1/30 | 235,000 | 199,750 | |
| Oklahoma Dev. Fin. Auth. Health Sys. Rev. (OU Medicine Proj.) Series 2018 B: | |||
| 5.5% 8/15/52 | 530,000 | 655,437 | |
| 5.5% 8/15/57 | 550,000 | 678,994 | |
| Oklahoma Pwr. Auth. Pwr. Supply Sys. Rev. Series 2021 A, 4% 1/1/47 (FSA Insured) | 250,000 | 293,787 | |
| Oklahoma Tpk. Auth. Tpk. Rev.: | |||
| Series 1989, 6% 1/1/22 (Escrowed to Maturity) | 1,545,000 | 1,552,190 | |
| Series 2017 C, 5% 1/1/47 | 160,000 | 191,524 | |
| Tulsa Indl. Auth. Rev. (Montereau, Inc. Proj.) Series 2017: | |||
| 5% 11/15/31 | 115,000 | 130,127 | |
| 5.25% 11/15/37 | 75,000 | 85,266 | |
| 5.25% 11/15/45 | 160,000 | 180,203 | |
| Tulsa Muni. Arpt. Trust Rev. Series 2001 B, 5.5% 12/1/35 (a) | 670,000 | 711,536 | |
| TOTAL OKLAHOMA | 6,231,740 | ||
| Oregon - 0.1% | |||
| Clackamas County Hosp. Facility Auth.: | |||
| (Willamette View, Inc.) Series 2017 A, 5% 11/15/47 | 85,000 | 93,003 | |
| (Williamette View Proj.) Series 2017 A, 5% 11/15/32 | 30,000 | 33,386 | |
| (Williamette View, Inc.) Series 2017 A: | |||
| 5% 11/15/37 | 30,000 | 33,146 | |
| 5% 11/15/52 | 90,000 | 98,296 | |
| Oregon Facilities Auth. Rev. (Legacy Health Proj.) Series 2016 A, 5% 6/1/46 | 505,000 | 587,793 | |
| Oregon State Hsg. & Cmnty. Svcs. Dept. (Single-Family Mtg. Prog.) Series 2018 C, 4.5% 7/1/49 | 250,000 | 270,808 | |
| Port of Portland Arpt. Rev.: | |||
| Series 2017 24B, 5% 7/1/42 (a) | 365,000 | 429,783 | |
| Series 2020 27A, 4% 7/1/39 (a) | 610,000 | 713,401 | |
| Series 2020, 5% 7/1/37 (a) | 300,000 | 377,566 | |
| Univ. of Oregon Gen. Rev. Series 2021 A, 3.5% 4/1/52 | 1,000,000 | 1,120,480 | |
| Yamhill County Hosp. Auth. Rev. Series 2016 A: | |||
| 4% 11/15/26 | 20,000 | 21,510 | |
| 5% 11/15/31 | 20,000 | 21,975 | |
| 5% 11/15/36 | 30,000 | 32,844 | |
| 5% 11/15/46 | 80,000 | 86,779 | |
| TOTAL OREGON | 3,920,770 | ||
| Pennsylvania - 0.8% | |||
| Allegheny County Hosp. Dev. Auth. Rev. Series 2018 A: | |||
| 4% 4/1/44 | 5,000 | 5,577 | |
| 5% 4/1/47 | 210,000 | 251,400 | |
| Allegheny County Indl. Dev. Auth. Enviromental Impt. Rev. (United States Steel Corp. Proj.) Series 2019, 4.875% 11/1/24 | 75,000 | 81,785 | |
| Allentown Neighborhood Impt. Zone Dev. Auth. Tax Rev.: | |||
| (City Ctr. Rfdg. Proj.): | |||
| Series 2017: | |||
| 5% 5/1/27 (c) | 465,000 | 546,145 | |
| 5% 5/1/32 (c) | 210,000 | 243,104 | |
| 5% 5/1/42 (c) | 545,000 | 622,474 | |
| Series 2018: | |||
| 5% 5/1/33 (c) | 210,000 | 247,466 | |
| 5% 5/1/42 (c) | 350,000 | 409,688 | |
| 5.375% 5/1/42 (c) | 580,000 | 676,369 | |
| Series 2012 A, 5% 5/1/42 | 90,000 | 91,633 | |
| Series 2022: | |||
| 5% 5/1/31 | 40,000 | 50,083 | |
| 5% 5/1/32 | 45,000 | 56,893 | |
| 5% 5/1/33 | 50,000 | 63,082 | |
| 5% 5/1/34 | 45,000 | 56,656 | |
| 5% 5/1/35 | 50,000 | 62,824 | |
| 5% 5/1/42 | 180,000 | 222,456 | |
| Butler County Hosp. Auth. Hosp. Rev. (Butler Health Sys. Proj.) Series 2015 A: | |||
| 5% 7/1/35 | 510,000 | 574,372 | |
| 5% 7/1/39 | 290,000 | 325,317 | |
| Chester County Indl. Dev. Auth. Rev. (Longwood Gardens, Inc. Proj.) Series 2021: | |||
| 4% 12/1/46 | 445,000 | 526,851 | |
| 4% 12/1/51 | 605,000 | 710,163 | |
| Commonwealth Fing. Auth. Tobacco: | |||
| Series 2018 A, 5% 6/1/31 | 300,000 | 369,477 | |
| Series 2018: | |||
| 4% 6/1/39 (FSA Insured) | 250,000 | 285,825 | |
| 5% 6/1/34 | 15,000 | 18,280 | |
| Cumberland County Muni. Auth. Rev.: | |||
| (Asbury Pennsylvania Obligated Group) Series 2012, 5.25% 1/1/32 | 180,000 | 180,726 | |
| Series 2021 A: | |||
| 4.5% 1/1/36 (c) | 240,000 | 255,022 | |
| 4.5% 1/1/40 (c) | 815,000 | 859,576 | |
| 4.5% 1/1/41 (c) | 255,000 | 268,401 | |
| Delaware Valley Reg'l. Fin. Auth. Local Govt. Rev. Series 1998 A, 5.5% 8/1/28 (AMBAC Insured) | 305,000 | 390,241 | |
| Doylestown Hosp. Auth. Hosp. Rev. Series 2019, 5% 7/1/49 | 450,000 | 525,656 | |
| East Hempfield Township Indl. Dev. Auth. Rev.: | |||
| Series 2014: | |||
| 5% 7/1/34 (Pre-Refunded to 7/1/24 @ 100) | 60,000 | 67,024 | |
| 5% 7/1/39 (Pre-Refunded to 7/1/24 @ 100) | 60,000 | 67,024 | |
| 5% 7/1/46 (Pre-Refunded to 7/1/24 @ 100) | 95,000 | 106,121 | |
| Series 2015: | |||
| 5% 7/1/30 (Pre-Refunded to 7/1/25 @ 100) | 50,000 | 57,875 | |
| 5% 7/1/35 (Pre-Refunded to 7/1/25 @ 100) | 65,000 | 75,237 | |
| 5% 7/1/47 (Pre-Refunded to 7/1/25 @ 100) | 455,000 | 526,661 | |
| Franklin County Indl. Dev. Auth. (Menno-Haven, Inc. Proj.) Series 2018: | |||
| 5% 12/1/38 | 120,000 | 132,125 | |
| 5% 12/1/43 | 75,000 | 82,069 | |
| 5% 12/1/48 | 80,000 | 87,191 | |
| 5% 12/1/53 | 85,000 | 92,473 | |
| Geisinger Auth. Health Sys. Rev. Series 2020 A, 4% 4/1/39 | 250,000 | 292,284 | |
| Lancaster County Hosp. Auth. Health Ctr. Rev.: | |||
| Series 2015: | |||
| 5.25% 7/1/35 | 15,000 | 16,212 | |
| 5.5% 7/1/45 | 60,000 | 64,653 | |
| Series 2021: | |||
| 5% 11/1/46 | 300,000 | 370,597 | |
| 5% 11/1/51 | 300,000 | 369,690 | |
| Lehigh County Gen. Purp. Hosp. Rev. Series 2019 A, 5% 7/1/44 | 250,000 | 309,338 | |
| Monroeville Fin. Auth. UPMC Rev. Series 2012, 4.25% 2/15/42 | 300,000 | 307,878 | |
| Montgomery County Higher Ed. & Health Auth. Rev. Series 2018 A: | |||
| 5% 9/1/34 | 335,000 | 411,713 | |
| 5% 9/1/37 | 305,000 | 373,194 | |
| 5% 9/1/43 | 305,000 | 369,622 | |
| Montgomery County Indl. Dev. Auth. Series 2015 A, 5.25% 1/15/45 | 1,385,000 | 1,566,291 | |
| Montgomery County Indl. Dev. Auth. Rev.: | |||
| (Foulkeways At Gwynedd Proj.) Series 2016, 5% 12/1/46 | 670,000 | 734,551 | |
| Series 2015: | |||
| 5.25% 1/1/40 | 210,000 | 225,658 | |
| 5.375% 1/1/50 | 725,000 | 776,834 | |
| Montgomery Gen. Oblig. Series 2021 A, 5% 1/1/37 | 285,000 | 374,111 | |
| Moon Indl. Dev. Auth. Rev. Series 2015, 6.125% 7/1/50 | 250,000 | 266,947 | |
| Pennsylvania Econ. Dev. Fing. Auth. Series 2017 A, 4% 11/15/42 | 250,000 | 284,071 | |
| Pennsylvania Econ. Dev. Fing. Auth. Solid Waste Disp. Rev.: | |||
| (Covanta Proj.) Series 2019 A, 3.25% 8/1/39 (a)(c) | 250,000 | 256,359 | |
| Bonds (Consol Energy, Inc. Proj.) Series 2021 A, 9%, tender 4/13/28 (a)(b)(c) | 700,000 | 863,409 | |
| Pennsylvania Higher Edl. Facilities Auth. Rev.: | |||
| Series 2007 A, 3 month U.S. LIBOR + 0.650% 0.738% 7/1/39 (XL Cap. Assurance, Inc. Insured) (b)(d) | 510,000 | 470,683 | |
| Series 2012 A: | |||
| 5% 7/1/32 (Pre-Refunded to 7/1/22 @ 100) | 100,000 | 102,791 | |
| 5% 7/1/41 (Pre-Refunded to 7/1/22 @ 100) | 395,000 | 406,026 | |
| Series 2013 A, 5.5% 7/15/38 (Pre-Refunded to 7/15/23 @ 100) | 170,000 | 184,173 | |
| Series 2014, 5% 7/15/38 | 145,000 | 157,334 | |
| Series 2015 A: | |||
| 5% 9/1/39 | 180,000 | 202,921 | |
| 5% 9/1/45 | 225,000 | 253,229 | |
| Series 2019: | |||
| 4% 8/15/44 | 350,000 | 408,838 | |
| 4% 8/15/49 | 570,000 | 659,949 | |
| Series 2021 A, 4% 8/15/43 | 640,000 | 766,933 | |
| Pennsylvania Tpk. Commission Oil Franchise Tax Rev. Series 2021 A, 4% 12/1/51 | 1,335,000 | 1,578,107 | |
| Pennsylvania Tpk. Commission Tpk. Rev.: | |||
| Series 2014 C, 5% 12/1/44 | 120,000 | 135,182 | |
| Series 2016 A1, 5% 12/1/46 | 250,000 | 292,588 | |
| Series 2018 A2, 5% 12/1/43 | 225,000 | 278,532 | |
| Series 2019 A, 5% 12/1/44 | 275,000 | 347,393 | |
| Philadelphia Arpt. Rev. Series 2021, 4% 7/1/46 (a) | 465,000 | 539,706 | |
| Philadelphia Auth. for Indl. Dev. Series 2016 2, 5% 4/1/34 | 935,000 | 1,061,633 | |
| Philadelphia Auth. for Indl. Dev. Sr. Living Facilities Rev. Series 2017 A: | |||
| 5% 7/1/37 | 190,000 | 212,808 | |
| 5% 7/1/42 | 130,000 | 144,394 | |
| 5% 7/1/49 | 220,000 | 242,568 | |
| Philadelphia Gen. Oblig. Series 2019 B, 5% 2/1/38 | 250,000 | 311,748 | |
| Philadelphia Hospitals & Higher Ed. Facilities Auth. Hosp. Rev. Series 2017: | |||
| 5% 7/1/28 | 305,000 | 365,281 | |
| 5% 7/1/30 | 60,000 | 71,266 | |
| Philadelphia School District: | |||
| Series 2019 A, 5% 9/1/44 | 755,000 | 940,994 | |
| Series 2021 A, 4% 9/1/46 | 610,000 | 713,037 | |
| Philadelphia Wtr. & Wastewtr. Rev.: | |||
| Series 2012, 5% 11/1/28 (Pre-Refunded to 11/1/22 @ 100) | 120,000 | 125,221 | |
| Series 2017 A, 5% 10/1/47 | 250,000 | 302,687 | |
| Pittsburgh Wtr. & Swr. Auth. Wtr. & Swr. Sys. Rev. Series 2019 A, 5% 9/1/44 (FSA Insured) | 250,000 | 312,827 | |
| State Pub. School Bldg. Auth. College Rev. (Cmnty. College of Philadelphia Proj.) Series 2015, 5% 6/15/28 | 250,000 | 284,557 | |
| State Pub. School Bldg. Auth. Lease Rev. (The School District of Philadelphia Proj.) Series 2016 A: | |||
| 5% 6/1/31 | 625,000 | 747,671 | |
| 5% 6/1/32 (FSA Insured) | 610,000 | 728,739 | |
| TOTAL PENNSYLVANIA | 31,854,570 | ||
| Puerto Rico - 2.0% | |||
| GDB Debt Recovery Auth. Series 2018, 7.5% 8/20/40 | 1,320,000 | 1,240,800 | |
| Puerto Rico Commonwealth Aqueduct & Swr. Auth.: | |||
| Series 2008 A, 6.125% 7/1/24 | 105,000 | 113,876 | |
| Series 2020 A: | |||
| 5% 7/1/30 (c) | 1,215,000 | 1,515,579 | |
| 5% 7/1/35 (c) | 1,235,000 | 1,508,218 | |
| 5% 7/1/47 (c) | 2,080,000 | 2,470,449 | |
| Series 2021 A: | |||
| 4% 7/1/42 (c) | 715,000 | 809,766 | |
| 5% 7/1/33 (c) | 250,000 | 313,543 | |
| Series 2021 B: | |||
| 4% 7/1/42 (c) | 755,000 | 855,068 | |
| 4% 7/1/47 (c) | 670,000 | 750,125 | |
| 5% 7/1/25 (c) | 250,000 | 284,232 | |
| 5% 7/1/29 (c) | 655,000 | 805,895 | |
| 5% 7/1/33 (c) | 625,000 | 783,858 | |
| 5% 7/1/37 (c) | 750,000 | 926,485 | |
| Series 2022 A: | |||
| 4% 7/1/42 | 1,070,000 | 1,183,314 | |
| 5% 7/1/25 | 250,000 | 277,284 | |
| 5% 7/1/28 | 250,000 | 293,743 | |
| 5% 7/1/29 | 250,000 | 297,783 | |
| 5% 7/1/33 | 1,275,000 | 1,570,675 | |
| 5% 7/1/37 | 1,425,000 | 1,742,532 | |
| Puerto Rico Commonwealth Infrastructure Fing. Auth. Series 2005 B, 5% 7/1/41 | 830,000 | 396,325 | |
| Puerto Rico Commonwealth Pub. Impt. Gen. Oblig.: | |||
| Series 2007 A, 5% 7/1/19 | 120,000 | 118,500 | |
| Series 2007 A4, 5.25% 7/1/30 (FSA Insured) | 90,000 | 90,898 | |
| Series 2008 A: | |||
| 5.125% 7/1/28 | 510,000 | 497,250 | |
| 5.25% 7/1/25 | 335,000 | 327,881 | |
| 5.5% 7/1/32 | 400,000 | 392,500 | |
| Series 2008 C, 5.9% 7/1/28 | 150,000 | 145,688 | |
| Series 2009 B: | |||
| 5.75% 7/1/38 | 1,110,000 | 1,076,700 | |
| 6.5% 7/1/37 | 200,000 | 201,250 | |
| Series 2009 C, 6% 7/1/39 | 1,630,000 | 1,593,325 | |
| Series 2011 C: | |||
| 6% 7/1/32 | 155,000 | 149,188 | |
| 6% 7/1/35 | 135,000 | 127,575 | |
| Series 2012 A: | |||
| 5% 7/1/35 (FSA Insured) | 750,000 | 755,661 | |
| 5% 7/1/41 | 5,000 | 4,425 | |
| Series 2012 B, 3.65% 7/1/16 | 195,000 | 177,694 | |
| Series 2021 A: | |||
| 5% 7/1/24 | 215,000 | 212,044 | |
| 5% 7/1/41 | 3,410,000 | 3,060,475 | |
| 5.125% 7/1/37 | 2,705,000 | 2,495,363 | |
| 5.25% 7/1/22 | 485,000 | 479,544 | |
| 5.25% 7/1/31 | 150,000 | 150,000 | |
| 5.25% 7/1/34 | 175,000 | 173,469 | |
| 5.375% 7/1/33 | 100,000 | 98,250 | |
| 5.5% 7/1/39 | 560,000 | 526,400 | |
| 5.75% 7/1/28 | 1,085,000 | 1,023,969 | |
| 5.75% 7/1/41 | 870,000 | 850,425 | |
| 6% 7/1/38 | 60,000 | 60,000 | |
| 8% 7/1/35 | 5,085,000 | 4,449,375 | |
| Series 2021 B, 6% 7/1/39 | 830,000 | 830,000 | |
| Series 2021 C, 5.75% 7/1/36 | 1,225,000 | 1,119,344 | |
| Series 2021: | |||
| 5% 7/1/35 | 150,000 | 148,125 | |
| 5.25% 7/1/27 | 5,000 | 4,944 | |
| 5.25% 7/1/30 | 685,000 | 678,150 | |
| Puerto Rico Elec. Pwr. Auth. Pwr. Rev.: | |||
| Series 2005 SS, 5% 7/1/24 (Nat'l. Pub. Fin. Guarantee Corp. Insured) | 305,000 | 309,532 | |
| Series 2007 TT: | |||
| 5% 7/1/20 | 65,000 | 62,563 | |
| 5% 7/1/24 | 255,000 | 250,538 | |
| 5% 7/1/25 | 80,000 | 78,600 | |
| 5% 7/1/26 | 100,000 | 98,250 | |
| 5% 7/1/27 | 275,000 | 270,188 | |
| 5% 7/1/32 | 365,000 | 358,613 | |
| 5% 7/1/37 | 1,145,000 | 1,124,963 | |
| Series 2008 WW: | |||
| 5% 7/1/28 | 260,000 | 255,450 | |
| 5.25% 7/1/33 | 435,000 | 428,475 | |
| 5.5% 7/1/18 | 55,000 | 53,281 | |
| 5.5% 7/1/38 | 550,000 | 543,125 | |
| Series 2010 AAA: | |||
| 5.25% 7/1/25 | 5,000 | 4,925 | |
| 5.25% 7/1/27 | 90,000 | 88,650 | |
| 5.25% 7/1/29 | 305,000 | 300,425 | |
| Series 2010 CCC: | |||
| 5% 7/1/27 | 20,000 | 19,650 | |
| 5% 12/31/49 | 115,000 | 110,688 | |
| 5.25% 7/1/26 | 120,000 | 118,200 | |
| 5.25% 7/1/27 | 560,000 | 551,600 | |
| 5.25% 7/1/28 | 235,000 | 231,475 | |
| Series 2010 XX: | |||
| 4.75% 7/1/26 | 30,000 | 29,363 | |
| 5.25% 7/1/27 | 25,000 | 24,625 | |
| 5.25% 7/1/35 | 265,000 | 261,025 | |
| 5.25% 7/1/40 | 520,000 | 512,200 | |
| 5.75% 7/1/36 | 210,000 | 208,163 | |
| Series 2010 ZZ: | |||
| 3.7% 7/1/17 | 15,000 | 13,931 | |
| 4.75% 7/1/27 | 25,000 | 24,469 | |
| 5% 7/1/17 | 25,000 | 24,063 | |
| 5% 7/1/19 | 150,000 | 144,375 | |
| 5% 7/1/28 | 20,000 | 19,650 | |
| 5.25% 7/1/19 | 200,000 | 193,250 | |
| 5.25% 7/1/23 | 50,000 | 49,250 | |
| 5.25% 7/1/24 | 40,000 | 39,400 | |
| 5.25% 7/1/26 | 295,000 | 290,575 | |
| Series 2012 A: | |||
| 5% 7/1/29 | 675,000 | 663,188 | |
| 5% 7/1/42 | 550,000 | 540,375 | |
| 5.05% 7/1/42 | 25,000 | 24,563 | |
| Series 2013 A, 6.75% 7/1/36 | 895,000 | 899,475 | |
| Puerto Rico Sales Tax Fing. Corp. Sales Tax Rev.: | |||
| Series 2018 A1: | |||
| 0% 7/1/27 | 1,100,000 | 1,005,277 | |
| 0% 7/1/29 | 740,000 | 639,250 | |
| 0% 7/1/31 | 2,060,000 | 1,652,798 | |
| 0% 7/1/33 | 1,545,000 | 1,154,997 | |
| 0% 7/1/46 | 13,560,000 | 4,517,560 | |
| 0% 7/1/51 | 4,670,000 | 1,124,502 | |
| 4.55% 7/1/40 | 270,000 | 306,028 | |
| 4.75% 7/1/53 | 3,175,000 | 3,590,351 | |
| 5% 7/1/58 | 7,310,000 | 8,374,024 | |
| Series 2019 A1, 4.5% 7/1/34 | 1,320,000 | 1,440,802 | |
| Series 2019 A2: | |||
| 4.329% 7/1/40 | 965,000 | 1,080,807 | |
| 4.329% 7/1/40 | 655,000 | 733,605 | |
| 4.536% 7/1/53 | 180,000 | 201,227 | |
| 4.784% 7/1/58 | 1,270,000 | 1,438,742 | |
| TOTAL PUERTO RICO | 76,639,063 | ||
| Rhode Island - 0.0% | |||
| Rhode Island Health & Edl. Bldg. Corp. Higher Ed. Facilities Rev.: | |||
| Series 2013 A: | |||
| 5.5% 9/1/28 (Pre-Refunded to 9/1/23 @ 100) | 180,000 | 196,491 | |
| 6% 9/1/33 (Pre-Refunded to 9/1/23 @ 100) | 245,000 | 269,445 | |
| Series 2016 B, 5% 9/1/36 | 305,000 | 344,870 | |
| Rhode Island Health and Edl. Bldg. Corp. Higher Ed. Facility Rev. Series 2009 B, 5.25% 9/15/29 | 160,000 | 160,651 | |
| Rhode Island Hsg. & Mtg. Fin. Corp. Series 2018 69B, 4% 10/1/48 | 250,000 | 272,820 | |
| TOTAL RHODE ISLAND | 1,244,277 | ||
| South Carolina - 0.3% | |||
| Connector 2000 Assoc., Inc. Toll Road Rev.: | |||
| Series 2011 A1: | |||
| 0% 1/1/32 | 861,263 | 452,001 | |
| 0% 1/1/42 | 2,402,723 | 633,425 | |
| 0% 7/22/51 | 3,706,348 | 463,680 | |
| Series 2016 A, 0% 1/1/22 | 15,000 | 14,963 | |
| Patriots Energy Group Fing. Agcy. Bonds Series 2018 A, 4%, tender 2/1/24 (b) | 860,000 | 920,774 | |
| Piedmont Muni. Pwr. Agcy. Elec. Rev. Series 2008 C, 5.75% 1/1/34 | 275,000 | 275,000 | |
| South Carolina Jobs-Econ. Dev. Auth. Series 2018 A: | |||
| 5% 5/1/35 | 265,000 | 322,198 | |
| 5% 5/1/36 | 610,000 | 740,406 | |
| South Carolina Jobs-Econ. Dev. Auth. Econ. Dev. Rev.: | |||
| (South Carolina Saves Green Cmnty. Prog. AAA East LLC Proj.) Series 2019 A, 7% 5/1/39 (a)(c) | 100,000 | 96,394 | |
| Series 2013, 5% 11/1/29 (Pre-Refunded to 11/1/22 @ 100) | 245,000 | 255,731 | |
| South Carolina Jobs-Econ. Dev. Auth. Solid Waste Disp. Rev.: | |||
| (Repower South Berkeley, LLC Proj.) Series 2017: | |||
| 6% 2/1/35 (a)(c)(h) | 385,000 | 154,000 | |
| 6.25% 2/1/45 (a)(c)(h) | 775,000 | 310,000 | |
| Series 2019, 8% 12/6/29 (h) | 120,000 | 108,915 | |
| South Carolina Jobs-Economoc Dev. Auth. Retirement Cmnty. Rev. Series 2018 C, 5% 11/15/47 | 235,000 | 269,350 | |
| South Carolina Pub. Svc. Auth. Rev.: | |||
| Series 2011 C, 5% 12/1/36 | 200,000 | 200,000 | |
| Series 2012 A, 5% 12/1/25 | 250,000 | 250,000 | |
| Series 2012 D, 5% 12/1/43 (Pre-Refunded to 6/1/22 @ 100) | 250,000 | 256,002 | |
| Series 2014 A, 5.5% 12/1/54 | 605,000 | 675,597 | |
| Series 2014 C, 5% 12/1/29 | 250,000 | 281,368 | |
| Series 2015 E, 5.25% 12/1/55 | 1,345,000 | 1,571,724 | |
| Series 2016 A, 5% 12/1/32 | 250,000 | 294,670 | |
| Series 2020 A: | |||
| 4% 12/1/40 | 250,000 | 294,886 | |
| 4% 12/1/42 | 300,000 | 352,113 | |
| 5% 12/1/43 | 300,000 | 382,085 | |
| Series 2021 B, 5% 12/1/51 | 610,000 | 776,155 | |
| Series A, 3% 12/1/41 | 250,000 | 270,327 | |
| South Carolina Trans. Infrastructure Bank Rev. Series 2017 A: | |||
| 5% 10/1/35 (FSA Insured) | 250,000 | 306,510 | |
| 5% 10/1/36 | 400,000 | 489,831 | |
| TOTAL SOUTH CAROLINA | 11,418,105 | ||
| South Dakota - 0.0% | |||
| Sioux Falls Health Facilities Rev. (Dow Rummel Village Proj.) Series 2017: | |||
| 5% 11/1/28 | 85,000 | 96,578 | |
| 5% 11/1/30 | 95,000 | 107,087 | |
| 5% 11/1/32 | 85,000 | 94,934 | |
| 5% 11/1/42 | 120,000 | 131,231 | |
| South Dakota Health & Edl. Facilities Auth. Rev.: | |||
| Series 2012 E, 5% 11/1/37 | 125,000 | 129,898 | |
| Series 2014 B, 5% 11/1/44 | 285,000 | 318,170 | |
| TOTAL SOUTH DAKOTA | 877,898 | ||
| Tennessee - 0.3% | |||
| Blount County Health & Edl. Facilities Board Rev. Series 2016 A, 5% 1/1/47 | 475,000 | 389,413 | |
| Chattanooga Health Ed. & Hsg. Facility Board Rev. (CDFI Phase I, LLC - Univ. of Tennessee at Chattanooga Proj.) Series 2015, 5% 10/1/35 | 165,000 | 182,968 | |
| Greeneville Health & Edl. Facilities Board Series 2018 A, 5% 7/1/36 | 395,000 | 480,151 | |
| Knox County Health Edl. & Hsg. Facilities Series 2012 A, 5% 1/1/26 | 165,000 | 172,652 | |
| Metropolitan Nashville Arpt. Auth. Rev.: | |||
| Series 2015 A, 5% 7/1/45 | 570,000 | 652,558 | |
| Series 2019 B: | |||
| 4% 7/1/49 (a) | 850,000 | 973,548 | |
| 4% 7/1/54 (a) | 975,000 | 1,108,840 | |
| 5% 7/1/33 (a) | 250,000 | 318,203 | |
| 5% 7/1/44 (a) | 365,000 | 454,348 | |
| 5% 7/1/49 (a) | 860,000 | 1,063,491 | |
| 5% 7/1/54 (a) | 595,000 | 731,773 | |
| Nashville and Davidson County Metropolitan Govt. Health & Edl. Facilities Board Rev. Series 2016 A: | |||
| 5% 7/1/35 | 340,000 | 402,836 | |
| 5% 7/1/40 | 190,000 | 224,439 | |
| 5% 7/1/46 | 1,610,000 | 1,889,997 | |
| Shelby County Health Edl. & Hsg. Facility Board Residential Care Facilitiy Mtg. Rev.: | |||
| Series 2012: | |||
| 5.25% 12/1/42 (Pre-Refunded to 12/1/22 @ 100) | 120,000 | 125,957 | |
| 5.375% 12/1/47 (Pre-Refunded to 12/1/22 @ 100) | 210,000 | 220,686 | |
| Series 2014: | |||
| 5% 12/1/34 | 30,000 | 32,460 | |
| 5.25% 12/1/44 | 70,000 | 75,568 | |
| 5.25% 12/1/49 | 205,000 | 220,874 | |
| Tennessee Energy Acquisition Corp.: | |||
| Bonds: | |||
| Series 2018, 4%, tender 11/1/25 (b) | 505,000 | 562,638 | |
| Series 2021 A, 5%, tender 11/1/31 (b) | 1,070,000 | 1,383,767 | |
| Series 2006 A: | |||
| 5.25% 9/1/24 | 320,000 | 359,199 | |
| 5.25% 9/1/26 | 725,000 | 852,794 | |
| Tennessee Hsg. Dev. Agcy. Residential Series 2018, 4.5% 7/1/49 | 250,000 | 275,013 | |
| TOTAL TENNESSEE | 13,154,173 | ||
| Texas - 1.8% | |||
| Austin Arpt. Sys. Rev.: | |||
| Series 2017 B, 5% 11/15/41 (a) | 200,000 | 237,521 | |
| Series 2019 B, 5% 11/15/44 (a) | 1,410,000 | 1,745,839 | |
| Austin Convention Enterprises, Inc.: | |||
| Series 2017 A: | |||
| 5% 1/1/28 | 55,000 | 62,751 | |
| 5% 1/1/30 | 125,000 | 141,258 | |
| 5% 1/1/31 | 175,000 | 197,295 | |
| 5% 1/1/32 | 205,000 | 230,988 | |
| 5% 1/1/33 | 190,000 | 213,149 | |
| 5% 1/1/34 | 375,000 | 419,496 | |
| Series 2017 B: | |||
| 5% 1/1/23 | 30,000 | 30,854 | |
| 5% 1/1/26 | 130,000 | 141,879 | |
| 5% 1/1/28 | 30,000 | 33,010 | |
| 5% 1/1/29 | 70,000 | 76,664 | |
| 5% 1/1/32 | 135,000 | 146,382 | |
| 5% 1/1/34 | 195,000 | 210,780 | |
| Board of Managers, Joint Guadalupe County, City of Seguin Hosp. Series 2015: | |||
| 5% 12/1/28 | 85,000 | 93,896 | |
| 5% 12/1/29 | 205,000 | 225,380 | |
| 5% 12/1/30 | 105,000 | 115,041 | |
| 5% 12/1/40 | 405,000 | 436,456 | |
| 5% 12/1/45 | 405,000 | 434,053 | |
| 5.25% 12/1/35 | 125,000 | 137,688 | |
| Central Reg'l. Mobility Auth.: | |||
| Series 2013, 5% 1/1/33 (Pre-Refunded to 1/1/23 @ 100) | 245,000 | 257,291 | |
| Series 2015 A, 5% 1/1/28 | 70,000 | 79,973 | |
| Series 2021 B: | |||
| 4% 1/1/40 | 45,000 | 53,189 | |
| 4% 1/1/41 | 35,000 | 41,238 | |
| 4% 1/1/51 | 650,000 | 752,600 | |
| 5% 1/1/34 | 30,000 | 38,740 | |
| 5% 1/1/39 | 10,000 | 12,752 | |
| 5% 1/1/46 | 1,715,000 | 2,152,157 | |
| Clifton Higher Ed. Fin. Corp. Ed. Rev. Series 2018 D, 6.125% 8/15/48 | 970,000 | 1,114,707 | |
| Conroe Local Govt. Hotel Rev.: | |||
| Series 2021 A, 4% 10/1/50 | 100,000 | 110,247 | |
| Series 2021 B: | |||
| 3.5% 10/1/31 | 20,000 | 19,968 | |
| 5% 10/1/50 | 105,000 | 115,251 | |
| Dallas Area Rapid Transit Sales Tax Rev.: | |||
| Series 2016 B, 4% 12/1/36 | 250,000 | 283,371 | |
| Series 2021 B: | |||
| 4% 12/1/51 (e) | 500,000 | 587,230 | |
| 5% 12/1/47 (e) | 1,350,000 | 1,733,001 | |
| Dallas County Hosp. District Series 2019, 5% 8/15/30 | 300,000 | 374,938 | |
| Dallas Fort Worth Int'l. Arpt. Rev.: | |||
| Series 2013 C, 5.125% 11/1/43 (Pre-Refunded to 11/1/22 @ 100) (a) | 565,000 | 589,694 | |
| Series 2013 F, 5.25% 11/1/30 | 570,000 | 622,122 | |
| Series 2014 A: | |||
| 5% 11/1/32 (a) | 500,000 | 540,240 | |
| 5.25% 11/1/30 (a) | 735,000 | 799,109 | |
| Series 2020 B, 4% 11/1/35 | 400,000 | 483,487 | |
| Decatur Hosp. Auth. Hosp. Rev.: | |||
| Series 2014 A, 5.25% 9/1/44 | 425,000 | 468,147 | |
| Series 2014, 5% 9/1/34 | 105,000 | 115,396 | |
| Fort Bend County Indl. Dev. Corp. (NRG Energy, Inc. Proj.) Series 2012 B, 4.75% 11/1/42 | 305,000 | 315,544 | |
| Grand Parkway Trans. Corp.: | |||
| Series 2018 A, 5% 10/1/43 | 250,000 | 309,177 | |
| Series 2020 C, 4% 10/1/49 | 800,000 | 927,067 | |
| Gulf Coast Indl. Dev. Auth. Solid Waste Disp. Rev. (Citgo Petroleum Corp. Proj.) Series 1995, 4.875% 5/1/25 (a) | 720,000 | 730,904 | |
| Harris County Cultural Ed. Facilities Fin. Corp. Rev.: | |||
| (Brazos Presbyterian Homes, Inc. Proj.) Series 2013 A: | |||
| 5% 1/1/38 | 30,000 | 30,953 | |
| 5% 1/1/43 | 30,000 | 30,901 | |
| Series 2013 B: | |||
| 6.375% 1/1/33 | 200,000 | 210,032 | |
| 7% 1/1/48 (Pre-Refunded to 1/1/23 @ 100) | 320,000 | 342,732 | |
| Series 2021 A, 4% 10/1/42 | 745,000 | 893,445 | |
| Harris County Cultural Ed. Facilities Fin. Corp. Thermal Util. Rev. (Teco Proj.) Series 2017: | |||
| 5% 11/15/31 | 80,000 | 97,957 | |
| 5% 11/15/33 | 800,000 | 979,045 | |
| Harris County Toll Road Rev. Series 2018 A, 5% 8/15/27 | 435,000 | 537,256 | |
| Houston Arpt. Sys. Rev.: | |||
| (United Airlines, Inc. Term. E Proj.) Series 2021 A, 4% 7/1/41 (a) | 125,000 | 133,580 | |
| (United Airlines, Inc. Term. Impt. Projs.): | |||
| Series 2015 B1: | |||
| 5% 7/15/30 (a) | 430,000 | 477,181 | |
| 5% 7/15/35 (a) | 885,000 | 976,236 | |
| Series 2021 B1, 4% 7/15/41 (a) | 305,000 | 324,957 | |
| Series 2018 A: | |||
| 5% 7/1/36 (a) | 135,000 | 164,480 | |
| 5% 7/1/37 (a) | 260,000 | 315,861 | |
| 5% 7/1/41 (a) | 395,000 | 478,350 | |
| Series 2018 C: | |||
| 5% 7/1/31 (a) | 365,000 | 450,213 | |
| 5% 7/1/32 (a) | 455,000 | 561,739 | |
| Series 2021 A, 4% 7/1/46 (a) | 555,000 | 648,880 | |
| Houston Gen. Oblig. Series 2017 A, 5% 3/1/29 | 250,000 | 302,196 | |
| Jefferson County Indl. Dev. Co. (TRP Crude Marketing, LLC Proj.) Series 2019, 7.75% 4/1/39 (c) | 100,000 | 103,190 | |
| Love Field Arpt. Modernization Rev.: | |||
| Series 2017: | |||
| 5% 11/1/35 (a) | 120,000 | 142,701 | |
| 5% 11/1/36 (a) | 120,000 | 142,691 | |
| Series 2021: | |||
| 4% 11/1/34 (FSA Insured) (a) | 250,000 | 299,669 | |
| 4% 11/1/35 (FSA Insured) (a) | 250,000 | 299,212 | |
| 4% 11/1/36 (FSA Insured) (a) | 250,000 | 298,673 | |
| 5% 11/1/33 (FSA Insured) (a) | 300,000 | 393,036 | |
| Matagorda County Navigation District No. 1 Poll. Cont. Rev. (AEP Texas Central Co. Proj.) Series 2008 2, 4% 6/1/30 | 365,000 | 382,776 | |
| Mission Econ. Dev. Corp. Rev. (Natgasoline Proj.) Series 2018, 4.625% 10/1/31 (a)(c) | 1,310,000 | 1,377,956 | |
| Mission Econ. Dev. Corp. Solid Waste Disp. Rev. Bonds (Republic Svcs., Inc. Proj.): | |||
| Series 2008 A, 0.2%, tender 2/1/22 (a)(b) | 970,000 | 970,032 | |
| Series 2020 A, 0.2%, tender 2/1/22 (a)(b) | 485,000 | 485,016 | |
| Montgomery County Toll Road Auth. Series 2018: | |||
| 5% 9/15/32 | 45,000 | 50,867 | |
| 5% 9/15/33 | 45,000 | 50,826 | |
| 5% 9/15/34 | 45,000 | 50,777 | |
| 5% 9/15/35 | 115,000 | 129,674 | |
| 5% 9/15/36 | 175,000 | 197,167 | |
| 5% 9/15/37 | 200,000 | 225,095 | |
| 5% 9/15/38 | 130,000 | 146,188 | |
| 5% 9/15/43 | 385,000 | 430,988 | |
| 5% 9/15/48 | 670,000 | 747,514 | |
| New Hope Cultural Ed. Facilities (Cardinal Bay, Inc. - Village on the Park/Carriage Inn Proj.) Series 2016 A1, 5% 7/1/46 | 15,000 | 14,385 | |
| New Hope Cultural Ed. Facilities Corp. Cap. Impt. Rev. (CHF - Collegiate Hsg. Denton, L.L.C. - Texas Woman's Univ. Hsg. Proj.) Series 2018 A1, 5% 7/1/58 (FSA Insured) | 180,000 | 215,705 | |
| New Hope Cultural Ed. Facilities Fin. Corp.: | |||
| (CHF - Collegiate Hsg. Stephenville III, L.L.C. - Tarleton State Univ. Proj.) Series 2015 A: | |||
| 5% 4/1/24 (Escrowed to Maturity) | 50,000 | 55,376 | |
| 5% 4/1/30 (Pre-Refunded to 4/1/25 @ 100) | 30,000 | 34,485 | |
| 5% 4/1/35 (Pre-Refunded to 4/1/25 @ 100) | 140,000 | 160,932 | |
| 5% 4/1/47 (Pre-Refunded to 4/1/25 @ 100) | 615,000 | 706,951 | |
| (CHF Collegiate Hsg. College Station I, LLC Texas A&M Univ. Proj.): | |||
| Series 2014 A: | |||
| 5% 4/1/29 | 355,000 | 377,451 | |
| 5% 4/1/46 | 950,000 | 994,827 | |
| Series 2017 A, 5% 4/1/46 | 190,000 | 207,524 | |
| (CHF Collegiate Hsg. Island Campus, LLC Texas A&M Univ. Corpus Christi Island Campus Proj.) Series 2017 A: | |||
| 5% 4/1/37 (Pre-Refunded to 4/1/27 @ 100) | 105,000 | 128,214 | |
| 5% 4/1/42 (Pre-Refunded to 4/1/27 @ 100) | 120,000 | 146,530 | |
| Series 2020 A, 5% 7/1/57 | 605,000 | 683,710 | |
| New Hope Cultural Ed. Facilities Fin. Corp. Retirement Facility Rev.: | |||
| (MRC Crestview Proj.) Series 2016: | |||
| 5% 11/15/36 (Pre-Refunded to 11/15/24 @ 102) | 35,000 | 40,120 | |
| 5% 11/15/46 (Pre-Refunded to 11/15/24 @ 102) | 95,000 | 108,896 | |
| (MRC Sr. Living - The Langford Proj.) Series 2016 A: | |||
| 5.375% 11/15/36 | 30,000 | 32,226 | |
| 5.5% 11/15/46 | 60,000 | 64,145 | |
| 5.5% 11/15/52 | 60,000 | 63,951 | |
| (Presbyterian Village North Proj.) Series 2018: | |||
| 5% 10/1/31 | 60,000 | 65,846 | |
| 5% 10/1/32 | 30,000 | 32,866 | |
| 5% 10/1/33 | 95,000 | 103,965 | |
| 5% 10/1/34 | 60,000 | 65,593 | |
| 5% 10/1/35 | 120,000 | 131,049 | |
| 5% 10/1/39 | 90,000 | 97,739 | |
| 5.25% 10/1/49 | 580,000 | 631,737 | |
| Series 2018 A, 5.5% 7/1/54 | 525,000 | 553,267 | |
| North Texas Tollway Auth. Rev.: | |||
| (Sr. Lien Proj.) Series 2017 A, 5% 1/1/37 | 610,000 | 731,488 | |
| Series 2015 A: | |||
| 4% 1/1/38 | 25,000 | 26,891 | |
| 5% 1/1/34 | 570,000 | 643,469 | |
| 5% 1/1/38 | 275,000 | 309,458 | |
| Series 2015 B, 5% 1/1/40 | 725,000 | 760,561 | |
| Series 2016 A, 5% 1/1/39 | 330,000 | 384,038 | |
| Series 2017 A, 5% 1/1/43 | 800,000 | 976,354 | |
| Port Beaumont Navigation District Dock Facility Rev. (Jefferson Gulf Coast Energy Proj.): | |||
| Series 2020 A: | |||
| 3.625% 1/1/35 (c) | 125,000 | 128,805 | |
| 4% 1/1/50 (c) | 235,000 | 242,227 | |
| Series 2021 A, 3% 1/1/50 (a)(c) | 150,000 | 146,647 | |
| Rockwall Independent School District Series 2016, 5% 2/15/46 (Pre-Refunded to 2/15/25 @ 100) | 225,000 | 257,817 | |
| San Antonio Elec. & Gas Sys. Rev. Series 2012, 5.25% 2/1/24 | 290,000 | 320,749 | |
| San Antonio Wtr. Sys. Rev. Bonds Series 2019 A, 2.625%, tender 5/1/24 (b) | 275,000 | 290,303 | |
| Tarrant County Cultural Ed. Facilities Fin. Corp. Retirement Facility Rev.: | |||
| (Buckingham Sr. Living Cmnty., Inc. Proj.): | |||
| Series 2014, 5.625% 11/15/41 | 180,000 | 102,600 | |
| Series 2015 A: | |||
| 5.25% 11/15/35 | 55,000 | 31,350 | |
| 5.5% 11/15/45 | 310,000 | 176,700 | |
| (Buckner Retirement Svcs., Inc. Proj.): | |||
| Series 2016 A: | |||
| 5% 11/15/27 | 90,000 | 106,779 | |
| 5% 11/15/28 | 70,000 | 82,703 | |
| 5% 11/15/29 | 100,000 | 117,673 | |
| 5% 11/15/30 | 150,000 | 175,832 | |
| 5% 11/15/37 | 285,000 | 330,186 | |
| Series 2016 B, 5% 11/15/46 | 590,000 | 675,863 | |
| (Buckner Retirement Svcs., Inc.) Series 2016 B, 5% 11/15/40 | 385,000 | 444,371 | |
| (Buckner Sr. Living - Ventana Proj.) Series 2017 A, 6.625% 11/15/37 | 130,000 | 147,588 | |
| (Northwest Sr. Hsg. Corp. Edgemere Proj.): | |||
| Series 2015 A, 5% 11/15/45 | 980,000 | 784,000 | |
| Series 2017, 5.25% 11/15/47 | 125,000 | 100,000 | |
| Series 2020, 5.75% 12/1/54 | 450,000 | 481,795 | |
| Tarrant County Cultural Ed. Facilities Fin. Corp. Rev. Series 2016 A: | |||
| 5% 2/15/41 | 350,000 | 413,023 | |
| 5% 2/15/47 | 1,460,000 | 1,722,896 | |
| Texas Gen. Oblig. Series 2017 A, 5% 10/1/33 | 200,000 | 246,319 | |
| Texas Muni. Gas Acquisition & Supply Corp. I Gas Supply Rev. Series 2008 D, 6.25% 12/15/26 | 85,000 | 98,038 | |
| Texas Muni. Gas Acquisition And Supply Corp. Series 2021: | |||
| 5% 12/15/27 | 200,000 | 243,094 | |
| 5% 12/15/28 | 730,000 | 902,077 | |
| 5% 12/15/29 | 790,000 | 990,365 | |
| 5% 12/15/30 | 590,000 | 752,193 | |
| 5% 12/15/31 | 240,000 | 311,313 | |
| 5% 12/15/32 | 445,000 | 586,714 | |
| Texas Muni. Gas Acquisition and Supply Corp. II Gas Supply Rev. Series 2012 C, 0.767% 9/15/27 (b) | 900,000 | 905,542 | |
| Texas Private Activity Bond Surface Trans. Corp.: | |||
| (Blueridge Trans. Group, LLC SH 288 Toll Lanes Proj.) Series 2016: | |||
| 5% 12/31/45 (a) | 425,000 | 475,621 | |
| 5% 12/31/50 (a) | 1,140,000 | 1,272,407 | |
| 5% 12/31/55 (a) | 495,000 | 551,197 | |
| (NTE Mobility Partners Segments 3 LLC Segment 3C Proj.) Series 2019, 5% 6/30/58 (a) | 1,910,000 | 2,291,698 | |
| Series 2013: | |||
| 6.75% 6/30/43 (a) | 285,000 | 315,680 | |
| 7% 12/31/38 (a) | 210,000 | 233,636 | |
| Texas Trans. Commission Series 2019 A, 5% 8/1/57 | 1,360,000 | 1,581,410 | |
| Texas Trans. Commission Central Texas Tpk. Sys. Rev.: | |||
| Series 2015 C: | |||
| 5% 8/15/34 | 250,000 | 279,686 | |
| 5% 8/15/37 | 1,350,000 | 1,510,837 | |
| Series 2020 A, 5% 8/15/39 | 1,020,000 | 1,297,451 | |
| Univ. of Texas Board of Regents Sys. Rev.: | |||
| Series 2019 A, 5% 8/15/33 | 300,000 | 385,176 | |
| Series 2019 B, 5% 8/15/49 | 1,155,000 | 1,817,728 | |
| Series 2020 C, 5% 8/15/31 | 300,000 | 409,911 | |
| West Harris County Reg'l. Wtr. Auth. Wtr. Sys. Rev. Series 2021: | |||
| 3.5% 12/15/46 | 325,000 | 370,507 | |
| 3.5% 12/15/60 | 1,000,000 | 1,114,302 | |
| TOTAL TEXAS | 69,610,520 | ||
| Utah - 0.3% | |||
| Military Installation Dev. Auth. Utah Tax Allocation Rev. Series 2021 A2, 4% 6/1/52 | 545,000 | 532,313 | |
| Salt Lake City Arpt. Rev.: | |||
| Series 2017 A: | |||
| 5% 7/1/42 (a) | 855,000 | 1,021,632 | |
| 5% 7/1/47 (a) | 1,600,000 | 1,909,902 | |
| Series 2017 B, 5% 7/1/42 | 395,000 | 475,280 | |
| Series 2018 A: | |||
| 5% 7/1/36 (a) | 460,000 | 558,201 | |
| 5% 7/1/43 (a) | 500,000 | 603,467 | |
| Series 2021 A: | |||
| 4% 7/1/51 (a) | 1,100,000 | 1,275,026 | |
| 5% 7/1/51 (a) | 1,320,000 | 1,659,360 | |
| Utah Associated Muni. Pwr. Sys. Rev. Series 2011 A, 5.5% 6/1/22 | 60,000 | 60,250 | |
| Utah Charter School Fin. Auth. (Spectrum Academy Proj.) Series 2020, 4% 4/15/45 | 250,000 | 286,715 | |
| Utah County Hosp. Rev. Series 2020 A: | |||
| 4% 5/15/43 | 300,000 | 352,911 | |
| 5% 5/15/43 | 500,000 | 634,058 | |
| Utah Hsg. Corp.: | |||
| Series 2021 E, 2% 4/21/51 | 245,900 | 251,107 | |
| Series 2021 F, 2.5% 5/21/51 | 246,323 | 257,738 | |
| Series 2021 G, 2.5% 6/21/51 | 294,539 | 308,188 | |
| Series 2021 H, 2.5% 7/21/51 | 395,332 | 413,652 | |
| Utah Transit Auth. Sales Tax Rev.: | |||
| Series 2012, 4% 6/15/39 (Pre-Refunded to 6/15/22 @ 100) | 700,000 | 714,408 | |
| Series 2018, 4% 12/15/41 | 300,000 | 345,363 | |
| Weber Basin Wtr. Conservancy District Series 2019 A, 5% 10/1/44 | 250,000 | 315,567 | |
| TOTAL UTAH | 11,975,138 | ||
| Virgin Islands - 0.0% | |||
| Virgin Islands Pub. Fin. Auth.: | |||
| (Cruzan Proj.) Series 2009 A, 6% 10/1/39 | 285,000 | 285,717 | |
| Series 2009 A, 6.75% 10/1/37 | 225,000 | 226,982 | |
| Series 2012 A, 5% 10/1/32 | 300,000 | 308,960 | |
| Series 2014 C, 5% 10/1/39 | 250,000 | 272,019 | |
| TOTAL VIRGIN ISLANDS | 1,093,678 | ||
| Virginia - 1.1% | |||
| Albemarle County Econ. Dev. Auth. Residential Care Facility Mtg. Rev. Series 2012 A, 5% 1/1/42 | 195,000 | 200,098 | |
| Arlington County IDA Hosp. Facilities Series 2020: | |||
| 3.75% 7/1/50 | 250,000 | 282,232 | |
| 4% 7/1/45 | 350,000 | 408,575 | |
| Chesapeake Bay Bridge and Tunnel District Gen. Resolution Rev. Series 2016: | |||
| 5% 7/1/41 (FSA Insured) | 520,000 | 607,556 | |
| 5% 7/1/46 | 1,850,000 | 2,178,991 | |
| 5% 7/1/51 | 1,275,000 | 1,498,832 | |
| Chesapeake Trans. Sys. Toll Road Rev. Series 2012 B, 0% 7/15/40 (f) | 455,000 | 502,483 | |
| Fairfax County Econ. Dev. Auth. Residential Care Facility Rev. Series 2013 A: | |||
| 5% 12/1/32 (Pre-Refunded to 12/1/23 @ 100) | 100,000 | 109,208 | |
| 5% 12/1/42 (Pre-Refunded to 12/1/23 @ 100) | 170,000 | 185,654 | |
| 5% 12/1/47 (Pre-Refunded to 12/1/23 @ 100) | 120,000 | 131,050 | |
| Fairfax County Indl. Dev. Auth. (Inova Health Sys. Proj.): | |||
| Series 2014 A, 5% 5/15/44 | 610,000 | 675,842 | |
| Series 2016 A, 5% 5/15/31 | 245,000 | 288,128 | |
| Series 2018 A, 4% 5/15/48 | 685,000 | 779,865 | |
| Fairfax County Swr. Rev. Series 2021 A, 4% 7/15/38 | 795,000 | 980,660 | |
| Greater Richmond Convention Ctr. Auth. Hotel Tax Rev. Series 2015, 5% 6/15/31 (Pre-Refunded to 6/15/25 @ 100) | 565,000 | 655,276 | |
| Hampton Roads Trans. Accountability Commission: | |||
| Series 2018 A, 5.5% 7/1/57 | 2,455,000 | 3,047,329 | |
| Series 2020 A: | |||
| 4% 7/1/50 | 250,000 | 294,416 | |
| 4% 7/1/55 | 750,000 | 881,094 | |
| 5% 7/1/60 | 425,000 | 533,331 | |
| Indl. Dev. Auth. Botetourt County Residential Care Facility Rev. Series 2014 A, 6% 7/1/34 | 445,000 | 494,897 | |
| James City County Econ. Dev. Auth. Residential Care Facility Rev. Series 2013 A, 6% 6/1/43 (Pre-Refunded to 6/1/23 @ 100) | 460,000 | 495,707 | |
| Lynchburg Econ. Dev. Series 2021, 4% 1/1/55 | 685,000 | 796,395 | |
| Norfolk Econ. Dev. Auth. Hosp. Facilities Rev. Bonds Series 2018 A, 5%, tender 11/1/28 (b) | 60,000 | 75,632 | |
| Norfolk Econ. Dev. Health Care Facilities Series 2012 B, 5% 11/1/43 | 120,000 | 124,758 | |
| Norfolk Redev. & Hsg. Auth. Rev.: | |||
| (Fort Norfolk Retirement Cmnty., Inc. Harbors Edge Proj.) Series 2014: | |||
| 5% 1/1/35 | 245,000 | 263,856 | |
| 5% 1/1/46 | 315,000 | 335,658 | |
| 5.375% 1/1/35 | 380,000 | 413,454 | |
| 5.375% 1/1/46 | 260,000 | 279,911 | |
| Series 2019 A, 5% 1/1/49 | 195,000 | 211,011 | |
| Richmond Pub. Util. Rev. Series 2013 A, 5% 1/15/38 (Pre-Refunded to 1/15/23 @ 100) | 60,000 | 63,223 | |
| Stafford County Econ. Dev. Auth. Hosp. Facilities Rev. Series 2016: | |||
| 5% 6/15/33 | 60,000 | 69,905 | |
| 5% 6/15/34 | 250,000 | 290,958 | |
| 5% 6/15/35 | 120,000 | 139,529 | |
| 5% 6/15/36 | 250,000 | 290,350 | |
| Tobacco Settlement Fing. Corp.: | |||
| Series 2007 C1, 0% 6/1/47 | 4,410,000 | 1,097,705 | |
| Series 2007 D, 0% 6/1/47 | 3,330,000 | 748,632 | |
| Virginia College Bldg. Auth. Edl. Facilities Rev.: | |||
| (Marymount Univ. Proj.): | |||
| Series 2015 A: | |||
| 5% 7/1/23 (c) | 100,000 | 104,739 | |
| 5% 7/1/24 (c) | 100,000 | 107,376 | |
| 5% 7/1/25 (c) | 100,000 | 109,588 | |
| 5% 7/1/30 (c) | 285,000 | 306,314 | |
| 5% 7/1/35 (c) | 100,000 | 106,705 | |
| 5% 7/1/45 (c) | 190,000 | 200,424 | |
| Series 2015 B: | |||
| 5% 7/1/45 (c) | 365,000 | 385,024 | |
| 5.25% 7/1/30 (c) | 100,000 | 108,325 | |
| 5.25% 7/1/35 (c) | 110,000 | 118,302 | |
| Series 2001, 5.75% 1/1/34 | 30,000 | 44,052 | |
| Virginia Small Bus. Fing. Auth.: | |||
| (95 Express Lane LLC Proj.) Series 2012: | |||
| 5% 7/1/34 (a) | 695,000 | 697,625 | |
| 5% 1/1/40 (a) | 2,625,000 | 2,634,743 | |
| (95 Express Lanes LLC Proj.): | |||
| Series 2017: | |||
| 5% 7/1/34 (a) | 640,000 | 642,418 | |
| 5% 1/1/40 (a) | 2,500,000 | 2,509,285 | |
| Series 2019: | |||
| 5% 1/1/44 (a) | 100,000 | 100,362 | |
| 5% 7/1/49 (a) | 835,000 | 837,954 | |
| (Transform 66 P3 Proj.) Series 2017: | |||
| 5% 12/31/47 (a) | 90,000 | 107,527 | |
| 5% 12/31/49 (a) | 790,000 | 942,361 | |
| 5% 12/31/52 (a) | 545,000 | 647,369 | |
| 5% 12/31/56 (a) | 6,130,000 | 7,276,491 | |
| Series 2012: | |||
| 4.75% 1/1/25 (a) | 130,000 | 133,229 | |
| 5% 7/1/25 (a) | 120,000 | 123,155 | |
| 5% 1/1/26 (a) | 120,000 | 123,119 | |
| 5% 7/1/26 (a) | 120,000 | 123,119 | |
| 5% 7/1/27 (a) | 120,000 | 123,083 | |
| 5.5% 1/1/42 (a) | 2,435,000 | 2,503,887 | |
| 6% 1/1/37 (a) | 1,875,000 | 1,935,147 | |
| TOTAL VIRGINIA | 43,483,924 | ||
| Washington - 0.6% | |||
| Adams County Pub. Hosp. District No. 2 Series 2014, 5.125% 12/1/44 | 160,000 | 172,800 | |
| Energy Northwest Elec. Rev.: | |||
| Series 2020 A: | |||
| 5% 7/1/33 | 180,000 | 235,670 | |
| 5% 7/1/34 | 220,000 | 287,493 | |
| 5% 7/1/36 | 290,000 | 376,243 | |
| 5% 7/1/37 | 300,000 | 388,361 | |
| Series 2021 A: | |||
| 4% 7/1/42 | 1,155,000 | 1,392,191 | |
| 5% 7/1/22 | 625,000 | 642,573 | |
| 5% 7/1/41 | 2,065,000 | 2,716,836 | |
| Greater Wenatchee Reg'l. Events Ctr. Pub. Facilities District Ltd. Sales Tax Series 2012 A: | |||
| 5% 9/1/27 (Pre-Refunded to 9/1/22 @ 100) | 95,000 | 98,424 | |
| 5.25% 9/1/32 (Pre-Refunded to 9/1/22 @ 100) | 60,000 | 62,274 | |
| 5.5% 9/1/42 (Pre-Refunded to 9/1/22 @ 100) | 170,000 | 176,761 | |
| Indl. Dev. Corp. of the Port of Seattle Spl. Facilities Rev. (Delta Air Lines, Inc. Proj.) Series 2012, 5% 4/1/30 (a) | 180,000 | 189,578 | |
| Port of Seattle Rev. Series 2021 C, 5% 8/1/37 (a) | 300,000 | 389,347 | |
| Washington Convention Ctr. Pub. Facilities: | |||
| Series 2021 B, 3% 7/1/58 (FSA Insured) | 500,000 | 527,599 | |
| Series 2021, 4% 7/1/31 | 460,000 | 533,830 | |
| Washington Gen. Oblig.: | |||
| Series 2020 C: | |||
| 5% 2/1/36 | 690,000 | 889,457 | |
| 5% 2/1/39 | 2,430,000 | 3,114,712 | |
| Series 2021 A, 5% 8/1/35 | 1,245,000 | 1,628,835 | |
| Series 2021 F: | |||
| 5% 6/1/39 | 800,000 | 1,057,457 | |
| 5% 6/1/40 | 1,455,000 | 1,919,766 | |
| Series 2021 R, 4% 7/1/41 | 1,430,000 | 1,746,814 | |
| Series 2022 A: | |||
| 5% 8/1/31 | 250,000 | 338,283 | |
| 5% 8/1/32 | 425,000 | 573,111 | |
| 5% 8/1/41 | 275,000 | 363,379 | |
| Washington Hsg. Fin. Commission Series 2021 1, 3.5% 12/20/35 | 1,068,736 | 1,238,757 | |
| Washington Hsg. Fin. Commission Nonprofit Hsg. Rev.: | |||
| (Judson Park Proj.) Series 2018, 5% 7/1/48 (c) | 125,000 | 133,726 | |
| (Presbyterian Retirement Cmntys. Northwest Projs.) Series 2016 A: | |||
| 5% 1/1/46 (c) | 195,000 | 211,274 | |
| 5% 1/1/51 (c) | 410,000 | 443,581 | |
| (The Hearthstone Proj.) Series 2018 A, 5% 7/1/48 (c) | 115,000 | 122,283 | |
| (Transforming Age Projs.): | |||
| Series 2019 A, 5% 1/1/55 (c) | 990,000 | 1,103,218 | |
| Series 2019 B, 2.375% 1/1/26 (c) | 595,000 | 595,504 | |
| Series 2015 A, 7% 7/1/45 (c) | 585,000 | 642,162 | |
| TOTAL WASHINGTON | 24,312,299 | ||
| West Virginia - 0.0% | |||
| Monongalia County West Commission Spl. District Excise Tax Rev.: | |||
| Series 2017 A: | |||
| 5.5% 6/1/37 (c) | 150,000 | 171,570 | |
| 5.75% 6/1/43 (c) | 150,000 | 171,825 | |
| Series 2021 A, 4.125% 6/1/43 (c) | 135,000 | 150,660 | |
| Series 2021 B, 4.875% 6/1/43 (c) | 100,000 | 108,254 | |
| West Virginia Econ. Dev. Auth. Solid Waste Disp. Facilities Rev. Bonds (Arch Resources Proj.) Series 2020, 5%, tender 7/1/25 (a)(b) | 180,000 | 194,985 | |
| TOTAL WEST VIRGINIA | 797,294 | ||
| Wisconsin - 0.3% | |||
| Pub. Fin. Auth. Sr Liv Rev. (Mary's Woods At Marylhurst, Inc. Proj.) Series 2017 A: | |||
| 5.25% 5/15/37 (c) | 35,000 | 38,256 | |
| 5.25% 5/15/42 (c) | 75,000 | 81,848 | |
| 5.25% 5/15/47 (c) | 75,000 | 81,848 | |
| 5.25% 5/15/52 (c) | 140,000 | 152,783 | |
| Pub. Fin. Auth. Charter School Rev. Series 2020 A: | |||
| 4% 7/1/30 (c) | 25,000 | 27,057 | |
| 5% 7/1/40 (c) | 45,000 | 50,480 | |
| 5% 7/1/55 (c) | 90,000 | 99,373 | |
| Pub. Fin. Auth. Ltd. Oblig. Pilot Rev. (American Dream Meadowlands Proj.) Series 2017, 7% 12/1/50 (c) | 245,000 | 268,925 | |
| Pub. Fin. Auth. Pub. Fin. Auth. Ed. Rev. Mountain Island Charter School: | |||
| Series 2017 A, 5.125% 6/15/47 (c) | 160,000 | 166,295 | |
| Series 2017: | |||
| 5% 7/1/37 | 50,000 | 54,158 | |
| 5% 7/1/47 | 120,000 | 129,098 | |
| 5% 7/1/52 | 260,000 | 279,430 | |
| Series 2019 A: | |||
| 4% 6/15/29 (c) | 60,000 | 63,099 | |
| 5% 6/15/39 (c) | 60,000 | 64,421 | |
| 5% 6/15/49 (c) | 105,000 | 111,507 | |
| Pub. Fin. Auth. Rev.: | |||
| Series 2016 A, 5% 1/1/24 (a) | 215,000 | 233,034 | |
| Series 2016 B, 5% 12/1/25 (a) | 485,000 | 560,212 | |
| Series 2016 C, 4.3% 11/1/30 (a) | 305,000 | 339,543 | |
| Series 2016 D, 4.05% 11/1/30 | 150,000 | 165,397 | |
| Pub. Fin. Auth. Solid Waste Bonds (Waste Mgmt., Inc. Proj.) Series 2017 A-2, 0.18%, tender 2/1/22 (a)(b) | 375,000 | 375,000 | |
| Pub. Fin. Auth. Spl. Facilities Rev.: | |||
| (Sky Harbour Cap. Llc Aviation Facilities Proj.) Series 2021, 4% 7/1/41 (a) | 75,000 | 78,980 | |
| Series 2021, 4.25% 7/1/54 (a) | 815,000 | 854,016 | |
| Pub. Fin. Auth. Student Hsg.: | |||
| (Univ. of Hawai'i Foundation Proj.): | |||
| Series 2021 B, 5.25% 7/1/61 | 100,000 | 103,032 | |
| Series 2021, 4% 7/1/61 | 475,000 | 507,751 | |
| Series 2019, 5% 5/1/55 (c) | 390,000 | 341,053 | |
| Pub. Fin. Auth. Wisconsin Retirement Facility Rev. Series 2018: | |||
| 5% 10/1/43 (c) | 535,000 | 588,570 | |
| 5% 10/1/48 (c) | 240,000 | 263,201 | |
| 5% 10/1/53 (c) | 480,000 | 525,481 | |
| Redev. Auth. Platteville Fixed Rate Redev. Rev. Series 2012 A, 5% 7/1/42 | 135,000 | 137,743 | |
| Roseman Univ. of Health: | |||
| (Church Home of Hartford, Inc. Proj.) Series 2015 A: | |||
| 5% 9/1/30 (c) | 50,000 | 54,031 | |
| 5% 9/1/38 (c) | 105,000 | 112,299 | |
| (Roseman Univ. of Health Sciences Proj.) Series 2020, 5% 4/1/40 (c) | 100,000 | 119,523 | |
| (Searstone CCRC Proj.) Series 2017 A: | |||
| 5.2% 6/1/37 | 485,000 | 541,373 | |
| 5.3% 6/1/47 | 670,000 | 748,876�� | |
| 5.375% 6/1/52 | 240,000 | 259,091 | |
| Series 2020, 5% 4/1/50 (c) | 120,000 | 141,443 | |
| Series 2021 A, 3% 7/1/50 (e) | 500,000 | 519,884 | |
| Wisconsin Gen. Oblig. Series 2021 A, 4% 5/1/40 | 500,000 | 586,278 | |
| Wisconsin Health & Edl. Facilities: | |||
| (Saint John's Cmntys., Inc. Proj.) Series 2018 A: | |||
| 5% 9/15/40 (Pre-Refunded to 9/15/23 @ 100) | 60,000 | 64,952 | |
| 5% 9/15/45 (Pre-Refunded to 9/15/23 @ 100) | 80,000 | 86,603 | |
| 5% 9/15/50 (Pre-Refunded to 9/15/23 @ 100) | 455,000 | 492,553 | |
| Series 2015 B, 5% 9/15/37 | 40,000 | 41,452 | |
| Series 2017: | |||
| 5% 6/1/37 | 65,000 | 71,364 | |
| 5% 6/1/41 | 100,000 | 109,226 | |
| Wisconsin Health & Edl. Facilities Auth. Rev.: | |||
| Series 2012 B, 5% 2/15/40 | 305,000 | 307,793 | |
| Series 2021, 4% 8/15/46 | 300,000 | 349,892 | |
| Series 2022: | |||
| 4% 9/15/36 | 45,000 | 47,752 | |
| 4% 9/15/41 | 45,000 | 47,231 | |
| 4% 9/15/45 | 40,000 | 41,669 | |
| Wisconsin Hsg. & Econ. Dev. Auth. Series 2018 D, 4% 3/1/47 | 250,000 | 271,663 | |
| TOTAL WISCONSIN | 11,756,539 | ||
| TOTAL MUNICIPAL BONDS | |||
| (Cost $1,055,763,784) | 1,064,129,246 | ||
| Municipal Notes - 0.9% | |||
| Arizona - 0.0% | |||
| Phoenix Indl. Dev. Auth. Health Care Facilities Series 2014 B, 0.01% 12/1/21 (Liquidity Facility Northern Trust Co.), VRDN (b) | 215,000 | $215,000 | |
| California - 0.0% | |||
| Los Angeles Dept. of Wtr. & Pwr. Rev. Series 2001 B3, 0.01% 12/1/21 (Liquidity Facility Barclays Bank PLC), VRDN (b) | 900,000 | 900,000 | |
| Los Angeles Dept. of Wtr. & Pwr. Wtrwks. Rev. Series 2019 A, 0.01% 12/1/21 (Liquidity Facility Toronto-Dominion Bank), VRDN (b) | 400,000 | 400,000 | |
| TOTAL CALIFORNIA | 1,300,000 | ||
| Georgia - 0.0% | |||
| Athens-Clarke County Unified Govt. Dev. Auth. Rev. (Univ. of Georgia Athletic Assoc. Proj.) Series 2005 B, 0.02% 12/1/21, LOC Wells Fargo Bank NA, VRDN (b) | 1,175,000 | 1,175,000 | |
| Burke County Indl. Dev. Auth. Poll. Cont. Rev. (Georgia Pwr. Co. Plant Vogtle Proj.) Series 2018, 0.07% 12/1/21, VRDN (b) | 450,000 | 450,000 | |
| TOTAL GEORGIA | 1,625,000 | ||
| Iowa - 0.0% | |||
| Iowa Fin. Auth. Health Facilities Rev. Series 2013 B1, 0.03% 12/1/21, LOC TD Banknorth, NA, VRDN (b) | 165,000 | 165,000 | |
| Kentucky - 0.1% | |||
| Louisville & Jefferson County Series 2011 B, 0.04% 12/1/21, LOC PNC Bank NA, VRDN (b) | 100,000 | 100,000 | |
| Louisville & Jefferson County Reg'l. Arpt. Auth. Spl. Facilities Rev. (UPS Worldwide Forwarding, Inc. Proj.) Series 1999 B, 0.07% 12/1/21, VRDN (a)(b) | 2,100,000 | 2,100,000 | |
| TOTAL KENTUCKY | 2,200,000 | ||
| Maryland - 0.1% | |||
| Maryland Health & Higher Edl. Facilities Auth. Rev. (Univ. of Maryland Med. Sys. Proj.): | |||
| Series 2008 D, 0.03% 12/1/21, LOC TD Banknorth, NA, VRDN (b) | 2,200,000 | 2,200,000 | |
| Series 2008 E, 0.03% 12/7/21, LOC Bank of Montreal, VRDN (b) | 700,000 | 700,000 | |
| Montgomery County Gen. Oblig. Series 2017 E, 0.04% 12/1/21 (Liquidity Facility U.S. Bank NA, Cincinnati), VRDN (b) | 210,000 | 210,000 | |
| TOTAL MARYLAND | 3,110,000 | ||
| Massachusetts - 0.1% | |||
| Massachusetts Dev. Fin. Agcy. Rev. (Boston Univ. Proj.) Series U-6C, 0.04% 12/1/21, LOC TD Banknorth, NA, VRDN (b) | 3,600,000 | 3,600,000 | |
| Michigan - 0.1% | |||
| Grand Traverse County Hosp. Fin. Auth. Series 2019 C, 0.05% 12/1/21, LOC PNC Bank NA, VRDN (b) | 5,340,000 | 5,340,000 | |
| Michigan Bldg. Auth. Rev. Series 2020 III, 0.09% 1/3/23, VRDN (b) | 100,000 | 100,000 | |
| TOTAL MICHIGAN | 5,440,000 | ||
| Minnesota - 0.1% | |||
| Hennepin County Gen. Oblig. Series 2018 B, 0.04% 12/7/21 (Liquidity Facility TD Banknorth, NA), VRDN (b) | 500,000 | 500,000 | |
| Minneapolis Health Care Sys. Rev. (Fairview Health Svcs.) Series 2018 C, 0.03% 12/1/21, LOC Wells Fargo Bank NA, VRDN (b) | 1,500,000 | 1,500,000 | |
| TOTAL MINNESOTA | 2,000,000 | ||
| Mississippi - 0.0% | |||
| Mississippi Bus. Fin. Corp. Series 2009 E, 0.02% 12/1/21, VRDN (b) | 135,000 | 135,000 | |
| New York - 0.3% | |||
| Nassau County Gen. Oblig. RAN Series 2021 A, 2% 12/10/21 | 1,100,000 | 1,100,509 | |
| New York City Gen. Oblig. Series 2021 3, 0.1% 12/8/21, VRDN (b) | 250,000 | 250,000 | |
| New York City Muni. Wtr. Fin. Auth. Wtr. & Swr. Sys. Rev.: | |||
| Series 2008 BB, 0.02% 12/1/21 (Liquidity Facility Bank of America NA), VRDN (b) | 120,000 | 120,000 | |
| Series 2011 DD-3A, 0.02% 12/1/21 (Liquidity Facility U.S. Bank NA, Cincinnati), VRDN (b) | 2,000,000 | 2,000,000 | |
| New York City Transitional Fin. Auth. Rev. Series 2011 A4 0.05% 12/1/21 (Liquidity Facility Barclays Bank PLC), VRDN (b) | 225,000 | 225,000 | |
| New York Metropolitan Trans. Auth. Dedicated Tax Fund Rev. BAN Series 2019 A, 5% 3/1/22 | 600,000 | 607,003 | |
| New York Metropolitan Trans. Auth. Rev. BAN Series 2019 D1, 5% 9/1/22 | 3,150,000 | 3,259,434 | |
| Triborough Bridge & Tunnel Auth. Revs. Series 2005 B, 0.02% 12/1/21, LOC U.S. Bank NA, Cincinnati, VRDN (b) | 2,450,000 | 2,450,000 | |
| TOTAL NEW YORK | 10,011,946 | ||
| North Carolina - 0.1% | |||
| Charlotte-Mecklenburg Hosp. Auth. Health Care Sys. Rev. (Carolinas Healthcare Sys. Proj.) Series 2007 B, 0.04% 12/1/21 (Liquidity Facility JPMorgan Chase Bank), VRDN (b) | 1,670,000 | 1,670,000 | |
| Raleigh Durham Arpt. Auth. Arpt. Rev. Series 2008 C, 0.03% 12/7/21, LOC TD Banknorth, NA, VRDN (b) | 500,000 | 500,000 | |
| Univ. of North Carolina Hosp. at Chapel Hill Rev. Series 2001 A, 0.03% 12/1/21, VRDN (b) | 875,000 | 875,000 | |
| TOTAL NORTH CAROLINA | 3,045,000 | ||
| Texas - 0.0% | |||
| Harris County Health Facilities Dev. Corp. Rev. (Methodist Hosp. Proj.) Series A1, 0.04% 12/1/21, VRDN (b) | 450,000 | 450,000 | |
| Virginia - 0.0% | |||
| Lynchburg Econ. Dev. Series 2017 B, 0.05% 12/1/21, LOC Truist Bank, VRDN (b) | 2,000,000 | 2,000,000 | |
| Wisconsin - 0.0% | |||
| Wisconsin Gen. Oblig. Series 2019 A, 0.06% 12/7/21, VRDN (b) | 525,000 | 525,000 | |
| TOTAL MUNICIPAL NOTES | |||
| (Cost $35,822,838) | 35,821,946 | ||
| Shares | Value | ||
| Municipal Bond Funds - 71.7% | |||
| BlackRock National Municipal Fund Investor A Shares | 12,095,550 | 138,131,176 | |
| Delaware Tax-Free U.S.A. Fund Class A | 161,976 | 1,997,167 | |
| DWS Managed Municipal Bond Fund - Class S | 5,832,384 | 54,532,790 | |
| DWS Strategic High Yield Tax-Free Fund Class S | 666,925 | 8,383,249 | |
| Fidelity Advisor Municipal Income Fund Class Z (i) | 183 | 2,494 | |
| Fidelity SAI Municipal Income Fund (i) | 43,711,316 | 476,453,342 | |
| Fidelity SAI Tax-Free Bond Fund (i) | 20,213,864 | 221,139,672 | |
| Fidelity Tax-Free Bond Fund (i) | 205 | 2,494 | |
| Franklin Federal Tax-Free Income Fund - Class R6 | 4,011,461 | 49,381,090 | |
| iShares S&P National Municipal Bond ETF | 709,245 | 82,712,152 | |
| MainStay MacKay High Yield Municipal Bond Fund Class A | 6,624,981 | 90,298,492 | |
| MainStay MacKay Tax Free Bond Fund Class A | 27,778,690 | 296,954,192 | |
| MFS Municipal Income Fund Class A | 42,462,224 | 390,227,836 | |
| T. Rowe Price Summit Municipal Income Fund Investor Class | 6,379,027 | 79,929,207 | |
| T. Rowe Price Tax-Free High Yield Fund | 1,489,394 | 18,885,514 | |
| T. Rowe Price Tax-Free Income Fund - I Class | 239 | 2,500 | |
| Vanguard High-Yield Tax-Exempt Fund Admiral Shares | 207 | 2,499 | |
| Vanguard Long-Term Tax-Exempt Fund Admiral Shares | 38,366,134 | 468,066,840 | |
| Wells Fargo Municipal Bond Fund - Class Admin | 14,686,815 | 158,176,995 | |
| Western Asset Managed Municipals Fund Class A | 16,915,396 | 283,163,722 | |
| TOTAL MUNICIPAL BOND FUNDS | |||
| (Cost $2,816,765,034) | 2,818,443,423 | ||
| Money Market Funds - 0.2% | |||
| Fidelity Investments Money Market Government Portfolio Class I 0.01% (i)(j) | 5,717,489 | 5,717,489 | |
| Fidelity Investments Money Market Government Portfolio Institutional Class 0.01% (i)(j) | 2,500 | 2,500 | |
| Fidelity SAI Municipal Money Market Fund 0.01% (i)(j) | 2,499 | 2,500 | |
| TOTAL MONEY MARKET FUNDS | |||
| (Cost $5,722,489) | 5,722,489 | ||
| TOTAL INVESTMENT IN SECURITIES - 99.9% | |||
| (Cost $3,914,074,145) | 3,924,117,104 | ||
| NET OTHER ASSETS (LIABILITIES) - 0.1% | 4,368,720 | ||
| NET ASSETS - 100% | $3,928,485,824 |
| Futures Contracts | |||||
| Number of contracts | Expiration Date | Notional Amount | Value | Unrealized Appreciation/(Depreciation) | |
| Sold | |||||
| Treasury Contracts | |||||
| CBOT 10-Year U.S. Treasury Note Contracts (United States) | 100 | March 2022 | $13,081,250 | $(181,480) | $(181,480) |
| CBOT Long Term U.S. Treasury Bond Contracts (United States) | 50 | March 2022 | 8,106,250 | (234,493) | (234,493) |
| TOTAL FUTURES CONTRACTS | $(415,973) |
The notional amount of futures sold as a percentage of Net Assets is 0.6%
Security Type Abbreviations
BAN – BOND ANTICIPATION NOTE
RAN – REVENUE ANTICIPATION NOTE
VRDN – VARIABLE RATE DEMAND NOTE (A debt instrument that is payable upon demand, either daily, weekly or monthly)
ETF – Exchange-Traded Fund
Legend
(a) Private activity obligations whose interest is subject to the federal alternative minimum tax for individuals.
(b) Coupon rates for floating and adjustable rate securities reflect the rates in effect at period end.
(c) Security exempt from registration under Rule 144A of the Securities Act of 1933. These securities may be resold in transactions exempt from registration, normally to qualified institutional buyers. At the end of the period, the value of these securities amounted to $81,377,248 or 2.1% of net assets.
(d) Coupon is indexed to a floating interest rate which may be multiplied by a specified factor and/or subject to caps or floors.
(e) Security or a portion of the security purchased on a delayed delivery or when-issued basis.
(f) Security initially issued in zero coupon form which converts to coupon form at a specified rate and date. The rate shown is the rate at period end.
(g) Security initially issued at one coupon which converts to a higher coupon at a specified date. The rate shown is the rate at period end.
(h) Level 3 security
(i) Affiliated Fund
(j) The rate quoted is the annualized seven-day yield of the fund at period end.
Affiliated Underlying Funds
Fiscal year to date information regarding the Fund's investments in affiliated Underlying Funds is presented below. Exchanges between classes of the same affiliated Underlying Funds may occur. If an underlying Fund changes its name, the name presented below is the name in effect at period end.
| Affiliate | Value, beginning of period | Purchases | Sales Proceeds | Dividend Income | Realized Gain (loss) | Change in Unrealized appreciation (depreciation) | Value, end of period |
| Fidelity Investments Money Market Government Portfolio Class I 0.01% | $ -- | $9,573,565 | $3,856,076 | $35 | $ -- | $ -- | $5,717,489 |
| Fidelity Advisor Municipal Income Fund Class Z | -- | 2,516 | -- | 10 | -- | (22) | 2,494 |
| Fidelity Investments Money Market Government Portfolio Institutional Class 0.01% | -- | 2,500 | -- | -- | -- | -- | 2,500 |
| Fidelity SAI Municipal Income Fund | -- | 474,668,746 | 5,036 | 1,238,821 | (5) | 1,789,637 | 476,453,342 |
| Fidelity SAI Municipal Money Market Fund 0.01% | -- | 2,500 | -- | -- | -- | -- | 2,500 |
| Fidelity SAI Tax-Free Bond Fund | -- | 379,957,221 | 156,049,599 | 1,454,223 | (1,382,959) | (1,384,991) | 221,139,672 |
| Fidelity Tax-Free Bond Fund | -- | 2,516 | -- | 13 | -- | (22) | 2,494 |
| Total | $-- | $864,209,564 | $159,910,711 | $2,693,101 | $(1,382,964) | $404,602 | $703,320,491 |
Amounts in the income column in the above table include any capital gain distributions from underlying funds, which are presented in the corresponding line-item in the Statement of Operations, if applicable.
Investment Valuation
The following is a summary of the inputs used, as of November 30, 2021, involving the Fund's assets and liabilities carried at fair value. The inputs or methodology used for valuing securities may not be an indication of the risk associated with investing in those securities. For more information on valuation inputs, and their aggregation into the levels used below, please refer to the Investment Valuation section in the accompanying Notes to Financial Statements.
| Valuation Inputs at Reporting Date: | ||||
| Description | Total | Level 1 | Level 2 | Level 3 |
| Investments in Securities: | ||||
| Municipal Securities | $1,099,951,192 | $-- | $1,099,378,277 | $572,915 |
| Municipal Bond Funds | 2,735,731,271 | 2,735,731,271 | -- | -- |
| Money Market Funds | 5,722,489 | 5,722,489 | -- | -- |
| Investment Companies | 82,712,152 | 82,712,152 | -- | -- |
| Total Investments in Securities: | $3,924,117,104 | $2,824,165,912 | $1,099,378,277 | $572,915 |
| Derivative Instruments: | ||||
| Liabilities | ||||
| Futures Contracts | $(415,973) | $(415,973) | $-- | $-- |
| Total Liabilities | $(415,973) | $(415,973) | $-- | $-- |
| Total Derivative Instruments: | $(415,973) | $(415,973) | $-- | $-- |
Value of Derivative Instruments
The following table is a summary of the Fund's value of derivative instruments by primary risk exposure as of November 30, 2021. For additional information on derivative instruments, please refer to the Derivative Instruments section in the accompanying Notes to Financial Statements.
| Primary Risk Exposure / Derivative Type | Value | |
| Asset | Liability | |
| Interest Rate Risk | ||
| Futures Contracts(a) | $0 | $(415,973) |
| Total Interest Rate Risk | 0 | (415,973) |
| Total Value of Derivatives | $0 | $(415,973) |
(a) Reflects gross cumulative appreciation (depreciation) on futures contracts as presented in the Schedule of Investments. In the Statement of Assets and Liabilities, the period end daily variation margin is included in receivable or payable for daily variation margin on futures contracts, and the net cumulative appreciation (depreciation) is included in Total accumulated earnings (loss).
See accompanying notes which are an integral part of the financial statements.
Financial Statements
Statement of Assets and Liabilities
| November 30, 2021 (Unaudited) | ||
| Assets | ||
| Investment in securities, at value — See accompanying schedule: Unaffiliated issuers (cost $3,211,158,248) | $3,220,796,613 | |
| Affiliated issuers (cost $702,915,897) | 703,320,491 | |
| Total Investment in Securities (cost $3,914,074,145) | $3,924,117,104 | |
| Segregated cash with brokers for derivative instruments | 325,000 | |
| Receivable for investments sold | ||
| Regular delivery | 1,787,339 | |
| Delayed delivery | 628,490 | |
| Receivable for fund shares sold | 10,185,737 | |
| Dividends receivable | 570,448 | |
| Interest receivable | 12,708,618 | |
| Prepaid expenses | 16,870 | |
| Other receivables | 23 | |
| Total assets | 3,950,339,629 | |
| Liabilities | ||
| Payable to custodian bank | $289,816 | |
| Payable for investments purchased | ||
| Regular delivery | 2,603,833 | |
| Delayed delivery | 9,291,334 | |
| Payable for fund shares redeemed | 3,115,383 | |
| Distributions payable | 6,079,022 | |
| Accrued management fee | 140,738 | |
| Payable for daily variation margin on futures contracts | 137,500 | |
| Other payables and accrued expenses | 196,179 | |
| Total liabilities | 21,853,805 | |
| Net Assets | $3,928,485,824 | |
| Net Assets consist of: | ||
| Paid in capital | $3,929,779,511 | |
| Total accumulated earnings (loss) | (1,293,687) | |
| Net Assets | $3,928,485,824 | |
| Net Asset Value, offering price and redemption price per share ($3,928,485,824 ÷ 395,250,734 shares) | $9.94 |
See accompanying notes which are an integral part of the financial statements.
Statement of Operations
| For the period June 17, 2021 (commencement of operations) through November 30, 2021 (Unaudited) | ||
| Investment Income | ||
| Dividends: | ||
| Unaffiliated issuers | $11,069,854 | |
| Affiliated issuers | 2,693,101 | |
| Interest | 1,965,025 | |
| Total income | 15,727,980 | |
| Expenses | ||
| Management fee | $2,116,590 | |
| Custodian fees and expenses | 8,864 | |
| Independent trustees' fees and expenses | 2,677 | |
| Registration fees | 393,005 | |
| Audit | 34,281 | |
| Legal | 151 | |
| Miscellaneous | 284 | |
| Total expenses before reductions | 2,555,852 | |
| Expense reductions | (1,925,465) | |
| Total expenses after reductions | 630,387 | |
| Net investment income (loss) | 15,097,593 | |
| Realized and Unrealized Gain (Loss) | ||
| Net realized gain (loss) on: | ||
| Investment securities: | ||
| Unaffiliated issuers | (10,185,102) | |
| Affiliated issuers | (1,382,964) | |
| Futures contracts | 442,664 | |
| Capital gain distributions from underlying funds: | ||
| Unaffiliated issuers | 2,058 | |
| Total net realized gain (loss) | (11,123,344) | |
| Change in net unrealized appreciation (depreciation) on: | ||
| Investment securities: | ||
| Unaffiliated issuers | 9,638,357 | |
| Affiliated issuers | 404,602 | |
| Futures contracts | (415,973) | |
| Total change in net unrealized appreciation (depreciation) | 9,626,986 | |
| Net gain (loss) | (1,496,358) | |
| Net increase (decrease) in net assets resulting from operations | $13,601,235 |
See accompanying notes which are an integral part of the financial statements.
Statement of Changes in Net Assets
| For the period June 17, 2021 (commencement of operations) through November 30, 2021 (Unaudited) | |
| Increase (Decrease) in Net Assets | |
| Operations | |
| Net investment income (loss) | $15,097,593 |
| Net realized gain (loss) | (11,123,344) |
| Change in net unrealized appreciation (depreciation) | 9,626,986 |
| Net increase (decrease) in net assets resulting from operations | 13,601,235 |
| Distributions to shareholders | (14,894,922) |
| Share transactions | |
| Proceeds from sales of shares | 4,036,951,669 |
| Reinvestment of distributions | 82,754 |
| Cost of shares redeemed | (107,254,912) |
| Net increase (decrease) in net assets resulting from share transactions | 3,929,779,511 |
| Total increase (decrease) in net assets | 3,928,485,824 |
| Net Assets | |
| Beginning of period | – |
| End of period | $3,928,485,824 |
| Other Information | |
| Shares | |
| Sold | 406,071,344 |
| Issued in reinvestment of distributions | 8,321 |
| Redeemed | (10,828,931) |
| Net increase (decrease) | 395,250,734 |
See accompanying notes which are an integral part of the financial statements.
Financial Highlights
Strategic Advisers Municipal Bond Fund
| Six months ended (Unaudited) November 30, | |
| 2021 A | |
| Selected Per–Share Data | |
| Net asset value, beginning of period | $10.00 |
| Income from Investment Operations | |
| Net investment income (loss)B | .088 |
| Net realized and unrealized gain (loss) | (.066) |
| Total from investment operations | .022 |
| Distributions from net investment income | (.082) |
| Total distributions | (.082) |
| Net asset value, end of period | $9.94 |
| Total ReturnC,D | .23% |
| Ratios to Average Net AssetsE,F | |
| Expenses before reductions | .33%G |
| Expenses net of fee waivers, if any | .08%G |
| Expenses net of all reductions | .08%G |
| Net investment income (loss) | 1.96%G |
| Supplemental Data | |
| Net assets, end of period (000 omitted) | $3,928,486 |
| Portfolio turnover rateH | 67%I |
A For the period June 17, 2021 (commencement of operations) through November 30, 2021.
B Calculated based on average shares outstanding during the period.
C Total returns for periods of less than one year are not annualized.
D Total returns would have been lower if certain expenses had not been reduced during the applicable periods shown.
E Fees and expenses of any underlying mutual funds or exchange-traded funds (ETFs) are not included in the Fund's expense ratio. The Fund indirectly bears its proportionate share of these expenses.
F Expense ratios reflect operating expenses of the class. Expenses before reductions do not reflect amounts reimbursed, waived, or reduced through arrangements with the investment adviser, brokerage services, or other offset arrangements, if applicable, and do not represent the amount paid by the class during periods when reimbursements, waivers or reductions occur.
G Annualized
H Amount does not include the portfolio activity of any underlying mutual funds or exchange-traded funds (ETFs).
I Amount not annualized.
See accompanying notes which are an integral part of the financial statements.
Notes to Financial Statements (Unaudited)
For the period ended November 30, 2021
1. Organization.
Strategic Advisers Municipal Bond Fund (the Fund) is a fund of Fidelity Rutland Square Trust II (the Trust), and is authorized to issue an unlimited number of shares. The Trust is registered under the Investment Company Act of 1940, as amended (the 1940 Act), as an open-end management investment company organized as a Delaware statutory trust. The Fund is offered exclusively to certain managed account clients of Strategic Advisers LLC (Strategic Advisers), an affiliate of Fidelity Management & Research Company LLC (FMR).
2. Significant Accounting Policies.
The Fund is an investment company and applies the accounting and reporting guidance of the Financial Accounting Standards Board (FASB) Accounting Standards Codification Topic 946 Financial Services - Investment Companies. The financial statements have been prepared in conformity with accounting principles generally accepted in the United States of America (GAAP), which require management to make certain estimates and assumptions at the date of the financial statements. Actual results could differ from those estimates. Subsequent events, if any, through the date that the financial statements were issued have been evaluated in the preparation of the financial statements. The Fund's Schedule of Investments lists any underlying mutual funds or exchange-traded funds (ETFs) but does not include the underlying holdings of these funds. The following summarizes the significant accounting policies of the Fund:
Investment Valuation. Investments are valued as of 4:00 p.m. Eastern time on the last calendar day of the period. The Board of Trustees (the Board) has delegated the day to day responsibility for the valuation of the Fund's investments to the Fair Value Committee (the Committee) established by the Fund's investment adviser. In accordance with valuation policies and procedures approved by the Board, the Fund attempts to obtain prices from one or more third party pricing vendors or brokers to value its investments. When current market prices, quotations or currency exchange rates are not readily available or reliable, investments will be fair valued in good faith by the Committee, in accordance with procedures adopted by the Board. Factors used in determining fair value vary by investment type and may include market or investment specific events, changes in interest rates and credit quality. The frequency with which these procedures are used cannot be predicted and they may be utilized to a significant extent. The Committee oversees the Fund's valuation policies and procedures and reports to the Board on the Committee's activities and fair value determinations. The Board monitors the appropriateness of the procedures used in valuing the Fund's investments and ratifies the fair value determinations of the Committee.
The Fund categorizes the inputs to valuation techniques used to value its investments into a disclosure hierarchy consisting of three levels as shown below:
- Level 1 – quoted prices in active markets for identical investments
- Level 2 – other significant observable inputs (including quoted prices for similar investments, interest rates, prepayment speeds, etc.)
- Level 3 – unobservable inputs (including the Fund's own assumptions based on the best information available)
Valuation techniques used to value the Fund's investments by major category are as follows:
Debt securities, including restricted securities, are valued based on evaluated prices received from third party pricing vendors or from brokers who make markets in such securities. Municipal securities are valued by pricing vendors who utilize matrix pricing which considers yield or price of bonds of comparable quality, coupon, maturity and type or by broker-supplied prices. When independent prices are unavailable or unreliable, debt securities may be valued utilizing pricing methodologies which consider similar factors that would be used by third party pricing vendors. Debt securities are generally categorized as Level 2 in the hierarchy but may be Level 3 depending on the circumstances.
Exchange-Traded Funds (ETFs) are valued at their last sale price or official closing price as reported by a third party pricing vendor on the primary market or exchange on which they are traded and are categorized as Level 1 in the hierarchy. In the event there were no sales during the day but the exchange reports a closing bid level, ETFs are valued at the closing bid and would be categorized as Level 1 in the hierarchy. In the event there was no closing bid, ETFs may be valued by another method that the Board believes reflects fair value in accordance with the Board's fair value pricing policies and may be categorized as Level 2 in the hierarchy.
Futures contracts are valued at the settlement price established each day by the board of trade or exchange on which they are traded and are categorized as Level 1 in the hierarchy. Investments in open-end mutual funds are valued at their closing net asset value (NAV) each business day and are categorized as Level 1 in the hierarchy. If an unaffiliated open-end mutual fund's NAV is unavailable, shares of that fund may be valued by another method that the Board believes reflects fair value in accordance with the Board's fair value pricing policies and is categorized as Level 2 in the hierarchy.
Changes in valuation techniques may result in transfers in or out of an assigned level within the disclosure hierarchy. The aggregate value of investments by input level as of November 30, 2021 is included at the end of the Fund's Schedule of Investments.
Investment Transactions and Income. For financial reporting purposes, the Fund's investment holdings and NAV include trades executed through the end of the last business day of the period. The NAV per share for processing shareholder transactions is calculated as of the close of business of the New York Stock Exchange (NYSE), normally 4:00 p.m. Eastern time and includes trades executed through the end of the prior business day. Gains and losses on securities sold are determined on the basis of identified cost. Dividend income is recorded on the ex-dividend date, except for certain dividends from foreign securities where the ex-dividend date may have passed, which are recorded as soon as the Fund is informed of the ex-dividend date. Non-cash dividends included in dividend income, if any, are recorded at the fair market value of the securities received. Interest income is accrued as earned and includes coupon interest and amortization of premium and accretion of discount on debt securities as applicable.
Expenses. Expenses directly attributable to a fund are charged to that fund. Expenses attributable to more than one fund are allocated among the respective funds on the basis of relative net assets or other appropriate methods. Expenses included in the accompanying financial statements reflect the expenses of that fund and do not include any expenses associated with any underlying mutual funds or exchange-traded funds. Although not included in a fund's expenses, a fund indirectly bears its proportionate share of these expenses through the net asset value of each underlying mutual fund or exchange-traded fund. Expense estimates are accrued in the period to which they relate and adjustments are made when actual amounts are known.
Income Tax Information and Distributions to Shareholders. Each year, the Fund intends to qualify as a regulated investment company under Subchapter M of the Internal Revenue Code, including distributing substantially all of its taxable income and realized gains. As a result, no provision for U.S. Federal income taxes is required. The Fund files a U.S. federal tax return, in addition to state and local tax returns as required. The Fund's federal income tax returns are subject to examination by the Internal Revenue Service (IRS) for a period of three fiscal years after they are filed. State and local tax returns may be subject to examination for an additional fiscal year depending on the jurisdiction.
Distributions are declared and recorded daily and paid monthly from net investment income. Distributions from realized gains, if any, are declared and recorded on the ex-dividend date. Income and capital gain distributions are determined in accordance with income tax regulations, which may differ from GAAP.
Capital accounts within the financial statements are adjusted for permanent book-tax differences. These adjustments have no impact on net assets or the results of operations. Capital accounts are not adjusted for temporary book-tax differences which will reverse in a subsequent period.
As of period end, the cost and unrealized appreciation (depreciation) in securities, and derivatives if applicable, for federal income tax purposes were as follows:
| Gross unrealized appreciation | $16,444,364 |
| Gross unrealized depreciation | (10,219,654) |
| Net unrealized appreciation (depreciation) | $6,224,710 |
| Tax cost | $3,917,476,421 |
Delayed Delivery Transactions and When-Issued Securities. During the period, certain Funds transacted in securities on a delayed delivery or when-issued basis. Payment and delivery may take place after the customary settlement period for that security. The price of the underlying securities and the date when the securities will be delivered and paid for are fixed at the time the transaction is negotiated. Securities purchased on a delayed delivery or when-issued basis are identified as such in the Schedule of Investments. Compensation for interest forgone in the purchase of a delayed delivery or when-issued debt security may be received. With respect to purchase commitments, each applicable Fund identifies securities as segregated in its records with a value at least equal to the amount of the commitment. Payables and receivables associated with the purchases and sales of delayed delivery securities having the same coupon, settlement date and broker are offset. Delayed delivery or when-issued securities that have been purchased from and sold to different brokers are reflected as both payables and receivables in the Statement of Assets and Liabilities under the caption "Delayed delivery", as applicable. Losses may arise due to changes in the value of the underlying securities or if the counterparty does not perform under the contract's terms, or if the issuer does not issue the securities due to political, economic, or other factors.
Restricted Securities (including Private Placements). Funds may invest in securities that are subject to legal or contractual restrictions on resale. These securities generally may be resold in transactions exempt from registration or to the public if the securities are registered. Disposal of these securities may involve time-consuming negotiations and expense, and prompt sale at an acceptable price may be difficult. Information regarding restricted securities held at period end is included at the end of the Schedule of Investments, if applicable.
3. Derivative Instruments.
Risk Exposures and the Use of Derivative Instruments. The Fund's investment objective allows the Fund to enter into various types of derivative contracts, including futures contracts. Derivatives are investments whose value is primarily derived from underlying assets, indices or reference rates and may be transacted on an exchange or over-the-counter (OTC). Derivatives may involve a future commitment to buy or sell a specified asset based on specified terms, to exchange future cash flows at periodic intervals based on a notional principal amount, or for one party to make one or more payments upon the occurrence of specified events in exchange for periodic payments from the other party.
The Fund used derivatives to increase returns and to manage exposure to certain risks as defined below. The success of any strategy involving derivatives depends on analysis of numerous economic factors, and if the strategies for investment do not work as intended, the Fund may not achieve its objectives.
The Fund's use of derivatives increased or decreased its exposure to the following risk:
| Interest Rate Risk | Interest rate risk relates to the fluctuations in the value of interest-bearing securities due to changes in the prevailing levels of market interest rates. |
The Fund is also exposed to additional risks from investing in derivatives, such as liquidity risk and counterparty credit risk. Liquidity risk is the risk that the Fund will be unable to close out the derivative in the open market in a timely manner. Counterparty credit risk is the risk that the counterparty will not be able to fulfill its obligation to the Fund. Counterparty credit risk related to exchange-traded futures contracts may be mitigated by the protection provided by the exchange on which they trade.
Investing in derivatives may involve greater risks than investing in the underlying assets directly and, to varying degrees, may involve risk of loss in excess of any initial investment and collateral received and amounts recognized in the Statement of Assets and Liabilities. In addition, there may be the risk that the change in value of the derivative contract does not correspond to the change in value of the underlying instrument.
Futures Contracts. A futures contract is an agreement between two parties to buy or sell a specified underlying instrument for a fixed price at a specified future date. The Fund used futures contracts to manage its exposure to the bond market and fluctuations in interest rates.
Upon entering into a futures contract, a fund is required to deposit either cash or securities (initial margin) with a clearing broker in an amount equal to a certain percentage of the face value of the contract. Futures contracts are marked-to-market daily and subsequent daily payments (variation margin) are made or received by a fund depending on the daily fluctuations in the value of the futures contracts and are recorded as unrealized appreciation or (depreciation). This receivable and/or payable, if any, is included in daily variation margin on futures contracts in the Statement of Assets and Liabilities. Realized gain or (loss) is recorded upon the expiration or closing of a futures contract. The net realized gain (loss) and change in net unrealized appreciation (depreciation) on futures contracts during the period is presented in the Statement of Operations.
Any open futures contracts at period end are presented in the Schedule of Investments under the caption "Futures Contracts". The notional amount at value reflects each contract's exposure to the underlying instrument or index at period end and is representative of volume of activity during the period. Securities deposited to meet initial margin requirements are identified in the Schedule of Investments.
4. Purchases and Sales of Investments.
Purchases and sales of securities, other than short-term securities and in-kind transactions, as applicable, are noted in the table below.
| Purchases ($) | Sales ($) | |
| Strategic Advisers Municipal Bond Fund | 5,193,309,661 | 1,305,732,489 |
Unaffiliated Exchanges In-Kind. During the period, the Fund redeemed shares of Delaware Tax-Free U.S.A. Fund Class A, MainStay MacKay Tax Free Bond Fund Class A, T. Rowe Price Summit Municipal Income Fund Investor Class, and T. Rowe Price Tax-Free High Yield Fund in exchange for investments as noted in the following table. The net realized gain (loss) on the Fund's redemptions of Delaware Tax-Free U.S.A. Fund Class A, MainStay MacKay Tax Free Bond Fund Class A, T. Rowe Price Summit Municipal Income Fund Investor Class, and T. Rowe Price Tax-Free High Yield Fund is included in "Net Realized gain (loss) on Investment Securities: Unaffiliated issuers" in the accompanying Statement of Operations. The Fund recognized a net loss on the exchanges for federal income tax purposes.
| Fund Name | Value of Investments ($) | Net realized gain (loss) ($) | Shares redeemed |
| Delaware Tax-Free U.S.A. Fund Class A | 133,316,728 | (652,576) | 10,716,779 |
| MainStay MacKay Tax Free Bond Fund Class A | 200,223,895 | (1,925,084) | 18,814,675 |
| T. Rowe Price Summit Municipal Income Fund Investor Class | 413,883,024 | (4,072,871) | 33,297,106 |
| T. Rowe Price Tax-Free High Yield Fund | 352,121,702 | (3,324,298) | 27,968,364 |
| Total | 1,099,545,349 | (9,974,829) | 90,796,924 |
5. Fees and Other Transactions with Affiliates.
Management Fee. Strategic Advisers (the investment adviser) provides the Fund with investment management related services. For these services, the Fund pays a monthly management fee to the investment adviser. The management fee is calculated by adding the annual management fee rate of .25% of the Fund's average net assets throughout the month to the aggregate of the fee rates, payable monthly by the investment adviser, to the Fund's sub-advisers. The Fund's maximum aggregate management fee will not exceed .60% of the Fund's average net assets. For the reporting period, the total annualized management fee rate was .27% of the Fund's average net assets.
During the period, the investment adviser waived a portion of its management fee as described in the Expense Reductions note.
Sub-Advisers. Delaware Investments Fund Advisers, Mackay Shields LLC and T. Rowe Price Associates, Inc. each served as a sub-adviser for the Fund during the period. Sub-advisers provide discretionary investment advisory services for their allocated portion of the Fund's assets and are paid as described in the Management Fee note.
FIAM LLC (an affiliate of the investment adviser) and Massachusetts Financial Services Company have been retained to serve as a sub-adviser for the Fund. As of the date of this report, however, these sub-advisers have not been allocated any portion of the Fund's assets. These sub-advisers in the future may provide discretionary investment advisory services for an allocated portion of the Fund's assets and will be paid by the investment adviser for providing these services.
Interfund Trades. Funds may purchase from or sell securities to other Fidelity Funds under procedures adopted by the Board. The procedures have been designed to ensure these interfund trades are executed in accordance with Rule 17a-7 of the 1940 Act. Any interfund trades are included within the respective purchases and sales amounts shown in the Purchases and Sales of Investments note. During the period there were no interfund trades.
6. Expense Reductions.
The investment adviser has contractually agreed to waive the Fund's management fee in an amount equal to .25% of the Fund's average net assets until September 30, 2024. During the period, this waiver reduced the Fund's management fee by $1,925,465.
7. Other.
A fund's organizational documents provide former and current trustees and officers with a limited indemnification against liabilities arising in connection with the performance of their duties to the fund. In the normal course of business, a fund may also enter into contracts that provide general indemnifications. A fund's maximum exposure under these arrangements is unknown as this would be dependent on future claims that may be made against a fund. The risk of material loss from such claims is considered remote.
Funds do not invest in underlying mutual funds for the purpose of exercising management or control; however, investments by funds within their principal investment strategies may represent a significant portion of the underlying mutual fund's net assets. At the end of the period, certain Funds were the owners of record of 10% or more of the total outstanding shares of the following underlying mutual funds as shown below.
| Fund | Strategic Advisers Municipal Bond Fund |
| Fidelity SAI Municipal Income Fund | 19% |
| Fidelity SAI Tax-Free Bond Fund | 10% |
8. Coronavirus (COVID-19) Pandemic.
An outbreak of COVID-19 first detected in China during December 2019 has since spread globally and was declared a pandemic by the World Health Organization during March 2020. Developments that disrupt global economies and financial markets, such as the COVID-19 pandemic, may magnify factors that affect the Fund's performance.
Shareholder Expense Example
As a shareholder, you incur two types of costs: (1) transaction costs, which may include sales charges (loads) on purchase payments or redemption proceeds, as applicable and (2) ongoing costs, which generally include management fees, distribution and/or service (12b-1) fees and other Fund expenses. This Example is intended to help you understand your ongoing costs (in dollars) of investing in a fund and to compare these costs with the ongoing costs of investing in other mutual funds.
The actual expense Example is based on an investment of $1,000 invested at the beginning of the period and held for the entire period (June 17, 2021 to November 30, 2021). The hypothetical expense Example is based on an investment of $1,000 invested for the one-half year period (June 1, 2021 to November 30, 2021).
Actual Expenses
The first line of the accompanying table provides information about actual account values and actual expenses. You may use the information in this line, together with the amount you invested, to estimate the expenses that you paid over the period. Simply divide your account value by $1,000.00 (for example, an $8,600 account value divided by $1,000.00 = 8.6), then multiply the result by the number in the first line for a class/Fund under the heading entitled "Expenses Paid During Period" to estimate the expenses you paid on your account during this period. If any fund is a shareholder of any underlying mutual funds or exchange-traded funds (ETFs) (the Underlying Funds), such fund indirectly bears its proportional share of the expenses of the Underlying Funds in addition to the direct expenses incurred presented in the table. These fees and expenses are not included in the annualized expense ratio used to calculate the expense estimate in the table below.
Hypothetical Example for Comparison Purposes
The second line of the accompanying table provides information about hypothetical account values and hypothetical expenses based on the actual expense ratio and an assumed rate of return of 5% per year before expenses, which is not the actual return. The hypothetical account values and expenses may not be used to estimate the actual ending account balance or expenses you paid for the period. You may use this information to compare the ongoing costs of investing in the Fund and other funds. To do so, compare this 5% hypothetical example with the 5% hypothetical examples that appear in the shareholder reports of the other funds. If any fund is a shareholder of any Underlying Funds, such fund indirectly bears its proportional share of the expenses of the Underlying Funds in addition to the direct expenses as presented in the table. These fees and expenses are not included in the annualized expense ratio used to calculate the expense estimate in the table below.
Please note that the expenses shown in the table are meant to highlight your ongoing costs only and do not reflect any transaction costs. Therefore, the second line of the table is useful in comparing ongoing costs only, and will not help you determine the relative total costs of owning different funds. In addition, if these transactional costs were included, your costs would have been higher.
| Annualized Expense Ratio-A | Beginning Account Value | Ending Account Value November 30, 2021 | Expenses Paid During Period | |
| Strategic Advisers Municipal Bond Fund | .08% | |||
| Actual | $1,000.00 | $1,002.30 | $.37-B | |
| Hypothetical-C | $1,000.00 | $1,024.67 | $.41-D |
A Annualized expense ratio reflects expenses net of applicable fee waivers.
B Actual expenses are equal to the annualized expense ratio, multiplied by the average account value over the period, multiplied by 167/365 (to reflect the period June 17, 2021 to November 30, 2021).
C 5% return per year before expenses
D Hypothetical expenses are equal to the annualized expense ratio, multiplied by the average account value over the period, multiplied by 183/365 (to reflect the one-half year period).
Board Approval of Investment Advisory Contracts and Management Fees
Strategic Advisers Municipal Bond Fund
In June 2021, the Board of Trustees, including the Independent Trustees (together, the Board) voted to approve (i) the management contract between Strategic Advisers LLC (Strategic Advisers) and Fidelity Rutland Square Trust II (Trust) on behalf of the fund (Management Contract); (ii) the sub-advisory agreements among Strategic Advisers, each of FIAM LLC (FIAM), MacKay Shields LLC (MacKay Shields), and T. Rowe Price Associates, Inc. (T. Rowe Price), and the Trust on behalf of the fund (each respective agreement, a Sub-Advisory Agreement and collectively, the Sub-Advisory Agreements); and (iii) the sub-subadvisory agreements among FIAM and each of FMR Investment Management (UK) Limited, Fidelity Management & Research (Japan) Limited and Fidelity Management & Research (Hong Kong) Limited, with respect to the fund (Sub-Subadvisory Agreements and together with the Management Contract and Sub-Advisory Agreements, the Advisory Contracts). Strategic Advisers and the sub-advisers are referred to herein as the Investment Advisers. The Board, assisted by the advice of fund counsel and Independent Trustees' counsel, considered a broad range of information it believed relevant to the approval of the Advisory Contracts.In considering whether to approve each Advisory Contract, the Board reached a determination, with the assistance of fund counsel and Independent Trustees' counsel and through the exercise of its business judgment, that the approval of each Advisory Contract is in the best interests of the fund and its shareholders and that the approval of such agreement does not involve a conflict of interest from which Strategic Advisers or its affiliates derive an inappropriate advantage. Also, the Board found that the advisory fees to be charged under each Advisory Contract bear a reasonable relationship to the services to be rendered and will be based upon services provided that will be in addition to, rather than duplicative of services provided under the advisory contract of any underlying fund in which the fund may invest. The Board's decision to approve each Advisory Contract was not based on any single factor, but rather was based on a comprehensive consideration of all the information provided to the Board. In addition, individual Trustees did not necessarily attribute the same weight or importance to each factor.Nature, Extent, and Quality of Services Provided. The Board considered the backgrounds of the investment personnel that will provide services to the fund, and also took into consideration the fund's investment objective, strategies and related investment philosophy and the proposed sub-adviser line-up. The Board considered the structure of each Investment Adviser's investment personnel compensation program and whether such structures provide appropriate incentives to act in the best interests of the fund. The Board noted that it is familiar with the nature, extent and quality of services provided by the Investment Advisers, with the exception of MacKay Shields, from its oversight of the Investment Advisers, on behalf of other funds overseen by the Board and that the same support staff, including compliance personnel, that currently provides services to other Strategic Advisers funds will also provide services to the fund.The Board noted Strategic Advisers' role in, among other things, (i) setting, implementing and monitoring the investment strategy for the fund; (ii) identifying and recommending to the Board the sub-advisers for the fund; (iii) overseeing compliance with federal securities laws by each sub-adviser with respect to fund assets; (iv) monitoring and overseeing the performance and investment capabilities of each sub-adviser; and (v) recommending the replacement of a sub-adviser as appropriate. The Board also noted that it receives from Strategic Advisers substantial information and periodic reports about Strategic Advisers' sub-adviser oversight and due diligence processes, as well as periodic reports regarding the performance of each sub-adviser.The Board noted that under the Sub-Advisory Agreements, and subject to oversight by Strategic Advisers, each sub-adviser will be responsible for, among other things, identifying investments for the portion of fund assets allocated to the sub-adviser, if any, and executing portfolio transactions to implement its investment strategy. In addition, the Board noted that each sub-adviser will be responsible for providing such reporting as may be requested from Strategic Advisers to fulfill its oversight responsibilities discussed above.Resources Dedicated to Investment Management and Support Services. The Board reviewed the general qualifications and capabilities of the Investment Advisers' investment staff that will provide services to the fund, their use of technology, and the Investment Advisers' approach to managing and compensating its investment personnel. The Board noted that the Investment Advisers' analysts have extensive resources, tools and capabilities which allow them to conduct sophisticated fundamental and/or quantitative analysis. Additionally, in their deliberations, the Board considered the Investment Advisers' trading capabilities and resources which are integral parts of the investment management process.Shareholder and Administrative Services. The Board considered (i) the nature, extent, quality, and cost of administrative, and shareholder services to be performed by Strategic Advisers and its affiliates under the Management Contract and under separate agreements covering transfer agency and pricing and bookkeeping services for the fund; (ii) the nature and extent of Strategic Advisers' supervision of third party service providers, including the sub-advisers; and (iii) the resources to be devoted to the fund's compliance policies and procedures.The Board noted that the growth of fund assets over time across the complex allows Strategic Advisers to reinvest in the development of services designed to enhance the value or convenience of the Strategic Advisers funds as investment vehicles. These services include 24-hour access to account information and market information through telephone representatives and over the Internet, investor education materials and asset allocation tools, and the expanded availability of Fidelity Investor Centers.Investment Performance. The fund is a new fund and therefore had no historical performance for the Board to review at the time it approved the fund's Advisory Contracts. Instead, the Board considered the historical investment performance of the portfolio managers in managing accounts under a similar investment mandate. Once the fund has been in operation for at least one calendar year, the Board will review the fund's absolute investment performance, as well as the fund's relative investment performance measured against a broad-based securities market index.Based on its review, the Board concluded that the nature, extent, and quality of services that will be provided to the fund under the Advisory Contracts should benefit the fund's shareholders.Competitiveness of Management Fee and Total Fund Expenses. In reviewing the Advisory Contracts, the Board considered the amount and nature of fees to be paid by the fund to the fund's investment adviser, Strategic Advisers, the amount and nature of fees to be paid by Strategic Advisers to the sub-advisers, and the projected total management fee rate and operating expenses of the fund.The Board noted that the fund's maximum aggregate annual management fee rate may not exceed 0.60% of the fund's average daily net assets and that Strategic Advisers has contractually agreed to waive its 0.25% portion of the fund's management fee through September 30, 2024. The Board considered that although the proposed maximum aggregate annual management fee rate is higher than the median fee rate of funds with similar Lipper investment objective categories and comparable management fee characteristics, the fund's estimated effective and total management fee rates are expected to be below the median based upon the expected average allocations to the sub-advisers and the effective sub-advisory fee rates applicable under the proposed sub-advisory agreements, before taking into account the management fee waiver. The Board noted that FIAM, and not the fund, will compensate the sub-subadvisers under the terms of each Sub-Subadvisory Agreement and that the fund and Strategic Advisers are not responsible for any such fees or expenses. The Board also considered that the fund's projected total net expenses, including acquired fund fees and expenses, if any, rank below the competitive median.Based on its review, the Board concluded that the fund's management fee structure and projected total expenses bear a reasonable relationship to the services that the fund and its shareholders will receive and the other factors considered.Costs of the Services and Profitability. The fund is a new fund and therefore no revenue, cost, or profitability data was available for the Board to review in respect of the fund at the time it approved the Advisory Contracts. The Board noted that it will consider costs of services and the profitability of Strategic Advisers and each sub-adviser as a result of their relationship with the fund in connection with future renewals of the Advisory Contracts.Potential Fall-Out Benefits. The fund is a new fund and therefore the Board was unable to consider any direct and indirect benefits to Strategic Advisers and its affiliates from their relationships with the fund. The Board noted that it will review information regarding the potential of direct and indirect benefits accruing to Strategic Advisers and its affiliates from their relationships with the fund, including non-advisory fee compensation paid to affiliates of Strategic Advisers, if any, as well as information regarding potential fall-out benefits accruing to each sub-adviser, if any, as a result of its relationship with the fund, in connection with future renewals of the Advisory Contracts.Possible Economies of Scale. The Board noted that because the fund is a new fund a determination of economies of scale was premature until the fund has assets. The Board noted that any breakpoints included in the Sub-Advisory Agreements have the potential to reduce sub-advisory fees paid to the sub-adviser as assets allocated to the sub-adviser grow.Conclusion. Based on its evaluation of all of the conclusions noted above, and after considering all factors it believed relevant, the Board ultimately concluded that the advisory fee structures proposed on behalf of the fund bear a reasonable relationship to the services to be rendered and that each Advisory Contract should be approved because each agreement is in the best interests of the fund and its shareholders. The Board also concluded that the advisory fees to be charged thereunder will be based on services provided that will be in addition to, rather than duplicative of, services provided under the advisory contract of any underlying fund in which the fund may invest. In addition, the Board concluded that the approval of each Sub-Advisory Agreement and Sub-Subadvisory Agreement does not involve a conflict of interest from which Strategic Advisers or its affiliates derive an inappropriate advantage.Board Approval of New Sub-Advisory Agreement
Strategic Advisers Municipal Bond Fund
In September 2021, the Board of Trustees, including the Independent Trustees (together, the Board) voted to approve new sub-advisory agreements among Strategic Advisers, each of Delaware Investments Fund Advisers, a series of Macquarie Investment Management Business Trust (Delaware), and Massachusetts Financial Services Company (MFS), and Fidelity Rutland Square Trust II (Trust) on behalf of the fund (each, a Sub-Advisory Agreement and collectively, the Sub-Advisory Agreements). MFS and Delaware are each referred to herein as a Sub-Adviser and collectively, as the Sub-Advisers. The Board, assisted by the advice of fund counsel and Independent Trustees' counsel, considered a broad range of information it believed relevant to the approval of the Sub-Advisory Agreements.In considering whether to approve each Sub-Advisory Agreement, the Board reached a determination, with the assistance of fund counsel and Independent Trustees' counsel and through the exercise of its business judgment, that the approval of each Sub-Advisory Agreement is in the best interests of the fund and its shareholders and that the approval of such agreement does not involve a conflict of interest from which Strategic Advisers or its affiliates derive an inappropriate advantage. Also, the Board found that the sub-advisory fees to be charged under each Sub-Advisory Agreement bear a reasonable relationship to the services to be rendered and will be based upon services provided that will be in addition to, rather than duplicative of services provided under the advisory contract of any underlying fund in which the fund may invest. The Board's decision to approve each Sub-Advisory Agreement was not based on any single factor, but rather was based on a comprehensive consideration of all the information provided to the Board. In addition, individual Trustees did not necessarily attribute the same weight or importance to each factor.Nature, Extent, and Quality of Services Provided. The Board considered the backgrounds of the investment personnel that will provide services to the fund, and also took into consideration the fund's investment objective, strategies and related investment philosophy and the proposed sub-adviser line-up. The Board considered the structure of each Sub-Adviser's investment personnel compensation program and whether such structure provides appropriate incentives to act in the best interests of the fund. The Board noted that it is familiar with the nature, extent and quality of services provided by MFS from its oversight of the MFS on behalf of another fund overseen by the Board and that MFS will utilize the same organizational, compliance, legal, operational and control structures for both funds.Resources Dedicated to Investment Management and Support Services. The Board reviewed the general qualifications and capabilities of each Sub-Adviser's investment staff that will provide services to the fund, its use of technology, and each Sub-Adviser's approach to managing and compensating its investment personnel. The Board noted that each Sub-Adviser's analysts have extensive resources, tools and capabilities which allow them to conduct sophisticated fundamental and/or quantitative analysis. Additionally, in its deliberations, the Board considered the Sub-Advisers' trading capabilities and resources and compliance infrastructure, which are integral parts of the investment management process. The Board also considered the Sub-Advisers' investments in business continuity planning in connection with the COVID-19 pandemic.Shareholder and Administrative Services. The Board considered (i) the nature, extent, quality, and cost of advisory services to be performed by each Sub-Adviser under its respective Sub-Advisory Agreement; and (ii) the resources to be devoted to the fund's compliance policies and procedures.Investment Performance. The Board considered the historical investment performance of the Sub-Advisers in managing accounts under similar investment mandates.Based on its review, the Board concluded that the nature, extent, and quality of services that will be provided to the fund under the Sub-Advisory Agreements should benefit the fund's shareholders.Competitiveness of Management Fee and Total Fund Expenses. The Board considered the amount and nature of fees to be paid by the fund to Strategic Advisers and by Strategic Advisers to each Sub-Adviser. The Board also considered the projected change in the fund's management fee and total operating expenses, if any, as a result of hiring the Sub-Advisers.The Board noted that neither Sub-Advisory Agreement will result in changes to the maximum aggregate annual management fee payable by the fund or Strategic Advisers' portion of the management fee. The Board considered Strategic Advisers' contractual agreement to waive its portion of the fund's management fee. The Board further considered that because the fund recently launched and none of its existing sub-advised mandates (Existing Mandates) have been funded yet, the fund's projected management fee and total expenses are based on the expected initial allocations to its Existing Mandates, as well as the initial funding estimates for the Sub-Advisers. The Board considered that after allocating expected assets to the Sub-Advisers, the fund's projected management fee is expected to increase and the fund's total net expenses are expected to decrease; however, each are expected to continue to rank below the competitive peer group medians reported in the June 2021 contract approval materials for the fund.Based on its review, the Board concluded that the fund's management fee structure and projected total expenses bear a reasonable relationship to the services that the fund and its shareholders will receive and the other factors considered.Costs of the Services and Profitability. Because each Sub-Advisory Agreement was negotiated at arm's length and will have no impact on the maximum management fees payable by the fund or Strategic Advisers' portion of the management fee, the Board did not consider the costs of services and profitability to be significant factors in its decision to approve the Sub-Advisory Agreements.Potential Fall-Out Benefits. The Board noted that the fund recently launched, and so the Board will review information regarding the potential of direct and indirect benefits accruing to Strategic Advisers and its affiliates from their relationships with the fund, including non-advisory fee compensation paid to affiliates of Strategic Advisers, if any, as well as information regarding potential fall-out benefits accruing to each sub-adviser, if any, as a result of its relationship with the fund, in connection with future renewals of the of the fund's management contract, sub-advisory agreements, and sub-subadvisory agreements. The Board considered Strategic Advisers' representation that it does not anticipate that the approval of the Sub-Advisory Agreements will have a significant impact on the profitability of, or potential fall-out benefits to, Strategic Advisers or its affiliates.Conclusion. Based on its evaluation of all of the conclusions noted above, and after considering all factors it believed relevant, the Board concluded that each Sub-Advisory Agreement's fee structure bears a reasonable relationship to the services to be rendered and that each Sub-Advisory Agreement is in the best interests of the fund and its shareholders and should be approved. The Board also concluded that the sub-advisory fees to be charged under each Amended Sub-Advisory Agreement will be based on services provided that will be in addition to, rather than duplicative of, services provided under the advisory contract of any underlying fund in which the fund may invest. In addition, the Board concluded that the approval of each Sub-Advisory Agreement does not involve a conflict of interest from which Strategic Advisers or its affiliates derive an inappropriate advantage.Possible Economies of Scale. The Board noted that the fund recently launched, and so the Board will review information regarding the potential of direct and indirect benefits to Strategic Advisers and its affiliates from their relationships with the fund, including non-advisory fee compensation paid to affiliates of Strategic Advisers, if any, as well as information regarding potential fall-out benefits accruing to each sub-adviser, if any, as a result of its relationship with the fund, during future renewals of the fund's management contract, sub-advisory agreements, and sub-subadvisory agreements. The Board noted that each Sub-Advisory Agreement provides for breakpoints that have the potential to reduce sub-advisory fees paid to the Sub-Adviser as assets allocated to the Sub-Adviser grow.![]()
SAM-SANN-0122
1.9903615.100
Item 2.
Code of Ethics
Not applicable.
Item 3.
Audit Committee Financial Expert
Not applicable.
Item 4.
Principal Accountant Fees and Services
Not applicable.
Item 5.
Audit Committee of Listed Registrants
Not applicable.
Item 6.
Investments
(a)
Not applicable.
(b)
Not applicable
Item 7.
Disclosure of Proxy Voting Policies and Procedures for Closed-End Management Investment Companies
Not applicable.
Item 8.
Portfolio Managers of Closed-End Management Investment Companies
Not applicable.
Item 9.
Purchase of Equity Securities by Closed-End Management Investment Company and Affiliated Purchasers
Not applicable.
Item 10.
Submission of Matters to a Vote of Security Holders
There were no material changes to the procedures by which shareholders may recommend nominees to the Fidelity Rutland Square Trust II’s Board of Trustees.
Item 11.
Controls and Procedures
(a)(i) The President and Treasurer and the Chief Financial Officer have concluded that the Fidelity Rutland Square Trust II’s (the “Trust”) disclosure controls and procedures (as
defined in Rule 30a-3(c) under the Investment Company Act) provide reasonable assurances that material information relating to the Trust is made known to them by the appropriate persons, based on their evaluation of these controls and procedures as of a date within 90 days of the filing date of this report.
(a)(ii) There was no change in the Trust’s internal control over financial reporting (as defined in Rule 30a-3(d) under the Investment Company Act) that occurred during the period covered by this report that has materially affected, or is reasonably likely to materially affect, the Trust’s internal control over financial reporting.
Item 12.
Disclosure of Securities Lending Activities for Closed-End Management
Investment Companies
Not applicable.
Item 13.
Exhibits
(a) | (1) | Not applicable. |
(a) | (2) | |
(a) | (3) | Not applicable. |
(b) |
SIGNATURES
Pursuant to the requirements of the Securities Exchange Act of 1934 and the Investment Company Act of 1940, the registrant has duly caused this report to be signed on its behalf by the undersigned, thereunto duly authorized.
Fidelity Rutland Square Trust II
By: | /s/Stacie M. Smith |
Stacie M. Smith | |
President and Treasurer | |
Date: | January 20, 2022 |
Pursuant to the requirements of the Securities Exchange Act of 1934 and the Investment Company Act of 1940, this report has been signed below by the following persons on behalf of the registrant and in the capacities and on the dates indicated.
By: | /s/Stacie M. Smith |
Stacie M. Smith | |
President and Treasurer | |
Date: | January 20, 2022 |
By: | /s/John J. Burke III |
John J. Burke III | |
Chief Financial Officer | |
Date: | January 20, 2022 |