UNITED STATES
SECURITIES AND EXCHANGE COMMISSION
Washington, D.C. 20549
FORM N-CSR
CERTIFIED SHAREHOLDER REPORT OF REGISTERED MANAGEMENT INVESTMENT COMPANIES
Investment Company Act file number 811-21910
Claymore Exchange-Traded Fund Trust 2
(Exact name of registrant as specified in charter)
227 West Monroe Street, Chicago, IL 60606
(Address of principal executive offices) (Zip code)
Amy J. Lee
227 West Monroe Street, Chicago, IL 60606
(Name and address of agent for service)
Registrant's telephone number, including area code: (312) 827-0100
Date of fiscal year end: August 31
Date of reporting period: September 1, 2016 - August 31, 2017
Item 1. Reports to Stockholders.
The registrant's annual report transmitted to shareholders pursuant to Rule 30e-1 under the Investment Company Act of 1940, as amended (the “Investment Company Act”), is as follows:
GUGGENHEIMINVESTMENTS.COM
... YOUR ROAD TO THE LATEST, MOST UP-TO-DATE INFORMATION
The shareholder report you are reading right now is just the beginning of the story. Online at guggenheiminvestments.com, you will find:
| · | Daily and historical fund pricing, fund returns, portfolio holdings and characteristics, and distribution history. |
| · | Investor guides and fund fact sheets. |
| · | Regulatory documents including a prospectus and copies of shareholder reports. |
Guggenheim Funds Distributors, LLC is constantly updating and expanding shareholder information services on each Fund’s website, in an ongoing effort to provide you with the most current information about how your Fund’s assets are managed, and the results of our efforts. It is just one more small way we are working to keep you better informed about your investment.
| | |
Contents | |
Dear Shareholder | 3 |
Economic and Market Overview | 4 |
Management Discussion of Fund Performance | 6 |
Performance Report and Fund Profile | 20 |
About Shareholders’ Fund Expenses | 34 |
Schedule of Investments | 35 |
Statements of Assets and Liabilities | 57 |
Statements of Operations | 59 |
Statements of Changes in Net Assets | 61 |
Financial Highlights | 65 |
Notes to Financial Statements | 72 |
Report of Independent Registered Public Accounting Firm | 85 |
Other Information | 86 |
Approval of Advisory Agreements – | |
Claymore Exchange-Traded Fund Trust 2 | 91 |
Trust Information | 96 |
About the Trust Adviser | Back Cover |
| | |
(Unaudited) | August 31, 2017 |
DEAR SHAREHOLDER
Guggenheim Funds Investment Advisors, LLC and Guggenheim Partners Investment Management, LLC (the “Investment Advisers”) are pleased to present the annual shareholder report for several of our exchange-traded funds (“ETFs” or “Funds”). This report covers performance of the Funds for the annual fiscal period ended August 31, 2017.
The Investment Advisers are each part of Guggenheim Investments, which represents the investment management businesses of Guggenheim Partners, LLC (“Guggenheim”), a global diversified financial services firm.
Guggenheim Funds Distributors, LLC, the distributor of the Funds, is committed to providing investors with innovative investment solutions. We have built on the investment management strengths of Guggenheim Investments and worked with a diverse group of index providers to create some of the most distinctive ETFs available.
To learn more about economic and market conditions over the last year and the objective and performance of each ETF, we encourage you to read the Economic and Market Overview section of the report, which follows this letter, and the Management Discussion of Fund Performance for each ETF, which begins on page 6.
We also note that Guggenheim Investments has entered into a definitive agreement to sell its exchange-traded funds business to Invesco Ltd. (“Invesco”), a leading global investment management company. As a result, we expect to propose to the Board of Trustees of the Claymore Exchange-Traded Fund Trust that it approve a reorganization of each Fund into a newly organized exchange-traded fund advised by an affiliate of Invesco. If approved by the Board, the reorganization of each Fund would be submitted to the shareholders of the respective Fund for their approval.
Sincerely,
Guggenheim Funds Investment Advisors, LLC and
Guggenheim Partners Investment Management, LLC
Claymore Exchange-Traded Fund Trust 2
September 30, 2017
| CLAYMORE EXCHANGE-TRADED FUND TRUST 2 ANNUAL REPORT l 3 |
| | |
ECONOMIC AND MARKET OVERVIEW (Unaudited) | August 31, 2017 |
Second-quarter U.S. real gross domestic product (“GDP”) growth was solid at 3.0% annualized, rebounding from a soft 1.4% reading in the first quarter. We anticipate that personal spending will continue to propel above-trend real GDP growth in coming quarters, supported by strong gains in household income and net worth.
The U.S. labor market has strengthened further, despite softer gains in August. The 12-month moving average stands at 175,000, roughly double the amount needed to keep the unemployment rate steady. Indeed, the unemployment rate has fallen by 0.5 percentage point over the past year to 4.4%, and we expect further declines going forward.
Inflation and wage gains have disappointed in recent months, however, with core personal consumption expenditure (“PCE”) inflation slowing from 1.9% to 1.4% year over year between February and July. While transitory factors account for some of the weakness, inflation should be accelerating, not slowing. Nevertheless, the U.S. Federal Reserve (the “Fed”) pressed forward with a quarter-point rate increase at its June meeting, and projected another hike in 2017, plus three more in both 2018 and 2019. The Fed’s forecasts show that it expects inflation weakness will not persist beyond 2017.
A key reason the Fed is shrugging off soft inflation data is that measures of broad U.S. financial conditions—which incorporate factors such as short- and long-term interest rates, credit spreads, equity prices and the exchange value of the dollar—have eased even as the Fed has tightened. There has also been a benign market reaction to the Fed’s pre-announcement of its balance sheet normalization strategy, which we expect to be implemented starting in October. The fact that growth-friendly financial conditions still prevail despite Fed tightening—and diminished odds of fiscal easing—has given the Fed confidence that it can stick to its plans to gradually raise rates and shrink its balance sheet without damaging the economy.
The European Central Bank’s (“ECB”) path is arguably more treacherous than the Fed’s because markets are more uncertain about the future of the ECB’s asset purchase program. Purchases are currently scheduled to continue at a pace of €60 billion per month through 2017. We expect the ECB will announce a reduction in the purchase pace to €40 billion through at least mid-2018, effective in January, later this fall. With the tide of central bank liquidity receding, markets are due for an increase in volatility.
For the 12-month period ended August 31, 2017, the Standard & Poor’s 500® (“S&P 500”) Index returned 16.23%. The MSCI Europe-Australasia-Far East (“EAFE”) Index returned 17.64%. The return of the MSCI Emerging Markets Index was 24.53%.
In the bond market, the Bloomberg Barclays U.S. Aggregate Bond Index posted a 0.49% return for the period, while the Bloomberg Barclays U.S. Corporate High Yield Index returned 8.63%. The return of the Bank of America (“BofA”) Merrill Lynch 3-Month U.S. Treasury Bill Index was 0.62% for the 12-month period.
The opinions and forecasts expressed may not actually come to pass. This information is subject to change at any time, based on market and other conditions, and should not be construed as a recommendation of any specific security or strategy.
4 l CLAYMORE EXCHANGE-TRADED FUND TRUST 2 ANNUAL REPORT |
| | |
ECONOMIC AND MARKET OVERVIEW (Unaudited) continued | August 31, 2017 |
Index Definitions
All indices described below are unmanaged and reflect no expenses. It is not possible to invest directly in any index.
BofA Merrill Lynch 3-Month U.S. Treasury Bill Index is an unmanaged market Index of U.S. Treasury securities maturing in 90 days that assumes reinvestment of all income.
The Bloomberg Barclays U.S. Aggregate Bond Index is a broad-based flagship benchmark that measures the investment grade, U.S. dollar-denominated, fixed-rate taxable bond market, including U.S. Treasuries, government-related and corporate securities, mortgage-backed securities or “MBS” (agency fixed-rate and hybrid adjustable-rate mortgage, or “ARM”, pass-throughs), asset-backed securities (“ABS”), and commercial mortgage-backed securities (“CMBS”) (agency and non-agency).
The Bloomberg Barclays U.S. Corporate High Yield Index measures the U.S. dollar-denominated, high yield, fixed-rate corporate bond market. Securities are classified as high yield if the middle rating of Moody’s, Fitch, and S&P is Ba1/BB +/BB + or below.
The Dow Jones Global Utilities Index includes those companies in the Dow Jones Global Index associated with generating and distributing electricity through the burning of fossil fuels such as coal, petroleum and natural gas, and through nuclear energy; alternative electricity companies generating and distributing electricity from a renewable source; distributors of gas to end users; and multi-utility and water companies.
The MSCI China Index is a capitalization-weighted index that measures the performance of large- and mid-cap securities in the Chinese equity markets and includes representation across China H shares, B shares, Red chips and P chips.
The MSCI EAFE Index is a capitalization-weighted measure of stock markets in Europe, Australasia, and the Far East.
The MSCI Emerging Markets Index is a free float-adjusted market capitalization-weighted index that is designed to measure equity market performance in the global emerging markets.
The MSCI World Index measures performance from a diverse range of global stock markets, including the U.S., Canada, Europe, Australia, New Zealand, and the Far East.
The S&P 500 is a broad-based index, the performance of which is based on the performance of 500 widely held common stocks chosen for market size, liquidity, and industry group representation.
The Standard & Poor’s Global BMI (Broad Market Index), which comprises the S&P Developed BMI and S&P Emerging BMI, is a comprehensive, rules-based index measuring global stock market performance.
Industry Sectors
Comments about industry sectors in these Fund commentaries are based on Bloomberg Barclays industry classifications.
| CLAYMORE EXCHANGE-TRADED FUND TRUST 2 ANNUAL REPORT l 5 |
| | |
MANAGEMENT DISCUSSION OF FUND PERFORMANCE (Unaudited) | August 31, 2017 |
YAO Guggenheim China All-Cap ETF
Fund Overview
The Guggenheim China All-Cap ETF, NYSE Arca ticker: YAO (the “Fund”) seeks investment results that correspond generally to the performance, before the Fund’s fees and expenses, of an equity index called the AlphaShares China All-Cap Index (the “Index”).
The Index is designed to measure and monitor the performance of the investable universe of publicly traded companies based in mainland China. The Index was created by AlphaShares, LLC (“AlphaShares”) and is maintained by Standard & Poor’s. The Index includes equity securities of companies of all capitalizations, as defined by AlphaShares, subject to certain minimum capitalization requirements. The Fund will invest at least 80% of its total assets in common stock, American depositary receipts (“ADRs”), American depositary shares (“ADSs”), global depositary receipts (“GDRs”), and international depositary receipts (“IDRs”) that comprise the Index and depositary receipts or shares representing common stocks included in the Index (or underlying securities representing ADRs, ADSs, GDRs, and IDRs included in the Index). The Fund generally will invest in all of the securities comprising the Index in proportion to their weightings in the Index.
Fund Performance
All Fund returns cited—whether based on net asset value (“NAV”) or market price—assume the reinvestment of all distributions. This report discusses the annual fiscal period ended August 31, 2017.
On a market price basis, the Fund generated a total return of 29.51%, which included an increase in market price over the period to $33.23 on August 31, 2017, from $26.23 on August 31, 2016. On an NAV basis, the Fund generated a total return of 29.33%, which included an increase in NAV over the period to $33.14 on August 31, 2017, from $26.19 on August 31, 2016. At the end of the period, the Fund’s shares were trading at a market price premium to NAV, which is to be expected from time to time. All NAV returns include the deduction of management fees, operating expenses, and other Fund expenses.
For comparison, the Index returned 30.34%, and the MSCI China Index returned 35.00% for the same period.
The Fund made an annual income distribution of $0.5415 per share on December 30, 2016, to shareholders of record on December 28, 2016.
Performance Attribution
For the 12-month period ended August 31, 2017, the information technology sector contributed the most to the Fund’s return, followed by the financials sector. The telecommunications services sector was the only one to detract from return. The utilities sector contributed least.
Positions that contributed the most to the Fund’s return included Alibaba Group Holding Ltd. ADR, which operates as a holding company that provides Internet infrastructure, e-commerce, online financial, and Internet content services through its subsidiaries; Tencent Holdings Ltd., a Chinese Internet service portal; and JD.com, Inc. ADR, also known as Jingdong and formerly called 360buy, which is a Chinese e-commerce company (7.5%, 6.8%, and 3.0%, respectively, of the Fund’s long-term investments at period end).
Positions that detracted the most from the Fund’s return included China Mobile Ltd., a telecommunications services provider in Mainland China (3.9% of the Fund’s long-term investments at period end); Vipshop Holdings Ltd. ADR, a Chinese company that operates the e-commerce website VIP.com specializing in online discount sales (0.3% of the Fund’s long-term investments at period end); and China Huishan Dairy Holdings Company Ltd., a producer and seller of raw milk, liquid milk products and milk powder products (less than 0.1% of the Fund’s long-term investments at period end).
| 6 l CLAYMORE EXCHANGE-TRADED FUND TRUST 2 ANNUAL REPORT |
| | |
MANAGEMENT DISCUSSION OF FUND PERFORMANCE (Unaudited) continued | August 31, 2017 |
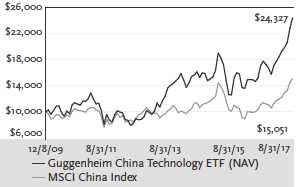
CQQQ Guggenheim China Technology ETF
Fund Overview
The Guggenheim China Technology ETF, NYSE Arca ticker: CQQQ (the “Fund”) seeks investment results that correspond generally to the performance, before the Fund’s fees and expenses, of an equity index called the AlphaShares China Technology Index (the “Index”).
The Index is designed to measure and monitor the performance of the universe of publicly traded companies that are based in mainland China, Hong Kong, or Macau, are in the Information Technology Sector, as defined by Standard & Poor’s Global Industry Classification Standard, and are open to foreign investment. The Index was created by AlphaShares, LLC (“AlphaShares”) and is maintained by Standard & Poor’s. The Index includes equity securities of companies of all categories of market capitalizations, as defined by AlphaShares (subject to certain minimum capitalization requirements).
The Index may include Hong Kong-listed securities, including China H-shares and Red Chips. China H-shares are issued by companies incorporated in mainland China and listed on the Hong Kong Stock Exchange. Red Chip shares are issued by companies with controlling Chinese shareholders that are incorporated outside mainland China and listed on the Hong Kong Stock Exchange. The Index may also include N-shares, which are issued by companies based in mainland China and listed on the NYSE Arca, Inc. or NASDAQ Stock Market. The Index does not include China A-Shares (which are subject to substantial restrictions on foreign investment) or China B-Shares (which offer a generally smaller market and limited liquidity), each of which trade on the Shanghai Stock Exchange and the Shenzhen Stock Exchange.
The Fund will invest at least 80% of its total assets in common stock, American depositary receipts (“ADRs”), American depositary shares (“ADSs”), global depositary receipts (“GDRs”), and international depositary receipts (“IDRs”) that comprise the Index and depositary receipts or shares representing common stocks included in the Index (or underlying securities representing ADRs, ADSs, GDRs, and IDRs included in the Index). The Fund generally will invest in all of the securities comprising the Index in proportion to their weightings in the Index.
Fund Performance
All Fund returns cited—whether based on net asset value (“NAV”) or market price—assume the reinvestment of all distributions. This report discusses the annual fiscal period ended August 31, 2017.
On a market price basis, the Fund generated a total return of 43.66%, which included an increase in market price over the period to $55.21 on August 31, 2017, from $39.08 on August 31, 2016. On an NAV basis, the Fund generated a total return of 42.43%, which included an increase in NAV over the period to $55.00 on August 31, 2017, from $39.26 on August 31, 2016. At the end of the period, the Fund’s shares were trading at a market price premium to NAV, which is to be expected from time to time. All NAV returns include the deduction of management fees, operating expenses, and other Fund expenses.
For comparison, the Index returned 42.92%, and the MSCI China Index returned 35.00% for the same period.
The Fund made an annual income distribution of $0.5953 per share on December 30, 2016, to shareholders of record on December 28, 2016.
Performance Attribution
For the 12-month period ended August 31, 2017, all of the holdings were in the information technology sector, which had positive return for the period.
Positions that contributed the most to the Fund’s return included Sunny Optical Technology Group Company Ltd, which designs and manufactures optical and optical related products; Tencent Holdings Ltd., a Chinese Internet service portal; and NetEase, Inc. ADR, a Chinese Internet company (7.3%, 11.7%, and 4.8%, respectively, of the Fund’s long-term investments at period end).
Positions that detracted the most from the Fund’s return included GCL-Poly Energy Holdings Ltd., a green energy supplier in China, providing power and heat via cogeneration, incineration, and wind power (1.1% of the Fund’s long-term investments at period end); Coolpad Group Ltd., which provides a range of wireless system solutions and wireless terminal products (less than 0.1% of the Fund’s long-term investments at period end); and Lenovo Group Ltd., which, through its subsidiaries, sells and manufacturers personal computers and handheld devices (2.4% of the Fund’s long-term investments at period end).
| CLAYMORE EXCHANGE-TRADED FUND TRUST 2 ANNUAL REPORT l 7 |
| | |
MANAGEMENT DISCUSSION OF FUND PERFORMANCE (Unaudited) continued | August 31, 2017 |
TAN Guggenheim Solar ETF
Fund Overview
The Guggenheim Solar ETF, NYSE Arca ticker: TAN (the “Fund”) seeks investment results that correspond generally to the performance, before the Fund’s fees and expenses, of an equity index called the MAC Global Solar Energy Index (the “Index”).
As of August 31, 2017, the Index is comprised of approximately 25 securities selected based on the relative importance of solar power within the company’s business model, as determined by MAC Indexing LLC (the “Index Provider”). The Index is designed to track companies within the following business segments of the solar energy industry: companies that produce solar power equipment and products for end users; companies that produce fabrication products (such as the equipment used by solar cell and module producers to manufacture solar power equipment) or services (such as companies specializing in the solar cell manufacturing or the provision of consulting services to solar cell and module producers) for solar power equipment producers; companies that supply raw materials or components to solar power equipment producers or integrators; companies that derive a significant portion of their business (as defined in the Fund prospectus under “Index Methodology”) from solar power system sales, distribution, installation, integration, or financing; and companies that specialize in selling electricity derived from solar power.
The Index is generally comprised of equity securities, including American depositary receipts (“ADRs”), and global depositary receipts (“GDRs”), traded in developed markets, as defined by the Index Provider. While the equity securities comprising the Index are traded in developed markets, the issuers of such securities may be located in emerging markets. Emerging market countries are countries that major international financial institutions, such as the World Bank, generally consider to be less economically mature than developed nations. The Fund will invest at least 90% of its total assets in common stock, ADRs, and GDRs that comprise the Index and depositary receipts representing common stocks included in the Index (or underlying securities representing ADRs and GDRs included in the Index). The Fund generally will invest in all of the securities comprising the Index in proportion to their weightings in the Index. The Fund will concentrate its investments (i.e., hold 25% or more of its assets) in a particular industry or group of industries to the extent the Index is so concentrated.
Fund Performance
All Fund returns cited—whether based on net asset value (“NAV”) or market price—assume the reinvestment of all distributions. This report discusses the annual fiscal period ended August 31, 2017.
On a market price basis, the Fund generated a total return of 9.01%, which included an increase in market price over the period to $21.70 on August 31, 2017, from $20.91 on August 31, 2016. On an NAV basis, the Fund generated a total return of 8.72%, which included a increase in NAV over the period to $21.62 on August 31, 2017, from $20.89 on August 31, 2016. At the end of the period, the Fund’s shares were trading at a market price premium to NAV, which is to be expected from time to time. All NAV returns include the deduction of management fees, operating expenses, and other Fund expenses.
For comparison, the Index returned 6.48%, and the MSCI World Index returned 16.19% for the same period.
The Fund made an annual income distribution of $0.8349 per share on December 30, 2016, to shareholders of record on December 28, 2016.
Performance Attribution
The utilities and financials sectors contributed the most to the Fund’s return for the 12-month period ended August 31, 2017. The industrials sector was the only one to detract from return. The consumer discretionary sector contributed least.
Positions that contributed the most to the Fund’s return included SolarEdge Technologies, Inc., a provider of power optimizer, solar inverter and monitoring solutions for photovoltaic arrays; First Solar, Inc., a leading global provider of comprehensive photovoltaic (PV) solar systems which use its advanced module and system technology; and Meyer Burger Technology AG, which supplies systems and production equipment to the photovoltaic, semiconductor, and optoelectronic industries (5.8%, 9.5%, and 5.0%, respectively, of the Fund’s long-term investments at period end).
Positions that detracted the most from the Fund’s return included Shunfeng International Clean Energy Ltd., a comprehensive solar energy operator; GCL-Poly Energy Holdings Ltd., a green energy supplier in China, providing power and heat via cogeneration, incineration, and wind power; and Xinyi Solar Holdings Ltd., a maker of solar glass (1.0%, 6.1%, and 6.3%, respectively, of the Fund’s long-term investments at period end).
| 8 l CLAYMORE EXCHANGE-TRADED FUND TRUST 2 ANNUAL REPORT |
| | |
MANAGEMENT DISCUSSION OF FUND PERFORMANCE (Unaudited) continued | August 31, 2017 |
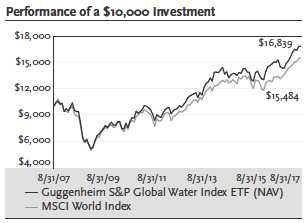
CGW Guggenheim S&P Global Water Index ETF
Fund Overview
The Guggenheim S&P Global Water Index ETF, NYSE Arca ticker: CGW (the “Fund”), seeks investment results that correspond generally to the performance, before the Fund’s fees and expenses, of an equity index called the S&P Global Water Index (the “Index”).
The Index is comprised of approximately 50 equity securities selected, based on investment and other criteria, from a universe of companies listed on global developed market exchanges. Standard & Poor’s (“S&P”) generally defines “developed markets” as the capital markets of those countries with high levels of per capita income and strict market regulation resulting in greater transparency. The universe of companies includes all companies classified by Standard & Poor’s Global Industry Classifications as being associated (in a manner representing a major component of such companies’ business) with the global demand for water, including water utilities, infrastructure, equipment, instruments, and materials. Total market capitalization and float-adjusted market capitalization of securities in the Index must be at least $250 million and $100 million, respectively, at the time of each reconstitution, which includes small-, mid-, and large-capitalization securities as defined by S&P. The companies in the universe are selected using criteria as identified by S&P. The Fund will invest at least 90% of its total assets in common stock and American depositary receipts (“ADRs”) that comprise the Index and depositary receipts representing common stocks included in the Index (or underlying securities representing ADRs included in the Index). The Fund generally will invest in all of the securities comprising the Index in proportion to their weightings in the Index. The Fund will concentrate its investments (i.e., hold 25% or more of its assets) in a particular industry or group of industries to the extent the Index is so concentrated.
Fund Performance
All Fund returns cited—whether based on net asset value (“NAV”) or market price—assume the reinvestment of all distributions. This report discusses the annual fiscal period ended August 31, 2017.
On a market price basis, the Fund generated a total return of 12.18%, which included an increase in market price over the period to $33.46 on August 31, 2017, from $30.32 on August 31, 2016. On an NAV basis, the Fund generated a total return of 12.09%, which included an increase in NAV over the period to $33.38 on August 31, 2017, from $30.27 on August 31, 2016. At the end of the period, shares of the Fund at NAV were trading at a market price premium to NAV, which is to be expected from time to time. All NAV returns include the deduction of management fees, operating expenses, and other Fund expenses.
For comparison, the Index returned 12.35%, the MSCI World Index returned 16.19%, and the Dow Jones Global Utilities Index returned 15.39% for the same period.
The Fund made an annual income distribution of $0.4701 per share on December 30, 2016, to shareholders of record on December 28, 2016.
Performance Attribution
For the 12-month period ended August 31, 2017, the industrials sector contributed the most to return, followed by the utilities sector. No sector detracted, but the information technology sector contributed least.
Positions that contributed the most to the Fund’s return included Alfa Laval AB, which provides specialized products and engineering solutions; Olin Corp., a manufacturer of chemicals and ammunition products; and Xylem, Inc., an American water-technology supplier (3.2%, 2.6%, and 5.4%, respectively, of the Fund’s long-term investments at period end).
Positions that detracted the most from the Fund’s return included Fomento de Construcciones y Contratas S.A., a Spanish concern that offers construction services and manufactures building materials (not held in the portfolio at period end); United Utilities Group Plc, which manages and operates the regulated electricity distribution, water, and wastewater networks in North West England (4.2% of the Fund’s long-term investments at period end); and Forterra, Inc., which manufactures pipe and precast concrete products (less than 0.1% of the Fund’s long-term investments at period end).
| CLAYMORE EXCHANGE-TRADED FUND TRUST 2 ANNUAL REPORT l 9 |
| | |
MANAGEMENT DISCUSSION OF FUND PERFORMANCE (Unaudited) continued | August 31, 2017 |
GHII Guggenheim S&P High Income Infrastructure ETF
Fund Overview
The Guggenheim S&P High Income Infrastructure ETF, NYSE Arca ticker: GHII (the “Fund”) seeks investment results that correspond generally to the performance, before the Fund’s fees and expenses, of the S&P High Income Infrastructure Index (the “Index”). The Fund, using a “passive” or “indexing” investment approach, seeks to replicate, before the Fund’s fees and expenses, the performance of the Index.
The Index is designed to measure and monitor the performance of 50 high-yielding global equity securities of companies that engage in various infrastructure-related sub-industries. Index constituents must meet size, listing, and liquidity requirements and also be part of the S&P Global BMI Index, which is a rules-based index that measures global stock market performance.
The Fund will invest at least 80% of its total assets in common stocks, American depositary receipts (“ADRs”), American depositary shares (“ADSs”), global depositary receipts (“GDRs”), and international depositary receipts (“IDRs”) that comprise the Index and depositary receipts representing common stocks included in the Index (or underlying securities representing the ADRs, ADSs, GDRs, and IDRs included in the Index).
Fund Performance
All Fund returns cited—whether based on net asset value (“NAV”) or market price—assume the reinvestment of all distributions. This report discusses the annual fiscal period ended August 31, 2017.
On a market price basis, the Fund generated a total return of 12.17%, which included an increase in market price over the period to $28.35 on August 31, 2017, from $26.48 on August 31, 2016. On an NAV basis, the Fund generated a total return of 12.98%, which included an increase in NAV over the period to $28.33 on August 31, 2017, from $26.28 on August 31, 2016. At the end of the period the Fund’s shares were trading at a market price premium to NAV, which is to be expected from time to time. All NAV returns include the deduction of management fees, operating expenses, and other Fund expenses.
For comparison, the Index returned 13.69%, and the S&P Global BMI Index returned 17.75% for the same period.
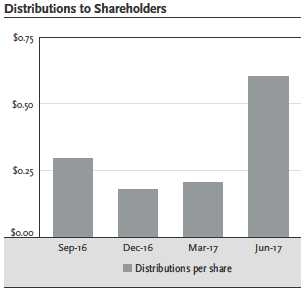
The Fund pays distributions quarterly on the last business day of each calendar quarter to shareholders of record two business days earlier. Per share distributions paid over the fiscal period ended August 31, 2017, were:
| | | | |
Payable Date | | Amount | |
| September 30, 2016 | | $ | 0.2954 | |
| December 30, 2016 | | $ | 0.1778 | |
| March 31, 2017 | | $ | 0.2067 | |
| June 30, 2017 | | $ | 0.6011 | |
| Total | | $ | 1.2810 | |
The total distribution on December 30, 2016 was composed of $0.1676 in ordinary income and $0.0102 in short-term capital gains.
Performance Attribution
For the annual fiscal period ended August 31, 2017, the utilities sector contributed the most to the Fund’s performance, followed by the energy sector. The financials sector was the only one to detract from return. The industrials sector contributed least.
Positions that contributed the most to the Fund’s return included Veresen, Inc., a Calgary-based energy infrastructure company (2.6% of the Fund’s long-term investments at period end); Golar LNG Ltd., an independent owner and operator of liquefied natural gas (LNG) infrastructure (not held in the portfolio at period end); and Abertis Infraestructuras S.A., which runs toll roads and telecommunication infrastructure in Europe and America (2.4% of the Fund’s long-term investments at period end).
Positions that detracted the most from the Fund’s return included Nordic American Tankers Ltd., a shipping company that owns and charters tankers for oil transportation (2.9% of the Fund’s long-term investments at period end); Teekay Tankers Ltd. Class A, an operator of mid-sized tankers and owner of a fleet of double-hull vessels (not held in the portfolio at period end); and Frontline Ltd., an oil tanker shipping company (0.8% of the Fund’s long-term investments at period end).
| 10 l CLAYMORE EXCHANGE-TRADED FUND TRUST 2 ANNUAL REPORT |
| | |
MANAGEMENT DISCUSSION OF FUND PERFORMANCE (Unaudited) continued | August 31, 2017 |
GTO Guggenheim Total Return Bond ETF
Fund Overview
The Guggenheim Total Return Bond ETF, NYSE Arca ticker: GTO (the “Fund”) seeks maximum total return, comprised of income and capital appreciation.
In managing the Fund, Guggenheim Partners Investment Management, LLC (“GPIM”) uses a process for selecting securities for purchase and sale that is based on intensive credit research and involves extensive due diligence on each issuer, region, and sector. GPIM also considers macroeconomic outlook and geopolitical issues. GPIM maintains targets with respect to portfolio maturity and duration, which are reviewed continually by various teams, including the portfolio management team. These targets are set based on the interest rate outlook, the macro environment, and can be either absolute or relative to a portfolio’s positioning to a benchmark.
The Fund will normally invest in a portfolio of fixed income instruments of varying maturities and of any credit quality. The Fund will normally invest at least 80% of its assets in fixed income instruments and also include exchange-traded funds (“ETFs”) and closed-end funds (“CEFs”) that invest substantially all of their assets in fixed income instruments. The Fund may invest in short-term instruments such as commercial paper, repurchase agreements, reverse repurchase agreements and short-term investment funds.
The fixed-income instruments in which the Fund invests include corporate debt securities of U.S. and non-U.S. issuers, including corporate bonds and other similar instruments, such as Treasury securities, collateralized loan obligations (“CLOs”), mortgage-backed securities (“MBS”), and asset-backed securities (“ABS”), issued by various U.S. and non-U.S. public- or private-sector entities, and municipal securities.
The Fund may invest up to 33 1 / 3 % of its total assets in high yield debt securities (“junk bonds”), which are debt securities that are rated below investment grade by nationally recognized statistical rating organizations, or are unrated securities that GPIM believes are of comparable below investment grade quality. The Fund may also invest up to 20% of its total assets in participations in, or assignments of, bank loans or corporate loans.
The Fund also may seek certain exposures through derivative transactions, which may also create economic leverage in the Fund. The Fund may engage in derivative transactions for speculative purposes to enhance total return, to seek to hedge against fluctuations in securities prices, interest rates or currency rates, to change the effective duration of its portfolio, to manage certain investment risks and/or as a substitute for the purchase or sale of securities or currencies. The Fund may use leverage to the extent permitted by applicable law by entering into reverse repurchase agreements and borrowing transactions (principally lines of credit) for investment purposes.
Fund Performance
All Fund returns cited—whether based on net asset value (“NAV”) or market price—assume the reinvestment of all distributions. This report discusses the annual fiscal period ended August 31, 2017.
On a market price basis, the Fund generated a total return of 3.47%, which included an increase in market price over the period to $52.67 on August 31, 2017, from $52.60 on August 31, 2016. On an NAV basis, the Fund generated a total return of 3.47%, which included an increase in NAV over the period to $52.61 on August 31, 2017, from $52.54 on August 31, 2016. At the end of the period the Fund’s shares were trading at a market price premium to NAV, which is to be expected from time to time. All NAV returns include the deduction of management fees, operating expenses, and all other Fund expenses.
For comparison, the Bloomberg Barclays U.S. Aggregate Bond Index returned 0.49% for the same period.
The Fund made the following monthly distributions for the annual fiscal period ended August 31, 2017:
| | | | |
Payable Date | | Amount | |
| September 8, 2016 | | $ | 0.1283 | |
| October 7, 2016 | | $ | 0.1164 | |
| November 7, 2016 | | $ | 0.0688 | |
| December 7, 2016 | | $ | 0.1155 | |
| January 4, 2017 | | $ | 0.4440 | |
| February 7, 2017 | | $ | 0.1619 | |
| March 7, 2017 | | $ | 0.1134 | |
| April 7, 2017 | | $ | 0.1436 | |
| May 5, 2017 | | $ | 0.1087 | |
| June 7, 2017 | | $ | 0.1065 | |
| July 10, 2017 | | $ | 0.1192 | |
| August 7, 2017 | | $ | 0.0640 | |
Total | | $ | 1.6903 | |
The total distribution on January 4, 2017 was composed of $0.1365 in ordinary income and $0.3075 in short-term capital gains.
| CLAYMORE EXCHANGE-TRADED FUND TRUST 2 ANNUAL REPORT l 11 |
| | |
MANAGEMENT DISCUSSION OF FUND PERFORMANCE (Unaudited) continued | August 31, 2017 |
GTO Guggenheim Total Return Bond ETF (continued)
Performance Review
Tightening credit spreads, duration, and the Fund’s carry led to outperformance versus the benchmark during the period. Carry refers to the income received net of borrowing costs from portfolio investments over a defined period. We continue to focus on higher quality and shorter spread duration investments until spreads widen to compensate investors appropriately for lower-quality credits and weaker structural protections. Positive returns have largely been driven by the Fund’s investments in collateralized loan obligations (CLOs), nonagency residential mortgage-backed securities (NA-RMBS), and commercial mortgage-back securities (CMBS).
Investment grade CLOs performed well during the period as spreads continue to trade at the tight end of post-crisis levels. The CLO market is reaching the end of its refinancing and reset wave. The total deal balance of CLOs refinanced or reset in the first half of 2017 reached $117 billion, plus $59 billion of new issues. Net new issuance of $25 billion for the full year is forecast. CLO refinance AAA rallied sharply in the second quarter, with spreads tightening from 125 to 95 basis points. We currently favor refinanced AAA and A CLO tranches.
CMBS positioning contributed to return. We generally prefer senior investment grade securities in select single asset single borrower (SASB) and AAA interest only CMBS conduit. We also remain active in commercial real estate (CRE) CLO transactions, given their short maturity profiles.
NA-RMBS positioning was a positive contributor during the period. We have been upgrading opportunistically to shorter maturity and more senior tranches for a relatively small spread concession. However, we believe opportunities exist to earn returns in excess of quoted spreads due to the nature of discount-priced RMBS. In addition, we continue to look at the resecuritization subsector for opportunities.
August new issue estimates of investment grade bond issuance were for $80-90 billion, well below last year’s record $116 billion, but above the $65 billion August average. On the whole, the positive technical environment for U.S. bonds and other fixed income instruments should continue. U.S. investment-grade corporate bond yields look attractive relative to European investment-grade corporates and foreign flows should limit potential spread widening in the U.S. corporate bond market.
High yield corporate bonds performed well during the period. With prices already near par, we continue to expect that bond market returns will largely consist of coupons, with limited price upside. Given current spread valuations, the fund reduced its exposure to high yield corporate bonds over the first half of 2017.
Bank loans, which have been stymied by refinancing activity, generally have reduced contractual spreads at the expense of the investor. Moreover, while three-month Libor increased from 1.0 percent to 1.3 percent over the course of the first half, it did not keep pace with increases in the effective fed funds rate.
The allocation to long dated treasury bonds detracted from performance, as 30 year treasury yields rose over the period.
Barbell key rate duration positioning added to performance as the yield curve flattened during the period. The fund was overweight to floating-rate assets at the short end, underweight fixed in the intermediary part of the curve, and overweight key rate duration exposure at the long end of the curve. We believe this rate strategy will continue to benefit the Fund versus the benchmark from a greater jump in short-term rates as the Fed accelerates its pace of rate hikes. Meanwhile, yields at the long-end should stay anchored near 3 percent, which is Guggenheim’s projection of the terminal fed funds rate in this tightening cycle.
| 12 l CLAYMORE EXCHANGE-TRADED FUND TRUST 2 ANNUAL REPORT |
| | |
MANAGEMENT DISCUSSION OF FUND PERFORMANCE (Unaudited) continued | August 31, 2017 |
OVLC Guggenheim U.S. Large Cap Optimized Volatility ETF
Fund Overview
The Guggenheim U.S. Large Cap Optimized Volatility ETF, NYSE Arca ticker: OVLC (the “Fund”) seeks investment results that correspond generally to the performance, before the Fund’s fees and expenses, of the Guggenheim U.S. Large Cap Optimized Volatility Index (the “Index”). The Index, composed of approximately 120 securities, is designed to capture the benefits of low volatility investing while outperforming these strategies during market rallies. The Index’s optimized volatility methodology attempts to have a low volatility exposure much of the time but adopts a higher volatility exposure as market reward-to-risk levels dictate. By utilizing a systematic process to optimize the index methodology’s volatility profile, the Index is designed to provide attractive risk-adjusted returns across a market cycle.
Guggenheim Index ServicesSM is the Index Provider (“Index Provider”), which is affiliated with Guggenheim Investment Advisors, LLC and Guggenheim Fund Distributors, LLC. The Index Provider selects securities from the constituents of the S&P 500 Index for inclusion in the Index using a proprietary methodology that calculates the reward to risk of each security in the investable universe.
The Fund will invest at least 80% of its total assets in securities that comprise the Index. The Fund generally will invest in all of the securities comprising the Index in proportion to their weightings in the Index.
Fund Performance
All Fund returns cited—whether based on net asset value (“NAV”) or market price—assume the reinvestment of all distributions. This report discusses the annual fiscal period ended August 31, 2017.
On a market price basis, the Fund generated a total return of 9.28%, which included an increase in market price over the period to $28.29 on August 31, 2017, from $26.14 on August 31, 2016. On an NAV basis, the Fund generated a total return of 10.50%, which included an increase in NAV over the period to $28.67 on August 31, 2017, from $26.20 on August 31, 2016. At the end of the period the Fund’s shares were trading at a market price discount to NAV, which is to be expected from time to time. All NAV returns include the deduction of management fees, operating expenses, and all other Fund expenses.
For comparison, the Index returned 10.93%, and the S&P 500 Index returned 16.23% for the 12-month period ended August 31, 2017.
The Fund made an annual income distribution of $0.2591 per share on December 30, 2016, to shareholders of record on December 28, 2016.
Performance Attribution
For the 12-month period ended August 31, 2017, the information technology sector contributed the most to the Fund’s return, followed by the health care sector. The telecommunications services sector detracted the most from the Fund’s return, followed by the energy sector.
Positions that contributed the most to the Fund’s return included Apple, Inc., a technology company that designs, develops, and sells consumer electronics, computer software, and online services; Intuitive Surgical, Inc., a maker of robotic surgical systems; and Wells Fargo & Co., a diversified financial services company (3.0%, 1.3%, and 0.2%, respectively, of the Fund’s long-term investments at period end).
Positions that detracted the most from the Fund’s return included Target Corp., a U.S. discount retailer (not held in the portfolio at period end); and both the Class A and Class C shares of Under Armour, Inc., an American company that manufactures footwear, sports and casual apparel (0.4% and 0.4%, respectively, of the Fund’s long-term investments at period end).
| CLAYMORE EXCHANGE-TRADED FUND TRUST 2 ANNUAL REPORT l 13 |
| | |
RISKS AND OTHER CONSIDERATIONS (Unaudited) | August 31, 2017 |
The views expressed in this report reflect those of the portfolio managers, Guggenheim Partners Investment Management, LLC and Guggenheim Funds Investment Advisors, LLC only through the report period as stated on the cover. These views are subject to change at any time, based on market and other conditions and should not be construed as a recommendation of any kind. The material may also contain forward looking statements that involve risk and uncertainty, and there is no guarantee they will come to pass.
This information does not represent an offer to sell securities of the Funds and it is not soliciting an offer to buy securities of the Funds. An investment in the various Guggenheim ETFs is subject to certain risks and other considerations. Below are some general risks and considerations associated with investing in a Fund, which may cause you to lose money, including the entire principal that you invest. Please refer to each individual ETF prospectus for a more detailed discussion of Fund-specific risks and considerations.
Active Management Risk (GTO only)—The Fund is actively managed, which means that investment decisions are made based on investment views. There is no guarantee that the investment views will produce the desired results or expected returns, causing the Fund to fail to meet its investment objective or underperform its benchmark index or funds with similar investment objectives and strategies. Furthermore, active trading that can accompany active management, also called “high turnover,” may have a negative impact on performance. Active trading may result in higher brokerage costs or mark-up charges, which are ultimately passed on to shareholders of the Fund. Active trading may also result in adverse tax consequences.
Asset-Backed Securities Risk (GTO only)—Investors in ABS, including MBS and structured finance investments, generally receive payments that are part interest and part return of principal. These payments may vary based on the rate at which the underlying borrowers pay off their loans. Some ABS, including MBS, may have structures that make their reaction to interest rates and other factors difficult to predict, causing their prices to be volatile. These instruments are particularly subject to interest rate, credit and liquidity and valuation risks.
Asset Class Risk—The securities in a Fund’s portfolio may underperform the returns of other securities or indices that track other industries, markets, asset classes or sectors.
China Investment Risk (YAO and CQQQ only)—Investing in securities of Chinese companies involves additional risks, including, but not limited to: the economy of China differs, often unfavorably, from the U.S. economy in such respects as structure, general development, government involvement, wealth distribution, rate of inflation, growth rate, allocation of resources and capital reinvestment, among others; the central government has historically exercised substantial control over virtually every sector of the Chinese economy through administrative regulation and/or state ownership; actions of the Chinese central and local government authorities continue to have a substantial effect on economic conditions in China (including both direct and indirect market stabilization efforts, which may affect valuations of Chinese issuers); and both interim and permanent market regulations may affect the ability of certain stockholders to sell Chinese securities when it would otherwise be advisable. In addition, the Chinese government has from time to time taken actions that influence the prices at which certain goods may be sold, encourage companies to invest or concentrate in particular industries, induce mergers between companies in certain industries and induce private companies to publicly offer their securities to increase or continue the rate of economic growth, control the rate of inflation or otherwise regulate economic expansion. It may do so in the future as well, potentially having a significant adverse effect on economic conditions in China, the economic prospects for, and the market prices and liquidity of, the securities of Chinese companies and the payments of dividends and interest by Chinese companies.
Collateralized Loan Obligations and Collateralized Debt Obligations Risk (GTO only)—Collateralized loan obligations (“CLOs”) bear many of the same risks as other forms of asset-backed securities, including interest rate risk, credit risk and default risk. As they are backed by pools of loans, CLOs also bear similar risks to investing in loans directly. CLOs issue classes or “tranches” that vary in risk and yield. CLOs may experience substantial losses attributable to loan defaults. Losses caused by defaults on underlying assets are borne first by the holders of subordinate tranches. The Fund’s investment in CLOs may decrease in market value when the CLO experiences loan defaults or credit impairment, the disappearance of a subordinate tranche, or market anticipation of defaults and investor aversion to CLO securities as a class.
Collateralized debt obligations (“CDOs”) are structured similarly to CLOs and bear the same risks as CLOs including interest rate risk, credit risk and default risk. CDOs are subject to additional risks because they are backed by pools of assets other than loans including securities (such as other asset-backed securities), synthetic instruments or bonds and may be highly leveraged. Like CLOs, losses incurred by a CDO are borne first by holders of subordinate tranches. Accordingly, the risks of CDOs depend largely on the type of underlying collateral and the tranche of CDOs in which the Fund invests. For example, CDOs that obtain their exposure through synthetic investments entail the risks associated with derivative instruments.
Commercial Paper Risk (GTO only)—The value of the Fund’s investment in commercial paper, which is an unsecured promissory note that generally has a maturity date between one and 270 days and is issued by a U.S. or foreign entity, is susceptible to changes in the issuer’s financial condition or credit quality. Investments in commercial paper are usually discounted from their value at maturity. Commercial paper can be fixed-rate or variable rate and can be adversely affected by changes in interest rates.
Concentration Risk (All Funds except GTO)—If the Index concentrates in an industry or group of industries, a Fund’s investments will be concentrated accordingly. In such event, the value of shares may rise and fall more than the value of the Fund’s shares of a fund that invests in securities of companies in a broader range of industries and the Fund’s performance will be particularly susceptible to adverse events impacting such industry.
14 l CLAYMORE EXCHANGE-TRADED FUND TRUST 2 ANNUAL REPORT |
| | |
RISKS AND OTHER CONSIDERATIONS (Unaudited) continued | August 31, 2017 |
Convertible Securities Risk (GTO only)—Convertible securities may be subordinate to other securities. The total return for a convertible security depends, in part, upon the performance of the underlying security into which it can be converted. The value of convertible securities tends to decline as interest rates increase. Convertible securities generally offer lower interest or dividend yields than non-convertible securities of similar quality.
Counterparty Credit Risk (GTO only)—The Fund makes investments in financial instruments and OTC-traded derivatives involving counterparties to gain exposure to a particular group of securities, index, asset class or other reference asset without actually purchasing those securities or investments, or to hedge a position. Through these investments, the Fund is exposed to credit risks that the counterparty may be unwilling or unable to make timely payments to meet its contractual obligations. If the counterparty becomes bankrupt or defaults on (or otherwise becomes unable or unwilling to perform) its payment obligations to the Fund, the Fund may not receive the full amount that it is entitled to receive or may experience delays in recovering the collateral held by, or on behalf of, the counterparty. If this occurs, the value of your shares in the Fund will decrease.
Credit Risk (GTO only)—The Fund could lose money if the issuer or guarantor of a fixed-income instrument or a counterparty to a transaction is unable or unwilling, or perceived to be unable or unwilling, to pay interest or repay principal on time or defaults. The issuer, guarantor or counterparty could also suffer a rapid decrease in credit quality rating, which would adversely affect the volatility of the value and liquidity of the instrument. Credit ratings may not be an accurate assessment of liquidity or credit risk.
Currency Risk (GTO only)—Indirect and direct exposure to foreign currencies subjects the Fund to the risk that those currencies will decline in value relative to the U.S. dollar, which would cause a decline in the U.S. value of the holdings of the Fund. Currency rates in foreign countries may fluctuate significantly over short periods of time for a number of reasons, including changes in interest rates and the imposition of currency controls or other political, economic and tax developments in the U.S. or abroad. The Fund’s foreign currency hedging transactions and techniques may not be effective and, in certain cases, may adversely affect the Fund. In addition, the Fund’s ability to engage in these transactions and techniques may be limited under certain circumstances.
Depositary Receipt Risk—The Funds may hold the securities of non-U.S. companies in the form of depositary receipts. The underlying securities of the depositary receipts in a Fund’s portfolio are subject to fluctuations in foreign currency exchange rates that may affect the value of a Fund’s portfolio. In addition, the value of the securities underlying the depositary receipts may change materially when the U.S. markets are not open for trading. Investments in the underlying foreign securities also involve political and economic risks distinct from those associated with investing in the securities of U.S. issuers.
Derivatives Risk (GTO only)—Derivatives may pose risks in addition to and greater than those associated with investing directly in securities, currencies or other investments, including risks relating to leverage, imperfect correlations with underlying investments or the Fund’s other portfolio holdings, high price volatility, lack of availability, counterparty credit, liquidity, valuation and legal restrictions. Their use is a highly specialized activity that involves investment techniques and risks different from those associated with ordinary portfolio securities transactions. If the Investment Adviser is incorrect about its expectations of market conditions, the use of derivatives could also result in a loss, which in some cases may be unlimited. Some of the derivatives in which the Fund invests are traded (and privately negotiated) in the over-the-counter (“OTC”) market. OTC derivatives are subject to heightened credit, liquidity and valuation risks. Certain risks also are specific to the derivatives in which the Fund invests.
Dollar Roll Transaction Risk (GTO only)—The Fund may enter into dollar roll transactions, in which the Fund sells a mortgage-backed or other security for settlement on one date and buys back a substantially similar security for settlement at a later date. Dollar rolls involve a risk of loss if the market value of the securities that the Fund is committed to buy declines below the price of the securities the Fund has sold.
Emerging Markets Risk (All Funds except OVLC)—Investments in or exposure to emerging markets are generally subject to a greater level of those risks associated with investing in or being exposed to developed foreign markets, as emerging markets are considered to be less developed than developing countries. Furthermore, investments in or exposure to emerging markets are generally subject to additional risks, including the risks associated with trading in smaller markets, lower volumes of trading, and being subject to lower levels of government regulation and less extensive accounting, financial and other reporting requirements.
Equity Securities Risk (All Funds except GTO)—The prices of equity securities generally fluctuate in value more than fixed-income investments, may rise or fall rapidly or unpredictably and may reflect real or perceived changes in the issuing company’s financial condition and changes in the overall market or economy. A decline in the value of equity securities held by a Fund will adversely affect the value of your investment in a Fund. Common stocks generally represent the riskiest investment in a company and dividend payments (if declared) to preferred stockholders generally rank junior to payments due to a company’s debtholders. A Fund may lose a substantial part, or even all, of its investment in a company’s stock
Extension Risk (GTO only)—An issuer may exercise its right to pay principal on an obligation later than expected, thereby effectively lengthening the maturity of the obligation and making the obligation more sensitive to interest rate changes. This may happen when there is a rise in interest rates. Under these circumstances, the value of the obligation will decrease and the Fund���s performance may suffer from its inability to invest in higher yielding securities.
Foreign Securities and Currency Risk (All Funds except OVLC)—Foreign securities carry unique or additional risks when compared to U.S. securities, including currency fluctuations, adverse political and economic developments, unreliable or untimely information, less liquidity and more volatility, limited legal recourse and higher transactional costs.
| CLAYMORE EXCHANGE-TRADED FUND TRUST 2 ANNUAL REPORT l 15 |
| | |
RISKS AND OTHER CONSIDERATIONS (Unaudited) continued | August 31, 2017 |
Hedging Risk (GTO only)—The Fund may, but is not required to, engage in various investments or transactions that are designed to hedge a position that the Fund holds. There can be no assurance that the Fund’s hedging investments or transactions will be effective. Hedging investments or transactions involve costs and may reduce gains or result in losses, which may adversely affect the Fund.
High Yield and Unrated Securities Risk (GTO only)—High yield, below investment grade and unrated high risk debt securities (which also may be known as “junk bonds”) may present additional risks because these securities may be less liquid, and therefore more difficult to value accurately and sell at an advantageous price or time, present more credit risk than investment grade bonds and subject to greater risk of default. The price of high yield securities tends to be subject to greater volatility due to issuer-specific operating results and outlook and to real or perceived adverse economic and competitive industry conditions.
Income Risk (GTO only)—The Fund’s income may decline during period of falling interest rates or when the Fund experiences defaults on debt securities it holds. The amount and rate of distributions that the Fund’s shareholders receive are affected by the income that the Fund receives from its portfolio holdings. If the income is reduced, distributions by the Fund to shareholders may be less.
Index Construction Risk (OVLC only)—A stock included in the Index may not exhibit the factor trait or provide specific factor exposure for which it was selected and consequently the Fund’s holdings may not exhibit returns consistent with that factor trait.
Infrastructure Risk (GHII only)—Companies within one of the Infrastructure Clusters that comprise the Index are subject to a variety of factors that may adversely affect their business or operations, including high interest costs in connection with capital construction and improvement programs, high leverage, costs associated with compliance with and changes in environmental and other regulations, difficulty in raising capital in adequate amounts and on reasonable terms in periods of high inflation and unsettled capital markets or government budgetary constraints that impact publicly funded projects, the effects of economic slowdown or recession and surplus capacity, increased competition from other providers of services, uncertainties concerning the availability of fuel at reasonable prices, the effects of energy conservation policies and other factors.
Interest Rate Risk (GTO only)—Investments in fixed-income instruments are subject to the possibility that interest rates could rise sharply, causing the value of the Fund’s holdings and share price to decline. The risks associated with rising interest rates are heightened given the historically low interest rate environment as of the date of this prospectus. Interest rates may continue to rise in the future, possibly suddenly and significantly, with unpredictable effects on the financial markets and the Fund’s investments. Fixed-income instruments with longer durations are subject to more volatility than those with shorter durations.
Investment in Investment Companies Risk (GTO only)—Investing in other investment companies, including ETFs and closed-end funds, subjects the Fund to those risks affecting the investment company, including the possibility that the value of the underlying securities held by the investment company could decrease or the portfolio becomes illiquid. Moreover, the Fund and its shareholders will incur its pro rata share of the underlying investment companies’ expenses, which will reduce the Fund’s performance, and the purchase of shares of some investment companies (in the case of closed-end investment companies) may sometimes require the payment of substantial premiums above the value of such companies’ portfolio securities or NAVs.
Investments in Loans Risk (GTO only)—Investments in loans, including loan syndicates and other direct lending opportunities, involve special types of risks, including credit risk, interest rate risk, counterparty risk and prepayment risk. Loans may offer a fixed or floating interest rate. Loans are often generally below investment grade and may be unrated. The Fund’s investments in loans can be difficult to value accurately and may be more susceptible to liquidity risk than fixed-income instruments of similar credit quality and/or maturity. The Fund is also subject to the risk that the value of the collateral for the loan may be insufficient to cover the borrower’s obligations should the borrower fail to make payments or become insolvent. Participations in loans may subject the Fund to the credit risk of both the borrower and the issuer of the participation and may make enforcement of loan covenants more difficult for the Fund as legal action may have to go through the issuer of the participations. Transactions in loans are often subject to long settlement periods, thus potentially limiting the ability of the Fund to invest sale proceeds in other investments and to use proceeds to meet its current redemption obligations. Thus, to the extent the Fund effects redemptions in cash, the Fund is subject to the risk of selling other investments or taking other actions necessary to raise cash to meet its redemption obligations.
Issuer-Specific Changes Risk—The value of an individual security or particular type of security can be more volatile than the market as a whole and can perform differently from the value of the market as a whole. The value of securities of smaller issuers can be more volatile than those of larger issuers.
Large-Capitalization Securities Risk—A Fund is subject to the risk that large-capitalization securities may underperform other segments of the equity market or the equity market as a whole. Larger, more established companies may be unable to respond quickly to new competitive challenges such as changes in technology and may not be able to attain the high growth rate of smaller companies, especially during extended periods of economic expansion.
Leverage Risk (GTO only)—The Fund’s use of leverage, through borrowings or instruments such as derivatives, may cause the Fund to be more volatile and riskier than if it had not been leveraged.
Limited Exposure Risk (YAO and CQQQ only)—China A-Shares and China B-Shares are not eligible for inclusion in the Index, even if they would otherwise qualify under the other criteria set forth in the Index methodology. China A-Shares are subject to substantial restrictions on foreign investment, while the China B-Share market generally is smaller and offers less liquidity
| 16 l CLAYMORE EXCHANGE-TRADED FUND TRUST 2 ANNUAL REPORT |
| | |
RISKS AND OTHER CONSIDERATIONS (Unaudited) continued | August 31, 2017 |
than the categories of securities which may be included in the Index. However, by excluding such shares from the Index, the exposure provided by the Index (and thus a Fund) to the Chinese presence in the sector may be more limited than would be the case if the Index included China A-Shares or China B-Shares.
Liquidity and Valuation Risk (GTO only)—In certain circumstances, it may be difficult for the Fund to purchase and sell particular investments within a reasonable time at a fair price, or the price at which it has been valued by the Investment Adviser for purposes of the Fund’s net asset value, causing the Fund to be less liquid and unable to realize what the Investment Adviser believes should be the price of the investment.
Market Price Risk—The Funds’ shares are listed for trading on NYSE Arca, Inc. (“NYSE Arca”) and are bought and sold in the secondary market at market prices. The market prices of shares may fluctuate continuously during trading hours, in some cases materially, in response to changes in the NAV and supply and demand for shares, among other factors. Although it is expected that the market price of shares typically will remain closely correlated to the NAV, the market price will generally differ from the NAV because of timing reasons, supply and demand imbalances and other factors. As a result, the trading prices of shares may deviate significantly from NAV during certain periods, especially those of market volatility. The Investment Adviser cannot predict whether shares will trade above (premium), below (discount) or at their NAV. Thus, an investor may pay more than NAV when buying shares in the secondary market and receive less than NAV when selling shares in the secondary market.
Market Risk—The value of, or income generated by, the securities held by a Fund may fluctuate rapidly and unpredictably as a result of factors affecting individual companies or changing economic, political, social or financial market conditions throughout the world. The performance of these investments may underperform the general securities markets or other types of securities.
Municipal Securities Risk (GTO only)—Municipal securities may be subject to credit, interest, prepayment, liquidity and valuation risks. In addition, municipal securities can be affected by unfavorable legislative or political developments and adverse changes in the economic and fiscal conditions of state and municipal issuers or the federal government in case it provides financial support to such issuers. Certain sectors of the municipal bond market have special risks that can affect them more significantly than the market as a whole. Because many municipal instruments are issued to finance similar projects, conditions in these industries can significantly affect the overall municipal market. Municipal securities that are insured by an insurer may be adversely affected by developments relevant to that particular insurer, or more general developments relevant to the market as a whole. Municipal securities can be difficult to value and be less liquid than other investments, which may affect the Fund’s performance.
Non-Diversification Risk—Certain Funds are considered non-diversified because it may invest a large portion of its assets in a small number of issuers. As a result, a Fund is more susceptible to risks associated with those issuers and a Fund may experience greater losses and volatility than a more diversified portfolio.
Passive Management Risk (All Funds except GTO)—Unlike many investment companies, the Funds, except for GTO, are not “actively” managed. Therefore, it would not necessarily sell a security because the security’s issuer was in financial trouble or defaulted on its obligations under the security, or whose credit rating was downgraded, unless that security is removed from the Index. In addition, a Fund will not otherwise take defensive positions in declining markets unless such positions are reflected in the Index.
Preferred Securities Risk (GTO only)—A company’s preferred stock generally pays dividends only after the company makes required payments to holders of its bonds and other debt. For this reason, the value of preferred stock will usually react more strongly than bonds and other debt to actual or perceived changes in the company’s financial condition or prospects.
Prepayment Risk (GTO only)—Securities subject to prepayment risk generally offer less potential for gains when interest rates decline, because issuers of the securities may be able to prepay the principal due on the securities. These securities generally offer less potential for gains when interest rates decline and may offer a greater potential for loss when interest rates rise.
Real Estate Securities Risk (GTO only)—The Fund may invest in securities of real estate companies and companies related to the real estate industry, including real estate investment trusts (“REITs”), which are subject to the same risks as direct investments in real estate. The real estate industry is particularly sensitive to economic downturns.
Regulatory and Legal Risk—U.S. and non-U.S. governmental agencies and other regulators regularly implement additional regulations and legislators may pass new laws that affect the investments held by a Fund, the strategies used by a Fund or the level of regulation or taxation applying to a Fund. These may impact the investment strategies, performance, costs and operations of a Fund or taxation of shareholders.
Repurchase Agreements and Reverse Repurchase Agreements Risk (GTO only)—In the event of the insolvency of the counterparty to a repurchase agreement or reverse repurchase agreement, recovery of the repurchase price owed to the Fund or, in the case of a reverse repurchase agreement, the securities sold by the Fund, may be delayed. Because reverse repurchase agreements may be considered to be the practical equivalent of borrowing funds, they constitute a form of leverage. If the Fund reinvests the proceeds of a reverse repurchase agreement at a rate lower than the cost of the agreement, entering into the agreement will lower the Fund’s yield.
Restricted Securities Risk (GTO only)—Restricted securities generally cannot be sold to the public and may involve a high degree of business, financial and liquidity risk, which may result in substantial losses to the Fund.
Risk of Cash Transactions (GTO only)—In certain instances, unlike most ETFs, the Fund may effect creations and redemptions for cash, rather than in-kind. As a result, an investment in the Fund may be less tax-efficient than an investment in a more conventional ETF.
| CLAYMORE EXCHANGE-TRADED FUND TRUST 2 ANNUAL REPORT l 17 |
| | |
RISKS AND OTHER CONSIDERATIONS (Unaudited) continued | August 31, 2017 |
Risks of Investing in Hong Kong (YAO and CQQQ only)—A Fund’s investments which are listed and traded in Hong Kong may expose a Fund to certain legal, regulatory, political, currency and economic risks. China is Hong Kong’s largest trading partner, both in terms of exports and imports. Any changes in the Chinese economy, trade regulations or currency exchange rates may have an adverse impact on Hong Kong’s economy.
Short Sale and Short Exposure Risk (GTO only)—Short selling a security involves selling a borrowed security with the expectation that the value of that security will decline so that the security may be purchased at a lower price when returning the borrowed security. A short exposure through a derivative exposes the Fund to counterparty credit risk and leverage risk. The risk for loss on a short sale or other short exposure is greater than a direct investment in the security itself because the price of the borrowed security may rise, thereby increasing the price at which the security must be purchased. The risk of loss through a short sale or other short exposure may in some cases be theoretically unlimited. Government actions also may affect the Fund’s ability to engage in short selling.
Micro-, Small- and Mid-Capitalization Securities Risk (All Funds except GTO and OVLC)—A Fund is subject to the risk that micro-, small- and mid-capitalization securities may underperform other segments of the equity market or the equity market as a whole. Securities of micro-, small- and mid-capitalization companies may be more speculative, volatile and less liquid than securities of larger companies. Micro-, small- and mid-capitalization companies tend to have inexperienced management as well as limited product and market diversification and financial resources, and may be more vulnerable to adverse developments than large capitalization companies.
Sovereign Debt Risk (GTO only)—The debt securities issued by sovereign entities may decline as a result of default or other adverse credit event resulting from a sovereign debtor’s unwillingness or inability to repay principal and pay interest in a timely manner, which may be affected by a variety of factors, including its cash flow situation, the extent of its reserves, the availability of sufficient foreign exchange on the date a payment is due, the relative size of the debt service burden to the economy as a whole, the sovereign debtor’s policy toward international lenders, and the political constraints to which a sovereign debtor may be subject. Sovereign debt risk is increased for emerging market issuers.
Special Situation Investments/Securities in Default Risk (GTO only)—Investments in the securities and debt of distressed issuers or issuers in default involve far greater risk than investing in issuers whose debt obligations are being met and whose debt trade at or close to its “par” or full value because the investments are highly speculative with respect to the issuer’s ability to make interest payments and/or to pay its principal obligations in full and/or on time.
Tracking Error Risk (All Funds except GTO)—The performance of a Fund may diverge from that of the Index for a number of reasons, including operating expenses, transaction costs, cash flows and operational inefficiencies. A Fund’s return also may diverge from the return of the Index because a Fund bears the costs and risks associated with buying and selling securities (especially when rebalancing the Fund’s securities holdings to reflect changes in the Index) while such costs and risks are not factored into the return of the Index. Transaction costs, including brokerage costs, will decrease a Fund’s NAV to the extent not offset by the transaction fee payable by an Authorized Participant. Market disruptions and regulatory restrictions could have an adverse effect on a Fund’s ability to adjust its exposure to the required levels in order to track the Index. In addition, a Fund’s use of a representative sampling approach may cause the Fund’s returns to not be as well correlated with the return of the Index as would be the case if the Fund purchased all of the securities in the Index in the proportions represented in the Index. Errors in the Index data, the Index computations and/or the construction of the Index in accordance with its methodology may occur from time to time and may not be identified and corrected by the Index Provider for a period of time or at all, which may have an adverse impact on the Funds and their shareholders. In addition, a Fund may be unable to invest in certain securities included in the Index, or invest in them in the exact proportions in which they are represented in the Index, due to legal restrictions or limitations imposed by the governments of certain countries, a lack of liquidity in markets in which such securities trade, potential adverse tax consequences or other regulatory reasons. To the extent a Fund calculates its NAV based on fair value prices and the value of the Index is based on the securities’ closing prices (i.e., the value of the Index is not based on fair value prices), a Fund’s ability to track the Index may be adversely affected. For tax efficiency purposes, a Fund may sell certain securities, and such sale may cause the Fund to realize a loss and, thus, the Fund’s performance to deviate from the performance of the Index. In light of the factors discussed above, the Fund’s return may deviate significantly from the return of the Index.
U.S. Government Securities Risk (GTO only)—U.S. government securities may or may not be backed by the full faith and credit of the U.S. government. U.S. government securities are subject to the risks associated with fixed-income and debt securities, particularly interest rate risk and credit risk.
Volatility Risk (OVLC only)—Although the Index is designed to seek lower volatility than the S&P 500® Index in typical market conditions, there is no guarantee that these strategies will be successful. Moreover, the Index may be unsuccessful in attempting to reflect higher volatility in certain market conditions, whether due to the reward to risk for some or all of the Index’s constituent securities being in fact lower than estimated under the Index methodology, or because the Index’s measurements of market conditions or the reward to risk do not correspond to actual market results.
Water-Related Company Risk (CGW only)—Adverse developments related to water-related companies may significantly affect the value of the securities held by the Fund. In particular, water-related companies can be affected by technological changes, climactic events, environmental considerations, water conservation, taxes, additional government regulation, including the increased cost of compliance, inflation, an increase in the cost of raw materials, an increase in interest rates and changes in consumer sentiment and spending.
| 18 l CLAYMORE EXCHANGE-TRADED FUND TRUST 2 ANNUAL REPORT |
| | |
RISKS AND OTHER CONSIDERATIONS (Unaudited) continued | August 31, 2017 |
There is no assurance that the requirements of the NYSE Arca necessary to maintain the listing of the Funds will continue to be met or will remain unchanged.
In addition to the risks described, there are certain other risks related to investing in the Funds. These risks are described further in each Fund’s Prospectus and Statement of Additional Information and at guggenheiminvestments.com.
This material is not intended as a recommendation or as investment advice of any kind, including in connection with rollovers, transfers, and distributions. Such material is not provided in a fiduciary capacity, may not be relied upon for or in connection with the making of investment decisions, and does not constitute a solicitation of an offer to buy or sell securities. All content has been provided for informational or educational purposes only and is not intended to be and should not be construed as legal or tax advice and/or a legal opinion. Always consult a financial, tax and/or legal professional regarding your specific situation.
| CLAYMORE EXCHANGE-TRADED FUND TRUST 2 ANNUAL REPORT l 19 |
| | |
| PERFORMANCE REPORT AND FUND PROFILE (Unaudited) | August 31, 2017 |
| | |
YAO Guggenheim China All-Cap ETF | |
| | |
Fund Statistics | | | |
| Share Price | | $ | 33.23 | |
| Net Asset Value | | $ | 33.14 | |
| Premium to NAV | | | 0.27 | % |
| Net Assets ($000) | | $ | 26,510 | |
| AVERAGE ANNUAL TOTAL RETURNS FOR THE PERIOD ENDED AUGUST 31, 2017 |
| | | | | | | | | | | | | |
| | | One Year | | | Three Year | | | Five Year | | | Since Inception (10/19/09) | |
Guggenheim China All-Cap ETF | | | | | | | | | | |
| NAV | | | 29.33 | % | | | 7.89 | % | | | 11.50 | % | | | 5.82 | % |
| Market | | | 29.51 | % | | | 8.05 | % | | | 11.45 | % | | | 5.86 | % |
| AlphaShares | | | | | | | | | | | | | | | | |
| China All | | | | | | | | | | | | | | | | |
| Cap Index | | | 30.34 | % | | | 8.10 | % | | | 11.96 | % | | | 6.39 | % |
| MSCI China | | | | | | | | | | | | | | | | |
| Index | | | 35.00 | % | | | 9.76 | % | | | 12.14 | % | | | 6.02 | % |
Performance data quoted represents past performance, which is no guarantee of future results and current performance may be lower or higher than the figures shown. All NAV returns include the deduction of management fees, operating expenses and all other Fund expenses. The deduction of taxes that a shareholder would pay on Fund distributions or the redemption of Fund shares is not reflected in the total returns. For the most recent month-end performance figures, please visit guggenheiminvestments.com. The investment return and principal value of an investment will fluctuate with changes in market conditions and other factors so that an investor’s shares, when redeemed, may be worth more or less than their original cost.
Since inception returns assume a purchase of the Fund at the initial share price of $24.82 per share for share price returns or initial net asset value (NAV) of $24.82 per share for NAV returns. Returns for periods of less than one year are not annualized.
The MSCI China Index is a capitalization-weighted index that measures the performance of large- and mid-cap securities in the Chinese equity markets and includes representation across China H shares, B shares, Red chips and P chips.
The referenced index is unmanaged and not available for direct investment. Index performance does not reflect transaction costs, fees or expenses.
The Fund’s annual operating expense ratio of 0.70% is expressed as a unitary fee and covers all expenses of the Fund, except for distribution fees, if any, brokerage expenses, taxes, interest, litigation expenses and other extraordinary expenses. Please see Financial Highlights for recent expense ratios.
| | | | |
Portfolio Breakdown | | % of Net Assets | |
| Financial | | | 34.3 | % |
| Communications | | | 31.5 | % |
| Consumer, Non-cyclical | | | 7.7 | % |
| Energy | | | 6.4 | % |
| Industrial | | | 6.3 | % |
| Consumer, Cyclical | | | 6.1 | % |
| Technology | | | 2.7 | % |
| Other | | | 4.6 | % |
| Total Long-Term Investments | | | 99.6 | % |
| Securities Lending Collateral | | | 2.3 | % |
Total Investments | | | 101.9 | % |
Other Assets & Liabilities, net | | | -1.9 | % |
Net Assets | | | 100.0 | % |
| | |
Ten Largest Holdings | | (% of Total Net Assets) | |
| Alibaba Group Holding Ltd. ADR | | | 7.5 | % |
| Tencent Holdings Ltd. | | | 6.8 | % |
| Baidu, Inc. ADR | | | 4.8 | % |
| China Construction Bank Corp. — Class H | | | 4.6 | % |
| Industrial & Commercial Bank of China Ltd. — Class H | | | 4.5 | % |
| China Mobile Ltd. | | | 3.9 | % |
| Ping An Insurance Group Company of China Ltd. — Class H | | | 3.1 | % |
| Bank of China Ltd. — Class H | | | 3.1 | % |
| JD.com, Inc. ADR | | | 3.0 | % |
| China Life Insurance Company Ltd. — Class H | | | 1.8 | % |
| Top Ten Total | | | 43.1 | % |
“Ten Largest Holdings” excludes any temporary cash investments.
| 20 l CLAYMORE EXCHANGE-TRADED FUND TRUST 2 ANNUAL REPORT |
| | |
PERFORMANCE REPORT AND FUND PROFILE (Unaudited) continued | August 31, 2017 |
YAO Guggenheim China All-Cap ETF continued
This graph compares a hypothetical $10,000 investment in the Fund, made at its inception, with a similar investment in the MSCI China Index.Results include the reinvestment of all dividends and capital gains. Past performance is no guarantee of future results. The MSCI China Index is a capitalization-weighted index that measures the performance of large and mid-cap securities in the Chinese equity markets and includes representation across China H shares, B shares, Red chips and P chips.The referenced index is unmanaged and not available for direct investment. Investment return and principal value will fluctuate with changes in market conditions and other factors and Fund shares, when redeemed, may be worth more or less than their original investment.
| CLAYMORE EXCHANGE-TRADED FUND TRUST 2 ANNUAL REPORT l 21 |
| | |
PERFORMANCE REPORT AND FUND PROFILE (Unaudited) continued | August 31, 2017 |
| | |
CQQQ Guggenheim China Technology ETF | |
| | |
| | |
Fund Statistics | | | |
| Share Price | | $ | 55.21 | |
| Net Asset Value | | $ | 55.00 | |
| Premium to NAV | | | 0.38 | % |
| Net Assets ($000) | | $ | 209,019 | |
| AVERAGE ANNUAL TOTAL RETURNS FOR THE PERIOD ENDED AUGUST 31, 2017 |
| | | | | | | | | | | | | |
| | | One Year | | | Three Year | | | Five Year | | | Since Inception (12/08/09) | |
Guggenheim China Technology ETF | | | | | | | | | | |
| NAV | | | 42.43 | % | | | 14.71 | % | | | 24.14 | % | | | 12.19 | % |
| Market | | | 43.66 | % | | | 15.06 | % | | | 24.32 | % | | | 12.25 | % |
| AlplhaShares | | | | | | | | | | | | | | | | |
| China | | | | | | | | | | | | | | | | |
| Technology | | | | | | | | | | | | | | | | |
| Index | | | 42.92 | % | | | 14.04 | % | | | 23.91 | % | | | 12.15 | % |
| MSCI China | | | | | | | | | | | | | | | | |
| Index | | | 35.00 | % | | | 9.76 | % | | | 12.14 | % | | | 5.43 | % |
Performance data quoted represents past performance, which is no guarantee of future results and current performance may be lower or higher than the figures shown. All NAV returns include the deduction of management fees, operating expenses and all other Fund expenses. The deduction of taxes that a shareholder would pay on Fund distributions or the redemption of Fund shares is not reflected in the total returns. For the most recent month-end performance figures, please visit guggenheiminvestments.com. The investment return and principal value of an investment will fluctuate with changes in market conditions and other factors so that an investor’s shares, when redeemed, may be worth more or less than their original cost.
Since inception returns assume a purchase of the Fund at the initial share price of $25.06 per share for share price returns or initial net asset value (NAV) of $25.06 per share for NAV returns. Returns for periods of less than one year are not annualized.
The MSCI China Index is a capitalized-weighted index that measures the performance of large- and mid-cap securities in the Chinese equity markets and includes representation across China H shares, B shares, Red chips, and P chips.
The referenced index is unmanaged and not available for direct investment. Index performance does not reflect transaction costs, fees or expenses.
The Fund’s annual operating expense ratio of 0.70% is expressed as a unitary fee and covers all expenses of the Fund, except for distribution fees, if any, brokerage expenses, taxes, interest, litigation expenses and other extraordinary expenses. Please see Financial Highlights for recent expense ratios.
| | | | |
Portfolio Breakdown | | % of Net Assets | |
| Communications | | | 54.7 | % |
| Technology | | | 18.5 | % |
| Industrial | | | 15.4 | % |
| Basic Materials | | | 3.7 | % |
| Energy | | | 2.8 | % |
| Consumer, Cyclical | | | 1.4 | % |
| Consumer, Non-cyclical | | | 0.9 | % |
| Other | | | 0.7 | % |
| Total Long-Term Investments | | | 98.1 | % |
| Securities Lending Collateral | | | 8.9 | % |
Total Investments | | | 107.0 | % |
Other Assets & Liabilities, net | | | -7.0 | % |
Net Assets | | | 100.0 | % |
| | |
Ten Largest Holdings | | (% of Total Net Assets) | |
| Tencent Holdings Ltd. | | | 11.4 | % |
| Alibaba Group Holding Ltd. ADR | | | 11.3 | % |
| Sunny Optical Technology Group Company Ltd. | | | 7.1 | % |
| Baidu, Inc. ADR | | | 7.0 | % |
| NetEase, Inc. ADR | | | 4.7 | % |
| AAC Technologies Holdings, Inc. | | | 4.7 | % |
| 58.com, Inc. ADR | | | 4.2 | % |
| Weibo Corp. ADR | | | 4.0 | % |
| SINA Corp. | | | 3.9 | % |
| Kingboard Chemical Holdings Ltd. | | | 2.7 | % |
| Top Ten Total | | | 61.0 | % |
“Ten Largest Holdings” excludes any temporary cash investments.
| 22 l CLAYMORE EXCHANGE-TRADED FUND TRUST 2 ANNUAL REPORT |
| | |
PERFORMANCE REPORT AND FUND PROFILE (Unaudited) continued | August 31, 2017 |
CQQQ Guggenheim China Technology ETF continued
Performance of a $10,000 Investment
This graph compares a hypothetical $10,000 investment in the Fund, with a similar investment in the MSCI China Index. Results include the reinvestment of all distributions and capital gains.Past performance is no guarantee of future results. The MSCI China Index is a capitalization- weighted index that measures the performance of large- and mid-cap securities in the Chinese equity markets and includes representation across China H shares, B shares, Red chips and P chips. The referenced index is unmanaged. It is not possible to invest directly in the MSCI China Index. Investment return and principal value will fluctuate with changes in market conditions and other factors and Fund shares, when redeemed, may be worth more or less than their original investment.
| CLAYMORE EXCHANGE-TRADED FUND TRUST 2 ANNUAL REPORT l 23 |
| | |
PERFORMANCE REPORT AND FUND PROFILE (Unaudited) continued | August 31, 2017 |
| | |
| | |
Fund Statistics | | | |
| Share Price | | $ | 21.70 | |
| Net Asset Value | | $ | 21.62 | |
| Premium to NAV | | | 0.37 | % |
| Net Assets ($000) | | $ | 360,008 | |
| AVERAGE ANNUAL TOTAL RETURNS FOR THE PERIOD ENDED AUGUST 31, 2017 |
| | | | | | | | | | | | | |
| | | One Year | | | Three Year | | | Five Year | | | Since Inception (04/15/08) | |
| Guggenheim Solar ETF | | | | | | | | | | | | |
| NAV | | | 8.72 | % | | | (18.59 | %) | | | 9.20 | % | | | (20.76 | %) |
| Market | | | 9.01 | % | | | (18.38 | %) | | | 9.30 | % | | | (20.73 | %) |
| MAC Global | | | | | | | | | | | | | | | | |
| Solar Energy | | | | | | | | | | | | | | | | |
| Index | | | 6.48 | % | | | (21.57 | %) | | | 6.05 | % | | | (22.35 | %) |
| MSCI World | | | | | | | | | | | | | | | | |
| Index | | | 16.19 | % | | | 5.92 | % | | | 11.10 | % | | | 5.47 | % |
Performance data quoted represents past performance, which is no guarantee of future results and current performance may be lower or higher than the figures shown. All NAV returns include the deduction of management fees, operating expenses and all other Fund expenses. The deduction of taxes that a shareholder would pay on Fund distributions or the redemption of Fund shares is not reflected in the total returns. For the most recent month-end performance figures, please visit guggenheiminvestments.com. The investment return and principal value of an investment will fluctuate with changes in market conditions and other factors so that an investor’s shares, when redeemed, may be worth more or less than their original cost.
Since inception returns assume a purchase of the Fund at the initial share price of $251.30* per share for share price returns or initial net asset value (NAV) of $251.30* per share for NAV returns.
The Morgan Stanley Capital International (MSCI) World Index measures performance from a diverse range of global stock markets, including the U.S., Canada, Europe, Australia, New Zealand, and the Far East.
The referenced index is unmanaged and not available for direct investment. Index performance does not reflect transaction costs, fees or expenses.
Per the most recent prospectus, the Fund’s annualized gross operating expense ratio, gross of any fee waivers or expense reimbursements, was 0.88%. In the Financial Highlights section of this Annual Report, the Fund’s annualized net operating expense ratio was 0.70% while the Fund’s annualized gross operating expense ratio, gross of any fee waivers or expense reimbursements, was 0.76%. There is a contractual fee waiver currently in place for this Fund through December 31, 2019 to the extent necessary in keeping the Fund’s operating expense ratio from exceeding 0.65% of average net assets per year. Some expenses fall outside of this expense cap and actual expenses may be higher than 0.65%. Without this expense cap, actual returns would be lower. Please see Financial Highlights for recent expense ratios.
| | | | |
Portfolio Breakdown | | % of Net Assets | |
| Energy | | | 62.2 | % |
| Industrial | | | 18.1 | % |
| Utilities | | | 7.9 | % |
| Technology | | | 4.2 | % |
| Financial | | | 4.1 | % |
| Basic Materials | | | 2.9 | % |
| Total Long-Term Investments | | | 99.4 | % |
| Securities Lending Collateral | | | 27.2 | % |
Total Investments | | | 126.6 | % |
Other Assets & Liabilities, net | | | -26.6 | % |
Net Assets | | | 100.0 | % |
| | |
Ten Largest Holdings | | (% of Total Net Assets) | |
| First Solar, Inc. | | | 9.5 | % |
| Xinyi Solar Holdings Ltd. | | | 6.3 | % |
| GCL-Poly Energy Holdings Ltd. | | | 6.0 | % |
| SolarEdge Technologies, Inc. | | | 5.8 | % |
| JinkoSolar Holding Company Ltd. ADR | | | 5.4 | % |
| Canadian Solar, Inc. | | | 5.1 | % |
| Meyer Burger Technology AG | | | 5.0 | % |
| SMA Solar Technology AG | | | 4.4 | % |
| TerraForm Power, Inc. — Class A | | | 4.3 | % |
| Sunrun, Inc. | | | 4.3 | % |
| Top Ten Total | | | 56.1 | % |
“Ten Largest Holdings” excludes any temporary cash investments
*Reflects 1 for 10 reverse stock split that occurred on February 15, 2012.
| 24 l CLAYMORE EXCHANGE-TRADED FUND TRUST 2 ANNUAL REPORT |
| | |
PERFORMANCE REPORT AND FUND PROFILE (Unaudited) continued | August 31, 2017 |
TAN Guggenheim Solar ETF continued
Performance of a $10,000 Investment
This graph compares a hypothetical $10,000 investment in the Fund, made at its inception, with a similar investment in the MSCI World Index.Results include the reinvestment of all dividends and capital gains. Past performance is no guarantee of future results. The MSCI World Index measures performance from a diverse range of global stock markets, including the U.S., Canada, Europe, Australia, New Zealand and the Far East. The referenced index is unmanaged. It is not possible to invest directly in the MSCI World Index. Investment return and principal value will fluctuate with changes in market conditions and other factors and Fund shares, when redeemed, may be worth more or less than their original investment.
| CLAYMORE EXCHANGE-TRADED FUND TRUST 2 ANNUAL REPORT l 25 |
| | |
PERFORMANCE REPORT AND FUND PROFILE (Unaudited) continued | August 31, 2017 |
| | |
CGW Guggenheim S&P Global Water Index ETF |
| | |
| | |
Fund Statistics | | | |
| Share Price | | $ | 33.46 | |
| Net Asset Value | | $ | 33.38 | |
| Premium to NAV | | | 0.24 | % |
| Net Assets ($000) | | $ | 610,253 | |
AVERAGE ANNUAL TOTAL RETURNS FOR THE PERIOD ENDED AUGUST 31, 2017 | |
| | |
| | | One Year | | | Three Year | | | Five Year | | | Ten Year | |
Guggenheim S&P Global Water Index ETF | | | | | | | |
| NAV | | | 12.09 | % | | | 6.56 | % | | | 11.56 | % | | | 5.35 | % |
| Market | | | 12.18 | % | | | 6.57 | % | | | 11.68 | % | | | 5.26 | % |
| S&P Global | | | | | | | | | | | | | | | | |
| Water Index | | | 12.35 | % | | | 6.80 | % | | | 11.85 | % | | | 5.81 | % |
| Dow Jones | | | | | | | | | | | | | | | | |
| Global | | | | | | | | | | | | | | | | |
| Utilities Index | | | 15.39 | % | | | 5.92 | % | | | 9.23 | % | | | 1.12 | % |
| MSCI World | | | | | | | | | | | | | | | | |
| Index | | | 16.19 | % | | | 5.92 | % | | | 11.10 | % | | | 4.47 | % |
Performance data quoted represents past performance, which is no guarantee of future results and current performance may be lower or higher than the figures shown. All NAV returns include the deduction of management fees, operating expenses and all other Fund expenses. The deduction of taxes that a shareholder would pay on Fund distributions or the redemption of Fund shares is not reflected in the total returns. For the most recent month-end performance figures, please visit guggenheiminvestments.com. The investment return and principal value of an investment will fluctuate with changes in market conditions and other factors so that an investor’s shares, when redeemed, may be worth more or less than their original cost.
The Morgan Stanley Capital International (MSCI) World Index measures performance from a diverse range of global stock markets, including the U.S., Canada, Europe, Australia, New Zealand, and the Far East. The Dow Jones Global Utilities Index consists of companies that provide electrical, water, natural gas, and telephone utilities. The index is quoted in USD.
The referenced indices are unmanaged and not available for direct investment. Index performance does not reflect transaction costs, fees or expenses.
Per the most recent prospectus, the Fund’s annualized gross operating expense ratio, gross of any fee waivers or expense reimbursements, was 0.64%. In the Financial Highlights section of this Annual Report, the Fund’s annualized net operating expense ratio was 0.63% while the Fund’s annualized gross operating expense ratio, gross of any fee waivers or expense reimbursements, was 0.63%. There is a contractual fee waiver currently in place for this Fund through December 31, 2019 to the extent necessary in keeping the Fund’s operating expense ratio from exceeding 0.65% of average net assets per year. Some expenses fall outside of this expense cap and actual expenses may be higher than 0.65%. Without this expense cap, actual returns would be lower. Please see Financial Highlights for recent expense ratios.
| | | | |
Portfolio Breakdown | | % of Net Assets | |
| Industrial | | | 47.6 | % |
| Utilities | | | 40.4 | % |
| Consumer, Non-cyclical | | | 4.6 | % |
| Basic Materials | | | 2.9 | % |
| Consumer, Cyclical | | | 2.4 | % |
| Energy | | | 1.8 | % |
| Total Long-Term Investments | | | 99.7 | % |
| Securities Lending Collateral | | | 0.1 | % |
Total Investments | | | 99.8 | % |
Other Assets & Liabilities, net | | | 0.2 | % |
Net Assets | | | 100.0 | % |
| | |
Ten Largest Holdings | | (% of Total Net Assets) | |
| Geberit AG | | | 8.2 | % |
| American Water Works Co., Inc. | | | 7.5 | % |
| Veolia Environnement S.A. | | | 6.0 | % |
| Xylem, Inc. | | | 5.4 | % |
| Pentair plc | | | 4.6 | % |
| Danaher Corp. | | | 4.5 | % |
| IDEX Corp. | | | 4.4 | % |
| United Utilities Group plc | | | 4.2 | % |
| Suez | | | 3.7 | % |
| Severn Trent plc | | | 3.6 | % |
| Top Ten Total | | | 52.1 | % |
“Ten Largest Holdings” excludes any temporary cash investments.
| 26 l CLAYMORE EXCHANGE-TRADED FUND TRUST 2 ANNUAL REPORT |
| | |
PERFORMANCE REPORT AND FUND PROFILE (Unaudited) continued | August 31, 2017 |
| | |
CGW Guggenheim S&P Global Water Index ETF continued | |
This Graph compares a hypothetical $10,000 investment in the Fund with a similar investment in the MSCI World Index. Results include the reinvestment of all distributions and capital gains.Past performance is no guarantee of future results. The MSCI World Index measures performance from a diverse range of global stock markets, including the U.S., Canada, Europe, Australia, New Zealand, and the Far East. The referenced index is unmanaged. It is not possible to invest directly in the MSCI World Index. Investment return and principal value will fluctuate with changes in market conditions and other factors and Fund shares, when redeemed, may be worth more or less than their original investment.
| CLAYMORE EXCHANGE-TRADED FUND TRUST 2 ANNUAL REPORT l 27 |
| | |
PERFORMANCE REPORT AND FUND PROFILE (Unaudited) continued | August 31, 2017 |
GHII Guggenheim S&P High Income Infrastructure ETF
| | | | |
Fund Statistics | | | |
| Share Price | | $ | 28.35 | |
| Net Asset Value | | $ | 28.33 | |
| Premium to NAV | | | 0.07 | % |
| Net Assets ($000) | | $ | 35,408 | |
| AVERAGE ANNUAL TOTAL RETURNS FOR THE PERIOD ENDED AUGUST 31, 2017 | |
| | | | | | | |
| | | One Year | | | Since Inception (02/11/15) | |
Guggenheim S&P High Income Infrastructure ETF | | | | |
| NAV | | | 12.98 | % | | | 9.96 | % |
| Market | | | 12.17 | % | | | 9.96 | % |
| S&P High Income | | | | | | | | |
| Infrastructure Index | | | 13.69 | % | | | 11.01 | % |
| S&P Global BMI Index | | | 17.75 | % | | | 8.18 | % |
Performance data quoted represents past performance, which is no guarantee of future results and current performance may be lower or higher than the figures shown. All NAV returns include the deduction of management fees, operating expenses and all other Fund expenses. The deduction of taxes that a shareholder would pay on Fund distributions or the redemption of Fund shares is not reflected in the total returns. For the most recent month-end performance figures, please visit guggenheiminvestments.com. The investment return and principal value of an investment will fluctuate with changes in market conditions and other factors so that an investor’s shares, when redeemed, may be worth more or less than their original cost.
Since inception returns assume a purchase of the Fund at the initial share price of $25.05 per share for share price returns or initial net asset value (NAV) of $25.05 per share for NAV returns. Returns for periods of less than one year are not annualized.
The S&P High Income Infrastructure Index is designed to serve as a benchmark for yield-seeking equity investors looking for infrastructure exposure. The index is composed of the 50 highest-dividend-paying companies within the S&P Global BMI that operate in the energy, transportation, and utilities sectors.
The S&P Global BMI is a comprehensive, rules-based index designed to measure global stock market performance. The index covers all publicly listed equities with float adjusted market values of $100 million or more and annual dollar value traded of at least $50 million in all included countries. The S&P Global BMI is made up of the S&P Developed BMI and the S&P Emerging BMI indices.
The referenced indices are unmanaged and not available for direct investment. Index performance does not reflect transaction costs, fees or expenses.
The Fund’s annual operating expense ratio of 0.45% is expressed as a unitary fee and covers all expenses of the Fund, except for distribution fees, if any, brokerage expenses, taxes, interest, litigation expenses and other extraordinary expenses. Please see Financial Highlights for recent expense ratios.
| | | | |
Portfolio Breakdown | | % of Net Assets | |
| Utilities | | | 49.8 | % |
| Energy | | | 26.4 | % |
| Industrial | | | 12.2 | % |
| Consumer, Non-cyclical | | | 9.2 | % |
| Consumer, Cyclical | | | 1.1 | % |
| Total Long-Term Investments | | | 98.7 | % |
| Securities Lending Collateral | | | 13.1 | % |
Total Investments | | | 111.8 | % |
Other Assets & Liabilities, net | | | -11.8 | % |
Net Assets | | | 100.0 | % |
| | |
Ten Largest Holdings | | (% of Total Net Assets) | |
| Ship Finance International Ltd. | | | 4.1 | % |
| Targa Resources Corp. | | | 3.9 | % |
| AltaGas Ltd. | | | 3.3 | % |
| SemGroup Corp. — Class A | | | 3.3 | % |
| Macquarie Infrastructure Corp. | | | 3.2 | % |
| Electricite de France S.A. | | | 3.2 | % |
| Enagas S.A. | | | 2.9 | % |
| Enbridge Income Fund Holdings, Inc. | | | 2.9 | % |
| Fortum Oyj | | | 2.9 | % |
| Snam SpA | | | 2.9 | % |
| Top Ten Total | | | 32.6 | % |
“Ten Largest Holdings” excludes any temporary cash investments.
| 28 l CLAYMORE EXCHANGE-TRADED FUND TRUST 2 ANNUAL REPORT |
| | |
PERFORMANCE REPORT AND FUND PROFILE (Unaudited) continued | August 31, 2017 |
GHII Guggenheim S&P High Income Infrastructure ETF continued
This graph compares a hypothetical $10,000 investment in the Fund, made at its inception, with a similar investment in the S&P Global BMI Index. Results include the reinvestment of all dividends and capital gains. Past performance is no guarantee of future results. The S&P Global BMI is a comprehensive, rules-based index designed to measure global stock market performance. The index covers all publicly listed equities with float adjusted market values of $100 million or more and annual dollar value traded of at least $50 million in all included countries. The S&P Global BMI is made up of the S&P Developed BMI and the S&P Emerging BMI indices. It is not possible to invest directly in the S&P Global BMI Index. Investment return and principal value will fluctuate with changes in market conditions and other factors and Fund shares, when redeemed, may be worth more or less than their original investment.
| CLAYMORE EXCHANGE-TRADED FUND TRUST 2 ANNUAL REPORT l 29 |
| | |
PERFORMANCE REPORT AND FUND PROFILE (Unaudited) continued | August 31, 2017 |
| | | |
GTO Guggenheim Total Return Bond ETF | |
| | |
| | |
Fund Statistics | | | |
| Share Price | | $ | 52.67 | |
| Net Asset Value | | $ | 52.61 | |
| Premium to NAV | | | 0.11 | % |
| Net Assets ($000) | | $ | 81,538 | |
| AVERAGE ANNUAL TOTAL RETURNS FOR THE PERIOD ENDED AUGUST 31, 2017 | | | | | | |
| | | | | | | |
| | | One Year | | | Since Inception (02/10/16) | |
| Guggenheim Total Return Bond ETF | | | | | | |
| NAV | | | 3.47 | % | | | 6.31 | % |
| Market | | | 3.47 | % | | | 6.40 | % |
| Bloomberg Barclays U.S. | | | | | | | | |
| Aggregate Bond Index | | | 0.49 | % | | | 2.74 | % |
Performance data quoted represents past performance, which is no guarantee of future results and current performance may be lower or higher than the figures shown. All NAV returns include the deduction of management fees, operating expenses and all other Fund expenses. The deduction of taxes that a shareholder would pay on Fund distributions or the redemption of Fund shares is not reflected in the total returns. For the most recent month-end performance figures, please visit guggenheiminvestments.com. The investment return and principal value of an investment will fluctuate with changes in market conditions and other factors so that an investor’s shares, when redeemed, may be worth more or less than their original cost.
Since inception returns assume a purchase of the Fund at the initial share price of $49.97 per share for share price returns or initial net asset value (NAV) of $49.97 per share for NAV returns. Returns for periods of less than one year are not annualized.
Bloomberg Barclays U.S. Aggregate Bond Index is a broad-based benchmark that measures the investment grade, U.S. dollar denominated, fixed-rate taxable bond market, including Treasuries, government-related and corporate securities, MBS (agency fixed-rate and hybrid ARM passthroughs), ABS and CMBS. The referenced indices are unmanaged and not available for direct investment. Index performance does not reflect transaction costs, fees or expenses.
The referenced indices are unmanaged and not available for direct investment. Index performance does not reflect transaction costs, fees or expenses.
The Fund’s annual operating expense ratio of 0.50% is expressed as a unitary fee and covers all expenses of the Fund, except for distribution fees, if any, brokerage expenses, taxes, interest, litigation expenses and other extraordinary expenses. For the year ended August 31, 2017, the Fund’s total net expense ratio was 0.49% due to voluntary expense waivers. Please see Financial Highlights for recent expense ratios.
| | | | |
Portfolio Breakdown | | % of Net Assets | |
| Corporate Bonds | | | 20.7 | % |
| Collateralized Mortgage Obligations | | | 17.3 | % |
| Asset-Backed Securities | | | 15.5 | % |
| Commercial Paper | | | 14.7 | % |
| Repurchase Agreements | | | 12.2 | % |
| U.S. Government Securities | | | 7.8 | % |
| Exchange-Traded Funds | | | 5.0 | % |
| Money Market Fund | | | 4.3 | % |
| Municipal Bonds | | | 4.2 | % |
| Other Instruments | | | 6.2 | % |
Total Long-Term Investments | | | 107.9 | % |
Other Assets & Liabilities, net | | | -7.9 | % |
Net Assets | | | 100.0 | % |
| | |
Ten Largest Holdings | | (% of Total Net Assets) | |
| U.S. Treasury Bonds 11/15/44 | | | 6.7 | % |
| Guggenheim Ultra Short Duration ETF | | | 5.0 | % |
| KKR CLO 15 Ltd. 2.86% | | | 1.3 | % |
| LMREC, Inc. 2.99% | | | 1.2 | % |
| Flatiron CLO Ltd. 2.76% | | | 1.2 | % |
| U.S. Treasury Bonds 11/15/46 | | | 1.1 | % |
Freddie Mac Multifamily Structured Pass Through Certificates 3.12% | | | 1.0 | % |
| Mitsubishi UFJ Financial Group, Inc. 3.20% | | | 1.0 | % |
| Guggenheim Strategic Opportunities Fund | | | 1.0 | % |
| State of California General Obligation Unlimited 7.60% | | | 1.0 | % |
| Top Ten Total | | | 20.5 | % |
“Ten Largest Holdings” excludes any temporary cash or derivative investments.
| 30 l CLAYMORE EXCHANGE-TRADED FUND TRUST 2 ANNUAL REPORT |
| | |
PERFORMANCE REPORT AND FUND PROFILE (Unaudited) continued | August 31, 2017 |
GTO Guggenheim Total Return Bond ETF continued
| CLAYMORE EXCHANGE-TRADED FUND TRUST 2 ANNUAL REPORT l 31 |
| | |
PERFORMANCE REPORT AND FUND PROFILE (Unaudited) continued | August 31, 2017 |
OVLC Guggenheim U.S. Large Cap Optimized Volatility ETF
| | | | |
Fund Statistics | | | |
| Share Price | | $ | 28.29 | |
| Net Asset Value | | $ | 28.67 | |
| Discount to NAV | | | -1.34 | % |
| Net Assets ($000) | | $ | 1,434 | |
| AVERAGE ANNUAL TOTAL RETURNS FOR THE PERIOD ENDED AUGUST 31, 2017 | |
| | | | | | | |
| | | One Year | | | Since Inception (05/10/16) | |
Guggenheim U.S. Large Cap Optimized Volatility ETF | | | | |
| NAV | | | 10.50 | % | | | 11.38 | % |
| Market | | | 9.28 | % | | | 10.24 | % |
| Guggenheim U.S. Large Cap | | | | | | | | |
| Optimized Volatility Index | | | 10.93 | % | | | 11.79 | % |
| S&P 500 Index | | | 16.23 | % | | | 17.44 | % |
Performance data quoted represents past performance, which is no guarantee of future results and current performance may be lower or higher than the figures shown. All NAV returns include the deduction of management fees, operating expenses and all other Fund expenses. The deduction of taxes that a shareholder would pay on Fund distributions or the redemption of Fund shares is not reflected in the total returns. For the most recent month-end performance figures, please visit guggenheiminvestments.com. The investment return and principal value of an investment will fluctuate with changes in market conditions and other factors so that an investor’s shares, when redeemed, may be worth more or less than their original cost.
Since inception returns assume a purchase of the Fund at the initial share price of $25.14 per share for share price returns or initial net asset value (NAV) of $25.14 per share for NAV returns. Returns for periods of less than one year are not annualized.
The Standard and Poor’s 500 Index (S&P 500®) is a broad-based index, the performance of which is based on the performance of 500 widely held common stocks chosen for market size, liquidity and industry group representation.
The referenced index is unmanaged and not available for direct investment. Index performance does not reflect transaction costs, fees or expenses.
The Fund’s annual operating expense ratio of 0.30% is expressed as a unitary fee and covers all expenses of the Fund, except for distribution fees, if any, brokerage expenses, taxes, interest, litigation expenses and other extraordinary expenses. Please see Financial Highlights for recent expense ratios.
| | | | |
Portfolio Breakdown | | % of Net Assets | |
| Financial | | | 21.5 | % |
| Consumer, Non-cyclical | | | 18.7 | % |
| Consumer, Cyclical | | | 13.1 | % |
| Utilities | | | 10.8 | % |
| Industrial | | | 10.7 | % |
| Technology | | | 10.5 | % |
| Communications | | | 7.4 | % |
| Other | | | 6.7 | % |
| Total Long-Term Investments | | | 99.4 | % |
| Securities Lending Collateral | | | 0.8 | % |
Total Investments | | | 100.2 | % |
Other Assets & Liabilities, net | | | -0.2 | % |
Net Assets | | | 100.0 | % |
| | |
Ten Largest Holdings | | (% of Total Net Assets) | |
| Apple, Inc. | | | 3.0 | % |
| Berkshire Hathaway, Inc. — Class B | | | 2.7 | % |
| Exxon Mobil Corp. | | | 2.5 | % |
| Procter & Gamble Co. | | | 2.2 | % |
| AT&T, Inc. | | | 2.1 | % |
| Verizon Communications, Inc. | | | 2.0 | % |
| Merck & Co., Inc. | | | 1.8 | % |
| Intel Corp. | | | 1.8 | % |
| Microsoft Corp. | | | 1.7 | % |
| Wal-Mart Stores, Inc. | | | 1.6 | % |
| Top Ten Total | | | 21.4 | % |
“Ten Largest Holdings” excludes any temporary cash investments.
| 32 l CLAYMORE EXCHANGE-TRADED FUND TRUST 2 ANNUAL REPORT |
| | |
PERFORMANCE REPORT AND FUND PROFILE (Unaudited) continued | August 31, 2017 |
OVLC Guggenheim U.S. Large Cap Optimized Volatility ETF continued
This graph compares a hypothetical $10,000 investment in the Fund, made at its inception, with a similar investment in the S&P 500 Index.Results include the reinvestment of all distributions and capital gains.Past performance is no guarantee of future results. The S&P 500 Index is a broad-based index, the performance of which is based on the performance of 500 widely held common stocks chosen for market size, liquidity and industry group representation. The referenced index is unmanaged. It is not possible to invest directly in the S&P 500 Index.Investment return and principal value will fluctuate with changes in market conditions and other factors and Fund shares, when redeemed,may be worth more or less than their original investment.
| CLAYMORE EXCHANGE-TRADED FUND TRUST 2 ANNUAL REPORT l 33 |
| | |
ABOUT SHAREHOLDERS’ FUND EXPENSES (Unaudited) | August 31, 2017 |
Shareholder Expense Example
As a shareholder of the Funds, you incur transaction costs such as creation and redemption fees or brokerage charges, and ongoing costs including advisory fees, trustee fees and, if applicable, distribution fees. All other Trust expenses are paid by the advisor. This example is intended to help you understand your ongoing costs (in dollars) of investing in a Fund and to compare these costs with the ongoing costs of investing in other mutual funds.
The example in the table is based on an investment of $1,000 invested on February 28, 2017 and held for the six months ended August 31, 2017.
Actual Expenses
The first table below provides information about actual account values and actual expenses. You may use the information in this table, together with the amount you invested, to estimate the expenses that you incurred over the period. Simply divide your account value by $1,000 (for example, an $8,600 account value divided by $1,000 = 8.6), then multiply the result by the number in the first table under the heading entitled “Expenses Paid During Period” to estimate the expenses attributable to your investment during this period.
Hypothetical Example for Comparison Purposes
The second table below provides information about hypothetical account values and hypothetical expenses based on a Fund’s actual expense ratio and an assumed rate of return of 5% per year before expenses, which is not a Fund’s actual return. Thus, you should not use the hypothetical account values and expenses to estimate the actual ending account balance or your expenses for the period. Rather, these figures are provided to enable you to compare the ongoing costs of investing in a Fund and other funds. To do so, compare this 5% hypothetical example with the 5% hypothetical examples that appear in the shareholder reports of other funds. Please note that the expenses shown in the table are meant to highlight your ongoing costs only and do not reflect any transaction costs, such as creation and redemption fees, or brokerage charges. Therefore, the second table is useful in comparing ongoing costs only, and will not help you determine the relative total costs of owning different funds. In addition, if these transaction costs were included, your costs would have been higher.
| | | | | | | | | | | | | | | | |
| | | Expense Ratio1 | | | Fund Return | | | Beginning Account Value February 28, 2017 | | | Ending Account Value August 31, 2017 | | | Expenses Paid During Period2 | |
Table 1. Based on actual Fund return3 | | | | | | | | | | | | | | | |
| Guggenheim China All-Cap ETF | | | 0.70 | % | | | 22.11 | % | | $ | 1,000.00 | | | $ | 1,221.10 | | | $ | 3.92 | |
| Guggenheim China Technology ETF | | | 0.70 | % | | | 37.05 | % | | | 1,000.00 | | | | 1,370.50 | | | | 4.18 | |
| Guggenheim Solar ETF | | | 0.70 | % | | | 15.49 | % | | | 1,000.00 | | | | 1,154.92 | | | | 3.80 | |
| Guggenheim S&P Global Water Index ETF | | | 0.63 | % | | | 10.90 | % | | | 1,000.00 | | | | 1,108.98 | | | | 3.35 | |
| Guggenheim S&P High Income Infrastructure ETF | | | 0.45 | % | | | 8.40 | % | | | 1,000.00 | | | | 1,084.05 | | | | 2.36 | |
| Guggenheim Total Return Bond ETF | | | 0.49 | % | | | 3.45 | % | | | 1,000.00 | | | | 1,034.54 | | | | 2.51 | |
| Guggenheim U.S. Large Cap Optimized Volatility ETF | | | 0.30 | % | | | 3.32 | % | | | 1,000.00 | | | | 1,033.15 | | | | 1.54 | |
| | |
Table 2. Based on hypothetical 5% return (before expenses) | | | | | | | | | | | | | | | | | |
| Guggenheim China All-Cap ETF | | | 0.70 | % | | | 5.00 | % | | $ | 1,000.00 | | | $ | 1,021.68 | | | $ | 3.57 | |
| Guggenheim China Technology ETF | | | 0.70 | % | | | 5.00 | % | | | 1,000.00 | | | | 1,021.68 | | | | 3.57 | |
| Guggenheim Solar ETF | | | 0.70 | % | | | 5.00 | % | | | 1,000.00 | | | | 1,021.68 | | | | 3.57 | |
| Guggenheim S&P Global Water Index ETF | | | 0.63 | % | | | 5.00 | % | | | 1,000.00 | | | | 1,022.03 | | | | 3.21 | |
| Guggenheim S&P High Income Infrastructure ETF | | | 0.45 | % | | | 5.00 | % | | | 1,000.00 | | | | 1,022.94 | | | | 2.29 | |
| Guggenheim Total Return Bond ETF | | | 0.49 | % | | | 5.00 | % | | | 1,000.00 | | | | 1,022.74 | | | | 2.50 | |
| Guggenheim U.S. Large Cap Optimized Volatility ETF | | | 0.30 | % | | | 5.00 | % | | | 1,000.00 | | | | 1,023.69 | | | | 1.53 | |
1 | Annualized and excludes expenses of the underlying funds in which the Funds invest, if any. |
2 | Expenses are equal to the Fund’s annualized expense ratio, net of any applicable fee waivers, multiplied by the average account value over the period, multiplied by 184/365 (to reflect the one-half year period). |
3 | Actual cumulative return at net asset value for the period February 28, 2017 to August 31, 2017. |
| 34 l CLAYMORE EXCHANGE-TRADED FUND TRUST 2 ANNUAL REPORT |
| | |
SCHEDULE OF INVESTMENTS | August 31, 2017 |
YAO Guggenheim China All-Cap ETF
| | | | | | | |
| | | Shares | | | Value | |
COMMON STOCKS† – 99.6% | | | | | | |
Financial – 34.3% | | | | | | |
| China Construction Bank Corp. — Class H | | | 1,381,549 | | | $ | 1,210,948 | |
| Industrial & Commercial Bank of China Ltd. — Class H | | | 1,585,126 | | | | 1,186,852 | |
| Ping An Insurance Group Company of China Ltd. — Class H | | | 103,152 | | | | 819,131 | |
| Bank of China Ltd. — Class H | | | 1,537,466 | | | | 809,353 | |
| China Life Insurance Company Ltd. — Class H | | | 150,995 | | | | 484,252 | |
| Bank of Communications Company Ltd. — Class H | | | 449,993 | | | | 343,829 | |
| China Overseas Land & Investment Ltd. | | | 89,995 | | | | 314,494 | |
| China Merchants Bank Company Ltd. — Class H | | | 76,493 | | | | 288,323 | |
| China Pacific Insurance Group Company Ltd. — Class H | | | 55,600 | | | | 261,787 | |
| Agricultural Bank of China Ltd. — Class H | | | 528,982 | | | | 248,728 | |
| China Evergrande Group* | | | 70,994 | | | | 214,530 | |
| Country Garden Holdings Company Ltd. | | | 157,873 | | | | 209,786 | |
| CITIC Ltd. | | | 128,000 | | | | 196,585 | |
| PICC Property & Casualty Company Ltd. — Class H | | | 93,995 | | | | 176,546 | |
| China Resources Land Ltd. | | | 55,999 | | | | 174,942 | |
| China CITIC Bank Corporation Ltd. — Class H | | | 246,993 | | | | 163,159 | |
| China Minsheng Banking Corporation Ltd. — Class H | | | 124,990 | | | | 124,727 | |
Sunac China Holdings Ltd.1 | | | 40,000 | | | | 120,106 | |
| Haitong Securities Company Ltd. — Class H | | | 65,200 | | | | 109,299 | |
| CITIC Securities Company Ltd. — Class H | | | 45,501 | | | | 100,927 | |
| New China Life Insurance Company Ltd. — Class H | | | 15,200 | | | | 97,301 | |
China Huarong Asset Management Company Ltd. — Class H2 | | | 219,000 | | | | 93,460 | |
| China Taiping Insurance Holdings Company Ltd. | | | 28,800 | | | | 87,396 | |
| China Vanke Company Ltd. — Class H | | | 26,396 | | | | 79,089 | |
Huatai Securities Company Ltd. — Class H2 | | | 31,927 | | | | 71,063 | |
| GF Securities Company Ltd. — Class H | | | 31,072 | | | | 66,301 | |
| People’s Insurance Company Group of China Ltd. — Class H | | | 136,000 | | | | 64,121 | |
| China Cinda Asset Management Company Ltd. — Class H | | | 171,000 | | | | 63,581 | |
| China Galaxy Securities Company Ltd. — Class H | | | 69,500 | | | | 62,960 | |
| Longfor Properties Company Ltd. | | | 23,999 | | | | 57,648 | |
| Shimao Property Holdings Ltd. | | | 23,999 | | | | 49,553 | |
Guangzhou R&F Properties Company Ltd. — Class H1 | | | 20,000 | | | | 46,713 | |
| CIFI Holdings Group Company Ltd. | | | 78,000 | | | | 43,851 | |
| Chong Sing Holdings FinTech Gr* | | | 306,515 | | | | 41,514 | |
| Sino-Ocean Group Holding Ltd. | | | 59,993 | | | | 41,393 | |
| China Everbright Ltd. | | | 18,000 | | | | 41,122 | |
| China Jinmao Holdings Group Ltd.* | | | 87,998 | | | | 39,128 | |
| Far East Horizon Ltd. | | | 42,000 | | | | 38,370 | |
| Chongqing Rural Commercial Bank Company Ltd. — Class H | | | 49,994 | | | | 34,814 | |
| Agile Group Holdings Ltd. | | | 28,000 | | | | 33,558 | |
Bank of Jinzhou Company Ltd. — Class H1 | | | 32,000 | | | | 33,037 | |
| Shanghai Industrial Holdings Ltd. | | | 9,000 | | | | 27,369 | |
China International Capital Corporation Ltd. — Class H2 | | | 13,600 | | | | 24,675 | |
| Shenzhen Investment Ltd. | | | 53,999 | | | | 24,631 | |
| | | Shares | | | Value | |
COMMON STOCKS† – 99.6% (continued) | | | | | | |
Financial – 34.3% (continued) | | | | | | |
| KWG Property Holding Ltd.* | | | 26,315 | | | $ | 23,940 | |
| Yuexiu Property Company Ltd. | | | 121,992 | | | | 22,445 | |
| SOHO China Ltd.* | | | 36,999 | | | | 21,557 | |
| Poly Property Group Company Ltd.* | | | 36,999 | | | | 19,382 | |
Harbin Bank Company Ltd. — Class H*,2 | | | 59,000 | | | | 18,243 | |
| Yanlord Land Group Ltd. | | | 13,100 | | | | 16,689 | |
| Huishang Bank Corporation Ltd. — Class H | | | 32,000 | | | | 16,109 | |
| Shui On Land Ltd. | | | 66,993 | | | | 15,664 | |
Guotai Junan International Holdings Ltd.1 | | | 47,000 | | | | 15,614 | |
| Greentown China Holdings Ltd. | | | 12,500 | | | | 15,173 | |
| Joy City Property Ltd. | | | 76,000 | | | | 12,818 | |
China South City Holdings Ltd.1 | | | 62,000 | | | | 12,754 | |
Noah Holdings Ltd.*,1 | | | 424 | | | | 12,419 | |
Shengjing Bank Company Ltd. — Class H2 | | | 14,318 | | | | 11,946 | |
| Hopson Development Holdings Ltd. | | | 12,000 | | | | 11,346 | |
| Central China Securities Company Ltd. — Class H | | | 19,000 | | | | 8,982 | |
| Bank of Tianjin Company Ltd. — Class H | | | 12,500 | | | | 8,880 | |
| Renhe Commercial Holdings Company Ltd.* | | | 377,930 | | | | 8,789 | |
Total Financial | | | | | | | 9,093,702 | |
Communications – 31.5% | | | | | | | | |
| Alibaba Group Holding Ltd. ADR* | | | 11,505 | | | | 1,975,868 | |
| Tencent Holdings Ltd. | | | 42,742 | | | | 1,796,743 | |
| Baidu, Inc. ADR* | | | 5,562 | | | | 1,268,414 | |
| China Mobile Ltd. | | | 96,951 | | | | 1,028,172 | |
| JD.com, Inc. ADR* | | | 18,807 | | | | 788,201 | |
| Ctrip.com International Ltd. ADR* | | | 8,148 | | | | 419,215 | |
| China Unicom Hong Kong Ltd.* | | | 121,995 | | | | 177,698 | |
| China Telecom Corporation Ltd. — Class H | | | 277,981 | | | | 142,783 | |
| SINA Corp.* | | | 1,193 | | | | 121,483 | |
| 58.com, Inc. ADR* | | | 1,808 | | | | 113,235 | |
Weibo Corp. ADR*,1 | | | 1,115 | | | | 112,727 | |
Autohome, Inc. ADR*,1 | | | 1,080 | | | | 69,412 | |
| Vipshop Holdings Ltd. ADR* | | | 7,187 | | | | 66,911 | |
| YY, Inc. ADR* | | | 890 | | | | 66,501 | |
| ZTE Corp. — Class H* | | | 15,048 | | | | 41,050 | |
BYD Electronic International Company Ltd.1 | | | 12,500 | | | | 34,498 | |
| Sohu.com, Inc.* | | | 613 | | | | 32,697 | |
| Bitauto Holdings Ltd. ADR* | | | 808 | | | | 28,926 | |
| 51job, Inc. ADR* | | | 451 | | | | 26,789 | |
Fang Holdings Ltd. ADR*,1 | | | 5,235 | | | | 19,370 | |
Baozun Inc. ADR*,1 | | | 506 | | | | 13,758 | |
| CITIC Telecom International Holdings Ltd. | | | 26,000 | | | | 7,740 | |
21Vianet Group, Inc. ADR*,1 | | | 1,219 | | | | 6,327 | |
Total Communications | | | | | | | 8,358,518 | |
| | |
See notes to financial statements. | |
| | CLAYMORE EXCHANGE-TRADED FUND TRUST 2 ANNUAL REPORT l 35 |
| | |
SCHEDULE OF INVESTMENTS continued | August 31, 2017 |
YAO Guggenheim China All-Cap ETF continued
| | | | | | | |
| | | Shares | | | Value | |
COMMON STOCKS† – 99.6% (continued) | | | | | | |
Consumer, Non-cyclical – 7.7% | | | | | | |
| New Oriental Education & Technology Group, Inc. ADR* | | | 2,602 | | | $ | 212,713 | |
| TAL Education Group ADR | | | 5,633 | | | | 171,412 | |
WH Group Ltd.2 | | | 140,500 | | | | 146,847 | |
| CSPC Pharmaceutical Group Ltd. | | | 94,000 | | | | 146,769 | |
| Hengan International Group Company Ltd. | | | 15,501 | | | | 129,530 | |
| China Mengniu Dairy Company Ltd.* | | | 53,998 | | | | 126,121 | |
| Sinopharm Group Company Ltd. — Class H | | | 23,601 | | | | 106,599 | |
Want Want China Holdings Ltd.1 | | | 125,993 | | | | 83,390 | |
| China Resources Beer Holdings Company Ltd. | | | 32,000 | | | | 80,302 | |
| Sino Biopharmaceutical Ltd. | | | 89,992 | | | | 78,994 | |
| China Conch Venture Holdings Ltd. | | | 36,000 | | | | 65,501 | |
BeiGene Ltd*,1 | | | 890 | | | | 61,339 | |
| Tingyi Cayman Islands Holding Corp. | | | 37,999 | | | | 50,591 | |
| China Medical System Holdings Ltd. | | | 26,495 | | | | 48,749 | |
| Jiangsu Expressway Company Ltd. — Class H | | | 26,000 | | | | 39,865 | |
| Zhejiang Expressway Company Ltd. — Class H | | | 29,999 | | | | 37,525 | |
| China Biologic Products, Inc.* | | | 369 | | | | 35,978 | |
| Shenzhen International Holdings Ltd. | | | 19,407 | | | | 35,658 | |
| Tsingtao Brewery Company Ltd. — Class H | | | 8,000 | | | | 33,170 | |
| Shandong Weigao Group Medical Polymer Company | | | | | | | | |
| Ltd. — Class H | | | 40,001 | | | | 31,944 | |
| Shanghai Fosun Pharmaceutical Group Company | | | | | | | | |
| Ltd. — Class H | | | 7,500 | | | | 28,174 | |
3SBio, Inc.*,1,2 | | | 20,454 | | | | 28,121 | |
| China First Capital Group Ltd.* | | | 50,000 | | | | 19,996 | |
| Uni-President China Holdings Ltd. | | | 23,000 | | | | 19,660 | |
| China Agri-Industries Holdings Ltd. | | | 39,999 | | | | 18,706 | |
Luye Pharma Group Ltd.1 | | | 36,000 | | | | 18,215 | |
| SSY Group Ltd. | | | 38,000 | | | | 17,576 | |
CAR, Inc.*,1 | | | 17,818 | | | | 15,823 | |
| Tong Ren Tang Technologies Company Ltd. — Class H | | | 11,000 | | | | 15,460 | |
| Guangzhou Baiyunshan Pharmaceutical Holdings Company | | | | | | | | |
| Ltd. — Class H | | | 6,000 | | | | 15,164 | |
China Resources Phoenix Healthcare Holdings Company Ltd.1 | | | 12,000 | | | | 15,164 | |
| Health and Happiness Ltd.* | | | 3,500 | | | | 12,522 | |
| Fu Shou Yuan International Group Ltd. | | | 18,000 | | | | 12,051 | |
| Shenzhen Expressway Company Ltd. — Class H | | | 12,000 | | | | 11,714 | |
| Universal Medical Financial & Technical Advisory Services | | | | | | | | |
Company Ltd.1,2 | | | 13,636 | | | | 11,395 | |
| Vinda International Holdings Ltd. | | | 6,000 | | | | 10,656 | |
| CP Pokphand Company Ltd. | | | 121,993 | | | | 10,599 | |
Tibet Water Resources Ltd.*,1 | | | 27,000 | | | | 10,591 | |
| China Modern Dairy Holdings Ltd.* | | | 52,989 | | | | 10,427 | |
China Shengmu Organic Milk Ltd.*,2 | | | 48,000 | | | | 7,973 | |
China Huishan Dairy Holdings Company Ltd.†††,4 | | | 59,000 | | | | – | |
Hua Han Health Industry Holdings Ltd.*,†††,2,4 | | | 91,200 | | | | – | |
| | | Shares | | | Value | |
COMMON STOCKS† – 99.6% (continued) | | | | | | |
Consumer, Non-cyclical – 7.7% (continued) | | | | | | |
China Animal Healthcare Ltd.*,†††,4 | | | 36,000 | | | $ | – | |
Total Consumer, Non-cyclical | | | | | | | 2,032,984 | |
Energy – 6.4% | | | | | | | | |
| China Petroleum & Chemical Corp. — Class H | | | 515,183 | | | | 394,298 | |
| CNOOC Ltd. | | | 326,990 | | | | 391,062 | |
| PetroChina Company Ltd. — Class H | | | 431,986 | | | | 275,978 | |
| China Shenhua Energy Company Ltd. — Class H | | | 67,996 | | | | 175,063 | |
| China Everbright International Ltd. | | | 52,999 | | | | 70,020 | |
| Kunlun Energy Company Ltd. | | | 67,994 | | | | 65,853 | |
Fullshare Holdings Ltd.*,1 | | | 134,384 | | | | 53,572 | |
| China Longyuan Power Group Corporation Ltd. — Class H | | | 61,998 | | | | 46,421 | |
| Yanzhou Coal Mining Company Ltd. — Class H | | | 35,999 | | | | 36,153 | |
Xinyi Solar Holdings Ltd.1 | | | 94,000 | | | | 31,948 | |
| China Oilfield Services Ltd. — Class H | | | 37,999 | | | | 31,171 | |
GCL-Poly Energy Holdings Ltd.*,1 | | | 245,995 | | | | 27,659 | |
| Sinopec Engineering Group Company Ltd. — Class H | | | 21,500 | | | | 19,394 | |
| China Coal Energy Company Ltd. — Class H | | | 37,993 | | | | 19,126 | |
| Shougang Fushan Resources Group Ltd.* | | | 70,000 | | | | 15,831 | |
| Sinopec Kantons Holdings Ltd. | | | 20,000 | | | | 12,394 | |
| Beijing Jingneng Clean Energy Co. Ltd. — Class H | | | 38,000 | | | | 10,245 | |
Sinopec Oilfield Service Corp. — Class H*,1 | | | 38,000 | | | | 6,603 | |
Total Energy | | | | | | | 1,682,791 | |
Industrial – 6.3% | | | | | | | | |
| AAC Technologies Holdings, Inc. | | | 14,982 | | | | 273,167 | |
| Sunny Optical Technology Group Company Ltd. | | | 13,970 | | | | 200,275 | |
| China Communications Construction Company Ltd. — Class H | | | 87,993 | | | | 117,153 | |
| Anhui Conch Cement Company Ltd. — Class H | | | 23,500 | | | | 87,678 | |
| CRRC Corporation Ltd. — Class H | | | 81,000 | | | | 73,068 | |
| China Railway Group Ltd. — Class H | | | 76,993 | | | | 61,583 | |
| Zhuzhou CRRC Times Electric Company Ltd. — Class H | | | 10,900 | | | | 57,032 | |
| Yangzijiang Shipbuilding Holdings Ltd. | | | 51,000 | | | | 56,145 | |
| China Railway Construction Corporation Ltd. — Class H | | | 38,499 | | | | 50,470 | |
| Xinyi Glass Holdings Ltd. | | | 49,999 | | | | 49,830 | |
| China State Construction International Holdings Ltd. | | | 33,999 | | | | 49,262 | |
| Beijing Capital International Airport Company Ltd. — Class H* | | | 30,000 | | | | 48,528 | |
| Haitian International Holdings Ltd. | | | 13,000 | | | | 39,034 | |
| Lee & Man Paper Manufacturing Ltd. | | | 29,999 | | | | 34,995 | |
| China National Building Material Company Ltd. — Class H | | | 53,998 | | | | 33,945 | |
COSCO SHIPPING Holdings Company Ltd. — Class H*,1 | | | 51,500 | | | | 32,637 | |
| China Communications Services Corp. Ltd. — Class H | | | 47,993 | | | | 26,000 | |
| China High Speed Transmission Equipment Group Co. Ltd. | | | 24,000 | | | | 24,747 | |
AviChina Industry & Technology Company Ltd. — Class H1 | | | 40,999 | | | | 24,254 | |
Shanghai Electric Group Company Ltd. — Class H*,1 | | | 51,998 | | | | 23,586 | |
| China Energy Engineering Corporation Ltd. — Class H | | | 124,000 | | | | 22,973 | |
| BBMG Corp. — Class H | | | 43,000 | | | | 22,142 | |
| |
See notes to financial statements. |
36 l CLAYMORE EXCHANGE-TRADED FUND TRUST 2 ANNUAL REPORT |
| | |
SCHEDULE OF INVESTMENTS continued | August 31, 2017 |
YAO Guggenheim China All-Cap ETF continued
| | | | | | | |
| | | Shares | | | Value | |
COMMON STOCKS† – 99.6% (continued) | | | | | | |
Industrial – 6.3% (continued) | | | | | | |
| Sinotrans Ltd. — Class H | | | 38,000 | | | $ | 21,461 | |
| SITC International Holdings Company Ltd. | | | 22,000 | | | | 20,492 | |
| Hollysys Automation Technologies Ltd.* | | | 971 | | | | 19,750 | |
| China Railway Signal & Communication Corporation | | | | | | | | |
Ltd. — Class H2 | | | 26,077 | | | | 19,725 | |
| COSCO SHIPPING Development Company Ltd. — Class H* | | | 74,990 | | | | 18,109 | |
| China Resources Cement Holdings Ltd. | | | 32,000 | | | | 17,581 | |
| China International Marine Containers Group Co. Ltd. — Class H | | | 8,300 | | | | 16,904 | |
| Guangshen Railway Company Ltd. — Class H | | | 28,000 | | | | 15,241 | |
| COSCO SHIPPING Energy Transportation Company | | | | | | | | |
| Ltd. — Class H | | | 26,000 | | | | 14,850 | |
| Beijing Enterprises Clean Energy Group Ltd.* | | | 579,031 | | | | 14,279 | |
| China Lesso Group Holdings Ltd. | | | 19,000 | | | | 13,643 | |
| China Zhongwang Holdings Ltd. | | | 25,599 | | | | 12,625 | |
| Xinjiang Goldwind Science & Technology Company | | | | | | | | |
Ltd. — Class H1 | | | 11,280 | | | | 12,380 | |
| Zoomlion Heavy Industry Science and Technology Company | | | | | | | | |
| Ltd. — Class H | | | 23,399 | | | | 10,673 | |
| China Logistics Property Holdings Company Ltd.* | | | 31,000 | | | | 10,576 | |
| Tianneng Power International Ltd. | | | 12,000 | | | | 10,273 | |
| China Machinery Engineering Corp. — Class H | | | 15,000 | | | | 9,832 | |
CT Environmental Group Ltd.1 | | | 48,000 | | | | 6,808 | |
| Chaowei Power Holdings Ltd. | | | 13,000 | | | | 6,727 | |
China Shanshui Cement Group Ltd.*,†††,4 | | | 105,999 | | | | – | |
Total Industrial | | | | | | | 1,680,433 | |
Consumer, Cyclical – 6.1% | | | | | | | | |
| Geely Automobile Holdings Ltd. | | | 104,993 | | | | 258,108 | |
| Brilliance China Automotive Holdings Ltd. | | | 59,996 | | | | 155,233 | |
| Shenzhou International Group Holdings Ltd.* | | | 11,999 | | | | 96,128 | |
| Guangzhou Automobile Group Company Ltd. — Class H | | | 45,999 | | | | 90,747 | |
| ANTA Sports Products Ltd. | | | 22,000 | | | | 86,577 | |
BYD Company Ltd. — Class H1 | | | 14,500 | | | | 86,335 | |
| Great Wall Motor Company Ltd. — Class H | | | 61,500 | | | | 77,165 | |
| Dongfeng Motor Group Company Ltd. — Class H | | | 58,000 | | | | 75,293 | |
| China Lodging Group Ltd.* | | | 623 | | | | 70,717 | |
| Haier Electronics Group Company Ltd.* | | | 25,000 | | | | 66,441 | |
| Minth Group Ltd. | | | 14,000 | | | | 64,486 | |
Weichai Power Company Ltd. — Class H1 | | | 40,600 | | | | 41,812 | |
Alibaba Pictures Group Ltd.*,1 | | | 230,000 | | | | 40,261 | |
| Sun Art Retail Group Ltd. | | | 43,499 | | | | 40,073 | |
| Shanghai Pharmaceuticals Holding Company Ltd. — Class H | | | 13,900 | | | | 34,206 | |
| Air China Ltd. — Class H | | | 37,999 | | | | 33,792 | |
| China Southern Airlines Company Ltd. — Class H | | | 42,000 | | | | 32,789 | |
Fuyao Glass Industry Group Company Ltd. — Class H2 | | | 10,063 | | | | 32,080 | |
| Zhongsheng Group Holdings Ltd. | | | 12,500 | | | | 27,152 | |
| GOME Retail Holdings Ltd. | | | 226,991 | | | | 23,783 | |
| | | Shares | | | Value | |
COMMON STOCKS† – 99.6% (continued) | | | | | | |
Consumer, Cyclical – 6.1% (continued) | | | | | | |
| Li Ning Company Ltd.* | | | 31,500 | | | $ | 23,344 | |
Red Star Macalline Group Corporation Ltd. — Class H2 | | | 20,637 | | | | 22,176 | |
| Skyworth Digital Holdings Ltd. | | | 37,999 | | | | 17,624 | |
| China Eastern Airlines Corporation Ltd. — Class H | | | 32,000 | | | | 17,622 | |
| Digital China Holdings Ltd.* | | | 28,000 | | | | 16,886 | |
BAIC Motor Corporation Ltd. — Class H2 | | | 18,453 | | | | 16,434 | |
| Imperial Pacific International Holdings Ltd.* | | | 980,000 | | | | 16,278 | |
China Travel International Investment Hong Kong Ltd.1 | | | 41,999 | | | | 13,147 | |
| Golden Eagle Retail Group Ltd. | | | 9,000 | | | | 11,499 | |
| China Dongxiang Group Company Ltd. | | | 59,000 | | | | 10,554 | |
Pou Sheng International Holdings Ltd.1 | | | 40,000 | | | | 7,411 | |
| China Minsheng Financial Holding Corporation Ltd.* | | | 110,000 | | | | 7,168 | |
| Xtep International Holdings Ltd. | | | 15,500 | | | | 5,506 | |
BEP International Holdings Ltd.1 | | | 221,817 | | | | 5,357 | |
China Jicheng Holdings Ltd.*,2 | | | 329,690 | | | | 421 | |
Total Consumer, Cyclical | | | | | | | 1,624,605 | |
Technology – 2.7% | | | | | | | | |
| NetEase, Inc. ADR | | | 1,500 | | | | 413,760 | |
| Lenovo Group Ltd. | | | 141,995 | | | | 77,652 | |
Semiconductor Manufacturing International Corp.*,1 | | | 75,692 | | | | 71,181 | |
| TravelSky Technology Ltd. — Class H | | | 19,000 | | | | 51,952 | |
| Kingsoft Corporation Ltd. | | | 15,000 | | | | 35,572 | |
NetDragon Websoft Holdings Ltd.1 | | | 5,500 | | | | 20,239 | |
| Chinasoft International Ltd.* | | | 38,000 | | | | 20,198 | |
Kingdee International Software Group Company Ltd.*,1 | | | 34,000 | | | | 14,466 | |
| AGTech Holdings Ltd.* | | | 56,000 | | | | 11,448 | |
Total Technology | | | | | | | 716,468 | |
Utilities – 2.5% | | | | | | | | |
| China Gas Holdings Ltd. | | | 47,999 | | | | 121,187 | |
| Guangdong Investment Ltd. | | | 57,998 | | | | 85,666 | |
| Beijing Enterprises Water Group Ltd.* | | | 97,986 | | | | 83,257 | |
| China Resources Power Holdings Company Ltd. | | | 35,999 | | | | 66,051 | |
| China Resources Gas Group Ltd. | | | 18,000 | | | | 63,477 | |
CGN Power Company Ltd. — Class H2 | | | 203,271 | | | | 56,100 | |
| Huaneng Power International, Inc. — Class H | | | 83,994 | | | | 54,948 | |
| Beijing Enterprises Holdings Ltd. | | | 9,500 | | | | 53,044 | |
| Huaneng Renewables Corporation Ltd. — Class H | | | 91,456 | | | | 28,045 | |
| China Power International Development Ltd. | | | 65,999 | | | | 22,516 | |
| Datang International Power Generation Company Ltd. — Class H* | | | 53,996 | | | | 17,731 | |
| Huadian Power International Corporation Ltd. — Class H | | | 28,000 | | | | 11,484 | |
| Huadian Fuxin Energy Corporation Ltd. — Class H | | | 46,000 | | | | 10,168 | |
Total Utilities | | | | | | | 673,674 | |
Basic Materials – 1.8% | | | | | | | | |
| Kingboard Chemical Holdings Ltd. | | | 13,300 | | | | 72,563 | |
Aluminum Corporation of China Ltd. — Class H*,1 | | | 77,994 | | | | 57,700 | |
| | |
See notes to financial statements. | |
| | CLAYMORE EXCHANGE-TRADED FUND TRUST 2 ANNUAL REPORT l 37 |
| | |
SCHEDULE OF INVESTMENTS continued | August 31, 2017 |
YAO Guggenheim China All-Cap ETF continued
| | | | | | | |
| | | Shares | | | Value | |
COMMON STOCKS† – 99.6% (continued) | | | | | | |
Basic Materials – 1.8% (continued) | | | | | | |
| Nine Dragons Paper Holdings Ltd. | | | 32,999 | | | $ | 55,065 | |
| Sinopec Shanghai Petrochemical Company Ltd. — Class H | | | 67,998 | | | | 42,399 | |
| Zijin Mining Group Company Ltd. — Class H | | | 113,992 | | | | 41,801 | |
| Jiangxi Copper Company Ltd. — Class H | | | 22,999 | | | | 39,907 | |
| China Molybdenum Co. Ltd. — Class H | | | 72,000 | | | | 39,098 | |
| Huabao International Holdings Ltd. | | | 36,999 | | | | 22,597 | |
| MMG Ltd.* | | | 40,000 | | | | 19,524 | |
| Angang Steel Company Ltd. — Class H | | | 22,000 | | | | 19,002 | |
Zhaojin Mining Industry Company Ltd. — Class H1 | | | 20,000 | | | | 17,377 | |
China Hongqiao Group Ltd.*,†††,4 | | | 23,500 | | | | 15,884 | |
| Fufeng Group Ltd.* | | | 19,000 | | | | 12,066 | |
| China BlueChemical Ltd. — Class H | | | 31,999 | | | | 9,853 | |
Total Basic Materials | | | | | | | 464,836 | |
Diversified – 0.3% | | | | | | | | |
| China Merchants Port Holdings Company Ltd. | | | 17,630 | | | | 57,667 | |
| Legend Holdings Corp. — Class H2 | | | 6,350 | | | | 15,091 | |
Carnival Group International Holdings Ltd.*,1 | | | 110,000 | | | | 8,995 | |
Total Diversified | | | | | | | 81,753 | |
Total Common Stocks | | | | | | | | |
| (Cost $22,383,407) | | | | | | | 26,409,764 | |
RIGHTS††,4 – 0.0% | | | | | | | | |
| Carnival Corp. | | | | | | | | |
| Expires 09/18/17 | | | 27,500 | | | | 1,135 | |
| Beijing Enterprises Clean Energy Group Ltd. | | | | | | | | |
| Expires 09/04/17 | | | 82,718 | | | | 243 | |
Total Rights | | | | | | | | |
| (Cost $– ) | | | | | | | 1,378 | |
| | | Face | | | | | |
| | | Amount | | | Value | |
SECURITIES LENDING COLLATERAL††,3 – 2.3% | | | | | | | | |
Repurchase Agreements | | | | | | | | |
| Citigroup Global Markets, Inc. | | | | | | | | |
| issued 08/31/17 at 1.08% | | | | | | | | |
| due 09/01/17 | | $ | 250,000 | | | | 250,000 | |
| Daiwa Capital Markets America | | | | | | | | |
| issued 08/31/17 at 1.10% | | | | | | | | |
| due 09/01/17 | | | 250,000 | | | | 250,000 | |
| BNP Paribas Securities Corp. | | | | | | | | |
| issued 08/31/17 at 1.05% | | | | | | | | |
| due 09/01/17 | | | 107,502 | | | | 107,502 | |
Total Securities Lending Collateral | | | | | | | | |
| (Cost $607,502) | | | | | | $ | 607,502 | |
Total Investments – 101.9% | | | | | | | | |
| (Cost $22,990,909) | | | | | | $ | 27,018,644 | |
Other Assets & Liabilities, net – (1.9)% | | | | | | | (508,402 | ) |
Total Net Assets – 100.0% | | | | | | $ | 26,510,242 | |
| | | |
| * | | Non-income producing security. |
| † | | Value determined based on Level 1 inputs, unless otherwise noted — See Note 4. |
| †† | | Value determined based on Level 2 inputs — See Note 4. |
| ††† | | Value determined based on Level 3 inputs — See Note 4. |
| 1 | | All or portion of this security is on loan at August 31, 2017 — See Note 7. |
| 2 | | Security is a 144A or Section 4(a)(2) security. These securities have been determined to be liquid under guidelines established by the Board of Trustees. The total market value of 144A or Section 4(a)(2) securities is $575,750 (cost $542,152), or 2.2% of total net assets. |
| 3 | | Securities lending collateral — See Note 7. |
| 4 | | Security was fair valued by the Valuation Committee at August 31, 2017. The total market value of fair valued securities amounts to $15,884, (cost $14,964) or less than 0.1% of total net assets. |
| | | |
| ADR | | American Depositary Receipt |
See Sector Classification in Other Information section.
| |
| Country Diversification |
| | % of Long-Term |
Country | Investments |
| China | 95.9% |
| Hong Kong | 4.0% |
| Singapore | 0.1% |
Total Long-Term Investments | 100.0% |
| |
| Currency Denomination |
| | % of Long-Term |
Currency | Investments |
| Hong Kong Dollar | 76.5% |
| United States Dollar | 23.2% |
| Singapore Dollar | 0.3% |
Total Long-Term Investments | 100.0% |
| |
See notes to financial statements. |
38 l CLAYMORE EXCHANGE-TRADED FUND TRUST 2 ANNUAL REPORT |
| | |
SCHEDULE OF INVESTMENTS continued | August 31, 2017 |
YAO Guggenheim China All-Cap ETF continued
The following table summarizes the inputs used to value the Fund’s investments at August 31, 2017 (See Note 4 in the Notes to Financial Statements):
| | | | | | | | | | | | | |
| | | | | | Level 2 | | | Level 3 | | | | |
Investments in | | | | | Significant | | | Significant | | | | |
Securities | | Level 1 | | | Observable | | | Unobservable | | | | |
(Assets) | | Quoted Prices | | | Inputs | | | Inputs | | | Total | |
| Common Stocks | | $ | 26,393,880 | | | $ | — | | | $ | 15,884 | | | $ | 26,409,764 | |
| Rights | | | — | | | | 1,378 | | | | — | | | | 1,378 | |
| Securities Lending | | | | | | | | | | | | | | | | |
| Collateral | | | — | | | | 607,502 | | | | — | | | | 607,502 | |
| Total Assets | | $ | 26,393,880 | | | $ | 608,880 | | | $ | 15,884 | | | $ | 27,018,644 | |
Transfers between investment levels may occur as the markets fluctuate and/or the availability of data used in an investment’s valuation changes. Transfers between valuation levels, if any, are in comparison to the valuation levels at the end of the previous fiscal year, and are effective using the fair value as of the end of the current fiscal period.
For the year ended August 31, 2017, the fund had a security with a total market value of $15,884 transfer from Level 1 to Level 3 due to the security being halted on the principal exchange on which it trades. The fund also had a security with a total market value of $23,586 transfer from Level 2 to Level 1 due to the availability of an active market price at year end.
| | |
See notes to financial statements. | |
| | CLAYMORE EXCHANGE-TRADED FUND TRUST 2 ANNUAL REPORT l 39 |
| | |
SCHEDULE OF INVESTMENTS continued | August 31, 2017 |
CQQQ Guggenheim China Technology ETF
| | |
| | | Shares | | | Value | |
COMMON STOCKS† – 98.1% | | | | | | |
Communications – 54.7% | | | | | | |
| Tencent Holdings Ltd. | | | 568,557 | | | $ | 23,900,395 | |
| Alibaba Group Holding Ltd. ADR* | | | 137,928 | | | | 23,687,755 | |
| Baidu, Inc. ADR* | | | 64,421 | | | | 14,691,209 | |
58.com, Inc. ADR*,1 | | | 140,995 | | | | 8,830,517 | |
Weibo Corp. ADR*,1 | | | 83,592 | | | | 8,451,151 | |
| SINA Corp.* | | | 79,171 | | | | 8,061,983 | |
Autohome, Inc. ADR*,1 | | | 84,363 | | | | 5,422,010 | |
| YY, Inc. ADR* | | | 63,126 | | | | 4,716,775 | |
| ZTE Corp. — Class H* | | | 1,184,417 | | | | 3,231,004 | |
| BYD Electronic International Company Ltd. | | | 984,884 | | | | 2,718,154 | |
| Sohu.com, Inc.* | | | 47,808 | | | | 2,550,079 | |
Bitauto Holdings Ltd. ADR*,1 | | | 62,841 | | | | 2,249,708 | |
Fang Holdings Ltd. ADR*,1 | | | 354,976 | | | | 1,313,411 | |
Baozun Inc. ADR*,1 | | | 39,457 | | | | 1,072,836 | |
Yangtze Optical Fibre and Cable Joint Stock Limited Co. — Class H2 | | | 232,000 | | | | 664,005 | |
| SUNeVision Holdings Ltd. | | | 924,000 | | | | 569,055 | |
| China All Access Holdings Ltd. | | | 1,988,707 | | | | 564,104 | |
21Vianet Group, Inc. ADR*,1 | | | 102,544 | | | | 532,203 | |
| Yirendai Ltd. ADR* | | | 12,237 | | | | 489,480 | |
| Comba Telecom Systems Holdings Ltd. | | | 2,148,540 | | | | 323,937 | |
Renren, Inc. ADR*,1 | | | 26,680 | | | | 201,167 | |
Coolpad Group Ltd.*,†††,4 | | | 1,977,868 | | | | 103,614 | |
Total Communications | | | | | | | 114,344,552 | |
Technology – 18.5% | | | | | | | | |
| NetEase, Inc. ADR | | | 35,712 | | | | 9,850,797 | |
| Lenovo Group Ltd. | | | 8,934,701 | | | | 4,886,062 | |
Semiconductor Manufacturing International Corp.*,1 | | | 4,795,266 | | | | 4,509,472 | |
| TravelSky Technology Ltd. — Class H | | | 1,452,860 | | | | 3,972,581 | |
| Kingsoft Corporation Ltd. | | | 1,143,744 | | | | 2,712,327 | |
| Momo, Inc. ADR* | | | 55,345 | | | | 2,132,443 | |
| Chinasoft International Ltd.* | | | 3,330,252 | | | | 1,770,132 | |
NetDragon Websoft Holdings Ltd.1 | | | 427,591 | | | | 1,573,462 | |
Kingdee International Software Group Company Ltd.*,1 | | | 2,913,242 | | | | 1,239,527 | |
| AGTech Holdings Ltd.* | | | 4,870,690 | | | | 995,739 | |
Hua Hong Semiconductor Ltd.2 | | | 540,060 | | | | 717,646 | |
| Changyou.com Ltd. ADR* | | | 17,551 | | | | 702,391 | |
PAX Global Technology Ltd.1 | | | 1,147,727 | | | | 634,982 | |
Tian Ge Interactive Holdings Ltd.1,2 | | | 913,956 | | | | 630,600 | |
| Ju Teng International Holdings Ltd. | | | 1,260,623 | | | | 499,324 | |
NQ Mobile, Inc. — Class A ADR*,1 | | | 133,158 | | | | 443,416 | |
Cheetah Mobile Inc ADR*,1 | | | 47,205 | | | | 430,510 | |
| Boyaa Interactive International Ltd.* | | | 827,001 | | | | 327,569 | |
Shanghai Fudan Microelectronics Group Company Ltd. — Class H* | | | 347,204 | | | | 237,342 | |
| | | Shares | | | Value | |
COMMON STOCKS† – 98.1% (continued) | | | | | | |
Technology – 18.5% (continued) | | | | | | |
| Sinosoft Technology Group Ltd. | | | 772,000 | | | $ | 236,736 | |
Shunfeng International Clean Energy Ltd.*,1 | | | 4,706,120 | | | | 204,445 | |
Total Technology | | | | | | | 38,707,503 | |
Industrial – 15.4% | | | | | | | | |
| Sunny Optical Technology Group Company Ltd. | | | 1,038,340 | | | | 14,885,645 | |
| AAC Technologies Holdings, Inc. | | | 537,228 | | | | 9,795,301 | |
Tongda Group Holdings Ltd.1 | | | 6,112,040 | | | | 1,694,654 | |
China Railway Signal & Communication Corporation Ltd. — Class H2 | | | 2,209,854 | | | | 1,671,554 | |
| Hollysys Automation Technologies Ltd.* | | | 76,822 | | | | 1,562,559 | |
Truly International Holdings Ltd.1 | | | 2,421,856 | | | | 733,385 | |
| GCL New Energy Holdings Ltd.* | | | 11,407,577 | | | | 619,466 | |
| China Aerospace International Holdings Ltd. | | | 3,016,570 | | | | 377,724 | |
Wasion Group Holdings Ltd.1 | | | 764,534 | | | | 326,271 | |
| Technovator International Ltd.* | | | 775,630 | | | | 234,876 | |
| China Electronics Corporation Holdings Company Ltd. | | | 1,344,164 | | | | 190,638 | |
Total Industrial | | | | | | | 32,092,073 | |
Basic Materials – 3.7% | | | | | | | | |
| Kingboard Chemical Holdings Ltd. | | | 1,022,358 | | | | 5,577,840 | |
| Kingboard Laminates Holdings Ltd. | | | 1,210,913 | | | | 2,054,690 | |
Total Basic Materials | | | | | | | 7,632,530 | |
Energy – 2.8% | | | | | | | | |
Xinyi Solar Holdings Ltd.1 | | | 6,836,578 | | | | 2,323,570 | |
GCL-Poly Energy Holdings Ltd.*,1 | | | 19,220,446 | | | | 2,161,132 | |
JinkoSolar Holding Company Ltd. ADR*,1 | | | 33,135 | | | | 922,147 | |
| JA Solar Holdings Company Ltd. ADR* | | | 61,268 | | | | 409,270 | |
Total Energy | | | | | | | 5,816,119 | |
Consumer, Cyclical – 1.4% | | | | | | | | |
| Landing International Development Ltd.* | | | 108,230,055 | | | | 1,161,615 | |
Digital China Holdings Ltd.*,1 | | | 1,877,579 | | | | 1,132,337 | |
| VSTECS Holdings Ltd. | | | 1,080,800 | | | | 324,525 | |
HNA Holding Group Company Ltd.*,1 | | | 6,083,297 | | | | 256,500 | |
Total Consumer, Cyclical | | | | | | | 2,874,977 | |
Consumer, Non-cyclical – 0.9% | | | | | | | | |
| HC International, Inc. | | | 932,254 | | | | 846,914 | |
| Hi Sun Technology China Ltd.* | | | 2,772,869 | | | | 641,273 | |
| China Innovationpay Group Ltd.* | | | 8,166,566 | | | | 417,383 | |
Anxin-China Holdings Ltd.*,†††,4 | | | 2,144,054 | | | | – | |
Total Consumer, Non-cyclical | | | | | | | 1,905,570 | |
Diversified – 0.6% | | | | | | | | |
Legend Holdings Corp. — Class H2 | | | 555,100 | | | | 1,319,226 | |
Financial – 0.1% | | | | | | | | |
| Rentian Technology Holdings Ltd.* | | | 5,370,000 | | | | 260,732 | |
| See notes to financial statements. |
| 40 l CLAYMORE EXCHANGE-TRADED FUND TRUST 2 ANNUAL REPORT |
| | |
SCHEDULE OF INVESTMENTS continued | August 31, 2017 |
CQQQ Guggenheim China Technology ETF continued
| | | | | | | |
| | | Shares | | | Value | |
COMMON STOCKS† – 98.1% (continued) | | | | | | |
Financial – 0.1% (continued) | | | | | | |
National Agricultural Holdings Ltd.*,†††,4 | | | 534,446 | | | $ | 45,752 | |
Total Financial | | | | | | | 306,484 | |
Total Common Stocks | | | | | | | | |
| (Cost $168,791,371) | | | | | | | 204,999,034 | |
| | | Face | | | | |
| | | Amount | | | Value | |
SECURITIES LENDING COLLATERAL††,3 – 8.9% | | | | | | |
Repurchase Agreements | | | | | | |
| Daiwa Capital Markets America | | | | | | |
| issued 08/31/17 at 1.10% | | | | | | |
| due 09/01/17 | | $ | 4,339,159 | | | $ | 4,339,159 | |
| Merrill Lynch, Pierce, Fenner & Smith, Inc. | | | | | | | | |
| issued 08/31/17 at 1.08% | | | | | | | | |
| due 09/01/17 | | | 4,339,159 | | | | 4,339,159 | |
| RBC Dominion Securities, Inc. | | | | | | | | |
| issued 08/31/17 at 1.05% | | | | | | | | |
| due 09/01/17 | | | 4,339,159 | | | | 4,339,159 | |
| Citibank | | | | | | | | |
| issued 08/31/17 at 1.08% | | | | | | | | |
| due 09/01/17 | | | 4,339,159 | | | | 4,339,159 | |
| J.P. Morgan Securities LLC | | | | | | | | |
| issued 08/31/17 at 1.06% | | | | | | | | |
| due 09/01/17 | | | 1,285,788 | | | | 1,285,788 | |
Total Securities Lending Collateral | | | | | | | | |
| (Cost $18,642,424) | | | | | | | 18,642,424 | |
Total Investments – 107.0% | | | | | | | | |
| (Cost $187,433,795) | | | | | | $ | 223,641,458 | |
Other Assets & Liabilities, net – (7.0)% | | | | | | | (14,622,720 | ) |
Total Net Assets – 100.0% | | | | | | $ | 209,018,738 | |
| * | | Non-income producing security. |
| † | | Value determined based on Level 1 inputs, unless otherwise noted — See Note 4. |
| †† | | Value determined based on Level 2 inputs — See Note 4. |
| ††† | | Value determined based on Level 3 inputs — See Note 4. |
| 1 | | All or portion of this security is on loan at August 31, 2017 — See Note 7. |
| 2 | | Security is a 144A or Section 4(a)(2) security. These securities have been determined to be liquid under guidelines established by the Board of Trustees. The total market value of 144A or Section 4(a)(2) securities is $5,003,031 (cost $4,830,904), or 2.4% of total net assets. |
| 3 | | Securities lending collateral — See Note 7. |
| 4 | | Security was fair valued by the Valuation Committee at August 31, 2017. The total market value of the fair valued securities amounts to $149,366, (cost $989,404) or less than 0.1% of the total net assets. |
| | | |
| ADR | | American Depositary Receipt |
See Sector Classification in Other Information section.
| | |
| Country Diversification |
| | % of Long-Term |
Country | Investments |
| China | 89.1% |
| Hong Kong | 10.9% |
Total Long-Term Investments | 100.0% |
| |
| Currency Denomination |
| | % of Long-Term |
Currency | Investments |
| Hong Kong Dollar | 51.8% |
| United States Dollar | 48.2% |
Total Long-Term Investments | 100.0% |
The following table summarizes the inputs used to value the Fund’s investments at August 31, 2017 (See Note 4 in the Notes to Financial Statements):
| | | | | | | | | | | | | |
| | | | | | Level 2 | | | Level 3 | | | | |
Investments in | | | | | Significant | | | Significant | | | | |
Securities | | Level 1 | | | Observable | | | Unobservable | | | | |
(Assets) | | Quoted Prices | | | Inputs | | | Inputs | | | Total | |
| Common Stocks | | $ | 204,849,668 | | | $ | — | | | $ | 149,366 | | | $ | 204,999,034 | |
| Securities Lending | | | | | | | | | | | | | | | | |
| Collateral | | | — | | | | 18,642,424 | | | | — | | | | 18,642,424 | |
| Total Assets | | $ | 204,849,668 | | | $ | 18,642,424 | | | $ | 149,366 | | | $ | 223,641,458 | |
Transfers between investment levels may occur as the markets fluctuate and/or the availability of data used in an investment’s valuation changes. Transfers between valuation levels, if any, are in comparison to the valuation levels at the end of the previous fiscal year, and are effective using the fair value as of the end of the current fiscal period.
For the year ended August 31, 2017, the Fund had securities with a total market value of $149,366 transfer from Level 1 to Level 3 due to the securities being halted on the principal exchange on which they trade.
| | |
See notes to financial statements. | |
| | CLAYMORE EXCHANGE-TRADED FUND TRUST 2 ANNUAL REPORT l 41 |
| | |
SCHEDULE OF INVESTMENTS continued | August 31, 2017 |
| | |
| | | Shares | | | Value | |
COMMON STOCKS† – 99.4% | | | | | | |
Energy – 62.2% | | | | | | |
| First Solar, Inc.* | | | 725,397 | | | $ | 34,064,644 | |
Xinyi Solar Holdings Ltd.1 | | | 66,262,676 | | | | 22,520,903 | |
GCL-Poly Energy Holdings Ltd.*,1 | | | 193,109,650 | | | | 21,713,100 | |
SolarEdge Technologies, Inc.*,1 | | | 781,615 | | | | 20,908,201 | |
JinkoSolar Holding Company Ltd. ADR*,1 | | | 694,015 | | | | 19,314,437 | |
Canadian Solar, Inc.*,1 | | | 1,157,426 | | | | 18,183,162 | |
| TerraForm Power, Inc. — Class A* | | | 1,117,563 | | | | 15,601,179 | |
Sunrun, Inc.*,1 | | | 2,322,713 | | | | 15,562,177 | |
Scatec Solar ASA1,2 | | | 2,598,664 | | | | 15,465,355 | |
| Capital Stage AG | | | 1,592,218 | | | | 12,565,649 | |
| JA Solar Holdings Company Ltd. ADR* | | | 1,629,697 | | | | 10,886,376 | |
Vivint Solar, Inc.*,1 | | | 1,974,253 | | | | 9,377,702 | |
| TerraForm Global, Inc. — Class A* | | | 1,514,478 | | | | 7,648,114 | |
Total Energy | | | | | | | 223,810,999 | |
Industrial – 18.1% | | | | | | | | |
Meyer Burger Technology AG*,1 | | | 12,324,443 | | | | 17,826,197 | |
SMA Solar Technology AG1 | | | 356,352 | | | | 15,756,165 | |
SunPower Corp. — Class A*,1 | | | 1,717,616 | | | | 15,183,725 | |
GCL New Energy Holdings Ltd.*,1 | | | 195,676,379 | | | | 10,625,822 | |
China Singyes Solar Technologies Holdings Ltd.*,1 | | | 17,506,258 | | | | 5,659,122 | |
Total Industrial | | | | | | | 65,051,031 | |
Utilities – 7.9% | | | | | | | | |
| Atlantica Yield plc | | | 725,362 | | | | 15,058,515 | |
| 8Point3 Energy Partners, LP | | | 916,167 | | | | 13,211,128 | |
Total Utilities | | | | | | | 28,269,643 | |
Technology – 4.2% | | | | | | | | |
REC Silicon ASA*,1 | | | 81,700,568 | | | | 10,890,119 | |
Shunfeng International Clean Energy Ltd.*,1 | | | 79,387,209 | | | | 3,448,773 | |
Hanwha Q Cells Co. Ltd. ADR*,1 | | | 128,910 | | | | 956,512 | |
Total Technology | | | | | | | 15,295,404 | |
Financial – 4.1% | | | | | | | | |
Hannon Armstrong Sustainable Infrastructure Capital, Inc. REIT | | | 635,674 | | | | 14,747,637 | |
Basic Materials – 2.9% | | | | | | | | |
Daqo New Energy Corp. ADR*,1 | | | 417,228 | | | | 10,614,280 | |
Total Common Stocks | | | | | | | | |
| (Cost $344,442,401) | | | | | | | 357,788,994 | |
| | | Face | | | | |
| | | Amount | | | Value | |
SECURITIES LENDING COLLATERAL††,3 – 27.2% | | | | | | |
Repurchase Agreements | | | | | | |
| Daiwa Capital Markets America | | | | | | |
| issued 08/31/17 at 1.10% | | | | | | |
| due 09/01/17 | | $ | 22,808,511 | | | $ | 22,808,511 | |
| Merrill Lynch, Pierce, Fenner & Smith, Inc. | | | | | | | | |
| issued 08/31/17 at 1.08% | | | | | | | | |
| due 09/01/17 | | | 22,808,511 | | | | 22,808,511 | |
| | | Face | | | | |
| | | Amount | | | Value | |
SECURITIES LENDING COLLATERAL††,3 – 27.2% (continued) | | | | | | |
Repurchase Agreements (continued) | | | | | | |
| RBC Dominion Securities, Inc. | | | | | | |
| issued 08/31/17 at 1.05% | | | | | | |
| due 09/01/17 | | $ | 22,808,511 | | | $ | 22,808,511 | |
| Citibank | | | | | | | | |
| issued 08/31/17 at 1.08% | | | | | | | | |
| due 09/01/17 | | | 22,808,511 | | | | 22,808,511 | |
| J.P. Morgan Securities LLC | | | | | | | | |
| issued 08/31/17 at 1.06% | | | | | | | | |
| due 09/01/17 | | | 6,758,622 | | | | 6,758,622 | |
Total Securities Lending Collateral | | | | | | | | |
| (Cost $97,992,666) | | | | | | | 97,992,666 | |
Total Investments – 126.6% | | | | | | | | |
| (Cost $442,435,067) | | | | | | $ | 455,781,660 | |
Other Assets & Liabilities, net – (26.6)% | | | | | | | (95,773,772 | ) |
Total Net Assets – 100.0% | | | | | | $ | 360,007,888 | |
| * | | Non-income producing security. |
| † | | Value determined based on Level 1 inputs — See Note 4. |
| †† | | Value determined based on Level 2 inputs — See Note 4. |
| 1 | | All or portion of this security is on loan at August 31, 2017 — See Note 7. |
| 2 | | Security is a 144A or Section 4(a)(2) security. These securities have been determined to be liquid under guidelines established by the Board of Trustees. The total market value of 144A or Section 4(a)(2) securities is $15,465,355 (cost $13,057,205), or 4.3% of total net assets. |
| 3 | | Securities lending collateral — See Note 7. |
| | | |
| ADR | | American Depositary Receipt |
| plc | | Public Limited Company |
| REIT | | Real Estate Investment Trust |
See Sector Classification in Other Information section.
| |
| Country Diversification |
| | | % of Long-Term |
Country | Investments |
| United States | 43.9% |
| Cayman Islands | 25.0% |
| Germany | 7.9% |
| Canada | | 5.1% |
| Switzerland | 5.0% |
| Bermuda | 4.6% |
| Norway | | 4.3% |
| United Kingdom | 4.2% |
Total Long-Term Investments | 100.0% |
| | |
See notes to financial statements. | |
| 42 l CLAYMORE EXCHANGE-TRADED FUND TRUST 2 ANNUAL REPORT | |
| | |
SCHEDULE OF INVESTMENTS continued | August 31, 2017 |
TAN Guggenheim Solar ETF continued
| | |
| Currency Denomination |
| | % of Long-Term |
Currency | Investments |
| United States Dollar | 61.8% |
| Hong Kong Dollar | 17.9% |
| Euro | 7.9% |
| Norwegian Krone | 7.4% |
| Swiss Franc | 5.0% |
Total Long-Term Investments | 100.0% |
The following table summarizes the inputs used to value the Fund’s investments at August 31, 2017 (See Note 4 in the Notes to Financial Statements):
| | | | | | | | | | | | | |
| | | | | | Level 2 | | | Level 3 | | | | |
Investments in | | | | | Significant | | | Significant | | | | |
Securities | | Level 1 | | | Observable | | | Unobservable | | | | |
(Assets) | | Quoted Prices | | | Inputs | | | Inputs | | | Total | |
| Common Stocks | | $ | 357,788,994 | | | $ | — | | | $ | — | | | $ | 357,788,994 | |
| Securities Lending | | | | | | | | | | | | | | | | |
| Collateral | | | — | | | | 97,992,666 | | | | — | | | | 97,992,666 | |
| Total Assets | | $ | 357,788,994 | | | $ | 97,992,666 | | | $ | — | | | $ | 455,781,660 | |
Transfers between investment levels may occur as the markets fluctuate and/or the availability of data used in an investment’s valuation changes. Transfers between valuation levels, if any, are in comparison to the valuation levels at the end of the previous fiscal year, and are effective using the fair value as of the end of the current fiscal period.
For the year ended August 31, 2017, there were no transfers between levels.
| | |
See notes to financial statements. | |
| | CLAYMORE EXCHANGE-TRADED FUND TRUST 2 ANNUAL REPORT l 43 |
| | |
SCHEDULE OF INVESTMENTS continued | August 31, 2017 |
CGW Guggenheim S&P Global Water Index ETF
| | | | | | | |
| | | Shares | | | Value | |
COMMON STOCKS† – 99.7% | | | | | | |
Industrial – 47.6% | | | | | | |
| Geberit AG | | | 109,906 | | | $ | 50,103,870 | |
| Xylem, Inc. | | | 532,521 | | | | 33,053,579 | |
| Pentair plc | | | 453,839 | | | | 28,160,710 | |
| IDEX Corp. | | | 226,242 | | | | 26,601,534 | |
| Alfa Laval AB | | | 851,538 | | | | 19,262,297 | |
Halma plc1 | | | 1,121,232 | | | | 15,791,267 | |
| Aalberts Industries N.V. | | | 285,454 | | | | 12,684,182 | |
| Andritz AG | | | 209,835 | | | | 11,403,398 | |
| Ebara Corp. | | | 324,800 | | | | 10,048,555 | |
| Kurita Water Industries Ltd. | | | 328,600 | | | | 9,449,563 | |
| Tetra Tech, Inc. | | | 183,075 | | | | 7,798,995 | |
Rotork plc1 | | | 2,574,432 | | | | 7,603,217 | |
| Rexnord Corp.* | | | 302,334 | | | | 7,219,735 | |
| Interpump Group SpA | | | 235,836 | | | | 6,852,617 | |
| Mueller Water Products, Inc. — Class A | | | 475,833 | | | | 5,705,238 | |
| Mueller Industries, Inc. | | | 169,482 | | | | 5,055,648 | |
| Watts Water Technologies, Inc. — Class A | | | 81,822 | | | | 5,048,417 | |
| Arcadis N.V. | | | 226,246 | | | | 4,908,953 | |
| Franklin Electric Company, Inc. | | | 113,273 | | | | 4,366,674 | |
| Sulzer AG | | | 37,290 | | | | 4,113,153 | |
| Badger Meter, Inc. | | | 85,655 | | | | 3,931,565 | |
| Lindsay Corp. | | | 31,277 | | | | 2,707,650 | |
| Aegion Corp. — Class A* | | | 107,013 | | | | 2,318,972 | |
| Advanced Drainage Systems, Inc. | | | 105,390 | | | | 2,049,836 | |
| Gorman-Rupp Co. | | | 51,429 | | | | 1,565,499 | |
| China Water Affairs Group Ltd. | | | 2,644,000 | | | | 1,526,986 | |
SIIC Environment Holdings Ltd.1 | | | 2,858,500 | | | | 1,126,140 | |
Forterra, Inc.*,1 | | | 54,550 | | | | 181,106 | |
Total Industrial | | | | | | | 290,639,356 | |
Utilities – 40.4% | | | | | | | | |
| American Water Works Co., Inc. | | | 569,236 | | | | 46,051,191 | |
| Veolia Environnement S.A. | | | 1,570,454 | | | | 36,800,777 | |
| United Utilities Group plc | | | 2,178,015 | | | | 25,538,983 | |
| Suez | | | 1,189,819 | | | | 22,541,256 | |
| Severn Trent plc | | | 752,880 | | | | 22,012,106 | |
| Aqua America, Inc. | | | 566,782 | | | | 18,930,519 | |
Pennon Group plc1 | | | 1,314,156 | | | | 13,750,051 | |
| Guangdong Investment Ltd. | | | 9,010,000 | | | | 13,308,154 | |
| Beijing Enterprises Water Group Ltd.* | | | 15,630,000 | | | | 13,280,542 | |
| Cia de Saneamento Basico do Estado de Sao Paulo ADR | | | 1,091,603 | | | | 11,123,435 | |
| Hera SpA | | | 1,887,062 | | | | 6,030,601 | |
| American States Water Co. | | | 115,874 | | | | 5,712,588 | |
| California Water Service Group | | | 151,943 | | | | 5,690,265 | |
| Middlesex Water Co. | | | 51,594 | | | | 1,959,540 | |
| | | Shares | | | Value | |
COMMON STOCKS† – 99.7% (continued) | | | | | | |
Utilities – 40.4% (continued) | | | | | | |
| Connecticut Water Service, Inc. | | | 35,604 | | | $ | 1,931,161 | |
| York Water Co. | | | 40,669 | | | | 1,338,010 | |
| China Water Industry Group Ltd.* | | | 3,780,000 | | | | 792,083 | |
Total Utilities | | | | | | | 246,791,262 | |
Consumer, Non-cyclical – 4.6% | | | | | | | | |
| Danaher Corp. | | | 332,673 | | | | 27,751,582 | |
Basic Materials – 2.9% | | | | | | | | |
| Olin Corp. | | | 490,770 | | | | 15,817,518 | |
| Calgon Carbon Corp. | | | 149,002 | | | | 1,817,824 | |
Total Basic Materials | | | | | | | 17,635,342 | |
Consumer, Cyclical – 2.4% | | | | | | | | |
| Coway Company Ltd. | | | 168,339 | | | | 14,749,817 | |
Energy – 1.8% | | | | | | | | |
| China Everbright International Ltd. | | | 8,448,000 | | | | 11,161,168 | |
Total Common Stocks | | | | | | | | |
| (Cost $457,607,235) | | | | | | | 608,728,527 | |
| | | Face | | | | |
| | | Amount | | | Value | |
SECURITIES LENDING COLLATERAL††,2 – 0.1% | | | | | | |
Repurchase Agreements | | | | | | |
| Daiwa Capital Markets America | | | | | | |
| issued 08/31/17 at 1.10% | | | | | | |
| due 09/01/17 | | $ | 250,000 | | | | 250,000 | |
| HSBC Securities (USA), Inc. | | | | | | | | |
| issued 08/31/17 at 1.05% | | | | | | | | |
| due 09/01/17 | | | 209,668 | | | | 209,668 | |
Total Securities Lending Collateral | | | | | | | | |
| (Cost $459,668) | | | | | | | 459,668 | |
Total Investments – 99.8% | | | | | | | | |
| (Cost $458,066,903) | | | | | | $ | 609,188,195 | |
Other Assets & Liabilities, net – 0.2% | | | | | | | 1,064,699 | |
Total Net Assets – 100.0% | | | | | | $ | 610,252,894 | |
| * | | Non-income producing security. |
| † | | Value determined based on Level 1 inputs — See Note 4. |
| †† | | Value determined based on Level 2 inputs — See Note 4. |
| 1 | | All or portion of this security is on loan at August 31, 2017 — See Note 7. |
| 2 | | Securities lending collateral — See Note 7. |
| ADR | | American Depositary Receipt |
| plc | | Public Limited Company |
See Sector Classification in Other Information section.
| | |
See notes to financial statements. | |
| 44 l CLAYMORE EXCHANGE-TRADED FUND TRUST 2 ANNUAL REPORT | |
| | |
SCHEDULE OF INVESTMENTS continued | August 31, 2017 |
CGW Guggenheim S&P Global Water Index ETF continued
| | |
| Country Diversification |
| | % of Long-Term |
Country | Investments |
| United States | 38.5% |
| United Kingdom | 13.9% |
| France | 9.8% |
| Switzerland | 8.9% |
| Ireland | 4.6% |
| Hong Kong | 4.0% |
| Japan | 3.2% |
| Other | 17.1% |
Total Long-Term Investments | 100.0% |
| |
| Currency Denomination |
| | % of Long-Term |
Currency | Investments |
| United States Dollar | 45.0% |
| Euro | 16.6% |
| British Pound Sterling | 13.9% |
| Swiss Franc | 8.9% |
| Hong Kong Dollar | 6.6% |
| Japanese Yen | 3.2% |
| Swedish Krona | 3.2% |
| Other | 2.6% |
Total Long-Term Investments | 100.0% |
The following table summarizes the inputs used to value the Fund’s investments at August 31, 2017 (See Note 4 in the Notes to Financial Statements):
| | | | | | | | | | | | | |
| | | | | | Level 2 | | | Level 3 | | | | |
Investments in | | | | | Significant | | | Significant | | | | |
Securities | | Level 1 | | | Observable | | | Unobservable | | | | |
(Assets) | | Quoted Prices | | | Inputs | | | Inputs | | | Total | |
| Common Stocks | | $ | 608,728,527 | | | $ | — | | | $ | — | | | $ | 608,728,527 | |
| Securities Lending | | | | | | | | | | | | | | | | |
| Collateral | | | — | | | | 459,668 | | | | — | | | | 459,668 | |
| Total Assets | | $ | 608,728,527 | | | $ | 459,668 | | | $ | — | | | $ | 609,188,195 | |
Transfers between investment levels may occur as the markets fluctuate and/or the availability of data used in an investment’s valuation changes. Transfers between valuation levels, if any, are in comparison to the valuation levels at the end of the previous fiscal year, and are effective using the fair value as of the end of the current fiscal period.
For the year ended August 31, 2017, there were no transfers between levels.
| | |
See notes to financial statements. | |
| | CLAYMORE EXCHANGE-TRADED FUND TRUST 2 ANNUAL REPORT l 45 |
| | |
SCHEDULE OF INVESTMENTS continued | August 31, 2017 |
| | | | |
GHII Guggenheim S&P High Income Infrastructure ETF |
| | |
| | | Shares | | | Value | |
COMMON STOCKS† – 98.7% | | | | | | |
Utilities – 49.8% | | | | | | |
| Electricite de France S.A. | | | 105,505 | | | $ | 1,116,370 | |
| Enagas S.A. | | | 35,401 | | | | 1,041,894 | |
| Fortum Oyj | | | 57,834 | | | | 1,036,883 | |
| Snam SpA | | | 212,528 | | | | 1,033,438 | |
| Engie S.A. | | | 57,468 | | | | 957,898 | |
| EDP – Energias de Portugal S.A. ADR | | | 226,715 | | | | 869,271 | |
| Endesa S.A. | | | 33,804 | | | | 814,441 | |
Datang International Power Generation Company Ltd. — Class H* | | | 2,427,979 | | | | 797,284 | |
| China Power International Development Ltd. | | | 2,167,853 | | | | 739,565 | |
| SSE plc | | | 38,337 | | | | 703,938 | |
| Spark Infrastructure Group | | | 325,268 | | | | 696,563 | |
| NRG Yield, Inc. — Class C | | | 37,227 | | | | 688,699 | |
| Centrica plc | | | 264,621 | | | | 681,614 | |
HK Electric Investments & HK Electric Investments Ltd.1,2 | | | 706,158 | | | | 647,831 | |
| Capital Power Corp. | | | 30,749 | | | | 644,043 | |
| China Resources Power Holdings Company Ltd. | | | 344,691 | | | | 632,440 | |
| AusNet Services | | | 445,392 | | | | 614,677 | |
| Gas Natural SDG S.A. | | | 24,783 | | | | 601,665 | |
| Huaneng Power International, Inc. — Class H | | | 899,699 | | | | 588,576 | |
| Northland Power, Inc. | | | 29,915 | | | | 571,457 | |
Korea Electric Power Corp. ADR2 | | | 29,312 | | | | 567,187 | |
| REN – Redes Energeticas Nacionais SGPS S.A. | | | 140,838 | | | | 462,141 | |
| Just Energy Group, Inc. | | | 47,675 | | | | 274,167 | |
| Keppel Infrastructure Trust | | | 597,895 | | | | 246,555 | |
| Mercury NZ Ltd. | | | 94,371 | | | | 232,504 | |
| Genesis Energy Ltd. | | | 105,671 | | | | 185,798 | |
| Infratil Ltd. | | | 77,442 | | | | 174,711 | |
Total Utilities | | | | | | | 17,621,610 | |
Energy – 26.4% | | | | | | | | |
| Targa Resources Corp. | | | 30,886 | | | | 1,376,589 | |
AltaGas Ltd.1 | | | 53,053 | | | | 1,171,715 | |
| SemGroup Corp. — Class A | | | 45,186 | | | | 1,161,280 | |
Enbridge Income Fund Holdings, Inc.1 | | | 42,048 | | | | 1,038,665 | |
| Inter Pipeline Ltd. | | | 55,381 | | | | 1,010,220 | |
| Veresen, Inc. | | | 65,331 | | | | 916,588 | |
| Pattern Energy Group, Inc. | | | 33,146 | | | | 832,628 | |
| Pembina Pipeline Corp. | | | 23,147 | | | | 743,104 | |
| Gibson Energy, Inc. | | | 28,169 | | | | 392,288 | |
| Saeta Yield S.A. | | | 31,215 | | | | 376,496 | |
| TransAlta Renewables, Inc. | | | 27,917 | | | | 316,189 | |
Total Energy | | | | | | | 9,335,762 | |
Industrial – 12.2% | | | | | | | | |
Ship Finance International Ltd.1 | | | 112,339 | | | | 1,466,024 | |
Nordic American Tankers Ltd.1 | | | 215,750 | | | | 1,022,655 | |
| | | Shares | | | Value | |
COMMON STOCKS† – 98.7% (continued) | | | | | | |
Industrial – 12.2% (continued) | | | | | | |
| DHT Holdings, Inc. | | | 150,615 | | | $ | 564,806 | |
| Euronav N.V. | | | 52,108 | | | | 398,532 | |
| Gaztransport Et Technigaz S.A. | | | 7,483 | | | | 381,039 | |
| Frontline Ltd. | | | 52,351 | | | | 262,433 | |
| Tsakos Energy Navigation Ltd.* | | | 45,769 | | | | 205,960 | |
| Nordic American Offshore Ltd. | | | 8,841 | | | | 10,698 | |
Total Industrial | | | | | | | 4,312,147 | |
Consumer, Non-cyclical – 9.2% | | | | | | | | |
| Macquarie Infrastructure Corp. | | | 15,369 | | | | 1,144,683 | |
| Abertis Infraestructuras S.A. | | | 41,714 | | | | 843,094 | |
| Hutchison Port Holdings Trust — Class U | | | 1,764,824 | | | | 802,995 | |
| Contact Energy Ltd.* | | | 119,465 | | | | 477,429 | |
Total Consumer, Non-cyclical | | | | | | | 3,268,201 | |
Consumer, Cyclical – 1.1% | | | | | | | | |
| Superior Plus Corp. | | | 45,265 | | | | 427,468 | |
Total Common Stocks | | | | | | | | |
| (Cost $33,965,379) | | | | | | | 34,965,188 | |
| | | Face | | | | |
| | | Amount | | | Value | |
SECURITIES LENDING COLLATERAL††,4 – 13.1% | | | | | | |
Repurchase Agreements | | | | | | |
| Nomura Securities International, Inc. | | | | | | |
| issued 08/31/17 at 1.08% | | | | | | |
| due 09/01/17 | | $ | 1,075,566 | | | | 1,075,566 | |
| Citigroup Global Markets, Inc. | | | | | | | | |
| issued 08/31/17 at 1.08% | | | | | | | | |
| due 09/01/17 | | | 1,075,566 | | | | 1,075,566 | |
| RBC Dominion Securities, Inc. | | | | | | | | |
| issued 08/31/17 at 1.05% | | | | | | | | |
| due 09/01/17 | | | 1,075,566 | | | | 1,075,566 | |
| Daiwa Capital Markets America | | | | | | | | |
| issued 08/31/17 at 1.10% | | | | | | | | |
| due 09/01/17 | | | 1,075,566 | | | | 1,075,566 | |
| Merrill Lynch, Pierce, Fenner & Smith, Inc. | | | | | | | | |
| issued 08/31/17 at 1.06% | | | | | | | | |
| due 09/01/17 | | | 318,720 | | | | 318,720 | |
Total Securities Lending Collateral | | | | | | | | |
| (Cost $4,620,984) | | | | | | | 4,620,984 | |
Total Investments – 111.8% | | | | | | | | |
| (Cost $38,586,363) | | | | | | $ | 39,586,172 | |
Other Assets & Liabilities, net – (11.8)% | | | | | | | (4,178,040 | ) |
Total Net Assets – 100.0% | | | | | | $ | 35,408,132 | |
| | |
See notes to financial statements. | |
| 46 l CLAYMORE EXCHANGE-TRADED FUND TRUST 2 ANNUAL REPORT | |
| | |
SCHEDULE OF INVESTMENTS continued | August 31, 2017 |
GHII Guggenheim S&P High Income Infrastructure ETF continued
| | | |
| † | | Value determined based on Level 1 inputs — See Note 4. |
| †† | | Value determined based on Level 2 inputs — See Note 4. |
| 1 | | All or portion of this security is on loan at August 31, 2017 — See Note 7. |
| 2 | | Security is a 144A or Section 4(a)(2) security. These securities have been determined to be liquid under guidelines established by the Board of Trustees. The total market value of 144A or Section 4(a)(2) securities is $647,831 (cost $619,399), or 1.8% of total net assets. |
| 3 | | Securities lending collateral — See Note 7. |
| | | |
| ADR | | American Depositary Receipt |
| plc | | Public Limited Company |
See Sector Classification in Other Information section.
| | |
| Country Diversification |
| | % of Long-Term |
Country | Investments |
| Canada | 21.5% |
| United States | 14.9% |
| Spain | 10.5% |
| Bermuda | 8.5% |
| France | 7.0% |
| Hong Kong | 5.8% |
| China | 4.0% |
| Other | 27.8% |
Total Long-Term Investments | 100.0% |
| | |
| Currency Denomination |
| | % of Long-Term |
Currency | Investments |
| Euro | 28.4% |
| United States Dollar | 28.1% |
| Canadian Dollar | 21.5% |
| Hong Kong Dollar | 9.7% |
| British Pound | 4.0% |
| Australian Dollar | 3.8% |
| New Zealand Dollar | 3.1% |
| Other | 1.4% |
Total Long-Term Investments | 100.0% |
The following table summarizes the inputs used to value the Fund’s investments at August 31, 2017 (See Note 4 in the Notes to Financial Statements):
| | | | | | | | | | | | | |
| | | | | | Level 2 | | | Level 3 | | | | |
Investments in | | | | | Significant | | | Significant | | | | |
Securities | | Level 1 | | | Observable | | | Unobservable | | | | |
(Assets) | | Quoted Prices | | | Inputs | | | Inputs | | | Total | |
| Common Stocks | | $ | 34,965,188 | | | $ | — | | | $ | — | | | $ | 34,965,188 | |
| Securities Lending | | | | | | | | | | | | | | | | |
| Collateral | | | — | | | | 4,620,984 | | | | — | | | | 4,620,984 | |
| Total Assets | | $ | 34,965,188 | | | $ | 4,620,984 | | | $ | — | | | $ | 39,586,172 | |
Transfers between investment levels may occur as the markets fluctuate and/or the availability of data used in an investment’s valuation changes. Transfers between valuation levels, if any, are in comparison to the valuation levels at the end of the previous fiscal year, and are effective using the fair value as of the end of the current fiscal period.
For the year ended August 31, 2017, there were no transfers between levels.
| | |
See notes to financial statements. | |
| | CLAYMORE EXCHANGE-TRADED FUND TRUST 2 ANNUAL REPORT l 47 |
| | |
SCHEDULE OF INVESTMENTS continued | August 31, 2017 |
| | | | |
GTO Guggenheim Total Return Bond ETF | |
| | |
| | | Shares | | | Value | |
EXCHANGE-TRADED FUNDS† – 5.0% | | | | | | |
Guggenheim Ultra Short Duration ETF2,3 | | | 80,516 | | | $ | 4,051,565 | |
Total Exchange-Traded Funds | | | | | | | | |
| (Cost $4,049,650) | | | | | | | 4,051,565 | |
CLOSED-END FUNDS† – 1.0% | | | | | | | | |
Guggenheim Strategic Opportunities Fund3 | | | 38,359 | | | | 813,594 | |
Total Closed-End Funds | | | | | | | | |
| (Cost $769,821) | | | | | | | 813,594 | |
MONEY MARKET FUND† – 4.3% | | | | | | | | |
| Federated U.S. Treasury Cash Reserve Fund Institutional Class | | | | | | | | |
0.84%4 | | | 3,526,338 | | | | 3,526,338 | |
Total Money Market Fund | | | | | | | | |
| (Cost $3,526,338) | | | | | | | 3,526,338 | |
| | | Face | | | | |
| | | Amount | | | Value | |
CORPORATE BONDS†† – 20.7% | | | | | | |
Financial – 14.7% | | | | | | |
| Citigroup, Inc. | | | | | | |
5.95% (3 Month LIBOR + 391 bps)5,6 | | $ | 450,000 | | | $ | 486,000 | |
5.95% (3 Month LIBOR + 407 bps)5,6 | | | 360,000 | | | | 387,900 | |
6.25% (3 Month LIBOR + 452 bps)5,6 | | | 100,000 | | | | 111,750 | |
| Mitsubishi UFJ Financial Group, Inc. | | | | | | | | |
3.20% (3 Month LIBOR + 188 bps) due 03/01/215 | | | 800,000 | | | | 832,456 | |
| Synchrony Financial | | | | | | | | |
| 3.70% due 08/04/26 | | | 620,000 | | | | 612,882 | |
2.54% (3 Month LIBOR + 123 bps) due 02/03/205 | | | 100,000 | | | | 101,101 | |
| JPMorgan Chase & Co. | | | | | | | | |
2.00% (3 Month LIBOR + 68 bps) due 06/01/215 | | | 350,000 | | | | 351,174 | |
6.10% (3 Month LIBOR + 333 bps)5,6 | | | 200,000 | | | | 218,500 | |
6.13% (3 Month LIBOR + 333 bps)5,6 | | | 100,000 | | | | 109,875 | |
| Hospitality Properties Trust | | | | | | | | |
| 5.25% due 02/15/26 | | | 570,000 | | | | 615,917 | |
| Physicians Realty, LP | | | | | | | | |
| 4.30% due 03/15/27 | | | 595,000 | | | | 614,181 | |
| Apollo Management Holdings, LP | | | | | | | | |
4.40% due 05/27/267 | | | 580,000 | | | | 608,735 | |
| MetLife, Inc. | | | | | | | | |
9.25% due 04/08/387 | | | 350,000 | | | | 519,751 | |
| 10.75% due 08/01/39 | | | 50,000 | | | | 84,000 | |
| Citizens Bank North America/Providence RI | | | | | | | | |
1.86% (3 Month LIBOR + 54 bps) due 03/02/205 | | | 300,000 | | | | 300,199 | |
2.13% (3 Month LIBOR + 81 bps) due 05/26/225 | | | 250,000 | | | | 249,213 | |
| Bank of America Corp. | | | | | | | | |
6.30% (3 Month LIBOR + 455 bps)5,6 | | | 300,000 | | | | 337,875 | |
6.10% (3 Month LIBOR + 390 bps)5,6 | | | 150,000 | | | | 164,438 | |
| UBS Group Funding Switzerland AG | | | | | | | | |
2.53% (3 Month LIBOR + 122 bps) due 05/23/235,7 | | | 300,000 | | | | 304,470 | |
3.08% (3 Month LIBOR + 178 bps) due 04/14/215,7 | | | 150,000 | | | | 155,389 | |
| Goldman Sachs Group, Inc. | | | | | | | | |
2.02% (3 Month LIBOR + 73 bps) due 12/27/205 | | | 400,000 | | | | 400,729 | |
| American Equity Investment Life Holding Co. | | | | | | | | |
| 5.00% due 06/15/27 | | | 350,000 | | | | 367,832 | |
| | | Face | | | | |
| | | Amount | | | Value | |
CORPORATE BONDS†† – 20.7% (continued) | | | | | | |
Financial – 14.7% (continued) | | | | | | |
| Morgan Stanley | | | | | | |
2.11% (3 Month LIBOR + 80 bps) due 02/14/205 | | $ | 250,000 | | | $ | 251,198 | |
2.23% (3 Month LIBOR + 98 bps) due 06/16/205 | | | 100,000 | | | | 101,099 | |
| Capital One Financial Corp. | | | | | | | | |
2.07% (3 Month LIBOR + 76 bps) due 05/12/205 | | | 350,000 | | | | 351,354 | |
| Wells Fargo & Co. | | | | | | | | |
5.90% (3 Month LIBOR + 311 bps)5,6 | | | 300,000 | | | | 325,500 | |
| First American Financial Corp. | | | | | | | | |
| 4.30% due 02/01/23 | | | 300,000 | | | | 310,715 | |
| CBRE Services, Inc. | | | | | | | | |
| 5.25% due 03/15/25 | | | 280,000 | | | | 309,857 | |
| Lexington Realty Trust | | | | | | | | |
| 4.40% due 06/15/24 | | | 300,000 | | | | 304,707 | |
| ING Groep N.V. | | | | | | | | |
2.45% (3 Month LIBOR + 115 bps) due 03/29/225 | | | 300,000 | | | | 304,639 | |
| Sumitomo Mitsui Trust Bank Ltd. | | | | | | | | |
1.83% (3 Month LIBOR + 51 bps) due 03/06/195,7 | | | 300,000 | | | | 300,762 | |
| Swedbank AB | | | | | | | | |
1.94% (3 Month LIBOR + 70 bps) due 03/14/225,7 | | | 300,000 | | | | 300,424 | |
| Credit Agricole S.A. | | | | | | | | |
2.20% (3 Month LIBOR + 97 bps) due 06/10/205,7 | | | 250,000 | | | | 253,413 | |
| Enstar Group Ltd. | | | | | | | | |
| 4.50% due 03/10/22 | | | 150,000 | | | | 156,314 | |
| KeyCorp | | | | | | | | |
5.00% (3 Month LIBOR + 361 bps)5,6 | | | 150,000 | | | | 154,500 | |
| Wilton Re Finance LLC | | | | | | | | |
5.88% (3 Month LIBOR + 383 bps) due 03/30/335,7 | | | 150,000 | | | | 153,375 | |
| Ares Finance Company LLC | | | | | | | | |
4.00% due 10/08/247 | | | 150,000 | | | | 145,725 | |
| Navigators Group, Inc. | | | | | | | | |
| 5.75% due 10/15/23 | | | 100,000 | | | | 109,460 | |
| Voya Financial, Inc. | | | | | | | | |
5.65% (3 Month LIBOR + 358 bps) due 05/15/535 | | | 100,000 | | | | 106,000 | |
| Infinity Property & Casualty Corp. | | | | | | | | |
| 5.00% due 09/19/22 | | | 41,000 | | | | 44,176 | |
Total Financial | | | | | | | 11,917,585 | |
Communications – 2.6% | | | | | | | | |
| Discovery Communications LLC | | | | | | | | |
| 4.90% due 03/11/26 | | | 570,000 | | | | 609,595 | |
| Verizon Communications, Inc. | | | | | | | | |
2.25% (3 Month LIBOR + 100 bps) due 03/16/225 | | | 550,000 | | | | 556,872 | |
| AT&T, Inc. | | | | | | | | |
2.20% (3 Month LIBOR + 89 bps) due 02/14/235 | | | 500,000 | | | | 499,240 | |
| MDC Partners, Inc. | | | | | | | | |
6.50% due 05/01/247 | | | 250,000 | | | | 249,063 | |
| SFR Group S.A. | | | | | | | | |
7.38% due 05/01/267 | | | 200,000 | | | | 216,004 | |
Total Communications | | | | | | | 2,130,774 | |
Basic Materials – 1.1% | | | | | | | | |
| Yamana Gold, Inc. | | | | | | | | |
| 4.95% due 07/15/24 | | | 580,000 | | | | 588,578 | |
| | |
See notes to financial statements. | |
| 48 l CLAYMORE EXCHANGE-TRADED FUND TRUST 2 ANNUAL REPORT | |
| | |
SCHEDULE OF INVESTMENTS continued | August 31, 2017 |
GTO Guggenheim Total Return Bond ETF continued
| | | | | | | |
| | | Face | | | | |
| | | Amount | | | Value | |
CORPORATE BONDS†† – 20.7% (continued) | | | | | | |
Basic Materials – 1.1% (continued) | | | | | | |
| Newcrest Finance Pty Ltd. | | | | | | |
4.20% due 10/01/227 | | $ | 200,000 | | | $ | 211,183 | |
| BHP Billiton Finance USA Ltd. | | | | | | | | |
| 6.75% (U.S. Dollar 5 year Swap Rate + 509 bps) | | | | | | | | |
due 10/19/755,7 | | | 100,000 | | | | 116,000 | |
Total Basic Materials | | | | | | | 915,761 | |
Consumer, Cyclical – 0.8% | | | | | | | | |
| Wyndham Worldwide Corp. | | | | | | | | |
| 4.50% due 04/01/27 | | | 325,000 | | | | 330,621 | |
| AutoNation, Inc. | | | | | | | | |
| 4.50% due 10/01/25 | | | 175,000 | | | | 186,343 | |
| Seminole Hard Rock Entertainment Inc. / Seminole | | | | | | | | |
| Hard Rock International LLC | | | | | | | | |
5.88% due 05/15/217 | | | 100,000 | | | | 100,250 | |
Total Consumer, Cyclical | | | | | | | 617,214 | |
Energy – 0.7% | | | | | | | | |
| Buckeye Partners, LP | | | | | | | | |
| 3.95% due 12/01/26 | | | 161,000 | | | | 160,092 | |
| 4.35% due 10/15/24 | | | 48,000 | | | | 49,954 | |
| Phillips 66 | | | | | | | | |
1.95% (3 Month LIBOR + 65 bps) due 04/15/195 | | | 150,000 | | | | 150,139 | |
| Hess Corp. | | | | | | | | |
| 4.30% due 04/01/27 | | | 100,000 | | | | 98,051 | |
| ConocoPhillips | | | | | | | | |
| 6.50% due 02/01/39 | | | 65,000 | | | | 85,549 | |
Total Energy | | | | | | | 543,785 | |
Consumer, Non-cyclical – 0.6% | | | | | | | | |
| Kraft Heinz Foods Co. | | | | | | | | |
2.13% (3 Month LIBOR + 82 bps) due 08/10/225 | | | 300,000 | | | | 300,099 | |
| Express Scripts Holding Co. | | | | | | | | |
| 4.50% due 02/25/26 | | | 200,000 | | | | 215,801 | |
Total Consumer, Non-cyclical | | | | | | | 515,900 | |
Industrial – 0.2% | | | | | | | | |
| Reynolds Group Issuer Incorporated | | | | | | | | |
| 5.75% due 10/15/20 | | | 200,000 | | | | 203,728 | |
Total Corporate Bonds | | | | | | | | |
| (Cost $16,582,323) | | | | | | | 16,844,747 | |
COLLATERALIZED MORTGAGE OBLIGATIONS†† – 17.3% | | | | | | | | |
Government Agency – 9.8% | | | | | | | | |
| Freddie Mac Multifamily Structured Pass Through Certificates | | | | | | | | |
| 2017-K066, 3.12% due 06/25/27 | | | 800,000 | | | | 833,396 | |
| 2017-K062, 3.41% due 12/25/26 | | | 500,000 | | | | 532,555 | |
2014-K037, 1.17% (WAC) due 01/25/245 | | | 6,612,160 | | | | 344,199 | |
2015-K042, 1.19% (WAC) due 12/25/245,8 | | | 4,463,891 | | | | 286,860 | |
2014-K038, 1.33% (WAC) due 03/25/245,8 | | | 4,418,755 | | | | 278,724 | |
| 2017-K066, 3.20% due 06/25/27 | | | 250,000 | | | | 260,455 | |
2014-K036, 0.91% (WAC) due 10/25/235,8 | | | 6,235,349 | | | | 245,416 | |
2013-K026, 1.14% (WAC) due 11/25/225,8 | | | 5,341,432 | | | | 232,928 | |
2013-K035, 0.55% (WAC) due 08/25/235,8 | | | 8,567,549 | | | | 178,222 | |
| | | Face | | | | |
| | | Amount | | | Value | |
COLLATERALIZED MORTGAGE OBLIGATIONS†† – 17.3% (continued) | | | | |
Government Agency – 9.8% (continued) | | | | | | |
| Federal National Mortgage Association | | | | | | |
| 3.08% due 10/01/32 | | $ | 750,000 | | | $ | 758,261 | |
| 3.15% due 10/01/29 | | | 500,000 | | | | 505,625 | |
| 2.86% due 09/01/29 | | | 500,000 | | | | 502,813 | |
| 2.99% due 09/01/29 | | | 500,000 | | | | 500,313 | |
| Fannie Mae | | | | | | | | |
| 2.96% due 07/01/27 | | | 499,432 | | | | 513,599 | |
| 2.58% due 07/01/26 | | | 500,000 | | | | 501,163 | |
| 2.91% due 07/01/27 | | | 250,000 | | | | 255,952 | |
| Freddie Mac | | | | | | | | |
| 3.55% due 10/01/33 | | | 500,000 | | | | 528,407 | |
| Fannie Mae-Aces | | | | | | | | |
2017-M8, 3.06% (WAC) due 05/25/275 | | | 500,000 | | | | 517,660 | |
| FREMF Mortgage Trust | | | | | | | | |
2013-K29, 0.13% due 05/25/467,8 | | | 30,307,425 | | | | 165,109 | |
Total Government Agency | | | | | | | 7,941,657 | |
Residential Mortgage Backed Securities – 3.4% | | | | | | | | |
| Bear Stearns Asset Backed Securities I Trust 2006-HE9 | | | | | | | | |
2006-HE9, 1.37% (1 Month LIBOR + 14 bps) due 11/25/365 | | | 568,373 | | | | 552,387 | |
| WaMu Asset-Backed Certificates WaMu Series 2007-HE4 Trust | | | | | | | | |
2007-HE4, 1.48% (1 Month LIBOR + 25 bps) due 07/25/475 | | | 749,853 | | | | 508,167 | |
| Structured Asset Securities Corporation Mortgage Loan Trust | | | | | | | | |
2008-BC4, 1.86% (1 Month LIBOR + 63 bps) due 11/25/375 | | | 349,047 | | | | 340,348 | |
| Alternative Loan Trust | | | | | | | | |
2007-OA7, 1.41% (1 Month LIBOR + 18 bps) due 05/25/475 | | | 289,062 | | | | 278,635 | |
| Nationstar Home Equity Loan Trust | | | | | | | | |
2007-C, 1.41% (1 Month LIBOR + 18 bps) due 06/25/375 | | | 238,378 | | | | 225,050 | |
| CSMC Series | | | | | | | | |
2015-12R, 1.73% (1 Month LIBOR + 50 bps) due 11/30/375,7 | | | 226,468 | | | | 223,076 | |
| RALI Series Trust | | | | | | | | |
2007-QO2, 1.38% (1 Month LIBOR + 15 bps) due 02/25/475 | | | 326,886 | | | | 215,549 | |
| Washington Mutual Mortgage Pass-Through Certificates | | | | | | | | |
| WMALT Series Trust | | | | | | | | |
| 2006-7, 4.31% due 09/25/36 | | | 340,940 | | | | 178,754 | |
| LSTAR Commercial Mortgage Trust | | | | | | | | |
2016-7, 3.23% (1 Month LIBOR + 200 bps) due 12/01/215,7 | | | 157,474 | | | | 157,277 | |
| LSTAR Securities Investment Ltd. | | | | | | | | |
2016-5, 3.24% (1 Month LIBOR + 200 bps) due 11/01/215,7 | | | 133,656 | | | | 133,740 | |
Total Residential Mortgage Backed Securities | | | | | | | 2,812,983 | |
Military Housing – 3.3% | | | | | | | | |
| Pacific Beacon LLC | | | | | | | | |
5.51% due 07/15/367 | | | 500,000 | | | | 589,121 | |
5.38% due 07/15/267 | | | 116,802 | | | | 131,888 | |
| Fort Knox Military Housing Privatization Project | | | | | | | | |
5.82% due 02/15/527 | | | 391,982 | | | | 406,407 | |
1.57% (1 Month LIBOR + 34 bps) due 02/15/52†††,5,11,16 | | | 240,326 | | | | 145,741 | |
| Camp Pendleton & Quantico Housing LLC | | | | | | | | |
5.94% due 10/01/437 | | | 310,000 | | | | 375,847 | |
| HP Communities LLC | | | | | | | | |
5.78% due 03/15/4611 | | | 150,000 | | | | 166,917 | |
5.86% due 09/15/5311 | | | 100,000 | | | | 110,651 | |
| | |
See notes to financial statements. | |
| | CLAYMORE EXCHANGE-TRADED FUND TRUST 2 ANNUAL REPORT l 49 |
| | |
SCHEDULE OF INVESTMENTS continued | August 31, 2017 |
GTO Guggenheim Total Return Bond ETF continued
| | | | | | | |
| | | Face | | | | |
| | | Amount | | | Value | |
COLLATERALIZED MORTGAGE OBLIGATIONS†† – 17.3% (continued) | | | | |
Military Housing – 3.3% (continued) | | | | | | |
| Mid-Atlantic Military Family Communities LLC | | | | | | |
5.30% due 08/01/507 | | $ | 234,830 | | | $ | 236,291 | |
| AMC East Communities LLC | | | | | | | | |
6.01% due 01/15/5311 | | | 195,090 | | | | 200,760 | |
| Fort Benning Family Communities LLC | | | | | | | | |
5.81% due 01/15/5111 | | | 200,000 | | | | 193,924 | |
| Atlantic Marine Corporations Communities LLC | | | | | | | | |
5.34% due 12/01/507 | | | 96,595 | | | | 106,080 | |
Total Military Housing | | | | | | | 2,663,627 | |
Commercial Mortgage Backed Securities – 0.8% | | | | | | | | |
| GS Mortgage Securities Corporation Trust 2017-STAY | | | | | | | | |
2017-STAY, 2.57% (1 Month LIBOR + 135 bps) due 07/15/325,7 | | | 500,000 | | | | 501,504 | |
| Wells Fargo Commercial Mortgage Trust | | | | | | | | |
2016-NXS5, 1.72% (WAC) due 01/15/595 | | | 1,974,636 | | | | 171,430 | |
Total Commercial Mortgage Backed Securities | | | | | | | 672,934 | |
Total Collateralized Mortgage Obligations | | | | | | | | |
| (Cost $13,776,135) | | | | | | | 14,091,201 | |
ASSET-BACKED SECURITIES†† – 15.5% | | | | | | | | |
Collateralized Loan Obligations – 10.1% | | | | | | | | |
| KKR CLO 15 Ltd. | | | | | | | | |
2016-15, 2.86% (3 Month LIBOR + 156 bps) due 10/18/285,7 | | | 1,000,000 | | | | 1,013,108 | |
| LMREC, Inc. | | | | | | | | |
2015-CRE1, 2.99% (1 Month LIBOR + 175 bps) due 02/22/325,7 | | | 1,000,000 | | | | 1,008,300 | |
| Flatiron CLO Ltd. | | | | | | | | |
2017-1A, 2.76% (3 Month LIBOR + 160 bps) due 07/17/265,7 | | | 1,000,000 | | | | 999,500 | |
| Woodmont Trust | | | | | | | | |
2017-3A, 2.97% (3 Month LIBOR + 173 bps) due 10/18/295,7 | | | 500,000 | | | | 499,396 | |
2017-2A, 3.03% (3 Month LIBOR + 180 bps) due 07/18/285,7 | | | 500,000 | | | | 499,368 | |
| Cerberus Loan Funding XVI, LP | | | | | | | | |
2016-2A, 3.65% (3 Month LIBOR + 235 bps) due 11/15/275,7 | | | 500,000 | | | | 501,196 | |
| Bsprt 2017-Fl1 Issuer Ltd. | | | | | | | | |
2017-FL1, 2.58% (1 Month LIBOR + 135 bps) due 06/15/275,7 | | | 500,000 | | | | 499,792 | |
| Golub Capital BDC CLO LLC | | | | | | | | |
2014-1A, 3.81% (3 Month LIBOR + 250 bps) due 04/25/265,7 | | | 500,000 | | | | 499,020 | |
| Golub Capital Partners CLO Ltd. | | | | | | | | |
2016-33A, 3.80% (3 Month LIBOR + 248 bps) due 11/21/285,7 | | | 500,000 | | | | 498,661 | |
| Anchorage Capital CLO 4 Ltd. | | | | | | | | |
2017-4A, 2.99% (3 Month LIBOR + 168 bps) due 07/28/265,7 | | | 300,000 | | | | 301,406 | |
| Golub Capital Partners CLO 16 Ltd. | | | | | | | | |
2017-16A, 3.16% (3 Month LIBOR + 185 bps) due 07/25/295,7 | | | 300,000 | | | | 299,639 | |
| OZLM Funding II Ltd. | | | | | | | | |
2016-2A, 4.06% (3 Month LIBOR + 275 bps) due 10/30/275,7 | | | 250,000 | | | | 251,333 | |
| Newstar Commercial Loan Funding LLC | | | | | | | | |
2016-1A, 5.07% (3 Month LIBOR + 375 bps) due 02/25/285,7 | | | 250,000 | | | | 250,290 | |
| FS Senior Funding Ltd. | | | | | | | | |
2015-1A, 3.10% (3 Month LIBOR + 180 bps) due 05/28/255,7 | | | 250,000 | | | | 250,232 | |
| Oaktree EIF I Series A1 Ltd. | | | | | | | | |
2016-A, 4.96% (3 Month LIBOR + 365 bps) due 01/20/275,7 | | | 250,000 | | | | 250,218 | |
| Marathon CLO VI Ltd. | | | | | | | | |
2017-6A, 2.91% (3 Month LIBOR + 160 bps) due 05/13/255,7 | | | 250,000 | | | | 249,993 | |
| | | Face | | | | |
| | | Amount | | | Value | |
| | |
ASSET-BACKED SECURITIES†† – 15.5% (continued) | | | | | | |
Collateralized Loan Obligations – 10.1% (continued) | | | | | | |
| ACIS CLO Ltd. | | | | | | |
2013-1A, 4.25% (3 Month LIBOR + 295 bps) due 04/18/245,7 | | $ | 250,000 | | | $ | 248,009 | |
| Venture XIII CLO Ltd. | | | | | | | | |
2013-13A, due 09/10/297,9 | | | 250,000 | | | | 132,216 | |
Total Collateralized Loan Obligations | | | | | | | 8,251,677 | |
Whole Business – 2.4% | | | | | | | | |
| Domino’s Pizza Master Issuer LLC | | | | | | | | |
2017-1A, 2.49% (3 Month LIBOR + 125 bps) due 07/25/475,7 | | | 600,000 | | | | 600,965 | |
| Wendys Funding LLC | | | | | | | | |
2015-1A, 4.50% due 06/15/457 | | | 491,250 | | | | 511,195 | |
| DB Master Finance LLC | | | | | | | | |
2015-1A, 3.98% due 02/20/457 | | | 487,500 | | | | 502,364 | |
| Miramax LLC | | | | | | | | |
2014-1A, 3.34% due 07/20/267 | | | 186,760 | | | | 188,066 | |
| Taco Bell Funding LLC | | | | | | | | |
2016-1A, 4.97% due 05/25/467 | | | 148,500 | | | | 158,662 | |
Total Whole Business | | | | | | | 1,961,252 | |
Transport-Aircraft – 1.4% | | | | | | | | |
| Castle Aircraft Securitization Trust | | | | | | | | |
| 2017-1, 3.97% due 07/15/42 | | | 496,550 | | | | 496,550 | |
| Apollo Aviation Securitization Equity Trust | | | | | | | | |
| 2016-2, 4.21% due 11/15/41 | | | 465,900 | | | | 469,295 | |
| ECAF I Ltd. | | | | | | | | |
2015-1A, 3.47% due 06/15/407 | | | 164,406 | | | | 164,011 | |
Total Transport-Aircraft | | | | | | | 1,129,856 | |
Net Lease – 0.6% | | | | | | | | |
| Store Master Funding I-VII | | | | | | | | |
2016-1A, 4.32% due 10/20/467 | | | 497,104 | | | | 515,745 | |
Collateralized Debt Obligations – 0.6% | | | | | | | | |
| Anchorage Credit Funding Ltd. | | | | | | | | |
2016-4A, 3.50% due 02/15/357 | | | 500,000 | | | | 500,506 | |
Transport-Container – 0.4% | | | | | | | | |
| Textainer Marine Containers Ltd. | | | | | | | | |
2017-2A, 3.52% due 06/20/427 | | | 296,151 | | | | 297,802 | |
Total Asset-Backed Securities | | | | | | | | |
| (Cost $12,582,799) | | | | | | | 12,656,838 | |
U.S. GOVERNMENT SECURITIES†† – 7.8% | | | | | | | | |
| U.S. Treasury Bonds | | | | | | | | |
due 11/15/4410 | | | 11,610,000 | | | | 5,432,432 | |
due 11/15/4610 | | | 2,100,000 | | | | 922,663 | |
Total U.S. Treasury Bonds | | | | | | | 6,355,095 | |
Total U.S. Government Securities | | | | | | | | |
| (Cost $6,104,573) | | | | | | | 6,355,095 | |
MUNICIPAL BONDS†† – 4.2% | | | | | | | | |
California – 2.6% | | | | | | | | |
| State of California General Obligation Unlimited | | | | | | | | |
| 7.60% due 11/01/40 | | | 500,000 | | | | 794,119 | |
| San Diego Unified School District General Obligation Unlimited | | | | | | | | |
due 07/01/3610 | | | 800,000 | | | | 414,656 | |
| | |
See notes to financial statements. | |
| 50 l CLAYMORE EXCHANGE-TRADED FUND TRUST 2 ANNUAL REPORT | |
| | |
SCHEDULE OF INVESTMENTS continued | August 31, 2017 |
GTO Guggenheim Total Return Bond ETF continued
| | | | | | | |
| | | Face | | | | |
| | | Amount | | | Value | |
MUNICIPAL BONDS†† – 4.2% (continued) | | | | | | |
California – 2.6% (continued) | | | | | | |
| Los Angeles Department of Power Revenue Bonds | | | | | | |
| 6.57% due 07/01/45 | | $ | 2255,000 | | | $ | 383,885 | |
| Santa Cruz County Redevelopment Agency Tax Allocation | | | | | | | | |
| 3.75% due 09/01/32 | | | 250,000 | | | | 256,043 | |
| Los Angeles Community College District General | | | | | | | | |
| Obligation Unlimited | | | | | | | | |
| 6.75% due 08/01/49 | | | 130,000 | | | | 200,821 | |
| Stockton Unified School District General Obligation Unlimited | | | | | | | | |
due 08/01/3610 | | | 250,000 | | | | 126,095 | |
Total California | | | | | | | 2,175,619 | |
New York – 0.5% | | | | | | | | |
| Port Authority of New York & New Jersey Revenue Bonds | | | | | | | | |
| 5.65% due 11/01/40 | | | 155,000 | | | | 205,549 | |
| Metropolitan Transportation Authority Revenue Bonds | | | | | | | | |
| 6.69% due 11/15/40 | | | 140,000 | | | | 198,094 | |
Total New York | | | | | | | 403,643 | |
Ohio – 0.5% | | | | | | | | |
| American Municipal Power, Inc. Revenue Bonds | | | | | | | | |
| 7.50% due 02/15/50 | | | 200,000 | | | | 292,956 | |
| 8.08% due 02/15/50 | | | 50,000 | | | | 84,852 | |
Total Ohio | | | | | | | 377,808 | |
Florida – 0.3% | | | | | | | | |
| County of Miami-Dade Florida Aviation Revenue Revenue Bonds | | | | | | | | |
| 3.73% due 10/01/37 | | | 250,000 | | | | 253,570 | |
Illinois – 0.3% | | | | | | | | |
| State of Illinois General Obligation Unlimited | | | | | | | | |
| 6.63% due 02/01/35 | | | 200,000 | | | | 242,858 | |
Total Municipal Bonds | | | | | | | | |
| (Cost $3,302,369) | | | | | | | 3,453,498 | |
SENIOR FLOATING RATE INTERESTS††,5 – 2.9% | | | | | | | | |
Consumer, Non-cyclical – 1.0% | | | | | | | | |
| Diamond Bank plc | | | | | | | | |
due 07/25/2412 | | | 250,000 | | | | 248,282 | |
| ACOF V DP Acquiror LLC | | | | | | | | |
due 08/15/2412 | | | 200,000 | | | | 199,500 | |
| Chobani LLC | | | | | | | | |
| 5.49% (3 Month LIBOR +425 bps) due 10/09/23 | | | 174,125 | | | | 175,267 | |
| Parexel International Corp. | | | | | | | | |
due 08/09/2412 | | | 100,000 | | | | 100,200 | |
| DJO Finance LLC | | | | | | | | |
| 4.48% (3 Month LIBOR +325 bps) due 06/08/20 | | | 50,320 | | | | 50,058 | |
| 4.50% (3 Month LIBOR + 325 bps) due 01/09/24 | | | 48,921 | | | | 48,666 | |
Total Consumer, Non-cyclical | | | | | | | 821,973 | |
Consumer, Cyclical – 0.6% | | | | | | | | |
| Cyan, Inc. | | | | | | | | |
due 07/26/2412 | | | 200,000 | | | | 201,126 | |
| Eyemart Express LLC | | | | | | | | |
| 4.25% (3 Month LIBOR +300 bps) due 08/04/24 | | | 100,000 | | | | 99,750 | |
| Acosta, Inc. | | | | | | | | |
| 4.49% (3 Month LIBOR +325 bps) due 09/26/21 | | | 98,332 | | | | 87,761 | |
| | | Face | | | | |
| | | Amount | | | Value | |
SENIOR FLOATING RATE INTERESTS†† – 2.9% (continued) | | | | | | |
Consumer, Cyclical – 0.6% (continued) | | | | | | |
| Floor & Decor Outlets of America, Inc. | | | | | | |
| 4.74% (3 Month LIBOR +425 bps) due 09/30/23 | | $ | 87,643 | | | $ | 87,643 | |
Total Consumer, Cyclical | | | | | | | 476,280 | |
Communications – 0.4% | | | | | | | | |
| Cengage Learning, Inc. | | | | | | | | |
| 5.48% (3 Month LIBOR +425 bps) due 06/07/23 | | | 195,494 | | | | 181,403 | |
| GTT Communications, Inc. | | | | | | | | |
| 4.50% (3 Month LIBOR +325 bps) due 01/09/24 | | | 150,000 | | | | 150,375 | |
Total Communications | | | | | | | 331,778 | |
Industrial – 0.4% | | | | | | | | |
| Optiv Security, Inc. | | | | | | | | |
| 4.56% (3 Month LIBOR +325 bps) due 02/01/24 | | | 120,820 | | | | 109,745 | |
| StandardAero Aviation Holdings, Inc. | | | | | | | | |
due 07/07/2212 | | | 100,000 | | | | 100,775 | |
| Diversitech Holdings, Inc. | | | | | | | | |
| 4.70% (3 Month LIBOR +350 bps) due 06/03/24 | | | 100,000 | | | | 99,875 | |
Total Industrial | | | | | | | 310,395 | |
Technology – 0.4% | | | | | | | | |
| Epicor Software Corp. | | | | | | | | |
| 4.99% (3 Month LIBOR + 375 bps) due 06/01/22 | | | 196,386 | | | | 196,738 | |
| Peak 10, Inc. | | | | | | | | |
| 4.81% (3 Month LIBOR +350 bps) due 08/01/24 | | | 100,000 | | | | 99,625 | |
Total Technology | | | | | | | 296,363 | |
Financial – 0.1% | | | | | | | | |
| Misys Ltd. | | | | | | | | |
| 4.82% (3 Month LIBOR +350 bps) due 06/13/24 | | | 100,000 | | | | 100,425 | |
Total Senior Floating Rate Interests | | | | | | | | |
| (Cost $2,365,784) | | | | | | | 2,337,214 | |
FEDERAL AGENCY NOTES†† – 2.0% | | | | | | | | |
Fannie Mae Principal Strips14 | | | | | | | | |
due 05/15/3010 | | | 850,000 | | | | 590,836 | |
due 05/15/2910 | | | 450,000 | | | | 324,345 | |
due 01/15/3010 | | | 350,000 | | | | 246,448 | |
Total Fannie Mae Principal Strips | | | | | | | 1,161,629 | |
Freddie Mac Coupon Strips14 | | | | | | | | |
due 09/15/3010 | | | 350,000 | | | | 237,898 | |
| Tennessee Valley Authority | | | | | | | | |
| 5.38% due 04/01/56 | | | 100,000 | | | | 138,894 | |
Freddie Mac14 | | | | | | | | |
due 12/14/2910 | | | 150,000 | | | | 105,948 | |
Total Federal Agency Notes | | | | | | | | |
| (Cost $1,597,018) | | | | | | | 1,644,369 | |
FOREIGN GOVERNMENT BONDS†† – 0.2% | | | | | | | | |
| Kenya Government International Bond | | | | | | | | |
6.88% due 06/24/247 | | | 100,000 | | | | 104,895 | |
| Dominican Republic International Bond | | | | | | | | |
6.85% due 01/27/457 | | | 70,000 | | | | 78,750 | |
Total Foreign Government Bonds | | | | | | | | |
| (Cost $172,204) | | | | | | | 183,645 | |
| | |
See notes to financial statements. | |
| | CLAYMORE EXCHANGE-TRADED FUND TRUST 2 ANNUAL REPORT l 51 |
| | |
SCHEDULE OF INVESTMENTS continued | August 31, 2017 |
GTO Guggenheim Total Return Bond ETF continued
| | | | | | | |
| | | Face | | | | |
| | | Amount | | | Value | |
COMMERCIAL PAPER†† – 14.7% | | | | | | |
| International Paper Co. | | | | | | |
1.36% due 09/15/1710,13 | | $ | 1,500,000 | | | $ | 1,499,085 | |
| Molex Electronic Technologies LLC | | | | | | | | |
1.41% due 09/19/1710,13 | | | 1,500,000 | | | | 1,498,830 | |
| McKesson Corp. | | | | | | | | |
1.35% due 09/21/1710,13 | | | 1,500,000 | | | | 1,498,710 | |
| Omnicom Capital, Inc. | | | | | | | | |
1.45% due 09/25/1710,13 | | | 1,500,000 | | | | 1,498,455 | |
| Eaton Corp. | | | | | | | | |
1.37% due 09/13/1710,13 | | | 1,200,000 | | | | 1,199,364 | |
| Campbell Soup Co. | | | | | | | | |
1.27% due 10/04/1710,13 | | | 1,200,000 | | | | 1,198,356 | |
| Marriott International Inc. | | | | | | | | |
1.47% due 10/17/1710,13 | | | 1,200,000 | | | | 1,197,648 | |
| Marsh & McLennan Companies, Inc. | | | | | | | | |
1.36% due 09/11/1710,13 | | | 1,100,000 | | | | 1,099,516 | |
| Ryder Sys, Inc. | | | | | | | | |
1.38% due 09/06/1710,13 | | | 800,000 | | | | 799,808 | |
| ITC Holdings Corp. | | | | | | | | |
1.42% due 09/18/1710,13 | | | 500,000 | | | | 489,735 | |
Total Commercial Paper | | | | | | | | |
| (Cost $11,990,424) | | | | | | | 11,979,507 | |
REPURCHASE AGREEMENTS††,15 – 12.2% | | | | | | | | |
| Bank of America | | | | | | | | |
| issued 08/30/17 at 1.72% due 10/06/17 | | | 3,300,000 | | | | 3,300,000 | |
| Deutsche Bank Securities, Inc. | | | | | | | | |
| issued 08/24/17 at 1.82% due 11/27/17 | | | 2,606,800 | | | | 2,606,800 | |
| Jefferies & Company, Inc. | | | | | | | | |
| issued 08/28/17 at 2.75% due 09/28/17 | | | 2,510,000 | | | | 2,510,000 | |
| Jefferies & Company, Inc. | | | | | | | | |
| issued 08/25/17 at 3.00% due 09/18/17 | | | 1,540,000 | | | | 1,540,000 | |
Total Repurchase Agreements | | | | | | | | |
| (Cost $9,956,800) | | | | | | | 9,956,800 | |
| | | Face | | | | |
| | | Amount | | | Value | |
SECURITIES LENDING COLLATERAL††,1 – 0.0% | | | | | | |
Repurchase Agreements | | | | | | |
| Merrill Lynch, Pierce, Fenner & Smith, Inc. | | | | | | |
| issued 08/31/17 at 1.20% due 09/01/17 | | $ | 1,199 | | | $ | 1,199 | |
| Nomura Securities International, Inc. | | | | | | | | |
| issued 08/31/17 at 1.20% due 09/01/17 | | | 1,199 | | | | 1,199 | |
| RBC Dominion Securities, Inc. | | | | | | | | |
| issued 08/31/17 at 0.90% due 09/01/17 | | | 1,199 | | | | 1,199 | |
| Daiwa Capital Markets America | | | | | | | | |
| issued 08/31/17 at 1.20% due 09/01/17 | | | 1,199 | | | | 1,199 | |
| Citigroup Global Markets, Inc. | | | | | | | | |
| issued 08/31/17 at 1.02% due 09/01/17 | | | 354 | | | | 354 | |
Total Securities Lending Collateral | | | | | | | | |
| (Cost $5,150) | | | | | | | 5,150 | |
| | | Contracts | | | Value | |
OPTIONS PURCHASED† – 0.1% | | | | | | |
Put options on: | | | | | | |
| iShares 20+ Year Treasury Bond | | | | | | |
| ETF Expiring October 2017 with strike price of $127.00 | | | | | | |
| (Notional Value $2,813,220) | | | 350 | | | $ | 78,750 | |
| iShares iBoxx $ High Yield | | | | | | | | |
| Corporate Bond ETF Expiring October 2017 with strike price | | | | | | | | |
| of $84.00 (Notional Value $524,875) | | | 651 | | | | 10,416 | |
Total Options Purchased (Cost $71,540) | | | | | | | 89,166 | |
Total Investments – 107.9% | | | | | | | | |
| (Cost $86,852,928) | | | | | | $ | 87,988,727 | |
OPTIONS WRITTEN† – 0.0% | | | | | | | | |
Put options on: | | | | | | | | |
| iShares 20+ Year Treasury Bond | | | | | | | | |
| ETF Expiring October 2017 with strike price of | | | | | | | | |
| $130.00 (Notional Value $1,567,878) | | | 350 | | | | (36,050 | ) |
Total Options Written | | | | | | | | |
| (Premiums received $19,250) | | | | | | | (36,050 | ) |
Other Assets & Liabilities, net – (7.9)% | | | | | | | (6,414,532 | ) |
Total Net Assets – 100.0% | | | | | | $ | 81,538,145 | |
CENTRALLY CLEARED INTEREST RATE SWAPS†† |
| |
| | | Floating | Floating | Fixed | Payment | Maturity | Notional | Market | Unrealized |
Counterparty | Exchange | Rate Type | Rate Index | Rate | Frequency | Date | Amount | Value | Loss |
| BOA Merrill Lynch | CME | Receive | 3 Month LIBOR | 2.11% | Quarterly | 09/01/27 | $ (400,000) | $ (1,160) | $ (1,160) |
| BOA Merrill Lynch | CME | Receive | 3 Month LIBOR | 1.94% | Quarterly | 09/01/24 | (600,000) | (1,230) | (1,230) |
| BOA Merrill Lynch | CME | Receive | 3 Month LIBOR | 2.11% | Quarterly | 09/01/27 | (500,000) | (1,269) | (1,269) |
| BOA Merrill Lynch | CME | Receive | 3 Month LIBOR | 2.13% | Quarterly | 08/30/27 | (400,000) | (1,895) | (1,895) |
| BOA Merrill Lynch | CME | Receive | 3 Month LIBOR | 1.99% | Quarterly | 08/15/24 | (400,000) | (2,412) | (2,412) |
| BOA Merrill Lynch | CME | Receive | 3 Month LIBOR | 2.15% | Quarterly | 08/29/27 | (500,000) | (2,969) | (2,969) |
| BOA Merrill Lynch | CME | Receive | 3 Month LIBOR | 2.17% | Quarterly | 08/22/27 | (400,000) | (3,094) | (3,094) |
| BOA Merrill Lynch | CME | Receive | 3 Month LIBOR | 2.19% | Quarterly | 08/14/27 | (300,000) | (3,130) | (3,130) |
| BOA Merrill Lynch | CME | Receive | 3 Month LIBOR | 2.13% | Quarterly | 08/30/27 | (800,000) | (3,233) | (3,233) |
| BOA Merrill Lynch | CME | Receive | 3 Month LIBOR | 1.99% | Quarterly | 08/22/24 | (600,000) | (3,389) | (3,389) |
| BOA Merrill Lynch | CME | Receive | 3 Month LIBOR | 2.20% | Quarterly | 08/18/27 | (400,000) | (4,343) | (4,343) |
| BOA Merrill Lynch | CME | Receive | 3 Month LIBOR | 2.17% | Quarterly | 08/15/27 | (600,000) | (5,002) | (5,002) |
| BOA Merrill Lynch | CME | Receive | 3 Month LIBOR | 2.06% | Quarterly | 07/26/24 | (500,000) | (5,158) | (5,158) |
| BOA Merrill Lynch | CME | Receive | 3 Month LIBOR | 1.97% | Quarterly | 08/30/24 | (1,400,000) | (5,341) | (5,341) |
| BOA Merrill Lynch | CME | Receive | 3 Month LIBOR | 2.16% | Quarterly | 02/13/24 | (850,000) | (14,637) | (14,637) |
| BOA Merrill Lynch | CME | Receive | 3 Month LIBOR | 2.24% | Quarterly | 08/11/27 | (1,400,000) | (19,352) | (19,352) |
| | | | | | | | | | $(77,614) |
| | |
See notes to financial statements. | |
| 52 l CLAYMORE EXCHANGE-TRADED FUND TRUST 2 ANNUAL REPORT | |
| | |
SCHEDULE OF INVESTMENTS continued | August 31, 2017 |
GTO Guggenheim Total Return Bond ETF continued
| | | |
| † | | Value determined based on Level 1 inputs — See Note 4. |
| †† | | Value determined based on Level 2 inputs, unless otherwise noted — See Note 4. |
| ††† | | Value determined based on Level 3 inputs — See Note 4. |
| 1 | | Securities lending collateral — See Note 7. |
| 2 | | All or portion of this security is on loan at August 31, 2017 — See Note 7. |
| 3 | | Investment in an affiliated issuer. |
| 4 | | Rate indicated is the 7 day yield as of August 31, 2017. |
| 5 | | Variable rate security. Rate indicated is rate effective at August 31, 2017. |
| 6 | | Perpetual maturity. |
| 7 | | Security is a 144A or Section 4(a)(2) security. These securities have been determined to be liquid under guidelines established by the Board of Trustees. The total market value of 144A or Section 4(a)(2) securities is $19,503,654 (cost $19,315,639), or 23.9% of total net assets. |
| 8 | | Maturity date indicated is next interest reset date. |
| 9 | | Security has no stated coupon. However, it is expected to receive residual cash flow payments on defined deal dates. |
| 10 | | Zero coupon rate security. |
| 11 | | Security is a 144A or Section 4(a)(2) security. These securities have been determined to be illiquid and restricted under guidelines established by the Board of Trustees. The total market value of 144A or Section 4(a)(2) illiquid and restricted securities is $817,993 (cost $823,033) or 1.0% of total net assets — See Note 10. |
| 12 | | Term loan interests in the Fund’s portfolio generally have variable rates. All or a portion of this security represents unsettled loan positions and may not have a stated coupon rate. |
| 13 | | Rate indicated is the effective yield at the time of purchase. |
| 14 | | On September 7, 2008, the issuer was placed in conservatorship by the Federal Housing Finance Agency (FHFA). As conservator, the FHFA has full powers to control the assets and operations of the firm. |
| 15 | | Repurchase Agreements — See Note 6. |
| 16 | | Security was fair valued by the Valuation Committee at August 31, 2017. The total market value of fair value securities amounts to $145,741 (cost $128,306), or 0.2% of total net assets. |
| | | |
| plc | | Public Limited Company |
| CME | | Chicago Mercantile Exchange |
| LIBOR | | London Interbank Offered Rate |
| WAC | | Weighted Average Coupon |
See Sector Classification in Other Information section.
| | | | |
| | | % of Long-Term | |
Country | | Investments | |
| United States | | | 82.9 | % |
| Cayman Islands | | | 10.2 | % |
| Japan | | | 1.7 | % |
| Canada | | | 0.9 | % |
| France | | | 0.7 | % |
| Switzerland | | | 0.7 | % |
| Bermuda | | | 0.7 | % |
| Other | | | 2.2 | % |
Total Long-Term Investments | | | 100 | % |
| | |
See notes to financial statements. | |
| | CLAYMORE EXCHANGE-TRADED FUND TRUST 2 ANNUAL REPORT l 53 |
| | |
SCHEDULE OF INVESTMENTS continued | August 31, 2017 |
GTO Guggenheim Total Return Bond ETF continued
The following table summarizes the inputs used to value the Fund’s investments at August 31, 2017 (See Note 4 in the Notes to Financial Statements):
| | | | | | | | | | | | | |
Investments in Securities (Assets) | | Level 1 Quoted Prices | | | Level 2 Significant Observable Inputs | | | Level 3 Significant Unobservable Inputs | | | Total | |
| Asset-Backed Securities | | $ | — | | | $ | 12,656,838 | | | $ | — | | | $ | 12,656,838 | |
| Closed-End Funds | | | 813,594 | | | | — | | | | — | | | | 813,594 | |
| Collateralized Mortgage Obligations | | | — | | | | 13,945,460 | | | | 145,741 | | | | 14,091,201 | |
| Commercial Paper | | | — | | | | 11,979,507 | | | | — | | | | 11,979,507 | |
| Corporate Bonds | | | — | | | | 16,844,747 | | | | — | | | | 16,844,747 | |
| Exchange-Traded Funds | | | 4,051,565 | | | | — | | | | — | | | | 4,051,565 | |
| Federal Agency Notes | | | — | | | | 1,644,369 | | | | — | | | | 1,644,369 | |
| Foreign Government Bonds | | | — | | | | 183,645 | | | | — | | | | 183,645 | |
| Money Market Fund | | | 3,526,338 | | | | — | | | | — | | | | 3,526,338 | |
| Municipal Bonds | | | — | | | | 3,453,498 | | | | — | | | | 3,453,498 | |
| Options Purchased | | | 89,166 | | | | — | | | | — | | | | 89,166 | |
| Repurchase Agreement | | | — | | | | 9,956,800 | | | | — | | | | 9,956,800 | |
| Securities Lending Collateral | | | — | | | | 5,150 | | | | — | | | | 5,150 | |
| Senior Floating Rate Interests | | | — | | | | 2,337,214 | | | | — | | | | 2,337,214 | |
| U.S. Government Securities | | | — | | | | 6,355,095 | | | | — | | | | 6,355,095 | |
| Total Assets | | $ | 8,480,663 | | | $ | 79,362,323 | | | $ | 145,741 | | | $ | 87,988,727 | |
| | |
Investments in Securities (Liabilities) | | Level 1 Quoted Prices | | | Level 2 Significant Observable Inputs | | | Level 3 Significant Unobservable Inputs | | | Total | |
| Interest Rate Swaps* | | $ | — | | | $ | 77,614 | | | $ | — | | | $ | 77,614 | |
| Options Written | | | 36,050 | | | | — | | | | — | | | | 36,050 | |
| Total Liabilities | | $ | 36,050 | | | $ | 77,614 | | | $ | — | | | $ | 113,664 | |
* Interest rate swaps are reported as unrealized gain/loss at period end.
Transfers between investment levels may occur as the markets fluctuate and/or the availability of data used in an investment’s valuation changes. Transfers between valuation levels, if any, are in comparison to the valuation levels at the end of the previous fiscal year, and are effective using the fair value as of the end of the current fiscal period.
For the year ended August 31, 2017, there were no transfers between levels.
Affiliated Transactions
Investments representing 5% or more of the outstanding voting shares of a portfolio company of a fund, or control of or by, or common control under Guggenheim Investments, result in that portfolio company being considered an affiliated company of such fund, as defined in the 1940 Act.
Transactions during the year ended August 31, 2017, in which the portfolio company is an “affiliated person”, were as follows:
| | | | | | | |
| | | Value | | | | | | | | | Realized | | | Change in | | | Value | | | Shares | | | Investment | |
Security Name | | 8/31/16 | | | Additions | | | Reductions | | | Gain (Loss) | | | Unrealized | | | 8/31/17 | | | 8/31/17 | | | Income | |
| Guggenheim Strategic Opportunities Fund | | $ | 207,688 | | | $ | 569,729 | | | $ | — | | | $ | — | | | $ | 36,177 | | | $ | 813,594 | | | | 38,359 | | | $ | 38,718 | |
| Guggenheim Ultra Short Duration ETF | | | — | | | | 7,250,596 | | | | (3,196,233 | ) | | | (4,713 | ) | | | 1,915 | | | | 4,051,565 | | | | 80,516 | | | | 16,882 | |
| | | $ | 207,688 | | | $ | 7,820,325 | | | $ | (3,196,233 | ) | | $ | (4,713 | ) | | $ | 38,092 | | | $ | 4,865,159 | | | | | | | $ | 55,600 | |
| |
See notes to financial statements. |
54 l CLAYMORE EXCHANGE-TRADED FUND TRUST 2 ANNUAL REPORT |
| | |
SCHEDULE OF INVESTMENTS continued | August 31, 2017 |
OVLC Guggenheim U.S. Large Cap Optimized Volatility ETF
| | | | | | | |
| | Shares | | | Value | |
COMMON STOCKS† – 99.4% | | | | | | |
Financial – 21.5% | | | | | | |
| Berkshire Hathaway, Inc. — Class B* | | | 216 | | | $ | 39,131 | |
| U.S. Bancorp | | | 377 | | | | 19,321 | |
| Crown Castle International Corp. REIT | | | 164 | | | | 17,784 | |
| BB&T Corp. | | | 373 | | | | 17,192 | |
| Simon Property Group, Inc. | | | 109 | | | | 17,097 | |
| CME Group, Inc. — Class A | | | 135 | | | | 16,983 | |
| Ventas, Inc. REIT | | | 227 | | | | 15,536 | |
| Welltower, Inc. REIT | | | 211 | | | | 15,449 | |
| Equity Residential REIT | | | 230 | | | | 15,445 | |
| AvalonBay Communities, Inc. REIT | | | 81 | | | | 15,206 | |
| M&T Bank Corp. | | | 98 | | | | 14,490 | |
| Essex Property Trust, Inc. | | | 49 | | | | 13,033 | |
| Digital Realty Trust, Inc. REIT | | | 108 | | | | 12,781 | |
| Boston Properties, Inc. REIT | | | 104 | | | | 12,542 | |
| HCP, Inc. REIT | | | 317 | | | | 9,450 | |
| Loews Corp. | | | 187 | | | | 8,710 | |
| Mid-America Apartment Communities, Inc. | | | 81 | | | | 8,623 | |
| Apartment Investment & Management Co. — Class A REIT | | | 158 | | | | 7,162 | |
| Federal Realty Investment Trust REIT | | | 56 | | | | 7,108 | |
| UDR, Inc. | | | 181 | | | | 7,026 | |
| JPMorgan Chase & Co. | | | 77 | | | | 6,999 | |
| People’s United Financial, Inc. REIT | | | 400 | | | | 6,680 | |
| Wells Fargo & Co. | | | 42 | | | | 2,145 | |
| Bank of America Corp. | | | 71 | | | | 1,696 | |
Total Financial | | | | | | | 307,589 | |
Consumer, Non-cyclical – 18.7% | | | | | | | | |
| Procter & Gamble Co. | | | 340 | | | | 31,372 | |
| Merck & Co., Inc. | | | 409 | | | | 26,119 | |
| Eli Lilly & Co. | | | 238 | | | | 19,347 | |
| Cigna Corp. | | | 101 | | | | 18,388 | |
| Aetna, Inc. | | | 116 | | | | 18,293 | |
| Intuitive Surgical, Inc.* | | | 18 | | | | 18,084 | |
| Express Scripts Holding Co.* | | | 264 | | | | 16,585 | |
| Sysco Corp. | | | 292 | | | | 15,380 | |
| Cardinal Health, Inc. | | | 209 | | | | 14,099 | |
| Clorox Co. | | | 87 | | | | 12,052 | |
| Kellogg Co. | | | 171 | | | | 11,194 | |
| Laboratory Corp. of America Holdings* | | | 69 | | | | 10,824 | |
| Johnson & Johnson | | | 77 | | | | 10,193 | |
| Quest Diagnostics, Inc. | | | 93 | | | | 10,077 | |
| Conagra Brands, Inc. | | | 273 | | | | 8,862 | |
| Verisk Analytics, Inc. — Class A* | | | 104 | | | | 8,429 | |
| Quanta Services, Inc.* | | | 220 | | | | 7,905 | |
| Perrigo Company plc | | | 97 | | | | 7,659 | |
| Biogen, Inc.* | | | 12 | | | | 3,799 | |
Total Consumer, Non-cyclical | | | | | | | 268,661 | |
Consumer, Cyclical – 13.1% | | | | | | | | |
| Wal-Mart Stores, Inc. | | | 297 | | | | 23,187 | |
| NIKE, Inc. — Class B | | | 375 | | | | 19,804 | |
| | | Shares | | | Value | |
COMMON STOCKS† – 99.4% (continued) | | | | | | |
Consumer, Cyclical – 13.1% (continued) | | | | | | |
| TJX Cos., Inc. | | | 238 | | | $ | 17,207 | |
| Carnival Corp. | | | 243 | | | | 16,884 | |
| Ford Motor Co. | | | 1,519 | | | | 16,755 | |
| Dollar Tree, Inc.* | | | 160 | | | | 12,742 | |
| AutoZone, Inc.* | | | 19 | | | | 10,040 | |
| Ralph Lauren Corp. — Class A | | | 98 | | | | 8,613 | |
| PVH Corp. | | | 67 | | | | 8,435 | |
| Fastenal Co. | | | 196 | | | | 8,363 | |
| Coach, Inc. | | | 190 | | | | 7,923 | |
| LKQ Corp.* | | | 217 | | | | 7,519 | |
| Chipotle Mexican Grill, Inc. — Class A* | | | 22 | | | | 6,968 | |
| Darden Restaurants, Inc. | | | 84 | | | | 6,896 | |
| WW Grainger, Inc. | | | 39 | | | | 6,340 | |
Under Armour, Inc. — Class A*,1 | | | 336 | | | | 5,426 | |
Under Armour, Inc. — Class C*,1 | | | 358 | | | | 5,406 | |
Total Consumer, Cyclical | | | | | | | 188,508 | |
Utilities – 10.8% | | | | | | | | |
| Duke Energy Corp. | | | 209 | | | | 18,246 | |
| Dominion Energy, Inc. | | | 217 | | | | 17,093 | |
| Exelon Corp. | | | 443 | | | | 16,776 | |
| PG&E Corp. | | | 238 | | | | 16,750 | |
| Southern Co. | | | 341 | | | | 16,457 | |
| PPL Corp. | | | 403 | | | | 15,814 | |
| Consolidated Edison, Inc. | | | 187 | | | | 15,759 | |
| American Water Works Co., Inc. | | | 121 | | | | 9,789 | |
| FirstEnergy Corp. | | | 300 | | | | 9,774 | |
| CMS Energy Corp. | | | 190 | | | | 9,223 | |
| CenterPoint Energy, Inc. | | | 291 | | | | 8,619 | |
Total Utilities | | | | | | | 154,300 | |
Industrial – 10.7% | | | | | | | | |
| Lockheed Martin Corp. | | | 67 | | | | 20,461 | |
| Raytheon Co. | | | 107 | | | | 19,475 | |
| General Dynamics Corp. | | | 89 | | | | 17,920 | |
| Emerson Electric Co. | | | 276 | | | | 16,295 | |
| Stanley Black & Decker, Inc. | | | 104 | | | | 14,976 | |
| Republic Services, Inc. — Class A | | | 156 | | | | 10,177 | |
| Kansas City Southern | | | 76 | | | | 7,861 | |
| J.B. Hunt Transport Services, Inc. | | | 79 | | | | 7,812 | |
| FLIR Systems, Inc. | | | 199 | | | | 7,562 | |
| PerkinElmer, Inc. | | | 111 | | | | 7,436 | |
| CH Robinson Worldwide, Inc. | | | 100 | | | | 7,063 | |
| Expeditors International of Washington, Inc. | | | 124 | | | | 6,956 | |
| Stericycle, Inc.* | | | 90 | | | | 6,470 | |
| General Electric Co. | | | 103 | | | | 2,529 | |
Total Industrial | | | | | | | 152,993 | |
| | |
See notes to financial statements. | |
| | CLAYMORE EXCHANGE-TRADED FUND TRUST 2 ANNUAL REPORT l 55 |
| | |
SCHEDULE OF INVESTMENTS continued | August 31, 2017 |
OVLC Guggenheim U.S. Large Cap Optimized Volatility ETF continued
| | | | | | | |
| | | Shares | | | Value | |
COMMON STOCKS† – 99.4% (continued) | | | | | | |
Technology – 10.5% | | | | | | |
| Apple, Inc. | | | 261 | | | $ | 42,804 | |
| Intel Corp. | | | 738 | | | | 25,882 | |
| Microsoft Corp. | | | 321 | | | | 24,001 | |
| International Business Machines Corp. | | | 149 | | | | 21,311 | |
| Fidelity National Information Services, Inc. | | | 188 | | | | 17,469 | |
| Paychex, Inc. | | | 216 | | | | 12,318 | |
| CA, Inc. | | | 223 | | | | 7,399 | |
Total Technology | | | | | | | 151,184 | |
Communications – 7.4% | | | | | | | | |
| AT&T, Inc. | | | 802 | | | | 30,043 | |
| Verizon Communications, Inc. | | | 588 | | | | 28,206 | |
| Amazon.com, Inc.* | | | 14 | | | | 13,728 | |
| Facebook, Inc. — Class A* | | | 66 | | | | 11,350 | |
| Motorola Solutions, Inc. | | | 111 | | | | 9,781 | |
| Alphabet, Inc. — Class A* | | | 7 | | | | 6,687 | |
| Alphabet, Inc. — Class C* | | | 7 | | | | 6,575 | |
Total Communications | | | | | | | 106,370 | |
Energy – 5.7% | | | | | | | | |
| Exxon Mobil Corp. | | | 470 | | | | 35,875 | |
| Kinder Morgan, Inc. | | | 864 | | | | 16,701 | |
| Pioneer Natural Resources Co. | | | 105 | | | | 13,613 | |
| Cabot Oil & Gas Corp. — Class A | | | 315 | | | | 8,048 | |
| National Oilwell Varco, Inc. | | | 257 | | | | 7,882 | |
Total Energy | | | | | | | 82,119 | |
Basic Materials – 1.0% | | | | | | | | |
| Newmont Mining Corp. | | | 360 | | | | 13,802 | |
Total Common Stocks | | | | | | | | |
| (Cost $1,437,797) | | | | | | | 1,425,526 | |
| | | Face | | | | |
| | | Amount | | | Value | |
SECURITIES LENDING COLLATERAL††,2 – 0.8% | | | | | | |
Repurchase Agreements | | | | | | |
| Nomura Securities International, Inc. | | | | | | |
| issued 08/31/17 at 1.13% | | | | | | |
| due 09/01/17 | | $ | 2,544 | | | $ | 2,544 | |
| Citigroup Global Markets, Inc. | | | | | | | | |
| issued 08/31/17 at 1.13% | | | | | | | | |
| due 09/01/17 | | | 2,544 | | | | 2,544 | |
| RBC Dominion Securities, Inc. | | | | | | | | |
| issued 08/31/17 at 0.99% | | | | | | | | |
| due 09/01/17 | | | 2,544 | | | | 2,544 | |
| Daiwa Capital Markets America | | | | | | | | |
| issued 08/31/17 at 1.13% | | | | | | | | |
| due 09/01/17 | | | 2,544 | | | | 2,544 | |
| Merrill Lynch, Pierce, Fenner & Smith, Inc. | | | | | | | | |
| issued 08/31/17 at 0.95% | | | | | | | | |
| due 09/01/17 | | | 754 | | | | 754 | |
| | | Value | |
Total Securities Lending Collateral | | | |
| (Cost $10,930) | | $ | 10,930 | |
Total Investments – 100.2% | | | | |
| (Cost $1,448,727) | | $ | 1,436,456 | |
Other Assets & Liabilities, net – (0.2)% | | | (2,725 | ) |
Total Net Assets – 100.0% | | $ | 1,433,731 | |
| * | | Non-income producing security. |
| † | | Value determined based on Level 1 inputs — See Note 4. |
| †† | | Value determined based on Level 2 inputs — See Note 4. |
| 1 | | All or portion of this security is on loan at August 31, 2017 — See Note 7. |
| 2 | | Securities lending collateral — See Note 7. |
| | | |
| plc | | Public Limited Company |
| REIT | | Real Estate Investment Trust |
See Sector Classification in Other Information section.
| |
| Country Diversification |
| | | % of Long-Term |
Country | Investments |
| United States | 98.3% |
| Panama | 1.2% |
| Ireland | | 0.5% |
Total Long-Term Investments | 100.0% |
The following table summarizes the inputs used to value the Fund’s investments at August 31, 2017 (See Note 4 in the Notes to Financial Statements):
| | | | | | | | | | | | | |
| | | | | | Level 2 | | | Level 3 | | | | |
Investments in | | | | | Significant | | | Significant | | | | |
Securities | | Level 1 | | | Observable | | | Unobservable | | | | |
(Assets) | | Quoted Prices | | | Inputs | | | Inputs | | | Total | |
| Common Stocks | | $ | 1,425,526 | | | $ | — | | | $ | — | | | $ | 1,425,526 | |
| Securities Lending | | | | | | | | | | | | | | | | |
| Collateral | | | — | | | | 10,930 | | | | — | | | | 10,930 | |
| Total Assets | | $ | 1,425,526 | | | $ | 10,930 | | | $ | — | | | $ | 1,436,456 | |
Transfers between investment levels may occur as the markets fluctuate and/or the availability of data used in an investment’s valuation changes. Transfers between valuation levels, if any, are in comparison to the valuation levels at the end of the previous fiscal year, and are effective using the fair value as of the end of the current fiscal period.
For the year ended August 31, 2017, there were no transfers between levels.
| | |
See notes to financial statements. | |
| 56 l CLAYMORE EXCHANGE-TRADED FUND TRUST 2 ANNUAL REPORT | |
| | |
STATEMENTS OF ASSETS AND LIABILITIES | August 31, 2017 |
| | | | | | | | | | | | | |
| | | Guggenheim China All-Cap ETF (YAO) | | | Guggenheim China Technology ETF (CQQQ) | | | Guggenheim Solar ETF (TAN) | | | Guggenheim S&P Global Water Index ETF (CGW) | |
ASSETS: | | | | | | | | | | | | |
| Investments, at value — including securities on loan | | $ | 26,411,142 | | | $ | 204,999,034 | | | $ | 357,788,994 | | | $ | 608,728,527 | |
| Repurchase agreements, at value | | | 607,502 | | | | 18,642,424 | | | | 97,992,666 | | | | 459,668 | |
| Foreign currency, at value | | | 7,701 | | | | — | | | | — | | | | 50,480 | |
| Cash | | | 40,130 | | | | 93,851 | | | | 1,158,719 | | | | — | |
| Prepaid expenses | | | — | | | | — | | | | 1,491 | | | | 3,673 | |
| Receivables: | | | | | | | | | | | | | | | | |
| Dividends | | | 64,603 | | | | 122,578 | | | | 852,913 | | | | 1,142,225 | |
| Investments sold | | | 3,556 | | | | 5,607, 959 | | | | — | | | | 402,700 | |
| Securities lending income | | | 1,998 | | | | 31,219 | | | | 481,699 | | | | 303 | |
| Fund shares sold | | | — | | | | 103,868 | | | | — | | | | — | |
| Tax reclaims | | | — | | | | — | | | | 25,306 | | | | 941,999 | |
Total assets | | | 27,136,632 | | | | 229,600,933 | | | | 458,301,788 | | | | 611,729,575 | |
LIABILITIES: | | | | | | | | | | | | | | | | |
| Due to custodian | | | — | | | | — | | | | — | | | | 134,717 | |
| Payable for: | | | | | | | | | | | | | | | | |
| Upon return of securities loaned | | | 607,502 | | | | 18,642,424 | | | | 97,992,666 | | | | 459,668 | |
| Management fees | | | 15,330 | | | | 99,511 | | | | 74,663 | | | | 229,270 | |
| Investments purchased | | | 3,558 | | | | 1,840,260 | | | | — | | | | 402,968 | |
| Registration fees | | | — | | | | — | | | | 79,970 | | | | 116,126 | |
| Professional fees | | | — | | | | — | | | | 32,391 | | | | 19,585 | |
| Intraday valuation fees | | | — | | | | — | | | | 5,982 | | | | 17,538 | |
| Other liabilities | | | — | | | | — | | | | 108,228 | | | | 96,809 | |
Total liabilities | | | 626,390 | | | | 20,582,195 | | | | 98,293,900 | | | | 1,476,681 | |
NET ASSETS | | $ | 26,510,242 | | | $ | 209,018,738 | | | $ | 360,007,888 | | | $ | 610,252,894 | |
NET ASSETS CONSIST OF: | | | | | | | | | | | | | | | | |
| Paid-in capital | | $ | 32,603,299 | | | $ | 191,492,670 | | | $ | 881,468,828 | | | $ | 531,374,811 | |
| Undistributed net investment income | | | 324,385 | | | | 741,562 | | | | 1,929,227 | | | | 8,831,330 | |
| Accumulated net realized loss on investments and | | | | | | | | | | | | | | | | |
| foreign currency transactions | | | (10,445,202 | ) | | | (19,422,051 | ) | | | (536,737,208 | ) | | | (81,084,550 | ) |
| Net unrealized appreciation on investments and | | | | | | | | | | | | | | | | |
| foreign currencies | | | 4,027,760 | | | | 36,206,557 | | | | 13,347,041 | | | | 151,131,303 | |
NET ASSETS | | $ | 26,510,242 | | | $ | 209,018,738 | | | $ | 360,007,888 | | | $ | 610,252,894 | |
| Shares outstanding ($0.01 par value with unlimited | | | | | | | | | | | | | | | | |
| amount authorized) | | | 800,000 | | | | 3,800,000 | | | | 16,648,000 | | | | 18,280,000 | |
| Net asset value | | $ | 33.14 | | | $ | 55.00 | | | $ | 21.62 | | | $ | 33.38 | |
| Investments in securities, at cost | | | 22,383,407 | | | | 168,791,371 | | | | 344,442,401 | | | | 457,607,235 | |
| Repurchase agreements, at cost | | | 607,502 | | | | 18,642,424 | | | | 97,992,666 | | | | 459,668 | |
| Foreign currency, at cost | | | 7,701 | | | | — | | | | — | | | | 49,029 | |
| Securities on loan, at value | | | 1,138,156 | | | | 23,590,771 | | | | 111,021,890 | | | | 423,631 | |
| | |
See notes to financial statements. | |
| | CLAYMORE EXCHANGE-TRADED FUND TRUST 2 ANNUAL REPORT l 57 |
| | |
STATEMENTS OF ASSETS AND LIABILITIES continued | August 31, 2017 |
| | | | | | | | | | |
| | | Guggenheim S&P High Income Infrastructure ETF (GHII) | | | Guggenheim Total Return Bond ETF (GTO) | | | Guggenheim U.S. Large Cap Optimized Volatility ETF (OVLC) | |
ASSETS: | | | | | | | | | |
| Investments in unaffiliated issuers, at value — including securities on loan | | $ | 34,965,188 | | | $ | 73,161,618 | | | $ | 1,425,526 | |
| Investments in affiliated issuers, at value | | | — | | | | 4,865,159 | | | | — | |
| Repurchase agreements, at value | | | 4,620,984 | | | | 9,961,950 | | | | 10,930 | |
| Foreign currency, at value | | | 40,264 | | | | — | | | | — | |
| Cash | | | 263,284 | | | | 248,813 | | | | 4,975 | |
| Cash at broker for open swap agreements | | | — | | | | 273,929 | | | | — | |
| Receivables: | | | | | | | | | | | | |
| Dividends | | | 113,860 | | | | — | | | | 3,547 | |
| Investments sold | | | 40,537 | | | | 371,611 | | | | — | |
| Securities lending income | | | 23,965 | | | | 5 | | | | 46 | |
| Tax reclaims | | | 15,114 | | | | — | | | | — | |
| Interest | | | — | | | | 277,495 | | | | — | |
| Total assets | | | 40,083,196 | | | | 89,160,580 | | | | 1,445,024 | |
LIABILITIES: | | | | | | | | | | | | |
| Options written, at value (proceeds $19,250) | | | — | | | | 36,050 | | | | — | |
| Variation margin on swap agreements | | | — | | | | 20,254 | | | | — | |
| Payable for: | | | | | | | | | | | | |
| Upon return of securities loaned | | | 4,620,984 | | | | 5,150 | | | | 10,930 | |
| Investments purchased | | | 40,545 | | | | 7,536,449 | | | | — | |
| Management fees | | | 13,535 | | | | 23,141 | | | | 363 | |
| Line of credit fees | | | — | | | | 1,391 | | | | — | |
| Other liabilities | | | — | | | | — | | | | — | |
Total liabilities | | | 4,675,064 | | | | 7,622,435 | | | | 11,293 | |
NET ASSETS | | $ | 35,408,132 | | | $ | 81,538,145 | | | $ | 1,433,731 | |
NET ASSETS CONSIST OF: | | | | | | | | | | | | |
| Paid-in capital | | $ | 34,216,921 | | | $ | 80,457,759 | | | $ | 1,504,798 | |
| Undistributed net investment income | | | 405,325 | | | | 132,140 | | | | 29,188 | |
| Accumulated net realized gain (loss) on investments and foreign currency transactions | | | (214,591 | ) | | | (93,139 | ) | | | (87,984 | ) |
| Net unrealized appreciation (depreciation) on investments and foreign currencies | | | 1,000,477 | | | | 1,041,385 | | | | (12,271 | ) |
NET ASSETS | | $ | 35,408,132 | | | $ | 81,538,145 | | | $ | 1,433,731 | |
| Shares outstanding ($0.01 par value with unlimited amount authorized) | | | 1,250,000 | | | | 1,550,000 | | | | 50,000 | |
| Net asset value | | $ | 28.33 | | | $ | 52.61 | | | $ | 28.67 | |
| Investments in unaffiliated issuers, at cost | | | 33,965,379 | | | | 72,071,507 | | | | 1,437,797 | |
| Investments in affiliated issuers, at cost | | | — | | | | 4,819,471 | | | | — | |
| Options written, at proceeds | | | — | | | | (19,250 | ) | | | — | |
| Repurchase agreements, at cost | | | 4,620,984 | | | | 9,961,950 | | | | 10,930 | |
| Foreign currency, at cost | | | 40,279 | | | | — | | | | — | |
| Securities on loan, at value | | | 5,101,094 | | | | 5,032 | | | | 10,598 | |
| |
See notes to financial statements. |
58 l CLAYMORE EXCHANGE-TRADED FUND TRUST 2 ANNUAL REPORT |
| | |
STATEMENTS OF OPERATIONS | August 31, 2017 |
| For the year ended August 31, 2017 | |
| | | | | | | | | | | | | |
| | | Guggenheim China All-Cap ETF (YAO) | | | Guggenheim China Technology ETF (CQQQ) | | | Guggenheim Solar ETF (TAN) | | | Guggenheim S&P Global Water Index ETF (CGW) | |
INVESTMENT INCOME: | | | | | | | | | | | | |
| Dividends, net of foreign taxes withheld* | | $ | 535,894 | | | $ | 1,271,978 | | | $ | 2,803,192 | | | $ | 12,777,111 | |
| Income from securities lending | | | 19,859 | | | | 205,248 | | | | 4,605,220 | | | | 168,204 | |
| Miscellaneous income | | | — | | | | — | | | | 1,328 | | | | — | |
| Interest | | | — | | | | — | | | | — | | | | 1,426 | |
| Total investment income | | | 555,753 | | | | 1,477,226 | | | | 7,409,740 | | | | 12,946,741 | |
EXPENSES: | | | | | | | | | | | | | | | | |
| Management fees | | | 154,991 | | | | 544,473 | | | | 1,135,353 | | | | 2,484,224 | |
| Listing fees | | | — | | | | — | | | | 5,000 | | | | 5,000 | |
| Printing fees | | | — | | | | — | | | | 53,084 | | | | 62,887 | |
| Intraday valuation fees | | | — | | | | — | | | | 6,507 | | | | 14,965 | |
| Insurance | | | — | | | | — | | | | 3,807 | | | | 6,355 | |
| Professional fees | | | — | | | | — | | | | 51,556 | | | | 70,615 | |
| Administration fees | | | — | | | | — | | | | 60,051 | | | | 113,089 | |
| Trustees’ fees and expenses** | | | — | | | | — | | | | 14,960 | | | | 23,274 | |
| Licensing fees | | | — | | | | — | | | | 315,606 | | | | 203,575 | |
| Custodian fees | | | — | | | | — | | | | 70,672 | | | | 132,619 | |
| Other expenses | | | — | | | | — | | | | 11,529 | | | | 9,947 | |
| Total expenses | | | 154,991 | | | | 544,473 | | | | 1,728,125 | | | | 3,126,550 | |
| Less: | | | | | | | | | | | | | | | | |
| Expenses waived by advisor | | | — | | | | — | | | | (141,131 | ) | | | (13,768 | ) |
| Reimbursement of custody fees | | | — | | | | — | | | | (2,674 | ) | | | (11,106 | ) |
| Total expenses waived/reimbursed | | | — | | | | — | | | | (143,805 | ) | | | (24,874 | ) |
| Net expenses | | | 154,991 | | | | 544,473 | | | | 1,584,320 | | | | 3,101,676 | |
| Net investment income | | | 400,762 | | | | 932,753 | | | | 5,825,420 | | | | 9,845,065 | |
NET REALIZED AND UNREALIZED GAIN (LOSS): | | | | | | | | | | | | | | | | |
| Net realized gain (loss) on: | | | | | | | | | | | | | | | | |
| Investments | | | (84,074 | ) | | | (2,448,436 | ) | | | (124,459,174 | ) | | | (8,869,420 | ) |
| In-kind transactions | | | 705,171 | | | | 1,979,462 | | | | 5,067,079 | | | | 1,110,598 | |
| Foreign currency transactions | | | (764 | ) | | | (2,539 | ) | | | (89,110 | ) | | | 23,055 | |
| Net realized gain (loss) | | | 620,333 | | | | (471,513 | ) | | | (119,481,205 | ) | | | (7,735,767 | ) |
| Net change in unrealized appreciation (depreciation) on: | | | | | | | | | | | | | | | | |
| Investments | | | 4,766,828 | | | | 35,524,589 | | | | 140,387,461 | | | | 58,500,151 | |
| Foreign currency translations | | | 26 | | | | (1,110 | ) | | | 1,720 | | | | 31,352 | |
| Net change in unrealized appreciation (depreciation) | | | 4,766,854 | | | | 35,523,479 | | | | 140,389,181 | | | | 58,531,503 | |
| Net realized and unrealized gain | | | 5,387,187 | | | | 35,051,966 | | | | 20,907,976 | | | | 50,795,736 | |
Net increase in net assets resulting from operations | | $ | 5,787,949 | | | $ | 35,984,719 | | | $ | 26,733,396 | | | $ | 60,640,801 | |
| * Foreign taxes withheld | | $ | 43,248 | | | $ | 6,140 | | | $ | 77,036 | | | $ | 888,265 | |
** Relates to Trustees not deemed “interested persons” within the meaning of Section 2(a)(19) of the 1940 Act. | | | | | | | | | |
| | |
See notes to financial statements. | |
| | CLAYMORE EXCHANGE-TRADED FUND TRUST 2 ANNUAL REPORT l 59 |
| | |
STATEMENTS OF OPERATIONS continued | August 31, 2017 |
| For the year ended August 31, 2017 | |
| | | | | | | | | | |
| | | Guggenheim S&P High Income Infrastructure ETF (GHII) | | | Guggenheim Total Return Bond ETF (GTO) | | | Guggenheim U.S. Large Cap Optimized Volatility ETF (OVLC) | |
INVESTMENT INCOME: | | | | | | | | | |
| Dividends from securities of unaffiliated issuers, net of foreign taxes withheld* | | $ | 1,534,316 | | | $ | 6,704 | | | $ | 58,582 | |
| Dividends from securities of affiliated issuers | | | — | | | | 55,600 | | | | — | |
| Income from securities lending | | | 149,621 | | | | 2,232 | | | | 246 | |
| Interest | | | — | | | | 1,034,267 | | | | — | |
| Total investment income | | | 1,683,937 | | | | 1,098,803 | | | | 58,828 | |
EXPENSES: | | | | | | | | | | | | |
| Management fees | | | 109,694 | | | | 163,800 | | | | 7,619 | |
| Line of credit fees | | | — | | | | 1,836 | | | | — | |
| Total expenses | | | 109,694 | | | | 165,636 | | | | 7,619 | |
| Less: | | | | | | | | | | | | |
| Expenses waived by advisor | | | — | | | | (5,874 | ) | | | — | |
| Net expenses | | | 109,694 | | | | 159,762 | | | | 7,619 | |
| Net investment income | | | 1,574,243 | | | | 939,041 | | | | 51,209 | |
NET REALIZED AND UNREALIZED GAIN (LOSS): | | | | | | | | | | | | |
| Net realized gain (loss) on: | | | | | | | | | | | | |
| Investments in unaffiliated issuers | | | (189,814 | ) | | | (176,408 | ) | | | (165,683 | ) |
| Investments in affiliated issuers | | | — | | | | (4,713 | ) | | | — | |
| In-kind transactions | | | 1,820,866 | | | | — | | | | 433,285 | |
| Foreign currency transactions | | | (3,073 | ) | | | — | | | | — | |
| Options purchased | | | — | | | | (36,248 | ) | | | — | |
| Options written | | | — | | | | 19,348 | | | | — | |
| Swap agreements | | | — | | | | 87,381 | | | | — | |
| Net realized gain (loss) | | | 1,627,979 | | | | (110,640 | ) | | | 267,602 | |
| Net change in unrealized appreciation (depreciation) on: | | | | | | | | | | | | |
| Investments in unaffiliated issuers | | | 956,915 | | | | 334,999 | | | | (84,063 | ) |
| Investments in affiliated issuers | | | — | | | | 38,092 | | | | — | |
| Swap agreements | | | — | | | | (78,501 | ) | | | — | |
| Options purchased | | | — | | | | 17,626 | | | | — | |
| Options written | | | — | | | | (16,800 | ) | | | — | |
| Foreign currency translations | | | 688 | | | | — | | | | — | |
| Net change in unrealized appreciation (depreciation) | | | 957,603 | | | | 295,416 | | | | (84,063 | ) |
| Net realized and unrealized gain | | | 2,585,582 | | | | 184,776 | | | | 183,539 | |
Net increase in net assets resulting from operations | | $ | 4,159,825 | | | $ | 1,123,817 | | | $ | 234,748 | |
| * Foreign taxes withheld | | $ | 142,089 | | | $ | — | | | $ | — | |
| |
See notes to financial statements. |
60 l CLAYMORE EXCHANGE-TRADED FUND TRUST 2 ANNUAL REPORT |
| | |
STATEMENTS OF CHANGES IN NET ASSETS | August 31, 2017 |
| | | | | | | | | | | | | |
| | | Guggenheim China All-Cap ETF (YAO) | | | Guggenheim China Technology ETF (CQQQ) | |
| | | Year Ended | | | Year Ended | | | Year Ended | | | Year Ended | |
| | | August 31, 2017 | | | August 31, 2016 | | | August 31, 2017 | | | August 31, 2016 | |
INCREASE (DECREASE) IN NET ASSETS FROM OPERATIONS: | | | | | | | | | | | | |
| Net investment income | | $ | 400,762 | | | $ | 532,036 | | | $ | 932,753 | | | $ | 454,675 | |
| Net realized gain (loss) on investments and foreign currency transactions | | | 620,333 | | | | (1,599,684 | ) | | | (471,513 | ) | | | 296,205 | |
| Net change in unrealized appreciation (depreciation) on investments | | | | | | | | | | | | | | | | |
| and foreign currencies | | | 4,766,854 | | | | 3,785,213 | | | | 35,523,479 | | | | 14,087,143 | |
| Net increase in net assets resulting from operations | | | 5,787,949 | | | | 2,717,565 | | | | 35,984,719 | | | | 14,838,023 | |
DISTRIBUTIONS TO SHAREHOLDERS FROM: | | | | | | | | | | | | | | | | |
| Net investment income | | | (433,200 | ) | | | (960,740 | ) | | | (773,890 | ) | | | (921,765 | ) |
SHAREHOLDER TRANSACTIONS: | | | | | | | | | | | | | | | | |
| Proceeds from shares purchased | | | 2,958,308 | | | | — | | | | 137,778,697 | | | | 1,611,539 | |
| Cost of shares redeemed | | | (5,376,934 | ) | | | (7,490,830 | ) | | | (9,123,754 | ) | | | (16,178,367 | ) |
| Net increase (decrease) in net assets resulting from shareholder transactions | | | (2,418,626 | ) | | | (7,490,830 | ) | | | 128,654,943 | | | | (14,566,828 | ) |
| Net increase (decrease) in net assets | | | 2,936,123 | | | | (5,734,005 | ) | | | 163,865,772 | | | | (650,570 | ) |
NET ASSETS: | | | | | | | | | | | | | | | | |
| Beginning of period | | | 23,574,119 | | | | 29,308,124 | | | | 45,152,966 | | | | 45,803,536 | |
| End of period | | $ | 26,510,242 | | | $ | 23,574,119 | | | $ | 209,018,738 | | | $ | 45,152,966 | |
| Undistributed net investment income at end of period | | $ | 324,385 | | | $ | 350,088 | | | $ | 741,562 | | | $ | 419,703 | |
CHANGES IN SHARES OUTSTANDING: | | | | | | | | | | | | | | | | |
| Shares sold | | | 100,000 | | | | — | | | | 2,900,000 | | | | 50,000 | |
| Shares redeemed | | | (200,000 | ) | | | (300,000 | ) | | | (250,000 | ) | | | (450,000 | ) |
| Net increase (decrease) in shares | | | (100,000 | ) | | | (300,000 | ) | | | 2,650,000 | | | | (400,000 | ) |
| | |
See notes to financial statements. | |
| | CLAYMORE EXCHANGE-TRADED FUND TRUST 2 ANNUAL REPORT l 61 |
| | |
STATEMENTS OF CHANGES IN NET ASSETS continued | August 31, 2017 |
| | | | | | | | | | | | | |
| | | Guggenheim Solar ETF (TAN) | | | Guggenheim S&P Global Water Index ETF (CGW) | |
| |
| |
| | | Year Ended | | | Year Ended | | | Year Ended | | | Year Ended | |
| | | August 31, 2017 | | | August 31, 2016 | | | August 31, 2017 | | | August 31, 2016 | |
INCREASE (DECREASE) IN NET ASSETS FROM OPERATIONS: | | | | | | | | | | | | |
| Net investment income | | $ | 5,825,420 | | | $ | 8,016,477 | | | $ | 9,845,065 | | | $ | 7,120,088 | |
| Net realized loss on investments and foreign currency transactions | | | (119,481,205 | ) | | | (113,588,689 | ) | | | (7,735,767 | ) | | | (769,530 | ) |
| Net change in unrealized appreciation (depreciation) on investments | | | | | | | | | | | | | | | | |
| and foreign currencies | | | 140,389,181 | | | | 17,978,639 | | | | 58,531,503 | | | | 46,408,846 | |
| Net increase (decrease) in net assets resulting from operations | | | 26,733,396 | | | | (87,593,573 | ) | | | 60,640,801 | | | | 52,759,404 | |
DISTRIBUTIONS TO SHAREHOLDERS FROM: | | | | | | | | | | | | | | | | |
| Net investment income | | | (8,422,471 | ) | | | (4,984,353 | ) | | | (7,164,324 | ) | | | (5,868,264 | ) |
SHAREHOLDER TRANSACTIONS: | | | | | | | | | | | | | | | | |
| Proceeds from shares purchased | | | 160,809,968 | | | | 139,579,996 | | | | 126,926,729 | | | | 45,042,866 | |
| Cost of shares redeemed | | | (49,867,230 | ) | | | (82,793,098 | ) | | | (2,394,469 | ) | | | (6,399,035 | ) |
| Net increase in net assets resulting from shareholder transactions | | | 110,942,738 | | | | 56,786,898 | | | | 124,532,260 | | | | 38,643,831 | |
| Net increase (decrease) in net assets | | | 129,253,663 | | | | (35,791,028 | ) | | | 178,008,737 | | | | 85,534,971 | |
NET ASSETS: | | | | | | | | | | | | | | | | |
| Beginning of period | | | 230,754,225 | | | | 266,545,253 | | | | 432,244,157 | | | | 346,709,186 | |
| End of period | | $ | 360,007,888 | | | $ | 230,754,225 | | | $ | 610,252,894 | | | $ | 432,244,157 | |
| Undistributed net investment income at end of period | | $ | 1,929,227 | | | $ | 5,669,490 | | | $ | 8,831,330 | | | $ | 6,123,003 | |
CHANGES IN SHARES OUTSTANDING: | | | | | | | | | | | | | | | | |
| Shares sold | | | 8,320,000 | | | | 5,120,000 | | | | 4,080,000 | | | | 1,520,000 | |
| Shares redeemed | | | (2,720,000 | ) | | | (3,040,000 | ) | | | (80,000 | ) | | | (240,000 | ) |
| Net increase in shares | | | 5,600,000 | | | | 2,080,000 | | | | 4,000,000 | | | | 1,280,000 | |
| | |
See notes to financial statements. | |
| 62 l CLAYMORE EXCHANGE-TRADED FUND TRUST 2 ANNUAL REPORT | |
| | |
STATEMENTS OF CHANGES IN NET ASSETS continued | August 31, 2017 |
| | | | | | | | | | | | | |
| | | Guggenheim S&P High Income Infrastructure ETF (GHII) | | | Guggenheim Total Return Bond ETF (GTO) | |
| | | Year Ended August 31, 2017 | | | Year Ended August 31, 2016 | | | Year Ended August 31, 2017 | | | Period from February 10, 2016a to August 31, 2016 | |
INCREASE (DECREASE) IN NET ASSETS FROM OPERATIONS: | | | | | | | | | | | | |
| Net investment income | | $ | 1,574,243 | | | $ | 150,376 | | | $ | 939,041 | | | $ | 281,496 | |
| Net realized gain (loss) on investments and foreign currency transactions | | | 1,627,979 | | | | 313,826 | | | | (110,640 | ) | | | 172,679 | |
| Net change in unrealized appreciation (depreciation) on investments | | | | | | | | | | | | | | | | |
| and foreign currencies | | | 957,603 | | | | 288,879 | | | | 295,416 | | | | 745,969 | |
| Net increase in net assets resulting from operations | | | 4,159,825 | | | | 753,081 | | | | 1,123,817 | | | | 1,200,144 | |
DISTRIBUTIONS TO SHAREHOLDERS FROM: | | | | | | | | | | | | | | | | |
| Net investment income | | | (1,197,010 | ) | | | (136,030 | ) | | | (825,480 | ) | | | (220,025 | ) |
| Capital gains | | | (8,160 | ) | | | — | | | | (199,875 | ) | | | — | |
| Total distributions to shareholders | | | (1,205,170 | ) | | | (136,030 | ) | | | (1,025,355 | ) | | | (220,025 | ) |
SHAREHOLDER TRANSACTIONS: | | | | | | | | | | | | | | | | |
| Proceeds from shares purchased | | | 38,347,143 | | | | 3,586,109 | | | | 78,345,394 | | | | 22,624,859 | |
| Cost of shares redeemed | | | (9,836,192 | ) | | | (2,548,058 | ) | | | (17,919,736 | ) | | | (2,590,953 | ) |
| Net increase in net assets resulting from shareholder transactions | | | 28,510,951 | | | | 1,038,051 | | | | 60,425,658 | | | | 20,033,906 | |
| Net increase in net assets | | | 31,465,606 | | | | 1,655,102 | | | | 60,524,120 | | | | 21,014,025 | |
NET ASSETS: | | | | | | | | | | | | | | | | |
| Beginning of period | | | 3,942,526 | | | | 2,287,424 | | | | 21,014,025 | | | | — | |
| End of period | | $ | 35,408,132 | | | $ | 3,942,526 | | | $ | 81,538,145 | | | $ | 21,014,025 | |
| Undistributed net investment income at end of period | | $ | 405,325 | | | $ | 37,222 | | | $ | 132,140 | | | $ | 72,694 | |
CHANGES IN SHARES OUTSTANDING: | | | | | | | | | | | | | | | | |
| Shares sold | | | 1,450,000 | | | | 150,000 | | | | 1,500,000 | | | | 450,000 | |
| Shares redeemed | | | (350,000 | ) | | | (100,000 | ) | | | (350,000 | ) | | | (50,000 | ) |
| Net increase in shares | | | 1,100,000 | | | | 50,000 | | | | 1,150,000 | | | | 400,000 | |
a Commencement of operations | | | | | | | | | | | | | | | | |
| | |
See notes to financial statements. | |
| | CLAYMORE EXCHANGE-TRADED FUND TRUST 2 ANNUAL REPORT l 63 |
| | |
STATEMENTS OF CHANGES IN NET ASSETS continued | August 31, 2017 |
| | | | | | | |
| | | Guggenheim U.S. Large Cap Optimized Volatility ETF (OVLC) | |
| | | Year Ended August 31, 2017 | | | Period from May 10, 2016a to August 31, 2016 | |
INCREASE (DECREASE) IN NET ASSETS FROM OPERATIONS: | | | | | | |
| Net investment income | | $ | 51,209 | | | $ | 18,240 | |
| Net realized gain (loss) on investments and foreign currency transactions | | | 267,602 | | | | (3,948 | ) |
| Net change in unrealized appreciation (depreciation) on investments and foreign currencies | | | (84,063 | ) | | | 71,792 | |
| Net increase in net assets resulting from operations | | | 234,748 | | | | 86,084 | |
DISTRIBUTIONS TO SHAREHOLDERS FROM: | | | | | | | | |
| Net investment income | | | (38,865 | ) | | | — | |
SHAREHOLDER TRANSACTIONS: | | | | | | | | |
| Proceeds from shares purchased | | | 5,452,109 | | | | 3,793,999 | |
| Cost of shares redeemed | | | (6,834,627 | ) | | | (1,259,717 | ) |
| Net increase (decrease) in net assets resulting from shareholder transactions | | | (1,382,518 | ) | | | 2,534,282 | |
| Net increase (decrease) in net assets | | | (1,186,635 | ) | | | 2,620,366 | |
NET ASSETS: | | | | | | | | |
| Beginning of period | | | 2,620,366 | | | | — | |
| End of period | | $ | 1,433,731 | | | $ | 2,620,366 | |
| Undistributed net investment income at end of period | | $ | 29,188 | | | $ | 17,541 | |
CHANGES IN SHARES OUTSTANDING: | | | | | | | | |
| Shares sold | | | 200,000 | | | | 150,000 | |
| Shares redeemed | | | (250,000 | ) | | | (50,000 | ) |
| Net increase (decrease) in shares | | | (50,000 | ) | | | 100,000 | |
a Commencement of operations | | | | | | | | |
| |
See notes to financial statements. |
64 l CLAYMORE EXCHANGE-TRADED FUND TRUST 2 ANNUAL REPORT |
| | |
FINANCIAL HIGHLIGHTS | August 31, 2017 |
YAO Guggenheim China All-Cap ETF
This table is presented to show selected data for a share outstanding throughout each period and to assist shareholders in evaluating an ETF’s performance for the periods presented.
| | | | | | | | | | | | | | | | |
| | | Year Ended | | | Year Ended | | | Year Ended | | | Year Ended | | | Year Ended | |
| | | August 31, | | | August 31, | | | August 31, | | | August 31, | | | August 31, | |
| | | 2017 | | | 2016 | | | 2015 | | | 2014 | | | 2013 | |
Per Share Data: | | | | | | | | | | | | | | | |
| Net asset value, beginning of period | | $ | 26.19 | | | $ | 24.42 | | | $ | 28.56 | | | $ | 24.63 | | | $ | 21.66 | |
| Income from investment operations: | | | | | | | | | | | | | | | | | | | | |
Net investment income(a) | | | 0.50 | | | | 0.52 | | | | 0.53 | | | | 0.62 | | | | 0.46 | |
| Net gain (loss) on investments (realized and unrealized) | | | 6.99 | | | | 2.12 | | | | (4.02 | ) | | | 3.80 | | | | 3.07 | |
| Total from investment operations | | | 7.49 | | | | 2.64 | | | | (3.49 | ) | | | 4.42 | | | | 3.53 | |
| Less distributions from: | | | | | | | | | | | | | | | | | | | | |
| Net investment income | | | (0.54 | ) | | | (0.87 | ) | | | (0.65 | ) | | | (0.49 | ) | | | (0.56 | ) |
| Total distributions to shareholders | | | (0.54 | ) | | | (0.87 | ) | | | (0.65 | ) | | | (0.49 | ) | | | (0.56 | ) |
| Net asset value, end of period | | $ | 33.14 | | | $ | 26.19 | | | $ | 24.42 | | | $ | 28.56 | | | $ | 24.63 | |
| Market value, end of period | | $ | 33.23 | | | $ | 26.23 | | | $ | 24.13 | | | $ | 28.52 | | | $ | 24.49 | |
Total Return(b) | | | | | | | | | | | | | | | | | | | | |
| Net asset value | | | 29.33 | % | | | 10.99 | % | | | (12.51 | %) | | | 18.05 | % | | | 16.25 | % |
Ratios/Supplemental Data: | | | | | | | | | | | | | | | | | | | | |
| Net assets, end of period (in thousands) | | $ | 26,510 | | | $ | 23,574 | | | $ | 29,308 | | | $ | 54,262 | | | $ | 46,804 | |
| Ratio to average net assets of: | | | | | | | | | | | | | | | | | | | | |
| Net investment income | | | 1.81 | % | | | 2.17 | % | | | 1.84 | % | | | 2.35 | % | | | 1.92 | % |
| Total expenses | | | 0.70 | % | | | 0.70 | % | | | 0.70 | % | | | 0.71 | % | | | 0.70 | % |
| Net expenses | | | 0.70 | % | | | 0.70 | % | | | 0.70 | % | | | 0.71 | % | | | 0.70 | % |
Portfolio turnover rate(c) | | | 10 | % | | | 26 | % | | | 17 | % | | | 12 | % | | | 16 | % |
| (a) | Based on average shares outstanding. |
| (b) | Total investment return is calculated assuming an initial investment made at the net asset value at the beginning of the period, reinvestment of all dividends and distribution at net asset value during the period, and redemption on the last day of the period. Transaction fees are not reflected in the calculation of total investment return. |
| (c) | Portfolio turnover does not include securities received or delivered from processing creations or redemptions. |
| | |
See notes to financial statements. | |
| | CLAYMORE EXCHANGE-TRADED FUND TRUST 2 ANNUAL REPORT l 65 |
| | |
FINANCIAL HIGHLIGHTS continued | August 31, 2017 |
CQQQ Guggenheim China Technology ETF
This table is presented to show selected data for a share outstanding throughout each period and to assist shareholders in evaluating an ETF’s performance for the periods presented.
| | | | | | | | | | | | | | | | |
| | | Year Ended | | | Year Ended | | | Year Ended | | | Year Ended | | | Year Ended | |
| | | August 31, | | | August 31, | | | August 31, | | | August 31, | | | August 31, | |
| | | 2017 | | | 2016 | | | 2015 | | | 2014 | | | 2013 | |
Per Share Data: | | | | | | | | | | | | | | | |
| Net asset value, beginning of period | | $ | 39.26 | | | $ | 29.55 | | | $ | 38.09 | | | $ | 29.55 | | | $ | 20.03 | |
| Income from investment operations: | | | | | | | | | | | | | | | | | | | | |
Net investment income(a) | | | 0.52 | | | | 0.32 | | | | 0.46 | | | | 0.43 | | | | 0.28 | |
| Net gain (loss) on investments (realized and unrealized) | | | 15.82 | | | | 10.03 | | | | (8.65 | ) | | | 8.39 | | | | 9.67 | |
| Total from investment operations | | | 16.34 | | | | 10.35 | | | | (8.19 | ) | | | 8.82 | | | | 9.95 | |
| Less distributions from: | | | | | | | | | | | | | | | | | | | | |
| Net investment income | | | (0.60 | ) | | | (0.64 | ) | | | (0.35 | ) | | | (0.28 | ) | | | (0.43 | ) |
| Total distributions to shareholders | | | (0.60 | ) | | | (0.64 | ) | | | (0.35 | ) | | | (0.28 | ) | | | (0.43 | ) |
| Net asset value, end of period | | $ | 55.00 | | | $ | 39.26 | | | $ | 29.55 | | | $ | 38.09 | | | $ | 29.55 | |
| Market value, end of period | | $ | 55.21 | | | $ | 39.08 | | | $ | 29.31 | | | $ | 37.88 | | | $ | 29.59 | |
Total Return(b) | | | | | | | | | | | | | | | | | | | | |
| Net asset value | | | 42.43 | % | | | 35.19 | % | | | (21.62 | %) | | | 29.89 | % | | | 50.39 | % |
Ratios/Supplemental Data: | | | | | | | | | | | | | | | | | | | | |
| Net assets, end of period (in thousands) | | $ | 209,019 | | | $ | 45,153 | | | $ | 45,804 | | | $ | 78,077 | | | $ | 22,164 | |
| Ratio to average net assets of: | | | | | | | | | | | | | | | | | | | | |
| Net investment income | | | 1.20 | % | | | 0.94 | % | | | 1.20 | % | | | 1.22 | % | | | 1.16 | % |
| Total expenses | | | 0.70 | % | | | 0.70 | % | | | 0.70 | % | | | 0.71 | % | | | 0.70 | % |
| Net expenses | | | 0.70 | % | | | 0.70 | % | | | 0.70 | % | | | 0.71 | % | | | 0.70 | % |
Portfolio turnover rate(c) | | | 10 | % | | | 48 | % | | | 32 | % | | | 39 | % | | | 26 | % |
| (a) | Based on average shares outstanding. |
| (b) | Total investment return is calculated assuming an initial investment made at the net asset value at the beginning of the period, reinvestment of all dividends and distribution at net asset value during the period, and redemption on the last day of the period. Transaction fees are not reflected in the calculation of total investment return. |
| (c) | Portfolio turnover does not include securities received or delivered from processing creations or redemptions. |
| | |
See notes to financial statements. | |
| 66 l CLAYMORE EXCHANGE-TRADED FUND TRUST 2 ANNUAL REPORT | |
| | |
FINANCIAL HIGHLIGHTS continued | August 31, 2017 |
TAN Guggenheim Solar ETF
This table is presented to show selected data for a share outstanding throughout each period and to assist shareholders in evaluating an ETF’s performance for the periods presented.
| | | | | | | | | | | | | | | | |
| | | Year Ended | | | Year Ended | | | Year Ended | | | Year Ended | | | Year Ended | |
| | | August 31, | | | August 31, | | | August 31, | | | August 31, | | | August 31, | |
| | | 2017 | | | 2016 | | | 2015 | | | 2014 | | | 2013 | |
Per Share Data: | | | | | | | | | | | | | | | |
| Net asset value, beginning of period | | $ | 20.89 | | | $ | 29.72 | | | $ | 43.58 | | | $ | 27.23 | | | $ | 16.74 | |
| Income from investment operations: | | | | | | | | | | | | | | | | | | | | |
Net investment income(a) | | | 0.49 | | | | 0.80 | | | | 0.72 | | | | 0.52 | | | | 0.56 | |
| Net gain (loss) on investments (realized and unrealized) | | | 1.07 | | | | (9.14 | ) | | | (13.94 | ) | | | 16.28 | | | | 11.35 | |
| Total from investment operations | | | 1.56 | | | | (8.34 | ) | | | (13.22 | ) | | | 16.80 | | | | 11.91 | |
| Less distributions from: | | | | | | | | | | | | | | | | | | | | |
| Net investment income | | | (0.83 | ) | | | (0.49 | ) | | | (0.64 | ) | | | (0.45 | ) | | | (1.42 | ) |
| Total distributions to shareholders | | | (0.83 | ) | | | (0.49 | ) | | | (0.64 | ) | | | (0.45 | ) | | | (1.42 | ) |
| Net asset value, end of period | | $ | 21.62 | | | $ | 20.89 | | | $ | 29.72 | | | $ | 43.58 | | | $ | 27.23 | |
| Market value, end of period | | $ | 21.70 | | | $ | 20.91 | | | $ | 29.57 | | | $ | 43.39 | | | $ | 27.16 | |
Total Return(b) | | | | | | | | | | | | | | | | | | | | |
| Net asset value | | | 8.72 | % | | | (28.59 | %) | | | (30.51 | %) | | | 62.06 | % | | | 77.60 | % |
Ratios/Supplemental Data: | | | | | | | | | | | | | | | | | | | | |
| Net assets, end of period (in thousands) | | $ | 360,008 | | | $ | 230,754 | | | $ | 266,545 | | | $ | 429,167 | | | $ | 170,150 | |
| Ratio to average net assets of: | | | | | | | | | | | | | | | | | | | | |
| Net investment income | | | 2.57 | % | | | 3.26 | % | | | 1.83 | % | | | 1.28 | % | | | 2.71 | % |
| Total expenses | | | 0.76 | % | | | 0.88 | % | | | 0.73 | % | | | 0.76 | % | | | 0.86 | % |
Net expenses(d) | | | 0.70 | % | | | 0.71 | % | | | 0.70 | % | | | 0.71 | % | | | 0.70 | % |
Portfolio turnover rate(c) | | | 57 | % | | | 53 | % | | | 51 | % | | | 47 | % | | | 68 | % |
| (a) | Based on average shares outstanding. |
| (b) | Total investment return is calculated assuming an initial investment made at the net asset value at the beginning of the period, reinvestment of all dividends and distribution at net asset value during the period, and redemption on the last day of the period. Transaction fees are not reflected in the calculation of total investment return. |
| (c) | Portfolio turnover does not include securities received or delivered from processing creations or redemptions. |
| (d) | Net expense information reflects the expense ratios after expense waivers. |
| | |
See notes to financial statements. | |
| | CLAYMORE EXCHANGE-TRADED FUND TRUST 2 ANNUAL REPORT l 67 |
| | |
FINANCIAL HIGHLIGHTS continued | August 31, 2017 |
CGW Guggenheim S&P Global Water Index ETF
This table is presented to show selected data for a share outstanding throughout each period and to assist shareholders in evaluating an ETF’s performance for the periods presented.
| | | | | | | | | | | | | | | | |
| | | Year Ended | | | Year Ended | | | Year Ended | | | Year Ended | | | Year Ended | |
| | | August 31, | | | August 31, | | | August 31, | | | August 31, | | | August 31, | |
| | | 2017 | | | 2016 | | | 2015 | | | 2014 | | | 2013 | |
Per Share Data: | | | | | | | | | | | | | | | |
| Net asset value, beginning of period | | $ | 30.27 | | | $ | 26.67 | | | $ | 29.02 | | | $ | 23.90 | | | $ | 21.05 | |
| Income from investment operations: | | | | | | | | | | | | | | | | | | | | |
Net investment income(a) | | | 0.61 | | | | 0.54 | | | | 0.48 | | | | 0.51 | | | | 0.49 | |
| Net gain (loss) on investments (realized and unrealized) | | | 2.97 | | | | 3.51 | | | | (2.33 | ) | | | 5.03 | | | | 2.81 | |
| Total from investment operations | | | 3.58 | | | | 4.05 | | | | (1.85 | ) | | | 5.54 | | | | 3.30 | |
| Less distributions from: | | | | | | | | | | | | | | | | | | | | |
| Net investment income | | | (0.47 | ) | | | (0.45 | ) | | | (0.50 | ) | | | (0.42 | ) | | | (0.45 | ) |
| Total distributions to shareholders | | | (0.47 | ) | | | (0.45 | ) | | | (0.50 | ) | | | (0.42 | ) | | | (0.45 | ) |
| Net asset value, end of period | | $ | 33.38 | | | $ | 30.27 | | | $ | 26.67 | | | $ | 29.02 | | | $ | 23.90 | |
| Market value, end of period | | $ | 33.46 | | | $ | 30.32 | | | $ | 26.64 | | | $ | 29.08 | | | $ | 23.88 | |
Total Return(b) | | | | | | | | | | | | | | | | | | | | |
| Net asset value | | | 12.09 | % | | | 15.40 | % | | | (6.47 | %) | | | 23.27 | % | | | 15.85 | % |
Ratios/Supplemental Data: | | | | | | | | | | | | | | | | | | | | |
| Net assets, end of period (in thousands) | | $ | 610,253 | | | $ | 432,244 | | | $ | 346,709 | | | $ | 367,914 | | | $ | 253,369 | |
| Ratio to average net assets of: | | | | | | | | | | | | | | | | | | | | |
| Net investment income | | | 1.98 | % | | | 1.93 | % | | | 1.69 | % | | | 1.83 | % | | | 2.13 | % |
| Total expenses | | | 0.63 | % | | | 0.64 | % | | | 0.64 | % | | | 0.65 | % | | | 0.71 | % |
Net expenses(d) | | | 0.63 | % | | | 0.64 | % | | | 0.64 | % | | | 0.65 | % | | | 0.70 | % |
Portfolio turnover rate(c) | | | 8 | % | | | 6 | % | | | 9 | % | | | 7 | % | | | 21 | % |
| (a) | Based on average shares outstanding. |
| (b) | Total investment return is calculated assuming an initial investment made at the net asset value at the beginning of the period, reinvestment of all dividends and distribution at net asset value during the period, and redemption on the last day of the period. Transaction fees are not reflected in the calculation of total investment return. |
| (c) | Portfolio turnover does not include securities received or delivered from processing creations or redemptions. |
| (d) | Net expense information reflects the expense ratios after expense waivers. |
| | |
See notes to financial statements. | |
| 68 l CLAYMORE EXCHANGE-TRADED FUND TRUST 2 ANNUAL REPORT | |
| | |
FINANCIAL HIGHLIGHTS continued | August 31, 2017 |
GHII Guggenheim S&P High Income Infrastructure ETF
This table is presented to show selected data for a share outstanding throughout each period and to assist shareholders in evaluating an ETF’s performance for the periods presented.
| | | | | | | | | | |
| | | Year Ended | | | Year Ended | | | Period Ended | |
| | | August 31, 2017 | | | August 31, 2016 | | | August 31, 2015(a) | |
Per Share Data: | | | | | | | | | |
| Net asset value, beginning of period | | $ | 26.28 | | | $ | 22.87 | | | $ | 25.05 | |
| Income from investment operations: | | | | | | | | | | | | |
Net investment income(b) | | | 1.76 | | | | 1.34 | | | | 0.71 | |
| Net gain (loss) on investments (realized and unrealized) | | | 1.57 | | | | 3.34 | | | | (2.45 | ) |
| Total from investment operations | | | 3.33 | | | | 4.68 | | | | (1.74 | ) |
| Less distributions from: | | | | | | | | | | | | |
| Net investment income | | | (1.27 | ) | | | (1.27 | ) | | | (0.44 | ) |
| Capital gains | | | (0.01 | ) | | | — | | | | — | |
| Total distributions to shareholders | | | (1.28 | ) | | | (1.27 | ) | | | (0.44 | ) |
| Net asset value, end of period | | $ | 28.33 | | | $ | 26.28 | | | $ | 22.87 | |
| Market value, end of period | | $ | 28.35 | | | $ | 26.48 | | | $ | 22.56 | |
Total Return(c) | | | | | | | | | | | | |
| Net asset value | | | 12.98 | % | | | 21.35 | % | | | -7.02 | % |
Ratios/Supplemental Data: | | | | | | | | | | | | |
| Net assets, end of period (in thousands) | | $ | 35,408 | | | $ | 3,943 | | | $ | 2,287 | |
| Ratio to average net assets of: | | | | | | | | | | | | |
| Net investment income | | | 6.46 | % | | | 5.82 | % | | | 5.13 | % |
| Total expenses | | | 0.45 | % | | | 0.45 | % | | | 0.45 | % |
| Net expenses | | | 0.45 | % | | | 0.45 | % | | | 0.45 | % |
Portfolio turnover rate(d) | | | 66 | % | | | 61 | % | | | 13 | % |
| (a) | Since commencement of operations: February 11, 2015. Percentage amounts for the period, except total return and portfolio turnover rate, have been annualized. |
| (b) | Based on average shares outstanding. |
| (c) | Total investment return is calculated assuming an initial investment made at the net asset value at the beginning of the period, reinvestment of all dividends and distribution at net asset value during the period, and redemption on the last day of the period. Transaction fees are not reflected in the calculation of total investment return. |
| (d) | Portfolio turnover does not include securities received or delivered from processing creations or redemptions. |
| | |
See notes to financial statements. | |
| | CLAYMORE EXCHANGE-TRADED FUND TRUST 2 ANNUAL REPORT l 69 |
| | |
FINANCIAL HIGHLIGHTS continued | August 31, 2017 |
GTO Guggenheim Total Return Bond ETF
This table is presented to show selected data for a share outstanding throughout each period and to assist shareholders in evaluating an ETF’s performance for the periods presented.
| | | | | | | |
| | | Year Ended | | | Period Ended | |
| | | August 31, 2017 | | | August 31, 2016(a) | |
Per Share Data: | | | | | | |
| Net asset value, beginning of period | | $ | 52.54 | | | $ | 49.97 | |
| Income from investment operations: | | | | | | | | |
Net investment income(b) | | | 1.47 | | | | 0.72 | |
| Net gain on investments (realized and unrealized) | | | 0.29 | | | | 2.42 | |
| Total from investment operations | | | 1.76 | | | | 3.14 | |
| Less distributions from: | | | | | | | | |
| Net investment income | | | (1.38 | ) | | | (0.57 | ) |
| Capital gains | | | (0.31 | ) | | | — | |
| Total distributions to shareholders | | | (1.69 | ) | | | (0.57 | ) |
| Net asset value, end of period | | $ | 52.61 | | | $ | 52.54 | |
| Market value, end of period | | $ | 52.67 | | | $ | 52.60 | |
Total Return(c) | | | | | | | | |
| Net asset value | | | 3.47 | % | | | 6.29 | % |
Ratios/Supplemental Data: | | | | | | | | |
| Net assets, end of period (in thousands) | | $ | 81,538 | | | $ | 21,014 | |
| Ratio to average net assets of: | | | | | | | | |
| Net investment income | | | 2.87 | % | | | 2.56 | % |
| Total expenses | | | 0.51 | % | | | 0.50 | % |
| Net expenses | | | 0.49 | % | | | 0.49 | % |
Portfolio turnover rate(d) | | | 171 | % | | | 131 | % |
| (a) | Since commencement of operations: February 10, 2016. Percentage amounts for the period, except total return and portfolio turnover rate, have been annualized. |
| (b) | Based on average shares outstanding. |
| (c) | Total investment return is calculated assuming an initial investment made at the net asset value at the beginning of the period, reinvestment of all dividends and distribution at net asset value during the period, and redemption on the last day of the period. Transaction fees are not reflected in the calculation of total investment return. |
| (d) | Portfolio turnover does not include securities received or delivered from processing creations or redemptions. |
| | |
See notes to financial statements. | |
| 70 l CLAYMORE EXCHANGE-TRADED FUND TRUST 2 ANNUAL REPORT | |
| | |
FINANCIAL HIGHLIGHTS continued | August 31, 2017 |
OVLC Guggenheim U.S. Large Cap Optimized Volatility ETF
This table is presented to show selected data for a share outstanding throughout each period and to assist shareholders in evaluating an ETF’s performance for the periods presented.
| | | | | | | |
| | | Year Ended | | | Period Ended | |
| | | August 31, 2017 | | | August 31, 2016(a) | |
Per Share Data: | | | | | | |
| Net asset value, beginning of period | | $ | 26.20 | | | $ | 25.14 | |
| Income from investment operations: | | | | | | | | |
Net investment income(b) | | | 0.54 | | | | 0.18 | |
| Net gain on investments (realized and unrealized) | | | 2.19 | | | | 0.88 | |
| Total from investment operations | | | 2.73 | | | | 1.06 | |
| Less distributions from: | | | | | | | | |
| Net investment income | | | (0.26 | ) | | | — | |
| Total distributions to shareholders | | | (0.26 | ) | | | — | |
| Net asset value, end of period | | $ | 28.67 | | | $ | 26.20 | |
| Market value, end of period | | $ | 28.29 | | | $ | 26.14 | |
Total Return(c) | | | | | | | | |
| Net asset value | | | 10.50 | % | | | 4.22 | % |
Ratios/Supplemental Data: | | | | | | | | |
| Net assets, end of period (in thousands) | | $ | 1,434 | | | $ | 2,620 | |
| Ratio to average net assets of: | | | | | | | | |
| Net investment income | | | 2.02 | % | | | 2.25 | % |
| Total expenses | | | 0.30 | % | | | 0.30 | % |
| Net expenses | | | 0.30 | % | | | 0.30 | % |
Portfolio turnover rate(d) | | | 104 | % | | | 21 | % |
| (a) | Since commencement of operations: May 10, 2016. Percentage amounts for the period, except total return and portfolio turnover rate, have been annualized. |
| (b) | Based on average shares outstanding. |
| (c) | Total investment return is calculated assuming an initial investment made at the net asset value at the beginning of the period, reinvestment of all dividends and distribution at net asset value during the period, and redemption on the last day of the period. Transaction fees are not reflected in the calculation of total investment return. |
| (d) | Portfolio turnover does not include securities received or delivered from processing creations or redemptions. |
| | |
See notes to financial statements. | |
| | CLAYMORE EXCHANGE-TRADED FUND TRUST 2 ANNUAL REPORT l 71 |
| | |
NOTES TO FINANCIAL STATEMENTS | August 31, 2017 |
Note 1 – Organization and Significant Accounting Policies
Organization
Claymore Exchange-Traded Fund Trust 2 (the “Trust”), which is registered under the Investment Company Act of 1940, as amended (the “1940 Act”), is an open-end, management investment company that was organized as a Delaware statutory trust on June 8, 2006.
The following seven portfolios have an annual reporting year ended on August 31, 2017:
Guggenheim China All-Cap ETF
Guggenheim China Technology ETF
Guggenheim Solar ETF
Guggenheim S&P Global Water Index ETF
Guggenheim S&P High Income Infrastructure ETF
Guggenheim Total Return Bond ETF
Guggenheim U.S. Large Cap Optimized Volatility ETF
Each portfolio represents a separate series of the Trust (each a “Fund” or collectively the “Funds”). Each Fund’s shares are listed and traded on the NYSE Arca, Inc. (“NYSE Arca”). The Funds’ market prices may differ to some degree from the net asset value (“NAV”) of the shares of each Fund. Unlike conventional mutual funds, each Fund issues and redeems shares on a continuous basis, at NAV, only in a large specified number of shares; each called a “Creation Unit.” Creation Units are issued and redeemed principally in-kind for securities included in the relevant index. Except when aggregated in Creation Units, shares are not individually redeemable securities of the Funds. The investment objective of each of the Funds is to correspond generally to the performance, before fees and expenses, of the following market indices:
| | |
Fund | Index |
| Guggenheim China All-Cap ETF | AlphaShares China All-Cap Index |
| Guggenheim China Technology ETF | AlphaShares China Technology Index |
| Guggenheim Solar ETF | MAC Global Solar Energy Index |
| Guggenheim S&P Global Water Index ETF | S&P Global Water Index |
| Guggenheim S&P High Income Infrastructure ETF | S&P High Income Infrastructure Index |
| Guggenheim U.S. Large Cap | Guggenheim U.S. Large Cap |
| Optimized Volatility ETF | Optimized Volatility Index |
Guggenheim Total Return Bond ETF is an actively managed ETF and therefore does not track an index.
Guggenheim Funds Investment Advisors, LLC and Guggenheim Partners Investment Management, LLC (for Guggenheim Total Return Bond ETF) (“GFIA”, “GPIM” or the “Investment Advisers”) provide advisory services. Guggenheim Funds Distributors, LLC (“GFD” or the “Distributor”) acts as principal underwriter for the Trust. The Investment Advisers and GFD are affiliated entities.
Significant Accounting Policies
The Funds operate as investment companies and, accordingly, follow the investment company accounting and reporting guidance of the Financial Accounting Standards Board (“FASB”) Accounting Standards Codification Topic 946 Financial Services – Investment Companies.
The following significant accounting policies are in conformity with U.S. generally accepted accounting principles (“U.S. GAAP”) and are consistently followed by the Trust. This requires management to make estimates and assumptions that affect the reported amount of assets and liabilities, contingent assets and liabilities at the date of the financial statements, and the reported amounts of revenues and expenses during the reporting period. Actual results could differ from these estimates. All time references are based on Eastern Time.
The NAV of a fund is calculated by dividing the market value of the fund’s securities and other assets, less all liabilities, by the number of outstanding shares of the fund.
(a) Valuation of Investments
The Board of Trustees of the Funds (the “Board”) has adopted policies and procedures for the valuation of the Funds’ investments (the “Valuation Procedures”). Pursuant to the Valuation Procedures, the Board has delegated to a valuation committee, consisting of representatives from Guggenheim’s investment management, fund administration, legal and compliance departments (the “Valuation Committee”), the day-to-day responsibility for implementing the Valuation Procedures, including, under most circumstances, the responsibility for determining the fair value of the Funds’ securities and/or other assets.
Valuations of the Funds’ securities are supplied primarily by pricing services appointed pursuant to the processes set forth in the Valuation Procedures. The Valuation Committee convenes monthly, or more frequently as needed, to review the valuation of all assets which have been fair valued for reasonableness. The Funds’ officers, through the Valuation Committee and consistent with the monitoring and review responsibilities set forth in the Valuation Procedures, regularly review procedures used and valuations provided by the pricing services.
If the pricing service cannot or does not provide a valuation for a particular investment or such valuation is deemed unreliable, such investment is fair valued by the Valuation Committee.
Equity securities listed on an exchange (New York Stock Exchange (“NYSE”) or American Stock Exchange) are valued at the last quoted sale price as of the close of business on the NYSE, usually 4:00 p.m. on the valuation date. Equity securities listed on the NASDAQ market system are valued at the NASDAQ Official Closing Price on the valuation date, which may not necessarily represent the last sale price. If there has been no sale on such exchange or NASDAQ on a given day, the security is valued at the closing bid price on that day.
Open-end investment companies (“mutual funds”) are valued at their NAV as of the close of business, on the valuation date. Exchange-traded funds (“ETFs”) and closed-end investment companies (“CEFs”) are valued at the last quoted sale price.
U.S. Government securities are valued by either independent pricing services, the last traded fill price, or at the reported bid price at the close of business.
| 72 l CLAYMORE EXCHANGE-TRADED FUND TRUST 2 ANNUAL REPORT |
| | |
NOTES TO FINANCIAL STATEMENTS continued | August 31, 2017 |
Certain U.S. Government and Agency Obligations are traded on a discount basis; the interest rates shown on the Schedules of Investments reflect the effective rates paid at the time of purchase by the Funds. Other securities bear interest at the rates shown, payable at fixed dates through maturity.
Debt securities with a maturity of greater than 60 days at acquisition are valued at prices that reflect broker-dealer supplied valuations or are obtained from independent pricing services, which may consider the trade activity, treasury spreads, yields or price of bonds of comparable quality, coupon, maturity, and type, as well as prices quoted by dealers who make markets in such securities. Short-term debt securities with a maturity of 60 days or less at acquisition are valued at amortized cost, provided such amount approximates market value. Money market funds are valued at net asset value.
Repurchase agreements are valued at amortized cost, provided such amounts approximate market value.
Typically, loans are valued using information provided by an independent third party pricing service which uses broker quotes. If the pricing service cannot or does not provide a valuation for a particular investment or such valuation is deemed unreliable, such investment is fair valued by the Valuation Committee.
Listed options are valued at the Official Settlement Price listed by the exchange, usually as of 4:00 p.m. Long options are valued using the bid price and short options are valued using the ask price. In the event that a settlement price is not available, fair valuation is enacted. Over-the-counter (“OTC”) options are valued using the average bid price (for long options) or average ask price (for short options) obtained from one or more security dealers.
The value of interest rate swap agreements entered into by a Fund is accounted for using the unrealized gain or loss on the agreements that is determined using the spread priced off the previous day’s Chicago Mercantile Exchange (“CME”) price.
Generally, trading in foreign securities markets is substantially completed each day at various times prior to the close of the NYSE. The values of foreign securities are determined as of the close of such foreign markets or the close of the NYSE, if earlier. All investments quoted in foreign currencies are valued in U.S. dollars on the basis of the foreign currency exchange rates prevailing at the close of U.S. business at 4:00 p.m. Investments in foreign securities may involve risks not present in domestic investments. The Valuation Committee will determine the current value of such foreign securities by taking into consideration certain factors which may include those discussed above, as well as the following factors, among others: the value of the securities traded on other foreign markets, ADR trading, closed-end fund trading, foreign currency exchange activity, and the trading prices of financial products that are tied to foreign securities such as World Equity Benchmark Securities. In addition, under the Valuation Procedures, the Valuation Committee and the Investment Advisers are authorized to use prices and other information supplied by a third party pricing vendor in valuing foreign securities.
Investments for which market quotations are not readily available are fair-valued as determined in good faith by the Investment Adviser, subject to review by the Valuation Committee, pursuant to methods established or ratified by the Board. Valuations in accordance with these methods are intended to reflect each security’s (or asset’s) “fair value”. Each such determination is based on a consideration of all relevant factors, which are likely to vary from one pricing context to another. Examples of such factors may include, but are not limited to market prices; sale prices; broker quotes; and models which derive prices based on inputs such as prices of securities with comparable maturities and characteristics, or based on inputs such as anticipated cash flows or collateral, spread over Treasuries, and other information analysis.
In connection with futures contracts and other derivative investments, such factors may include obtaining information as to how (a) these contracts and other derivative investments trade in the futures or other derivative markets, respectively, and (b) the securities underlying these contracts and other derivative investments trade in the cash market.
(b) Repurchase Agreements
The Funds may enter into repurchase agreements with financial institutions. In a repurchase agreement, a Fund buys a security and the seller simultaneously agrees to repurchase the security on a specified future date at an agreed-upon price. The repurchase price reflects an agreed-upon interest rate during the time the Fund’s money is invested in the security. Because the security constitutes collateral for the repurchase obligation, a repurchase agreement can be considered a collateralized loan. The Funds follow certain procedures designed to minimize the risks inherent in such agreements. These procedures include effecting repurchase transactions only with large, well capitalized and well-established financial institutions whose condition will be continually monitored by GFIA. In addition, the value of the collateral underlying the repurchase agreement will always be at least equal to the repurchase price, including any accrued interest earned on the repurchase agreement. In the event of a default or bankruptcy by a selling financial institution, the Funds will seek to liquidate such collateral. However, the exercising of the Funds right to liquidate such collateral could involve certain costs or delays and, to the extent that proceeds from any sale upon a default of the obligation to repurchase were less than the repurchase price, the Funds could suffer a loss. It is the current policy of the Funds not to invest in repurchase agreements that do not mature within seven days if any such investment, together with any other illiquid assets held by the Funds, amounts to more than 15% of a Fund’s net assets. The investments of the Funds in repurchase agreements, at times, may be substantial when, in the view of the Investment Advisers, liquidity or other considerations so warrant.
(c) Senior Loans
Senior loans in which the Funds invest generally pay interest rates which are periodically adjusted by reference to a base short-term floating rate, plus a premium. These base lending rates are generally (i) the lending rate offered by one or more major European banks, such as the one-month or three-month London Inter-Bank Offered Rate (LIBOR), (ii) the prime rate offered by one or more major United States banks, or (iii) the bank’s
| CLAYMORE EXCHANGE-TRADED FUND TRUST 2 ANNUAL REPORT l 73 |
| | |
NOTES TO FINANCIAL STATEMENTS continued | August 31, 2017 |
certificate of deposit rate. Senior floating rate interests often require prepayments from excess cash flows or permit the borrower to repay at its election. The rate at which the borrower repays cannot be predicted with accuracy. As a result, the actual remaining maturity may be substantially less than the stated maturities shown. The interest rate indicated is the rate in effect at August 31, 2017.
(d) Interests in Securities
The Funds may purchase and sell interests in securities on a when-issued and delayed delivery basis, with payment and delivery scheduled for a future date. No income accrues to the Fund on such interests or securities in connection with such transactions prior to the date the Funds actually take delivery of such interests or securities. These transactions are subject to market fluctuations and are subject to the risk that the value at delivery may be more or less than the trade date purchase price. Although the Funds will generally purchase these securities with the intention of acquiring such securities, they may sell such securities before the settlement date.
(e) Options
Upon the purchase of an option, the premium paid is recorded as an investment, the value of which is marked-to-market daily. If a purchased option expires, the Fund realizes a loss in the amount of the cost of the option. When the Fund enters into a closing sale transaction, it realizes a gain or loss depending on whether the proceeds from the closing sale transaction are greater or less than the cost of the option. If the Fund exercises a put option, it realizes a gain or loss from the sale of the underlying security and the proceeds from such sale will be decreased by the premium originally paid. When the Fund exercises a call option, the cost of the security purchased by the Fund upon exercise increases by the premium originally paid.
When the Fund writes (sells) an option, an amount equal to the premium received is entered in that Fund’s accounting records as an asset and equivalent liability. The amount of the liability is subsequently marked-to-market to reflect the current value of the option written. When a written option expires, or if the Fund enters into a closing purchase transaction, it realizes a gain (or loss if the cost of a closing purchase transaction exceeds the premium received when the option was sold).
(g) Currency Translations
The accounting records of the Funds are maintained in U.S. dollars. All assets and liabilities initially expressed in foreign currencies are converted into U.S. dollars at prevailing exchange rates. Purchases and sales of investment securities, dividend and interest income, and certain expenses are translated at the rates of exchange prevailing on the respective dates of such transactions. Changes in the relationship of these foreign currencies to the U.S. dollar can significantly affect the value of the investments and earnings of the Funds. Foreign investments may also subject the Funds to foreign government exchange restrictions, expropriation, taxation, or other political, social or economic developments, all of which could affect the market and/or credit risk of the investments.
The Funds do not isolate that portion of the results of operations resulting from changes in the foreign exchange rates on investments from the fluctuations arising from changes in the market prices of securities held. Such fluctuations are included with the net realized and unrealized gain or loss on investments.
Reported net realized foreign exchange gains and losses arise from sales of foreign currencies and currency gains or losses realized between the trade and settlement dates on investment transactions. Net unrealized exchange gains and losses arise from changes in the fair values of assets and liabilities other than investments in securities at the fiscal period end, resulting from changes in exchange rates.
(h) Foreign Taxes
The Funds may be subject to foreign taxes (a portion of which may be reclaimable) on income, stock dividends, capital gains on investments or certain foreign currency transactions. All foreign taxes are recorded in accordance with the applicable foreign tax regulations and rates that exist in the foreign jurisdictions in which the Funds invest. These foreign taxes, if any, are paid by the Funds and reflected in their Statement of Operations as follows: foreign taxes withheld at source are presented as a reduction of income and foreign taxes on capital gains from sales of investments are included with the net realized gain (loss) on investments. Foreign taxes payable or deferred as of August 31, 2017, if any, are disclosed in the Funds’ Statements of Assets Liabilities.
(i) Investment Transactions and Investment Income
Security transactions are recorded on the trade date for financial reporting purposes. Realized gains and losses from securities transactions are recorded using the identified cost basis. Proceeds from lawsuits related to investment holdings are recorded as realized gains in the respective Fund. Dividend income is recorded on the ex-dividend date, net of applicable taxes withheld by foreign countries. Taxable non-cash dividends are recorded as dividend income. Interest income, including amortization of premiums and accretion of discounts, is accrued on a daily basis. Dividend income from Real Estate Investment Trusts (“REITs”) is recorded based on the income included in the distributions received from the REIT investments using published REIT classifications, including some management estimates when actual amounts are not available. Distributions received in excess of this estimated amount are recorded as a reduction of the cost of investments or reclassified to capital gains. The actual amounts of income, return of capital, and capital gains are only determined by each REIT after its fiscal year-end, and may differ from the estimated amounts.
| 74 l CLAYMORE EXCHANGE-TRADED FUND TRUST 2 ANNUAL REPORT |
| | |
NOTES TO FINANCIAL STATEMENTS continued | August 31, 2017 |
(j) Distributions
The Funds intend to pay substantially all of their net investment income to shareholders. Distribution frequency is as follows:
| | |
Fund | Frequency |
| Guggenheim China All-Cap ETF | Annual |
| Guggenheim China Technology ETF | Annual |
| Guggenheim Solar ETF | Annual |
| Guggenheim S&P Global Water Index ETF | Annual |
| Guggenheim S&P High Income Infrastructure ETF | Quarterly |
| Guggenheim Total Return Bond ETF | Monthly |
| Guggenheim U.S. Large Cap Optimized Volatility ETF | Annual |
In addition, the Funds intend to distribute any capital gains to shareholders as capital gain dividends at least annually. The amount and timing of distributions are determined in accordance with federal income tax regulations, which may differ from U.S. GAAP.
(k) Cash
The Funds may leave cash overnight in their cash account with the custodian. Periodically, a Fund may have cash due to the custodian bank as an overdraft balance. A fee is incurred on this overdraft, calculated by multiplying the overdraft by a rate based on the federal funds rate, which was 1.07% at August 31, 2017.
(l) Indemnifications
Under the Funds’ organizational documents, the Trustees and Officers are indemnified against certain liabilities arising out of the performance of their duties to the Trust. In addition, throughout the normal course of business, the Funds enter into contracts that contain a variety of representations and warranties which provide general indemnifications. The Funds’ maximum exposure under these arrangements is unknown, as this would involve future claims that may be made against the Funds and/or their affiliates that have not yet occurred. However, based on experience, the Funds expect the risk of loss to be remote.
Note 2 – Financial Instruments and Derivatives
As part of their investment strategy, the Funds utilize a variety of derivative instruments. These investments involve, to varying degrees, elements of market risk and risks in excess of the amounts recognized in the Statements of Assets and Liabilities. Valuation and accounting treatment of these instruments can be found under Significant Accounting Policies in Note 1 of these Notes to Financial Statements.
Derivatives
Derivatives are instruments whose values depend on, or are derived from, in whole or in part, the value of one or more other assets, such as securities, currencies, commodities or indices. Derivative instruments may be used to increase investment flexibility (including to maintain cash reserves while maintaining exposure to certain other assets), for risk management (hedging) purposes, to facilitate trading, to reduce transaction costs and to pursue higher investment returns. Derivative instruments may also be used to mitigate certain investment risks, such as foreign currency exchange rate risk, interest rate risk and credit risk. U.S. GAAP requires disclosures to enable investors to better understand how and why a Fund uses derivative instruments, how these derivative instruments are accounted for and their effects on the Fund’s financial position and results of operations.
The Funds may utilize derivatives for the following purposes:
Duration: the use of an instrument to manage the interest rate risk of a portfolio.
Hedge: an investment made in order to reduce the risk of adverse price movements in a security, by taking an offsetting position to protect against broad market moves.
Options Purchased and Written
A call option on a security gives the purchaser of the option the right to buy, and the writer of a call option the obligation to sell, the underlying security. The purchaser of a put option has the right to sell, and the writer of the put option the obligation to buy, the underlying security at any time during the option period. The risk associated with purchasing options is limited to the premium originally paid.
The following table represents the Funds’ use, and volume of call/put options purchased on a quarterly basis:
| | | |
| | | Average Number |
Fund | Use | of Contracts |
| Guggenheim Total Return Bond ETF | Duration, Hedge | 250 |
The risk in writing a call option is that a Fund may incur a loss if the market price of the underlying security increases and the option is exercised. The risk in writing a put option is that a Fund may incur a loss if the market price of the underlying security decreases and the option is exercised. In addition, there may be an imperfect correlation between the movement in prices of options and the underlying securities where a Fund may not be able to enter into a closing transaction because of an illiquid secondary market; or, for OTC options, a Fund may be at risk because of the counterparty’s inability to perform.
Swaps
A swap is an agreement that obligates two parties to exchange a series of cash flows at specified intervals based upon or calculated by reference to changes in specified prices or rates for a specified amount of an underlying asset. A Fund utilizing OTC swaps bears the risk of loss of the amount expected to be received under a swap agreement in the event of the default or bankruptcy of a swap agreement counterparty or if the underlying asset declines in value. Certain standardized swaps are subject to mandatory central clearing and are executed on a multi-lateral or other trade facility platform, such as a registered exchange. There is limited counterparty credit risk with respect to centrally-cleared swaps as the transaction is facilitated through a central clearinghouse, much like an exchange-traded futures contract. Upon entering into a centrally-cleared swap transaction, the Fund is required to deposit with its clearing broker an amount of cash or securities as an initial margin. Subsequent variation margin payments or receipts are made or received by the Fund, depending on fluctuations in the fair value of the reference entity.
| CLAYMORE EXCHANGE-TRADED FUND TRUST 2 ANNUAL REPORT l 75 |
| | |
NOTES TO FINANCIAL STATEMENTS continued | August 31, 2017 |
Interest rate swaps involve the exchange by the Funds with another party for their respective commitment to pay or receive a fixed or variable interest rate on a notional amount of principal. Interest rate swaps are generally centrally-cleared, but central clearing does not make interest rate swap transactions risk free. Central clearing generally reduces counterparty credit risk and increases liquidity, but central clearing does not make swap transactions risk-free.
The following table represents the Funds’ use and volume of interest rate swaps on a quarterly basis:
| | | Average Notional |
Fund | Use | Long | Short |
| Guggenheim Total Return Bond ETF | Duration, Hedge | $61,075 | $(19,531) |
Derivative Investment Holdings Categorized by Risk Exposure
The following is a summary of the location of derivative investments on the Funds’ Statements of Assets and Liabilities as of August 31, 2017:
| | | |
Derivative | | |
Investment Type | Asset Derivatives | Liability Derivatives |
| Interest Rate contracts | | Variation margin |
| | | on swap agreements |
| | Investments in unaffiliated issuers, at value | Options written, at value |
The following table sets forth the fair value of the Funds’ derivative investments categorized by primary risk exposure at August 31, 2017:
| | | | | | | | | | | | | |
| Asset Derivative Investments Value | |
| | | | | | Options | | | Options | | | | |
| | | Swap | | | Written | | | Purchased | | | Total | |
| | | Interest | | | Interest | | | Interest | | | Value at | |
| | | Rate | | | Rate | | | Rate | | | August 31, | |
Fund | | Contracts | | | Contracts | | | Contracts | | | 2017 | |
| Guggenheim Total | | | | | | | | | | | | |
| Return Bond ETF | | $ | – | | | $ | – | | | $ | 89,166 | | | $ | 89,166 | |
| Liability Derivative Investments Value | |
| | | | | | | Options | | | Options | | | | | |
| | | Swap | | | Written | | | Purchased | | | Total | |
| | | Interest | | | Interest | | | Interest | | | Value at | |
| | | Rate | | | Rate | | | Rate | | | August 31, | |
Fund | | Contracts | | | Contracts | | | Contracts | | | | 2017 | |
| Guggenheim Total | | | | | | | | | | | | | | | | |
| Return Bond ETF | | $ | 77,614 | * | | $ | 36,050 | | | $ | – | | | $ | 113,664 | |
* Includes cumulative appreciation (depreciation) of swap agreements as reported on the Schedules of Investments. Only current day’s variation margin is reported within the Statements of Assets and Liabilities.
The following is a summary of the location of derivative investments on the Funds’ Statements of Operations for the year ended August 31, 2017:
| Derivative Investment Type | Location of Gain (Loss) on Derivatives |
| Interest rate contracts | Net realized gain (loss) on options purchased Net change in unrealized appreciation (depreciation) on options purchased Net realized gain (loss) on options written Net change in unrealized appreciation (depreciation) on options written Net realized gain (loss) on swap agreements Net change in unrealized appreciation (depreciation) on swap agreements |
The following is a summary of the Funds’ realized gain (loss) and change in unrealized appreciation (depreciation) on derivative investments recognized on the Statements of Operations categorized by primary risk exposure for the year ended August 31, 2017:
| | | | | | | | | | | | | |
| Realized Gain (Loss) on Derivative Investments | |
| Recognized on the Statements of Operations | |
| | | | | | Options | | | Options | | | | |
| | | Swaps | | | Written | | | Purchased | | | | |
| | | Interest | | | Interest | | | Interest | | | | |
| | | Rate | | | Rate | | | Rate | | | | |
Fund | | Contracts | | | Contracts | | | Contracts | | | Total | |
| Guggenheim Total | | | | | | | | | | | | |
| Return Bond ETF | | $ | 87,381 | | | $ | 19,348 | | | $ | (36,248 | ) | | $ | 70,481 | |
| Change in Unrealized Appreciation(Depreciation) on | |
| Derivative Investments Recognized on the Statements of Operations | |
| | | | | | | Options | | | Options | | | | | |
| | | Swaps | | | Written | | | Purchased | | | | | |
| | | Interest | | | Interest | | | Interest | | | | | |
| | | Rate | | | Rate | | | Rate | | | | | |
Fund | | Contracts | | | Contracts | | | Contracts | | | Total | |
| Guggenheim Total | | | | | | | | | | | | | | | | |
| Return Bond ETF | | $ | (78,501 | ) | | $ | (16,800 | ) | | $ | 17,626 | | | $ | (77,675 | ) |
In conjunction with the use of derivative instruments, the Funds are required to maintain collateral in various forms. The Funds use, where appropriate, depending on the financial instrument utilized and the broker involved, margin deposits at the broker, cash and/or securities segregated at the custodian bank, discount notes or the repurchase agreements allocated to the Funds.
The Trust has established counterparty credit guidelines and enters into transactions only with financial institutions of investment grade or better. The Trust monitors the counterparty credit risk.
Note 3 – Offsetting
In the normal course of business, the Fund enters into transactions subject to enforceable master netting arrangements or other similar arrangements. Generally, the right to offset in those agreements allows the Fund to counteract the exposure to a specific counterparty with collateral received from or delivered to that counterparty based on the terms of the arrangements. These arrangements provide for the right to liquidate upon the occurrence of an event of default, credit event upon merger or additional termination event.
| 76 l CLAYMORE EXCHANGE-TRADED FUND TRUST 2 ANNUAL REPORT |
| | |
NOTES TO FINANCIAL STATEMENTS continued | August 31, 2017 |
In order to better define their contractual rights and to secure rights that will help the Fund mitigate its counterparty risk, the Fund may enter into an International Swaps and Derivatives Association, Inc. Master Agreement (“ISDA Master Agreement”) or similar agreement with its derivative contract counterparties. An ISDA Master Agreement is a bilateral agreement between a Fund and a counterparty that governs OTC derivatives, including foreign exchange contracts, and typically contains, among other things, collateral posting terms and netting provisions in the event of a default and/or termination event. The provisions of the ISDA Master Agreement typically permit a single net payment in the event of a default (close-out netting) or similar event, including the bankruptcy or insolvency of the counterparty.
For derivatives traded under an ISDA Master Agreement, the collateral requirements are typically calculated by netting the mark-to-market amount for each transaction under such agreement and comparing that amount to the value of any collateral currently pledged by the Fund and the counterparty. For financial reporting purposes, cash collateral that has been pledged to cover obligations of the Fund and cash collateral received from the counterparty, if any, are reported separately on the Statement of Assets and Liabilities as cash at broker/receivable for variation margin, or payable for swap settlement/variation margin. Generally, the amount of collateral due from or to a counterparty must exceed a minimum transfer amount threshold (e.g., $300,000) before a transfer is required to be made. To the extent amounts due to the Fund from its counterparties are not fully collateralized, contractually or otherwise, the Fund bears the risk of loss from counterparty nonperformance. The Fund attempts to mitigate counterparty risk by only entering into agreements with counterparties believed to be of good standing and by monitoring the financial stability of those counterparties.
For financial reporting purposes, the Fund does not offset derivative assets and derivative liabilities that are subject to netting arrangements in the Statement of Assets and Liabilities.
The centrally cleared swaps and options held in the fund are not subject to netting arrangements.
The following table presents deposits held by others in connection with derivative investments as of August 31, 2017. The Fund has the right to offset these deposits against any related liabilities outstanding with each counterparty.
| | | |
Counterparty | Cash Pledged | Cash Received |
| Guggenheim Total Return Bond ETF | | |
| Bank of America Merrill Lynch | 273,929 | – |
Note 4 – Fair Value Measurement
In accordance with U.S. GAAP, fair value is defined as the price that the Funds would receive to sell an investment or pay to transfer a liability in an orderly transaction with an independent buyer in the principal market, or in the absence of a principal market, the most advantageous market for the investment or liability. U.S. GAAP establishes a three-tier fair value hierarchy based on the types of inputs used to value assets and liabilities and requires corresponding disclosure. The hierarchy and the corresponding inputs are summarized below:
Level 1 — quoted prices in active markets for identical assets or liabilities.
Level 2 — significant other observable inputs (for example quoted prices for securities that are similar based on characteristics such as interest rates, prepayment speeds, credit risk, etc.).
Level 3 — significant unobservable inputs based on the best information available under the circumstances, to the extent observable inputs are not available, which may include assumptions.
The types of inputs available depend on a variety of factors, such as the type of security and the characteristics of the markets in which it trades, if any. Fair valuation determinations that rely on fewer or no observable inputs require greater judgment. Accordingly, fair value determinations for Level 3 securities require the greatest amount of judgment.
Independent pricing services are used to value a majority of the Funds’ investments. When values are not available from a pricing service, they will be determined under the valuation policies that have been reviewed and approved by the Board. In any event, values are determined using a variety of sources and techniques, including: market prices; broker quotes; and models which derive prices based on inputs such as prices of securities with comparable maturities and characteristics or based on inputs such as anticipated cash flows or collateral spread over Treasuries, and other information and analysis.
The inputs or methodologies used for valuing securities are not necessarily an indication of the risk associated with investing in those securities. The suitability of the techniques and sources employed to determine fair valuation are regularly monitored and subject to change.
Note 5 – Federal Income Tax Information
The Funds intend to comply with the provisions of Subchapter M of the Internal Revenue Code applicable to regulated investment companies and will distribute substantially all taxable net investment income and capital gains sufficient to relieve the Funds from all, or substantially all, federal income, excise and state income taxes. Therefore, no provision for federal or state income tax is required.
Tax positions taken or expected to be taken in the course of preparing the Funds’ tax returns are evaluated to determine whether the tax positions are “more-likely-than-not” of being sustained by the applicable tax authority. Tax positions not deemed to meet the more-likely-than-not threshold would be recorded as a tax benefit or expense in the current year. Management has analyzed the Funds’ tax positions taken, or to be taken, on federal income tax returns for all open tax years, and has concluded that no provision for income tax is required in the Funds’ financial statements. The Funds’ federal tax returns are subject to examination by the Internal Revenue Service for a period of three years after they are filed.
| CLAYMORE EXCHANGE-TRADED FUND TRUST 2 ANNUAL REPORT l 77 |
| | |
NOTES TO FINANCIAL STATEMENTS continued | August 31, 2017 |
The tax character of distributions paid during the year ended August 31, 2017 was as follows:
| | | | |
| | | Ordinary | |
Fund | | Income | |
| Guggenheim China All-Cap ETF | | $ | 433,200 | |
| Guggenheim China Technology ETF | | | 773,890 | |
| Guggenheim Solar ETF | | | 8,422,471 | |
| Guggenheim S&P Global Water Index ETF | | | 7,164,324 | |
| Guggenheim S&P High Income Infrastructure ETF | | | 1,205,170 | |
| Guggenheim Total Return Bond ETF | | | 1,025,355 | |
| Guggenheim U.S. Large Cap Optimized Volatility ETF | | | 38,865 | |
The tax character of distributions paid during the year ended August 31, 2016 was as follows:
| | | | |
| | | Ordinary | |
Fund | | Income | |
| Guggenheim China All-Cap | | $ | 960,740 | |
| Guggenheim China Technology ETF | | | 921,765 | |
| Guggenheim Solar ETF | | | 4,984,353 | |
| Guggenheim S&P Global Water Index ETF | | | 5,868,264 | |
| Guggenheim S&P High Income Infrastructure ETF | | | 136,030 | |
| Guggenheim Total Return Bond ETF | | | 220,025 | |
| Guggenheim U.S. Large Cap Optimized Volatility ETF | | | — | |
Note: For federal income tax purposes, short-term capital gain distributions are treated as ordinary income distributions.
The tax components of accumulated earnings/(deficit) as of August 31, 2017 were as follows:
| | | | | | | | | | | | | | | | |
| | | Undistributed | | | Undistributed | | | Net Unrealized | | | Accumulated | | | | |
| | | Ordinary | | | Long-Term | | | Appreciation | | | Capital and | | | | |
Fund | | Income | | | Capital Gain | | | (Depreciation) | | | Other Losses | | | Total | |
| Guggenheim China All-Cap ETF | | $ | 421,866 | | | $ | — | | | $ | 3,829,029 | | | $ | (10,343,952 | ) | | $ | (6,093,057 | ) |
| Guggenheim China Technology ETF | | | 2,543,157 | | | | — | | | | 31,813,808 | | | | (16,830,897 | ) | | | 17,526,068 | |
| Guggenheim Solar ETF | | | 1,929,227 | | | | — | | | | (51,582,704 | ) | | | (471,807,463 | ) | | | (521,460,940 | ) |
| Guggenheim S&P Global Water Index ETF | | | 8,831,330 | | | | — | | | | 145,118,265 | | | | (75,071,512 | ) | | | 78,878,083 | |
| Guggenheim S&P High Income Infrastructure ETF | | | 603,080 | | | | — | | | | 588,131 | | | | — | | | | 1,191,211 | |
| Guggenheim Total Return Bond ETF | | | 158,242 | | | | 98,381 | | | | 823,763 | | | | — | | | | 1,080,386 | |
| Guggenheim U.S. Large Cap Optimized Volatility ETF | | | 29,188 | | | | — | | | | (25,178 | ) | | | (75,077 | ) | | | (71,067 | ) |
For Federal income tax purposes, capital loss carryforwards represent realized losses of the Funds that may be carried forward and applied against future capital gains. For taxable years beginning on or before December 22, 2010, such capital losses may be carried forward for a maximum of eight years. Under the RIC Modernization Act of 2010, the Funds are permitted to carry forward capital losses incurred in taxable years beginning after December 22, 2010 for an unlimited period. However, any losses incurred during those taxable years must be utilized prior to the losses incurred in pre-enactment taxable years. As a result of this ordering rule, pre-enactment capital loss carryforwards may be more likely to expire unused. Additionally, post-enactment capital losses that are carried forward will retain their character as either short-term or long-term capital losses rather than being considered all short-term as under previous law. As of August 31, 2017, capital loss carryforwards for the Funds were as follows:
| | | | | | | | | | | | | | | | | |
| | | | | | | | | | | | | | | | Total | |
| | | Expires in | | | Expires in | | | | | Unlimited | | | | | Capital Loss | |
Fund | | 2018 | | | 2019 | | | Short-Term | | | | Long-Term | | | Carryforward | |
| Guggenheim China All-Cap ETF | | $ | (29,627 | ) | | $ | (853,049 | ) | | $ | (1,432,416 | ) | | | $ | (8,028,860 | ) | | $ | (10,343,952 | ) |
| Guggenheim China Technology ETF | | | — | | | | (188,097 | ) | | | (6,756,600 | ) | | | | (9,886,200 | ) | | | (16,830,897 | ) |
| Guggenheim Solar ETF | | | (118,836,026 | ) | | | (21,764,929 | ) | | | (79,423,178 | ) | | | | (251,783,330 | ) | | | (471,807,463 | ) |
| Guggenheim S&P Global Water Index ETF | | | (38,476,281 | ) | | | (16,548,141 | ) | | | (1,410,834 | ) | | | | (18,636,256 | ) | | | (75,071,512 | ) |
| Guggenheim U.S. Large Cap Optimized Volatility ETF | | | — | | | | — | | | | (75,077 | ) | | | | — | | | | (75,077 | ) |
| 78 l CLAYMORE EXCHANGE-TRADED FUND TRUST 2 ANNUAL REPORT |
| | |
NOTES TO FINANCIAL STATEMENTS continued | August 31, 2017 |
For the year ended August 31, 2017, the following capital loss carryforward amounts expired:
| | | | |
Fund | | Amount | |
| Guggenheim Solar ETF | | $ | 6,030,482 | |
| Guggenheim S&P Global Water Index ETF | | | 31,879,617 | |
Net investment income and net realized gains (losses) may differ for financial statement and tax purposes because of temporary or permanent book/tax differences. These differences are primarily due to investments in real estate investment trusts and swaps, losses deferred due to wash sales, redemption in-kind transactions, foreign currency gains and losses, dividend reclasses, return of capital distributions received, and the “mark-to market” or disposition of certain Passive Foreign Investment Companies (PFICs). Additional differences may result from the tax treatment of the expiration of capital loss carryforward amounts, paydown gains and losses, and excise taxes paid. To the extent these differences are permanent, reclassifications are made to the appropriate capital accounts in the period that the differences arise. These reclassifications have no effect on net assets or NAV per share.
The following adjustments were made on the Statements of Assets and Liabilities as of August 31, 2017 for permanent book/tax differences:
| | | | | | | | | | |
| | | | | | Undistributed | | | Accumulated | |
| | | Paid In | | | Net Investment | | | Net Realized | |
Fund | | Capital | | | Income/(Loss) | | | Gain/(Loss) | |
| Guggenheim China All-Cap ETF | | $ | 679,655 | | | $ | 6,735 | | | $ | (686,390 | ) |
| Guggenheim China Technology ETF | | | 869,580 | | | | 162,996 | | | | (1,032,576 | ) |
| Guggenheim Solar ETF | | | (8,793,411 | ) | | | (1,143,212 | ) | | | 9,936,623 | |
| Guggenheim S&P Global Water | | | | | | | | | | | | |
| Index ETF | | | (30,905,796 | ) | | | 27,586 | | | | 30,878,210 | |
| Guggenheim S&P High Income | | | | | | | | | | | | |
| Infrastructure ETF | | | 1,740,298 | | | | (9,130 | ) | | | (1,731,168 | ) |
| Guggenheim Total Return Bond ETF | | | (1,805 | ) | | | (54,115 | ) | | | 55,920 | |
| Guggenheim U.S. Large Cap | | | | | | | | | | | | |
| Optimized Volatility ETF | | | 331,309 | | | | (697 | ) | | | (330,612 | ) |
At August 31, 2017, the cost of securities for Federal income tax purposes, the aggregate gross unrealized gain for all securities for which there was an excess of value over tax cost and the aggregate gross unrealized loss for all securities for which there was an excess of tax cost over value, were as follows:
| | | | | | | | | | | | | |
| | | | | | Tax | | | Tax | | | Net | |
| | | Tax | | | Unrealized | | | Unrealized | | | Unrealized | |
Fund | | Cost | | | Gain | | | (Loss) | | | Gain/(Loss) | |
| Guggenheim China | | | | | | | | | | | | |
| All-Cap ETF | | $ | 23,189,640 | | | $ | 6,439,070 | | | $ | (2,610,066 | ) | | $ | 3,829,004 | |
| Guggenheim China | | | | | | | | | | | | | | | | |
| Technology ETF | | | 191,826,544 | | | | 40,952,298 | | | | (9,137,384 | ) | | | 31,814,914 | |
| Guggenheim Solar ETF | | | 507,364,812 | | | | 3,881,862 | | | | (55,465,014 | ) | | | (51,583,152 | ) |
| Guggenheim S&P Global | | | | | | | | | | | | | | | | |
| Water Index ETF | | | 464,079,941 | | | | 151,291,280 | | | | (6,183,026 | ) | | | 145,108,254 | |
| Guggenheim S&P | | | | | | | | | | | | | | | | |
| High Income | | | | | | | | | | | | | | | | |
| Infrastructure ETF | | | 38,998,709 | | | | 2,286,913 | | | | (1,699,450 | ) | | | 587,463 | |
| Guggenheim Total | | | | | | | | | | | | | | | | |
| Return Bond ETF | | | 87,051,300 | | | | 1,084,149 | | | | (260,386 | ) | | | 823,763 | |
| Guggenheim U.S. Large | | | | | | | | | | | | | | | | |
| Cap Optimized | | | | | | | | | | | | | | | | |
| Volatility ETF | | | 1,461,634 | | | | 39,496 | | | | (64,674 | ) | | | (25,178 | ) |
Note 6 – Repurchase Agreements
Each of the Funds may engage in repurchase agreements. Repurchase agreements are fixed income securities in the form of agreements backed by collateral. These agreements typically involve the acquisition by the Fund of securities from the selling institution coupled with the agreement that the selling institution will repurchase the underlying securities at a specified price and at a fixed time in the future. The Fund may accept a wide variety of underlying securities as collateral for the repurchase agreements entered into by the Fund. Any such securities serving as collateral are marked-to-market daily in order to maintain full collateralization.
The use of repurchase agreements involves certain risks. For example, if the selling institution defaults on its obligation to repurchase the underlying securities at a time when the value of securities has declined, the Fund may incur a loss upon disposition of them. In the event of an insolvency or bankruptcy by the selling institution, the Fund’s right to control the collateral could be affected and result in certain costs and delays. In addition the Fund could incur a loss if the value of the underlying collateral falls below the agreed upon repurchase price.
| CLAYMORE EXCHANGE-TRADED FUND TRUST 2 ANNUAL REPORT l 79 |
| | |
NOTES TO FINANCIAL STATEMENTS continued | August 31, 2017 |
As of August 31, 2017 the repurchase agreements held in Guggenheim Total Return Bond ETF were as follows:
| | | | | | | |
| | | | Repurchase | | | |
Fund | Counterparty and Terms of Agreement | Face Value | Price | Collateral | Par Value | Fair Value |
| Guggenheim Total Return Bond ETF | Jeffries & Company, Inc. | | | Century Aluminum Co | | |
| | 2.75% - 3.00% | | | 7.50% | | |
| | due 09/18/17 - 09/28/17 | $4,050,000 | $4,059,024 | 06/01/21 | $3,061,000 | $3,126,046 |
| | | | | Puerto Rico Electric Power Authority | | |
| | | | | 6.05% | | |
| | | | | 07/01/32 | 5,600,000 | 2,800,000 |
| | | | | | $8,661,000 | $5,926,046 |
| | Bank of America | | | Banc of America Funding Corp. | | |
| | 1.72% | | | 1.23% | | |
| | due 10/6/17 | 3,300,000 | 3,305,834 | 10/03/39 | 4,231,000 | 4,125,013 |
| | Deutsche Bank Securities, Inc. | | | BHMS Mortgage Trust | | |
| | 1.82% | | | 5.23% | | |
| | due 11/27/17 | 2,606,800 | 2,619,301 | 07/05/33 | 3,200,000 | 3,200,000 |
Note 7 – Portfolio Securities Loaned
Each Fund may lend portfolio securities to certain creditworthy borrowers, including the Funds’ securities lending agent to earn additional income. The securities on loan are collateralized at all times by cash and/or high grade debt obligations in an amount at least equal to 102% of the market value of domestic securities loaned and 105% of foreign securities loaned as determined at the close of business on the preceding business day. The cash collateral received is held in a separately managed account established for each respective Fund and maintained by the lending agent exclusively for the investment of securities lending cash collateral on behalf of each Fund. The lending agent aggregates the available collateral in all the separately managed accounts to invest in short-term investments valued at amortized cost, which approximates market value. Each separately managed account is allocated a percentage of the aggregated repurchase agreement and the related collateral. Although the collateral mitigates the risk, the Funds could experience a delay in recovering its securities and a possible loss of income or value if the borrower fails to return the securities. The Funds have the right under the securities lending agreement to recover the securities from the borrower on demand. Securities lending transactions are accounted for as secured borrowings. The remaining contractual maturity of the securities lending agreement is overnight and continuous.
Each Fund separately receives compensation for lending securities from interest or dividends earned on the cash, cash equivalents, repurchase agreements, or U.S. government securities held as collateral, net of fee rebates paid to the borrower plus reasonable administrative and custody fees paid to the lending agent. Such compensation is accrued daily and payable to the Fund monthly. The dividend and interest income earned on the securities loaned is accounted for in the same manner as other dividend and interest income. The borrower pays to the Funds an amount equal to any dividends or interest received on loaned securities. These payments from the borrower are not eligible for reduced tax rates as “qualified dividend income” under the Jobs and Growth Tax Reconciliation Act of 2003. The Funds retain all or a portion of the interest received on investment of cash collateral or receives a fee from the borrower. The securities lending income earned by the Funds are disclosed on the Statements of Operations.
At August 31, 2017, the Funds participated in securities lending transactions, which are subject to enforceable netting arrangements, as follows:
| | | | | | | | | | | | | | | | | | | |
| | | Gross Amounts Not Offset in the | | | | | | | | | | |
| | | Statements of Assets and Liabilities | | | | | | Securities Lending Collateral | |
Fund | | Value of Securities Loaned | | | Collateral Receiveda | | | Net Amount | | | Cash Collateral | | | Non-Cash Collateral | | | Total Collateral | |
| Guggenheim China All-Cap ETF | | $ | 1,138,156 | | | $ | (1,138,156 | ) | | $ | – | | | $ | 607,502 | | | $ | 638,342 | | | $ | 1,245,844 | |
| Guggenheim China Technology ETF | | | 23,590,771 | | | | (23,590,771 | ) | | | – | | | | 18,642,424 | | | | 6,109,089 | | | | 24,751,513 | |
| Guggenheim Solar ETF | | | 111,021,890 | | | | (111,021,890 | ) | | | – | | | | 97,992,666 | | | | 18,809,019 | | | | 116,801,685 | |
| Guggenheim S&P Global Water Index ETF | | | 423,631 | | | | (423,631 | ) | | | – | | | | 459,668 | | | | 82,650 | | | | 542,318 | |
| Guggenheim S&P High Income Infrastructure ETF | | | 5,101,094 | | | | (5,101,094 | ) | | | – | | | | 4,620,984 | | | | 668,925 | | | | 5,289,909 | |
| Guggenheim Total Return Bond ETF | | | 5,032 | | | | (5,032 | ) | | | – | | | | 5,150 | | | | — | | | | 5,150 | |
| Guggenheim U.S. Large Cap Optimized Volatility ETF | | | 10,598 | | | | (10,598 | ) | | | – | | | | 10,930 | | | | — | | | | 10,930 | |
a Actual collateral received by the Funds are greater than the amount shown due to over collateralization. |
In the event of counterparty default, the Funds have the right to collect the collateral to offset losses incurred. There is potential loss to the Funds in the event the Funds are delayed or prevented from exercising their rights to dispose of the collateral securities, including the risk of a possible decline in the value of the underlying securities during the period while the Funds seek to assert their rights. GI, acting under the supervision of the Board, reviews the value of the collateral and the creditworthiness of those banks and dealers to evaluate potential risks.
| 80 l CLAYMORE EXCHANGE-TRADED FUND TRUST 2 ANNUAL REPORT |
| | |
NOTES TO FINANCIAL STATEMENTS continued | August 31, 2017 |
The following represents the aggregate collateral balances reinvested by the lending agent on behalf of the Funds with each counterparty for the repurchase agreements at August 31, 2017:
| | | | | | | | | | | | | | | |
Counterparty and Terms of Agreement | | | Face Value | | | Repurchase Price | | Collateral | | Par Value | | | Fair Value | |
RBC Dominion Securities, Inc. | | | | | | | | | | | | | | |
| 0.90% - 1.05% | | | | | | | Various U.S. Government obligations and | | | | | | |
Due 09/01/17 | | | $ | 28,226,979 | | | $ | 28,227,802 | | U.S. Government agency securities | | $ | 165,432,601 | | | $ | 28,791,520 | |
Daiwa Capital Markets America | | | | | | | | | | | | | | | | | | |
| 1.10% - 1.20% | | | | | | | | | Various U.S. Government obligations and | | | | | | | | |
Due 09/01/17 | | | | 28,726,979 | | | | 28,727,858 | | U.S. Government agency securities | | | 60,086,676 | | | | 29,301,519 | |
Merrill Lynch, Pierce, Fenner & Smith, Inc. | | | | | | | | | | | | | | | | | | |
| 0.95% - 1.20% | | | | | | | | | Various U.S. Government obligations and | | | | | | | | |
Due 09/01/17 | | | | 27,468,343 | | | | 27,469,166 | | U.S. Government agency securities | | | 40,713,408 | | | | 28,017,710 | |
Citibank | | | | | | | | | | | | | | | | | | |
| 1.08% | | | | | | | | | Various U.S. Government obligations and | | | | | | | | |
Due 09/01/17 | | | | 27,147,670 | | | | 27,148,484 | | U.S. Government agency securities | | | 51,909,134 | | | | 27,690,623 | |
J.P. Morgan Securities LLC | | | | | | | | | | | | | | | | | | |
| 1.06% | | | | | | | | | Various U.S. Government obligations and | | | | | | | | |
Due 09/01/17 | | | | 8,044,410 | | | | 8,044,647 | | U.S. Government agency securities | | | 8,351,999 | | | | 8,205,335 | |
Nomura Securities International, Inc. | | | | | | | | | | | | | | | | | | |
| 1.08% - 1.20% | | | | | | | | | Various U.S. Government obligations and | | | | | | | | |
Due 09/01/17 | | | | 1,079,309 | | | | 1,079,341 | | U.S. Government agency securities | | | 1,210,422 | | | | 1,100,895 | |
Citigroup Global Markets, Inc. | | | | | | | | | | | | | | | | | | |
| 1.02% - 1.13% | | | | | | | | | Various U.S. Government obligations and | | | | | | | | |
Due 09/01/17 | | | | 1,328,464 | | | | 1,328,504 | | U.S. Government agency securities | | | 3,502,564 | | | | 1,355,033 | |
HSBC Securities (USA), Inc. | | | | | | | | | | | | | | | | | | |
| 1.05% | | | | | | | | | Various U.S. Government obligations and | | | | | | | | |
Due 09/01/17 | | | | 209,668 | | | | 209,674 | | U.S. Government agency securities | | | 210,992 | | | | 213,862 | |
BNP Paribas Securities Corp. | | | | | | | | | | | | | | | | | | |
| 1.05% | | | | | | | | | Various U.S. Government obligations and | | | | | | | | |
Due 09/01/17 | | | | 107,502 | | | | 107,505 | | U.S. Government agency securities | | | 91,946 | | | | 109,652 | |
Each Fund’s exposure to each respective counterparty is identified in the schedule of investments. Under the terms of the agreement, each Fund participates in the earnings generated by each security it has exposure to on a pro rata basis.
Note 8 – Fees and Other Transactions with Affiliates
Under the terms of an investment advisory contract, the Trust pays the Investment Advisers management fees calculated at the annualized rates below, based on the average daily net assets of the Funds.
| | | |
| | | Management |
| | Investment | Fees (as a % of |
Fund | Advisor | Net Assets) |
| Guggenheim Solar ETF | GFIA | 0.50% |
| Guggenheim S&P Global Water Index ETF | GFIA | 0.50% |
Under the terms of an investment advisory contract, the Trust pays the Investment Advisers a unitary management fee for the services and facilities it provides. The unitary management fee is calculated at the annualized rates below, based on the average daily net assets of the Funds.
| | | |
| | | Unitary |
| | | Management |
| | Investment | Fees (as a % of |
Fund | Advisor | Net Assets) |
| Guggenheim China All-Cap ETF | GFIA | 0.70% |
| Guggenheim China Technology ETF | GFIA | 0.70% |
| Guggenheim S&P High Income Infrastructure ETF | GFIA | 0.45% |
| Guggenheim Total Return Bond ETF | GPIM | 0.50% |
| Guggenheim U.S. Large Optimized Volatility ETF | GFIA | 0.30% |
Out of the unitary management fee, the Investment Advisers pay substantially all the expenses of each Fund, including the cost of transfer agency, custody, fund administration, legal, audit, and other services, except for the fee payments under the Agreement, distribution fees, if any, brokerage expenses, taxes, interest, litigation expenses and other extraordinary expenses.
The Board has adopted a distribution and service plan (the “Plan”) pursuant to Rule 12b-1 under the 1940 Act. Under the Plan, each Fund is authorized to pay distribution fees in connection with the sale and distribution of its shares and pay service fees in connection with the provision of ongoing services to shareholders and the maintenance of shareholder accounts in an amount up to 0.25% of its average daily net assets each year. No 12b-1 fees are currently paid by the Funds, and there are no current plans to impose these fees. No such fee may be paid in the future without further approval by the Board.
The investment advisory contracts for the following Funds provide that the total expenses be limited to a percentage of average net assets exclusive of interest expense, a portion of the Fund’s licensing fees, offering costs, brokerage commissions and other trading expenses, taxes and
| CLAYMORE EXCHANGE-TRADED FUND TRUST 2 ANNUAL REPORT l 81 |
| | |
NOTES TO FINANCIAL STATEMENTS continued | August 31, 2017 |
extraordinary expenses such as litigation and other expenses not incurred in the ordinary course of the Fund’s business. The limits are listed below:
| | | |
| | | Contract |
Fund | Limit | End Date |
| Guggenheim Solar ETF | 0.65% | 12/31/19 |
| Guggenheim S&P Global Water Index ETF | 0.65% | 12/31/19 |
For the year ended August 31, 2017, GFIA waived management fees as follows:
| | |
Fund | Advisory Fees Waived |
| Guggenheim Solar ETF | 141,131 |
| Guggenheim S&P Global Water Index ETF | 13,768 |
The Investment Advisor has voluntarily agreed to waive the Management Fee and/or reimburse fund expenses of Guggenheim Total Return Bond ETF in an amount equal to the Fund’s management fee attributable to the Fund’s assets invested in affiliated funds. For the year ended August 31, 2017, the Investment Adviser waived $5,874 in Management Fees relating to assets invested in affiliated funds.
Amounts owed to each Fund from the Investment Advisers are shown in the Statements of Assets and Liabilities. These receivables are settled on a periodic basis.
Certain officers and trustees of the Trust may also be officers, directors and/or employees of the Investment Advisers. The Trust does not compensate its officers or trustees who are officers, directors and/or employees of the Investment Advisers.
Licensing Fee Agreements:
GFIA has entered into licensing agreements on behalf of each Fund with the following Licensors:
| | | |
Fund | | Licensor |
| Guggenheim China All-Cap ETF | | AlphaShares, LLC |
| Guggenheim China Technology ETF | | AlphaShares, LLC |
| Guggenheim Solar ETF | | MAC Indexing LLC |
| Guggenheim S&P Global Water Index ETF | | Standard & Poor’s Financial Services LLC, a division of McGraw-Hill Financial |
| Guggenheim S&P High Income Infrastructure ETF | S&P Dow Jones Index Group |
| Guggenheim U.S. Large Cap Optimized Volatility ETF | Accretive Asset Management, LLC |
The Funds are not sponsored, endorsed, sold or promoted by the Licensors and the Licensors make no representation regarding the advisability of investing in shares of the Funds. Up to 5 basis points of licensing fees may be excluded from the expense cap for certain Funds without a unitary management fee.
Accretive Asset Management, LLC is affiliated with the Investment Adviser and the Distributor.
On October 4, 2016, Rydex Fund Services, LLC (“RFS”) was purchased by MUFG Investor Services and as of that date RFS ceased to be an affiliate of the Investment Advisers. In connection with its acquisition, RFS changed its name to MUFG Investor Services (US), LLC (“MUIS”). This change had no impact on the financial statements of the Funds.
MUIS acts as the Fund’s administrator. The Bank of New York Mellon Corp. (“BNY”) acts as the Funds’ custodian, accounting agent, transfer agent and securities lending agent. As custodian, BNY is responsible for the custody of the Funds’ assets. As accounting agent, BNY is responsible for maintaining the books and records of the Funds. As transfer agent, BNY is responsible for performing transfer agency services for the Funds. As securities lending agent, BNY is responsible for executing the lending of portfolio securities to creditworthy borrowers. For providing administration, accounting and custody services, MUIS and BNY are entitled to receive a monthly fee equal to an annual percentage of the Fund’s average daily net assets subject to certain minimum monthly fees and out of pocket expenses.
In November 2016, the Bank of New York Mellon Corporation, the Funds’ custodian and accounting agent, identified inconsistencies in the way in which clients were invoiced for certain expenses during a 4-year period dating back to 2012. The issue was the result of inaccurate billing rates that were not subsequently reviewed or adjusted. The amount of the difference in what was charged and what should have been charged, plus interest, was paid back to the Funds or the Advisor in February 2017. The amounts that were reimbursed to the Funds, if any, were recognized as a change in accounting estimate and are reflected in Reimbursement of custody fees within the Statements of Operations.
Note 9 – Securities Transactions
For the year ended August 31, 2017, the cost of purchases and proceeds from sales of investment securities, excluding government securities, short-term investments and in-kind transactions, were as follows:
| | | | | | | |
| | | Purchases | | | Sales | |
| Guggenheim China All-Cap ETF | | $ | 2,193,612 | | | $ | 2,137,755 | |
| Guggenheim China Technology ETF | | | 8,269,860 | | | | 11,677,917 | |
| Guggenheim Solar ETF | | | 133,188,591 | | | | 131,668,917 | |
| Guggenheim S&P Global Water Index ETF | | | 43,477,569 | | | | 37,567,215 | |
| Guggenheim S&P High Income | | | | | | | | |
| Infrastructure ETF | | | 22,064,952 | | | | 16,019,043 | |
| Guggenheim Total Return Bond ETF | | | 59,688,370 | | | | 29,964,866 | |
| Guggenheim U.S. Large Cap Optimized | | | | | | | | |
| Volatility ETF | | | 2,590,480 | | | | 3,376,726 | |
| 82 l CLAYMORE EXCHANGE-TRADED FUND TRUST 2 ANNUAL REPORT |
| | |
NOTES TO FINANCIAL STATEMENTS continued | August 31, 2017 |
For the year ended August 31, 2017, the Funds had investments transactions in-kind associated with subscriptions and redemptions as follows:
| | | | | | �� | |
| | | Subscriptions | | | Redemptions | |
| Guggenheim China All-Cap ETF | | $ | 2,898,337 | | | $ | 5,354,514 | |
| Guggenheim China Technology ETF | | | 137,301,122 | | | | 9,063,270 | |
| Guggenheim Solar ETF | | | 155,770,104 | | | | 49,585,177 | |
| Guggenheim S&P Global Water Index ETF | | | 123,299,678 | | | | 2,329,029 | |
| Guggenheim S&P High Income | | | | | | | | |
| Infrastructure ETF | | | 30,885,993 | | | | 8,474,972 | |
| Guggenheim Total Return Bond ETF | | | — | | | | — | |
| Guggenheim U.S. Large Cap Optimized | | | | | | | | |
| Volatility ETF | | | 5,355,732 | | | | 5,908,566 | |
The Funds are permitted to purchase or sell securities from or to certain affiliated funds under specified conditions outlined in procedures adopted by the Board. The procedures have been designed to ensure that any purchase or sale of securities by a Fund from or to another fund or portfolio that is or could be considered an affiliate by virtue of having a common investment adviser (or affiliated investment advisers), common Trustees and/or common officers complies with Rule 17a-7 of the 1940 Act. Further, as defined under these procedures, each transaction is effected at the current market price to save costs, where permissible. For the year August 31, 2017, the Funds engaged in purchases and sales of securities, pursuant to Rule 17a-7 of the 1940 Act, as follows:
| | | | |
Fund | | Purchases | |
| Guggenheim Total Return Bond ETF | | $ | 424,006 | |
Note 10 – Restricted Securities
The securities below are considered illiquid and restricted under guidelines established by the Board of Trustees:
| | |
Fund | Restricted Securities | Acquisition Date | Cost | Value |
| Guggenheim Total Return Bond ETF | AMC East Communities LLC | | | |
| | 6.01% due 01/15/53 | 07/28/16 | $214,164 | $200,760 |
| | Fort Benning Family Communities LLC | | | |
| | 5.81% due 01/15/51 | 05/26/16 | 189,000 | 193,924 |
| | Fort Knox Military Housing Privatization Project | | | |
| | 1.57% due 02/15/52 | 02/08/17 | 128,306 | 145,741 |
| | HP Communities LLC | | | |
| | 5.78% due 03/15/46 | 08/23/16 | 177,807 | 166,917 |
| | HP Communities LLC | | | |
| | 5.86% due 09/15/53 | 10/06/16 | 113,756 | 110,651 |
| | | | $823,033 | $817,993 |
Note 11 – Capital
Shares are issued and redeemed by the Funds only in creation unit size aggregations of 50,000 to 100,000 shares. Transactions are permitted on an in-kind basis, with a separate cash payment, which is balancing each component to equate the transaction to the net asset value per share of the Fund on the transaction date. Transaction fees ranging from $500 to $4,000 are charged to those persons creating or redeeming creation units. An additional charge on the transaction may be imposed with respect to transactions effected outside of the clearing process or to the extent that cash is used in lieu of securities to purchase creation units or redeem for cash.
Note 12 – Line of Credit
Guggenheim Total Return Bond ETF and certain affiliated funds, secured a 364-day committed, $800,000,000 line of credit from Citibank, N.A., which was in place through October 6, 2016, at which time the line of credit was renewed. A Fund may draw (borrow) from the line of credit as a temporary measure for emergency purposes, to facilitate redemption requests, or for other short-term liquidity purposes consistent with the Fund’s investment objective and program. For example, it may be advantageous for the Fund to borrow money rather than sell existing portfolio positions to meet redemption requests. Fees related to borrowings, if any, varied under this arrangement between the greater of Citibank’s “base rate”, LIBOR plus 1%, or the federal funds rate plus ½ of 1%. The commitment fee that may be paid by the Funds was at an annualized rate of 0.15% of the average daily amount of their unused commitment amount.
On October 6, 2016, the Guggenheim Total Return Bond ETF and certain affiliated funds, renewed the line of credit from Citibank, N.A., with an increased commitment amount to $1,000,000,000. Fees related to borrowings, if any, vary under this arrangement between the greater of Citibank’s “base rate”, LIBOR plus 1%, or the federal funds rate plus ½ of 1%. Affiliated funds that participate in the line of credit paid upfront costs totaling $2,032,388 to renew the line of credit. Guggenheim Total Return Bond ETF did not pay any of the upfront costs associated with this renewal. The commitment fee that may be paid by the Funds is at an annualized rate of 0.15% of the average daily amount of their unused commitment amount. There were no commitment fees allocated to the above mentioned Fund. The allocated interest expense amount for the Fund is referenced in the Statement of Operations under “Line of credit fee”. The Fund did not have borrowings under this agreement during the year ended August 31, 2017.
| CLAYMORE EXCHANGE-TRADED FUND TRUST 2 ANNUAL REPORT l 83 |
| | |
NOTES TO FINANCIAL STATEMENTS continued | August 31, 2017 |
Note 13 – Subsequent Events
Guggenheim Investments announced on September 28, 2017, that it had entered into a definitive agreement to sell its exchange-traded funds business to Invesco Ltd. (“Invesco”), a leading global investment management company. As a result, the Investment Advisers for the Funds expect to propose to the Board that it approve a reorganization of each Fund into a newly organized exchange-traded fund advised by an affiliate of Invesco. If approved by the Board, the reorganization of each Fund would be submitted to the shareholders of the respective Fund for their approval.
The Funds evaluated subsequent events through the date the financial statements were available for issue and determined there were no additional material events that would require adjustment to or disclosure in the Funds’ financial statements.
| 84 l CLAYMORE EXCHANGE-TRADED FUND TRUST 2 ANNUAL REPORT |
| | |
REPORT OF INDEPENDENT REGISTERED PUBLIC ACCOUNTING FIRM | August 31, 2017 |
The Board of Trustees and Shareholders of Claymore Exchange-Traded Fund Trust 2
We have audited the accompanying statements of assets and liabilities, including the schedules of investments, of Guggenheim China All-Cap ETF, Guggenheim China Technology ETF, Guggenheim Solar ETF, Guggenheim S&P Global Water Index ETF, Guggenheim S&P High Income Infrastructure ETF, Guggenheim Total Return Bond ETF, and Guggenheim U.S. Large Cap Optimized Volatility ETF (seven of the series constituting the Claymore Exchange-Traded Fund Trust 2) (the “Funds”) as of August 31, 2017, and the related statements of operations, changes in net assets, and the financial highlights for the periods indicated therein. These financial statements and financial highlights are the responsibility of the Funds’ management. Our responsibility is to express an opinion on these financial statements and financial highlights based on our audits.
We conducted our audits in accordance with the standards of the Public Company Accounting Oversight Board (United States). Those standards require that we plan and perform the audit to obtain reasonable assurance about whether the financial statements and financial highlights are free of material misstatement. We were not engaged to perform an audit of the Fund’s internal control over financial reporting. Our audits included consideration of internal control over financial reporting as a basis for designing audit procedures that are appropriate in the circumstances, but not for the purpose of expressing an opinion on the effectiveness of the Funds’ internal control over financial reporting. Accordingly, we express no such opinion. An audit also includes examining, on a test basis, evidence supporting the amounts and disclosures in the financial statements and financial highlights, assessing the accounting principles used and significant estimates made by management, and evaluating the overall financial statement presentation. Our procedures included confirmation of securities owned as of August 31, 2017, by correspondence with the custodian, brokers, and agent banks or by other appropriate auditing procedures where replies from brokers or agent banks were not received. We believe that our audits provide a reasonable basis for our opinion.
In our opinion, the financial statements and financial highlights referred to above present fairly, in all material respects, the financial position of each of the above listed Funds (seven of the series constituting the Claymore Exchange-Traded Fund Trust 2) at August 31, 2017, the results of their operations, changes in their net assets, and the financial highlights for the periods indicated therein, in conformity with U.S. generally accepted accounting principles.
Tysons, Virginia
October 30, 2017
| CLAYMORE EXCHANGE-TRADED FUND TRUST 2 ANNUAL REPORT l 85 |
| | |
OTHER INFORMATION (Unaudited) | August 31, 2017 |
Federal Income Tax Information
This information is being provided as required by the Internal Revenue Code. Amounts shown may differ from those elsewhere in the report because of differences in tax and financial reporting practice.
In January 2018, shareholders will be advised on IRS Form 1099 DIV or substitute 1099 DIV as to the federal tax status of the distributions received by shareholders in the calendar year 2017.
The Funds’ investment income (dividend income plus short-term gains, if any) qualifies as follows:
Guggenheim China All-Cap ETF intends to designate $42,810 of foreign tax withholding on foreign source income of $570,633.
Guggenheim Solar ETF intends to designate $74,264 of foreign tax withholding on foreign source income of $1,473,439.
Guggenheim S&P Global Water Index ETF intends to designate $561,421 of foreign tax withholding on foreign source income of $7,650,563.
Guggenheim S&P High Income Infrastructure ETF intends to designate $110,316 of foreign tax withholding on foreign source income of $1,173,799.
Of the taxable ordinary income distributions paid during the fiscal year ended August 31, 2017, the following funds had the corresponding percentages qualify for the reduced tax rate pursuant to the Jobs and Growth Tax Relief and Reconciliation Act of 2003 or for the dividends received deduction for corporations. See the qualified dividend income and dividend received deduction columns in the table below.
Additionally, of the taxable ordinary income distributions paid during the fiscal year ended August 31, 2017, the following funds had the corresponding percentages qualify as interest related dividends and qualified short-term capital gains as permitted by IRC Section 871(k)(1) and IRC Section 871(k)(2), respectively. See qualified interest income and qualified short-term capital gain columns in the table below.
| | | | | |
| | Qualified | Dividend | Qualified | Qualified |
| | Dividend | Received | Interest | Short-Term |
Fund | Income | Deduction | Income | Capital Gain |
| Guggenheim China All-Cap ETF | 56.07% | 0.00% | 0.00% | 0.00% |
| Guggenheim China Technology ETF | 12.94% | 0.00% | 0.00% | 0.00% |
| Guggenheim Solar ETF | 12.92% | 6.57% | 0.00% | 0.00% |
| Guggenheim S&P Global Water Index ETF | 98.50% | 30.08% | 0.00% | 0.00% |
| Guggenheim S&P High Income Infrastructure ETF | 55.01% | 8.23% | 0.00% | 100.00% |
| Guggenheim Total Return Bond ETF | 4.25% | 4.47% | 54.21% | 100.00% |
| Guggenheim U.S. Large Cap Optimized Volatility ETF | 90.61% | 88.91% | 0.00% | 0.00% |
Sector Classification
Information in the “Schedule of Investments” is categorized by sectors using sector-level Classifications defined by the Bloomberg Industry Classification System, a widely recognized industry classification system provider. Each Fund’s registration statement has investment policies relating to concentration in specific sectors/industries. For purposes of these investment policies, the Funds usually classify sectors/industries based on industry-level Classifications used by widely recognized industry classification system providers such as Bloomberg Industry Classification System, Global Industry Classification Standards and Barclays Global Classification Scheme.
Quarterly Portfolio Schedules Information
The Trust files its complete schedule of portfolio holdings with the SEC for the first and third quarters of each fiscal year on Form N-Q, which are available on the SEC’s website at https://www.sec.gov. The Funds’ Forms N-Q may be reviewed and copied at the SEC’s Public Reference Room in Washington, DC, and that information on the operation of the Public Reference Room may be obtained by calling 800-SEC-0330. Copies of the portfolio holdings are also available to shareholders, without charge and upon request, by calling 800.820.0888.
Trustees
The Statement of Additional Information that includes additional information about the Trustees is also available, without charge, upon request via our website at guggenheiminvestments.com or by calling 800.820.0888.
| 86 l CLAYMORE EXCHANGE-TRADED FUND TRUST 2 ANNUAL REPORT |
| | |
INFORMATION ON BOARD OF TRUSTEES AND OFFICERS (Unaudited) continued | August 31, 2017 |
The Trustees of the Trust and their principal business occupations during the past five years:
| | | | | | |
| | | Term of | | Number of | |
| | Position(s) | Office and | | Portfolios in | |
Name, Address* | Held | Length of | Principal Occupation(s) | Fund Complex | Other Directorships |
and Year of Birth | with Trust | Time Served** | During Past Five Years | Overseen | Held by Trustee |
| Independent Trustees: | | | | |
Randall C. Barnes | Trustee | Since 2006 | Current: Private Investor (2001-present). | 96 | Current: Trustee, Purpose |
| (1951) | | | | | Investments Funds (2014-present). |
| | | Former: Senior Vice President and Treasurer, PepsiCo, Inc. (1993- 1997); President, Pizza Hut International (1991-1993); Senior Vice President, Strategic Planning and New Business Development, PepsiCo, Inc. (1987-1990). | | |
Donald A. Chubb, Jr. | Trustee and Chairman | Since 2014 | Current: Retired. | 93 | Former: Midland Care, Inc. |
| (1946 ) | of the Valuation | | | | (2011-2016). |
| | Oversight Committee | | Former: Business broker and manager of commercial real estate, Griffith & Blair, Inc. (1997-2017). | | |
Jerry B. Farley | Trustee and Chairman | Since 2014 | Current: President, Washburn University (1997-present). | 93 | Current: Westar Energy, Inc. |
| (1946) | of the Audit Committee | | | | (2004-present); CoreFirst Bank & |
| | (effective 5/24/17) | | | | Trust (2000-present). |
| | | | | | |
Roman Friedrich III | Trustee and Chairman | Since 2010 | Current: Founder and Managing Partner, Roman Friedrich & | 93 | Current: Zincore Metals, Inc. |
| (1946) | of the Contracts | | Company (1998-present). | | (2009-present). |
| | Review Committee | | | | |
| | | | Former: Senior Managing Director, MLV & Co. LLC (2010-2011). | | Former: Axiom Gold and Silver Corp. (2011-2012). |
Robert B. Karn III | Trustee | Since 2010 | Current: Consultant (1998-present). | 93 | Current: GP Natural Resource |
| (1942) | | | | | Partners, LLC (2002- present). |
| | | | Former: Arthur Andersen LLP (1965-1997) and Managing
Partner, Financial and Economic Consulting, St. Louis
office (1987-1997). | | |
| | | | | Former: Peabody Energy Company (2003-April 2017). |
Ronald A. Nyberg | Trustee and Chairman | Since 2006 | Current: Partner, Momkus McCluskey Roberts, | 98 | Current: Edward-Elmhurst |
| (1953) | of the Nominating and | | LLC (2016- present). | | Healthcare System |
| | Governance Committee | | | | (2012-present). |
| | | | Former: Partner, Nyberg & Cassioppi, LLC (2000-2016); Executive Vice President, General Counsel, and Corporate Secretary, Van Kampen Investments (1982-1999). | | |
| | | | | |
| | | | | |
Maynard F. Oliverius | Trustee | Since 2014 | Current: Retired. | 93 | Current: Robert J. Dole Institute of Politics (2016-present); Stormont- Vail Foundation (2013-present); University of Minnesota MHA Alumni Philanthropy Committee (2009-present); Fort Hays State University (1999-present). |
| (1943) | | | | |
| | | | Former: President and CEO, Stormont-Vail HealthCare (1996-2012). | |
| | | | | |
| | | | | |
| | | | | |
| | | | | |
| |
| | | | | | Former: Topeka Community Foundation (2009-2014). |
| | | | | |
Ronald E. Toupin, Jr. | Trustee and Chairman | Since 2006 | Current: Portfolio Consultant (2010-present). | 95 | Former: Bennett Group of |
| (1958) | of the Board | | | | Funds (2011-2013). |
| | | | Former: Vice President, Manager and Portfolio Manager, Nuveen Asset Management (1998-1999); Vice President, Nuveen Investment Advisory Corp. (1992-1999); Vice President and Manager, Nuveen Unit Investment Trusts (1991-1999); and Assistant Vice President and Portfolio Manager, Nuveen Unit Investment Trusts (1988-1999), each of John Nuveen & Co., Inc. (1982-1999). | | |
| CLAYMORE EXCHANGE-TRADED FUND TRUST 2 ANNUAL REPORT l 87 |
| | |
INFORMATION ON BOARD OF TRUSTEES AND OFFICERS (Unaudited) continued | August 31, 2017 |
| | | | | | |
| | | Term of | | Number of | |
| | Position(s) | Office and | | Portfolios in | |
Name, Address* | Held | Length of | Principal Occupation(s) | Fund Complex | Other Directorships |
and Year of Birth | with Trust | Time Served** | During Past Five Years | Overseen | Held by Trustee |
Interested Trustee: | | | | | |
Donald C. | President, | Since 2012 | Current: President and CEO, certain other funds in the Fund | 226 | Current: Clear Spring Life |
Cacciapaglia*** | Chief Executive | | Complex (2012-present); Vice Chairman, Guggenheim | | Insurance Company (2015- |
| (1951) | Officer and Trustee | | Investments (2010-present). | | present); Guggenheim Partners |
| | | | | | Japan, Ltd. (2014-present); |
| | | | Former: Chairman and CEO, Channel Capital Group, | | Guggenheim Partners Investment |
| | | | Inc. (2002-2010). | | Management Holdings, LLC |
| | | | | | (2014-present); Delaware Life |
| | | | | | (2013-present); Guggenheim Life |
| | | | | | and Annuity Company |
| | | | | | (2011-present); Paragon |
| | | | | | Life Insurance Company of Indiana |
| | | | | | (2011-present). |
| * | The business address of each Trustee is c/o Guggenheim Investments, 227 West Monroe Street, Chicago, IL 60606. |
| ** | Each Trustee serves an indefinite term, until his successor is elected and qualified. |
| *** | This Trustee is deemed to be an “interested person” of the Funds under the 1940 Act by reason of his position with the Funds’ Investment Adviser and/or the parent of the Investment Adviser. |
| 88 l CLAYMORE EXCHANGE-TRADED FUND TRUST 2 ANNUAL REPORT |
| | |
INFORMATION ON BOARD OF TRUSTEES AND OFFICERS (Unaudited) continued | August 31, 2017 |
Officers
The Officers of the Trust, who are not trustees, and their principal occupations during the past five years:
| | | | |
| | | Term of Office | |
Name, Address* | Position(s) held | and Length of | Principal Occupations |
and Year of Birth | with the Trust | Time Served** | During Past Five Years |
Officers: | | | |
Joanna M. Catalucci | Chief | Since 2012 | Current: Chief Compliance Officer, certain funds in the Fund Complex (2012-present); Senior Managing |
| (1966) | Compliance Officer | | Director, Guggenheim Investments (2012-present); AML officer, certain funds in the Fund Complex |
| | | | (2016-present). |
| |
| | | | Former: Chief Compliance Officer and Secretary, certain other funds in the Fund Complex (2008-2012); Senior |
| | | | Vice President & Chief Compliance Officer, Security Investors, LLC and certain affiliates (2010-2012); Chief |
| | | | Compliance Officer and Senior Vice President, Rydex Advisors, LLC and certain affiliates (2010-2011). |
James M. Howley | Assistant Treasurer | Since 2006 | Current: Managing Director, Guggenheim Investments (2004-present); Assistant Treasurer, certain other funds |
| (1972) | | | in the Fund Complex (2006-present). |
| |
| | | | Former: Manager of Mutual Fund Administration, Van Kampen Investments, Inc. (1996-2004). |
Keith Kemp | Assistant Treasurer | Since 2016 | Current: Treasurer and Assistant Treasurer, certain other funds in the Fund Complex (2010-present); Managing |
| (1960) | | | Director of Guggenheim Partners Investments Management, LLC (2015-present); Chief Financial Officer, |
| | | | Guggenheim Specialized Products, LLC (2016-present). |
| |
| | | | Former: Managing Director and Director, Transparent Value, LLC (2010-2016); Director, Guggenheim Partners |
| | | | Investments, LLC (2010-2015); Chief Operating Officer, Macquarie Capital Investment Management (2007-2009). |
Amy J. Lee | Chief Legal Officer | Since 2013 | Current: Chief Legal Officer, certain other funds in the Fund Complex (2013-present); Senior Managing Director, |
| (1961) | | | Guggenheim Investments (2012-present). |
| |
| | | | Former: Vice President, Associate General Counsel and Assistant Secretary, Security Benefit Life Insurance |
| | | | Company and Security Benefit Corporation (2004-2012). |
Mark E. Mathiasen | Secretary | Since 2011 | Current: Secretary, certain other funds in the Fund Complex (2007-present); Managing Director, Guggenheim |
| (1978) | | | Investments (2007-present). |
Glenn McWhinnie | Assistant Treasurer | Since 2016 | Current: Vice President, Guggenheim Investments (2009-present). |
| (1969) | | | |
| | | | Former: Tax Compliance Manager, Ernst & Young LLP (1996-2009). |
Michael P. Megaris | Assistant Secretary | Since 2014 | Current: Assistant Secretary, certain other funds in the Fund Complex (2014-present); Vice President, |
| (1984) | | | Guggenheim Investments (2012-present). |
| |
| | | | Former: J.D., University of Kansas School of Law (2009-2012). |
Adam J. Nelson | Assistant Treasurer | Since 2015 | Current: Vice President, Guggenheim Investments (2015-present); Assistant Treasurer, certain other funds in |
| (1979) | | | the Fund Complex (2015-present). |
| |
| | | | Former: Assistant Vice President and Fund Administration Director, State Street Corporation (2013-2015); |
| | | | Fund Administration Assistant Director, State Street (2011-2013); Fund Administration Manager, State Street |
| | | | (2009-2011). |
Kimberly J. Scott | Assistant Treasurer | Since 2012 | Current: Director, Guggenheim Investments (2012-present); Assistant Treasurer, certain other funds in the |
| (1974) | | | Fund Complex (2012-present). |
| |
| | | | Former: Financial Reporting Manager, Invesco, Ltd. (2010-2011); Vice President/Assistant Treasurer of Mutual |
| | | | Fund Administration, Van Kampen Investments, Inc./Morgan Stanley Investment Management (2009-2010); |
| | | | Manager of Mutual Fund Administration, Van Kampen Investments, Inc./Morgan Stanley Investment |
| | | | Management (2005-2009). |
| CLAYMORE EXCHANGE-TRADED FUND TRUST 2 ANNUAL REPORT l 89 |
| | |
INFORMATION ON BOARD OF TRUSTEES AND OFFICERS (Unaudited) continued | August 31, 2017 |
| | | | |
| | | Term of Office | |
Name, Address* | Position(s) held | and Length of | Principal Occupations |
and Year of Birth | with the Trust | Time Served** | During Past Five Years |
Officers (continued): | | | |
Bryan Stone | Vice President | Since 2014 | Current: Vice President, certain other funds in the Fund Complex (2014-present); Director, Guggenheim |
| (1979) | | | Investments (2013-present). |
| |
| | | | Former: Senior Vice President, Neuberger Berman Group LLC (2009-2013); Vice President, Morgan Stanley |
| | | | (2002-2009). |
John L. Sullivan | Chief Financial | Since 2010 | Current: CFO, Chief Accounting Officer and Treasurer, certain other funds in the Fund Complex (2010-present); |
| (1955) | Officer, Chief | | Senior Managing Director, Guggenheim Investments (2010-present). |
| | Accounting Officer | | |
| | and Treasurer | | Former: Managing Director and CCO, each of the funds in the Van Kampen Investments fund complex |
| | | | (2004-2010); Managing Director and Head of Fund Accounting and Administration, Morgan Stanley Investment |
| | | | Management (2002-2004); CFO and Treasurer, Van Kampen Funds (1996-2004). |
| * | The business address of each officer is c/o Guggenheim Investments, 227 West Monroe Street, Chicago, IL 60606. |
| ** | Each officer serves an indefinite term, until his or her successor is duly elected and qualified. The date reflects the commencement date upon which the officer held any officer position with the Trust. |
| 90 l CLAYMORE EXCHANGE-TRADED FUND TRUST 2 ANNUAL REPORT |
| | |
APPROVAL OF ADVISORY AGREEMENTS – | |
CLAYMORE EXCHANGE-TRADED FUND TRUST 2 | August 31, 2017 |
Claymore Exchange-Traded Fund Trust 2 (the “Trust”) was organized as a Delaware statutory trust on June 8, 2006, and is registered as an open-end management investment company under the Investment Company Act of 1940, as amended (the “1940 Act”). The Trust includes the following series (collectively, the “Funds” or individually, a “Fund”):
| · | Guggenheim Canadian Energy Income ETF (ENY) |
| · | Guggenheim China All-Cap ETF (YAO) |
| · | Guggenheim China Real Estate ETF (TAO) |
| · | Guggenheim China Small Cap ETF (HAO) |
| · | Guggenheim China Technology ETF (CQQQ) |
| · | Guggenheim Frontier Markets ETF (FRN) |
| · | Guggenheim MSCI Global Timber ETF (CUT) |
| · | Guggenheim International Multi-Asset Income ETF (HGI) |
| · | Guggenheim Shipping ETF (SEA) |
| · | Guggenheim Solar ETF (TAN) |
| · | Guggenheim S&P Global Water Index ETF (CGW) |
| · | Guggenheim S&P High Income Infrastructure ETF (GHII) |
| · | Guggenheim Total Return Bond ETF (GTO) |
| · | Guggenheim U.S. Large Cap Optimized Volatility ETF (OVLC) |
Guggenheim Funds Investment Advisors, LLC (“GFIA”), an indirect subsidiary of Guggenheim Partners, LLC, a global, diversified financial services firm (“Guggenheim Partners”), serves as investment adviser to each of the Funds, with the exception of Guggenheim Total Return Bond ETF (GTO). Guggenheim Partners Investment Management, LLC (“GPIM” and together with GFIA, the “Advisers” or each, an “Adviser”), also an indirect subsidiary of Guggenheim Partners, serves as investment adviser for GTO. (Guggenheim Partners, GFIA, GPIM and their affiliates may be referred to herein collectively as “Guggenheim.” “Guggenheim Investments” refers to the global asset management and investment advisory division of Guggenheim Partners and includes GFIA, GPIM, Security Investors, LLC and other affiliated investment management businesses of Guggenheim Partners.)
Under the supervision of the Board of Trustees of the Trust (the “Board,” with the members of the Board referred to individually as the “Trustees”), and subject to the terms of investment advisory agreements between the Trust and each Adviser (together, the “Advisory Agreements”), the Advisers are responsible for the overall management and administration of the Funds and provides certain facilities and personnel in connection with such services.
Following an initial two-year term, each of the Advisory Agreements continues in effect from year to year provided that such continuance is specifically approved at least annually by (i) the Board or a majority of the outstanding voting securities (as defined in the 1940 Act) of each Fund, and, in either event, and (ii) the vote of a majority of the Trustees who are not “interested person[s],” as defined by the 1940 Act, of the Trust (the “Independent Trustees”) casting votes in person at a meeting called for such purpose. At meetings held in person on April 25, 2017 (the “April Meeting”) and on May 23, 2017 (the “May Meeting”), the Contracts Review Committee of the Board (the “Committee”), consisting solely of the Independent Trustees, met separately from Guggenheim to consider the proposed renewal of the Advisory Agreements in connection with the Committee’s annual contract review schedule.
As part of its review process, the Committee was represented by independent legal counsel to the Independent Trustees (“Independent Legal Counsel”). Independent Legal Counsel reviewed and discussed with the Committee various key aspects of the Trustees’ legal responsibilities relating to the proposed renewal of the Advisory Agreements and other principal contracts. The Committee took into account various materials received from Guggenheim and Independent Legal Counsel. Recognizing that the evaluation process with respect to the services provided by the Advisers is an ongoing one, the Committee also considered the variety of written materials, reports and oral presentations the Board receives throughout the year regarding performance and operating results of the Funds.
In connection with the contract review process, FUSE Research Network LLC (“FUSE”), an independent, third-party research provider, was engaged to prepare advisory contract renewal reports designed specifically to help the Board fulfill its advisory contract renewal responsibilities. The objective of the reports is to present the subject funds’ relative position regarding fees, expenses, total return performance and tracking error, with peer group and universe comparisons. The Committee assessed the data provided in the FUSE reports as well as commentary and supporting data presented by Guggenheim, including, among other things, a summary of notable distinctions between certain Funds and the applicable peer group identified in the FUSE reports, as well as a discussion of those instances in which FUSE adjusted a peer group after considering a request by management to re-evaluate the peer group constituent funds.
In addition, Guggenheim provided materials and data in response to formal requests for information sent by Independent Legal Counsel on behalf of the Independent Trustees. Guggenheim also made a presentation at the April Meeting. Throughout the process, the Committee asked questions of management and requested certain additional information which Guggenheim provided following the April Meeting (collectively with the foregoing reports and materials, the “Contract Review Materials”). The Committee considered the Contract Review Materials in the context of its accumulated experience governing the Trust and weighed the factors and standards discussed with Independent Legal Counsel.
Following an analysis and discussion of the factors identified below and in the exercise of its business judgment, the Committee concluded that it was in the best interest of each Fund to recommend that the Board approve the renewal of each of the Advisory Agreements for an additional annual term.
| CLAYMORE EXCHANGE-TRADED FUND TRUST 2 ANNUAL REPORT l 91 |
| | |
APPROVAL OF ADVISORY AGREEMENTS – | |
CLAYMORE EXCHANGE-TRADED FUND TRUST 2 continued | August 31, 2017 |
Nature, Extent and Quality of Services Provided by each Adviser: With respect to the nature, extent and quality of services currently provided by each Adviser, the Committee considered the qualifications, experience and skills of key personnel performing services for the Funds, including those personnel providing compliance oversight, as well as the supervisors and reporting lines for such personnel. In this connection, the Committee considered Guggenheim’s resources and related efforts to retain, attract and motivate capable personnel to serve the Funds and noted Guggenheim’s report on recent additions, departures and transitions in personnel who work on matters relating to the Funds or are significant to the operations of each Adviser. The Committee also considered Guggenheim’s attention to relevant developments in the mutual fund industry, and issues germane to exchange-traded funds (“ETFs”) in particular, and its observance of compliance and regulatory requirements, and noted that on a regular basis the Board receives and reviews information from the Trust’s Chief Compliance Officer regarding compliance policies and procedures established pursuant to Rule 38a-1 under the 1940 Act, as well as from Guggenheim’s Chief Risk Officer. In addition, the Committee noted Guggenheim’s implementation of additional controls and oversight processes relating to risk management, including the establishment of an Enterprise Risk Management Committee comprised of a multi-disciplinary team of senior personnel, as well as enhancements to the organization’s information security program.
In connection with the Committee’s evaluation of the overall package of services provided by the Advisers, the Committee considered Guggenheim’s administrative capabilities, including its role in monitoring and coordinating compliance responsibilities with the accounting agent, administrator, custodian, distributor, securities lending agent, transfer agent and other service providers to the Funds. In this respect, the Committee took into account the initiatives undertaken by Guggenheim in connection with the outsourcing of its fund administration and transfer agency services business resulting from Guggenheim’s sale of Rydex Fund Services, LLC (“RFS”), formerly a Guggenheim affiliate and now known as MUFG Investor Services (US), LLC (“MUFG IS”), to Mitsubishi UFJ Trust and Banking Corporation, the trust banking arm of Mitsubishi UFJ Financial Group, a Japanese financial services organization (the “RFS Transaction”). In particular, the Committee considered Guggenheim’s establishment of the Office of Chief Financial Officer (“OCFO”), its structure and responsibilities, including its role in overseeing the services provided by MUFG IS. The Committee also considered the resources allocated by Guggenheim to support the OCFO and the detailed plans presented by management for functions for the OCFO both during and upon completion of the transition period with MUFG IS.
The Committee also noted the distinctive nature of the Funds as ETFs, each of which (with the exception of GTO, an actively managed ETF) generally is constructed to track the performance of a defined index of securities, before fund fees and expenses. In this connection, the Committee considered the experience and expertise appropriate in an investment adviser to ETFs. The Committee also considered Guggenheim’s monitoring of the ETFs’ participation in the securities lending program and the secondary market support services provided by Guggenheim to the Funds, including Guggenheim’s efforts to educate investment professionals about the Funds and other Guggenheim Funds.
With respect to Guggenheim’s resources and each Adviser’s ability to carry out its responsibilities under the Advisory Agreements, the Chief Financial Officer of Guggenheim Investments reviewed with the Committee certain unaudited financial information concerning the holding company for Guggenheim Investments, Guggenheim Partners Investment Management Holdings, LLC (“GPIMH”). The Committee received the audited consolidated financial statements of GPIMH as supplemental information. (Thereafter, the Committee received the audited consolidated financial statements of GPIM.)
The Committee also considered the acceptability of the terms of the Advisory Agreements, including the scope of services required to be performed by each Adviser.
Based on the foregoing, and based on other information received (both oral and written) at the April Meeting and the May Meeting, as well as other considerations, including the Committee’s knowledge of how the Advisers perform their duties obtained through Board meetings, discussions, and reports during the year, the Committee concluded that each Adviser and its personnel were qualified to serve the Funds in such capacity and may reasonably be expected to continue to provide a high quality of services under the applicable Advisory Agreement with respect to the Funds.
Investment Performance: Index/Non-Actively Managed ETFs: The Committee noted that, in view of the distinctive investment objective of the Funds, and the expectations of shareholders, the investment performance of the Funds (excluding GTO, the actively managed ETF) in absolute terms was not of the relevance that normally attaches to the performance of actively managed funds. Of greater relevance to the Committee was the extent to which each Fund achieved its objective to provide investment results that, before fund fees and expenses, correspond generally to the price and yield performance of securities of companies in its applicable index. Thus, the Committee focused its attention primarily on the tracking error data provided in the FUSE reports for each Fund, which was provided for the five-year, three-year, one-year and since inception periods as of December 31, 2016, as applicable.
In this regard, the Committee noted Guggenheim’s statement that it monitors tracking error regularly for purposes of: (i) determining whether the tracking error is stable or trending; (ii) evaluating factors underlying any trending in tracking error, particularly where the trend is toward greater tracking error; and (iii) assessing whether there are any tools or strategies at Guggenheim’s disposal to mitigate any trend toward greater tracking error. The Committee also took into account Guggenheim’s explanation that it places greater emphasis on tracking error trends than it does on absolute tracking error because certain index-benchmarked ETFs may be more disposed to higher levels of tracking error, such as, for instance, with respect to a new ETF or an ETF that has yet to reach critical asset mass and consequently, may be unable to deploy its assets in a
| 92 l CLAYMORE EXCHANGE-TRADED FUND TRUST 2 ANNUAL REPORT |
| | |
APPROVAL OF ADVISORY AGREEMENTS – | |
CLAYMORE EXCHANGE-TRADED FUND TRUST 2 continued | August 31, 2017 |
manner that replicates all of the constituent holdings of an index in the same proportion that the index holds them. The Committee noted other factors identified by Guggenheim that may impact tracking error, including pricing of halted or less liquid securities, time zone pricing related issues, regulatory restrictions and currency conversion sources. In the course of its review of tracking error data, the Committee considered management’s views and explanation of tracking error and tracking error trends for the Funds.
The Committee considered the investment performance of the Funds as measured by total return in comparison to its peer group of funds as a measure for considering the Adviser’s oversight of the applicable index. In this connection, the Committee noted Guggenheim’s statement that although such performance is typically outside of the Adviser’s control given a Fund’s objective to track the index, management monitors investment performance to ensure the Fund continues to provide clients with consistent exposures and that the Fund remains competitive relative to other similar ETFs.
In further considering the tracking error data presented in the Contract Review Materials and addressed by Guggenheim, the Committee made the following observation:
Guggenheim Frontier Markets ETF (FRN): The Fund exhibited tracking error of 2.78%, 2.12% and 2.48% for the one-year, three-year and five-year periods ended December 31, 2016, respectively. The Committee noted Guggenheim’s explanation that frontier markets are often less liquid and can often be difficult to access and track. In this regard, the Committee considered that Guggenheim has historically been unable to secure local access in Vietnam, which has contributed a significant portion of the Fund’s tracking error. The Committee noted, however, that Guggenheim successfully secured local access in Vietnam in 2016. Additionally, Guggenheim stated that the Fund has accrued for certain country tax withholdings which also impaired the Fund’s ability to efficiently track its index. The Committee took into account Guggenheim’s conclusion that, given the aforementioned factors impacting tracking error, it considers the level of tracking error to be reasonable.
After reviewing the foregoing and related factors, the Committee concluded, within the context of its overall conclusions regarding the Advisory Agreement, that: (i) the Funds had in fact tracked their indexes within an acceptable range; or (ii) it was satisfied with Guggenheim’s efforts and explanation for the tracking error data presented in the FUSE reports.
Guggenheim Total Return Bond ETF (GTO): For the actively managed ETF, the Committee reviewed information comparing the Fund’s total return for the since-inception and three-month periods ended December 31, 2016, compared to the performance of a peer group of funds identified by FUSE. The Committee noted that the peer group consists of 4 other actively managed intermediate term bond funds, and that a larger universe of similar funds was not identified. The Committee observed that the Fund’s returns for both the since-inception and three-month periods ended December 31, 2016 outperformed the peer group median, ranking in first quartile (25th and 1st percentiles, respectively). The Committee determined that the Fund’s performance was acceptable and that the portfolio managers should have an opportunity to implement the Fund’s investment strategies over a full market cycle.
Comparative Fees, Costs of Services Provided and the Profits Realized by the Adviser from Its Relationship with the Funds: The Committee compared each Fund’s contractual advisory fee and total net expense ratio to the applicable peer group.
The Committee noted that either: (i) the Adviser has contractually agreed to waive a portion of the advisory fee and/or reimburse expenses to absorb annual operating expenses of certain Funds (excluding interest expenses, all or a portion of each Fund’s licensing fees, brokerage commissions and other trading expenses, taxes and extraordinary expenses such as litigation and other expenses not incurred in the ordinary course of a Fund’s business) over a particular amount; or (ii) the advisory fee is a unitary fee pursuant to which the Adviser assumes all expenses of the Fund (including the cost of transfer agency, custody, fund administration, legal, audit and other services) other than the fee payments under the Advisory Agreement, payments under the Funds’ 12b-1 plan, if any, brokerage expenses, taxes, interest, litigation expenses and other extraordinary expenses. In addition, the Committee considered, as to each Fund, the comparative fee and expense data provided relative to the peer group within the context of the Fund’s investment objective and the uniqueness of the Fund’s underlying index.
In further considering the comparative fee and expense data presented in the Contract Review Materials and addressed by Guggenheim, the Committee made the following observations:
Guggenheim Canadian Energy Income ETF (ENY): The Fund’s contractual advisory fee ranks in the third quartile (60th percentile) of its peer group. The Fund’s total net expense ratio ranks in the fourth quartile (80th percentile) of its peer group. In considering the foregoing rankings, the Committee took into account the peer group data, including the small number of peer group constituent funds, the wide dispersion in the relative size of the constituents in the peer group and the fund complexes represented in the peer group (with four of the five peer funds being products of two large fund complexes).
Guggenheim China All-Cap ETF (YAO): The Fund is subject to a unitary fee which ranks in the third quartile (73rd percentile) of its peer group with respect to contractual advisory fee rankings and second quartile (36th percentile) as to its total net expense ratio.
Guggenheim China Real Estate ETF (TAO): The Fund’s contractual advisory fee ranks in the first quartile (1st percentile) of its peer group. The Fund’s total net expense ratio ranks in the second quartile (36th percentile) of its peer group.
Guggenheim China Small Cap ETF (HAO): The Fund’s contractual advisory fee ranks in the first quartile (1st percentile) of its peer group and its total net expense ratio is in line with the peer group median (50th percentile).
| CLAYMORE EXCHANGE-TRADED FUND TRUST 2 ANNUAL REPORT l 93 |
| | |
APPROVAL OF ADVISORY AGREEMENTS – | |
CLAYMORE EXCHANGE-TRADED FUND TRUST 2 continued | August 31, 2017 |
Guggenheim China Technology ETF (CQQQ): Although the Fund’s unitary fee ranks in the fourth quartile (100th percentile) relative to the peer group contractual advisory fee, the unitary fee is equal to the peer group median total net expense ratio. In considering the foregoing rankings, the Committee took into account that the Fund’s peer group contains only two other China technology funds identified by FUSE.
Guggenheim Frontier Markets ETF (FRN): The Fund’s contractual advisory fee ranks in the second quartile (33rd percentile) of its peer group. The Fund’s total net expense ratio ranks in the third quartile (67th percentile) of its peer group.
Guggenheim International Multi-Asset Income ETF (HGI): The Fund’s contractual advisory fee equals its peer group median and its total net expense ratio is in the third quartile (75th percentile) of its peer group. The Committee considered Guggenheim’s statement that the Fund is unique in that it follows a multi-asset strategy with a broader investment mandate than its peer group, which is equity dividend-income focused.
Guggenheim MSCI Global Timber ETF (CUT): The contractual advisory fee and total net expense ratio are in the fourth quartile (100th percentile as to each) of its peer group. In considering the foregoing rankings, the Committee took into account that the Fund’s peer group contains only one other fund. The Committee also the Fund changed its name, index and index provider in 2016 to provide more direct real asset exposure and improve both brand recognition and performance of the offering.
Guggenheim S&P Global Water Index ETF (CGW): The Fund’s contractual advisory fee ranks in the second quartile (33rd percentile) of its peer group and its total net expense ratio ranks in the third quartile (67th percentile). In considering the foregoing rankings, the Committee took into account the peer group data, including the small number of peer group constituent funds and the fund complexes represented in the peer group (with two of the three peer funds being products of the same large fund complex).
Guggenheim S&P High Income Infrastructure ETF (GHII): The Fund is subject to a unitary fee which ranks in the first quartile (20th percentile) with respect to both its contractual advisory fee and total net expense ratio rankings.
Guggenheim Shipping ETF (SEA): The Fund is subject to a unitary fee which ranks in the fourth quartile (88th percentile) of its peer group. The Fund’s total net expense ratio ranks in the third quartile (75th percentile) of its peer group. The Committee considered the Adviser’s statement that the Fund provides unique exposure to shipping companies, while its peer group consists of competitors that are more broadly focused on transportation or industrials. As a result, the Adviser believes that the Fund is unique relative to its peers and is priced accordingly.
Guggenheim Solar ETF (TAN): The Fund’s contractual advisory fee ranks in the first quartile (1st percentile) of its peer group. The Fund’s total net expense ratio ranks in the fourth quartile (100th percentile) of its peer group. In considering the foregoing rankings, the Committee took into account that the Fund’s peer group consists of only one other fund.
Guggenheim Total Return Bond ETF (GTO): The Fund’s contractual advisory fee ranks in the first quartile (25th percentile) of its peer group and its total net expense ratio is equal to the peer group median.
Guggenheim U.S. Large Cap Optimized Volatility ETF (OVLC): The Fund is subject to a unitary fee that ranks in the third quartile (67th percentile) as to both its peer group contractual advisory fee and total net expense ratio rankings. In considering the foregoing rankings, the Committee took into account the wide dispersion in the relative size of the constituents in the peer group and the fund complexes represented in the peer group. The Committee also considered that the Fund recently launched, with an inception date of May 10, 2016.
As part of its evaluation of each Fund’s advisory fee, the Committee considered how such fees compared to the advisory fee charged by the Adviser to one or more other clients that it manages pursuant to similar investment strategies, to the extent applicable, noting that, in certain instances, Guggenheim charges a lower advisory fee to such other clients. In this connection, the Committee considered, among other things, Guggenheim’s representations about the significant differences between managing mutual funds and ETFs as compared to other types of accounts. The Committee also considered Guggenheim’s explanation that lower fees are charged in certain instances due to various other factors, including the scope of contract, type of investors, differences in fee structure, applicable legal, governance and capital structures, tax status and historical pricing reasons. The Committee concluded that the information it received demonstrated that the aggregate services provided to each Fund at issue were sufficiently different from those provided to other clients with similar investment strategies and/or the risks borne by Guggenheim were sufficiently greater than those associated with managing other clients with similar investment strategies to support the difference in fees.
With respect to the costs of services provided and profits realized by Guggenheim Investments from its relationship with the Funds, the Committee reviewed a profitability analysis and data from management for each Fund setting forth the average assets under management for the twelve months ended December 31, 2016, ending assets under management of the Trust as of December 31, 2016, gross revenues received by Guggenheim Investments, expenses allocated to the Funds, expense waivers (as applicable), earnings and the operating margin/profitability rate, including variance information relative to the foregoing amounts as of December 31, 2015. In addition, the Chief Financial Officer of Guggenheim Investments reviewed with, and addressed questions from, the Committee concerning the expense allocation methodology employed in producing the profitability analysis.
In the course of its review of Guggenheim Investments’ profitability, the Committee took into account the methods used by Guggenheim Investments to determine expenses and profit. The Committee also noted steps taken by management to refine its methodology in preparation for contract review, including, among other things, revisions to the process for allocating expenses for shared service functions, as previously reported to and discussed with the Board. The Committee considered all of the foregoing in evaluating the costs of services provided, the profitability to
| 94 l CLAYMORE EXCHANGE-TRADED FUND TRUST 2 ANNUAL REPORT |
| | |
APPROVAL OF ADVISORY AGREEMENTS – | |
CLAYMORE EXCHANGE-TRADED FUND TRUST 2 continued | August 31, 2017 |
Guggenheim Investments, and the profitability rates presented, and concluded that the profits were not unreasonable.
The Committee considered other benefits available to each Adviser because of its relationship with the Funds and noted Guggenheim’s statement that until the completion of the RFS Transaction on October 4, 2016, the Adviser may have benefited from arrangements whereby an affiliate received fees from the Funds for providing certain fund administration services. The Committee also noted Guggenheim’s statement that the contractual arrangement between Accretive Asset Management LLC (“Accretive”), the index provider to Guggenheim U.S. Large Cap Optimized Volatility ETF (which is subject to a unitary fee) and certain other ETFs sponsored by Guggenheim, may be deemed to be a “fall-out benefit.” In this connection, the Committee noted the total amount paid to Accretive during the calendar year 2016, as well as Guggenheim’s representation that the fees paid to Accretive are competitive. In addition, the Committee noted Guggenheim’s statement that it may benefit from marketing synergies arising from offering a broad spectrum of products, including the Funds.
Economies of Scale: The Committee received and considered information regarding whether there have been economies of scale with respect to the management of the Funds as Fund assets grow, whether the Funds have appropriately benefited from any economies of scale, and whether there is potential for realization of any further economies of scale. The Committee considered whether economies of scale in the provision of services to the Funds were being passed along to the shareholders. The Committee noted Guggenheim’s statement that it believes it is appropriately sharing potential economies of scale and that costs continue to increase in many key areas, including compensation of portfolio managers, key analysts and support staff, as well as for infrastructure needs, with respect to risk management oversight, valuation processes and disaster recovery systems, among other things, and that, in this regard, management’s costs for providing services have increased in recent years without regard to asset levels.
The Committee was of the view that economies of scale were being shared appropriately with the Funds by virtue of the level at which the advisory fee was set at each Fund’s inception that subsumed economies of scale in the fee itself.
The Committee determined that, taking into account all relevant factors, the advisory fee for each Fund was reasonable.
Overall Conclusions
Based on the foregoing, the Committee determined that the investment advisory fees are fair and reasonable in light of the extent and quality of the services provided and other benefits received and that the continuation of each of the Advisory Agreements is in the best interest of each Fund. In reaching this conclusion, no single factor was determinative or conclusive and each Committee member, in the exercise of his business judgment, may attribute different weights to different factors. At the May Meeting, the Committee, constituting all of the Independent Trustees, recommended the renewal of each of the Advisory Agreements for an additional annual term.
Thereafter, on May 24, 2017, the Board, including all of the Independent Trustees, approved the renewal of each of the Advisory Agreements for an additional annual term.
| CLAYMORE EXCHANGE-TRADED FUND TRUST 2 ANNUAL REPORT l 95 |
| | |
TRUST INFORMATION | August 31, 2017 |
| | | | |
Board of Trustees | Principal Executive Officers | Investment Adviser | Accounting Agent, |
| Randall C. Barnes | Donald C. Cacciapaglia | Guggenheim Funds | Custodian and |
| | President and Chief | Investment Advisors, LLC | Transfer Agent |
| Donald C. Cacciapaglia* | Executive Officer | Chicago, IL | The Bank of New York |
| | | | Mellon Corp. |
| Donald A. Chubb, Jr. | Joanna M. Catalucci | Investment Adviser | New York, NY |
| | Chief Compliance Officer | (for Guggenheim | |
| Jerry B. Farley | | Total Return Bond ETF) | Legal Counsel |
| | Amy J. Lee | Guggenheim Partners | Dechert LLP |
| Roman Friedrich III | Chief Legal Officer | Investment | New York, NY |
| | | Management, LLC | |
| Robert B. Karn III | Mark E. Mathiasen | Santa Monica, CA | Independent Registered |
| | Secretary | | Public Accounting Firm |
| Ronald A. Nyberg | | Distributor | Ernst & Young LLP |
| | John L. Sullivan | Guggenheim Funds | Tysons, VA |
| Maynard F. Oliverius | Chief Financial Officer, | Distributors, LLC | |
| | Chief Accounting Officer | Chicago, IL | |
| Ronald E. Toupin, Jr., | and Treasurer | | |
Chairman | | Administrator | |
| * Trustee is an “interested | | MUFG Investor Services | |
| person” (as defined in section | | (US), LLC | |
| 2(a)(19) of the 1940 Act) | | Rockville, MD | |
| (“Interested Trustee”) of the | | | |
| Trust because of his position | | | |
| as the President and CEO of | | | |
| the Investment Adviser and | | | |
| the Distributor. | | | |
| | | | |
| | | | |
| 96 l CLAYMORE EXCHANGE-TRADED FUND TRUST 2 ANNUAL REPORT |
| | |
GUGGENHEIM INVESTMENTS PRIVACY POLICIES (Unaudited) | August 31, 2017 |
Our Commitment to You
When you become a Guggenheim Investments investor, you entrust us with not only your hard-earned money but also with personal and financial information about you. We recognize that your relationship with us is based on trust and that you expect us to act responsibly and in your best interests. Because we have access to this private information about you, we hold ourselves to the highest standards in its safekeeping and use. This means, most importantly, that we do not sell client information to anyone—whether it is your personal information or if you are a current or former Guggenheim Investments client.
The Information We Collect About You
In the course of doing business with shareholders and investors, we collect nonpublic personal information about you. You typically provide personal information when you complete a Guggenheim Investments account application or when you request a transaction that involves Guggenheim Investments funds or one of the Guggenheim Investments affiliated companies. “Nonpublic personal information” is personally identifiable private information about you. For example, it includes information regarding your name and address, Social Security or taxpayer identification number, assets, income, account balance, bank account information and investment activity (e.g., purchase and redemption history).
How We Handle Your Personal Information
As emphasized above, we do not sell information about current or former clients or their accounts to third parties. Nor do we share such information, except when necessary to complete transactions at your request or to make you aware of related investment products and services that we offer. Additional details about how we handle your personal information are provided below. To complete certain transactions or account changes that you direct, it may be necessary to provide identifying information to companies, individuals or groups that are not affiliated with Guggenheim Investments. For example, if you ask to transfer assets from another financial institution to Guggenheim Investments, we will need to provide certain information about you to that company to complete the transaction. To alert you to other Guggenheim Investments investment products and services, we may share your information within the Guggenheim Investments family of affiliated companies. This would include, for example, sharing your information within Guggenheim Investments so we can make you aware of new Rydex and Guggenheim Investments funds or the services offered through another Guggenheim Investments affiliated company. In certain instances, we may contract with nonaffiliated companies to perform services for us. Where necessary, we will disclose information we have about you to these third parties.
In all such cases, we provide the third party with only the information necessary to carry out its assigned responsibilities and only for that purpose. And we require these third parties to treat your private information with the same high degree of confidentiality that we do. In certain instances, we may share information with other financial institutions regarding individuals and entities in response to the U.S.A. Patriot Act. Finally, we will release information about you if you direct us to do so, if we are compelled by law to do so or in other circumstances permitted by law.
Opt Out Provisions
We do not sell your personal information to anyone. The law allows you to “opt out” of only certain kinds of information sharing with third parties. The firm does not share personal information about you with any third parties that triggers this opt-out right. This means you are already opted out.
How We Protect Privacy Online
Our concern for the privacy of our shareholders also extends to those who use our web site, guggenheiminvestments.com. Our web site uses some of the most secure forms of online communication available, including encryption technology, Secure Socket Layer (SSL) protocol, firewalls and user names and passwords. These technologies provide a high level of security and privacy when you access your account information or initiate online transactions. The Guggenheim Investments web site offers customized features that require our use of “http cookies”—tiny pieces of information that we ask your browser to store. However, we make very limited use of these cookies. We only use cookies for session management and security features on the Guggenheim Investments web site. We do not use them to pull data from your hard drive, to learn your email address, or to view data in cookies created by other web sites. We will not share the information in our cookies or give others access to it. See the legal information area on our web site for more details about web site security and privacy features.
Questions concerning your shares of the Trust?
• If your shares are held in a Brokerage Account, contact your Broker.
This report is sent to shareholders of the Funds for their information. It is not a Prospectus, circular or representation intended for use in the purchase or sale of shares of the Funds or of any securities mentioned in this report.
A description of the Funds’ proxy voting policies and procedures related to portfolio securities is available without charge, upon request, by calling the Funds at (800)345-7999.
Information regarding how the Funds voted proxies for portfolio securities, if applicable, during the most recent 12-month period ended June 30, is also available, without charge and upon request by calling (800) 345-7999, by visiting Guggenheim Investments’ website at guggenheiminvestments.com or by accessing the Funds’ Form N-PX on the U.S. Securities and Exchange Commission’s (“SEC”) website at www.sec.gov.
The Funds file their complete schedule of portfolio holdings with the SEC for the first and third quarters of each fiscal year on Form N-Q. The Funds’ Form N-Q is available on the SEC website at www.sec.gov or by visiting Guggenheim Investments’ website at guggenheiminvestments.com. The Funds’ Form N-Q may also be viewed and copied at the SEC’s Public Reference Room in Washington, DC; information on the operation of the Public Reference Room may be obtained by calling (800) SEC-0330.
| CLAYMORE EXCHANGE-TRADED FUND TRUST 2 ANNUAL REPORT l 97 |
This Page Intentionally Left Blank.
This Page Intentionally Left Blank.
ABOUT THE TRUST ADVISER
Guggenheim Funds Investment Advisors, LLC
Guggenheim Funds Investment Advisors, LLC (the “Investment Adviser”) manages the investment and reinvestment of certain Funds’ assets and administers the affairs of such Funds to the extent requested by the Board of Trustees. The Investment Adviser also acts as investment adviser to closed-end and open-end management investment companies. The Investment Adviser and its affiliates provide supervision, management or servicing of assets with a commitment to consistently delivering exceptional service. The Investment Adviser is a subsidiary of Guggenheim Partners, LLC, a global, diversified financial services firm with more than $295 billion in total assets as of August 31, 2017. Guggenheim Partners, LLC, through its affiliates, provides investment management, investment advisory, insurance, investment banking, and capital markets services. The firm is headquartered in Chicago and New York with a global network of offices throughout the United States, Europe, and Asia.
Guggenheim Partners Investment Management, LLC
Guggenheim Partners Investment Management, LLC (“GPIM”) is an indirect subsidiary of Guggenheim Partners, LLC, a diversified financial services firm. The firm provides capital markets services, portfolio and risk management expertise, wealth management, and investment advisory services. Clients of Guggenheim Partners, LLC subsidiaries are an elite mix of individuals, family offices, endowments, foundations, insurance companies and other institutions.
Portfolio Management
The portfolio managers who are currently responsible for the day-to-day management of Guggenheim China All-Cap ETF, Guggenheim China Technology ETF, Guggenheim Solar ETF, Guggenheim S&P High Income Infrastructure ETF and Guggenheim S&P Global Water Index ETF’s portfolios are Michael P. Byrum, CFA, James R. King, CFA, and Cindy Gao. The portfolio managers who are currently responsible for the day-to-day management of Guggenheim U.S. Large Cap Optimized Volatility ETF’s portfolio are Michael P. Byrum, CFA, James R. King, CFA, and Adrian Bachman, CFA. Mr. Byrum is a Senior Managing Director and Portfolio Manager of Guggenheim Investments and joined Guggenheim Investments in 1993. Mr. Byrum holds a degree in finance from Miami University of Ohio and is a member of the CFA Institute and the Washington Society of Investment Analysts. Mr. King is a Managing Director and Portfolio Manager of Guggenheim Investments and rejoined Guggenheim Investments in 2011 as the lead portfolio manager for exchange-traded products. Mr. King holds a bachelor’s degree in finance from the University of Maryland, and has earned the Chartered Financial Analyst designation. Ms. Gao is a Vice President of Guggenheim Investments and joined Guggenheim Investments in December of 2010. Ms. Gao received a M.S. in Accounting from the University of Illinois at Chicago. Mr. Bachman is a Director and Portfolio Manager of Guggenheim Investments and joined Guggenheim in August of 2014. Mr. Bachman has a bachelor’s degree in finance and international business from the University of Maryland, College Park and has earned the Chartered Financial Analysis designation.
The portfolio managers who are currently responsible for the day-to-day management of the Guggenheim Total Return Bond ETF are B. Scott Minerd, Anne Walsh, CFA, James Michal, Steve Brown, CFA, and Adam Bloch. Messrs. Minerd, Michal and Brown and Ms. Walsh have each managed the Fund’s portfolio since the Fund’s inception in February 2016. Mr. Bloch has managed the Fund’s portfolio since January 2017. Mr. Minerd is the Global Chief Investment Officer of Guggenheim Investments and joined Guggenheim Investments in 1998. Mr. Minerd is a member of the Portfolio Construction Group and guides the investment strategies of the sector portfolio managers. Mr. Minerd holds a B.S. degree in Economics from the Wharton School, University of Pennsylvania, and has completed graduate work at the University of Chicago Graduate School of Business and the Wharton School, University of Pennsylvania. Ms. Walsh is a Senior Managing Director and Assistant Chief Investment Officer of Guggenheim Investments and joined the firm in 2007. Ms. Walsh is head of the Portfolio Construction Group where she oversees more than $60 billion in fixed-income investments including Agencies, Credit, Municipals, Residential Mortgage Backed Securities, Commercial Mortgage Backed Securities and Asset Backed Securities across several Guggenheim affiliates. Ms. Walsh received her BSBA and MBA from Auburn University and her J.D. from the University of Miami School of Law. Mr. Michal is a Senior Managing Director and Portfolio Manager at Guggenheim Investments and joined the firm in 2008. Mr. Michal is dedicated to portfolio management for Guggenheim Investments’ Total Return mandates. Mr. Michal earned a BSBA in Finance and International Business from Georgetown University. Mr. Brown is a Managing Director and Portfolio Manager at Guggenheim Investments and joined the firm in 2010. Mr. Brown is a part of the Portfolio Management team for Guggenheim Investments’ Active Fixed-Income and Total Return mandates. Mr. Brown earned a BS in Finance from Indiana University’s Kelley School of Business. Mr. Bloch is a Director and Portfolio Manager at Guggenheim Investments and joined the firm in 2012. Mr. Bloch works directly with sector traders, research heads, and risk managers and is responsible for buy and sell recommendations, day-to-day risk monitoring, and various special projects for Guggenheim Investments’ Total Return mandates. Mr. Bloch graduated from the University of Pennsylvania.
Claymore Exchange-Traded Fund Trust 2 Overview
The Claymore Exchange-Traded Fund Trust 2 (the “Trust”) is an investment company complex consisting of 14 separate exchange-traded “funds” as of September 30, 2017. The investment objective of each of the index funds is to correspond generally to the performance, before fees and expenses, of a specified market index.
This material must be preceded or accompanied by a prospectus for the fund being offered. The prospectus contains information about the Fund including a discussion of investment objectives, risks, ongoing expenses and sales charges. If a prospectus did not accompany this report, you can obtain one from your financial adviser, from our website at http://guggenheiminvestments.com or by calling (800)345-7999. Please read the prospectus carefully before investing. All Funds are subject to market risk and shares when sold may be worth more or less than their original cost. You can lose money investing in the Funds.
| | |
Guggenheim Funds Distributors, LLC | |
| 227 West Monroe Street | |
| Chicago, IL 60606 | |
| Member FINRA/SIPC | |
| (10/17) | |
NOT FDIC-INSURED l NOT BANK-GUARANTEED l MAY LOSE VALUE |
ETF-002-AR-0817
Item 2. Code of Ethics.
(a) The registrant has adopted a code of ethics that applies to its principal executive officer, principal financial officer, principal accounting officer or controller, or persons performing similar functions (the "Code of Ethics").
(b) No information need be disclosed pursuant to this paragraph.
(c) The registrant has not amended its Code of Ethics during the period covered by the report presented in Item 1 hereto.
(d) The registrant has not granted a waiver or an implicit waiver to its principal executive officer, principal financial officer, principal accounting officer or controller, or persons performing similar functions from a provision of its Code of Ethics during the period covered by this report.
(e) Not applicable.
(f) (1) The registrant's Code of Ethics is attached hereto as Exhibit (a)(1).
(2) Not applicable.
(3) Not applicable.
Item 3. Audit Committee Financial Expert.
The registrant's Board of Trustees has determined that it has at least one audit committee financial expert serving on its audit committee (the “Audit Committee”), Dr. Jerry B. Farley. Dr. Farley is “independent,” meaning that he is not an “interested person” of the Registrant (as that term is defined in Section 2(a)(19) of the Investment Company Act of 1940, as amended) and he does not accept any consulting, advisory, or other compensatory fee from the Registrant (except in his capacity as a Board or committee member). Dr. Farley qualifies as an audit committee financial expert by virtue of his experience at educational institutions, where his business responsibilities have included all aspects of financial management and reporting.
(Under applicable securities laws, a person who is determined to be an audit committee financial expert will not be deemed an "expert" for any purpose, including without limitation for purposes of Section 11 of the Securities Act of 1933, as amended, as a result of being designated or identified as an audit committee financial expert. The designation or identification of a person as an audit committee financial expert does not impose on such person any duties, obligations, or liabilities that are greater than the duties, obligations, and liabilities imposed on such person as a member of the Audit Committee and Board of Trustees in the absence of such designation or identification. The designation or identification of a person as an audit committee financial expert does not affect the duties, obligations or liability of any other member of the Audit Committee or Board of Trustees.)
Item 4. Principal Accountant Fees and Services.
(a) Audit Fees: the aggregate fees billed for professional services rendered by the principal accountant for the audit of the registrant's annual financial statements or services that are normally provided by the
accountant in connection with statutory and regulatory filings or engagements were $81,244 and $60,371 for the fiscal years ending August 31, 2017 and August 31, 2016, respectively.
(b) Audit-Related Fees: the aggregate fees billed for assurance and related services by the principal accountant that are reasonably related to the performance of the audit of the registrant’s financial statements and are not reported under paragraph (a) of this Item, including agreed upon procedures reports performed for rating agencies and the issuance of comfort letters, were $0 and $0 for the fiscal years ending August 31, 2017 and August 31, 2016, respectively.
The registrant’s principal accountant did not bill fees for non-audit services that required preapproval by the Audit Committee pursuant to paragraph (c)(7)(ii) of Rule 2-01 of Regulation S-X during the registrant’s last two fiscal years.
(c) Tax Fees: the aggregate fees billed for professional services rendered by the principal accountant for tax compliance, tax advice and tax planning, including federal, state and local income tax return preparation and related advice and determination of taxable income and miscellaneous tax advice were $59,308 and $71,945 for the fiscal years ending August 31, 2017 and August 31, 2016, respectively.
The registrant’s principal accountant did not bill fees for tax services that required preapproval by the Audit Committee pursuant to paragraph (c)(7)(ii) of Rule 2-01 of Regulation S-X during the registrant’s last two fiscal years.
(d) All Other Fees: the aggregate fees billed for products and services provided by the principal accountant, other than the services reported in paragraphs 4(a) through 4(c) of this Item were $0 and $0 for the fiscal years ending August 31, 2017 and August 31, 2016, respectively.
The registrant’s principal accountant did not bill fees for services not included in Items 4(a), (b) or (c) above that required preapproval by the Audit Committee pursuant to paragraph (c)(7)(ii) of Rule 2-01 of Regulation S-X during the registrant’s last two fiscal years.
(e) Audit Committee Pre-Approval Policies and Procedures.
(i) The Audit Committee reviews, and in its sole discretion, pre-approves, pursuant to written pre-approval procedures (A) all engagements for audit and non-audit services to be provided by the principal accountant to the registrant and (B) all engagements for non-audit services to be provided by the principal accountant (1) to the registrant’s investment adviser (not including a sub-adviser whose role is primarily portfolio management and is sub-contracted or overseen by another investment adviser) and (2) to any entity controlling, controlled by or under common control with the registrant’s investment adviser that provides ongoing services to the registrant; but in the case of the services described in subsection (B)(1) or (2), only if the engagement relates directly to the operations and financial reporting of the registrant; provided that such pre-approval need not be obtained in circumstances in which the pre-approval requirement is waived under rules promulgated by the Securities and Exchange Commission or New York Stock Exchange listing standards. Sections V.B.2 and V.B.3 of the Audit Committee’s revised Audit Committee Charter contain the Audit Committee’s Pre-Approval Policies and Procedures and such sections are included below.
Section V.B.2: Pre-approve any engagement of the independent auditors to provide any services, other than “prohibited non-audit services,” to the Trust, including the fees and other compensation to be paid to the independent auditors (unless an exception is available under Rule 2-01 of Regulation S-X).
| (a) | The categories of services to be reviewed and considered for pre-approval include the following (collectively, “Identified Services”): |
Audit Services
| · | Annual financial statement audits |
| · | Seed audits (related to new product filings, as required) |
| · | SEC and regulatory filings and consents |
Audit-Related Services
| · | Accounting consultations |
| · | Fund merger/reorganization support services |
| · | Other accounting related matters |
| · | Agreed upon procedures reports |
| · | Other internal control reports |
Tax Services
| o | Preparation of Federal and state income tax returns, including extensions |
| o | Preparation of calculations of taxable income, including fiscal year tax designations |
| o | Preparation of annual Federal excise tax returns (if applicable) |
| o | Preparation of calendar year excise distribution calculations |
| o | Calculation of tax equalization on an as-needed basis |
| o | Preparation of the estimated excise distribution calculations on an as-needed basis |
| o | Preparation of quarterly Federal, state and local and franchise tax estimated tax payments on an as-needed basis |
| o | Preparation of state apportionment calculations to properly allocate Fund taxable income among the states for state tax filing purposes |
| o | Provision of tax compliance services in India for Funds with direct investments in India |
| o | Assistance with management’s identification of passive foreign investment companies (PFICs) for tax purposes |
| · | Permissible non-recurring tax services upon request: |
| o | Assistance with determining ownership changes which impact a Fund’s utilization of loss carryforwards |
| o | Assistance with calendar year shareholder reporting designations on Form 1099 |
| o | Assistance with corporate actions and tax treatment of complex securities and structured products |
| o | Assistance with IRS ruling requests and calculation of deficiency dividends |
| o | Conduct training sessions for the Adviser’s internal tax resources |
| o | Assistance with Federal, state, local and international tax planning and advice regarding the tax consequences of proposed or actual transactions |
| o | Tax services related to amendments to Federal, state and local returns and sales and use tax compliance |
| o | RIC qualification reviews |
| o | Tax distribution analysis and planning |
| o | Tax authority examination services |
| o | Tax appeals support services |
| o | Tax accounting methods studies |
| o | Fund merger, reorganization and liquidation support services |
| o | Tax compliance, planning and advice services and related projects |
| (b) | The Committee has pre-approved Identified Services for which the estimated fees are less than $25,000. |
| (c) | For Identified Services with estimated fees of $25,000 or more, but less than $50,000, the Chair or any member of the Committee designated by the Chair is hereby authorized to pre-approve such services on behalf of the Committee. |
| (d) | For Identified Services with estimated fees of $50,000 or more, such services require pre-approval by the Committee. |
| (e) | All requests for Identified Services to be provided by the independent auditor that were pre-approved by the Committee shall be submitted to the Chief Accounting Officer (“CAO”) of the Trust by the independent auditor using the pre-approval request form attached as Appendix C to the Audit Committee Charter. The Trust’s CAO will determine whether such services are included within the list of services that have received the general pre-approval of the Committee. |
| (f) | The independent auditors or the CAO of the Trust (or an officer of the Trust who reports to the CAO) shall report to the Committee at each of its regular scheduled meetings all audit, audit-related and permissible non-audit services initiated since the last such report (unless the services were contained in the initial audit plan, as previously presented to, and approved by, the Committee). The report shall include a general description of the services and projected fees, and the means by which such services were approved by the Committee (including the particular category of Identified Services under which pre-approval was obtained). |
Section V.B.3: Pre-approve any engagement of the independent auditors, including the fees and other compensation to be paid to the independent auditors, to provide any non-audit services to the Adviser (or any “control affiliate” of the Adviser providing ongoing services to the Trust), if the engagement relates directly to the operations and financial reporting of the Trust (unless an exception is available under Rule 2-01 of Regulation S-X).
| (a) | The Chair or any member of the Committee designated by the Chair may grant the pre-approval for non-audit services to the Adviser (or any “control affiliate” of the Adviser providing ongoing services to the Trust) relating directly to the operations and financial reporting of the Trust for which the estimated fees are less than $25,000. All such delegated pre-approvals shall be presented to the Committee no later than the next Committee meeting. |
| (b) | For non-audit services to the Adviser (or any “control affiliate” of the Adviser providing ongoing services to the Trust) relating directly to the operations and financial reporting of the Trust for which the estimated fees are $25,000 or more, such services require pre-approval by the Committee. |
(ii) None of the services described in each of Items 4(b) through (d) were approved by the Audit Committee pursuant to paragraph (c)(7)(i)(C) of Rule 2-01 of Regulation S-X.
(f) Not applicable.
(g) The aggregate non-audit fees billed by the registrant's accountant for services rendered to the registrant, the registrant’s investment adviser (not including a sub-adviser whose role is primarily portfolio management and is sub-contracted with or overseen by another investment adviser) and/or any entity controlling, controlled by, or under common control with the adviser that provides ongoing services to the registrant that directly related to the operations and financial reporting of the registrant were $59,308 and $71,945 for the fiscal years ending August 31, 2017, and August 31, 2016, respectively.
(h) Not applicable.
Item 5. Audit Committee of Listed Registrants.
(a) The Audit Committee was established as a separately designated standing audit committee in accordance with Section 3(a)(58)(A) of the Securities Exchange Act of 1934, as amended. The Audit Committee of the registrant is composed of Ronald A. Nyberg, Donald A. Chubb, Jerry B. Farley, Maynard F. Oliverius, Ronald E. Toupin, Jr., Randall C. Barnes, Roman Friedrich III and Robert B. Karn III.
(b) Not applicable.
Item 6. Schedule of Investments.
The Schedule of Investments is included as part of Item 1.
Item 7. Disclosure of Proxy Voting Policies and Procedures for Closed-End Management Investment Companies.
Not Applicable.
Item 8. Portfolio Managers of Closed-End Management Investment Companies.
Not Applicable.
Item 9. Purchases of Equity Securities by Closed-End Management Investment Company and Affiliated Purchasers.
Not Applicable.
Item 10. Submission of Matters to a Vote of Security Holders.
The registrant has not made any material changes to the procedures by which shareholders may recommend nominees to the registrant’s Board of Trustees.
Item 11. Controls and Procedures.
(a) The registrant's principal executive officer and principal financial officer have evaluated the registrant's disclosure controls and procedures (as defined in Rule 30a-3(c) under the Investment Company Act) as of a date within 90 days of this filing and have concluded that based on such evaluation, as required by Rule 30a-3(b) under the Investment Company Act, that the registrant's disclosure controls and procedures were effective as of that date in ensuring that information required to be disclosed by the registrant in this Form N-CSR was recorded, processed, summarized, and reported within the time periods specified in the Securities and Exchange Commission’s rules and forms.
(b) There were no changes in the registrant’s internal control over financial reporting (as defined in Rule 30a-3(d) under the Investment Company Act) that occurred during the registrant’s last fiscal quarter of the period covered by this report that have materially affected, or are reasonably likely to materially affect, the registrant’s internal control over financial reporting.
Item 12. Exhibits.
(a)(1) Code of Ethics for Chief Executive and Senior Financial Officers.
(a)(2) Certifications of principal executive officer and principal financial officer pursuant to Rule 30a-2(a) under the Investment Company Act.
(b) Certifications of principal executive officer and principal financial officer pursuant to Rule 30a-2(b) under the Investment Company Act and Section 906 of the Sarbanes-Oxley Act of 2002.
SIGNATURES
Pursuant to the requirements of the Securities Exchange Act of 1934 and the Investment Company Act of 1940, the registrant has duly caused this report to be signed on its behalf by the undersigned, thereunto duly authorized.
Claymore Exchange-Traded Fund Trust 2
By: /s/ Amy J. Lee
Name: Amy J. Lee
Title: Vice President
Date: 11/08/2017
Pursuant to the requirements of the Securities Exchange Act of 1934 and the Investment Company Act of 1940, this report has been signed by the following persons on behalf of the registrant and in the capacities and on the dates indicated.
By: /s/ Amy J. Lee
Name: Amy J. Lee
Title: Vice President
Date: 11/08/2017
By: /s/ John L. Sullivan
Name: John L. Sullivan
Title: Chief Financial Officer, Chief Accounting Officer and Treasurer
Date: 11/08/2017