UNITED STATES
SECURITIES AND EXCHANGE COMMISSION
Washington, D.C. 20549
FORM N-CSR
CERTIFIED SHAREHOLDER REPORT OF REGISTERED MANAGEMENT INVESTMENT COMPANIES
Investment Company Act file number 811-21910
Claymore Exchange-Traded Fund Trust 2
(Exact name of registrant as specified in charter)
227 West Monroe Street, Chicago, 60606
(Address of principal executive offices) (Zip code)
Amy J. Lee
227 West Monroe Street, Chicago, 60606
(Name and address of agent for service)
Registrant's telephone number, including area code: (312) 827-0100
Date of fiscal year end: May 31
Date of reporting period: June 1, 2016 - May 31, 2017
Item 1. Reports to Stockholders.
The registrant's annual report transmitted to shareholders pursuant to Rule 30e-1 under the Investment Company Act of 1940, as amended (the "Investment Company Act"), is as follows:
GUGGENHEIMINVESTMENTS.COM
. . . YOUR ROAD TO THE LATEST, MOST UP-TO-DATE INFORMATION
The shareholder report you are reading right now is just the beginning of the story. Online at guggenheiminvestments.com, you will find:
| • | Daily and historical fund pricing, fund returns, portfolio holdings and characteristics, and distribution history. |
| | |
| • | Investor guides and fund fact sheets. |
| | |
| • | Regulatory documents including a prospectus and copies of shareholder reports. |
Guggenheim Funds Distributors, LLC is constantly updating and expanding shareholder information services on each Fund’s website, in an ongoing effort to provide you with the most current information about how your Fund’s assets are managed, and the results of our efforts. It is just one more small way we are working to keep you better informed about your investment.
| Contents | | |
| | | |
| Dear Shareholder | 3 | |
| | | |
| Economic and Market Overview | 4 | |
| | | |
| Management Discussion of Fund Performance | 6 | |
| | | |
| Risks and Other Considerations | 13 | |
| | | |
| Performance Report and Fund Profile | 14 | |
| | | |
| Fees and Expenses | 25 | |
| | | |
| Schedules of Investments | 27 | |
| | | |
| Statements of Assets and Liabilities | 47 | |
| | | |
| Statements of Operations | 49 | |
| | | |
| Statements of Changes in Net Assets | 51 | |
| | | |
| Financial Highlights | 55 | |
| | | |
| Notes to Financial Statements | 62 | |
| | | |
| Report of Independent Registered Public | | |
| Accounting Firm | 70 | |
| | | |
| Other Information | 71 | |
| | | |
| Approval of Advisory Agreements – Claymore | | |
| Exchange-Traded Fund Trust 2 | 72 | |
| | | |
| Information on Board of Trustees and Officers | 77 | |
| | | |
| Trust Information | 81 | |
| | | |
| Guggenheim Investments Privacy Policies | 82 | |
| | | |
| About the Trust Adviser | Back Cover | |
DEAR SHAREHOLDER
Guggenheim Funds Investment Advisors, LLC (the “Investment Adviser”) is pleased to present the annual shareholder report for several of our exchange-traded funds (“ETFs” or “Funds”). This report covers performance of the Funds for the 12 months ended May 31, 2017.
The Investment Adviser is part of Guggenheim Investments, which represents the investment management businesses of Guggenheim Partners, LLC (“Guggenheim”), a global diversified financial services firm.
Guggenheim Funds Distributors, LLC, the distributor of the Funds, is committed to providing investors with innovative investment solutions; as of the date of this report, we offer ETFs with a wide range of domestic and global themes, as well as closed-end funds and unit investment trusts. We have built on the investment management strengths of Guggenheim Investments and worked with a diverse group of index providers to create some of the most distinctive ETFs available.
To learn more about economic and market conditions over the last year and the objective and performance of each ETF, we encourage you to read the Economic and Market Overview section of the report, which follows this letter, and the Management Discussion of Fund Performance for each ETF, which begins on page 6.
Sincerely,

Donald Cacciapaglia
President and Chief Executive Officer
Claymore Exchange-Traded Fund Trust 2
June 30, 2017
| |
| CLAYMORE EXCHANGE-TRADED FUND TRUST 2 ANNUAL REPORT l 3 |
| ECONOMIC AND MARKET OVERVIEW (Unaudited) | May 31, 2017 |
The period was marked by significant events in the political sphere, both in the U.S. and globally. Late last June, Britain’s vote to depart the European Union shocked world markets, distressing the many market participants who had positioned themselves for the opposite outcome. The result was a sharp, but brief market sell off at the end of the second quarter of 2016.
With the election of Donald Trump, the market began anticipating that reduced regulation and fiscal stimulus would lead to stronger economic growth in the U.S. and globally. With the potential to finance some of this stimulus increased Treasury issuance, nominal interest rates climbed higher by the end of 2016.
By spring 2017, markets were reassessing their optimistic economic outlooks after not seeing much progress on the legislative front. This helped bond prices to stabilize and the yield curve to flatten. With the rate rise in June and the U.S. Federal Reserve’s (the “Fed”) announcement about reducing the size of its balance sheet, after the period ended, investors may see increased Treasury market volatility through the rest of the year.
Still, the global macroeconomic environment remains positive. China has stabilized, Europe is recovering, corporate earnings in the United States are rising, confidence measures are strong, and a U.S. recession appears unlikely before 2019. However, tracking estimates for first-quarter real Gross Domestic Product (“GDP”) growth gradually fell throughout the quarter despite strong gains in consumer and business sentiment since the election. GDP increased at an annual rate of 1.4% in the first quarter of 2017. The prospects for quarterly U.S. GDP growth are better going forward, and we expect a bounce back in the second quarter.
Our medium-term growth outlook has dimmed marginally as a result of the minimal progress seen to date on the Trump administration’s fiscal policy initiatives. The ongoing struggle to create a healthcare bill has sapped early legislative momentum, and tax reform shows that work still needs to be done to put the agenda into effect in a timely manner—meaning markets may come to realize that the Trump rally may be long on promise and short on delivery.
With the Fed set to continue raising interest rates—possibly at a faster pace than that the market is pricing in—the shape of the yield curve going forward will remain a major theme in many portfolios. In addition to another potential rate hike this year, the Fed may raise rates three to four more times in 2018. The Fed’s strategy to reduce its balance sheet could pressure yields higher in the short end and belly of the curve, which is where most of the new Treasury issuance is likely to come. At the long end, rates are likely to stay low for some time. Recall that the last time the 10-year Treasury note traded below 3%, it lasted nearly 22 years (June 1934 through March 1956.)
By many measures, the stock and bond markets have rarely been more expensive and more stable than in the second quarter of 2017. High-yield bonds were trading near their narrowest-ever spreads relative to Treasuries in May 2017. At the same time, U.S. stock market indexes are continuing to reach new highs while the Chicago Board Options Exchange Volatility Index (VIX), which measures option-implied S&P 500 volatility, is near its lowest level since 1993. The amount of complacency built into the markets argues for caution.
For the 12 months ended May 31, 2017, the Standard & Poor’s 500® (“S&P 500”) Index* returned 17.47%. The MSCI Europe-Australasia-Far East (“EAFE”) Index* returned 16.44%. The return of the MSCI Emerging Markets Index* was 27.41%.
In the bond market, the Bloomberg Barclays U.S. Aggregate Bond Index* posted a 1.58% return for the period, while the Bloomberg Barclays U.S. Corporate High Yield Index* returned 13.58%. The return of the Bloomberg Barclays 1-3 Month U.S. Treasury Bill Index* was 0.40% for the 12-month period.
The opinions and forecasts expressed may not actually come to pass. This information is subject to change at any time, based on market and other conditions, and should not be construed as a recommendation of any specific security or strategy.
| |
| 4 l CLAYMORE EXCHANGE-TRADED FUND TRUST 2 ANNUAL REPORT |
| ECONOMIC AND MARKET OVERVIEW (Unaudited) continued | May 31, 2017 |
*Index Definitions
All indices described below are unmanaged and reflect no expenses. It is not possible to invest directly in any index.
The Bloomberg Barclays U.S. Aggregate Bond Index is a broad-based flagship benchmark that measures the investment grade, U.S. dollar-denominated, fixed-rate taxable bond market, including U.S. Treasuries, government-related and corporate securities, mortgage-backed securities or “MBS” (agency fixed-rate and hybrid adjustable-rate mortgage, or “ARM”, pass-throughs), asset-backed securities (“ABS”), and commercial mortgage-backed securities (“CMBS”) (agency and non-agency).
The Bloomberg Barclays U.S. Corporate High Yield Index measures the U.S. dollar-denominated, high yield, fixed-rate corporate bond market. Securities are classified as high yield if the middle rating of Moody’s, Fitch, and S&P is Ba1/BB +/BB + or below.
The Bloomberg Barclays 1-3 month U.S. Treasury Bill Index tracks the performance of the U.S. Treasury Bills with a remaining maturity of one to three months. U.S. Treasury Bills, which are short-term loans to the U.S. government, are full-faith-and-credit obligations of the U.S. Treasury and are generally regarded as being free of any risk of default.
The MSCI China Index is a capitalization-weighted index that monitors the performance of stocks from the country of China.
The MSCI EAFE Index is a capitalization weighted measure of stock markets in Europe, Australasia and the Far East.
The MSCI Emerging Markets Index is a free float-adjusted market capitalization weighted index that is designed to measure equity market performance in the global emerging markets.
The MSCI World Index is a free float-adjusted market capitalization weighted index that is designed to measure equity market performance of developed markets. The MSCI World Index (Net) is calculated with net dividends reinvested.
The Standard & Poor’s (“S&P 500”) Index is a capitalization-weighted index of 500 stocks designed to measure the performance of the broad economy, representing all major industries and is considered a representation of U.S. stock market.
The S&P/TSX Composite Index is a capitalization-weighted index. The index is designed to measure performance of the broad Canadian economy through changes in the aggregate market value of stocks representing all major industries.
The S&P Global Timber & Forestry Index is comprised of 25 of the largest publicly traded companies engaged in the ownership, management, or the upstream supply chain of forests and timberlands. These may be forest products companies, timber REITs, paper products companies, paper packaging companies, or agricultural product companies that are engaged in the ownership, management, or the upstream supply chain of forests and timberlands.
Industry Sectors
Comments about industry sectors in these fund commentaries are based on Bloomberg Barclays industry classifications.
| |
| CLAYMORE EXCHANGE-TRADED FUND TRUST 2 ANNUAL REPORT l 5 |
| MANAGEMENT DISCUSSION OF FUND PERFORMANCE (Unaudited) | May 31, 2017 |
ENY Guggenheim Canadian Energy Income ETF
Fund Overview
The Guggenheim Canadian Energy Income ETF, NYSE Arca ticker: ENY (the “Fund”) seeks investment results that correspond generally to the performance, before the Fund’s fees and expenses, of an equity index called the S&P/TSX Canadian High Income Energy Index (the “Index”). The Index includes the constituent stocks of the S&P/TSX Composite Index that are classified as energy companies, according to the Global Industry Classification Standard (“GICS”), and that also meet specific yield requirements.
The Fund will invest at least 80% of its total assets in securities that comprise the Index. The Fund generally will invest in all of the stocks comprising the Index in proportion to their weightings in the Index.
Fund Performance
All Fund returns cited–whether based on net asset value (“NAV”) or market price–assume the reinvestment of all distributions. This report discusses the annual fiscal period ended May 31, 2017.
On a market price basis, the Fund generated a total return of -0.01%, which included a decrease in market price over the period to $8.09 on May 31, 2017, from $8.33 on May 31, 2016. On an NAV basis, the Fund generated a total return of 0.36%, which included a decrease in NAV over the period to $8.14 on May 31, 2017, from $8.35 on May 31, 2016. At the end of the period the Fund’s shares were trading at a market price discount to NAV, which is to be expected from time to time. All NAV returns include the deduction of management fees, operating expenses, and all other Fund expenses.
For underlying index and broad Canadian equity market comparison purposes, the underlying Index returned 1.66%, and the S&P/TSX Composite Index returned 8.82% for the 12-month period ended May 31, 2017.
The Fund made the following quarterly distributions per share during the annual period ended May 31, 2017, which were characterized as ordinary income.
| Month | | Distribution per Share | |
| June 2016 | | $ | 0.0693 | |
| September | | $ | 0.0658 | |
| December | | $ | 0.0742 | |
| March 2017 | | $ | 0.0463 | |
| Total | | $ | 0.2556 | |
Performance Attribution
Since nearly all of the Fund’s portfolio is invested in the energy sector, the return of this sector was the major source of the Fund’s positive NAV return for the 12-month period ended May 31, 2017.
Positions that contributed the most to return included Veresen, Inc., Alberta-based energy infrastructure company involved in pipelines, natural gas and power generation; Suncor Energy, Inc., a Canadian integrated energy company that specializes in production of synthetic crude from oil sands; and TransCanada Corp., network of natural gas and crude oil pipelines, along with wind, solar and nuclear power facilities (6.1%, 5.4%, and 5.3%, respectively, of the Fund’s long-term investments at period end).
Positions that detracted the most included Crescent Point Energy Corp., an oil and gas company based in Calgary, Alberta; Peyto Exploration & Development Corp., an explorer and producer of unconventional natural gas in Alberta’s Deep Basin; and ARC Resources Ltd., a Canadian oil and gas producer (4.3%, 4.3%, and 4.6%, respectively, of the Fund’s long-term investments at period end).
| |
| 6 l CLAYMORE EXCHANGE-TRADED FUND TRUST 2 ANNUAL REPORT |
| MANAGEMENT DISCUSSION OF FUND PERFORMANCE (Unaudited) continued | May 31, 2017 |
TAO Guggenheim China Real Estate ETF
Fund Overview
The Guggenheim China Real Estate ETF, NYSE Arca ticker: TAO (the “Fund”) seeks investment results that correspond generally to the performance, before the Fund’s fees and expenses, of an equity index called the AlphaShares China Real Estate Index (the “Index”).
The Index is designed to measure and monitor the performance of the investable universe of publicly-traded companies and real estate investment trusts (“REITs”) which are open to foreign ownership and derive a majority of their revenues from real estate development, management, and/or ownership of property in China or the Special Administrative Regions of China, such as Hong Kong, and Macau. The Index was created by AlphaShares, LLC and is maintained by Standard & Poor’s.
The Fund will invest at least 90% of its total assets in common stock, American Depositary Receipts (“ADRs”), American Depositary Shares (“ADSs”), Global Depositary Receipts (“GDRs”), and International Depositary Receipts (“IDRs”) that comprise the Index and depositary receipts representing common stocks included in the Index (or underlying securities representing the ADRs, ADSs, GDRs, and IDRs included in the Index). The Fund generally will invest in all of the securities comprising the Index in proportion to their weightings in the Index.
Fund Performance
All Fund returns cited—whether based on net asset value (“NAV”) or market price—assume the reinvestment of all distributions. This report discusses the annual fiscal period ended May 31, 2017.
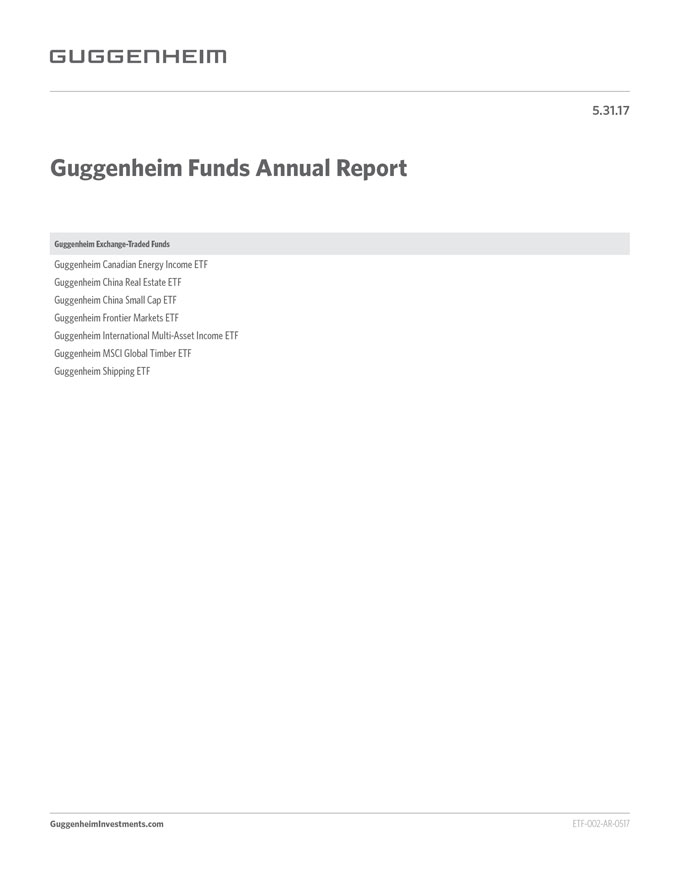
On a market price basis, the Fund generated a total return of 36.26%, which included an increase in market price over the period to $25.14 on May 31, 2017, from $18.83 on May 31, 2016. On an NAV basis, the Fund generated a total return of 34.94%, which included an increase in NAV over the period to $25.02 on May 31, 2017, from $18.92 on May 31, 2016. At the end of the period the Fund’s shares were trading at a market price premium to NAV, which is to be expected from time to time. All NAV returns include the deduction of management fees, operating expenses, and all other Fund expenses.
For underlying index and market comparison purposes, the Index returned 35.92% and the MSCI China Index returned 30.60% for the 12-month period ended May 31, 2017.
The Fund made a distribution of $0.4027 per share on December 30, 2016, which was characterized as ordinary income.
Performance Attribution
Nearly all of the Fund’s investments are in the real estate sector. For the 12-month period ended May 31, 2017, that sector contributed the most to return.
Positions that contributed the most to the Fund’s return included Country Garden Holdings Co. Ltd., a property development company based in Guangdong Province; China Wharf Holdings Ltd., which operates businesses in property investment and development, and communications, media, and entertainment; and China Evergrande Group, a property developer in Guangdong that sell apartments to upper- and middle-income dwellers (5.5%, 5.1%, and 3.9%, respectively, of the Fund’s long-term investments at period end).
Positions that detracted the most from the Fund’s return included China Logistics Property Holdings Co. Ltd., which constructs warehouses and provides leasing services to logistic firms (0.4% of the Fund’s long-term investments at period end); Swire Pacific Ltd.—Class A, a London-based conglomerate that operates in the property development, aviation, beverage, and marine services industries (3.1% of the Fund’s long-term investments at period end); and China New City Commercial Development Ltd., a commercial property developer, owner, and operator with a focus on developing integrated commercial complexes in sub-city centers of second-tier cities in the Yangtze River Delta Region (not held in the Fund’s portfolio at period end).
| |
| CLAYMORE EXCHANGE-TRADED FUND TRUST 2 ANNUAL REPORT l 7 |
| MANAGEMENT DISCUSSION OF FUND PERFORMANCE (Unaudited) continued | May 31, 2017 |
HAO Guggenheim China Small Cap ETF
Fund Overview
The Guggenheim China Small Cap ETF, NYSE Arca ticker: HAO (the “Fund”) seeks investment results that correspond generally to the performance, before the Fund’s fees and expenses, of an equity index called the AlphaShares China Small Cap Index (the “Index”).
The Index is designed to measure and monitor the performance of publicly traded mainland China-based small-capitalization companies. The Index was created by AlphaShares, LLC (“AlphaShares”) and is maintained by Standard & Poor’s. For inclusion in the Index, AlphaShares defines small-capitalization companies as those companies with a maximum $1.5 billion float-adjusted market capitalization.
The Fund will invest at least 90% of its total assets in common stock, American Depositary Receipts (“ADRs”), American Depositary Shares (“ADSs”), Global Depositary Receipts (“GDRs”), and International Depositary receipts (“IDRs”) that comprise the Index and depositary receipts representing common stocks included in the Index (or underlying securities representing the ADRs, ADSs, GDRs, and IDRs included in the Index). The Fund generally will invest in all of the securities comprising the Index in proportion to their weightings in the Index.
Fund Performance
All Fund returns cited—whether based on net asset value (“NAV”) or market price—assume the reinvestment of all distributions. This report discusses the annual fiscal period ended May 31, 2017.
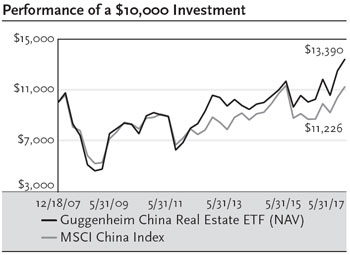
On a market price basis, the Fund generated a total return of 17.13%, which included an increase in market price over the period to $24.97 on May 31, 2017, from $22.04 on May 31, 2016. On an NAV basis, the Fund generated a total return of 18.05%, which included an increase in NAV over the period to $25.20 on May 31, 2017, from $22.06 on May 31, 2016. At the end of the period the Fund’s shares were trading at a market price discount to NAV, which is to be expected from time to time. All NAV returns include the deduction of management fees, operating expenses, and all other Fund expenses.
For underlying index and broad market comparison purposes, the Index returned 18.72% and the MSCI China Index returned 30.60% for the 12-month period ended May 31, 2017.
The Fund made a distribution of $0.7553 per share on December 30, 2016, which was characterized as ordinary income.
Performance Attribution
For the 12-month period ended May 31, 2017, the real estate sector was the largest contributor to the Fund’s return, followed by the materials sector. The consumer staples sector was the only detractor from return; the telecommunications services sector contributed least.
Positions that contributed the most to the Fund’s return included Sunac China Holdings Ltd., which focuses on large-scale property developments in Tianjin and other cities; China Lodging Group Ltd. ADR, a leading hotel operator and franchisor in China under 12 brand names; and Kingboard Chemical Holdings Ltd., a laminate manufacturer (1.3%, 1.1%, and 1.1%, respectively, of the Fund’s long-term investments at period end).
Positions that detracted the most from the Fund’s return included 58.com, Inc. ADR—Class A, which operates the largest online marketplace serving local merchants and consumers in China; Tech Pro Technology Development Ltd., an investment holding company principally engaged in the manufacture and sale of Light Emitting Diode (LED) lighting products and accessories; and China Huishan Dairy Holdings Co. Ltd., a dairy farm operator (none held in the Fund’s portfolio at period end).
| |
| 8 l CLAYMORE EXCHANGE-TRADED FUND TRUST 2 ANNUAL REPORT |
| MANAGEMENT DISCUSSION OF FUND PERFORMANCE (Unaudited) continued | May 31, 2017 |
FRN Guggenheim Frontier Markets ETF
Fund Overview
The Guggenheim Frontier Markets ETF, NYSE Arca ticker: FRN (the “Fund”), seeks investment results that correspond generally to the performance, before the Fund’s fees and expenses, of the BNY Mellon New Frontier Index (the “Index”).
The Index is composed of all liquid (as defined by the criteria set forth below) American depositary receipts (“ADRs”), global depositary receipts (“GDRs”), and local securities of certain countries that are represented in the Index. The Index tracks the performance of ADRs listed on a U.S. exchange, GDRs traded on the London Stock Exchange (“LSE”), and ordinary share classes of equity securities listed on exchanges in Frontier Market countries (as defined below).
The Bank of New York Mellon, the Fund’s Index provider (“BNY Mellon” or the “Index Provider”), categorizes countries as “Frontier Market” based upon an evaluation of gross domestic product growth, per capita income growth, experienced and expected inflation rates, privatization of infrastructure, and social inequalities. These countries currently are: Argentina*, Bahrain*, Bangladesh*, Bulgaria, Croatia, Cyprus, Jordan*, Kazakhstan*, Kenya, Kuwait, Latvia, Lithuania, Morocco, Nigeria, Oman, Pakistan, Panama, Romania, Sri Lanka*, Tunisia*, Vietnam and Zambia (* denotes that such country must have an eligible class in a developed or emerging market).
The universe of potential Index constituents includes all liquid ADRs, GDRs, and ordinary shares which meet certain criteria with respect to trading volume and market capitalization. Potential Index constituents include securities with free-float market capitalizations greater than $250 million, which may include securities of all categories of market capitalizations, as defined by the Index Provider. The Fund also may invest directly in other exchange-traded funds (“ETFs”) that provide exposure to securities similar to those securities in which the Fund may directly invest.
Fund Performance
All Fund returns cited—whether based on net asset value (“NAV”) or market price—assume the reinvestment of all distributions. This report discusses the annual period ended May 31, 2017.
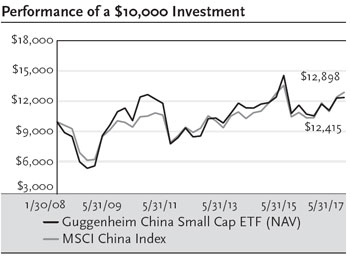
On a market price basis, the Fund generated a total return of 26.20%, which included an increase in market price over the period to $13.74 on May 31, 2017, from $11.33 on May 31, 2016. On an NAV basis, the Fund generated a total return of 24.72%, which included an increase in NAV over the period to $13.76 on May 31, 2017, from $11.48 on May 31, 2016. At the end of the period the Fund’s shares were trading at a market price discount to NAV, which is to be expected from time to time. All NAV returns include the deduction of management fees, operating expenses, and all other Fund expenses.
The Index returned 27.30% and the MSCI Emerging Markets Index returned 27.41% for the 12-month period ended May 31, 2017.
The Fund made a distribution of $0.4702 per share on December 30, 2016, which was characterized as ordinary income.
Performance Attribution
For the 12-month period ended May 31, 2017, the financials sector was the largest contributor to return, followed by the industrials sector. The consumer staples sector was the only detractor from return; the health care sector contributed least.
Positions that contributed the most to the Fund’s return included MercadoLibre, Inc. an Argentine online marketplace dedicated to e-commerce and online auctions; Copa Holdings, S.A.—Class A, which provides international airline passenger and cargo service; and KAZ Minerals Plc, a copper company focused on large scale, low cost open pit mining in Kazakhstan (6.3%, 4.9%, and 2.3%, respectively, of the Fund’s long-term investments at period end).
Positions that detracted the most from the Fund’s return included Nigerian Breweries Plc, a large brewing company that serves the Nigerian market and exports to other parts of West Africa (2.8% of the Fund’s long-term investments at period end); Zenith Bank Plc, a Nigerian multinational financial services provider (not held in the Fund’s portfolio at period end); and Equity Bank Ltd., is a financial services provider headquartered in Nairobi, Kenya (not held in the Fund’s portfolio at period end).
| |
| CLAYMORE EXCHANGE-TRADED FUND TRUST 2 ANNUAL REPORT l 9 |
| MANAGEMENT DISCUSSION OF FUND PERFORMANCE (Unaudited) continued | May 31, 2017 |
HGI Guggenheim International Multi-Asset Income ETF
Fund Overview
The Guggenheim International Multi-Asset Income ETF, NYSE Arca ticker: HGI (the “Fund”) seeks investment results that correspond generally to the performance, before the Fund’s fees and expenses, of an index called the Zacks International Multi-Asset Income Index (the “Index”).
The Index is comprised of approximately 150 securities selected, based on investment and other criteria, from a universe of international companies, global real estate investment trusts (“REITs”), master limited partnerships (“MLPs”), Canadian royalty trusts, and American Depositary Receipts (“ADRs”) of emerging market companies and U.S. listed closed-end funds that invest in international companies, and at all times is comprised of at least 40% non-U.S. securities. The companies in the universe are selected using a proprietary strategy developed by Zacks Investment Research, Inc.
The Fund will invest at least 90% of its total assets in securities that comprise the Index and underlying securities representing the ADRs included in the Index. The Fund generally will invest in all of the securities comprising the Index in proportion to their weightings in the Index.
Fund Performance
All Fund returns cited—whether based on net asset value (“NAV”) or market price—assume the reinvestment of all distributions. This report discusses the annual fiscal period ended May 31, 2017.
On a market price basis, the Fund generated a total return of 18.69%, which included an increase in market price over the period to $16.79 on May 31, 2017, from $14.66 on May 31, 2016. On an NAV basis, the Fund generated a total return of 18.09%, which included an increase in NAV over the period to $16.81 on May 31, 2017, from $14.75 on May 31, 2016. At the end of the period the Fund’s shares were trading at a market price discount to NAV, which is to be expected from time to time. All NAV returns include the deduction of management fees, operating expenses, and all other Fund expenses.
For underlying index and broad market comparison purposes, the Index returned 18.36% and the MSCI EAFE Index returned 16.44% for the 12-month period ended May 31, 2017.
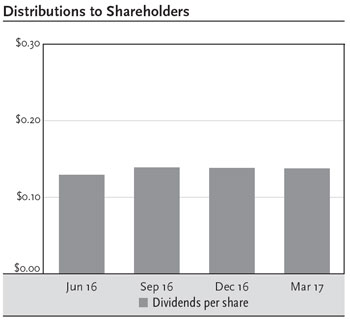
The Fund made the following quarterly distributions per share during the annual period ended May 31, 2017, which were characterized as ordinary income.
| Month | | Distribution per Share | |
| June 2016 | | $ | 0.1289 | |
| September | | $ | 0.1390 | |
| December | | $ | 0.1380 | |
| March 2017 | | $ | 0.1372 | |
| Total | | $ | 0.5431 | |
Performance Attribution
For the 12-month period ended May 31, 2017, the financials sector was the largest contributor to return, followed by the industrials sector. The energy sector was the only detractor from return.
Positions that contributed the most to the Fund’s return included Qiwi Plc ADR—Class B, a provider of payment services in Russia and the CIS; Man Wah Holdings Ltd., a Chinese furniture and bedding manufacturer; and Braskem S.A. Preferred ADR—Class A, a Brazilian petrochemical company (2.3%, 2.0%, and 1.3%, respectively, of the Fund’s long-term investments at period end).
Positions that detracted the most from the Fund’s return included Crescent Point Energy Corp., an oil and gas company based in Calgary, Alberta, Canada (0.6% of the Fund’s long-term investments at period end); PLDT, Inc. ADR, the largest telecommunications and digital services company in the Philippines (not held in the Fund’s portfolio at period end); and DRDGOLD Ltd. ADR, a South African gold producer (0.6% of the Fund’s long-term investments at period end).
| |
| 10 l CLAYMORE EXCHANGE-TRADED FUND TRUST 2 ANNUAL REPORT |
| MANAGEMENT DISCUSSION OF FUND PERFORMANCE (Unaudited) continued | May 31, 2017 |
CUT Guggenheim MSCI Global Timber ETF
Fund Overview
The Guggenheim MSCI Global Timber ETF, NYSE Arca ticker: CUT (the “Fund”) seeks investment results that correspond generally to the performance, before the Fund’s fees and expenses, of an equity index called the MSCI ACWI IMI Timber Select Capped Index (the “Index”).
The MSCI ACWI IMI Timber Select Capped Index is designed to measure the performance of securities that are engaged in the ownership and management of forests and timberlands and production of finished products which use timber as raw material. These companies include companies that produce forest products, paper products and paper packaging products, and real estate investment trusts (“REITs”) that own and/or manage timberland. Index constituents must be constituents of the MSCI ACWI Investable Market Index, a rules-based index that measures equity market performance of developed and emerging markets.
The Fund will invest at least 90% of its total assets in common stock, American depositary receipts (“ADRs”) and global depositary receipts (“GDRs”) that comprise the Index and depositary receipts representing common stocks included in the Index (or underlying securities representing the ADRs and GDRs included in the Index). The Fund generally will invest in all of the securities comprising the Index in proportion to their weightings in the Index.
Fund Performance
All Fund returns cited—whether based on net asset value (“NAV”) or market price—assume the reinvestment of all distributions. This report discusses the annual fiscal period ended May 31, 2017.
On a market price basis, the Fund generated a total return of 19.09%, which included an increase in market price over the period to $27.52 on May 31, 2017, from $23.59 on May 31, 2016. On an NAV basis, the Fund generated a total return of 19.09%, which included an increase in NAV over the period to $27.57 on May 31, 2017, from $23.63 on May 31, 2016. At the end of the period the Fund’s shares were trading at a market price discount to NAV, which is to be expected from time to time. All NAV returns include the deduction of management fees, operating expenses, and all other Fund expenses.
The MSCI ACWI IMI Timber Select Capped Index returned 19.23% for the 12-month period ended May 31, 2017. The S&P Global Timber and Forestry Index returned 26.94%; and the MSCI World Index returned 16.42%. The STOXX® Europe TMI (Total Market Index) Forestry & Paper Index returned 42.58%. It is a market-capitalization weighted index of all companies in the Forestry & Paper sector of the STOXX Europe TMI.
The Fund made a distribution of $0.5152 per share on December 30, 2016, which was characterized as ordinary income.
Performance Attribution
Most of the Fund’s portfolio is invested in the materials sector, and it was the major contributor to the Fund’s return for the 12-month period ended May 31, 2017. The Fund also has positions in the financials sector, which contributed to return for the period.
Positions that contributed the most to the Fund’s return included UPM-Kymmene Oyj, a Finnish forest industry company; WestRock Co., an American corrugated packaging company; and Packaging Corporation of America, a manufacturer of containerboard and corrugated packaging (5.1%, 5.0%, and 4.9%, respectively, of the Fund’s long-term investments at period end).
Positions detracting the most from the Fund’s return included Bemis Company, Inc., global manufacturer of flexible packaging products and pressure-sensitive materials; Huhtamaki Oyj, a Finnish global food packaging concern; and Stella-Jones, Inc., a North American manufacturer of pressure treated wood products (2.1%, 1.8%, and 0.8%, respectively, of the Fund’s long-term investments at period end).
| |
| CLAYMORE EXCHANGE-TRADED FUND TRUST 2 ANNUAL REPORT l 11 |
| MANAGEMENT DISCUSSION OF FUND PERFORMANCE (Unaudited) continued | May 31, 2017 |
SEA Guggenheim Shipping ETF
Fund Overview
The Guggenheim Shipping ETF, NYSE Arca ticker: SEA (the “Fund”) seeks investment results that correspond generally to the performance, before the Fund’s fees and expenses, of an equity index called the Dow Jones Global Shipping IndexSM (the “Index”).
The Index is designed to measure the performance of high-dividend paying companies in the global shipping industry. CME Group Index Services, LLC (the “Index Provider”) uses a rules-based methodology to rank companies by yield that are involved in the shipping industry globally that primarily transport goods and materials. The Index Provider considers a company to be in the shipping industry if its revenues are derived primarily from shipping activities (excluding companies solely involved in transporting passengers). The Index Provider determines whether a company is “high-dividend paying” by ranking it relative to other companies in the shipping industry based upon indicated annual yield (most recent distribution annualized and divided by the current share price). The companies in the Index may be located in any country, including those classified as emerging markets.
The Fund will at all times invest at least 90% of its total assets in common stock, American Depositary Receipts (“ADRs”), Global Depositary Receipts(“GDRs”), and master limited partnerships (“MLPs”) that comprise the Index and the underlying stocks of the ADRs and GDRs in the Index. The Fund generally will invest in all of the securities comprising the Index in proportion to their weightings in the Index.
Fund Performance
All Fund returns cited—whether based on net asset value (“NAV”) or market price—assume the reinvestment of all distributions. This report discusses the annual fiscal period ended May 31, 2017.
On a market price basis, the Fund generated a total return of 1.79%, which included a decrease in market price over the period to $11.49 on May 31, 2017, from $12.00 on May 31, 2016. On an NAV basis, the Fund generated a total return of 1.83%, which included a decrease in NAV over the period to $11.50 on May 31, 2017, from $12.01 on May 31, 2016. At the end of the period the Fund’s shares were trading at a market price discount to NAV, which is to be expected from time to time. All NAV returns include the deduction of management fees, operating expenses, and all other Fund expenses.
For underlying index and broad market comparison purposes, the Index returned 0.76% and the MSCI World Index returned 16.42% for the 12-month period ended May 31, 2017.
The Fund made the following quarterly distributions per share during the annual period ended May 31, 2017, which were characterized as ordinary income.
| Month | | Distribution per Share | |
| June 2016 | | $ | 0.3503 | |
| September | | $ | 0.1603 | |
| December | | $ | 0.1059 | |
| March 2017 | | $ | 0.0810 | |
| Total | | $ | 0.6975 | |
Performance Attribution
Most of the Fund’s portfolio is invested in the energy and the industrials sectors; the industrials sector contributed to return, while the energy sector detracted.
Positions that contributed most to the Fund’s return included A.P. Moller-Maersk AS—Class B, a Danish business conglomerate with activities in the transport & logistics and energy sectors; Kawasaki Kisen Kaisha Ltd., an integrated logistics company known as the “K” Line; and Golar LNG Partners LP, which owns and operates floating storage and regasification units and LNG carriers (24.0%, 6.3%, and 3.6%, respectively, of the Fund’s long-term investments at period end).
Positions that detracted the most from the Fund’s return included Nordic American Tankers Ltd., which owns 33 crude oil tankers; Seaspan Corp., an independent owner and manager of containerships; and Teekay Offshore Partners LP, an international provider of marine transportation, oil production, storage, long-distance towing and other services to the oil industry (2.7%, 2.0%, and 1.6%, respectively, of the Fund’s long-term investments at period end).
| |
| 12 l CLAYMORE EXCHANGE-TRADED FUND TRUST 2 ANNUAL REPORT |
| RISKS AND OTHER CONSIDERATIONS (Unaudited) | May 31, 2017 |
The views expressed in this report reflect those of the portfolio managers and Guggenheim Investments only through the report period as stated on the cover. These views are subject to change at any time, based on market and other conditions and should not be construed as a recommendation of any kind. The material may also contain forward-looking statements that involve risk and uncertainty, and there is no guarantee they will come to pass.
This information does not represent an offer to sell securities of the Funds and it is not soliciting an offer to buy securities of the Funds. An investment in the various Guggenheim Investments ETFs is subject to certain risks and other considerations. Below are some general risks and considerations associated with investing in the Funds, which may cause you to lose money, including the entire principal that you invest. Please refer to the individual ETF prospectus for a more detailed discussion of the Fund-specific risks and considerations.
Equity Risk: The value of the equity securities held by the Funds may fall due to general market and economic conditions, perceptions regarding the industries in which the issuers of securities held by the Funds participate, or factors relating to specific companies in which the Funds invest.
Foreign Investment Risk: Investing in non-U.S. issuers may involve unique risks such as currency, political, and economic risk, as well as less market liquidity, generally greater market volatility and less complete financial information than for U.S. issuers.
Small- and Medium-Sized Company Risk: Investing in securities of these companies involves greater risk as their stocks may be more volatile and less liquid than investing in more established companies. These stocks may have returns that vary, sometimes significantly, from the overall stock market.
Non-Correlation Risk: The Funds’ return may not match the return of the Index including, but not limited to, operating expenses and costs in buying and selling securities to reflect changes in the Index. The Funds may not be fully invested at times. If the Funds utilize a sampling approach or futures or other derivative positions, their return may not correlate with the Index return, as would be the case if they purchased all of the stocks with the same weightings as the Index.
Passive Management Risk: The Funds are not “actively” managed. Therefore, they would not necessarily sell a stock because the stock’s issuer was in financial trouble unless that stock is removed from the Index.
Issuer-Specific Changes: The value of an individual security or particular type of security can be more volatile than the market as a whole and can perform differently from the value of the market as a whole. The value of securities of smaller issuers can be more volatile than that of larger issuers.
Industry Risk: If its Index is comprised of issuers in a particular industry or sector, a Fund would therefore be focused in that industry or sector. Accordingly, that Fund may be subject to more risks than if it were broadly diversified over numerous industries and sectors of the economy.
Non-Diversified Fund Risk: Certain Funds are considered non-diversified and can invest a greater portion of assets in securities of individual issuers than a diversified fund. As a result, changes in the market value of a single investment could cause greater fluctuations in share price than would occur in a diversified fund.
Emerging Markets Risk (excluding CUT, FRN, HGI, TAO, HAO and SEA): Investment in securities of issuers based in developing or “emerging markets” countries entails all of the risks of investing in securities of non-U.S. issuers, as previously described, but to a heightened degree.
Canadian Risk (ENY and HGI): Investing in Canadian royalty trusts and stocks listed on the TSX are subject to: Commodity Exposure Risk, Reliance on Exports Risk, U.S. Economic Risk and Structural Risk (Political Risk).
Master Limited Partnership (MLP) Risk (FRN, SEA and HGI): Investments in securities of MLPs involve risks that differ from an investment in common stock. Holders of the units of MLPs have more limited control and limited rights to vote on matters affecting the partnership. There are also certain tax risks associated with an investment in units of MLPs.
China Investment Risk (HAO and TAO): Investing in securities of Chinese companies involves additional risks, including, but not limited to: the economy of China differs, often unfavorably, from the U.S. economy in such respects as structure, general development, government involvement, wealth distribution, rate of inflation, growth rate, allocation of resources and capital reinvestment, among others; the central government has historically exercised substantial control over virtually every sector of the Chinese economy through administrative regulation and/or state ownership; and actions of the Chinese central and local government authorities continue to have a substantial effect on economic conditions in China.
REIT Risk (HGI, TAO and CUT): Investments in securities of real estate companies involve risks. These risks include, among others, adverse changes in national, state or local real estate conditions; obsolescence of properties; changes in the availability, cost and terms of mortgage funds; and the impact of changes in environmental laws.
Risks of Investing In Other Investment Companies (HGI): Investments in securities of other investment companies involve risks, including, among others, the fact that shares of other investment companies are subject to the management fees and other expenses of those companies, and the purchase of shares of some investment companies (in the case of closed-end investment companies) may sometimes require the payment of substantial premiums above the value of such companies’ portfolio securities or net asset values.
Risks of Investing in Frontier Securities (FRN): Investment in securities in emerging markets countries involves risks not associated with investments in securities in developed countries, including risks associated with expropriation and/or nationalization, political or social instability, armed conflict, the impact on the economy as a result of civil war, religious or ethnic unrest and the withdrawal or non-renewal of any license enabling the Fund to trade in securities of a particular country, confiscatory taxation, restrictions on transfers of assets, lack of uniform accounting, auditing and financial reporting standards, less publicly available financial and other information, diplomatic development which could affect U.S. investments in those countries and potential difficulties in enforcing contractual obligations. Frontier countries generally have smaller economies or less developed capital markets than traditional emerging markets, and, as a result, the risk of investing in emerging markets countries are magnified in frontier countries.
As of the date of this report, a significant percentage of the BNY Mellon New Frontier Index is comprised of securities of companies from Kuwait, Morocco and Pakistan. To the extent that the Index is focused on securities of any one country, including Kuwait, Morocco or Pakistan, the value of the Index will be especially affected by adverse developments in such country, including the risks described above.
Securities Lending Risk: Although each Fund will receive collateral in connection with all loans of its securities holdings, the Funds would be exposed to a risk of loss should a borrower default on its obligation to return the borrowed securities (e.g., the loaned securities may have appreciated beyond the value of the collateral held by the Fund). In addition, the Funds will bear the risk of loss of any cash collateral that they invest.
In addition to the risks described, there are certain other risks related to investing in the Funds. These risks are described further in the Prospectus and Statement of Additional Information and at guggenheiminvestments.com/etf.
This material is not intended as a recommendation or as investment advice of any kind, including in connection with rollovers, transfers, and distributions. Such material is not provided in a fiduciary capacity, may not be relied upon for or in connection with the making of investment decisions, and does not constitute a solicitation of an offer to buy or sell securities. All content has been provided for informational or educational purposes only and is not intended to be and should not be construed as legal or tax advice and/or a legal opinion. Always consult a financial, tax and/or legal professional regarding your specific situation.
| |
| CLAYMORE EXCHANGE-TRADED FUND TRUST 2 ANNUAL REPORT l 13 |
| PERFORMANCE REPORT AND FUND PROFILE (Unaudited) | May 31, 2017 |
ENY Guggenheim Canadian Energy Income ETF
| Fund Statistics | | | |
| Share Price | | $ | 8.09 |
| Net Asset Value | | $ | 8.14 |
| Discount to NAV | | | -0.61% |
| Net Assets ($000) | | $ | 24,596 |
AVERAGE ANNUAL TOTAL RETURNS FOR THE
PERIOD ENDED May 31, 2017 |
| | | | | | | | | Since |
| | | One | | Three | | Five | | Inception |
| | | Year | | Year | | Year | | (07/03/07) |
| Guggenheim Canadian | | | | | | | | |
| Energy Income ETF | | | | | | | | |
| NAV | | 0.36% | | -18.20% | | -8.53% | | -7.45% |
| Market | | -0.01% | | -18.50% | | -8.51% | | -7.51% |
| Sustainable Canadian | | | | | | | | |
| Energy Income | | | | | | | | |
| Index S&P/TSX/ | | | | | | | | |
| Canadian High | | | | | | | | |
| Income Energy | | | | | | | | |
| Index | | 1.66% | | -17.37% | | -8.09%1 | | -6.41%1 |
| S&P/TSX | | | | | | | | |
| Composite | | | | | | | | |
| Index | | 8.82% | | -2.66% | | 3.44% | | 1.33% |
Performance data quoted represents past performance, which is no guarantee of future results and current performance may be lower or higher than the figures shown. All NAV returns include the deduction of management fees, operating expenses and all other Fund expenses. The deduction of taxes that a shareholder would pay on Fund distributions or the redemption of Fund shares is not reflected in the total returns. For the most recent month-end performance figures, please visit guggenheiminvestments.com. The investment return and principal value of an investment will fluctuate with changes in market conditions and other factors so that an investor’s shares, when redeemed, may be worth more or less than their original cost.
Since inception returns assume a purchase of the Fund at the initial share price of $25.05 per share for share price returns or initial net asset value (NAV) of $25.05 per share for NAV returns. Returns for periods of less than one year are not annualized.
The S&P/TSX Composite is the headline index for the Canadian equity market. It is the broadest in the S&P/TSX family and is the basis for multiple sub-indices.The referenced indices are unmanaged and not available for direct investment. Index performance does not reflect transaction costs, fees or expenses.
Per the most recent prospectus, the Fund’s annualized gross operating expense ratio, gross of any fee waivers or expense reimbursements, was 0.87%. In the Financial Highlights section of this Annual Report, the Fund’s annualized net operating expense ratio was 0.66% while the Fund’s annualized gross operating expense ratio, gross of any fee waivers or expense reimbursements, was 0.90%. There is a contractual fee waiver currently in place for this Fund through December 31, 2019 to the extent necessary in keeping the Fund’s operating expense ratio from exceeding 0.65% of average net assets per year. Some expenses fall outside of this expense cap and actual expenses may be higher than 0.65%. Without this expense cap, actual returns would be lower. Please see the Financial Highlights for recent expense ratios.
| Country Diversification |
| | % of Long-Term |
| Country | Investments |
| Canada | 100.0% |
| Ten Largest Holdings | | (% of Total Net Assets) |
| Veresen, Inc. | | 6.1% |
| Keyera Corp. | | 5.5% |
| Suncor Energy, Inc. | | 5.4% |
| PrairieSky Royalty Ltd. | | 5.3% |
| TransCanada Corp. | | 5.3% |
| Pembina Pipeline Corp. | | 5.2% |
| AltaGas Ltd. | | 5.0% |
| Inter Pipeline Ltd. | | 4.9% |
| Enbridge, Inc. | | 4.9% |
| Canadian Natural Resources Ltd. | | 4.6% |
| Top Ten Total | | 52.2% |
“Ten Largest Holdings” excludes any temporary cash investments.
| 1 | Benchmark returns reflect the blended return of the Sustainable Canadian Energy Income Index from 7/3/07 – 7/31/13 and the return of the S&P/TSX Canadian High Income Energy Index, net of foreign withholding taxes, from 8/1/13 – 5/31/17. |
| |
| 14 l CLAYMORE EXCHANGE-TRADED FUND TRUST 2 ANNUAL REPORT |
| PERFORMANCE REPORT AND FUND PROFILE (Unaudited) continued | May 31, 2017 |
ENY Guggenheim Canadian Energy Income ETF continued


This graph compares a hypothetical $10,000 investment in the Fund, made at its inception, with a similar investment in the Standard and Poor’s Toronto Stock Exchange Composite Index (S&P/TSX Composite Index). Results include the reinvestment of all dividends and capital gains. Past performance is no guarantee of future results. The S&P/TSX Composite Index is a capitalization-weighted index. The index is designed to measure performance of the broad Canadian economy through changes in the aggregate market value of stocks representing all major industries. It is not possible to invest directly in the S&P/TSX Composite Index. Investment return and principal value will fluctuate with changes in market conditions and other factors and Fund shares, when redeemed, may be worth more or less than their original investment.
| |
| CLAYMORE EXCHANGE-TRADED FUND TRUST 2 ANNUAL REPORT l 15 |
| PERFORMANCE REPORT AND FUND PROFILE (Unaudited) continued | May 31, 2017 |
TAO Guggenheim China Real Estate ETF
| Fund Statistics | | | |
| Share Price | | $ | 25.14 |
| Net Asset Value | | $ | 25.02 |
| Premium to NAV | | | 0.48% |
| Net Assets ($000) | | $ | 44,038 |
| AVERAGE ANNUAL TOTAL RETURNS FOR THE |
| PERIOD ENDED MAY 31, 2017 |
| | | | | Since |
| | One | Three | Five | Inception |
| | Year | Year | Year | (12/18/07) |
| Guggenheim China | | | | |
| Real Estate ETF | | | | |
| NAV | 34.94% | 10.20% | 11.52% | 3.14% |
| Market | 36.26% | 10.57% | 11.62% | 3.18% |
| AlphaShares China | | | | |
| Real Estate | | | | |
| Index | 35.92% | 10.66% | 12.08% | 3.84% |
| MSCI China | | | | |
| Index | 30.60% | 8.38% | 8.90% | 1.24% |
Performance data quoted represents past performance, which is no guarantee of future results and current performance may be lower or higher than the figures shown. All NAV returns include the deduction of management fees, operating expenses and all other Fund expenses. The deduction of taxes that a shareholder would pay on Fund distributions or the redemption of Fund shares is not reflected in the total returns. For the most recent month-end performance figures, please visit guggenheiminvestments.com. The investment return and principal value of an investment will fluctuate with changes in market conditions and other factors so that an investor’s shares, when redeemed, may be worth more or less than their original cost.
Since inception returns assume a purchase of the Fund at the initial share price of $23.50 per share for share price returns or initial net asset value (NAV) of $23.50 per share for NAV returns. Returns for periods of less than one year are not annualized.
The MSCI China Index is a capitalization-weighted index that measures the performance of large- and mid-cap securities in the Chinese equity markets and includes representation across China H shares, B shares, Red chips and P chips. The referenced indices are unmanaged and not available for direct investment. Index performance does not reflect transaction costs, fees or expenses.
Per the most recent prospectus, the Fund’s annualized gross operating expense ratio, gross of any fee waivers or expense reimbursements, was 1.15%. In the Financial Highlights section of this Annual Report, the Fund’s annualized net operating expense ratio was 0.70% while the Fund’s annualized gross operating expense ratio, gross of any fee waivers or expense reimbursements, was 0.99%. There is a contractual fee waiver currently in place for this Fund through December 31, 2019 to the extent necessary in keeping the Fund’s operating expense ratio from exceeding 0.65% of average net assets per year. Some expenses fall outside of this expense cap and actual expenses may be higher than 0.65%. Without this expense cap, actual returns would be lower. Please see the Financial Highlights for recent expense ratios.
| Portfolio Breakdown | % of Net Assets |
| Financial | 87.3% |
| Diversified | 9.5% |
| Energy | 1.7% |
| Consumer, Cyclical | 0.7% |
| Industrial | 0.4% |
| Total Common Stocks | 99.6% |
| Securities Lending Collateral | 2.0% |
| Total Investments | 101.6% |
| Other Assets & Liabilities, net | -1.6% |
| Net Assets | 100.0% |
| Ten Largest Holdings | (% of Total Net Assets) |
| Country Garden Holdings Company Ltd. | 5.5% |
| Wharf Holdings Ltd. | 5.0% |
| Hongkong Land Holdings Ltd. | 5.0% |
| Henderson Land Development Company Ltd. | 4.8% |
| China Resources Land Ltd. | 4.8% |
| Link REIT | 4.8% |
| Sun Hung Kai Properties Ltd. | 4.7% |
| Cheung Kong Property Holdings Ltd. | 4.6% |
| China Overseas Land & Investment Ltd. | 4.4% |
| New World Development Company Ltd. | 4.2% |
| Top Ten Total | 47.8% |
“Ten Largest Holdings” excludes any temporary cash investments.
This graph compares a hypothetical $10,000 investment in the Fund, made at its inception, with a similar investment in the MSCI China Index. Results include the reinvestment of all dividends and capital gains. Past performance is no guarantee of future results. The MSCI China Index is a capitalization-weighted index that monitors the performance of stocks from the country of China. The referenced index is unmanaged. It is not possible to invest directly in the MSCI China Index. Investment return and principal value will fluctuate with changes in market conditions and other factors and Fund shares, when redeemed, may be worth more or less than their original investment.
| |
| 16 l CLAYMORE EXCHANGE-TRADED FUND TRUST 2 ANNUAL REPORT |
| PERFORMANCE REPORT AND FUND PROFILE (Unaudited) continued | May 31, 2017 |
HAO Guggenheim China Small Cap ETF
| Fund Statistics | | | |
| Share Price | | $ | 24.97 |
| Net Asset Value | | $ | 25.20 |
| Discount to NAV | | | -0.91% |
| Net Assets ($000) | | $ | 85,687 |
| AVERAGE ANNUAL TOTAL RETURNS FOR THE |
| PERIOD ENDED MAY 31, 2017 |
| | | | | Since |
| | One | Three | Five | Inception |
| | Year | Year | Year | (01/30/08) |
| Guggenheim China | | | | |
| Small Cap ETF | | | | |
| NAV | 18.05% | 3.81% | 7.45% | 2.34% |
| Market | 17.13% | 3.55% | 7.22% | 2.24% |
| AlphaShares China | | | | |
| Small Cap | | | | |
| Index | 18.72% | 1.68% | 6.31% | 2.33% |
| MSCI China | | | | |
| Index | 30.60% | 8.38% | 8.90% | 2.76% |
Performance data quoted represents past performance, which is no guarantee of future results and current performance may be lower or higher than the figures shown. All NAV returns include the deduction of management fees, operating expenses and all other Fund expenses. The deduction of taxes that a shareholder would pay on Fund distributions or the redemption of Fund shares is not reflected in the total returns. For the most recent month-end performance figures, please visit guggenheiminvestments.com. The investment return and principal value of an investment will fluctuate with changes in market conditions and other factors so that an investor’s shares, when redeemed, may be worth more or less than their original cost.
Since inception returns assume a purchase of the Fund at the initial share price of $24.34 per share for share price returns or initial net asset value (NAV) of $24.34 per share for NAV returns. Returns for periods of less than one year are not annualized.
The MSCI China Index is a capitalization-weighted index that measures the performance of large- and mid-cap securities in the Chinese equity markets and includes representation across China H shares, B shares, Red chips and P chips. The referenced index is unmanaged and not available for direct investment. Index performance does not reflect transaction costs, fees or expenses.
Per the most recent prospectus, the Fund’s annualized gross operating expense ratio, gross of any fee waivers or expense reimbursements, was 0.87%. In the Financial Highlights section of this Annual Report, the Fund’s annualized net operating expense ratio was 0.75% while the Fund’s annualized gross operating expense ratio, gross of any fee waivers or expense reimbursements, was 0.90%. There is a contractual fee waiver currently in place for this Fund through December 31, 2019 to the extent necessary in keeping the Fund’s operating expense ratio from exceeding 0.70% of average net assets per year. Some expenses fall outside of this expense cap and actual expenses may be higher than 0.70%. Without this expense cap, actual returns would be lower. Please see the Financial Highlights for recent expense ratios.
| Portfolio Breakdown | % of Net Assets |
| Financial | 21.7% |
| Industrial | 17.3% |
| Consumer, Non-cyclical | 17.0% |
| Consumer, Cyclical | 15.4% |
| Basic Materials | 8.6% |
| Communications | 6.7% |
| Technology | 5.4% |
| Other | 7.3% |
| Total Long-Term Investments | 99.4% |
| Securities Lending Collateral | 10.9% |
| Total Investments | 110.3% |
| Other Assets & Liabilities, net | -10.3% |
| Net Assets | 100.0% |
| Ten Largest Holdings | (% of Total Net Assets) |
| Sunac China Holdings Ltd. | 1.3% |
| TravelSky Technology Ltd. — Class H | 1.2% |
| Kingboard Chemical Holdings Ltd. | 1.1% |
| Xinyi Glass Holdings Ltd. | 1.0% |
| China Lodging Group Ltd. ADR | 1.0% |
| Autohome, Inc. ADR | 1.0% |
| Yangzijiang Shipbuilding Holdings Ltd. | 1.0% |
| Sihuan Pharmaceutical Holdings Group Ltd. | 1.0% |
| Beijing Capital International Airport Company Ltd. — Class H | 0.9% |
| Sinopec Shanghai Petrochemical Company Ltd. — Class H | 0.9% |
| Top Ten Total | 10.4% |
“Ten Largest Holdings” excludes any temporary cash investments.
This graph compares a hypothetical $10,000 investment in the Fund, made at its inception, with a similar investment in the MSCI China Index. Results include the reinvestment of all dividends and capital gains. Past performance is no guarantee of future results. The MSCI China Index is a capitalization-weighted index that monitors the performance of stocks from the country of China. The index is unmanaged. It is not possible to invest directly in the MSCI China Index. Investment return and principal value will fluctuate with changes in market conditions and other factors and Fund shares, when redeemed, may be worth more or less than their original investment.
| |
| CLAYMORE EXCHANGE-TRADED FUND TRUST 2 ANNUAL REPORT l 17 |
| PERFORMANCE REPORT AND FUND PROFILE (Unaudited) continued | May 31, 2017 |
FRN Guggenheim Frontier Markets ETF
| Fund Statistics | | | |
| Share Price | | $ | 13.74 |
| Net Asset Value | | $ | 13.76 |
| Discount to NAV | | | -0.15% |
| Net Assets ($000) | | $ | 63,834 |
| AVERAGE ANNUAL TOTAL RETURNS FOR THE |
| PERIOD ENDED MAY 31, 2017 |
| | | | | Since |
| | One | Three | Five | Inception |
| | Year | Year | Year | (06/12/08) |
| Guggenheim Frontier | | | | |
| Markets ETF | | | | |
| NAV | 24.72% | -3.60% | -3.32% | -3.66% |
| Market | 26.20% | -3.77% | -3.52% | -3.67% |
| BNY Mellon | | | | |
| New Frontier | | | | |
| Index | 27.30% | -1.51% | -1.90% | -2.57% |
| MSCI Emerging | | | | |
| Markets | | | | |
| Index | 27.41% | 1.62% | 4.54% | 1.07% |
Performance data quoted represents past performance, which is no guarantee of future results and current performance may be lower or higher than the figures shown. All NAV returns include the deduction of management fees, operating expenses and all other Fund expenses. The deduction of taxes that a shareholder would pay on Fund distributions or the redemption of Fund shares is not reflected in the total returns. For the most recent month-end performance figures, please visit guggenheiminvestments.com. The investment return and principal value of an investment will fluctuate with changes in market conditions and other factors so that an investor’s shares, when redeemed, may be worth more or less than their original cost.
Since inception returns assume a purchase of the Fund at the initial share price of $24.34 per share for share price returns or initial net asset value (NAV) of $24.34 per share for NAV returns. Returns for periods of less than one year are not annualized.
The MSCI Emerging Markets Index is a free float-adjusted market capitalization index that is designed to measure equity market performance in the global emerging markets. The referenced indices are unmanaged and not available for direct investment. Index performance does not reflect transaction costs, fees or expenses.
Per the most recent prospectus, the Fund’s annualized gross operating expense ratio, gross of any fee waivers or expense reimbursements, was 1.28%. In the Financial Highlights section of this Annual Report, the Fund’s annualized net operating expense ratio was 0.70% while the Fund’s annualized gross operating expense ratio, gross of any fee waivers or expense reimbursements, was 1.17%. There is a contractual fee waiver currently in place for this Fund through December 31, 2019 to the extent necessary in keeping the Fund’s operating expense ratio from exceeding 0.65% of average net assets per year. Some expenses fall outside of this expense cap and actual expenses may be higher than 0.65%. Without this expense cap, actual returns would be lower. Please see the Financial Highlights for recent expense ratios.
| Country Diversification |
| | | % of Long-Term |
| Country | | Investments |
| Kuwait | | 13.3% |
| Morocco | | 9.9% |
| Pakistan | | 9.5% |
| Nigeria | | 9.4% |
| Romania | | 9.4% |
| Vietnam | | 9.1% |
| Argentina | | 8.3% |
| Other | | 31.1% |
| Total Long-Term Investments | | 100.0% |
| Ten Largest Holdings | | (% of Total Net Assets) |
| MercadoLibre, Inc. | | 6.3% |
| Guaranty Trust Bank plc | | 5.1% |
| Copa Holdings S.A. — Class A | | 4.9% |
| National Bank of Kuwait SAKP | | 3.5% |
| Aroundtown Property Holdings plc | | 3.4% |
| Banca Transilvania S.A. | | 3.3% |
| Safaricom Ltd. | | 3.0% |
| Nigerian Breweries plc | | 2.8% |
| Vietnam Dairy Products JSC | | 2.6% |
| YPF S.A. ADR | | 2.5% |
| Top Ten Total | | 37.4% |
“Ten Largest Holdings” excludes any temporary cash investments.
This graph compares a hypothetical $10,000 investment in the Fund, made at its inception, with a similar investment in the MSCI Emerging Markets Index. Results include the reinvestment of all dividends and capital gains. Past performance is no guarantee of future results. The MSCI Emerging Markets Index is a free float-adjusted market capitalization index that is designed to measure equity market performance in the global emerging markets. It is not possible to invest directly in the MSCI Emerging Market Index. Investment return and principal value will fluctuate with changes in market conditions and other factors and Fund shares, when redeemed, may be worth more or less than their original investment.
| |
| 18 l CLAYMORE EXCHANGE-TRADED FUND TRUST 2 ANNUAL REPORT |
| PERFORMANCE REPORT AND FUND PROFILE (Unaudited) continued | May 31, 2017 |
HGI Guggenheim International Multi-Asset Income ETF
| Fund Statistics | | | |
| Share Price | | $ | 16.79 |
| Net Asset Value | | $ | 16.81 |
| Discount to NAV | | | -0.12% |
| Net Assets ($000) | | $ | 15,132 |
| AVERAGE ANNUAL TOTAL RETURNS FOR THE |
| PERIOD ENDED MAY 31, 2017 |
| | | | | Since |
| | One | Three | Five | Inception |
| | Year | Year | Year | (07/11/07) |
| Guggenheim | | | | |
| International | | | | |
| Multi-Asset | | | | |
| Income ETF | | | | |
| NAV | 18.09% | -1.49% | 6.29% | 0.23% |
| Market | 18.69% | -1.73% | 6.21% | 0.21% |
| Zacks International | | | | |
| Multi-Asset | | | | |
| Income | | | | |
| Index | 18.36% | -1.49% | 6.34% | 0.56% |
| MSCI EAFE | | | | |
| Index | 16.44% | 1.53% | 10.21% | 0.87% |
Performance data quoted represents past performance, which is no guarantee of future results and current performance may be lower or higher than the figures shown. All NAV returns include the deduction of management fees, operating expenses and all other Fund expenses. The deduction of taxes that a shareholder would pay on Fund distributions or the redemption of Fund shares is not reflected in the total returns. For the most recent month-end performance figures, please visit guggenheiminvestments.com. The investment return and principal value of an investment will fluctuate with changes in market conditions and other factors so that an investor’s shares, when redeemed, may be worth more or less than their original cost.
Since inception returns assume a purchase of the Fund at the initial share price of $24.98 per share for share price returns or initial net asset value (NAV) of $24.98 per share for NAV returns. Returns for periods of less than one year are not annualized.
The MSCI EAFE Index measures the performance for a diverse range of global stock markets within Europe, Australasia and the Far East. The referenced index is unmanaged and not available for direct investment. Index performance does not reflect transaction costs, fees or expenses.
Per the most recent prospectus, the Fund’s annualized gross operating expense ratio, gross of any fee waivers or expense reimbursements, was 1.13%. In the Financial Highlights section of this Annual Report, the Fund’s annualized net operating expense ratio was 0.70% while the Fund’s annualized gross operating expense ratio, gross of any fee waivers or expense reimbursements, was 1.37%. There is a contractual fee waiver currently in place for this Fund through December 31, 2019 to the extent necessary in keeping the Fund’s operating expense ratio from exceeding 0.65% of average net assets per year. Some expenses fall outside of this expense cap and actual expenses may be higher than 0.65%. Without this expense cap, actual returns would be lower. Please see the Financial Highlights for recent expense ratios.
| Country Diversification |
| | | % of Long-Term |
| Country | | Investments |
| United States | | 15.1% |
| Japan | | 13.8% |
| United Kingdom | | 11.6% |
| France | | 7.9% |
| Cayman Islands | | 4.8% |
| China | | 4.0% |
| Netherlands | | 3.9% |
| Other | | 38.9% |
| Total Long-Term Investments | | 100.0% |
| Ten Largest Holdings | | (% of Total Net Assets) |
| QIWI plc ADR | | 2.3% |
| Huaneng Power International, Inc. ADR | | 2.1% |
| Man Wah Holdings Ltd. | | 2.0% |
| ChipMOS Technologies, Inc. | | 1.7% |
| Koninklijke KPN N.V. | | 1.5% |
| Hopewell Highway Infrastructure Ltd. | | 1.5% |
| Societe Generale S.A. | | 1.5% |
| BNP Paribas S.A. | | 1.4% |
| Lloyds Banking Group plc | | 1.4% |
| Braskem S.A. ADR | | 1.3% |
| Top Ten Total | | 16.7% |
“Ten Largest Holdings” excludes any temporary cash investments.
| |
| CLAYMORE EXCHANGE-TRADED FUND TRUST 2 ANNUAL REPORT l 19 |
| PERFORMANCE REPORT AND FUND PROFILE (Unaudited) continued | May 31, 2017 |
HGI Guggenheim International Multi-Asset Income ETF continued
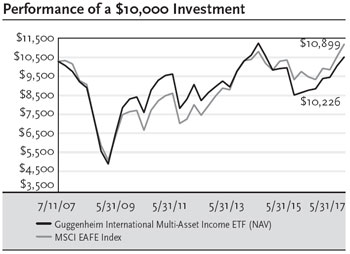
This graph compares a hypothetical $10,000 investment in the Fund, made at its inception, with a similar investment in the MSCI EAFE Index. Results include the reinvestment of all dividends and capital gains. Past performance is no guarantee of future results. The Morgan Stanley Capital International EAFE Index (“MSCI EAFE Index”) measures the performance for a diverse range of global stock markets within Europe, Australasia and the Far East. The referenced indices are unmanaged and not available for direct investment. Index performance does not reflect transaction costs, fees, or expenses.
| |
| 20 l CLAYMORE EXCHANGE-TRADED FUND TRUST 2 ANNUAL REPORT |
| PERFORMANCE REPORT AND FUND PROFILE (Unaudited) continued | May 31, 2017 |
CUT Guggenheim MSCI Global Timber ETF
| Fund Statistics | | | |
| Share Price | | $ | 27.52 |
| Net Asset Value | | $ | 27.57 |
| Discount to NAV | | | -0.18% |
| Net Assets ($000) | | $ | 190,203 |
| AVERAGE ANNUAL TOTAL RETURNS FOR THE |
| PERIOD ENDED MAY 31, 2017 | | |
| | | | | Since |
| | One | Three | Five | Inception |
| | Year | Year | Year | (11/09/07) |
| Guggenheim MSCI | | | | |
| Global Timber ETF | | | | |
| NAV | 19.09% | 5.00% | 13.93% | 3.00% |
| Market | 19.09% | 5.00% | 13.83% | 2.98% |
| MSCI ACWI IMI Timber | | | | |
| Select Capped | | | | |
| Index/Beacon | | | | |
| Global | | | | |
| Timber | | | | |
| Index | 19.23% | 5.17%1 | 14.42%1 | 4.08%1 |
| MSCI World | | | | |
| Index | 16.42% | 5.73% | 12.41% | 3.93% |
| S&P Global Timber & | | | | |
| Forestry | | | | |
| Index | 26.94% | 7.40% | 13.68% | 2.19% |
| STOXX® Europe | | | | |
| TMI Forestry & | | | | |
| Paper | | | | |
| Index | 42.58% | 14.96% | 24.99% | 5.88% |
Performance data quoted represents past performance, which is no guarantee of future results and current performance may be lower or higher than the figures shown. All NAV returns include the deduction of management fees, operating expenses and all other Fund expenses. The deduction of taxes that a shareholder would pay on Fund distributions or the redemption of Fund shares is not reflected in the total returns. For the most recent month-end performance figures, please visit guggenheiminvestments.com. The investment return and principal value of an investment will fluctuate with changes in market conditions and other factors so that an investor’s shares, when redeemed, may be worth more or less than their original cost.
Since inception returns assume a purchase of the Fund at the initial share price of $24.91 per share for share price returns or initial net asset value (NAV) of $24.91 per share for NAV returns. Returns for periods of less than one year are not annualized.
The Morgan Stanley Capital International (MSCI) World Index measures performance from a diverse range of global stock markets, including the U.S., Canada, Europe, Australia, New Zealand, and the Far East.
The S&P Global Timber & Forestry Index is comprised of 25 of the largest publicly traded companies engaged in the ownership, management or the upstream supply chain of forests and timberlands. These may be forest products companies, timber REITs, paper products companies, paper packaging companies, or agricultural product companies that are engaged in the ownership, management or the upstream supply chain of forests and timberlands.
The STOXX® Europe TMI Forestry & Paper Index is a market capitalization weighted index of all companies in the Forestry & Paper sector of the STOXX Europe TMI index. Using the market standard ICB (Industry Classification Benchmark), companies with primary revenue sources from the Forestry & Paper sector are selected from the STOXX Europe TMI universe, which covers 95 percent of the free float market capitalization across 18 Western European countries (Austria, Belgium, Denmark, Finland, France, Germany, Greece, Iceland, Ireland, Italy, Luxembourg, the Netherlands, Norway, Portugal, Spain, Sweden, Switzerland and the United Kingdom).
The referenced indices are unmanaged and not available for direct investment. Index performance does not reflect transaction costs, fees or expenses.
Per the most recent prospectus, the Fund’s annualized gross operating expense ratio, gross of any fee waivers or expense reimbursements, was 0.75%. In the Financial Highlights section of this Annual Report, the Fund’s annualized net operating expense ratio was 0.57% while the Fund’s annualized gross operating expense ratio, gross of any fee waivers or expense reimbursements, was 0.70%. There is a contractual fee waiver currently in place for this Fund through December 31, 2019 to the extent necessary in keeping the Fund’s operating expense ratio from exceeding 0.55% of average net assets per year. Some expenses fall outside of this expense cap and actual expenses may be higher than 0.55%. Without this expense cap, actual returns would be lower. Please see the Financial Highlights for recent expense ratios.
| Country Diversification |
| | | % of Long-Term |
| Country | | Investments |
| United States | | 44.7% |
| Finland | | 11.1% |
| South Africa | | 8.6% |
| Australia | | 6.3% |
| Japan | | 5.1% |
| Canada | | 4.7% |
| Brazil | | 4.3% |
| Other | | 15.2% |
| Total Long-Term Investments | | 100.0% |
| 1 | Benchmark returns reflect the blended return of the Beacon Global Timber Index from 11/09/07 – 05/19/16 and the return of the MSCI ACWI IMI Timber Select Capped Index from 05/20/16 – 05/31/17. |
| |
| CLAYMORE EXCHANGE-TRADED FUND TRUST 2 ANNUAL REPORT l 21 |
| PERFORMANCE REPORT AND FUND PROFILE (Unaudited) continued | May 31, 2017 |
CUT Guggenheim MSCI Global Timber ETF continued
| Ten Largest Holdings | (% of Total Net Assets) |
| International Paper Co. | 5.1% |
| UPM-Kymmene Oyj | 5.1% |
| Weyerhaeuser Co. | 5.0% |
| Amcor Ltd. | 5.0% |
| WestRock Co. | 5.0% |
| Packaging Corporation of America | 4.8% |
| Mondi plc | 4.8% |
| Sealed Air Corp. | 4.3% |
| Avery Dennison Corp. | 3.8% |
| Stora Enso Oyj — Class R | 3.5% |
| Top Ten Total | 46.4% |
“Ten Largest Holdings” excludes any temporary cash investments.
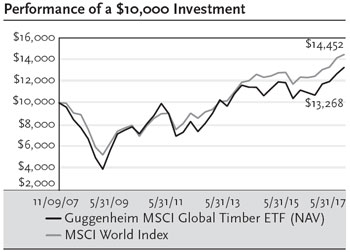
This graph compares a hypothetical $10,000 investment in the Fund, made at its inception, with a similar investment in the MSCI World Index. Results include the reinvestment of all dividends and capital gains. Past performance is no guarantee of future results. The MSCI World Index measures performance from a diverse range of global stock markets, including the U.S., Canada, Europe, Australia, New Zealand and the Far East. The referenced index is unmanaged. It is not possible to invest directly in the MSCI World Index. Investment return and principal value will fluctuate with changes in market conditions and other factors and Fund shares, when redeemed, may be worth more or less than their original investment.
| |
| 22 l CLAYMORE EXCHANGE-TRADED FUND TRUST 2 ANNUAL REPORT |
| PERFORMANCE REPORT AND FUND PROFILE (Unaudited) continued | May 31, 2017 |
SEA Guggenheim Shipping ETF
| Fund Statistics | | | |
| Share Price | | $ | 11.49 |
| Net Asset Value | | $ | 11.50 |
| Discount to NAV | | | -0.09% |
| Net Assets ($000) | | $ | 103,484 |
| AVERAGE ANNUAL TOTAL RETURNS FOR THE |
| PERIOD ENDED MAY 31, 2017 |
| | | | | Since |
| | One | Three | Five | Inception |
| | Year | Year | Year | (06/11/10) |
| Guggenheim Shipping ETF | | | | |
| NAV | 1.83% | -14.98% | -1.74% | -7.00% |
| Market | 1.79% | -15.03% | -1.71% | -7.02% |
| Delta Global Shipping Index/ | | | | |
| Dow Jones Global | | | | |
| Shipping | | | | |
| IndexSM | 0.76% | -15.82% | -2.35% | -7.32%1 |
| MSCI World | | | | |
| Index | 16.42% | 5.73% | 12.41% | 10.86% |
Performance data quoted represents past performance, which is no guarantee of future results and current performance may be lower or higher than the figures shown. All NAV returns include the deduction of management fees, operating expenses and all other Fund expenses. The deduction of taxes that a shareholder would pay on Fund distributions or the redemption of Fund shares is not reflected in the total returns. For the most recent month-end performance figures, please visit guggenheiminvestments.com. The investment return and principal value of an investment will fluctuate with changes in market conditions and other factors so that an investor’s shares, when redeemed, may be worth more or less than their original cost.
Since inception returns assume a purchase of the Fund at the initial share price of $25.96 per share for share price returns or initial net asset value (NAV) of $25.96 per share for NAV returns. Returns for periods of less than one year are not annualized.
The Morgan Stanley Capital International (MSCI) World Index measures performance from a diverse range of global stock markets, including the U.S., Canada, Europe, Australia, New Zealand, and the Far East. The referenced indices are unmanaged and not available for direct investment. Index performance does not reflect transaction costs, fees or expenses.
The Fund’s annual operating expense ratio of 0.65% is expressed as a unitary fee and covers all expenses of the Fund, except for distribution fees, if any, brokerage expenses, taxes, interest, litigation expenses and other extraordinary expenses. Please see Financial Highlights for recent expense ratios.
| Portfolio Breakdown | % of Net Assets |
| Industrial | 90.2% |
| Consumer, Non-cyclical | 5.6% |
| Energy | 3.6% |
| Total Long-Term Investments | 99.4% |
| Securities Lending Collateral | 17.4% |
| Total Investments | 116.8% |
| Other Assets & Liabilities, net | -16.8% |
| Net Assets | 100.0% |
| Ten Largest Holdings | (% of Total Net Assets) |
| AP Moller - Maersk A/S — Class B | 23.8% |
| Nippon Yusen K.K. | 7.1% |
| Kawasaki Kisen Kaisha Ltd. | 6.2% |
| COSCO SHIPPING Ports Ltd. | 5.6% |
| Matson, Inc. | 4.1% |
| Golar LNG Partners, LP | 3.6% |
| Euronav N.V. | 3.6% |
| Sembcorp Marine Ltd. | 3.6% |
| Ship Finance International Ltd. | 3.3% |
| Teekay LNG Partners, LP | 3.2% |
| Top Ten Total | 64.1% |
“Ten Largest Holdings” excludes any temporary cash investments.
| 1 | The benchmark return reflects the blended return of the Delta Global Shipping Index from 6/11/10 – 7/26/11 and the return of the Dow Jones Global Shipping IndexSM from 7/27/11 – 5/31/17. |
| |
| CLAYMORE EXCHANGE-TRADED FUND TRUST 2 ANNUAL REPORT l 23 |
| PERFORMANCE REPORT AND FUND PROFILE (Unaudited) concluded | May 31, 2017 |
SEA Guggenheim Shipping ETF continued
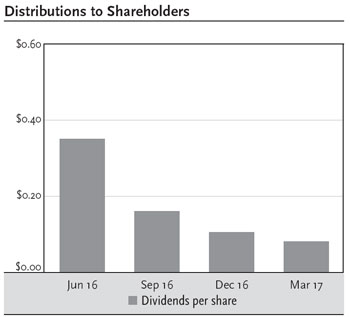
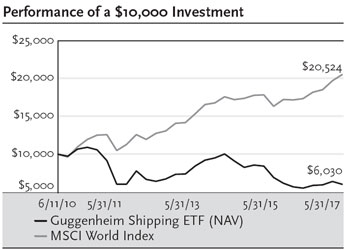
This graph compares a hypothetical $10,000 investment in the Fund, made at its inception, with a similar investment in the MSCI World Index. Results include the reinvestment of all dividends and capital gains. Past performance is no guarantee of future results. The MSCI World Index measures performance from a diverse range of global stock markets, including the U.S., Canada, Europe, Australia, New Zealand, and the Far East. The referenced index is unmanaged. It is not possible to invest directly in the MSCI World Index. Investment return and principal value will fluctuate with changes in market conditions and other factors and Fund shares, when redeemed, may be worth more or less than their original investment.
| |
| 24 l CLAYMORE EXCHANGE-TRADED FUND TRUST 2 ANNUAL REPORT |
| FEES AND EXPENSES (Unaudited) | May 31, 2017 |
Shareholder Expense Example
As a shareholder of the Funds, you incur transaction costs such as creation and redemption fees or brokerage charges, and ongoing costs including advisory fees, trustee fees and, if applicable, distribution fees. All other Trust expenses are paid by the advisor. This example is intended to help you understand your ongoing costs (in dollars) of investing in a Fund and to compare these costs with the ongoing costs of investing in other mutual funds.
The example in the table is based on an investment of $1,000 invested on November 30, 2016 and held for the six months ended May 31, 2017.
Actual Expenses
The first table below provides information about actual account values and actual expenses. You may use the information in this table, together with the amount you invested, to estimate the expenses that you incurred over the period. Simply divide your account value by $1,000 (for example, an $8,600 account value divided by $1,000 = 8.6), then multiply the result by the number in the first table under the heading entitled “Expenses Paid During Period” to estimate the expenses attributable to your investment during this period.
Hypothetical Example for Comparison Purposes
The second table below provides information about hypothetical account values and hypothetical expenses based on a Fund’s actual expense ratio and an assumed rate of return of 5% per year before expenses, which is not a Fund’s actual return. Thus, you should not use the hypothetical account values and expenses to estimate the actual ending account balance or your expenses for the period. Rather, these figures are provided to enable you to compare the ongoing costs of investing in a Fund and other funds. To do so, compare this 5% hypothetical example with the 5% hypothetical examples that appear in the shareholder reports of other funds. Please note that the expenses shown in the table are meant to highlight your ongoing costs only and do not reflect any transaction costs, such as creation and redemption fees, or brokerage charges. Therefore, the second table is useful in comparing ongoing costs only, and will not help you determine the relative total costs of owning different funds. In addition, if these transaction costs were included, your costs would have been higher.
| | | | | | | Beginning | | Ending | | | |
| | | Expense | | | | account value | | Account Value | | Expenses Paid | |
| | | Ratio1 | | Fund Return | | November 30, 2016 | | May 31, 2017 | | During Period2 | |
| Table 1. Based on actual Fund return3 | | | | | | | | | | | | | | | | |
| Guggenheim Canadian Energy Income ETF | | | 0.65 | % | | (6.57 | )% | $ | 1,000.00 | | $ | 934.33 | | $ | 3.13 | |
| Guggenheim China Real Estate ETF | | | 0.70 | % | | 19.98 | % | | 1,000.00 | | | 1,199.76 | | | 3.84 | |
| Guggenheim China Small Cap ETF | | | 0.75 | % | | 6.96 | % | | 1,000.00 | | | 1,069.55 | | | 3.87 | |
| Guggenheim Frontier Markets ETF | | | 0.70 | % | | 22.35 | % | | 1,000.00 | | | 1,223.55 | | | 3.88 | |
| Guggenheim International Multi-Asset Income ETF | | | 0.70 | % | | 14.20 | % | | 1,000.00 | | | 1,142.00 | | | 3.74 | |
| Guggenheim MSCI Global Timber ETF | | | 0.55 | % | | 13.24 | % | | 1,000.00 | | | 1,132.44 | | | 2.92 | |
| Guggenheim Shipping ETF | | | 0.65 | % | | 8.28 | % | | 1,000.00 | | | 1,082.79 | | | 3.38 | |
| |
| CLAYMORE EXCHANGE-TRADED FUND TRUST 2 ANNUAL REPORT l 25 |
| FEES AND EXPENSES (Unaudited) concluded | May 31, 2017 |
| | | | | | | Beginning | | Ending | | | |
| | | Expense | | | | account value | | Account Value | | Expenses Paid | |
| | | Ratio1 | | Fund Return | | November 30, 2016 | | May 31, 2017 | | During Period2 | |
| Table 2. Based on hypothetical 5% return (before expenses) | | | | | | | | | | | | | | | | |
| Guggenheim Canadian Energy Income ETF | | | 0.65 | % | | 5.00 | % | $ | 1,000.00 | | $ | 1,021.69 | | $ | 3.28 | |
| Guggenheim China Real Estate ETF | | | 0.70 | % | | 5.00 | % | | 1,000.00 | | | 1,021.44 | | | 3.53 | |
| Guggenheim China Small Cap ETF | | | 0.75 | % | | 5.00 | % | | 1,000.00 | | | 1,021.19 | | | 3.78 | |
| Guggenheim Frontier Markets ETF | | | 0.70 | % | | 5.00 | % | | 1,000.00 | | | 1,021.44 | | | 3.53 | |
| Guggenheim International Multi-Asset Income ETF | | | 0.70 | % | | 5.00 | % | | 1,000.00 | | | 1,021.44 | | | 3.53 | |
| Guggenheim MSCI Global Timber ETF | | | 0.55 | % | | 5.00 | % | | 1,000.00 | | | 1,022.19 | | | 2.77 | |
| Guggenheim Shipping ETF | | | 0.65 | % | | 5.00 | % | | 1,000.00 | | | 1,021.69 | | | 3.28 | |
| 1 | Annualized net expense and excludes expenses of the underlying funds in which the Funds invest, if any. |
| 2 | Expenses are equal to the Fund’s annualized expense ratio, net of any applicable fee waivers, multiplied by the average account value over the period, multiplied by 182/365 (to reflect the one-half year period). |
| 3 | Actual cumulative return at net asset value for the period November 30, 2016 to May 31, 2017. |
| |
| 26 l CLAYMORE EXCHANGE-TRADED FUND TRUST 2 ANNUAL REPORT |
| SCHEDULE OF INVESTMENTS | May 31, 2017 |
ENY Guggenheim Canadian Energy Income ETF
| | | | Shares | | | Value | |
| COMMON STOCKS† – 99.5% | | | | | | | |
| Canada – 99.5% | | | | | | | |
| Veresen, Inc.1 | | | 110,586 | | $ | 1,503,190 | |
| Keyera Corp. | | | 45,120 | | | 1,342,877 | |
| Suncor Energy, Inc. | | | 42,408 | | | 1,327,467 | |
| PrairieSky Royalty Ltd.1 | | | 60,551 | | | 1,306,327 | |
| TransCanada Corp. | | | 27,836 | | | 1,292,364 | |
| Pembina Pipeline Corp. | | | 39,858 | | | 1,273,910 | |
| AltaGas Ltd.1 | | | 55,689 | | | 1,241,427 | |
| Inter Pipeline Ltd. | | | 61,363 | | | 1,215,266 | |
| Enbridge, Inc. | | | 31,065 | | | 1,195,958 | |
| Canadian Natural Resources Ltd. | | | 39,661 | | | 1,143,406 | |
| ARC Resources Ltd.1 | | | 89,260 | | | 1,114,840 | |
| Vermilion Energy, Inc. | | | 34,572 | | | 1,081,927 | |
| Cameco Corp. | | | 117,015 | | | 1,078,579 | |
| Peyto Exploration & Development Corp.1 | | | 58,046 | | | 1,052,452 | |
| Crescent Point Energy Corp. | | | 120,756 | | | 1,047,798 | |
| Whitecap Resources, Inc.1 | | | 129,895 | | | 880,905 | |
| Enbridge Income Fund Holdings, Inc.1 | | | 35,039 | | | 841,538 | |
| Parkland Fuel Corp. | | | 33,929 | | | 772,175 | |
| Gibson Energy, Inc. | | | 49,989 | | | 663,214 | |
| ShawCor Ltd. | | | 24,646 | | | 560,360 | |
| Mullen Group Ltd. | | | 36,543 | | | 403,388 | |
| Enerflex Ltd. | | | 31,140 | | | 395,388 | |
| Secure Energy Services, Inc. | | | 57,189 | | | 385,720 | |
| Pason Systems, Inc. | | | 25,990 | | | 375,217 | |
| Freehold Royalties Ltd. | | | 33,204 | | | 317,610 | |
| Ensign Energy Services, Inc. | | | 44,593 | | | 228,462 | |
| TORC Oil & Gas Ltd.1 | | | 45,849 | | | 184,659 | |
| Surge Energy, Inc. | | | 79,597 | | | 132,004 | |
| Bonterra Energy Corp.1 | | | 8,969 | | | 105,182 | |
| Total Canada | | | | | | 24,463,610 | |
| Total Common Stocks | | | | | | | |
| (Cost $29,463,897) | | | | | | 24,463,610 | |
| | | | Face Amount | | | | |
| SECURITIES LENDING COLLATERAL††,2 – 33.2% | | | | | | | |
| Repurchase Agreements | | | | | | | |
| Daiwa Capital Markets America Inc. | | | | | | | |
| issued 05/31/17 at 0.85% | | | | | | | |
| due 06/01/17 | | $ | 1,900,482 | | $ | 1,900,482 | |
| Nomura Securities International, Inc. | | | | | | | |
| issued 05/31/17 at 0.82% | | | | | | | |
| due 06/01/17 | | | 1,900,482 | | | 1,900,482 | |
| Citigroup Global Markets, Inc. | | | | | | | |
| issued 05/31/17 at 0.81% | | | | | | | |
| due 06/01/17 | | | 1,900,482 | | | 1,900,482 | |
| RBC Dominion Securities, Inc. | | | | | | | |
| issued 05/31/17 at 0.80% | | | | | | | |
| due 06/01/17 | | | 1,900,482 | | | 1,900,482 | |
| Royal Bank of Scotland plc | | | | | | | |
| issued 05/31/17 at 0.79% | | | | | | | |
| due 06/01/17 | | | 563,227 | | | 563,227 | |
| Total Securities Lending Collateral | | | | | | | |
| (Cost $8,165,155) | | | | | | 8,165,155 | |
| Total Investments – 132.7% | | | | | | | |
| (Cost $37,629,052) | | | | | $ | 32,628,765 | |
| Other Assets & Liabilities, net – (32.7)% | | | | | | (8,032,318 | ) |
| Total Net Assets – 100.0% | | | | | $ | 24,596,447 | |
| † | | Value determined based on Level 1 inputs — See Note 4. |
| †† | | Value determined based on Level 2 inputs — See Note 4. |
| 1 | | All or portion of this security is on loan at May 31, 2017 — See Note 5. |
| 2 | | Securities lending collateral — See Note 5. |
| | | |
| plc | | Public Limited Company |
| Portfolio Breakdown | % of Net Assets |
| Energy | 95.1% |
| Basic Materials | 4.4% |
| Total Common Stocks | 99.5% |
| Securities Lending Collateral | 33.2% |
| Total Investments | 132.7% |
| Other Assets & Liabilities, net | -32.7% |
| Net Assets | 100.0% |
| Currency Denomination |
| | % of Long-Term |
| Currency | Investments |
| Canadian Dollar | 100.0% |
The following table summarizes the inputs used to value the Fund’s investments at May 31, 2017 (See Note 4 in the Notes to Financial Statements):
| | | | | | | | | | | | | | |
| | | | | | | Level 2 | | | Level 3 | | | | |
| | | | | | | Significant | | | Significant | | | | |
| | | | Level 1 | | | Observable | | | Unobservable | | | | |
| | | | Quoted Prices | | | Inputs | | | Inputs | | | Total | |
| Assets | | | | | | | | | | | | | |
| Common Stocks | | $ | 24,463,610 | | $ | — | | $ | — | | $ | 24,463,610 | |
| Securities Lending | | | | | | | | | | | | | |
| Collateral | | | — | | | 8,165,155 | | | — | | | 8,165,155 | |
| Total | | $ | 24,463,610 | | $ | 8,165,155 | | $ | — | | $ | 32,628,765 | |
Transfers between investment levels may occur as the markets fluctuate and/or the availability of data used in an investment’s valuation changes. Transfers between valuation levels, if any, are in comparison to the valuation levels at the end of the previous fiscal year, and are effective using the fair value as of the end of the current fiscal period.
For the year ended May 31, 2017, there were no transfers between levels.
| See notes to financial statements. |
| CLAYMORE EXCHANGE-TRADED FUND TRUST 2 ANNUAL REPORT l 27 |
| SCHEDULE OF INVESTMENTS continued | May 31, 2017 |
TAO Guggenheim China Real Estate ETF
| | | | Shares | | | Value | |
| COMMON STOCKS† – 99.6% | | | | | | | |
| Financial – 87.3% | | | | | | | |
| Country Garden Holdings Company Ltd. | | | 2,053,559 | | $ | 2,427,128 | |
| Hongkong Land Holdings Ltd. | | | 292,400 | | | 2,210,544 | |
| Henderson Land Development Company Ltd. | | | 329,782 | | | 2,130,848 | |
| China Resources Land Ltd. | | | 722,513 | | | 2,123,279 | |
| Link REIT | | | 266,636 | | | 2,104,359 | |
| Sun Hung Kai Properties Ltd. | | | 139,195 | | | 2,059,581 | |
| Cheung Kong Property Holdings Ltd. | | | 272,000 | | | 2,041,977 | |
| China Overseas Land & Investment Ltd. | | | 650,992 | | | 1,954,868 | |
| New World Development Company Ltd. | | | 1,474,648 | | | 1,835,634 | |
| China Evergrande Group1 | | | 950,822 | | | 1,705,817 | |
| Wheelock & Company Ltd. | | | 212,149 | | | 1,587,214 | |
| Hang Lung Properties Ltd. | | | 552,934 | | | 1,429,797 | |
| Sino Land Company Ltd. | | | 819,474 | | | 1,426,004 | |
| Hang Lung Group Ltd. | | | 230,415 | | | 955,079 | |
| Swire Properties Ltd. | | | 281,396 | | | 938,895 | |
| China Vanke Company Ltd. — Class H | | | 351,391 | | | 933,441 | |
| Sunac China Holdings Ltd.1 | | | 485,122 | | | 788,153 | |
| Hysan Development Company Ltd. — Class A* | | | 165,495 | | | 781,553 | |
| Longfor Properties Company Ltd. | | | 328,131 | | | 667,846 | |
| Kerry Properties Ltd. | | | 161,631 | | | 571,442 | |
| Shimao Property Holdings Ltd. | | | 307,297 | | | 524,488 | |
| Fortune Real Estate Investment Trust | | | 364,536 | | | 448,627 | |
| Guangzhou R&F Properties Company Ltd. — Class H1 | | | 266,708 | | | 431,253 | |
| Sino-Ocean Group Holding Ltd. | | | 790,152 | | | 398,501 | |
| Shenzhen Investment Ltd. | | | 786,113 | | | 375,279 | |
| Champion REIT | | | 564,224 | | | 367,825 | |
| Agile Group Holdings Ltd. | | | 385,470 | | | 366,057 | |
| China Jinmao Holdings Group Ltd.* | | | 1,086,713 | | | 355,616 | |
| Great Eagle Holdings Ltd. | | | 64,799 | | | 319,320 | |
| Yuexiu Property Company Ltd. | | | 1,635,617 | | | 285,461 | |
| KWG Property Holding Ltd. | | | 354,347 | | | 280,569 | |
| CIFI Holdings Group Company Ltd. | | | 702,000 | | | 274,766 | |
| Zall Group Ltd.*,1 | | | 450,000 | | | 266,797 | |
| SOHO China Ltd.* | | | 492,219 | | | 246,348 | |
| Chinese Estates Holdings Ltd. | | | 126,386 | | | 241,339 | |
| Yanlord Land Group Ltd. | | | 173,963 | | | 236,411 | |
| Shui On Land Ltd. | | | 907,758 | | | 220,170 | |
| Poly Property Group Company Ltd.*,1 | | | 508,177 | | | 215,206 | |
| Logan Property Holdings Company Ltd. | | | 328,000 | | | 207,514 | |
| K Wah International Holdings Ltd. | | | 302,102 | | | 195,781 | |
| Yuexiu Real Estate Investment Trust | | | 288,335 | | | 174,279 | |
| Greentown China Holdings Ltd.*,1 | | | 159,573 | | | 167,919 | |
| Sunlight Real Estate Investment Trust | | | 261,044 | | | 167,498 | |
| Hopson Development Holdings Ltd. | | | 171,031 | | | 161,759 | |
| China South City Holdings Ltd. | | | 841,549 | | | 160,913 | |
| Joy City Property Ltd. | | | 944,000 | | | 146,583 | |
| China Overseas Grand Oceans Group Ltd. | | | 238,416 | | | 123,913 | |
| Renhe Commercial Holdings Company Ltd.* | | | 4,373,929 | | | 108,893 | |
| Tian An China Investment Company Ltd.* | | | 139,427 | | | 104,135 | |
| SEA Holdings Ltd. | | | 64,000 | | | 91,986 | |
| Glorious Property Holdings Ltd.* | | | 754,300 | | | 83,247 | |
| Asian Growth Properties Ltd. | | | 78,305 | | | 27,799 | |
| Dan Form Holdings Co Ltd. | | | 16,045 | | | 4,468 | |
| Total Financial | | | | | | 38,454,179 | |
| | | | | | | | |
| Diversified – 9.5% | | | | | | | |
| Wharf Holdings Ltd. | | | 260,306 | | | 2,214,746 | |
| Swire Pacific Ltd. — Class A | | | 137,894 | | | 1,357,271 | |
| Swire Pacific Ltd. — Class B | | | 252,685 | | | 444,897 | |
| Carnival Group International Holdings Ltd.*,1 | | | 1,477,945 | | | 149,834 | |
| Total Diversified | | | | | | 4,166,748 | |
| | | | | | | | |
| Energy – 1.7% | | | | | | | |
| Fullshare Holdings Ltd.*,1 | | | 1,843,768 | | | 752,418 | |
| | | | | | | | |
| Consumer, Cyclical – 0.7% | | | | | | | |
| Red Star Macalline Group Corporation Ltd. — Class H2 | | | 278,878 | | | 302,411 | |
| | | | | | | | |
| Industrial – 0.4% | | | | | | | |
| China Logistics Property Holdings Company Ltd.* | | | 484,000 | | | 170,806 | |
| Total Common Stocks | | | | | | | |
| (Cost $41,744,360) | | | | | | 43,846,562 | |
| | | | Face Amount | | | | |
| SECURITIES LENDING COLLATERAL††,3 – 2.0% | | | | | | | |
| Repurchase Agreements | | | | | | | |
| Daiwa Capital Markets America Inc. | | | | | | | |
| issued 05/31/17 at 0.85% | | | | | | | |
| due 06/01/17 | | $ | 250,000 | | $ | 250,000 | |
| Nomura Securities International, Inc. | | | | | | | |
| issued 05/31/17 at 0.82% | | | | | | | |
| due 06/01/17 | | | 250,000 | | | 250,000 | |
| RBC Dominion Securities, Inc. | | | | | | | |
| issued 05/31/17 at 0.80% | | | | | | | |
| due 06/01/17 | | | 250,000 | | | 250,000 | |
| Royal Bank of Scotland plc | | | | | | | |
| issued 05/31/17 at 0.79% | | | | | | | |
| due 06/01/17 | | | 149,363 | | | 149,363 | |
| Total Securities Lending Collateral | | | | | | | |
| (Cost $899,363) | | | | | | 899,363 | |
| Total Investments – 101.6% | | | | | | | |
| (Cost $42,643,723) | | | | | $ | 44,745,925 | |
| Other Assets & Liabilities, net – (1.6)% | | | | | | (707,814 | ) |
| Total Net Assets – 100.0% | | | | | $ | 44,038,111 | |
| See notes to financial statements. |
| 28 l CLAYMORE EXCHANGE-TRADED FUND TRUST 2 ANNUAL REPORT |
| SCHEDULE OF INVESTMENTS continued | May 31, 2017 |
TAO Guggenheim China Real Estate ETF continued
| * | | Non-income producing security. |
| † | | Value determined based on Level 1 inputs — See Note 4. |
| †† | | Value determined based on Level 2 inputs — See Note 4. |
| 1 | | All or portion of this security is on loan at May 31, 2017 — See Note 5. |
| 2 | | Security is a 144A or Section 4(a)(2) security. These securities have been determined to be liquid under guidelines established by the Board of Trustees. The total market value of 144A or Section 4(a)(2) liquid securities is $302,411 (cost $308,706), or 0.7% of total net assets. |
| 3 | | Securities lending collateral — See Note 5. |
| | | |
| plc | | Public Limited Company |
| REIT | | Real Estate Investment Trust |
See Sector Classification in Other Information section.
| Country Diversification |
| | | % of Long-Term |
| Country | | Investments |
| Hong Kong | | 75.4% |
| China | | 22.6% |
| Singapore | | 2.0% |
| Total Long-Term Investments | | 100.0% |
| Currency Denomination |
| | % of Long-Term |
| Currency | Investments |
| Hong Kong Dollar | 94.4% |
| United States Dollar | 5.0% |
| Singapore Dollar | 0.5% |
| British Pound | 0.1% |
| Total Long-Term Investments | 100.0% |
The following table summarizes the inputs used to value the Fund’s investments at May 31, 2017 (See Note 4 in the Notes to Financial Statements):
| | | | | | | Level 2 | | | Level 3 | | | | |
| | | | | | | Significant | | | Significant | | | | |
| | | | Level 1 | | | Observable | | | Unobservable | | | | |
| | | | Quoted Prices | | | Inputs | | | Inputs | | | Total | |
| Assets | | | | | | | | | | | | | |
| Common Stocks | | $ | 43,846,562 | | $ | — | | $ | — | | $ | 43,846,562 | |
| Securities Lending | | | | | | | | | | | | | |
| Collateral | | | — | | | 899,363 | | | — | | | 899,363 | |
| Total | | $ | 43,846,562 | | $ | 899,363 | | $ | — | | $ | 44,745,925 | |
Transfers between investment levels may occur as the markets fluctuate and/or the availability of data used in an investment’s valuation changes. Transfers between valuation levels, if any, are in comparison to the valuation levels at the end of the previous fiscal year, and are effective using the fair value as of the end of the current fiscal period.
For the year ended May 31, 2017, there were no transfers between levels.
| See notes to financial statements. |
| CLAYMORE EXCHANGE-TRADED FUND TRUST 2 ANNUAL REPORT l 29 |
| SCHEDULE OF INVESTMENTS continued | May 31, 2017 |
HAO Guggenheim China Small Cap ETF
| | | | Shares | | | Value | |
| COMMON STOCKS† – 99.4% | | | | | | | |
| Financial – 21.7% | | | | | | | |
| Sunac China Holdings Ltd.1 | | | 677,955 | | $ | 1,101,438 | |
| Far East Horizon Ltd. | | | 834,955 | | | 773,617 | |
| China Everbright Ltd. | | | 318,182 | | | 714,561 | |
| Bank of Jinzhou Company Ltd. — Class H | | | 608,188 | | | 702,434 | |
| Credit China Fintech Holdings Ltd.*,1 | | | 5,326,390 | | | 697,203 | |
| Chongqing Rural Commercial Bank Company Ltd. — Class H | | | 949,433 | | | 649,407 | |
| Guangzhou R&F Properties Company Ltd. — Class H1 | | | 383,544 | | | 620,170 | |
| Sino-Ocean Group Holding Ltd. | | | 1,078,826 | | | 544,089 | |
| Shanghai Industrial Holdings Ltd. | | | 167,821 | | | 524,410 | |
| Shenzhen Investment Ltd. | | | 1,069,804 | | | 510,709 | |
| China Reinsurance Group Corp. — Class H | | | 2,185,884 | | | 496,508 | |
| Agile Group Holdings Ltd. | | | 517,188 | | | 491,141 | |
| China Jinmao Holdings Group Ltd.* | | | 1,495,420 | | | 489,361 | |
| Yuexiu Property Company Ltd. | | | 2,236,326 | | | 390,301 | |
| KWG Property Holding Ltd. | | | 483,787 | | | 383,059 | |
| CIFI Holdings Group Company Ltd. | | | 971,024 | | | 380,063 | |
| Harbin Bank Company Ltd. — Class H*,2 | | | 1,085,900 | | | 370,679 | |
| Zall Group Ltd.*,1 | | | 617,671 | | | 366,206 | |
| China International Capital Corporation Ltd. — Class H*,2 | | | 252,329 | | | 360,727 | |
| SOHO China Ltd.* | | | 671,787 | | | 336,219 | |
| Yanlord Land Group Ltd. | | | 237,177 | | | 322,317 | |
| Shui On Land Ltd. | | | 1,240,751 | | | 300,935 | |
| Poly Property Group Company Ltd.*,1 | | | 699,700 | | | 296,314 | |
| Logan Property Holdings Company Ltd. | | | 466,524 | | | 295,153 | |
| Huishang Bank Corporation Ltd. — Class H | | | 587,234 | | | 284,858 | |
| Guotai Junan International Holdings Ltd. | | | 873,833 | | | 281,467 | |
| Orient Securities Company Ltd. — Class H*,2 | | | 298,888 | | | 279,616 | |
| Greentown China Holdings Ltd.*,1 | | | 219,583 | | | 231,067 | |
| China Zheshang Bank Company Ltd. — Class H | | | 424,498 | | | 228,253 | |
| Noah Holdings Ltd. ADR*,1 | | | 8,236 | | | 225,831 | |
| Yuzhou Properties Company Ltd. | | | 441,274 | | | 224,248 | |
| Hopson Development Holdings Ltd. | | | 234,641 | | | 221,920 | |
| Powerlong Real Estate Holdings Ltd. | | | 507,066 | | | 221,894 | |
| China South City Holdings Ltd. | | | 1,156,121 | | | 221,063 | |
| Central China Securities Company Ltd. — Class H1 | | | 423,900 | | | 205,628 | |
| Joy City Property Ltd. | | | 1,287,445 | | | 199,913 | |
| China SCE Property Holdings Ltd. | | | 526,833 | | | 199,444 | |
| Shengjing Bank Company Ltd. — Class H2 | | | 225,025 | | | 183,371 | |
| Future Land Development Holdings Ltd. | | | 548,123 | | | 167,410 | |
| China Overseas Grand Oceans Group Ltd. | | | 316,125 | | | 164,301 | |
| Bank of Tianjin Company Ltd. — Class H | | | 226,517 | | | 154,646 | |
| Greentown Service Group Company Ltd. | | | 325,627 | | | 154,613 | |
| Bank of Zhengzhou Company Ltd. — Class H2 | | | 253,889 | | | 152,481 | |
| China Aoyuan Property Group Ltd. | | | 486,633 | | | 151,127 | |
| Beijing Capital Land Ltd. — Class H | | | 312,406 | | | 150,742 | |
| Bank of Chongqing Company Ltd. — Class H | | | 183,387 | | | 150,382 | |
| Renhe Commercial Holdings Company Ltd.*,1 | | | 5,847,714 | | | 145,584 | |
| Redco Properties Group Ltd.*,2 | | | 325,213 | | | 128,959 | |
| Fanhua, Inc.*,1 | | | 13,798 | | | 126,666 | |
| Times Property Holdings Ltd. | | | 189,506 | | | 121,596 | |
| Sunshine 100 China Holdings Ltd.2 | | | 282,434 | | | 120,332 | |
| Shanghai Industrial Urban Development Group Ltd. | | | 494,475 | | | 111,047 | |
| Glorious Property Holdings Ltd.* | | | 1,006,176 | | | 111,045 | |
| Ronshine China Holdings Ltd.* | | | 119,108 | | | 105,467 | |
| LVGEM China Real Estate Investment Company Ltd. | | | 409,214 | | | 105,028 | |
| Bank of Qingdao Company Ltd. — Class H2 | | | 118,801 | | | 101,079 | |
| Beijing Enterprises Medical & Health Group Ltd.* | | | 1,618,099 | | | 100,710 | |
| Jiayuan International Group Ltd.* | | | 195,791 | | | 92,211 | |
| Yida China Holdings Ltd. | | | 342,726 | | | 90,603 | |
| China Development Bank Financial Leasing | | | | | | | |
| Company Ltd. — Class H*,2 | | | 340,818 | | | 87,037 | |
| China Overseas Property Holdings Ltd.1 | | | 478,812 | | | 84,181 | |
| Fantasia Holdings Group Company Ltd. | | | 518,465 | | | 79,176 | |
| Guorui Properties Ltd. | | | 252,356 | | | 77,076 | |
| Hydoo International Holding Ltd.* | | | 597,901 | | | 64,452 | |
| China Financial International Investments Ltd.* | | | 1,696,921 | | | 63,152 | |
| Colour Life Services Group Company Ltd.* | | | 102,707 | | | 60,893 | |
| National Agricultural Holdings Ltd.*,†††,4 | | | 308,064 | | | 26,488 | |
| Mingfa Group International Company Ltd.*,†††,4 | | | 563,025 | | | — | |
| Total Financial | | | | | | 18,574,078 | |
| | | | | | | | |
| Industrial – 17.3% | | | | | | | |
| Yangzijiang Shipbuilding Holdings Ltd. | | | 926,509 | | | 850,561 | |
| Beijing Capital International Airport Company Ltd. — Class H* | | | 532,365 | | | 777,459 | |
| China National Building Material Company Ltd. — Class H | | | 1,086,205 | | | 603,567 | |
| Haitian International Holdings Ltd. | | | 233,339 | | | 541,991 | |
| China Communications Services Corp. Ltd. — Class H | | | 865,188 | | | 514,064 | |
| Lee & Man Paper Manufacturing Ltd. | | | 585,500 | | | 508,677 | |
| AviChina Industry & Technology Company Ltd. — Class H1 | | | 744,624 | | | 457,719 | |
| China High Speed Transmission Equipment Group Co. Ltd.1 | | | 424,902 | | | 434,583 | |
| Shanghai Electric Group Company Ltd. — Class H* | | | 1,000,134 | | | 433,811 | |
| China Energy Engineering Corporation Ltd. — Class H | | | 2,238,503 | | | 428,026 | |
| COSCO SHIPPING Holdings Company Ltd. — Class H* | | | 929,206 | | | 422,124 | |
| BBMG Corp. — Class H1 | | | 844,055 | | | 415,938 | |
| China Railway Signal & Communication | | | | | | | |
| Corporation Ltd. — Class H2 | | | 509,834 | | | 369,007 | |
| Sinotrans Ltd. — Class H | | | 774,562 | | | 362,806 | |
| Metallurgical Corporation of China Ltd. — Class H* | | | 1,033,770 | | | 356,864 | |
| SITC International Holdings Company Ltd. | | | 441,494 | | | 320,677 | |
| China Resources Cement Holdings Ltd. | | | 625,419 | | | 309,802 | |
| COSCO SHIPPING Development Company Ltd. — Class H* | | | 1,346,661 | | | 290,331 | |
| Hollysys Automation Technologies Ltd.* | | | 17,441 | | | 278,882 | |
| See notes to financial statements. |
| 30 l CLAYMORE EXCHANGE-TRADED FUND TRUST 2 ANNUAL REPORT |
| SCHEDULE OF INVESTMENTS continued | May 31, 2017 |
HAO Guggenheim China Small Cap ETF continued
| | | | Shares | | | Value | |
| COMMON STOCKS† – 99.4% (continued) | | | | | | | |
| Industrial – 17.3% (continued) | | | | | | | |
| Guangshen Railway Company Ltd. — Class H | | | 509,620 | | $ | 278,601 | |
| China Lesso Group Holdings Ltd. | | | 359,293 | | | 274,803 | |
| Xinjiang Goldwind Science & Technology | | | | | | | |
| Company Ltd. — Class H1 | | | 180,185 | | | 273,777 | |
| China International Marine Containers | | | | | | | |
| Group Co. Ltd. — Class H | | | 166,613 | | | 271,115 | |
| COSCO SHIPPING Energy Transportation | | | | | | | |
| Company Ltd. — Class H | | | 474,749 | | | 271,113 | |
| China Logistics Property Holdings Company Ltd.* | | | 674,624 | | | 238,079 | |
| Beijing Enterprises Clean Energy Group Ltd.* | | | 8,955,883 | | | 236,756 | |
| China Machinery Engineering Corp. — Class H | | | 300,414 | | | 222,830 | |
| Greatview Aseptic Packaging Company Ltd. | | | 407,878 | | | 218,269 | |
| China Zhongwang Holdings Ltd. | | | 507,951 | | | 217,066 | |
| Zoomlion Heavy Industry Science and Technology | | | | | | | |
| Company Ltd. — Class H | | | 464,261 | | | 206,141 | |
| Tianneng Power International Ltd. | | | 257,578 | | | 201,634 | |
| China Water Affairs Group Ltd. | | | 297,442 | | | 194,670 | |
| Lonking Holdings Ltd. | | | 675,586 | | | 187,267 | |
| CT Environmental Group Ltd.1 | | | 1,006,263 | | | 180,787 | |
| CSSC Offshore and Marine Engineering Group | | | | | | | |
| Company Ltd. — Class H | | | 80,523 | | | 143,015 | |
| West China Cement Ltd.* | | | 954,481 | | | 139,636 | |
| Harbin Electric Company Ltd. — Class H | | | 237,963 | | | 134,366 | |
| Chaowei Power Holdings Ltd. | | | 238,154 | | | 130,195 | |
| SIIC Environment Holdings Ltd. | | | 324,605 | | | 126,708 | |
| Dongjiang Environmental Company Ltd. — Class H | | | 72,524 | | | 118,198 | |
| China National Materials Company Ltd. — Class H | | | 381,181 | | | 114,465 | |
| CPMC Holdings Ltd. | | | 206,915 | | | 108,868 | |
| Dongfang Electric Corporation Ltd. — Class H | | | 122,112 | | | 104,679 | |
| China Aircraft Leasing Group Holdings Ltd. | | | 84,543 | | | 101,116 | |
| Sinotrans Shipping Ltd.1 | | | 459,461 | | | 100,236 | |
| China Ocean Industry Group Ltd.* | | | 3,903,810 | | | 96,187 | |
| China Aerospace International Holdings Ltd. | | | 687,972 | | | 90,936 | |
| Tianjin Port Development Holdings Ltd. | | | 553,099 | | | 90,853 | |
| Wasion Group Holdings Ltd.1 | | | 185,027 | | | 86,667 | |
| COSCO SHIPPING International Hong Kong Company Ltd. | | | 203,965 | | | 86,376 | |
| Seaspan Corp.*,1 | | | 16,339 | | | 84,799 | |
| China Singyes Solar Technologies Holdings Ltd.* | | | 189,375 | | | 83,357 | |
| NVC Lighting Holding Ltd. | | | 737,455 | | | 82,334 | |
| Tianjin Capital Environmental Protection Group | | | | | | | |
| Company Ltd. — Class H | | | 118,912 | | | 77,825 | |
| Ozner Water International Holding Ltd.*,1,2 | | | 312,249 | | | 77,336 | |
| First Tractor Company Ltd. — Class H | | | 144,969 | | | 74,415 | |
| Kangda International Environmental Co. Ltd.2 | | | 333,068 | | | 71,807 | |
| Chiho-Tiande Group Ltd.* | | | 139,398 | | | 66,010 | |
| Jiangnan Group Ltd. | | | 638,368 | | | 63,899 | |
| AVIC International Holding HK Ltd.* | | | 1,155,631 | | | 62,287 | |
| Sany Heavy Equipment International Holdings Company Ltd.* | | | 325,471 | | | 55,968 | |
| China Electronics Corporation Holdings Company Ltd. | | | 301,819 | | | 54,225 | |
| China Shanshui Cement Group Ltd.*,†††,4 | | | 2,598,948 | | | — | |
| Total Industrial | | | | | | 14,776,560 | |
| | | | | | | | |
| Consumer, Non-cyclical – 17.0% | | | | | | | |
| Sihuan Pharmaceutical Holdings Group Ltd. | | | 1,931,799 | | | 830,487 | |
| Jiangsu Expressway Company Ltd. — Class H | | | 443,644 | | | 644,475 | |
| Zhejiang Expressway Company Ltd. — Class H | | | 540,693 | | | 634,195 | |
| Tsingtao Brewery Company Ltd. — Class H | | | 125,179 | | | 570,277 | |
| Shenzhen International Holdings Ltd. | | | 347,252 | | | 563,272 | |
| Shandong Weigao Group Medical Polymer | | | | | | | |
| Company Ltd. — Class H | | | 683,791 | | | 537,033 | |
| BeiGene Ltd*,1 | | | 14,300 | | | 525,524 | |
| Shanghai Fosun Pharmaceutical Group | | | | | | | |
| Company Ltd. — Class H | | | 132,952 | | | 509,290 | |
| 3SBio, Inc.*,1,2 | | | 346,476 | | | 481,089 | |
| Dali Foods Group Company Ltd.*,2 | | | 736,909 | | | 452,976 | |
| Luye Pharma Group Ltd.1 | | | 644,313 | | | 387,789 | |
| China First Capital Group Ltd.* | | | 1,002,165 | | | 371,675 | |
| Uni-President China Holdings Ltd. | | | 463,665 | | | 346,300 | |
| China Agri-Industries Holdings Ltd.* | | | 788,809 | | | 339,112 | |
| Tong Ren Tang Technologies Company Ltd. — Class H | | | 213,408 | | | 335,760 | |
| China Resources Phoenix Healthcare Holdings Company Ltd.1 | | | 204,814 | | | 278,607 | |
| CAR, Inc.*,1 | | | 305,994 | | | 277,625 | |
| Virscend Education Company Ltd.*,2 | | | 398,388 | | | 271,473 | |
| SSY Group Ltd. | | | 637,276 | | | 246,161 | |
| Shenzhen Expressway Company Ltd. — Class H | | | 249,345 | | | 238,387 | |
| Universal Medical Financial & Technical Advisory Services | | | | | | | |
| Company Ltd.1,2 | | | 256,995 | | | 220,966 | |
| Fu Shou Yuan International Group Ltd. | | | 347,748 | | | 220,008 | |
| Guangzhou Baiyunshan Pharmaceutical Holdings | | | | | | | |
| Company Ltd. — Class H | | | 79,431 | | | 215,079 | |
| Tibet Water Resources Ltd.1 | | | 523,477 | | | 211,609 | |
| China Shengmu Organic Milk Ltd.*,1,2 | | | 934,090 | | | 207,378 | |
| Vinda International Holdings Ltd. | | | 101,249 | | | 205,293 | |
| China Modern Dairy Holdings Ltd.* | | | 1,002,588 | | | 196,852 | |
| CP Pokphand Company Ltd. | | | 2,339,896 | | | 195,180 | |
| Livzon Pharmaceutical Group, Inc. — Class H | | | 28,958 | | | 194,169 | |
| Tarena International, Inc.*,1 | | | 11,290 | | | 193,398 | |
| Lifetech Scientific Corp.* | | | 788,247 | | | 190,172 | |
| China Maple Leaf Educational Systems Ltd. | | | 217,104 | | | 187,503 | |
| Biostime International Holdings Ltd.* | | | 65,344 | | | 177,355 | |
| Qingdao Port International Company Ltd. — Class H2 | | | 305,814 | | | 172,285 | |
| Wumart Stores, Inc. — Class H*,†† | | | 322,551 | | | 172,194 | |
| Yuexiu Transport Infrastructure Ltd. | | | 228,280 | | | 165,810 | |
| See notes to financial statements. |
| CLAYMORE EXCHANGE-TRADED FUND TRUST 2 ANNUAL REPORT l 31 |
| SCHEDULE OF INVESTMENTS continued | May 31, 2017 |
HAO Guggenheim China Small Cap ETF continued
| | | | Shares | | | Value | |
| COMMON STOCKS† – 99.4% (continued) | | | | | | | |
| Consumer, Non-cyclical – 17.0% (continued) | | | | | | | |
| Goodbaby International Holdings Ltd. | | | 305,917 | | $ | 149,573 | |
| United Laboratories International Holdings Ltd.* | | | 213,854 | | | 142,433 | |
| Shandong Luoxin Pharmaceutical Group Stock | | | | | | | |
| Company Ltd. — Class H | | | 62,985 | | | 137,085 | |
| Dalian Port PDA Company Ltd. — Class H | | | 751,030 | | | 131,076 | |
| Sichuan Expressway Company Ltd. — Class H | | | 305,750 | | | 129,481 | |
| Consun Pharmaceutical Group Ltd. | | | 178,338 | | | 129,077 | |
| Microport Scientific Corp.* | | | 169,469 | | | 121,788 | |
| Yestar Healthcare Holdings Company Ltd. | | | 244,291 | | | 119,442 | |
| China Shineway Pharmaceutical Group Ltd. | | | 101,189 | | | 116,220 | |
| Anhui Expressway Company Ltd. — Class H | | | 145,926 | | | 113,109 | |
| Hi Sun Technology China Ltd.* | | | 665,345 | | | 111,852 | |
| YiChang HEC ChangJiang Pharmaceutical | | | | | | | |
| Company Ltd. — Class H2 | | | 47,752 | | | 104,666 | |
| Golden Meditech Holdings Ltd.*,1 | | | 676,991 | | | 102,516 | |
| China Foods Ltd. | | | 259,697 | | | 100,980 | |
| Sinovac Biotech Ltd*,1 | | | 18,214 | | | 97,081 | |
| Qinhuangdao Port Company Ltd. — Class H | | | 264,443 | | | 82,803 | |
| Shanghai Haohai Biological Technology | | | | | | | |
| Company Ltd. — Class H2 | | | 14,432 | | | 81,120 | |
| Dawnrays Pharmaceutical Holdings Ltd. | | | 139,870 | | | 78,977 | |
| Shanghai Fudan-Zhangjiang Bio-Pharmaceutical | | | | | | | |
| Company Ltd. — Class H | | | 100,901 | | | 76,138 | |
| Poly Culture Group Corporation Ltd. — Class H | | | 29,138 | | | 72,916 | |
| Xiamen International Port Company Ltd. — Class H | | | 344,740 | | | 66,803 | |
| China Yurun Food Group Ltd.* | | | 485,959 | | | 66,728 | |
| China Distance Education Holdings Ltd. ADR | | | 7,144 | | | 65,368 | |
| China Huiyuan Juice Group Ltd.* | | | 184,371 | | | 63,409 | |
| YuanShengTai Dairy Farm Ltd.* | | | 1,029,506 | | | 57,470 | |
| Yashili International Holdings Ltd. | | | 306,047 | | | 53,021 | |
| PW Medtech Group Ltd.* | | | 238,369 | | | 52,614 | |
| China Beidahuang Industry Group Holdings Ltd. — Class A* | | | 994,171 | | | 50,395 | |
| Harmonicare Medical Holdings Ltd.2 | | | 86,824 | | | 40,334 | |
| Qianhai Health Holdings Ltd.* | | | 3,065,136 | | | 36,975 | |
| China Animal Healthcare Ltd.*,†††,4 | | | 863,000 | | | — | |
| China Huishan Dairy Holdings Company Ltd.†††,4 | | | 1,348,437 | | | — | |
| Hua Han Health Industry Holdings Ltd.*,†††,4 | | | 2,279,911 | | | — | |
| Anxin-China Holdings Ltd.*,†††,4 | | | 2,827,938 | | | — | |
| Total Consumer, Non-cyclical | | | | | | 14,718,208 | |
| | | | | | | | |
| Consumer, Cyclical – 15.4% | | | | | | | |
| Xinyi Glass Holdings Ltd. | | | 910,123 | | | 894,653 | |
| China Lodging Group Ltd. ADR* | | | 11,645 | | | 889,678 | |
| Shanghai Pharmaceuticals Holding Company Ltd. — Class H | | | 263,255 | | | 761,814 | |
| Fuyao Glass Industry Group Company Ltd. — Class H2 | | | 190,932 | | | 719,139 | |
| Air China Ltd. — Class H | | | 723,491 | | | 687,982 | |
| Weichai Power Company Ltd. — Class H | | | 350,360 | | | 568,313 | |
| GOME Electrical Appliances Holding Ltd.1 | | | 4,110,473 | | | 532,769 | |
| China Southern Airlines Company Ltd. — Class H | | | 654,369 | | | 500,489 | |
| Red Star Macalline Group Corporation Ltd. — Class H2 | | | 382,133 | | | 414,379 | |
| Li Ning Company Ltd.* | | | 588,494 | | | 404,038 | |
| BAIC Motor Corporation Ltd. — Class H2 | | | 377,992 | | | 368,657 | |
| Skyworth Digital Holdings Ltd. | | | 664,313 | | | 362,316 | |
| Zhongsheng Group Holdings Ltd.1 | | | 221,128 | | | 339,959 | |
| China Eastern Airlines Corporation Ltd. — Class H | | | 571,844 | | | 335,367 | |
| Imperial Pacific International Holdings Ltd.* | | | 17,839,169 | | | 295,318 | |
| Digital China Holdings Ltd.*,1 | | | 339,065 | | | 266,293 | |
| Golden Eagle Retail Group Ltd. | | | 159,041 | | | 228,588 | |
| China Jicheng Holdings Ltd.*,1,2 | | | 6,731,203 | | | 224,591 | |
| China Travel International Investment Hong Kong Ltd.1 | | | 778,242 | | | 222,713 | |
| BEP International Holdings Ltd.1 | | | 4,482,152 | | | 221,449 | |
| China Dongxiang Group Company Ltd. | | | 1,177,001 | | | 209,951 | |
| China Yongda Automobiles Services Holdings Ltd. | | | 233,242 | | | 202,040 | |
| Hisense Kelon Electrical Holdings Company Ltd. — Class H | | | 134,407 | | | 192,837 | |
| China ZhengTong Auto Services Holdings Ltd.1 | | | 301,026 | | | 173,451 | |
| China Minsheng Financial Holding Corporation Ltd.* | | | 2,203,523 | | | 155,527 | |
| Sinotruk Hong Kong Ltd. | | | 238,027 | | | 146,620 | |
| Grand Baoxin Auto Group Ltd.* | | | 313,471 | | | 146,428 | |
| IMAX China Holding, Inc.*,2 | | | 33,167 | | | 144,501 | |
| C.banner International Holdings Ltd.* | | | 373,514 | | | 141,402 | |
| Pou Sheng International Holdings Ltd. | | | 725,507 | | | 137,794 | |
| Xinhua Winshare Publishing and Media | | | | | | | |
| Company Ltd. — Class H | | | 161,760 | | | 135,138 | |
| Dah Chong Hong Holdings Ltd. | | | 291,845 | | | 134,079 | |
| Shanghai Jin Jiang International Hotels | | | | | | | |
| Group Co. Ltd. — Class H | | | 450,552 | | | 125,467 | |
| Xtep International Holdings Ltd. | | | 325,005 | | | 120,952 | |
| China Harmony New Energy Auto Holding Ltd.* | | | 278,035 | | | 117,744 | |
| NewOcean Energy Holdings Ltd.* | | | 346,912 | | | 106,846 | |
| China Lilang Ltd. | | | 169,169 | | | 105,507 | |
| Cosmo Lady China Holdings Company Ltd.2 | | | 229,443 | | | 98,638 | |
| Best Pacific International Holdings Ltd. | | | 105,678 | | | 94,931 | |
| Bosideng International Holdings Ltd. | | | 1,273,769 | | | 94,808 | |
| Ajisen China Holdings Ltd. | | | 221,932 | | | 91,992 | |
| Qingling Motors Company Ltd. — Class H | | | 266,386 | | | 91,958 | |
| Haichang Ocean Park Holdings Ltd.*,2 | | | 442,210 | | | 90,798 | |
| Citychamp Watch & Jewellery Group Ltd. | | | 405,046 | | | 87,845 | |
| 500.com Ltd. ADR*,1 | | | 9,009 | | | 83,243 | |
| TCL Multimedia Technology Holdings Ltd.* | | | 172,367 | | | 82,949 | |
| Neo Telemedia Ltd.* | | | 2,039,107 | | | 78,503 | |
| Yadea Group Holdings Ltd.*,2 | | | 358,737 | | | 77,802 | |
| Hengdeli Holdings Ltd.* | | | 764,096 | | | 72,561 | |
| Welling Holding Ltd. | | | 325,191 | | | 70,109 | |
| See notes to financial statements. |
| 32 l CLAYMORE EXCHANGE-TRADED FUND TRUST 2 ANNUAL REPORT |
| SCHEDULE OF INVESTMENTS continued | May 31, 2017 |
HAO Guggenheim China Small Cap ETF continued
| | | | Shares | | | Value | |
| COMMON STOCKS† – 99.4% (continued) | | | | | | | |
| Consumer, Cyclical – 15.4% (continued) | | | | | | | |
| China Animation Characters Company Ltd. | | | 168,860 | | $ | 69,993 | |
| 361 Degrees International Ltd. | | | 217,032 | | | 66,844 | |
| Weiqiao Textile Co. — Class H†††, 4 | | | 154,357 | | | 62,199 | |
| Jumei International Holding Ltd. ADR*,1 | | | 20,531 | | | 55,639 | |
| Kandi Technologies Group, Inc.*,1 | | | 11,933 | | | 49,522 | |
| HNA Holding Group Company Ltd.*,1 | | | 1,341,284 | | | 47,335 | |
| Total Consumer, Cyclical | | | | | | 13,202,458 | |
| | | | | | | | |
| Basic Materials – 8.6% | | | | | | | |
| Kingboard Chemical Holdings Ltd. | | | 244,477 | | | 901,990 | |
| Sinopec Shanghai Petrochemical Company Ltd. — Class H | | | 1,319,056 | | | 775,273 | |
| Nine Dragons Paper Holdings Ltd. | | | 634,489 | | | 752,354 | |
| Zijin Mining Group Company Ltd. — Class H | | | 2,167,413 | | | 712,046 | |
| Aluminum Corporation of China Ltd. — Class H*,1 | | | 1,489,771 | | | 693,988 | |
| China Molybdenum Co. Ltd. — Class H1 | | | 1,311,089 | | | 410,533 | |
| Huabao International Holdings Ltd.* | | | 655,436 | | | 381,025 | |
| Kingboard Laminates Holdings Ltd. | | | 269,248 | | | 317,537 | |
| Zhaojin Mining Industry Company Ltd. — Class H1 | | | 371,139 | | | 303,391 | |
| China Hongqiao Group Ltd.†††,4 | | | 509,285 | | | 259,464 | |
| Angang Steel Company Ltd. — Class H1 | | | 386,395 | | | 257,846 | |
| Fufeng Group Ltd.*,1 | | | 475,712 | | | 256,401 | |
| MMG Ltd.*,1 | | | 727,196 | | | 239,834 | |
| Maanshan Iron & Steel Company Ltd. — Class H*,1 | | | 612,404 | | | 216,121 | |
| China BlueChemical Ltd. — Class H | | | 628,406 | | | 159,673 | |
| Xingda International Holdings Ltd. | | | 313,592 | | | 121,534 | |
| Shandong Chenming Paper Holdings Ltd. — Class H | | | 90,570 | | | 105,302 | |
| China Metal Resources Utilization Ltd.*,2 | | | 241,706 | | | 93,364 | |
| North Mining Shares Company Ltd. — Class C*,1 | | | 4,021,876 | | | 83,096 | |
| Sinofert Holdings Ltd. | | | 622,149 | | | 78,243 | |
| Munsun Capital Group Ltd.* | | | 3,688,364 | | | 61,059 | |
| Shougang Concord International Enterprises Company Ltd.* | | | 1,553,334 | | | 48,041 | |
| Dongyue Group Ltd.†††,4 | | | 631,769 | | | 194,594 | |
| Total Basic Materials | | | | | | 7,422,709 | |
| | | | | | | | |
| Communications – 6.7% | | | | | | | |
| Autohome, Inc. ADR* | | | 20,360 | | | 862,857 | |
| YY, Inc. ADR* | | | 13,024 | | | 759,820 | |
| ZTE Corp. — Class H1 | | | 285,361 | | | 580,796 | |
| Sohu.com, Inc.* | | | 11,561 | | | 518,973 | |
| BYD Electronic International Company Ltd. | | | 224,685 | | | 429,622 | |
| Bitauto Holdings Ltd. ADR*,1 | | | 14,499 | | | 381,904 | |
| 51job, Inc. ADR* | | | 8,037 | | | 350,333 | |
| Fang Holdings Ltd. ADR*,1 | | | 94,941 | | | 322,799 | |
| Tuniu Corp ADR*,1 | | | 24,636 | | | 201,769 | |
| Baozun Inc. ADR*,1 | | | 9,045 | | | 185,874 | |
| 21Vianet Group, Inc. ADR*,1 | | | 31,522 | | | 168,643 | |
| CITIC Telecom International Holdings Ltd. | | | 517,120 | | | 164,577 | |
| Cogobuy Group*,1,2 | | | 212,984 | | | 163,446 | |
| China All Access Holdings Ltd. | | | 477,561 | | | 132,989 | |
| Yangtze Optical Fibre and Cable Joint Stock | | | | | | | |
| Limited Co. — Class H1,2 | | | 52,043 | | | 98,176 | |
| Huayi Tencent Entertainment Company Ltd.* | | | 2,259,888 | | | 95,703 | |
| Comba Telecom Systems Holdings Ltd. | | | 497,630 | | | 67,692 | |
| Yirendai Ltd. ADR*,1 | | | 2,772 | | | 64,255 | |
| Coolpad Group Ltd.*,†††,4 | | | 1,155,484 | | | 60,796 | |
| Wisdom Sports Group* | | | 251,585 | | | 45,200 | |
| Renren, Inc. ADR*,1 | | | 6,097 | | | 41,399 | |
| Total Communications | | | | | | 5,697,623 | |
| | | | | | | | |
| Technology – 5.4% | | | | | | | |
| TravelSky Technology Ltd. — Class H | | | 348,985 | | | 1,030,056 | |
| Kingsoft Corporation Ltd.1 | | | 272,744 | | | 733,272 | |
| Momo, Inc. ADR* | | | 12,485 | | | 474,929 | |
| Chinasoft International Ltd.* | | | 776,162 | | | 418,338 | |
| Kingdee International Software Group Company Ltd.*,1 | | | 676,477 | | | 269,985 | |
| NetDragon Websoft Holdings Ltd.1 | | | 99,539 | | | 266,972 | |
| AGTech Holdings Ltd.*,1 | | | 1,162,270 | | | 208,815 | |
| Leyou Technologies Holdings Ltd.*,1 | | | 846,625 | | | 176,008 | |
| Tian Ge Interactive Holdings Ltd.*,1,2 | | | 226,962 | | | 173,590 | |
| Hua Hong Semiconductor Ltd.2 | | | 124,753 | | | 163,937 | |
| Changyou.com Ltd. ADR* | | | 4,041 | | | 157,437 | |
| Ju Teng International Holdings Ltd. | | | 300,175 | | | 125,579 | |
| Cheetah Mobile Inc ADR*,1 | | | 9,975 | | | 119,800 | |
| NQ Mobile, Inc. — Class A ADR*,1 | | | 30,970 | | | 106,847 | |
| Boyaa Interactive International Ltd.* | | | 183,770 | | | 87,729 | |
| Shunfeng International Clean Energy Ltd.*,1 | | | 1,083,359 | | | 63,952 | |
| Total Technology | | | | | | 4,577,246 | |
| | | | | | | | |
| Energy – 3.7% | | | | | | | |
| Xinyi Solar Holdings Ltd.*,1 | | | 1,637,670 | | | 512,793 | |
| Yanzhou Coal Mining Company Ltd. — Class H1 | | | 670,648 | | | 499,170 | |
| Sinopec Engineering Group Company Ltd. — Class H | | | 428,496 | | | 393,718 | |
| China Coal Energy Company Ltd. — Class H1 | | | 753,340 | | | 330,631 | |
| Shougang Fushan Resources Group Ltd.* | | | 1,372,539 | | | 230,740 | |
| Beijing Jingneng Clean Energy Co. Ltd. — Class H | | | 716,580 | | | 213,343 | |
| Sinopec Kantons Holdings Ltd. | | | 348,004 | | | 183,996 | |
| CIMC Enric Holdings Ltd.* | | | 202,215 | | | 137,536 | |
| JinkoSolar Holding Company Ltd. ADR*,1 | | | 7,622 | | | 136,129 | |
| Sinopec Oilfield Service Corp. — Class H*,1 | | | 746,695 | | | 126,486 | |
| China Suntien Green Energy Corporation Ltd. — Class H | | | 614,881 | | | 118,361 | |
| Concord New Energy Group Ltd. | | | 2,329,022 | | | 103,114 | |
| JA Solar Holdings Company Ltd. ADR* | | | 14,201 | | | 97,703 | |
| China Tian Lun Gas Holdings Ltd. | | | 131,747 | | | 73,038 | |
| Total Energy | | | | | | 3,156,758 | |
| See notes to financial statements. |
| CLAYMORE EXCHANGE-TRADED FUND TRUST 2 ANNUAL REPORT l 33 |
| SCHEDULE OF INVESTMENTS continued | May 31, 2017 |
HAO Guggenheim China Small Cap ETF continued
| | | | Shares | | | Value | |
| COMMON STOCKS† – 99.4% (continued) | | | | | | | |
| Utilities – 2.6% | | | | | | | |
| Huaneng Renewables Corporation Ltd. — Class H | | | 1,406,953 | | $ | 465,828 | |
| China Power International Development Ltd. | | | 1,190,221 | | | 453,639 | |
| Datang International Power Generation | | | | | | | |
| Company Ltd. — Class H1 | | | 1,020,566 | | | 373,260 | |
| Huadian Power International Corporation Ltd. — Class H | | | 591,716 | | | 280,198 | |
| Huadian Fuxin Energy Corporation Ltd. — Class H1 | | | 918,344 | | | 214,488 | |
| China Oil & Gas Group Ltd. | | | 1,621,023 | | | 116,494 | |
| China Power New Energy Development Company Ltd. | | | 165,523 | | | 104,083 | |
| China Datang Corporation Renewable Power | | | | | | | |
| Company Ltd. — Class H | | | 817,662 | | | 81,845 | |
| Tianjin Development Holdings Ltd. | | | 142,839 | | | 80,471 | |
| Yunnan Water Investment Company Ltd. — Class H | | | 129,880 | | | 59,003 | |
| Total Utilities | | | | | | 2,229,309 | |
| | | | | | | | |
| Diversified – 1.0% | | | | | | | |
| Legend Holdings Corp. — Class H2 | | | 127,985 | | | 373,651 | |
| Carnival Group International Holdings Ltd.*,1 | | | 2,062,038 | | | 209,050 | |
| C C Land Holdings Ltd.* | | | 452,076 | | | 114,289 | |
| CITIC Resources Holdings Ltd.* | | | 817,825 | | | 104,951 | |
| China Chengtong Development Group Ltd.* | | | 1,020,379 | | | 51,068 | |
| Total Diversified | | | | | | 853,009 | |
| Total Common Stocks | | | | | | | |
| (Cost $100,410,995) | | | | | | 85,207,958 | |
| | | | Face Amount | | | Value | |
| SECURITIES LENDING COLLATERAL††,3 – 10.9% | | | | | | | |
| Repurchase Agreements | | | | | | | |
| Daiwa Capital Markets America Inc. | | | | | | | |
| issued 05/31/17 at 0.85% | | | | | | | |
| due 06/01/17 | | $ | 2,176,504 | | $ | 2,176,504 | |
| Nomura Securities International, Inc. | | | | | | | |
| issued 05/31/17 at 0.82% | | | | | | | |
| due 06/01/17 | | | 2,176,504 | | | 2,176,504 | |
| Citigroup Global Markets, Inc. | | | | | | | |
| issued 05/31/17 at 0.81% | | | | | | | |
| due 06/01/17 | | | 2,176,504 | | | 2,176,504 | |
| RBC Dominion Securities, Inc. | | | | | | | |
| issued 05/31/17 at 0.80% | | | | | | | |
| due 06/01/17 | | | 2,176,504 | | | 2,176,504 | |
| Royal Bank of Scotland plc | | | | | | | |
| issued 05/31/17 at 0.79% | | | | | | | |
| due 06/01/17 | | | 645,027 | | | 645,027 | |
| Total Securities Lending Collateral | | | | | | | |
| (Cost $9,351,043) | | | | | | 9,351,043 | |
| Total Investments – 110.3% | | | | | | | |
| (Cost $109,762,038) | | | | | $ | 94,559,001 | |
| Other Assets & Liabilities, net – (10.3)% | | | | | | (8,871,964 | ) |
| Total Net Assets – 100.0% | | | | | $ | 85,687,037 | |
| * | | Non-income producing security. |
| † | | Value determined based on Level 1 inputs, unless otherwise noted — See Note 4. |
| †† | | Value determined based on Level 2 inputs — See Note 4. |
| ††† | | Value determined based on Level 3 inputs — See Note 4. |
| 1 | | All or portion of this security is on loan at May 31, 2017 — See Note 5. |
| 2 | | Security is a 144A or Section 4(a)(2) security. These securities have been determined to be liquid under guidelines established by the Board of Trustees. The total market value of 144A or Section 4(a)(2) liquid securities is $7,539,387 (cost $7,708,792), or 8.8% of total net assets. |
| 3 | | Securities lending collateral — See Note 5. |
| 4 | | Security was fair valued by the Valuation Committee at May 31, 2017. The total market value of fair valued securities amounts to $603,541, (cost $5,422,529) or 0.7% of total net assets. |
| | | |
| ADR | | American Depositary Receipt |
| plc | | Public Limited Company |
See Sector Classification in Other Information section.
| Country Diversification |
| | % of Long-Term |
| Country | Investments |
| China | 74.8% |
| Hong Kong | 24.4% |
| Singapore | 0.5% |
| Australia | 0.3% |
| Total Long-Term Investments | 100.0% |
| Currency Denomination |
| | % of Long-Term |
| Currency | Investments |
| Hong Kong Dollar | 89.5% |
| United States Dollar | 9.0% |
| Singapore Dollar | 1.5% |
| Total Long-Term Investments | 100.0% |
| See notes to financial statements. |
| 34 l CLAYMORE EXCHANGE-TRADED FUND TRUST 2 ANNUAL REPORT |
| SCHEDULE OF INVESTMENTS continued | May 31, 2017 |
HAO Guggenheim China Small Cap ETF continued
The following table summarizes the inputs used to value the Fund’s investments at May 31, 2017 (See Note 4 in the Notes to Financial Statements):
| | | | | | | Level 2 | | | Level 3 | | | | |
| | | | | | | Significant | | | Significant | | | | |
| | | | Level 1 | | | Observable | | | Unobservable | | | | |
| | | | Quoted Prices | | | Inputs | | | Inputs | | | Total | |
| Assets | | | | | | | | | | | | | |
| Common Stocks | | $ | 84,432,223 | | $ | 172,194 | | $ | 603,541 | | $ | 85,207,958 | |
| Securities Lending | | | | | | | | | | | | | |
| Collateral | | | — | | | 9,351,043 | | | — | | | 9,351,043 | |
| Total | | $ | 84,432,223 | | $ | 9,523,237 | | $ | 603,541 | | $ | 94,559,001 | |
Transfers between investment levels may occur as the markets fluctuate and/or the availability of data used in an investment’s valuation changes. Transfers between valuation levels, if any, are in comparison to the valuation levels at the end of the previous fiscal year, and are effective using the fair value as of the end of the current fiscal period.
As of May 31, 2017 the Fund had securities with a total value of $408,947 transfer from Level 1 to Level 3 due to the securities being halted due to lack of active market at period end and the subsequent use of a fair value price determined by the Fund’s Valuation Committee. As of May 31, 2017 the Fund had securities with a total value of $63,152 transfer from Level 2 to Level 1 due to the availability of an active market price at period end.
| See notes to financial statements. |
| CLAYMORE EXCHANGE-TRADED FUND TRUST 2 ANNUAL REPORT l 35 |
| SCHEDULE OF INVESTMENTS continued | May 31, 2017 |
FRN Guggenheim Frontier Markets ETF
| | | | Shares | | | Value | |
| COMMON STOCKS† – 99.4% | | | | | | | |
| Kuwait – 13.2% | | | | | | | |
| National Bank of Kuwait SAKP | | | 993,780 | | $ | 2,225,125 | |
| Kuwait Finance House KSCP | | | 968,295 | | | 1,555,904 | |
| Mobile Telecommunications Company KSC | | | 934,315 | | | 1,310,564 | |
| Agility Public Warehousing Company KSC | | | 227,198 | | | 542,373 | |
| Gulf Bank KSCP | | | 511,034 | | | 400,481 | |
| Mabanee Company SAK | | | 153,837 | | | 395,103 | |
| Boubyan Bank KSCP | | | 224,458 | | | 310,413 | |
| Boubyan Petrochemicals Company KSCP* | | | 144,247 | | | 275,005 | |
| Qurain Petrochemical Industries Company KSC | | | 216,924 | | | 239,995 | |
| Burgan Bank SAK | | | 191,095 | | | 205,756 | |
| Kuwait Projects Company Holding KSCP | | | 174,484 | | | 201,085 | |
| Human Soft Holding Company KSC | | | 11,659 | | | 160,470 | |
| Kuwait International Bank KSCP | | | 167,184 | | | 137,072 | |
| Alimtiaz Investment Company KSCC | | | 261,005 | | | 134,069 | |
| Warba Bank KSCP* | | | 161,168 | | | 130,548 | |
| Mezzan Holding Company KSCC | | | 37,887 | | | 122,256 | |
| National Industries Group Holding SAK* | | | 272,838 | | | 99,720 | |
| National Gulf Holdings*,†††,3 | | | 51,616 | | | — | |
| Total Kuwait | | | | | | 8,445,939 | |
| | | | | | | | |
| Morocco – 9.9% | | | | | | | |
| Attijariwafa Bank | | | 34,360 | | | 1,510,725 | |
| Banque Centrale Populaire | | | 38,228 | | | 1,067,668 | |
| Maroc Telecom | | | 76,455 | | | 1,032,327 | |
| LafargeHolcim Maroc S.A. | | | 4,190 | | | 895,307 | |
| Cosumar | | | 15,625 | | | 620,813 | |
| BMCE Bank | | | 30,247 | | | 618,046 | |
| Douja Promotion Groupe Addoha S.A. | | | 68,096 | | | 330,027 | |
| Societe d’Exploitation des Ports* | | | 14,413 | | | 213,109 | |
| Total Morocco | | | | | | 6,288,022 | |
| | | | | | | | |
| Pakistan – 9.5% | | | | | | | |
| Habib Bank Ltd. | | | 270,432 | | | 699,200 | |
| Lucky Cement Ltd. | | | 77,880 | | | 638,299 | |
| MCB Bank Ltd. | | | 280,572 | | | 589,593 | |
| United Bank Ltd. | | | 180,692 | | | 409,524 | |
| Oil & Gas Development Company Ltd. | | | 242,411 | | | 408,886 | |
| Engro Corporation Ltd. | | | 108,250 | | | 384,200 | |
| Hub Power Company Ltd. | | | 259,055 | | | 327,467 | |
| Pakistan State Oil Company Ltd. | | | 72,595 | | | 322,441 | |
| Pakistan Petroleum Ltd. | | | 177,989 | | | 296,572 | |
| Fauji Fertilizer Company Ltd. | | | 257,256 | | | 236,263 | |
| SUI Northern Gas Pipeline* | | | 125,953 | | | 217,581 | |
| Pakistan Oilfields Ltd. | | | 39,290 | | | 198,277 | |
| DG Khan Cement Company Ltd. | | | 80,681 | | | 183,411 | |
| Millat Tractors Ltd. | | | 10,875 | | | 158,426 | |
| Packages Ltd. | | | 19,041 | | | 148,790 | |
| Searle Company Ltd. | | | 25,013 | | | 143,794 | |
| Mari Petroleum Company Ltd. | | | 8,758 | | | 141,203 | |
| National Bank of Pakistan | | | 192,053 | | | 121,514 | |
| Bank Alfalah Ltd.* | | | 270,722 | | | 117,162 | |
| Fauji Cement Company Ltd. | | | 254,097 | | | 109,821 | |
| Nishat Mills Ltd. | | | 62,209 | | | 102,195 | |
| Maple Leaf Cement Factory Ltd. | | | 83,845 | | | 89,056 | |
| Total Pakistan | | | | | | 6,043,675 | |
| | | | | | | | |
| Nigeria – 9.4% | | | | | | | |
| Guaranty Trust Bank plc | | | 30,411,658 | | | 3,286,101 | |
| Nigerian Breweries plc | | | 3,768,896 | | | 1,790,150 | |
| Nestle Nigeria plc | | | 327,068 | | | 909,254 | |
| Total Nigeria | | | | | | 5,985,505 | |
| | | | | | | | |
| Romania – 9.3% | | | | | | | |
| Banca Transilvania S.A.* | | | 2,873,162 | | | 2,120,676 | |
| OMV Petrom S.A. | | | 14,043,215 | | | 1,138,452 | |
| Societatea Nationala de Gaze Naturale ROMGAZ S.A. | | | 102,379 | | | 853,893 | |
| BRD-Groupe Societe Generale S.A. | | | 246,823 | | | 788,230 | |
| Societatea Energetica Electrica S.A. | | | 155,950 | | | 573,230 | |
| Transgaz S.A. Medias | | | 4,267 | | | 471,370 | |
| Total Romania | | | | | | 5,945,851 | |
| | | | | | | | |
| Vietnam – 9.0% | | | | | | | |
| Vietnam Dairy Products JSC | | | 251,240 | | | 1,655,762 | |
| PetroVietnam Gas JSC | | | 345,290 | | | 845,174 | |
| Vingroup JSC* | | | 281,240 | | | 498,345 | |
| Bank for Investment and Development of Vietnam JSC | | | 577,490 | | | 469,060 | |
| Saigon Beer Alcohol Beverage Corp. | | | 47,160 | | | 392,602 | |
| Masan Group Corp. | | | 193,115 | | | 367,271 | |
| Bao Viet Holdings | | | 117,850 | | | 298,840 | |
| Hoa Phat Group JSC | | | 218,938 | | | 293,010 | |
| FLC Faros Construction JSC* | | | 41,040 | | | 238,489 | |
| No. Va Land Investment Group Corp.* | | | 72,900 | | | 215,025 | |
| Bank for Foreign Trade of Vietnam JSC | | | 101,734 | | | 162,129 | |
| Saigon Securities, Inc. | | | 114,270 | | | 124,759 | |
| Saigon Thuong Tin Commercial JSB* | | | 191,240 | | | 105,239 | |
| Ho Chi Minh City Infrastructure Investment JSC | | | 55,420 | | | 95,152 | |
| Total Vietnam | | | | | | 5,760,857 | |
| | | | | | | | |
| Argentina – 8.2% | | | | | | | |
| YPF S.A. ADR | | | 64,004 | | | 1,578,339 | |
| Pampa Energia SA ADR* | | | 20,249 | | | 1,265,967 | |
| Grupo Financiero Galicia S.A. ADR | | | 21,321 | | | 950,064 | |
| Banco Macro S.A. ADR | | | 5,322 | | | 476,159 | |
| BBVA Banco Frances S.A. ADR1 | | | 14,239 | | | 283,356 | |
| Cresud S.A. ADR*,1 | | | 10,559 | | | 213,714 | |
| IRSA Inversiones y Representaciones S.A. ADR* | | | 6,139 | | | 150,406 | |
| See notes to financial statements. |
| 36 l CLAYMORE EXCHANGE-TRADED FUND TRUST 2 ANNUAL REPORT |
| SCHEDULE OF INVESTMENTS continued | May 31, 2017 |
FRN Guggenheim Frontier Markets ETF continued
| | | | Shares | | | Value | |
| COMMON STOCKS† – 99.4% (continued) | | | | | | | |
| Argentina – 8.2% (continued) | | | | | | | |
| Telecom Argentina S.A. ADR1 | | | 5,223 | | $ | 134,597 | |
| Empresa Distribuidora y Comercializadora Norte S.A. ADR*,1 | | | 3,171 | | | 101,440 | |
| Grupo Supervielle S.A. ADR* | | | 4,684 | | | 80,424 | |
| Total Argentina | | | | | | 5,234,466 | |
| | | | | | | | |
| United States – 6.3% | | | | | | | |
| MercadoLibre, Inc. | | | 14,665 | | | 4,034,488 | |
| | | | | | | | |
| Kenya – 5.8% | | | | | | | |
| Safaricom Ltd. | | | 8,868,774 | | | 1,908,416 | |
| East African Breweries Ltd. | | | 399,099 | | | 930,202 | |
| KCB Group Ltd. | | | 2,249,434 | | | 864,749 | |
| Total Kenya | | | | | | 3,703,367 | |
| | | | | | | | |
| Panama – 4.9% | | | | | | | |
| Copa Holdings S.A. — Class A | | | 27,463 | | | 3,104,417 | |
| | | | | | | | |
| Oman – 4.0% | | | | | | | |
| Bank Muscat SAOG | | | 1,137,170 | | | 1,193,135 | |
| Oman Telecommunications Company SAOG | | | 325,395 | | | 1,047,889 | |
| Ooredoo | | | 248,904 | | | 320,624 | |
| Total Oman | | | | | | 2,561,648 | |
| | | | | | | | |
| Cyprus – 3.4% | | | | | | | |
| Aroundtown Property Holdings plc | | | 413,003 | | | 2,140,985 | |
| | | | | | | | |
| Kazakhstan – 3.2% | | | | | | | |
| KazMunaiGas Exploration Production JSC GDR | | | 152,090 | | | 1,473,752 | |
| Halyk Savings Bank of Kazakhstan JSC GDR* | | | 72,882 | | | 571,395 | |
| Total Kazakhstan | | | | | | 2,045,147 | |
| | | | | | | | |
| United Kingdom – 2.3% | | | | | | | |
| KAZ Minerals plc* | | | 233,361 | | | 1,461,702 | |
| | | | | | | | |
| British Virgin Islands – 0.5% | | | | | | | |
| Arcos Dorados Holdings, Inc. — Class A* | | | 40,735 | | | 350,321 | |
| | | | | | | | |
| Luxembourg – 0.5% | | | | | | | |
| Adecoagro S.A.* | | | 29,007 | | | 319,077 | |
| Total Common Stocks | | | | | | | |
| (Cost $55,755,926) | | | | | | 63,425,467 | |
| | | | Face Amount | | | Value | |
| SECURITIES LENDING COLLATERAL††,2 – 0.4% | | | | | | | |
| Repurchase Agreements | | | | | | | |
| Daiwa Capital Markets America Inc. | | | | | | | |
| issued 05/31/17 at 0.85% | | | | | | | |
| due 06/01/17 | | $ | 250,000 | | $ | 250,000 | |
| Nomura Securities International, Inc. | | | | | | | |
| issued 05/31/17 at 0.80% | | | | | | | |
| due 06/01/17 | | | 3,163 | | | 3,163 | |
| Total Securities Lending Collateral | | | | | | | |
| (Cost $253,163) | | | | | | 253,163 | |
| Total Investments – 99.8% | | | | | | | |
| (Cost $56,009,089) | | | | | $ | 63,678,630 | |
| Other Assets & Liabilities, net – 0.2% | | | | | | 155,408 | |
| Total Net Assets – 100.0% | | | | | $ | 63,834,038 | |
| * | | Non-income producing security. |
| † | | Value determined based on Level 1 inputs, unless otherwise noted — See Note 4. |
| †† | | Value determined based on Level 2 inputs — See Note 4. |
| ††† | | Value determined based on Level 3 inputs — See Note 4. |
| 1 | | All or portion of this security is on loan at May 31, 2017 — See Note 5. |
| 2 | | Securities lending collateral — See Note 5. |
| 3 | | Security was fair valued by the Valuation Committee at May 31, 2017. The total market value of fair valued securities amounts to $0, (cost $0) or 0.0% of total net assets. |
| | | |
| ADR | | American Depositary Receipt |
| GDR | | Global Depositary Receipt |
| plc | | Public Limited Company |
| Currency Denomination |
| | % of Long-Term |
| Currency | Investments |
| United States Dollar | 23.8% |
| Kuwaiti Dinar | 13.3% |
| Moroccan Dirham | 9.9% |
| Pakistani Rupee | 9.5% |
| Nigerian Naira | 9.4% |
| Romanian Leu | 9.4% |
| Vietnamese Dong | 9.1% |
| Other | 15.6% |
| Total Long-Term Investments | 100.0% |
| Portfolio Breakdown | % of Net Assets |
| Financial | 41.5% |
| Communications | 15.4% |
| Consumer, Non-cyclical | 11.4% |
| Energy | 11.4% |
| Consumer, Cyclical | 6.4% |
| Utilities | 4.6% |
| Industrial | 4.4% |
| Basic Materials | 4.3% |
| Total Long-Term Investments | 99.4% |
| Securities Lending Collateral | 0.4% |
| Total Investments | 99.8% |
| Other Assets & Liabilities, net | 0.2% |
| Net Assets | 100.0% |
| See notes to financial statements. |
| CLAYMORE EXCHANGE-TRADED FUND TRUST 2 ANNUAL REPORT l 37 |
| SCHEDULE OF INVESTMENTS continued | May 31, 2017 |
FRN Guggenheim Frontier Markets ETF continued
The following table summarizes the inputs used to value the Fund’s investments at May 31, 2017 (See Note 4 in the Notes to Financial Statements):
| | | | | | | Level 2 | | | Level 3 | | | | |
| | | | | | | Significant | | | Significant | | | | |
| | | | Level 1 | | | Observable | | | Unobservable | | | | |
| | | | Quoted Prices | | | Inputs | | | Inputs | | | Total | |
| Assets | | | | | | | | | | | | | |
| Common Stocks | | $ | 63,425,467 | | $ | — | | $ | — | * | $ | 63,425,467 | |
| Securities Lending | | | | | | | | | | | | | |
| Collateral | | | — | | | 253,163 | | | — | | | 253,163 | |
| Total | | $ | 63,425,467 | | $ | 253,163 | | $ | — | * | $ | 63,678,630 | |
* Includes a security with a market value of $0.
Transfers between investment levels may occur as the markets fluctuate and/or the availability of data used in an investment’s valuation changes. Transfers between valuation levels, if any, are in comparison to the valuation levels at the end of the previous fiscal year, and are effective using the fair value as of the end of the current fiscal period.
For the year ended May 31, 2017, there were no transfers between levels.
| See notes to financial statements. |
| 38 l CLAYMORE EXCHANGE-TRADED FUND TRUST 2 ANNUAL REPORT |
| SCHEDULE OF INVESTMENTS continued | May 31, 2017 |
HGI Guggenheim International Multi-Asset Income ETF
| | | | Shares | | | Value | |
| COMMON STOCKS† – 87.0% | | | | | | | |
| Japan – 13.8% | | | | | | | |
| Casio Computer Company Ltd. | | | 9,100 | | $ | 141,538 | |
| Sumitomo Mitsui Financial Group, Inc. | | | 3,900 | | | 140,150 | |
| Nippon Telegraph & Telephone Corp. | | | 2,700 | | | 129,598 | |
| NTT DOCOMO, Inc. | | | 5,200 | | | 127,761 | |
| Tokio Marine Holdings, Inc. | | | 2,900 | | | 123,254 | |
| Wacoal Holdings Corp. | | | 9,000 | | | 115,567 | |
| Kao Corp. | | | 1,600 | | | 101,033 | |
| Honda Motor Co., Ltd. | | | 3,500 | | | 98,653 | |
| Seven & i Holdings Company Ltd. | | | 2,000 | | | 85,147 | |
| Sekisui House Ltd. | | | 4,800 | | | 82,471 | |
| NSK Ltd. | | | 6,900 | | | 82,362 | |
| Mitsubishi Corp. | | | 4,000 | | | 80,228 | |
| Kyocera Corp. | | | 1,300 | | | 75,013 | |
| Isuzu Motors Ltd. | | | 5,900 | | | 72,186 | |
| Bridgestone Corp. | | | 1,700 | | | 71,514 | |
| ANA Holdings, Inc. | | | 21,000 | | | 68,914 | |
| Kirin Holdings Company Ltd. | | | 3,200 | | | 67,611 | |
| Marui Group Company Ltd. | | | 4,600 | | | 67,013 | |
| MINEBEA MITSUMI, Inc. | �� | | 3,900 | | | 63,727 | |
| Fujitsu Ltd. | | | 8,000 | | | 58,438 | |
| Ajinomoto Company, Inc. | | | 2,600 | | | 55,745 | |
| Internet Initiative Japan, Inc. | | | 2,600 | | | 50,855 | |
| Asahi Glass Company Ltd. | | | 5,000 | | | 40,874 | |
| Central Japan Railway Co. | | | 200 | | | 32,798 | |
| Alps Electric Company Ltd. | | | 1,100 | | | 30,935 | |
| Olympus Corp. | | | 500 | | | 18,289 | |
| Total Japan | | | | | | 2,081,674 | |
| | | | | | | | |
| United Kingdom – 11.6% | | | | | | | |
| Lloyds Banking Group plc | | | 223,645 | | | 203,804 | |
| Carnival plc | | | 2,246 | | | 144,104 | |
| TalkTalk Telecom Group plc1 | | | 53,968 | | | 123,664 | |
| Pearson plc | | | 13,539 | | | 123,483 | |
| Foxtons Group plc | | | 83,372 | | | 120,814 | |
| ITV plc | | | 43,752 | | | 110,534 | |
| Persimmon plc | | | 3,076 | | | 97,487 | |
| Halfords Group plc | | | 20,709 | | | 97,126 | |
| Vodafone Group plc | | | 32,192 | | | 96,207 | |
| Aberdeen Asset Management plc | | | 25,058 | | | 93,488 | |
| Capita plc | | | 12,042 | | | 90,553 | |
| Interserve plc | | | 30,030 | | | 87,226 | |
| Legal & General Group plc | | | 24,827 | | | 80,703 | |
| Royal Dutch Shell plc — Class A | | | 2,947 | | | 79,893 | |
| SSE plc | | | 3,878 | | | 75,345 | |
| Centrica plc | | | 25,119 | | | 65,925 | |
| Ashtead Group plc | | | 3,247 | | | 65,642 | |
| Total United Kingdom | | | | | | 1,755,998 | |
| | | | | | | | |
| France – 7.9% | | | | | | | |
| Societe Generale S.A.1 | | | 4,294 | | | 225,352 | |
| BNP Paribas S.A.1 | | | 3,047 | | | 215,243 | |
| Electricite de France S.A. | | | 11,362 | | | 122,553 | |
| Carrefour S.A. | | | 4,662 | | | 121,861 | |
| Engie S.A.1 | | | 7,909 | | | 120,820 | |
| Cie Generale des Etablissements Michelin — Class B1 | | | 934 | | | 117,632 | |
| Publicis Groupe S.A.1 | | | 1,456 | | | 111,580 | |
| L’Oreal S.A. | | | 382 | | | 81,810 | |
| Capgemini SE | | | 779 | | | 80,731 | |
| Total France | | | | | | 1,197,582 | |
| | | | | | | | |
| United States – 5.1% | | | | | | | |
| EOG Resources, Inc. | | | 1,607 | | | 145,128 | |
| Apache Corp. | | | 2,988 | | | 139,719 | |
| Murphy Oil Corp. | | | 5,528 | | | 134,938 | |
| Noble Energy, Inc. | | | 4,307 | | | 123,568 | |
| Devon Energy Corp. | | | 3,544 | | | 120,425 | |
| SM Energy Co. | | | 6,283 | | | 106,623 | |
| Total United States | | | | | | 770,401 | |
| | | | | | | | |
| Cayman Islands – 4.8% | | | | | | | |
| Hopewell Highway Infrastructure Ltd. | | | 411,000 | | | 229,962 | |
| Xinyuan Real Estate Co. Ltd. ADR | | | 33,117 | | | 156,312 | |
| CK Hutchison Holdings Ltd. | | | 9,500 | | | 123,864 | |
| China State Construction International Holdings Ltd. | | | 70,000 | | | 121,451 | |
| Silicon Motion Technology Corp. ADR | | | 1,207 | | | 63,066 | |
| NetEase, Inc. ADR | | | 111 | | | 31,611 | |
| Total Cayman Islands | | | | | | 726,266 | |
| | | | | | | | |
| China – 4.0% | | | | | | | |
| Huaneng Power International, Inc. ADR1 | | | 10,167 | | | 321,480 | |
| Sun Hung Kai Properties Ltd. | | | 11,000 | | | 162,760 | |
| China Telecom Corporation Ltd. ADR1 | | | 1,389 | | | 68,908 | |
| China Southern Airlines Company, Ltd. ADR | | | 1,574 | | | 60,363 | |
| Total China | | | | | | 613,511 | |
| | | | | | | | |
| Netherlands – 3.9% | | | | | | | |
| Koninklijke KPN N.V. | | | 68,490 | | | 233,594 | |
| Koninklijke Ahold Delhaize N.V. | | | 5,489 | | | 121,164 | |
| Randstad Holding N.V. | | | 2,061 | | | 119,356 | |
| ASM International N.V. | | | 1,281 | | | 79,529 | |
| ASML Holding N.V. | | | 325 | | | 42,942 | |
| Total Netherlands | | | | | | 596,585 | |
| | | | | | | | |
| Taiwan, Province of China – 3.7% | | | | | | | |
| ChipMOS Technologies, Inc.1 | | | 12,591 | | | 254,211 | |
| Chunghwa Telecom Company Ltd. ADR1 | | | 3,717 | | | 133,849 | |
| See notes to financial statements. |
| CLAYMORE EXCHANGE-TRADED FUND TRUST 2 ANNUAL REPORT l 39 |
| SCHEDULE OF INVESTMENTS continued | May 31, 2017 |
HGI Guggenheim International Multi-Asset Income ETF continued
| | | | Shares | | | Value | |
| COMMON STOCKS† – 87.0% (continued) | | | | | | | |
| Taiwan, Province of China – 3.7% (continued) | | | | | | | |
| Advanced Semiconductor Engineering, Inc. ADR | | | 14,238 | | $ | 90,554 | |
| Taiwan Semiconductor Manufacturing Company Ltd. ADR | | | 2,211 | | | 78,181 | |
| Total Taiwan, Province of China | | | | | | 556,795 | |
| | | | | | | | |
| Sweden – 2.7% | | | | | | | |
| Telia Company AB | | | 20,695 | | | 94,899 | |
| Tele2 AB — Class B | | | 8,423 | | | 86,852 | |
| Svenska Handelsbanken AB — Class A | | | 5,481 | | | 77,334 | |
| Hennes & Mauritz AB — Class B REIT | | | 3,075 | | | 76,742 | |
| Assa Abloy AB — Class B | | | 3,068 | | | 69,034 | |
| Total Sweden | | | | | | 404,861 | |
| | | | | | | | |
| Canada – 2.5% | | | | | | | |
| Canadian Natural Resources Ltd. | | | 5,475 | | | 158,008 | |
| Encana Corp.1 | | | 14,184 | | | 137,868 | |
| Crescent Point Energy Corp1 | | | 10,421 | | | 90,142 | |
| Total Canada | | | | | | 386,018 | |
| | | | | | | | |
| Bermuda – 2.5% | | | | | | | |
| Man Wah Holdings Ltd. | | | 304,800 | | | 305,095 | |
| Li & Fung Ltd. | | | 176,000 | | | 72,501 | |
| Total Bermuda | | | | | | 377,596 | |
| | | | | | | | |
| Hong Kong – 2.5% | | | | | | | |
| Far East Consortium International Ltd. | | | 216,216 | | | 109,878 | |
| Television Broadcasts Ltd. | | | 25,800 | | | 97,175 | |
| China Resources Power Holdings Company Ltd. | | | 42,000 | | | 86,669 | |
| China Merchants Port Holdings Company Ltd. | | | 28,000 | | | 83,003 | |
| Total Hong Kong | | | | | | 376,725 | |
| | | | | | | | |
| Germany – 2.4% | | | | | | | |
| Bayer AG | | | 819 | | | 108,766 | |
| Continental AG | | | 362 | | | 80,600 | |
| Henkel AG & Company KGaA | | | 494 | | | 61,411 | |
| MTU Aero Engines AG | | | 416 | | | 58,755 | |
| HeidelbergCement AG | | | 543 | | | 50,607 | |
| Total Germany | | | | | | 360,139 | |
| | | | | | | | |
| Cyprus – 2.3% | | | | | | | |
| QIWI plc ADR | | | 15,151 | | | 350,140 | |
| | | | | | | | |
| Switzerland – 1.9% | | | | | | | |
| LafargeHolcim Ltd.* | | | 2,007 | | | 120,621 | |
| Panalpina Welttransport Holding AG | | | 642 | | | 88,183 | |
| Zurich Insurance Group AG | | | 283 | | | 83,272 | |
| Total Switzerland | | | | | | 292,076 | |
| | | | | | | | |
| Argentina – 1.9% | | | | | | | |
| Nortel Inversora S.A. | | | 5,388 | | | 160,562 | |
| Telecom Argentina S.A. ADR | | | 3,997 | | | 103,003 | |
| YPF S.A. ADR | | | 718 | | | 17,706 | |
| Grupo Financiero Galicia S.A. ADR | | | 94 | | | 4,189 | |
| Total Argentina | | | | | | 285,460 | |
| | | | | | | | |
| Australia – 1.8% | | | | | | | |
| Brambles Ltd. | | | 16,919 | | | 130,614 | |
| National Australia Bank Ltd. | | | 3,194 | | | 71,619 | |
| Telstra Corp., Ltd. | | | 19,560 | | | 64,070 | |
| Total Australia | | | | | | 266,303 | |
| | | | | | | | |
| Spain – 1.5% | | | | | | | |
| Telefonica S.A. | | | 9,798 | | | 109,231 | |
| Industria de Diseno Textil S.A. | | | 2,190 | | | 89,628 | |
| Gamesa Corporation Tecnologica S.A. | | | 1,217 | | | 27,630 | |
| Total Spain | | | | | | 226,489 | |
| | | | | | | | |
| Denmark – 1.5% | | | | | | | |
| Novo Nordisk A/S — Class B | | | 4,064 | | | 172,858 | |
| Vestas Wind Systems A/S | | | 576 | | | 51,237 | |
| Total Denmark | | | | | | 224,095 | |
| | | | | | | | |
| South Africa – 1.3% | | | | | | | |
| Sibanye Gold Ltd. ADR1 | | | 21,143 | | | 106,983 | |
| DRDGOLD Ltd. ADR1 | | | 28,901 | | | 86,703 | |
| Total South Africa | | | | | | 193,686 | |
| | | | | | | | |
| Chile – 1.0% | | | | | | | |
| Banco Santander Chile ADR | | | 5,348 | | | 132,095 | |
| Cencosud S.A. ADR1 | | | 3,038 | | | 25,215 | |
| Total Chile | | | | | | 157,310 | |
| | | | | | | | |
| Colombia – 1.0% | | | | | | | |
| Grupo Aval Acciones y Valores S.A. | | | 18,525 | | | 154,869 | |
| | | | | | | | |
| Israel – 1.0% | | | | | | | |
| Bank Hapoalim BM | | | 11,341 | | | 75,558 | |
| Formula Systems 1985 Ltd. | | | 1,762 | | | 74,576 | |
| Total Israel | | | | | | 150,134 | |
| | | | | | | | |
| Peru – 1.0% | | | | | | | |
| Cementos Pacasmayo S.A.A.1 | | | 12,928 | | | 146,733 | |
| Fossal S.A.A.* | | | 10 | | | 11 | |
| Total Peru | | | | | | 146,744 | |
| | | | | | | | |
| Austria – 0.8% | | | | | | | |
| Flughafen Wien AG1 | | | 1,979 | | | 75,196 | |
| Telekom Austria AG* | | | 6,460 | | | 52,978 | |
| Total Austria | | | | | | 128,174 | |
| | | | | | | | |
| Ireland – 0.6% | | | | | | | |
| James Hardie Industries plc | | | 6,652 | | | 96,962 | |
| | | | | | | | |
| Indonesia – 0.5% | | | | | | | |
| Telekomunikasi Indonesia Persero Tbk PT ADR | | | 2,110 | | | 69,567 | |
| | | | | | | | |
| Jersey – 0.4% | | | | | | | |
| Randgold Resources Ltd. ADR1 | | | 447 | | | 42,385 | |
| Shire plc | | | 375 | | | 21,647 | |
| Total Jersey | | | | | | 64,032 | |
| | | | | | | | |
| Portugal – 0.4% | | | | | | | |
| Pharol SGPS S.A.1 | | | 203,608 | | | 61,589 | |
| See notes to financial statements. |
| 40 l CLAYMORE EXCHANGE-TRADED FUND TRUST 2 ANNUAL REPORT |
| SCHEDULE OF INVESTMENTS continued | May 31, 2017 |
HGI Guggenheim International Multi-Asset Income ETF continued
| | | | Shares | | | Value | |
| COMMON STOCKS† – 87.0% (continued) | | | | | | | |
| Brazil – 0.4% | | | | | | | |
| Banco Santander Brasil S.A. ADR | | | 7,411 | | $ | 57,361 | |
| | | | | | | | |
| India – 0.2% | | | | | | | |
| HDFC Bank Ltd. ADR | | | 235 | | | 20,633 | |
| Dr Reddy’s Laboratories Ltd. ADR | | | 442 | | | 17,079 | |
| Total India | | | | | | 37,712 | |
| | | | | | | | |
| Republic of Korea – 0.1% | | | | | | | |
| SK Telecom Company Ltd. ADR | | | 348 | | | 8,742 | |
| Total Common Stocks | | | | | | | |
| (Cost $12,512,704) | | | | | | 13,175,596 | |
| | | | | | | | |
| PREFERRED STOCKS† – 2.6% | | | | | | | |
| Brazil – 1.4% | | | | | | | |
| Braskem S.A. ADR | | | 9,457 | | | 194,814 | |
| | | | | | | | |
| Colombia – 0.7% | | | | | | | |
| Bancolombia S.A. ADR | | | 2,558 | | | 112,578 | |
| | | | | | | | |
| Chile – 0.5% | | | | | | | |
| Embotelladora Andina S.A. — Class B ADR1 | | | 3,283 | | | 81,090 | |
| Total Preferred Stocks | | | | | | | |
| (Cost $318,469) | | | | | | 388,482 | |
| | | | | | | | |
| ROYALTY TRUST† – 0.4% | | | | | | | |
| United States – 0.4% | | | | | | | |
| BP Prudhoe Bay Royalty Trust1 | | | 2,730 | | | 55,965 | |
| Total Royalty Trust | | | | | | | |
| (Cost $74,483) | | | | | | 55,965 | |
| | | | | | | | |
| CLOSED-END FUNDS† – 9.5% | | | | | | | |
| United States – 9.5% | | | | | | | |
| Western Asset Global High Income Fund, Inc.1 | | | 10,644 | | | 108,887 | |
| Morgan Stanley Emerging Markets Domestic Debt Fund, Inc. | | | 13,321 | | | 108,033 | |
| Western Asset High Income Fund II, Inc. | | | 14,761 | | | 107,903 | |
| Alpine Global Premier Properties Fund | | | 17,027 | | | 104,716 | |
| Barings Global Short Duration High Yield Fund1 | | | 5,020 | | | 101,655 | |
| DoubleLine Income Solutions Fund1 | | | 4,920 | | | 100,762 | |
| Nuveen Global High Income Fund | | | 5,800 | | | 99,122 | |
| Eaton Vance Tax-Advantaged Global Dividend Income Fund1 | | | 5,653 | | | 95,310 | |
| Cohen & Steers Select Preferred and Income Fund, Inc.1 | | | 3,272 | | | 91,485 | |
| First Trust Intermediate Duration Preferred & Income Fund1 | | | 3,703 | | | 90,983 | |
| Western Asset High Yield Defined Opportunity Fund, Inc. | | | 5,851 | | | 90,339 | |
| Prudential Global Short Duration High Yield Fund, Inc.1 | | | 5,892 | | | 89,735 | |
| BlackRock Multi-Sector Income Trust1 | | | 4,871 | | | 87,629 | |
| Diversified Real Asset Income Fund1 | | | 4,999 | | | 87,433 | |
| AllianceBernstein Global High Income Fund, Inc.1 | | | 6,413 | | | 82,151 | |
| Total Closed-End Funds | | | | | | | |
| (Cost $1,386,838) | | | | | | 1,446,143 | |
| | | | Face Amount | | | Value | |
| SECURITIES LENDING COLLATERAL††,2 – 14.9% | | | | | | | |
| Repurchase Agreements | | | | | | | |
| Daiwa Capital Markets America Inc. | | | | | | | |
| issued 05/31/17 at 0.85% | | | | | | | |
| due 06/01/17 | | $ | 523,524 | | $ | 523,524 | |
| Nomura Securities International, Inc. | | | | | | | |
| issued 05/31/17 | | | | | | | |
| at 0.82% due 06/01/17 | | | 523,524 | | | 523,524 | |
| Citigroup Global Markets, Inc. | | | | | | | |
| issued 05/31/17 at 0.81% | | | | | | | |
| due 06/01/17 | | | 523,524 | | | 523,524 | |
| HSBC Securities (USA), Inc. | | | | | | | |
| issued 05/31/17 at 0.79% | | | | | | | |
| due 06/01/17 | | | 523,524 | | | 523,524 | |
| Royal Bank of Scotland plc | | | | | | | |
| issued 05/31/17 at 0.79% | | | | | | | |
| due 06/01/17 | | | 155,146 | | | 155,146 | |
| Total Securities Lending Collateral | | | | | | | |
| (Cost $2,249,242) | | | | | | 2,249,242 | |
| Total Investments – 114.4% | | | | | | | |
| (Cost $16,541,736) | | | | | $ | 17,315,428 | |
| Other Assets & Liabilities, net – (14.4)% | | | | | | (2,182,962 | ) |
| Total Net Assets – 100.0% | | | | | $ | 15,132,466 | |
| * | | Non-income producing security. |
| † | | Value determined based on Level 1 inputs — See Note 4. |
| †† | | Value determined based on Level 2 inputs — See Note 4. |
| 1 | | All or portion of this security is on loan at May 31, 2017 — See Note 5. |
| 2 | | Securities lending collateral — See Note 5. |
| | | |
| AB | | Stock Company |
| A/S | | Common Stock Company |
| ADR | | American Depositary Receipt |
| N.V. | | Publicly Traded Company |
| plc | | Public Limited Company |
| REIT | | Real Estate Investment Trust |
| S.A. | | Corporation |
| See notes to financial statements. |
| CLAYMORE EXCHANGE-TRADED FUND TRUST 2 ANNUAL REPORT l 41 |
| SCHEDULE OF INVESTMENTS continued | May 31, 2017 |
HGI Guggenheim International Multi-Asset Income ETF continued
| Portfolio Breakdown | % of Net Assets |
| Financial | 14.8% |
| Communications | 12.8% |
| Consumer, Non-cyclical | 12.3% |
| Consumer, Cyclical | 12.1% |
| Closed-End Fund | 9.6% |
| Industrial | 9.3% |
| Energy | 8.0% |
| Other | 20.6% |
| Total Long-Term Investments | 99.5% |
| Securities Lending Collateral | 14.9% |
| Total Investments | 114.4% |
| Other Assets & Liabilities, net | -14.4% |
| Net Assets | 100.0% |
| Currency Denomination |
| | % of Long-Term |
| Currency | Investments |
| United States Dollar | 38.6% |
| Euro | 17.1% |
| Japanese Yen | 13.8% |
| British Pound | 11.8% |
| Hong Kong Dollar | 9.2% |
| Swedish Krona | 2.7% |
| Australian Dollar | 2.4% |
| Other | 4.4% |
| Total Long-Term Investments | 100.0% |
The following table summarizes the inputs used to value the Fund’s investments at May 31, 2017 (See Note 4 in the Notes to Financial Statements):
| | | | | | | Level 2 | | | Level 3 | | | | |
| | | | | | | Significant | | | Significant | | | | |
| | | | Level 1 | | | Observable | | | Unobservable | | | | |
| | | | Quoted Prices | | | Inputs | | | Inputs | | | Total | |
| Assets | | | | | | | | | | | | | |
| Closed-End Funds | | $ | 1,446,143 | | $ | — | | $ | — | | $ | 1,446,143 | |
| Common Stocks | | | 13,175,596 | | | — | | | — | | | 13,175,596 | |
| Preferred Stocks | | | 388,482 | | | — | | | — | | | 388,482 | |
| Royalty Trust | | | 55,965 | | | — | | | — | | | 55,965 | |
| Securities Lending | | | | | | | | | | | | | |
| Collateral | | | — | | | 2,249,242 | | | — | | | 2,249,242 | |
| Total | | $ | 15,066,186 | | $ | 2,249,242 | | $ | — | | $ | 17,315,428 | |
Transfers between investment levels may occur as the markets fluctuate and/or the availability of data used in an investment’s valuation changes. Transfers between valuation levels, if any, are in comparison to the valuation levels at the end of the previous fiscal year, and are effective using the fair value as of the end of the current fiscal period.
For the year ended May 31, 2017, there were no transfers between levels.
| See notes to financial statements. |
| 42 l CLAYMORE EXCHANGE-TRADED FUND TRUST 2 ANNUAL REPORT |
| SCHEDULE OF INVESTMENTS continued | May 31, 2017 |
CUT Guggenheim MSCI Global Timber ETF
| | | | Shares | | | Value | |
| COMMON STOCKS† – 98.7% | | | | | | | |
| United States – 44.7% | | | | | | | |
| International Paper Co. | | | 184,771 | | $ | 9,770,691 | |
| Weyerhaeuser Co. REIT | | | 290,552 | | | 9,576,594 | |
| WestRock Co. | | | 174,311 | | | 9,486,005 | |
| Packaging Corporation of America | | | 90,049 | | | 9,199,406 | |
| Sealed Air Corp. | | | 184,900 | | | 8,213,258 | |
| Avery Dennison Corp. | | | 85,465 | | | 7,201,281 | |
| Sonoco Products Co. | | | 94,971 | | | 4,815,979 | |
| Graphic Packaging Holding Co. | | | 298,255 | | | 4,029,425 | |
| Bemis Company, Inc. | | | 88,352 | | | 3,944,033 | |
| Rayonier, Inc. REIT | | | 117,501 | | | 3,300,603 | |
| Louisiana-Pacific Corp.* | | | 137,919 | | | 3,072,835 | |
| Domtar Corp. | | | 59,814 | | | 2,176,033 | |
| Potlatch Corp. REIT | | | 38,750 | | | 1,772,813 | |
| KapStone Paper and Packaging Corp. | | | 83,158 | | | 1,757,129 | |
| Neenah Paper, Inc. | | | 16,059 | | | 1,252,602 | |
| Schweitzer-Mauduit International, Inc. | | | 29,351 | | | 1,094,205 | |
| Boise Cascade Co.* | | | 36,680 | | | 988,526 | |
| PH Glatfelter Co. | | | 41,627 | | | 763,023 | |
| Clearwater Paper Corp.* | | | 15,733 | | | 729,225 | |
| Deltic Timber Corp. | | | 10,456 | | | 709,544 | |
| Mercer International, Inc. | | | 43,278 | | | 504,189 | |
| CatchMark Timber Trust, Inc. — Class A REIT | | | 37,076 | | | 419,700 | |
| Resolute Forest Products, Inc.* | | | 55,600 | | | 250,200 | |
| Total United States | | | | | | 85,027,299 | |
| | | | | | | | |
| Finland – 11.1% | | | | | | | |
| UPM-Kymmene Oyj | | | 343,390 | | | 9,692,166 | |
| Stora Enso Oyj — Class R | | | 526,479 | | | 6,666,210 | |
| Huhtamaki Oyj | | | 87,535 | | | 3,403,817 | |
| Metsa Board Oyj1 | | | 183,268 | | | 1,399,316 | |
| Total Finland | | | | | | 21,161,509 | |
| | | | | | | | |
| South Africa – 8.6% | | | | | | | |
| Mondi plc | | | 350,960 | | | 9,170,177 | |
| Sappi Ltd. | | | 531,641 | | | 3,895,106 | |
| Mondi Ltd. | | | 113,068 | | | 2,960,755 | |
| Mpact Ltd. | | | 164,459 | | | 404,093 | |
| Total South Africa | | | | | | 16,430,131 | |
| | | | | | | | |
| Australia – 6.3% | | | | | | | |
| Amcor Ltd. | | | 834,546 | | | 9,530,397 | |
| Orora Ltd. | | | 1,153,191 | | | 2,412,365 | |
| Quintis Ltd.††,1 | | | 312,667 | | | 68,666 | |
| Total Australia | | | | | | 12,011,428 | |
| | | | | | | | |
| Japan – 5.1% | | | | | | | |
| Oji Holdings Corp. | | | 824,472 | | | 4,048,364 | |
| Nippon Paper Industries Company Ltd.1 | | | 99,966 | | | 1,901,962 | |
| Rengo Company Ltd. | | | 168,072 | | | 943,823 | |
| Hokuetsu Kishu Paper Co. Ltd. | | | 119,953 | | | 923,091 | |
| Daio Paper Corp.1 | | | 64,248 | | | 788,975 | |
| Pack Corp. | | | 11,412 | | | 341,581 | |
| Tokushu Tokai Paper Company Ltd. | | | 8,600 | | | 311,073 | |
| Daiken Corp. | | | 13,200 | | | 281,105 | |
| Mitsubishi Paper Mills Ltd.* | | | 26,300 | | | 175,753 | |
| Total Japan | | | | | | 9,715,727 | |
| | | | | | | | |
| Canada – 4.7% | | | | | | | |
| West Fraser Timber Company Ltd. | | | 65,266 | | | 2,841,707 | |
| Stella-Jones, Inc. | | | 43,077 | | | 1,425,588 | |
| Norbord, Inc.1 | | | 41,000 | | | 1,168,350 | |
| Canfor Corp.* | | | 69,804 | | | 994,320 | |
| Interfor Corp.* | | | 66,876 | | | 872,898 | |
| Cascades, Inc. | | | 63,204 | | | 767,882 | |
| Western Forest Products, Inc. | | | 377,917 | | | 593,162 | |
| Canfor Pulp Products, Inc. | | | 28,758 | | | 263,159 | |
| Total Canada | | | | | | 8,927,066 | |
| | | | | | | | |
| Ireland – 3.4% | | | | | | | |
| Smurfit Kappa Group plc | | | 226,290 | | | 6,375,574 | |
| | | | | | | | |
| Brazil – 3.3% | | | | | | | |
| Klabin S.A. | | | 563,401 | | | 2,901,441 | |
| Fibria Celulose S.A. ADR | | | 238,220 | | | 2,722,855 | |
| Duratex S.A. | | | 297,502 | | | 736,691 | |
| Total Brazil | | | | | | 6,360,987 | |
| | | | | | | | |
| United Kingdom – 2.7% | | | | | | | |
| DS Smith plc | | | 905,018 | | | 5,107,954 | |
| | | | | | | | |
| Sweden – 2.5% | | | | | | | |
| BillerudKorsnas AB | | | 169,141 | | | 2,702,357 | |
| Holmen AB — Class B | | | 47,502 | | | 2,139,370 | |
| Total Sweden | | | | | | 4,841,727 | |
| | | | | | | | |
| Chile – 1.5% | | | | | | | |
| Empresas CMPC S.A. | | | 1,194,586 | | | 2,841,880 | |
| | | | | | | | |
| Bermuda – 1.3% | | | | | | | |
| Nine Dragons Paper Holdings Ltd. | | | 1,563,000 | | | 1,853,348 | |
| Multi Packaging Solutions International Ltd.* | | | 33,413 | | | 601,434 | |
| Total Bermuda | | | | | | 2,454,782 | |
| | | | | | | | |
| Portugal – 1.1% | | | | | | | |
| Navigator Company S.A.* | | | 171,423 | | | 776,844 | |
| Corticeira Amorim SGPS S.A. | | | 38,131 | | | 519,685 | |
| Semapa-Sociedade de Investimento e Gestao | | | 23,300 | | | 434,148 | |
| Altri SGPS S.A. | | | 58,811 | | | 287,017 | |
| Total Portugal | | | | | | 2,017,694 | |
| See notes to financial statements. |
| CLAYMORE EXCHANGE-TRADED FUND TRUST 2 ANNUAL REPORT l 43 |
| SCHEDULE OF INVESTMENTS continued | May 31, 2017 |
CUT Guggenheim MSCI Global Timber ETF continued
| | | | Shares | | | Value | |
| COMMON STOCKS† – 98.7% (continued) | | | | | | | |
| Cayman Islands – 1.0% | | | | | | | |
| Lee & Man Paper Manufacturing Ltd. | | | 1,518,000 | | $ | 1,318,823 | |
| Greatview Aseptic Packaging Company Ltd. | | | 1,023,000 | | | 547,441 | |
| China Wood Optimization Holding Ltd. | | | 286,773 | | | 78,755 | |
| Total Cayman Islands | | | | | | 1,945,019 | |
| | | | | | | | |
| Spain – 0.7% | | | | | | | |
| Ence Energia y Celulosa S.A. | | | 131,547 | | | 518,476 | |
| Miquel y Costas & Miquel S.A. | | | 12,827 | | | 458,971 | |
| Papeles y Cartones de Europa S.A. | | | 37,220 | | | 324,368 | |
| Total Spain | | | | | | 1,301,815 | |
| | | | | | | | |
| China – 0.4% | | | | | | | |
| Shandong Chenming Paper Holdings Ltd. — Class H | | | 618,307 | | | 718,883 | |
| | | | | | | | |
| France – 0.1% | | | | | | | |
| Oeneo S.A. | | | 23,983 | | | 261,329 | |
| | | | | | | | |
| Malaysia – 0.1% | | | | | | | |
| Ta Ann Holdings BHD | | | 168,875 | | | 136,915 | |
| Jaya Tiasa Holdings BHD | | | 323,200 | | | 86,086 | |
| Total Malaysia | | | | | | 223,001 | |
| | | | | | | | |
| Thailand – 0.1% | | | | | | | |
| Polyplex Thailand PCL | | | 301,000 | | | 123,723 | |
| Total Common Stocks | | | | | | | |
| (Cost $152,884,963) | | | | | | 187,847,528 | |
| | | | | | | | |
| PREFERRED STOCKS† – 1.0% | | | | | | | |
| Brazil – 1.0% | | | | | | | |
| Suzano Papel E Celulose S.A. | | | 386,145 | | | 1,827,842 | |
| Total Preferred Stocks | | | | | | | |
| (Cost $1,112,002) | | | | | | 1,827,842 | |
| | | | Face Amount | | | Value | |
| SECURITIES LENDING COLLATERAL††,2 – 1.1% | | | | | | | |
| Repurchase Agreements | | | | | | | |
| Daiwa Capital Markets America Inc. issued 05/31/17 at 0.85% | | | | | | | |
| due 06/01/17 | | $ | 473,398 | | $ | 473,398 | |
| Nomura Securities International, Inc. issued | | | | | | | |
| 05/31/17 at 0.82% due 06/01/17 | | | 473,398 | | | 473,398 | |
| Citigroup Global Markets, Inc. issued 05/31/17 at 0.81% | | | | | | | |
| due 06/01/17 | | | 473,398 | | | 473,398 | |
| RBC Dominion Securities, Inc. issued 05/31/17 at 0.80% | | | | | | | |
| due 06/01/17 | | | 473,398 | | | 473,398 | |
| Royal Bank of Scotland plc issued 05/31/17 at 0.79% | | | | | | | |
| due 06/01/17 | | | 140,296 | | | 140,296 | |
| Total Securities Lending Collateral | | | | | | | |
| (Cost $2,033,888) | | | | | | 2,033,888 | |
| Total Investments – 100.8% | | | | | | | |
| (Cost $156,030,853) | | | | | $ | 191,709,258 | |
| Other Assets & Liabilities, net – (0.8)% | | | | | | (1,506,507 | ) |
| Total Net Assets – 100.0% | | | | | $ | 190,202,751 | |
| * | | Non-income producing security. |
| † | | Value determined based on Level 1 inputs, unless otherwise noted — See Note 4. |
| †† | | Value determined based on Level 2 inputs — See Note 4. |
| 1 | | All or portion of this security is on loan at May 31, 2017 — See Note 5. |
| 2 | | Securities lending collateral — See Note 5. |
| | | |
| ADR | | American Depositary Receipt |
| plc | | Public Limited Company |
| REIT | | Real Estate Investment Trust |
| S.A. | | Corporation |
| Portfolio Breakdown | % of Net Assets |
| Basic Materials | 51.7% |
| Industrial | 36.3% |
| Financial | 7.9% |
| Consumer, Non-cyclical | 3.8% |
| Total Long-Term Investments | 99.7% |
| Securities Lending Collateral | 1.1% |
| Total Investments | 100.8% |
| Other Assets & Liabilities, net | -0.8% |
| Net Assets | 100.0% |
| Currency Denomination |
| | % of Long-Term |
| Currency | Investments |
| United States Dollar | 46.6% |
| Euro | 16.4% |
| British Pound | 7.5% |
| Australian Dollar | 6.3% |
| Japanese Yen | 5.1% |
| Canada | 4.7% |
| South African Rand | 3.8% |
| Brazilian Real | 2.9% |
| Other | 6.7% |
| Total Long-Term Investments | 100.0% |
The following table summarizes the inputs used to value the Fund’s investments at May 31, 2017 (See Note 4 in the Notes to Financial Statements):
| | | | | | | Level 2 | | | Level 3 | | | | |
| | | | | | | Significant | | | Significant | | | | |
| | | | Level 1 | | | Observable | | | Unobservable | | | | |
| | | | Quoted Prices | | | Inputs | | | Inputs | | | Total | |
| Assets | | | | | | | | | | | | | |
| Common Stocks | | $ | 187,778,862 | | $ | 68,666 | | $ | — | | $ | 187,847,528 | |
| Preferred Stocks | | | 1,827,842 | | | — | | | — | | | 1,827,842 | |
| Securities Lending | | | �� | | | | | | | | | | |
| Collateral | | | — | | | 2,033,888 | | | — | | | 2,033,888 | |
| Total | | $ | 189,606,704 | | $ | 2,102,554 | | $ | — | | $ | 191,709,258 | |
Transfers between investment levels may occur as the markets fluctuate and/or the availability of data used in an investment’s valuation changes. Transfers between valuation levels, if any, are in comparison to the valuation levels at the end of the previous fiscal year, and are effective using the fair value as of the end of the current fiscal period.
For the year ended May 31, 2017, there were no transfers between levels.
| See notes to financial statements. |
| 44 l CLAYMORE EXCHANGE-TRADED FUND TRUST 2 ANNUAL REPORT |
| SCHEDULE OF INVESTMENTS continued | May 31, 2017 |
SEA Guggenheim Shipping ETF
| | | | Shares | | | Value | |
| COMMON STOCKS† – 80.4% | | | | | | | |
| Denmark – 23.8% | | | | | | | |
| AP Moller – Maersk A/S — Class B | | | 12,928 | | $ | 24,640,953 | |
| | | | | | | | |
| Bermuda – 20.8% | | | | | | | |
| COSCO SHIPPING Ports Ltd. | | | 4,930,161 | | | 5,757,427 | |
| Ship Finance International Ltd.1 | | | 253,898 | | | 3,427,623 | |
| GasLog Ltd.1 | | | 217,259 | | | 2,813,504 | |
| Nordic American Tankers Ltd.1 | | | 459,297 | | | 2,737,410 | |
| Tsakos Energy Navigation Ltd. | | | 619,972 | | | 2,647,280 | |
| BW LPG Ltd.1,2 | | | 556,968 | | | 2,269,560 | |
| Avance Gas Holding Ltd.*,1,2 | | | 714,248 | | | 1,891,115 | |
| Total Bermuda | | | | | | 21,543,919 | |
| | | | | | | | |
| Japan – 13.4% | | | | | | | |
| Nippon Yusen K.K.* | | | 4,042,266 | | | 7,347,248 | |
| Kawasaki Kisen Kaisha Ltd.*,1 | | | 2,487,412 | | | 6,455,552 | |
| Total Japan | | | | | | 13,802,800 | |
| | | | | | | | |
| Marshall Islands – 11.1% | | | | | | | |
| Costamare, Inc. | | | 422,101 | | | 2,764,762 | |
| DHT Holdings, Inc.1 | | | 605,435 | | | 2,554,936 | |
| Teekay Tankers Ltd. — Class A | | | 1,160,394 | | | 2,181,541 | |
| Seaspan Corp.1 | | | 397,333 | | | 2,062,158 | |
| Teekay Corp.1 | | | 318,151 | | | 1,943,903 | |
| Total Marshall Islands | | | | | | 11,507,300 | |
| | | | | | | | |
| United States – 4.1% | | | | | | | |
| Matson, Inc. | | | 145,046 | | | 4,244,046 | |
| | | | | | | | |
| Belgium – 3.6% | | | | | | | |
| Euronav N.V.1 | | | 489,208 | | | 3,717,981 | |
| | | | | | | | |
| Singapore – 3.6% | | | | | | | |
| Sembcorp Marine Ltd.1 | | | 3,040,621 | | | 3,703,518 | |
| Total Common Stocks | | | | | | | |
| (Cost $89,839,660) | | | | | | 83,160,517 | |
| | | | | | | | |
| MASTER LIMITED PARTNERSHIPS† – 19.0% | | | | | | | |
| Marshall Islands – 19.0% | | | | | | | |
| Golar LNG Partners, LP1 | | | 188,789 | | | 3,730,471 | |
| Teekay LNG Partners, LP1 | | | 221,183 | | | 3,361,981 | |
| GasLog Partners, LP | | | 136,704 | | | 2,993,818 | |
| Capital Product Partners, LP | | | 845,551 | | | 2,815,685 | |
| KNOT Offshore Partners, LP1 | | | 132,444 | | | 2,807,813 | |
| Dynagas LNG Partners, LP1 | | | 167,148 | | | 2,321,686 | |
| Teekay Offshore Partners, LP1 | | | 512,234 | | | 1,603,292 | |
| Total Master Limited Partnerships | | | | | | | |
| (Cost $21,807,919) | | | | | | 19,634,746 | |
| | | | Face | | | | |
| | | | Amount | | | Value | |
| SECURITIES LENDING COLLATERAL††,3 – 17.4% | | | | | | | |
| Repurchase Agreements | | | | | | | |
| Daiwa Capital Markets America Inc. | | | | | | | |
| issued 05/31/17 at 0.85% | | | | | | | |
| due 06/01/17 | | $ | 4,199,251 | | $ | 4,199,251 | |
| Nomura Securities International, Inc. | | | | | | | |
| issued 05/31/17 at 0.82% | | | | | | | |
| due 06/01/17 | | | 4,199,251 | | | 4,199,251 | |
| Citigroup Global Markets, Inc. | | | | | | | |
| issued 05/31/17 at 0.81% | | | | | | | |
| due 06/01/17 | | | 4,199,251 | | | 4,199,251 | |
| HSBC Securities (USA), Inc. | | | | | | | |
| issued 05/31/17 at 0.79% | | | | | | | |
| due 06/01/17 | | | 4,199,251 | | | 4,199,251 | |
| Royal Bank of Scotland plc | | | | | | | |
| issued 05/31/17 at 0.79% | | | | | | | |
| due 06/01/17 | | | 1,244,401 | | | 1,244,401 | |
| Total Securities Lending Collateral | | | | | | | |
| (Cost $18,041,405) | | | | | | 18,041,405 | |
| Total Investments – 116.8% | | | | | | | |
| (Cost $129,688,984) | | | | | $ | 120,836,668 | |
| Other Assets & Liabilities, net – (16.8)% | | | | | | (17,352,388 | ) |
| Total Net Assets – 100.0% | | | | | $ | 103,484,280 | |
| * | | Non-income producing security. |
| † | | Value determined based on Level 1 inputs — See Note 4. |
| †† | | Value determined based on Level 2 inputs — See Note 4. |
| 1 | | All or portion of this security is on loan at May 31, 2017 — See Note 5. |
| 2 | | Security is a 144A or Section 4(a)(2) security. These securities have been determined to be liquid under guidelines established by the Board of Trustees. The total market value of 144A or Section 4(a)(2) liquid securities is $4,160,675 (cost $3,832,892), or 4.0% of total net assets. |
| 3 | | Securities lending collateral — See Note 5. |
| | | |
| A/S | | Limited Liability Stock Company or Stock Company |
| K.K. | | Joint Stock Company |
| N.V. | | Publicly Traded Company |
| plc | | Public Limited Company |
| See notes to financial statements. |
| CLAYMORE EXCHANGE-TRADED FUND TRUST 2 ANNUAL REPORT l 45 |
| SCHEDULE OF INVESTMENTS continued | May 31, 2017 |
SEA Guggenheim Shipping ETF continued
| Country Diversification |
| | | % of Long-Term |
| Country | | Investments |
| Marshall Islands | | 30.3% |
| Denmark | | 24.0% |
| Bermuda | | 21.0% |
| Japan | | 13.4% |
| United States | | 4.1% |
| Belgium | | 3.6% |
| Singapore | | 3.6% |
| Total Long-Term Investments | | 100.0% |
| Currency Denomination |
| | | % of Long-Term |
| Country | | Investments |
| United States Dollar | | 49.4% |
| Danish Krone | | 24.0% |
| Japanese Yen | | 13.4% |
| Hong Kong Dollar | | 5.6% |
| Norwegian Krone | | 4.0% |
| Singapore Dollar | | 3.6% |
| Total Long-Term Investments | | 100.0% |
The following table summarizes the inputs used to value the Fund’s investments at May 31, 2017 (See Note 4 in the Notes to Financial Statements):
| | | | | | | Level 2 | | | Level 3 | | | | |
| | | | | | | Significant | | | Significant | | | | |
| | | | Level 1 | | | Observable | | | Unobservable | | | | |
| | | | Quoted Prices | | | Inputs | | | Inputs | | | Total | |
| Assets | | | | | | | | | | | | | |
| Common Stocks | | $ | 83,160,517 | | $ | — | | $ | — | | $ | 83,160,517 | |
| Master Limited | | | | | | | | | | | | | |
| Partnerships | | | 19,634,746 | | | — | | | — | | | 19,634,746 | |
| Securities Lending | | | | | | | | | | | | | |
| Collateral | | | — | | | 18,041,405 | | | — | | | 18,041,405 | |
| Total | | $ | 102,795,263 | | $ | 18,041,405 | | $ | — | | $ | 120,836,668 | |
Transfers between investment levels may occur as the markets fluctuate and/or the availability of data used in an investment’s valuation changes. Transfers between valuation levels, if any, are in comparison to the valuation levels at the end of the previous fiscal year, and are effective using the fair value as of the end of the current fiscal period.
For the year ended May 31, 2017, there were no transfers between levels.
| See notes to financial statements. |
| 46 l CLAYMORE EXCHANGE-TRADED FUND TRUST 2 ANNUAL REPORT |
| STATEMENTS OF ASSETS AND LIABILITIES | May 31, 2017 |
| | | Guggenheim | | Guggenheim | | Guggenheim | | Guggenheim | |
| | | Canadian Energy | | China Real Estate | | China Small Cap | | Frontier Markets | |
| | | Income ETF | | ETF | | ETF | | ETF | |
| | | (ENY | ) | (TAO | ) | (HAO | ) | (FRN | ) |
| ASSETS: | | | | | | | | | | | | | |
| Investments, at value — including securities on loan | | $ | 24,463,610 | | $ | 43,846,562 | | $ | 85,207,958 | | $ | 63,425,467 | |
| Repurchase agreements, at value | | | 8,165,155 | | | 899,363 | | | 9,351,043 | | | 253,163 | |
| Foreign currency, at value | | | 9,307 | | | 74,047 | | | 70,029 | | | 248,881 | |
| Cash | | | 133,903 | | | 69,556 | | | 72,840 | | | — | |
| Prepaid expenses | | | 163 | | | — | | | 300 | | | 221 | |
| Receivables: | | | | | | | | | | | | | |
| Dividends | | | 66,343 | | | 151,034 | | | 485,101 | | | 424,918 | |
| Due from adviser | | | — | | | 11,062 | | | — | | | 2,673 | |
| Securities lending income | | | 2,111 | | | 10,947 | | | 38,314 | | | 1,020 | |
| Investments sold | | | — | | | 73,063 | | | 43,124 | | | 426,304 | |
| Tax reclaims | | | — | | | — | | | — | | | 1,004 | |
| Total assets | | | 32,840,592 | | | 45,135,634 | | | 95,268,709 | | | 64,783,651 | |
| LIABILITIES: | | | | | | | | | | | | | |
| Due to custodian | | | — | | | — | | | — | | | 315,646 | |
| Payable for: | | | | | | | | | | | | | |
| Upon return of securities loaned | | | 8,165,155 | | | 899,363 | | | 9,351,043 | | | 253,163 | |
| Professional fees | | | 26,446 | | | 43,796 | | | 17,366 | | | 31,644 | |
| Intraday valuation fees | | | 19,770 | | | 30,955 | | | 29,998 | | | 12,197 | |
| Management fees | | | 17,077 | | | — | | | 37,342 | | | — | |
| Investments purchased | | | — | | | 73,102 | | | 43,145 | | | 151,104 | |
| Fund shares redeemed | | | — | | | — | | | 17,057 | | | — | |
| Foreign capital gain tax | | | — | | | — | | | — | | | 40,578 | |
| Other liabilities | | | 15,697 | | | 50,307 | | | 85,721 | | | 145,281 | |
| Total liabilities | | | 8,244,145 | | | 1,097,523 | | | 9,581,672 | | | 949,613 | |
| NET ASSETS | | $ | 24,596,447 | | $ | 44,038,111 | | $ | 85,687,037 | | $ | 63,834,038 | |
| NET ASSETS CONSIST OF: | | | | | | | | | | | | | |
| Paid-in capital | | $ | 126,623,704 | | $ | 56,872,533 | | $ | 164,956,324 | | $ | 130,826,782 | |
| Undistributed net investment income | | | 135,517 | | | 454,283 | | | 1,866,978 | | | 859,968 | |
| Accumulated net realized loss on investments and foreign currency transactions | | | (97,162,709 | ) | | (15,390,846 | ) | | (65,932,413 | ) | | (75,472,600 | ) |
| Net unrealized appreciation (depreciation) on investments and foreign currencies | | | (5,000,065 | ) | | 2,102,141 | | | (15,203,852 | ) | | 7,619,888 | |
| NET ASSETS | | $ | 24,596,447 | | $ | 44,038,111 | | $ | 85,687,037 | | $ | 63,834,038 | |
| Shares outstanding ($0.01 par value with unlimited amount authorized) | | | 3,020,000 | | | 1,760,000 | | | 3,400,000 | | | 4,640,000 | |
| Net asset value | | $ | 8.14 | | $ | 25.02 | | $ | 25.20 | | $ | 13.76 | |
| Investments in securities, at cost | | | 29,463,897 | | | 41,744,360 | | | 100,410,995 | | | 55,755,926 | |
| Repurchase agreements, at cost | | | 8,165,155 | | | 899,363 | | | 9,351,043 | | | 253,163 | |
| Foreign currency, at cost | | | 9,229 | | | 74,044 | | | 70,354 | | | 214,451 | |
| Securities on loan, at value | | | 7,688,287 | | | 2,611,688 | | | 14,533,970 | | | 247,996 | |
| See notes to financial statements. |
| CLAYMORE EXCHANGE-TRADED FUND TRUST 2 ANNUAL REPORT l 47 |
| STATEMENTS OF ASSETS AND LIABILITIES continued | May 31, 2017 |
| | | Guggenheim | | | | | | | |
| | International Multi-Asset | | Guggenheim MSCI | | Guggenheim | |
| | | Income ETF | | Global Timber ETF | | Shipping ETF | |
| | | (HGI | ) | (CUT | ) | (SEA | ) |
| ASSETS: | | | | | | | | | | |
| Investments, at value — including securities on loan | | $ | 15,066,186 | | $ | 189,675,370 | | $ | 102,795,263 | |
| Repurchase agreements, at value | | | 2,249,242 | | | 2,033,888 | | | 18,041,405 | |
| Foreign currency, at value | | | 4,245 | | | 648 | | | 2,263 | |
| Cash | | | — | | | 1,677,632 | | | 180,512 | |
| Prepaid expenses | | | 148 | | | 348 | | | — | |
| Receivables: | | | | | | | | | | |
| Dividends | | | 68,236 | | | 338,965 | | | 205,541 | |
| Due from adviser | | | 10,450 | | | — | | | — | |
| Investments sold | | | 50,330 | | | 4,932,974 | | | — | |
| Tax reclaims | | | 20,500 | | | 447,562 | | | 286,609 | |
| Securities lending income | | | 6,662 | | | 18,577 | | | 74,200 | |
| Total assets | | | 17,475,999 | | | 199,125,964 | | | 121,585,793 | |
| LIABILITIES: | | | | | | | | | | |
| Due to custodian | | | 17,522 | | | — | | | — | |
| Payable for: | | | | | | | | | | |
| Upon return of securities loaned | | | 2,249,242 | | | 2,033,888 | | | 18,041,405 | |
| Professional fees | | | 37,405 | | | 32,564 | | | — | |
| Intraday valuation fees | | | 14,970 | | | 19,385 | | | — | |
| Investments purchased | | | 11,092 | | | 6,682,725 | | | — | |
| Management fees | | | — | | | 76,299 | | | 60,108 | |
| Other liabilities | | | 13,302 | | | 78,352 | | | — | |
| Total liabilities | | | 2,343,533 | | | 8,923,213 | | | 18,101,513 | |
| NET ASSETS | | $ | 15,132,466 | | $ | 190,202,751 | | $ | 103,484,280 | |
| NET ASSETS CONSIST OF: | | | | | | | | | | |
| Paid-in capital | | $ | 51,663,073 | | $ | 201,366,318 | | $ | 138,815,200 | |
| Undistributed (distributions in excess of) net investment income | | | (17,190 | ) | | 2,007,980 | | | 1,052,504 | |
| Accumulated net realized loss on investments and foreign currency transactions | | | (37,286,604 | ) | | (48,841,192 | ) | | (27,541,488 | ) |
| Net unrealized appreciation (depreciation) on investments and foreign currencies | | | 773,187 | | | 35,669,645 | | | (8,841,936 | ) |
| NET ASSETS | | $ | 15,132,466 | | $ | 190,202,751 | | $ | 103,484,280 | |
| Shares outstanding ($0.01 par value with unlimited amount authorized) | | | 900,000 | | | 6,900,000 | | | 9,000,000 | |
| Net asset value | | $ | 16.81 | | $ | 27.57 | | $ | 11.50 | |
| Investments in securities, at cost | | | 14,292,494 | | | 153,996,965 | | | 111,647,579 | |
| Repurchase agreements, at cost | | | 2,249,242 | | | 2,033,888 | | | 18,041,405 | |
| Foreign currency, at cost | | | 4,173 | | | 649 | | | 2,210 | |
| Securities on loan, at value | | | 2,188,507 | | | 3,058,964 | | | 28,752,679 | |
| See notes to financial statements. |
| 48 l CLAYMORE EXCHANGE-TRADED FUND TRUST 2 ANNUAL REPORT |
| STATEMENTS OF OPERATIONS | May 31, 2017 |
| For the year ended May 31, 2017 | |
| | | Guggenheim | | Guggenheim | | Guggenheim | | Guggenheim | |
| | | Canadian Energy | | China Real Estate | | China Small Cap | | Frontier | |
| | | Income ETF | | ETF | | ETF | | Markets ETF | |
| | | (ENY | ) | (TAO | ) | (HAO | ) | (FRN | ) |
| INVESTMENT INCOME: | | | | | | | | | | | | | |
| Dividends, net of foreign taxes withheld* | | $ | 986,571 | | $ | 1,446,487 | | $ | 2,350,834 | | $ | 1,570,434 | |
| Income from securities lending | | | 44,556 | | | 59,121 | | | 512,073 | | | 36,769 | |
| Total investment income | | | 1,031,127 | | | 1,505,608 | | | 2,862,907 | | | 1,607,203 | |
| EXPENSES: | | | | | | | | | | | | | |
| Management fees | | | 142,942 | | | 196,157 | | | 520,891 | | | 227,585 | |
| Professional fees | | | 51,727 | | | 57,805 | | | 52,091 | | | 52,436 | |
| Intraday valuation fees | | | 14,965 | | | 14,965 | | | 14,995 | | | 13,140 | |
| Printing fees | | | 10,741 | | | 10,642 | | | 14,482 | | | 13,266 | |
| Trustees’ fees and expenses** | | | 9,033 | | | 9,131 | | | 11,299 | | | 9,487 | |
| Administration fees | | | 7,862 | | | 10,788 | | | 26,044 | | | 12,517 | |
| Listing fees | | | 5,000 | | | 5,000 | | | 5,000 | | | 5,000 | |
| Licensing fees | | | 3,269 | | | 39,738 | | | 117,061 | | | 45,517 | |
| Insurance | | | 1,313 | | | 1,061 | | | 2,376 | | | 1,470 | |
| Custodian fees | | | 9,499 | | | 36,425 | | | 84,539 | | | 151,281 | |
| Other expenses | | | — | | | 6,460 | | | 7,790 | | | 1,143 | |
| Total expenses | | | 256,351 | | | 388,172 | | | 856,568 | | | 532,842 | |
| Less: | | | | | | | | | | | | | |
| Expenses waived by advisor | | | (51,384 | ) | | (95,385 | ) | | (69,938 | ) | | (206,705 | ) |
| Reimbursement of custody fees | | | (15,865 | ) | | (18,168 | ) | | (76,325 | ) | | (7,518 | ) |
| Total Expenses waived | | | (67,249 | ) | | (113,553 | ) | | (146,263 | ) | | (214,223 | ) |
| Net expenses | | | 189,102 | | | 274,619 | | | 710,305 | | | 318,619 | |
| Net investment income | | | 842,025 | | | 1,230,989 | | | 2,152,602 | | | 1,288,584 | |
| NET REALIZED AND UNREALIZED GAIN (LOSS): | | | | | | | | | | | | | |
| Net realized gain (loss) on: | | | | | | | | | | | | | |
| Investments*** | | | (2,169,867 | ) | | (809,950 | ) | | (9,051,549 | ) | | (2,379,933 | ) |
| In-kind transactions | | | 683,061 | | | 925,086 | | | (1,297,624 | ) | | 92,621 | |
| Foreign currency transactions | | | 3,497 | | | (1,687 | ) | | (2,986 | ) | | (135,773 | ) |
| Net realized gain (loss) | | | (1,483,309 | ) | | 113,449 | | | (10,352,159 | ) | | (2,423,085 | ) |
| Net change in unrealized appreciation (depreciation) on: | | | | | | | | | | | | | |
| Investments**** | | | 1,117,135 | | | 5,911,687 | | | 23,608,931 | | | 11,751,590 | |
| Foreign currency translations | | | 452 | | | 12 | | | 226 | | | (9,536 | ) |
| Net change in unrealized appreciation | | | 1,117,587 | | | 5,911,699 | | | 23,609,157 | | | 11,742,054 | |
| Net realized and unrealized gain (loss) | | | (365,722 | ) | | 6,025,148 | | | 13,256,998 | | | 9,318,969 | |
| Net increase in net assets resulting from operations | | $ | 476,303 | | $ | 7,256,137 | | $ | 15,409,600 | | $ | 10,607,553 | |
| * Foreign taxes withheld | | $ | 170,673 | | $ | 7,349 | | $ | 119,476 | | $ | 123,219 | |
| ** | Relates to Trustees not deemed “interested persons” within the meaning of Section 2(a)(19) of the 1940 Act. |
| *** | Includes foreign capital gains tax paid of $(17,648) for Guggenheim Frontier Markets ETF. |
| **** | Includes change in foreign capital gains tax accrued of $(40,578) for Guggenheim Frontier Markets ETF. |
| See notes to financial statements. |
| CLAYMORE EXCHANGE-TRADED FUND TRUST 2 ANNUAL REPORT l 49 |
| STATEMENTS OF OPERATIONS continued | May 31, 2017 |
For the year ended May 31, 2017
| | | Guggenheim | | | | | | | |
| | International Multi-Asset | | Guggenheim MSCI | | Guggenheim | |
| | | Income ETF | | Global Timber ETF | | Shipping ETF | |
| | | (HGI | ) | (CUT | ) | (SEA | ) |
| INVESTMENT INCOME: | | | | | | | | | | |
| Dividends, net of foreign taxes withheld* | | $ | 596,171 | | $ | 4,095,020 | | $ | 3,197,674 | |
| Income from securities lending | | | 53,703 | | | 113,722 | | | 785,159 | |
| Miscellaneous income | | | 16 | | | — | | | — | |
| Total investment income | | | 649,890 | | | 4,208,742 | | | 3,982,833 | |
| EXPENSES: | | | | | | | | | | |
| Management fees | | | 78,368 | | | 872,180 | | | 471,274 | |
| Professional fees | | | 53,912 | | | 58,970 | | | — | |
| Licensing fees | | | 15,674 | | | 104,662 | | | — | |
| Intraday valuation fees | | | 14,965 | | | 14,965 | | | — | |
| Trustees’ fees and expenses** | | | 8,606 | | | 13,934 | | | — | |
| Printing fees | | | 5,843 | | | 37,179 | | | — | |
| Listing fees | | | 5,000 | | | 5,000 | | | — | |
| Administration fees | | | 4,310 | | | 47,970 | | | — | |
| Insurance | | | 1,117 | | | 3,351 | | | — | |
| Custodian fees | | | 27,356 | | | 63,535 | | | — | |
| Other expenses | | | — | | | 1,097 | | | — | |
| Total expenses | | | 215,151 | | | 1,222,843 | | | 471,274 | |
| Less: | | | | | | | | | | |
| Expenses waived by advisor | | | (72,318 | ) | | (229,118 | ) | | — | |
| Reimbursement of custody fees | | | (33,118 | ) | | (7,373 | ) | | — | |
| Total Expenses waived | | | (105,436 | ) | | (236,491 | ) | | — | |
| Net expenses | | | 109,715 | | | 986,352 | | | 471,274 | |
| Net investment income | | | 540,175 | | | 3,222,390 | | | 3,511,559 | |
| NET REALIZED AND UNREALIZED GAIN (LOSS): | | | | | | | | | | |
| Net realized gain (loss) on: | | | | | | | | | | |
| Investments | | | 513,785 | | | 877,242 | | | (14,845,276 | ) |
| In-kind transactions | | | 93,745 | | | 2,673,680 | | | 2,022,494 | |
| Foreign currency transactions | | | (5,066 | ) | | (26,506 | ) | | (12,380 | ) |
| Net realized gain (loss) | | | 602,464 | | | 3,524,416 | | | (12,835,162 | ) |
| Net change in unrealized appreciation (depreciation) on: | | | | | | | | | | |
| Investments | | | 1,395,570 | | | 24,478,136 | | | 9,353,510 | |
| Foreign currency translations | | | 1,595 | | | (2,491 | ) | | 16,466 | |
| Net change in unrealized appreciation | | | 1,397,165 | | | 24,475,645 | | | 9,369,976 | |
| Net realized and unrealized gain (loss) | | | 1,999,629 | | | 28,000,061 | | | (3,465,186 | ) |
| Net increase in net assets resulting from operations | | $ | 2,539,804 | | $ | 31,222,451 | | $ | 46,373 | |
| * Foreign taxes withheld | | $ | 44,262 | | $ | 201,949 | | $ | 145,013 | |
| ** | Relates to Trustees not deemed “interested persons” within the meaning of Section 2(a)(19) of the 1940 Act. |
| See notes to financial statements. |
| 50 l CLAYMORE EXCHANGE-TRADED FUND TRUST 2 ANNUAL REPORT |
| STATEMENTS OF CHANGES IN NET ASSETS | May 31, 2017 |
| | | Guggenheim Canadian | | Guggenheim China | |
| | | Energy Income ETF | | Real Estate ETF | |
| | | (ENY) | | (TAO) | |
| | | | Year Ended | | | Year Ended | | | Year Ended | | | Year Ended | |
| | | | May 31, 2017 | | | May 31, 2016 | | | May 31, 2017 | | | May 31, 2016 | |
| INCREASE (DECREASE) IN NET ASSETS FROM OPERATIONS: | | | | | | | | | | | | | |
| Net investment income | | $ | 842,025 | | $ | 1,090,597 | | $ | 1,230,989 | | $ | 731,491 | |
| Net realized gain (loss) on investments and foreign currency transactions | | | (1,483,309 | ) | | (11,346,515 | ) | | 113,449 | | | (1,387,186 | ) |
| Net change in unrealized appreciation (depreciation) on investments and foreign currencies | | | 1,117,587 | | | 1,890,153 | | | 5,911,699 | | | (5,096,974 | ) |
| Net increase (decrease) in net assets resulting from operations | | | 476,303 | | | (8,365,765 | ) | | 7,256,137 | | | (5,752,669 | ) |
| DISTRIBUTIONS TO SHAREHOLDERS FROM: | | | | | | | | | | | | | |
| Net investment income | | | (846,327 | ) | | (1,087,513 | ) | | (950,372 | ) | | (834,630 | ) |
| SHAREHOLDER TRANSACTIONS: | | | | | | | | | | | | | |
| Proceeds from shares purchased | | | — | | | 1,333,331 | | | 46,360,577 | | | 1,228,064 | |
| Cost of shares redeemed | | | (4,407,991 | ) | | (4,587,286 | ) | | (21,118,129 | ) | | (16,698,821 | ) |
| Net increase (decrease) in net assets resulting from shareholder transactions | | | (4,407,991 | ) | | (3,253,955 | ) | | 25,242,448 | | | (15,470,757 | ) |
| Net increase (decrease) in net assets | | | (4,778,015 | ) | | (12,707,233 | ) | | 31,548,213 | | | (22,058,056 | ) |
| NET ASSETS: | | | | | | | | | | | | | |
| Beginning of period | | | 29,374,462 | | | 42,081,695 | | | 12,489,898 | | | 34,547,954 | |
| End of period | | $ | 24,596,447 | | $ | 29,374,462 | | $ | 44,038,111 | | $ | 12,489,898 | |
| Undistributed net investment income at end of period | | $ | 135,517 | | $ | 113,535 | | $ | 454,283 | | $ | 142,343 | |
| CHANGES IN SHARES OUTSTANDING: | | | | | | | | | | | | | |
| Shares sold | | | — | | | 200,000 | | | 2,100,000 | | | 50,000 | |
| Shares redeemed | | | (500,000 | ) | | (600,000 | ) | | (1,000,000 | ) | | (800,000 | ) |
| Net increase (decrease) in shares | | | (500,000 | ) | | (400,000 | ) | | 1,100,000 | | | (750,000 | ) |
| See notes to financial statements. |
| CLAYMORE EXCHANGE-TRADED FUND TRUST 2 ANNUAL REPORT l 51 |
| STATEMENTS OF CHANGES IN NET ASSETS continued | May 31, 2017 |
| | | Guggenheim China | | Guggenheim Frontier | |
| | | Small Cap ETF | | Markets ETF | |
| | | (HAO) | | (FRN) | |
| | | Year Ended | | Year Ended | | Year Ended | | Year Ended | |
| | | May 31, 2017 | | May 31, 2016 | | May 31, 2017 | | May 31, 2016 | |
| INCREASE (DECREASE) IN NET ASSETS FROM OPERATIONS: | | | | | | | | | | | | | |
| Net investment income | | $ | 2,152,602 | | $ | 4,261,804 | | $ | 1,288,584 | | $ | 1,298,053 | |
| Net realized loss on investments and foreign currency transactions | | | (10,352,159 | ) | | (24,756,386 | ) | | (2,423,085 | ) | | (5,994,723 | ) |
| Net change in unrealized appreciation (depreciation) on investments and foreign currencies | | | 23,609,157 | | | (76,327,592 | ) | | 11,742,054 | | | (2,372,785 | ) |
| Net increase (decrease) in net assets resulting from operations | | | 15,409,600 | | | (96,822,174 | ) | | 10,607,553 | | | (7,069,455 | ) |
| DISTRIBUTIONS TO SHAREHOLDERS FROM: | | | | | | | | | | | | | |
| Net investment income | | | (3,021,200 | ) | | (4,786,860 | ) | | (1,546,958 | ) | | (738,556 | ) |
| SHAREHOLDER TRANSACTIONS: | | | | | | | | | | | | | |
| Proceeds from shares purchased | | | — | | | 22,182,320 | | | 17,028,606 | | | — | |
| Cost of shares redeemed | | | (21,580,496 | ) | | (124,781,522 | ) | | (1,735,744 | ) | | (14,769,473 | ) |
| Net increase (decrease) in net assets resulting from shareholder transactions | | | (21,580,496 | ) | | (102,599,202 | ) | | 15,292,862 | | | (14,769,473 | ) |
| Net increase (decrease) in net assets | | | (9,192,096 | ) | | (204,208,236 | ) | | 24,353,457 | | | (22,577,484 | ) |
| NET ASSETS: | | | | | | | | | | | | | |
| Beginning of period | | | 94,879,133 | | | 299,087,369 | | | 39,480,581 | | | 62,058,065 | |
| End of period | | $ | 85,687,037 | | $ | 94,879,133 | | $ | 63,834,038 | | $ | 39,480,581 | |
| Undistributed net investment income at end of period | | $ | 1,866,978 | | $ | 2,644,640 | | $ | 859,968 | | $ | 1,258,290 | |
| CHANGES IN SHARES OUTSTANDING: | | | | | | | | | | | | | |
| Shares sold | | | — | | | 650,000 | | | 1,350,000 | | | — | |
| Shares redeemed | | | (900,000 | ) | | (4,950,000 | ) | | (150,000 | ) | | (1,250,000 | ) |
| Net increase (decrease) in shares | | | (900,000 | ) | | (4,300,000 | ) | | 1,200,000 | | | (1,250,000 | ) |
| See notes to financial statements. |
| 52 l CLAYMORE EXCHANGE-TRADED FUND TRUST 2 ANNUAL REPORT |
| STATEMENTS OF CHANGES IN NET ASSETS continued | May 31, 2017 |
| | | Guggenheim International | | Guggenheim MSCI | |
| | | Multi-Asset Income ETF | | Global Timber ETF | |
| | | (HGI) | | (CUT) | |
| | | Year Ended | | Year Ended | | Year Ended | | Year Ended | |
| | | May 31, 2017 | | May 31, 2016 | | May 31, 2017 | | May 31, 2016 | |
| INCREASE (DECREASE) IN NET ASSETS FROM OPERATIONS: | | | | | | | | | | | | | |
| Net investment income | | $ | 540,175 | | $ | 730,024 | | $ | 3,222,390 | | $ | 5,077,519 | |
| Net realized gain (loss) on investments and foreign currency transactions | | | 602,464 | | | (5,282,371 | ) | | 3,524,416 | | | (3,492,035 | ) |
| Net change in unrealized appreciation (depreciation) on investments and foreign currencies | | | 1,397,165 | | | 593,516 | | | 24,475,645 | | | (21,484,523 | ) |
| Net increase (decrease) in net assets resulting from operations | | | 2,539,804 | | | (3,958,831 | ) | | 31,222,451 | | | (19,899,039 | ) |
| DISTRIBUTIONS TO SHAREHOLDERS FROM: | | | | | | | | | | | | | |
| Net investment income | | | (556,170 | ) | | (766,760 | ) | | (3,735,200 | ) | | (2,705,920 | ) |
| SHAREHOLDER TRANSACTIONS: | | | | | | | | | | | | | |
| Proceeds from shares purchased | | | — | | | — | | | 13,735,812 | | | 32,597,878 | |
| Cost of shares redeemed | | | (3,080,112 | ) | | (5,525,120 | ) | | (14,080,512 | ) | | (46,642,136 | ) |
| Net decrease in net assets resulting from shareholder transactions | | | (3,080,112 | ) | | (5,525,120 | ) | | (344,700 | ) | | (14,044,258 | ) |
| Net increase (decrease) in net assets | | | (1,096,478 | ) | | (10,250,711 | ) | | 27,142,551 | | | (36,649,217 | ) |
| NET ASSETS: | | | | | | | | | | | | | |
| Beginning of period | | | 16,228,944 | | | 26,479,655 | | | 163,060,200 | | | 199,709,417 | |
| End of period | | $ | 15,132,466 | | $ | 16,228,944 | | $ | 190,202,751 | | $ | 163,060,200 | |
| Undistributed (distributions in excess of) net investment income at end of period | | $ | (17,190 | ) | $ | (12,119 | ) | $ | 2,007,980 | | $ | 2,550,786 | |
| CHANGES IN SHARES OUTSTANDING: | | | | | | | | | | | | | |
| Shares sold | | | — | | | — | | | 550,000 | | | 1,350,000 | |
| Shares redeemed | | | (200,000 | ) | | (400,000 | ) | | (550,000 | ) | | (2,050,000 | ) |
| Net decrease in shares | | | (200,000 | ) | | (400,000 | ) | | — | | | (700,000 | ) |
| See notes to financial statements. |
| CLAYMORE EXCHANGE-TRADED FUND TRUST 2 ANNUAL REPORT l 53 |
| STATEMENTS OF CHANGES IN NET ASSETS continued | May 31, 2017 |
| | | Shipping ETF | |
| | | (SEA) | |
| | | Year Ended | | Year Ended | |
| | | May 31, 2017 | | May 31, 2016 | |
| INCREASE (DECREASE) IN NET ASSETS FROM OPERATIONS: | | | | | | | |
| Net investment income | | $ | 3,511,559 | | $ | 3,041,925 | |
| Net realized loss on investments and foreign currency transactions | | | (12,835,162 | ) | | (9,634,671 | ) |
| Net change in unrealized appreciation (depreciation) on investments and foreign currencies | | | 9,369,976 | | | (11,629,696 | ) |
| Net increase (decrease) in net assets resulting from operations | | | 46,373 | | | (18,222,442 | ) |
| DISTRIBUTIONS TO SHAREHOLDERS FROM: | | | | | | | |
| Net investment income | | | (3,310,900 | ) | | (4,480,010 | ) |
| SHAREHOLDER TRANSACTIONS: | | | | | | | |
| Proceeds from shares purchased | | | 80,133,626 | | | 19,976,902 | |
| Cost of shares redeemed | | | (10,609,735 | ) | | (30,626,060 | ) |
| Net increase (decrease) in net assets resulting from shareholder transactions | | | 69,523,891 | | | (10,649,158 | ) |
| Net increase (decrease) in net assets | | | 66,259,364 | | | (33,351,610 | ) |
| NET ASSETS: | | | | | | | |
| Beginning of period | | | 37,224,916 | | | 70,576,526 | |
| End of period | | $ | 103,484,280 | | $ | 37,224,916 | |
| Undistributed net investment income at end of period | | $ | 1,052,504 | | $ | 839,266 | |
| CHANGES IN SHARES OUTSTANDING: | | | | | | | |
| Shares sold | | | 6,800,000 | | | 1,600,000 | |
| Shares redeemed | | | (900,000 | ) | | (2,100,000 | ) |
| Net increase (decrease) in shares | | | 5,900,000 | | | (500,000 | ) |
| See notes to financial statements. |
| 54 l CLAYMORE EXCHANGE-TRADED FUND TRUST 2 ANNUAL REPORT |
| FINANCIAL HIGHLIGHTS | May 31, 2017 |
ENY Guggenheim Canadian Energy Income ETF
This table is presented to show selected data for a share outstanding throughout each period and to assist shareholders in evaluating an ETF’s performance for the periods presented.
| | | Year Ended | | Year Ended | | Year Ended | | Year Ended | | Year Ended | |
| | | May 31, 2017 | | May 31, 2016 | | May 31, 2015 | | May 31, 2014 | | May 31, 2013 | |
| Per Share Data: | | | | | | | | | | | | | | | | |
| Net asset value, beginning of period | | $ | 8.35 | | $ | 10.74 | | $ | 16.36 | | $ | 14.51 | | $ | 14.83 | |
| Income from investment operations: | | | | | | | | | | | | | | | | |
| Net investment income(a) | | | 0.26 | | | 0.29 | | | 0.41 | | | 0.42 | | | 0.45 | |
| Net gain (loss) on investments (realized and unrealized) | | | (0.21 | ) | | (2.39 | ) | | (5.63 | ) | | 1.88 | | | (0.33 | ) |
| Total from investment operations | | | 0.05 | | | (2.10 | ) | | (5.22 | ) | | 2.30 | | | 0.12 | |
| Less distributions from: | | | | | | | | | | | | | | | | |
| Net investment income | | | (0.26 | ) | | (0.29 | ) | | (0.40 | ) | | (0.39 | ) | | (0.42 | ) |
| Return of capital | | | — | | | — | | | — | | | (0.06 | ) | | (0.02 | ) |
| Total distributions to shareholders | | | (0.26 | ) | | (0.29 | ) | | (0.40 | ) | | (0.45 | ) | | (0.44 | ) |
| Net asset value, end of period | | $ | 8.14 | | $ | 8.35 | | $ | 10.74 | | $ | 16.36 | | $ | 14.51 | |
| Market value, end of period | | $ | 8.09 | | $ | 8.33 | | $ | 10.79 | | $ | 16.44 | | $ | 14.43 | |
| Total Return(b) | | | | | | | | | | | | | | | | |
| Net asset value | | | 0.36 | % | | -19.34 | % | | -32.39 | % | | 16.30 | % | | 0.61 | % |
| Ratios/Supplemental Data: | | | | | | | | | | | | | | | | |
| Net assets, end of period (in thousands) | | $ | 24,596 | | $ | 29,374 | | $ | 42,082 | | $ | 46,127 | | $ | 60,518 | |
| Ratio to average net assets of: | | | | | | | | | | | | | | | | |
| Net investment income | | | 2.95 | % | | 3.68 | % | | 3.15 | % | | 2.87 | % | | 2.89 | % |
| Total expenses | | | 0.90 | % | | 0.87 | % | | 0.79 | % | | 0.80 | % | | 0.83 | % |
| Net expenses | | | 0.66 | % | | 0.69 | % | | 0.70 | % | | 0.71 | % | | 0.70 | % |
| Portfolio turnover rate(c) | | | 22 | % | | 35 | % | | 28 | % | | 80 | % | | 130 | % |
| (a) | Based on average shares outstanding. |
| (b) | Total investment return is calculated assuming an initial investment made at the net asset value at the beginning of the period, reinvestment of all dividends and distribution at net asset value during the period, and redemption on the last day of the period. Transaction fees are not reflected in the calculation of total investment return. |
| (c) | Portfolio turnover does not include securities received or delivered from processing creations or redemptions. |
| See notes to financial statements. |
| CLAYMORE EXCHANGE-TRADED FUND TRUST 2 ANNUAL REPORT l 55 |
| FINANCIAL HIGHLIGHTS continued | May 31, 2017 |
TAO Guggenheim China Real Estate ETF
This table is presented to show selected data for a share outstanding throughout each period and to assist shareholders in evaluating an ETF’s performance for the periods presented.
| | | Year Ended | | Year Ended | | Year Ended | | Year Ended | | Year Ended | |
| | | May 31, 2017 | | May 31, 2016 | | May 31, 2015 | | May 31, 2014 | | May 31, 2013 | |
| Per Share Data: | | | | | | | | | | | | | | | | |
| Net asset value, beginning of period | | $ | 18.92 | | $ | 24.50 | | $ | 20.52 | | $ | 22.03 | | $ | 16.72 | |
| Income from investment operations: | | | | | | | | | | | | | | | | |
| Net investment income(a) | | | 0.68 | | | 0.81 | | | 0.66 | | | 0.68 | | | 0.41 | |
| Net gain (loss) on investments (realized and unrealized) | | | 5.82 | | | (5.42 | ) | | 3.86 | | | (1.54 | ) | | 5.29 | |
| Total from investment operations | | | 6.50 | | | (4.61 | ) | | 4.52 | | | (0.86 | ) | | 5.70 | |
| Less distributions from: | | | | | | | | | | | | | | | | |
| Net investment income | | | (0.40 | ) | | (0.97 | ) | | (0.54 | ) | | (0.65 | ) | | (0.39 | ) |
| Total distributions to shareholders | | | (0.40 | ) | | (0.97 | ) | | (0.54 | ) | | (0.65 | ) | | (0.39 | ) |
| Net asset value, end of period | | $ | 25.02 | | $ | 18.92 | | $ | 24.50 | | $ | 20.52 | | $ | 22.03 | |
| Market value, end of period | | $ | 25.14 | | $ | 18.83 | | $ | 24.55 | | $ | 20.43 | | $ | 21.66 | |
| Total Return(b) | | | | | | | | | | | | | | | | |
| Net asset value | | | 34.94 | % | | -19.05 | % | | 22.50 | % | | -3.82 | % | | 34.05 | % |
| Ratios/Supplemental Data: | | | | | | | | | | | | | | | | |
| Net assets, end of period (in thousands) | | $ | 44,038 | | $ | 12,490 | | $ | 34,548 | | $ | 22,778 | | $ | 50,881 | |
| Ratio to average net assets of: | | | | | | | | | | | | | | | | |
| Net investment income | | | 3.14 | % | | 3.94 | % | | 3.04 | % | | 3.32 | % | | 1.88 | % |
| Total expenses | | | 0.99 | % | | 1.15 | % | | 0.88 | % | | 0.95 | % | | 0.93 | % |
| Net expenses | | | 0.70 | % | | 0.70 | % | | 0.70 | % | | 0.71 | % | | 0.70 | % |
| Portfolio turnover rate(c) | | | 17 | % | | 32 | % | | 16 | % | | 9 | % | | 20 | % |
| (a) | Based on average shares outstanding. |
| (b) | Total investment return is calculated assuming an initial investment made at the net asset value at the beginning of the period, reinvestment of all dividends and distribution at net asset value during the period, and redemption on the last day of the period. Transaction fees are not reflected in the calculation of total investment return. |
| (c) | Portfolio turnover does not include securities received or delivered from processing creations or redemptions. |
| See notes to financial statements. |
| 56 l CLAYMORE EXCHANGE-TRADED FUND TRUST 2 ANNUAL REPORT |
| FINANCIAL HIGHLIGHTS continued | May 31, 2017 |
HAO Guggenheim China Small Cap ETF
This table is presented to show selected data for a share outstanding throughout each period and to assist shareholders in evaluating an ETF’s performance for the periods presented.
| | | Year Ended | | Year Ended | | Year Ended | | Year Ended | | Year Ended | |
| | | May 31, 2017 | | May 31, 2016 | | May 31, 2015 | | May 31, 2014 | | May 31, 2013 | |
| Per Share Data: | | | | | | | | | | | | | | | | |
| Net asset value, beginning of period | | $ | 22.06 | | $ | 34.78 | | $ | 24.72 | | $ | 24.68 | | $ | 19.97 | |
| Income from investment operations: | | | | | | | | | | | | | | | | |
| Net investment income(a) | | | 0.55 | | | 0.72 | | | 0.51 | | | 0.56 | | | 0.41 | |
| Net gain (loss) on investments (realized and unrealized) | | | 3.35 | | | (12.50 | ) | | 10.14 | | | 0.03 | | | 4.61 | |
| Total from investment operations | | | 3.90 | | | (11.78 | ) | | 10.65 | | | 0.59 | | | 5.02 | |
| Less distributions from: | | | | | | | | | | | | | | | | |
| Net investment income | | | (0.76 | ) | | (0.94 | ) | | (0.59 | ) | | (0.55 | ) | | (0.31 | ) |
| Total distributions to shareholders | | | (0.76 | ) | | (0.94 | ) | | (0.59 | ) | | (0.55 | ) | | (0.31 | ) |
| Net asset value, end of period | | $ | 25.20 | | $ | 22.06 | | $ | 34.78 | | $ | 24.72 | | $ | 24.68 | |
| Market value, end of period | | $ | 24.97 | | $ | 22.04 | | $ | 34.56 | | $ | 24.70 | | $ | 24.31 | |
| Total Return(b) | | | | | | | | | | | | | | | | |
| Net asset value | | | 18.05 | % | | -34.14 | % | | 43.88 | % | | 2.24 | % | | 25.24 | % |
| Ratios/Supplemental Data: | | | | | | | | | | | | | | | | |
| Net assets, end of period (in thousands) | | $ | 85,687 | | $ | 94,879 | | $ | 299,087 | | $ | 206,421 | | $ | 236,923 | |
| Ratio to average net assets of: | | | | | | | | | | | | | | | | |
| Net investment income | | | 2.27 | % | | 2.83 | % | | 1.86 | % | | 2.23 | % | | 1.81 | % |
| Total expenses | | | 0.90 | % | | 0.87 | % | | 0.83 | % | | 0.84 | % | | 0.84 | % |
| Net expenses | | | 0.75 | % | | 0.75 | % | | 0.75 | % | | 0.76 | % | | 0.75 | % |
| Portfolio turnover rate(c) | | | 27 | % | | 28 | % | | 31 | % | | 29 | % | | 31 | % |
| (a) | Based on average shares outstanding. |
| (b) | Total investment return is calculated assuming an initial investment made at the net asset value at the beginning of the period, reinvestment of all dividends and distribution at net asset value during the period, and redemption on the last day of the period. Transaction fees are not reflected in the calculation of total investment return. |
| (c) | Portfolio turnover does not include securities received or delivered from processing creations or redemptions. |
| See notes to financial statements. |
| CLAYMORE EXCHANGE-TRADED FUND TRUST 2 ANNUAL REPORT l 57 |
| FINANCIAL HIGHLIGHTS continued | May 31, 2017 |
FRN Guggenheim Frontier Markets ETF
This table is presented to show selected data for a share outstanding throughout each period and to assist shareholders in evaluating an ETF’s performance for the periods presented.
| | | Year Ended | | Year Ended | | Year Ended | | Year Ended | | Year Ended | |
| | | May 31, 2017 | | May 31, 2016 | | May 31, 2015 | | May 31, 2014 | | May 31, 2013 | |
| Per Share Data: | | | | | | | | | | | | | | | | |
| Net asset value, beginning of period | | $ | 11.48 | | $ | 13.23 | | $ | 16.79 | | $ | 17.41 | | $ | 19.08 | |
| Income from investment operations: | | | | | | | | | | | | | | | | |
| Net investment income(a) | | | 0.34 | | | 0.34 | | | 0.23 | | | 0.38 | | | 0.71 | |
| Net gain (loss) on investments (realized and unrealized) | | | 2.41 | | | (1.89 | ) | | (3.36 | ) | | (0.35 | ) | | (1.77 | ) |
| Total from investment operations | | | 2.75 | | | (1.55 | ) | | (3.13 | ) | | 0.03 | | | (1.06 | ) |
| Less distributions from: | | | | | | | | | | | | | | | | |
| Net investment income | | | (0.47 | ) | | (0.20 | ) | | (0.43 | ) | | (0.65 | ) | | (0.61 | ) |
| Total distributions to shareholders | | | (0.47 | ) | | (0.20 | ) | | (0.43 | ) | | (0.65 | ) | | (0.61 | ) |
| Net asset value, end of period | | $ | 13.76 | | $ | 11.48 | | $ | 13.23 | | $ | 16.79 | | $ | 17.41 | |
| Market value, end of period | | $ | 13.74 | | $ | 11.33 | | $ | 13.33 | | $ | 16.86 | | $ | 17.17 | |
| Total Return(b) | | | | | | | | | | | | | | | | |
| Net asset value | | | 24.72 | % | | -11.59 | % | | -18.75 | % | | 0.24 | % | | -5.94 | % |
| Ratios/Supplemental Data: | | | | | | | | | | | | | | | | |
| Net assets, end of period (in thousands) | | $ | 63,834 | | $ | 39,481 | | $ | 62,058 | | $ | 87,970 | | $ | 112,098 | |
| Ratio to average net assets of: | | | | | | | | | | | | | | | | |
| Net investment income | | | 2.83 | % | | 2.96 | % | | 1.50 | % | | 2.28 | % | | 3.66 | % |
| Total expenses | | | 1.17 | % | | 1.28 | % | | 0.77 | % | | 0.81 | % | | 0.75 | % |
| Net expenses | | | 0.70 | % | | 0.70 | % | | 0.70 | % | | 0.71 | % | | 0.70 | % |
| Portfolio turnover rate(c) | | | 74 | % | | 57 | % | | 94 | % | | 24 | % | | 46 | % |
| (a) | Based on average shares outstanding. |
| (b) | Total investment return is calculated assuming an initial investment made at the net asset value at the beginning of the period, reinvestment of all dividends and distribution at net asset value during the period, and redemption on the last day of the period. Transaction fees are not reflected in the calculation of total investment return. |
| (c) | Portfolio turnover does not include securities received or delivered from processing creations or redemptions. |
| See notes to financial statements. |
| 58 l CLAYMORE EXCHANGE-TRADED FUND TRUST 2 ANNUAL REPORT |
| FINANCIAL HIGHLIGHTS continued | May 31, 2017 |
HGI Guggenheim International Multi-Asset Income ETF
This table is presented to show selected data for a share outstanding throughout each period and to assist shareholders in evaluating an ETF’s performance for the periods presented.
| | | Year Ended | | Year Ended | | Year Ended | | Year Ended | | Year Ended | |
| | | May 31, 2017 | | May 31, 2016 | | May 31, 2015 | | May 31, 2014 | | May 31, 2013 | |
| Per Share Data: | | | | | | | | | | | | | | | | |
| Net asset value, beginning of period | | $ | 14.75 | | $ | 17.65 | | $ | 19.61 | | $ | 17.26 | | $ | 15.05 | |
| Income from investment operations: | | | | | | | | | | | | | | | | |
| Net investment income(a) | | | 0.53 | | | 0.54 | | | 0.70 | | | 0.65 | | | 0.74 | |
| Net gain (loss) on investments (realized and unrealized) | | | 2.07 | | | (2.89 | ) | | (2.00 | ) | | 2.41 | | | 2.22 | |
| Total from investment operations | | | 2.60 | | | (2.35 | ) | | (1.30 | ) | | 3.06 | | | 2.96 | |
| Less distributions from: | | | | | | | | | | | | | | | | |
| Net investment income | | | (0.54 | ) | | (0.55 | ) | | (0.66 | ) | | (0.68 | ) | | (0.75 | ) |
| Return of capital | | | — | | | — | | | — | | | (0.03 | ) | | — | |
| Total distributions to shareholders | | | (0.54 | ) | | (0.55 | ) | | (0.66 | ) | | (0.71 | ) | | (0.75 | ) |
| Net asset value, end of period | | $ | 16.81 | | $ | 14.75 | | $ | 17.65 | | $ | 19.61 | | $ | 17.26 | |
| Market value, end of period | | $ | 16.79 | | $ | 14.66 | | $ | 17.60 | | $ | 19.74 | | $ | 17.19 | |
| Total Return(b) | | | | | | | | | | | | | | | | |
| Net asset value | | | 18.09 | % | | -13.30 | % | | -6.64 | % | | 18.23 | % | | 20.03 | % |
| Ratios/Supplemental Data: | | | | | | | | | | | | | | | | |
| Net assets, end of period (in thousands) | | $ | 15,132 | | $ | 16,229 | | $ | 26,480 | | $ | 33,344 | | $ | 119,116 | |
| Ratio to average net assets of: | | | | | | | | | | | | | | | | |
| Net investment income | | | 3.45 | % | | 3.56 | % | | 3.81 | % | | 3.70 | % | | 4.45 | % |
| Total expenses | | | 1.37 | % | | 1.13 | % | | 0.97 | % | | 0.84 | % | | 0.81 | % |
| Net expenses | | | 0.70 | % | | 0.70 | % | | 0.70 | % | | 0.70 | % | | 0.70 | % |
| Portfolio turnover rate(c) | | | 103 | % | | 117 | % | | 108 | % | | 85 | % | | 60 | % |
| (a) | Based on average shares outstanding. |
| (b) | Total investment return is calculated assuming an initial investment made at the net asset value at the beginning of the period, reinvestment of all dividends and distribution at net asset value during the period, and redemption on the last day of the period. Transaction fees are not reflected in the calculation of total investment return. |
| (c) | Portfolio turnover does not include securities received or delivered from processing creations or redemptions. |
| See notes to financial statements. |
| CLAYMORE EXCHANGE-TRADED FUND TRUST 2 ANNUAL REPORT l 59 |
| FINANCIAL HIGHLIGHTS continued | May 31, 2017 |
CUT Guggenheim MSCI Global Timber Index ETF
This table is presented to show selected data for a share outstanding throughout each period and to assist shareholders in evaluating an ETF’s performance for the periods presented.
| | | Year Ended | | Year Ended | | Year Ended | | Year Ended | | Year Ended | |
| | | May 31, 2017 | | May 31, 2016 | | May 31, 2015 | | May 31, 2014 | | May 31, 2013 | |
| Per Share Data: | | | | | | | | | | | | | | | | |
| Net asset value, beginning of period | | $ | 23.63 | | $ | 26.28 | | $ | 25.37 | | $ | 22.19 | | $ | 15.71 | |
| Income from investment operations: | | | | | | | | | | | | | | | | |
| Net investment income(a) | | | 0.47 | | | 0.67 | | | 0.61 | | | 0.53 | | | 0.46 | |
| Net gain (loss) on investments (realized and unrealized) | | | 3.99 | | | (2.96 | ) | | 0.99 | | | 3.01 | | | 6.27 | |
| Total from investment operations | | | 4.46 | | | (2.29 | ) | | 1.60 | | | 3.54 | | | 6.73 | |
| Less distributions from: | | | | | | | | | | | | | | | | |
| Net investment income | | | (0.52 | ) | | (0.36 | ) | | (0.69 | ) | | (0.36 | ) | | (0.25 | ) |
| Total distributions to shareholders | | | (0.52 | ) | | (0.36 | ) | | (0.69 | ) | | (0.36 | ) | | (0.25 | ) |
| Net asset value, end of period | | $ | 27.57 | | $ | 23.63 | | $ | 26.28 | | $ | 25.37 | | $ | 22.19 | |
| Market value, end of period | | $ | 27.52 | | $ | 23.59 | | $ | 26.26 | | $ | 25.33 | | $ | 22.10 | |
| Total Return(b) | | | | | | | | | | | | | | | | |
| Net asset value | | | 19.09 | % | | -8.72 | % | | 6.50 | % | | 15.93 | % | | 43.01 | % |
| Ratios/Supplemental Data: | | | | | | | | | | | | | | | | |
| Net assets, end of period (in thousands) | | $ | 190,203 | | $ | 163,060 | | $ | 199,709 | | $ | 253,668 | | $ | 223,035 | |
| Ratio to average net assets of: | | | | | | | | | | | | | | | | |
| Net investment income | | | 1.85 | % | | 2.83 | % | | 2.44 | % | | 2.18 | % | | 2.28 | % |
| Total expenses | | | 0.70 | % | | 0.75 | % | | 0.76 | % | | 0.75 | % | | 0.76 | % |
| Net expenses | | | 0.57 | % | | 0.60 | % | | 0.70 | % | | 0.71 | % | | 0.70 | % |
| Portfolio turnover rate(c) | | | 8 | % | | 60 | % | | 29 | % | | 5 | % | | 2 | % |
| (a) | Based on average shares outstanding. |
| (b) | Total investment return is calculated assuming an initial investment made at the net asset value at the beginning of the period, reinvestment of all dividends and distribution at net asset value during the period, and redemption on the last day of the period. Transaction fees are not reflected in the calculation of total investment return. |
| (c) | Portfolio turnover does not include securities received or delivered from processing creations or redemptions. |
| See notes to financial statements. |
| 60 l CLAYMORE EXCHANGE-TRADED FUND TRUST 2 ANNUAL REPORT |
| FINANCIAL HIGHLIGHTS continued | May 31, 2017 |
SEA Guggenheim Shipping ETF
This table is presented to show selected data for a share outstanding throughout each period and to assist shareholders in evaluating an ETF’s performance for the periods presented.
| | | Year Ended | | Year Ended | | Year Ended | | Year Ended | | Year Ended | |
| | | May 31, 2017 | | May 31, 2016 | | May 31, 2015 | | May 31, 2014 | | May 31, 2013 | |
| Per Share Data: | | | | | | | | | | | | | | | | |
| Net asset value, beginning of period | | $ | 12.01 | | $ | 19.60 | | $ | 22.68 | | $ | 17.51 | | $ | 16.03 | |
| Income from investment operations: | | | | | | | | | | | | | | | | |
| Net investment income(a) | | | 0.57 | | | 1.02 | | | 0.99 | | | 0.56 | | | 0.45 | |
| Net gain (loss) on investments (realized and unrealized) | | | (0.38 | ) | | (7.15 | ) | | (3.35 | ) | | 5.06 | | | 1.49 | |
| Total from investment operations | | | 0.19 | | | (6.13 | ) | | (2.36 | ) | | 5.62 | | | 1.94 | |
| Less distributions from: | | | | | | | | | | | | | | | | |
| Net investment income | | | (0.70 | ) | | (1.46 | ) | | (0.72 | ) | | (0.45 | ) | | (0.46 | ) |
| Total distributions to shareholders | | | (0.70 | ) | | (1.46 | ) | | (0.72 | ) | | (0.45 | ) | | (0.46 | ) |
| Net asset value, end of period | | $ | 11.50 | | $ | 12.01 | | $ | 19.60 | | $ | 22.68 | | $ | 17.51 | |
| Market value, end of period | | $ | 11.49 | | $ | 12.00 | | $ | 19.55 | | $ | 22.69 | | $ | 17.43 | |
| Total Return(b) | | | | | | | | | | | | | | | | |
| Net asset value | | | 1.83 | % | | -32.56 | % | | -10.52 | % | | 32.57 | % | | 12.44 | % |
| Ratios/Supplemental Data: | | | | | | | | | | | | | | | | |
| Net assets, end of period (in thousands) | | $ | 103,484 | | $ | 37,225 | | $ | 70,577 | | $ | 117,953 | | $ | 35,011 | |
| Ratio to average net assets of: | | | | | | | | | | | | | | | | |
| Net investment income | | | 4.84 | % | | 6.95 | % | | 4.82 | % | | 2.72 | % | | 2.76 | % |
| Total expenses | | | 0.65 | % | | 0.65 | % | | 0.65 | % | | 0.66 | % | | 0.65 | % |
| Portfolio turnover rate(c) | | | 24 | % | | 34 | % | | 27 | % | | 18 | % | | 42 | % |
| (a) | Based on average shares outstanding. |
| (b) | Total investment return is calculated assuming an initial investment made at the net asset value at the beginning of the period, reinvestment of all dividends and distribution at net asset value during the period, and redemption on the last day of the period. Transaction fees are not reflected in the calculation of total investment return. |
| (c) | Portfolio turnover does not include securities received or delivered from processing creations or redemptions. |
| See notes to financial statements. |
| CLAYMORE EXCHANGE-TRADED FUND TRUST 2 ANNUAL REPORT l 61 |
| NOTES TO FINANCIAL STATEMENTS | May 31, 2017 |
Note 1 – Organization and Significant Accounting Policies
Organization
Claymore Exchange-Traded Fund Trust 2 (the “Trust”), which is registered under the Investment Company Act of 1940, as amended (the “1940 Act”), is an open-end, management investment company that was organized as a Delaware statutory trust on June 8, 2006.
The following seven portfolios have an annual reporting year ended on May 31, 2017:
| | Guggenheim Canadian Energy Income ETF |
| | Guggenheim China Real Estate ETF |
| | Guggenheim China Small Cap ETF |
| | Guggenheim Frontier Markets ETF |
| | Guggenheim International Multi-Asset Income ETF |
| | Guggenheim MSCI Global Timber ETF |
| | Guggenheim Shipping ETF |
Each portfolio represents a separate series of the Trust (each a “Fund” or collectively the “Funds”). Each Fund’s shares are listed and traded on the NYSE Arca, Inc. (“NYSE Arca”). The Funds’ market prices may differ from the net asset value (“NAV”) of the shares of each Fund. Unlike conventional mutual funds, each Fund issues and redeems shares on a continuous basis, at NAV, only in a large specified number of shares; each called a “Creation Unit.” Creation Units are issued and redeemed principally in-kind for securities included in the relevant index. Except when aggregated in Creation Units, shares are not individually redeemable securities of the Funds. The investment objective of each of the Funds is to correspond generally to the performance, before fees and expenses, of the following market indices:
| Fund | Index |
| Guggenheim Canadian Energy Income ETF | S&P/TSX Canadian High Income Energy Index |
| Guggenheim China Real Estate ETF | AlphaShares China Real Estate Index |
| Guggenheim China Small Cap ETF | AlphaShares China Small Cap Index |
| Guggenheim Frontier Markets ETF | BNY Mellon New Frontier Index |
| Guggenheim International Multi-Asset | Zacks International Multi-Asset |
| Income ETF | Income Index |
| Guggenheim MSCI Global Timber ETF | MSCI ACWI IMI Timber Select Capped Index |
| Guggenheim Shipping ETF | Dow Jones Global Shipping Index |
Guggenheim Funds Investment Advisors, LLC (“GFIA”) provides advisory services. Guggenheim Funds Distributors, LLC (“GFD”) acts as principal underwriter for the Trust. GFIA and GFD are affiliated entities.
Note 2 – Significant Accounting Policies
The Funds operate as investment companies and, accordingly, follow the investment company accounting and reporting guidance of the Financial Accounting Standards Board (“FASB”) Accounting Standards Codification Topic 946 Financial Services – Investment Companies.
The following significant accounting policies are in conformity with U.S. generally accepted accounting principles (“U.S. GAAP”) and are consistently followed by the Trust. This requires management to make estimates and assumptions that affect the reported amount of assets and liabilities, contingent assets and liabilities at the date of the financial statements, and the reported amounts of revenues and expenses during the reporting period. Actual results could differ from these estimates. All time references are based on Eastern Time.
The NAV of a fund is calculated by dividing the market value of the fund’s securities and other assets, less all liabilities, by the number of outstanding shares of the fund.
A. The Board of Trustees of the Funds (the “Board”) has adopted policies and procedures for the valuation of the Funds’ investments (the “Valuation Procedures”). Pursuant to the Valuation Procedures, the Board has delegated to a valuation committee, consisting of representatives from Guggenheim’s investment management, fund administration, legal and compliance departments (the “Valuation Committee”), the day-to-day responsibility for implementing the Valuation Procedures, including, under most circumstances, the responsibility for determining the fair value of the Funds’ securities and/or other assets.
Valuations of the Funds’ securities are supplied primarily by pricing services appointed pursuant to the processes set forth in the Valuation Procedures. The Valuation Committee convenes monthly, or more frequently as needed, to review the valuation of all assets which have been fair valued for reasonableness. The Funds’ officers, through the Valuation Committee and consistent with the monitoring and review responsibilities set forth in the Valuation Procedures, regularly review procedures used and valuations provided by the pricing services.
If the pricing service cannot or does not provide a valuation for a particular investment or such valuation is deemed unreliable, such investment is fair valued by the Valuation Committee.
Equity securities listed on an exchange (New York Stock Exchange (“NYSE”) or American Stock Exchange) are valued at the last quoted sales price as of the close of business on the NYSE, usually 4:00 p.m. on the valuation date. Equity securities listed on the NASDAQ market system are valued at the NASDAQ Official Closing Price on the valuation date, which may not necessarily represent the last sale price. If there has been no sale on such exchange or NASDAQ on a given day, the security is valued at the closing bid price on that day.
Exchange-traded funds (“ETFs”) are valued at the last quoted sales price.
Repurchase agreements are valued at amortized cost, provided such amounts approximate market value.
Generally, trading in foreign securities markets is substantially completed each day at various times prior to the close of the NYSE. The values of foreign securities are determined as of the close of such foreign markets or the close of the NYSE, if earlier. All investments quoted in foreign currency are valued in U.S. dollars on the basis of the foreign currency exchange rates prevailing at the close of U.S. business at 4:00 p.m. Investments in foreign securities may involve risks not present in domestic investments. The Valuation Committee will determine the current value of such foreign
| |
| 62 l CLAYMORE EXCHANGE-TRADED FUND TRUST 2 ANNUAL REPORT |
| NOTES TO FINANCIAL STATEMENTS continued | May 31, 2017 |
securities by taking into consideration certain factors which may include those discussed above, as well as the following factors, among others: the value of the securities traded on other foreign markets, ADR trading, closed-end fund trading, foreign currency exchange activity, and the trading prices of financial products that are tied to foreign securities such as World Equity Benchmark Securities. In addition, under the Valuation Procedures, the Valuation Committee and GFIA (or the “Investment Adviser”) are authorized to use prices and other information supplied by a third party pricing vendor in valuing foreign securities.
Investments for which market quotations are not readily available are fair-valued as determined in good faith by GI under the direction of the Board using methods established or ratified by the Board. Valuations in accordance with these methods are intended to reflect each security’s (or asset’s) “fair value.” Each such determination is based on a consideration of all relevant factors, which are likely to vary from one pricing context to another. Examples of such factors may include, but are not limited to market prices; sale prices; broker quotes; and models which derive prices based on inputs such as prices of securities with comparable maturities and characteristics, or based on inputs such as anticipated cash flows or collateral, spread over Treasuries, and other information analysis.
B. The Funds may enter into repurchase agreements with financial institutions. In a repurchase agreement, a Fund buys a security and the seller simultaneously agrees to repurchase the security on a specified future date at an agreed-upon price. The repurchase price reflects an agreed-upon interest rate during the time the Fund’s money is invested in the security. Because the security constitutes collateral for the repurchase obligation, a repurchase agreement can be considered a collateralized loan. The Funds follow certain procedures designed to minimize the risks inherent in such agreements. These procedures include effecting repurchase transactions only with large, well capitalized and well-established financial institutions whose condition will be continually monitored by GFIA. In addition, the value of the collateral underlying the repurchase agreement will always be at least equal to the repurchase price, including any accrued interest earned on the repurchase agreement. In the event of a default or bankruptcy by a selling financial institution, the Funds will seek to liquidate such collateral. However, the exercising of the Funds right to liquidate such collateral could involve certain costs or delays and, to the extent that proceeds from any sale upon a default of the obligation to repurchase were less than the repurchase price, the Funds could suffer a loss. It is the current policy of the Funds not to invest in repurchase agreements that do not mature within seven days if any such investment, together with any other illiquid assets held by the Funds, amounts to more than 15% of a Fund’s net assets. The investments of the Funds in repurchase agreements, at times, may be substantial when, in the view of GFIA, liquidity or other considerations so warrant.
C. The accounting records of the Funds are maintained in U.S. dollars. All assets and liabilities initially expressed in foreign currencies are converted into U.S. dollars at prevailing exchange rates. Purchases and sales of investment securities, dividend and interest income, and certain expenses are translated at the rates of exchange prevailing on the respective dates of such transactions. Changes in the relationship of these foreign currencies to the U.S. dollar can significantly affect the value of the investments and earnings of the Funds. Foreign investments may also subject the Funds to foreign government exchange restrictions, expropriation, taxation, or other political, social or economic developments, all of which could affect the market and/or credit risk of the investments.
The Funds do not isolate that portion of the results of operations resulting from changes in the foreign exchange rates on investments from the fluctuations arising from changes in the market prices of securities held. Such fluctuations are included with the net realized and unrealized gain or loss on investments.
Reported net realized foreign exchange gains and losses arise from sales of foreign currencies and currency gains or losses realized between the trade and settlement dates on investment transactions. Net unrealized exchange gains and losses arise from changes in the fair values of assets and liabilities other than investments in securities at the fiscal period end, resulting from changes in exchange rates.
D. The Funds may be subject to foreign taxes (a portion of which may be reclaimable) on income, stock dividends, capital gains on investments or certain foreign currency transactions. All foreign taxes are recorded in accordance with the applicable foreign tax regulations and rates that exist in the foreign jurisdictions in which the Funds invest. These foreign taxes, if any, are paid by the Funds and reflected in their Statements of Operations as follows: foreign taxes withheld at source are presented as a reduction of income and foreign taxes on capital gains from sales of investments are included within the net realized gain (loss) on investments. Foreign taxes payable or deferred as of May 31, 2017, if any, are disclosed in the Funds’ Statements of Assets and Liabilities.
E. Security transactions are recorded on the trade date for financial reporting purposes. Realized gains and losses from securities transactions are recorded using the identified cost basis. Proceeds from lawsuits related to investment holdings are recorded as realized gains in the respective Fund. Dividend income is recorded on the ex-dividend date, net of applicable taxes withheld by foreign countries. Taxable non-cash dividends are recorded as dividend income. Interest income, including amortization of premiums and accretion of discounts, is accrued on a daily basis. Dividend income from REITs is recorded based on the income included in the distributions received from the REIT investments using published REIT classifications, including some management estimates when actual amounts are not available. Distributions received in excess of this estimated amount are recorded as a reduction of the cost of investments or reclassified to capital gains. The actual amounts of income, return of capital, and capital gains are only determined by each REIT after its fiscal year-end, and may differ from the estimated amounts.
F. The Funds record the character of dividends received from master limited partnerships (“MLPs”) based on estimates made at the time such distributions are received. These estimates are based upon a historical
| |
| CLAYMORE EXCHANGE-TRADED FUND TRUST 2 ANNUAL REPORT l 63 |
| NOTES TO FINANCIAL STATEMENTS continued | May 31, 2017 |
review of information available from each MLP and other industry sources. The characterization of the estimates may subsequently be revised based on information received from MLPs after their tax reporting periods conclude.
G. The Funds intend to pay substantially all of their net investment income to shareholders. Distribution frequency is as follows:
| Fund | Frequency |
| Guggenheim Canadian Energy Income ETF | Quarterly |
| Guggenheim China Real Estate ETF | Annual |
| Guggenheim China Small Cap ETF | Annual |
| Guggenheim Frontier Markets ETF | Annual |
| Guggenheim International Multi-Asset Income ETF | Quarterly |
| Guggenheim MSCI Global Timber ETF | Annual |
| Guggenheim Shipping ETF | Quarterly |
In addition, the Funds intend to distribute any capital gains to shareholders as capital gain dividends at least annually. The amount and timing of distributions are determined in accordance with federal income tax regulations, which may differ from U.S. GAAP.
H. The Funds may leave cash overnight in their cash account with the custodian. Periodically, a Fund may have cash due to the custodian bank as an overdraft balance. A fee is incurred on this overdraft, calculated by multiplying the overdraft by a rate based on the federal funds rate, which was 0.91% at May 31, 2017.
I. Under the Funds’ organizational documents, the Trustees and Officers are indemnified against certain liabilities arising out of the performance of their duties to the Trust. In addition, throughout the normal course of business, the Funds enter into contracts that contain a variety of representations and warranties which provide general indemnifications. The Funds’ maximum exposure under these arrangements is unknown, as this would involve future claims that may be made against the Funds and/or their affiliates that have not yet occurred.
Note 3 – Fees and Other Transactions with Affiliates
Under the terms of an investment advisory contract, the Funds pay GFIA investment advisory fees calculated at the annualized rates below, based on the average daily net assets of the Funds:
| | Management Fees |
| Fund | (as a % of Net Assets) |
| Guggenheim Canadian Energy Income ETF | 0.50% |
| Guggenheim China Real Estate ETF | 0.50% |
| Guggenheim China Small Cap ETF | 0.55% |
| Guggenheim Frontier Markets ETF | 0.50% |
| Guggenheim International Multi-Asset Income ETF | 0.50% |
| Guggenheim MSCI Global Timber ETF | 0.50% |
The Guggenheim Shipping ETF pays GFIA a unitary management fee of 0.65% for the services and facilities it provides. Out of the unitary management fee, GFIA pays substantially all the expenses of the Fund, including the cost of transfer agency, custody, fund administration, legal, audit and other services, except for the fee payments under the agreement, distribution fees, if any, brokerage expenses, taxes, interest, litigation expenses and other extraordinary expenses.
GFIA engages external service providers to perform other necessary services for the Trust, such as audit and accounting related services, legal services, custody, printing and mailing, licensing, etc., on a pass-through basis. Such expenses are allocated to various Funds within the complex based on relative net assets.
The Board has adopted a distribution and service plan (the “Plan”) pursuant to Rule 12b-1 under the 1940 Act. Under the Plan, each Fund is authorized to pay distribution fees in connection with the sale and distribution of its shares and pay service fees in connection with the provision of ongoing services to shareholders and the maintenance of shareholder accounts in an amount up to 0.25% of its average daily net assets each year. No 12b-1 fees are currently paid by the Funds, and there are no current plans to impose these fees. No such fee may be paid in the future without further approval by the Board.
The investment advisory contracts for the following Funds provide that the total expenses be limited to a percentage of average net assets for each class of shares, exclusive of interest expense, a portion of the Fund’s licensing fees, offering costs, brokerage commissions and other trading expenses, taxes and extraordinary expenses such as litigation and other expenses not incurred in the ordinary course of the Fund’s business. The limits are listed below:
| | | Contract |
| Fund | Limit | End Date |
| Guggenheim Canadian Energy Income ETF | 0.65% | 12/31/19 |
| Guggenheim China Real Estate ETF | 0.65% | 12/31/19 |
| Guggenheim China Small Cap ETF | 0.70% | 12/31/19 |
| Guggenheim Frontier Markets ETF | 0.65% | 12/31/19 |
| Guggenheim International Multi-Asset Income ETF | 0.65% | 12/31/19 |
| Guggenheim MSCI Global Timber ETF | 0.55% | 12/31/19 |
For the year ended May 31, 2017, the Investment Adviser waived Advisory Fees as follows:
| Fund | Advisory Fees Waived |
| Guggenheim Canadian Energy Income ETF | | $ | 51,384 |
| Guggenheim China Real Estate ETF | | | 95,385 |
| Guggenheim China Small Cap ETF | | | 69,938 |
| Guggenheim Frontier Markets ETF | | | 206,705 |
| Guggenheim International Multi-Asset Income ETF | | | 72,318 |
| Guggenheim MSCI Global Timber ETF | | | 229,118 |
Amounts owed to each Fund from the Investment Adviser are shown in the Statements of Assets and Liabilities. These receivables are settled on a periodic basis.
| |
| 64 l CLAYMORE EXCHANGE-TRADED FUND TRUST 2 ANNUAL REPORT |
| NOTES TO FINANCIAL STATEMENTS continued | May 31, 2017 |
Certain officers and trustees of the Trust may also be officers, directors, and/or employees of the Investment Adviser. The trust does not compensate its officers or trustees who are officers, directors, and/or employees of the Investment Adviser.
Licensing Fee Agreements:
The Investment Adviser has entered into licensing agreements on behalf of each Fund with the following Licensors:
| Fund | Licensor |
| Guggenheim Canadian Energy Income ETF | Standard & Poor’s |
| Guggenheim China Real Estate ETF | AlphaShares LLC |
| Guggenheim China Small Cap ETF | AlphaShares LLC |
| Guggenheim Frontier Markets ETF | The Bank of New York Mellon Corp. |
| Guggenheim International Multi-Asset Income ETF | Zacks Investment Research, Inc. |
| Guggenheim MSCI Global Timber ETF | MSCI, Inc. |
| Guggenheim Shipping ETF | CME Group Index Services LLC |
On October 4, 2016, Rydex Fund Services, LLC (“RFS”) was purchased by MUFG Investor Services and as of that date RFS ceased to be an affiliate of GFIA. In connection with its acquisition, RFS changed its name to MUFG Investor Services (US), LLC (“MUIS”). This change had no impact on the financial statements of the Funds.
MUIS acts as the Fund’s administrator. The Bank of New York Mellon Corp. (“BNY”) acts as the Funds’ custodian, accounting agent, transfer agent and securities lending agent. As custodian, BNY is responsible for the custody of the Funds’ assets. As accounting agent, BNY is responsible for maintaining the books and records of the Funds. As transfer agent, BNY is responsible for performing transfer agency services for the Funds. As securities lending agent, BNY is responsible for executing the lending of portfolio securities to creditworthy borrowers. For providing administration, accounting and custody services, MUIS and BNY are entitled to receive a monthly fee equal to an annual percentage of the Fund’s average daily net assets subject to certain minimum monthly fees and out of pocket expenses.
In November 2016, the Bank of New York Mellon Corporation, the Funds’ custodian and accounting agent, identified inconsistencies in the way in which clients were invoiced for certain expenses during a 4-year period dating back to 2012. The issue was the result of inaccurate billing rates that were not subsequently reviewed or adjusted. The amount of the difference in what was charged and what should have been charged, plus interest, was paid back to the Funds or the Advisor in February 2017. The amounts that were reimbursed to the Funds, if any, were recognized as a change in accounting estimate and are reflected in Reimbursement of custody fees within the Statements of Operations.
Note 4 – Fair Value Measurement
In accordance with U.S. GAAP, fair value is defined as the price that the Funds would receive to sell an investment or pay to transfer a liability in an orderly transaction with an independent buyer in the principal market, or in the absence of a principal market, the most advantageous market for the investment or liability. U.S. GAAP establishes a three-tier fair value hierarchy based on the types of inputs used to value assets and liabilities and requires corresponding disclosure. The hierarchy and the corresponding inputs are summarized below:
Level 1 — quoted prices in active markets for identical assets or liabilities.
Level 2 — significant other observable inputs (for example quoted prices for securities that are similar based on characteristics such as interest rates, prepayment speeds, credit risk, etc.).
Level 3 — significant unobservable inputs based on the best information available under the circumstances, to the extent observable inputs are not available, which may include assumptions.
The types of inputs available depend on a variety of factors, such as the type of security and the characteristics of the markets in which it trades, if any. Fair valuation determinations that rely on fewer or no observable inputs require greater judgment. Accordingly, fair value determinations for Level 3 securities require the greatest amount of judgment.
Independent pricing services are used to value a majority of the Funds’ investments. When values are not available from a pricing service, they will be determined under the valuation policies that have been reviewed and approved by the Board. In any event, values are determined using a variety of sources and techniques, including: market prices; broker quotes; and models which derive prices based on inputs such as prices of securities with comparable maturities and characteristics or based on inputs such as anticipated cash flows or collateral spread over Treasuries, and other information and analysis.
The inputs or methodologies used for valuing securities are not necessarily an indication of the risk associated with investing in those securities. The suitability of the techniques and sources employed to determine fair valuation are regularly monitored and subject to change.
Note 5 – Portfolio Securities Loaned
Each Fund may lend portfolio securities to certain creditworthy borrowers, including the Funds’ securities lending agent to earn additional income. The securities on loan are collateralized at all times by cash and/or high grade debt obligations in an amount at least equal to 102% of the market value of domestic securities loaned and 105% of foreign securities loaned as determined at the close of business on the preceding business day. The cash collateral received is held in a separately managed account established for each respective Fund and maintained by the lending agent exclusively for the investment of securities lending cash collateral on behalf of each Fund. The lending agent aggregates the available collateral in all the separately managed accounts to invest in short-term investments valued at amortized cost, which approximates market value. Each separately managed account is allocated a percentage of the aggregated repurchase agreement and the related collateral. Although the collateral mitigates the risk, the Funds could experience a delay in recovering its securities and a possible loss of income or value if the borrower fails to return the securities. The Funds have the right under the securities lending agreement to recover the securities from the borrower on demand.
| |
| CLAYMORE EXCHANGE-TRADED FUND TRUST 2 ANNUAL REPORT l 65 |
| NOTES TO FINANCIAL STATEMENTS continued | May 31, 2017 |
Each Fund separately receives compensation for lending securities from interest or dividends earned on the cash, cash equivalents, repurchase agreements, or U.S. government securities held as collateral, net of fee rebates paid to the borrower plus reasonable administrative and custody fees paid to the lending agent. Such compensation is accrued daily and payable to the Fund monthly. The dividend and interest income earned on the securities loaned is accounted for in the same manner as other dividend and interest income. The borrower pays to the Funds an amount equal to any dividends or interest received on loaned securities. These payments from the borrower are not eligible for reduced tax rates as “qualified dividend income” under the Jobs and Growth Tax Reconciliation Act of 2003. The Funds retain all or a portion of the interest received on investment of cash collateral or receives a fee from the borrower. The securities lending income earned by the Funds are disclosed on the Statements of Operations.
At May 31, 2017, the Funds participated in securities lending transactions, which are subject to enforceable netting arrangements, as follows:
| | | Gross Amounts Not Offset in the | | | | | | | |
| | | Statements of Assets and Liabilities | | Securities Lending Collateral | |
| | | | Value of | | | | | | | | | | | | | | | | |
| | | | Securities | | | Collateral | | | Net | | | Cash | | | Non-Cash | | | Total | |
| Fund | | | Loaned | | | Receiveda | | | Amount | | | Collateral | | | Collateral | | | Collateral | |
| Guggenheim Canadian Energy Income ETF | | $ | 7,688,287 | | $ | (7,688,287 | ) | $ | — | | $ | 8,165,155 | | $ | — | | $ | 8,165,155 | |
| Guggenheim China Real Estate ETF | | | 2,611,688 | | | (2,611,688 | ) | | — | | | 899,363 | | | 1,946,438 | | | 2,845,801 | |
| Guggenheim China Small Cap ETF | | | 14,533,970 | | | (14,533,970 | ) | | — | | | 9,351,043 | | | 6,466,344 | | | 15,817,387 | |
| Guggenheim Frontier Markets ETF | | | 247,996 | | | (247,996 | ) | | — | | | 253,163 | | | — | | | 253,163 | |
| Guggenheim International Multi-Asset Income ETF | | | 2,188,507 | | | (2,188,507 | ) | | — | | | 2,249,242 | | | 38,770 | | | 2,288,012 | |
| Guggenheim MSCI Global Timber ETF | | | 3,058,964 | | | (3,058,964 | ) | | — | | | 2,033,888 | | | 1,333,967 | | | 3,367,855 | |
| Guggenheim Shipping ETF | | | 28,752,679 | | | (28,752,679 | ) | | — | | | 18,041,405 | | | 12,340,651 | | | 30,382,056 | |
| a | Actual collateral received by the Funds is greater than the amount shown due to over collateralization. |
In the event of counterparty default, the Funds have the right to collect the collateral to offset losses incurred. There is potential loss to the Funds in the event the Funds are delayed or prevented from exercising their rights to dispose of the collateral securities, including the risk of a possible decline in the value of the underlying securities during the period while the Funds seek to assert their rights. GFIA, acting under the supervision of the Board, reviews the value of the collateral and the creditworthiness of those banks and dealers to evaluate potential risks.
The following represents the aggregate collateral balances reinvested by the lending agent on behalf of the Funds with each counterparty for the repurchase agreements at May 31, 2017:
| | | | | | | | | | | | | | | | |
| Counterparty and | | | | | | | | | | | | | | | |
| Terms of Agreement | | | Face Value | | | Repurchase Price | | Collateral | | | Par Value | | | Fair Value | |
| Daiwa Capital Markets America Inc. | | $ | 9,773,159 | | $ | 9,773,159 | | Various U.S. Government obligations and | | $ | 20,306,338 | | $ | 9,968,622 | |
| 0.85% | | | | | | | | U.S. Government agency securities | | | | | | | |
| Due 06/01/17 | | | | | | | | | | | | | | | |
| Nomura Securities International, Inc. | | | 9,526,322 | | | 9,526,322 | | Various U.S. Government obligations and | | | 11,692,951 | | | 9,716,848 | |
| 0.82% | | | | | | | | U.S. Government agency securities | | | | | | | |
| Due 06/01/17 | | | | | | | | | | | | | | | |
| Citigroup Global Markets, Inc. | | | 9,273,159 | | | 9,273,159 | | Various U.S. Government obligations and | | | 60,822,925 | | | 9,458,621 | |
| 0.81% | | | | | | | | U.S. Government agency securities | | | | | | | |
| Due 06/01/17 | | | | | | | | | | | | | | | |
| RBC Dominion Securities, Inc. | | | 4,800,384 | | | 4,800,384 | | Various U.S. Government obligations and | | | 9,282,604 | | | 4,896,392 | |
| 0.80% | | | | | | | | U.S. Government agency securities | | | | | | | |
| Due 06/01/17 | | | | | | | | | | | | | | | |
| HSBC Securities (USA), Inc. | | | 4,722,775 | | | 4,722,775 | | Various U.S. Government obligations and | | | 9,113,925 | | | 4,817,268 | |
| 0.79% | | | | | | | | U.S. Government agency securities | | | | | | | |
| Due 06/01/17 | | | | | | | | | | | | | | | |
| Royal Bank of Scotland plc | | | 2,897,460 | | | 2,897,460 | | Various U.S. Government obligations and | | | 2,945,521 | | | 2,955,428 | |
| 0.79% | | | | | | | | U.S. Government agency securities | | | | | | | |
| Due 06/01/17 | | | | | | | | | | | | | | | |
| |
| 66 l CLAYMORE EXCHANGE-TRADED FUND TRUST 2 ANNUAL REPORT |
| NOTES TO FINANCIAL STATEMENTS continued | May 31, 2017 |
Note 6 – Investments in Securities
For the year ended May 31, 2017, the cost of purchases and proceeds from sales of investment securities, excluding government securities, short-term investments and in-kind transactions, were as follows:
| | | | Purchases | | | Sales | |
| Guggenheim Canadian Energy Income ETF | | $ | 6,235,653 | | $ | 6,090,636 | |
| Guggenheim China Real Estate ETF | | | 6,714,662 | | | 6,475,121 | |
| Guggenheim China Small Cap ETF | | | 24,906,490 | | | 25,974,393 | |
| Guggenheim Frontier Markets ETF | | | 44,689,844 | | | 33,629,032 | |
| Guggenheim International Multi-Asset Income ETF | | | 16,121,638 | | | 16,137,690 | |
| Guggenheim MSCI Global Timber ETF | | | 14,717,140 | | | 14,010,530 | |
| Guggenheim Shipping ETF | | | 18,114,757 | | | 17,638,813 | |
For the year ended May 31, 2017, in-kind transactions were as follows:
| | | | Purchases | | | Sales | |
| Guggenheim Canadian Energy Income ETF | | $ | — | | $ | 4,423,406 | |
| Guggenheim China Real Estate ETF | | | 46,162,742 | | | 21,026,219 | |
| Guggenheim China Small Cap ETF | | | — | | | 21,485,607 | |
| Guggenheim Frontier Markets ETF | | | 5,226,521 | | | 449,578 | |
| Guggenheim International Multi-Asset Income ETF | | | — | | | 3,054,828 | |
| Guggenheim MSCI Global Timber ETF | | | 13,084,576 | | | 13,436,659 | |
| Guggenheim Shipping ETF | | | 79,533,735 | | | 10,547,898 | |
Note 7 – Federal Income Taxes
The Funds intend to comply with the provisions of Subchapter M of the Internal Revenue Code applicable to regulated investment companies and will distribute substantially all taxable net investment income and capital gains sufficient to relieve the Funds from all, or substantially all, federal income, excise and state income taxes. Therefore, no provision for federal or state income tax is required.
Tax positions taken or expected to be taken in the course of preparing the Funds’ tax returns are evaluated to determine whether the tax positions are “more-likely-than-not” of being sustained by the applicable tax authority. Tax positions not deemed to meet the more-likely-than-not threshold would be recorded as a tax benefit or expense in the current year. Management has analyzed the Funds’ tax positions taken, or to be taken, on federal income tax returns for all open tax years, and has concluded that no provision for income tax is required in the Funds’ financial statements. The Funds’ federal tax returns are subject to examination by the Internal Revenue Service for a period of three years after they are filed.
At May 31, 2017, the cost of securities for federal income tax purposes, the aggregate gross unrealized gain for all securities for which there was an excess of value over tax cost, and the aggregate gross unrealized loss for all securities for which there was an excess of tax cost over value were as follows:
| | | | | | | | | Net Tax | |
| | | Cost of | | | | | | Unrealized | |
| | | Investments | | Gross Tax | | Gross Tax | | Appreciation | |
| | | for Tax | | Unrealized | | Unrealized | | (Depreciation | ) |
| | | Purposes | | Appreciation | | Depreciation | | on Investments | |
| Guggenheim Canadian Energy Income ETF | | $ | 38,553,052 | | $ | 911,539 | | $ | (6,835,826 | ) | $ | (5,924,287 | ) |
| Guggenheim China Real Estate ETF | | | 42,959,426 | | | 4,663,069 | | | (2,876,570 | ) | | 1,786,499 | |
| Guggenheim China Small Cap ETF | | | 111,655,703 | | | 10,690,714 | | | (27,787,416 | ) | | (17,096,702 | ) |
| Guggenheim Frontier Markets ETF | | | 57,843,550 | | | 8,897,870 | | | (3,062,790 | ) | | 5,835,080 | |
| Guggenheim International Multi-Asset Income ETF | | | 16,576,834 | | | 1,539,656 | | | (801,062 | ) | | 738,594 | |
| Guggenheim MSCI Global Timber ETF | | | 158,444,926 | | | 36,021,992 | | | (2,757,660 | ) | | 33,264,332 | |
| Guggenheim Shipping ETF | | | 139,133,877 | | | 3,822,879 | | | (22,120,088 | ) | | (18,297,209 | ) |
| |
| CLAYMORE EXCHANGE-TRADED FUND TRUST 2 ANNUAL REPORT l 67 |
| NOTES TO FINANCIAL STATEMENTS continued | May 31, 2017 |
The tax components of accumulated earnings/(deficit) as of May 31, 2017, were as follows:
| | | | | Net Unrealized | | Capital Loss | | Other | |
| | | Undistributed | | Appreciation/ | | Carryforward & | | Temporary | |
| | | Ordinary Income | | (Depreciation | ) | Other Losses | | Differences | |
| Guggenheim Canadian Energy Income ETF | | $ | 221,771 | | $ | (5,924,065 | ) | $ | (96,324,963 | ) | $ | — | |
| Guggenheim China Real Estate ETF | | | 482,158 | | | 1,786,438 | | | (15,103,018 | ) | | — | |
| Guggenheim China Small Cap ETF | | | 2,669,638 | | | (17,097,517 | ) | | (64,841,408 | ) | | — | |
| Guggenheim Frontier Markets ETF | | | 1,120,854 | | | 5,785,430 | | | (73,899,028 | ) | | — | |
| Guggenheim International Multi-Asset Income ETF | | | 11,618 | | | 738,089 | | | (37,280,314 | ) | | — | |
| Guggenheim MSCI Global Timber ETF | | | 2,007,980 | | | 33,255,572 | | | (46,427,119 | ) | | — | |
| Guggenheim Shipping ETF | | | 2,160,982 | | | (18,286,829 | ) | | (18,242,236 | ) | | (962,837 | ) |
Capital Loss Carryforward amounts may be limited due to Federal income tax regulations.
Net investment income and net realized gains (losses) may differ for financial statement and tax purposes because of temporary or permanent book/tax differences. These differences are primarily due to investments in real estate investment trusts, investments in partnerships and trusts, losses deferred due to wash sales, redemption in-kind transactions, foreign currency gains and losses, return of capital, distributions received, and the “mark-to market” or disposition of certain Passive Foreign Investment Companies (PFICs). Additional differences may result from the tax treatment of the expiration of capital loss carryforward amounts. To the extent these differences are permanent, reclassifications are made to the appropriate capital accounts in the period that the differences arise. These reclassifications have no effect on net assets or NAV per share.
The following adjustments were made on the Statement of Assets and Liabilities as of May 31, 2017 for permanent book/tax differences:
| | | Undistributed | | Accumulated | | | | |
| | | Net Investment | | Net Realized | | Paid In | |
| Fund | | Income/(Loss | ) | Gain/(Loss | ) | Capital | |
| Guggenheim Canadian Energy Income ETF | | $ | 26,284 | | $ | 3,203,726 | | $ | (3,230,010 | ) |
| Guggenheim China Real Estate ETF | | | 31,323 | | | (809,175 | ) | | 777,852 | |
| Guggenheim China Small Cap ETF | | | 90,936 | | | 1,730,868 | | | (1,821,804 | ) |
| Guggenheim Frontier Markets ETF | | | (139,948 | ) | | 312,696 | | | (172,748 | ) |
| Guggenheim International Multi-Asset Income ETF | | | 10,924 | | | 2,118,345 | | | (2,129,269 | ) |
| Guggenheim MSCI Global Timber ETF | | | (29,996 | ) | | 1,569,808 | | | (1,539,812 | ) |
| Guggenheim Shipping ETF | | | 12,579 | | | (51,854 | ) | | 39,275 | |
Distributions to Shareholders
The tax character of distributions paid during the year ended May 31, 2017, was as follows:
| | | Ordinary Income | |
| Guggenheim Canadian Energy Income ETF | | $ | 846,327 | |
| Guggenheim China Real Estate ETF | | | 950,372 | |
| Guggenheim China Small Cap ETF | | | 3,021,200 | |
| Guggenheim Frontier Markets ETF | | | 1,546,958 | |
| Guggenheim International Multi-Asset Income ETF | | | 556,170 | |
| Guggenheim MSCI Global Timber ETF | | | 3,735,200 | |
| Guggenheim Shipping ETF | | | 3,310,900 | |
The tax character of distributions paid during the year ended May 31, 2016, was as follows:
| | | Ordinary Income | |
| Guggenheim Canadian Energy Income ETF | | $ | 1,087,513 | |
| Guggenheim China Real Estate ETF | | | 834,630 | |
| Guggenheim China Small Cap ETF | | | 4,786,860 | |
| Guggenheim Frontier Markets ETF | | | 738,556 | |
| Guggenheim International Multi-Asset Income ETF | | | 766,760 | |
| Guggenheim MSCI Global Timber ETF | | | 2,705,920 | |
| Guggenheim Shipping ETF | | | 4,480,010 | |
| |
| 68 l CLAYMORE EXCHANGE-TRADED FUND TRUST 2 ANNUAL REPORT |
| NOTES TO FINANCIAL STATEMENTS continued | May 31, 2017 |
For Federal income tax purposes, capital loss carryforwards represent realized losses of the Funds that may be carried forward and applied against future capital gains. For taxable years beginning on or before December 22, 2010, such capital losses may be carried forward for a maximum of eight years. Under the RIC Modernization Act of 2010, the Funds are permitted to carry forward capital losses incurred in taxable years beginning after December 22, 2010 for an unlimited period. However, any losses incurred during those taxable years must be utilized prior to the losses incurred in pre-enactment taxable years. As a result of this ordering rule, pre-enactment capital loss carryforwards may be more likely to expire unused. Additionally, post-enactment capital losses that are carried forward will retain their character as either short-term or long-term capital losses rather than being considered all short-term as under previous law. As of May 31, 2017, capital loss carryforwards for the Funds were as follows:
| | | | | | | | | Unlimited | | Total | |
| | | | | | | | | | | Capital Loss | |
| | | Expires in 2018 | | Expires in 2019 | | Short-Term | | Long-Term | | Carryforward | |
| Guggenheim Canadian Energy Income ETF | | $ | (12,656,635 | ) | $ | (713,500 | ) | $ | (50,360,362 | ) | $ | (32,594,466 | ) | $ | (96,324,963 | ) |
| Guggenheim China Real Estate ETF | | | (4,375,466 | ) | | (6,818,237 | ) | | (982,830 | ) | | (2,926,485 | ) | | (15,103,018 | ) |
| Guggenheim China Small Cap ETF | | | (5,907,224 | ) | | — | | | (8,268,296 | ) | | (50,665,888 | ) | | (64,841,408 | ) |
| Guggenheim Frontier Markets ETF | | | (3,686,218 | ) | | (364,152 | ) | | (10,436,803 | ) | | (59,411,855 | ) | | (73,899,028 | ) |
| Guggenheim International Multi-Asset Income ETF | | | (3,876,528 | ) | | (2,491,614 | ) | | (19,460,277 | ) | | (11,451,895 | ) | | (37,280,314 | ) |
| Guggenheim MSCI Global Timber ETF | | | (17,944,749 | ) | | (1,561,810 | ) | | (13,008,404 | ) | | (13,912,156 | ) | | (46,427,119 | ) |
| Guggenheim Shipping ETF | | | — | | | — | | | (4,725,435 | ) | | (13,516,801 | ) | | (18,242,236 | ) |
For the year ended May 31, 2017, the following capital loss carryforward amounts expired or were used:
| Fund | | | Expired | | | Utilized | | | Total | |
| Guggenheim Canadian Energy Income ETF | | $ | 3,622,034 | | $ | — | | $ | 3,622,034 | |
| Guggenheim Frontier Markets ETF | | | 241,589 | | | — | | | 241,589 | |
| Guggenheim International Multi-Asset Income ETF | | | 2,191,498 | | | 536,388 | | | 2,727,886 | |
| Guggenheim MSCI Global Timber ETF | | | 3,822,255 | | | 1,245,931 | | | 5,068,186 | |
Note 8 – Capital
Shares are issued and redeemed by the Funds only in creation unit size aggregations of 50,000 to 100,000 shares. Transactions are permitted on an in-kind basis, with a separate cash payment, which is balancing each component to equate the transaction to the net asset value per share of the Fund on the transaction date. Transaction fees ranging from $500 to $4,000 are charged to those persons creating or redeeming creation units. An additional charge on the transaction may be imposed with respect to transactions effected outside of the clearing process or to the extent that cash is used in lieu of securities to purchase creation units or redeem for cash.
Note 9 – Subsequent Events
The Funds evaluated subsequent events through the date the financial statements were available for issue and determined there were no additional material events that would require adjustment to or disclosure in the Funds’ financial statements.
| |
| CLAYMORE EXCHANGE-TRADED FUND TRUST 2 ANNUAL REPORT l 69 |
| REPORT OF INDEPENDENT REGISTERED PUBLIC ACCOUNTING FIRM | May 31, 2017 |
The Board of Trustees and Shareholders of
Claymore Exchange-Traded Fund Trust 2
We have audited the accompanying statements of assets and liabilities, including the schedules of investments, of Guggenheim Canadian Energy Income ETF, Guggenheim China Real Estate ETF, Guggenheim China Small Cap ETF, Guggenheim Frontier Markets ETF, Guggenheim International Multi-Asset Income ETF, Guggenheim MSCI Global Timber ETF, and Guggenheim Shipping ETF (seven of the series constituting the Claymore Exchange-Traded Fund Trust 2) (the “Funds”) as of May 31, 2017, and the related statements of operations for the year then ended, and the statements of changes in net assets for each of the two years in the period then ended, and the financials highlights for each of the five years in the period then ended. These financial statements and financial highlights are the responsibility of the Funds’ management. Our responsibility is to express an opinion on these financial statements and financial highlights based on our audits.
We conducted our audits in accordance with the standards of the Public Company Accounting Oversight Board (United States). Those standards require that we plan and perform the audit to obtain reasonable assurance about whether the financial statements and financial highlights are free of material misstatement. We were not engaged to perform an audit of the Fund’s internal control over financial reporting. Our audits included consideration of internal control over financial reporting as a basis for designing audit procedures that are appropriate in the circumstances, but not for the purpose of expressing an opinion on the effectiveness of the Funds’ internal control over financial reporting. Accordingly, we express no such opinion. An audit also includes examining, on a test basis, evidence supporting the amounts and disclosures in the financial statements and financial highlights, assessing the accounting principles used and significant estimates made by management, and evaluating the overall financial statement presentation. Our procedures included confirmation of securities owned as of May 31, 2017, by correspondence with the custodian and brokers or by other appropriate auditing procedures where replies from brokers were not received. We believe that our audits provide a reasonable basis for our opinion.
In our opinion, the financial statements and financial highlights referred to above present fairly, in all material respects, the financial position of each of the above listed Funds (seven of the series constituting the Claymore Exchange-Traded Fund Trust 2) at May 31, 2017, the results of their operations for the year then ended, the changes in their net assets for each of the two years in the period then ended, and the financial highlights for each of the five years in the period then ended, in conformity with U.S. generally accepted accounting principles.

Tysons, Virginia
July 31, 2017
| |
| 70 l CLAYMORE EXCHANGE-TRADED FUND TRUST 2 ANNUAL REPORT |
| OTHER INFORMATION (Unaudited) | May 31, 2017 |
Tax Information
In January 2018, shareholders will be advised on IRS Form 1099-DIV or substitute 1099-DIV as to the federal tax status of the distributions received by shareholders in the calendar year 2017.
The Trust’s investment income (dividend income plus short-term gains, if any) qualifies as follows:
The Guggenheim Canadian Energy Income ETF intends to designate $124,941 of foreign tax withholding on foreign source income of $843,319.
The Guggenheim China Real Estate ETF intends to designate $7,349 of foreign tax withholding on foreign source income of $1,438,457.
The Guggenheim China Small Cap ETF intends to designate $107,430 of foreign tax withholding on foreign source income of $2,244,261.
The Guggenheim Frontier Markets ETF intends to designate $122,725 of foreign tax withholding on foreign source income of $1,644,058.
The Guggenheim International Multi-Asset Income ETF intends to designate $31,117 of foreign tax withholding on foreign source income of $392,173.
The Guggenheim MSCI Global Timber ETF intends to designate $115,066 of foreign tax withholding on foreign source income of $2,056,334.
The Guggenheim Shipping ETF intends to designate $144,658 of foreign tax withholding on foreign source income of $2,076,789.
The Trust’s investment income (dividend income plus short-term gains, if any) qualifies as follows:
| | | Qualified | | Dividend | |
| Fund | | Dividend Income | | Received Deduction | |
| Guggenheim Canadian Energy Income ETF | | | 72.02 | % | | 0.00 | % |
| Guggenheim China Real Estate ETF | | | 6.68 | % | | 0.00 | % |
| Guggenheim China Small Cap ETF | | | 25.34 | % | | 0.00 | % |
| Guggenheim Frontier Markets ETF | | | 38.25 | % | | 1.13 | % |
| Guggenheim International Multi-Asset Income ETF | | | 77.75 | % | | 17.74 | % |
| Guggenheim MSCI Global Timber ETF | | | 99.75 | % | | 35.84 | % |
| Guggenheim Shipping ETF | | | 25.55 | % | | 1.51 | % |
Proxy Voting Information
A description of the policies and procedures that the Trust uses to determine how to vote proxies relating to securities held in the Funds’ portfolios is available, without charge and upon request, by calling 800.820.0888. This information is also available from the EDGAR database on the SEC’s website at https://www.sec.gov.Information regarding how the Funds voted proxies relating to portfolio securities during the most recent 12-month period is available without charge, upon request, by calling 800.820.0888. This information is also available from the EDGAR database on the SEC’s website at https://www.sec.gov.
Sector Classification
Information in the “Schedule of Investments” is categorized by sectors using sector-level Classifications defined by the Bloomberg Industry Classification System, a widely recognized industry classification system provider. Each Fund’s registration statement has investment policies relating to concentration in specific sectors/industries. For purposes of these investment policies, the Funds usually classify sectors/industries based on industry-level Classifications used by widely recognized industry classification system providers such as Bloomberg Industry Classification System, Global Industry Classification Standards and Barclays Global Classification Scheme.
Quarterly Portfolio Schedules Information
The Trust files its complete schedule of portfolio holdings with the SEC for the first and third quarters of each fiscal year on Form N-Q, which are available on the SEC’s website at https://www.sec.gov. The Funds’ Forms N-Q may be reviewed and copied at the SEC’s Public Reference Room in Washington, DC, and that information on the operation of the Public Reference Room may be obtained by calling 800-SEC-0330. Copies of the portfolio holdings are also available to shareholders, without charge and upon request, by calling 800.820.0888.
| |
| CLAYMORE EXCHANGE-TRADED FUND TRUST 2 ANNUAL REPORT l 71 |
| APPROVAL OF ADVISORY AGREEMENTS – | |
| CLAYMORE EXCHANGE-TRADED FUND TRUST 2 | May 31, 2017 |
Claymore Exchange-Traded Fund Trust 2 (the “Trust”) was organized as a Delaware statutory trust on June 8, 2006, and is registered as an open-end management investment company under the Investment Company Act of 1940, as amended (the “1940 Act”). The Trust includes the following series (collectively, the “Funds” or individually, a “Fund”):
| • | Guggenheim Canadian Energy Income ETF (ENY) |
| • | Guggenheim China All-Cap ETF (YAO) |
| • | Guggenheim China Real Estate ETF (TAO) |
| • | Guggenheim China Small Cap ETF (HAO) |
| • | Guggenheim China Technology ETF (CQQQ) |
| • | Guggenheim Frontier Markets ETF (FRN) |
| • | Guggenheim International Multi-Asset Income ETF (HGI) |
| • | Guggenheim MSCI Global Timber ETF (CUT) |
| • | Guggenheim Shipping ETF (SEA) |
| • | Guggenheim Solar ETF (TAN) |
| • | Guggenheim S&P Global Water Index ETF (CGW) |
| • | Guggenheim S&P High Income Infrastructure ETF (GHII) |
| • | Guggenheim Total Return Bond ETF (GTO) |
| • | Guggenheim U.S. Large Cap Optimized Volatility ETF (OVLC) |
| |
Guggenheim Funds Investment Advisors, LLC (“GFIA”), an indirect subsidiary of Guggenheim Partners, LLC, a global, diversified financial services firm (“Guggenheim Partners”), serves as investment adviser to each of the Funds, with the exception of Guggenheim Total Return Bond ETF (GTO). Guggenheim Partners Investment Management, LLC (“GPIM” and together with GFIA, the “Advisers” or each, an “Adviser”), also an indirect subsidiary of Guggenheim Partners, serves as investment adviser for GTO. (Guggenheim Partners, GFIA, GPIM and their affiliates may be referred to herein collectively as “Guggenheim.” “Guggenheim Investments” refers to the global asset management and investment advisory division of Guggenheim Partners and includes GFIA, GPIM, Security Investors, LLC and other affiliated investment management businesses of Guggenheim Partners.)
Under the supervision of the Board of Trustees of the Trust (the “Board,” with the members of the Board referred to individually as the “Trustees”), and subject to the terms of investment advisory agreements between the Trust and each Adviser (together, the “Advisory Agreements”), the Advisers are responsible for the overall management and administration of the Funds and provides certain facilities and personnel in connection with such services.
Following an initial two-year term, each of the Advisory Agreements continues in effect from year to year provided that such continuance is specifically approved at least annually by (i) the Board or a majority of the outstanding voting securities (as defined in the 1940 Act) of each Fund, and, in either event, and (ii) the vote of a majority of the Trustees who are not “interested person[s],” as defined by the 1940 Act, of the Trust (the “Independent Trustees”) casting votes in person at a meeting called for such purpose. At meetings held in person on April 25, 2017 (the “April Meeting”) and on May 23-24, 2017 (the “May Meeting”), the Contracts Review Committee of the Board (the “Committee”), consisting solely of the Independent Trustees, met separately from Guggenheim to consider the proposed renewal of the Advisory Agreements in connection with the Committee’s annual contract review schedule.
As part of its review process, the Committee was represented by independent legal counsel to the Independent Trustees (“Independent Legal Counsel”). Independent Legal Counsel reviewed and discussed with the Committee various key aspects of the Trustees’ legal responsibilities relating to the proposed renewal of the Advisory Agreements and other principal contracts. The Committee took into account various materials received from Guggenheim and Independent Legal Counsel. Recognizing that the evaluation process with respect to the services provided by the Advisers is an ongoing one, the Committee also considered the variety of written materials, reports and oral presentations the Board receives throughout the year regarding performance and operating results of the Funds.
In connection with the contract review process, FUSE Research Network LLC (“FUSE”), an independent, third-party research provider, was engaged to prepare advisory contract renewal reports designed specifically to help the Board fulfill its advisory contract renewal responsibilities. The objective of the reports is to present the subject funds’ relative position regarding fees, expenses, total return performance and tracking error, with peer group and universe comparisons. The Committee assessed the data provided in the FUSE reports as well as commentary and supporting data presented by Guggenheim, including, among other things, a summary of notable distinctions between certain Funds and the applicable peer group identified in the FUSE reports, as well as a discussion of those instances in which FUSE adjusted a peer group after considering a request by management to re-evaluate the peer group constituent funds.
In addition, Guggenheim provided materials and data in response to formal requests for information sent by Independent Legal Counsel on behalf of the Independent Trustees. Guggenheim also made a presentation at the April Meeting. Throughout the process, the Committee asked questions of management and requested certain additional information which Guggenheim provided following the April Meeting (collectively with the foregoing reports and materials, the “Contract Review Materials”). The Committee considered the Contract Review Materials in the context of its
| |
| 72 l CLAYMORE EXCHANGE-TRADED FUND TRUST 2 ANNUAL REPORT |
| APPROVAL OF ADVISORY AGREEMENTS – | |
| CLAYMORE EXCHANGE-TRADED FUND TRUST 2 (continued) | May 31, 2017 |
accumulated experience governing the Trust and weighed the factors and standards discussed with Independent Legal Counsel.
Following an analysis and discussion of the factors identified below and in the exercise of its business judgment, the Committee concluded that it was in the best interest of each Fund to recommend that the Board approve the renewal of each of the Advisory Agreements for an additional annual term.
Nature, Extent and Quality of Services Provided by each Adviser: With respect to the nature, extent and quality of services currently provided by each Adviser, the Committee considered the qualifications, experience and skills of key personnel performing services for the Funds, including those personnel providing compliance oversight, as well as the supervisors and reporting lines for such personnel. In this connection, the Committee considered Guggenheim’s resources and related efforts to retain, attract and motivate capable personnel to serve the Funds and noted Guggenheim’s report on recent additions, departures and transitions in personnel who work on matters relating to the Funds or are significant to the operations of each Adviser. The Committee also considered Guggenheim’s attention to relevant developments in the mutual fund industry, and issues germane to exchange-traded funds (“ETFs”) in particular, and its observance of compliance and regulatory requirements, and noted that on a regular basis the Board receives and reviews information from the Trust’s Chief Compliance Officer regarding compliance policies and procedures established pursuant to Rule 38a-1 under the 1940 Act, as well as from Guggenheim’s Chief Risk Officer. In addition, the Committee noted Guggenheim’s implementation of additional controls and oversight processes relating to risk management, including the establishment of an Enterprise Risk Management Committee comprised of a multi-disciplinary team of senior personnel, as well as enhancements to the organization’s information security program.
In connection with the Committee’s evaluation of the overall package of services provided by the Advisers, the Committee considered Guggenheim’s administrative capabilities, including its role in monitoring and coordinating compliance responsibilities with the accounting agent, administrator, custodian, distributor, securities lending agent, transfer agent and other service providers to the Funds. In this respect, the Committee took into account the initiatives undertaken by Guggenheim in connection with the outsourcing of its fund administration and transfer agency services business resulting from Guggenheim’s sale of Rydex Fund Services, LLC (“RFS”), formerly a Guggenheim affiliate and now known as MUFG Investor Services (US), LLC (“MUFG IS”), to Mitsubishi UFJ Trust and Banking Corporation, the trust banking arm of Mitsubishi UFJ Financial Group, a Japanese financial services organization (the “RFS Transaction”). In particular, the Committee considered Guggenheim’s establishment of the Office of Chief Financial Officer (“OCFO”), its structure and responsibilities, including its role in overseeing the services provided by MUFG IS. The Committee also considered the resources allocated by Guggenheim to support the OCFO and the detailed plans presented by management for functions for the OCFO both during and upon completion of the transition period with MUFG IS.
The Committee also noted the distinctive nature of the Funds as ETFs, each of which (with the exception of GTO, an actively managed ETF) generally is constructed to track the performance of a defined index of securities, before fund fees and expenses. In this connection, the Committee considered the experience and expertise appropriate in an investment adviser to ETFs. The Committee also considered Guggenheim’s monitoring of the ETFs’ participation in the securities lending program and the secondary market support services provided by Guggenheim to the Funds, including Guggenheim’s efforts to educate investment professionals about the Funds and other Guggenheim Funds.
With respect to Guggenheim’s resources and each Adviser’s ability to carry out its responsibilities under the Advisory Agreements, the Chief Financial Officer of Guggenheim Investments reviewed with the Committee certain unaudited financial information concerning the holding company for Guggenheim Investments, Guggenheim Partners Investment Management Holdings, LLC (“GPIMH”). The Committee received the audited consolidated financial statements of GPIMH as supplemental information. (Thereafter, the Committee received the audited consolidated financial statements of GPIM.)
The Committee also considered the acceptability of the terms of the Advisory Agreements, including the scope of services required to be performed by each Adviser.
Based on the foregoing, and based on other information received (both oral and written) at the April Meeting and the May Meeting, as well as other considerations, including the Committee’s knowledge of how the Advisers perform their duties obtained through Board meetings, discussions, and reports during the year, the Committee concluded that each Adviser and its personnel were qualified to serve the Funds in such capacity and may reasonably be expected to continue to provide a high quality of services under the applicable Advisory Agreement with respect to the Funds.
Investment Performance: Index/Non-Actively Managed ETFs: The Committee noted that, in view of the distinctive investment objective of the Funds, and the expectations of shareholders, the investment performance of the Funds (excluding GTO, the actively managed ETF) in absolute terms was not of the relevance that normally attaches to the performance of actively managed funds. Of greater relevance to the Committee was the extent to which each Fund achieved its objective to provide investment results that, before fund fees and expenses, correspond generally to the price and yield performance of securities of companies in its applicable index. Thus, the Committee focused its attention primarily on the tracking error data provided in the FUSE reports for each Fund, which was provided for the five-year, three-year, one-year and since inception periods as of December 31, 2016, as applicable.
| |
| CLAYMORE EXCHANGE-TRADED FUND TRUST 2 ANNUAL REPORT l 73 |
| APPROVAL OF ADVISORY AGREEMENTS – | |
| CLAYMORE EXCHANGE-TRADED FUND TRUST 2 (continued) | May 31, 2017 |
In this regard, the Committee noted Guggenheim’s statement that it monitors tracking error regularly for purposes of: (i) determining whether the tracking error is stable or trending; (ii) evaluating factors underlying any trending in tracking error, particularly where the trend is toward greater tracking error; and (iii) assessing whether there are any tools or strategies at Guggenheim’s disposal to mitigate any trend toward greater tracking error. The Committee also took into account Guggenheim’s explanation that it places greater emphasis on tracking error trends than it does on absolute tracking error because certain index-benchmarked ETFs may be more disposed to higher levels of tracking error, such as, for instance, with respect to a new ETF or an ETF that has yet to reach critical asset mass and consequently, may be unable to deploy its assets in a manner that replicates all of the constituent holdings of an index in the same proportion that the index holds them. The Committee noted other factors identified by Guggenheim that may impact tracking error, including pricing of halted or less liquid securities, time zone pricing related issues, regulatory restrictions and currency conversion sources. In the course of its review of tracking error data, the Committee considered management’s views and explanation of tracking error and tracking error trends for the Funds.
The Committee considered the investment performance of the Funds as measured by total return in comparison to its peer group of funds as a measure for considering the Adviser’s oversight of the applicable index. In this connection, the Committee noted Guggenheim’s statement that although such performance is typically outside of the Adviser’s control given a Fund’s objective to track the index, management monitors investment performance to ensure the Fund continues to provide clients with consistent exposures and that the Fund remains competitive relative to other similar ETFs.
In further considering the tracking error data presented in the Contract Review Materials and addressed by Guggenheim, the Committee made the following observation:
Guggenheim Frontier Markets ETF (FRN): The Fund exhibited tracking error of 2.78%, 2.12% and 2.48% for the one-year, three-year and five-year periods ended December 31, 2016, respectively. The Committee noted Guggenheim’s explanation that frontier markets are often less liquid and can often be difficult to access and track. In this regard, the Committee considered that Guggenheim has historically been unable to secure local access in Vietnam, which has contributed a significant portion of the Fund’s tracking error. The Committee noted, however, that Guggenheim successfully secured local access in Vietnam in 2016. Additionally, Guggenheim stated that the Fund has accrued for certain country tax withholdings which also impaired the Fund’s ability to efficiently track its index. The Committee took into account Guggenheim’s conclusion that, given the aforementioned factors impacting tracking error, it considers the level of tracking error to be reasonable.
After reviewing the foregoing and related factors, the Committee concluded, within the context of its overall conclusions regarding the Advisory Agreement, that: (i) the Funds had in fact tracked their indexes within an acceptable range; or (ii) it was satisfied with Guggenheim’s efforts and explanation for the tracking error data presented in the FUSE reports.
Guggenheim Total Return Bond ETF (GTO): For the actively managed ETF, the Committee reviewed information comparing the Fund’s total return for the since-inception and three-month periods ended December 31, 2016, compared to the performance of a peer group of funds identified by FUSE. The Committee noted that the peer group consists of 4 other actively managed intermediate term bond funds, and that a larger universe of similar funds was not identified. The Committee observed that the Fund’s returns for both the since-inception and three-month periods ended December 31, 2016 outperformed the peer group median, ranking in first quartile (25th and 1st percentiles, respectively). The Committee determined that the Fund’s performance was acceptable and that the portfolio managers should have an opportunity to implement the Fund’s investment strategies over a full market cycle.
Comparative Fees, Costs of Services Provided and the Profits Realized by the Adviser from Its Relationship with the Funds: The Committee compared each Fund’s contractual advisory fee and total net expense ratio to the applicable peer group.
The Committee noted that either: (i) the Adviser has contractually agreed to waive a portion of the advisory fee and/or reimburse expenses to absorb annual operating expenses of certain Funds (excluding interest expenses, all or a portion of each Fund’s licensing fees, brokerage commissions and other trading expenses, taxes and extraordinary expenses such as litigation and other expenses not incurred in the ordinary course of a Fund’s business) over a particular amount; or (ii) the advisory fee is a unitary fee pursuant to which the Adviser assumes all expenses of the Fund (including the cost of transfer agency, custody, fund administration, legal, audit and other services) other than the fee payments under the Advisory Agreement, payments under the Funds’ 12b-1 plan, if any, brokerage expenses, taxes, interest, litigation expenses and other extraordinary expenses. In addition, the Committee considered, as to each Fund, the comparative fee and expense data provided relative to the peer group within the context of the Fund’s investment objective and the uniqueness of the Fund’s underlying index.
In further considering the comparative fee and expense data presented in the Contract Review Materials and addressed by Guggenheim, the Committee made the following observations:
Guggenheim Canadian Energy Income ETF (ENY): The Fund’s contractual advisory fee ranks in the third quartile (60th percentile) of its peer group. The Fund’s total net expense ratio ranks in the fourth quartile (80th percentile) of its peer group. In considering the foregoing rankings, the Committee took into account the peer group data, including the small number of peer group constituent funds, the wide dispersion in the relative size of the constituents in the peer group and the fund complexes
| |
| 74 l CLAYMORE EXCHANGE-TRADED FUND TRUST 2 ANNUAL REPORT |
| APPROVAL OF ADVISORY AGREEMENTS – | |
| CLAYMORE EXCHANGE-TRADED FUND TRUST 2 (continued) | May 31, 2017 |
represented in the peer group (with four of the five peer funds being products of two large fund complexes).
Guggenheim China All-Cap ETF (YAO): The Fund is subject to a unitary fee which ranks in the third quartile (73rd percentile) of its peer group with respect to contractual advisory fee rankings and second quartile (36th percentile) as to its total net expense ratio.
Guggenheim China Real Estate ETF (TAO): The Fund’s contractual advisory fee ranks in the first quartile (1st percentile) of its peer group. The Fund’s total net expense ratio ranks in the second quartile (36th percentile) of its peer group.
Guggenheim China Small Cap ETF (HAO): The Fund’s contractual advisory fee ranks in the first quartile (1st percentile) of its peer group and its total net expense ratio is in line with the peer group median (50th percentile).
Guggenheim China Technology ETF (CQQQ): Although the Fund’s unitary fee ranks in the fourth quartile (100th percentile) relative to the peer group contractual advisory fee, the unitary fee is equal to the peer group median total net expense ratio. In considering the foregoing rankings, the Committee took into account that the Fund’s peer group contains only two other China technology funds identified by FUSE.
Guggenheim Frontier Markets ETF (FRN): The Fund’s contractual advisory fee ranks in the second quartile (33rd percentile) of its peer group. The Fund’s total net expense ratio ranks in the third quartile (67th percentile) of its peer group.
Guggenheim International Multi-Asset Income ETF (HGI): The Fund’s contractual advisory fee equals its peer group median and its total net expense ratio is in the third quartile (75th percentile) of its peer group. The Committee considered Guggenheim’s statement that the Fund is unique in that it follows a multi-asset strategy with a broader investment mandate than its peer group, which is equity dividend-income focused.
Guggenheim MSCI Global Timber ETF (CUT): The contractual advisory fee and total net expense ratio are in the fourth quartile (100th percentile as to each) of its peer group. In considering the foregoing rankings, the Committee took into account that the Fund’s peer group contains only one other fund. The Committee also the Fund changed its name, index and index provider in 2016 to provide more direct real asset exposure and improve both brand recognition and performance of the offering.
Guggenheim S&P Global Water Index ETF (CGW): The Fund’s contractual advisory fee ranks in the second quartile (33rd percentile) of its peer group and its total net expense ratio ranks in the third quartile (67th percentile). In considering the foregoing rankings, the Committee took into account the peer group data, including the small number of peer group constituent funds and the fund complexes represented in the peer group (with two of the three peer funds being products of the same large fund complex).
Guggenheim S&P High Income Infrastructure ETF (GHII): The Fund is subject to a unitary fee which ranks in the first quartile (20th percentile) with respect to both its contractual advisory fee and total net expense ratio rankings.
Guggenheim Shipping ETF (SEA): The Fund is subject to a unitary fee which ranks in the fourth quartile (88th percentile) of its peer group. The Fund’s total net expense ratio ranks in the third quartile (75th percentile) of its peer group. The Committee considered the Adviser’s statement that the Fund provides unique exposure to shipping companies, while its peer group consists of competitors that are more broadly focused on transportation or industrials. As a result, the Adviser believes that the Fund is unique relative to its peers and is priced accordingly.
Guggenheim Solar ETF (TAN): The Fund’s contractual advisory fee ranks in the first quartile (1st percentile) of its peer group. The Fund’s total net expense ratio ranks in the fourth quartile (100th percentile) of its peer group. In considering the foregoing rankings, the Committee took into account that the Fund’s peer group consists of only one other fund.
Guggenheim Total Return Bond ETF (GTO): The Fund’s contractual advisory fee ranks in the first quartile (25th percentile) of its peer group and its total net expense ratio is equal to the peer group median.
Guggenheim U.S. Large Cap Optimized Volatility ETF (OVLC): The Fund is subject to a unitary fee that ranks in the third quartile (67th percentile) as to both its peer group contractual advisory fee and total net expense ratio rankings. In considering the foregoing rankings, the Committee took into account the wide dispersion in the relative size of the constituents in the peer group and the fund complexes represented in the peer group. The Committee also considered that the Fund recently launched, with an inception date of May 10, 2016.
As part of its evaluation of each Fund’s advisory fee, the Committee considered how such fees compared to the advisory fee charged by the Adviser to one or more other clients that it manages pursuant to similar investment strategies, to the extent applicable, noting that, in certain instances, Guggenheim charges a lower advisory fee to such other clients. In this connection, the Committee considered, among other things, Guggenheim’s representations about the significant differences between managing mutual funds and ETFs as compared to other types of accounts. The Committee also considered Guggenheim’s explanation that lower fees are charged in certain instances due to various other factors, including the scope of contract, type of investors, differences in fee structure, applicable legal, governance and capital structures, tax status and historical pricing reasons. The Committee concluded that the information it received demonstrated that the aggregate services provided to each Fund at issue were sufficiently different from those provided to other clients with similar investment strategies and/or the risks borne by Guggenheim were sufficiently greater than those associated with managing other clients with similar investment strategies to support the difference in fees.
| |
| CLAYMORE EXCHANGE-TRADED FUND TRUST 2 ANNUAL REPORT l 75 |
| APPROVAL OF ADVISORY AGREEMENTS – | |
| CLAYMORE EXCHANGE-TRADED FUND TRUST 2 (continued) | May 31, 2017 |
With respect to the costs of services provided and profits realized by Guggenheim Investments from its relationship with the Funds, the Committee reviewed a profitability analysis and data from management for each Fund setting forth the average assets under management for the twelve months ended December 31, 2016, ending assets under management of the Trust as of December 31, 2016, gross revenues received by Guggenheim Investments, expenses allocated to the Funds, expense waivers (as applicable), earnings and the operating margin/profitability rate, including variance information relative to the foregoing amounts as of December 31, 2015. In addition, the Chief Financial Officer of Guggenheim Investments reviewed with, and addressed questions from, the Committee concerning the expense allocation methodology employed in producing the profitability analysis.
In the course of its review of Guggenheim Investments’ profitability, the Committee took into account the methods used by Guggenheim Investments to determine expenses and profit. The Committee also noted steps taken by management to refine its methodology in preparation for contract review, including, among other things, revisions to the process for allocating expenses for shared service functions, as previously reported to and discussed with the Board. The Committee considered all of the foregoing in evaluating the costs of services provided, the profitability to Guggenheim Investments, and the profitability rates presented, and concluded that the profits were not unreasonable.
The Committee considered other benefits available to each Adviser because of its relationship with the Funds and noted Guggenheim’s statement that until the completion of the RFS Transaction on October 4, 2016, the Adviser may have benefited from arrangements whereby an affiliate received fees from the Funds for providing certain fund administration services. The Committee also noted Guggenheim’s statement that the contractual arrangement between Accretive Asset Management LLC (“Accretive”), the index provider to Guggenheim U.S. Large Cap Optimized Volatility ETF (which is subject to a unitary fee) and certain other ETFs sponsored by Guggenheim, may be deemed to be a “fall-out benefit.” In this connection, the Committee noted the total amount paid to Accretive during the calendar year 2016, as well as Guggenheim’s representation that the fees paid to Accretive are competitive. In addition, the Committee noted Guggenheim’s statement that it may benefit from marketing synergies arising from offering a broad spectrum of products, including the Funds.
Economies of Scale: The Committee received and considered information regarding whether there have been economies of scale with respect to the management of the Funds as Fund assets grow, whether the Funds have appropriately benefited from any economies of scale, and whether there is potential for realization of any further economies of scale. The Committee considered whether economies of scale in the provision of services to the Funds were being passed along to the shareholders. The Committee noted Guggenheim’s statement that it believes it is appropriately sharing potential economies of scale and that costs continue to increase in many key areas, including compensation of portfolio managers, key analysts and support staff, as well as for infrastructure needs, with respect to risk management oversight, valuation processes and disaster recovery systems, among other things, and that, in this regard, management’s costs for providing services have increased in recent years without regard to asset levels.
The Committee was of the view that economies of scale were being shared appropriately with the Funds by virtue of the level at which the advisory fee was set at each Fund’s inception that subsumed economies of scale in the fee itself.
The Committee determined that, taking into account all relevant factors, the advisory fee for each Fund was reasonable.
Overall Conclusions
Based on the foregoing, the Committee determined that the investment advisory fees are fair and reasonable in light of the extent and quality of the services provided and other benefits received and that the continuation of each of the Advisory Agreements is in the best interest of each Fund. In reaching this conclusion, no single factor was determinative or conclusive and each Committee member, in the exercise of his business judgment, may attribute different weights to different factors. At the May Meeting, the Committee, constituting all of the Independent Trustees, recommended the renewal of each of the Advisory Agreements for an additional annual term.
Thereafter, on May 24, 2017, the Board, including all of the Independent Trustees, approved the renewal of each of the Advisory Agreements for an additional annual term.
| |
| 76 l CLAYMORE EXCHANGE-TRADED FUND TRUST 2 ANNUAL REPORT |
| INFORMATION ON BOARD OF TRUSTEES AND OFFICERS (Unaudited) | May 31, 2017 |
Trustees
The Statement of Additional Information that includes additional information about the Trustees is also available, without charge, upon request via our website at guggenheiminvestments.com or by calling 800.820.0888.
The Trustees of the Trust and their principal business occupations during the past five years:
| | | | | Term of | | | | Number of | | | |
| | | Position(s) | | Office and | | | | Portfolios in | | | |
| Name, Address* | | Held with | | Length of | | Principal Occupation(s) | | Fund Complex | | Other Directorships | |
| and Year of Birth | | Trust | | Time Served** | | During Past Five Years | | Overseen | | Held by Trustees | |
| Independent Trustees: | | | | | | | |
Randall C. Barnes
(1951) | | Trustee | | Since 2006 | | Current: Private Investor (2001-present).
Former: Senior Vice President and Treasurer, PepsiCo, Inc. (1993-1997); President, Pizza Hut International (1991-1993); Senior Vice President, Strategic Planning and New Business Development, PepsiCo, Inc. (1987-1990). | | 98 | | Current: Trustee, Purpose Investments Funds (2014-present). | |
Donald A. Chubb, Jr.
(1946) | | Trustee and
Chairman of the
Valuation Oversight
Committee | | Since 2014 | | Current: Business broker and manager of commercial real estate, Griffith & Blair, Inc. (1997-present). | | 95 | | Current: Midland Care, Inc.
(2011-2016). | |
Jerry B. Farley
(1946) | | Trustee and
Chairman of the
Audit Committee | | Since 2014 | | Current: President, Washburn University (1997-present). | | 95 | | Current: Westar Energy, Inc.
(2004-present); CoreFirst Bank & Trust (2000-present). | |
Roman Friedrich III
(1946) | | Trustee and
Chairman of the
Contracts Review
Committee | | Since 2010 | | Current: Founder and Managing Partner, Roman Friedrich & Company (1998-present).
Former: Senior Managing Director, MLV & Co. LLC (2010-2011). | | 95 | | Current: Zincore Metals, Inc.
(2009-present).
Former: Axiom Gold and Silver Corp. (2011-2012). | |
Robert B. Karn III
(1942) | | Trustee | | Since 2010 | | Current: Consultant (1998-present).
Former: Arthur Andersen LLP (1965-1997) and Managing Partner, Financial and Economic Consulting, St. Louis office (1987-1997). | | 95 | | Current: GP Natural Resource
Partners, LLC (2002- present).
Former: Peabody Energy Company (2003-April 2017). | |
Ronald A. Nyberg
(1953) | | Trustee and
Chairman of the
Nominating and
Governance
Committee | | Since 2006 | | Current: Partner, Momkus McCluskey Roberts, LLC (2016-present).
Former: Partner, Nyberg & Cassioppi, LLC (2000-2016); Executive Vice President, General Counsel, and Corporate Secretary, Van Kampen Investments (1982-1999). | | 100 | | Current: Edward-Elmhurst Healthcare System (2012-present). | |
Maynard F. Oliverius
(1943) | | Trustee | | Since 2014 | | Current: Retired.
Former: President and CEO, Stormont-Vail HealthCare (1996-2012). | | 95 | | Current: Robert J. Doe Institute of Politics (2016-present); Stormont- Vail Foundation (2013-present); University of Minnesota MHA
Alumni Philanthropy Committee (2009-present); Fort Hays State University (1999-present).
Former: Topeka Community Foundation (2009-2014). | |
Ronald E. Toupin, Jr.
(1958) | | Trustee and
Chairman of the
Board | | Since 2006 | | Current: Portfolio Consultant (2010-present).
Former: Vice President, Manager and Portfolio Manager, Nuveen Asset Management (1998-1999); Vice President, Nuveen Investment Advisory Corp. (1992-1999); Vice President and Manager, Nuveen Unit Investment Trusts (1991-1999); and Assistant Vice President and Portfolio Manager, Nuveen Unit Investment Trusts (1988-1999), each of John Nuveen & Co., Inc. (1982-1999). | | 97 | | Former: Bennett Group of Funds (2011-2013). | |
| |
| CLAYMORE EXCHANGE-TRADED FUND TRUST 2 ANNUAL REPORT l 77 |
| INFORMATION ON BOARD OF TRUSTEES AND OFFICERS (Unaudited) continued | May 31, 2017 |
| | | | | Term of | | | | Number of | | | |
| | | Position(s) | | Office and | | | | Portfolios in | | | |
| Name, Address* | | Held with | | Length of | | Principal Occupation(s) | | Fund Complex | | Other Directorships | |
| and Year of Birth | | Trust | | Time Served** | | During Past Five Years | | Overseen | | Held by Trustees | |
| Interested Trustee: | | | | | | | | |
Donald C.
Cacciapaglia***
(1951) | | President, Chief
Executive Officer
and Trustee | | Since 2012 | | Current: President and CEO, certain other funds in the Fund Complex (2012-present); Vice Chairman, Guggenheim Investments (2010-present).
Former: Chairman and CEO, Channel Capital Group, Inc. (2002-2010). | | 230 | | Current: Clear Spring Life
Insurance Company
(2015-present);
Guggenheim Partners Japan, Ltd.
(2014-present); Guggenheim
Partners Investment Management
Holdings, LLC (2014-present);
Delaware Life (2013-present);
Guggenheim Life and Annuity
Company (2011-present);
Paragon Life Insurance
Company of Indiana
(2011-present). | |
| * | The business address of each Trustee is c/o Guggenheim Investments, 227 West Monroe Street, Chicago, IL 60606. |
| ** | Each Trustee serves an indefinite term, until his successor is duly elected and qualified. |
| *** | This Trustee is deemed to be an “interested person” of the Funds under the 1940 Act by reason of his position with the Funds’ Investment Adviser and/or the parent of the Investment Adviser. |
| |
| 78 l CLAYMORE EXCHANGE-TRADED FUND TRUST 2 ANNUAL REPORT |
| INFORMATION ON BOARD OF TRUSTEES AND OFFICERS (Unaudited) continued | May 31, 2017 |
Officers
The Officers of the Trust, who are not Trustees, and their principal occupations during the past five years:
| | | | | Term of Office | | | |
| Name, Address* | | Position(s) held | | and Length of | | Principal Occupations | |
| and Year of Birth | | with the Trust | | Time Served** | | During Past Five Years | |
| Officers: | | | | | | | |
Joanna M. Catalucci
(1966) | | Chief Compliance
Officer | | Since 2012 | | Current: Chief Compliance Officer, certain funds in the Fund Complex (2012-present); Senior Managing
Director, Guggenheim Investments (2012-present). AML Officer, certain funds in the Fund Complex
(2016-present).
Former: Chief Compliance Officer and Secretary, certain other funds in the Fund Complex (2008-2012); Senior Vice President & Chief Compliance Officer, Security Investors, LLC and certain affiliates (2010-2012); Chief Compliance Officer and Senior Vice President, Rydex Advisors, LLC and certain affiliates (2010-2011). | |
James M. Howley
(1972) | | Assistant Treasurer | | Since 2006 | | Current: Managing Director, Guggenheim Investments (2004-present); Assistant Treasurer, certain other funds in the Fund Complex (2006-present).
Former: Manager of Mutual Fund Administration, Van Kampen Investments, Inc. (1996-2004). | |
Keith Kemp
(1960) | | Assistant Treasurer | | Since 2016 | | Current: Treasurer and Assistant Treasurer, certain other funds in the Fund Complex (2010-present); Managing Director of Guggenheim Partners Investments Management, LLC (2015-present); Chief Financial Officer, Guggenheim Specialized Products, LLC (2016-present).
Former: Managing Director and Director, Transparent Value, LLC (2010-2016); Director, Guggenheim Partners Investments, LLC (2010-2015); Chief Operating Officer, Macquarie Capital Investment Management
(2007-2009). | |
Amy J. Lee
(1961) | | Chief Legal Officer | | Since 2013 | | Current: Chief Legal Officer, certain other funds in the Fund Complex (2013-present); Senior Managing Director, Guggenheim Investments (2012-present).
Former: Vice President, Associate General Counsel and Assistant Secretary, Security Benefit Life Insurance Company and Security Benefit Corporation (2004-2012). | |
Mark E. Mathiasen
(1978) | | Secretary | | Since 2011 | | Current: Secretary, certain other funds in the Fund Complex (2007-present); Managing Director, Guggenheim Investments (2007-present). | |
Glenn McWhinnie
(1969) | | Assistant Treasurer | | Since 2016 | | Current: Vice President, Guggenheim Investments (2009-present).
Former: Tax Compliance Manager, Ernst & Young LLP (1996-2009). | |
Michael P. Megaris
(1984) | | Assistant Secretary | | Since 2014 | | Current: Assistant Secretary, certain other funds in the Fund Complex (April 2014-present); Vice President, Guggenheim Investments (2012-present).
Former: J.D., University of Kansas School of Law (2009-2012). | |
Adam J. Nelson
(1979) | | Assistant Treasurer | | Since 2015 | | Current: Vice President, Guggenheim Investments (2015-present); Assistant Treasurer, certain other funds in the Fund Complex (2015-present).
Former: Assistant Vice President and Fund Administration Director, State Street Corporation (2013-2015); Fund Administration Assistant Director, State Street (2011-2013); Fund Administration Manager, State Street
(2009-2011). | |
Kimberly J. Scott
(1974) | | Assistant Treasurer | | Since 2012 | | Current: Director, Guggenheim Investments (2012-present); Assistant Treasurer, certain other funds in the Fund Complex (2012-present).
Former: Financial Reporting Manager, Invesco, Ltd. (2010-2011); Vice President/Assistant Treasurer of Mutual Fund Administration, Van Kampen Investments, Inc./Morgan Stanley Investment Management (2009-2010); Manager of Mutual Fund Administration, Van Kampen Investments, Inc./Morgan Stanley Investment Management (2005-2009). | |
| |
| CLAYMORE EXCHANGE-TRADED FUND TRUST 2 ANNUAL REPORT l 79 |
| INFORMATION ON BOARD OF TRUSTEES AND OFFICERS (Unaudited) continued | May 31, 2017 |
| | | | | Term of Office | | | |
| Name, Address* | | Position(s) held | | and Length of | | Principal Occupations | |
| and Year of Birth | | with the Trust | | Time Served** | | During Past Five Years | |
| Officers: continued: | | | |
Bryan Stone
(1979) | | Vice President | | Since 2014 | | Current: Vice President, certain other funds in the Fund Complex (2014-present); Director, Guggenheim Investments (2013-present).
Former: Senior Vice President, Neuberger Berman Group LLC (2009-2013); Vice President, Morgan Stanley (2002-2009). | |
John L. Sullivan
(1955) | | Chief Financial
Officer, Chief
Accounting
Officer and
Treasurer | | Since 2010 | | Current: CFO, Chief Accounting Officer and Treasurer, certain other funds in the Fund Complex (2010-present); Senior Managing Director, Guggenheim Investments (2010-present).
Former: Managing Director and CCO, each of the funds in the Van Kampen Investments fund complex (2004-2010); Managing Director and Head of Fund Accounting and Administration, Morgan Stanley Investment Management (2002-2004); CFO and Treasurer, Van Kampen Funds (1996-2004). | |
| * | The business address of each officer is c/o Guggenheim Investments, 227 West Monroe Street, Chicago, IL 60606. |
| ** | Each officer serves an indefinite term, until his or her successor is duly elected and qualified. The date reflects the commencement date upon which the officer held any officer position with the Trust. |
| |
| 80 l CLAYMORE EXCHANGE-TRADED FUND TRUST 2 ANNUAL REPORT |
| TRUST INFORMATION | May 31, 2017 |
| | Board of Trustees | | Principal Executive Officers | | Investment Adviser | | Accounting Agent, | |
| | Randall C. Barnes
Donald C. Cacciapaglia*
Donald A. Chubb, Jr.
Jerry B. Farley
Roman Friedrich III
Robert B. Karn III
Ronald A. Nyberg
Maynard F. Oliverius
Ronald E. Toupin, Jr.,
Chairman
| | Donald C. Cacciapaglia
President and Chief
Executive Officer
Joanna M. Catalucci
Chief Compliance Officer
Amy J. Lee
Chief Legal Officer
Mark E. Mathiasen
Secretary
John L. Sullivan
Chief Financial Officer,
Chief Accounting Officer
and Treasurer | | Guggenheim Funds
Investment Advisors, LLC
Chicago, IL
Distributor
Guggenheim Funds
Distributors, LLC
Chicago, IL
Administrator
MUFG Investor Services
(US), LLC
Rockville, MD | | Custodian and
Transfer Agent
The Bank of New York
Mellon Corp.
New York, NY
Legal Counsel
Dechert LLP
New York, NY
Independent Registered
Public Accounting Firm
Ernst & Young LLP
Tysons, VA | |
| * | Trustee is an “interested person” (as defined in section 2(a)(19) of the 1940 Act) (“Interested Trustee”) of the Trust because of his position as the President and CEO of the Investment Adviser and the Distributor. | | | | | | | |
| |
| CLAYMORE EXCHANGE-TRADED FUND TRUST 2 ANNUAL REPORT l 81 |
| GUGGENHEIM INVESTMENTS PRIVACY POLICIES (Unaudited) | May 31, 2017 |
Guggenheim Investments as used herein refers to Guggenheim Partners, LLC, Guggenheim Funds Investment Advisors, LLC, Guggenheim Partners Investment Management, LLC, Guggenheim Funds Distributors, LLC and Security Investors, LLC as well as the funds in the Guggenheim Funds complex (the “funds”).
Our Commitment to You
When you become a Guggenheim Investments investor, you entrust us with not only your hard-earned money but also with personal and financial information about you. We recognize that your relationship with us is based on trust and that you expect us to act responsibly and in your best interests. Because we have access to personal information about you, we hold ourselves to high standards in its safekeeping and use. This means, most importantly, that we do not sell client or account information to anyone—whether you are a current or former Guggenheim Investments client.
The Information We Collect About You and How We Collect It
In the course of doing business with shareholders and investors, we collect nonpublic personal information about you. You typically provide personal information when you complete a Guggenheim Investments account application or when you request a transaction that involves Rydex and Guggenheim Funds or one of the Guggenheim affiliated companies. “Nonpublic personal information” is personally identifiable information about you. For example it includes your name and address, Social Security or taxpayer identification number, assets, income, account balance, bank account information and investment activity (e.g. purchase and redemption history).
How We Share Your Personal Information
As a matter of policy, we do not disclose your nonpublic personal information to nonaffiliated third parties except as required or permitted by law. As emphasized above, we do not sell information about current or former clients or their accounts to third parties. Nor do we share such information, except when necessary to complete transactions at your request or to make you aware of related investment products and services that we offer. Additional details about how we handle your personal information are provided below.
To complete certain transactions or account changes that you direct, it may be necessary to provide your personal information to companies, individuals or groups that are not affiliated with Guggenheim Investments. For example if you ask to transfer assets from another financial institution to Guggenheim Investments, we will need to provide certain information about you to that company to complete the transaction. In connection with servicing your accounts or to alert you to other Guggenheim Investments investment products and services, we may share your information within the Guggenheim Investments family of affiliated companies. This would include, for example, sharing your information within Guggenheim Investments so we can make you aware of new funds or the services offered through another Guggenheim Investments affiliated company. In certain instances, we may contract with nonaffiliated companies to perform services for us. Where necessary, we will disclose information we have about you to these third parties. In all such cases, we provide the third party with only the information necessary to carry out its assigned responsibilities and only for that purpose. And we require these third parties to treat your personal information with the same high degree of confidentiality that we do. In certain instances, we may share information with other financial institutions regarding individuals and entities in response to the U.S.A. Patriot Act. Finally we will share personal information about you if we are compelled by law to do so, if you direct us to do so with your consent, or in other circumstances as permitted by law.
How We Safeguard Your Personal Information
We maintain physical, electronic and procedural safeguards to protect your personal information. Within Guggenheim Investments, access to such information is limited to those who need it to perform their jobs such as servicing your account, resolving problems or informing you of new products and services.
| |
| 82 l CLAYMORE EXCHANGE-TRADED FUND TRUST 2 ANNUAL REPORT |
This Page Intentionally Left Blank.
Guggenheim Funds Investment Advisors, LLC
Guggenheim Funds Investment Advisors, LLC (the “Investment Adviser”) serves as the investment adviser for each of the Funds and administers the affairs of each Fund to the extent requested by the Board of Trustees. The Investment Adviser also acts as investment adviser to closed-end and open-end management investment companies. The Investment Adviser and its affiliates provide supervision, management or servicing of assets with a commitment to consistently delivering exceptional service. The Investment Adviser is a subsidiary of Guggenheim Partners, LLC, a global, diversified financial services firm with more than $260 billion in assets under supervision as of March 31, 2017. Guggenheim Partners, LLC, through its affiliates, provides investment management, investment advisory, insurance, investment banking, and capital markets services. The firm is headquartered in Chicago and New York with a global network of offices throughout the United States, Europe, and Asia.
Portfolio Management
The portfolio managers who are currently responsible for the day-to-day management of each Fund’s portfolio are Michael P. Byrum, CFA, James R. King, CFA, and Cindy Gao. Messrs. Byrum and King have managed the Funds’ portfolios since December 2013. Ms. Gao has managed the Funds’ portfolios since January 2014.
Mr. Byrum is a Senior Managing Director and Portfolio Manager of Guggenheim Investments and joined Guggenheim Investments in 1993. He has ultimate responsibility for the management of the Funds and reviews the activities of the portfolio managers of the Funds. He holds a degree in finance from Miami University of Ohio and is a member of the CFA Institute and the Washington Society of Investment Analysts. Mr. King is a Managing Director and Portfolio Manager of Guggenheim Investments and rejoined Guggenheim Investments in 2011 as the lead portfolio manager for exchange-traded products. Mr. King holds a bachelor’s degree in finance from the University of Maryland, and has earned the Chartered Financial Analyst designation. Ms. Gao is an ETF Analyst, ETF Portfolio Management of Guggenheim Investments, and joined Guggenheim Investments in December 2010. Ms. Gao received a M.S. in Accounting from the University of Illinois at Chicago.
Claymore Exchange-Traded Fund Trust 2 Overview
The Claymore Exchange-Traded Fund Trust 2 is an investment company consisting of 14 separate exchange-traded “index funds” as of May 31, 2017. The investment objective of each of the funds is to replicate as closely as possible, before fees and expenses, the performance of a specified market index.
This material must be preceded or accompanied by a prospectus for the fund being offered. The prospectus contains information about the fund including a discussion of investment objectives, risks, ongoing expenses and sales charges. If a prospectus did not accompany this report, you can obtain one from your financial adviser, from our website at http://guggenheiminvestments.com or by calling (800)345-7999. Please read the prospectus carefully before investing. The Statement of Additional Information that includes additional information about the Trustees is also available, without charge, upon request via our website at http://guggenheiminvestments.com or by calling (800)345-7999. All funds are subject to market risk and shares when sold may be worth more or less than their original cost. You can lose money investing in the funds.
Guggenheim Funds Distributors, LLC
227 West Monroe Street
Chicago, IL 60606
Member FINRA/SIPC
(07/17)
NOT FDIC-INSURED l NOT BANK-GUARANTEED l MAY LOSE VALUE
ETF-002-AR-0517