GUGGENHEIMINVESTMENTS.COM
. . . YOUR ROAD TO THE LATEST, MOST UP-TO-DATE INFORMATION
The shareholder report you are reading right now is just the beginning of the story. Online at guggenheiminvestments.com, you will find:
• Daily and historical fund pricing, fund returns, portfolio holdings and characteristics, and distribution history.
• Investor guides and fund fact sheets.
• Regulatory documents including a prospectus and copies of shareholder reports.
Guggenheim Funds Distributors, LLC is constantly updating and expanding shareholder information services on each Fund's website, in an ongoing effort to provide you with the most current information about how your Fund's assets are managed, and the results of our efforts. It is just one more small way we are working to keep you better informed about your investment.
| Contents | |
| Dear Shareholder | 3 |
| | |
| Economic and Market Overview | 4 |
| | |
| Management Discussion of Fund Performance | 6 |
| | |
| Performance Report and Fund Profile | 14 |
| | |
| About Shareholders' Fund Expenses | 26 |
| | |
| Schedule of Investments | 27 |
| | |
| Statement of Assets and Liabilities | 41 |
| | |
| Statement of Operations | 43 |
| | |
| Statements of Changes in Net Assets | 45 |
| | |
| Financial Highlights | 48 |
| | |
| Notes to Financial Statements | 54 |
| | |
| Report of Independent Registered Public Accounting Firm | 61 |
| | |
| Supplemental Information | 62 |
| | |
| Approval of Advisory Agreement – Claymore Exchange Traded Fund Trust 2 | 65 |
| | |
| Trust Information | 71 |
| | |
| About the Trust Adviser | Back Cover |
DEAR SHAREHOLDER
Guggenheim Funds Investment Advisors, LLC (the "Investment Adviser"), is pleased to present the annual shareholder report for several of our exchange-traded funds ("ETFs" or "Funds"). This report covers performance of the Funds for the annual fiscal period ended August 31, 2015.
The Investment Adviser is part of Guggenheim Investments, which represents the investment management businesses of Guggenheim Partners, LLC ("Guggenheim"), a global diversified financial services firm.
Guggenheim Funds Distributors, LLC, the distributor of the Funds, is committed to providing investors with innovative investment solutions. We have built on the investment management strengths of Guggenheim Investments and worked with a diverse group of index providers to create some of the most distinctive ETFs available.
To learn more about economic and market conditions over the last year and the objective and performance of each ETF, we encourage you to read the Economic and Market Overview section of the report, which follows this letter, and the Management Discussion of Fund Performance for each ETF, which begins on page 6.
Sincerely,
Donald Cacciapaglia
President, Chief Executive Officer and Trustee
Claymore Exchange-Traded Fund Trust 2
September 30, 2015
| CLAYMORE EXCHANGE-TRADED FUND TRUST 2 ANNUAL REPORT | 3 |
| ECONOMIC AND MARKET OVERVIEW | August 31, 2015 |
The U.S. economic expansion is beginning to approach its late stages, but the underlying fundamentals of the economy remain strong. Growth mid-year bounced back from a weather-induced slowdown in the first quarter, with GDP increasing 3.7% for the third quarter. The labor and housing markets continue to strengthen, and consumption has benefited from low energy prices.
Markets have been anticipating a rate hike by the U.S. Federal Reserve (the "Fed") sometime before the end of 2015, but the Fed's insistence on being data dependent provides it with significant flexibility. Among measures being watched closely is wage growth, an indicator of inflationary pressure, which has been subdued. Once the Fed begins its tightening process, the terminal value of the Fed funds rate may be lower than expected.
Overseas, growth in the Chinese economy continues to slow, with a recent devaluation a government attempt to stimulate exports. Policymakers are likely to continue to do whatever is necessary to maintain growth at an acceptable level, but turbulence is expected to persist. The Japanese economy's long-term prospects also remain weak, with continued monetary accommodation leading to more capital being exported. In Europe, economic data have also slipped recently, and export growth may suffer due to falling demand from China. Events in Greece are likely to remain unsettled.
Responsible for much of this international turbulence is the massive misalignment of exchange rates, which finds its roots in quantitative easing. Japan, for example, has weakened its currency by over 50% against the U.S. dollar while China, Japan's largest trading partner, has basically pegged the renminbi to the dollar. Strains on the terms of trade between countries that have devalued and those that have not have built to the point that perpetuating these disparities is destabilizing to the countries that have staunchly fought devaluation. Witness China's recent move to devalue the renminbi versus the dollar, proving that artificial equilibrium is not only impossible to maintain, but ultimately disruptive to markets and economic growth.
Now we are facing the turbulent path to a new equilibrium, including the potential for several months of volatility for risk assets. In such a challenging period, many take comfort in governments' willingness to use the printing press. It is a handy tool to prop up asset prices and temporarily spur economic growth, which is the main reason a recession does not appear to be on the horizon for either the G-7 nations or China. It's also worth noting that there has never been a recession in the post-war period without the Fed first raising interest rates, after which it typically takes several years for a recession to be induced.
For the 12 months ended August 31, 2015, the Standard & Poor's 500® ("S&P 500") Index returned 0.48%. The Morgan Stanley Capital International ("MSCI") Europe-Australasia-Far East ("EAFE") Index returned -7.47%. The return of the MSCI Emerging Markets Index was -22.95%.
In the bond market, the Barclays U.S. Aggregate Bond Index posted a 1.56% return for the period, while the Barclays U.S. Corporate High Yield Index returned -2.93%. The return of the Bank of America Merrill Lynch 3-Month U.S. Treasury Bill Index was 0.03% for the 12-month period.
The opinions and forecasts expressed may not actually come to pass. This information is subject to change at any time, based on market and other conditions, and should not be construed as a recommendation of any specific security or strategy.
| 4 | CLAYMORE EXCHANGE-TRADED FUND TRUST 2 ANNUAL REPORT |
Index Definitions
All indices described below are unmanaged and reflect no expenses. It is not possible to invest directly in any index.
The Bank of America Merrill Lynch 3-Month U.S. Treasury Bill Index is an unmanaged market index of U.S. Treasury securities maturing in 90 days that assumes reinvestment of all income.
The Barclays U.S. Aggregate Bond Index is a broad-based benchmark that measures the investment grade, U.S. dollar-denominated, fixed-rate, taxable bond market, including U.S. Treasuries, government-related and corporate securities, mortgage-backed securities or "MBS" (agency fixed-rate and hybrid adjustable-rate mortgage, or "ARM", pass-throughs), asset-backed securities ("ABS"), and commercial mortgage-backed securities ("CMBS").
The Barclays U.S. Corporate High Yield Index measures the market of U.S. dollar-denominated, non-investment grade, fixed-rate, taxable corporate bonds. Securities are classified as high yield if the middle rating of Moody's, Fitch, and S&P is Ba1/BB +/BB + or below.
The Dow Jones Global Utilities Index includes those companies in the Dow Jones Global Index associated with generating and distributing electricity through the burning of fossil fuels such as coal, petroleum and natural gas, and through nuclear energy; alternative electricity companies generating and distributing electricity from a renewable source; distributors of gas to end users; and multi-utility and water companies.
The FTSE EPRA/NAREIT Global Real Estate Index is an unmanaged portfolio of approximately 423 constituents from 37 countries, including both developed and emerging markets.
The MSCI (Morgan Stanley Capital International) China Index is a capitalization-weighted index that measures the performance of large- and mid-cap securities in the Chinese equity markets and includes representation across China H shares, B shares, Red chips and P chips.
The MSCI EAFE Index is a capitalization-weighted measure of stock markets in Europe, Australasia, and the Far East.
The MSCI Emerging Markets Index is a free float-adjusted market-capitalization weighted index that is designed to measure equity market performance in the global emerging markets.
The MSCI World Index measures performance from a diverse range of global stock markets, including the U.S., Canada, Europe, Australia, New Zealand, and the Far East.
The Standard and Poor's 500 Index (S&P 500®) is a broad-based index, the performance of which is based on the performance of 500 widely held common stocks chosen for market size, liquidity and industry group representation.
The Standard & Poor's Global BMI (Broad Market Index), which comprises the S&P Developed BMI and S&P Emerging BMI, is a comprehensive, rules-based index measuring global stock market performance.
Industry Sectors
Comments about industry sectors in these fund commentaries are based on Bloomberg industry classifications.
| CLAYMORE EXCHANGE-TRADED FUND TRUST 2 ANNUAL REPORT | 5 |
| MANAGEMENT DISCUSSION OF FUND PERFORMANCE (Unaudited) | August 31, 2015 |
YAO Guggenheim China All-Cap ETF
Fund Overview
The Guggenheim China All-Cap ETF, NYSE Arca ticker: YAO (the "Fund") seeks investment results that correspond generally to the performance, before the Fund's fees and expenses, of an equity index called the AlphaShares China All-Cap Index (the "Index").
The Index is designed to measure and monitor the performance of the investable universe of publicly traded companies based in mainland China. The Index was created by AlphaShares, LLC ("AlphaShares") and is maintained by Standard & Poor's. The Index includes equity securities of companies of all capitalizations, as defined by AlphaShares, subject to certain minimum capitalization requirements. The Fund will invest at least 80% of its total assets in common stock, American depositary receipts ("ADRs"), American depositary shares ("ADSs"), global depositary receipts ("GDRs"), and international depositary receipts ("IDRs") that comprise the Index and depositary receipts or shares representing common stocks included in the Index (or underlying securities representing ADRs, ADSs, GDRs, and IDRs included in the Index). The Fund generally will invest in all of the securities comprising the Index in proportion to their weightings in the Index.
Fund Performance
All Fund returns cited—whether based on net asset value ("NAV") or market price—assume the reinvestment of all distributions. This report discusses the annual fiscal period ended August 31, 2015.
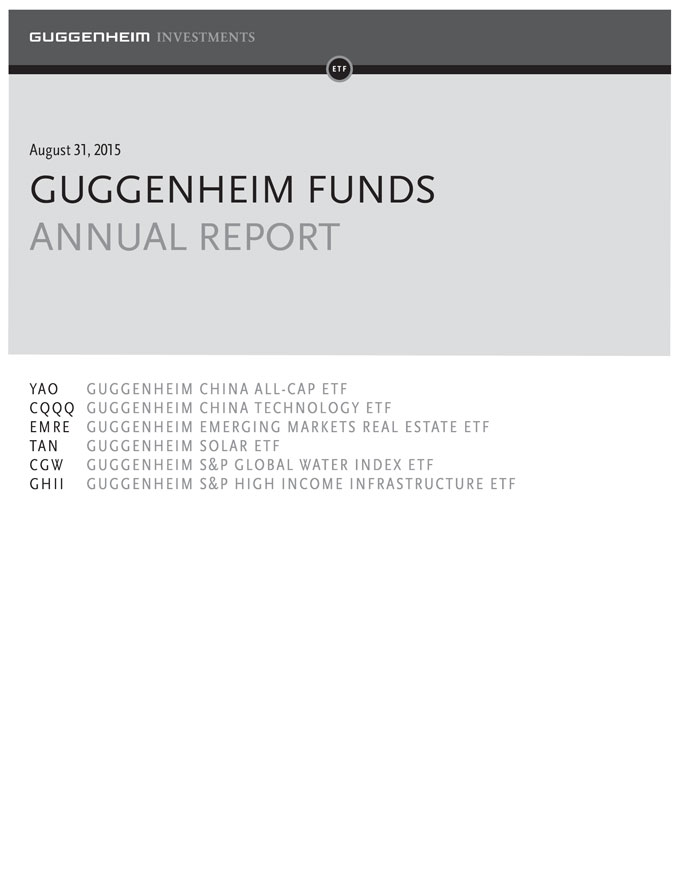
On a market price basis, the Fund generated a total return of -13.42%, which included a decrease in market price over the period to $24.13 as of August 31, 2015, from $28.52 as of August 31, 2014. On an NAV basis, the Fund generated a total return of -12.51%, which included a decrease in NAV over the period to $24.42 as of August 31, 2015, from $28.56 as of August 31, 2014. At the end of the period, the Fund's shares were trading at a market price discount to NAV, which is to be expected from time to time. NAV performance data reflects fees and expenses of the Fund.
For comparison, the Index returned -13.10% and the MSCI China Index returned -9.34% for the same period.
The Fund made an annual income distribution of $0.6450 per share on December 31, 2014, to shareholders of record on December 29, 2014.
Performance Attribution
For the 12-month period ended August 31, 2015, the financial sector contributed the most to the Fund's return, followed by the industrial sector. The energy sector detracted the most from return, followed by the communications sector.
Positions that contributed the most to the Fund's return included Ping An Insurance Group Company of China Ltd., a provider of insurance services in China (2.7% of the Fund's long-term investments at period end); China Life Insurance Co. Ltd., which provides life insurance and annuity products (3.0% of the Fund's long-term investments at period end); and Tech Pro Technology Development Ltd., which makes and sells electrolytic capacitors (not held at period end).
Positions that detracted the most from the Fund's return included Alibaba Group Holding Ltd., ADR, which operates as a holding company providing internet infrastructure, e-commerce, online financial, and Internet content services through its subsidiaries PetroChina Co. Ltd., an oil and gas company; and CNOOC Ltd., a producer of oil and natural gas (2.9%, 2.1%, and 2.3%, respectively, of the Fund's long-term investments at period end).
| 6 | CLAYMORE EXCHANGE-TRADED FUND TRUST 2 ANNUAL REPORT |
| MANAGEMENT DISCUSSION OF FUND PERFORMANCE (Unaudited) continued | August 31, 2015 |
CQQQ Guggenheim China Technology ETF
Fund Overview
The Guggenheim China Technology ETF, NYSE Arca ticker: CQQQ (the "Fund") seeks investment results that correspond generally to the performance, before the Fund's fees and expenses, of an equity index called the AlphaShares China Technology Index (the "Index").
The Index is designed to measure and monitor the performance of the universe of publicly traded companies that are based in mainland China, Hong Kong, or Macau, are in the Information Technology Sector, as defined by Standard & Poor's Global Industry Classification Standard, and are open to foreign investment. The Index was created by AlphaShares, LLC ("AlphaShares") and is maintained by Standard & Poor's. The Index includes equity securities of companies of all categories of market capitalizations, as defined by AlphaShares (subject to certain minimum capitalization requirements).
The Index may include Hong Kong-listed securities, including China H-shares and Red Chips. China H-shares are issued by companies incorporated in mainland China and listed on the Hong Kong Stock Exchange. Red Chip shares are issued by companies with controlling Chinese shareholders that are incorporated outside mainland China and listed on the Hong Kong Stock Exchange. The Index may also include N-shares, which are issued by companies based in mainland China and listed on the NYSE Arca, Inc. or NASDAQ Stock Market. The Index does not include China A-Shares (which are subject to substantial restrictions on foreign investment) or China B-Shares (which offer a generally smaller market and limited liquidity), each of which trade on the Shanghai Stock Exchange and the Shenzhen Stock Exchange.
The Fund will invest at least 80% of its total assets in common stock, American depositary receipts ("ADRs"), American depositary shares ("ADSs"), global depositary receipts ("GDRs"), and international depositary receipts ("IDRs") that comprise the Index and depositary receipts or shares representing common stocks included in the Index (or underlying securities representing ADRs, ADSs, GDRs, and IDRs included in the Index). The Fund generally will invest in all of the securities comprising the Index in proportion to their weightings in the Index.
Fund Performance
All Fund returns cited—whether based on net asset value ("NAV") or market price—assume the reinvestment of all distributions. This report discusses the annual fiscal period ended August 31, 2015.
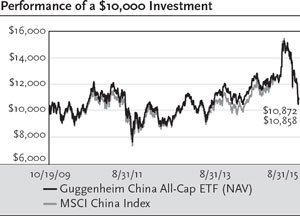
On a market price basis, the Fund generated a total return of -21.85%, which included a decrease in market price over the period to $29.31 as of August 31, 2015, from $37.88 as of August 31, 2014. On an NAV basis, the Fund generated a total return of -21.62%, which included a decrease in NAV over the period to $29.55 as of August 31, 2015, from $38.09 as of August 31, 2014. At the end of the period, the Fund's shares were trading at a market price discount to NAV, which is to be expected from time to time. NAV performance data reflects fees and expenses of the Fund.
For comparison, the Index returned -23.56% and the MSCI China Index returned -9.34% for the same period.
The Fund made an annual income distribution of $0.3450 per share on December 31, 2014, to shareholders of record on December 29, 2014.
Performance Attribution
For the 12-month period ended August 31, 2015, all sectors detracted from the Fund's return. The diversified sector and the consumer, cyclical sector detracted the least from the Fund's return. The communications sector and the energy sector detracted the most.
Positions that contributed the most to the Fund's return included NetEase, Inc., ADR, a Chinese Internet company (8.1% of the Fund's long-term investments at period end); Tech Pro Technology Development Ltd., which makes and sells electrolytic capacitors (not held at period end) and Tencent Holdings Ltd., whose sub-sidiaries provide medin, entertainment, Internet, and Mobile services (13.2% of the Fund's long-term holdings at period end).
Positions that detracted the most from the Fund's return included Baidu, Inc., ADR, which operates an Internet search engine; Lenovo Group Ltd., which, through its subsidiaries, sells and manufactures personal computers and handheld devices; and Qihoo 360 Technology Company Ltd., ADR, an Internet security service provider (10.0%, 5.4%, and 4.9%, respectively, of the Fund's long-term investments at period end).
| CLAYMORE EXCHANGE-TRADED FUND TRUST 2 ANNUAL REPORT | 7 |
| MANAGEMENT DISCUSSION OF FUND PERFORMANCE (Unaudited) continued | August 31, 2015 |
EMRE Guggenheim Emerging Markets Real Estate ETF
Fund Overview
The Guggenheim Emerging Markets Real Estate ETF, NYSE Arca ticker: EMRE (the "Fund") seeks investment results that correspond generally to the performance, before the Fund's fees and expenses, of an equity index called the AlphaShares Emerging Markets Real Estate Index (the "Index"). EMRE invests in publicly traded emerging markets real estate securities that seek to benefit from the growth of the real estate industry across nearly two dozen emerging market countries and the income typically generated by real estate investments.
The Index is designed to measure and monitor the performance of the investable universe of publicly traded companies and real estate investment trusts (REITs) deriving a majority of their revenues from real estate development, management, and/or ownership of property in the countries of the S&P BMI Emerging Markets Index. The S&P Emerging BMI captures all companies domiciled in the emerging markets within the S&P Global BMI with a float-adjusted market capitalization of at least $100 million and a minimum annual trading liquidity of $50 million. The index is segmented by country/region, size (large, mid, and small), style (value and growth), and GICS (sectors/industry groups).
A substantial portion of the Index may consist of the securities of Chinese issuers. The Index may include Hong Kong-listed securities, including China H-shares (which are issued by companies incorporated in mainland China), Red Chip shares (which are issued by companies with controlling Chinese shareholders that are incorporated outside mainland China), and N-Shares (which are issued by companies based in mainland China and listed on the NYSE Arca or NASDAQ). The Index will not include China A-Shares or China B-Shares, each of which trade on the Shanghai Stock Exchange and the Shenzhen Stock Exchange.
The Fund will invest at least 80% of its total assets in common stocks, American depositary receipts ("ADRs"), American depositary shares ("ADSs"), global depositary receipts ("GDRs"), and international depositary receipts ("IDRs") that comprise the Index and depositary receipts representing common stocks included in the Index (or underlying securities representing the ADRs, ADSs, GDRs, and IDRs included in the Index).
Fund Performance
All Fund returns cited—whether based on net asset value ("NAV") or market price—assume the reinvestment of all distributions. This report discusses the abbreviated annual fiscal period beginning at the Fund's inception of September 29, 2014, through August 31, 2015.
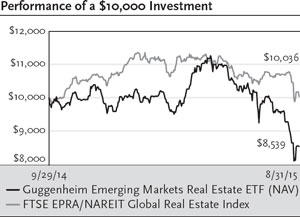
On a market price basis, the Fund generated a total return of -14.22%, which included a decrease in market price over the period to $20.73 on August 31, 2015, from $25.00 at inception. On an NAV basis, the Fund generated a total return of -14.61%, which included a decrease in NAV over the period to $20.64 on August 31, 2015, from $24.99 at inception. At the end of the period the Fund's shares were trading at a market price premium to NAV, which is to be expected from time to time. NAV performance data reflects fees and expenses of the Fund.
For comparison, the Index returned -11.26% since inception. There were a number of factors that contributed to the underperformance of the NAV return vs. the Index. These factors included complexities with investing the initial proceeds of the Fund, the relatively small asset size of the Fund, and the lack of liquidity of certain securities held within the Index. The FTSE EPRA/NAREIT Global Real Estate Index returned 0.36% since inception.
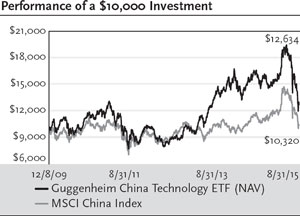
The Fund made the following quarterly income distributions for the abbreviated annual fiscal period ended August 31, 2015:
| Payable Date | | | Amount | |
| December 31, 2014 | | $ | 0.3580 | |
| March 31, 2015 | | $ | 0.0615 | |
| June 30, 2015 | | $ | 0.4032 | |
| Total | | $ | 0.8227 | |
Performance Attribution
For the abbreviated annual fiscal period ended August 31, 2015, the financial sector composed 97% of the Fund and accounted for most of the Fund's negative performance.
Positions that contributed the most to the Fund's return included Evergrande Real Estate Group Ltd., an integrated residential property developer in China; Resilient Property Income Fund Ltd., a property investment company in South Africa; and China Resources Land Ltd., which through its subsidiaries develops and invests in properties (2.4%, 2.0%, and 3.9%, respectively, of the Fund's long-term investments at period end).
Positions that detracted the most from the Fund's return included BR Malls Participacoes S.A., a service provider for Brazilian shopping malls; Fibra Uno Administracios S.A. De CV, a real estate investment trust focusing on Mexican properties; and Emaar Properties PJSC, a Dubai-based real estate development company (1.3%, 4.0%, and 5.8%, respectively, of the Fund's long-term investments at period end).
| 8 | CLAYMORE EXCHANGE-TRADED FUND TRUST 2 ANNUAL REPORT |
| MANAGEMENT DISCUSSION OF FUND PERFORMANCE (Unaudited) continued | August 31, 2015 |
TAN Guggenheim Solar ETF
Fund Overview
The Guggenheim Solar ETF, NYSE Arca ticker: TAN (the "Fund") seeks investment results that correspond generally to the performance, before the Fund's fees and expenses, of an equity index called the MAC Global Solar Energy Index (the "Index").
As of August 31, 2015, the Index is comprised of approximately 26 securities selected based on the relative importance of solar power within the company's business model, as determined by MAC Indexing LLC (the "Index Provider"). As of such date, the median market capitalization of securities included in the Index was $400 million. The Index is designed to track companies within the following business segments of the solar energy industry: companies that produce solar power equipment and products for end users; companies that produce fabrication products (such as the equipment used by solar cell and module producers to manufacture solar power equipment) or services (such as companies specializing in the solar cell manufacturing or the provision of consulting services to solar cell and module producers) for solar power equipment producers; companies that supply raw materials or components to solar power equipment producers or integrators; companies that derive a significant portion of their business (as defined in the Fund prospectus under "Index Methodology") from solar power system sales, distribution, installation, integration, or financing; and companies that specialize in selling electricity derived from solar power.
The Index is generally comprised of equity securities, including American depositary receipts ("ADRs"), and global depositary receipts ("GDRs"), traded in developed markets, as defined by the Index Provider. While the equity securities comprising the Index are traded in developed markets, the issuers of such securities may be located in emerging markets. Emerging market countries are countries that major international financial institutions, such as the World Bank, generally consider to be less economically mature than developed nations. The Fund will invest at least 90% of its total assets in common stock, ADRs, and GDRs that comprise the Index and depositary receipts representing common stocks included in the Index (or underlying securities representing ADRs and GDRs included in the Index). The Fund generally will invest in all of the securities comprising the Index in proportion to their weightings in the Index. The Fund will concentrate its investments (i.e., hold 25% or more of its assets) in a particular industry or group of industries to the extent the Index is so concentrated.
Fund Performance
All Fund returns cited—whether based on net asset value ("NAV") or market price—assume the reinvestment of all distributions. This report discusses the annual fiscal period ended August 31, 2015.
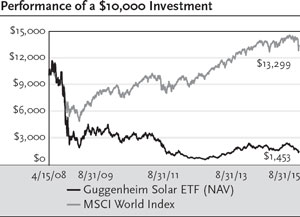
On a market price basis, the Fund generated a total return of -30.57%, which included a decrease in market price over the period to $29.57 as of August 31, 2015, from $43.39 as of August 31, 2014. On an NAV basis, the Fund generated a total return of -30.51%, which included a decrease in NAV over the period to $29.72 as of August 31, 2015, from $43.58 as of August 31, 2014. At the end of the period, the Fund's shares were trading at a market price discount to NAV, which is to be expected from time to time. NAV performance data reflects fees and expenses of the Fund.
For comparison, the Index returned -34.20% and the MSCI World Index returned -4.13% for the same period.
The Fund made an annual income distribution of $0.6400 per share on December 31, 2014, to shareholders of record on December 29, 2014.
Performance Attribution
The Fund's holdings are mostly in the energy, technology, and industrial sectors. The technology sector contributed the most to the Fund's return for the 12-month period ended August 31, 2015. The energy sector detracted the most from return, followed by the industrial sector.
Positions that contributed the most to the Fund's return included Hanwha Q Cells Co. Ltd., which manufactures photovoltaic (PV) cells and modules and provides PV cell processing services in China (2.3% of the Fund's long-term investments at period end); SMA Solar Technology AG, which manufactures solar inverters (6.0% of the Fund's long-term investments at period end) and Advanced Energy Industries, Inc., which makes power conversion, solar inverters and control systems used in plasma-based thin film production equipment (4.1% of the Fund's long-term investments at period end).
Positions that detracted most from the Fund's return included GCL-Poly Energy Holdings Ltd., which provides power and heat via cogeneration, incineration, and wind power (5.2% of the Fund's long-term investments at period end); Shunfeng International Clean Energy Ltd., which develops and operates solar power plants (2.0% of the Fund's long-term investments at period end); and GT Advanced Technologies, Inc., a provider of crystal growth equipment (not held at period end).
| CLAYMORE EXCHANGE-TRADED FUND TRUST 2 ANNUAL REPORT | 9 |
| MANAGEMENT DISCUSSION OF FUND PERFORMANCE (Unaudited) continued | August 31, 2015 |
CGW Guggenheim S&P Global Water Index ETF
Fund Overview
The Guggenheim S&P Global Water Index ETF, NYSE Arca ticker: CGW (the "Fund"), seeks investment results that correspond generally to the performance, before the Fund's fees and expenses, of an equity index called the S&P Global Water Index (the "Index").
The Index is comprised of approximately 50 equity securities selected, based on investment and other criteria, from a universe of companies listed on global developed market exchanges. Standard & Poor's Financial Services LLC, a division of McGraw Hill Financial ("S&P"), generally defines "developed markets" as the capital markets of those countries with high levels of per capita income and strict market regulation resulting in greater transparency. The universe of companies includes all companies classified by Standard & Poor's Global Industry Classifications as being associated (in a manner representing a major component of such companies' business) with the global demand for water, including water utilities, infrastructure, equipment, instruments, and materials. Total market capitalization and float-adjusted market capitalization of securities in the Index must be at least $250 million and $100 million, respectively, at the time of each reconstitution, which includes small-, mid-, and large-capitalization securities as defined by S&P. The companies in the universe are selected using criteria as identified by S&P. The Fund will invest at least 90% of its total assets in common stock and American depositary receipts ("ADRs") that comprise the Index and depositary receipts representing common stocks included in the Index (or underlying securities representing ADRs included in the Index). The Fund generally will invest in all of the securities comprising the Index in proportion to their weightings in the Index. The Fund will concentrate its investments (i.e., hold 25% or more of its assets) in a particular industry or group of industries to the extent the Index is so concentrated.
Fund Performance
All Fund returns cited—whether based on net asset value ("NAV") or market price—assume the reinvestment of all distributions. This report discusses the annual fiscal period ended August 31, 2015.
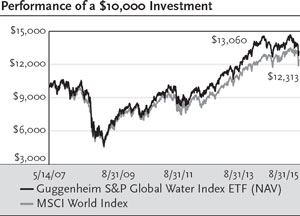
On a market price basis, the Fund generated a total return of -6.77%, which included a decrease in market price over the period to $26.64 as of August 31, 2015, from $29.08 as of August 31, 2014. On an NAV basis, the Fund generated a total return of -6.47%, which included a decrease in NAV over the period to $26.67 as of August 31, 2015, from $29.02 as of August 31, 2014. At the end of the period, shares of the Fund at NAV were trading at a market price discount to NAV, which is to be expected from time to time. NAV performance data reflects fees and expenses of the Fund.
For comparison, the Index returned -6.25%, the MSCI World Index returned -4.13%, and the Dow Jones Global Utilities Index returned -8.56% for the same period.
The Fund made an annual income distribution of $0.4980 per share on December 31, 2014, to shareholders of record on December 29, 2014.
Performance Attribution
For the 12-month period ended August 31, 2015, the Fund was invested mostly in the utilities and industrial sectors. Both of those sectors detracted from performance.
Positions that contributed the most to the Fund's return included Veolia Environnement S.A., a France-based operator of utility and public transportation businesses; Danaher Corp., which makes and markets products and services for the medical, industrial, and commercial sectors; and American Water Works Co., Inc., which provides drinking water, wastewater, and other water-related services in multiple U.S. states and Ontario, Canada (6.1%, 5.6%, and 6.0%, respectively, of the Fund's long-term investments at period end).
Positions that detracted the most from the Fund's return included Pentair plc, a U.K.-based provider of services related to water and other fluids, thermal management, and equipment protection; Cia de Saneamento Basico de Estado de Sao Paulo, ADR, a Brazilian company that collects, treats, and distributes water; and Alfa Laval AB, a Swedish company that provides equipment and systems for heating, cooling, separation, and transportation of various foods, chemicals, and liquids (5.9%, 1.0%, and 3.1%, respectively, of the Fund's long-term investments at period end).
| 10 | CLAYMORE EXCHANGE-TRADED FUND TRUST 2 ANNUAL REPORT |
| MANAGEMENT DISCUSSION OF FUND PERFORMANCE (Unaudited) continued | August 31, 2015 |
GHII Guggenheim S&P High Income Infrastructure ETF
Fund Overview
The Guggenheim S&P High Income Infrastructure ETF, NYSE Arca ticker: GHII (the "Fund") seeks investment results that correspond generally to the performance, before the Fund's fees and expenses, of the S&P High Income Infrastructure Index (the "Index"). The Fund, using a "passive" or "indexing" investment approach, seeks to replicate, before the Fund's fees and expenses, the performance of the Index.
The Index is designed to measure and monitor the performance of 50 high-yielding global equity securities of companies that engage in various infrastructure-related sub-industries. Index constituents must meet size, listing, and liquidity requirements and also be part of the S&P Global BMI Index, which is a rules-based index that measures global stock market performance.
The Fund will invest at least 80% of its total assets in common stocks, American depositary receipts ("ADRs"), American depositary shares ("ADSs"), global depositary receipts ("GDRs"), and international depositary receipts ("IDRs") that comprise the Index and depositary receipts representing common stocks included in the Index (or underlying securities representing the ADRs, ADSs, GDRs, and IDRs included in the Index).
Fund Performance
All Fund returns cited—whether based on net asset value ("NAV") or market price—assume the reinvestment of all distributions. This report discusses the abbreviated annual fiscal period beginning at the Fund's inception of February 11, 2015, through August 31, 2015.
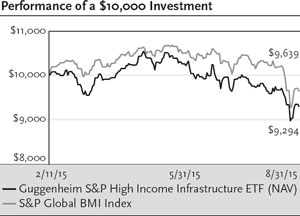
On a market price basis, the Fund generated a total return of -8.37%, which included a decrease in market price over the period to $22.56 on August 31, 2015, from $25.05 at inception. On an NAV basis, the Fund generated a total return of -7.06%, which included a decrease in NAV over the period to $22.87 on August 31, 2015, from $25.05 at inception. At the end of the period the Fund's shares were trading at a market price discount to NAV, which is to be expected from time to time. NAV performance data reflects fees and expenses of the Fund.
For comparison, the Index returned -5.91% since inception, and the S&P Global BMI Index returned -3.62% for the same period.
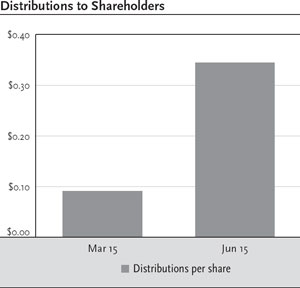
The fund made the following quarterly income distributions for the abbreviated annual fiscal period ended August 31, 2015:
| Payable Date | | | Amount | |
| March 31, 2015 | | $ | 0.0915 | |
| June 30, 2015 | | $ | 0.3447 | |
| Total | | $ | 0.4362 | |
Performance Attribution
For the abbreviated annual fiscal period ended August 31, 2015, the industrial sector contributed the most to the Fund's performance. The utilities sector detracted the most, followed by the energy sector.
Positions that contributed the most to the Fund's return included Williams Cos., Inc., a leading energy infrastructure company in North America (not held at period end); Hutchison Port Holdings Trust, the first publicly traded container port business trust that is affiliated with Hutchison Port Holdings and a subsidiary of Hutchison Whampoa Ltd. (4.0% of the Fund's long-term investments at period end); and Sydney Airport, a company that operates the airport in the Australian city (4.8% of the Fund's long-term investments at period end).
Positions that detracted the most from the Fund's return included TransCanada Corp., a leading energy infrastructure company in North America; Kinder Morgan, Inc., a provider of pipeline transportation and energy storage; and Fortum OYJ, a Finland-based provider of energy related products and services (3.9%, 4.2%, and 2.0%, respectively, of the Fund's long-term investments at period end).
| CLAYMORE EXCHANGE-TRADED FUND TRUST 2 ANNUAL REPORT | 11 |
Risks and Other Considerations
The views expressed in this report reflect those of the portfolio managers and Guggenheim Funds Investment Advisors, LLC only through the report period as stated on the cover. These views are subject to change at any time, based on market and other conditions and should not be construed as a recommendation of any kind. The material may also contain forward looking statements that involve risk and uncertainty, and there is no guarantee they will come to pass.
This information does not represent an offer to sell securities of the Funds and it is not soliciting an offer to buy securities of the Funds. An investment in the various Guggenheim ETFs is subject to certain risks and other considerations. Below are some general risks and considerations associated with investing in a Fund, which may cause you to lose money, including the entire principal that you invest. Please refer to each individual ETF prospectus for a more detailed discussion of Fund-specific risks and considerations.
Investment Risk. An investment in a Fund is subject to investment risk, including the possible loss of the entire principal amount that you invest.
Equity Risk. The value of the securities held by each Fund may fall due to general market and economic conditions, perceptions regarding the industries in which the issuers of securities held by each Fund participate, or factors relating to specific companies in which such Fund invests.
Foreign Investment Risk. A Fund's investments in non-U.S. issuers may involve unique risks compared to investing in securities of U.S. issuers, including, among others, greater market volatility than U.S. securities and less complete financial information than for U.S. issuers. In addition, adverse political, economic, or social developments could undermine the value of such Fund's investments or prevent such Fund from realizing the full value of its investments. Financial reporting standards for companies based in foreign markets differ from those in the U.S. Finally, the value of the currency of the country in which a Fund has invested could decline relative to the value of the U.S. dollar, which may affect the value of the investment to U.S. investors. In addition, the underlying issuers of certain depositary receipts, particularly unsponsored or unregistered depositary receipts, are under no obligation to distribute shareholder communications to the holders of such receipts, or to pass through to them any voting rights with respect to the deposited securities.
Emerging Markets Risk. Investment in securities of issuers based in developing or "emerging market" countries entails all of the risks of investing in securities of non-U.S. issuers, as previously described, but to a heightened degree.
Micro-, Small-, and Medium-Sized Company Risk. Investing in securities of these companies involves greater risk as their stocks may be more volatile and less liquid than investing in more established companies. These stocks may have returns that vary, sometimes significantly, from the overall stock market. Micro-cap companies may be newly formed, less developed, and there may be less available information about the company.
Replication Management Risk. The Funds are not "actively" managed. Therefore, a Fund would not necessarily sell a security because the stock's issuer was in financial trouble unless that stock is removed from such Fund's Index.
Non-Correlation Risk. A Fund's return may not match the return of such Fund's index for a number of reasons. For example, the Fund incurs a number of operating expenses not applicable to the Index, and incurs costs in buying and selling securities, especially when rebalancing the Fund's securities holdings to reflect changes in the composition of the Index. A Fund may not be fully invested at times, either as a result of cash flows into such Fund or reserves of cash held by a Fund to meet redemptions and expenses. If a Fund utilizes a sampling approach or futures or other derivative positions, its return may not correlate as well with the return on the Index, as would be the case if it purchased all of the securities in the Index with the same weightings as the Index.
Issuer-Specific Changes. The value of an individual security or particular type of security can be more volatile than the market as a whole and can perform differently from the value of the market as a whole. The value of securities of smaller issuers can be more volatile than that of larger issuers.
Non-Diversified Fund Risk. Certain Funds are considered non-diversified and can invest a greater portion of assets in securities of individual issuers than a diversified fund. As a result, changes in the market value of a single investment could cause greater fluctuations in share price than would occur in a diversified fund.
Concentration Risk. If the Index concentrates in an industry or group of industries, the Fund's investments will be concentrated accordingly. In such event, the value of the Fund's shares may rise and fall more than the value of shares of a fund that invests in securities of companies in a broader range of industries.
China Investment Risk (YAO CQQQ and EMRE). Investing in securities of Chinese companies involves additional risks, including, but not limited to: the economy of China differs, often unfavorably, from the U.S. economy in such respects as structure, general development, government involvement, wealth distribution, rate of inflation, growth rate, allocation of resources, and capital reinvestment, among others; the central government has historically exercised substantial control over virtually every sector of the Chinese economy through administrative regulation and/or state ownership; and actions of the Chinese central and local government authorities continue to have a substantial effect on economic conditions in China.
Guggenheim Emerging Markets Real Estate ETF may not be suitable for all investors. Investments in the real estate industry, including REITS, subjects the Fund to the same risks as direct investments in real estate, which are particularly sensitive to economic downturns. Investments in foreign securities carry additional risks when compared to U.S. securities, due to the impact of diplomatic, political, or economic developments in the country in question (investments in emerging markets securities are generally subject to an even greater level of risks). Investments in Chinese companies may also involve additional risks. Investments in small- or medium-sized companies may involve greater risk than investing in larger, more established companies. Investments in securities of smaller issuers can be more volatile than that of larger issuers. Investments in micro-cap stocks involve substantially greater risks of loss and price fluctuations because their earnings and revenues tend to be less predictable and their shares tend to be more volatile and their markets less liquid than companies with larger market capitalizations.
| 12 | CLAYMORE EXCHANGE-TRADED FUND TRUST 2 ANNUAL REPORT |
Recent Market Developments Risk. Global and domestic financial markets have experienced periods of unprecedented turmoil. Recently, markets have witnessed more stabilized economic activity as expectations for an economic recovery increased. However, risks to a robust resumption of growth persist. Continuing uncertainty as to the status of the euro and the European Monetary Union has created significant volatility in currency and financial markets generally. A return to unfavorable economic conditions or sustained economic slowdown could adversely impact the Funds' portfolios. Financial market conditions, as well as various social and political tensions in the U.S. and around the world, have contributed to increased market volatility and may have long-term effects on the U.S. and worldwide financial markets and cause further economic uncertainties or deterioration in the U.S. and worldwide. The Investment Adviser does not know how long the financial markets will continue to be affected by these events and cannot predict the effects of these or similar events in the future on the U.S. and global economies and securities markets.
There is no assurance that the requirements of the NYSE Arca necessary to maintain the listing of the Funds will continue to be met or will remain unchanged.
In addition to the risks described, there are certain other risks related to investing in the Funds. These risks are described further in each Fund's Prospectus and Statement of Additional Information and at guggenheiminvestments.com.
| CLAYMORE EXCHANGE-TRADED FUND TRUST 2 ANNUAL REPORT | 13 |
| PERFORMANCE REPORT AND FUND PROFILE (Unaudited) | August 31, 2015 |
YAO Guggenheim China All-Cap ETF
| | | | |
| Fund Statistics | | | |
| Share Price | | $ | 24.13 |
| Net Asset Value | | $ | 24.42 |
| Discount to NAV | | | -1.19% |
| Net Assets ($000) | | $ | 29,308 |
| AVERAGE ANNUAL TOTAL RETURNS FOR |
| THE PERIOD ENDED AUGUST 31, 2015 |
| | | | | | | | | Since |
| | | One | | Three | | Five | | Inception |
| | | Year | | Year | | Year | | (10/19/09) |
| Guggenheim China All-Cap ETF | | | | | | | | |
| NAV | | -12.51% | | 6.29% | | 1.90% | | 1.44% |
| Market | | -13.42% | | 5.68% | | 1.66% | | 1.22% |
| AlphaShares China | | | | | | | | |
| All Cap Index | | -13.10% | | 6.56% | | 2.36% | | 1.95% |
| MSCI China Index | | -9.34% | | 6.73% | | 2.14% | | 1.41% |
Performance data quoted represents past performance, which is no guarantee of future results and current performance may be lower or higher than the figures shown. NAV performance data reflects fees and expenses of the Fund. The deduction of taxes that a shareholder would pay on Fund distributions or the redemption of Fund shares is not reflected in the total returns. For the most recent month-end performance figures, please visit guggenheiminvestments.com. The investment return and principal value of an investment will fluctuate with changes in market conditions and other factors so that an investor's shares, when redeemed, may be worth more or less than their original cost.
Since inception returns assume a purchase of the Fund at the initial share price of $24.82 per share for share price returns or initial net asset value (NAV) of $24.82 per share for NAV returns. Returns for periods of less than one year are not annualized.
The MSCI China Index is a capitalization-weighted index that measures the performance of large- and mid-cap securities in the Chinese equity markets and includes representation across China H shares, B shares, Red chips and P chips.
The referenced indices are unmanaged and not available for direct investment. Index performance does not reflect transaction costs, fees or expenses.
The Fund's annual operating expense ratio of 0.70% is expressed as a unitary fee and covers all expenses of the Fund, except for distribution fees, if any, brokerage expenses, taxes, interest, litigation expenses and other extraordinary expenses.
| Portfolio Breakdown | | % of Net Assets |
| Investments: | | |
| Financial | | 36.6% |
| Communications | | 24.8% |
| Energy | | 9.1% |
| Consumer, Non-cyclical | | 8.6% |
| Industrial | | 6.6% |
| Consumer, Cyclical | | 5.9% |
| Utilities | | 3.7% |
| Other | | 4.6% |
| Total Common Stocks | | 99.9% |
| Securities Lending Collateral | | 14.0% |
| Total Investments | | 113.9% |
| Other Assets & Liabilities, net | | -13.9% |
| Net Assets | | 100.0% |
| Ten Largest Holdings | | |
| (% of Total Net Assets) | | |
| Tencent Holdings Ltd. | | 6.6% |
| China Mobile Ltd. | | 5.8% |
| China Construction Bank Corp. — Class H | | 4.9% |
| Industrial & Commercial Bank of China Ltd. — Class H | | 4.8% |
| Baidu, Inc. ADR | | 3.7% |
| Bank of China Ltd. — Class H | | 3.7% |
| China Life Insurance Company Ltd. — Class H | | 3.0% |
| Alibaba Group Holding Ltd. ADR | | 2.9% |
| Ping An Insurance Group Company of China Ltd. — Class H | | 2.7% |
| CNOOC Ltd. | | 2.3% |
| Top Ten Total | | 40.4% |
"Ten Largest Holdings" exclude any temporary cash or derivative investments.
| 14 | CLAYMORE EXCHANGE-TRADED FUND TRUST 2 ANNUAL REPORT |
| PERFORMANCE REPORT AND FUND PROFILE (Unaudited) continued | August 31, 2015 |
YAO Guggenheim China All-Cap ETF continued
This graph compares a hypothetical $10,000 investment in the Fund,made at its inception, with a similar investment in the MSCI China Index. Results include the reinvestment of all dividends and capital gains. Past performance is no guarantee of future results. The MSCI China Index is a capitalization-weighted index that measures the performance of large- and mid-cap securities in the Chinese equity markets and includes representation across China H shares, B shares, Red chips and P chips. The referenced index is unmanaged and not available for direct investment. The index is unmanaged. It is not possible to invest directly in the MSCI China Index. Investment return and principal value will fluctuate with changes in market conditions and other factors and Fund shares, when redeemed,may be worth more or less than their original investment.
| CLAYMORE EXCHANGE-TRADED FUND TRUST 2 ANNUAL REPORT | 15 |
| PERFORMANCE REPORT AND FUND PROFILE (Unaudited) continued | August 31, 2015 |
CQQQ Guggenheim China Technology ETF
| Fund Statistics | | | |
| Share Price | | $ | 29.31 |
| Net Asset Value | | $ | 29.55 |
| Discount to NAV | | | -0.81% |
| Net Assets ($000) | | $ | 45,804 |
| AVERAGE ANNUAL TOTAL RETURNS FOR |
| THE PERIOD ENDED AUGUST 31, 2015 |
| | | | | | | | | Since |
| | | One | | Three | | Five | | Inception |
| | | Year | | Year | | Year | | (12/08/09) |
| Guggenheim China Technology ETF | | | | | | | | |
| NAV | | -21.62% | | 15.25% | | 5.38% | | 4.16% |
| Market | | -21.85% | | 15.06% | | 5.17% | | 4.01% |
| AlphaShares China | | | | | | | | |
| Technology | | | | | | | | |
| Index | | -23.56% | | 14.61% | | 5.11% | | 3.98% |
| MSCI China Index | | -9.34% | | 6.73% | | 2.14% | | 0.55% |
Performance data quoted represents past performance, which is no guarantee of future results and current performance may be lower or higher than the figures shown. NAV performance data reflects fees and expenses of the Fund. The deduction of taxes that a shareholder would pay on Fund distributions or the redemption of Fund shares is not reflected in the total returns. For the most recent month-end performance figures, please visit guggenheiminvestments.com. The investment return and principal value of an investment will fluctuate with changes in market conditions and other factors so that an investor's shares, when redeemed, may be worth more or less than their original cost.
Since inception returns assume a purchase of the Fund at the initial share price of $25.06 per share for share price returns or initial net asset value (NAV) of $25.06 per share for NAV returns. Returns for periods of less than one year are not annualized.
The MSCI China Index is a capitalized-weighted index that measures the performance of large- and mid-cap securities in the Chinese equity markets and includes representation across China H shares, B shares, Red chips, and P chips.
The referenced indices are unmanaged and not available for direct investment. Index performance does not reflect transaction costs, fees or expenses.
The Fund's annual operating expense ratio of 0.70% is expressed as a unitary fee and covers all expenses of the Fund, except for distribution fees, if any, brokerage expenses, taxes, interest, litigation expenses and other extraordinary expenses.
| Portfolio Breakdown | | % of Net Assets |
| Investments: | | |
| Communications | | 55.7% |
| Technology | | 25.2% |
| Industrial | | 9.4% |
| Energy | | 5.4% |
| Basic Materials | | 1.8% |
| Consumer, Cyclical | | 1.3% |
| Consumer, Non-cyclical | | 0.9% |
| Diversified | | 0.2% |
| Total Common Stocks | | 99.9% |
| Securities Lending Collateral | | 22.7% |
| Total Investments | | 122.6% |
| Other Assets & Liabilities, net | | -22.6% |
| Net Assets | | 100.0% |
| Ten Largest Holdings | | |
| (% of Total Net Assets) | | |
| Tencent Holdings Ltd. | | 12.1% |
| Baidu, Inc. ADR | | 9.1% |
| Alibaba Group Holding Ltd. ADR | | 8.7% |
| NetEase, Inc. ADR | | 7.3% |
| AAC Technologies Holdings, Inc. | | 5.3% |
| Lenovo Group Ltd. | | 4.9% |
| Qihoo 360 Technology Company Ltd. ADR | | 4.5% |
| Semiconductor Manufacturing International Corp. | | 2.9% |
| SINA Corp. | | 2.9% |
| Youku Tudou, Inc. ADR | | 2.4% |
| Top Ten Total | | 60.1% |
"Ten Largest Holdings" exclude any temporary cash or derivative investments.
| 16 | CLAYMORE EXCHANGE-TRADED FUND TRUST 2 ANNUAL REPORT |
| PERFORMANCE REPORT AND FUND PROFILE (Unaudited) continued | August 31, 2015 |
CQQQ Guggenheim China Technology ETF continued
This graph compares a hypothetical $10,000 investment in the Fund, made at its inception, with a similar investment in the MSCI China Index. Results include the reinvestment of all distributions and capital gains. Past performance is no guarantee of future results. The MSCI China Index is a capitalization-weighted index that measures the performance of large- and mid-cap securities in the Chinese equity markets and includes representation across China H shares, B shares, Red chips and P chips. The referenced index is unmanaged. It is not possible to invest directly in the MSCI China Index. Investment return and principal value will fluctuate with changes in market conditions and other factors and Fund shares, when redeemed, may be worth more or less than their original investment.
| CLAYMORE EXCHANGE-TRADED FUND TRUST 2 ANNUAL REPORT | 17 |
| PERFORMANCE REPORT AND FUND PROFILE (Unaudited) continued | August 31, 2015 |
EMRE Guggenheim Emerging Markets Real Estate ETF
| Fund Statistics | | | |
| Share Price | | $ | 20.73 |
| Net Asset Value | | $ | 20.64 |
| Premium to NAV | | | 0.44% |
| Net Assets ($000) | | $ | 2,064 |
| TOTAL RETURN FOR | | |
| THE PERIOD ENDED AUGUST 31, 2015 | | |
| | | Since |
| | | Inception |
| | | (09/29/14) |
| | | (non-annualized) |
| Guggenheim Emerging Market Real Estate ETF | | |
| NAV | | -14.61% |
| Market | | -14.22% |
| AlphaShares Emerging | | |
| Markets Real Estate | | |
| Index | | -11.26% |
| FTSE EPRA/NAREIT Global Real Estate Index | | 0.36% |
Performance data quoted represents past performance, which is no guarantee of future results and current performance may be lower or higher than the figures shown. NAV performance data reflects fees and expenses of the Fund. The deduction of taxes that a shareholder would pay on Fund distributions or the redemption of Fund shares is not reflected in the total returns. For the most recent month-end performance figures, please visit guggenheiminvestments.com. The investment return and principal value of an investment will fluctuate with changes in market conditions and other factors so that an investor's shares, when redeemed, may be worth more or less than their original cost.
Since inception returns assume a purchase of the Fund at the initial share price of $24.99 per share for share price returns or initial net asset value (NAV) of $24.99 per share for NAV returns. Returns for periods of less than one year are not annualized.
FTSE EPRA/NAREIT Global Real Estate Index is an unmanaged portfolio of approximately 423 constituents from 37 countries, including both developed and emerging markets.
The referenced indices are unmanaged and not available for direct investment. Index performance does not reflect transaction costs, fees or expenses.
The Fund's annual operating expense ratio of 0.65% is expressed as a unitary fee and covers all expenses of the Fund, except for distribution fees, if any, brokerage expenses, taxes, interest, litigation expenses and other extraordinary expenses.
| Portfolio Breakdown | | % of Net Assets |
Investments: | | |
| Financial | | 97.1% |
| Consumer, Cyclical | | 1.1% |
| Industrial | | 1.0% |
| Diversified | | 0.8% |
| Total Common Stocks | | 100.0% |
| Securities Lending Collateral | | 3.7% |
| Total Investments | | 103.7% |
| Other Assets & Liabilities, net | | -3.7% |
| Net Assets | | 100.0% |
| Ten Largest Holdings | | |
| (% of Total Net Assets) | | |
| China Overseas Land & Investment Ltd. | | 6.0% |
| Emaar Properties PJSC | | 5.8% |
| Fibra Uno Administracion S.A. de CV | | 4.0% |
| China Resources Land Ltd. | | 3.9% |
| Ayala Land, Inc. | | 3.5% |
| Growthpoint Properties Ltd. | | 3.3% |
| SM Prime Holdings, Inc. | | 3.1% |
| Evergrande Real Estate Group Ltd. | | 2.4% |
| Redefine Properties Ltd. | | 2.4% |
| China Vanke Company Ltd. — Class H | | 2.3% |
| Top Ten Total | | 36.7% |
"Ten Largest Holdings" exclude any temporary cash or derivative investments.
| 18 | CLAYMORE EXCHANGE-TRADED FUND TRUST 2 ANNUAL REPORT |
| PERFORMANCE REPORT AND FUND PROFILE (Unaudited) continued | August 31, 2015 |
EMRE Guggenheim Emerging Markets Real Estate ETF continued
This graph compares a hypothetical $10,000 investment in the Fund, made at its inception, with a similar investment in the FTSE EPRA/NAREIT Global Real Estate Index. Results include the reinvestment of all dividends and capital gains. Past performance is no guarantee of future results. The FTSE EPRA/NAREIT Global Real Estate Index is an unmanaged portfolio of approximately 423 constituents from 37 countries, including both developed and emerging markets. It is not possible to invest directly in the FTSE EPRA/NAREIT Global Real Estate Index . Investment return and principal value will fluctuate with changes in market conditions and other factors and Fund shares, when redeemed, may be worth more or less than their original investment.
| CLAYMORE EXCHANGE-TRADED FUND TRUST 2 ANNUAL REPORT | 19 |
| PERFORMANCE REPORT AND FUND PROFILE (Unaudited) continued | August 31, 2015 |
TAN Guggenheim Solar ETF
| Fund Statistics | | | |
| Share Price | | $ | 29.57 |
| Net Asset Value | | $ | 29.72 |
| Discount to NAV | | | -0.50% |
| Net Assets ($000) | | $ | 266,545 |
| AVERAGE ANNUAL TOTAL RETURNS FOR |
| THE PERIOD ENDED AUGUST 31, 2015 |
| | | | | | | | | Since |
| | | One | | Three | | Five | | Inception |
| | | Year | | Year | | Year | | (04/15/08) |
| Guggenheim Solar ETF | | | | | | | | |
| NAV | | -30.51% | | 25.99% | | -13.04% | | -23.01% |
| Market | | -30.57% | | 25.83% | | -13.03% | | -23.06% |
| MAC Global Solar | | | | | | | | |
| Energy Index | | -34.20% | | 22.30% | | -16.04% | | -24.39% |
| MSCI World Index | | -4.13% | | 10.95% | | 11.07% | | 3.94% |
Performance data quoted represents past performance, which is no guarantee of future results and current performance may be lower or higher than the figures shown. NAV performance data reflects fees and expenses of the Fund. The deduction of taxes that a shareholder would pay on Fund distributions or the redemption of Fund shares is not reflected in the total returns. For the most recent month-end performance figures, please visit guggenheiminvestments.com. The investment return and principal value of an investment will fluctuate with changes in market conditions and other factors so that an investor's shares, when redeemed, may be worth more or less than their original cost.
Since inception returns assume a purchase of the Fund at the initial share price of $251.30* per share for share price returns or initial net asset value (NAV) of $251.30* per share for NAV returns. Returns for periods of less than one year are not annualized.
The Morgan Stanley Capital International (MSCI) World Index measures performance from a diverse range of global stock markets, including the U.S., Canada, Europe, Australia, New Zealand, and the Far East.
The referenced indices are unmanaged and not available for direct investment. Index performance does not reflect transaction costs, fees or expenses.
Per the most recent prospectus, the Fund's annualized gross operating expense ratio, gross of any fee waivers or expense reimbursements, was 0.76%. In the Financial Highlights section of this Annual Report, the Fund's annualized net operating expense ratio was 0.70% while the Fund's annualized gross operating expense ratio, gross of any fee waivers or expense reimbursements, was 0.73%. There is a contractual fee waiver currently in place for this Fund through December 31, 2018, to the extent necessary in keeping the Fund's operating expense ratio from exceeding 0.65% of average net assets per year. Some expenses fall outside of this expense cap and actual expenses may be higher than 0.65%. Without this expense cap, actual returns would be lower.
| Portfolio Breakdown | | % of Net Assets |
Investments: | | |
| Energy | | 60.0% |
| Industrial | | 24.5% |
| Technology | | 9.6% |
| Utilities | | 3.3% |
| Basic Materials | | 2.1% |
| Total Common Stocks | | 99.5% |
| Securities Lending Collateral | | 43.1% |
| Total Investments | | 142.6% |
| Other Assets & Liabilities, net | | -42.6% |
| Net Assets | | 100.0% |
| Ten Largest Holdings | | |
| (% of Total Net Assets) | | |
| First Solar, Inc. | | 8.5% |
| SolarCity Corp. | | 7.2% |
| SMA Solar Technology AG | | 6.0% |
| SunPower Corp. — Class A | | 5.4% |
| GCL-Poly Energy Holdings Ltd. | | 5.2% |
| Xinyi Solar Holdings Ltd. | | 5.1% |
| Meyer Burger Technology AG | | 4.9% |
| Trina Solar Ltd. ADR | | 4.3% |
| Advanced Energy Industries, Inc. | | 4.1% |
| TerraForm Power, Inc. — Class A | | 3.9% |
| Top Ten Total | | 54.6% |
"Ten Largest Holdings" exclude any temporary cash or derivative investments.
*Reflects 1 for 10 reverse stock split that occurred on February 15, 2012.
| 20 | CLAYMORE EXCHANGE-TRADED FUND TRUST 2 ANNUAL REPORT |
| PERFORMANCE REPORT AND FUND PROFILE (Unaudited) continued | August 31, 2015 |
TAN Guggenheim Solar ETF continued
This graph compares a hypothetical $10,000 investment in the Fund, made at its inception, with a similar investment in the MSCI World Index. Results include the reinvestment of all distributions and capital gains. Past performance is no guarantee of future results. The MSCI World Index measures performance from a diverse range of global stock markets, including the U.S., Canada, Europe, Australia, New Zealand, and the Far East. The referenced index is unmanaged. It is not possible to invest directly in the MSCI World Index. Investment return and principal value will fluctuate with changes in market conditions and other factors and Fund shares, when redeemed, may be worth more or less than their original investment.
| CLAYMORE EXCHANGE-TRADED FUND TRUST 2 ANNUAL REPORT | 21 |
| PERFORMANCE REPORT AND FUND PROFILE (Unaudited) continued | August 31, 2015 |
CGW Guggenheim S&P Global Water Index ETF
| Fund Statistics | | | |
| Share Price | | $ | 26.64 |
| Net Asset Value | | $ | 26.67 |
| Discount to NAV | | | -0.11% |
| Net Assets ($000) | | $ | 346,709 |
| AVERAGE ANNUAL TOTAL RETURNS FOR |
| THE PERIOD ENDED AUGUST 31, 2015 |
| | | | | | | | | Since |
| | | One | | Three | | Five | | Inception |
| | | Year | | Year | | Year | | (05/14/07) |
| Guggenheim S&P Global | | | | | | | | |
| Water Index ETF | | | | | | | | |
| NAV | | -6.47% | | 10.13% | | 11.37% | | 3.27% |
| Market | | -6.77% | | 10.21% | | 11.50% | | 3.25% |
| S&P Global | | | | | | | | |
| Water Index | | -6.25% | | 10.46% | | 11.73% | | 3.79% |
| MSCI World Index | | -4.13% | | 10.95% | | 11.07% | | 2.53% |
| Dow Jones Global | | | | | | | | |
| Utilities Index | | -8.56% | | 6.16% | | 2.83% | | -2.20% |
Performance data quoted represents past performance, which is no guarantee of future results and current performance may be lower or higher than the figures shown. NAV performance data reflects fees and expenses of the Fund. The deduction of taxes that a shareholder would pay on Fund distributions or the redemption of Fund shares is not reflected in the total returns. For the most recent month-end performance figures, please visit guggenheiminvestments.com. The investment return and principal value of an investment will fluctuate with changes in market conditions and other factors so that an investor's shares, when redeemed, may be worth more or less than their original cost.
Since inception returns assume a purchase of the Fund at the initial share price of $24.78 per share for share price returns or initial net asset value (NAV) of $24.78 per share for NAV returns. Returns for periods of less than one year are not annualized.
The Morgan Stanley Capital International (MSCI) World Index measures performance from a diverse range of global stock markets, including the U.S., Canada, Europe, Australia, New Zealand, and the Far East. The Dow Jones Global Utilities Index consists of companies that provide electrical, water, natural gas, and telephone utilities. The index is quoted in USD. The referenced indices are unmanaged and not available for direct investment. Index performance does not reflect transaction costs, fees or expenses.
Per the most recent prospectus, the Fund's annualized gross operating expense ratio, gross of any fee waivers or expense reimbursements, was 0.65%. In the Financial Highlights section of this Annual Report, the Fund's annualized net operating expense ratio was 0.64% while the Fund's annualized gross operating expense ratio, gross of any fee waivers or expense reimbursements, was 0.64%. There is a contractual fee waiver currently in place for this Fund through December 31, 2018 to the extent necessary in keeping the Fund's operating expense ratio from exceeding 0.65% of average net assets per year. Some expenses fall outside of this expense cap and actual expenses may be higher than 0.65%. Without this expense cap, actual returns would be lower.
| Portfolio Breakdown | | % of Net Assets |
Investments: | | |
| Industrial | | 48.6% |
| Utilities | | 41.0% |
| Consumer, Non-cyclical | | 5.6% |
| Consumer, Cyclical | | 2.4% |
| Basic Materials | | 1.9% |
| Total Common Stocks | | 99.5% |
| Securities Lending Collateral | | 1.5% |
| Total Investments | | 101.0% |
| Other Assets & Liabilities, net | | -1.0% |
| Net Assets | | 100.0% |
| Ten Largest Holdings | | |
| (% of Total Net Assets) | | |
| Geberit AG | | 7.0% |
| Veolia Environnement S.A. | | 6.1% |
| American Water Works Company, Inc. | | 6.0% |
| Pentair plc | | 5.9% |
| United Utilities Group plc | | 5.7% |
| Danaher Corp. | | 5.6% |
| Severn Trent plc | | 4.9% |
| Suez Environnement Co. | | 4.0% |
| Xylem, Inc. | | 3.5% |
| IDEX Corp. | | 3.3% |
| Top Ten Total | | 52.0% |
"Ten Largest Holdings" exclude any temporary cash or derivative investments.
| 22 | CLAYMORE EXCHANGE-TRADED FUND TRUST 2 ANNUAL REPORT |
| PERFORMANCE REPORT AND FUND PROFILE (Unaudited) continued | August 31, 2015 |
CGW Guggenheim S&P Global Water Index ETF continued
This graph compares a hypothetical $10,000 investment in the Fund, made at its inception, with a similar investment in the MSCI World Index. Results include the reinvestment of all distributions and capital gains. Past performance is no guarantee of future results. The MSCI World Index measures performance from a diverse range of global stock markets, including the U.S., Canada, Europe, Australia, New Zealand, and the Far East. The referenced index is unmanaged. It is not possible to invest directly in the MSCI World Index. Investment return and principal value will fluctuate with changes in market conditions and other factors and Fund shares, when redeemed, may be worth more or less than their original investment.
| CLAYMORE EXCHANGE-TRADED FUND TRUST 2 ANNUAL REPORT | 23 |
| PERFORMANCE REPORT AND FUND PROFILE (Unaudited) continued | August 31, 2015 |
GHII Guggenheim S&P High Income Infrastructure ETF
| Fund Statistics | | | |
| Fund Statistics | | | |
| Share Price | | $ | 22.56 |
| Net Asset Value | | $ | 22.87 |
| Discount to NAV | | | -1.36% |
| Net Assets ($000) | | $ | 2,287 |
| TOTAL RETURN FOR | | |
| THE PERIOD ENDED AUGUST 31, 2015 | | |
| | | Since |
| | | Inception |
| | | (02/11/15) |
| | | (non-annualized) |
| Guggenheim S&P High Income Infrastructure ETF | | |
| NAV | | -7.06% |
| Market | | -8.37% |
| S&P High Income Infrastructure Index | | -5.91% |
| S&P Global BMI Index | | -3.62% |
Performance data quoted represents past performance, which is no guarantee of future results and current performance may be lower or higher than the figures shown. NAV performance data reflects fees and expenses of the Fund. The deduction of taxes that a shareholder would pay on Fund distributions or the redemption of Fund shares is not reflected in the total returns. For the most recent month-end performance figures, please visit guggenheiminvestments.com. The investment return and principal value of an investment will fluctuate with changes in market conditions and other factors so that an investor's shares, when redeemed, may be worth more or less than their original cost.
Since inception returns assume a purchase of the Fund at the initial share price of $25.05 per share for share price returns or initial net asset value (NAV) of $25.05 per share for NAV returns. Returns for periods of less than one year are not annualized.
The S&P High Income Infrastructure Index is designed to serve as a benchmark for yield-seeking equity investors looking for infrastructure exposure. The index is composed of the 50 highest-dividend-paying companies within the S&P Global BMI that operate in the energy, transportation, and utilities sectors.
The S&P Global BMI is a comprehensive, rules-based index designed to measure global stock market performance. The index covers all publicly listed equities with float adjusted market values of $100 million or more and annual dollar value traded of at least $50 million in all included countries. The S&P Global BMI is made up of the S&P Developed BMI and the S&P Emerging BMI indices.
The referenced indices are unmanaged and not available for direct investment. Index performance does not reflect transaction costs, fees or expenses.
The Fund's annual operating expense ratio of 0.45% is expressed as a unitary fee and covers all expenses of the Fund, except for distribution fees, if any, brokerage expenses, taxes, interest, litigation expenses and other extraordinary expenses.
| Portfolio Breakdown | | % of Net Assets |
Investments: | | |
| Utilities | | 47.8% |
| Energy | | 27.7% |
| Consumer, Non-cyclical | | 14.9% |
| Industrial | | 8.6% |
| Total Common Stocks | | 99.0% |
| Other Instruments: | | |
| Securities Lending Collateral | | 3.8% |
| Preferred Stocks | | 0.7% |
| Total Other Instruments | | 4.5% |
| Total Investments | | 103.5% |
| Other Assets & Liabilities, net | | -3.5% |
| Net Assets | | 100.0% |
| Ten Largest Holdings | | |
| (% of Total Net Assets) | | |
| ONEOK, Inc. | | 4.9% |
| Sydney Airport | | 4.7% |
| Veresen, Inc. | | 4.7% |
| Transurban Group | | 4.4% |
| Abertis Infraestructuras S.A. | | 4.3% |
| Kinder Morgan, Inc. | | 4.2% |
| Hutchison Port Holdings Trust — Class U | | 4.0% |
| Pembina Pipeline Corp. | | 4.0% |
| TransCanada Corp. | | 3.9% |
| Ship Finance International Ltd. | | 3.9% |
| Top Ten Total | | 43.0% |
"Ten Largest Holdings" exclude any temporary cash or derivative investments.
| 24 | CLAYMORE EXCHANGE-TRADED FUND TRUST 2 ANNUAL REPORT |
| PERFORMANCE REPORT AND FUND PROFILE (Unaudited) continued | August 31, 2015 |
GHII Guggenheim S&P High Income Infrastructure ETF continued
This graph compares a hypothetical $10,000 investment in the Fund, made at its inception, with a similar investment in the S&P Global BMI Index. Results include the reinvestment of all dividends and capital gains. Past performance is no guarantee of future results. The S&P Global BMI is a comprehensive, rules-based index designed to measure global stock market performance. The index covers all publicly listed equities with float adjusted market values of $100 million or more and annual dollar value traded of at least $50 million in all included countries. The S&P Global BMI is made up of the S&P Developed BMI and the S&P Emerging BMI indices. It is not possible to invest directly in the S&P Global BMI Index. Investment return and principal value will fluctuate with changes in market conditions and other factors and Fund shares, when redeemed, may be worth more or less than their original investment.
| CLAYMORE EXCHANGE-TRADED FUND TRUST 2 ANNUAL REPORT | 25 |
| ABOUT SHAREHOLDERS' FUND EXPENSES (Unaudited) | August 31, 2015 |
All funds have operating expenses and it is important for our shareholders to understand the impact of costs on their investments. Shareholders of a Fund incur advisory fees and other Fund expenses which are deducted from a Fund's gross income and reduce the investment return of the Fund.
A fund's expenses are expressed as a percentage of its average net assets, which is known as the expense ratio. The following examples are intended to help investors understand the ongoing costs (in dollars) of investing in a Fund and to compare these costs with the ongoing costs of investing in other funds.
The examples are based on an investment of $1,000 made at the beginning of the period and held for the entire six-month period beginning February 28, 2015 and ending August 31, 2015.
The following tables illustrate a Fund's costs in two ways:
Table 1. Based on actual Fund return. This section helps investors estimate the actual expenses paid over the period. The "Ending Account Value" shown is derived from the Fund's actual return, and the fifth column shows the dollar amount that would have been paid by an investor who started with $1,000 in the Fund. Investors may use the information here, together with the amount invested, to estimate the expenses paid over the period. Simply divide the Fund's account value by $1,000 (for example, an $8,600 account value divided by $1,000 = 8.6), then multiply the result by the number provided under the heading "Expenses Paid During Period."
Table 2. Based on hypothetical 5% return. This section is intended to help investors compare a Fund's cost with those of other funds. The table provides information about hypothetical account values and hypothetical expenses based on the Fund's actual expense ratio and an assumed rate of return of 5% per year before expenses, which is not the Fund's actual return. The hypothetical account values and expenses may not be used to estimate the actual ending account balance or expenses paid during the period. The example is useful in making comparisons because the U.S. Securities and Exchange Commission (the "SEC") requires all mutual funds to calculate expenses based on the 5% return. Investors can assess a Fund's costs by comparing this hypothetical example with the hypothetical examples that appear in shareholder reports of other funds.
The calculations illustrated above assume no shares were bought or sold during the period. Actual costs may have been higher or lower, depending on the amount of investment and the timing of any purchases or redemptions.
Please note that the expenses shown in the table are meant to highlight your ongoing costs only and do not reflect any transactional costs, such as sales charges (loads) on purchase payments, and contingent deferred sales charges ("CDSC") on redemptions, if any. Therefore, the second table is useful in comparing ongoing costs only, and will not help you determine the relative total costs of owning different funds. In addition, if these transactional costs were included, your costs would have been higher.
More information about a Fund's expenses, including annual expense ratios for the past five years, can be found in the Financial Highlights section of this report. For additional information on operating expenses and other shareholder costs, please refer to the appropriate Fund prospectus.
| | | | | | | | | | | | | | Expenses | |
| | | | | | | | Beginning | | | Ending | | | Paid | |
| | | | Expense | | Fund | | Account Value | | | Account Value | | | During | |
| | | | Ratio1 | | Return | | February 28, 2015 | | | August 31, 2015 | | | Period2 | |
Table 1. Based on actual Fund return3 | | | | | | | | | | | | | | | | |
| Guggenheim China All-Cap ETF | | | 0.70 | % | | (13.98 | )% | $ | 1,000.00 | | $ | 860.17 | | $ | 3.28 | |
| Guggenheim China Technology ETF | | | 0.70 | % | | (17.46 | )% | | 1,000.00 | | | 825.42 | | | 3.22 | |
| Guggenheim Emerging Markets Real Estate ETF | | | 0.65 | % | | (16.12 | )% | | 1,000.00 | | | 838.81 | | | 3.01 | |
| Guggenheim Solar ETF | | | 0.70 | % | | (24.59 | )% | | 1,000.00 | | | 754.12 | | | 3.09 | |
| Guggenheim S&P Global Water Index ETF | | | 0.64 | % | | (6.06 | )% | | 1,000.00 | | | 939.42 | | | 3.13 | |
| Guggenheim S&P High Income Infrastructure ETF | | | 0.45 | % | | (7.82 | )% | | 1,000.00 | | | 921.82 | | | 2.18 | |
| | | | | | | | | | | | | | | | | |
| Table 2. Based on hypothetical 5% return (before expenses) | | | | | | | | | | | | | | | | |
| Guggenheim China All-Cap ETF | | | 0.70 | % | | 5.00 | % | $ | 1,000.00 | | $ | 1,021.68 | | $ | 3.57 | |
| Guggenheim China Technology ETF | | | 0.70 | % | | 5.00 | % | | 1,000.00 | | | 1,021.68 | | | 3.57 | |
| Guggenheim Emerging Markets Real Estate ETF | | | 0.65 | % | | 5.00 | % | | 1,000.00 | | | 1.021.93 | | | 3.31 | |
| Guggenheim Solar ETF | | | 0.70 | % | | 5.00 | % | | 1,000.00 | | | 1,021.68 | | | 3.57 | |
| Guggenheim S&P Global Water Index ETF | | | 0.64 | % | | 5.00 | % | | 1,000.00 | | | 1,021.98 | | | 3.26 | |
| Guggenheim S&P High Income Infrastructure ETF | | | 0.45 | % | | 5.00 | % | | 1,000.00 | | | 1,022.94 | | | 2.29 | |
| 1 | Annualized and excludes expenses of the underlying funds in which the Funds invest, if any. |
| 2 | Expenses are equal to the Fund's annualized expense ratio, net of any applicable fee waivers, multiplied by the average account value over the period, multiplied by 184/365 (to reflect the one-half year period). |
| 3 | Actual cumulative return at net asset value for the period February 28, 2015 to August 31, 2015. |
| 26 | CLAYMORE EXCHANGE-TRADED FUND TRUST 2 ANNUAL REPORT |
| SCHEDULE OF INVESTMENTS | August 31, 2015 |
YAO Guggenheim China All-Cap ETF
| | | | Shares | | | Value | |
COMMON STOCKS† - 99.9% | | | | | | | |
| Financial - 36.6% | | | | | | | |
| China Construction Bank Corp. — Class H | | | 2,059,549 | | $ | 1,448,318 | |
| Industrial & Commercial Bank of China Ltd. — Class H | | | 2,367,126 | | | 1,398,886 | |
| Bank of China Ltd. — Class H | | | 2,343,466 | | | 1,070,428 | |
| China Life Insurance Company Ltd. — Class H | | | 254,995 | | | 881,784 | |
| Ping An Insurance Group Company of China Ltd. — Class H | | | 159,852 | | | 782,754 | |
| Bank of Communications Company Ltd. — Class H | | | 703,993 | | | 530,489 | |
| China Overseas Land & Investment Ltd. | | | 163,995 | | | 480,343 | |
| China Merchants Bank Company Ltd. — Class H | | | 156,993 | | | 373,945 | |
| CITIC Ltd. | | | 185,000 | | | 338,966 | |
| Agricultural Bank of China Ltd. — Class H | | | 816,982 | | | 329,953 | |
| PICC Property & Casualty Company Ltd. — Class H | | | 153,995 | | | 292,489 | |
| China Pacific Insurance Group Company Ltd. — Class H | | | 66,000 | | | 240,153 | |
| China Minsheng Banking Corporation Ltd. — Class H | | | 219,490 | | | 212,692 | |
| China Resources Land Ltd. | | | 81,999 | | | 204,625 | |
| Haitong Securities Company Ltd. — Class H | | | 116,800 | | | 168,492 | |
| China CITIC Bank Corporation Ltd. — Class H* | | | 267,993 | | | 164,253 | |
| China Cinda Asset Management Company Ltd. — Class H | | | 396,000 | | | 147,158 | |
| Huishang Bank Corporation Ltd. — Class H | | | 266,000 | | | 119,442 | |
| People's Insurance Company Group of China Ltd. — Class H | | | 246,000 | | | 116,492 | |
| China Taiping Insurance Holdings Company Ltd.* | | | 39,600 | | | 111,901 | |
Evergrande Real Estate Group Ltd.1 | | | 163,994 | | | 107,918 | |
| China Vanke Company Ltd. — Class H | | | 44,496 | | | 101,163 | |
| Country Garden Holdings Company Ltd. | | | 280,873 | | | 98,577 | |
| Sino-Ocean Land Holdings Ltd. | | | 128,493 | | | 67,148 | |
| China Everbright Ltd. | | | 32,000 | | | 66,890 | |
| New China Life Insurance Company Ltd. — Class H | | | 16,800 | | | 65,682 | |
| Shimao Property Holdings Ltd. | | | 42,499 | | | 59,663 | |
| CITIC Securities Company Ltd. — Class H | | | 28,001 | | | 56,146 | |
| Longfor Properties Company Ltd. | | | 45,499 | | | 55,009 | |
| Chongqing Rural Commercial Bank Company Ltd. — Class H | | | 84,994 | | | 49,680 | |
| Shanghai Industrial Holdings Ltd. | | | 18,000 | | | 43,896 | |
Renhe Commercial Holdings Company Ltd.*,1 | | | 777,930 | | | 43,162 | |
| Far East Horizon Ltd. | | | 54,000 | | | 42,991 | |
| Bank of Chongqing Company Ltd. — Class H | | | 52,500 | | | 38,613 | |
| Yuexiu Property Company Ltd. | | | 225,992 | | | 35,575 | |
| Sunac China Holdings Ltd. | | | 61,000 | | | 32,979 | |
| Guangzhou R&F Properties Company Ltd. — Class H | | | 34,400 | | | 31,426 | |
| Shenzhen Investment Ltd. | | | 85,999 | | | 30,405 | |
Harbin Bank Company Ltd. — Class H2 | | | 101,000 | | | 30,235 | |
| KWG Property Holding Ltd. | | | 44,815 | | | 28,334 | |
| Franshion Properties China Ltd. | | | 109,998 | | | 27,535 | |
| SOHO China Ltd. | | | 63,999 | | | 27,334 | |
| Shui On Land Ltd. | | | 117,493 | | | 25,772 | |
| Agile Property Holdings Ltd. | | | 52,000 | | | 25,497 | |
China South City Holdings Ltd.1 | | | 88,000 | | | 22,710 | |
Greentown China Holdings Ltd.*,1 | | | 27,500 | | | 21,326 | |
| Guotai Junan International Holdings Ltd. | | | 79,000 | | | 20,693 | |
Poly Property Group Company Ltd.1 | | | 66,999 | | | 17,895 | |
| Yanlord Land Group Ltd. | | | 21,400 | | | 16,464 | |
| Hopson Development Holdings Ltd.* | | | 20,000 | | | 15,381 | |
E-House China Holdings Ltd. ADR1 | | | 2,523 | | | 14,255 | |
| China Overseas Grand Oceans Group Ltd. | | | 31,000 | | | 9,800 | |
Kaisa Group Holdings Ltd.*,†††,3 | | | 113,999 | | | — | |
| Total Financial | | | | | | 10,743,717 | |
| | | | | | | | |
| Communications - 24.8% | | | | | | | |
| Tencent Holdings Ltd. | | | 114,442 | | | 1,946,240 | |
| China Mobile Ltd. | | | 140,451 | | | 1,701,711 | |
Baidu, Inc. ADR*,1 | | | 7,306 | | | 1,075,808 | |
Alibaba Group Holding Ltd. ADR*,1 | | | 12,786 | | | 845,410 | |
| Ctrip.com International Ltd. ADR* | | | 4,855 | | | 322,615 | |
| China Telecom Corporation Ltd. — Class H | | | 469,981 | | | 246,208 | |
| China Unicom Hong Kong Ltd. | | | 153,995 | | | 202,279 | |
| Vipshop Holdings Ltd. ADR* | | | 10,550 | | | 189,795 | |
| Qihoo 360 Technology Company Ltd. ADR* | | | 3,023 | | | 159,826 | |
SINA Corp.*,1 | | | 1,974 | | | 76,493 | |
| Youku Tudou, Inc. ADR* | | | 3,834 | | | 63,683 | |
| ZTE Corp. — Class H | | | 27,248 | | | 54,918 | |
YY, Inc. ADR*,1 | | | 1,003 | | | 54,784 | |
Sohu.com, Inc.*,1 | | | 1,026 | | | 48,561 | |
Autohome, Inc. ADR*,1 | | | 1,401 | | | 43,599 | |
SouFun Holdings Ltd. ADR1 | | | 6,794 | | | 37,095 | |
| China Communications Services Corp. Ltd. — Class H | | | 91,993 | | | 33,829 | |
| 21Vianet Group, Inc. ADR* | | | 1,575 | | | 28,019 | |
58.com, Inc. ADR*,1 | | | 542 | | | 24,639 | |
Bitauto Holdings Ltd.*,1 | | | 787 | | | 21,131 | |
| 51job, Inc. ADR* | | | 679 | | | 18,204 | |
| Coolpad Group Ltd. | | | 84,000 | | | 15,608 | |
| CITIC Telecom International Holdings Ltd. | | | 45,000 | | | 14,400 | |
TCL Communication Technology Holdings Ltd.1 | | | 19,000 | | | 12,846 | |
BYD Electronic International Company Ltd.*,1 | | | 21,500 | | | 12,428 | |
E-Commerce China Dangdang, Inc. — Class A ADR*,1 | | | 1,891 | | | 11,289 | |
| Total Communications | | | | | | 7,261,418 | |
| | | | | | | | |
| Energy - 9.1% | | | | | | | |
| CNOOC Ltd. | | | 547,990 | | | 679,503 | |
| PetroChina Company Ltd. — Class H | | | 721,986 | | | 599,943 | |
| China Petroleum & Chemical Corp. — Class H | | | 873,183 | | | 581,367 | |
| See notes to financial statements. |
| CLAYMORE EXCHANGE-TRADED FUND TRUST 2 ANNUAL REPORT | 27 |
| SCHEDULE OF INVESTMENTS continued | August 31, 2015 |
YAO Guggenheim China All-Cap ETF continued
| | | | Shares | | | Value | |
COMMON STOCKS† - 99.9% (continued) | | | | | | | |
| Energy - 9.1% (continued) | | | | | | | |
| China Shenhua Energy Company Ltd. — Class H | | | 116,996 | | $ | 202,892 | |
| China Longyuan Power Group Corporation Ltd. — Class H | | | 114,998 | | | 122,121 | |
Kunlun Energy Company Ltd.1 | | | 105,994 | | | 74,948 | |
| China Coal Energy Company Ltd. — Class H | | | 136,993 | | | 63,989 | |
| China Oilfield Services Ltd. — Class H | | | 57,999 | | | 62,414 | |
GCL-Poly Energy Holdings Ltd.*,1 | | | 352,995 | | | 56,479 | |
Xinyi Solar Holdings Ltd.1 | | | 112,000 | | | 37,429 | |
| Sinopec Engineering Group Company Ltd. — Class H | | | 38,500 | | | 33,234 | |
| Yanzhou Coal Mining Company Ltd. — Class H | | | 61,999 | | | 29,279 | |
| Trina Solar Ltd. ADR* | | | 2,959 | | | 26,335 | |
Sinopec Oilfield Service Corp. — Class H*,1 | | | 70,000 | | | 20,413 | |
| Beijing Jingneng Clean Energy Co. Ltd. — Class H | | | 70,000 | | | 20,232 | |
Sinopec Kantons Holdings Ltd.1 | | | 38,000 | | | 20,152 | |
| Shougang Fushan Resources Group Ltd. | | | 134,000 | | | 16,944 | |
| United Energy Group Ltd.* | | | 129,994 | | | 14,928 | |
| CIMC Enric Holdings Ltd. | | | 20,000 | | | 10,529 | |
China Suntien Green Energy Corporation Ltd. — Class H1 | | | 60,000 | | | 9,677 | |
| Total Energy | | | | | | 2,682,808 | |
| | | | | | | | |
| Consumer, Non-cyclical - 8.6% | | | | | | | |
| Hengan International Group Company Ltd. | | | 27,501 | | | 269,863 | |
| Want Want China Holdings Ltd. | | | 233,993 | | | 188,703 | |
| China Mengniu Dairy Company Ltd. | | | 42,999 | | | 150,357 | |
| Sinopharm Group Company Ltd. — Class H | | | 35,601 | | | 134,824 | |
WH Group Ltd.*,2 | | | 237,500 | | | 124,725 | |
| Sino Biopharmaceutical Ltd. | | | 103,995 | | | 123,450 | |
| WuXi PharmaTech Cayman, Inc. ADR* | | | 2,419 | | | 102,227 | |
COSCO Pacific Ltd.†† | | | 74,000 | | | 97,393 | |
| Tingyi Cayman Islands Holding Corp. | | | 61,999 | | | 95,358 | |
| New Oriental Education & Technology Group ADR* | | | 4,447 | | | 91,119 | |
| Mindray Medical International Ltd. ADR | | | 3,000 | | | 72,660 | |
China Huishan Dairy Holdings Company Ltd.1 | | | 195,000 | | | 71,458 | |
Sihuan Pharmaceutical Holdings Group Ltd.†††,3 | | | 288,988 | | | 69,357 | |
| Tsingtao Brewery Company Ltd. — Class H | | | 14,000 | | | 68,825 | |
| CSPC Pharmaceutical Group Ltd. | | | 72,000 | | | 65,961 | |
| China Conch Venture Holdings Ltd. | | | 27,000 | | | 59,504 | |
| Uni-President China Holdings Ltd. | | | 62,000 | | | 56,160 | |
| Zhejiang Expressway Company Ltd. — Class H | | | 49,999 | | | 53,677 | |
| Shandong Weigao Group Medical Polymer Company | | | | | | | |
| Ltd. — Class H | | | 72,001 | | | 50,354 | |
| Shenzhen International Holdings Ltd. | | | 34,323 | | | 47,476 | |
| China Medical System Holdings Ltd. | | | 43,495 | | | 47,255 | |
| Jiangsu Expressway Company Ltd. — Class H | | | 38,000 | | | 44,913 | |
| Luye Pharma Group Ltd.* | | | 51,500 | | | 43,858 | |
TAL Education Group ADR*,1 | | | 1,324 | | | 40,607 | |
| Shanghai Fosun Pharmaceutical Group Company Ltd. — | | | | | | | |
| Class H | | | 11,000 | | | 32,148 | |
| Guangzhou Baiyunshan Pharmaceutical Holdings | | | | | | | |
| Company Ltd. — Class H | | | 12,000 | | | 29,109 | |
| China Agri-Industries Holdings Ltd.* | | | 75,999 | | | 28,830 | |
| Tong Ren Tang Technologies Company Ltd. — Class H | | | 20,000 | | | 25,858 | |
| CP Pokphand Company Ltd. | | | 225,993 | | | 24,203 | |
| SSY Group Ltd. | | | 78,000 | | | 22,444 | |
| Fu Shou Yuan International Group Ltd. | | | 36,000 | | | 21,042 | |
| China Modern Dairy Holdings Ltd. | | | 77,989 | | | 20,327 | |
| Phoenix Healthcare Group Company Ltd. | | | 13,500 | | | 19,579 | |
| Vinda International Holdings Ltd. | | | 9,000 | | | 17,350 | |
| Shenzhen Expressway Company Ltd. — Class H | | | 26,000 | | | 16,975 | |
China Shengmu Organic Milk Ltd.*,2 | | | 77,000 | | | 16,890 | |
| Hua Han Bio-Pharmaceutical Holdings Ltd. | | | 123,200 | | | 15,738 | |
| Tibet 5100 Water Resources Holdings Ltd. | | | 50,000 | | | 13,484 | |
| China Shineway Pharmaceutical Group Ltd. | | | 9,000 | | | 10,800 | |
| China Yurun Food Group Ltd.* | | | 45,000 | | | 10,393 | |
China Animal Healthcare Ltd.*,†††,3 | | | 36,000 | | | 10,219 | |
| Wumart Stores, Inc. — Class H* | | | 17,000 | | | 9,169 | |
| Total Consumer, Non-cyclical | | | | | | 2,514,642 | |
| | | | | | | | |
| Industrial - 6.6% | | | | | | | |
| China Communications Construction Company Ltd. — | | | | | | | |
| Class H | | | 148,993 | | | 177,253 | |
| AAC Technologies Holdings, Inc. | | | 25,482 | | | 143,520 | |
| Anhui Conch Cement Company Ltd. — Class H | | | 45,500 | | | 137,673 | |
| China Everbright International Ltd. | | | 91,999 | | | 120,370 | |
| China Railway Group Ltd. — Class H | | | 127,993 | | | 114,781 | |
China State Construction International Holdings Ltd.1 | | | 61,999 | | | 81,918 | |
| China Railway Construction Corporation Ltd. — Class H | | | 56,999 | | | 74,723 | |
| Yangzijiang Shipbuilding Holdings Ltd. | | | 95,500 | | | 74,487 | |
China COSCO Holdings Company Ltd. — Class H*,††,1 | | | 108,499 | | | 69,159 | |
| China Shipping Container Lines Company Ltd. — | | | | | | | |
Class H*,††,1 | | | 157,994 | | | 63,401 | |
| Beijing Capital International Airport Company Ltd. — Class H | | | 54,000 | | | 58,111 | |
| China National Building Material Company Ltd. — Class H | | | 97,998 | | | 57,154 | |
| Shanghai Electric Group Company Ltd. — Class H | | | 101,998 | | | 56,328 | |
| AviChina Industry & Technology Company Ltd. — Class H | | | 78,999 | | | 54,942 | |
Tech Pro Technology Development Ltd.*,1 | | | 176,000 | | | 42,921 | |
Metallurgical Corporation of China Ltd. — Class H†† | | | 113,999 | | | 42,069 | |
| Lee & Man Paper Manufacturing Ltd. | | | 72,999 | | | 41,821 | |
China Shipping Development Co. Ltd. — Class H†† | | | 54,000 | | | 38,253 | |
Sunny Optical Technology Group Company Ltd.1 | | | 22,000 | | | 36,676 | |
China Shanshui Cement Group Ltd.*,†††,1,3 | | | 105,999 | | | 36,381 | |
| Haitian International Holdings Ltd. | | | 20,000 | | | 36,284 | |
See notes to financial statements.
| 28 | CLAYMORE EXCHANGE-TRADED FUND TRUST 2 ANNUAL REPORT |
| SCHEDULE OF INVESTMENTS continued | August 31, 2015 |
YAO Guggenheim China All-Cap ETF continued
| | | | Shares | | | Value | |
COMMON STOCKS† - 99.9% (continued) | | | | | | | |
| Industrial - 6.6% (continued) | | | | | | | |
| China International Marine Containers Group Co. | | | | | | | |
| Ltd. — Class H | | | 20,200 | | $ | 35,969 | |
| China Resources Cement Holdings Ltd. | | | 62,000 | | | 30,480 | |
| CT Environmental Group Ltd. | | | 78,000 | | | 25,564 | |
| BBMG Corp. — Class H | | | 39,500 | | | 25,484 | |
| Sinotrans Ltd. — Class H | | | 55,000 | | | 25,264 | |
| Xinjiang Goldwind Science & Technology Company Ltd. — | | | | | | | |
| Class H | | | 14,200 | | | 24,149 | |
| China High Speed Transmission Equipment Group Co. Ltd.* | | | 35,000 | | | 24,071 | |
| China Machinery Engineering Corp. — Class H | | | 31,000 | | | 22,960 | |
| China Lesso Group Holdings Ltd. | | | 32,000 | | | 22,462 | |
| SITC International Holdings Company Ltd. | | | 43,000 | | | 21,583 | |
| Guangshen Railway Company Ltd. — Class H | | | 48,000 | | | 19,819 | |
| Zoomlion Heavy Industry Science and Technology Company | | | | | | | |
| Ltd. — Class H | | | 48,399 | | | 19,484 | |
| SIIC Environment Holdings Ltd.* | | | 150,600 | | | 18,047 | |
| China Zhongwang Holdings Ltd. | | | 50,399 | | | 17,493 | |
| Dongfang Electric Corporation Ltd. — Class H | | | 11,200 | | | 12,443 | |
| Harbin Electric Company Ltd. — Class H | | | 22,000 | | | 11,525 | |
| China Singyes Solar Technologies Holdings Ltd.* | | | 17,000 | | | 10,551 | |
China Huarong Energy Company Ltd.*,1 | | | 165,494 | | | 6,620 | |
| Total Industrial | | | | | | 1,932,193 | |
| | | | | | | | |
| Consumer, Cyclical - 5.9% | | | | | | | |
| Belle International Holdings Ltd. | | | 161,993 | | | 148,196 | |
China Resources Enterprise Ltd.1 | | | 38,000 | | | 119,393 | |
| Great Wall Motor Company Ltd. — Class H | | | 37,500 | | | 100,160 | |
| Dongfeng Motor Group Company Ltd. — Class H | | | 98,000 | | | 98,631 | |
| Byd Company Ltd. — Class H* | | | 21,500 | | | 87,803 | |
| Shenzhou International Group Holdings Ltd. | | | 16,999 | | | 85,872 | |
| Brilliance China Automotive Holdings Ltd. | | | 69,996 | | | 84,537 | |
| Haier Electronics Group Company Ltd. | | | 42,000 | | | 75,329 | |
| ANTA Sports Products Ltd. | | | 29,000 | | | 73,042 | |
| Geely Automobile Holdings Ltd. | | | 169,993 | | | 65,803 | |
| GOME Electrical Appliances Holding Ltd. | | | 394,991 | | | 62,688 | |
Sun Art Retail Group Ltd.1 | | | 74,999 | | | 62,515 | |
| Air China Ltd. — Class H | | | 73,999 | | | 53,470 | |
| Guangzhou Automobile Group Company Ltd. — Class H | | | 75,999 | | | 53,444 | |
| Shanghai Pharmaceuticals Holding Company Ltd. — Class H | | | 21,800 | | | 45,456 | |
| China Southern Airlines Company Ltd. — Class H | | | 62,000 | | | 40,400 | |
| Minth Group Ltd. | | | 22,000 | | | 38,266 | |
Xinyi Glass Holdings Ltd.1 | | | 83,999 | | | 37,718 | |
| Weichai Power Company Ltd. — Class H | | | 34,800 | | | 37,449 | |
Intime Retail Group Company Ltd.1 | | | 33,500 | | | 35,229 | |
| Skyworth Digital Holdings Ltd. | | | 59,999 | | | 34,606 | |
| China Eastern Airlines Corporation Ltd. — Class H* | | | 60,000 | | | 31,974 | |
| China Travel International Investment Hong Kong Ltd. | | | 85,999 | | | 29,961 | |
| China Dongxiang Group Company Ltd. | | | 115,000 | | | 28,639 | |
| Homeinns Hotel Group* | | | 1,027 | | | 27,318 | |
| Digital China Holdings Ltd.* | | | 31,000 | | | 27,120 | |
| China Lodging Group Ltd. ADR* | | | 953 | | | 24,444 | |
| Li Ning Company Ltd.* | | | 50,500 | | | 23,328 | |
Golden Eagle Retail Group Ltd.1 | | | 19,000 | | | 21,157 | |
REXLot Holdings Ltd.†††,1,3 | | | 399,993 | | | 15,329 | |
| Shanghai Jin Jiang International Hotels Group Co. | | | | | | | |
| Ltd. — Class H | | | 46,000 | | | 14,067 | |
Dah Chong Hong Holdings Ltd.1 | | | 31,000 | | | 11,200 | |
| China ZhengTong Auto Services Holdings Ltd. | | | 27,500 | | | 10,893 | |
| Bosideng International Holdings Ltd. | | | 107,999 | | | 10,033 | |
| Zhongsheng Group Holdings Ltd. | | | 21,500 | | | 8,988 | |
| Baoxin Auto Group Ltd. | | | 26,500 | | | 8,959 | |
| Ajisen China Holdings Ltd. | | | 18,000 | | | 7,014 | |
| Total Consumer, Cyclical | | | | | | 1,740,431 | |
| | | | | | | | |
| Utilities - 3.7% | | | | | | | |
| China Resources Power Holdings Company Ltd. | | | 61,999 | | | 151,837 | |
| Huaneng Power International, Inc. — Class H | | | 119,994 | | | 138,263 | |
| Guangdong Investment Ltd. | | | 99,998 | | | 135,222 | |
| China Gas Holdings Ltd. | | | 79,999 | | | 116,849 | |
Beijing Enterprises Water Group Ltd.*,1 | | | 157,993 | | | 113,143 | |
| Beijing Enterprises Holdings Ltd. | | | 17,500 | | | 102,177 | |
| China Resources Gas Group Ltd. | | | 30,000 | | | 79,161 | |
| China Power International Development Ltd. | | | 90,999 | | | 60,587 | |
| Huadian Power International Corporation Ltd. — Class H | | | 62,000 | | | 50,480 | |
| Huaneng Renewables Corporation Ltd. — Class H | | | 129,992 | | | 47,468 | |
| Datang International Power Generation Company | | | | | | | |
| Ltd. — Class H | | | 105,996 | | | 42,808 | |
| Huadian Fuxin Energy Corporation Ltd. — Class H | | | 78,000 | | | 27,375 | |
| China Oil & Gas Group Ltd. | | | 97,992 | | | 6,196 | |
| Total Utilities | | | | | | 1,071,566 | |
| | | | | | | | |
| Technology - 2.4% | | | | | | | |
| NetEase, Inc. ADR | | | 2,504 | | | 278,394 | |
| Lenovo Group Ltd. | | | 213,995 | | | 175,613 | |
| Semiconductor Manufacturing International Corp.* | | | 905,983 | | | 79,492 | |
Kingsoft Corporation Ltd.1 | | | 31,000 | | | 65,360 | |
| TravelSky Technology Ltd. — Class H | | | 29,000 | | | 35,137 | |
| NetDragon Websoft, Inc. | | | 9,500 | | | 22,677 | |
| Shanda Games Ltd. ADR* | | | 3,164 | | | 20,471 | |
| Ju Teng International Holdings Ltd. | | | 32,000 | | | 12,222 | |
| Shunfeng International Clean Energy Ltd.* | | | 38,000 | | | 9,120 | |
| Total Technology | | | | | | 698,486 | |
| See notes to financial statements. |
| CLAYMORE EXCHANGE-TRADED FUND TRUST 2 ANNUAL REPORT | 29 |
| SCHEDULE OF INVESTMENTS continued | August 31, 2015 |
YAO Guggenheim China All-Cap ETF continued
| | | | Shares | | | Value | |
COMMON STOCKS† - 99.9% (continued) | | | | | | | |
| Basic Materials - 1.4% | | | | | | | |
| Jiangxi Copper Company Ltd. — Class H | | | 45,999 | | $ | 58,106 | |
| Zijin Mining Group Company Ltd. — Class H | | | 199,992 | | | 51,610 | |
| Aluminum Corporation of China Ltd. — Class H* | | | 129,994 | | | 43,443 | |
| Sinopec Shanghai Petrochemical Company Ltd. — Class H* | | | 115,998 | | | 42,358 | |
| Nine Dragons Paper Holdings Ltd. | | | 53,999 | | | 30,309 | |
| Kingboard Chemical Holdings Ltd. | | | 20,300 | | | 26,351 | |
China Molybdenum Co. Ltd. — Class H1 | | | 42,000 | | | 22,761 | |
| Huabao International Holdings Ltd. | | | 66,999 | | | 22,304 | |
| China BlueChemical Ltd. — Class H | | | 61,999 | | | 17,600 | |
| Angang Steel Company Ltd. — Class H | | | 38,000 | | | 17,014 | |
China Hongqiao Group Ltd.1 | | | 33,500 | | | 16,037 | |
Zhaojin Mining Industry Company Ltd. — Class H1 | | | 29,500 | | | 14,692 | |
| Kingboard Laminates Holdings Ltd. | | | 36,500 | | | 14,506 | |
| Yingde Gases Group Company Ltd. | | | 33,500 | | | 13,962 | |
Maanshan Iron & Steel Company Ltd. — Class H*,1 | | | 62,000 | | | 13,920 | |
| Dongyue Group Ltd. | | | 42,000 | | | 10,080 | |
| North Mining Shares Company Ltd. — Class C* | | | 400,000 | | | 5,574 | |
| Total Basic Materials | | | | | | 420,627 | |
| | | | | | | | |
| Diversified - 0.8% | | | | | | | |
| China Merchants Holdings International Company Ltd. | | | 58,000 | | | 193,831 | |
| Carnival Group International Holdings Ltd.* | | | 280,000 | | | 35,045 | |
| Total Diversified | | | | | | 228,876 | |
| | | | | | | | |
| Total Common Stocks | | | | | | | |
| (Cost $33,819,071) | | | | | | 29,294,764 | |
| | | | | | | | |
SECURITIES LENDING COLLATERAL†,4 - 14.0% | | | | | | | |
| BNY Mellon Separately Managed Cash Collateral | | | | | | | |
| Account, 0.1276% | | | 4,092,518 | | | 4,092,518 | |
| Total Securities Lending Collateral | | | | | | | |
| (Cost $4,092,518) | | | | | | 4,092,518 | |
| Total Investments - 113.9% | | | | | | | |
| (Cost $37,911,589) | | | | | $ | 33,387,282 | |
| Other Assets & Liabilities, net - (13.9)% | | | | | | (4,079,158 | ) |
| Total Net Assets - 100.0% | | | | | $ | 29,308,124 | |
| * | | Non-income producing security. |
| † | | Value determined based on Level 1 inputs, unless otherwise noted —See Note 4. |
| †† | | Value determined based on Level 2 inputs — See Note 4. |
| ††† | | Value determined based on Level 3 inputs — See Note 4. |
| 1 | | All or a portion of this security is on loan at August 31, 2015 — See Note 2. |
| 2 | | Security is a 144A or Section 4(a)(2) security. The total market value of 144A or Section 4(a)(2) securities is $171,850 (cost $183,491), or 0.6% of total net assets. These securities have been determined to be liquid under guidelines established by the Board of Trustees. |
| 3 | | Security was fair valued by the Valuation Committee at August 31, 2015. The total market value of fair valued securities amounts to $131,286, (cost $258,889) or 0.4% of total net assets. |
| 4 | | Securities lending collateral — See Note 2. |
| | | |
| ADR | | American Depositary Receipt |
| Country Diversification |
| | | % of Common |
| Country | | Stocks |
| China | | 99.4% |
| Singapore | | 0.4% |
| United States | | 0.2% |
| Total Common Stocks | | 100.0% |
| Currency Denomination |
| | | % of Common |
| Currency | | Stocks |
| Hong Kong Dollar | | 86.2% |
| United States Dollar | | 12.7% |
| Chinese Yuan Renminbi | | 0.7% |
| Singapore Dollar | | 0.4% |
| Total Common Stocks | | 100.0% |
| See notes to financial statements. |
| 30 | CLAYMORE EXCHANGE-TRADED FUND TRUST 2 ANNUAL REPORT |
| SCHEDULE OF INVESTMENTS continued | August 31, 2015 |
CQQQ Guggenheim China Technology ETF
| | | | Shares | | | Value | |
COMMON STOCKS† - 99.9% | | | | | | | |
| Communications - 55.7% | | | | | | | |
| Tencent Holdings Ltd. | | | 324,557 | | $ | 5,519,528 | |
| Baidu, Inc. ADR* | | | 28,341 | | | 4,173,213 | |
| Alibaba Group Holding Ltd. ADR* | | | 59,986 | | | 3,966,274 | |
| Qihoo 360 Technology Company Ltd. ADR* | | | 39,093 | | | 2,066,847 | |
SINA Corp.*,1 | | | 33,748 | | | 1,307,735 | |
Youku Tudou, Inc. ADR*,1 | | | 65,600 | | | 1,089,616 | |
YY, Inc. ADR*,1 | | | 16,957 | | | 926,191 | |
| ZTE Corp. — Class H | | | 436,136 | | | 879,019 | |
Sohu.com, Inc.*,1 | | | 17,576 | | | 831,872 | |
| Autohome, Inc. ADR* | | | 23,916 | | | 744,266 | |
SouFun Holdings Ltd. ADR1 | | | 115,856 | | | 632,574 | |
21Vianet Group, Inc. ADR*,1 | | | 26,842 | | | 477,519 | |
58.com, Inc. ADR*,1 | | | 9,253 | | | 420,641 | |
| Bitauto Holdings Ltd.* | | | 13,410 | | | 360,059 | |
| Coolpad Group Ltd. | | | 1,562,670 | | | 290,352 | |
| TCL Communication Technology Holdings Ltd. | | | 368,799 | | | 249,354 | |
| BYD Electronic International Company Ltd. | | | 363,223 | | | 209,965 | |
| China All Access Holdings Ltd. | | | 657,310 | | | 206,945 | |
Suncorp Technologies Ltd.*,1 | | | 7,014,727 | | | 205,462 | |
China Fiber Optic Network System Group Ltd.††,1 | | | 821,733 | | | 166,466 | |
Renren, Inc. ADR*,1 | | | 51,380 | | | 162,875 | |
| Weibo Corp ADR* | | | 10,449 | | | 126,746 | |
| V1 Group Ltd.* | | | 1,691,972 | | | 113,525 | |
Comba Telecom Systems Holdings Ltd.1 | | | 577,604 | | | 112,539 | |
Phoenix New Media Ltd. ADR*,1 | | | 17,170 | | | 82,244 | |
China Public Procurement Ltd.*,1 | | | 4,953,802 | | | 75,425 | |
| Pacific Online Ltd. | | | 229,315 | | | 64,800 | |
| Synertone Communication Corp. | | | 2,840,980 | | | 57,186 | |
| Total Communications | | | | | | 25,519,238 | |
| | | | | | | | |
| Technology - 25.2% | | | | | | | |
| NetEase, Inc. ADR | | | 30,149 | | | 3,351,966 | |
| Lenovo Group Ltd. | | | 2,758,701 | | | 2,263,900 | |
| Semiconductor Manufacturing International Corp.* | | | 15,329,220 | | | 1,345,007 | |
Kingsoft Corporation Ltd.1 | | | 487,158 | | | 1,027,111 | |
| TravelSky Technology Ltd. — Class H | | | 541,047 | | | 655,536 | |
NetDragon Websoft, Inc.1 | | | 148,821 | | | 355,248 | |
PAX Global Technology Ltd.1 | | | 379,727 | | | 353,756 | |
| Shanda Games Ltd. ADR* | | | 54,576 | | | 353,107 | |
Kingdee International Software Group Company Ltd.1 | | | 979,258 | | | 336,104 | |
Chinasoft International Ltd.*,1 | | | 727,230 | | | 238,342 | |
| Ju Teng International Holdings Ltd. | | | 510,033 | | | 194,798 | |
| Shunfeng International Clean Energy Ltd.* | | | 730,121 | | | 175,228 | |
| Changyou.com Ltd. ADR* | | | 6,585 | | | 138,219 | |
NQ Mobile, Inc. ADR*,1 | | | 30,175 | | | 124,321 | |
Tian Ge Interactive Holdings Ltd.2 | | | 329,182 | | | 123,177 | |
| Boyaa Interactive International Ltd. | | | 267,001 | | | 113,001 | |
Cheetah Mobile Inc ADR*,1 | | | 6,354 | | | 109,734 | |
| Shanghai Fudan Microelectronics Group Company | | | | | | | |
| Ltd. — Class H | | | 149,204 | | | 98,570 | |
TPV Technology Ltd.1 | | | 532,802 | | | 81,810 | |
| China ITS Holdings Company Ltd.* | | | 660,793 | | | 77,589 | |
| Total Technology | | | | | | 11,516,524 | |
| | | | | | | | |
| Industrial - 9.4% | | | | | | | |
| AAC Technologies Holdings, Inc. | | | 428,228 | | | 2,411,875 | |
Sunny Optical Technology Group Company Ltd.1 | | | 388,862 | | | 648,266 | |
| Wasion Group Holdings Ltd. | | | 279,633 | | | 269,529 | |
| Tongda Group Holdings Ltd. | | | 1,702,040 | | | 263,540 | |
| Truly International Holdings Ltd. | | | 825,856 | | | 203,532 | |
| Hi Sun Technology China Ltd.* | | | 1,051,302 | | | 173,633 | |
| China Aerospace International Holdings Ltd. | | | 1,080,357 | | | 151,946 | |
GCL New Energy Holdings Ltd.*,1 | | | 1,573,577 | | | 95,429 | |
| Yingli Green Energy Holding Company Ltd. ADR* | | | 73,262 | | | 54,947 | |
| Kingwell Group Ltd.* | | | 986,146 | | | 40,082 | |
| Total Industrial | | | | | | 4,312,779 | |
| | | | | | | | |
| Energy - 5.4% | | | | | | | |
| GCL-Poly Energy Holdings Ltd. | | | 6,090,446 | | | 974,465 | |
| Xinyi Solar Holdings Ltd. | | | 1,939,968 | | | 648,321 | |
Trina Solar Ltd. ADR*,1 | | | 50,463 | | | 449,121 | |
JinkoSolar Holding Company Ltd. ADR*,1 | | | 11,647 | | | 237,016 | |
JA Solar Holdings Company Ltd. ADR*,1 | | | 22,492 | | | 180,161 | |
| Total Energy | | | | | | 2,489,084 | |
| | | | | | | | |
| Basic Materials - 1.8% | | | | | | | |
| Kingboard Chemical Holdings Ltd. | | | 354,591 | | | 460,279 | |
| Kingboard Laminates Holdings Ltd. | | | 623,653 | | | 247,850 | |
| Landing International Development Ltd.* | | | 3,850,055 | | | 118,730 | |
| Total Basic Materials | | | | | | 826,859 | |
| | | | | | | | |
| Consumer, Cyclical - 1.3% | | | | | | | |
| Digital China Holdings Ltd.* | | | 523,490 | | | 457,966 | |
| VST Holdings Ltd. | | | 420,800 | | | 125,425 | |
| Total Consumer, Cyclical | | | | | | 583,391 | |
| See notes to financial statements. |
| CLAYMORE EXCHANGE-TRADED FUND TRUST 2 ANNUAL REPORT | 31 |
| SCHEDULE OF INVESTMENTS continued | August 31, 2015 |
CQQQ Guggenheim China Technology ETF continued
| | | | Shares | | | Value | |
COMMON STOCKS† - 99.9% (continued) | | | | | | | |
| Consumer, Non-cyclical - 0.9% | | | | | | | |
| China Innovationpay Group Ltd.* | | | 2,550,566 | | $ | 154,678 | |
| HC International, Inc.* | | | 252,254 | | | 108,388 | |
Goldpac Group Ltd.1 | | | 183,625 | | | 99,275 | |
Anxin-China Holdings Ltd.†††,3 | | | 2,144,054 | | | 47,031 | |
| Total Consumer, Non-cyclical | | | | | | 409,372 | |
| | | | | | | | |
| Diversified - 0.2% | | | | | | | |
| Beijing Development HK Ltd.* | | | 420,555 | | | 91,165 | |
| | | | | | | | |
| Total Common Stocks | | | | | | | |
| (Cost $59,152,490) | | | | | | 45,748,412 | |
| | | | | | | | |
SECURITIES LENDING COLLATERAL†,4 - 22.7% | | | | | | | |
| BNY Mellon Separately Managed Cash Collateral | | | | | | | |
| Account, 0.1277% | | | 10,416,106 | | | 10,416,106 | |
| Total Securities Lending Collateral | | | | | | | |
| (Cost $10,416,106) | | | | | | 10,416,106 | |
| Total Investments - 122.6% | | | | | | | |
| (Cost $69,568,596) | | | | | $ | 56,164,518 | |
| Other Assets & Liabilities, net - (22.6)% | | | | | | (10,360,982 | ) |
| Total Net Assets - 100.0% | | | | | $ | 45,803,536 | |
| * | | Non-income producing security. |
| † | | Value determined based on Level 1 inputs, unless otherwise noted —See Note 4. |
| †† | | Value determined based on Level 2 inputs — See Note 4. |
| ††† | | Value determined based on Level 3 inputs — See Note 4. |
| 1 | | All or a portion of this security is on loan at August 31, 2015 — See Note 2. |
| 2 | | Security is a 144A or Section 4(a)(2) security. The total market value of 144A or Section 4(a)(2) securities is $123,177 (cost $181,359), or 0.3% of total net assets. These securities have been determined to be liquid under guidelines established by the Board of Trustees. |
| 3 | | Security was fair valued by the Valuation Committee at August 31, 2015. The total market value of fair valued securities amounts to $47,031, (cost $436,315) or 0.1% of total net assets. |
| 4 | | Securities lending collateral — See Note 2. |
| | | |
| ADR | | American Depositary Receipt |
| Country Diversification |
| | | % of Common |
| Country | | Stocks |
| China | | 100.0% |
| Currency Denomination |
| | | % of Common |
| Currency | | Stocks |
| Hong Kong Dollar | | 51.1% |
| United States Dollar | | 48.9% |
| Total Common Stocks | | 100.0% |
| See notes to financial statements. |
| 32 | CLAYMORE EXCHANGE-TRADED FUND TRUST 2 ANNUAL REPORT |
| SCHEDULE OF INVESTMENTS continued | August 31, 2015 |
EMRE Guggenheim Emerging Markets Real Estate ETF
| | | | Shares | | | Value | |
COMMON STOCKS† - 100.0% | | | | | | | |
| China - 33.3% | | | | | | | |
| China Overseas Land & Investment Ltd. | | | 42,000 | | $ | 123,020 | |
| China Resources Land Ltd. | | | 32,000 | | | 79,856 | |
Evergrande Real Estate Group Ltd.1 | | | 76,000 | | | 50,013 | |
| China Vanke Company Ltd. — Class H | | | 21,000 | | | 47,744 | |
| Country Garden Holdings Company Ltd. | | | 128,000 | | | 44,924 | |
| Sino-Ocean Land Holdings Ltd. | | | 66,000 | | | 34,490 | |
| Shimao Property Holdings Ltd. | | | 22,500 | | | 31,587 | |
| Longfor Properties Company Ltd. | | | 22,500 | | | 27,203 | |
| Yuexiu Property Company Ltd. | | | 120,000 | | | 18,890 | |
| Sunac China Holdings Ltd. | | | 32,000 | | | 17,301 | |
| KWG Property Holding Ltd. | | | 26,631 | | | 16,838 | |
| Carnival Group International Holdings Ltd.* | | | 130,000 | | | 16,271 | |
| Guangzhou R&F Properties Company Ltd. — Class H | | | 17,200 | | | 15,713 | |
| SOHO China Ltd. | | | 34,000 | | | 14,521 | |
| Shenzhen Investment Ltd. | | | 38,000 | | | 13,435 | |
| Shui On Land Ltd. | | | 60,500 | | | 13,271 | |
| China South City Holdings Ltd. | | | 50,000 | | | 12,903 | |
| Agile Property Holdings Ltd. | | | 26,000 | | | 12,748 | |
Greentown China Holdings Ltd.*,1 | | | 16,000 | | | 12,408 | |
Renhe Commercial Holdings Company Ltd.*,1 | | | 198,000 | | | 10,986 | |
| Franshion Properties China Ltd. | | | 42,000 | | | 10,513 | |
| Poly Property Group Company Ltd. | | | 36,000 | | | 9,615 | |
| E-House China Holdings Ltd. ADR | | | 1,305 | | | 7,373 | |
| Beijing Capital Land Ltd. — Class H | | | 18,000 | | | 7,200 | |
| Logan Property Holdings Company Ltd. | | | 14,000 | | | 5,979 | |
| Colour Life Services Group Company Ltd. | | | 8,000 | | | 5,915 | |
| Glorious Property Holdings Ltd.* | | | 42,000 | | | 4,552 | |
| China Overseas Grand Oceans Group Ltd. | | | 14,000 | | | 4,426 | |
| Wuzhou International Holdings Ltd.* | | | 26,000 | | | 4,261 | |
| Wanda Hotel Development Company Ltd.* | | | 28,000 | | | 4,155 | |
| Shanghai Industrial Urban Development Group Ltd.* | | | 26,000 | | | 4,126 | |
| Fantasia Holdings Group Company Ltd. | | | 30,000 | | | 3,174 | |
| Yuzhou Properties Company Ltd. | | | 14,000 | | | 2,999 | |
| Hydoo International Holding Ltd. | | | 20,000 | | | 2,374 | |
Kaisa Group Holdings Ltd.*,†††,2 | | | 45,000 | | | — | |
| Total China | | | | | | 690,784 | |
| | | | | | | | |
| South Africa - 13.4% | | | | | | | |
| Growthpoint Properties Ltd. REIT | | | 34,462 | | | 67,967 | |
| Redefine Properties Ltd. REIT | | | 56,570 | | | 48,960 | |
| Resilient Property Income Fund Ltd. | | | 5,007 | | | 42,278 | |
| Hyprop Investments Ltd. REIT | | | 3,220 | | | 30,102 | |
| Capital Property Fund Ltd. REIT | | | 23,393 | | | 27,513 | |
| Attacq Ltd.* | | | 11,739 | | | 19,736 | |
| Vukile Property Fund Ltd. REIT | | | 7,865 | | | 10,851 | |
| Emira Property Fund Ltd. REIT | | | 7,434 | | | 9,853 | |
| S.A. Corporate Real Estate Fund Nominees Pty Ltd. REIT | | | 24,043 | | | 9,244 | |
| Arrowhead Properties Ltd. — Class A REIT | | | 6,200 | | | 4,534 | |
| Arrowhead Properties Ltd. — Class B REIT | | | 6,113 | | | 4,447 | |
| Total South Africa | | | | | | 275,485 | |
| | | | | | | | |
| United Arab Emirates - 8.8% | | | | | | | |
| Emaar Properties PJSC | | | 64,593 | | | 118,704 | |
| Aldar Properties PJSC | | | 70,369 | | | 44,639 | |
| Union Properties PJSC | | | 23,654 | | | 6,375 | |
| Deyaar Development PJSC* | | | 34,677 | | | 6,278 | |
| Eshraq Properties Company PJSC* | | | 26,547 | | | 4,553 | |
| Total United Arab Emirates | | | | | | 180,549 | |
| | | | | | | | |
| Philippines - 8.7% | | | | | | | |
| Ayala Land, Inc. | | | 92,900 | | | 71,454 | |
| SM Prime Holdings, Inc. | | | 153,600 | | | 64,083 | |
| Megaworld Corp. | | | 217,000 | | | 20,103 | |
| Robinsons Land Corp. | | | 25,800 | | | 16,008 | |
| Vista Land & Lifescapes, Inc. | | | 54,400 | | | 6,785 | |
| Belle Corp . | | | 400 | | | 26 | |
| Total Philippines | | | | | | 178,459 | |
| | | | | | | | |
| Mexico - 7.4% | | | | | | | |
| Fibra Uno Administracion S.A. de CV REIT | | | 38,511 | | | 82,369 | |
| Mexico Real Estate Management S.A. de CV REIT* | | | 12,800 | | | 17,362 | |
| PLA Administradora Industrial S de RL de CV REIT* | | | 8,200 | | | 15,305 | |
| Corporation Inmobiliaria Vesta SAB de CV | | | 5,414 | | | 8,376 | |
| Prologis Property Mexico S.A. de CV REIT* | | | 5,170 | | | 8,023 | |
| Concentradora Fibra Hotelera Mexicana S.A. de CV REIT | | | 7,700 | | | 7,328 | |
| Concentradora Fibra Danhos S.A. de CV REIT | | | 3,578 | | | 7,201 | |
| Fibra Shop Portafolios Inmobiliarios SAPI de CV REIT | | | 6,053 | | | 5,768 | |
| Asesor de Activos Prisma SAPI de CV REIT | | | 4,200 | | | 3,797 | |
| Total Mexico | | | | | | 155,529 | |
| | | | | | | | |
| Indonesia - 5.1% | | | | | | | |
| Lippo Karawaci Tbk PT | | | 355,200 | | | 27,051 | |
| Summarecon Agung Tbk PT | | | 154,100 | | | 17,768 | |
| Bumi Serpong Damai Tbk PT | | | 146,700 | | | 16,758 | |
| Ciputra Development Tbk PT | | | 180,400 | | | 11,106 | |
| See notes to financial statements. |
| CLAYMORE EXCHANGE-TRADED FUND TRUST 2 ANNUAL REPORT | 33 |
| SCHEDULE OF INVESTMENTS continued | August 31, 2015 |
EMRE Guggenheim Emerging Markets Real Estate ETF continued
| | | | Shares | | | Value | |
COMMON STOCKS† - 100.0% (continued) | | | | | | | |
| Indonesia - 5.1% (continued) | | | | | | | |
| Pakuwon Jati Tbk PT | | | 409,500 | | $ | 11,075 | |
| Alam Sutera Realty Tbk PT | | | 167,700 | | | 4,225 | |
| Kawasan Industri Jababeka Tbk PT | | | 286,519 | | | 4,017 | |
| Modernland Realty Tbk PT | | | 150,000 | | | 3,843 | |
| Intiland Development Tbk PT | | | 103,300 | | | 3,661 | |
| Lippo Cikarang Tbk PT* | | | 6,600 | | | 3,323 | |
| Sentul City Tbk PT* | | | 376,800 | | | 1,636 | |
| Total Indonesia | | | | | | 104,463 | |
| | | | | | | | |
| Thailand - 4.8% | | | | | | | |
| Central Pattana PCL | | | 22,800 | | | 28,623 | |
| Land & Houses PCL | | | 56,900 | | | 12,382 | |
| Hemaraj Land and Development PCL | | | 78,200 | | | 9,381 | |
| Pruksa Real Estate PCL | | | 11,700 | | | 8,323 | |
| Bangkok Land PCL | | | 193,200 | | | 7,708 | |
| Quality Houses PCL | | | 77,116 | | | 5,077 | |
| Supalai PCL | | | 10,600 | | | 4,968 | |
| WHA Corporation PCL* | | | 46,000 | | | 4,440 | |
| LPN Development PCL | | | 9,500 | | | 4,134 | |
| Sansiri PCL | | | 88,800 | | | 3,914 | |
| U City PCL — Class F* | | | 2,858,600 | | | 3,190 | |
| TICON Industrial Connection PCL — Class F | | | 8,800 | | | 2,897 | |
| Country Group Development PCL* | | | 57,600 | | | 2,057 | |
| Total Thailand | | | | | | 97,094 | |
| | | | | | | | |
| Malaysia - 3.9% | | | | | | | |
| KLCCP Stapled Group | | | 7,300 | | | 12,167 | |
| IOI Properties Group BHD | | | 25,500 | | | 11,111 | |
| Sunway BHD | | | 11,400 | | | 9,229 | |
| IGB Real Estate Investment Trust REIT | | | 26,600 | | | 8,297 | |
| SP Setia BHD Group | | | 10,000 | | | 7,357 | |
| Sunway Real Estate Investment Trust REIT | | | 18,100 | | | 6,421 | |
| UEM Sunrise BHD | | | 31,100 | | | 6,257 | |
| Eastern & Oriental BHD | | | 14,740 | | | 5,370 | |
| Mah Sing Group BHD | | | 15,375 | | | 5,088 | |
| CapitaMalls Malaysia Trust REIT | | | 13,800 | | | 4,370 | |
| IGB Corporation BHD | | | 5,900 | | | 3,709 | |
| Sunway Construction Group BHD* | | | 1,140 | | | 304 | |
| Total Malaysia | | | | | | 79,680 | |
| | | | | | | | |
| Brazil - 3.2% | | | | | | | |
| BR Malls Participacoes S.A. | | | 8,936 | | | 27,478 | |
| Multiplan Empreendimentos Imobiliarios S.A. | | | 1,438 | | | 16,258 | |
| BR Properties S.A. | | | 3,702 | | | 10,266 | |
| Iguatemi Empresa de Shopping Centers S.A. | | | 1,144 | | | 6,470 | |
| Aliansce Shopping Centers S.A. | | | 1,306 | | | 3,980 | |
| LPS Brasil Consultoria de Imoveis S.A. | | | 1,401 | | | 1,227 | |
| Total Brazil | | | | | | 65,679 | |
| | | | | | | | |
| Taiwan, Province of China - 3.0% | | | | | | | |
| Highwealth Construction Corp.* | | | 11,000 | | | 17,006 | |
| Ruentex Development Company Ltd. | | | 14,000 | | | 14,974 | |
| Huaku Development Company Ltd. | | | 4,000 | | | 6,454 | |
| Prince Housing & Development Corp. | | | 20,000 | | | 5,674 | |
| Farglory Land Development Company Ltd. | | | 5,000 | | | 4,641 | |
| Chong Hong Construction Company Ltd. | | | 3,000 | | | 4,186 | |
| Radium Life Tech Company Ltd.* | | | 12,240 | | | 3,856 | |
| Hung Sheng Construction Ltd.* | | | 8,000 | | | 3,664 | |
| Kindom Construction Corp. | | | 6,000 | | | 2,729 | |
| Total Taiwan, Province of China | | | | | | 63,184 | |
| | | | | | | | |
| Qatar - 1.9% | | | | | | | |
| Barwa Real Estate Co. | | | 2,135 | | | 25,800 | |
| United Development Company QSC | | | 1,789 | | | 11,492 | |
| Total Qatar | | | | | | 37,292 | |
| | | | | | | | |
| Egypt - 1.6% | | | | | | | |
| Talaat Moustafa Group | | | 19,449 | | | 18,356 | |
| Medinet Nasr Housing* | | | 2,110 | | | 5,737 | |
| Six of October Development & Investment* | | | 4,119 | | | 4,992 | |
| Palm Hills Developments SAE* | | | 15,499 | | | 4,097 | |
| Total Egypt | | | | | | 33,182 | |
| | | | | | | | |
| Turkey - 1.4% | | | | | | | |
| Emlak Konut Gayrimenkul Yatirim Ortakligi AS REIT | | | 34,213 | | | 29,265 | |
| | | | | | | | |
| India - 1.1% | | | | | | | |
| DLF Ltd . | | | 7,700 | | | 12,846 | |
| Housing Development & Infrastructure Ltd.* | | | 5,000 | | | 4,509 | |
| Indiabulls Real Estate Ltd.* | | | 4,000 | | | 3,722 | |
| Unitech Ltd.* | | | 27,000 | | | 2,457 | |
| Total India | | | | | | 23,534 | |
| See notes to financial statements. |
| 34 | CLAYMORE EXCHANGE-TRADED FUND TRUST 2 ANNUAL REPORT |
| SCHEDULE OF INVESTMENTS continued | August 31, 2015 |
EMRE Guggenheim Emerging Markets Real Estate ETF continued
| | | | Shares | | | Value | |
COMMON STOCKS† - 100.0% (continued) | | | | | | | |
| Chile - 0.9% | | | | | | | |
| Parque Arauco S.A. | | | 10,639 | | $ | 18,597 | |
| | | | | | | | |
| Russian Federation - 0.6% | | | | | | | |
| LSR Group GDR | | | 3,741 | | | 7,482 | |
| Etalon Group Ltd. GDR | | | 2,276 | | | 4,211 | |
| Total Russian Federation | | | | | | 11,693 | |
| | | | | | | | |
| Poland - 0.3% | | | | | | | |
| Globe Trade Centre S.A.* | | | 4,515 | | | 7,061 | |
| | | | | | | | |
| Morocco - 0.3% | | | | | | | |
| Douja Promotion Groupe Addoha S.A. | | | 2,087 | | | 6,034 | |
| Alliances Developpement Immobilier S.A. | | | 85 | | | 472 | |
| Total Morocco | | | | | | 6,506 | |
| | | | | | | | |
| Greece - 0.3% | | | | | | | |
| Grivalia Properties REIC REIT | | | 703 | | | 6,144 | |
| | | | | | | | |
| Total Common Stocks | | | | | | | |
| (Cost $2,457,428) | | | | | | 2,064,180 | |
| | | | | | | | |
SECURITIES LENDING COLLATERAL†,3 - 3.7% | | | | | | | |
| BNY Mellon Separately Managed Cash Collateral | | | | | | | |
| Account, 0.1371% | | | 76,171 | | | 76,171 | |
| Total Securities Lending Collateral | | | | | | | |
| (Cost $76,171) | | | | | | 76,171 | |
| Total Investments - 103.7% | | | | | | | |
| (Cost $2,533,599) | | | | | $ | 2,140,351 | |
| Other Assets & Liabilities, net - (3.7)% | | | | | | (76,720 | ) |
| Total Net Assets - 100.0% | | | | | $ | 2,063,631 | |
| * | | Non-income producing security. |
| † | | Value determined based on Level 1 inputs, unless otherwise noted —See Note 4. |
| ††† | | Value determined based on Level 3 inputs — See Note 4. |
| 1 | | All or a portion of this security is on loan at August 31, 2015 — See Note 2. |
| 2 | | Security was fair valued by the Valuation Committee at August 31, 2015. The total market value of fair valued securities amounts to $0, (cost $16,584) or less than 0.1% of total net assets. |
| 3 | | Securities lending collateral — See Note 2. |
| | | |
| ADR | | American Depositary Receipt |
| GDR | | Global Depositary Receipt |
| Country Diversification |
| | | % of Common |
| Country | | Stocks |
| China | | 33.5% |
| South Africa | | 13.4% |
| United Arab Emirates | | 8.8% |
| Philippines | | 8.7% |
| Mexico | | 7.5% |
| Indonesia | | 5.1% |
| All Other Countries | | 23.0% |
| Total Common Stocks | | 100.0% |
| Currency Denomination |
| | | % of Common |
| Currency | | Stocks |
| Hong Kong Dollar | | 30.7% |
| South African Rand | | 13.4% |
| United Arab Emirates Dirham | | 8.8% |
| Philippine Peso | | 8.7% |
| Mexican Nuevo Peso | | 7.5% |
| All Other Currencies | | 30.9% |
| Total Common Stocks | | 100.0% |
| See notes to financial statements. |
| CLAYMORE EXCHANGE-TRADED FUND TRUST 2 ANNUAL REPORT | 35 |
| SCHEDULE OF INVESTMENTS continued | August 31, 2015 |
TAN Guggenheim Solar ETF
| | | | Shares | | | Value | |
COMMON STOCKS† - 99.5% | | | | | | | |
| United States - 41.2% | | | | | | | |
| First Solar, Inc.* | | | 472,797 | | $ | 22,618,608 | |
SolarCity Corp.*,1 | | | 395,460 | | | 19,092,809 | |
SunPower Corp. — Class A*,1 | | | 588,468 | | | 14,276,233 | |
| Advanced Energy Industries, Inc.* | | | 453,201 | | | 10,999,188 | |
| TerraForm Power, Inc. — Class A | | | 462,307 | | | 10,401,908 | |
SunEdison, Inc.*,1 | | | 989,973 | | | 10,295,719 | |
Vivint Solar, Inc.*,1 | | | 819,208 | | | 10,190,948 | |
SolarEdge Technologies, Inc.*,1 | | | 277,379 | | | 6,967,760 | |
Enphase Energy, Inc.*,1 | | | 1,116,595 | | | 5,136,337 | |
| Total United States | | | | | | 109,979,510 | |
| | | | | | | | |
| Cayman Islands - 32.4% | | | | | | | |
GCL-Poly Energy Holdings Ltd.1 | | | 86,228,348 | | | 13,796,447 | |
Xinyi Solar Holdings Ltd.1 | | | 40,356,000 | | | 13,486,628 | |
Trina Solar Ltd. ADR*,1 | | | 1,292,332 | | | 11,501,755 | |
JA Solar Holdings Company Ltd. ADR*,1 | | | 1,290,406 | | | 10,336,152 | |
JinkoSolar Holding Company Ltd. ADR*,1 | | | 454,172 | | | 9,242,400 | |
Hanwha Q Cells Co. Ltd.*,1 | | | 455,815 | | | 6,012,200 | |
Daqo New Energy Corp.*,1 | | | 405,712 | | | 5,708,368 | |
| Yingli Green Energy Holding Company Ltd. ADR* | | | 7,570,064 | | | 5,677,548 | |
| Shunfeng International Clean Energy Ltd.* | | | 22,596,000 | | | 5,423,005 | |
| Comtec Solar Systems Group Ltd.* | | | 56,518,475 | | | 5,177,788 | |
| Total Cayman Islands | | | | | | 86,362,291 | |
| | | | | | | | |
| Germany - 6.0% | | | | | | | |
SMA Solar Technology AG1 | | | 411,582 | | | 16,035,141 | |
| | | | | | | | |
| Switzerland - 4.9% | | | | | | | |
Meyer Burger Technology AG*,1 | | | 1,608,745 | | | 13,009,034 | |
| | | | | | | | |
| Canada - 3.7% | | | | | | | |
Canadian Solar, Inc.*,1 | | | 524,278 | | | 9,814,484 | |
| | | | | | | | |
| Norway - 3.3% | | | | | | | |
REC Silicon ASA*,1 | | | 55,780,398 | | | 8,913,742 | |
| | | | | | | | |
| United Kingdom - 3.3% | | | | | | | |
Abengoa Yield plc1 | | | 385,053 | | | 8,763,806 | |
| | | | | | | | |
| British Virgin Islands - 2.7% | | | | | | | |
ReneSola Ltd. ADR*,1 | | | 5,755,344 | | | 7,136,627 | |
| | | | | | | | |
| Bermuda - 2.0% | | | | | | | |
China Singyes Solar Technologies Holdings Ltd.1 | | | 8,484,245 | | | 5,265,672 | |
| | | | | | | | |
| Total Common Stocks | | | | | | | |
| (Cost $410,299,582) | | | | | | 265,280,307 | |
| | | | | | | | |
SECURITIES LENDING COLLATERAL†,2 – 43.1% | | | | | | | |
| BNY Mellon Separately Managed Cash Collateral | | | | | | | |
| Account, 0.1277% | | | 114,747,111 | | | 114,747,111 | |
| Total Securities Lending Collateral | | | | | | | |
| (Cost $114,747,111) | | | | | | 114,747,111 | |
| Total Investments – 142.6% | | | | | | | |
| (Cost $525,046,693) | | | | | $ | 380,027,418 | |
| Other Assets & Liabilities, net - (42.6)% | | | | | | (113,482,165 | ) |
| Total Net Assets - 100.0% | | | | | $ | 266,545,253 | |
| * | | Non-income producing security. |
| † | | Value determined based on Level 1 inputs — See Note 4. |
| 1 | | All or a portion of this security is on loan at August 31, 2015 — See Note 2. |
| 2 | | Securities lending collateral — See Note 2. |
| | | |
| ADR | | American Depositary Receipt |
| plc | | Public Limited Company |
| Country Diversification |
| | | % of Common |
| Country | | Stocks |
| United States | | 41.5% |
| Cayman Islands | | 32.6% |
| Germany | | 6.0% |
| Switzerland | | 4.9% |
| Canada | | 3.7% |
| Norway | | 3.3% |
| United Kingdom | | 3.3% |
| British Virgin Islands | | 2.7% |
| Bermuda | | 2.0% |
| Total Common Stocks | | 100.0% |
| Currency Denomination |
| | | % of Common |
| Currency | | Stocks |
| United States Dollar | | 69.4% |
| Hong Kong Dollar | | 16.3% |
| Euro | | 6.0% |
| Swiss Franc | | 4.9% |
| Norwegian Krone | | 3.4% |
| Total Common Stocks | | 100.0% |
| See notes to financial statements. |
| 36 | CLAYMORE EXCHANGE-TRADED FUND TRUST 2 ANNUAL REPORT |
| SCHEDULE OF INVESTMENTS continued | August 31, 2015 |
CGW Guggenheim S&P Global Water Index ETF
| | | | Shares | | | Value | |
COMMON STOCKS† - 99.5% | | | | | | | |
| United States - 32.0% | | | | | | | |
| American Water Works Company, Inc. | | | 398,572 | | $ | 20,701,830 | |
| Danaher Corp. | | | 221,383 | | | 19,264,749 | |
| Xylem, Inc. | | | 369,766 | | | 11,998,907 | |
| IDEX Corp. | | | 158,671 | | | 11,397,338 | |
| Aqua America, Inc. | | | 392,000 | | | 9,941,120 | |
| Rexnord Corp.* | | | 206,255 | | | 4,135,413 | |
| Mueller Industries, Inc. | | | 115,453 | | | 3,672,560 | |
| Tetra Tech, Inc. | | | 136,696 | | | 3,551,362 | |
| American States Water Co. | | | 84,731 | | | 3,198,595 | |
| Watts Water Technologies, Inc. — Class A | | | 57,479 | | | 3,152,723 | |
| Mueller Water Products, Inc. — Class A | | | 324,030 | | | 2,900,069 | |
| Franklin Electric Company, Inc. | | | 80,039 | | | 2,344,342 | |
| Itron, Inc.* | | | 77,629 | | | 2,328,870 | |
| California Water Service Group | | | 105,976 | | | 2,186,285 | |
Lindsay Corp.1 | | | 24,371 | | | 1,857,801 | |
| Calgon Carbon Corp. | | | 107,054 | | | 1,740,698 | |
| Badger Meter, Inc. | | | 29,315 | | | 1,708,771 | |
| Aegion Corp. — Class A* | | | 82,780 | | | 1,523,152 | |
| Advanced Drainage Systems, Inc. | | | 49,691 | | | 1,411,721 | |
| Gorman-Rupp Co. | | | 38,349 | | | 926,895 | |
| Connecticut Water Service, Inc. | | | 24,637 | | | 856,136 | |
| Total United States | | | | | | 110,799,337 | |
| | | | | | | | |
| United Kingdom - 17.8% | | | | | | | |
| United Utilities Group plc | | | 1,511,671 | | | 19,878,324 | |
| Severn Trent plc | | | 528,298 | | | 16,876,090 | |
| Pennon Group plc | | | 884,787 | | | 10,484,983 | |
| Halma L.C. plc | | | 766,425 | | | 8,899,651 | |
| Rotork plc | | | 1,759,766 | | | 5,659,334 | |
| Total United Kingdom | | | | | | 61,798,382 | |
| | | | | | | | |
| France - 10.2% | | | | | | | |
| Veolia Environnement S.A. | | | 968,431 | | | 21,214,226 | |
| Suez Environnement Co. | | | 766,493 | | | 13,814,685 | |
| Total France | | | | | | 35,028,911 | |
| | | | | | | | |
| Switzerland - 8.4% | | | | | | | |
| Geberit AG | | | 76,663 | | | 24,361,244 | |
| Sulzer AG | | | 47,949 | | | 4,891,338 | |
| Total Switzerland | | | | | | 29,252,582 | |
| | | | | | | | |
| Ireland - 5.9% | | | | | | | |
| Pentair plc | | | 370,032 | | | 20,459,069 | |
| | | | | | | | |
| China - 5.1% | | | | | | | |
| Guangdong Investment Ltd. | | | 6,378,000 | | | 8,624,646 | |
| China Everbright International Ltd. | | | 6,063,000 | | | 7,932,700 | |
Kangda International Environmental Company Ltd.*,2 | | | 2,154,000 | | | 564,205 | |
| China Water Industry Group Ltd.* | | | 2,213,771 | | | 428,469 | |
| Total China | | | | | | 17,550,020 | |
| | | | | | | | |
| Sweden - 3.1% | | | | | | | |
| Alfa Laval AB | | | 633,431 | | | 10,660,139 | |
| | | | | | | | |
| Netherlands - 2.9% | | | | | | | |
| Aalberts Industries N.V. | | | 195,124 | | | 6,058,414 | |
Arcadis N.V.1 | | | 149,237 | | | 3,745,728 | |
| Total Netherlands | | | | | | 9,804,142 | |
| | | | | | | | |
| Japan - 2.5% | | | | | | | |
| Kurita Water Industries Ltd. | | | 229,600 | | | 4,785,820 | |
| Ebara Corp. | | | 1,031,000 | | | 4,117,704 | |
| Total Japan | | | | | | 8,903,524 | |
| | | | | | | | |
| South Korea - 2.4% | | | | | | | |
| Coway Company Ltd. | | | 117,975 | | | 8,418,592 | |
| | | | | | | | |
| Bermuda - 2.3% | | | | | | | |
Beijing Enterprises Water Group Ltd.1 | | | 10,040,000 | | | 7,189,889 | |
China Water Affairs Group Ltd.1 | | | 1,828,000 | | | 797,239 | |
| Total Bermuda | | | | | | 7,987,128 | |
| | | | | | | | |
| Austria - 2.0% | | | | | | | |
| Andritz AG | | | 147,655 | | | 7,067,912 | |
| | | | | | | | |
| Italy - 1.6% | | | | | | | |
| Hera SpA | | | 1,353,885 | | | 3,458,823 | |
Interpump Group SpA1 | | | 163,417 | | | 2,222,940 | |
| Total Italy | | | | | | 5,681,763 | |
| | | | | | | | |
| Israel - 1.4% | | | | | | | |
| Israel Chemicals Ltd. | | | 873,324 | | | 4,905,754 | |
| | | | | | | | |
| Brazil - 0.9% | | | | | | | |
| Cia de Saneamento Basico do Estado de Sao Paulo ADR | | | 757,636 | | | 3,280,564 | |
| | | | | | | | |
| Spain - 0.7% | | | | | | | |
Fomento de Construcciones y Contratas S.A.*,1 | | | 254,410 | | | 2,332,698 | |
| | | | | | | | |
| Singapore - 0.3% | | | | | | | |
| SIIC Environment Holdings Ltd.* | | | 8,503,200 | | | 1,018,961 | |
| | | | | | | | |
| Total Common Stocks | | | | | | | |
| (Cost $298,737,720) | | | | | | 344,949,478 | |
| See notes to financial statements. |
| CLAYMORE EXCHANGE-TRADED FUND TRUST 2 ANNUAL REPORT | 37 |
| SCHEDULE OF INVESTMENTS continued | August 31, 2015 |
CGW Guggenheim S&P Global Water Index ETF continued
| | | | Face | | | | |
| | | | Amount | | | Value | |
SECURITIES LENDING COLLATERAL†,3 - 1.5% | | | | | | | |
| BNY Mellon Separately Managed Cash Collateral | | | | | | | |
| Account, 0.1277% | | $ | 5,246,450 | | $ | 5,246,450 | |
| Total Securities Lending Collateral | | | | | | | |
| (Cost $5,246,450) | | | | | | 5,246,450 | |
| Total Investments - 101.0% | | | | | | | |
| (Cost $303,984,170) | | | | | $ | 350,195,928 | |
| Other Assets & Liabilities, net - (1.0)% | | | | | | (3,486,742 | ) |
Total Net Assets - 100.0% | | | | | $ | 346,709,186 | |
| * | | Non-income producing security. |
| † | | Value determined based on Level 1 inputs — See Note 4. |
| 1 | | All or a portion of this security is on loan at August 31, 2015 — See Note 2. |
| 2 | | Security is a 144A or Section 4(a)(2) security. The total market value of 144A or Section 4(a)(2) securities is $564,205 (cost $1,325,367), or 0.2% of total net assets. These securities have been determined to be liquid under guidelines established by the Board of Trustees. |
| 3 | | Securities lending collateral — See Note 2. |
| | | |
| ADR | | American Depositary Receipt |
| plc | | Public Limited Company |
| Country Diversification |
| | | % of Common |
| Country | | Stocks |
| United States | | 32.1% |
| United Kingdom | | 17.9% |
| France | | 10.2% |
| Switzerland | | 8.5% |
| Ireland | | 5.9% |
| China | | 5.1% |
| Sweden | | 3.1% |
| Netherlands | | 2.8% |
| Other | | 14.4% |
| Total Common Stocks | | 100.0% |
| Currency Denomination |
| | | % of Common |
| Currency | | Stocks |
| United States Dollar | | 39.0% |
| Pound Sterling | | 17.9% |
| Euro | | 17.4% |
| Swiss Franc | | 8.5% |
| Hong Kong Dollar | | 7.4% |
| All other currencies | | 9.8% |
| Total Common Stocks | | 100.0% |
| See notes to financial statements. |
| 38 | CLAYMORE EXCHANGE-TRADED FUND TRUST 2 ANNUAL REPORT |
| SCHEDULE OF INVESTMENTS continued | August 31, 2015 |
GHII Guggenheim S&P High Income Infrastructure ETF
| | | | Shares | | | Value | |
COMMON STOCKS† - 99.0% | | | | | | | |
| Canada - 19.4% | | | | | | | |
| Veresen, Inc. | | | 10,581 | | $ | 108,077 | |
| Pembina Pipeline Corp. | | | 3,305 | | | 90,667 | |
| TransCanada Corp. | | | 2,562 | | | 88,385 | |
| Gibson Energy, Inc. | | | 4,928 | | | 71,855 | |
| Capital Power Corp. | | | 2,413 | | | 37,106 | |
| Northland Power, Inc. | | | 2,750 | | | 33,938 | |
| TransAlta Renewables, Inc. | | | 1,718 | | | 14,230 | |
| Total Canada | | | | | | 444,258 | |
| | | | | | | | |
| United States - 18.5% | | | | | | | |
| ONEOK, Inc. | | | 3,137 | | | 112,963 | |
| Kinder Morgan, Inc. | | | 2,951 | | | 95,642 | |
| PPL Corp. | | | 1,087 | | | 33,686 | |
| CenterPoint Energy, Inc. | | | 1,785 | | | 33,237 | |
| Southern Co. | | | 765 | | | 33,209 | |
| Consolidated Edison, Inc. | | | 466 | | | 29,316 | |
| Entergy Corp. | | | 442 | | | 28,876 | |
| FirstEnergy Corp. | | | 884 | | | 28,253 | |
| SCANA Corp. | | | 530 | | | 28,032 | |
| Talen Energy Corp.* | | | 0.2 | | | 2 | |
| Total United States | | | | | | 423,216 | |
| | | | | | | | |
| Australia - 17.6% | | | | | | | |
| Sydney Airport | | | 26,576 | | | 108,336 | |
| Transurban Group | | | 14,705 | | | 100,915 | |
| DUET Group | | | 30,236 | | | 46,944 | |
| Spark Infrastructure Group | | | 28,847 | | | 40,698 | |
| AGL Energy Ltd. | | | 3,306 | | | 39,587 | |
| AusNet Services | | | 40,056 | | | 37,059 | |
| APA Group | | | 4,605 | | | 28,632 | |
| Total Australia | | | | | | 402,171 | |
| | | | | | | | |
| Spain - 9.6% | | | | | | | |
| Abertis Infraestructuras S.A. | | | 5,964 | | | 98,636 | |
| Enagas S.A . | | | 1,245 | | | 34,066 | |
| Endesa S.A. | | | 1,488 | | | 30,845 | |
| Iberdrola S.A. | | | 4,264 | | | 28,930 | |
| Gas Natural SDG S.A. | | | 1,311 | | | 26,588 | |
| Total Spain | | | | | | 219,065 | |
| | | | | | | | |
| United Kingdom – 6.9% | | | | | | | |
| SSE plc | | | 1,677 | | | 37,940 | |
| National Grid plc | | | 2,668 | | | 35,293 | |
| Centrica plc | | | 7,870 | | | 29,437 | |
| Severn Trent plc | | | 907 | | | 28,973 | |
| United Utilities Group plc | | | 2,057 | | | 27,049 | |
| Total United Kingdom | | | | | | 158,692 | |
| | | | | | | | |
| China - 4.2% | | | | | | | |
| Jiangsu Expressway Company Ltd. — Class H | | | 42,872 | | | 50,672 | |
HK Electric Investments & HK Electric Investments Ltd.2 | | | 65,500 | | | 45,469 | |
| Total China | | | | | | 96,141 | |
| | | | | | | | |
| New Zealand - 4.0% | | | | | | | |
| Z Energy Ltd. | | | 5,941 | | | 21,783 | |
| Contact Energy Ltd. | | | 6,447 | | | 21,189 | |
| Mighty River Power Ltd. | | | 10,492 | | | 18,404 | |
| Genesis Energy Ltd. | | | 15,845 | | | 17,961 | |
| Infratil Ltd. | | | 6,584 | | | 12,508 | |
| Total New Zealand | | | | | | 91,845 | |
| | | | | | | | |
| Singapore - 4.0% | | | | | | | |
| Hutchison Port Holdings Trust — Class U | | | 173,911 | | | 91,303 | |
| | | | | | | | |
| Bermuda - 3.9% | | | | | | | |
Ship Finance International Ltd.1 | | | 5,254 | | | 88,267 | |
| | | | | | | | |
| France - 3.4% | | | | | | | |
| Electricite de France S.A. | | | 1,810 | | | 39,122 | |
| Engie | | | 2,102 | | | 37,649 | |
| Total France | | | | | | 76,771 | |
| | | | | | | | |
| Italy - 3.1% | | | | | | | |
| Snam SpA | | | 7,798 | | | 38,114 | |
| Terna Rete Elettrica Nazionale SpA | | | 7,247 | | | 33,748 | |
| Total Italy | | | | | | 71,862 | |
| | | | | | | | |
| Finland - 2.0% | | | | | | | |
| Fortum Oyj | | | 2,783 | | | 45,247 | |
| | | | | | | | |
| Portugal - 1.4% | | | | | | | |
| EDP - Energias de Portugal S.A. ADR | | | 9,155 | | | 32,067 | |
| | | | | | | | |
| Germany - 1.0% | | | | | | | |
| E.ON SE | | | 2,071 | | | 23,449 | |
| | | | | | | | |
| Total Common Stocks | | | | | | | |
| (Cost $2,503,353) | | | | | | 2,264,354 | |
| | | | | | | | |
PREFERRED STOCKS† - 0.7% | | | | | | | |
| Utilities - 0.7% | | | | | | | |
| RWE AG | | | 1,323 | | | 16,025 | |
| Total Preferred Stocks | | | | | | | |
| (Cost $22,950) | | | | | | 16,025 | |
| | | | | | | | |
SECURITIES LENDING COLLATERAL†,3 - 3.8% | | | | | | | |
| BNY Mellon Separately Managed Cash Collateral | | | | | | | |
| Account, 0.0600% | | | 86,992 | | | 86,992 | |
| Total Securities Lending Collateral | | | | | | | |
| (Cost $86,992) | | | | | | 86,992 | |
| Total Investments - 103.5% | | | | | | | |
| (Cost $2,613,295) | | | | | $ | 2,367,371 | |
| Other Assets & Liabilities, net - (3.5)% | | | | | | (79,947 | ) |
| Total Net Assets - 100.0% | | | | | $ | 2,287,424 | |
| See notes to financial statements. |
| CLAYMORE EXCHANGE-TRADED FUND TRUST 2 ANNUAL REPORT | 39 |
| SCHEDULE OF INVESTMENTS continued | August 31, 2015 |
GHII Guggenheim S&P High Income Infrastructure ETF (continued)
| * | | Non-income producing security. |
| † | | Value determined based on Level 1 inputs — See Note 4. |
| 1 | | All or a portion of this security is on loan at August 31, 2015 — See Note 2. |
| 2 | | Security is a 144A or Section 4(a)(2) security. The total market value of 144A or Section 4(a)(2) securities is $45,469 (cost $46,037), or 2.0% of total net assets. These securities have been determined to be liquid under guidelines established by the Board of Trustees. |
| 3 | | Securities lending collateral — See Note 2. |
| | | |
| ADR | | American Depositary Receipt |
| plc | | Public Limited Company |
| Country Diversification |
| | | % of Long-Term |
| Country | | Investments |
| Canada | | 19.5% |
| United States | | 18.6% |
| Australia | | 17.6% |
| Spain | | 9.6% |
| United Kingdom | | 7.0% |
| China | | 4.2% |
| New Zealand | | 4.0% |
| Other | | 19.5% |
| Total Long-Term Investments | | 100.0% |
| Currency Denomination |
| | | % of Long-Term |
| Currency | | Investments |
| United States Dollar | | 22.4% |
| Euro | | 21.3% |
| Canadian Dollar | | 19.5% |
| Australian Dollar | | 17.6% |
| Hong Kong Dollar | | 8.2% |
| British Pound | | 7.0% |
| New Zealand Dollar | | 4.0% |
| Total Long-Term Investments | | 100.0% |
| See notes to financial statements. |
| 40 | CLAYMORE EXCHANGE-TRADED FUND TRUST 2 ANNUAL REPORT |
| STATEMENT OF ASSETS AND LIABILITIES | August 31, 2015 |
| | | | | Guggenheim | | Guggenheim | | | |
| | | Guggenheim | | China Technology | | Emerging Markets | | Guggenheim | |
| | | China All-Cap ETF | | ETF | | Real Estate ETF | | Solar ETF | |
| | | (YAO | ) | (CQQQ | ) | (EMRE | ) | (TAN | ) |
| ASSETS: | | | | | | | | | | | | | |
| Investments, at value — including securities on loan | | $ | 33,387,282 | | $ | 56,164,518 | | $ | 2,140,351 | | $ | 380,027,418 | |
| Foreign currency, at value | | | 11,621 | | | — | | | 418 | | | 145 | |
| Cash | | | 145,768 | | | 39,661 | | | — | | | 790,741 | |
| Prepaid expenses | | | — | | | — | | | — | | | 16 | |
| Receivables: | | | | | | | | | | | | | |
| Dividends | | | 14,191 | | | 70,790 | | | 4,368 | | | 364,919 | |
| Securities lending income | | | 3,021 | | | 13,283 | | | 169 | | | 267,923 | |
| Investments sold | | | — | | | — | | | — | | | 154,873 | |
| Tax reclaims | | | — | | | — | | | — | | | 10,890 | |
| Total assets | | | 33,561,883 | | | 56,288,252 | | | 2,145,306 | | | 381,616,925 | |
| LIABILITIES: | | | | | | | | | | | | | |
| Payable for: | | | | | | | | | | | | | |
| Upon return of securities loaned | | | 4,092,518 | | | 10,416,106 | | | 76,171 | | | 114,747,111 | |
| Fund shares redeemed | | | 137,702 | | | 29,319 | | | — | | | — | |
| Management fees | | | 23,539 | | | 39,291 | | | 1,217 | | | 136,837 | |
| Due to custodian | | | — | | | — | | | 4,287 | | | — | |
| Administration fees | | | — | | | — | | | — | | | 4,619 | |
| Trustees' fees and expenses* | | | — | | | — | | | — | | | — | |
| Other fees | | | — | | | — | | | — | | | 183,105 | |
| Total liabilities | | | 4,253,759 | | | 10,484,716 | | | 81,675 | | | 115,071,672 | |
| NET ASSETS | | $ | 29,308,124 | | $ | 45,803,536 | | $ | 2,063,631 | | $ | 266,545,253 | |
| NET ASSETS CONSIST OF: | | | | | | | | | | | | | |
| Paid-in capital | | $ | 41,684,193 | | $ | 72,862,476 | | $ | 2,500,000 | | $ | 722,306,513 | |
| Undistributed (distributions in excess of) net investment income | | | 776,183 | | | 853,434 | | | (16,519 | ) | | 2,948,189 | |
| Accumulated net realized loss on investments | | | (8,627,945 | ) | | (14,508,309 | ) | | (26,452 | ) | | (313,688,670 | ) |
| Net unrealized depreciation on investments | | | (4,524,307 | ) | | (13,404,065 | ) | | (393,398 | ) | | (145,020,779 | ) |
| NET ASSETS | | $ | 29,308,124 | | $ | 45,803,536 | | $ | 2,063,631 | | $ | 266,545,253 | |
| Shares outstanding ($0.01 par value with unlimited amount authorized) | | | 1,200,000 | | | 1,550,000 | | | 100,000 | | | 8,968,000 | |
| Net asset value | | $ | 24.42 | | $ | 29.55 | | $ | 20.64 | | $ | 29.72 | |
| Investments in securities, at cost | | | 37,911,589 | | | 69,568,596 | | | 2,533,599 | | | 525,046,693 | |
| Foreign currency, at cost | | | 11,618 | | | — | | | 419 | | | 145 | |
| Securities on loan, at value | | | 3,976,167 | | | 10,378,777 | | | 60,420 | | | 118,196,929 | |
| * | Relates to Trustees not deemed "interested persons" within the meaning of Section 2(a)(19) of the 1940 Act. |
| See notes to financial statements. |
| CLAYMORE EXCHANGE-TRADED FUND TRUST 2 ANNUAL REPORT | 41 |
| STATEMENT OF ASSETS AND LIABILITIES continued | August 31, 2015 |
| | | Guggenheim S&P | | Guggenheim S&P | |
| | | Global Water | | High Income | |
| | | Index ETF | | Infrastructure ETF | |
| | | (CGW | ) | (GHII | ) |
| ASSETS: | | | | | | | |
| Investments, at value — including securities on loan | | $ | 350,195,928 | | $ | 2,367,371 | |
| Foreign currency, at value | | | 644 | | | — | |
| Cash | | | 1,027,352 | | | — | |
| Prepaid expenses | | | 303 | | | — | |
| Receivables: | | | | | | | |
| Dividends | | | 682,623 | | | 9,919 | |
| Tax reclaims | | | 435,328 | | | 1,369 | |
| Securities lending income | | | 5,682 | | | 28 | |
| Total assets | | | 352,347,860 | | | 2,378,687 | |
| LIABILITIES: | | | | | | | |
| Payable for: | | | | | | | |
| Upon return of securities loaned | | | 5,246,450 | | | 86,992 | |
| Management fees | | | 152,768 | | | 911 | |
| Administration fees | | | 7,385 | | | — | |
| Trustees' fees and expenses* | | | 1,084 | | | — | |
| Due to custodian | | | — | | | 3,360 | |
| Other fees | | | 230,987 | | | — | |
| Total liabilities | | | 5,638,674 | | | 91,263 | |
| NET ASSETS | | $ | 346,709,186 | | $ | 2,287,424 | |
| NET ASSETS CONSIST OF: | | | | | | | |
| Paid-in capital | | $ | 397,010,740 | | $ | 2,528,973 | |
| Undistributed net investment income | | | 5,114,694 | | | 25,245 | |
| Accumulated net realized gain (loss) on investments | | | (101,607,202 | ) | | (20,789 | ) |
| Net unrealized appreciation (depreciation) on investments | | | 46,190,954 | | | (246,005 | ) |
| NET ASSETS | | $ | 346,709,186 | | $ | 2,287,424 | |
| Shares outstanding ($0.01 par value with unlimited amount authorized) | | | 13,000,000 | | | 100,000 | |
| Net asset value | | $ | 26.67 | | $ | 22.87 | |
| Investments in securities, at cost | | | 303,984,170 | | | 2,613,295 | |
| Foreign currency, at cost | | | 634 | | | — | |
| Securities on loan, at value | | | 4,984,635 | | | 84,369 | |
| * | Relates to Trustees not deemed "interested persons" within the meaning of Section 2(a)(19) of the 1940 Act. |
| See notes to financial statements. |
| 42 | CLAYMORE EXCHANGE-TRADED FUND TRUST 2 ANNUAL REPORT |
| STATEMENT OF OPERATIONS | August 31, 2015 |
| For the year ended August 31, 2015 | |
| | | | | Guggenheim | | Guggenheim | | | |
| | | Guggenheim | | China Technology | | Emerging Markets | | Guggenheim | |
| | | China All-Cap ETF | | ETF | | Real Estate ETF | | Solar ETF | |
| | | (YAO | ) | (CQQQ | ) | (EMRE | )1 | (TAN | ) |
| INVESTMENT INCOME: | | | | | | | | | | | | | |
| Dividends, net of foreign taxes withheld* | | $ | 1,217,542 | | $ | 682,892 | | $ | 76,583 | | $ | 1,332,257 | |
| Less return of capital received | | | — | | | — | | | — | | | (401,816 | ) |
| Income from securities lending | | | 94,958 | | | 884,215 | | | 1,470 | | | 7,891,692 | |
| Total investment income | | | 1,312,500 | | | 1,567,107 | | | 78,053 | | | 8,822,133 | |
| EXPENSES: | | | | | | | | | | | | | |
| Management fees | | | 361,975 | | | 578,339 | | | 14,859 | | | 1,746,186 | |
| Licensing fees | | | — | | | — | | | — | | | 498,856 | |
| Custodian fees | | | — | | | — | | | — | | | 107,968 | |
| Administration fees | | | — | | | — | | | — | | | 84,848 | |
| Printing fees | | | — | | | — | | | — | | | 52,990 | |
| Professional fees | | | — | | | — | | | — | | | 33,610 | |
| Trustees' fees and expenses** | | | — | | | — | | | — | | | 11,357 | |
| Insurance | | | — | | | — | | | — | | | 5,409 | |
| Registration and filings | | | — | | | — | | | — | | | 5,000 | |
| Other fees | | | 21 | | | 17 | | | — | | | 13,464 | |
| Total expenses | | | 361,996 | | | 578,356 | | | 14,859 | | | 2,559,688 | |
| Less: | | | | | | | | | | | | | |
| Expenses waived by advisor | | | — | | | — | | | — | | | (114,866 | ) |
| Net expenses | | | 361,996 | | | 578,356 | | | 14,859 | | | 2,444,822 | |
| Net investment income | | | 950,504 | | | 988,751 | | | 63,194 | | | 6,377,311 | |
| NET REALIZED AND UNREALIZED GAIN (LOSS): | | | | | | | | | | | | | |
| Net realized gain (loss) on: | | | | | | | | | | | | | |
| Investments | | | (1,281,274 | ) | | (4,673,909 | ) | | (23,939 | ) | | (18,901,407 | ) |
| In-kind transactions | | | 1,979,671 | | | 11,533,611 | | | — | | | 38,387,403 | |
| Foreign currency transaction | | | 869 | | | (5,680 | ) | | 44 | | | (78,197 | ) |
| Net realized gain (loss) | | | 699,266 | | | 6,854,022 | | | (23,895 | ) | | 19,407,799 | |
| Net change in unrealized appreciation (depreciation) on: | | | | | | | | | | | | | |
| Investments | | | (6,297,764 | ) | | (24,750,327 | ) | | (393,248 | ) | | (153,023,946 | ) |
| Foreign currency translations | | | — | | | 10 | | | (150 | ) | | (3,444 | ) |
| Net change in unrealized appreciation (depreciation) | | | (6,297,764 | ) | | (24,750,317 | ) | | (393,398 | ) | | (153,027,390 | ) |
| Net realized and unrealized loss | | | (5,598,498 | ) | | (17,896,295 | ) | | (417,293 | ) | | (133,619,591 | ) |
| Net decrease in net assets resulting from operations | | $ | (4,647,994 | ) | $ | (16,907,544 | ) | $ | (354,099 | ) | $ | (127,242,280 | ) |
| * Foreign taxes withheld | | $ | 98,999 | | $ | 3,943 | | $ | 5,801 | | $ | 365 | |
| ** | Relates to Trustees not deemed "interested persons" within the meaning of Section 2(a)(19) of the 1940 Act. |
| 1 | Commencement of investment operations September 29, 2014. |
| See notes to financial statements. |
| CLAYMORE EXCHANGE-TRADED FUND TRUST 2 ANNUAL REPORT | 43 |
| STATEMENT OF OPERATIONS (continued) | August 31, 2015 |
| For the year ended August 31, 2015 | |
| | | Guggenheim S&P | | Guggenheim S&P | |
| | | Global Water | | High Income | |
| | | Index ETF | | Infrastructure ETF | |
| | | (CGW | ) | (GHII | )2 |
| INVESTMENT INCOME: | | | | | | | |
| Dividends, net of foreign taxes withheld* | | $ | 7,925,445 | | $ | 76,412 | |
| Income from securities lending | | | 311,040 | | | 347 | |
| Total investment income | | | 8,236,485 | | | 76,759 | |
| EXPENSES: | | | | | | | |
| Management fees | | | 1,768,746 | | | 6,190 | |
| Licensing fees | | | 176,875 | | | — | |
| Custodian fees | | | 108,609 | | | — | |
| Administration fees | | | 85,750 | | | — | |
| Printing fees | | | 44,156 | | | — | |
| Professional fees | | | 37,295 | | | — | |
| Trustees' fees and expenses** | | | 11,053 | | | — | |
| Registration and filings | | | 5,000 | | | — | |
| Insurance | | | 4,234 | | | — | |
| Other fees | | | 17,935 | | | — | |
| Total expenses | | | 2,259,653 | | | 6,190 | |
| Less: | | | | | | | |
| Expenses waived by advisor | | | (2,217 | ) | | — | |
| Net expenses | | | 2,257,436 | | | 6,190 | |
| Net investment income | | | 5,979,049 | | | 70,569 | |
| NET REALIZED AND UNREALIZED GAIN (LOSS): | | | | | | | |
| Net realized gain (loss) on: | | | | | | | |
| Investments | | | (5,094,664 | ) | | (28,106 | ) |
| In-kind transactions | | | 10,251,220 | | | 39,633 | |
| Foreign currency transactions | | | (75,129 | ) | | (1,704 | ) |
| Net realized gain | | | 5,081,427 | | | 9,823 | |
| Net change in unrealized appreciation (depreciation) on: | | | | | | | |
| Investments | | | (36,653,158 | ) | | (245,924 | ) |
| Foreign currency translations | | | (11,495 | ) | | (81 | ) |
| Net change in unrealized appreciation (depreciation) | | | (36,664,653 | ) | | (246,005 | ) |
| Net realized and unrealized loss | | | (31,583,226 | ) | | (236,182 | ) |
| Net decrease in net assets resulting from operations | | $ | (25,604,177 | ) | $ | (165,613 | ) |
| * Foreign taxes withheld | | $ | 550,618 | | $ | 7,301 | |
| ** | Relates to Trustees not deemed "interested persons" within the meaning of Section 2(a)(19) of the 1940 Act. |
| 2 | Commencement of investment operations February 11, 2015. |
| See notes to financial statements. |
| 44 | CLAYMORE EXCHANGE-TRADED FUND TRUST 2 ANNUAL REPORT |
| STATEMENTS OF CHANGES IN NET ASSETS | August 31, 2015 |
| | | Guggenheim China | | Guggenheim China | |
| | | All-Cap ETF | | Technology | |
| | | (YAO) | | ETF (CQQQ) | |
| | | Year Ended | | Year Ended | | Year Ended | | Year Ended | |
| | | August 31, 2015 | | August 31, 2014 | | August 31, 2015 | | August 31, 2014 | |
| INCREASE (DECREASE) IN NET ASSETS FROM OPERATIONS: | | | | | | | | | | | | | |
| Net investment income | | $ | 950,504 | | $ | 1,242,318 | | $ | 988,751 | | $ | 813,128 | |
| Net realized gain on investments | | | 699,266 | | | 1,725,711 | | | 6,854,022 | | | 2,469,486 | |
| Net change in unrealized appreciation (depreciation) on investments | | | (6,297,764 | ) | | 5,517,271 | | | (24,750,317 | ) | | 7,930,974 | |
| Net increase (decrease) in net assets resulting from operations | | | (4,647,994 | ) | | 8,485,300 | | | (16,907,544 | ) | | 11,213,588 | |
| DISTRIBUTIONS TO SHAREHOLDERS FROM: | | | | | | | | | | | | | |
| Net investment income | | | (1,225,500 | ) | | (972,000 | ) | | (672,750 | ) | | (538,200 | ) |
| SHAREHOLDER TRANSACTIONS: | | | | | | | | | | | | | |
| Proceeds from shares purchased | | | — | | | 13,240,856 | | | 33,478,490 | | | 60,146,670 | |
| Cost of shares redeemed | | | (19,080,099 | ) | | (13,296,666 | ) | | (48,172,069 | ) | | (14,908,182 | ) |
| Net decrease in net assets resulting from share transactions | | | (19,080,099 | ) | | (55,810 | ) | | (14,693,579 | ) | | 45,238,488 | |
| Net increase (decrease) in net assets | | | (24,953,593 | ) | | 7,457,490 | | | (32,273,873 | ) | | 55,913,876 | |
| NET ASSETS: | | | | | | | | | | | | | |
| Beginning of year | | | 54,261,717 | | | 46,804,227 | | | 78,077,409 | | | 22,163,533 | |
| End of year | | $ | 29,308,124 | | $ | 54,261,717 | | $ | 45,803,536 | | $ | 78,077,409 | |
| Undistributed net investment income at end of year | | $ | 776,183 | | $ | 973,154 | | $ | 853,434 | | $ | 451,736 | |
| CHANGES IN SHARES OUTSTANDING: | | | | | | | | | | | | | |
| Shares sold | | | — | | | 500,000 | | | 900,000 | | | 1,750,000 | |
| Shares redeemed | | | (700,000 | ) | | (500,000 | ) | | (1,400,000 | ) | | (450,000 | ) |
| Net increase (decrease) in shares | | | (700,000 | ) | | — | | | (500,000 | ) | | 1,300,000 | |
| See notes to financial statements. |
| CLAYMORE EXCHANGE-TRADED FUND TRUST 2 ANNUAL REPORT | 45 |
| STATEMENTS OF CHANGES IN NET ASSETS continued | August 31, 2015 |
| | | Guggenheim | | | |
| | | Emerging Markets | | | |
| | | Real Estate ETF | | Guggenheim Solar ETF | |
| | | (EMRE) | | (TAN) | |
| | | Period from | | | | | |
| | | September 29, 2014a | | Year Ended | | Year Ended | |
| | | to August 31, 2015 | | August 31, 2015 | | August 31, 2014 | |
| INCREASE (DECREASE) IN NET ASSETS FROM OPERATIONS: | | | | | | | | | | |
| Net investment income | | $ | 63,194 | | $ | 6,377,311 | | $ | 5,069,615 | |
| Net realized gain (loss) on investments | | | (23,895 | ) | | 19,407,799 | | | 114,880,096 | |
| Net change in unrealized depreciation on investments | | | (393,398 | ) | | (153,027,390 | ) | | (18,474,838 | ) |
| Net increase (decrease) in net assets resulting from operations | | | (354,099 | ) | | (127,242,280 | ) | | 101,474,873 | |
| DISTRIBUTIONS TO SHAREHOLDERS FROM: | | | | | | | | | | |
| Net investment income | | | (82,270 | ) | | (5,534,720 | ) | | (3,755,928 | ) |
| SHAREHOLDER TRANSACTIONS: | | | | | | | | | | |
| Proceeds from shares purchased | | | 2,500,000 | | | 221,513,539 | | | 536,328,892 | |
| Cost of shares redeemed | | | — | | | (251,358,632 | ) | | (375,030,252 | ) |
| Net increase (decrease) in net assets resulting from share transactions | | | 2,500,000 | | | (29,845,093 | ) | | 161,298,640 | |
| Net increase (decrease) in net assets | | | 2,063,631 | | | (162,622,093 | ) | | 259,017,585 | |
| NET ASSETS: | | | | | | | | | | |
| Beginning of period | | | — | | | 429,167,346 | | | 170,149,761 | |
| End of period | | $ | 2,063,631 | | $ | 266,545,253 | | $ | 429,167,346 | |
| Undistributed (distributions in excess of) net investment income at end of period | | $ | (16,519 | ) | $ | 2,948,189 | | $ | 2,310,754 | |
| CHANGES IN SHARES OUTSTANDING: | | | | | | | | | | |
| Shares sold | | | 100,000 | | | 5,440,000 | | | 13,040,000 | |
| Shares redeemed | | | — | | | (6,320,000 | ) | | (9,440,000 | ) |
| Net increase (decrease) in shares | | | 100,000 | | | (880,000 | ) | | 3,600,000 | |
a Commencement of operations | | | | | | | | | | |
| See notes to financial statements. |
| 46 | CLAYMORE EXCHANGE-TRADED FUND TRUST 2 ANNUAL REPORT |
| STATEMENTS OF CHANGES IN NET ASSETS continued | August 31, 2015 |
| | | | | Guggenheim S&P | |
| | | | | High Income | |
| | | Guggenheim S&P | | Infrastructure | |
| | | Global Water Index ETF | | ETF | |
| | | (CGW) | | (GHII) | |
| | | | | Period from | |
| | | Year Ended | | Year Ended | | February 11, 2015a | |
| | | August 31, 2015 | | August 31, 2014 | | to August 31, 2015 | |
| INCREASE (DECREASE) IN NET ASSETS FROM OPERATIONS: | | | | | | | | | | |
| Net investment income | | $ | 5,979,049 | | $ | 5,857,082 | | $ | 70,569 | |
| Net realized gain on investments | | | 5,081,427 | | | 2,861,520 | | | 9,823 | |
| Net change in unrealized appreciation (depreciation) on investments | | | (36,664,653 | ) | | 50,434,537 | | | (246,005 | ) |
| Net increase (decrease) in net assets resulting from operations | | | (25,604,177 | ) | | 59,153,139 | | | (165,613 | ) |
| DISTRIBUTIONS TO SHAREHOLDERS FROM: | | | | | | | | | | |
| Net investment income | | | (5,956,080 | ) | | (4,754,400 | ) | | (43,620 | ) |
| SHAREHOLDER TRANSACTIONS: | | | | | | | | | | |
| Proceeds from shares purchased | | | 36,765,776 | | | 77,073,947 | | | 3,704,303 | |
| Cost of shares redeemed | | | (26,410,686 | ) | | (16,927,043 | ) | | (1,207,646 | ) |
| Net increase in net assets resulting from share transactions | | | 10,355,090 | | | 60,146,904 | | | 2,496,657 | |
| Net increase (decrease) in net assets | | | (21,205,167 | ) | | 114,545,643 | | | 2,287,424 | |
| NET ASSETS: | | | | | | | | | | |
| Beginning of period | | | 367,914,353 | | | 253,368,710 | | | — | |
| End of period | | $ | 346,709,186 | | $ | 367,914,353 | | $ | 2,287,424 | |
| Undistributed net investment income at end of period | | $ | 5,114,694 | | $ | 5,166,854 | | $ | 25,245 | |
| CHANGES IN SHARES OUTSTANDING: | | | | | | | | | | |
| Shares sold | | | 1,280,000 | | | 2,720,000 | | | 150,000 | |
| Shares redeemed | | | (960,000 | ) | | (640,000 | ) | | (50,000 | ) |
| Net increase in shares | | | 320,000 | | | 2,080,000 | | | 100,000 | |
a Commencement of operations | | | | | | | | | | |
| See notes to financial statements. |
| CLAYMORE EXCHANGE-TRADED FUND TRUST 2 ANNUAL REPORT | 47 |
| FINANCIAL HIGHLIGHTS | August 31, 2015 |
YAO Guggenheim China All-Cap ETF
This table is presented to show selected data for a share outstanding throughout each period and to assist shareholders in evaluating an ETF's performance for the periods presented.
| | | | Year Ended | | | Year Ended | | | Year Ended | | | Year Ended | | | Year Ended | |
| | | | August 31, | | | August 31, | | | August 31, | | | August 31, | | | August 31, | |
| | | | 2015 | | | 2014 | | | 2013 | | | 2012 | | | 2011 | |
| Per Share Data: | | | | | | | | | | | | | | | | |
| Net asset value, beginning of period | | $ | 28.56 | | $ | 24.63 | | $ | 21.66 | | $ | 25.04 | | $ | 24.56 | |
| Income from investment operations: | | | | | | | | | | | | | | | | |
Net investment income(a) | | | 0.53 | | | 0.62 | | | 0.46 | | | 0.52 | | | 0.41 | |
| Net gain (loss) on investments (realized and unrealized) | | | (4.02 | ) | | 3.80 | | | 3.07 | | | (3.32 | ) | | 0.35 | |
| Total from investment operations | | | (3.49 | ) | | 4.42 | | | 3.53 | | | (2.80 | ) | | 0.76 | |
| Less distributions from: | | | | | | | | | | | | | | | | |
| Net investment income | | | (0.65 | ) | | (0.49 | ) | | (0.56 | ) | | (0.58 | ) | | (0.28 | ) |
| Total distributions to shareholders | | | (0.65 | ) | | (0.49 | ) | | (0.56 | ) | | (0.58 | ) | | (0.28 | ) |
| Net asset value, end of period | | $ | 24.42 | | $ | 28.56 | | $ | 24.63 | | $ | 21.66 | | $ | 25.04 | |
| Market value, end of period | | $ | 24.13 | | $ | 28.52 | | $ | 24.49 | | $ | 21.76 | | $ | 25.07 | |
Total Return(b) | | | | | | | | | | | | | | | | |
| Net asset value | | | -12.51 | % | | 18.05 | % | | 16.25 | % | | -11.17 | % | | 3.01 | % |
| Ratios/Supplemental Data: | | | | | | | | | | | | | | | | |
| Net assets, end of period (in thousands) | | $ | 29,308 | | $ | 54,262 | | $ | 46,804 | | $ | 49,822 | | $ | 72,607 | |
| Ratio to average net assets of: | | | | | | | | | | | | | | | | |
| Net investment income | | | 1.84 | % | | 2.35 | % | | 1.92 | % | | 2.25 | % | | 1.50 | % |
| Total expenses | | | 0.70 | % | | 0.71 | % | | 0.70 | % | | 0.70 | % | | 0.70 | % |
| Net expenses | | | 0.70 | % | | 0.71 | % | | 0.70 | % | | 0.70 | % | | 0.70 | % |
Portfolio turnover rate(c) | | | 17 | % | | 12 | % | | 16 | % | | 12 | % | | 16 | % |
| (a) | Based on average shares outstanding. |
| (b) | Total investment return is calculated assuming an initial investment made at the net asset value at the beginning of the period, reinvestment of all dividends and distribution at net asset value during the period, and redemption on the last day of the period. Transaction fees are not reflected in the calculation of total investment return. |
| (c) | Portfolio turnover does not include securities received or delivered from processing creations or redemptions. |
| See notes to financial statements. |
| 48 | CLAYMORE EXCHANGE-TRADED FUND TRUST 2 ANNUAL REPORT |
| FINANCIAL HIGHLIGHTS continued | August 31, 2015 |
CQQQ Guggenheim China Technology ETF
This table is presented to show selected data for a share outstanding throughout each period and to assist shareholders in evaluating an ETF's performance for the periods presented.
| | | | Year Ended | | | Year Ended | | | Year Ended | | | Year Ended | | | Year Ended | |
| | | | August 31, | | | August 31, | | | August 31, | | | August 31, | | | August 31, | |
| | | | 2015 | | | 2014 | | | 2013 | | | 2012 | | | 2011 | |
| Per Share Data: | | | | | | | | | | | | | | | | |
| Net asset value, beginning of period | | $ | 38.09 | | $ | 29.55 | | $ | 20.03 | | $ | 25.44 | | $ | 24.36 | |
| Income from investment operations: | | | | | | | | | | | | | | | | |
Net investment income(a) | | | 0.46 | | | 0.43 | | | 0.28 | | | 0.54 | | | 0.31 | |
| Net gain (loss) on investments (realized and unrealized) | | | (8.65 | ) | | 8.39 | | | 9.67 | | | (5.38 | ) | | 0.90 | |
| Total from investment operations | | | (8.19 | ) | | 8.82 | | | 9.95 | | | (4.84 | ) | | 1.21 | |
| Less distributions from: | | | | | | | | | | | | | | | | |
| Net investment income | | | (0.35 | ) | | (0.28 | ) | | (0.43 | ) | | (0.57 | ) | | (0.13 | ) |
| Total distributions to shareholders | | | (0.35 | ) | | (0.28 | ) | | (0.43 | ) | | (0.57 | ) | | (0.13 | ) |
| Net asset value, end of period | | $ | 29.55 | | $ | 38.09 | | $ | 29.55 | | $ | 20.03 | | $ | 25.44 | |
| Market value, end of period | | $ | 29.31 | | $ | 37.88 | | $ | 29.59 | | $ | 19.96 | | $ | 25.57 | |
Total Return(b) | | | | | | | | | | | | | | | | |
| Net asset value | | | -21.62 | % | | 29.89 | % | | 50.39 | % | | -19.10 | % | | 4.94 | % |
| Ratios/Supplemental Data: | | | | | | | | | | | | | | | | |
| Net assets, end of period (in thousands) | | $ | 45,804 | | $ | 78,077 | | $ | 22,164 | | $ | 17,029 | | $ | 31,805 | |
| Ratio to average net assets of: | | | | | | | | | | | | | | | | |
| Net investment income | | | 1.20 | % | | 1.22 | % | | 1.16 | % | | 2.38 | % | | 1.09 | % |
| Total expenses | | | 0.70 | % | | 0.71 | % | | 0.70 | % | | 0.70 | % | | 0.70 | % |
| Net expenses | | | 0.70 | % | | 0.71 | % | | 0.70 | % | | 0.70 | % | | 0.70 | % |
Portfolio turnover rate(c) | | | 32 | % | | 39 | % | | 26 | % | | 43 | % | | 28 | % |
| (a) | Based on average shares outstanding. |
| (b) | Total investment return is calculated assuming an initial investment made at the net asset value at the beginning of the period, reinvestment of all dividends and distribution at net asset value during the period, and redemption on the last day of the period. Transaction fees are not reflected in the calculation of total investment return. |
| (c) | Portfolio turnover does not include securities received or delivered from processing creations or redemptions. |
| See notes to financial statements. |
| CLAYMORE EXCHANGE-TRADED FUND TRUST 2 ANNUAL REPORT | 49 |
| FINANCIAL HIGHLIGHTS continued | August 31, 2015 |
EMRE Guggenheim Emerging Markets Real Estate ETF
This table is presented to show selected data for a share outstanding throughout each period and to assist shareholders in evaluating an ETF's performance for the period presented.
| | | Period Ended | |
| | | | August 31, 2015(a) | |
| Per Share Data: | | | | |
| Net asset value, beginning of period | | $ | 24.99 | |
| Income from investment operations: | | | | |
Net investment income(b) | | | 0.63 | |
| Net loss on investments (realized and unrealized) | | | (4.16 | ) |
| Total from investment operations | | | (3.53 | ) |
| Less distributions from: | | | | |
| Net investment income | | | (0.82 | ) |
| Total distributions to shareholders | | | (0.82 | ) |
| Net asset value, end of period | | $ | 20.64 | |
| Market value, end of period | | $ | 20.73 | |
Total Return(c) | | | | |
| Net asset value | | | -14.61 | % |
| Ratios/Supplemental Data: | | | | |
| Net assets, end of period (in thousands) | | $ | 2,064 | |
| Ratio to average net assets of: | | | | |
| Net investment income | | | 2.76 | % |
| Total expenses | | | 0.65 | % |
| Net expenses | | | 0.65 | % |
Portfolio turnover rate(d) | | | 25 | % |
| (a) | Since commencement of operations: September 29, 2014. Percentage amounts for the period, except total return and portfolio turnover rate, have been annualized. |
| (b) | Based on average shares outstanding. |
| (c) | Total investment return is calculated assuming an initial investment made at the net asset value at the beginning of the period, reinvestment of all dividends and distribution at net asset value during the period, and redemption on the last day of the period. Transaction fees are not reflected in the calculation of total investment return. |
| (d) | Portfolio turnover does not include securities received or delivered from processing creations or redemptions. |
| See notes to financial statements. |
| 50 | CLAYMORE EXCHANGE-TRADED FUND TRUST 2 ANNUAL REPORT |
| FINANCIAL HIGHLIGHTS continued | August 31, 2015 |
TAN Guggenheim Solar ETF
This table is presented to show selected data for a share outstanding throughout each period and to assist shareholders in evaluating an ETF's performance for the periods presented.
| | | | Year Ended | | | Year Ended | | | Year Ended | | | Year Ended | | | Year Ended | |
| | | | August 31, | | | August 31, | | | August 31, | | | August 31, | | | August 31, | |
| | | | 2015 | | | 2014 | | | 2013 | | | 2012 | | | 2011 | |
| Per Share Data*: | | | | | | | | | | | | | | | | |
| Net asset value, beginning of period | | $ | 43.58 | | $ | 27.23 | | $ | 16.74 | | $ | 54.90 | | $ | 73.30 | |
| Income from investment operations: | | | | | | | | | | | | | | | | |
Net investment income(a) | | | 0.72 | | | 0.52 | | | 0.56 | | | 1.84 | | | 1.80 | |
| Net gain (loss) on investments (realized and unrealized) | | | (13.94 | ) | | 16.28 | | | 11.35 | | | (37.89 | ) | | (19.90 | ) |
| Total from investment operations | | | (13.22 | ) | | 16.80 | | | 11.91 | | | (36.05 | ) | | (18.10 | ) |
| Less distributions from: | | | | | | | | | | | | | | | | |
| Net investment income | | | (0.64 | ) | | (0.45 | ) | | (1.42 | ) | | (2.11 | ) | | (0.30 | ) |
| Total distributions to shareholders | | | (0.64 | ) | | (0.45 | ) | | (1.42 | ) | | (2.11 | ) | | (0.30 | ) |
| Net asset value, end of period | | $ | 29.72 | | $ | 43.58 | | $ | 27.23 | | $ | 16.74 | | $ | 54.90 | |
| Market value, end of period | | $ | 29.57 | | $ | 43.39 | | $ | 27.16 | | $ | 16.71 | | $ | 54.60 | |
Total Return(b) | | | | | | | | | | | | | | | | |
| Net asset value | | | -30.51 | % | | 62.06 | % | | 77.60 | % | | -66.93 | % | | -24.81 | % |
| Ratios/Supplemental Data: | | | | | | | | | | | | | | | | |
| Net assets, end of period (in thousands) | | $ | 266,545 | | $ | 429,167 | | $ | 170,150 | | $ | 42,992 | | $ | 116,473 | |
| Ratio to average net assets of: | | | | | | | | | | | | | | | | |
| Net investment income | | | 1.83 | % | | 1.28 | % | | 2.71 | % | | 7.07 | % | | 2.40 | % |
| Total expenses | | | 0.73 | % | | 0.76 | % | | 0.86 | % | | 1.01 | % | | 0.88 | % |
| Net expenses | | | 0.70 | % | | 0.71 | % | | 0.70 | % | | 0.70 | % | | 0.70 | % |
Portfolio turnover rate(c) | | | 51 | % | | 47 | % | | 68 | % | | 49 | % | | 38 | % |
| * | Reflects 1 for 10 reverse stock split that occurred February 15, 2012. |
| (a) | Based on average shares outstanding. |
| (b) | Total investment return is calculated assuming an initial investment made at the net asset value at the beginning of the period, reinvestment of all dividends and distribution at net asset value during the period, and redemption on the last day of the period. Transaction fees are not reflected in the calculation of total investment return. |
| (c) | Portfolio turnover does not include securities received or delivered from processing creations or redemptions. |
| See notes to financial statements. |
| CLAYMORE EXCHANGE-TRADED FUND TRUST 2 ANNUAL REPORT | 51 |
| FINANCIAL HIGHLIGHTS continued | August 31, 2015 |
CGW Guggenheim S&P Global Water Index ETF
This table is presented to show selected data for a share outstanding throughout each period and to assist shareholders in evaluating an ETF's performance for the periods presented.
| | | | Year Ended | | | Year Ended | | | Year Ended | | | Year Ended | | | Year Ended | |
| | | | August 31, | | | August 31, | | | August 31, | | | August 31, | | | August 31, | |
| | | | 2015 | | | 2014 | | | 2013 | | | 2012 | | | 2011 | |
| Per Share Data: | | | | | | | | | | | | | | | | |
| Net asset value, beginning of period | | $ | 29.02 | | $ | 23.90 | | $ | 21.05 | | $ | 20.06 | | $ | 17.11 | |
| Income from investment operations: | | | | | | | | | | | | | | | | |
Net investment income(a) | | | 0.48 | | | 0.51 | | | 0.49 | | | 0.44 | | | 0.38 | |
| Net gain (loss) on investments (realized and unrealized) | | | (2.33 | ) | | 5.03 | | | 2.81 | | | 0.96 | | | 2.99 | |
| Total from investment operations | | | (1.85 | ) | | 5.54 | | | 3.30 | | | 1.40 | | | 3.37 | |
| Less distributions from: | | | | | | | | | | | | | | | | |
| Net investment income | | | (0.50 | ) | | (0.42 | ) | | (0.45 | ) | | (0.41 | ) | | (0.42 | ) |
| Total distributions to shareholders | | | (0.50 | ) | | (0.42 | ) | | (0.45 | ) | | (0.41 | ) | | (0.42 | ) |
| Net asset value, end of period | | $ | 26.67 | | $ | 29.02 | | $ | 23.90 | | $ | 21.05 | | $ | 20.06 | |
| Market value, end of period | | $ | 26.64 | | $ | 29.08 | | $ | 23.88 | | $ | 20.98 | | $ | 19.99 | |
Total Return(b) | | | | | | | | | | | | | | | | |
| Net asset value | | | -6.47 | % | | 23.27 | % | | 15.85 | % | | 7.23 | % | | 19.60 | % |
| Ratios/Supplemental Data: | | | | | | | | | | | | | | | | |
| Net assets, end of period (in thousands) | | $ | 346,709 | | $ | 367,914 | | $ | 253,369 | | $ | 199,547 | | $ | 214,190 | |
| Ratio to average net assets of: | | | | | | | | | | | | | | | | |
| Net investment income | | | 1.69 | % | | 1.83 | % | | 2.13 | % | | 2.22 | % | | 1.85 | % |
| Total expenses | | | 0.64 | % | | 0.65 | % | | 0.71 | % | | 0.76 | % | | 0.78 | % |
| Net expenses | | | 0.64 | % | | 0.65 | % | | 0.70 | % | | 0.70 | % | | 0.70 | % |
Portfolio turnover rate(c) | | | 9 | % | | 7 | % | | 21 | % | | 31 | % | | 8 | % |
| (a) | Based on average shares outstanding. |
| (b) | Total investment return is calculated assuming an initial investment made at the net asset value at the beginning of the period, reinvestment of all dividends and distribution at net asset value during the period, and redemption on the last day of the period. Transaction fees are not reflected in the calculation of total investment return. |
| (c) | Portfolio turnover does not include securities received or delivered from processing creations or redemptions. |
| See notes to financial statements. |
| 52 | CLAYMORE EXCHANGE-TRADED FUND TRUST 2 ANNUAL REPORT |
| FINANCIAL HIGHLIGHTS continued | August 31, 2015 |
GHII Guggenheim S&P High Income Infrastructure ETF
This table is presented to show selected data for a share outstanding throughout each period and to assist shareholders in evaluating an ETF's performance for the period presented.
| | | Period Ended | |
| | | August 31, 2015(a) | |
| Per Share Data: | | | | |
| Net asset value, beginning of period | | $ | 25.05 | |
| Income from investment operations: | | | | |
Net investment income(b) | | | 0.71 | |
| Net loss on investments (realized and unrealized) | | | (2.45 | ) |
| Total from investment operations | | | (1.74 | ) |
| Less distributions from: | | | | |
| Net investment income | | | (0.44 | ) |
| Total distributions to shareholders | | | (0.44 | ) |
| Net asset value, end of period | | $ | 22.87 | |
| Market value, end of period | | $ | 22.56 | |
Total Return(c) | | | | |
| Net asset value | | | -7.06 | % |
| Ratios/Supplemental Data: | | | | |
| Net assets, end of period (in thousands) | | $ | 2,287 | |
| Ratio to average net assets of: | | | | |
| Net investment income | | | 5.13 | % |
| Total expenses | | | 0.45 | % |
| Net expenses | | | 0.45 | % |
Portfolio turnover rate(d) | | | 13 | % |
| (a) | Since commencement of operations: February 11, 2015. Percentage amounts for the period, except total return and portfolio turnover rate, have been annualized. |
| (b) | Based on average shares outstanding. |
| (c) | Total investment return is calculated assuming an initial investment made at the net asset value at the beginning of the period, reinvestment of all dividends and distribution at net asset value during the period, and redemption on the last day of the period. Transaction fees are not reflected in the calculation of total investment return. |
| (d) | Portfolio turnover does not include securities received or delivered from processing creations or redemptions. |
| See notes to financial statements. |
| CLAYMORE EXCHANGE-TRADED FUND TRUST 2 ANNUAL REPORT | 53 |
| NOTES TO FINANCIAL STATEMENTS | August 31, 2015 |
Note 1 – Organization:
Claymore Exchange-Traded Fund Trust 2 (the "Trust"), which is registered under the Investment Company Act of 1940, as amended (the "1940 Act"), is an open-end, management investment company that was organized as a Delaware statutory trust on June 8, 2006.
The following six portfolios have an annual reporting period ended on August 31, 2015:
Guggenheim China All-Cap ETF
Guggenheim China Technology ETF
Guggenheim Emerging Markets Real Estate ETF
Guggenheim Solar ETF
Guggenheim S&P Global Water Index ETF
Guggenheim S&P High Income Infrastructure ETF
Each portfolio represents a separate series of the Trust (each a "Fund" or collectively the "Funds"). Each Fund's shares are listed and traded on the NYSE Arca, Inc. ("NYSE Arca"). The Funds' market prices may differ to some degree from the net asset value ("NAV") of the shares of each Fund. Unlike conventional mutual funds, each Fund issues and redeems shares on a continuous basis, at NAV, only in a large specified number of shares; each called a "Creation Unit." Creation Units are issued and redeemed principally in-kind for securities included in the relevant index. Except when aggregated in Creation Units, shares are not individually redeemable securities of the Funds. The investment objective of each of the Funds is to correspond generally to the performance, before fees and expenses, of the following market indices:
| Fund | Index |
| Guggenheim China All-Cap ETF | AlphaShares China All-Cap Index |
| Guggenheim China Technology ETF | AlphaShares China Technology Index |
| Guggenheim Emerging Markets | AlphaShares Emerging Markets |
| Real Estate ETF | Real Estate Index |
| Guggenheim Solar ETF | MAC Global Solar Energy Index |
| Guggenheim S&P Global Water Index ETF | S&P Global Water Index |
| Guggenheim S&P High Income | S&P High Income |
| Infrastructure ETF | Infrastructure Index |
Note 2 – Accounting Policies:
The Trust operates as an investment company and accordingly follows the investment company accounting and reporting guidance of the Financial Accounting Standards Board ("FASB") Accounting Standards Codification Topic 946 Financial Services – Investment Companies.
The preparation of the financial statements in accordance with U.S. generally accepted accounting principles ("GAAP") requires management to make estimates and assumptions that affect the reported amounts and disclosures in the financial statements. Actual results could differ from these estimates.
The following is a summary of the significant accounting policies followed by the Funds.
(a) Valuation of Investments
The Board of Trustees of the Funds (the "Board") has adopted policies and procedures for the valuation of the Funds' investments (the "Valuation Procedures"). Pursuant to the Valuation Procedures, the Board has delegated to a valuation committee, consisting of representatives from Guggenheim's investment management, fund administration, legal and compliance departments (the "Valuation Committee"), the day-to-day responsibility for implementing the Valuation Procedures, including, under most circumstances, the responsibility for determining the fair value of the Funds' securities or other assets.
Valuations of the Funds' securities are supplied primarily by pricing services appointed pursuant to the processes set forth in the Valuation Procedures. The Valuation Committee convenes monthly, or more frequently as needed and will review the valuation of all assets which have been fair valued for reasonableness. The Funds' officers, through the Valuation Committee and consistent with the monitoring and review responsibilities set forth in the Valuation Procedures, regularly review procedures used by, and valuations provided by, the pricing services.
If the pricing service cannot or does not provide a valuation for a particular investment or such valuation is deemed unreliable, such investment is fair valued by the Valuation Committee.
Equity securities listed on an exchange (New York Stock Exchange ("NYSE") or American Stock Exchange) are valued at the last quoted sale price as of the close of U.S. business on the NYSE, usually 4:00 p.m. Eastern time on the valuation date. Equity securities listed on the NASDAQ market system are valued at the NASDAQ Official Closing Price on the valuation date, which may not necessarily represent the last sale price. If there has been no sale on such exchange or NASDAQ on such day, the security is valued at the mean of the most recent bid and ask prices on such day.
Open-end investment companies ("Mutual Funds") are valued at their NAV as of the close of business on the valuation date. Exchange traded funds ("ETFs") and closed-end investment companies are valued at the last quoted sale price.
Debt securities with a maturity of greater than 60 days at acquisition are valued at prices that reflect broker/dealer supplied valuations or are obtained from independent pricing services, which may consider the trade activity, treasury spreads, yields or price of bonds of comparable quality, coupon, maturity, and type, as well as prices quoted by dealers who make markets in such securities. Short-term debt securities with a maturity of 60 days or less at acquisition and repurchase agreements are valued at amortized cost, which approximates market value. Money market funds are valued at net asset value.
Generally, trading in foreign securities markets is substantially completed each day at various times prior to the close of the NYSE. The values of foreign securities are determined as of the close of such foreign markets or the close of the NYSE, if earlier. All investments quoted in foreign currency are valued in U.S. dollars on the basis of the foreign currency exchange rates prevailing at the close of U.S. business at 4:00 p.m. Eastern time.
| 54 | CLAYMORE EXCHANGE-TRADED FUND TRUST 2 ANNUAL REPORT |
| NOTES TO FINANCIAL STATEMENTS continued | August 31, 2015 |
Investments in foreign securities may involve risks not present in domestic investments. The Valuation Committee will determine the current value of such foreign securities by taking into consideration certain factors which may include those discussed above, as well as the following factors, among others: the value of the securities traded on other foreign markets, ADR trading, closed-end fund trading, foreign currency exchange activity, and the trading prices of financial products that are tied to foreign securities such as World Equity Benchmark Securities. In addition, under the Valuation Procedures, the Valuation Committee and Guggenheim Funds Investment Advisors, LLC ("GFIA" or the "Investment Adviser") are authorized to use prices and other information supplied by a third party pricing vendor in valuing foreign securities.
Investments for which market quotations are not readily available are fair valued as determined in good faith by the Investment Adviser, subject to review by the Valuation Committee, pursuant to methods established or ratified by the Board. Valuations in accordance with these methods are intended to reflect each security's (or asset's) "fair value." Each such determination is based on a consideration of all relevant factors, which are likely to vary from one pricing context to another. Examples of such factors may include, but are not limited to: (i) the type of security, (ii) the initial cost of the security, (iii) the existence of any contractual restrictions on the security's disposition, (iv) the price and extent of public trading in similar securities of the issuer or of comparable companies, (v) quotations or evaluated prices from broker/ dealers and/or pricing services, (vi) information obtained from the issuer, analysts, and/or the appropriate stock exchange (for exchange traded securities), (vii) an analysis of the company's financial statements, and (viii) an evaluation of the forces that influence the issuer and the market(s) in which the security is purchased and sold (e.g. the existence of pending merger activity, public offerings or tender offers that might affect the value of the security).
(b) Investment Transactions and Investment Income
Investment transactions are accounted for on the trade date for financial reporting purposes. Realized gains and losses on investments are determined on the identified cost basis. Dividend income is recorded net of applicable withholding taxes on the ex-dividend date. Interest income, including the amortization of premiums and accretion of discount, is accrued daily over the life of the security.
Real Estate Investment Trust ("REIT") distributions received by a Fund are generally comprised of ordinary income, long-term and short-term capital gains and return of capital. The actual character of amounts received during the year is not known until after the REITs' fiscal year end. A Fund records the character of distributions received from REITs during the year based on historical information available. A Fund's characterization may be subsequently revised based on information received from REITs after their tax reporting periods conclude.
(c) Currency Translations
Assets and liabilities denominated in foreign currencies are translated into U.S. dollars at the mean of the bid and ask price of respective exchange rates on the last day of the period. Purchases and sales of investments denominated in foreign currencies are translated at the mean of the bid and ask price of respective exchange rates on the date of the transaction.
The Funds do not isolate that portion of the results of operations resulting from changes in foreign exchange rates on investments from the fluctuations arising from changes in market prices of securities held. Such fluctuations are included with the net realized and unrealized gain or loss from investments.
Foreign exchange realized gain or loss resulting from holding of a foreign currency, expiration of a currency exchange contract, difference in exchange rates between the trade date and settlement date of an investment purchased or sold, and the difference between dividends actually received compared to the amount shown in a Fund's accounting records on the date of receipt, if any, are included as net realized gains or losses on foreign currency transactions in the Funds' Statement of Operations.
Foreign exchange unrealized gain or loss on assets and liabilities, other than investments, if any, are included in the net change in unrealized appreciation (depreciation) on foreign currency translation in the Funds' Statement of Operations.
(d) Foreign Taxes
The Funds may be subject to foreign taxes (a portion of which may be reclaimable) on income, stock dividends, capital gains on investments or certain foreign currency transactions. All foreign taxes are recorded in accordance with the applicable foreign tax regulations and rates that exist in the foreign jurisdictions in which the Funds invest. These foreign taxes, if any, are paid by the Funds and reflected in their Statement of Operations as follows: foreign taxes withheld at source are presented as a reduction of income and foreign taxes on capital gains from sales of investments are included with the net realized gain (loss) on investments. Foreign taxes payable or deferred as of August 31, 2015, if any, are disclosed in the Funds' Statements of Assets and Liabilities.
(e) Distributions
The Funds intend to pay substantially all of their net investment income to shareholders. Distribution frequency is as follows:
| Fund | Frequency |
| Guggenheim China All-Cap ETF | Annual |
| Guggenheim China Technology ETF | Annual |
| Guggenheim Emerging Markets Real Estate ETF | Quarterly |
| Guggenheim Solar ETF | Annual |
| Guggenheim S&P Global Water Index ETF | Annual |
| Guggenheim S&P High Income Infrastructure ETF | Quarterly |
In addition, the Funds intend to distribute any capital gains to shareholders as capital gain dividends at least annually. The amount and timing of distributions are determined in accordance with federal income tax regulations, which may differ from GAAP.
(f) Securities Lending
Each Fund may lend portfolio securities to certain creditworthy borrowers, including the Funds' securities lending agent. The loans are collateralized at all times by cash and/or high grade debt obligations in an amount at
| CLAYMORE EXCHANGE-TRADED FUND TRUST 2 ANNUAL REPORT | 55 |
| NOTES TO FINANCIAL STATEMENTS continued | August 31, 2015 |
least equal to 102% of the market value of domestic securities loaned and 105% of foreign securities loaned as determined at the close of business on the preceding business day. The cash collateral received is held in a separately managed account established for each respective Fund and maintained by the lending agent exclusively for the investment of securities lending cash collateral on behalf of each Fund. The separately managed accounts invest in short-term investments valued at amortized cost, which approximates market value. Each Fund receives compensation for lending securities from interest or dividends earned on the cash, cash equivalents or U.S. government securities held as collateral, net of fee rebates paid to the borrower plus reasonable administrative and custody fees paid to the lending agent. Such compensation is accrued daily and payable to the Fund monthly. The dividend and interest income earned on the securities loaned is accounted for in the same manner as other dividend and interest income. The borrower pays to the Funds an amount equal to any dividends or interest received on loaned securities. These payments from the borrower are not eligible for reduced tax rates as "qualified dividend income" under the Jobs and Growth Tax Reconciliation Act of 2003. The Funds retain all or a portion of the interest received on investment of cash collateral or receive a fee from the borrower. Lending portfolio securities could result in a loss or delay in recovering each Fund's securities if the borrower defaults. The securities lending income earned by the Funds is disclosed on the Statement of Operations.
| | | | Value of | | | | | | | | | | |
| | | | Securities | | | Cash | | | Non-Cash | | | Total | |
| Fund | | | Loaned | | | Collateral | | | Collateral | | | Collateral | |
| Guggenheim China | | | | | | | | | | | | | |
| All-Cap ETF | | $ | 3,976,167 | | $ | 4,092,518 | | $ | 141,947 | | $ | 4,234,465 | |
| Guggenheim China | | | | | | | | | | | | | |
| Technology ETF | | | 10,378,777 | | | 10,416,106 | | | 419,213 | | | 10,835,319 | |
| Guggenheim Emerging | | | | | | | | | | | | | |
| Market Real Estate ETF | | | 60,420 | | | 76,171 | | | — | | | 76,171 | |
| Guggenheim Solar ETF | | | 118,196,929 | | | 114,747,111 | | | 9,584,882 | | | 124,331,993 | |
| Guggenheim S&P Global | | | | | | | | | | | | | |
| Water Index ETF | | | 4,984,635 | | | 5,246,450 | | | — | | | 5,246,450 | |
| Guggenheim S&P | | | | | | | | | | | | | |
| High Income | | | | | | | | | | | | | |
| Infrastructure ETF | | | 84,369 | | | 86,992 | | | — | | | 86,992 | |
Note 3 – Investment Advisory Agreement and Other Agreements:
Pursuant to an Investment Advisory Agreement (the "Agreement") between the Trust, on behalf of each Fund, and GFIA, the Investment Adviser manages the investment and reinvestment of each Fund's assets and administers the affairs of each Fund to the extent requested by the Board.
Pursuant to the Agreement, each Fund listed in the following table pays the Investment Adviser an advisory fee. The advisory fee is payable on a monthly basis at the annual rate set forth below based on each Fund's average daily net assets:
| Fund | Rate |
| Guggenheim Solar ETF | 0.50% |
| Guggenheim S&P Global Water Index ETF | 0.50% |
Pursuant to the Agreement, each Fund listed in the following table pays the Investment Adviser a unitary management fee for the services and facilities it provides. The unitary management fee is payable on a monthly basis at the annual rate set forth below based on each Fund's average daily net assets:
| Fund | Rate |
| Guggenheim China All-Cap ETF | 0.70% |
| Guggenheim China Technology ETF | 0.70% |
| Guggenheim Emerging Markets Real Estate ETF | 0.65% |
| Guggenheim S&P High Income Infrastructure ETF | 0.45% |
Out of the unitary management fee, the Investment Adviser pays substantially all the expenses of each Fund, including the cost of transfer agency, custody, fund administration, legal, audit and other services, except for the fee payments under the Agreement, distribution fees, if any, brokerage expenses, taxes, interest, litigation expenses and other extraordinary expenses.
Rydex Fund Services, LLC ("RFS"), an affiliate of the Investment Adviser, provides fund administration services to the Funds. As compensation for these services, RFS receives a fund administration fee payable monthly at the annual rate set forth below as a percentage of the average daily net assets of each Fund:
| Net Assets | Rate |
| First $200,000,000 | 0.0275% |
| Next $300,000,000 | 0.0200% |
| Next $500,000,000 | 0.0150% |
| Over $1,000,000,000 | 0.0100% |
For the year ended August 31, 2015, the following Funds recognized Fund Administration expenses as follows:
| Fund | Fund Administration Expense | |
| Guggenheim Solar ETF | | $ | 84,848 | |
| Guggenheim S&P Global Water Index ETF | | | 85,750 | |
Due to their unitary management fee structure, Guggenheim China All-Cap ETF, Guggenheim China Technology ETF, Guggenheim Emerging Markets Real Estate ETF and Guggenheim S&P High Income Infrastructure ETF do not pay a separate Fund Administration fee.
The Bank of New York Mellon Corp. ("BNY") acts as the Funds' custodian, accounting agent, transfer agent and security lending agent. As custodian, BNY is responsible for the custody of the Funds' assets. As accounting agent, BNY is responsible for maintaining the books and records of the Funds. As transfer agent, BNY is responsible for performing transfer agency services for the Funds. As securities lending agent, BNY is responsible for executing the lending of portfolio securities to creditworthy borrowers.
The Investment Adviser has contractually agreed to waive fees and/or pay Fund expenses to the extent necessary to prevent the operating expenses of Guggenheim Solar ETF and Guggenheim S&P Global Water Index ETF (excluding interest expense, a portion of the Fund's licensing fees, offering costs, brokerage commissions and other trading expenses, taxes and extraordinary expenses such as litigation and other expenses not incurred
| 56 | CLAYMORE EXCHANGE-TRADED FUND TRUST 2 ANNUAL REPORT |
| NOTES TO FINANCIAL STATEMENTS continued | August 31, 2015 |
in the ordinary course of the Fund's business), from exceeding 0.65% of average net assets per year, at least until December 31, 2018.
For the year ended August 31, 2015, the Investment Adviser waived Advisory Fees as follows:
| Fund | Advisory Fees Waived | |
| Guggenheim Solar ETF | | $ | 114,866 | |
| Guggenheim S&P Global Water Index ETF | | | 2,217 | |
Amounts owed to each Fund from the Investment Adviser are shown in the Statement of Assets and Liabilities. This receivable is settled on a periodic basis.
Certain officers and trustees of the Trust may also be officers, directors and/or employees of the Investment Adviser. The Trust does not compensate its officers or trustees who are officers, directors and/or employees of the Investment Adviser.
Licensing Fee Agreements:
The Investment Adviser has entered into licensing agreements on behalf of each Fund with the following Licensors:
| Fund | Licensor |
| Guggenheim China All-Cap ETF | AlphaShares, LLC |
| Guggenheim China Technology ETF | AlphaShares, LLC |
| Guggenheim Emerging Markets Real Estate ETF | AlphaShares, LLC |
| Guggenheim Solar ETF | MAC Indexing LLC |
| Guggenheim S&P Global Water Index ETF | Standard & Poor's Financial Services LLC, |
| | a division of McGraw-Hill Financial |
| Guggenheim S&P High Income Infrastructure ETF | S&P Dow Jones Index Group |
The Funds are not sponsored, endorsed, sold or promoted by the Licensors and the Licensors make no representation regarding the advisability of investing in shares of the Funds. Up to 5 basis points of licensing fees are excluded from the expense cap for the Funds without a unitary management fee.
Note 4 – Fair Value Measurement:
In accordance with GAAP, fair value is defined as the price that the Funds would receive to sell an investment or pay to transfer a liability in an orderly transaction with an independent buyer in the principal market, or in the absence of a principal market, the most advantageous market for the investment or liability. GAAP establishes a three-tier fair value hierarchy based on the types of inputs used to value assets and liabilities and requires corresponding disclosure. The hierarchy and the corresponding inputs are summarized below:
Level 1 — quoted prices in active markets for identical assets or liabilities.
Level 2 — significant other observable inputs (for example quoted prices for securities that are similar based on characteristics such as interest rates, prepayment speeds, credit risk, etc.).
Level 3 — significant unobservable inputs based on the best information available under the circumstances, to the extent observable inputs are not available, which may include assumptions.
The types of inputs available depend on a variety of factors, such as the type of security and the characteristics of the markets in which it trades, if any. Fair valuation determinations that rely on fewer or no observable inputs require greater judgment. Accordingly, fair value determinations for Level 3 securities require the greatest amount of judgment.
The following table represents the Funds' investments carried on the Statement of Assets and Liabilities by caption and by level within the fair value hierarchy as of August 31, 2015:
| | | Level 1 | | Level 2 | | Level 3 | | | |
| | | Investments | | Investments | | Investments | | | |
| | | In Securities | | In Securities | | In Securities | | Total | |
| Assets | | | | | | | | | | | | | |
| Guggenheim China | | | | | | | | | | | | | |
| All-Cap ETF | | $ | 32,945,721 | | $ | 310,275 | | $ | 131,286 | | $ | 33,387,282 | |
| Guggenheim China | | | | | | | | | | | | | |
| Technology ETF | | | 55,951,021 | | | 166,466 | | | 47,031 | | | 56,164,518 | |
| Guggenheim Emerging | | | | | | | | | | | | | |
| Markets Real | | | | | | | | | | | | | |
| Estate ETF | | | 2,140,351 | | | — | | | — | | | 2,140,351 | |
| Guggenheim Solar ETF | | | 380,027,418 | | | — | | | — | | | 380,027,418 | |
| Guggenheim S&P | | | | | | | | | | | | | |
| Global Water | | | | | | | | | | | | | |
| Index ETF | | | 350,195,928 | | | — | | | — | | | 350,195,928 | |
| Guggenheim S&P | | | | | | | | | | | | | |
| High Income | | | | | | | | | | | | | |
| Infrastructure ETF | | | 2,367,371 | | | — | | | — | | | 2,367,371 | |
Independent pricing services are used to value a majority of the Funds' investments. When values are not available from a pricing service, they will be determined under the valuation policies that have been reviewed and approved by the Board. In any event, values are determined using a variety of sources and techniques, including: market prices; broker quotes; and models which derive prices based on inputs such as prices of securities with comparable maturities and characteristics or based on inputs such as anticipated cash flows or collateral, spread over Treasuries, and other information and analysis.
The inputs or methodologies used for valuing securities are not necessarily an indication of the risk associated with investing in those securities. The suitability of the techniques and sources employed to determine fair valuation are regularly monitored and subject to change.
| CLAYMORE EXCHANGE-TRADED FUND TRUST 2 ANNUAL REPORT | 57 |
| NOTES TO FINANCIAL STATEMENTS continued | August 31, 2015 |
The following is a summary of significant unobservable inputs used in the fair valuation of assets and liabilities categorized within Level 3 of the fair value hierarchy
| | | | | | | | | | | |
| | | | | | Ending Balance | | Valuation | | Unobservable | |
| Fund | | Category | | | at 8/31/15 | | Technique | | Inputs | |
| Guggenheim | | | | | | | | | | |
| China All-Cap | | | | | | | Last trade | | 25%-100% | |
| ETF | | Common Stocks | | $ | 131,286 | | with Adjustment | | Discount | |
| Guggenheim | | | | | | | | | | |
| China | | | | | | | | | | |
| Technology | | | | | | | Last trade | | | |
| ETF | | Common Stocks | | $ | 47,031 | | with Adjustment | | 25% Discount | |
Any remaining level 3 securities held by the Trust and excluded from the table above were not considered material to the Trust.
Transfers between investment levels may occur as the markets fluctuate and/or the availability of data used in an investment's valuation changes. Transfers between valuation levels, if any, are in comparison to the valuation levels at the end of the previous fiscal year, and are effective using the fair value as of the end of the current fiscal period.
The transfers in and out of the valuation levels as of August 31, 2015, compared to the valuation levels at the end of the previous fiscal year are detailed below:
| Guggenheim China All-Cap ETF | | | | |
| Transfer from Level 1 to Level 2 | | $ | 310,275 | |
| Transfer from Level 1 to Level 3 | | | 121,067 | |
The transfer from Level 1 to Level 2 and the transfer from Level 1 to Level 3 are the results of securities being halted on the principal exchange on which they trade.
| Guggenheim China Technology ETF | | | | |
| Transfer from Level 1 to Level 2 | | $ | 166,466 | |
| Transfer from Level 1 to Level 3 | | | 47,031 | |
The transfer from Level 1 to Level 2 is due to lack of an active market.
The transfer from Level 1 to Level 3 is the result of the security being halted on the principal exchange on which it trades.
Except for Guggenheim China All-Cap ETF and Guggenheim China Technology ETF, there were no transfers between levels for these Funds for the year ended August 31, 2015.
Summary of Fair Value Level 3 Activity
Following is a reconciliation of Level 3 assets for which significant unobservable inputs were used to determine fair value for the year ended August 31, 2015:
| Level 3 – Fair value measurement using significant unobservable inputs | | | | |
| Guggenheim China All-Cap ETF | | | | |
| Beginning Balance | | $ | 15,888 | |
| Realized Gain/Loss | | | (52,584 | ) |
| Change in Unrealized Gain/Loss | | | 19,203 | |
| Purchases | | | 27,712 | |
| Transfer In | | | 121,067 | |
| Ending Balance | | $ | 131,286 | |
| Level 3 – Fair value measurement using significant unobservable inputs | | | | |
| Guggenheim China Technology ETF | | | | |
| Beginning Balance | | $ | — | |
| Transfer In | | | 47,031 | |
| Ending Balance | | $ | 47,031 | |
| Level 3 – Fair value measurement using significant unobservable inputs | | | | |
| Guggenheim Emerging Markets Real Estate ETF | | | | |
| Beginning Balance | | $ | — | |
| Change in Unrealized Gain/Loss | | | (16,584 | ) |
| Purchases | | | 16,584 | |
| Ending Balance | | $ | — | |
Note 5 – Federal Income Taxes:
The Funds intend to comply with the requirements of Subchapter M of the Internal Revenue Code of 1986, as amended (the "Internal Revenue Code"), applicable to regulated investment companies. Accordingly, no provision for U.S. federal income taxes is required. In addition, by distributing substantially all of its ordinary income and long-term capital gains, if any, during each calendar year, each Fund intends not to be subject to U.S. federal excise tax.
As of August 31, 2015, the cost of investments and accumulated unrealized appreciation/depreciation on investments for federal income tax purposes were as follows:
| | | | | | | | | Net Tax | |
| | | Cost of | | Gross Tax | | Gross Tax | | Unrealized | |
| | | Investments for | | Unrealized | | Unrealized | | Appreciation | |
| | | Tax Purposes | | Appreciation | | (Depreciation | ) | (Depreciation | ) |
| Guggenheim China All-Cap ETF | | $ | 38,105,462 | | $ | 3,544,358 | | $ | (8,262,538 | ) | $ | (4,718,180 | ) |
| Guggenheim China Technology ETF | | | 71,069,814 | | | 2,261,877 | | | (17,167,173 | ) | | (14,905,296 | ) |
| Guggenheim Emerging Markets Real Estate ETF | | | 2,546,922 | | | 86,470 | | | (493,041 | ) | | (406,571 | ) |
| Guggenheim Solar ETF | | | 534,641,131 | | | 5,785,123 | | | (160,398,836 | ) | | (154,613,713 | ) |
| Guggenheim S&P Global Water Index ETF | | | 309,310,913 | | | 63,437,039 | | | (22,552,024 | ) | | 40,885,015 | |
| Guggenheim S&P High Income Infrastructure ETF | | | 2,613,295 | | | 12,044 | | | (257,968 | ) | | (245,924 | ) |
| 58 | CLAYMORE EXCHANGE-TRADED FUND TRUST 2 ANNUAL REPORT |
| NOTES TO FINANCIAL STATEMENTS continued | August 31, 2015 |
Tax components accumulated earnings (deficit) of the following balances as of August 31, 2015, were as follows:
| | | | | Net Unrealized | | Accumulated | |
| | | Undistributed | | Appreciation | | Capital and | |
| Fund | | Ordinary Income | | (Depreciation | ) | Other Losses | |
| Guggenheim China All-Cap ETF | | $ | 796,945 | | $ | (4,718,180 | ) | $ | (8,454,834 | ) |
| Guggenheim China Technology ETF | | | 921,679 | | | (14,905,283 | ) | | (13,075,336 | ) |
| Guggenheim Emerging Markets | | | | | | | | | | |
| Real Estate ETF | | | — | | | (406,721 | ) | | (29,648 | ) |
| Guggenheim Solar ETF | | | 2,948,189 | | | (154,615,217 | ) | | (304,094,232 | ) |
| Guggenheim S&P Global | | | | | | | | | | |
| Water Index ETF | | | 5,114,694 | | | 40,864,211 | | | (96,280,459 | ) |
| Guggenheim S&P High Income | | | | | | | | | | |
| Infrastructure ETF | | | 25,245 | | | (246,005 | ) | | (20,789 | ) |
Note: Capital Loss Carryforward amounts may be limited due to Federal income tax regulations.
Distributions to Shareholders:
The tax character of distributions paid during the year ended August 31, 2015, was as follows:
| Distributions Paid from Ordinary Income | |
| Guggenheim China All-Cap ETF | | $ | 1,225,500 | |
| Guggenheim China Technology ETF | | | 672,750 | |
| Guggenheim Emerging Markets Real Estate ETF | | | 82,270 | |
| Guggenheim Solar ETF | | | 5,534,720 | |
| Guggenheim S&P Global Water Index ETF | | | 5,956,080 | |
| Guggenheim S&P High Income Infrastructure ETF | | | 43,620 | |
The tax character of distributions paid during the year ended August 31, 2014, was as follows:
| Distributions Paid from Ordinary Income | |
| Guggenheim China All-Cap ETF | | $ | 972,000 | |
| Guggenheim China Technology ETF | | | 538,200 | |
| Guggenheim Solar ETF | | | 3,755,928 | |
| Guggenheim S&P Global Water Index ETF | | | 4,754,400 | |
As of August 31, 2015, the following reclassifications were made to the capital accounts of the Funds, to reflect permanent book/tax differences and income and gains available for distributions under income tax regulations, which are primarily due to the inherent differences between book and tax treatment of investment in real estate investment trusts, foreign currency transactions, redemption in-kind transactions, disposition of passive foreign investment company stocks, wash sales from redemption in-kind transactions and return of capital distributions. Net investment income, net realized gains and net assets were not affected by these changes.
| | | | | Undistributed | | | |
| | | | | (Distributions in | | | |
| | | | | Excess of) | | Accumulated | |
| | | Paid-In | | Net Investment | | Net Realized | |
| Fund | | | Capital | | | Income | | | Gain (Loss | ) |
| Guggenheim China All-Cap ETF | | $ | 1,465,355 | | $ | 78,025 | | $ | (1,543,380 | ) |
| Guggenheim China Technology ETF | | | 9,090,766 | | | 85,697 | | | (9,176,463 | ) |
| Guggenheim Emerging | | | | | | | | | | |
| Markets Real Estate ETF | | | — | | | 2,557 | | | (2,557 | ) |
| Guggenheim Solar ETF | | | 29,792,422 | | | (205,156 | ) | | (29,587,266 | ) |
| Guggenheim S&P Global | | | | | | | | | | |
| Water Index ETF | | | 9,688,893 | | | (75,129 | ) | | (9,613,764 | ) |
| Guggenheim S&P High | | | | | | | | | | |
| Income Infrastructure ETF | | | 32,316 | | | (1,704 | ) | | (30,612 | ) |
For Federal income tax purposes, capital loss carryforwards represent realized losses of the Funds that may be carried forward and applied against future capital gains. For taxable years beginning on or before December 22, 2010, such capital losses may be carried forward for a maximum of eight years. Under the RIC Modernization Act of 2010, the Funds are permitted to carry forward capital losses incurred in taxable years beginning after December 22, 2010 for an unlimited period. However, any losses incurred during those taxable years must be utilized prior to the losses incurred in pre-enactment taxable years. As a result of this ordering rule, pre-enactment capital loss carryforwards may be more likely to expire unused. Additionally, post-enactment capital losses that are carried forward will retain their character as either short-term or long-term capital losses rather than being considered all short-term as under previous law. As of August 31, 2015, capital loss carryforwards for the Funds were as follows:
| | | | | | | | | Unlimited | | Unlimited | | Total | |
| | | Capital Loss | | Capital Loss | | Capital Loss | | Short-Term | | Long-Term | | Capital Loss | |
| Fund | | Expiring in 2017 | | Expiring in 2018 | | Expiring in 2019 | | Capital Loss | | Capital Loss | | Carryforward | |
| Guggenheim China All-Cap ETF | | $ | — | | $ | (29,627 | ) | $ | (853,049 | ) | $ | (1,059,278 | ) | $ | (6,512,880 | ) | $ | (8,454,834 | ) |
| Guggenheim China Technology ETF | | | — | | | — | | | (188,097 | ) | | (5,182,855 | ) | | (7,704,384 | ) | | (13,075,336 | ) |
| Guggenheim Emerging Markets Real Estate ETF | | | — | | | — | | | — | | | (16,374 | ) | | — | | | (16,374 | ) |
| Guggenheim Solar ETF | | | (6,030,482 | ) | | (118,836,026 | ) | | (21,764,929 | ) | | (31,089,341 | ) | | (126,373,454 | ) | | (304,094,232 | ) |
| Guggenheim S&P Global Water Index ETF | | | (31,879,617 | ) | | (38,476,281 | ) | | (16,548,141 | ) | | (1,193,868 | ) | | (8,182,552 | ) | | (96,280,459 | ) |
| Guggenheim S&P High Income | | | | | | | | | | | | | | | | | | | |
| Infrastructure ETF | | | — | | | — | | | — | | | (20,789 | ) | | — | | | (20,789 | ) |
| CLAYMORE EXCHANGE-TRADED FUND TRUST 2 ANNUAL REPORT | 59 |
| NOTES TO FINANCIAL STATEMENTS continued | August 31, 2015 |
Pursuant to Federal income tax regulations applicable to investment companies, the Funds can elect to treat net capital losses and certain ordinary losses realized between November 1 and August 31 of each year as occurring on the first day of the following tax year. The Funds also can elect to treat certain ordinary losses realized between January 1 and August 31 of each year as occurring on the first day of the following tax year. The following Fund has elected to treat the ordinary loss as a post-October Loss:
| Fund | | | Ordinary | | | Capital | |
| Guggenheim Emerging Markets Real Estate ETF | | $ | 13,274 | | $ | — | |
For all open tax years and all major jurisdictions, management of the Trust has concluded that there are no significant uncertain tax positions that would require recognition in the financial statements. Uncertain tax positions are tax positions taken or expected to be taken in the course of preparing each Fund's tax returns that would not meet a more-likely-than-not threshold of being sustained by the applicable tax authority and would be recorded as a tax expense in the current year. Open tax years are those that are open for examination by taxing authorities (i.e. generally the last four tax year ends and the interim tax period since then). Furthermore, management of the Trust is also not aware of any tax positions for which it is reasonably possible that the total amounts of unrecognized tax benefits will significantly change in the next twelve months.
Note 6 – Investments in Securities:
For the year ended August 31, 2015, the cost of investments purchased and proceeds from sales of investments, excluding short-term investments and in-kind transactions, were as follows:
| | | | Purchases | | | Sales | |
| Guggenheim China All-Cap ETF | | $ | 8,566,480 | | $ | 9,040,252 | |
| Guggenheim China Technology ETF | | | 26,127,296 | | | 25,489,317 | |
| Guggenheim Emerging Markets Real Estate ETF | | | 1,127,710 | | | 602,909 | |
| Guggenheim Solar ETF | | | 174,901,403 | | | 176,605,279 | |
| Guggenheim S&P Global Water Index ETF | | | 32,451,992 | | | 33,210,837 | |
| Guggenheim S&P High Income Infrastructure ETF | | | 1,200,839 | | | 336,390 | |
For the year ended August 31, 2015, in-kind transactions were as follows:
| | | | Purchases | | | Sales | |
| Guggenheim China All-Cap ETF | | $ | — | | $ | 18,870,478 | |
| Guggenheim China Technology ETF | | | 33,257,276 | | | 47,964,870 | |
| Guggenheim Emerging Markets Real Estate ETF | | | 1,956,963 | | | — | |
| Guggenheim Solar ETF | | | 217,364,394 | | | 244,979,437 | |
| Guggenheim S&P Global Water Index ETF | | | 35,674,683 | | | 25,653,051 | |
| Guggenheim S&P High Income Infrastructure ETF | | | 2,505,306 | | | 854,976 | |
Note 7 – Capital:
Shares are issued and redeemed by the Funds only in creation unit size aggregations of 50,000 to 100,000 shares. Transactions are permitted on an in-kind basis, with a separate cash payment, which is balancing each component to equate the transaction to the net asset value per share of the Fund on the transaction date. Transaction fees ranging from $500 to $3,000 are charged to those persons creating or redeeming creation units. An additional charge on the transaction may be imposed with respect to transactions effected outside of the clearing process or to the extent that cash is used in lieu of securities to purchase creation units or redeem for cash.
Note 8 – Distribution and Service Plan:
The Board has adopted a distribution and service plan (the "Plan") pursuant to Rule 12b-1 under the 1940 Act. Under the Plan, each Fund is authorized to pay distribution fees in connection with the sale and distribution of its shares and pay service fees in connection with the provision of ongoing services to shareholders and the maintenance of shareholder accounts in an amount up to 0.25% of its average daily net assets each year. No 12b-1 fees are currently paid by the Funds, and there are no current plans to impose these fees. No such fee may be paid in the future without further approval by the Board.
Note 9 – Indemnifications:
In the normal course of business, the Funds enter into contracts that contain a variety of representations, which provide general indemnifications. Each Fund's maximum exposure under these arrangements is unknown, as this would require future claims that may be made against a Fund that have not yet occurred. However, the Funds expect the risk of loss to be remote.
Note 10 – Subsequent Event:
The Funds evaluated subsequent events through the date the financial statements were available for issue and determined there were no additional material events that would require disclosure in the Funds' financial statements.
| 60 | CLAYMORE EXCHANGE-TRADED FUND TRUST 2 ANNUAL REPORT |
| REPORT OF INDEPENDENT REGISTERED PUBLIC ACCOUNTING FIRM | August 31, 2015 |
The Board of Trustees and Shareholders of Claymore Exchange-Traded Fund Trust 2
We have audited the accompanying statements of assets and liabilities, including the portfolios of investments, of Guggenheim China All-Cap ETF, Guggenheim China Technology ETF, Guggenheim Emerging Markets Real Estate ETF, Guggenheim Solar ETF, Guggenheim S&P Global Water Index ETF, and Guggenheim S&P High Income Infrastructure ETF (six of the portfolios constituting the Claymore Exchange-Traded Fund Trust 2 (the Trust)) as of August 31, 2015, and the related statements of operations, changes in net assets, and the financials highlights for the periods indicated therein. These financial statements and financial highlights are the responsibility of the Trust's management. Our responsibility is to express an opinion on these financial statements and financial highlights based on our audits.
We conducted our audits in accordance with the standards of the Public Company Accounting Oversight Board (United States). Those standards require that we plan and perform the audits to obtain reasonable assurance about whether the financial statements and financial highlights are free of material misstatement. We were not engaged to perform an audit of the Trust's internal control over financial reporting. Our audits included consideration of internal control over financial reporting as a basis for designing audit procedures that are appropriate in the circumstances, but not for the purpose of expressing an opinion on the effectiveness of the Trust's internal control over financial reporting. Accordingly, we express no such opinion. An audit also includes examining, on a test basis, evidence supporting the amounts and disclosures in the financial statements and financial highlights, assessing the accounting principles used and significant estimates made by management, and evaluating the overall financial statement presentation. Our procedures included confirmation of securities owned as of August 31, 2015, by correspondence with the custodian. We believe that our audits provide a reasonable basis for our opinion.
In our opinion, the financial statements and financial highlights referred to above present fairly, in all material respects, the financial position of each of the respective six portfolios constituting the Claymore Exchange-Traded Fund Trust 2 at August 31, 2015, the results of their operations, changes in their net assets, and their financial highlights for the periods indicated therein, in conformity with U.S. generally accepted accounting principles.
Chicago, Illinois
October 26, 2015
| CLAYMORE EXCHANGE-TRADED FUND TRUST 2 ANNUAL REPORT | 61 |
| SUPPLEMENTAL INFORMATION (Unaudited) | August 31, 2015 |
Federal Income Tax Information
In January 2016, shareholders will be advised on IRS Form 1099 DIV or substitute 1099 DIV as to the federal tax status of the distributions received by shareholders in the calendar year 2015.
The Trust intends to designate the maximum amount of dividends that qualify for the reduced tax rate pursuant to the Jobs and Growth Tax Relief Reconciliation Act of 2003. See qualified dividend income column in the table below.
The Trust's investment income(dividend income plus short-term gains, if any) qualifies as follows:
Guggenheim Emerging Market Real Estate ETF intends to designate $5,275 of foreign tax withholding on foreign source income of $75,818.
Guggenheim China All-Cap ETF intends to designate $97,737 of foreign tax withholding on foreign source income of $1,105,865.
Guggenheim S&P Global Water Index ETF intends to designate $360,952 of foreign tax withholding on foreign source income of $5,394,621.
Of the ordinary income distributions paid during the year, the following funds had the corresponding percentages qualify for the dividends received deduction for corporations:
| Fund | Dividend received deduction |
| Guggenheim China All-Cap ETF | 0.04% |
| Guggenheim China Technology ETF | 0.00% |
| Guggenheim Emerging Markets Real Estate ETF | 0.29% |
| Guggenheim Solar ETF | 0.03% |
| Guggenheim S&P Global Water ETF | 21.71% |
| Guggenheim S&P High Income Infrastructure ETF | 13.48% |
Additionally, the following amounts of taxable ordinary income dividends paid during the fiscal year qualified for the lower income tax rate available to individuals under the Jobs and Growth Tax Relief Reconciliation Act of 2003:
| Fund | Qualified dividend income |
| Guggenheim China All-Cap ETF | 65.36% |
| Guggenheim China Technology ETF | 20.60% |
| Guggenheim Emerging Markets Real Estate ETF | 33.87% |
| Guggenheim Solar ETF | 3.49% |
| Guggenheim S&P Global Water ETF | 99.09% |
| Guggenheim S&P High Income Infrastructure ETF | 98.93% |
Trustees
The Statement of Additional Information that includes additional information about the Trustees is also available, without charge, upon request via our website at guggenheiminvestments.com or by calling (800) 345-7999.
The Trustees of the Trust and their principal business occupations during the past five years:
Name, Address*
and Year of Birth | | Position(s)
Held
with Trust | | Office and
Length of
Time Served** | | Principal Occupation(s)
During Past Five Years | | Number of
Portfolios in
Fund Complex
Overseen | | Other Directorships
Held by Trustee |
| Independent Trustees: | | | | | | | | |
Randall C. Barnes
(1951) | | Trustee | | Since 2006 | | Current: Private Investor (2001-present). Former: Senior Vice President and Treasurer, PepsiCo, Inc. (1993-1997); President, Pizza Hut International (1991-1993); Senior Vice President, Strategic Planning and New Business Development, PepsiCo, Inc. (1987-1990). | | 93 | | Current: Trustee, Purpose Investments Funds (2014-present). |
Donald A. Chubb, Jr.
(1946 ) | | Trustee | | Since 2014 | | Current: Business broker and manager of commercial real estate, Griffith & Blair, Inc. (1997-present). | | 89 | | Current: Midland Care, Inc. (2011- present) |
Jerry B. Farley
(1946) | | Trustee | | Since 2014 | | Current: President, Washburn University (1997-present). | | 89 | | Current: Westar Energy, Inc. (2004- present); CoreFirst Bank & Trust (2000-present). |
| 62 | CLAYMORE EXCHANGE-TRADED FUND TRUST 2 ANNUAL REPORT |
| SUPPLEMENTAL INFORMATION (Unaudited) continued | August 31, 2015 |
Name, Address*
and Year of Birth | | Position(s)
Held
with Trust | | Office and
Length of
Time Served** | | Principal Occupation(s)
During Past Five Years | | Number of
Portfolios in
Fund Complex
Overseen | | Other Directorships
Held by Trustee |
| Independent Trustees continued: | | | | | | | | |
Roman Friedrich III
(1946) | | Trustee and Chairman of the Contracts Review Committee | | Since 2010 | | Current: Founder and Managing Partner, Roman Friedrich & Company(1998-present).
Former: Senior Managing Director, MLV & Co. LLC (2010-2011). | | 89 | | Current: Zincore Metals, Inc. (2009-present). Former: Axiom Gold and Silver Corp. (2011-2012). |
Robert B. Karn III
(1942) | | Trustee and Chairman of the Audit Committee | | Since 2010 | | Current: Consultant (1998-present).
Former: Arthur Andersen (1965-1997) and Managing Partner, Financial and Economic Consulting, St. Louis office (1987-1997). | | 89 | | Current: Peabody Energy Company (2003-present); GP Natural Resource Partners, LLC (2002-present). |
Ronald A. Nyberg
(1953) | | Trustee and Chairman of the Nominating and Governance Committee | | Since 2006 | | Current: Partner, Nyberg & Cassioppi, LLC (2000-present).
Former: Executive Vice President, General Counsel, and Corporate Secretary, Van Kampen Investments (1982-1999). | | 95 | | Current: Edward-Elmhurst Healthcare System (2012-present). |
Maynard F. Oliverius
(1943) | | Trustee | | Since 2014 | | Current: Retired.
Former: President and CEO, Stormont-Vail HealthCare (1996-2012). | | 89 | | Current: Fort Hays State University Foundation (1999-present); Stormont-Vail Foundation (2013- present); University of Minnesota HealthCare Alumni Association Foundation (2009-present). |
Ronald E. Toupin, Jr.
(1958) | | Trustee and Chairman of the Board | | Since 2006 | | Current: Portfolio Consultant (2010-present).
Former: Vice President, Manager and Portfolio Manager, Nuveen Asset Management (1998-1999); Vice President, Nuveen Investment Advisory Corp. (1992-1999); Vice President and Manager, Nuveen Unit Investment Trusts (1991-1999); and Assistant Vice President and Portfolio Manager, Nuveen Unit Investment Trusts (1988-1999), each of John Nuveen & Co., Inc. (1982-1999). | | 92 | | Former: Bennett Group of Funds (2011-2013). |
| | | | | | | | | | | |
| Interested Trustee: | | | | | | | | | | |
Donald C.
Cacciapaglia***
(1951) | | President, Chief Executive Officer and Trustee | | Since 2012 | | Current: President and CEO, certain other funds in the Fund Complex (2012-present); Vice Chairman, Guggenheim Investments (2010-present).
Former: Chairman and CEO, Channel Capital Group, Inc. (2002-2010). | | 224 | | Current: Clear Spring Life Insurance Company (2015-present) Guggenheim Partners Japan, Ltd. (2014-present); Delaware Life (2013-present); Guggenheim Life and Annuity Company (2011- present); Paragon Life Insurance Company of Indiana (2011-present). |
| * | The business address of each Trustee is c/o Guggenheim Investments, 227 West Monroe Street, Chicago, IL 60606. |
| ** | Each Trustee serves an indefinite term, until his successor is elected and qualified. |
| *** | This Trustee is deemed to be an "interested person" of the Funds under the 1940 Act by reason of his position with the Funds' Investment Adviser and/or the parent of the Investment Adviser. |
| CLAYMORE EXCHANGE-TRADED FUND TRUST 2 ANNUAL REPORT | 63 |
| SUPPLEMENTAL INFORMATION (Unaudited) continued | August 31, 2015 |
Officers
The Principal Executive Officers of the Trust, who are not Trustees, and their principal occupations during the past five years:
Name, Address*
and Year of Birth | | Position(s) held
with the Trust | | Term of Office
and Length of
Time Served** | | Principal Occupations
During Past Five Years |
| Officers: | | | | | | |
Joseph M. Arruda
(1966) | | Assistant Treasurer | | Since 2014 | | Current: Assistant Treasurer, certain other funds in the Fund Complex (2006-present); Vice President, Security Investors, LLC (2010-present); CFO and Manager, Guggenheim Specialized Products, LLC (2009-present).
Former: Vice President, Security Global Investors, LLC (2010-2011); Vice President, Rydex Advisors, LLC (2010); Vice President, Rydex Advisors II, LLC (2010). |
William H. Belden, III
(1965) | | Vice President | | Since 2006 | | Current: Vice President, certain other funds in the Fund Complex (2006-present); Managing Director, Guggenheim Funds Investment Advisors, LLC (2005-present).
Former: Vice President of Management, Northern Trust Global Investments (1999-2005). |
Joanna M. Catalucci
(1966) | | Chief Compliance Officer | | Since 2012 | | Current: Chief Compliance Officer, certain funds in the Fund Complex (2012-present); Senior Managing Director, Guggenheim Investments (2012-present).
Former: Chief Compliance Officer and Secretary, certain other funds in the Fund Complex (2008-2012); Senior Vice President & Chief Compliance Officer, Security Investors, LLC and certain affiliates (2010-2012); Chief Compliance Officer and Senior Vice President, Rydex Advisors, LLC and certain affiliates (2010-2011). |
Mark J. Furjanic
(1959) | | Assistant Treasurer | | Since 2008 | | Current: Vice President, Guggenheim Investments (2005-present); Assistant Treasurer, certain other funds in the Fund Complex (2008-present).
Former: Senior Manager, Ernst & Young LLP (1999-2005). |
James M. Howley
(1972) | | Assistant Treasurer | | Since 2006 | | Current: Director, Guggenheim Investments (2004-present); Assistant Treasurer, certain other funds in the Fund Complex (2006-present).
Former: Manager of Mutual Fund Administration, Van Kampen Investments, Inc. (1996-2004). |
Amy J. Lee
(1961) | | Chief Legal Officer | | Since 2013 | | Current: Chief Legal Officer, certain other funds in the Fund Complex (2013-present); Senior Managing Director, Guggenheim Investments (2012-present).
Former: Vice President, Associate General Counsel and Assistant Secretary, Security Benefit Life Insurance Company and Security Benefit Corporation (2004-2012). |
Mark E. Mathiasen
(1978) | | Secretary | | Since 2011 | | Current: Secretary, certain other funds in the Fund Complex (2007-present); Managing Director, Guggenheim Investments (2007-present). |
Michael P. Megaris
(1984) | | Assistant Secretary | | Since 2014 | | Current: Assistant Secretary, certain other funds in the Fund Complex (2014-present); Senior Associate, Guggenheim Investments (2012-present).
Former: J.D., University of Kansas School of Law (2009-2012). |
Kimberly J. Scott
(1974) | | Assistant Treasurer | | Since 2012 | | Current: Vice President, Guggenheim Investments (2012-present); Assistant Treasurer, certain other funds in the Fund Complex (2012-present).
Former: Financial Reporting Manager, Invesco, Ltd. (2010-2011); Vice President/Assistant Treasurer of Mutual Fund Administration, Van Kampen Investments, Inc./Morgan Stanley Investment Management (2009-2010); Manager of Mutual Fund Administration, Van Kampen Investments, Inc./Morgan Stanley Investment Management (2005-2009). |
Bryan Stone
(1979) | | Vice President | | Since 2014 | | Current: Vice President, certain other funds in the Fund Complex (2014-present); Director, Guggenheim Investments (2013-present).
Former: Senior Vice President, Neuberger Berman Group LLC (2009-2013); Vice President, Morgan Stanley (2002-2009). |
John L. Sullivan
(1955) | | Chief Financial Officer, Chief Accounting Officer and Treasurer | | Since 2010 | | Current: CFO, Chief Accounting Officer and Treasurer, certain other funds in the Fund Complex (2010-present); Senior Managing Director, Guggenheim Investments (2010-present).
Former: Managing Director and CCO, each of the funds in the Van Kampen Investments fund complex (2004- 2010); Managing Director and Head of Fund Accounting and Administration, Morgan Stanley Investment Management (2002-2004); CFO and Treasurer, Van Kampen Funds (1996-2004). |
| * | The business address of each officer is c/o Guggenheim Investments, 227 West Monroe Street, Chicago, IL 60606. |
| ** | Each officer serves an indefinite term, until his or her successor is duly elected and qualified. The date reflects the commencement date upon which the officer held any officer position with the Trust. |
| 64 | CLAYMORE EXCHANGE-TRADED FUND TRUST 2 ANNUAL REPORT |
| APPROVAL OF ADVISORY AGREEMENT – | |
| CLAYMORE EXCHANGE TRADED FUND TRUST 2 | August 31, 2015 |
Claymore Exchange-Traded Fund Trust 2 (the "Trust") was organized as a Delaware statutory trust on June 8, 2006, and is authorized to establish multiple series, each representing interests in a separate portfolio of securities and other assets of the Trust (each, a "Fund" and collectively, the "Funds"). The Trust is an open-end management investment company registered under the Investment Company Act of 1940, as amended (the "1940 Act"). Guggenheim Funds Investment Advisors, LLC ("GFIA" or the "Adviser"), a subsidiary of Guggenheim Funds Services, LLC ("GFS"), an indirect subsidiary of Guggenheim Partners, LLC, a global, diversified financial services firm ("Guggenheim Partners"), serves as each Fund's investment adviser and provides certain administrative and other services pursuant to an investment advisory agreement between the Trust, with respect to the Funds, and GFIA (the "Advisory Agreement"). (Guggenheim Partners, GFIA, GFS and their affiliates may be referred to herein collectively as "Guggenheim.") Under the supervision of the Board of Trustees of the Trust (the "Board," with the members of the Board referred to individually as the "Trustees"), GFIA is responsible for the overall management and administration of the Funds and provides certain facilities and personnel in connection with such services.
Following an initial two-year term, the Advisory Agreement continues in effect from year to year provided that such continuance is specifically approved at least annually by (i) the Board or a majority of the outstanding voting securities (as defined in the 1940 Act) of each Fund, and, in either event, (ii) the vote of a majority of the Trustees who are not "interested persons," as defined by the 1940 Act, of the Trust (the "Independent Trustees") casting votes in person at a meeting called for such purpose. At meetings held in person on April 29, 2015 (the "April Meeting") and on May 19, 2015 (the "May Meeting"), the Contracts Review Committee of the Board (the "Committee"), consisting solely of the Independent Trustees, met separately from Guggenheim to consider the proposed renewal of the Advisory Agreement. As part of its review process, the Committee was represented by independent legal counsel to the Independent Trustees ("Independent Legal Counsel"). Independent Legal Counsel reviewed and discussed with the Committee various key aspects of the Trustees' legal responsibilities relating to the proposed renewal of the Advisory Agreement and other principal contracts. In this connection, Independent Legal Counsel advised the Committee of: (i) the responsibilities of board members under applicable law; (ii) the standards for determining what constitutes an excessive fee as delineated by the courts and the factors the Trustees should consider in determining whether to approve the fee arrangements; and (iii) the disclosure requirements pertaining to these approvals, as required by the Securities and Exchange Commission. The Committee took into account various materials received from Guggenheim and Independent Legal Counsel. Recognizing that the evaluation process with respect to the services provided by GFIA is an ongoing one, the Committee also considered the variety of written materials, reports and oral presentations it received (and also received by the full Board) during the year regarding performance and operating results of the Funds.
In connection with the contract review process, FUSE Research Network LLC ("FUSE"), an independent, third-party research provider, was engaged to prepare advisory contract renewal reports designed specifically to help boards of directors/trustees fulfill their advisory contract renewal responsibilities. The objective of the reports is to present the subject funds' relative position regarding fees, expenses, total return performance and tracking error, with peer group and universe comparisons. The Committee assessed the data provided in the FUSE reports as well as commentary and supporting data presented by Guggenheim, including, among other things, a summary of notable distinctions between certain Funds and the applicable peer group identified in the FUSE reports.
Guggenheim prepared a presentation in response to a formal request for information sent by Independent Legal Counsel on behalf of the Independent Trustees. In addition, Guggenheim made a presentation at the April Meeting, which addressed areas identified for discussion by the Committee Chair and Independent Legal Counsel. Throughout the process, the Committee asked questions of management and requested certain additional information which Guggenheim provided following the April Meeting (collectively with the foregoing reports and materials, the "Contract Materials").
Among other things, Guggenheim provided: (i) staffing reports and biographies of those key personnel of Guggenheim providing services to the Funds and other registered investment companies for which GFIA or an affiliate serves as investment adviser ("Guggenheim Funds"); (ii) descriptions of various services performed by Guggenheim for the Guggenheim Funds, including the provision of a continuous investment program for each Fund, monitoring compliance with Fund investment strategies and statutory requirements, reviewing trading processes and conducting investment performance analyses; (iii) information regarding compliance and regulatory history for GFIA, including its Form ADV; and (iv) information concerning the parent company and overall Guggenheim organization and strategic plans and goals, all to assist the Committee in assessing the nature, extent and quality of services provided by GFIA. In addition, Guggenheim's response included information comparing the investment performance, tracking error, advisory fee and total net expense ratio (and/or unitary fee, as applicable) of each Fund to other funds (including such information presented in the FUSE reports as well as supplemental information prepared by Guggenheim), charts showing gross revenues, expenses and earnings for Guggenheim by product line and with respect to each Fund, including a breakout of various expenses, a description of Guggenheim's expense allocation methodology and information about the profitability of the Funds to Guggenheim Investments (the investment management business of Guggenheim Partners), financial information for Guggenheim Investments and certain information about Guggenheim's insurance policies, business continuity plan, proxy voting procedures, trade allocation, shareholder communications and compliance monitoring, among other things.
The Committee considered the foregoing Contract Materials in the context of its substantial accumulated experience in governing the Trust and weighed the factors and standards discussed with Independent Legal Counsel. Following an analysis and discussion of the factors identified below and in the exercise of its business judgment, the Committee
| CLAYMORE EXCHANGE-TRADED FUND TRUST 2 ANNUAL REPORT | 65 |
| APPROVAL OF ADVISORY AGREEMENT – | |
| CLAYMORE EXCHANGE TRADED FUND TRUST 2 continued | August 31, 2015 |
concluded that it was in the best interests of each Fund to recommend that the Board approve the renewal of the Advisory Agreement for an additional 12-month term as to the Funds listed in Appendix A.
Nature, Extent and Quality of Services Provided by the Adviser: With respect to the nature, extent and quality of services currently provided by the Adviser, the Committee considered the information provided by Guggenheim concerning the education, experience, professional affiliations, areas of responsibility and duties of key personnel performing services for the Funds, including those personnel providing compliance oversight. In this connection, the Committee considered Guggenheim's resources and related efforts to retain, attract and motivate capable personnel to serve the Funds and noted Guggenheim's report on recent additions and departures in personnel who work on matters relating to the Funds or are significant to the operations of the Adviser.
The Committee also considered the Adviser's attention to relevant developments in the mutual fund industry and its observance of compliance and regulatory requirements and noted that on a regular basis the Board receives and reviews information from the Trust's Chief Compliance Officer regarding compliance policies and procedures established pursuant to Rule 38a-1 under the 1940 Act. In addition, the Committee took into account the various compliance and risk management initiatives undertaken by Guggenheim, including, among other things, the hiring of additional staff to support the firm's Chief Risk Officer, initiatives related to the risks associated with the investment process and risk at the enterprise level, the organization's risk management infrastructure and critical activities. The Committee also considered Guggenheim's other initiatives intended to achieve greater enhancements and efficiencies in the organization's ability to provide services to all Guggenheim Funds, including the Funds, such as efforts to consolidate compliance manuals and align processes of the Funds with those of other Funds managed by the Adviser or another Guggenheim affiliate. In addition, in connection with the Committee's evaluation of the overall package of services provided by the Adviser, the Committee considered the Adviser's administrative capabilities, including its role in monitoring and coordinating compliance responsibilities with the accounting agent, administrator, custodian, distributor, securities lending agent, transfer agent and other service providers to the Funds.
The Committee also noted the distinctive nature of the Funds, as exchange-traded funds ("ETFs"), each of which generally is constructed to track the performance of a defined index of securities, before fund fees and expenses. In this connection, the Committee considered the experience and expertise appropriate in an investment adviser to ETFs. The Committee also considered the Adviser's monitoring of the ETFs' participation in the securities lending program and the secondary market support services provided by the Adviser to the Funds, including the Adviser's efforts to educate investment professionals about the Funds and other Guggenheim Funds.
With respect to Guggenheim's resources and the Adviser's ability to carry out its responsibilities under the Advisory Agreement, the Chief Financial Officer of Guggenheim Investments reviewed with the Committee certain unaudited financial information concerning Guggenheim Investments' holding company, Guggenheim Partners Investment Management Holdings, LLC ("GPIMH"), including GFIA. (The Committee received the audited consolidated financial statements of GPIMH and audited financial statements of GFIA once available following the April Meeting.)
The Committee also considered the acceptability of the terms of the Advisory Agreement. Based on the foregoing, and based on other information received (both oral and written) at the April Meeting and at the May Meeting, as well as other considerations, including the Committee's knowledge of the Adviser's quality of performance of its duties through Board meetings, discussions, and reports during the year, the Committee concluded that the Adviser and its personnel were qualified to serve the Funds in such capacity and may reasonably be expected to continue to provide a high quality of services under the Advisory Agreement with respect to the Funds.
Investment Performance: The Committee noted that, in view of the distinctive investment objective of the Funds, and the expectations of shareholders, the investment performance of the Funds in absolute terms was not of the importance that normally attaches to the performance of actively managed funds. Of more importance to the Committee was the extent to which each Fund achieved its objective to provide investment results that, before fund fees and expenses, correspond generally to the price and yield performance of securities of companies in its applicable index. Thus, the Committee focused its attention primarily on the tracking error data provided in the FUSE reports for each Fund, which was provided for the five-year, three-year, one-year, three-month and since inception periods as of December 31, 2014, as applicable. In this regard, the Committee noted Guggenheim's statement that it examines the tracking error on a monthly and quarterly basis for purposes of: (i) determining whether the tracking error is stable or trending; (ii) evaluating factors underlying any trending in tracking error, particularly where the trend is toward greater tracking error; and (iii) assessing whether there are any tools or strategies at Guggenheim's disposal to mitigate any trend toward greater tracking error. The Committee also took into account Guggenheim's explanation that it places greater emphasis on tracking error trends than it does on absolute tracking error because certain index-benchmarked ETFs may be more disposed to higher levels of tracking error, such as, for instance, with respect to a new ETF or an ETF that has yet to reach critical asset mass and consequently, may be unable to deploy its assets in a manner that replicates all of the constituent holdings of an index in the same proportion that the index holds them. The Committee noted other factors identified by Guggenheim that may impact tracking error, including pricing of halted or less liquid securities, time zone pricing-related issues and currency conversion sources.
In the course of its review of tracking error data, the Committee considered management's views and explanation of tracking error and tracking error trends for the Funds. The Committee considered the investment performance of the Funds as measured by total return in comparison to its peer group of funds as a measure for considering the Adviser's oversight of the applicable index. As to tracking error trends, the Committee observed that the Guggenheim China Small Cap ETF (HAO),
| 66 | CLAYMORE EXCHANGE-TRADED FUND TRUST 2 ANNUAL REPORT |
| APPROVAL OF ADVISORY AGREEMENT – | |
| CLAYMORE EXCHANGE TRADED FUND TRUST 2 continued | August 31, 2015 |
an index-benchmarked ETF, has exhibited recent upticks in tracking error. The Committee considered the Adviser's statement that there are challenges associated with this Fund, including difficulties in pricing its securities, which are foreign securities or proxies for foreign securities that are less liquid and at times, subject to trading halts. The Adviser noted that AlphaShares, LLC (the index provider) had recently introduced a new regimen for dealing with halted securities that seeks to mitigate the gap in pricing information.
After reviewing the foregoing and related factors, the Committee concluded, within the context of its overall conclusions regarding the Advisory Agreement, that: (i) the Funds had in fact tracked their indexes within an acceptable range; (ii) over time the tracking by the Funds had improved and as of the most recent annual period had in fact tracked their indexes within an acceptable range; or (iii) it was satisfied with Guggenheim's efforts and explanation for the tracking error data presented in the FUSE reports.
Comparative Fees, Costs of Services Provided and the Profits Realized by the Adviser from Its Relationship with the Funds: The Committee reviewed and discussed the information provided by the Adviser as to each Fund's contractual advisory fee and total net expense ratio, as compared to those of the peer group funds presented in the FUSE report. The Committee noted that either: (i) the Adviser has contractually agreed to waive a portion of the advisory fee and/or reimburse expenses to absorb annual operating expenses of certain Funds (excluding interest expenses, all or a portion of each Fund's licensing fees, brokerage commissions and other trading expenses, taxes and extraordinary expenses such as litigation and other expenses not incurred in the ordinary course of a Fund's business) over a particular amount; or (ii) the advisory fee is a unitary fee pursuant to which the Adviser assumes all expenses of the Fund (including the cost of transfer agency, custody, fund administration, legal, audit and other services) other than the fee payments under the Advisory Agreement, payments under the Funds' 12b-1 plan, if any, brokerage expenses, taxes, interest, litigation expenses and other extraordinary expenses. The Committee noted that, for most of the Funds, the advisory fees, after giving effect to the contractual waivers where applicable, were generally within the range of the peer group of funds in the FUSE report. As to each Fund, the Committee considered the comparative fee and expense data provided relative to the peer group within the context of the Fund's investment objective and the uniqueness of the Fund's underlying index.
In further considering the comparative fee and expense data presented in the Contract Materials and addressed by Guggenheim, the Committee made the following observations for certain Funds:
Guggenheim Shipping ETF (SEA): The contractual advisory fee is in the fourth quartile (80th percentile) of its peer group and the total net expense ratio is in the third quartile (60th percentile) of its peer group (1 basis point above the median). The Committee considered the Adviser's statement that the Fund's exposure is exclusively to global shipping companies, while its peer group consists of competitors that are more broadly focused on domestic transportation or industrials.
Guggenheim Timber ETF (CUT): The contractual advisory fee and total net expense ratio are in the fourth quartile (100th percentile as to each) of its peer group. The Committee noted that the Fund's peer group contains only one other fund. In addition, the Adviser has entered into an expense limitation agreement with respect to the Fund.
Guggenheim China Real Estate ETF (TAO): The contractual advisory fee and total net expense ratio are in the fourth quartile (100th percentile as to each) of its peer group. The Committee noted that the Fund's peer group contains only one other fund. In addition, the Adviser has entered into an expense limitation agreement with respect to the Fund.
Guggenheim China Technology ETF (CQQQ): The contractual advisory fee and total net expense ratio are in the fourth quartile (100th percentile as to each) of its peer group. The Committee observed that the Fund's contractual advisory fee and total net expense ratio are 2 basis points and 3 basis points, respectively, above the median advisory fee and total net expense ratio of its peers. The Committee also noted that the Fund's peer group contains only two other funds.
With respect to the costs of services provided and profits realized by Guggenheim Investments from its relationship with the Funds, the Committee reviewed a profitability analysis and data from management for each Fund setting forth the average assets under management for the twelve months ended December 31, 2014, ending assets under management as of December 31, 2014, gross revenues received by Guggenheim Investments, expenses incurred in providing services to the Funds, earnings and the operating margin/profitability rate, including variance information relative to the foregoing amounts as of December 31, 2013. In addition, the Chief Financial Officer of Guggenheim Investments reviewed with, and addressed questions from, the Committee concerning the expense allocation methodology employed in producing the profitability analysis.
The Committee considered other benefits available to the Adviser because of its relationship with the Funds and noted that the administrative service fees received by the Adviser's affiliate, Rydex Fund Services, LLC, from serving as administrator provide Guggenheim with additional revenue for those Funds without a unitary fee structure. The Committee also noted Guggenheim's statement that it may benefit from marketing synergies arising from offering a broad spectrum of products, including the Funds. The Committee considered the limitations of the methodologies used by Guggenheim for determining the profitability for the ETFs on a Fund-by-Fund basis. The Committee noted that, for the ETFs as a product group, the profitability is not unreasonable. The Committee also considered the variances in the profitability information presented for the individual Funds, including how the structure of a unitary fee versus a non-unitary fee impacted the profitability calculation. Based on all of the information provided and its review, the Committee determined that Guggenheim Investments' profitability from its relationship with the Funds is not unreasonable.
Economies of Scale: The Committee considered the extent to which economies of scale could be realized with respect to the management of the Funds as the Funds grow and whether fee levels reflected a reasonable
| CLAYMORE EXCHANGE-TRADED FUND TRUST 2 ANNUAL REPORT | 67 |
| APPROVAL OF ADVISORY AGREEMENT – | |
| CLAYMORE EXCHANGE TRADED FUND TRUST 2 continued | August 31, 2015 |
sharing of such economies of scale for the benefit of Fund investors. The Committee considered each Fund's asset size, advisory fee structure, net expense ratio giving effect to any applicable expense waiver and/or reimbursement agreement or unitary fee agreement with the Adviser and whether the investment process produced economies of scale. The Committee was of the view that economies of scale were being shared with the Funds subject to a unitary fee arrangement by virtue of an advisory fee, set at a relatively low level since the inception of each applicable Fund, that subsumed economies of scale in the fee itself. As to economies of scale with respect to the Funds not subject to a unitary fee, and as to Guggenheim's suite of ETF products generally, the Committee took into account its discussion with the Chief Financial Officer of Guggenheim Investments and management's statement that the Funds have experienced significant volatility in assets under management and are not yet stabilized at an asset size at which economies of scale are realized. In addition, the Committee noted the Adviser's statement that it will continue to monitor the ETF fee landscape and recommend changes as the ETFs' assets individually and across the complex grow to levels where economies of scale may be achievable. The Committee also noted the Adviser's statement that Guggenheim continues to develop the infrastructure needed to support Fund asset growth and to achieve economies of scale across the firm's various products and product lines. Thus, while Guggenheim may be benefiting from certain economies of scale and related cost efficiencies, it is concurrently realizing new costs and expenses associated with investment in infrastructure, personnel and systems.
Overall Conclusions
Based on the foregoing, the Committee determined at the May Meeting that the investment advisory fees are fair and reasonable in light of the extent and quality of the services provided and other benefits received and that the continuation of the Advisory Agreement is in the best interests of each Fund. In reaching this conclusion, no single factor was determinative or conclusive and each Committee member, in the exercise of his business judgment, may attribute different weights to different factors. At the May Meeting, the Committee, constituting all of the Independent Trustees, recommended the renewal of the Advisory Agreement for an additional 12-month term. Thereafter, at a meeting held on May 20, 2015, the Board, including all of the Independent Trustees, approved the removal of the Advisory Agreement for an additional 12-month term.
| 68 | CLAYMORE EXCHANGE-TRADED FUND TRUST 2 ANNUAL REPORT |
| APPENDIX A | August 31, 2015 |
Claymore Exchange-Traded Fund Trust 2
• Guggenheim Canadian Energy Income ETF (ENY)
• Guggenheim China All-Cap ETF (YAO)
• Guggenheim China Real Estate ETF (TAO)
• Guggenheim China Small Cap ETF (HAO)
• Guggenheim China Technology ETF (CQQQ)
• Guggenheim Frontier Markets ETF (FRN)
• Guggenheim International Multi-Asset Income ETF (HGI)
• Guggenheim Shipping ETF (SEA)
• Guggenheim Solar ETF (TAN)
• Guggenheim Timber ETF (CUT)
• Guggenheim S&P Global Water Index ETF (CGW)
| CLAYMORE EXCHANGE-TRADED FUND TRUST 2 ANNUAL REPORT | 69 |
This Page Intentionally Left Blank.
| TRUST INFORMATION | August 31, 2015 |
| Board of Trustees | | Principal Executive Officers | | Investment Adviser | | Accounting Agent, |
| Randall C. Barnes | | Donald C. Cacciapaglia | | Guggenheim Funds | | Custodian and |
| | | President and Chief | | Investment Advisors, LLC | | Transfer Agent |
| Donald C. Cacciapaglia* | | Executive Officer | | Chicago, IL | | The Bank of New York |
| | | | | | | Mellon Corp. |
| Donald A. Chubb, Jr. | | Joanna M. Catalucci | | Distributor | | New York, NY |
| | | Chief Compliance Officer | | Guggenheim Funds | | |
| Jerry B. Farley | | | | Distributors, LLC | | Legal Counsel |
| | | Amy J. Lee | | Chicago, IL | | Dechert LLP |
| Roman Friedrich III | | Chief Legal Officer | | | | New York, NY |
| | | | | Administrator | | |
| Robert B. Karn III | | Mark M. Mathiasen | | Rydex Fund Services, LLC | | Independent Registered |
| | | Secretary | | Rockville, MD | | Public Accounting Firm |
| Ronald A. Nyberg | | | | | | Ernst & Young LLP |
| | | John L. Sullivan | | | | Chicago, IL |
| Maynard F. Oliverius | | Chief Financial Officer, | | | | |
| | | Chief Accounting Officer | | | | |
| Ronald E. Toupin, Jr., | | and Treasurer | | | | |
| Chairman | | | | | | |
| | | | | | | |
| * Trustee is an "interested person" (as defined in section 2(a)(19) of the 1940 Act) ("Interested Trustee") of the Trust because of his position as the President and CEO of the Investment Adviser and the Distributor. | | | | | | |
Privacy Principles of the Trust for Shareholders
The Funds are committed to maintaining the privacy of their shareholders and to safeguarding their non-public personal information. The following information is provided to help you understand what personal information the Funds collect, how we protect that information and why, in certain cases, we may share information with select other parties.
Generally, the Funds do not receive any non-public personal information relating to their shareholders, although certain non-public personal information of their shareholders may become available to the Funds. The Funds do not disclose any non-public personal information about their shareholders or former shareholders to anyone, except as permitted by law or as is necessary in order to service shareholder accounts (for example, to a transfer agent or third party administrator).
The Funds restrict access to non-public personal information about the shareholders to Guggenheim Funds Investment Advisors, LLC employees with a legitimate business need for the information. The Funds maintain physical, electronic and procedural safeguards designed to protect the non-public personal information of their shareholders.
Questions concerning your shares of the Trust?
• If your shares are held in a Brokerage Account, contact your Broker.
This report is sent to shareholders of the Funds for their information. It is not a Prospectus, circular or representation intended for use in the purchase or sale of shares of the Funds or of any securities mentioned in this report.
A description of the Funds' proxy voting policies and procedures related to portfolio securities is available without charge, upon request, by calling the Funds at (800)345-7999.
Information regarding how the Funds voted proxies for portfolio securities, if applicable, during the most recent 12-month period ended June 30, is also available, without charge and upon request by calling (800) 345-7999, by visiting Guggenheim Investments' website at guggenheiminvestments.com or by accessing the Funds' Form N-PX on the U.S. Securities and Exchange Commission's ("SEC") website at www.sec.gov.
The Funds file their complete schedule of portfolio holdings with the SEC for the first and third quarters of each fiscal year on Form N-Q. The Funds' Form N-Q is available on the SEC website at www.sec.gov or by visiting Guggenheim Investments' website at guggenheiminvestments.com. The Funds' Form N-Q may also be viewed and copied at the SEC's Public Reference Room in Washington, DC; information on the operation of the Public Reference Room may be obtained by calling (800) SEC-0330.
Premium/Discount Information
Information showing the number of days the market price of each Fund's shares was greater than the Fund's NAV and the number of days it was less than the Fund's NAV (i.e., premium or discount) for various time periods is available by visiting the Funds' website at guggenheiminvestments.com.
| CLAYMORE EXCHANGE-TRADED FUND TRUST 2 ANNUAL REPORT | 71 |
Guggenheim Funds Investment Advisors, LLC
Guggenheim Funds Investment Advisors, LLC (the "Investment Adviser") manages the investment and reinvestment of each Fund's assets and administers the affairs of each Fund to the extent requested by the Board of Trustees. The Investment Adviser also acts as investment adviser to closed-end and open-end management investment companies. The Investment Adviser and its affiliates provide supervision, management or servicing of assets with a commitment to consistently delivering exceptional service. The Investment Adviser is a subsidiary of Guggenheim Partners, LLC, a global, diversified financial services firm with more than $240 billion in total assets as of June 30, 2015. Guggenheim Partners, LLC, through its affiliates, provides investment management, investment advisory, insurance, investment banking, and capital markets services. The firm is headquartered in Chicago and New York with a global network of offices throughout the United States, Europe, and Asia.
Portfolio Management
The portfolio managers who are currently responsible for the day-to-day management of Guggenheim China All-Cap ETF, Guggenheim China Technology ETF, Guggenheim Solar ETF, Guggenheim Emerging Markets Real Estate ETF, Guggenheim S&P High Income Infrastructure ETF and Guggenheim S&P Global Water Index ETF's portfolios are Michael P. Byrum, CFA, James R. King, CFA, and Cindy Gao. Mr. Byrum is a Senior Vice President of Guggenheim Investments and joined Guggenheim Investments in 1993. Mr. Byrum holds a degree in finance from Miami University of Ohio and is a member of the CFA Institute and the Washington Society of Investment Analysts. Mr. King is a Portfolio Manager of Guggenheim Investments and rejoined Guggenheim Investments in 2011 as the lead portfolio manager for exchange-traded products. Mr. King holds a bachelor's degree in finance from the University of Maryland, and has earned the Chartered Financial Analyst designation. Ms. Gao is an ETF Analyst in ETF Portfolio Management of Guggenheim Investments and joined Guggenheim Investments in December of 2010. Ms. Gao received a M.S. in Accounting from the University of Illinois at Chicago.
Claymore Exchange-Traded Fund Trust 2 Overview
The Claymore Exchange-Traded Fund Trust 2 (the "Trust") is an investment company complex consisting of 13 separate exchange-traded "index funds" as of September 30, 2015. The investment objective of each of the index funds is to correspond generally to the performance, before fees and expenses, of a specified market index.
This material must be preceded or accompanied by a prospectus for the fund being offered. The prospectus contains information about the Fund including a discussion of investment objectives, risks, ongoing expenses and sales charges. If a prospectus did not accompany this report, you can obtain one from your financial adviser, from our website at http://guggenheiminvestments.com or by calling (800)345-7999. Please read the prospectus carefully before investing. All Funds are subject to market risk and shares when sold may be worth more or less than their original cost. You can lose money investing in the Funds.
Guggenheim Funds Distributors, LLC
227 West Monroe Street
Chicago, IL 60606
Member FINRA/SIPC (10/15)
NOT FDIC-INSURED l NOT BANK-GUARANTEED l MAY LOSE VALUE
ETF-002-AR-0815
Item 2. Code of Ethics.
(a) The registrant has adopted a code of ethics that applies to its principal executive officer, principal financial officer, principal accounting officer or controller, or persons performing similar functions (the "Code of Ethics").
(b) No information need be disclosed pursuant to this paragraph.
(c) The registrant has not amended its Code of Ethics during the period covered by the report presented in Item 1 hereto.
(d) The registrant has not granted a waiver or an implicit waiver to its principal executive officer, principal financial officer, principal accounting officer or controller, or persons performing similar functions from a provision of its Code of Ethics during the period covered by this report.
(e) Not applicable.
(f) (1) The registrant's Code of Ethics is attached hereto as Exhibit (a)(1).
Item 3. Audit Committee Financial Expert.
(Under applicable securities laws, a person who is determined to be an audit committee financial expert will not be deemed an "expert" for any purpose, including without limitation for purposes of Section 11 of the Securities Act of 1933, as amended, as a result of being designated or identified as an audit committee financial expert. The designation or identification of a person as an audit committee financial expert does not impose on such person any duties, obligations, or liabilities that are greater than the duties, obligations, and liabilities imposed on such person as a member of the Audit Committee and Board of Trustees in the absence of such designation or identification. The designation or identification of a person as an audit committee financial expert does not affect the duties, obligations or liability of any other member of the Audit Committee or Board of Trustees.)
Item 4. Principal Accountant Fees and Services.
The registrant’s principal accountant did not bill fees for non-audit services that required preapproval by the Audit Committee pursuant to paragraph (c)(7)(ii) of Rule 2-01 of Regulation S-X during the registrant’s last two fiscal years.
The registrant’s principal accountant did not bill fees for tax services that required preapproval by the Audit Committee pursuant to paragraph (c)(7)(ii) of Rule 2-01 of Regulation S-X during the registrant’s last two fiscal years.
The registrant’s principal accountant did not bill fees for services not included in Items 4(a), (b) or (c) above that required preapproval by the Audit Committee pursuant to paragraph (c)(7)(ii) of Rule 2-01 of Regulation S-X during the registrant’s last two fiscal years.
(i) The Audit Committee reviews, and in its sole discretion, pre-approves, pursuant to written pre-approval procedures (A) all engagements for audit and non-audit services to be provided by the principal accountant to the registrant and (B) all engagements for non-audit services to be provided by the principal accountant (1) to the registrant’s investment adviser (not including a sub-adviser whose role is primarily portfolio management and is sub-contracted or overseen by another investment adviser) and (2) to any entity controlling, controlled by or under common control with the registrant’s investment adviser that provides ongoing services to the registrant; but in the case of the services described in subsection (B)(1) or (2), only if the engagement relates directly to the operations and financial reporting of the registrant; provided that such pre-approval need not be obtained in circumstances in which the pre-approval requirement is waived under rules promulgated by the Securities and Exchange Commission or New York Stock Exchange listing standards. Sections V.B.2 and V.B.3 of the Audit Committee’s revised Audit Committee Charter contain the Audit Committee’s Pre-Approval Policies and Procedures and such sections are included below.
(ii) None of the services described in each of Items 4(b) through (d) were approved by the Audit Committee pursuant to paragraph (c)(7)(i)(C) of Rule 2-01 of Regulation S-X.
(f) Not applicable.
(g) The aggregate non-audit fees billed by the registrant's accountant for services rendered to the registrant, the registrant’s investment adviser (not including a sub-adviser whose role is primarily portfolio management and is sub-contracted with or overseen by another investment adviser) and/or any entity controlling, controlled by, or under common control with the adviser that provides ongoing services to the registrant that directly related to the operations and financial reporting of the registrant were $58,370 and $30,900 for the fiscal years ending August 31, 2015, and August 31, 2015, respectively.
(h) Not applicable.
Item 5. Audit Committee of Listed Registrants.
(a) The Audit Committee was established as a separately designated standing audit committee in accordance with Section 3(a)(58)(A) of the Securities Exchange Act of 1934, as amended. The Audit Committee of the registrant is composed of Ronald A. Nyberg, Donald A. Chubb, Jerry B. Farley, Maynard F. Oliverius, Ronald E. Toupin, Jr., Randall C. Barnes, Roman Friedrich III and Robert B. Karn III.
(b) Not applicable.
Item 6. Schedule of Investments.
The Schedule of Investments is included as part of Item 1.
Item 7. Disclosure of Proxy Voting Policies and Procedures for Closed-End Management Investment Companies.
Not Applicable.
Item 8. Portfolio Managers of Closed-End Management Investment Companies.
Not Applicable.
Item 9. Purchases of Equity Securities by Closed-End Management Investment Company and Affiliated Purchasers.
Not Applicable.
Item 10. Submission of Matters to a Vote of Security Holders.
The registrant has not made any material changes to the procedures by which shareholders may recommend nominees to the registrant’s Board of Trustees.
Item 11. Controls and Procedures.
(a) The registrant's principal executive officer and principal financial officer have evaluated the registrant's disclosure controls and procedures (as defined in Rule 30a-3(c) under the Investment Company Act) as of a date within 90 days of this filing and have concluded based on such evaluation as required by Rule 30a-3(b) under the Investment Company Act, that the registrant's disclosure controls and procedures were effective as of that date in ensuring that information required to be disclosed by the registrant in this Form N-CSR was recorded, processed, summarized, and reported within the time periods specified in the Securities and Exchange Commission’s rules and forms.
(b) There were no changes in the registrant’s internal control over financial reporting (as defined in Rule 30a-3(d) under the Investment Company Act) that occurred during the registrant’s second fiscal quarter of the period covered by this report that have materially affected, or are reasonably likely to materially affect, the registrant’s internal control over financial reporting.
Item 12. Exhibits.
(a)(1) Code of Ethics for Chief Executive and Senior Financial Officers.
(a)(2) Certifications of principal executive officer and principal financial officer pursuant to Rule 30a-2(a) under the Investment Company Act.
(b) Certifications of principal executive officer and principal financial officer pursuant to Rule 30a-2(b) under the Investment Company Act and Section 906 of the Sarbanes-Oxley Act of 2002.
Name: Donald C. Cacciapaglia
Name: Donald C. Cacciapaglia
Name: John L. Sullivan